Hedging Interest Rate Risk With Financial Futures
42
University of North Dakota University of North Dakota UND Scholarly Commons UND Scholarly Commons Undergraduate Theses and Senior Projects Theses, Dissertations, and Senior Projects 5-1986 Hedging Interest Rate Risk With Financial Futures Hedging Interest Rate Risk With Financial Futures Jerry M. Stai Follow this and additional works at: https://commons.und.edu/senior-projects Recommended Citation Recommended Citation Stai, Jerry M., "Hedging Interest Rate Risk With Financial Futures" (1986). Undergraduate Theses and Senior Projects. 167. https://commons.und.edu/senior-projects/167 This Senior Project is brought to you for free and open access by the Theses, Dissertations, and Senior Projects at UND Scholarly Commons. It has been accepted for inclusion in Undergraduate Theses and Senior Projects by an authorized administrator of UND Scholarly Commons. For more information, please contact [email protected].
-
Upload
khangminh22 -
Category
Documents
-
view
0 -
download
0
Transcript of Hedging Interest Rate Risk With Financial Futures

University of North Dakota University of North Dakota
UND Scholarly Commons UND Scholarly Commons
Undergraduate Theses and Senior Projects Theses, Dissertations, and Senior Projects
5-1986
Hedging Interest Rate Risk With Financial Futures Hedging Interest Rate Risk With Financial Futures
Jerry M. Stai
Follow this and additional works at: https://commons.und.edu/senior-projects
Recommended Citation Recommended Citation Stai, Jerry M., "Hedging Interest Rate Risk With Financial Futures" (1986). Undergraduate Theses and Senior Projects. 167. https://commons.und.edu/senior-projects/167
This Senior Project is brought to you for free and open access by the Theses, Dissertations, and Senior Projects at UND Scholarly Commons. It has been accepted for inclusion in Undergraduate Theses and Senior Projects by an authorized administrator of UND Scholarly Commons. For more information, please contact [email protected].

HEDGING INTE ST RATE RISK
\~ITH
FINANCIAL FUTURES
Jerry M. S
3 l or of
Minot State College, 1975
An Independent Study
Submitted to the Graduate F act!1 of
The University of North Dakota
in partial fulfillment of the requirements
of
Masters of Business Administration
of North Dakota Graduate Center
May
1986

is i
the requi
Universi
submi
Degree
Dakota is
iversi
s
D
APPROVAL
Jerry M. Stai in partial
Business Adminis
Facul
-i-
1 llment
on

PERMISSION
Title: HEDGING INTEREST RATE RISK WITH FINANCIAL FUTURES
Department: School of Business and Public Administration
Degree: Master of Business Administration
In presenting this independent study in partial fulfillment of the require
ments for a graduate degree from the University of North Dakota, I agree that
the Library of this University shall make it freely available for inspection. I
further agree that permission for extensive copying for scholarly purposes may
be granted by the professor who supervised my work or, in his absence, by the
Chairman of the Department. It is understood that any copying or publication or
other use of this independent study or part thereof for financial gain shall not
be allowed without my written permission. It is a 1 so unders toad that due
recognition shall be given to me and to the University of North Dakota in any
scholarly use which may be made of any material in my independent study.
Signature
Date
-ii-

TABLE OF CONTENTS
List of Exhi ts ......... . . . . . . . . . . . . . . . . . . . . . . . . . . . ........... . iv
Acknowledgments ..... . . . . . . . . . ...... . • • • • • • • • • • • • • • • • • ••••• 9 •• V
Abs act.. • •••• Ill • • • • • • • • • • • • • • • • • • • • • • • • • • • • • • • • • • •••••••
I I 1
Background Information........ . . . . . . 1 Research Objective................... ............. 5 Research Methodo l . . . . . . . . . . . . . . . . . . . 6
CHAPTER II. THE CONCEPT OF HEDGING ........................... . 8
of Basis . . . . . . . . . . . . . . . . . . . . . . . . . . . . . 9 Hedge...... . . . . . . . . . . . . . . . . . . . . 12
CHAPTER IIL MARKET INSTRUMENTS USED IN HEDGING............ . . . . . 19
Treasury Bills...................... .... ......... 19 Treasury Notes and Bonds. . . .. . . . . . . . . . . .. . . . . . . . . 20 G NMJ\ 1 s . . . . . . . . . . . . . . . . . . . . . . . . . . . . . . . . . . . . . . . . . . . 2 2
CHAPTER IV. DESIGNING HEDGE STRATEGIES FOR THRIFTS •.............. 24
Regulatory Authorization...................... . . . 24 Hedging Assets............. ....•................ . 26 Hedging Liabilities..... ............ . ........ . 27 Hedging Mortgage Banking Operations................ 28
CHAPTER V. SUMMARY AND CONCLUSIONS ......•........•............ 30
Summary.......................................... . 30 Conclusion •......................•...•....•.•..•.. 31
Bibliography ... .......................... . 32
-iii-

LIST OF EXHIBITS
Exhibits Page
A. Interest-rate Sensitive Assets Versus Liabilities and the Effect on Net Interest Margin ••..••.••.•••••••.•.••.•..•.••.•• 2
8. Rate-Sensitivity Trends of FSLIC-Insured Associations ••••••.••••••• 3
-iv-

I express my sincerest ati to many people in comp1 on is
s I am th ul for ins ration and assistance of the f acul and
s of Universi D have s er us so at
r Base. I s s his
id·eas, commen ons, e ing
discussions. He s ence and relentless encour t whi I
am deeply grateful.
I want to k i i V 1 s me f i i1 r~WS. are:
Frank ,J son, Finan 11 i am M arter, and As
Mark Lahey, Shearson Lehman Brothers; and Martin Finegold, Goldman-Sachs.
The completion is study was made possible through the eff i ency and
hard work of the highest quality typists. My thanks Lisa H and Pam
Miller.
-v-

ABSTRACT
In the period of volatile i t since 1979, many businesses have
sought lower their exposure i t-rate sk, whi is the lity
that profits and values will adversely affected by changes in market interest
rates The thrift indus has cularly been damaged by i ate
By
fas
Loan
s
assets, cause a assi
, the regulatory agency for the
, l i abil i es
if ts, has set i
authorizing i ividual thri utilize financial futures as a
interest- The centr a 1 issue of is paper is
ng certain about i t is
1 aw ons
reduce
go up or Hedging wi financial to someone e 1 se ..

INTRODUCTION
A. BACKGROUND INFORMATION
In the period of volatile interest rates since October of 1979, many busi
nesses have sought to lower their exposure to interest rate risk, which is the
probability that profits and values will be adversely affected by changes in
market interest rates. Virtually all businesses that must finance in the short
term interest markets have some exposure to interest rate risk. This risk can
make good investments unprofitable, distort balance sheets, and generally con
found the planning process. The uncertainty of future interest rate levels
makes accurate financial planning difficult and can lead to undesired earnings
volatility unless interest rates on assets adjust with those of liabilities.
The thrift industry has particularly been damaged by interest rate risk as
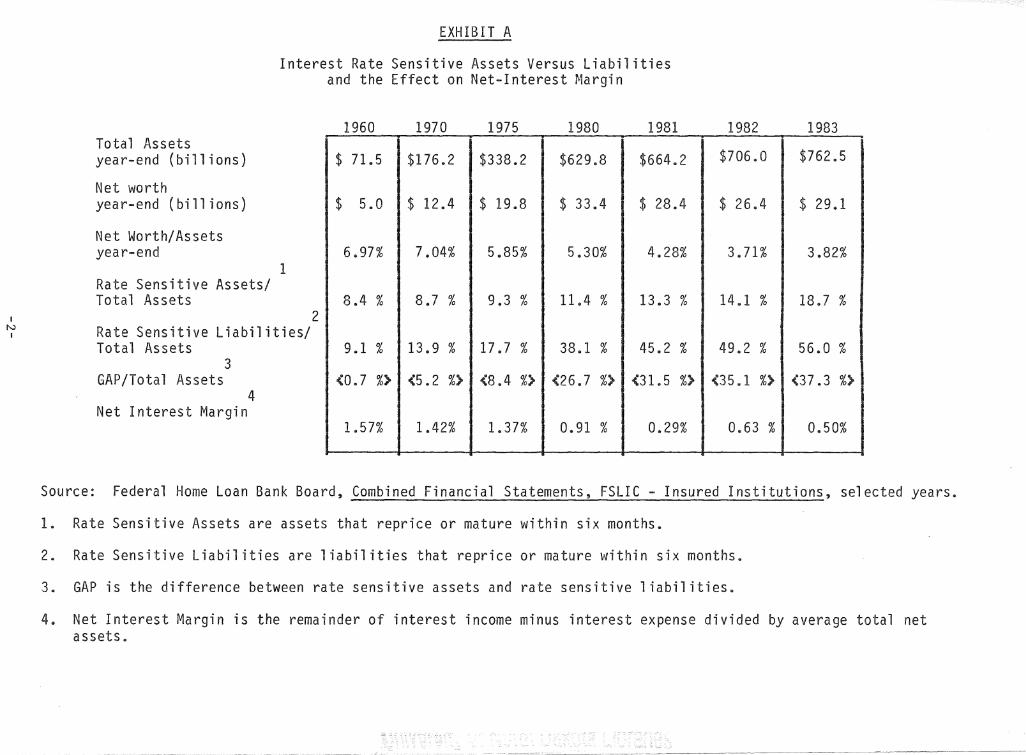
can be seen in Exhibit A. Although thrift institutions have enjoyed growth in
assets over the last two decades and have been able to increase absolute dollars
of net worth, their collective networth-to-assets ratio declined steadily from
7.04% in 1970 to 3.71% in 1982. Over the same period, rate-sensitive assets,
which reprice or mature within six months, increased modestly relative to rate
sensitive liabilities and Exhibit B illustrates this relationship. The most
notable change in this asset-liability relationship was in 1980, three years
after thrifts started offering 6-months certificates of deposit, which followed
closely to the 6-month Treasury bill. As the level of interest rates rose in
the early 1980 1 s the GAP, defined as rate-sensitive assets minus rate-sensitive
liabilities, increased dramatically meaning liabilities repriced or matured
-1-
I N
I
EXHIBIT A
Interest Rate Sensitive Assets Versus Liabilities and the Effect on Net-Interest Margin
Total Assets year-end (billions)
Net worth year-end (billions)
Net Worth/Assets year-end
1 Rate Sensitive Assets/ Total Assets
2 Rate Sensitive Liabilities/ Total Assets
3 GAP/Total Assets
4 Net Interest Margin
1960
$ 71.5
$ 5.0
6.97%
8.4 %
9.1 %
(0.7 %>
1.57%
1970
$176.2
$ 12.4
7.04%
8.7 %
13.9 %
(5.2 %)
1.42%
1975 1980 1981
$338.2 $629.8 $664.2
$ 19.8 $ 33.4 $ 28.4
5.85% 5.30% 4.28%
9.3 % 11.4 % 13.3 %
17.7 % 38.1 % 45.2 %
(8.4 %) (26.7 %) (31.5 %)
1.37% 0.91 % 0.29%
1982 1983
$706.0 $762.5
$ 26.4 $ 29.1
3. 71% 3.82%
14.1 % 18.7 %
49.2 % 56.0 %
(35.1 %) (37.3 %)
0.63 % 0.50%
Source: Federal Horne Loan Bank Board, Combined Financial Statements, FSLIC - Insured Institutions, selected years.
1. Rate Sensitive Assets are assets that reprice or mature within six months.
2. Rate Sensitive Liabilities are liabilities that reprice or mature within six months.
3. GAP is the difference between rate sensitive assets and rate sensitive liabilities.
4. Net Interest Margin is the remainder of interest income minus interest expense divided by average total net assets

rt:r 1..1::111., UI KAlt-~tN~lllV!IT IKtNU~ Ending FSLIC-INSURED ASSOCIATIONS Assets
55%
50%
45%
40%
35%
30% I
(.,.) Rate-Sensitive Liabilities I
25%
20%
15%
10% Rate-Sensitive Assets
5%
0%
1970 1971 1972 1973 1974 1975 1976 1977 1978 1979 1980 1981 1982 1983 1984 1985
Rate-Sensitive Assets and Liabilities are those assets and liabilities that 11 either mature or be repriced thin six months.

faster than the assets. I1:1 an increasing interest-rate environment, liability
costs rose faster that assets earned. This can be reflected in the net interest
margin, which is the remainder of interest income minus interest expense divided
by the average total net assets. As shown in Exhibit A the net interest margin
in 1960 was 1.57% and steadily deteriorated to 0.63% in 1982 causing the net
worth ratio to decline.
The degree of interest-rate risk in thrifts has increased subs tan ti ally
during the last decade because of greater fluctuations in market interest rates
and the large shift to interest sensitive liabilities. Regulatory authorization
for hedging and futures operations as well as more rate-sensitive types of
assets has provided tools for more effective management of interest-rate risk.
Hedging
Hedging refers to any action taken to reduce an existing risk. Traditional
hedging theory emphasizes the risk avoidance potential of futures markets.I
Whereas the cash market is the market in which an actual physical commodity is
traded, a forward market transaction is merely a cash transaction in which two
parties agree to the purchase and sale of a commodity at some time in the future
under such terms as the two parties state. The future market is distinguished
from the forward market in that the futures contract is a standardized agreement
obligating two parties to a transaction involving a set amount and grade of a
commodity at a price and time specified. Hence, hedgers take futures positions
equal and opposite of their position in the cash market so the price change in
one market offsets the price charge in the other.
1 Mark J. Powers, Inside the Financial Futures Markets, 2d Ed. (New York: John Wiley and Sons, Inc., 1984) p. 175.
-4-

Hedging cannot take place in the absence of active speculative interest,
and speculation cannot take place in the absence of price volatility that
generates a need for active hedging operations. A hedger enters the futures
market to offset or manage an existing risk by shifting that risk of price
change to a speculator. The speculator in the futures market invests for the
prospect of gain rather than to offset a risk position.2
Once financial futures have been chosen as a tool, the hedger must identify
whether his application requires going long or short contracts. In going long,
an investor purchases the obligation to take delivery of a financial instrument
at a set price at a future date. In going short, an obligation is established
to make delivery in the same manner. The effect of going long is much like
lengthening the maturity of a portfolio to benefit from a rise in market price.
Conversely, going short is similar to shortening maturity or selling assets
held in a portfolio to benefit from a decline in market price.
Because financial futures have neither a yield nor a unique credit risk,
the main feature captured by the contracts is the volatility of the instrument
on which the contracts are written. For this reason, financial futures can be
used effectively as a principal management tool to offset general market volati-
1 i ty.
. B. RESEARCH OBJECTIVE
As a group, thrift institutions generally rely on savings deposits as a
main source of borrowed money. Their assets tend to be longer term investments
2 Oliver H. Jones, Financial Futures Market, (U.S. League of Savings Institution, 1983), pp. 22-23.
-5-

in a atively sm l hi ly liquid l io term
inves This term
inves a for f lure.
rates as and l i 1 i es narrows and even-
ly ve, due i ncreas ·i cos a is i t r
m Since i t r are i insi to ifts iness es
i ve 1 y and man uce un s on.
s r
costly
ri vi f
could
1
a f
F
icient
ng sys
d
s
as a
g
as a
Loan
icy
uce
e.
The is research is to determine how thrifts can use finan-
ci al
Because
tures
if
mortgage 1 oan
interest-rate ri
in recent
on,
a"'" , :,
e sts
loan is originated and sold. A sub-
thri
and
can use f i nanci
1 oans.
in i
C. RESEARCH METHODOL
Constraints
Given t-rate risk
asset and liabili man t.
more i 11 in s 1 i ir
r ri
is research is
in es r ri
Ht i
me a
determine
in origi-
are
other sol uti ans including internal hedges, forward cash markets, and shorter-
term investments. None of these al tern a ti ves remove the essential need for
mastering the process of hedging in financial futures. This paper will be
-6-

limited to the financial futures as a hedging tool for the thrift industry
against interest-rate risk. The research will be constrained to the currently
published literature.
Methodology
The methodology used in conducting this study will consist of a complete
review of the available literature. In addition, personal interviews will be
conducted with investment bankers and other practitioners of financial futures
operations.
Organization of the Study
In order to use financial futures to reduce interest-rate risk, Chapter II
entitled "The Concept of Hedging" will introduce, explain, and illustrate con
cepts of hedging using financial futures. Chapter III consists of "Market
Instruments Used In Hedging", describing the various contracts used in the
hedging process. Chapter IV wi 11 combine the kn owl edge of hedging and the
market instruments in "Designing the Hedge Strategies for Thrifts". Chapter V
will summarize and conclude this paper.
-7-

CHAPTER II
THE CONCEPT OF HEDGING
Hedgi in the ures market can ined as the use
contracts as an economic ( ice) s tute a tr an sac on at 11
a later me in cash markeL 3 The ve an t rate
am is
corTespondi
rate '
volatni
Hedgi s
decisions as
f o 11 owing can
1.
2.
f anges in ue asse or 1 i 1 i
profit or loss from ons, 4 gi i
one can establish in a s fie ra i
ld as a s man t
and utilize futures
aid in this ,...
process::)
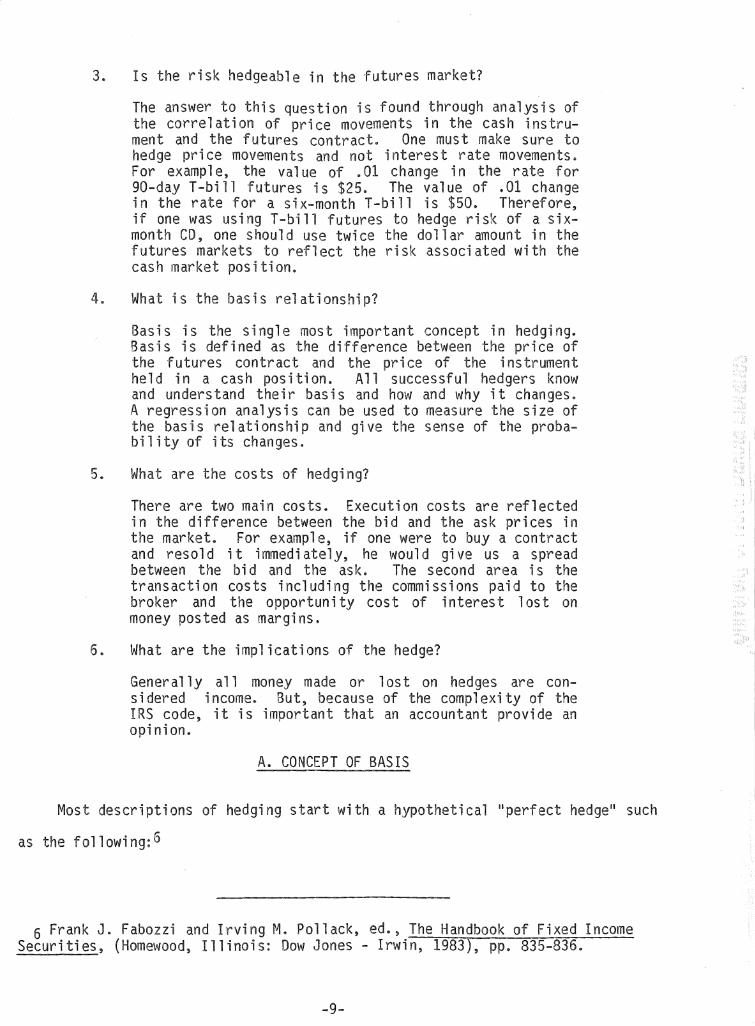
What is the risk exposure?
This step is quanti the loss at would be incurred if there were no hedge. The answer includes analysis
outlook for interest rates, the es mation of the size of the rate change and probability of i occurrence, Once this has been i den f i ed, the outcome can be calculated.
Is the ri affordable?
If ri is rel ve the capi of the no hedge m necess How,2ver, if the risk is large relative the capital, then hedge should be implemented.
3 Nancy H. Roths n, ed., The Han McGraw-Hill, 1984), p. 157.
of Finan al Futures, (Nev,.1 Y
4 Ibid.
.~ I.,
futures
hedg
es
in t
t
involves
The
5 Mark J. Powers, Inside the Financial Futures Markets, 2nd ed. (New York: John Wiley & Sons, Inc., 1984), pp. 182-184.
-8-
as £ I
t
3.
4&
,J.
I" o.
Is ri geable in f es mar
if one mon futures cash m
at is
Basis is Bas·is is
Fu
are
ions i
There are n costs. Execu on cos in the difference between the d and
What are the
ally l sidered ncome. I code, it is
nion.
criptions
ng:6
if one \l'Jere he 1,wuld
ask. s ar~a ing the commissions d i cost in
ge?
made or 1 os t on compl
an accountant
A. CONCEPT OF BASIS
start a i cal 11
ysis ins
on
an
6 Frank J. Fabozzi and Irving M. Pollack, ed., The Handbook of Fixed Income Securities, (Homewood, Illinois: Dow Jones - Irwin, 1983), pp. 835-836.
-9-

June 1: Owns $1 million U.S. Treasury 7 7/8 of 1995 at 68-04 to 12.329 percent.
No transaction. December 1:
U.S. Treasury 7 7/8s of 1995 are at 60-12 to yield 13.870 percent.
No transaction. Unrealized loss:
7 24/32 or $77,500
Sellers 10 December bond contracts at 69-02 to yield 12.152 percent.
Buys 10 December bond contracts at 61-10 to yield 13.705 percent.
Realized profit (before commissions): 7 24/32 or $77,500
In a rising interest rate environment, shorting futures against an inven
tory of financial assets hedges the inventory against the loss of value that
would result as interest rates rise (prices fall). A short futures position
would yield a profit as rates rise. The erosion in the value of the cash market
asset would be hedged to the extent of the profit made on the futures.
In the above example, the futures and the cash prices declined by identical
amounts between June 1 and December 1, so that the $77,500 paper loss incurred
in the bond portfolio was perfectly offset by an equivalent profit on the short
futures position. Another way to look at it is that the hedge was initiated on
June 1 at a 30/32 difference (69-02 minus 68-04) and was unwound on December 1
again at 30/32. This difference between cash and futures prices, called the
basis, is the controlling factor in determining the outcome of all hedge posi
tions.
If the basis on December 1 was less than 30/32, signifying that the futures
price had declined 1 ess than the cash market, the futures gain on the short
position would not have matched the decline in the market value of the cash
position. If, on the other hand, the basis on December 1 was greater than
30/32, the futures gain would have exceeded the cash market loss. In either
-10-
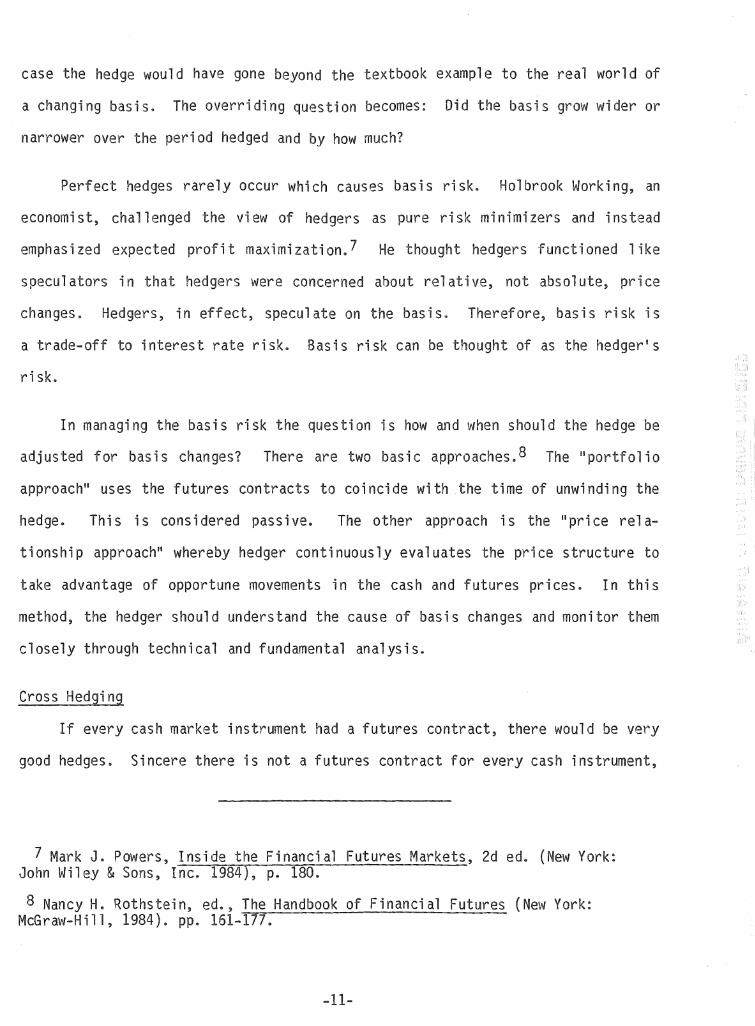
case would e e world
a an is' overriding d is or
narrower over
occur is H i an
ew s as ri mini zers and ins
m z on. 7 un l
s 1 u i C'"' '-''-
l is is
a to i t risk. 13 as is can as 's
risk.
In man is sk on is and s d
us s an are 8 io
approach 11 uses the futures contr me
is is considered passive, 0 approach is 11 price a-
continuously ce structure
hedge.
tionship
take tage rnovemen i the cash and -f ices. In this
method, the
clos y through
Cross Hedging
ger should understand the cause
i cal and fundamental an
If every cash market ins a f
basis chan s and monitor
is'
contr d be ve,ry
good hedges. Sincere there is not a futures contract cash ins
7 Mark J. Powers, Inside the Financial Futures Markets, 2d ed. (New York: John Wiley & Sons, Inc. 1984), p. 180.
8 Nancy H. Rothstein, ed., The Handbook of Financial Futures (New York: McGraw-Hill, 1984). pp. 161-177.
-11-

hedgers may have to use a futures contract different for that of the cash posi
tion but similar in price changes. This is called a cross hedge. An example of
a cross hedge is the use of T -bi 11 futures to hedge a cash market instrument
such as commercial paper. The reason for using cross hedges is that the cost of
additional basis risk is weighed against the cost of not being hedged at all.
The futures contract for the hedge is selected after a corr elation analysis
identifies the extent in which the cash instrument prices change with it.9
B. STRUCTURING THE HEDGE
The purpose of a hedge transaction is to earn from the futures position an
amount of money equal to the change in value of the interest rate exposure being
hedged. Because of maturity, coupon, credit worthiness and other differences
between the cash instrument and the futures contract, there usually is no dollar
for dollar change in values as interest rate changes. Therefore, a hedger must
use dollar equivalency,10 which refers to the process of structuring the hedge
in such a way that the hedger obtains equivalent dollar changes in the cash and
futures positions for the same interest rate change. Once this analysis is
complete, it wi 11 determine the hedge ratio, the number of futures contracts
required to offset the equivalence in the cash market.
Maturity Adjustments
The maturities of the debt instruments in the cash and futures positions
will usually be· different. This needs to be compensated. For example, assume a
$1,000,000 floating rate loan for one year, with the rate tied to the prime
rate. This loan could best be hedged by using 90-day CD or Euro do 11 ars
9 Mark J. Powers, Inside the Financial Futures Markets, 2d ed. (New York: John Wiley & Sons Inc., 1984) pp. 185-191.
10 Ibid.
-12-
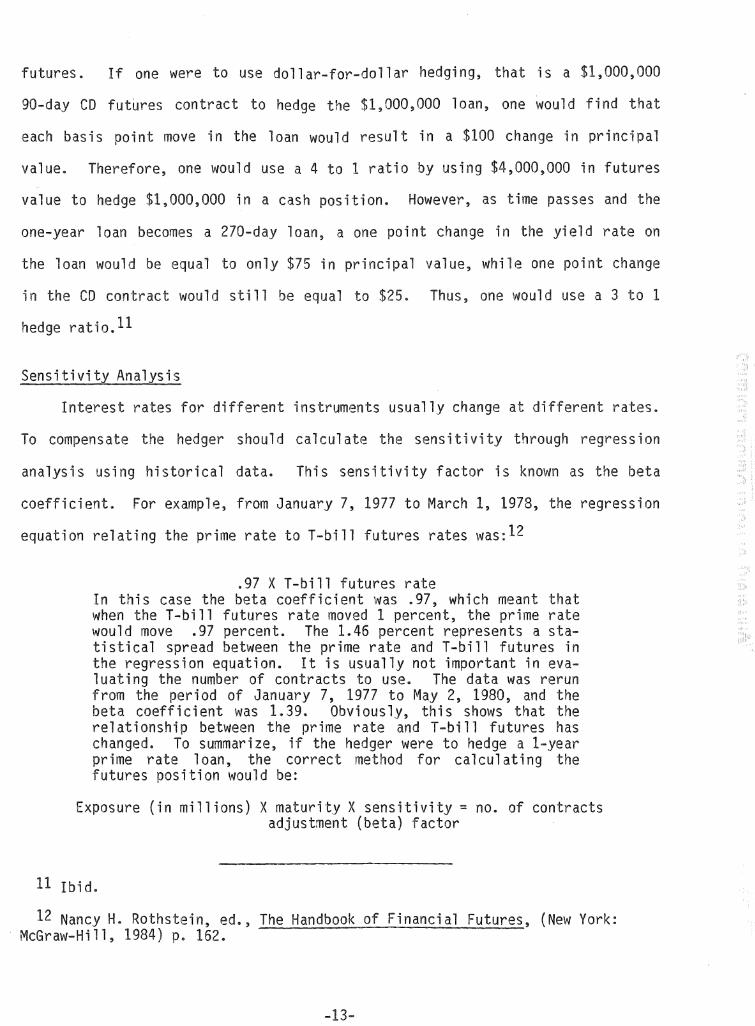
futures. If one were to use dollar-for-dollar hedging, that is a $1,000,000
90-day CD futures contract to hedge the $1,000,000 loan, one would find that
each basis point move in the loan would result in a $100 change in principal
value. Therefore, one would use a 4 to 1 ratio by using $4,000,000 in futures
value to hedge $1,000,000 in a cash position. However, as time passes and the
one-year loan becomes a 270-day loan, a one point change in the yield rate on
the loan would be equal to only $75 in principal value, while one point change
in the CD contract would still be equal to $25. Thus, one would use a 3 to 1
hedge ratio.11
Sensitivity Analysis
Interest rates for different instruments usually change at different rates.
To compensate the hedger should calculate the sensitivity through regression
analysis using historical data. This sensitivity factor is known as the beta
coefficient. For example, from January 7, 1977 to March l, 1978, the regression
equation relating the prime rate to T-bill futures rates was:12
.97 X T-bill futures rate In this case the beta coefficient was .97, which meant that when the T-bill futures rate moved 1 percent, the prime rate would move .97 percent. The 1.46 percent represents a statistical spread between the prime rate and T-bill futures in the regression equation. It is usually not important in eva-1 uati ng the number of contracts to use. The data was rerun from the period of January 7, 1977 to May 2, 1980, and the beta coefficient was 1.39. Obviously, this shows that the relationship between the prime rate and T-bill futures has changed. To summarize, if the hedger were to hedge a 1-year prime rate loan, the correct method for calculating the futures position would be:
Exposure (in millions) X maturity X sensitivity= no. of contracts adjustment (beta) factor
11 Ibid.
12 Nancy H. Rothstein, ed., The Handbook of Financial Futures, (New York: McGraw-Hill, 1984) p. 162.
-13-

Conversion
The conversion factor equates the coupon of the instrument being hedged
with the futures contract coupon.13 In these cases, hedgers should weight their
hedges, using a greater or lesser number of contracts than the face value of the
cash item being hedged in order to achieve the same dollar value in the two
coupons for the same rate change. For example, a 10-year Treasury future
contract with an 8% coupon needs to be weighted if the cash item is something
other than an 8%, 10-year instrument. This is so because a small increase in
interest rates for an 8% coupon might lose only $100 of value, while a 13%
coupon would lose $130 of value. Therefore, a hedge hedger would use 1.3 times
as many futures contracts as the amount being hedged.
Selecting the Contract Month
As in basis management there are two approaches in selecting the contract
months of the futures instruments in a hedge position. With the "portfolio
approach" the hedger wi 11 unlikely change the contract month of his hedge
because he selects the contract month to coincide as close as possible with the
maturity month of his cash position. In contrast the "price relationship
approach" involves continuous evaluation of delivery month price relationships.
Here a hedger would take advantage of unusual price relationships to place,
manage or lift his hedge positions. The hedger generally does not want to hold
positions during a contract's delivery month because of the unusual basis moves
during the delivery month. Another concern is the liquidity for the contract
month, which is reflected in the total volume being traded for that contract.
13 Ibid. pp. 174-175.
-14-

To understand the effects of one contract month over another contract month
in a 11 price relationship approach11 the hedger needs to be aware of shifts in the
yield curve, changes in financing costs, and convergence.
A yield curve is a chart in which yields are plotted on the vertical axis
and the term to maturity of U.S. government debt instruments is plotted on the
horizontal axis.14 A normal yield curve as shown in (a) below is an upward
curve to the right, reflecting the investor's demands for higher yields for
longer term investments. In (b} below, the yield curve is flat showing rates a
fairly even across the maturity range. An inverted yield curve as shown in (c)
below exists when short-term rates are higher than long-term rates and sometimes
yield curves become humped as shown in (d).
Yield Yield
(a) (b)
Yield Yield
r,,... ______ ,,.......,...--_
Time Time ---------(c) ( d)
An informed judgment regarding the basis begins with the study of the cash
futures price structure. Just as you can develop a yield curve for the cash
14 Ibid. p. 607.
-15-
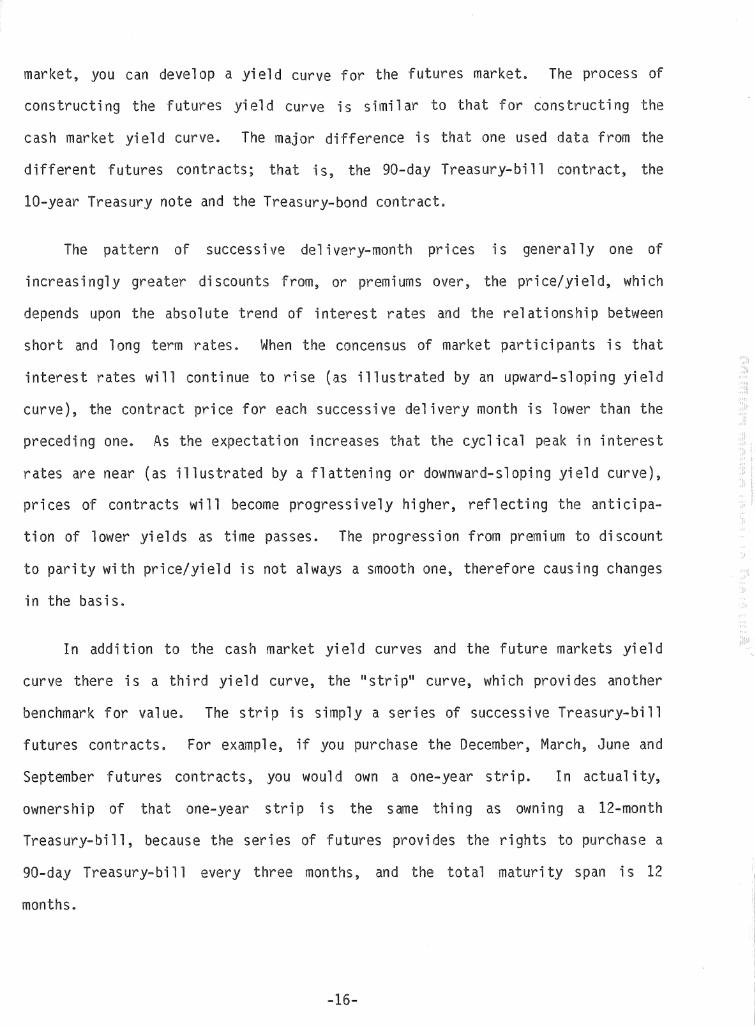
market, you can develop a yield curve for the futures market. The process of
constructing the futures yield curve is similar to that for constructing the
cash market yield curve. The major difference is that one used data from the
different futures contracts; that is, the 90-day Treasury-bi 11 contract, the
10-year Treasury note and the Treasury-bond contract.
The pattern of successive delivery-month prices is generally one of
increasingly greater discounts from, or premiums over, the price/yield, which
depends upon the absolute trend of interest rates and the relationship between
short and 1 ong term rates. When the concensus of market par ti ci pants is that
interest rates will continue to rise (as illustrated by an upward-sloping yield
curve), the contract price for each successive delivery month is lower than the
preceding one. As the expectation increases that the cyclical peak in interest
rates are near (as illustrated by a flattening or downward-sloping yield curve),
prices of contracts will become progressively higher, reflecting the anticipa
tion of lower yields as time passes. The progression from premium to discount
to parity with price/yield is not always a smooth one, therefore causing changes
in the basis.
In addition to the cash market yield curves and the future markets yield
curve there is a third yield curve, the "strip" curve, which provides another
benchmark for value. The strip is simply a series of successive Treasury-bill
futures contracts. For example, if you purchase the December, March, June and
September futures contracts, you would own a one-year strip. In actuality,
ownership of that one-year strip is the same thing as owning a 12-month
Treasury-bill, because the series of futures provides the rights to purchase a
90-day Treasury-bi 11 every three months, and the total maturity span is 12
months.
-16-
·.11
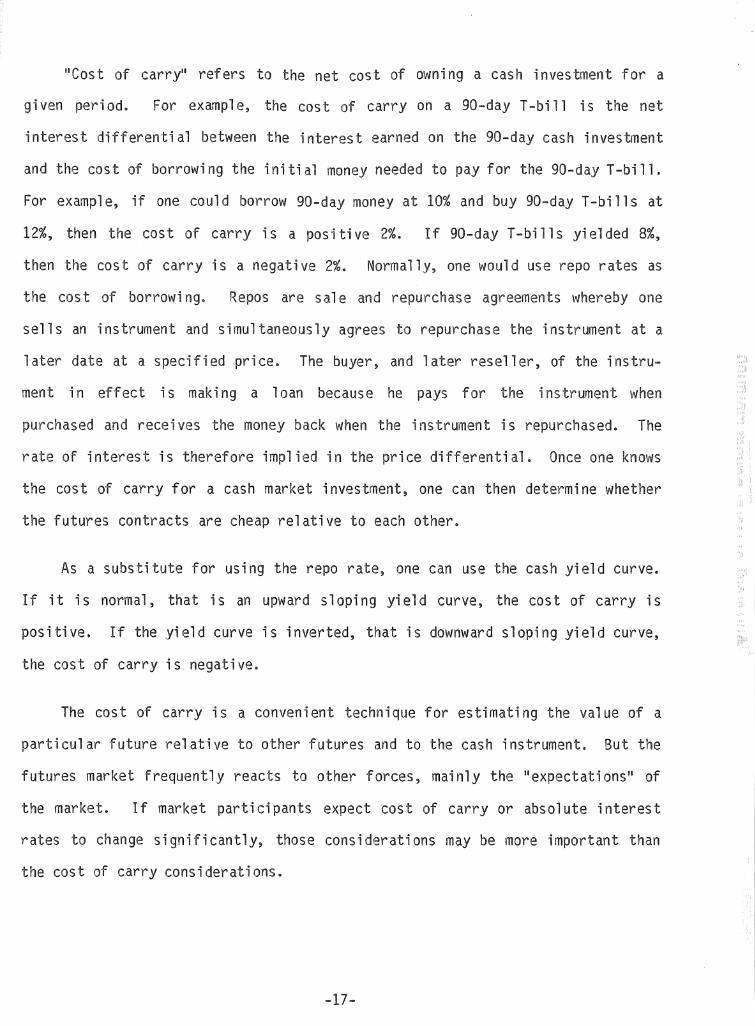
11 Cost of carry11 refers to the net cost of owning a cash investment for a
given period. For example, the cost of carry on a 90-day T-bill is the net
interest differential between the interest earned on the 90-day cash investment
and the cost of borrowing the initial money needed to pay for the 90-day T-bill.
For example, if one could borrow 90-day money at 10% and buy 90-day T-bills at
12%, then the cost of carry is a positive 2%. If 90-day T-bills yielded 8%,
then the cost of carry is a negative 2%. Normally, one would use repo rates as
the cost of borrowing. Repos are sale and repurchase agreements whereby one
sells an instrument and simultaneously agrees to repurchase the instrument at a
later date at a specified price. The buyer, and later reseller, of the instru
ment in effect is making a loan because he pays for the instrument when
purchased and receives the money back when the instrument is repurchased. The
rate of interest is therefore implied in the price differential. Once one knows
the cost of carry for a cash market investment, one can then determine whether
the futures contracts are cheap relative to each other.
As a substitute for using the repo rate, one can use the cash yield curve.
If it is normal, that is an upward sloping yield curve, the cost of carry is
positive. If the yield curve is inverted, that is downward sloping yield curve,
the cost of carry is negative.
The cost of carry is a convenient technique for estimating the value of a
particular future relative to other futures and to the cash instrument. But the
futures market frequently reacts to other forces, mainly the 11 expectations 11 of
the market. If market participants expect cost of carry or absolute interest
rates to change significantly, those considerations may be more important than
the cost of carry considerations.
-17-

Since
the closer
expec
flue
contract
close
ices are a
date maturi
ions. The oser
from the s ice.
11 equal the price
tr ing on
conver ce.
ons
fu
on of
or contr
de l i
In f
cost of carry and
on,
h~ss
ice of an
the deliverable cash ~arket
ra l on is is
selected, one s d s
tations,
t
ice will
t at
to as
con act's s f i cations careful 1 y determine if there are any is ions
that :Tlay make it di ly from cash.
fications
are major areas con-
cern. First contract
very, whereby deliverable item could
b
ins t in a
i
oad
spectrum i es? Deliverable grade specifications should examined to
see what may be delivered if a position was held to expiration. Second, is the
con act '#ritten to Facilitate delivery? Some contracts will have severe
aberrations from the cash market due to their contract delivery ifications.
So, when possible, use a contract that does
very distor on.
present the added risk of deli-
15 Arthur J. Powers, Inside the Financial Futures Markets, 2d ed., (New York: John Wiley & Sons, Inc., 1984), pp. 128-144.
-18-

CHAPTER III
MARKET INSTRUMENTS USED IN HEDGING
A
The Bills are s term U.S. t ns
m es one ar or l i::S S, are d
,-,J. or mon m uri es. er d T
180-d ls y and 11 s
a 0 ice d is 1 ess ace
the face ue s ,_ over l,
l mar in 1
one the 1 ar t markets. Hed is rn
investors cost money is pegged to s i t r
acts for T-bills are i ver ab 1 e in M , June, s
December. ice a f act s i an
de i ng the actual ann ized 11 d s r
100. example, an index of 94.00 repres an annual yield
• are
3,
1 s and
ce
11
i
e
and
ge-
,0. rise
in the i means a ine in yie1 minimum price ange lls is
one is A basis i is a '
a day 11 is 5, '
a
T -bill , $1 Thus, if a 90-day 11 ice from
alue contract anged
Treasury Bill Formulas
1. Calculating the actual dollar price from the quoted yield prices.16
a ar
.10, the
16 Mark J. Powers, Inside the Financial Futures Markets, 2d ed. (New York: McGraw-Hill, 1984) pp. 519-520.
-19-

$price= $1,000,000 - (days to maturity X T-bill yield X $1,000,000)
360
2. Determining yield when T-bill face value, days to maturity, and actual issue price are known.
(T-bill face value - actual issue price) X 360 = T-bill yield days to maturity T-bill face value
for example, $1,000,000 X 91 days: ($1,000,000 - $984,833.33) X 360
$l,000,000 91
3. Calculating equivalent bond yield. This is a much misunderstood number. It relates the yield on T-bills to the yields on coupon-bearing securities, taking into consideration the amount of the discount from face value and the time until maturity. T-bill yields are calculated on a 365-day basis.
(T-bill face value - actual dollar price) X actual dollar price to maturity
365 actual days
For example, 6% yield, $1,000,000 worth of T-bills, with 91 days to maturity:
(1,000,000 - 984,833.33) X 365 = G.lB 984,833.33 91
This formula will cause a slight overstatement of T-bill yield versus coupon-bearing investments when comparisons are made of T-bi 11 s over 180 days to maturity, because the coupon instrument will have a coupon interest payment to reinvest after six months. Treasury bills make no six-month interest payments; they only pay 100% of face value at maturity.
B. TREASURY NOTES AND BONDS
Treasury notes are coupon-bearing securities issued by the U.S. Government
with maturities of more than one year and less than ten years. Notes are sold
in a variety of cycles. Two-year notes are issued each month with a two-year
maturity. Four-year notes are issued in the last week of each quarter with a
-20-

four-year maturity. Eventually these notes wi 11 have two years remaining to
maturity and thus become two-year notes. In January, April, July and October
five-year and ten-year notes are issued. Treasury Bonds are issued in two dif
ferent cycles: (1) each January and July 15-year bonds are auctioned; and (2)
every quarterly refunding has bonds of 25 to 30 year maturities.
The Treasury-bond contract is the most actively traded of all futures. It
trades on a basis of hypothetical bond issue created by the exchange: (1)
setting a standard coupon rate at 8%; and (2) establishing a minimum maturity
date whereby the remaining maturity is not less than 15 years. The futures are
traded on a dollar price. The Chicago Board of Trade (CBT) uses a factor method
of converting different coupons and maturity dates to equate with the 8%
exchange standard. This ensures equal price of any deliverable bond. The
hedger needs to weight a hedge to get the correct dollar value relationship bet
ween cash and futures markets.
For example, two different bonds both with a CBT price of $80,000 for the
March 1980 contract:17
1. Issue 7 5/8 of 2/15/2002-07. Time from call date until delivery date of March 20, 1980 = 21 3/4 years.
2. Issued 10 3/8 of 1115/04-09. Time from cal 1 date unti 1 delivery date of March 20 = 20 3/4 years.
The factor for the 7 5/6 with 21 3/4 years is 0.9614. The factor for the 10 3/8 with 24 3/4 years is 1.2540. The factor is multiplied by the exchange price to get the
correct principal value for each bond.
80 (exchange price for March 80 futures) X 0.9614 (factor)= 76.912 for 7 5/8 of 07.
80 X 1.2540 = 100.32 is the price for 10 3/8 of 2009.
17 Ibid.
-21-
"I\ ,,,

The
total ice
• 00) The "is added.
To illus assume
into the ~lune would
, the
X 0.
ice is found by multiplying amount. ($100,000 X 7. 9912 =
interest the last d
price
CBT futures in above
::: .944
C. 's
i ona l
Housing and Urban t.
on (GNMA) is a di ision
t pools s FHA Department
(Federal
issues a cer
inis ion) and (Veterans Adminis ion) mortgages and
at aran incipal in 11
d i i an inves ases a cer-
ficate receives a if i cate s ng an ownership share in a
mortgages. The certHicate contains the description of the ; the face
value; the percentage of unpaid inci
current princip balance;
ber; and the date the
coupon rates
vvas issued.
outstanding on the mortgages; the
1 der receives; trie l num-
Payment of incip and interest are paid to the II owner of record" on a
monthly
or
the G
is. Any prepaymen occur borrowers
ault are id to the certificate lders on a
certificate consists of 30-year mortgages his
mortgages prepay on an av~rage of 12 years.
ng off
rata basis. Although
has s these
GNW\ certificates gh coupons 11 a tendency to pay earlier
as the level of interest rates decline; GNMA certificates with lower coupons
will have a tendency to have a longer life as the level of interest rates rise.
-22-

The f ures
Coll
ar m
that
balance of GNMA 8 1 s
vered t are adj us
exchange a
Recei
in _ years.
1111 ori nator
co ) • C
sel er were del i ver a G
If coupon
s l er 1,110ul d i ver 1 ess than
GNMA futures
The CDR is
CIJR is a
i ted
contract call CDR
on an
cument sign
($1 , 000
a
nimum pri
or
other than 8% coupons can
a
i
pal
i-
equi
less
-23-
8%
iver
el This means that if a
d i ver more
was

CHAPTER IV
DESIGNING HEDGE STRATEGIES FOR THRIFTS
A. REGULATION AUTHORIZATION
On October 8, 1975, the Federal Home Loan Bank Board informed the thrift
industry of its intention to set into law regulations on the use of financial
futures. On May 21, 1976, the Bank Board adopted final regulations dealing with
mortgage futures transactions. In May 1981, the regulations were revised to
include trading in financial options and to eliminate several former limitations
and restrictions. In its statement the Bank Board said the interest rate
futures market provides an opportunity for users to hedge against the risks of
unanticipated movements of interests rates, most notably by:18
1. Lowering the risk of forward commitments (e.g., to purchase mortgage-related securities or loan commitments to builders) by assuring offsetting compensation when the securities or loans are below market rate at a settlement. (In effect, a hedge transaction can assure that a fixed-rate forward commitment yields approximately a market rate of return upon settlement, even if the interest rates have risen in the interim);
2. Locking in sources of financing sensitive to market rates of interest (such as MMC's and SSC's) at known rates so as to decrease the risk involved in making long-term loans and forward commitments; and
3. Diminishing the adverse effects of decreasing asset yield/liability cost spreads resulting from increases in interest rates on liabilities relative to the yields on assets.
18 Nancy R. Rothstein, ed. The Handbook of Financial Futures, (New York: McGraw-Hill, 1984) pp. 519-520.
-24-

l~utliori ans actions
In amen
ins ans
r risk
structure." All
1
2.
3.
l ati ons in t Bank B0ard 1 s i ion is to
i !1 II trans ions uce net i
ure ari s i
e s
from the insti
ures positions i
on 1 s asset and li
uded:19
f i X 1 i
against the to ori nate
es.
ue in portf io,
1 i costs.
loans or invest-
4, To protect against at her ri resulting from a m i
Wi
inherent n
ance as and liabilities.
to long i ons, Bank ard
if t ins
l i eves
ure
low
t
l i
ri
11
not be 1 es sened. and most probably
and liabili
11 be increased, by 1 ong i ons in the
futures market. lt did recognize that these ins tutions wi mortgage king
aper
not yet
ons may use 1 ong itions >.1\/hen have contracted to sell mor t,gages
nated. Therefore, the Bank Board does allow long f positions
be taken in connection with forward commitments to sell mortgages not
originated.
The Bank Soard 1 s May 1981 on the use Treasury bi l "Is,
riot es, and
final regul
futures contracts in addition to GNM!\ futures acts. The
ons now permit institu ons engag,~ in interest rate futures
trans ons us i t f t is ated the
commodity futures trading commission and is based upon a security in which the
institution is authorized to invest.
19 Ibid. p. 522.
-25-

B. HEDGING ASSETS
nimize ri increasing i t r
long loan), f can ge n t f
For example:20
On Jan 5, 1981, a financial million in GNMA securities carryi
2nds). Havi watched ar earlier havi
in less
Cash Market
January 12
Holds $10, 13%
March 2
ins
,000
Cash market is 92-15 Mar value
,246,875,
Loss: $359,375
Net Gain on Hedge: $121,875
ion's
Market
January 12
Sells 100 GNM~-CDR Mar futures con ac at 14, or
,043,750,
March 2
Buys 100 GNMA-CDR NJ arch futures contracts at 65-20, or $6,562,500.
Gain: $481,250
is ex~nple was based upon actual prices. During the peri
in pl ace, basis strengthened by 39/32nds and produced a net
hedge $121,875, Of course, every hedge turns out so well
had the hedger i,el d his futures position un l the March contr
g ue a
0
the hedge vrns
in
In this case,
closed, he
would have ased offsetting contr at 68-2 and found that the value of
his GNW\ ldings declined to 94-8, The net res t would
of $56,250. Convergence was at work.
20 Oliver H. Jones, Financial Futures Market, (U.S. League of Savings Institutions, 1983) p. 66.
-26-
a gain

C.
ift ins ons ly
l i 1 i es fund
if i is a s ·l x-mon
bi 11 ices or m ures s X
nves in
ass and l i 'Ii m ties.
ween ass and l 1 i es narrows
ins ions could use
to i a
It is mos t
if i c is on
institution should short t11Jice as many
ficates outstandi
bi 11
11
ice.
d
i ncreas
exarnple:21
l\s i
ine. The
cost
Cash Market
December 3, 1981
in t cost
21 Ibid. p. 72.
t
y as a source
s n ·i are usu ly a
it 011
to
s a ass C
ev~n ve.
f i nanci t
cost it
11 s on s
d lL t Ht
T - 11 contracts as it has cer-
011 T -bills rise,
s t
Futures Market
December 3, 1981
tion sells
ice
ition in
ng day !LS. bi 11
contracts:
' in M
contr . 75, or $1,735,000.
$2,000,000 in June contract at 86.90, or $1,738,000.
the
futures
ficates
-27-

June 3, 1982
Rolls over certificates at .5%. Cost for n weeks: U25,
p
Gain on Hedge: $36,
March 5, 1982
June 1~ 1982
June or $1,
4,
G non June
in 88.l
contr t24,800.
D. HEDGING MORTGAGE BANKING OPERATIONS
In recent ars if t ins ons more activf~ in s ling
their mortgages. FHA and VA mortgages originated by the ift can be used to
issue a GNMA certificate. To ill us tr ate, a thrift commits to sell mortgages
yet gi nated. Should mortgage rates f l dur-i 119 ori gi nation period, the
thrift has fill the com~itment discounting th,Jse loans made at lower
rates. HO\"i/ever, by doing a long hedge vJith Financial futures, the thrift can
lock in its position and protect its profit.
For example:22
Cash Market
March 24
Obtains a f irrn forward com~itment
sell $2,000,000 in GNMAs at the current coupon of 12~% and the current price of 91-12, or $1,826,000.
22 Ibid. p. 70.
Futures Market
March 24
Buys 27 GNMA-CDR Seotember contracts at
12, or $1,7 ,100.
-28-

June 27
Cash market is 104, or $2,080,000.
Potential Loss: $254,000
Net Gain on Hedge: $125,181
June 27
Sells GNMA-CDR September contracts at 80-11, or $2,169,281.
Gain: $379,181
Other situations regarding mortgage lending warrant hedging. When a thrift
sells mortgages out of portfolio without a reinvestment for the proceeds, it can
1 ock up a current yi e 1 d by buying futures contracts at commitment date of the
sale. So if rates decline, the gains in the hedge will offset the lesser yield
on the reinvestment. Another hedge situation exists when an institution origi
nates a mortgage loan without a commitment to sell it. To protect against
rising interest rates, a thrift can create a short hedge by selling futures
contracts. If rates increase the gain in the short hedge can be used to offset
the loss on the sale of the loans.
Cash Market
June 1: The S & L makes commitments for $1 million mortgage pool based on current GNMA 16% cash price of 98-28.
January 1: The S & L sells $1 million of GNMA 16% to investors at 93-28.
Loss: $50,000 (5% of $1 million)
For example:23
Futures Market
June 1: The S & L sells 15* March 1982 GNMA futures contracts at 58-05.
January 1: The S & L buys 15 March 1982 contracts at 54-26.
Gain: $50,156.25 (107/32 X 31.25 X 15)
23 Nancy Rothstein, ed. ·The Handbook of Financial Futures, (New York: McGraw-Hill, 1904), p. 130.
-29-

as a
ef
s
t
l
e
t
I illus
CHAPTER V
SUMMARY AND CONCLUSIONS
is :,
in
i t i
and most
Vilas
A.
"i nves
for H
has cost
if ts use
i
W tr1 mos
i r ass consis
g
nsti
f i nan
ons.
t in
as a
ear y,
more
h on
is a classic i es. Unders tan di g exis ng
n ass ated th r
it is s
ite
volatili and
ion i ner a.
fr cash pas i on so
an in the
C
The
late on
in
II
is
i Se assure
cash and futures
is maturi mi
rs can t
ice
as a ri
are s
ge ains
ame in
hedge
fici
s
conversion, contr mon and
tions.
in one
man
in
i val
us
t
an
ge,
t the
s.
a
f ica-
Chapter III described the different debt instruments used in the hedging
process.
-30-

Chapter IV stated that the Federal Horne Loan Bank Board authorized thrift
ins tutions to engage in the futures transactions that reduce interest rate
risk. To minimize the risk of increasing rates (decreasing value of assets),
thrifts can sell futures to hedge their long posi on in assets. To minimize
the addi onal costs of deposits when interest rates rise, thrif can sell
futures to offset the increased cost of deposits. Hedging with futures is used
in mortgage banking operations also.
CONCLUSION
The centr issue of is paper is that interest-rate risk needs to be
managed. One thing certain about interest rates is that they will either go up
or down. Hedging with financial futures transfers that risk to someone else.
1-

BIBLIOGRAPHY
Books
Fabozzi, Frank J. and Pollack, Irving M., The Handbook of Fixed Income Securities, (Homewood, Illinois: Dow Jones - Irwin, 1983)
Jones, Oliver H., Financial Futures Market, (U.S. League of Savings Institutions, 1983)
Maginn, John L. and Tuttle, Donald L., Managing Investment Portfolios, (Boston: Warren, Gorham & Lamont, 1983)
Powers, Mark J., Inside the Financial Futures Markets, 2d ed., (New York: John Wiley & Sons, Inc., 1984)
Rothstein, Nancy H., ed., The Handbook of Financial Futures, (New York: McGraw-Hill, 1984)
Rebell, Arthur L. and Gordon, Gail, Financial Futures and Investment Strategy, (Homewood, Illinois: Dow Jones - Irwin, 1984)
Magazines
Aakins, L., "How to Hedge on Interest Rates, 11 Duns Business Month, September ·1984, pp. 66-67
Beidleman, C.R., "Applying Financial Futures in Banks, 11 Magazine of Bank Administration, January 1984, p. 50
Belongia, M.J. and Santoni, G.L., "Hedging Interest Rate Risk With Financial Futures: Some Basic Principles, 11 Federal Reserve Bank of St. Louis Review, October 1984, pp. 15-25
Booth, J.R., 11 Use of Interest Rate Futures By Financial Institutions, 11 Journal of Bank Research, Spring 1984, pp. 15-20
Brown, C. and Gardener, T., "Financial Futures - New Tools to Tackle Old Problems?," Accountancy, December 1983, pp. 113-116
Cheung, J.K. and Roy, S.B., "Financial Futures: A Valuable Opportunity for Risk Management," CA Magazine, June 1984, pp. 30-34
Fitch, T. P., 11 Financial Futures Market, 11 United States Banker, November 1984, pp. 34-36
-32-

3ibliography - cont.
3au, G.W. and Goldberg, M.A., 11 Interest Rate Risk, Residential Mortgage and 1=inancial Futures Markets, 11 Journal of the American Real Estate and Urban Economics Association, Winter 1983, pp. 445-461
Hill, J.M. and Schneeweis, T., 11 Reducing Volatility With Financial Futures," Financial Analysts Journal, November-December 1984, pp. 34-40
Hume, J.G., nRemaining Calm in Troubled Markets: Hedging Interest Rate Exposure, 11 The Journal of Commercial Bank Len di !J.9., January 1985, pp. 48-54
Jacobs, R.L., 11 Fixed Rate lending and Interest Rate Futures Heding,81 Journal of Bank Research, Autumn 1983, pp, 193-202
Ray, R., 11 Financial Futures: A Powerful Risk Management Tool, 11 Management Review, June 1983, pp. 26-28
Smith, R.S. and Lennox, J.J., 11 Hedging Risk: Forward Market or Futures Market, 11
Mortgage Banking, September 1984, pp. 87-88
Interviews
Finegold, Martin A., Goldman-Sachs, New York, New York. Interview, January 1985
Johnson, Francis, Cottonwood Financial, Bozeman, Montana. Interview, September 1985 and January 1986
Lahey, Mark K., Shearson-lehman Brothers, Chicago, Illinois. Interview, .January 1986
Mawharter, William, Govaars and ,l.\ssociates, Nev1port Beach, California. Interview, October 1985
-33-

332.8 S782
Stai, Jerry M.
Hedging interest rate risk with financial futures
332.8 S782
_ Stai, Je-qy_J1_. Hedging interest rate risk
with financ:t@:l futures ____ _
~UE