Healthcare Utilization for Behavioral Health Disorders
156
University of Nebraska Medical Center University of Nebraska Medical Center DigitalCommons@UNMC DigitalCommons@UNMC Theses & Dissertations Graduate Studies Spring 5-5-2018 Healthcare Utilization for Behavioral Health Disorders: Policy Healthcare Utilization for Behavioral Health Disorders: Policy Implications on Nationwide Readmissions, and Outcomes in the Implications on Nationwide Readmissions, and Outcomes in the States of Nebraska and New York States of Nebraska and New York Rajvi J. Wani University of Nebraska Medical Center Follow this and additional works at: https://digitalcommons.unmc.edu/etd Part of the Community Health Commons, Health Policy Commons, Health Services Administration Commons, Health Services Research Commons, Psychiatric and Mental Health Commons, and the Substance Abuse and Addiction Commons Recommended Citation Recommended Citation Wani, Rajvi J., "Healthcare Utilization for Behavioral Health Disorders: Policy Implications on Nationwide Readmissions, and Outcomes in the States of Nebraska and New York" (2018). Theses & Dissertations. 254. https://digitalcommons.unmc.edu/etd/254 This Dissertation is brought to you for free and open access by the Graduate Studies at DigitalCommons@UNMC. It has been accepted for inclusion in Theses & Dissertations by an authorized administrator of DigitalCommons@UNMC. For more information, please contact [email protected].
-
Upload
khangminh22 -
Category
Documents
-
view
1 -
download
0
Transcript of Healthcare Utilization for Behavioral Health Disorders

University of Nebraska Medical Center University of Nebraska Medical Center
DigitalCommons@UNMC DigitalCommons@UNMC
Theses & Dissertations Graduate Studies
Spring 5-5-2018
Healthcare Utilization for Behavioral Health Disorders: Policy Healthcare Utilization for Behavioral Health Disorders: Policy
Implications on Nationwide Readmissions, and Outcomes in the Implications on Nationwide Readmissions, and Outcomes in the
States of Nebraska and New York States of Nebraska and New York
Rajvi J. Wani University of Nebraska Medical Center
Follow this and additional works at: https://digitalcommons.unmc.edu/etd
Part of the Community Health Commons, Health Policy Commons, Health Services Administration
Commons, Health Services Research Commons, Psychiatric and Mental Health Commons, and the
Substance Abuse and Addiction Commons
Recommended Citation Recommended Citation Wani, Rajvi J., "Healthcare Utilization for Behavioral Health Disorders: Policy Implications on Nationwide Readmissions, and Outcomes in the States of Nebraska and New York" (2018). Theses & Dissertations. 254. https://digitalcommons.unmc.edu/etd/254
This Dissertation is brought to you for free and open access by the Graduate Studies at DigitalCommons@UNMC. It has been accepted for inclusion in Theses & Dissertations by an authorized administrator of DigitalCommons@UNMC. For more information, please contact [email protected].

HEALTHCARE UTILIZATION FOR BEHAVIORAL HEALTH DISORDERS:
POLICY IMPLICATIONS ON NATIONWIDE READMISSIONS, AND
OUTCOMES IN THE STATES OF NEBRASKA AND NEW YORK
By
Rajvi J. Wani, MS
A DISSERTATION
Presented to the Faculty of
The University of Nebraska Graduate College
in Partial Fulfillment of the Requirements
for the Degree of Doctor of Philosophy
Health Services Research, Administration and Policy
Graduate Program
Under the supervision of Associate Professor Fernando A. Wilson
University of Nebraska Medical Center
Omaha, Nebraska
January 2018
Supervisory Committee:
Li-Wu Chen, Ph.D. Shinobu Watanabe-Galloway, Ph.D.
Nizar K. Wehbi, M.D, M.P.H, M.B.A Hyo Jung Tak, PhD

i
ACKNOWLEDGEMENTS
Foremost, I would like to express my sincerest gratitude to my supervisor and dissertation Chair,
Dr. Fernando A. Wilson for his constant support and patience in academic and non-academic
issues throughout my program. I would be ever thankful to Dr. Wilson for giving me the freedom
to explore my research interests and encouraging me through this tortuous process. His
experience with healthcare utilization, policy analysis, and health economics has been vital in
shaping the foundation of this dissertation project.
I would also like to thank each member of the committee for their constant inputs,
insights, willing to participate in some brainstorming sessions, and above all for their belief in my
ideas. Specifically, I would like to thank Dr. Li-Wu Chen for introducing me to the concepts of
healthcare utilization in rural areas. Drs. Chen and Shinobu Watanabe-Galloway were the firsts to
bring to my notice the issues regarding behavioral healthcare in the US. I thank Dr. Watanabe-
Galloway for being the subject matter expert and for her quick and intellectual responses to my
questions and for being an honest critic of my work. My work throughout my Ph.D. program has
been an enriched learning experience mostly because of Dr. Nizar Wehbi’s guidance. Having
worked on several research projects with Dr. Wehbi, I have gained project management skills,
writing and presentation skills. I am indebted to him for giving me endless opportunities and for
lending an ear to my aberrant ideas and I could not have asked for a better mentor to conduct
research on the projects that built my Graduate Assistantship portfolio. Additionally, I would like
to thank Dr. Hyo Jung Tak for being the most approachable member of our department and for
being a thorough student advocate. I have been fortunate to perform data analysis on this
dissertation under her supervision and guidance. Dr. Tak has been instrumental in teaching me
data management and analytical skills for simple and complicated datasets. Her positivity has
pushed me to pursue the most ambitious research methodologies and she has played a catalytic
role in my dissertation-related accomplishments and learning Stata software package.

ii
I am thankful to Dr. Donald Klepser for buying the Nationwide Readmissions Databases
at a time when I had to restructure my dissertation without funding. Dr. Klepser has been a silent
but a strong mentor during my highs and lows in this program. I am appreciative of his
willingness to give me the opportunity to work on community pharmacy-based research projects
with some creative liberties.
I am thankful to Nebraska DHHS for specially designing a map showing the six
behavioral health regions and major cities in Nebraska, within hours of requesting favor. Also, I
would like to thank my coworkers at Nebraska DHHS for encouraging and cooperating with me
towards the end of my dissertation phase, especially, Derry Stover, Jessical O. Ball and Dr.
Charles ‘Frtiz’ Craft.
I also owe a debt of gratitude to my friends and family at UNMC, College of Public
Health, specifically Ashvita Garg, Aurora Le, Ketki Patel, Kushal Karan, Sankeerth Rampa,
Shreya Roy, Xiaoting Sun, and Yangyuna Yang. In addition, I would like to thank other fellow
pursuants of PhD at UNMC for the friendly support and for involving me in stimulating
discussions, especially, Aneesha Dasgupta, Shrey Kanvinde, Deep Bhattacharya, Tanmay
Kulkarni, and Prathamesh Patil.
The largest thank you goes to my family, especially my parents-Dr. Nita Wani and Adv.
Jayant Wani for their love, undeterred beliefs, undying optimism, and wise and motivating words.
I would not have completed this work without the backing of my brother Neel who has been a
huge pillar of support. Finally, I would like to take this opportunity to thank my fiancé Jigar
Jasani for the unconditional love and support, and for taking the backseat at times so that I could
achieve my goals, especially throughout the whole dissertation writing process.

iii
HEALTHCARE UTILIZATION FOR BEHAVIORAL HEALTH DISORDERS: POLICY
IMPLICATIONS ON NATIONWIDE READMISSIONS, AND OUTCOMES IN THE
STATES OF NEBRASKA AND NEW YORK
Rajvi J. Wani, Ph.D.
University of Nebraska, 2018
ABSTRACT
Supervisor: Fernando A. Wilson, Ph.D.
The main goal of this dissertation was to estimate national-level inpatient readmissions and state-
level hospital-based emergency department (ED) visits with behavioral health (BH) conditions in
the states of Nebraska and New York. The dissertation aims to assess the impact of the policy
mandates under the Patient Protection and Affordable Care Act on these state and national
estimates. The Nationwide Readmissions Database and the State Emergency Department
databases maintained by the Healthcare Cost and Utilization Project were used for this
dissertation. US Adult population with high-risk of readmissions in the inpatient departments for
alcohol-related disorders (ARD) and of visiting ED for BH conditions were identified. Prediction
of economic burden due to 30-day readmissions, specifically for recurrences of ARD, patient and
hospital-level rates, costs, and predictors of 30-day readmissions were derived at the national-
level. Region-level data on ED facilities and BH workforce in Nebraska were obtained from the
Health Professionals Tracking Services. In addition, the location of substance abuse treatment
centers and ED facilities in New York were procured from the National Survey of Substance
Abuse Treatment Services and the National Emergency Department Inventory, respectively. To
identify BH conditions, International Classification of Diseases, Ninth Revision, Clinical
Modification codes were used. Estimates of total charges for ED visits in Nebraska and New
York were performed along with an assessment of the availability of substance abuse treatment
centers, BH workforce, and EDs. The dissertation underlines the need for integrated behavioral
health services at primary level and development of preventative health programs tailored
specifically for high-risk populations.

iv
TABLE OF CONTENTS
ACKNOWLEDGEMENTS ……………………………………………...………………......... i
ABSTRACT ..……………………………………………………………………………….…...iii
TABLE OF CONTENTS ……………………………………………………………………….iv
LIST OF TABLES ……………………………………………………………………….……...vi
LIST OF FIGURES .………………………………………………………………...…………viii
LIST OF ABBREVATIONS .…………………………………………………………………...ix
CHAPTER I: BACKGROUND ….…………………………………...…………………………1
CHAPTER II: CONCEPTUAL FRAMEWORK ………………..…………………………...16
CHAPTER III: PREDICTORS AND COSTS OF THIRTY-DAY READMISSIONS
AFTER HOSPITALIZATIONS FOR ALCOHOL-RELATED DISORDERS IN US
ADULTS ………………………………………………………………………………………...21
Introduction………………………………………………………………………………21
Methods…………………………………………………………………………………..23
Results……………………………………………………………………………………31
Discussion………………………………………………………………………………..37
Conclusion……………………………………………………………………………….42
CHAPTER IV: EMERGENCY DEPARTMENTS UTILIZATION FOR BEHAVIORAL
HEALTH CONDITIONS AND DISTRIBUTION OF BEHAVIORAL HEALTH
WORKFORCE AND EMERGENCY DEPARTMENTS IN NEBRASKA, 2011-2013 ...….57
Introduction………………………………………………………………………………57
Methods…………………………………………………………………………………..59
Results……………………………………………………………………………………64
Discussion………………………………………………………………………………..68
Conclusion……………………………………………………………………………….73

v
CHAPTER V: EMERGENCY DEPARTMENT UTILIZATION FOR SUBSTANCE USE-
RELATED DISORDERS AND ASSESSMENT OF TREATMENT FACILITIES IN NEW
YORK STATE, 2011–2013 …………………………………………………………….............84
Introduction………………………………………………………………………………84
Methods…………………………………………………………………………………..87
Results…………………………………………………………………………………....91
Discussion………………………………………………………………………………..96
Conclusion……………………………………………………………………………...101
CHAPTER VI: DISCUSSION AND CONCLUSIONS ...…………………………………...112
REFERENCES ………………………………………………………………………………...121
APPENDIX 1: International Classification of Diseases, Ninth Revision, Clinical
Modification diagnosis codes defining alcohol-related disorders ……..................................137
APPENDIX 2: Results of two-part model of factors associated with total cost of
readmissions for alcohol-related disorders, NRD 2014 ……………………………………..138
APPENDIX 3: Diagnoses used in the analysis of behavioral health disorders in Nebraska
and their corresponding codes as per International Classification of Diseases, Ninth
Revision, Clinical Modification ...……………………………………………………………..140
APPENDIX 4: Behavioral health regions and major cities in Nebraska ...………………..142
APPENDIX 5: Diagnoses related to substance use disorders used in the analysis and their
corresponding codes as per International Classification of Diseases, Ninth Revision, Clinical
Modification ......………………………………………………………………………………..143
vi
LIST OF TABLES
CHAPTER I: BACKGROUND
1. Trend of behavioral health professionals in Nebraska from 2010–2016………………...15
CHAPTER III: PREDICTORS AND COSTS OF THIRTY-DAY READMISSIONS
AFTER HOSPITALIZATIONS FOR ALCOHOL-RELATED DISORDERS IN US
ADULTS
1. Flow chart of exclusion criteria for numbers of observed hospital discharges per unique
patients applicable to index admissions and readmissions from the NRD, 2014. ……...43
2. Characteristics of patients and hospitals registered in the NRD 2014 with an index
hospitalization for alcohol-related disorders based on 30-day all-cause readmissions
….………………………………………………………..……………………………….44
3. Logistic regression for 30-day readmissions on index hospitalizations for alcohol-related
disorders, NRD 2014 ……………………………………………………………………50
4. Post-regression estimates for predicted and incremental costs for readmissions with index
hospitalizations for alcohol-related disorders using the NRD 2014 ………………….....52
5. Post-regression estimates for average marginal effects among readmitted individuals with
and without recurrences due to alcohol-related disorders and NRD 2014 ……………...54
CHAPTER IV: EMERGENCY DEPARTMENTS UTILIZATION FOR BEHAVIORAL
HEALTH CONDITIONS AND DISTRIBUTION OF BEHAVIORAL HEALTH
WORKFORCE AND EMERGENCY DEPARTMENTS IN NEBRASKA, 2011–2013
1. Number and percent of emergency department visits stratified by diagnoses for
behavioral health conditions, NE SEDD, 2011–2013 .......………..…………………….74
2. Descriptive characteristics for emergency department visits related to behavioral health
conditions in NE SEDD, 2011–2013 ................................................................................75
3. Counties served, emergency department facilities, and emergency visits for behavioral
health disorders and providers per 10,000 population by behavioral health region in
Nebraska. ……………………………………………………………………..................78
4. Multivariate linear regression model for hospital-based emergency department charges
(in dollars) due to behavioral health conditions NE SEDD, 2011–2013. .........................79
5. Adjusted odds ratios from multivariate logistic regression analysis of discharge against
medical advice by patient-level characteristics, NE SEDD 2011–2013 ………………...81
vii
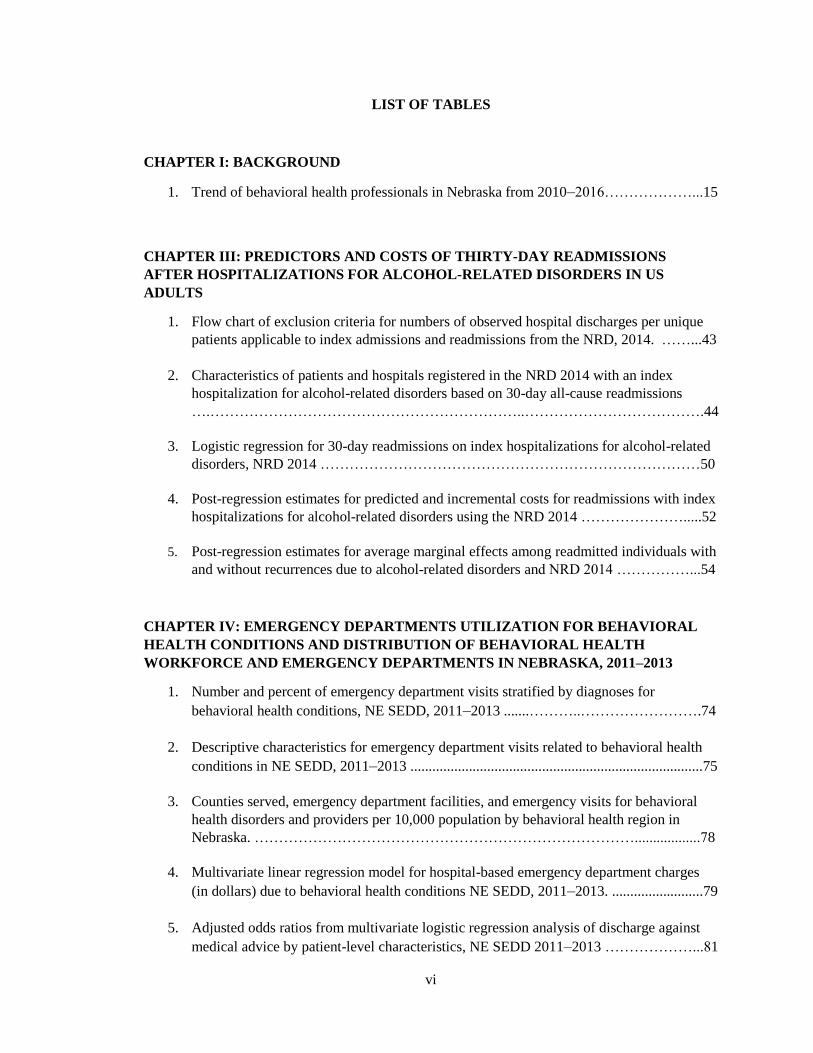
CHAPTER V: EMERGENCY DEPARTMENT UTILIZATION FOR SUBSTANCE USE-
RELATED DISORDERS AND ASSESSMENT OF TREATMENT FACILITIES IN NEW
YORK STATE, 2011– 2013
1. Emergency department visits for substance use disorders stratified by patient
characteristics in NY SEDD, 2011–2013 ..………………………..…………………...102
2. Number, percent and rates of substance use disorders-related emergency department
visits per 10,000 population by year in New York, SEDD 2011–2013. ………………105
3. Number, percent and rates of substance use disorders-related emergency department
visits per 10,000 population by age groups in New York, SEDD 2011–2013…………106
4. Multivariate generalized linear model of hospital-based emergency department charges
due to substance use disorders using NY SEDD, 2011–2013 ...……………………….107
viii
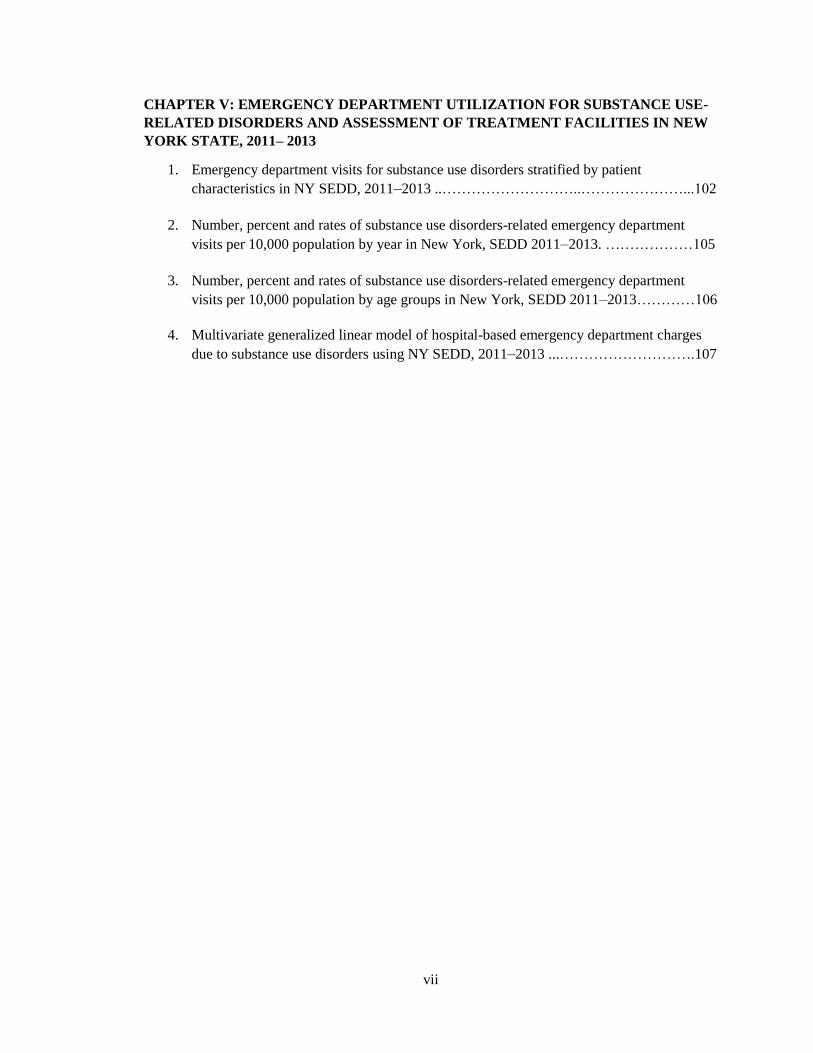
LIST OF FIGURES
CHAPTER II: CONCEPTUAL FRAMEWORK
1. Framework for the dissertation based on the Aday and Anderson model of 1974………20
CHAPTER III: PREDICTORS AND COSTS OF THIRTY-DAY READMISSIONS
AFTER HOSPITALIZATIONS FOR ALCOHOL-RELATED DISORDERS IN US
ADULTS
1. Proportions of 30-day readmissions (all-cause) against number of days after discharge
from index hospitalization for alcohol-related disorders using NRD, 2014 …………….49
2. Forest plot demonstrating adjusted odds ratio for 30-day readmissions on index
hospitalizations due to alcohol-related disorders for comorbidities, key patient and
hospital characteristics using NRD, 2014. …....................................................................51
CHAPTER IV: EMERGENCY DEPARTMENTS UTILIZATION FOR BEHAVIORAL
HEALTH CONDITIONS AND DISTRIBUTION OF BEHAVIORAL HEALTH
WORKFORCE AND EMERGENCY DEPARTMENTS IN NEBRASKA, 2011–2013
1. Emergency department visits in Nebraska related to behavioral health and supply of
behavioral health professionals per 10,000 population, NE SEDD, 2011–2013 …..……82
2. Emergency department visits in Nebraska related to behavioral health and number of
emergency departments by county, NE SEDD, 2011– 2013 …..………………………..83
CHAPTER V: EMERGENCY DEPARTMENT UTILIZATION FOR SUBSTANCE USE-
RELATED DISORDERS AND ASSESSMENT OF TREATMENT FACILITIES IN NEW
YORK STATE, 2011– 2013
1. Number and average emergency department charges for substance use disorders visits,
NY SEDD, 2011–2013.………………………………………………………………...109
2. Emergency department visits per 10,000 population for substance use disorders and their
treatment centers in the New York State using NY SEDD, 2011–2013 and
SAMHSA 2013 .………………………………………………………………………..110
3. Emergency department visits per 10,000 population for substance use disorders and the
distribution of emergency departments in the State of New York using NY SEDD, 2011–
2013 and EMNet 2013………………………………………………………………….111

ix
LIST OF ABBREVIATIONS
2PM – Two-part model
ACA – Patient Protection and Affordable Care Act
AHRQ – Agency for Healthcare Research and Quality
AMA – Discharge against medical advice
ARD – Alcohol-related disorders
BH – Behavioral health
CCR – Cost-to-Charge Ratio
CCS – Clinical Classification Software
CMS – Centers for Medicare and Medicaid Services
ECI – Elixhauser Comorbidity Index
ED – Emergency department
EMNet – Emergency Medicine Network
GLM – Generalized linear model
HCUP – Healthcare Cost and Utilization Project
HEDIS – Healthcare Effectiveness Data and Information Set
HPTS – Health Professionals Tracking Services
HRPP – Hospital Readmissions Reduction Program
ICD – 9-CM - International Classification of Diseases, Ninth Revision, Clinical Modification
LOS – Length of stay
MHPAEA – Mental Health Parity and Addiction Equity Act of 2008
NCQA – National Committee for Quality Assurance
NE – State of Nebraska
NEDI – National Emergency Department Inventory
NRD – Nationwide Readmissions Database

x
N-SSATS – National Survey of Substance Abuse Treatment Services
NY – State of New York
SAMHSA – Substance Abuse and Mental Health Services Administration
SEDD – State Emergency Department Database
SID – State Inpatient Databases
SUDs – Substance Use disorders

1
CHAPTER I: BACKGROUND
Burden of behavioral health-related problems
Behavioral Health disorder are comprised of mental illnesses and substance use disorders.
American Psychiatric Association defined mental illnesses as health conditions involving changes
in thinking, emotion or behavior (or a combination of these) (American Psychiatric Association,
2015). Also, mental illnesses are related with distress and/or problems functioning in social, work
or family activities (Substance Abuse and Mental Health Services., 2015). The Substance Abuse
and Mental Health Services Administration defined substance use disorders as conditions that
occur when the recurrent use of alcohol and/or drugs causes clinically and functionally significant
impairment, such as health problems, disability, and failure to meet major responsibilities at
work, school, or home. Behavioral health (BH) disorders are health conditions that are
characterized by alterations in thinking, mood, and behavior that are associated with impaired
functioning (Centers for Disease Control and Prevention, 2013; Substance Abuse and Mental
Health Services., 2015; World Health Organization, 2014a).
BH is an important public health issue globally and in the US. Worldwide, the number of
years lived with disability due to BH problems has been greater than any other medical conditions
in the past two decades (World Health Organization, 2004). In the US, one in every four adults
and one in ten children experience BH illnesses (Centers for Disease Control and Prevention,
2013; Leong, Ph, & Kalibatseva, 2011; Nayar et al., 2016; Nguyen, Trout, Chen, Madison, &
Watkins, 2016). The National Comorbidity Survey estimated that overall 57.4 percent of US
adults have experienced some form of diagnosable mental illness in their lifetime (Leong et al.,
2011).
Approximately 75 percent of those who suffer from BH disorders-related disabilities are
unemployed and 15 percent of those BH conditions patients who are diagnosed with
schizophrenia, bipolar disorder, or depression are homeless (World Health Organization, 2010).

2
In addition, unmet BH care needs can create social problems (e.g., unemployment, poverty,
disruption of family relations and social life) that may increase crime and political instability
(Ngui, Khasakhala, Ndetei, & Weiss, 2011). Unfortunately, only a third of those who suffer from
mental illnesses and substance abuse actually receive community-based behavioral health
treatment such as outpatient pharmacological and psychotherapeutic treatments (Doren,
Grimsley, Noone, & Neese, 2016).
Previous literature suggests that undiagnosed, untreated and delayed diagnoses of BH
conditions can lead to emergency department (ED) (Doren et al., 2016; Grupp-Phelan, Harman,
& Kelleher, 2007). Many of these ED visits could have been prevented if the patient had an
adequate access to the community-based BH care. Because state and federal laws mandate EDs to
screen, diagnose and treat patients 24 hours daily, EDs have become de-facto BH care facilities at
a high cost (Grupp-Phelan et al., 2007). The Kaiser Family Foundation found that 18% of
frequent ED users (i.e., those who use the ED four or more times in a two-year duration) had a
BH condition compared to only 6% of the total study population (Peppe, Mays, & Chang, 2007).
Because of the state and federal laws, ED physicians and staff are required to care for
people with BH conditions with their limited experience in detecting and treating BH conditions,
which leaves them ill-prepared for the responsibility (Bernstein & Onofrio, 2013; Doren,
Grimsley, Noone, & Neese, 2016; Johnson et al., 2015; Little, Clasen, Hendricks, & Walker,
2011; Owens, Mutter, & Stocks, 2010; Rhodes, 2008; Rn, Nurse, Dip, & Icu, 2007). Also, BH
diagnoses are not usually meant to be conducted in the ED, and hence, they may conduct an
incomplete and/or inaccurate assessment prognosis and may not direct the patient to the right
psychotherapy services (Doren et al., 2016). Also, there are no standardized protocols to follow
up with patients after the discharge from the ED (Doren et al., 2016).
The economic and social costs associated with BH are substantial, which underscores the
importance of treating these conditions (American Hospital Association, 2012). In the US, the
indirect costs of BH conditions is estimated to be over $79 billion (Ngui, Khasakhala, Ndetei, &

3
Weiss, 2011). In addition, the national expenditures for BH services and substance use disorder
treatment from all public and private sources was estimated at $172 billion in 2009 (Smith,
Stocks, & Santora, 2015; Substance Abuse and Mental Health Services., 2013). A study by
Stranges et al. suggests that the cost for 1.8 million inpatient stays for mental health and
substance abuse conditions was $9.7 billion in 2009 (Smith et al., 2015; Stranges, Levit, Stocks,
& Santora, 2011).
The total costs for hospitalizations reflect on the aggregate use of services, resources, and
time invested by the healthcare workforce in providing BH services. Findings from studies that
estimate the total cost allow hospital administrators to make decisions about planning, prioritizing
and funding new programs (Stensland, Watson, & Grazier, 2012). Also, hospital charges are set
within the context of the hospitals’ competitors, payers, and customers (Dobson, DaVanzo,
Doherty, & Tanamor, 2005). Furthermore, uninsurance and under-insurance for treatment of BH
conditions may lead to a substantial difference between charges and received reimbursements and
cost shifting between payers (Anderson, 2007; Stensland, Watson, & Grazier, 2012).
Length of stay (LOS), a quantitative performance indicator, is measured as the number of
days of hospitalization for selected conditions and procedures. It is a proxy for inpatient resource
usage and roughly relates to efficiency of inpatient hospital services (Kroch, Duan, Silow-carroll,
& Meyer, 2007; Ormel et al., 2007). However, some researchers have been using LOS as a
qualitative outcome measure to grade performance in improvement programs (Brasel, Lim,
Nirula, & Weigelt, 2007). LOS is a significant marker to observe reduction in risk-adjusted LOS.
Risk-adjusted LOS is defined as actual LOS rate divided by the mean expected LOS (expected
rate) which is then multiplied by the national observed LOS (Agency for Healthcare Research and
Quality, 2012). LOS also reflect the financial pressures on hospitals to reduce costs, discharge
patients quickly or treat them in outpatient departments (Kroch et al., 2007). The availability of
BH prescribers and professionals can prevent delayed-diagnoses of psychiatric illnesses and
thereby avoid sudden ED visits and reduce the average LOS due to BH disorders. In a study by
4
Saba, Levit, and Elixhauser, the average LOS for hospitalizations principally for mental health
was greater than for all other stays (8.2 days versus 4.6 days, respectively) (Saba, Levit, &
Elixhauser, 2008). Hence, it is not only important to study the clinical, demographic, county, and
patient-level factors that regulate the LOS of inpatient hospitalizations, but also understand the
extent to which the supply of BH workforce affects LOS. Efficiency of hospital services and
LOS are essential parameters that help policymakers design effective BH-related policies, such as
the expansion of benefits for BH conditions under the Patient Protection and Affordable Care Act
(ACA). Therefore, it is important to assess the economic implications of admitting BH patients in
EDs and inpatient departments.
Undiagnosed, untreated and delayed diagnoses of BH conditions can lead patients to ED
visits. Although EDs were designed to treat life-threatening conditions, over the years, EDs have
been used to treat chronically ill patients, including psychiatric patients. Also, because state and
federal laws mandate EDs to screen, diagnose and treat patients 24 hours daily, EDs have become
an important unit for treating BH conditions and at a high cost (Grupp-Phelan, Harman, &
Kelleher, 2007). The Kaiser Family Foundation found that 18% of frequent ED users (those who
use the ED four or more times in the two-year duration) had a BH conditions compared to only
6% of the total study population (Peppe, Mays, & Chang, 2007). Hence, we intend to assess the
economic implications of admitting BH patients in the EDs, after accounting for factors such as
the supply of BH professionals, existing co-morbidities, and location of the hospital. We
anticipate that this project will estimate the expenditures of admitting BH patients in EDs and
provide estimates for extended LOS in areas with a shortage of practicing BH professionals.
The Nebraska Behavioral Health Needs Assessment of 2016 showed that 114,000 (7.6%)
individuals 12 older suffer from alcohol abuse or dependence, out of which only 5.3% received
treatment (Braun et al., 2016). Further, approximately 32,000 (2.2%) of individuals in Nebraska
have shown dependence on illicit drugs and only 9.3% of these individuals received treatment.
Statistically, based on poverty rates, the ratio of youth to adult population, and/or the ratio of

5
elderly to the adult population, 78 of the 93 counties in Nebraska are facing shortages of BH
professionals. More importantly, 32 counties in Nebraska have no BH providers of any kind.
Further, 71 counties do not have a psychiatric prescriber (psychiatrist, psychiatric nurse
practitioner, or psychiatric physician assistant) (Braun et al., 2016). Over the last few years,
Nebraska has made progress in supplying psychologists, nurse practitioners, physician assistants,
independent mental health practitioners and addiction counselors, as shown in Table 1. However,
the number of licensed mental health practitioners (LMPHs), licensed alcohol and drug abuse
counselors (LADACs) was reduced by 21% between 2010 and 2016 (Braun et al., 2016).
There is a concern that the growing BH needs of the US population are not being met by
the healthcare system in many parts of the country (Becker & Kleinman, 2013; M. Prince et al.,
2007). The former First Lady, Michelle Obama, advocated for changing the conversation around
‘Mental Health’ and raised the need to expand benefits for BH and substance use disorders under
the ACA (Office of the First Lady, 2015). The literature on BH epidemiology and services points
towards the rising burden of BH conditions in the US, including adverse effects on social and
financial well-being, associated stigma and the impact on education and employment
opportunities (Becker & Kleinman, 2013; Centers for Disease Control and Prevention, 2013;
World Health Organization, 2014b). Thus, current efforts to reduce the societal costs of BH
conditions have been limited (Becker & Kleinman, 2013; Vos, Flaxman, & Naghavi M, 2012).
In general, there is a lack of literature that estimates the current supply of the behavioral
workforce at state and county-level. However, one study suggested that the number of active
doctoral-level psychologists in the US was about 83,142, or on a per capita basis, 1 per 3,802
people (Olfson, 2016). The number of psychiatrists was 37,296, or 1 per 8,476 people in 2013
(Olfson, 2016). These per-capita rates of psychologists and psychiatrists may not be sufficient to
address current and future treatment needs for behavioral health patients. Additionally, the
national shortage of psychiatrists and psychologists is further compromised by geographic
maldistribution (Olfson, 2016). The designed models of BH service delivery in urban areas are

6
often unsuitable and challenging to implement in rural settings (Elhai, Baugher, Quevillon,
Sauvageot, & Frueh, 2004). For illustration, urban settings are more likely to offer a variety of
treatment options that can serve diverse urban population including minorities, HIV positive
patients, etc. For successful outcomes, urban health services provide auxiliary services like
detoxification. Moreover, the rural areas have fewer primary care settings that are dispersed and
located at greater distances. This poses a threat to patients’ adherence to treatment and also may
mean a lack of anonymity with higher recognition in group-based settings (Pullen & Oser, 2014).
There are studies that suggest that rural residents may have a lower risk of recurrent
mental distress than urban residents (Probst et al., 2006; Rohrer, Borders, & Blanton, 2005).
However, contradicting these studies was a study by Fontanella et al. that stated that suicide rates
for adolescents were higher in rural than in urban areas (Rohrer et al., 2005). Other studies also
provided evidence that there are considerable unmet needs for BH services in most rural areas,
especially among men (Chou & Cheung, 2013; Gfroerer, Larson, & Colliver, 2007; Hedeker,
2003). Results from Deen and Bridges showed lower rates of utilization of specialty BH services,
including psychiatrists, psychologists, counselors, and social workers in rural areas compared to
urban areas (Deen, 2011). Similarly, Ziller et al. estimated that BH-related spending was lower
among rural residents than those living in urban areas (Ziller, Anderson, & Coburn, 2010). They
attribute this finding to the lower cost of psychotherapy in rural versus urban areas (Ziller et al.,
2010).
Likewise, many health conditions increase the risk for psychiatric disorders, and the
existence of diagnosed or undiagnosed comorbidities complicates the processes of seeking help,
screening and diagnosis, treatment, and prognoses (M. Prince et al., 2007; Diefenbach & Goethe,
2006). The current healthcare system does not provide health services equitably to people with a
spectrum of BH disorders, and it is important to mention that the quality of care for both mental
and physical health conditions for such patients need to be improved (M. Prince et al., 2007).
Intervention programs often fail to assess comorbid BH disorders, which is a crucial marker to

7
manage a multi-drug dosage treatment or to develop specific lines of treatment to cure
comorbidities (Chou & Cheung, 2013; Diefenbach & Goethe, 2006; Ormel et al., 2007). The
common comorbidities with BH conditions are diabetes, cardiovascular disorder or pulmonary
disease (Ormel et al., 2007).
The high prevalence of BH diagnoses among people with chronic medical conditions
raises the need for healthcare administrators and policymakers to help in the integration of care
for BH and physical health (Druss & Walker, 2011). Treating comorbid conditions is expensive.
For example, about 80% of the annual increased costs are due to non-behavioral medical services
for comorbid psychological disorders in the US (Melek & Norris, 2011). Also, the average total
monthly spending for a person with a chronic disease and a depression diagnosis is $560 more
than for a person without depression (Melek & Norris, 2011). Bipolar disorders are associated
with high costs of health services and utilization of services due to comorbidities (Melek &
Norris, 2011; Rajagopalan et al., 2006).
Financial cost projections estimated that lost earnings and public disability insurance
payments associated with behavioral disorders were at least $467 billion in the US (Leong, Ph, &
Kalibatseva, 2011). Specifically, $400 billion annually in crime, health, and lost productivity are
incurred for substance misuse and substance use disorders, with $249 billion spent on alcohol-
related disorders (U.S. Department of Health and Human Services (HHS), 2016). These costs are
even higher than other major health problems such as diabetes ($245 billion) (U.S. Department of
Health and Human Services (HHS), 2016). In a report by Substance Abuse and Mental Health
Services Administration, public payers accounted for 59% of spending on mental health
treatment, whereas 41% of this spending was accounted by private payers (Substance Abuse and
Mental Health Services Administration., 2016).
In 2002, President Bush initiated the President’s New Freedom Commission on Mental
Health to endorse policies meant for adoption by federal, state, and local governments to improve
existing BH services (Leong, Ph, & Kalibatseva, 2011). The commission decided to focus on six
8
goals that would transform the existing BH system: (1) accepting that BH is essential to overall
health; (2) offering family-driven mental health care; (3) eliminating disparities; (4) focusing
interventions for early detection, assessment, and treatment; (5) implementing evidence-based
research into practice; and (6) using technology while providing care and access to information.
Moreover, the federal government had started making calls for expanding workforce research and
workforce development initiatives for better BH delivery. States such as North Carolina, Idaho,
Alaska, Hawaii, and Colorado planned workforce development activities (Nayar et al., 2016).
In the State of Nebraska, the legislature passed the Legislative Bill 1083, the Nebraska
Behavioral Health Systems Act of 2004. This act assesses the ability of the BH system in
Nebraska by analyzing the geographic and demographic availability of the state’s BH
professionals (including psychiatrists, social workers, community rehabilitation workers,
psychologists, substance abuse counselors, licensed mental health practitioners and behavioral
analysts) (Nayar et al., 2016). More recently, with the passage of the Patient Protection and
Affordable Care Act (ACA), the financing and delivery of behavioral healthcare and addiction
care are expected to benefit (Barry & Huskamp, 2011). The ACA requires parity in coverage,
thereby making behavioral healthcare equivalent to all other medical and surgical benefits. Also,
the ACA’s implementation is likely to improve access problems and system fragmentation that
will be of assistance to people suffering from BH disorders (Barry & Huskamp, 2011; Leong et
al., 2011). Consequently, the ACA will increase the demand for BH services and, hopefully,
reduce the ED admissions for BH disorders. In addition, we can expect the inclusion of BH-
related benefits and services to be covered by private insurance plans, and also offer protection
for insurance access for patients identified with pre-existing BH conditions (Olfson, 2016).
Available evidence gathered from individual health professionals, health agencies and
medical associations show that there is a critical shortage of BH professionals and services in
inpatient and outpatient departments, causing the patients to seek help from EDs (S. D. Case,
Case, Olfson, Linakis, & Laska, 2011; Mulkern, Raab, Potter, Raab, & Potter, 2007; L. Thomas,

9
2003). For example, in predominantly rural Nebraska, 81 of Nebraska’s 93 counties have been
state-designated as shortage areas for behavioral health professionals and services (Nayar,
Nguyen, Apenteng, & Shaw-Sutherland, 2011). The shortage of psychiatric prescribers and BH
professionals in Nebraska can result in missed or late BH diagnoses. This can prove to be
detrimental, especially for patients suffering from existing co-morbidities such as diabetes and
cardiovascular diseases, leading to an increase in their length of stay and total hospital charges
(Galski, Bruno, Zorowitz, & Walker, 1993; Kim, Hwang, Oh, & Kang, 2013; Kwok et al., 2012).
A longer LOS also places patients at risk of contracting nosocomial infections (Hoover,
Sambamoorthi, Walkup, & Crystal, 2004). However, little is known about the impact of BH
disorders on the Nebraskan healthcare system resulting from shortages of BH services,
particularly in rural communities. The absence of Medicaid expansion under the ACA in
Nebraska also may mean that many individuals with BH disorders will remain uninsured,
increasing the likelihood of undiagnosed disorders.
Conversely, in a predominantly urban state of New York (NY), Medicaid expansion was
adopted, and Medicaid Managed Care Plans provide some mental health and substance use
services to their enrollees. However, even though 1.8 million residents of NY are suffering from
substance use disorder, only 15% receive treatment (The New York State Office of Alcoholism
and Substance Abuse Services, 2012). Also, among all states, NY spends the most for treating
and preventing substance use disorder (The Pew Charitable Trusts and the John D. and Catherine
T. MacArthur Foundation, 2015). Thus, for policymakers, hospital administrators, and planners
of community outreach, accurate estimates of the frequency of ED visits for substance use
disorder, total ED charges, and geographic assessment of available primary and ED-level access
to care are crucial but understudied.
At the national-level, it has been found that hospitalizations for BH-related disorders,
especially alcohol-related disorders (ARD) are among the top ten principal diagnoses that result

10
in 30-day readmissions. As of 2013, readmission rates for index hospitalizations for ARD were
about 19% (Fingar & Washington, 2015). The ACA introduced two recent programs that focus on
reducing readmission rates beginning 2014. One of the two programs mandated in 2013 is called
the Hospital Readmissions Reduction Program (HRRP), which requires hospitals with greater
rates of readmissions to pay penalties designated under the Medicare reimbursement system
(Boccuti & Casillas, 2017; Cutler, 2010). Another program is called the Bundled Payments for
Care Improvement Initiative, which ensures that hospitals receive a single payment for a
complete episode of care, cumulative of index hospitalizations and all the following readmissions
(Cutler, 2010; Medicare Payment Advisory Commission, 2011). Hence, for hospital
administrators to monitor spending their budget, especially considering that most hospitals do not
budget for readmission encounters, estimates such as readmission rates, costs, and relapses of
ARD would be helpful. Additionally, policymakers that revise and amend programs under the
ACA must evaluate outcomes of readmissions to understand the sustainability of the programs.
Knowledge gap
The objective of this study is to address knowledge gaps by evaluating the differences in clinical,
demographic and county-level factors, among rural and urban hospitalizations (i.e., ED
admission) for BH-related conditions in Nebraska and NY, which impact not only health
outcomes but also associated charges. Moreover, plotting county-level availability of BH
providers, community-based substance abuse treatment centers, and ED will help us map access
to care. By understanding the national-level prevalence of index inpatient hospitalizations for
ARD, the resulting 30-day unplanned all-cause readmissions, and corresponding costs, rates,
relapses of ARD, hospital administrators and policymakers may improve the allocation of
resources for such cases. In addition, our findings will help providers design and adopt better
protocols to follow-up with patients at the primary-level after index hospital discharges.

11
The central hypothesis is that diagnoses of BH-related conditions, patient-and county-level
factors, and the supply of BH providers are associated with healthcare outcomes such as length of
stay, total charges TC and rates of index hospitalizations and readmissions. This hypothesis is
based on a national level literature review that shows evidence of delayed BH diagnoses in rural
areas due to shortage of BH professionals, ED, and treatment centers. Also, it can be anticipated
that incidence of hospitalizations and costs may be associated with hospital-level characteristics
such as locations, teaching status, and ownership, as well as patient-level socioeconomic factors.
Motivation of the study
The following are the influential factors that drive the findings of this study: (1) access to BH
care is a major concern; (2) lack of studies that examine BH-related ED visits using state-specific
samples; (3) states vary in their adult Medicaid policy for BH services and rural-urban
distribution (NE & NY); and (4) rates of readmissions have been reported to increase, especially
post-ACA implementation
Innovation of the study
The proposed study will be the first study to systematically examine the economic impact of
treating BH in the EDs in Nebraska and New York. In addition, this study provides national-level
estimates of rates and costs of readmissions following index hospitalizations due to ARD. This is
an innovative study that could lead to advances in an overall understanding of available BH
services and estimate the proportion utilized by rural and urban residents in the US. With the
proposed new American Health Care Act of 2017 and the President’s Commission on Combating
Drug Addiction and the Opioid Crisis established by President Trump, these findings could help
identify gaps for BH services and suggest recommendations that could be incorporated in the
healthcare system. Hereby, it is anticipated that the results from this study will be able to provide
a direction for policymakers to amend, update and/or implement BH policies.

12
Specific Aims
Descriptive statistics such as the prevalence of BH-related disorders in the US have been
reported. However, hospital-based ED visits and the associated charges for BH conditions within
the state of Nebraska are not well understood. In addition, with New York State adopting
Medicaid expansion and annual increases in public funding to treat substance use disorder, the
impact on hospital-based ED visits and associated charges for substance use disorder is unclear.
Finally, providers, hospital administrators, and policymakers are struggling to understand the
rates and costs of readmissions following index hospitalizations due to ARD. The specific aims of
the dissertation are as follows:
Study 1:
Aim 1: Examine the 30-day readmission due to ARD and identify predictors of 30-day
readmission for ARD
Hypothesis 1.1: The 30-day readmission rate for ARD would be significantly lower during the
post-ACA period compared to pre-ACA period
Hypothesis 1.2: At least one-third of readmissions for ARD occur within 7 days of the discharge.
Aim 2: Examine the costs of hospitalization due to ARD and identify factors related to higher
costs of hospitalization due to ARD
Hypothesis 2.1: The average cost of index hospitalization due to ARD would be significantly
lower during the post-ACA period compared to pre-ACA period
The goal of the first study of this dissertation is to identify patient- and hospital-level factors that
are associated with 30-day readmissions following the index inpatient stays for ARD. The ACA-
mandated provisions such as the Hospital Readmissions Reduction Program and the Bundled
Payments for Care Improvement Initiative focus on all-cause readmissions but are likely to
impact admissions related to ARD. The findings from this study will help us better understand

13
patient and hospital-level factors that are associated with readmissions, subsequent readmission
costs, and the overall economic burden attributed to ARD.
Study 2:
Aim 1: Examine ED admission rates due to BH conditions and identify factors associated with
ER admission and discharge against medical advice.
Hypothesis 1.1: Individuals with less access to care (e.g., rural, uninsured, lower SES) are more
likely to be admitted to ED than those with more access.
Hypothesis 1.2: Individuals with less access to care (e.g., uninsured, low-income) are more likely
to be leave against medical advice
Aim 2: Examine the charge for ED admission due to BH conditions and identify factors
associated with higher ED charges
Hypothesis 2.1: Individuals with less access to care (e.g., uninsured, low-income) and with
comorbidities (e.g., elderly) are will have higher ED charges.
Aim 3: Investigate a relationship between BH workforce supply and distribution of ED with ED
visits.
The goal of the second study of this dissertation is to provide characteristics of BH-related ED
visits and charges between the years 2011 to 2013 within Nebraska at the region-level. To
understand the reason for ED visits and discharge against medical advice, we linked the
availability of BH professionals at the region-level, which will help measure supply of BH
workforce in predominantly rural Nebraska. Correspondingly, knowing the distribution of ED at
the region-level will help explain the higher proportions of ED visits that may be due to lack of
integrated behavioral health services at the primary level. Results from this study will enable

14
policymakers to improve access to care, introduce incentives for BH professionals to provide
care, and identify high-risk groups that have unmet BH needs.
Study 3:
Aim 1: Investigate ED admission for substance use disorders (SUDs) and describe the
characteristics of individuals admitted to ED for SUDs in New York.
Hypothesis 1.1: Individuals who are urban poor (e.g., urban, uninsured, low-income) are more
likely to be admitted to ED than those with more access.
Aim 2: Investigate the time trend of the ED admission for SUDs and the ED charge for SUDs
Hypothesis 2.1: Post-Medicaid expansion, ED charges and number of visits would reduce.
Aim 3: Identify factors that explain higher ED charges for SUD
Hypothesis 2.1: ED charges will be higher for those with less access to care (e.g., rural,
uninsured) and with multiple comorbidities
Aim 4: Investigate a relationship between substance abuse treatment facilities and distribution of
ED with ED visits.
The goal of this third aim of this dissertation project is to characterize ED visits and charges for
SUD between the years 2011 to 2013 within New York State at the county-level. We mapped the
distribution of EDs and substance use treatment centers at the county-level. We then estimated
the correlation of these geographical findings to rates of SUD-related ED visits in New York
State. We anticipated that the findings from this study would help identify counties with no or
few specialty care facilities that have higher rates of ED use for SUD.

15
Table 1: Trend of behavioral health professionals in Nebraska from 2010 to 2016.
2010 2012 2014 2016Diff. 2010-
2016
% Diff. 2010-
2016
Psychiatrists 162 156 156 164 2 1%
APRNs Practicing Psychiatry 78 75 98 113 35 45%
PAs Practicing Psychiatry 9 12 16 15 6 67%
Total 249 243 270 292 43 17%
Psychologists 318 335 366 355 37 12%
LIMHPs 589 703 814 1034 445 76%
LMHPs 991 1028 918 783 -208 -21%
LADACs 132 152 143 105 -27 -21%
Total 2030 2218 2241 2277 247 12%
Grand Total 2279 2461 2511 2569 290 13%
Prescribers
Non-Prescribers

16
CHAPTER II: CONCEPTUAL FRAMEWORK
To analyze the factors that are associated with service utilization as well as the quality and cost of
care for BH conditions, a structured framework that explains an individual’s access to and use of
health services needs to be considered (Andersen, 1995; Phillips, Morrison, Andersen, & Aday,
1998). This dissertation uses the Aday and Andersen model (Aday & Andersen, 1974). The
model incorporates three main domains of determinants that contribute to utilization of health
services: predisposing characteristics, enabling resources, and healthcare needs. These domains
have patient and hospital-based characteristics and have a linear relationship with each other, as
shown in Figure 1.
The structure of the healthcare system includes its organizational structure, resources
such as the supply of providers necessary for delivering health services, financial arrangements
that impact accessibility and availability, and acceptability (standard) of medical care services
(e.g., physician supply) (Phillips et al., 1998). These factors are important to examine because
studies have shown that they play a role in healthcare utilization (Phillips et al., 1998). Philips et
al. also suggest that utilization patterns differ based on the structure of managed care. Also, the
authors state that researchers and policymakers are curious to understand the influence of health
policies or organizations on consumption of healthcare services (Phillips et al., 1998). Hence, the
conceptual model should not only focus on population-level characteristics but also on hospital-
level characteristics. Amendments to policies impact the economic climate and sustainability of
hospitals and healthcare stings, which in turn affects financial standing of the system such as
politics. As illustrated in Figure 1, it is noteworthy that outcomes such as readmission
possibilities, costs, and utilization of health services are interdependent. An individual’s health
behavior is based on his/her personal health practices, for example, whether they have a regular
source of care and go for regular check-ups. Personal health practices and population
characteristics, together influence one’s use of health services, which include the type of services

17
(physical, dental or behavioral), purpose, length of stay in inpatient and emergency departments,
costs borne and time investment (Andersen, 1995; Fenta, Hyman, & Noh, 2006; Phillips et al.,
1998).
An adaptation of the Aday and Andersen framework suggests an association between
population and hospital characteristics and health behavior with health outcomes. Studies have
suggested using a complex correlation between perceived health status and health care utilization
with consuming medical care. This method may indicate that individuals perceive their health
status ‘worse’ if they have been visiting facilities numerous times. (Fenta, Hyman, & Noh, 2006;
Jahangir, Irazola, & Rubinstein, 2012; Maguen et al., 2007; Rebhan, 2011). Conversely,
individuals who have a poor perception of their own health may also seek medical care more
frequently. Thus, it is challenging to assess causation, but one cannot infer causality between
perception and utilization. Likewise, evaluated health status by physicians is also relative, for
example, those who visit the physician more frequently either are sick and being treated or
utilizing the insurance coverage to stay healthy (Andersen, 1995; Fenta et al., 2006). However,
we cannot make conclusions about those who do not visit the physicians as they may be healthy,
in denial of help or without insurance. Additionally, another health outcome parameter that
measures for ED inpatient department-related charges, costs of index hospitalizations and the
probable readmissions. This comprehensive factor can be measured by evaluating the access,
cost, and quality of the behavioral health services provided while controlling for patient and
hospital characteristics.
Predisposing characteristics
These are socio-cultural factors of individuals that exist before the individual develops a specific
health condition. The major predisposing factors include demographics (e.g., age and sex) that
represent the biological imperatives that indicate the probability that people will need health
services and, thereby, help in identifying the ‘high-risk’ population.
Enabling factors

18
Enabling factors include income, location, and insurance status. Individuals with more financial
resources, have health insurance and live in an area with sufficient access to health care are more
likely to seek and use health care services. These variables play an important role in estimating
the consumption of BH services because of the associated stigma towards such conditions (Fenta
et al., 2006).
Need
Individuals who have multiple health conditions are in greater need for health care services.
Patients that have greater needs for BH services if they also suffer from comorbidities because
various physical conditions are treated using prescriptions containing antidepressants, sedatives,
hypnotics, opioids, and laxatives. Improper, prolonged and overuse of such drugs can result in
such patients seeking care for BH conditions including non-dependent type substance use
disorders. About 68% of adults with serious mental disorders have medical conditions such as
diabetes, cardiovascular diseases, pulmonary diseases (Druss & Walker, 2011; Lagisetty, Maust,
Heisler, & Bohnert, 2017). Hyperlipidemia, HIV, Hepatitis C, and hypertension were found to be
common comorbidities with SUDs. Also, patients with SUD had a significantly higher percentage
of psychiatric comorbidities of depression, bipolar disease, and anxiety. Recently, an increased
level of attention has been paid on an opioid epidemic stemming from the over-use of
prescription medications. This is one example of the need for BH care driven by providing
integrated behavioral health services. Patients suffering from BH diseases might benefit from
novel care models to co-manage BH and common chronic medical conditions. Also, in the
presence of more comorbidities, individuals are likely to seek help in various healthcare settings
including EDs.
In general, the above conceptual framework controls for probable confounding factors
such as income and insurance status, presence of comorbid conditions including chronic illnesses
that could affect the correlation between inpatient and emergency admissions due to behavioral

19
health disorders. Age and sex also tend to act as confounding factors and hence, the research
methods should include multivariate analyses.

20
Figure 1: Framework for the dissertation based on the Aday and Anderson model of 1974.
UTILIZATION:
Emergency dept. and
inpatient dept. for BH
OUTCOMES:
Hospital-based
ED charges; costs of
index hospitalizations,
and readmissions (and
recurrences)
CHARACTERISTICS OF
POPULATION AT RISK:
• Predisposing: Age, sex,
Race/ethnicity
• Enabling: Income level,
location & insurance
status
• Need: Co-morbidity
burden
SUPPLY:
BH workforce, treatment
centers and resources
(e.g., EDs)
HEALTH POLICY:
ACA implementation and
State Medicaid policies for
BH-related disorders

21
CHAPTER III: PREDICTORS AND COSTS OF THIRTY-DAY READMISSIONS
AFTER HOSPITALIZATIONS FOR ALCOHOL-RELATED DIRORDERS IN US
ADULTS
Introduction
Thirty-day readmissions have been accepted as a gold standard indicator to measure the quality of
care delivered in US hospitals (Axon & Williams, 2011) mainly because of the high prevalence,
costs (McCarthy, Johnson, & Audet, 2013), and preventability of some readmissions. Two health
policies introduced under the Patient Protection and Affordable Care Act (ACA) of 2010 are
meant to strengthen the US healthcare system by incentivizing hospitals to reduce readmission
rates and their corresponding costs. First, starting the fiscal year 2015, the Hospital Readmissions
Reduction Program of 2013 mandates financial penalties to hospitals with greater rates of
readmissions for certain conditions (e.g., heart attack, heart failure, pneumonia). These penalties
are implemented as part of the Medicare reimbursement system (Boccuti & Casillas, 2017;
Centers of Medicare & Medicaid Services, 2014; Cutler, 2010). Implementation of this program
compelled healthcare administrators to emphasize effective post-discharge case management in
order to reduce unnecessary and preventable readmissions. Another program initiated by the
ACA is the Bundled Payments for Care Improvement Initiative to regulate the payment method.
With this program, hospitals receive a single payment for an entire episode of care, including
both index hospitalizations and subsequent readmissions (Cutler, 2010; Medicare Payment
Advisory Commission, 2011). Hence, understanding the excess costs of care incurred by
hospitals for readmissions becomes essential and a driving factor for hospital strategic
management. The salaried providers receive no additional incentive to readmit patients and
certain hospitals functioning within an annual budget (e.g., Veterans Health Administration-based
hospitals) do not allocate additional budget to treat readmissions (Carey & Stefos, 2016). These

22
ACA programs have motivated the health care systems to more accurately forecast rates and costs
of readmissions, especially for the preventable readmissions.
Nationally, among all other medical conditions, hospitalization due to alcohol-related
disorders (ARD) resulted in the highest 7-day (the second rank) and 30-day (the fourth rank)
readmissions (Fingar & Washington, 2015). Alcohol-induced disorders, acute alcohol
intoxication, unspecified alcohol dependence, alcohol abuse, alcoholic polyneuropathy, alcoholic
cardiomyopathy, alcoholic gastritis, liver damage due to alcohol abuse, alcohol affecting fetus or
newborn via placenta or breast milk, and toxic effects of ethyl alcohol are some types of ARD.
Readmissions due to ARDs are potentially preventable (Patterson, Lindsey, & Roohan, 2009;
Viggiano, Pincus, & Crystal, 2012). While overall economic costs and hospital (index stay) costs
for excessive alcohol consumption (Bouchery, Harwood, Sacks, Simon, & Brewer, 2011;
Gryczynski et al., 2016; Mukamal et al., 2006; Shepard, Daley, Ritter, Hodgkin, & Beinecke,
2002) and their association with clinical factors including comorbidities, and patient-level
characteristics have been examined, these studies to do not provide comprehensive data on
ARDs. Other studies estimated the hospital spending for primary diagnosis of mental illnesses
(e.g., schizophrenia, depression) with ARD as a comorbidity (Bouchery et al., 2011; Gryczynski
et al., 2016; Mukamal et al., 2006; J. D. Prince et al., 2008; Sacco, Unick, Zanjani, & Camlin,
2015; Shepard et al., 2002; G. Singh, Zhang, Kuo, & Sharma, 2016; Slaughter, Farris, Singer,
Smyth, & Singer, 2017). Hinde et al measured hospital costs and proportion of readmissions in
Arizona after the state started to mandate screening for ARD in trauma centers (Hinde, Bray,
Aldridge, & Zarkin, 2015). Fingar and Washington studied readmission costs for ARD in US
between 2009-2013 and reported an aggregate spending of $366 million (Fingar & Washington,
2015).
Importantly, all of these studies were conducted before the implementation of the ACA.
Because the two mandates under the ACA can have a large impact on the readmission rate and

23
the associated cost, it is necessary to use more recent data to understand the potential impact of
the ACA. Finally, few studies have fully explored the combined impact of patient and hospital-
level characteristics on probabilities of 30-day unplanned all-cause readmissions following index
hospitalizations primarily for ARD. The analysis of readmission rates and costs post-ACA is
essential for policymakers, hospital administrators, insurance analysts, patients, and providers.
To our knowledge, nationally representative 30-day readmission rates and their
corresponding costs following index hospitalizations with ARD as the primary diagnosis have not
been studied. Moreover, besides clinical factors and patients’ socio-economic characteristics,
non-clinical factors and other factors such as hospitals’ location, teaching status, bed-size, and
ownership could be important in impacting readmission rates and costs. The aims of this study
were to expand the existing literature by using post-ACA data for a nationally representative
sample of patients with primary diagnosis of ARDs. Five aims of the study are to: (a) determine
the incidence of index hospitalizations for patients with principal diagnosis of ARD, (b) estimate
the distribution of the proportion of 30-day unplanned all-cause readmissions across the number
of days after the index discharge, (c) identify patient and hospital-level predictors of 30-day
unplanned all-cause readmissions, (d) predict incremental cost of 30-day readmissions, and (e)
evaluate costs due to repeated diagnosis of ARD at the first immediate 30-day readmission.
Methods
Data source
Nationwide Readmissions Database
The Healthcare Cost and Utilization Project (HCUP), sponsored by the Agency for Healthcare
Research and Quality (AHRQ), has drawn the 2014 Nationwide Readmissions Database (NRD)
from the same sample of discharges as the HCUP State Inpatient Databases (SID). This study
utilizes information from the NRD that contains reliable data from 22 states and hospital

24
readmissions for all types of payers and the uninsured (Healthcare Cost and Utilization Project,
2017). These states are geographically dispersed and account for 51.2 percent of the total US
resident population and 49.3 percent of all the US. A verified patient linkage number helps track a
patient across hospitals within a state. AHRQ has computed encrypted identifiers that helps flag
discharges per patient throughout the year 2014 (Healthcare Cost and Utilization Project, 2017).
The 2014 NRD is comprised of 14,894,613 unweighted discharges collected from 2,048 hospitals
that amount to 35,306,427 discharges with weighting. We used the visit linkage variable to query
the number and days to readmission by patients (Healthcare Cost and Utilization Project, 2017).
The NRD also provides a hospital identifier that traces patients across hospitals within a state.
Moreover, hospital discharges in the NRD database are stratified and a single stage cluster sample
with variables for weights that help quantify nationally representative estimates of index
hospitalizations and readmissions.
Study sample
Recommendations made by CMS, the National Committee for Quality Assurance (NCQA),
Healthcare Effectiveness Data and Information Set (HEDIS), and National Quality Strategy
Annual Reports, were followed to design the inclusion and exclusion criteria for the study
(Horwitz et al., 2014; National Committee for Quality Assurance, 2015; National Quality
Strategy, 2012). The study population included those discharges in which the patient were adults
(over 18 years of age), did not die in the hospital, with one or more days in length of stay (LOS),
and discharges between January and November. The study excluded those discharges for the
month of December; patients admitted in an out-of-residency state at index stay; transferred to
acute care facilities, left against medical advice, discharged to unknown location; and/or had
primary diagnoses for (1) cancer, (2) rehabilitation, (3) pregnancy, (4) condition originating in the
perinatal period. Only the first readmission is counted within the 30-day period because the
outcome measure assessed in this study is percentage of admissions with a readmission.

25
The following steps that were taken to create the sample. As shown in Row 1 of Table 1,
a total of 14,894,613 discharges among 10,203,006 patients were identified. For the calculation of
30-day readmission counts, discharges made after November were excluded because their 30-day
follow-ups cannot be observed in the NRD. Row 2 shows that based on CMS and HCUP
recommendations, those discharges where the patients were transferred to acute-care facilities
(n=131,761), left against medical advice (n=189,690) or had missing information on disposition
status (n=15,186) were omitted from the study cohort. Similarly, we excluded from index
hospitalizations any discharges for cancer (n=572,679) and rehabilitation (n=21,332) from index
hospitalizations (Rows 3 and 4) because they would likely be deemed as ‘planned readmissions’.
In addition, we excluded admissions that took place in a state that was not the patient’s state of
residency (n=569,766). This is because these patients would most likely be readmitted in their
state of residence, which would not be captured in the NRD (Row 5). Individuals who died during
their initial hospitalization and those with missing LOS (n=16) and with zero LOS (n=198,287)
(Row 6) were excluded so as to be able to calculate the number of days to a subsequent
readmission. Lastly, following NCQA and HEDIS guidelines, the analyses excluded hospital
stays for acute inpatient discharge with a principal diagnosis of pregnancy (n=1,846,607) (Row 7)
or of a condition originating in the perinatal period (n=731,439) (Row 8). Moreover, a principal
diagnosis of organ transplant (Kidney Transplant, Bone Marrow Transplant Organ Transplant
Other Than Kidney) and potentially planned procedures without principal acute diagnosis were
also queried for deletion but no such cases were found in the study sample. Because disease
development and comorbidities vary between children/adolescents and adults, and both these
groups have different risk factors; this study excluded patients under the age of 18 years
(n=414,844).
The 2014 NRD was queried for ARD using the International Classification of Diseases
(ICD) Clinical Classification Software (CCS) Code 660 (Appendix 1). The ICD-9-CM

26
(International Classification of Diseases, Ninth Revision, Clinical Modification) was used to
identify hospitalizations with primary diagnoses for alcohol-induced disorders (291.00-291.90),
acute alcohol intoxication (303.00-303.03), unspecified alcohol dependence (303.90–303.93),
alcohol abuse (305.00-305.03), alcoholic polyneuropathy (357.5), alcoholic cardiomyopathy
(425.5), alcoholic gastritis (535.30, 535.31), liver damage due to alcohol abuse (571.00-571.30),
alcohol affecting fetus or newborn via placenta or breast milk (760.71) and toxic effects of ethyl
alcohol (980.00) (Healthcare Cost and Utilization Project (HCUP), 2015). Although the study
includes those discharges for patients with primary diagnoses of ARD, the readmissions to these
hospitalizations were all-cause and unplanned. Because NRD is built on information mentioned
on the discharge form, index hospitalizations were classified according to primary diagnoses on
discharge. A hospitalization with primary diagnoses for ICD code of 660 as per CCS was
considered as an index hospitalization and each qualifying hospital stay was counted as a separate
index admission. Therefore, a patient can have multiple index stays during the January to
November observation period.
Measures
Independent variables
Patient-level characteristics included age, sex, length of stay, median household income national
quartile for patient’s home ZIP code, payer, disposition status, patient location, utilization of
emergency services, and number of chronic and comorbid conditions at discharge. Age was
stratified into five categories (18-24, 25-44, 45-64 and > 65 years old). NRD includes insurance
status as the primary payer listed for the index hospital discharge without listing information on
the secondary payer. It is important to note that for patients over the age of 65 years, Medicare
was coded as their primary payer, given their eligibility to enroll in Medicare. Also, NRD
presents all Medicare beneficiaries, whether they use the fee-for-service or Medicare Advantage,
into one common category called Medicare. Categories including Worker's Compensation,

27
TRICARE/CHAMPUS, CHAMPVA, Title V, and other government programs are grouped as
‘other’ insurance (Healthcare Cost and Utilization Project (HCUP), 2017c). NRD does not
provide information on patients’ race, ethnicity, and state of residency.
The variable ‘utilization of services’ indicates records that have evidence of ED services
reported on the HCUP record. Some of the ED services included were ED revenue (ICD-9-CM
code of 450-459) or any positive ED charge, Current Procedural Terminology (CPT) code of
99281-99285, condition code of P7 (point of origin in emergency room), and admission source of
ED. A non-negative value specifies that there is evidence of ED services, whereas a value of zero
means that no ED services has been used.
We used a variety of hospital-level characteristics including the ownership, location,
teaching status, hospital volume, the number of beds, and the length of hospital stays. The
ownership or hospital control is based on mission, vision and values of the organization and
include categories like government nonfederal (public), private not-for-profit (voluntary) and
private investor-owned (proprietary). NRD also entails hospital location variable that is based on
urban-rural designation of the hospital depending on the county of the hospital; and information
on teaching status of hospital defined based on approval of the American Medical Association for
their residency program. The hospital volume was measured by the annual admissions and
divided into equal thirds based on the number of admissions for ARD through 2014 (< 41, 42-98,
and > 99). The hospital bed size variable was categorized specific to the hospital's location and
teaching status. Moreover, the length of inpatient hospital stays (LOS) in days was used in the
analysis.
To capture the overall health of the patients, this study constructed variables measuring
their comorbid conditions using HCUP Comorbidity Software Version 3.7 (Healthcare Cost and
Utilization Project (HCUP)., 2017). All comorbid conditions used the ICD-9-CM codes. This
comorbidity software utilizes 29 binary indicators for calculating the Elixhauser Comorbidity

28
Index (ECI) (Elixhauser A, Steiner C, Harris DR, 1998). To avoid collinearity and to follow the
norms of constructing the ECI measure, we removed alcohol-related comorbidity and categorized
the remaining 28 conditions into two groups. Drug-related conditions, depression, and psychoses
were categorized as “related” comorbid conditions. The remaining conditions were categorized as
“unrelated” comorbid conditions. An ECI measure of 0, for both related and unrelated comorbid
conditions, indicates an absence of any comorbid condition.
Outcomes
Index hospitalizations for ARD and 30-day all-cause unplanned readmissions are the units of
analysis. It is difficult to determine which readmissions are preventable and which are not.
Additionally, from the hospitals’ perspective, an all-cause readmission is an important quality
improvement metric that drives their strategies to contain high healthcare expenditures. Hence,
we included all-cause and unplanned 30-day readmissions (Horwitz et al., 2014). Also, we used
the nearest in time or the immediate 30-day readmission, measured as a binary indicator (0/1),
that occurred following an index hospitalization between January 1, 2014 to November 31, 2014
for ARD, which is the commonly used method by the CMS (Krumholz et al., 2000; Strom et al.,
2017). All subsequent re-hospitalizations that occur after the first readmission and beyond 30-
days from the first index hospitalization is considered as a new index hospitalization for the same
patient. Because the average rate of readmissions through 2014 per patient following an index
hospitalization due to ARD is 1.11, patient-level clustering of readmissions would not have a
statistically significant impact on the resulting estimates (Strom et al., 2017).
The incurred inpatient hospital costs in dollars for index hospitalizations and first
readmissions in 2014 are the desired primary outcomes. The NRD contains data on inpatient
hospital charges. HCUP’s Cost-to-Charge Ratio (CCR) files were used to convert the charges into
actual costs, which provides the cost in dollars of resources used for providing inpatient care for
all hospitals and conditions (“HCUP Cost-to-Charge Ratio Files (CCR).,” 2017). The CCR files

29
include neither any information on who ultimately paid for inpatient services nor how much of
these costs were covered by the insurance provider. However, estimates of inpatient costs by all
payers are validated by HCUP. Moreover, NRD is sampled such that using the weights, strata and
cluster variables, nationally representative estimates of hospital costs and readmission costs can
be derived (Healthcare Cost and Utilization Project (HCUP), 2015).
Analytical approach
Index hospitalizations for ARD and all-cause and unplanned first 30-day readmissions were the
units of analysis. Descriptive statistics were calculated for the number of inpatient index
hospitalizations for ARD and the proportion of them that led to immediate 30-day readmissions,
stratified by various patient and hospital-level characteristics. The categorical variables were
expressed as frequencies and percentages while the continuous variables were expressed as means
(with standard deviations) and medians. Univariate analyses were performed using the Student t-
test for continuous data. Chi-square tests at significance level of 0.05 were used to determine
differences in grouping variables to estimate the proportions of index hospitalizations for ARD
that were and were not followed up by 30-day readmissions. By definition, each patient can have
multiple index hospitalizations. Therefore, descriptive statistics are performed at the discharge-
level with ARD.
The distribution of the proportion of 30-day readmissions across the number of days after index
hospitalization for ARD was estimated. To identify the predictors for an all-cause 30-day
readmission, this study performed multivariate logistic regression while adjusting for patient
demographics, hospital characteristics, and comorbidities. Simultaneously, a forest plot
demonstrating adjusted odds ratios for readmission for key patient and hospital-level
characteristics was drawn.

30
A two-part model (2PM) was used to link the probability of readmission to the
corresponding readmission cost to determine patient- and hospital-level estimates for the
expected readmissions for overall index hospitalizations with ARD. In short, the 2PM linked the
readmission probability model to a readmission cost model. This two-part model based on mixed-
discrete-continuous variable regressions was used to not only account for zero costs of
readmission visits but to also estimate incremental costs of inpatient readmissions (Manning &
Mullahy, 2001). Because this model evaluates individual cost data that typically includes a
substantial proportion of zero value costs and, consequently, have skewed distribution (heavy
right-side tail) of non-zero values of costs, (Mullahy, 1998) it is an appropriate choice for the
analyses.
The first part of 2PM helps evaluate the probability of non-zero costs of readmissions
distinctly different from level of costs which are conditional on non-zero readmission costs using
a logit link function. This method has been used for hospital-cost analyses in previous studies
(Carey & Stefos, 2016; Kang & Barner, 2017; Li, Cairns, Fotheringham, & Ravanan, 2016; Ruhl
et al., 2017). This part applies a logistic regression for the binary distribution of the cost variable.
The second part of the model uses the generalized linear model with a log-link to estimate
conditional costs only for those discharges that had positive costs of readmissions (Belotti, Deb,
& Norton, 2015). The expected cost of readmission following an index hospitalization with ARD
was calculated as a product of the predictions obtained from estimating each part of the model,
i.e., the probability that any given readmission had an inpatient cost and their mean cost. This
study adjusted for all the predisposing, enabling and need factors of the Anderson model (Aday &
Andersen, 1974). Post-regression estimation of the 2PM enabled us to predict readmission costs,
estimate average and incremental costs in readmission for ARD. Additionally, analyses to
estimate readmission costs for readmissions that had primary diagnoses of ARD for the index stay
as well as 30-day readmission (called recurrence of ARD diagnoses at readmission, for this

31
study). The estimates of readmission costs for recurrence of ARD at readmission were compared
to those that had primary diagnoses of ARD for that index stay but not the immediate 30-day
readmissions.
SAS version 9.4 was used for all the descriptive analyses, multivariate logistic regression
and plotting the forest plots (SAS Institute Inc, Cary, NC). However, analyses for the 2PM were
performed using the user-built ‘twopm’ command in Stata (Stata Corp, College Station, TX).
Also, post-regression estimates for the average and incremental costs were computed using the
‘margins’ command. To account for the complex survey design, we used sampling weights,
clustering and stratification of all patient and hospital-level analyses to produce national estimates
of readmission costs for index hospitalizations due to ARD.
Results
Readmission rates of patient- and hospital-level characteristics
Out of 10,203,006 discharges recorded from 2,048 hospitals in the NRD 2014, 285,767 index
hospitalizations occurred for ARD. About 18.9% (54,083) of these index hospitalizations for
ARD were readmitted within 30-days. Patient- and hospital-level characteristics of ARD index
hospitalizations (weighted) are shown in Table 2. The mean age of patients who had 30-day
readmissions was 49.8 years. Patients who were 45-64 years old had the majority (57.90%) of
index hospitalizations for ARD, followed by those aged between 25-44 years (31.17%). Males
contributed the majority (71.9%) of index hospitalizations. Medicaid (34.9%), private insurers
(23.9%), and Medicare (19.4%) were the top three payers for index hospitalizations for ARD. The
majority of hospitalizations resulted in routine discharges (overall (86.6%). Also, most
hospitalizations were for urban residents (87.1%). About half (41.7%) of hospitalized individuals
had at least one related comorbid conditions and 82% had at least one unrelated comorbid
conditions. The majority (90.8%) of hospitalized individuals had non-elective admission and

32
78.48% used emergency services. The mean LOS was 5.3 days and the mean cost of the index
hospitalization was $8,188. The majority (74.1%) of individuals were admitted to non-profit
private hospitals. Over half of the individuals were admitted to large hospitals. The majority
(66.7%) of them were admitted to metropolitan teaching hospitals.
All of the patient- and hospital-level variables were significantly associated with the re-
admission status mainly due to the large sample size. The notable associations include age,
primary payer, unrelated comorbid conditions, and teaching status. For example, 62.3% of re-
admitted individuals were between 45 and 64 years of age while 56.7% of individual without
readmission were in that age group (<.0001). The proportion of Medicare (23.3% vs. 19.2%) and
Medicaid (41.4% vs. 33.7%) coverage was higher among individuals with at least one
readmission compared to those without readmissions. Patient who were readmitted had higher
proportion patients lived in low-income areas (the first quartile: 32.6% vs. 29.4%) than those that
were not readmitted. A higher proportion of hospitalizations with 4 or more comorbidities (20.5%
vs.16.4%) resulted in readmissions in contrast to those that did not have 30-day readmissions.
Among those who were readmitted, 70.7% of hospitalizations were at metropolitan teaching
hospitals while 65.8% of the hospitalizations without readmissions were admitted at such
hospitals.
The distribution of the proportion of readmissions was plotted across the number of days
(within 30-days) after the index discharges for ARD. As shown in the Figure 1, a higher
proportion (3.5-4.5%) of the readmissions occurred during the first 8 days.
The multivariable logistic regression, adjusted for comorbidities as well as patient and
hospital characteristics, was performed to identify predictors for all-cause 30-day readmission
occurring on index hospitalizations for ARD (Table 3) and Figure 2 visually illustrates the results.
Males were slightly less likely to be readmitted than females (OR=0.94; 95% CI: 0.90-0.98).
Compared to patients between 18-24 years, those aged between 25-44 years (OR=1.93; 95% CI:

33
1.62-2.29), and 65 years and older (OR=1.48; 95% CI: 1.22-1.80), were much more likely to be
readmitted but the odds of readmission were highest among those 45-64 years old (OR=2.14;
95% CI: 1.80-2.54). Hospitalizations in rural areas were less likely to result in readmissions than
those in urban areas (OR=0.83; 95% CI: 0.75-0.91). Individuals living in higher-income areas
(the third quartile: OR=0.92; CI: 0.86-0.98; and the fourth quartile: OR=0.92; CI: 0.86-0.98) were
less likely to be readmitted when compared to those living in low-income areas (the first quartile).
The likelihood of being readmitted increased with increase in the index measure for unrelated
comorbidity. In contrast to individuals with no unrelated comorbidity, those with one (OR=1.09;
CI: 1.03-1.5), two (OR=1.19; CI: 1.12-1.27), and three (OR=1.29; CI: 1.20-1.38) had higher
readmissions, but the odds of readmissions were highest among those with four or more
(OR=0.91; CI: 0.85-0.98) unrelated comorbidities. Small metropolitan areas (OR: 0.89; CI: 0.83-
0.96), micropolitan (OR: 0.76; CI: 0.65-0.89), areas classified as neither metropolitan nor
micropolitan areas (OR: 0.72; CI: 0.60-0.87) had lower odds of readmissions due to ARD when
compared to the large metropolitan areas. Individuals admitted to hospitals with medium (OR:
1.10; CI: 1.02-1.20) and large number of beds (OR: 1.19; CI: 1.10-1.29) had a higher likelihood
of readmissions due to ARD when compared to those admitted in hospitals with small bed size.
Costs of readmissions for ARD
The estimated coefficients for patients who revisited the hospital for ARD diagnosis; those with
one or more unrelated comorbidities as per ECI measure; and hospitals with large bed-size are
positively associated with the increased costs of readmissions in the 2PM model and statistically
found to be significant at the 1% level (Appendix 2). Individuals admitted for ARD as a primary
diagnosis at readmissions are likely to cost more than those whose primary cause of readmission
is other than ARD, which is conditional on spending any amount. The probability of readmissions
costs following an index hospitalization for ARD increases with the number of unrelated
comorbidities. Also, the probability of readmissions costs for patients admitted at hospitals with a

34
large number of short-term acute care beds set up and staffed in a hospital (bed-size) will likely
be more than hospitalizations at hospitals with smaller number of short-term acute care beds.
Similarly, the estimated coefficients for females; those hospitalizations that were
uninsured and not charged; and admitted in hospitals built in small metropolitan, micropolitan
and not metro or micropolitan areas; are negative in both parts and statistically found to be
significant at the 1% level (Appendix 2). This indicates that those patients who paid for self and
not charged will have lower readmission costs than those who are covered by Medicare. Also,
hospitalizations not in metropolitan areas are likely to have less readmissions costs than those in
metropolitan areas.
Predicted and incremental readmission costs following index stays for ARD
The mean cost was predicted to be $2,520 per recurrence of ARD diagnoses, $918 more than the
cost of readmission without recurring ARD. Readmissions by males were predicted to cost an
average of $1,754, about $44 more than that for females. The highest average cost of $1,908 was
predicted to be incurred by those between the ages of 45-64 years, which is $1,018 more than the
readmissions costs for young adults (18-24 years). The cost of readmissions was the highest for
those covered by Medicare ($2,133). Readmission costs increase with the number of unrelated
comorbidities increases. For example, the mean cost was $2,414 among patients with 4 or more
conditions, which is $1,170 more than those with no unrelated comorbidities. Because the
average length of stay for index and revisit hospitalizations for ARD is about 5 days, predicted
marginal effects were measured at 5 days and found to be $1,966, which would increase by $295
for every additional day.
The predicted mean readmission cost for hospitals located in large metropolitan areas is
$2,032, which is $485, $930 and $1,002 more than readmissions occurring in hospitals located in
small metropolitan, micropolitan, and neither metro nor micropolitan areas, respectively. The

35
readmission cost in hospitals with large number of bed in short-term acute care hospitals is
predicted to be an average of $1,964, which is $413 more than hospitals with smaller number of
beds. Readmissions in non-federal government hospitals (predicted mean costs: $2,109) costs
more by $337 and $567 than readmissions in private not-for-profit (voluntary) and private
investor-owned hospitals, respectively. Hospitals experiencing lower volumes of cases for ARD
are predicted to cost more to patients for their rehospitalizations. For example, readmission costs
are predicted to be the least ($1,666) in hospitals that experience high volume of ARD cases by
$488 than those experiencing low volume of ARD cases.
Incremental costs of readmissions with and without recurrence of ARD
Table 5 represents an estimation of incremental costs for readmissions with and without
recurrence of ARD (primary diagnoses of ARD at index discharge and readmission). The initial
analyses found that 25.7% of readmissions to index hospitalizations for ARD also had primary
diagnosis of ARD. This is a huge population of ‘frequent users’ who get hospitalized in inpatient
departments within 30-days for the same diagnoses. We estimated that average marginal costs of
readmissions were statistically and significantly greater through all age groups of adults in the
group of patients that were readmitted for ARD as recurring diagnoses versus those that were
readmitted for other primary diagnoses. For illustration, as compared to young adults, the costs
for the elderly with recurrence of ARD was $1,003 (P<0.0001) higher while that for the elderly
with no recurrence for ARD was higher by $641 (P<0.0001). Compared to individuals covered by
Medicare and readmitted for recurrence of ARD; the privately insured (-$1,040 vs.-$718), not
charged (-$1,176 vs. -$784) and using other insurances compared to Medicare (-$939 vs. $570)
incurred lesser costs when compared to those who were not readmitted for recurrence of ARD.
However, individuals who were uninsured and had a recurrence for ARD (-$1,154 vs. -$779) paid
the least readmission costs compared to those covered by Medicare and without recurrence of
ARD. Incremental readmission costs for recurrences of ARD increase significantly with increase

36
in the number unrelated comorbidities than those readmissions without recurrence of ARD.
However, the incremental readmission costs for recurrence of ARD was significantly higher by
$419 for every extra day of stay while that for readmissions without recurrence of ARD was
increased by $264 only. Compared to readmission costs without recurrence of ARD, costs for
treating recurrence of ARD at hospitals in smaller areas was much higher. For example, costs of
treating recurrence of ARD in hospitals located in neither metropolitan nor micropolitan areas
than those located in large metropolitan areas is less by $1,389 (-$905 less for readmissions
without recurrence of ARD at hospitals in neither metropolitan nor micropolitan areas). Similarly,
rehospitalizations with higher number of beds incurred more incremental readmissions costs than
those with small number of beds for readmissions with recurrence of ARD versus those without
recurrence of ARD ($564 vs.$375). Readmissions at non-federal government hospitals incurred
more incremental readmissions costs than private not-for-profit (voluntary) (incremental cost: -
$473 with recurrence of ARD vs. -$302 without recurrence of ARD) and private investor-owned
hospitals (-$804 vs. -$498 without recurrence of ARD) for readmissions due to ARD versus those
without ARD. Lastly, readmissions at hospitals experiencing medium (-$424 vs. -$272) and high
(incremental cost: -$693 vs. -$441) volume of cases for recurrence of ARD cost significantly less
than readmissions at hospitals that experience low volume of cases, especially for readmissions
with ARD versus without ARD at primary diagnosis.
Estimated burden of ARD in the US
Based on the weighted number of index hospitalizations for ARD (N=285,767), the estimated
total costs of hospitalizations among patients with primary diagnosis of ARD is $2.3 billion
(Table 1) per year in the US. Moreover, $512 million (Table 1) is spent on the first 30-day
unplanned and all-cause readmissions following these index hospitalizations to ARD, of which it
is predicted that $136 million (Table 4) is spent on those readmissions whose primary diagnoses
is ARD.

37
Discussion
To our knowledge, this study is the first to provide nationally representative estimates of the rates
of unplanned all-cause 30-day readmissions to index hospitalizations for patients with primary
diagnoses of ARD. Previous studies have looked at predictors of readmissions following index
hospitalizations where ARD and other psychiatric disorders were comorbidities (Baumeister,
Haschke, Munzinger, Hutter, & Tully, 2015; Sacco, Unick, Zanjani, & Camlin, 2015; G. Singh,
Zhang, Kuo, & Sharma, 2016; Slaughter, Farris, Singer, Smyth, & Singer, 2017) and not as the
primary cause of hospitalizations. Despite the fact that readmissions for ARD are potentially
preventable (Patterson et al., 2009; Viggiano et al., 2012), we found that even after the ACA
implementation about 19% of index hospitalizations with ARD resulted in 30-day readmissions.
The difference in readmission rate maybe because the number of Americans that received access
to care increased post-ACA while quality of care and discharge protocols remained mostly
unchanged. Also, consistent with pre-ACA findings by Fingar and Washington (2015) for the
period 2009-2013 (Fingar & Washington, 2015), our study shows that readmissions following the
index discharge due to ARD occur within the first 8 days. Suicidality and social problems have
been regarded as the commonest immediate reason behind readmission (N. Chakraborty &
Aryiku, 2008). These preventable readmissions may be due to untimely discharge without
adequately stabilizing patients and poor transition; failure to continue care after discharge; or
insufficient communication among hospital staff, patients, caregivers and community-based
clinicians (Viggiano et al., 2012). Furthermore, consistent with previous studies, our study
identified high-risk patients that included those who were males, between the age of 45-64 years
(B. J. Clark et al., 2013; Weiss, Barrett, Heslin, & Stocks, 2016), covered by Medicaid (Hines,
Barrett, Jiang, & Steiner, 2014), residing in urban but low-income areas (Weiss et al., 2016), had
utilized emergency departments before inpatient admissions, and having 3 or more chronic
conditions and up to 2 unrelated comorbidities (H. Chakraborty et al., 2017; Smith, Stocks, &

38
Santora, 2015; Walley et al., 2012), were more likely to be hospitalized for ARD which can result
in 30-day unplanned readmissions. Additionally, patients who were males, 25 years old and
above, with Medicare coverage, 2 or more unrelated comorbidities (Barker et al., 2017;
Campbell, Bahorik, Kline-simon, & Satre, 2017; J. D. Prince et al., 2008), residents of urban, and
low-income areas have higher odds of readmission. Our results also show that patients were more
likely to be readmitted within 30-days than those without unrelated comorbidities, which is
consistent with existing literature.
To the best of our understanding, this is the first published study that incorporated
patient- as well as hospital-level characteristics to estimate the rates, probability and costs of 30-
day readmissions. Our study shows that readmission rates were higher for those hospitalizations
that occurred in those hospitals that were not-for-profit private, with large numbers of beds,
located in metropolitan areas, had a metropolitan teaching status, and experienced high volume of
cases for ARD. This is comparable to results found in the literature (J. D. Prince et al., 2008;
Sacco et al., 2015). Patients admitted at hospitals with medium and large bed-size also had higher
odds of 30-day readmissions, thereby, indicating that such facilities must improve delivery of
integrated treatment and ensure consistent communication across the care team. Like previous
literature, we found that readmissions occurring in hospitals located in large metropolitan areas
cost higher than those in rural areas. Higher wages for providers, provision of graduate medical
education, payer and case mix, higher probability of competition, and treatment of poor,
uninsured and Medicaid patients were the reported reasons for the differences in costs of
treatment between rural and urban hospitals (iVantage Health Analytics, 2016; Thorpe, 1988).
This issue indicates that urban hospitals need to offer less fragmented care, emphasize on
continuity of care together with home follow-up visits, and increase education to patients
including teaching them self-management of care. These strategies may also be applied by those
hospitals where patients incur higher costs of hospitalizations and had large bed-size, were non-
39
federal public/government hospitals, and had experienced lower volume of ARD cases. Reports
which evaluated treatment costs for other diseases also had similar associations between costs of
hospitalizations and hospital-level factors (Brinjikji, Rabinstein, & Cloft, 2012; Chen, Jha,
Ridgway, Orav, & Epstein, 2010; Walkey & Wiener, 2014). However, this study shows that
hospitals that were non-federal government, located in large metropolitan areas and have a larger
number of beds, may offer comparatively lower hospitalizations costs to those who had
recurrences of ARD at readmissions than without recurrence of ARD. Hence, this indicates that
rehospitalizations for the same diagnoses may be treated at lower costs than for different
diagnoses at these hospitals. Because there is paucity of similar studies to compare findings on
recurrences of ARD, future research needs to be conducted on estimating differences in costs of
readmissions with and without recurrences of ARD by patient and hospital-level characteristics.
It is noteworthy that the average cost of index inpatient stays for ARD we found was
$8,188, which was almost twice that from findings on all substance abuse-related inpatient
hospital stays ($4,600) in 2008 (Stranges et al., 2011). With the absence of recent statistics and
comparable studies performed on a national-level on readmissions following index discharge with
ARD, our results provide useful, detailed information on possible cost drivers among patient and
hospital characteristics. After the implementation of the ACA and other health policies that
increase access and coverage for mental health and substance use-related disorders, outpatient
services offering follow-ups for ARD should render reduction of readmission rates and costs.
Also, we anticipated reduced readmission costs for treating recurrence of ARD because certain
elements of treatment such as costs for diagnostics and pathology tests would not be repeated
within 30 days. Compared to results of pre-ACA estimated aggregate costs of readmissions ($366
million between 2009-2013) (Fingar & Washington, 2015), our study shows that post-ACA in
2014 alone, a cost of $512 million was incurred for immediate 30-day readmissions. There are
only two other studies in our understanding that have attempted to provide similar estimates but

40
at state-level. The first study used Ontario, Canada’s population to derive and validate sex-
specific models to predict 30-day psychiatric readmissions (Barker et al., 2017). The second used
inpatient data from the San Francisco General Hospital to measure 30-day readmission rates for
alcohol dependence to evaluate the discharge protocol (Wei et al., 2015) without estimating costs
of readmissions. In the advent of healthcare policy reform, such a comprehensive analysis of
rates, costs, and predictors of 30-day readmissions following index stay for ARD provides
evidence to the US healthcare policymakers indicating high healthcare utilization for preventable
conditions.
Because recurrence of ARD as primary diagnoses was seen frequently (among one in
every four 30-day readmissions), cost analyses for readmissions is important. This study is
exclusive in evaluating the incremental costs of readmissions with and without recurrence of
ARD. Our study showed that the cost of treating recurrence of ARD ($2,520 vs. $1,601) was
higher than treating other diagnoses. This result emphasizes the need to provide integrated
behavioral health services which can reduce the costs of recurring hospitalizations for ARD. Our
findings show that readmissions costs increased with an increase in age and ECI for unrelated
comorbidities for those with and without recurrences of ARD at readmissions. However,
incremental differences in readmission costs with and without recurrences of ARD were not
found to be significantly associated with sex, patient location, and income status for those
patients. Therefore, our study highlights that hospital administrators and providers have an
opportunity to reduce costs of readmissions by regulating factors that have higher incremental
costs for readmissions with recurrence of ARD.
Using health information technology; increasing patient outreach via telephone reminders
for outpatient follow-ups; introducing protocols for best practices in discharge planning; and
proactively scheduling the first outpatient session after discharge may help reduce readmission
rates (Kripalani, Theobald, Anctil, & Vasilevskis, 2014). In a randomized study by Jack et al.,

41
reports that medication reconciliation, reviewing test results and pending tests, discussion related
to action plans of future treatments, and sharing post-discharge plans in both written (patient
education) and verbal (instructions in plain language) formats have helped reduce readmissions at
inpatient and emergency departments (Jack et al., 2009). Author Coleman et al. conducted ‘Care
Transitions Intervention’ by utilizing nurses to be coaches of transitions to offer home visits
within 48-72 hours of discharge to significantly reduced 30-day readmissions (Coleman, Parry,
Chalmers, & Min, 2006). A few recommendations and interventions are specifically suggested to
reduce readmission rates among these patients with multiple comorbid and chronic conditions.
Patients who are not provided holistically managed care must be referred to suitable intensive
services. Also, by offering peer coaching for transitioning from ARD and managing other
comorbidities; and implementing clinical interventions to encourage adherence to treatment,
readmission rates may be reduced (Hudali, Robinson, & Bhattarai, 2017; Kripalani, Theobald,
Anctil, & Vasilevskis, 2014; Pincus, 2014)
In summary, this national-level study contributes to the knowledgebase on economic
burden of primary diagnoses by using sophisticated analysis of several types of patient and
hospital-level characteristics that are predictors of readmissions, the cost of index stays and
readmissions. Also, our study provides robust estimates on readmission costs by simultaneously
addressing the problem of zero costs of readmissions and thus skewed (to the right) distribution
of hospital and readmission costs, which is novel for studies with ARD as a primary or even
secondary diagnosis. Policymakers and hospital administrators can benefit from the findings and
may implement protocols for hospitals that monitor and bridge care after index hospitalizations to
outpatient settings. Local and state public health departments must contrive for community-based
outreach programs to educate high-risk patients to curb readmission rates for ARD which are
comparatively top ten in volume but also preventable.

42
Conclusions
One in five index hospitalizations for ARD in the US results in unplanned all-cause 30-day
readmission, with a major proportion occurring within the first 8 days. One in 4 of these
readmissions chances to be for a principal diagnosis for ARD. Readmissions rates, an
international indicator of healthcare quality, are fund to be more likely among those patients who
are 45-64 years old and suffer from multiple comorbidities. Overall, readmissions costs are found
to be higher in hospitals located in large metropolitan areas, with high number of beds, of not-for-
profit government status, and treat low volume of ARD cases per year. However, in contrast,
these hospital characteristics render lower costs for treating readmissions for recurrence of ARD.
The estimated burden of ARD-driven index hospitalization in the US in 2014 was $2.3 billion of
which approximately $474 million were costs on the hospital stays that led to readmissions.
Nationally, $512 million were spent on treating the first readmissions following the index
hospitalizations for ARD of which $136 million is predicted to be spent on relapse visits for
principal diagnosis for ARD. These exorbitant costs on index stays and readmissions indicate the
fragmented behavioral care offered currently, despite the advent of value-based care, and
highlight the need for integrated behavioral health services, which can curb these preventable
readmissions for ARD. An ecological, multifaceted, and combined effort by patients and
hospitals can together reduce factors that propel preventable readmissions and steep costs for
ARD. Future studies must analyze patient-level predictors and costs of treating patients with
ARD in the outpatient departments or other healthcare settings after index discharge and before
being readmitted within 30 days. Such analysis will help in understanding the extent to which
patients are utilizing follow-up care before being readmitted.

43
Table 1: Flow chart of exclusion criteria for numbers of observed hospital discharges per
unique patients applicable to index admissions and readmissions from the NRD, 2014.
Observed
discharges (n) &
unique patients (N)
Excluded
discharges (n) &
unique patients
(N)
Explanations
n = 14,894,613 All discharges in NRD
N = 10,943,999
n=14,557,976 n=336,637 Excluded if discharge status is:
N= 10,727,851 N=216,148 a) Transfer to acute (n=131,761; N= 90,467)
b) Left against medical advice (n=189,690; N=
116,738)
c) Unknown (n=15,186; N= 8,943) a
n=13,985,297 N=572,679 Excluded if discharges for primary diagnoses of
Cancer b
N=10,178,040 N=549,811
n=13,963,965 n=21,332 Excluded if discharges primary diagnoses of
Rehabilitation b
N=10,162,858 N=15,182
n=13,394,199 n=569,766 Exclude who were not residents of the state in
which the initial hospitalization took place were
excluded since they would most likely be
readmitted in their state of residence and this
would not be captured in the NRD.
N=10,031,591 N=131,267
n=13,195,896 n=198,303 Excluded if LOS is:c
N=9,894,825 N=136,766 a) LOS is missing (n= 16; N= 16)
b) LOS=0 (n=198,287 and N=136,750)
n=11,349,289 n=1,846,607 Acute inpatient discharge with a principal
diagnosis of pregnancy.d N=8,153,943 N=1,740,882
n=10,617,850 n=731,439 Acute inpatient discharge with a principal
diagnosis of a condition originating in the
perinatal period. N=7,441,110 N=712,833
n=10,203,006 n= 414844 Excluded children and adolescents from the
study
N= 7,108,419 N=332691
NRD, Nationwide Readmissions Database; n, number of observed discharges; N= unique number
of patients; LOS, length of stay.
a Healthcare Cost and Utilization Project (HCUP). (2017). Nationwide readmissions database description of data
elements. Retrieved from https://www.hcup-us.ahrq.gov/db/vars/nrd_visitlink/nrdnote.jsp b Horwitz, L., Grady, J., Lin, Z., Nwosu, C., Keenan, M., Bhat, K. R., … Drye, E. (2014). 2014 Measure Updates and
Specifications Report : Hospital-Wide All-Cause Unplanned Readmission. Centers for Medicare & Medicaid
Services (CMS). c Yoon, F., Sheng, M., Jiang, H., Steiner, C., & Barrett, M. (2017). Calculating Nationwide Readmissions Database
(NRD) Variances. HCUP Methods Series Report # 2017-01. ONLINE. January 24, 2017. U.S. Agency for
Healthcare Research and Quality. Available: http://www.hcupus.ahrq.gov/reports/methods/methods.jsp d National Committee for Quality Assurance. (2015). Proposed Changes to Existing Measure for HEDIS ® 2015: Plan
All-Cause Readmissions (PCR).

44
Table 2: Characteristics of patients and hospitals registered in the NRD 2014 with an index hospitalization for alcohol-related
disorders based on 30-day all-cause readmissions.
Characteristics Overall N=285,767 (100%)
Readmissions No Readmissions
P value N= 54,083 (18.93%) N= 231,684 (81.07%)
Number Percent Number Percent Number Percent
PATIENT-LEVEL CHARACTERISTICS
Age in years
18 to 24 6,124 2.1 503 0.9 5,622 2.4 <.0001
25 to 44 89,087 31.2 15,357 28.4 73,730 31.8
45 to 64 165,458 57.9 33,723 62.4 131,736 56.9
65 and over 25,097 8.8 4,500 8.3 20,597 8.9
Mean age + SD 48.9 ± 0.11 49.8 ± 0.15 48.7 ± 0.11
Sex <.0001
Male 205,366 71.9 39,811 73.6 165,554 71.5
Female 80,401 28.1 14,271 26.4 66,130 28.5
Primary payer* <.0001
Medicare 57,164 19.9 12,580 23.3 44,584 19.2
Medicaid 100,181 34.9 22,374 41.4 77,807 33.5
Private
Insurance 68,582 23.2 9,475 17.5 59,107 25.4
Uninsured 39,763 13.8 6,320 11.7 33,443 14.4
No charge 6,870 2.4 1,267 2.3 5,603 2.4
Other 12,786 4.5 1,989 3.7 10,797 4.6
Admission Day 0.0014
Weekday 219,108 76.7 40,973 75.8 178,135 76.9
Weekend 66,658 23.3 13,109 24.2 53,549 23.1
Disposition status <.0001
Routine 247,328 86.6 46,813 86.6 200,516 86.6

45
Transfer to
Nursing,
intermediate or
other facility
26,299 9.2 4,371 8.1 21,927 9.5
Home Health
Care (HHC) 12,140 4.2 2,899 5.4 9,241 4.0
Median household income national
quartile for patient ZIP code** <.0001
First quartile 85,736 30 17,615 32.6 68,121 29.4
Second quartile 71,798 25.1 13,541 25.0 58,257 25.2
Third quartile 63,405 22.2 11,347 21.0 52,058 22.5
Fourth quartile 60,454 21.15 10,791 20.0 49,663 21.4
Patient location* <.0001
Urban 249,709 87.11 48,384 89.5 201,325 86.6
Rural 32,893 11.47 4,870 9.0 28,023 12.1
Number of chronic conditions <.0001
0 16 0.01 0 0.0 16 0.0
1 10,274 3.6 1,311 2.4 8,963 3.9
2 27,853 9.75 4,220 7.8 23,633 10.2
3 or more 247,624 86.65 48,552 89.8 199,072 85.9
Elixhauser Comorbidity Index measure
Related comorbid conditions a <.0001
0 160,174 56.05 28,620 52.9 131,554 56.8
1 119,179 41.7 23,927 44.2 95,252 41.1
2 6,332 2.22 1,506 2.8 4,826 2.1
Unrelated comorbid conditions b <.0001
0 53,551 18.74 8,357 15.5 45,194 19.5
1 69,762 24.41 12,190 22.5 57,572 24.9

46
2 65,630 22.97 12,623 23.3 53,007 22.9
3 47,846 16.74 9,828 18.2 38,018 16.4
4 or more 48,977 17.14 11,084 20.5 37,893 16.4
Elective <.0001
Non-elective
admission 258,955 90.78 50,275 93.2 208,680 90.2
Elective
admission 26,312 9.22 3,679 6.8 22,633 9.8
Utilization of emergency services NA
Yes 224,357 78.48 44,159 81.6 180,198 77.5
No 61,410 21.52 9,924 18.4 51,486 22.5
Length of stay
in days, mean ±
SD (median)
5.3±0.11 (3.01) 5.3 ±0.10 (3.18) 5.3 ±0.12 (2.98) NA
Total cost of
index
hospitalizations
$2,316,239,719.00 $473,917,432.00 $1,842,322,287.00
Cost of index
hospitalization
in dollars,
mean + SD
(median)
$8,188.28 ± 204.78
($5,012.08)
$8,839.60 ± 344.91
($5,271.74)
$8,035.97 ± 182.51
($4950.55) NA
Total cost of
immediate
readmission
$512,763,105.00
HOSPITAL-LEVEL CHARACTERISTICS
Hospital control/ ownership 0.3893
Government,
nonfederal 36,468 12.76 7,253 13.4 29,215 12.6
Private, non-
profit 211,842 74.13 39,637 73.3 172,206 74.3

47
Private, invest-
own 37,456 13.11 7,193 13.3 30,263 13.1
Bed-size of hospital 0.0006
Small 47,737 16.7 8,191 15.2 39,546 17.1
Medium 87,472 30.61 16,189 29.9 71,282 30.8
Large 150,557 52.69 29,702 54.9 120,855 52.2
Hospital location
Large
metropolitan
areas
165,264 57.83 33,320 61.6 131,944 57.0 <.0001
Small
metropolitan
areas
98,560 34.49 17,665 32.7 80,895 34.9
Micropolitan
areas 16,680 5.84 2,443 4.5 14,236 6.1
Not
metropolitan or
micropolitan
5,263 1.84 654 1.2 4,609 2.0
Teaching status <.0001
Metropolitan
non-teaching 73,209 25.62 12,726 23.5 60,483 26.1
Metropolitan
teaching 190,615 66.7 38,259 70.7 152,356 65.8
Non-
metropolitan
hospital
21,942 7.68 3,097 5.7 18,845 8.1
Hospital volume c 0.0041
Low 50,055 17.52 8,667 16.0 41,388 17.9
Medium 70,117 24.54 13,328 24.7 56,789 24.5
High 165,496 57.93 32,064 59.3 133,432 57.6
NRD, Nationwide Readmissions Database.

48
P-value in the last column represents the significance of difference of characteristics between index hospitalizations without readmission
group and index hospitalizations with at least one readmission group.
*The sum of individual counts may not add up to the total number of visits because of missing information for certain variables.
**Median household income quartiles of residents in the patient’s ZIP code for 2014 are defined as: (1) $1 - $39,999; (2) $40,000 -
$50,999; (3) $51,000 - $65,999; and (4) $66,000 or more. a Count of related comorbid conditions including drug-related, depression, and psychoses. b Count of non-related comorbid conditions which comprises of a count of one for congestive heart failure, valvular disease, pulmonary
circulation disease, peripheral vascular disease, paralysis, other neurological disorders, chronic pulmonary disease, diabetes without
chronic complications, diabetes with chronic complications, hypothyroidism, renal failure, liver disease, peptic ulcer bleeding, acquired
immune efficiency syndrome, lymphoma, metastatic cancer, solid tumor without metastasis, rheumatoid arthritis, coagulopathy, obesity,
weight loss, fluid and electrolyte disorders, chronic blood loss anemia, and deficiency anemia. c Computed based on the tertile cutoff values of (1) up to 41, (2) 42-97, and (3) 98 and over index admissions at each facility for ARD.

49
Figure 1: Proportions of 30-day readmissions (all-cause) against number of days after
discharge from index hospitalization for alcohol-related disorders using NRD, 2014.
NRD, Nationwide Readmissions Database
0
0.5
1
1.5
2
2.5
3
3.5
4
4.5
5
0 5 10 15 20 25 30
Per
centa
ge
of
30
-day
Rea
dm
issi
ons
Days to readmission from index discharge
Proportions of readmissions (all-cause) against number of days after
discharge from index hospitalization.

50
Table 3: Logistic regression for 30-day readmissions on index hospitalizations for alcohol-
related disorders, NRD 2014.
Variable Estimate Odds ratio 95% confidence level
P-value Lower limit Upper limit
Intercept -2.076 <.0001
Sex
Male Reference
Female -0.067 0.935 0.896 0.976 0.002
Age
18 to 24 Reference
25 to 44 0.655 1.926 1.620 2.290 <.0001
45 to 64 0.760 2.138 1.803 2.535 <.0001
65 and over 0.394 1.482 1.222 1.797 <.0001
Primary payer
Medicare Reference
Medicaid -0.053 0.948 0.894 1.005 0.073
Private Insurance -0.572 0.564 0.529 0.602 <.0001
Uninsured -0.452 0.636 0.579 0.699 <.0001
No charge -0.318 0.727 0.641 0.826 <.0001
Other -0.444 0.641 0.557 0.738 <.0001
Patient location
Urban Reference
Rural -0.188 0.829 0.754 0.911 <.0001
Median household income national quartile for patient ZIP code**
First quartile Reference
Second quartile -0.006 0.994 0.936 1.057 0.851
Third quartile -0.087 0.916 0.861 0.975 0.006
Fourth quartile -0.089 0.915 0.855 0.979 0.010
Elixhauser Comorbidity Index for unrelated comorbid conditions
0 Reference
1 0.085 1.089 1.032 1.149 0.002
2 0.177 1.194 1.124 1.268 <.0001
3 0.252 1.287 1.201 1.379 <.0001
4 or more 0.368 1.445 1.346 1.551 <.0001
Hospital urban-rural designation
Large metropolitan areas Reference
Small metropolitan areas -0.114 0.893 0.830 0.960 0.002
Micropolitan areas -0.272 0.762 0.653 0.889 0.001
Not metro or micro -0.328 0.720 0.596 0.871 0.001
Bedsize of hospital
Small Reference
Medium 0.099 1.104 1.017 1.198 0.018
Large 0.177 1.193 1.104 1.290 <.0001
NRD, Nationwide Readmissions Database; metro, metropolitan; micro, micropolitan.
**Median household income quartiles of residents in the patient’s ZIP code for 2014 are defined
as: (1) $1 - $39,999; (2) $40,000 - $50,999; (3) $51,000 - $65,999; and (4) $66,000 or more.
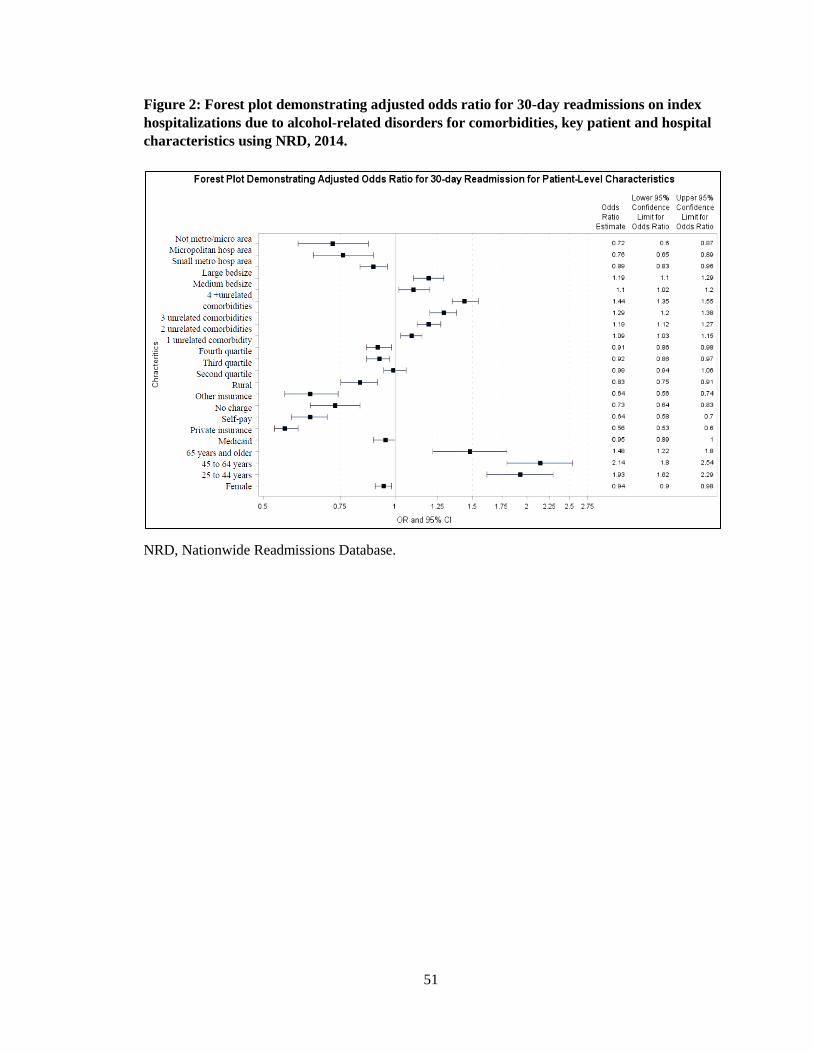
51
Figure 2: Forest plot demonstrating adjusted odds ratio for 30-day readmissions on index
hospitalizations due to alcohol-related disorders for comorbidities, key patient and hospital
characteristics using NRD, 2014.
NRD, Nationwide Readmissions Database.

52
Table 4: Post-regression estimates for predicted and incremental costs for readmissions with index hospitalizations for alcohol-
related disorders using the NRD 2014.
Characteristics
Predicted marginal
costs Average
marginal
effects (dy/dx)
SE P>z
95% confidence interval
Mean SE Lower limit Upper limit
Recurrence of ARD diagnoses
No $1,601.67 $33.50 Reference
Yes $2,519.89 $73.32 $918.22 71.32 <.0001 778.45 1,057.99
Sex
Male $1,798.31 $37.04 Reference
Female $1,754.46 $49.09 -$43.85 49.822 0.379 -141.50 53.80
Age
18 to 24 $890.09 $162.38 Reference
25 to 44 $1,636.67 $46.27 $746.58 168.42 <.0001 416.48 1076.67
45 to 64 $1,908.29 $39.81 $1,018.20 164.15 <.0001 696.47 1339.93
65 and over $1,603.48 $88.12 $713.38 184.50 <.0001 351.78 1074.99
Primary payer
Medicare $2,132.53 $64.47 Reference
Medicaid $2,112.33 $51.61 -$20.20 79.09 0.798 -175.20 134.81
Private Insurance $1,350.67 $50.24 -$781.86 76.28 <.0001 -931.37 -632.36
Uninsured $1,279.42 $50.99 -$853.11 79.72 <.0001 -1009.36 -696.86
No charge $1,271.25 $96.98 -$861.28 114.22 <.0001 -1085.14 -637.41
Other $1,429.62 $127.48 -$702.91 135.54 <.0001 -968.57 -437.25
Patient location
Urban $1,781.07 $33.61 Reference
Rural $1,841.36 $143.78 $60.29 144.98 0.678 -223.87 344.44
Median household income national quartile for patient ZIP code**
First quartile $1,735.07 $49.39
Second quartile $1,807.45 $52.29 $72.38 63.73 0.256 -52.53 197.30
Third quartile $1,745.86 $58.67 $10.79 68.62 0.875 -123.70 145.27
Fourth quartile $1,876.69 $67.17 $141.62 81.47812 0.082 -18.08 301.31
Elixhauser Comorbidity Index for unrelated comorbid conditions

53
0 $1,244.17 $44.37 Reference
1 $1,478.73 $43.98 $234.57 58.28 <.0001 120.35 348.79
2 $1,733.70 $51.45 $489.53 61.42 <.0001 369.16 609.90
3 $2,075.12 $68.83 $830.96 78.31 <.0001 677.48 984.44
4 or more $2,414.64 $86.39 $1,170.47 98.46 <.0001 977.50 1363.45
Length of stay a $1,966.15 $49.57 $295.28 41.19 <.0001 214.54 376.015
Hospital urban-rural designation
Large metropolitan areas $2,032.20 $53.42 Reference
Small metropolitan areas $1,547.50 $51.05 -$484.70 69.64 <.0001 -621.19 -348.22
Micropolitan areas $1,102.39 $97.64 -$929.81 121.32 <.0001 -1167.59 -692.02
Not metro or micropolitan $1,030.69 $123.30 -$1,001.51 139.81 <.0001 -1275.54 -727.49
Bed-size of hospital
Small $1,551.04 $62.86 Reference
Medium $1,627.36 $48.82 $76.32 75.50 0.312 -71.66 224.29
Large $1,964.03 $53.25 $412.99 82.99 <.0001 250.34 575.64
Hospital control/ ownership
Government, nonfederal $2,109.25 $96.71 Reference
Private, non-profit $1,772.75 $39.41 -$336.50 103.57 0.001 -539.49 -133.50
Private, invest-own $1,542.12 $64.50 -$567.13 114.28 <.0001 -791.11 -343.15
Hospital volume b
Low $2,154.79 $80.36 Reference
Medium $1,852.60 $62.58 -$302.19 93.03 0.001 -484.52 -119.85
High $1,665.99 $44.90 -$488.80 92.80 <.0001 -670.69 -306.91
NRD, Nationwide Readmissions Database; SE, Standard error
** Median household income quartiles of residents in the patient’s ZIP code for 2014 are defined as: (1) $1 - $39,999; (2) $40,000 -
$50,999; (3) $51,000 - $65,999; and (4) $66,000 or more. a Predicted marginal costs are computed using the mean length of stay of 5 days. b Computed based on the tertile cutoff values of (1) up to 41, (2) 42-97, and (3) 98 and more index admissions at each facility for ARD.

54
Table 5: Post-regression estimates for average marginal effects among individuals with and without readmissions with recurrence
of alcohol-related disorders, NRD 2014.
Characteristics
Readmission with recurrence of ARD
N=13,906 (25.71%)
Readmission without recurrence of ARD
N=40,177 (74.29%)
Average
marginal
effects
(dy/dx)
Std. Err. P>z
95% Conf. Interval Average
marginal
effects
(dy/dx)
Std. Err. P>z
95% Conf. Interval
Lower
limit
Upper
limit
Lower
limit
Upper
limit
PATIENT CHARACTERISTICS
Sex
Male Reference Reference
Female -$53.09 $69.08 0.442 -188.48 82.30 -$41.62 $45.01 0.355 -$129.85 $46.60
Age
18 to 24 Reference Reference
25 to 44 $1,022.29 $245.33 <.0001 541.46 1503.12 $677.89 $149.46 <.0001 384.96 970.82
45 to 64 $1,391.33 $240.81 <.0001 919.36 1863.30 $925.27 $145.57 <.0001 639.96 1210.58
65 and over $1,002.47 $265.75 <.0001 481.61 1523.34 $641.06 $164.46 <.0001 318.72 963.40
Primary Payer
Medicare Reference Reference
Medicaid -$20.76 $107.71 0.847 -231.87 190.36 -$20.09 $72.04 0.780 -161.28 121.10
Private Insurance -$1,040.37 $107.00 <.0001 -1250.08 -830.66 -$718.12 $69.48 <.0001 -854.30 -581.94
Uninsured -$1,153.71 $112.04 <.0001 -1373.3 -934.12 -$778.89 $72.67 <.0001 -921.33 -636.45
No charge -$1,176.13 $160.00 <.0001 -1489.73 -862.53 -$783.48 $103.61 <.0001 -986.56 -580.40
Other -$939.41 $188.69 <.0001 -1309.24 -569.59 -$644.57 $122.77 <.0001 -885.20 -403.93
Patient location
Urban Reference Reference
Rural $108.62 $204.18 0.595 -291.57 508.81 $47.89 $130.15 0.713 -207.19 302.97
Median household income national quartile for patient ZIP code**
First quartile Reference Reference
Second quartile $103.31 $87.55 0.238 -68.29 274.90 $64.60 $57.81 0.264 -48.70 177.89
Third quartile $26.75 $94.49 0.777 -158.45 211.95 $6.66 $62.16 0.915 -115.18 128.49
Fourth quartile $211.77 $112.68 0.06 -9.08 432.62 $123.86 $73.73 0.093 -20.64 268.36
Elixhauser Comorbidity Index for unrelated comorbid conditions

55
0 Reference Reference
1 $326.85 $81.63 <.0001 166.85 486.85 $211.73 $52.62 <.0001 108.61 314.86
2 $678.33 $86.09 <.0001 509.59 847.07 $442.84 $55.77 <.0001 333.54 552.15
3 $1,149.65 $116.22 <.0001 921.86 1377.45 $752.16 $69.87 <.0001 615.23 889.10
4 or more $1,608.78 $139.56 <.0001 1335.25 1882.32 $1,062.19 $89.83 <.0001 886.14 1238.25
Length of stay $418.59 $57.16 <.0001 306.55 530.63 $264.27 $37.45 <.0001 190.87 337.67
HOSPITAL CHARACTERISTICS
Hospital urban-rural designation
Large
metropolitan areas Reference Reference
Small
metropolitan areas -$671.17 $94.26 <.0001 -855.91 -486.43 -$438.02 $63.89 0 -563.24 -312.80
Micropolitan
areas -$1,290.99 $175.88 <.0001 -1635.7 -946.276 -$839.34 $108.50 0 -1052.00 -626.69
Not metro or
micropolitan -$1,388.80 $200.82 <.0001 -1782.39 -995.2 -$904.54 $125.38 0 -1150.28 -658.80
Bed-size of
hospital
Small Reference Reference
Medium $97.94 $104.00 0.346 -105.89 301.78 $70.99 $68.39 0.299 -63.06 205.04
Large $563.39 $114.55 <.0001 338.87 787.91 $375.40 $75.33 0 227.77 523.04
Hospital control/ ownership
Government,
nonfederal Reference Reference
Private, non-profit -$473.39 $140.78 0.001 -749.32 -197.45 -302.12 94.49 0.00 -487.31 -116.93
Private, invest-
own -$803.85 $156.14 <.0001 -1109.88 -497.81 -507.62 104.26 0.00 -711.95 -303.28
Hospital volume
Low Reference Reference
Medium -$424.10 $128.67 0.001 -676.29 -171.91 -271.56 84.25 0.00 -436.69 -106.44
High -$693.28 $128.50 <.0001 -945.13 -441.42 -437.36 84.19 0.00 -602.37 -272.35
ARD, Alcohol-related disorders; NRD, Nationwide Readmission Database; SE, Standard error.

56
**Median household income quartiles of residents’ ZIP code for 2014 are: (1) $1 - $39,999; (2) $40,000 - $50,999; (3) $51,000 - $65,999;
and (4) $66,000 or more. a Predicted marginal effects of length of stay was measured at 5 days (average length of stay) to treat both index
hospitalizations and readmissions for ARD.
b Computed based on the tertile cutoff values of (1) up to 41, (2) 42-97, and (3) 98 and more index admissions at each facility for ARD.

57
CHAPTER IV: EMERGENCY DEPARTMENTS UTILIZATION FOR BEHAVIORAL
HEALTH CONDITIONS AND DISTRIBUTION OF BEHAVIORAL HEALTH
WORKFORCE AND EMERGENCY DEPARTMENTS IN NEBRASKA, 2011-2013
Introduction
Previous literature has shown that patients suffering from behavioral health (BH) and comorbid
conditions frequently visit the emergency departments (EDs), which often become an entry point
for treating such conditions (Crane, Collins, Hall, & Rochester, 2012; Curran et al., 2003; Doupe,
Palatnick, Day, Chateau, & Soodeen, 2012; Mulkern et al., 2007; Owens et al., 2010; Pines et al.,
2011; Smith, Stocks, & Santora, 2015). Reports suggest that patients seeking psychiatric care
account for between 6 to 9% of all ED visits (Hazlett, McCarthy, Londner, & Onyike, 2004;
Larkin, Claassen, Emond, Pelletier, & Camargo, 2005; Owens et al., 2010; Zeller, Calma, &
Stone, 2014) and that 18% of frequent ED users had BH conditions compared to only 6% of the
total study population (Peppe et al., 2007). Hence, it has become necessary to evaluate the
reasons for patients to utilize the ED for BH-related conditions. Some communities lack access to
general health services and specialty care. Under such circumstances, patients tend to visit and
treat the ED as an ‘open door' for uncomplicated and routine BH care (Clarke, Dusome, &
Hughes, 2007; Doren et al., 2016). It should be noted that many EDs have few BH services to
offer, which compels patients to wait or “board” while the ED staff searches for an open inpatient
psychiatric bed. This results in two issues: (i) the patient’s condition might worsen, eventually
requiring more psychiatric care, and (ii) an ED visit incurs a high cost ($2,264 per visit) (Korn,
Currier, & Henderson, 2000; Nicks & Manthey, 2012; Zeller et al., 2014).
In 2014, the Kaiser Family Foundation reported that about 30.2% of Nebraska’s residents
suffer from some form of BH condition, (Kaiser Family Foundation, 2014) leading to $167
million in expenditures (Insel, 2008). But in Nebraska, 88 out of 93 counties have been
designated as Mental Health Professions Shortage Areas and 32 counties have no BH provider of

58
any kind (Liu & Khan, 2017). It has been well-documented that there exists a health disparity
between rural and urban areas, which is associated with residents’ ability to access BH specialists
(Edelstein, Pater, Sharma, & Albert, 2014). BH service delivery models in urban areas might
often be unsuitable and challenging to implement in rural settings (Elhai et al., 2004). It is widely
thought that rural residents experience severe living circumstances, such as low income, lack of
employment, and scarcity of health services, which result in a higher prevalence of BH disorders
(Probst et al., 2006; Rohrer, Borders, & Blanton, 2005; Ziller, Anderson, & Coburn, 2010). In
addition, because of the long distances between rural homes and primary care clinics, EDs in
rural hospitals have become the closest point of health services (Greenwood-Ericksen, Tipirneni,
& Abir, 2017). Previous literature has shown increased mortality among adults living in rural
areas due to suicide and substance use disorders (A. Case & Deaton, 2015; Joynt, Nguyen,
Samson, & Snyder, 2016). However, there is limited research at the state-level to investigate the
economic impact due to a shortage of BH workforce and existing rural-urban disparities on
hospital-based EDs. Nebraska is in the unique position to conduct this type of study because it
implements an active surveillance of health professionals, which provides county-level data on
BH professionals.
ED outcomes include routine release upon treatment, transfer to short-term
hospitals/skilled nursing facility (SNF), discharge with commencement of home health services
(HHC), and discharge against medical advice. Those patients who leave against medical advice
have a higher likelihood of not adhering to treatment, participating in follow-up care at
rehabilitation centers or outpatient clinics with specialty care for BH disorders. Also, such
patients may not use preventative services for existing BH disorders and may not monitor the
severity of the BH condition for which they were admitted in the ED. Previous studies analyzed
impact of BH disorders on the ED outcome of discharge against medical advice among specific
classes of patients. For example, one study examined impact of discharge against medical advice
among those suffering from HIV (B. Choi, DiNitto, Marti, & Choi, 2016), while another focused

59
on older adults (Choi, Dinitto, Marti, & Choi, 2015). O’Toole and group studied the impact of
leaving against medical advice in a hospital’s outpatient substance abuse treatment unit.
However, to our knowledge, little information is available on the association of patient-related
factors such as age, sex, insurance and income statuses, and existing comorbidities with being
discharged against medical advice following an ED visit for primary diagnosis of BH disorders.
With an increase in prevalence of BH disorders in both rural and urban areas across all age
groups (Reynolds, Pietrzak, El-Gabalawy, Mackenzie, & Sareen, 2015; Robinson et al., 2017),
these disorders are an important public health issue that affect the well-being of individuals and
the healthcare system in terms of use of services and the corresponding costs. Hence,
identification of the high-risk groups who leave ED against medical advice following primary
diagnoses for BH can help public health practitioners, hospital administrators, and BH clinicians
to create unique programs, especially for patients in rural areas with less access to care and find
ways to encourage such patients to comply with treatments.
This study aims to estimate hospital-based ED visits, ED outcomes, and associated
charges for BH conditions within the state of Nebraska. The objectives of this study were four-
fold. First, we characterized ED visits for BH conditions from 2011 to 2013 within Nebraska at
the regional-level. Second, we mapped the distribution of BH workforce, availability of EDs, and
patient BH-related ED visits at the region-level. Third, we determined patient-related
characteristics associated with ED visits for BH. Finally, we estimated the association of patient-
level factors with being discharged against medical advice. We anticipate that findings from this
study will help to guide policy recommendations for predominantly rural states such as Nebraska
to address specific BH-related treatment needs by increasing workforce and access in such areas.
We expect that such health policies will improve patient outcomes and reduce rates of costly
revisits and ED visits.
Methods
Data Sources
60
State Emergency Department Database
This study utilizes the Nebraska State Emergency Department Database (SEDD) from the
Healthcare Cost and Utilization Project (HCUP) for the years 2011 to 2013, which contains de-
identified patient information. SEDD belongs to the family of databases sponsored by the Agency
for Healthcare Research and Quality (AHRQ). SEDD provides census data on treat-and-release
emergency department visits, which include more than 80% of all emergency department visits.
(Healthcare Cost and Utilization Project, 2015) It must be noted that SEDD contains information
on only those emergency visits that did not eventually result in hospitalizations. Important patient
and hospital-related variables available in SEDD include age, sex, the presence of co-morbid
conditions, charges, disposition status, patient location, the number of ED visits, and insurance
and median household income.
Health Professions Tracking Service annual survey database
We used data obtained from the University of Nebraska Medical Center’s College of Public
Health, Health Professions Tracking Service (HPTS) annual survey database for 2013 to calculate
the number of EDs and BH professionals available in Nebraska at county-level (Appendix 3).
HPTS builds a database from licensure data of Nebraska’s healthcare professionals, which is
continuously updated through extensive data collection and data exchange activities.
BH professionals are categorized as psychiatric prescribers, independent BH
professionals, and other BH professionals. Based on the ability of these professionals to prescribe
within the state of Nebraska, psychiatric prescribers consist of three licensed professionals:
psychiatrists, advanced practice registered nurses, and physician assistants. Similarly, those
professionals who held board-certified licenses and were actively practicing within the state, such
as psychologists and independent mental health practitioners, were classified as independent BH
professionals. Additionally, alcohol and drug counselors, as well as other BH professionals that
practiced as a mental health practitioner in the state of Nebraska and held a license, were included

61
in the group as other BH professionals. For this study, we included all seven sub-types of BH
professionals. All patients within Nebraska who had visited the ED for BH disorders comprised
the study population.
Measures
All hospital-based ED visits for patients with BH conditions in the State of Nebraska in 2011 to
2013 were selected. Appendix 4 presents the list of all primary diagnoses and surgical codes for
each patient that has been used in this study. The codes 290–294 for psychotic conditions; 295–
299 for other neurotic disorders; 300–316 for neurotic disorders, personality disorders, substance-
use-related and other nonpsychotic mental disorders; and 317–319 for intellectual disabilities
have been identified by the International Classification of Diseases, Ninth Revision, Clinical
Modification (ICD-9-CM).
The independent variables included in the study were patient-related demographic
characteristics such as age and sex. Patient location includes categories such as urban, large rural,
small rural, and isolated rural towns defined upon by the ZIP codes using population, primary
destination of commuting information from the Census. Based on the patients’ disposition at
discharge (routine, transfer to another hospital, died, etc.), a variable called the disposition status
was classified and used. Income status was defined using a quartile classification of the estimated
median household income of residents in the patient's ZIP Code. The variable “insurance status”
in our study indicated the primary payer who was expected to cover charges for the ED visit, for
example, Medicaid, Medicare, private insurance. SEDD also included information on those
patients who paid for themselves, were uninsured, or not charged.
The comorbid burden was estimated using the Elixhauser Comorbidity Index (ECI)
measure, which was computed by summing up the 29 binary Elixhauser comorbidity variables
available in the current HCUP Elixhauser Comorbidity Software, Version 3.7 (HCUP
Comorbidity Software, Version 3.7.,” 2017). An ECI measure of 0 indicates the absence of co-
morbid conditions. All comorbidity variables were determined by the ICD-9-CM codes. Clinical

62
conditions primarily responsible for the emergency visits such as depression, psychoses, alcohol
and drug-related abuse were not considered comorbidities, as per the standard norms of
computing ECI measure using the Elixhauser Comorbidity Software (Elixhauser A, Steiner C,
Harris DR, 1998; H. B. Mehta et al., 2017; Moore, White, Washington, Coenen, & Elixhauser,
2017; Sarfati, 2016; Strom et al., 2017). The remaining conditions called ‘unrelated comorbid
conditions’ comprise of congestive heart failure, valvular disease, pulmonary circulation disease,
peripheral vascular disease, paralysis, other neurological disorders, chronic pulmonary disease,
diabetes without chronic complications, diabetes with chronic complications, hypothyroidism,
renal failure, liver disease, peptic ulcer bleeding, acquired immune deficiency syndrome,
lymphoma, metastatic cancer, solid tumor without metastasis, rheumatoid arthritis, coagulopathy,
obesity, weight loss, fluid and electrolyte disorders, chronic blood loss anemia, and deficiency
anemia.
Outcomes
One of the primary outcome variables for this study was the incurred hospital ED charges (in
dollars). Here, total charges represent the amount billed for each hospitalization reported by the
facilities. Data on cost of care provided to patients or the amount of reimbursement for services
rendered were not available. These charges were adjusted for inflation to the value of 2013 US
dollars, using the Bureau of Labor Statistics Consumer Price Index.
The outcome variable of discharge against medical advice was coded as a binary variable
(0/1). Disposition statuses such as routine discharge, transfer to a short-term hospital; transfer to
other facilities (e.g., SNF); and initiation of HHC were categorized as those ED visits which were
not discharged against medical advice.
Behavioral Health Regions in Nebraska
Nebraska has been divided into six behavioral health regions and have a total of 13 major cities
(Appendix 4). They are combined local units of the governments that plans and implements
services by partnering with the state. The regions also purchase services from the providers that
63
serve the areas and if needed, also from other service providers across the state. Hence, for our
study, we conducted descriptive and geographical analyses of ED visits for BH disorders in
Nebraska by region.
Analytical Approach
An individual ED visit was the unit of analysis. Descriptive statistics included the number of BH-
related ED visits per 10,000 population in Nebraska, number of ED visits stratified by clinically
diagnosed for BH conditions, and patient characteristics. The population-based incidence rates of
BH conditions per 10,000 people were calculated using the 2013 US Census population estimates
for each county. ED visits in Nebraska were stratified at the county-level using the five-digit
Federal Information Processing Standard code.
The main interest of our study was to identify important patient-related factors associated
with ED charges. In this study, charges have non-negative values (> 10% have zero values), a
distribution with a longer right tail, and outliers when compared to a normal distribution. Using
ordinary least square regression might provide biased estimates of means and
marginal/incremental effects (Manning, 2006; Partha, Manning, & Norton, 2010). Therefore, we
estimated total charges using a generalized linear model (GLM) with a gamma distribution and
log-link function, which best fits this particular data structure and is a common method in cases
where the log-transformed dependent variables do not have heavy tails (N. G. Choi, Dinitto,
Marti, & Choi, 2015; J. A. Singh & Yu, 2016; Thompson & Nixon, 2005). The log-link function
accounts for the non-normal distributional characteristics of the total charges data (Kazley,
Simpson, Simpson, & Teufel, 2014; Malehi, Pourmotahari, & Angali, 2015; Manning, Basu, &
Mullahy, 2005). To examine the distributional characteristics of the residuals, we selected the
gamma distribution (λ = 2) based on the Modified Park Test, a diagnostic test recommended for
the GLM family (S. D. Case et al., 2011; Malehi, Pourmotahari, & Angali, 2015; Manning et al.,
2005). For interpretability, we converted coefficients to average marginal effects (AME), which
is measured as the difference in adjusted predicted outcome between the reference group and the

64
comparison group after adjusting for other covariates. Statistical significance was assessed at a
level of 0.05.
By categorizing disposition status into those ED visits that were discharged against
medical advice and those that were discharged otherwise, a multivariate logistic regression
analysis was used to estimate association of discharge against medical advice following ED visits
for primary diagnoses of BH disorders on patient characteristics.
All descriptive statistical analyses were performed using SAS software, version 9.4 (SAS
Institute, Cary, NC). The log-linked gamma distributed GLM analyses were conducted using the
Stata (StataCorp, College Station, TX). The average marginal effects of health care charges due
to ED visits were calculated using the ‘‘margins’’ post-regression command in Stata software.
Geographic information system maps were created using ArcGIS software, Version 10.4 (Esri,
Redlands, CA). The University of Nebraska Medical Center’s Institutional Review Board deemed
this study exempt.
Results
SEDD reported 52,035 BH-related conditions in Nebraska from 2011 to 2013. Anxiety (23.4%),
nondependent use of drugs (17.0%), episodic mood disorders (15.6%), depressive disorders
(7.8%), and having a history of mental disorders accompanied by family-based problems and
suicidal ideation (6.2%) were the most common BH conditions (Table 1).
Table 2 presents characteristics of patient with primary diagnoses for BH conditions
stratified by the State-designated BH regions. There has been almost 5% increase in BH-related
ED visits from 15,756 in 2011 to 18,297 in 2013. From 2011 to 2013, all regions had an
increasing number of ED visits for BH conditions, except Region II. Overall, males represented
over half of ED visits for all the BH disorders. The mean age of patients ranged from 35.5 to 41.2
years with the younger age groups residing in the urban regions V and VI. Across all regions,
those between 24 to 44 years old made the highest proportion of ED visits for BH conditions

65
(35.5%), followed by patients between 45 to 64 years old (23.78%) and younger adults between
18 to 24 years of age (18.1%).
About 40% of patients that visited an ED for BH-related conditions were covered by
private insurance, followed by 23.1% of patients that were uninsured. Only 17.9% and 14.9% of
the ED visits related to BH were covered by Medicare and Medicaid, respectively. The
predominantly rural Regions I to IV (24.0 to 30.4%) had higher proportion of ED visits made by
Medicare enrollees when compared to the urban regions V (19.4%) and VI (15.2%). In contrast,
the uninsured patients residing in urban regions of V (21.4%) and VI (26.8%) made higher ED
visits for BH disorders than most rural regions of I, III and IV (10.0, 15.0, and 17.1%,
respectively), except for region II (19.2%) that had comparatively higher visits by the uninsured.
Interestingly, a sizeable proportion of the visits for BH-related conditions occurred on weekdays
(71.6%), and about 81.2% of the visits were routinely discharged.
Table 2 also presents ED visits by patient location. Overall, approximately
71.0% of the ED visits were in urban areas, followed by large rural towns (15.7%), small rural
towns (7.5%) and, finally, isolated rural areas (6%). Specifically, Region I - III being rural areas
had no visit made by urban residents and the converse was true for the primarily urban regions V
(77.5%) and VI (93.3%). Also, nearly a third of ED visits due to BH conditions were for patients
residing in zip codes with low median household incomes. Interestingly, about 95% of the ED
visits in region II belonged to the low-income areas with no visits from the high-income
population whereas over one-third of ED visits in Regions V and VI were made by high-income
populations.
As shown in Table 2, eighty-two percent of the ED visits related to BH conditions were
not concurrent with comorbid conditions. ED visits made by patients with 1 or more unrelated
comorbidities were higher in the rural regions I (26.3%), II (25.7%) and III (31.6%) whereas the
urban regions V (85.0%) and VI (83.7%) had higher proportion of patients without any unrelated
comorbidities. After adjusting for inflation, mean hospital ED charges per visit were $1,854 with

66
a total of approximately $96.4 million in ED charges due to BH-related conditions during the
study period. Among the rural regions, region II had higher ED charges of $1,717.25 while the
most charges were made by residents from region VI ($2,120.44).
Table 3 shows the number of BH-related ED visits per 10,000 population made by
region, and the availability of ED facilities and BH providers by region. The highest number ED
visits were made by residents of rural region II (11,805 per 10,000 population), followed by the
urban region V (3,015 per 10,000 population) while, conversely, the least visits were made by
those residing in region VI (1,394 per 10,000 population). Regions IV (21) and V (22) had the
highest number of EDs whereas region I had the least number of EDs (8). Interestingly,
comparatively lower ED admission rates were observed in regions III and IV (2,538 and 1,908
per 10,000 population, respectively) which had higher number of BH providers (94 and 89,
respectively).
Figure 1 represents the distribution of population estimates of BH-related ED visits and
BH professionals in Nebraska by BH regions. This map depicts that ED admission rates could be
higher in rural regions (scarcely populated rural regions I, II and IV) where BH workforce supply
is low and vice-versa. For illustration, region II had access to 37 BH providers and had the
highest ED admission rates of 11,805 per 10,000 population. Also, the converse is also true
because region IV had access to higher (89) BH providers which was found to be correlated to
reduced ED admission rates (1,908 per 10,000 population) for BH disorders. On the other hand,
in the urban region VI, despite the lower supply of BH providers, the ED admission rate is lower
which maybe because of sufficient access to primary-level behavioral healthcare services.
However, for the other urban Region V, despite the moderate supply of BH providers (83), the
ED admission rate was found to high (3,015 per 10,000 population).
Figure 2 represents that the EDs in rural regions of Nebraska had higher ED admission
rates. For example, region I had lower number of EDs (8) which accommodated 2,072 visits per
10,00 population for BH disorders. Similarly, region II had only 9 EDs which provided

67
emergency behavioral services to 11,805 BH-related visits per 10,000 population. Moreover,
region III had 2,538 visits per 10,000 population at 18 EDs for BH disorders despite having the
highest supply of BH professionals (94) in the state.
Table 4 shows the results of regression using a multivariate log-linked Gamma
Distributed Generalized Linear model that evaluates the effect of patient-related factors on
hospital-based ED charges. The AME indicates that the total charges for females was
significantly lower compared to for males (by $105 per visit). Older age groups were associated
with higher charges than younger age groups. Compared to children and adolescents under the
age of 18 years, those aged 18 to 24 years, 25 to 44 years, and 45 to 64 years incurred
significantly higher ED charged by $408, $473, and $678, respectively, but the elderly (65 years
and older) incurred the highest ED charges by $1,120. Patients who were covered by Medicare
had significantly lower ED charges than those who were covered by self, Medicaid, private, and
other insurance types by $318, $240, $213, and $205. The patient’s location was also significantly
associated with ED charges. Patients residing in large rural towns, small rural towns, and isolated
rural areas had lower ED charges per visit by $123, $527, and $378, respectively, than patients
residing in urban areas. Patients whose median household income at the ZIP code level fell into
the fourth quartile had significantly higher ED charges by $314. ED charges were significantly
increased with an increase in ECI. In contrast to those with 0 unrelated comorbidities, those with
2 and 3 comorbidities had significantly higher ED charges by $549 and $930. However, ED visits
made by those with 3 or more unrelated comorbidities to BH disorders incurred $2,015 more than
those with no unrelated comorbidity.
Table 5 displays the results from the multivariate logistic regression that was conducted
to evaluate the associations between patient-level factors and discharged against medical advice.
Females (OR: 0.63; CI: 0.82-0.98, P<.001) are significantly less likely to be discharged against
medical advice than males. Compared to those up to the age of 17 years, those aged 25 to 44
years (OR: 1.83; CI: 1.42-2.36, P<.001), and aged 44 to 64 years (OR: 2.31; CI: 1.78-3.00,

68
P<.001) were associated with higher odds for discharge against medical advice. Among the payer
type, those who were uninsured were associated with higher odds (OR: 1.56; CI: 1.27-1.91,
P<.001) of being discharged against medical advice compared to those covered by Medicare.
Those residing in living in ZIP codes with median household income belonging to the second
(OR: 0.77, CI: 0.66-0.89, P=0.0003), third (OR: 0.59, CI: 0.49-0.75, P<.001), and fourth (OR:
0.67, CI: 0.53-0.85, P<.001), quartile were associated with significantly lower odds for discharge
against medical advice than those living in ZIP codes with first quartile median household
income.
Discussion
These findings show that the majority of the ED visits were by males of 25- to 44-years-old but
that the elderly had the highest ED charges. Consistent with common beliefs, we found that the
uninsured incurred higher total ED charges for BH-related conditions. Because one-third of
counties in Nebraska have no BH professional and about one-fourth counties have no EDs, it can
be concluded that state-wide access to care is minimal, particularly in rural counties. The average
charge levied on patients was as high as $1,854 per ED visit. Multivariate logistic regression
modeling also suggested that patients discharged against medical advice were more likely to be
males, between the age of 18 to 64 years, uninsured, living in low-income areas (first quartile)
and with no unrelated comorbidities.
Currently, there is uncertainty for the future of healthcare coverage in the US, and an
understanding of the economic implications of providing behavioral health services for states that
did not expand Medicaid eligibility under the Affordable Care Act requires state-specific
analyses. Few studies have examined the distribution of BH professionals or BH-related ED
utilization in largely rural states. One prior study examined only the urban counties of North
Carolina (Doren et al., 2016), while Choi et al. studied the impact of specific BH illnesses on
non-suicidal self-injury and suicide attempts among 50-years and older ED patients (N. G. Choi

69
et al., 2015). Other studies have focused on specific subpopulations, such as adolescents (Doshi,
Glick, & Polsky, 2006) and older adults (Pines et al., 2011).
One of the key findings from this study is that about $96.4 million was spent during
2011–2013 on a total of 52,035 ED visits due to BH-related conditions, across all age groups.
Because federal law mandates EDs to screen, diagnose and treat patients, EDs have become an
important place for treating BH-related conditions, though at a high cost (Fahimi, Aurrecoechea,
Anderson, Herring, & Alter, 2015). Our data show that 12 out of 93 counties in Nebraska have an
ED but do not have any practicing BH professionals. Many BH-related conditions can be
assessed and treated successfully in outpatient settings through the use of integrated care and
telemental services. In addition to the high cost of ED treatment, ED staff members in rural areas
have limited experience in detecting and treating BH-related conditions (Rhodes, 2008). This may
further increase the costs of treating these conditions in the long run. Undiagnosed, untreated or
delayed diagnoses of BH conditions can lead to an increased number of ED visits, require more
intensive interventions compared to early diagnosis, or result in societal costs such as increased
arrest and incarceration rates (Insel, 2008; Mark et al., 2007).
Young adults in Nebraska are the more likely to be burdened by BH disorders (18% ED
visits), as per our study, given that they comprise only 7% of the population (Kaiser Family
Foundation, 2017). Even though patients living in non-metropolitan areas make up for 40% of the
population in Nebraska (Nebraska Department of Health and Human Services, 2008), urban
population make majority of the ED visits for BH disorders. Likewise, patients covered by
Medicare, other insurances, and the uninsured are the most burdened by BH disorders,
considering that within Nebraska the insurance coverage for this population comprise of only 13,
7, and 9%, respectively (Kaiser Family Foundation, 2016). Our results also suggest that a
substantial proportion of ED patients are uninsured (23%), and the charges levied on them are the
highest when compared to other payers. Additionally, we found that one-third of BH patients

70
using the ED are covered under either Medicare or Medicaid, despite that it is often known to be
difficult to find a provider accepting Medicaid.
Our data show that urban patients were levied higher ED charges than those living in
rural towns. This may be because EDs within urban areas offer more health services and have
more comprehensive health insurance coverage than rural residents. However, a study shows that
BH services are provided to rural populations at lower reimbursement rates than in urban areas
(Ziller et al., 2010). Besides, rural residents often travel long distances to procure health services,
are less likely to be insured for BH services, may face greater social stigma, and have less
probability to be diagnosed with BH-related illnesses than urban residents (Substance Abuse and
Mental Health Services., 2013). This is consistent with our results depicting that there are fewer
ED visits and charges for rural patients than those from urban areas for BH disorders.
The findings from our study are consistent with the literature, which reports that the
leading causes of BH disorders are anxiety, episodic mood, and depressive disorders, and alcohol
dependence (Hazlett et al., 2004; Huynh, Ferland, Blanchette-martin, & Me, 2016; Pines et al.,
2011; Richmond et al., 2007). In our study, patients aged 25 to 44 years, residing in low-income
or urban areas, and with private insurance, were more likely to utilize ED for BH conditions.
These patients are ‘high-risk', and prior studies have found similar results (Huynh et al., 2016;
Pines et al., 2011; Smith et al., 2015). Therefore, our findings suggest the need to tailor
interventions to address BH issues for high-risk patients.
In the past, one study reported that one in five patients with either primary or secondary
diagnoses of substance abuse disorders specifically were discharged against medical advice
(Bradley & Zarkin, 1997). Specifically, chronic alcoholism and drug addiction were the common
causes which were discharged against medical advice (Jankowski & Drum, 1977). The unwanted
consequences of being discharged against medical advice could be high risk of revisits (in
inpatient and outpatient departments) or even mortality (Hwang, Li, Gupta, Chien, & Martin,
2003). Consequently, the revisits could be accompanied by greater severity of disorders. This

71
issue can also potentially increase healthcare expenditures towards what could have been a single
episode of care. To our knowledge, in the recent years, no prior work has evaluated the problem
of leaving ED against medical advice following primary diagnoses for BH disorders across all
age groups, especially in rural states that offer limited healthcare services. Overall, 2.1% of our
study population was discharged against medical advice. Our results show these patients are more
likely to be males, uninsured, living in low-income areas (first quartile), and with no other
unrelated comorbidities. Parents play a vital role in facilitating healthcare needs and more often
make decisions as significant as obtaining discharge against medical needs. Hence, this could be
the reason why children and adolescents have lower odds of leaving against medical needs. Also,
as per expectation, those who are uninsured and have low-income status would be discharged
against the advice of providers because financial problems and/or were refused treatment by
hospital staff. Because there are limited such studies that have provided evidence-based research,
our findings are not comparable and the implication of BH-related discharges against medical
advice on policy for revisits (as inpatient stay and/or ED) and associated costs are uncertain.
However, our findings are generalizable in similar states which are predominantly rural, and with
shortage of BH services. By identifying the high-risk cohort, community-based health programs
could be tailored for this group to encourage compliance to treatment and provide screenings for
psychiatric disorders. ED-based peer coaching, education for such conditions, and counselling for
this cohort can improve ED outcomes as well as likely reduce the discharges against medical
advice.
Multiple studies have demonstrated that there are substantial geographic shortages and
maldistribution of the BH workforce in the US (Doren et al., 2016; Hoge et al., 2009; K. C.
Thomas, Ellis, Konrad, Holzer, & Morrissey, 2009). From Figures 1, it is evident that BH-related
ED visits are more in areas where the numbers of BH providers are fewer. One of the reason for
this could be that these rural regions had higher proportion of uninsured, low-income population
with higher comorbidities. However, it should be noted that not all of these BH professionals are

72
licensed to prescribe medication. Most prescribers in Nebraska are concentrated near the major
medical centers and state hospitals located in Nebraska’s three most populated counties (regions
V and VI). Among those BH professionals who are board-certified to prescribe in rural areas,
many may not be working as full-time professionals. This could be the reason why certain regions
have greater ED use for BH services despite having moderate supply of BH professionals.
On the other hand, Figure 2 shows EDs in rural regions of Nebraska maybe overcrowded
and a ‘failsafe’ healthcare setting for BH disorders because ED visits are more common in those
regions which have fewer ED facilities (except urban regions V and VI that are home to the
largest two big cities in Nebraska). This highlights the consequences of unmet BH needs,
shortage of BH services and providers. ED facilities in such counties may also be expected to be
crowded. Hence, further research must be conducted to understand the ratios of ED and outpatient
facilities to visits for BH-related conditions, impact of the lack of access to full-time BH
professionals, and prescribers in rural communities and its impact on preventable ED utilization.
Region II has remarkably high proportion of ED visits for the scare population in the
region, despite fewer ED facilities. This may be because this region has the highest proportion of
low-income population with comorbidities and a substantial number of uninsured. However, there
has been a 4% reduction in the numbers of BH-related ED visits between 2012 and 2013. In
future, efforts need to be made to provide adequate services to this population.
The Center for Medicaid and CHIP Services (CMCS), in their 2013 bulletin,
recommended that efforts need to be made to expanded primary care access, design and
implement programs targeting super-utilizers or high-risk cohort, and address co-morbid mental
health and substance abuse issues (US Department of Health and Human Servives, 2013). Using
geographic mapping to locate high ED utilizers, the States of Maine, Massachusetts, and New
Jersey structured interdisciplinary teams including nurse care managers, social workers, and
behavioral health workers and provided visits to patients in their homes and community settings.
Such teams also worked with primary care practices to identify referrals and coordinate care for

73
patients (Center for Health Information and Analysis, 2015; Green, Singh, & Byrne, 2010; US
Department of Health and Human Servives, 2013). The findings from our study can be utilized by
region-based teams in Nebraska to target the highest utilizers and provide care coordination,
supportive therapy, substance abuse treatment, supportive housing, and assertive community
outreach to those routinely discharged as well as transferred to home health agencies. These
teams can also ensure that rural residents are provided access to community-based organizations,
or large community-based primary care practices such as federally-qualified health centers.
Conclusions
Many patients needing BH-related services seek help in EDs instead of more appropriate settings
for psychiatric care such as primary clinics, leading to substantial and preventable healthcare
expenditures, particularly in rural communities. Community-based interventions should be
tailored with a goal of reducing unnecessary and expensive ED visits among high-risk patient
groups that include those aged 25-44 years, uninsured, covered by private insurance, residing in
low-income areas, and suffer from other comorbid conditions. Being male, between 18 to 64
years of age, uninsured, living in low-income areas had higher odds of patient discharge against
medical advice. Innovative rural-centric public health programs can focus on encouraging
patients to adhere to ED-treatment and continue follow-up BH care, provide education and
counselling, thereby, improving ED outcomes and reducing hospital revisits. Increasing BH
workforce, especially in rural areas, can alleviate the problem and reduce the number of frequent
ED users for BH conditions. Future studies should work towards identifying challenges to
providing and procuring holistic BH services.

74
Table 1: Number and percent of emergency department visits stratified by diagnoses for
behavioral health conditions, NE SEDD, 2011–2013
Types of BH conditions ED visits (N= 52,035)
N %
Anxiety, dissociative and somatoform disorders 12,154 23.4
Nondependent abuse of drugs 8,827 17.0
Episodic mood disorders 8,115 15.6
Depressive disorders 4,060 7.8
History of mental disorders, family-based problems, and suicidal
ideation
3,244 6.2
Alcohol dependence syndrome 3,012 5.8
Other nonorganic psychoses 1,887 3.6
Schizophrenic disorders 1,590 3.1
Other specifically mental health-related conditions 1,498 2.9
Special symptoms or syndromes not elsewhere classified 1,145 2.2
Adjustment reaction 1,057 2.0
Drug-induced mental disorders 971 1.9
Alcohol-induced mental disorders 796 1.5
Specific nonpsychotic mental disorders due to brain damage 752 1.5
Disturbance of conduct not elsewhere classified 696 1.3
Disturbance of emotions specific to childhood and adolescence 662 1.3
Persistent mental disorders due to conditions classified elsewhere 604 1.2
Acute reaction to stress 569 1.1
Drug dependence 396 .8
SEDD, State Emergency Department Database; BH, Behavioral health; ED, Emergency
department

75
Table 2: Descriptive characteristics for emergency department visits related to behavioral health conditions in NE SEDD, 2011–
2013 *
Characteristics Overall ED
visits
Region I
(n=1,405)
Region II
(n=2,534)
Region III
(3,739)
Region IV
(1,747)
Region V
(12,886)
Region VI
(25,151)
N % N % N % N % N % N % N %
Sex
Male 26,333 50.6 667 47.5 1,206 47.6 1,728 46.2 775 44.4 6,459 50.1 13,079 52.01
Female 25,682 49.4 728 51.8 1,320 52.1 2,011 53.8 972 55.6 6,427 49.9 12,072 47.99
Age group (in years)
up to 17 7,340 14.1 193 13.7 285 11.2 396 10.6 210 12.0 1,976 15.3 3,819 15.2
18 to 24 9,396 18.1 223 15.9 450 17.8 678 18.1 281 16.1 2,293 17.8 4,434 17.6
25 to 44 18,464 35.5 424 30.2 810 32.0 1,224 32.7 580 33.2 4,432 34.4 9,193 36.6
45 to 64 12,356 23.7 332 23.6 658 26.0 844 22.6 348 19.9 3,027 23.5 6,115 24.3
65 and over 4,479 8.6 233 16.6 331 13.1 597 16.0 328 18.8 1,158 9.0 1,590 6.3
Mean age (in
years) 36.6 40.9 39.8 40.7 41.2 36.5 35.5
Primary payer
Medicare 9,317 17.9 428 30.5 609 24.0 929 24.8 478 27.4 2,506 19.4 3,953 15.7
Medicaid 7,762 14.9 355 25.3 326 12.9 619 16.6 233 13.3 1,070 8.3 4,741 18.9
Private
Insurance 20,872 40.1 462 32.9 1,077 42.5 1,525 40.8 707 40.5 6,088 47.2 8,627 34.3
Uninsured 12,036 23.1 142 10.1 486 19.2 562 15.0 298 17.1 2,756 21.4 6,732 26.8
Other 2,048 3.9 18 1.3 36 1.4 104 2.8 31 1.8 466 3.6 1,098 4.4
Admission day
Weekday 37,245 71.6 1,019 72.5 1,791 70.7 2,536 67.8 1,202 68.8 9,347 72.5 18,150 72.2
Weekend 14,789 28.4 386 27.5 743 29.3 1,203 32.2 545 31.2 3,539 27.5 7,000 27.8
Disposition status
Routine 40,746 81.2 1,111 79.1 2,065 81.5 3,096 82.8 1,465 83.9 11,766 91.3 19,054 75.8
Transfer to
short-term
hospital
4,230 8.4 141 10.0 143 5.6 238 6.4 136 7.8 458 3.6 2,842 11.3

76
Transfer Other:
Includes SNF,
ICF, Another
Type of Facility
4,139 8.3 124 8.8 239 9.4 344 9.2 126 7.2 358 2.8 2,725 10.8
Home Health
Care (HHC) 25 0.1 0 0.0 4 0.2 2 0.1 0 0.0 6 0.0 12 0.0
Against
Medical Advice
(AMA)
1,054 2.1 29 2.1 83 3.3 59 1.6 20 1.1 298 2.3 518 2.1
Patient location
Urban 36,177 70.8 0 0.0 0 0.0 0 0.0 27 1.5 9,982 77.5 23,472 93.3
Large rural
town 8,014 15.7 459 32.7 1,634 64.5 2,651 70.9 630 36.1 610 4.7 1,106 4.4
Small rural
town 3,835 7.5 641 45.6 557.0 22.0 357 9.5 347 19.9 1,380 10.7 238 0.9
Isolated rural 3,093 6.1 288 20.5 286 11.3 678 18.1 725 41.5 650 5.0 143 0.6
Median household income national quartile for patient ZIP code**
First quartile 16,284 31.8 510 36.3 239 9.4 298 8.0 318 18.2 3,444 26.7 10,358 41.2
Second quartile 18,757 36.6 795 56.6 2,157 85.1 3,100 82.9 1,162 66.5 4,391 34.1 5,724 22.8
Third quartile 9,769 19.1 83 5.9 81 3.2 287 7.7 249 14.3 3,556 27.6 4,275 17.0
Fourth quartile 6,399 12.5 0 0.0 0 0.0 1 0.0 0 0.0 1,230 9.5 4,684 18.6
Elixhauser Unrelated Comorbidity Index measure***
0 42,691 82.04 1,035 73.7 1,884 74.3 2,558 68.4 1,409 80.7 10,948 85.0 21,052 83.7
1 6,585 12.65 259 18.4 428 16.9 787 21.0 235 13.5 1,361 10.6 2934 11.7
2 2,119 4.07 88 6.3 145 5.7 278 7.4 79 4.5 419 3.3 956 3.8
=> 3 640 1.23 23 1.6 77 3.0 116 3.1 24 1.4 158 1.2 209 0.8
Behavioral health-related ED visits by year
2011 15,756 30.91 422 30.0 796 31.4 1,188 31.8 566 32.4 4,104 31.8 7,181 28.6
2012 16,924 33.20 426 30.3 915 36.1 1249 33.4 572 32.7 4314 33.5 8,519 33.9
2013 18,297 35.89 557 39.6 823 32.5 1,302 34.8 609 34.9 4,468 34.7 9,451 37.6
Hospital ED charges (inflation adjusted to 2013 US dollar value)
Mean (median)
charges
$1,854.48
(1,352.00)
$1,663.25
(1,240)
$1,717.25
(1,163.25)
$1,693.53
(1,157.74)
$1,486.76
(995.28)
$1,418.44
(701.00)
$2,2120.44
(1,597.82)
Total charges $96,353,163.18 $2,330,214.51 $4,347,037.37 $6,330,422.39 $2,597,377.38 $18,273,816.23 $53,210,242.25
SEDD, State Emergency Department Database; ED, Emergency department; N, Number
77
*The sum of individual counts may not add up to the total number of visits because of missing information for certain variables.
** Median household income quartiles of residents in the patient’s ZIP code differ every year. The levels were $1 to $38,999 (quartile 1),
$39,000 to $47,999 (quartile 2), $48,000 to $63,999 (quartile 3) and $64,000 or higher (quartile 4) in the year 2011. The levels were $1 to
$38,999 (quartile 1), $39,000 to $47,999 (quartile 2), $48,000 to $62,999 (quartile 3) and $63,000 or higher (quartile 4) in the year 2012.
The levels were $1 to $37,999 (quartile 1), $38,000 to $47,999 (Quartile 2), $48,000 to $63,999 (quartile 3) and $64,000 or higher
(quartile 4) in the year 2013.
*** Unrelated comorbid conditions comprise congestive heart failure, valvular disease, pulmonary circulation disease, peripheral vascular
disease, paralysis, other neurological disorders, chronic pulmonary disease, diabetes without chronic complications, diabetes with chronic
complications, hypothyroidism, renal failure, liver disease, peptic ulcer bleeding, acquired immune deficiency syndrome, lymphoma,
metastatic cancer, solid tumor without metastasis, rheumatoid arthritis, coagulopathy, obesity, weight loss, fluid and electrolyte disorders,
chronic blood loss anemia, and deficiency anemia.

78
Table 3: Counties served, emergency department facilities, and emergency visits for
behavioral health disorders and providers per 10,000 population by behavioral health
region in Nebraska.
Behavioral
Health
Region
Counties served
ED visits
per 10,000
population
Number
of ED
facilities
Number of
providers per
10,000
population
1
Sheridan, Dawes, Sioux, Box
Butte, Morrill, Scotts Bluff,
Banner, Cheyenne, Deuel,
Garden, and Kimball
2,072 8 38
2
Arthur, Chase, Dawson, Dundy,
Frontier, Gosper, Grant, Hayes,
Hitchcock, Hooker, Keith,
Lincoln, Logan, McPherson,
Perkins, Red Willow, and
Thomas
11,805 9 37
3
Adams, Blaine, Buffalo, Clay,
Custer, Franklin, Furnas,
Garfield, Greeley, Hall,
Hamilton, Harlan, Howard,
Kearney, Loup, Merrick,
Nuckolls, Phelps, Valley,
Sherman, Webster and Wheeler
2,538 18 94
4
Antelope, Boone, Boyd, Brown,
Burt, Cedar, Cherry, Colfax,
Cuming, Dakota, Dixon, Holt,
Keya Paha, Knox, Madison,
Nance, Pierce, Platte, Rock,
Stanton, Thurston & Wayne
1,908 21 89
5
Butler, Fillmore, Gage,
Jefferson, Johnson, Lancaster,
Nemaha, Otoe, Pawnee, Polk,
Richardson, Saline, Saunders,
Seward, Thayer, and York
3,015 22 83
6 Cass, Dodge, Douglas, Sarpy,
and Washington 1,394 16 31
The population estimates for behavioral health regions 1 through 6 were (1) 87,839; (2) 101,213;
(3) 227,270; (4) 207,646; (5) 448,995; and (6) 769,678, respectively.

79
Table 4: Multivariable linear regression model for hospital-based emergency department
charges (in dollars) due to behavioral health conditions NE SEDD, 2011–2013. a
Parameter
AME Standard
Error
95% Confidence
Intervals P-value b
(dollars) a Lower Upper
Sex
Male Reference
Female -105.429 14.40826 -133.67 -77.19 <.001
Age group
0 to 17 Reference
18 to 24 408.1 21.44 366.09 450.116 <.001
25 to 44 472.75 19.144 435.23 510.27 <.001
45 to 64 678.26 22.81 633.56 722.96 <.001
65 and over 1,119.48 45.22 1030.86 1208.1 <.001
Primary Payer
Medicare Reference
Medicaid 239.64 27.92 184.91 294.36 <.001
Private Insurance 212.94 22.64 168.57 257.3 <.001
Uninsured 317.46 25.38 267.71 367.21 <.001
Other insurance 204.64 41.07 124.13 285.13 <.001
Median household income national quartile for patient ZIP code**
First quartile Reference
Second quartile -18.76 18.85 -55.71 18.18 0.32
Third quartile 15.91 20.68 -24.62 56.44 0.44
Fourth quartile 313.84 27.43 260.08 367.59 <.001
Patient Location
Urban Reference
Large rural town -123.44 22.61 -167.75 -79.13 <.001
Small rural town -527.38 22.67 -571.81 -482.95 <.001
Isolated rural -377.56 26.83 -430.14 -324.99 <.001
Elixhauser Comorbidity Index measure ***
0 Reference
1 594.13 27.33 540.57 647.68 <.001
2 929.73 53.12 825.63 1033.84 <.001
≥3 2,015.1 133.47 1753.52 2276.69 <.001
SEDD, State Emergency Department Database
a Average Marginal Effect (AME) is measured as the difference in the adjusted predicted
outcome between reference group and comparison group.
b P values were calculated using multivariate Log-linked Gamma Distributed Generalized Linear
Model.

80
** Median household income quartiles of residents in the patient’s ZIP code vary by year. The
levels were $1 to $38,999 (quartile 1), $39,000 to $47,999 (quartile 2), $48,000 to $63,999
(quartile 3) and $64,000 or higher (quartile 4) in the year 2011. The levels were $1 to $38,999
(quartile 1), $39,000 to $47,999 (quartile 2), $48,000 to $62,999 (quartile 3) and $63,000 or
higher (quartile 4) in the year 2012. The levels were $1 to $37,999 (quartile 1), $38,000 to
$47,999 (Quartile 2), $48,000 to $63,999 (quartile 3) and $64,000 or higher (quartile 4) in the
year 2013.
*** Unrelated comorbid conditions comprise of congestive heart failure, valvular disease,
pulmonary circulation disease, peripheral vascular disease, paralysis, other neurological
disorders, chronic pulmonary disease, diabetes without chronic complications, diabetes with
chronic complications, hypothyroidism, renal failure, liver disease, peptic ulcer bleeding,
acquired immune deficiency syndrome, lymphoma, metastatic cancer, solid tumor without
metastasis, rheumatoid arthritis, coagulopathy, obesity, weight loss, fluid and electrolyte
disorders, chronic blood loss anemia, and deficiency anemia.

81
Table 5: Adjusted odds ratios from multivariate logistic regression analysis of discharge
against medical advice by patient-level characteristics, NE SEDD, 2011-2013.
Characteristics Estimate Odds ratio
(AMA)
95% confidence level P-
value OR
Lower
OR
Upper
Intercept -4.02 <.0001
Sex
Male Reference
Female 0.72 0.63 0.82 0.98 <.0001
Age
up to 17 Reference
18 to 24 0.19 1.20 0.91 1.60 0.200
25 to 44 0.61 1.83 1.42 2.36 <.0001
45 to 64 0.84 2.31 1.78 3.00 <.0001
65 and over -0.35 0.704 0.443 1.12 0.139
Primary payer
Medicare Reference
Medicaid 0.03 1.03 0.80 1.33 0.829
Private Insurance -0.08 0.92 0.74 1.14 0.457
Uninsured 0.44 1.56 1.27 1.91 <.0001
Other -0.21 0.81 0.53 1.25 0.340
Median household income national quartile for patient ZIP code**
First quartile Reference
Second quartile -0.27 0.77 0.66 0.89 0.0003
Third quartile -0.53 0.59 0.49 0.72 <.0001
Fourth quartile -0.40 0.67 0.53 0.85 0.001
Elixhauser Comorbidity Index for unrelated comorbid conditions***
0 Reference
1 -0.42 0.66 0.53 0.82 0.0002
2 -0.26 0.77 0.55 1.10 0.149
3 or more -0.25 0.78 0.40 1.52 0.464
AMA, Discharge against medical advice; SEDD, State Emergency Department Database
** Median household income quartiles of residents in the patient’s ZIP code vary by year. The
levels were $1 to $38,999 (quartile 1), $39,000 to $47,999 (quartile 2), $48,000 to $63,999
(quartile 3) and $64,000 or higher (quartile 4) in the year 2011. The levels were $1 to $38,999
(quartile 1), $39,000 to $47,999 (quartile 2), $48,000 to $62,999 (quartile 3) and $63,000 or
higher (quartile 4) in the year 2012. The levels were $1 to $37,999 (quartile 1), $38,000 to
$47,999 (Quartile 2), $48,000 to $63,999 (quartile 3) and $64,000 or higher (quartile 4) in the
year 2013.
*** Unrelated comorbid conditions comprise of congestive heart failure, valvular disease,
pulmonary circulation disease, peripheral vascular disease, paralysis, other neurological
disorders, chronic pulmonary disease, diabetes without chronic complications, diabetes with
chronic complications, hypothyroidism, renal failure, liver disease, peptic ulcer bleeding,
acquired immune deficiency syndrome, lymphoma, metastatic cancer, solid tumor without
metastasis, rheumatoid arthritis, coagulopathy, obesity, weight loss, fluid and electrolyte
disorders, chronic blood loss anemia, and deficiency anemia.

82
Figure 1: Emergency Department visits in Nebraska related to behavioral health and
supply of behavioral health professionals per 10,000 population by designated behavioral
health regions, NE SEDD, 2011-2013.
SEDD, State Emergency Department Database

83
Figure 2: Emergency Department visits in Nebraska related to behavioral health and
number of emergency departments by designated behavioral health regions, NE SEDD,
2011-2013
SEDD, State Emergency Department Database

84
CHAPTER V: EMERGENCY DEPARTMENT UTILIZATION FOR SUBSTANCE USE-
RELATED DISORDERS AND ASSESSMENT OF TREATMENT FACILITIES IN
NEW YORK STATE, 2011- 2013
Introduction
Substance use disorders (SUDs), the leading cause of premature illnesses and death (Bernstein &
D’Onofrio, 2013; Shroeder, 2007), were experienced by about 21.5 million Americans over the
age of 12 years in 2014 (Tice, Hedden, Kennet, Lipari, & Medley, 2014), thereby, attributed as an
important public health issue. For 2017 alone, the US Department of Health and Human Services
allocated $2.6 billion for substance abuse treatment and $211 million for prevention of SUDs (US
Department of Health and Human Servives, 2017). However, the overall social and economic
burden to society is compounded not only by the direct consequences of overuse of substances,
but also such disorders have an effect on public safety, health, welfare, and socioeconomic status
(Han, Sherman, Link, Wang, & Mcneely, 2017; Kosten & O’Connor, 2003; U.S. Department of
Health and Human Services (HHS), 2016). On the other hand, from the providers perspective,
unmanaged treatment of SUDs impact patient safety because there is a possibility of withdrawal
while admitted to the hospital. For example, withdrawal from drugs such as opioid and its
conjugates, alcohol, and benzodiazepines are not only lethal but also can result in unwanted
interactions between the drug and medications (Han et al., 2017; Kosten & O’Connor, 2003).
Thus, these disorders not only contribute to the disease burden but cost heavily to the nation.
Over the last decade, many health policies have been introduced to address parity issues
for mental health and SUDs. The latest amendment of 2016 to the Mental Health Parity and
Addiction Equity Act of 2008 (MHAEA) mandates both public, including Medicaid non-
managed care and benchmark-equivalent plans, and private insurance to provide coverage for
behavioral health conditions. To complement these policies, the Patient Protection and Affordable
Care Act of 2010 (ACA) along with the National Drug Control Strategy have categorically
emphasized early detection of SUDs and embraced integration of behavioral health services in

85
medical settings (Executive Office of the President, 2011; Wu et al., 2013). The increased number
of insured Americans under the ACA present more opportunities to healthcare organizations to
treat SUDs at primary-care level and also allows them to acquire more plausible revenue. The
profits generated due to implementation of such Acts, help the organizations to adapt themselves
with changes in health policies (Aletraris et al., 2017; Pfeffer & Salancik, 1978). For example, an
ED equipped with a behavioral health professional and requisite toolkits to treat SUDs, and a
primary care integrated with behavioral health services; can take advantage of the changes in the
health laws for SUDs to generate pockets of revenue (Aletraris et al., 2017). By Executive Order,
President Trump too has assembled the President’s Commission on Combating Drug Addiction
and the Opioid Crisis, besides asking the Congress to provide funding of additional $500 million
for state grants in the fiscal year 2018 stipulated under the 21st Century Cures Act of 2016 (H. W.
Clark, 2017). Therefore, it would be interesting to study the effects of such rigorous, timely and
frequently updating health policies on the utilization of various healthcare settings for SUDs.
Annually, 11% or 1.8 million residents of New York (NY) over 12 years of age,
experience SUDs but only 15% of them receive treatment (The New York State Office of
Alcoholism and Substance Abuse Services, 2012). An additional state funding of $25 million was
approved for 2016-17 to facilitate development and implementation of prevention and support
services, especially for individuals with heroin and opioid use disorders (DiNapoli, 2016).
Moreover, the federal government has announced recently that 21 community health centers in
NY will receive a total of $7.3 million in Substance Abuse Service Expansion awards to help
address opioid abuse and heroin epidemic in the State (DiNapoli, 2016). Overall, the public
spending for SUDs treatment has grown faster than private spending. It is noteworthy that of all
the spending in 2013 from SUDs state and local agencies across the US, NY State has spent the
highest of $413, 750 (The Pew Charitable Trusts and the John D. and Catherine T. MacArthur
Foundation, 2015). Therefore, there is a pressing need to evaluate the utilization of healthcare
spending on SUDs in NY State.

86
Previous studies have shown that among those SUD patients who receive treatment,
many are likely to not adhere to the therapy (Heaton, Tundia, & Luder, 2013) and lack strong
connections to primary care settings (Han, 2017; Hinkin & Barclay, 2010), which explains the
fact that hospitalized patients have more sever SUDs in contrast to those examined in outpatient
settings (Han et al., 2017; Holt et al., 2012). Moreover, it has been established that misuse of
alcohol, drugs and other substances is more likely among users of emergency departments (ED)
than non-users (Beaudoin, Baird, Liu, & Merchant, 2015; Bernstein & D’Onofrio, 2013; Blow et
al., 2007; Cherpitel & Ye, 2012). Studies have also shown that ED utilization is 50-100% higher
for patients with SUD than those without (Bahorik et al., 2017; Cherpitel & Ye, 2012; Frank et
al., 2016; John & Wu, 2017). In 2011 alone, over 5 million ED visits were made for SUD, as
reported in the Drug Abuse Warning Network (DAWN) (Bernstein & D’Onofrio, 2013;
Substance Abuse and Mental Health Services Administration Center forMental Health Services.
Rockville, 2001). ED has, therefore, evolved from being a treatment setting for acute illness and
injuries to becoming a “failsafe” site of psychiatric services. Additionally, the National Hospital
Ambulatory Medical Care Survey revealed that 55% of the nation’s EDs “board” or hold the
patients in the ED until they can allocate an inpatient bed for psychiatric services (Bernstein &
D’Onofrio, 2013). It is also known that most psychiatric facilities are overcrowded and thus may
increase reliance on EDs for SUD treatment (Chakravarthy et al., 2013; Honberg, Diehl, &
Kimball, 2011). Also, with a rise in the number of individuals who seek care in ED for SUD, it is
becoming essential for healthcare leaders to introduce innovative methods to encourage follow-up
of care on discharge for SUD patients and to curb healthcare costs (Bernstein & D’Onofrio, 2013;
Gau et al., 2005). However, the health professionals who are primarily trained in emergency
medicine specialty to treat acute illnesses, trauma and injuries and not psychiatric care; are not
conventional choice of professionals to diagnose and treat SUD. Also, the ratio of population to
mental health providers for NY state is 420:1 which is much lower than the US median ratio of

87
1060:1 (Robert Wood Johnson Foundation Program and University of Wisconsin Population
Health Institute 2016).
Regardless of the importance of the ED as a key clinical point of care for patients at high-
risk, the relationship between ED utilization patterns and SUDs is understudied. ED utilization
patterns and frequencies are solid predictors of subsequent death due to an overdose. Thus, it is
important to understand the timing of overdose death with respect to ED utilization for
identifying at-risk patients that require overdose prevention interventions. With rising cases of
ED visits in NY State, clinical practice needs to re-evaluate their need to incorporate brief
intervention and referrals to addiction counselors as part of emergency treatment.
The first objective of this study was to provide estimates and rates of hospital-based ED
visits between the years 2011 to 2013 within NY at the county-level. Secondly, the study
evaluated the effect of patient-level characteristics (age, sex, race, ethnicity, insurance status,
patient location, income level, and comorbid conditions) on the associated charges for SUDs
within the State over the period of 2011-2013. Finally, the study presents the geographic
distribution of substance use treatment centers, ED, and patient SUDs-related ED visits at the
county-level.
Methods
Data Sources
State Emergency Department Database
This study utilized the NY State Emergency Department Database (SEDD) data for the years
2011 to 2013 available from the Healthcare Cost and Utilization Project (HCUP). HCUP is
sponsored by The Agency for Healthcare Research and Quality (AHRQ) and collects longitudinal
hospital care de-identified patient information. SEDD provides census data on treat-and-release
emergency department visits, which include more than 80% of all emergency department visits

88
(Agency for Healthcare Research and Quality. HCUP Databases., 2015). However, SEDD does
not contain information on those emergency visits that resulted in hospitalizations. SEDD
includes patient- and hospital-related variables such as age, sex, race, ethnicity, the presence of
co-morbid conditions, charges, disposition status, patient location, and insurance and income.
Emergency Medicine Network
We used the 2013 data obtained from the Emergency Medicine Network (EMNet) to calculate the
number of EDs in NY at county-level. EMNet collects data through the National Emergency
Department Inventory (NEDI) that includes ongoing cross-sectional web-based surveys and
contains data on all EDs at state, and county-level, including facility location and annual visit
volume. NEDI has ED as a primary unit of analysis and has over an 80% response rate
(Emergency Medicine Network., 2012).
National Survey of Substance Abuse Treatment Services
We used the substance abuse facilities locator that was generated by the National Survey of
Substance Abuse Treatment Services (N-SSATS) to procure the number of substance use
treatment centers in NY at the county-level. The annual census data from all the public and
privately known substance abuse treatment facilities in the United States comprise N-SSATS.
The N-SSATS conducted by the Mathematica Policy Research for the Substance Abuse and
Mental Health Services Administration (SAMHSA). Federal, state, and local governments use the
N-SSATS to assess treatment resources, update their inventories containing information on
behavioral health services, and generate resource for the public to access and estimate trends in
available services (Substance Abuse and Mental Health Services., 2017). The treatment centers
included in this database offer services such as assessment, counseling, pharmacotherapies used,
testing, transitional, and ancillary services (Substance Abuse and Mental Health Services., 2017).
Measures

89
All hospital-based ED visits for patients with SUDs in the State of NY between the years 2011 to
2013 were selected. Appendix 5 presents the list of all primary diagnoses codes used in this study.
Disorders due to alcohol; amphetamines; cannabis; cocaine; drug-induced mental disorders;
hallucinogens; opioids; sedatives, hypnotics, anxiolytics, tranquilizers, barbiturates; tobacco; and
other combinations drugs were identified by the International Classification of Diseases, Ninth
Revision, Clinical Modification (ICD-9-CM). The independent variables included in the study
were patient-related demographic characteristics such as age, race, sex, patient location,
disposition status, income and insurance statuses, and co-morbid conditions.
The comorbid burden was measured using the Elixhauser comorbidity index (ECI)
measure, a summation of 29 binary Elixhauser comorbidity variables, which is available in the
current HCUP Elixhauser Comorbidity Software, Version 3.7 (“Healthcare Cost and Utilization
Project (HCUP). HCUP Comorbidity Software, Version 3.7.,” 2017). By definition, an ECI
measure of 0 indicates the absence of co-morbid conditions. For the premise of this study, we
computed two separate variables: related and unrelated ECI measure. Clinical conditions
primarily responsible for emergency visits such as depression and psychoses were considered as
related comorbidity conditions and measures for alcohol and drug-related abuse were not
considered comorbidities. Congestive heart failure, valvular disease, pulmonary circulation
disease, peripheral vascular disease, paralysis, other neurological disorders, chronic pulmonary
disease, diabetes without chronic complications, diabetes with chronic complications,
hypothyroidism, renal failure, liver disease, peptic ulcer bleeding, acquired immune deficiency
syndrome, lymphoma, metastatic cancer, solid tumor without metastasis, rheumatoid arthritis,
coagulopathy, obesity, weight loss, fluid and electrolyte disorders, chronic blood loss anemia, and
deficiency anemia were considered as unrelated ECI measures. All comorbidity variables were
determined by the International Classification of Diseases, Clinical Modification, Version 9

90
(ICD-9-CM) codes (Elixhauser A, Steiner C, Harris DR, 1998; H. Mehta, 2012; Moore et al.,
2017).
Outcomes
The key outcome variable for this study was the incurred hospital ED charges (in dollars) for
hospital visits in NY State’s hospitals. In SEDD, total charges represent the amount billed for
each hospitalization reported by the facilities. Data in SEDD on cost of care provided to patients
or the amount of reimbursement for services rendered were not available. These charges were
adjusted for inflation to the value of 2013 US dollars, using the Bureau of Labor Statistics
Consumer Price Index.
Analytical Approach
An individual ED visit was the unit of analysis. Descriptive statistics included the number and
rates of SUDs-related ED visits per 10,000 population in NY where the visits stratified by
clinically diagnosed SUD conditions and patient characteristics. The population-based incidence
rates of SUDs per 10,000 people were calculated using the 2013 US Census population estimates
for each county. ED visits in NY were stratified at the county-level using the five-digit Federal
Information Processing Standard code.
The main interest of this study was to identify important patient-related factors associated
with ED charges. In this study, charges have non-negative values (> 10% have zero values) with
a distribution with longer right tail and outliers when compared to normal distribution. In this
case, using ordinary least square regression may provide inaccurate estimates of means and
marginal/incremental effects (Manning, 2006; Manning et al., 2005; Partha et al., 2010).
Therefore, total charges were estimated using a generalized linear model (GLM) with a gamma
distribution and log-link function which best fits our data structure and is a common method in
cases where the log-transformed dependent variables do not have heavy tails (N. G. Choi et al.,

91
2015; J. A. Singh & Yu, 2016; Thompson & Nixon, 2005). The log-link function accounts for the
non-normal distributional characteristics of the total charges data (Kazley et al., 2014; Malehi et
al., 2015; Manning et al., 2005). The gamma distribution was selected based on the recommended
diagnostic test (λ = 2) for the GLM family, called the modified Park Test, to examine the
distributional characteristics of the residuals (S. D. Case et al., 2011; Malehi et al., 2015;
Manning et al., 2005). For interpretability, coefficients were converted to average marginal
effects (AME) which measures the difference in adjusted predicted outcomes between the
reference group and the comparison groups after adjusting for other covariates. Statistical
significance was assessed at a level of 0.05.
All of the descriptive analyses were carried out using SAS version 9.4 (SAS Institute Inc,
Cary, NC), whereas log-linked Gamma distributed Generalized Linear model analyses were
conducted using Stata (StataCorp, College Station, TX). Geographic information system (GIS)
maps were created using ArcGIS software, version 10.4 (Esri, Redlands, CA). The University of
Nebraska Medical Center IRB deemed this study exempt from human subject protocol.
Results
Patient Characteristics
Table 1 is a compilation of SUDs-related ED visits in NY stratified by patient characteristics over
the study period. The majority (74.3%) of the ED visits for SUD were made by males. While the
mean age of patients admitted in the ED for SUDs was 41 years, over 41% of the visits were
made by those aged between 45 to 64 years, followed by adults within the 25 to 44 years age
group (38.2%). Young adults belonging to the 17 to 24 years old age group represented 15% of
the ED visits for SUD. About 41% of patients who visited the ED for SUDs were White,
followed by 23.6% of Black patients and 19.1% were Hispanic. About 77% of these patients had
non-Spanish or non-Hispanic ethnicity. The majority were covered by Medicaid (42%) uninsured

92
(31%). Only 15% of these patients were privately insured and less than 9% were covered by
Medicare.
Table 1 also shows that about 95% ED visits were made by patients living in urban areas
with about 57% of ED visits occurred in patients living in zip codes with the first (38%) and
second (19%) quartile median household income. However, about a quarter of ED visits
comprised of those patients living in zip codes within the fourth quartile. Using the ECI measure,
the present study found that 93% of the ED visits for SUDs were made by patients who had zero
related comorbidities. However about 7% had 1 or 2 related comorbid conditions such as
depression and psychoses. The present study categorized ECI measures for unrelated comorbid
conditions and found that 86% ED visits for SUDs comprised of patients who did not suffer from
any related comorbid condition, but there were 13% of visits made by patients who had 1 to 2
unrelated comorbid conditions.
NY’s EDs reported a total of 492,419 ED visits for a primary diagnosis of SUDs during
2011 to 2013, as shown in Table 2. There was an overall reduction in the number of ED visits for
SUD (9% from 2011 to 2012 and 6% from 2011 to 2013). In our study, we found that the most
common causes of SUDs-related ED visits were made for abuse of alcohol (72.5%), opioids
(7.9%), combination of drugs (7.8%), and drugs (5.5%). While rates of ED visits for some types
SUDs reduced, rates for drug-induced mental disorders increased. Specifically, the rates of drug-
related ED visits increased from 4.0 in 2011 to 5.0 in 2013 per 10,000 population. However, rates
of ED visits for alcohol abuse (61.9 in 2011 to 61.8 in 2013 per 10,000 population);
amphetamines (0.1 per 10,000 population through 2011-2013); sedatives, hypnotics, anxiolytics,
tranquilizers, barbiturates (0.37 per 10,000 population through 2011-2013); and tobacco use (3
per 10,000 population through 2011-2013) have remained steady. Interestingly, rates of ED visits
due to abuse of cannabis (4.0 vs. 12.6), cocaine (3.5 vs.1.6 per 10,000 population) opioids (75.8
vs. 61.8 per 10,000 population), and abuse of combination of drugs (6.9 vs. 6.2 per 10,000

93
population) have decreased from 2011 to 2013. But cases of disorders caused due to drug induced
mental disorders (4.0 vs. 4.9) has increased over the three years. (Table 1).
Table 3 shows that SUDs visits caused by alcohol, opioids, combination of drugs, and
drugs-induced mental disorders are most prevalent. Over the study period, in NY State, for
alcohol abuse-related disorders have had the highest rates of ED visits across all age groups.
Among those under the age of 18 years had alcohol as the main cause of ED visits with the rate of
3.2 per 10,000 population. But it is the most common cause among those aged between 45 to 64
years (83.6 per 10,000 population), followed 25 to 44 years (62.5 per 10,000 population), and 18
to 24 years (24.1 per 10,000 population) age groups. Interestingly, among the elderly ED visit
rates for alcohol-abuse is the predominant cause as 90 out 100 per 10,000 population are admitted
for this type of SUDs.
The second most common type of SUD that had high rates of ED visits was opioid use.
Specifically, among all ages, those aged between 25 to 44 years (9.6 per 10,000 population) had
higher rates of ED visits for opioid abuse, followed by age groups of 45 to 64 years (6.1 per
10,000 population) and 18 to 24 (3.8 per 10,000) years. Use of drugs as mixtures or in
combination was the third leading cause of ED visits in NY State over the study period. Similarly,
those between 25 to 44 years (9.7 per 10,000 population) had the highest rates of ED visits,
followed by those between 45 to 64 years (5.3 per 10,000 population) and 18 to 24 years (4.0 per
10,000 population) of age for abuse of combination of drugs. Among those patients who are 25 to
44 years old, high rates of ED visits for drug-induced mental disorders (6.9 per 10,000
population) and abuse of cocaine (3.3 per 10,000 population) were the other common causes. It is
noteworthy that those between 45 to 64 years (103.1 per 10,000) of age had the most ED visit
rates among all age groups for SUDs.
Hospital ED Charges for SUD

94
After adjusting hospital ED charges for inflation to the value of 2013 US dollars, the aggregated
ED charges have increased by 9% from $276 million in 2011 to approximately $300 million in
2013. The total ED charges incurred from SUD in the state of NY was $856 million with an
average ED visit charge of $1,764 (Table 1). As seen in Figure 2, the number of ED visits for
SUD decreased from 2011 (172,958) to 2012 (153,444) and then increased to 162,522 in 2013.
From 2011 to 2013, both total ED charges and average ED charges for SUDs-related visits
showed a substantial increase after inflation adjusted to 2013 US dollars. The average hospital
ED charges increased from $1,658 in 2011 to $1,845 in 2013.
Table 4 represents the findings of the effect of patient-related factors on hospital-based
ED charges for SUDs using a multivariate log-linked gamma distributed GLM. As indicated by
average marginal effects (AME), the total charges for females are significantly higher than males
by $64. Interestingly, ED visits made by patients below the ages of 17 years were charged higher
than all other age groups. Adults between the ages of 45-64 years incurred hospital ED charges of
SUD lower than children under the age of 17 years by $278. Race was significantly associated
with hospital ED charges for SUDs. White patients incurred higher ED charges than all other
races. Asians and Pacific Islanders incurred ED charges $178 lower than Whites for SUDs.
Privately insured patients had ED charges higher by $36 than those covered by Medicare.
However, those patients covered by other insurance types that includes CHAMPUS/VA were
charged $272 less than those covered by Medicare. Patients covered by Medicaid also had $148
less than those covered by Medicare. Patients whose median household income at the ZIP code
level fell into the fourth quartile had significantly higher ED charges than those living in the first,
second and third quartile by $569, $591 and $368, respectively. The regression model also
indicates that patient location is significantly associated with ED charges for SUDs. Patients
residing in large, small and isolated rural towns had higher ED charges for SUD by $327, $158
and $297 more than those residing in urban areas. Additionally, ED charges are also significantly

95
associated with an ECI measure for unrelated comorbid conditions. Hospital ED charges for
SUDs increased with an increase in the index measure, with ED charges being $1064 higher for
those patients with 3 or more unrelated comorbid conditions than those with no unrelated
comorbid conditions.
GIS Analysis Results
Overall, the maps depict geographic patterns of ED admission for SUDs and explore potential
reasons for geographic variations by plotting available distribution of EDs and substance abuse
treatment centers. Figure 2 presents the distribution of population-based estimates of ED visits for
SUDs and the available treatment centers for SUDs in NY by county during 2011-2013. The
majority of the substance abuse treatment centers were clustered in the urban five boroughs area
(Greater NY City) comprised of the Richmond, Kings, Queens, New York, and Bronx counties
which had also experienced high number of ED visits (>over 400 per 10,000 population) for
SUDs. In contrast, some rural counties had a moderate proportion of ED visits for SUDs but less
than 5 treatment centers (e.g., Schenectady and Broome: 201-400 ED visits per 10,000
population) or zero treatment centers (Chemung, Schuyler and Delaware: 101-200 400 ED visits
per 10,000 population). Interestingly, even urban counties (Washington, Herkimer, and Tioga)
had 0-1 treatment centers but their residents made <100 ED visits per 10,000 population for SUD.
Figure 3 shows the distribution of population-based estimates of ED visits for SUDs and
the distribution of EDs in NY by county between 2011 and 2013. Within the five-borough region,
there are most number of EDs. Also, the neighboring urban counties of Suffolk, Nassau, and
Westchester have between 11-15 EDs. In contrast, their neighboring urban county of Richmond
had fewer EDs (3-5). Even though, the urban counties of Broome, Schenectady, and Rensselaer
counties had high rates of ED visits for SUDs, they had only 1-2 ED facilities. Interestingly,
counties such as Saratoga and Rensselaer were moderately populated and urban, but had only 1
ED whereas urban county of Tioga had no ED. Moreover, there were 20 other counties that had
96
only 1-2 EDs. Markedly, rural counties of Greene, and Hamilton had no EDs although their
residents had between 80-200 visits per 10,000 population for SUDs.
Discussion
The racially and culturally diverse NY State happens to be predominantly urban (Hevesi, 2004;
RLS Demographics, 2011), adopted Medicaid expansion under ACA, and its state substance
abuse agency had the highest spending per capita in the US. These facts make NY an important
state to evaluate regarding their healthcare utilization for SUDs at both the EDs and treatment
centers. To our knowledge, this study is the first to examine hospital-based ED visits for all ten
types of SUDs in NY. Researchers have examined ED visits for misuse of cannabis, alcohol,
heroin and opioid-related disorders. For example, Schmidt et al. analyzed ED utilization for
cannabis abuse in California (Schmidt, Behar, Cordova, & Beckum, 2017), while Campbell and
Bahorik examined specifically encounters in ED for alcohol, cannabis, and opioid use disorders
(Bahorik et al., 2017; Campbell, Bahorik, Kline-simon, & Satre, 2017). John and Wu (2017) have
evaluated nationwide utilization of ED and inpatient hospitalization for only alcohol use among
individuals with cannabis use disorders (John & Wu, 2017). However, after implementation of
ACA, there are no data published examining the burden of ED visits in NY for all ten SUDs
categories.
This study indicated that a total of 492,419 ED visits for SUDs occurred during the study
period resulting in total ED charges of close to $856 million. Most ED visits across all age groups
were made for alcohol abuse. Nevertheless, it is noteworthy that 90% of the ED visits made by
elderly were for alcohol abuse resulting in alcohol-induced delirium, amnesia and sleep disorders
which is common among elderly.
Considering that SUDs are conventionally treated at substance abuse treatment centers,
rehabilitation centers, and at outpatient clinics; average ED spending of $285 million per year for
SUDs is alarming. Moreover, considering that ED staff usually do not have behavioral health

97
providers on their team for treating SUDs, the approach to treat SUDs may lack definitive
diagnoses and is rather symptomatic which may delay the required line of treatment.
Based on the demographic distribution in NY State, males; patients who were between
25-64 years old; of Black, Hispanics and other racial minorities; Medicaid and uninsured; urban
residents are the most burdened with SUDs. Consistent with previous literature, this study shows
that males (Bohnert, Tracy, & Galea, 2012; Fahimi et al., 2015; Meiman, Tomasallo, & Paulozzi,
2015a), mostly adults who are 25-64 years old, and Whites represent a substantial proportion of
ED visits for SUDs (DiNapoli, 2016; Tice et al., 2014; Wu et al., 2013; Xie et al., 2014). A
sizeable proportion of ED visits for SUDs were made by those patients covered by Medicaid
which has been the case nationally (U.S. Department of Health and Human Services (HHS),
2016; Weiss, Barrett, Heslin, & Stocks, 2016). Additionally, about 57% of the SUDs-related ED
visits occurred in patients living in zip codes with the first and second quartile median household
income. This finding explains that more SUDs occur among those living urban but low-income
areas. However, unlike the national-level studies, the second largest number of ED visits were
made by uninsured (31.3%) in NY followed by those privately insured (14.9%). Other studies
have also reported that most of the ED visits for SUDs occurred over weekdays (Fahimi et al.,
2015) and were routinely discharged (Mark et al., 2010; Schildhaus et al., 2013). Similar to
published reports, we that urban or metropolitan population (Meiman, Tomasallo, & Paulozzi,
2015b; Schildhaus et al., 2013; Schroeder & Leigh-peterson, 2017), had a greater proportion of
ED visits. EDs are located more in urban and densely populated areas, especially the five
boroughs region in NY.
This study was able to identify high-risk cohorts who are likely to visit an ED for SUDs
and have higher ED charges in the NY. Specifically, females, >17 years of age, Whites, those
privately insured, and living in low-income areas had higher ED charges. Few studies have
reported that behavioral disorders-related ED charges for adolescents, pediatrics, and young
adults have been expensive (Akosa Antwi, Moriya, & Simon, 2015; Torio, Encinosa, Berdahl,

98
McCormick, & Simpson, 2015). However, there are no epidemiologic studies that have presented
comparison on ED charges between children, adolescents and adults with which the present
findings could be compared, and more research is needed to further explore this area. A high
proportion (95%) of ED visits for SUDs were made by urban patients who could be due to an
array of parameters including acceptance of risky substance use as ‘normal’ by the communities
(Center on Addiction and Substance Abuse Columbia, 2013). Efforts need to be made by
policymakers and healthcare administrators to implement preventative behavioral health
programs targeted towards these individuals. Also, because there are unmet behavioral healthcare
needs in low-income quartile areas, primary care settings must pursue to be integrated with
behavioral health services.
SAMHSA reported that the highest spending by payer for SUDs with and without the
impact of ACA, is by Medicaid and private insurance companies, followed by the uninsured (U.S.
Department of Health and Human Services, 2016). This study shows that, even though there are
statistically significant changes in the proportion of charges covered by payers, overall, the
population covered by Medicaid, the uninsured, and the privately insured contributed to a
substantial proportion of ED visits for SUD. These findings for NY differ from those at the
national level (Fahimi et al., 2015; U.S. Department of Health and Human Services, 2016), and
those for the states of California (Bahorik et al., 2017; Campbell, Bahorik, Kline-simon, & Satre,
2017b), and North Carolina (Doren et al., 2016) suggesting, that state-specific studies should be
performed. In NY, most substance abuse services (including all outpatient services) and mental
health services were excluded from its managed care benefit package. These services were only
offered on a fee-for-service basis or as an optional Medicaid benefit. However, on expanding
Medicaid under the ACA, NY State’s Medicaid program offered to include substance abuse
services to the benefits package along with comprehensive behavioral health services (Bachrach,
Boozang, & Lipson, 2015; Boozang, Bachrach, & Detty, 2014). On identifying high-risk cohorts,
this evidence-based research, can help policymakers examine the state reimbursement policies
99
may negatively impact access to behavioral health services. Furthermore, despite the ACA’s
expansion of SUDs treatment coverage and reduction in the number of ED visits from 2011 to
2013, the average hospital ED charges for SUDs increased. This proposes that the ED-level
spending for SUDs needs to be re-evaluated by introducing cost-effective programs that use
screening, intervention, and referral toolkits, and peer-SUDs-afflicted coaches on the ED staff to
direct patients with SUDs to appropriate healthcare settings.
Figures 2 and 3 display the ED utilization pattern for SUDs across the geographic regions
in NY indicating that visits are higher in areas with more treatment facilities and EDs. This could
be because of the greater number of low-income and uninsured population in these urban
counties. Also, in our study, ED visits were mainly made by those who are living in low-income
areas and covered by Medicaid and the uninsured. This indicates that despite the availability of
treatment centers, this population maybe limited in their access to these facilities and ultimately
seek help in ED. US DHHS projected a shortage of behavioral health professionals in 2025 (U.S.
Department of Health and Human Services, 2016). Subsequently, there is a possibility of
insufficient behavioral healthcare with sustained health disparities in NY. In addition, the maps
displayed that the ED utilization pattern for SUD across the geographic regions in NY. Counties
that form the five boroughs region such as Kings, Queens, New York, Richmond, and Bronx
counties had high rates of ED rates and high proportion of the high-risk cohort that belonged to
29-44 years old age group. Contrastingly, even though Suffolk and Westchester counties had high
proportion of high-risk age group (29- 44 years) because of the high numbers of treatment centers
their rates of ED visits were low (less than 200 ED visits per 10,000 population). Therefore, from
the figures, there is clear evidence that the SUD-related ED visits are higher in urban areas with
more substance abuse treatment facilities and EDs. This could be because of the greater number
of low-income and uninsured population in these counties (mostly urban five boroughs region).
Also, in our study, ED visits are majorly made by those who are living in low-income areas and
covered by Medicaid and the uninsured. This also reinstates that access of EDs drives their

100
utilization. Subsequently, dearth of treatment centers compels both urban and urban residents to
seek healthcare services for SUDs in EDs, which maybe because his population may be limited in
their access to these facilities. Further studies need to be performed to understand the severity of
disorders among SUD-related ED visitors.
Health systems need to emphasize educating the population in NY about available
provisions for behavioral healthcare and unwanted outcomes of substance abuse. According to a
report by the US Department of Health and Human Services, there will be a projected shortage of
psychiatrists; clinical, counseling, and school psychologists; and mental health and substance
abuse social workers in 2025 (U.S. Department of Health and Human Services, 2016). This
indicates that there is a possibility of deteriorating behavioral health care and sustained health
disparities in behavioral health care access in NY. Specifically, Broome, Schenectady, Albany,
Richmond, Tompkins and Rensselaer and Cortland counties need treatment facilities. Also,
policymakers need to design policies that could improve access to integrated or segregated
behavioral healthcare and reduce ED visits and deaths due to SUD. For illustration, to avoid
readmissions in inpatient or emergency departments, especially among the high-risk cohorts,
integrated behavioral health services must be provided by the ED hospital staff. Allocation of a
CPT code for follow-ups, reminders, peer-coaching and adherence to therapy for patients with
SUDs will encourage the healthcare professionals and hospital staff to participate in supportive
community outreach and procure reimbursements for delivering patient-centered and coordinated
care with primary care providers. New York State can adopt such Patient-centered approach from
predominantly urban states with similar demography such as New Jersey, Massachusetts, and
Oregon. These states manage the social, behavioral, and medical needs of those individuals with
high charges of ED visits for SUDs by including the hospital administrators and policymakers on
their interdisciplinary teams. It could be anticipated that combined efforts from patients, providers
and policymakers can break the harmful and costly cycle of inappropriate and costly ED and/or
inpatient admissions.

101
Conclusions
This study provides estimates of characteristics of patients across all ages that make ED visits in
the State of NY for ten types of SUD. This study also examined the significant changes in the
proportion of charges covered by Medicaid, the uninsured and those privately insured due to the
impact of altering health policies in NY. Treatment charges are significantly higher for females,
children, privately insured and patients in rural areas. The study identified that males, Whites,
those aged 25-64 years, uninsured, covered by Medicaid and private insurance, and residing in
low-income areas and belonging to urban areas were at high-risk in the State of NY. Additionally,
despite sufficient access to behavioral healthcare services in urban areas, more substance use-
related problems exist, especially in the five boroughs areas of NY. On the other hand, there are
counties in NY that have no EDs or have insufficient substance abuse treatment centers available
implying high numbers of unmet behavioral health needs. In the future, studies should be
conducted to better understand the barriers to access for behavioral healthcare at the primary
level, especially among high-risk groups. These findings emphasize that it is essential to design
state-specific preventive health policies and programs to improve access to care and reduce
dependence on ED for treatment of SUD. We anticipate that the findings will provide evidence to
psychiatric healthcare providers and policymakers.

102
Table 1: Emergency Department visits for substance use disorders stratified by patient
characteristics in NY SEDD, 2011 – 2013. *
Characteristics Number (Percent)
Sex
Male 365,693 (74.3)
Female 126,694 (25.7)
Age group (in years)
up to 17 9,093 (1.9)
17 to 24 73,594 (15.0)
25 to 44 188,233 (38.2)
45 to 64 201,771 (41.0)
65 and over 19,728 (4.0)
Mean Age (years) 41.00
Race
White 200,656 (41.0)
Black 115,735 (23.6)
Hispanic 93,744 (19.1)
Asian and Pacific Islander 8,247 (1.7)
Other (includes NA) 71,509 (14.6)
Ethnicity*
Spanish/Hispanic origin 93,744 (19.9)
Non-Spanish/Non-Hispanic 378,502 (76.9)
Primary payer
Medicare 43,014 (8.7)
Medicaid 209,005 (42.5)
Private Insurance 73,462 (14.9)
Uninsured 153,862 (31.3)
Other (includes No charge) 12,928 (2.6)
Admission Day
Weekday 336,863 (68.41)
Weekend 155,556 (31.59)
Disposition status
Routine 459,855 (93.42)
Transfer to short-term hospital 3,926 (0.80)
Transfer Other: Includes SNF, ICF, Another Type
of Facility 6,874 (1.40)

103
Home Health Care (HHC) 1,310 (0.27)
Against Medical Advice (AMA) 20,270 (4.12)
Died in hospital 36 (0.01)
Missing 148
Patient Location
Urban 451,330 (95.09)
Large rural town 14,093 (2.97)
Small rural town 5,365 (1.13)
Isolated rural 3,850 (0.81)
Median household income national quartile for patient ZIP code**
First quartile 181,819 (38.20)
Second quartile 89,468 (18.80)
Third quartile 85,610 (17.99)
Fourth quartile 119,047 (25.01)
Elixhauser Comorbidity Index
Related comorbid conditions a
0 457,219 (92.9)
1 34,025 (6.9)
2 1,175 (0.2)
Unrelated comorbid conditions b
0 423, 338 (86.0)
1 51,930 (10.6)
2 13, 987 (2.8)
3 or more 3, 164 (0.6)
Hospital ED charges (inflation adjusted to 2013 US dollars)
2011 $276,123,421.00
2012 $280,069,900.00
2013 $299,824,373.00
Total charges $856,017,694
Mean (median) charges $1,764.4 ($1,266.7)
ED, emergency department; SEDD, State Emergency Department Database; NA, Native
Americans; SNF, Skilled Nursing Facility; ICF, Intermediate Care Facility.
* The sum of individual counts may not add up to the total number of visits because of missing
information for certain variables.
** Median household income quartiles of residents in the patient’s ZIP code vary by year.
The levels were $1 to $38,999 (quartile 1), $39,000 to $47,999 (quartile 2), $48,000 to $63,999
(quartile 3) and $64,000 or higher (quartile 4) in the year 2011.

104
The levels were $1 to $38,999 (quartile 1), $39,000 to $47,999 (quartile 2), $48,000 to $62,999
(quartile 3) and $63,000 or higher (quartile 4) in the year 2012.
The levels were $1 to $37,999 (quartile 1), $38,000 to $47,999 (Quartile 2), $48,000 to $63,999
(quartile 3) and $64,000 or higher (quartile 4) in the year 2013.
a Count of related comorbid conditions from 2011 to 2013 which includes depression and
psychoses.
b Count of unrelated comorbid conditions from 2011 to 2013 which comprises of a count of one
for congestive heart failure, valvular disease, pulmonary circulation disease, peripheral vascular
disease, paralysis, other neurological disorders, chronic pulmonary disease, diabetes without
chronic complications, diabetes with chronic complications, hypothyroidism, renal failure, liver
disease, peptic ulcer bleeding, acquired immune deficiency syndrome, lymphoma, metastatic
cancer, solid tumor without metastasis, rheumatoid arthritis, coagulopathy, obesity, weight loss,
fluid and electrolyte disorders, chronic blood loss anemia, and deficiency anemias.

105
Table 2: Number, percent and rates of substance use disorders-related emergency department visits per 10,000 population by year
in New York, SEDD 2011 – 2013.
Type of SUD 2011 2012 2013 Total
N % R N % R N % R N % R
Alcohol 120,591 69.7 61.95 114,844 73.3 58.7 121,413 74.6 61.8 356,848 72.5 182.4
Amphetamines 226 0.1 0.12 237 0.2 0.1 262 0.2 0.1 725 0.1 0.4
Cannabis 7,759 4.5 3.99 2,520 1.6 1.3 2,481 1.5 1.3 12,760 2.6 6.5
Cocaine 6,755 3.9 3.47 3,379 2.2 1.7 3,198 2.0 1.6 13,332 2.7 6.8
Drug-induced mental
disorders 7,889 4.6 4.05 9,463 6.0 4.8 9,691 6.0 4.9 27,043 5.5 13.8
Hallucinogens 294 0.2 0.15 166 0.1 0.1 138 0.1 0.1 598 0.1 0.3
Opioids 14,763 8.5 7.58 11,990 7.7 6.1 12,136 7.5 6.2 38,889 7.9 19.9
Sedatives, hypnotics,
anxiolytics,
tranquilizers,
barbiturates
710 0.4 0.36 639 0.4 0.3 730 0.4 0.4 2,079 0.4 1.1
Tobacco 499 0.3 0.26 506 0.3 0.3 568 0.3 0.3 1,573 0.3 0.8
Other 13,472 7.8 6.92 12,980 8.3 6.6 12,120 7.4 6.2 38,572 7.8 19.7
Total 172,958 100.0 88.85 156,724 100.0 80.1 162,737 100.0 82.8 492,419 100.0 251.7
ED, emergency department; SEDD, State Emergency Department Database; SUD, Substance Use Disorders; N, Number R, Rate
Note: Rate is calculated using population estimates of New York to be 19,465,197 in 2011; 19,570,261 in 2012; and 19,651,127 in 2013.

106
Table 3: Number, percent and rates of substance use disorders-related emergency department visits per 10,000 population by age
groups in New York, SEDD 2011 – 2013.
Types of SUD
Age in years Total
1 to 17 18 to 24 25 to 44 45 to 64 65 and more
N (%) R N (%) R N (%) R N (%) R N (%) R N (%) R
Alcohol 6,190
(68.1) 3.2
47,088
(64.0) 24.1
122,193
(64.9) 62.5
163,625
(81.1) 83.6
17,752
(90.0) 9.1
356,848
(72.5) 182.4
Amphetamines 26 (0.3) 0.0 254 0.1 368
(0.02) 0.2 75 (0.0) 0.0
89.98
(0.5) 0.0
725
(0.1) 0.4
Cannabis 1,324
(14.6) 0.7
4,121
(5.6) 2.1
5,790
(3.1) 3.0
1,497
(0.7) 0.8
28
(0.1) 0.0
12,760
(2.6) 6.5
Cocaine 31
(0.3) 0.0
971
(1.3) 0.5
6,447
(3.4) 3.3
5,753
(2.9) 2.9
130
(0.7) 0.1
13,332
(2.7) 6.8
Drug-induced
mental disorders
383
(4.2) 0.2
4,921
(6.7) 2.5
13,545
(7.2) 6.9
7,435
(3.7) 3.8
759
(3.8) 0.4
27,043
(5.5) 13.8
Hallucinogens 22
(0.2) 0.0
254
(0.3) 0.1
278
(0.1) 0.1 43 (0.0) 0.0 1 (0.0) 0.0
598
(0.1) 0.3
Opioids 135
(1.5) 0.1
7,413
(10.1) 3.8
18,818
(10.0) 9.6
12,019
(6.0) 6.1
504
(2.6) 0.3
38,889
(7.9) 19.9
Sedatives,
hypnotics,
anxiolytics,
tranquilizers,
barbiturates
46
(0.5) 0.0
408
(0.6) 0.2
1,011
(0.5) 0.5
559
(0.3) 0.3
55
(0.3) 0.0
2,079
(0.4) 1.1
Tobacco 18
(0.2) 0.0
315
(0.4) 0.2
725
(0.4) 0.4
459
(0.2) 0.2
56
(0.3) 0.0
1573
(0.3) 0.8
Other
combinations
918
(10.1) 0.5
7,849
(10.7) 4.0
19,058
(10.1) 9.7
10,306
(5.1) 5.3
441
(2.2) 0.2
38,572
(7.8) 19.7
Total 9,093 4.6 73,594 37.6 188,233 96.2 201771 103.1 19,728 10.1 492,419 251.7
ED, emergency department; SEDD, State Emergency Department Database; SUD, Substance Use Disorders; N, Number R, Rate
Note: Rate is calculated using average population estimates of New York to be 19,562,195 between 2011 and 2013.

107
Table 4: Multivariate generalized linear model of hospital-based emergency department
charges due to substance use disorders, NY SEDD 2011 – 2013.
Parameter
AME
(dy/dx) in
dollars
Standard
Error
95% Confidence
Intervals P-
value Lower Upper
Sex
Male Reference
Female 64.41 5.09 54.44 74.39 <.0001
Age group
0 to 17 Reference
18 to 24 -250.83 18.48 -287.05 -214.60 <.001
25 to 44 -194.43 18.16 -230.02 -158.83 <.001
45 to 64 -277.87 18.16 -313.47 -242.27 <.001
65 and over -210.63 21.70 -253.16 -168.10 <.001
Race
White Reference
Black -169.92 5.91 -181.50 -158.34 <.001
Hispanic -81.76 6.34 -94.18 -69.34 <.001
Asian and Pacific Islander -178.29 16.02 -209.68 -146.90 <.001
Other (includes NA) -155.74 6.67 -168.81 -142.68 <.001
Primary Payer
Medicare Reference
Medicaid -148.00 9.18 -165.99 -130.01 <.001
Private Insurance 35.91 10.71 14.92 56.90 0.001
Uninsured -75.09 9.54 -93.78 -56.40 <.001
Other insurance -271.78 14.67 -300.53 -243.03 <.001
Median household income national quartile for patient ZIP code**
Fourth quartile Reference
First quartile -568.76 6.54 -581.58 -555.93 <.001
Second quartile -590.47 7.15 -604.47 -576.46 <.001
Third quartile -367.66 7.41 -382.19 -353.42 <.001
Patient Location
Urban Reference
Large rural town 327.40 15.36 297.28 357.51 <.001
Small rural town 157.62 22.20 114.11 201.13 <.001
Isolated rural 296.62 27.96 241.83 351.42 <.001
Elixhauser Comorbidity Index Measure for Unrelated Comorbid Conditions***
0 Reference
1 476.16 8.52 459.46 492.87 <.001
2 582.23 16.80 549.31 615.15 <.001
=> 3 1063.56 42.43 980.40 1146.73 <.001

108
NY SEDD, NY State Emergency Department Database; AME, Average marginal effects; NA,
Native Americans.
** Median household income quartiles of residents in the patient’s ZIP code vary by year. The
levels were $1 to $38,999 (quartile 1), $39,000 to $47,999 (quartile 2), $48,000 to $63,999
(quartile 3) and $64,000 or higher (quartile 4) in the year 2011. The levels were $1 to $38,999
(quartile 1), $39,000 to $47,999 (quartile 2), $48,000 to $62,999 (quartile 3) and $63,000 or
higher (quartile 4) in the year 2012. The levels were $1 to $37,999 (quartile 1), $38,000 to
$47,999 (Quartile 2), $48,000 to $63,999 (quartile 3) and $64,000 or higher (quartile 4) in the
year 2013.
***Count of unrelated comorbid conditions from 2011 to 2013 which comprises of a count of one
for congestive heart failure, valvular disease, pulmonary circulation disease, peripheral vascular
disease, paralysis, other neurological disorders, chronic pulmonary disease, diabetes without
chronic complications, diabetes with chronic complications, hypothyroidism, renal failure, liver
disease, peptic ulcer bleeding, acquired immune deficiency syndrome, lymphoma, metastatic
cancer, solid tumor without metastasis, rheumatoid arthritis, coagulopathy, obesity, weight loss,
fluid and electrolyte disorders, chronic blood loss anemia, and deficiency anemias.

109
Figure 1: Number of ED visits and average Emergency Department charges* for Substance
Use Disorders, NY SEDD 2011–2013.
* Hospital ED charges– inflation adjusted to 2013 US dollar value

110
Figure 2: Emergency department visits per 10,000 population for substance use disorders
and their treatment centers in the New York State using NY SEDD, 2011–2013 and
SAMHSA 2013.
SAMHSA, Substance Abuse and Mental Health Agency; SEDD, State Emergency Department
Database

111
Figure 3: Emergency department visits per 10,000 population for substance use disorders
and the distribution of emergency departments in the State of New York using NY SEDD,
2011– 2013 and EMNet 2013.
SEDD, State Emergency Department Database; EMNet, Emergency Medicine Network

112
CHAPTER VI: DISCUSSION AND CONCLUSIONS
Studies outlined in this dissertation project examined three different aspects of behavioral health
(BH) services in the United States (US). Each of these three independent studies have addressed
vital questions based on healthcare utilization for BH services, available access to care, and the
implications of healthcare reforms and the mandated policies. The findings of this dissertation
will benefit policymakers who are developing the American Health Care Act of 2017 and shaping
the President Trump’s Commission on Combating Drug Addiction and the Opioid Crisis. In
addition, the findings of this dissertation laid down salient features that will enable hospital
administrators and providers to recognize high-risk population suffering from BH conditions, and
design methods to curb charges and costs of hospitalization as well as rates and costs of
readmissions. Subsequently, the actions by policymakers and health administrators will aid public
health program developers to design community outreach to address the problem of BH
conditions that can eventually be advantageous to patients.
The first study of this dissertation analyzed the rates, costs and relapses of 30-day
unplanned all-cause readmissions following index hospitalizations for alcohol-related disorders
(ARD) among US adults. The conclusions derived from this study will help policymakers, budget
and discharge protocol designers at hospitals, and eventually patients. The second study examined
the incidence of emergency department (ED) visits and the corresponding incurred charges for
BH disorders as well as predicted cohorts that have higher odds of leaving against medical
advice, and correlation BH workforce in Nebraska between 2011 and 2013. The findings from
this study will depict ED outcomes among high-risk cohort and also highlight that BH provider
shortages are responsible for high number of ED visits and charges for BH disorders, despite
limited availability of EDs in rural Nebraska. The third study examined the frequency of ED
visits and the hence incurred charges for substance use disorders (SUD) in New York between
2011 and 2013 during the adoption of Medicaid expansion under Patient Protection and

113
Affordable Care Act (ACA). The results from this study explained that there is a need to develop
policies and increase access to primary care clinics or substance abuse treatment centers despite
New York being a predominantly urban state. This concluding section of the dissertation will
briefly discuss the findings of the three studies, policy implications, and suggest few new ideas
for future research.
All three studies used data from the Healthcare Cost and Utilization Project (HCUP)
database maintained and curated by the Agency for Healthcare Research and Quality. The first
study used 2014 Nationwide Readmissions Database to obtain patient and hospital-level
characteristics and discharges (index hospitalizations and readmissions) for ARD. Although NRD
contains information from 22 states, national-level estimates that produce nationally
representative results. HCUP’s 2011-2013 Nebraska State Emergency Department Database
(SEDD) was queried for the second study for number of cases for all BH-related disorders,
patient-level characteristics, and charges for ED visits, etc at BH regions. Similarly, for the third
study, 2011-2013 New York SEDD was retrieved for ED visits on SUD. In addition, for the
second study data on BH workforce and availability of EDs at county-level were provided by the
Health Professionals Tracking Services (HPTS). National Emergency Department Inventories
(NEDI) and National Survey of Substance Abuse Treatment Services (N-SSATS) provided
information locations of EDs and substance abuse treatment centers, respectively, for the third
study.
Summary of the Study Findings
Hospitalizations principally due to alcohol-related disorders (ARD) are at high-risk of 30-
day unplanned all-cause readmissions. However, national estimates of the overall economic
burden of index hospitalizations for ARD, factors associated with readmissions and their costs;
have not been studied considering the recent policies for readmissions under the Patient
Protection and Affordable Care Act. The first study examines the frequency and distribution of

114
readmissions following index discharges due to ARD; patient and hospital-level predictors of
readmissions; and costs for readmissions with and without recurrences of ARD. 2014 NRD
representing over 49% of all the US hospitalizations, was used for this study. ARD were
identified through ICD-9 Clinical Classification Software Code 660 for inpatient hospital stays.
Chi-square test was used for descriptive analysis to calculate frequency of index hospitalizations
with ARD and the proportion that had at least one 30-day readmissions. Multivariate logistic
regression was used to estimate patient and hospital-level characteristics that are predictors for
the 30-day readmissions for index hospitalizations for ARD. Two-part models (2PM) were used
to estimate the incremental and predicted costs of the immediate all-cause readmissions among
patients with index hospitalizations for ARD after adjusting for predisposing, enabling, need-
related factors selected based on the Anderson Healthcare Behavior Model. Additionally, costs of
readmissions with and without relapses for ARD from the 2PM were estimated. All analyses were
analyzed at significance level of ≤0.05. About 286,655 index hospitalizations were made for
ARD out of which 54,092 (18.9%) hospitalizations resulted into at least one 30-days unplanned
all-cause readmissions. Index hospitalizations with ARD among patients who were males,
between 45-64 years old, covered by Medicaid, belonging to urban and low-income areas, with 1-
2 unrelated but zero related comorbidities measure using Elixhauser Comorbidity Index were at
high-risk to 30-day readmissions. Similarly, patients admitted in hospitals that are privately
controlled for not-profit, had high number of beds, located in large metropolitan areas, and with
metropolitan teaching status had high proportions of readmissions. Those index stays that resulted
in readmissions had a higher average cost of $8,840 versus those without readmissions ($8,036).
However, those patients who were between 25-64 years old, with multiple unrelated
comorbidities and admitted in hospitals with medium or large number of beds had statistically
higher odds of readmissions. Predicted mean costs for readmissions on index stay with ARD was
greater among those with recurrence of ARD ($2,520), males ($1,798), between 45-64 years old
($1,908), covered by Medicare ($2,132), rural residents ($1,841), high-income ($1,877), 4 or

115
more unrelated comorbidities ($2,415), average length of stay of 5 days ($1,966); and admitted in
hospitals in large metropolitan areas ($2,032), large number of beds ($1,551), non-federal
government owned ($2,109), and with low volume of cases for ARD ($2,154). Patients with
recurrences of ARD, 45-64 years old, and 4 or more unrelated comorbidities had greater
readmission costs by $919 and $1,608 than those without recurrences for ARD. Similarly,
patients readmitted in large metropolitan areas, large number of beds, non-federal government
hospitals, and low volume of cases for ARD had readmission costs higher by $1,002, $413, $567,
and $489 than admissions in micropolitan areas, small number of beds, private investor-owned
hospitals, and with high volume of cases for ARD. However, hospitals that are non-federal
government, located in large metropolitan areas and have high number of beds, offer
comparatively reduced readmission costs to recurrences with ARD than non-recurrence cases.
Overall costs of index hospitalizations primarily for ARD was $2.3 billion in 2014, of which
$512 million were spent on those stays that resulted in at least one 30-day readmissions. Also,
this study predicts that $136 million were spent on those readmissions that were for recurrences
to ARD. Although, readmission rates did not significantly decline after the implementation of
ACA, the study estimates that greater readmissions costs were amounted in 2014, especially
among those with relapses to ARD. Therefore, there is a need to develop and implement more
sustainable policies to reduced readmission rates and costs among individuals with ARD.
Using Aday and Andersen model for healthcare utilization, the second study estimated
hospital-based emergency department (ED) visits and the incurred charges for BH conditions,
including mental health and substance abuse disorders, within Nebraska between 2011and 2013.
The study also focused on correlating behavioral workforce distribution in Nebraska with ED
utilization. The 2011-2013 Nebraska SEDD provided information on utilization of services in
ED, charges, diagnoses, and demographic variables, such as age, sex, patient location, health
insurance, and income status. The 2013 HPTS annual survey database provided the number of
EDs and the distribution of BH professionals in Nebraska by region. The study population was

116
comprised of patients within Nebraska who had visited the ED for BH-related conditions. To
examine the effect of patient characteristics on the outcome variable ED charges, multivariate
linear regression model was used. $96.4 million was spent on 52,035 ED visits for BH-related
conditions over three years. Of these, 35% were between 25- and 44-years-old. Private insurance
covered 40% of these patients. ED charges were significantly greater for patients who were male,
older, uninsured, and residing in rural areas. Males, those between 18 to 64 years of age,
uninsured, living in low-income areas, with no unrelated comorbidity had higher odds of obtained
discharge against medical advice following ED visits for primary diagnoses of BH disorders.
This explains that a majority of Nebraskan regions have BH provider shortages and limited
availability of EDs. Health policies are needed to increase access to BH services in the rural areas
of Nebraska.
Using the utilization model, the third study examines hospital-based emergency
department (ED) visits due to SUD and the corresponding incurred charges within the state of
New York during 2011 to 2013. HCUP’s New York SEDD provided information on utilization of
services in emergency departments, charges, diagnoses, and discharge, as well as demographic
variables such as age, race, sex, patient location, health insurance and income status. All patients
within New York who had visited the ED for SUD comprised the study population. The
distribution of EDs and Substance Abuse treatment centers at county-level was obtained from
NEDI and N-SSATS, respectively. To examine the effect of patient characteristics on the
outcome variable ED charges, we used a multivariate log-linked Gamma Distributed Generalized
Linear Model. A total of 492,419 SUD ED visits were reported between the years 2011 to 2013.
These findings show that a substantial proportion (38%) of patients belonged to the age group of
25 to 44 years. About 74% ED visits were made by males. Whites comprised forty-one percent of
ED visits. Medicaid covered forty-two percent of patients, and sixty-eight percent of visits were
made on weekdays. Over three years, $856 million was spent in treating SUD in EDs, with an

117
average charge of $1,764 per case. ED charges spent were significantly greater for those patients
who were white, male, less than 18 years of age, covered by private insurance, and residing in
urban areas. Patients who are males, aged 25 – 44 years, covered by private insurance and
residing in urban areas are identified to be at high-risk. The geographical analyses displayed that
access of EDs drives their utilization. Also, paucity of treatment centers compels both urban and
urban residents to seek healthcare services for SUDs in EDs, which maybe because his population
maybe limited in their access to these facilities. There is a need to develop health policies and
programs to improve access to care for substance-use disorders in urban states.
Contribution to Existing Literature
Although some studies have shown the correlation between patient-level factors on readmissions,
no other study has shown the combined impact of hospital and patient characteristics on both
index stays and readmissions among US adults. Also, the first study is a unique study that has
produced nation level estimates for hospitalizations due to primary diagnoses for ARD, whereas
previous studies have results with ARD as a comorbidity. Moreover, unlike other studies, the first
study has provided readmissions-related rates, costs, predictors, forecast of economic burden and
recurrences of ARD, post-ACA mandated programs.
Results from the second study has proven the association between ED charges and
patient-level characteristics for BH disorders, in the absence of Medicaid expansion in Nebraska.
For predominantly rural and agrarian state of Nebraska, dearth of BH providers compel residents
to seek care in the ED. Also, the study is the first to plot the availability of ED and BH workforce
by region, thereby weighing the supply of facilities and providers against the demand (proportion
of unmet) of treatment for BH conditions. Moreover, this is a unique study that studied the ED
outcomes and identified high-risk patients that discharged against medical advice.
In the largely urban State of New York that expanded Medicaid under ACA and has
rising number of cases for SUD, the findings from the last study will be the first to identify ED
charges accounted for ten types of SUD. Also, findings from the plotted maps showing the

118
distribution of primary level care available (substance abuse treatment centers) and emergency
care (ED) will show access of care with change in health policies. Yet the results show the high
proportion of unmet behavioral healthcare needs even in urban states.
Study Limitations
Despite the notable strengths that the first study present, the findings should be
interpreted in light of a number of limitations. This study uses administrative database that does
not contain information on pathological tests performed during treatment that could describe the
severity of ARD and the patients-to-doctor ratios. Also, individuals admitted to the hospital for
ARD may suffer from mental health-related conditions that result into excessive alcohol use.
Even though, this study carefully excludes the comorbidity index measure for related
comorbidities (such as depression, drug-related, and psychoses disorders) from analytical models
as they contribute to collinearity, the results do not estimate for predisposing factors such as
mental health disorders that may cause ARD and lead to admissions. NRD being an
administrative data does not provide information on reasons (diagnostic or causality) that
influenced the decision for admission but only the primary and secondary diagnosis on admission.
Moreover, the study excludes non-residents of states in this study as the NRD only captures
readmissions in a given state and does not provide state identifiers. Hence, the results are likely to
be underestimated for those patients whose index admission and readmissions occurred in their
out-of-state hospitals which maybe their temporary location of residency. In addition, the NRD
does not contain information on the distance traveled by the patients to the hospital to seek
medical help. The findings are, hence, underestimated for those living on the state borders and
were admitted in nearby hospitals in neighboring state. Because NRD had discharge-level
weights, the univariate and bivariate analysis of patient and hospital-level characteristics
performed at an individual level cannot be weighted. This applies to all weighted results that are
to be interpreted at discharge level (single episodes of care) and not individual patient-level,

119
thereby, limiting derivation of the results to the overall cost of care per individual at other than
inpatient settings. Additionally, NRD does not include race/ethnicity and education status-related
results which restricts the interpretation of the findings in the context of health disparities.
Finally, the discharge records may not have been assigned proper ICD-9-CM codes- a
phenomenon called non-differential misclassification of diagnoses in data. Also, it is possible that
there could be differences in coding practices across providers and states. Nevertheless, even if
the estimates were biased due to misclassification, it is likely that we underestimated rather than
overestimated the number of index hospitalizations for ARD and resulting readmissions.
Findings from the second study must be interpreted in the context of some limitations.
Although Nebraska SEDD contains detailed information on healthcare utilization, there is a
possibility that the discharge records may not have been assigned proper ICD-9-CM codes. This
is a commonly occurring research phenomenon called non-differential misclassification of
diagnoses in data. However, even if the estimates were biased due to misclassification, it is still
likely that we underestimated rather than overestimated the number of ED visits related to BH
disorders. It is also possible that there could be differences in coding practices across providers in
Nebraska that cannot be accounted for. The Nebraska data does not include race and ethnicity for
patients, which limits the interpretation of the findings regarding disparities. Moreover, SEDD
data did not provide information on patient’s education level and homelessness, which may be
associated with BH utilization. Also, HCUP's SEDD contains information on only those
emergency visits that did not eventually result in hospitalizations. Finally, we were unable to
establish causality between availability of BH professionals and ED utilization for BH-related
care.
The third study also has a retrospective design because it uses secondary datasets presents
certain limitations. Firstly, the information in this study is about the use of ED visits for SUD and
does not include the resulting inpatient hospitalizations, if any. Consequently, this study
underestimates the total amount of ED charges due to primary admission in ED. Secondly, the

120
HCUP SEDD dataset informs us about the primary diagnoses and not the actual cause of the ED
admission. Finally, SEDD does not provide any information on events or health outcomes after
discharging the patients. Hence, future studies need to be conducted regarding emergency visits
made by patients in substance abuse treatment centers, primary outpatient clinics or rehabilitation
and therapy centers.
Future Research Directions
The ACA has introduced policies focusing on reducing readmissions, and so more longitudinal
studies must be performed understanding the readmission rates before and after these programs
was implemented. Like the study on Nebraska, research must be conducted on other rural states
that adopted to expand Medicaid to see the effect of rurality. Similarly, urban states without
Medicaid expansion but with higher number of ED visits for all types SUD of must be studied to
see the impact of available access to care. Impact of ACA will bring more insurance-covered
patients at various healthcare settings. However, to further improvise on the ACA’s BH-related
policies, the following amendments can be recommended: (1) offering team-based BH services at
primary care clinics, (2) providing BH-related training to social workers so that they can
participate in BH interventions, and (3) expanding federal education loan repayment initiatives
for BH practitioners to work in rural areas.
With upcoming and anticipated changes in health policies under the administration of
President Trump, future studies should monitor differential changes in healthcare utilization for
BH-related disorders across primary and emergency care. In addition, efforts must be made to
understand readmissions-related costs, rates and economic burden for other behavioral disorders
other than ARD such as drug-related disorders, depression, and anxiety, which are widely
prevalent.

121
REFERENCES
Aday, L. A., & Andersen, R. (1974). A Framework for the Study of Access to Medical Care.
Health Services Research, 9(3), 208–220. https://doi.org/10.3205/psm000089
Agency for Healthcare Research and Quality. (2012). Toolkit for Using the AHRQ Quality
Indicators. Retrieved November 1, 2017, from
http://www.ahrq.gov/professionals/systems/hospital/qitoolkit/index.html
Agency for Healthcare Research and Quality. HCUP Databases. (2015). Healthcare Cost and
Utilization Project (HCUP). Rockville, MD.Available at : https://www.hcup-
us.ahrq.gov/db/state/sedddbdocumentation.jsp. Accessed Date: 9 November, 2017.
Akosa Antwi, Y., Moriya, A. S., & Simon, K. I. (2015). Access to health insurance and the use of
inpatient medical care: Evidence from the Affordable Care Act young adult mandate.
Journal of Health Economics, 39, 171–187. https://doi.org/10.1016/j.jhealeco.2014.11.007
Aletraris, L., Edmond, M. B., Roman, P. M., Aletraris, L., Edmond, M. B., Insurance, P. M. R.,
… Ph, D. (2017). Insurance Receipt and Readiness for Opportunities under the Affordable
Care Act : A National Survey of Treatment Providers for Substance Use Disorders
Insurance Receipt and Readiness for Opportunities under the Affordable Care. Journal of
Psychoactive Drugs, 49(2), 141–150. https://doi.org/10.1080/02791072.2017.1306661
American Hospital Association. (2012). Bringing Behavioral Health into the Care Continuum.
Trendwatch, (January), 1–12.
American Psychiatric Association. (2015). What is Mental Illness? Retrieved from
https://www.psychiatry.org/patients-families/what-is-mental-illness
Andersen, R. (1995). Revisting the Behavioral Model and Access to Medical Care: Does it
Matter?*. Journal of Health and Social Beahvior, 36(March), 1–10.
Anderson, G. F. (2007). MarketWatch: From “soak the rich” to “soak the poor”: Recent trends in
hospital pricing. Health Affairs, 26(3), 780–789. https://doi.org/10.1377/hlthaff.26.3.780
Axon, R. N., & Williams, M. V. (2011). Hospital Readmission as an Accountability Measure.
JAMA, 305(5), 504. https://doi.org/10.1001/jama.2011.72
Bachrach, D., Boozang, P., & Lipson, M. (2015). The Impact of Medicaid Expansion on
Uncompensated Care Costs : Early Results and Policy Implications for States.
Bahorik, A. L., Satre, D. D., Kline-simon, A. H., Constance, M., Young-wolff, K. C., Campbell,
C. I., … Alcohol, C. I. C. (2017a). Alcohol , marijuana , and opioid use disorders : 5- Year
patterns and characteristics of emergency department encounters. Substance Abuse, 0(0), 1–
10. https://doi.org/10.1080/08897077.2017.1356789
Barker, L. C., Gruneir, A., Fung, K., Herrmann, N., Kurdyak, P., Lin, E., … Vigod, S. N. (2017).
Predicting psychiatric readmission: sex-specific models to predict 30-day readmission
following acute psychiatric hospitalization. Social Psychiatry and Psychiatric
Epidemiology, 0(0), 1–11. https://doi.org/10.1007/s00127-017-1450-5
Barry, C., & Huskamp, H. (2011). Moving beyond Parity — Mental Health and Addiction Care
under the ACA. The New England Journal of Medicine, 365(11), 973–975.
Baumeister, H., Haschke, A., Munzinger, M., Hutter, N., & Tully, P. J. (2015). Inpatient and

122
outpatient costs in patients with coronary artery disease and mental disorders: a systematic
review. BioPsychoSocial Medicine, 9(1), 11. https://doi.org/10.1186/s13030-015-0039-z
Beaudoin, F. L., Baird, J., Liu, T., & Merchant, R. C. (2015). Sex Differences in Substance Use
Among Adult Emergency Department Patients: Prevalence, Severity, and Need for
Intervention. Academic Emergency Medicine, 22, 1307–1315.
https://doi.org/10.1111/acem.12810
Becker, A. E., & Kleinman, A. (2013). Mental Health and the Global Agenda. The New England
Journal of Medicine, 369, 66–73. https://doi.org/10.1056/NEJMra1110827
Belotti, F., Deb, P., & Norton, E. C. (2015). twopm : Two-part models. The Stata Journal, 15(1),
3–20.
Bernstein, S. L., & Onofrio, G. D. (2013). A Promising Approach For Emergency Departments
To Care For Patients With Substance Use And Behavioral Disorders. Health Affairs, 32(12),
2122–2128. https://doi.org/10.1377/hlthaff.2013.0664
Blow, F., Walton, M., Murray, R., Cunningham, R., Chermack, S., Barry, K., … Booth, B.
(2007). Intervention Attendance Among Emergency Department Patients With Alcohol- and
Drug-Use Disorders. Journal of Studies on Alcohol and Drugs, 71(5), 713–719.
Boccuti, C., & Casillas, G. (2017). Aiming for Fewer Hospital U-turns : The Medicare Hospital
Readmission Reduction Program. Policy Brief. Retrieved from http://bit.ly/1KWsOkd
Bohnert, A. S. B., Tracy, M., & Galea, S. (2012). Characteristics of drug users who witness many
overdoses : Implications for overdose prevention. Drug and Alcohol Dependence, 120(1–3),
168–173. https://doi.org/10.1016/j.drugalcdep.2011.07.018
Boozang, P., Bachrach, D., & Detty, A. (2014). MEDICAID MANAGED CARE
INFORMATION RESOURCE CENTER Coverage and Delivery of Adult Substance Abuse
Services in Medicaid Managed Care, (2).
Bouchery, E. E., Harwood, H. J., Sacks, J. J., Simon, C. J., & Brewer, R. D. (2011). Economic
costs of excessive alcohol consumption in the U.S., 2006. American Journal of Preventive
Medicine, 41(5), 516–524. https://doi.org/10.1016/j.amepre.2011.06.045
Bradley, C. J., & Zarkin, G. A. (1997). An inpatient profile of patients with a substance abuse
diagnosis in Maryland. J Subst Abuse Treat, 14(2), 155–162. Retrieved from
http://www.ncbi.nlm.nih.gov/entrez/query.fcgi?cmd=Retrieve&db=PubMed&dopt=Citation
&list_uids=9258860
Brasel, K. J., Lim, H. J., Nirula, R., & Weigelt, J. A. (2007). Length of Stay. An appropriate
quality measure? Archives of Surgery, 142, 461–466. https://doi.org/10.1378/chest.08-0359
Braun, S. M., Deras, M., Erickson, K. C., Grimm, B. L., Lovgren, K. E., Palm, D. W., …
Woodruff, S. (2016). Nebraska Behavioral Health Needs Assessment.
Brinjikji, W., Rabinstein, A. A., & Cloft, H. J. (2012). Hospitalization costs for acute ischemic
stroke patients treated with intravenous thrombolysis in the United States are substantially
higher than medicare payments. Stroke, 43(4), 1131–1133.
https://doi.org/10.1161/STROKEAHA.111.636142
Campbell, C. I., Bahorik, A. L., Kline-simon, A. H., & Satre, D. D. (2017). The role of marijuana
use disorder in predicting emergency department and inpatient encounters : A retrospective
cohort study. Drug and Alcohol Dependence, 178(March), 170–175.

123
https://doi.org/10.1016/j.drugalcdep.2017.04.017
Carey, K., & Stefos, T. (2016). The cost of hospital readmissions: evidence from the VA. Health
Care Management Science, 19(3), 241–248. https://doi.org/10.1007/s10729-014-9316-9
Case, A., & Deaton, A. (2015). Rising morbidity and mortality in midlife among white non-
Hispanic Americans in the 21st century. Proceedings of the National Academy of Sciences,
112(49), 15078–15083. https://doi.org/10.1073/pnas.1518393112
Case, S. D., Case, B. G., Olfson, M., Linakis, J. G., & Laska, E. M. (2011). Length of stay of
pediatric mental health emergency department visits in the United States. Journal of the
American Academy of Child and Adolescent Psychiatry, 50(11), 1110–1119.
https://doi.org/10.1016/j.jaac.2011.08.011
Center for Health Information and Analysis. (2015). Access to substance use disorder treatment
in Massachusetts.
Center on Addiction and Substance Abuse Columbia. (2013). Key Facts for States on Risky
Substance Use and Addiction. The National Center on Addiction and Substance Abuse.
Centers for Disease Control and Prevention. (2013). Mental Illness. American Psychiatric
Association. Retrieved from http://www.cdc.gov/mentalhealth/basics/mental-illness.htm
Centers of Medicare & Medicaid Services. Readmissions Reduction Program (2014). Retrieved
from https://www.cms.gov/Medicare/Medicare-Fee-for-Service-
Payment/AcuteInpatientPPS/Readmissions-Reduction-Program.html
Chakraborty, H., Axon, R. N., Brittingham, J., Lyons, G. R., Cole, L., & Turley, C. B. (2017).
Differences in Hospital Readmission Risk across All Payer Groups in South Carolina.
Health Services Research, 52(3), 1040–1060. https://doi.org/10.1111/1475-6773.12579
Chakraborty, N., & Aryiku, C. (2008). Reasons for rapid readmission to general adult psychiatry
wards. Progress in Neurology and Psychiatry, 12(5), 14–18. https://doi.org/10.1002/pnp.78
Chakravarthy, B., Tenny, M., Anderson, C. L., Ms, S. R., Bs, T. I., Lotfipour, S., … Anderson, C.
L. (2013). Analysis of Mental Health Substance Abuse – Related Emergency Department
Visits from 2002 to 2008 Analysis of Mental Health Substance Abuse – Related Emergency
Department Visits from 2002 to 2008, 7077(April 2017).
https://doi.org/10.1080/08897077.2013.775999
Chen, L. M., Jha, A. K., Ridgway, A. B., Orav, E. J., & Epstein, A. M. (2010). Hospital Cost of
Care, Quality of Care, and Readmission Rates. Health Care Reform, 170(4), 340–346.
Cherpitel, C. J., & Ye, Y. U. (2012). Trends in Alcohol- and Drug-Related Emergency
Department and Primary Care Visits : Data From, (May), 454–458.
Choi, B., DiNitto, D., Marti, C., & Choi, N. (2016). Impact of Mental Health and Substance Use
Disorders on Emergency Department Visit Outcomes for HIV Patients. Western Journal of
Emergency Medicine, 17(2), 153–164. https://doi.org/10.5811/westjem.2016.1.28310
Choi, N. G., Dinitto, D. M., Marti, C. N., & Choi, B. Y. (2015). Associations of Mental Health
and Substance Use Disorders With Presenting Problems and Outcomes in Older Adults’
Emergency Department Visits. Academic Emergency Medicine, 22, 1316–1326.
https://doi.org/10.1111/acem.12803
Chou, K. L., & Cheung, K. C. (2013). Major Depressive Disorder in Vulnerable Groups of Older

124
Adults, Their Course and Treatment, and Psychiatric Comorbidity. Depress Anxiety,
537(February), 528–537. https://doi.org/10.1002/da.22073
Clark, B. J., Keniston, A., Douglas, I. S., Beresford, T., Macht, M., Williams, A., … Moss, M.
(2013). Healthcare utilization in medical intensive care unit survivors with alcohol
withdrawal. Alcoholism: Clinical and Experimental Research, 37(9), 1536–1543.
https://doi.org/10.1111/acer.12124
Clark, H. W. (2017). Health Reform and the Substance Use Disorder Treatment System : A Time
of Change Health Reform and the Substance Use Disorder Treatment System : A Time of.
Journal of Psychoactive Drugs, 49(2), 91–94.
https://doi.org/10.1080/02791072.2017.1315471
Clarke, D. E., Dusome, D., & Hughes, L. (2007). Emergency department from the mental health
client ’ s perspective. International Journal of Mental Health Nursing, 16, 126–131.
https://doi.org/10.1111/j.1447-0349.2007.00455.x
Coleman, E. A., Parry, C., Chalmers, S., & Min, S. (2006). The Care Transitions Intervention:
Results of a Randomized Trial. Arch Intern Med, 166, 1822–1828.
https://doi.org/10.1001/archinte.166.17.1822.
Crane, S., Collins, L., Hall, J., & Rochester, D. (2012). Reducing Utilization by Uninsured
Frequent Users of the Emergency Department : Combining Case Management and Drop-in
Group Medical Appointments. The Journal of the American Board of Family Medicine,
25(2), 184–191. https://doi.org/10.3122/jabfm.2012.02.110156
Curran, G. M., Sullivan, G., Williams, K., Han, X., Collins, K., Keys, J., & Kotrla, K. J. (2003).
Emergency Department Use of Persons With Comorbid Psychiatric and Substance Abuse
Disorders. Annals of Emergency Medicine, (May). https://doi.org/10.1067/mem.2003.154
Cutler, D. (2010). Analysis & commentary: How health care reform must bend the cost curve.
Health Affairs, 29(6), 1131–1135. https://doi.org/10.1377/hlthaff.2010.0416
Deen, T. L. (2011). Cognitive appraisals of specialty mental health services and their relation to
mental health service utilization in the rural population. Dissertation Abstracts
International, B: Sciences and Engineering, 71(9), 5373. https://doi.org/10.1111/j.1748-
0361.2011.00375.x
Diefenbach, G. J., & Goethe, J. (2006). Clinical interventions for late-life anxious depression.
Clinical Interventions in Aging, 1(1), 41–50. https://doi.org/10.2147/ciia.2006.1.1.41
DiNapoli, T. P. Prescription Opioid Abuse and Heroin Addiction in New York State, Office of
New York State Comptroller § (2016).
Dobson, A., DaVanzo, J., Doherty, J., & Tanamor, M. (2005). A Study of Hospital Charge
Setting Practices, (5).
Doren, B. A. Van, Grimsley, K. G., Noone, J. M., & Neese, J. B. (2016). Mental Health and
Substance Misuse-Related Emergency Department Discharges in Urban Counties of North
Carolina, 77(1), 63–68.
Doshi, J. A., Glick, H. A., & Polsky, D. (2006). Analyses of cost data in economic evaluations
conducted alongside randomized controlled trials. Value in Health, 9(5), 334–340.
https://doi.org/10.1111/j.1524-4733.2006.00122.x
Doupe, M. B., Palatnick, W., Day, S., Chateau, D., & Soodeen, R. (2012). Frequent Users of

125
Emergency Departments : Developing Standard Definitions and Defining Prominent Risk
Factors. Annals of Behavioral Medicine, 60(1), 24–32.
https://doi.org/10.1016/j.annemergmed.2011.11.036
Druss, B. G., & Walker, E. R. (2011). Mental disorders and medical comorbidity. A research
synthesis report. Robert Wood Johnson Foundation: The Synthesis Project., (21), 1–26.
Edelstein, O., Pater, K., Sharma, R., & Albert, S. M. (2014). Influence of urban residence on use
of psychotropic medications in Pennsylvania, USA: Cross-sectional comparison of older
adults attending senior centers. Drugs and Aging, 31(2), 141–148.
https://doi.org/10.1007/s40266-013-0147-z
Elhai, J. D., Baugher, S. N., Quevillon, R. P., Sauvageot, J., & Frueh, B. C. (2004). Psychiatric
symptoms and health service utilization in rural and urban combat veterans with
posttraumatic stress disorder. The Journal of Nervous and Mental Disease, 192(10), 701–
704. https://doi.org/10.1097/01.nmd.0000142019.08890.35
Elixhauser A, Steiner C, Harris DR, C. R. (1998). Comorbidity measures for use with
administrative data. Medical Care, 36, 8–27.
Emergency Medicine Network. (2013). 2013 National Emergency Department Inventory - USA.
Executive Office of the President. Office of National Drug Control Policy. National Drug Control
Strategy 2011. (2011).
Fahimi, J., Aurrecoechea, A., Anderson, E., Herring, A., & Alter, H. (2015). Substance Abuse
and Mental Health Visits Among Adolescents Presenting to US Emergency Departments.
Pediatric Emergency Care, 31(5), 331–338.
https://doi.org/10.1097/PEC.0000000000000421.Substance
Fenta, H., Hyman, I., & Noh, S. (2006). Mental Health Service Utilization by Ethiopian
Immigrants and Refugees in Toronto, 194(12), 925–934.
https://doi.org/10.1097/01.nmd.0000249109.71776.58
Fingar, K., & Washington, R. (2015). Trends in Hospital Readmissions for Four High-Volume
Conditions, 2009-2013 #196. HCUP Statistical Brief #196, C, 1–17. Retrieved from
https://www.hcup-us.ahrq.gov/reports/statbriefs/sb196-Readmissions-Trends-High-Volume-
Conditions.jsp
Frank, J. W., Binswanger, I. A., Calcaterra, S. L., Brenner, L. A., Levy, C., Mental, M., …
Medicine, P. (2016). Non-Medical Use of Prescription Pain Medications and Increased
Emergency Department Utilization: Results of a National Survey. Drug and Alcohol
Dependence, 1(157), 150–157. https://doi.org/10.1016/j.drugalcdep.2015.10.027.Non-
Medical
Galski, T., Bruno, R. L., Zorowitz, R., & Walker, J. (1993). Predicting length of stay, functional
outcome, and aftercare in the rehabilitation of stroke patients. The dominant role of higher-
order cognition. Stroke, 24(12), 1794–1800. https://doi.org/10.1161/01.STR.24.12.1794
Gau, S. S. F., Chong, M., Yang, P., Yen, C., Liang, K., & Cheng, A. W. T. A. (2005). Psychiatric
and psychosocial predictors of substance use disorders among adolescents Longitudinal
study *. British Journal of Psychiatry, 190, 42–49.
Gfroerer, J. C., Larson, S. L., & Colliver, J. D. (2007). Drug use patterns and trends in rural
communities. The Journal of Rural Health, 23(Suppl1), 10–15.
https://doi.org/http://dx.doi.org/10.1111/j.1748-0361.2007.00118.x

126
Green, S. R., Singh, V., & Byrne, W. O. (2010). Hope for New Jersey â€TM s City Hospitals : the
Camden Initiative. Perspectives in Health Information Management, pp. 1–8.
Greenwood-Ericksen, M. B., Tipirneni, R., & Abir, M. (2017). An Emergency Medicine –
Primary Care Partnership to Improve Rural Population Health : Expanding the Role of
Emergency Medicine. Annals of Emergency Medicine, 70(5), 640–647.
https://doi.org/10.1016/j.annemergmed.2017.06.025
Grupp-Phelan, J., Harman, J. S., & Kelleher, K. J. (2007). Trends in mental health and chronic
condition visits by children presenting for care at U.S. emergency departments. Public
Health Rep, 122(1), 55–61.
Gryczynski, J., Mitchell, S. G., Gonzales, A., Moseley, A., Thomas, R., Ondersma, S. J., …
Schwartz, R. P. (2016). A Randomized Trial of Computerized vs. In-person Brief
Intervention for Illicit Drug Use in Primary Care: Outcomes through 12 months. Journal of
Substance Abuse Treatment, March(50), 3–10. https://doi.org/10.1016/j.jsat.2014.09.002.A
Han, B. H., Sherman, S. E., Link, A. R., Wang, B., & Mcneely, J. (2017). Comparison of the
Substance Use Brief Screen ( SUBS ) to the AUDIT-C and ASSIST for detecting unhealthy
alcohol and drug use in a population of hospitalized smokers. Journal of Substance Abuse
Treatment, 79, 67–74. https://doi.org/10.1016/j.jsat.2017.05.014
Hazlett, S. B., McCarthy, M. L., Londner, M. S., & Onyike, C. U. (2004). Epidemiology of Adult
Psychiatric Visits to U.S. Emergency Departments. Academic Emergency Medicine, 11(2),
193–195. https://doi.org/10.1197/j.aem.2003.09.014
Healthcare Cost and Utilization Project. (2017). HCUP supplemental variables for revisit
analyses. Retrieved from https://www.hcup-us.ahrq.gov/toolssoftware/revisit/revisit.jsp
Healthcare Cost and Utilization Project (HCUP). (2015). Producing National HCUP Estimates.
Retrieved from https://www.hcup-
us.ahrq.gov/tech_assist/nationalestimates/508_course/508course.jsp
Healthcare Cost and Utilization Project (HCUP). (2017a). Clinical Classifications Software
(CCS) for ICD-9-CM. Retrieved from https://www.hcup-
us.ahrq.gov/toolssoftware/ccs/ccs.jsp
Healthcare Cost and Utilization Project (HCUP). (2017b). HCUP Databases. Retrieved from
https://www.hcup-us.ahrq.gov/databases.jsp
Healthcare Cost and Utilization Project (HCUP). (2017c). Nationwide readmissions database
description of data elements. Retrieved from https://www.hcup-
us.ahrq.gov/db/vars/nrd_visitlink/nrdnote.jsp
Healthcare Cost and Utilization Project (HCUP). (2017d). Nationwide readmissions database
documentation. Retrieved from http://www.hcup-
us.ahrq.gov/db/nation/nrd/nrddbdocumentation.jsp
Healthcare Cost and Utilization Project (HCUP). (2017). HCUP Elixhauser Comorbidity
Software. Retrieved from https://www.hcup-
us.ahrq.gov/toolssoftware/comorbidity/comorbidity.jsp
Healthcare Cost and Utilization Project (HCUP). 2006-2009. (2017). HCUP Cost-to-Charge
Ratio Files (CCR). Retrieved from www.hcup-us.ahrq.gov/db/state/%0Acosttocharge.jsp
Healthcare Cost and Utilization Project (HCUP). HCUP Comorbidity Software, Version 3.7.
127
(2017).
Heaton, P. C., Tundia, N. L., & Luder, H. R. (2013). U.S. emergency departments visits resulting
from poor medication adherence: 2005–07. Journal of American Pharmacists Association,
53, 513–519. https://doi.org/10.1331/JAPhA.2013.12213
Hedeker, D. (2003). A mixed-effects multinomial logistic regression model. Statis, 22, 1433–
1446. https://doi.org/10.1002/sim.1522
Hevesi, A. G. (2004). Population Trend in York State ’ s Cities. A Research Series from the
Office of the New York State Comptroller, 1(1), 1–16.
Hinde, J. M., Bray, J. W., Aldridge, A., & Zarkin, G. A. (2015). The Impact of a Mandated
Trauma Center Alcohol Intervention on Readmission and Cost per Readmission in Arizona.
Medical Care, 53(7), 639–645. https://doi.org/10.1097/MLR.0000000000000381
Hines, A. L., Barrett, M. L., Jiang, J., & Steiner, C. A. (2014). Conditions With the Largest
Number of Adult Hospital Readmissions by Payer,. Healthcare Cost and Utilization
Project, 363(7), 1–10.
Hinkin, C. H., & Barclay, T. R. (2010). Drug Use and Medication Adherence among HIV-1
Infected Individuals. AIDS Behavior, 11(2), 185–194. https://doi.org/10.1007/s10461-006-
9152-0.Drug
Hoge, M. A., Morris, J. A., Stuart, G. W., Huey, L. Y., Bergeson, S., Flaherty, M. T., …
Madenwald, K. (2009). A National Action Plan for Workforce Development in Behavioral
Health. Psychiatric Services, 60(7), 3–7.
Holt, S. R., Ramos, J., Harma, M. A., Cabrera, F., Louis-ashby, C., Dinh, A., … Fiellin, D. A.
(2012). Prevalence of Unhealthy Substance Use on Teaching and Hospitalist Medical
Services : Implications for Education. The American Journal on Addictions, 21, 111–119.
https://doi.org/10.1111/j.1521-0391.2011.00207.x
Honberg, R., Diehl, S., & Kimball, A. (2011). State Mental Health Cuts Are A National Crisis;
State-By-State Data Released.
Hoover, D. R., Sambamoorthi, U., Walkup, J. T., & Crystal, S. (2004). Mental illness and length
of inpatient stay for medicaid recipients with AIDS. Health Services Research, 39(5), 1319–
1339. https://doi.org/10.1111/j.1475-6773.2004.00292.x
Horwitz, L., Grady, J., Lin, Z., Nwosu, C., Keenan, M., Bhat, K. R., … Drye, E. (2014). 2014
Measure Updates and Specifications Report : Hospital-Wide All-Cause Unplanned
Readmission. Centers for Medicare & Medicaid Services (CMS).
Hudali, T., Robinson, R., & Bhattarai, M. (2017). Reducing 30-Day Rehospitalization Rates
Using a Transition of Care Clinic Model in a Single Medical Center. Hindawi: Advances in
Medicine, 2017, 1–7.
Huynh, C., Ferland, F., Blanchette-martin, N., & Me, J. (2016). Factors Influencing the
Frequency of Emergency Department Utilization by Individuals with Substance Use
Disorders. Psychiatric Quarterly, 87, 713–728. https://doi.org/10.1007/s11126-016-9422-6
Hwang, S. W., Li, J., Gupta, R., Chien, V., & Martin, R. E. (2003). What happens to patients who
leave hospital against medical advice? Canadian Medical Association Journal, 168(4), 417–
420.

128
Insel, T. R. (2008). Assessing the economic costs of serious mental illness. The American Journal
of Psychiatry, 165(6), 663–665. https://doi.org/10.1176/appi.ajp.2008.08030366
iVantage Health Analytics. (2016). 2016 Rural Relevance - Vulnerability to Value. A Hospital
Strength Index Study.
Jack, B. W., Chetty, V. K., Anthony, D., Greenwald, J. L., Sanchez, G. M., Johnson, A. E., …
Culpepper, L. (2009). A reengineered hospital discharge program to decrease
rehospitalization. Annals of Internal Medicine, 150(3), 178–187.
https://doi.org/10.7326/0003-4819-150-3-200902030-00007
Jahangir, E., Irazola, V., & Rubinstein, A. (2012). Determinants of Access to Preventative Care in
Argentina : Analysis of the National Survey of Risk Factors, 7(9).
https://doi.org/10.1371/journal.pone.0045053
Jankowski, C. B., & Drum, D. E. (1977). Diagnostic Correlates of Discharge Against Medical
Advice. Archives of General Psychiatry, 34(2), 153–155.
https://doi.org/10.1001/archpsyc.1977.01770140043004
John, W. S., & Wu, L. (2017). Problem alcohol use and healthcare utilization among persons with
cannabis use disorder in the United States. Drug and Alcohol Dependence, 178(March),
477–484. https://doi.org/10.1016/j.drugalcdep.2017.05.035
Johnson, C. E., Bush, R. L., Harman, J., Bolin, J., Hudnall, G. E., & Nguyen, A. M. (2015).
Variation in Utilization of Health Care Services for Rural VA Enrollees With Mental
Health-Related Diagnoses, 31, 244–253. https://doi.org/10.1111/jrh.12105
Joynt, K., Nguyen, N., Samson, L. W., & Snyder, J. (2016). Rural Hospital Participation and
Perfromance in Value-Based Purchasing and other Delivery System Reform Initiatives.
Kaiser Family Foundation. (2014). State Mental Health Agency (SMHA) Per Capita Mental
Health Services Expenditures (in millions). Retrieved from http://kff.org/other/state-
indicator/smha-expenditures-per-capita/
Kaiser Family Foundation. (2016). Health Insurance Coverage of the Total Population. Retrieved
from https://www.kff.org/other/state-indicator/total-
population/?currentTimeframe=0&selectedRows=%7B%22states%22:%7B%22nebraska%2
2:%7B%7D%7D%7D&sortModel=%7B%22colId%22:%22Location%22,%22sort%22:%2
2asc%22%7D
Kaiser Family Foundation. (2017). Population distribution by age. Retrieved from
http://www.kff.org/other/state-indicator/distribution-by-
age/?currentTimeframe=0&sortModel=%7B%22colId%22:%22Location%22,%22sort%22:
%22asc%22%7D
Kang, H. A., & Barner, J. C. (2017). The relationship between out-of-pocket healthcare
expenditures and insurance status among individuals with chronic obstructive pulmonary
disease. Journal of Pharmaceutical Health Services Research, 8(2), 107–113.
https://doi.org/10.1111/jphs.12170
Kazley, A. S., Simpson, A. N., Simpson, K. N., & Teufel, R. (2014). Association of Electronic
Health Records With. The American Journal of Managed Care, 20(6), 183–190.
Kim, S. M., Hwang, S. W., Oh, E. H., & Kang, J. K. (2013). Determinants of the Length of Stay
in Stroke Patients. Osong Public Health and Research Perspectives, 4(6), 329–341.
https://doi.org/10.1016/j.phrp.2013.10.008

129
Korn, C., Currier, G. W., & Henderson, S. O. (2000). “Medical Clearance” of Psychiatric Patients
without Medical Complaints in the Emergency Department. The Journal of Emergency
Medicine, 18(2), 173–176.
Kosten, T. R., & O’Connor, P. G. (2003). Management of Drug and Alcohol Withdrawal. New
England Journal of Medicine, 348(18), 1786–1795. https://doi.org/10.1056/NEJMra020617
Kripalani, S., Theobald, C. N., Anctil, B., & Vasilevskis, E. E. (2014). Reducing Hospital
Readmission: Current Strategies and Future Directions. Annual Review of Medicine, 65,
471–485. https://doi.org/10.1146/annurev-med-022613-090415.Reducing
Kroch, E., Duan, M., Silow-carroll, S., & Meyer, J. A. (2007). Hospital Performance
Improvement: Trends In Quality and Efficiency a Quantitative Analysis of Performance
Improvement in US . Hospitals. The Commonwealth Fund.
Krumholz, H. M., Chen, Y. T., Wang, Y., Vaccarino, V., Radford, M. J., & Horwitz, R. I. (2000).
Predictors of readmission among elderly survivors of admission with heart failure.
American Heart Journal, 139(1 Pt 1), 72–77. https://doi.org/10.1016/S0002-
8703(00)90311-9
Kwok, C. S., Clark, A., Ford, G. a., Durairaj, R., Dixit, A. K., Davis, J., … Myint, P. K. (2012).
Association between prestroke disability and inpatient mortality and length of acute hospital
stay after acute stroke. Journal of the American Geriatrics Society, 60(4), 726–732.
https://doi.org/10.1111/j.1532-5415.2011.03889.x
Lagisetty, P. A., Maust, D., Heisler, M., & Bohnert, A. (2017). Physical and mental health
comorbidities associated with primary care visits for substance use disorders. Journal of
Addiction Medicine, 11(2), 161–162. https://doi.org/10.1097/ADM.0000000000000280
Larkin, G. L., Claassen, C. a, Emond, J. a, Pelletier, A. J., & Camargo, C. a. (2005). Trends in
U.S. emergency department visits for mental health conditions, 1992 to 2001. Psychiatric
Services (Washington, D.C.), 56(6), 671–677. https://doi.org/10.1176/appi.ps.56.6.671
Leong, B. F. T. L., Ph, D., & Kalibatseva, Z. (2011). Cross-Cultural Barriers to Mental Health
Services in the United States, (March), 1–13.
Li, B., Cairns, J., Fotheringham, J., & Ravanan, R. (2016). Predicting hospital costs for patients
receiving renal replacement therapy to inform an economic evaluation. The European
Journal of Health Economics, 17(6), 659–668. https://doi.org/10.1007/s10198-015-0705-x
Little, D. R., Clasen, M. E., Hendricks, J. L., & Walker, I. A. (2011). Impact of closure of mental
health center: emergency department utilization and length of stay among patients with
severe mental illness. Journal of Health Care for the Poor and Underserved, 22(2), 469–72.
https://doi.org/10.1353/hpu.2011.0057
Liu, H., & Khan, B. (2017). Legislative Report for FY 2016 & 2017 from the Directors.
Behavioral Health Education Center of Nebraska.
Maguen, S., Schumm, J. A., Norris, R. L., Taft, C., King, L. A., King, D. W., & Litz, B. T.
(2007). Predictors of Mental and Physical Health Service Utilization Among Vietnam
Veterans, 4(3), 168–180. https://doi.org/10.1037/1541-1559.4.3.168
Malehi, A. S., Pourmotahari, F., & Angali, K. A. (2015). Statistical models for the analysis of
skewed healthcare cost data : a simulation study. Health Economics Review, 5(11), 1–16.
https://doi.org/10.1186/s13561-015-0045-7

130
Manning, W. G. (2006). Dealing with skewed data on costs and expenditures. cheltenham (UK):
Edward Elgar.
Manning, W. G., Basu, A., & Mullahy, J. (2005). Generalized modeling approaches to risk
adjustment of skewed outcomes data. Journal of Health Economics, 24(3), 465–488.
https://doi.org/10.1016/j.jhealeco.2004.09.011
Manning, W. G., & Mullahy, J. (2001). Estimating log models: To transform or not to transform?
Journal of Health Economics, 20(4), 461–494. https://doi.org/10.1016/S0167-
6296(01)00086-8
Mark, T. L., Vandivort-Warren, R., Owens, P., Buck, J., Levit, K., Coffey, R., & Stocks, C.
(2010). Psychiatric Discharges in Community Hospitals With and Without Psychiatric
Units : How Many and for Whom ? Psychiatric Services, 61(6), 562–568.
McCarthy, D., Johnson, M. B., & Audet, A.-M. (2013). Recasting readmissions by placing the
hospital role in community context. JAMA, 309(4), 351–352.
https://doi.org/10.1001/jama.2013.1
Medicare Payment Advisory Commission. Report to the Congress: Medicare Payment Policy
(2011).
Mehta, H. (2012). Comparison of Five Diagnosis Based Comorbidity Measures in Predicting
Health-related Quality of Life ( HRQoL ) in Multiple Sclerosis Patients No funding received
for this study, (August).
Mehta, H. B., Dimou, F., Adhikari, D., Nina, P., Sieloff, E., Williams, T. P., & Kuo, Y. (2017).
HHS Public Access, 54(2), 180–187.
https://doi.org/10.1097/MLR.0000000000000465.Comparison
Meiman, J., Tomasallo, C., & Paulozzi, L. (2015). Trends and characteristics of heroin overdoses
in Wisconsin ,. Drug and Alcohol Dependence, 152, 177–184.
https://doi.org/10.1016/j.drugalcdep.2015.04.002
Melek, S., & Norris, D. (2011). Chronic conditions and comorbid psychological disorders.
Journal of Mental Health Policy and Economics, 14(July), S21–S22. Retrieved from
http://oxfordsfx.hosted.exlibrisgroup.com/oxford?sid=OVID:embase&id=pmid:&id=doi:&i
ssn=1091-4358&isbn=&volume=14&issue=&spage=S21&pages=S21-
S22&date=2011&title=Journal+of+Mental+Health+Policy+and+Economics&atitle=Chroni
c+conditions+and+comorbid+psychologi
Moore, B. J., White, S., Washington, R., Coenen, N., & Elixhauser, A. (2017). Identifying
Increased Risk of Readmission and In-hospital, 55(7).
Mukamal, K. J., Lumley, T., Luepker, R. V, Lapin, P., Mittleman, M. A., McBean, A. M., …
Siscovick, D. S. (2006). Alcohol consumption in older adults and Medicare costs. Health
Care Financing Review, 27(3), 49–61. https://doi.org/hcfr-27-3-049 [pii]
Mulkern, V., Raab, B., Potter, D., Raab, B., & Potter, D. (2007). A rising tide: use of emergency
departments for mental health care for Connecticut’s children. Farmington, CT. Child
Health and Development Institute of Connecticut, 1.
Mullahy, J. (1998). Much ado about two: Reconsidering retransformation and the two-part model
in health econometrics. Journal of Health Economics, 17(3), 247–281.
https://doi.org/10.1016/S0167-6296(98)00030-7

131
National Committee for Quality Assurance. (2015). Proposed Changes to Existing Measure for
HEDIS ® 2015: Plan All-Cause Readmissions (PCR).
National Quality Strategy. (2012). 2012 Annual Progress Report to Congress on the National
Strategy for Quality Improvement in Health Care. Retrieved from
http://www.ahrq.gov/workingforquality/nqs/nqs2012annlrpt.htm
Nayar, P., Apenteng, B., Nguyen, A. T., Shaw-sutherland, K., Ojha, D., & Deras, M. (2016).
Needs Assessment for Behavioral Health Workforce : a State-Level Analysis. The Journal
of Behavioral Health Services & Research, March, 1–9. https://doi.org/10.1007/s11414-
016-9500-4
Nayar, P., Nguyen, A. T., Apenteng, B., & Shaw-sutherland, K. (2011). Nebraska ’ s Behavioral
Health Workforce – 2000 to 2010 Nebraska for Rural Health.
Nebraska Department of Health and Human Services. (2008). Rural 2010 Health Goals and
Objectives for Nebraska.
Ngui, E. M., Khasakhala, L., Ndetei, D., & Weiss, L. (2011). NIH Public Access, 22(3), 235–244.
https://doi.org/10.3109/09540261.2010.485273.Mental
Nguyen, A. T., Trout, K. E., Chen, L., Madison, L., & Watkins, K. L. (2016). Nebraska ’ s rural
behavioral healthcare workforce distribution and relationship between supply and county
characteristics, 1–10.
Nicks, B. A., & Manthey, D. M. (2012). The Impact of Psychiatric Patient Boarding in
Emergency Departments. Emergency Medicine International, 2012, 1–5.
https://doi.org/10.1155/2012/360308
Office of the First Lady. (2015, March). Remarks by The First lady at “Change Direction” Mental
Health Event. The White House Briefing Room.
Olfson, M. (2016). Building The Mental Health Workforce Capacity Needed To Treat Adults
With Serious Mental Illnesses. Health Affairs, 35(6), 983–990.
https://doi.org/10.1377/hlthaff.2015.1619
Ormel, J., Von Korff, M., Burger, H., Scott, K., Demyttenaere, K., Huang, Y. Q., … Kessler, R.
(2007). Mental disorders among persons with heart disease - results from World Mental
Health surveys. General Hospital Psychiatry, 29(4), 325–334.
https://doi.org/10.1016/j.genhosppsych.2007.03.009
Owens, P., Mutter, R., & Stocks, C. (2010). Mental Health and Substance Abuse-Related
Emergency Department Visits among Adults, 2007. Health Care Cost and Utilization
Project Statistical Brief #92, 671–677. Retrieved from
http://www.ncbi.nlm.nih.gov/books/NBK52659/
Partha, D., Manning, W., & Norton, E. (2010). Modeling health care costs and counts. In ASHE
2010 Cornelll University.
Patterson, W., Lindsey, M., & Roohan, P. (2009). A Comparison of Potentially Preventable
Hospital Readmissions where Preceding Admission was a Behavioral Health , Medical or
Surgical Admission : New York State Medicaid Program , 2007.
Peppe, E., Mays, J., & Chang, H. (2007). Characteristics of frequent emergency department users.
Kaiser Family Foundation, (October), 1–17. https://doi.org/10.1097/00006565-199512000-
00003

132
Pfeffer, J., & Salancik, G. R. (1978). The external control of organizations: A resource
dependence perspective. Stanford University Press, 2003.
Phillips, K. A., Morrison, K. R., Andersen, R., & Aday, L. A. (1998). Understanding the Context
of Healthcare Utilization : Assessing Environmental and Provider-Related Variables in the
Behavioral Model of Utilization. Health Services Research, 33(3), 571–596.
Pincus, H. A. (2014). Care Transition Interventions to Reduce Psychiatric Re-Hospitalizations
Care Transition Interventions to Reduce Psychiatric Re-Hospitalizations.
Pines, J. M., Asplin, B. R., Kaji, A. H., Lowe, R. A., Magid, D. J., Raven, M., … Yealy, D. M.
(2011). Frequent Users of Emergency Department. Academic Emergency Medicine, 18(6),
64–69. https://doi.org/10.1111/j.1553-2712.2011.01086.x
Prince, J. D., Akincigil, A., Kalay, E., Walkup, J. T., Hoover, D. R., Lucas, J., … Crystal, S.
(2008). Psychiatric Rehospitalization Among Elderly Persons in the United States.
Psychiatric Services, 59(9), 1038–1045. https://doi.org/10.1176/ps.2008.59.9.1038
Prince, M., Patel, V., Saxena, S., Maj, M., Maselko, J., Phillips, M. R., & Rahman, A. (2007). No
health without mental health. Lancet, 370(9590), 859–877. https://doi.org/10.1016/S0140-
6736(07)61238-0
Probst, J. C., Laditka, S. B., Moore, C. G., Harun, N., Powell, M. P., & Baxley, E. G. (2006).
Rural-urban differences in depression prevalence: Implications for family medicine. Family
Medicine, 38(9), 653–660.
Pullen, E., & Oser, C. (2014). Barriers to Substance Abuse Treatment in Rural and Urban
Communities: A Counselor Perspective. Substance Use & Misuse, 49(7), 891–901.
https://doi.org/10.1016/j.jacc.2007.01.076.White
Rajagopalan, K., Kleinman, N. L., Brook, R. a, Gardner, H. H., Brizee, T. J., & Smeeding, J. E.
(2006). Costs of physical and mental comorbidities among employees: a comparison of
those with and without bipolar disorder. Current Medical Research and Opinion, 22(3),
443–452. https://doi.org/10.1185/030079906X89748
Rebhan, D. P. (2011). Health Care Utilization: Understanding and applying theories and models
of health care seeking behavior.
Reynolds, K., Pietrzak, R. H., El-Gabalawy, R., Mackenzie, C. S., & Sareen, J. (2015).
Prevalence of psychiatric disorders in U. S. older adults: findings from a nationally
representative survey. World Psychiatry, 14(February), 74–81.
https://doi.org/10.1002/wps.20193
Rhodes, K. V. (2008). Mood disorders in the emergency department: the challenge of linking
patients to appropriate services. General Hospital Psychiatry, 30(1), 1–3.
https://doi.org/10.1016/j.genhosppsych.2007.10.009
Richmond, T. S., Robinson, K., Ackerson, T. H., Robinson, K., Gracias, V., Shults, J., &
Amsterdam, J. (2007). NIH Public Access. Nursing Research, 56(4), 275–282.
https://doi.org/10.1097/01.NNR.0000280616.13566.84.Psychiatric
RLS Demographics. (2011). Population Distribution and Diversity in New York State.
Rn, S. A. K., Nurse, M., Dip, G., & Icu, E. (2007). What general emergency nurses want to know
about mental health patients presenting to their emergency department, 48–55.
https://doi.org/10.1016/j.aaen.2006.09.003

133
Robert Wood Johnson Foundation Program and University of Wisconsin Population Health
Institute. (2016). County Health Rankings 2016: New York.
Robinson, L. R., Holbrook, J. R., Bitsko, R. H., Hartwig, S. A., Kaminski, J. W., Ghandour, R.
M., … Boyle, C. A. (2017). Differences in Health Care, Family, and Community Factors
Associated with Mental, Behavioral, and Developmental Disorders Among Children Aged
2–8 Years in Rural and Urban Areas — United States, 2011–2012. MMWR. Surveillance
Summaries, 66(8), 1–11. https://doi.org/10.15585/mmwr.ss6608a1
Rohrer, J. E., Borders, T. F., & Blanton, J. (2005). Rural residence is not a risk factor for frequent
mental distress: a behavioral risk factor surveillance survey. BMC Public Health, 5, 46.
https://doi.org/10.1186/1471-2458-5-46
Ruhl, A. P., Huang, M., Colantuoni, E., Karmarkar, T., Dinglas, V. D., Hopkins, R. O., &
Needham, D. M. (2017). Healthcare utilization and costs in ARDS survivors: a 1-year
longitudinal national US multicenter study. Intensive Care Medicine, 43(7), 980–991.
https://doi.org/10.1007/s00134-017-4827-8
Saba, D., Levit, K., & Elixhauser, A. (2008). Hospital Stays Related to Mental Health , 2006.
Healthcare Cost and Utilization Progject, 1–13. https://doi.org/NBK54564 [bookaccession]
Sacco, P., Unick, G. J., Zanjani, F., & Camlin, E. A. S. (2015). Hospital Outcomes in Major
Depression Among Older Adults: Differences by Alcohol Comorbidity. Journal of Dual
Diagnosis, 11(1), 83–92. https://doi.org/10.1080/15504263.2014.993295
Sarfati, D. (2016). How Do We Measure Comorbidity ? https://doi.org/10.1007/978-981-10-1844-
2
Schildhaus, S., Stocks, C., Santora, P. B. (2013). Journal of Substance Abuse Treatment
Community hospital admission from the emergency department by persons with substance
use disorders. Journal of Substance Abuse Treatment, 44(2), 201–207.
https://doi.org/10.1016/j.jsat.2012.05.003
Schmidt, E. M., Behar, S., Cordova, M., & Beckum, L. (2017). Potentially Preventable Medical
Hospitalizations and Emergency Department Visits by the Behavioral Health Population.
https://doi.org/10.1007/s11414-017-9570-y
Schroeder, S., & Leigh-peterson, M. (2017). Rural and Urban Utilization of the Emergency
Department for Mental Health and Substance Abuse, 1–6.
Shepard, D. S., Daley, M., Ritter, G. A., Hodgkin, D., & Beinecke, R. H. (2002). Managed Care
and the Quality of Substance Abuse Treatment. The Journal of Mental Health Policy and
Economics, 5, 163–174.
Shroeder, S. A. (2007). People, We Can Do Better — Improving the Health of the American.
New England Journal of Medicine, 357, 1221–1228.
Singh, G., Zhang, W., Kuo, Y.-F., & Sharma, G. (2016). Association of Psychological Disorders
With 30-Day Readmission Rates in Patients With COPD. Chest, 149(4), 905–915.
https://doi.org/10.1378/chest.15-0449
Singh, J. A., & Yu, S. (2016). Emergency Department and Inpatient Healthcare utilization due to
Hypertension. BMC Health Services Research, 16(3), 1–11. https://doi.org/10.1186/s12913-
016-1563-7
Slaughter, M. E., Farris, C., Singer, M. I., Smyth, K. A., & Singer, M. E. (2017). Using Claims

134
Data to Examine Hospital Readmission Risk in Patients With Schizophrenia and Comorbid,
(March), 278–286.
Smith, M. W., Stocks, C., & Santora, P. B. (2015). Hospital Readmission Rates and Emergency
Department Visits for Mental Health and Substance Abuse Conditions. Community Mental
Health Journal, 51, 190–197. https://doi.org/10.1007/s10597-014-9784-x
Stensland, M., Watson, P. R., & Grazier, K. L. (2012). An examination of costs, charges, and
payments for inpatient psychiatric treatment in community hospitals. Psychiatric Services,
63(7), 666–71. https://doi.org/10.1176/appi.ps.201100402
Stranges, E., Levit, K., Stocks, C., & Santora, P. (2011). State Variation in Inpatient
Hospitalizations for Mental Health and Substance Abuse Conditions, 2002-2008. HCUP
Statistical Brief, No. 117. Retrieved, 2010, 1–11. Retrieved from http://www.hcup-
us.ahrq.gov/reports/statbriefs/sb117.pdf
Strom, J. B., Kramer, D. B., Wang, Y., Shen, C., Wasfy, J. H., Landon, E., … Yeh, R. W. (2017).
Short-term rehospitalization across the spectrum of age and insurance types in the United
States. PloS One, 12(7), e0180767. https://doi.org/10.1371/journal.pone.0180767
Substance Abuse and Mental Health Services. (2013). National Expenditures for Mental Health
Services and Substance Abuse Treatment, 1986-2009.
Substance Abuse and Mental Health Services. (2015). Substance Use Disorders. Retrieved
November 15, 2017, from https://www.samhsa.gov/disorders/substance-use
Substance Abuse and Mental Health Services. (2017). Substance Abuse Facilities Data (N-
SSATS). Accessed on 11/11/2017. Retrieved from https://findtreatment.samhsa.gov/locator
Substance Abuse and Mental Health Services Administration. (2016). Behavioral Health
Spending and Use Accounts, 1986-2014. HHS Publication No. SMA-16-4975. Rockville,
MD: Substance Abuse and Mental Health Services Administration.
Substance Abuse and Mental Health Services Administration Center forMental Health Services.
Rockville, M. S. 2001. (2001). Mental Health Care for Youth: A National Assessment,
Annual/final Progress Report. January 2001–December 2001.
The New York State Office of Alcoholism and Substance Abuse Services. (2012). The New York
State Office of Alcoholism and Substance Abuse Services: 2012 Interim Report.
The Pew Charitable Trusts and the John D. and Catherine T. MacArthur Foundation. (2015).
Substance Use Disorders and the Role of the States.
Thomas, K. C., Ellis, A. R., Konrad, T. R., Holzer, C. E., & Morrissey, J. P. (2009). County-
Level Estimates of Mental Health Professional Shortage in the United States. Psychiatric
Services, 60(10), 3–8.
Thomas, L. (2003). Trends and shifting ecologies: part I. Child Adolesc Psychiatr Clin North Am,
12, 599–611.
Thompson, S. G., & Nixon, R. M. (2005). How Sensitive Are Cost-Effectiveness Analyses to
Choice of Parametric Distributions ? Medical Decision Making, 25, 416–423.
https://doi.org/10.1177/0272989X05276862
Thorpe, K. E. (1988). Why are urban hospital costs so high? The relative importance of patient
source of admission, teaching, competition, and case mix. Health Services Research, 22(6),

135
821–836.
Tice, S. L., Hedden, J., Kennet, R., Lipari, G., & Medley, P. (2014). Behavioral Health Trends in
the United States : Results from the 2014 National Survey on Drug Use and Health Results
from the 2014 National Survey on Drug Use and Health.
Torio, C. M., Encinosa, W., Berdahl, T., McCormick, M. C., & Simpson, L. A. (2015). Annual
report on health care for children and youth in the United States: National estimates of cost,
utilization and expenditures for children with mental health conditions. Academic
Pediatrics, 15(1), 19–35. https://doi.org/10.1016/j.acap.2014.07.007
U.S. Department of Health and Human Services. (2016). National Projections of Supply and
Demand for Selected Behavioral Health Practitioners.
U.S. Department of Health and Human Services (HHS). (2016). Facing Addiction in America:
The Surgeon General’s Report on Alcohol, Drugs, and Health. U.S. Department of Health
and Human Services (HHS), Office of the Surgeon General (Vol. Washington).
US Department of Health and Human Servives. (2013). CMCS Informational Bulletin on
Targeting Medicaid Super-Utilizers to Decrease Costs and Improve Quality.
US Department of Health and Human Servives. (2017). HHS FY 2017 Budget in Brief -
SAMHSA.
Viggiano, T., Pincus, H. A., & Crystal, S. (2012). Care transition interventions in mental health.
Current Opinion in Psychiatry, 25(6), 551–558.
https://doi.org/10.1097/YCO.0b013e328358df75
Vos, T., Flaxman, A., & Naghavi M, et al. (2012). Years lived with disability (YLDs) for 1160
sequelae of 289 diseases and injuries 1990-2010: a systematic analysis for the Global
Burden of Disease Study 2010. Lancet, (380), 2163–2196.
Walkey, A. J., & Wiener, R. S. (2014). Hospital case volume and outcomes among patients
hospitalized with severe sepsis. American Journal of Respiratory and Critical Care
Medicine, 189(5), 548–555. https://doi.org/10.1164/rccm.201311-1967OC
Walley, A. Y., Paasche-Orlow, M., Lee, E. C., Forsythe, S., Chetty, V. K., Mitchell, S., & Jack,
B. W. (2012). Acute Care Hospital Utilization Among Medical Inpatients Discharged With
a Substance Use Disorder Diagnosis. Journal of Addiction Medicine, 6(1), 50–56.
https://doi.org/10.1097/ADM.0b013e318231de51
Weiss, A. J., Barrett, M. L., Heslin, K. C., & Stocks, C. (2016). Statistical Brief No.216 Trends in
Emergency Department Visits Involving Mental and Substance Use department (ED) visits
per Disorders, 2006–2013 (Vol. 45).
World Health Organization. (2004). The global burden of disease: 2004 update, Table A2:
Burden of disease in DALYs by cause, sex, and income group in WHO regions, estimates for
2004.
World Health Organization. (2010). Mental health and development: Targeting people with
mental health conditions as a vulnerable group.
World Health Organization. (2014a). Mental health: a state of well-being. Retrieved from
http://www.who.int/features/factfiles/mental_health/en/
World Health Organization. (2014b). Mental health: strengthening our response. Retrieved

136
January 1, 2016, from http://www.who.int/mediacentre/factsheets/fs220/en/
Wu, L.-T., Marvin, S. S., Zunyou, W., Paolo, M., Chongming, Y., & Blazer, D. G. (2013).
Alcohol and Drug Use Disorders among Adults in Emergency Department Settings in the
United States. Annals of Emergency Medicine, 60(2), 172–180.
https://doi.org/10.1016/j.annemergmed.2012.02.003.Alcohol
Xie, L., Joshi, A. V, Schaaf, D., Mardekian, J., Harnett, J., & Shah, N. D. (2014). Differences in
Healthcare Utilization and Associated Costs Between Patients Prescribed vs . Nonprescribed
Opioids During an Inpatient or Emergency Department Visit. Pain Practice, 14(5), 446–
456.
Zeller, S., Calma, N., & Stone, A. (2014). Effects of a Dedicated Regional Psychiatric Emergency
Service on Boarding of Psychiatric Patients in Area Emergency Departments, XV(1).
https://doi.org/10.5811/westjem.2013.6.17848
Ziller, E. C., Anderson, N. J., & Coburn, A. F. (2010). Access to Rural Mental Health Services:
Service Use and Out-of-Pocket Costs. Journal of Rural Health, 26(3), 214–224.
https://doi.org/10.1111/j.1748-0361.2010.00291.x
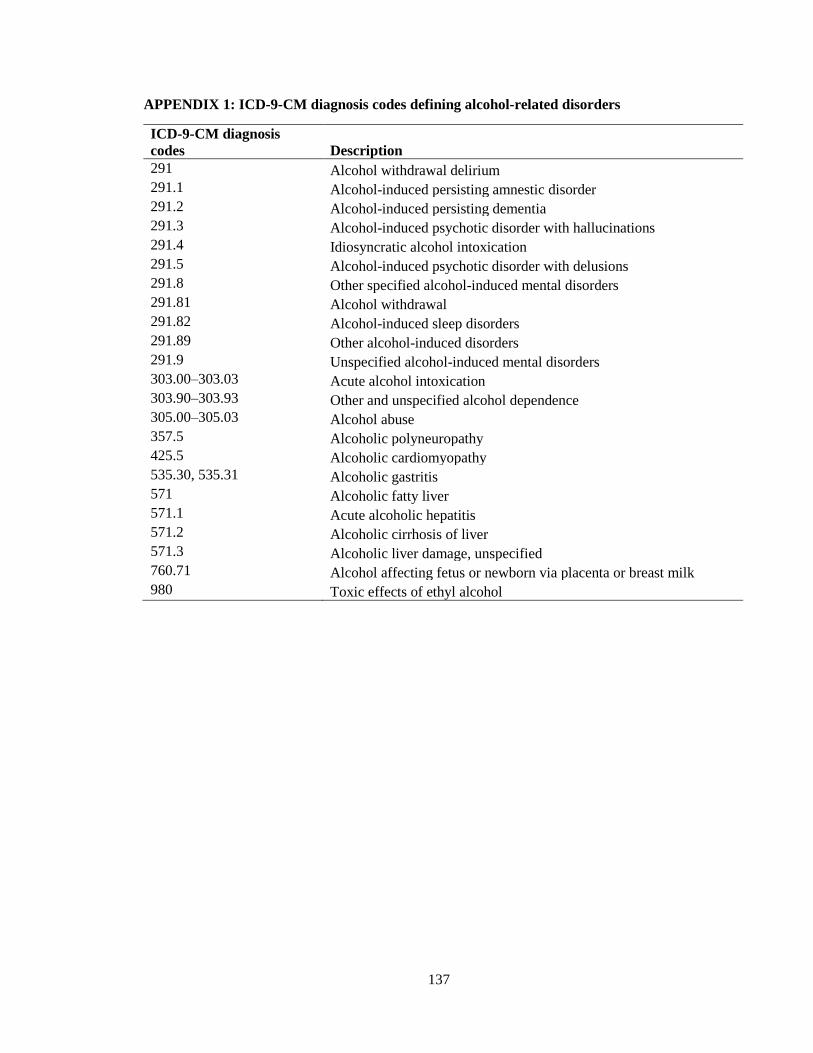
137
APPENDIX 1: ICD-9-CM diagnosis codes defining alcohol-related disorders
ICD-9-CM diagnosis
codes Description
291 Alcohol withdrawal delirium
291.1 Alcohol-induced persisting amnestic disorder
291.2 Alcohol-induced persisting dementia
291.3 Alcohol-induced psychotic disorder with hallucinations
291.4 Idiosyncratic alcohol intoxication
291.5 Alcohol-induced psychotic disorder with delusions
291.8 Other specified alcohol-induced mental disorders
291.81 Alcohol withdrawal
291.82 Alcohol-induced sleep disorders
291.89 Other alcohol-induced disorders
291.9 Unspecified alcohol-induced mental disorders
303.00–303.03 Acute alcohol intoxication
303.90–303.93 Other and unspecified alcohol dependence
305.00–305.03 Alcohol abuse
357.5 Alcoholic polyneuropathy
425.5 Alcoholic cardiomyopathy
535.30, 535.31 Alcoholic gastritis
571 Alcoholic fatty liver
571.1 Acute alcoholic hepatitis
571.2 Alcoholic cirrhosis of liver
571.3 Alcoholic liver damage, unspecified
760.71 Alcohol affecting fetus or newborn via placenta or breast milk
980 Toxic effects of ethyl alcohol

138
APPENDIX 2: Results of two-part model of factors associated with total cost of readmissions for alcohol-related disorders, NRD
2014.
Variable
Logit GLM with Gamma log-link
Coeff SE P-
value
95% confidence level Coeff SE
P-
value
95% confidence level
Lower Upper Lower Upper
Intercept -2.144 0.113 <.0001 -2.366 -1.922 8.844 0.176 <.0001 8.499 9.189
Revisit for ARD
No Reference Reference
Yes 0.425 0.024 <.0001 0.378 0.472 0.124 0.026 <.0001 0.074 0.174
Sex
Male Reference Reference
Female -0.070 0.022 0.001 -0.113 -0.027 0.031 0.023 0.192 -0.015 0.076
AGE
18 to 24 Reference Reference
25 to 44 0.638 0.088 <.0001 0.465 0.812 0.074 0.163 0.651 -0.246 0.393
45 to 64 0.748 0.087 <.0001 0.577 0.918 0.141 0.163 0.387 -0.179 0.461
65 and over 0.382 0.099 <.0001 0.187 0.576 0.262 0.169 0.122 -0.070 0.594
Primary Payer
Medicare Reference Reference
Medicaid -0.045 0.030 0.132 -0.104 0.014 0.025 0.029 0.395 -0.032 0.082
Private Insurance -0.577 0.034 <.0001 -0.643 -0.511 0.009 0.034 0.798 -0.059 0.076
Uninsured -0.439 0.049 <.0001 -0.535 -0.344 -0.161 0.037 <.0001 -0.233 -0.089
No charge -0.312 0.064 <.0001 -0.437 -0.186 -0.272 0.071 <.0001 -0.411 -0.133
Other -0.432 0.072 <.0001 -0.573 -0.291 -0.056 0.052 0.281 -0.158 0.046
Patient location
Urban Reference Reference
Rural -0.186 0.048 <.0001 -0.279 -0.092 0.186 0.072 0.01 0.044 0.327
Median household income national quartile for patient ZIP code**
First quartile Reference Reference
Second quartile -0.011 0.031 0.731 -0.072 0.050 0.049 0.029 0.093 -0.008 0.107
Third quartile -0.092 0.033 0.005 -0.156 -0.028 0.079 0.032 0.012 0.017 0.141

139
Fourth quartile -0.092 0.036 0.01 -0.162 -0.022 0.151 0.034 <.0001 0.084 0.218
Elixhauser Comorbidity Index for unrelated comorbid conditions
0 Reference Reference
1 0.078 0.028 0.005 0.0238 0.1331 0.109 0.034 0.001 0.042 0.176
2 0.168 0.031 <.0001 0.1075 0.2291 0.196 0.032 <.0001 0.132 0.260
3 0.246 0.037 <.0001 0.1746 0.3180 0.314 0.036 <.0001 0.245 0.384
4 or more 0.352 0.039 <.0001 0.2758 0.4275 0.385 0.039 <.0001 0.309 0.460
Length of stay -0.016 0.017 0.373 -0.050 0.019 0.178 0.016 <.0001 0.146 0.209
Hospital urban-rural designation
Large metropolitan areas Reference Reference
Small metropolitan areas -0.104 0.038 0.007 -0.179 -0.029 -0.190 0.030 <.0001 -0.250 -0.131
Micropolitan areas -0.244 0.079 0.002 -0.399 -0.090 -0.416 0.076 <.0001 -0.566 -0.266
Not metropolitan or
micropolitan -0.312 0.101 0.002 -0.510 -0.113 -0.428 0.088 <.0001 -0.601 -0.254
Bedsize of hospital
Small Reference Reference
Medium 0.092 0.043 0.031 0.008 0.176 -0.026 0.037 0.486 -0.097 0.046
Large 0.164 0.042 <.0001 0.082 0.246 0.106 0.038 0.005 0.032 0.180
Hospital control/ ownership
Government, nonfederal Reference Reference
Private, non-profit -0.010 0.063 0.87 -0.134 0.114 -0.166 0.047 <.0001 -0.258 -0.073
Private, invest-own 0.034 0.069 0.624 -0.102 0.170 -0.340 0.057 <.0001 -0.451 -0.229
Hospital volume
Low Reference Reference
Medium -0.018 0.039 0.637 -0.094 0.057 -0.137 0.038 <.0001 -0.210 -0.063
High 0.028 0.037 0.45 -0.045 0.102 -0.279 0.035 <.0001 -0.349 -0.210
NRD, Nationwide Readmissions Database; Coeff, Coefficient; SE, standard error; GLM, Generalized linear regression model
**Median household income quartiles of residents’ ZIP code for 2014 are: (1) $1 - $39,999; (2) $40,000 - $50,999; (3) $51,000 - $65,999;
and (4) $66,000 or more.

140
APPENDIX 3: Diagnoses used in the analysis of behavioral health disorders in Nebraska
and their corresponding codes as per International Classification of Diseases, Ninth
Revision, Clinical Modification.
Mental Disorders
Category Codes
Dementias 290.0, 290.10, 290.11, 290.12, 290.13, 290.20, 290.21,
290.3, 290.40, 290.41, 290.42, 290.43, 290.8, 290.9
Transient mental disorders due to
conditions classified elsewhere
293.0, 293.1, 293.82, 293.83, 293.84, 293.89, 293.9
Persistent mental disorders due to
conditions classified elsewhere
294.0, 294.10, 294.11, 294.20, 294.21, 294.8, 294.9
Schizophrenic disorders 295.02, 295.04, 295.10, 295.11, 295.12, 295.13,
295.14, 295.20, 295.22, 295.24, 295.30, 295.31,
295.32, 295.33, 295.34, 295.35, 295.40, 295.42,
295.44, 295.50, 295.54, 295.60, 295.62, 295.63,
295.64, 295.65, 295.70, 295.71, 295.72, 295.73,
295.74, 295.75, 295.80, 295.82, 295.83, 295.84,
295.90, 295.92, 295.94
Episodic mood disorders 296.00, 296.01, 296.03, 296.04, 296.10, 296.20,
296.21, 296.22, 296.23, 296.24, 296.25, 296.26,
296.30, 296.31, 296.32, 29633, 296.34, 296.35, 296.36,
296.40, 296.41, 296.42, 296.43, 296.44, 296.45,
296.46, 296.50, 296.51, 296.52, 296.53, 29654, 29655,
296.56, 296.60, 296.61, 296.62, 296.63, 296.64,
296.65, 296.66, 296.7, 296.80, 296.81, 296.82, 296.89,
296.90, 296.99
Delusional disorders 297.0, 297.1, 297.3, 297.8, 297.9
Other nonorganic psychoses 298.0, 298.1, 298.2, 298.3, 298.4, 298.8, 298.9
Pervasive developmental disorders 299.00, 299.01, 299.80, 299.90
Anxiety, dissociative and somatoform
disorders
300.00, 300.01, 300.02, 300.09, 300.10, 300.11,
300.12, 300.13, 300.14, 300.15, 300.16, 300.19,
300.20, 300.21, 300.23, 300.29, 300l3, 300.4, 300.5,
300.6, 300.7, 300.81, 300.82, 300.89, 300.9
Personality Disorders 301.0, 301.13, 301.22, 301.3, 301.4, 301.51, 301.6,
301.7, 301.81, 301.83, 301.89, 301.9
Sexual and gender identity disorders 302.2, 302.85, 302.89, 302.9
Physiological malfunctions arising from
mental factors
306.0, 306.1, 306.2, 306.4, 306.8, 306.9
Special Symptoms not elsewhere
classified
307.0, 307.1, 307.20, 307.23, 307.41, 307.42, 307.47,
307.50, 307.51, 307.54, 307.59, 307.7, 307.80, 307.81,
307.9
Acute reactions to stress 308.0, 308.2, 308.3, 308.9
Adjustment reaction 309.0, 309.1, 309.21, 309.24, 309.28, 309.29, 309.3,
309.4, 309.81, 309.89, 309.9
Specific nonpsychotic mental disorders
due to brain damage
310.0, 310.1, 310.2, 310.8, 310.89, 310.9

141
Depressive disorder, not elsewhere
classified
311
Disturbances of conduct 312.00, 312.30, 312.31, 312.32, 312.34, 312.4, 312.81,
312.82, 312.89, 312.9
Disturbances of emotions specific to
childhood and adolescents
313.81, 313.89
Hyperkinetic syndrome of childhood 314.00, 314.01
Specific delays in development 315.8, 315.9
Intellectual diabilities and Psychic factors
associated with diseases classified
elsewhere
317, 318.0, 318.1-318.2, 319
Other ill-defined and unknown causes of
morbidity and mortality
799.2, 799.21, 799.22, 799.24, 799.25, 799.29, 799.59
V Codes
V11.8, V61.10, V61.20, V62.83, V62.84, V62.85,
V70.1, V70.2, V71.01, V71.02, V71.09
Substance Disorders
Category Codes
Alcohol-Induced mental disorders
291.0, 291.1, 291.2, 291.3, 291.5, 291.81, 291.89,
291.9
Drug-Induced mental disorders 292.0, 292.11, 292.12, 292.2, 292.81, 292.82, 292.84,
292.85, 292.89, 292.9
Alcohol Dependence Syndrome 303.00, 303.01, 303.02, 303.03, 303.90, 303.91,
303.92, 303.93
Drug Dependence Syndrome 304.00, 304.01, 304.10, 304.11, 304.20, 304.21,
304.22, 304.30, 304.31, 304.40, 304.41, 304.42,
304.43, 304.60, 304.61, 304.62, 304.70, 304.71,
304.73, 304.80, 304.81, 304.83, 304.90, 304.91
Non-dependent Drug Abuse 305.00, 305.01, 305.02, 305.03, 305.1, 305.20, 305.21,
305.23, 305.30, 305.40, 305.41, 305.50, 305.51,
305.52, 305.53, 305.60, 305.61, 305.62, 305.70,
305.71, 305.72, 305.80, 305.90, 305.91

142
APPENDIX 4: Behavioral health regions and major cities in Nebraska.

143
APPENDIX 5: Diagnoses related to substance use disorders used in the analysis and their
corresponding codes as per International Classification of Diseases, Ninth Revision, Clinical
Modification
Category
number
ICD-9-CM diagnosis codes
Description
1 Alcohol 291 Alcohol withdrawal delirium 291.1 Alcohol-induced persisting amnestic disorder 291.2 Alcohol-induced persisting dementia
291.3 Alcohol-induced psychotic disorder with
hallucinations 291.4 Idiosyncratic alcohol intoxication
291.5 Alcohol-induced psychotic disorder with
delusions
291.8 Other specified alcohol-induced mental
disorders 291.81 Alcohol withdrawal 291.82 Alcohol-induced sleep disorders 291.89 Other alcohol-induced disorders 291.9 Unspecified alcohol-induced mental disorders 303.00–303.03 Acute alcohol intoxication 303.90–303.93 Other and unspecified alcohol dependence 305.00–305.03 Alcohol abuse
2 Amphetamines 304.40–304.43 Amphetamines dependence 305.70–305.73 Nondependent amphetamine abuse
3 Cannabis 304.30–304.33 Cannabis dependence 305.20–305.23 Nondependent cannabis abuse
4 Cocaine 304.20–304.23 Cocaine dependence 305.60–305.63 Nondependent cocaine abuse
5 Drug-induced mental disorders 292 Drug withdrawal
292.11 Drug-induced psychotic disorder with
delusions
292.12 Drug-induced psychotic disorder with
hallucinations 292.2 Pathological drug intoxication 292.81 Drug-induced delirium 292.82 Drug-induced persistent dementia 292.83 Drug-induced persistent amnestic disorder 292.84 Drug-induced mood disorder 292.85 Drug-induced sleep disorders

144
292.89 Other drug-induced mental disorder 292.9 Unspecified drug-induced mental disorder
6 Hallucinogens 304.50–304.53 Hallucinogen dependence 305.30–305.33 Nondependent hallucinogen abuse 969.6 Poisoning by hallucinogens (psychodysleptics)
7 Opioids 304.00–304.03 Opioid type dependence 304.70–304.73 Combinations of opioids with any other 305.50–305.53 Nondependent opioid abuse
8 Sedatives, hypnotics, anxiolytics, tranquilizers, barbituates 304.10–304.13 Sedatives, hypnotics, or anxiolytic dependence
305.40–305.43 Nondependent sedative, hypnotic, or
anxiolytic abuse
9 Tobocco 305.00–305.13 Nondependent tobacco use disorder
10 Other 304.60–304.63 Other, specified drug dependence 304.80–304.83 Combinations excluding opioids
304.90–304.93 Unspecified drug dependence
305.90–305.93 Other, mixed or unspecified drug abuse
SUD, substance use disorders.