
Washington Hospital Healthcare System
89
Washington Hospital Healthcare System 2016 Community Health Needs Assessment (CHNA) Page | 1 Washington Hospital Healthcare System
-
Upload
khangminh22 -
Category
Documents
-
view
1 -
download
0
Transcript of Washington Hospital Healthcare System
Washington Hospital Healthcare System
2016 Community Health Needs Assessment (CHNA)
P a g e | 1
Washington Hospital
Healthcare System

Washington Hospital Healthcare System
2016 Community Health Needs Assessment (CHNA)
P a g e | 2
ACKNOWLEDGMENTS
Applied Survey Research (ASR) prepared this report on behalf of the hospitals listed in this
report. ASR gratefully acknowledges the contributions of the following individuals:
Diana Camacho, John Muir Health
Molly Bergstrom, Kaiser Permanente – Diablo Area
Jean Nudelman, Kaiser Permanente – East Bay Area
Debra Lambert, Kaiser Permanente – Greater Southern Alameda Area
Michael Cobb, St. Rose Hospital
Sue Fairbanks, San Ramon Regional Medical Center
Karen Reid, San Ramon Regional Medical Center
Tim Traver, San Ramon Regional Medical Center
Denise Bouillerce, Stanford Health Care – ValleyCare
Shelby Salonga, Stanford Health Care – ValleyCare
Adam Davis, UCSF Benioff Children’s Hospital Oakland
Lucy Hernandez, Washington Hospital Healthcare System
Ruth Traylor, Washington Hospital Healthcare System
ASR is also pleased to acknowledge the contributions of the following individuals:
Dale Ainsworth, California State University, Sacramento
Marianne Balin, Kaiser Permanente – Diablo Area
Debi Ford, San Ramon Regional Medical Center
Susan Miranda, Kaiser Permanente – Greater Southern Alameda Area
Dana Williamson, Kaiser Permanente – Northern California Region
Applied Survey Research is a social research firm dedicated to helping people build better communities. BAY AREA OFFICE 1871 The Alameda, Suite 180 San Jose, CA 95126 Phone: (408) 247-8319| Fax: (408) 260-7749
Washington Hospital Healthcare System
2016 Community Health Needs Assessment (CHNA)
P a g e | 3
Table of Contents
1. Executive Summary ..................................................................................................................................................... 4 Community Health Needs Assessment (CHNA) Background ...................................................................................... 4 Process & Methods .............................................................................................................................................................. 4 Prioritized Needs .................................................................................................................................................................. 4 Next Steps ............................................................................................................................................................................. 6
2. Introduction/Background ........................................................................................................................................... 7 Purpose of CHNA Report & ACA Requirements ............................................................................................................. 7 Impact of the ACA on CHNA ............................................................................................................................................ 7
3. About Our Hospital ...................................................................................................................................................... 9 Mission .................................................................................................................................................................................... 9 Values Statement ................................................................................................................................................................ 9 Community Served ............................................................................................................................................................ 10
4. Assessment Team ...................................................................................................................................................... 14 Hospitals & Other Partner Organizations ....................................................................................................................... 14 Identity & Qualifications of Consultants ......................................................................................................................... 14
5. 2013 CHNA Summary & Results ................................................................................................................................ 15 6. Process & Methods .................................................................................................................................................... 21
Primary Qualitative Data (Community Input) ............................................................................................................... 21 Community Leader Input ................................................................................................................................................. 21 Secondary Quantitative Data Collection ..................................................................................................................... 23 Information Gaps & Limitations ....................................................................................................................................... 24
7. Identification & Prioritization of Community Health Needs .................................................................................... 25 Overview of the Prioritization Process ............................................................................................................................ 25 Identification of Community Health Needs .................................................................................................................. 26 Prioritization of Health Needs ........................................................................................................................................... 27
8. Community Health Needs ........................................................................................................................................ 28 9. Conclusion ................................................................................................................................................................. 32 10. List of Appendices ..................................................................................................................................................... 33
Appendix A: Health Needs Profiles ................................................................................................................................. 34
Washington Hospital Healthcare System
2016 Community Health Needs Assessment (CHNA)
P a g e | 4
1. EXECUTIVE SUMMARY
Community Health Needs Assessment (CHNA) Background
The Affordable Care Act (ACA), enacted by Congress on March 23, 2010, stipulates that
nonprofit hospital organizations complete a community health needs assessment (CHNA)
every three years and make it widely available to the public. This assessment includes
feedback from the community and experts in public health, clinical care, and others. This
CHNA serves as the basis for implementation strategies that are filed with the Internal
Revenue Service (IRS).
The IRS requires that the hospital conduct a CHNA and adopt an implementation strategy
for each of its facilities by the last day of its taxable year, which for Washington Hospital
Healthcare System (Washington Hospital) is September 30, 2017. The CHNA itself was
conducted in 2015, meeting the requirement that the assessment be conducted in the
same tax year it is due, or in the two years immediately preceding that year.
This 2016 assessment is the second such assessment conducted since the ACA was enacted
and builds upon the information and understanding that resulted from the 2013 CHNA. This
2016 CHNA report documents how the CHNA was conducted and describes the related
findings. The Washington Township Health Care District Board of Directors adopted the 2013
CHNA on June 11, 2014.
Process & Methods
Twelve local hospitals in Alameda and Contra Costa Counties (“the Hospitals”) began the
second CHNA cycle in 2015. The Hospitals’ goal was to collectively gather community
feedback, understand existing data about health status, and prioritize local health needs.
Community input was obtained during the summer and fall of 2015 via key informant
interviews with local health experts, focus groups with community leaders and
representatives, and focus groups with community residents. Secondary data were
obtained from a variety of sources – see Appendix D for a complete list.
In November 2015, health needs were identified by synthesizing primary qualitative research
and secondary data, and then filtering those needs against a set of criteria. Needs were
then further prioritized and the results of the prioritization are included on the next page.
Prioritized Needs
Based on community input and secondary data, Washington Hospital generated a list of 11
health needs and prioritized a total of seven. These needs are listed below in alphabetical
order.
Washington Hospital Healthcare System
2016 Community Health Needs Assessment (CHNA)
P a g e | 5
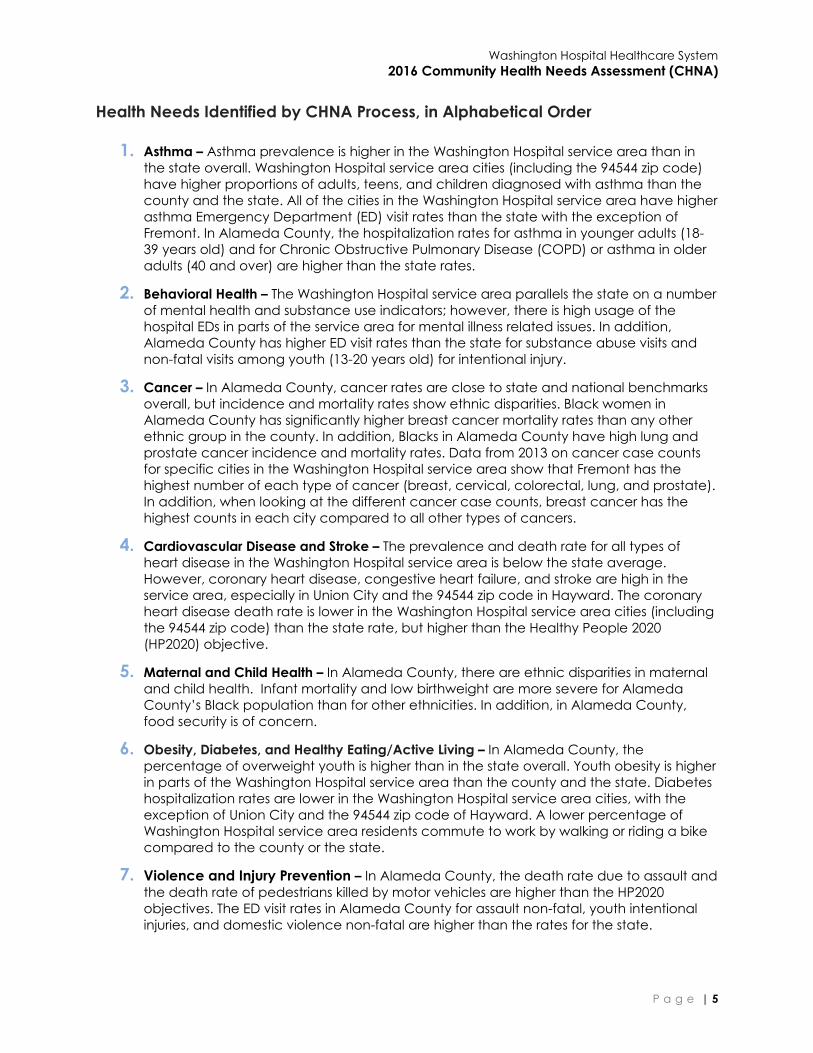
Health Needs Identified by CHNA Process, in Alphabetical Order
1. Asthma – Asthma prevalence is higher in the Washington Hospital service area than in
the state overall. Washington Hospital service area cities (including the 94544 zip code)
have higher proportions of adults, teens, and children diagnosed with asthma than the
county and the state. All of the cities in the Washington Hospital service area have higher
asthma Emergency Department (ED) visit rates than the state with the exception of
Fremont. In Alameda County, the hospitalization rates for asthma in younger adults (18-
39 years old) and for Chronic Obstructive Pulmonary Disease (COPD) or asthma in older
adults (40 and over) are higher than the state rates.
2. Behavioral Health – The Washington Hospital service area parallels the state on a number
of mental health and substance use indicators; however, there is high usage of the
hospital EDs in parts of the service area for mental illness related issues. In addition,
Alameda County has higher ED visit rates than the state for substance abuse visits and
non-fatal visits among youth (13-20 years old) for intentional injury.
3. Cancer – In Alameda County, cancer rates are close to state and national benchmarks
overall, but incidence and mortality rates show ethnic disparities. Black women in
Alameda County has significantly higher breast cancer mortality rates than any other
ethnic group in the county. In addition, Blacks in Alameda County have high lung and
prostate cancer incidence and mortality rates. Data from 2013 on cancer case counts
for specific cities in the Washington Hospital service area show that Fremont has the
highest number of each type of cancer (breast, cervical, colorectal, lung, and prostate).
In addition, when looking at the different cancer case counts, breast cancer has the
highest counts in each city compared to all other types of cancers.
4. Cardiovascular Disease and Stroke – The prevalence and death rate for all types of
heart disease in the Washington Hospital service area is below the state average.
However, coronary heart disease, congestive heart failure, and stroke are high in the
service area, especially in Union City and the 94544 zip code in Hayward. The coronary
heart disease death rate is lower in the Washington Hospital service area cities (including
the 94544 zip code) than the state rate, but higher than the Healthy People 2020
(HP2020) objective.
5. Maternal and Child Health – In Alameda County, there are ethnic disparities in maternal
and child health. Infant mortality and low birthweight are more severe for Alameda
County’s Black population than for other ethnicities. In addition, in Alameda County,
food security is of concern.
6. Obesity, Diabetes, and Healthy Eating/Active Living – In Alameda County, the
percentage of overweight youth is higher than in the state overall. Youth obesity is higher
in parts of the Washington Hospital service area than the county and the state. Diabetes
hospitalization rates are lower in the Washington Hospital service area cities, with the
exception of Union City and the 94544 zip code of Hayward. A lower percentage of
Washington Hospital service area residents commute to work by walking or riding a bike
compared to the county or the state.
7. Violence and Injury Prevention – In Alameda County, the death rate due to assault and
the death rate of pedestrians killed by motor vehicles are higher than the HP2020
objectives. The ED visit rates in Alameda County for assault non-fatal, youth intentional
injuries, and domestic violence non-fatal are higher than the rates for the state.

Washington Hospital Healthcare System
2016 Community Health Needs Assessment (CHNA)
P a g e | 6
Details of each health need are described in-depth in Section 8, “Community Health
Needs.”
Next Steps
After making this CHNA report publicly available in 2017, Washington Hospital will develop
individual implementation plans based on this shared data.
Washington Hospital Healthcare System
2016 Community Health Needs Assessment (CHNA)
P a g e | 7
2. INTRODUCTION/BACKGROUND
Purpose of CHNA Report & ACA Requirements
Enacted on March 23, 2010, the ACA provides guidance at a national level for CHNAs for
the first time. Federal requirements included in the ACA stipulate that hospital organizations
under 501(c)(3) status must adhere to new regulations 501(r), one of which is conducting a
CHNA every three years. The CHNA report must document how the assessment was done,
including the community served, who was involved in the assessment, the process and
methods used to conduct the assessment, and the community’s health needs that were
identified and prioritized as a result of the assessment. Final requirements were published in
December 2014. The 2016 CHNA meets both state (SB697) and federal (ACA) requirements.
The federal definition of community health needs includes the social determinants of health
in addition to morbidity and mortality. This broad definition of health needs is indicative of
the wider focus on both upstream and downstream factors that contribute to health. Such
an expanded view presents opportunities for nonprofit hospitals to look beyond immediate
presenting factors to identify and take action on the larger constellation of influences on
health, including the social determinants of health. In addition to providing a national set of
standards and definitions related to community health needs, the ACA has had an impact
on upstream factors. For example, the ACA created more incentives for healthcare
providers to focus on prevention of disease by including lower or no co-payments for
preventative screenings. Also, funding has been established to support community-based
primary and secondary prevention efforts.
Impact of the ACA on CHNA
The last CHNA report conducted was in 2013, before the full implementation of the ACA.
Healthcare access was a top concern for the community and nonprofit hospitals and
remains so in 2016.
The intent of the ACA is to increase the number of insured individuals and make insurance
affordable through Medi-Cal expansion and healthcare exchanges implemented by
participating states. While the ACA has expanded coverage of care for many people and
families, there still exists a large population of people who remain uninsured as well as those
who experience barriers to healthcare, including costs of healthcare premiums and services
and getting access to timely, coordinated, culturally appropriate services.
State and County Impacts
Following the institution of the ACA in January 2014, Medi-Cal expanded in California to
low-income adults who were not previously eligible for coverage. Specifically, adults
earning less than 138% of the Federal Poverty Level (FPL, approximately $15,856 annually for
an individual) are now eligible for Medi-Cal. In 2014, “Covered California,” a State Health
Benefit Exchange, was created to provide a marketplace for healthcare coverage for any
Washington Hospital Healthcare System
2016 Community Health Needs Assessment (CHNA)
P a g e | 8
Californian. In addition, Americans and legal residents with incomes between 139% and
400% of the FPL can benefit from subsidized premiums.1
Between 2013 and 2014 there was a 12% drop in the number of uninsured Californians aged
18-64 years old,2 according to data cited by the California Health Care Foundation.
According to the California Health Interview Survey, in 2013 19% of the population aged 18-
64 in Alameda County was not insured (191,000 people).3 Previous years (2011 and 2012)
had seen the uninsured rate at 14%, demonstrating an unexpected increase between 2011
and 2013 in Alameda County.4 Also according to the California Health Interview Survey, in
2014 18% of the population aged 18-64 in Contra Costa County was not insured (122,000
people). This continues the unexpected increasing trend, beginning in 2012 when 15% of
the 18-64 population in Contra Costa County was uninsured, and continuing in 2013, when
16% of that population was uninsured.5
Although some Alameda County residents may have obtained health insurance for the first
time, health insurance costs, the cost of care, and access to timely appointments remain a
concern. As discussed later in this report, residents (including those whose insurance plans
did not change since ACA) are experiencing difficulties with getting timely appointments
for care, which they attribute to the lack of healthcare professionals. Indeed, professionals
who participated in this assessment also expressed concern about the lack of a sufficient
number of doctors and clinics that accept Medi-Cal and/or Denti-Cal insurance. This is
supported by evidence that there has been an increase in the percentage of people who
said they had forgone care because they could not get an appointment (from 5% in 2013
to 8% in 2014).6
While 2014 survey data are informative in understanding initial changes in healthcare
access, a clearer picture on what healthcare access looks like will be forthcoming in future
CHNA reports. While healthcare access is important in achieving health, a broader view
takes into consideration the influence of other factors including income, education, and
where a person lives. These factors are shaped by the distribution of money, power, and
resources at global, national, and local levels, which are themselves influenced by policy
choices. These underlying social and economic factors cluster and accumulate over one’s
life and influence health inequities across different populations and places.7 According to
the Robert Wood Johnson Foundation’s approach of what creates good health, health
outcomes are largely shaped by social and economic factors (40%), followed by health
behaviors (30%), clinical care (20%), and the physical environment (10%).8 To address the
bigger picture of what creates good health, healthcare systems are increasingly extending
beyond the walls of medical offices to the places where people live, learn, work, and play.
1 http://www.healthforcalifornia.com/covered-california. 2 California Health Interview Survey (CHIS), 2014. Retrieved Nov. 1, 2015 from http://www.chcf.org/aca-411/. 3 Insured/uninsured figures for Alameda County for 2014 are not considered statistically stable. 4 California Health Interview Survey (CHIS), 2011-2014. Retrieved Dec. 11, 2015 from
http://ask.chis.ucla.edu/AskCHIS/tools/_layouts/AskChisTool/home.aspx#/geography. 5 California Health Interview Survey (CHIS), 2011-2014. Retrieved Dec. 11, 2015 from
http://ask.chis.ucla.edu/AskCHIS/tools/_layouts/AskChisTool/home.aspx#/geography. 6 California Health Interview Survey (CHIS), 2014. Retrieved Nov. 1, 2015 from http://www.chcf.org/aca-411/. 7 Santa Clara County Public Health Department, 2014 Santa Clara County Community Health Assessment. 8 http://www.countyhealthrankings.org/our-approach.

Washington Hospital Healthcare System
2016 Community Health Needs Assessment (CHNA)
P a g e | 9
3. ABOUT OUR HOSPITAL
Washington Hospital is a District hospital which opened in 1958. It is governed by an elected
Board of Directors made up of five members. Washington Hospital serves the residents of
Fremont, Newark, Union City, and part of south Hayward and unincorporated Sunol, and it
encompasses approximately 124 square miles of Southern Alameda County. The District's
population is approximately 429,500.
The 2013 CHNA was coordinated in conjunction with the Hospital Council of Northern
California. The report included input from the Alameda County Public Health Department
and the City of Berkeley Public Health Department. The 2013 CHNA was adopted on June
11, 2014, by the Washington Township Health Care District Board of Directors.
In accordance with proposed IRS regulations pursuant to the Patient Protection and
Affordable Care Act of 2010, for the purposes of Washington Hospital Healthcare System’s
CHNA, the service area of focus includes the Washington Township Health Care District
boundaries of Fremont, Newark, Union City, Sunol, and a portion of the Hayward ZIP codes
94544 and 94545. The District area in 94545 consists of a golf course and there are no
residential homes on the land; therefore, for the purposes of this report, when referring to
Hayward, this will include the area of 94544 solely.
Mission
As the local Health Care District, our mission is to meet the healthcare needs of District
residents through medical services, education, and research. Within this scope, Washington
Township Health Care District is committed to assuming the leadership role in improving and
maintaining the health status of the residents by:
Identifying and assessing community healthcare needs.
Developing mechanisms to respond to the identified need within the financial
capabilities of the District.
Committing to a culture of patient safety and accountability.
Adopting identified best practices.
Providing access to high-quality, cost-effective health services through an integrated
delivery system.
Providing appropriate employee, professional, and community educational
resources to enhance patient care and health promotion throughout the District.
To support the fulfillment of the mission, the District's strategic vision is to be the regional
medical center of Southern Alameda County, offering services that span the full range of
care within the available financial resources.
Values Statement
Our organizational values stem directly from the origins of the Hospital District in 1948.
The District was formed to provide access to patient care services for the residents of
the Township, at a time when people had to leave their community and travel

Washington Hospital Healthcare System
2016 Community Health Needs Assessment (CHNA)
P a g e | 10
significant distances to find hospital care. The District serves its community by
providing high-quality, affordable, and convenient care. We are committed not only
in law but in spirit to local accountability.
Healthcare is an intensely personal service. Underlying all that we offer is the
recognition that healthcare is not a commodity. Our essential purpose is to improve
the human condition. Our reason for being begins and ends with our patients and
our community. To our patients we owe comfort, compassion, and whenever
possible, a cure. Our efforts are focused not just on the individual, but also on the
overall health of the community.
It is our obligation to provide responsible stewardship of our resources, acting in all
areas of our healthcare system with integrity, professionalism, and with respect for a
patient's right to choice.
To our fellow employees, volunteers, and members of our medical staff we owe a
commitment to perform all of our responsibilities with loyalty, perseverance, self-
discipline, and dependability. We achieve these goals through our organizational
commitment to process improvements and pursuit of excellence.
Community Served
The IRS defines the "community served" by a hospital as those individuals residing within its
hospital service area. A hospital service area includes all residents in a defined geographic
area and does not exclude low-income or underserved populations.
Washington Hospital collaborated on the 2016 CHNA with other hospitals (Kaiser
Permanente and St. Rose Hospital) in the Greater Southern Alameda County area.
Geographic Description of the Community Served (Towns, Counties, and/or ZIP codes)
Although Washington Hospital patients come from all around Alameda County, the majority
reside in the southern part of Alameda County. The Washington Hospital service area mainly
covers the cities of Hayward, Union City, Newark, Sunol, and Fremont. The ZIP codes are
94536, 94538, 94539, 94544, 94555, 94560, 94586, and 94587. The city of Sunol has a
population of less than 1,000. Readers should be aware that when the population is small,
relatively minor differences in numbers can appear large.
Washington Hospital Healthcare System
2016 Community Health Needs Assessment (CHNA)
P a g e | 11
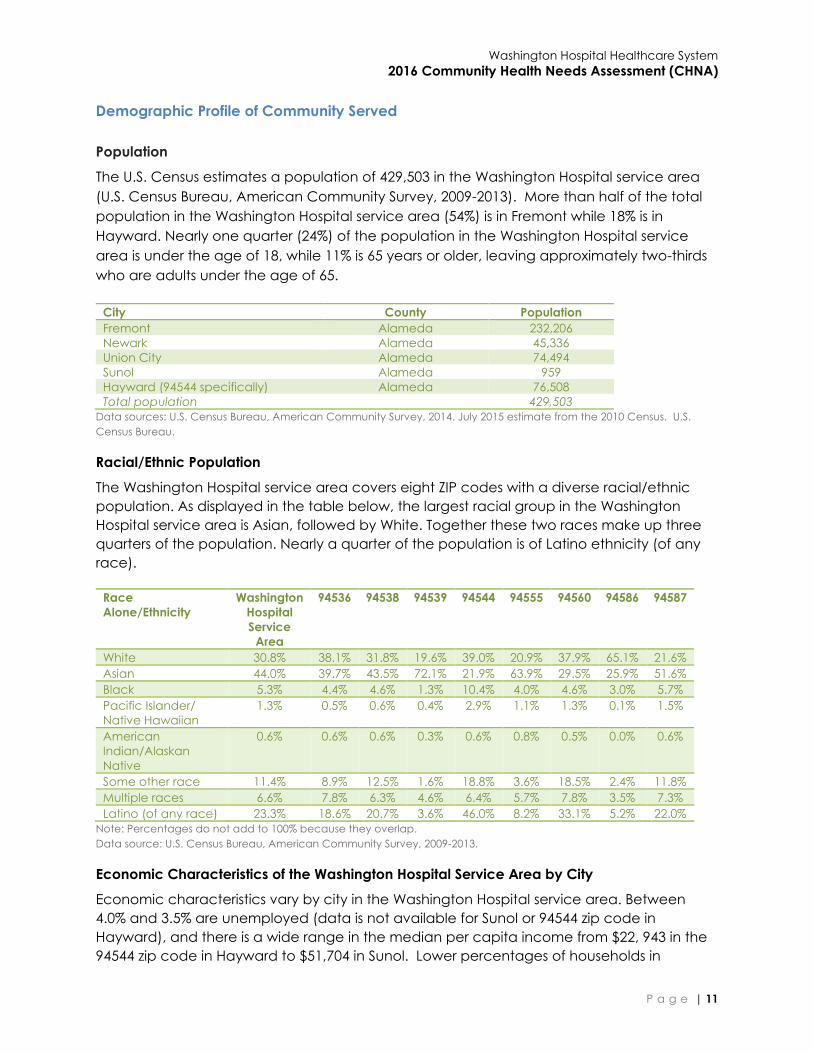
Demographic Profile of Community Served
Population
The U.S. Census estimates a population of 429,503 in the Washington Hospital service area
(U.S. Census Bureau, American Community Survey, 2009-2013). More than half of the total
population in the Washington Hospital service area (54%) is in Fremont while 18% is in
Hayward. Nearly one quarter (24%) of the population in the Washington Hospital service
area is under the age of 18, while 11% is 65 years or older, leaving approximately two-thirds
who are adults under the age of 65.
City County Population
Fremont Alameda 232,206
Newark Alameda 45,336
Union City Alameda 74,494
Sunol Alameda 959
Hayward (94544 specifically) Alameda 76,508
Total population 429,503
Data sources: U.S. Census Bureau, American Community Survey, 2014. July 2015 estimate from the 2010 Census. U.S.
Census Bureau.
Racial/Ethnic Population
The Washington Hospital service area covers eight ZIP codes with a diverse racial/ethnic
population. As displayed in the table below, the largest racial group in the Washington
Hospital service area is Asian, followed by White. Together these two races make up three
quarters of the population. Nearly a quarter of the population is of Latino ethnicity (of any
race).
Race
Alone/Ethnicity
Washington
Hospital
Service
Area
94536 94538 94539 94544 94555 94560 94586 94587
White 30.8% 38.1% 31.8% 19.6% 39.0% 20.9% 37.9% 65.1% 21.6%
Asian 44.0% 39.7% 43.5% 72.1% 21.9% 63.9% 29.5% 25.9% 51.6%
Black 5.3% 4.4% 4.6% 1.3% 10.4% 4.0% 4.6% 3.0% 5.7%
Pacific Islander/
Native Hawaiian
1.3% 0.5% 0.6% 0.4% 2.9% 1.1% 1.3% 0.1% 1.5%
American
Indian/Alaskan
Native
0.6% 0.6% 0.6% 0.3% 0.6% 0.8% 0.5% 0.0% 0.6%
Some other race 11.4% 8.9% 12.5% 1.6% 18.8% 3.6% 18.5% 2.4% 11.8%
Multiple races 6.6% 7.8% 6.3% 4.6% 6.4% 5.7% 7.8% 3.5% 7.3%
Latino (of any race) 23.3% 18.6% 20.7% 3.6% 46.0% 8.2% 33.1% 5.2% 22.0%
Note: Percentages do not add to 100% because they overlap.
Data source: U.S. Census Bureau, American Community Survey, 2009-2013.
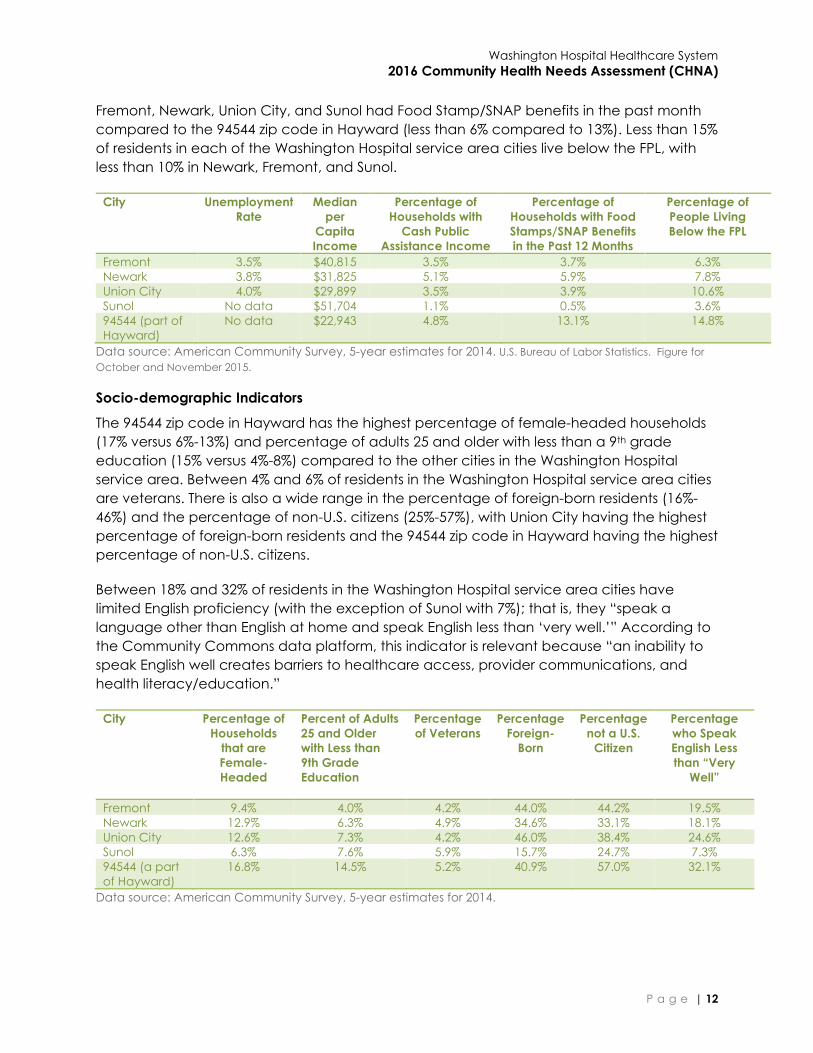
Economic Characteristics of the Washington Hospital Service Area by City
Economic characteristics vary by city in the Washington Hospital service area. Between
4.0% and 3.5% are unemployed (data is not available for Sunol or 94544 zip code in
Hayward), and there is a wide range in the median per capita income from $22, 943 in the
94544 zip code in Hayward to $51,704 in Sunol. Lower percentages of households in
Washington Hospital Healthcare System
2016 Community Health Needs Assessment (CHNA)
P a g e | 12
Fremont, Newark, Union City, and Sunol had Food Stamp/SNAP benefits in the past month
compared to the 94544 zip code in Hayward (less than 6% compared to 13%). Less than 15%
of residents in each of the Washington Hospital service area cities live below the FPL, with
less than 10% in Newark, Fremont, and Sunol.
City Unemployment
Rate
Median
per
Capita
Income
Percentage of
Households with
Cash Public
Assistance Income
Percentage of
Households with Food
Stamps/SNAP Benefits
in the Past 12 Months
Percentage of
People Living
Below the FPL
Fremont 3.5% $40,815 3.5% 3.7% 6.3%
Newark 3.8% $31,825 5.1% 5.9% 7.8%
Union City 4.0% $29,899 3.5% 3.9% 10.6%
Sunol No data $51,704 1.1% 0.5% 3.6%
94544 (part of
Hayward)
No data $22,943 4.8% 13.1% 14.8%
Data source: American Community Survey, 5-year estimates for 2014. U.S. Bureau of Labor Statistics. Figure for
October and November 2015.
Socio-demographic Indicators
The 94544 zip code in Hayward has the highest percentage of female-headed households
(17% versus 6%-13%) and percentage of adults 25 and older with less than a 9th grade
education (15% versus 4%-8%) compared to the other cities in the Washington Hospital
service area. Between 4% and 6% of residents in the Washington Hospital service area cities
are veterans. There is also a wide range in the percentage of foreign-born residents (16%-
46%) and the percentage of non-U.S. citizens (25%-57%), with Union City having the highest
percentage of foreign-born residents and the 94544 zip code in Hayward having the highest
percentage of non-U.S. citizens.
Between 18% and 32% of residents in the Washington Hospital service area cities have
limited English proficiency (with the exception of Sunol with 7%); that is, they “speak a
language other than English at home and speak English less than ‘very well.’” According to
the Community Commons data platform, this indicator is relevant because “an inability to
speak English well creates barriers to healthcare access, provider communications, and
health literacy/education.”
City Percentage of
Households
that are
Female-
Headed
Percent of Adults
25 and Older
with Less than
9th Grade
Education
Percentage
of Veterans
Percentage
Foreign-
Born
Percentage
not a U.S.
Citizen
Percentage
who Speak
English Less
than “Very
Well”
Fremont 9.4% 4.0% 4.2% 44.0% 44.2% 19.5%
Newark 12.9% 6.3% 4.9% 34.6% 33.1% 18.1%
Union City 12.6% 7.3% 4.2% 46.0% 38.4% 24.6%
Sunol 6.3% 7.6% 5.9% 15.7% 24.7% 7.3%
94544 (a part
of Hayward)
16.8% 14.5% 5.2% 40.9% 57.0% 32.1%
Data source: American Community Survey, 5-year estimates for 2014.

Washington Hospital Healthcare System
2016 Community Health Needs Assessment (CHNA)
P a g e | 13
Map of Community Served
Washington Hospital Healthcare System Service Area Map
Washington Hospital Healthcare System
2016 Community Health Needs Assessment (CHNA)
P a g e | 14
4. ASSESSMENT TEAM
Hospitals & Other Partner Organizations
Community benefit managers from twelve local hospitals in Alameda and Contra Costa
Counties (“the Hospitals”) contracted with Applied Survey Research in 2015 to conduct the
CHNA in 2016. The Hospitals comprised:
John Muir Health
Kaiser Permanente Diablo (Antioch and Walnut Creek hospitals)
Kaiser Permanente East Bay (Oakland and Richmond hospitals)
Kaiser Permanente Greater Southern Alameda (Fremont and San Leandro hospitals)
St. Rose Hospital
San Ramon Regional Hospital
Stanford Health Care – ValleyCare
UCSF Benioff Children’s Hospital Oakland
Washington Hospital Healthcare System
Identity & Qualifications of Consultants
The CHNA was completed by ASR, a nonprofit social research firm. For this assessment ASR
conducted primary research, collected secondary data, synthesized primary and
secondary data, facilitated the process of identification of community health needs and
assets and of prioritization of community health needs, and documented the process and
findings into a report.
ASR was uniquely suited to provide the Hospitals with consulting services relevant to
conducting the CHNA. The team that participated in the work, including Dr. Jennifer van
Stelle, Abigail Stevens, Angie Aguirre, Samantha Green, Martine Watkins, Chandrika Rao,
Melanie Espino, Kristin Ko, James Connery, Christina Connery, Emmeline Taylor, Paige
Combs, and sub-contractors Dr. Julie Absey, Robin Dean, Lynn Baskett, and Nancy Ducos,
brought together diverse, complementary skill sets and various schools of thought (public
health, anthropology, sociology, social ethics, psychology, education, public affairs,
healthcare administration, and public policy).
In addition to their research and academic credentials, the ASR team has a 35-year history
of working with vulnerable and underserved populations including young children, teen
mothers, seniors, low-income families, immigrant families, families who have experienced
domestic violence and child maltreatment, the homeless, and children and families with
disabilities.
Communities recently assessed by ASR include Arizona (six regions), Alaska (three regions),
the San Francisco Bay Area including San Mateo, Santa Clara, Alameda, Contra Costa,
Santa Cruz, and Monterey Counties, San Luis Obispo County, the Central Valley area
including Stanislaus and San Joaquin Counties, Marin County, Nevada County, Pajaro
Valley, and Solano and Napa Counties.
Washington Hospital Healthcare System
2016 Community Health Needs Assessment (CHNA)
P a g e | 15
5. 2013 CHNA SUMMARY & RESULTS
A CHNA for Washington Hospital was completed in September 2013 to satisfy the IRS
requirement, and it was adopted by Washington Township Health Care District Board of
Directors in June 2014, according to guidelines proposed in the ACA. As of the time of this
CHNA report, our hospital had not received written comments about the 2013 CHNA report.
The 2013 CHNA identified health needs that formed the foundation for Washington
Hospital’s implementation strategies for fiscal years 2015 and 2016 (July 1, 2014 – June 30,
2016). These health needs included heart health, diabetes, stroke prevention, cancer
prevention, weight management, public safety, mental health, and other areas. The
following is a summary of what has been accomplished during this time period to address
the identified needs.
2013 Washington Hospital CHNA Health Needs List
Heart Health
Diabetes
Stroke Prevention
Cancer Prevention
Weight Management
Public Safety
Mental Health
Other
Heart Health Washington Hospital established a Clinical Operations Reducing
Readmissions Committee. One of the initiatives is to follow up with
congestive heart failure (CHF) patients by phone to ensure they have
obtained medications and attend follow-up appointments.
The Washington on Wheels Mobile Health Clinic received several
grants to fund operational expenses. This allowed staff to continue to
provide services to uninsured patients; services include wellness visits,
medical physicals, prescription drug follow-up visits, and blood
pressure, glucose, and cholesterol screenings, all of which directly
affect heart health.
Washington Hospital conducted two free peripheral vascular disease
screenings and three free abdominal aortic aneurysm screening
events.
A total of 576 community members were screened. Of those
screened, 104 were found to have cardiovascular issues and were
referred for follow up with their primary healthcare provider for further
testing and treatment.
Washington Hospital Healthcare System
2016 Community Health Needs Assessment (CHNA)
P a g e | 16
Diabetes Washington Hospital hosted three Diabetes Awareness Health Fairs;
over 325 community members attended.
Washington Hospital continued providing Diabetes Matters, a free
monthly diabetes education class with expert speakers to help all
community members increase their knowledge about diabetes
followed by a group discussion. From July 1, 2014, through June 30,
2016, over 190 community members attended. Washington Hospital’s
television station, InHealth, also recorded and aired the
programming.
From July 1, 2014 – June 30, 2016, Washington on Wheels Mobile
Health Clinic continued to provide free blood sugar screenings
during the summer months; 1,121 community members were
screened. Of those screened, 107 people were found to have
elevated blood glucose and were referred to follow-up with their
primary healthcare provider for further testing and treatment.
Washington Outpatient Diabetes Center continued offering the
BASICS Program. The BASICS Program is a comprehensive approach
to successfully manage diabetes. More than 90% of participants who
have completed the BASICS Program have reduced their A1C blood
test values (the gold standard 3-month glucose level) to less than 7%.
o As of July 2015, Washington Hospital expanded the program
to the Washington Township Medical Foundation Newark
Clinic site. This provided greater access to the residents of
Newark where hospitalization and emergency room visits
rates were high due to diabetes.
Stroke
Prevention
Washington Hospital continued providing a four-part Stroke
Education Series to the community.
o The series includes:
Part 1: Introduction - Stroke and Risk Factors for Stroke
Part 2: Acute Management of Stroke and Chronic
Care and Stroke Rehabilitation
Part 3: Stroke Prevention and Other Disease Processes
and Healthy Lifestyle - Be Smart and Avoid Stroke
Part 4: Living with Stroke and Future in Diagnosis and
Management
o From July 1, 2014, through June 30, 2016, over 150 community
members attended.
Washington Hospital adopted the Act FAST campaign. Act FAST is an
easy way to remember and identify the most common symptoms of
a stroke. The Hospital also distributed Act FAST refrigerator magnets
at large community events in addition to stroke awareness programs
and seminars.
On the first Tuesday of each May, members of the Washington
Hospital stroke team partner with EMS responders to pass out cards

Washington Hospital Healthcare System
2016 Community Health Needs Assessment (CHNA)
P a g e | 17
identifying the signs and symptoms of a stroke to commuters at the
Fremont BART station.
Washington Hospital hosted three annual Stroke Awareness Day
screening events. The free screening consists of a Doppler study of
the neck, an EKG, and blood pressure, cholesterol, and glucose
screenings.
o A total of 304 community members were screened. Of those
screened, 72 were found to be at high risk for stroke based on
other risk factors and were referred to follow up with their
primary healthcare provider for further testing and treatment.
Cancer
Prevention
Washington Hospital continued providing grants for mammograms to
uninsured clients referred by community clinics such as Tri-City Health
Center and Tiburcio Vasquez Health Center. These clients include
women ages 40 to 70 or ages 30 to 40 who are asymptomatic and
considered at high risk for breast cancer as defined by the Medicare
program.
o From July 1, 2014 – June 30, 2016, 135 patients were referred
and received free mammograms. Of the 135 mammograms
performed, 33 cases resulted in abnormal findings and were
referred for follow up with their primary healthcare provider
for further testing and treatment.
Washington Hospital continued using the Gail Model to identify
women who may be at high risk for developing breast cancer.
o From July 1, 2014 – June 30, 2016, 82 patients were identified
as high risk for developing breast cancer. High risk patients
are encouraged to obtain an annual MRI and consult with
medical oncologists for consideration of chemoprevention.
o Of the 82 patients, 34 underwent recommended MRI breast
exams, one breast cancer incidence was identified, and one
patient with atypical ductal hyperplasia was identified.
Washington Hospital hosted three Annual Think Pink! Breast Health
Awareness events. Think Pink offers women the latest information on
breast care and other tips for leading a healthier life. During the
event, Washington Hospital medical staff and clinicians presented
lectures on nutritious foods for breast health, survivorship, and how to
prevent breast cancer, including an overview of the Gail Model.
Washington Hospital implemented a lung cancer screening tool to
identify those who may be at high risk for developing lung cancer.
o From July 1, 2014 – June 30, 2016, 33 patients were identified
as high risk and underwent low-dose computed tomography
(LDCT) or non-contrast CT scans. No cancers were identified;
however, patients will undergo annual LDCT scans.
Through an affiliation with the University of California San Francisco
Medical Center (UCSF), Washington Hospital continued to offer a
cancer genetics program, which provided private consultations for
genetic counseling and risk assessment for cancer.
Washington Hospital Healthcare System
2016 Community Health Needs Assessment (CHNA)
P a g e | 18
o From July 1, 2014 – June 30, 2016, 98 patients were referred to
Washington Hospital for genetic counseling and risk
assessment for cancer. Of the 98 patients, 54 were screened,
11 had positive mutations, and 10 results are pending.
Washington Hospital hosted 11 free community seminars focused on
prevention, screening, and early detection for various cancers, e.g.,
breast, colorectal, lung, prostate, and skin, as part of the Health and
Wellness Series. Over 1,040 community members attended.
Weight
Management
Washington Hospital hosted 14 free community seminars focused on
nutrition education. From July 1, 2014, through June 30, 2016, over
400 community members attended.
Washington Hospital participated in 11 local school health fairs; over
2,375 students, parents, and teachers received information on
healthy eating, eating on the go, and tips to fuel a young athlete.
Washington Hospital continued to coordinate with the Alameda
County Food Bank and CalFresh programs to ensure that families
with lower incomes have access to healthy, fresh foods. The Food
and Nutrition/Clinical Services Department staff volunteered at the
Alameda County Food Bank; staff helped prepare food bags for
pick-up.
Washington Hospital Foundation and the Washington Hospital
Employees’ Association donated funds to TCV Food Bank and Thrift
Store (Tri-City Volunteers) towards the purchase of a mobile food
pantry, increasing access to healthy food to underserved
communities.
Public Safety The Washington Hospital Maternal Child Health Department
provided child passenger safety information to families being
discharged from the hospital with new babies and car seat
inspections for families with small children.
Washington Hospital’s television station, InHealth, aired the following
public service announcements:
o Acetaminophen
Overuse Danger
o Arthritis o Autism
o Bike Safety o Car Seat Safety o Childhood
Obesity
o Cyber Bullying o Diabetes o Enterovirus D68
o Flu Prevention o Food Safety o General
Vaccination
o Genetic
Counseling
o Heart Disease o Nutrition
o Obesity
Prevention
o Shingles o Texting and
Driving
Washington Hospital Healthcare System
2016 Community Health Needs Assessment (CHNA)
P a g e | 19
o Toddler Seat o Sports-Related
Concussions
o Stroke Awareness
o Whooping
Cough
o Zika Virus
Washington Hospital worked with the City of Fremont to implement
improvements to enhance pedestrian safety at the Civic Center
Drive crosswalk adjacent to the Hospital. Some of the many
improvements included installation of rectangular rapid flashing
beacons (RRFBs), travel lanes on Civic Center Drive were reduced to
9 feet wide, and buffered lanes were added between the bicycle
lane and the travel lane. Washington Hospital is currently evaluating
implementing a stop light for additional safety measures.
Washington Sports Medicine and Washington Outpatient
Rehabilitation Center established a bimonthly sports medicine
education series for coaches, athletes, parents, and athletic trainers;
topics include prevention and treatment of injuries.
Washington Sports Medicine continued providing education to high
school athletic departments on concussion safety. Sports Medicine
also recently implemented EYE-SYNC®, a cognitive assessment tool
to test for concussion and/or other cognitive impairments
immediately after an on-field collision. This virtual reality tool
drastically reduces the time it takes to diagnose a concussion.
Mental Health Washington Hospital began preliminary discussions with Alameda
Health System to explore a possible collaboration to increase access
to mental health resources within the District.
Washington Hospital developed a matrix outlining local mental
health resources for increased access to services. The matrix includes
a list of comprehensive healthcare services such as drug
rehabilitation centers for teens, psychiatric hospitals, and centers for
outpatient and inpatient services. However, a majority of the services
are located in Northern Alameda County.
Other Washington Hospital continued providing grants for emergency room
care, laboratory, and medical imaging services to uninsured clients
referred to Washington Hospital by community clinics and
organizations such as Tri-City Health Center, Tiburcio Vasquez Health
Center, and CURA (drug rehabilitation center). Washington Hospital
plans to continue providing these services to ensure care for chronic
and acute illness for some of the most vulnerable community
members.
Washington Hospital provided a hand hygiene program educating
1st through 3rd graders within the District on how to properly wash
hands and why it is so important.
From July 1, 2014 – June 30, 2016, Washington Hospital provided 145
classroom presentations, reaching 3,707 students.

Washington Hospital Healthcare System
2016 Community Health Needs Assessment (CHNA)
P a g e | 20
Washington Hospital also distributed small bottles of hand sanitizer at
various health fairs in addition to large public functions such as the
Fremont Free Summer Concerts in Central Park.
Washington Hospital successfully executed improvements to reduce
C. difficile rates.
o Some of the improvements included:
Education for departments: Environmental Services,
Medical Imaging, transport & lift team, Nuclear
Medicine & EKG/ECHO staff.
Improved cleaning and disinfection procedure, e.g.,
cleaning “high-touch” surface areas with bleach
wipes.
Rounding on the floors by observing compliance for
isolation precautions, allowing for one-to-one staff
education, and increased accountability of
Environmental Services staff.
Washington Hospital provided free access to health education to
assist community members in making informed decisions about their
health and healthcare. Sources of education included Washington
Hospital’s Community Health Resource Library; the Hospital’s website;
a weekly health column in the Tri-City Voice newspaper promoting
health and safety education, as well as personal wellness tips; and
Washington Hospital’s television station, InHealth, which airs
throughout Fremont, Newark, and Union City, as well as being
available online.
Washington Hospital Healthcare System
2016 Community Health Needs Assessment (CHNA)
P a g e | 21
6. PROCESS & METHODS
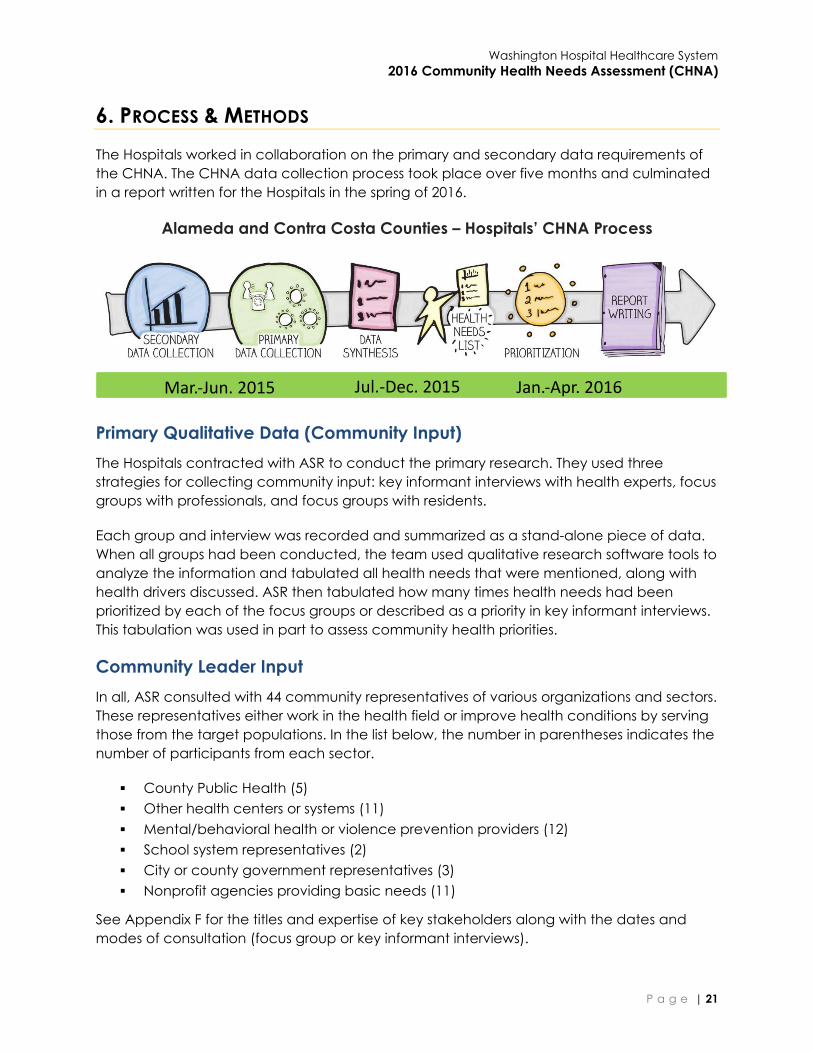
The Hospitals worked in collaboration on the primary and secondary data requirements of
the CHNA. The CHNA data collection process took place over five months and culminated
in a report written for the Hospitals in the spring of 2016.
Alameda and Contra Costa Counties – Hospitals’ CHNA Process
Primary Qualitative Data (Community Input)
The Hospitals contracted with ASR to conduct the primary research. They used three
strategies for collecting community input: key informant interviews with health experts, focus
groups with professionals, and focus groups with residents.
Each group and interview was recorded and summarized as a stand-alone piece of data.
When all groups had been conducted, the team used qualitative research software tools to
analyze the information and tabulated all health needs that were mentioned, along with
health drivers discussed. ASR then tabulated how many times health needs had been
prioritized by each of the focus groups or described as a priority in key informant interviews.
This tabulation was used in part to assess community health priorities.
Community Leader Input
In all, ASR consulted with 44 community representatives of various organizations and sectors.
These representatives either work in the health field or improve health conditions by serving
those from the target populations. In the list below, the number in parentheses indicates the
number of participants from each sector.
County Public Health (5)
Other health centers or systems (11)
Mental/behavioral health or violence prevention providers (12)
School system representatives (2)
City or county government representatives (3)
Nonprofit agencies providing basic needs (11)
See Appendix F for the titles and expertise of key stakeholders along with the dates and
modes of consultation (focus group or key informant interviews).
Mar.-Jun. 2015 Jul.-Dec. 2015 Jan.-Apr. 2016
Washington Hospital Healthcare System
2016 Community Health Needs Assessment (CHNA)
P a g e | 22
See Appendix G for key informant interview and focus group protocols.
Key Informant Interviews
ASR conducted primary research via key informant interviews with 18 Alameda County
experts from various organizations. Between June and October 2015, experts including the
public health officers, community clinic managers, and clinicians were consulted. These
experts had countywide experience and expertise.
ASR interviewed experts in person or by telephone for approximately one hour. Informants
were asked to identify the top needs of their constituencies, including specific groups or
areas with greater or special needs, how access to healthcare has changed in the post-
ACA environment, drivers of the health needs they identified and barriers to health, and
suggested solutions for the health needs they identified, including existing or needed
resources.
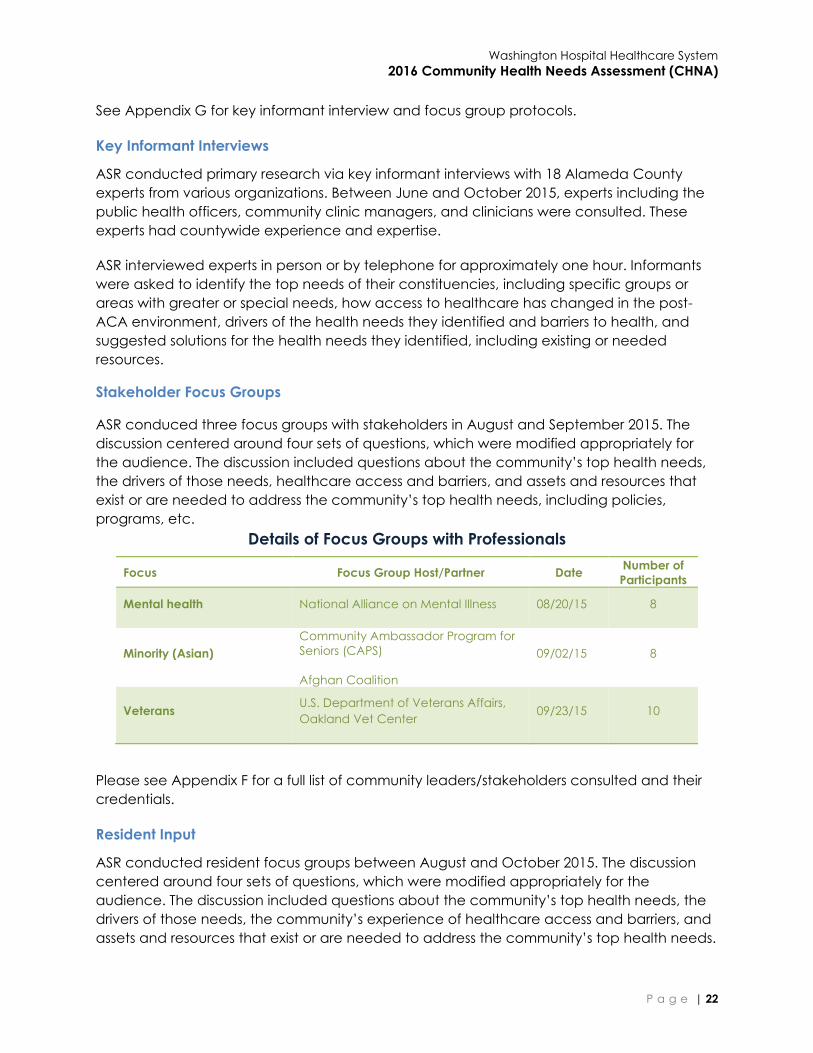
Stakeholder Focus Groups
ASR conduced three focus groups with stakeholders in August and September 2015. The
discussion centered around four sets of questions, which were modified appropriately for
the audience. The discussion included questions about the community’s top health needs,
the drivers of those needs, healthcare access and barriers, and assets and resources that
exist or are needed to address the community’s top health needs, including policies,
programs, etc.
Details of Focus Groups with Professionals
Focus Focus Group Host/Partner Date Number of
Participants
Mental health National Alliance on Mental Illness 08/20/15 8
Minority (Asian)
Community Ambassador Program for
Seniors (CAPS)
Afghan Coalition
09/02/15 8
Veterans U.S. Department of Veterans Affairs,
Oakland Vet Center 09/23/15 10
Please see Appendix F for a full list of community leaders/stakeholders consulted and their
credentials.
Resident Input
ASR conducted resident focus groups between August and October 2015. The discussion
centered around four sets of questions, which were modified appropriately for the
audience. The discussion included questions about the community’s top health needs, the
drivers of those needs, the community’s experience of healthcare access and barriers, and
assets and resources that exist or are needed to address the community’s top health needs.
Washington Hospital Healthcare System
2016 Community Health Needs Assessment (CHNA)
P a g e | 23
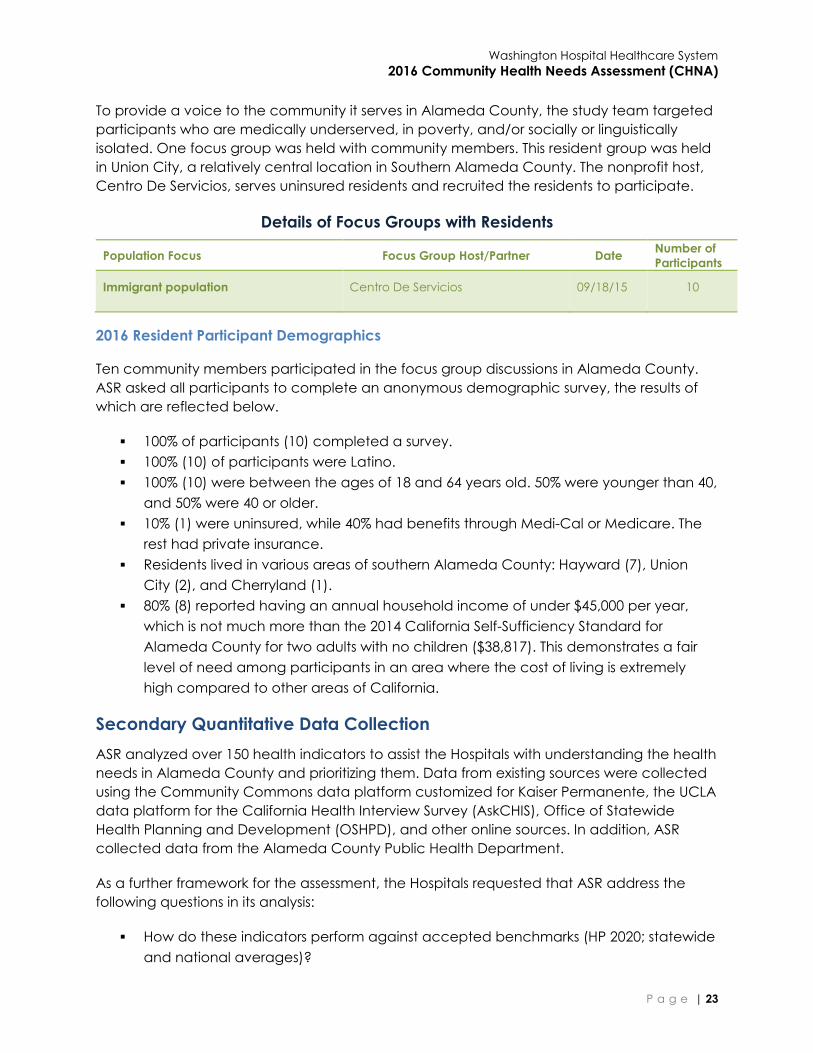
To provide a voice to the community it serves in Alameda County, the study team targeted
participants who are medically underserved, in poverty, and/or socially or linguistically
isolated. One focus group was held with community members. This resident group was held
in Union City, a relatively central location in Southern Alameda County. The nonprofit host,
Centro De Servicios, serves uninsured residents and recruited the residents to participate.
Details of Focus Groups with Residents
Population Focus Focus Group Host/Partner Date Number of
Participants
Immigrant population Centro De Servicios 09/18/15 10
2016 Resident Participant Demographics
Ten community members participated in the focus group discussions in Alameda County.
ASR asked all participants to complete an anonymous demographic survey, the results of
which are reflected below.
100% of participants (10) completed a survey.
100% (10) of participants were Latino.
100% (10) were between the ages of 18 and 64 years old. 50% were younger than 40,
and 50% were 40 or older.
10% (1) were uninsured, while 40% had benefits through Medi-Cal or Medicare. The
rest had private insurance.
Residents lived in various areas of southern Alameda County: Hayward (7), Union
City (2), and Cherryland (1).
80% (8) reported having an annual household income of under $45,000 per year,
which is not much more than the 2014 California Self-Sufficiency Standard for
Alameda County for two adults with no children ($38,817). This demonstrates a fair
level of need among participants in an area where the cost of living is extremely
high compared to other areas of California.
Secondary Quantitative Data Collection
ASR analyzed over 150 health indicators to assist the Hospitals with understanding the health
needs in Alameda County and prioritizing them. Data from existing sources were collected
using the Community Commons data platform customized for Kaiser Permanente, the UCLA
data platform for the California Health Interview Survey (AskCHIS), Office of Statewide
Health Planning and Development (OSHPD), and other online sources. In addition, ASR
collected data from the Alameda County Public Health Department.
As a further framework for the assessment, the Hospitals requested that ASR address the
following questions in its analysis:
How do these indicators perform against accepted benchmarks (HP 2020; statewide
and national averages)?

Washington Hospital Healthcare System
2016 Community Health Needs Assessment (CHNA)
P a g e | 24
Are there disparate outcomes and conditions for people in the community?
Information Gaps & Limitations
ASR and the Hospitals were limited in their ability to assess some of the identified community
health needs due to a lack of secondary data. Such limitations included data on sub-
populations, such as foreign-born, the LGBTQ population, and incarcerated individuals.
Health topics in which data are limited include: bullying, substance abuse (particularly, use
of illegal drugs and misuse of prescription medication), use of e-cigarettes and related
behaviors such as vaping, dental health (particularly dental caries), consumption of sugar-
sweetened beverages (SSBs), elder health, disabilities, flu vaccines, quality of life and
stressors, police-associated violence, human trafficking, discrimination and perceptions
related to race, sexual behaviors, and extended data on breastfeeding.
Washington Hospital Healthcare System
2016 Community Health Needs Assessment (CHNA)
P a g e | 25
7. IDENTIFICATION & PRIORITIZATION OF COMMUNITY HEALTH NEEDS
Overview of the Prioritization Process
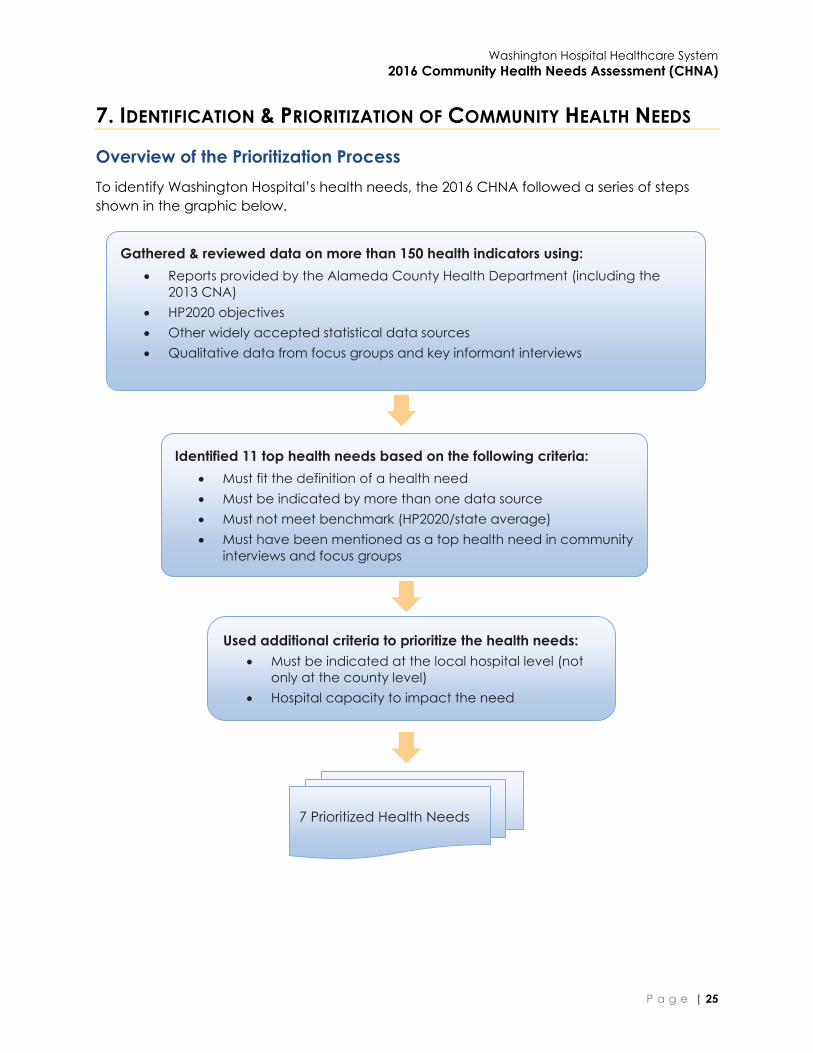
To identify Washington Hospital’s health needs, the 2016 CHNA followed a series of steps
shown in the graphic below.
Gathered & reviewed data on more than 150 health indicators using:
Reports provided by the Alameda County Health Department (including the
2013 CNA)
HP2020 objectives
Other widely accepted statistical data sources
Qualitative data from focus groups and key informant interviews
Identified 11 top health needs based on the following criteria:
Must fit the definition of a health need
Must be indicated by more than one data source
Must not meet benchmark (HP2020/state average)
Must have been mentioned as a top health need in community
interviews and focus groups
Used additional criteria to prioritize the health needs:
Must be indicated at the local hospital level (not
only at the county level)
Hospital capacity to impact the need
7 Prioritized Health Needs

Washington Hospital Healthcare System
2016 Community Health Needs Assessment (CHNA)
P a g e | 26
Identification of Community Health Needs
As described in Section 6, a wide variety of experts and community members were
consulted about the health of the community. Community members were frank and
forthcoming about their personal experiences with health challenges and their perceptions
about the needs of their families and community.
Collectively, they identified a diverse set of health conditions and demonstrated a clear
understanding of the health behaviors and other drivers (environmental and clinical) that
affect the health outcomes. They spoke about prevention, access to care, clinical
practices that work and don’t work, and their overall perceptions of the community’s
health.
In order to generate a list of health needs, ASR used a
spreadsheet (known as the “data culling tool”) to list
indicator data and evaluate whether they were “health
needs.” The indicator data collected included Community
Commons web platform data, secondary data from county
public health department reports, and qualitative data
from focus groups and key informant interviews.
In order to be categorized as a prioritized community
health need, all four of the following criteria needed to be
met:
1. The issue must fit the definition of a “health need.”
2. The issue is suggested or confirmed by more than
one source of secondary and/or primary data.
3. At least one related indicator performs poorly
against the Healthy People 2020 (“HP2020”)
benchmark or, if no HP2020 benchmark exists,
against the state average.
4. The need must meet a minimum threshold of being
prioritized by the community (e.g. was prioritized by
at least five of fourteen key informant interviews or
one of four focus groups).
Any health needs that did not reach the primary data
threshold in criterion #4 above needed to meet the
following criteria to qualify as a priority health need:
(a) Three or more indicators must miss a state or national benchmark by 5% or more from
target
(b) At least one indicator must show an ethnic disparity.
Terminology
Health condition: A disease,
impairment, or other state of physical
or mental ill health that contributes to
a poor health outcome.
Health driver: A behavioral,
environmental, or clinical care
factor, or a more upstream social or
economic factor that impacts
health.
Health need: A poor health outcome
and its associated health driver, or a
health driver associated with a poor
health outcome where the outcome
itself has not yet arisen as a need.
Health outcome: A snapshot of
diseases in a community that can be
described in terms of both morbidity
(quality of life) and mortality.
Health indicator: A characteristic of
an individual, population, or
environment which is subject to
measurement (directly or indirectly).
and can be used to describe one or
more aspects of the health of an
individual or population.

Washington Hospital Healthcare System
2016 Community Health Needs Assessment (CHNA)
P a g e | 27
A total of 11 health conditions or drivers fit all four criteria or conditional criteria and were
considered as top community health needs.
Prioritization of Health Needs
Washington Hospital further prioritized the list of health needs based on the following
criteria:
1) Local level: The health needs had to be evident at the local hospital level. Needs for
which there were only county level data were not prioritized.
2) Hospital expertise: Washington Hospital has the capacity and expertise to impact
the need.
A total of 7 health needs were retained and are described in Section 8 below.
Washington Hospital Healthcare System
2016 Community Health Needs Assessment (CHNA)
P a g e | 28
8. COMMUNITY HEALTH NEEDS
Asthma
Asthma is a chronic inflammatory disorder of the airways characterized by episodes of
reversible breathing problems due to airway narrowing and obstruction. Asthma is
considered a significant public health burden and its prevalence has been rising since 1980.
In the Washington Hospital service area, the percentage of adults with asthma is higher in
Newark (16%) and Fremont (16%) than Union City (15%) and the 94544 zip code in Hayward
(15%). All cities in the Washington Hospital service area have higher percentages of adults
(18 and older) who were told they have asthma, compared to the county (14%) and the
state (14%). More children and teens in Union City (24%), Fremont (24%), and the 94544 zip
code in Hayward (22%) have asthma than in the county (20%) and the state (15%). The
community felt they are more aware of and concerned about childhood asthma than
adult asthma.
The 94544 zip code in Hayward has the highest asthma ED visit rate (846.4 per 100,000) and
Fremont has the lowest visit rate (393.2) of Washington Hospital service area cities
compared to the state and county averages (498.7 and 649.0, respectively). The rate of
COPD or asthma hospitalizations for older adults in Alameda County (297.0) is close to the
rate for the state (296.0). However, hospitalizations for younger adults in Alameda County
(31.0) is higher than the rest of the state (25.0).
Behavioral Health
Mental health is a state of successful performance of mental function, resulting in
productive activities, fulfilling relationships with other people, and the ability to adapt to
change and to cope with challenges. It is essential to personal well-being, family and
interpersonal relationships, and the ability to contribute to community or society. Substance
abuse is related to mental health because many cope with mental health issues by using
drugs or abusing alcohol.
The rate of ED visits for mental illness problems is much higher in Newark (391.5 per 100,000),
Union City (397.8), Sunol (341.6), the 94544 zip code of Hayward (782.6), and Alameda
County (489.3) than in the state overall (320.0). The ED visit rate for substance use is also
higher in the 94544 zip code of Hayward (2488.9 per 100,000) and the city of Sunol (1416.3),
as well as Alameda County overall (1642.7) than in the state (1275.4). Additionally, ED visits
for intentional injury by youth are higher in Alameda County (954.1 per 100,000) than in the
state (738.7).
Compared to the state (9.8 per 100,000), the death rate due to suicide is lower in Alameda
County (8.2) and in all the cities in the Washington Hospital service area with the exception
of Sunol, which is much higher than the state (40.1).
Washington Hospital Healthcare System
2016 Community Health Needs Assessment (CHNA)
P a g e | 29
Cancer
Cancer is the second most common cause of death in the United States. Behavioral and
environmental factors play a large role in reducing the nation’s cancer burden, along with
the availability and accessibility of high-quality screening. In Alameda County, the breast
cancer incidence rate is 127.9 per 100,000, higher than the 121.5 rate for the state overall.
The prostate cancer incidence rate in Alameda County is 103.1, higher than the 98.0 rate
for the state overall.
Ethnic disparities can also be seen in incidence and mortality rates. White women in
Alameda County have higher incidence rates for breast cancer (155.4) than all women in
Alameda County (127.9) and White women in California overall (138.3). Black women in
Alameda County have significantly higher breast cancer mortality rates (27.6) than any
other ethnic group in the county. The colorectal cancer incidence rate in Alameda County
for Blacks (37.3) is higher than the county (34.2) and state (35.3) averages for everyone.
Blacks in Alameda County also have very high lung cancer incidence (57.4) and mortality
rates (52.2). In addition, the prostate cancer incidence (192.8) and mortality (49.7) rates for
Blacks in Alameda County are higher than the county (incidence 103.1, mortality 20.4) and
state (incidence 98.0, mortality 19.5) averages and compared to Blacks overall in California
(incidence 158.4, mortality 43.0)
Data from 2013 on cancer case counts for specific cities in the Washington Hospital service
area show that Fremont has the highest number of each type of cancer (breast, cervical,
colorectal, lung, and prostate). In addition, when looking at the different cancer case
counts, breast cancer has the highest counts in each city compared to all the other types
of cancers.
Cardiovascular Disease and Stroke
Nationally, more than one in three adults (81.1 million) live with one or more types of
cardiovascular disease. In addition to being the first and third leading causes of death
respectively, heart disease and stroke result in serious illness and disability, decreased quality
of life, and hundreds of billions of dollars in economic loss every year. It is imperative to
address risk factors early in life to prevent complications of chronic cardiovascular disease.
Black residents of Alameda County are much more likely than other groups to die from any
kind of heart disease (374.4 per 100,000 versus 245.2 for Alameda County, overall). The
coronary heart disease hospitalization rates for the 94544 zip code of Hayward (402.9 per
100,000), Newark (290.7), Union City (300.0), and Sunol (315.6) are higher than the county
(232.8) and state (247.8) averages. Deaths due to coronary heart disease are much higher
in the Washington Hospital service area cities of Fremont (125.3), Newark (125.8), Union City
(128), Sunol (130.5), and the 94544 zip code of Hayward (154.9) than the HP2020 objective
(103.4).
Congestive heart failure hospitalizations are high in Alameda County (195.9 per 100,000)
and in certain parts of the Washington Hospital service area. Union City has a very high rate
(225.4), but not as high as the 94544 zip code in Hayward (265.5).
Washington Hospital Healthcare System
2016 Community Health Needs Assessment (CHNA)
P a g e | 30
Only in Union City (281.0 per 100,000) is the stroke hospitalization rate higher than the state
average (215.5).
Maternal and Child Health
The topic area of maternal and child health addresses a wide range of conditions, health
behaviors, and health systems indicators that affect the health, wellness, and quality of life
of women, children, and families. Data indicators that measure progress in this area include
low birthweight, infant mortality, and access to prenatal care. Healthy birth outcomes and
early identification and treatment of health conditions among infants can prevent death or
disability and enable children to reach their full potential.
In 2013, the infant mortality rate for Black children (10.4 per 1,000) was much higher than the
Alameda County average (4.2) and the rate for Asian (3.0), White (3.1), and Latino (4.1)
children. Infants in Alameda County born to Black mothers were also more likely to suffer
low birthweight (10%) than those born to mothers of other ethnicities in the county (Asian
9%, multiracial 7%, Latino 6%, White 6%, Pacific Islander 5%). Black expectant mothers (90%)
were more likely to receive prenatal care in their first trimester than American Indian/Alaska
Native (83%) and Latina (88%) women but not as likely as Asian/Pacific Islander (92%), White
(92%), and multiracial women (92%).
Obesity, Diabetes, and Healthy Eating/Active Living
Healthy diets and achievement and maintenance of a healthy body weight reduce the risk
of chronic diseases and promote health. Efforts to change diet and weight should address
individual behaviors, as well as the policies and environments that support these behaviors
in settings such as schools, worksites, healthcare organizations, and communities. Creating
and supporting healthy food and physical environments allows people to make healthier
choices and live healthier lives.
Alameda County has a higher percentage of overweight youth (23%) than the state overall
(19%), while youth obesity in Alameda County (16%) is lower than for the state (19%). In the
94544 zip code of Hayward (39%), Newark (35%), and Union City (31%), youth obesity is
alarmingly high. The proportion of youth who are overweight in those areas (94544: 15%,
Union City: 13%, Newark: 14%), however, is lower than in the county (23%) and the state
(19%). Additionally, in Alameda County there are ethnic disparities in youth obesity and the
percentage of overweight youth. Latino (27%) and Black (24%) youth are more likely to be
overweight than their peers of other races or ethnicities. Of the youth in Alameda County
who are obese, 53% are Latino, 18% are Black, 15% are White, 11% are Asian, and 3% are
multiple races.
In the 94544 zip code of Hayward and Union City, there are very high diabetes
hospitalization rates (1,492.0 per 100,000 and 1,098.8) compared to the state (1,017.7).
The percentage of people who are physically active in terms of commuting to work by
walking or riding a bike is notably lower in all of the Washington Hospital service area cities
(including the 94544 zip code of Hayward) than the county and state averages. The
percentage of children in the 94544 zip code of Hayward (48%) who are physically inactive
Washington Hospital Healthcare System
2016 Community Health Needs Assessment (CHNA)
P a g e | 31
is higher than in the county (36%) and state (36%). In Alameda County, Latino (51%) and
Black (45%) children have much higher levels of inactivity than the county and state overall
and higher than other Latino (42%) and Black (43%) children in California.
Alameda County has a higher density of fast food restaurants (79.7 establishments per
100,000 population) than the state average of 74.9.
Food insecurity is associated with chronic diseases such as hypertension, diabetes, and
obesity. In 2014, 15% of the population in Alameda County reported experiencing food
insecurity at some point during the year, higher than the state average of 14%. The
percentage of families living below the FPL in the Washington Hospital service area and in
the county overall is lower than the state average.
Violence and Injury Prevention
Violence and intentional injury contribute to poorer physical health for victims, perpetrators,
and community members. In addition to direct physical injury, victims of violence are at
increased risk of depression, substance abuse disorders, anxiety, reproductive health
problems, and suicidal behavior. Crime in a neighborhood causes fear, stress, unsafe
feelings, and poor mental health. Witnessing and experiencing violence in a community
can cause long-term behavioral and emotional problems in youth.
The death rate due to homicide is higher in the 94544 zip code of Hayward (11.4 per
100,000), Newark (7.9), and Alameda County (8.5) than in the state (5.2) and the HP2020
objective (5.5). The death rate for pedestrians killed by motor vehicles is much higher in
Union City (4.0 per 100,000) than in the state (2.0) and slightly higher in Alameda County
(1.5) than the HP2020 objective (1.4).
Alameda County has a lower assault (injury) rate (394.3 ED visits per 100,000) than the
HP2020 objective (461.2), but assault injuries are more common in Alameda County than in
the state overall (290.3). The youth intentional injury rate is quite a bit higher in Alameda
County (954.1 ED visits per 100,000) than in the state (738.7). The occurrence of domestic
violence is more frequent in Alameda County (12.1 ED visits per 100,000) than in the state
(9.5). The unintentional injury ED visit rates in the Washington Hospital service areas cities are
all below the HP2020 objective (8,310.1) with the exception of the 94544 zip code in
Hayward (8,544.9).
Washington Hospital Healthcare System
2016 Community Health Needs Assessment (CHNA)
P a g e | 32
9. CONCLUSION
The Hospitals worked in collaboration to meet the requirements of the federally required
CHNA by pooling expertise, guidance, and resources for a shared assessment. By gathering
secondary data and doing new primary research as a team, the Hospitals were able to
collectively understand the community’s perception of health needs and prioritize health
needs with an understanding of how each compares against benchmarks.
After making this CHNA report publicly available in 2017, each hospital will develop
individual implementation plans based on this shared data.
Washington Hospital Healthcare System
2016 Community Health Needs Assessment (CHNA)
P a g e | 33
10. LIST OF APPENDICES
Appendix A: Health Needs Profiles
Appendix B: IRS Checklist
Appendix C: Glossary
Appendix D: Secondary Data Sources
Appendix E: Indicator List
Appendix F: List of Community Leaders and Their Credentials
Appendix G: Focus Group and Key Informant Interview Protocols
Appendix H: Community Assets and Resources
Washington Hospital Healthcare System
2016 Community Health Needs Assessment (CHNA)
P a g e | 34
APPENDIX A: HEALTH NEEDS PROFILES
o Asthma
o Behavioral Health
o Cancer
o Cardiovascular Disease and Stroke
o Maternal and Child Health
o Obesity, Diabetes, and Healthy Eating/Active Living
o Violence and Injury Prevention

Profile of Washington Hospital Healthcare System Health Needs
ASTHMA
© Applied Survey Research, 2016
Asthma is a chronic inflammatory disorder of the airways
characterized by episodes of reversible breathing problems due to
airway narrowing and obstruction. These episodes can range in
severity from mild to life threatening. Symptoms of asthma include
wheezing, coughing, chest tightness, and shortness of breath.i Risk
factors for asthma currently being investigated include having a
parent with asthma; sensitization to irritants and allergens;
respiratory infections in childhood; and being overweight.
Asthma affects people of every race, sex, and age. However,
significant disparities in asthma morbidity and mortality exist, in
particular for low-income and minority populations. The
populations with higher rates of asthma include Blacks, people living below the Federal Poverty Level, children, and
people with certain exposures in the workplace.i
Asthma is considered a significant public health burden and its prevalence has been rising since 1980.i Specific methods
of detection, intervention, and treatment exist that may reduce this burden and promote health.
Why Is It a Community Health Need?
While Alameda County’s air quality was better than the state’s as a whole, three of the cities in the Washington Hospital Healthcare System (Washington Hospital) service area had higher asthma Emergency Department (ED) visit rates than the state. Washington Hospital cities also had higher proportions of adults, teens, and children diagnosed with asthma than the county and the state.
Washington Hospital Healthcare System Service Area
Fremont Newark Union City
Sunol Alameda
County CA
State
Air Quality: % of days exceeding fine particulate matter (PM2.5) standards. Population adjusted average ii
Countywide measures only 0.0% iii 0.46%
Hospitalization Rate for Chronic Obstructive Pulmonary Disease (COPD) (chronic bronchitis or emphysema) or Asthma in Older Adults (Ages 40 and over). Rate is risk adjusted and per 100,000 iv
Countywide measures only 297.0 296.0
Hospitalization Rate for Asthma in Younger Adults (Ages 18-39). Rate is risk adjusted and per 100,000 v
Countywide measures only 31.0 25.0
Asthma Emergency Department Visits Rate. Rate is age adjusted and per 100,000
393.2vi 617.4vi 619.6vi 768.9 vii 649.0 vi 498.7 viii
Asthma Prevalence (Adult): % Adults 18 and older ever told they have asthma
15.6% ix 16.1% ix 15.2% ix n/a 13.7% x 13.8% X
Asthma Prevalence (Children and Teens): % Children and Teens ages 1-17 ever diagnosed with asthma
24.0% ix n/a 24.1% ix n/a 20.1% xi 15.2% xi
Fremont had a notably low asthma ED visit rate (393.2 per 100,000) compared to the other cities in the Washington Hospital service area.
ASTHMA PREVALENCE IS HIGH
Asthma prevalence is higher in the service area than in the state overall.
The community is more aware of and concerned about childhood
asthma than adult asthma.
ASTHMA | Profile of Health Needs
Data found in this 2016 Community Health Needs Assessment health profile was retrieved from the Community Commons platform unless otherwise noted.
The proportion of adults with asthma was higher in Newark (16.1%) than in Fremont (15.6%) and Union City (15.2%). Data are not available for Sunol. All cities had higher adult asthma than the county (13.7%) and the state (13.8%)
More children and teens in Fremont (24.0%) and Union City (24.1%) had asthma than in the county (20.1%) and the state (15.2%). Data are not available for Newark and Sunol
The rate of asthma hospitalizations for older adults in Alameda County (297.0) was close to the rate for the state (296.0). However, hospitalizations for younger adults in Alameda County (31.0) was higher than the rest of the state (25.0)
What Does the Community Say? Residents said asthma is a “bigger deal” in elementary school
The community had concerns about how asthma will be managed without a hospital nearby
The community expressed concern about childhood asthma
Depending on the time of the year, according to residents, there can be high number of pediatric respiratory problems
Commitment to Improving Community Health In 2016, in collaboration with 11 other hospitals throughout Alameda and Contra Costa Counties, the CHNA process
identified asthma as one of the top health needs in the community based on statistical data and community input. Each
hospital posts its final 2016 Community Health Needs Assessment (CHNA) publically on its website. Each hospital’s
Implementation Strategy report describes in detail the investments made in the community, including programming and
partnerships.
i Healthy People 2020. Office of Disease Prevention and Health Promotion. Web. December 2015 ii US Environmental Protection Agency: 2012 iii 0% denotes all days were within NAQSS Standards iv Office of Statewide Health Planning and Development: 2014 v Office of Statewide Health Planning and Development: 2014 vi Office of Statewide Health Planning and Development: 2014 vii Office of Statewide Health Planning and Development: 2011-13 viii Office of Statewide Health Planning and Development: 2013 ix California Health Interview Survey: 2011-12 x California Health Interview Survey: 2014 xi California Health Interview Survey: 2013-14
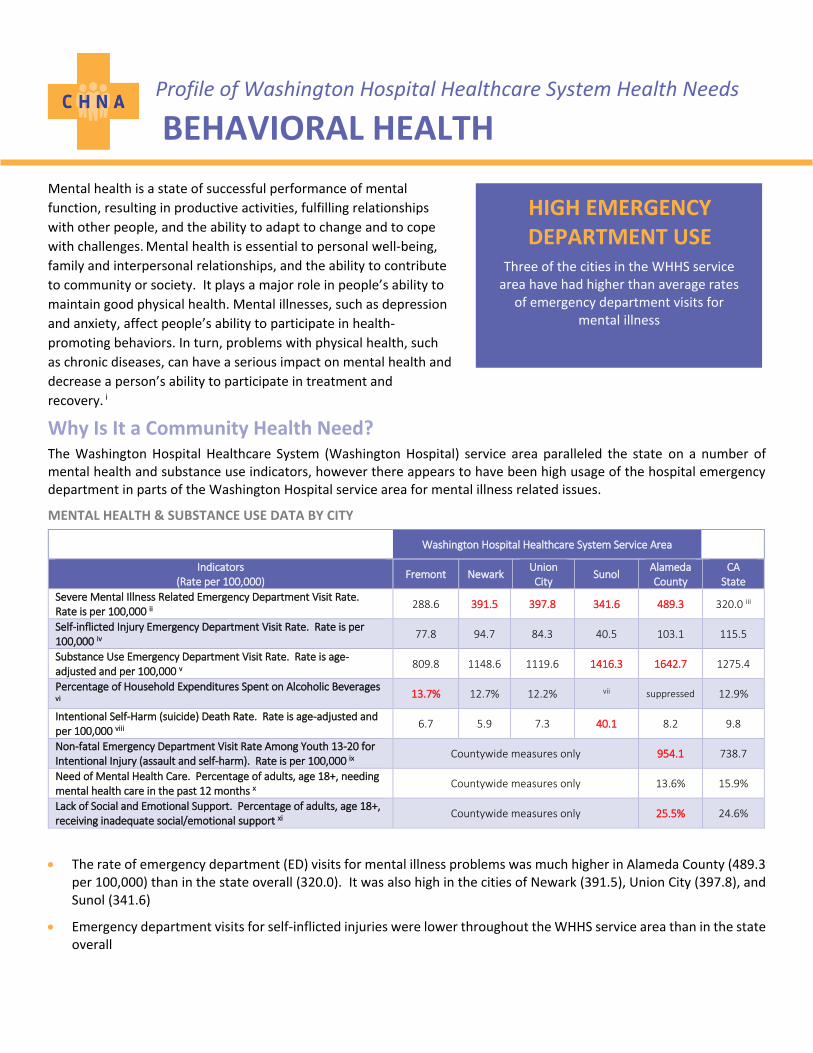
Profile of Washington Hospital Healthcare System Health Needs
BEHAVIORAL HEALTH
Mental health is a state of successful performance of mental
function, resulting in productive activities, fulfilling relationships
with other people, and the ability to adapt to change and to cope
with challenges. Mental health is essential to personal well-being,
family and interpersonal relationships, and the ability to contribute
to community or society. It plays a major role in people’s ability to
maintain good physical health. Mental illnesses, such as depression
and anxiety, affect people’s ability to participate in health-
promoting behaviors. In turn, problems with physical health, such
as chronic diseases, can have a serious impact on mental health and
decrease a person’s ability to participate in treatment and
recovery. i
Why Is It a Community Health Need? The Washington Hospital Healthcare System (Washington Hospital) service area paralleled the state on a number of mental health and substance use indicators, however there appears to have been high usage of the hospital emergency department in parts of the Washington Hospital service area for mental illness related issues.
MENTAL HEALTH & SUBSTANCE USE DATA BY CITY
Washington Hospital Healthcare System Service Area
Indicators (Rate per 100,000)
Fremont Newark Union City
Sunol Alameda County
CA State
Severe Mental Illness Related Emergency Department Visit Rate. Rate is per 100,000 ii
288.6 391.5 397.8 341.6 489.3 320.0 iii
Self-inflicted Injury Emergency Department Visit Rate. Rate is per 100,000 iv
77.8 94.7 84.3 40.5 103.1 115.5
Substance Use Emergency Department Visit Rate. Rate is age-adjusted and per 100,000 v
809.8 1148.6 1119.6 1416.3 1642.7 1275.4
Percentage of Household Expenditures Spent on Alcoholic Beverages vi
13.7% 12.7% 12.2% vii suppressed 12.9%
Intentional Self-Harm (suicide) Death Rate. Rate is age-adjusted and per 100,000 viii
6.7 5.9 7.3 40.1 8.2 9.8
Non-fatal Emergency Department Visit Rate Among Youth 13-20 for Intentional Injury (assault and self-harm). Rate is per 100,000 ix
Countywide measures only 954.1 738.7
Need of Mental Health Care. Percentage of adults, age 18+, needing mental health care in the past 12 months x
Countywide measures only 13.6% 15.9%
Lack of Social and Emotional Support. Percentage of adults, age 18+, receiving inadequate social/emotional support xi
Countywide measures only 25.5% 24.6%
The rate of emergency department (ED) visits for mental illness problems was much higher in Alameda County (489.3 per 100,000) than in the state overall (320.0). It was also high in the cities of Newark (391.5), Union City (397.8), and Sunol (341.6)
Emergency department visits for self-inflicted injuries were lower throughout the WHHS service area than in the state overall
HIGH EMERGENCY DEPARTMENT USE
Three of the cities in the WHHS service area have had higher than average rates
of emergency department visits for mental illness

BEHAVIORAL HEALTH | Profile of Health Needs
Data found in this 2016 Community Health Needs Assessment health profile was retrieved from the Community Commons platform unless otherwise noted.
However, the ED visit rate for substance use was higher in both Alameda County overall (1642.7 per 100,000) and in the city of Sunol (1416.3) than in the state (1275.4). Fremont (809.8), Newark (1148.6), and Union City (1119.6) were all below the state average
In Fremont, the percentage of household expenditures spent on alcohol (13.7%) was slightly higher than the state average (12.9%)
Compared to the state (9.8 per 100,000), the death rate due to suicide is lower in Alameda County (8.2) and in the cities of Fremont (6.7), Newark (5.9), and Union City (7.3), but much higher in Sunol (40.1)
ED visits for intentional injury by youth was higher in Alameda County (954.1) than in the state (738.7)
The percentage of adults receiving inadequate social/emotional support in Alameda County (25.5%) was only slightly higher than in the state overall (24.6%)
While risk factors such as binge drinking (Alameda County: 11.7%, state: 15%) and poor mental health (Alameda County: 8.2%, state: 11.1%) were better in Alameda County than in the state, there was a slightly higher percentage of heavy drinkers in Alameda County (6.5%) than in the state (5.8%) xix
What Does the Community Say?
Participants did not consider mental health an illness
The community members felt there is a lack of mental health providers
Residents reported a lack of information as to where and who to speak with to obtain services
The community members had experienced poor discharge procedures and lack of follow-up after mental health emergencies
Participants said there was a lack of “placement care” and behavioral health services for adolescents
Residents reported that a lot of mental health providers do not accept insurance
Commitment to Improving Community Health
In 2016, in collaboration with 11 other hospitals throughout Alameda and Contra Costa Counties, the CHNA process
identified mental health as one of the top health needs in the community based on statistical data and community
input. Each hospital posts its final 2016 Community Health Needs Assessment (CHNA) publicly on its website. Each
hospital’s Implementation Strategy report describes in detail the investments made in the community, including
programming and partnerships.
i Healthy People 2020. Office of Disease Prevention and Health Promotion. Web. December 2015. ii Office of Statewide Health Planning and Development: 2012-2014 iii Office of Statewide Health Planning and Development: 2013 iv Office of Statewide Health Planning and Development: 2012-2014 v Office of Statewide Health Planning and Development: 2012-2014 vi Nielsen, Nielsen SiteReports: 2014 vii Recent data are not available viii California Department of Public Health, Death Public Use Data: 2010-12 ix California Department of Public Health, California EpiCenter: 2011-2013 x University of California Center for Health Policy Research, California Health Interview Survey: 2013-2014 xi Centers for Disease Control and Prevention, Behavioral Risk Factor Surveillance System: 2006-2012
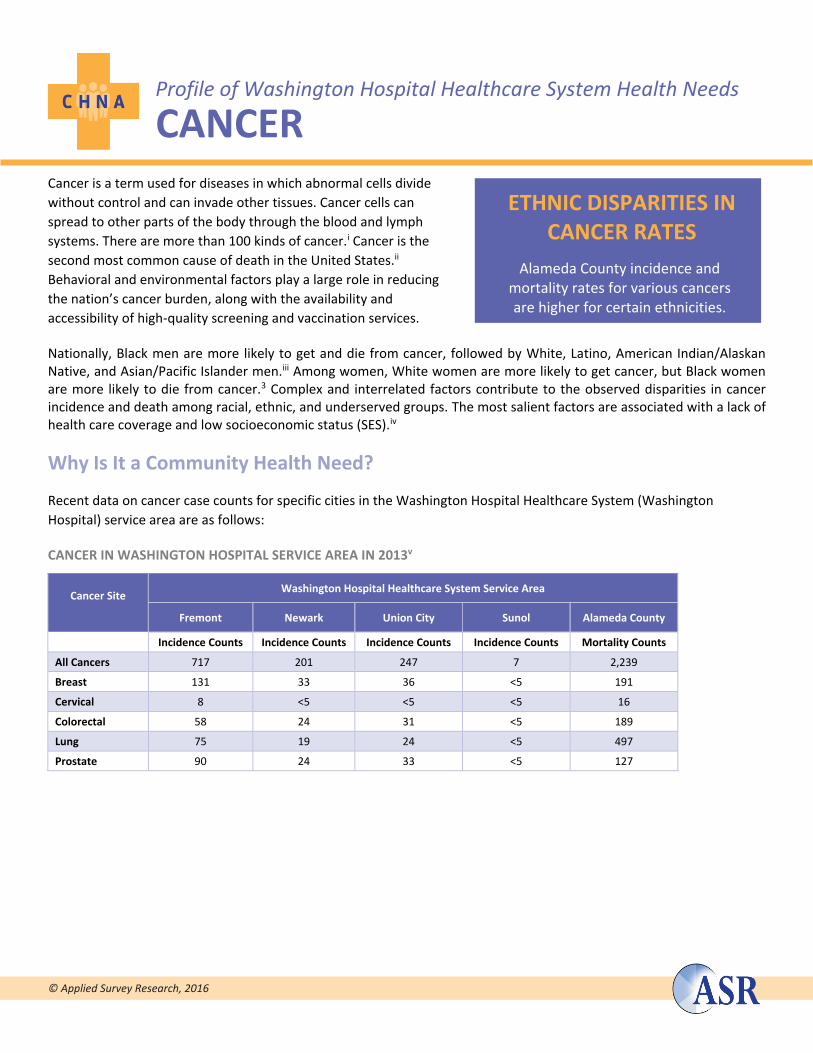
Profile of Washington Hospital Healthcare System Health Needs
CANCER
© Applied Survey Research, 2016
Cancer is a term used for diseases in which abnormal cells divide
without control and can invade other tissues. Cancer cells can
spread to other parts of the body through the blood and lymph
systems. There are more than 100 kinds of cancer.i Cancer is the
second most common cause of death in the United States.ii
Behavioral and environmental factors play a large role in reducing
the nation’s cancer burden, along with the availability and
accessibility of high-quality screening and vaccination services.
Nationally, Black men are more likely to get and die from cancer, followed by White, Latino, American Indian/Alaskan Native, and Asian/Pacific Islander men.iii Among women, White women are more likely to get cancer, but Black women are more likely to die from cancer.3 Complex and interrelated factors contribute to the observed disparities in cancer incidence and death among racial, ethnic, and underserved groups. The most salient factors are associated with a lack of health care coverage and low socioeconomic status (SES).iv
Why Is It a Community Health Need?
Recent data on cancer case counts for specific cities in the Washington Hospital Healthcare System (Washington
Hospital) service area are as follows:
CANCER IN WASHINGTON HOSPITAL SERVICE AREA IN 2013v
Cancer Site
Washington Hospital Healthcare System Service Area
Fremont Newark Union City Sunol Alameda County
Incidence Counts Incidence Counts Incidence Counts Incidence Counts Mortality Counts
All Cancers 717 201 247 7 2,239
Breast 131 33 36 <5 191
Cervical 8 <5 <5 <5 16
Colorectal 58 24 31 <5 189
Lung 75 19 24 <5 497
Prostate 90 24 33 <5 127
ETHNIC DISPARITIES IN CANCER RATES
Alameda County incidence and mortality rates for various cancers are higher for certain ethnicities.
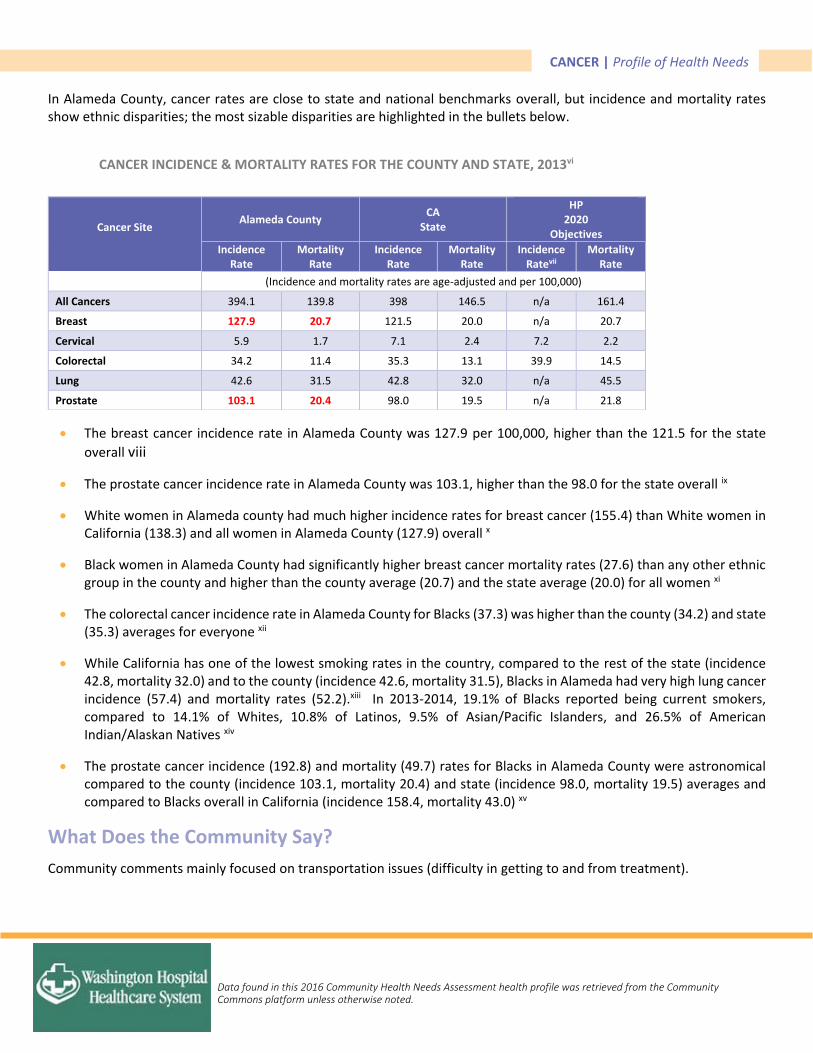
CANCER | Profile of Health Needs
Data found in this 2016 Community Health Needs Assessment health profile was retrieved from the Community Commons platform unless otherwise noted.
In Alameda County, cancer rates are close to state and national benchmarks overall, but incidence and mortality rates show ethnic disparities; the most sizable disparities are highlighted in the bullets below.
CANCER INCIDENCE & MORTALITY RATES FOR THE COUNTY AND STATE, 2013vi
The breast cancer incidence rate in Alameda County was 127.9 per 100,000, higher than the 121.5 for the state
overall viii
The prostate cancer incidence rate in Alameda County was 103.1, higher than the 98.0 for the state overall ix
White women in Alameda county had much higher incidence rates for breast cancer (155.4) than White women in California (138.3) and all women in Alameda County (127.9) overall x
Black women in Alameda County had significantly higher breast cancer mortality rates (27.6) than any other ethnic group in the county and higher than the county average (20.7) and the state average (20.0) for all women xi
The colorectal cancer incidence rate in Alameda County for Blacks (37.3) was higher than the county (34.2) and state (35.3) averages for everyone xii
While California has one of the lowest smoking rates in the country, compared to the rest of the state (incidence 42.8, mortality 32.0) and to the county (incidence 42.6, mortality 31.5), Blacks in Alameda had very high lung cancer incidence (57.4) and mortality rates (52.2).xiii In 2013-2014, 19.1% of Blacks reported being current smokers, compared to 14.1% of Whites, 10.8% of Latinos, 9.5% of Asian/Pacific Islanders, and 26.5% of American Indian/Alaskan Natives xiv
The prostate cancer incidence (192.8) and mortality (49.7) rates for Blacks in Alameda County were astronomical compared to the county (incidence 103.1, mortality 20.4) and state (incidence 98.0, mortality 19.5) averages and compared to Blacks overall in California (incidence 158.4, mortality 43.0) xv
What Does the Community Say?
Community comments mainly focused on transportation issues (difficulty in getting to and from treatment).
Cancer Site
Alameda County CA
State
HP 2020
Objectives
Incidence Rate
Mortality Rate
Incidence Rate
Mortality Rate
Incidence Ratevii
Mortality Rate
(Incidence and mortality rates are age-adjusted and per 100,000)
All Cancers 394.1 139.8 398 146.5 n/a 161.4
Breast 127.9 20.7 121.5 20.0 n/a 20.7
Cervical 5.9 1.7 7.1 2.4 7.2 2.2
Colorectal 34.2 11.4 35.3 13.1 39.9 14.5
Lung 42.6 31.5 42.8 32.0 n/a 45.5
Prostate 103.1 20.4 98.0 19.5 n/a 21.8
CANCER | Profile of Health Needs
Data found in this 2016 Community Health Needs Assessment health profile was retrieved from the Community Commons platform unless otherwise noted.
Commitment to Improving Community Health
In 2016, in collaboration with 11 other hospitals throughout Alameda and Contra Costa Counties, the CHNA process
identified cancer as one of the top health needs in the community based on statistical data and community input. Each
hospital posts its final 2016 Community Health Needs Assessment (CHNA) publically on its website. Each hospital’s
Implementation Strategy report describes in detail the investments made in the community, including programming and
partnerships.
i How to Prevent Cancer or Find It Early. Cancer Prevention and Control, Centers for Disease Control and Prevention. Web. Dec. 2015. ii Fast Stats, Leading Causes of Death. Centers for Disease Control and Prevention. Web. Dec. 2015. iii Cancer Rates by Race and Ethnicity. Cancer Prevention and Control, Centers for Disease Control and Prevention. Web. Dec. 2015. iv Cancer Health Disparities. National Cancer Institute. Web. Dec. 2015. v California Cancer Registry, 2013 vi California Cancer Registry, 2013 vii n/a=HP2020 uses different indicators or does not set objectives for this indicator viii California Cancer Registry, 2013 ix California Cancer Registry, 2013 x California Cancer Registry, 2013 xi California Cancer Registry, 2013 xii California Cancer Registry, 2013 xiii California Cancer Registry, 2013 xiv Behavioral Risk Factor Surveillance System, 2013-2014. xv California Cancer Registry, 2013
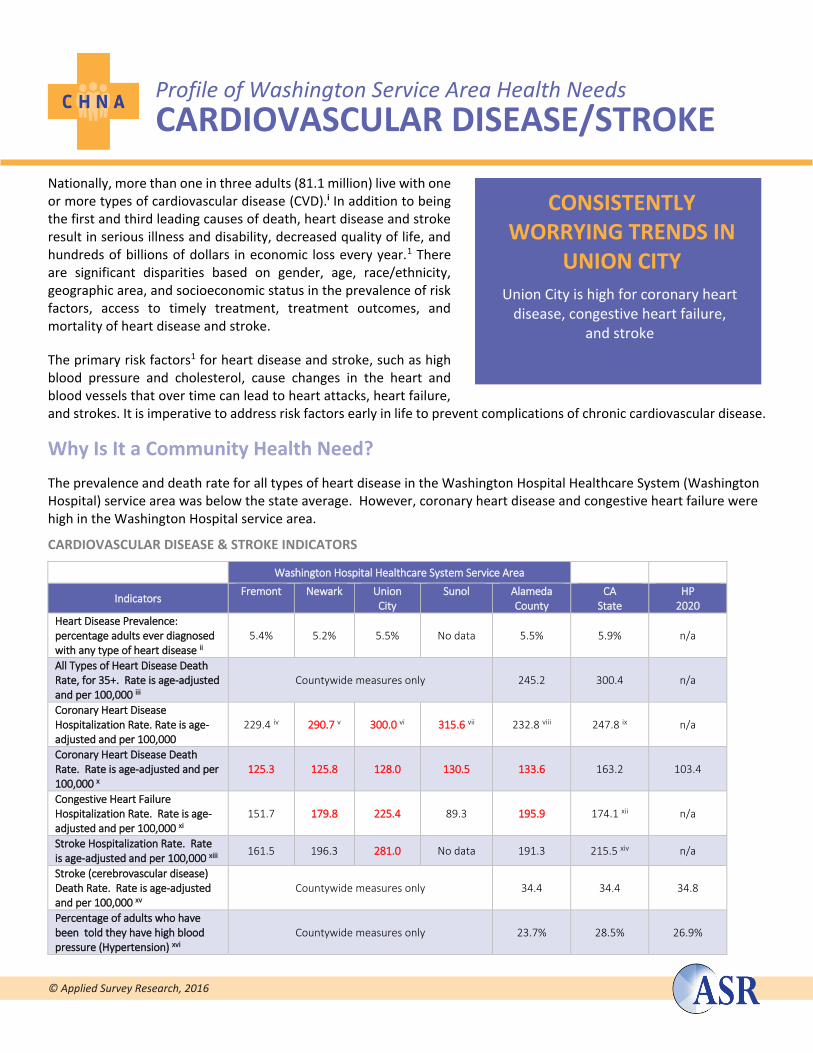
Profile of Washington Service Area Health Needs
CARDIOVASCULAR DISEASE/STROKE
© Applied Survey Research, 2016
Nationally, more than one in three adults (81.1 million) live with one or more types of cardiovascular disease (CVD).i In addition to being the first and third leading causes of death, heart disease and stroke result in serious illness and disability, decreased quality of life, and hundreds of billions of dollars in economic loss every year.1 There are significant disparities based on gender, age, race/ethnicity, geographic area, and socioeconomic status in the prevalence of risk factors, access to timely treatment, treatment outcomes, and mortality of heart disease and stroke.
The primary risk factors1 for heart disease and stroke, such as high blood pressure and cholesterol, cause changes in the heart and blood vessels that over time can lead to heart attacks, heart failure, and strokes. It is imperative to address risk factors early in life to prevent complications of chronic cardiovascular disease.
Why Is It a Community Health Need?
The prevalence and death rate for all types of heart disease in the Washington Hospital Healthcare System (Washington Hospital) service area was below the state average. However, coronary heart disease and congestive heart failure were high in the Washington Hospital service area.
CARDIOVASCULAR DISEASE & STROKE INDICATORS
Washington Hospital Healthcare System Service Area
Indicators Fremont Newark Union
City Sunol Alameda
County CA
State HP
2020
Heart Disease Prevalence: percentage adults ever diagnosed with any type of heart disease ii
5.4% 5.2% 5.5% No data 5.5% 5.9% n/a
All Types of Heart Disease Death Rate, for 35+. Rate is age-adjusted and per 100,000 iii
Countywide measures only 245.2 300.4 n/a
Coronary Heart Disease Hospitalization Rate. Rate is age-adjusted and per 100,000
229.4 iv 290.7 v 300.0 vi 315.6 vii 232.8 viii 247.8 ix n/a
Coronary Heart Disease Death Rate. Rate is age-adjusted and per 100,000 x
125.3 125.8 128.0 130.5 133.6 163.2 103.4
Congestive Heart Failure Hospitalization Rate. Rate is age-adjusted and per 100,000 xi
151.7 179.8 225.4 89.3 195.9 174.1 xii n/a
Stroke Hospitalization Rate. Rate is age-adjusted and per 100,000 xiii
161.5 196.3 281.0 No data 191.3 215.5 xiv n/a
Stroke (cerebrovascular disease) Death Rate. Rate is age-adjusted and per 100,000 xv
Countywide measures only 34.4 34.4 34.8
Percentage of adults who have been told they have high blood pressure (Hypertension) xvi
Countywide measures only 23.7% 28.5% 26.9%
CONSISTENTLY WORRYING TRENDS IN
UNION CITY
Union City is high for coronary heart disease, congestive heart failure,
and stroke
CVD/STROKE | Profile of Health Needs
Data found in this 2016 Community Health Needs Assessment health profile was retrieved from the Community Commons platform unless otherwise noted.
Black residents of Alameda County were much more likely than other groups to die from any kind of heart disease (374.4 per 100,000 versus 245.2 for Alameda County, overall)
Newark, Union City, and Sunol had coronary heart disease hospitalization rates (290.7 per 100,000, 300.0, and 315.6, respectively) that were higher than the county (232.8) and state (247.8) averages
Deaths due to coronary heart disease were much higher in California (163.2 per 100,000) than the HP2020 objective (103.4). In Alameda County (133.6) and the Washington Hospital service area cities of Fremont (125.3), Newark (125.8), Union City (128), and Sunol (130.5), they were not as high as the rest of the state, but still higher than the HP2020 objective
Congestive heart failure hospitalizations were also high in Alameda County (195.9 per 100,000) and parts of the Washington Hospital service area. Union City had a very high rate (225.4). Newark (179.8) was about the same as the state average (174.1), while Fremont (151.5) and Sunol (89.3) were well below it
Only in Union City (281.0 per 100,000) is the stroke hospitalization rate higher than the state average (215.5)
The stroke death rate in Alameda County (34.4 per 100,000) is the same as the state average
The percentage of adults in Alameda County who have high blood pressure (23.7%) is slightly lower than the state average (28.5%) and the HP2020 objective (26.9%)
What Does the Community Say? Residents said that, in specific geographic areas, there are few/no supermarkets or farmers’ markets offering healthy
food, and there is a lack of access to open spaces for exercise
Key informants noted that they are seeing an increase in the number of Afghani and Indian residents with cardiac problems; that there are lots of multiple diagnoses (e.g., obesity, hypertension, asthma all co-occurring); and that Latinos & Blacks tend to have higher levels of hypertension and other risk factors
Commitment to Improving Community Health In 2016, in collaboration with 11 other hospitals throughout Alameda and Contra Costa Counties, the CHNA process identified cardiovascular disease and stroke as one of the top health needs in the community based on statistical data and community input. Each hospital posts its final 2016 Community Health Needs Assessment (CHNA) publicly on its website. Each hospital’s Implementation Strategy report describes in detail the investments made in the community, including programming and partnerships.
i Healthy People 2020. Office of Disease Prevention and Health Promotion. Web. December 2015. ii California Health Interview Survey: 2014 iii Centers for Disease Control, National Center for Health Statistics, Deaths National Vital Statistics System: 2011-2013 iv Office of Statewide Health Planning and Development: 2012-2014 v Office of Statewide Health Planning and Development: 2012-2014 vi Office of Statewide Health Planning and Development: 2012-2014 vii Office of Statewide Health Planning and Development: 2010-2012 viii Office of Statewide Health Planning and Development: 2012-2014 ix Office of Statewide Health Planning and Development: 2013 x California Department of Public Health, CDPH – Death Public Use Data: 2010-2012 xi Office of Statewide Health Planning and Development: 2012-2014 xii Office of Statewide Health Planning and Development: 2013 xiii Office of Statewide Health Planning and Development: 2012-2014 xiv Office of Statewide Health Planning and Development: 2013 xv Office of Statewide Health Planning and Development: 2012-2014 xvi California Health Interview Survey: 2014
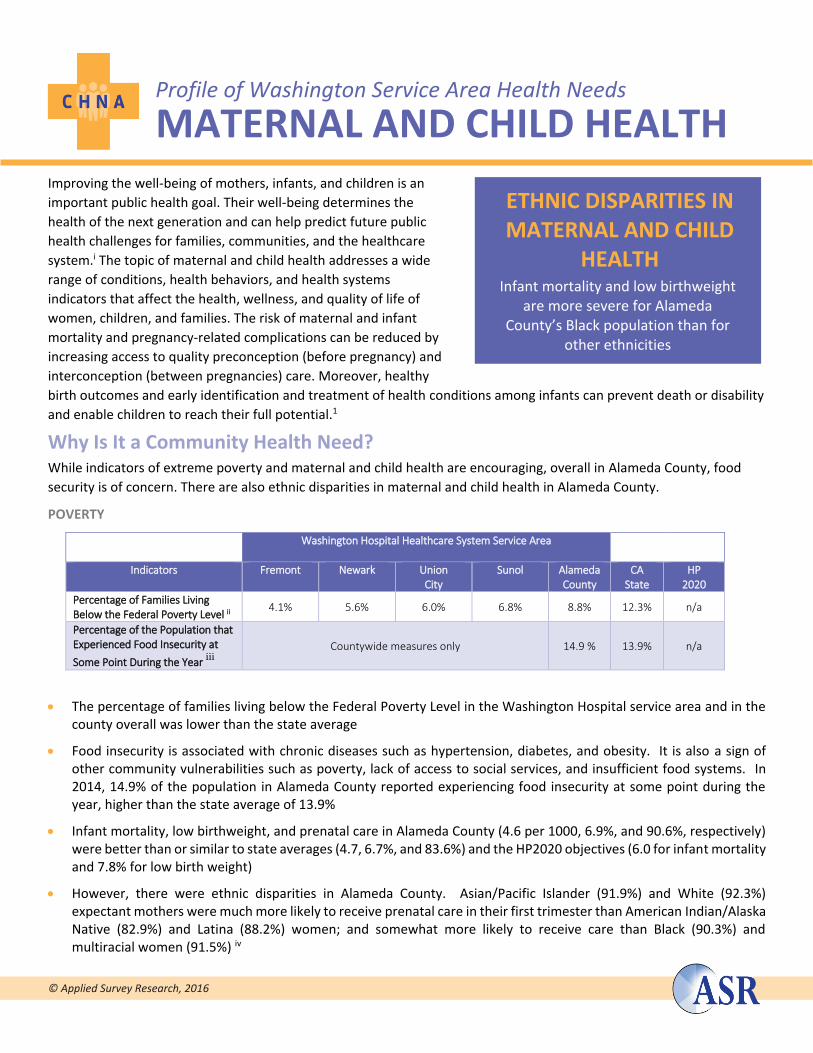
Profile of Washington Service Area Health Needs
MATERNAL AND CHILD HEALTH
© Applied Survey Research, 2016
Improving the well-being of mothers, infants, and children is an
important public health goal. Their well-being determines the
health of the next generation and can help predict future public
health challenges for families, communities, and the healthcare
system.i The topic of maternal and child health addresses a wide
range of conditions, health behaviors, and health systems
indicators that affect the health, wellness, and quality of life of
women, children, and families. The risk of maternal and infant
mortality and pregnancy-related complications can be reduced by
increasing access to quality preconception (before pregnancy) and
interconception (between pregnancies) care. Moreover, healthy
birth outcomes and early identification and treatment of health conditions among infants can prevent death or disability
and enable children to reach their full potential.1
Why Is It a Community Health Need? While indicators of extreme poverty and maternal and child health are encouraging, overall in Alameda County, food
security is of concern. There are also ethnic disparities in maternal and child health in Alameda County.
POVERTY
Washington Hospital Healthcare System Service Area
Indicators Fremont Newark Union City
Sunol Alameda County
CA State
HP 2020
Percentage of Families Living Below the Federal Poverty Level ii
4.1% 5.6% 6.0% 6.8% 8.8% 12.3% n/a
Percentage of the Population that Experienced Food Insecurity at
Some Point During the Year iii
Countywide measures only 14.9 % 13.9% n/a
The percentage of families living below the Federal Poverty Level in the Washington Hospital service area and in the county overall was lower than the state average
Food insecurity is associated with chronic diseases such as hypertension, diabetes, and obesity. It is also a sign of other community vulnerabilities such as poverty, lack of access to social services, and insufficient food systems. In 2014, 14.9% of the population in Alameda County reported experiencing food insecurity at some point during the year, higher than the state average of 13.9%
Infant mortality, low birthweight, and prenatal care in Alameda County (4.6 per 1000, 6.9%, and 90.6%, respectively) were better than or similar to state averages (4.7, 6.7%, and 83.6%) and the HP2020 objectives (6.0 for infant mortality and 7.8% for low birth weight)
However, there were ethnic disparities in Alameda County. Asian/Pacific Islander (91.9%) and White (92.3%) expectant mothers were much more likely to receive prenatal care in their first trimester than American Indian/Alaska Native (82.9%) and Latina (88.2%) women; and somewhat more likely to receive care than Black (90.3%) and multiracial women (91.5%) iv
ETHNIC DISPARITIES IN MATERNAL AND CHILD
HEALTH Infant mortality and low birthweight
are more severe for Alameda County’s Black population than for
other ethnicities
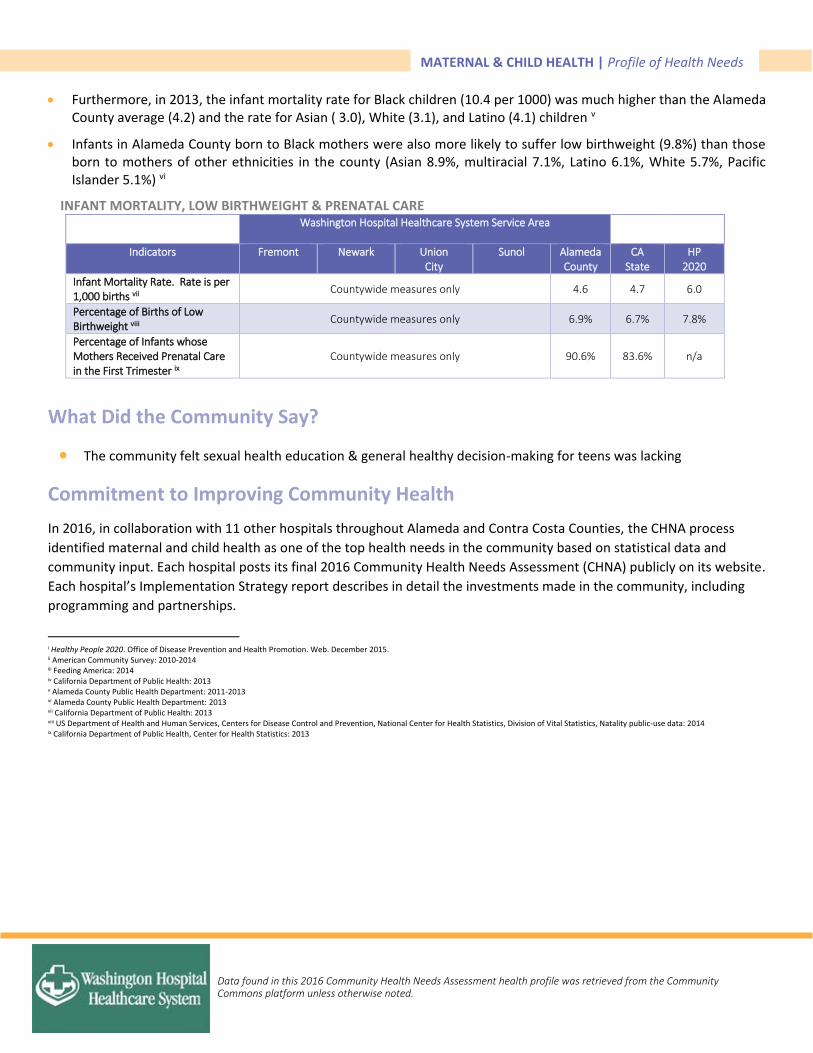
MATERNAL & CHILD HEALTH | Profile of Health Needs
Data found in this 2016 Community Health Needs Assessment health profile was retrieved from the Community Commons platform unless otherwise noted.
Furthermore, in 2013, the infant mortality rate for Black children (10.4 per 1000) was much higher than the Alameda County average (4.2) and the rate for Asian ( 3.0), White (3.1), and Latino (4.1) children v
Infants in Alameda County born to Black mothers were also more likely to suffer low birthweight (9.8%) than those born to mothers of other ethnicities in the county (Asian 8.9%, multiracial 7.1%, Latino 6.1%, White 5.7%, Pacific Islander 5.1%) vi
INFANT MORTALITY, LOW BIRTHWEIGHT & PRENATAL CARE Washington Hospital Healthcare System Service Area
Indicators Fremont Newark Union City
Sunol Alameda County
CA State
HP 2020
Infant Mortality Rate. Rate is per 1,000 births vii
Countywide measures only 4.6 4.7 6.0
Percentage of Births of Low Birthweight viii
Countywide measures only 6.9% 6.7% 7.8%
Percentage of Infants whose Mothers Received Prenatal Care in the First Trimester ix
Countywide measures only 90.6% 83.6% n/a
What Did the Community Say?
The community felt sexual health education & general healthy decision-making for teens was lacking
Commitment to Improving Community Health
In 2016, in collaboration with 11 other hospitals throughout Alameda and Contra Costa Counties, the CHNA process
identified maternal and child health as one of the top health needs in the community based on statistical data and
community input. Each hospital posts its final 2016 Community Health Needs Assessment (CHNA) publicly on its website.
Each hospital’s Implementation Strategy report describes in detail the investments made in the community, including
programming and partnerships.
i Healthy People 2020. Office of Disease Prevention and Health Promotion. Web. December 2015. ii American Community Survey: 2010-2014 iii Feeding America: 2014 iv California Department of Public Health: 2013 v Alameda County Public Health Department: 2011-2013 vi Alameda County Public Health Department: 2013 vii California Department of Public Health: 2013 viii US Department of Health and Human Services, Centers for Disease Control and Prevention, National Center for Health Statistics, Division of Vital Statistics, Natality public-use data: 2014 ix California Department of Public Health, Center for Health Statistics: 2013

Profile of Washington Hospital Healthcare System Health Needs
OBESITY/DIABETES/HEAL (HEALTHY EATING ACTIVE LIVING)
© Applied Survey Research, 2016
Diabetes mellitus occurs when the body cannot produce or respond
appropriately to insulin. Without a properly functioning insulin
system, blood glucose levels become elevated and other metabolic
abnormalities occur, potentially leading to serious outcomes such as
reduced life expectancy, increased risk of heart disease, kidney
failure, amputations, and blindness.i Physical inactivity and obesity
are strongly associated with the development of type 2 diabetes, the
most common form. People who are genetically susceptible to type
2 diabetes are more vulnerable when these risk factors are present.ii
Obesity is also a risk factor for cardiovascular disease and health
problems that can include heart attack, heart failure, stroke, cancer, arthritis, and others.iii The risk of diabetes and
other diseases can be lowered by losing weight and making lifestyle changes. Efforts to change diet and activity level
address individual behaviors, as well as the policies and environments that support these behaviors.iv
Type 2 diabetes disproportionately affects Blacks, American Indians, Asian Americans, Latinos, and Pacific Islanders.
These groups also make up a disproportionate share of the poor and uninsured. v Low income and food-insecure
populations are especially vulnerable to obesity because they have less access to nutritious foods and to quality health
care. They also may undergo cycles of abundance and deprivation, have less opportunity to exercise, and experience
more stress.vi
Why Is It a Community Health Need? Diabetes is the seventh leading cause of death in the United States and over a quarter of the people who have diabetes are undiagnosed.vii A smaller proportion of people in Alameda County (6.8%) were diagnosed with diabetes as compared to the state (8.9%), and adult obesity was quite a bit lower in Alameda County (19.8%) than in the state overall (27%). However:
DIABETES-RELATED INDICATORS IN THE WASHINGTON HOSPITAL SERVICE ARE
Indicators Fremont Newark Union City Sunol Alameda County
CA State
Overweight (Youth): Percentage of children in grades 5,7, and 9 within the overweight body composition category viii
14.7% 13.8% 13.2% 8.9% 22.8% 19.3%
Obesity (Adults): Percentage of adults 18 and older who have a Body Mass Index (BMI) of 30 or over ix
Countywide measures only 19.8% 27.0%
Obesity (Youth): Percentage of children in grades 5,7, and 9 within the obese body composition category x
19.2% 35.0% 30.7% 8.9% 15.5% 19.0%
Diabetes Prevalence: Percentage of adults 18 and older who have ever been diagnosed with diabetes xi
Countywide measures only 6.8% 8.9%
Diabetes Hospitalization Rate (Rate is per 100,000 and age adjusted) xii
771.6 999.6 1098.8 303.7 879.6 1017.7 xiii
HIGH RISK FOR SERIOUS OUTCOMES
Some areas in the WHHS Service Area have high diabetes
hospitalization rates and high youth obesity.
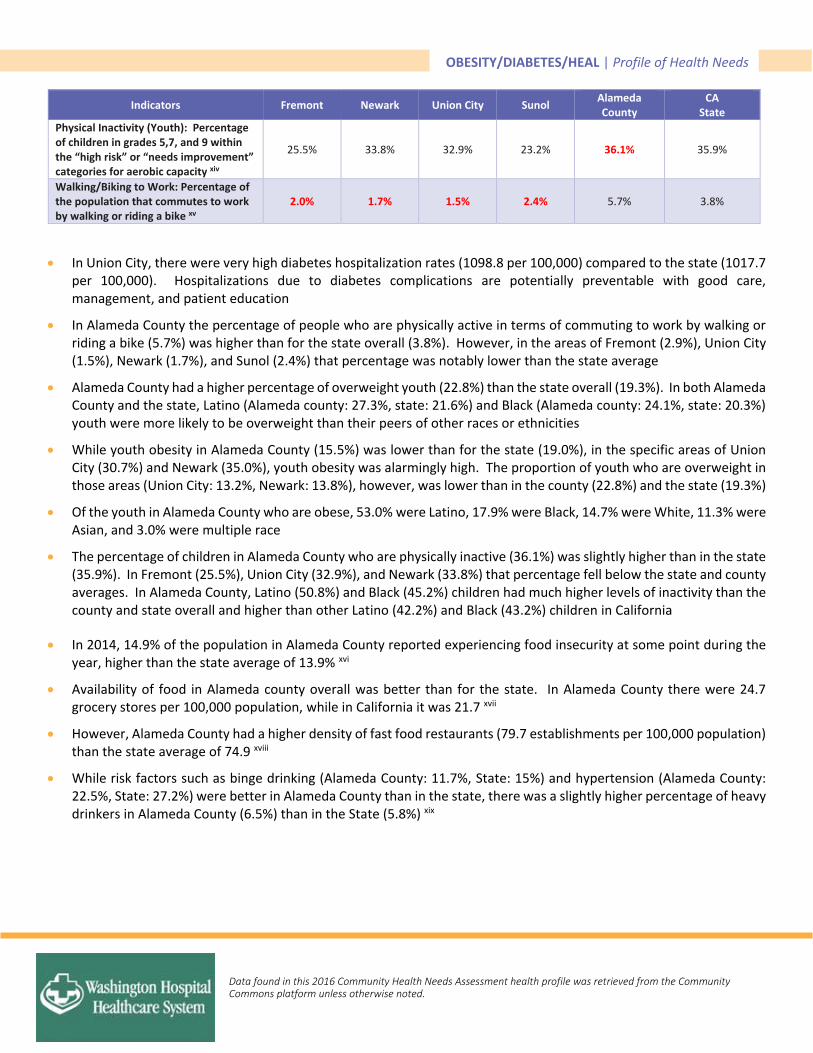
OBESITY/DIABETES/HEAL | Profile of Health Needs
Data found in this 2016 Community Health Needs Assessment health profile was retrieved from the Community Commons platform unless otherwise noted.
Indicators Fremont Newark Union City Sunol Alameda County
CA State
Physical Inactivity (Youth): Percentage of children in grades 5,7, and 9 within the “high risk” or “needs improvement” categories for aerobic capacity xiv
25.5% 33.8% 32.9% 23.2% 36.1% 35.9%
Walking/Biking to Work: Percentage of the population that commutes to work by walking or riding a bike xv
2.0% 1.7% 1.5% 2.4% 5.7% 3.8%
In Union City, there were very high diabetes hospitalization rates (1098.8 per 100,000) compared to the state (1017.7 per 100,000). Hospitalizations due to diabetes complications are potentially preventable with good care, management, and patient education
In Alameda County the percentage of people who are physically active in terms of commuting to work by walking or riding a bike (5.7%) was higher than for the state overall (3.8%). However, in the areas of Fremont (2.9%), Union City (1.5%), Newark (1.7%), and Sunol (2.4%) that percentage was notably lower than the state average
Alameda County had a higher percentage of overweight youth (22.8%) than the state overall (19.3%). In both Alameda County and the state, Latino (Alameda county: 27.3%, state: 21.6%) and Black (Alameda county: 24.1%, state: 20.3%) youth were more likely to be overweight than their peers of other races or ethnicities
While youth obesity in Alameda County (15.5%) was lower than for the state (19.0%), in the specific areas of Union City (30.7%) and Newark (35.0%), youth obesity was alarmingly high. The proportion of youth who are overweight in those areas (Union City: 13.2%, Newark: 13.8%), however, was lower than in the county (22.8%) and the state (19.3%)
Of the youth in Alameda County who are obese, 53.0% were Latino, 17.9% were Black, 14.7% were White, 11.3% were Asian, and 3.0% were multiple race
The percentage of children in Alameda County who are physically inactive (36.1%) was slightly higher than in the state (35.9%). In Fremont (25.5%), Union City (32.9%), and Newark (33.8%) that percentage fell below the state and county averages. In Alameda County, Latino (50.8%) and Black (45.2%) children had much higher levels of inactivity than the county and state overall and higher than other Latino (42.2%) and Black (43.2%) children in California
In 2014, 14.9% of the population in Alameda County reported experiencing food insecurity at some point during the year, higher than the state average of 13.9% xvi
Availability of food in Alameda county overall was better than for the state. In Alameda County there were 24.7 grocery stores per 100,000 population, while in California it was 21.7 xvii
However, Alameda County had a higher density of fast food restaurants (79.7 establishments per 100,000 population) than the state average of 74.9 xviii
While risk factors such as binge drinking (Alameda County: 11.7%, State: 15%) and hypertension (Alameda County: 22.5%, State: 27.2%) were better in Alameda County than in the state, there was a slightly higher percentage of heavy drinkers in Alameda County (6.5%) than in the State (5.8%) xix

OBESITY/DIABETES/HEAL | Profile of Health Needs
Data found in this 2016 Community Health Needs Assessment health profile was retrieved from the Community Commons platform unless otherwise noted.
What Does the Community Say?
Community members complained of a lack of access to healthy foods (i.e., fresh produce)
The community felt it was expensive to eat healthy
Residents were experiencing food insecurity: Families are stretching one weeks’ worth of food to three weeks
Community members said there was a lack of affordable sports and recreational activities for youth and adults (e.g., fitness classes, open spaces for exercise)
The community believed that culturally familiar food is unhealthy: “Eating healthy isn't always a top priority for new immigrants; eating food that is familiar to them provides comfort.”
Residents said health providers do not give culturally-specific nutrition recommendations
A key informant noted there are lots of multiple diagnoses (e.g., obesity, hypertension, asthma all co-occurring)
Commitment to Improving Community Health
In 2016, in collaboration with 11 other hospitals throughout Alameda and Contra Costa Counties, the CHNA process
identified obesity, diabetes, and healthy eating/active living as some of the top health needs in the community based on
statistical data and community input. Each hospital posts its final 2016 Community Health Needs Assessment (CHNA)
publically on its website. Each hospital’s Implementation Strategy report describes in detail the investments made in the
community, including programming and partnerships.
i Healthy People 2020. Office of Disease Prevention and Health Promotion. Web. July 2016. ii National Institute of Diabetes and Digestive and Kidney Diseases. Web. July 2016 iii National Heart Lung and Blood Institute. Web. July 2016 iv Healthy People 2020. Office of Disease Prevention and Health Promotion. Web. December 2015. v Alliance to Reduce Disparities in Diabetes. Web. July 2016 vi Food Research and Action Center. Web. July 2016 vii American Diabetes Association. Web. July 2016 viii California Department of Education, FITNESSGRAM® Physical Fitness Testing: 2013-2014 ix California Health Interview Survey: 2014 x California Department of Education, FITNESSGRAM® Physical Fitness Testing: 2013-2014 xi California Health Interview Survey: 2014 xii Office of Statewide Health Planning and Development: 2012-2014 xiii Office of Statewide Health Planning and Development: 2013 xiv California Department of Education, FITNESSGRAM® Physical Fitness Testing: 2013-2014 xv US Census Bureau. American Community Survey: 2010-2014 xvi Feeding America: 2014 xvii US Census Bureau, County Business Patterns. Additional analysis by CARES: 2013 xviii US Census Bureau, County Business Patterns. Additional analysis by CARES: 2013 xix California Behavioral Risk Factor Surveillance System: 2014

Profile of Washington Hospital Healthcare System Health Needs
VIOLENCE/INJURY PREVENTION
© Applied Survey Research, 2016
Violence and intentional injury contribute to poor health outcomes
for victims, perpetrators, and community members. In addition to
direct physical injury, victims of violence are at increased risk for
depression, substance abuse, anxiety, reproductive health problems,
and suicidal behavior.i Crime in a neighborhood causes fear, stress,
unsafe feelings, and poor mental health. In one study, individuals
who reported feeling unsafe when going out during the day were
64% more likely to be in the lowest quartile of mental health.ii
Witnessing and experiencing violence can cause long term
behavioral and emotional problems in youth. For example, a study in
the San Francisco Bay area showed that youth who were exposed to violence showed higher rates of self-reported PTSD,
depressive symptoms, and perpetration of violence.iii
Why Is It a Community Health Need?
While unintentional injuries in the Washington Hospital Healthcare System (Washington Hospital) service area are not higher than state averages or Healthy People 2020 (HP2020) objectives, violence is more likely to occur in Alameda County and some of the cities in the Washington Hospital service area.
INJURY DATA BY SERVICE AREA
Washington Hospital Healthcare System Service Area
Indicators (Rate per 100,000)
Fremont Newark Union
City Sunol
Alameda County
CA State
HP 2020 iv
Death Rate due to Unintentional Injury. Rate is age-adjusted and per 100,000 v
Countywide measures only 23.9 28.2 36.4
Unintentional Injury Emergency Department Visit Rate. Rate is per 100,000 vi
5037.5 6274.8 6195.2 7352.5 6749.6 No data 8310.1
Death Rate due to Assault (homicide). Rate is age-adjusted and per 100,000 vii
2.7 7.9 4.5 0.0 8.5 5.2 5.5
Death Rate of Pedestrians Killed by Motor Vehicles. Rate is age-adjusted and per 100,000 viii
1.3 0.0 4.0 0.0 1.5 2.0 1.4
Assault (injury) Non-fatal Emergency Department Visit Rate. Rate is per 100,000 ix
Countywide measures only 394.3 290.3 461.2
Youth Intentional Injury Emergency Department Visit Rate (ages 13-20). Rate is per 100,000 x
Countywide measures only 954.1 738.7 n/a
Domestic Violence Non-fatal Emergency Department Visit Rate (females 10 years and older). Rate is per 100,000 xi
Countywide measures only 12.1 9.5 n/a
VIOLENCE RATES WORSE THAN STATE
Violent injuries and deaths are higher than state averages in some parts of
the service area

VIOLENCE/INJURY PREVENTION | Profile of Health
Needs
Data found in this 2016 Community Health Needs Assessment health profile was retrieved from the Community Commons platform unless otherwise noted.
The unintentional injury emergency department visit rates in Fremont (5037.5 ED visits per 100,000), Newark (6274.8), Union City (6195.2), Sunol (7352.5), and Alameda County (6749.6) overall were all below the HP2020 objective (8310.1) for this indicator
The death rate due to homicide was higher in Newark (7.9 per 100,000) and Alameda County (8.5) than in the state (5.2) and higher than the HP2020 objective (5.5)
The death rate for pedestrians killed by motor vehicles was much higher in Union City (4.0 per 100,000) than in the state (2.0) and slightly higher in Alameda County (1.5) than the HP2020 objective (1.4)
Alameda County had a lower Assault (injury) rate (394.3 emergency department (ED) visits per 100,000) than the HP2020 objective (461.2), but assault injuries were more common in Alameda county than in the state overall (290.3)
The youth intentional injury rate was quite a bit higher in Alameda County (954.1 ED visits per 100,000) than in the state (738.7)
The occurrence of domestic violence was more frequent in Alameda County (12.1 ED visits per 100,000) than in the state (9.5)
What Does the Community Say?
Residents worried about being attacked when they walk along the streets
Community members felt there is a lack of empathy from healthcare and law enforcement towards victims
Regarding domestic violence (DV), community members reported:
a lack of effective screening for DV victims. Often DV victims are prevented by abuser from having a primary care provider
poor communication/lack of connection between clinics and DV organizations for referrals
not enough providers and facilities for DV victims; existing facilities have wait lists
Commitment to Improving Community Health
In 2016, in collaboration with 11 other hospitals throughout Alameda and Contra Costa Counties, the CHNA process
identified violence/injury prevention as one of the top health needs in the community based on statistical data and
community input. Each hospital posts its final 2016 Community Health Needs Assessment (CHNA) publicly on its website.
Each hospital’s Implementation Strategy Report describes in detail the investments made in the community, including
programming and partnerships.
i Krug, E.G., Dalhberg, L.L., Mercy, J.A., Zwi, A.B., & Lozano, R. (Eds.). (2002). World report on violence and health. World Health Organization, Geneva, Switzerland. Retrieved from http://www.who.int/violence_injury_prevention/violence/world_report/en/summary_en.pdf ii Guite, H.F., Clark, C., & Ackrill, G. (2006). The impact of the physical and urban environment on mental well-being. Public Health 120:1117-1126 as cited in Human Impact Partners. Retrieved from http://www.humanimpact.org/evidencebase/category/violent_crime_in_a_community_impacts_physical_and_mental_health iii Perez-Smith, A.M., Albus, K.E., & Weist, M.D. (2001). Exposure to violence and neighborhood affiliation among inner-city youth. Journal of Clinical Child Psychology, 30(4):464-472; Ozer, E.J. & McDonald, K.L. (2006). Exposure to violence and mental health among Chinese American urban adolescents. Journal of Adolescent Health, 39(1):73-79, as cited in Human Impact Partners retrieved from http://www.humanimpact.org/evidencebase/category/violent_crime_in_a_community_impacts_physical_and_mental_health iv n/a=HP2020 uses different indicators or does not set objectives for this indicator v California Department of Public Health: 2012-2014 vi Office of Statewide Health Planning and Development: 2012-2014 vii California Department of Public Health, Death Public Use Data: 2010-2012 viii California Department of Public Health, Death Public Use Data: 2010-2012 ix California Department of Public Health, California EpiCenter: 2011-2013 x California Department of Public Health, California EpiCenter: 2011-2013 xi California Department of Public Health, California EpiCenter: 2011-2013
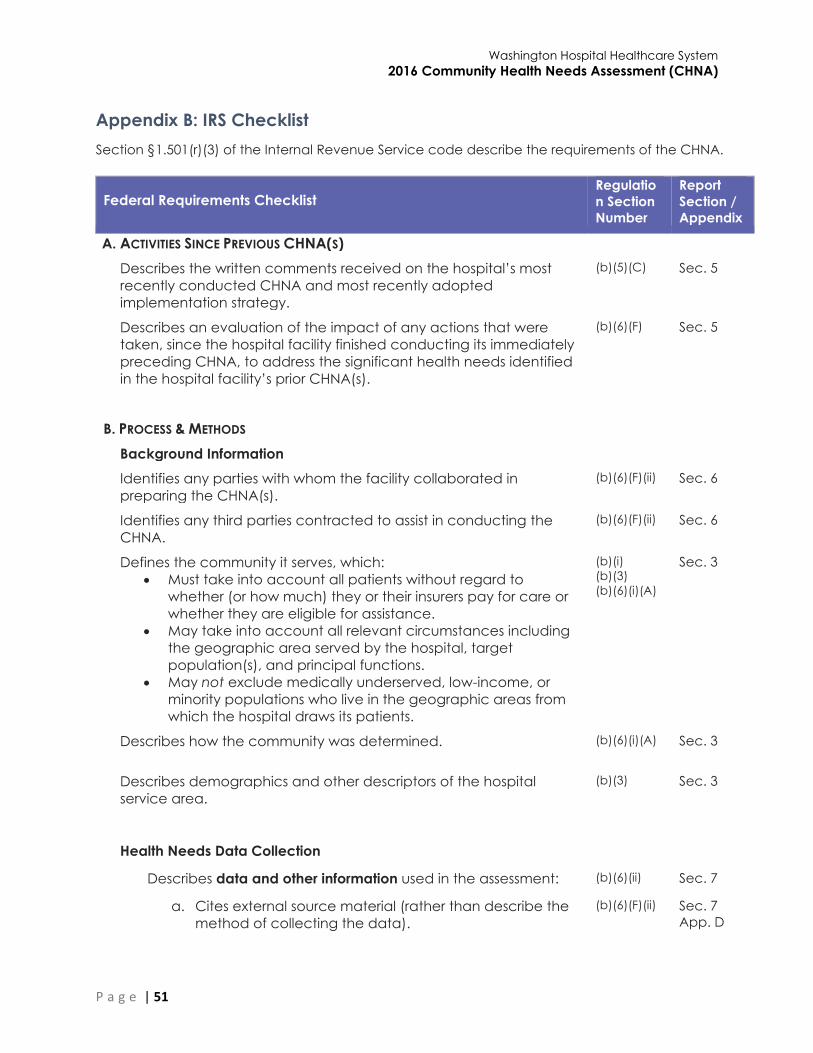
Washington Hospital Healthcare System
2016 Community Health Needs Assessment (CHNA)
P a g e | 51
Appendix B: IRS Checklist
Section §1.501(r)(3) of the Internal Revenue Service code describe the requirements of the CHNA.
Federal Requirements Checklist Regulatio
n Section
Number
Report
Section /
Appendix
A. ACTIVITIES SINCE PREVIOUS CHNA(S)
Describes the written comments received on the hospital’s most
recently conducted CHNA and most recently adopted
implementation strategy.
(b)(5)(C) Sec. 5
Describes an evaluation of the impact of any actions that were
taken, since the hospital facility finished conducting its immediately
preceding CHNA, to address the significant health needs identified
in the hospital facility’s prior CHNA(s).
(b)(6)(F) Sec. 5
B. PROCESS & METHODS
Background Information
Identifies any parties with whom the facility collaborated in
preparing the CHNA(s).
(b)(6)(F)(ii) Sec. 6
Identifies any third parties contracted to assist in conducting the
CHNA.
(b)(6)(F)(ii) Sec. 6
Defines the community it serves, which:
Must take into account all patients without regard to
whether (or how much) they or their insurers pay for care or
whether they are eligible for assistance.
May take into account all relevant circumstances including
the geographic area served by the hospital, target
population(s), and principal functions.
May not exclude medically underserved, low-income, or
minority populations who live in the geographic areas from
which the hospital draws its patients.
(b)(i)
(b)(3)
(b)(6)(i)(A)
Sec. 3
Describes how the community was determined. (b)(6)(i)(A) Sec. 3
Describes demographics and other descriptors of the hospital
service area.
(b)(3) Sec. 3
Health Needs Data Collection
Describes data and other information used in the assessment: (b)(6)(ii) Sec. 7
a. Cites external source material (rather than describe the
method of collecting the data).
(b)(6)(F)(ii) Sec. 7
App. D
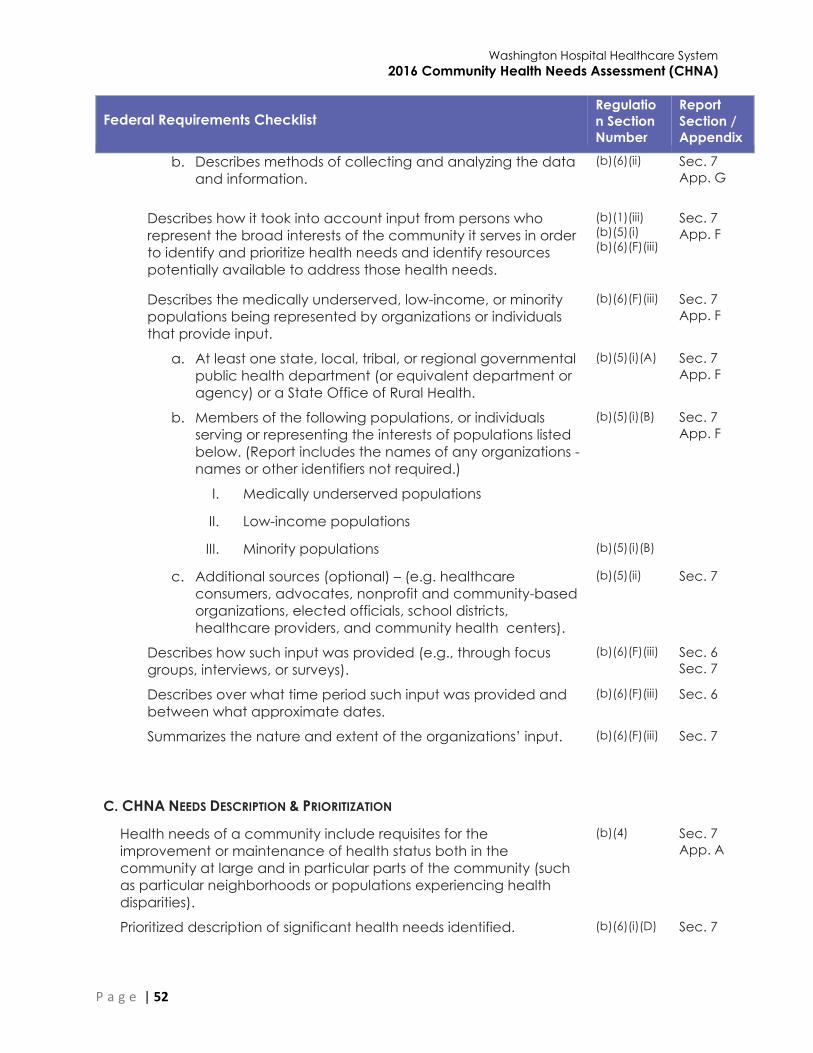
Washington Hospital Healthcare System
2016 Community Health Needs Assessment (CHNA)
P a g e | 52
Federal Requirements Checklist Regulatio
n Section
Number
Report
Section /
Appendix
b. Describes methods of collecting and analyzing the data
and information.
(b)(6)(ii) Sec. 7
App. G
Describes how it took into account input from persons who
represent the broad interests of the community it serves in order
to identify and prioritize health needs and identify resources
potentially available to address those health needs.
(b)(1)(iii)
(b)(5)(i)
(b)(6)(F)(iii)
Sec. 7
App. F
Describes the medically underserved, low-income, or minority
populations being represented by organizations or individuals
that provide input.
(b)(6)(F)(iii) Sec. 7
App. F
a. At least one state, local, tribal, or regional governmental
public health department (or equivalent department or
agency) or a State Office of Rural Health.
(b)(5)(i)(A) Sec. 7
App. F
b. Members of the following populations, or individuals
serving or representing the interests of populations listed
below. (Report includes the names of any organizations -
names or other identifiers not required.)
(b)(5)(i)(B) Sec. 7
App. F
I. Medically underserved populations
II. Low-income populations
III. Minority populations (b)(5)(i)(B)
c. Additional sources (optional) – (e.g. healthcare
consumers, advocates, nonprofit and community-based
organizations, elected officials, school districts,
healthcare providers, and community health centers).
(b)(5)(ii) Sec. 7
Describes how such input was provided (e.g., through focus
groups, interviews, or surveys).
(b)(6)(F)(iii) Sec. 6
Sec. 7
Describes over what time period such input was provided and
between what approximate dates.
(b)(6)(F)(iii) Sec. 6
Summarizes the nature and extent of the organizations’ input. (b)(6)(F)(iii) Sec. 7
C. CHNA NEEDS DESCRIPTION & PRIORITIZATION
Health needs of a community include requisites for the
improvement or maintenance of health status both in the
community at large and in particular parts of the community (such
as particular neighborhoods or populations experiencing health
disparities).
(b)(4) Sec. 7
App. A
Prioritized description of significant health needs identified. (b)(6)(i)(D) Sec. 7
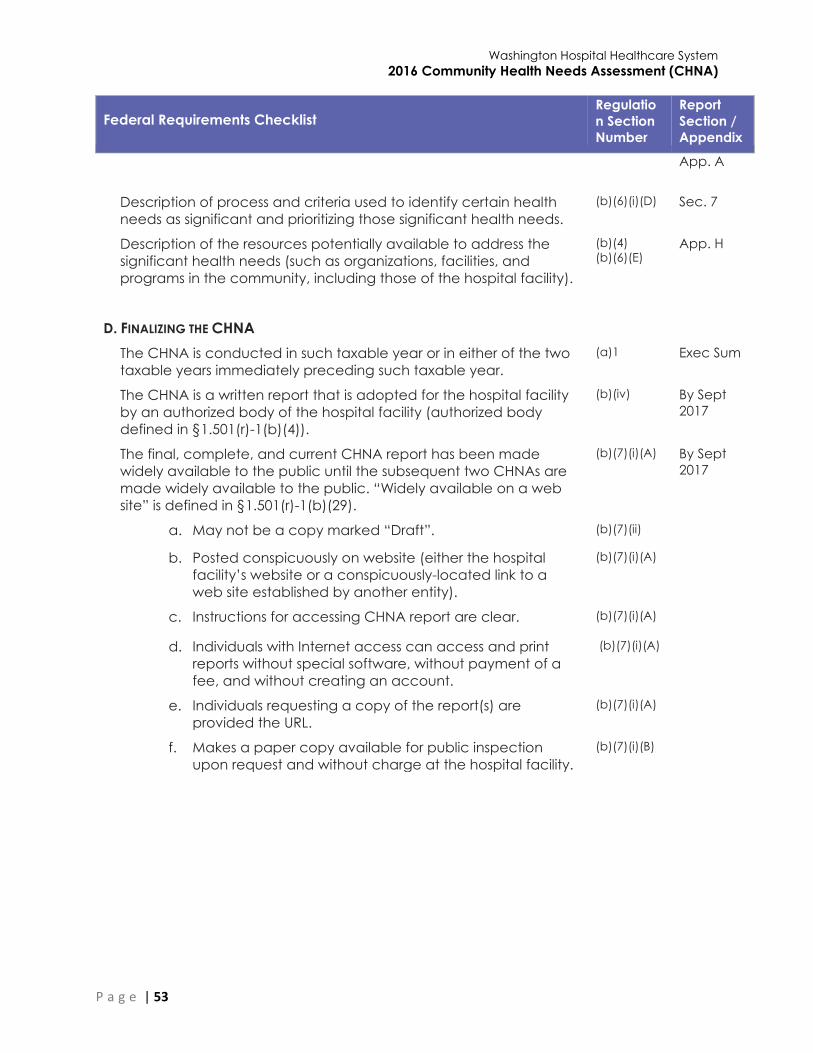
Washington Hospital Healthcare System
2016 Community Health Needs Assessment (CHNA)
P a g e | 53
Federal Requirements Checklist Regulatio
n Section
Number
Report
Section /
Appendix
App. A
Description of process and criteria used to identify certain health
needs as significant and prioritizing those significant health needs.
(b)(6)(i)(D) Sec. 7
Description of the resources potentially available to address the
significant health needs (such as organizations, facilities, and
programs in the community, including those of the hospital facility).
(b)(4)
(b)(6)(E) App. H
D. FINALIZING THE CHNA
The CHNA is conducted in such taxable year or in either of the two
taxable years immediately preceding such taxable year.
(a)1 Exec Sum
The CHNA is a written report that is adopted for the hospital facility
by an authorized body of the hospital facility (authorized body
defined in §1.501(r)-1(b)(4)).
(b)(iv) By Sept
2017
The final, complete, and current CHNA report has been made
widely available to the public until the subsequent two CHNAs are
made widely available to the public. “Widely available on a web
site” is defined in §1.501(r)-1(b)(29).
(b)(7)(i)(A) By Sept
2017
a. May not be a copy marked “Draft”. (b)(7)(ii)
b. Posted conspicuously on website (either the hospital
facility’s website or a conspicuously-located link to a
web site established by another entity).
(b)(7)(i)(A)
c. Instructions for accessing CHNA report are clear. (b)(7)(i)(A)
d. Individuals with Internet access can access and print
reports without special software, without payment of a
fee, and without creating an account.
(b)(7)(i)(A)
e. Individuals requesting a copy of the report(s) are
provided the URL.
(b)(7)(i)(A)
f. Makes a paper copy available for public inspection
upon request and without charge at the hospital facility.
(b)(7)(i)(B)
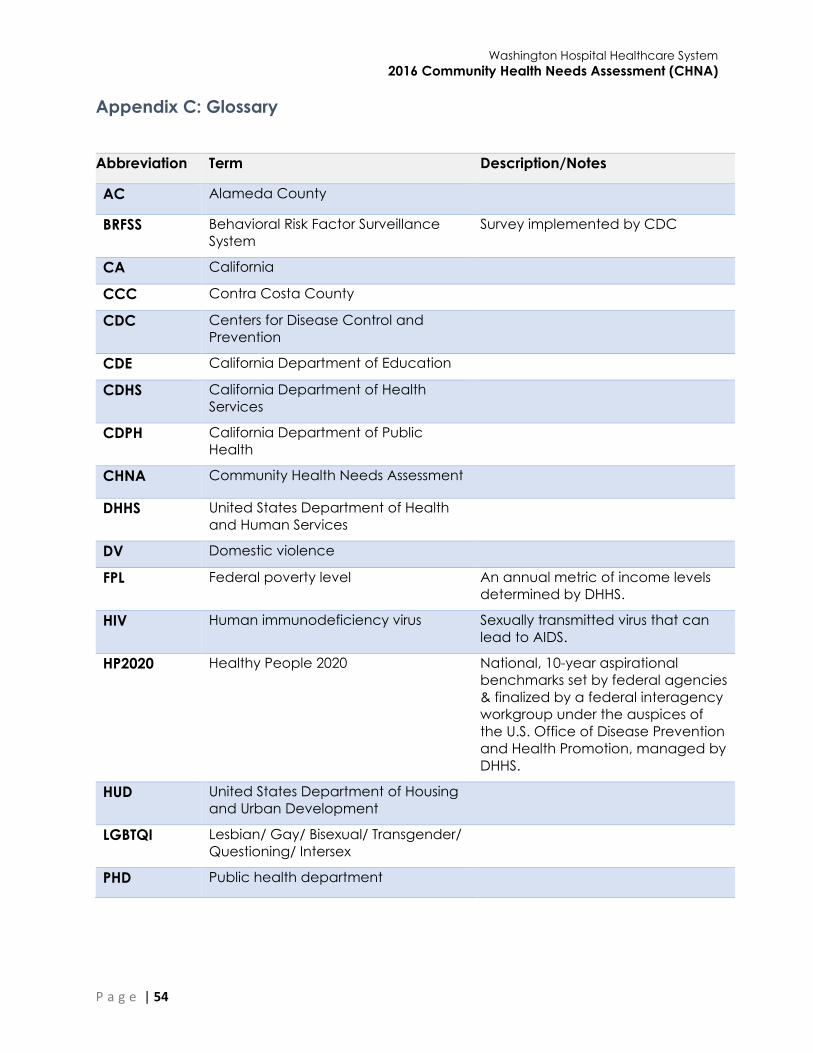
Washington Hospital Healthcare System
2016 Community Health Needs Assessment (CHNA)
P a g e | 54
Appendix C: Glossary
Abbreviation Term Description/Notes
AC Alameda County
BRFSS Behavioral Risk Factor Surveillance
System
Survey implemented by CDC
CA California
CCC Contra Costa County
CDC Centers for Disease Control and
Prevention
CDE California Department of Education
CDHS California Department of Health
Services
CDPH California Department of Public
Health
CHNA Community Health Needs Assessment
DHHS United States Department of Health
and Human Services
DV Domestic violence
FPL Federal poverty level An annual metric of income levels
determined by DHHS.
HIV Human immunodeficiency virus Sexually transmitted virus that can
lead to AIDS.
HP2020 Healthy People 2020 National, 10-year aspirational
benchmarks set by federal agencies
& finalized by a federal interagency
workgroup under the auspices of
the U.S. Office of Disease Prevention
and Health Promotion, managed by
DHHS.
HUD United States Department of Housing
and Urban Development
LGBTQI Lesbian/ Gay/ Bisexual/ Transgender/
Questioning/ Intersex
PHD Public health department

Washington Hospital Healthcare System
2016 Community Health Needs Assessment (CHNA)
P a g e | 55
Appendix D: Secondary Data Sources
1. Alameda County Public Health Department. Alameda County Health Data Profile. 2014.
2. Alameda County Public Health Department. http://www.healthyalamedacounty.org/.
Various.
3. California Department of Education. 2012-2013.
4. California Department of Education. 2013.
5. California Department of Education, FITNESSGRAM®; Physical Fitness Testing. 2013-2014.
6. California Department of Public Health, CDPH – Birth Profiles by ZIP Code. 2011.
7. California Department of Public Health, CDPH – Breastfeeding Statistics. 2012.
8. California Department of Public Health, CDPH – Death Public Use Data. University of Missouri,
Center for Applied Research and Environmental Systems. 2010-2012.
9. California Department of Public Health, CDPH – Tracking. 2005-2012.
10. California Office of Statewide Health Planning and Development, OSHPD Patient Discharge
Data. 2011.
11. Centers for Disease Control and Prevention, Behavioral Risk Factor Surveillance System. 2006-
2010.
12. Centers for Disease Control and Prevention, Behavioral Risk Factor Surveillance System. 2006-
2012.
13. Centers for Disease Control and Prevention, Behavioral Risk Factor Surveillance System. 2011-
2012.
14. Centers for Disease Control and Prevention, Behavioral Risk Factor Surveillance System. US
Department of Health & Human Services, Health Indicators Warehouse. 2005-2009.
15. Centers for Disease Control and Prevention, Behavioral Risk Factor Surveillance System. US
Department of Health & Human Services, Health Indicators Warehouse. 2006-2012.
16. Centers for Disease Control and Prevention, National Center for Chronic Disease Prevention
and Health Promotion. 2012.
17. Centers for Disease Control and Prevention, National Center for HIV/AIDS, Viral Hepatitis, STD,
and TB Prevention. US Department of Health & Human Services, Health Indicators
Warehouse. 2010.
18. Centers for Disease Control and Prevention, National Center for HIV/AIDS, Viral Hepatitis, STD,
and TB Prevention. US Department of Health & Human Services, Health Indicators
Warehouse. 2012.
19. Centers for Disease Control and Prevention, National Environmental Public Health Tracking
Network. 2008.
20. Centers for Disease Control and Prevention, National Vital Statistics System. Centers for
Disease Control and Prevention, Wide Ranging Online Data for Epidemiologic Research.
2006-2010.
21. Centers for Disease Control and Prevention, National Vital Statistics System. Centers for
Disease Control and Prevention, Wide Ranging Online Data for Epidemiologic Research.
2007-2010.
22. Centers for Disease Control and Prevention, National Vital Statistics System. Centers for
Disease Control and Prevention, Wide Ranging Online Data for Epidemiologic Research.
2007-2011.
23. Centers for Disease Control and Prevention, National Vital Statistics System. University of
Wisconsin Population Health Institute, County Health Rankings. 2008-2010.
24. Centers for Disease Control and Prevention, National Vital Statistics System. US Department of
Health & Human Services, Health Indicators Warehouse. 2006-2012.
25. Centers for Medicare and Medicaid Services. 2012.

Washington Hospital Healthcare System
2016 Community Health Needs Assessment (CHNA)
P a g e | 56
26. Child and Adolescent Health Measurement Initiative, National Survey of Children’s Health.
2011-2012.
27. Dartmouth College Institute for Health Policy & Clinical Practice. Dartmouth Atlas of Health
Care. 2012.
28. Environmental Protection Agency, EPA Smart Location Database. 2011.
29. Federal Bureau of Investigation, FBI Uniform Crime Reports. 2010-2012.
30. Feeding America. 2012.
31. Multi-Resolution Land Characteristics Consortium, National Land Cover Database. 2011.
32. National Center for Education Statistics, NCES – Common Core of Data. 2012-2013.
33. National Oceanic and Atmospheric Administration, North America Land Data Assimilation
System (NLDAS). 2014.
34. New America Foundation, Federal Education Budget Project. 2011.
35. Nielsen, Nielsen Site Reports. 2014.
36. State Cancer Profiles. National Institutes of Health, National Cancer Institute, Surveillance,
Epidemiology, and End Results Program. 2007-2011.
37. University of California Center for Health Policy Research, California Health Interview Survey.
2009.
38. University of California Center for Health Policy Research, California Health Interview Survey.
2012.
39. University of California Los Angeles (UCLA) Center for Health Policy Research. AskCHIS
Neighborhood Edition. 2015.
40. University of California Los Angeles (UCLA) Center for Health Policy Research. AskCHIS. 2015.
41. University of Wisconsin Population Health Institute, County Health Rankings. 2012-2013.
42. University of Wisconsin Population Health Institute, County Health Rankings. 2014.
43. US Census Bureau, American Community Survey. 2009-2013.
44. US Census Bureau, American Housing Survey. 2011, 2013.
45. US Census Bureau, County Business Patterns. 2011.
46. US Census Bureau, County Business Patterns. 2012.
47. US Census Bureau, County Business Patterns. 2013.
48. US Census Bureau, Decennial Census. 2000-2010.
49. US Census Bureau, Decennial Census, ESRI Map Gallery. 2010.
50. US Census Bureau, Small Area Income & Poverty Estimates. 2010.
51. US Department of Agriculture, Economic Research Service, USDA – Food Access Research
Atlas. 2010.
52. US Department of Agriculture, Economic Research Service, USDA – Food Environment Atlas.
2011.
53. US Department of Agriculture, Economic Research Service, USDA – Child Nutrition Program.
2013.
54. US Department of Education, EDFacts. 2011-2012.
55. US Department of Health & Human Services, Administration for Children and Families. 2014.
56. US Department of Health & Human Services, Center for Medicare & Medicaid Services,
Provider of Services File. June 2014.
57. US Department of Health & Human Services, Health Resources and Services Administration,
Area Health Resource File. 2012.
58. US Department of Health & Human Services, Health Resources and Services Administration,
Area Health Resource File. 2013.
59. US Department of Health & Human Services, Health Resources and Services Administration,
Health Professional Shortage Areas. March 2015.

Washington Hospital Healthcare System
2016 Community Health Needs Assessment (CHNA)
P a g e | 57
60. US Department of Health and Human Services, Office of Disease Prevention and Health
Promotion, HealthyPeople.gov, Healthy People 2020. http://www.healthypeople.gov/.
2015.
61. US Department of Housing and Urban Development. 2013.
62. US Department of Labor, Bureau of Labor Statistics. June 2015.
63. US Department of Transportation, National Highway Traffic Safety Administration, Fatality
Analysis Reporting System. 2011-2013.
64. US Drought Monitor. 2012-2014

Washington Hospital Healthcare System
2016 Community Health Needs Assessment (CHNA)
P a g e | 58
Appendix E: Indicator List
Indicator Variable Data Source
Age 0-4 (Percentage) US Census Bureau, American Community Survey. 2009-13.
Age 18-24 (Percentage) US Census Bureau, American Community Survey. 2009-13.
Age 25-34 (Percentage) US Census Bureau, American Community Survey. 2009-13.
Age 35-44 (Percentage) US Census Bureau, American Community Survey. 2009-13.
Age 45-54 (Percentage) US Census Bureau, American Community Survey. 2009-13.
Age 5-17 (Percentage) US Census Bureau, American Community Survey. 2009-13.
Age 55-64 (Percentage) US Census Bureau, American Community Survey. 2009-13.
Age 65+ (Percentage) US Census Bureau, American Community Survey. 2009-13.
Alcoholic Beverage
Expenditures, Percentage of
Total Food-At-Home
Expenditures
Nielsen, Nielsen Site Reports. 2014.
Annual Breast Cancer Incidence
Rate (Per 100,000 Pop.)
National Institutes of Health, National Cancer Institute,
Surveillance, Epidemiology, and End Results Program.
State Cancer Profiles. 2007-11.
Annual Cervical Cancer
Incidence Rate (Per 100,000
Pop.)
National Institutes of Health, National Cancer Institute,
Surveillance, Epidemiology, and End Results Program.
State Cancer Profiles. 2007-11.
Annual Colon and Rectum
Cancer Incidence Rate (Per
100,000 Pop.)
National Institutes of Health, National Cancer Institute,
Surveillance, Epidemiology, and End Results Program.
State Cancer Profiles. 2007-11.
Annual Lung Cancer Incidence
Rate (Per 100,000 Pop.)
National Institutes of Health, National Cancer Institute,
Surveillance, Epidemiology, and End Results Program.
State Cancer Profiles. 2007-11.
Annual Prostate Cancer
Incidence Rate (Per 100,000
Pop.)
National Institutes of Health, National Cancer Institute,
Surveillance, Epidemiology, and End Results Program.
State Cancer Profiles. 2007-11.
Assault Injuries Rate (per 100,000
Pop.)
California EpiCenter data platform for Overall Injury
Surveillance. 2011-13.
Assault Rate (Per 100,000 Pop.) Federal Bureau of Investigation, FBI Uniform Crime Reports.
Additional analysis by the National Archive of Criminal
Justice Data. Accessed via the Inter-university Consortium
for Political and Social Research. 2010-12.
Asthma Hospitalizations Age-
Adjusted Discharge Rate (Per
10,000 Pop.)
California Office of Statewide Health Planning and
Development, OSHPD Patient Discharge Data, additional
data analysis by CARES, 2011, and Alameda County Public
Health Department. Alameda County Health Data Profile,
2014, and Contra Costa Health Services and Hospital
Council of Northern and Central California, 2010,
Community Health Indicators for Contra Costa County.
Asthma Prevalence
(Percentage, Adults)
Centers for Disease Control and Prevention, Behavioral Risk
Factor Surveillance System. Additional data analysis by
CARES. 2011-12.
Average Daily School Breakfast
Program Participation Rate
US Department of Agriculture, Food and Nutrition Service,
USDA - Child Nutrition Program. 2013.
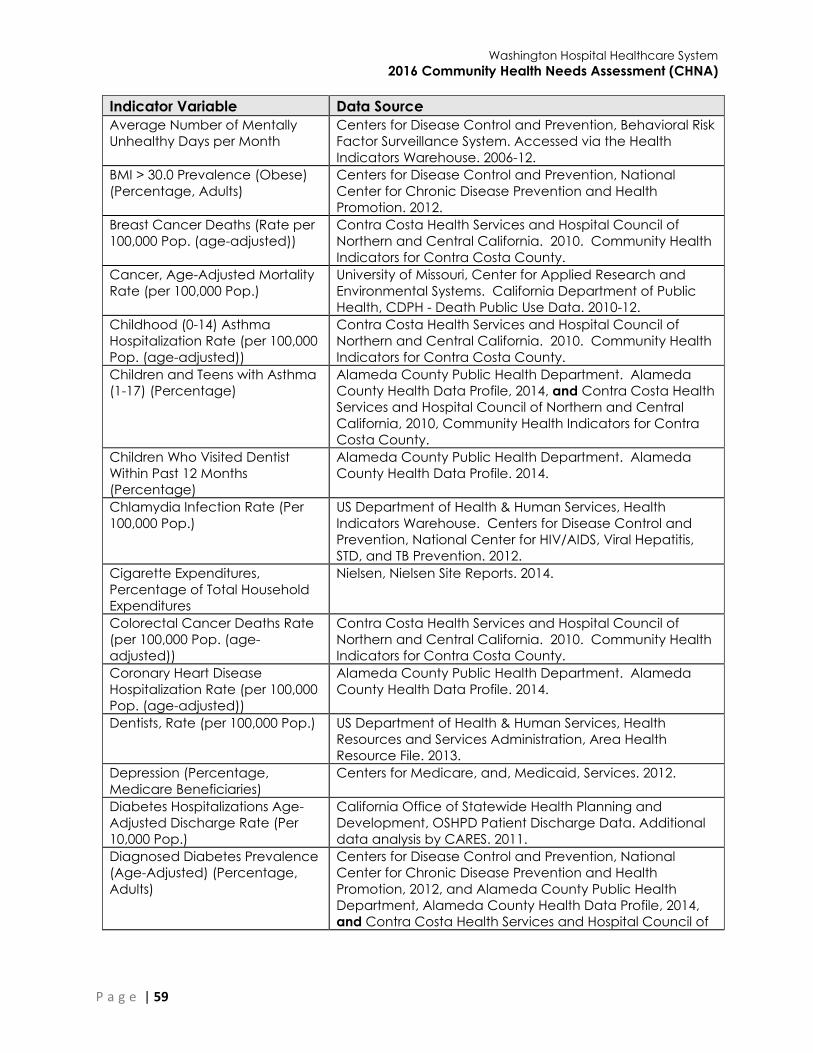
Washington Hospital Healthcare System
2016 Community Health Needs Assessment (CHNA)
P a g e | 59
Indicator Variable Data Source
Average Number of Mentally
Unhealthy Days per Month
Centers for Disease Control and Prevention, Behavioral Risk
Factor Surveillance System. Accessed via the Health
Indicators Warehouse. 2006-12.
BMI > 30.0 Prevalence (Obese)
(Percentage, Adults)
Centers for Disease Control and Prevention, National
Center for Chronic Disease Prevention and Health
Promotion. 2012.
Breast Cancer Deaths (Rate per
100,000 Pop. (age-adjusted))
Contra Costa Health Services and Hospital Council of
Northern and Central California. 2010. Community Health
Indicators for Contra Costa County.
Cancer, Age-Adjusted Mortality
Rate (per 100,000 Pop.)
University of Missouri, Center for Applied Research and
Environmental Systems. California Department of Public
Health, CDPH - Death Public Use Data. 2010-12.
Childhood (0-14) Asthma
Hospitalization Rate (per 100,000
Pop. (age-adjusted))
Contra Costa Health Services and Hospital Council of
Northern and Central California. 2010. Community Health
Indicators for Contra Costa County.
Children and Teens with Asthma
(1-17) (Percentage)
Alameda County Public Health Department. Alameda
County Health Data Profile, 2014, and Contra Costa Health
Services and Hospital Council of Northern and Central
California, 2010, Community Health Indicators for Contra
Costa County.
Children Who Visited Dentist
Within Past 12 Months
(Percentage)
Alameda County Public Health Department. Alameda
County Health Data Profile. 2014.
Chlamydia Infection Rate (Per
100,000 Pop.)
US Department of Health & Human Services, Health
Indicators Warehouse. Centers for Disease Control and
Prevention, National Center for HIV/AIDS, Viral Hepatitis,
STD, and TB Prevention. 2012.
Cigarette Expenditures,
Percentage of Total Household
Expenditures
Nielsen, Nielsen Site Reports. 2014.
Colorectal Cancer Deaths Rate
(per 100,000 Pop. (age-
adjusted))
Contra Costa Health Services and Hospital Council of
Northern and Central California. 2010. Community Health
Indicators for Contra Costa County.
Coronary Heart Disease
Hospitalization Rate (per 100,000
Pop. (age-adjusted))
Alameda County Public Health Department. Alameda
County Health Data Profile. 2014.
Dentists, Rate (per 100,000 Pop.) US Department of Health & Human Services, Health
Resources and Services Administration, Area Health
Resource File. 2013.
Depression (Percentage,
Medicare Beneficiaries)
Centers for Medicare, and, Medicaid, Services. 2012.
Diabetes Hospitalizations Age-
Adjusted Discharge Rate (Per
10,000 Pop.)
California Office of Statewide Health Planning and
Development, OSHPD Patient Discharge Data. Additional
data analysis by CARES. 2011.
Diagnosed Diabetes Prevalence
(Age-Adjusted) (Percentage,
Adults)
Centers for Disease Control and Prevention, National
Center for Chronic Disease Prevention and Health
Promotion, 2012, and Alameda County Public Health
Department, Alameda County Health Data Profile, 2014,
and Contra Costa Health Services and Hospital Council of

Washington Hospital Healthcare System
2016 Community Health Needs Assessment (CHNA)
P a g e | 60
Indicator Variable Data Source
Northern and Central California, 2010, Community Health
Indicators for Contra Costa County.
Disability (Percentage,
Population)
US Census Bureau, American Community Survey. 2009-13.
Domestic Violence Injuries Rate
(per 100,000 Pop. (Females Age
10+))
California EpiCenter data platform for Overall Injury
Surveillance. 2011-13.
Drought Weeks (Any)
(Percentage)
US, Drought, Monitor. 2012-14.
Estimated Adults Drinking
Excessively (Age-Adjusted
Percentage)
Centers for Disease Control and Prevention, Behavioral Risk
Factor Surveillance System. Accessed via the Health
Indicators Warehouse. US Department of Health & Human
Services, Health Indicators Warehouse. 2006-12.
Fast Food Restaurants, Rate (Per
100,000 Pop.)
US Census Bureau, County Business Patterns. Additional
data analysis by CARES. 2011.
Federally Qualified Health
Centers, Rate (per 100,000 Pop.)
US Department of Health & Human Services, Center for
Medicare & Medicaid Services, Provider of Services File.
June 2014.
Female Population (Percentage) US Census Bureau, American Community Survey. 2009-13.
Food Insecurity (Percentage,
Population)
Feeding, America. 2012.
Fruit / Vegetable Expenditures,
Percentage of Total Food-At-
Home Expenditures
Nielsen, Nielsen Site Reports. 2014.
Full Immunization at 24 Months
(Percentage)
Contra Costa Health Services and Hospital Council of
Northern and Central California. 2010. Community Health
Indicators for Contra Costa County.
Gini Index Value (Income
Inequality)
US Census Bureau, American Community Survey. 2009-13.
Grade 4 ELA Test Score Not
Proficient (Percentage)
California, Department of Education., 2012-13.
Grocery Stores, Rate (Per
100,000 Pop.)
US Census Bureau, County Business Patterns. Additional
data analysis by CARES. 2011.
Head Start Programs Rate (Per
10,000 Children Under Age 5)
US Department of Health & Human Services, Administration
for Children and Families. 2014.
Heart Disease Prevalence
(Percentage, Adults)
University of California Center for Health Policy Research,
California Health Interview Survey. 2011-12.
Heart Disease, Age-Adjusted
Mortality Rate (per 100,000 Pop.)
University of Missouri, Center for Applied Research and
Environmental Systems. California Department of Public
Health, CDPH - Death Public Use Data. 2010-12.
Heat-related Emergency
Department Visits, Rate (per
100,000 Pop.)
California Department of Public Health, CDPH - Tracking.
2005-12.
Hemoglobin A1c Test, Annual
(Percentage, Medicare Enrollees
with Diabetes)
Dartmouth College Institute for Health Policy & Clinical
Practice, Dartmouth Atlas of Health Care. 2012.
High Blood Pressure and Not
Taking Medication (Percentage,
Adults)
Centers for Disease Control and Prevention, Behavioral Risk
Factor Surveillance System. Additional data analysis by
CARES. 2006-10.
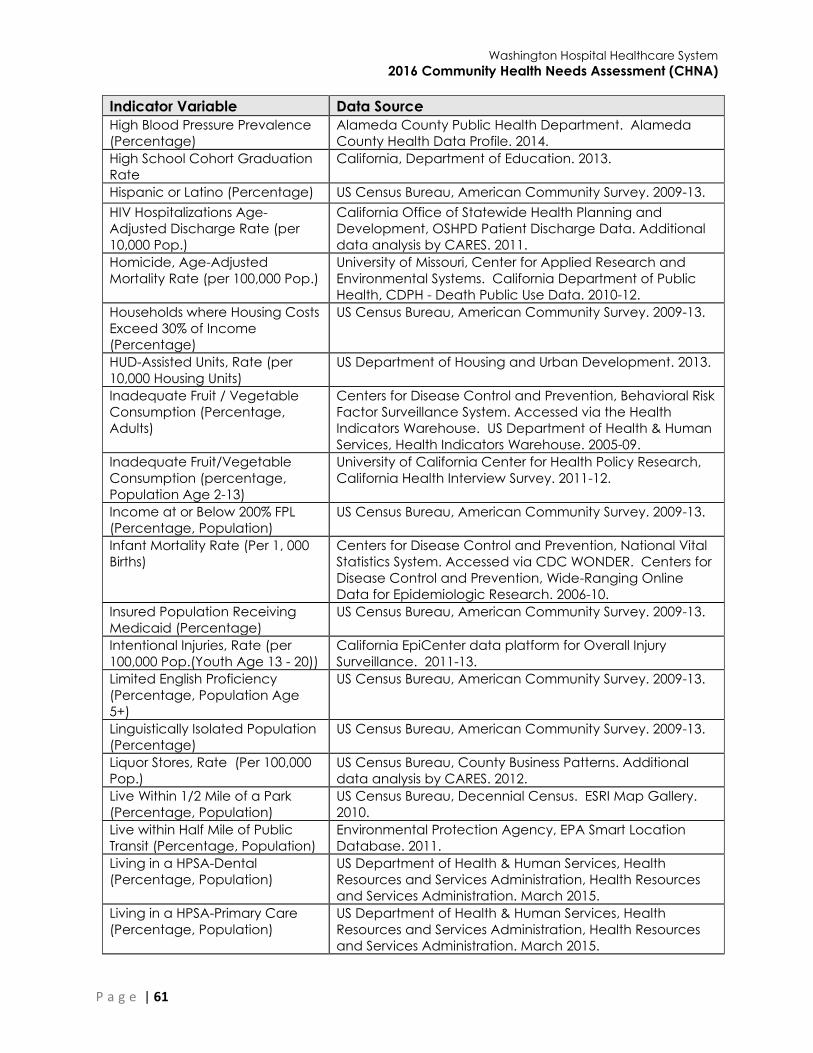
Washington Hospital Healthcare System
2016 Community Health Needs Assessment (CHNA)
P a g e | 61
Indicator Variable Data Source
High Blood Pressure Prevalence
(Percentage)
Alameda County Public Health Department. Alameda
County Health Data Profile. 2014.
High School Cohort Graduation
Rate
California, Department of Education. 2013.
Hispanic or Latino (Percentage) US Census Bureau, American Community Survey. 2009-13.
HIV Hospitalizations Age-
Adjusted Discharge Rate (per
10,000 Pop.)
California Office of Statewide Health Planning and
Development, OSHPD Patient Discharge Data. Additional
data analysis by CARES. 2011.
Homicide, Age-Adjusted
Mortality Rate (per 100,000 Pop.)
University of Missouri, Center for Applied Research and
Environmental Systems. California Department of Public
Health, CDPH - Death Public Use Data. 2010-12.
Households where Housing Costs
Exceed 30% of Income
(Percentage)
US Census Bureau, American Community Survey. 2009-13.
HUD-Assisted Units, Rate (per
10,000 Housing Units)
US Department of Housing and Urban Development. 2013.
Inadequate Fruit / Vegetable
Consumption (Percentage,
Adults)
Centers for Disease Control and Prevention, Behavioral Risk
Factor Surveillance System. Accessed via the Health
Indicators Warehouse. US Department of Health & Human
Services, Health Indicators Warehouse. 2005-09.
Inadequate Fruit/Vegetable
Consumption (percentage,
Population Age 2-13)
University of California Center for Health Policy Research,
California Health Interview Survey. 2011-12.
Income at or Below 200% FPL
(Percentage, Population)
US Census Bureau, American Community Survey. 2009-13.
Infant Mortality Rate (Per 1, 000
Births)
Centers for Disease Control and Prevention, National Vital
Statistics System. Accessed via CDC WONDER. Centers for
Disease Control and Prevention, Wide-Ranging Online
Data for Epidemiologic Research. 2006-10.
Insured Population Receiving
Medicaid (Percentage)
US Census Bureau, American Community Survey. 2009-13.
Intentional Injuries, Rate (per
100,000 Pop.(Youth Age 13 - 20))
California EpiCenter data platform for Overall Injury
Surveillance. 2011-13.
Limited English Proficiency
(Percentage, Population Age
5+)
US Census Bureau, American Community Survey. 2009-13.
Linguistically Isolated Population
(Percentage)
US Census Bureau, American Community Survey. 2009-13.
Liquor Stores, Rate (Per 100,000
Pop.)
US Census Bureau, County Business Patterns. Additional
data analysis by CARES. 2012.
Live Within 1/2 Mile of a Park
(Percentage, Population)
US Census Bureau, Decennial Census. ESRI Map Gallery.
2010.
Live within Half Mile of Public
Transit (Percentage, Population)
Environmental Protection Agency, EPA Smart Location
Database. 2011.
Living in a HPSA-Dental
(Percentage, Population)
US Department of Health & Human Services, Health
Resources and Services Administration, Health Resources
and Services Administration. March 2015.
Living in a HPSA-Primary Care
(Percentage, Population)
US Department of Health & Human Services, Health
Resources and Services Administration, Health Resources
and Services Administration. March 2015.
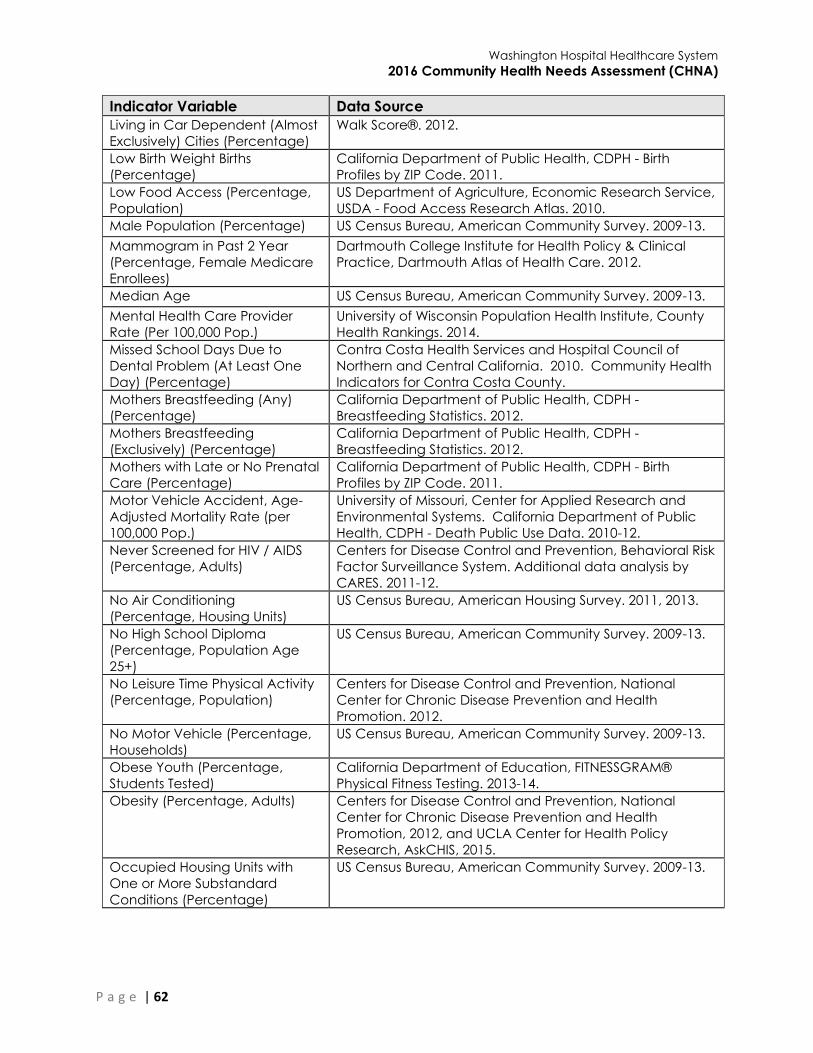
Washington Hospital Healthcare System
2016 Community Health Needs Assessment (CHNA)
P a g e | 62
Indicator Variable Data Source
Living in Car Dependent (Almost
Exclusively) Cities (Percentage)
Walk Score®. 2012.
Low Birth Weight Births
(Percentage)
California Department of Public Health, CDPH - Birth
Profiles by ZIP Code. 2011.
Low Food Access (Percentage,
Population)
US Department of Agriculture, Economic Research Service,
USDA - Food Access Research Atlas. 2010.
Male Population (Percentage) US Census Bureau, American Community Survey. 2009-13.
Mammogram in Past 2 Year
(Percentage, Female Medicare
Enrollees)
Dartmouth College Institute for Health Policy & Clinical
Practice, Dartmouth Atlas of Health Care. 2012.
Median Age US Census Bureau, American Community Survey. 2009-13.
Mental Health Care Provider
Rate (Per 100,000 Pop.)
University of Wisconsin Population Health Institute, County
Health Rankings. 2014.
Missed School Days Due to
Dental Problem (At Least One
Day) (Percentage)
Contra Costa Health Services and Hospital Council of
Northern and Central California. 2010. Community Health
Indicators for Contra Costa County.
Mothers Breastfeeding (Any)
(Percentage)
California Department of Public Health, CDPH -
Breastfeeding Statistics. 2012.
Mothers Breastfeeding
(Exclusively) (Percentage)
California Department of Public Health, CDPH -
Breastfeeding Statistics. 2012.
Mothers with Late or No Prenatal
Care (Percentage)
California Department of Public Health, CDPH - Birth
Profiles by ZIP Code. 2011.
Motor Vehicle Accident, Age-
Adjusted Mortality Rate (per
100,000 Pop.)
University of Missouri, Center for Applied Research and
Environmental Systems. California Department of Public
Health, CDPH - Death Public Use Data. 2010-12.
Never Screened for HIV / AIDS
(Percentage, Adults)
Centers for Disease Control and Prevention, Behavioral Risk
Factor Surveillance System. Additional data analysis by
CARES. 2011-12.
No Air Conditioning
(Percentage, Housing Units)
US Census Bureau, American Housing Survey. 2011, 2013.
No High School Diploma
(Percentage, Population Age
25+)
US Census Bureau, American Community Survey. 2009-13.
No Leisure Time Physical Activity
(Percentage, Population)
Centers for Disease Control and Prevention, National
Center for Chronic Disease Prevention and Health
Promotion. 2012.
No Motor Vehicle (Percentage,
Households)
US Census Bureau, American Community Survey. 2009-13.
Obese Youth (Percentage,
Students Tested)
California Department of Education, FITNESSGRAM®
Physical Fitness Testing. 2013-14.
Obesity (Percentage, Adults) Centers for Disease Control and Prevention, National
Center for Chronic Disease Prevention and Health
Promotion, 2012, and UCLA Center for Health Policy
Research, AskCHIS, 2015.
Occupied Housing Units with
One or More Substandard
Conditions (Percentage)
US Census Bureau, American Community Survey. 2009-13.
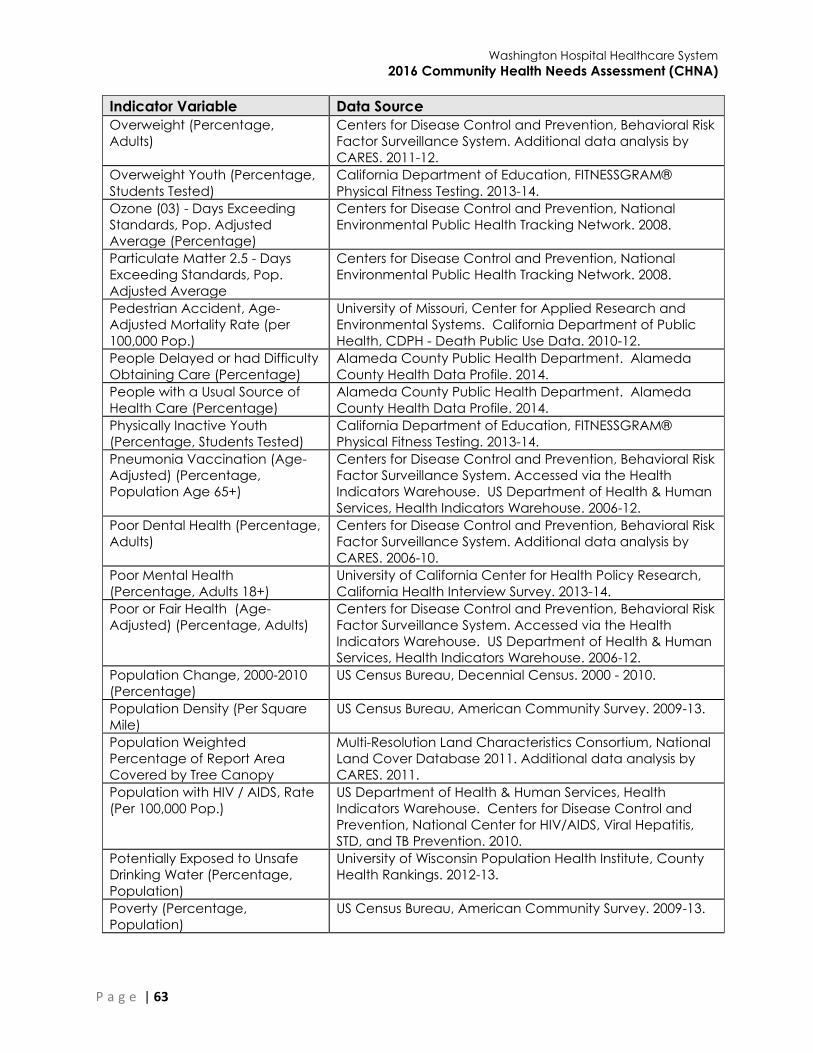
Washington Hospital Healthcare System
2016 Community Health Needs Assessment (CHNA)
P a g e | 63
Indicator Variable Data Source
Overweight (Percentage,
Adults)
Centers for Disease Control and Prevention, Behavioral Risk
Factor Surveillance System. Additional data analysis by
CARES. 2011-12.
Overweight Youth (Percentage,
Students Tested)
California Department of Education, FITNESSGRAM®
Physical Fitness Testing. 2013-14.
Ozone (03) - Days Exceeding
Standards, Pop. Adjusted
Average (Percentage)
Centers for Disease Control and Prevention, National
Environmental Public Health Tracking Network. 2008.
Particulate Matter 2.5 - Days
Exceeding Standards, Pop.
Adjusted Average
Centers for Disease Control and Prevention, National
Environmental Public Health Tracking Network. 2008.
Pedestrian Accident, Age-
Adjusted Mortality Rate (per
100,000 Pop.)
University of Missouri, Center for Applied Research and
Environmental Systems. California Department of Public
Health, CDPH - Death Public Use Data. 2010-12.
People Delayed or had Difficulty
Obtaining Care (Percentage)
Alameda County Public Health Department. Alameda
County Health Data Profile. 2014.
People with a Usual Source of
Health Care (Percentage)
Alameda County Public Health Department. Alameda
County Health Data Profile. 2014.
Physically Inactive Youth
(Percentage, Students Tested)
California Department of Education, FITNESSGRAM®
Physical Fitness Testing. 2013-14.
Pneumonia Vaccination (Age-
Adjusted) (Percentage,
Population Age 65+)
Centers for Disease Control and Prevention, Behavioral Risk
Factor Surveillance System. Accessed via the Health
Indicators Warehouse. US Department of Health & Human
Services, Health Indicators Warehouse. 2006-12.
Poor Dental Health (Percentage,
Adults)
Centers for Disease Control and Prevention, Behavioral Risk
Factor Surveillance System. Additional data analysis by
CARES. 2006-10.
Poor Mental Health
(Percentage, Adults 18+)
University of California Center for Health Policy Research,
California Health Interview Survey. 2013-14.
Poor or Fair Health (Age-
Adjusted) (Percentage, Adults)
Centers for Disease Control and Prevention, Behavioral Risk
Factor Surveillance System. Accessed via the Health
Indicators Warehouse. US Department of Health & Human
Services, Health Indicators Warehouse. 2006-12.
Population Change, 2000-2010
(Percentage)
US Census Bureau, Decennial Census. 2000 - 2010.
Population Density (Per Square
Mile)
US Census Bureau, American Community Survey. 2009-13.
Population Weighted
Percentage of Report Area
Covered by Tree Canopy
Multi-Resolution Land Characteristics Consortium, National
Land Cover Database 2011. Additional data analysis by
CARES. 2011.
Population with HIV / AIDS, Rate
(Per 100,000 Pop.)
US Department of Health & Human Services, Health
Indicators Warehouse. Centers for Disease Control and
Prevention, National Center for HIV/AIDS, Viral Hepatitis,
STD, and TB Prevention. 2010.
Potentially Exposed to Unsafe
Drinking Water (Percentage,
Population)
University of Wisconsin Population Health Institute, County
Health Rankings. 2012-13.
Poverty (Percentage,
Population)
US Census Bureau, American Community Survey. 2009-13.
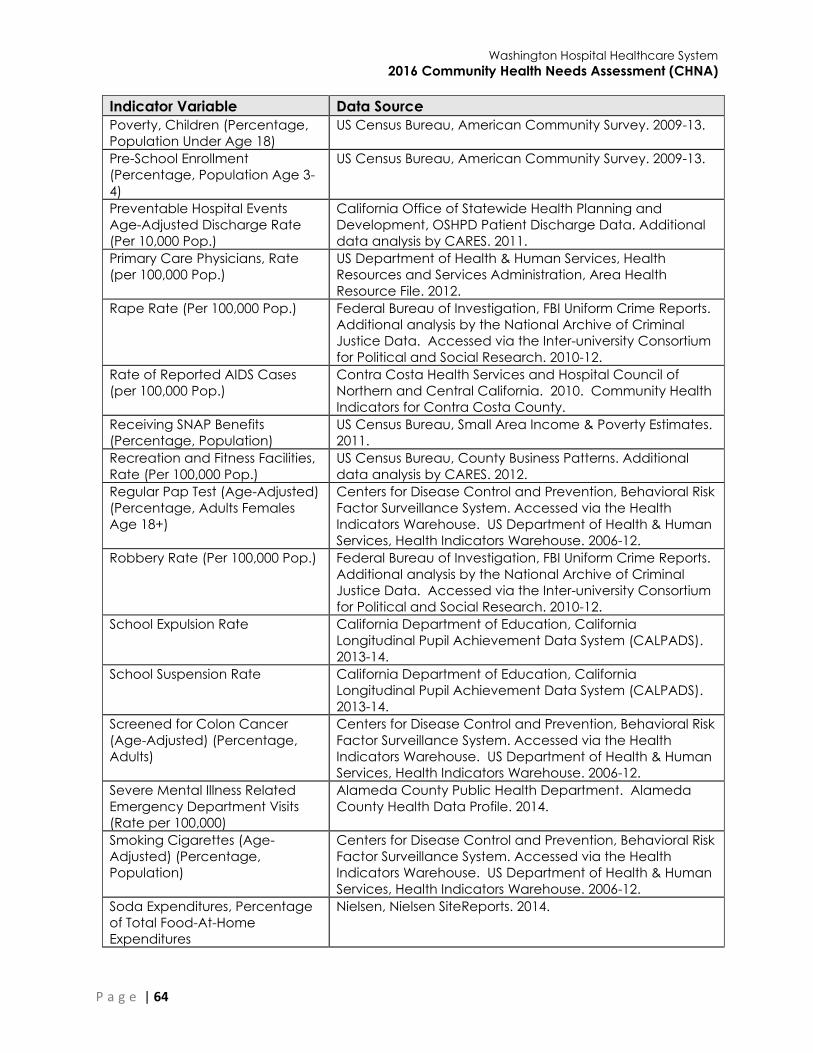
Washington Hospital Healthcare System
2016 Community Health Needs Assessment (CHNA)
P a g e | 64
Indicator Variable Data Source
Poverty, Children (Percentage,
Population Under Age 18)
US Census Bureau, American Community Survey. 2009-13.
Pre-School Enrollment
(Percentage, Population Age 3-
4)
US Census Bureau, American Community Survey. 2009-13.
Preventable Hospital Events
Age-Adjusted Discharge Rate
(Per 10,000 Pop.)
California Office of Statewide Health Planning and
Development, OSHPD Patient Discharge Data. Additional
data analysis by CARES. 2011.
Primary Care Physicians, Rate
(per 100,000 Pop.)
US Department of Health & Human Services, Health
Resources and Services Administration, Area Health
Resource File. 2012.
Rape Rate (Per 100,000 Pop.) Federal Bureau of Investigation, FBI Uniform Crime Reports.
Additional analysis by the National Archive of Criminal
Justice Data. Accessed via the Inter-university Consortium
for Political and Social Research. 2010-12.
Rate of Reported AIDS Cases
(per 100,000 Pop.)
Contra Costa Health Services and Hospital Council of
Northern and Central California. 2010. Community Health
Indicators for Contra Costa County.
Receiving SNAP Benefits
(Percentage, Population)
US Census Bureau, Small Area Income & Poverty Estimates.
2011.
Recreation and Fitness Facilities,
Rate (Per 100,000 Pop.)
US Census Bureau, County Business Patterns. Additional
data analysis by CARES. 2012.
Regular Pap Test (Age-Adjusted)
(Percentage, Adults Females
Age 18+)
Centers for Disease Control and Prevention, Behavioral Risk
Factor Surveillance System. Accessed via the Health
Indicators Warehouse. US Department of Health & Human
Services, Health Indicators Warehouse. 2006-12.
Robbery Rate (Per 100,000 Pop.) Federal Bureau of Investigation, FBI Uniform Crime Reports.
Additional analysis by the National Archive of Criminal
Justice Data. Accessed via the Inter-university Consortium
for Political and Social Research. 2010-12.
School Expulsion Rate California Department of Education, California
Longitudinal Pupil Achievement Data System (CALPADS).
2013-14.
School Suspension Rate California Department of Education, California
Longitudinal Pupil Achievement Data System (CALPADS).
2013-14.
Screened for Colon Cancer
(Age-Adjusted) (Percentage,
Adults)
Centers for Disease Control and Prevention, Behavioral Risk
Factor Surveillance System. Accessed via the Health
Indicators Warehouse. US Department of Health & Human
Services, Health Indicators Warehouse. 2006-12.
Severe Mental Illness Related
Emergency Department Visits
(Rate per 100,000)
Alameda County Public Health Department. Alameda
County Health Data Profile. 2014.
Smoking Cigarettes (Age-
Adjusted) (Percentage,
Population)
Centers for Disease Control and Prevention, Behavioral Risk
Factor Surveillance System. Accessed via the Health
Indicators Warehouse. US Department of Health & Human
Services, Health Indicators Warehouse. 2006-12.
Soda Expenditures, Percentage
of Total Food-At-Home
Expenditures
Nielsen, Nielsen SiteReports. 2014.

Washington Hospital Healthcare System
2016 Community Health Needs Assessment (CHNA)
P a g e | 65
Indicator Variable Data Source
Stroke, Age-Adjusted Mortality
Rate (per 100,000 Pop.)
University of Missouri, Center for Applied Research and
Environmental Systems. California Department of Public
Health, CDPH - Death Public Use Data. 2010-12.
Students Eligible for Free or
Reduced Price Lunch
(Percentage)
National Center for Education Statistics, NCES - Common
Core of Data. 2013-14.
Substance Use Emergency
Department Visit Rate (Rate per
100,000 (age-adjusted))
Alameda County Public Health Department. Alameda
County Health Data Profile. 2014.
Suicide, Age-Adjusted Mortality
Rate (per 100,000 Pop.)
University of Missouri, Center for Applied Research and
Environmental Systems. California Department of Public
Health, CDPH - Death Public Use Data. 2010-12.
Teen Birth Rate (Per 1, 000
Female Pop. Under Age 20)
California Department of Public Health, CDPH - Birth
Profiles by ZIP Code. 2011.
Teens Who Engage in Regular
Physical Activity (Percentage)
Alameda County Public Health Department. Alameda
County Health Data Profile. 2014.
Total Road Network Density
(Road Miles per Acre)
Environmental Protection Agency, EPA Smart Location
Database. 2011.
Tuberculosis Incidence Rate (per
100,000)
Alameda County Public Health Department. Alameda
County Health Data Profile. 2014.
Unable to Afford Dental Care,
Youth (Percentage, Population
Age 5-17)
University of California Center for Health Policy Research,
California Health Interview Survey. 2009.
Unemployment Rate US Department of Labor, Bureau of Labor Statistics. 2015 -
June.
Uninsured Population
(Percentage)
US Census Bureau, American Community Survey. 2009-13.
Vacant Housing Units
(Percentage)
US Census Bureau, American Community Survey. 2009-13.
Violent Crime Rate (Per 100,000
Pop.)
Federal Bureau of Investigation, FBI Uniform Crime Reports.
Additional analysis by the National Archive of Criminal
Justice Data. Accessed via the Inter-university Consortium
for Political and Social Research. 2010-12.
Walking or Biking to Work
(Percentage, Aged 16+)
US Census Bureau, American Community Survey. 2009-13.
Walking/Skating/Biking to School
(Percentage, Aged 5-17)
University of California Center for Health Policy Research,
California Health Interview Survey. 2011-12.
Weather Observations with High
Heat Index Values (Percentage)
National Oceanic and Atmospheric Administration, North
America Land Data Assimilation System (NLDAS). Accessed
via CDC WONDER. Additional data analysis by CARES.
2014.
WIC-Authorized Food Stores,
Rate (Per 100,000 Pop.)
US Department of Agriculture, Economic Research Service,
USDA - Food Environment Atlas. 2011.
Without Adequate Social /
Emotional Support (Age-
Adjusted) (Percentage, Adults)
Centers for Disease Control and Prevention, Behavioral Risk
Factor Surveillance System. Accessed via the Health
Indicators Warehouse. US Department of Health & Human
Services, Health Indicators Warehouse. 2006-12.
Without Dental Insurance
(Percentage, Adults)
University of California Center for Health Policy Research,
California Health Interview Survey. 2009.

Washington Hospital Healthcare System
2016 Community Health Needs Assessment (CHNA)
P a g e | 66
Indicator Variable Data Source
Without Recent Dental Exam
(Percentage, Adults)
Centers for Disease Control and Prevention, Behavioral Risk
Factor Surveillance System. Additional data analysis by
CARES. 2006-10.
Without Regular Doctor
(Percentage, Total Population)
University of California Center for Health Policy Research,
California Health Interview Survey. 2011-12.
Workers Commuting by Car,
Alone (Percentage)
US Census Bureau, American Community Survey. 2009-13.
Workers Commuting More than
60 Minutes (Percentage)
US Census Bureau, American Community Survey. 2009-13.
Years of Potential Life Lost, Rate
(per 100,000 Pop.)
University of Wisconsin Population Health Institute, County
Health Rankings. Centers for Disease Control and
Prevention, National Vital Statistics System. Accessed via
CDC WONDER. 2008-10.
Youth Without Recent Dental
Exam (Percentage)
University of California Center for Health Policy Research,
California Health Interview Survey. 2013-14.
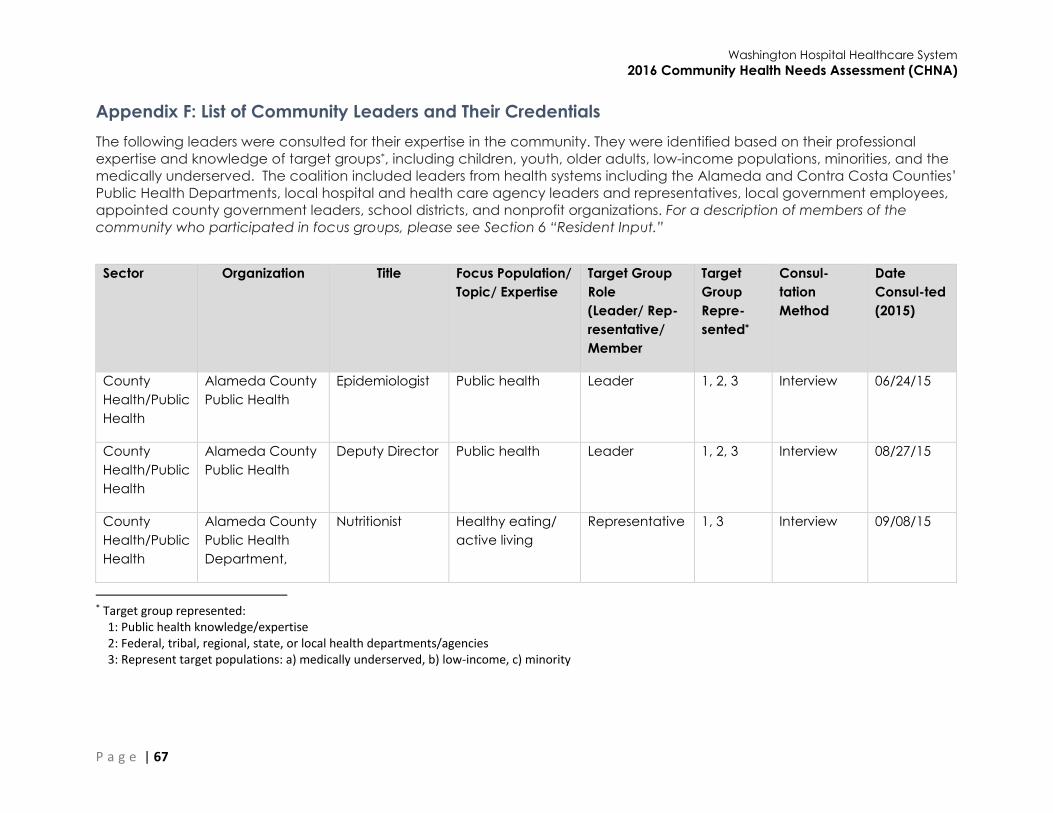
Washington Hospital Healthcare System
2016 Community Health Needs Assessment (CHNA)
P a g e | 67
Appendix F: List of Community Leaders and Their Credentials
The following leaders were consulted for their expertise in the community. They were identified based on their professional
expertise and knowledge of target groups*, including children, youth, older adults, low-income populations, minorities, and the
medically underserved. The coalition included leaders from health systems including the Alameda and Contra Costa Counties’
Public Health Departments, local hospital and health care agency leaders and representatives, local government employees,
appointed county government leaders, school districts, and nonprofit organizations. For a description of members of the
community who participated in focus groups, please see Section 6 “Resident Input.”
Sector Organization Title Focus Population/
Topic/ Expertise
Target Group
Role
(Leader/ Rep-
resentative/
Member
Target
Group
Repre-
sented*
Consul-
tation
Method
Date
Consul-ted
(2015)
County
Health/Public
Health
Alameda County
Public Health
Epidemiologist Public health Leader 1, 2, 3 Interview 06/24/15
County
Health/Public
Health
Alameda County
Public Health
Deputy Director Public health Leader 1, 2, 3 Interview 08/27/15
County
Health/Public
Health
Alameda County
Public Health
Department,
Nutritionist Healthy eating/
active living
Representative 1, 3 Interview 09/08/15
* Target group represented: 1: Public health knowledge/expertise 2: Federal, tribal, regional, state, or local health departments/agencies 3: Represent target populations: a) medically underserved, b) low-income, c) minority
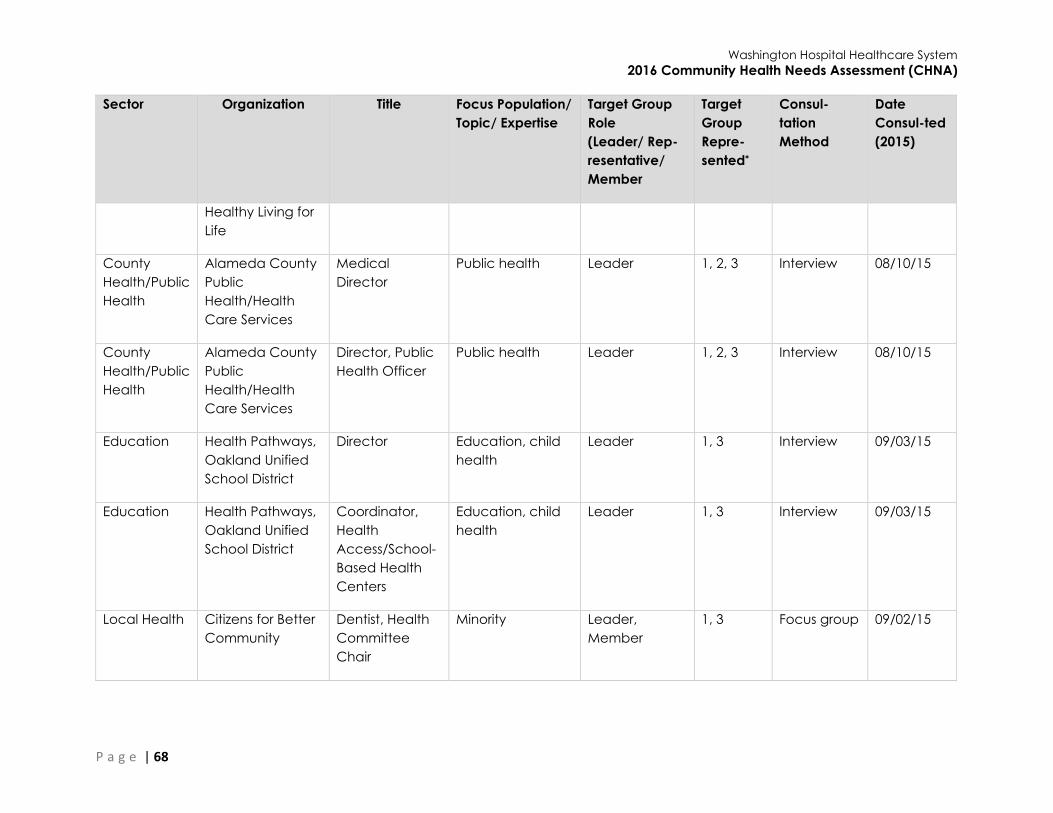
Washington Hospital Healthcare System
2016 Community Health Needs Assessment (CHNA)
P a g e | 68
Sector Organization Title Focus Population/
Topic/ Expertise
Target Group
Role
(Leader/ Rep-
resentative/
Member
Target
Group
Repre-
sented*
Consul-
tation
Method
Date
Consul-ted
(2015)
Healthy Living for
Life
County
Health/Public
Health
Alameda County
Public
Health/Health
Care Services
Medical
Director
Public health Leader 1, 2, 3 Interview 08/10/15
County
Health/Public
Health
Alameda County
Public
Health/Health
Care Services
Director, Public
Health Officer
Public health Leader 1, 2, 3 Interview 08/10/15
Education Health Pathways,
Oakland Unified
School District
Director Education, child
health
Leader 1, 3 Interview 09/03/15
Education Health Pathways,
Oakland Unified
School District
Coordinator,
Health
Access/School-
Based Health
Centers
Education, child
health
Leader 1, 3 Interview 09/03/15
Local Health Citizens for Better
Community
Dentist, Health
Committee
Chair
Minority Leader,
Member
1, 3 Focus group 09/02/15
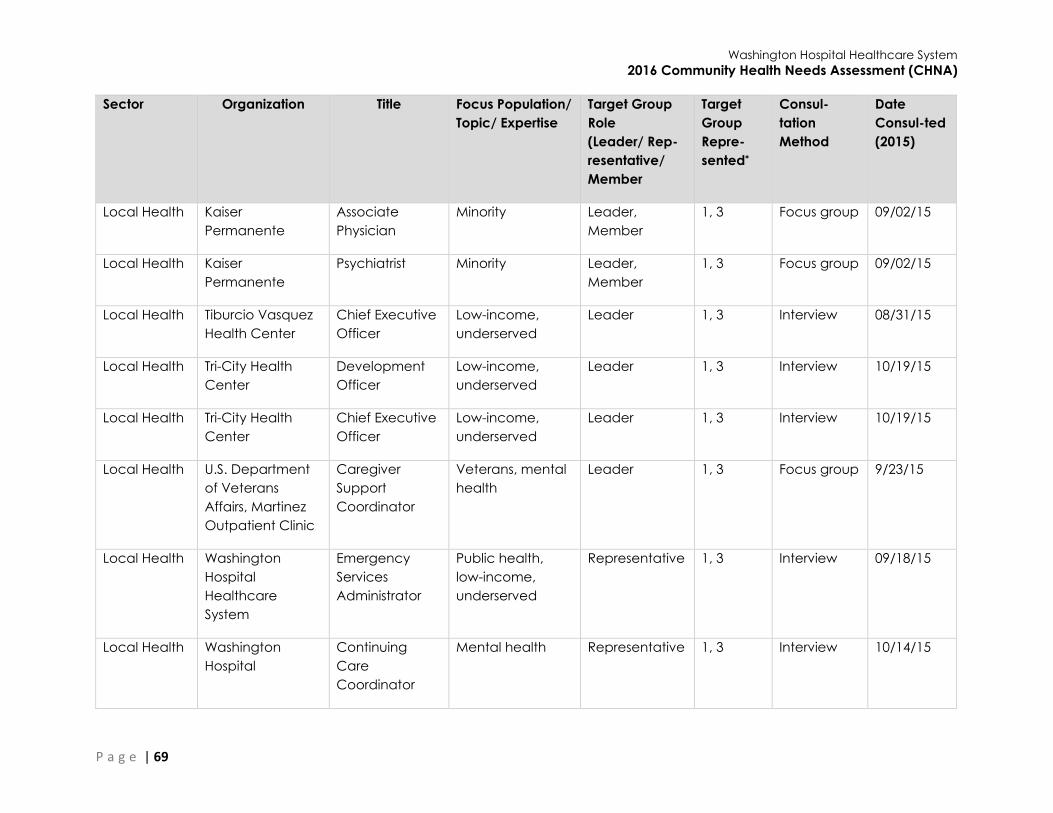
Washington Hospital Healthcare System
2016 Community Health Needs Assessment (CHNA)
P a g e | 69
Sector Organization Title Focus Population/
Topic/ Expertise
Target Group
Role
(Leader/ Rep-
resentative/
Member
Target
Group
Repre-
sented*
Consul-
tation
Method
Date
Consul-ted
(2015)
Local Health Kaiser
Permanente
Associate
Physician
Minority Leader,
Member
1, 3 Focus group 09/02/15
Local Health Kaiser
Permanente
Psychiatrist Minority Leader,
Member
1, 3 Focus group 09/02/15
Local Health Tiburcio Vasquez
Health Center
Chief Executive
Officer
Low-income,
underserved
Leader 1, 3 Interview 08/31/15
Local Health Tri-City Health
Center
Development
Officer
Low-income,
underserved
Leader 1, 3 Interview 10/19/15
Local Health Tri-City Health
Center
Chief Executive
Officer
Low-income,
underserved
Leader 1, 3 Interview 10/19/15
Local Health U.S. Department
of Veterans
Affairs, Martinez
Outpatient Clinic
Caregiver
Support
Coordinator
Veterans, mental
health
Leader 1, 3 Focus group 9/23/15
Local Health Washington
Hospital
Healthcare
System
Emergency
Services
Administrator
Public health,
low-income,
underserved
Representative 1, 3 Interview 09/18/15
Local Health Washington
Hospital
Continuing
Care
Coordinator
Mental health Representative 1, 3 Interview 10/14/15
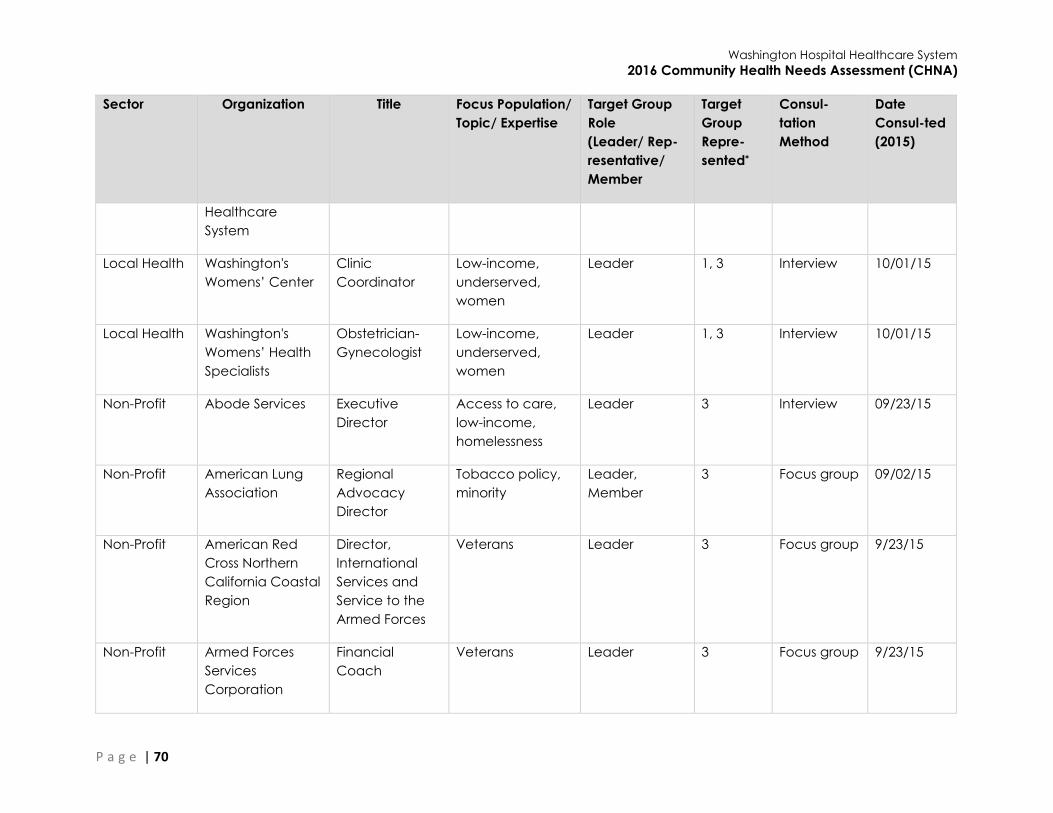
Washington Hospital Healthcare System
2016 Community Health Needs Assessment (CHNA)
P a g e | 70
Sector Organization Title Focus Population/
Topic/ Expertise
Target Group
Role
(Leader/ Rep-
resentative/
Member
Target
Group
Repre-
sented*
Consul-
tation
Method
Date
Consul-ted
(2015)
Healthcare
System
Local Health Washington's
Womens’ Center
Clinic
Coordinator
Low-income,
underserved,
women
Leader 1, 3 Interview 10/01/15
Local Health Washington's
Womens’ Health
Specialists
Obstetrician-
Gynecologist
Low-income,
underserved,
women
Leader 1, 3 Interview 10/01/15
Non-Profit Abode Services Executive
Director
Access to care,
low-income,
homelessness
Leader 3 Interview 09/23/15
Non-Profit American Lung
Association
Regional
Advocacy
Director
Tobacco policy,
minority
Leader,
Member
3 Focus group 09/02/15
Non-Profit American Red
Cross Northern
California Coastal
Region
Director,
International
Services and
Service to the
Armed Forces
Veterans Leader 3 Focus group 9/23/15
Non-Profit Armed Forces
Services
Corporation
Financial
Coach
Veterans Leader 3 Focus group 9/23/15
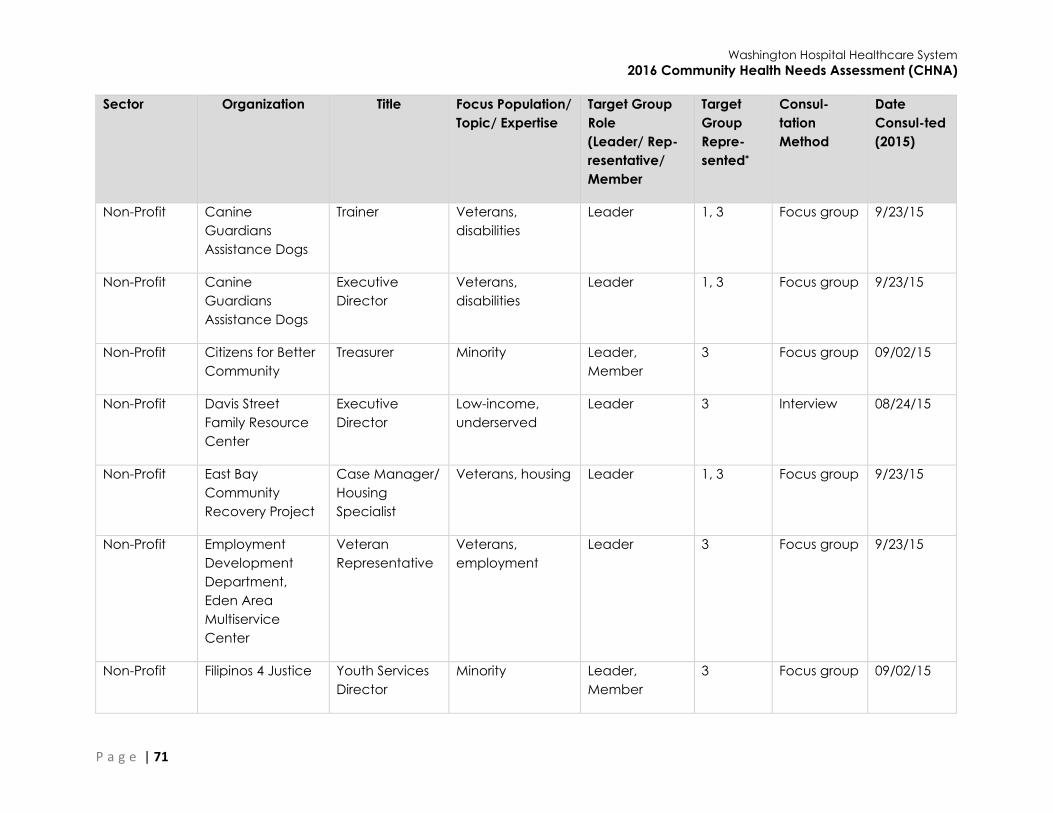
Washington Hospital Healthcare System
2016 Community Health Needs Assessment (CHNA)
P a g e | 71
Sector Organization Title Focus Population/
Topic/ Expertise
Target Group
Role
(Leader/ Rep-
resentative/
Member
Target
Group
Repre-
sented*
Consul-
tation
Method
Date
Consul-ted
(2015)
Non-Profit Canine
Guardians
Assistance Dogs
Trainer Veterans,
disabilities
Leader 1, 3 Focus group 9/23/15
Non-Profit Canine
Guardians
Assistance Dogs
Executive
Director
Veterans,
disabilities
Leader 1, 3 Focus group 9/23/15
Non-Profit Citizens for Better
Community
Treasurer Minority Leader,
Member
3 Focus group 09/02/15
Non-Profit Davis Street
Family Resource
Center
Executive
Director
Low-income,
underserved
Leader 3 Interview 08/24/15
Non-Profit East Bay
Community
Recovery Project
Case Manager/
Housing
Specialist
Veterans, housing Leader 1, 3 Focus group 9/23/15
Non-Profit Employment
Development
Department,
Eden Area
Multiservice
Center
Veteran
Representative
Veterans,
employment
Leader 3 Focus group 9/23/15
Non-Profit Filipinos 4 Justice Youth Services
Director
Minority Leader,
Member
3 Focus group 09/02/15

Washington Hospital Healthcare System
2016 Community Health Needs Assessment (CHNA)
P a g e | 72
Sector Organization Title Focus Population/
Topic/ Expertise
Target Group
Role
(Leader/ Rep-
resentative/
Member
Target
Group
Repre-
sented*
Consul-
tation
Method
Date
Consul-ted
(2015)
Non-Profit Filipinos 4 Justice Youth
Counselor
Minority Leader,
Member
3 Focus group 09/02/15
Non-Profit National Alliance
on Mental Illness
Mentor Mental health Representative 3 Focus group 08/20/15
Non-Profit National Alliance
on Mental Illness
Mentor Mental health Representative 3 Focus group 08/20/15
Non-Profit National Alliance
on Mental Illness
Mentor Mental health Representative 3 Focus group 08/20/15
Non-Profit National Alliance
on Mental Illness
Mentor Mental health Representative 3 Focus group 08/20/15
Non-Profit National Alliance
on Mental Illness
Mentor Mental health Representative 3 Focus group 08/20/15
Non-Profit National Alliance
on Mental Illness
Mentor Mental health Representative 3 Focus group 08/20/15
Non-Profit National Alliance
on Mental Illness
Mentor Mental health Representative 3 Focus group 08/20/15
Non-Profit National Alliance
on Mental Illness
Mentor Mental health Representative 3 Focus group 08/20/15
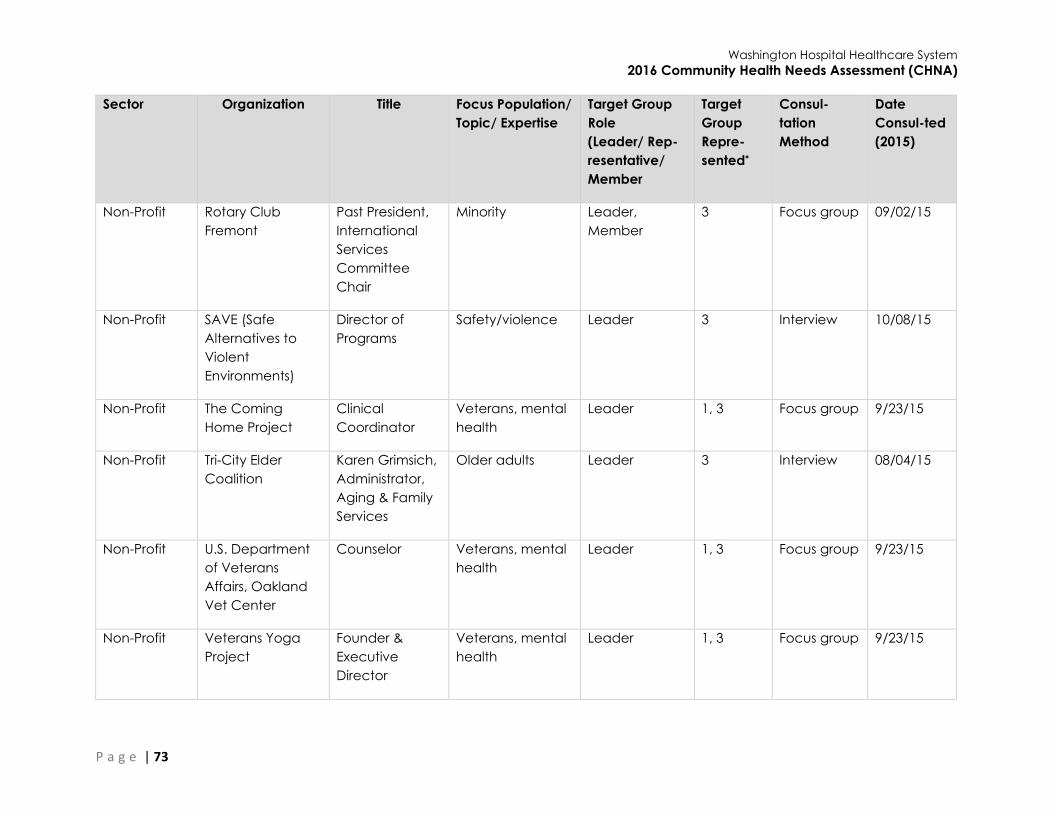
Washington Hospital Healthcare System
2016 Community Health Needs Assessment (CHNA)
P a g e | 73
Sector Organization Title Focus Population/
Topic/ Expertise
Target Group
Role
(Leader/ Rep-
resentative/
Member
Target
Group
Repre-
sented*
Consul-
tation
Method
Date
Consul-ted
(2015)
Non-Profit Rotary Club
Fremont
Past President,
International
Services
Committee
Chair
Minority Leader,
Member
3 Focus group 09/02/15
Non-Profit SAVE (Safe
Alternatives to
Violent
Environments)
Director of
Programs
Safety/violence Leader 3 Interview 10/08/15
Non-Profit The Coming
Home Project
Clinical
Coordinator
Veterans, mental
health
Leader 1, 3 Focus group 9/23/15
Non-Profit Tri-City Elder
Coalition
Karen Grimsich,
Administrator,
Aging & Family
Services
Older adults Leader 3 Interview 08/04/15
Non-Profit U.S. Department
of Veterans
Affairs, Oakland
Vet Center
Counselor Veterans, mental
health
Leader 1, 3 Focus group 9/23/15
Non-Profit Veterans Yoga
Project
Founder &
Executive
Director
Veterans, mental
health
Leader 1, 3 Focus group 9/23/15
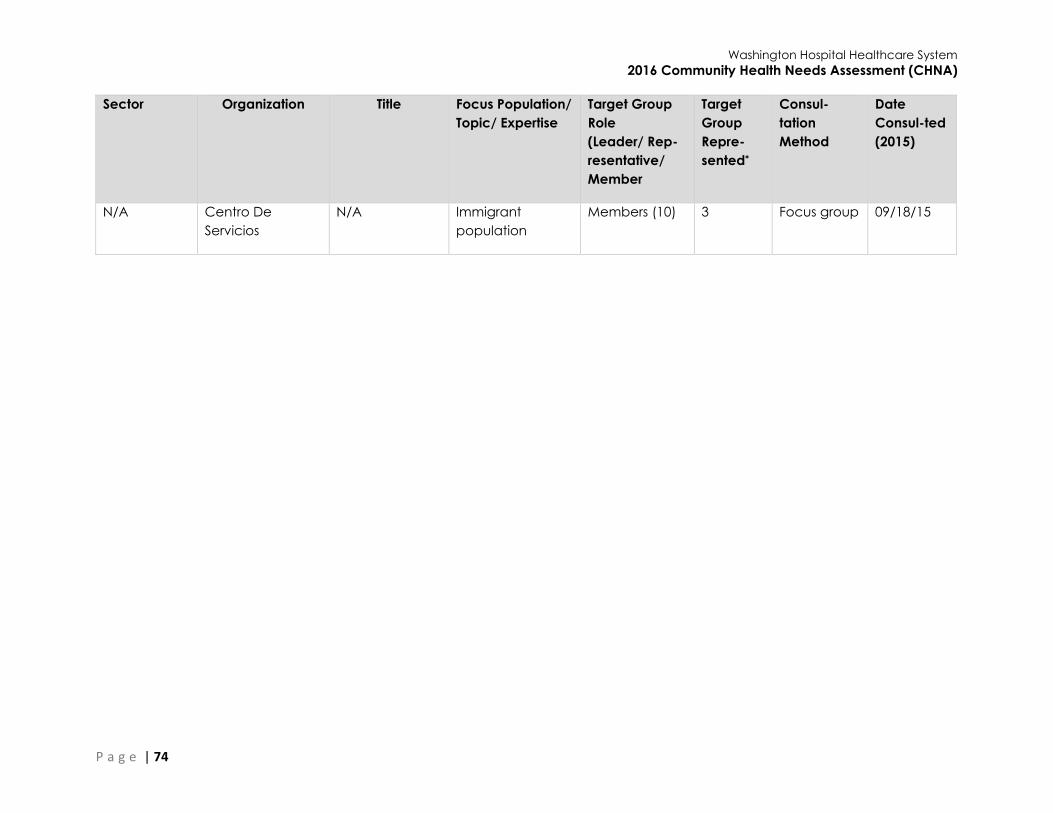
Washington Hospital Healthcare System
2016 Community Health Needs Assessment (CHNA)
P a g e | 74
Sector Organization Title Focus Population/
Topic/ Expertise
Target Group
Role
(Leader/ Rep-
resentative/
Member
Target
Group
Repre-
sented*
Consul-
tation
Method
Date
Consul-ted
(2015)
N/A Centro De
Servicios
N/A Immigrant
population
Members (10) 3 Focus group 09/18/15
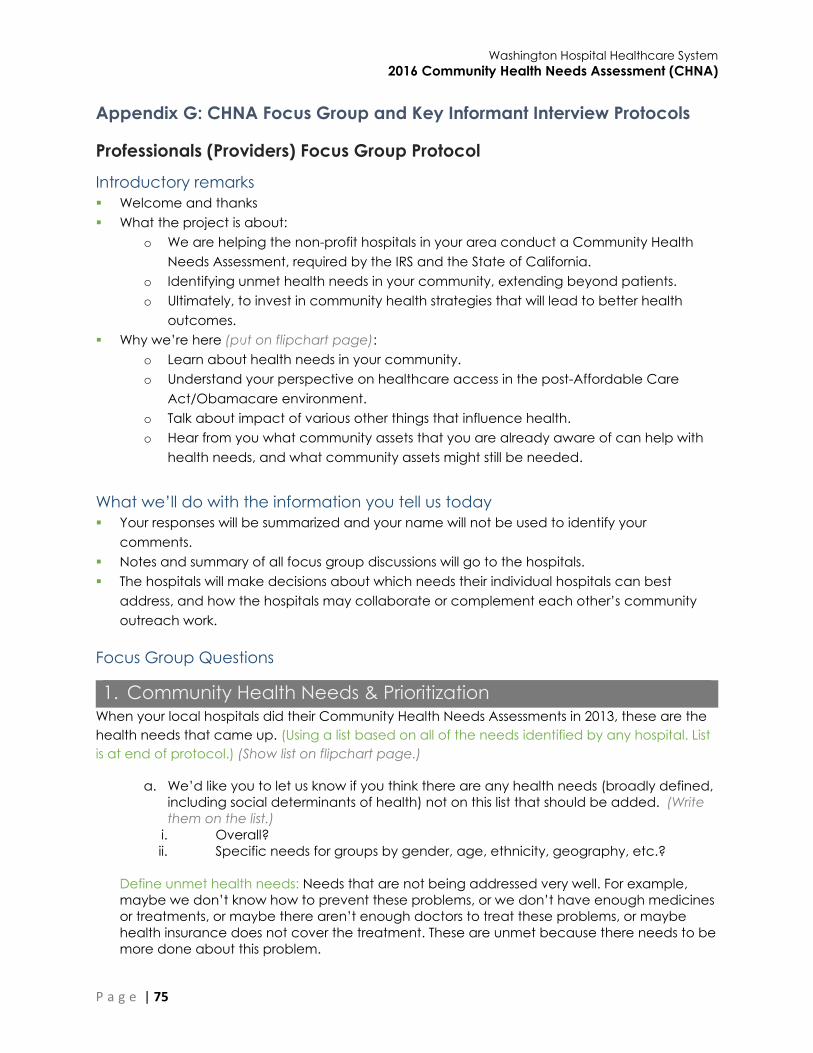
Washington Hospital Healthcare System
2016 Community Health Needs Assessment (CHNA)
P a g e | 75
Appendix G: CHNA Focus Group and Key Informant Interview Protocols
Professionals (Providers) Focus Group Protocol
Introductory remarks
Welcome and thanks
What the project is about:
o We are helping the non-profit hospitals in your area conduct a Community Health
Needs Assessment, required by the IRS and the State of California.
o Identifying unmet health needs in your community, extending beyond patients.
o Ultimately, to invest in community health strategies that will lead to better health
outcomes.
Why we’re here (put on flipchart page):
o Learn about health needs in your community.
o Understand your perspective on healthcare access in the post-Affordable Care
Act/Obamacare environment.
o Talk about impact of various other things that influence health.
o Hear from you what community assets that you are already aware of can help with
health needs, and what community assets might still be needed.
What we’ll do with the information you tell us today
Your responses will be summarized and your name will not be used to identify your
comments.
Notes and summary of all focus group discussions will go to the hospitals.
The hospitals will make decisions about which needs their individual hospitals can best
address, and how the hospitals may collaborate or complement each other’s community
outreach work.
Focus Group Questions
1. Community Health Needs & Prioritization When your local hospitals did their Community Health Needs Assessments in 2013, these are the
health needs that came up. (Using a list based on all of the needs identified by any hospital. List
is at end of protocol.) (Show list on flipchart page.)
a. We’d like you to let us know if you think there are any health needs (broadly defined,
including social determinants of health) not on this list that should be added. (Write
them on the list.)
i. Overall?
ii. Specific needs for groups by gender, age, ethnicity, geography, etc.?
Define unmet health needs: Needs that are not being addressed very well. For example,
maybe we don’t know how to prevent these problems, or we don’t have enough medicines
or treatments, or maybe there aren’t enough doctors to treat these problems, or maybe
health insurance does not cover the treatment. These are unmet because there needs to be
more done about this problem.

Washington Hospital Healthcare System
2016 Community Health Needs Assessment (CHNA)
P a g e | 76
b. Please think about the top three from the list (including the added needs, if any) you
believe are the most important to address in your community – the needs that still
need attention.
You’ll find some sticky colored dots on the table; once you’ve decided which three
of these needs you think are the most important, please come on up here and put
one sticky dot next to each one of those three.
We will discuss your ideas on how these might be able to be addressed later in our
conversation.
c. Any particular subpopulations that are disproportionately affected? (Prompt for
ethnic minorities, LGBTQ, low-income population, urban vs. rural/geographically
isolated, etc.) Any other trends you are seeing in the past 5 years or so? How are the
needs changing? We will discuss your ideas on how these might be able to be
addressed later in our conversation.
2. Access to Care
We would like to get your perspective on how access has changed in the post- Affordable Care
Act environment.
a) Based on your observations and interactions with the clients you serve, to what
extent are your clients aware of how to obtain health care? (Explain if needed:
Where to find a clinic, how to make an appointment, etc.)
b) To what extent are your clients aware of how to obtain health insurance?
c) What barriers to access still exist? (Focus on comparison pre- and post-ACA)
i. Is the same proportion still medically uninsured/under-insured; or is it a smaller
proportion, or a larger proportion than before ACA?
ii. Do more people, the same, or fewer people have a primary care physician
than before ACA?
iii. Are people using the ER as primary care to the same degree, less, or more
than before ACA?
iv. Is the same proportion of the community facing difficulties affording health
care, or is it a smaller proportion, or a greater proportion than before ACA?
d) Now thinking about the mental health needs in your community, what keeps people
from getting the prevention and/or early intervention mental health/counseling
services they need?
3. Drivers/Barriers
What other drivers or barriers are contributing to the health needs that you prioritized? We will
talk about solutions in just a minute.
Prompts if they are having trouble thinking of anything:
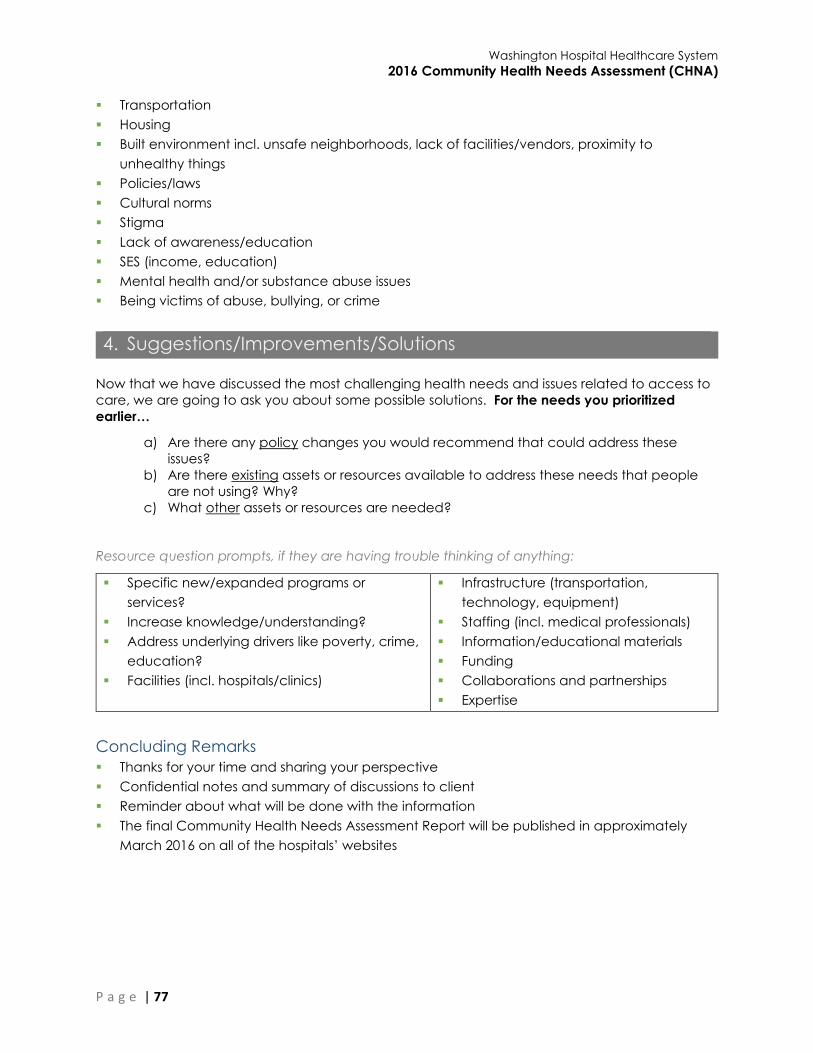
Washington Hospital Healthcare System
2016 Community Health Needs Assessment (CHNA)
P a g e | 77
Transportation
Housing
Built environment incl. unsafe neighborhoods, lack of facilities/vendors, proximity to
unhealthy things
Policies/laws
Cultural norms
Stigma
Lack of awareness/education
SES (income, education)
Mental health and/or substance abuse issues
Being victims of abuse, bullying, or crime
4. Suggestions/Improvements/Solutions
Now that we have discussed the most challenging health needs and issues related to access to
care, we are going to ask you about some possible solutions. For the needs you prioritized
earlier…
a) Are there any policy changes you would recommend that could address these
issues?
b) Are there existing assets or resources available to address these needs that people
are not using? Why?
c) What other assets or resources are needed?
Resource question prompts, if they are having trouble thinking of anything:
Specific new/expanded programs or
services?
Increase knowledge/understanding?
Address underlying drivers like poverty, crime,
education?
Facilities (incl. hospitals/clinics)
Infrastructure (transportation,
technology, equipment)
Staffing (incl. medical professionals)
Information/educational materials
Funding
Collaborations and partnerships
Expertise
Concluding Remarks
Thanks for your time and sharing your perspective
Confidential notes and summary of discussions to client
Reminder about what will be done with the information
The final Community Health Needs Assessment Report will be published in approximately
March 2016 on all of the hospitals’ websites
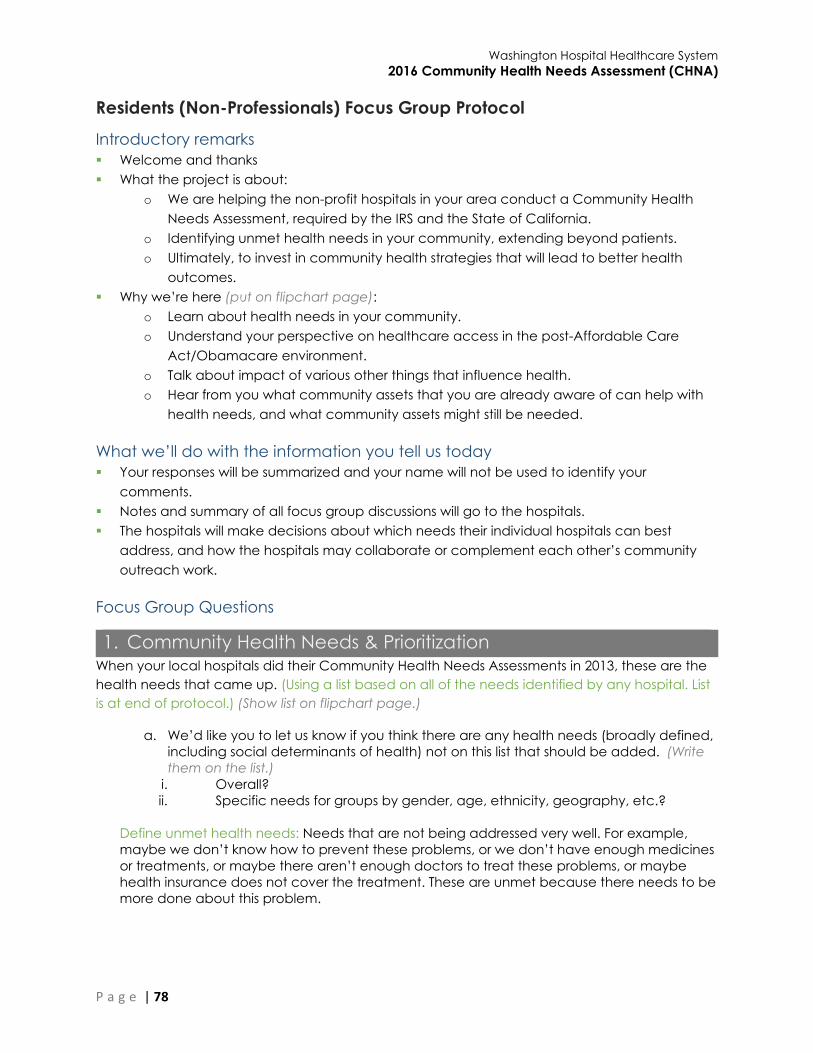
Washington Hospital Healthcare System
2016 Community Health Needs Assessment (CHNA)
P a g e | 78
Residents (Non-Professionals) Focus Group Protocol
Introductory remarks
Welcome and thanks
What the project is about:
o We are helping the non-profit hospitals in your area conduct a Community Health
Needs Assessment, required by the IRS and the State of California.
o Identifying unmet health needs in your community, extending beyond patients.
o Ultimately, to invest in community health strategies that will lead to better health
outcomes.
Why we’re here (put on flipchart page):
o Learn about health needs in your community.
o Understand your perspective on healthcare access in the post-Affordable Care
Act/Obamacare environment.
o Talk about impact of various other things that influence health.
o Hear from you what community assets that you are already aware of can help with
health needs, and what community assets might still be needed.
What we’ll do with the information you tell us today
Your responses will be summarized and your name will not be used to identify your
comments.
Notes and summary of all focus group discussions will go to the hospitals.
The hospitals will make decisions about which needs their individual hospitals can best
address, and how the hospitals may collaborate or complement each other’s community
outreach work.
Focus Group Questions
1. Community Health Needs & Prioritization When your local hospitals did their Community Health Needs Assessments in 2013, these are the
health needs that came up. (Using a list based on all of the needs identified by any hospital. List
is at end of protocol.) (Show list on flipchart page.)
a. We’d like you to let us know if you think there are any health needs (broadly defined,
including social determinants of health) not on this list that should be added. (Write
them on the list.)
i. Overall?
ii. Specific needs for groups by gender, age, ethnicity, geography, etc.?
Define unmet health needs: Needs that are not being addressed very well. For example,
maybe we don’t know how to prevent these problems, or we don’t have enough medicines
or treatments, or maybe there aren’t enough doctors to treat these problems, or maybe
health insurance does not cover the treatment. These are unmet because there needs to be
more done about this problem.
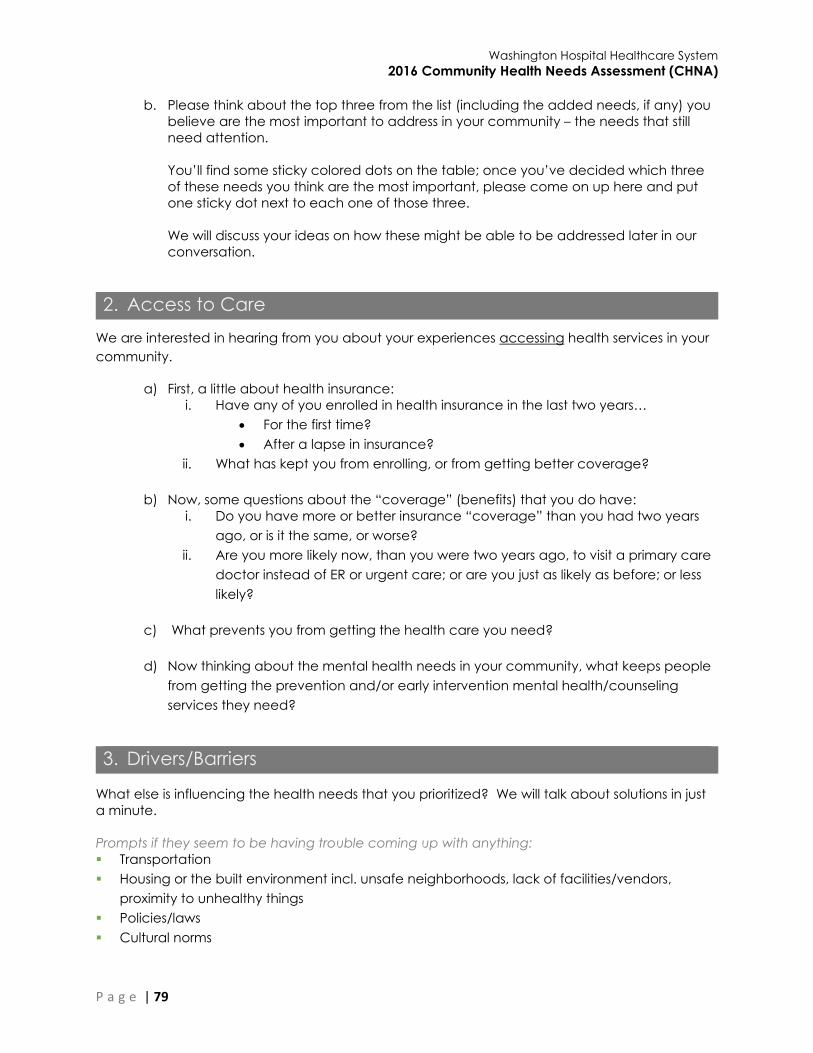
Washington Hospital Healthcare System
2016 Community Health Needs Assessment (CHNA)
P a g e | 79
b. Please think about the top three from the list (including the added needs, if any) you
believe are the most important to address in your community – the needs that still
need attention.
You’ll find some sticky colored dots on the table; once you’ve decided which three
of these needs you think are the most important, please come on up here and put
one sticky dot next to each one of those three.
We will discuss your ideas on how these might be able to be addressed later in our
conversation.
2. Access to Care
We are interested in hearing from you about your experiences accessing health services in your
community.
a) First, a little about health insurance:
i. Have any of you enrolled in health insurance in the last two years…
For the first time?
After a lapse in insurance?
ii. What has kept you from enrolling, or from getting better coverage?
b) Now, some questions about the “coverage” (benefits) that you do have:
i. Do you have more or better insurance “coverage” than you had two years
ago, or is it the same, or worse?
ii. Are you more likely now, than you were two years ago, to visit a primary care
doctor instead of ER or urgent care; or are you just as likely as before; or less
likely?
c) What prevents you from getting the health care you need?
d) Now thinking about the mental health needs in your community, what keeps people
from getting the prevention and/or early intervention mental health/counseling
services they need?
3. Drivers/Barriers
What else is influencing the health needs that you prioritized? We will talk about solutions in just
a minute.
Prompts if they seem to be having trouble coming up with anything:
Transportation
Housing or the built environment incl. unsafe neighborhoods, lack of facilities/vendors,
proximity to unhealthy things
Policies/laws
Cultural norms
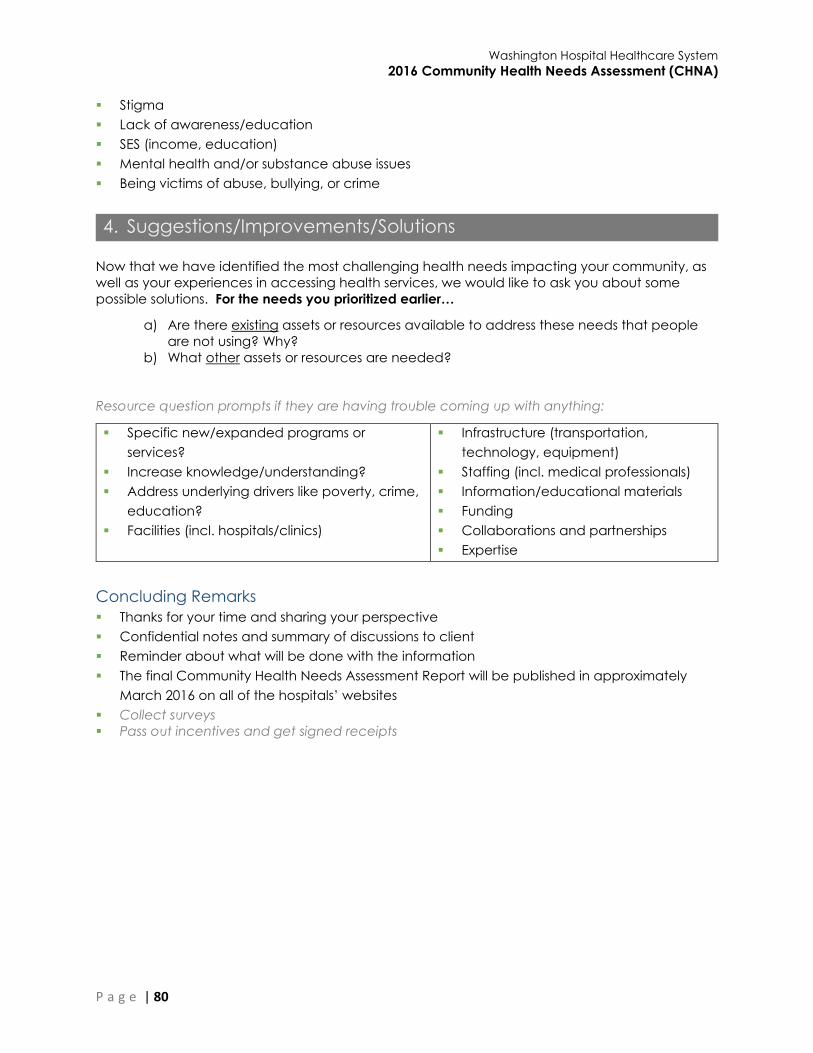
Washington Hospital Healthcare System
2016 Community Health Needs Assessment (CHNA)
P a g e | 80
Stigma
Lack of awareness/education
SES (income, education)
Mental health and/or substance abuse issues
Being victims of abuse, bullying, or crime
4. Suggestions/Improvements/Solutions
Now that we have identified the most challenging health needs impacting your community, as
well as your experiences in accessing health services, we would like to ask you about some
possible solutions. For the needs you prioritized earlier…
a) Are there existing assets or resources available to address these needs that people
are not using? Why?
b) What other assets or resources are needed?
Resource question prompts if they are having trouble coming up with anything:
Specific new/expanded programs or
services?
Increase knowledge/understanding?
Address underlying drivers like poverty, crime,
education?
Facilities (incl. hospitals/clinics)
Infrastructure (transportation,
technology, equipment)
Staffing (incl. medical professionals)
Information/educational materials
Funding
Collaborations and partnerships
Expertise
Concluding Remarks
Thanks for your time and sharing your perspective
Confidential notes and summary of discussions to client
Reminder about what will be done with the information
The final Community Health Needs Assessment Report will be published in approximately
March 2016 on all of the hospitals’ websites
Collect surveys
Pass out incentives and get signed receipts
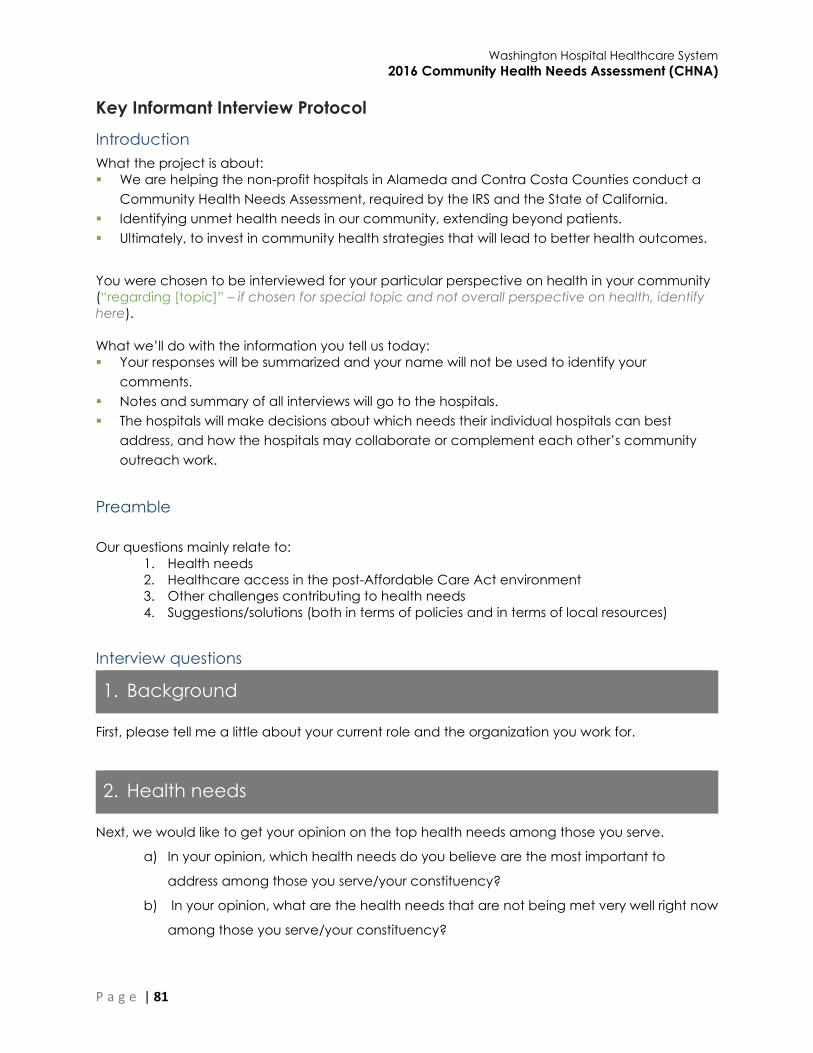
Washington Hospital Healthcare System
2016 Community Health Needs Assessment (CHNA)
P a g e | 81
Key Informant Interview Protocol
Introduction
What the project is about:
We are helping the non-profit hospitals in Alameda and Contra Costa Counties conduct a
Community Health Needs Assessment, required by the IRS and the State of California.
Identifying unmet health needs in our community, extending beyond patients.
Ultimately, to invest in community health strategies that will lead to better health outcomes.
You were chosen to be interviewed for your particular perspective on health in your community
(“regarding [topic]” – if chosen for special topic and not overall perspective on health, identify
here).
What we’ll do with the information you tell us today:
Your responses will be summarized and your name will not be used to identify your
comments.
Notes and summary of all interviews will go to the hospitals.
The hospitals will make decisions about which needs their individual hospitals can best
address, and how the hospitals may collaborate or complement each other’s community
outreach work.
Preamble
Our questions mainly relate to:
1. Health needs
2. Healthcare access in the post-Affordable Care Act environment
3. Other challenges contributing to health needs
4. Suggestions/solutions (both in terms of policies and in terms of local resources)
Interview questions
1. Background
First, please tell me a little about your current role and the organization you work for.
2. Health needs
Next, we would like to get your opinion on the top health needs among those you serve.
a) In your opinion, which health needs do you believe are the most important to
address among those you serve/your constituency?
b) In your opinion, what are the health needs that are not being met very well right now
among those you serve/your constituency?

Washington Hospital Healthcare System
2016 Community Health Needs Assessment (CHNA)
P a g e | 82
c) Are there any specific groups that have greater health needs, or special health
needs?
i. Differences by gender
ii. Within specific ethnic groups
iii. Among different age groups like seniors or children
iv. Within different parts of the county
v. Any other specific groups
If they identified more than three health needs, ask question d; if not, go on to section 3.
d) Which would you say are the most urgent or pressing of all the health needs that
you’ve named?
3. Challenges: Access to healthcare – post-ACA
We would like to get your perspective on how access has changed in the post- Affordable Care
Act environment.
a) Based on your observations and interactions with the clients you serve, to what
extent are clients aware of how to obtain health care? (Explain if needed: Where to
find a clinic, how to make an appointment, etc.)
b) To what extent are clients aware of how to obtain health insurance?
c) What barriers to access still exist? (Focus on comparison pre- and post-ACA)
i. Is the same proportion still medically uninsured/under-insured?
ii. Do more people or fewer people have a primary care physician?
iii. Are people using the ER as primary care to the same degree?
iv. Is the same proportion of the community facing difficulties affording health
care?
d) Now thinking specifically about the mental health needs in your community, what
keeps people from getting the prevention and/or early intervention mental
health/counseling services they need?
4. Other Challenges
Are there any other drivers or barriers that are contributing to health needs? We will talk about
solutions in just a minute.
Washington Hospital Healthcare System
2016 Community Health Needs Assessment (CHNA)
P a g e | 83
Prompts if they are having trouble thinking of anything:
Transportation
Housing
Built environment incl. unsafe neighborhoods, lack of facilities/vendors, proximity to
unhealthy things
Policies/laws
Cultural norms
Stigma
Lack of awareness/education
SES (income, education)
Mental health and/or substance abuse issues
Being victims of abuse, bullying, or crime
5. Suggestions/Improvements/Solutions
Now that we have discussed health needs and issues related to access to care, we are going to
ask you about some possible solutions. In order to maintain or improve the health of your
community…
a) Are there any policy changes you would recommend that could address these
issues? Consider those that are readily achievable and politically feasible.
b) Are there existing resources available to address these needs? If so, why aren’t
people using them?
c) What other resources are needed?
d) Of the resources/solutions to improve health, which do you feel is the most significant
improvement needed, second, and third?
Resource question prompts if they are having trouble thinking of anything:
Specific new/expanded programs or
services?
Increase knowledge/understanding?
Address underlying drivers like poverty, crime,
education?
Facilities (incl. hospitals/clinics)
Infrastructure (transportation,
technology, equipment)
Staffing (incl. medical professionals)
Information/educational materials
Funding
Collaborations and partnerships
Expertise
Concluding Remarks
Thanks for your time and sharing your perspective
Confidential notes and summary of discussions to client
Reminder about what will be done with the information
Final CHNA report will be published in Spring 2016 on all of the hospitals’ websites
Alameda/Contra Costa Counties Health Needs 2013
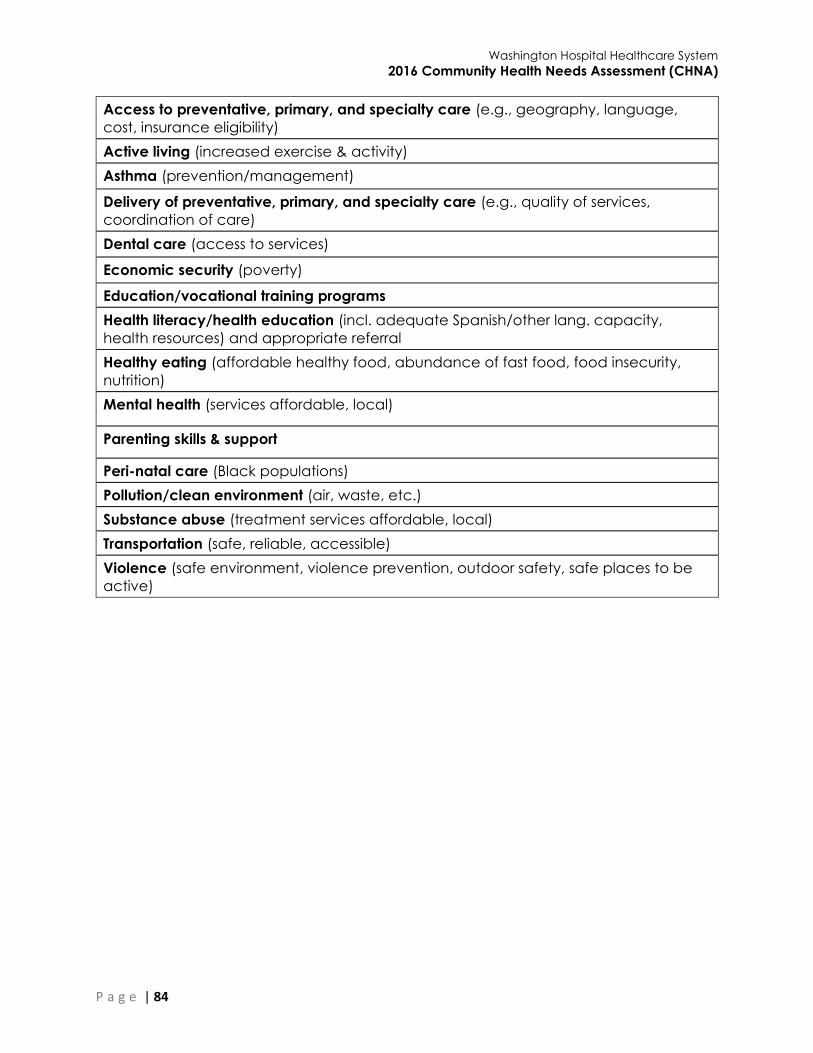
Washington Hospital Healthcare System
2016 Community Health Needs Assessment (CHNA)
P a g e | 84
Access to preventative, primary, and specialty care (e.g., geography, language,
cost, insurance eligibility)
Active living (increased exercise & activity)
Asthma (prevention/management)
Delivery of preventative, primary, and specialty care (e.g., quality of services,
coordination of care)
Dental care (access to services)
Economic security (poverty)
Education/vocational training programs
Health literacy/health education (incl. adequate Spanish/other lang. capacity,
health resources) and appropriate referral
Healthy eating (affordable healthy food, abundance of fast food, food insecurity,
nutrition)
Mental health (services affordable, local)
Parenting skills & support
Peri-natal care (Black populations)
Pollution/clean environment (air, waste, etc.)
Substance abuse (treatment services affordable, local)
Transportation (safe, reliable, accessible)
Violence (safe environment, violence prevention, outdoor safety, safe places to be
active)

Washington Hospital Healthcare System
2016 Community Health Needs Assessment (CHNA)
P a g e | 85
Appendix H: Community Assets & Resources
The following resources are available to respond to the identified health needs of the
community.
Overall:
Existing Healthcare Facilities
John Muir Health
Kaiser Permanente – Diablo (Antioch and Walnut Creek)
Kaiser Permanente – East Bay (Oakland and Richmond)
Kaiser Permanente – Greater Southern Alameda (Fremont and San Leandro)
Saint Rose Hospital
San Ramon Regional Hospital
Stanford Health Care – ValleyCare
UCSF Benioff Children’s Hospital – Oakland
Washington Hospital
Existing Clinics
Abode Services: HOPE Project Mobile Health Clinic
Highland Hospital and Clinics
India Community Center
Newark Wellness Center
Tiburcio Vasquez Health Center
Tri-City Health Center
Washington on Wheels Mobile Health Clinic
Washington Township Medical Foundation
Winton Wellness Clinic
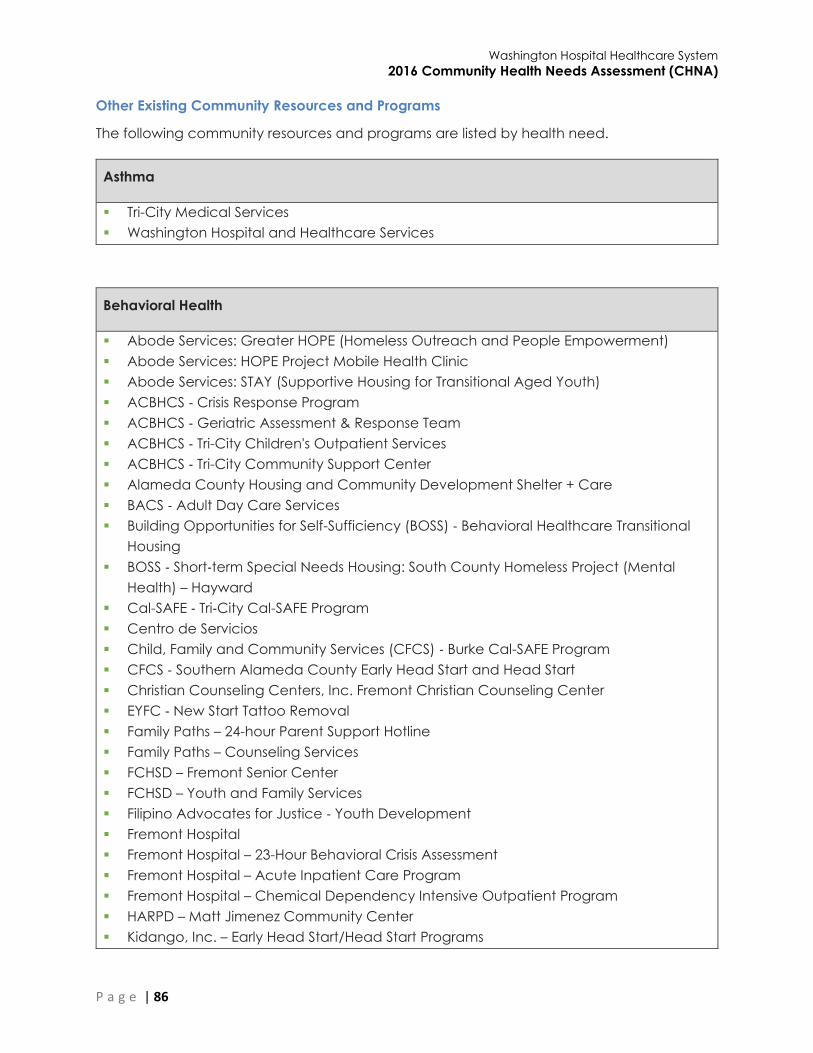
Washington Hospital Healthcare System
2016 Community Health Needs Assessment (CHNA)
P a g e | 86
Other Existing Community Resources and Programs
The following community resources and programs are listed by health need.
Asthma
Tri-City Medical Services
Washington Hospital and Healthcare Services
Behavioral Health
Abode Services: Greater HOPE (Homeless Outreach and People Empowerment)
Abode Services: HOPE Project Mobile Health Clinic
Abode Services: STAY (Supportive Housing for Transitional Aged Youth)
ACBHCS ‐ Crisis Response Program
ACBHCS ‐ Geriatric Assessment & Response Team
ACBHCS ‐ Tri-City Children's Outpatient Services
ACBHCS ‐ Tri-City Community Support Center
Alameda County Housing and Community Development Shelter + Care
BACS ‐ Adult Day Care Services
Building Opportunities for Self-Sufficiency (BOSS) ‐ Behavioral Healthcare Transitional
Housing
BOSS ‐ Short‐term Special Needs Housing: South County Homeless Project (Mental
Health) – Hayward
Cal-SAFE ‐ Tri‐City Cal-SAFE Program
Centro de Servicios
Child, Family and Community Services (CFCS) ‐ Burke Cal-SAFE Program
CFCS ‐ Southern Alameda County Early Head Start and Head Start
Christian Counseling Centers, Inc. Fremont Christian Counseling Center
EYFC ‐ New Start Tattoo Removal
Family Paths – 24-hour Parent Support Hotline
Family Paths – Counseling Services
FCHSD – Fremont Senior Center
FCHSD – Youth and Family Services
Filipino Advocates for Justice ‐ Youth Development
Fremont Hospital
Fremont Hospital – 23-Hour Behavioral Crisis Assessment
Fremont Hospital – Acute Inpatient Care Program
Fremont Hospital – Chemical Dependency Intensive Outpatient Program
HARPD – Matt Jimenez Community Center
Kidango, Inc. – Early Head Start/Head Start Programs
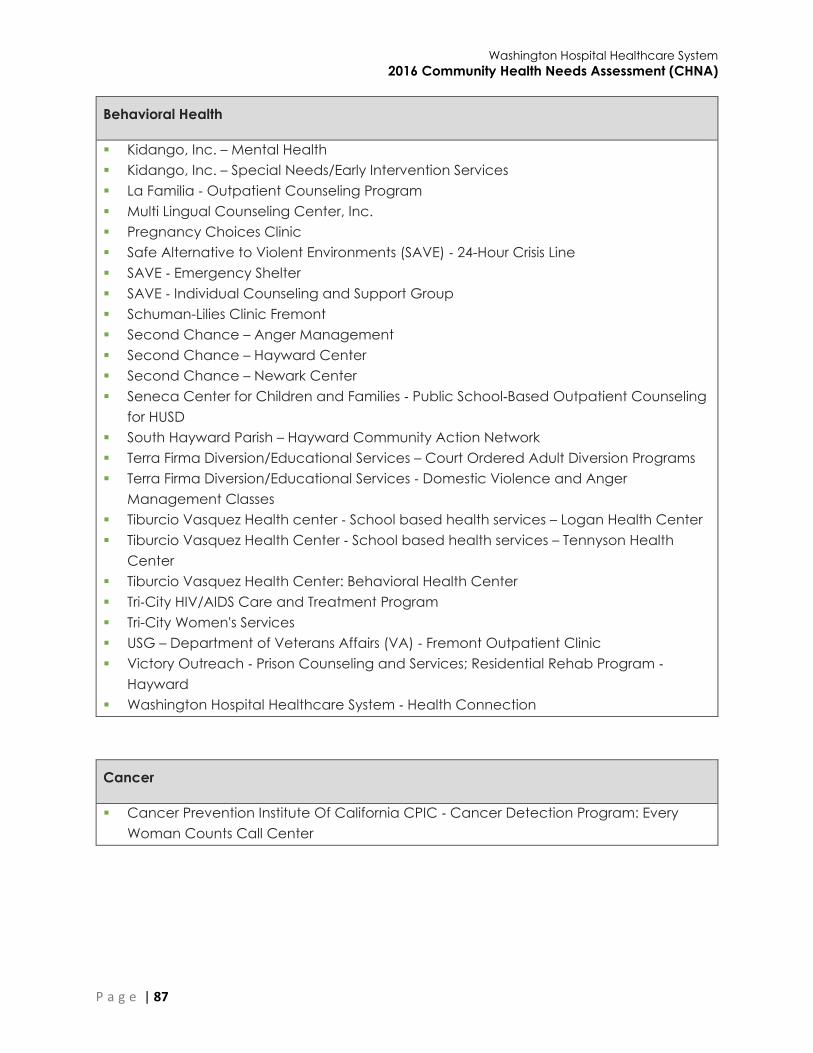
Washington Hospital Healthcare System
2016 Community Health Needs Assessment (CHNA)
P a g e | 87
Behavioral Health
Kidango, Inc. – Mental Health
Kidango, Inc. – Special Needs/Early Intervention Services
La Familia ‐ Outpatient Counseling Program
Multi Lingual Counseling Center, Inc.
Pregnancy Choices Clinic
Safe Alternative to Violent Environments (SAVE) ‐ 24-Hour Crisis Line
SAVE ‐ Emergency Shelter
SAVE ‐ Individual Counseling and Support Group
Schuman-Lilies Clinic Fremont
Second Chance – Anger Management
Second Chance – Hayward Center
Second Chance – Newark Center
Seneca Center for Children and Families ‐ Public School‐Based Outpatient Counseling
for HUSD
South Hayward Parish – Hayward Community Action Network
Terra Firma Diversion/Educational Services – Court Ordered Adult Diversion Programs
Terra Firma Diversion/Educational Services ‐ Domestic Violence and Anger
Management Classes
Tiburcio Vasquez Health center ‐ School based health services – Logan Health Center
Tiburcio Vasquez Health Center ‐ School based health services – Tennyson Health
Center
Tiburcio Vasquez Health Center: Behavioral Health Center
Tri‐City HIV/AIDS Care and Treatment Program
Tri-City Women's Services
USG – Department of Veterans Affairs (VA) ‐ Fremont Outpatient Clinic
Victory Outreach ‐ Prison Counseling and Services; Residential Rehab Program ‐
Hayward
Washington Hospital Healthcare System ‐ Health Connection
Cancer
Cancer Prevention Institute Of California CPIC ‐ Cancer Detection Program: Every
Woman Counts Call Center
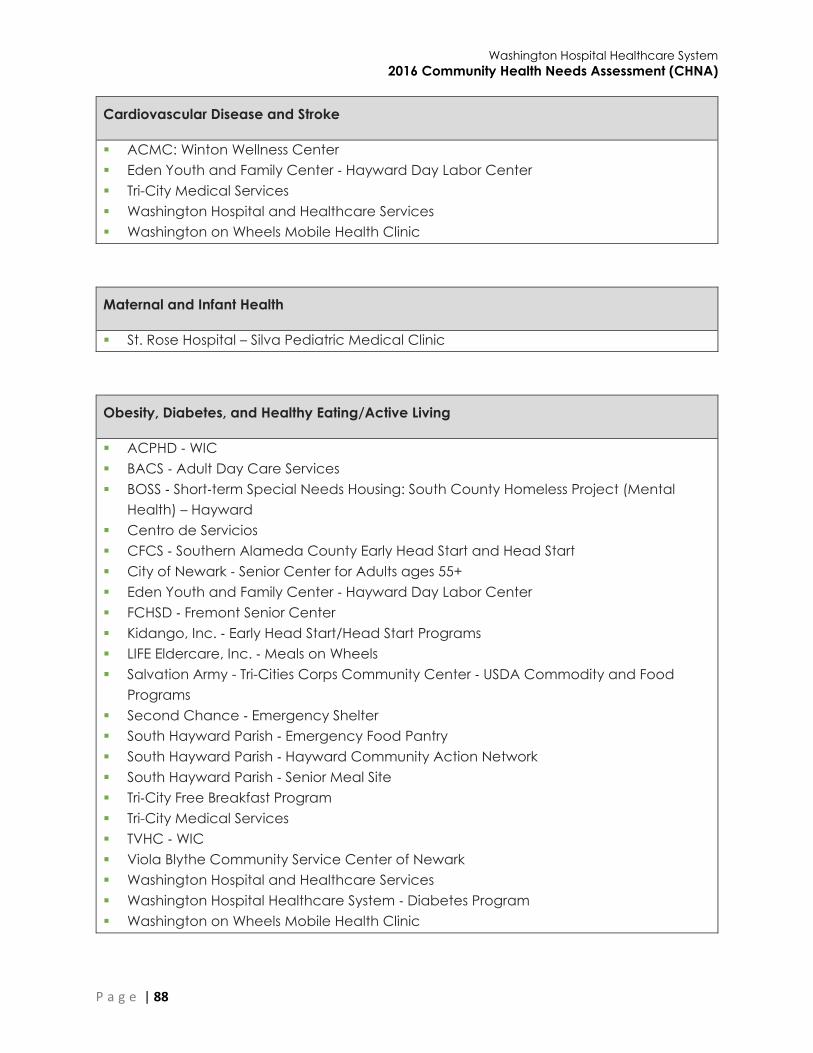
Washington Hospital Healthcare System
2016 Community Health Needs Assessment (CHNA)
P a g e | 88
Cardiovascular Disease and Stroke
ACMC: Winton Wellness Center
Eden Youth and Family Center ‐ Hayward Day Labor Center
Tri-City Medical Services
Washington Hospital and Healthcare Services
Washington on Wheels Mobile Health Clinic
Maternal and Infant Health
St. Rose Hospital – Silva Pediatric Medical Clinic
Obesity, Diabetes, and Healthy Eating/Active Living
ACPHD ‐ WIC
BACS ‐ Adult Day Care Services
BOSS ‐ Short‐term Special Needs Housing: South County Homeless Project (Mental
Health) – Hayward
Centro de Servicios
CFCS ‐ Southern Alameda County Early Head Start and Head Start
City of Newark ‐ Senior Center for Adults ages 55+
Eden Youth and Family Center ‐ Hayward Day Labor Center
FCHSD ‐ Fremont Senior Center
Kidango, Inc. ‐ Early Head Start/Head Start Programs
LIFE Eldercare, Inc. ‐ Meals on Wheels
Salvation Army - Tri-Cities Corps Community Center ‐ USDA Commodity and Food
Programs
Second Chance ‐ Emergency Shelter
South Hayward Parish ‐ Emergency Food Pantry
South Hayward Parish ‐ Hayward Community Action Network
South Hayward Parish ‐ Senior Meal Site
Tri‐City Free Breakfast Program
Tri-City Medical Services
TVHC ‐ WIC
Viola Blythe Community Service Center of Newark
Washington Hospital and Healthcare Services
Washington Hospital Healthcare System ‐ Diabetes Program
Washington on Wheels Mobile Health Clinic

Washington Hospital Healthcare System
2016 Community Health Needs Assessment (CHNA)
P a g e | 89
Violence and Injury Prevention
Safe Alternatives to Violent Environments (SAVE)
Washington Hospital Tattoo Removal Program