Health related quality of life of adolescents in Vietnam: cross-cultural adaptation and validation...
20
Journal of Adolescence Journal of Adolescence 28 (2005) 127–146 Health related quality of life of adolescents in Vietnam: cross-cultural adaptation and validation of the Adolescent Duke Health Profile Vo Thi Xuan Hanh a,b , Francis Guillemin a, , Duong Dinh Cong a,b , George R. Parkerson Jr c , Pham Bach Thu b , Pham Tu Quynh b , Serge Brianc - on a a Faculte´de Me´decine, School of Public Health of Nancy, Ecole de sante´Publique, Universite´Henri Poincare´, Nancy 1, 9, avenue de la Foreˆt de Haye, B.P. 184, 54505 Vandoeuvre-Le`s-Nancy Cedex, France b Department of Community Health, University Training Center for Health Care Professionals of HoChiMinh-City, Vietnam c Department of Community and Family Medicine, Duke University Medical Center, USA Abstract Quality of life (QOL) of adolescents has been scarcely documented in a general population sample. The study was aimed at translating and adapting the Adolescent Duke Health Profile to Vietnamese, validating the questionnaire, determining reference value, and identifying determinants of poor QOL. Following a cross-cultural methodology, the Adolescent Duke Health Profile (ADHP) had content adapted to Vietnamese by alteration of 2 out of 17 items. Test–retest validity was checked in 408 adolescents. Construct validity and internal consistency were assessed in a 1408 probability sample of adolescents in Vietnam, and determinants were analysed by multiple linear regression. The ADHP showed satisfactory internal consistency (Cronbach’s a=0.87–0.92) and satisfactory construct validity in relation with drug abuse or not, or with parent situation living in couple or alone. Test–retest reliability was acceptable (ICC=0.7–0.8) and major determinants were age, sex, education, chronic disease, alcohol and drug use. ARTICLE IN PRESS www.elsevier.com/locate/jado 0140-1971/$30.00 r 2004 The Association for Professionals in Services for Adolescents. Published by Elsevier Ltd. All rights reserved. doi:10.1016/j.adolescence.2003.11.016 Corresponding author. Tel.: +333-83-85-21-63; fax: +333-83-85-12-05. E-mail address: [email protected] (F. Guillemin).
-
Upload
independent -
Category
Documents
-
view
2 -
download
0
Transcript of Health related quality of life of adolescents in Vietnam: cross-cultural adaptation and validation...
ARTICLE IN PRESS
Journal ofAdolescence
Journal of Adolescence 28 (2005) 127–146
0140-1971/$30
rights reserved
doi:10.1016/j.
�CorresponE-mail add
www.elsevier.com/locate/jado
Health related quality of life of adolescents in Vietnam:cross-cultural adaptation and validation of the Adolescent
Duke Health Profile
Vo Thi Xuan Hanha,b, Francis Guillemina,�, Duong Dinh Conga,b, GeorgeR. Parkerson Jrc, Pham Bach Thub, Pham Tu Quynhb, Serge Brianc-ona
aFaculte de Medecine, School of Public Health of Nancy, Ecole de sante Publique, Universite Henri Poincare,
Nancy 1, 9, avenue de la Foret de Haye, B.P. 184, 54505 Vandoeuvre-Les-Nancy Cedex, FrancebDepartment of Community Health, University Training Center for Health Care Professionals of HoChiMinh-City,
VietnamcDepartment of Community and Family Medicine, Duke University Medical Center, USA
Abstract
Quality of life (QOL) of adolescents has been scarcely documented in a general population sample. Thestudy was aimed at translating and adapting the Adolescent Duke Health Profile to Vietnamese, validatingthe questionnaire, determining reference value, and identifying determinants of poor QOL.Following a cross-cultural methodology, the Adolescent Duke Health Profile (ADHP) had content
adapted to Vietnamese by alteration of 2 out of 17 items. Test–retest validity was checked in 408adolescents. Construct validity and internal consistency were assessed in a 1408 probability sample ofadolescents in Vietnam, and determinants were analysed by multiple linear regression.The ADHP showed satisfactory internal consistency (Cronbach’s a=0.87–0.92) and satisfactory
construct validity in relation with drug abuse or not, or with parent situation living in couple or alone.Test–retest reliability was acceptable (ICC=0.7–0.8) and major determinants were age, sex, education,chronic disease, alcohol and drug use.
.00r 2004 The Association for Professionals in Services for Adolescents. Published by Elsevier Ltd. All
.
adolescence.2003.11.016
ding author. Tel.: +333-83-85-21-63; fax: +333-83-85-12-05.
ress: [email protected] (F. Guillemin).
ARTICLE IN PRESS
V. Thi Xuan Hanh et al. / Journal of Adolescence 28 (2005) 127–146128
This works provide a validated, simple health related QOL scale suited to adolescent population withreference values. Taking into account determinants identified will help program prevention andintervention health policy and to evaluate the effect of these actions.r 2004 The Association for Professionals in Services for Adolescents. Published by Elsevier Ltd. All rightsreserved.
Keywords: Adolescent health; Quality of life; Duke Health Profile; Cross-cultural adaptation; Validation; Vietnam
Introduction
‘‘Quality of Life’’ (QOL) has become a widely used measure in health outcome during the pastten years. Conceptualization of health, of QOL and in methods for measuring health usingstandardized survey questionnaires have advanced since that time (Ware and Gandek, 1998).QOL is defined by WHO as ‘‘the perception that an individual has of his or her place in life,
within the context of the culture and system values in which he or she lives, and in relation to theobjectives, expectations, standards and concerns of this individual’’ (WHO, 1994). This definitionof QOL is broad. In order to discuss some aspects of it more specifically in relation to health, anarrower perspective can be considered, through the notion of ‘‘Health Related Quality of Life’’(HRQOL) (Mozes, Maor, & Shmueli, 1999; Apolone & Mosconi, 1998; Guyatt, Feeney, &Donald, 1993). HRQOL can be then defined ‘‘as an integrative measure of physical and emotionalwell-being, level of independence, social relationships and their relationship to salient features oftheir environment’’ (WHOQoL Group, 1995).The conceptualization of the term QOL is both objective and subjective and so the
measurement of it requires reference to varied and complex areas, depending on whoseperspective it is based from. For example, social workers will assess QOL from a differentperspective than medical workers. QOL measurement can also be very personal because ofexperiences, beliefs, and expectations and perceptions influence the way in which individuals thinkand behave (Guillemin, Bombardier, & Beaton, 1993).Many measurement tools are used for the HRQOL surveys. However, there are two basic
approaches, generic instruments and specific instruments. During the last decade, there has beenconsiderable debate regarding approaches to conduct the cross-cultural adaptation and validationof the instruments (Guillemin et al., 1993; Leplege and Verdier, 1995; Bullinger et al.,1998; Hunt,Alonso, Bucquet, Niero, Wiklund, & McKenna, 1991). Most of generic instrument have beentranslated into other languages so that they can be used cross culturally, such as the SicknessHealth Profile (SIP), the Duke Health Profile (DHP), the Nottingham Health profile (NHP), theShort Form 36 (SF-36) (Chwalow et al., 1992; Parkerson, 1999; Bucquet, Condon, & Ritchie,1990; Wagner et al., 1998).When translating these instruments it is important to consider and adapt aspects of the new
setting (Hunt, 1986; Guillemin, Paul-Dauphin, Virion, Bouchet, & Brianc-on, 1997).Behaviours, beliefs and understandings are influenced by the culture in which individuals arepart of. Consequently, when measuring health status and QOL perception, researchers need toensure that the instrument used provides cross-cultural equivalence when compared to theoriginal source.
ARTICLE IN PRESS
V. Thi Xuan Hanh et al. / Journal of Adolescence 28 (2005) 127–146 129
HoChiMinh-City, formerly known as Saigon, is the biggest city in Vietnam and is situated inthe south. Economically it represents 25% of the national economic production. Sincereunification in 1975 and the recent adoption of a modified free market, it has undergone deepand rapid social and economic changes (Pham Bich San, 1997). Vietnam has a population ofeighty million and HoChiMinh-City has an official population of 5 million. Of this 5 million,9.4% are adolescents aged between 12 and 15 years and 10.1% aged between 16 and 19 years(Statistical Office of HoChiMinh-City, 2000).Adolescent health is a relatively unexplored component of Public Health in HoChiMinh-City.
There is no national or provincial policies, strategies or facilities for adolescent health, although,recently HIV-AIDS, drug abuse and reproductive health issues in adolescent population haveheightened society awareness (Hoang, 1999; Police Service of HoChiMinh-City, 2000; Le TruongGiang, 1999). The problems mentioned above can indeed be seen as the expression of unrest, adifficulty in the act of being, a need to integrate into society and to feel welcomed and expected init. QOL is a better overall approach, and more reliable, informative and straightforward tool tomeasure this health status. Since 1998, the Vietnamese government has acknowledged QOL as apriority in all national programs; consequently people are becoming more aware of aspectsrelating to this theme (Ban Chap Hanh Trung Uong Dang Cong San Vietnam, 1998).To develop the health programs in Vietnam for adolescents—one population in area of need, it
was essential for us to consider the HRQOL perspective. We believed it necessary for healthplanners to have an understanding of this group’s needs, so that programs to address the issuesfor adolescent health could be designed more appropriately and more effectively. Informationgained would be useful for the future planning and development of health promotion programs inVietnam. This article gives a brief summary of a recent study conducted with adolescents inHoChiMinh-City.The study aimed: (1) to adapt the Adolescent version of the Duke Health Profile (ADHP)
(Statistical Office of HoChiMinh-City, 2000) into Vietnamese language, (2) to validate theVietnamese ADHP, (3) to describe HRQOL of adolescents aged 12–19 years in HoChiMinh-Cityand to determine the reference values of the HRQOL in ten dimensions of ADHP, (4) to examinethe relationship of HRQOL and factors such as socio-demography, risk behaviours by using theself-report ADHP among a representative sample of adolescents aged 12–19 in HoChiMinh-City.
Method
This study proceeded in three steps: the first one was a cross-cultural adaptation of ADHP; thesecond step was a psychometric quality validation and the last step was the determination ofHRQOL reference values of Vietnamese adolescent population and an identification ofdeterminants of QOL.
Cross-cultural adaptation
QuestionnaireThe DHP had been validated for adolescents in another setting and is available for use (Arene,
Janvrin, & Baudier, 1998). The DHP is a 17-item generic self-report instrument. It contains six

ARTICLE IN PRESS
V. Thi Xuan Hanh et al. / Journal of Adolescence 28 (2005) 127–146130
health measures or dimensions such as physical (items 8–12), mental (items 1, 4, 5, 13, 14), social(items 2, 6, 7, 15, 16), general health (15 items), perceived health (item 3), self-esteem (items 1, 2, 4,6, 7), and four dysfunction measures such as anxiety (items 2, 5, 7, 10, 12, 14), depression (items 4,5, 10, 12, 13), pain (item 11) and disability (items 17). These 17 items were derived from 63 itemsDuke University North-Carolina Health Profile, based upon face validity and item-remaindercorrelation. The DHP is presented as a brief technique for measuring health related QOL as anoutcome of medical intervention, health promotion and as a new indicator in the communitydiagnostic of the health promotion planning. The scores of these dimensions are calculated from 0(poor) to 100 (excellent) (Parkerson, Broadhead, & TSE, 1990). In this study the high scores meangood health status, even for pain, depression, anxiety, and disability dimensions.The ADHP has been developed in France from the original DHP, and had one item about
social dimension modified to fit adolescent social relationship (item 15).
Cross-cultural adaptation procedure (Guillemin et al., 1993; Leplege & Verdier, 1995; Bullingeret al., 1998; Hunt et al., 1991; Hunt, 1986; Guillemin et al., 1997)
The cross-cultural adaptation comprised of a translation in standard language plus adjustmentof cultural words, idioms and context. The process we applied had four important phases:
1)
Translation: We invited three Vietnamese bilingual translators, who had experiences abouthealth study, and who were familiar with the questionnaire building process, to translate theoriginal French ADHP independently of each other. They were not informed about the studyprocess or how to use the questionnaire.2)
Backward translation: Another three Vietnamese bilingual translators, who had experiencesabout health study, were invited to translate independently the Vietnamese questionnaire intoEnglish. No one was informed about the original ADHP or DHP.3)
Expert committee: A multidisciplinary committee consisted of one sociologist, one pediatricphysician, one demographer, two public health specialists, two physicians from district healthsystem and four adolescents. This committee’s role was to examine all translations in order toaccept a semi-final translation before testing it; and to review the semi-final questionnaire toensure that the final-translation was fully comprehensible to verify cross-cultural equivalence ofthe source and final version. In all steps, we referred also to the original English version ofadult DHP for better understanding of the items.4)
Testing: The final version of the ADHP Vietnamese adaptation was pre-tested with a pilotgroup of 30 adolescents to probe for comprehensibility and understanding, through individualand group discussion. This sample was recruited by quota and composed of 6 groups of 5adolescents with different ages (40% aged 12–14 years, 0.6% aged 15–18 years), and differentliving regions (33.33% living in urban area/66.6% in rural area).Validation of psychometric quality, measure of adolescent QOL
Validation of psychometric qualityThe validation of psychometric quality (Nunnally, 1978; Shrout & Fleiss, 1979; Fermanian,
1996) process is composed of two main parts, reliability and validity.

ARTICLE IN PRESS
V. Thi Xuan Hanh et al. / Journal of Adolescence 28 (2005) 127–146 131
Reliability: The internal consistency was assessed by Cronbach’s a. To assess this, we used alldata of the sample of 1408 adolescents in HCMCity. The reproducibility is the property of themeasurement method to give a same result when assessing the same phenomenon. The ADHP is aself-administered instrument (no observer) so it was assessed in another sample of 408 adolescents(first year medical and nursing students) by a test–retest (after four weeks).
Validity: The face and content validity of the DHP had been documented by The DukeUniversity (Parkerson et al., 1990). The construct validity was assessed by two hypotheses: (1) InVietnamese culture and tradition, the family is very important for child or adolescent life (Deslande,2000; Papin, 2000). Therefore, we hypothesized that the dimension scores of the adolescents wouldbe lower when parents were divorced or separated. (2) Drug users in Vietnamese society have manyproblems in their life-personal, family and school problems. So our hypothesis was that theHRQOL dimension scores of the drug users would be lower than the non-users. These hypotheseswere based on existing literature and previous observations in France (Arene et al., 1998).
Population and sampling
The target population was adolescents aged from 12 to 19 years living in HCM—City,approximately 750,000 adolescents within this age range (Statistical Office of HoChiMinh-City, 2000).The city is divided into 22 districts (17 urban and 5 rural). Each district is divided into wards or
communes according to its urban or rural structure, (303 wards/communes in HoChiMinh-City).Wards or communes are further divided into sub-units, whereby approximately 60 families aregrouped for administration purposes (Statistical Office of Ho Chi Minh City, 2000).Two samples were constituted: (1) a representative sample was used for the validation of the
psychometric quality and to determine the HRQOL norms of the adolescents of HoChiMinh-Cityand the associations between HRQOL scores and socio-demographic factors; and (2) a specificsample was constituted for test–retest reliability assessment.A sample of 1496 adolescents was obtained by three degrees cluster-sampling. We sampled 5
districts out of 22 (with stratification on the urban and rural character (1 and 4)); then six wardsor communes by district; and one sub-unit by ward/commune (the number of adolescents in thesub-units ranged from 40 to 56). Household surveys were carried out from the June 5th 2000 toJune 25th 2000. All adolescents of the 1496 selected sub-units were invited to participate in thishousehold survey, 1408 responded (94%).Another sample of 408 adolescents (all of first year medical students of HoChiMinh-City
medical school) was invited to do the test–retest (after 4 weeks). There were 130 first year medicalstudents (36.9% males and 23.1% females) and 278 first year nursing students (9.4% males and90.6% females), aged from 17 to 19 years (17 year 13.5%, 18 year 45.6%, 19 year 29.9% and 20years 13.0%), all living in HoChiMinh-City (64.2% living in rural area and 35.8% in urban area).All adolescents filled in the ADHP questionnaire.
Data collection. Data were collected using an anonymous ADHP questionnaire. The ques-tionnaires were filled at home for principal study (household surveys) and during class time for thetest–retest. In all two studies, research assistants introduced themselves to adolescents, informedthem that participation was voluntary, that privacy and confidentiality would be ensured andexplained instructions. Participants’ names were not recorded. The research assistants clarified itemterms when necessary, but took care to avoid influencing the content of answers in any way.
ARTICLE IN PRESS
V. Thi Xuan Hanh et al. / Journal of Adolescence 28 (2005) 127–146132
In household surveys, questionnaires were filled out in two phases. During the first phase researchassistants gave a questionnaire for the adolescent to follow whilst she/he read out and filled in itemsfor identification and general questions. In the second phase, adolescents were given time to fill in thispart away from the research assistants as we believed this provided privacy to answer for thequestions regarding risk behaviours and 17 items of the ADHP.
Data analysisSPSS9.0 software was used to analyse the data.
Psychometric quality validity of the DHP was documented as follows:
�
The internal consistency was assessed by Cronbach’s a on the data of 1408 adolescents’ sample. � The reproducibility, calculated by intraclass correlation coefficients (ICC) from fixed effectstwo-way ANOVA, was assessed in the sample of 408 adolescents.�
The Student t test for group comparison and r correlation coefficient for continuous variableassessed the construct validity.�
Measures of the ten dimensions of ADHPThe ten dimensions of ADHP was calculated using the Duke University formula. However wereversed the value (x) of the dysfunctional dimensions: anxiety, depression, pain and disability by(100�x) because we thought this would be more ‘‘user friendly’’; and would provide all scoredimensions with the same value (0=poor, 100=excellent).
Adolescents’ characteristics and associations. Description of the adolescents’ characteristics usedpercentage for categorical variables and mean (SD) for continuous variables. The relation ofHRQOL and dimensions with other factors were examined by using the t test for categoricalvariables and the correlation coefficient (r) for continuous variables and were further explored bymultivariate analysis (linear regression) to detect independent associated factors.
Results
The distribution between gender, age and setting of the sample and the population is almostequal (Table 1). Mean age: 15.7 years. Rate adolescent in school: 78.0%. Family situation: 79.1%live with parents, 20.9% live with one of their parents or recomposed parents (due to the divorce,judicial separation, widow situation).
�
Risk behavioursIn the last month, more than 13% of adolescents had smoked at least one cigarette and 28.8%adolescents had drunk beer or alcohol. More than four percent (4.2%) of adolescents had useddrugs at least once in the past.�
Disease or disabilityEighty-six (6.4%) adolescents reported suffering from or having had one kind of chronicdisease during the last 6 months. The most common chronic diseases were asthma (20%),rhinitis (15%) and gastro-enteritis (7%). Sixty-nine (5.3%) adolescents reported having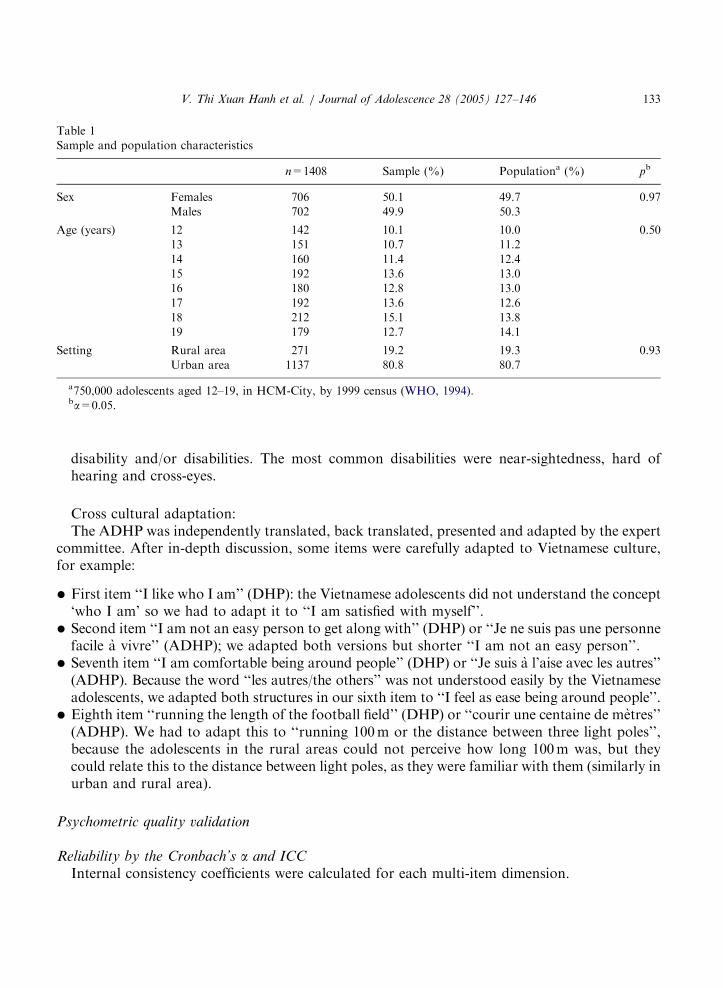
ARTICLE IN PRESS
Table 1
Sample and population characteristics
n=1408 Sample (%) Populationa (%) pb
Sex Females 706 50.1 49.7 0.97
Males 702 49.9 50.3
Age (years) 12 142 10.1 10.0 0.50
13 151 10.7 11.2
14 160 11.4 12.4
15 192 13.6 13.0
16 180 12.8 13.0
17 192 13.6 12.6
18 212 15.1 13.8
19 179 12.7 14.1
Setting Rural area 271 19.2 19.3 0.93
Urban area 1137 80.8 80.7
a750,000 adolescents aged 12–19, in HCM-City, by 1999 census (WHO, 1994).ba=0.05.
V. Thi Xuan Hanh et al. / Journal of Adolescence 28 (2005) 127–146 133
disability and/or disabilities. The most common disabilities were near-sightedness, hard ofhearing and cross-eyes.
Cross cultural adaptation:The ADHP was independently translated, back translated, presented and adapted by the expert
committee. After in-depth discussion, some items were carefully adapted to Vietnamese culture,for example:
�
First item ‘‘I like who I am’’ (DHP): the Vietnamese adolescents did not understand the concept‘who I am’ so we had to adapt it to ‘‘I am satisfied with myself’’.�
Second item ‘‘I am not an easy person to get along with’’ (DHP) or ‘‘Je ne suis pas une personnefacile a vivre’’ (ADHP); we adapted both versions but shorter ‘‘I am not an easy person’’.�
Seventh item ‘‘I am comfortable being around people’’ (DHP) or ‘‘Je suis a l’aise avec les autres’’(ADHP). Because the word ‘‘les autres/the others’’ was not understood easily by the Vietnameseadolescents, we adapted both structures in our sixth item to ‘‘I feel as ease being around people’’.�
Eighth item ‘‘running the length of the football field’’ (DHP) or ‘‘courir une centaine de metres’’(ADHP). We had to adapt this to ‘‘running 100m or the distance between three light poles’’,because the adolescents in the rural areas could not perceive how long 100m was, but theycould relate this to the distance between light poles, as they were familiar with them (similarly inurban and rural area).Psychometric quality validation
Reliability by the Cronbach’s a and ICC
Internal consistency coefficients were calculated for each multi-item dimension.
ARTICLE IN PRESS
V. Thi Xuan Hanh et al. / Journal of Adolescence 28 (2005) 127–146134
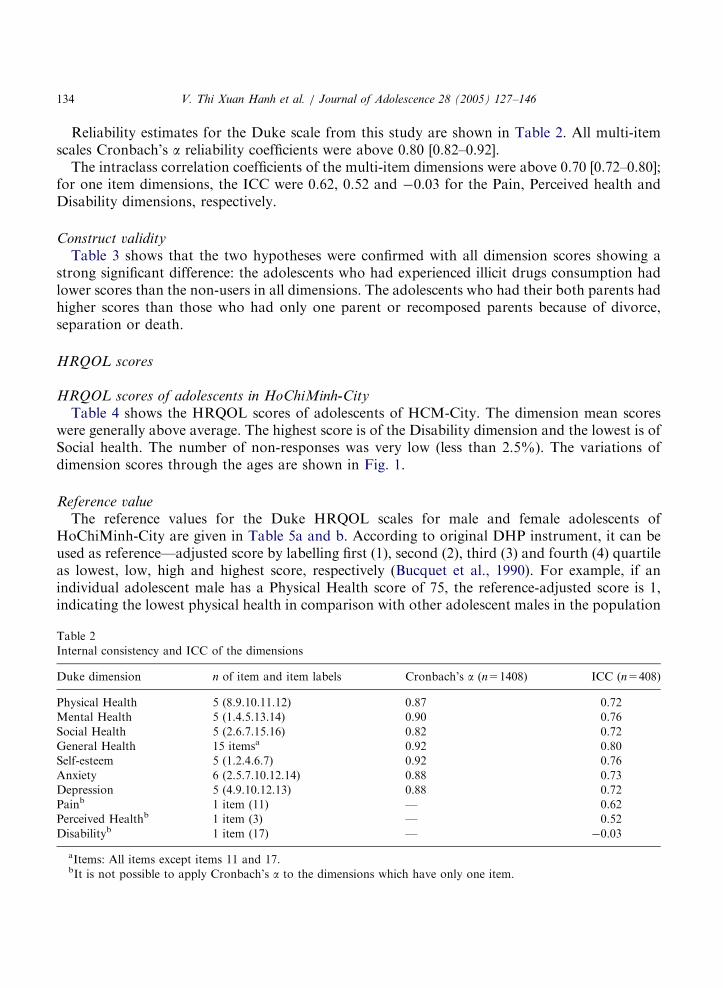
Reliability estimates for the Duke scale from this study are shown in Table 2. All multi-itemscales Cronbach’s a reliability coefficients were above 0.80 [0.82–0.92].The intraclass correlation coefficients of the multi-item dimensions were above 0.70 [0.72–0.80];
for one item dimensions, the ICC were 0.62, 0.52 and �0.03 for the Pain, Perceived health andDisability dimensions, respectively.
Construct validity
Table 3 shows that the two hypotheses were confirmed with all dimension scores showing astrong significant difference: the adolescents who had experienced illicit drugs consumption hadlower scores than the non-users in all dimensions. The adolescents who had their both parents hadhigher scores than those who had only one parent or recomposed parents because of divorce,separation or death.
HRQOL scores
HRQOL scores of adolescents in HoChiMinh-City
Table 4 shows the HRQOL scores of adolescents of HCM-City. The dimension mean scoreswere generally above average. The highest score is of the Disability dimension and the lowest is ofSocial health. The number of non-responses was very low (less than 2.5%). The variations ofdimension scores through the ages are shown in Fig. 1.
Reference valueThe reference values for the Duke HRQOL scales for male and female adolescents of
HoChiMinh-City are given in Table 5a and b. According to original DHP instrument, it can beused as reference—adjusted score by labelling first (1), second (2), third (3) and fourth (4) quartileas lowest, low, high and highest score, respectively (Bucquet et al., 1990). For example, if anindividual adolescent male has a Physical Health score of 75, the reference-adjusted score is 1,indicating the lowest physical health in comparison with other adolescent males in the population
Table 2
Internal consistency and ICC of the dimensions
Duke dimension n of item and item labels Cronbach’s a (n=1408) ICC (n=408)
Physical Health 5 (8.9.10.11.12) 0.87 0.72
Mental Health 5 (1.4.5.13.14) 0.90 0.76
Social Health 5 (2.6.7.15.16) 0.82 0.72
General Health 15 itemsa 0.92 0.80
Self-esteem 5 (1.2.4.6.7) 0.92 0.76
Anxiety 6 (2.5.7.10.12.14) 0.88 0.73
Depression 5 (4.9.10.12.13) 0.88 0.72
Painb 1 item (11) — 0.62
Perceived Healthb 1 item (3) — 0.52
Disabilityb 1 item (17) — �0.03
aItems: All items except items 11 and 17.bIt is not possible to apply Cronbach’s a to the dimensions which have only one item.

ARTICLE IN PRESS
Table 3
Construct validity of ADHP: difference in HRQOL scores in relation to hypothesized factors
Duke dimension Drug users
n=55
Non-drug
users n=1246
p* Mono-parent
n=290
Both parents
n=1118
p*
Physical health 70 84 0.001 81 84 0.032
Mental health 57 74 0.001 70 74 0.007
Social health 45 59 0.001 52 60 0.001
General health 57 72 0.001 68 73 0.001
Perceived health 50 60 0.031 60 60 0.970
Self-esteem 52 69 0.001 61 69 0.001
Anxiety 58 75 0.001 70 75 0.001
Depression 60 77 0.001 74 78 0.001
Pain 65 82 0.001 80 82 0.274
Disability 88 97 0.005 95 98 0.011
p* degree of signification.
Table 4
Value of ten dimensions of Duke HRQOL of adolescents in HCM-City, 2000
Duke Dimension N Mean SD Min. Max Floor (%) Ceiling (%)
Physical Health 1389 83 17.6 0 100 0.1 34.3
Mental Health 1387 73 20.4 0 100 0.1 15.1
Social Health 1386 58 21.4 0 100 0.5 3.6
General Health 1373 72 14.2 23 100 0.1 0.8
Perceived Health 1408 60 35.4 0 100 17.3 36.4
Self-esteem 1389 68 21.2 0 100 0.2 10.7
Anxiety 1391 74 17.6 8 100 0.1 9.3
Depression 1388 77 19.6 10 100 0.2 23.0
Pain 1408 81 28.1 0 100 4.2 66.5
Disability 1408 97 13.1 0 100 0.7 90.9
50
55
60
65
70
75
80
85
90
12 13 14 15 16 17 18 19
Age
Scor
e
Physical H. Mental H. Social H. Self-esteem
Fig. 1. Score of physical–mental–social health–self-esteem by age.
V. Thi Xuan Hanh et al. / Journal of Adolescence 28 (2005) 127–146 135

ARTICLE IN PRESS
Table 5
Reference value for the Duke Health Profile of male and female adolescents in HCM-City, 2000 (n=702)
DUKE
Dimension
Male Female p value
Mean SD Mean SD
Physical health 86 16.6 80 18.2 0.001
Mental health 75 19.3 71 21.2 0.001
Social health 59 21.0 56 21.7 0.033
General health 73 13.1 70 14.9 0.001
Perceived health 62 35.6 58 35.2 0.040
Self-esteem 69 20.2 66 22.2 0.010
Anxiety 76 16.7 72 18.2 0.001
Depressed 79 18.6 74 20.3 0.001
Pain 83 26.9 79 29.2 0.010
Disability 97 11.9 96 14.3 0.102
V. Thi Xuan Hanh et al. / Journal of Adolescence 28 (2005) 127–146136
(i.e. 75 is in the first quartile in Table 5a). On the other hand, an individual female adolescent withthe same Physical Health score of 75 would have a reference-adjusted score of 2 (i.e. 75 is in thesecond quartile in Table 5b).
Association between HRQOL dimensions and factors
Univariate analysis
The associations between HRQOL dimension scores and some socio-demographic factors suchas age, environmental setting (urban/rural), school enrollment and whether living with parents ornot, are shown in Tables 3 and 6.
�
Eight HRQOL dimension scores, except Physical, Perceived health and Disability, hadsignificant associations with age. The scores of these 8 dimensions were lower when the age washigher.�
HRQOL dimension scores of male and female adolescents are shown in Tables 5a and b. Boysdeclared better QOL than girls for all dimensions (po0.04) except for the disability dimension.�
Those who lived in rural area had six HRQOL scores higher in Mental, Social, General health,Self-Esteem, Anxiety, Depression, but lesser in Perceived health (the Physical health, Pain andDisability had no significant association).�
The score of eight dimensions—Mental, Social, General, Perceived health, Self-esteem, Anxiety,Depression, and Disability—of those who were school children were higher; only twodimensions (Physical health and Pain) had no significant association.Besides that, the study results showed significant associations between the HRQOL and otherhealth and risk behaviour factors:
�
Smoking: The non-smokers had higher scores (po0.01) in six-dimensions related morewith mental health—Mental, Social, General health, Self-esteem, Anxiety, Depression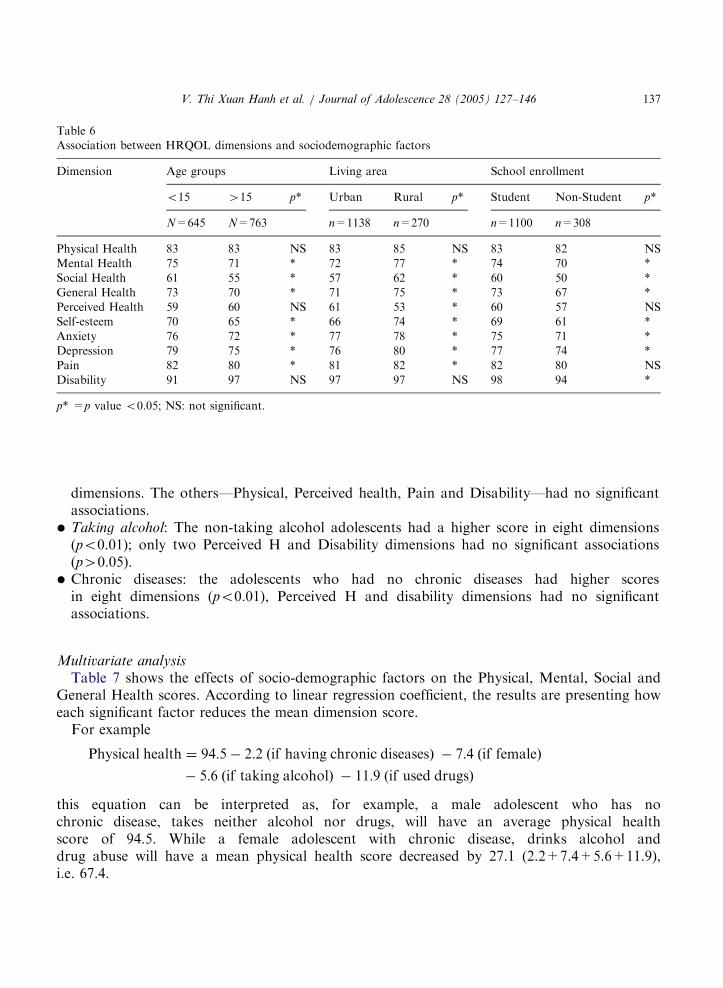
ARTICLE IN PRESS
Table 6
Association between HRQOL dimensions and sociodemographic factors
Dimension Age groups Living area School enrollment
o15 415 p* Urban Rural p* Student Non-Student p*
N=645 N=763 n=1138 n=270 n=1100 n=308
Physical Health 83 83 NS 83 85 NS 83 82 NS
Mental Health 75 71 * 72 77 * 74 70 *
Social Health 61 55 * 57 62 * 60 50 *
General Health 73 70 * 71 75 * 73 67 *
Perceived Health 59 60 NS 61 53 * 60 57 NS
Self-esteem 70 65 * 66 74 * 69 61 *
Anxiety 76 72 * 77 78 * 75 71 *
Depression 79 75 * 76 80 * 77 74 *
Pain 82 80 * 81 82 * 82 80 NS
Disability 91 97 NS 97 97 NS 98 94 *
p* =p value o0.05; NS: not significant.
V. Thi Xuan Hanh et al. / Journal of Adolescence 28 (2005) 127–146 137
dimensions. The others—Physical, Perceived health, Pain and Disability—had no significantassociations.
�
Taking alcohol: The non-taking alcohol adolescents had a higher score in eight dimensions(po0.01); only two Perceived H and Disability dimensions had no significant associations(p40.05).�
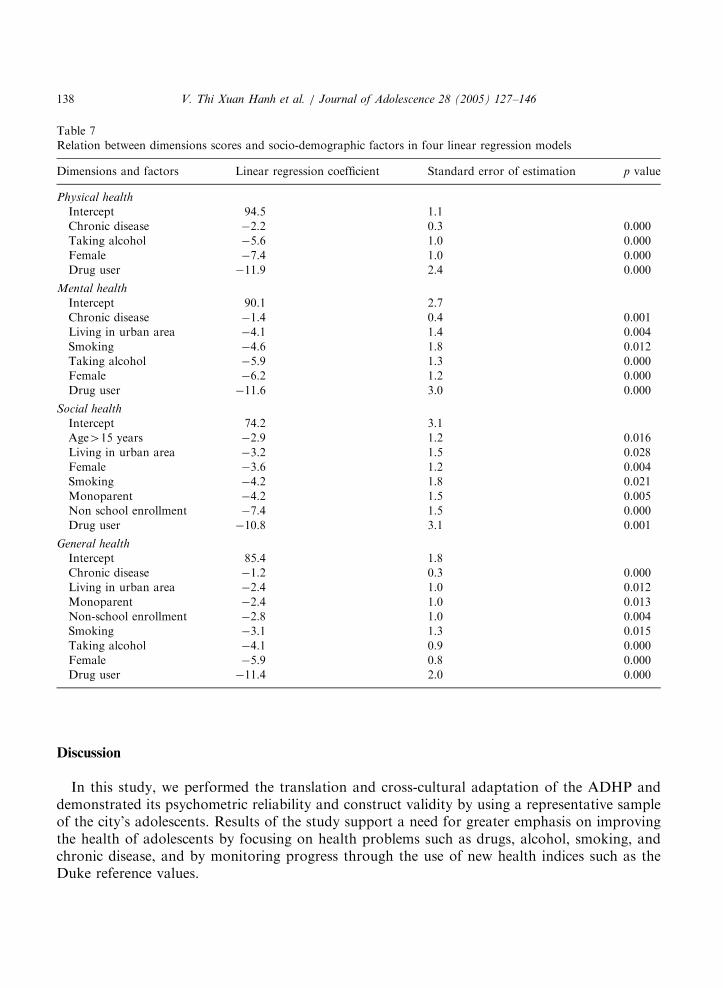
Chronic diseases: the adolescents who had no chronic diseases had higher scoresin eight dimensions (po0.01), Perceived H and disability dimensions had no significantassociations.Multivariate analysisTable 7 shows the effects of socio-demographic factors on the Physical, Mental, Social and
General Health scores. According to linear regression coefficient, the results are presenting howeach significant factor reduces the mean dimension score.For example
Physical health ¼ 94:5� 2:2 ðif having chronic diseasesÞ � 7:4 ðif femaleÞ
� 5:6 ðif taking alcoholÞ � 11:9 ðif used drugsÞ
this equation can be interpreted as, for example, a male adolescent who has nochronic disease, takes neither alcohol nor drugs, will have an average physical healthscore of 94.5. While a female adolescent with chronic disease, drinks alcohol anddrug abuse will have a mean physical health score decreased by 27.1 (2.2+7.4+5.6+11.9),i.e. 67.4.
ARTICLE IN PRESS
Table 7
Relation between dimensions scores and socio-demographic factors in four linear regression models
Dimensions and factors Linear regression coefficient Standard error of estimation p value
Physical health
Intercept 94.5 1.1
Chronic disease �2.2 0.3 0.000
Taking alcohol �5.6 1.0 0.000
Female �7.4 1.0 0.000
Drug user �11.9 2.4 0.000
Mental health
Intercept 90.1 2.7
Chronic disease �1.4 0.4 0.001
Living in urban area �4.1 1.4 0.004
Smoking �4.6 1.8 0.012
Taking alcohol �5.9 1.3 0.000
Female �6.2 1.2 0.000
Drug user �11.6 3.0 0.000
Social health
Intercept 74.2 3.1
Age415 years �2.9 1.2 0.016
Living in urban area �3.2 1.5 0.028
Female �3.6 1.2 0.004
Smoking �4.2 1.8 0.021
Monoparent �4.2 1.5 0.005
Non school enrollment �7.4 1.5 0.000
Drug user �10.8 3.1 0.001
General health
Intercept 85.4 1.8
Chronic disease �1.2 0.3 0.000
Living in urban area �2.4 1.0 0.012
Monoparent �2.4 1.0 0.013
Non-school enrollment �2.8 1.0 0.004
Smoking �3.1 1.3 0.015
Taking alcohol �4.1 0.9 0.000
Female �5.9 0.8 0.000
Drug user �11.4 2.0 0.000
V. Thi Xuan Hanh et al. / Journal of Adolescence 28 (2005) 127–146138
Discussion
In this study, we performed the translation and cross-cultural adaptation of the ADHP anddemonstrated its psychometric reliability and construct validity by using a representative sampleof the city’s adolescents. Results of the study support a need for greater emphasis on improvingthe health of adolescents by focusing on health problems such as drugs, alcohol, smoking, andchronic disease, and by monitoring progress through the use of new health indices such as theDuke reference values.

ARTICLE IN PRESS
V. Thi Xuan Hanh et al. / Journal of Adolescence 28 (2005) 127–146 139
Although there are other generic HRQOL instruments for adolescents: QOL profile adolescentsversion (QOLPAV) with 54 items (Raphael, Rukholm, Brown, Hill-Baley, & Donato, 1996),Child health and illness profile with 275 items (Spieth and Harris, 1996), French HRQOL with 40items (Simeoni, Auquier, Antoniotti, Sanpin, & San Marco, 2000), the ADHP was chosen for oursurvey because of its type (generic scale), its applicability and acceptability. We believe it to beeasy to apply in a new setting such as Vietnam; it can be used worldwide (the DHP is nowavailable in 17 languages other than American English).
Translation and cross-cultural adaptation
The cross-cultural adaptation process used in the four steps of this process (Guillemin et al.,1997) are similar with the WHO-QOL (WHO, 1994), SF36 (Wagner et al., 1998), (IQOLA)(Bullinger et al., 1998) and the EURONHP (Nottingham Health Profile) (Bucquet et al., 1990)process; some differences can be noted.
Forward translation: All translators had experiences in health measurement methodology. NHPand WHO-QOL process had two translators, while IQOLA and our process had 3. All, exceptWHOQOL worked independently.
Back translation: The WHOQOL and EURONHP process had only one back translator. TheIQOLA had two whereas we had three independent, unaware of the study scope, nor of theconcepts underlying the questionnaire.
Expert committee: Our expert panel had the same objective as that of the NHP. Fouradolescents participated in our committee. We focused our attention on an expert committeereview to produce a synthesis of the translations by consensus, with the presence of targetpopulation (adolescents).The early and final test in our study was the same as in IQOLA and in WHOQOL. This was to
ensure that the language in our instrument was comprehensible for the Vietnamese adolescentsand that it reflected the meaning and intent of that of the original DHP, i.e. to preserveequivalence in content. Less emphasis was put on back translation, which has been shown to besometimes misleading (Leplege & Verdier, 1995).
Psychometric quality
This was the first time that a HRQOL instrument was used in Vietnam. Our mastery of thisinstrument in adult led us to extent its use over ado. Such a brief measure is amenable to use inadolescents. The ADHP is short, simple, and easy to understand for the adolescent study groupand it is suitable for longitudinal use in adolescent clinical evaluation or in primary health careprograms (Parkerson, Broadhead, & Tse, 1996; Parkerson et al., 1988).The internal consistency as measured by Cronbach’s a of this study was satisfactory (higher
than 0.80) as it follows the standards for acceptable reliability of (Nunnally, 1978). It was a littlehigher than those of Parkerson of the DHP in USA (from 0.57 to 0.80—Primary care patients1997 (Parkerson, 1999)), and those of Guillemin in France (from 0.54 to 0.81—adults, 1997(Guillemin et al., 1997)). We also found the Cronbach’s a of the social health scale to be lowerthan the other dimensions, however this could be explained by the diversity of its items, coveringbroad aspects of social relationships.
ARTICLE IN PRESS
V. Thi Xuan Hanh et al. / Journal of Adolescence 28 (2005) 127–146140
There was four weeks duration between the test and retest. We supposed the HRQOL statuswas globally stable, so the reproducibility of this study was acceptable. The level of reproducibilitywas the same as the French study (601 people, SUVIMAX study, 1996) (Guillemin et al., 1997),except for the ICC of Disability dimension. The four-weeks interval time was long, so as to avoidrecall bias.The statistically significant associations of Duke mean dimension scores according to two
hypotheses (Table 3) supported the construct validity. The HRQOL mean score difference washigh between the drug users and non-drug users; for example, the anxiety mean score for the drugsusers was 57.6717.7 SD compared with 75717.2 SD for the non-users. Note that some recentstudies and data showed that heroin is the most used (97.7%) by the young drugs users in Vietnam(Pelc & Lam, 2000).
HRQOL level of the Vietnamese adolescents
The HoChiMinh-City adolescent HRQOL DHP scores are similar with the results of theFrench adolescent study (scores 58–83 from Vietnamese adolescents aged 12–19 years, 67–77French adolescents aged 12–19 years, 62–73 French school children aged 13–18 years). Girls havea perception that differs from that boys, being more pessimistic for all dimensions). Thedimension ranks are not different in the categories of physical health, mental health and socialhealth (Fig. 1).We noted some particularities. These being, the perceived health and the social health of
Vietnamese adolescents had a lower rating in our sample vis a vis similar population in France(59.6 versus 73.4 and 58.1 versus 67.8, respectively). The low perceived health score could beexplained by the idea that adolescents in Vietnam rejected ‘high score or excellent’ labellingbecause it does not conform to Confucian concept of modesty. This explanation is morecompelling in the context of traditional norms whereby parents give their children ugly names,and speak negatively of them in the hope of distracting attention from hostile spirits intent ofstealing young lives. The low social health score can be explained by the fact that Vietnameseadolescents stay at home longer due to strong family control (Le & Luu, 1999).
Reference values of the HRQOL of the Vietnamese adolescents
The quality of the adolescent Duke reference values of this study is reliable for two reasons. Thefirst being that the sample was representative of the adolescent population, as demonstrated bythe similarities in sex, age and setting region characteristics (p40.05). The second reason is thatthese data are collected from household survey allowing for a higher response rate (94%) thanother data collection methods like telephone or mail survey. However, to limit a potential bias dueto direct interview, e.g. desirability bias, adolescents were left alone for filling in the ADHP duringthe second phase of survey.The adolescent Duke reference values of this study can be used to interpret the Duke scores of
individual adolescent, of groups of adolescents who belong to HoChiMinh-City. The referencevalues can be used for a number of purposes. They can be used as a benchmark to characterizeparticular subgroups of adolescent (by social or any other category). They can be used by thegovernment as a baseline data before public health interventions are introduced, as well as a basis
ARTICLE IN PRESS
V. Thi Xuan Hanh et al. / Journal of Adolescence 28 (2005) 127–146 141
for future comparison after interventions have been accomplished. They can also be used in futureresearch for comparison, either inside or outside of Vietnam.
Association between HRQOL scores and socio-demographic factors
In this study, we found many significant associations between adolescents with different socio-demographic characteristics or risk behaviours. These findings are much more important thanmerely data to support validation of a health measure, because they quantify and document somevery serious health problems of the adolescent population of HoChiMinh-City. The drug abusehad a strong effect on all HRQOL dimension scores is such an example. This finding could beuseful for future health promotion program planning, such as population diagnosis, interventionplanning, monitoring, and evaluation.
Conclusion
The ADHP is now made available for use in Vietnam and will serve several purpose. It has beendocumented for validity after careful cross-cultural adaptation and this makes it reliable for cross-cultural research in youth of other countries.We have established norms values that can serve as references to describe the severity of
sickness in different conditions and their perceptions by patients. We have identified age, gender,living setting, monoparent, non-school enrollment, chronic disease and risk behaviours asdeterminants of adolescent HRQOL, in situation similar with other countries (Arene et al., 1998;Spieth & Harris, 1996; Simeoni et al., 2000).This instrument and informations obtained from this study will be a primary importance to
development public health, intervention for prevention, promotion and can be targeted toadolescent population representing a high proportion and a high risk of current Vietnamesepopulation.
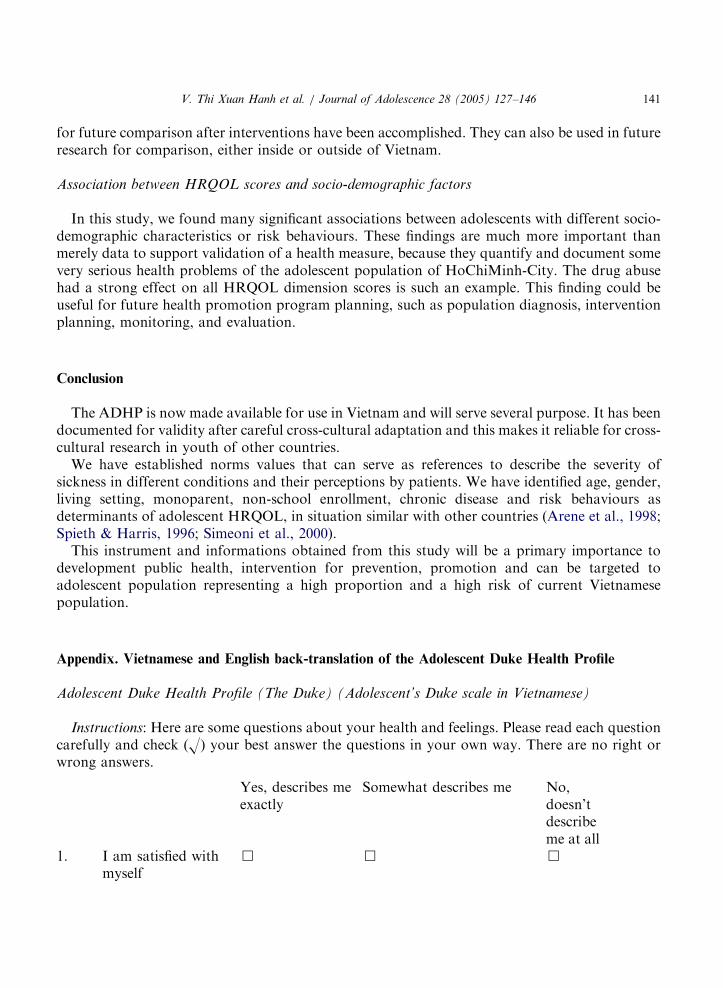
Appendix. Vietnamese and English back-translation of the Adolescent Duke Health Profile
Adolescent Duke Health Profile (The Duke) (Adolescent’s Duke scale in Vietnamese)
Instructions: Here are some questions about your health and feelings. Please read each questioncarefully and check (O) your best answer the questions in your own way. There are no right orwrong answers.
Yes, describes meexactly
Somewhat describes me
No,doesn’tdescribeme at all1.
I am satisfied withmyself&
& &
ARTICLE IN PRESS
V. Thi Xuan Hanh et al. / Journal of Adolescence 28 (2005) 127–146142
2.
I am not an easyperson to get alongwith&
& &3.
I am basically ahealthy person&
& &4.
I give up too easily & & &5.
I have difficultyconcentrating&
& &6.
I am happy with myfamily relationships&
& &7.
I feel at ease beingaround people&
& &Today: Would you have any physical trouble or difficulty
None Some A lot8.
Walking up a flightof stairs&
& &9.
Running the lengthof 100 meters or thedistance betweenthree light poles&
& &During Last Week: How much trouble have you had with
None Some A lot10.
Sleeping & & & 11. Hurting or achingin any part ofyour body
&
& &12.
Getting tiredeasily&
& &13.
Feeling depressedor sad&
& &14.
Nervousness & & & During Last Week: How often did youNone
Some A lot 15. Socialize withother people (talkor visit withfriends orrelatives)
&
& &16.
Take part insocial, religious orrecreationactivities(meetings, church,&
& &
ARTICLE IN PRESS
V. Thi Xuan Hanh et al. / Journal of Adolescence 28 (2005) 127–146 143
pagoda, movies,sports, parties)
During Last Week: How often did you
None 1–4 days 5–7 days17.
Stay in your houseor hospitalbecause ofsickness, injury,or other healthproblem&
& &BAUNG CAAU HOUI Duke daønh cho Vo Thaønh Niean
Hooungdaan:
Naay laø baung caau houi vea tınh traıng souc khoue maø baın nang caumnhaan.
Haoy noıc thaat kyo looong toøng caau moat vaø naunh daau X vaøo caautrau loøi phuø hoıp cho baın nhaat. Nghoa laø phuø hoıp voui tınh traınghiean thoøi cuua baın nhaat.Hoaøn toaøn nuungvoui trooøng hoıpcuua toai
Gaan nuungnho trooønghoıp cuuatoai
Khoang nuungvoui trooønghoıp cuua toai
1.
Toai thaay haøi loøng veabaun thaan mınh&
& &2.
Toai khoang phaui laømoat ngooøi dea chou&
& &3.
Toai laø ngooøi khouemaınh&
& &4.
Toai raat dea naun long & & & 5. Toai khou taap trung suyngho
& & &6.
Toai haøi loøng vea gianınh toai&
& &7.
Toai caum thaay thoauimaui voui nhoong ngooøixung quanh&
& &NGAØY HOAM NAY: Baın thaay khou khaen khi
Hoaøn toaønkhoangNoai chuut
Nhieau8.
ni boa lean baac thang & & & 9. Chaıy boa 100m hoaecchaıy qua 3 coat neon
& & &
ARTICLE IN PRESS
V. Thi Xuan Hanh et al. / Journal of Adolescence 28 (2005) 127–146144
NGAØY GAAN NAAY:
Hoaøn toaønkhoang
Noai chuut
Nhieau10.
Baın cou vaan nea veagiaac nguu&
& &11.
Baın cou bo nau ou naaunou trong ngooøi&
& &12.
Baın cou caum giauc deabo meat&
& &13.
Baın nao bo buoan hoaecxuoang tinh thaan&
& &14.
Baın bo caeng thaunghoaec cauu gaet&
& &15.
Baın cou gaep goo baø conhoı haøng hoaec baın beøngoaøi gioø hoıc&
& &16.
Baın nao cou tham gia sinhhoaıt taap thea (hoıpNoaøn Noai, sinh hoaıttoan giauo, caau laıcboay) hoaec vui choigiaui trı (xem phim, theathao, doı tieacy)&
& &NGAØY GAAN NAAY:
Hoaøn toaønkhoang
1–4 ngaøy
5–7 ngaøy17.
Baın nao phaui nghæ ounhaø hoaec naem beanhviean vı beanh hoaec tainaın&
& &References
Apolone, G., & Mosconi, P. (1998). Review of the concept of quality of life assessment and discussion of the present
trend in clinical research. Nephrol Dial Transplant, 13, 65–69.
Arene, J., Janvrin, M. P., & Baudier, F. (1998). Barometre sante Jeunes 97/98. Comite franc-ais d’education pour la
sante. CFES Editions, 330, 33–62.
Ban Chap Hanh Trung Uong Dang Cong San Vietnam. (1998). Nghi quyet so 4 ve nhung van de cap bach cua su
nghiep cham soc suc khoe nhan dan. [Central committee of communist party. Resolution no 4 for emergency
problems in health care and protection of people’s health.].
Bucquet, D., Condon, S., & Ritchie, K. (1990). The French version of the Nottingham Health Profile. A comparison of
items weights with those of the source version. Social Science and Medicine, 30(7), 829–835.

ARTICLE IN PRESS
V. Thi Xuan Hanh et al. / Journal of Adolescence 28 (2005) 127–146 145
Bullinger, M., Alonso, J., Apolone, G., Leplege, A., Sullivan, M., Wood-Dauphinee, S., et al. (1998). Translating
health status questionnaires and evaluating their quality: the IQOLA project approach. Journal of Clinical
Epidemiology, 51(11), 913–923.
Chwalow, A. J., Lurie, A., Bean, K., Parent du Chatelet, I., Venot, A., Dusser, D., Douot, T., & Strauch, G. (1992). A
French version of the Sickness Impact Profile (SIP): stages in the cross cultural validation of a generic quality of life
scale. Fundamental Clinical Pharmacology, 6(7), 319–326.
Deslande, P. (2000). Le Vietnam Face a l’avenir. Paris: L’Harmattan. 192p.
Fermanian, J. (1996). Evaluating correctly the validity of a rating scale: the many pitfalls to be avoided. Revued D
Epidemiologie et de Sante Publique, 44, 278–286.
Guillemin, F., Bombardier, C., & Beaton, D. (1993). Cross cultural adaptation of health related quality of life measures:
literature review and proposed guideline. Journal of Clinical Epidemiology, 46, 1417–1432.
Guillemin, F., Paul-Dauphin, A., Virion, J. M., Bouchet, C., & Brianc-on, S. (1997). Le profil de sante de Duke: Un
instrument generique de mesure de qualite de vie liee a la sante. Revued D Epidemiologie et de Sante Publique, 1,
35–44.
Guyatt, G. H., Feeney, D. H., & Donald, L. P. (1993). Measuring health related quality of life. Annals of Internal
Medicine, 118, 622–629.
Hoang B. Q. (1999). Tong quan tinh hinh thanh nien, cong tac Doan va phong trao thanh thieu nien. Hanoi: La jeunesse de
Hanoi; 2e edition: pp. 23–342.
Hunt, S. M. (1986). Cross-cultural issues in the use of socio-medical indicators. Health Policy, 6(2), 149–158.
Hunt, S. M., Alonso, J., Bucquet, D., Niero, M., Wiklund, I., & McKenna, S. (1991). Cross-cultural adaptation of
health measures. European Group for health management and quality of life assessment. Health Policy, 19(1),
33–44.
Le, T. V., & Luu, K. T. (1999). Life Rites. Hanoi: Ethnic Culture Publishing House. 42p.
Leplege, A., & Verdier, A. (1995). The adaptation of health status measures: methodology aspects of the translation
procedure. Rapid Communication of Oxford Ltd, pp. 93–101.
Le Truong Giang. (1999). Evaluation de la politique de lutte contre le sida a HCM-Ville 1994–1998. Ph.D. thesis.
Nancy I, France: University Henri Poincare.
Mozes, B., Maor, Y., & Shmueli, A. (1999). Do you know what global rating of Health related quality of life measure.
Quality Life Research, 8, 269–273.
Nunnally, J. C. (1978). Psychometric theory (2nd ed.). New York, NY: MacGraw-Hill.
Papin, P. (2000). Vietnam parcours d’une nation. Asie Plurielle. Paris: La Documentation Franc-aise. pp. 101–113.
Parkerson, G. R. (1999). User’s Guide for Duke Health Measures. Duke University Medical Center. Edition, Vol. 182,
pp. 9–12.
Parkerson, G. R., Broadhead, W. E., & TSE, C. -K. J. (1990). The Duke health profile—A 17-item measure of health
and dysfunction. Medical Care, 28, 1056–1072.
Parkerson, G. R., Jr., Broadhead, W. E., & Tse, C. -K. J. (1996). Anxiety and depression symptom identification using
the Duke health profile. Journal of Clinical Epidemiology, 49, 85–93.
Parkerson, G. R., Jr., Eisenson, H. J., Munning, K. A., et al. (1988). A health promotion program for medical students.
Journal of Medical Education, 63, 722–724.
Pelc, I., & Lam, X.D. (2000). La toxicomanie a HCM-Ville en 1999. Rapport scientifique. Centre d’Etudes et
Cooperation medicale de l’Universite Libre de Bruxelles et de l’Agence de Cooperation de Developpement du
Royaume de Belgique, 230p.
Pham Bich San. (1997). Social implications of economic renovation. In B. Beckman, E. Hansson, & L. Roman (Eds.),
Viet Nam Reform and Transformation. Conference Proceedings. Stockholm: Centre for Pacific Asia Studies.
Police Service of HoChiMinh-City. (2000). Bao cao cong tac phong chong ma tuy 7 thang dau nam 2000. (Report
covering seven months of drug abuse and control during.) Ho Chi Minh City: Police Service of Ho Chi Minh City.
Raphael, D., Rukholm, E., Brown, I., Hill-Baley, P., & Donato, E. (1996). The quality of life profile—adolescent
version: background, description and initial validation. Journal of Adolescence Health, 19, 366–375.
Shrout, P. E., & Fleiss, J. L. (1979). Intraclasse correlation: uses in assessing rater reliability. Psychological Bulletin, 56,
420–425.

ARTICLE IN PRESS
V. Thi Xuan Hanh et al. / Journal of Adolescence 28 (2005) 127–146146
Simeoni, M. C., Auquier, P., Antoniotti, S., Sanpin, C., & San Marco, J. L. (2000). Validation of French health related
quality of life instrument for adolescents: the VSP-A. Quality Life Research, 9(4), 393–403.
Spieth, L. E., & Harris, C. V. (1996). Assessment of health related quality of life in children and adolescents: an
integrative review. Journal of Pediatric Psychology, 21(2), 175–193.
Statistical Office of HoChiMinh-City (2000a). Report of the National Census 01.4.1999 of the Population and Housing of
HoChiMinh-City. Ho Chi Minh City: Statistical Publishing House.
Statistical Office of Ho Chi Minh City (2000b). Statistical Yearbook 1999. Ho Chi Minh City: Statistical Publishing
House.
Wagner, A. K., Gandek, B., Aaronson, N. K., Acquadro, C., Alonso, J., Apolone, G., et al. (1998). Cross-cultural
comparisons of the content of SF-36 translations across 10 countries: results from the IQOLA project. Journal of
Clinical Epidemiology, 5, 925–932.
Ware, J. E., & Gandek, B. (1998). Overview of the SF-36 Health Survey and the International Quality of Life
Assessment (IQOLA) project. Journal of Clinical Epidemiology, 51(11), 903–912.
WHO (1994). The development of the World Health Organization quality of life assessment instrument (the
WHOQOL). In J. Orley, & W. Kuyken (Eds.), Quality of Life Assessment: International Perspectives (pp. 41–57).
Berlin: Springer.
WHOQoL Group (1995). World Health Organisation quality of life assessment: position paper from the World Health
Organisation. Social Science and Medicine, 41, 1403.