HEALTH POLICY AND SYSTEMS Nursing Home Staffing Standards and Staffing Levels in Six Countries
11
HEALTH POLICY AND SYSTEMS Nursing Home Staffing Standards and Staffing Levels in Six Countries Charlene Harrington, RN, PhD 1 , Jacqueline Choiniere, RN, PhD 2 , Monika Goldmann, PhD 3 , Frode Fadnes Jacobsen, PhD, RN 4 , Liz Lloyd, PhD 5 , Margaret McGregor, MD, MHSc 6 , Vivian Stamatopoulos, MA 7 , & Marta Szebehely, PhD 8 1 Professor Emeritus of Sociology and Nursing, Department of Social & Behavioral Sciences, University of California, San Francisco, CA, USA 2 Assistant Professor, School of Nursing, Faculty of Health, York University, Toronto, ON, Canada 3 Research and Deputy Executive Director, Sozialforschungsstelle (sfs), ZwE Technische Universitaet Dortmund, Dortmund, Germany 4 Professor and Director, Centre for Care Research West Norway, Bergen University College, Norway 5 Senior Lecturer in Social Gerontology, School for Policy Studies, University of Bristol, Bristol, UK 6 Scientist, Department of Family Practice, Centre for Clinical Epidemiology and Evaluation, University of British Columbia, Vancouver, BC, Canada 7 Doctoral Candidate, Department of Sociology, York University, Toronto, ON, Canada 8 Professor, Department of Social Work, Stockholm University, Stockholm, Sweden Key words Nurse staffing, quality, international, nursing homes Correspondence Dr. Charlene Harrington, Department of Social & Behavioral Sciences, University of California, San Francisco, CA 94143–0612. E-mail: [email protected] Accepted October 29, 2011 doi: 10.1111/j.1547-5069.2011.01430.x Abstract Purpose: This study was designed to collect and compare nurse staffing stan- dards and staffing levels in six counties: the United States, Canada, England, Germany, Norway, and Sweden. Design: The study used descriptive information on staffing regulations and policies as well as actual staffing levels for registered nurses, licensed nurses, and nursing assistants across states, provinces, regions, and countries. Methods: Data were collected from Internet searches of staffing regulations and policies along with statistical data on actual staffing from reports and doc- uments. Staffing data were converted to hours per resident day to facilitate comparisons across countries. Findings: We found wide variations in both nurse staffing standards and ac- tual staffing levels within and across countries, although comparisons were difficult to make due to differences in measuring staffing, the vagueness of standards, and limited availability of actual staffing data. Both the standards and levels in most countries (except Norway and Sweden) were lower than the recommended levels by experts. Conclusions: Our findings demonstrate the need for further attention to nurse staffing standards and levels in order to assure the quality of nursing home care. Clinical Relevance: A high quality of nursing home care requires adequate levels of nurse staffing, and nurse staffing standards have been shown to im- prove staffing levels. Nursing home quality is a major concern in a number of countries. Many U.S. government studies have de- scribed serious quality problems (US Government Ac- countability Office [U.S. GAO], 1987, 2009), such as resident weight loss, pressure ulcers, infections, pain, de- pression, and other treatable or preventable problems (Schnelle et al., 2004; U.S. Centers for Medicare and Medicaid Services [U.S. CMS], 2001). In Canada as well, reports have surfaced of poor care quality and staffing problems (Jansen, 2010; Wagner & Rust, 2008). Qual- ity concerns in England’s social care homes led to the development of new standards and regulatory oversight for care homes (Dixon, Kaambwa, Nancarrow, Martin, & Bryan, 2010; U.K. Care Quality Commission, 2010), and 88 Journal of Nursing Scholarship, 2012; 44:1, 88–98. C 2012 Sigma Theta Tau International
-
Upload
independent -
Category
Documents
-
view
0 -
download
0
Transcript of HEALTH POLICY AND SYSTEMS Nursing Home Staffing Standards and Staffing Levels in Six Countries

HEALTH POLICY AND SYSTEMS
Nursing Home Staffing Standards and Staffing Levelsin Six CountriesCharlene Harrington, RN, PhD1, Jacqueline Choiniere, RN, PhD2, Monika Goldmann, PhD3,Frode Fadnes Jacobsen, PhD, RN4, Liz Lloyd, PhD5, Margaret McGregor, MD, MHSc6,Vivian Stamatopoulos, MA7, & Marta Szebehely, PhD8
1 Professor Emeritus of Sociology and Nursing, Department of Social & Behavioral Sciences, University of California, San Francisco, CA, USA2 Assistant Professor, School of Nursing, Faculty of Health, York University, Toronto, ON, Canada3 Research and Deputy Executive Director, Sozialforschungsstelle (sfs), ZwE Technische Universitaet Dortmund, Dortmund, Germany4 Professor and Director, Centre for Care Research West Norway, Bergen University College, Norway5 Senior Lecturer in Social Gerontology, School for Policy Studies, University of Bristol, Bristol, UK6 Scientist, Department of Family Practice, Centre for Clinical Epidemiology and Evaluation, University of British Columbia, Vancouver, BC, Canada7 Doctoral Candidate, Department of Sociology, York University, Toronto, ON, Canada8 Professor, Department of Social Work, Stockholm University, Stockholm, Sweden
Key wordsNurse staffing, quality, international, nursing
homes
CorrespondenceDr. Charlene Harrington, Department of Social
& Behavioral Sciences, University of California,
San Francisco, CA 94143–0612. E-mail:
Accepted October 29, 2011
doi: 10.1111/j.1547-5069.2011.01430.x
Abstract
Purpose: This study was designed to collect and compare nurse staffing stan-dards and staffing levels in six counties: the United States, Canada, England,Germany, Norway, and Sweden.Design: The study used descriptive information on staffing regulations andpolicies as well as actual staffing levels for registered nurses, licensed nurses,and nursing assistants across states, provinces, regions, and countries.Methods: Data were collected from Internet searches of staffing regulationsand policies along with statistical data on actual staffing from reports and doc-uments. Staffing data were converted to hours per resident day to facilitatecomparisons across countries.Findings: We found wide variations in both nurse staffing standards and ac-tual staffing levels within and across countries, although comparisons weredifficult to make due to differences in measuring staffing, the vagueness ofstandards, and limited availability of actual staffing data. Both the standardsand levels in most countries (except Norway and Sweden) were lower thanthe recommended levels by experts.Conclusions: Our findings demonstrate the need for further attention tonurse staffing standards and levels in order to assure the quality of nursinghome care.Clinical Relevance: A high quality of nursing home care requires adequatelevels of nurse staffing, and nurse staffing standards have been shown to im-prove staffing levels.
Nursing home quality is a major concern in a numberof countries. Many U.S. government studies have de-scribed serious quality problems (US Government Ac-countability Office [U.S. GAO], 1987, 2009), such asresident weight loss, pressure ulcers, infections, pain, de-pression, and other treatable or preventable problems(Schnelle et al., 2004; U.S. Centers for Medicare and
Medicaid Services [U.S. CMS], 2001). In Canada as well,reports have surfaced of poor care quality and staffingproblems (Jansen, 2010; Wagner & Rust, 2008). Qual-ity concerns in England’s social care homes led to thedevelopment of new standards and regulatory oversightfor care homes (Dixon, Kaambwa, Nancarrow, Martin, &Bryan, 2010; U.K. Care Quality Commission, 2010), and
88 Journal of Nursing Scholarship, 2012; 44:1, 88–98.C© 2012 Sigma Theta Tau International
Harrington et al. Nursing Home Staffing
quality problems in Sweden led to new guidelines for de-mentia care units (Sweden National Board of Health andWelfare [SNBHW], 2009).
Poor quality in nursing home care has been found tobe associated with low nurse staffing levels (U.S. CMS,2001; Wagner & Rust, 2008). A systematic review of 87research articles and reports from 1975 to 2003 foundthat high total staffing levels, especially among RNs, wereassociated with improved care processes and resident out-comes for functional ability, pressure ulcers, and weightloss (Bostick, Rantz, Flesner, & Riggs, 2006). Otherresearch reviews found positive relationships betweenstaffing levels and outcomes, including deficiencies, res-ident outcomes, and other measures such as avoid-able hospitalizations (Castle, 2008; Spilsbury, Hewitt,Stirk, & Bowman, 2011). Although there are some mixedand inconsistent findings across studies, the benefits asso-ciated with high nurse staffing underline the importanceof nurse staffing standards and staffing levels.
While nursing home quality and nurse staffing levelshave been widely studied in the United States, there havebeen only a few studies on the impact of nurse staffingstandards. Following the adoption of U.S. legislation in1987 that required nursing homes to meet higher stan-dards of care and staffing, Zhang and Grabowski (2004)found an increase in staffing levels and a decrease inresident pressure ulcers, physical restraints, and urinarycatheters. In the United States, states with higher nursinghome staffing standards have higher actual staffing lev-els than states with lower standards (Harrington, Swanand Carrillo, 2007; Mueller et al., 2006; Park & Stearns,2009). California’s higher nurse staffing law in 2000 re-sulted in an increase in nurse staffing levels in nursinghomes, lower resident mortality (Tong, 2011), and fewerdeficiencies (Kim, Kovner, Harrington, Greene, & Mezey,2009). Florida’s 2002 legislation that increased the state’sminimum staffing standards also led to increased staffingand quality improvements (Hyer et al., 2011).
Aim and Description of the Study
The growing concern about nursing home quality andstaffing levels in different industrialized countries demon-strates the need to more closely examine staffing stan-dards and levels. This study was designed to describeand compare nurse staffing standards and actual nursestaffing levels in nursing homes in six industrializedcounties: the United States, Canada, England, Germany,Norway, and Sweden. This cooperative study was basedon documents and regulations of nursing home staffingstandards as well as actual nurse staffing levels, collectedby researchers from Internet, government websites,
government documents, research papers, and reports, inthese six countries. The available data were standardizedacross states, provinces, and regions in each country andsummarized for each country for comparative purposes.
Methods
Study Design and Data Collection
Descriptive data were collected on nurse staffing stan-dards and actual staffing levels in each of the six coun-tries in 2010–2011. In the United States, a website sur-vey of state government documents was conducted inAugust 2010 to collect information from each of the 50states and the District of Columbia, to update a previoussurvey for statutes, regulations, and policies (Harrington,2005). In Canada, a website survey of province docu-ments was conducted in 2011 that collected regulationsand standards from nine provinces. The data for England,Germany, Norway, and Sweden were gathered from re-cent government documents and reports. In each coun-try, we searched for the specific requirements regard-ing the number and type of directors of nursing andnursing staff (RNs, licensed vocational or practical nurses[LVN/LPNs], licensed nurses [RNs and LVNs/LPNs], andnursing assistants or aides [NAs]) along with reports ofactual staffing levels from government reports and stud-ies. We also presented each country’s nomenclature fornursing homes, the number of homes, and the educa-tional and training requirements where data were avail-able. Although the documents collected for the projectappeared to accurately reflect government regulations,the difficulty in obtaining the documents from the differ-ent jurisdictions identified the lack of public accessibilityabout staffing.
Data Analysis
Descriptions of staffing standards and levels were de-veloped to summarize information from each country,and we attempted to standardize the data. In the UnitedStates, requirements are generally presented as hours perresident day (hprd) or in ratios of staff to residents. Inorder to convert staff ratios to hprd in the United States,each full-time equivalent employee (FTE) was assumedto work 8 hr per day in three 9-hr work shifts (it mayactually be about 7.5 hr). For example, if 1 NA had 10residents on the day and on the evening shift, 8 hr wasdivided by 10 residents (0.8 hr per resident for each shift,and 1 staff to 15 residents at night would be 0.53 hprd),and the total direct care would be 2.13 hprd. Canada alsoreported hprd and staff ratios.
89
Nursing Home Staffing Harrington et al.
The European countries reported staffing in FTEs,which we converted by dividing the number of hours perFTE per day by the number of residents. Another con-sideration was that the hours for all care staff and nurs-ing staff were not always reported separately in Canadaand Europe. In the United States, staffing standards andlevels for housekeeping, dietary, clerical, and other sup-port staff members were reported separately from nursingstandards. Thus, there were many limitations in the avail-able data, and the efforts to standardize the data weresomewhat subjective.
Findings
United States staffing. The U.S. had about 16,000licensed or certified nursing homes in 2009. (Residen-tial care facilities do not provide nursing services.) TheU.S. federal staffing standards for all certified nursinghomes that provide Medicare and Medicaid services re-quired one RN on duty for 8 consecutive hours 7 daysa week (including a full-time director of nursing [DON])and one RN and one licensed nurse (LN; either an RN orLVN-LPN) for the two remaining shifts, with no adjust-ment for resident acuity (U.S. CMS, 2011). The standardsalso require adequate staffing levels to meet the needs ofthe residents to attain or maintain the highest practicablelevels of physical, mental, and psychosocial well-being.RNs have 2 or more years of education, LVNs/LPNs have1 year of training, and NAs have a minimum of 75 hr oftraining or higher in some states. Separate federal stan-dards are set for medical directors, therapy and socialservices, dietary services, pharmacy, housekeeping, andother services.
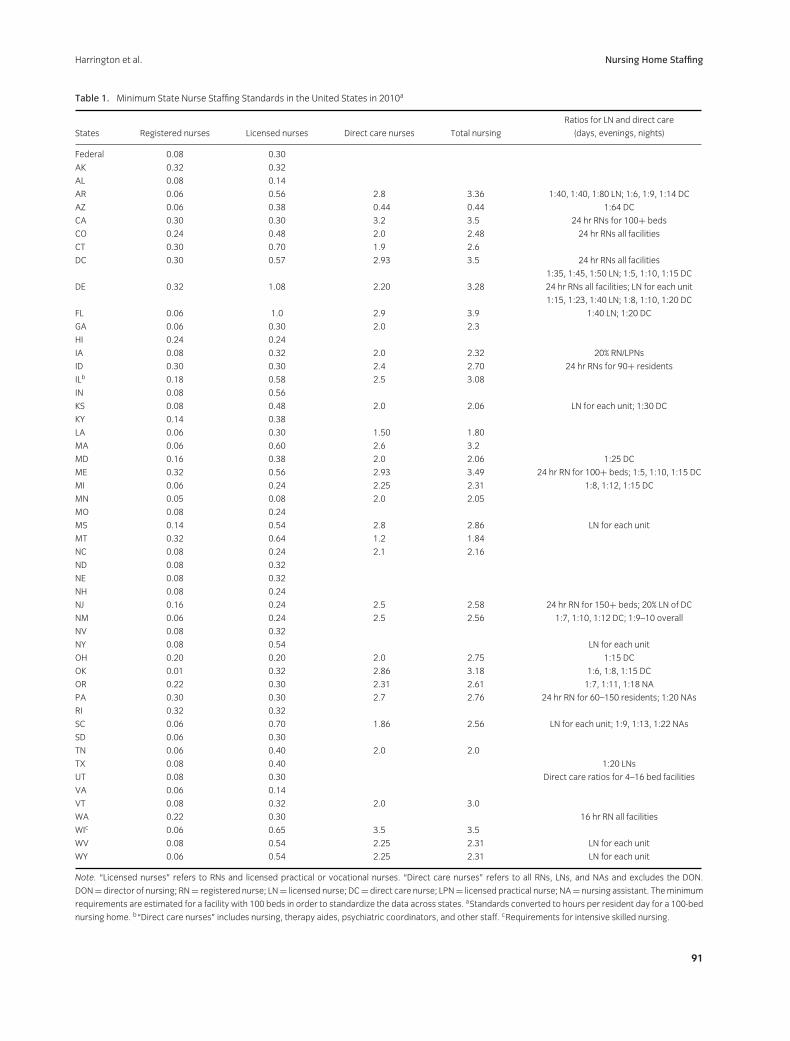
States may set higher staffing standards than the fed-eral standards, which apply to all licensed and federallycertified homes within each state. If the state standardsare lower, they only apply to licensed facilities. Overall,20 states had higher requirements for RNs than the fed-eral requirements, 15 had the same, and 16 had lower re-quirements in 2010 (Table 1). In addition, 23 states hadhigher LN requirements than the federal requirements,and 3 states required 24-hr/day RN coverage. Overall,the LN standards for a 100-bed facility ranged from alow of 0.14 LN hprd in Alabama and Virginia to a highof 1.08 hprd in Delaware (see Table 1). Of the total, 34states set minimum standards for direct care staff or “cer-tified” NAs (who met the federal standards of 75 hr oftraining or higher in some states). Direct care (includ-ing LNs) standards were about 2.0 to 2.5 hprd and var-ied widely across states, up to 2.9 hprd in the District ofColumbia, Maine, and Florida (see Table 1). Ratios wererequired for direct care in 18 states (see Table 1), wherethe best standards were a 1:5 direct care to resident ratio
during the day, 1:10 in the evening, and 1:15 at night inthe District of Columbia and Maine. Florida had the bestoverall standard of 3.9 for nursing staff in 2010.
U.S. nursing homes had an actual staffing average of0.71 RN hours, 0.80 LVN-LPN hours, and 2.41 nursingassistant (NA) hprd (3.9 total hours) in 2010 (Harrington,Carrillo, Blank, & O’Brian, 2011). These were actualhours worked (not paid hours, which included vacationand time off). The actual staffing levels varied substan-tially by state and within states. U.S. nursing homes alsohad an average of 0.24 hr of professional staff, 0.42 hr oftherapy staff, and 2.39 hr of other staff (such as house-keeping and dietary staff), with a total of 3.05 hr. Com-bined with nursing staffing, the total was 6.9 hr in 2010in all nursing homes of actual productive hours.
Canadian staffing. Canadian nursing homes (calledresidential care facilities) are those with four beds ormore that are funded, licensed, or approved by provincialor territorial departments of health or social services. In2008–2009, there were 2,216 residential care homes forthe aged with 214,368 beds in Canada (Statistics Canada,2011).
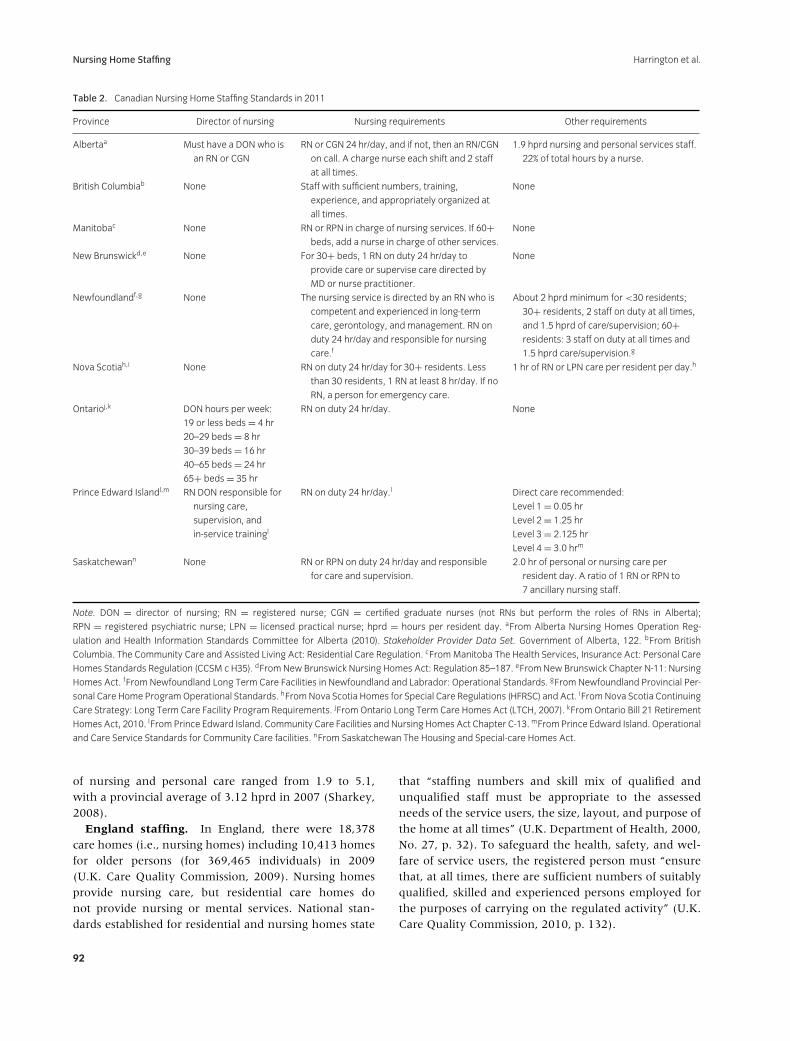
In Canada, staffing standards have been the respon-sibility of provincial governments. Table 2 shows threeprovinces required an RN DON and seven required anRN on duty 24 hr per day in 2011. Five had specificrequirements for direct care staffing levels in 2011. Al-berta specified at least 1.9 hprd of nursing and per-sonal services, and 22% of the hours had to be pro-vided by a nurse. Newfoundland required a minimumof 3 staff on duty at all times for 60 or more residentsand 1.5 hprd of care and supervision. Nova Scotia re-quired 1 hprd of RNs or LPNs, while Prince Edward Is-land standards ranged from 0.05 hr in Level 1 to 3 hrin Level 4 facilities. Saskatchewan had a standard of2.0 hprd of personal or nursing care and a ratio of 1 RNor registered psychiatric nurse to 7 ancillary nursing staff.Overall, the standards for 24-hr LN nursing were higher,but the direct care standards (which ranged from 1.9to 3.0 hprd) were generally lower than in the UnitedStates, except in Prince Edward Island for high-acuityfacilities.
Canada had actual average staffing (184,400 FTEs for178,680 beds) of 5.9 total hprd in 2008–2009 (in paidhours; including “direct care” and “general services,”i.e., administration and support staff) for residential carehomes for the aged (Statistics Canada, 2011). Actualstaffing varied by province and sometimes included non-residential care, making it difficult to compare data acrossprovinces. British Columbia total staffing hours (nursing,therapy, and activity staff) ranged from 2.25 to 3.5 hprd,while nurse staff levels ranged from 2.1 to 3.3 hprd in2006 (McGregor et al., 2010). In Ontario, total paid hours
90
Harrington et al. Nursing Home Staffing
Table 1. Minimum State Nurse Staffing Standards in the United States in 2010a
Ratios for LN and direct care
States Registered nurses Licensed nurses Direct care nurses Total nursing (days, evenings, nights)
Federal 0.08 0.30
AK 0.32 0.32
AL 0.08 0.14
AR 0.06 0.56 2.8 3.36 1:40, 1:40, 1:80 LN; 1:6, 1:9, 1:14 DC
AZ 0.06 0.38 0.44 0.44 1:64 DC
CA 0.30 0.30 3.2 3.5 24 hr RNs for 100+ beds
CO 0.24 0.48 2.0 2.48 24 hr RNs all facilities
CT 0.30 0.70 1.9 2.6
DC 0.30 0.57 2.93 3.5 24 hr RNs all facilities
1:35, 1:45, 1:50 LN; 1:5, 1:10, 1:15 DC
DE 0.32 1.08 2.20 3.28 24 hr RNs all facilities; LN for each unit
1:15, 1:23, 1:40 LN; 1:8, 1:10, 1:20 DC
FL 0.06 1.0 2.9 3.9 1:40 LN; 1:20 DC
GA 0.06 0.30 2.0 2.3
HI 0.24 0.24
IA 0.08 0.32 2.0 2.32 20% RN/LPNs
ID 0.30 0.30 2.4 2.70 24 hr RNs for 90+ residents
ILb 0.18 0.58 2.5 3.08
IN 0.08 0.56
KS 0.08 0.48 2.0 2.06 LN for each unit; 1:30 DC
KY 0.14 0.38
LA 0.06 0.30 1.50 1.80
MA 0.06 0.60 2.6 3.2
MD 0.16 0.38 2.0 2.06 1:25 DC
ME 0.32 0.56 2.93 3.49 24 hr RN for 100+ beds; 1:5, 1:10, 1:15 DC
MI 0.06 0.24 2.25 2.31 1:8, 1:12, 1:15 DC
MN 0.05 0.08 2.0 2.05
MO 0.08 0.24
MS 0.14 0.54 2.8 2.86 LN for each unit
MT 0.32 0.64 1.2 1.84
NC 0.08 0.24 2.1 2.16
ND 0.08 0.32
NE 0.08 0.32
NH 0.08 0.24
NJ 0.16 0.24 2.5 2.58 24 hr RN for 150+ beds; 20% LN of DC
NM 0.06 0.24 2.5 2.56 1:7, 1:10, 1:12 DC; 1:9–10 overall
NV 0.08 0.32
NY 0.08 0.54 LN for each unit
OH 0.20 0.20 2.0 2.75 1:15 DC
OK 0.01 0.32 2.86 3.18 1:6, 1:8, 1:15 DC
OR 0.22 0.30 2.31 2.61 1:7, 1:11, 1:18 NA
PA 0.30 0.30 2.7 2.76 24 hr RN for 60–150 residents; 1:20 NAs
RI 0.32 0.32
SC 0.06 0.70 1.86 2.56 LN for each unit; 1:9, 1:13, 1:22 NAs
SD 0.06 0.30
TN 0.06 0.40 2.0 2.0
TX 0.08 0.40 1:20 LNs
UT 0.08 0.30 Direct care ratios for 4–16 bed facilities
VA 0.06 0.14
VT 0.08 0.32 2.0 3.0
WA 0.22 0.30 16 hr RN all facilities
WIc 0.06 0.65 3.5 3.5
WV 0.08 0.54 2.25 2.31 LN for each unit
WY 0.06 0.54 2.25 2.31 LN for each unit
Note. “Licensed nurses” refers to RNs and licensed practical or vocational nurses. “Direct care nurses” refers to all RNs, LNs, and NAs and excludes the DON.
DON= director of nursing; RN= registered nurse; LN= licensed nurse; DC= direct care nurse; LPN= licensed practical nurse; NA= nursing assistant. Theminimum
requirements are estimated for a facility with 100 beds in order to standardize the data across states. aStandards converted to hours per resident day for a 100-bed
nursing home. b“Direct care nurses” includes nursing, therapy aides, psychiatric coordinators, and other staff. cRequirements for intensive skilled nursing.
91
Nursing Home Staffing Harrington et al.
Table 2. Canadian Nursing Home Staffing Standards in 2011
Province Director of nursing Nursing requirements Other requirements
Albertaa Must have a DON who is
an RN or CGN
RN or CGN 24 hr/day, and if not, then an RN/CGN
on call. A charge nurse each shift and 2 staff
at all times.
1.9 hprd nursing and personal services staff.
22% of total hours by a nurse.
British Columbiab None Staff with sufficient numbers, training,
experience, and appropriately organized at
all times.
None
Manitobac None RN or RPN in charge of nursing services. If 60+beds, add a nurse in charge of other services.
None
New Brunswickd,e None For 30+ beds, 1 RN on duty 24 hr/day to
provide care or supervise care directed by
MD or nurse practitioner.
None
Newfoundlandf,g None The nursing service is directed by an RN who is
competent and experienced in long-term
care, gerontology, and management. RN on
duty 24 hr/day and responsible for nursing
care.f
About 2 hprd minimum for <30 residents;
30+ residents, 2 staff on duty at all times,
and 1.5 hprd of care/supervision; 60+residents: 3 staff on duty at all times and
1.5 hprd care/supervision.g
Nova Scotiah,i None RN on duty 24 hr/day for 30+ residents. Less
than 30 residents, 1 RN at least 8 hr/day. If no
RN, a person for emergency care.
1 hr of RN or LPN care per resident per day.h
Ontarioj,k DON hours per week: RN on duty 24 hr/day. None
19 or less beds = 4 hr
20–29 beds = 8 hr
30–39 beds = 16 hr
40–65 beds = 24 hr
65+ beds = 35 hr
Prince Edward Islandl,m RN DON responsible for
nursing care,
supervision, and
in-service trainingl
RN on duty 24 hr/day.l Direct care recommended:
Level 1 = 0.05 hr
Level 2 = 1.25 hr
Level 3 = 2.125 hr
Level 4 = 3.0 hrm
Saskatchewann None RN or RPN on duty 24 hr/day and responsible
for care and supervision.
2.0 hr of personal or nursing care per
resident day. A ratio of 1 RN or RPN to
7 ancillary nursing staff.
Note. DON = director of nursing; RN = registered nurse; CGN = certified graduate nurses (not RNs but perform the roles of RNs in Alberta);
RPN = registered psychiatric nurse; LPN = licensed practical nurse; hprd = hours per resident day. aFrom Alberta Nursing Homes Operation Reg-
ulation and Health Information Standards Committee for Alberta (2010). Stakeholder Provider Data Set. Government of Alberta, 122. bFrom British
Columbia. The Community Care and Assisted Living Act: Residential Care Regulation. cFrom Manitoba The Health Services, Insurance Act: Personal Care
Homes Standards Regulation (CCSM c H35). dFrom New Brunswick Nursing Homes Act: Regulation 85–187. eFrom New Brunswick Chapter N-11: Nursing
Homes Act. fFrom Newfoundland Long Term Care Facilities in Newfoundland and Labrador: Operational Standards. gFrom Newfoundland Provincial Per-
sonal Care Home ProgramOperational Standards. hFromNova Scotia Homes for Special Care Regulations (HFRSC) and Act. iFrom Nova Scotia Continuing
Care Strategy: Long Term Care Facility Program Requirements. jFrom Ontario Long Term Care Homes Act (LTCH, 2007). kFrom Ontario Bill 21 Retirement
Homes Act, 2010. lFrom Prince Edward Island. Community Care Facilities and Nursing Homes Act Chapter C-13. mFrom Prince Edward Island. Operational
and Care Service Standards for Community Care facilities. nFrom Saskatchewan The Housing and Special-care Homes Act.
of nursing and personal care ranged from 1.9 to 5.1,with a provincial average of 3.12 hprd in 2007 (Sharkey,2008).
England staffing. In England, there were 18,378care homes (i.e., nursing homes) including 10,413 homesfor older persons (for 369,465 individuals) in 2009(U.K. Care Quality Commission, 2009). Nursing homesprovide nursing care, but residential care homes donot provide nursing or mental services. National stan-dards established for residential and nursing homes state
that “staffing numbers and skill mix of qualified andunqualified staff must be appropriate to the assessedneeds of the service users, the size, layout, and purpose ofthe home at all times” (U.K. Department of Health, 2000,No. 27, p. 32). To safeguard the health, safety, and wel-fare of service users, the registered person must “ensurethat, at all times, there are sufficient numbers of suitablyqualified, skilled and experienced persons employed forthe purposes of carrying on the regulated activity” (U.K.Care Quality Commission, 2010, p. 132).
92
Harrington et al. Nursing Home Staffing
The standards also require sufficient numbers of do-mestic staff to meet resident needs for nutrition andcleanliness, with a minimum ratio of 50% trained to to-tal staff members (excluding the registered or care man-agers; U.K. Department of Health, 2000). The registeredmanager must be qualified (with at least 2 years of se-nior management experience in the past 5 years), musthave a National Vocational Qualification at level 4 orbe a first-level RN with a management qualification,and must be registered with the National Care StandardsCommission.
Minimum hours of care or ratios of care were not spec-ified in the national regulations, although certificates ofregistration issued to individual care homes may spec-ify some staffing levels and staff qualifications that arebased on the needs of residents. The U.K. Royal Collegeof Nursing (2010) published guidelines for nursing homeswith a patient to staff ratio of 1:5 for early shifts, 1:6 forlate shifts, and 1:10 for nights with an average of 35%RNs and 65% care assistants. Enforcement of national re-quirements has not been strong; for example, 1,000 carehomes did not have a registered manager that met thestandards in 2010 (U.K. Care Quality Commission, 2010).
In terms of actual staffing hours, the U.K. Royal Collegeof Nursing (2010) reported that care homes had 4.2 staffduring the day and 8.6 at night per resident (equivalentto 4.26 hprd) in 2009. RNs made up 25% of total nursingstaff during the day in 2009, but this had declined from34% in 2007. Their employment survey found 29% ofrespondents reported inadequate numbers of permanentRNs to meet the needs of residents.
Germany staffing. Germany had 11,029 nurs-ing homes with 799,059 beds in 2007 (StatistischesBundesamt, 2009). Its staffing standards vary by the re-gion and with the level of care provided by the nursinghome. Germany has three levels of skilled nursing care:Level 1, where residents need a considerable amount ofcare; Level 2, where residents need intensive care; andLevel 3, where the residents need highly intensive care.Nursing homes have three shifts a day and the nursestaffing standards were set in FTEs for the number of res-idents at each level per day.
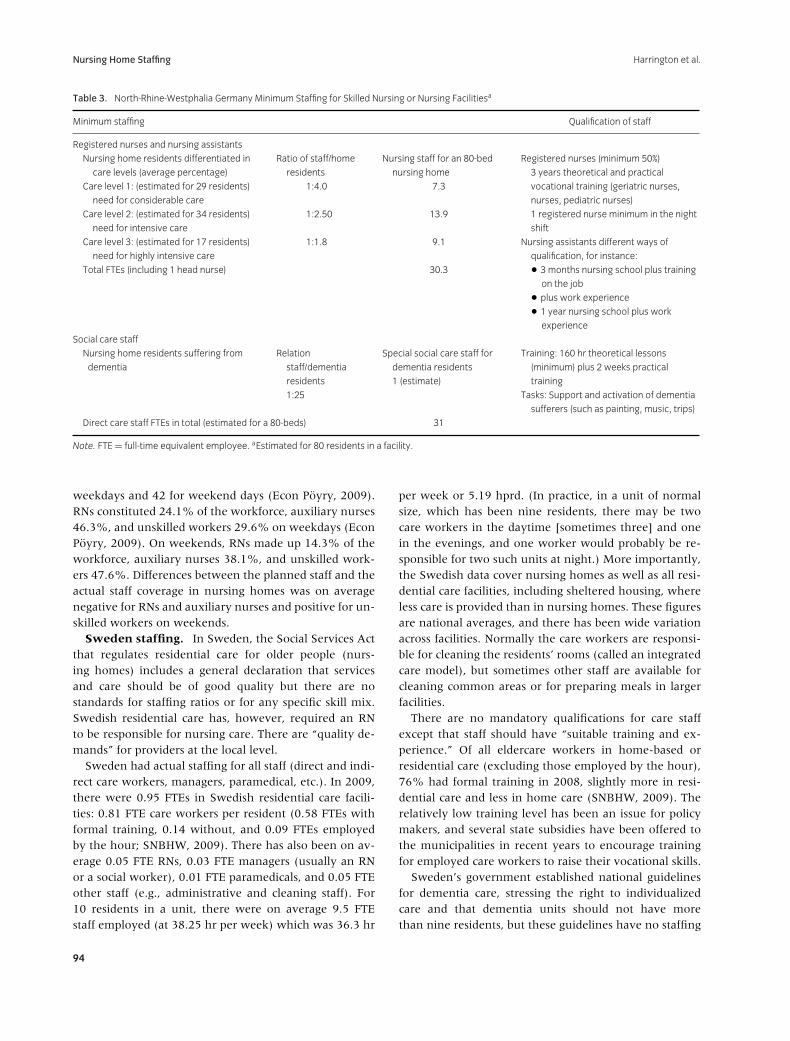
Germany has a very sharply controlled minimumstandard for long-term care homes, requiring that aminimum of 50% of all care staff are RNs. In addition,nursing facilities must have 24 hr per day RN staffing.RNs who work in this setting have been required to have3 years of training in both theoretical and practice nurs-ing to work with the elderly (geriatrics). RNs can eitherhave 3 months of nursing school education plus trainingon the job plus work experience in nursing facilities or1 year of nursing school education plus work experience(Table 3).
In the North-Rhine-Westphalia region of Germany (seeTable 3), the requirement was for 1 FTE for 4 residentsfor Level 1, 1 FTE for 2.5 residents for Level 2, and 1 FTEfor 1.8 residents for Level 3. In a facility with 80 residents(where 29 residents were Level 1, 34 were Level 2, and 17were Level 3), the facility would be required to have 30FTE nursing staff for each day. If each FTE is equivalentto 8 hr in a day, a total of 30 FTEs would have a totalof 240 staff hours per day for 80 residents (equivalentto 3.0 nursing hprd). Although data were unavailable onthe actual nurse staffing levels in the region, the regionsclosely monitor homes to ensure that the standards aremet.
Norway staffing. Norway has no formal staffingstandards for nursing homes so that nursing homes candecide on their own staffing levels. Most nursing homesare owned and operated by municipalities, althoughsome private facilities are under contract to municipalitiesto provide care, and some municipalities have informalor unofficial standards for staffing. For example, in theBergen municipality, the unofficial standard of staffinghas been a ratio of 0.94 FTE workers for each resident,including all personnel nurses, managers, and house-keeping staff. Each FTE was assumed to work 38 hr perweek times 0.94 FTEs or 35.7 hr per week and 5.1 hprd intotal staff. On units of 8 residents, they plan for 6.18 FTEsfor direct care workers (which includes RNs, LVNs, andNAs in total), who would provide 235 hr per week or4.2 hprd. Government and the municipalities, however,do not follow up to see if nursing homes are meeting theirinformal standards.
Nursing homes in Norway informally require an RNDON and a charge nurse to be responsible for the nurs-ing care in each nursing home, with very few exceptions,regardless of the size of the facility. Norwegian nursinghomes also informally require RNs at the intermediateleadership levels on each ward or department, with onefor each 8 to 10 residents. RNs have 3 years of educa-tion from university colleges. Nursing homes also havephysiotherapists, occupational therapists, and social ed-ucators. The category of auxiliary nurses with 1 yearof education was closed and replaced by a 3-year up-per secondary school-based education for care workers.Finally, nursing homes have unskilled care workers innursing homes that have no care education or only shortcourses.
Although there is a dearth of studies dealing with staffcoverage and composition in long-term care in Norway,one study comparing 19 nursing home departmentsfound the average actual direct care staff was 0.79 FTEsper resident (Paulson, 2004). Another study, comparing12 nursing homes in four of the largest municipalities,found the actual staff was 54 FTEs per 100 residents for
93
Nursing Home Staffing Harrington et al.
Table 3. North-Rhine-Westphalia Germany Minimum Staffing for Skilled Nursing or Nursing Facilitiesa
Minimum staffing Qualification of staff
Registered nurses and nursing assistants
Nursing home residents differentiated in
care levels (average percentage)
Ratio of staff/home
residents
Nursing staff for an 80-bed
nursing home
Registered nurses (minimum 50%)
3 years theoretical and practical
Care level 1: (estimated for 29 residents)
need for considerable care
1:4.0 7.3 vocational training (geriatric nurses,
nurses, pediatric nurses)
Care level 2: (estimated for 34 residents)
need for intensive care
1:2.50 13.9 1 registered nurse minimum in the night
shift
Care level 3: (estimated for 17 residents)
need for highly intensive care
1:1.8 9.1 Nursing assistants different ways of
qualification, for instance:
Total FTEs (including 1 head nurse) 30.3 � 3 months nursing school plus training
on the job� plus work experience� 1 year nursing school plus work
experience
Social care staff
Nursing home residents suffering from Relation Special social care staff for Training: 160 hr theoretical lessons
dementia staff/dementia
residents
1:25
dementia residents
1 (estimate)
(minimum) plus 2 weeks practical
training
Tasks: Support and activation of dementia
sufferers (such as painting, music, trips)
Direct care staff FTEs in total (estimated for a 80-beds) 31
Note. FTE = full-time equivalent employee. aEstimated for 80 residents in a facility.
weekdays and 42 for weekend days (Econ Poyry, 2009).RNs constituted 24.1% of the workforce, auxiliary nurses46.3%, and unskilled workers 29.6% on weekdays (EconPoyry, 2009). On weekends, RNs made up 14.3% of theworkforce, auxiliary nurses 38.1%, and unskilled work-ers 47.6%. Differences between the planned staff and theactual staff coverage in nursing homes was on averagenegative for RNs and auxiliary nurses and positive for un-skilled workers on weekends.
Sweden staffing. In Sweden, the Social Services Actthat regulates residential care for older people (nurs-ing homes) includes a general declaration that servicesand care should be of good quality but there are nostandards for staffing ratios or for any specific skill mix.Swedish residential care has, however, required an RNto be responsible for nursing care. There are “quality de-mands” for providers at the local level.
Sweden had actual staffing for all staff (direct and indi-rect care workers, managers, paramedical, etc.). In 2009,there were 0.95 FTEs in Swedish residential care facili-ties: 0.81 FTE care workers per resident (0.58 FTEs withformal training, 0.14 without, and 0.09 FTEs employedby the hour; SNBHW, 2009). There has also been on av-erage 0.05 FTE RNs, 0.03 FTE managers (usually an RNor a social worker), 0.01 FTE paramedicals, and 0.05 FTEother staff (e.g., administrative and cleaning staff). For10 residents in a unit, there were on average 9.5 FTEstaff employed (at 38.25 hr per week) which was 36.3 hr
per week or 5.19 hprd. (In practice, in a unit of normalsize, which has been nine residents, there may be twocare workers in the daytime [sometimes three] and onein the evenings, and one worker would probably be re-sponsible for two such units at night.) More importantly,the Swedish data cover nursing homes as well as all resi-dential care facilities, including sheltered housing, whereless care is provided than in nursing homes. These figuresare national averages, and there has been wide variationacross facilities. Normally the care workers are responsi-ble for cleaning the residents’ rooms (called an integratedcare model), but sometimes other staff are available forcleaning common areas or for preparing meals in largerfacilities.
There are no mandatory qualifications for care staffexcept that staff should have “suitable training and ex-perience.” Of all eldercare workers in home-based orresidential care (excluding those employed by the hour),76% had formal training in 2008, slightly more in resi-dential care and less in home care (SNBHW, 2009). Therelatively low training level has been an issue for policymakers, and several state subsidies have been offered tothe municipalities in recent years to encourage trainingfor employed care workers to raise their vocational skills.
Sweden’s government established national guidelinesfor dementia care, stressing the right to individualizedcare and that dementia units should not have morethan nine residents, but these guidelines have no staffing
94
Harrington et al. Nursing Home Staffing
ratios. A recent report from Stockholm based on inter-views and observations from a number of group homesfor the elderly with dementia recommended that in aunit with nine residents, there should be nine direct careworkers (FTE) and 0.9 FTE RNs, 0.5 FTE paramedicals,and a manager (not specified) (Wanell & Trygg, 2010).Observations in six dementia units with nine residentseach showed that only the unit with three care workersduring the day had enough staff to provide the individ-ualized care expected (Wanell & Trygg, 2010). Staffinglevels for dementia units have recently become an issuein Sweden after a televised report of one nursing homewhere there was no staff in a ward at night, and unan-nounced visits to 94 dementia care units found 58% ofunits had inadequate staffing at night.
Discussion
Wide Variations in Staffing Standardsand Actual Staffing Levels
The key finding from this study was the wide varia-tions in both nurse staffing standards and actual staffinglevels within and across countries. In the United States,the federal standards were minimal for licensed nurseswhile state standards varied widely (20 states had higherlicensed nurse standards and 34 states had higher directcare standards than federal standards). In most Canadianprovinces, the 24-hr RN standards were higher than inU.S. states, although these also generally did not varyby the size of the facility or the acuity of residents. Thedirect care standards in Canada varied by province and,where specified, were generally lower than in the UnitedStates, except in one province. Germany had clearly spec-ified regional staffing standards (which were lower thanin some states in the United States) that varied by level ofacuity, took the number of residents into account, and re-quired 24-hr RN staffing. In contrast, England, Norway,and Sweden did not have specific staffing standards.
The variations across countries were not surprisingsince each country has a unique system of nursing homecare. Canada, for example, had a highly differential task-oriented work structure while Sweden had an integratedcare work model, where nursing staff provide nursing aswell as prepare food and carry out some housekeeping ac-tivities (Daly & Szebehely, 2011). Norway also had an in-tegrated care model, in contrast to the United States andEngland which have also been task oriented with manyprofessional and support services to supplement nursingservices.
The six counties also reported differences in the sizeof nursing homes. Most U.S. nursing homes were large(108 beds on average in 2010; Harrington et al., 2011),
and Canada reported that 65% of its homes for the agedhad 50 or more beds, including 35% with more than100 beds (Statistics Canada, 2011). In contrast, the av-erage size of care homes in England was 25 beds in 2009(U.K. Care Quality Commission, 2009) because commu-nity care policies in the 1990s emphasized “home-like”environments, although the recent trend is toward fewer,larger homes. Norway and Sweden also have smallernursing homes (often with 8 to 10 residents in a homeor a unit).
The countries also vary in the extent of their priva-tization and the use of for-profit nursing homes. About70% of U.S. nursing homes are for-profit, and over halfare nursing home chains that have grown through merg-ers and acquisitions (Harrington et al., 2010; Harrington,Hauser, Olney, & Rosenau, 2011). Numerous scandalsand reports documenting poor quality and weak regu-latory oversight (U.S. GAO, 1987, 2009) at the state andnational levels have led to increasing regulatory require-ments. Although there are considerable differences acrossprovinces, Canadian nursing homes are trending to-ward more private for-profit ownership (55% in Canadain 2008–2009; Statistics Canada, 2011). Similarly, inEngland, private for-profit facilities have grown rapidly,and 76% of residential and nursing homes were privatein 2009 (Godden and Pollock, 2010; U.K. Care QualityCommission 2009). Germany has had a number of pri-vate and for-profit nursing homes and has developedspecific standards for facilities, which may be related toits clear staffing requirements. Sweden has had recentgrowth in for-profit ownership of nursing homes (Stolt,Blomqvist, & Winblad, 2011), but ownership in Norwayhas continued to be largely by municipalities (95%). Be-cause of the large public involvement in nursing homes,Norway and Sweden have not had strong pressures to de-velop regulatory standards.
The growth in for-profit nursing homes is a particu-lar concern given the evidence from a recent systemicreview and meta-analysis that for-profit nursing homeshave poorer quality of care on average than not-for-profithomes (Comondore et al., 2009). For-profit homes havelower nursing staff levels than other types of homes in theUnited States (Harrington et al., 2007), British Columbia(McGregor et al., 2010), and Ontario (Berta, Laporte, &Valdmanis, 2005). In Sweden, private facilities have anapproximately 10% lower staffing ratio than public ones(Stolt et al., 2011).
Low Nurse Staffing Standards and StaffingLevels
The second major finding is how low the nurse staffingstandards and the actual staffing levels are in comparison
95

Nursing Home Staffing Harrington et al.
with the recommended levels by experts in the UnitedStates. The actual nurse staffing levels were 3.9 hprd inthe United States in 2010 and 6.9 hprd for total staff(Harrington et al., 2011) compared with recommendedlevels of 0.75 hprd for RNs, 1.3 hprd for LNs, and 4.1 hprdfor total nurse staffing (U.S. CMS, 2001). Some expertshave recommended adopting even higher staffing stan-dards (4.55 hprd), with adjustments to take into accountresident acuity (or case mix) (Harrington et al. 2000; In-stitute of Medicine, 2003).
The Canadian provinces generally had low nursestaffing standards, and actual staffing levels varied acrossprovinces (British Columbia reported 2.1 to 3.3 hprd ofdirect care nursing staff in 2006; McGregor et al., 2010)and 5.9 hprd for total staff. England reported an aver-age of 4.26 hprd in care homes, with RNs making up25% of total nursing staff during the day in 2009 (U.K.Royal College of Nursing, 2010), but inadequate num-bers of RNs to meet the needs of residents in about onethird of homes. Data on actual staffing levels were notavailable for Germany and Norway. Sweden reported thehighest staffing levels of any country (5.19 hr of care perday on average in 2009). Although this ratio included allnurses, managers, paramedical, and support staff, mostwere nursing staff. Because of differences in the nurs-ing home care models and methods of data reporting,it was difficult to compare actual staffing levels in thedifferent countries. The study shows that actual staffingdata for nursing homes are not readily available in mostcountries.
Clinical Implications
The increasing resident acuity levels and care needsin nursing homes are a concern because most countriesdid not have acuity-adjusted staffing standards, with theexception of Germany. In the United States, the reportedacuity of nursing home residents has increased substan-tially in recent years (Medicare Payment Advisory Com-mission, 2009). Similar increases in acuity were reportedin British Columbia, where nursing homes reported anincrease of the highest acuity residents from 4% to 38%between 1996 and 2006 (McGregor et al., 2010), andOntario reported that more than 85% of residents re-quired high levels of care in 2008 (Sharkey, 2008). Acuitydata were not available in England, Norway, and Sweden.While these acuity increases support the need for nursingexpertise in care, current nursing home standards are notaddressing changing resident care needs.
Conclusions
This study has shown that data on nurse staffing stan-dards, actual staffing hours, levels of educational prepa-
ration, and professional credentials for nursing homes arenot readily available in most countries. Given the growingevidence that nurse staffing levels make a difference tonursing home quality, this lack of basic information aboutactual staffing hours along with the lack of standards in somany jurisdictions raises serious concerns about whethernursing homes are meeting the needs of an increasinglyfrail population. Residents and their families are signifi-cantly disadvantaged by this lack of critical information.Moreover, governments are limited in their ability moni-tor the quality of nursing care and to address critical pol-icy and planning issues about staff resources, education,and training.
Based on the concerns about quality of care, the lowand limited staffing standards, and the low staffing lev-els, this research shows the need to further study nursestaffing standards in nursing homes. Studies should ex-amine the acuity of residents and their individual needsalong with facility size and type. Moreover, studies shouldfurther examine the education, skills, and expertise of thenursing staff needed to provide different levels and typesof care. At the same time, additional research is neededon what staffing standards are needed to better safeguardthe quality and safety of nursing home residents. Nurs-ing researchers and clinicians should place a high prior-ity on transparency in reporting of nursing home staffingdata and on conducting research that addresses staffingstandards and levels because of the critical importance ofstaffing to provide high quality nursing home care.
Acknowledgments
We would like to acknowledge the assistance of EricCollier, Assistant Adjunct Professor at the University ofCalifornia, San Francisco. We also acknowledge supportfrom the project Reimagining Long-term Residential Carefunded by the Social Sciences and Humanities ResearchCouncil of Canada.
Clinical Resources� Sigma Theta Tau International: Geriatric Nursing
Leadership Academy: http://thefutureofnursing.org/resource/detail/sigma-theta-tau-international-geriatric-nursing-leadership-academy
� The Consumer Voice: www.theconsumervoice.org� Hartford Institute for Geriatric Nursing: www.
hartfordign.org and www.hartfordign.org/Practice/ConsultGeriRN/
� Building Academic Geriatric Nursing Capacity:www.geriatricnursing.org
96
Harrington et al. Nursing Home Staffing
References
Berta, W., Laporte, A., & Valdmanis, V. (2005). Observations
on institutional long-term care in Ontario: 1996–2002.
Canadian Journal on Aging, 24(1), 71–84.
Bostick, J. E., Rantz, M. J., Flesner, M. K., & Riggs, C. J.
(2006). Systematic review of studies of staffing and quality
in nursing homes. Journal of the American Medical Directors
Association, 7, 366–376.
Castle, N. (2008). Nursing home caregiver staffing levels and
quality of care: A literature review. Journal of Applied
Gerontology, 27, 375–405.
Comondore, V. R., Devereaux, P. J., Zhou, Q., Stone, S. B.,
Busse, J. W., Ravindran, N. C. ... Guyatt, G. H. (2009).
Quality of care in for-profit and not-for-profit nursing
homes: Systematic review and meta-analysis. British
Medical Journal, 339, b2732. doi:10.1136/bmj.b2732
Daly, T., & Szebehely, M. (2011). Unheard voices, unmapped
terrain: Care work in long-term residential care for older people in
Canada and Sweden. Unpublished manuscript, York
University, Toronto, Ontario, Canada, and Stockholm
University, Stockholm, Sweden.
Dixon, S., Kaambwa, B., Nancarrow, S., Martin, G. P., &
Bryan, S. (2010). The relationship between staff skill mix,
costs, and outcomes in intermediate care services. BMC
Health Services Research, 10, 221–226.
Econ Poyry. (2009). Bemanning i kommunal pleie og omsorg.
Econ-report no. 2009–072. Oslo, Norway: Author.
Godden, S., & Pollock, A. M. (2010). The future of social care
in the UK. Research, Policy and Planning, 28(1), 11–14.
Harrington, C. (2005). Nurse staffing in nursing homes in the
United States, Part 1. Journal of Gerontological Nursing, 31(3),
9–15.
Harrington, C., Carrillo, H., Blank, B. W., & O’Brian, T.
(2011). Nursing facilities, staffing, residents, and facility
deficiencies, 2005–10. San Francisco, CA: University of
California.
Harrington, C., Hauser, C., Olney, B., & Rosenau, P. V.
(2011). Ownership, financing, and management strategies
of the ten largest for-profit nursing home chains in the US.
International Journal of Health Services, 41(4), 725–746.
Harrington, C., Kovner, C., Kayser-Jones, J., Burger, S.,
Mohler, M., Burke, R., Zimmerman, D. (2000). Experts
recommend minimum nurse staffing standards for nursing
facilities in the United States. Gerontologist, 40(1), 1–12.
Harrington, C., Swan, J. H., & Carrillo, H. (2007). Nurse
staffing levels and Medicaid reimbursement rates in
nursing facilities. Health Services Research, 42, 1105–1129.
Hyer, K., Thomas, K. S., Branch, L. B., Harman, J. S.,
Johnson, C. E., & Weech-Maldonado, R. (2011). The
influence of nurse staffing levels on quality of care in
nursing homes. The Gerontologist, 51(5), 610.
Institute of Medicine. (2003). Keeping patients safe: Transforming
the work environment of nurses. Washington, DC: National
Academy of Medicine.
Jansen, I. (2010). Residential long-term care: Public solutions
to access and quality problems. Canadian Union of Public
Employees. HealthcarePapers, 10(4), 1–22.
Kim, H., Kovner, C., Harrington, C., Greene, W., & Mezey, M.
(2009). A panel data analysis of the relationships of
nursing home staffing levels and standards to regulatory
deficiencies. Journal of Gerontology: Social Sciences, 64B(2),
269–278.
McGregor, M. J., Tate, R. B., Ronald, L. A., McGrail, K. M.,
Cox, M. B., Berta, W., & Broemeling, A. (2010). Trends in
long-term care staffing by facility ownership in British
Columbia, 1996 to 2006. Statistics Canada. No.
82-003-XPE. Health Reports, 21(4), 1–7.
Medicare Payment Advisory Commission. (March 2009).
Report to Congress: Medicare payment policy. Washington, DC:
Author. Retrieved from http://www.medpac.gov/
documents/Mar09 Entire-Report.pdf
Mueller, C., Arling, G., Kane, R., Bershadsky, J., Holland, D.,
& Joy, A. (2006). Nursing home staffing standards: Their
relationship to nurse staffing levels. The Gerontologist, 46(1),
74–80.
Park, J., & Stearns, S. C. (2009). Effects of state minimum
staffing standards on nursing home staffing and
quality of care. Health Services Research, 44(1),
56–78.
Paulsen, B. 2004. Bemanning og tjenestetilbud i sykehjem.
SINTEF-report. Trondheim, Norway: SINTEF.
Schnelle, J. F., Simmons, S. F., Harrington, C., Cadogan, M.,
Garcia, E., & Bates-Jensen, B. (2004). Relationship of
nursing home staffing to quality of care? Health Services
Research, 39(2), 225–250.
Sharkey, S. (2008). People caring for people: Impacting the quality
of life and care of residents of long term care homes. Toronto,
Ontario, Canada: Ontario Ministry of Health and
Long-Term Care.
Spilsbury, K., Hewitt, C., Stirk, L., & Bowman, C. (2011). The
relationship between nurse staffing and quality of care in
nursing homes: A systematic review. International Journal of
Nursing Studies, 48(6), 732–750.
Statistics Canada, Health Statistics Division. (2011). Residential
care facilities 2008/2009. No. 83-237-X. Ottawa, Ontario,
Canada: Author. Retrieved from
http://www.statcan.gc.ca/pub/83-237-x/83–237-
x2011001-eng.htm
Statistisches Bundesamt. (2009). 4 Bericht
Landervergleich-Pflegeheime. Wiesbaden, Germany: Author.
Stolt, R., Blomqvist, P., & Winblad, U. (2011). Privatization of
social services: Quality differences in Swedish elderly care.
Social Science & Medicine, 72(4), 560–567.
Sweden National Board of Health and Welfare. (2009). Vard
och omsorg for aldre. Lagesrapport for 2008 [Care and services
to older persons. Status report 2008]. Stockholm:
Socialstyrelsen.
Tong, P. K. (2011). The effects of California minimum
nurse staffing laws on nurse labor and patient mortality
97

Nursing Home Staffing Harrington et al.
in skilled nursing facilities. Health Economics, 20,
802–816.
U.K. Care Quality Commission. (2009, November). The quality
and capacity of adult social care services: An overview of the adult
social care market in England 2008/09. London: Author.
U.K. Care Quality Commission. (2010, March). Guidance about
compliance: Essential standards of quality and safety. London:
Author.
U.K. Department of Health. (2000). Care Standards Act 2000:
National minimum standards for care homes for older people
(pp. 31–36). London: Author.
U.K. Royal College of Nursing. (2010). Guidance on safe nurse
staffing levels in the UK. London: Author.
U.S. Centers for Medicare and Medicaid Services. (2011,
January 7). State operations manual. Appendix PP. Guidance for
surveyors for long term care facilities (revision 70). Baltimore,
MD: Author.
U.S. Centers for Medicare and Medicaid Services, prepared by
Abt Associates Inc. (2001). Appropriateness of minimum nurse
staffing ratios in nursing homes. Report to Congress: Phase II final
(Vol. I–III). Baltimore, MD: Author.
U.S. Government Accountability Office. (1987). Medicare and
Medicaid: Stronger enforcement of nursing home requirements
needed. Washington, DC: Author.
U.S. Government Accountability Office. (2009). Nursing
homes: Addressing the factors underlying understatement of
serious care problems requires sustained CMS and state
commitment. GAO-10–70. Washington,
DC: Author.
Wagner, L. M., & Rust, T. B. (2008). Safety in long-term care
settings: Broadening the patient safety agenda. Edmonton,
Alberta, Canada: Canadian Patient Safety
Institute.
Wanell, S. E., & Trygg, B. (2010). Lamplig bemanning i
boende sarskilt avsedd for personer med demenssjukdom
[Appropriate staffing ratios in residential care for
people with dementia]. Rapport nr 2010:10. Stockholm,
Sweden: Stockholm Gerontology Research
Center.
Zhang, Z. X., & Grabowski, D. C. (2004). Nursing home
staffing and quality under the nursing home reform act.
The Gerontologist, 44, 13–23.
98