The staffing of science departments in New Zealand ...
80
Copyright is owned by the Author of the thesis. Permission is given for a copy to be downloaded by an individual for the purpose of research and private study only. The thesis may not be reproduced elsewhere without the permission of the Author.
-
Upload
khangminh22 -
Category
Documents
-
view
0 -
download
0
Transcript of The staffing of science departments in New Zealand ...
Copyright is owned by the Author of the thesis. Permission is given for a copy to be downloaded by an individual for the purpose of research and private study only. The thesis may not be reproduced elsewhere without the permission of the Author.

"THE STAFFING OF SCIENCE DEPARTMENTS
IN NEW ZEALAND SECONDARY SCHOOLS".
A thesis presented in partial fulfilment of
the requirements for the degree of Master of
Philosophy in Education at Massey University.
Max Anthony Gerritsen
1980.
ABSTRACT
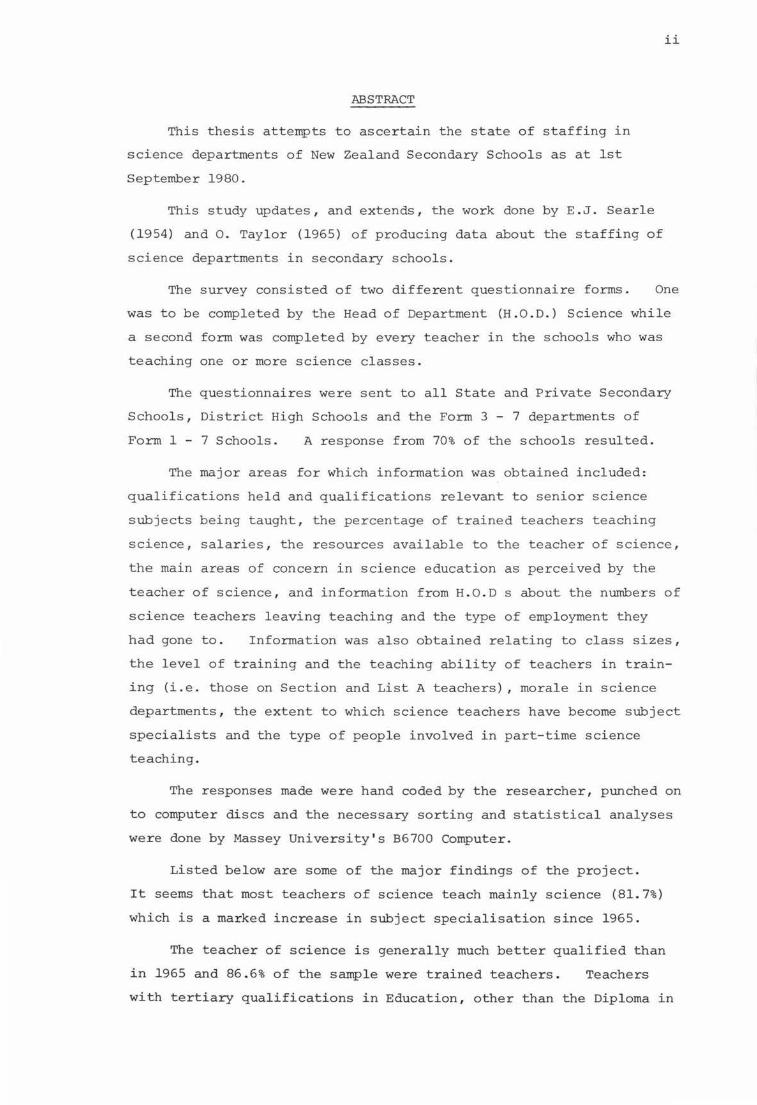
This thesis attempts to ascertain the state of staffing in
science departments of New Zealand Secondary Schools as at 1st
September 1980.
This study updates, and extends, the work done by E.J. Searle
(1954) and 0. Taylor (1965) of producing data about the staffing of
science departments in secondary schools.
ii
The survey consisted of two different questionnaire forms. One
was to be completed by the Head of Department (H.O.D.) Science while
a second form was completed by every teacher in the schools who was
teaching one or more science classes.
The questionnaires were sent to all State and Private Secondary
Schools, District High Schools and the Form 3 - 7 departments of
Form 1 - 7 Schools. A response from 70 % of the schools resulted.
The major areas for which information was obtained included:
qualifications held and qualifications relevant to senior science
subjects being taught, the percentage of trained teachers teaching
science, salaries, the resources available to the teacher of science,
the main areas of concern in science education as perceived by the
teacher of science, and information from H.O.D s about the numbers of
science teachers leaving teaching and the type of employment they
had gone to. Information was also obtained relating to class sizes,
the level of training and the teaching ability of teachers in train
ing (i.e. those on Section and List A teachers), morale in science
departments, the extent to which science teachers have become subject
specialists and the type of people involved in part-time science
teaching.
The responses made were hand coded by the researcher, punched on
to computer discs and the necessary sorting and statistical analyses
were done by Massey University's B6700 Computer.
Listed below are some of the major findings of the project.
It seems that most teachers of science teach mainly science (81.7%)
which is a marked increase in subject specialisation since 1965.
The teacher of science is generally much better qualified than
in 1965 and 86.6% of the sample were trained teachers. Teachers
with tertiary qualifications in Education, other than the Diploma in
iii
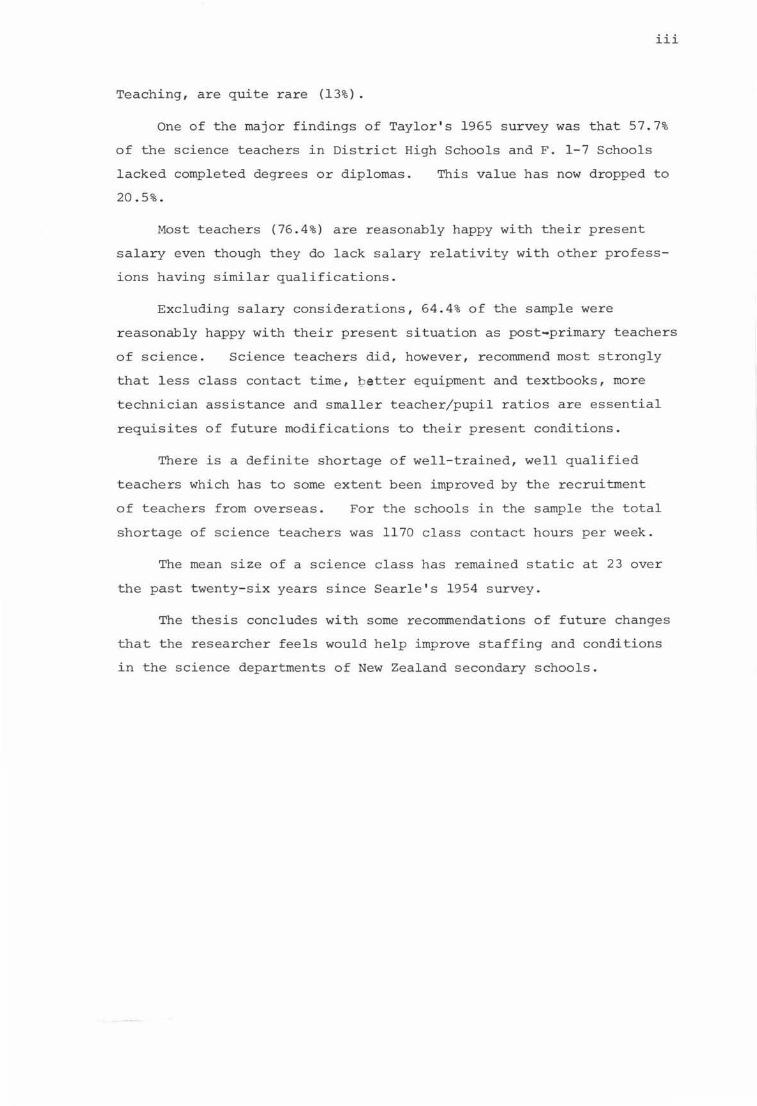
Teaching, are quite rare (13%).
One of the major findings of Taylor's 1965 survey was that 57.7%
of the science teachers in District High Schools and F. 1-7 Schools
lacked completed degrees or diplomas.
20.5%.
This value has now dropped to
Most teachers (76.4%) are reasonably happy with their present
salary even though they do lack salary relativity with other profess
ions having similar qualifications.
Excluding salary considerations, 64.4% of the sample were
reasonably happy with their present situation as post-primary teachers
of science. Science teachers did, however, recommend most strongly
that less class contact time, t etter equipment and textbooks, more
technician assistance and smaller teacher/pupil ratios are essential
requisites of future modifications to their present conditions.
There is a definite shortage of well-trained, well qualified
teachers which has to some extent been improved by the recruitment
of teachers from overseas. For the schools in the sample the total
shortage of science teachers was 1170 class contact hours per week.
The mean size of a science class has remained static at 23 over
the past twenty-six years since Searle's 1954 survey.
The thesis concludes with some recommendations of future changes
that the researcher feels would help improve staffing and conditions
in the science departments of New Zealand secondary schools.
ABSTRACT
TABLE OF CONTENTS
LIST OF TABLES
LIST OF ABBREVIATIONS
ACKNOWLEDGEMENTS
PAR!' 1
Chapter 1.
Chapter 2.
PART 2 1 FINDINGS
Chapter 3.
Chapter 4.
Chapter 5.
PART 3
Chapter 6.
APPENDICES
BIBLIOGRAPHY
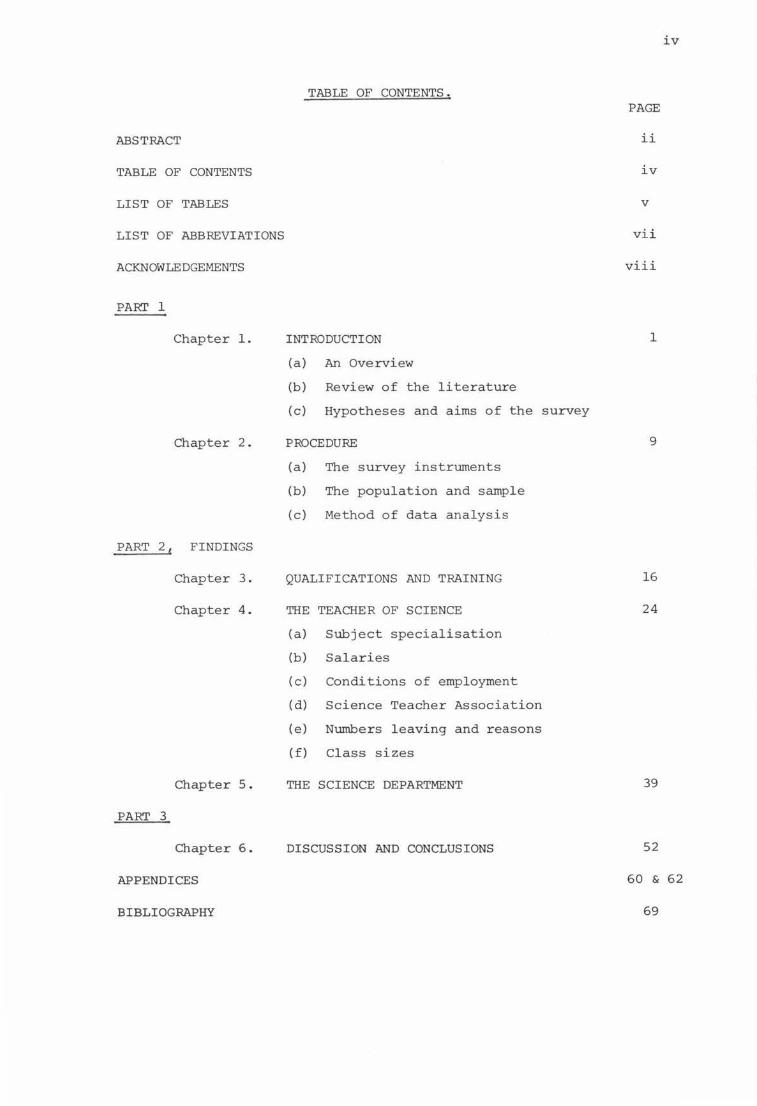
TABLE OF CONTENTS.
INTRODUCTION
(a) An Overview
(b) Review of the literature
(c) Hypotheses and aims of the survey
PROCEDURE
(a) The survey instruments
(b) The population and sample
(c) Method of data analysis
QUALIFICATIONS AND TRAINING
THE TEACHER OF SCIENCE
(a) Subject specialisation
(b) Salaries
(c) Conditions of employment
(d) Science Teacher Association
(e) Numbers leaving and reasons
(f) Class sizes
THE SCIENCE DEPARTMENT
DISCUSSION AND CONCLUSIONS
PAGE
ii
iv
V
vii
viii
1
9
16
24
39
52
iv
60 & 62
69
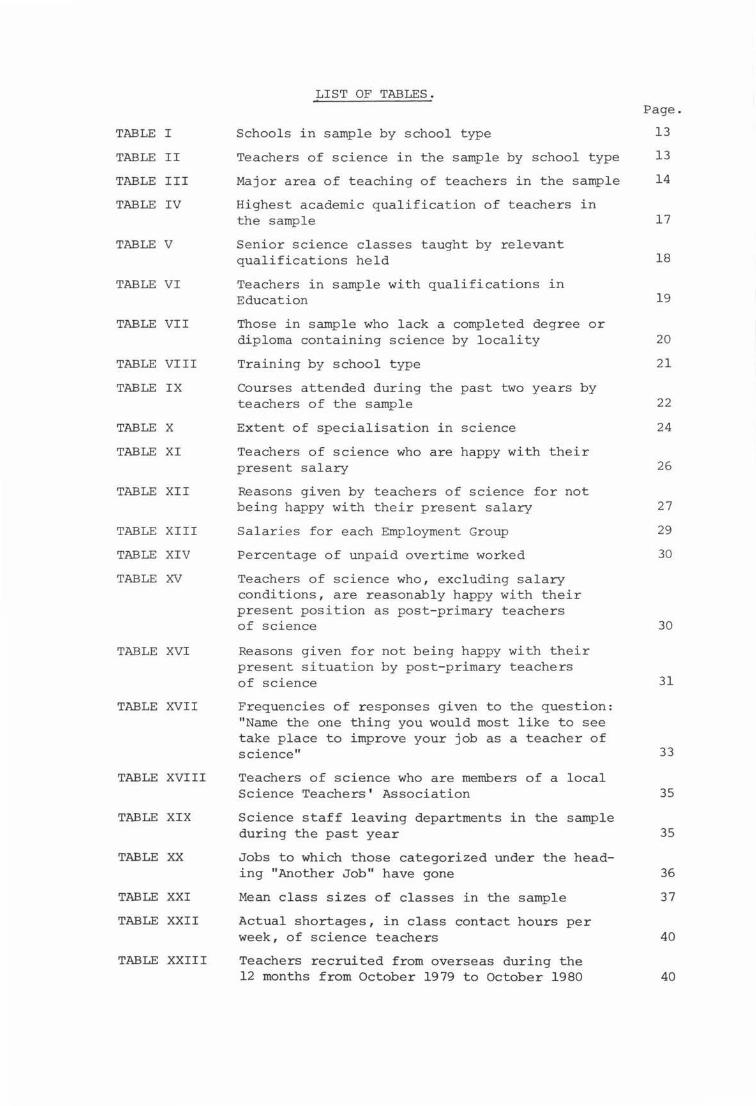
TABLE I
TABLE II
TABLE III
TABLE IV
TABLE V
TABLE VI
TABLE VII
TABLE VIII
TABLE IX
TABLE X
TABLE XI
TABLE XII
TABLE XIII
TABLE XIV
TABLE XV
TABLE XVI
TABLE XVII
TABLE XVIII
TABLE XIX
TABLE XX
TABLE XXI
TABLE XXII
TABLE XXIII
LIST OF TABLES. Page.
Schools in sample by school type 13
Teachers of science in the sample by school type 13
Major area of teaching of teachers in the sample 14
Highest academic qualification of teachers in the sample 17
Senior science classes taught by relevant qualifications held 18
Teachers in sample with qualifications in Education 19
Those in sample who lack a completed degree or diploma containing science by locality 20
Training b y school type 21
Courses attended during the past two years by teachers of the sample 22
Extent of specialisation in science 24
Teachers of science who are happy with their present salary 26
Reasons given by teachers of science for not being happy with their present salary
Salaries for each Employment Group
Percentage of unpaid overtime worked
Teachers of science who, excluding salary conditions, are reasonably happy with their present position as post-primary teachers of science
Reasons given for not being happy with their present situation by post-primary teachers of science
Frequencies of responses given to the question: "Name the one thing you would most like to see take place to improve your job as a teacher of science"
Teachers of science who are members of a local Science Teachers' Association
Science staff leaving departments in the sample during the past year
Jobs to which those categorized under the heading "Another Job" have gone
Mean class sizes of classes in the sample
Actual shortages, in class contact hours per week, of science teachers
Teachers recruited from overseas during the 12 months from October 1979 to October 1980
27
29
30
30
31
33
35
35
36
37
40
40
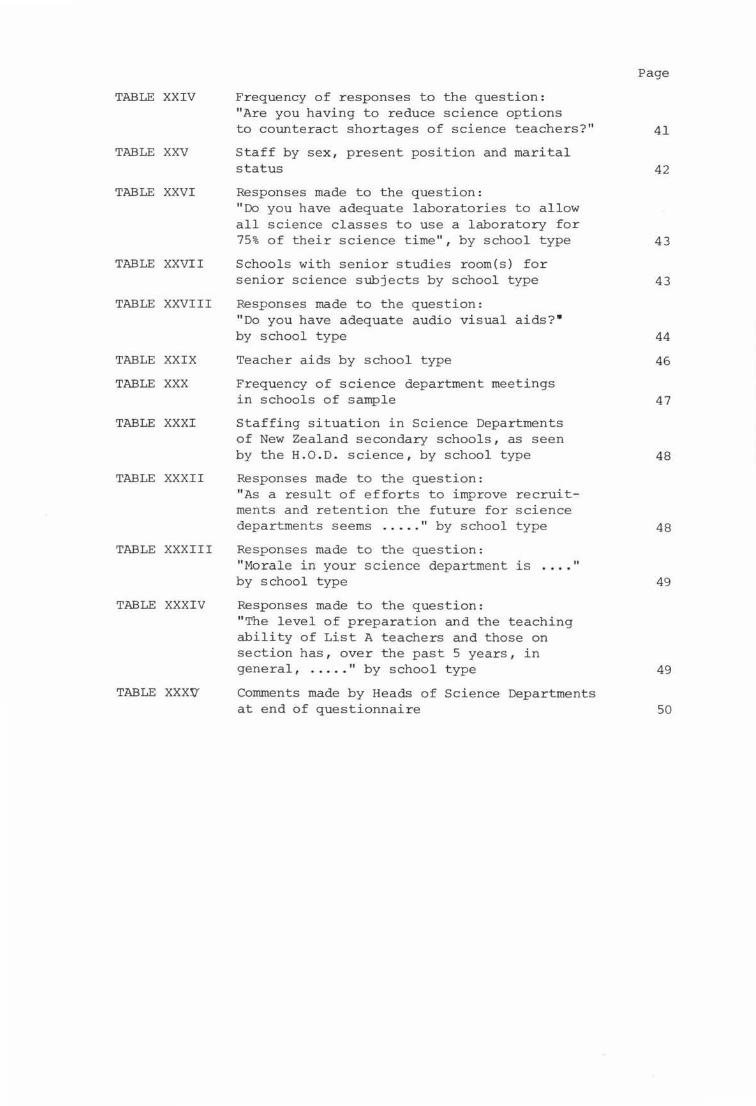
TABLE XXIV
TABLE XXV
TABLE XXVI
TABLE XXVII
TABLE XXVIII
TABLE XXIX
TABLE XXX
TABLE XXXI
TABLE XXXII
TABLE XXXIII
TABLE XXXIV
TABLE XXXV
Frequency of responses to the question: "Are you having to reduce science options to counteract shortages of science teachers?"
Staff by sex, present position and marital status
Responses made to the question: "Do you have adequate laboratories to allow all science classes to use a laboratory for 75 % of their science time", by school type
Schools with senior studies room(s) for senior science subjects by school type
Responses made to the question: "Do you have adequate audio visual aids?• by school type
Teacher aids by school type
Frequency of science department meetings in schools of sample
Staffing situation in Science Departments of New Zealand secondary schools, as seen by the H.O.D. science, by school type
Responses made to the question: "As a result of efforts to improve recruitments and retention the future for science departments seems ..... " by school type
Responses made to the question : "Morale in your science department is by school type
Responses made to the question: "The level of preparation and the teaching ability of List A teachers and those on section has, over the past 5 years, in general, ..... " by school type
II
Comments made by Heads of Science Departments at end of questionnaire
Page
41
42
43
43
44
46
47
48
48
49
49
50
B.A.
B.Ag.Sc.
B.Ed.
B.H.Sc.
B.Sc.
B.Sc. (Hons.)
Co-ed
Dip.H.Sc.
Dip.P.E.
Dip.Ed.
D.H.S.
F. 1-7
H.O.D.
Hons.
incom.
M.A.
M.Ag.Sc.
M.Ed.
M.H.Sc.
M.Phil.
M.Sc.
M.Sc. (Hons.)
N.Z.C.S.
N.Z.I.C.
N.Z.P.P.T.A.
N.Z.S.T.A.
Ph.D.
P.P.T.A.
P.R.
P.s.s.c. S.T.A.
T.C.
T.T.C.
%
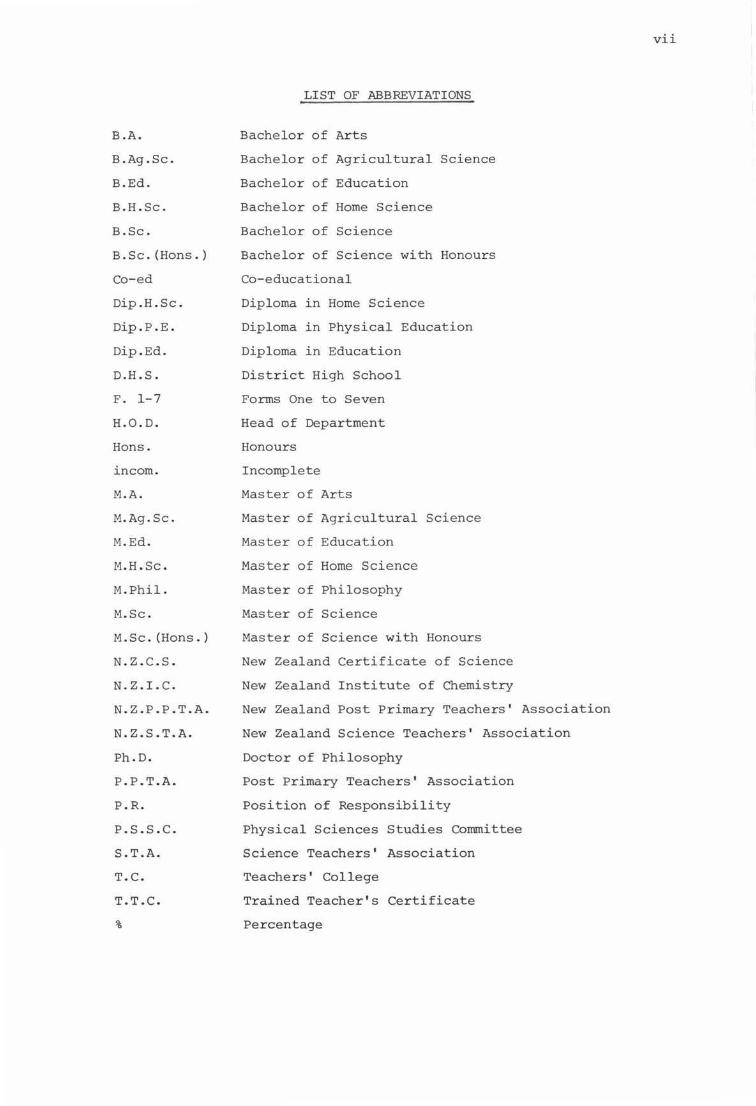
LIST OF ABBREVIATIONS
Bachelor of Arts
Bachelor of Agricultural Science
Bachelor of Education
Bachelor of Home Science
Bachelor of Science
Bachelor of Science with Honours
Co-educational
Diploma in Home Science
Diploma in Physical Education
Diploma in Education
District High School
Forms One to Seven
Head of Department
Honours
Incomplete
Master of Arts
Master of Agricultural Science
Master of Education
Master of Home Science
Master of Philosophy
Master of Science
Master of Science with Honours
New Zealand Certificate of Science
New Zealand Institute of Chemistry
New Zealand Post Primary Teachers' Association
New Zealand Science Teachers' Association
Doctor of Philosophy
Post Primary Teachers' Association
Position of Responsibility
Physical Sciences Studies Corranittee
Science Teachers' Association
Teachers' College
Trained Teacher's Certificate
Percentage
vii
ACKNOWLEDGEMENTS,
The initial supervision for this project was given by the
late Professor C.G.N . Hill, Dean of the Faculty of Education,
viii
'Massey -'University. Under his guidance the first set of hypotheses
were developed and correspondence for financial assistance was
initiated.
After Professor Hill's death early in l980, Dr, David Sten
house, Senior Lecturer in Education, Massey University, kindly
agreed to take over as supervisor. His extensive comments and
criticisms through a number of revisions of questionnaires, corres
pondence and thesis drafts - especially many positive suggestions
and general encouragement (to say nothing of many cups of coffee!) -
have been deeply appreciated. During a ten week absence of Dr.
Stenhouse on overseas study leave (21/6/80 to 31/8/80), Dr. G.J.F.
Hunt, Senior Lecturer in Education and Miss Cathy Smith of Massey
University's Computer Unit provided the guidance in adapting the
questionnaires for computer analy sis.
Mr . W. Abbell of the Computer Unit helped with the comp uter
analysis of the coded material.
The Department of Education provided a grant of up to $636.00
to cover postage and computing costs. Their officers, especially
Dr. M.J. Coppen, Department of Research and Statistics, were very
helpful especially during a visit I had with them on 30th June 1980.
The major change suggested by them was that of moving from a 'manual'
analysis of the results to a computer analysis. Although the latter
has had its problems, I remain grateful to them for this suggestion.
Massey University's Education Department provided the envelopes,
paper and duplicating facilities required. Thanks are due to
Professor R.S. Adams for continuing his Department's support of this
work.
My thanks also go to:
Mr. O. Taylor whose Diploma in Education Dissertation provided
an initial stimulus and base-line for the present research.
Feilding Agricultural High School for the use of School letter
head and for duplicating facilities.
The New Zealand Institute of Chemistry for information related
to salaries.
ix
The Post-Primary Teachers' Colleges in Auckland and Christchurch
for their work in finding information about Teacher's College
students.
The Heads of Science Departments and those teachers in their
departments, who, by their responses to the questionnaires provided
the material on which the analysis and discussion incorporated in
this thesis is based.
Mrs. Margaret Donald for the many hours involved in the typing
and presentation of this thesis and last, but by no means least, to
my wife for her understanding and encouragement over the past
twenty-four months since this thesis first began.

CHAPTER l.
INTRODUCTION.
This Chapter consists of three main sections:
(a) An overview of the thesis
(b) The review of the relevant literature
(c) The hypothese s and aims of the project.
AN OVERVIEW
This thesis attempts to ascertain the present state of staffing
of science departments in New Zealand Secondary Schools as at 1st
September 1980.
1
For some time the researcher has felt that there has been a
shortage of adequately qualified teachers of science in New Zealand
secondary schools and because of this many students are denied a satis-
factory education in science. In an attempt to ascertain just what
the present staffing position is, and to see whether it has deterior
ated or improved some of the findings are compared with those of Owen
Tay lor's 1965 survey of s taffing in the science departments of New
Zealand secondary schools. Taylor's survey was based on, and attempt
ed to update, E.J. Searle's 1954 survey published in his book "The
Teaching of Science in Post Primary Schools" (1958). Thus, in places
it was possible to compare the 1980 situation with what it was both
fifteen and twenty-six years ago.
While Taylor's survey concentrated primarily on qualifications
this survey looks also at training, salaries and conditions.
The thesis begins with a review of the literature followed by a
statement of the hypotheses and aims of the project.
Chapter 2 looks at the procedure that was followed. The nature
of the population, the invited sample and the data producing sample
is outlined. Comments are made about the questionnaire forms used;
the problems that arose in producing the final format of the data
collection instruments and a critical appraisal of both their re
liability and validity. The method used to analyse the data is dis
cussed.
The results of the survey are presented in the following three
chapters headed: "Qualifications and Training", "The Teacher of

Science" and "The Science Department".
Chapter 3, "Qualifications and Training", presents the quali
fications held by teachers in the sample and discusses their rele-
vance to the science subjects being taught. The percentage of
trained teachers in the sample is also given and discussed.
2
Chapter 4, "The Teacher of Science", presents the information
obtained which the researcher used to attempt to answer the questions:
1. Are most teachers of science happy with their present salary and,
if not, why?
2. Are teachers of science happy with their present situation as
secondary school science teachers and, if not, why?
3. What things would the teachers of science most like to see take
place to improve their jobs as teachers of science?
4. How many teachers of science are members of Science Teacher
Associations?
5. From the information given by H. 0. Ds ·· on science teachers leav
ing teaching:
(a) How many have left teaching in the past year?
(b) To where have they gone?
6. What sized classes are teachers of science encountering?
Chapter 5, "The Science Department", presents much of the in
formation obtained from the questionnaire form that only the H.O.D.
completed. This chapter presents information obtained about the
shortage of science teachers in the schools of the sample, the avail
ability of equipment and teacher aids (e.g. laboratory technicians,
laboratory monitors, accelerant teachers and remedial teachers), the
type of person available to do part-time science teaching and, finally
are listed some subjective comments made by the H.O.Ds · of science on
such topics as: teacher morale, List A teachers, the present situation
and the future of science education.
Chapter 6, "Discussion and Conclusion::; ",relates the results ob
tained to the hypotheses and aims of the survey as outlined in
Chapter 1. Decisions are made concerning whether or not the hypo
theses have been refuted or verified and conclusions are drawn about
the aims of the project.
REVIEW OF THE LITERATURE
"serious erosion of secondary teacher morale and escalating losses
of able, qualified teachers from the profession have been the high-
3
lights of the 1978-79 Association year", began the Annual Report
l978-79 of the New Zealand Post Primary Teachers' Association
(N.Z.P.P.T.A.) and it continued "The loss-rate of quality teachers
from our schools is nothing short of a professional arterial haemorr
hage which unless promptly arrested, must inevitably and quickly re
turn secondary education to the enfeebled and damaging circumstances
of the late sixties".
In 1978 secondary teacher losses for the year reached an all
time high of 1,659 i.e. 13.2 %, of all full time teaching positions.
The drift at that time was to occupations which were not related to
teaching. Those that were leaving were, on average, better qualified
than the teaching force overall, and the so called 'basic subjects'
of Science, Mathematics, Economics and English were being affected
most.
In his address to the 1979 P.P.T.A. Conference Mr. Wellington,
Minister of Education, pointed out what he considered were the main
points of concern as seen by secondary teachers.
Firstly, he felt that there was deep concern that secondary
teaching has become more complex. He pointed out that" .... there
is a larger more dis ruptive group of students in schools. Not only
does this place a greater strain upon individual teachers but, more
importantly, it impedes the work of the classroom teacher with the
very large majority of pupils who are keen to learn".
" ..... lessens individual job satisfaction".
This he said
Secondly, he pointed to the dissatisfaction with salary levels.
There was at that time (August 1979) an expectation of immediate
salary gains which in the last two rounds of salary negotiations had
not been met.
His third point concerned staff shortages and the burdens that
were then put on staff because of increased teaching loads and the
need to help poorly qualified colleagues.
Fourthly, he said that he was aware of the" ...• uncertainty
that is currently being generated by the problem of falling rolls -
by the uncertainty of promotion prospects within the service because
of this - by the uncertainty of tenure for individual teachers".
Fifthly, the problems associated with the knowledge of unem-
ployment among school leavers. "In this I am all too aware of the
concern this has for your students and the effect which this has on
you as their teachers".
Finally, he believed that there was a feeling among teachers
that" society , parents and employers expect too much from the
schools - they provide insufficient support and often their expect-
ations are in conflict. I think h e re of the conflict between the
demand for an improvement in the basics and a desire for a broad
liberal education".
4
There was at this time, too, the legislation based on the re
commendations of the registration and discipline of teachers which
was soon to be introduced to parliament. Teachers were uneasy about
the real possibility that the legislation would keep effective pro
fessionalism even further beyond the reach of teachers.
Salaries were not good at the time. From 1972 to mid 1979 the
Consumer Price Index had risen 106. 2% , nominal wage rates 107% but
the salaries of secondary teachers (e.g. top step, Group 3, Basic
Scale) had rise n b y only 69.4% (P.P.T.A. salaries circular July 1979).
Many group s had h ad spe cific adjustmen ts de signed to corre ct a n oma
lies cause d b y gove rnme nt wage s policie s, but s e condary t e achers
needed an increase of 17.8% jus t to r e store their buy ing power to
the level of their earnings in 1972. Wage negotiations seemed to be
unproductive, "poor relativity " almost became a clich~ and teachers
were far from happy.
Statistics were widely publicised, mainly by the P. P .T.A. e.g.
"In 1978 1,659 secondary teachers left the service - the most ever.
This represented 13.2% of the teaching force. In 1978 only 1,815
new teachers started, giving a nett gain of 156 teachers - the lowest
ever. In 1978, over 23% of the teachers leaving went to jobs out-
side of teaching - the highest ever. This means that the education
of up to 120,000 children will be affected to their disadvantage'' and
so on (N.Z.P.P.T.A. stopwork meeting pamphlet '79).
Fortunately, later in 1979 wage increases backdated to November
1978 were announced and with the promise of large backpay cheques the
"bomb was defused". Salaries obtained still fell short of what the
N.Z.P.P.T.A. and most teachers wanted and no real improvements in
areas such as 'Master Teacher' scales were obtained. In fact, con-
ditions of service are still the major area needing attention.
Secondary teachers have a professional responsibility related to
that critical part of all people's lives in which the child becomes
an adult. All professions have some special responsibility towards
the development of people, but this particular field - the nurturing
of the growing-up process - is the field of the secondary teacher,
5
and of course, the parent, and to be able to perform this professional
function adequately matters more, in personal satisfaction and ful
filment, to most secondary teachers than does the amount of money
they are paid or how that relates to what other people are paid.
This is not to say that salaries are unimportant, but professional
frustration is, or should be, more trying than anxiety about the
latest salary increment. In fact, both job satisfaction and salary
levels tend to be regarded as low, it seems, for a majority of teach
ers - and this must be presumed to reduce their morale and effective
ness still further.
Mr. Derek Wood, Chairman of the P.P.T.A's Principals' Advisory
Committee has pressed for new directives in education and the need
for the Government to state a clear set of priorities for education
in the 1980's to give teachers a sense of direction. He points out
that all the 1980 salary settlement did was to" ... restore some
relativity with outside professions which have attracted, and are still
attracting, teachers to leave teaching". (P.P.T.A. News, June '80).
There is certainly a need for a clear statement of policies.
Mr. Wellington however, feels that it is "politically dishonest" to
make any promises to teachers (P.P.T.A. News, June '80). But, there
must be some overall plan or changes become 'bitsy'; wild efforts
are made to cope with today or sort out the problems of yesterday
rather than diverting money, time and manpower into planning for a
well organised future. The basic educational desideratum of setting
broad aims and specific objectives seems to have been forgotten by
some who should be most able to improve the state of education in New
Zealand.
Long awaited salary increases early in 1980 made little differ
ence to the nett take-home pay of the average teacher ($7 - $8/week).
However, as has been mentioned it was accompanied by sizeable backpay
cheques which produced a mild state of euphoria among teachers.
Now that that has probably been spent teachers look again at
their friends in other jobs who stop work at 4.30 p.m. and leave it
behind them, while they go home to prepare lessons or to mark and set

examinations. The 1980 Annual New Zealand Institute of Chemistry
salary survey points out that those involved in teaching put in far
more unpaid hours of overtime than chemists involved in any other
form of employment.
John Craig, Principal of Heretaunga College, Upper Hutt, states
in the March '80 P.P.T.A. News that staffing shortages this year are
the worst on record and already some of his teachers are working at
least 60-hour weeks to cope with the shortfall. "Last year we had
6
23 full-time teachers pass through this school - 23 teachers who left
and that is only a little bit higher than the national average".
"The taxpayer gets poor value for his tax dollars spent in secondary
education", says Bruce Webster, General Secretary of the P.P.T.A.,
w"when so many teachers are leaving secondary teaching where there is
a $100,000 training cost of a secondary teacheru.
This was, and still is, the overall picture of education as pre-
sented b y those who are critical of it. The major aim of this
thesis is to determine whether it is a substantially - or even
partially - true picture of science education. Are science H.O.Ds
finding it hard to staff their departments? Are they getting well
qualified, well-trained teachers? Are practising science teachers
happy with their conditions and salaries? What changes would they
most like to see take place to improve their jobs as teachers of
science? How many science teachers are leaving the profession and
to what jobs are they going?
This list of questions could be expanded and made more detailed -
but it can be seen that even the most general questions, and their
answers, relate to issues of great significance to this country.
HYPOTHESES AND AIMS OF THE PROJECT
As has previously been stated some of this project is based on
and attempts to update research done by others (e.g. Searle, (1952),
Taylor (1965), N.Z.I.C. (1978, 1980) and N.Z.P.P.T.A.). Thus,
wherever possible research hypotheses have been formulated which state
the researchers expectations resulting from the review of the relevant
literature.
Other aspects of this project have not previously been studied
in the way that they were here. Thus, these areas of the project
were treated as aims rather than hypotheses. In most cases the aim
was that of collecting information about the particular phenomenon
that was being studied.
HYPOTHESIS ONE
7
"That the standard of tertiary qualifications held by permanent
science teachers teaching science has improved since the 1965 Survey".
Since 1965 salary increases have been considerable (see Supple
ments to 'Education Gazette' (1965-1980)).
It was hypothesised that the massive percentage increases to
salaries in the early 1970's along with increased Government expend
iture on Education, which has improved conditions,would result in
better qualified people being attracted to teaching.
HYPOTHESIS TWO
"That there is a shortage of science teachers".
In his Minister's address to the 1979 Conference, Mr. Wellington
said with respect to staffing shortages that" .... the so-called
'basic subjects' of Science, Mathematics, Economics and English were
being affected most". The researche r believed that this was still
the case as no data were available to disp rove this hypothesis.
HYPOTHESIS THREE
"That science teachers have lost salary relativity with other
professions having similar qualifications".
Lack of salary relativity with other professions having similar
qualifications has usually been a major argument used by the N.Z.P.P.T.A.
in salary negotiations.
This hypothesis is tested using the results of the N.Z.I.C.
Annual Salary Survey (1980).
AIMS OF THE PROJECT
Apart from the above three hypotheses the researcher felt that
there were other areas related to science teaching where empirical
data about staffing and conditions were needed.
Thus, this project also aimedto obtain information from science
teachers and H.O.Ds about:
1. The level of tertiary qualifications of those teachers teaching
science who are teaching senior science classes.
2. The mean class sizes in science subjects.
3. Whether there has been an improvement in the level of training
and the teaching ability of teachers in training (i.e. those on
section and List A teachers), as perceived by H.O.Ds.
4. The present conditions under which teachers of science are
operating.
5. The things that science teachers feel are most needed to improve
their professional activities.
8
6. The morale in science departments as perceived by H.O.Ds.
7. The numbers of science teachers leaving the New Zealand secondary
teaching service.
8. The employment to which those leaving have gone.
9. Whether part-time teachers of science are primarily
(a) male or female
(b) married or single.
CHAPTER 2.
THE PROCEDURE.
THE SURVEY INSTRUMENTS.
The survey instruments are presented in Appendix B. Two in
struments were used: one a questionnaire form to be filled out by
9
the HOD Scrence and a second questionnaire form to be filled out by
every teacher in the Science Department who taught one or more science
classes.
QUESTIONNAIRE FORM ONE.
This was the questionnaire filled out by the HOD Science.
It consisted of two parts. Items 1 to 6 asked for empirical
data and aimed to be entirely objective with the exception of Item
6 (h). This latter question required the HOD to decide whether or not
his department had" .. adequate audio-visual aids". What each HOD
would consider to be adequate would probably be different. This
question could have asked for numbers of overhead projectors, slide
projectors etc. in the department, but this would still have given no
information as to the frequency of their use or whether the number
given was in fact adequate. The final decision was to leave this
item as it appeared, but its limitations were realised.
Like Item 6 (h), Items 7 and 8 required some objectivity on the
part of the HOD, but they were intentionally worded to obtain the
general 'feeling' that HODs had about the staffing situation both in
their own departments and nationally.
The following is a discussion of the estimated reliability of
this questionnaire.
Firstly, one can never be sure that the information received
is,in fact,correct. While the questionnaire forms were both headed
"STRICTLY CONFIDENTIAL" the requirement of the school's name may have
affected the type of response made by some HODs .. Only one HOD re
fused to fill in the name of his school, but did give locality, type
and size. As the name of the school was used only to determine type,
locality and size, it may have been preferable to have had three such
items, thus eliminating the need for the school's name.
Ambiguity also creates problems. Item 6 (e) was not explained
in enough detai 1. Some HOD!:; took "Science Resource Room ( s) " to mean

10
preparation rooms attached to laboratories. What was wanted here
was the number of room(s) where resources other than basic equipment
were kept i.e. schemes of work, past examination questions, class
sets of textbooks, audio-visual aids etc. There would usually only
be one such room for science resources. Due to its obvious
ambiguity (e.g. one HOD said their school had twelve such rooms) this
item was disregarded in the analysis.
The format of Items 7(a) to 7(e) were r evised more frequently
than any others. The initial format had each of the first four items
presented in the form "Morale in your science department is very low"
followed b y the possible responses: strongly agree, agree, undecided,
disagree, strongly disagree. This format was considered to possibly
bias the response made by suggesting, indirectly, what the researcher
considered the situation to be or how he hoped the HOD would respond.
Variations of this were contemplated e.g. "Morale in your
science department is very good" or "Morale in your sci;ence department
is O.K.", but in each case similar criticisms could be made.
The format used was considered to be less likely to bias the
responses made and, as it would thus increase the reliability , it was
used. The criticism of this format is that it does allow HODs to
remain neutral with responses like "satisfactory" and "O.K." It was
noted that most respondents chose this middle category for each item
(at least 35 %) while very few chose the responses at either end of the
continuum (generally less than 5%). Thus, the subjectivity of these
items does, to some extent, bring into question their reliability.
Many other factors affect responses to items such as these.
A cluster of chance factors such as fatigue and boredom, external dis
tractions like noise, other people or other activities, and internal
distractions like tension or anxiety can all operate to reduce the
stability of an individual's response to any item at a certain point in
time. These naturally reduce the reliability of the results produced.
Reliability, it is realised, is a prerequisite for validity.
An instrument must measure something accurately before there is any
need to worry about what it is measuring and the mere fact that it is
measuring something accurately does not mean it is necessarily
measuring what we believe it to be measuring.
This questionnaire form, in the researcher's opinion, has very
good face validity for items 1 to 5, but lacks some face validity in

ll
parts of item 6 (e.g. e and ht, and in item 7. In these later
sections, as outlined above, the instrument may not be measuring ex
actly what it is aiming to measure.
In conclusion the later sections of this questionnaire form were
included to obtain information about the HOD's informed opinion of
the staffing situation.
The obvious limitations of the results were realised, but it was
felt that with such a large sample the results would provide some in
sight into the state of staffing in New Zealand secondary school
science departments, as perceived by HODs .
QUESTIONNAIRE FORM TWO.
This was the form filled out by members in the science department
who taught one or more science classes.
Items 1 to 11 required empirical data and with the exception of
item 10 there seemed to be no problems concerning ambiguity. Many
respondents were a little unsure about the number of inservice courses
they had been on in the past two years. Some made responses like
" .. about 2". Such a response was coded as "2". The other problem
with this item was that most teachers put down all inservice courses
they had attended but,some put down only those that were in science.
The researcher wanted the total number of inservice courses attended,
whether or not they were directly related to science. This item was
attempting to ascertain how much ongoing training the teacher of
science was receiving. This item should have been worded "How many
inservice courses have you attended over the past two years (include
all courses attended, whether or not they were directly related to
science)". It is believed that a course in reading may be as im-
portant in the ongoing training of a science teacher as a course in
junior science.
Items 12 to 14 would probably suffer from similar problems of
reliability and validity as did the later sections of the HOD
questionnaire. However, these problems will always arise when
attempting to obtain information about opinions. One of the major
factors affecting results here would have been that all questionnaire
forms were returned to the HOD for posting. It was felt that the
extra cost involved in providing every teacher of science with a
stamped, self-addressed envelope, to ensure complete confidentiality,
could not be justified. So there was a need to accept that some
te~cners· 1l)ay haye woderated their responses in view of who might
srght therr completed questronnaire form.
12
Item 14 was not filled out by 10.2% of the respondents. The
marn group who did not respond were those who taught only one or two
science classes. They may not have considered themselves to be
science teachers, but the wording was q uite specific i.e. " .. to
improve your job as a teacher of science". Anyone who teaches one
or more science classes is a "teacher of science", but not necessarily
a "science teacher". This latter category is taken to mean those who
teach mainly science subjects.
to have been needed.
A more detailed explanation appears
In conclusion, this form appe ared to be completed accurately b y
most, but there were ambiguities in Items 10 and 14 as outlined above .
The forms used were intentionally printed on different coloured
paper. The HOD form was green while the form filled out by all
teachers of science was white. The aim here was to reinforce the fact
that there were two different forms to be completed by the HOD and one
by t h e members of his department.
THE S~1!.El.
The survey forms, covering letter and postage paid , self-addressed
enyelopes were sent to all State and Private Secondary Schools in New
Zealand and to the secondary departments of all District High Schools
and F .1 - 7 schools, hereafter referred to as "the population".
Of the 395 schools to which surveys were sent 271 replied in time
to be used in the computer analysis, these hereafter are referred to as
'' the sample". Another 5 replies came later which have not been used
in the sample.
The response rate was thus, 70 %, and the sample was 68.6% of the
population.

TABLE I ,
SCHOOLS IN SAMPLE BY SCHOOL TYPE .
School Type. Number in Number in % of popPopulation. Sample. ulation. -
Private,Boys 37 20 54.0
Private,Girls 48 26 54.1
Private,Co-ed 15 7 46.6
State, Boy s 29 18 62.l
State, Girls 28 2 3 82.l
State, Co-ed 160 131 81.8
D.H.S. and F.l-7 78 46 58 .9
Total 395 271
% of total Sample.
7.4
9. 6
2.6
6.6
8.5
48.3
17. 0
100.0
13
Table I above shows that proportionally Private Co-educational
(Co-ed) Schools were not as well represented as other schools and this
fact mus t be take n into account when the data are later used to draw
compariso n s betwee n diffe rent t ypes of schools.
TABLE II.
TEACHERS OF SCIENCE IN SAMPLE BY SCHOOL TYPE.
School Type. Number. Percentage of Samp le.
Private,Boys 103 6.1
Private,Girls 114 6 .7
Private, Co-ed 21 1.2
State, Boys 151 8.9
State, Girls 189 11.1
State, Co-ed 965 56.9
D.H.S. and F.1-7 153 9.0
Total 1696 100.0
Table II outlines the frequency distribution of the teachers in
the sample. It can be seen that 1696 teachers of science responded
by filling in survey form 2.
The major area of teaching of the teachers in the sample is
presented in Table III on the following page.

TABLE III.
MAJOR AREA OF TEACHING OF THE TEACHERS IN THE SAMPLE.
Major Area of Teaching Number % of Sample.
Science 1387 81. 7
Mathematics 151 8.9
Physical Education 48 2 .8
Social Studies 28 1. 7
Home Economics 24 1.4
Other 58 3.5
Total 1696 100.0
Of the science teachers in the sample, 81.7% were teaching
almost solely sciences. Many HODs connnented that other teachers,
especially mathematics and physical education teachers, were being
brought in to " .. fill the gaps on the s ci.ence timetable". It was
evident from the survey results that mathematics teachers were being
us ed in the science department to teach one or two senior science
classes (especially physics) while physical education teachers were
being used to take junior science classes. This result was somewhat
expected when one looks at the sort of tertiary qualifications that
both categories of teachers usually have i.e. a Bachelor's degree in
Mathematics often contains Stage I or II physics while physical
education teachers cover enough science in the Diploma in Physical
Education to equip them to teach junior science.
Data Analysis:
The completed questionnaire forms were coded by the researcher.
14
These coded results were then punched on to computer discs and the
punching verified by the computer punch-operators of Massey University's
Computer Science Department. The researcher, under the guidance of
Mr. W. Abbell, Computer Science Department, then prepared the necessary
programmes to produce frequencies, sums, means, percentages and cross
tabulations of the data, as required. The computer analysis was
carried out using Massey University's Burroughs B6700 Computer. The
data produced are presented in the following chapters.
Timing of the Survey:
The survey forms were posted to all schools on the 1st August 1980.

This was three weeks before the end of term two. The decision was
made to send them then rather than to wait the six weeks until the
l5
beginning of term three. The result was that about 60% of the returns
came in before the end of term two and the remaining 40% after the
holidays. It is possible that the timing of the survey may have had
a detrimental effect on the response rate.
Firstly, a teacher's motivational state can be quite low after a
long, wet winter term and the questionnaire may not have had a good
reception.
Secondly, many schools have examinations at this time of the
year and teachers are under pressure to set, supervise and mark exam
inations, as well as write reports.
Finally, this survey was last in a line of three surveys that
had been received by the HOD of Science during term two. One was
rather cumbersome, difficult to fill out and had created some bad
attitudes towards surveys.
Howeve r, the ease of response, the inclu~ion of a p ostage-paid,
s e lf-addressed envelope and the real concern science teachers have
about science education were, in part, responsible for a gratify ing
response rate of 70%.
CHAPTER 3.
QUALIFICATIONS AND TRAINING.
It is not easy to assess the academic qualifications of teachers
in a manner that does justice to them. It is recognised that an in-
completed science degree may be a better qualification for teaching
science than a completed arts degree. Furthermore, it is recognised
that a degree or diploma in science does not necessarily guarantee
good teaching.
However, it is· probably desirable for a teacher of science to
have a wide scientific background and one criterion for judging
whether a teacher is so equipped is whether or not he possesses a
sound science degree or similar qualification.
Table IV, on the following page, sets out the qualifications of
the teachers in the sample.
the i965 survey.
The values in brackets are those from
16

r-r-i
Boys, Private
Girls, Private
Co-ed, Private
Boys, State
Girls, State
Co-ed, State
D.H.S. &
F. 1-7
~
() ti}
Ul C • 0
::;: ::i:: ' .._. .
0 () • U)
..c:: p. Ill
15 .9
(10)
20.8 (19)
14.3
27. 5
(23.2)
22.5 (9. 5)
23.3
( 13. 7)
19.8
( 3. 7)
. () U) . Ill
44.6
( 35)
42.5 (28.6)
33.3
47.7
( 39. 2)
48.7 (32.3)
50.2
(33.2)
44.4
( 22 . 5)
~
~ . 5 () C
·r-1 .._.
() U)
Ill
5.9
(8. 3)
l.9 ( 4. 8)
l4.3
l.6 (0. 8)
2.2
(5.0)
2.0
(8. 7)
(i)
TABLE I V.
HIGHEST ACADEMIC QUALIFICATIONS OF TEACHERS IN THE SAMPI£. (Percentages).
~ . ~
s . 0 s ~
() 0 . C () s
·r-1 C 0 .._. ·..-1 () . . . .._. C () () () () ·r-1 U) U) U) U) () () () .._. . . . . U) U) U) -I< -I< -I< ::i:: tJ) tr, tr, . . . ~ ~ ~ ::i:: ::i:: ::i:: ~ ~ ~ ~ . . . . . . ·r-1 ::;: Ill Ill ::;: Ill Ill ::;: Ill Ill 0
4.0 5.9 l.O
(_6 . 7) (0. 5) (10) (6. 7) (3.3) (4. 8)
0.9 7.5 l.9 6.6 (8. 5) (4. 8) ( 7 .1) ( 4. 7)
4.8
0.7 0 . 7 0.7 3.4 4.0 l. 3 (0. 9) (3. 3) (1. 4) ( 3. 3) ( 2. 3)
0.5 3.2 1.6 2.7 l.l 5 . 3 (0. 8) (6. 7) (3.4) (5.0) (1. 7) (5.0)
0.2 l.6 0.3 0.8 1.0 3.3 0.4 1. 3 (O. 3) ( 2. 9) (0. 2) (1.8) (0. 3) (3.2) (6. 3) (1.6) ( 3. 4)
0.7 2.6 2 . 6 4.0 0.7 0.7
( 1. 3) (1. 3) (7.5) (10) (2.5)
Values in brackets relate too. Taylor's 1965 survey.
(ii) * means "contains science".
ti} re, nl r-i Q) Q) s 0 tr, .µ 0 0 I C l'(j Q) r-i
-I< ..c:: 0 ti} .µ r-i ~ ti} () H tll C ~ ·r-1 Q) U) p. ~ Q) l:l 0 ti} () 0 Q) H ~ 4-1 r-i H U H U ;:J 0 l'(j Q) 0 C 0 l'(j Q) C ~ tr, Q) u -I< re, () H 0 s:: Q) ·r-1
H C C Q) ·..-I r-i ·..-1 Q) () . Q) 0 Q) ~ ~ ro ~ H Ul u ii () •,-I .µ () tr, . Q) () Q) Q) 0 nl ~ S:: E-i 0 U) U) ::;: 4-1 8 r-i ·r-1
5.9 l2.0 5.0 16.8 ( 3. 3) (5.0) (ll. 7) (26.6)
4.7 8.5 3.7 10. 3 (4. 8) (ll. 9) ( 7 .1) (2.4) ( 19 .1)
14.3 4.8 14.3 42.9
4.0 5.4 4.7 10.7
(1. 9) (10.3) ( 8. 5) (5.6) (24)
4.8 5.8 2 . 1 10.1 (12.4) ( 10. 8) (11.6) (l. 7) (28. 2)
4.2 7.4 3.8 12.2
(10) ( 5. 7) (12.4) (0. 6) (29.9)
7.9 7.3 7.3 20.5
(8. 7) ( 3. 8) (30) (1. 3) (58. 7)
One thing is i'IllIDediately apparent: qualifications held have
i'Illproved dramatically since 1965. The percentage of teachers with a
B.Sc . qualification, or higher, has increased from around 40 % to
around 60~70 % overall, and the percentage of teachers lacking a com-
pleted degree or diploma in science has fallen markedly. One very
notable change is the percentage of teachers in D.H.S. and F. 1-7
schools who lack a completed degree or diploma in science.
this value was 58.7% while in 1980 it has fallen to 20.5 %.
In 1965
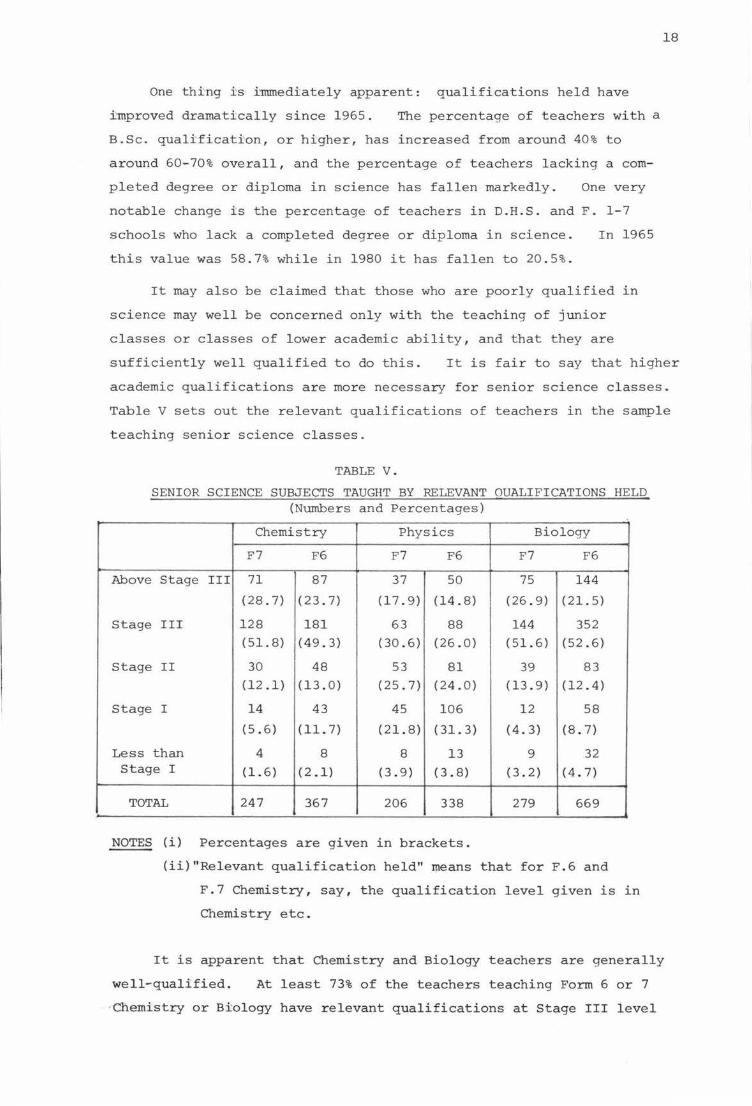
It may also be claimed that those who are poorly qualified in
science may well be concerned only with the teaching of junior
classes or classes of lower academic ability, and that they are
18
sufficiently well qualified to do this. It is fair to say that higher
academic qualifications are more necessary for senior science classes.
Table V sets out the relevant qualifications of teachers in the sample
teaching senior science classes.
TABLE V .
SENIOR SCIENCE SUBJECTS TAUGHT BY RELEVANT QUALIFICATIONS HELD (Numbe rs and Percentages)
Chemistry Phy sics Biology
F7 F6 F7 F6 F7 F6
Above Stage III 71 87 37 50 75 144
(28.7) ( 2 3. 7) (17.9) (14.8) (26. 9) (21.5)
Stage III 128 181 63 88 144 352
(51.8) (49.3) (30.6) (26.0) (51.6) (52.6)
Stage II 30 48 53 81 39 83
(12 .1) (13.0) (25. 7) (24.0) (13.9) (12.4)
Stage I 14 43 45 106 12 58
(5 .6) (11.7) (21.8) ( 31. 3) (4.3) (8. 7)
Less than 4 8 8 13 9 32 Stage I (1. 6) ( 2 .1) (3.9) ( 3. 8) (3.2) ( 4. 7)
TOTAL 247 367 206 338 279 669
NOTES (i) Percentages are given in brackets.
(ii)"Relevant qualification held" I11eans that for F.6 and
F.7 Chemistry, say, the qualification level given is in
Chemistry etc.
It is apparent that Chemistry and Biology teachers are generally
well-qualified. At least 73% of the teachers teaching Form 6 or 7
-ehemistry or Biology have relevant qualifications at Stage III level
19
or higher. Less than 5 % of the teachers in these areas had relevant
qualifications below Stage I.
Physics teachers are, in general, not quite so well qualified.
Much smaller percentages have Stage III and above physics qualifi
cations with 35 % of Form 6 physics teachers having Stage I physics,
or less, as their only qualifications in phys ics. The percentage of
Form 6 phy sics teachers with Stage I as their highest qualification
has increased from 18.9% in 1965 to 31.3% in 1980 - a noticeable
decline in tertiary qualifications.
However, it is fair to conclude that qualifications held by
teachers of senior science classes are generally very good with most
having Stage III, or higher, qualifications.
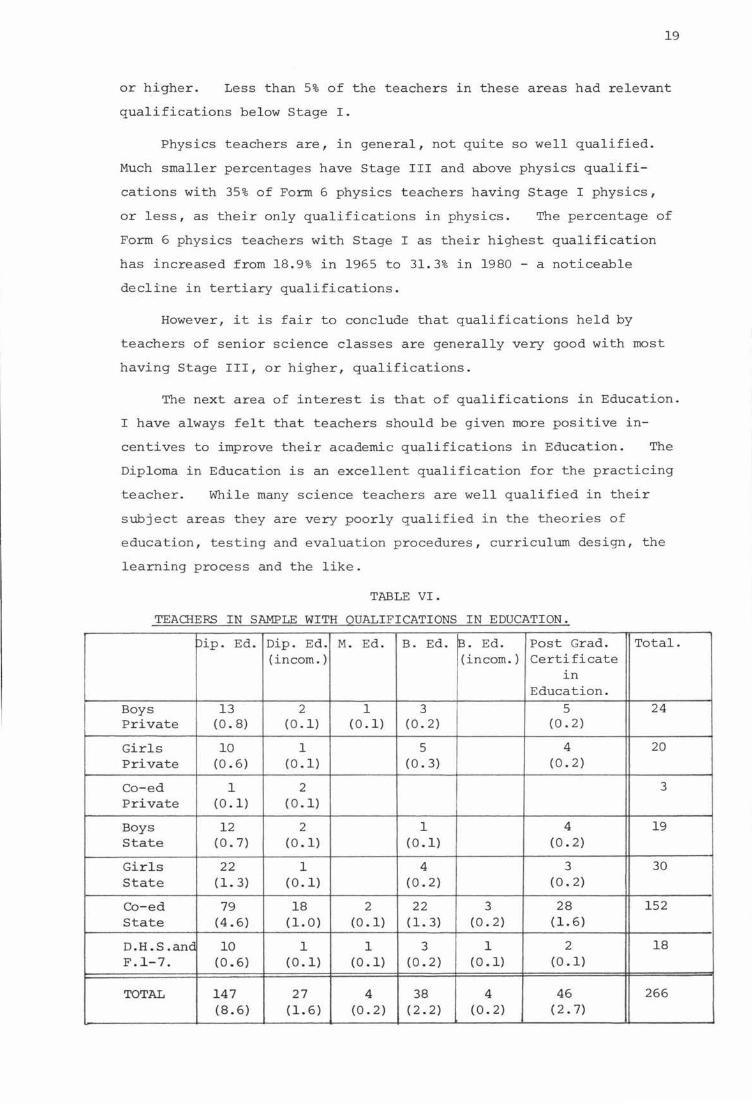
The next area of interest is that of qualifications in Education.
I have always felt that teachers should be given more positive in
centives to improve their academic qualifications in Education. The
Diploma in Education is an excellent qualification for the practicing
teacher. While many science teachers are well qualified in their
subject areas they are very poorly qualified in the theories of
e ducation, testing and evaluation procedures, curriculum design, the
learning process and the like.
TABLE VI.
TEACHERS IN SAMPLE WITH QUALIFICATIONS IN EDUCATION.
)ip. Ed. Dip. Ed. M. Ed. B. Ed. ~- Ed. Post Grad. Total. (incom.) (incom.) Certificate
in Education.
Boys 13 2 l 3 5 24 Private (0. 8) (0 .1) (0 .1) (0. 2) (0. 2)
Girls 10 l 5 4 20 Private (0. 6) (0.1) (0. 3) (O. 2)
Co-ed l 2 3 Private (0.1) (0.1)
Boys 12 2 l 4 19 State (0. 7) (0 .1) (0 .1) (O. 2)
Girls 22 l 4 3 30 State (l. 3) (O. l) (0. 2) (0. 2)
Co-ed 79 18 2 22 3 28 152 State (4. 6) (1. 0) (0 .1) (1. 3) (0. 2) (l. 6)
D.H.S.and 10 l l 3 l 2 18 F.l-7. (0. 6) ( 0 .1) (0 .1) (O. 2) (0 .1) (0 .1)
TOTAL 147 27 4 38 4 46 266 ( 8. 6) (1. 6) (O. 2) ( 2. 2) (0. 2) ( 2. 7)
20
Table VI shows the numbers of teachers in the sample with qualifi-
cat±ons in Education. It excludes the Diploma in Teaching which around
75 % of science teachers have.
Excluding the Post-Graduate Certificate in Education, which many of
the British teachers have, and which is very similar to the New Zealand
Diploma in Teaching, only 13% of the teachers in the sample have an in-1
complete degree or diploma,or higher qualification,in Education.
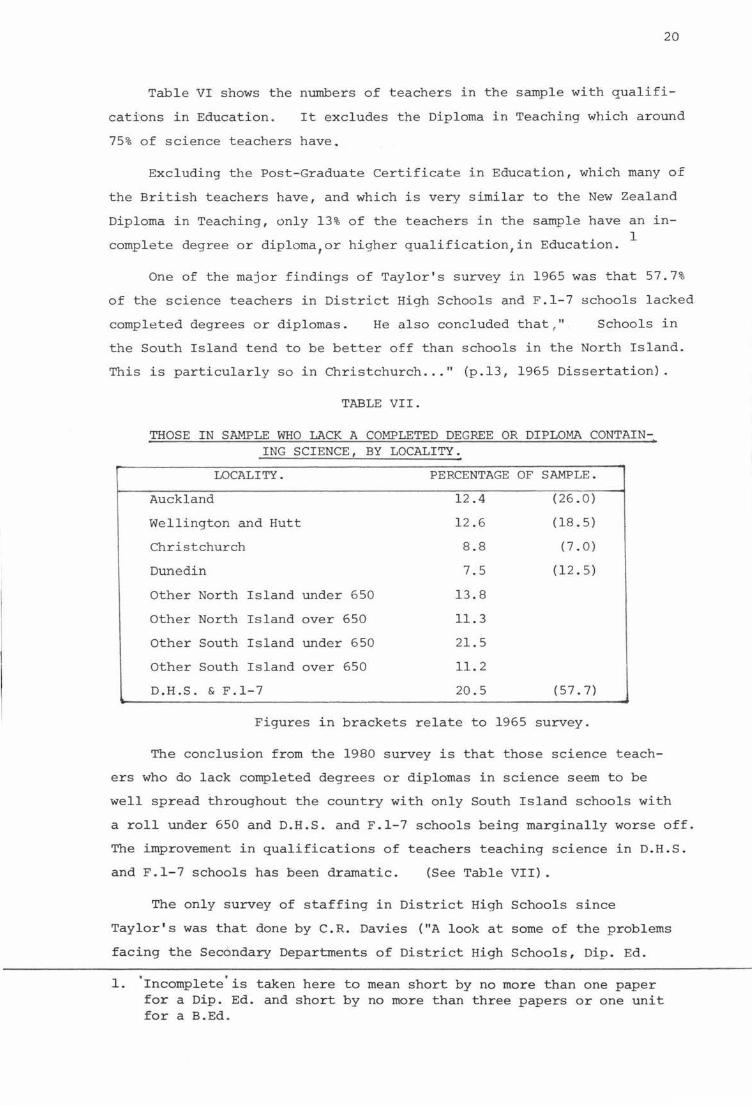
One of the major findings of Taylor's survey in 1965 was that 57.7%
of the science teachers in District High Schools and F.1-7 schools lacked
completed degrees or diplomas. He also concluded that , " Schools in
the South Island tend to be better off than schools in the North Island.
This is particularly so in Christchurch ... " (p.13, 1965 Dissertation).
TABLE VII.
THOSE IN SAMPLE WHO LACK A COMPLETED DEGREE OR DIPLOMA CONTAINING SCIENCE, BY LOCALITY.
LOCALITY.
Auckland
Wellington and Hutt
Christchurch
Dunedin
Other North Island under 650
Other North Island over 650
Other South Island under 650
Other South Island over 650
D.H.S. & F.1-7
PERCENTAGE OF SAMPLE.
12.4
12.6
8.8
7.5
13.8
11. 3
21. 5
11. 2
20.5
(26.0)
(18.5)
(7. 0)
(12.5)
(57. 7)
Figures in brackets relate to 1965 survey.
The conclusion from the 1980 survey is that those science teach
ers who do lack completed degrees or diplomas in science seem to be
well spread throughout the country with only South Island schools with
a roll under 650 and D.H.S. and F.1-7 schools being marginally worse off.
The improvement in qualifications of teachers teaching science in D.H.S.
and F.1-7 schools has been dramatic. (See Table VII) .
The only survey of staffing in District High Schools since
Taylor's was that done by C.R. Davies ("A look at some of the problems
facing the Secondary Departments of District High Schools, Dip. Ed.
l. 'Incomplete'is taken here to mean short by no more than one paper for a Dip. Ed. and short by no more than three papers or one unit for a B.Ed.

Dissertation, l970, Massey University}.
He was able to draw the following conclusions about the staffing
situation in these rural schools:
(i) The percentage of permanent positions actually filled is
lower than the norm for the country.
(ii) Subject options could really only be catered for by large
numbers of part-time teachers.
(iii) Most teachers only have Trained Teacher's Certificates.
(iv) Headmasters felt that the 11 •• quality of the staff .. 11
was a major area of concern.
2.1
(v) Most teachers were young and were quite satisfied teaching
in a District High School, but they did not like the lack of
specialist contact and the inadequacy of equipment.
Thus, in the five years since Taylor's survey there had been some
improvements and now fifteen years after the 1965 survey things have
improved considerably in District High Schools. Their isolation and
small senior rolls will probably always produce unique problems with
respect to staffing. However, the provision of cheap school houses
and the country service requirements do help their lot considerably.
TRAINING
Boys, Private
Girls, Private
Co-ed, Private
Boys, State
Girls, State
Co-ed, State
D.H.S. & F.1-7
TOTAL
TABLE VIII.
TYPE OF TRAINING BY SCHOOL TYPE (Rounded Percentages)
SECONDARY PRIMARY NONE
57 10 30
67 8 20
62 10 24
73 10 14
74 7 16
78 10 10
69 12 14
74.3 9.5 13.5
It can be seen from Table VIII that:
OTHER
3
5
4
3
3
2
5
4.7
(i) Private Schools have much larger percentages of untrained
science teachers, possibly because of the financial penalties
that untrained teachers experience in State Schools. The
highest is 30% in boys' private schools.
(ii) State Schools are considerably better off with only 10% of
the teachers in Co-ed State Schools being untrained.
(iii) An overall percentage of l3.5% or 229 teachers of science
who are not trained.
22
While it is possible to accept that there is no great need for
teachers of junior classes to necessarily have a completed degree or
diploma in science to do an effective job, teacher traininq is essen-
tial. If teachers wish for the complete professionalism which seems
to be evading them, then it is essential that the first prerequisite
of entry to teaching is that of secondary teacher training.
I hope that in time the requirement of a completed degree or
diploma will also be obligatory.
There are, of course, methods of remedying the lack of training
some teachers have. In-school training is carried out by most
schools, but the full-time, expertise and technical equipment that can
be offered by teachers' colleges is not available, nor are the variety
of experiences that students gain while on their three different
'sections'. The other area of training is that of residential,
one-day, and in-school courses that are run regularly .
TABLE I X.
COURSES ATTENDED DURING THE PAST TWO YEARS BY TEACHERS OF SAMPLE.
1
Residential 197
One-day courses 450
In-school courses 381
2
4 2
402
280
3
6
178
60
More than 3
3
160
61
% of sample involved.
14.6
70.2
46.1
2 Table IX shows that during the last two years only 70.2% of all
teachers of science have attended one or more one-day courses. The
need for in-service courses is a real one and it is pleasing to see
that as from August 1980 all schools will be closed one day per year
so that all teachers may attend an in-service course of their choice.
It seems then, that teachers of science are generally well
qualified and well-trained. It is also apparent that senior science
classes, especially chemistry and biology classes, have very well
2. Refer to the comments made in Chapter 1 regarding this statistic.
qualified teachers . The concentration of poorly qualified teachers
in rural schools is no longer as apparent as it was in 1965 and the
only aspect of qualifications that seems to be a little weak is that
of the numbers of science teachers with degrees or diplomas in
Education. This will be discussed in more detail in Chapter Six.
23

CHAPTER 4.
THE TEACHER OF SCIENCE.
As can be seen from the _previous chapte·r- the teacher of science
is generally well-trained and well-qualified.
The questions that must now be answered are:-
24
1. To what extent is the teacher of science a subject specialist?
2. Is he happy with his present salary and, if not, why?
3. Is he happy with his present situation as a secondary school
science teacher and, if not, why?
4. What things would science teachers most like to see take place
to improve their job as teachers of science?
5. Is he likely to be involved in a Science Teachers' Association?
6. How many science teachers are leaving the profession and to
where are they going?
7. What sized classes are teachers of science experiencing?
Subject Specialization
Table X below outlines the extent of specialization in science
of the teachers in the sample. The extent of specialization is
presented as a ratio of the number of teachers who teach mainly science
to the number of teachers who teach little science.
TABLE X.
EXTENT OF SPECIALIZATION IN SCIENCE.
1954 *
1965 ** 1980
Ratio of teachers who teach mainly science to teachers who teach little science.
10
10
10
18
15
2
* **
E.J. Searle's results.
O. Taylor's results.
This is a dramatic change. There has obviously been a real
movement from the "all rounder", as is the norm in primary schools,
to the "subject specialist".
of factors, e.g.
This could be a result of a variety
(i) Improved qualifications mean that secondary teachers obtain
a degree in one subject area, are thus specialists in this
area, and prefer to teach only their specialist area.
(ii) H.O.Ds like to keep their department as a unit i.e. they
prefer to have all their science teachers teaching only
science. There are reasons for this e.g. fewer problems
with equipment, staff are displaced from their own labor
atories less frequently, they have fewer people to be
responsible to/for.
(iii) The professional snobbery related to the possible status of
being a chemistry teacher, say, rather than a teacher of
general subjects.
(iv) The possible move in smaller schools, with a staff of about
five, to have one teacher teaching all the science and
mathematics.
Whatever the reasons may be there has been a dramatic movement
towards subject specialization with about 80% of our science teachers
teaching all, or nearly all, science classes.
Two other pieces of relevant information were obtained about the
teacher of science:-
(i) 15.5% of the sample are List A teachers. This SU!Jgests
that in a department of ten science teachers an H.O.D. can
expect to have one or two List A teachers who will need
some training and advice.
(ii) 53% of the sample have had less than seven years teaching
experience which suggests that we have a relatively young
group of people teaching science in New Zealand secondary
schools.
SALARIES
25
Perhaps the area that has been most talked about and most pub
licised over the past ten years or more, is that of salaries. Prior
to 1971 salaries of teachers were very low compared to other profess
ions, staffing shortages were chronic, morale was at its lowest ever
and only the very dedicated remained. With a massive boost to
salaries a marked improvement in recruitment and retention was evident
and selection panels of Teachers' College applicants had plenty of
good quality candidates to choose from. Towards the later part of
the seventies salary relativity again fell and once more principals
found it difficult to staff their schools with well qualified, trained,
permanent teachers (see Chapter 1). This was followed in 1979 by
salary increases and cost of living adjustments that resulted in many
teachers receiving gross increases of around 25 per cent. The

situation stabilised a little, but was still felt by many to be far
from ideal.
This survey of science teachers, however, shows that a rather
unexpectedly high per cent of teachers are quite happy with their
present salaries (see Table XI) .
TABLE XI.
TEACHERS OF SCIENCE WHO ARE HAPPY WITH THEIR PRESENT SALARY .
Number Percentage of Sample
Happy 1295 76.4
Not happy 386 22 . 8
Did not respond 15 0.9
Total 1696 100.0
Only 22.8% of the sample were not happy with their present
salary. The two main reasons given were that it was simply "Not
enough!" or that it did not compare well with what one would get in
other occupations where similar qualifications were required. It
should be noted here that many who said it was not enough pointed out
that they were quite happy with their gross salary, but that the tax
was too high.
26
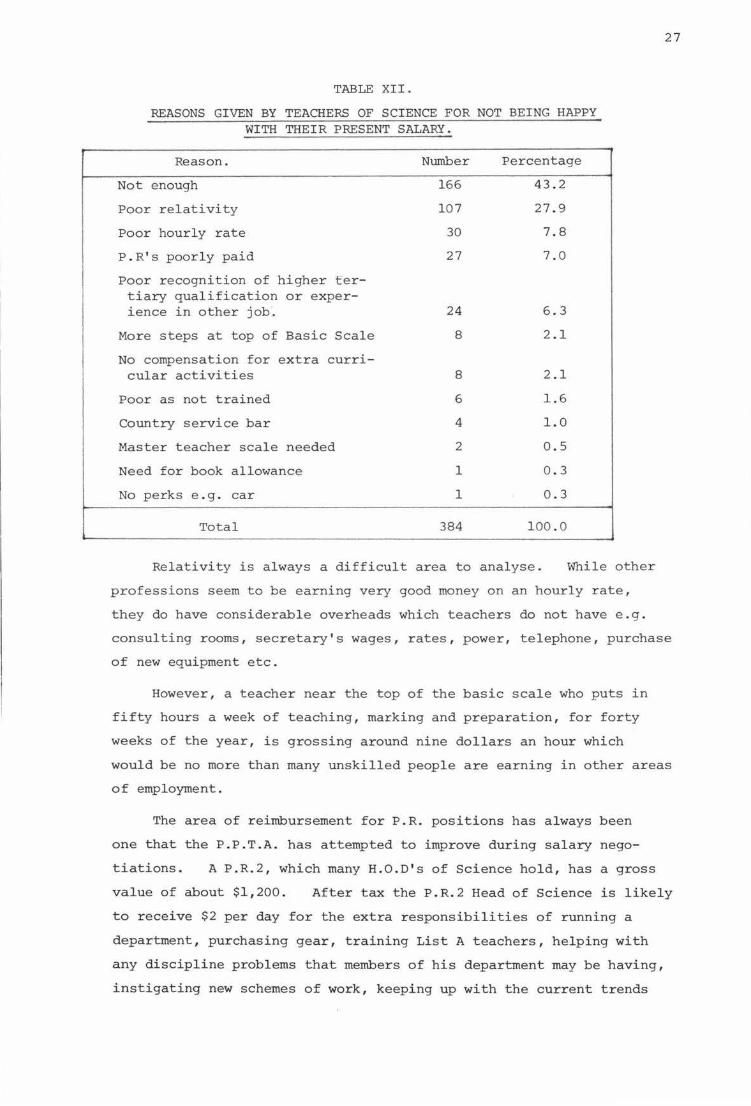
TABLE XII.
REASONS GIVEN BY TEACHERS OF SCIENCE FOR NOT BEING HAPPY WITH THEIR PRESENT SALARY.
Reason.
Not enough
Poor relativity
Poor hourly rate
P.R's poorly paid
Poor recognition of higher tertiary qualification or experience in other job.
More steps at top of Basic Scale
No compensation for extra curri-cular activities
Poor as not trained
Country service bar
Master teacher scale needed
Need for book allowance
No perks e.g. car
Total
Number
166
107
30
27
24
8
8
6
4
2
1
1
384
Percentage
43.2
27.9
7.8
7.0
6.3
2.1
2.1
1.6
1.0
0.5
0.3
0.3
1 00 .0
Relativity is always a difficult area to analyse . While other
professions seem to be earning very good money on an hourly rate,
27
they do have considerable overheads which teachers do not have e.g.
consulting rooms, secretary's wages, rates, power, telephone, purchase
of new equipment etc.
However, a teacher near the top of the basic scale who puts in
fifty hours a week of teaching, marking and preparation, for forty
weeks of the year, is grossing around nine dollars an hour which
would be no more than many unskilled people are earning in other areas
of employment.
The area of reimbursement for P.R. positions has always been
one that the P.P.T.A. has attempted to improve during salary nego-
tiations. A P.R.2, which many H.O.D's of Science hold, has a gross
value of about $1,200. After tax the P.R.2 Head of Science is likely
to receive $2 per day for the extra responsibilities of running a
department, purchasing gear, training List A teachers, helping with
any discipline problems that members of his department may be having,
instigating new schemes of work, keeping up with the current trends
28
in science education and, of course, teaching five science classes.
Attainment of higher tertiary qualifications once one has started
teaching result in small, if any, increments in salary, e.g. the
completion of a Diploma in Education entitles one to the "Service
Increment" of around $500, BUT one does not receive this until one
has been on the top of the basic scale for five years. A wait of
ten years for the B.Sc. or B.A. holder who completes their Dip. Ed.
in their second year of teaching! There is no direct financial gain
for the person who then goes on to complete, say, a Master ' s degree
in Education.
The country service bar is another area of concern. It is
entirely punitive. Teachers who are supposed to provide their
students with positive reinforcement are themselves subjected to
negative reinforcement when it comes to the country service require-
ments. There should be a financial incentive for those who do go to
country schools and not a negative financial 'punishment' for those
who do not choose to go.
The Master Teacher concept is one that needs to be looked at very
closely. At present the only line of advancement is to move out of
the classroom and into administration. Unfortunately, it is to
administrative jobs that some of our best science teachers are going.
It is not difficult to understand this when an H.O.D. Science c~~ ... ,.., increase his gross salary by some $8,000 ~ $9,000 on becoming a
principal of a Class D Secondary School. If he remains in the class-
room his only increases in salary over the next 25-30 years would be
cost of living adjustments.
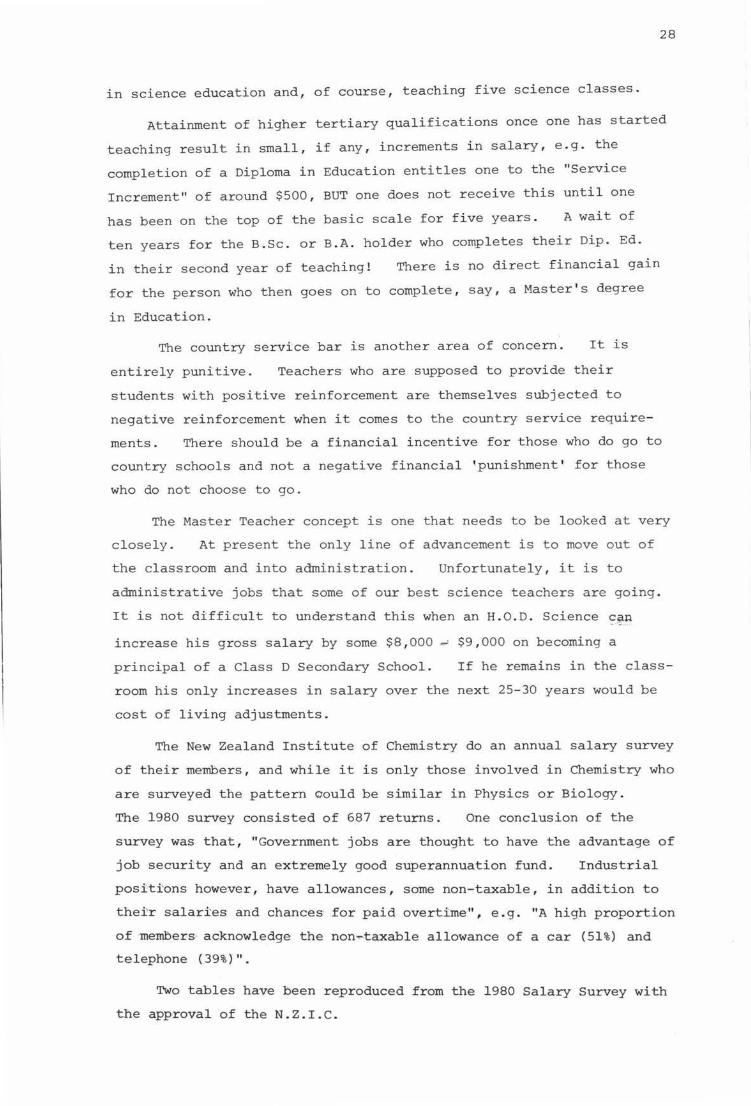
The New Zealand Institute of Chemistry do an annual salary survey
of their members, and while it is only those involved in Chemistry who
are surveyed the pattern oould be similar in Physics or Biology.
The l980 survey consisted of 687 returns. One conclusion of the
survey was that, "Government jobs are thought to have the advantage of
job security and an extremely good superannuation fund. Industrial
positions however, have allowances, some non-taxable, in addition to
their salaries and chances for paid overtime", e.g. "A high proportion
of-members acknowledge the non~taxable allowance of a car (51%) and
telephone (39%)".
Two tables have been reproduced from the 1980 Salary Survey with
the approval of the N.Z.I.C.
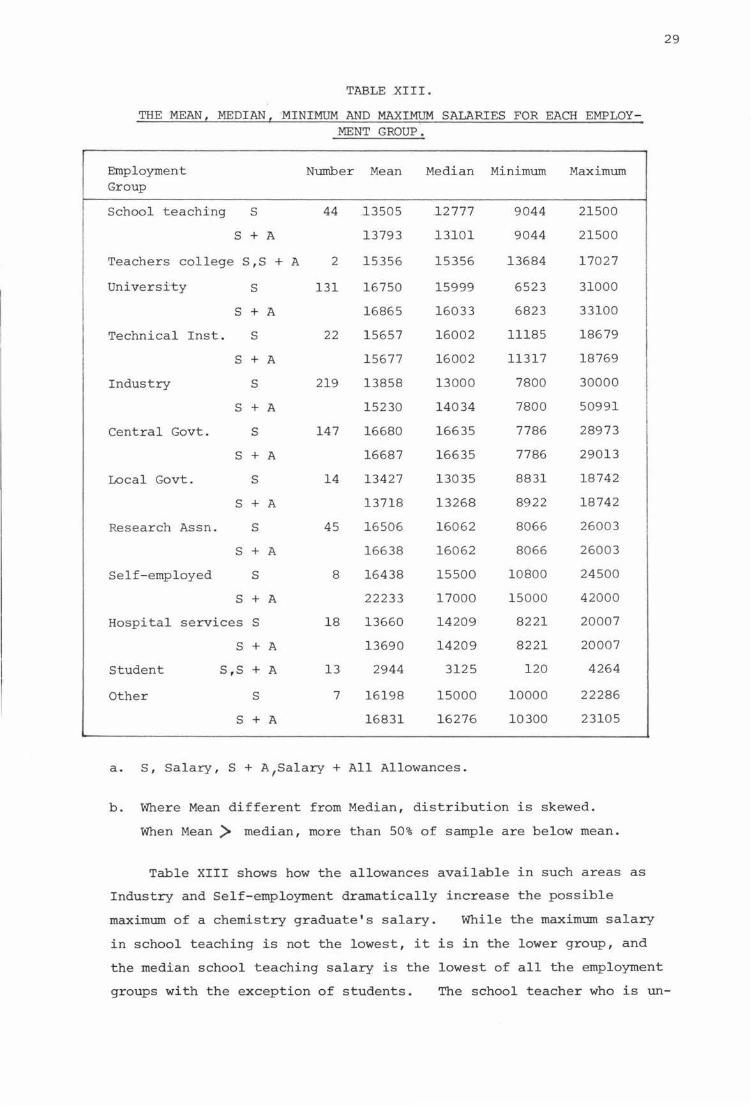
TABLE .XIII.
THE MEAN, MEDIAN, MINIMUM AND MAXIMUM SALARIES FOR EACH EMPLOYMENT GROUP,
Employment Group
School teaching s
S + A
Teachers college s,s + A
Universi'ty s
Technical Inst.
S + A
s
Industry
Central Govt.
Local Govt.
Research Assn.
Self-employed
S + A
s
S + A
s
S + A
s
S + A
s
S + A
s
S + A
Hospital services S
Student
Other
S + A
S,S + A
s
S + A
Number Mean
44
2
131
22
219
147
14
45
8
18
13
7
_]_3505
13793
15356
16750
16865
15657
15677
13858
15230
16680
16687
13427
13718
16506
16638
16438
22233
13660
13690
2944
16198
16831
Median Minimum
_]_2777
13101
15356
15999
16033
16002
16002
13000
14034
16635
16635
13035
13268
16062
16062
15500
17000
14209
14209
3125
15000
16276
9044
9044
13684
6523
6823
11185
11317
7800
7800
7786
7786
8831
8922
8066
8066
10800
15000
8221
8221
120
10000
10300
a. S, Salary, S + A1Salary + All Allowances.
Maximum
21500
21500
17027
31000
33100
18679
18769
30000
50991
28973
29013
18742
18742
26003
26003
24500
42000
20007
20007
4264
22286
23105
b. Where Mean different from Median, distribution is skewed.
When Mean> median, more than 50% of sample are below mean.
Table XIII shows how the allowances available in such areas as
Industry and Self-employment dramatically increase the possible
maximum of a chemistry graduate's salary. While the maximum salary
in school teaching is not the lowest, it is in the lower group, and
the median school teaching salary is the lowest of all the employment
29
groups with the exception of students. The school teacher who is un-

able to obtain the allowances, often non-taxable, that are available
in the private sector, will never be able to increase his salary by
$20,000 plus as some can that are employed in, say, industry.
30
It is very difficult to compare overtime done in industry to that
done in teaching. Many teachers feel that marking and preparation
done out of school time is not overtime, but rather part of the job for
which they, as professionals, are paid. However, Table XIV does show
that those in school teaching and university science teaching put in a
greater percentage of unpaid overtime than those in other areas of
employment.
TABLE XIV .
PERCENTAGE OF UNPAID OVERTIME WORKED.
Time Total School Univer- Industry Central Research hours/week Teaching sity Govt . Assns.
NIL 43.4 45.5 35.1 31.l 66.0 46.7
1 - 3 14.3 4.5 1.5 24.2 15.0 15.6
4 - 6 12.4 9.1 16.8 15.1 7.5 11.1
7 - 9 8.8 6.8 9 . 9 11.9 4.1 11.1
10 - 14 9.1 13.6 13. 7 8 . 2 3.4 6 .7
15 + 10.3 15.9 18.3 9 .1 3.4 6 .7
Unspecified 1.6 4.5 4.7 0.4 0.6 2.2
THE PRESENT SITUATION
Perhaps of more importance to the teacher of science is not his
salary, but rather his conditions of employment.
TABLE XV.
TEACHERS OF SCIENCE WHO, EXCLUDING SALARY CONDITIONS, ARE REASONABLY HAPPY WITH THEIR PRESENT SITUATION AS POST~
PRIMARY TEACHERS OF SCIENCE.
Number Percentage of Sample.
Happy 1092 64.4
Not happy 590 34.8
Did not respond 14 0.8
TOTAL 1696 100.0
Table XV shows that 64.4% of the sample were reasonably happy
with their situation as teachers of science while Table XVI on the
following page lists the reasons given by the 590 teachers (34.8%)
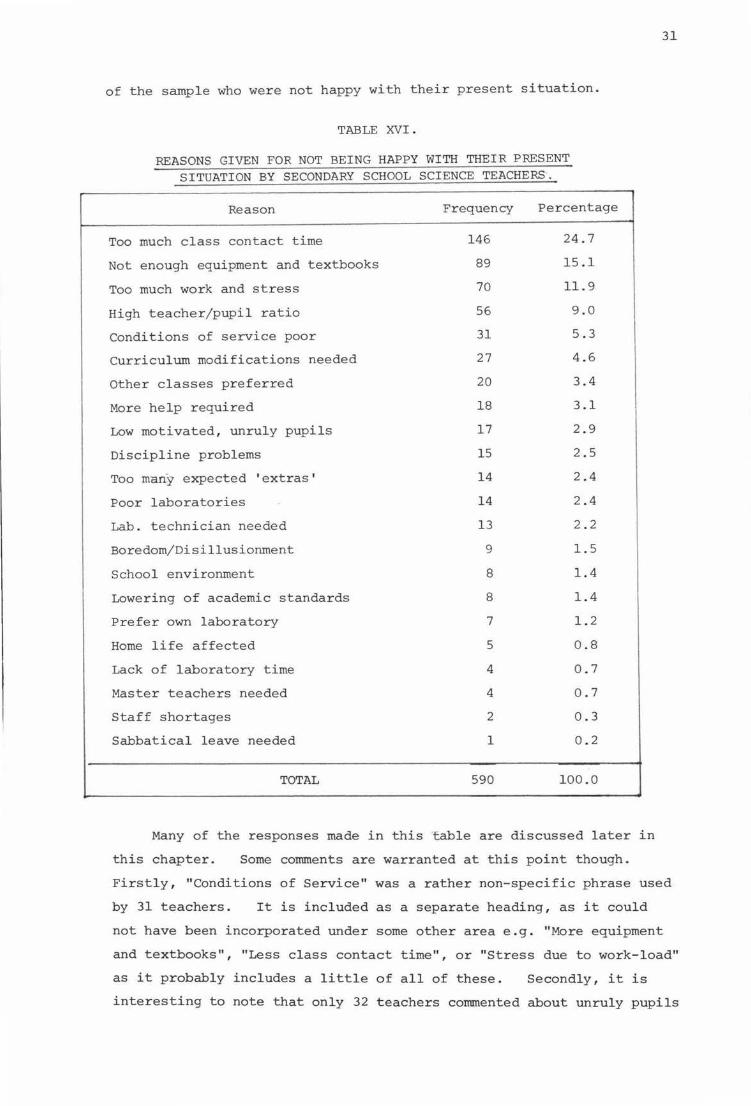
of the sample who were not happy with their present situation.
TABLE XVI.
REASONS GIVEN FOR NOT BEING HAPPY WITH THEIR PRESENT SITUATION BY SECONDARY SCHOOL SCIENCE TEACHERS'.
Reason
Too much class contact time
Not enough equipment and textbooks
Too much work and stress
High teacher/pupil ratio
Conditions of service poor
Curriculum modifications needed
Other classes preferred
More help required
Low motivated, unruly pupils
Discipline problems
Too many expected 'extras'
Poor laboratories
Lab. technician needed
Boredom/Disillusionment
School environment
Lowering of academic standards
Prefer own laboratory
Home life affected
Lack of laboratory time
Master teachers needed
Staff shortages
Sabbatical leave needed
TOTAL
Frequency
146
89
70
56
31
27
20
18
17
15
14
14
13
9
8
8
7
5
4
4
2
1
590
Percentage
24.7
15.l
11.9
9.0
5.3
4.6
3.4
3.1
2.9
2.5
2.4
2.4
2.2
1.5
1.4
1.4
1.2
0.8
0.7
0.7
0.3
0.2
100.0
Many of the responses made in this ·table are discussed later in
this chapter. Some comments are warranted at this point though.
31
Firstly, "Conditions of Service" was a rather non-specific phrase used
by 31 teachers. It is included as a separate heading, as it could
not have been incorporated under some other area e.g. "More equipment
and textbooks", "Less class contact time", or "Stress due to work-load"
as it probably includes a little of all of these. Secondly, it is
interesting to note that only 32 teachers commented about unruly pupils
or discipline problems . While it is realised that some of the other
areas mentioned may well result in discipline problems e.g. high
pupil/teacher ratios or lack of preparation time, it is also possible
that teachers do not wish to state - or even accept themselves -
that they have discipline problems. Discipline problems are what
other teachers have! Thirdly, this table and the next one (i.e.
Table XVII) both highlight the need for less class contact time,
better equipment and textbooks, lower teacher/pupil ratios and more
technician assistance. In both t 'ables these four account for more
than half of the responses made.
32
Table XVII on the following page lists the responses given by all
teachers in the sample to the question: "Name the one thing you
would most like to see take place to improve your job as a teacher of
science".
All the responses made to this question have been included for
they represent a hierarchical ordering of future changes to science
education as recommended b y seventy percent of the teachers of science
in New Zealand s econdary schools.
10.2% or 174 teachers made no response to this question for the
reason that they did not feel that the y were science teachers. Many
were taking one science class to help with staff shortages in the
science department. 361 science teachers felt that less class contact
time was essential in order to improve their job as teachers of science.
The largest problem for teachers who truly attempt to enter into
the spirit of 'learning by doing~ or enquiry based methods of science
instruction1 is that all their students are doing practical work and
each student is often doing something different. There is a tremen-
dous amount of teacher preparation necessary for this, gear has to be
set up and tidied away as each class comes and goes. For forty
minute periods the problem is compounded. The preparation involved
becomes so onerous for a normal teaching programme - let alone a pupil
centred,enquiry-base~ one~ that practical work is avoided. Thus,
teachers are avoiding the one thing that science educators agree is
the best learning environment simply because of lack of non-contact
time and technician assistance. The need for technician assistance
was fourth highest on the list of improvements needed, Many smaller
schools are not eligible for a part-time laboratory technician and thus
must make do themselves or enlist the aid of lab. rnoni tors. However,

TABLE XVII.
RESPONSES GIVEN TO THE QUESTION~ "NAME THE ONE THING YOU WOULD MOST LIKE TO SEE TAKE PLACE TO IMPROVE YOUR JOB AS A
TEACHER OF SCIENCE".
Improvement needed.
Less class contact time
More equipment, facilities and textbooks
Lower teacher/pupil ratios
Increased lab . technician time
Science curricula changes
More laboratory time
More refresher courses
Improvement in student attitudes
Sabbatical leave needed
Improvement in science dept. organisation
Laboratory design
Non-compulsory education introduced
Slow learner courses needed
A more academic attitude
Not to teach science
More assistance from Dept. of Education
Less exam emphasis
No clerical or administrative tasks
Communication between Universities, l Teachers' Colleges and Schools f Streamed classes needed
More help
Better qualified colleagues
Improvement in pupils' English or Maths.
Own Laboratory
Master teacher needed
Compensation for extracurricular activities
U.E. moved to F.7
No complaints
More P.R's in science department
Educational daytime T.V. needed
Better library facilities
No response
TOTAL
Frequency
361
303
231
2.14
74
68
34
32
29
29
22
16
13
12
8
8
8
8
7
7
6
6
5
5
4
3
3
2
2
l
l
174
1696
Percentage
21. 3
17.8
13.6
.12. 6
4.3
4.0
2.0
1.9
1. 7
1. 7
1. 3
0.9
0.8
0.7
0.5
0.5
0.5
0.5
0.4
0.4
0.4
0.4
0.3
0.3
0.2
0.2
0.2
0.1
0.1
0.1
0.1
10.2
100.0
33
there is a limit to what the latter can be expected to do and they
need a considerable amount of training which again uses up the few
free lunch hours that the teacher of science has.
34
The need for more money to purchase equipment, improve facilities
and upgrade science textbooks was the second most important area need
ing improvement. Some private schools and smaller state schools
appear to be very badly off in this area. Science teaching without
apparatus is a fraud. The nature of science demands that students
observe natural phenomena for themselves. If those crying "back to
basics" have this in mind then they would deserve support. Ideally
each student should have a piece of apparatus to himself, but there
are many reasons why this is usually impossible. At best students
will work in two's or three's, and to economise on time and equipment
teachers may perform demonstration experiments - one piece of equip
ment for the whole class. This is not to deny that there are many
who improvise brilliantly with apparatus - but there is a limit to
what can be done with cardboard, rubber bands and jam jars.
The third highest priority was that of smaller teacher/ pupil
ratios. This will be discussed in a later part of this chapter.
The other areas suggested are by no means any less worthy than
the four already mentioned and it was interesting to note that only
two teachers out of 1696 had no complaints at all about their present
situation.
Perhaps the last word should be left with the obviously dis
illusioned teacher who simply said that the one thing he needed to
improve his job as a teacher of science was "A visit from God!"
SCIENCE TEACHER ASSOCIATIONS.
The New Zealand Science Teachers' Association (N.Z.S.T.A.) is a
reasonably active group with branches throughout the country. It
aims to bring science teachers together on usually a monthly basis to
discuss problems of science education, listen to guest speakers, visit
places of interest and to just get together over a cup of coffee to
swap good and bad ideas.
For many science teachers it can be a very heartening experience
to find that you are not the only one with a class of forty slow-stream
third formers, no equipment and a textbook with a reading age three
years above that of your best student.
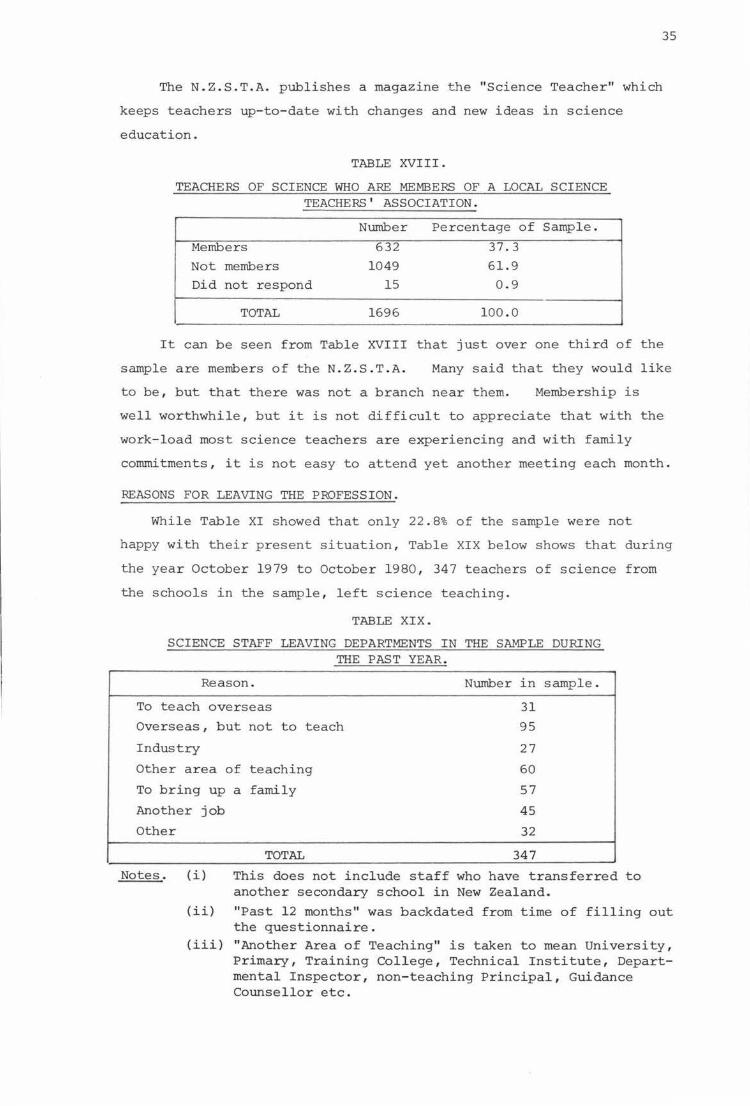
35
The N.Z.S.T.A. publishes a magazine the "Science Teacher" which
keeps teachers up-to-date with changes and new ideas in science
education.
TABLE XVIII.
TEACHERS OF SCIENCE WHO ARE MEMBERS OF A LOCAL SCIENCE TEACHERS' ASSOCIATION.
Number Percentage of Sample.
Members 632 37.3
Not members 1049 61.9
Did not respond 15 0.9
TOTAL 1696 100.0
It can be seen from Table XVIII that just over one third of the
sample are members of the N.Z.S.T.A. Many said that they would like
to be, but that there was not a branch near them. Membership is
well worthwhile, but it is not difficult to appreciate that with the
work-load most science teachers are experiencing and with family
commitments, it is not easy to attend yet another meeting each month.
REASONS FOR LEAVING THE PROFESSION.
While Table XI showed that only 22.8% of the sample were not
happy with their present situation, Table XIX below shows that during
the year October 1979 to October 1980, 347 teachers of science from
the schools in the sample , left science teaching.
TABLE XIX.
SCIENCE STAFF LEAVING DEPARTMENTS IN THE SAMPLE DURING THE PAST YEAR.
Reason. Number in sample.
To teach overseas 31
Overseas, but not to teach 95
Industry 27
Other area of teaching 60
To bring up a family 57
Another job 45
Other
Notes.
32
TOTAL 347
( i) This does not include staff who have transferred to another secondary school in New Zealand.
(ii) "Past 12 months" was backdated from time of filling out the questionnaire.
(iii) "Another Area of Teaching" is taken to mean University, Primary, Training College, Technical Institute, Departmental Inspector, non-teaching Principal, Guidance Counsellor etc.
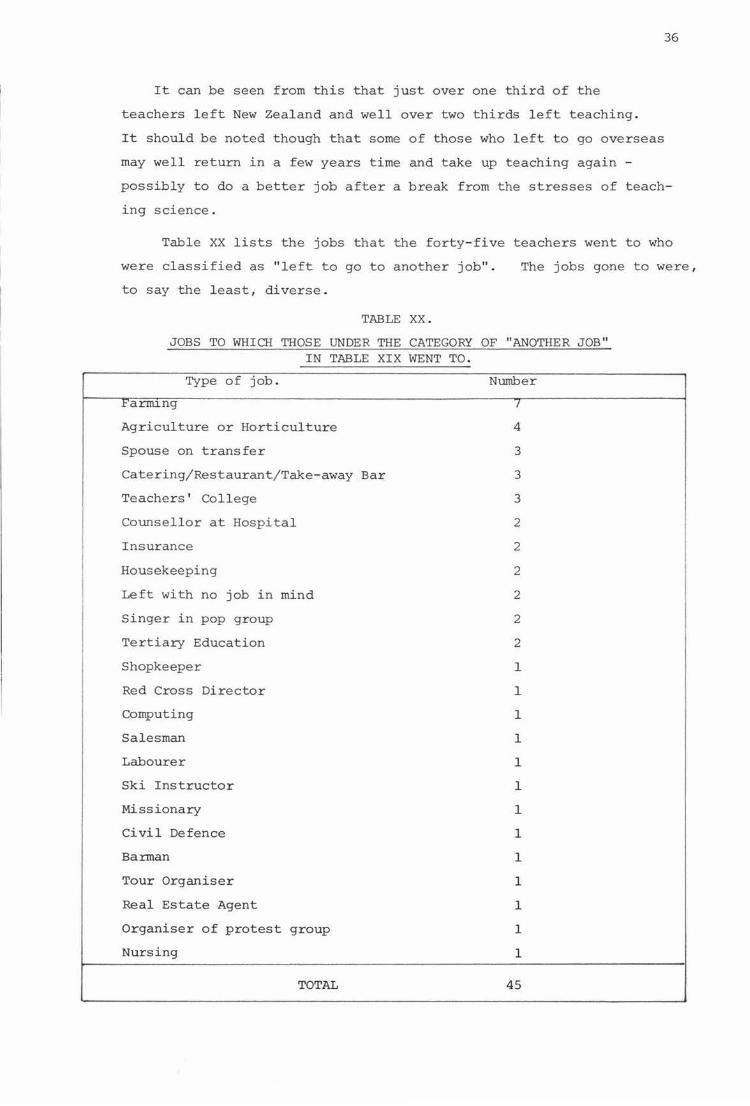
It can be seen from this that just over one third of the
teachers left New Zealand and well over two thirds left teaching.
36
It should be noted though that some of those who left to go overseas
may well return in a few years time and take up teaching again -
possibly to do a better job after a break from the stresses of teach
ing science.
Table XX lists the jobs that the forty -five teachers went to who
were classified as "left to go to another job".
to say the least, diverse.
TABLE XX.
The jobs gone to were,
JOBS TO WHICH THOSE UNDER THE CATEGORY OF "ANOTHER JOB" IN TABLE XIX WENT TO.
Type of job.
l"a:rnung
Agriculture or Horticulture
Spouse on transfer
Catering/Restaurant/Take-away Bar
Teachers' College
Counsellor at Hospital
Insurance
Housekeeping
Left with no job in mind
Singer in pop group
Tertiary Education
Shopkeeper
Red Cross Director
Computing
Salesman
Labourer
Ski Instructor
Missionary
Civil Defence
Barman
Tour Organiser
Real Estate Agent
Organiser of protest group
Nursing
TOTAL
Number
I
4
3
3
3
2
2
2
2
2
2
1
1
1
1
l
1
1
1
1
1
1
1
1
45
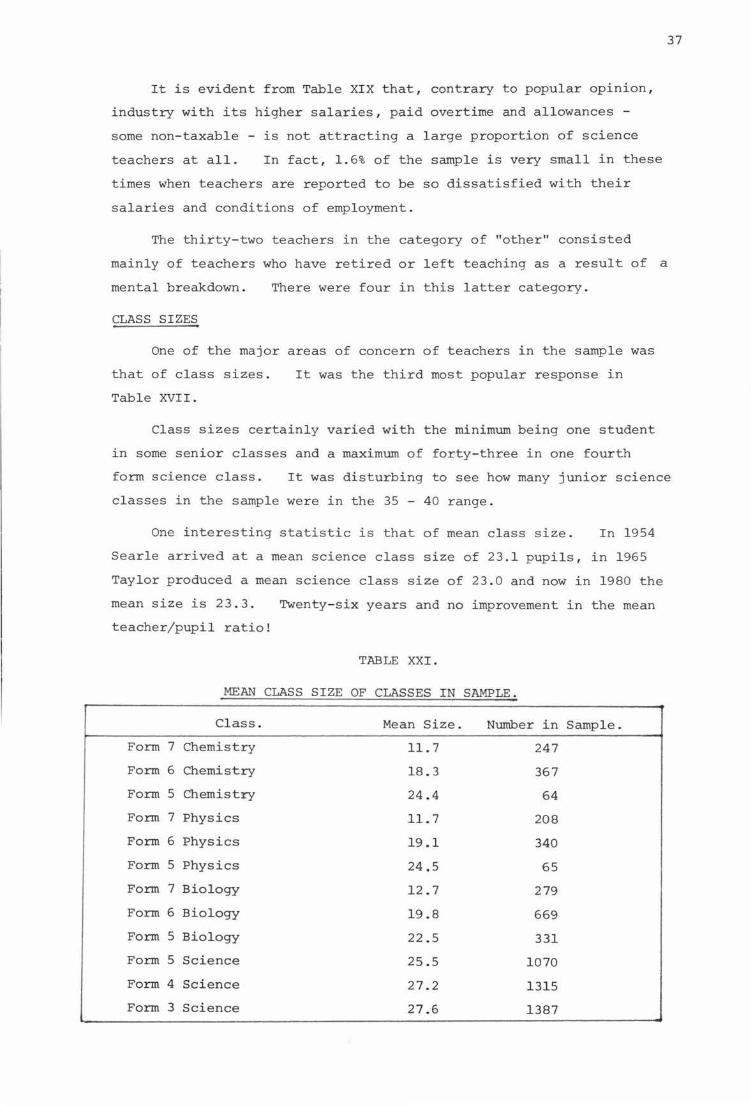
It is evident from Table XIX that, contrary to popular opinion,
industry with its higher salaries, paid overtime and allowances -
some non-taxable - is not attracting a large proportion of science
teachers at all. In fact, 1.6% of the sample is very small in these
times when teachers are reported to be so dissatisfied with their
salaries and conditions of employment.
The thirty-two teachers in the category of "other" consisted
mainly of teachers who have retired or left teaching as a result of a
mental breakdown. There were four in this latter category.
CLASS SIZES
One of the major areas of concern of teachers in the sample was
that of class sizes.
Table XVII.
It was the third most popular response in
Class sizes certainly varied with the minimum being one student
in some senior classes and a maximum of forty-three in one fourth
37
form science class. It was disturbing to see how many junior science
classes in the sample were in the 35 - 40 range.
One interesting statistic is that of mean class size. In 1954
Searle arrived at a mean science class size of 23.l pupils , in 1965
Taylor produced a mean science class size of 23.0 and now in 1980 the
mean size is 23.3.
teacher/pupil ratio!
Twenty-six years and no improvement in the mean
TABLE XXI.
MEAN CLASS SIZE OF CLASSES IN SAMPLE.
Class. Mean Size. Number in Sample.
Form 7 Chemistry 11. 7 247
Form 6 Chemistry 18.3 367
Form 5 Chemistry 24.4 64
Form 7 Physics 11. 7 208
Form 6 Physics 19.1 340
Form 5 Physics 24,5 65
Form 7 Biology 12.7 279
Form 6 Biology 19.8 669
Form 5 Biology 22.5 331
Form 5 Science 25.5 1070
Form 4 Science 27 .2 1315
Form 3 Science 27.6 1387

38
Table XXI lists the mean class sizes of the classes in the
sample. Perhaps the comment many teachers would make is: "I seem to
teach a lot more students than that." It should be remembered that
there are many small or rural schools in the sample with very small
numbers of senior pupils. It is not, however, this end of the con-
tinuurn which is in need of immediate attention, but rather the end
where junior science classes are around 40 pupils. This is quite
unacceptable. No science teacher can adequately control, instruct
and carry out pupil experimentation safely and effectively with a class
of forty third or fourth formers. Principals would be hard pressed
to adequately justify science classes of this size, even if they do
have acute staff shortages.
The science teacher has difficulties which are unique. Every
subject has its special burdens: the technical teacher has his work
shop, tools and materials to organise. Language and mathematics
teachers have much marking. English teachers have to correct long
essays. Art teachers have to store work and organise materials, and
protect much easily purloined and attractive equipment. The science
teacher fights his or her battle on many fronts simultaneously. There
is both the purchasing and the day to day distribution of apparatus
and consumables. Visual aids are important, and it takes time to make
and store them. Textbooks are often not suitable or even available,
and the teacher is forced to write study sheets. With the growth of
individualised learning, the construction of experiment worksheets is
almost a full-time job. Seldom is a laboratory entirely self
sufficient, and equipment has continually to travel from one room to
another. Equipment repair is time-consuming. Due to the shortage of
staff, science classes are often over-large, and the teacher is under
even IDore pressure because the subject is more intellectually demanding
than some others and this does not improve pupil behaviour. Plenty
of suitable experimental work can help to minimise the problems, but
this in turn requires good equipment, technical assistance and non-con
tact ti-me to allow the teacher to prepare for,and to clean up after,
each practical session.

39
CHAPTER 5.
THE SCIENCE DEPARTMENT.
Many of the staffing problems experienced by science departments
result from the science departments themselves. If a new science
teacher enters a school where the science department lacks any cohesion,
where the teachers do their own 'thing', where there is no sharing of
ideas and resources, where there is no real leadership and help from
the H.O.D., where laboratories are scarce and poorly equipped, where
there is no ancillary assistance in the form of a laboratory technician,
where the 'better' classes are taken by senior science teachers and
where there are no efforts to improve the present schemes of work or
to try new methods of presenting the science cirriculum, then any
enthusiasm the new recruit may have had will be precipitated first as
confusion, then disillusionment and finally as a complete rejection of
science teaching as a career.
Many of the problems and frustrations science teachers face to-
day are major ones, but most are surmountable if he or she is a
member of a well-lead, co-operative, sharing, and concerned team of
science teachers who aim to make the best of the present situation, but
are intolerant of the suggestion that nothing can be done to improve it.
Thus, the morale of science departments is dependent to some ex
tent on staffing shortages, but can also produce these staffing short
ages.
The aim of this chapter is to look in more detail at the area of
staff shortages, to assess the av.ailability and types of relievers and
part-times available in science, to look at the availability of equip
ment, aids and resources and finally to look at some subjective comments
made by H.O.Ds · of science.
STAFF SHORTAGES
One aim of the questionnaire that was completed by the H.O.Ds
was to determine the total number of class contact hours - per week,
that each school was short by.

TABLE XXII.
ACTUAL SHORTAGES, IN CLASS CONTACT HOURS (PER WEEK), OF SCIENCE TEACHERS.
Number of Total Number Schools. of Hours.
Boys, Private 2 6
Girls, Private 7 92
Co-ed, Private 4 72
Girls, State 7 167
Boys, State 8 66
Co-ed, State 42 620
F. 1-7 & D.H.S. 18 147
TOTAL 88 1170
Table XXII shows that 88 of the 271 schools in the sample have
actual shortages of science teachers. This amoun1s to a total of
1170 hours or 55 - 60 full~time science teachers. D.H.S. and F. 1-7
schools again have quite a large proportion of the shortages due
probably to their isolation and small numbers of senior students,
which often results in students without teachers.
One method of counteracting this deficiency of science teachers
40
is to recruit teachers from overseas. As can be seen from Table XXIII
below, the number of shortages would be twice the above value if the
54 science teachers from overseas had not been recruited.
TABLE XXIII.
TEACHERS RECRUITED FROM OVERSEAS DURING THE 12 MONTHS FROM SEPTEMBER 1979 TO SEPTEMBER 1980.
Number of Schools Total Number Recruiting. Recruits.
Boys, Private 4 5
Girls, Private 3 3
Co-ed, Private 2 3
Girls, State 2 3
Boys, State 3 3
Co-ed, State 22 35
F. l-7 & D.H.S. 2 2
TOTAL 38 54
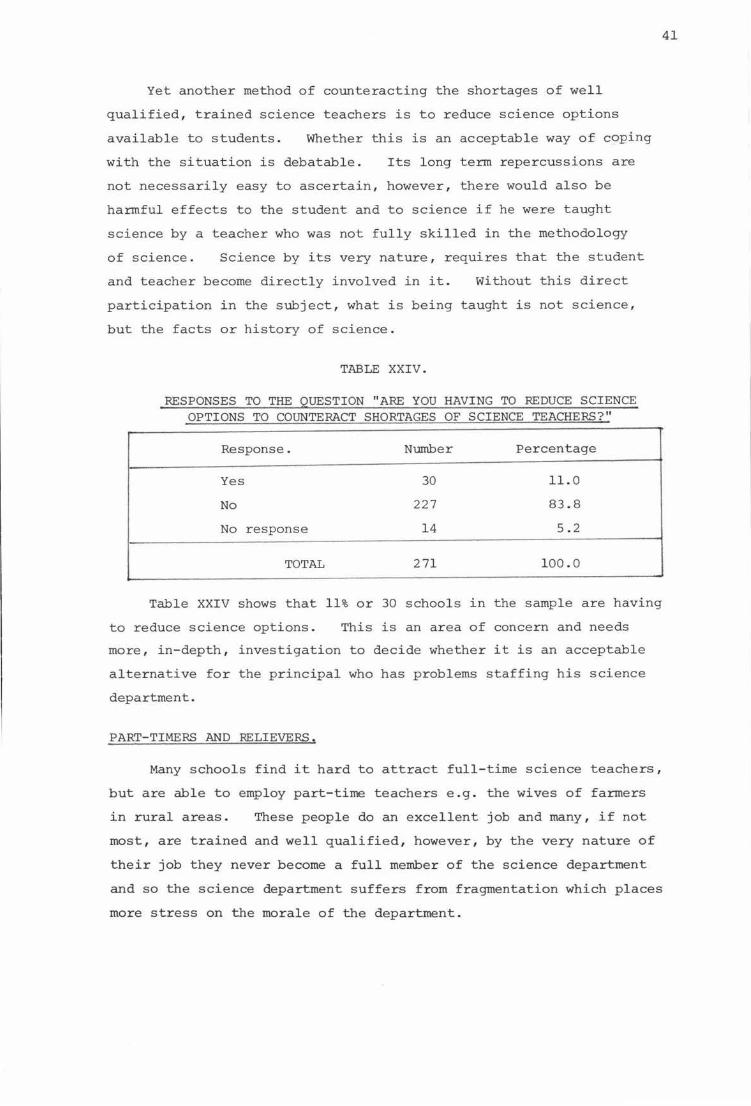
Yet another method of counteracting the shortages of well
qualified, trained science teachers is to reduce science options
available to students. Whether this is an acceptable way of co£ing
with the situation is debatable. Its long term repercussions are
not necessarily easy to ascertain, however, there would also be
harmful effects to the student and to science if he were taught
science by a teacher who was not fully skilled in the methodology
of science. Science by its very nature, requires that the student
and teacher become directly involved in it. Without this direct
participation in the subject, what is being taught is not science,
but the facts or history of science.
TABLE XXIV.
RESPONSES TO THE QUESTION "ARE YOU HAVING TO REDUCE SCIENCE OPTIONS TO COUNTERACT SHORTAGES OF SCIENCE TEACHERS?"
Response. Number Percentage
Yes 30 11.0
No 227 83.8
No response 14 5.2
TOTAL 271 100.0
Table XXIV shows that 11% or 30 schools in the sample are having
to reduce science options. This is an area of concern and needs
more, in-depth, investigation to decide whether it is an acceptable
alternative for the principal who has problems staffing his science
department.
PART-TIMERS AND RELIEVERS,
Many schools find it hard to attract full-time science teachers,
but are able to employ part-time teachers e.g. the wives of farmers
in rural areas. These people do an excellent job and many, if not
most, are trained and well qualified, however, by the very nature of
their job they never become a full member of the science department
and so the science department suffers from fragmentation which places
more stress on the morale of the department.
41
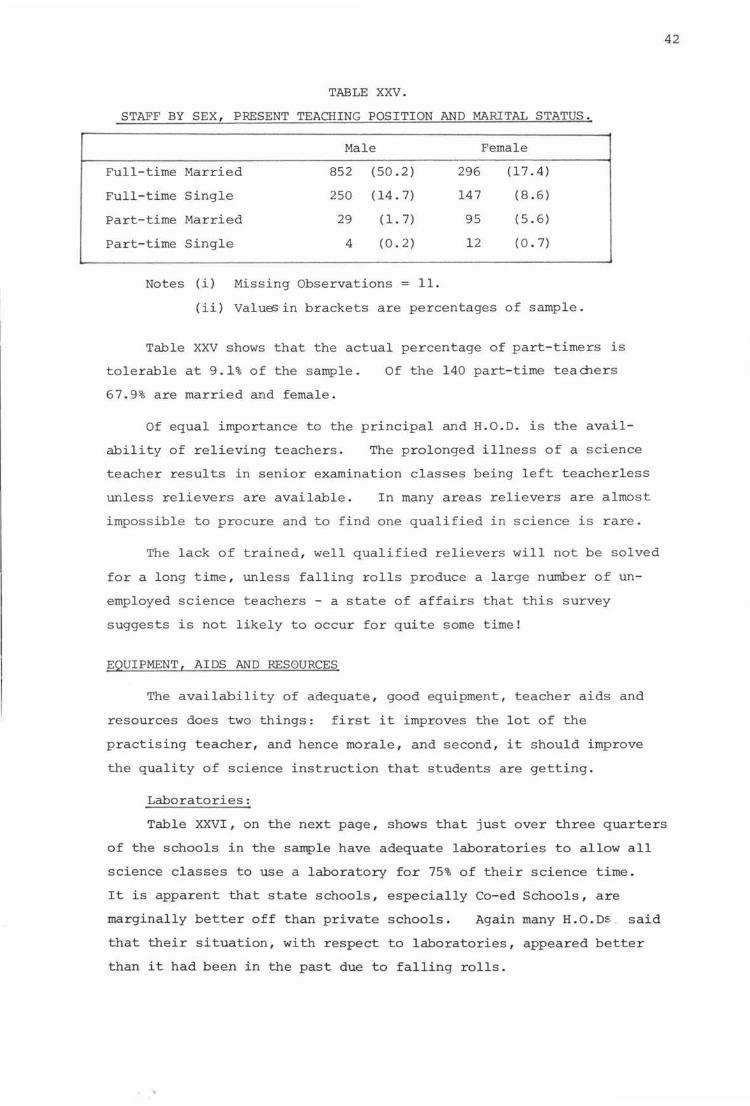
TABLE XXV.
STAFF BY SEX, PRESENT TEACHING POSITION AND MARITAL STATUS.
Male Female
Full-time Married 852 (50.2) 296 (17.4)
Full-time Single 250 ( 14. 7) 147 ( 8 .6)
Part-time Married 29 ( 1. 7) 95 ( 5. 6)
Part-time Single 4 (0. 2) 12 (0. 7)
Notes (i) Missing Observations= 11.
(ii) Valu~in brackets are percentages of sample.
Table XXV shows that the actual percentage of part-timers is
tolerable at 9.1% of the sample.
67.9 % are married and female.
Of the 140 part-time teachers
Of equal importance to the principal and H.O.D. is the avail-
ability of relieving teachers. The prolonged illness of a science
teacher results in senior examination classes being left teacherless
unless relievers are available. In many areas relievers are almost
impossible to procure and to find one qualified in science is rare.
The lack of trained, well qualified relievers will not be solved
for a long time, unless falling rolls produce a large number of un
employed science teachers - a state of affairs that this survey
suggests is not likely to occur for quite some time!
EQUIPMENT, AIDS AND RESOURCES
The availability of adequate, good equipment, teacher aids and
resources does two things: first it improves the lot of the
practising teacher, and hence morale, and second, it should improve
the quality of science instruction that students are getting.
Laboratories:
42
Table XXVI, on the next page, shows that just over three quarters
of the schools in the sample have adequate laboratories to allow all
science classes to use a laboratory for 75% of their science time.
It is apparent that state schools, especially Co-ed Schools, are
marginally better off than private schools. Again many H.O.Ds said
that their situation, with respect to laboratories, appeared better
than it had been in the past due to falling rolls.

TABLE XXVI
RESPONSE MADE TO THE QUESTION: "DO YOU HAVE ADEQUATE LABORATORIES TO ALLOW ALL SCIENCE CLASSES TO USE A LABORATORY FOR
75 % OF THEIR SCIENCE TIME" BY SCHOOL TYPE,
( Percentages )
Boy s Girls Co-ed Boys Girls Co-ed D.H.S. & Total Respon se Private Private Private State State State F. 1-7. Overall.
Yes 65 65 67 67 78 83 74 76.6
No 35 35 33 33 22 17 26 23.4
100.0
Senior Studies rooms:
Most n ew schools are now being equipped with s e nior studies
blocks. These blocks usually contain senior laboratories e s p ecial ly
for form 6 and 7 Chemistry, Physics and Biology. There i s often
one or two small seminar rooms and a courtyard which can be used to
set up an aviary, animal pens and fish pond, if so desired. These
blocks are well equipped with quite sophisticated apparatus . Older
schools are able to apply for a senior s tudies modification to bring
the ir p r e s e nt laboratories up to a s tandard s imilar to t hose being
built in n ew schools.
TABLE XXVII
SCHOOLS WITH SENIOR STUDIES ROOM(S) FOR SCIENCE SUBJECTS BY SCHOOL TYPE.
Boys Girls Co-ed Boy s Girls Co-ed D.H.S. & Total. Private Private Private State State State F . 1-7.
Number l 0 l 4 7 42 3 64
(5.0) (0) ( 14. 3) ( 2 3 . 2) ( 30 . 4) ( 32 .1) ( 6. 5) (23.6)
Note: Figures in brackets are percentages of total sample.
Table XXVII lists the numbers of schools in the sample who have
43
such laboratories. It is understandable that the greatest proportion
of these are in Co-ed State Schools as this is the type of school that
is being built at present and hence the sort of school which is most
likely to have a senior studies block.
Audio-Visual Aids:
To most science teachers audiO'll'isual aids probably include: an
overhead projector, a slide projector, possibly a tape recorder and
the availability of a movie projector. A recent addition to the audio-
visual aids line up has been the closed circuit television with its
movie camera and film cassettes. This equipment can be used to record
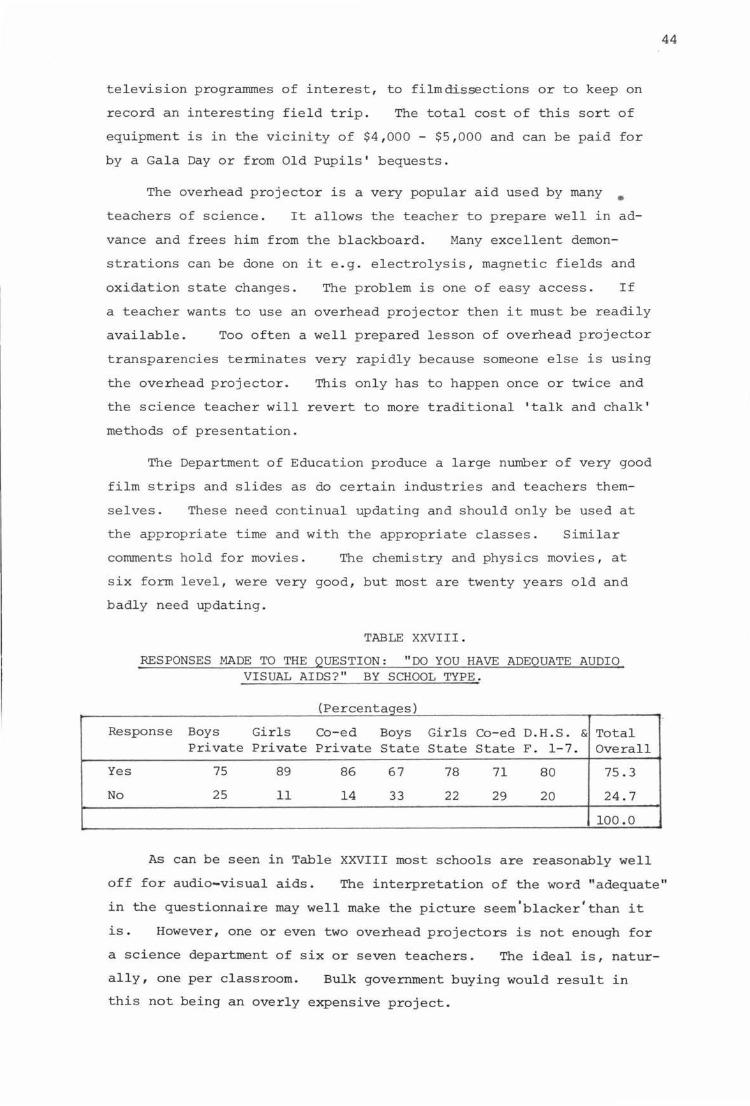
television programmes of interest, to filmdissections or to keep on
record an interesting field trip. The total cost of this sort of
equipment is in the vicinity of $4,000 - $5,000 and can be paid for
by a Gala Day or from Old Pupils' bequests.
The overhead projector is a very popular aid used by many • teachers of science. It allows the teacher to prepare well in ad-
vance and frees him from the blackboard. Many excellent demon-
strations can be done on it e.g. electrolysis, magnetic fields and
oxidation state changes. The problem is one of easy access. If
a teacher wants to use an overhead projector then it must be readily
available. Too often a well prepared lesson of overhead projector
transparencies terminates very rapidly because someone else is using
the overhead projector. This only has to happen once or twice and
the science teacher will revert to more traditional 'talk and chalk'
methods of presentation.
The Department of Education produce a large number of very good
film strips and slides as do certain industries and teachers them-
selves. These need continual updating and should only be used at
the approp riate time and with the appropriate classes. Similar
comments hold for movies. The chemistry and physics movies, at
six form level, were very good, but most are twenty years old and
badly need updating.
TABLE XXVIII.
RESPONSES MADE TO THE QUESTION: "DO YOU HAVE ADEQUATE AUDIO VISUAL AIDS?" BY SCHOOL TYPE.
(P t ercen aqes
Response Boys Girls Co-ed Boys Girls Co-ed D.H.S. & Total Private Private Private State State State F. 1-7. Overall
Yes 75 89 86 67 78 71 80 75.3
No 25 11 14 33 22 29 20 24.7
100.0
44
As can be seen in Table XXVIII most schools are reasonably well
off for audio-visual aids. The interpretation of the word "adequate"
in the questionnaire may well make the picture seem1
blacker'than it
is. However, one or even two overhead projectors is not enough for
a science department of six or seven teachers. The ideal is, natur-
ally, one per classroom. Bulk government buying would result in
this not being an overly expensive project.
45
Many schools, especially the private ones, seem to be well
off in this area as government supplies of audio-visual equipment have
been supplemented using money from fund raising activities, old
pupils' bequests and donations. The main area of concern is for the
24.7% who did not have adequate audio-visual aids!
Teacher Aids;
Very few teachers of science would hesitate in agreeing that a
well trained laboratory technician is essential in any science de
partment. They need not be full-time, but their availability for
a few hours a day makes life for the teacher of science much more
acceptable. While pupil laboratory monitors can do an excellent job
in keeping the laboratory tidy, moving gear from lab. to lab. and in
preparing simple experimental gear the laboratory technician is
needed to prepare standard solutions, make agar plates, do glass
blowing, mend electrical equipment and help in the ordering of new
equipment to name but a few tasks.
From Table XXIX on the following page it can be seen that only
189 schools (70 % of the sample) have a laboratory technician and
most of these are part-time and unqualified. Pupil laboratory moni
tors are only used by 40% of the schools in the sample. Well
trained, conscientious lab. monitors can be a valuable asset to any
science department.
The availability of a remedial or accelerant teacher to help those
science students who are less able or who are particularly gifted is
extremely limited. This is an area that needs much more attention;
particularly where non-streaming of classes is practised. Individ-
ualised instruction programmes can help to cope with the differences
in ability and relevant past experiences of the students, but such
programmes require a lot of preparation and most science teachers
would simply not have the time available that is necessary to imple-
ment them. Perhaps a well organised science department could make
such a programme a group activity, where two or three teachers try
it initially with one class level and expand the project from there,
BUT more time, more preparation, more meetings and still five other
classes to teach!
Meetings:
Communication problems can be a major factor in creating poor
morale. The need for formal and informal meetings to keep everyone
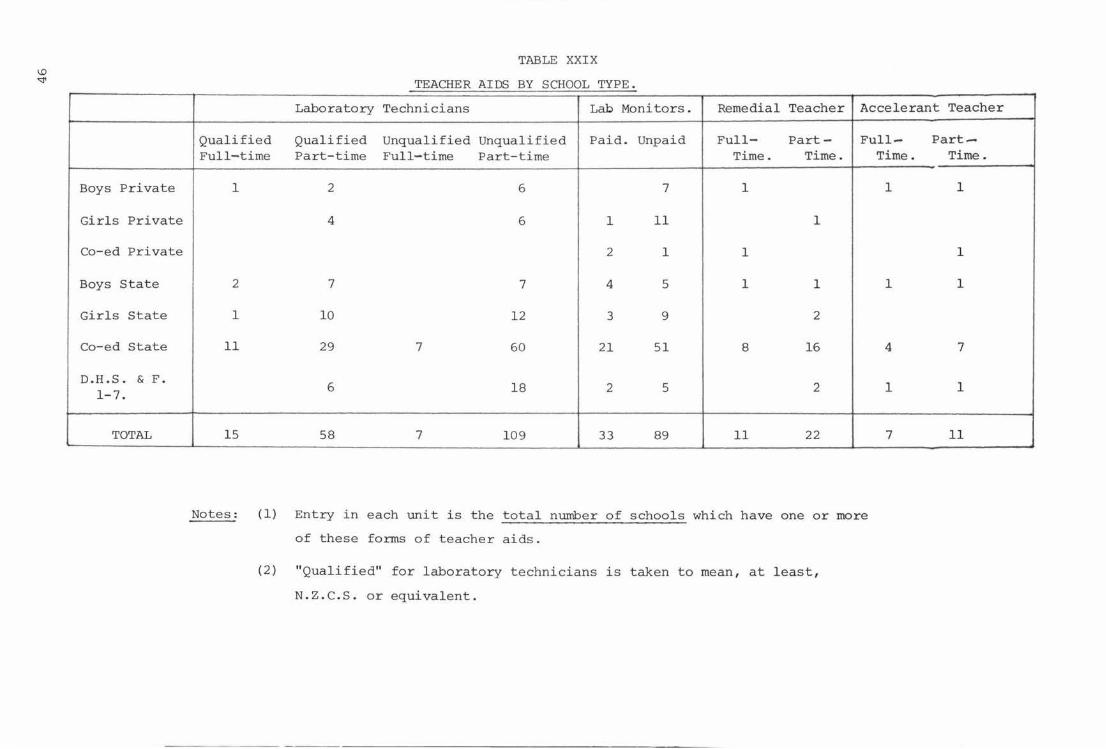
\.0
""'
Boys Private
Girls Private
Co-ed Private
Boys State
Girls State
Co-ed State
D.H.S. & F. 1-7.
TOTAL
TABLE XXI X
TEACHER AIDS BY SCHOOL TYPE.
Laboratory Technicians Lab Monitors. Remedial Teacher Accelerant Teacher
Qualifie d Qualified Unqualified Unqualifie d Paid. Unp aid Full- Part- Full-Full- time Part-time Full-time Part-time Time. Time.
1
2
1
11
15
Notes:
2 6 7 1
4 6 1 11 1
2 1 1
7 7 4 5 1 1
10 1 2 3 9 2
29 7 60 21 51 8 16
6 1 8 2 5 2
58 7 109 33 89 11 22
(1) Entry in e ach unit is the total n wnber of schools which have one or more
of these forms of t e acher aids .
(2) "Qualified" for laboratory t e chnicians is taken to mean, at least,
N.Z.C.S. or equivalent.
Time.
1
1
4
1
7
Part-Time.
1
1
1
7
1
11
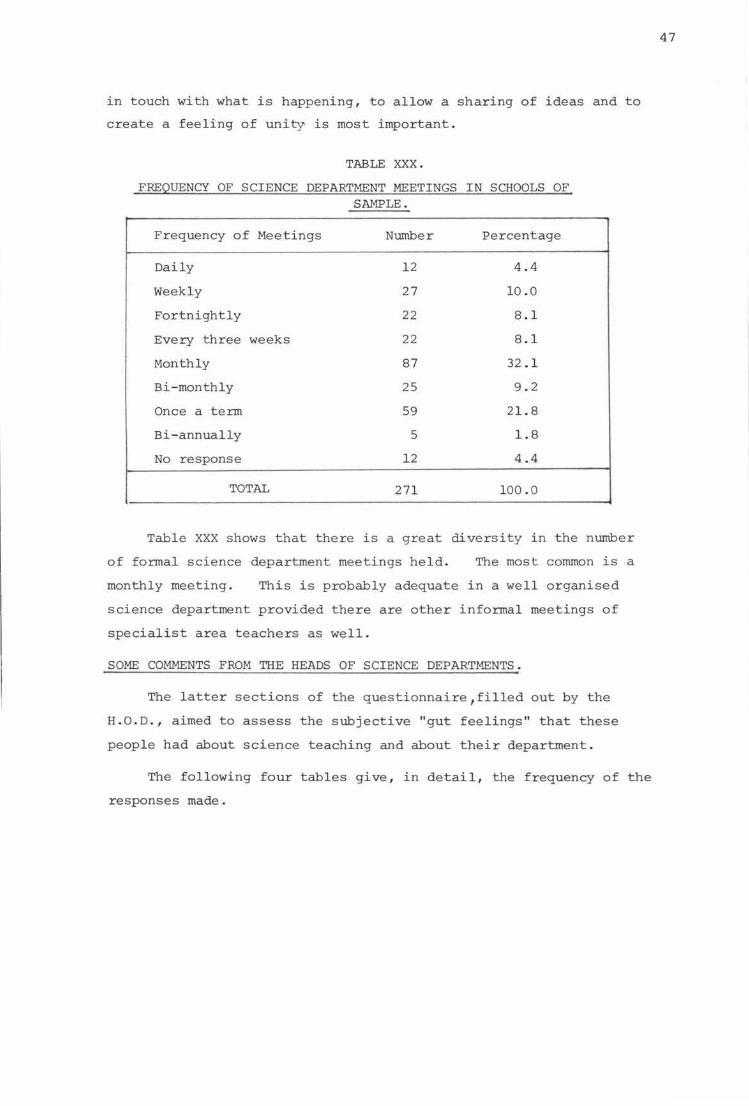
in touch with what is happening, to allow a sharing of ideas and to
create a feeling of unity is most important.
TABLE XXX.
FREQUENCY OF SCIENCE DEPARTMENT MEETINGS IN SCHOOLS OF SAMPLE.
Frequency of Meetings Number Percentage
Daily 12 4.4
Weekly 27 10.0
Fortnightly 22 8.1
Every three weeks 22 8.1
Monthly 87 32 .1
Bi-monthly 25 9.2
Once a term 59 21.8
Bi-annually 5 1.8
No response 12 4.4
TOTAL 271 100.0
Table XXX shows that there is a great diversity in the number
of formal science department meetings held. The most common is a
monthly meeting. This is probably adequate in a well organised
science department provided there are other informal meetings of
specialist area teachers as well.
SOME COMMENTS FROM THE HEADS OF SCIENCE DEPARTMENTS.
The latter sections of the questionnaire,filled out by the
H.O.D., aimed to assess the subjective "gut feelings" that these
people had about science teaching and about their department.
The following four tables give, in detail, the frequency of the
responses made .
47
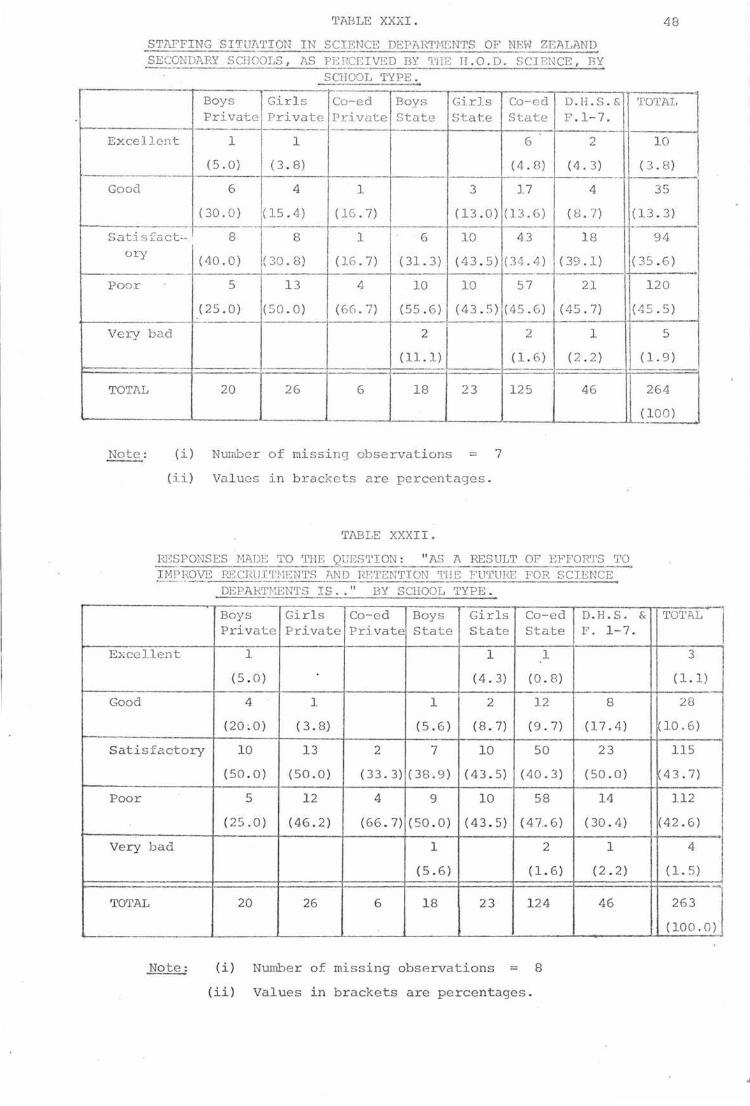
TABLE XXXI.
STAI'FING SITUATION IN SCIENCE DEPARTMENTS OF NEW ZEALAND SECONDARY SCHOOLS , AS PERCEIVED BY TIIE H .0. D. SCJF.NCE , BY
SCHOOL •rYPE.
Boys Girl s Co-ed Boys Girls Co-ed D.H.S . & Private Private Priva te State State State F .1-7.
Excellen t 1 1 6 2
(5.0) ( 3 . 8 ) ( 4 . 8) ( 4. 3 )
Good 6 4 1 3 17 4
(30 . 0 ) ( 15. 4 ) ( 16 . 7) (13. 0 ) (13 . 6) ( 8 . 7 )
Sati s fact '-- 8 8 1 6 10 43 1 8 ory
( 40 . 0 ) (30. 8 ) ( 16 . 7) ( 31. 3) ( 43 . 5) (34 . 4) ( 39 .1)
Poor 5 13 4 10 10 5 7 2 1
( 25 . 0) (50 . 0 ) (66 . 7) (55 . 6 ) (4 3 . 5 ) (45 .6) (45. 7)
Very bad 2 2 1
TOTAL
Note :
( 11. 1) ( 1. 6 ) ( 2 . 2 )
20 26 6 18 23 125 4 6
( i ) Number of mi ss i ng obse rvations 7
(ii ) Va lues in brackets a re percentages .
TABLE XXXII.
RESPONSES MADE TO THE QUES'rION : " AS A RESULT OF EFFORTS TO I MPROVE RE CRUITMENTS 7\ND RETENTION 'l'IIE FUTURE FOR SCIENCE
DEPAl<TMENTS IS .. " BY SCHOOL TYPE .
Boys Girls Co-ed Boys Girls Co-ed D. H. S.
48
TOTAL
1 0
( 3. 8 )
35
(13 . 3 )
94
(35 . 6 )
1 20
(45 . 5 )
5
( 1. 9 )
264
( 1 00 )
-, & TO'l'I\L
Private Private Privat e State State State F . 1-7. I Excellent
Good
Satisfactory
Poor
Very bad
TOTAL
1 1 1
(5 . 0 ) ( 4. 3) (0 . 8 )
4 1 1 2 12
(20;0) ( 3. 8 ) (5.6) ( 8 . 7) (9 . 7)
10 13 2 7 10 50
(5 0 .0) (50.0) ( 33 .3) (38.9) ( 43 . 5) (40.3 )
5 12 4 9 10 58
( 25.0) ( 46. 2) (66 . 7) ( 50 . 0) (43. 5) ( 47.6 )
1 2
(5 . 6) ( 1. 6)
20 26 6 18 23 124
(i) Number of missing observations = 8
(ii) Values in brackets are percentages.
3
( 1. 1)
8 28
(17.4) (10 .6 )
23 ll5
( 50 . 0 ) K43 . 7l
14 112
( 30. 4 ) (42. 6 )
1 4
( 2 . 2) (1. 5)
46 263
(10 0 . 0 )
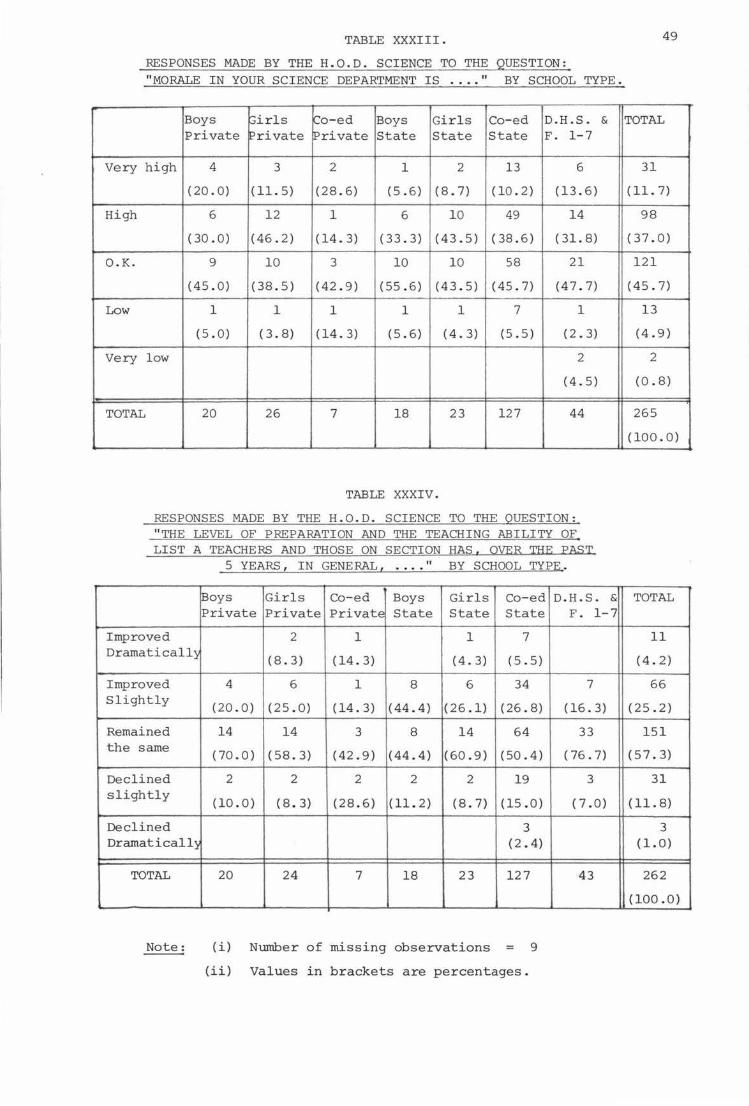
TABLE XXXIII.
RESPONSES MADE BY THE H.O.D. SCIENCE TO THE QUESTION: "MORALE IN YOUR SCIENCE DEPARTMENT IS .... " BY SCHOOL TYPE.
Boys Girls Co-ed Boys Girls Co-ed D.H.S. Private Private Private State State State F. 1-7
Very high 4 3 2 1 2 13 6
(20.0) (11.5) (28.6) (5.6) ( 8. 7) (10.2) (13.6)
High 6 12 1 6 10 49 14
( 30. 0) (46. 2) (14. 3) (33. 3) (43.5) (38.6) ( 31. 8)
O.K. 9 10 3 10 10 58 21
(45. 0) (38.5) (42.9) (55.6) (43. 5) ( 45. 7) (47. 7)
Low 1 1 1 1 1 7 1
( 5. O) ( 3. 8) (14. 3) (5. 6) (4. 3) ( 5. 5) ( 2. 3)
Very low 2
TOTAL
( 4. 5)
20 26 7 18 23 127 44
TABLE XXXIV.
RESPONSES MADE BY THE H.O.D. SCIENCE TO THE QUESTION: "THE LEVEL OF PREPARATION AND THE TEACHING ABILITY OF LIST A TEACHERS AND THOSE ON SECTION HAS. OVER THE PAST
5 YEARS, IN GENERAL, " BY SCHOOL TYPE.
Boys Girls Co-ed Boys Girls Co-ed D.H.S.
&
&
Private Private Private State State State F. 1-7
Improved Dramaticall1
Improved Slightly
Remained the same
Declined slightly
Declined Dramatically
TOTAL
Note: --
2 1 1 7
( 8. 3) ( 14. 3) ( 4. 3) ( 5. 5)
4 6 1 8 6 34
(20. O) (25 .0) ( 14. 3) (44.4) ( 26 .1) (26. 8)
14 14 3 8 14 64
(70.0) (58. 3) (42.9) ( 44. 4) (60.9) (50.4)
2 2 2 2 2 19
(10.0) ( 8. 3) (28.6) (11.2) (8. 7) (15.0)
3 (2. 4)
20 24 7 18 23 127
(i) Number of missing observations = 9
(ii) Values in brackets are percentages.
7
( 16. 3)
33
( 76. 7)
3
( 7 .0)
43
49
TOTAL
31
( 11. 7)
98
(37.0)
121
( 45. 7)
13
(4.9)
2
(0. 8)
265
(100.0)
TOTAL
11
( 4. 2)
66
(25.2)
151
( 57. 3)
31
( 11. 8)
3 (1.0)
262
(100.0)

Perhaps what is most interesting is the general trend of each
table.
As perceived by H.O.Ds of Science:
(i) The staffing situation with respect to science teachers is
satisfactory to poor
(ii) The future for science departments is satisfactory to poor
(iii) Morale in science departments seems to be in the O.K. to
high range
(iv) The quality of list A teachers seems to have remained very
much the same over the past five years with only a slight
improvement suggested.
TABLE XXXV.
COMMENTS MADE BY HEADS OF SCIENCE DEPARTMENTS AT END OF QUESTIONNAIRE.
Comment
Hard to get and/or keep teachers
All is going well
More freedom in curriculum choice needed
More money needed for equipment
All is not going well
Need for more laboratory technician time
Science teachers are worst off of all teachers
Hard to get part-timers and relievers
Less class contact time needed
Problems of teacher movement between labs.
More labs. needed
Poorly designed labs.
Teachers becoming less professional
Fewer periods of science needed
Need extra P.R's in department
Too many teachers of science not qualified in science
Need local Science Teachers' Association
Too many administrative tasks
No comment made
TOTAL
Number Percentage
54 19.9
52 19 .2
16 5.9
15 5.5
12 4.4
9 3.3
8 3.0
3 1.1
3 1.1
2 0.7
2 0.7
2 0.7
1 0.4
1 0.4
1 0.4
1 0.4
1 0.4
1 0.4
87 32 .1
271 100.0
50
At the end of questionnaire one there was a space left for the
H.O.D. to make any comments that he or she wished to. Of the 271
in the sample 184 made some comment.
Table XXXV on the previous page.
These have been listed in
Again a wide variety of responses resulted. But no matter
how the question was phrased both H.O.Ds of science and teachers of
science see that less class contact time, more ancillary aid and
better facilities and equipment are essential if we are to improve
the staffing situation in secondary school science departments.
51
CHAPTER 6.
DISCUSSION AND CONCLUSIONS.
This chapter summarises the main findings of the project by
commenting on the hypotheses and aims of the project as outlined
in Chapter 1. Some of the implications of the findings are dis
cussed in light of the findings that the study has produced.
This project looked at four main areas related to science
teaching in secondary schools namely: qualifications, conditions,
teacher shortages and salaries.
QUALIFICATIONS
"That the standard of tertiary qualifications held by
permanent science teachers teaching science has improved since the
1965 survey", was the first hypothesis that resulted from the
literature review.
The study showed that tertiary qualifications have improved
dramatically since 1965 especially in District High Schools and
F. 1-7 schools. The pe rcentage of teachers with incompleted
52
degrees or diplomas in these schools has dropped from 58.7% to 20 .5%.
There is now a much more even spread of well-qualified teachers
over the whole country. This was not the case in 1965 when urban,
university towns had much higher percentages of qualified science
teachers than other areas.
Only 13% of the sample have made any efforts to attain any
tertiary qualifications in Education, other than the Diploma in
Teaching course.
If teachers wish to achieve full professional status - which
they do not seem to have at the moment - then as professional
educators they need to be well-qualified in Education. Most
teachers have spent a minimum of three years achieving tertiary level,
subject qualifications, but spend very little time studying the
theories of teaching and learning, the processes of evaluation and
assessment, the theories of curriculum design and sociological
aspects of education. Here the Diploma in Education does an ex
cellent job. Later on the teacher needs to study aspects of
educational administration and public relations if he moves out of
the classroom and into an administrative position. The Diploma in
53
Educational Administration is a very relevant qualification for
such people.
At present there are no study grants or paid leave to obtain
such qualifications. Study is usually done extramurally and
when completed there is no financial reward until one has been on
the top of the basic salary scale for five years. Thus, it is
strongly believed, by the researcher, that more positive incent
ives should be given to teachers to improve their tertiary quali-
fications in Education. This could take the form of study grants,
paid study leave and immediate increases in salaries for those who
do complete a degree or diploma in Education.
86.5% of teachers have undergone some tertiary teacher train
ing. As it is now a prerequisite that all new teachers are
trained, and that those who are not trained are financially penal
ised, this percentage should increase considerably during the next
few years.
A second aim of the project was to obtain information about
the level of tertiary qualifications of those teachers of science
who are teaching senior science classes. The study showed that
teachers of F.6 and F.7 chemistry and biology classes are generally
very well-qualified with 73% having relevant tertiary qualifications
at the stage III level or higher. Physics teachers are generally
not as well-qualified with 35.1% of F.6 physics teachers having
stage I physics, or less, as their major physics qualification.
However, the percentage in all subjects, of teachers with no
university qualifications in the subject they are teaching is very
low (less than 4.7%).
Finally, in the area of qualifications and training the project
determined whether, as perceived by the H.O.Ds, there has been an
improvement in the level of training and the teaching ability of
teachers in training (i.e. those on section and List A teachers)
during the past five years. The information obtained showed that
57.6% of H.O.Ds felt that there had been no change during this time
while 25.6% felt that there had been a slight improvement. A
much smaller number felt that the teaching ability and level of
training had declined slightly. Many commented on the excellent
training and teaching ability of teachers recruited from Australia.

The fact that some H.O.Ds made this comment suggests that we may
need to look at our own Teachers' College programmes in relation
to what is being done in Australian Teachers' Colleges.
CONDITIONS:
The next group of aims of the project were included to
obtain information about the conditions under which teachers were
operating. It is very easy to use statistics to make all appear
well. What should be pointed out is that while 76.6% of the
schools may have adequate laboratories, say, there are 23.4%
who haven't. It is this latter group of sixty-three schools
that warrant concern.
The teacher of science who is about to choose a school in
which to teach has a 23% chance of choosing a school with inade
quate laboratories, and a 25% chance of choosing a school with in
adequate audio-visual aids. He will be teaching anything from one
to forty-three students in his classes and will probably teach for
22 out of a possible 25 hours per week. He has only a 24% chance
of teaching his senior science classes in a senior studies block.
There is a 31% chance that he will not have any technician assist
ance to help him prepare and tidy away laboratory equipment. He
54
is entering a system where most H.O.Ds are tending to be pessimistic
about the future for science departments. The colleagues he works
with will probably be well trained, well qualified, subject special
ists, 35% of whom are not happy with their present situation, as
secondary school science teachers. Thus, it can be seen that in
many schools considerable improvements are needed.
There were four main things that teachers of science felt were
most needed to improve their professional activities. These four
improvements were chosen by 65% of the sample. In order they were:
(i) Less class contact time
(ii) Better equipment, facilities and textbooks
(iii) Lower teacher/pupil ratios
(iv) Additional technician assistance
An improvement in each of these would free the teacher to
improve his courses of work and be better prepared for each lesson.
These, in turn, improve his classroom discipline. The result
would certainly be an improvement in the retention of well-quali
fied, well-trained science teachers.
In the area of t e acher/pupil ratios it was predictably found
that the mean class sizes increased from form 7 classes down to
form 3 classes. The mean class size at form 7 level was around 12,
at form 6 level around 19, at form 5 level around 25 and at form 3
and 4 level around 27-28.
The mean over-all size of a science class in the sample was
23.2 which compares with a 1954 value of 23.1 and a 1965 value of
23.0. No noticeable change in twenty six years! The range of
class sizes was 1 to 43.
As perceived by H.O.Ds most science departments appeared to be
in good spirits. Only 15 H.O.Ds (5.7% of the sample) felt that
the morale in their science departments was less than O.K., while
132 (48.7%) felt that the morale in the department was high or very
high.
TEACHER SHORTAGES:
A third aim of the survey was to determine whether there was
a shortage of scie nce teachers.
Of the 2 71 s chools in the sample (68% of the p op ulation)
there was a total shortage of 1170 class contact hours per week.
This means that there is a shortage of 53-59 List B teachers in the
science departments of the sample.
The situation would be 100% worse if the 54 overseas teachers
had not been recruited during the year.
From the schools of the sample a total of 347 science teachers
left science teaching during the year October 1979 to October 1980.
This extrapolates to 496 for the population. Of those who left
teaching an unexpectedly low 7.8% of those leaving went to industry.
Most left to go overseas, but not to teach (27%). The variety of
jobs to which science teachers went was very diverse as can be seen
in Table xx.
One method of remedying the situation of a lack of full time
science teachers is to employ part-time teachers. Of the sample,
76% of the part-time teachers were female. The majority of part
time teachers of science were married and female (67.9%). No
statistics were produced to assess the qualifications or level of
training of these part-time teachers - an area that warrants further
study.
55

SALARIES
The fourth major aim of the survey was to attempt to determine
whether science teachers have lost salary relativity with other
professions having similar qualifications.
Statistics available from the P.P.T.A. showed that teachers'
salaries were behind other professions with similar qualifications.
However, improvements had resulted from the salary increases that
occurred early in 1980. The 1980 N.Z.I.C. Annual Salary Survey
showed that school teachers are in the lower income group of the
chemists sampled in their survey. It is probable that physicists
and biologists with their very marketable qualifications would be
in a similar, if not worse, situation.
It appears then that the morale, conditions and salaries of
teachers of science have improved since 1965. Science teachers
are now better qualified and most are trained. However, the
conditions under which they work are far from ideal, and this may,
in part, be responsible for the relatively large number of science
teachers leaving the teaching profession (20 % of the sample).
There are two main factors which will determine the success
of recruitment and retention of science teachers in the future:
salaries and conditions.
The P.P.T.A. do an excellent job in the area of salary
negotiations and are well aware of the need for increases in the
basic scale, more steps at the top of this scale, removal of the
country service bar, the poor return for P.R. positions and the
need for a Master Teacher scale, to name but a few. Salary claims
must be vetted by many Government Departments. Progress is slow,
claims are seldom fully met and consequently teachers become frus
trated and disillusioned. Positive financial incentives are
needed for those at the top of the basic scale who do not wish to
be promoted out of the classroom and into administrative positions.
There is a need for innnediate financial rewards for those who im
prove their professional qualifications and some financial assist
ance for those involved in extra-curricular activities. The area
of relativity, though difficult to assess,also needs attention.
Highest on the list of improvements to conditions is that of
less class contact time. Six classes, three non-contact periods
per week, and no ancillary assistance is taxing to say the least.
56
•
A minimum of one non-contact period per day is reconunended as
essential for any full-time teacher of science ,
Insufficient and unsatisfactory apparatus fails to develop
manipulative skills and full understanding. This must handicap
advanced studies, and in the event of these pupils entering
science teaching they will be hindered by lack of practical skill.
A vicious circle may be set up.
New Zealand has a particular problem in that its population
is not big enough to support a thriving science apparatus industry
and we must necessarily import much from overseas. The expense of
freight and the import licence system allows for massive increases
in costs. Much equipment must be bought by catalogue without in
spection.
A report produced by Mr. R.A. Hoare, Science Equipment Advis
ory Committee, Dept. of Education, 1978 suggested the following:
(a) Cost saving by bulk purchase of basic items by consortia of
schools or a central purchasing agency.
(b) Production of kits for assembly by schools. This approach
was used in the American PSSC Physics scheme, but was only
partly successful, because of the inferior design sometimes
used.
(c) Manufacture of basic items by a small equipment unit, operated
by the Department of Education. Many parts, of course, would
need to be bought in from commercial firms.
(d) Manufacture of equipment to specifications issued by the equip-
ment unit, by tender from local firms. The tender system has
been in force for some years for a limited variety of apparatus,
and is generally satisfactory.
(e) To guide science teachers, items offered on the conunercial
market should be regularly assessed, rather in the manner of the
Consumers' Institute.
schools.
Regular information would be sent to
(f) The provision of adequate technician support is vital. The
average New Zealand school has about one-quarter of the
technician-hours that British schools enjoy- and the latter are
not content with their level of assistance.
(g) Redistribution of .scientific apparatus no longer needed by
higher education or by industry.
more advanced classes.
This is of use mainly to
57
(h) Allocation of more time to staff to allow making and maintenance
of equipment. This would of course make the staff shortage
more acute for a time - but would tend to retain teachers and
break the 'vicious circle'.
(i) There must be opportunity for science staff and technicians to
learn a range of constructional skills, and familiarise them-
selves with modern methods. This is especially necessary for
58
teachers in country areas, who are cut off from the cross
fertilisation of ideas which city teachers enjoy. The Inspect
orate do take some part in this, but it is impossible for them
to have great influence because their main commitment is in
another direction and their visits infrequent and without
equipment. It is amazing that though (in Auckland) there are
four Science Advisers for the Primary Service, there is no
permanent full-time adviser for secondary science in the whole
country".
Class sizes seem to have changed little over nearly three
decades and the range of class sizes is large. With the previous-
ly mentioned strains that a science teacher has in a practical
laboratory session it is fair to say that he cannot control, advise
and effectively teach experimental skills to thirty or forty junior
students. Science teachers should insist on a maximum allowable
class size of 20-25 pupils at all levels.
Government money would be well spent in training more labor
atory technicians. With large numbers of quite well-qualified
young people being unemployed this could be one way of (a) giving
them a meaningful occupation and (b) helping to reduce the stresses
that so many science teachers are experiencing due tofre-avyworkloads.
The cost involved in training a laboratory technician would be sub
stantially less than the $100,000 to train science teachers who,
because of the poor conditions,leave teaching.
Curriculum change must always be an ongoing process so that
what is taught is relevant to the technology and needs of society.
The F.5 Chemistry syllabus which has remained unchanged since the
1940's is but one example of the lack of ongoing, updating and
modification. Professor B.R. Penfold, Subject Convenor for the
Sixth Form Chemistry Syllabus Committee commented in his 1980 re
port that" ... teachers find themselves under great pressure in
attempting to cover adequately all topics in the time available
to them ...... and the difficulties have increased in the few
years since the present prescriptions were drawn up because of the
more diverse clientele".
Curricula must be adapted to cater for the present and future
needs both of the individual and the scientific community in which
he will operate.
59
Science education in the future will need to move from an
emphasis on academic excellence in the physical sciences to more
emphasis on the technological and applied sciences. But perhaps
most importantly there will be a need for students to have a deeper
understanding of the Social and b iological Sciences, so that the
student can learn to cope with the stresses imposed by ever increas
ing technological advances. These will produce redundancy, many
changes of occupation during a life-span, plenty (too much?)
leisure time, and associated social, psychological and physical
problems will result.
Science students will need to address themselves more and
more to the already critical state of pollution, lack of energy
resources and psychological health problems. More emphasis will
be needed on the control and dispersement of population, industry
and food resources. These problems will be addressed to the pure,
applied and social scientist, the economist, politician, health
authority and, of course, the science educator.
Thus, the 1980's and 90's will bring to science education a
revolution similar to that imposed on science education in the
western world by the launching of the Russian spacecraft 'Sputnik'
in the late 1950's.
New courses, new classroom materials and new teaching tech
niques will all be needed to educate science students as we move
into the latter part of the twentieth century.

60
APPEtlDIX A
Covering letter
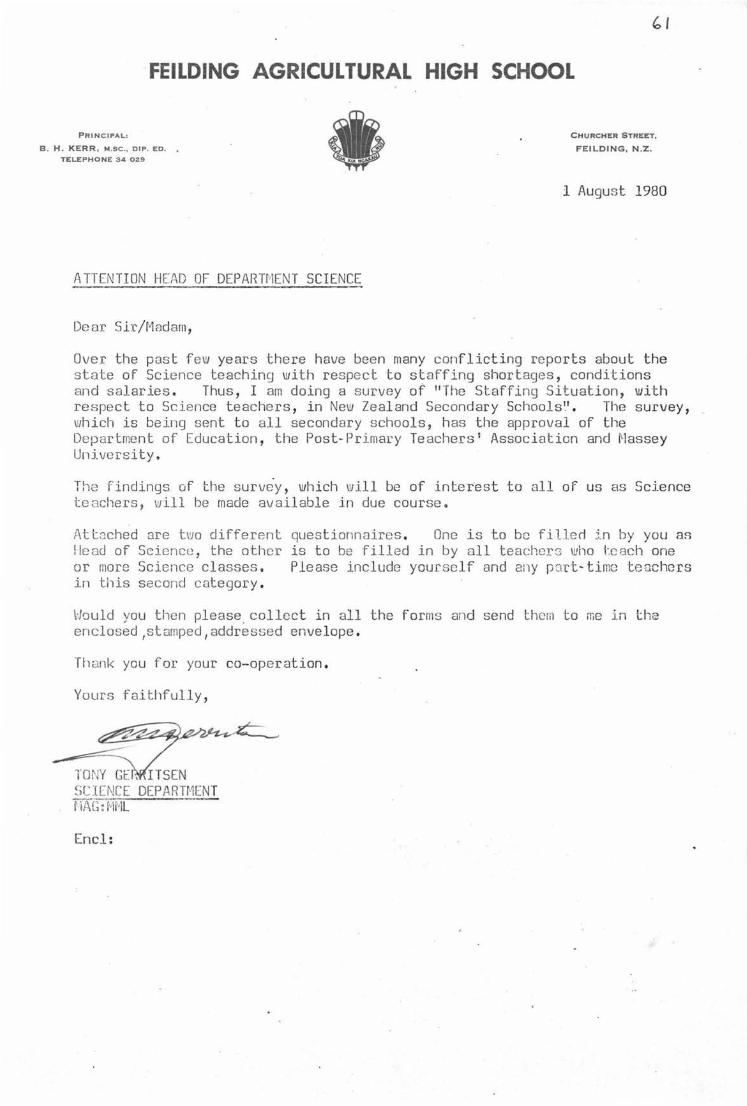
FEILDING AGRICULTURAL HIGH SCHOOL
PRINCIPAL:
B . H . KERR , M.SC., DIP. ED. TELEPHONE 34 029 •
ATTENTION HEAD OF DEPARTMENT SCIENCE
Dear S.ir/Madarn,
CHURCHER STREET,
FEILOING, N .Z .
l August 1980
Over the past few years there have been many conflicting reports about the state of Science teaching with respect to staffing shortages, conditions and salaries. Thus, I am doing a survey of 11 The Staffing Situation, with re s pect to Science teachers , in New Zealand Secondary Schools" . The survey, which is being sent to all secondary schools, has the approval of the Department of Education, the Post-Primary Teachers 1 Association and Masse y University.
The findings of the survey, which will be of interest to all of us as Science teachers, will be made available in due course.
Attached are t ~o different questionnaires. One is to be filled i n by you as Head of Science , the other is to be filled in by all teacher s who Le ach one or more Science classes. Please include yourself and 2:1y pa-rt-time tenchcrs in this second category .
Would you then please. collect in all the forms and send them to me in the enclosed,stamped,addressed envelope .
Th ank you for your co-operation.
Yours faithfully,
TONY GE , ITSEN SCIENCE DEPARTMENT 'f.T:n:c : MML
Encl :

APPENDIX B
Questionnaire forms:
(i) Sheet l
(ii) Sheet 2
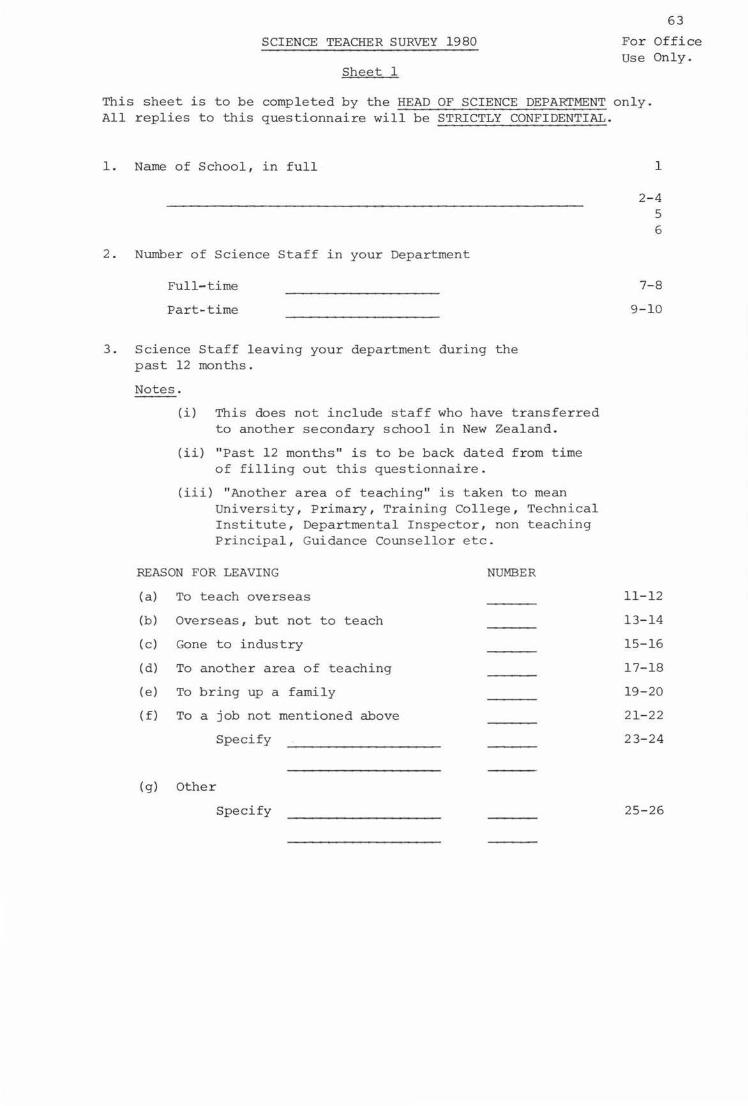
SCIENCE TEACHER SURVEY 1980
Sheet 1
63
For Office Use Only.
This sheet is to be completed by the HEAD OF SCIENCE DEPARTMENT only. All replies to this questionnaire will be STRICTLY CONFIDENTIAL.
1. Name of School, in full
2. Number of Science Staff in your Department
Full-time
Part-time
3. Science Staff leaving your department during the past 12 months.
Notes.
(i) This does not include staff who have transferred to another secondary school in New Zealand.
(ii) "Past 12 months" is to be back dated from time of filling out this questionnaire.
(iii) "Another area of teaching" is taken to mean University, Primary, Training College, Technical Institute, Departmental Inspector, non teaching Principal, Guidance Couns e llor e tc.
REASON FOR LEAVING
(a) To teach overseas
(b) Overseas, but not to teach
(c) Gone to industry
(d) To another area of teaching
(e) To bring up a family
(f) To a job not mentioned above
Specify
(g) Other
Specify
NUMBER
1
2-4 5 6
7-8
9-10
11-12
13-14
15-16
17-18
19-20
21-22
23-24
25-26

- 2 -
4. Action being taken to counteract shortages in your department of well-qualified science teachers.
PART A
Please indicate the number of hours of class contact time per week for which this form of action has had to be taken. (e.g. if 1 class of Form 7 Chemistry and 1 class of Form 5 Physics are on correspondence this would be 8 hours)
N.B. Please only indicate if due to an actual shortage of teachers i.e. not because it is more expedient timetable wise, or because numbers are very small etc.
(a) Classes out of normal school time
(b) Staff losing non-contact time to teach classes that would otherwise be teacherless
Contact Hours
(c) Teachers without appropriate tertiary qualifications teaching science
(d) Neighbouring schools combining senior science classes
(e) Science subjects being taught by correspondence
(f) Form 6 & 7 being combined
(g) Others Specify
PART B
(a) Are you having to reduce science options? Yes
No
(b) How many science teachers has your school recruited from overseas in the past year?
Number ------------5. ACTUAL SHORTAGES OF SCIENCE TEACHERS
Include all shortages whether or not they are being covered by action mentioned above. (A "teacher hour" means one hour of actual class contact time. Please convert period length to hours and sumrnate to nearest whole hour if necessary).
Number of Teacher Hours Short
For Office Use Only
27-29
30-32
33-35
36-38
39-41
42-44
45-47
48
49-50
51-53
64

- 3 -
6. TEACHER AIDS IN YOUR DEPARTMENT Please indicate number
(a) Lab Technician (s)
Full-time qualified
Full-time unqualified
Part-time qualified
Part-time unqualified
NUMBER
(N.B. qualified means N.Z.C.S. or equivalent)
(b) Lab Monitor(s)
Paid
Unpaid
(c) Remedial Teacher(s)
Full-time
Part-time
(d) Teacher(s) responsible for accelerant work
Full-time
Part-time
(e) Science Resource room(s)
(f) Senior Studies Room(s) for science subjects
(g) Do you have adequate laboratories to allow all science classes to use a laboratory for 75% of their science time?
Yes
No
(h) Do you have adequate Audio .. visual aids
For Office Use Only
54
55
56
57
58-59
60-61
62
63
64
65
66
67
68
(e.g. overhead projectors, slide projectors etc.)?
Yes
No
7. PLEASE TICK YOUR DESIRED RESPONSE
(a) The staffing situation, with respect to science teachers in N.Z. secondary schools is
Excellent
Good
Satisfactory
Poor
Very bad
69
70
65

- 4 -
(b) As a result of efforts to improve recruitments and retention the future for science departments seems
Excellent
Good
Satisfactory
Poor
Very bad
(c) Morale in your science department is
Very high
High
O.K.
Low
Very low
(d) The level of preparation and the teaching ability of List A teachers and those on section has, over the past 5 years, in general,
Improved dramatically
Improved slightly
Remained the same
Declined slightly
Declined dramatically
(e) Please indicate how frequently you have a science department meeting. (e.g. annually, once a term, weekly etc.)
Daily
Fortnightly
Monthly
Once a term
Weekly
Every 3 weeks
Bi-monthly
Bi-annually
8. Please make any comments at all concerning the staffing situation in your science department, or on any aspect of science teaching at all.
THANK YOU FOR YOUR CO-OPERATION.
66
For Office Use Only
71
72
73
74-75
76-77

SCIENCE TEACHER SURVEY 1980 For Office Use Only
Sheet 2
This sheet is to be answered by any person who teaches 1 one or more science classes. 2-4
1.
2.
Sex (Please tick appropriate box) Male ( ) Female ( )
Present Position Full~time Part-time
3. Marital Status Married Single
4. Completed years of teaching service
_____________ years
5. Write down all your tertiary qualifications including degree(s), diploma(s) and certificate(s) (e.g. B.Sc., Dip. Ed. etc.) N.B. 1. Please suggest N.Z. equivalent in
brackets if appropriate.
2. If your degree is short b y 1 unit or 3 papers please write B.Sc. (incom.) etc.
3. Please put an asterisk next to any degree containing science. (e.g. B.Sc.* M.A.*) .
6. Highest relevant qualifications in Chemistry, Physics and Biology. Please use stages rather papers for tertiary qualifications. Your highest relevant qualification may be Teachers' College Science or School Science. (e.g. Chem. III, Teachers' College Physics course, School Certificate Biology, 1st Class Honours Chemistry etc.)
CHEMISTRY
PHYSICS
BIOLOGY
7. What is your major teaching area?
5 6
7
8
9
10-11
12-13
14-15
16-17
18-19
20-21
22-23
24-25
67

-2-
8. Classes taught and numbers in each class.
9.
(e.g. Form 3 Science 28.
1.
2.
3.
4.
5.
6.
7.
8.
Form 7 Chemistry 16. etc.)
CLASS NUMBER OF STUDENTS
Formal Teacher Training (Please tick) Secondary ( ) Primary ( ) None ( ) Other (specify) ________ (4)
10. How many inservice courses have you attended over the past TWO years?
For Office Use Only
26-29
30-33
34-37
38-41
42-45
46-49
50-53
54-57
58
Residential ___________ 59-60
11.
12.
One day courses
In school courses
Are you a member of a local Science Teachers' Association? (Please tick)
Yes ( ) No ( )
Are you happy with your present salary? Yes ( ) No ( )
If no please state why
13. Excluding salary conditions are you reasonably happy with your present situation as a post-primary science teacher?
Yes No
If no please state why
14. Name the one thing you would most like to see take place to improve your job as a teacher of science.
61-62
63-64
65
66
67-68
69
70-71
72-73
68
69.
BIBLIOGRAPHY.
B6700 User Handbook, Massey University Computer Centre, March 1980.
Coles, D.A., The Coles Report, Wellington, Govt. Print., 1976.
Davies, C.R., A Look at some of the problems facing the Secondary Department of District High Schools, Thesis, Dip. Ed. Massey University, 1970.
Directory of Secondary Schools and Technical Institutes, 1979, Educational Services Section, Department of Education, Wellington, Govt. Print., 1979, 37 p.
Exodus: the story of 1979, P.P.T.A. News, Vol. 1, No. 4, March 1980, p. 1.
Fox, D.J., The Research Process in Education 1st Ed. Holt, Rhinehart and Winston, Inc. 1969. 758 p.
Gainsford, G.J. and W.A. Singers. The 1978 N.Z.I.C. Salary Survey, Chemistry in New Zealand, Vol. 42, No. 26, 1978.
Gainsford, G.H. and W.A. Singers. The 1980 N.Z.I.C. Salary Survey, Chemistry in New Zealand, Vol. 44, No. 4, p. 133-139, 1980.
Hoare, R.A., Report for Science Equipment Advisory Committee, Dept. of Ed., Manurewa, 1978.
Jeffcott, R.W.L. Preferred Teaching Styles of Sixth and Seventh Formers: Rural and Urban, and Science and Humanities comparisons, Thesis, Dip. Ed. Massey Un i versity , 1974.
Kuhn, T.S. The Structure of Scientific Revolutions, Chicago, University of Chicago Press, 1962.
N.Z. Journal of Educational Studies, Vol. 11, No. 2, Nov. 1976. Wright and Carman Ltd., 1976.
New Zealand Post-Primary Teachers' Association, Annual Report 1978-1979, P.P.T.A. Journal, October 1979.
New Zealand Post-Primary Teachers' Association (Registered), Annual Report 1979-1980, P.P.T.A. Journal, October 1980.
Penfold, B.R., Report of Convenor of Sixth Form Syllabus Committee, Canterbury University, 1979.
Porter, J.B., Survey of Teachers from the United Kingdom who have been recruited to Secondary Schools in New Zealand, Thesis, Dip. Ed., Massey University, 1973.
Pressing for new directives, P.P.T.A. News, Vol. 1, No. 8, June 1980, p.3.
Roth, H., A Bibliography of New Zealand Education, New Zealand Council for Educational Research, 1964, 233 p.
Searle, E.J. The Teaching of Science in Post-Primary Schools, New Zealand Council for Educational Research, 1958, 259 p.
Staffing Crisis, P.P.T.A. News, Vol. 1, No. 3, March 1980, p. 1-2.
Taylor, O., The Staffing of Science Departments of New Zealand Secondary Schools, Thesis, Dip. Ed., Massey University, 1965.

The Minister's Address, P.P.T.A. Journal, October 1979, p. 20-22.
Webster, B. The Eighties - a decade of challenge, P.P.T.A. News, Vol. 1, No. 2, February 1980, p. 7.
70