POLICE STAFFING ASSESSMENT
151
POLICE STAFFING ASSESSMENT CARLSBAD POLICE DEPARTMENT CARLSBAD, CALIFORNIA CENTER FOR PUBLIC SAFETY MANAGEMENT, LLC 475 K STREET NW STE 702 • WASHINGTON, DC 20001 WWW.CPSM.US • 716-969-1360 Exclusive Provider of Public Safety Technical Services for International City/County Management Association C E N T E R F O R P U B L I C S A F E T Y M A N A G E M E N T , L L C POLICE OPERATIONS
-
Upload
khangminh22 -
Category
Documents
-
view
2 -
download
0
Transcript of POLICE STAFFING ASSESSMENT

POLICE STAFFING
ASSESSMENT CARLSBAD POLICE
DEPARTMENT
CARLSBAD, CALIFORNIA
CENTER FOR PUBLIC SAFETY MANAGEMENT, LLC
475 K STREET NW STE 702 • WASHINGTON, DC 20001
WWW.CPSM.US • 716-969-1360
Exclusive Provider of Public Safety Technical Services for International City/County Management Association
CE
NT
ER
F
OR
P
UB
LI
C
SA
FE
TY
M
AN
AG
EM
EN
T,
L
LC
P O L I C E O P E R A T I O N S

i
THE ASSOCIATION & THE COMPANY
The International City Management Association is a 103-year old, nonprofit professional
association of local government administrators and managers, with approximately 13,000
members located in 32 countries.
Since its inception in 1914, ICMA has been dedicated to assisting local governments and their
managers in providing services to its citizens in an efficient and effective manner. ICMA
advances the knowledge of local government best practices with its website (www.icma.org),
publications, research, professional development, and membership. The ICMA Center for Public
Safety Management (ICMA/CPSM) was launched by ICMA to provide support to local
governments in the areas of police, fire, and emergency medical services.
ICMA also represents local governments at the federal level and has been involved in numerous
projects with the Department of Justice and the Department of Homeland Security.
In 2014, as part of a restructuring at ICMA, the Center for Public Safety Management (CPSM)
was spun out as a separate company. It is now the exclusive provider of public safety technical
assistance for ICMA. CPSM provides training and research for the Association’s members and
represents ICMA in its dealings with the federal government and other public safety professional
associations such as CALEA, PERF, IACP, IFCA, IPMA-HR, DOJ, BJA, COPS, NFPA, and others.
The Center for Public Safety Management, LLC, maintains the same team of individuals
performing the same level of service as when it was a component of ICMA. CPSM’s local
government technical assistance experience includes workload and deployment analysis using
our unique methodology and subject matter experts to examine department organizational
structure and culture, identify workload and staffing needs, and align department operations
with industry best practices. We have conducted more 305 such studies in 41 states and
provinces and 215 communities ranging in population from 8,000 (Boone, Iowa) to 800,000
(Indianapolis, Ind.).
Thomas Wieczorek is the Director of the Center for Public Safety Management. Leonard
Matarese serves as the Director of Research & Program Development. Dr. Dov Chelst is the
Director of Quantitative Analysis.
ii
CENTER FOR PUBLIC SAFETY MANAGEMENT
PROJECT CONTRIBUTORS
Thomas J. Wieczorek, Director
Leonard A. Matarese, Director, Research & Project Development
Dov Chelst, Director of Quantitative Analysis
Sarita Vasudevan, Data Analyst
Shan Zhou, Data Analyst
Wayne Hiltz, Senior Public Safety Consultant – Team Leader
John Clark, Senior Public Safety Consultant
Dennis Kouba, Senior Editor

iii
CONTENTS
Tables ............................................................................................................................. v
Figures .......................................................................................................................... vii
Section 1. Executive Summary .................................................................................... 1
Key Recommendations ............................................................................................................................... 3
Operations Bureau .................................................................................................................................... 3
Support Bureau Recommendations ...................................................................................................... 3
Section 2. Methodology ............................................................................................... 6
Section 3. Department Staffing .................................................................................... 7
Section 4. Reported Crime Data .................................................................................. 8
Section 5. Operations Bureau .................................................................................... 12
Patrol Division ............................................................................................................................................... 12
Patrol Division Staffing/Schedule ......................................................................................................... 12
Supervision ................................................................................................................................................ 13
Deployment Schedule ........................................................................................................................... 13
Minimum Staffing ..................................................................................................................................... 14
Call / Workload Demand ...................................................................................................................... 14
Out-of-service Activities ......................................................................................................................... 19
Analysis of Patrol Deployment vs. Workload Demand .................................................................... 20
Examination of Patrol Deployment vs. Workload Data ................................................................... 22
Patrol Workload Demand Summary ................................................................................................... 32
Transportation and Booking of Prisoners ............................................................................................. 34
Patrol Division Summary ......................................................................................................................... 34
Community Service Officers ..................................................................................................................... 37
Staffing / Deployment ............................................................................................................................ 37
Workload Analysis ................................................................................................................................... 37
Traffic Division ............................................................................................................................................... 43
Staffing / Deployment ............................................................................................................................ 43
Workload Analysis ................................................................................................................................... 43
Response time to community-initiated calls for service 2018 /2013 ................................................ 50
Section 6. Support Services Bureau ........................................................................... 51
Investigations Division ................................................................................................................................. 51
Current Staffing ........................................................................................................................................ 51
Case Management ................................................................................................................................ 51
Clearance Rates ..................................................................................................................................... 54
iv
Communications ......................................................................................................................................... 56
Communications Staffing ...................................................................................................................... 56
Impact of Technology............................................................................................................................ 62
Dispatch Staffing Summary ................................................................................................................... 63
High-priority Calls ..................................................................................................................................... 63
Quality Control Audits ............................................................................................................................ 65
Homeless Outreach Team (HOT) ............................................................................................................. 66
Records Division ........................................................................................................................................... 69
Records Management System ............................................................................................................. 69
Records Staffing ...................................................................................................................................... 70
FBI UCR Reporting ................................................................................................................................... 73
Telephone Services ................................................................................................................................. 75
Payment Options .................................................................................................................................... 75
Technology ................................................................................................................................................... 76
Section 7. Staffing Recommendation Summary ...................................................... 78
Operations Bureau Recommended Staffing Increases .................................................................. 78
Support Bureau Recommended Staffing Increases ........................................................................ 78
Section 8. Data Analysis ............................................................................................. 79
Workload Analysis ....................................................................................................................................... 79
Out-of-Service Activities ............................................................................................................................. 99
Deployment .............................................................................................................................................. 105
Response Times ......................................................................................................................................... 115
All Calls ................................................................................................................................................... 116
High-priority Calls .................................................................................................................................. 121
Traffic Units ................................................................................................................................................. 123
Community Service Officers .................................................................................................................. 128
Appendix A: Call Type Classification ................................................................................................... 134
Appendix B: Uniform Crime Report Information ................................................................................. 140

v
TABLES
TABLE 3-1: Authorized Staffing Levels for Fiscal Years 2015-2019 .............................................................. 7
TABLE 4-1: Reported Crime Rates by Jurisdiction, Per 100,000*, 2017 ..................................................... 8
TABLE 4-2: Carlsbad Police Department Reported Actual Part 1 Offenses, 2016 to 2018* ................ 9
TABLE 4-3: Reported Municipal, State, and National Crime Rates, by Year, 2008-2017* .................. 11
TABLE 5-1: Operations Bureau Patrol Authorized Staffing Levels for FY 2018/2019 ............................. 12
TABLE 5-2: Deployment Schedule / Minimum Staffing ............................................................................. 13
TABLE 5-3: Calls per Day, by Category........................................................................................................ 16
TABLE 5-4: Primary Unit’s Average Occupied Times, by Category and Initiator ................................. 17
TABLE 5-5: Average Number of Responding Units, by Initiator and Category .................................... 18
TABLE 5-6: Number of Responding Units, by Category, Community-initiated Calls ........................... 18
TABLE 5-7: Out-of-service Activities and Occupied Times by Description ............................................ 19
TABLE 5-8: Workload Percentage, 2018 vs. 2013 ....................................................................................... 33
TABLE 5-9: CSO Events and Calls, by Category ......................................................................................... 38
TABLE 5-10: CSO Out-of-service Activities and Occupied Times by Description ................................ 38
TABLE 5-11: CSO Calls per Day, by Month .................................................................................................. 39
TABLE 5-12: Traffic Bureau Authorized Staffing Levels, FY 2017/2018 ..................................................... 43
TABLE 5-13: Traffic Events, Calls, and Workload by Category ................................................................ 44
TABLE 5-14: Traffic Out-of-service Activities and Occupied Times by Description ............................. 45
TABLE 5-15: Traffic Calls per Day, by Month ............................................................................................... 46
TABLE 5-16: Average Dispatch, Travel, and Response Times for Community-initiated Calls for
Service, by Priority, 2018 / 2013 ..................................................................................................................... 50
TABLE 5-17: Average Response Time Components, by Beat .................................................................. 50
TABLE 6-1: Investigations Case Tracking ...................................................................................................... 53
TABLE 6-2: Reported Carlsbad, California, and National Clearance Rates, 2017 .............................. 55
TABLE 6-3: Communications Personnel ....................................................................................................... 56
TABLE 6-4: Communications Division Work Schedule ............................................................................... 58
TABLE 6-5: Telephone Incoming Call Load and Radio Dispatches by Year*....................................... 59
TABLE 6-6: Total and Average Daily Telephone Call Volume by Hour, 2016–2018* ........................... 60
TABLE 6-7: Average Daily Telephone Call Volume by Hour by Dispatch Shifts, 2016–2018 .............. 61
TABLE 6-8: Average Dispatch, Travel, and Response Times, by Priority ................................................ 63
TABLE 6-9: Homeless Outreach Team Activity, 2017–2018 ....................................................................... 67
TABLE 6-10: Records Unit Personnel .............................................................................................................. 70
TABLE 6-11: Reported Carlsbad, California, and National Crime 2017 Clearance Rates ................. 75
TABLE 8-1: Events per Day, by Initiator ......................................................................................................... 81
TABLE 8-2: Events per Day, by Category..................................................................................................... 83
TABLE 8-3: Calls per Day, by Category........................................................................................................ 85
TABLE 8-4: Calls per Day, by Initiator and Months ..................................................................................... 86
TABLE 8-5: Calls per Day, by Category and Month .................................................................................. 88
TABLE 8-6: Primary Unit’s Average Occupied Times, by Category and Initiator ................................. 90

vi
TABLE 8-7: Average Number of Responding Units, by Initiator and Category .................................... 91
TABLE 8-8: Number of Responding Units, by Category, Community-initiated Calls ........................... 92
TABLE 8-9: Calls and Work Hours by Area, per Day .................................................................................. 94
TABLE 8-10: Calls and Work Hours per Day, by Category, Winter 2018 ................................................ 96
TABLE 8-11: Calls and Work Hours per Day, by Category, Summer 2018 ............................................. 98
TABLE 8-12: Activities and Occupied Times by Description ................................................................. 100
TABLE 8-13: Activities per Day, by Month ................................................................................................. 101
TABLE 8-14: Activities per Day, by Day of Week ..................................................................................... 102
TABLE 8-15: Activities per Hour, by Hour of Day ...................................................................................... 104
TABLE 8-16: Average Response Time Components, by Category ...................................................... 118
TABLE 8-17: 90th Percentiles for Response Time Components, by Category ................................... 119
TABLE 8-18: Average Response Time Components, by Beat ............................................................... 120
TABLE 8-19: Average Dispatch, Travel, and Response Times, by Priority ........................................... 121
TABLE 8-20: Traffic Events, Calls, and Workload by Category ............................................................. 123
TABLE 8-21: Traffic Activities and Occupied Times by Description ..................................................... 124
TABLE 8-22: Traffic Calls per Day, by Month ............................................................................................ 125
TABLE 8-23: CSO Events and Calls, by Category .................................................................................... 128
TABLE 8-24: CSO Activities and Occupied Times by Description ........................................................ 129
TABLE 8-25: CSO Calls per Day, by Month ............................................................................................... 130
TABLE 8-26: Call Type, by Category .......................................................................................................... 134
TABLE 8-27: Reported Crime Rates in 2017, by City ............................................................................... 140
TABLE 8-28: Reported Carlsbad, California, and National Crime Rates, by Year ............................ 142
TABLE 8-29: Reported Carlsbad, California, and National Crime Clearance Rates, 2017 ............ 142

vii
FIGURES
FIGURE 4-1: Carlsbad Reported Violent and Property Crime Rates, by Year...................................... 10
FIGURE 4-2: Reported City and State Crime Rates, by Year ................................................................... 10
FIGURE 5-1: Deployed Officers, Weekdays, Winter 2018 ......................................................................... 24
FIGURE 5-2: Deployed Officers, Weekends, Winter 2018 ......................................................................... 24
FIGURE 5-3: Deployed Officers, Weekdays, Summer 2018 ...................................................................... 25
FIGURE 5-4: Deployed Officers, Weekends, Summer 2018 ...................................................................... 25
FIGURE 5-5: Deployment and All Workload, Weekdays, Winter 2018 ................................................... 27
FIGURE 5-6: Deployment and All Workload, Weekends, Winter 2018 ................................................... 27
FIGURE 5-7: Deployment and All Workload, Weekdays, Summer 2018 ................................................ 28
FIGURE 5-8: Deployment and All Workload, Weekends, Summer 2018 ................................................ 28
FIGURE 5-9: Percentage of Workload, Weekdays, Winter 2018 ............................................................. 30
FIGURE 5-10: Percentage of Workload, Weekends, Winter 2018 ........................................................... 30
FIGURE 5-11: Percentage of Workload, Weekdays, Summer 2018 ........................................................ 31
FIGURE 5-12: Percentage of Workload, Weekends, Summer 2018 ........................................................ 31
FIGURE 5-13: CSO Calls per Day, by Month ............................................................................................... 39
FIGURE 5-14: Deployment and All Workload, Weekdays, CSO Units .................................................... 41
FIGURE 5-15: Workload Percentage by Hour, CSO Units ......................................................................... 41
FIGURE 5-16: Traffic Calls per Day, by Month ............................................................................................. 46
FIGURE 5-17: Deployment and All Workload, Weekdays, Traffic Units .................................................. 47
FIGURE 5-18: Workload Percentage by Hour, Traffic Units ....................................................................... 47
FIGURE 6-1: Average Response Time and Dispatch Delay for High-priority Calls, by Hour ............... 64
FIGURE 8-1: Percentage Events per Day, by Initiator ............................................................................... 81
FIGURE 8-2: Percentage Events per Day, by Category ........................................................................... 82
FIGURE 8-3: Percentage Calls per Day, by Category .............................................................................. 84
FIGURE 8-4: Calls per Day, by Initiator and Month .................................................................................... 86
FIGURE 8-5: Calls per Day, by Category and Month ................................................................................ 87
FIGURE 8-6: Primary Unit’s Average Occupied Times, by Category and Initiator .............................. 89
FIGURE 8-7: Number of Responding Units, by Initiator and Category ................................................... 91
FIGURE 8-8: Number of Responding Units, by Category, Community-initiated Calls ........................ 92
FIGURE 8-9: Percentage Calls and Work Hours, by Beat ......................................................................... 94
FIGURE 8-10: Percentage Calls and Work Hours, by Category, Winter 2018 ....................................... 95
FIGURE 8-11: Percentage Calls and Work Hours, by Category, Summer 2018.................................... 97
FIGURE 8-12: Activities per Day, by Month .............................................................................................. 101
FIGURE 8-13: Activities per Day, by Day of Week .................................................................................. 102
FIGURE 8-14: Activities per Day, by Hour of Day .................................................................................... 103
FIGURE 8-15: Deployed Officers, Weekdays, Winter 2018 .................................................................... 106
FIGURE 8-16: Deployed Officers, Weekends, Winter 2018 .................................................................... 106
FIGURE 8-17: Deployed Officers, Weekdays, Summer 2018 ................................................................. 107
FIGURE 8-18: Deployed Officers, Weekends, Summer 2018 ................................................................. 107

viii
FIGURE 8-19: Deployment and All Workload, Weekdays, Winter 2018 .............................................. 109
FIGURE 8-20: Deployment and All Workload, Weekends, Winter 2018 .............................................. 109
FIGURE 8-21: Deployment and All Workload, Weekdays, Summer 2018 ........................................... 110
FIGURE 8-22: Deployment and All Workload, Weekends, Summer 2018 ........................................... 110
FIGURE 8-23: Percentage of Workload, Weekdays, Winter 2018 ........................................................ 112
FIGURE 8-24: Percentage of Workload, Weekends, Winter 2018 ........................................................ 112
FIGURE 8-25: Percentage of Workload, Weekdays, Summer 2018 ..................................................... 113
FIGURE 8-26: Percentage of Workload, Weekends, Summer 2018 ..................................................... 113
FIGURE 8-27: Average Response Time and Dispatch Delays, by Hour of Day, Winter and Summer
2018 ................................................................................................................................................................. 116
FIGURE 8-28: Average Response Time by Category, Winter 2018 ...................................................... 117
FIGURE 8-29: Average Response Time by Category, Summer 2018 ................................................... 117
FIGURE 8-30: Average Response Time Components, by Beat ............................................................ 120
FIGURE 8-31: Average Response Times and Dispatch Delays for High-priority Calls, by Hour ....... 121
FIGURE 8-32: Traffic Calls per Day, by Month .......................................................................................... 125
FIGURE 8-33: Deployment and All Workload, Weekdays, Traffic Units ............................................... 126
FIGURE 8-34: Workload Percentage by Hour, Traffic Units .................................................................... 126
FIGURE 8-35: CSO Calls per Day, by Month ............................................................................................ 130
FIGURE 8-36: Deployment and All Workload, Weekdays, CSO Units ................................................. 131
FIGURE 8-37: Workload Percentage by Hour, CSO Units ...................................................................... 131
FIGURE 8-38: Reported Violent and Property Crime Rates, by Year .................................................. 141
FIGURE 8-39: Reported City and State Crime Rates, by Year .............................................................. 141
1
SECTION 1. EXECUTIVE SUMMARY
In May 2014, the Center for Public Safety Management, LLC (CPSM) conducted a
comprehensive assessment of all operational aspects of the Carlsbad Police Department. While
our analysis covered all aspects of the department’s operations, particular areas of focus of that
study included identifying appropriate staffing levels given the workload, community
demographics, and crime rate; the effectiveness of the organizational structure; and efficiency
and effectiveness of bureau/unit processes. In October 2014, CPSM provided a report of our
findings and recommendations.
In December 2018, CPSM was commissioned to conduct a limited follow-up study of the
department. Specifically, the scope of the present work includes assessing appropriate staffing
levels for defined department functions, including Patrol, Traffic, Investigations, Records, and
Communications, based upon current workload demands. Included in our evaluation are areas
such as the volume of community-initiated calls for service and self-initiated activity, call
response times, the impacts of prisoner handling, impacts of homeless and/or mentally ill on
service demands, public records requests, and workload impacts related to new or expanding
technologies.
As noted, this analysis is limited to the evaluation of staffing needs based upon current workload
demands, and unlike the 2014 study, does not include a comprehensive operational assessment
to include efficiency and effectiveness of bureau/unit processes. Nonetheless, where CPSM feels
that readily identifiable and beneficial changes in staffing models would lead to improvement in
operational efficiency and effectiveness, recommendations will be offered.
We analyzed the workload demands using operations research methodology and compared
that workload to staffing and deployment levels. We reviewed other performance indicators
that enabled us to understand the implications of service demand on current staffing. Our study
involved data collection, interviews with key operational and administrative personnel, on-site
observations of the job environment, data analysis, and comparative analysis.
This report is made up of two parts, namely the Staffing Assessment and a Data Analysis. The
staffing assessment is based upon interviews with staff, the review of numerous documents
provided by the city, a data analysis, and the site visit by the CPSM team. The data analysis
report primarily examines patrol and traffic workload activity. This information is derived from
computer-aided dispatch (CAD) records provided by the department. The two parts of the
report complement one another. Readers will note that some information, especially tables and
figures, is reflected in both portions of the report; the consultants used the material from the data
analysis to assist in their staffing assessment. We urge the consumers of this information to
thoroughly review the report in its entirety.
As part of this Executive Summary, below we have included a master list of unit-specific staffing
recommendations for consideration. Some of these recommendations include the addition of
staff within the existing organizational framework, while others address opportunities for the
creation of new job classifications and/or the reassignment/repurposing of job duties. In the
report narrative, we will offer a detailed discussion of supporting factors for each
recommendation. We believe these recommendations, if adopted, will enhance the
department’s capacity to serve the community.
2
CPSM staff would like to thank Chief Gallucci, Assistant Chief Williams, Captains Magro and
Pascual, Senior Management Analyst Anderson, and the entire staff of the Carlsbad Police
Department for their gracious cooperation and assistance in completing this project.

3
KEY RECOMMENDATIONS
Operations Bureau
Patrol Recommendations 1. Increase sergeant staffing by four FTEs, one each per primary patrol shift. (See p. 36.)
2. Increase minimum staffing levels of patrol shifts by one police officer for the hours specified in
this report. (See p. 36.)
3. Consider establishing a Police Service Officer classification, staffing for which would include
two new FTEs and the upgrade of two Community Service Officers (CSOs). PSOs would be
assigned to the patrol function, with duties that include those of existing patrol CSOs plus
added responsibilities of transport/booking of prisoners. (See p. 36.)
4. Over a three-month period, assess the number of calls for service handled by patrol officers
that are deemed appropriate for assignment to a CSO. If sufficient numbers exist to warrant
additional CSO staffing, submit budget requests to hire appropriate numbers of CSO staff.
(See p. 36.)
5. Consider expanding the utilization of K9 units in handling of calls for service. (See p. 36.)
6. Examine causative factors contributing to the extraordinary rate of out-of-service time.
(See p. 36.)
7. Examine shift deployment schedules and adjust as necessary to better align available
personnel to workload demands. (See p. 36.)
CSO Recommendations 8. Expand the role of CSOs in response to traffic collisions and other appropriate duties.
(See p. 42.)
9. Expand the Community Service Officer complement to eight authorized positions, with the
end goal of incorporating Police Service Officers into the staffing complement. Ultimately,
the complement would include four CSOs and four PSOs. (See p. 42.)
Traffic Recommendations 10. Increase FTE staffing by three motor officers to allow for staffing during evening commute
times as well as limited weekend deployments. (See p. 49.)
11. Reconsider the practice of granting motorcycle officers a one-hour maintenance period per
day to conduct activities largely limited to checking engine oil, tire air pressure, and light
cleaning, duties that should take only minutes. (See p. 49.)
12. Examine causative factors contributing to high levels of out-of-service time. (See p. 49.)
Support Bureau Recommendations
Investigations Recommendations 13. A clear policy that outlines department case screening criteria and those accountable for
such screening should be developed and approved by department command staff.
(See p. 55.)
14. The case screening flow chart recently developed by CPD should be considered as part of
policy development. (See p. 55.)

4
15. A policy should be developed that requires that NETRMS be utilized by department
managers and supervisors to assess individual and unit workload. (See p. 55.)
16. Develop benchmarks to track individual investigation progress from assignment to include
case closure standards and required approvals. (See p. 55.)
17. Extract case information from NETRMS and massage this information into relevant and timely
management reports for investigative supervisors and department managers so they may
analyze and evaluate the effectiveness of the department’s investigative function.
(See p. 55.)
18. Continue to evaluate NETRMS data for clarity and consistency to ensure input provides a
level of confidence in the resulting output for caseload assessment and analysis of the
investigative function. (See p. 55.)
19. CPSM recommends the addition of one General Investigations detective in order to reduce
the annual detective caseload average from 209 to 167. (See p. 55.)
20. CPSM recommends the addition of one Family Services detective in order to reduce the
annual detective caseload average from 218 to 163. (See p. 55.)
21. Management in Investigations should review case clearance rates to assess bureau
effectiveness in solving crime and the effectiveness of individual detectives. (See p. 55.)
22. Periodic training for Records and Investigators staff is recommended regarding FBI case
clearance guidelines to ensure correct reporting of UCR statistics. (See p. 55.)
Communications Recommendations
23. Ensure that reliance upon supervisors to intermittently perform line duties does not interfere
with them performing their role as supervisors. (See p. 65.)
24. Ensure all department personnel are required to reflect their department cell phone number
on their business cards to aid in reducing the number of calls handled by Communications.
(See p. 65.)
25. Require that each officer regularly reviews and responds to phone messages. (See p. 65.)
26. Communications PRA requests should be absorbed by the CPSM-recommended Discovery
Unit (see Records Division section of this report for detail). (See p. 65.)
27. As new technology tools are deployed in the future, evaluate Communications staffing
levels to meet increased workload to potentially include a “technology” desk. (See p. 65.)
28. A team from Communications and Operations should jointly examine ways to reduce
dispatch delays of all calls to field units. (See p. 65.)
Homeless Outreach Team Recommendations 29. CPSM recommends the HOT staff be assigned for five-year periods to enhance staff
relationships with clientele served. (See p. 68.)
30. HOT members should consider identifying and prioritizing intervention with homeless
individuals who generate the greatest number of calls for services to reduce costs to the city
and improve quality of life. (See p. 68.)
31. The HOT should accurately track its efforts in both qualitative and quantitative terms.
(See p. 69.)

5
32. CPSM recommends creating three HOT teams consisting of a police officer and a licensed
clinical social worker to support patrol and HOT personnel; this would require an additional
police officer FTE and three LCSW FTEs. (See p. 69.)
33. With the increase in HOT team size, adding a sergeant to supervise the teams is
recommended. (See p. 69.)
34. Carlsbad’s administrators and elected officials should continually monitor the department’s
and city’s efforts to address the homeless situation to ensure the city is providing the
appropriate level of services and meeting the expectations of the community. (See p. 69.)
Records Recommendations 35. The department should consider developing a section within the policy manual specific to
the Records function. (See p. 76.)
36. Records should also develop a procedural manual for staff reference, improved consistency,
and guidelines for new employees. (See p. 76.)
37. The report deferral policy must be followed and communication improved between Records
and patrol supervisors to address this issue. (See p. 76.)
38. The requirement that the E-tickets be cut to a particular size by Records staff as requested by
the Court should be reviewed as a seemingly unnecessary task. (See p. 76.)
39. Consideration should be given to assigning a Community Service Officer position to the
public counter to address department inquiries. (See p. 76.)
40. An additional FTE should be funded and assigned to Records to allow the current P/E FTE to
concentrate on P/E responsibilities on a full-time basis. (See p. 76.)
41. For the establishment of a “Discovery Unit” within Records to centralize the tasks required for
completion of judicial and PRA requests, recommended initial staffing should be not less
than 1.0 civilian FTEs. This staffing level assumes this unit will undertake the workload presently
spread through the department. (See p. 76.)
42. CPSM recommends a Records Supervisor position be assigned to Records to lessen the
manager’s workload to allow for appropriate management oversight. (See p. 76.)
43. CPSM recommends frequent training be provided to appropriate staff to ensure the correct
criteria is adhered to in reporting of UCR crime and clearances. (See p. 76.)
44. CPSM recommends here, as in Communications, that CPD should ensure all personnel are
required to reflect their department cellphone number on their business cards, and that
each officer be required to regularly review and respond to phone messages. (See p. 76.)
45. CPSM recommends the CPD eliminate the acceptance of cash at its public window as a
payment option for department services or records. (See p. 76.)

6
SECTION 2. METHODOLOGY
Data Analysis CPSM used numerous sources of data to support our conclusions and recommendations for the
Carlsbad Police Department. Information was obtained from the FBI Uniform Crime Reporting
(UCR) Program, Part I offenses, along with numerous sources of internal information. UCR Part I
crimes are defined as murder, rape, robbery, aggravated assault, burglary, larceny-theft, and
larceny of a motor vehicle. Internal sources included data from the computer-aided dispatch
(CAD) system for information on calls for service (CFS).
Document Review CPSM consultants were furnished with numerous reports and summary documents by the
Carlsbad Police Department. Information on strategic plans, personnel staffing and deployment,
monthly and annual reports, operations manuals, intelligence bulletins, evaluations, training
records, and performance statistics were reviewed by project team staff. Follow-up phone calls
were used to clarify information as needed.
Interviews This study relied extensively on intensive interviews with personnel. On-site and in-person
interviews were conducted with all relevant bureau/section commanders regarding their
operations.
Operational/Administrative Observations Over the course of the evaluation period, numerous observations were conducted. These
included observations of general patrol; investigations; support services such as records,
communications, property and evidence; and administrative functions. CPSM representatives
engaged all facets of department operations from a “participant observation” perspective.
Staffing Analysis In virtually all CPSM studies, we are asked to identify appropriate staffing levels. For this study,
that is the exclusive study objective. In the following subsections, we will extensively discuss
workload, operational and safety conditions, and other factors to be considered in establishing
appropriate staffing levels. Staffing recommendations are based upon our comprehensive
evaluation of all relevant factors.

7
SECTION 3. DEPARTMENT STAFFING
The following table displays the authorized staffing levels for the department for FY 2015 through
2019. Staffing levels will be addressed throughout the report as we discuss specific operating
sections. This table is examines staffing levels/changes for the past five years, as well as
vacancies at present.
TABLE 3-1: Authorized Staffing Levels for Fiscal Years 2015-2019
Position 2015 2016 2017 2018 2019 Vacant
Sworn Positions (as of 4/2/2019)
Chief 1 1 1 1 1
Assistant Chief 0 0 0 0 1
Captain 2 2 2 2 2
Lieutenant 7 7 7 7 8
Sergeant 15 15 15 15 15
Officer 88 88 88 90 93 2
Sworn Total 113 113 113 115 120 2
Civilian Personnel
Administrative Secretary 1 1 1 1 1
Office Specialist 1 1 1 1 1
Senior Management Analyst 1 1 1 1 1
Crime Analyst 1 1 1 1 1
Records - Property/Evidence Manager 1 1 1 1 1
Records Specialists 4 4 4 4 4
Property and Evidence Technician 2 2 2 2 2
Communications Manager 1 1 1 1 1
Dispatch Supervisor 4 4 4 4 4
Dispatcher 16 16 16 16 16
Community Relations Manager 1 1 1 1 1
Juvenile Justice Coordinator 1 1 1 1 1
Training Coordinator 1 1 1 1 1
Administrative Assistant (part-time) 2 2 2 2 2
Community Services Officer 11 11 11 11 11
Ranger 0 0 0 2 2
Cal ID Techs 2 2 2 2 2
Civilian Total 50 50 50 52 52
Total Authorized Personnel 163 163 163 167 172
Source: Carlsbad PD

8
SECTION 4. REPORTED CRIME DATA
While communities differ from one another in population, demographics, geographical
landscape, and social-economic distinctions, comparisons to other jurisdictions can be helpful in
illustrating how crime rates in the City of Carlsbad measure against those of other local California
agencies as well as the State of California and the nation overall.
The FBI’s Uniform Crime Reporting (UCR) Program assembles data on crime from police
departments across the United States; the reports are utilized to measure the extent, fluctuation,
and distribution of crime. For reporting purposes, criminal offenses are divided into two
categories: Part 1 offenses and Part 2 offenses. In Part 1 offenses, representing the most serious
crimes, the UCR indexes incidents in two categories: violent crimes and property crimes. Violent
crimes include murder, rape, robbery, and aggravated assault. Property crimes include burglary,
larceny, and motor vehicle theft. Crime rates are expressed (indexed) as the number of
incidents per 100,000 population to allow for comparison.
Data acquired by CPSM from the FBI for use in this reporting reflects the most currently available
information (2017). As indicated in Table 4-1, in 2017, the Carlsbad Police Department reported a
UCR Part I violent crime rate of 214 (indexed) and a property crime rate of 1,915 (indexed).
In comparing Carlsbad Police Department data with other California cities and the nation, one
can see Carlsbad reports below-average rates compared to statewide and national figures for
both violent crime and property crime. Property crime rates in this case are largely driven by
larceny offenses, including shoplifting.
TABLE 4-1: Reported Crime Rates by Jurisdiction, Per 100,000*, 2017
City State Population Crime Rates
Violent Property Total
Buena Park CA 83,552 349 3,368 3,717
Chula Vista CA 271,109 298 1,432 1,730
Costa Mesa CA 113,267 319 3,795 4,114
El Cajon CA 104,447 411 2,231 2,642
Escondido CA 152,845 377 1,704 2,081
Fullerton CA 141,637 207 2,790 2,997
Hemet CA 85,166 537 3,643 4,180
Indio CA 90,055 710 2,540 3,250
Menifee CA 90,403 136 2,181 2,317
Murrieta CA 113,016 71 1,400 1,471
Newport Beach CA 86,910 143 2,443 2,586
Orange CA 141,130 154 1,831 1,985
Tustin CA 81,246 162 2,399 2,561
Westminster CA 91,863 306 3,075 3,381
Carlsbad CA 115,344 214 1,915 2,129
California 39,536,653 449 2,497 2,946
National 325,719,178 383 2,362 2,745
*Indexed per 100,000 population. Source: FBI Uniform Crime Report.

9
Table 4-2 shows the actual number of offenses. In this table, we included data for 2018, which
was provided by the department, as the 2018 data is not yet available from the FBI UCR. As can
be seen, while rates vary by category, the total number of incidents has been relatively
unchanged over the past three years.
TABLE 4-2: Carlsbad Police Department Reported Actual Part 1 Offenses, 2016 to
2018*
Crime 2016 2017 2018*
Murder/ Manslaughter 2 0 2
Rape 26 30 39
Robbery 55 46 52
Aggravated Assault 182 171 151
Burglary 497 432 299
Larceny 1463 1638 1649
Vehicle Theft 149 139 152
Total 2,374 2,456 2,344
*Note: FBI data for 2018 not yet available. Data for 2018 provided by CPD.
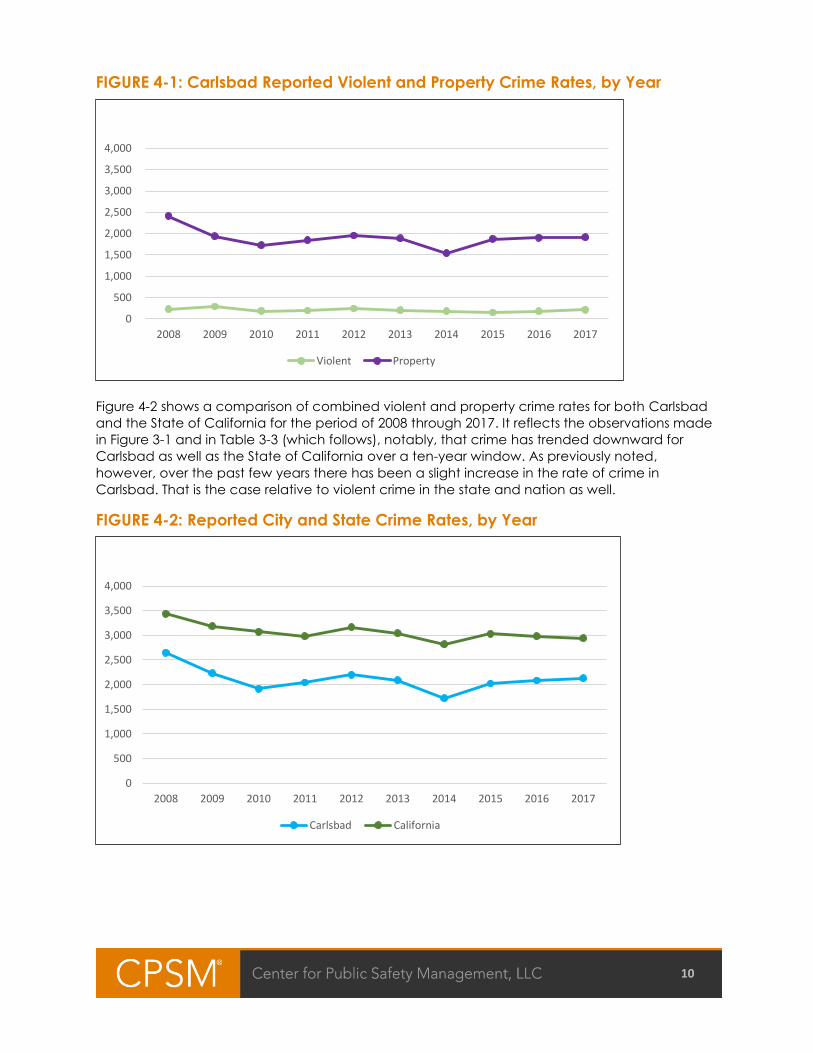
Figure 4-1 reflects the trend in Part 1 crime over the past ten years. It shows that both violent
crime and property crime fluctuated somewhat between 2008 and 2017, but largely trended
downward, though slight increases are noted over the past three years. The highest violent crime
rate of this period occurred in 2009 at 291 (indexed). The lowest rate, at 151 (indexed), occurred
in 2015. For 2017, the rate was 214 (indexed). As noted, property crime also trended downward
over this period. The highest property crime rate occurred in 2008 at 2,414 (indexed), with the
low of 1,541 (indexed) in 2014. These rates largely follow state and national trends, which
generally show declines in both violent and property crime over the referenced ten-year period.
10
FIGURE 4-1: Carlsbad Reported Violent and Property Crime Rates, by Year
Figure 4-2 shows a comparison of combined violent and property crime rates for both Carlsbad
and the State of California for the period of 2008 through 2017. It reflects the observations made
in Figure 3-1 and in Table 3-3 (which follows), notably, that crime has trended downward for
Carlsbad as well as the State of California over a ten-year window. As previously noted,
however, over the past few years there has been a slight increase in the rate of crime in
Carlsbad. That is the case relative to violent crime in the state and nation as well.
FIGURE 4-2: Reported City and State Crime Rates, by Year
0
500
1,000
1,500
2,000
2,500
3,000
3,500
4,000
2008 2009 2010 2011 2012 2013 2014 2015 2016 2017
Violent Property
0
500
1,000
1,500
2,000
2,500
3,000
3,500
4,000
2008 2009 2010 2011 2012 2013 2014 2015 2016 2017
Carlsbad California

11
Table 4-3 compares Carlsbad crime rates to both the state and national rates year by year for the period 2007 through 2016. Again,
this data is indexed per 100,000 population. It is provided for illustration purposes only.
TABLE 4-3: Reported Municipal, State, and National Crime Rates, by Year, 2008-2017*
Year Carlsbad California National
Population Violent Property Total Population Violent Property Total Population Violent Property Total
2008 97,670 232 2,414 2,647 36,876,276 502 2,931 3,433 309,327,055 438 3,055 3,493
2009 98,482 291 1,937 2,229 37,061,435 471 2,717 3,188 312,367,926 416 2,906 3,322
2010 105,328 185 1,728 1,913 37,346,022 439 2,629 3,068 314,170,775 393 2,833 3,225
2011 106,566 197 1,849 2,046 37,819,249 410 2,574 2,983 317,186,963 376 2,800 3,176
2012 107,879 246 1,955 2,201 38,183,375 421 2,747 3,169 319,697,368 377 2,758 3,135
2013 110,505 200 1,887 2,087 38,498,377 394 2,646 3,041 321,947,240 362 2,627 2,989
2014 112,297 182 1,541 1,723 38,970,399 389 2,430 2,819 324,699,246 357 2,464 2,821
2015 113,972 151 1,872 2,023 39,315,550 424 2,605 3,029 327,455,769 368 2,376 2,744
2016 115,040 182 1,902 2,084 39,421,283 443 2,541 2,984 329,308,297 383 2,353 2,736
2017 115,344 214 1,915 2,129 39,536,653 449 2,497 2,946 325,719,178 383 2,362 2,745
*Indexed per 100,000 population. Source: FBI Uniform Crime Report.
12
SECTION 5. OPERATIONS BUREAU
The Carlsbad Police Department Operations Bureau provides the community with a full range of
police services, including responding to emergencies and calls for service (CFS), performing
directed patrol activities, engaging in neighborhood problem solving, and traffic enforcement.
The bureau is comprised of two divisions: Patrol and Traffic. While each is integrally involved in
supporting the other, we will address both functions separately. Reporting on each separately
allows the reader to better comprehend each function and its independent as well as collective
value in providing policing services to the City of Carlsbad.
The Operations Bureau serves under the direction of a captain who reports directly to the
Assistant Chief of Police. Five lieutenants are assigned to Operations Bureau, four in patrol (one
for each primary patrol team) and one to traffic.
PATROL DIVISION
Uniformed patrol is considered the “backbone” of American policing. Officers assigned to this
important function are the most visible members of the department and command the largest
share of resources committed by the department. Proper staffing and allocation of these
resources is critical to ensuring that the department is capable of both timely and efficient
response to emergency calls as well providing general law enforcement services to the public.
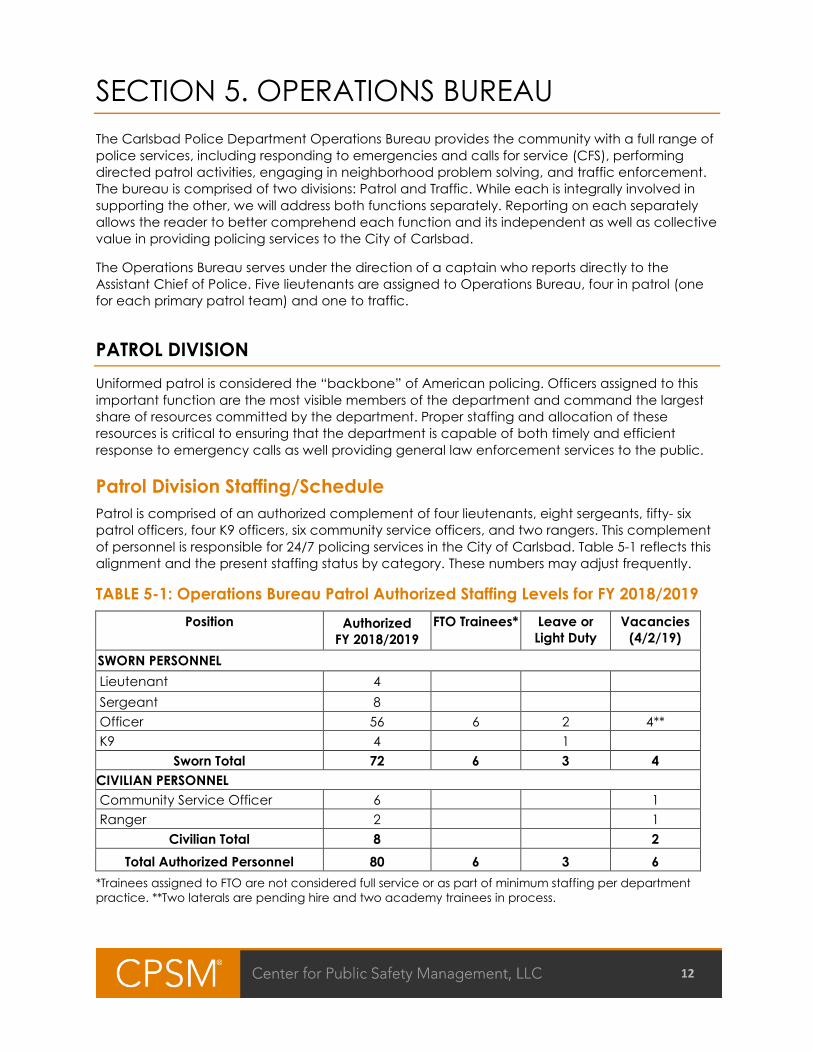
Patrol Division Staffing/Schedule
Patrol is comprised of an authorized complement of four lieutenants, eight sergeants, fifty- six
patrol officers, four K9 officers, six community service officers, and two rangers. This complement
of personnel is responsible for 24/7 policing services in the City of Carlsbad. Table 5-1 reflects this
alignment and the present staffing status by category. These numbers may adjust frequently.
TABLE 5-1: Operations Bureau Patrol Authorized Staffing Levels for FY 2018/2019
Position Authorized
FY 2018/2019
FTO Trainees* Leave or
Light Duty
Vacancies
(4/2/19)
SWORN PERSONNEL
Lieutenant 4
Sergeant 8
Officer 56 6 2 4**
K9 4 1
Sworn Total 72 6 3 4
CIVILIAN PERSONNEL
Community Service Officer 6 1
Ranger 2 1
Civilian Total 8 2
Total Authorized Personnel 80 6 3 6
*Trainees assigned to FTO are not considered full service or as part of minimum staffing per department
practice. **Two laterals are pending hire and two academy trainees in process.

13
Supervision
It is common policing practice at agencies of Carlsbad’s size and staffing alignment that a
lieutenant serves as the patrol “watch commander.” In doing so, lieutenants spend much of
their time in the station handling various administrative duties related to patrol shift operations As
well, they are heavily burdened with collateral duties including project research, personnel
mentoring/development, performance reviews, administrative reports, and attendance at both
community and department meetings. After normal business hours the watch commander
becomes the functional supervisor of all department operations, including 911/communications,
Records, etc. Additional, though limited time, is spent in the field. In the absence of a lieutenant,
sergeants may serve in the capacity of watch commander.
Sergeants, on the other hand, are generally responsible for field supervision and serve as
additional staffing in support of patrol officers during especially busy periods. They provide for a
critical need in directing and supervising field operations on a 24/7 basis. Absence of adequate
and proactive field supervision in policing creates significant liability for an agency. We will
discuss staffing levels for sergeants in the patrol summary subsection.
Deployment Schedule
Personnel work a 12-hour day and alternate working three and four-day work weeks per their
MOU. Generally, Wednesday shifts are eight hours in duration. This schedule ensures personnel
reach 160 work hours in the 28-day cycle. One day and one night shift team work Sunday to
Wednesday, the second day and night teams work Wednesday to Sunday, again, with
alternate Wednesdays off. Four cover teams of officers work a morning and evening mid-shift for
each day and night team. This ensures some coverage during primary shift changes. Table 5-2
reflects this alignment, along with minimum staffing. Actual numbers change frequently.
TABLE 5-2: Deployment Schedule / Minimum Staffing
Watch Hours Work Days Lt.* Sgt. PO Actual** Min. Staffing
Day 1 0400X1600 Su, M, Tu 1 2 7 6 8
Cover D-1 0600X1800 6 4
Day 2 0400x1600 Th, F, Sa 1 2 7 5 8
Cover D-2 0600x1800 6 5
Eve 1 1600x0400 Su, M, Tu 1 2 11 8 9
Cover E-1 1700x0500 3 3
Eve 2 1600x0400 Th, F, Sa 1 2 13 10 12
Cover E-2 1700x0500 4 3
Total 4 8 56 44 N/A
* Lieutenants are designated as watch commanders and work three 12-hour shifts each week, with an 8-
hour shift on alternating Wednesdays, as do sergeants and officers. They have the flexibility to stagger their
start times to meet the operational needs of the watch, as do sergeants and patrol officers. ** Does not
include FTO Trainees.
Staffing levels are affected by both the number of officers assigned to the patrol function as well
as the impact of time off associated with vacations, training, court appearances, FMLA, and
illness/injury, etc. In general, the combination of these leave factors results in officers being
unavailable for a shift at a rate of 25 percent of the time. For instance, while a team may be
staffed with twelve officers, only nine may report to work due to various leave factors.

14
Minimum Staffing
Virtually all agencies establish minimum staffing levels for patrol functions. The primary reasons
include ensuring that sufficient resources are available to respond to emergency calls for
service, ensure that sufficient resources are available to provide for the safety of the community
and the department’s deployed staff, and ensure that resources are available to handle the
volume of workload common in the community. As such, minimum staffing will vary from agency
to agency based both upon the size of the agency, and the nature and volume of workload. It
is often a subjective decision made by the department’s leadership team.
The department has established a minimum staffing level of eight officers on day shift, nine on
Sunday through Thursday evenings, and twelve on Thursday through Saturday evenings. The
minimum staffing is an informal standard since neither department policy nor the collective
bargaining agreements for impacted employees reference minimum staffing. This is appropriate,
as the Police Chief must have the flexibility to adjust minimum staffing based upon ever-
changing workload conditions.
Over the two-year period of 2017 through 2018, the department reported hiring officers to meet
minimum staffing an average of 2,232 hours per year. It is estimated that the overtime costs
associated with minimum staffing near or exceed $200,000 per year. While this exceeds an FTE
amount of 2,080 hours by 152 hours, the time period in which officers must be hired on overtime
to meet minimum staffing requires factoring in a 24-hour day, 365 days per year (8,760 hours). As
such, hiring to meet minimum staffing practices occurred roughly 26 percent of all deployment
hours. Therefore, the hiring of an FTE to cover hours requiring minimum staffing is impractical.
The department does not include K9 officers or trainees assigned to an FTO program as part of its
minimum staffing complement. While some but not all police departments do not include
trainees as part of minimum staffing, it is unusual that K9 officers are not included. As noted,
minimum staffing levels are established to address the need to have sufficient personnel
available to respond to emergency calls for service, and to ensure community and officer
safety. We submit that no regular duties of the K9 officers should interfere with responses to these
types of needs, and as such, they should be included in minimum staffing counts. However,
given the limited role they have in terms of calls for service response, they do not significantly
impact workload carried by patrol officers.
It is important to keep in mind that minimum standards are just that, minimums, not optimal.
Minimums simply establish a reasonable number of personnel available to generally ensure
citizen and officer safety and the ability to respond to emergency calls for service in a timely
manner. Minimum staffing numbers do not allow for routine proactive policing, problem solving,
and timely response to non-emergency calls.
As we explore deployment and workload later in this section, we will identify actual staffing
levels (personnel that are on-duty at any given time period) and compare those against
workload demands.
Call / Workload Demand
As noted in the Executive Summary, our work followed two tracks: (1) the operational
assessment, and (2) a data analysis of workload, primarily related to Operations Bureau
functions. For this study, at the request of the department, we have separated our workload
assessment of the Operations Bureau into three reporting areas: Patrol, Patrol CSO, and Traffic.
15
In the following pages, we draw upon the data analysis report to assist in our operational
assessment. The data analysis report, in full, can be found following the operational assessment
and readers are encouraged to thoroughly review it. The data analysis is rich with information,
only a portion of which is included in this segment of the report. For purposes of our analysis, we
use computer-aided dispatch (CAD) records supplied by the department’s dispatch center.
These records pertain to identifiable workload associated with specific units and are the most
accurate, verifiable, and comprehensive records available.
Crime statistics for the City of Carlsbad indicate a below average level of both violent and
property crimes in comparison to the State of California and national levels. These figures were
discussed in Section 4 and depicted in Tables 4-1 and 4-3. While slight fluctuations have
occurred, crime has been trending downward over the past ten years, following a national path
that began in the 1990s. But as previously noted, overall crime rates have inched slightly higher
over the past few years, especially relative to violent crime.
Prevention of crime and the apprehension of criminals are at the forefront of responsibilities for
police departments, but demands on police resources involve much more than crime. Traffic
enforcement, the efficient flow of traffic through the community, and maintaining peace and
order are but a few of the many such noncrime activities that fall into the scope of work of a
police department. As we examine workload demands we will explore all activities.
Table 5-3 presents information on the main categories of calls for service the department
handled during the study period of January 1, 2018 through December 31, 2018.
The 911/dispatch center recorded approximately 51,623 events that were assigned call numbers
and which include an adequate record of a responding unit. When measured daily, the
department reported an average of 141.4 patrol-related events per day. The data that follows in
Table 5-3 eliminates events for directed patrol or out-of-service activities rather than specific
calls. Other events had fewer than 30 seconds spent on the call (indicating the call had been
canceled) or lacked arrival times or other pertinent call information. Excluding these categories,
the analysis focused on the remaining 39,850 calls for service. The data includes both officer-
initiated activity and community-initiated activity, e.g., residents, alarm companies, transfers
from other law enforcement agencies, etc.
Again, these figures only represent the main patrol workload. Additional event and call data
relative to Traffic and CSO workload will be reported upon separately.

16
TABLE 5-3: Calls per Day, by Category
Category No. of Calls Calls per Day
911 hang up 317 0.9
Accident 1,296 3.6
Alarm 3,481 9.5
Animal 172 0.5
Assist other agency 1,065 2.9
Check 4,914 13.5
Crime–person 1,529 4.2
Crime–property 3,031 8.3
Disturbance 4,210 11.5
Investigation 1,338 3.7
Miscellaneous 1,388 3.8
Public contact 4,452 12.2
Suspicious incident 4,202 11.5
Traffic enforcement 8,455 23.2
Total 39,850 109.2
Note: The focus here is on recorded calls rather than recorded events. We removed 749 events with zero
time on scene, 3,813 out of service, and 7,211 directed patrol activities.
In total, officers were involved in 39,850 calls during the 12-month study period, an average of
109.2 calls per day, or 4.5 per hour. The top four categories of calls accounted for 59 percent of
all calls: 24 percent of calls were traffic-related, 12 percent were checks, 11 percent were
crimes, and 11 percent were public contact checks.
In Table 5-4 we examine both the origin of the call and the average time spent on a call by the
primary unit. Community-initiated calls include calls from citizens, businesses, alarm companies,
transfers from other law enforcement agencies, etc. Police-initiated refers to calls generated by
a patrol officer or other Carlsbad police employees.

17
TABLE 5-4: Primary Unit’s Average Occupied Times, by Category and Initiator
Category Community-initiated Police-initiated
Minutes Calls Minutes Calls
911 hang up 14.3 317 NA 0
Accident 50.2 1,190 32.6 106
Alarm 17.0 3,477 10.5 4
Animal 20.6 167 23.1 5
Assist other agency 33.7 985 22.1 80
Check 31.0 3,792 33.0 1,122
Crime–person 67.8 1,454 91.0 74
Crime–property 46.4 2,910 43.6 121
Disturbance 40.5 3,919 38.9 291
Investigation 55.3 1,215 30.9 123
Miscellaneous 29.3 1,123 42.3 264
Public contact 29.5 2,495 23.8 1,955
Suspicious incident 27.2 2,860 16.6 1,341
Traffic enforcement 25.6 2,327 15.0 6,128
Weighted Average/Total Calls 34.8 28,231 20.8 11,614
Note: Here again, the information is limited to calls and excludes all events involving out of service time,
directed patrol, and that show zero time on scene. A unit’s occupied time is measured as the time from
when the unit was dispatched until the unit becomes available again. The times shown are the average
occupied minutes per call for the primary unit, rather than the total occupied minutes for all units assigned
to a call.
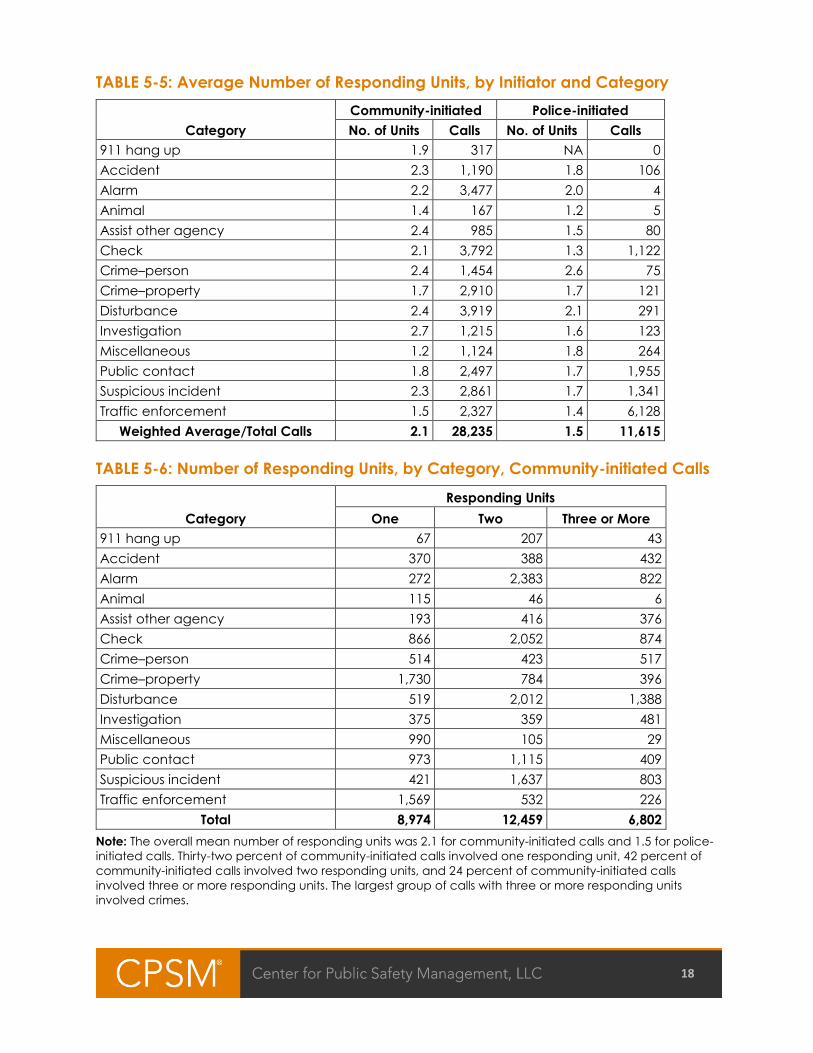
In Tables 5-5 and 5-6 we look at the average number of police units that responded to an
activity. Generally, as CPD deploys one-officer units, that translates to the average number of
officers that responded. The information in these tables is limited to calls and excludes all events
that show zero time on scene, directed patrol, and out of service.
18
TABLE 5-5: Average Number of Responding Units, by Initiator and Category
Category
Community-initiated Police-initiated
No. of Units Calls No. of Units Calls
911 hang up 1.9 317 NA 0
Accident 2.3 1,190 1.8 106
Alarm 2.2 3,477 2.0 4
Animal 1.4 167 1.2 5
Assist other agency 2.4 985 1.5 80
Check 2.1 3,792 1.3 1,122
Crime–person 2.4 1,454 2.6 75
Crime–property 1.7 2,910 1.7 121
Disturbance 2.4 3,919 2.1 291
Investigation 2.7 1,215 1.6 123
Miscellaneous 1.2 1,124 1.8 264
Public contact 1.8 2,497 1.7 1,955
Suspicious incident 2.3 2,861 1.7 1,341
Traffic enforcement 1.5 2,327 1.4 6,128
Weighted Average/Total Calls 2.1 28,235 1.5 11,615
TABLE 5-6: Number of Responding Units, by Category, Community-initiated Calls
Category
Responding Units
One Two Three or More
911 hang up 67 207 43
Accident 370 388 432
Alarm 272 2,383 822
Animal 115 46 6
Assist other agency 193 416 376
Check 866 2,052 874
Crime–person 514 423 517
Crime–property 1,730 784 396
Disturbance 519 2,012 1,388
Investigation 375 359 481
Miscellaneous 990 105 29
Public contact 973 1,115 409
Suspicious incident 421 1,637 803
Traffic enforcement 1,569 532 226
Total 8,974 12,459 6,802
Note: The overall mean number of responding units was 2.1 for community-initiated calls and 1.5 for police-
initiated calls. Thirty-two percent of community-initiated calls involved one responding unit, 42 percent of
community-initiated calls involved two responding units, and 24 percent of community-initiated calls
involved three or more responding units. The largest group of calls with three or more responding units
involved crimes.
19
Out-of-service Activities
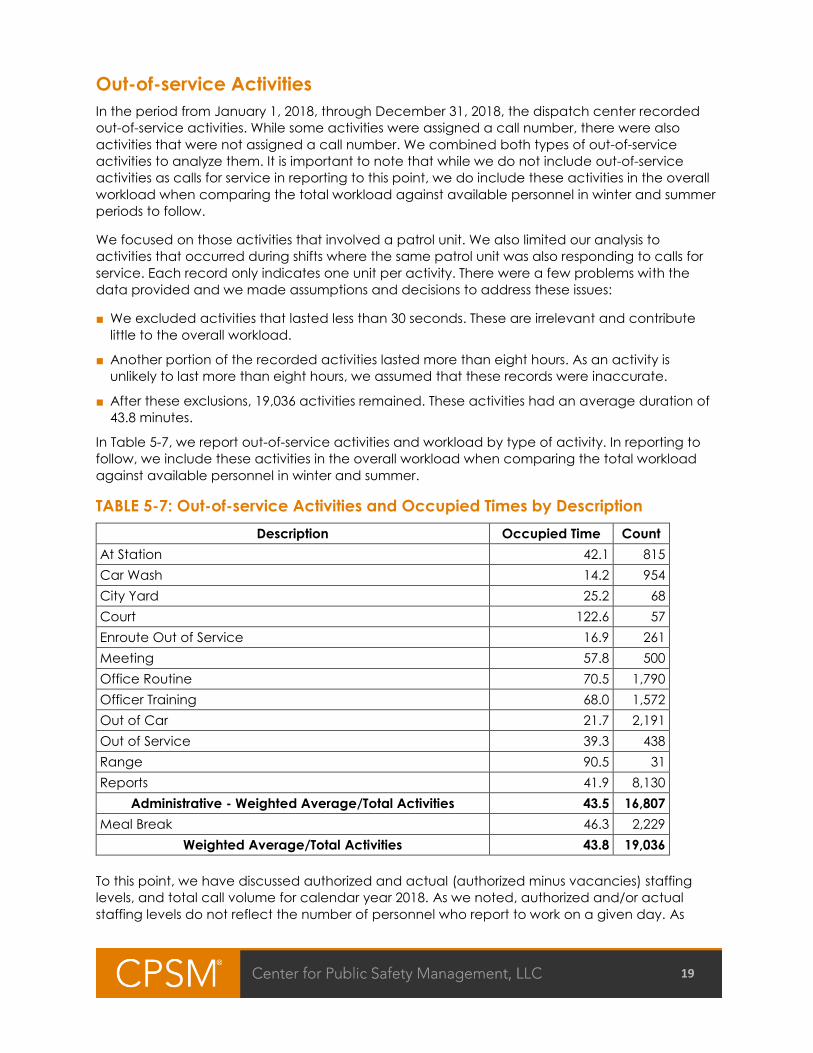
In the period from January 1, 2018, through December 31, 2018, the dispatch center recorded
out-of-service activities. While some activities were assigned a call number, there were also
activities that were not assigned a call number. We combined both types of out-of-service
activities to analyze them. It is important to note that while we do not include out-of-service
activities as calls for service in reporting to this point, we do include these activities in the overall
workload when comparing the total workload against available personnel in winter and summer
periods to follow.
We focused on those activities that involved a patrol unit. We also limited our analysis to
activities that occurred during shifts where the same patrol unit was also responding to calls for
service. Each record only indicates one unit per activity. There were a few problems with the
data provided and we made assumptions and decisions to address these issues:
■ We excluded activities that lasted less than 30 seconds. These are irrelevant and contribute
little to the overall workload.
■ Another portion of the recorded activities lasted more than eight hours. As an activity is
unlikely to last more than eight hours, we assumed that these records were inaccurate.
■ After these exclusions, 19,036 activities remained. These activities had an average duration of
43.8 minutes.
In Table 5-7, we report out-of-service activities and workload by type of activity. In reporting to
follow, we include these activities in the overall workload when comparing the total workload
against available personnel in winter and summer.
TABLE 5-7: Out-of-service Activities and Occupied Times by Description
Description Occupied Time Count
At Station 42.1 815
Car Wash 14.2 954
City Yard 25.2 68
Court 122.6 57
Enroute Out of Service 16.9 261
Meeting 57.8 500
Office Routine 70.5 1,790
Officer Training 68.0 1,572
Out of Car 21.7 2,191
Out of Service 39.3 438
Range 90.5 31
Reports 41.9 8,130
Administrative - Weighted Average/Total Activities 43.5 16,807
Meal Break 46.3 2,229
Weighted Average/Total Activities 43.8 19,036
To this point, we have discussed authorized and actual (authorized minus vacancies) staffing
levels, and total call volume for calendar year 2018. As we noted, authorized and/or actual
staffing levels do not reflect the number of personnel who report to work on a given day. As
20
previously reported, that number is reduced from authorized/actual numbers due to vacation,
training, illness, FMLA, military leave, etc. In reporting to follow, we will examine workload based
upon available workforce as deployed by shift.
Analysis of Patrol Deployment vs. Workload Demand
As previously mentioned, uniformed patrol is considered the “backbone” of American policing.
Proper staffing and allocation of these resources is critical to have officers available to respond
to calls for service and provide law enforcement services to the public.
Although some police administrators suggest that there are national standards for the number of
officers per thousand residents that a department should employ, that is not the case. The
International Association of Chiefs of Police (IACP) states that ready-made, universally
applicable patrol staffing standards do not exist. Furthermore, ratios such as officers-per-
thousand population are inappropriate to use as the basis for staffing decisions.
According to Public Management magazine, “A key resource is discretionary patrol time, or the
time available for officers to make self-initiated stops, advise a victim in how to prevent the next
crime, or call property owners, neighbors, or local agencies to report problems or request
assistance. Understanding discretionary time, and how it is used, is vital. Yet most police
departments do not compile such data effectively. To be sure, this is not easy to do and, in some
departments may require improvements in management information systems.”1
Essentially, “discretionary time” on patrol is the amount of time available each day where
officers are not committed to handling CFS and workload demands from the public. It is
“discretionary” and intended to be used at the discretion of the officers to address problems in
the community and be available in the event of emergencies. When there is no discretionary
time, officers are entirely committed to service demands, do not get the chance to address
other community problems that do not arise through 911, and are not available in times of
serious emergency. The lack of discretionary time indicates a department is understaffed.
Conversely, when there is too much discretionary time, officers are idle. This may be an
indication that the department is overstaffed.
Staffing decisions, particularly for patrol, must be based on actual workload as well as ensuring
that sufficient staffing exists to respond to emergency situations involving the safety of the public
and officers alike. Once the actual workload is determined, and the amount of discretionary
time is determined, then staffing decisions can be made consistent with the department’s
policing philosophy and the community’s ability to fund service. The Carlsbad Police
Department is a full-service police department, and its philosophy is to address essentially all
requests for service in a community policing style. With this in mind it is necessary to look at
workload to understand the impact of this style of policing in the context of community
demand.
To understand actual workload (the time required to complete certain activities), it is critical to
review total reported events within the context of how the events originated, such as through
directed patrol, administrative tasks, officer-initiated activities, and citizen-initiated activities.
Analysis of this type enables identification of activities that are really “calls” from those activities
that are some other type of event.
1. John Campbell, Joseph Brann, and David Williams, “Officer-per-Thousand Formulas and Other Policy
Myths,” Public Management 86 (March 2004): 2227.
21
In general, a “Rule of 60” can be applied to evaluate patrol staffing. This rule has two parts. The
first part states that 60 percent of the sworn officers in a department should be dedicated to the
patrol function (patrol staffing) and the second part states that no more than 60 percent of their
time should be committed to calls for service. This commitment of 60 percent of their time is
referred to as the patrol saturation index.
The Rule of 60 is not a hard-and-fast rule, but rather a starting point for discussion on patrol
deployment. Resource allocation decisions must be made from a policy and/or managerial
perspective through which costs and benefits of competing demands are considered. The
patrol saturation index indicates the percentage of time dedicated by police officers to public
demands for service and administrative duties related to their jobs. Effective patrol deployment
would exist at amounts where the saturation index was less than 60.
This Rule of 60 for patrol deployment does not mean the remaining 40 percent of time is
downtime or break time. It reflects the extent to which patrol officer time is saturated by calls for
service. The time when police personnel are not responding to calls should be committed to
management-directed operations. This is a more focused use of time and can include
supervised allocation of patrol officer activities toward proactive enforcement, crime
prevention, community policing, and citizen safety initiatives. It will also provide ready and
available resources in the event of a large-scale emergency.
From an organizational standpoint, it is important to have uniformed patrol resources available
at all times of the day to deal with issues such as proactive enforcement, community policing,
and emergency response. Patrol is generally the most visible and available resource in policing,
and the ability to harness this resource is critical for successful operations.
Understanding the difference between the various types of police department events and the
resulting staffing implications is critical to determining deployment needs. This portion of the
study looks at the total deployed hours of the police department with a comparison to current
time spent to provide services.
From an organizational standpoint, it is important to have uniformed patrol resources available
at all times of the day to deal with issues such as proactive enforcement and community
policing. Patrol is generally the most visible and most available resource in policing and the
ability to harness this resource is critical for successful operations.
From an officer’s standpoint, once a certain level of CFS activity is reached, the officer’s focus
shifts to a CFS-based reactionary mode. Once that threshold is reached, the patrol officer’s
mindset begins to shift from one that looks for ways to deal with crime and quality-of-life
conditions in the community to one that continually prepares for the next call. After saturation,
officers cease proactive policing and engage in a reactionary style of policing. The outlook
becomes, “Why act proactively when my actions are only going to be interrupted by a call?”
Any uncommitted time is spent waiting for the next call. Sixty percent of time spent responding
to calls for service is believed to be the saturation threshold.
Rule of 60 – Part 1 According to the department personnel data available at the time of the site visit (April 2019),
the department is authorized for 120 full-time sworn officers. When fully staffed, 72 of those
personnel are assigned to patrol functions (includes lieutenants, sergeants, and officers/patrol
and K9). When fully staffed, patrol staffing would thus represent 60 percent of total sworn
staffing, meeting CPSM’s Rule of 60 recommendation.

22
Rule of 60 – Part 2 The second part of the “Rule of 60” examines workload and discretionary time and suggests that
no more than 60 percent of time should be committed to calls for service and self-initiated
arrests, etc. In other words, CPSM suggests that no more than 60 percent of available patrol
officer time be spent responding to the service demands in the community. The remaining 40
percent of the time is the “discretionary time” for officers to be available to address community
problems and be available for serious emergencies. This Rule of 60 for patrol deployment does
not mean the remaining 40 percent of time is downtime or break time. It is simply a reflection of
the point at which patrol officer time is “saturated” by CFS.
This ratio of dedicated time compared to discretionary time is referred to as the “Saturation
Index” (SI). It is CPSM’s contention that patrol staffing is optimally deployed when the SI is below
the 60 percent range. An SI greater than 60 percent indicates that the patrol manpower is
largely reactive and overburdened with CFS and workload demands. An SI of somewhat less
than 60 percent indicates that patrol manpower is optimally staffed. SI levels significantly lower
than 60 percent, however, indicate patrol resources may be underutilized, and may signal an
opportunity for a reduction in patrol resources or reallocation of police personnel.
Departments must be cautious in interpreting the SI too narrowly. For example, one should not
conclude that SI can never exceed 60 percent at any time during the day, or that in any given
hour no more than 60 percent of any officer’s time be committed to CFS. The SI at 60 percent is
intended to be a benchmark to evaluate overall service demands on patrol staffing. When SI
levels exceed 60 percent for substantial periods of a given shift, or at isolated but consistent and
specific times during the day, then decisions should be made to reallocate or realign personnel
to reduce the SI to levels below 60. Lastly, this is not a hard-and-fast rule, but a benchmark to be
used in evaluating staffing decisions. Other factors such as the availability of sufficient resources
to safely, efficiently, and effectively respond to emergency calls for service must be considered.
Examination of Patrol Deployment vs. Workload Data
While the call data referenced in Tables 5-3 to 5-7 reflects call activity for the entire one-year
study period, for next portion of the study we drill down to examine not just the total number of
calls, but the actual time spent on these calls, other related duties, and available staffing.
Here, we examine deployment information for eight weeks in winter (January 4 through February
28, 2018) and eight weeks in summer (July 7 through August 31, 2018). We compare “all”
workload, which includes other-initiated calls, police-initiated calls, directed patrol work, and
out-of-service activities.
In Figures 5-1 through 5-12 that will follow, our analysis examines solely the department’s main
patrol deployment (added patrol includes K9, DUI patrols, reserves, etc.). Traffic and CSOs, both
sworn and civilian, are not reflected in these figures, and will be addressed in separate reporting.
This allows for assessment of how the department and its main patrol force is positioned to meet
the demands of calls for service while also engaging in proactive policing to combat crime and
disorder, and assist in addressing traffic issues in the community.
The department’s main patrol force consists of patrol officers, sergeants, and bike patrol officers.
As previously noted, patrol operates on 12-hour shifts starting at 4:00 a.m. and 4:00 p.m. A
portion of the day shift starts later, at 6:00 a.m., while a portion of the evening shift starts at 5:00
p.m. These staggered hours assure field coverage during primary shift rotations. It should be
noted that CPSM did not conduct an analysis of the shift configuration and reporting times as it
was outside of the scope of this study.

23
The department's main patrol force deployed an average of 8.9 officers per hour during the 24-
hour day in both winter and summer 2018. When additional units (K9, extra units, reserves, and
traffic officers in DUI cars) were included, the department averaged 11.2 officers per hour during
the 24-hour day in winter, and 11.1 officers in summer 2018.
We considered only those personnel who reported for duty rather than authorized staffing levels
and describe the deployment and workload in distinct steps, distinguishing between winter and
summer, and between weekdays (Monday through Friday), and weekends (Saturday and
Sunday).
■ First, we focus on patrol deployment alone.
■ Next, we compare “all” workload, which includes community-initiated calls, police-initiated
calls, directed patrol activities, and out-of-service activities.
■ Finally, we compare the workload against deployment by percentage.
Comments follow each set of four figures, with separate discussions for winter and summer.
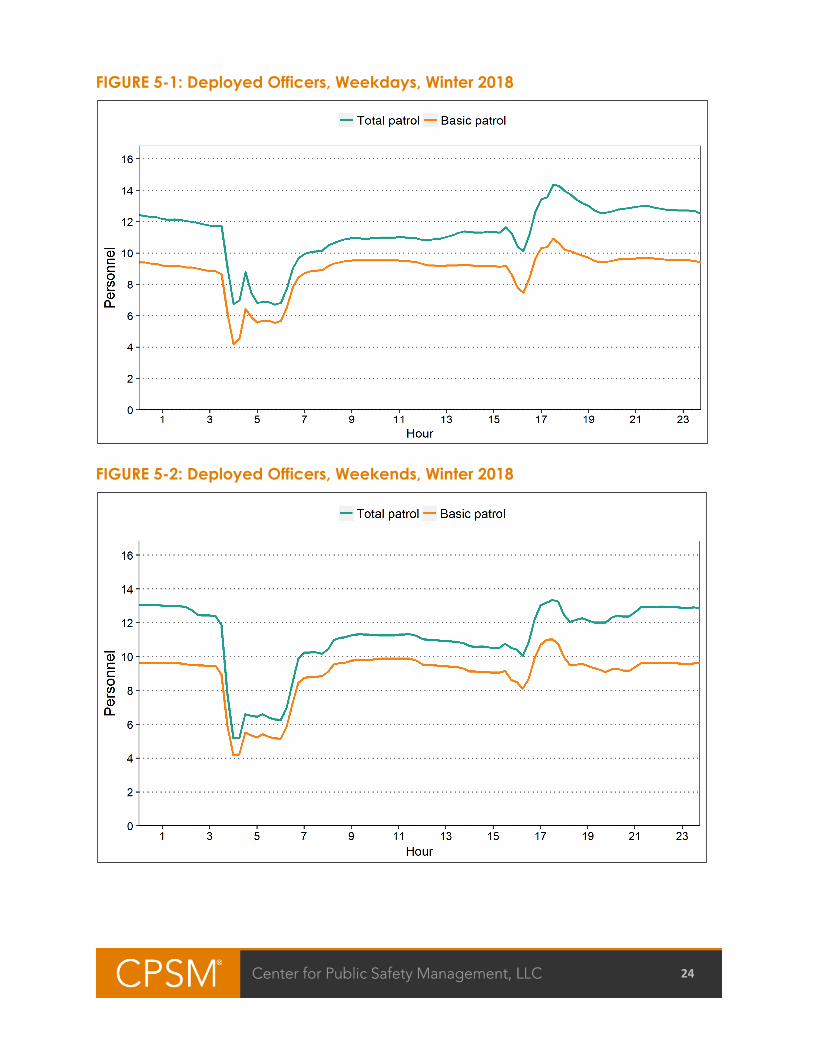
24
FIGURE 5-1: Deployed Officers, Weekdays, Winter 2018
FIGURE 5-2: Deployed Officers, Weekends, Winter 2018

25
FIGURE 5-3: Deployed Officers, Weekdays, Summer 2018
FIGURE 5-4: Deployed Officers, Weekends, Summer 2018

26
Observations:
■ For winter (January 4 through February 28, 2018):
□ The average deployment was 11.3 officers per hour during the week and 11.1 officers per
hour on the weekend.
□ Average deployment varied from 6.7 to 14.3 officers per hour on weekdays and 5.2 to 13.3
officers per hour on weekends.
■ For summer (July 7 through August 31, 2018):
□ The average deployment was 11.2 officers per hour during the week and 10.8 officers per
hour on the weekend.
□ Average deployment varied from 5.7 to 15.3 officers per hour on weekdays and 6.2 to 13.7
officers per hour on weekends.
In examining data from the 2014 CPSM study, and comparing average deployment between
2018 and 2013, it was noted that during the winter of 2018, weekday deployments were slightly
lower than those of 2013 (11.3 vs. 11.9), and weekends as well (11.2 vs. 11.5). For summer, the
weekday deployments were slightly higher in 2018 (11.2 vs. 10.7), and higher as well on
weekends (11.1 vs. 10.5). Total deployment in both 2018 and 2013 were virtually unchanged.
In Figures 5-5 through 5-8 that follow, we examine the allocation of time to workload by
category for deployed personnel. The numbers at the left side of the figures represent the
number of personnel on duty. Moving right across the figure, staffing is reflected by hour of day
over the 24-hour day. For instance, at noon, there are approximately 11 officers on patrol duty.
This would include, approximately two traffic and/or K9 officers, reflected as Added Patrol (dark
green). Of those 11 personnel deployed at noon, approximately 4.5 were committed to a
community-generated activity, 2.5 were out of service, 0.5 were involved in directed patrol or on
a self-initiated activity, and 3.5 were out of service. Again, these are averages over the eight-
week period.

27
FIGURE 5-5: Deployment and All Workload, Weekdays, Winter 2018
FIGURE 5-6: Deployment and All Workload, Weekends, Winter 2018
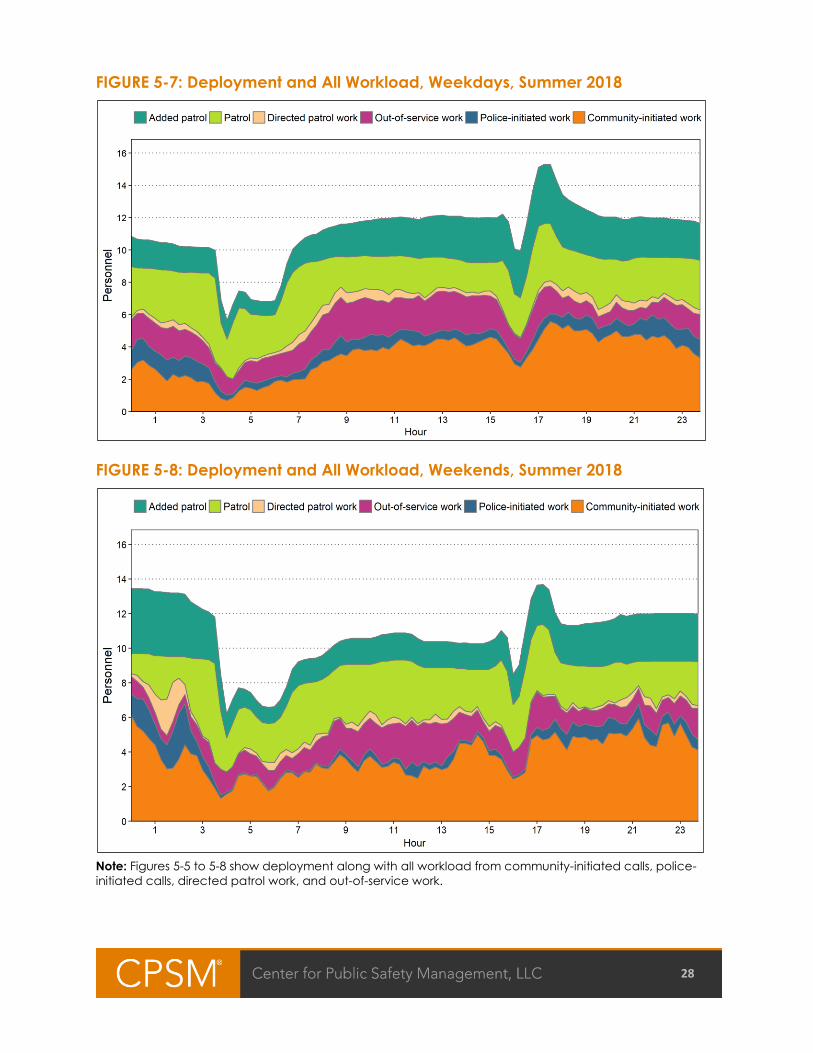
28
FIGURE 5-7: Deployment and All Workload, Weekdays, Summer 2018
FIGURE 5-8: Deployment and All Workload, Weekends, Summer 2018
Note: Figures 5-5 to 5-8 show deployment along with all workload from community-initiated calls, police-
initiated calls, directed patrol work, and out-of-service work.

29
Observations:
Winter:
■ Community-initiated work:
□ Average other-initiated workload was 3.3 officers per hour during the week and 3.6 officers
per hour on weekends.
□ This was approximately 29 percent of hourly deployment during the week and 32 percent of
hourly deployment on weekends.
■ All work:
□ Average workload was 6.4 officers per hour during the week and 5.9 officers per hour on
weekends.
□ This was approximately 56 percent of hourly deployment during the week and 53 percent of
hourly deployment on weekends.
Summer:
■ Community-initiated work:
□ Average other-initiated workload was 3.5 officers per hour during the week and 3.7 officers
per hour on weekends.
□ This was approximately 31 percent of hourly deployment during the week and 35 percent of
hourly deployment on weekends.
■ All work:
□ Average workload was 6.2 officers per hour during the week and 6.0 officers per hour on
weekends.
□ This was approximately 56 percent of hourly deployment during the week and 55 percent of
hourly deployment on weekends.
In Figures 5-9 through 5-12 that follow, the saturation index is explored. Patrol resources available
are denoted by the dashed black line at the top. The 100 percent value indicates the total
police officer hours available during the 24-hour period. The number of personnel may vary
during the day consistent with the staffing of the shifts, but at any given hour the total amount of
available manpower will equal 100. The red dashed line fixed at the 60 percent level represents
the saturation index (SI). As discussed above in the Rule of 60, Part 2, this is the point at which
patrol resources become largely reactive as CFS and workload demands consume a larger and
larger portion of available time. The gold line represents the percentage of available resources
committed to community-initiated activity, and the green line represents to percentage of
available resources committed to all activity (community-initiated and self-initiated).
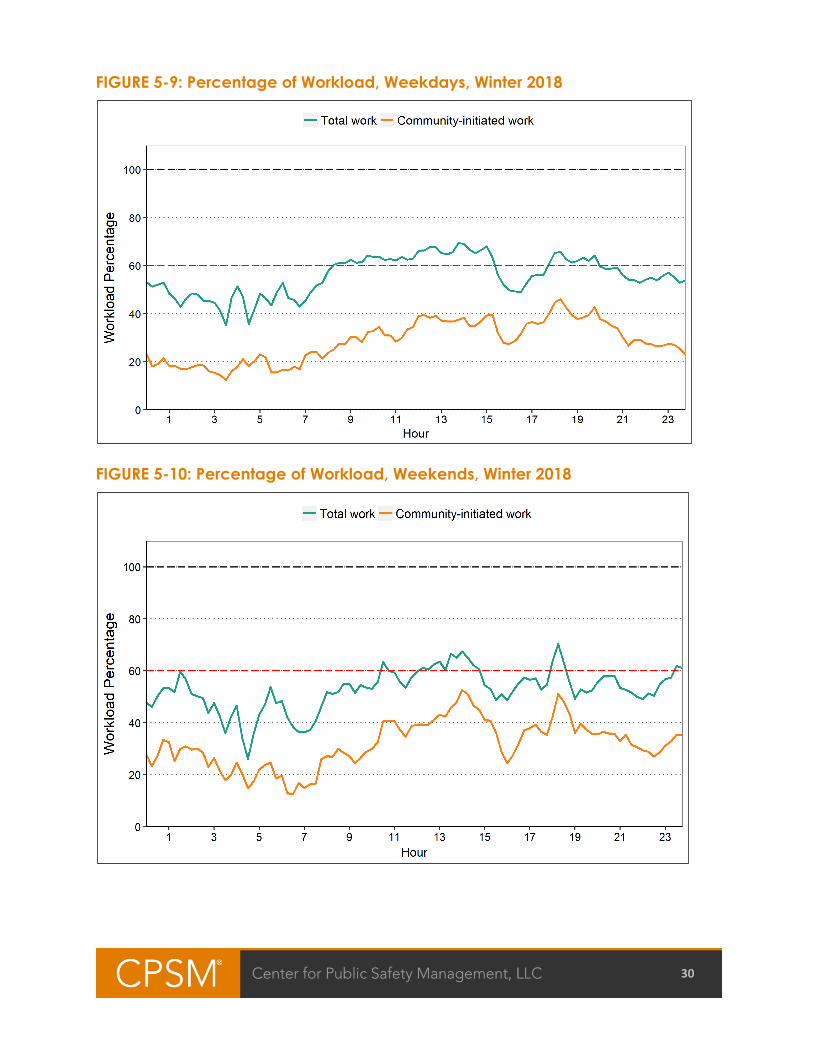
30
FIGURE 5-9: Percentage of Workload, Weekdays, Winter 2018
FIGURE 5-10: Percentage of Workload, Weekends, Winter 2018
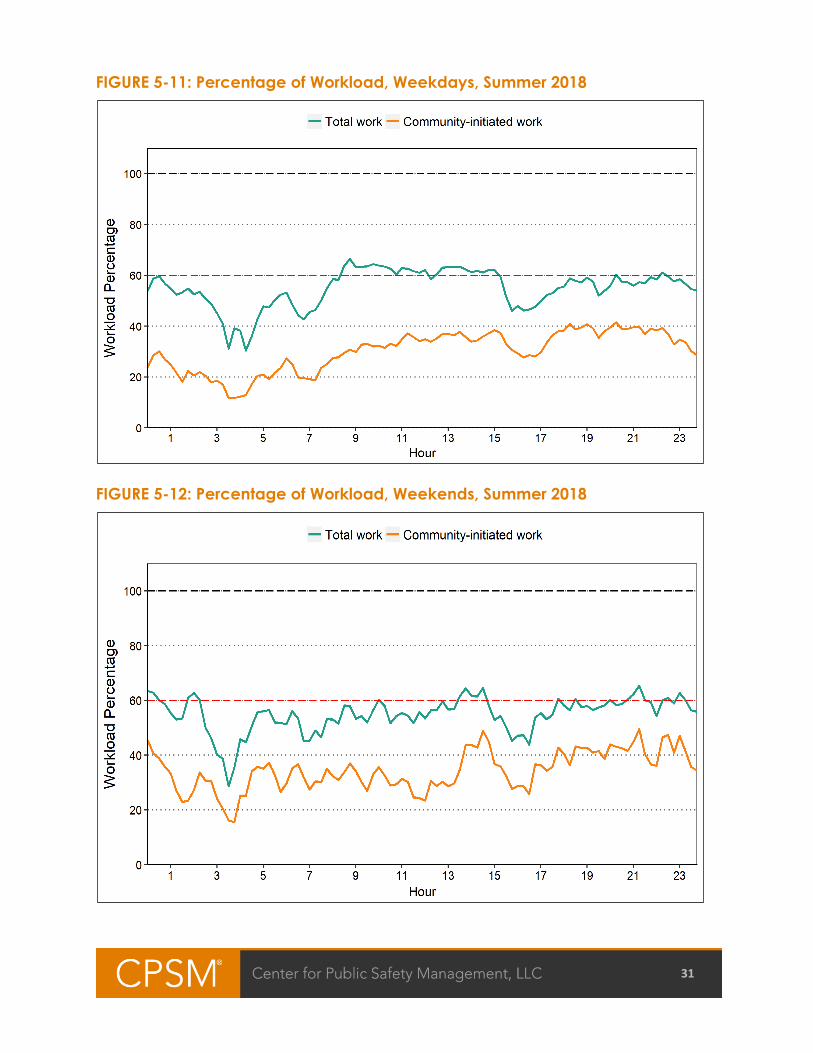
31
FIGURE 5-11: Percentage of Workload, Weekdays, Summer 2018
FIGURE 5-12: Percentage of Workload, Weekends, Summer 2018

32
Observations:
Winter:
■ Community-initiated work:
□ During the week, workload reached a maximum of 46 percent of deployment between
6:15 p.m. and 6:30 p.m.
□ On weekends, workload reached a maximum of 53 percent of deployment between
2:00 p.m. and 2:15 p.m.
■ All work:
□ During the week, workload reached a maximum of 74 percent of deployment between
2:15 p.m. and 2:30 p.m. and between 6:30 p.m. and 7:00 p.m.
□ On weekends, workload reached a maximum of 79 percent of deployment between
6:30 p.m. and 6:45 p.m.
Summer:
■ Community-initiated work:
□ During the week, workload reached a maximum of 41 percent of deployment between
6:15 p.m. and 6:30 p.m., between 7:00 p.m. and 7:15 p.m., and between 8:15 p.m. and
8:30 p.m.
□ On weekends, workload reached a maximum of 50 percent of deployment between
9:15 p.m. and 9:30 p.m.
■ All work:
□ During the week, workload reached a maximum of 66 percent of deployment between
8:45 a.m. and 9:00 a.m.
□ On weekends, workload reached a maximum of 65 percent of deployment between
2:30 p.m. and 2:45 p.m. and between 9:15 p.m. and 9:30 p.m.
Patrol Workload Demand Summary
We have extensively discussed workload to this point. It is evident that while present workload
often exceeds standards established in the “Rule of 60” discussion, given the present vacancy
rate, this is to be expected.
The data reveals that given present deployment numbers, the CPD main patrol force is under
stress at numerous times throughout the day during both winter and summer, and both
weekdays and weekends. Daily saturation indexes in the mid-50s and above the 60 percent
range during much the time periods under observation suggest that CPD officers on patrol likely
operate in an almost entirely reactive mode.
This may be a significant factor in the relatively low levels of productivity outside of handling
assigned calls for service. As reflected in Figures 5-5 through 5-8, very minimal time is spent on
self-initiated activities, more than half of which results from traffic stops (Table 5-3). And out-of-
service time dwarfs time spent on self-initiated activity, regardless of time of day. More on this
shortly.
In Table 5-8, we examine 2018 workload data vs. that of 2013. We must qualify that there are
some variables between the data comparisons. In the 2018 study, the department asked that

33
we separate workload for patrol, community service officers, and traffic officers. For the 2014
study, the data was combined as a single patrol force. Nonetheless, the patrol officers make up
the greatest percentage of the workforce (authorized 56 vs. six CSOs and six traffic officers). As
such, though the numbers may vary, clearly workload has increased.
TABLE 5-8: Workload Percentage, 2018 vs. 2013
Weekday
2018
Weekday
2013
Weekend
2018
Weekend
2013
Winter Workload
Community Initiated 29 20 32 18
All Workload* 56 35 53 32
Summer Workload
Community Initiated 31 21 35 25
All Workload* 56 34 55 36
*Includes community-initiated, officer-initiated, directed patrol, and out of service.
As we mentioned previously, a significant portion of officer-initiated activity falls within the
category of Out of Service, which dwarfs officer-initiated activity. This is a departure from the
2013 data, which reflected that officer-initiated activity was consistently higher than out-of-
service activity, and significantly so at most periods of the day. As such, we more closely
examined 2018 workload data for patrol officers.
Based upon data provided by the department for 2018, patrol officers responded to 28,231calls
for service from the public and conducted 11,614 self-initiated activities. The department further
reported that personnel assigned to patrol (patrol officers and K9s) totaled 56 (does not include
vacant positions).
For a perspective on individual workload, if one assumes every activity was handled equally and
each patrol officer worked the equivalent of 161 12-hour shifts per year (assumes six weeks leave
average), annually, each of the 56 patrol officers served as the primary handling unit on about
504 calls for service from the public (3.1 calls per shift), assisted as a back-up officer on 555 calls
from the public (3.4 assists per shift), conducted 207 self-initiated activities (1.3 per shift), and
assisted another officer on a self-initiated activity at a rate of 104 occurrences (0.65 assists per
shift).
Relative to documented police reports, the department does not separate data by work group.
However, it reported that for 2018, 8,705 police reports were submitted to the Records Section.
At that number, and even if CSOs, traffic officers, nor specialized units prepared any reports,
which is clearly not the case, each officer would have written 155 reports per year, or less than
one per shift. Relative to arrests, the department reported that for 2018, 2,214 persons were
taken into custody (does not include cite release). Using the same deployment and staffing
formula, this would indicate that officers made one arrest every 4.1 shifts. We attempted to
obtain traffic citation data, but were advised that the department was unable to obtain records
on the total number of citations issued.
These numbers neither reflect vacancies, additional shifts that an officer worked to meet
minimum staffing, nor any activities performed by personnel outside of basic patrol officers.
Nonetheless, the numbers provide a point of reference as to activity level. It is understood that
some officers are more active than others, and their individual data will vary from the averages,
up or down.

34
Transportation and Booking of Prisoners
CPSM was asked to consider the impact of transportation and processing of prisoners. Due to
state regulations governing the operation of jails, costs associated with staffing and operating
the facility, and liability concerns, few except larger agencies or those with high rates of arrest
opt to operate a jail. Rather, as is the case in Carlsbad, they transport prisoners to the nearest
county jail or other contract jail facility. For Carlsbad, that is the San Diego County Jail facility in
Vista, California.
Staff estimated that it generally takes one to two hours to complete the process and return to
Carlsbad. This is, of course, dependent upon traffic congestion and any delays in processing a
prisoner resulting from a backlog of bookings at the jail facility. In the experience of CPSM staff,
these estimates are very reasonable. And, if there is a medical condition associated with the
prisoner, the processing time may be significantly extended.
As noted before, the department reports that for 2018 it booked 2,214 prisoners into the county
jail. On average, therefore, the department booked approximately six prisoners per day during
that period. While those bookings are spread out throughout the 24-hour day, on average at
least 12 hours per day are spent transporting and processing prisoners. If all prisoner transports
involve two officers, that figure doubles. This commitment of time and resources is a concern
expressed in virtually all agencies for which we conduct similar operational assessments.
While most municipal police departments utilize police officers to transport and process
prisoners, CPSM would suggest that the department consider the utilization of civilians for this
purpose. This would involve the creation of a new classification of personnel, Police Service
Officer (PSO). PSOs would, in addition to the duties presently performed by patrol CSOs, take on
the added responsibility of transporting and/or booking prisoners at the county jail. Appropriate
training and equipment would be required. In the case of violent or high-risk prisoners, police
officers would continue to be responsible for some or all of the transportation and processing, as
appropriate.
For some police administrators this is a foreign concept, but in reality the use of civilians in
transporting and processing prisoners is commonplace. Anecdotal reports from agencies where
these responsibilities are assigned to civilians, whether their title be PSO, custody officer, jailor, or
something else, suggest that adequately trained and equipped civilians can safely and more
cost effectively carry out these duties. Utilization of civilians is generally well received by officers
who no longer incur significant “down time” in performing these duties. There is a clear cost
benefit to the city. As such, we recommend the city and department consider the creation of a
PSO classification, the addition of two new FTEs in this position, and the upgrade of two existing
CSO positions to PSO. This would allow for a total PSO staffing of four positions. While this would
reduce patrol CSO staffing from six to four, PSOs would perform CSO duties until called upon to
transport and process prisoners. In so doing, they remain a significant resource to patrol
operations and overall, represent a net gain.
At the time of the site visit, this option was discussed with Chief Gallucci, and a referral made to
a Southern California municipal police agency that has such a program.
Patrol Division Summary
At the time of the CPSM visit, patrol was being significantly impacted by staffing shortages due
to the number of trainees (considered by the department as an unfilled position for staffing
purposes) and vacancies. Our calculation reflected that the rate of vacancy was
approximately 18 percent of authorized staffing. That is actually down from a 27 percent

35
vacancy rate at the beginning of the year. Fatigue, morale, and low productivity all develop
when mandated overtime is required to routinely staff shifts just to meet minimum staffing. As we
reported on in the minimum staffing discussion, overtime is required at a rate of approximately
every fourth shift.
As was reviewed in the section on Workload Demand Analysis, and specifically in Figures 5-9 to
5-12, during a great share of the day, patrol workload measures in the 50 percent to high 60+
percent range. It is in this range that officers shut down self-initiated activities. Summer and
winter weekends and weekdays all reflect these levels of patrol saturation, which results in little
proactivity.
It is clear that community-initiated workload demands have increased since CPSM last assessed
this issue in 2014 (Table 5-8). That is a significant contributing factor to overall workload demand.
More surprisingly, the amount of out-of-service time has soared. This is worthy of further
examination by the department. Regardless, based upon present operational protocols,
workload demands have all but curtailed self-initiated activity.
With present staffing levels, the workload demands are excessive, often in the range of
saturation (Rule of 60), and at times above. Given the vacancy rate, patrol frequently operates
at minimum staffing. In examining Figures 5-1 through 5-4, it would even appear that patrol often
operates below minimum staffing during weekend evening deployments. Based upon data in
Table 5-2, it would appear that this is the period (Evening Watch) where the majority of patrol
vacancies exist. While it would seem simple to reassign personnel from day watch to evening
watch, this would likely result in day watch deployments falling below minimum staffing.
In any event, in order to reduce workload demands, CPSM recommends increasing minimum
staffing by the addition of one officer between the hours of 8:00 a.m. and 1:00 a.m. during
winter weekdays, and 10:00 a.m. to 1:00 a.m. during winter weekends. For summer weekdays,
minimum staffing should be increased by one officer between 8:00 a.m. and 4:00 a.m. during
the week, and all 24 hours on weekends. At present, due to vacancies, to get to these staffing
levels requires overtime personnel. The addition of these personnel equates to the approximate
equivalent of four FTEs. If the recommended increase were to occur, it would reduce the
saturation index rate from its present percentage level in the mid-50s (averaged over 24 hours)
to approximately 50 percent.
If the department can fill its vacancies, the need for overtime expenditures to reach minimum
staffing, even at these increased levels, would be infrequent.
A more significant issue is the lack of adequate supervision assigned to each shift. As we
previously noted, present levels consist of one lieutenant and two sergeants. Again, the
lieutenants’ role is largely administrative, with very limited time spent in the field. Sergeants on
the other hand should spend the majority of their time directing field operations. Nonetheless,
they also have administrative and collateral duties, including review and approval of police
reports, supervision of collateral duty assignments which may include SWAT, K9, bicycle patrols,
attendance at neighborhood functions, handling of personnel complaints, serving as the watch
commander in the absence of a lieutenant, and a host of others, nearly all of which take them
out of the field.
As discussed, all personnel are on various forms of leave (vacation, sick, training, etc.) at a rate
of approximately 25 percent. With a lieutenant and only two sergeants assigned to a shift, it is
not uncommon for only two supervisors to report to work, be that a lieutenant and a sergeant, or
two sergeants. At that staffing level, the sergeant is left to try to manage both field operations

36
and ensure that the variety of administrative duties are handled. This level of supervision is
inadequate to perform the vital role for which they are charged.
There is no question that at present, line staffing levels in patrol are inadequate to meet
workload demands. We have made recommendations to, in part, address this. These include
the creation of a PSO classification, expanding the current role of CSOs, expanding the role of
the K9 units, and increasing minimum staffing. A significant cause of the heavy workload
demand is the present vacancy rate, as calculated by the department. Once vacancies are
filled and new hires are trained, and if the CPSM recommendations are adopted, adequate line
staff will be available to manage the workload. CPSM data analysts calculated that if the
described staffing levels were attained, the workload would fall below the 50 percent saturation
index to a level closer to 45 percent. To meet the service level expectation of the residents of
Carlsbad, this saturation index rate is appropriate.
For these reasons, while we are not recommending the addition of patrol officers, we strongly
encourage the city to increase staffing levels for supervision through the addition of four
sergeants, one to each of the primary patrol shifts.
While discussion of the shift configurations are outside of the scope of work for this study, we
noted in the 2014 study that the department should look to an alternate schedule that better
aligns staffing to workload demand. That may be as simple as a shift in the reporting times under
the existing 3/12 plan. Doing so would aid in addressing workload demands during peak periods
without the addition of new personnel.
Patrol Recommendations:
■ Increase sergeant staffing by four FTEs, one each per primary patrol shift. (Recommendation
No. 1.)
■ Increase minimum staffing levels of patrol shifts by one police officer for the hours specified in
this report. (Recommendation No. 2.)
■ Consider establishing a Police Service Officer classification, staffing for which would include
two new FTEs and the upgrade of two Community Service Officers (CSOs). PSOs would be
assigned to the patrol function, with duties that include those of existing patrol CSOs plus
added responsibilities of transport/booking of prisoners. (Recommendation No. 3.)
■ Over a three-month period, assess the number of calls for service handled by patrol officers
that are deemed appropriate for assignment to a CSO. If sufficient numbers exist to warrant
additional CSO staffing, submit budget requests to hire appropriate numbers of CSO staff.
(Recommendation No. 4.)
■ Consider expanding the utilization of K9 units in handling of calls for service.
(Recommendation No. 5.)
■ Examine causative factors contributing to the extraordinary rate of out-of-service time.
(Recommendation No. 6.)
■ Examine shift deployment schedules and adjust as necessary to better align available
personnel to workload demands. (Recommendation No. 7.)

37
COMMUNITY SERVICE OFFICERS
Community Service Officers (CSOs) are civilian employees who perform limited duties, generally
not involving instances where suspects are present or known. Their duties typically include report
writing, parking enforcement, traffic control, handling abandoned autos, and evidence
collection, among others. The value of CSOs cannot be overstated. They relieve officers from
handling a myriad of duties that would otherwise encumber officers’ availability to respond on
more serious incidents and/or engage in community policing strategies. Additionally,
operational costs associated with CSOs, including hiring, training, equipment, and salaries and
benefits, are significantly lower than for sworn police officers.
As police agencies evaluate the propriety of utilizing CSOs as part of their workforce, and to
what extent, they must consider whether sufficient workload demands exist to warrant their
utilization. Where sufficient workload demands exist, they are a cost-effective alternative to
sworn police officers, without a compromise in service. As we examine workload in Carlsbad, we
will evaluate this.
Staffing / Deployment
The Patrol Division is budgeted for six CSOs. At the time of the site visit, one vacancy existed.
Coverage is scheduled seven days per week from 6:00 a.m. to 12:00 midnight, as staffing allows.
Given the present level of staffing, this generally results in one CSO available during these hours.
When CSO vacancies occur, it has a significant impact on patrol operations, as sworn police
officers are then called upon to perform CSO duties. Notwithstanding the discussion regarding
PSOs, a concerted effort should be made to minimize vacancies in the CSO staffing levels. Such
efforts should not be secondary to those of recruiting for police officers.
In recommending the creation of a PSO position, by no means do we intend to diminish the role
of the CSO. Rather, the PSO positions would supplement the work of CSOs until such time as PSOs
are diverted to handle prisoner transportation. Given the rate of arrests, the majority of the PSO
assignment would be spent supplementing CSO work efforts.
Workload Analysis
As we discuss workload, we draw upon the data report for analysis. Significant portions of the
information from the data report are imported into this assessment. Additional detail is available
in the data report and we encourage readers to review it. It is important to note here, that unlike
sworn patrol deployments, the Rule of 60 does not apply to CSO deployment. Indeed, it is the
objective that CSOs’ availability will be fully encumbered by workload in order to allow for sworn
officers time to be freed up for community policing activities and availability for emergency
responses.
From January 1, 2018 to December 31, 2018, the dispatch center recorded 4,933 events which
involved community service officers (CSOs). During this period, the dispatch center also
recorded activities assigned to CSOs that were not assigned a call number. After excluding
activities that lasted less than 30 seconds or more than 8 hours, 814 non-call activities were
included in the analysis.
Tables 5-9, 5-10, and 5-11 and Figure 5-13 that follow contain workload data for the entire year.
This includes an overview of the number of events, calls, out-of-service activities, deployment,
and workload for CSOs.
Table 5-9 explores workload by category and total workhours associated with each.

38
TABLE 5-9: CSO Events and Calls, by Category
Category Events Calls Work Hours
Accident 53 53 46.3
Alarm 2 2 1.0
Animal 18 15 4.4
Assist other agency 21 20 15.2
Check 221 220 109.7
Crime–person 48 47 55.9
Crime–property 1,361 1,342 1,420.6
Directed patrol 700
Disturbance 15 15 19.6
Investigation 182 180 164.5
Miscellaneous 181 178 115.6
Out of service–administrative 221
Public contact 95 94 49.1
Suspicious incident 53 52 34.8
Traffic enforcement 1,762 1,728 621.4
Total 4,933 3,946 2,658.2
Note: Events include all recorded calls which involved a CSO unit. We removed events with zero time on
scene, directed patrol, and out-of-service activities when calculating the number of calls and the work
hours associated with each call category.
Table 5-10 reflects out-of-service activities.
TABLE 5-10: CSO Out-of-service Activities and Occupied Times by Description
Description Occupied Time Count
At Station 39.1 98
Car Wash 19.1 39
Court 180.0 3
Meeting 46.4 37
Office Routine 34.0 116
Officer Training 92.7 24
Out of Car 13.9 188
Out of Service 49.9 6
Reports 44.9 305
VIA 1021 19.1 1
Administrative - Weighted Average/Total Activities 36.3 817
Meal Break 41.1 218
Weighted Average/Total Activities 37.3 1,035

39
Observations:
■ There were 72 zero on scene calls that involved CSOs.
■ 14 percent of the events were directed patrol events and 4 percent were out of service-
administrative events.
■ The top three categories–traffic (enforcement and accidents), crime (person and property),
and checks–accounted for 86 percent of calls.
■ Traffic enforcement accounted for 44 percent of calls and 23 percent of workload.
■ Property crime calls accounted for 34 percent of calls and 53 percent of workload.
■ Out-of-service activities had an average duration of 37.3 minutes.
■ The most common administrative activity was “reports.”
FIGURE 5-13: CSO Calls per Day, by Month
Note: The number of calls per day was calculated based on the number of days in the month that
community service officers handled at least one call.
TABLE 5-11: CSO Calls per Day, by Month
Jan Feb Mar Apr May Jun Jul Aug Sep Oct Nov Dec
Calls per Day 7.0 7.9 8.5 10.0 10.8 8.2 13.9 14.0 15.2 14.7 13.1 11.4
Observations:
■ The number of calls per day was lowest in the month of January and highest in the month of
September.

40
In Figures 5-14 and 5-15 we examine deployment and workload in the same manner as was
done for uniformed patrol. The first period is from January 4 through February 28, 2018, or winter,
and the second period is from July 7 through August 31, 2018, or summer. In this case, the figures
do not cover a 24 hour day, but rather, the work hours when CSOs are generally deployed. You
will note in Figure 5-15 that CSO occupied times are generally higher than those of sworn
officers; again, this is an objective of their utilization. You will also note that at times, there
appears to be rapid changes in workload. This results from the fact that there is generally only
one CSO on duty at a time. The page following the figures highlights observations with
percentages.

41
FIGURE 5-14: Deployment and All Workload, Weekdays, CSO Units
FIGURE 5-15: Workload Percentage by Hour, CSO Units

42
Observations:
Winter:
■ Deployment:
□ The average deployment was 0.6 officers per hour during the 24-hour day in winter.
□ The average deployment was 0.7 officers per hour during the week and 0.4 officers per hour
on the weekend.
□ Average deployment varied from 0.3 to 1.2 officers per hour on weekdays and 0.1 to 0.4
officers per hour on weekends.
■ Other-initiated work:
□ Average other-initiated workload was 0.2 officers per hour during the week and
0.1 officers per hour on weekends.
□ This was approximately 33 percent of hourly deployment during the week and 32 percent of
hourly deployment on weekends.
□ During the week, workload reached a maximum of 80 percent of deployment between
5:00 p.m. and 5:30 p.m.
□ During the weekend, workload reached a maximum of 71 percent of deployment between
6:15 p.m. and 6:30 p.m.
■ All work:
□ Average total workload was 0.4 officers per hour during the week and 0.2 officers per hour
on weekends.
□ This was approximately 56 percent of hourly deployment during the week and 57 percent of
hourly deployment on weekends.
□ During the week, workload reached a maximum of 89 percent of deployment between
5:00 p.m. and 5:15 p.m.
□ On weekends, workload reached a maximum of 89 percent of deployment between
11:15 p.m. and 11:30 p.m.
It is evident that the utilization of CSOs is of value to policing operations for the City of Carlsbad.
This is reflected in the activity rates reflected in Figures 5-14 and 5-15. CPSM suggests that this role
could and should be expanded. For instance, while CSOs served as the primary handling unit on
53 traffic collisions in 2018 (Table 5-8), patrol officers served as the primary handling unit on 1,296
(Table 5-5), the vast majority of which required two, three, or more units (Table 5-6). Clearly, the
CSOs could and should take on a greater role in this arena, and likely others, and thus, free up
patrol officer resources.
CSO Recommendations:
■ Expand the role of CSOs in response to traffic collisions and other appropriate duties.
(Recommendation No. 8.)
■ Expand the Community Service Officer complement to eight authorized positions with the end
goal of incorporating Police Service Officers into the staffing complement. Ultimately, the
complement would include four CSOs and four PSOs. (Recommendation No. 9.)

43
TRAFFIC DIVISION
Traffic safety and the efficient flow of traffic are always important factors for any community. In
communities of similar demographics to that of Carlsbad, traffic-related matters are generally
the primary complaint/concern expressed to the police department. While concerns often
emanate from residential areas and school zones, traffic accidents often occur more frequently
in areas with a high retail concentration and/or high traffic volume. Anecdotal evidence
suggests that this is also the case in Carlsbad; therefore, it is imperative that CPD commit
adequate resources to address all traffic-related issues.
Staffing / Deployment
The CPD has a dedicated Traffic Division. Table 5-12 reflects authorized and actual staffing.
TABLE 5-12: Traffic Bureau Authorized Staffing Levels, FY 2017/2018
Position FY 2018/2019
SWORN PERSONNEL
Lieutenant 1
Sergeant 1*
Accident Investigator 2*
Motor Officer 6
Sworn Total 10
CIVILIAN PERSONNEL
Community Services Officer 1
Civilian Total 1
Total Authorized Personnel 11*
*Note: The sergeant is currently on long-term injury leave. The position is temporarily filled by an accident
investigator, leaving one accident investigator at present.
Traffic officers work an overlapping 4-10 schedule from 6:00 a.m. to 4:00 p.m., either Monday
through Thursday, or Tuesday through Friday. Traffic personnel also work overtime assignments at
special events and enforcement programs, including some weekends.
Workload Analysis
Duties of the division are divided as follows:
■ Accident investigators are responsible for the investigation of fatal or major injury collisions as
well as follow-up investigation of all hit and run incidents.
■ Motor officers conduct traffic enforcement, respond to traffic complaints, conduct
safety/education campaigns at schools, and as necessary, assist patrol with general calls for
service.
■ The CSO responds to parking complaints, impounds vehicles as necessary, assists with
enforcement needs associated with street sweeping and the Farmers Market, and assists with
the division’s administrative activities.
As we discuss workload, we again draw upon the data report for analysis. Significant portions of
the information from the data report are imported into this assessment. Additional detail is

44
available in the data report and we encourage readers to review it. It is important to note here,
that like sworn patrol deployments, the Rule of 60 applies. Traffic officers must have a sufficient
amount of uncommitted time to conduct enforcement efforts. Monitoring high-frequency traffic
collision locations, school zones, areas where speeding violations are common, and responding
to community complaints all require substantial uncommitted time.
Between January 1, 2018 and December 31, 2018, the dispatch center recorded 5,117 events
which involved accident investigators and motor units. During this period, the dispatch center
also recorded activities assigned to traffic units that were not assigned a call number. After
excluding activities that lasted less than 30 seconds or more than 8 hours, 1,028 noncall activities
were included in the analysis.
This section gives an overview of the number of calls, out-of-service activities, deployment, and
workload for traffic units. Tables 5-13, 5-14, 5-15 and Figure 5-16 contain data for the entire year.
TABLE 5-13: Traffic Events, Calls, and Workload by Category
Category Events Calls Work Hours
911 hang up 4 4 0.4
Accident 198 197 316.6
Alarm 14 14 3.3
Animal 7 6 3.8
Assist other agency 35 33 24.6
Check 291 291 409.4
Crime–person 21 19 13.7
Crime–property 22 21 16.1
Directed patrol 211
Disturbance 24 23 25.3
Investigation 50 50 55.8
Miscellaneous 40 40 84.4
Out of service–administrative 271
Public contact 73 72 25.0
Suspicious incident 46 45 19.7
Traffic enforcement 3,810 3,792 792.4
Total 5,117 4,607 1,790.6
Note: Events include all recorded calls which involved a traffic unit. We removed events with zero time on
scene, directed patrol, and out-of-service activities when calculating the number of calls and the work
hours associated with each call category.
It is interesting to note here, as with CSOs, in 2018, traffic officers handled relatively few accident
calls for service (197) vs. patrol (1,296). While as a percentage of total staffing, traffic officers
handled somewhat more accident calls than patrol officers, given the mission of the assignment
and substantial additional uncommitted time vs. patrol, it may present an opportunity for traffic
officers to take a greater role in the investigations of accidents, thereby reducing workload
demands on patrol.
It should be noted that we attempted to obtain Traffic Section citation data for the past two
years to assist in our workload evaluation. Unfortunately, a longstanding IT problem linking
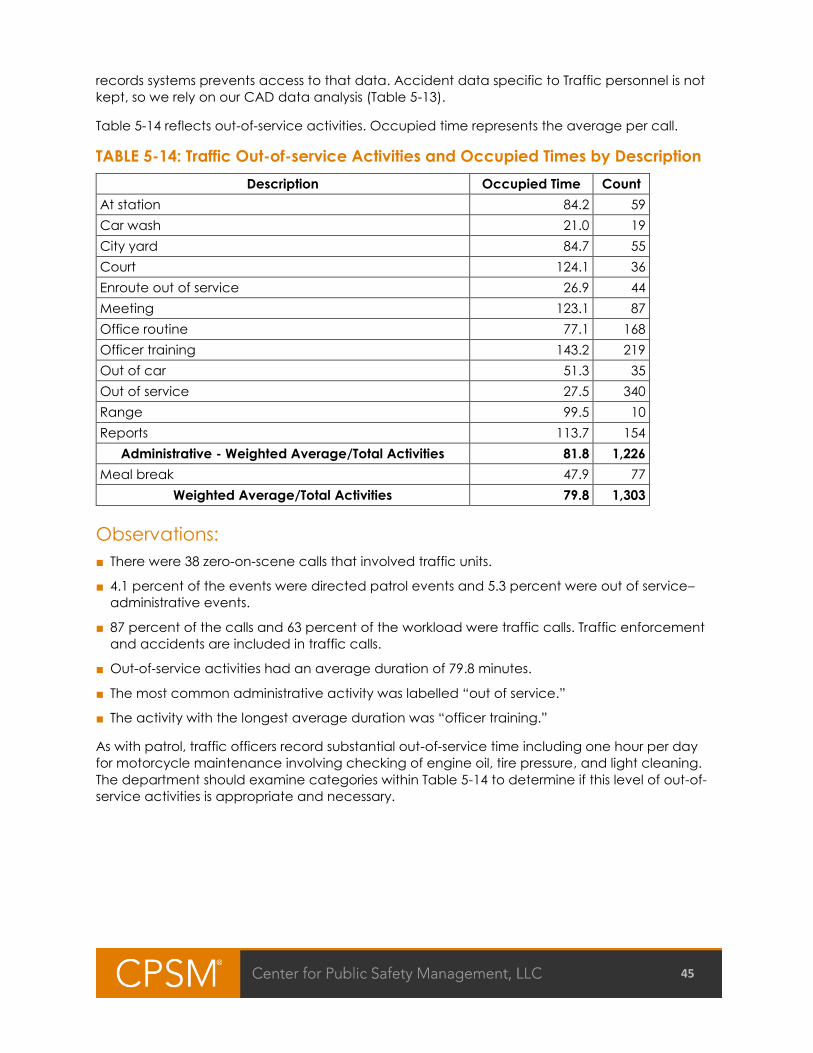
45
records systems prevents access to that data. Accident data specific to Traffic personnel is not
kept, so we rely on our CAD data analysis (Table 5-13).
Table 5-14 reflects out-of-service activities. Occupied time represents the average per call.
TABLE 5-14: Traffic Out-of-service Activities and Occupied Times by Description
Description Occupied Time Count
At station 84.2 59
Car wash 21.0 19
City yard 84.7 55
Court 124.1 36
Enroute out of service 26.9 44
Meeting 123.1 87
Office routine 77.1 168
Officer training 143.2 219
Out of car 51.3 35
Out of service 27.5 340
Range 99.5 10
Reports 113.7 154
Administrative - Weighted Average/Total Activities 81.8 1,226
Meal break 47.9 77
Weighted Average/Total Activities 79.8 1,303
Observations:
■ There were 38 zero-on-scene calls that involved traffic units.
■ 4.1 percent of the events were directed patrol events and 5.3 percent were out of service–
administrative events.
■ 87 percent of the calls and 63 percent of the workload were traffic calls. Traffic enforcement
and accidents are included in traffic calls.
■ Out-of-service activities had an average duration of 79.8 minutes.
■ The most common administrative activity was labelled “out of service.”
■ The activity with the longest average duration was “officer training.”
As with patrol, traffic officers record substantial out-of-service time including one hour per day
for motorcycle maintenance involving checking of engine oil, tire pressure, and light cleaning.
The department should examine categories within Table 5-14 to determine if this level of out-of-
service activities is appropriate and necessary.

46
FIGURE 5-16: Traffic Calls per Day, by Month
Note: The number of calls per day was calculated based on the number of days in the month that traffic
officers handled at least one call.
TABLE 5-15: Traffic Calls per Day, by Month
Jan Feb Mar Apr May Jun Jul Aug Sep Oct Nov Dec
Calls per Day 7.8 4.2 7.4 14.4 18.8 14.3 22.1 23.0 20.5 29.8 16.0 11.1
Observations:
■ The number of calls per day varied significantly throughout the year.
■ February had the least number of calls and October had the largest number of calls.
In Figures 5-17 and 5-18, we examine deployment and workload in the same manner as was
done for uniformed patrol as well as CSOs. Once again, we utilize two eight-week sample
periods of January 4 through February 28, 2018, or winter, and July 7 through August 31, 2018, or
summer. In this case, as with CSOs, the figures do not cover a 24-hour day, but rather, the work
hours when Traffic Division officers are generally deployed.

47
FIGURE 5-17: Deployment and All Workload, Weekdays, Traffic Units
FIGURE 5-18: Workload Percentage by Hour, Traffic Units

48
Observations:
Winter:
■ Deployment:
□ The average deployment was 1.8 traffic officers per hour in winter.
□ Average deployment varied from 0.3 to 2.0 traffic officers per hour.
■ Other-initiated work:
□ Average other-initiated workload was 0.1 officers per hour, which was approximately
6 percent of hourly deployment.
□ Average workload reached a maximum of 14 percent of deployment between 8:45 a.m.
and 9:00 a.m.
■ All work:
□ Average total workload was 0.6 officers per hour.
□ This was approximately 33 percent of hourly deployment.
□ During the week, workload reached a maximum of 48 percent of deployment between
11:15 a.m. and 11:30 a.m.
Summer:
■ Deployment:
□ The average deployment was 4.0 traffic officers per hour in summer.
□ Average deployment varied from 1.5 to 4.6 traffic officers per hour.
■ Other-initiated work:
□ Average other-initiated workload was 0.1 officers per hour, which was approximately
4 percent of hourly deployment.
□ Average workload reached a maximum of 9 percent of deployment between 2:30 p.m.
and 2:45 p.m.
■ All work:
□ Average total workload was 1.4 officers per hour, which was approximately 36 percent of
hourly deployment.
□ During the week, workload reached a maximum of 45 percent of deployment between
10:45 a.m. and 11:00 a.m., between 3:00 p.m. and 3:15 p.m., and at 5:00 p.m.
As reflected in Figure 5-18, community-initiated demand is low at an average of six percent of
Traffic Division workload for the winter period, and nine percent for summer. When including
officer-initiated activities, winter workload averaged 33 percent, with the summer period
averaging 36 percent. As such, when factoring in total workload, including out-of-service
activities, officers’ time was uncommitted for 67 percent of the day during the winter evaluation
period and 64 percent of the day during the summer period. As we noted previously, this is not
idle time, but rather, time available to monitor high-frequency collision locations, or those areas
of other safety concerns. Given this data, it would appear that Traffic officers have sufficient
time to perform their assigned duties.
While we were unable to obtain comprehensive citation data, we did review a monthly report
dated March 14, 2019. The report indicated that motor officers were available for deployment
49
for 870 hours for the month, or 87 ten hour shifts. Of that time period, only 219.5 hours were
available for patrol due to multiple factors including vacation, comp time off, sick leave,
motorcycle maintenance, and special projects or otherwise out-of-service time. As such, of
available deployment time, only 25 percent was spent on traffic enforcement. During that time,
108 citations were issued and 106 warnings given. With six motorcycle officers assigned to the
unit, that would suggest that each officer averaged 35.7 citations or warnings per month, or
approximately 2.2 per work day (16 shifts). We leave this to the department to evaluate time
management and productivity levels.
As noted, the personnel in the division generally works hours covering Monday through Friday,
from 6:00 a.m. to 4:00 p.m. There is no deployment during the busy evening commute, nor on
weekends, except by special assignment. While we believe that out-of-service time and
productivity levels should be examined, we also believe that coverage during the hours of
4:00 p.m. to 7:00 p.m. weekdays, and coverage on weekends, is also important. By adding three
additional staff, a work schedule can be easily established to accomplish this objective.
Traffic Recommendations:
■ Increase FTE staffing by three motor officers to allow for staffing during evening commute
times as well as limited weekend deployments. (Recommendation No. 10.)
■ Reconsider the practice of granting motorcycle officers a one-hour maintenance period per
day to conduct activities largely limited to checking engine oil, tire air pressure, and light
cleaning, duties that should take only minutes. (Recommendation No. 11.)
■ Examine causative factors contributing to high levels of out-of-service time.
(Recommendation No. 12.)
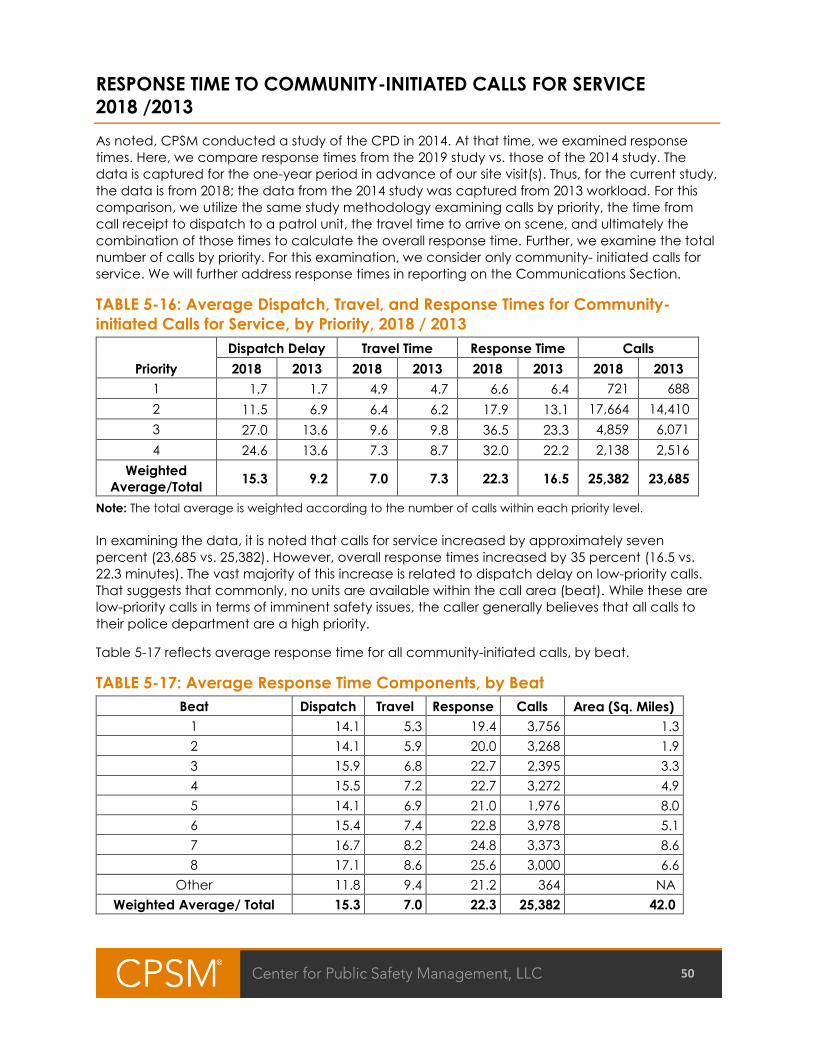
50
RESPONSE TIME TO COMMUNITY-INITIATED CALLS FOR SERVICE
2018 /2013
As noted, CPSM conducted a study of the CPD in 2014. At that time, we examined response
times. Here, we compare response times from the 2019 study vs. those of the 2014 study. The
data is captured for the one-year period in advance of our site visit(s). Thus, for the current study,
the data is from 2018; the data from the 2014 study was captured from 2013 workload. For this
comparison, we utilize the same study methodology examining calls by priority, the time from
call receipt to dispatch to a patrol unit, the travel time to arrive on scene, and ultimately the
combination of those times to calculate the overall response time. Further, we examine the total
number of calls by priority. For this examination, we consider only community- initiated calls for
service. We will further address response times in reporting on the Communications Section.
TABLE 5-16: Average Dispatch, Travel, and Response Times for Community-
initiated Calls for Service, by Priority, 2018 / 2013
Priority
Dispatch Delay Travel Time Response Time Calls
2018 2013 2018 2013 2018 2013 2018 2013
1 1.7 1.7 4.9 4.7 6.6 6.4 721 688
2 11.5 6.9 6.4 6.2 17.9 13.1 17,664 14,410
3 27.0 13.6 9.6 9.8 36.5 23.3 4,859 6,071
4 24.6 13.6 7.3 8.7 32.0 22.2 2,138 2,516
Weighted
Average/Total 15.3 9.2 7.0 7.3 22.3 16.5 25,382 23,685
Note: The total average is weighted according to the number of calls within each priority level.
In examining the data, it is noted that calls for service increased by approximately seven
percent (23,685 vs. 25,382). However, overall response times increased by 35 percent (16.5 vs.
22.3 minutes). The vast majority of this increase is related to dispatch delay on low-priority calls.
That suggests that commonly, no units are available within the call area (beat). While these are
low-priority calls in terms of imminent safety issues, the caller generally believes that all calls to
their police department are a high priority.
Table 5-17 reflects average response time for all community-initiated calls, by beat.
TABLE 5-17: Average Response Time Components, by Beat
Beat Dispatch Travel Response Calls Area (Sq. Miles)
1 14.1 5.3 19.4 3,756 1.3
2 14.1 5.9 20.0 3,268 1.9
3 15.9 6.8 22.7 2,395 3.3
4 15.5 7.2 22.7 3,272 4.9
5 14.1 6.9 21.0 1,976 8.0
6 15.4 7.4 22.8 3,978 5.1
7 16.7 8.2 24.8 3,373 8.6
8 17.1 8.6 25.6 3,000 6.6
Other 11.8 9.4 21.2 364 NA
Weighted Average/ Total 15.3 7.0 22.3 25,382 42.0

51
SECTION 6. SUPPORT SERVICES BUREAU
INVESTIGATIONS DIVISION
The contracted scope of work for the Investigations Division as outlined by Carlsbad Police
Department for the staffing assessment was limited to the General Investigations Unit. However,
from a practical standpoint, a review of CPD investigative units where a staffing model can be
applied against available investigator caseload provides a more comprehensive assessment.
This expanded assessment of its investigative units to include General, Family Services, and
Crimes of Violence provides CPD with a broader evaluation of investigative staffing needs.
Current Staffing
General Investigations ■ 1 Sergeant.
■ 4 Investigators.
■ 1 Community Service Officer.
The General Investigations Unit handles investigations related to property crimes to include
burglary, possession of stolen property, grand theft, petty theft, ID theft, fraud, embezzlement,
and financial elder abuse.
Family Services ■ 1 Sergeant.
■ 3 Detectives.
■ 4 School Resource Officers.
■ 1 Community Service Officer.
The Family Services Unit handles investigations related to domestic violence, child abuse, elder
abuse, sex offenses, and juvenile crime.
Crimes of Violence ■ 1 Sergeant.
■ 3 Detectives.
■ 1 Community Service Officer.
■ 2 Cal-ID Technicians .
The Crimes of Violence Unit handles investigations related to homicide, sexual assaults, kidnap
felony assault, extortion, and robbery.
Case Management
As noted, CPSM examined the case management practices of the General Investigations,
Family Services, and Crimes of Violence units and found this to be an area of opportunity for the
CPD.
52
Case management, as part of a department-wide, integrated records management system, is
a significant factor utilized by a department in the management of its investigative functions. At
the time of the 2014 CPSM assessment of CPD, case management was limited to tracking
workload on an Excel spreadsheet, which made it challenging to determine appropriate
investigative staffing models. Shortly after that assessment, the Case Level Evaluation,
Assignment and Tracking System (CLEATS) was implemented as an interim solution until a
department-wide records management system could be deployed. Such a case management
system was implemented by CPD in March 2017, with department-wide functionality achieved
by October 2017. NETRMS by Motorola has been utilized since as the CPD Investigations Division’s
case management system and CPD’s overall records management system.
In general, a case management process begins with the assigned sergeant reviewing the
department report queue for new cases relevant to the unit. The cases are screened based on
the department’s case screening criteria and predetermined solvability factors. Also considered
are the sergeants’ knowledge of the investigative staff’s current workload and consideration of
the expertise each detective possesses in certain types of crimes. Based on this screening, cases
are either assigned to an investigator, referred back to patrol for follow-up, or suspended
pending development of further investigative information.
CPD lacks policy that outlines screening standards. Based on discussion with CPD staff, each
units’ case screening follows a format similar to that described above. However, the lack of
documented department case screening standards forces sergeants to apply their own
standards as they see fit, but these standards may not meet department expectations. A clear
policy outlining department case screening criteria and those accountable for such screening
should be developed, and approved by department command staff. During the CPSM
assessment process, a case screening flow chart was created by CPD investigative staff to
document CPD’s current case screening practice; this flow chart should be considered as part
of policy development.
Through discussion with staff, it was determined that NETRMS is not yet utilized by department
managers and supervisors to assess individual or unit workload. More rigorous oversight of the
progress of investigations would create a more efficient assessment and utilization of staff
resources. For example, benchmarks could be set and tracked relative to investigations. Limits
could be set on the amount of time to contact the complainant, file the first follow-up report,
interview victims/witnesses, close a case, etc. Under CLEATS, 30/60/90 day case standards were
utilized to track case status. Similar status reports have not been required since implementation
of NETRMS. Investigators are required to submit cases to be closed for approval to the unit
supervisor; however, there are no case closure standards in place. This means, among other
things, that a case could remain open for a long time after investigative leads have been
exhausted. There is no indication that cases are remaining open for extended periods, but there
is no way of knowing either. Investigations management indicates that as a result of ongoing
discussions between CPD and CPSM staff, case management benchmarks are being
developed currently and are expected to be deployed in the coming months.
Going forward, case information needs to be extracted from NETRMS and massaged into
relevant and timely management reports for investigative supervisors and department
managers to analyze. The lack of a quantitative and qualitative assessment process limits CPD
management’s ability to evaluate the effectiveness of the department’s investigative function
and the success of its efforts to address crime in the community as a whole.
Case management also provides information that helps assess investigative staffing levels.
Unfortunately, the absence of a robust case management system at CPD hampers CPSM’s
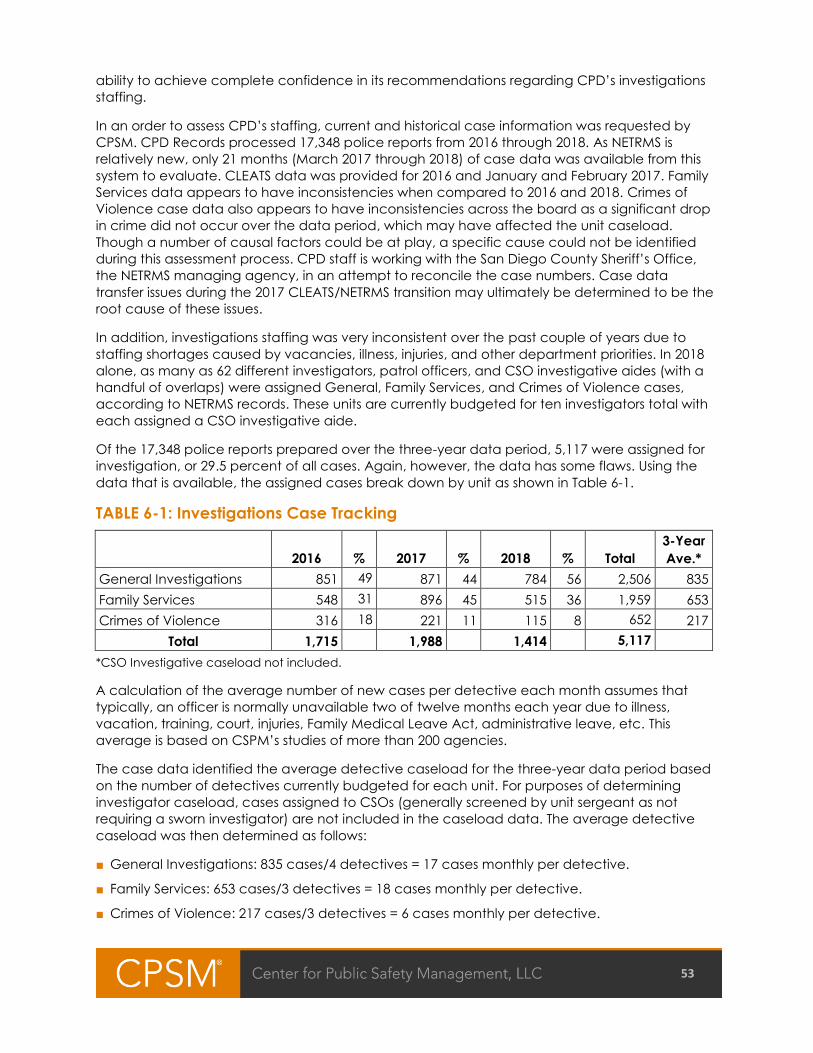
53
ability to achieve complete confidence in its recommendations regarding CPD’s investigations
staffing.
In an order to assess CPD’s staffing, current and historical case information was requested by
CPSM. CPD Records processed 17,348 police reports from 2016 through 2018. As NETRMS is
relatively new, only 21 months (March 2017 through 2018) of case data was available from this
system to evaluate. CLEATS data was provided for 2016 and January and February 2017. Family
Services data appears to have inconsistencies when compared to 2016 and 2018. Crimes of
Violence case data also appears to have inconsistencies across the board as a significant drop
in crime did not occur over the data period, which may have affected the unit caseload.
Though a number of causal factors could be at play, a specific cause could not be identified
during this assessment process. CPD staff is working with the San Diego County Sheriff’s Office,
the NETRMS managing agency, in an attempt to reconcile the case numbers. Case data
transfer issues during the 2017 CLEATS/NETRMS transition may ultimately be determined to be the
root cause of these issues.
In addition, investigations staffing was very inconsistent over the past couple of years due to
staffing shortages caused by vacancies, illness, injuries, and other department priorities. In 2018
alone, as many as 62 different investigators, patrol officers, and CSO investigative aides (with a
handful of overlaps) were assigned General, Family Services, and Crimes of Violence cases,
according to NETRMS records. These units are currently budgeted for ten investigators total with
each assigned a CSO investigative aide.
Of the 17,348 police reports prepared over the three-year data period, 5,117 were assigned for
investigation, or 29.5 percent of all cases. Again, however, the data has some flaws. Using the
data that is available, the assigned cases break down by unit as shown in Table 6-1.
TABLE 6-1: Investigations Case Tracking
2016 % 2017 % 2018 % Total
3-Year
Ave.*
General Investigations 851 49 871 44 784 56 2,506 835
Family Services 548 31 896 45 515 36 1,959 653
Crimes of Violence 316 18 221 11 115 8 652 217
Total 1,715 1,988 1,414 5,117
*CSO Investigative caseload not included.
A calculation of the average number of new cases per detective each month assumes that
typically, an officer is normally unavailable two of twelve months each year due to illness,
vacation, training, court, injuries, Family Medical Leave Act, administrative leave, etc. This
average is based on CSPM’s studies of more than 200 agencies.
The case data identified the average detective caseload for the three-year data period based
on the number of detectives currently budgeted for each unit. For purposes of determining
investigator caseload, cases assigned to CSOs (generally screened by unit sergeant as not
requiring a sworn investigator) are not included in the caseload data. The average detective
caseload was then determined as follows:
■ General Investigations: 835 cases/4 detectives = 17 cases monthly per detective.
■ Family Services: 653 cases/3 detectives = 18 cases monthly per detective.
■ Crimes of Violence: 217 cases/3 detectives = 6 cases monthly per detective.

54
Staffing decisions must also consider these numbers do not capture the entirety of an
investigator’s workload. The records management system is not designed to track the time that
investigators spend assisting other investigators, both internally and for other agencies, work
hours associated with investigations, including the most time-consuming cases, interviews,
obtaining and serving search warrants, court time, travel time, etc.
There are no absolute standards to determine appropriate caseload for police investigators.
One murder investigation could occupy the time of several detectives for months, and on the
other hand, one detective could handle hundreds of theft cases in a similar period. Nonetheless,
the International Association of Chiefs of Police suggests that a detective caseload between
120 and 180 cases per year (10 to 15 per month) is manageable.
Based on the available case data, the accuracy of which has been discussed here, CPSM
recommends the addition of one General Investigations detective to reduce the annual
detective caseload average from 209 to 167. CPSM recommends the addition of one Family
Services detective to reduce the annual detective caseload average from 218 to 163. Based on
the low annual caseload of Crimes of Violence detectives (72 cases per detective), no staffing
increase is recommended. The caseload in the Crimes of Violence unit tends to include more
complicated and long-term investigations based on the types of cases assigned, which drives
the lower case-to-staff ratio compared to the other investigative units.
As additional NETRMS case data is accumulated and verified, CPD can evaluate the data
periodically and apply the staffing standards noted in this report to determine the appropriate
investigative staff level for the department and make necessary adjustments.
Clearance Rates
While preventing crime is crucial to law enforcement agencies, solving crimes is as important.
Solving crime results in prosecution of offenders, which not only prevents future crime, it also
provides much-needed closure to crime victims. The clearance rate is the relationship between
reported crimes and persons arrested for those crimes. It is an important measure of the overall
effectiveness of a police department and an important measure of the performance of an
investigative unit in a police department.
Annually, departments report clearance rates to the FBI for inclusion in the UCR. In the CPD, this
report is prepared by the Records Section based upon data entered into the records
management system by Records staff. Investigations management indicated case clearances
were not the division’s responsibility and clearance rates were not reviewed or utilized to assess
division performance.
Accurate case clearance is an important performance evaluation tool for supervisors. It is
essential to track the effectiveness of individual detectives through their diligence in solving and
clearing cases. Awareness of a detective’s performance is critical to identifying increased
oversight or training needs. The number of cases assigned per detective is important, as well as a
supervisor’s anecdotal knowledge, but performance evaluation must be supported by data.
Clearance rates are also another benchmark of a department’s effectiveness in solving crime
and should be part of the Investigation Division’s evaluation process. See the Records section of
this report for additional discussion on UCR clearance rates.
Table 6-2 reflects the most recently published UCR data as reported by the department. CPSM
noted that the department’s stated clearance rates across the board were fairly consistent with
state and national clearance rates.
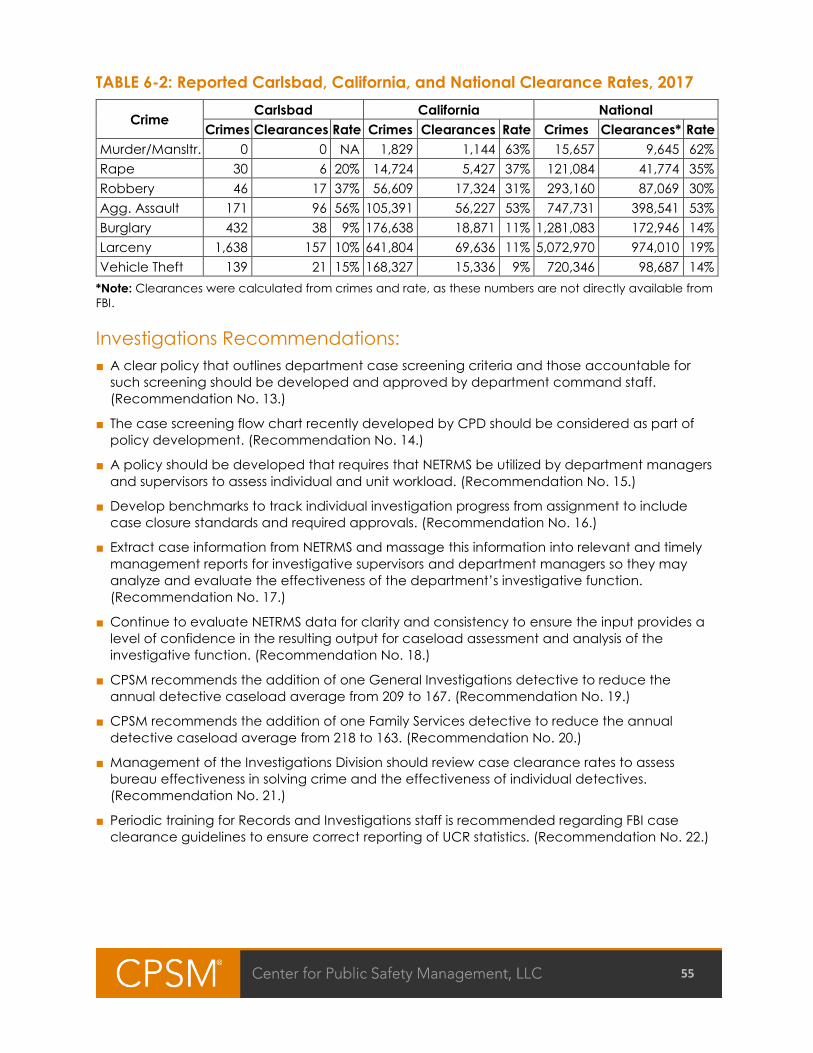
55
TABLE 6-2: Reported Carlsbad, California, and National Clearance Rates, 2017
Crime Carlsbad California National
Crimes Clearances Rate Crimes Clearances Rate Crimes Clearances* Rate
Murder/Mansltr. 0 0 NA 1,829 1,144 63% 15,657 9,645 62%
Rape 30 6 20% 14,724 5,427 37% 121,084 41,774 35%
Robbery 46 17 37% 56,609 17,324 31% 293,160 87,069 30%
Agg. Assault 171 96 56% 105,391 56,227 53% 747,731 398,541 53%
Burglary 432 38 9% 176,638 18,871 11% 1,281,083 172,946 14%
Larceny 1,638 157 10% 641,804 69,636 11% 5,072,970 974,010 19%
Vehicle Theft 139 21 15% 168,327 15,336 9% 720,346 98,687 14%
*Note: Clearances were calculated from crimes and rate, as these numbers are not directly available from
FBI.
Investigations Recommendations:
■ A clear policy that outlines department case screening criteria and those accountable for
such screening should be developed and approved by department command staff.
(Recommendation No. 13.)
■ The case screening flow chart recently developed by CPD should be considered as part of
policy development. (Recommendation No. 14.)
■ A policy should be developed that requires that NETRMS be utilized by department managers
and supervisors to assess individual and unit workload. (Recommendation No. 15.)
■ Develop benchmarks to track individual investigation progress from assignment to include
case closure standards and required approvals. (Recommendation No. 16.)
■ Extract case information from NETRMS and massage this information into relevant and timely
management reports for investigative supervisors and department managers so they may
analyze and evaluate the effectiveness of the department’s investigative function.
(Recommendation No. 17.)
■ Continue to evaluate NETRMS data for clarity and consistency to ensure the input provides a
level of confidence in the resulting output for caseload assessment and analysis of the
investigative function. (Recommendation No. 18.)
■ CPSM recommends the addition of one General Investigations detective to reduce the
annual detective caseload average from 209 to 167. (Recommendation No. 19.)
■ CPSM recommends the addition of one Family Services detective to reduce the annual
detective caseload average from 218 to 163. (Recommendation No. 20.)
■ Management of the Investigations Division should review case clearance rates to assess
bureau effectiveness in solving crime and the effectiveness of individual detectives.
(Recommendation No. 21.)
■ Periodic training for Records and Investigations staff is recommended regarding FBI case
clearance guidelines to ensure correct reporting of UCR statistics. (Recommendation No. 22.)

56
COMMUNICATIONS
The Communications Division serves as the Public Safety Answering Point (PSAP) for the Carlsbad
Police Department (CPD). The dispatch/communications function is a vital component of an
effective law enforcement agency. 911/dispatch operators serve in two primary roles: (1)
answering 911 and non-emergency telephone calls, and (2) radio dispatch duties. In the case of
CPD, all full-time personnel are cross-trained in both roles.
Often the first point of contact for a citizen seeking assistance, 911 operators play a significant
role in setting the tone for the community’s attitude toward the agency. The efficiency with
which they collect information from callers and relay that information to responding personnel
significantly impacts the safety of citizens and officers alike. And for crimes in progress, their work
substantially affects the chances of apprehending criminals.
The Communications Division can and should serve as an important addition to the investigative
effort for in-progress crimes or the active search for wanted suspects. As officers search for
suspects in the field, Communications staff can simultaneously search various computer
databases, technology sources, and social media platforms for information that may be of
value to the investigative effort. This can apply to missing persons as well. CPD staff advised that
all efforts are made in this area when adequate staffing exists.
Communications Staffing
The Communications Division and its personnel operate under the direction of a civilian
manager. The manager is supported by four shift supervisors. Sixteen full-time and one part-time
dispatch positions round out the authorized staffing for the unit. At present, the unit is fully
staffed. Dispatchers play a dual role in the center, with one assigned as the primary radio
operator and remaining staff assigned as call takers and secondary radio operators.
Table 6-3 reflects all authorized (budgeted) staffing assigned to Communications as indicated
above. It depicts authorized positions, actual staffing, and vacancies.
TABLE 6-3: Communications Personnel
Rank Authorized Actual Vacant
Manager 1 1 0
Supervisor 4 4 0
Dispatcher (Full-time) 16 16 0
Dispatcher (Part-time) .5 .5 0
Total 21.5 21.5 0
The position of 911/Dispatch operator involves challenging and stressful duty. Virtually every
agency studied by CPSM reports that finding qualified applicants who can complete the
rigorous training program required to perform these duties is a struggle. This is consistent with the
experience of CPSM staff in the agencies that employed them as law enforcement officers. CPD
has had success outside the norm, which speaks to its hiring, selection process, and work
environment. The manager attributes the success to a modification in hiring practices which
allows him to interview applicants even though a testing process may not be open at the time.
Also, department background investigations have been outsourced, which expedites
completion of the hiring process. This also helps the Communications team’s morale by
eliminating long periods of working with vacant positions.
57
Relative to supervisory positions, it must be noted that in most law enforcement agencies of the
CPD’s size, dispatch supervisors frequently and appropriately perform some routine dispatch and
call-taker duties. CPD utilizes supervisors at an acceptable rate as a result of the current staffing
level, which only intermittently requires supervisors to fill the dispatcher role. It is important,
however, that CPD not come to rely upon supervisors to routinely perform these line duties at the
peril of failing to perform their role as supervisors. Doing so could impact their ability to perform a
myriad of supervisory as well as associated administrative duties. It can also undermine
supervisory authority among their subordinates, who may come to look at them as peers.
As workload data is examined, staffing levels will be reviewed and recommendations made
regarding staffing adjustments as warranted. These recommendations will be reflected in a
Staffing Summary subsection that will follow our workload assessment.
Work Schedules At present, dispatchers work a 3/12 schedule, with alternating three-day and four-day work
weeks. Under this schedule, one day of the four-day work week involves an eight-hour shift,
which enables the employee to reach 160 hours of work over a 28-day period. To address
minimum staffing issues, CPD employs several strategies in addition to the part-time employee’s
flexible scheduling. Based on seniority, each dispatcher is placed on-call for two days each
month on a rotating basis. If the unit falls below minimum staffing, the on-call employee for the
day is required to respond to the Communications Center. The employee is compensated for
on-call time and receives regular or overtime pay, as the case may be, if they are called in to
work. A second option utilized is paying an off-duty dispatcher overtime for three hours of work
to cover lunches and breaks. Four-hour shift holdovers are also used on eight-hour shift days. The
strategies employed are determined by supervisors to make the most efficient use of resources.
The budgeted, non-benefited, part-time position is used by management to hire desirable
lateral candidates willing to work part-time in anticipation of a full-time position. After
completing training, the part-time employee is utilized as relief for employee leave as needed.
This temporary position also gives management a period of evaluation of a new employee who
has limited civil service protections.
As noted, there are presently four communication supervisors. All supervisors work a 3/12
schedule in the same format as described above for dispatchers. There are no supervisor relief
personnel. In the absence of a supervisor, an acting supervisor may be designated. A patrol
supervisor is available to provide direction as needed when no Communications supervisor is
available.
Table 6-4 reflects this work schedule and staffing as presently available and assigned.

58
TABLE 6-4: Communications Division Work Schedule
Shift Work Schedule
Average # Staff Presently
Available for Duty*
D-1 Sunday – Tuesday
(Plus every other Wed.) 4:00 a.m. to 4:00 p.m.
4 Dispatchers
1 Supervisor
D-2 Thursday – Saturday
(Plus every other Wed.) 4:00 a.m. to 4:00 p.m.
4 Dispatchers
1 Supervisor
E-1 Sunday – Tuesday
(Plus every other Wed.) 4:00 p.m. to 4:00 a.m.
4 Dispatchers
1 Supervisor
E-2 Thursday – Saturday
(Plus every other Wed.) 4:00 p.m. to 4:00 a.m.
4 Dispatchers
1 Supervisor
*Note: It is important to note that these staffing numbers reflect total personnel presently available for full
duty as per Table 6-3. Also, these numbers do not factor in time off due to vacation, illness, mandatory
training, etc. Based upon scheduled time off, the actual number of personnel reporting for duty on a
scheduled shift will be approximately 20 percent to 25 percent lower than is reflected.
Minimum Staffing The department’s minimum staffing objective is three dispatch personnel at all hours for all shifts.
This minimum staffing level is an increase as recommended in the 2014 CPSM assessment. After
that earlier CPSM study, two full-time dispatcher positions were funded to increase minimum
staffing to present-day levels. It is important to note that as we discuss minimum staffing, it is just
that, minimum, not optimal.
And, as reflected in Table 6-4, at present, if all existing authorized personnel report to work on all
shifts, dispatch operates above minimum staffing throughout the day. As personnel take
scheduled or unscheduled leave due to training, vacation, illness, FMLA, etc., staffing can fall
below the levels indicated. However, CPD staff reported that staffing dips to the minimum only
occasionally at a rate of one day out of seven. As this occurs, the strategies described above
are employed. For FY 17/18, 2,083 overtime hours were expended to meet minimum staffing.
When this number of hours is translated to a full-time equivalent (FTE) position, it equals 1.00 FTE
position. However, with the sporadic nature of the overtime use, the utilization of the previously
described staffing strategies to address minimum staffing is more cost-effective and provides
scheduling flexibility, thus negating the need to hire an additional staff member.
As previously noted, there are two primary duties in dispatch centers; (1) radio dispatch, and (2)
answering 911 emergency and general telephone calls. Best practices for a city of this size and
call volume call for (1) a lead dispatcher who is responsible for all radio communication
between field units, with no telephone answering responsibilities, (2) a back-up dispatcher who
provides support to the lead dispatcher, monitors secondary radio frequencies, and may be
called upon to support 911 call takers, and (3) a sufficient number of calls takers to generally
manage all incoming calls, both 911 and general calls. Given these generally accepted staffing
and deployment practices, CPSM asserts that the minimum staffing as established by the
department is at an appropriate level.
Call/Workload Demand In addition to serving as the 911 Public Safety Answering Point (PSAP) where all 911 calls are
received, dispatch also receives various other calls via the department’s telephone lines. In
2018, the unit answered a total of 113,402 incoming telephone calls and a total of 328,241 over
the last three years. This is a 7.8 percent increase in call volume over the past three years.

59
Current year call volume equates to an average of one call every 4.64 minutes. Of course, call
volume would be higher during peak activity times, and lower during slower times of the day. Of
total calls, 32,509 (28.7 percent) were 911 calls. The remaining 80,893 (71.3 percent) were non-
emergency and/or general business calls. This represents a significant volume of non-emergency
call activity for the center. In addition to the incoming calls, the Communications Division made
more than 43,086 outgoing calls. The ratio of outgoing calls to incoming calls is generally
consistent with other law enforcement agencies. Ninety-eight percent of 911 calls were
answered within ten seconds, exceeding the National Emergency Number Association (NENA)
standard of 95 percent within 15 seconds; 99 percent of 911 calls were answered within the
15-second standard, and 98 percent of 10-digit lines were answered within ten seconds. All of
these tasks were completed well within industry standards.
Table 6-5 compares incoming call demand from 2016 through 2018.
TABLE 6-5: Telephone Incoming Call Load and Radio Dispatches by Year*
2016 2017 2018
All Calls 105,231 109,608 113,402
911 Calls 27,410 29,145 32,509
911 % of Total Calls 26.0% 26.6% 28.7%
*Source: Carlsbad PD
CAD data revealed that 48,403 calls for service were dispatched to CPD units (Patrol, Traffic,
CSO) in 2018. In CPSM studies, it is common to find that the hours between 8:00 a.m. and 8:00
p.m. represent those that are busiest for most communication centers relative to telephone calls,
though this varies somewhat from agency to agency based upon community demographics. To
examine this, CPSM requested telephone call data by hour to enable our analysis. Table 6-6
shows call activity by hour of day for calendar years 2016, 2017, and 2018. In the case of
Carlsbad, the hours between 8:00 a.m. and 8:00 p.m. also reflect the highest call volumes.

60
TABLE 6-6: Total and Average Daily Telephone Call Volume by Hour, 2016–2018*
Hour of
Day
Call Volume Daily
Average 2016 2017 2018
Midnight 2,222 2,384 2,465 6.46
1:00 a.m. 1,893 1,947 1,961 5.30
2:00 a.m. 1,809 1,784 1,666 4.80
3:00 a.m. 1,390 1,520 1,454 3.99
4:00 a.m. 1,149 1,264 1,357 3.44
5:00 a.m. 1,409 1,489 1,734 4.23
6:00 a.m. 2,218 2,208 2,454 6.28
7:00 a.m. 4,033 4,052 4,365 11.37
8:00 a.m. 5,603 5,808 6,091 15.98
9:00 a.m. 5,893 6,171 6,472 16.93
10:00 a.m. 6,517 6,576 6,958 18.31
11:00 a.m. 6,466 6,899 7,252 18.83
Noon 6,574 6,683 7,046 18.54
1:00 p.m. 6,692 6,831 7,130 18.86
2:00 p.m. 6,662 6,942 7,267 19.06
3:00 p.m. 6,822 6,971 7,333 19.29
4:00 p.m. 6,420 6,853 7,179 18.68
5:00 p.m. 6,357 6,718 6,877 18.22
6:00 p.m. 5,472 5,930 5,693 15.61
7:00 p.m. 4,873 4,990 5,011 13.58
8:00 p.m. 4,426 4,738 4,726 12.68
9:00 p.m. 4,111 4,127 4,093 11.26
10:00 p.m. 3,395 3,690 3,735 9.88
11:00 p.m. 2,825 3,033 3,083 8.17
Total 105,231 109,608 113,402 299.76
Three-
year Total 328,241
*This does not include radio traffic workload.

61
Table 6-7 reflects call volume by hour of day relative to shift schedules for calendar years 2016,
2017, and 2018.
TABLE 6-7: Average Daily Telephone Call Volume by Hour by Dispatch Shifts,
2016–2018
D1 and D2 E1 and E2
4:00 a.m. 3,770 1.15% 4:00 p.m. 20,452 6.23%
5:00 a.m. 4,632 1.41% 5:00 p.m. 19,952 6.08%
6:00 a.m. 6,880 2.10% 6:00 p.m. 17,095 5.21%
7:00 a.m. 12,450 3.79% 7:00 p.m. 14,874 4.53%
8:00 a.m. 17,502 5.33% 8:00 p.m. 13,890 4.23%
9:00 a.m. 18,536 5.65% 9:00 p.m. 12,331 3.76%
10:0 0a.m. 20,051 6.11% 10:00 p.m. 10,820 3.30%
11:00 a.m. 20,617 6.28% 11:00 p.m. 8,941 2.72%
Noon 20,303 6.19% Midnight 7,071 2.15%
1:00 p.m. 20,653 6.29% 1:00 a.m. 5,801 1.77%
2:00 p.m. 20,871 6.36% 2:00 a.m. 5,259 1.60%
3:00 p.m. 21,126 6.44% 3:00 a.m. 4,364 1.33% 187,391 57.09% 140,850 42.91%
Previously, we discussed the division’s work schedule (Table 6-4). The two primary reporting times
are 4:00 a.m. and 4:00 p.m. In comparing work schedules with telephone call demand
(Tables 6-5, 6-6, and 6-7) and calls for service activity outlined in the CPSM Data Report, the
deployment schedule reasonably matches call workload demand and call for service activity
within the established shift parameters.
Communications is the general phone answering point for the department during non-business
hours. As was previously indicated, for 2016 through 2018, an average of 72.9 percent of
telephone calls received by Communications were non-911 calls. While some of these calls are
appropriately handled by dispatch, in many cases, dispatch simply reroutes the caller to the
appropriate party. In a recent study, another department reported this to be the case for 31
percent of all calls. Carlsbad does not track this number; however, staff reported that transfer of
in-coming telephone calls is routine. The 2014 CPSM report recommended CPD explore options
to reduce the volume of non-essential calls into Communications. CPSM has been advised that
an executive decision was made at that time to continue accepting the calls in
Communications so persons calling for assistance would be greeted by an employee, not an
employee’s voicemail. Unfortunately, it was reported to CPSM that currently a significant
majority of the calls internally transferred by Communications to other department personnel
ultimately are answered by a voicemail system anyway.
While the unit or party to which the call is transferred varies, it was reported that many of the
transferred calls are from a citizen seeking to contact an officer who had previously handled a
call for service with the calling party. Though each officer is issued a department cell phone, not
all officers’ business cards reflect the officer’s individual cell phone number, hence the calling
party utilizes Communications to connect them to the desired officer. CPD should ensure that all
personnel are required to reflect their department cell phone number on their business cards,
and that each officer be required to regularly review and respond to phone messages. This

62
should aid in reducing the number of transfer calls through Communications. These non-
emergency calls have a significant negative impact on the 911/dispatch operation and should
be further addressed by the department should the above action be insufficient to reasonably
reduce the number of such calls.
Communications received 526 PRA requests in 2018. These requests were for phone and radio
traffic recordings. Requested recordings are handled by a Communications supervisor or the
manager. Most of the recordings are downloaded into the County Qtel system to be available
to officers and the D.A.’s office. Recordings for DMV or private attorneys are copied onto disks
for the requesting party. The time needed to copy the recordings varies by the incident type
and the data requested. If only the 911 call is needed the process can be completed in 15 to 20
minutes. Requests that also include the radio traffic can take significantly longer, up to 60
minutes. The estimated average time to prepare the recordings for all requests is 30 minutes. The
PRA requests are generally forwarded to Communications by Records. Records prepares the
department’s PRA response to the concerned party upon receipt of the requested recording.
These tasks should be absorbed by the CPSM-recommended Discovery Unit (see Records
Division section of this report for detail).
Impact of Technology
In 2014, CPD was found to be one of the least technologically sophisticated departments that
CPSM has evaluated. Since that time, CPD has made great strides in acquiring and
implementing technological resources throughout the department. These resources utilized
and/or accessed by Communications include license plate reader cameras, 3Si Alarms (banks,
and department-deployed bait bikes/vehicles/property), station CCTV cameras, CCTV cameras
in city parks, various websites (Findum/Sendum, Blackboard Connect, Take-Me-Home Registry,
Drug ID, One-Call-Now SWAT notification, social media, Vigilant LPR Date files, CHP CAD, VIN
Assist), and county, state, and federal databases.
As a result, in addition to answering 911 and non-emergency telephone calls and handling radio
traffic, dispatchers are expected to monitor and respond as appropriate to video camera
images and technology resources. This responsibility includes 75 security cameras and 51 license
plate reader (ALPR) cameras, with more to be added soon, strategically located throughout the
city. When a crime occurs, dispatchers are charged with not only dealing with the caller,
dispatching units, and providing call information, but also reviewing the camera feeds and
noted technology resources and relaying information to the units in the field. While the available
technology provides exceptional tools for aiding responding officers, the volume of information
coming into and available to Communications staff can be a burden at times. Other emerging
technologies, such as body-worn cameras, video door bells, Text-to-911, and language
translation lines, which are at various stages of deployment, along with other yet-to-be-
developed systems, will have further impact on PSAP staffing.
PSAP centers across the country are dealing with these same issues. In discussions with
Communications management, it was indicated this trend has not yet reached a level that
requires additional staff within CPD. It is feasible that in the not-too-distant future a “technology”
desk may become an industry-wide part of communications center staffing, similar to primary
dispatcher, backup dispatcher, and call taker positions today. Any such staffing evaluation
should also include a technology assessment to ensure only truly beneficial systems are
deployed in a communications center.

63
Dispatch Staffing Summary
At present, CPD Communications is authorized four supervisors. Providing 24/7 supervisory
coverage would require 4.3 FTE (full-time equivalent) positions. The current staffing level allows
for supervisory oversight for each of the four primary shifts (Day 1, Day 2, Evening 1, and Evening
2). Even at that, when factoring in leave time, some shifts will continue to rely on acting
supervisors or patrol supervision. That dilemma is a reality of shift work.
Communications is currently authorized 16 dispatchers and has no existing vacancies. As noted,
the addition of the two staff dispatchers as a result of the 2014 CPSM study enabled consistent
minimum staffing across the work schedule. In the occasional instance when a minimum staffing
level is reached, the staffing strategies utilized to mitigate intermittent staff shortages appear to
be efficient and economical. As noted previously, the department expended 2,083 hours of
overtime in 2018 in order to cover staff training and leave time. Although this number of hours
roughly equates to 1.0 FTE, the overtime use schedule varies from month to month, so an
additional staff member working on a set schedule would not address the overtime issue in an
efficient way.
In our examination of staffing and workload demands, we found that the authorized staffing
levels for both dispatch supervisor and dispatcher currently meet the needs of the CPD
Communications Division. The staff appear to handle all radio traffic, telephone calls, and
related duties with the efficiency and effectiveness expected by the city and department. As
new technology tools are deployed, staffing levels can be examined to meet increased
workload.
High-priority Calls
The computer-aided dispatch (CAD) system has been programed to assign priorities to calls
based upon the nature of the call. The department assigns calls as priority 1 through priority 4,
with priority 1 as the highest priority. Table 6-8 reflects average response times by priority.
TABLE 6-8: Average Dispatch, Travel, and Response Times, by Priority
Priority Dispatch Delay Travel Time Response Time Calls
1 1.7 4.9 6.6 721
2 11.5 6.4 17.9 17,664
3 27.0 9.6 36.5 4,859
4 24.6 7.3 32.0 2,138
Weighted Average/Total 15.3 7.0 22.3 25,382
Note: The total average is weighted according to the number of calls within each priority level.
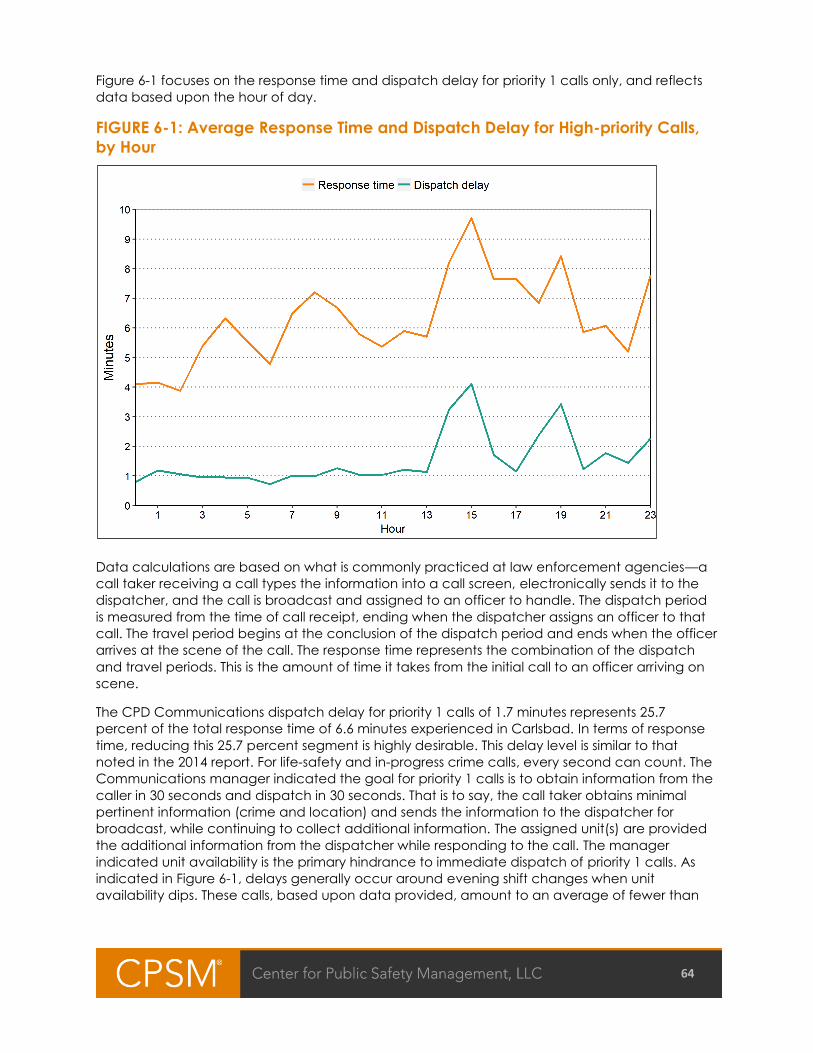
64
Figure 6-1 focuses on the response time and dispatch delay for priority 1 calls only, and reflects
data based upon the hour of day.
FIGURE 6-1: Average Response Time and Dispatch Delay for High-priority Calls,
by Hour
Data calculations are based on what is commonly practiced at law enforcement agencies—a
call taker receiving a call types the information into a call screen, electronically sends it to the
dispatcher, and the call is broadcast and assigned to an officer to handle. The dispatch period
is measured from the time of call receipt, ending when the dispatcher assigns an officer to that
call. The travel period begins at the conclusion of the dispatch period and ends when the officer
arrives at the scene of the call. The response time represents the combination of the dispatch
and travel periods. This is the amount of time it takes from the initial call to an officer arriving on
scene.
The CPD Communications dispatch delay for priority 1 calls of 1.7 minutes represents 25.7
percent of the total response time of 6.6 minutes experienced in Carlsbad. In terms of response
time, reducing this 25.7 percent segment is highly desirable. This delay level is similar to that
noted in the 2014 report. For life-safety and in-progress crime calls, every second can count. The
Communications manager indicated the goal for priority 1 calls is to obtain information from the
caller in 30 seconds and dispatch in 30 seconds. That is to say, the call taker obtains minimal
pertinent information (crime and location) and sends the information to the dispatcher for
broadcast, while continuing to collect additional information. The assigned unit(s) are provided
the additional information from the dispatcher while responding to the call. The manager
indicated unit availability is the primary hindrance to immediate dispatch of priority 1 calls. As
indicated in Figure 6-1, delays generally occur around evening shift changes when unit
availability dips. These calls, based upon data provided, amount to an average of fewer than

65
two per day; however, they are potentially the most significant calls to which the department
responds.
A team from Communications and Operations should jointly examine ways to reduce the
1.7-minute dispatch delay of not only priority 1 calls, but the dispatch delay of all calls to field
units. In the Operations section of this report, we showed that the overall response times have
increased by 35 percent since the previous CPSM study, with the majority of this increase related
to dispatch delay on low-priority calls. Field unit availability was also cited as a common factor in
these delays. The effort to resolve this issue will provide for increased victim safety and enhanced
opportunities for apprehension of suspects, and will also give the community the belief that all
calls to their police department are a high priority.
Quality Control Audits
Periodic review of random recorded phone calls and radio activity handled by each
dispatcher/call taker is important to ensure quality control and help to identify training and/or
performance issues. CPD supervisors conduct monthly audits for all staff. The audit involves
review of recorded conversations between the parties to include a priority 1 call, a second
random call, and a transferred call. A 24-point call taker check-off form is utilized to document
the audit, which assesses information gathered, timeliness of call entry to creation, overall
demeanor and empathy, etc. A 16-point dispatcher check-off form is utilized to document the
audit, which assesses compliance with radio protocols, clarity and accuracy of information
provided, overall demeanor, etc. Audits are an important aspect of managing a 911/dispatch
operation and the department is to be commended for its commitment to this effort.
Communications Recommendations: ■ Ensure that reliance upon supervisors to intermittently perform line duties does not interfere
with them performing their role as supervisors. (Recommendation No. 23.)
■ Ensure that all personnel are required to reflect their department cell phone number on their
business cards to aid in reducing the number of calls handled by Communications.
(Recommendation No. 24.)
■ Require that each officer regularly reviews and responds to phone messages.
(Recommendation No. 25.)
■ Communications PRA requests should be absorbed by the CPSM-recommended Discovery
Unit (see Records Division section of this report for detail). (Recommendation No. 26.)
■ As new technology tools are deployed in the future, evaluate Communications staffing levels
to meet increased workload to potentially include a “technology” desk. (Recommendation
No. 27.)
■ A team from Communications and Operations should jointly examine ways to reduce
dispatch delays of all calls to field units. (Recommendation No. 28.)
66
HOMELESS OUTREACH TEAM (HOT)
Much like other communities, the City of Carlsbad has experienced an increase in issues related
to homelessness, including increased calls for emergency and police services, and citizen
complaints. Residents and other community members, including business owners, requested a
response from the city to address the increasing impacts associated with this challenging issue,
both to the homeless individuals themselves and to the surrounding community. In late 2017, the
city developed and began implementation of the Homeless Response Plan. The Homeless
Outreach Team (HOT) came to fruition in conjunction with this city-wide plan.
The HOT has many responsibilities, with an overall goal of providing services to the area homeless
while reducing homelessness overall, and applying the law when necessary through
compassionate enforcement. The Carlsbad homeless population in 2018 was estimated to be
210 individuals, including 152 unsheltered homeless, which was a 50 percent increase from 2017.
The results of a January 2019 homeless count was pending as of this writing.
Some duties of the Homeless Outreach Team include:
■ Make consistent and frequent contact with the homeless and seek opportunities to connect
the homeless residents with appropriate resources and services.
■ Focus on the clean-up of homeless encampments and take other actions to address
community concerns as related to the homeless residents, including any related criminal
activity.
■ Coordinate with other departments for resource referrals, and other municipalities and the
county to provide resources, as available, and make enforcement efforts more effective.
■ Conduct community outreach and education to social service agencies, churches, and
others.
■ Respond to citizen requests for addressing impacts of the homeless and homelessness.
The Homeless Outreach Team is staffed by two full-time police officers, whose positions were
added to the department budget as part of the Homeless Response Plan. The HOT works a 4/10
schedule, deploying Monday through Thursday from 7:00 a.m. to 5:00 p.m. Each HOT member
drives their own department vehicle, but as necessary, the team members work in combination
based on the mission for the day for officer safety and efficiency. The team vehicles are being
transitioned from unmarked SUVs to pickups to better facilitate team duties. Although
organizationally the team is supervised by the Crime Suppression Team/Homeless Outreach
Team sergeant, the assigned officers function independently of the CST. Assignment to the HOT
team is limited to two years to minimize the impact of the duties on assigned staff. CPSM
believes this assignment period should be for a longer term in the range of five years. The
homeless population tend to be relationship and service adverse. Once confidence is gained it
can be disruptive to department efforts and relationships with the homeless to cycle staff too
frequently.
Since its inception, the HOT has created collaborative partnerships with many stakeholders in the
community, including city, county and private entities, in their effort to provide services and
impact the homeless population with a complete, comprehensive approach. The team works
with social workers, psychological services, and health services workers, including Interfaith
Community Services, which provides two full-time licensed clinical social workers (LCSW) funded
by the city to deliver individualized services those in need in the community. Periodically, these
representatives ride along with the team members, providing the opportunity for side-by-side
coordination of the delivery of services.
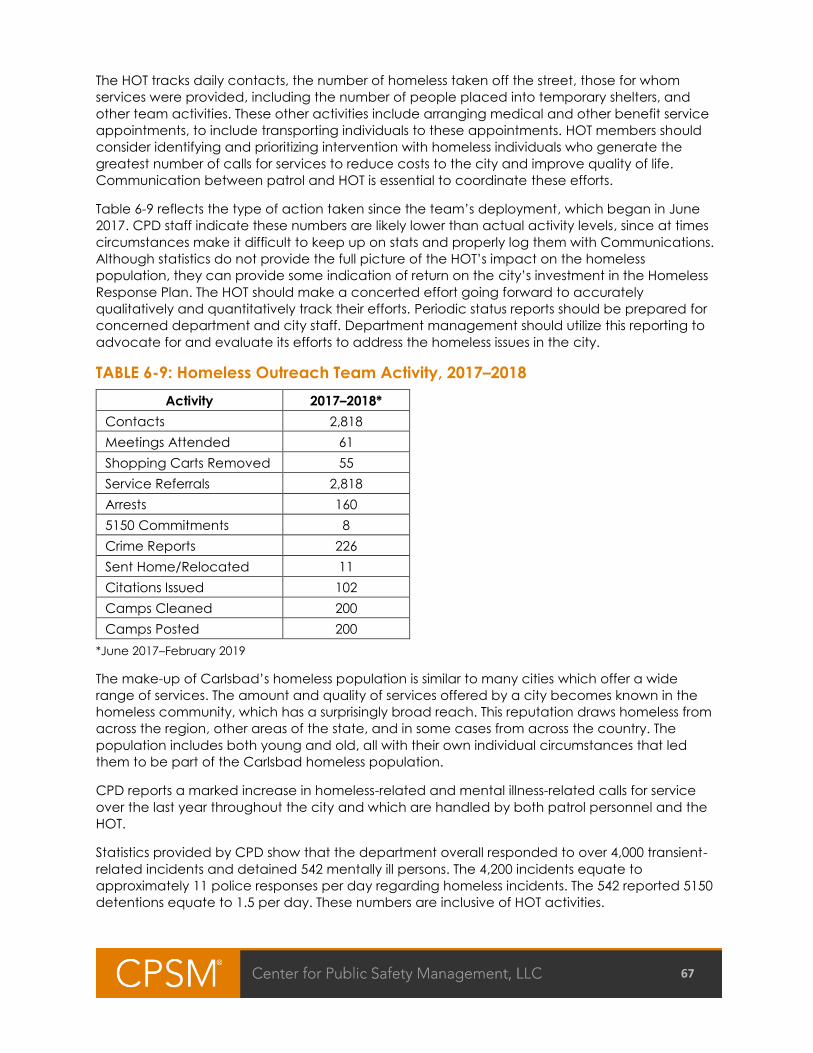
67
The HOT tracks daily contacts, the number of homeless taken off the street, those for whom
services were provided, including the number of people placed into temporary shelters, and
other team activities. These other activities include arranging medical and other benefit service
appointments, to include transporting individuals to these appointments. HOT members should
consider identifying and prioritizing intervention with homeless individuals who generate the
greatest number of calls for services to reduce costs to the city and improve quality of life.
Communication between patrol and HOT is essential to coordinate these efforts.
Table 6-9 reflects the type of action taken since the team’s deployment, which began in June
2017. CPD staff indicate these numbers are likely lower than actual activity levels, since at times
circumstances make it difficult to keep up on stats and properly log them with Communications.
Although statistics do not provide the full picture of the HOT’s impact on the homeless
population, they can provide some indication of return on the city’s investment in the Homeless
Response Plan. The HOT should make a concerted effort going forward to accurately
qualitatively and quantitatively track their efforts. Periodic status reports should be prepared for
concerned department and city staff. Department management should utilize this reporting to
advocate for and evaluate its efforts to address the homeless issues in the city.
TABLE 6-9: Homeless Outreach Team Activity, 2017–2018
Activity 2017–2018*
Contacts 2,818
Meetings Attended 61
Shopping Carts Removed 55
Service Referrals 2,818
Arrests 160
5150 Commitments 8
Crime Reports 226
Sent Home/Relocated 11
Citations Issued 102
Camps Cleaned 200
Camps Posted 200
*June 2017–February 2019
The make-up of Carlsbad’s homeless population is similar to many cities which offer a wide
range of services. The amount and quality of services offered by a city becomes known in the
homeless community, which has a surprisingly broad reach. This reputation draws homeless from
across the region, other areas of the state, and in some cases from across the country. The
population includes both young and old, all with their own individual circumstances that led
them to be part of the Carlsbad homeless population.
CPD reports a marked increase in homeless-related and mental illness-related calls for service
over the last year throughout the city and which are handled by both patrol personnel and the
HOT.
Statistics provided by CPD show that the department overall responded to over 4,000 transient-
related incidents and detained 542 mentally ill persons. The 4,200 incidents equate to
approximately 11 police responses per day regarding homeless incidents. The 542 reported 5150
detentions equate to 1.5 per day. These numbers are inclusive of HOT activities.

68
Carlsbad’s local emergency shelter, Tri-City Hospital Behavioral Health Unit, closed recently,
which limits HOT and patrol officers’ options for 5150 services. This closure also increased officer
drive time to the only available mental health facility located in downtown San Diego,
impacting resources in the city while transporting mentally ill detainees.
Many agencies in California and across the country employ homeless outreach teams in full-
time partnership with licensed clinical social workers (LCSWs) who have expertise in providing
social services and mental health evaluation as a means of providing a consistent service, while
at the same time lessening the workload on patrol personnel. These teams have the necessary
expertise, including knowledge and access to mental health and homeless services in the
region, and the county as a whole, to more appropriately and efficiently address mental health
and homeless concerns.
CPSM recommends modifying the current HOT configuration to create three teams consisting of
a police officer and a licensed clinical social worker (LCSW). This would require an additional FTE
police officer and three FTE LCSWs to staff the three teams. This configuration would broaden
HOT’s reach to provide evening and weekend response. The enhanced staffing could actively
solve problems and address community homeless issues in an even more meaningful way
beyond the current staff’s ability. The enhanced teams would be equipped to address the
increase in homeless and mental illness-related calls for service reported by CPD. As the city
currently provides monies to Interfaith Community Services for two full-time licensed clinical
social workers, these funds could be redirected to city-employed LCSWs or the collaborative
effort with ICS could continue. With either path, additional monies would be required for a third
LCSW. In addition, with the increase in HOT team size, adding a sergeant to supervise the teams
is recommended. Funding limitations for groups currently collaborating with HOT may hamper
their ability to grow with this expansion unless additional funding sources are identified.
The City of Carlsbad and the police department have refocused their efforts on the needs of the
city’s homeless with the implementation of the Homeless Response Plan. The city has developed
collaborative efforts with area stakeholders to expand its reach within the homeless community
to provide services and address homeless-related impacts on the community. A lawsuit was
recently filed against several Orange County, Calif., cities and the Sheriff’s Department alleging
not enough services and shelters were being provided for homeless populations. The complaint,
filed on behalf of three homeless persons and three homeless advocacy groups, argues that
anti-camping ordinances and other laws violate their civil rights. Lack of shelter and the
criminalization of the homeless forced to sleep in public were issues also included in the
complaint. These mirror a federal civil rights suit pending against the City of Santa Ana for
removing homeless encampments from the city. According to reports, several of the named
cities believed they were providing appropriate services to their homeless population.
Carlsbad’s administrators and elected officials, while working with homeless advocate groups,
should continually monitor their efforts to aid the homeless to ensure the city is providing the
appropriate level of services and meeting the expectations of the community.
HOT Recommendations:
■ CPSM recommends the HOT staff be assigned for five-year periods to enhance staff
relationships with clientele served. (Recommendation No. 29.)
■ HOT members should consider identifying and prioritizing intervention with homeless individuals
who generate the greatest number of calls for services in order to reduce costs to the city and
improve quality of life. (Recommendation No. 30.)

69
■ The HOT should accurately track its efforts in both qualitative and quantitative terms.
(Recommendation No. 31.)
■ CPSM recommends creating three two-person HOT teams consisting of a police officer and a
licensed clinical social worker to support patrol and HOT personnel; this would require an
additional police officer FTE and three LCSW FTEs. (Recommendation No. 32.)
■ With the increase in HOT team size, adding a sergeant to supervise the teams is
recommended. (Recommendation No. 33.)
■ Carlsbad’s administrators and elected officials should continually monitor the city’s efforts to
address homeless issues to ensure it is providing the appropriate level of services and meeting
the expectations of the community. (Recommendation No. 34.)
RECORDS DIVISION
Contrary to the common perception that functions performed in law enforcement records
sections are as simple as filing reports and providing copies as needed, there is an exhaustive list
of duties performed. A police department’s records section is daily called upon to: review and
process citations and incident reports; conduct criminal history checks; answer telephone calls
related to the records operation; handle walk-in customers at the front desk; organize and
maintain reports in various databases; upload and maintain digital photographs; maintain
records on incarcerated individuals; respond to document and/or photographic image requests
from the public and law enforcement/criminal justice community; register sex offenders; prepare
and distribute reports for prosecutors and others; maintain information on local wanted/missing
persons and property in local, state, and federal databases; accept and process various civil
papers for service; monitor and respond to requests received through the agency’s central
email box; conduct background checks for employment and prepare clearance letters;
respond to requests for the release of various documents/video and voice data/photographs as
required under the Freedom of Information Act; receive and distribute incoming and outgoing
mail; purge records as directed by the prevailing record retention schedule; order and maintain
department supplies for records-related duties; prepare statistical reports including those for the
State of California and the FBI; and more.
The Carlsbad Police Department policies do not reference the functions and responsibilities of
the Records Division in detail. Policy 806, Records Division, and Policy 810, Records Maintenance
and Release, provide a minimal outline of a small portion of Records’ activity. The department
should consider developing a section within the policy manual specific to the Records function.
This will ensure that Records staff can more easily comply with legal mandates and department
operating guidelines. Records should also develop a procedural manual for staff reference,
improved consistency, and guidelines for new employees.
Records Management System
The records management system used by the CPD is NETRMS, which is an integrated law
enforcement software product offered by Motorola. CPD also uses NETRMS department-wide for
its CAD, Property and Evidence function, and Investigations. This system has been in place since
March 2017. Records staff report the system is a significant upgrade in their records
management process and its implementation has provided CPD with its first integrated records
management system. Initial issues with the system have been resolved as department staff have
gained experience in the system’s use.

70
Records Staffing
The Records Division falls under the direction of the Captain of the Support Bureau; however,
day-to-day management of Records is the responsibility of the Records Manager, who also
manages the Property and Evidence Division (P/E). The authorized staffing for the unit includes
the manager, four records specialists, and one half-time administrative assistant position. Two
employees job-share one records specialist position.
The Records Division was staffed by 5.5 specialist positions until three years ago, when one
Records FTE was moved to Property and Evidence to address a line staffing need, reducing
Records to 4.5 FTE positions. Today, as has been the case for some time, a P/E staff member
frequently assists Records with necessary duties due to workload, including mandatory lunch
breaks.
CPSM recommended in the 2014 report that a P/E supervisor position be created to be
responsible for the overall management of property and evidence. The report supported this
recommendation by outlining potential issues of mismanagement of evidence or property that
can seriously jeopardize the prosecution of criminal cases and unnecessarily expose the
department to liability, though finding no evidence to suggest deficiencies in CPD at the time of
the report. Based on today’s organizational chart, the Records manager was designated as P/E
manager in lieu of the recommendation, and now manages both the records function and the
P/E function. The Records manager asserts she spends 80 percent of her time with Records and
20 percent of her time with P/E, though admittedly states P/E is not getting the oversight it needs,
due to the workload the manager faces in Records.
Table 6-10 reflects all staffing assigned to Records. It shows authorized positions, vacancies at
present, and actual staffing.
TABLE 6-10: Records Unit Personnel
Rank Authorized Actual Vacant
Records Manager 1 1 0
Records Specialist 4* 4* 0
Administrative Assistant .5 .5 0
Total 5.5 5.5 0
*One records specialist position is job-shared by two employees working 20 hours per week each.
In the introduction to Records, above, some of the myriad responsibilities of a law enforcement
agency records section were described. The majority of these functions are performed by CPD
Records. Records staff are cross-trained in all of the assigned responsibilities. Records has
periodic rotations in place to ensure skills and knowledge are maintained, which also deters
complacency.
As the functions performed by law enforcement records sections vary greatly from agency to
agency, there is no universally accepted formula for establishing a department’s staffing level.
Therefore, CPSM draws upon our experience in both leading law enforcement agencies and our
work across the nation in conducting studies such as this to assess staffing levels.
CPD has grown in sworn staffing over the last 20 years by 25 positions. This is an increase of 21.8
percent in overall sworn staffing and a 15 percent increase in patrol staffing. CPD staff have an
expectation that an additional eight sworn staff will be added in the coming budget year.
During this same period, CPD management indicates the only Records staff change has been

71
the reduction noted above. However, Records does also anticipate two positions will be
requested in the coming budget year.
As workload data is examined, staffing levels will be reviewed and recommendations made
regarding staffing adjustments as warranted. These recommendations will be reflected in a
Staffing Summary section that follows our workload assessment.
Work Schedules/Public Access Hours
The public counter is open Monday through Friday from 8:00 a.m. to 5:00 p.m. Staff work a 4/10
schedule with some employees off Mondays and some Fridays. Records staff is available
Monday through Friday, 6:00 a.m. to 5:00 p.m. The manager works a 9/80 schedule with
alternating Fridays off.
Workload Demand Over the last three years, although not inclusive of all work performed, CPD Records processed
an average of 8,744 police reports, 1,993 arrests, 545 Coplogic reports (online public reporting),
and 80 subpoenas.
Completed patrol officer reports are submitted through NETRMS where they remain in a queue
for a patrol sergeant to review and approve. Once approved, the report is available for Records
to process. Supplemental documents not submitted through NETRMS are hand-carried to
Records and scanned into NETRMS by assigned staff. This required scanning has increased staff
workload. Upon completion of individual case review by Records, reports become available to
Investigations for assignment, delivery to court, or other processing. Records regularly suffers a
workload backlog following the weekend due to no staff being scheduled over the weekend,
plus a light staff on Fridays. This staffing model causes a backlog of report processing and other
Records workload.
Report processing is also impacted by the timely completion of police reports by patrol
personnel. Policy 344.1.2 outlines report completion requirements specifying supervisory approval
for the deferral of reports and a documented tracking of such deferral approvals.
Documentation of such an approval or the tracking of a deferral is not practiced per policy to
ensure reports are completed, approved, and processed to Records. Records does audit issued
report numbers a few times each month. Staff send requests to officers to complete reports, but
patrol supervisors are not part of this effort; consequently, these requests are not always acted
on promptly. A lack of patrol supervisory oversight, specifically during extended-shift report
writing, contributes to this issue, which is most problematic when this occurs with in-custody
reports. Records is frequently required to locate and process arrest reports for court submission
due to unapproved deferrals. The report deferral policy must be followed and communication
improved between Records and patrol supervisors to address this issue.
The secondary workload issue for Records staff is the processing of tasks such as entering
warning and municipal code citations. These low-priority tasks are addressed as staff availability
allows, but addressing them through operational and staffing adjustments to be discussed here
regarding public counter and phone activity may effect this backlog. Due to staff workload,
Records utilizes a senior volunteer to complete most of the required general document purging.
CPD has recently deployed E-ticket technology, which should positively impact Records
workload demand with a reduction in processing time. The requirement that the E-tickets be cut
to a particular size by Records staff as requested by the Court should be reviewed as a
seemingly unnecessary task. Records expends minimal overtime to address workload, but this is
due to job-share and part-time employees working additional shifts. Records could not provide

72
an accurate accounting of these extra shifts as there is only straight time recorded for these
employees.
Daily, one Records staff member is assigned to handle public counter activity not only related to
Records, but any other general inquiries or requests for assistance, and answering the
department’s general phone line. The public window is currently within the Records office, but
with the planned office remodel the window will not be within the office. Consideration should
be given to assigning a Community Service Officer position to this assignment to address
department inquiries, thus relieving the Records staff member to handle records-related
workload.
The Records manager’s workload is frequently backlogged by reviewing report dispositions and
making corrections, the completion of monthly stats, completing PRA requests (see below), and
processing detention certificates. The manager indicated there are approximately 1,500
detention certificates awaiting processing by her. The manager raised concern regarding
litigation for failure to complete processing in a timely manner. Purging of items such as PRAs,
subpoenas, and citations are out of compliance also, as this task falls to the manager due to
staffing issues. The dual role managing Records and P/E, and the manager’s individual workload,
contribute to the manager’s inability to exercise the appropriate level of management and
quality control over either unit.
CPD management identified a few areas with potential for Records workload impact in the
CPSM assessment scope of work. These include the transition from UCR reporting to NIBRS
reporting and its increase in report review time. The Records manager said it is anticipated the
transition will have minimal impact on staff workload as a county-wide working group is working
on NIBRS issues as they arise, thus providing solutions to the concerned agencies and
participating departments. Patrol sergeants will be responsible for ensuring proper NIBRS coding
while Records will audit the information periodically. It is unknown when CPD will begin the
transition to NIBRS. Responsibility for body-worn camera (BWC) video requests and redactions
are delegated to the requesting party such as Professional Standards, District Attorney, or City
Attorney. The Records manager does the necessary BWC research and burns copies for the City
Attorney and Risk Management, primarily for DUI subpoenas. The manager also does research
for the District Attorney when that staff cannot locate video in the BWC system.
Public Records Requests A routine function of any police department records section is the release of public records to
include police reports. The Records manager prepares all of the department public records act
(PRA) responses. Due to short legal timelines on PRAs, immediate attention is required to meet
the deadline for the City Attorney, requiring the manager to put other workload aside to address
these requests.
Over the last few years, agencies have hurried to deploy body cameras without the policy
preparation or the resources required to store and manage the cameras’ recordings. Significant
increases in staff time to review, redact, and process recordings for judicial discovery and public
records requests (PRA) seeking access to the camera recordings have overwhelmed agencies.
Though CPD contracts out redaction services and storage processes have improved, Records
staff must address any questions or errors that occur. The CPD Records Division, along with other
units including Dispatch, Property and Evidence, Patrol, and Administration, have become
burdened with elements of this task and other matters requested through the ”discovery” and
PRA process.
This added and sometimes complex workload has negatively disrupted primary duties in each of
the units identified. As well, parceling out the responsibility for producing such records lends itself

73
to omission errors that can compromise legal proceedings and public trust in the agency. The
establishment of a “Discovery Unit” within Records, with appropriate staffing, should be
considered to centralize the tasks required for completion of these responses. Recently,
California Senate Bill 1421 and Assembly Bill 748, substantially expanded public access to police
records. These new laws will undoubtedly place an increased burden on the department in
responding to public record and discovery requests. Initial release of records under SB 1421 was
provided by City Attorney, but as additional cases are added, redaction, review and submission
will fall to the Records staff. Additional staffing will be required to meet this demand.
Records Staffing Summary In examining staffing and workload demands, it is clear the authorized staffing level for Records
should be increased.
Since the one Records FTE transferred to P/E three years ago is providing daily assistance to
Records, it is recommended that an additional FTE be funded and assigned to Records. This
allows the current P/E FTE to concentrate on P/E responsibilities on a full-time basis.
Consideration should be given to assigning a Community Service Officer position to the public
counter to address department inquiries, thus relieving the currently assigned Records staff
member to handle records-related workload.
The establishment of a “Discovery Unit” within Records to centralize the tasks required for
completion of judicial and PRA requests is recommended. Initial staffing should be one civilian
FTE. This staffing level assumes this unit undertakes the workload presently spread through the
department.
As Property and Evidence (P/E) was not part of the current assessment, CPSM cannot speak
specifically to its operational efficiency. However, CPSM recommends a Records supervisor
position be assigned to Records to lessen the manager’s workload, providing the manager the
opportunity to carry out appropriate management oversight of both units, and move to ensure
P/E does not face any of the potential pitfalls noted in the 2014 report.
FBI UCR Reporting
Virtually all law enforcement agencies provide statistical data to the FBI on crime rates and
clearances, among many other facets. Until recently, under UCR criteria, an incident of crime is
reported as a single crime, even in the event of multiple offenses within that one incident. The
reported offense is for that charge which is the most serious of the crimes from that single
incident. For instance, an armed robbery that included an aggravated assault is reported as
one incident, an armed robbery.
The FBI is now transitioning to the National Incident-Based Reporting System (NIBRS), with a goal
of nationwide implementation in 2021. Implemented to improve the overall quality of crime data
collected by law enforcement, NIBRS captures details on each single crime incident—as well as
on separate offenses within the same incident—including information on victims, known
offenders, relationships between victims and offenders, arrestees, and property involved in
crimes. Unlike data reported through the UCR Program’s traditional Summary Reporting System
(SRS)—an aggregate monthly tally of crimes—NIBRS goes much deeper because of its ability to
provide circumstances and context for crimes like location, time of day, and whether the
incident was cleared. The vision for NIBRS is for it to become the law enforcement community’s
standard for quantifying crime, which will help law enforcement and communities around the
country use resources more strategically and effectively. This will further support the mission of
the FBI’s UCR Program to generate reliable information for use in law enforcement

74
administration, operation, and management. According to Records staff, the transition to NIBRS
has been seamless for the most part due to it interface with NETRMS and has not impacted
workload demand.
In the Carlsbad Police Department, the responsibility for reporting crime rates rests with the
Records Section. While this would seem to be a simple, straightforward task, it is anything but. To
ensure consistency in reporting, the FBI has issued strict and detailed guidelines regarding
classification and crime clearance criteria (coding). Among the important aspects of such
reporting is to enable the reporting agency to effectively measure its crimefighting and
solvability rates against other communities. This is not to be used to grade an agency against
any other agency, but rather, to be used as a tool to better identify crimefighting strategies and
measure the effectiveness of the department and its investigators in solving crime. Should the
department have low solvability (clearance) rates, or extraordinarily high rates, examination of
the reasons should be undertaken. It may suggest a performance anomaly, or, it may stem from
improper coding.
While preventing crime is of utmost importance to law enforcement agencies, solving crime
should also have parity. The solving of crimes, which results in the prosecution of offenders, not
only prevents future crime, it also provides much-needed closure to crime victims. Clearance
rates, as defined and measured by the FBI, are the benchmark for a department’s effectiveness
in solving crime.
The FBI establishes a three-pronged rule, each of which must be met to clear a case. For FBI
reporting purposes, a crime is considered cleared when: (1) a law enforcement agency has
arrested the offender; (2) the offender has been charged with the offense; AND (3) the offender
is turned over to the court for prosecution (whether following arrest, court summons, or police
notice). The arrest of one person may clear several crimes or the arrest of several persons may
clear only one crime.
In certain situations, elements beyond law enforcement’s control prevent the agency from
arresting and formally charging the offender. Examples include the death of an offender or the
lack of an extradition treaty with a foreign government in a nation to which the offender has
fled. When this occurs, the agency can clear the offense exceptionally. Law enforcement
agencies must meet the following four conditions in order to clear an offense by exceptional
means: The agency must have identified the offender; gathered enough evidence to support
an arrest, make a charge, and turn over the offender to the court for prosecution; identified the
offender’s exact location so that the suspect could be taken into custody immediately; or
encountered a circumstance outside the control of law enforcement that prohibits the agency
from arresting, charging, and prosecuting the offender
CPSM discussed reporting practices with Records staff (coding) and found there to be an
understanding of the clearance criteria established by the FBI UCR. A review of CPD clearance
rates showed a consistency with California and national clearance rates (see Table 6-11). CPSM
recommends frequent training be provided to appropriate staff to ensure the correct criteria is
adhered to in reporting of crime and clearances. Based upon the complexity of coding criteria,
coding should be the responsibility of a limited number of staff, not to exceed two.
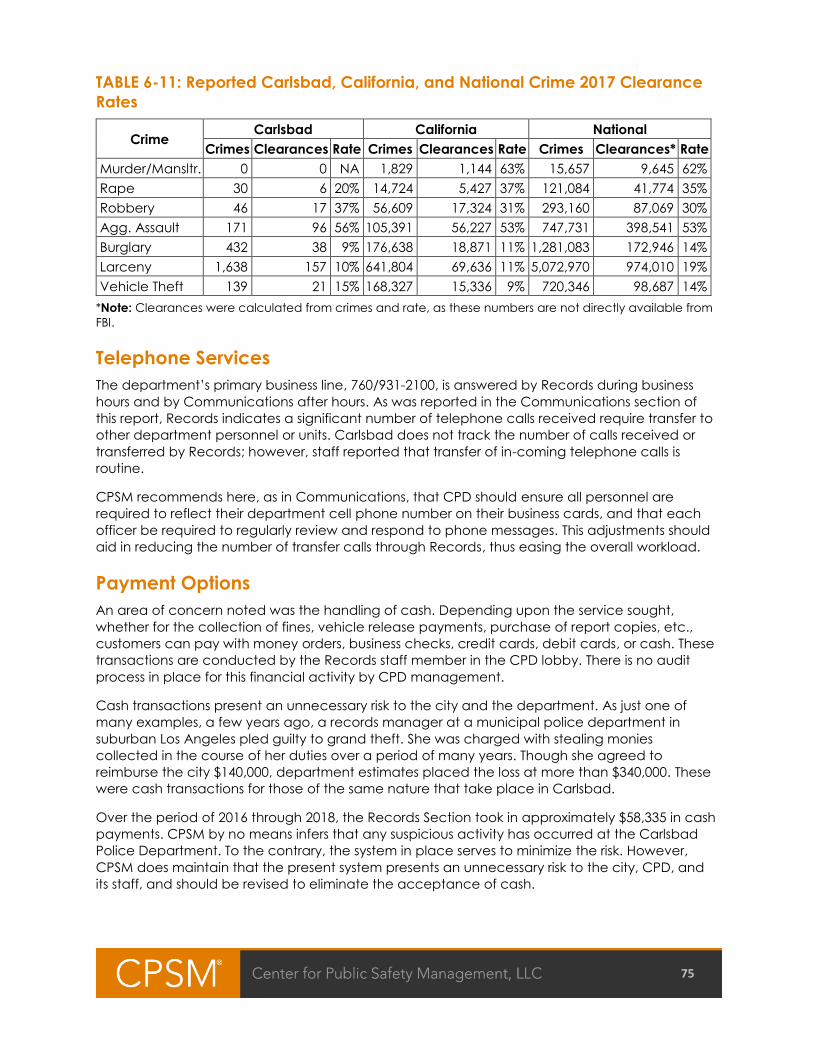
75
TABLE 6-11: Reported Carlsbad, California, and National Crime 2017 Clearance
Rates
Crime Carlsbad California National
Crimes Clearances Rate Crimes Clearances Rate Crimes Clearances* Rate
Murder/Mansltr. 0 0 NA 1,829 1,144 63% 15,657 9,645 62%
Rape 30 6 20% 14,724 5,427 37% 121,084 41,774 35%
Robbery 46 17 37% 56,609 17,324 31% 293,160 87,069 30%
Agg. Assault 171 96 56% 105,391 56,227 53% 747,731 398,541 53%
Burglary 432 38 9% 176,638 18,871 11% 1,281,083 172,946 14%
Larceny 1,638 157 10% 641,804 69,636 11% 5,072,970 974,010 19%
Vehicle Theft 139 21 15% 168,327 15,336 9% 720,346 98,687 14%
*Note: Clearances were calculated from crimes and rate, as these numbers are not directly available from
FBI.
Telephone Services
The department’s primary business line, 760/931-2100, is answered by Records during business
hours and by Communications after hours. As was reported in the Communications section of
this report, Records indicates a significant number of telephone calls received require transfer to
other department personnel or units. Carlsbad does not track the number of calls received or
transferred by Records; however, staff reported that transfer of in-coming telephone calls is
routine.
CPSM recommends here, as in Communications, that CPD should ensure all personnel are
required to reflect their department cell phone number on their business cards, and that each
officer be required to regularly review and respond to phone messages. This adjustments should
aid in reducing the number of transfer calls through Records, thus easing the overall workload.
Payment Options
An area of concern noted was the handling of cash. Depending upon the service sought,
whether for the collection of fines, vehicle release payments, purchase of report copies, etc.,
customers can pay with money orders, business checks, credit cards, debit cards, or cash. These
transactions are conducted by the Records staff member in the CPD lobby. There is no audit
process in place for this financial activity by CPD management.
Cash transactions present an unnecessary risk to the city and the department. As just one of
many examples, a few years ago, a records manager at a municipal police department in
suburban Los Angeles pled guilty to grand theft. She was charged with stealing monies
collected in the course of her duties over a period of many years. Though she agreed to
reimburse the city $140,000, department estimates placed the loss at more than $340,000. These
were cash transactions for those of the same nature that take place in Carlsbad.
Over the period of 2016 through 2018, the Records Section took in approximately $58,335 in cash
payments. CPSM by no means infers that any suspicious activity has occurred at the Carlsbad
Police Department. To the contrary, the system in place serves to minimize the risk. However,
CPSM does maintain that the present system presents an unnecessary risk to the city, CPD, and
its staff, and should be revised to eliminate the acceptance of cash.
76
Records Recommendations:
■ The department should consider developing a section within the policy manual specific to the
Records function. (Recommendation No. 35.)
■ Records should also develop a procedural manual for staff reference, improved consistency,
and guidelines for new employees. (Recommendation No. 36.)
■ The report deferral policy must be followed and communication improved between Records
and patrol supervisors to address this issue. (Recommendation No. 37.)
■ The requirement that the E-tickets be cut to a particular size by Records staff as requested by
the Court should be reviewed as a seemingly unnecessary task. (Recommendation No. 38.)
■ Consideration should be given to assigning a Community Service Officer position to the public
counter to address department inquiries. (Recommendation No. 39.)
■ An additional FTE should be funded and assigned to Records to allow the current P/E FTE to
concentrate on P/E responsibilities on a full-time basis. (Recommendation No. 40.)
■ For the establishment of a “Discovery Unit” within Records to centralize the tasks required for
completion of judicial and PRA requests, the recommended initial staffing should be not less
than 1.0 civilian FTEs. This staffing level assumes this unit will undertake the workload presently
spread through the department. (Recommendation No. 41.)
■ CPSM recommends a Records supervisor position be assigned to Records to lessen the
manager’s workload to allow for appropriate management oversight. (Recommendation
No. 42.)
■ CPSM recommends frequent training be provided to appropriate staff to ensure the correct
criteria is adhered to in reporting of UCR crime and clearances. (Recommendation No. 43.)
■ CPSM recommends here, as in Communications, that CPD should ensure all personnel are
required to reflect their department cell phone number on their business cards, and that each
officer be required to regularly review and respond to phone messages. (Recommendation
No. 44.)
■ CPSM recommends the CPD eliminate the acceptance of cash at its public window as a
payment option for department services or records. (Recommendation No. 45.)
TECHNOLOGY
In 2014, CPD was found to be one of the least technologically sophisticated departments that
CPSM has evaluated. At the time of the report, the city was in the process of establishing a five-
year strategic IT plan. CPD has made great strides in acquiring and implementing technological
resources throughout the department since the last report.
Technology support for CPD is provided by city IT staff who are embedded with the police
department. The staff consists of a manager, two analysts, a technician, and a network
administrator who provide direct support of department hardware and software systems. The IT
team has had a significant role in the department’s technology improvements. Concerned
department members and IT staff work together to ensure technologies to be deployed address
the needs of all levels including the end-user.
77
Systems implemented in recent years include:
■ NETRMS records management system.
■ Body-worn cameras, including enhancements in redaction software.
■ Individual officer assigned laptops.
■ Mobile command post with communication and technology enhancements.
Systems and improvements to be implemented soon are:
■ E-cite technology.
■ Dispatch software update with analytics module and improved GIS.
■ New 9-1-1 system to include text 9-1-1 capability.
■ Radio system upgrade.
■ Drone technology for SWAT and operational needs.
Added and/or enhanced technology and its impact on workload is challenging to quantify.
Technology is generally intended to provide operational efficiency and in turn reduce workload.
However, many times added technology means another process to employ, piece of
equipment to handle, system to access, screen to view, information to process, or another
unintended consequence. The learning curve can create an initial workload which dissipates as
user expertise grows.
As noted in the Communications section of this report, technology resources utilized and/or
accessed by Communications have also been enhanced in recent years. PSAP centers across
the country are dealing with this same issue. In discussions with Communications management it
was indicated this trend has not yet reached a level that requires additional staff within CPD. It is
feasible in the not-too-distant future that a “technology” desk may become an industry-wide
component of communications center staffing, similar to primary dispatcher, backup
dispatcher, and call taker positions are today. Any future staffing evaluation should also include
a technology assessment to ensure only truly beneficial systems are deployed in
communications centers.
No recommendations are offered.

78
SECTION 7. STAFFING RECOMMENDATION
SUMMARY
Throughout this report we have identified areas where additional staffing should be considered.
Those recommendations are included in section-specific reporting. Here, we provide a summary
of those recommendations.
We believe that each of the recommended positions offer significant added value to the city.
While we understand that costs associated with the recommendations may be considerable,
our objective is to identify staffing needs based upon workload demand and best practices,
and we do so without constraint based upon fiscal realities. It is the responsibility of the city to
determine if any, or all, of these recommendations are feasible.
Operations Bureau Recommended Staffing Increases
Patrol ■ Four sergeant FTEs, one for each primary patrol team.
■ Create a PSO classification and staff with four FTEs. Two of those would be new positions and
two would be upgraded CSOs.
■ Increase minimum staffing as outlined.
CSO ■ If the decision is made to not establish a PSO classification as described, increase CSO staffing
by two FTEs.
Traffic ■ Three motor officers (with added workload responsibilities).
Support Bureau Recommended Staffing Increases
Investigations ■ Two investigator FTEs.
Homeless Outreach Team ■ One police officer FTE.
■ Three LCSW FTEs (Increase of one LCSW with redirected assignment for the two existing).
■ One sergeant FTE.
Records ■ One Community Service Officer FTE.
■ Two records specialist FTEs.
■ One Records supervisor FTE.

79
SECTION 8. DATA ANALYSIS
This data analysis on police patrol operations for the Carlsbad Police Department focuses on
three main areas: workload, deployment, and response times. These three areas are related
almost exclusively to patrol operations, which constitute a significant portion of the police
department’s personnel and financial commitment.
All information in this analysis was developed using data from the department’s computer-aided
dispatch (CAD) system.
CPSM collected data for a one-year period of January 1, 2018, through December 31, 2018. The
majority of the first section of the report, concluding with Table 8-8, uses call data for the one-
year period. For the detailed workload analysis, we use two eight-week sample periods. The first
period is from January 4 through February 28, 2018, or winter, and the second period is from
July 7 through August 31, 2018, or summer.
WORKLOAD ANALYSIS
When CPSM analyzes a set of dispatch records, we go through a series of steps:
■ We first process the data to improve accuracy. For example, we remove duplicate patrol units
recorded on a single event as well as records that do not indicate an actual activity. We also
remove incomplete data, as found in situations where there is not enough time information to
evaluate the record.
■ At this point, we have a series of records that we call “events.” We identify these events in
three ways:
□ We distinguish between patrol and nonpatrol units.
□ We assign a category to each event based upon its description.
□ We indicate whether the call is “zero time on scene” (i.e., patrol units spent less than 30
seconds on scene), “police-initiated,” or “community-initiated.”
■ We then remove all records that do not involve a patrol unit to get a total number of patrol-
related events.
□ The patrol force includes patrol officers, sergeants, bike patrol, extra units, K9, traffic DUI,
and reserve units.
□ Traffic accident investigators, motor units, and community service officers are analyzed
separately.
□ All other personnel, e.g. investigations, crime suppression, school resource officers,
volunteers, etc., are not analyzed in the data analysis report.
■ At important points during our analysis, we focus on a smaller group of events designed to
represent actual calls for service. This excludes events with no officer time spent on scene and
directed patrol activities.
In this way, we first identify a total number of records, then limit ourselves to patrol events, and
finally focus on calls for service.

80
As with similar cases around the country, we encountered a number of issues when analyzing
Carlsbad’s dispatch data. We made assumptions and decisions to address these issues.
■ 749 events (about 1.5 percent) involved patrol units spending zero time on scene.
■ 5 calls lacked accurate busy times. We excluded these calls when evaluating busy times and
work hours.
■ The computer-aided dispatch (CAD) system used approximately 228 different event
descriptions, which we condensed into 16 categories for our tables and 13 categories for our
figures (shown in Chart 8-1). Table 8-26 in the appendix shows how each call description was
categorized.
Between January 1, 2018, and December 31, 2018, the communications center recorded
approximately 51,600 events that were assigned call numbers, and which included an
adequate record of a responding patrol unit as either the primary or secondary unit. When
measured daily, the department reported an average of 141 patrol-related events per day,
approximately 1.5 percent of which (2.1 per day) had fewer than 30 seconds spent on the call.
In the following pages, we show two types of data: activity and workload. The activity levels are
measured by the average number of calls per day, broken down by the type and origin of the
calls, and categorized by the nature of the calls (crime, traffic, etc.). Workloads are measured in
average work hours per day.
CHART 8-1: Event Descriptions for Tables and Figures
Table Category Figure Category
911 hang up 911 hang up
Alarm Alarm
Assist other agency Assist
Check Check
Crime–person Crime
Crime–property
Directed patrol Directed patrol
Disturbance Disturbance
Animal General noncriminal
Miscellaneous
Investigation Investigation
Out of service–administrative Out of service
Public contact Public contact
Suspicious incident Suspicious incident
Accident Traffic
Traffic enforcement

81
FIGURE 8-1: Percentage Events per Day, by Initiator
Note: Percentages are based on a total of 51,623 events.
TABLE 8-1: Events per Day, by Initiator
Initiator No. of Events Events per Day
Community-initiated 28,235 77.4
Police-initiated 22,639 62.0
Zero on scene 749 2.1
Total 51,623 141.4
Observations:
■ 55 percent of all events were community-initiated.
■ 44 percent of all events were police-initiated.
■ 1 percent of the events had zero time on scene.
■ On average, there were 141 events per day, or 5.9 per hour.
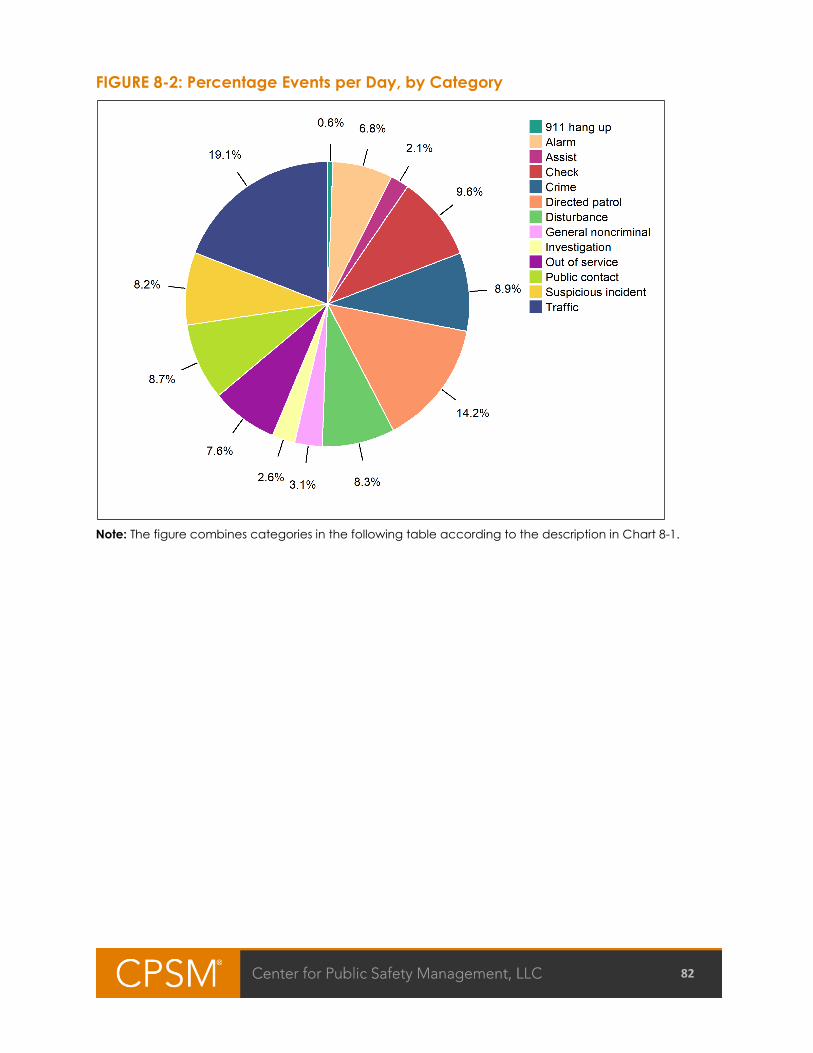
82
FIGURE 8-2: Percentage Events per Day, by Category
Note: The figure combines categories in the following table according to the description in Chart 8-1.

83
TABLE 8-2: Events per Day, by Category
Category No. of Events Events per Day
911 hang up 322 0.9
Accident 1,300 3.6
Alarm 3,517 9.6
Animal 174 0.5
Assist other agency 1,087 3.0
Check 4,975 13.6
Crime–person 1,535 4.2
Crime–property 3,054 8.4
Directed patrol 7,353 20.1
Disturbance 4,276 11.7
Investigation 1,344 3.7
Miscellaneous 1,442 4.0
Out of service–administrative 3,905 10.7
Public contact 4,511 12.4
Suspicious incident 4,253 11.7
Traffic enforcement 8,575 23.5
Total 51,623 141.4
Note: Observations below refer to events shown within the figure rather than the table.
Observations:
■ The top four categories accounted for 52 percent of events:
□ 19 percent of events were traffic-related.
□ 14 percent of events were directed patrol events.
□ 10 percent of events were checks.
□ 9 percent of events were crimes.

84
FIGURE 8-3: Percentage Calls per Day, by Category
Note: The figure combines categories in the following table according to the description in Chart 8-1.
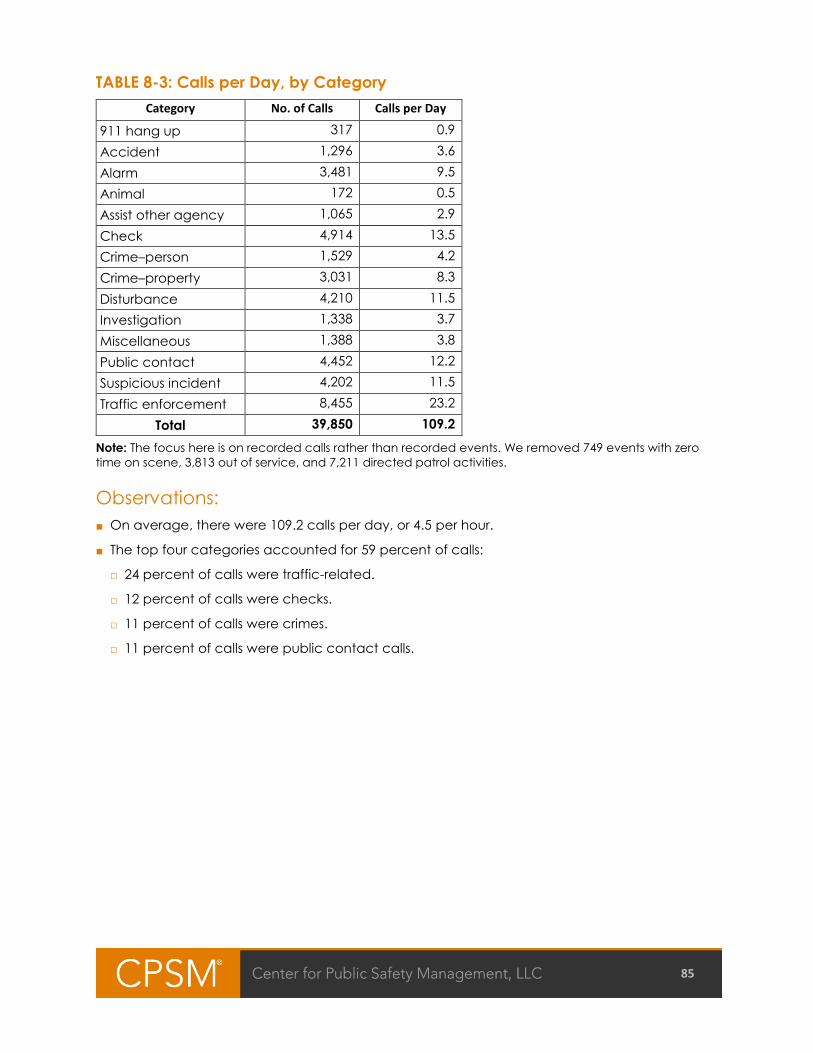
85
TABLE 8-3: Calls per Day, by Category
Category No. of Calls Calls per Day
911 hang up 317 0.9
Accident 1,296 3.6
Alarm 3,481 9.5
Animal 172 0.5
Assist other agency 1,065 2.9
Check 4,914 13.5
Crime–person 1,529 4.2
Crime–property 3,031 8.3
Disturbance 4,210 11.5
Investigation 1,338 3.7
Miscellaneous 1,388 3.8
Public contact 4,452 12.2
Suspicious incident 4,202 11.5
Traffic enforcement 8,455 23.2
Total 39,850 109.2
Note: The focus here is on recorded calls rather than recorded events. We removed 749 events with zero
time on scene, 3,813 out of service, and 7,211 directed patrol activities.
Observations:
■ On average, there were 109.2 calls per day, or 4.5 per hour.
■ The top four categories accounted for 59 percent of calls:
□ 24 percent of calls were traffic-related.
□ 12 percent of calls were checks.
□ 11 percent of calls were crimes.
□ 11 percent of calls were public contact calls.

86
FIGURE 8-4: Calls per Day, by Initiator and Month
TABLE 8-4: Calls per Day, by Initiator and Months
Initiator Jan Feb Mar Apr May Jun Jul Aug Sep Oct Nov Dec
Community 76.1 78.2 76.5 74.4 75.7 83.3 81.7 81.5 75.7 75.9 76.8 72.6
Police 28.8 34.4 29.9 33.6 34.3 31.0 30.4 35.0 30.6 33.0 32.6 28.6
Total 104.9 112.5 106.4 108.0 110.0 114.3 112.1 116.5 106.4 108.9 109.3 101.2
Observations:
■ The number of calls per day was lowest in December.
■ The number of calls per day was highest in August.
■ The months with the most calls had 15 percent more calls than the months with the fewest
calls.
■ August had the most police-initiated calls, with 22 percent more than January and December,
which had the fewest.
■ June had the most community-initiated calls, with 15 percent more than December, which
had the fewest.
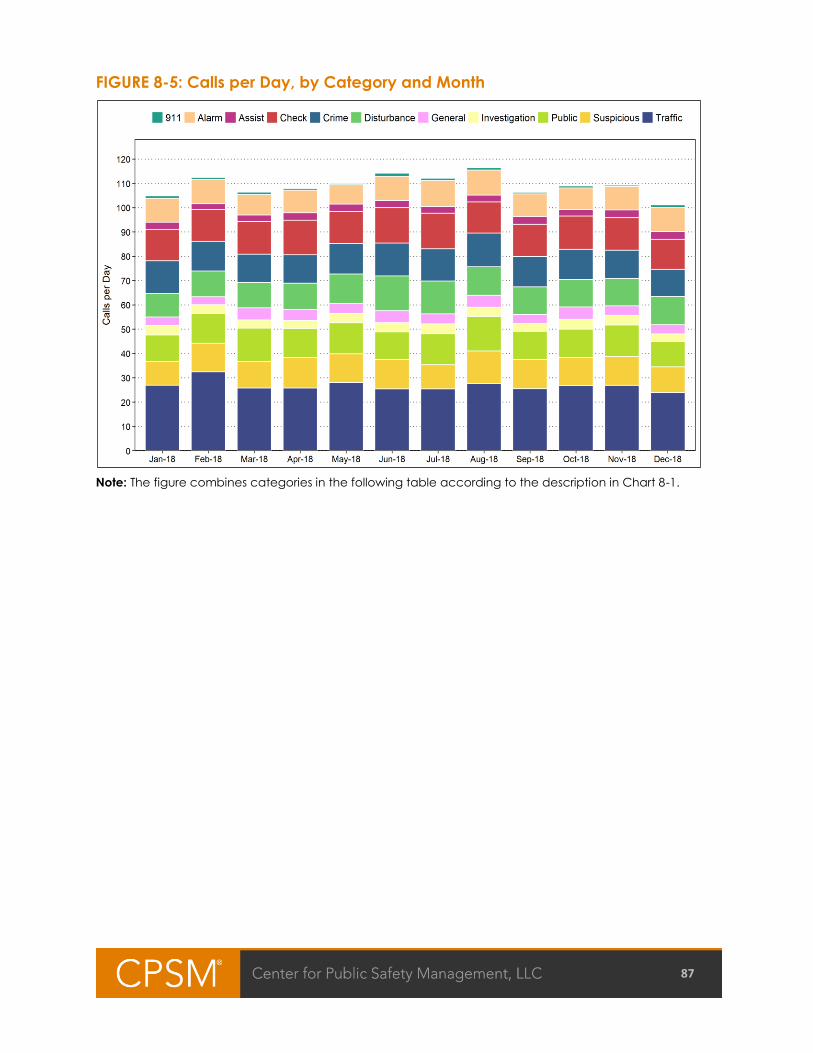
87
FIGURE 8-5: Calls per Day, by Category and Month
Note: The figure combines categories in the following table according to the description in Chart 8-1.

88
TABLE 8-5: Calls per Day, by Category and Month
Category Jan Feb Mar Apr May Jun Jul Aug Sep Oct Nov Dec
911 hang up 1.0 0.9 0.9 0.8 0.5 1.3 0.9 1.0 0.7 0.7 0.6 1.0
Accident 3.4 3.9 3.9 3.4 3.8 3.3 3.2 3.9 3.7 3.2 3.0 3.8
Alarm 9.8 10.0 8.5 9.3 8.1 10.1 10.7 10.3 9.3 9.0 9.6 9.9
Animal 0.1 0.3 0.6 0.5 0.3 0.8 0.9 0.6 0.4 0.4 0.3 0.4
Assist other
agency
3.0 2.5 2.7 3.0 3.1 2.8 2.8 2.8 3.2 2.6 3.2 3.2
Check 12.9 13.0 13.5 14.3 13.2 14.6 14.6 12.8 13.3 13.7 13.4 12.4
Crime–person 3.1 3.1 4.6 4.2 4.0 5.1 4.6 4.8 4.3 4.5 4.3 3.5
Crime–property 10.5 9.0 7.0 7.4 8.5 8.5 8.6 9.1 8.2 7.7 7.4 7.6
Disturbance 9.5 10.6 10.5 10.9 11.9 14.2 13.5 11.8 11.3 11.4 11.2 11.6
Investigation 3.9 3.5 3.4 3.3 3.9 3.7 4.0 3.7 3.2 4.1 4.1 3.1
Miscellaneous 3.5 3.1 4.3 4.0 3.8 4.2 3.3 4.3 3.5 4.6 3.5 3.4
Public contact 10.8 12.3 13.7 11.9 12.8 11.5 12.7 14.2 11.5 11.6 12.9 10.4
Suspicious
incident
9.7 11.7 10.9 12.5 11.8 12.0 9.9 13.4 12.0 11.6 12.0 10.6
Traffic
enforcement
23.6 28.6 21.9 22.4 24.2 22.2 22.3 23.7 21.8 23.7 23.9 20.1
Total 104.9 112.5 106.4 108.0 110.0 114.3 112.1 116.5 106.4 108.9 109.3 101.2
Note: Calculations were limited to calls rather than events.
Observations:
■ The top four categories averaged between 57 and 62 percent of calls throughout the year:
□ Traffic-related calls averaged between 23.9 and 32.5 calls per day throughout the year.
□ Checks averaged between 12.4 and 14.6 calls per day throughout the year.
□ Crimes averaged between 11.2 and 13.8 calls per day throughout the year.
□ Public contact calls averaged between 10.4 and 14.2 calls per day throughout the year.
■ Crimes accounted for 11 to 13 percent of total calls.

89
FIGURE 8-6: Primary Unit’s Average Occupied Times, by Category and Initiator
Note: The figure combines categories using weighted averages from the following table according to the
description in Chart 8-1. For this graph and the following Table 8-6, we removed five calls with inaccurate
busy times.
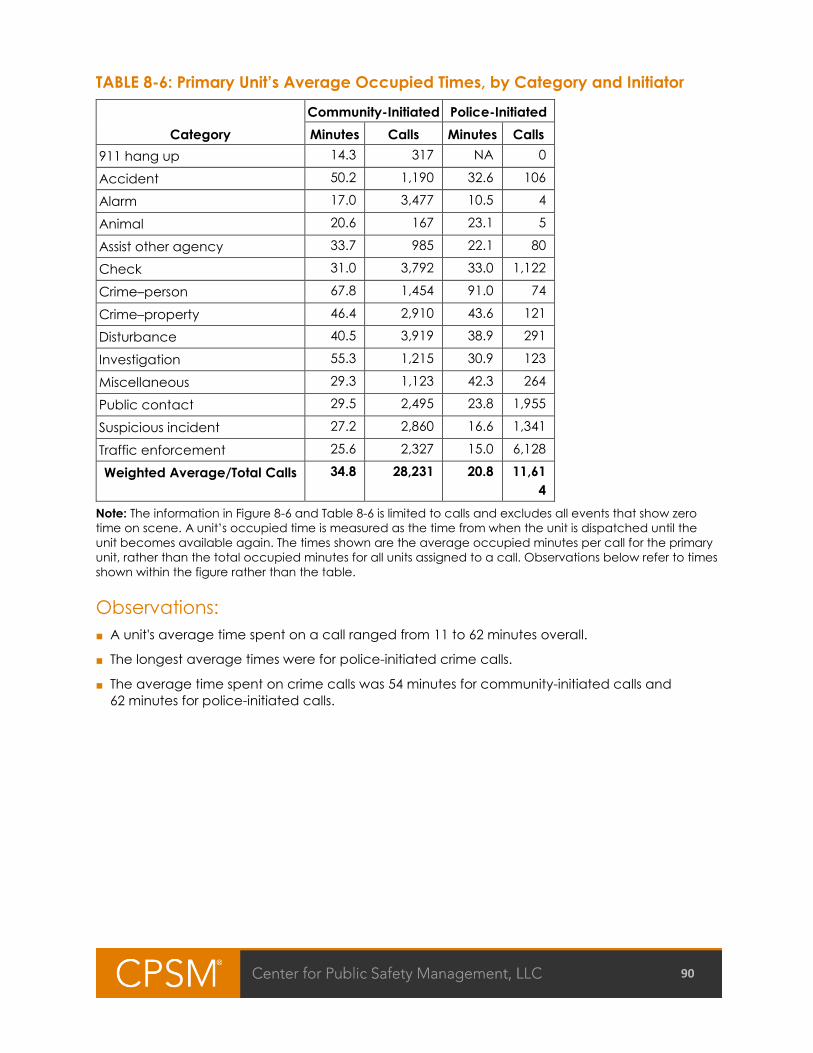
90
TABLE 8-6: Primary Unit’s Average Occupied Times, by Category and Initiator
Category
Community-Initiated Police-Initiated
Minutes Calls Minutes Calls
911 hang up 14.3 317 NA 0
Accident 50.2 1,190 32.6 106
Alarm 17.0 3,477 10.5 4
Animal 20.6 167 23.1 5
Assist other agency 33.7 985 22.1 80
Check 31.0 3,792 33.0 1,122
Crime–person 67.8 1,454 91.0 74
Crime–property 46.4 2,910 43.6 121
Disturbance 40.5 3,919 38.9 291
Investigation 55.3 1,215 30.9 123
Miscellaneous 29.3 1,123 42.3 264
Public contact 29.5 2,495 23.8 1,955
Suspicious incident 27.2 2,860 16.6 1,341
Traffic enforcement 25.6 2,327 15.0 6,128
Weighted Average/Total Calls 34.8 28,231 20.8 11,61
4
Note: The information in Figure 8-6 and Table 8-6 is limited to calls and excludes all events that show zero
time on scene. A unit’s occupied time is measured as the time from when the unit is dispatched until the
unit becomes available again. The times shown are the average occupied minutes per call for the primary
unit, rather than the total occupied minutes for all units assigned to a call. Observations below refer to times
shown within the figure rather than the table.
Observations:
■ A unit's average time spent on a call ranged from 11 to 62 minutes overall.
■ The longest average times were for police-initiated crime calls.
■ The average time spent on crime calls was 54 minutes for community-initiated calls and
62 minutes for police-initiated calls.

91
FIGURE 8-7: Number of Responding Units, by Initiator and Category
Note: The figure combines categories using weighted averages from the following table according to the
description in Chart 8-1.
TABLE 8-7: Average Number of Responding Units, by Initiator and Category
Category
Community-Initiated Police-Initiated
No. of Units Calls No. of Units Calls
911 hang up 1.9 317 NA 0
Accident 2.3 1,190 1.8 106
Alarm 2.2 3,477 2.0 4
Animal 1.4 167 1.2 5
Assist other agency 2.4 985 1.5 80
Check 2.1 3,792 1.3 1,122
Crime–person 2.4 1,454 2.6 75
Crime–property 1.7 2,910 1.7 121
Disturbance 2.4 3,919 2.1 291
Investigation 2.7 1,215 1.6 123
Miscellaneous 1.2 1,124 1.8 264
Public contact 1.8 2,497 1.7 1,955
Suspicious incident 2.3 2,861 1.7 1,341
Traffic enforcement 1.5 2,327 1.4 6,128
Weighted Average/Total Calls 2.1 28,235 1.5 11,615
Note: The information in Figure 8-7 and Table 8-7 is limited to calls and excludes all events that show zero
time on scene. Observations refer to the number of responding units shown within the figure rather than the
table.
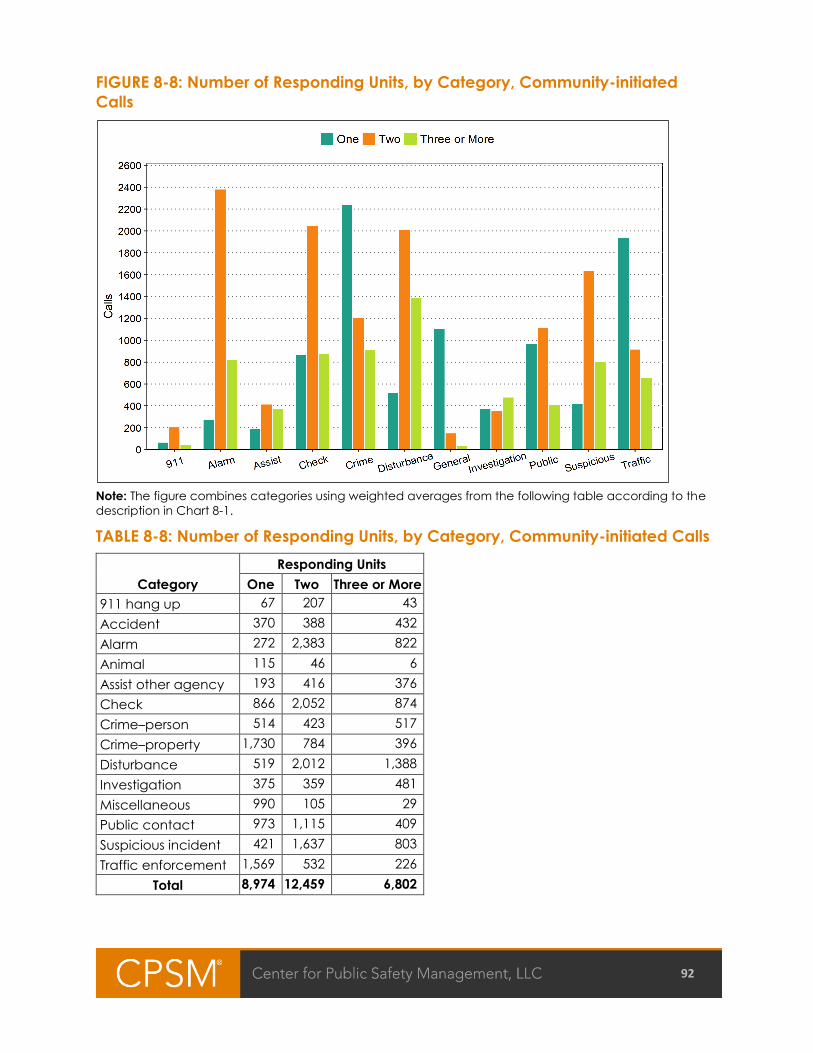
92
FIGURE 8-8: Number of Responding Units, by Category, Community-initiated
Calls
Note: The figure combines categories using weighted averages from the following table according to the
description in Chart 8-1.
TABLE 8-8: Number of Responding Units, by Category, Community-initiated Calls
Category
Responding Units
One Two Three or More
911 hang up 67 207 43
Accident 370 388 432
Alarm 272 2,383 822
Animal 115 46 6
Assist other agency 193 416 376
Check 866 2,052 874
Crime–person 514 423 517
Crime–property 1,730 784 396
Disturbance 519 2,012 1,388
Investigation 375 359 481
Miscellaneous 990 105 29
Public contact 973 1,115 409
Suspicious incident 421 1,637 803
Traffic enforcement 1,569 532 226
Total 8,974 12,459 6,802

93
Observations:
■ The overall mean number of responding units was 2.1 for community-initiated calls and 1.5 for
police-initiated calls.
■ The mean number of responding units was as high as 2.7 for investigation calls that were
community-initiated.
■ 32 percent of community-initiated calls involved one responding unit.
■ 44 percent of community-initiated calls involved two responding units.
■ 24 percent of community-initiated calls involved three or more responding units.
■ The largest group of calls with three or more responding units were disturbances.
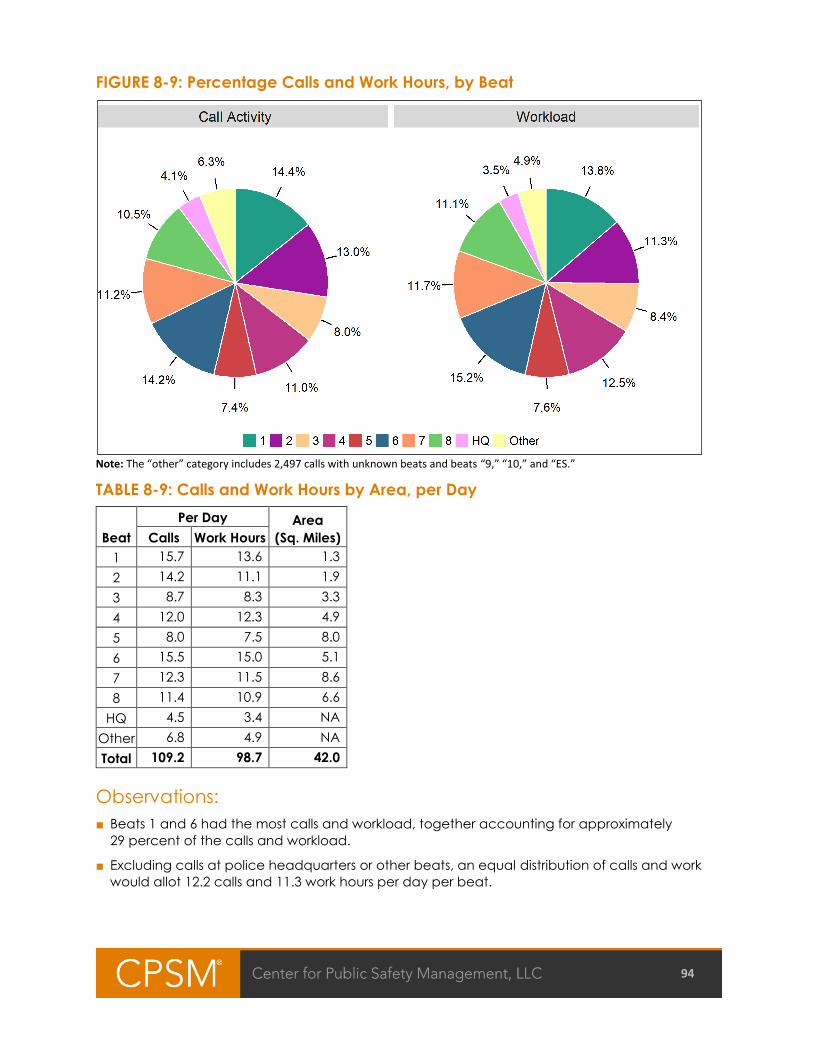
94
FIGURE 8-9: Percentage Calls and Work Hours, by Beat
Note: The “other” category includes 2,497 calls with unknown beats and beats “9,” “10,” and “ES.”
TABLE 8-9: Calls and Work Hours by Area, per Day
Beat
Per Day Area
(Sq. Miles) Calls Work Hours
1 15.7 13.6 1.3
2 14.2 11.1 1.9
3 8.7 8.3 3.3
4 12.0 12.3 4.9
5 8.0 7.5 8.0
6 15.5 15.0 5.1
7 12.3 11.5 8.6
8 11.4 10.9 6.6
HQ 4.5 3.4 NA
Other 6.8 4.9 NA
Total 109.2 98.7 42.0
Observations:
■ Beats 1 and 6 had the most calls and workload, together accounting for approximately
29 percent of the calls and workload.
■ Excluding calls at police headquarters or other beats, an equal distribution of calls and work
would allot 12.2 calls and 11.3 work hours per day per beat.

95
FIGURE 8-10: Percentage Calls and Work Hours, by Category, Winter 2018

96
TABLE 8-10: Calls and Work Hours per Day, by Category, Winter 2018
Category
Per Day
Calls Work
Hours 911 hang up 1.0 0.5
Accident 3.7 6.6
Alarm 9.9 5.6
Animal 0.2 0.1
Assist other agency 2.8 3.1
Check 12.8 11.6
Crime–person 3.1 7.0
Crime–property 9.7 10.7
Disturbance 9.9 13.2
Investigation 3.8 6.9
Miscellaneous 3.3 2.4
Public contact 11.7 8.0
Suspicious incident 10.8 9.3
Traffic enforcement 25.8 11.0
Total 108.4 96.0
Note: Workload calculations focused on calls rather than events.
Observations, Winter:
■ Total calls averaged 108 per day, or 4.5 per hour.
■ Total workload averaged 96 hours per day, meaning that on average 4.0 officers per hour
were busy responding to calls.
■ Traffic calls constituted 27 percent of calls and 18 percent of workload.
■ Checks constituted 12 percent of calls and 12 percent of workload.
■ Crimes constituted 12 percent of calls and 18 percent of workload.
■ Public contact calls constituted 11 percent of calls and 8 percent of workload.
■ These top four categories constituted 62 percent of calls and 57 percent of workload.

97
FIGURE 8-11: Percentage Calls and Work Hours, by Category, Summer 2018

98
TABLE 8-11: Calls and Work Hours per Day, by Category, Summer 2018
Category
Per Day
Calls Work Hours
911 hang up 0.9 0.3
Accident 3.6 5.6
Alarm 10.4 5.8
Animal 0.7 0.4
Assist other agency 2.8 3.0
Check 13.4 11.1
Crime–person 4.6 10.8
Crime–property 8.9 10.6
Disturbance 12.4 14.8
Investigation 4.0 8.6
Miscellaneous 3.9 2.8
Public contact 13.4 8.6
Suspicious incident 11.9 9.2
Traffic enforcement 22.2 9.9
Total 113.1 101.5
Note: Workload calculations focused on calls rather than events.
Observations, Summer:
■ The average calls per day and daily workload were higher in summer than in winter.
■ Total calls averaged 113 per day, or 4.7 per hour.
■ Total workload averaged 102 hours per day, meaning that on average 4.2 officers per hour
were busy responding to calls.
■ Traffic calls constituted 23 percent of calls and 15 percent of workload.
■ Checks constituted 12 percent of calls and 11 percent of workload.
■ Crimes constituted 12 percent of calls and 21 percent of workload.
■ Public contact calls constituted 12 percent of calls and 8 percent of workload.
■ These top four categories constituted 58 percent of calls and 56 percent of workload.
99
OUT-OF-SERVICE ACTIVITIES
In the period from January 1, 2018, through December 31, 2018, the dispatch center recorded
out-of-service activities. While some activities were assigned a call number, there were also
activities that were not assigned a call number. We combine both types of out-of-service
activities and analyze all of them in this section.
We focused on those activities that involved a patrol unit. We also limited our analysis to
activities that occurred during shifts where the same patrol unit was also responding to calls for
service. Each record only indicates one unit per activity. There were a few problems with the
data provided and we made assumptions and decisions to address these issues:
■ We excluded activities that lasted less than 30 seconds. These are irrelevant and contribute
little to the overall workload.
■ Another portion of the recorded activities lasted more than eight hours. As an activity is
unlikely to last more than eight hours, we assumed that these records were inaccurate.
■ After these exclusions, 19,036 activities remained. These activities had an average duration of
43.8 minutes.
In this section, we report out-of-service activities and workload by type of activity. In the next
section, we include these activities in the overall workload when comparing the total workload
against available personnel in winter and summer.
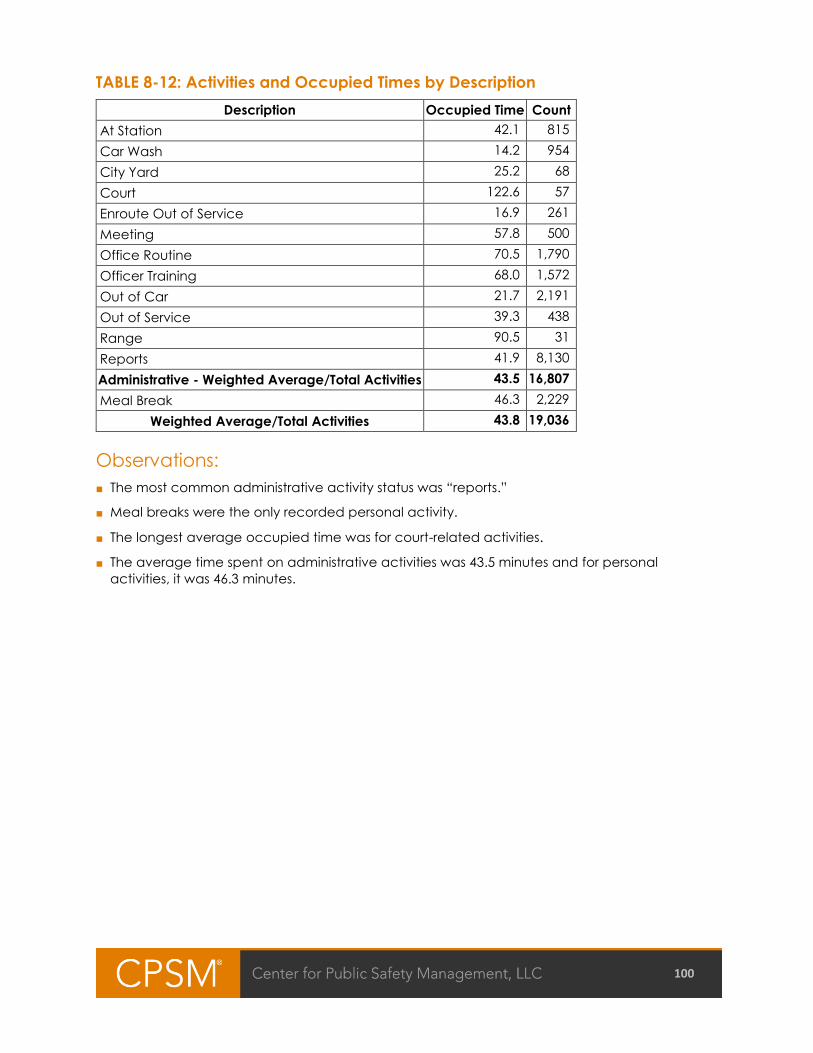
100
TABLE 8-12: Activities and Occupied Times by Description
Description Occupied Time Count
At Station 42.1 815
Car Wash 14.2 954
City Yard 25.2 68
Court 122.6 57
Enroute Out of Service 16.9 261
Meeting 57.8 500
Office Routine 70.5 1,790
Officer Training 68.0 1,572
Out of Car 21.7 2,191
Out of Service 39.3 438
Range 90.5 31
Reports 41.9 8,130
Administrative - Weighted Average/Total Activities 43.5 16,807
Meal Break 46.3 2,229
Weighted Average/Total Activities 43.8 19,036
Observations:
■ The most common administrative activity status was “reports.”
■ Meal breaks were the only recorded personal activity.
■ The longest average occupied time was for court-related activities.
■ The average time spent on administrative activities was 43.5 minutes and for personal
activities, it was 46.3 minutes.
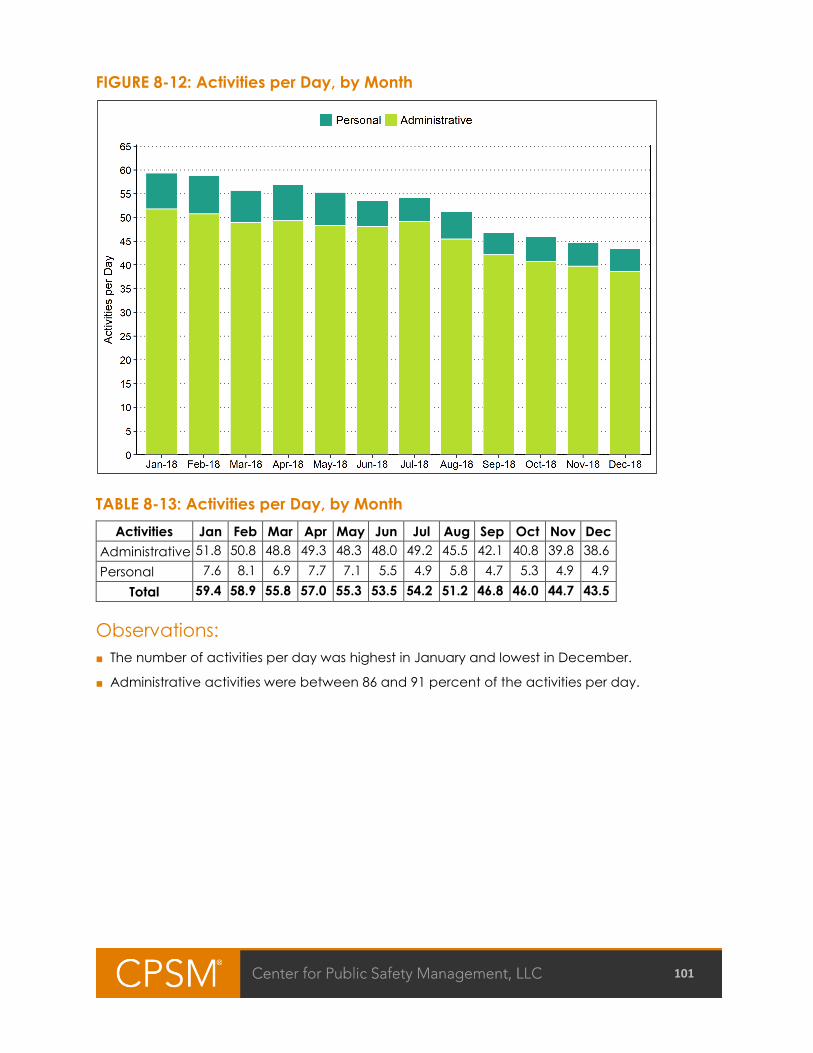
101
FIGURE 8-12: Activities per Day, by Month
TABLE 8-13: Activities per Day, by Month
Activities Jan Feb Mar Apr May Jun Jul Aug Sep Oct Nov Dec
Administrative 51.8 50.8 48.8 49.3 48.3 48.0 49.2 45.5 42.1 40.8 39.8 38.6
Personal 7.6 8.1 6.9 7.7 7.1 5.5 4.9 5.8 4.7 5.3 4.9 4.9
Total 59.4 58.9 55.8 57.0 55.3 53.5 54.2 51.2 46.8 46.0 44.7 43.5
Observations:
■ The number of activities per day was highest in January and lowest in December.
■ Administrative activities were between 86 and 91 percent of the activities per day.
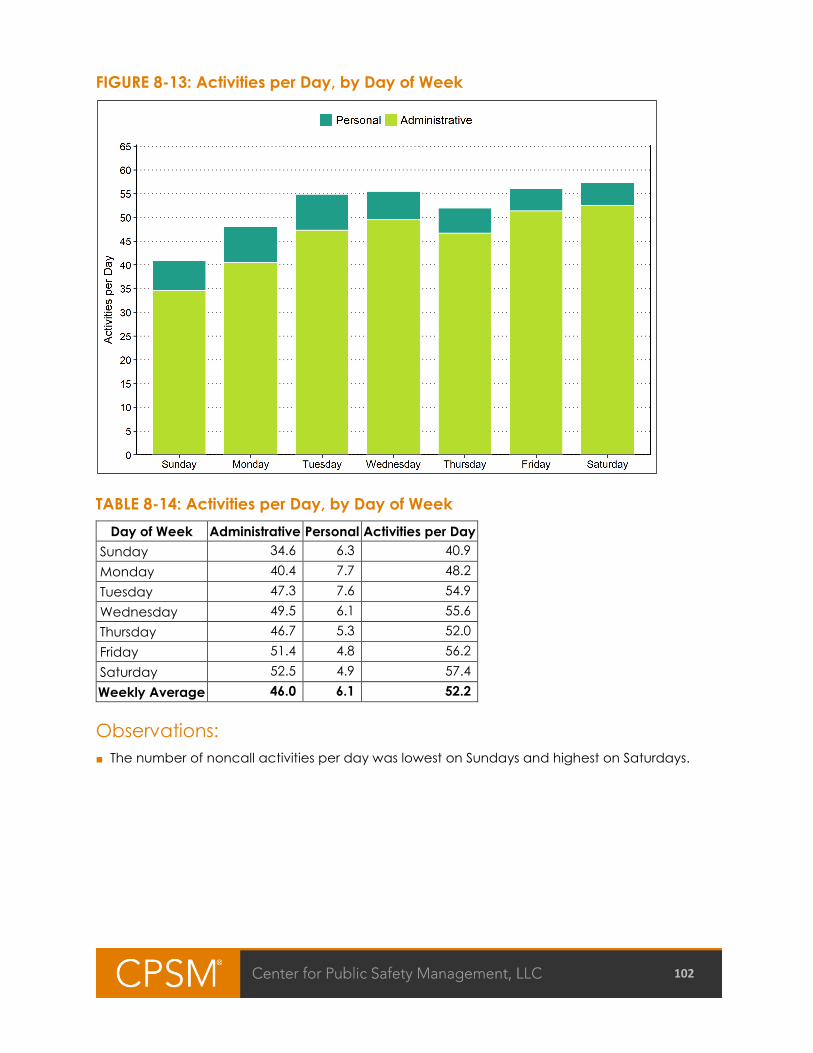
102
FIGURE 8-13: Activities per Day, by Day of Week
TABLE 8-14: Activities per Day, by Day of Week
Day of Week Administrative Personal Activities per Day
Sunday 34.6 6.3 40.9
Monday 40.4 7.7 48.2
Tuesday 47.3 7.6 54.9
Wednesday 49.5 6.1 55.6
Thursday 46.7 5.3 52.0
Friday 51.4 4.8 56.2
Saturday 52.5 4.9 57.4
Weekly Average 46.0 6.1 52.2
Observations:
■ The number of noncall activities per day was lowest on Sundays and highest on Saturdays.

103
FIGURE 8-14: Activities per Day, by Hour of Day

104
TABLE 8-15: Activities per Hour, by Hour of Day
Hour Personal Administrative Total
0 0.2 1.6 1.8
1 0.1 1.6 1.6
2 0.1 1.5 1.6
3 0.0 1.5 1.5
4 0.0 1.5 1.5
5 0.0 2.1 2.1
6 0.0 2.1 2.1
7 0.1 2.6 2.7
8 0.3 2.7 3.1
9 0.5 2.1 2.6
10 0.6 2.1 2.6
11 0.9 1.9 2.9
12 1.0 2.1 3.1
13 0.7 2.4 3.1
14 0.3 2.2 2.5
15 0.0 2.2 2.3
16 0.0 1.8 1.9
17 0.0 1.8 1.8
18 0.0 1.7 1.8
19 0.1 1.6 1.8
20 0.3 1.6 1.8
21 0.2 1.7 1.9
22 0.3 1.8 2.1
23 0.3 1.8 2.1
Hourly Average 0.3 1.9 2.2
Observations:
■ The number of activities per hour was highest between noon and 2:00 p.m.
■ The number of activities per hour was lowest between 3:00 a.m. and 5:00 a.m.

105
DEPLOYMENT
For this study, we examined deployment information for eight weeks in winter (January 4 through
February 28, 2018) and eight weeks in summer (July 7 through August 31, 2018). The
department’s main patrol force consists of patrol officers, sergeants, and bike patrol officers
operating on 12-hour shifts starting at 4:00 a.m. and 4:00 p.m. A portion of the day shift starts
later, at 5:00 a.m. and 6:00 a.m., while a portion of the evening shift starts at 5:00 p.m.
The police department's main patrol force deployed an average of 8.9 officers per hour during
the 24-hour day in winter 2018 and in summer 2018. When additional units (K9, extra units,
reserves, and traffic officers in DUI cars) are included, the department averaged 11.2 officers per
hour during the 24-hour day in winter and 11.1 officers in summer 2018. CSO officers, motor units,
and traffic accident investigators are not included in the initial analysis. They are included in
separate sections of the report.
In this section, we describe the deployment and workload in distinct steps, distinguishing
between winter and summer and between weekdays (Monday through Friday) and weekends
(Saturday and Sunday):
■ First, we focus on patrol deployment alone.
■ Next, we compare “all” workload, which includes community-initiated calls, police-initiated
calls, directed patrol activities, and out-of-service activities.
■ Finally, we compare the workload against deployment by percentage.
Comments follow each set of four figures, with separate discussions for winter and summer.

106
FIGURE 8-15: Deployed Officers, Weekdays, Winter 2018
FIGURE 8-16: Deployed Officers, Weekends, Winter 2018

107
FIGURE 8-17: Deployed Officers, Weekdays, Summer 2018
FIGURE 8-18: Deployed Officers, Weekends, Summer 2018

108
Observations:
■ For winter (January 4 through February 28, 2018):
□ The average deployment was 11.3 officers per hour during the week and 11.1 officers per
hour on the weekend.
□ Average deployment varied from 6.7 to 14.3 officers per hour on weekdays and 5.2 to 13.3
officers per hour on weekends.
■ For summer (July 7 through August 31, 2018):
□ The average deployment was 11.2 officers per hour during the week and 10.8 officers per
hour on the weekend.
□ Average deployment varied from 5.7 to 15.3 officers per hour on weekdays and 6.2 to 13.7
officers per hour on weekends.

109
FIGURE 8-19: Deployment and All Workload, Weekdays, Winter 2018
FIGURE 8-20: Deployment and All Workload, Weekends, Winter 2018

110
FIGURE 8-21: Deployment and All Workload, Weekdays, Summer 2018
FIGURE 8-22: Deployment and All Workload, Weekends, Summer 2018
Note: Figures 8-19 to 8-22 show deployment along with all workload from community-initiated calls, police-
initiated calls, directed patrol work, and out-of-service work.

111
Observations:
Winter:
■ Community-initiated work:
□ Average other-initiated workload was 3.3 officers per hour during the week and 3.6 officers
per hour on weekends.
□ This was approximately 29 percent of hourly deployment during the week and 32 percent of
hourly deployment on weekends.
■ All work:
□ Average workload was 6.4 officers per hour during the week and 5.9 officers per hour on
weekends.
□ This was approximately 56 percent of hourly deployment during the week and 53 percent of
hourly deployment on weekends.
Summer:
■ Community-initiated work:
□ Average other-initiated workload was 3.5 officers per hour during the week and 3.7 officers
per hour on weekends.
□ This was approximately 31 percent of hourly deployment during the week and 35 percent of
hourly deployment on weekends.
■ All work:
□ Average workload was 6.2 officers per hour during the week and 6.0 officers per hour on
weekends.
□ This was approximately 56 percent of hourly deployment during the week and 55 percent of
hourly deployment on weekends.

112
FIGURE 8-23: Percentage of Workload, Weekdays, Winter 2018
FIGURE 8-24: Percentage of Workload, Weekends, Winter 2018

113
FIGURE 8-25: Percentage of Workload, Weekdays, Summer 2018
FIGURE 8-26: Percentage of Workload, Weekends, Summer 2018

114
Observations:
Winter:
■ Community-initiated work:
□ During the week, workload reached a maximum of 46 percent of deployment between
6:15 p.m. and 6:30 p.m.
□ On weekends, workload reached a maximum of 53 percent of deployment between 2:00
p.m. and 2:15 p.m.
■ All work:
□ During the week, workload reached a maximum of 74 percent of deployment between
2:15 p.m. and 2:30 p.m. and between 6:30 p.m. and 7:00 p.m.
□ On weekends, workload reached a maximum of 79 percent of deployment between
6:30 p.m. and 6:45 p.m.
Summer:
■ Community-initiated work:
□ During the week, workload reached a maximum of 41 percent of deployment between
6:15 p.m. and 6:30 p.m., between 7:00 p.m. and 7:15 p.m., and between 8:15 p.m. and
8:30 p.m.
□ On weekends, workload reached a maximum of 50 percent of deployment between
9:15 p.m. and 9:30 p.m.
■ All work:
□ During the week, workload reached a maximum of 66 percent of deployment between
8:45 a.m. and 9:00 a.m.
□ On weekends, workload reached a maximum of 65 percent of deployment between
2:30 p.m. and 2:45 p.m. and between 9:15 p.m. and 9:30 p.m.
115
RESPONSE TIMES
We analyzed the response times to various types of calls, separating the duration into dispatch
delay and travel time, to determine whether response times varied by call type. Response time is
measured as the difference between when a call is received and when the first unit arrives on
scene. This is further divided into dispatch delay and travel time. Dispatch delay is the time
between when a call is received and when the first unit is dispatched. Travel time is the
remaining time until the first unit arrives on scene.
We begin the discussion with statistics that include all calls combined. We started with 6,073 calls
for winter and 6,336 calls for summer. We limited our analysis to community-initiated calls, which
amounted to 4,331 calls for winter and 4,533 calls for summer. In addition, we excluded calls
located at the police department’s headquarters. Finally, we removed a few calls lacking a
recorded arriving unit. We were left with 3,890 calls in winter and 4,073 calls in summer for our
analysis. For the entire year, we began with 39,850 calls, limited our analysis to 28,235
community-initiated calls. With similar exclusions, we were left with 25,382 calls.
Our initial analysis does not distinguish calls based on priority; instead, it examines the difference
in response to all calls by time of day and compares winter and summer periods. We then
present a brief analysis of response time for high-priority calls alone.

116
All Calls
This section looks at all calls without considering their priorities. In addition to examining the
differences in response times by both time of day and season (winter vs. summer), we show
differences in response times by category.
FIGURE 8-27: Average Response Time and Dispatch Delays, by Hour of Day,
Winter and Summer 2018
Observations:
■ Average response times varied significantly by the hour of the day.
■ In winter, the longest response times were between 3:00 p.m. and 4:00 p.m., with an average
of 41.0 minutes.
■ In winter, the shortest response times were between 1:00 a.m. and 2:00 a.m., with an average
of 10.4 minutes.
■ In summer, the longest response times were between 3:00 p.m. and 4:00 p.m., with an
average of 37.2 minutes.
■ In summer, the shortest response times were between 1:00 a.m. and 2:00 a.m., with an
average of 15.3 minutes.
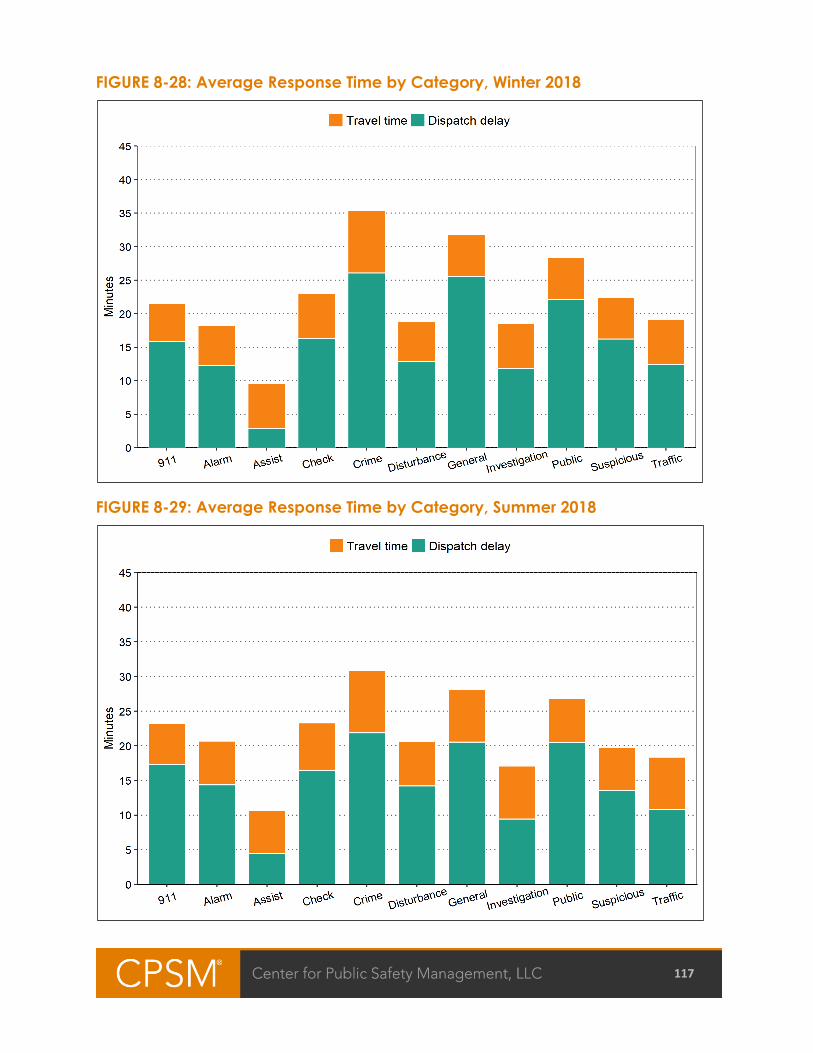
117
FIGURE 8-28: Average Response Time by Category, Winter 2018
FIGURE 8-29: Average Response Time by Category, Summer 2018
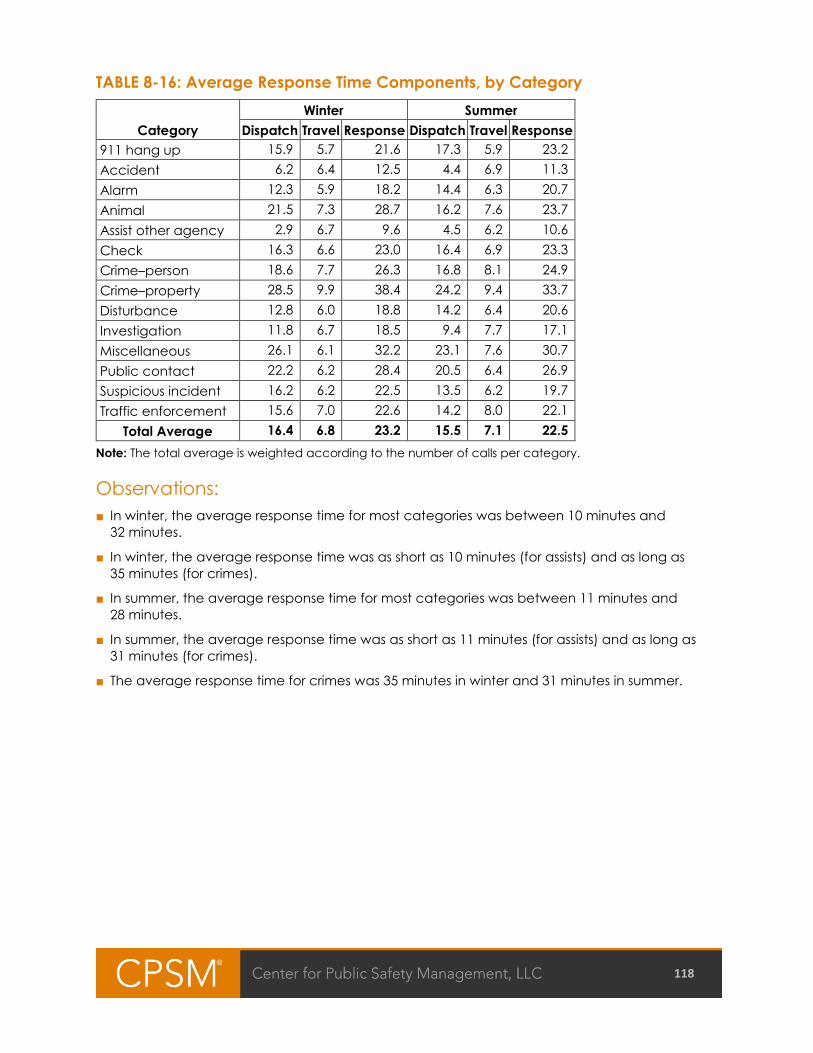
118
TABLE 8-16: Average Response Time Components, by Category
Category
Winter Summer
Dispatch Travel Response Dispatch Travel Response
911 hang up 15.9 5.7 21.6 17.3 5.9 23.2
Accident 6.2 6.4 12.5 4.4 6.9 11.3
Alarm 12.3 5.9 18.2 14.4 6.3 20.7
Animal 21.5 7.3 28.7 16.2 7.6 23.7
Assist other agency 2.9 6.7 9.6 4.5 6.2 10.6
Check 16.3 6.6 23.0 16.4 6.9 23.3
Crime–person 18.6 7.7 26.3 16.8 8.1 24.9
Crime–property 28.5 9.9 38.4 24.2 9.4 33.7
Disturbance 12.8 6.0 18.8 14.2 6.4 20.6
Investigation 11.8 6.7 18.5 9.4 7.7 17.1
Miscellaneous 26.1 6.1 32.2 23.1 7.6 30.7
Public contact 22.2 6.2 28.4 20.5 6.4 26.9
Suspicious incident 16.2 6.2 22.5 13.5 6.2 19.7
Traffic enforcement 15.6 7.0 22.6 14.2 8.0 22.1
Total Average 16.4 6.8 23.2 15.5 7.1 22.5
Note: The total average is weighted according to the number of calls per category.
Observations:
■ In winter, the average response time for most categories was between 10 minutes and
32 minutes.
■ In winter, the average response time was as short as 10 minutes (for assists) and as long as
35 minutes (for crimes).
■ In summer, the average response time for most categories was between 11 minutes and
28 minutes.
■ In summer, the average response time was as short as 11 minutes (for assists) and as long as
31 minutes (for crimes).
■ The average response time for crimes was 35 minutes in winter and 31 minutes in summer.

119
TABLE 8-17: 90th Percentiles for Response Time Components, by Category
Category
Winter Summer
Dispatch Travel Response Dispatch Travel Response
911 hang up 38.3 12.3 49.0 47.0 10.9 55.3
Accident 17.9 12.4 25.4 12.5 12.5 22.8
Alarm 31.4 10.8 41.6 37.7 12.7 46.4
Animal 57.5 12.0 57.5 39.1 14.1 72.4
Assist other agency 5.3 12.2 17.5 9.5 9.8 20.7
Check 42.7 13.6 52.4 43.0 13.1 51.6
Crime–person 64.9 16.4 81.3 58.2 21.0 92.3
Crime–property 93.5 24.4 118.4 77.4 20.6 92.5
Disturbance 38.2 12.2 49.6 44.6 12.3 50.9
Investigation 38.3 16.6 52.0 23.8 14.8 46.6
Miscellaneous 91.0 14.6 118.4 58.5 21.4 75.7
Public contact 76.1 12.6 87.9 69.6 13.8 79.3
Suspicious incident 46.8 12.4 55.1 35.3 11.9 43.4
Traffic enforcement 44.0 14.7 57.6 42.9 20.1 60.3
Total Average 52.0 14.0 63.8 46.4 14.6 58.5
Note: A 90th percentile value of 63.8 minutes means that 90 percent of all calls are responded to in fewer
than 63.8 minutes. For this reason, the columns for dispatch delay and travel time may not be equal to the
total response time.
Observations:
■ In winter, the 90th percentile value for response time was as short as 18 minutes (for assists) and
as long as 118 minutes (for general noncriminal calls).
■ In summer, the 90th percentile value for response time was as short as 21 minutes (for assists)
and as long as 93 minutes (for crimes).

120
FIGURE 8-30: Average Response Time Components, by Beat
Note: The “other” category includes about 364 calls with unknown beats and beats “9,” “10,” and “ES.”
TABLE 8-18: Average Response Time Components, by Beat
Beat Dispatch Travel Response Calls Area (Sq. Miles)
1 14.1 5.3 19.4 3,756 1.3
2 14.1 5.9 20.0 3,268 1.9
3 15.9 6.8 22.7 2,395 3.3
4 15.5 7.2 22.7 3,272 4.9
5 14.1 6.9 21.0 1,976 8.0
6 15.4 7.4 22.8 3,978 5.1
7 16.7 8.2 24.8 3,373 8.6
8 17.1 8.6 25.6 3,000 6.6
Other 11.8 9.4 21.2 364 NA
Weighted Average/ Total 15.3 7.0 22.3 25,382 42.0
Observations:
■ Beat 1 had the shortest overall response time.
■ Beat 8 had the longest overall response time.
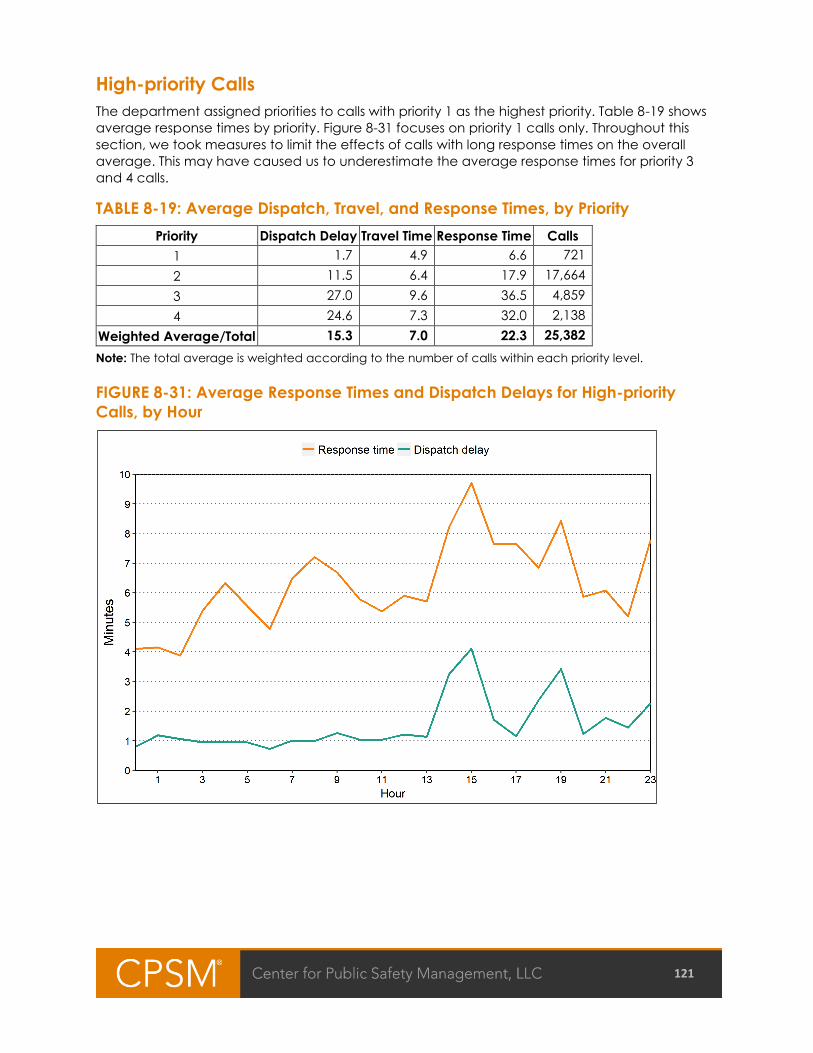
121
High-priority Calls
The department assigned priorities to calls with priority 1 as the highest priority. Table 8-19 shows
average response times by priority. Figure 8-31 focuses on priority 1 calls only. Throughout this
section, we took measures to limit the effects of calls with long response times on the overall
average. This may have caused us to underestimate the average response times for priority 3
and 4 calls.
TABLE 8-19: Average Dispatch, Travel, and Response Times, by Priority
Priority Dispatch Delay Travel Time Response Time Calls
1 1.7 4.9 6.6 721
2 11.5 6.4 17.9 17,664
3 27.0 9.6 36.5 4,859
4 24.6 7.3 32.0 2,138
Weighted Average/Total 15.3 7.0 22.3 25,382
Note: The total average is weighted according to the number of calls within each priority level.
FIGURE 8-31: Average Response Times and Dispatch Delays for High-priority
Calls, by Hour

122
Observations:
■ High-priority calls (priority 1) had an average response time of 6.6 minutes, lower than the
overall average of 22.3 minutes for all calls.
■ Average dispatch delay was 1.7 minutes for high-priority calls, compared to 15.3 minutes
overall.
■ For high-priority calls, the longest response times were between 3:00 p.m. and 4:00 p.m., with
an average of 9.7 minutes.
■ For high-priority calls, the shortest response times were between 2:00 a.m. and 4:00 a.m., with
an average of 3.9 minutes.
■ Average dispatch delay for high-priority calls was consistently 2.5 minutes or less, except
between 2:00 p.m. and 4:00 p.m., and between 7:00 p.m. and 8:00 p.m.

123
TRAFFIC UNITS
Between January 1, 2018 and December 31, 2018, the dispatch center recorded 5,117 events
which involved accident investigators and motor units. During this period, the dispatch center
also recorded activities assigned to traffic units that were not assigned a call number. After
excluding activities that lasted less than 30 seconds or over 8 hours, 1,028 noncall activities were
included in the analysis.
This section gives an overview of the number of calls, out-of-service activities, deployment, and
workload for traffic units. The first two tables contain data for the entire year. For the next two
figures, the detailed workload analysis, we use two eight-week sample periods. The first period is
from January 4 through February 28, 2018, or winter, and the second period is from July 7
through August 31, 2018, or summer. Since traffic units were usually deployed between 6:00 a.m.
and 5:00 p.m., Monday through Friday, we only included these hours in the detailed workload
analysis.
TABLE 8-20: Traffic Events, Calls, and Workload by Category
Category Events Calls Work Hours
911 hang up 4 4 0.4
Accident 198 197 316.6
Alarm 14 14 3.3
Animal 7 6 3.8
Assist other agency 35 33 24.6
Check 291 291 409.4
Crime–person 21 19 13.7
Crime–property 22 21 16.1
Directed patrol 211
Disturbance 24 23 25.3
Investigation 50 50 55.8
Miscellaneous 40 40 84.4
Out of service–administrative 271
Public contact 73 72 25.0
Suspicious incident 46 45 19.7
Traffic enforcement 3,810 3,792 792.4
Total 5,117 4,607 1,790.6
Note: Events include all recorded calls which involved a traffic unit. We removed events with zero time on
scene, directed patrol, and out-of-service activities when calculating the number of calls and the work
hours associated with each call category.

124
TABLE 8-21: Traffic Activities and Occupied Times by Description
Description Occupied Time Count
At station 84.2 59
Car wash 21.0 19
City yard 84.7 55
Court 124.1 36
Enroute out of service 26.9 44
Meeting 123.1 87
Office routine 77.1 168
Officer training 143.2 219
Out of car 51.3 35
Out of service 27.5 340
Range 99.5 10
Reports 113.7 154
Administrative - Weighted Average/Total Activities 81.8 1,226
Meal break 47.9 77
Weighted Average/Total Activities 79.8 1,303
Observations:
■ There were 38 zero on scene calls that involved traffic units.
■ 4.1 percent of the events were directed patrol events and 5.3 percent were out of service–
administrative events.
■ 87 percent of the calls and 63 percent of the workload were traffic calls. Traffic enforcement
and accidents are included in traffic calls.
■ Out-of-service activities had an average duration of 79.8 minutes.
■ The most common administrative activity was labelled “out of service.”
■ The activity with the longest average duration was “officer training.”

125
FIGURE 8-32: Traffic Calls per Day, by Month
Note: The number of calls per day was calculated based on the number of days in the month that traffic
officers handled at least one call.
TABLE 8-22: Traffic Calls per Day, by Month
Jan Feb Mar Apr May Jun Jul Aug Sep Oct Nov Dec
Calls per Day 7.8 4.2 7.4 14.4 18.8 14.3 22.1 23.0 20.5 29.8 16.0 11.1
Observations:
■ The number of calls per day varied significantly throughout the year.
■ February had the least number of calls and October had the largest number of calls.

126
FIGURE 8-33: Deployment and All Workload, Weekdays, Traffic Units
FIGURE 8-34: Workload Percentage by Hour, Traffic Units

127
Observations:
Winter:
■ Deployment:
□ The average deployment was 1.8 traffic officers per hour in winter.
□ Average deployment varied from 0.3 to 2.0 traffic officers per hour.
■ Other-initiated work:
□ Average other-initiated workload was 0.1 officers per hour, which was approximately
6 percent of hourly deployment.
□ Average workload reached a maximum of 14 percent of deployment between
8:45 a.m. and 9:00 a.m.
■ All work:
□ Average total workload was 0.6 officers per hour.
□ This was approximately 33 percent of hourly deployment.
□ During the week, workload reached a maximum of 48 percent of deployment between
11:15 a.m. and 11:30 a.m.
Summer:
■ Deployment:
□ The average deployment was 4.0 traffic officers per hour in summer.
□ Average deployment varied from 1.5 to 4.6 traffic officers per hour.
■ Other-initiated work:
□ Average other-initiated workload was 0.1 officers per hour, which was approximately
4 percent of hourly deployment.
□ Average workload reached a maximum of 9 percent of deployment between 2:30 p.m.
and 2:45 p.m.
■ All work:
□ Average total workload was 1.4 officers per hour, which was approximately 36 percent of
hourly deployment.
□ During the week, workload reached a maximum of 45 percent of deployment between
10:45 a.m. and 11:00 a.m., between 3:00 p.m. and 3:15 p.m., and at 5:00 p.m.

128
COMMUNITY SERVICE OFFICERS
Between January 1, 2018 and December 31, 2018, the dispatch center recorded 4,933 events
which involved community service officers (CSOs). During this period, the dispatch center also
recorded activities assigned to CSOs that were not assigned a call number. After excluding
activities that lasted less than 30 seconds or over 8 hours, 814 noncall activities were included in
the analysis.
This section gives an overview of the number of calls, out-of-service activities, deployment, and
workload for CSOs. The first two tables contain data for the entire year. For the next two figures,
the detailed workload analysis, we use two eight-week sample periods. The first period is from
January 4 through February 28, 2018, or winter, and the second period is from July 7 through
August 31, 2018, or summer. Since CSOs were usually deployed between 6:00 a.m. and midnight,
we only included these hours in the detailed workload analysis.
TABLE 8-23: CSO Events and Calls, by Category
Category Events Calls Work Hours
Accident 53 53 46.3
Alarm 2 2 1.0
Animal 18 15 4.4
Assist other agency 21 20 15.2
Check 221 220 109.7
Crime-person 48 47 55.9
Crime-property 1,361 1,342 1,420.6
Directed patrol 700
Disturbance 15 15 19.6
Investigation 182 180 164.5
Miscellaneous 181 178 115.6
Out of service-administrative 221
Public contact 95 94 49.1
Suspicious incident 53 52 34.8
Traffic enforcement 1,762 1,728 621.4
Total 4,933 3,946 2,658.2
Note: Events include all recorded calls which involved a CSO unit. We removed events with zero time on
scene, directed patrol, and out-of-service activities when calculating the number of calls and the work
hours associated with each call category.

129
TABLE 8-24: CSO Activities and Occupied Times by Description
Description Occupied Time Count
At Station 39.1 98
Car Wash 19.1 39
Court 180.0 3
Meeting 46.4 37
Office Routine 34.0 116
Officer Training 92.7 24
Out of Car 13.9 188
Out of Service 49.9 6
Reports 44.9 305
VIA 1021 19.1 1
Administrative - Weighted Average/Total Activities 36.3 817
Meal Break 41.1 218
Weighted Average/Total Activities 37.3 1,035
Observations:
■ There were 72 zero on scene calls that involved CSOs.
■ 14 percent of the events were directed patrol events and 4 percent were out of service–
administrative events.
■ The top three categories—traffic (enforcement and accidents), crime (person and property),
and checks—accounted for 86 percent of calls.
■ Traffic enforcement accounted for 44 percent of calls and 23 percent of workload.
■ Property crime calls accounted for 34 percent of calls and 53 percent of workload.
■ Out-of-service activities had an average duration of 37.3 minutes.
■ The most common administrative activity was “reports.”
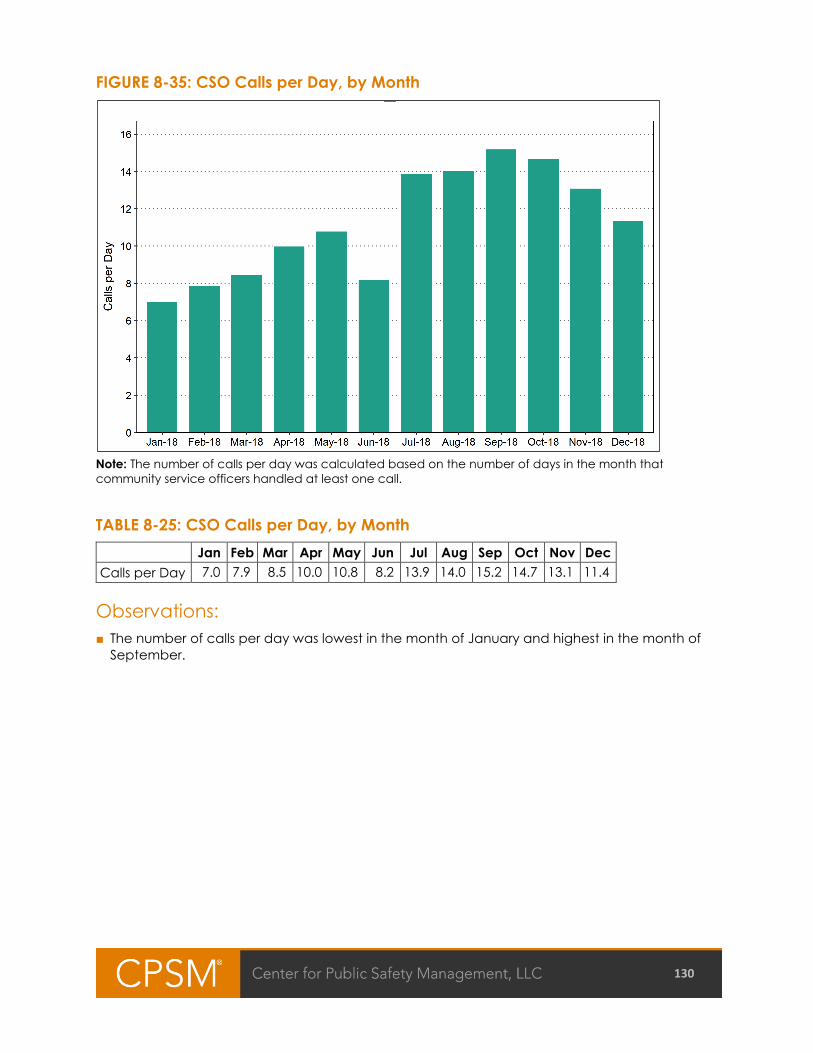
130
FIGURE 8-35: CSO Calls per Day, by Month
Note: The number of calls per day was calculated based on the number of days in the month that
community service officers handled at least one call.
TABLE 8-25: CSO Calls per Day, by Month
Jan Feb Mar Apr May Jun Jul Aug Sep Oct Nov Dec
Calls per Day 7.0 7.9 8.5 10.0 10.8 8.2 13.9 14.0 15.2 14.7 13.1 11.4
Observations:
■ The number of calls per day was lowest in the month of January and highest in the month of
September.

131
FIGURE 8-36: Deployment and All Workload, Weekdays, CSO Units
FIGURE 8-37: Workload Percentage by Hour, CSO Units

132
Observations:
Winter:
■ Deployment:
□ The average deployment was 0.6 officers per hour during the 24-hour day in winter.
□ The average deployment was 0.7 officers per hour during the week and 0.4 officers per hour
on the weekend.
□ Average deployment varied from 0.3 to 1.2 officers per hour on weekdays and 0.1 to 0.4
officers per hour on weekends.
■ Other-initiated work:
□ Average other-initiated workload was 0.2 officers per hour during the week and
0.1 officers per hour on weekends.
□ This was approximately 33 percent of hourly deployment during the week and 32 percent of
hourly deployment on weekends.
□ During the week, workload reached a maximum of 80 percent of deployment between
5:00 p.m. and 5:30 p.m.
□ During the weekend, workload reached a maximum of 71 percent of deployment between
6:15 p.m. and 6:30 p.m.
■ All work:
□ Average total workload was 0.4 officers per hour during the week and 0.2 officers per hour
on weekends.
□ This was approximately 56 percent of hourly deployment during the week and 57 percent of
hourly deployment on weekends.
□ During the week, workload reached a maximum of 89 percent of deployment between
5:00 p.m. and 5:15 p.m.
□ On weekends, workload reached a maximum of 89 percent of deployment between
11:15 p.m. and 11:30 p.m.

133
Summer:
■ Deployment:
□ The average deployment was 1.0 officer per hour during the 24-hour day in summer.
□ The average deployment was 1.1 officers per hour during the week and 0.8 officers per hour
on the weekend.
□ Average deployment varied from 0 to 2 officers per hour on weekdays and 0 to 1.6 officers
per hour on weekends.
■ Other-initiated work:
□ Average other-initiated workload was 0.4 officers per hour during the week and
0.3 officers per hour on weekends.
□ This was approximately 34 percent of hourly deployment during the week and on
weekends.
□ During the week, workload reached a maximum of 64 percent of deployment between
4:45 p.m. and 5:00 p.m., and between 5:45 p.m. and 6:00 p.m.
□ On weekends, workload reached a maximum of 63 percent of deployment between
5:15 p.m. and 5:30 p.m.
■ All work:
□ Average total workload was 0.8 officers per hour during the week and 0.5 officers per hour
on weekends.
□ This was approximately 73 percent of hourly deployment during the week and 57 percent of
hourly deployment on weekends.
□ During the week, workload reached a maximum of maximum of 88 percent of deployment
between 11:15 p.m. and 11:30 p.m.
□ On weekends, workload reached a maximum of 82 percent of deployment between
5:15 p.m. and 5:30 p.m.
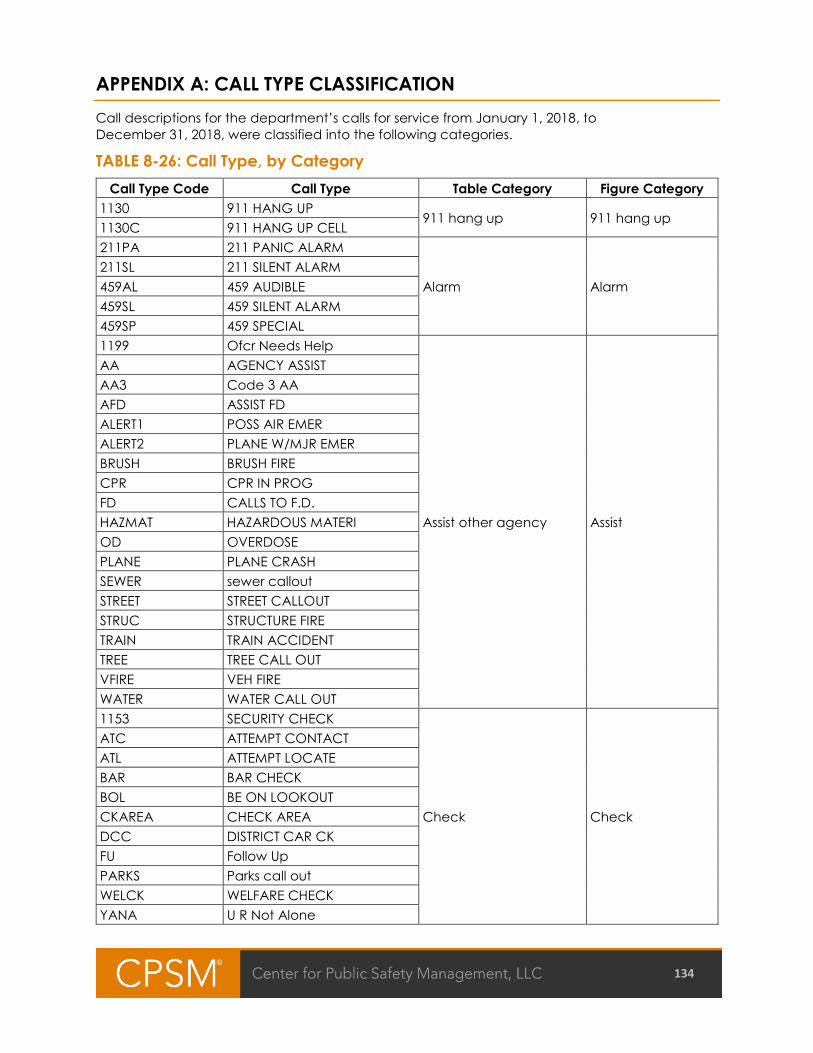
134
APPENDIX A: CALL TYPE CLASSIFICATION
Call descriptions for the department’s calls for service from January 1, 2018, to
December 31, 2018, were classified into the following categories.
TABLE 8-26: Call Type, by Category
Call Type Code Call Type Table Category Figure Category
1130 911 HANG UP 911 hang up 911 hang up
1130C 911 HANG UP CELL
211PA 211 PANIC ALARM
Alarm Alarm
211SL 211 SILENT ALARM
459AL 459 AUDIBLE
459SL 459 SILENT ALARM
459SP 459 SPECIAL
1199 Ofcr Needs Help
Assist other agency Assist
AA AGENCY ASSIST
AA3 Code 3 AA
AFD ASSIST FD
ALERT1 POSS AIR EMER
ALERT2 PLANE W/MJR EMER
BRUSH BRUSH FIRE
CPR CPR IN PROG
FD CALLS TO F.D.
HAZMAT HAZARDOUS MATERI
OD OVERDOSE
PLANE PLANE CRASH
SEWER sewer callout
STREET STREET CALLOUT
STRUC STRUCTURE FIRE
TRAIN TRAIN ACCIDENT
TREE TREE CALL OUT
VFIRE VEH FIRE
WATER WATER CALL OUT
1153 SECURITY CHECK
Check Check
ATC ATTEMPT CONTACT
ATL ATTEMPT LOCATE
BAR BAR CHECK
BOL BE ON LOOKOUT
CKAREA CHECK AREA
DCC DISTRICT CAR CK
FU Follow Up
PARKS Parks call out
WELCK WELFARE CHECK
YANA U R Not Alone
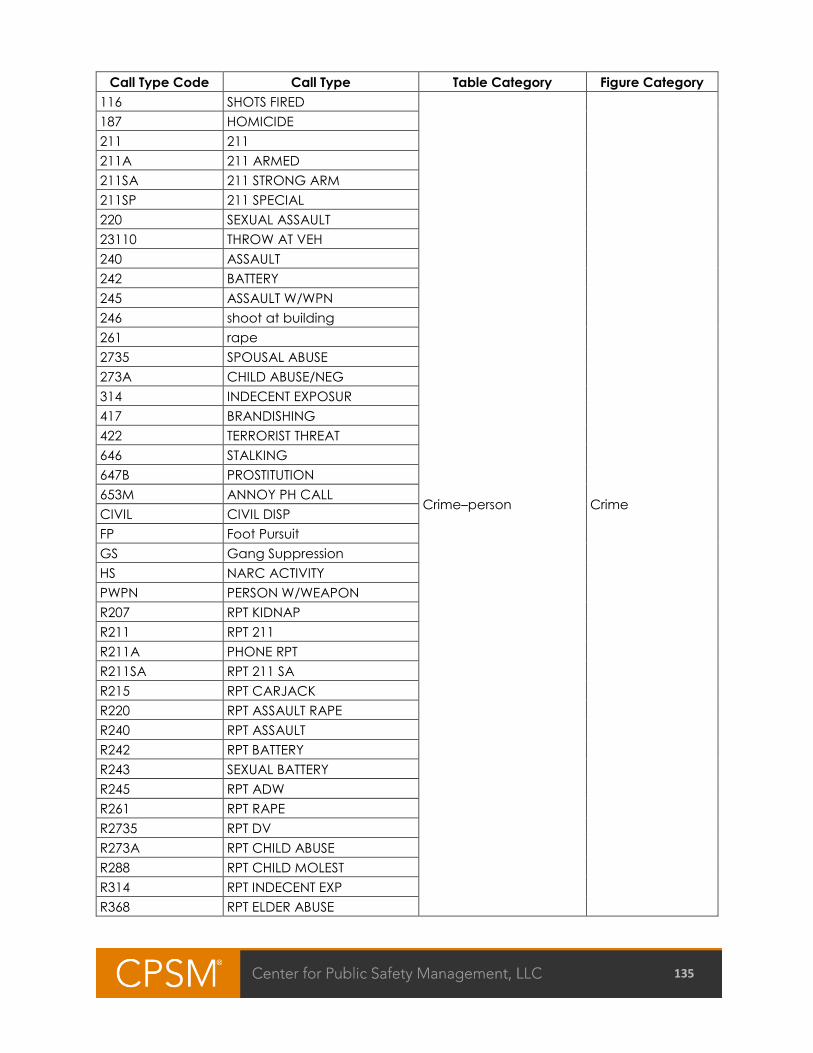
135
Call Type Code Call Type Table Category Figure Category
116 SHOTS FIRED
Crime–person Crime
187 HOMICIDE
211 211
211A 211 ARMED
211SA 211 STRONG ARM
211SP 211 SPECIAL
220 SEXUAL ASSAULT
23110 THROW AT VEH
240 ASSAULT
242 BATTERY
245 ASSAULT W/WPN
246 shoot at building
261 rape
2735 SPOUSAL ABUSE
273A CHILD ABUSE/NEG
314 INDECENT EXPOSUR
417 BRANDISHING
422 TERRORIST THREAT
646 STALKING
647B PROSTITUTION
653M ANNOY PH CALL
CIVIL CIVIL DISP
FP Foot Pursuit
GS Gang Suppression
HS NARC ACTIVITY
PWPN PERSON W/WEAPON
R207 RPT KIDNAP
R211 RPT 211
R211A PHONE RPT
R211SA RPT 211 SA
R215 RPT CARJACK
R220 RPT ASSAULT RAPE
R240 RPT ASSAULT
R242 RPT BATTERY
R243 SEXUAL BATTERY
R245 RPT ADW
R261 RPT RAPE
R2735 RPT DV
R273A RPT CHILD ABUSE
R288 RPT CHILD MOLEST
R314 RPT INDECENT EXP
R368 RPT ELDER ABUSE
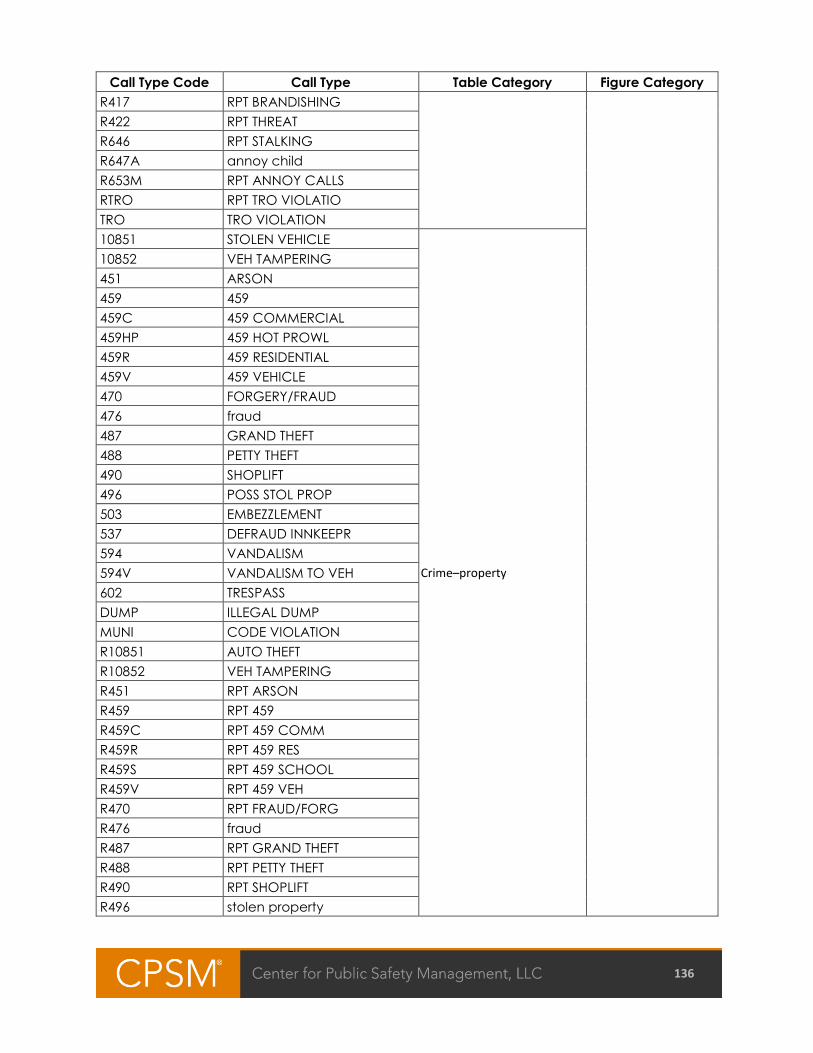
136
Call Type Code Call Type Table Category Figure Category
R417 RPT BRANDISHING
R422 RPT THREAT
R646 RPT STALKING
R647A annoy child
R653M RPT ANNOY CALLS
RTRO RPT TRO VIOLATIO
TRO TRO VIOLATION
10851 STOLEN VEHICLE
Crime–property
10852 VEH TAMPERING
451 ARSON
459 459
459C 459 COMMERCIAL
459HP 459 HOT PROWL
459R 459 RESIDENTIAL
459V 459 VEHICLE
470 FORGERY/FRAUD
476 fraud
487 GRAND THEFT
488 PETTY THEFT
490 SHOPLIFT
496 POSS STOL PROP
503 EMBEZZLEMENT
537 DEFRAUD INNKEEPR
594 VANDALISM
594V VANDALISM TO VEH
602 TRESPASS
DUMP ILLEGAL DUMP
MUNI CODE VIOLATION
R10851 AUTO THEFT
R10852 VEH TAMPERING
R451 RPT ARSON
R459 RPT 459
R459C RPT 459 COMM
R459R RPT 459 RES
R459S RPT 459 SCHOOL
R459V RPT 459 VEH
R470 RPT FRAUD/FORG
R476 fraud
R487 RPT GRAND THEFT
R488 RPT PETTY THEFT
R490 RPT SHOPLIFT
R496 stolen property

137
Call Type Code Call Type Table Category Figure Category
R503 RPT EMBEZZLEMENT
R530 RPT ID THEFT
R537 RPT DEFRAUD INNK
R594 RPT VANDALISM
R594G graffiti
R594R RPT VAND RES
R594V RPT VAND VEH
R602 RPT TRESPASS
RECOV RECOVER 10851
BIKE bike patrol
Directed patrol Directed patrol
CODE5 STAKEOUT/CODE5
DETAIL SPECIAL DETAIL
EVENT Special Event
EXTRAP EXTRA PATROL
FOOT Foot Patrol
FPAT Foot Patrol
LAGOON Lagoon Patrol
MALL Mall Patrol
SWAT SWAT CALL OUT
TENT tented house - needs extra
patrol
415 DISTURBANCE
Disturbance Disturbance
415C 415 CIVIL
415D 415 DOG
415FAM 415 FAMILY
415FI 415 FIGHT
415FW 415 FIREWORKS
415GRP 415 GROUP
415M 415 MUSIC
415N 415 NOISE
415P 415 PARTY
415V 415 VERBAL
5150 5150
647F PUBLIC DRUNK
PEACE KEEP THE PEACE
PERT PERT RESPONSE
R415 RPT DISTURBANCE
RJ RUNAWAY JUV
SKATE SKATERS
597 CRUELTY TO ANIM
Animal General
noncriminal
ANIMAL ANIMAL CALL
BITE ANIMAL BITE
1021 CALL RP Miscellaneous
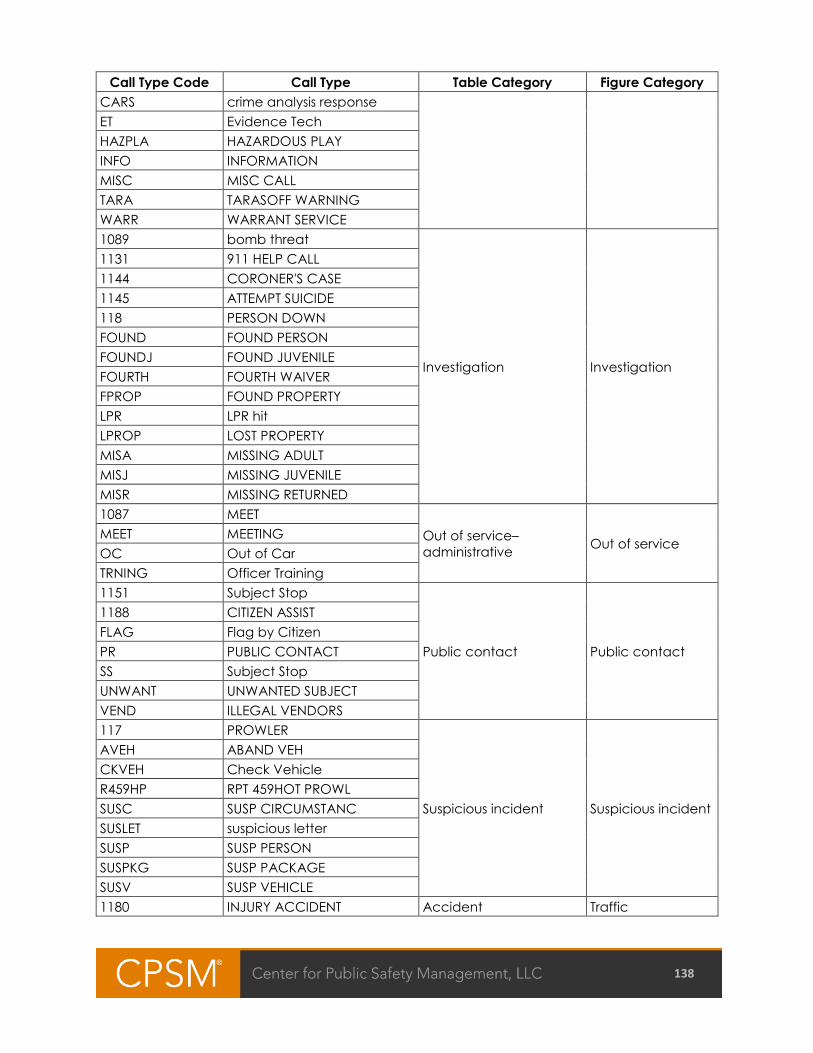
138
Call Type Code Call Type Table Category Figure Category
CARS crime analysis response
ET Evidence Tech
HAZPLA HAZARDOUS PLAY
INFO INFORMATION
MISC MISC CALL
TARA TARASOFF WARNING
WARR WARRANT SERVICE
1089 bomb threat
Investigation Investigation
1131 911 HELP CALL
1144 CORONER'S CASE
1145 ATTEMPT SUICIDE
118 PERSON DOWN
FOUND FOUND PERSON
FOUNDJ FOUND JUVENILE
FOURTH FOURTH WAIVER
FPROP FOUND PROPERTY
LPR LPR hit
LPROP LOST PROPERTY
MISA MISSING ADULT
MISJ MISSING JUVENILE
MISR MISSING RETURNED
1087 MEET
Out of service–
administrative Out of service
MEET MEETING
OC Out of Car
TRNING Officer Training
1151 Subject Stop
Public contact Public contact
1188 CITIZEN ASSIST
FLAG Flag by Citizen
PR PUBLIC CONTACT
SS Subject Stop
UNWANT UNWANTED SUBJECT
VEND ILLEGAL VENDORS
117 PROWLER
Suspicious incident Suspicious incident
AVEH ABAND VEH
CKVEH Check Vehicle
R459HP RPT 459HOT PROWL
SUSC SUSP CIRCUMSTANC
SUSLET suspicious letter
SUSP SUSP PERSON
SUSPKG SUSP PACKAGE
SUSV SUSP VEHICLE
1180 INJURY ACCIDENT Accident Traffic

139
Call Type Code Call Type Table Category Figure Category
1181 MINOR INJ ACC
1182 NON INJ ACC
1183 UNK INJ ACC
20001 HIT&RUN W/INJURY
20002 HIT&RUN NON INJ
R1181 RPT TC MINOR INJ
1150 Traf Stop Return
Traffic enforcement
1184 Traffic Control
23103 RECKLESS DRIVING
23109 DRAG RACING
23152 DUI
ENFOR Traf Enforcement
FIXIT TICKET SIGN OFF
PARK ILLEGAL PARKING
R1182 RPT TC NONINJURY
R20001 RPT H&R INJ
R20002 RPT H&R
R23103 ROAD RAGE
SIGS SIGNAL MAINTENCE
T Traffic Stop
TCOMP Traf Enforcement
THAZ TRAFFIC HAZARD
TP Traffic Pursuit

140
APPENDIX B: UNIFORM CRIME REPORT INFORMATION
This section presents information obtained from Uniform Crime Reports (UCR) collected by the
Federal Bureau of Investigation (FBI) California Department of Justice. The tables and figures
include the most recent information that is publicly available at the national level. This includes
crime reports for 2008 through 2017, along with clearance rates for 2017. Crime rates are
expressed as incidents per 100,000 population.
TABLE 8-27: Reported Crime Rates in 2017, by City
City State Population
Crime Rates
Violent Property Total
Buena Park CA 83,552 349 3,368 3,717
Chula Vista CA 271,109 298 1,432 1,730
Costa Mesa CA 113,267 319 3,795 4,114
El Cajon CA 104,447 411 2,231 2,642
Escondido CA 152,845 377 1,704 2,081
Fullerton CA 141,637 207 2,790 2,997
Hemet CA 85,166 537 3,643 4,180
Indio CA 90,055 710 2,540 3,250
Menifee CA 90,403 136 2,181 2,317
Murrieta CA 113,016 71 1,400 1,471
Newport Beach CA 86,910 143 2,443 2,586
Orange CA 141,130 154 1,831 1,985
Tustin CA 81,246 162 2,399 2,561
Westminster CA 91,863 306 3,075 3,381
Carlsbad CA 115,344 214 1,915 2,129
California 39,536,653 449 2,497 2,946
National 325,719,178 383 2,362 2,745
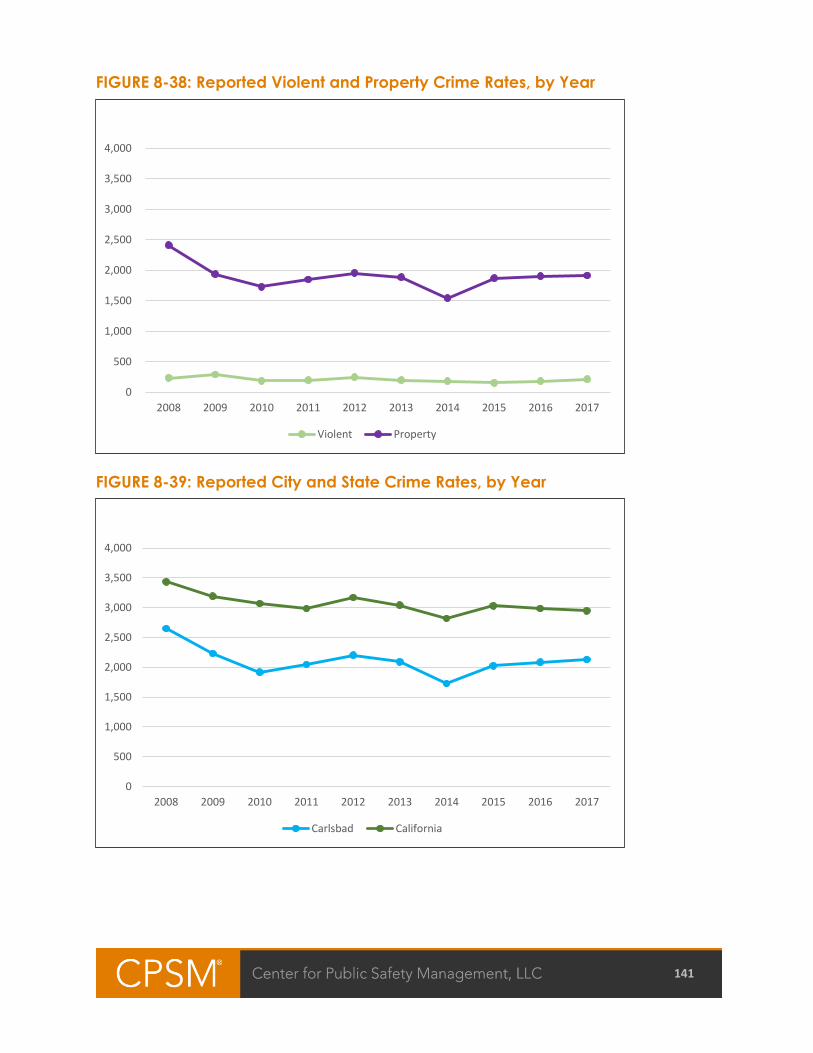
141
FIGURE 8-38: Reported Violent and Property Crime Rates, by Year
FIGURE 8-39: Reported City and State Crime Rates, by Year
0
500
1,000
1,500
2,000
2,500
3,000
3,500
4,000
2008 2009 2010 2011 2012 2013 2014 2015 2016 2017
Violent Property
0
500
1,000
1,500
2,000
2,500
3,000
3,500
4,000
2008 2009 2010 2011 2012 2013 2014 2015 2016 2017
Carlsbad California

142
TABLE 8-28: Reported Carlsbad, California, and National Crime Rates, by Year
Year Carlsbad California National
Population Violent Property Total Population Violent Property Total Population Violent Property Total
2008 97,670 232 2,414 2,647 36,876,276 502 2,931 3,433 309,327,055 438 3,055 3,493
2009 98,482 291 1,937 2,229 37,061,435 471 2,717 3,188 312,367,926 416 2,906 3,322
2010 105,328 185 1,728 1,913 37,346,022 439 2,629 3,068 314,170,775 393 2,833 3,225
2011 106,566 197 1,849 2,046 37,819,249 410 2,574 2,983 317,186,963 376 2,800 3,176
2012 107,879 246 1,955 2,201 38,183,375 421 2,747 3,169 319,697,368 377 2,758 3,135
2013 110,505 200 1,887 2,087 38,498,377 394 2,646 3,041 321,947,240 362 2,627 2,989
2014 112,297 182 1,541 1,723 38,970,399 389 2,430 2,819 324,699,246 357 2,464 2,821
2015 113,972 151 1,872 2,023 39,315,550 424 2,605 3,029 327,455,769 368 2,376 2,744
2016 115,040 182 1,902 2,084 39,421,283 443 2,541 2,984 329,308,297 383 2,353 2,736
2017 115,344 214 1,915 2,129 39,536,653 449 2,49 2,946 325,719,178 383 2,362 2,745
TABLE 8-29: Reported Carlsbad, California, and National Crime Clearance Rates, 2017
Crime Carlsbad California National
Crimes Clearances Rate Crimes Clearances Rate Crimes Clearances* Rate
Murder Manslaughter 0 0 NA 1,829 1,144 63% 15,657 9,645 62%
Rape 30 6 20% 14,724 5,427 37% 121,084 41,774 35%
Robbery 46 17 37% 56,609 17,324 31% 293,160 87,069 30%
Aggravated Assault 171 96 56% 105,391 56,227 53% 747,731 398,541 53%
Burglary 432 38 9% 176,638 18,871 11% 1,281,083 172,946 14%
Larceny 1,638 157 10% 641,804 69,636 11% 5,072,970 974,010 19%
Vehicle Theft 139 21 15% 168,327 15,336 9% 720,346 98,687 14%
Note: *Clearances were calculated from crimes and rates, as these numbers are not directly available from the FBI.