HCS Road: An Enterprise System for Integrated HCS Data Management and Analysis
11
http://jbx.sagepub.com/ Journal of Biomolecular Screening http://jbx.sagepub.com/content/15/7/882 The online version of this article can be found at: DOI: 10.1177/1087057110374233 2010 15: 882 originally published online 16 July 2010 J Biomol Screen Christopher Miller and James Gill Nawade, Michele Agler, Normand J. Cloutier, Myles Fennell, Qi Guo, Judith Wardwell-Swanson, Dandan Zhao, Yingjie Zhu, Donald Jackson, Michael Lenard, Alexander Zelensky, Mohammad Shaikh, James V. Scharpf, Richard Shaginaw, Mahesh HCS Road: An Enterprise System for Integrated HCS Data Management and Analysis Published by: http://www.sagepublications.com On behalf of: Journal of Biomolecular Screening can be found at: Journal of Biomolecular Screening Additional services and information for http://jbx.sagepub.com/cgi/alerts Email Alerts: http://jbx.sagepub.com/subscriptions Subscriptions: http://www.sagepub.com/journalsReprints.nav Reprints: http://www.sagepub.com/journalsPermissions.nav Permissions: What is This? - Jul 16, 2010 OnlineFirst Version of Record - Aug 20, 2010 Version of Record >> by guest on October 11, 2013 jbx.sagepub.com Downloaded from by guest on October 11, 2013 jbx.sagepub.com Downloaded from by guest on October 11, 2013 jbx.sagepub.com Downloaded from by guest on October 11, 2013 jbx.sagepub.com Downloaded from by guest on October 11, 2013 jbx.sagepub.com Downloaded from by guest on October 11, 2013 jbx.sagepub.com Downloaded from by guest on October 11, 2013 jbx.sagepub.com Downloaded from by guest on October 11, 2013 jbx.sagepub.com Downloaded from by guest on October 11, 2013 jbx.sagepub.com Downloaded from by guest on October 11, 2013 jbx.sagepub.com Downloaded from by guest on October 11, 2013 jbx.sagepub.com Downloaded from
-
Upload
independent -
Category
Documents
-
view
0 -
download
0
Transcript of HCS Road: An Enterprise System for Integrated HCS Data Management and Analysis
http://jbx.sagepub.com/Journal of Biomolecular Screening
http://jbx.sagepub.com/content/15/7/882The online version of this article can be found at:
DOI: 10.1177/1087057110374233
2010 15: 882 originally published online 16 July 2010J Biomol ScreenChristopher Miller and James Gill
Nawade, Michele Agler, Normand J. Cloutier, Myles Fennell, Qi Guo, Judith Wardwell-Swanson, Dandan Zhao, Yingjie Zhu, Donald Jackson, Michael Lenard, Alexander Zelensky, Mohammad Shaikh, James V. Scharpf, Richard Shaginaw, Mahesh
HCS Road: An Enterprise System for Integrated HCS Data Management and Analysis
Published by:
http://www.sagepublications.com
On behalf of:
Journal of Biomolecular Screening
can be found at:Journal of Biomolecular ScreeningAdditional services and information for
http://jbx.sagepub.com/cgi/alertsEmail Alerts:
http://jbx.sagepub.com/subscriptionsSubscriptions:
http://www.sagepub.com/journalsReprints.navReprints:
http://www.sagepub.com/journalsPermissions.navPermissions:
What is This?
- Jul 16, 2010 OnlineFirst Version of Record
- Aug 20, 2010Version of Record >>
by guest on October 11, 2013jbx.sagepub.comDownloaded from by guest on October 11, 2013jbx.sagepub.comDownloaded from by guest on October 11, 2013jbx.sagepub.comDownloaded from by guest on October 11, 2013jbx.sagepub.comDownloaded from by guest on October 11, 2013jbx.sagepub.comDownloaded from by guest on October 11, 2013jbx.sagepub.comDownloaded from by guest on October 11, 2013jbx.sagepub.comDownloaded from by guest on October 11, 2013jbx.sagepub.comDownloaded from by guest on October 11, 2013jbx.sagepub.comDownloaded from by guest on October 11, 2013jbx.sagepub.comDownloaded from by guest on October 11, 2013jbx.sagepub.comDownloaded from

882 www.sbsonline.org © 2010 Society for Laboratory Automation and Screening
INTRODUCTION
HIGH-CONTENT SCREENING (HCS) HAS DEMONSTRATED
UTILITY at multiple points in the drug discovery process, including target identification, target validation, lead identifica-tion, lead evaluation and profiling,1 mechanism-of-action determination,2 and toxicology assessment.3 Within a single organization, HCS may be used for multiple purposes with distinct groups and even instruments supporting different
stages of drug discovery. The scope of HCS projects can range from large-scale compound and RNAi collections tested in high-throughput screens to the detailed characterization of small numbers of compounds in multiple assays and cell lines. Despite their different roles, each group has common needs for data analysis, including deriving numeric measurements from images; connecting results with treatments, cell lines, and assay readouts; identifying positive and negative controls to normal-ize data; rejecting failed data points; and selecting hits or fitting concentration-response curves. Establishing a common frame-work for HCS data allows users from different groups to ana-lyze their results and share best practices and algorithms between users and instruments.
HCS data can be divided into 3 types: image data, derived data (e.g., single-cell measurements and well-level summary statistics), and metadata.4 This last data type includes both procedural information (e.g., how the images were acquired and analyzed) and experimental annotation (e.g., what cell lines, fluorescent probes, and treatments were used). Procedural metadata are captured by most HCS platforms and by open-source projects such as the Open Microscopy Environment (OME).5,6 Experimental annotation metadata are less well sup-ported, even though they are essential for the interpretation and analysis of HCS results. The Minimum Information About
1Applied Genomics Group, Applied Biotechnology Department, Bristol-Myers Squibb Research and Development, Princeton, NJ.2Research Informatics and Automation, Discovery Research Informatics, Bristol-Myers Squibb Research and Development, Princeton, NJ.3Alpha Consulting Corp, East Brunswick, NJ.4Lead Discovery Group, Applied Biotechnology Department, Bristol-Myers Squibb Research and Development, Wallingford, CT.*These authors contributed equally to this work.
Received Jan 6, 2010, and in revised form Apr 29, 2010. Accepted for publica-tion May 2, 2010.
Supplementary material for this article is available on the Journal of Biomolecular Screening Web site at http://jbx.sagepub.com/supplemental.
Journal of Biomolecular Screening 15(7); 2010DOI: 10.1177/1087057110374233
HCS Road: An Enterprise System for Integrated HCS Data Management and Analysis
DONALD JACKSON,1,* MICHAEL LENARD,2,* ALEXANDER ZELENSKY,3 MOHAMMAD SHAIKH,2 JAMES V. SCHARPF,2 RICHARD SHAGINAW,2 MAHESH NAWADE,2 MICHELE AGLER,4
NORMAND J. CLOUTIER,2 MYLES FENNELL,1 QI GUO,1 JUDITH WARDWELL-SWANSON,1 DANDAN ZHAO,1 YINGJIE ZHU,4 CHRISTOPHER MILLER,1 and JAMES GILL2
The effective analysis and interpretation of high-content screening (HCS) data requires joining results to information on experimental treatments and controls, normalizing data, and selecting hits or fitting concentration-response curves. HCS data have unique requirements that are not supported by traditional high-throughput screening databases, including the ability to designate separate positive and negative controls for different measurements in multiplexed assays; the ability to capture information on the cell lines, fluorescent reagents, and treatments in each assay; the ability to store and use individual-cell and image data; and the ability to support HCS readers and software from multiple vendors along with third-party image analysis tools. To address these requirements, the authors developed an enterprise system for the storage and processing of HCS images and results. This system, HCS Road, supports target identification, lead discovery, lead evaluation, and lead profiling activities. A dedicated client supports experimental design, data review, and core analyses and displays images together with results for assay development, hit assessment, and troubleshooting. Data can be exported to third-party applica-tions for further analysis and exploration. HCS Road provides a single source for high-content results across the organization, regardless of the group or instrument that produced them. (Journal of Biomolecular Screening 2010:882-891)
Key words: high-content screening, information management, data analysis software, data integration, scientific databases

Integrated HCS Data Management and Analysis
Journal of Biomolecular Screening 15(7); 2010 www.sbsonline.org 883
a Cellular Assay (MIACA) standard established guidelines for what experimental annotation should be included in sci-entific publications7 but is not intended for laboratory data management.
HCS data share many requirements with other types of high-throughput screening (HTS) data, especially from cell-based assays. In particular, the need to capture assay design information in a structured and consistent manner is essential for the analysis and reporting of experimental results.8 Other essential components include a reagent registry (for com-pounds, RNAi reagents, and other reagent types), a reagent inventory database (with information on plate maps), and tools for hit selection and concentration-response analysis.9
Despite the parallels to HTS data, managing and analyzing HCS data presents distinct challenges not encountered with other assay platforms, including single-endpoint cell-based assays. First, HCS is image based. Access to the underlying images is essential to troubleshoot problems, confirm and understand results, and communicate results to colleagues. Second, HCS produces large amounts of data. For example, a single 384-well plate can produce over 2 GB of images and millions of records of derived data4; this scale of data requires support from information technology experts along with mechanisms to systematically identify and delete unneeded data. Third, HCS assays often multiplex several distinct bio-logical readouts in the same well. This requires the ability to designate separate positive and negative controls for different channels or even measurements so that assay performance and result normalization can generate meaningful values. Fourth, multiple vendors produce HCS readers and image analysis packages, along with third-party analysis packages such as CellProfiler.10 Results and images must be converted to a common format so data and analysis tools can be shared between groups. Finally, HCS assays are inherently cell based. Consistent identification of the cell lines, fluorescent dyes or antibody conjugates, and fluorescent proteins used in each assay is essential for the proper documentation and long-term mining of HCS results.
To address these requirements, we developed HCS Road, a data management system specifically designed for HCS. As the name indicates, HCS Road provides a smooth, well-defined route from image quantification to data analysis and reporting. The system combines an experiment definition tool, a rela-tional database for results storage, assay performance reports, data normalization, and analysis capabilities. HCS Road cur-rently supports multiple imaging platforms and provides a common repository for HCS data across instruments and user groups. In this work, we describe the approaches we took for data storage, experimental annotation, and data analysis and the scientific and business reasons for those decisions. We also present a XML schema for HCS data that supports multiple HCS platforms.
METHODS
Image acquisition and analysis
Images were acquired using multiple HCS instrument types and analyzed using software supplied by the individual instru-ment manufacturers. HCS Road currently supports 3 instru-ment types and software: the Cellomics ArrayScan and vHCS Scan application (Thermo Scientific Cellomics, Pittsburgh, PA), the InCell 1000 and InCell Investigator application (GE Healthcare Life Sciences, Piscataway, NJ), and the Evotec Opera and Acapella application (PerkinElmer Life and Analytical Sciences, Waltham, MA).
Databases and software
Databases were implemented using Oracle 11g (Oracle Corporation, Redwood Shores, CA). The database is hosted on a dedicated server with 4 IA64 CPUs and 24 MB RAM. The HCS Road Data Explorer client was developed using VB.NET, and the Data Import client was developed using VB.NET and ASP.NET. Both clients run on Microsoft Windows XP. The clients interact with the Road database using Web services implemented in VB.NET and ASP.Net and Oracle PL-SQL stored procedures. Image conversion services were imple-mented using LeadTools Raster Imaging Pro 15 (Lead Technologies, Inc., Charlotte, NC) and Image Magick 6.4.4 (Image Magick Studio, LLC; www.imagemagick.org). Concentration-response curve fitting was performed using XLfit equation 205 within MathIQ (IDBS Business Solutions, Guilford, UK).
RESULTS AND DISCUSSION
System architecture
Figure 1 shows an overview of the architecture of HCS Road. HCS Road currently supports 3 HCS readers: the Cellomics ArrayScan, the GE Healthcare InCell 1000, and the PerkinElmer/Evotec Opera. Images are analyzed using instrument-specific software applications provided by the system manufacturers, and the results are collected in a relational data-base (for Cellomics systems) or in platform-specific file for-mats (for the InCell and Opera systems). An HCS Road service converts data from the instrument-specific format to a common XML schema, HcsXmlPlate.xsd, for import into the HCS Road database. The resulting XML file contains the plate metadata, information on image acquisition and analysis settings, and the measurement names and values for well-level results. Cell-level results are not included in the XML file because the large number of elements interferes with processing of the file. Instead, cell features are loaded directly from the platform data-base (based on the plate and scan identifier) or from instrument

Jackson et al.
884 www.sbsonline.org Journal of Biomolecular Screening 15(7); 2010
output files (using the file path included in the plate metadata). The XML schema and an example data set are provided as sup-plemental information (Suppl. data S1-S2). This common XML schema facilitates data import from additional instru-ments or image analysis software. The XML file is transferred to HCS Road, and results are extracted, loaded into the data-base, and merged with experimental annotation and treatment plate maps. Data import and merging can be performed manu-ally or automatically based on previously registered plate bar-codes. QC metrics and normalized results are calculated automatically and can be reviewed and analyzed using the HCS Road client or exported to third-party applications such as TIBCO Spotfire (TIBCO Software, Cambridge, MA).
Users interact with HCS Road through 2 client applications. The Data Import application enables users to select plates for import from the platform-specific data repository (Cellomics database, Opera, or InCell file share). The import job is per-formed on a central server. Multiple plates can be transferred in parallel for faster import, and well summary results are imported separately from cell-level measurements so users can review
well-level results more quickly. A Web-based administration tool controls the number of threaded processes and other data import settings. Experimental annotation, data mining, and visualization are supported by the dedicated Data Explorer client application. Data-intensive operations, including data extraction and updates, quality control (QC), and data analysis, are implemented on the servers and the database to reduce the amount of data transferred from server to client. The Data Explorer also allows users to view images for selected wells or as a “poster” of images for an entire plate. Images can also be viewed in third-party applications such as TIBCO Spotfire as Web pages (Fig. 1). In either case, the image conversion server retrieves images from the appropriate platform repository and converts them from proprietary formats to standard TIFF or JPEG formats as needed.
The large volumes of data generated by HCS require par-ticular attention to image and data storage and management. For file storage, we adopted a disk-based network attached storage system (Isilon Systems, Seattle, WA). This system pro-vides scalable and extensible storage that is well suited for
FIG. 1. Overview of HCS Road components showing data flow from high-content screening (HCS) instruments through the HCS Road data-base and file share to data analysis and visualization tools. Blue icons designate instrument-specific databases and file shares. Green arrows and the green box indicate HCS Road components. Gray arrows indicate data import or export to existing enterprise databases or third-party analysis tools.
Integrated HCS Data Management and Analysis
Journal of Biomolecular Screening 15(7); 2010 www.sbsonline.org 885
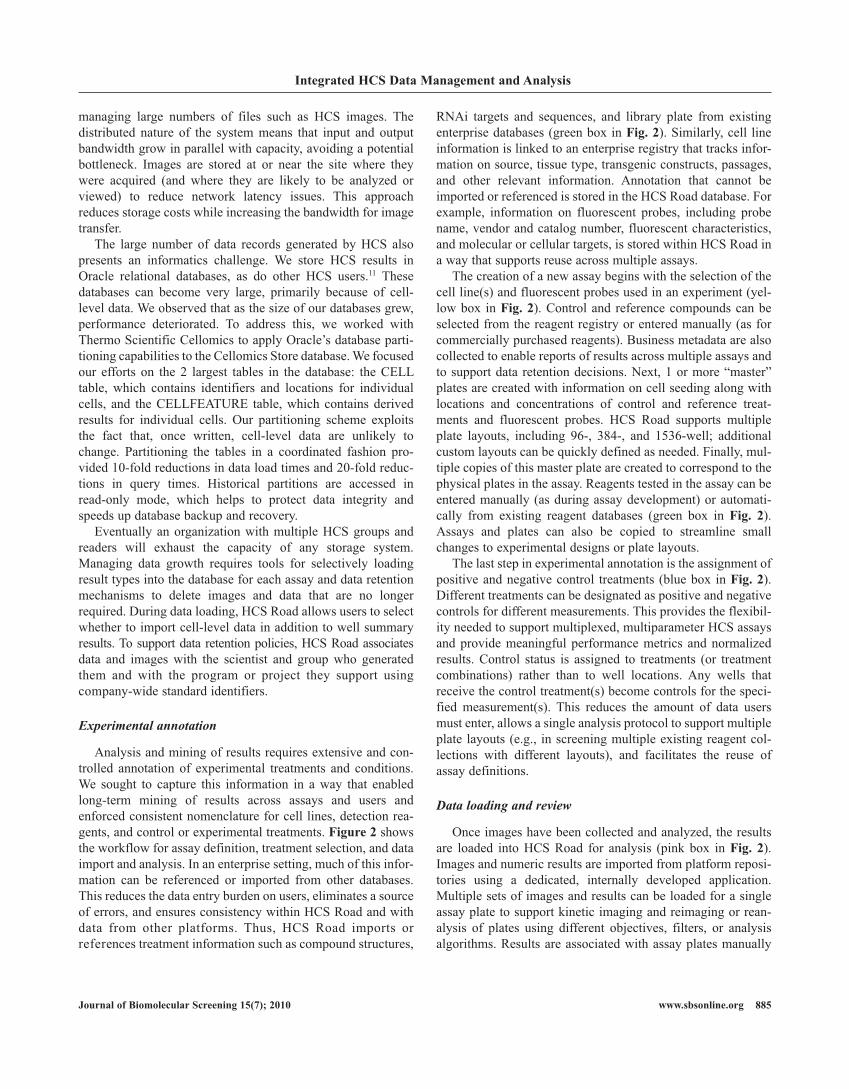
managing large numbers of files such as HCS images. The distributed nature of the system means that input and output bandwidth grow in parallel with capacity, avoiding a potential bottleneck. Images are stored at or near the site where they were acquired (and where they are likely to be analyzed or viewed) to reduce network latency issues. This approach reduces storage costs while increasing the bandwidth for image transfer.
The large number of data records generated by HCS also presents an informatics challenge. We store HCS results in Oracle relational databases, as do other HCS users.11 These databases can become very large, primarily because of cell-level data. We observed that as the size of our databases grew, performance deteriorated. To address this, we worked with Thermo Scientific Cellomics to apply Oracle’s database parti-tioning capabilities to the Cellomics Store database. We focused our efforts on the 2 largest tables in the database: the CELL table, which contains identifiers and locations for individual cells, and the CELLFEATURE table, which contains derived results for individual cells. Our partitioning scheme exploits the fact that, once written, cell-level data are unlikely to change. Partitioning the tables in a coordinated fashion pro-vided 10-fold reductions in data load times and 20-fold reduc-tions in query times. Historical partitions are accessed in read-only mode, which helps to protect data integrity and speeds up database backup and recovery.
Eventually an organization with multiple HCS groups and readers will exhaust the capacity of any storage system. Managing data growth requires tools for selectively loading result types into the database for each assay and data retention mechanisms to delete images and data that are no longer required. During data loading, HCS Road allows users to select whether to import cell-level data in addition to well summary results. To support data retention policies, HCS Road associates data and images with the scientist and group who generated them and with the program or project they support using company-wide standard identifiers.
Experimental annotation
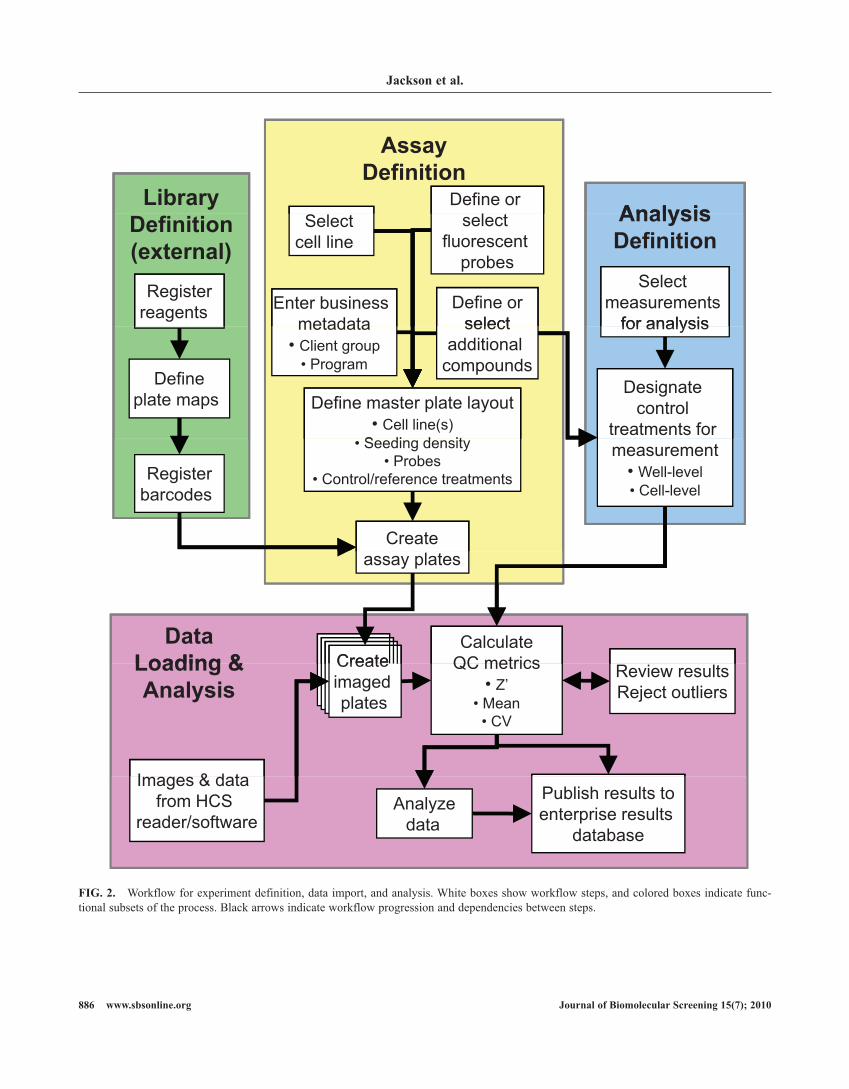
Analysis and mining of results requires extensive and con-trolled annotation of experimental treatments and conditions. We sought to capture this information in a way that enabled long-term mining of results across assays and users and enforced consistent nomenclature for cell lines, detection rea-gents, and control or experimental treatments. Figure 2 shows the workflow for assay definition, treatment selection, and data import and analysis. In an enterprise setting, much of this infor-mation can be referenced or imported from other databases. This reduces the data entry burden on users, eliminates a source of errors, and ensures consistency within HCS Road and with data from other platforms. Thus, HCS Road imports or references treatment information such as compound structures,
RNAi targets and sequences, and library plate from existing enterprise databases (green box in Fig. 2). Similarly, cell line information is linked to an enterprise registry that tracks infor-mation on source, tissue type, transgenic constructs, passages, and other relevant information. Annotation that cannot be imported or referenced is stored in the HCS Road database. For example, information on fluorescent probes, including probe name, vendor and catalog number, fluorescent characteristics, and molecular or cellular targets, is stored within HCS Road in a way that supports reuse across multiple assays.
The creation of a new assay begins with the selection of the cell line(s) and fluorescent probes used in an experiment (yel-low box in Fig. 2). Control and reference compounds can be selected from the reagent registry or entered manually (as for commercially purchased reagents). Business metadata are also collected to enable reports of results across multiple assays and to support data retention decisions. Next, 1 or more “master” plates are created with information on cell seeding along with locations and concentrations of control and reference treat-ments and fluorescent probes. HCS Road supports multiple plate layouts, including 96-, 384-, and 1536-well; additional custom layouts can be quickly defined as needed. Finally, mul-tiple copies of this master plate are created to correspond to the physical plates in the assay. Reagents tested in the assay can be entered manually (as during assay development) or automati-cally from existing reagent databases (green box in Fig. 2). Assays and plates can also be copied to streamline small changes to experimental designs or plate layouts.
The last step in experimental annotation is the assignment of positive and negative control treatments (blue box in Fig. 2). Different treatments can be designated as positive and negative controls for different measurements. This provides the flexibil-ity needed to support multiplexed, multiparameter HCS assays and provide meaningful performance metrics and normalized results. Control status is assigned to treatments (or treatment combinations) rather than to well locations. Any wells that receive the control treatment(s) become controls for the speci-fied measurement(s). This reduces the amount of data users must enter, allows a single analysis protocol to support multiple plate layouts (e.g., in screening multiple existing reagent col-lections with different layouts), and facilitates the reuse of assay definitions.
Data loading and review
Once images have been collected and analyzed, the results are loaded into HCS Road for analysis (pink box in Fig. 2). Images and numeric results are imported from platform reposi-tories using a dedicated, internally developed application. Multiple sets of images and results can be loaded for a single assay plate to support kinetic imaging and reimaging or rean-alysis of plates using different objectives, filters, or analysis algorithms. Results are associated with assay plates manually
Jackson et al.
886 www.sbsonline.org Journal of Biomolecular Screening 15(7); 2010
AssayDefinition
Define or l
LibraryAnalysisSelect
cell line select
fluorescentprobes
Enter business Define orselect
Definition(external)
Registerreagents
AnalysisDefinition
Selectmeasurements
for analysis
Define master plate layout• Cell line(s)
S di d it
metadata• Client group
• Program
selectadditional
compoundsDefine
plate maps
for analysis
Designatecontrol
treatments for • Seeding density
• Probes• Control/reference treatments
Create
Registerbarcodes
measurement• Well-level• Cell-level
assay plates
CalculateCreateI dCreateCreateCreate
DataLoading & QC metrics
• Z’• Mean• CV
Review resultsReject outliers
ImagedPlatesImagedPlatesImagedPlates
Createimagedplates
Loading &Analysis
Images & datafrom HCS
reader/softwareAnalyze
data
Publish results toenterprise results
database
FIG. 2. Workflow for experiment definition, data import, and analysis. White boxes show workflow steps, and colored boxes indicate func-tional subsets of the process. Black arrows indicate workflow progression and dependencies between steps.

Integrated HCS Data Management and Analysis
Journal of Biomolecular Screening 15(7); 2010 www.sbsonline.org 887
or using barcodes on the assay plates. HCS Road calculates multiple QC metrics and provides tools for rejecting failed wells or plates.
The data-loading process can be automated; users register their assay plates in HCS Road and enter the time range, imag-ing protocol, and primary database or file share where the results will be deposited. HCS Road monitors the designated repository for corresponding plates and imports them auto-matically. This enables users to go directly from setting up their scans to reviewing the fully annotated results and performance metrics within HCS Road. Alternatively, users may import their results first and define the assay and link assay plates to the results later. This provides the flexibility to support both large-scale screens and small-scale assay development or experi-ments.
For data review, HCS Road automatically calculates metrics for assay performance. In addition to the Z′ metric of Zhang et al.,12 the plate mean, median, standard deviation, minimum, and maximum are reported for negative control, positive con-trol, and sample wells for each plate in a run (Fig. 3A). Users can select individual plates for review in a format that displays individual well values in a plate heatmap view with access to the appropriate images (Fig. 3B). For a failed or outlier well, the user can choose to reject all measurements or only reject selected measurements and recalculate the plate statistics. The ability to selectively reject measurements is necessary because of the multiparameter nature of HCS assays. For example, a treatment may reduce cell count in a multiplexed assay; this is a legitimate result, but measurements in other channels may not be reliable.
Data analysis
HCS Road automatically calculates multiple normalizations when data are loaded. The calculations include percent control, percent inhibition, signal to background, and z score.13 These normalizations are calculated on a per-plate basis. Both raw and normalized results can be exported or analyzed within the HCS Road Data Explorer. Users can select the appropriate normalization for their assay and measurements.
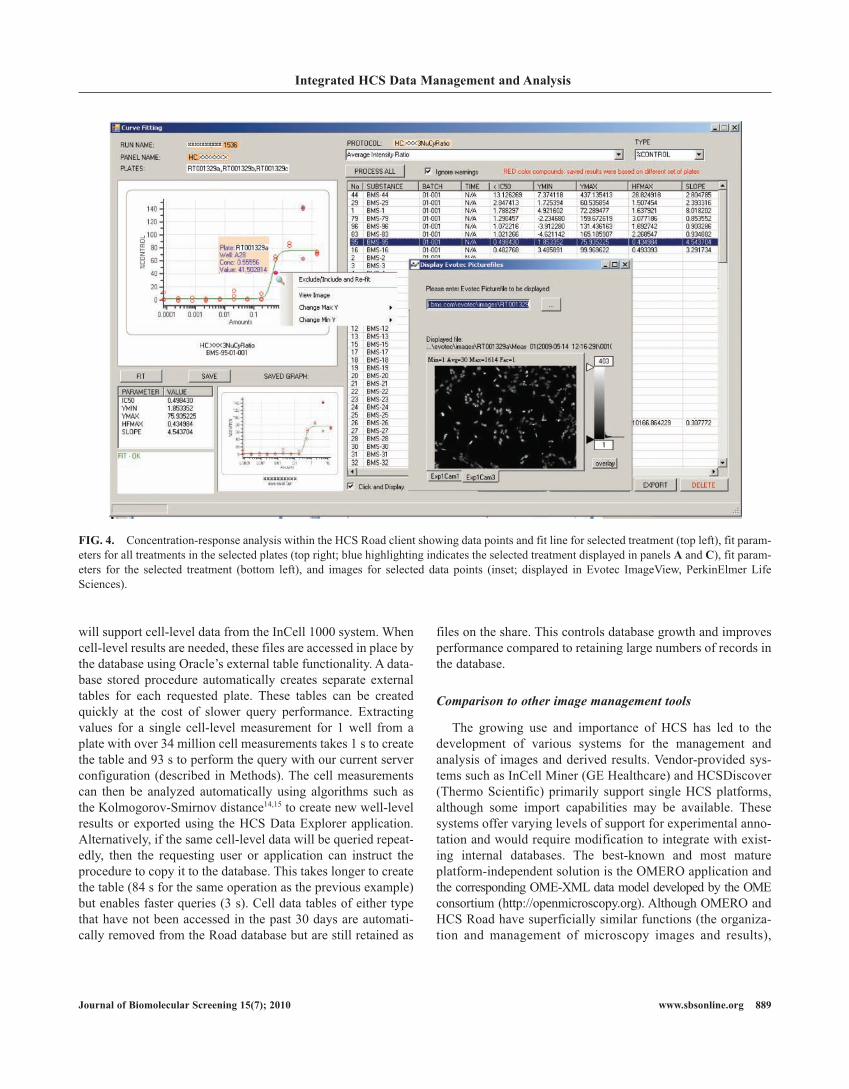
We implemented analyses that are performed frequently with fixed workflows within the HCS Road Data Explorer applica-tion. The first analysis we implemented was concentration- response curve fitting. Curves are fit using a 4-parameter logis-tic regression with XLfit equation 205 (IDBS Business Solutions). Replicate wells from single or multiple plates are incorporated into a single analysis as independent data points. Figure 4 shows an example report for an HCS measurement of the nuclear-cytoplasmic distribution of a fluorescent protein fusion across a collection of treatments. The report contains the fit parameters (IC50, Ymin, Ymax, HFmax, and slope) for each com-pound. A graphic view shows the fit line and data points for an individual compound. Data points are linked to the corresponding
images so users can review the images for a well and choose to reject it and recalculate the fit. The resulting IC50 values were consistent with those produced by our existing HTS analysis tools (not shown).
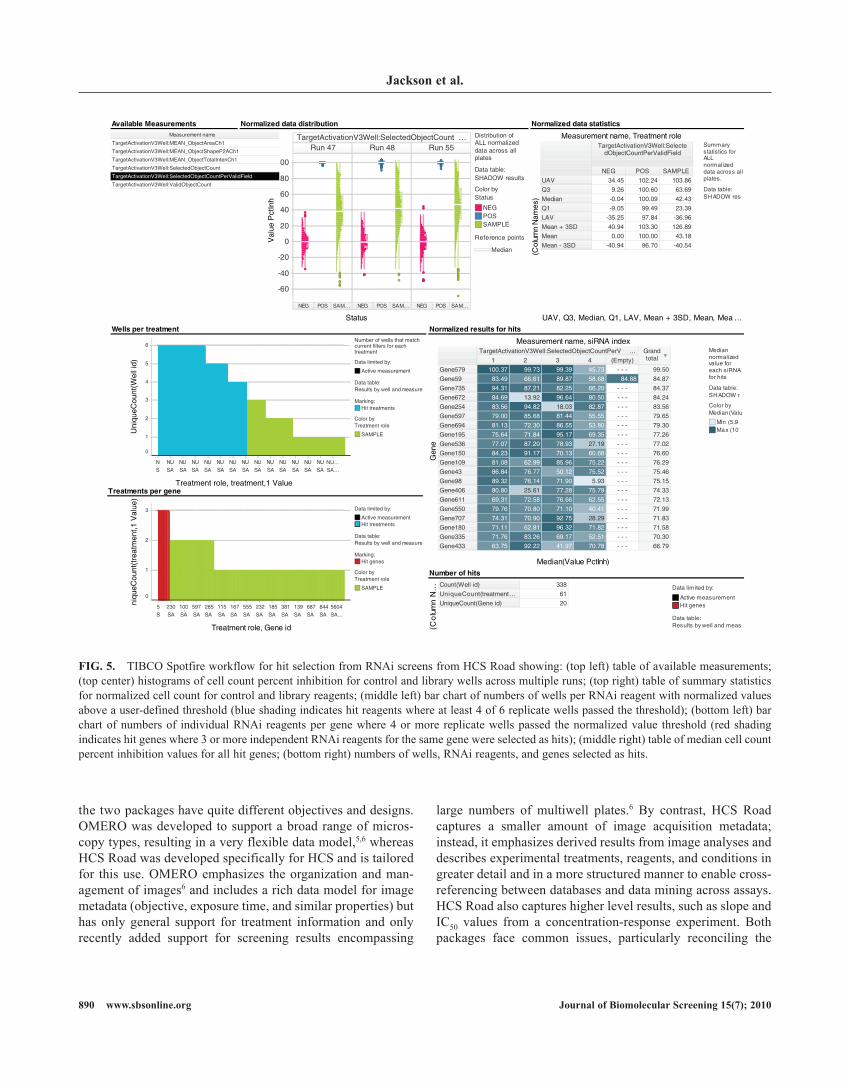
We also identified a need to export results and annotation from HCS Road to third-party applications so researchers can perform calculations and generate visualizations that are not part of a common workflow. We use TIBCO Spotfire for many of our external visualizations because it can retrieve data directly from the HCS Road database, supports multiple user-configurable visualizations, provides tools for filtering and annotating data, and can perform additional analyses using internal calculations or by communicating with Accelerys PipelinePilot (San Diego, CA). Figure 5 shows a Spotfire visu-alization for analyzing RNAi screening results. This workflow retrieves results and treatment information from the HCS Road database. The user is presented with information on the distri-bution of normalized values for each endpoint and can select wells that pass the desired activity threshold. Additional panels identify RNAi reagents where multiple replicate wells pass the threshold and genes where multiple different RNAi reagents scored as hits, an analysis that is unique to RNAi screening. Within Spotfire, HCS assay results can be cross-referenced with other information such as mRNA expression profiling to identify RNAi reagents whose phenotype correlates with levels of target expression in the assay cell line (not shown).
Cell-level data
Managing and analyzing cell-level data was a high priority in the development of HCS Road. Cell-level data enable the analysis of correlations between measurements at the cellular level, the use of alternative data reduction algorithms such as the Kolmogorov-Smirnov distance,14,15 classification of sub-populations by cell cycle phase,16 and other approaches beyond basic well-level summaries.17 Implementing these and other methods requires a single format for cell-level measurements from multiple instrument platforms and groups. However, the volume of cell data in an HCS experiment can be very large. A single 384-well plate can generate many millions of database rows if stored in normal relational form. As the data tables grow, performance deteriorates and storage costs mount. Instead, we store cell-level results in a pair of comma-separated value (.CSV) files for each plate. The cell-level data are gener-ated by instrument-specific analysis applications; for Opera results, the data are extracted from the output file specified by the file path in the XML import file (Suppl. data S2), and for ArrayScan results, the data are extracted from the platform database. The cell-level results are written to new, standardized comma-delimited files on the HCS Road file share. One file contains the cell coordinates (well, field, cell number, X and Y position, width, and height), and a second contains the values for each individual measurement on each cell. A future version

Jackson et al.
888 www.sbsonline.org Journal of Biomolecular Screening 15(7); 2010
FIG. 3. Assay performance reports and data review tools. (A) summary report showing analysis protocol selection, result annotation tools, and a report of Z′ values and additional metrics for each plate in a run; (B) plate heatmap/image view showing result values for a single measurement in each well with treatment information and sample images for selected wells.
Integrated HCS Data Management and Analysis
Journal of Biomolecular Screening 15(7); 2010 www.sbsonline.org 889
will support cell-level data from the InCell 1000 system. When cell-level results are needed, these files are accessed in place by the database using Oracle’s external table functionality. A data-base stored procedure automatically creates separate external tables for each requested plate. These tables can be created quickly at the cost of slower query performance. Extracting values for a single cell-level measurement for 1 well from a plate with over 34 million cell measurements takes 1 s to create the table and 93 s to perform the query with our current server configuration (described in Methods). The cell measurements can then be analyzed automatically using algorithms such as the Kolmogorov-Smirnov distance14,15 to create new well-level results or exported using the HCS Data Explorer application. Alternatively, if the same cell-level data will be queried repeat-edly, then the requesting user or application can instruct the procedure to copy it to the database. This takes longer to create the table (84 s for the same operation as the previous example) but enables faster queries (3 s). Cell data tables of either type that have not been accessed in the past 30 days are automati-cally removed from the Road database but are still retained as
files on the share. This controls database growth and improves performance compared to retaining large numbers of records in the database.
Comparison to other image management tools
The growing use and importance of HCS has led to the development of various systems for the management and analysis of images and derived results. Vendor-provided sys-tems such as InCell Miner (GE Healthcare) and HCSDiscover (Thermo Scientific) primarily support single HCS platforms, although some import capabilities may be available. These systems offer varying levels of support for experimental anno-tation and would require modification to integrate with exist-ing internal databases. The best-known and most mature platform-independent solution is the OMERO application and the corresponding OME-XML data model developed by the OME consortium (http://openmicroscopy.org). Although OMERO and HCS Road have superficially similar functions (the organiza-tion and management of microscopy images and results),
FIG. 4. Concentration-response analysis within the HCS Road client showing data points and fit line for selected treatment (top left), fit param-eters for all treatments in the selected plates (top right; blue highlighting indicates the selected treatment displayed in panels A and C), fit param-eters for the selected treatment (bottom left), and images for selected data points (inset; displayed in Evotec ImageView, PerkinElmer Life Sciences).
Jackson et al.
890 www.sbsonline.org Journal of Biomolecular Screening 15(7); 2010
the two packages have quite different objectives and designs. OMERO was developed to support a broad range of micros-copy types, resulting in a very flexible data model,5,6 whereas HCS Road was developed specifically for HCS and is tailored for this use. OMERO emphasizes the organization and man-agement of images6 and includes a rich data model for image metadata (objective, exposure time, and similar properties) but has only general support for treatment information and only recently added support for screening results encompassing
large numbers of multiwell plates.6 By contrast, HCS Road captures a smaller amount of image acquisition metadata; instead, it emphasizes derived results from image analyses and describes experimental treatments, reagents, and conditions in greater detail and in a more structured manner to enable cross-referencing between databases and data mining across assays. HCS Road also captures higher level results, such as slope and IC50 values from a concentration-response experiment. Both packages face common issues, particularly reconciling the
Normalized data distribution
Status
100
80
60
40
20
0
-20
-40
-60
TargetActivationV3Well:SelectedObjectCount …Run 47 Run 48 Run 55
NEG POS SAM… NEG POS SAM… NEG POS SAM…
Distribution of ALL normalized data across all plates
Data table:SHADOW results
Color byStatus
NEGPOSSAMPLE
Reference points
Median
Wells per treatment
Treatment role, treatment,1 Value
N
S
NU
SA
NU
SA
NU
SA
NU
SA
NU
SA
NU
SA
NU
SA
NU
SA
NU
SA
NU
SA
NU
SA
NU
SA
NU
SANU…
SA…
6
5
4
3
2
1
0
Number of wells that match current filters for each treatment
Data limited by:
Active measurement
Data table:Results by well and measure
Marking:Hit treatments
Color byTreatment role
SAMPLE
Available MeasurementsMeasurement name
TargetActivationV3Well:MEAN_ObjectAreaCh1
TargetActivationV3Well:MEAN_ObjectShapeP2ACh1
TargetActivationV3Well:MEAN_ObjectTotalIntenCh1
TargetActivationV3Well:SelectedObjectCount
TargetActivationV3Well:SelectedObjectCountPerValidField
TargetActivationV3Well:ValidObjectCount
Treatments per gene
Treatment role, Gene id
niqu
eCou
nt(t
reat
men
t,1 V
alue
)
5
S
230
SA
100
SA
597
SA
285
SA
115
SA
167
SA
555
SA
232
SA
185
SA
381
SA
139
SA
687
SA
844
SA
5604
SA…
3
2
1
0
Data limited by:
Active measurementHit treatments
Data table:Results by well and measure
Marking:Hit genes
Color byTreatment role
SAMPLE
Normalized data statistics
Summary statistics for ALL normalized data across all plates.
Data table:SHADOW res
TargetActivationV3Well:SelectedObjectCountPerValidField
NEG POS SAMPLE
UAV 34.45 102.24 103.86
Q3 9.26 100.60 63.69
Median -0.04 100.09 42.43
Q1 -9.05 99.49 23.39
LAV -35.25 97.84 -36.96
Mean + 3SD 40.94 103.30 126.89
Mean 0.00 100.00 43.18
Mean - 3SD -40.94 96.70 -40.54
(Col
umn
Nam
es)
Measurement name, Treatment role
UAV, Q3, Median, Q1, LAV, Mean + 3SD, Mean, Mea …Normalized results for hits
Median normalized value for each siRNA for hits
Data table:SHADOW r
Color byMedian(Valu
Min (5.9Max (10
TargetActivationV3Well:SelectedObjectCountPerV … Grand total1 2 3 4 (Empty)
Gene579 100.37 99.73 99.39 45.73 - - - 99.50
Gene59 83.49 66.61 89.87 58.68 84.88 84.87
Gene735 94.31 87.21 82.25 66.20 - - - 84.37
Gene672 84.69 13.92 96.64 80.50 - - - 84.24
Gene254 83.56 94.82 18.03 82.87 - - - 83.56
Gene597 79.00 85.68 81.44 55.55 - - - 79.65
Gene694 81.13 72.30 86.55 53.80 - - - 79.30
Gene195 75.64 71.84 95.17 69.35 - - - 77.26
Gene536 77.07 87.20 78.93 27.19 - - - 77.02
Gene150 84.23 91.17 70.13 60.68 - - - 76.60
Gene109 81.08 62.99 85.96 75.22 - - - 76.29
Gene43 86.84 76.77 50.12 75.52 - - - 75.46
Gene98 89.32 76.14 71.90 5.93 - - - 75.15
Gene406 80.80 25.61 77.28 75.79 - - - 74.33
Gene611 69.31 72.58 76.66 62.55 - - - 72.13
Gene550 79.76 70.80 71.10 40.41 - - - 71.99
Gene707 74.31 70.90 92.75 28.29 - - - 71.83
Gene180 71.11 62.81 96.32 71.82 - - - 71.58
Gene335 71.76 83.26 69.17 52.51 - - - 70.30
Gene433 63.75 92.22 41.97 70.78 - - - 66.79
Gen
e
Measurement name, siRNA index
Median(Value PctInh)Number of hits
Data limited by:
Active measurementHit genes
Data table:Results by well and meas
Count(Well id) 338
UniqueCount(treatment… 61
UniqueCount(Gene id) 20
(Co
lum
n N
…
Uni
queC
ount
(Wel
l id)
Val
ue P
ctIn
h
FIG. 5. TIBCO Spotfire workflow for hit selection from RNAi screens from HCS Road showing: (top left) table of available measurements; (top center) histograms of cell count percent inhibition for control and library wells across multiple runs; (top right) table of summary statistics for normalized cell count for control and library reagents; (middle left) bar chart of numbers of wells per RNAi reagent with normalized values above a user-defined threshold (blue shading indicates hit reagents where at least 4 of 6 replicate wells passed the threshold); (bottom left) bar chart of numbers of individual RNAi reagents per gene where 4 or more replicate wells passed the normalized value threshold (red shading indicates hit genes where 3 or more independent RNAi reagents for the same gene were selected as hits); (middle right) table of median cell count percent inhibition values for all hit genes; (bottom right) numbers of wells, RNAi reagents, and genes selected as hits.

Integrated HCS Data Management and Analysis
Journal of Biomolecular Screening 15(7); 2010 www.sbsonline.org 891
variety of proprietary image file formats and data models used by different instrument vendors. One interesting future direc-tion would be to integrate HCS Road with OMERO and OME, using the former for experimental annotation and numeric results and the latter for image management and image meta-data.
Benefits of integrated data management
We chose to develop our own HCS data management system rather than adopt an existing package because at the time, the available HTS data management and analysis tools were not well suited for HCS.9 Furthermore, we needed to integrate our HCS data with existing internal databases for treatment infor-mation, plate maps, cell line annotation, and data publication. Developing our own database and tools provided the flexibility to align to our existing systems. This integration reduces the amount of data users must enter, reduces opportunities for mis-takes, and ensures that HCS results can be integrated with results from other assay types. The common XML schema we developed for image analysis results facilitates the integration of new HCS instruments and third-party image analysis appli-cations with HCS Road. An enterprise-wide data management system also facilitates the sharing of assays and analysis tools between groups within an organization. Users can view assay data, determine whether a cell line or fluorescent probe has been used successfully, and see how a hit from their assay per-formed in previous experiments.
Because HCS Road is so closely integrated with existing internal databases, it cannot readily be adapted for standalone use and distribution. Furthermore, some organizations will wish to adapt their HCS database to their own existing enter-prise systems. Instead, we have described design choices and solutions that we found valuable for the management and analysis of HCS results. We describe solutions for managing the large volume of images and derived data inherent to HCS using network storage and the database partitioning and exter-nal table functionalities of Oracle. We present the XML schema we developed for derived data (Suppl. data S1-S2). We plan to contribute additional portions of our work to projects working to establish standard formats for data exchange and reporting, particularly the data models we developed for experimental annotation and for image analysis results. In the interim, interested parties may contact us for additional details.
ACKNOWLEDGMENTS
The authors acknowledge Isaac Neuhaus for assistance with cell data management and analysis, David Mosenkis of TIBCO Software for assistance with the use and configura-tion of TIBCO Spotfire, Thermo Scientific Cellomics for assistance with database partitioning, and Namjin Chung and John Feder for comments on this manuscript. The authors are
employees or contractors of Bristol-Myers Squibb, which funded this work.
REFERENCES
1. Agler M, Prack M, Zhu Y, Kolb J, Nowak K, Ryseck R, et al: High-content glucocorticoid receptor translocation assay for compound mechanism-of-action evaluation. J Biomol Screen 2007;12:1029-1041.
2. Ross-Macdonald P, de Silva H, Guo Q, Xiao H, Hung CY, Penhallow B, et al: Identification of a nonkinase target mediating cytotoxicity of novel kinase inhibitors. Mol Cancer Ther 2008;7:3490-3498.
3. Zock JM: Applications of high content screening in life science research. Comb Chem High Throughput Screen 2009;12:870-876.
4. Dunlay RT, Czekalski WJ, Collins MA: Overview of informatics for high content screening. Methods Mol Biol 2007;356:269-280.
5. Goldberg IG, Allan C, Burel JM, Creager D, Falconi A, Hochheiser H, et al: The Open Microscopy Environment (OME) Data Model and XML file: open tools for informatics and quantitative analysis in biological imaging. Genome Biol 2005;6:R47.
6. Swedlow JR, Goldberg IG, Eliceiri KW: Bioimage informatics for experi-mental biology. Annu Rev Biophys 2009;38:327-346.
7. Miaca Draft Specification. Retrieved from http://cdnetworks-us-2.dl.sourceforge .net/project/miaca/Documentation/MIACA_080404/MIACA_080404.pdf
8. Palmer M, Kremer A, Terstappen GC: A primer on screening data manage-ment. J Biomol Screen 2009;14:999-1007.
9. Ling XB: High throughput screening informatics. Comb Chem High Throughput Screen 2008;11:249-257.
10. Carpenter AE, Jones TR, Lamprecht MR, Clarke C, Kang IH, Friman O, et al: CellProfiler: image analysis software for identifying and quantifying cell phenotypes. Genome Biol 2006;7:R100.
11. Garfinkel LS: Large-scale data management for high content screening. Methods Mol Biol 2007;356:281-291.
12. Zhang JH, Chung TD, Oldenburg KR: A simple statistical parameter for use in evaluation and validation of high throughput screening assays. J Biomol Screen 1999;4:67-73.
13. Malo N, Hanley JA, Cerquozzi S, Pelletier J, Nadon R: Statistical practice in high-throughput screening data analysis. Nat Biotechnol 2006;24:167-175.
14. Giuliano KA, Chen YT, Taylor DL: High-content screening with siRNA optimizes a cell biological approach to drug discovery: defining the role of P53 activation in the cellular response to anticancer drugs. J Biomol Screen 2004;9:557-568.
15. Perlman ZE, Slack MD, Feng Y, Mitchison TJ, Wu LF, Altschuler SJ: Multidimensional drug profiling by automated microscopy. Science 2004;306:1194-1198.
16. Low J, Huang S, Blosser W, Dowless M, Burch J, Neubauer B, et al: High-content imaging characterization of cell cycle therapeutics through in vitro and in vivo subpopulation analysis. Mol Cancer Ther 2008;7:2455-2463.
17. Collins MA: Generating ‘omic knowledge’: the role of informatics in high content screening. Comb Chem High Throughput Screen 2009;12:917-925.
Address correspondence to:Donald Jackson, Ph.D.
Applied Genomics Group, Applied Biotechnology Department Bristol-Myers Squibb Research and Development
P.O. Box 5400 Princeton, NJ 08534
E-mail: [email protected]