HCl and ClO profiles inside the Antarctic vortex as observed by SMILES in November 2009: Comparisons...
15
Atmos. Meas. Tech., 6, 3099–3113, 2013 www.atmos-meas-tech.net/6/3099/2013/ doi:10.5194/amt-6-3099-2013 © Author(s) 2013. CC Attribution 3.0 License. Atmospheric Measurement Techniques Open Access HCl and ClO profiles inside the Antarctic vortex as observed by SMILES in November 2009: comparisons with MLS and ACE-FTS instruments T. Sugita 1 , Y. Kasai 2 , Y. Terao 1 , S. Hayashida 3 , G. L. Manney 4,5 , W. H. Daffer 6 , H. Sagawa 2 , M. Suzuki 7 , M. Shiotani 8 , K. A. Walker 9,10 , C. D. Boone 10 , and P. F. Bernath 11,12 1 National Institute for Environmental Studies, Tsukuba, Ibaraki, Japan 2 National Institute of Information and Communications Technology (NICT), Koganei, Tokyo, Japan 3 Faculty of Science, Nara Women’s University, Nara, Japan 4 NorthWest Research Associates, Inc., Socorro, New Mexico, USA 5 New Mexico Institute of Mining and Technology, Socorro, New Mexico, USA 6 Jet Propulsion Laboratory, California Institute of Technology, Pasadena, California, USA 7 Institute of Space and Astronautical Science, Japan Aerospace Exploration Agency (JAXA), Sagamihara, Kanagawa, Japan 8 Research Institute for Sustainable Humanosphere, Kyoto University, Uji, Kyoto, Japan 9 Department of Physics, University of Toronto, Toronto, Ontario, Canada 10 Department of Chemistry, University of Waterloo, Waterloo, Ontario, Canada 11 Department of Chemistry and Biochemistry, Old Dominion University, Norfolk, Virginia, USA 12 Department of Chemistry, University of York, Heslington, York, UK Correspondence to: T. Sugita ([email protected]) Received: 8 July 2013 – Published in Atmos. Meas. Tech. Discuss.: 23 July 2013 Revised: 15 October 2013 – Accepted: 16 October 2013 – Published: 18 November 2013 Abstract. We present vertical profiles of hydrogen chloride (HCl) and chlorine monoxide (ClO) as observed by the Su- perconducting Submillimeter-Wave Limb-Emission Sounder (SMILES) on the International Space Station (ISS) inside the Antarctic vortex on 19–24 November 2009. The SMILES HCl value reveals 2.8–3.1 ppbv between 450 K and 500 K levels in potential temperature (PT). The high value of HCl is highlighted since it is suggested that HCl is a main com- ponent of the total inorganic chlorine (Cl y ), defined as Cl y HCl + ClO + chlorine nitrate (ClONO 2 ), inside the Antarc- tic vortex in spring, owing to low ozone values. To con- firm the quality of two SMILES level 2 (L2) data prod- ucts provided by the Japan Aerospace Exploration Agency (JAXA) and Japan’s National Institute of Information and Communications Technology (NICT), vis-à-vis the partition- ing of Cl y , comparisons are made using other satellite data from the Aura Microwave Limb Sounder (MLS) and At- mospheric Chemistry Experiment Fourier Transform Spec- trometer (ACE-FTS). HCl values from the SMILES NICT L2 product agree to within 10 % (0.3 ppbv) with the MLS HCl data between 450 and 575 K levels in PT and with the ACE-FTS HCl data between 425 and 575 K. The SMILES JAXA L2 product is 10 to 20 % (0.2–0.5 ppbv) lower than that from MLS between 400 and 700 K and from ACE-FTS between 500 and 700 K. For ClO in daytime, the difference between SMILES (JAXA and NICT) and MLS is less than ±0.05 ppbv (100 %) between 500 K and 650 K with the ClO values less than 0.2 ppbv. ClONO 2 values as measured by ACE-FTS also reveal 0.2 ppbv at 475–500 K level, resulting in the HCl / Cl y ratios of 0.91–0.95. The HCl / Cl y ratios de- rived from each retrieval agree to within -5 to 8 % with re- gard to their averages. The high HCl values and HCl / Cl y ratios observed by the three instruments in the lower strato- spheric Antarctic vortex are consistent with previous obser- vations in late Austral spring. Published by Copernicus Publications on behalf of the European Geosciences Union.
-
Upload
independent -
Category
Documents
-
view
0 -
download
0
Transcript of HCl and ClO profiles inside the Antarctic vortex as observed by SMILES in November 2009: Comparisons...
Atmos. Meas. Tech., 6, 3099–3113, 2013www.atmos-meas-tech.net/6/3099/2013/doi:10.5194/amt-6-3099-2013© Author(s) 2013. CC Attribution 3.0 License.
Atmospheric Measurement
TechniquesO
pen Access
HCl and ClO profiles inside the Antarctic vortex as observed bySMILES in November 2009: comparisons with MLS and ACE-FTSinstruments
T. Sugita1, Y. Kasai2, Y. Terao1, S. Hayashida3, G. L. Manney4,5, W. H. Daffer6, H. Sagawa2, M. Suzuki7,M. Shiotani8, K. A. Walker 9,10, C. D. Boone10, and P. F. Bernath11,12
1National Institute for Environmental Studies, Tsukuba, Ibaraki, Japan2National Institute of Information and Communications Technology (NICT), Koganei, Tokyo, Japan3Faculty of Science, Nara Women’s University, Nara, Japan4NorthWest Research Associates, Inc., Socorro, New Mexico, USA5New Mexico Institute of Mining and Technology, Socorro, New Mexico, USA6Jet Propulsion Laboratory, California Institute of Technology, Pasadena, California, USA7Institute of Space and Astronautical Science, Japan Aerospace Exploration Agency (JAXA), Sagamihara, Kanagawa, Japan8Research Institute for Sustainable Humanosphere, Kyoto University, Uji, Kyoto, Japan9Department of Physics, University of Toronto, Toronto, Ontario, Canada10Department of Chemistry, University of Waterloo, Waterloo, Ontario, Canada11Department of Chemistry and Biochemistry, Old Dominion University, Norfolk, Virginia, USA12Department of Chemistry, University of York, Heslington, York, UK
Correspondence to:T. Sugita ([email protected])
Received: 8 July 2013 – Published in Atmos. Meas. Tech. Discuss.: 23 July 2013Revised: 15 October 2013 – Accepted: 16 October 2013 – Published: 18 November 2013
Abstract. We present vertical profiles of hydrogen chloride(HCl) and chlorine monoxide (ClO) as observed by the Su-perconducting Submillimeter-Wave Limb-Emission Sounder(SMILES) on the International Space Station (ISS) inside theAntarctic vortex on 19–24 November 2009. The SMILESHCl value reveals 2.8–3.1 ppbv between 450 K and 500 Klevels in potential temperature (PT). The high value of HClis highlighted since it is suggested that HCl is a main com-ponent of the total inorganic chlorine (Cly), defined as Cly '
HCl + ClO + chlorine nitrate (ClONO2), inside the Antarc-tic vortex in spring, owing to low ozone values. To con-firm the quality of two SMILES level 2 (L2) data prod-ucts provided by the Japan Aerospace Exploration Agency(JAXA) and Japan’s National Institute of Information andCommunications Technology (NICT), vis-à-vis the partition-ing of Cly, comparisons are made using other satellite datafrom the Aura Microwave Limb Sounder (MLS) and At-mospheric Chemistry Experiment Fourier Transform Spec-trometer (ACE-FTS). HCl values from the SMILES NICT
L2 product agree to within 10 % (0.3 ppbv) with the MLSHCl data between 450 and 575 K levels in PT and with theACE-FTS HCl data between 425 and 575 K. The SMILESJAXA L2 product is 10 to 20 % (0.2–0.5 ppbv) lower thanthat from MLS between 400 and 700 K and from ACE-FTSbetween 500 and 700 K. For ClO in daytime, the differencebetween SMILES (JAXA and NICT) and MLS is less than±0.05 ppbv (100 %) between 500 K and 650 K with the ClOvalues less than 0.2 ppbv. ClONO2 values as measured byACE-FTS also reveal 0.2 ppbv at 475–500 K level, resultingin the HCl / Cly ratios of 0.91–0.95. The HCl / Cly ratios de-rived from each retrieval agree to within−5 to 8 % with re-gard to their averages. The high HCl values and HCl / Clyratios observed by the three instruments in the lower strato-spheric Antarctic vortex are consistent with previous obser-vations in late Austral spring.
Published by Copernicus Publications on behalf of the European Geosciences Union.
3100 T. Sugita et al.: HCl and ClO in the 2009 Antarctic as measured by SMILES/MLS/ACE-FTS
1 Introduction
Hydrogen chloride (HCl) and chlorine monoxide (ClO) playan important role in the mechanism of ozone destructionin the stratosphere. The total inorganic chlorine (Cly) inthe stratosphere is defined as the sum of the volume mix-ing ratios of Cl, 2×Cl2, ClO, HOCl, 2×ClOOCl, OClO,chlorine nitrate (ClONO2), and HCl. Observing the timeevolution of these species in both the Arctic and Antarc-tic vortices (lower stratosphere) is essential since HCl andClONO2 act as reservoirs for the chlorine radicals (ClOx= Cl + ClO + 2×ClOOCl) that destroy ozone catalytically(e.g.,WMO, 2007). It is also useful to evaluate model stud-ies of the time series of Cly species (e.g.,Santee et al.,2008b). The reservoirs, HCl and ClONO2, are decomposedto yield Cl2 through heterogeneous reactions occurring in/onsulfate aerosols and polar stratospheric clouds (PSCs) inwinter. Consequently, ClOx is elevated through photoly-sis/photochemical reactions in winter/spring, then it is deac-tivated into the reservoirs.
Increased amounts of HCl in the springtime Antarcticwhen ClOx is deactivated were observed by ground-basedFourier Transform Infrared Spectroscopy (FTIR) instrumentsstarting in 1987 (e.g.,Murcray et al., 1989; Liu et al., 1992;Kreher et al., 1996). Using satellite instruments on board theUpper Atmosphere Research Satellite (UARS) in the 1990s,several studies showed the time evolution of ClO and HCl inthe spring Antarctic vortices (e.g.,Douglass et al., 1995; San-tee et al., 1996; Chipperfield et al., 1996; Grooß et al., 1997;Mickley et al., 1997). On 3–12 November 1994, measure-ments from the Atmospheric Trace MOlecule Spectroscopy(ATMOS) on the Space Shuttle were conducted.Rinslandet al. (1996) andMichelsen et al.(1999) suggested that thehigh HCl / Cly ratio (∼0.9) was maintained in the Antarc-tic vortex. Also, in November 1996, it was reported thatthe high HCl and low ClONO2 were observed by HALo-gen Occultation Experiment (HALOE) and Improved LimbAtmospheric Spectrometer (ILAS) satellite instruments, re-spectively (Hayashida and Sugita, 2007). All of these re-sults confirm a theoretical study byPrather and Jaffe(1990)who showed a mechanism for increased HCl values afterthe “ozone hole” period in the Antarctic. This can be un-derstood as low values of ozone shifting the partitioning ofClOx into Cl, so that the reaction Cl + CH4 that forms HClproceeds faster than the reaction ClO + NO2 + M that formsClONO2, thus reaching a steady state with a high HCl / Clyratio (see Sect. 4.3). In addition, there was indirect evidenceof increased values of HCl in the Antarctic in October 1993from aircraft measurements of the isotopic composition ofCO (Müller et al., 1996; Brenninkmeijer et al., 1996).
Simultaneous in situ aircraft measurements of ClO, HCl,and ClONO2 have been available since 1997 (Bonne et al.,2000). An aircraft mission was performed in the 1999/2000Arctic winter; the time evolution of the Cly species hasbeen investigated (e.g.,Wilmouth et al., 2006). Dufour et al.
(2006) also showed an evolution of the Cly partitioning inthe 2004/2005 Arctic winter from the Atmospheric Chem-istry Experiment-Fourier Transform Spectrometer (ACE-FTS) measurements. However, the HCl value or HCl / Cly ra-tio in the Arctic was lower than those in the Antarctic (e.g.,Santee et al., 2008b; Manney et al., 2011; Wegner et al.,2012), even with severe ozone loss in the 2010/2011 Arc-tic winter (e.g.,Manney et al., 2011). An exception was the1996/1997 Arctic winter when the breakup of the vortex oc-curred in May; an HCl / Cly ratio of 0.8–0.9 was observed byHALOE (Douglass and Kawa, 1999; Konopka et al., 2003).Very low ozone values in the Antarctic play a central role inthe difference in Cly partitioning between the Arctic and theAntarctic (e.g.,Douglass et al., 1995), except in the unusualAntarctic winter 2002, when some deactivation into ClONO2occurred (e.g.,Grooß et al., 2005; Höpfner et al., 2004).
In the Antarctic, no comprehensive aircraft campaign hasbeen done since the 1994 mission (Tuck et al., 1997; Jaegléet al., 1997), so satellite measurements are crucial to studythe partitioning of Cly in the Antarctic. Although a highHCl / Cly ratio is usually seen in the upper stratosphere, it hasalso been seen in the lower stratosphere in the combined datafrom the Aura Microwave Limb Sounder (MLS) and ACE-FTS data (WMO, 2007; Santee et al., 2008b) or just in theMLS data (Santee et al., 2011; de Laat and van Weele, 2011)since 2004. This is due to the combination of diabatic descentof air inside the vortex, low ozone values, and isolation of thelower stratospheric vortex.
The International Space Station (ISS) borne instrument,the Superconducting Submillimeter-Wave Limb-EmissionSounder (SMILES), started operations in October 2009.SMILES observed latitudes between∼66◦ N and∼38◦ S.On 19–24 November 2009, there were, however, measure-ments including the Antarctic (∼38◦ N to ∼66◦ S) due tothe ISS observation geometry (see Sect. 2.1). The breakupof the Antarctic vortex in the lower stratosphere occurred inDecember 2009 (NOAA, 2009), so that some measurementswere taken inside the vortex where high HCl values are ex-pected. In this paper, we focus on these SMILES measure-ments, and analyze the vertical profiles of HCl and ClO in-side the Antarctic vortex to confirm those data quality vis-à-vis the partitioning of Cly, through comparisons with satellitedata for the same time period from the MLS and ACE-FTSinstruments. Comparisons performed when the HCl value ishigh (∼3 ppbv) in the lower stratosphere will provide valu-able information on the HCl measurements.
Data from satellite measurements used here are describedin Sect. 2. The methodology of the study is mentioned inSect. 3. Vertical profiles of HCl, ClO, and HCl / Cly ratioare shown in Sect. 4 and discussion of the Cly partitioning,including the diurnal changes in ClO and ClONO2, is alsogiven in Sect. 4. The conclusions of the study are summa-rized in Sect. 5.
Atmos. Meas. Tech., 6, 3099–3113, 2013 www.atmos-meas-tech.net/6/3099/2013/
T. Sugita et al.: HCl and ClO in the 2009 Antarctic as measured by SMILES/MLS/ACE-FTS 3101
2 Satellite measurements
2.1 SMILES
SMILES is a passive sensor to measure the limb of Earth’satmosphere in the frequency bands around 625 GHz and650 GHz. The instrument was attached to the JapaneseExperiment Module (JEM) on board ISS. The emissionlines of O3, HCl, ClO, HO2, HOCl, BrO, and othermolecules can be found in the low-noise spectra obtainedwith a 4 K mechanical cooler and superconductor-insulator-superconductor (SIS) mixers. The SMILES observationsstarted on 12 October 2009 and ceased on 21 April 2010 dueto the failure of a critical component in the submillimeter lo-cal oscillator. Results from SMILES have demonstrated itshigh potential for observing atmospheric minor constituentsin the middle atmosphere, as shown inKikuchi et al.(2010).
Because the ISS is in a non-sun-synchronous circular or-bit with an inclination angle of 51.6◦ to the Equator, theSMILES measurements at each tangent point occur at var-ious local solar times (LST). For several specific periods, in-cluding 19–24 November 2009, the ISS rotated 180◦ aroundits yaw axis, and thus the observation latitude range wasshifted to southern high latitudes up to 66◦ S. A more de-tailed description of the observation latitudes and periods isfound in Fig. 1 ofKasai et al.(2013). There were also south-ern high latitude measurements on 10–19 February and 8–17April 2010.
Since SMILES has three specified detection bands –624.32–625.52 GHz (Band A), 625.12–626.32 GHz (BandB), and 649.12–650.32 GHz (Band C) – with two acousto-optical spectrometers, observations of Bands A, B, and C aremade on a time-sharing basis, such as Bands A+B, A+C,or B+C. In the period that we analyze, Bands B+C mea-surements were performed. The H35Cl rotational transition(J = 1–0) is located at 625.9 GHz in Band B. The ClO tran-sitions in the ground ro-vibronic state (J = 35/2–33/2) arelocated at 649.445 GHz and 649.451 GHz in Band C. Verti-cal resolution is 3.5–4.1 km and vertical range of the mea-surements is from∼12 km to 96 km.
The SMILES level 2 (L2) data processing systems (Taka-hashi et al., 2010; Baron et al., 2011) retrieve vertical pro-files of the atmospheric minor constituents from the cali-brated radiance observations (Level 1b data, hereafter re-ferred to as L1b). In this paper, we used two SMILES L2data products, which are separately processed with differentretrieval algorithms: the version 2.1 (hereafter referred to asv2.1) of JAXA L2 products (Mitsuda et al., 2011) (hereafterSMILES-JAXA) and the v2.1.5 of NICT L2 products (Ka-sai et al., 2013; Sagawa et al., 2013) (hereafter SMILES-NICT). Both of the data sets were publicly released on 5March 2012 (http://smiles.tksc.jaxa.jp/for SMILES-JAXAandhttp://smiles.nict.go.jp/for SMILES-NICT).
Both of the retrieval algorithms used same L1b data andsimilar instrument functions in the forward model calcu-
lations. The vertical inversion of the volume mixing ratioprofiles are based on the optimal estimation method (e.g.,Rodgers, 2000). However, several differences in the two al-gorithms made different data products (Kasai et al., 2013;Sagawa et al., 2013). Thus, it is of importance to compareboth of the L2 products to investigate matters relating to thealgorithms. Here, we briefly present the differences that af-fect mostly the lower stratosphere data quality.
One of the major differences is the spectral bandwidthused in the retrieval analysis. The SMILES-JAXA L2 algo-rithm uses a full bandwidth (∼1.2 GHz) of each detectionband to simultaneously retrieve all the observed species inthat band. On the other hand, SMILES-NICT processing em-ploys the sequential retrieval approach using a narrow band-width around the targeted species (Baron et al., 2011). Forexample, after O3 and temperature profiles were retrieved,HCl is retrieved from the spectra extracted at±300 MHz ofthe HCl line center. ClO is retrieved from the spectra in BandC using a spectral bandwidth of 400 MHz centered on theClO line. For the species of interest in this paper (HCl andClO), the information in the lower stratosphere can be re-trieved also from the far wings of their lines. Therefore, theusage of a limited spectral bandwidth results in a decreaseof the sensitivity and degradation of the vertical resolution atlower altitudes (Sagawa et al., 2013). Whereas, for the fullbandwidth approach, it is difficult to deal with nonlinearityof the detector in the far wings. Both of the approaches, thus,have some disadvantages.
Different assumptions on a priori state also introducesystematic biases on retrieved profiles, particularly whenthe measurement sensitivity is low. The a priori profile ofSMILES-JAXA is based on mean profiles for month, lati-tude, (daytime and nighttime separately for ClO), using theMLS version 2.2 data. The MLS ClO data have been bias-corrected as suggested bySantee et al.(2008a). SMILES-NICT used a single common a priori profile for HCl or ClOfor all observations. However, as stated in Sect. 4.1, the im-pact of the difference on the retrieved HCl values is insignif-icant because of the high sensitivity of the measurementsstudied here.
For the modeling of continuum absorptions of H2O anddry air, SMILES-JAXA uses the MPM-93 model (Liebeet al., 1993) with a scaling factor of 1.34. SMILES-NICTuses a model on the basis ofPardo et al.(2001). The dry aircontinuum absorption coefficient was increased by a factorof 20 % from the original formula, and retrieves H2O as thecontinuum (Kasai et al., 2013). The above differences em-ployed in each retrieval processing could be the cause ofdifferences in the results of retrieved volume mixing ratioprofiles. There are other lower stratospheric differences inthe SMILES-JAXA and SMILES-NICT processing: the ap-proach for measurement tangent height correction, a prioristate of temperature and pressure, and so on. More detaileddescriptions of these differences are found elsewhere (Kasaiet al., 2013; Sagawa et al., 2013). There are also differences
www.atmos-meas-tech.net/6/3099/2013/ Atmos. Meas. Tech., 6, 3099–3113, 2013
3102 T. Sugita et al.: HCl and ClO in the 2009 Antarctic as measured by SMILES/MLS/ACE-FTS
in spectroscopic parameters used in each forward model;however, the impact of the differences on the retrieved dataproducts seems to be small in the lower stratosphere, asshown inSagawa et al.(2013) for ClO and Yokoyama et al.(2013) for HCl. A list of the parameters, namely the line fre-quencyν0, the air broadening coefficientγair, and its temper-ature dependencenair, is shown in Table1.
We present error analysis and validation results for bothHCl and ClO achieved thus far. For previous versions ofSMILES-JAXA, precision is 10 % at 15 km and 1 % at 30 kmfor HCl (Kikuchi et al., 2010; Shiotani et al., 2010). For ClO,precision is estimated to be 10 pptv between 19 and 28 km(Suzuki et al., 2012). This is evaluated from the standard de-viation of the nighttime ClO measurements. The mean night-time data also provide a good measure for a bias estimationof the JAXA ClO data products, which has already shown avalidity for the BrO data product (Stachnik et al., 2013). Thisbias will be considered for ClO later (Sect. 4.2). The cause ofthis bias is unknown, but it seems to be due to an unexpectedquadratic spectral baseline of the L1b data, which should beflattened by calibration, and a small residual between L1band the forward model calculation, which could also arisefrom the quadratic continuum emission feature (Suzuki et al.,2012). The full-bandwidth approach used in the JAXA pro-cessing system tends to be susceptible to these baseline-related effects. Validation studies for SMILES-JAXA are, todate, in preparation.
For HCl from SMILES-NICT (v2.1.5), the precision is es-timated to be∼1–2 % at the 10 hPa level and it increasesto 8 % at 80 hPa. The validation of SMILES-NICT HClwas performed by comparing with MLS version 3.3 dataand ACE-FTS version 3.0 data (Yokoyama et al., 2013):the absolute difference between SMILES-NICT and MLSamounts to –0.2 ppbv at 80 hPa and +0.1 ppbv at 10 hPa. Theabsolute difference between SMILES-NICT and ACE-FTSranges from zero to +0.1 ppbv at 80–10 hPa levels. For ClOfrom SMILES-NICT (v2.1.5), the precision is estimated tobe 100 pptv and 30 pptv between 100 hPa and 10 hPa (Satoet al., 2012). Sagawa et al.(2013) have also estimated thebias uncertainty of 5–10 pptv below 20 hPa level and made avalidation study: the absolute differences between SMILES-NICT and MLS version 3.3 data or Odin Sub-Millimeter Ra-diometer (SMR) Chalmers Version 2.1 data (Murtagh et al.,2002) is within±0.1 ppbv at 80–10 hPa levels.
We analyzed SMILES data obtained on 19–24 Novem-ber, when the measurements were conducted between 38◦ Nand 66◦ S. During those days, the polar vortex was some-what shifted toward South America, so that the edge ofthe vortex reached to around 50◦ S in the lower strato-sphere (de Laat et al., 2010). Therefore, we extracted theSMILES data between 50◦ S and 66◦ S. The profiles ofSMILES (both JAXA and NICT) were discarded whenflagged with “field-of-view interference” and “altitude error”according to a release note (http://smiles.tksc.jaxa.jp/l2data/index_e.html). For SMILES-JAXA, profiles with “conver-
Table 1.Spectroscopic parameters for HCl and ClO in the SMILESforward models (see Sect. 2.1).
ν0 (MHz) γ air (MHz/hPa) nair
H35Cl
JAXA 625901.6584a 2.54b 0.72b
625918.6975a
625932.0081a
NICT 625901.6627c 2.54d 0.72d
625918.7020c
625931.9977c
ClO
JAXA 649445.250e 2.11e 0.85e
649451.072e
NICT 649445.040d 2.15d 0.77d
649451.170d
a Perrin et al.(2005), b Read et al.(2004), c Cazzoli and Puzzarini(2004), d an original laboratory study; seeBaron et al.(2011), e Ohand Cohen(1994).
gence” value greater than 10 are discarded. Further, datapoints with precision larger than a half of a priori errorare also discarded. For SMILES-NICT, profiles with “chi-square” value larger than 0.8 are discarded. For the NICT re-trieval, chi-square is the summation of the squared and vari-ance weighted residuals in the measurement space and thenull space after they are normalized by the number of mea-surements and retrieval parameters. Typical chi-square val-ues are smaller than unity because of the overestimation ofthe measurement noise (Baron et al., 2011). Thus, no goodretrievals have been discarded by this data selection. Datapoints with measurement response smaller than 0.8 are alsodiscarded.
2.2 MLS
Since August 2004, the MLS instrument on the NationalAeronautics and Space Administration (NASA) Earth Ob-serving System (EOS) Aura satellite (Waters et al., 2006)has operated between 82◦ N and 82◦ S. MLS measuresmillimeter- and submillimeter-wavelength thermal emissionfrom the limb of Earth’s atmosphere. We used HCl and ClOdata products retrieved with the version 3.3 data processingalgorithm (Livesey et al., 2006), which are publicly availablefrom http://mls.jpl.nasa.gov/. The quality of the HCl data isas follows (Livesey et al., 2011): vertical resolution in thelower stratosphere is∼3 km and precision is 0.3–0.2 ppbvat 100–10 hPa. The quality of the ClO data is as follows(Livesey et al., 2011): vertical resolution is 3.0–4.5 km, pre-cision is±0.3 ppbv at 147 hPa and±0.1 ppbv at 100–22 hPa,and bias estimates are from−0.1 to zero ppbv at 50–70◦ S inNovember. In this study, we used data taken at 50–66◦ S on
Atmos. Meas. Tech., 6, 3099–3113, 2013 www.atmos-meas-tech.net/6/3099/2013/
T. Sugita et al.: HCl and ClO in the 2009 Antarctic as measured by SMILES/MLS/ACE-FTS 3103
19–24 November 2009. Data screening is also done accord-ing toLivesey et al.(2011).
2.3 ACE-FTS
ACE-FTS, the primary instrument on the SCISAT-1 satellite,is a high-resolution infrared Fourier transform spectrome-ter that measures solar occultation spectra between 2.2 and13.3 µm (Bernath et al., 2005). The observations began inFebruary 2004. It has also operated in the period of 19–24November at latitudes between 65.7◦ S and 69.3◦ S. This is asomewhat more southerly latitude than SMILES and MLSmeasurements used in this study. Vertical resolution is 3–4 km. We used HCl and ClONO2 data products retrievedwith the version 3.0 data processing algorithm (Boone et al.,2005) (http://www.ace.uwaterloo.ca/). The error analysis ofthe HCl data has not yet been evaluated, but the measure-ment variability that provides an upper limit on retrieval pre-cision is estimated to be on the order of 5 % at 20–55 km(Mahieu et al., 2008). The fitting error of the ClONO2 datais below 10 % at 20–30 km and increases to 40 % at 14 km(Wolff et al., 2008). Dufour et al.(2006) have provided anerror budget for a single occultation: the total errors for HCland ClONO2 are, respectively, estimated to be 4–7 % and 10–19 % between 16.5 km and 28.5 km.
2.4 MIPAS
The Michelson Interferometer for Passive AtmosphericSounding (MIPAS) on board ESA’s Envisat is a mid-infraredemission spectrometer (Fischer et al., 2008). The observa-tions were performed from July 2002 to April 2012. Weused the Institute for Meteorology and Climate Research(IMK)/Instituto de Astrofísica de Andalucía (IAA) ClONO2data product, version V5R_CLONO2_220 (von Clarmannet al., 2009, 2013). The vertical resolution at the tangent al-titude of 20 km is∼3 km, and the precision between 15 and25 km is∼8 % (von Clarmann et al., 2009). This data set isused for an interpretation of the diurnal cycle of Cly species,as described in Sect. 4.3.
3 Method
In order to show the quality of the SMILES data for study-ing Cly partitioning inside the Antarctic vortex, we havemade comparisons with the other satellite data sets describedabove. The 2009 Antarctic vortex at 450 K potential temper-ature (PT) level exhibited a typical seasonal pattern: it devel-oped in mid-May, maximized around September, and thendiminished in the late November/December period (NOAA,2009).
To extract observed data only inside the Antarctic vortex,we used derived meteorological products (DMPs) (Manneyet al., 2007). For both the MLS and ACE-FTS measurementlocations and times, DMPs are produced to facilitate compar-
isons between different satellite instruments. They includePT, potential vorticity (PV), equivalent latitude (EqL), hori-zontal winds, and tropopause locations. The EqL is the lat-itude that would enclose the same area between it and thepole as a given PV contour (Butchart and Remsberg, 1986).In this study, we used DMPs derived from the NASA GlobalModeling and Assimilation Office (GMAO) Goddard EarthObserving System (GEOS) data set (version 5), hereafter re-ferred to as GEOS-5 (Reinecker et al., 2008). Using DMPsto view measurements with respect to their air mass charac-teristics is valuable in a study of chemistry and dynamics in-side/outside the vortex. To compare SMILES measurementswith those from MLS and ACE-FTS, we also obtained DMPsfor the SMILES measurements for the study period.
We used PT for a vertical coordinate, since we focus on theobservations in the lower stratosphere, where Cly has a muchlonger chemical lifetime compared to the transport timescaleat this time and location. In this study, we constructed av-eraged “vortex profiles” using data points at each verticallevel that are poleward of the vortex edge center shown inthe each DMP file. For instance, the vortex edge center islocated at∼−65◦ EqL (negative values are assigned in theSouthern Hemisphere) at the 490 K PT level. The resultingEqL values around 490 K inside the Antarctic vortex are, onaverage,−71◦ EqL,−76◦ EqL, and−75◦ EqL for SMILES,MLS, and ACE-FTS observations, respectively. The volumemixing ratio of tracer species mapped with respect to the PTand EqL is nearly constant with EqL over a certain PT rangewithin the vortex (e.g., Fig. 5 ofLingenfelser and Grose,2002).
For the SMILES and ACE-FTS data, PT values from theDMPs are assigned at each altitude grid point, whereas forthe MLS data, PT values from the DMPs are assigned at eachpressure grid point. The averaged profiles are calculated fromdata contained within a 25 K wide PT bin. In general, inter-comparison among satellite measurements is a difficult taskbecause of the different vertical and horizontal resolutionsconsidered (e.g.,Ceccherini et al., 2003; Ridolfi et al., 2006).Thus, any interpolation of data onto specific PT levels hasnot applied in this study. In addition, the uncertainty in themeteorological data should also be concerned in such a com-parison study. However, it was suggested that the GEOS-5temperatures have about 1 K low bias (Lambert et al., 2012),which has a small impact on the calculation of PT. The point-ing uncertainty in the tangent altitude was estimated to be340 m, 150 m, and 150 m for SMILES, MLS, and ACE-FTS,respectively (Kikuchi et al., 2010; Cofield and Stek, 2006;Harrison and Bernath, 2013). These uncertainties are inher-ent in the constructed average profiles. The individual pro-files from SMILES HCl / ClO, MLS HCl / ClO, and ACE-FTS HCl / ClONO2 used for the averages are found inSugitaet al.(2012).
Figure 1 shows measurement latitudes as a functionof LST used in this study (data taken inside the vortex). Asmentioned in Sect. 2.1, the SMILES measurements occur at
www.atmos-meas-tech.net/6/3099/2013/ Atmos. Meas. Tech., 6, 3099–3113, 2013
3104 T. Sugita et al.: HCl and ClO in the 2009 Antarctic as measured by SMILES/MLS/ACE-FTS
-70
-65
-60
-55
-50
Latit
ude
(deg
.)
1815129630
Local solar time (hour)
> 85
80
70
60
50
40
SZ
A (deg.)
SMILES-JAXA MLS ACE-FTS
Nov. 19-24, 2009
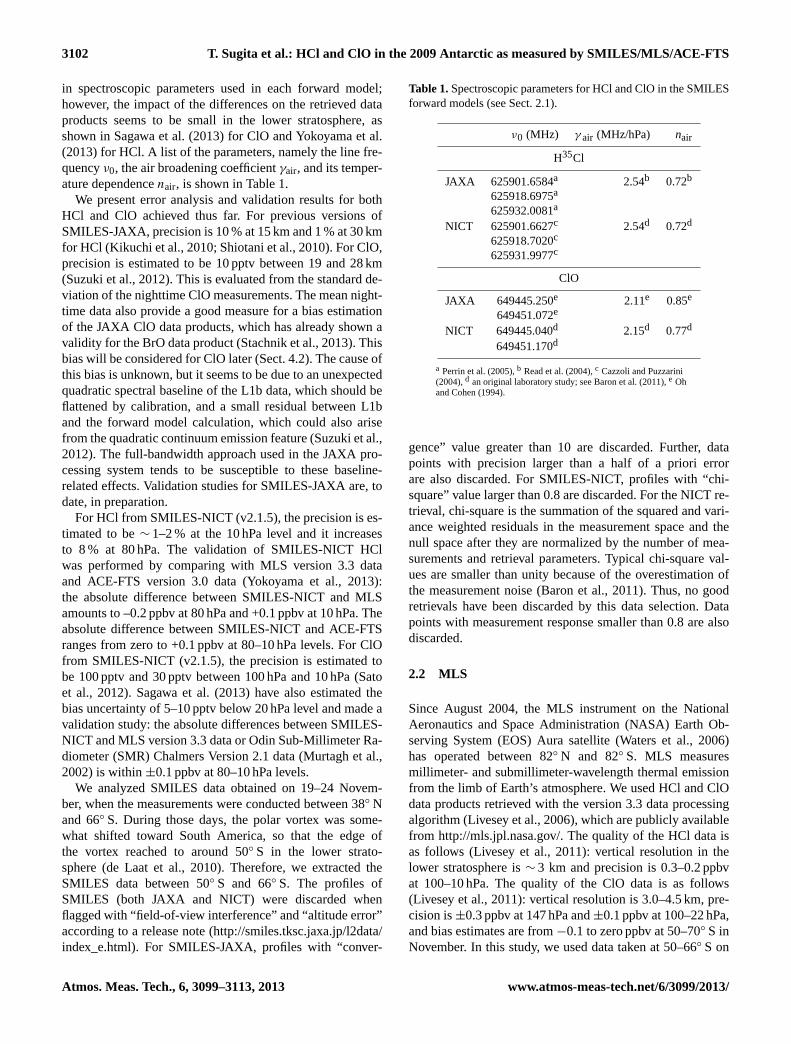
Fig. 1. Measurement latitude as a function of local solar timefor SMILES (open circles), MLS (crosses), and ACE-FTS (opensquares). Solar zenith angle (SZA) is color-coded between 40◦ and85◦. Above 85◦, the symbols are coded in black. Data only insidethe Antarctic vortex (within the edge center) between 19 and 24November 2009 are used.
various LST. Therefore, it is crucial to consider the diurnalcycle of ClO and ClONO2 in comparisons between SMILES,MLS, and ACE-FTS. In the following section, we considerSMILES and MLS ClO data only for solar zenith angles(SZAs) less than 85◦, representing daytime measurements.The daytime measurements from SMILES occurred at LSTsbetween 03:00 and 09:00 LST, whereas the daytime mea-surements from MLS occurred at LSTs of 14:00–15:00 LST.These LST differences are carefully treated in the follow-ing discussion. Data with SZAs larger than 85◦ are coded inblack for each symbol. For ACE-FTS measurements, all ofthe occultations occurred at a SZA of 90◦ from the satellitesunset for this time and location.
4 Results and discussion
4.1 HCl
Figure2 shows the vortex profiles of SMILES and MLS HClvolume mixing ratios taken on 19–24 November 2009 at lat-itudes between 50◦ S and 66◦ S as a function of PT. PTs of400, 500, 600, and 700 K approximately correspond to alti-tudes of 15, 19, 23, and 26 km, respectively. Data are aver-aged within the PT bin between 400–425 K and 675–700 K.At first, we focus on the results from SMILES. The aver-age and one sigma standard deviation are shown for bothSMILES-JAXA and SMILES-NICT data in the left panel(blue and green squares, respectively). The absolute differ-ences between the SMILES-JAXA and SMILES-NICT av-erages in each bin are also shown in the same panel (black
-40 0 40(X1 – X2)/ave. (%)
294
135
308
117
271
139
72
245
84
53
161
16
235
183
31
63
278
72
9
36
165
53
105
85
66
6
89
50
13
36
60
8
4
31
X1 X2 NICT – JAXA MLS – JAXA MLS – NICT
750
700
650
600
550
500
450
400
Pot
entia
l tem
pera
ture
(K
)
43210HCl (ppbv)
16
18
20
22
24
(km)Nov. 19-24, 2009 SMILES-JAXA
SMILES-NICT MLS (v3.3) NICT – JAXA MLS – JAXA MLS – NICT Precision (JAXA) Precision (NICT) Precision (MLS)
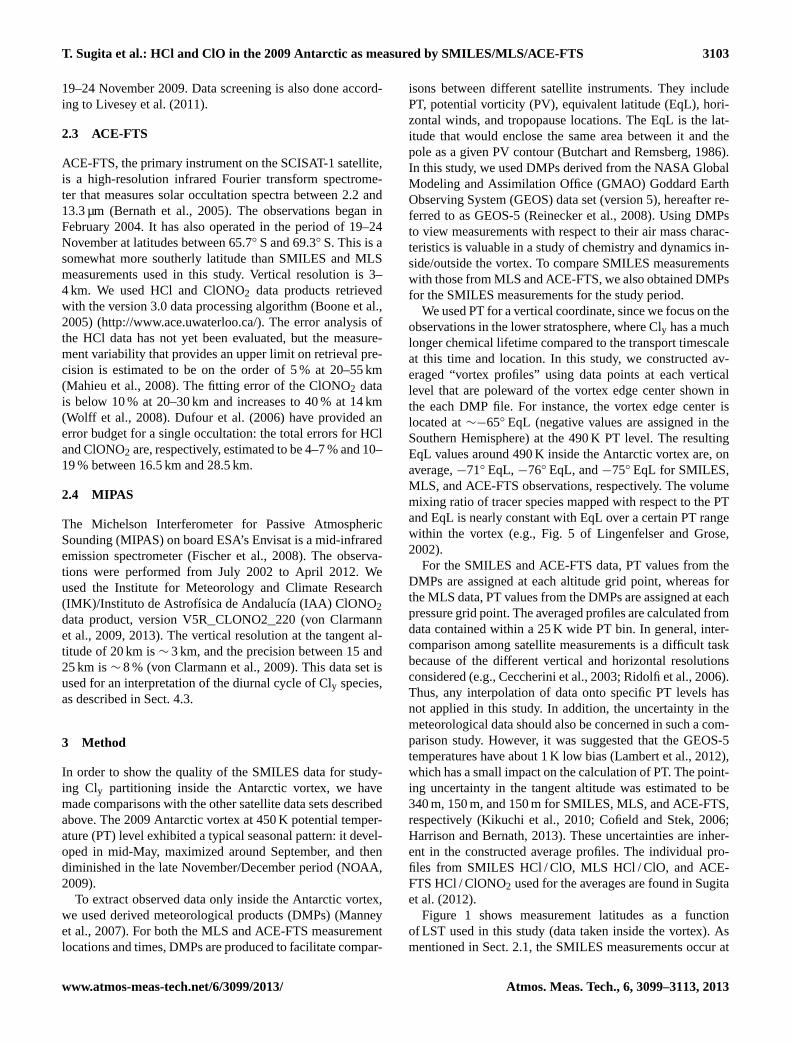
Fig. 2. Vertical profiles, as a function of potential temperature (PT),of HCl volume mixing ratios as measured by SMILES and MLSon 19–24 November 2009 inside the vortex (within the edge cen-ter). The left panel shows average profiles of HCl in each 25 KPT bin (each vertical bar corresponds to 25 K) for the SMILES-JAXA (blue), SMILES-NICT (green), and MLS (red) data prod-ucts. Squares and horizontal bars show average and±1σ stan-dard deviations, respectively. Dashed lines show reported preci-sions. The black crosses show the absolute difference between thetwo SMILES products. The blue and green crosses show the abso-lute difference between the MLS and SMILES-JAXA or SMILES-NICT, respectively. Approximate altitudes corresponding to PT areshown on the right-hand side of the panel. The right panel showsthe relative difference with regard to the absolute difference dividedby its mean value of SMILES-JAXA and SMILES-NICT, MLS andSMILES-JAXA, or MLS and SMILES-NICT products. The num-bers of data used in the averages are also listed outside of the rightpanel: SMILES-JAXA (blue), SMILES-NICT (green), and MLS(red).
crosses). Precision was calculated as an average derived fromthe measurement precision reported for the respective datafiles, and is shown as the dashed line: it is quite small com-pared to the retrieved value. The right panel shows the rela-tive difference expressed as the absolute difference dividedby the mean of SMILES-JAXA and SMILES-NICT data(black circles). The data values used in each bin are shownon the right-hand side of the right panel. Since the PT in-terval is narrower than the retrieval grids, these numbers arenonuniform in the vertical range.
The peak value of SMILES HCl reveals 2.8 and 3.1 ppbvat 450–475 K bin (JAXA) and 475–500 K bin (NICT), re-spectively. The relative difference between SMILES-JAXAand SMILES-NICT amounts to 7–21 % between 425–450 Kand 550–575 K bins (the absolute difference up to 0.5 ppbv),and−10 to 2 % between 575–600 K and 650–675 K bins, re-sulting in a better agreement than in the lower PT levels. Thecause of these differences of up to 20 % found in the lowerlevels is unclear, but it is related to the different approachesused in the forward models and retrieval schemes describedin Sect. 2.1. Besides the difference in the spectral bandwidth
Atmos. Meas. Tech., 6, 3099–3113, 2013 www.atmos-meas-tech.net/6/3099/2013/
T. Sugita et al.: HCl and ClO in the 2009 Antarctic as measured by SMILES/MLS/ACE-FTS 3105
used in the retrieval analysis, another possible cause couldbe the different a priori profiles used for each algorithm. Wehave tested JAXA’s processing system using a more realis-tic a priori (constructed from the MLS version 2.2 HCl datainside the Antarctic vortex). However, the result was almostthe same because the measurement sensitivity is sufficientlyhigh that the retrieval is insensitive to the a priori. Anothercontributing factor may be the difference in dealing with themodeling of continuum absorptions (see Sect. 2.1). A furtherinvestigation to quantify the difference is ongoing along withupdates of both retrieval algorithms.
To compare these SMILES HCl data products with thosefrom other satellite instruments, the Aura MLS and ACE-FTS HCl data are analyzed. Figure2 also shows the vortexprofiles of MLS HCl (red squares). The maximum mixing ra-tio of MLS is seen at 475–500 K bin with a value of 3.4 ppbv.The shape of the profile is similar to that of SMILES-NICT.Better agreement is found between SMILES-NICT and MLS(green crosses) than from SMILES-JAXA and MLS (bluecrosses). The relative difference between SMILES-NICT andMLS ranges from−5 to 13 % between 425–450 K and 575–600 K bins, but it increases to 19 % at 650–675 K bin. ForSMILES-JAXA and MLS, the relative difference amountsto 7–23 % between 400–425 K and 675–700 K bins, exceptfor 33 % at 425–450 K bin. In the period of November 2009,band 13 (primary to detect H35Cl) of the MLS instrumentwas not used and HCl was retrieved using band 14; it hasbeen suggested that retrievals of HCl from band 14 have ahigh bias at high HCl values (above∼3 ppbv) (Livesey et al.,2011). The positive difference found in both of the compar-isons between SMILES and MLS at 450–500 K might reflectan artifact of the MLS band 14 measurement to some extent.
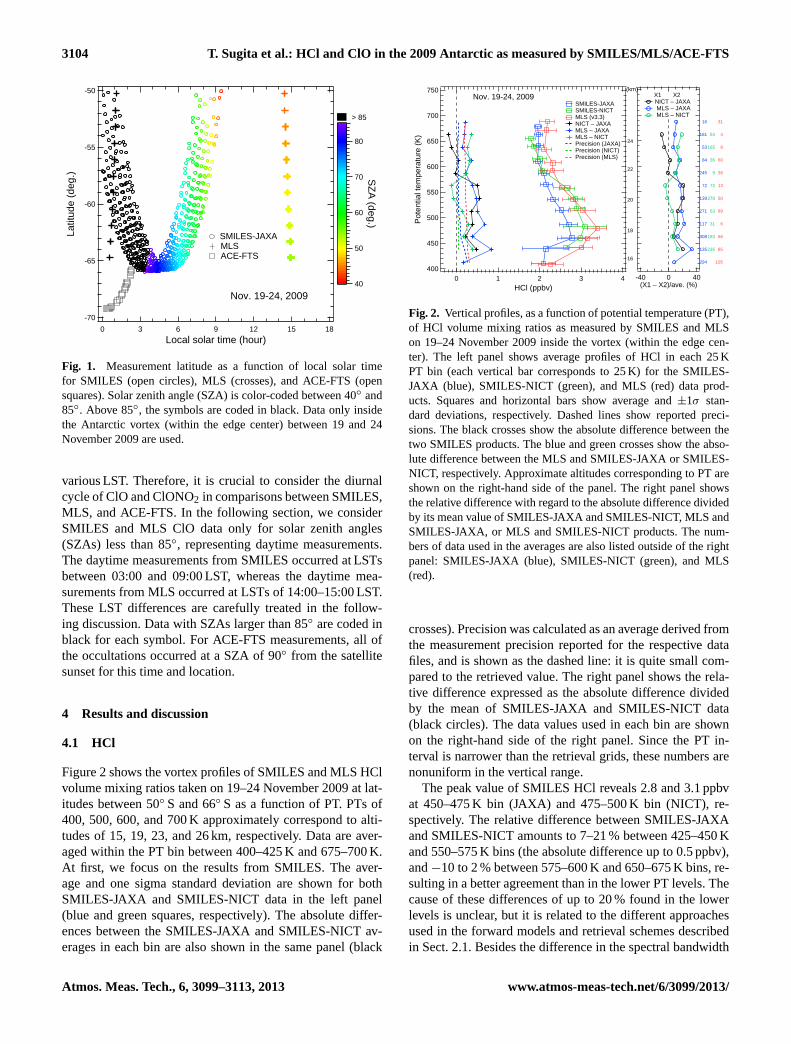
Figure3 shows the vortex profiles of SMILES and ACE-FTS HCl taken on 19–24 November 2009 as a function ofPT. The SMILES data are identical to those shown in Fig.2.Since the ACE-FTS measurements are made using solar oc-cultation, observations are limited to a certain latitude in acertain period (see Sect. 3 and Fig.1). The number of obser-vations (occultation events) inside the vortex for ACE-FTSis 26. Since we used the 1 km altitude grid data, some pro-files have two data points in a bin. Thus, the number of dataused in the 400–425 K bin is 29 at the maximum. The max-imum mixing ratio of ACE-FTS is seen at 500–525 K binwith a value of 2.9 ppbv that is similar to the results fromSMILES and MLS, with a slightly higher PT level than thoseof SMILES and MLS.
The relative difference between SMILES-JAXA and ACE-FTS (blue circles) ranges from−5 % to 19 %. The relativedifference between SMILES-NICT and ACE-FTS (green cir-cles) ranges from−9 % to −1 % between 425–450 K and500–575 K bins, but it increases to 16–22 % between 575–600 K and 650–675 K bins. In summary, a general feature isthat SMILES-JAXA HCl is somewhat lower than both MLSand ACE-FTS, whereas SMILES-NICT HCl shows betteragreement with both MLS and ACE-FTS between 425 K and
-40 0 40(X1 – X2)/ave. (%)
294
135
308
117
271
139
72
245
84
53
161
16
235
183
31
63
278
72
9
36
165
53
29
22
16
15
14
12
6
13
10
5
11
9
X1 X2 ACE – JAXA ACE – NICT
750
700
650
600
550
500
450
400
Pot
entia
l tem
pera
ture
(K
)
43210HCl (ppbv)
16
18
20
22
24
(km)Nov. 19-24, 2009 SMILES-JAXA
SMILES-NICT ACE-FTS (v3) ACE – JAXA ACE – NICT Precision (JAXA) Precision (NICT) Precision (ACE)
Fig. 3. Same as Fig.2, but for SMILES and ACE-FTS. The abso-lute and relative differences between SMILES-JAXA and SMILES-NICT are omitted.
575 K. Above 575 K, SMILES-NICT HCl is, however, lowerthan that from both MLS and ACE-FTS.
The HCl values from MLS and ACE-FTS agree to within10 % above 550 K (not shown). In general, both SMILES re-trievals are a maximum of 23 % smaller than MLS and ACE-FTS at these levels.
4.2 ClO
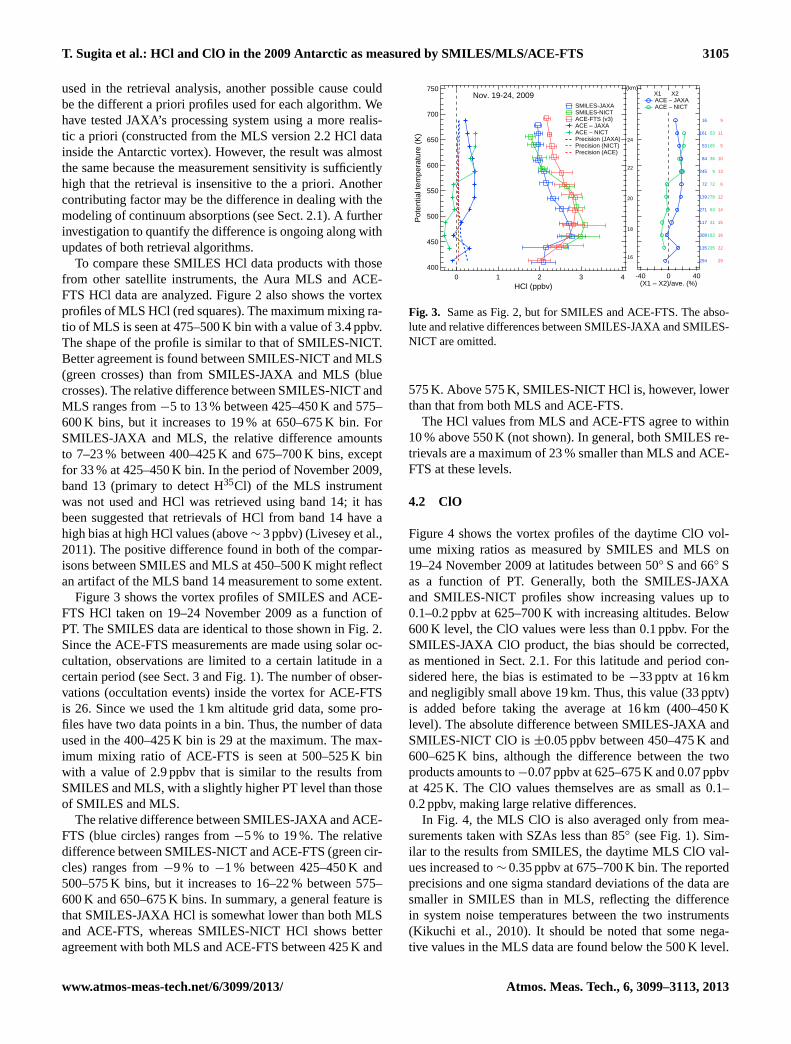
Figure4 shows the vortex profiles of the daytime ClO vol-ume mixing ratios as measured by SMILES and MLS on19–24 November 2009 at latitudes between 50◦ S and 66◦ Sas a function of PT. Generally, both the SMILES-JAXAand SMILES-NICT profiles show increasing values up to0.1–0.2 ppbv at 625–700 K with increasing altitudes. Below600 K level, the ClO values were less than 0.1 ppbv. For theSMILES-JAXA ClO product, the bias should be corrected,as mentioned in Sect. 2.1. For this latitude and period con-sidered here, the bias is estimated to be−33 pptv at 16 kmand negligibly small above 19 km. Thus, this value (33 pptv)is added before taking the average at 16 km (400–450 Klevel). The absolute difference between SMILES-JAXA andSMILES-NICT ClO is±0.05 ppbv between 450–475 K and600–625 K bins, although the difference between the twoproducts amounts to−0.07 ppbv at 625–675 K and 0.07 ppbvat 425 K. The ClO values themselves are as small as 0.1–0.2 ppbv, making large relative differences.
In Fig. 4, the MLS ClO is also averaged only from mea-surements taken with SZAs less than 85◦ (see Fig.1). Sim-ilar to the results from SMILES, the daytime MLS ClO val-ues increased to∼0.35 ppbv at 675–700 K bin. The reportedprecisions and one sigma standard deviations of the data aresmaller in SMILES than in MLS, reflecting the differencein system noise temperatures between the two instruments(Kikuchi et al., 2010). It should be noted that some nega-tive values in the MLS data are found below the 500 K level.
www.atmos-meas-tech.net/6/3099/2013/ Atmos. Meas. Tech., 6, 3099–3113, 2013

3106 T. Sugita et al.: HCl and ClO in the 2009 Antarctic as measured by SMILES/MLS/ACE-FTS
-100 0 100(X1 – X2)/ave. (%)
169
44
54
193
63
10
42
157
54
5
19
57
139
102
21
31
155
47
5
14
97
33
49
40
35
4
46
26
11
22
33
4
16
X1 X2 NICT – JAXA MLS – JAXA MLS – NICT
750
700
650
600
550
500
450
400
Pot
entia
l tem
pera
ture
(K
)
0.40.30.20.10.0-0.1ClO (ppbv)
16
18
20
22
24
(km)Nov. 19-24, 2009
SMILES-JAXA SMILES-NICT MLS (v3.3) Precision (JAXA) Precision (NICT) Precision (MLS)
-0.1 0 0.1X1 – X2 (ppbv)
X1 X2 NICT – JAXA MLS – JAXA MLS – NICT
Fig. 4. Same as Fig.2, but for ClO volume mixing ratios as mea-sured by SMILES and MLS. For clarity, absolute differences areshown in the middle panel. Measurements with solar zenith anglesless than 85◦ (daytime) are used. Arrows in the right panel showlarger relative differences owing to the averages close to zero.
We have bias-corrected with 0.09–0.15 ppbv (added) below500 K (100 hPa and 68 hPa levels), depending on latitudes(5-degrees bin) for each ClO data before taking the averages,as suggested byLivesey et al.(2011). The absolute differ-ence between SMILES and MLS ClO is almost±0.05 ppbvbetween 400 K and 650 K, although the values themselvesare again below 0.15 ppbv, making large relative differences.Although the number of data points is small, the SMILESClO values in the SZA range between 85◦ and 95◦ are zeroto 0.05 ppbv between 400 K and 700 K levels. For measure-ments with SZAs larger than 95◦, ClO reveal values aroundzero.
As shown in Fig.1, the MLS observations were takenat 14:00–15:00 LST, whereas the SMILES observationswere taken at 03:00–09:00 LST. Thus, a large difference(0.14 ppbv) between SMILES-JAXA and MLS at 675–700 K bin (∼26 km) could be partly associated with diurnalchanges in ClO. At this altitude, time, and location, the diur-nal cycle of ClO is thought to take place via the photolysis ofClONO2 (Santee et al., 2008b). Indeed, if we take an aver-age only using the SMILES-JAXA ClO data with SZAs lessthan 55◦ in the 675–700 K bin (the number of data is 5 out of57), the ClO value of 0.21 ppbv (SZAs less than 85◦) variesto 0.30 ppbv. As a result, the absolute difference betweenSMILES-JAXA and MLS in the 675–700 K bin becomesfrom 0.14 ppbv to 0.05 ppbv, revealing better agreement (notshown). Therefore, the SZA or LST difference found in com-parison to ClO within the daytime should be carefully treatedat this altitude. A further discussion of the diurnal changes inClO and ClONO2 is provided in the next subsection.
4.3 Cly partitioning
Since Cly in the stratosphere in 2009 was∼3.3–3.5 ppbv(WMO, 2011), it is clear that HCl dominates Cly in this alti-tude range and time period. Such a feature is usually not seen
in the lower stratosphere, but is seen in the upper stratosphere(Cly ' HCl) (e.g.,WMO, 2011). This high HCl occurs as aresult of low O3 values (“ozone hole”) in October, as follows(e.g.,Mickley et al., 1997). The two competing reactions ofthe NO radical,
NO+ClO→ Cl+NO2 (R1)
NO+O3→O2+NO2, (R2)
are the key to understanding this behavior. Under “ozonehole” conditions with low O3 and high ClO values, Reaction(R1) becomes faster than Reaction (R2), allowing increasedvalues of Cl. The low O3 values directly slow the reaction:
Cl+O3→ ClO+O2 . (R3)
Thus, the production of HCl occurs from September to Oc-tober through the following reaction:
Cl+CH4→ HCl+CH3 (R4)
as shown in, e.g.,Santee et al.(2008b). HCl production isthus sensitive to the amount of O3. A recent theoretical studysuggests that this conversion is quite rapid in the Antarc-tic vortex through Reaction (R4) and a reaction Cl + CH2O(Grooß et al., 2011).
HCl is destroyed through reactions with the OH radicaland on the surface of sulfate aerosols, but both are so slowthat the chemical lifetime of HCl is long compared to thetransport time in November (i.e., high HCl values should befound as long as the vortex exists).
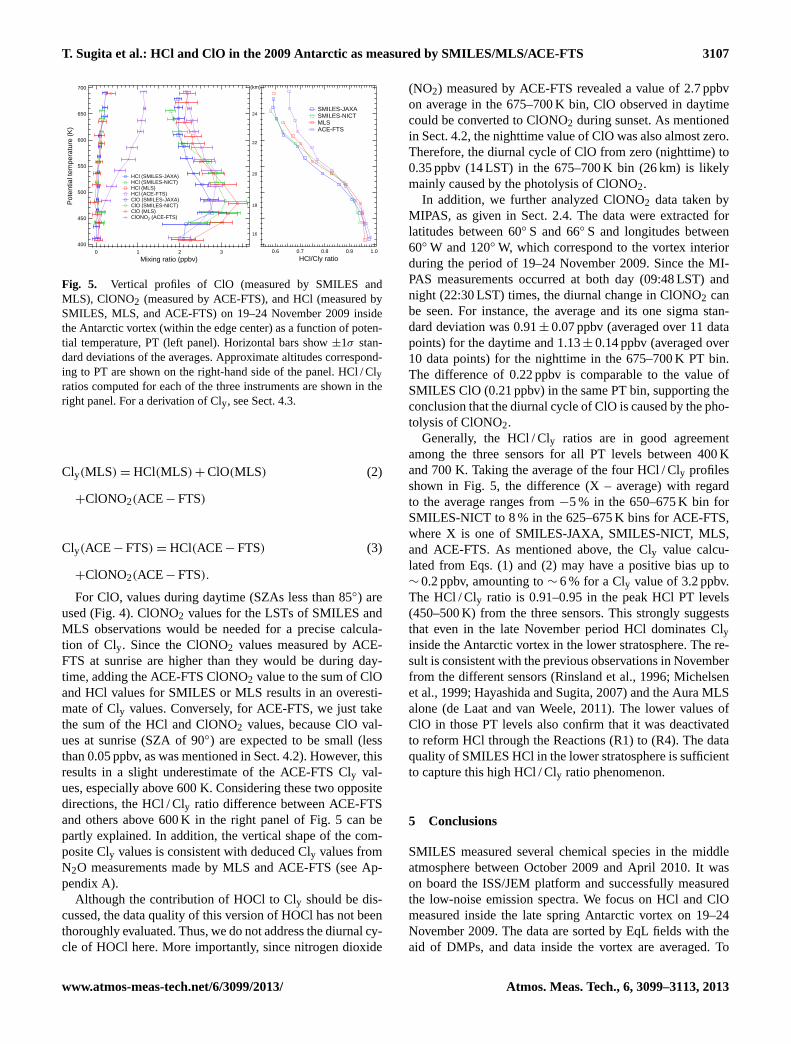
Figure 5 (left panel) shows vertical profiles of ClO,ClONO2, and HCl inside the vortex on 19–24 November2009, summarizing Figs.2, 3, and4. The bars show the onesigma standard deviation of data for each average. For theACE-FTS ClONO2 data, the same occultation measurementsare used in the average as were used for the HCl data. It isof importance to examine Cly species other than HCl andClO. Because of Reactions (R1) through (R4), the forma-tion of ClONO2 by ClO + NO2 + M should also be sup-pressed significantly inside the vortex where the HCl valueis high at 450–500 K level (e.g.,Prather and Jaffe, 1990). In-deed, the ACE-FTS ClONO2 values are less than 0.3 ppbvbelow 475–500 K bin, as shown in Fig.5. Above the 500–525 K level, ClONO2 increases with altitude to 1.1–1.2 ppbvat 650–700 K.
The ratio of HCl to Cly is shown in the right panel of Fig.5.We take composite Cly values as computed by the equationsbelow:
Cly(SMILES)= HCl(SMILES)+ClO(SMILES) (1)
+ClONO2(ACE−FTS)
Atmos. Meas. Tech., 6, 3099–3113, 2013 www.atmos-meas-tech.net/6/3099/2013/
T. Sugita et al.: HCl and ClO in the 2009 Antarctic as measured by SMILES/MLS/ACE-FTS 3107
1.00.90.80.70.6
HCl/Cly ratio
SMILES-JAXA SMILES-NICT MLS ACE-FTS
700
650
600
550
500
450
400
Pot
entia
l tem
pera
ture
(K
)
3210
Mixing ratio (ppbv)
16
18
20
22
24
(km)
HCl (SMILES-JAXA) HCl (SMILES-NICT) HCl (MLS) HCl (ACE-FTS) ClO (SMILES-JAXA) ClO (SMILES-NICT) ClO (MLS) ClONO2 (ACE-FTS)
Fig. 5. Vertical profiles of ClO (measured by SMILES andMLS), ClONO2 (measured by ACE-FTS), and HCl (measured bySMILES, MLS, and ACE-FTS) on 19–24 November 2009 insidethe Antarctic vortex (within the edge center) as a function of poten-tial temperature, PT (left panel). Horizontal bars show±1σ stan-dard deviations of the averages. Approximate altitudes correspond-ing to PT are shown on the right-hand side of the panel. HCl / Clyratios computed for each of the three instruments are shown in theright panel. For a derivation of Cly, see Sect. 4.3.
Cly(MLS)= HCl(MLS)+ClO(MLS) (2)
+ClONO2(ACE−FTS)
Cly(ACE−FTS)= HCl(ACE−FTS) (3)
+ClONO2(ACE−FTS).
For ClO, values during daytime (SZAs less than 85◦) areused (Fig.4). ClONO2 values for the LSTs of SMILES andMLS observations would be needed for a precise calcula-tion of Cly. Since the ClONO2 values measured by ACE-FTS at sunrise are higher than they would be during day-time, adding the ACE-FTS ClONO2 value to the sum of ClOand HCl values for SMILES or MLS results in an overesti-mate of Cly values. Conversely, for ACE-FTS, we just takethe sum of the HCl and ClONO2 values, because ClO val-ues at sunrise (SZA of 90◦) are expected to be small (lessthan 0.05 ppbv, as was mentioned in Sect. 4.2). However, thisresults in a slight underestimate of the ACE-FTS Cly val-ues, especially above 600 K. Considering these two oppositedirections, the HCl / Cly ratio difference between ACE-FTSand others above 600 K in the right panel of Fig.5 can bepartly explained. In addition, the vertical shape of the com-posite Cly values is consistent with deduced Cly values fromN2O measurements made by MLS and ACE-FTS (see Ap-pendix A).
Although the contribution of HOCl to Cly should be dis-cussed, the data quality of this version of HOCl has not beenthoroughly evaluated. Thus, we do not address the diurnal cy-cle of HOCl here. More importantly, since nitrogen dioxide
(NO2) measured by ACE-FTS revealed a value of 2.7 ppbvon average in the 675–700 K bin, ClO observed in daytimecould be converted to ClONO2 during sunset. As mentionedin Sect. 4.2, the nighttime value of ClO was also almost zero.Therefore, the diurnal cycle of ClO from zero (nighttime) to0.35 ppbv (14 LST) in the 675–700 K bin (26 km) is likelymainly caused by the photolysis of ClONO2.
In addition, we further analyzed ClONO2 data taken byMIPAS, as given in Sect. 2.4. The data were extracted forlatitudes between 60◦ S and 66◦ S and longitudes between60◦W and 120◦W, which correspond to the vortex interiorduring the period of 19–24 November 2009. Since the MI-PAS measurements occurred at both day (09:48 LST) andnight (22:30 LST) times, the diurnal change in ClONO2 canbe seen. For instance, the average and its one sigma stan-dard deviation was 0.91±0.07 ppbv (averaged over 11 datapoints) for the daytime and 1.13±0.14 ppbv (averaged over10 data points) for the nighttime in the 675–700 K PT bin.The difference of 0.22 ppbv is comparable to the value ofSMILES ClO (0.21 ppbv) in the same PT bin, supporting theconclusion that the diurnal cycle of ClO is caused by the pho-tolysis of ClONO2.
Generally, the HCl / Cly ratios are in good agreementamong the three sensors for all PT levels between 400 Kand 700 K. Taking the average of the four HCl / Cly profilesshown in Fig.5, the difference (X – average) with regardto the average ranges from−5 % in the 650–675 K bin forSMILES-NICT to 8 % in the 625–675 K bins for ACE-FTS,where X is one of SMILES-JAXA, SMILES-NICT, MLS,and ACE-FTS. As mentioned above, the Cly value calcu-lated from Eqs. (1) and (2) may have a positive bias up to∼0.2 ppbv, amounting to∼6 % for a Cly value of 3.2 ppbv.The HCl / Cly ratio is 0.91–0.95 in the peak HCl PT levels(450–500 K) from the three sensors. This strongly suggeststhat even in the late November period HCl dominates Clyinside the Antarctic vortex in the lower stratosphere. The re-sult is consistent with the previous observations in Novemberfrom the different sensors (Rinsland et al., 1996; Michelsenet al., 1999; Hayashida and Sugita, 2007) and the Aura MLSalone (de Laat and van Weele, 2011). The lower values ofClO in those PT levels also confirm that it was deactivatedto reform HCl through the Reactions (R1) to (R4). The dataquality of SMILES HCl in the lower stratosphere is sufficientto capture this high HCl / Cly ratio phenomenon.
5 Conclusions
SMILES measured several chemical species in the middleatmosphere between October 2009 and April 2010. It wason board the ISS/JEM platform and successfully measuredthe low-noise emission spectra. We focus on HCl and ClOmeasured inside the late spring Antarctic vortex on 19–24November 2009. The data are sorted by EqL fields with theaid of DMPs, and data inside the vortex are averaged. To
www.atmos-meas-tech.net/6/3099/2013/ Atmos. Meas. Tech., 6, 3099–3113, 2013
3108 T. Sugita et al.: HCl and ClO in the 2009 Antarctic as measured by SMILES/MLS/ACE-FTS
confirm the quality of SMILES-JAXA and SMILES-NICTdata products from the view point of partitioning of Cly, com-parisons are made with Aura MLS and ACE-FTS satellitedata taken in the same time period.
The SMILES HCl reveals 2.8–3.1 ppbv between 450 Kand 500 K, along with a result that the NICT product is, at themaximum, 0.5 ppbv larger than the JAXA product between425 K and 575 K. The SMILES-NICT HCl agrees within10 % with the MLS HCl between 450 and 575 K and with theACE-FTS HCl between 425 and 575 K. Above 575 K, theSMILES-NICT HCl values are, however, 11–19 % smallerthan those from MLS and 16–22 % smaller than those fromACE-FTS. The SMILES-JAXA HCl is 10 to 20 % smallerthan that from MLS between 400 and 700 K and ACE-FTSbetween 500 and 700 K.
For ClO in daytime (SZAs less than 85◦), SMILES-JAXAand SMILES-NICT agree to within±0.05 ppbv between450 K and 625 K, although the difference between the twoproducts amounts to−0.07 ppbv at 625–675 K and 0.07 ppbvat 425 K. The difference between MLS and SMILES-JAXAor SMILES-NICT was less than±0.05 ppbv between 500 Kand 650 K with ClO values less than 0.2 ppbv.
Considering the low ClONO2 values also inside theAntarctic vortex as measured by ACE-FTS, HCl was themain component of Cly below the 500 K level in Novem-ber 2009. All three sensors show high values (> 0.9) of theHCl / Cly ratios, in agreement with the past observations in-side the spring Antarctic vortex. These results can be usefulfor assessing the performance of recent chemistry–climatemodels (CCM) in CCM validation activities (e.g., Fig. 6.32of SPARC CCMVal, 2010). The results from SMILES-JAXA(v2.1) and SMILES-NICT (v2.1.5) suggest the validity ofboth HCl and ClO data in the lower stratosphere, where HClvalues were as high as 3 ppbv during the period studied here.
Appendix A
Comparison between Cly and Cly∗
The composite Cly values are compared with a surrogate forCly, which is referred to as Cly
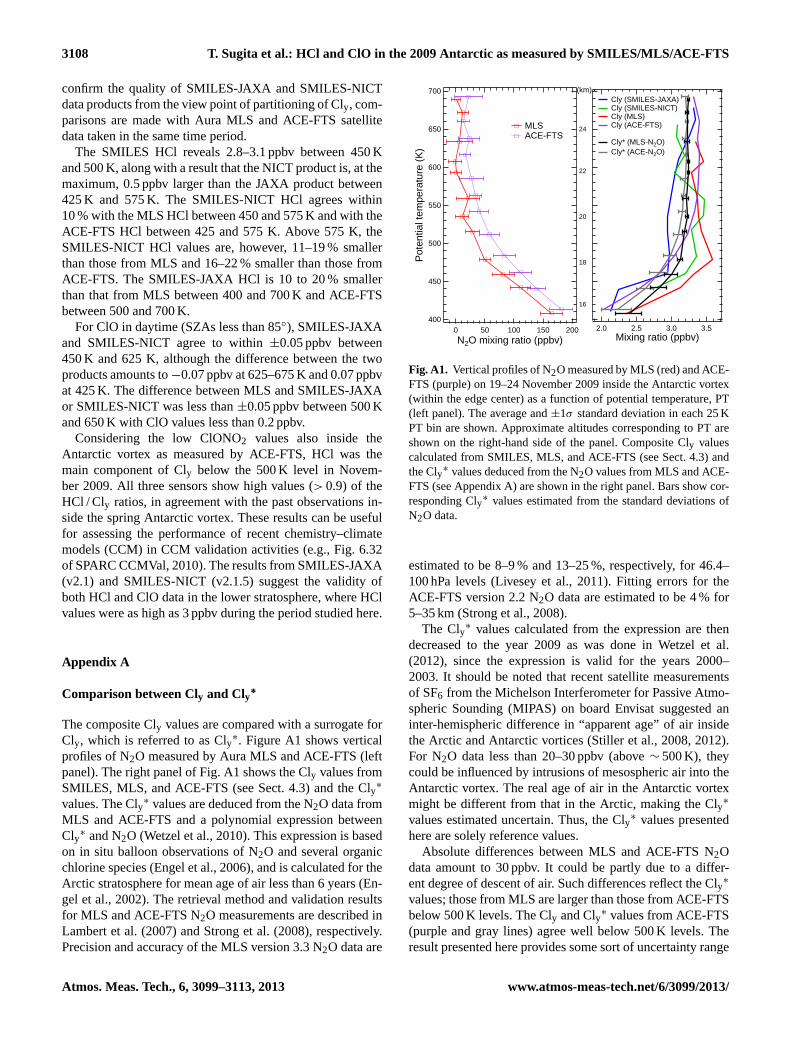
∗. FigureA1 shows verticalprofiles of N2O measured by Aura MLS and ACE-FTS (leftpanel). The right panel of Fig.A1 shows the Cly values fromSMILES, MLS, and ACE-FTS (see Sect. 4.3) and the Cly
∗
values. The Cly∗ values are deduced from the N2O data fromMLS and ACE-FTS and a polynomial expression betweenCly∗ and N2O (Wetzel et al., 2010). This expression is basedon in situ balloon observations of N2O and several organicchlorine species (Engel et al., 2006), and is calculated for theArctic stratosphere for mean age of air less than 6 years (En-gel et al., 2002). The retrieval method and validation resultsfor MLS and ACE-FTS N2O measurements are described inLambert et al.(2007) andStrong et al.(2008), respectively.Precision and accuracy of the MLS version 3.3 N2O data are
700
650
600
550
500
450
400
Pot
entia
l tem
pera
ture
(K
)
200150100500N2O mixing ratio (ppbv)
16
18
20
22
24
(km)
MLS ACE-FTS
3.53.02.52.0Mixing ratio (ppbv)
Cly (SMILES-JAXA) Cly (SMILES-NICT) Cly (MLS) Cly (ACE-FTS)
Cly* (MLS-N2O) Cly* (ACE-N2O)
Fig. A1. Vertical profiles of N2O measured by MLS (red) and ACE-FTS (purple) on 19–24 November 2009 inside the Antarctic vortex(within the edge center) as a function of potential temperature, PT(left panel). The average and±1σ standard deviation in each 25 KPT bin are shown. Approximate altitudes corresponding to PT areshown on the right-hand side of the panel. Composite Cly valuescalculated from SMILES, MLS, and ACE-FTS (see Sect. 4.3) andthe Cly∗ values deduced from the N2O values from MLS and ACE-FTS (see Appendix A) are shown in the right panel. Bars show cor-responding Cly∗ values estimated from the standard deviations ofN2O data.
estimated to be 8–9 % and 13–25 %, respectively, for 46.4–100 hPa levels (Livesey et al., 2011). Fitting errors for theACE-FTS version 2.2 N2O data are estimated to be 4 % for5–35 km (Strong et al., 2008).
The Cly∗ values calculated from the expression are thendecreased to the year 2009 as was done inWetzel et al.(2012), since the expression is valid for the years 2000–2003. It should be noted that recent satellite measurementsof SF6 from the Michelson Interferometer for Passive Atmo-spheric Sounding (MIPAS) on board Envisat suggested aninter-hemispheric difference in “apparent age” of air insidethe Arctic and Antarctic vortices (Stiller et al., 2008, 2012).For N2O data less than 20–30 ppbv (above∼500 K), theycould be influenced by intrusions of mesospheric air into theAntarctic vortex. The real age of air in the Antarctic vortexmight be different from that in the Arctic, making the Cly
∗
values estimated uncertain. Thus, the Cly∗ values presented
here are solely reference values.Absolute differences between MLS and ACE-FTS N2O
data amount to 30 ppbv. It could be partly due to a differ-ent degree of descent of air. Such differences reflect the Cly
∗
values; those from MLS are larger than those from ACE-FTSbelow 500 K levels. The Cly and Cly∗ values from ACE-FTS(purple and gray lines) agree well below 500 K levels. Theresult presented here provides some sort of uncertainty range
Atmos. Meas. Tech., 6, 3099–3113, 2013 www.atmos-meas-tech.net/6/3099/2013/

T. Sugita et al.: HCl and ClO in the 2009 Antarctic as measured by SMILES/MLS/ACE-FTS 3109
for the Cly level in the Antarctic stratosphere in this time pe-riod.
Acknowledgements.The JEM/SMILES mission is a joint projectof the Japan Aerospace Exploration Agency (JAXA) and theNational Institute of Information and Communications Technology(NICT). We thank the JEM/SMILES mission team and the relatedmembers before the mission. Work at the Jet Propulsion Laboratory(JPL), California Institute of Technology, was done under contractwith the National Aeronautics and Space Administration (NASA).The Atmospheric Chemistry Experiment (ACE), also knownas SCISAT-1, is a Canadian-led mission mainly supported bythe Canadian Space Agency (CSA) and the Natural Sciencesand Engineering Research Council (NSERC) of Canada. Thejoint IMK/IAA generated MIPAS/Envisat data were obtainedfrom the IMK – Atmospheric Trace Gases and Remote Sensing(ASF) data server (http://www.imk-asf.kit.edu/english/308.php).Instructions on using the MIPAS data from Thomas von Clarmannare acknowledged. Helpful comments from Rolf Müller are alsoacknowledged. This work was partly done by using resourcesof the OneSpaceNet in the NICT Science Cloud. This work wasperformed as one of approved themes under the JEM/SMILESResearch Announcement.
Edited by: H. Worden
References
Baron, P., Urban, J., Sagawa, H., Möller, J., Murtagh, D. P., Men-drok, J., Dupuy, E., Sato, T. O., Ochiai, S., Suzuki, K., Manabe,T., Nishibori, T., Kikuchi, K., Sato, R., Takayanagi, M., Mu-rayama, Y., Shiotani, M., and Kasai, Y.: The Level 2 researchproduct algorithms for the Superconducting Submillimeter-WaveLimb-Emission Sounder (SMILES), Atmos. Meas. Tech., 4,2105–2124, doi:10.5194/amt-4-2105-2011, 2011.
Bernath, P. F., McElroy, C. T., Abrams, M. C., Boone, C. D., Butler,M., Camy-Peyret, C., Carleer, M., Clerbaux, C., Coheur, P.-F.,Colin, R., DeCola, P., DeMaziére, M., Drummond, J. R., Du-four, D., Evans, W. F. J., Fast, H., Fussen, D., Gilbert, K., Jen-nings, D. E., Llewellyn, E. J., Lowe, R. P., Mahieu, E., Mc-Connell, J. C., McHugh, M., McLeod, S. D., Michaud, R., Mid-winter, C., Nassar, R., Nichitiu, F., Nowlan, C., Rinsland, C. P.,Rochon, Y. J., Rowlands, N., Semeniuk, K., Simon, P., Skel-ton, R., Sloan, J. J., Soucy, M.-A., Strong, K., Tremblay, P.,Turnbull, D., Walker, K. A., Walkty, I., Wardle, D. A., Wehrle,V., Zander, R., and Zou, J.: Atmospheric Chemistry Experiment(ACE): Mission overview, Geophys. Res. Lett., 32, L15S01,doi:10.1029/2005GL022386, 2005.
Bonne, G. P., Stimpfle, R. M., Cohen, R. C., Voss, P. B., Perkins,K. K., Anderson, J. G., Salawitch, R. J., Elkins, J. W., Dutton,G. S., Jucks, K. W., and Toon, G. C.: An examination of the inor-ganic chlorine budget in the lower stratosphere, J. Geophys. Res.,105, 1957–1971, doi:10.1029/1999JD900996, 2000.
Boone, C. D., Nassar, R., Walker, K. A., Rochon, Y., McLeod,S. D., Rinsland, C. P., and Bernath, P. F.: Retrievals for the atmo-spheric chemistry experiment Fourier-transform spectrometer,Appl. Opt., 44, 7218–7231, doi:10.1364/AO.44.007218, 2005.
Brenninkmeijer, C. A. M., Müller, R., Crutzen, P. J., Lowe, D. C.,Manning, M. R., Sparks, R. J., and van Velthoven, P. F. J.: A large13CO deficit in the lower Antarctic stratosphere due to “OzoneHole” Chemistry: Part I, Observations, Geophys. Res. Lett., 23,2125–2128, doi:10.1029/96GL01471, 1996.
Butchart, N. and Remsberg, E. E.: The area of the stratospheric po-lar vortex as a diagnostic for tracer transport on an isentropicsurface, J. Atmos. Sci., 43, 1319–1339, 1986.
Cazzoli, G. and Puzzarini, C.: Hyperfine structure of theJ = 1←0 transition of H35Cl and H37Cl: improvedground state parameters, J. Mol. Spectrosc., 226, 161–168,doi:10.1016/j.jms.2004.03.020, 2004.
Ceccherini, S., Carli, B., Pascale, E., Prosperi, M., Raspollini, P.,and Dinelli, B. M.: Comparison of measurements made with twodifferent instruments of the same atmospheric vertical profile,Appl. Opt., 42, 6465–6473, doi:10.1364/AO.42.006465, 2003.
Chipperfield, M. P., Santee, M. L., Froidevaux, L., Manney, G. L.,Read, W. G., Waters, J. W., Roche, A. E., and Russell, J. M.:Analysis of UARS data in the southern polar vortex in September1992 using a chemical transport model, J. Geophys. Res., 101,18861–18881, doi:10.1029/96JD00936, 1996.
Cofield, R. and Stek, P.: Design and field-of-view calibration of114-660-GHz optics of the Earth observing system microwavelimb sounder, Geoscience and Remote Sensing, IEEE Trans-actions on, 44, 1166–1181, doi:10.1109/TGRS.2006.873234,2006.
de Laat, A. T. J. and van Weele, M.: The 2010 Antarctic ozone hole:Observed reduction in ozone destruction by minor sudden strato-spheric warmings, Sci. Rep., 1, 1–8, doi:10.1038/srep00038,2011.
de Laat, A. T. J., van der A, R. J., Allaart, M. A. F., van Weele, M.,Benitez, G. C., Casiccia, C., Paes Leme, N. M., Quel, E., Sal-vador, J., and Wolfram, E.: Extreme sunbathing: Three weeks ofsmall total O3 columns and high UV radiation over the southerntip of South America during the 2009 Antarctic O3 hole season,Geophys. Res. Lett., 37, L14805, doi:10.1029/2010GL043699,2010.
Douglass, A. R. and Kawa, S. R.: Contrast between 1992 and 1997high-latitude spring Halogen Occultation Experiment observa-tions of lower stratospheric HCl, J. Geophys. Res., 104, 18739–18754, doi:10.1029/1999JD900281, 1999.
Douglass, A. R., Schoeberl, M. R., Stolarski, R. S., Waters, J. W.,Russell, J. M., Roche, A. E., and Massie, S. T.: Interhemi-spheric differences in springtime production of HCl and ClONO2in the polar vortices, J. Geophys. Res., 100, 13967–13978,doi:10.1029/95JD00698, 1995.
Dufour, G., Nassar, R., Boone, C. D., Skelton, R., Walker, K. A.,Bernath, P. F., Rinsland, C. P., Semeniuk, K., Jin, J. J., Mc-Connell, J. C., and Manney, G. L.: Partitioning between the in-organic chlorine reservoirs HCl and ClONO2 during the Arcticwinter 2005 from the ACE-FTS, Atmos. Chem. Phys., 6, 2355–2366, doi:10.5194/acp-6-2355-2006, 2006.
Engel, A., Strunk, M., Müller, M., Haase, H.-P., Poss, C., Levin,I., and Schmidt, U.: Temporal development of total chlorine inthe high-latitude stratosphere based on reference distributions ofmean age derived from CO2 and SF6, J. Geophys. Res., 107,ACH 1–1–ACH 1–11, doi:10.1029/2001JD000584, 2002.
Engel, A., Möbius, T., Haase, H.-P., Bönisch, H., Wetter, T.,Schmidt, U., Levin, I., Reddmann, T., Oelhaf, H., Wetzel, G.,
www.atmos-meas-tech.net/6/3099/2013/ Atmos. Meas. Tech., 6, 3099–3113, 2013
3110 T. Sugita et al.: HCl and ClO in the 2009 Antarctic as measured by SMILES/MLS/ACE-FTS
Grunow, K., Huret, N., and Pirre, M.: Observation of meso-spheric air inside the arctic stratospheric polar vortex in early2003, Atmos. Chem. Phys., 6, 267–282, doi:10.5194/acp-6-267-2006, 2006.
Fischer, H., Birk, M., Blom, C., Carli, B., Carlotti, M., von Clar-mann, T., Delbouille, L., Dudhia, A., Ehhalt, D., Endemann, M.,Flaud, J. M., Gessner, R., Kleinert, A., Koopman, R., Langen, J.,López-Puertas, M., Mosner, P., Nett, H., Oelhaf, H., Perron, G.,Remedios, J., Ridolfi, M., Stiller, G., and Zander, R.: MIPAS: aninstrument for atmospheric and climate research, Atmos. Chem.Phys., 8, 2151–2188, doi:10.5194/acp-8-2151-2008, 2008.
Grooß, J.-U., Pierce, R. B., Crutzen, P. J., Grose, W. L., andRussell, J. M.: Re-formation of chlorine reservoirs in southernhemisphere polar spring, J. Geophys. Res., 102, 13141–13152,doi:10.1029/96JD03505, 1997.
Grooß, J.-U., Paul, K., and Müller, R.: Ozone chemistry duringthe 2002 Antarctic vortex split, J. Atmos. Sci., 62, 860–870,doi:10.1175/JAS-3330.1, 2005.
Grooß, J.-U., Brautzsch, K., Pommrich, R., Solomon, S., andMüller, R.: Stratospheric ozone chemistry in the Antarctic: whatdetermines the lowest ozone values reached and their recov-ery?, Atmos. Chem. Phys., 11, 12217–12226, doi:10.5194/acp-11-12217-2011, 2011.
Harrison, J. J. and Bernath, P. F.: ACE-FTS observations of acetoni-trile in the lower stratosphere, Atmos. Chem. Phys., 13, 7405–7413, doi:10.5194/acp-13-7405-2013, 2013.
Hayashida, S. and Sugita, T.: Hemispheric contrast of inorganicchlorine Partitioning in the polar lower stratosphere during ozonerecovery period observed from space, Sci. Online Lett. Atmos.,3, 117–120, doi:10.2151/sola.2007-030, 2007.
Höpfner, M., von Clarmann, T., Fischer, H., Glatthor, N.,Grabowski, U., Kellmann, S., Kiefer, M., Linden, A.,Mengistu Tsidu, G., Milz, M., Steck, T., Stiller, G. P., Wang,D. Y., and Funke, B.: First spaceborne observations of Antarc-tic stratospheric ClONO2 recovery: Austral spring 2002, J. Geo-phys. Res., 109, D11308, doi:10.1029/2004JD004609, 2004.
Jaeglé, L., Webster, C. R., May, R. D., Scott, D. C., Stimpfle, R. M.,Kohn, D. W., Wennberg, P. O., Hanisco, T. F., Cohen, R. C., Prof-fitt, M. H., Kelly, K. K., Elkins, J., Baumgardner, D., Dye, J. E.,Wilson, J. C., Pueschel, R. F., Chan, K. R., Salawitch, R. J., Tuck,A. F., Hovde, S. J., and Yung, Y. L.: Evolution and stoichiom-etry of heterogeneous processing in the Antarctic stratosphere,J. Geophys. Res., 102, 13235–13253, doi:10.1029/97JD00935,1997.
Kasai, Y., Sagawa, H., Kreyling, D., Dupuy, E., Baron, P., Men-drok, J., Suzuki, K., Sato, T. O., Nishibori, T., Mizobuchi, S.,Kikuchi, K., Manabe, T., Ozeki, H., Sugita, T., Fujiwara, M., Ir-imajiri, Y., Walker, K. A., Bernath, P. F., Boone, C., Stiller, G.,von Clarmann, T., Orphal, J., Urban, J., Murtagh, D., Llewellyn,E. J., Degenstein, D., Bourassa, A. E., Lloyd, N. D., Froidevaux,L., Birk, M., Wagner, G., Schreier, F., Xu, J., Vogt, P., Traut-mann, T., and Yasui, M.: Validation of stratospheric and meso-spheric ozone observed by SMILES from International SpaceStation, Atmos. Meas. Tech., 6, 2311–2338, doi:10.5194/amt-6-2311-2013, 2013.
Kikuchi, K., Nishibori, T., Ochiai, S., Ozeki, H., Irimajiri, Y.,Kasai, Y., Koike, M., Manabe, T., Mizukoshi, K., Murayama,Y., Nagahama, T., Sano, T., Sato, R., Seta, M., Takahashi, C.,Takayanagi, M., Masuko, H., Inatani, J., Suzuki, M., and Sh-
iotani, M.: Overview and early results of the Superconduct-ing Submillimeter-Wave Limb-Emission Sounder (SMILES), J.Geophys. Res., 115, D23306, doi:10.1029/2010JD014379, 2010.
Konopka, P., Grooß, J.-U., Bausch, S., Müller, R., McKenna, D. S.,Morgenstern, O., and Orsolini, Y.: Dynamics and chemistry ofvortex remnants in late Arctic spring 1997 and 2000: Simula-tions with the Chemical Lagrangian Model of the Stratosphere(CLaMS), Atmos. Chem. Phys., 3, 839–849, doi:10.5194/acp-3-839-2003, 2003.
Kreher, K., Keys, J. G., Johnston, P. V., Platt, U., and Liu, X.:Ground-based measurements of OClO and HCl in austral spring1993 at Arrival Heights, Antarctica, Geophys. Res. Lett., 23,1545–1548, doi:10.1029/96GL01318, 1996.
Lambert, A., Read, W. G., Livesey, N. J., Santee, M. L., Manney,G. L., Froidevaux, L., Wu, D. L., Schwartz, M. J., Pumphrey,H. C., Jimenez, C., Nedoluha, G. E., Cofield, R. E., Cuddy, D. T.,Daffer, W. H., Drouin, B. J., Fuller, R. A., Jarnot, R. F., Knosp,B. W., Pickett, H. M., Perun, V. S., Snyder, W. V., Stek, P. C.,Thurstans, R. P., Wagner, P. A., Waters, J. W., Jucks, K. W.,Toon, G. C., Stachnik, R. A., Bernath, P. F., Boone, C. D., Walker,K. A., Urban, J., Murtagh, D., Elkins, J. W., and Atlas, E.: Vali-dation of the Aura Microwave Limb Sounder middle atmospherewater vapor and nitrous oxide measurements, J. Geophys. Res.,112, D24S36, doi:10.1029/2007JD008724, 2007.
Lambert, A., Santee, M. L., Wu, D. L., and Chae, J. H.: A-trainCALIOP and MLS observations of early winter Antarctic polarstratospheric clouds and nitric acid in 2008, Atmos. Chem. Phys.,12, 2899–2931, doi:10.5194/acp-12-2899-2012, 2012.
Liebe, H. J., Hufford, G. A., and Cotton, M. G. (Eds.): Propagationmodeling of moist air and suspended water/ice particles at fre-quencies below 1000 GHz, 52nd Specialists Meeting of the Elec-tromagnetic Wave Propagation Panel, Palma De Mallorca, Spain,1993.
Lingenfelser, G. S. and Grose, W. L.: Use of long-lived tracerobservations to examine transport characteristics in the lowerstratosphere, J. Geophys. Res., 107, ACL 6-1–ACL 6-13,doi:10.1029/2001JD001296, 2002.
Liu, X., Blatherwick, R. D., Murcray, F. J., Keys, J. G., andSolomon, S.: Measurements and model calculations of HCl col-umn amounts and related parameters over McMurdo during theaustral spring in 1989, J. Geophys. Res., 97, 20795–20804,doi:10.1029/92JD02435, 1992.
Livesey, N., Van Snyder, W., Read, W., and Wagner, P.: Retrievalalgorithms for the EOS Microwave Limb Sounder (MLS), Geo-science and Remote Sensing, IEEE Transactions on, 44, 1144–1155, doi:10.1109/TGRS.2006.872327, 2006.
Livesey, N. J., Read, W. G., Froidevaux, L., Lambert, A., Manney,G. L., Pumphrey, H. C., Santee, M. L., Schwartz, M. J., Wang,S., Cofield, R. E., Cuddy, D. T., Fuller, R. A., Jarnot, R. F., Jiang,J. H., Knosp, B. W., Stek, P. C., Wagner, P. A., and Wu, D. L.:Earth Observing System (EOS), Aura Microwave Limb Sounder(MLS), Version 3.3 Level 2 data quality and description docu-ment, D-33509, Jet Propulsion Laboratory, California Instituteof Technology, Pasadena, California, 2011.
Mahieu, E., Duchatelet, P., Demoulin, P., Walker, K. A., Dupuy, E.,Froidevaux, L., Randall, C., Catoire, V., Strong, K., Boone, C.D., Bernath, P. F., Blavier, J.-F., Blumenstock, T., Coffey, M., DeMazière, M., Griffith, D., Hannigan, J., Hase, F., Jones, N., Jucks,K. W., Kagawa, A., Kasai, Y., Mebarki, Y., Mikuteit, S., Nassar,
Atmos. Meas. Tech., 6, 3099–3113, 2013 www.atmos-meas-tech.net/6/3099/2013/
T. Sugita et al.: HCl and ClO in the 2009 Antarctic as measured by SMILES/MLS/ACE-FTS 3111
R., Notholt, J., Rinsland, C. P., Robert, C., Schrems, O., Senten,C., Smale, D., Taylor, J., Tétard, C., Toon, G. C., Warneke, T.,Wood, S. W., Zander, R., and Servais, C.: Validation of ACE-FTS v2.2 measurements of HCl, HF, CCl3F and CCl2F2 usingspace-, balloon- and ground-based instrument observations, At-mos. Chem. Phys., 8, 6199–6221, doi:10.5194/acp-8-6199-2008,2008.
Manney, G. L., Daffer, W. H., Zawodny, J. M., Bernath, P. F., Hop-pel, K. W., Walker, K. A., Knosp, B. W., Boone, C., Rems-berg, E. E., Santee, M. L., Harvey, V. L., Pawson, S., Jackson,D. R., Deaver, L., McElroy, C. T., McLinden, C. A., Drum-mond, J. R., Pumphrey, H. C., Lambert, A., Schwartz, M. J.,Froidevaux, L., McLeod, S., Takacs, L. L., Suarez, M. J., Trepte,C. R., Cuddy, D. C., Livesey, N. J., Harwood, R. S., and Wa-ters, J. W.: Solar occultation satellite data and derived me-teorological products: Sampling issues and comparisons withAura Microwave Limb Sounder, J. Geophys. Res., 112, D24S50,doi:10.1029/2007JD008709, 2007.
Manney, G. L., Santee, M. L., Rex, M., Livesey, N. J., Pitts, M. C.,Veefkind, P., Nash, E. R., Wohltmann, I., Lehmann, R., Froide-vaux, L., Poole, L. R., Schoeberl, M. R., Haffner, D. P., Davies,J., Dorokhov, V., Gernandt, H., Johnson, B., Kivi, R., Kyrö, E.,Larsen, N., Levelt, P. F., Makshtas, A., McElroy, C. T., Nakajima,H., Parrondo, M. C., Tarasick, D. W., von der Gathen, P., Walker,K. A., and Zinoviev, N. S.: Unprecedented Arctic ozone loss in2011, Nature, 478, 469–475, doi:10.1038/nature10556, 2011.
Michelsen, H. A., Webster, C. R., Manney, G. L., Scott, D. C., Mar-gitan, J. J., May, R. D., Irion, F. W., Gunson, M. R., Russell,J. M., and Spivakovsky, C. M.: Maintenance of high HCl / Clyand NOx/NOy in the Antarctic vortex: A chemical signature ofconfinement during spring, J. Geophys. Res., 104, 26419–26436,doi:10.1029/1999JD900473, 1999.
Mickley, L. J., Abbatt, J. P. D., Frederick, J. E., and Russell,J. M.: Evolution of chlorine and nitrogen species in the lowerstratosphere during Antarctic spring: Use of tracers to deter-mine chemical change, J. Geophys. Res., 102, 21479–21491,doi:10.1029/97JD00422, 1997.
Mitsuda, C., Suzuki, M., Iwata, Y., Manago, N., Naito, Y., Taka-hashi, C., Imai, K., Nishimoto, E., Hayashi, H., Shiotani,M., Sano, T., Takayanagi, M., and Taniguchi, H.: Currentstatus of level 2 product of Superconducting Submillimeter-Wave Limb-Emission Sounder (SMILES), in: Sensors, Sys-tems, and Next-generation Satellites XV, edited by: Meynart,R., Neeck, S. P., and Shimoda, H., vol. 8176 of Proc. SPIE,doi:10.1117/12.898135, 81760M, 2011.
Müller, R., Brenninkmeijer, C. A. M., and Crutzen, P. J.: A Large13CO deficit in the lower Antarctic stratosphere due to “ozonehole” chemistry: Part II, Modeling, Geophys. Res. Lett., 23,2129–2132, doi:10.1029/96GL01472, 1996.
Murcray, F. J., Goldman, A., Blatherwick, R., Matthews, A.,and Jones, N.: HNO3 and HCl amounts over McMurdo dur-ing the spring of 1987, J. Geophys. Res., 94, 16615–16618,doi:10.1029/JD094iD14p16615, 1989.
Murtagh, D., Frisk, U., Merino, F., Ridal, M., Jonsson, A., Stegman,J., Witt, G., Eriksson, P., Jiménez, C., Megie, G., de La Noë, J.,Ricaud, P., Baron, P., Pardo, J. R., Hauchcorne, A., Llewellyn,E. J., Degenstein, D. A., Gattinger, R. L., Lloyd, N. D., Evans,W. F. J., McDade, I. C., Haley, C. S., Sioris, C., von Savigny, C.,Solheim, B. H., McConnell, J. C., Strong, K., Richardson, E. H.,
Leppelmeier, G. W., Kyrölä, E., Auvinen, H., and Oikarinen, L.:An overview of the Odin atmospheric mission, Can. J. Phys., 80,309–319, doi:10.1139/p01-157, 2002.
NOAA: Southern Hemisphere Winter 2009 Summary, Strato-sphere: Winter bulletins, http://www.cpc.ncep.noaa.gov/products/stratosphere/winter_bulletins/, 2009.
Oh, J. and Cohen, E.: Pressure broadening of ClO by N2 and O2near 204 and 649 GHz and new frequency measurements be-tween 632 and 725 GHz, J. Quant. Spectrosc. Radiat. Transfer,52, 151–156, doi:10.1016/0022-4073(94)90004-3, 1994.
Pardo, J., Cernicharo, J., and Serabyn, E.: Atmospheric transmis-sion at microwaves (ATM): an improved model for millime-ter/submillimeter applications, Antennas and Propagation, IEEETransactions on, 49, 1683–1694, doi:10.1109/8.982447, 2001.
Perrin, A., Puzzarini, C., Colmont, J.-M., Verdes, C., Wlodar-czak, G., Cazzoli, G., Buehler, S., Flaud, J.-M., and Demai-son, J.: Molecular Line Parameters for the "MASTER" (Mil-limeter Wave Acquisitions for Stratosphere/Troposphere Ex-change Research) Database, J. Atmos. Chem., 51, 161–205,doi:10.1007/s10874-005-7185-9, 2005.
Prather, M. and Jaffe, A. H.: Global impact of the Antarctic ozonehole: Chemical propagation, J. Geophys. Res., 95, 3473–3492,doi:10.1029/JD095iD04p03473, 1990.
Read, W. G., Shippony, Z., and Snyder, W. V.: Earth ObservingSystem (EOS), Aura Microwave Limb Sounder (MLS), forwardmodel algorithm theoretical basis document, Version 1.0, D-18130, Jet Propulsion Laboratory, California Institute of Tech-nology, Pasadena, California, 2004.
Reinecker, M. M., Suarez, M. J., Todling, R., Bacmeister, J., Takacs,L., Liu, H.-C., Gu, W., Sienkiewicz, M., Koster, R. D., Gelaro,R., Stajner, I., and Nielsen, J. E.: The GEOS-5 data assimilationsystem: Documentations of versions of 5.0.1, 5.1.0, and 5.2.0,vol. 27 of Technical Report Series on Global Modeling and DataAssimilation, NASA/TM-2008-104606, Hanover, MD, 2008.
Ridolfi, M., Ceccherini, S., and Carli, B.: Optimal interpolationmethod for intercomparison of atmospheric measurements, Opt.Lett., 31, 855–857, doi:10.1364/OL.31.000855, 2006.
Rinsland, C. P., Gunson, M. R., Salawitch, R. J., Michelsen, H. A.,Zander, R., Newchurch, M. J., Abbas, M. M., Abrams, M. C.,Manney, G. L., Chang, A. Y., Irion, F. W., Goldman, A., andMahieu, E.: ATMOS/ATLAS-3 measurements of stratosphericchlorine and reactive nitrogen partitioning inside and outside theNovember 1994 Antarctic vortex, Geophys. Res. Lett., 23, 2365–2368, doi:10.1029/96GL01474, 1996.
Rodgers, C. D.: Inverse methods for atmospheric sounding: The-ory and practice, vol. 2 of Series on Atmospheric, Oceanic andPlanetary physics, World Scientific Publishing, London, 238 pp.,2000.
Sagawa, H., Sato, T. O., Baron, P., Dupuy, E., Livesey, N., Ur-ban, J., von Clarmann, T., de Lange, A., Wetzel, G., Kagawa,A., Murtagh, D., and Kasai, Y.: Comparison of SMILES ClOprofiles with other satellite and balloon-based measurements,Atmos. Meas. Tech. Discuss., 6, 613–663, doi:10.5194/amtd-6-613-2013, 2013.
Santee, M. L., Froidevaux, L., Manney, G. L., Read, W. G., Wa-ters, J. W., Chipperfield, M. P., Roche, A. E., Kumer, J. B.,Mergenthaler, J. L., and Russell, J. M.: Chlorine deactiva-tion in the lower stratospheric polar regions during late win-
www.atmos-meas-tech.net/6/3099/2013/ Atmos. Meas. Tech., 6, 3099–3113, 2013
3112 T. Sugita et al.: HCl and ClO in the 2009 Antarctic as measured by SMILES/MLS/ACE-FTS
ter: Results from UARS, J. Geophys. Res., 101, 18835–18859,doi:10.1029/96JD00580, 1996.
Santee, M. L., Lambert, A., Read, W. G., Livesey, N. J., Manney,G. L., Cofield, R. E., Cuddy, D. T., Daffer, W. H., Drouin, B. J.,Froidevaux, L., Fuller, R. A., Jarnot, R. F., Knosp, B. W., Perun,V. S., Snyder, W. V., Stek, P. C., Thurstans, R. P., Wagner, P. A.,Waters, J. W., Connor, B., Urban, J., Murtagh, D., Ricaud, P.,Barret, B., Kleinböhl, A., Kuttippurath, J., Küllmann, H., vonHobe, M., Toon, G. C., and Stachnik, R. A.: Validation of theAura Microwave Limb Sounder ClO measurements, J. Geophys.Res., 113, D15S22, doi:10.1029/2007JD008762, 2008a.
Santee, M. L., MacKenzie, I. A., Manney, G. L., P., C. M., Bernath,P. F., Walker, K. A., Boone, C. D., Froidevaux, L., Livesey, N. J.,and Waters, J. W.: A study of stratospheric chlorine partitioningbased on new satellite measurements and modeling, J. Geophys.Res., 113, D12307, doi:10.1029/2007JD009057, 2008b.
Santee, M. L., Manney, G. L., Livesey, N. J., Froidevaux,L., Schwartz, M. J., and Read, W. G.: Trace gas evolu-tion in the lowermost stratosphere from Aura MicrowaveLimb Sounder measurements, J. Geophys. Res., 116, D18306,doi:10.1029/2011JD015590, 2011.
Sato, T. O., Sagawa, H., Kreyling, D., Manabe, T., Ochiai, S.,Kikuchi, K., Baron, P., Mendrok, J., Urban, J., Murtagh, D.,Yasui, M., and Kasai, Y.: Strato-mesospheric ClO observationsby SMILES: error analysis and diurnal variation, Atmos. Meas.Tech., 5, 2809–2825, doi:10.5194/amt-5-2809-2012, 2012.
Shiotani, M., Takayanagi, M., Suzuki, M., and Sano, T.: Re-cent results from the Superconducting submillimeter-wave limb-emission sounder (SMILES) onboard ISS/JEM, in: Sensors, Sys-tems, and Next-generation Satellites XIV, edited by: Meynart,R., Neeck, S. P., and Shimoda, H., vol. 7826 of Proc. SPIE,doi:10.1117/12.865806, 78260D, 2010.
SPARC CCMVal: SPARC Report on the Evaluation of Chemistry-Climate Models, edited by: Eyring, V., Shepherd, T. G., andWaugh, D. W., SPARC Report No. 5, WCRP-132, WMO/TD-No. 1526, 434 pp.,http://www.sparc-climate.org/, 2010.
Stachnik, R. A., Millán, L., Jarnot, R., Monroe, R., McLinden, C.,Kühl, S., Pukite, J., Shiotani, M., Suzuki, M., Kasai, Y., Goutail,F., Pommereau, J. P., Dorf, M., and Pfeilsticker, K.: Strato-spheric BrO abundance measured by a balloon-borne submil-limeterwave radiometer, Atmos. Chem. Phys., 13, 3307–3319,doi:10.5194/acp-13-3307-2013, 2013.
Stiller, G. P., von Clarmann, T., Höpfner, M., Glatthor, N.,Grabowski, U., Kellmann, S., Kleinert, A., Linden, A., Milz,M., Reddmann, T., Steck, T., Fischer, H., Funke, B., López-Puertas, M., and Engel, A.: Global distribution of mean age ofstratospheric air from MIPAS SF6 measurements, Atmos. Chem.Phys., 8, 677–695, doi:10.5194/acp-8-677-2008, 2008.
Stiller, G. P., von Clarmann, T., Haenel, F., Funke, B., Glatthor,N., Grabowski, U., Kellmann, S., Kiefer, M., Linden, A., Los-sow, S., and López-Puertas, M.: Observed temporal evolution ofglobal mean age of stratospheric air for the 2002 to 2010 period,Atmos. Chem. Phys., 12, 3311–3331, doi:10.5194/acp-12-3311-2012, 2012.
Strong, K., Wolff, M. A., Kerzenmacher, T. E., Walker, K. A.,Bernath, P. F., Blumenstock, T., Boone, C., Catoire, V., Coffey,M., De Mazière, M., Demoulin, P., Duchatelet, P., Dupuy, E.,Hannigan, J., Höpfner, M., Glatthor, N., Griffith, D. W. T., Jin,J. J., Jones, N., Jucks, K., Kuellmann, H., Kuttippurath, J., Lam-
bert, A., Mahieu, E., McConnell, J. C., Mellqvist, J., Mikuteit,S., Murtagh, D. P., Notholt, J., Piccolo, C., Raspollini, P., Ri-dolfi, M., Robert, C., Schneider, M., Schrems, O., Semeniuk, K.,Senten, C., Stiller, G. P., Strandberg, A., Taylor, J., Tétard, C.,Toohey, M., Urban, J., Warneke, T., and Wood, S.: Validation ofACE-FTS N2O measurements, Atmos. Chem. Phys., 8, 4759–4786, doi:10.5194/acp-8-4759-2008, 2008.
Sugita, T., Kasai, Y., Terao, Y., Hayashida, S., Manney, G. L.,Daffer, W. H., Sagawa, H., Suzuki, M., and Shiotani, M.:HCl / Cly ratios just before the breakup of the Antarctic vor-tex as observed by SMILES/MLS/ACE-FTS, in: Remote Sens-ing of Atmosphere, Clouds, and Precipitation IV, edited by:Hayasaka, T., Nakamura, K., and Im, E., vol. 8523 of Proc. SPIE,doi:10.1117/12.975667, 85231K, 2012.
Suzuki, M., Mitsuda, C., Kikuchi, K., Nishibori, T., Ochiai, S.,Ozeki, H., Sano, T., Mizobuchi, S., Takahashi, C., Manago,N., Imai, K., Naito, Y., Hayashi, H., Nishimoto, E., and Sh-iotani, M.: Overview of Superconducting Submillimeter-WaveLimb-Emission sounder (SMILES) and sensitivity to chlo-rine monoxide, ClO, IEEJ Trans. Fund. Mater., 132, 609–615,doi:10.1541/ieejfms.132.609, 2012.
Takahashi, C., Ochiai, S., and Suzuki, M.: Operational retrievalalgorithms for JEM/SMILES level 2 data processing sys-tem, J. Quant. Spectrosc. Radiat. Transfer, 111, 160–173,doi:10.1016/j.jqsrt.2009.06.005, 2010.
Tuck, A. F., Brune, W. H., and Hipskind, R. S.: Air-borne Southern Hemisphere Ozone Experiment Measure-ments for Assessing the Effects of Stratospheric Aircraft(ASHOE/MAESA): A road map, J. Geophys. Res., 102, 3901–3904, doi:10.1029/96JD02745, 1997.
von Clarmann, T., Höpfner, M., Kellmann, S., Linden, A., Chauhan,S., Funke, B., Grabowski, U., Glatthor, N., Kiefer, M., Schiefer-decker, T., Stiller, G. P., and Versick, S.: Retrieval of temperature,H2O, O3, HNO3, CH4, N2O, ClONO2 and ClO from MIPASreduced resolution nominal mode limb emission measurements,Atmos. Meas. Tech., 2, 159–175, doi:10.5194/amt-2-159-2009,2009.
von Clarmann, T., Funke, B., López-Puertas, M., Kellmann, S., Lin-den, A., Stiller, G. P., Jackman, C. H., and Harvey, V. L.: The so-lar proton events in 2012 as observed by MIPAS, Geophys. Res.Lett., 40, 2339–2343, doi:10.1002/grl.50119, 2013.
Waters, J., Froidevaux, L., Harwood, R., Jarnot, R., Pickett, H.,Read, W., Siegel, P., Cofield, R., Filipiak, M., Flower, D.,Holden, J., Lau, G., Livesey, N., Manney, G., Pumphrey, H.,Santee, M., Wu, D., Cuddy, D., Lay, R., Loo, M., Perun, V.,Schwartz, M., Stek, P., Thurstans, R., Boyles, M., Chandra, K.,Chavez, M., Chen, G.-S., Chudasama, B., Dodge, R., Fuller,R., Girard, M., Jiang, J., Jiang, Y., Knosp, B., LaBelle, R.,Lam, J., Lee, K., Miller, D., Oswald, J., Patel, N., Pukala, D.,Quintero, O., Scaff, D., Van Snyder, W., Tope, M., Wagner,P., and Walch, M.: The Earth Observing System MicrowaveLimb Sounder (EOS MLS) on the Aura satellite, Geoscienceand Remote Sensing, IEEE Transactions on, 44, 1075–1092,doi:10.1109/TGRS.2006.873771, 2006.
Wegner, T., Grooß, J.-U., von Hobe, M., Stroh, F., Suminska-Ebersoldt, O., Volk, C. M., Hösen, E., Mitev, V., Shur, G., andMüller, R.: Heterogeneous chlorine activation on stratosphericaerosols and clouds in the Arctic polar vortex, Atmos. Chem.Phys., 12, 11095–11106, doi:10.5194/acp-12-11095-2012, 2012.
Atmos. Meas. Tech., 6, 3099–3113, 2013 www.atmos-meas-tech.net/6/3099/2013/
T. Sugita et al.: HCl and ClO in the 2009 Antarctic as measured by SMILES/MLS/ACE-FTS 3113
Wetzel, G., Oelhaf, H., Kirner, O., Ruhnke, R., Friedl-Vallon, F.,Kleinert, A., Maucher, G., Fischer, H., Birk, M., Wagner, G., andEngel, A.: First remote sensing measurements of ClOOCl alongwith ClO and ClONO2 in activated and deactivated Arctic vortexconditions using new ClOOCl IR absorption cross sections, At-mos. Chem. Phys., 10, 931–945, doi:10.5194/acp-10-931-2010,2010.
Wetzel, G., Oelhaf, H., Kirner, O., Friedl-Vallon, F., Ruhnke, R.,Ebersoldt, A., Kleinert, A., Maucher, G., Nordmeyer, H., andOrphal, J.: Diurnal variations of reactive chlorine and nitrogenoxides observed by MIPAS-B inside the January 2010 Arcticvortex, Atmos. Chem. Phys., 12, 6581–6592, doi:10.5194/acp-12-6581-2012, 2012.
Wilmouth, D. M., Stimpfle, R. M., Anderson, J. G., Elkins, J. W.,Hurst, D. F., Salawitch, R. J., and Lait, L. R.: Evolution of inor-ganic chlorine partitioning in the Arctic polar vortex, J. Geophys.Res., 111, D16308, doi:10.1029/2005JD006951, 2006.
WMO: Scientific Assessment of Ozone Depletion: 2006, GlobalOzone Research and Monitoring Project–Report No. 50, 572 pp.,Geneva, Switzerland, 2007.
WMO: Scientific Assessment of Ozone Depletion: 2010, GlobalOzone Research and Monitoring Project–Report No. 52, 516 pp.,Geneva, Switzerland, 2011.
Wolff, M. A., Kerzenmacher, T., Strong, K., Walker, K. A., Toohey,M., Dupuy, E., Bernath, P. F., Boone, C. D., Brohede, S., Catoire,V., von Clarmann, T., Coffey, M., Daffer, W. H., De Mazière,M., Duchatelet, P., Glatthor, N., Griffith, D. W. T., Hannigan, J.,Hase, F., Höpfner, M., Huret, N., Jones, N., Jucks, K., Kagawa,A., Kasai, Y., Kramer, I., Küllmann, H., Kuttippurath, J., Mahieu,E., Manney, G., McElroy, C. T., McLinden, C., Mébarki, Y.,Mikuteit, S., Murtagh, D., Piccolo, C., Raspollini, P., Ridolfi, M.,Ruhnke, R., Santee, M., Senten, C., Smale, D., Tétard, C., Ur-ban, J., and Wood, S.: Validation of HNO3, ClONO2, and N2O5from the Atmospheric Chemistry Experiment Fourier TransformSpectrometer (ACE-FTS), Atmos. Chem. Phys., 8, 3529–3562,doi:10.5194/acp-8-3529-2008, 2008.
Yokoyama, K., Sagawa, H., Manabe, T., Sato, T. O., Kuribayashi,K., Froidevaux, L., Livesey, N. J., Walker, K. A., TELIS teammember, and Kasai, Y.: First observation of HCl in the up-per stratosphere and mesosphere measured by Superconduct-ing Submillimeter-Wave Limb-Emission Sounder (SMILES), J.Geophys. Res, submitted, 2013.
www.atmos-meas-tech.net/6/3099/2013/ Atmos. Meas. Tech., 6, 3099–3113, 2013


 2](https://static.fdokumen.com/doc/165x107/6333ca3928cb31ef600d6bc8/two-temperature-independent-spinomers-of-the-dinuclear-mniii-compound-mnh-2.jpg)


 2 studied by infrared and Raman spectroscopies and DFT computations](https://static.fdokumen.com/doc/165x107/6316cce2d16b3722ff0d1094/molecular-structure-and-vibrational-spectrum-of-mgch-3-2so-6clo-4-2-studied.jpg)


