hazard identification and risk analysis of nighttime offshore ...
381
HAZARD IDENTIFICATION AND RISK ANALYSIS OF NIGHTTIME OFFSHORE HELICOPTER OPERATIONS Felipe Augusto Coutinho Nascimento (Graduação em Ciências Navais, Prêmio Greenhalgh; MSc) February 2014 A thesis submitted as fulfilment of the requirements for the Degree of Doctor of Philosophy (PhD) and the Diploma of Membership of Imperial College London (DIC) Centre for Transport Studies Department of Civil and Environmental Engineering Imperial College London, United Kingdom
-
Upload
khangminh22 -
Category
Documents
-
view
1 -
download
0
Transcript of hazard identification and risk analysis of nighttime offshore ...
HAZARD IDENTIFICATION AND RISK ANALYSIS OF NIGHTTIME OFFSHORE HELICOPTER OPERATIONS
Felipe Augusto Coutinho Nascimento (Graduação em Ciências Navais, Prêmio Greenhalgh; MSc)
February 2014
A thesis submitted as fulfilment of the requirements for the Degree of Doctor of Philosophy (PhD) and the Diploma of Membership of Imperial College London (DIC)
Centre for Transport Studies Department of Civil and Environmental Engineering
Imperial College London, United Kingdom

2

This work is dedicated to
Those who perished in offshore helicopter accidents.
May this thesis help preserve the lives of the people who work at sea.
3

4

DECLARATION OF ORIGINALITY
I hereby declare that the entire work presented in this thesis has been personally carried out. Where sources of information or the work of others have been used, they are fully cited and referenced and/or appropriate acknowledgement is given.
.....................................................................................
Felipe Augusto Coutinho Nascimento
‘The copyright of this thesis rests with the author and is made available under a Creative Commons Attribution Non-Commercial No Derivatives Licence. Researchers are free to copy, distribute or transmit the thesis on the condition that they attribute it, that they do not use it for commercial purposes and that they do not alter, transform or build upon it. For any reuse or redistribution, researchers must make clear to others the licence terms of this work’.
5

6
ABSTRACT Helicopters play a vital role in the movement of people and cargo to and from the
installations of the oil and gas industry at sea, often in challenging environments, such as
nighttime, where accidents tend to have serious impacts.
The ability to remain safe is largely reliant on the processes of hazard identification and risk
analysis. However, the processes currently used do not provide the offshore helicopter
industry with the desired levels of safety in nighttime operations. The reasons for this include
serious methodological weaknesses in current processes, especially the lack of a holistic view
of the safety-critical components of the industry; biased and over-simplistic analysis of
accidents; overreliance on reported incidents of doubtful statistical utility; ad hoc survey
methods to elicit opinions of pilots rather than facts about hazards; and the complete absence
of predictive analysis using hazard data. This thesis addresses these weaknesses by
developing and implementing a new and comprehensive methodology consisting of a number
of processes used in an integrated manner, with novel contributions in taxonomy
development, data quality and qualitative and quantitative data analytics to enhance hazard
identification and risk analysis of nighttime offshore helicopter operations.
The thesis demonstrates that this new methodology is effective in describing the safety-
critical components of the offshore helicopter industry, identifying systematic hazards
patterns and trends from the statistical analysis of accident reports, establishing the
appropriate use of incident reports for hazard identification and risk analysis and exploiting
knowledge and facts elicited directly from surveys of pilots to discriminate accurately the
riskiest phases of flight, identify an exhaustive and statistically representative range of
hazards related to the riskiest of such phases and analyse the hazard data through quantitative
predictive analysis. The methodology is easily transferable to other operations in the
helicopter domain by institutions of international reach (e.g., the International Civil Aviation
Organisation, ICAO) and individual helicopter operators.
7

8

ACKNOWLEDGEMENTS First and foremost my gratitude goes to my supervisors Dr. Arnab Majumdar and Professor
Washington Yotto Ochieng, who gave me the opportunity to conduct my PhD research at
Imperial College London and, tirelessly, supported me to achieve my goals.
I am also eternally grateful to The Lloyd’s Register Foundation (LRF), who funded my PhD
research from end to end. With this generous support I have realised a project of global
impact which will help preserving human lives and serve the public good.
At Imperial College London, I would like to thank loudly all the helpful people who eased
the pain of the writing-up period, especially Dr. Wolfgang Schuster, Nicole Kalas, Jackie
Sime (aka my British mum), Fionnuala, Gianluca and Tanya, my lovely flatmates Nicolo
Daina, Vatche Attarian and Becky Jeffers. Also thank to Santander Universities for two
consecutive international mobility awards.
For support and collaboration, I thank, inter alia, the UK Civil Aviation Authority (especially
Dave Howson, Jim Lyons, Mark Swan, Bob Jones and Tony Eagles); CHC in the UK,
Norway, Netherlands and Thailand; Bristow Norway; Australian Transportation Safety
Bureau (ATSB); Helicópteros Marinos in Argentina; in Brazil: Aeróleo Taxi Aéreo, BHS,
Líder Aviação, Omni Taxi Aéreo and Senior Taxi Aéreo; DanCopter in Denmark; Gulf
Helicopter Safety Team (HST) in the Middle East; the European Helicopter Safety
Implementation Team (EHSIT); INAER in Spain; and Arctic Air Service in the USA.
Colleagues from the LRF Transport Risk Management Centre, past and present: Sabine,
Miltos and Bush: we ran this mile together! Milena, KC, Gonzalo, Sophie, Nicole Schnittfeld
(Kudla), Marie-Do, Kohei, Sifra and Satoru. Other great friends from the 6th floor: Pablo,
Wim Baby-Boy, Severine, Jacek, Sebastian, Sarah, Samira, Tau, Stavros, Peri, Altti, Rocky,
Ali, Robin North, Mark. From the great memories of the 504 Happy Family: Sofia Galligani
and Adrien.
Friends brought to me by the research post: Miguel Silveira, Khalid Nur, Michael Bagshaw,
Steve Jarvis, Jason Devereux, Marie Langer, Donizeti de Andrade, Marcelo Leão. In the
Navy: Bruno Villela, Alexandre de Souza Hup, Guilherme Padão, Elias Voulgarelis and
Tony Hedworth.
9

Friends who I dearly miss: Terezinha ‘mãe-da-vida’, Nilton Júnior, Thiago Lopes, Bruno
Hildenbrand, família Cicarelli (especialmente Tatiana e José ‘seu Corelli’), Sergio Pereirinha-
de-Marinha, Gelta, Patricia Doria Solana, Alicia Navalón, Ron and Pauline.
My family, who showed me the path of hard work and commitment and made me get this far:
my mum Edla, I owe you every single degree I have. Vó Edla e vô Coutinho (in memoriam):
for the loving care. Leo & Lu: for the constant support throughout this and other journeys.
Yasmin, for perpetuating the Coutinho (Nascimento) spirit; and finally my dad Euvaldo. May
God be with you.
10
CONTENTS
Declaration of Originality ....................................................................................................... 5
Abstract.....................................................................................................................................7
Acknowledgements .................................................................................................................. 9
Contents...................................................................................................................................11
CHAPTER 1 Introduction .................................................................................................. 29
1.1 Background ................................................................................................................ 29
1.2 Aim and objectives .................................................................................................... 32
1.3 Thesis outline ............................................................................................................. 34
CHAPTER 2 Fundamentals of Nighttime Offshore Helicopter Operations, Safety, Hazard Identification and Risk Analysis ............................................................................. 37
2.1 Helicopter, offshore operations and the nighttime .................................................... 37
2.2 Safety ......................................................................................................................... 39
2.2.1 Risk ................................................................................................................... 40
2.2.2 Hazard .............................................................................................................. 41
2.2.3 Accident and incident ....................................................................................... 42
2.2.4 Safety management .......................................................................................... 44
2.2.4.1 State Safety Programme ................................................................................. 45
2.2.4.2 Safety Management System ........................................................................... 46
2.3 Hazard identification and risk analysis ...................................................................... 47
2.3.1 Consolidated view from the safety-critical industries ...................................... 47
2.3.2 Consolidated view from flights in degraded visual environments ................... 48
2.3.2.1 Visual perception and spatial orientation ....................................................... 49
2.3.2.2 The treacherous nature of human decision-making ....................................... 50
2.3.2.3 Decision-making in multi-crew cockpits ....................................................... 50
2.3.2.4 Context, hazard identification and risk analysis............................................. 51
2.3.3 Consolidated view from offshore helicopter operations .................................. 52
2.3.3.1 Hazard identification through reactive processes........................................... 52
2.3.3.1.1 Statistical analysis of accident reports ................................................................ 53
2.3.3.1.2 Statistical analysis of incident reports ................................................................. 58
2.3.3.2 Hazard identification through proactive processes ........................................ 60
2.3.3.2.1 Surveys ................................................................................................................ 60
2.3.3.3 Hazard identification through predictive processes ....................................... 64
11
2.3.3.4 Risk analysis ................................................................................................... 64
2.3.3.4.1 Risk matrix .......................................................................................................... 65
2.3.3.4.2 Bow tie ................................................................................................................ 67
2.4 Conclusions................................................................................................................ 68
CHAPTER 3 The Offshore Helicopter Transportation Industry’s Taxonomy ............. 73
3.1 Brief theoretical background ..................................................................................... 73
3.2 Taxonomy development options................................................................................ 73
3.2.1 Hierarchical Task Analysis .............................................................................. 74
3.2.2 Functional Resonance Analysis Method .......................................................... 74
3.2.3 SHELL model .................................................................................................. 75
3.2.4 Other techniques ............................................................................................... 76
3.3 Process to establish the industry’s taxonomy ............................................................ 76
3.3.1 Purpose ............................................................................................................. 76
3.3.2 Stopping rules ................................................................................................... 77
3.3.3 Steps ................................................................................................................. 77
3.3.4 Validation ......................................................................................................... 79
3.3.5 Knowledge sources .......................................................................................... 79
3.4 Process implementation ............................................................................................. 80
3.4.1 High level mission analysis .............................................................................. 80
3.4.2 Identification of typical phases of flight .......................................................... 81
3.4.3 Identification of tasks to be performed ............................................................ 81
3.4.4 Identification of actors ..................................................................................... 82
3.4.5 Grouping of actors ............................................................................................ 93
3.5 Ensuring completeness .............................................................................................. 94
3.5.1 Aviation system and risk models ..................................................................... 96
3.5.1.1 Subotic et al. (2005) ....................................................................................... 96
3.5.1.2 Greenberg et al. (2005)................................................................................... 96
3.5.1.3 Hokstad et al. (2001) and Herrera et al. (2010) .............................................. 98
3.5.1.4 Gibb et al. (2010) ......................................................................................... 100
3.5.1.5 Harris and Smith (1997) ............................................................................... 100
3.5.2 Morphological accident models ..................................................................... 101
3.5.2.1 Swiss Cheese and subsidiary models ........................................................... 101
3.5.2.2 Risk Management Framework and Migration of Work Practice model, AcciMap and ActorMap ............................................................................................. 103
3.5.2.3 Systems Theoretic Accident Modelling and Processes ................................ 105
12
3.5.3 Performance shaping factors .......................................................................... 107
3.6 Validation of results ................................................................................................. 107
3.7 Conclusions.............................................................................................................. 109
CHAPTER 4 Analysis of Accidents ................................................................................. 111
4.1 Status of helicopter accident analysis ...................................................................... 111
4.1.1 Operation-specific methods ............................................................................ 111
4.1.2 Methods adapted from fixed-wing operations ............................................... 112
4.1.3 Methods based on non operation-related risk factors ..................................... 112
4.1.4 Epidemiological studies ................................................................................. 112
4.1.5 Data quality .................................................................................................... 113
4.2 Process development ............................................................................................... 114
4.2.1 Timeframe selection ....................................................................................... 116
4.2.2 Definition of terms ......................................................................................... 116
4.2.3 Identification of relevant countries ................................................................ 116
4.2.4 Operational data collection ............................................................................. 116
4.2.5 Accident data collection ................................................................................. 117
4.2.6 Statistical analysis .......................................................................................... 117
4.3 Process implementation ........................................................................................... 118
4.3.1 Timeframe selection ....................................................................................... 118
4.3.2 Definition of terms ......................................................................................... 118
4.3.3 Identification of relevant countries ................................................................ 119
4.3.4 Operational data collection ............................................................................. 120
4.3.4.1 Procedure to estimate flight hours per lighting condition ............................ 120
4.3.4.1.1 Nighttime flying hours in North Sea regular passenger ferrying missions ....... 121
4.3.4.1.2 Nighttime flying hours in North Sea medvac missions ..................................... 121
4.3.4.1.3 Overall North Sea nighttime flying hours ......................................................... 122
4.3.4.1.4 Confirmatory interviews with experts in the North Sea .................................... 123
4.3.4.1.5 Worldwide nighttime flying hours .................................................................... 123
4.3.5 Accident data collection – sources and sampling strategy ............................. 123
4.3.6 Identification of variables relevant to accidents and data completeness ........ 124
4.3.6.1 Regions of occurrence .................................................................................. 126
4.3.6.2 Aircraft categories ........................................................................................ 127
4.3.6.3 Phases of flight ............................................................................................. 128
4.3.6.4 Lighting conditions ...................................................................................... 128
4.3.6.5 Outcomes ...................................................................................................... 128
13
4.3.6.6 Causes........................................................................................................... 129
4.3.7 Development of accident cause classification scheme ................................... 129
4.3.8 Statistical analysis .......................................................................................... 131
4.3.8.1 Calculation and analysis of accident rates.................................................... 133
4.3.8.2 Bivariate accident analyses .......................................................................... 134
4.3.8.2.1 Cross-tabulations of categorical variables ........................................................ 134
4.3.8.2.2 Distributions of accident-fatalities per variable of relevance to accidents ........ 135
4.3.8.3 Multivariate accident analysis ...................................................................... 135
4.4 Results and discussion ............................................................................................. 136
4.4.1 Calculation and analysis of accident rates ...................................................... 137
4.4.2 Bivariate accident analysis ............................................................................. 140
4.4.2.1 Cross-tabulations of categorical variables.................................................... 140
4.4.2.2 Distributions of accident-fatalities per variable of relevance to accidents... 142
4.4.3 Multivariate accident analyses ....................................................................... 145
4.4.3.1 Multinomial logistic regression .................................................................... 145
4.4.3.2 Binomial logistic regression ......................................................................... 146
4.4.4 Validation ....................................................................................................... 148
4.5 Conclusions.............................................................................................................. 149
CHAPTER 5 Assessment of the Statistical Utility of Reported Incidents .................... 153
5.1 Theoretical background ........................................................................................... 153
5.2 Data quality considerations ...................................................................................... 154
5.2.1 Stakeholders involved .................................................................................... 154
5.2.2 Critical factors for effective incident reporting .............................................. 155
5.2.3 Reporting culture and data quality in helicopter operations .......................... 157
5.3 Process development ............................................................................................... 159
5.3.1 Type of reported incidents to be used ............................................................ 160
5.3.2 Criteria for the selection of model incident databases ................................... 161
5.3.3 Database selection .......................................................................................... 161
5.3.4 Timeframe selection ....................................................................................... 162
5.3.5 Sampling incidents from the database ............................................................ 162
5.3.6 Extraction of relevant variables ...................................................................... 162
5.3.7 Completeness checks ...................................................................................... 162
5.3.8 Sampling accident data ................................................................................... 163
5.3.9 Procedure to assess the fit of the data to Heinrich’s theory, as applied in the aviation industry............................................................................................................. 163
5.4 Process implementation ........................................................................................... 163 14
5.4.1 Type of reported incidents chosen ................................................................. 163
5.4.2 Model database ............................................................................................... 164
5.4.2.1 National accident investigation authorities .................................................. 164
5.4.2.2 Civil aviation regulators ............................................................................... 164
5.4.2.2.1 The UK’s Mandatory Occurrence Reporting Scheme ...................................... 165
5.4.3 Analysis timeframe ........................................................................................ 166
5.4.4 Sampling of incidents ..................................................................................... 166
5.4.5 Variables extracted and completeness checks ................................................ 168
5.4.6 Sampling of accident data .............................................................................. 168
5.4.7 Assessment of the fit of the data to Heinrich’s theory, as applied in the aviation industry...........................................................................................................................169
5.5 Results...................................................................................................................... 170
5.5.1 Frequency analysis ......................................................................................... 170
5.5.2 Bivariate analysis ........................................................................................... 171
5.5.2.1 Clustered phases of flight and causes ........................................................... 171
5.5.2.2 Clustered phases of flight and lighting conditions ....................................... 174
5.5.2.3 Causes and lighting conditions ..................................................................... 174
5.6 Discussion ................................................................................................................ 175
5.6.1 Sudden failures ............................................................................................... 176
5.6.2 Underreporting of safety occurrences ............................................................ 177
5.6.3 The continued importance of reporting incidents .......................................... 178
5.7 Validation ................................................................................................................ 179
5.8 Limitations ............................................................................................................... 180
5.9 Conclusions.............................................................................................................. 180
CHAPTER 6 Identification of the Riskiest Phases of Nighttime Flights ...................... 183
6.1 Safety analysis on the basis of phases of flight ....................................................... 183
6.2 Taxonomies of phases of flight................................................................................ 184
6.3 Nighttime accidents and serious incidents re-visited ............................................... 186
6.3.1 Accidents ........................................................................................................ 186
6.3.2 Serious incidents ............................................................................................ 188
6.4 Limitations of ongoing phase-of-flight-specific safety interventions ..................... 189
6.5 Methodology ............................................................................................................ 189
6.5.1 Development of the taxonomy of phases of nighttime flights ....................... 190
6.5.2 Questionnaire design ...................................................................................... 192
6.5.2.1 Demographic variables ................................................................................. 193
6.5.2.2 Rating scales ................................................................................................. 194
15
6.5.3 Piloting ........................................................................................................... 194
6.5.4 Region, company and pilot sampling strategies ............................................. 195
6.5.5 Sample sizes ................................................................................................... 197
6.5.6 Statistical analysis .......................................................................................... 199
6.6 Results and discussion ............................................................................................. 200
6.6.1 Descriptive statistics ....................................................................................... 200
6.6.2 Hypothesis testing .......................................................................................... 203
6.6.2.1 Preliminary statistical tests (i.e., the tests of H01-4) ..................................... 203
6.6.2.2 Post hoc analysis of the preliminary statistical tests .................................... 203
6.6.2.3 Further statistical testing (i.e., the tests of H05-6) ......................................... 204
6.6.2.4 Risk ratings per demographic variables (i.e., the tests of H06-19) ................ 205
6.6.2.5 Impacts of the results of the hypotheses tested (i.e., H01-19) ....................... 206
6.7 Limitations and their mitigation .............................................................................. 208
6.8 Conclusions.............................................................................................................. 208
CHAPTER 7 Task-Based Hazard Identification Survey Process – Template Development.........................................................................................................................211
7.1 Theoretical background ........................................................................................... 211
7.2 Task analysis and hazard identification ................................................................... 212
7.3 Process development ............................................................................................... 213
7.3.1 Select task, geographical scope and sample sizes .......................................... 215
7.3.2 Preliminary hazard identification ................................................................... 215
7.3.3 Template development cycle .......................................................................... 217
7.3.3.1 Collect hazard data through task analysis .................................................... 217
7.3.3.1.1 Question design ................................................................................................. 217
7.3.3.1.2 Method of interview application ....................................................................... 218
7.3.3.1.3 Conduct a pilot study ........................................................................................ 218
7.3.3.1.4 Obtain ethical approval ..................................................................................... 218
7.3.3.2 Grounded Theory ......................................................................................... 219
7.3.3.3 Template Analysis ........................................................................................ 221
7.3.3.4 Template reassessment ................................................................................. 222
7.3.4 Content Analysis ............................................................................................ 222
7.4 Process implementation ........................................................................................... 223
7.4.1 Selection of task, geographical scope and pilot sampling considerations ...... 223
7.4.1.1 Selection of task ........................................................................................... 223
7.4.1.2 Selection of geographical scope ................................................................... 225
16
7.4.1.3 Pilot sampling ............................................................................................... 225
7.4.2 Preliminary hazard identification ................................................................... 226
7.4.2.1 Literature ...................................................................................................... 226
7.4.2.2 Taxonomies .................................................................................................. 226
7.4.2.3 Safety data .................................................................................................... 229
7.4.2.4 Outcome of the preliminary hazard identification ....................................... 229
7.4.3 Template development cycle .......................................................................... 229
7.4.3.1 Collection of data through task analysis – practical considerations............. 229
7.4.3.1.1 Design of questions and pilot study .................................................................. 229
7.4.3.1.2 Method of interview application and recording ................................................ 231
7.5 Results and discussion ............................................................................................. 232
7.5.1 Interim results ................................................................................................. 232
7.5.2 Template exhaustiveness ................................................................................ 232
7.5.3 Sample sizes for statistical analysis ............................................................... 232
7.5.4 Timeliness ...................................................................................................... 235
7.5.5 Final template ................................................................................................. 236
7.6 Conclusions.............................................................................................................. 236
CHAPTER 8 Task-Based Hazard Identification Survey Process – Quantitative Analysis.................................................................................................................................239
8.1 Preliminary considerations ...................................................................................... 239
8.2 Content Analysis procedure ..................................................................................... 240
8.2.1 Descriptive analysis ........................................................................................ 240
8.2.2 Analysis of codes and analysis of categories ................................................. 241
8.2.3 Bivariate analysis ........................................................................................... 242
8.2.4 Meta-demographic analysis ............................................................................ 242
8.2.5 Multivariate analysis ...................................................................................... 242
8.2.6 Industry instantiation and update ................................................................... 242
8.3 Results and discussion ............................................................................................. 243
8.3.1 Descriptive analysis ........................................................................................ 243
8.3.1.1 Contextual factors (Table 8-3) ..................................................................... 248
8.3.1.2 Impacts on crews (Table 8-4) ....................................................................... 252
8.3.2 Analysis of codes ........................................................................................... 252
8.3.2.1 Bivariate analyses ......................................................................................... 252
8.3.2.1.1 Demographic analysis ....................................................................................... 252
8.3.2.1.2 Cross-tabulation ................................................................................................ 255
17
8.3.2.2 Meta-demographic analysis.......................................................................... 257
8.3.2.3 Multivariate analysis and hazard code prediction ........................................ 258
8.3.2.3.1 Handling ............................................................................................................ 259
8.3.2.3.2 Attentional resources ......................................................................................... 260
8.3.2.3.3 Perception.......................................................................................................... 261
8.3.2.3.4 Decision-making ............................................................................................... 261
8.3.2.3.5 Crew cooperation .............................................................................................. 262
8.3.2.4 Industry instantiation and update ................................................................. 263
8.3.3 Analysis of key categories .............................................................................. 263
8.3.3.1 Selection of key categories ........................................................................... 265
8.3.3.2 Bivariate analysis ......................................................................................... 273
8.3.3.2.1 Demographic analysis ....................................................................................... 273
8.3.3.2.2 Cross-tabulation ................................................................................................ 275
8.3.3.3 Multivariate analysis and key hazard category prediction ........................... 278
8.3.3.3.1 Switching between visual and instrument scans ............................................... 278
8.3.3.3.2 Speed control..................................................................................................... 279
8.3.3.3.3 Height control ................................................................................................... 280
8.3.3.3.4 Visual illusions .................................................................................................. 280
8.3.3.4 Industry instantiation and update ................................................................. 281
8.4 Validation ................................................................................................................ 283
8.5 Limitations ............................................................................................................... 285
8.6 Conclusions.............................................................................................................. 287
CHAPTER 9 Conclusions and Recommendations for Future Work ........................... 289
9.1 Main findings of the thesis in relation to the theoretical background ..................... 289
9.2 Future work .............................................................................................................. 295
9.3 High-impact achievements ...................................................................................... 296
9.3.1 Publication format: peer-reviewed journal ..................................................... 297
9.3.2 Publication format: book chapter ................................................................... 297
9.3.3 Publication format: conference proceedings .................................................. 297
9.3.4 Key conference presentations ......................................................................... 298
9.3.5 Awards ........................................................................................................... 299
9.3.6 Membership to public review ......................................................................... 299
References.............................................................................................................................301
Appendix 1............................................................................................................................325
Appendix 2............................................................................................................................337
18

Appendix 3............................................................................................................................345
Appendix 4............................................................................................................................347
Appendix 5............................................................................................................................349
Appendix 6............................................................................................................................355
Appendix 7............................................................................................................................359
Appendix 8............................................................................................................................361
Appendix 9............................................................................................................................365
Appendix 10..........................................................................................................................367
Appendix 11..........................................................................................................................377
19

20
LIST OF FIGURES
Figure 2-1 – The risk matrix risk analysis process (ICAO, 2012c, pp. 38-41) ........................ 66 Figure 2-2 – Bow tie analysis (DNV, 2013) ............................................................................ 67 Figure 2-3 – Thesis’ methodology ........................................................................................... 71 Figure 3-1 – Process to establish an industry’s taxonomy ....................................................... 78 Figure 3-2 – Typical offshore helicopter flight profile and phases (Teixeira, 2006, pp.52) ... 81 Figure 3-3 – Initial version of the Offshore Helicopter Transportation Industry’s Taxonomy.................................................................................................................................................. 95 Figure 3-4 – The Air Transport System described by Subotic et al. (2005, pp. 278) .............. 97 Figure 3-5 – Risk frequency influencing factors (Herrera et al., 2010a), coded as in Figure 3-4.................................................................................................................................................. 99 Figure 3-6 – The aviation system model, adapted from Gibb et al. (2010), codified as in Figure 3-4 ............................................................................................................................... 101 Figure 3-7 – The Swiss Cheese model (Reason, 2008; cited in Salmon et al., 2011, pp. 3), codified as in Figure 3-4 ........................................................................................................ 102 Figure 3-8 – Rail version of HFACS codified as in Figure 3-4 ............................................. 104 Figure 3-9 – Rasmussen’s model, codified as in Figure 3-4.................................................. 105 Figure 3-10 – STAMP, codified as in Figure 3-4 .................................................................. 106 Figure 3-11 – The Offshore Helicopter Transportation Industry’s Taxonomy ..................... 108 Figure 4-1 – Analysis process ................................................................................................ 115 Figure 4-2 – Timelines showing the nighttime with respects to the typical flight schedule of Aberdeen (UK) in 2010 ......................................................................................................... 122 Figure 4-3 – Worldwide overall and fatal accident rates (solid blue and dotted red lines, respectively) for all causes, per lighting conditions (left: daytime; right: nighttime) ........... 138 Figure 4-4 – Worldwide overall and fatal accident rates (solid blue and dotted red lines, respectively) for operational causes, per lighting conditions (left: daytime; right: nighttime)................................................................................................................................................ 138 Figure 4-5 – Worldwide overall and fatal accident rates (solid blue and dotted red lines, respectively) for technical causes, per lighting conditions (left: daytime; right: nighttime) . 138 Figure 4-6 – The Offshore Helicopter Transportation Industry’s Taxonomy updated with the risky scenario of nighttime operations ................................................................................... 151 Figure 5-1 – Process for assessing the statistical utility of reported incidents as precursors to accidents, as applied in the aviation industry ......................................................................... 160 Figure 5-2 – Example of a Mandatory Occurrence Report (MOR) ....................................... 167 Figure 7-1 – Task-Based Hazard Identification Survey Process ........................................... 214 Figure 7-2 – Template exhaustion shown by the decreasing number of hazard categories formed at each new round of interview data collection and analysis .................................... 235 Figure 8-1 – Content Analysis procedure .............................................................................. 241 Figure 8-2 – Final hazard template’s ‘Contextual Factors’ codes mapped onto the Offshore Helicopter Transportation Industry’s Taxonomy................................................................... 249 Figure 8-3 – Instantiation of ‘crew cooperation’ hazards, with their reliable predictors and the odds ratios .............................................................................................................................. 264 Figure 8-4 – ‘Training’ code of the ‘Contextual Factors’ section of the template ................ 266 Figure 8-5 – ‘Procedures’ code of the ‘Contextual Factors’ section of the template ............ 267 Figure 8-6 – ‘Offshore installation’ code of the ‘Contextual Factors’ section of the template................................................................................................................................................ 267
21
Figure 8-7 – ‘Aircraft/OEM’ code of the ‘Contextual Factors’ section of the template ....... 268 Figure 8-8 – ‘Internal factors’ code of the ‘Contextual Factors’ section of the template ...... 268 Figure 8-9 – ‘Environmental conditions’ code of the ‘Contextual Factors’ section of template................................................................................................................................................ 269 Figure 8-10 – ‘Regulator’ code of the ‘Contextual Factors’ section of template .................. 269 Figure 8-11 – ‘Organisational issues’ code of the ‘Contextual Factors’ section of template 270 Figure 8-12 – ‘Handling’ code of the ‘Impacts on Crews’ section of the template ............... 270 Figure 8-13 – ‘Attentional resources’ code of the ‘Impacts on Crews’ section of the template................................................................................................................................................ 271 Figure 8-14 – ‘Perception’ code of the ‘Impacts on Crews’ section of the template ............ 271 Figure 8-15 – ‘Decision-making’ code of the ‘Impacts on Crews’ section of the template .. 272 Figure 8-16 – ‘Communication breakdown’ code of ‘Impacts on Crews’ section of template................................................................................................................................................ 272 Figure 8-17 – Instantiation of ‘switching between visual and instrument scan’ hazards, with their reliable predictors and the odds ratios ........................................................................... 282
22
LIST OF TABLES
Table 2-1 – Definitions of risk in aviation ............................................................................... 40 Table 2-2 – Definitions of hazard in aviation .......................................................................... 41 Table 2-3 – Definitions of accident, serious incident and incident in aviation (ICAO, 2010e).................................................................................................................................................. 43 Table 3-1 (across three pages) – Tasks performed and the actors involved in the phases of a flight between an onshore airport and an offshore fixed platform ........................................... 82 Table 3-2 (across two pages) – Tasks performed and the actors involved in the phases of a flight between an onshore airport and an offshore moving boat ............................................. 85 Table 3-3 (across two pages) – Tasks performed and the actors involved in the phases of a flight between two offshore fixed platforms ............................................................................ 86 Table 3-4 (across two pages) – Tasks performed and the actors involved in the phases of a flight between two offshore moving boats ............................................................................... 87 Table 3-5 – Tasks performed and the actors involved in the phases of a flight between an offshore fixed platform to an offshore moving boat ................................................................ 89 Table 3-6 – Tasks performed and the actors involved in the phases of a flight between an offshore moving boat to an offshore fixed platform ................................................................ 90 Table 3-7 (across two pages) – Tasks performed and the actors involved in the phases of a flight from an offshore fixed platform to an onshore airport ................................................... 91 Table 3-8 (across two pages) – Tasks performed and the actors involved in the phases of a flight from an offshore moving boat to an onshore airport ...................................................... 92 Table 4-1 – Pilot demographic variables initially considered for the analysis, with the results of the completeness checks (failures shaded in red) .............................................................. 125 Table 4-2 – Variables describing the operating scenario initially considered for the analysis, with the results of the completeness checks (failures shaded in red) .................................... 126 Table 4-3 – Clustering of ‘other regions’ .............................................................................. 127 Table 4-4 – Helicopter category classification scheme ......................................................... 128 Table 4-5 – Flight phases classification scheme .................................................................... 129 Table 4-6 – Cause classification scheme ............................................................................... 130 Table 4-7 – Examples of accident cause classification .......................................................... 132 Table 4-8 – Results of the statistical tests applied to accident rates ...................................... 139 Table 4-9 – Results of the statistical tests applied to pairs of categorical variables .............. 141 Table 4-10 – Summary of the results of the statistical tests applied to the distributions of accident-fatalities ................................................................................................................... 143 Table 4-11 – Results of multinomial logistic regression ....................................................... 146 Table 4-12 – Results of binomial logistic regression............................................................. 147 Table 5-1 – Accident and serious incident reports available from the national accident investigation authorities investigated in Chapter 4 (1997-2011 period) ................................ 165 Table 5-2 – Most frequent causes, phases of flight and lighting conditions across accidents and distributions of such variables across incidents in the 1997-2010 period ....................... 171 Table 5-3 (across two pages) – Causes, phases of flight and lighting conditions of accidents and distributions of such variables across incidents .............................................................. 172 Table 5-4 – Contingency table for the analysis of association between clustered phases of flight and causes (at the top level) ......................................................................................... 174 Table 6-1 – Nighttime accidents happened in ‘other regions’ between 1997 and 2011 ........ 187 Table 6-2 – Taxonomy of phases of nighttime flights ........................................................... 192
23
Table 6-3 – Areas covered by the regional sampling strategy ............................................... 195 Table 6-4 – Areas and number of respondents ...................................................................... 201 Table 6-5 – Main demographic characteristics of helicopter pilots ....................................... 201 Table 6-6 – Aircraft flown by participants (ordered by empty weight) ................................. 201 Table 6-7 – Medians, means and SDs of ratings assigned to phases of flight (highest medians in bold font) ........................................................................................................................... 202 Table 6-8 – Statistical analysis of risk ratings at the most critical phases across demographic variables ................................................................................................................................. 207 Table 7-1 – Content Analysis steps compared to Grounded Theory and Template Analysis224 Table 7-2 (across two pages) – Summary of interim results, controls and methods implemented in the template development cycle ................................................................... 233 Table 8-1 – Major demographic characteristics of pilots ...................................................... 243 Table 8-2 – Aircraft flown by participants (ordered by empty weight; some participants flew more than one type of aircraft) ............................................................................................... 243 Table 8-3 (across three pages) – ‘Contextual factors’ affecting the crews’ ability to fly visual segments of nighttime instrument approaches offshore, with the number and percentage of participants who commented on each code and category, and a comment per code ............. 244 Table 8-4 (across two pages) – ‘Impacts on the crews’ flying visual segments of nighttime instrument approaches offshore, with the number and percentage of participants who commented on each code and category, and a comment per code ........................................ 246 Table 8-5 – Demographic analysis of hazard codes .............................................................. 254 Table 8-6 – Cross-tabulation of hazard codes ........................................................................ 256 Table 8-7 – Meta-demographic analysis ................................................................................ 258 Table 8-8 – Prediction of impacts on ‘handling’ ................................................................... 259 Table 8-9 – Prediction of impacts on ‘attentional resources’ ................................................ 260 Table 8-10 – Prediction of impacts on ‘perception’ .............................................................. 261 Table 8-11 – Prediction of impacts on ‘decision-making’ ..................................................... 261 Table 8-12 – Prediction of impacts on ‘crew cooperation’.................................................... 262 Table 8-13 – Demographic analysis of key hazard categories .............................................. 274 Table 8-14 – Cross-tabulation of key hazard categories ........................................................ 277 Table 8-15 – Prediction of impacts on ‘switching between visual and instrument scans’ .... 278 Table 8-16 – Prediction of impacts on ‘speed control’ .......................................................... 279 Table 8-17 – Prediction of impacts on ‘height control’ ......................................................... 280 Table 8-18 – Prediction of impacts on ‘visual illusions’ ....................................................... 281 Table 8-19 – Statistical analysis of time gap for assured recency per demographic variables................................................................................................................................................ 284 Table 8-20 – Meta-demographic analysis of participants of the validation exercise ............ 285
24
LIST OF ABBREVIATIONS
AAIB Aircraft Accident Investigation Branch ACCERS Aviation Causal Contributors for Event Reporting Systems ADREP Accident and Incident Data Reporting Af Africa AIBN Accident Investigation Board of Norway AIDS Accident/Incident Data System ALARP As Low As Reasonably Practicable ALoS Acceptable Level of Safety Am Americas except the Gulf of Mexico ANSP Air Navigation Service Provider ARA Airborne Radar Approach ASC Aviation Sub-Committee ASMS Air Safety Management Systems ASRS Aviation Safety Reporting System ATA Air Transport Association ATC Air Traffic Control ATM Air Traffic Management ATPL Air Transport Pilot’s Licence ATSB Australian Transportation Safety Bureau Au Australasia AVAD Automatic Voice Alerting Device CAA Civil Aviation Authority CADORS Canadian Civil Aviation Daily Occurrence Reporting System CAST Commercial Aviation Safety Team CENIPA Air Accident Prevention and Investigation Centre (Brazil) CFIT Controlled Flight Into Terrain CFITW Controlled Flight Into Terrain or Water CIS Commonwealth of Independent States COO Chief Operating Officer CPL Commercial Pilot’s Licence CRM Crew Resource Management DGCA Directorate General of Civil Aviation (India) DoD Department of Defence DS Drive Shaft DVE Degraded Visual Environment EASA European Aviation Safety Agency EASP European Aviation Safety Programme ECCAIRS European Co-Ordination Centre for Accident and Incident Reporting
Systems 25
ECR European Central Repository EMS Emergency Medical Services ER Engine-Related ETTO Efficiency-Thoroughness Trade-Off EU European Union EUROCONTROL The European Organisation for the Safety of Air Navigation FAA Federal Aviation Administration (USA) FDA Flight Data Analysis FDM Flight Data Monitoring FET Fisher's Exact Test FRAM Functional Resonance Analysis Method GOM Gulf of Mexico GPS Global Positioning System H High H0i Null hypothesis i HAI Helicopter Association International HEMS Helicopter Emergency Medical Services HFACS Human Factors Analysis and Classification System HFDM Helicopter Flight Data Monitoring HLO Helideck Landing Officer HRA Human Reliability Analysis HSAC Helicopter Safety Advisory Conference HSE Health and Safety Executive HSRMC Helicopter Safety Research Management Committee (North Sea
countries) HT Heavy Twin Turbine HTA Hierarchical Task Analysis I Instrument IAC Interstate Aviation Committee (CIS countries) IATA International Air Transport Association ICAO International Civil Aviation Organisation ICS International Chamber of Shipping IFR Instrument Flight Rules IH Instrument scan – High kinetic state IHSS International Helicopter Safety Symposium IHST International Helicopter Safety Team IL Instrument scan – Low kinetic state IMC Instrument Meteorological Conditions IMO International Maritime Organisation ISO International Organisation for Standardisation Ks Kinetic state KS-Z Kolmogorov-Smirnov Z Test KTb Kendall's Tau b Test
26
KW Kruskal-Wallis Test L Low LOSA Line Operation Safety Audit LT Light Twin Turbine MAP Missed Approach Point MDH Minimum Descent Height ME Multi-Engine or Middle East MOR Mandatory Occurrence Reporting MoU Memorandum of Understanding MR Main Rotor MS Member State MT Medium Twin Turbine MTER Moses Test of Extreme Reaction MW/B Mann-Whitney U Test with Bonferroni Correction MW Mann-Whitney U Test NAA National Aviation Authority NAOMS National Aviation Operational Monitoring Service NASA National Aeronautics and Space Administration (USA) NB Nota Bene NDB Non-Directional Beacon NNS Northern North Sea NS North Sea NTSB National Transportation Safety Board (USA) NVIS Night Visual Imaging System OEM Original Equipment Manufacturer O&G Oil and Gas OGP International Association of Oil and Gas Producers OS Obstacles Strike PP Pilot Procedure PPRuNe Professional Pilots Rumour Network PRA Probabilistic Risk Assessment SAR Search and Rescue SARPs Standards and Recommended Practices SD Standard Deviation SE Single Engine SHELL Software-Hardware-Environment-Liveware-Liveware SME Subject Matter Expert SMICG Safety Management International Collaborating Working Group SMM Safety Management Manual SMS Safety Management System SNS Southern North Sea SOP Standard Operating Procedure SP Single Piston
27
SPI Safety Performance Indicator SRM Safety Risk Management SSP State Safety Programme St Scan technique ST Single Turbine STAMP Systems Theoretic Accident Modelling and Processes TAWS Terrain Awareness and Warning System TR Tail Rotor Tripod DELTA Tripod Diagnostic Evaluation Tool for Accident Prevention TSB Transport Safety Board (Canada) UK United Kingdom UN United Nations USA United States of America V Visual VH Visual scan - High kinetic state VL Visual scan – Low kinetic state VMC Visual Meteorological Conditions X2 Chi-Square Test XMSM Transmission(s)
28
CHAPTER 1 INTRODUCTION This chapter presents the context of the research in this thesis by examining the role of hazard
identification and risk analysis in preventing accidents in nighttime offshore helicopter
operations. It establishes the rationale for the need for a new methodology which integrates
enhanced processes for hazard identification and risk analysis and formulates six objectives
for its realisation. This is followed by a description of the structure of the thesis.
1.1 Background
The offshore helicopter industry started its activities in the 1940s in North America, where
frequent rough sea conditions prevented the transportation by boat of equipment and
personnel to and from offshore oil platforms. The dangerous conditions, along with long
journey times made helicopters an appealing mode of transportation compared with water
borne transport (e.g., Swartz, 2014; U.S. JHSAT, 2007; Qian et al., 2012; Kaiser, 2007). This
initiated an inextricable link between the continuity of energy exploitation and safety of
offshore helicopters.
Since its inception, the offshore helicopter industry has experienced continuous growth and
expansion worldwide. In 2011, helicopter operations in support of oil and gas activities
transported over 20 million passengers around the world on more than 6 million flights,
equivalent to over 2.3 million flying hours (Stevens, 2013)1. A limited but important part of
such flights, estimated at 3% of the total flying hours, are undertaken in the nighttime.
The industry profile encompasses small local companies with a few helicopters to large
enterprises with hundreds of helicopters operating in all continents. The typical offshore
helicopter operator provides aircraft, personnel (e.g., pilots, technicians and support staff) and
aircraft maintenance facilities to sustain helicopter operations (Farrell, 2013; U.S. JHSAT,
2007). In contrast to the traditional commercial aviation, the customers are not the flying
public per se but primarily the oil and gas companies which employ the workers at the
installations at sea.
1 Additionally, private communication with Mr. Mark Stevens, Managing Director of Shell Aircraft International, on 12 June, 2013.
29
Oil and gas companies are renowned for low acceptance of risk and the historical sponsorship
of important developments in safety. Such developments extend in turn to their sub-
contractors including offshore helicopter operators (Hudson, 2000; Lewis, 2011). Currently,
the oil and gas industry sets safety requirements for helicopter operations worldwide (Fox,
2002; U.S. Joint Helicopter Safety Analysis Team, 2011a) with novel safety infrastructure
and advanced safety management programmes, including challenging safety targets, that
subsequently benefit the wider helicopter community (e.g., CAA, 2004). The safety
management programmes address the need to identify hazards and analyse risks, which are
subsequently fed back into the management system for sound decision-making to avoid
accidents. This is essential given the daunting characteristics of offshore helicopter flights.
Offshore helicopter flights are often undertaken over water at distances in excess of 300
nautical miles from the shore, in both visual and instrument meteorological conditions (VMC
and IMC, respectively), in daytime and at night. This environment is associated with, inter
alia, higher aircraft corrosion rates due to salinity, limited visibility due to the interactions
between the sea and the atmosphere, strong winds and operations conducted at a high tempo
on platforms and boats that are plagued with obstacles (Prior and Evans, 2005; U.S. JHSAT,
2007; Morrison, 2001).
The accident rates in the offshore helicopter industry are still at least one order of magnitude
greater than those of commercial fixed-wing operations (Oil & Gas UK, 2011; OGP, 2010a).
Furthermore, helicopters are the biggest contributor to the overall risk of fatal accidents in the
offshore environment (Okstad et al., 2012; Olsen and Lindøe, 2009; Hokstad et al., 2001;
OGP, 2000, 2012a; Vinnem, 2011, 2010; Flin et al., 1996). These problems are particularly
acute at night, when the accident rates are considerably higher than in the daytime and the
knowledge of the hazards and risks associated with such accidents is very limited (OGP,
2013a; Ross and Gibb, 2008). This is aggravated by the expected increase in nighttime
offshore helicopter activities associated with, for example, the beginning of the exploration of
oil and gas in polar regions.
Overall, the safety of offshore helicopter transportation is a cause of great concern to
operators, regulators and the workforce (Mitchell and Braithwaite, 2008; Oil & Gas UK,
2011; Tharaldsen et al., 2008; Rundmo and Sjöberg, 1996; Skjerve, 2008; Hope et al., 2010;
Herrera et al., 2010a), leading to many safety reviews (e.g., HSE, 2003a, b; Oil & Gas UK,
30
2007; Canada-Newfoundland and Labrador Offshore Petroleum Board, 2010; CAA, 2013;
Lindøe et al., 2011) and uncertainty over the sustainability of the offshore helicopter industry.
Currently, this industry operates in an unstable environment where flights are instantly
interrupted following an accident and the associated decrease in public acceptance of
helicopter travel (Fox, 2002; Cwerner, 2006; Mitchell and Braithwaite, 2008). This has
recently been the case in the North Sea (BBC News, 2013; Carrell, 2009) and many other
places (e.g., Bailey, 2010; TSB Canada, 2011), with the potential for discontinuities in oil and
gas production flows and severe economic, political and social impacts (Mitchell and
Braithwaite, 2008; Clark et al., 2006).
Despite the many safety reviews, considerable investment in safety (Stevens, 2013; Howson,
2006, 2008; CAA, 2010c, b, a), advanced safety management programmes and the attentive
watch of coordinated stakeholders (e.g., customers, workforce and regulatory bodies), the
offshore helicopter industry still fails to meet its own safety target. Since 2005, the
International Association of Oil and Gas Producers (OGP) has determined that the risk per
period of flying exposure for an individual flying on OGP contracted businesses should not
be greater than that of the average global airline (Stevens, 2013). The accidents and incidents
in the nighttime are key contributors to the failure to meet this commitment (OGP, 2010b,
2009; GCAA, 2010; Barnett, 2009b; Doty, 2010; Herrera et al., 2010a), which leads to
serious doubts over the industry’s ability to identify hazards, analyse risks and learn from its
operational experience to manage safety accordingly (Pasztor and Connect, 2013; Pasztor and
Michaels, 2013; Doty, 2010; Stevens, 2013; BBC News, 2012; Ross and Gibb, 2008). This is
due to the following limitations.
• There is a lack of a process to outline the safety-critical components of the industry
and, consequently, no agreed view of the industry’s components which are relevant
to safety. This prevents the achievement of a holistic view of the hazards faced and
perpetuates the ongoing silo approach to hazard identification and risk analysis,
whereby stakeholders focus on their areas of responsibility oblivious to the impacts
of their actions in other components of the industry.
• There is no robust accident analysis process. This prevents the capture of high
quality accident data and impedes detailed statistical analysis to identify systematic
hazard trends and patterns, not evident from the pure description of the hazard data
captured. 31
• There is no agreed process to assess empirically the statistical precursor relationship
between reported incidents and accidents, as believed to exist in the aviation
industry, i.e., that the characteristics reported to occur most frequently across
incidents represent the characteristics of an impending accident. This prevents the
identification of how to best use reported incidents to identify hazards and analyse
risks.
• There are no factual hazard identification and risk analysis survey processes. This
compromises the believability and generalisability, both geographically and with
respect to phases of flight, of the hazards and risks of the nighttime, which currently
can only be identified and analysed from surveys of pilots.
• There is a lack of statistical analysis of the hazard data captured during surveys. This
impedes the establishment of probabilistic predictions of safety-critical outcomes
based on the occurrence of hazards elicited from surveys.
This thesis addresses these limitations and, for the first time, develops a methodology that
integrates novel hazard identification and risk analysis processes which enhance hazard and
risk knowledge and, therefore, improves the management of safety in nighttime offshore
helicopter operations.
1.2 Aim and objectives
From the background above, the aim of this thesis is to develop a methodology that integrates
enhanced hazard identification and risk analysis processes which improve safety management
in nighttime offshore helicopter operations. Six research objectives have been formulated to
achieve this aim.
1. Provide a systematic review of the hazard identification and risk analysis literature
applicable to nighttime offshore helicopter operations.
This highlights the limitations of current hazard identification and risk analysis
processes and enables the development of customised solutions which address the
limitations identified.
2. Develop and implement a process to generate a customised taxonomy which
consolidates a comprehensive characterisation, from a safety standpoint, of the
worldwide offshore helicopter transportation industry.
32
This helps in understanding the context of offshore helicopter operations and
subsequently identifies the parts of the industry whose interactions lead to increased
vulnerability to hazards, risks and ultimately accidents in nighttime operations.
3. Develop and implement a robust accident analysis process to enable the collection of
accident and operational data worldwide, assess their quality, recommend
improvements to data collection where needed and perform statistical analysis to
identify systematic hazard trends and patterns across the dataset.
This allows a broad understanding of the industry’s failure modes, placing nighttime
hazards in the wider context of all offshore helicopter hazards identified from the
analysis of accidents using the taxonomy developed during the previous research
objective. The process improves on the current over-simplistic accident analyses
solely based on describing the data captured.
4. Develop and implement a process to assess the utility of reported incidents as
statistical precursors to an impending accident, as believed to exist in the aviation
industry.
This further enables to understand nighttime incidents in the wider context of offshore
helicopter incidents and to establish the empirical relationship between reported
incidents and accidents. This, in turn, avoids misusing reported incident data and,
therefore, prevents misguided prioritisation of safety interventions, including in the
nighttime.
5. Develop and implement survey processes to capture factual, exhaustive and
statistically representative information about the risks experienced and hazards
encountered by pilots during nighttime offshore helicopter operations, especially in
the most critical flying conditions.
This enables an integral picture of the existing risks and hazards to be built, alleviates
the current over-reliance on ad hoc incident reports and prepares the survey data for
the focused quantitative analysis of hazards in the most critical conditions.
6. Develop and implement a quantitative analysis procedure that generates predictions of
safety-critical outcomes from the hazard data captured from surveys.
This enables an assessment, in probabilistic terms, of the impact of the occurrence of
the hazards on the safety of the offshore helicopter industry during the most critical
condition of nighttime operations. This includes the illustration of such impacts using
the industry’s taxonomy developed in the second objective.
33
1.3 Thesis outline
The thesis is organised in nine chapters. Chapter 2 reviews the literature on the fundamentals
of nighttime offshore helicopter transportation, safety, hazard identification and risk analysis.
This includes the definitions of safety and the associated terms and an overview of the
processes of safety management applicable to nighttime offshore helicopter operations, with
an emphasis on hazard identification and risk analysis. Overall, this chapter highlights the
critical weaknesses affecting the industry’s ability to learn from its operational experience.
Chapter 3 develops and implements a novel process to outline the Offshore Helicopter
Transportation Industry’s Taxonomy. The process builds on a brief appraisal of three relevant
techniques useful to outline an industry’s taxonomy to then select hierarchical task analysis
complemented by the study of relevant models from the literature. Validity is ensured by the
critique obtained from carefully-selected Subject Matter Experts (SMEs).
Chapter 4 develops and implements the novel Accident Analysis Process. The process is
developed to ensure that the limitations identified in Chapter 2 are addressed and statistical
analysis is possible. The implementation of the process reveals the most hazardous aspects of
worldwide offshore helicopter operations with respect to the taxonomy developed in Chapter
3 and place nighttime accidents in the wider context of the overall accidents in offshore
helicopter transportation. The validity of the results is assured by consultation with carefully
selected SMEs knowledgeable in worldwide offshore helicopter operations and comparison
with the pre-existing literature.
Chapter 5 develops and implements a novel process for the assessment of the utility of
reported incidents as statistical precursors to accidents, as believed to exist in the aviation
industry. The process includes the assessment of data for completeness and a procedure
designed to enable the comparison of incidents and accidents for their frequencies of
occurrence. The process is implemented using incident data from the UK Civil Aviation
Authority’s Mandatory Occurrence Reporting (MOR) Scheme’s database and the results
obtained directly challenge the long-lasting belief in the aviation industry whereby the
incidents occurring most frequently indicate the characteristics of an impending accident.
Furthermore, the results lead to a heightened awareness of the persistent problem of
underreporting of incidents in the offshore helicopter industry. Finally, the chapter provides
34
recommendations on how incident reports should be used for maximum benefit in hazard
identification and risk analysis. These are essential for the exploitation of reported incidents
to improve safety in nighttime operations. Validation of the results is done through SME
critique.
Chapter 6 establishes the importance of analysing risks and identifying hazards on the basis
of phases of flight and develops a survey methodology to uncover the riskiest phases of
nighttime offshore helicopter flights. In order to achieve this, the chapter provides a critical
review of existing taxonomies of phases of flight and analyses in greater detail the few
reports concerning nighttime accidents and incidents available. Finally, the chapter develops
a novel and bespoke taxonomy of the phases of nighttime offshore helicopter flights which
underpins the development of a questionnaire survey. Critical sampling of respondents
ensures data representativeness and the generalisability of the results of the multiple
hypotheses tested. The results identify the phases flown using visual scan techniques at high
kinetic states, especially the visual segment of nighttime instrument approaches, as the
riskiest phases of nighttime offshore helicopter flights.
Chapter 7 develops the novel Task-Based Hazard Identification Survey Process and, based on
the findings of Chapter 6, implements the process to identify the hazards of the visual
segment of nighttime instrument approaches. The process comprises a preliminary hazard
identification stage based on the available information, e.g., the literature, followed by factual
data collection through the application of the Talk-Through task analysis technique to a
representative sample of pilots. The hazard data collected are then subject to categorisation
and analysis using Grounded Theory and Template Analysis. The outcome of this process is
the creation of a hazard template which is exhaustive and statistically representative, ready
for quantitative analysis in Chapter 8.
Chapter 8 develops a novel Content Analysis-based quantitative analysis procedure and
implements it to the template. This aims to explore the systematic statistical relationships
across the hazard data and fit regression models to predict the occurrence of adverse
outcomes based on the occurrence of explanatory hazards. Validation is undertaken through a
limited concurrent validity exercise using an alternative dataset. Furthermore, this chapter
generates multiple hypotheses that provide avenues for future research.
35

Chapter 9 ends the thesis by reviewing its results, providing suggestions for future research
and listing the high-impact achievements.
36
CHAPTER 2 FUNDAMENTALS OF NIGHTTIME OFFSHORE HELICOPTER OPERATIONS, SAFETY, HAZARD IDENTIFICATION AND RISK ANALYSIS
This chapter contributes to the investigation on hazard identification and risk analysis of
nighttime offshore helicopter operations in several ways. Section 2.1 establishes the basic
terminological definitions that are necessary to ensure consistency throughout the thesis and
define its scope. Section 2.2 discusses key interpretations of safety and the associated terms,
which identify the prime role of hazard identification and risk analysis in the effective
management of safety. In Section 2.3, hazard identification and risk analysis are discussed in
greater depth, leading to identifying the gaps currently failing to protect offshore helicopter
operations in the nighttime. Section 2.4 concludes the chapter by summarising the gaps and
providing the workflow to address them in the remainder of the thesis.
2.1 Helicopter, offshore operations and the nighttime
A helicopter is a heavier-than-air aircraft which derives both lift and propulsion from
controlling the reactions of the air on one or more power-driven rotors mounted on
substantially vertical axes (Oxford Dictionaries, 2013; Taneja and Wiegmann, 2003; Conroy
et al., 1992; ICAO, 2012a)2. Given their unique ability to land and takeoff from an in-flight
stationary position, helicopters are ideal aircraft for performing diverse types of off-runway
missions, including offshore transportation (Fox, 2002).
A problem arises with the inconsistent definitions of what constitutes offshore operations
(e.g., CAA, 2008; ICAO, 2010c, 2005a; Barroso, 2012). In this thesis, such operations refer
only to the movement of people and/or cargo to or from installations operated by the oil and
gas industry on the sea (Simons et al., 2011; CAA, 2008). These include fixed and moving
installations (e.g., platforms and boats) for the exploration and/or exploitation of oil and gas
reserves on the seabed.
2 Powered-lift (e.g., tilt rotor) and gyroplane aircraft are not covered by this thesis since they are not considered to be helicopters (ICAO, 2012a)
37
The nighttime comprises of the hours between the end of the evening civil twilight and the
beginning of the morning civil twilight (ICAO, 2010c)3. In this period of time, the horizon
and terrestrial objects cannot be distinguished clearly in the absence of light from sources
other than the sun. The considerable safety implications of this are investigated in this thesis.
Nighttime offshore helicopter operations correspond to only approximately 3% of the overall
hours flown by offshore helicopter worldwide (Ross and Gibb, 2008). However, offshore
helicopter activities at night are expected to increase considerably in the near future due to
four important drivers: expansion towards the polar circles, redress of repressed demand,
emergency attendance and technology developments. These drivers are briefly described
below.
Expansion towards the poles, where the availability of daylight hours is short during several
months of the year, accompanies the search for new oil and gas deposits necessary to meet
the growing demand for energy worldwide (Wheatcroft, 2010; Donnelly, 2005; Alaska
Department of Natural Resources, 2009; Gautier, 2007; BarentsObserver, 2011b;
Nikitinskaya, 2011; BarentsObserver, 2011a; OGP, 2013b; Oil & Gas UK, 2010; Schenk et
al., 2009). Repressed demand refers to intense oil and gas activities which would require
helicopter support beyond the available daylight hours but remain limited to such by local
laws or practice which are currently under revision, for example, in Brazil and the Middle
East (Sosa, 2010; Quintão, 2010; Barnett, 2009a). Emergency attendance increases with the
growing offshore population, which may require nighttime evacuation by helicopter on an
individual basis (e.g., for medical conditions, known as medical evacuation or ‘medvac’) or
collectively. Examples of the latter are accidents involving platforms/ships (e.g., McGinnes
and Sims, 2012) and natural catastrophes, such as extreme storms, monsoons, hurricanes and
cyclones (Vinnem, 2011; HART Aviation, 2007). Finally, technological developments refer
to new infrastructure devised to support sustained flights in degraded visual environments
(DVE), especially the nighttime. These include the redesign of helideck lighting schemes,
incorporation of Global Positioning System (GPS) guidance into Airborne Radar Approach
3 The end of the evening civil twilight and the beginning of the morning civil twilight correspond to the moments when the geometric centre of the sun reaches 6o below the horizon after the sunset and before the sunrise, respectively ICAO (2010c). The Convention on International Civil Aviation - Annex 6 - Operation of Aircraft. 7th ed. Montréal: ICAO.
38
(ARA) procedures4, development of satellite-based differential GPS signals for vertical
guidance on approach manoeuvres and the widespread use of Automatic Voice Alerting
Devices (AVAD) and Terrain Awareness and Warning Systems (TAWS; see Howson, 2006
for all technological developments).
In order to understand its role in nighttime offshore helicopter operations, the definition of
safety is explored in the next section.
2.2 Safety
Numerous definitions of safety can be found in the literature, each reflecting slightly different
interpretations within specific domains (e.g., Lewis, 2011; ISO/IEC, 1999; JSSI - Occurrence
Data Analysis Working Group, 2006; Hollnagel, 2013; Weick, 1987; Reason, 2008).
However, a common understanding is that safety represents the absence of unexpected and
undesirable events with damaging consequences, typically accidents (Hollnagel, 2004). The
definitions of safety by the absence of such events are currently referred to as ‘Safety-I’
(Hollnagel, 2013), which encapsulates the definition adopted by the International Civil
Aviation Organisation5 (ICAO). According to the ICAO, safety is the ‘state in which harm to
persons or of property damage is reduced to, and maintained at or below, an acceptable level
through a continuing process of hazard identification and risk management’ (ICAO, 2012,
pp.12).
An alternative view, called ‘Safety-II’, stipulates that safety should be understood primarily
as the presence of expected and intended events, in addition to the absence of unexpected and
unintended events (Hollnagel et al., 2011; Hollnagel, 2013). This corrects what Reason
(2008) referred to as an ‘imbalance of understanding’ of safety (pp. 265) created by the
apparent lack of empirical activity during its long-lasting presence. However, the definition
outlined by the ICAO is adopted in this thesis to ensure consistency with ongoing practices in
4 This is an instrument navigation procedure in which the airborne meteorological radar is used for horizontal navigation and the radar altimeter is used for vertical navigation. See Nascimento (2009). 5 The International Civil Aviation Organisation (ICAO) is the United Nations’ specialised agency for international civil aviation, with 191 member countries in 2013. ICAO (2013). 2013 Safety Report. Montréal: ICAO.6 The European Aviation Safety Agency (EASA) is the aviation regulator across 29 European contracting States.
39
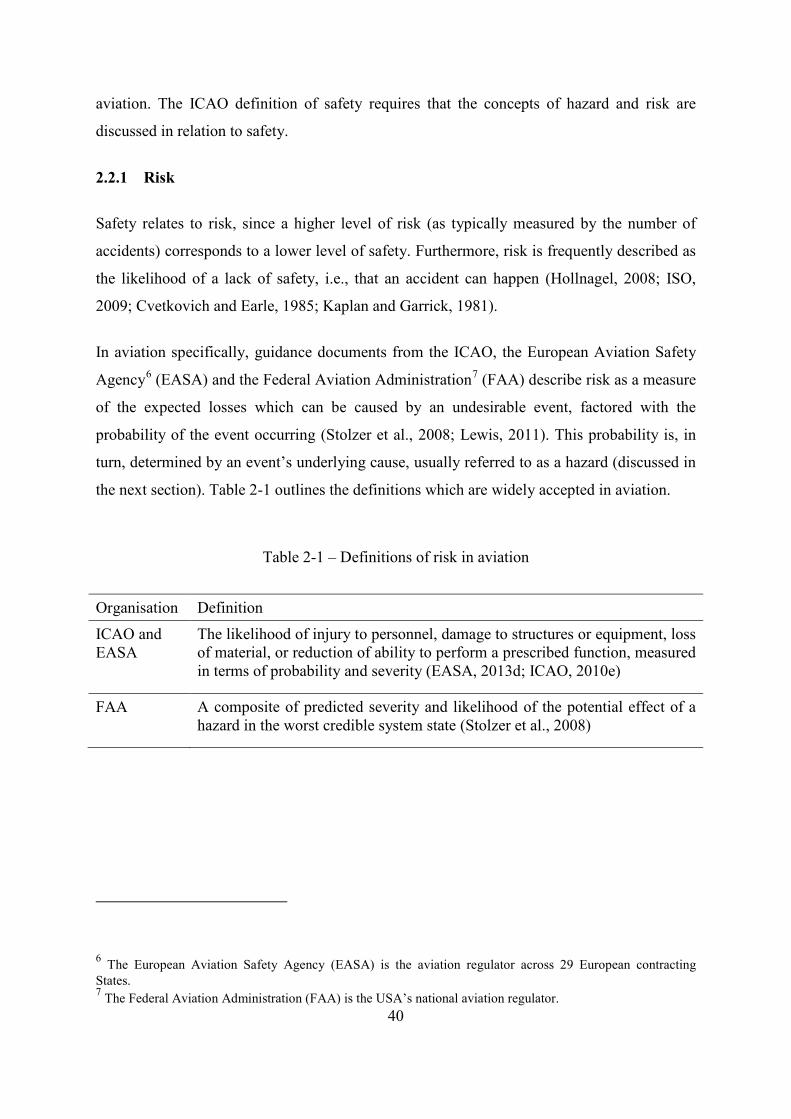
aviation. The ICAO definition of safety requires that the concepts of hazard and risk are
discussed in relation to safety.
2.2.1 Risk
Safety relates to risk, since a higher level of risk (as typically measured by the number of
accidents) corresponds to a lower level of safety. Furthermore, risk is frequently described as
the likelihood of a lack of safety, i.e., that an accident can happen (Hollnagel, 2008; ISO,
2009; Cvetkovich and Earle, 1985; Kaplan and Garrick, 1981).
In aviation specifically, guidance documents from the ICAO, the European Aviation Safety
Agency6 (EASA) and the Federal Aviation Administration7 (FAA) describe risk as a measure
of the expected losses which can be caused by an undesirable event, factored with the
probability of the event occurring (Stolzer et al., 2008; Lewis, 2011). This probability is, in
turn, determined by an event’s underlying cause, usually referred to as a hazard (discussed in
the next section). Table 2-1 outlines the definitions which are widely accepted in aviation.
Table 2-1 – Definitions of risk in aviation
Organisation Definition
ICAO and EASA
The likelihood of injury to personnel, damage to structures or equipment, loss of material, or reduction of ability to perform a prescribed function, measured in terms of probability and severity (EASA, 2013d; ICAO, 2010e)
FAA A composite of predicted severity and likelihood of the potential effect of a hazard in the worst credible system state (Stolzer et al., 2008)
6 The European Aviation Safety Agency (EASA) is the aviation regulator across 29 European contracting States. 7 The Federal Aviation Administration (FAA) is the USA’s national aviation regulator.
40
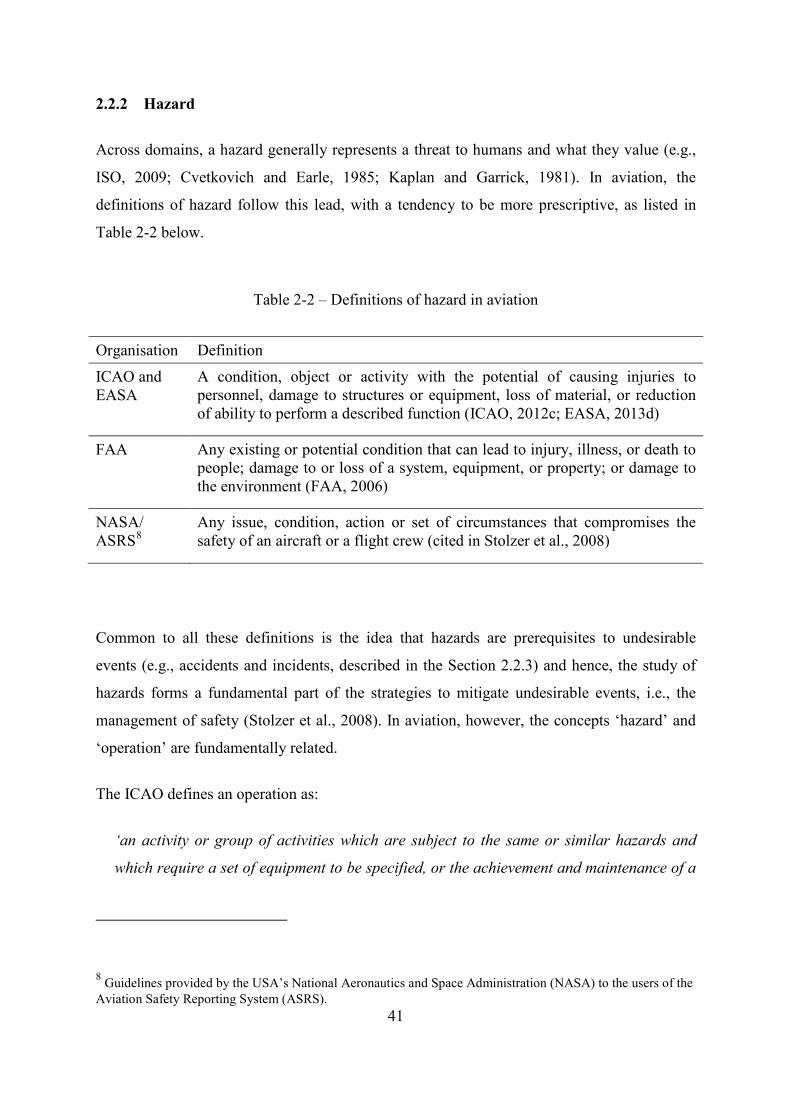
2.2.2 Hazard
Across domains, a hazard generally represents a threat to humans and what they value (e.g.,
ISO, 2009; Cvetkovich and Earle, 1985; Kaplan and Garrick, 1981). In aviation, the
definitions of hazard follow this lead, with a tendency to be more prescriptive, as listed in
Table 2-2 below.
Table 2-2 – Definitions of hazard in aviation
Organisation Definition
ICAO and EASA
A condition, object or activity with the potential of causing injuries to personnel, damage to structures or equipment, loss of material, or reduction of ability to perform a described function (ICAO, 2012c; EASA, 2013d)
FAA
Any existing or potential condition that can lead to injury, illness, or death to people; damage to or loss of a system, equipment, or property; or damage to the environment (FAA, 2006)
NASA/ ASRS8
Any issue, condition, action or set of circumstances that compromises the safety of an aircraft or a flight crew (cited in Stolzer et al., 2008)
Common to all these definitions is the idea that hazards are prerequisites to undesirable
events (e.g., accidents and incidents, described in the Section 2.2.3) and hence, the study of
hazards forms a fundamental part of the strategies to mitigate undesirable events, i.e., the
management of safety (Stolzer et al., 2008). In aviation, however, the concepts ‘hazard’ and
‘operation’ are fundamentally related.
The ICAO defines an operation as:
‘an activity or group of activities which are subject to the same or similar hazards and
which require a set of equipment to be specified, or the achievement and maintenance of a
8 Guidelines provided by the USA’s National Aeronautics and Space Administration (NASA) to the users of the Aviation Safety Reporting System (ASRS).
41
set of pilot competencies, to eliminate or mitigate the risk of such hazards’ (ICAO, 2010c,
pp. I-1-8).
This definition has two main implications. Firstly, since hazards are operation-specific, there
is no one-size-fits-all accident prevention strategy applicable across the gamut of operations
undertaken by helicopters (U.S. JHSAT, 2007). Secondly, there is little justification for
constraining the collection and analysis of hazard data based on arbitrary and artificial
boundaries, such as company and the country of operation (Harris, 2006a; Lewis, 2011). This
constraint currently exists (as further explained in Section 2.3.3) and may prevent important
hazards from being identified, especially as accidents and incidents become progressively
rare (Amalberti, 2001). The definitions of ‘accident’ and ‘incident’ and the possible
relationship between them are discussed below.
2.2.3 Accident and incident
Although the definitions of an ‘accident’ and ‘incident’ are mostly domain-specific (Dupuy,
2011; Hollnagel, 2004), they usually converge in that an accident represents a sudden,
unwanted and unforeseen event involving an observable, well defined and damaging loss. An
incident, however, is usually loosely defined and represents an occurrence of sufficient
(actual or potential) severity to warrant reporting, but one which still represents an affordable
loss (Hollnagel, 2004; Reason, 2008; Kjellén, 2000). In aviation, a subset of the incidents,
called ‘serious incidents’, is considered important. Table 2-3 outlines the various definitions
used in aviation.
The importance of identifying and reporting the occurrence of incidents (and serious
incidents) stems from the fact that such events are generally believed to share the aetiology of
accidents, i.e., the hazards leading to accidents and incidents/serious incidents are largely the
same. Therefore, the occurrence of an incident/serious incident is viewed as important (even
necessary) to enable lessons to be learned for the purposes of preventing accidents
(Hollnagel, 2004; Reason, 2008; Kjellén, 2000).
However, the definitions presented in Table 2-3 show that assigning the status of ‘incident’ or
‘serious incident’ to an occurrence depends on a value judgement made by the observer.
42
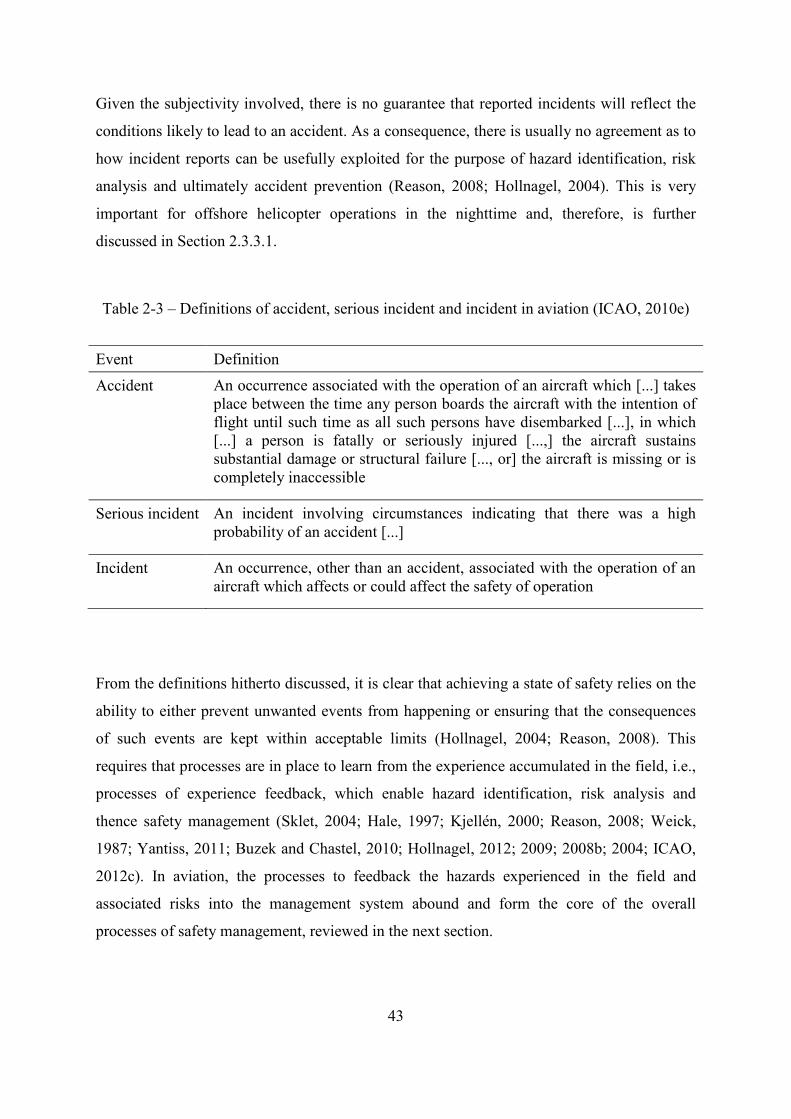
Given the subjectivity involved, there is no guarantee that reported incidents will reflect the
conditions likely to lead to an accident. As a consequence, there is usually no agreement as to
how incident reports can be usefully exploited for the purpose of hazard identification, risk
analysis and ultimately accident prevention (Reason, 2008; Hollnagel, 2004). This is very
important for offshore helicopter operations in the nighttime and, therefore, is further
discussed in Section 2.3.3.1.
Table 2-3 – Definitions of accident, serious incident and incident in aviation (ICAO, 2010e)
Event Definition
Accident An occurrence associated with the operation of an aircraft which [...] takes place between the time any person boards the aircraft with the intention of flight until such time as all such persons have disembarked [...], in which [...] a person is fatally or seriously injured [...,] the aircraft sustains substantial damage or structural failure [..., or] the aircraft is missing or is completely inaccessible
Serious incident An incident involving circumstances indicating that there was a high probability of an accident [...]
Incident An occurrence, other than an accident, associated with the operation of an aircraft which affects or could affect the safety of operation
From the definitions hitherto discussed, it is clear that achieving a state of safety relies on the
ability to either prevent unwanted events from happening or ensuring that the consequences
of such events are kept within acceptable limits (Hollnagel, 2004; Reason, 2008). This
requires that processes are in place to learn from the experience accumulated in the field, i.e.,
processes of experience feedback, which enable hazard identification, risk analysis and
thence safety management (Sklet, 2004; Hale, 1997; Kjellén, 2000; Reason, 2008; Weick,
1987; Yantiss, 2011; Buzek and Chastel, 2010; Hollnagel, 2012; 2009; 2008b; 2004; ICAO,
2012c). In aviation, the processes to feedback the hazards experienced in the field and
associated risks into the management system abound and form the core of the overall
processes of safety management, reviewed in the next section.
43
2.2.4 Safety management
Safety management in aviation is best understood from the umbrella regulations established
by the ICAO. The ICAO, in its pursuit of the safe, orderly and economic development of air
transport, requires that various processes of safety management are implemented according to
a three-layered hierarchy of control structures formed by the ICAO itself, Member States and
individual aviation product and service providers (ICAO, 2012c). The requirements of the
ICAO are established in the 19 annexes to the Convention on International Civil Aviation9
(ICAO, 2006a), which contain international standards and recommended practices (SARPs).
Some SARPs mostly regulate safety (Stolzer et al., 2008; ICAO, 2013) irrespective of the
aircraft type and, therefore, the majority of the annexes apply to offshore helicopter
operations. A summary of the safety aspects of the annexes, with their applications and
limitations in offshore helicopter transportation, is provided in Appendix 1.
According to the SARPs, ICAO’s main function which directly impacts safety management
through hazard identification and risk analysis is the gathering and aggregate analysis of
accident and serious incident reports at the worldwide level (ICAO, 2010e). However, this
has serious shortcomings in offshore helicopter operations, explained in Section 2.3.3.1.
ICAO’s SARPs related to a State’s safety management support the discharge of two functions
which are key for hazard identification and risk analysis at the State level: the investigation of
accidents and serious incidents (explained in Section 2.3.3.1) and the establishment and
maintenance of a State Safety Programme (SSP), explained in Section 2.2.4.1.
At the organisational level, the SARPs establish the high-level requirements for hazard
identification and risk analysis on the basis of the Safety Management System (SMS) and the
analysis of various types of datasets. This is explained in Section 2.2.4.2.
9 Adherence to the mandate of the Convention on International Civil Aviation is obligatory unless a Notification of Differences is filed by the State where national regulations and practices differ from the standards established by the ICAO. ICAO (2006a). The Convention on International Civil Aviation. 9th ed. Montréal: ICAO.
44
2.2.4.1 State Safety Programme
A State Safety Programme (SSP) is a management system for the regulation and
administration of safety by the State, which aims to achieve an acceptable level of safety
(ALoS) in the State, as measured by the aggregate safety performance of the State’s aviation
industry. This is pursued through the application of safety-focused business and quality
management processes at the State level, aimed at supporting data-driven decisions by the
State (Stolzer et al., 2008, 2011; Yantiss, 2011; CAA, 2010e). The underlying assumption is
that safety is an emergent property of robust processes (Yantiss, 2011; Transport Canada,
2008; Hsu et al., 2010; Maurino, 2007; SMICG, 2010a).
Combining performance-based and prescriptive requirements (ICAO, 2012c), the SSP is
formed of four components, also referred to as the pillars of: State safety policies and
objectives, State safety promotion, State safety risk management and State safety assurance.
State safety policies and objectives involve the enactment of the legislative framework to
ensure aviation safety in the State. State safety promotion trains State safety professionals to
the level required for the competent discharge of their functions and creates an environment
in which information flows openly between the stakeholders involved in safety management
within the State. State safety risk management and State safety assurance are the SSP’s
components directly related to hazard identification and risk analysis.
The State safety risk management component establishes the requirements and oversees the
development of the SMS which should enable product and service providers to continuously
and effectively identify hazards and analyse/mitigate risks in their organisations, as well as
demonstrate their safety management capability to the State (Hernandez, 2005; Yantiss,
2011). This includes the agreement with the Safety Performance Indicators (SPIs) proposed
by the provider, including the associated alert and target levels of performance (ICAO,
2012c). SPIs are metrics on the basis of which the safety status of the product and service
provider is inferred with reference to (i) unwanted outcomes which could not be prevented
(i.e., lagging indicators, e.g., number of accidents) and (ii) the performance on key safety
processes believed to control unwanted outcomes, i.e., leading indicators, e.g., level of
regulatory compliance (Okstad et al., 2012; Grabowski et al., 2007; Vinnem, 2010). SPIs are
important for hazard identification and risk analysis since, in essence, a lagging SPI refers to
45
a hazard which could not be mitigated and a leading SPI represents a hazard which may still
be mitigate before any adverse outcome occurs.
The State safety assurance component cyclically gathers and analyses data on hazards and
risks at the State level basically through oversight and surveillance activities of the product
and service providers’ SMS (e.g., through the actual performance achieved on the SPIs).
Together with the State safety assurance component, State safety risk management should
enable the experience feedback to take place at a State level largely based upon the hazards
identified and risks analysed by various product and service providers through the Safety
Management System (SMS).
2.2.4.2 Safety Management System
In compliance with the ICAO requirements ratified by the State, product and service
providers must develop and implement a Safety Management System (SMS) within their
organisations. An SMS is defined as ‘a systematic approach to managing safety, including
the necessary organisational structures, accountabilities, policies and procedures’ (ICAO,
2012c, pp. 10), which are developed by operators under the supervision of - and subject to
approval by - the State (Yantiss, 2011).
Like with the SSP, the SMS is built upon the premise that safety is an emergent property of
robust business- and quality-oriented processes (Transport Canada, 2008; ICAO, 2012c;
Yantiss, 2011; Stolzer et al., 2011, 2008; Hsu et al., 2010; Maurino, 2007; CAA, 2010e)
realised according to the four components of safety policies and objectives, safety risk
management, safety assurance and safety promotion (Yantiss, 2011; ICAO, 2012c).
Safety policy and objectives create the frame of reference for the operation of the SMS within
the organisation. Safety promotion ensures the right qualification of safety personnel and
publicity of the SMS (ICAO, 2012c; Yantiss, 2011). Safety risk management and safety
assurance perform hazard identification and risk analysis/mitigation in complementary
circumstances. Safety risk management addresses the need of ad hoc hazard identification
and risk analysis/mitigation related to, for example, an increase in safety-related events.
Safety assurance, in turn, is a closed-loop control function in which the organisation
formulates goals (typically by means of target and alert levels of SPIs), identifies the actual
state of affairs with reference to these goals and gears the state of affairs towards the goals by
46
subjecting any deviations detected to hazard identification and risk analysis/mitigation
(Yantiss, 2011; ICAO, 2012c; Harper et al., 2011). Analysing multiple datasets (e.g., accident
and incident reports, surveys of aircrew) independently is essential since it is at the
organisational level that various hazards and risks are directly experienced.
This and the previous sections have highlighted that hazard identification and risk analysis
are essentially conducted through the investigation of data collected from multiple sources
primarily at the organisational level, followed by escalated analyses at the State and
international levels (SMICG, 2010b; ICAO, 2012c). The actual realisation of hazard
identification and risk analysis, in terms of processes and requirements, are discussed in the
following section.
2.3 Hazard identification and risk analysis
Hazard identification and risk analysis, as currently realised in offshore helicopter operations,
including in the nighttime, are best understood in the context of the processes used across
various safety-critical industries. This is important because the scientific literature on hazard
identification and risk analysis processes in offshore helicopter operations is poor to say the
least. A consolidated view of the processes in use across various safety-critical industries is
provided in the next section.
2.3.1 Consolidated view from the safety-critical industries
Safety-critical industries, such as nuclear energy generation, chemical processing, civil
aviation and oil and gas exploitation, have employed various processes to identify hazards
and analyse risks in their operations. Appendix 2 presents an extensive list of 147 such
processes drawn from the safety literature, along with examples of the processes’ areas of
application and further bibliographic references. The list includes well-know processes, such
as the Failure Modes and Effects Analysis (FMEA) and Hazard and Operability (HAZOP)
studies, as well as processes which focus on specific types of hazards and risks, e.g., the
Management Oversight and Risk Tree (MORT). Whereas some processes only deal with
hazard identification, other processes are focused on risk analysis (e.g., safety audits and risk
matrix, respectively). Furthermore, there are processes which are complete frameworks fit for
both hazard identification and risk analysis (e.g., the Cause-Consequence Analysis (CCA)
process). Since the references in Appendix 2 explain the processes listed extensively (and
47
provide yet further references), the processes are only discussed in this thesis if and where
used.
Most hazard identification and risk analysis processes are customised to a specific industry,
application (e.g., only technical systems), situation or type of hazard (e.g., human error).
Therefore, the choice of processes to address a given problem must be done accordingly. For
example, hazard identification and risk analysis through accident and incident statistical
analysis are suitable with high frequency accidents. Alternatively, in-depth investigations of
single events are typically used to identify the hazards associated with infrequent accidents.
Finally, the identification of the hazards likely to lead to very rare large scale accidents is
usually undertaken through systemic analytical processes which scrutinise normal operations
(Sklet, 2004; Rasmussen, 1997; Shryane et al., 2000; Hollnagel, 2008). In the face of
different types of hazards for a single operation, different processes should be selected
(Reason, 2008; Hollnagel, 2004).
The selection of hazard identification and risk analysis processes should also reflect the
complexity of the activity under investigation. For example, simple, directly linked activities,
such as the operation of non-complex mechanical devices, may be covered by processes
which enable the identification of hazards and the analysis of risks irrespective of the
surrounding context, e.g., checklists. Complex activities with considerable human
involvement, on the other hand, require processes which characterise the operational context
in detail. This is essential because the context largely shapes human performance (Hollnagel,
2012; 2009; 2004), as is the case in nighttime offshore helicopter flying. A consolidated
review of the human factors literature on the requirements for human orientation in flights in
degraded visual environments (DVE) endorses this view.
2.3.2 Consolidated view from flights in degraded visual environments
Safe flights from pilots in DVE require both sustained spatial orientation and the ability to
avoid collisions. These in turn depend on accurate visual perception and decision-making,
both of which are highly context-dependent and prone to impairment in DVE, as discussed
below.
48
2.3.2.1 Visual perception and spatial orientation
The human ability to move in space depends significantly on information captured by vision,
which accounts for approximately 80% of the sensual inputs needed for Earth-based two-
dimensional (2-D) locomotion. Visual reliance is greater in aviation, where 3-D acceleration
often misleads the proprioceptive and vestibular systems which would otherwise contribute to
20% of the orientation inputs (Newman, 2007). The human ability to move in space also
depends on the central nervous system integrating these inputs and interpreting them against
internal models of locomotion (Cheung, 2004). Therefore, perception and orientation depend
both on ‘bottom-up’ neural sensing mechanisms as well as ‘top-down’ interpretative
processes (Cheung et al., 1995). Consequently, misperceptions (and spatial disorientation)
may result from the following:
• Absence or insufficiency of external visual stimuli;
• Breakdown in the capture of external stimuli;
• Breakdown in the stimuli integration mechanism;
• Breakdown in the retrieval of internal models of orientation from the long-term
memory;
• Breakdown in the matching process between external cues and internal models;
• Inadequacy of the internal models.
Given the mechanisms of misperception listed above, avoiding misperceptions in nighttime
flying depends not only on the sufficiency and capture of external stimuli but on the
integration of visual external stimuli, memory retrieval and interpretation against internal
models, all of which are dependent on the availability of cognitive resources, thus workload
and task complexity (Cheung et al., 1995). These in turn are affected by pilots’ chosen use of
automation and familiarity with the task (e.g., by training). Familiarity is also important for
the development of adequate internal models. This is a key consideration in the context of
nighttime offshore helicopter operations because the internal models of locomotion of human
beings are naturally inefficient for orientation in DVE, with a direct impact in decision-
making. This discussed in the following two sections.
49
2.3.2.2 The treacherous nature of human decision-making
Since humans usually spend their lives in daylight, their internal models for orientation are
built upon redundant visual cues, with many of the human perception mechanisms, e.g.,
convergence, relative size and linear perspective, working efficiently and effortlessly to de-
bias and interpret such cues. However, in DVE the fewer cues available compromise the
performance of human visual perception mechanisms (Gibb et al., 2010; Padfield et al., 2001;
CAA, 2007), whilst the over-estimation of visual capabilities remains (Andrade, 2011).
Consequently, unless attention is focused on actively seeking reliable visual cues, models of
which have to be internalised a priori, wrong decisions may result. Wrong decisions in DVE,
especially the nighttime, have led to high accident rates in aviation also beyond the offshore
helicopter domain (see Gibb et al., 2010; CAA, 2007; Helmreich and Khatwa, 1998; Khatwa
and Roelen, 1996; EHEST, 2010; U.S.JHSAT, 2010; Kontogiannis and Malakis, 2011). One
of the main strategies to counter-act flawed decision-making in aviation is the inclusion of
another pilot in the cockpit for pondered decision-making. However, this also has key
limitations, discussed below.
2.3.2.3 Decision-making in multi-crew cockpits
While it may be possible to solve the decision-making problem, to some extent, by
introducing a discussion forum for situation assessment in multi-crew cockpits (Greenberg et
al., 2005), social influences and communication problems are also inherited. This requires
clear communication standards and unambiguous intervention policies, without which the
intended shared decision-making can be expected to breakdown (Helmreich and Khatwa,
1998; Gibb and Olson, 2008). Moreover, in highly stressful or unfamiliar circumstances, such
a pondered decision-making process should give way to naturalistic strategies in which
immediately available heuristics and recognised patterns of familiar situations are chosen
instead (Carvalho et al., 2009; Wickens and Carswell, 2006; Reason, 2008). However, with
poorly developed internal models, this process suffers and can potentially cause visual
misperception and disorientation to both pilots individually, more so if crew communication
and procedural interventions are not in place. These in turn are directly affected by
organisational shortcomings (Majumdar et al., 2009b; Inglis et al., 2010).
The literature presented in the previous two and this section endorses that human perception,
orientation and decision-making are correlated to the internal and external factors present as
50
tasks are executed (e.g., available automation, training levels, quality of visual environment,
organisational practices). The cognitive strategies (i.e., mental models and heuristics) that
enable the perception needed for spatial orientation, situation awareness and decision-making
are a by-product of the operator’s experience with the work environment (Endsley, 1995;
Gibb et al., 2010). Therefore, there is a need to understand how experience within the
industry actually frames operators’ performance. The context of the operation needs to be
understood (Carvalho et al., 2009) for accurate hazard identification and risk analysis.
2.3.2.4 Context, hazard identification and risk analysis
Characterising the context of operation in support of hazard identification and risk analysis
usually involves the elicitation of subject matter expertise, which might require some form of
survey or task analysis methodology to be applied (Hollnagel, 2012; 2009; 2004; Marti,
2000; Militello and Hutton, 2000; Ainsworth and Marshall, 2000). This use of task analysis is
widely recommended in the technical literature of aviation (e.g., Stolzer et al., 2008; FAA Air
Traffic Organization, 2008; FAA, 2006; Arendt and Adamski, 2011; ICAO, 2012c) and has
recently been applied in support of safe airport operations (Wilke et al., 2014). Applying task
analysis enables a frame of reference to be created with regard to an industry’s safety-critical
components (e.g., stakeholders), underpinning the identification of what might otherwise
appear to be disconnected and unfamiliar hazards (Hollnagel, 2012, 2009, 2004; Harris,
2006a; Kontogiannis and Malakis, 2011; SMICG, 2013b; EASA, 2011; Borys, 2000; FAA,
2006; ICAO, 2012c; Arendt and Adamski, 2011; Roland and Moriarty, 1990; Shepherd,
2000; Stolzer et al., 2008; Deming, 2000; FAA Air Traffic Organization, 2008).
However, the task analysis techniques suitable for this purpose are poorly specified in the
technical and scientific literatures (Stolzer et al., 2008; FAA Air Traffic Organization, 2008;
FAA, 2006; Arendt and Adamski, 2011; ICAO, 2012c), with the consequences that the
uptake of such techniques is still very limited in offshore helicopter operations and the
characterisation of the industry’s activities, which could support hazard identification and risk
analysis, is currently absent. The development and implementation of a process to
characterise offshore helicopter operations by means of a customised taxonomy of its safety-
critical components is addressed in Chapter 3.
51
In spite of this absence, a number of hazard identification and risk analysis processes are
currently in use in offshore helicopter operations, including the nighttime, all with serious
flaws as discussed in the following section.
2.3.3 Consolidated view from offshore helicopter operations
Understanding the limitations of the processes of hazard identification and risk analysis
which support safe nighttime offshore helicopter operations requires a review of technical
literature. This is necessary because the scientific literature is, as mentioned in Section 2.3,
extremely incomplete. Hazard identification in particular requires special attention since any
hazards which are not identified will be excluded from risk analysis and mitigation altogether
(Paltrinieri et al., 2012; Aven, 2008; Trbojevic and Carr, 2000).
The hazard datasets and associated hazard identification processes applied in offshore
helicopter operations are part of those used in aviation and shown in Appendix 3, classified
by various attributes. The classification most frequently used, labels hazard datasets and
associated hazard identification processes as reactive, proactive and predictive (Stolte et al.,
2010; ICAO, 2012c). This classification is used to discuss the processes employed in the
offshore helicopter industry in Sections 2.3.3.1 to 2.3.3.3.
2.3.3.1 Hazard identification through reactive processes
Reactive hazard identification processes are those which rely on the analysis of past safety
occurrences (e.g., accidents and serious incidents) to identify the hazards which contributed
to the occurrence (Reason, 2008; ICAO, 2012c). These correspond to what the safety
literature presented in Appendix 2 labels as ‘accident and incident investigation’ and
‘accident and incident statistics’.
Whereas the identification of hazards through the investigation of individual accidents and
serious incidents is highly regulated and usually thorough in aviation (ICAO, 2010e), the
identification of hazards through the statistical analysis of multiple accident and serious
incident reports is still deficient. This is associated with various shortcomings discussed in
Section 2.3.3.1.1, with a focus on the analyses of nighttime accidents/serious incidents.
Furthermore, hazard identification through the statistical analysis of incident reports is
particularly deficient given that the assumption of shared aetiology with accidents mentioned
52
in Section 2.2.3 is usually accepted unverified. This is further discussed in Section 2.3.3.1.2,
with special attention to the nighttime incidents.
2.3.3.1.1 Statistical analysis of accident reports
Under the provisions of Annex 13, an ICAO Contracting State must identify hazards to safe
air operations from the investigation of the accidents of aircraft that occur in its territory
(ICAO, 2010e). However, given the relatively low frequency of accidents in offshore
helicopter transportation (OGP, 2012b, 2010a), the number of accidents in individual States
is usually insufficient to identify statistically significant trends or give early indications of
systematic as opposed to random hazards patterns across a number of accidents (Joint
Research Centre of the European Commission, 2005). This prevent the allocation of
resources for in-depth follow-up analyses and mitigation in areas of likely maximum benefit
(Aven, 1992; Kjellén, 2000).
In order to ameliorate this, the sharing of information between States is recommended by
ICAO; however, this sharing is non-obligatory and tends to be inconsistent (Harper et al.,
2011; ICAO, 2010e). This leads to a silo, country-based contrived approach to the analysis of
accidents, which hampers the identification of the hazards that are common across multiple
accidents.
These hazards can potentially be identified if accident sampling and analysis are based on the
common operational hazards, i.e., an international, operation-based (also called mission-
based) analysis approach (ICAO, 2010c; European Commission, 2011). This is currently
undertaken by the ICAO, EASA, International Association of Oil and Gas Producers
(OGP10), similar oil- and gas-related associations (e.g., the Helicopter Advisory Safety
Conference, HSAC11) and the International Helicopter Safety Team (IHST12). However, each
such attempt has serious limitations, each of which is described in turn below.
10 Formed in 1974, the OGP brings together many of the world’s leading oil and gas companies with the aim to promote responsible and profitable operations. In 2013, the OGP included 71 companies, with over 46% of the estimated air movements of the worldwide oil and gas activity Stevens, M. (2013). Aviation safety in the oil & gas business. Vancouver, Canada: CHC Safety and Quality Summit. 11 The HSAC oversees the operations of helicopters contracted by the oil and gas industry in the Gulf of Mexico (USA) and routinely exchanges information with the OGP.
53
2.3.3.1.1.1 Analysis by the International Civil Aviation Organisation
The ICAO requires the States to report the accidents which involve aircraft with a certified
maximum take-off weight of over 2250 kg13. The reports submitted to the ICAO are stored in
the Accident and Incident Data Reporting (ADREP) database and analysed collectively for
frequency of occurrence and number of fatalities involved (ICAO, 2012c). Based on these,
high risk accident categories are identified globally, e.g., controlled flight into terrain – CFIT,
on an annual basis (ICAO, 2013). Furthermore, three-way cross-tabulations (e.g., descriptive
summaries of accidents per types of safety event, phases of operations and aircraft categories)
are provided upon the request of a State (ICAO, 1987, 2003).
The restriction imposed on data entry by aircraft weight makes it impossible for
approximately 30% of the worldwide offshore helicopter fleet to have their accidents reported
to the ICAO (Farrell, 2013). This seriously limits the utility of the ADREP as a data
collection platform to enable hazard identification on the basis of the statistical analysis of
offshore helicopter accident reports at the worldwide level. This is aggravated by the
constraint of the analysis to annual periods and the associated low numbers of accidents
registered. Additionally, the best possible analysis provided, i.e., three-way cross-tabulations,
does not involve statistical testing and, therefore, it cannot identify the hazards which occur
systematically across accidents.
2.3.3.1.1.2 Analysis by the European Aviation Safety Agency
The EASA overseas safety of offshore helicopter operations in Europe, which are routinely
undertaken in two main areas: the North Sea, which refers to the sea areas of the UK,
Norway, Denmark, Netherlands, Belgium, France, Germany and Ireland; and the
12 The IHST is a joint industry-regulator effort which was officially formed during the first International Helicopter Safety Symposium (IHSS) hosted in 2005 in Montréal. The goal of the IHST is to reduce helicopter accident rates by 80% in the ten years between 2006 and 2016. This goal is to be pursued through a data-driven approach based on the collective analysis of helicopter accident reports IHST (2011). The developing history of an accident-free future [Online]. Available: http://www.ihst.org/Default.aspx?tabid=1780&language=en-US [Accessed 04/11 2013]. 13 These are the aircraft deemed to primarily represent the aggregate safety in the global air transport industry because they account for the majority of commercial flights ICAO (2013). 2013 Safety Report. Montréal: ICAO.
54
Mediterranean Sea, which refers to the waters of Spain, Portugal and Italy (EASA, 2013c; Oil
& Gas UK, 2010).
Since the North Sea is internationally renowned as one of the world’s safest areas for
offshore helicopter operations (HART Aviation, 2007; Vinnem, 2011) and the Mediterranean
Sea is an area of very low offshore helicopter traffic (EASA, 2013b), the accidents in Europe
have insufficient numbers to enable any statistical testing to be undertaken for the
identification of systematic hazard trends and patterns.
A number of other shortcomings also affect hazard identification based on the study of
accident reports in Europe: the low quality and incompleteness of the data collected,
complexity of the hazard taxonomies used (Selvi, 2011; European Commission, 2011;
Moussas, 2010; Ferrante et al., 2004; JSSI - Occurrence Data Analysis Working Group,
2006), lack of data on the level of aviation activity at the States (European Commission,
2011), analysis constrained to annual periods (EASA, 2013a) and simplistic statistical
analysis techniques (Joint Research Centre of the European Commission, 2005; JSSI -
Occurrence Data Analysis Working Group, 2006; EASA, 2013b). Ultimately, hazard
identification based on accident information in Europe is only achievable on the basis of
individual accident reports.
2.3.3.1.1.3 Analysis by the International Association of Oil and Gas Producers and similar associations
The International Association of Oil and Gas Producers (OGP) operates an Aviation Sub-
Committee (ASC) which requires the contracted helicopter service providers to report any
accidents in which they are involved. The occurrences reported are input into a worldwide
database which the OGP uses proprietarily for the collective analysis of accident data.
Between 1998 and 2007, the results of the analysis were published as high-level descriptive
summaries of the accidents’ main characteristics, presented with reference to annual periods
(OGP, 2012b; HSAC, 2000; OGP, 1999). These reports formed the principal basis for safety
interventions in the offshore helicopter domain.
However, the accident data collected by the OGP are incomplete since adherence to the
OGP’s ASC is not obligatory and, in 2010, only 12% of the worldwide oil and gas companies
actively participated in the ASC (Doty, 2010; OGP, 2010a; Vinnem, 2011). This directly
55
affects the scope of the analyses undertaken by the OGP and compromises the reliability of
many other studies which are primarily based on the OGP’s accident dataset (e.g., Clark et
al., 2006; Williams, 2000; Zoers, 2005; Vinnem, 2011, 2008).
In addition, terminological disagreements have biased the studies of offshore helicopter
accidents, undertaken by the OGP. For example, the HSAC has identified that the accident
statistics in the Gulf of Mexico are frequently understated because the National
Transportation Safety Board (NTSB)14 classifies as ‘incidents’ occurrences which would
elsewhere be labelled ‘accidents’, e.g., some types of survivable forced-landings at sea, also
known as ‘ditchings’ (Williams, 2012).
Another key shortcoming in the analysis of accidents by the OGP is the absence of an
analysis process which employs statistical testing for the identification of systematic hazard
trends and patterns. Given the purely qualitative nature of the OGP’s analyses, the results
cannot be generalised.
However, one such qualitative study is worth mentioning because it specifically focused on
risk management of nighttime offshore helicopter operations worldwide. Ross and Gibb
(2008) reviewed accidents of helicopters involved in maritime operations between 1990 and
2007 to identify an accident rate five times higher than the overall rate in this period. This
was primarily caused by the lack of pilot standardisation and the application of improper
flying techniques, which resulted in a number of recommendations, especially related to dual
crew pairing, pilot training, procedure standardisation and enhanced technologies. However,
this study can be criticised on a number of grounds. Firstly, the accidents were sampled on
the basis of data availability as opposed to any theoretical consideration, e.g., data timeliness.
Secondly, accidents from operations other than offshore (e.g., marine pilot transfer and
maintenance flights) were pooled together with data from offshore operations and analysed.
This might have led to the identification of hazards which do not necessarily exist in the
offshore domain. Finally, only the nighttime accidents were analysed, which prevented the
identification of any specific hazard trends associated with the nighttime by comparison with
the hazards present in all lighting conditions.
14 NTSB is the USA’s national accident investigation authority. 56
Qualitative analysis, with the associated inability to generalise any results, has also been the
focus of many other studies of helicopter accidents undertaken at regional and national levels
by organisations which, like the OGP, request the reporting of accident data contractually in
their spheres of influence. These include Oil & Gas UK, Norwegian Oil and Gas Association
and the HSAC in the Gulf of Mexico (Herrera et al., 2010a; Hokstad et al., 1999; HSE,
2003b; Vinnem, 2011, 2008; Barnett, 2009a; Morrison, 2001; Oil & Gas UK, 2011; 2007).
Overall, the studies of accidents undertaken by the offshore oil and gas industry are of limited
utility for hazard identification, risk analysis and ultimately for any safety improvements in
helicopter operations.
2.3.3.1.1.4 Analysis by the International Helicopter Safety Team
The International Helicopter Safety Team (IHST) identifies hazards from the analysis of
official accident reports using a framework adapted from that produced by the Commercial
Aviation Safety Team (CAST) in the context of fixed-wing aircraft operations in the USA in
the 1990s. The CAST’s framework required the regional analysis of accident reports on an
annual basis using bespoke taxonomies. This led the IHST to adopt a per-region (e.g., Persian
Gulf) or per-country, per-calendar-year, per-operation-type helicopter accident data collection
and analysis strategy (IHST, 2011).
Even though the IHST’s analyses cover offshore helicopter operations, the data collection
strategy is constrained by annual periods and sometimes for single countries. This has
perpetuated the problem of a low number of accidents recorded and, therefore, poor statistical
utility. Furthermore, the IHST’s analysis framework is also qualitative in nature, i.e., the
analysis yields solely accident frequency counts, with no hypothesis testing which could
identify systematic hazard trends and patterns (U.S. JHSAT, 2007; 2009, 2010; EHEST,
2010; Canadian Joint Helicopter Safety Analysis Team, 2011).
Another fundamental problem associated with the IHST’s framework is the inappropriateness
of the taxonomies inherited from the fixed-wing domain when applied to the analysis of
helicopter accidents. For example, the unique phases of flight of helicopters are poorly
covered, the breakdown into helicopter operations is too generic (e.g., onshore and offshore
activities being grouped together as commercial air transport) and the classification of human
factors-related hazards is unsound. There is usually a significant bias to assign ‘pilot
57
judgement and actions’ as the cause of accidents (Howson, 2012). Consequently, the analysis
outputs achieved are too simplistic to realise the safety improvement pursued (Huber, 2013).
Given the various limitations in the sampling and analysis of accident reports mentioned in
Sections 2.3.3.1.1.1 to 2.3.3.1.1.3 and this section, the hazards to offshore helicopter
operations are still identified primarily from the investigation of individual accidents and the
safety interventions are devised accordingly (European Commission, 2011; Rowe et al.,
2006; Howson, 2006; CAA, 2010d; Hart, 2005). However, addressing the hazards identified
from individual investigations is likely to have only incremental effects on the overall safety
level achieved by the whole industry. As explained before, this stems from the fact that the
precipitating circumstances (i.e., the hazards) prevailing in the population of accidents cannot
be identified from single events (Helmreich and Merritt, 1998). Furthermore, the ability to
predict critical accident characteristics on the basis of statistical analysis of hazard data is
desirable in aviation (further explained in Section 2.3.3.3) but currently inexistent.
In order to enable the systematic hazard trends and patterns to be identified across the
accident data, especially in the nighttime, a novel accident analysis process is required. This
process should enable the analysis of the hazards of accidents in all lighting conditions so that
the hazards of the nighttime may be assessed with respect to the overall hazards of accidents
in the offshore helicopter environment. A novel accident analysis process is developed and
implemented in Chapter 4.
Given the low numbers of accidents typically recorded, the analysis of reported incidents is
given considerable importance in offshore helicopter operations, discussed below.
2.3.3.1.2 Statistical analysis of incident reports
Sections 2.2.3 and 2.3.3.1 introduced the use of incident (and serious incident) reports for
hazard identification in lieu of the infrequent accident reports, on the basis of the acceptance
of a shared aetiology principle. Under this assumption, monitoring and acting appropriately
on the hazards identified from the analysis of incidents and serious incidents enable accidents
to be prevented (Hollnagel, 2004; Reason, 2008; Kjellén, 2000).
This view largely stems from the pioneering work of Heinrich, first published in 1931 and
revised a number of times since (e.g., Heinrich, 1980). Based on the review of a large number
58
of industrial accident reports sampled from factories and insurance claims, Heinrich
concluded that accidents of varying severities were related to each other by their frequencies
of occurrence in an iceberg- or pyramid-like fashion. According to the iceberg/pyramid, in a
unit group of 330 accidents sharing the same set of characteristics (e.g., underlying hazards
expressed by the causes of the occurrence), 300 resulted in no injury, 29 in minor injuries and
1 in a major injury or lost-time case. From this observation, it was concluded that ‘in the
largest injury group – the minor injuries – lie the most valuable clues to accident causes’
(cited in Manuele, 2011, pp.57).
This observation has since impacted hazard identification and risk analysis/mitigation in
various industries. The main impact was the establishment of a statistical precursor
relationship whereby safety events of lower severity precede high severity and relate to them
by their shared characteristics according to threshold levels, i.e., those of the 1:29:300 ratios
(Smith and Borgonovo, 2007; Nielsen et al., 2006). In aviation specifically, this has resulted
in the widespread belief that the incident/serious incident reported to occur most frequently
directly indicate the characteristics of an impending accident15 (CAA, 2000).
However, the pyramid/iceberg, as well as its specific application in aviation, has been
disputed on a number of grounds. These include empirical evidence contradicting the
frequencies theoretically postulated (e.g., Manuele, 2011; SMICG, 2013b), lack of empirical
evidence of the causal relationship between incidents and accidents (Nielsen et al., 2006),
difficulties in harmonising definitions and thus comparing the subjectively-determined
incidents to accidents (Reason, 2008; Hollnagel, 2004), the existence of incidents that do not
share the aetiology of accidents (SMICG, 2010a; Westrum, 2006; Shanon and Manning,
1980; Salminen et al., 1992; Kjellén, 2000; Nielsen et al., 2006) and poor incident data
quality in general (Hollnagel, 2004; Harper et al., 2011).
Unless the statistical precursor relationship between incidents and accidents, as applied in the
aviation industry, is tested and validated, the use of the hazards most frequently reported
across incidents as indicators of an impending accident might be an ineffective way to
15Private communications with Captains Jon Hopkinson, Manager of Flight Operations at CHC Helicopters, the world’s largest offshore helicopter operator; Fernando Moraes from Petrobras; Valter Pinto from Aeróleo and Paulo Víctor from BHS.
59
identify key hazards in need of priority intervention. This is very important in offshore
helicopter operations since reported incidents are widely trusted as reliable sources of hazard
information on the basis of their frequencies (ICAO, 2012c; Vinnem, 2010; CHC, 2010;
Lewis, 2011; Prince, 1999; McCarroll, 2011). This includes the use of incident reports in
probabilistic risk assessments (PRAs, e.g., CAA, 2010c) and as safety performance indicators
(Herrera et al., 2010a; ICAO, 2012c). Chapter 5 develops and implements a process to assess
the utility of reported incidents as statistical precursors of impending accidents, as believed to
occur in the aviation industry. This enables the identification of the best use of reported
incidents as tools for hazard identification and risk analysis/mitigation, guiding their
utilisation in support of safe operations in the nighttime.
2.3.3.2 Hazard identification through proactive processes
Proactive processes of hazard identification actively seek hazards in the operation as
undertaken, exploiting process measures instead of negative outcomes. As such, proactive
processes attempt to isolate latent failures and areas where organisational defences are weak
in anticipation of an adverse event (Reason, 1997; 2008; ICAO, 2012c).
In offshore helicopter transportation, it is generally agreed16 that there are two main types of
proactive hazard identification processes: those which only address regulatory compliance
(i.e., a bureaucratic task) and those expected to provide vital information about hazards that
need to be addressed. Forming the first group are, for example, audits and internal process
evaluations. The latter are basically comprised of surveys (ICAO, 2012c; Vinnem, 2010;
CHC, 2010), described in the next section.
2.3.3.2.1 Surveys
A survey is the process of collecting information from a sample of people who have been
selected to represent a defined population (Burns and Burns, 2008). In aviation, surveys are
used to identify hazards directly from the front-line personnel exposed, usually by means of
16 Private communication with Captains Rafael Ramos, Gilvan Barros and Luiz Fleury Curado, Aviation Safety Officers for three major offshore helicopter operators, i.e., Líder Aviação, Senior Taxi Aéreo and Omni Brasil, respectively, in August, 2013. Meeting held in April, 2013 in Aberdeen with the senior safety managers of CHC, the world’s largest helicopter operator. Private communication in December, 2012 with the UK CAA Helicopter Safety Research Manager.
60
questionnaires and interviews. These produce invaluable information where accidents are
relatively infrequent and occurrence data is unreliable, as in offshore helicopter operations,
especially in the nighttime (see Section 2.3.3.1; also Huber, 2013; Stevens, 2013; ICAO,
2012c; Kontogiannis and Malakis, 2011; Dery et al., 2007; Boschert et al., 2007;
EUROCONTROL, 2000). The hazards of nighttime offshore helicopter operations were
identified, to varying extent, in three surveys: CAA (1997), Nascimento (2009) and Herrera
et al. (2010a).
In CAA (1997), the impacts of in-flight paperwork in North Sea operations were assessed
through a questionnaire survey of pilots. The questionnaire comprised mostly of rating scales
in which pilots evaluated the workload and accident potential of hazards related to various
scenarios. Poor helideck lighting was identified as a major hazard during the nighttime
approach manoeuvre and, subsequently, ongoing research into an optimal helideck lighting
scheme has gained impetus (CAA, 2014, 2010b, 2009, 1997; Howson, 2009, 2006).
However, because the focus of the study was not nighttime operations, there were no further
contributions to hazard identification and risk analysis.
Nascimento (2009) investigated the hazards during the visual segment of nighttime
instrument approaches from 22 semi-structured interviews with individual pilots based at
Aberdeen’s Dyce airport. Using task analysis and Grounded Theory (Kirwan and Ainsworth,
1992; Strauss and Corbin, 1998), an extensive, factual and bespoke list of hazards (i.e., a
hazard template) was produced and subjected to multiple reliability and validity checks.
Three major areas of concern were identified:
• Decision-making conflicts - for example, pilots staying on instrument flight rules
(IFR) after the missed approach point (MAP), in anticipation of reaching visual
meteorological conditions (VMC).
• Unexpected events caused by factors encountered at the offshore installation - for
example, near collisions with the platform metalwork resulting from unknowingly
misplaced obstacles close to the aircraft’s flight path.
• The potential for visual spatial disorientation - resulting from factors such as a lack of
visual cues for depth and surface texture perception during the deceleration
manoeuvre prior to landing. This scenario was perceived by crews to be related to the
interplay of the following seven factors: perceptual problems, attentional problems,
61
human-aircraft interface problems, Crew Resource Management (CRM) issues,
training problems and oversight tolerance.
These areas reflected some known hazards of offshore helicopter operations in general. For
example, decision-making conflicts were previously identified amongst pilots who felt
inclined to fly under adverse conditions due to their salaries being based on wage-by-the-
flight-hour (Mata et al., 2006). Unexpected events in offshore installations are well-
documented with respect to turbulence and obstructions created by topside structures, loose
items, thermal effects, wrongly positioned cranes and poor aeronautical charts (Morrison,
2001; Hart, 2006; CAA, 2010b; ICAO, 2009b; Quintão, 2010; Mata et al., 2006; Gomes et
al., 2009). The potential for visual spatial disorientation in DVE is well established in the
aviation literature discussed in Section 2.3.2 and Nascimento (2009), and is especially acute
in the transitions between scan types, i.e., from instrument scanning to visual scanning and
vice versa (e.g., Braithwaite et al., 1998; Cheung, 2004; Cheung et al., 1995; Dunford et al.,
1995; Gibb and Olson, 2008; Gibb et al., 2010, 2008; Kern, 2002; Schmidt, 1999; Tormes
and Guedry, 1975; Young, 2003; e.g., Berbaum et al., 1991; CAA, 2002a, b; Masson et al.,
2009; Smith and Foster, 1995; U.S. Joint Helicopter Safety Analysis Team, 2011b, a).
Finally, such hazards were mostly associated with speed and height control problems, which
could lead to an accident.
Although generally consistent with the literature, the investigation of Nascimento (2009) has
fundamental limitations. Firstly, it only covered British Northern North Sea operations.
Secondly, this was a qualitative study and, therefore, the generalised nature of the results in
regions away from the North Sea is questionable. Finally, because the study was
commissioned to support the investigation of a specific accident that occurred in the visual
approach phase (AAIB, 2011), it did not attempt to assess the hazards of any other phase of
flight. However, it is possible that other phases of flight present higher levels of risk than the
visual approach phase when worldwide operations are analysed. Assessing the hazards and
risk levels on a phase-of-flight basis also in areas away from the North Sea is addressed in
Chapters 4, 5 and especially in Chapter 6.
Herrera et al. (2010a) followed up on the risk model developed by Hokstad et al., (1999;
2001) to assess the frequencies and consequences of a range of hazards of helicopter
operations in the Norwegian continental shelf between 1999 and 2009 and forecast the risks
62
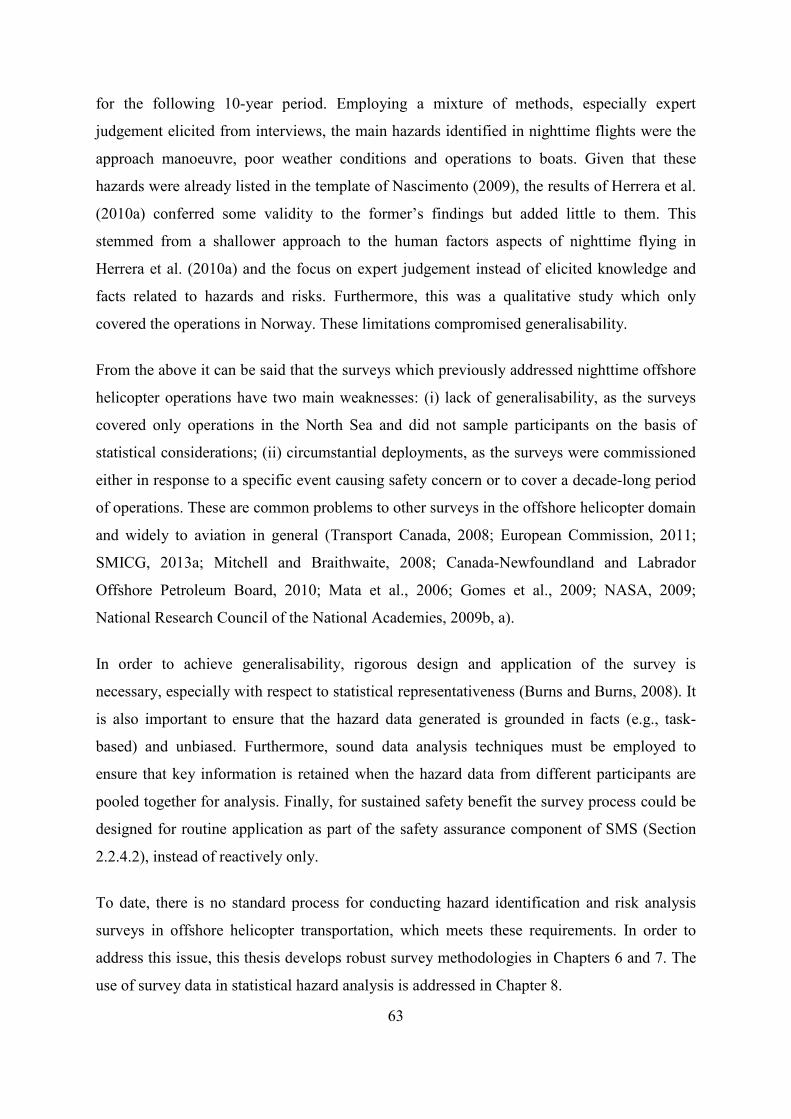
for the following 10-year period. Employing a mixture of methods, especially expert
judgement elicited from interviews, the main hazards identified in nighttime flights were the
approach manoeuvre, poor weather conditions and operations to boats. Given that these
hazards were already listed in the template of Nascimento (2009), the results of Herrera et al.
(2010a) conferred some validity to the former’s findings but added little to them. This
stemmed from a shallower approach to the human factors aspects of nighttime flying in
Herrera et al. (2010a) and the focus on expert judgement instead of elicited knowledge and
facts related to hazards and risks. Furthermore, this was a qualitative study which only
covered the operations in Norway. These limitations compromised generalisability.
From the above it can be said that the surveys which previously addressed nighttime offshore
helicopter operations have two main weaknesses: (i) lack of generalisability, as the surveys
covered only operations in the North Sea and did not sample participants on the basis of
statistical considerations; (ii) circumstantial deployments, as the surveys were commissioned
either in response to a specific event causing safety concern or to cover a decade-long period
of operations. These are common problems to other surveys in the offshore helicopter domain
and widely to aviation in general (Transport Canada, 2008; European Commission, 2011;
SMICG, 2013a; Mitchell and Braithwaite, 2008; Canada-Newfoundland and Labrador
Offshore Petroleum Board, 2010; Mata et al., 2006; Gomes et al., 2009; NASA, 2009;
National Research Council of the National Academies, 2009b, a).
In order to achieve generalisability, rigorous design and application of the survey is
necessary, especially with respect to statistical representativeness (Burns and Burns, 2008). It
is also important to ensure that the hazard data generated is grounded in facts (e.g., task-
based) and unbiased. Furthermore, sound data analysis techniques must be employed to
ensure that key information is retained when the hazard data from different participants are
pooled together for analysis. Finally, for sustained safety benefit the survey process could be
designed for routine application as part of the safety assurance component of SMS (Section
2.2.4.2), instead of reactively only.
To date, there is no standard process for conducting hazard identification and risk analysis
surveys in offshore helicopter transportation, which meets these requirements. In order to
address this issue, this thesis develops robust survey methodologies in Chapters 6 and 7. The
use of survey data in statistical hazard analysis is addressed in Chapter 8.
63
2.3.3.3 Hazard identification through predictive processes
Predictive hazard identification processes rely on the ‘analysis of system processes and
environment to identify potential future hazards’ (ICAO, 2012c, pp. 35). This definition
resonates with task analysis and departs from the engineering view of prediction, which
invariably refers to probabilities and statistical analysis. In engineering, predictions can be
made from virtually any dataset (e.g., the accident dataset mentioned in see Section 2.3.3.1.1)
discriminated as matched explanatory and outcome variables, provided that there are
sufficient observations of the events of such variables and that statistical procedures which fit
the data characteristics are applied (e.g., logistic regression applied to categorical data).
As currently applied in the offshore helicopter industry, ‘predictive processes’, such as the
analysis of data recorded by Helicopter Flight Data Monitoring (HFDM) devices and direct
observations, might lead an operator into wrongly believing that his/her organisation is safely
‘predicting’ hazards when it is not. For example, whereas the HFDM routinely registers the
events of useful outcome variables in nighttime offshore helicopter operations (e.g., the
stability of flight profiles), the explanatory variables (i.e., factors likely to have an impact on
pilots’ ability to maintain a stable flight profile at night) are only collected when an
investigation is commissioned to find explanations to a safety occurrence deemed sufficiently
severe (Pilgrim, 2010)17. This approach prevents the establishment of statistical predictions
due to the absence of information on the events of the explanatory variables when the
outcome variable is not considered a severe safety occurrence. Since predictive hazard
identification is the ultimate goal pursued in aviation (ICAO, 2012c), establishing statistical
predictions on the basis of hazard data is addressed in Chapter 4 and especially in Chapter 8.
Following hazard identification, any associated risk must then be analysed. This is explained
in the next section.
2.3.3.4 Risk analysis
Risk analysis evaluates the potential loss associated with a hazard, as compared with the cost
of controlling the hazard (Yantiss, 2011). Even though many risk analysis processes exist
17 Private communication on 21 September, 2010 with Captain Mike Pilgrim, the Co-Chair of the Global HFDM Community and the HFDM Advisor for CHC, the world’s largest helicopter operator.
64
(refer to Section 2.3.1 and Appendix 2), two processes are currently in use in offshore
helicopter operations: risk matrix and bow tie.
2.3.3.4.1 Risk matrix
Risk analysis using the risk matrix is based on the worst credible severity that can be
expected from a hazard and the likelihood that an event of such severity may occur (CAA,
2010c; ICAO, 2012c). The underlying assumption is that if protection is devised against the
worst credible severity, then protection against any severity is assured (Aven and Zio, 2011).
The matrix is formed by colour-coded risk indexes which translate the tolerability of the risk
on the basis of its expected severity and likelihood (or alternatively frequency or probability)
of the hazard realising. If the risk is intolerable, a response action (i.e., a mitigation measure)
is required. Once action is taken, the hazard is re-assessed in the matrix and acted upon
recursively until a sufficiently low level of risk, i.e., as low as reasonably practicable
(ALARP), is obtained. ALARP is obtained when any attempt to further reduce risk results in
incremental benefits that do not justify the investment made for such reduction (ICAO,
2012c; Hollnagel, 2008). An example of risk matrix and associated guidelines is provided in
Figure 2-1.
Although widely used, the risk matrix has a number of problems. Firstly, it is often found
difficult to calibrated and use18. This is associated with subjectivities in the assessment of
likelihood and interpreted severity, which stem from the flexibility to tailor the matrix in
accordance with a service provider’s business risk appetite (Yantiss, 2011; Arendt and
Adamski, 2011). Secondly, the risk index matrix is actually a shortcut tool which uses a
single point estimate (i.e., the worst case scenario) in lieu of a more accurate analysis
approach using probability distributions of possible outcome severity levels (Stolzer et al.,
2008; Vinnem, 2010; NASA, 2013). This might overburden product and service providers
who devise stringent mitigations for unrealistically pessimist risks. Therefore, a more
accurate approach with multiple possible outcomes is needed. This provided by the bow tie
method explained below.
18 Private communication in August, 2013, with Captains Gilvan Barros and Luiz Fleury Curado, Aviation Safety Officers for two major offshore helicopter operators, i.e., Senior Taxi Aéreo and Omni Brasil.
65
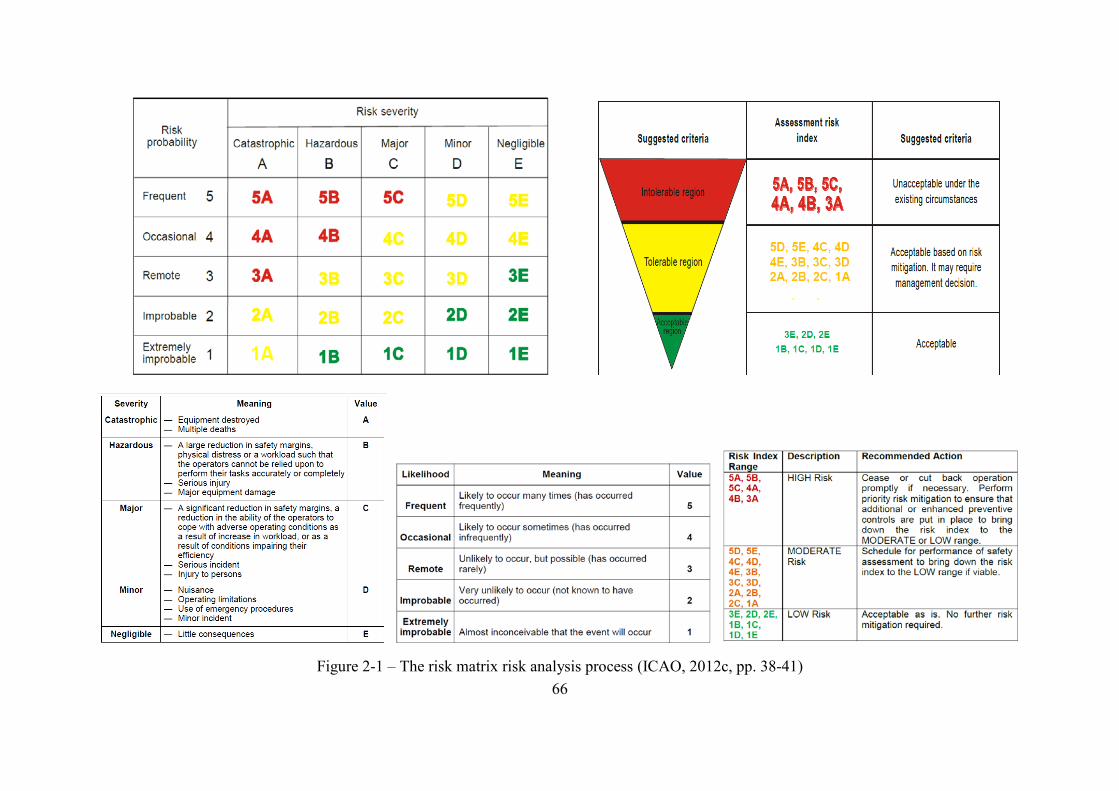
Figure 2-1 – The risk matrix risk analysis process (ICAO, 2012c, pp. 38-41)66
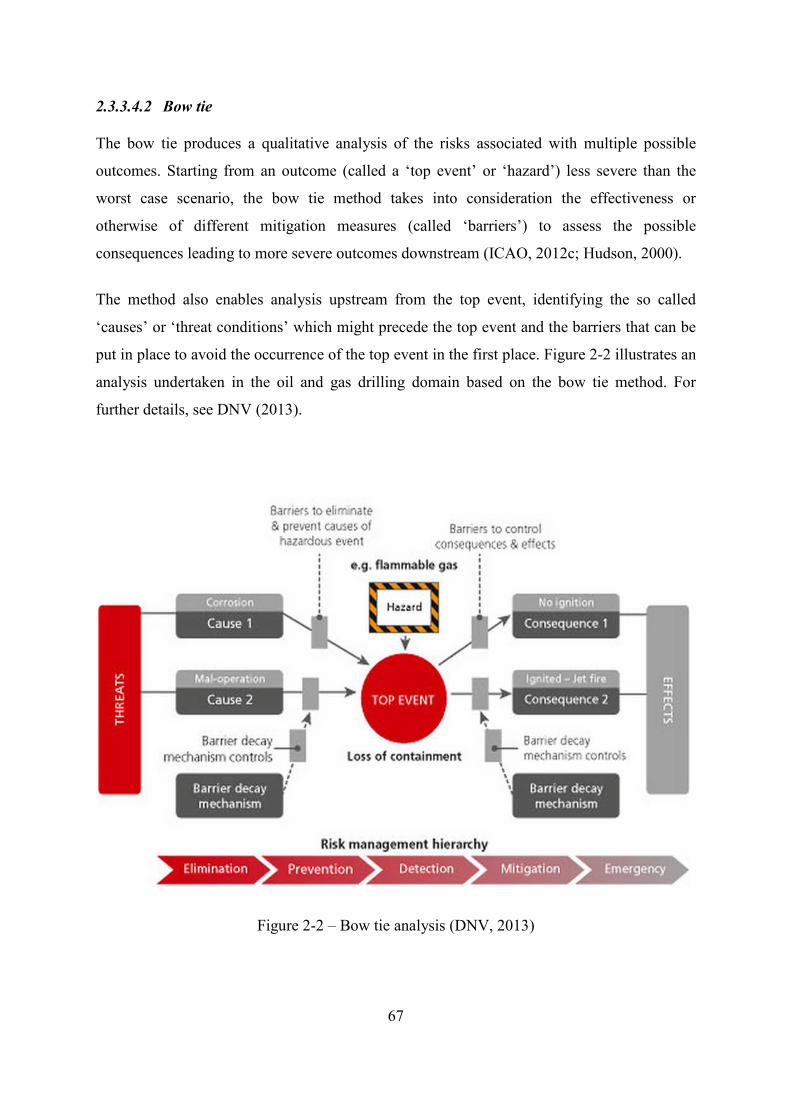
2.3.3.4.2 Bow tie
The bow tie produces a qualitative analysis of the risks associated with multiple possible
outcomes. Starting from an outcome (called a ‘top event’ or ‘hazard’) less severe than the
worst case scenario, the bow tie method takes into consideration the effectiveness or
otherwise of different mitigation measures (called ‘barriers’) to assess the possible
consequences leading to more severe outcomes downstream (ICAO, 2012c; Hudson, 2000).
The method also enables analysis upstream from the top event, identifying the so called
‘causes’ or ‘threat conditions’ which might precede the top event and the barriers that can be
put in place to avoid the occurrence of the top event in the first place. Figure 2-2 illustrates an
analysis undertaken in the oil and gas drilling domain based on the bow tie method. For
further details, see DNV (2013).
Figure 2-2 – Bow tie analysis (DNV, 2013)
67
However, the bow tie also has serious limitations. Firstly, it is an impoverished qualitative-
only version of the Cause-Consequence Analysis (CCA) technique, with the disadvantage
that probabilistic risk quantification is not possible in the bow tie. This stems from hazards
which are usually not discriminated into independent events and minimal cut-sets, preventing
the use of Boolean algebra (Nielsen, 1974; Svedung and Rasmussen, 2002). Secondly, the
bow tie only holds true if both the causes and consequences of top events are linearly
arranged. This is rarely the case in complex operations, such as nighttime offshore helicopter
transportation, where multiple interactions take place in a network fashion (Hollnagel, 2004,
2009; Herrera et al., 2010a). Given these limitations, a more accurate approach founded on
probability analysis is certainly desirable.
Probability analysis-based risk analysis processes exist in the safety literature, e.g., Monte
Carlo simulations of hazard outcome distributions (Stolzer et al., 2008; Goodheart, 2013),
classical Probabilistic Risk Assessment (PRA) techniques (e.g., Fault Tree Analysis, FTA)
and regression analysis based on data on outcome and explanatory variables stored in a
database (Stolzer et al., 2008; Helmreich and Merritt, 1998; see also Section 2.3.1).
Currently, there is no standard, universally-accepted risk analysis methodology in use across
the aviation domain. Hence, an approach which enables comparable priority setting to
address the greatest risks does not exist. Risk analysis in aviation is an area still under
development with significant effort required on research (SMICG, 2013c; European
Commission, 2011; Aven and Zio, 2011). Chapter 8 develops a process for predictive
analysis of risky conditions based on expert knowledge elicitation, which can be viewed as an
alternative risk analysis process on its own right.
2.4 Conclusions
This chapter has defined basic terms and investigated hazard identification and risk analysis
in offshore helicopter operations, with an emphasis on the nighttime. Five key weaknesses
were identified.
Firstly, there is no process prescribed to outline the safety-critical components of the industry
and no agreed view of such components, e.g., by means of a customised taxonomy. These
favour low awareness of the industry-embedded hazard generating mechanisms and
encourage a silo approach to hazard identification and risk analysis whereby stakeholders
68
tend to focus on their areas of responsibility with little awareness of the overall impact of
their actions on other related activities.
Secondly, the statistical analysis of accidents is fraught with unreliable data collection and
over-simplistic interpretations of the data collected. This prevents understanding systematic
industry-wide hazard trends and patterns that should be addressed as matters of priority
intervention unconstrained by artificial political boundaries.
Thirdly, the statistical precursor relationship between accidents and incidents, as believed to
exist in the aviation industry, has not been empirically verified even though this belief
reinforces the ongoing over-reliance on reported incidents and their potentially wrong use for
hazard identification and risk analysis based on the frequency of reporting.
Fourthly, the generalisability of the hazards identified and risks analysed through surveys is
poor, both geographically and with respect to phases of flight. Furthermore, the majority of
the surveys are focused on judgements about hazards and risks instead of task-related facts.
As a consequence, the validity of the hazards identified and risks analysed is questionable.
Finally, even though the word ‘predictive hazard identification’ (or, alternatively, ‘predictive
safety’) is routinely used across the industry, at present no statistical analysis is undertaken,
which predicts safety-critical outcomes on the basis of the occurrence of hazards. In reality,
there is no hazard-related predictive capability in the industry.
Overall, hazard identification and risk analysis in nighttime offshore helicopter operations is
ineffective from the highest international levels down to the practices of individual offshore
helicopter operators. Therefore, a methodology which integrates enhanced processes of
hazard identification and risk analysis, applicable to nighttime offshore helicopter operations,
is required. This methodology formed of integrated processes is proposed and implemented
in this thesis.
Initially, a process to generate a customised taxonomy of the safety-critical components of
the offshore helicopter transportation industry is developed and implemented. This captures
the main parts of offshore helicopter operations with the potential to create hazards. This is
followed by the development and implementation of a process for the analysis of accidents
worldwide, which identifies systematic hazard trends and patterns, including high-level
69
statistical predictions, in the nighttime, in comparison to the overall hazards of offshore
helicopter operations. Then, a process to assess the statistical utility of reported incidents, as
believed to exist in the aviation industry, is developed and implemented. This identifies how
incident reports can be exploited to correctly identify hazards in nighttime operations and
beyond. On the basis of the accident analyses and the conclusions from the statistical utility
of reported incidents, two survey processes are developed and implemented to, initially,
screen the riskiest phases of nighttime flights and, then, elicit the factual, task-based
knowledge of pilots with respect to the hazards of the riskiest phase. The results of the latter
are initially analysed qualitatively to form an exhaustive and statistically representative
hazard template, which is subsequently analysed statistically. The statistical analysis
procedure developed predicts critical outcomes probabilistically based on a set of explanatory
hazards. The overall task-based survey process, with both the qualitative and quantitative
hazard analysis capabilities, is designed to be transferable to other tasks and be applied
routinely. Furthermore, in order to ensure that hazard knowledge is maintained and updated,
any interaction between the hazards identified from the implementation of the process
mentioned above is used to instantiate the industry’s taxonomy dynamically. Finally, each
such process is validated to ensure scientific rigour.
The new methodology explained in this previous paragraph is outlined in Figure 2-3, together
with the chapters in which each process is developed and implemented. The next chapter
starts the underpinning work of developing and implementing the process to create the
taxonomy of the industry’s safety-critical components.
70
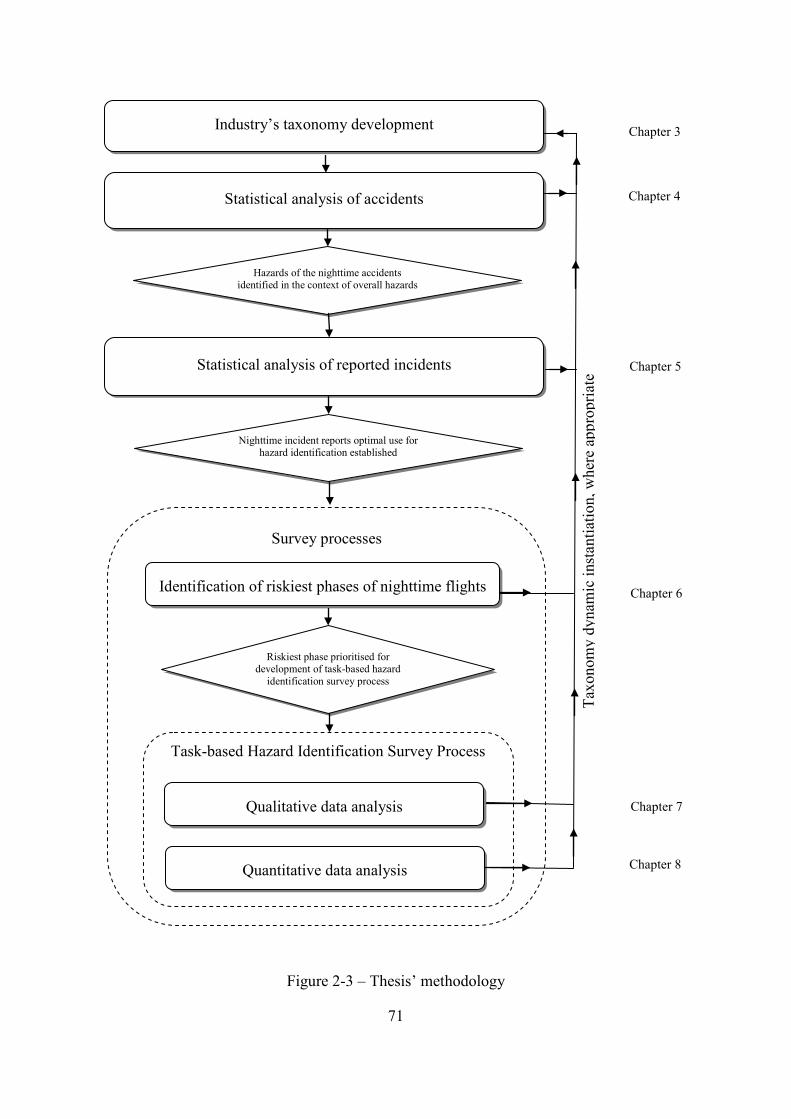
Figure 2-3 – Thesis’ methodology
Survey processes
Task-based Hazard Identification Survey Process
Industry’s taxonomy development
Statistical analysis of accidents
Statistical analysis of reported incidents
Hazards of the nighttime accidents identified in the context of overall hazards
Identification of riskiest phases of nighttime flights
Qualitative data analysis
Quantitative data analysis
Taxo
nom
y dy
nam
ic in
stan
tiatio
n, w
here
app
ropr
iate
Chapter 3
Chapter 4
Chapter 5
Chapter 6
Chapter 7
Chapter 8
Nighttime incident reports optimal use for hazard identification established
Riskiest phase prioritised for development of task-based hazard
identification survey process
71

72
CHAPTER 3 THE OFFSHORE HELICOPTER TRANSPORTATION INDUSTRY’S TAXONOMY
The previous chapter established the need for an overarching description of the offshore
helicopter industry in order to effectively identify hazards and analyse risks. This is addressed
in this chapter by outlining the Offshore Helicopter Transportation Industry’s Taxonomy. In
Section 3.1, the theoretical justifications for outlining an industry’s taxonomy are briefly
recapitulated. In Section 3.2, relevant techniques applicable to the problem of developing a
taxonomy of an existing industry are introduced, along with a discussion of their suitability to
describe the operations of the offshore helicopter transportation industry. This leads, in
Section 3.3, to the establishment of the process used in this thesis to outline the taxonomy of
the offshore helicopter transportation industry and its subsequent implementation in Section
3.4. In order to ensure the completeness of the seminal taxonomy developed, in Section 3.5
the results are compared to relevant model structures in the safety literature. This is followed
in Section 3.6 by a validation exercise using Subject Matter Experts (SMEs) from academia
and industry, knowledgeable in worldwide offshore helicopter operations. As concluded in
Section 3.7, this ensures the utility of the taxonomy as the foundation of future hazard
identification and risk analysis in the offshore helicopter domain.
3.1 Brief theoretical background
As discussed in the previous chapter (Sections 2.3.1 and 2.3.2), the context of operation
determines human performance in flight. Therefore, describing the operational context of the
industry, e.g., by means of a customised taxonomy of its safety-critical components, is an
important step which should precede and underpin hazard identification and risk analysis in
offshore helicopter operations (see Section 2.3.2.4). However, except for the recommendation
to employ task analysis methods, there is currently an absence of prescribed process to
generate this taxonomy. The techniques which are potentially useful to develop this
taxonomy are investigated in the next section.
3.2 Taxonomy development options
There are over 100 task analysis techniques, each developed to address specific problems in
system design and assessment. This section discusses a limited number of techniques which
73
are capable of addressing the frequently overlooked problem of describing the safety-critical
components of an industry through a customised taxonomy. The techniques are the
Hierarchical Task Analysis (HTA), the Functional Resonance Analysis Method (FRAM) and
the SHELL model19. The other techniques are extensively reviewed by Annett and Stanton
(2000b), Kirwan and Ainsworth (1992), Drury (1983), Stanton and Annett (2000) and
Chipman et al. (2000) and, therefore, are not discussed in this thesis.
3.2.1 Hierarchical Task Analysis
Hierarchical Task Analysis (HTA) is the most common, flexible and fundamental approach
to task analysis. HTA was developed by Annett and Duncan (1967) as a way to explore the
tasks that should be carried out to meet a system’s goals in virtually any domain (Kirwan and
Ainsworth, 1992; Annett, 2003; Annett and Stanton, 2000a). The tasks are described by a
hierarchy of sub-goals that indicate what a person or collaborative team is expected to do and
by plans that indicate the conditions under which the sub-goals should be carried out
(Shepherd, 2000; Shryane et al., 2000; Salmon et al., 2011). Because HTA provides an
accurate description of the steps required in order to complete a task (Preece et al., 1994;
Kirwan and Ainsworth, 1992), it can also identify the safety-critical components of an
industry and enable their arrangement in a taxonomy. HTA has recently been successfully
applied to outline the safety-critical components of airport operations (Wilke et al., 2014).
3.2.2 Functional Resonance Analysis Method
The Functional Resonance Analysis Method (FRAM) was specifically designed to model
complex socio-technical systems, with a view to discovering mechanisms of aggregate
performance variability that might affect safety and productivity. FRAM achieves this by
describing the functions performed, where a function is defined as an activity or a set of
activities that are required to achieve specified system goals. An activity in turn, is defined as
a task-as-done, as opposed to task-as-imagined or -planned-for, which might be more
frequently used in task analysis methods (Hollnagel, 2012).
19 NB: neither FRAM nor the SHELL model is usually considered a task analysis method. However, FRAM shares a number of common characteristics with task analysis, especially when FRAM is applied at a generic level. The SHELL model in turn is widely used in support of task analysis. FRAM and the SHELL model are further explained in sections 3.2.2 and 3.2.3, respectively.
74
Starting from any given function, FRAM explores six possible aspects that might couple a
given function to other functions. The aspects explored are inputs, outputs, resources,
preconditions, time constraints and controls. Having mapped the couplings between
functions, the performance variability of the functions is assessed for their overall impact on
the system’s stability (i.e., ability to remain safe). When the combined variability surpasses
the system’s coping ability, functional resonance takes place (Hollnagel, 2012).
The application of FRAM and HTA is virtually the same when analysis is undertaken at a
high level, e.g., to describe, by means of a taxonomy, the safety-critical components an
industry. Both techniques exploit empirical evidence related to the dependencies between
tasks.
However, since FRAM aims to develop a model based on various aspects of functional
coupling, its application requires extensive access to data sources, personnel working in the
field, subject matter expertise, human factors expertise and potentially human performance
databases (Hollnagel, 2012). Therefore, FRAM might be more appropriately employed in
support of thorough analyses, for example in support of accident investigations (e.g., Nouvel
et al., 2007). For a high-level of analysis, FRAM might be an overly detailed response and
the application of HTA is preferred as it fulfils the purpose of high-level description of the
safety-critical components of an industry in a simpler manner.
3.2.3 SHELL model
The SHELL (i.e., Software-Hardware-Environment-Liveware-Liveware) model has been
extensively mentioned in the literature as the provider of the attitude expected from the
analysts engaged in systems modelling and safety analysis. In the SHELL model, the
components of the model’s acronym mentioned above, together with their interfaces, are the
safety-critical components which require attention for assured safety (Edwards, 1972; cited in
Stolzer et al., 2008).
The concepts encapsulated by the SHELL model have been reproduced in virtually every
existing system modelling guidance material (e.g., DoD, 2012; ICAO, 2012c; NASA, 2013)
and many accident analysis manuals (e.g., ICAO, 2011f; JSSI - Occurrence Data Analysis
Working Group, 2006). However, the SHELL model is loosely defined. Therefore, it is best
75
used as a support tool to help establish the correct mindset for safety analysts involved in
more structured task analysis exercises (DoD, 2012; ICAO, 2012c; NASA, 2013).
3.2.4 Other techniques
Techniques which are developed from a negative outcome perspective (e.g., Fault Tree
Analysis, FTA) have not been considered fit for the purpose of outlining the Offshore
Helicopter Transportation Industry’s Taxonomy. Negative stance (as opposed to neutral
stance) techniques allow awareness of only a subset of an industry’s operation to be
developed, i.e., the parts and environmental conditions involved in the failure case studied.
However, techniques of a negative stance can be used to ensure the completeness of a
developing taxonomy, as explained in Section 3.5.
3.3 Process to establish the industry’s taxonomy
Given the features of the techniques discussed in Section 3.2, HTA was selected as the
technique to describe the Offshore Helicopter Transportation Industry’s Taxonomy. The next
stage in the taxonomy development exercise is to establish the purposes and stopping rules of
the HTA (Kirwan and Ainsworth, 1992; Hollnagel, 2012, 2009). Stopping rules are essential
in order to ensure that the taxonomy is as wide as the purposes of its definition dictate, while
still compact enough to be manageable (Harris, 2008). This is essential since HTA can, in
principle, continue indefinitely and become an unmanageably laborious process (Kirwan and
Ainsworth, 1992; Annett and Stanton, 2000a).
3.3.1 Purpose
The purpose of developing the taxonomy in this chapter is the following:
To consolidate a comprehensive characterisation, from a safety standpoint, of the
worldwide offshore helicopter transportation industry, with respect to the component
parts and operating environment.
76
3.3.2 Stopping rules
In order to ensure that the taxonomy is developed at a comprehensive and generic level with
worldwide applicability, analysis stops when further analysis would require describing tasks
specific to helicopter types, helicopter operators (e.g., company procedures) or countries.
3.3.3 Steps
In order to create the Offshore Helicopter Transportation Industry’s Taxonomy, a series of
steps were envisaged. They begin with a high-level mission analysis (Jarvis and Harris, 2008;
Arendt and Adamski, 2011) for the identification of typical flight profiles in offshore
helicopter operations. For each profile, the typical phases of flight are identified. HTA is then
used to highlight the tasks that ideally need to be undertaken for the successful completion of
each of the phases. For each of these tasks, the actors (defined in Section 3.4.4) who should
perform or participate in them are identified. Then, by grouping the actors meaningfully, the
taxonomy is provisionally outlined. Subsequently, this provisional taxonomy is compared to
relevant structures of aviation models, risk models, accident models and performance shaping
factors. This is aimed at ensuring the taxonomy’s completeness. Finally, the taxonomy is
validated.
The couplings between the actors described in the taxonomy (i.e., the processes actually
undertaken during the operation of the offshore helicopter industry) are embedded into the
HTA exercise and are described in the tables produced. However, such couplings are
deliberately generic and may vary considerably in response to specific conditions (e.g.,
during nighttime operations). Therefore, in this thesis the coupling between actors is explored
on a circumstantial basis, e.g., from overlaying the results of the statistical analysis of
accidents onto the taxonomy to update it dynamically (further explained in Section 2.4). This
is accordance with the need to instantiate (i.e., exemplify) FRAM-derived models, or define
accident/conflict scenario prior to conducting detailed risk assessments (Hollnagel, 2012;
NASA, 2013; CAA, 2010c; Svedung and Rasmussen, 2002). This is dealt with in Chapters 4
and 8. Figure 3-1 summarises the steps of the process to outline the industry’s taxonomy.
77
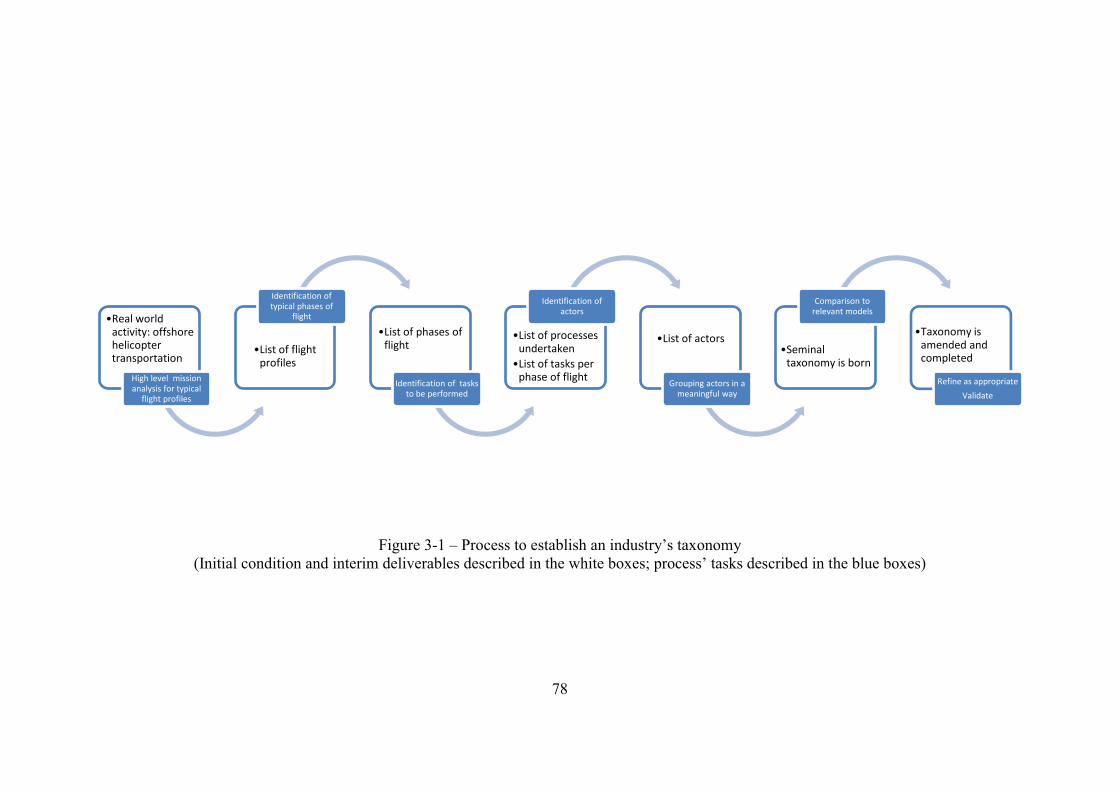
Real world activity: offshore helicopter transportation
High level mission analysis for typical
flight profiles
List of flight profiles
Identification of typical phases of
flight
List of phases of flight
Identification of tasks to be performed
List of processes undertaken List of tasks per phase of flight
Identification of actors
List of actors
Grouping actors in a meaningful way
Seminal taxonomy is born
Comparison to relevant models
Taxonomy is amended and completed
Refine as appropriate Validate
3.3.4 Validation
In order to ensure that the process outlined could fulfil its purpose, experts in the field were
invited to peer-review and comment on the overall validity of the process and constituent
steps. These were a consultant in airport safety and a lecturer in aviation and transport, both
with a PhD degree from a world-leading UK university, and two senior offshore helicopter
pilots involved in safety management in Brazil. All experts were confident that the process
could deliver the result intended.
3.3.5 Knowledge sources
HTA is usually undertaken based on the expertise accrued by the analyst during the course of
the investigation and may be reviewed by collaborating operational personnel (Kirwan and
Ainsworth, 1992). The implementation of the steps mentioned above was initially based on
the researcher’s experience as a professional maritime helicopter pilot and, as advised by
Bertoloni (2007), analysis of procedures, observations and unstructured interviews (i.e.,
informal conversations) with experts in the field (i.e., pilots, maintenance engineers, air
traffic controllers, flight dispatchers, helideck landing officers, safety officers and safety
research managers), especially during on-site visits (to both airfields and an oil platform).
During the course of the research, the researcher observed and interviewed over 100 such
professionals at their companies in the following scenarios:
• British Northern North Sea (Aberdeen);
• British Southern North Sea (Blackpool);
• Brazil’s Campos basin (Macaé, Rio de Janeiro and Cabo Frio);
• Norway (Stavanger and Bergen);
• Spain (Reus, Amposta and Bilbao);
• Netherlands (Den Helder);
• USA (Santa Maria).
Additionally, interviews were conducted over the phone and Skype with SMEs (senior pilots
in safety positions) based in the following places:
• Argentina (Magallanes Straight);
• USA (Gulf of Mexico); 79
• United Arab Emirates (Abu Dhabi);
• Australia (Canberra);
• Thailand (Nakhon Si Thammarat);
• Denmark (Esbjerg);
• Nigeria (Port Harcourt).
Moreover, observations of pilots from the UK, Netherlands and Brazil were undertaken on
four different occasions in high fidelity flight simulators in France. The simulators
corresponded to three types of helicopter widely used in the offshore environment (i.e.,
EC225, EC155 and AS365N2). The simulator sessions were held in support of bi-annual
flight training required by regulation (typically 8-hour long sessions for each pilot) and
included scenario-based training in offshore installations. Considering the number of pilots
observed in all four sessions (N=16), the simulator observation exercise exceeded 50
simulator flight hours.
Finally, general information on offshore helicopter operations was obtained from private
communications with the regulators of the UK, Brazil, Norway and Australia.
3.4 Process implementation
3.4.1 High level mission analysis
The definition of offshore transportation presented in Chapter 2 (Section 2.1) was used to
analyse the mission at a high-level and derive the associated flight profiles. According to the
definition, offshore helicopter transportation occurs to or from installations at sea (i.e., fixed
platforms and moving boats) and the following eight flight profiles encompass this:
• From onshore airport to offshore fixed platform – also known as long-haul;
• From onshore airport to offshore moving boat – also known as long-haul;
• Between offshore fixed platforms – also known as shuttling;
• Between offshore moving boats – also known as shuttling;
• From offshore fixed platform to offshore moving boat – also known as shuttling;
• From offshore moving boat to offshore fixed platform – also known as shuttling;
• From offshore fixed platform to onshore airport – also known as long-haul;
80

• From offshore moving boat to onshore airport – also known as long-haul.
3.4.2 Identification of typical phases of flight
The phases of offshore helicopter flights were described in Teixeira (2006) as part of the
development of a Flight Data Monitoring (FDM) analysis software. Because these phases are
a considerable improvement over previous taxonomies derived from the fixed wing-domain
(e.g., CAST/ICAO, 2011, see Section 2.3.3.1.1.4), Teixeira’s phases are used in this step and
shown in Figure 3-2. The initiating and end events of each phase are listed in Appendix 4.
Figure 3-2 – Typical offshore helicopter flight profile and phases (Teixeira, 2006, pp.52)
3.4.3 Identification of tasks to be performed
For each phase of flight, HTA was applied to respect both the purpose and stopping rules
established in Sections 3.3.1 and 3.3.2, respectively. The results are shown in a tabular format
(Tables 3-1 to 3-8), together with the identified actors, detailed in the next section. The goals
and the typically sequential plans of the HTA are embedded in the texts of each table.
81
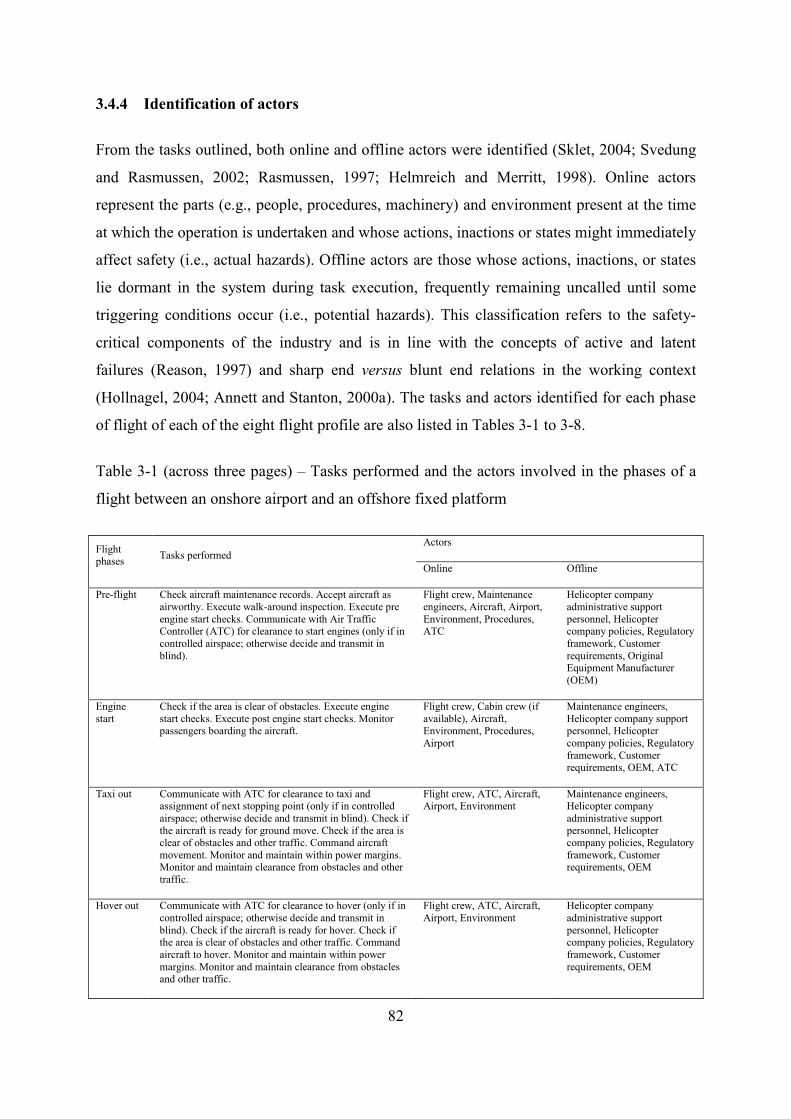
3.4.4 Identification of actors
From the tasks outlined, both online and offline actors were identified (Sklet, 2004; Svedung
and Rasmussen, 2002; Rasmussen, 1997; Helmreich and Merritt, 1998). Online actors
represent the parts (e.g., people, procedures, machinery) and environment present at the time
at which the operation is undertaken and whose actions, inactions or states might immediately
affect safety (i.e., actual hazards). Offline actors are those whose actions, inactions, or states
lie dormant in the system during task execution, frequently remaining uncalled until some
triggering conditions occur (i.e., potential hazards). This classification refers to the safety-
critical components of the industry and is in line with the concepts of active and latent
failures (Reason, 1997) and sharp end versus blunt end relations in the working context
(Hollnagel, 2004; Annett and Stanton, 2000a). The tasks and actors identified for each phase
of flight of each of the eight flight profile are also listed in Tables 3-1 to 3-8.
Table 3-1 (across three pages) – Tasks performed and the actors involved in the phases of a
flight between an onshore airport and an offshore fixed platform
Flight phases Tasks performed
Actors
Online Offline
Pre-flight Check aircraft maintenance records. Accept aircraft as airworthy. Execute walk-around inspection. Execute pre engine start checks. Communicate with Air Traffic Controller (ATC) for clearance to start engines (only if in controlled airspace; otherwise decide and transmit in blind).
Flight crew, Maintenance engineers, Aircraft, Airport, Environment, Procedures, ATC
Helicopter company administrative support personnel, Helicopter company policies, Regulatory framework, Customer requirements, Original Equipment Manufacturer (OEM)
Engine start
Check if the area is clear of obstacles. Execute engine start checks. Execute post engine start checks. Monitor passengers boarding the aircraft.
Flight crew, Cabin crew (if available), Aircraft, Environment, Procedures, Airport
Maintenance engineers, Helicopter company support personnel, Helicopter company policies, Regulatory framework, Customer requirements, OEM, ATC
Taxi out Communicate with ATC for clearance to taxi and assignment of next stopping point (only if in controlled airspace; otherwise decide and transmit in blind). Check if the aircraft is ready for ground move. Check if the area is clear of obstacles and other traffic. Command aircraft movement. Monitor and maintain within power margins. Monitor and maintain clearance from obstacles and other traffic.
Flight crew, ATC, Aircraft, Airport, Environment
Maintenance engineers, Helicopter company administrative support personnel, Helicopter company policies, Regulatory framework, Customer requirements, OEM
Hover out Communicate with ATC for clearance to hover (only if in controlled airspace; otherwise decide and transmit in blind). Check if the aircraft is ready for hover. Check if the area is clear of obstacles and other traffic. Command aircraft to hover. Monitor and maintain within power margins. Monitor and maintain clearance from obstacles and other traffic.
Flight crew, ATC, Aircraft, Airport, Environment
Helicopter company administrative support personnel, Helicopter company policies, Regulatory framework, Customer requirements, OEM
82
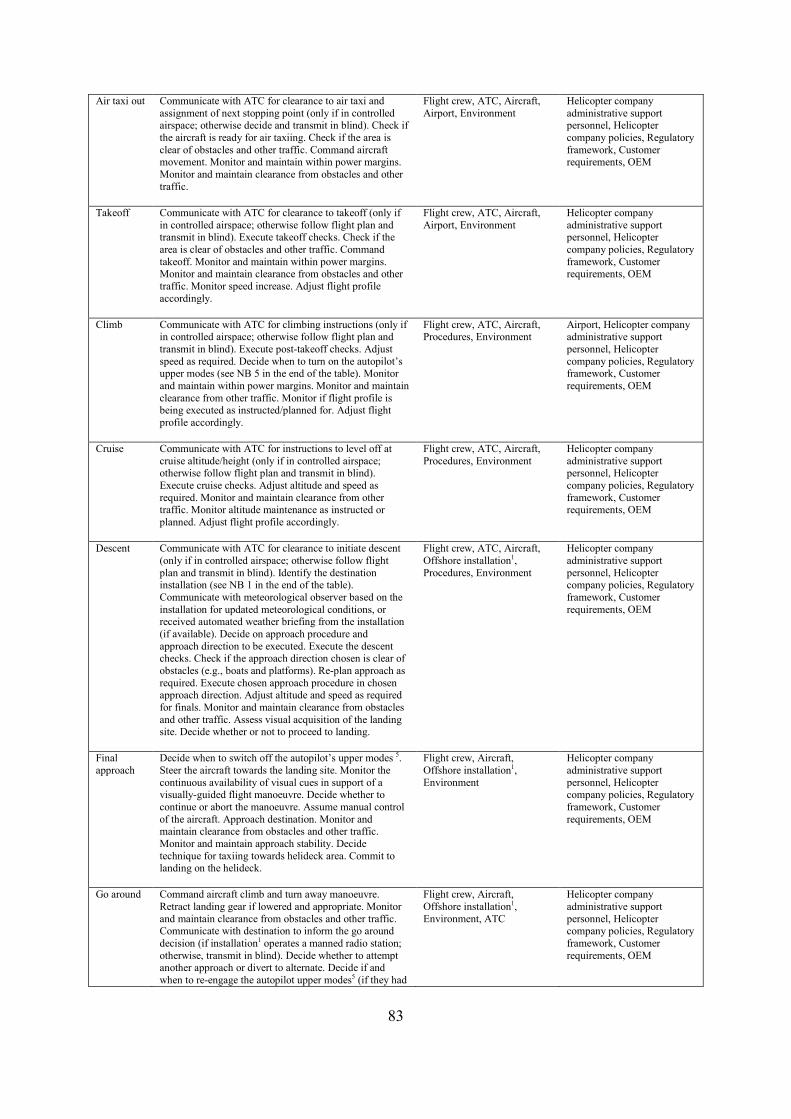
Air taxi out Communicate with ATC for clearance to air taxi and assignment of next stopping point (only if in controlled airspace; otherwise decide and transmit in blind). Check if the aircraft is ready for air taxiing. Check if the area is clear of obstacles and other traffic. Command aircraft movement. Monitor and maintain within power margins. Monitor and maintain clearance from obstacles and other traffic.
Flight crew, ATC, Aircraft, Airport, Environment
Helicopter company administrative support personnel, Helicopter company policies, Regulatory framework, Customer requirements, OEM
Takeoff Communicate with ATC for clearance to takeoff (only if in controlled airspace; otherwise follow flight plan and transmit in blind). Execute takeoff checks. Check if the area is clear of obstacles and other traffic. Command takeoff. Monitor and maintain within power margins. Monitor and maintain clearance from obstacles and other traffic. Monitor speed increase. Adjust flight profile accordingly.
Flight crew, ATC, Aircraft, Airport, Environment
Helicopter company administrative support personnel, Helicopter company policies, Regulatory framework, Customer requirements, OEM
Climb Communicate with ATC for climbing instructions (only if in controlled airspace; otherwise follow flight plan and transmit in blind). Execute post-takeoff checks. Adjust speed as required. Decide when to turn on the autopilot’s upper modes (see NB 5 in the end of the table). Monitor and maintain within power margins. Monitor and maintain clearance from other traffic. Monitor if flight profile is being executed as instructed/planned for. Adjust flight profile accordingly.
Flight crew, ATC, Aircraft, Procedures, Environment
Airport, Helicopter company administrative support personnel, Helicopter company policies, Regulatory framework, Customer requirements, OEM
Cruise Communicate with ATC for instructions to level off at cruise altitude/height (only if in controlled airspace; otherwise follow flight plan and transmit in blind). Execute cruise checks. Adjust altitude and speed as required. Monitor and maintain clearance from other traffic. Monitor altitude maintenance as instructed or planned. Adjust flight profile accordingly.
Flight crew, ATC, Aircraft, Procedures, Environment
Helicopter company administrative support personnel, Helicopter company policies, Regulatory framework, Customer requirements, OEM
Descent Communicate with ATC for clearance to initiate descent (only if in controlled airspace; otherwise follow flight plan and transmit in blind). Identify the destination installation (see NB 1 in the end of the table). Communicate with meteorological observer based on the installation for updated meteorological conditions, or received automated weather briefing from the installation (if available). Decide on approach procedure and approach direction to be executed. Execute the descent checks. Check if the approach direction chosen is clear of obstacles (e.g., boats and platforms). Re-plan approach as required. Execute chosen approach procedure in chosen approach direction. Adjust altitude and speed as required for finals. Monitor and maintain clearance from obstacles and other traffic. Assess visual acquisition of the landing site. Decide whether or not to proceed to landing.
Flight crew, ATC, Aircraft, Offshore installation1, Procedures, Environment
Helicopter company administrative support personnel, Helicopter company policies, Regulatory framework, Customer requirements, OEM
Final approach
Decide when to switch off the autopilot’s upper modes 5. Steer the aircraft towards the landing site. Monitor the continuous availability of visual cues in support of a visually-guided flight manoeuvre. Decide whether to continue or abort the manoeuvre. Assume manual control of the aircraft. Approach destination. Monitor and maintain clearance from obstacles and other traffic. Monitor and maintain approach stability. Decide technique for taxiing towards helideck area. Commit to landing on the helideck.
Flight crew, Aircraft, Offshore installation1, Environment
Helicopter company administrative support personnel, Helicopter company policies, Regulatory framework, Customer requirements, OEM
Go around Command aircraft climb and turn away manoeuvre. Retract landing gear if lowered and appropriate. Monitor and maintain clearance from obstacles and other traffic. Communicate with destination to inform the go around decision (if installation1 operates a manned radio station; otherwise, transmit in blind). Decide whether to attempt another approach or divert to alternate. Decide if and when to re-engage the autopilot upper modes5 (if they had
Flight crew, Aircraft, Offshore installation1, Environment, ATC
Helicopter company administrative support personnel, Helicopter company policies, Regulatory framework, Customer requirements, OEM
83
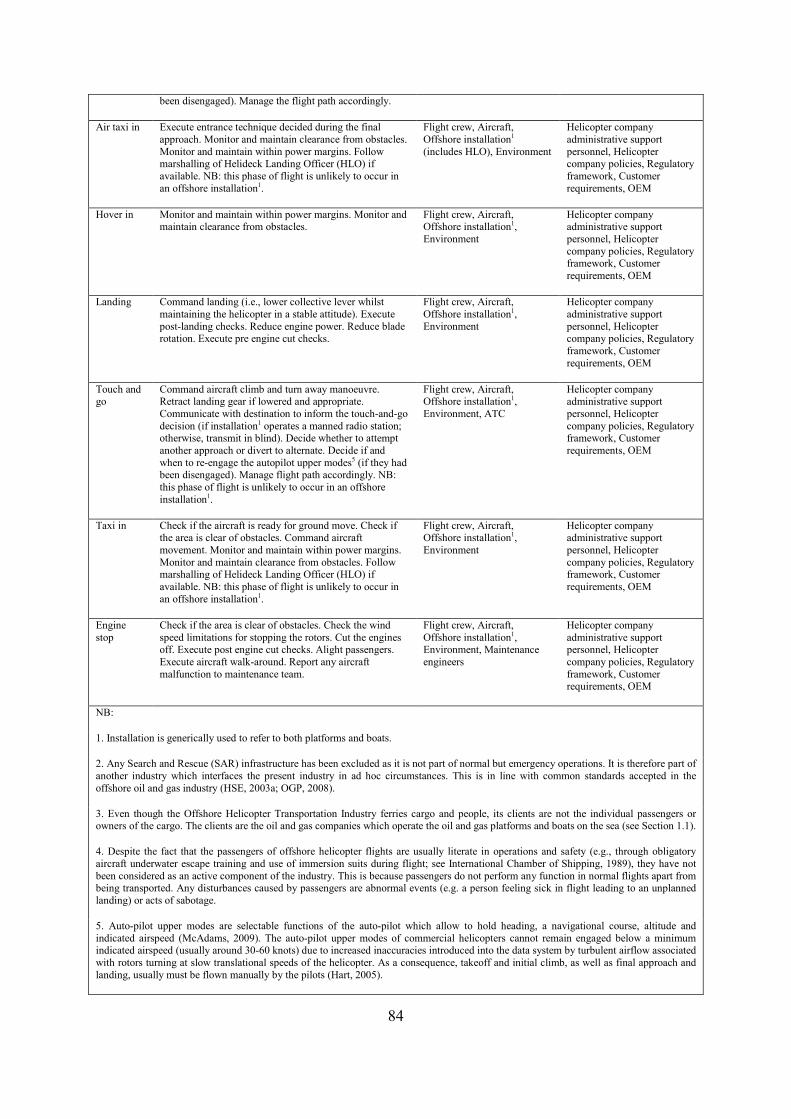
been disengaged). Manage the flight path accordingly.
Air taxi in Execute entrance technique decided during the final approach. Monitor and maintain clearance from obstacles. Monitor and maintain within power margins. Follow marshalling of Helideck Landing Officer (HLO) if available. NB: this phase of flight is unlikely to occur in an offshore installation1.
Flight crew, Aircraft, Offshore installation1 (includes HLO), Environment
Helicopter company administrative support personnel, Helicopter company policies, Regulatory framework, Customer requirements, OEM
Hover in Monitor and maintain within power margins. Monitor and maintain clearance from obstacles.
Flight crew, Aircraft, Offshore installation1, Environment
Helicopter company administrative support personnel, Helicopter company policies, Regulatory framework, Customer requirements, OEM
Landing Command landing (i.e., lower collective lever whilst maintaining the helicopter in a stable attitude). Execute post-landing checks. Reduce engine power. Reduce blade rotation. Execute pre engine cut checks.
Flight crew, Aircraft, Offshore installation1, Environment
Helicopter company administrative support personnel, Helicopter company policies, Regulatory framework, Customer requirements, OEM
Touch and go
Command aircraft climb and turn away manoeuvre. Retract landing gear if lowered and appropriate. Communicate with destination to inform the touch-and-go decision (if installation1 operates a manned radio station; otherwise, transmit in blind). Decide whether to attempt another approach or divert to alternate. Decide if and when to re-engage the autopilot upper modes5 (if they had been disengaged). Manage flight path accordingly. NB: this phase of flight is unlikely to occur in an offshore installation1.
Flight crew, Aircraft, Offshore installation1, Environment, ATC
Helicopter company administrative support personnel, Helicopter company policies, Regulatory framework, Customer requirements, OEM
Taxi in Check if the aircraft is ready for ground move. Check if the area is clear of obstacles. Command aircraft movement. Monitor and maintain within power margins. Monitor and maintain clearance from obstacles. Follow marshalling of Helideck Landing Officer (HLO) if available. NB: this phase of flight is unlikely to occur in an offshore installation1.
Flight crew, Aircraft, Offshore installation1, Environment
Helicopter company administrative support personnel, Helicopter company policies, Regulatory framework, Customer requirements, OEM
Engine stop
Check if the area is clear of obstacles. Check the wind speed limitations for stopping the rotors. Cut the engines off. Execute post engine cut checks. Alight passengers. Execute aircraft walk-around. Report any aircraft malfunction to maintenance team.
Flight crew, Aircraft, Offshore installation1, Environment, Maintenance engineers
Helicopter company administrative support personnel, Helicopter company policies, Regulatory framework, Customer requirements, OEM
NB:
1. Installation is generically used to refer to both platforms and boats.
2. Any Search and Rescue (SAR) infrastructure has been excluded as it is not part of normal but emergency operations. It is therefore part of another industry which interfaces the present industry in ad hoc circumstances. This is in line with common standards accepted in the offshore oil and gas industry (HSE, 2003a; OGP, 2008).
3. Even though the Offshore Helicopter Transportation Industry ferries cargo and people, its clients are not the individual passengers or owners of the cargo. The clients are the oil and gas companies which operate the oil and gas platforms and boats on the sea (see Section 1.1).
4. Despite the fact that the passengers of offshore helicopter flights are usually literate in operations and safety (e.g., through obligatory aircraft underwater escape training and use of immersion suits during flight; see International Chamber of Shipping, 1989), they have not been considered as an active component of the industry. This is because passengers do not perform any function in normal flights apart from being transported. Any disturbances caused by passengers are abnormal events (e.g. a person feeling sick in flight leading to an unplanned landing) or acts of sabotage.
5. Auto-pilot upper modes are selectable functions of the auto-pilot which allow to hold heading, a navigational course, altitude and indicated airspeed (McAdams, 2009). The auto-pilot upper modes of commercial helicopters cannot remain engaged below a minimum indicated airspeed (usually around 30-60 knots) due to increased inaccuracies introduced into the data system by turbulent airflow associated with rotors turning at slow translational speeds of the helicopter. As a consequence, takeoff and initial climb, as well as final approach and landing, usually must be flown manually by the pilots (Hart, 2005).
84
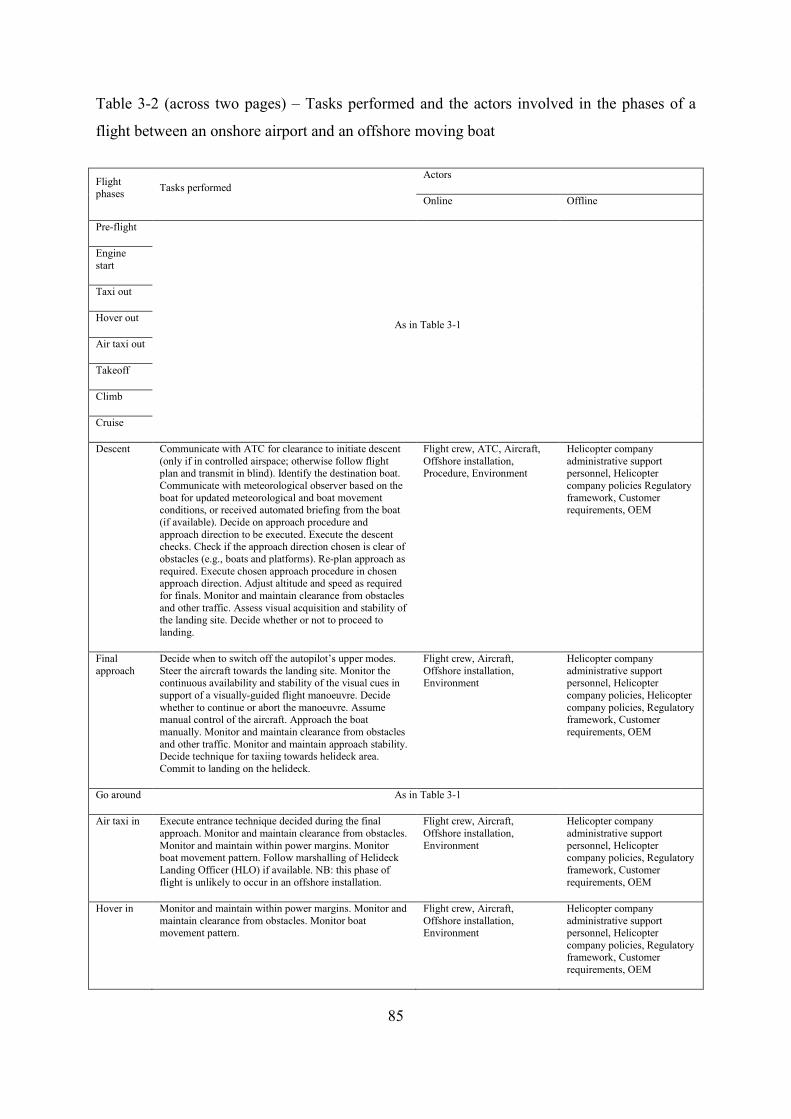
Table 3-2 (across two pages) – Tasks performed and the actors involved in the phases of a
flight between an onshore airport and an offshore moving boat
Flight phases Tasks performed
Actors
Online Offline
Pre-flight
As in Table 3-1
Engine start
Taxi out
Hover out
Air taxi out
Takeoff
Climb
Cruise
Descent Communicate with ATC for clearance to initiate descent (only if in controlled airspace; otherwise follow flight plan and transmit in blind). Identify the destination boat. Communicate with meteorological observer based on the boat for updated meteorological and boat movement conditions, or received automated briefing from the boat (if available). Decide on approach procedure and approach direction to be executed. Execute the descent checks. Check if the approach direction chosen is clear of obstacles (e.g., boats and platforms). Re-plan approach as required. Execute chosen approach procedure in chosen approach direction. Adjust altitude and speed as required for finals. Monitor and maintain clearance from obstacles and other traffic. Assess visual acquisition and stability of the landing site. Decide whether or not to proceed to landing.
Flight crew, ATC, Aircraft, Offshore installation, Procedure, Environment
Helicopter company administrative support personnel, Helicopter company policies Regulatory framework, Customer requirements, OEM
Final approach
Decide when to switch off the autopilot’s upper modes. Steer the aircraft towards the landing site. Monitor the continuous availability and stability of the visual cues in support of a visually-guided flight manoeuvre. Decide whether to continue or abort the manoeuvre. Assume manual control of the aircraft. Approach the boat manually. Monitor and maintain clearance from obstacles and other traffic. Monitor and maintain approach stability. Decide technique for taxiing towards helideck area. Commit to landing on the helideck.
Flight crew, Aircraft, Offshore installation, Environment
Helicopter company administrative support personnel, Helicopter company policies, Helicopter company policies, Regulatory framework, Customer requirements, OEM
Go around As in Table 3-1
Air taxi in Execute entrance technique decided during the final approach. Monitor and maintain clearance from obstacles. Monitor and maintain within power margins. Monitor boat movement pattern. Follow marshalling of Helideck Landing Officer (HLO) if available. NB: this phase of flight is unlikely to occur in an offshore installation.
Flight crew, Aircraft, Offshore installation, Environment
Helicopter company administrative support personnel, Helicopter company policies, Regulatory framework, Customer requirements, OEM
Hover in Monitor and maintain within power margins. Monitor and maintain clearance from obstacles. Monitor boat movement pattern.
Flight crew, Aircraft, Offshore installation, Environment
Helicopter company administrative support personnel, Helicopter company policies, Regulatory framework, Customer requirements, OEM
85
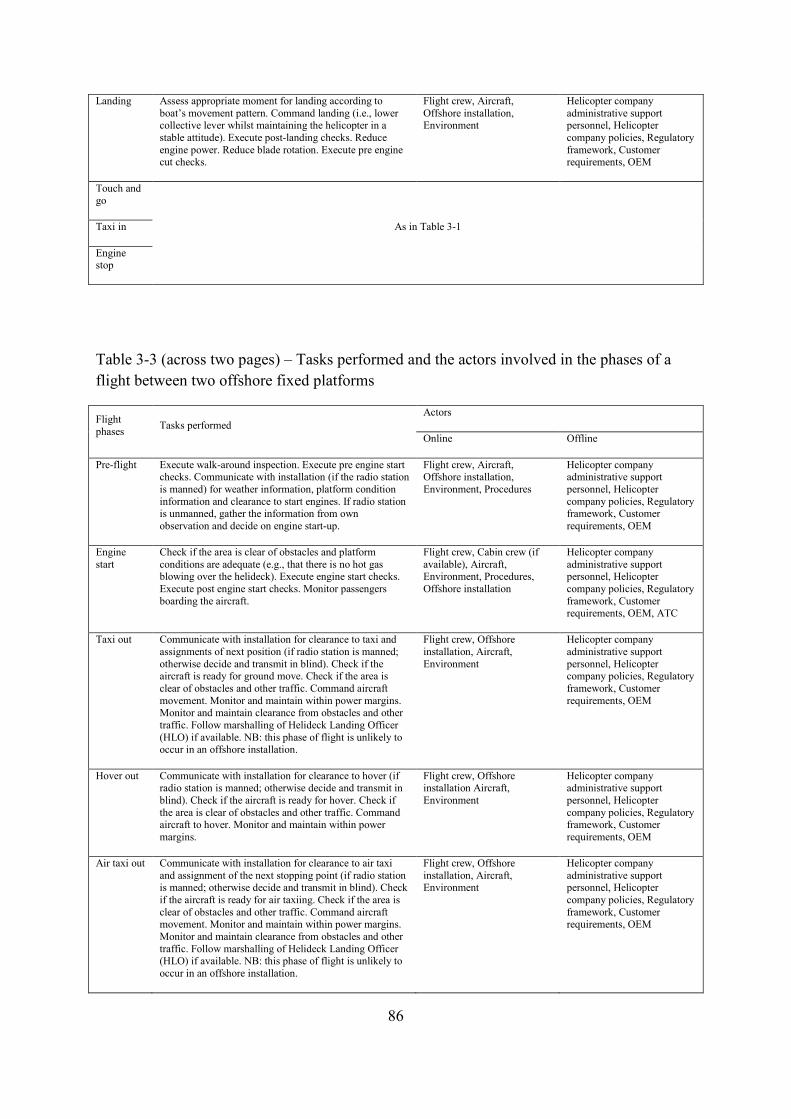
Landing Assess appropriate moment for landing according to boat’s movement pattern. Command landing (i.e., lower collective lever whilst maintaining the helicopter in a stable attitude). Execute post-landing checks. Reduce engine power. Reduce blade rotation. Execute pre engine cut checks.
Flight crew, Aircraft, Offshore installation, Environment
Helicopter company administrative support personnel, Helicopter company policies, Regulatory framework, Customer requirements, OEM
Touch and go
As in Table 3-1 Taxi in
Engine stop
Table 3-3 (across two pages) – Tasks performed and the actors involved in the phases of a flight between two offshore fixed platforms
Flight phases Tasks performed
Actors
Online Offline
Pre-flight Execute walk-around inspection. Execute pre engine start checks. Communicate with installation (if the radio station is manned) for weather information, platform condition information and clearance to start engines. If radio station is unmanned, gather the information from own observation and decide on engine start-up.
Flight crew, Aircraft, Offshore installation, Environment, Procedures
Helicopter company administrative support personnel, Helicopter company policies, Regulatory framework, Customer requirements, OEM
Engine start
Check if the area is clear of obstacles and platform conditions are adequate (e.g., that there is no hot gas blowing over the helideck). Execute engine start checks. Execute post engine start checks. Monitor passengers boarding the aircraft.
Flight crew, Cabin crew (if available), Aircraft, Environment, Procedures, Offshore installation
Helicopter company administrative support personnel, Helicopter company policies, Regulatory framework, Customer requirements, OEM, ATC
Taxi out Communicate with installation for clearance to taxi and assignments of next position (if radio station is manned; otherwise decide and transmit in blind). Check if the aircraft is ready for ground move. Check if the area is clear of obstacles and other traffic. Command aircraft movement. Monitor and maintain within power margins. Monitor and maintain clearance from obstacles and other traffic. Follow marshalling of Helideck Landing Officer (HLO) if available. NB: this phase of flight is unlikely to occur in an offshore installation.
Flight crew, Offshore installation, Aircraft, Environment
Helicopter company administrative support personnel, Helicopter company policies, Regulatory framework, Customer requirements, OEM
Hover out Communicate with installation for clearance to hover (if radio station is manned; otherwise decide and transmit in blind). Check if the aircraft is ready for hover. Check if the area is clear of obstacles and other traffic. Command aircraft to hover. Monitor and maintain within power margins.
Flight crew, Offshore installation Aircraft, Environment
Helicopter company administrative support personnel, Helicopter company policies, Regulatory framework, Customer requirements, OEM
Air taxi out Communicate with installation for clearance to air taxi and assignment of the next stopping point (if radio station is manned; otherwise decide and transmit in blind). Check if the aircraft is ready for air taxiing. Check if the area is clear of obstacles and other traffic. Command aircraft movement. Monitor and maintain within power margins. Monitor and maintain clearance from obstacles and other traffic. Follow marshalling of Helideck Landing Officer (HLO) if available. NB: this phase of flight is unlikely to occur in an offshore installation.
Flight crew, Offshore installation, Aircraft, Environment
Helicopter company administrative support personnel, Helicopter company policies, Regulatory framework, Customer requirements, OEM
86
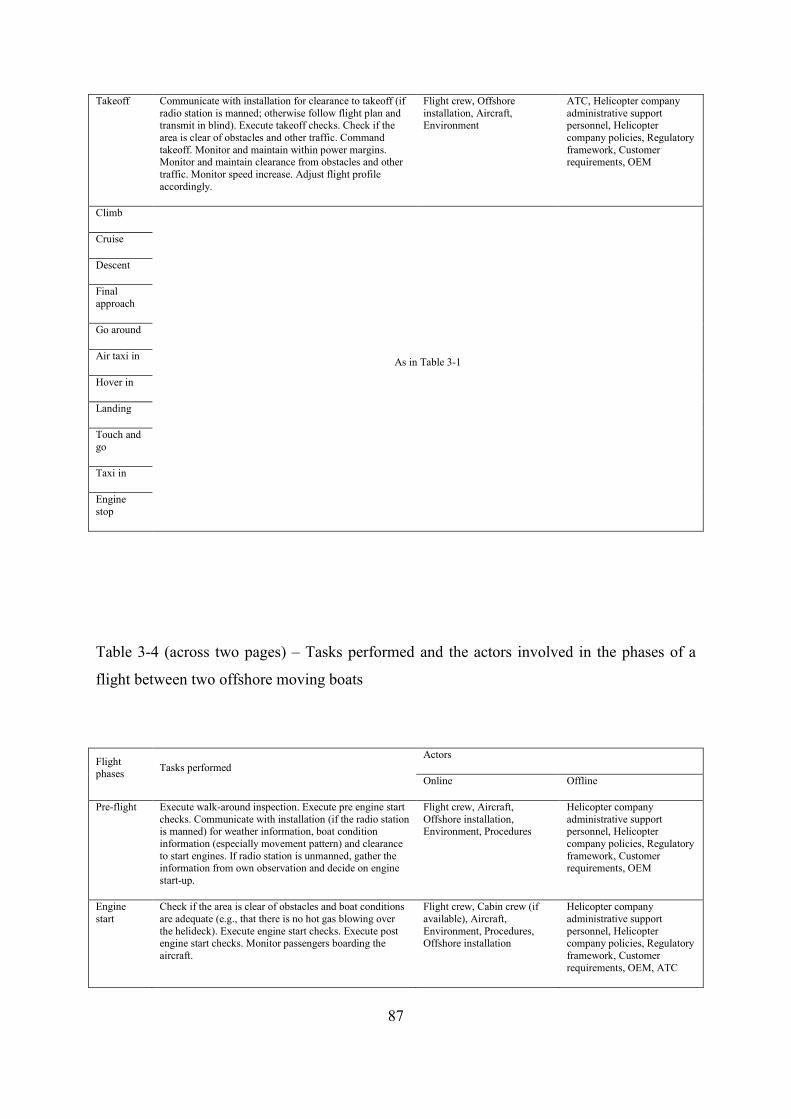
Takeoff Communicate with installation for clearance to takeoff (if radio station is manned; otherwise follow flight plan and transmit in blind). Execute takeoff checks. Check if the area is clear of obstacles and other traffic. Command takeoff. Monitor and maintain within power margins. Monitor and maintain clearance from obstacles and other traffic. Monitor speed increase. Adjust flight profile accordingly.
Flight crew, Offshore installation, Aircraft, Environment
ATC, Helicopter company administrative support personnel, Helicopter company policies, Regulatory framework, Customer requirements, OEM
Climb
As in Table 3-1
Cruise
Descent
Final approach
Go around
Air taxi in
Hover in
Landing
Touch and go
Taxi in
Engine stop
Table 3-4 (across two pages) – Tasks performed and the actors involved in the phases of a
flight between two offshore moving boats
Flight phases Tasks performed
Actors
Online Offline
Pre-flight Execute walk-around inspection. Execute pre engine start checks. Communicate with installation (if the radio station is manned) for weather information, boat condition information (especially movement pattern) and clearance to start engines. If radio station is unmanned, gather the information from own observation and decide on engine start-up.
Flight crew, Aircraft, Offshore installation, Environment, Procedures
Helicopter company administrative support personnel, Helicopter company policies, Regulatory framework, Customer requirements, OEM
Engine start
Check if the area is clear of obstacles and boat conditions are adequate (e.g., that there is no hot gas blowing over the helideck). Execute engine start checks. Execute post engine start checks. Monitor passengers boarding the aircraft.
Flight crew, Cabin crew (if available), Aircraft, Environment, Procedures, Offshore installation
Helicopter company administrative support personnel, Helicopter company policies, Regulatory framework, Customer requirements, OEM, ATC
87
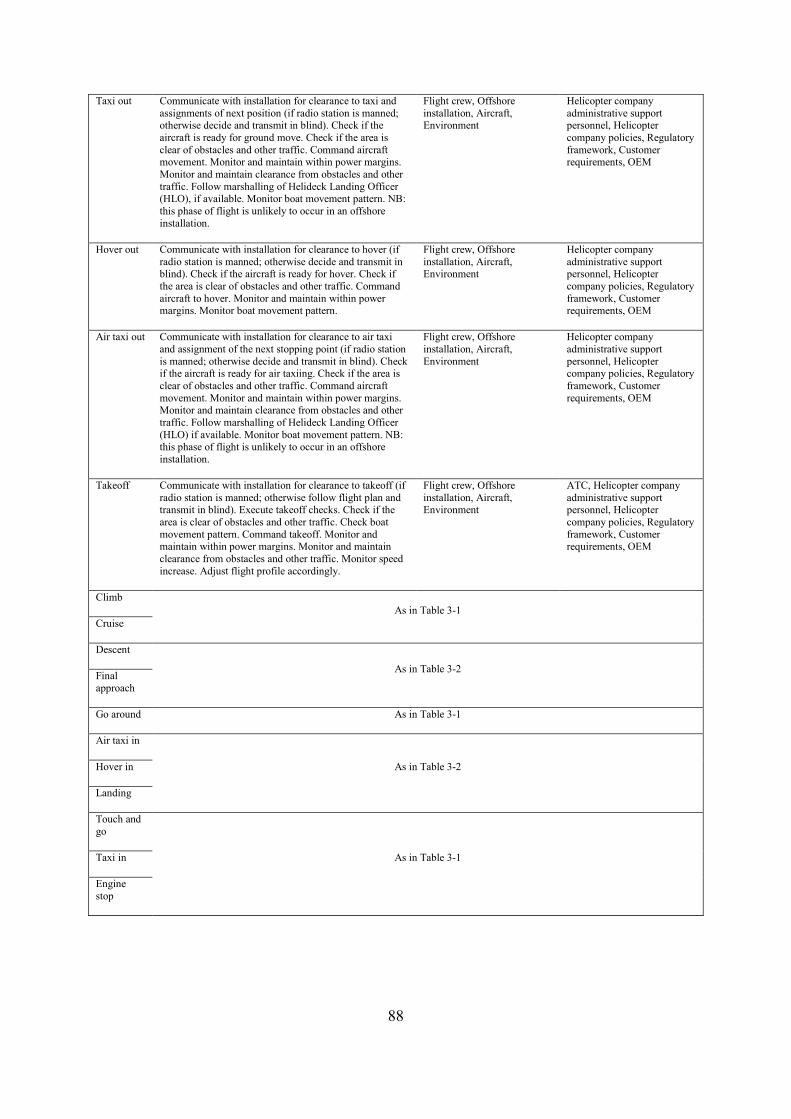
Taxi out Communicate with installation for clearance to taxi and assignments of next position (if radio station is manned; otherwise decide and transmit in blind). Check if the aircraft is ready for ground move. Check if the area is clear of obstacles and other traffic. Command aircraft movement. Monitor and maintain within power margins. Monitor and maintain clearance from obstacles and other traffic. Follow marshalling of Helideck Landing Officer (HLO), if available. Monitor boat movement pattern. NB: this phase of flight is unlikely to occur in an offshore installation.
Flight crew, Offshore installation, Aircraft, Environment
Helicopter company administrative support personnel, Helicopter company policies, Regulatory framework, Customer requirements, OEM
Hover out Communicate with installation for clearance to hover (if radio station is manned; otherwise decide and transmit in blind). Check if the aircraft is ready for hover. Check if the area is clear of obstacles and other traffic. Command aircraft to hover. Monitor and maintain within power margins. Monitor boat movement pattern.
Flight crew, Offshore installation, Aircraft, Environment
Helicopter company administrative support personnel, Helicopter company policies, Regulatory framework, Customer requirements, OEM
Air taxi out Communicate with installation for clearance to air taxi and assignment of the next stopping point (if radio station is manned; otherwise decide and transmit in blind). Check if the aircraft is ready for air taxiing. Check if the area is clear of obstacles and other traffic. Command aircraft movement. Monitor and maintain within power margins. Monitor and maintain clearance from obstacles and other traffic. Follow marshalling of Helideck Landing Officer (HLO) if available. Monitor boat movement pattern. NB: this phase of flight is unlikely to occur in an offshore installation.
Flight crew, Offshore installation, Aircraft, Environment
Helicopter company administrative support personnel, Helicopter company policies, Regulatory framework, Customer requirements, OEM
Takeoff Communicate with installation for clearance to takeoff (if radio station is manned; otherwise follow flight plan and transmit in blind). Execute takeoff checks. Check if the area is clear of obstacles and other traffic. Check boat movement pattern. Command takeoff. Monitor and maintain within power margins. Monitor and maintain clearance from obstacles and other traffic. Monitor speed increase. Adjust flight profile accordingly.
Flight crew, Offshore installation, Aircraft, Environment
ATC, Helicopter company administrative support personnel, Helicopter company policies, Regulatory framework, Customer requirements, OEM
Climb As in Table 3-1
Cruise
Descent
As in Table 3-2 Final approach
Go around As in Table 3-1
Air taxi in
As in Table 3-2 Hover in
Landing
Touch and go
As in Table 3-1 Taxi in
Engine stop
88

Table 3-5 – Tasks performed and the actors involved in the phases of a flight between an
offshore fixed platform to an offshore moving boat
Flight phases Tasks performed
Actors
Online Offline
Pre-flight
As in Table 3-3
Engine start
Taxi out
Hover out
Air taxi out
Takeoff
Climb Communicate with ATC for climbing instructions (only if in controlled airspace; otherwise follow flight plan and transmit in blind). Execute post-takeoff checks. Adjust speed as required. Decide if the autopilot’s upper modes will be turned on and when. Monitor and maintain within power margins. Monitor and maintain clearance from other traffic. Monitor if flight profile is being executed as instructed/planned for. Adjust flight profile accordingly.
Flight crew, ATC, Aircraft, Procedures, Environment
Airport, Helicopter company administrative support personnel, Helicopter company policies, Regulatory framework, Customer requirements, OEM
Cruise Communicate with ATC for instructions to level off at cruise altitude/height (only if in controlled airspace; otherwise follow flight plan or convenient altitude/height and transmit in blind). Execute cruise checks. Adjust altitude and speed as required. Monitor and maintain clearance from other traffic. Monitor altitude maintenance as instructed or planned. Adjust flight profile accordingly.
Flight crew, ATC, Aircraft, Procedures, Environment
Helicopter company administrative support personnel, Helicopter company policies, Regulatory framework, Customer requirements, OEM
Descent As in Table 3-2
Final approach
Go around As in Table 3-1
Air taxi in
As in Table 3-2 Hover in
Landing
Touch and go
As in Table 3-1 Taxi in
Engine stop
89
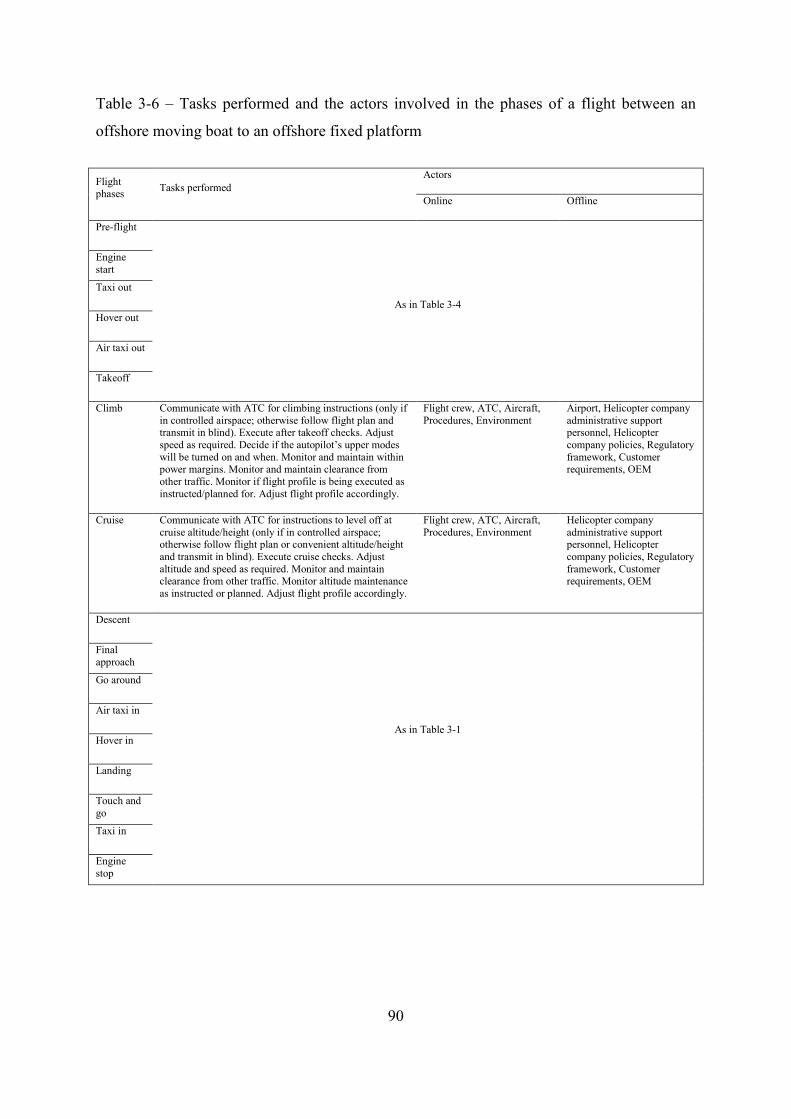
Table 3-6 – Tasks performed and the actors involved in the phases of a flight between an
offshore moving boat to an offshore fixed platform
Flight phases Tasks performed
Actors
Online Offline
Pre-flight
As in Table 3-4
Engine start
Taxi out
Hover out
Air taxi out
Takeoff
Climb Communicate with ATC for climbing instructions (only if in controlled airspace; otherwise follow flight plan and transmit in blind). Execute after takeoff checks. Adjust speed as required. Decide if the autopilot’s upper modes will be turned on and when. Monitor and maintain within power margins. Monitor and maintain clearance from other traffic. Monitor if flight profile is being executed as instructed/planned for. Adjust flight profile accordingly.
Flight crew, ATC, Aircraft, Procedures, Environment
Airport, Helicopter company administrative support personnel, Helicopter company policies, Regulatory framework, Customer requirements, OEM
Cruise Communicate with ATC for instructions to level off at cruise altitude/height (only if in controlled airspace; otherwise follow flight plan or convenient altitude/height and transmit in blind). Execute cruise checks. Adjust altitude and speed as required. Monitor and maintain clearance from other traffic. Monitor altitude maintenance as instructed or planned. Adjust flight profile accordingly.
Flight crew, ATC, Aircraft, Procedures, Environment
Helicopter company administrative support personnel, Helicopter company policies, Regulatory framework, Customer requirements, OEM
Descent
As in Table 3-1
Final approach
Go around
Air taxi in
Hover in
Landing
Touch and go
Taxi in
Engine stop
90
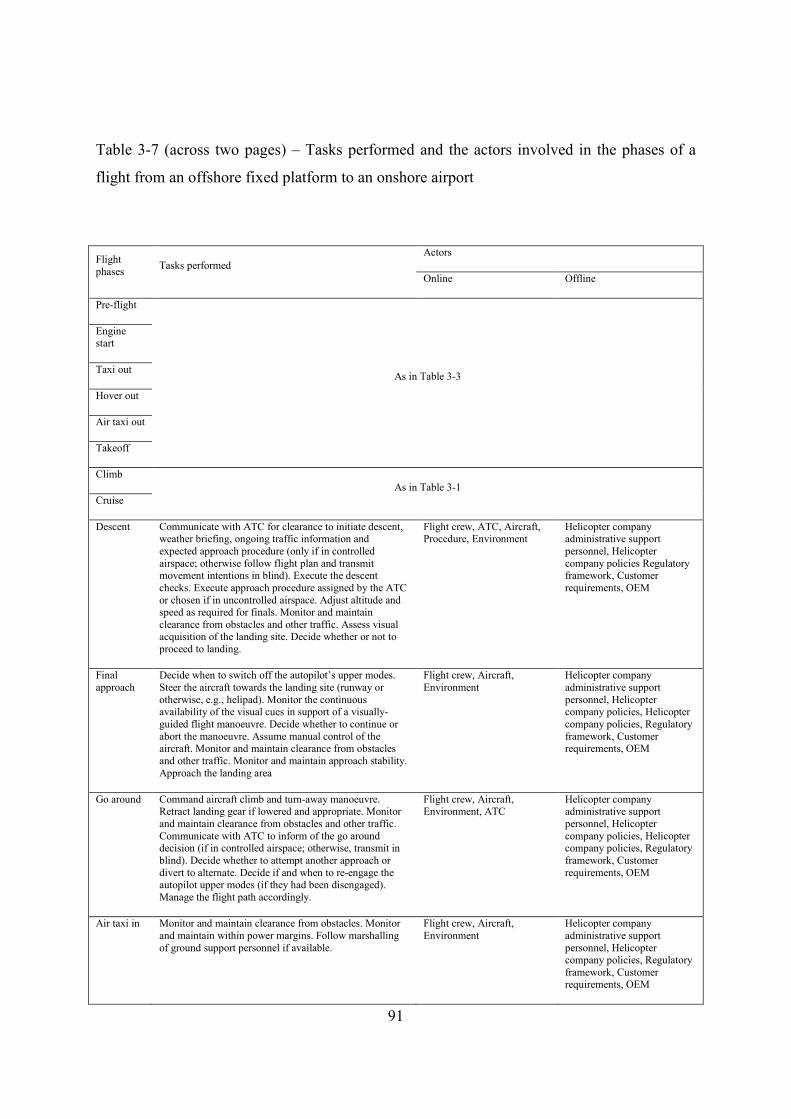
Table 3-7 (across two pages) – Tasks performed and the actors involved in the phases of a
flight from an offshore fixed platform to an onshore airport
Flight phases Tasks performed
Actors
Online Offline
Pre-flight
As in Table 3-3
Engine start
Taxi out
Hover out
Air taxi out
Takeoff
Climb As in Table 3-1
Cruise
Descent Communicate with ATC for clearance to initiate descent, weather briefing, ongoing traffic information and expected approach procedure (only if in controlled airspace; otherwise follow flight plan and transmit movement intentions in blind). Execute the descent checks. Execute approach procedure assigned by the ATC or chosen if in uncontrolled airspace. Adjust altitude and speed as required for finals. Monitor and maintain clearance from obstacles and other traffic. Assess visual acquisition of the landing site. Decide whether or not to proceed to landing.
Flight crew, ATC, Aircraft, Procedure, Environment
Helicopter company administrative support personnel, Helicopter company policies Regulatory framework, Customer requirements, OEM
Final approach
Decide when to switch off the autopilot’s upper modes. Steer the aircraft towards the landing site (runway or otherwise, e.g., helipad). Monitor the continuous availability of the visual cues in support of a visually-guided flight manoeuvre. Decide whether to continue or abort the manoeuvre. Assume manual control of the aircraft. Monitor and maintain clearance from obstacles and other traffic. Monitor and maintain approach stability. Approach the landing area
Flight crew, Aircraft, Environment
Helicopter company administrative support personnel, Helicopter company policies, Helicopter company policies, Regulatory framework, Customer requirements, OEM
Go around Command aircraft climb and turn-away manoeuvre. Retract landing gear if lowered and appropriate. Monitor and maintain clearance from obstacles and other traffic. Communicate with ATC to inform of the go around decision (if in controlled airspace; otherwise, transmit in blind). Decide whether to attempt another approach or divert to alternate. Decide if and when to re-engage the autopilot upper modes (if they had been disengaged). Manage the flight path accordingly.
Flight crew, Aircraft, Environment, ATC
Helicopter company administrative support personnel, Helicopter company policies, Helicopter company policies, Regulatory framework, Customer requirements, OEM
Air taxi in Monitor and maintain clearance from obstacles. Monitor and maintain within power margins. Follow marshalling of ground support personnel if available.
Flight crew, Aircraft, Environment
Helicopter company administrative support personnel, Helicopter company policies, Regulatory framework, Customer requirements, OEM
91
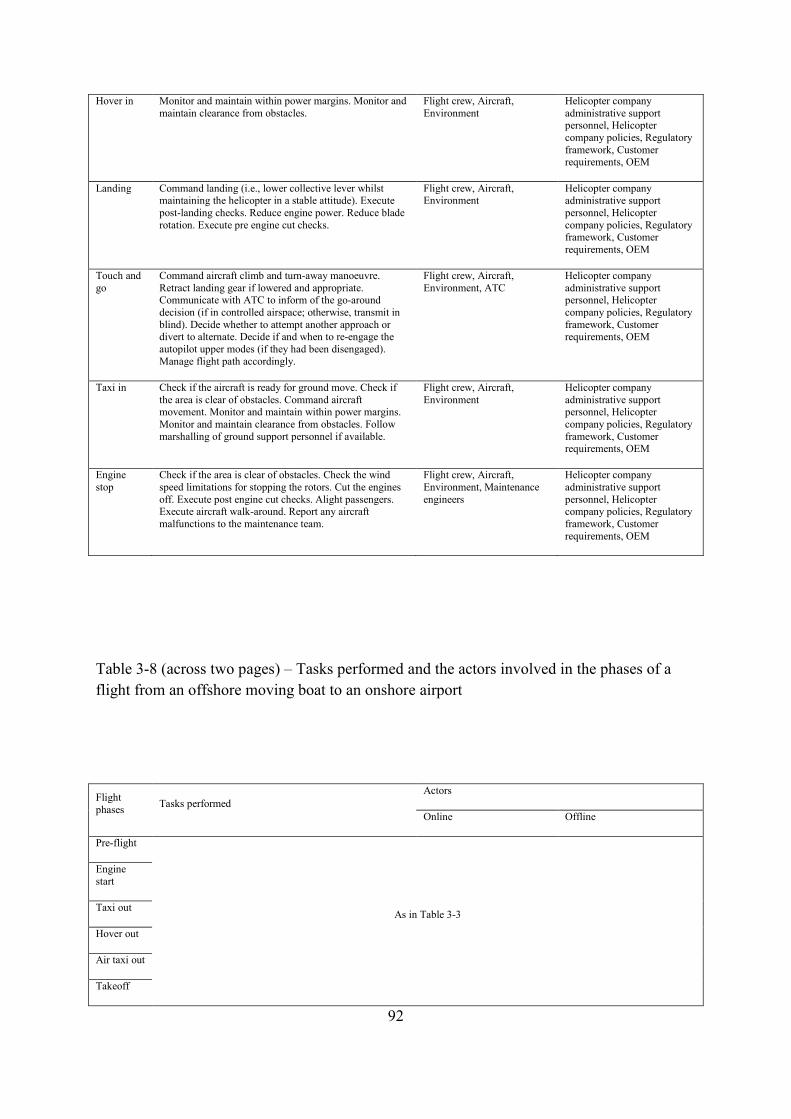
Hover in Monitor and maintain within power margins. Monitor and maintain clearance from obstacles.
Flight crew, Aircraft, Environment
Helicopter company administrative support personnel, Helicopter company policies, Regulatory framework, Customer requirements, OEM
Landing Command landing (i.e., lower collective lever whilst maintaining the helicopter in a stable attitude). Execute post-landing checks. Reduce engine power. Reduce blade rotation. Execute pre engine cut checks.
Flight crew, Aircraft, Environment
Helicopter company administrative support personnel, Helicopter company policies, Regulatory framework, Customer requirements, OEM
Touch and go
Command aircraft climb and turn-away manoeuvre. Retract landing gear if lowered and appropriate. Communicate with ATC to inform of the go-around decision (if in controlled airspace; otherwise, transmit in blind). Decide whether to attempt another approach or divert to alternate. Decide if and when to re-engage the autopilot upper modes (if they had been disengaged). Manage flight path accordingly.
Flight crew, Aircraft, Environment, ATC
Helicopter company administrative support personnel, Helicopter company policies, Regulatory framework, Customer requirements, OEM
Taxi in Check if the aircraft is ready for ground move. Check if the area is clear of obstacles. Command aircraft movement. Monitor and maintain within power margins. Monitor and maintain clearance from obstacles. Follow marshalling of ground support personnel if available.
Flight crew, Aircraft, Environment
Helicopter company administrative support personnel, Helicopter company policies, Regulatory framework, Customer requirements, OEM
Engine stop
Check if the area is clear of obstacles. Check the wind speed limitations for stopping the rotors. Cut the engines off. Execute post engine cut checks. Alight passengers. Execute aircraft walk-around. Report any aircraft malfunctions to the maintenance team.
Flight crew, Aircraft, Environment, Maintenance engineers
Helicopter company administrative support personnel, Helicopter company policies, Regulatory framework, Customer requirements, OEM
Table 3-8 (across two pages) – Tasks performed and the actors involved in the phases of a flight from an offshore moving boat to an onshore airport
Flight phases Tasks performed
Actors
Online Offline
Pre-flight
As in Table 3-3
Engine start
Taxi out
Hover out
Air taxi out
Takeoff
92
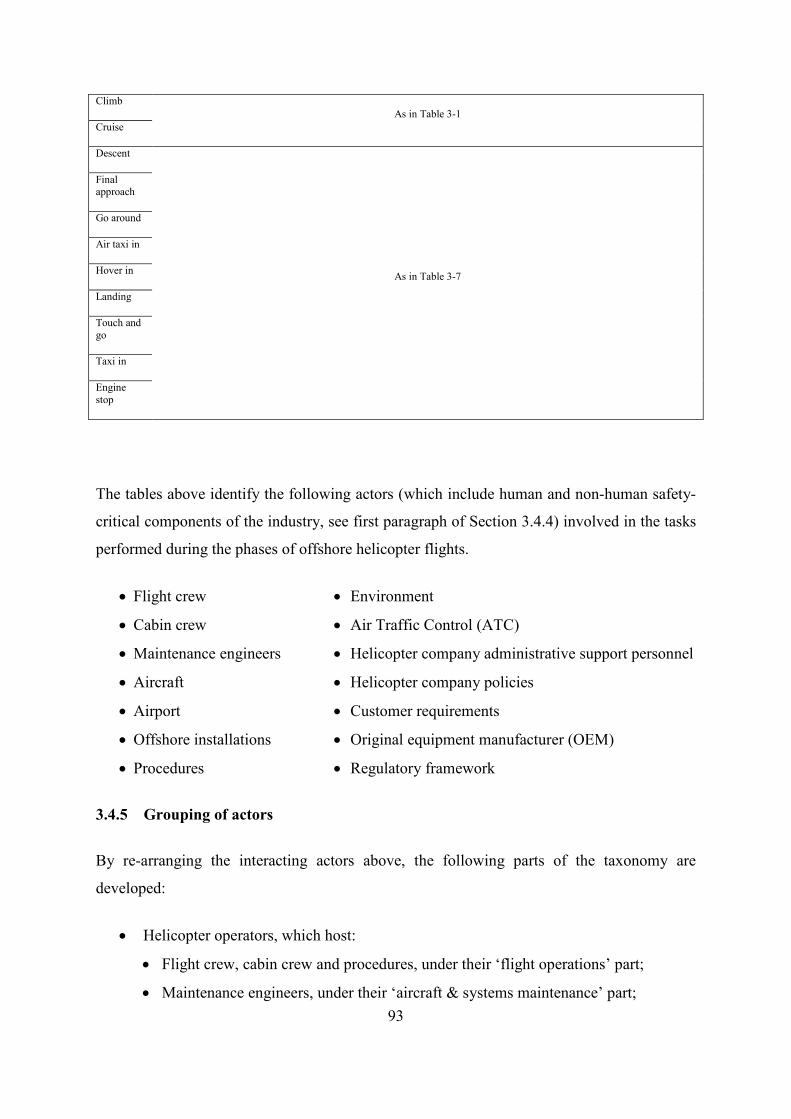
Climb As in Table 3-1
Cruise
Descent
As in Table 3-7
Final approach
Go around
Air taxi in
Hover in
Landing
Touch and go
Taxi in
Engine stop
The tables above identify the following actors (which include human and non-human safety-
critical components of the industry, see first paragraph of Section 3.4.4) involved in the tasks
performed during the phases of offshore helicopter flights.
• Flight crew • Cabin crew • Maintenance engineers • Aircraft • Airport • Offshore installations • Procedures
• Environment • Air Traffic Control (ATC) • Helicopter company administrative support personnel • Helicopter company policies • Customer requirements • Original equipment manufacturer (OEM) • Regulatory framework
3.4.5 Grouping of actors
By re-arranging the interacting actors above, the following parts of the taxonomy are
developed:
• Helicopter operators, which host:
• Flight crew, cabin crew and procedures, under their ‘flight operations’ part;
• Maintenance engineers, under their ‘aircraft & systems maintenance’ part; 93
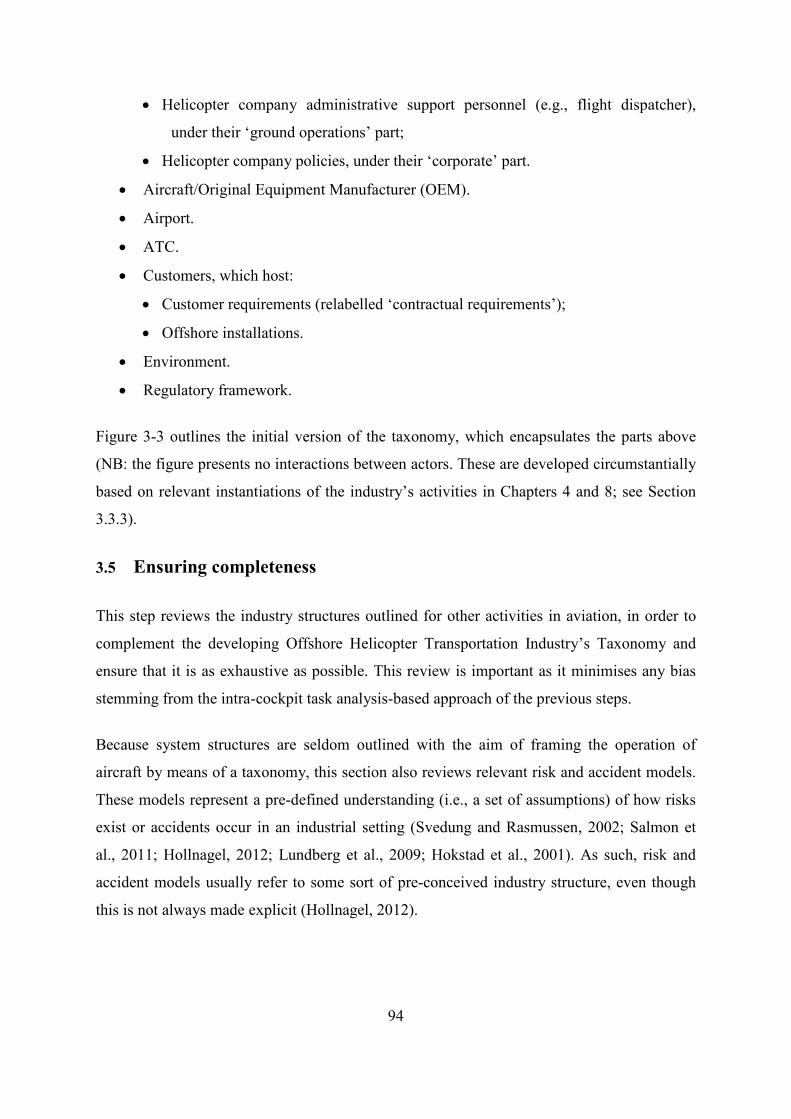
• Helicopter company administrative support personnel (e.g., flight dispatcher),
under their ‘ground operations’ part;
• Helicopter company policies, under their ‘corporate’ part.
• Aircraft/Original Equipment Manufacturer (OEM).
• Airport.
• ATC.
• Customers, which host:
• Customer requirements (relabelled ‘contractual requirements’);
• Offshore installations.
• Environment.
• Regulatory framework.
Figure 3-3 outlines the initial version of the taxonomy, which encapsulates the parts above
(NB: the figure presents no interactions between actors. These are developed circumstantially
based on relevant instantiations of the industry’s activities in Chapters 4 and 8; see Section
3.3.3).
3.5 Ensuring completeness
This step reviews the industry structures outlined for other activities in aviation, in order to
complement the developing Offshore Helicopter Transportation Industry’s Taxonomy and
ensure that it is as exhaustive as possible. This review is important as it minimises any bias
stemming from the intra-cockpit task analysis-based approach of the previous steps.
Because system structures are seldom outlined with the aim of framing the operation of
aircraft by means of a taxonomy, this section also reviews relevant risk and accident models.
These models represent a pre-defined understanding (i.e., a set of assumptions) of how risks
exist or accidents occur in an industrial setting (Svedung and Rasmussen, 2002; Salmon et
al., 2011; Hollnagel, 2012; Lundberg et al., 2009; Hokstad et al., 2001). As such, risk and
accident models usually refer to some sort of pre-conceived industry structure, even though
this is not always made explicit (Hollnagel, 2012).
94
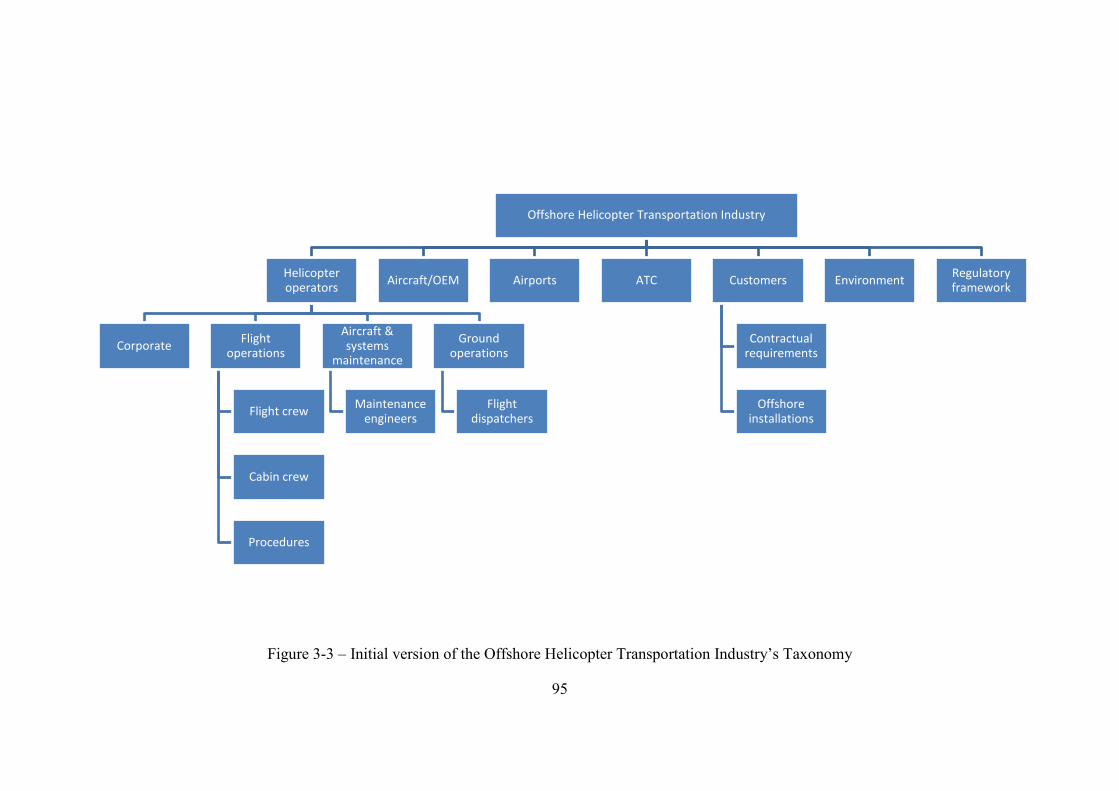
Figure 3-3 – Initial version of the Offshore Helicopter Transportation Industry’s Taxonomy
Offshore Helicopter Transportation Industry
Helicopter operators
Corporate Flight operations
Flight crew
Cabin crew
Procedures
Aircraft & systems
maintenance
Maintenance engineers
Ground operations
Flight dispatchers
Aircraft/OEM Airports ATC Customers
Contractual requirements
Offshore installations
Environment Regulatory framework
95
By reviewing only the accident models which incorporate an explicit underlying structure
(i.e., morphological accident models; Sklet, 2004), this section does not intend to be an
exhaustive review of all possible accident models since such reviews already exist in the
literature (e.g., Hollnagel, 2004, 2009, 2012; Rollenhagen et al., 2010; Lundberg et al., 2009;
Salmon et al., 2011; Reason, 2008; Sklet, 2004; Kjellén, 2000; Borys, 2000; Saleh et al.,
2010). Finally, the literature on performance shaping factors is also discussed because it also
refers to industry elements which affect human performance.
3.5.1 Aviation system and risk models
3.5.1.1 Subotic et al. (2005)
Subotic et al. (2005) described the Air Transport System from an Air Traffic Management’s
(ATM) perspective, in order to derive target levels of safety (TLS) for equipment failure.
This model is depicted in Figure 3-4, together with the parts already incorporated into the
offshore helicopter transportation industry’s developing taxonomy, those parts used to
complement it and those found not to be directly relevant (i.e., the elements related to the
ATM perspective of safety) given the level of detail pursued.
3.5.1.2 Greenberg et al. (2005)
Greenberg et al. (2005, pp. 562) proposed a model for the safety assessment of fixed-wing
civil aviation operations using a Bayesian belief network. The model is based on each crew
member’s readiness to fly (e.g., level of fatigue, age and medical situation); level of
airworthiness of aircraft (e.g., severity of any existing malfunction); company roster policy,
economic situation and safety culture; society type (i.e., hierarchical or not) and authority
gradient; atmospheric weather and visibility and finally mission characteristics (e.g., flight
length and altitude).
96
Figure 3-4 – The Air Transport System described by Subotic et al. (2005, pp. 278)
NB: coding scheme: elements already incorporated into the developing Offshore Helicopter Transportation Industry’s taxonomy: ✓; elements further used to complement the developing model: +; and elements found less relevant: X.
✓ ✓ ✓ ✓ ✓
✓ ✓ ✓
✓
✓
+
+
+ + +
+ +
X
X
X
X X
X
X X
X
97
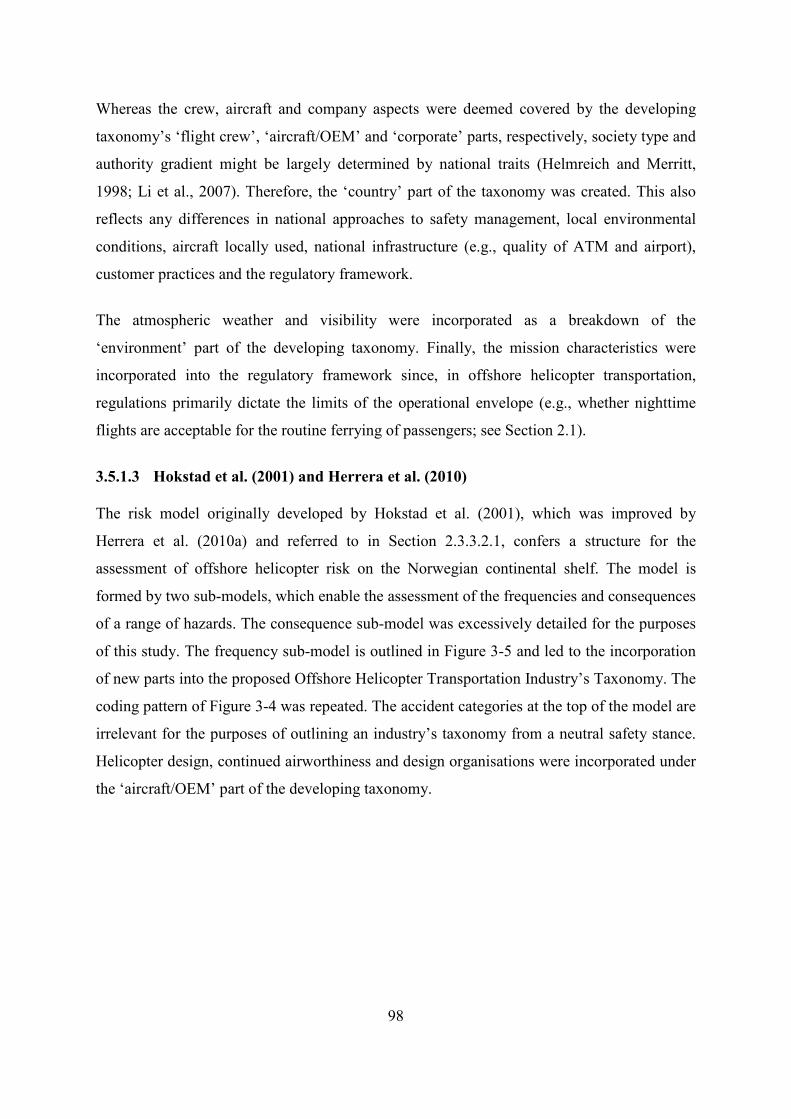
Whereas the crew, aircraft and company aspects were deemed covered by the developing
taxonomy’s ‘flight crew’, ‘aircraft/OEM’ and ‘corporate’ parts, respectively, society type and
authority gradient might be largely determined by national traits (Helmreich and Merritt,
1998; Li et al., 2007). Therefore, the ‘country’ part of the taxonomy was created. This also
reflects any differences in national approaches to safety management, local environmental
conditions, aircraft locally used, national infrastructure (e.g., quality of ATM and airport),
customer practices and the regulatory framework.
The atmospheric weather and visibility were incorporated as a breakdown of the
‘environment’ part of the developing taxonomy. Finally, the mission characteristics were
incorporated into the regulatory framework since, in offshore helicopter transportation,
regulations primarily dictate the limits of the operational envelope (e.g., whether nighttime
flights are acceptable for the routine ferrying of passengers; see Section 2.1).
3.5.1.3 Hokstad et al. (2001) and Herrera et al. (2010)
The risk model originally developed by Hokstad et al. (2001), which was improved by
Herrera et al. (2010a) and referred to in Section 2.3.3.2.1, confers a structure for the
assessment of offshore helicopter risk on the Norwegian continental shelf. The model is
formed by two sub-models, which enable the assessment of the frequencies and consequences
of a range of hazards. The consequence sub-model was excessively detailed for the purposes
of this study. The frequency sub-model is outlined in Figure 3-5 and led to the incorporation
of new parts into the proposed Offshore Helicopter Transportation Industry’s Taxonomy. The
coding pattern of Figure 3-4 was repeated. The accident categories at the top of the model are
irrelevant for the purposes of outlining an industry’s taxonomy from a neutral safety stance.
Helicopter design, continued airworthiness and design organisations were incorporated under
the ‘aircraft/OEM’ part of the developing taxonomy.
98
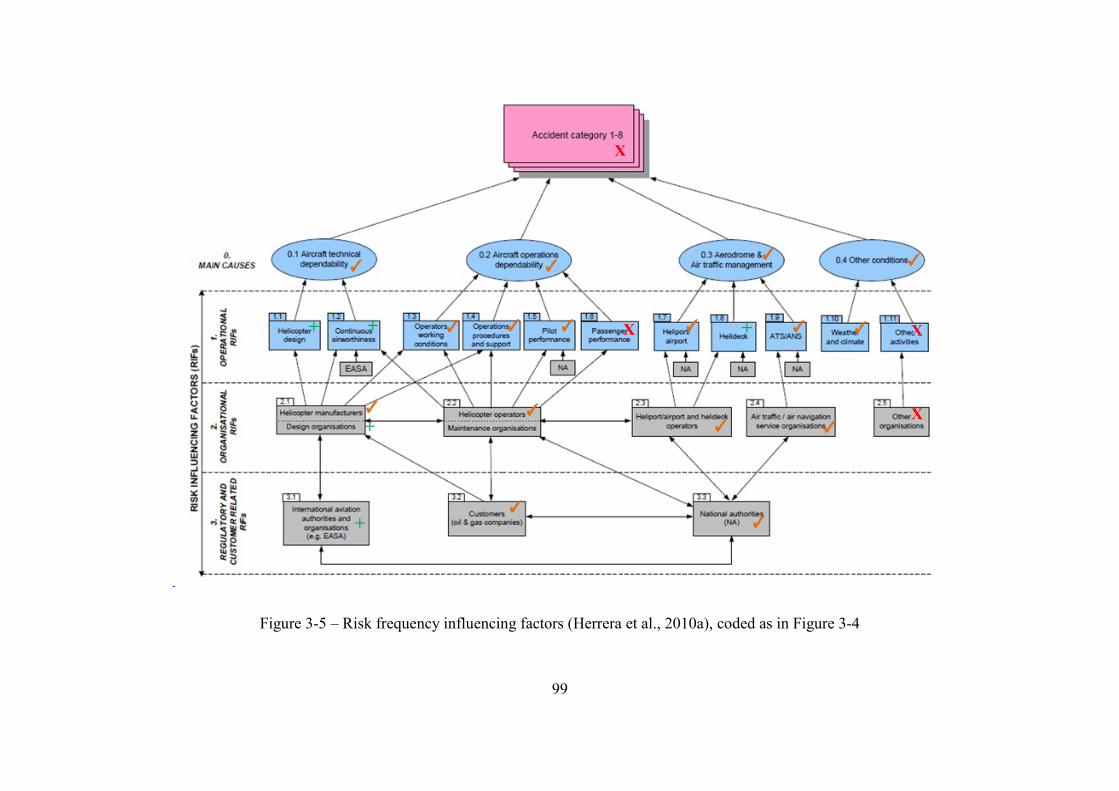
Figure 3-5 – Risk frequency influencing factors (Herrera et al., 2010a), coded as in Figure 3-4
✓ ✓ ✓ ✓ ✓ ✓
✓ ✓ ✓ ✓
✓
+ + +
+
+
X
X
✓ ✓ ✓ ✓
X
X
✓
99
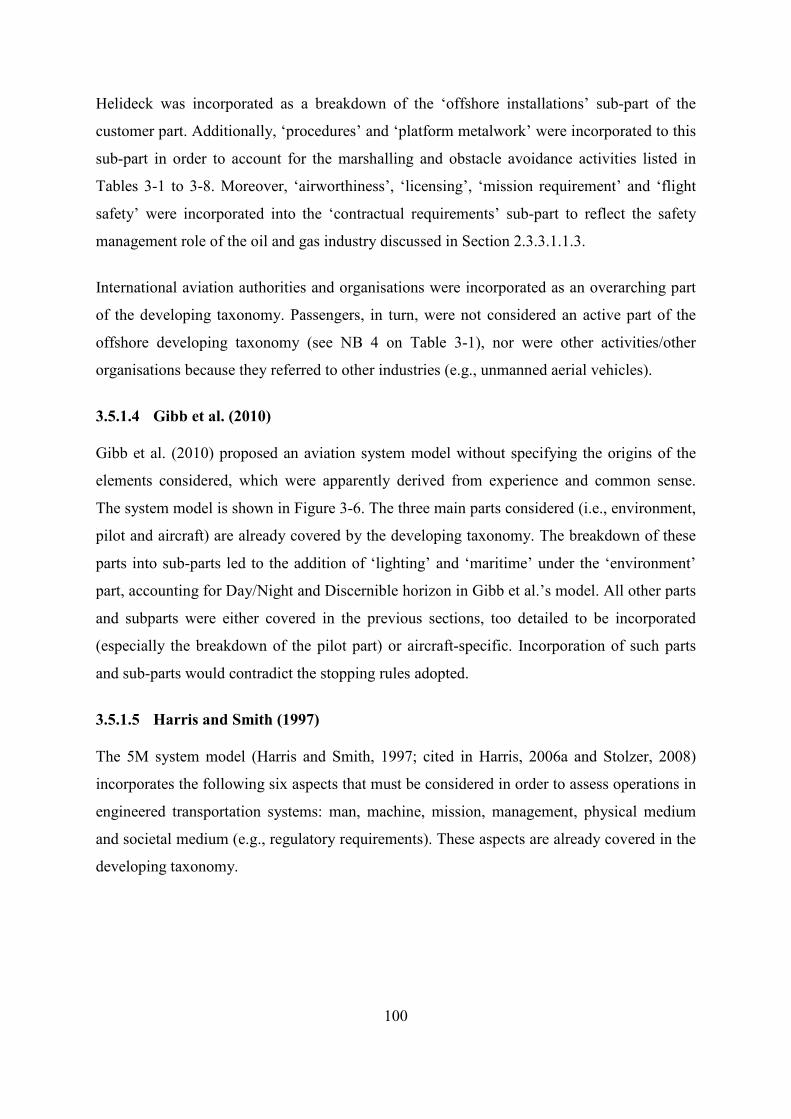
Helideck was incorporated as a breakdown of the ‘offshore installations’ sub-part of the
customer part. Additionally, ‘procedures’ and ‘platform metalwork’ were incorporated to this
sub-part in order to account for the marshalling and obstacle avoidance activities listed in
Tables 3-1 to 3-8. Moreover, ‘airworthiness’, ‘licensing’, ‘mission requirement’ and ‘flight
safety’ were incorporated into the ‘contractual requirements’ sub-part to reflect the safety
management role of the oil and gas industry discussed in Section 2.3.3.1.1.3.
International aviation authorities and organisations were incorporated as an overarching part
of the developing taxonomy. Passengers, in turn, were not considered an active part of the
offshore developing taxonomy (see NB 4 on Table 3-1), nor were other activities/other
organisations because they referred to other industries (e.g., unmanned aerial vehicles).
3.5.1.4 Gibb et al. (2010)
Gibb et al. (2010) proposed an aviation system model without specifying the origins of the
elements considered, which were apparently derived from experience and common sense.
The system model is shown in Figure 3-6. The three main parts considered (i.e., environment,
pilot and aircraft) are already covered by the developing taxonomy. The breakdown of these
parts into sub-parts led to the addition of ‘lighting’ and ‘maritime’ under the ‘environment’
part, accounting for Day/Night and Discernible horizon in Gibb et al.’s model. All other parts
and subparts were either covered in the previous sections, too detailed to be incorporated
(especially the breakdown of the pilot part) or aircraft-specific. Incorporation of such parts
and sub-parts would contradict the stopping rules adopted.
3.5.1.5 Harris and Smith (1997)
The 5M system model (Harris and Smith, 1997; cited in Harris, 2006a and Stolzer, 2008)
incorporates the following six aspects that must be considered in order to assess operations in
engineered transportation systems: man, machine, mission, management, physical medium
and societal medium (e.g., regulatory requirements). These aspects are already covered in the
developing taxonomy.
100
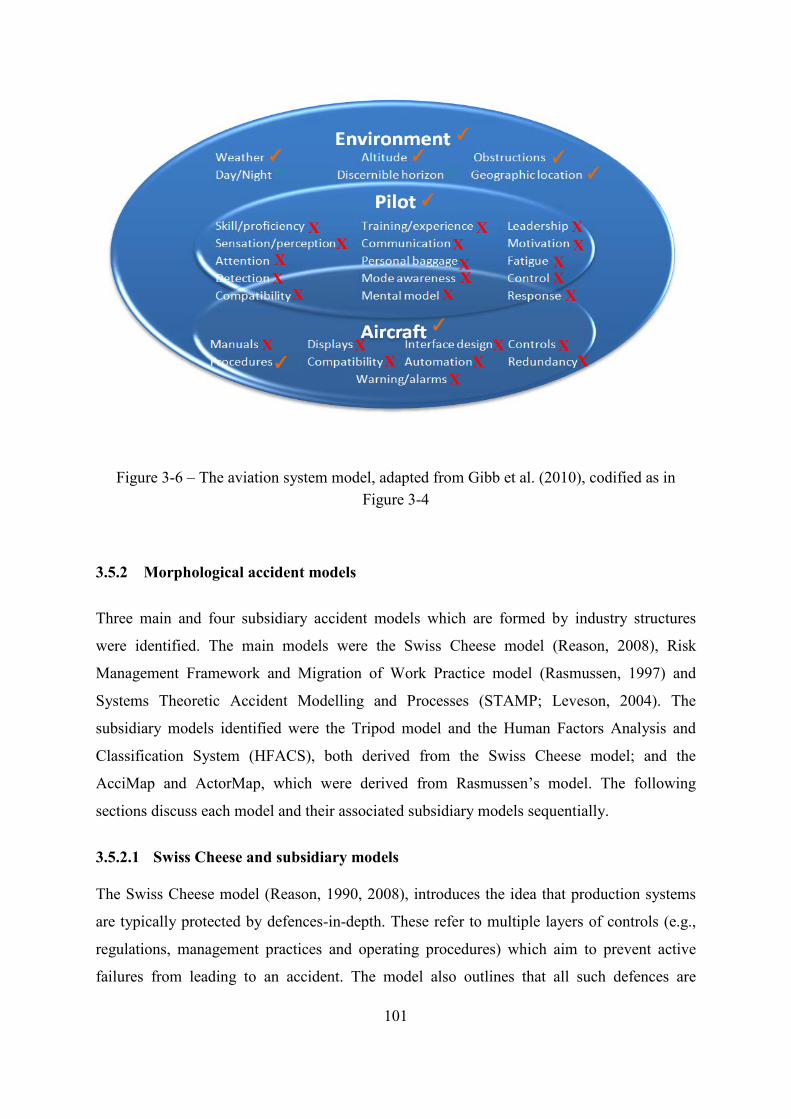
Figure 3-6 – The aviation system model, adapted from Gibb et al. (2010), codified as in Figure 3-4
3.5.2 Morphological accident models
Three main and four subsidiary accident models which are formed by industry structures
were identified. The main models were the Swiss Cheese model (Reason, 2008), Risk
Management Framework and Migration of Work Practice model (Rasmussen, 1997) and
Systems Theoretic Accident Modelling and Processes (STAMP; Leveson, 2004). The
subsidiary models identified were the Tripod model and the Human Factors Analysis and
Classification System (HFACS), both derived from the Swiss Cheese model; and the
AcciMap and ActorMap, which were derived from Rasmussen’s model. The following
sections discuss each model and their associated subsidiary models sequentially.
3.5.2.1 Swiss Cheese and subsidiary models
The Swiss Cheese model (Reason, 1990, 2008), introduces the idea that production systems
are typically protected by defences-in-depth. These refer to multiple layers of controls (e.g.,
regulations, management practices and operating procedures) which aim to prevent active
failures from leading to an accident. The model also outlines that all such defences are
✓
✓
✓
X X
X X
X X X X
X X
X X
X X
X
+ + ✓
✓ X X
X X X
X X
X
✓ ✓ ✓
101

fallible and thus create the latent conditions for accidents. When latent conditions combine
with local triggering factors in the workplace (e.g., suboptimal working conditions, errors
from operators, or malfunctioning equipment), accidents may occur. The model is shown in
Figure 3-7, together with the assessment of the applicability of the model’s components to the
Offshore Helicopter Transportation Industry’s Taxonomy.
Figure 3-7 – The Swiss Cheese model (Reason, 2008; cited in Salmon et al., 2011, pp. 3),
codified as in Figure 3-4
Whilst board decision and policy are covered by the ‘corporate’ part of the developing model,
line management was incorporated as ‘maintenance supervision’, which is important for the
safety of aircraft (Herrera et al., 2009). The other elements of the Swiss Cheese model were
found to be too accident specific and, therefore, not transferable to a neutral stance taxonomy.
From the slightly different version of the model outlined in ICAO (2012c), ‘training’ was
identified as a transferable element, which was placed under the ‘flight operations’ sub-part
of the developing taxonomy.
The Tripod Diagnostic Evaluation Tool for Accident Prevention (i.e., Tripod DELTA;
Hudson et al., 1994) is formed by a set of checklists designed to perform health checks in
X X
X
X
✓
+
102
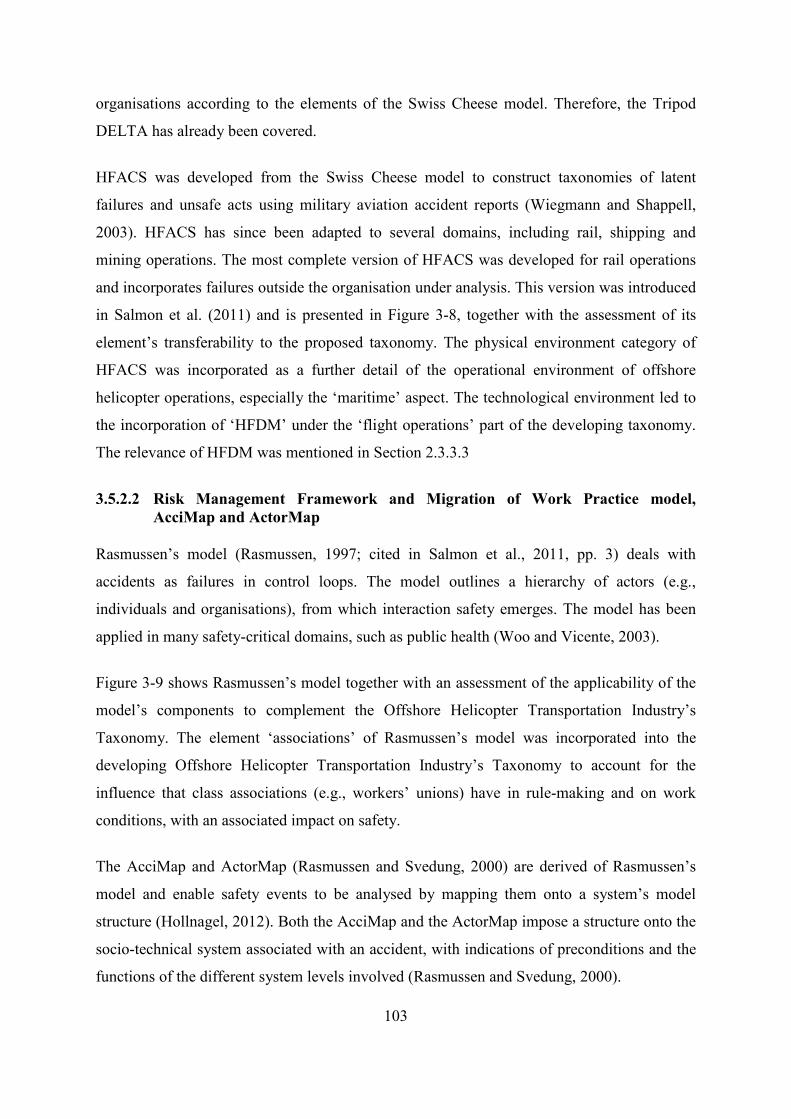
organisations according to the elements of the Swiss Cheese model. Therefore, the Tripod
DELTA has already been covered.
HFACS was developed from the Swiss Cheese model to construct taxonomies of latent
failures and unsafe acts using military aviation accident reports (Wiegmann and Shappell,
2003). HFACS has since been adapted to several domains, including rail, shipping and
mining operations. The most complete version of HFACS was developed for rail operations
and incorporates failures outside the organisation under analysis. This version was introduced
in Salmon et al. (2011) and is presented in Figure 3-8, together with the assessment of its
element’s transferability to the proposed taxonomy. The physical environment category of
HFACS was incorporated as a further detail of the operational environment of offshore
helicopter operations, especially the ‘maritime’ aspect. The technological environment led to
the incorporation of ‘HFDM’ under the ‘flight operations’ part of the developing taxonomy.
The relevance of HFDM was mentioned in Section 2.3.3.3
3.5.2.2 Risk Management Framework and Migration of Work Practice model, AcciMap and ActorMap
Rasmussen’s model (Rasmussen, 1997; cited in Salmon et al., 2011, pp. 3) deals with
accidents as failures in control loops. The model outlines a hierarchy of actors (e.g.,
individuals and organisations), from which interaction safety emerges. The model has been
applied in many safety-critical domains, such as public health (Woo and Vicente, 2003).
Figure 3-9 shows Rasmussen’s model together with an assessment of the applicability of the
model’s components to complement the Offshore Helicopter Transportation Industry’s
Taxonomy. The element ‘associations’ of Rasmussen’s model was incorporated into the
developing Offshore Helicopter Transportation Industry’s Taxonomy to account for the
influence that class associations (e.g., workers’ unions) have in rule-making and on work
conditions, with an associated impact on safety.
The AcciMap and ActorMap (Rasmussen and Svedung, 2000) are derived of Rasmussen’s
model and enable safety events to be analysed by mapping them onto a system’s model
structure (Hollnagel, 2012). Both the AcciMap and the ActorMap impose a structure onto the
socio-technical system associated with an accident, with indications of preconditions and the
functions of the different system levels involved (Rasmussen and Svedung, 2000).
103
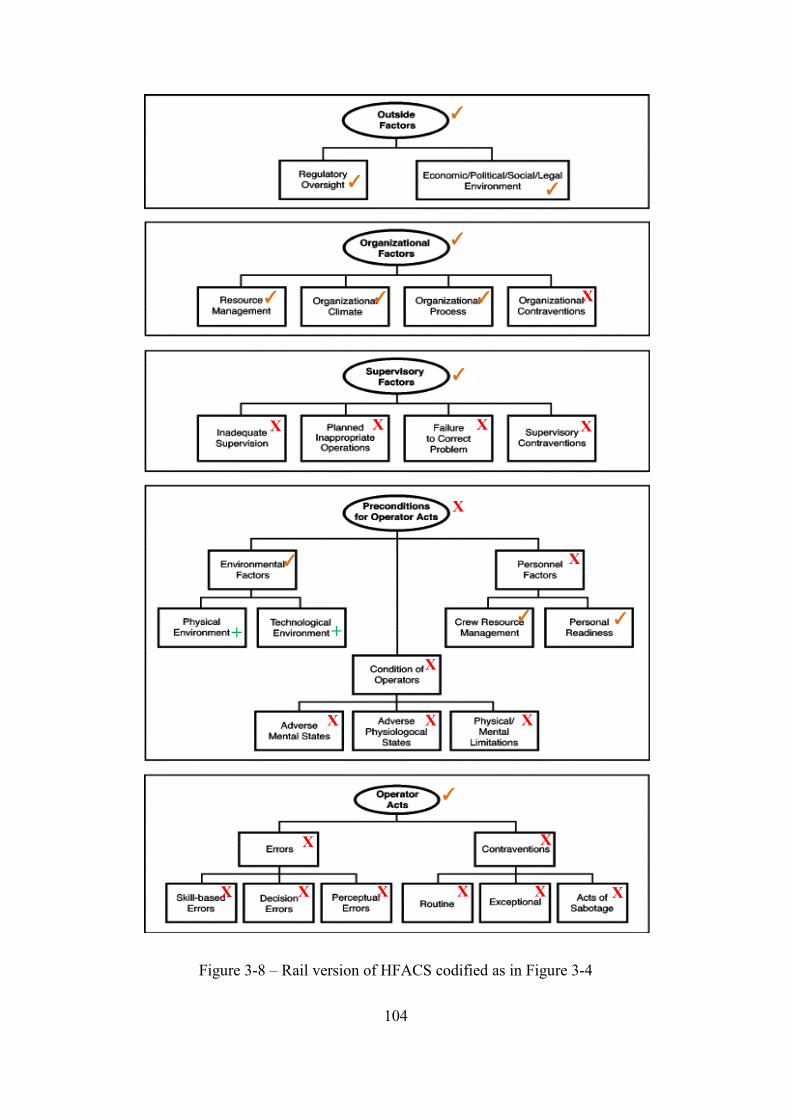
Figure 3-8 – Rail version of HFACS codified as in Figure 3-4
X X X X X X
X X
X X X
X
X
X X X X
X
✓ ✓
✓
✓
✓ ✓ ✓
✓
✓
✓
✓
+ +
✓
X
104
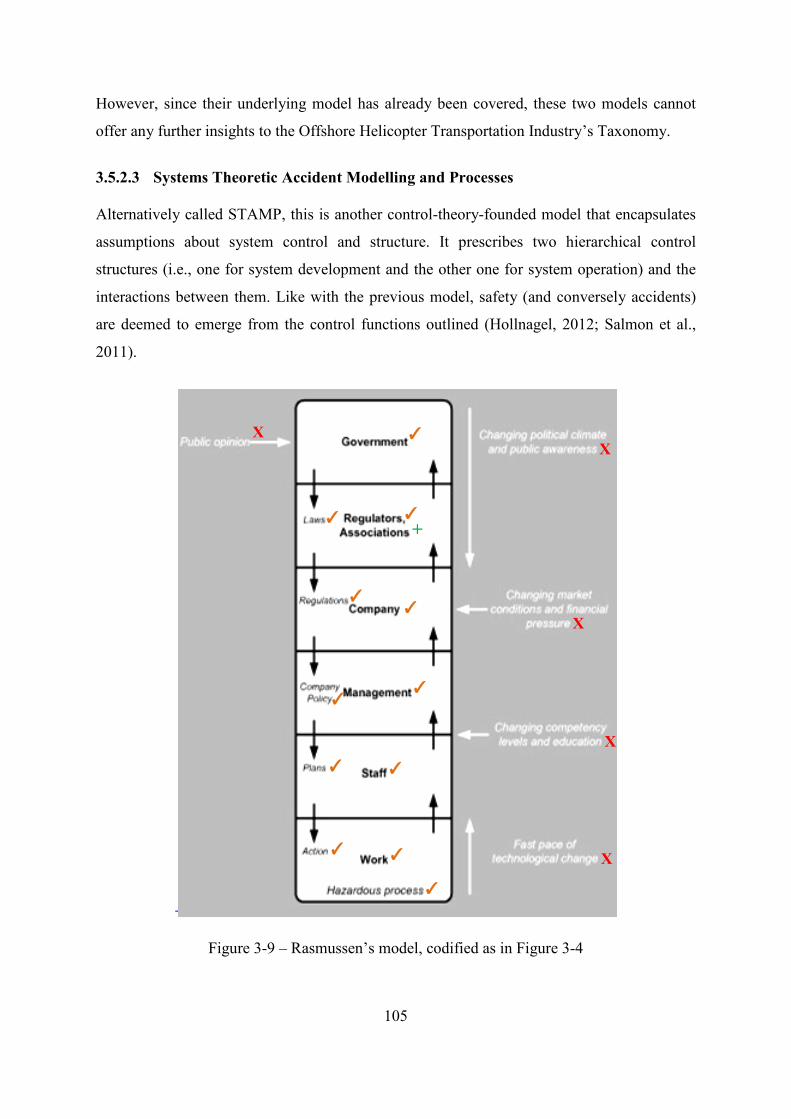
However, since their underlying model has already been covered, these two models cannot
offer any further insights to the Offshore Helicopter Transportation Industry’s Taxonomy.
3.5.2.3 Systems Theoretic Accident Modelling and Processes
Alternatively called STAMP, this is another control-theory-founded model that encapsulates
assumptions about system control and structure. It prescribes two hierarchical control
structures (i.e., one for system development and the other one for system operation) and the
interactions between them. Like with the previous model, safety (and conversely accidents)
are deemed to emerge from the control functions outlined (Hollnagel, 2012; Salmon et al.,
2011).
Figure 3-9 – Rasmussen’s model, codified as in Figure 3-4
✓
✓
✓
✓
✓
✓
✓
✓
✓
✓
✓
✓
X
X
X
X X
+
105
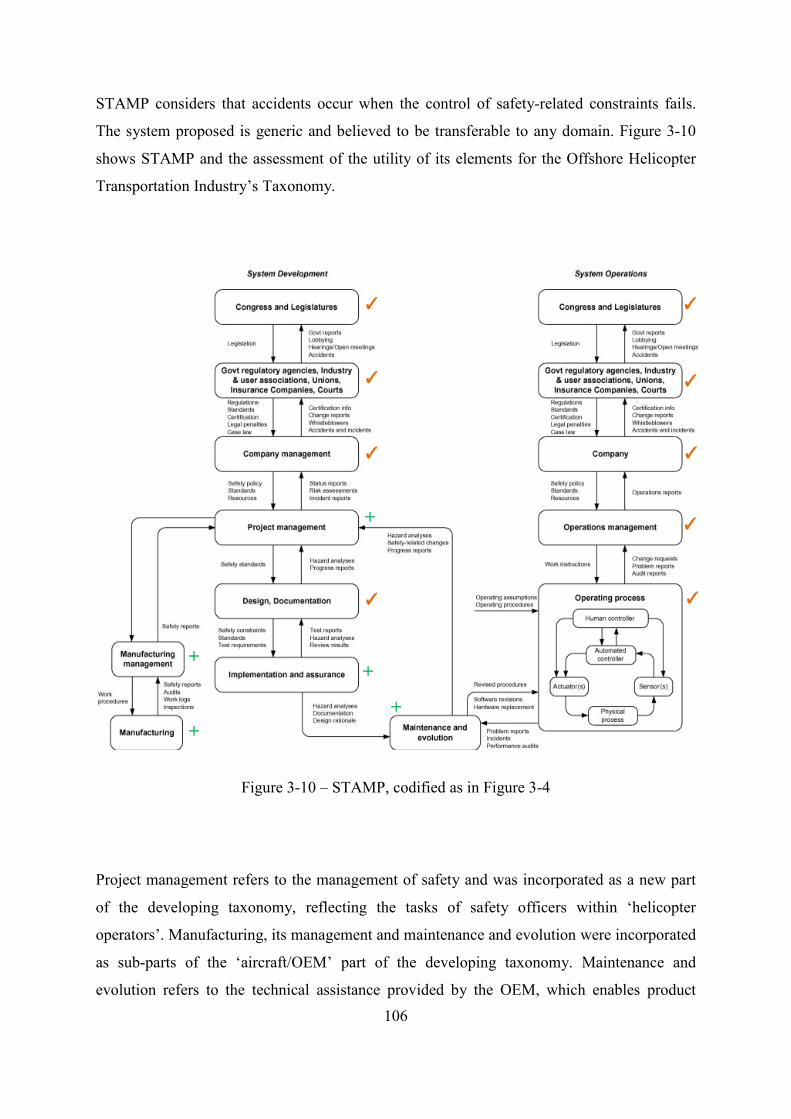
STAMP considers that accidents occur when the control of safety-related constraints fails.
The system proposed is generic and believed to be transferable to any domain. Figure 3-10
shows STAMP and the assessment of the utility of its elements for the Offshore Helicopter
Transportation Industry’s Taxonomy.
Figure 3-10 – STAMP, codified as in Figure 3-4
Project management refers to the management of safety and was incorporated as a new part
of the developing taxonomy, reflecting the tasks of safety officers within ‘helicopter
operators’. Manufacturing, its management and maintenance and evolution were incorporated
as sub-parts of the ‘aircraft/OEM’ part of the developing taxonomy. Maintenance and
evolution refers to the technical assistance provided by the OEM, which enables product
✓
✓
✓
✓
✓
✓
✓
✓
✓
+
+
+
+
+
106
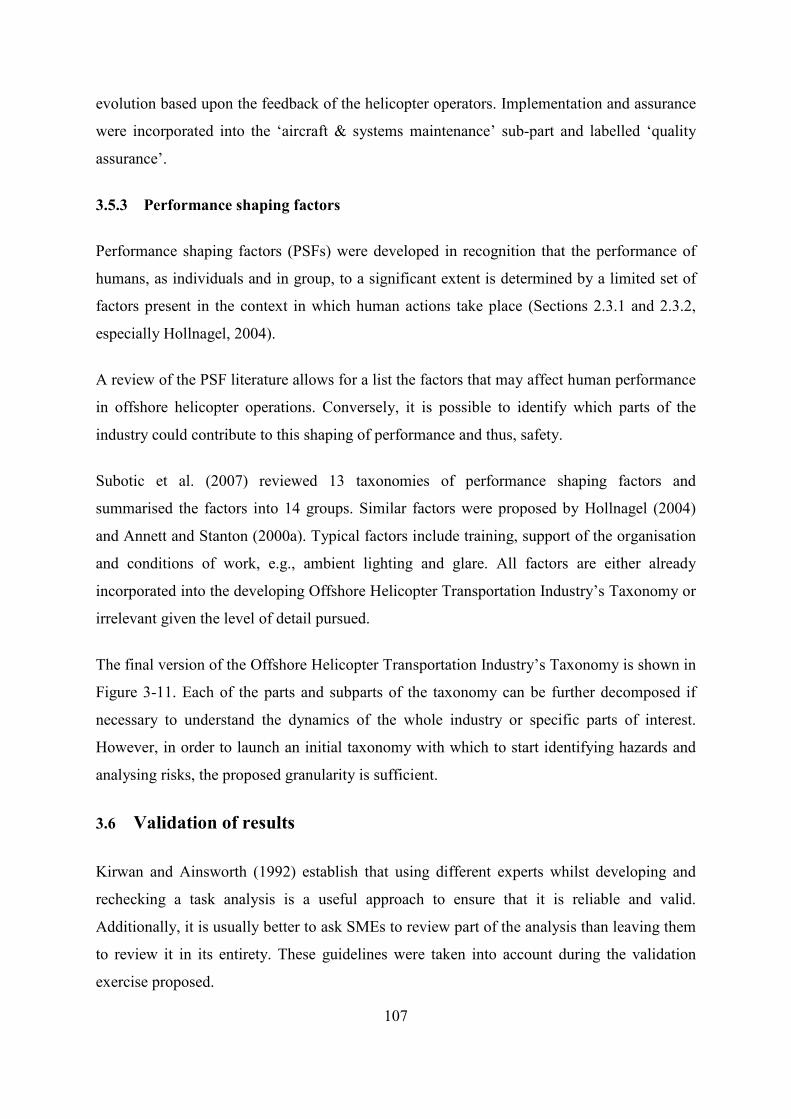
evolution based upon the feedback of the helicopter operators. Implementation and assurance
were incorporated into the ‘aircraft & systems maintenance’ sub-part and labelled ‘quality
assurance’.
3.5.3 Performance shaping factors
Performance shaping factors (PSFs) were developed in recognition that the performance of
humans, as individuals and in group, to a significant extent is determined by a limited set of
factors present in the context in which human actions take place (Sections 2.3.1 and 2.3.2,
especially Hollnagel, 2004).
A review of the PSF literature allows for a list the factors that may affect human performance
in offshore helicopter operations. Conversely, it is possible to identify which parts of the
industry could contribute to this shaping of performance and thus, safety.
Subotic et al. (2007) reviewed 13 taxonomies of performance shaping factors and
summarised the factors into 14 groups. Similar factors were proposed by Hollnagel (2004)
and Annett and Stanton (2000a). Typical factors include training, support of the organisation
and conditions of work, e.g., ambient lighting and glare. All factors are either already
incorporated into the developing Offshore Helicopter Transportation Industry’s Taxonomy or
irrelevant given the level of detail pursued.
The final version of the Offshore Helicopter Transportation Industry’s Taxonomy is shown in
Figure 3-11. Each of the parts and subparts of the taxonomy can be further decomposed if
necessary to understand the dynamics of the whole industry or specific parts of interest.
However, in order to launch an initial taxonomy with which to start identifying hazards and
analysing risks, the proposed granularity is sufficient.
3.6 Validation of results
Kirwan and Ainsworth (1992) establish that using different experts whilst developing and
rechecking a task analysis is a useful approach to ensure that it is reliable and valid.
Additionally, it is usually better to ask SMEs to review part of the analysis than leaving them
to review it in its entirety. These guidelines were taken into account during the validation
exercise proposed.
107
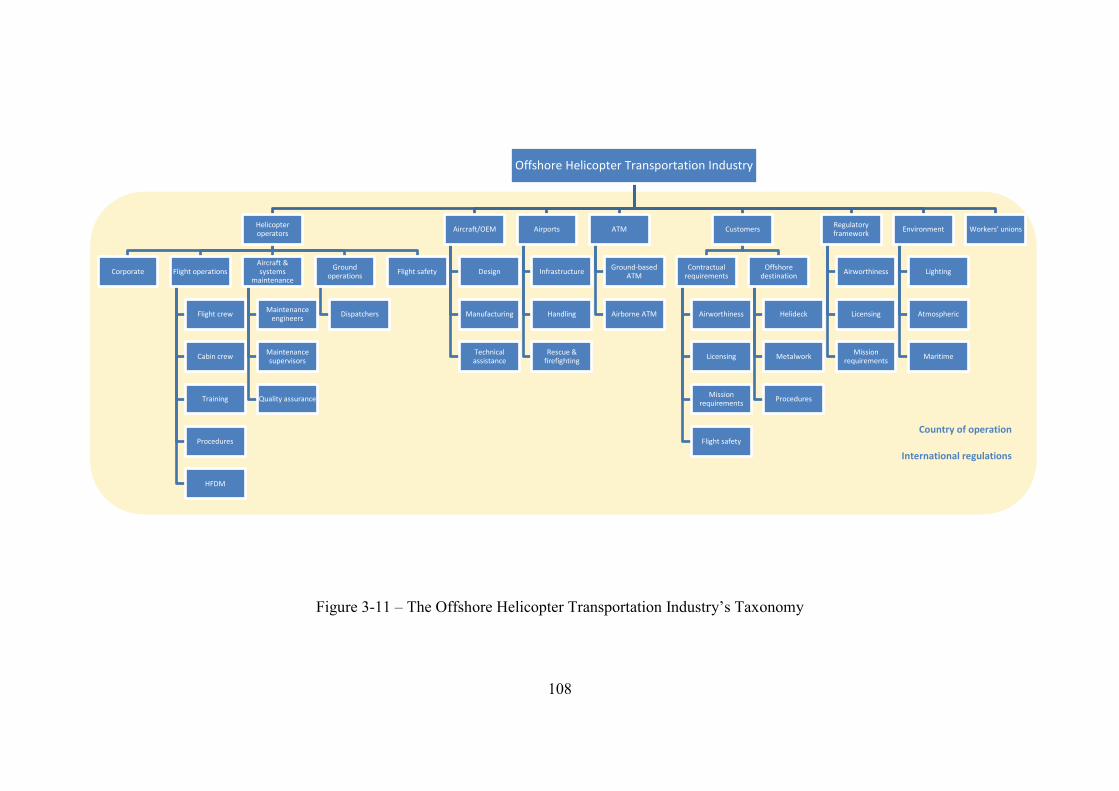
Country of operation
International regulations
Offshore Helicopter Transportation Industry
Helicopter operators
Corporate Flight operations
Flight crew
Cabin crew
Training
Procedures
HFDM
Aircraft & systems
maintenance
Maintenance engineers
Maintenance supervisors
Quality assurance
Ground operations
Dispatchers
Flight safety
Aircraft/OEM
Design
Manufacturing
Technical assistance
Airports
Infrastructure
Handling
Rescue & firefighting
ATM
Ground-based ATM
Airborne ATM
Customers
Contractual requirements
Airworthiness
Licensing
Mission requirements
Flight safety
Offshore destination
Helideck
Metalwork
Procedures
Regulatory framework
Airworthiness
Licensing
Mission requirements
Environment
Lighting
Atmospheric
Maritime
Workers' unions
Validation was achieved by observation and recording of the tasks undertaken by the pilots
during flight simulation training (see Section 3.3.4), followed by a replay of a sample of the
recordings to five senior offshore helicopter instructors and an open group discussion on the
correctness of the tasks captured by the researcher. 159 videos were recorded, corresponding
to various parts of the training of 16 pilots from three different companies and three
nationalities (i.e., British, Dutch and Brazilian), undertaken in three different helicopter types.
Each of the five senior helicopter instructors who assessed the tasks captured and reviewed
the sample of videos recorded had over 5,000 flying hours accrued in their careers and held
positions of leadership within their companies (e.g., chief pilot).
The flight instructors were asked to review the tasks captured during the task analysis
exercise for each phase proposed and use the video samples if needed to assure that there was
a common understanding about the phases of flight to be reviewed. A sample of 14 video
recordings was used, corresponding to the phases of flight of Figure 3-2, except for pre-flight,
taxi out and taxi in. The tasks of the pre-flight phase are only executable in the actual aircraft
and the other two phases are of lesser importance to offshore operations (see Tables 3-1 to 3-
8). The senior pilots agreed that the tasks captured in the task analysis reflected both real
flight experience and the dynamics of the simulator training exercises.
3.7 Conclusions
The previous chapter established the need of a holistic view of the safety-critical components
of the offshore helicopter industry to underpin hazard identification and risk analysis. This
gap was addressed in this chapter by the development and implementation of a process which
generated a customised taxonomy.
In order to ensure the necessary scientific rigour, the process and the taxonomy were subject
to peer-reviewing and a final validation exercise. With the assured validity, the Offshore
Helicopter Transportation Industry’s Taxonomy developed in this chapter provides the basis
for hazard identification and risk analysis in this thesis.
However, it is important to use the taxonomy flexibly and remain open to the need to update
it as more knowledge in the field is accrued, more data are collected and analysed, operations
change, or specific problems require that parts of the taxonomy are further developed and
109
understood. In all such cases, the taxonomy supports hazard identification and risk analysis
by anchoring the main concepts related to the operation of offshore helicopters.
Having defined the Offshore Helicopter Transportation Industry’s Taxonomy at a generic
level, the next step to support hazard identification and risk analysis in the nighttime is to
explore the industry’s failure modes through the analysis of accidents and update the
taxonomy on the basis of any relevant results. This is important since the previous chapter
has shown that the analyses of accidents in this domain are fraught with unreliable data and
executed too simplistically to be trustworthy.
In the next chapter, a process with which the lessons from accidents can be exploited in a
global scale is developed and implemented. This process enables further updates to the
industry’s taxonomy to be carried out and to improve the ability to identify hazards and
analyse risks in nighttime operations.
110
CHAPTER 4 ANALYSIS OF ACCIDENTS Chapter 3 redressed the lack of a frame of reference by developing a new taxonomy
encapsulating the safety-critical components of the offshore helicopter transportation
industry. This chapter builds on this to address yet another important weakness affecting
hazard identification and risk analysis of nighttime offshore helicopter operations: the lack of
an accident analysis process which supports the identification of systematic hazard trends and
patterns in the nighttime amongst the overall hazards of offshore helicopter operations. This
shortcoming is addressed in five sections. Section 4.1 reviews the accident analysis processes
used across the helicopter industry for their lessons and limitations. Section 4.2 builds on the
review to specify the architecture of the new process and its implementation is described in
Section 4.3. The results are presented and discussed in Section 4.4 and conclusions are drawn
in Section 4.5. The latter include recommendations for the continuous improvement of
accident data collection and analysis, which enhance hazard identification and risk analysis in
the industry, especially with respect to nighttime operations.
4.1 Status of helicopter accident analysis
Chapter 2 (Section 2.3.3.1) has shown that whereas the investigation of individual accidents
continues to be a cornerstone of hazard identification and risk analysis in the offshore
helicopter industry, statistical analysis of accident reports remains fundamentally flawed.
However, there are other processes in use in the helicopter industry in general which need to
be reviewed. In the helicopter industry in general, the methods for the statistical analysis of
accidents can be summarised in four groups: (i) operation-specific, (ii) adapted from fixed-
wing operations, (iii) based on non operation-related hazards and (iv) epidemiological
studies. Each of these suffers from significant weaknesses, which are recapitulated and
described in Sections 4.1.1 to 4.1.4, followed by a comment on data quality in Section 4.1.5.
4.1.1 Operation-specific methods
As discussed in Section 2.3.3.1.1.3, the existing mission-tailored process of the oil and gas
industry analyse incomplete datasets, focus on simple frequency counts and do not
adequately explore the statistical interactions between hazards. Additionally, such analyses
can be criticised for a lack of theoretical underpinning with respect to accident data sampling,
111
e.g., by using data of opportunity with low validity at present, which compromises data
timeliness (OGP, 2012b; HSAC, 2000; OGP, 1999; Doty, 2010; Herrera et al., 2010a; Ross
and Gibb, 2008).
4.1.2 Methods adapted from fixed-wing operations
As discussed in Sections 2.3.3.1.1.1, 2.3.3.1.1.2 and 2.3.3.1.1.4, these methods have the
weakness of constraining analysis per annual periods, with the associated reduction in the
number of accidents available for analysis and the production of only qualitative descriptions.
Furthermore, these methods introduce significant biases in the results due to the inadequacy
of the taxonomies employed, which require the application of complimentary human factors
taxonomies (EHEST, 2010; Howson, 2012; Canadian Joint Helicopter Safety Analysis Team,
2011).
4.1.3 Methods based on non operation-related risk factors
These methods ignore the operation-specific nature of hazards described in Section 2.2.2 and
focus on features across many operation types (e.g., analysis per helicopter category).
Therefore, these methods are only able to provide conclusions with respect to hazards at a
high level. Furthermore, information on the level of the activity is usually missing, preventing
the understanding of accidents with respect to the size of operations through the calculation
of accident rates (Minter and Irving, 1996; Majumdar et al., 2009b; Morley and MacDonald,
2005; Fox, 2002; Harris, 2006b; Harris et al., 2000; EASA, 2013b).
4.1.4 Epidemiological studies
Even though such studies are usually rigorous and typically employ some sort of statistical
analysis to identify systematic hazard trends, patterns and high risk scenarios, they focus on
the risk of fatality or injury to helicopter occupants instead of the risk of an accident per se.
Additionally, they typically analyse data of opportunity instead of data collected through
designed processes aimed at assuring statistical utility and addressing theoretical
considerations such as data timeliness (e.g., Mapes, 2010; Chalmers et al., 2000; O'Hare et
al., 2003; Li and Baker, 1993, 1999; Krebs et al., 1995; Conroy et al., 1992).
112
4.1.5 Data quality
A common drawback of all these methods is the low quality of accident data used, which
further limits statistical analysis. Only recently has the importance of data quality been
formally acknowledged in safety for aviation (ICAO, 2012c). This directly contrasts with the
high importance given to data quality in other critical industries (e.g., banking and consumer
goods manufacturing, see Lee et al., 2002; Pipino et al., 2002), which have for decades
viewed quality data as fundamental enablers of sound decisions.
Generating quality data is, therefore, essential to hazard identification and risk analysis. This
involves the identification of relevant data quality dimensions, such as believability (i.e., the
extent to which the data is regarded as true and credible, Pipino et al., 2002), completeness,
timeliness and value-added, and the development of metrics with which to evaluate such
dimensions (e.g., simple ratio, minimum and maximum operators, weighted averages).
Exhaustive lists of quality dimensions and metrics can be found in Lee et al. (2006, 2002),
Pipino et al. (2002), Wand and Wang (1996), Lee and Strong (2003), Wang and Strong
(1996), Levitin and Redman (1995) and are not further discussed in this thesis. However, the
data quality dimensions most critically affected in previous helicopter accident analyses are
discussed below. These dimensions are timeliness, scope, completeness and appropriate
amount.
Timeliness has been affected by excessively large analysis timeframes which identified risk
factors of low relevance to current operations (Harris, 2006b; Harris et al., 2000). Data scope
has been affected by the use of inconsistent terminological definitions which led to the
incomplete sampling of accidents (see Section 2.3.3.1.1.3, especially Williams, 2012).
Completeness has been compromised by a lack of accident data from helicopters which were
not recovered from the bottom of the ocean and partial investigations resulting from a lack of
sufficient resources to the original investigators (Conroy et al., 1992; Krebs et al., 1995;
O'Hare et al., 2003; U.S.JHSAT, 2010; Taneja and Wiegmann, 2003). Finally, the collection
of an appropriate amount of data has been affected by sampling strategies constrained by
political jurisdictions (U.S. Joint Helicopter Safety Analysis Team, 2011b, a; Camargo, 2009;
Majumdar et al., 2009a; Herrera et al., 2010a; Hokstad et al., 1999; Oil & Gas UK, 2007,
2011; HSE, 2003b; CAA, 2007, 2010c; Vinnem, 2011, 2008; Brooks et al., 2008; Barnett,
2009a; Morrison, 2001; EHEST, 2010).
113
Despite these limitations, current methods have been useful in identifying a number of critical
hazards and risks in offshore helicopter operations, which help understanding the issues of
the nighttime in the broader context. The main hazards and risk in offshore helicopter
operations are currently reckoned as the nighttime itself, instrument meteorological
conditions (IMC), arrival segments, operations in developing countries and the use of single
engine aircraft (Doty, 2010; Ross and Gibb, 2008; HSAC, 2000; OGP, 1999, 2012b; Harris,
2006b; Harris et al., 2000; Williams, 2012). However, as mentioned before, this initial set of
potentially critical areas needs validation.
In order to identify systematic hazard trends and patterns in nighttime offshore helicopter
operations, a robust analysis process is required. The next section proposes this new process
that accounts for the weaknesses identified above and, by analysing the complete set of
hazards in all lighting conditions, enables the identification of the issues which are specific to
the nighttime. The results obtained from the implementation of the process are compared to
the known risks and discussed with experts to ensure validity.
4.2 Process development
Figure 4-1 captures the architecture of the new process. Initially, the selection of an
appropriate timeframe for the analysis is required, addressing the issues of poor data
timeliness. This is followed by the precise definition of terms which ensures the appropriate
data scope, the identification of relevant countries and the collection of operational and
accident data independently, both of which address the requirement of an appropriate amount
of data. The collection of accident data involves the identification of accident data sources,
identification of appropriate variables for accident analysis (e.g., lighting conditions which
enable any systematic hazard trends and patterns of the nighttime to be identified),
development of an accident cause classification scheme, extraction of information regarding
the statuses of the appropriate variables and the assessment of data completeness. The
collection of operational data involves the identification of sources of variables useful for the
calculation of accident rates (i.e., the denominator which represents the size of operations),
choice of appropriate variables for the calculation of accident rates, extraction of information
regarding the statuses of such variables and a check for operational data completeness. With
both the information on the size of the operation and the accidents, accident rates are
calculated (this is further explained in Section 4.2.6). Finally, a three-fold statistical analysis 114
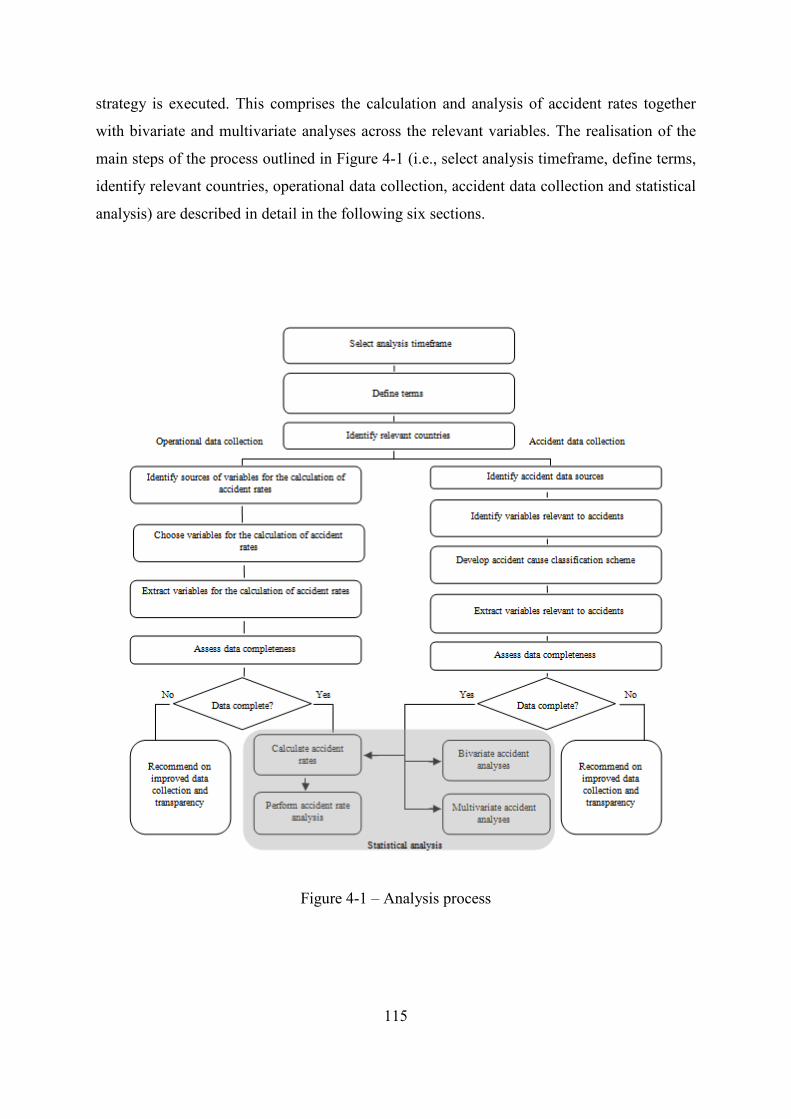
strategy is executed. This comprises the calculation and analysis of accident rates together
with bivariate and multivariate analyses across the relevant variables. The realisation of the
main steps of the process outlined in Figure 4-1 (i.e., select analysis timeframe, define terms,
identify relevant countries, operational data collection, accident data collection and statistical
analysis) are described in detail in the following six sections.
Figure 4-1 – Analysis process
115
4.2.1 Timeframe selection
In order to ensure relevance to current operations (i.e., data timeliness), the timeframe
selected should be representative of both the technologies and operating conditions (e.g.,
helicopter types used and platform designs). Selection should be underpinned by consultation
of summaries of helicopter activity issued by institutions of international reach, e.g., OGP
(2012b), national aviation authorities of countries that perform offshore helicopter operations
and helicopter accident studies (e.g., EHEST, 2010).
4.2.2 Definition of terms
This assures the comparability of data issued by different sources (i.e., adequate data scope)
and includes definitions at a high level where needed, for example, for the terms ‘offshore’
and ‘accident’ (see Sections 2.1 and 2.3.3.1.1.3).
4.2.3 Identification of relevant countries
Chapter 2 has shown that Annex 13 of the Convention on International Civil Aviation
requires national authorities to be responsible for accident investigations (ICAO, 2010e).
Therefore, it is at a country level that accident reports are issued and the analysis of offshore
helicopter accidents requires the identification of the countries where this operation is known
or expected to have occurred. This ensures that data will be collected to an appropriate
amount. The sources mentioned in Section 4.2.1 and the literature (e.g., Section 4.1) should
be used for country identification.
4.2.4 Operational data collection
As explained in Sections 4.2 and 4.2.4, operational data refers to data useful for the
calculation of accident rates. This is an important step since the calculation of accident rates
is often impaired in the offshore helicopter industry due to low quality data (Vinnem et al.,
2006). Therefore, the sources of such data should be identified (see Sections 4.2 and 4.2.4)
and the variables to be used for the calculation of accident rates selected. For example,
although flying hours typically estimate time at risk, other metrics reflect alternative risk
perspectives, e.g., cycles of take-off and landing (Oil & Gas UK, 2011), number of
passengers and occupants carried (OGP, 2012b), distance travelled, helicopter fleet size
116
(Harris, 2006b) and combinations of these variables (Oil & Gas UK, 2011). Data
completeness checks are required to assess the quality of such data and to make
recommendations for improved data collection and dissemination where needed. Simple ratio
completeness check might be executed by calculating the ratio between the cases in which the
events of a variable are known over the overall number of cases. This ensures that only data
which are complete to an arbitrary acceptable amount are analysed.
4.2.5 Accident data collection
The reports issued by national accident investigation authorities might be complemented by
those published by unofficial sources (e.g., those mentioned in Sections 4.2 and 4.2.3),
especially where national accident investigation authorities are not transparent. From such
sources and the literature, variables of potential relevance to accidents (i.e., hazards, e.g.,
phases of flight) are identified and a bespoke cause classification scheme developed. This
might start from existing mature classification schemes (e.g., that of the OGP, see Section
2.3.3.1.1.3), which can be adapted as necessary to capture the finest possible level of detail
with respect to the hazards associated with the occurrences. However, given the potentially
different accident models and investigation stopping rules employed by the original accident
investigators, varying levels of detail might be reported, which may prevent causal analysis at
the desired level of detail (for extensive discussions on the subjective nature of accident cause
attribution, accident investigation, and the impacts of accident models on the findings of
accident investigations, see Appendix 1 and Hollnagel, 2012, 2009; 2008, 2004; Lundberg et
al., 2009; Saleh et al., 2010). Following data extraction, completeness checks are applied as
mentioned in the previous section.
4.2.6 Statistical analysis
In order to identify systematic hazard trends and patterns, understand complex relationships
and make inferences and predictions related to accidents, rigorous statistical analysis is
required. A three-fold analysis plan is desirable as this enables the examination of accident
characteristics from different and complementary viewpoints. The analysis plan comprises of
the calculation and analysis of accident rates, bivariate and multivariate analyses.
The calculation of accident rates is undertaken by simple ratio, where the numerator is the
number of accidents with specific characteristics (e.g., cause and lighting condition) in a 117
given year and region and the denominator is the value of the associated operational variable
selected for the calculation of accident rates (e.g., flying hours in the year, region and lighting
condition considered; see Section 4.2.4). A bivariate analysis follows the analysis of accident
rates to validate the results, to investigate the variables for which accident rates are
unavailable or inapplicable and to cover any gaps caused by suboptimal data quality.
Subsequently, a multivariate analysis identifies the multi-way interactions among variables
and generates predictions based on past accident data in line with the pursuit of predictive
safety (see Section 2.3.3.3). The tests to be applied depend on the characteristics and
distributions of the data, as well as on assumptions about data representativeness. These are
presented during the implementation of the process in the next section.
4.3 Process implementation
The implementation of the process developed in Section 4.2 is described in Sections 4.3.1 to
4.3.8.
4.3.1 Timeframe selection
The UK CAA understands that the 20 years prior to 2013 are representative of current
operations in the North Sea (Howson, 2013). In the context of occupational safety, Kjellén
(2000) recommends that a five-year period is used. Considering primarily the types of
helicopter used and platform/boat technologies, worldwide offshore helicopter operations
between 1997 and 2011 were considered to fulfil the conditions outlined in Section 4.2.1 (Oil
& Gas UK, 2011; OGP, 2012b).
4.3.2 Definition of terms
Section 2.3.3.1.1.3 identified that the accident statistics of offshore helicopter operations are
frequently understated because certain catastrophic types of occurrences, such as survivable
ditchings, as not classified as ‘accidents’ in the USA (Williams, 2012). This is possible
because the ICAO definition of accident (presented in Section 2.2.3) requires that at least one
person is in the aircraft with the intention of flight when (i) a fatality or serious injury occurs,
(ii) the aircraft sustains substantial damage or structural failure, or (iii) the aircraft is missed
or made inaccessible. Therefore, the case of a survivable ditching followed by successful
118
occupant evacuation and destruction of the helicopter by wave impact, inversion, immersion,
or sinking can still be classified as an incident.
The ICAO definition of accident fails to consider that an aircraft destroyed by the hostile
environment (e.g., the rough sea), when the contact with the hostile environment is associated
with the operation of the aircraft, is a serious occurrence which requires causal investigation
commensurate with the title of accident (for further discussion, see Appendix 1). The need to
account for the impact of hostile environments in the safety of helicopter operations has been
consistently mentioned in the literature (e.g., O’Collard, 2010; Couch and Lindell, 2010;
EHEST, 2010; O'Hare et al., 2006; 2003) and has led to on-going revisions of regulations
(e.g., EASA, 2012; TSB Canada, 2011). Most countries acknowledge this and consider any
ditching as an accident. For example, two controlled precautionary landings recently
occurred, in which there were no victims, were classified as accidents in the UK (AAIB,
2012a, b).
To overcome this issue, the ICAO definition of accident is refined as follows:
‘An accident is an occurrence associated with the operation of an aircraft which takes
place between the time any person boards the aircraft with the intention of flight until such
time as all such persons have disembarked, (a) in which a person is fatally or seriously
injured as a result of: being in the aircraft; or direct contact with any part of the aircraft;
or direct exposure to jet blast; or (b) as a consequence of which, at any time until
recovery, the aircraft sustains damage or structural failure which: adversely affects the
structural strength, performance or flight characteristics of the aircraft and would
normally require major repair or replacement of the affected component; or (c) in which
the aircraft is missing or is completely inaccessible.’
4.3.3 Identification of relevant countries
A total of 50 countries were identified from summaries of petroleum activity (e.g., BP, 2010;
Kaiser, 2007; Williams, 2000) and the helicopter safety analyses mentioned in Section 4.1.
Appendix 5 presents the complete list of countries identified.
119
4.3.4 Operational data collection
Public domain data to support the calculation of accident rates were complete only for flight
hours between 1997 and 2009 (HSAC, 2000; OGP, 1999, 2012b; Doty, 2010). These hours
were discriminated by the OGP regions of operation, which are introduced and further
detailed in Sections 4.3.4.1 and 4.3.6.1, respectively. In order to enable the analysis of
accident rates per lighting condition (i.e., daytime and nighttime), a procedure was
established to calculate the available nighttime (and, conversely, daylight) hours throughout
the year in regions of different latitudes. This is described in the next section.
4.3.4.1 Procedure to estimate flight hours per lighting condition
At present, nighttime offshore helicopter flights occur in two basic conditions: (i) the regular
ferrying of passengers at high latitude locations; and (ii) anywhere in the world in attendance
to emergencies, especially medical evacuations (i.e., ‘medvac’) from offshore installations.
Amongst the high latitude locations where offshore helicopter flights take place, the North
Sea concentrates the greatest volume of operations. In this area, operations are of such
intensity that the daily flight schedule usually cannot be accommodated into the short
daylight hours available in the winter. In the other high latitude locations, e.g., southern
Argentina, the passenger ferrying flights are considerably fewer compared to the North Sea.
This is because any flight tends to be fitted into the available daylight hours in these regions,
even in winter time20. Therefore, this section assumes that nighttime operations for regular
passenger ferrying purposes only occur in the North Sea.
This section uses as basis the 3% worldwide nighttime flight hour proportion mentioned in
Section 2.1 and adjusts the value regionally on the basis of astronomical calculations of the
length of the day throughout the year and assumptions about medvac missions in the North
Sea. This enables to derive the proportion of flight hours for the following three generic
regions: North Sea, Gulf of Mexico and ‘other regions’. These are the main areas of offshore
helicopter operations according to the OGP (discussed in Section 4.3.6.1). Sections 4.3.4.1.1
20 Private communication on the 10 January, 2011, with Captain Guillermo Bolibar, Flight Safety Officer for Helicópteros Marinos (Argentina).
120
to 4.3.4.1.4 describe how the nighttime flying hours of the North Sea were estimated and
validated. Section 4.3.4.1.5 describes the estimation of the nighttime flying hours for the Gulf
of Mexico and ‘other regions’.
4.3.4.1.1 Nighttime flying hours in North Sea regular passenger ferrying missions
Nascimento (2009) found that the flight schedule of British offshore helicopter operations is
typically contained within the hours between 06:00 and 18:00 throughout the year. Assuming
this is generally true, the periods of nighttime flying were determined by calculating the civil
twilights for all days of the year using the astronomical almanac (USNO, 2012) and
subtracting from the beginning and end hours of the flight schedule when there was an
overlap. Figure 4-2 illustrates the daylight cycles for key days of the year at the latitude of
Aberdeen in 2010. This city was chosen as representative of the North Sea because it is its
main base for operations (CAA, 2014), concentrating over 60% of the total hours flown
offshore in the UK sector of the North Sea (Oil & Gas UK, 2011). In Figure 4-2, the shaded
and blue areas represent the hours of darkness and the typical flying schedule, respectively.
The calculations revealed that, approximately 8% of the passenger ferrying flights out of
Aberdeen are typically undertaken during the nighttime. This was assumed as a fair
representation of the passenger ferrying nighttime flying hours in the whole North Sea.
4.3.4.1.2 Nighttime flying hours in North Sea medvac missions
The British and Norwegian North Sea scenarios are fairly similar, for example with respect to
the regulatory framework and platform structures (HSE, 2003a). Therefore, since data on
medvac missions in the UK were not publicly available, data related to operations in Norway
were used for the estimation of nighttime medvac flying hours.
Although medvac flights are stochastic in nature, the average number of such missions,
observed for the 5-year period between 2003 and 2007 (Vinnem, 2011) was used as
representative of the North Sea. The percentage of medvac flight hours was calculated in
relation to the overall flight hours of the Norwegian sector (available from Herrera et al.,
2010a) during the same period. The assumption behind this calculation is that passenger
ferrying and medvac flight hours are intrinsically correlated. This is because they are both, to
some extent, determined by the size of the offshore population.
121
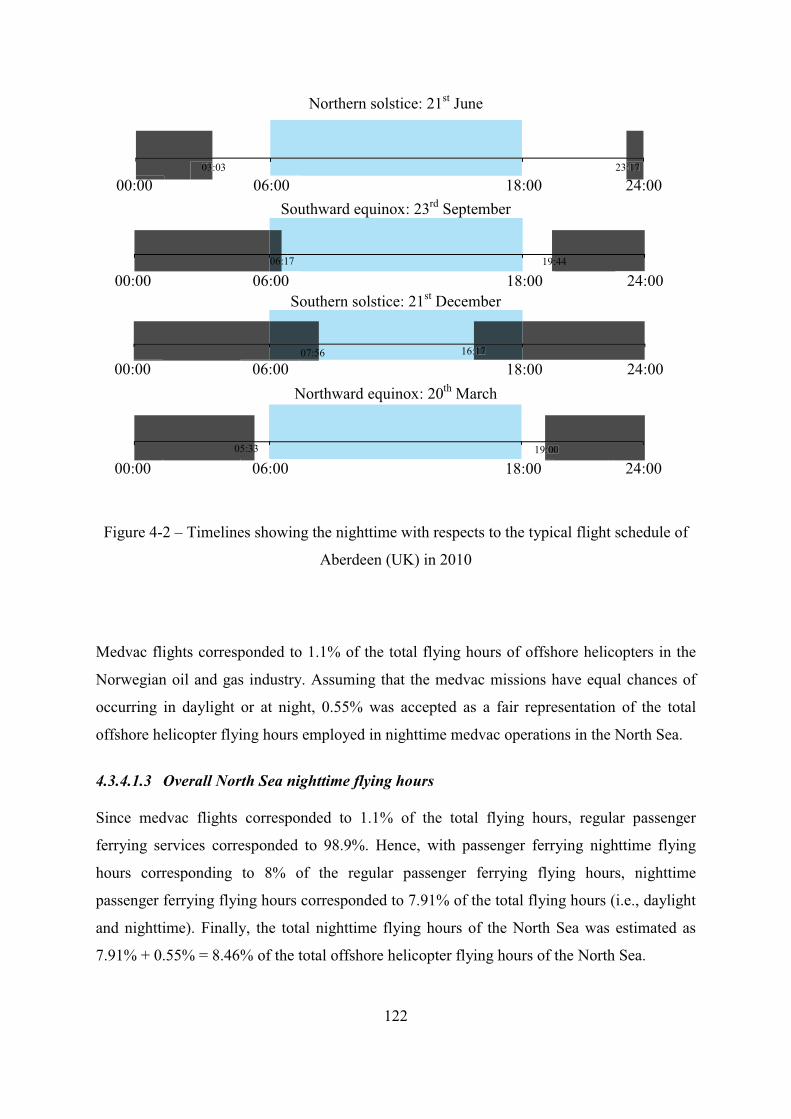
4.3.4.1.4 Confirmatory interviews with experts in the North Sea
The assumptions aforementioned were discussed with four safety experts: a safety research
manager of the UK CAA, the Chief Operating Officer (COO) of a Norwegian offshore
helicopter operator, the flight safety officer of a UK offshore helicopter operator and a former
flight operations inspector of the UK CAA. The safety experts agreed that the assumptions
were realistic.
Additionally, the nighttime flying hours and volume of nighttime medvac missions estimated
were checked against the flying hours and missions logged by four experienced pilots based
in the UK and Norway (two pilots from each place). It was concluded that the proportion of
nighttime flying hours calculated and the volume of nighttime medvac missions actually
undertaken generally reflected the overall experience of the experienced pilots.
4.3.4.1.5 Worldwide nighttime flying hours
Having calculated the nighttime flying hours in the North Sea, the remainder of the
worldwide nighttime flying hours were split between the remaining flying regions (i.e., Gulf
of Mexico and ‘other regions’) in proportion to the total flying hours in each region
(described in Section 4.3.6.1).
The end product of the whole Section 4.3.4.1 was the estimation of the hours flown by
offshore helicopters in each year of the 1997-2009 period, further discriminated by four
regions of operations (i.e., Gulf of Mexico, North Sea, ‘other regions’ and worldwide, which
is the sum of all regions), each of which subsequently broken down by three possible lighting
conditions (i.e., daytime, nighttime and whole day, which is the sum of both lighting
conditions).
4.3.5 Accident data collection – sources and sampling strategy
Accident information was sought from the reports issued by the official accident investigation
authorities of the 50 relevant countries listed in Appendix 5. Of these, 46 target databases
were available online. The accident information gathered was cross-checked against the
analyses outlined in Section 4.1, to ensure information consistency. This was especially
relevant for developing countries, where accident information was found to be shared
inconsistently (Oil & Gas UK, 2011).
123
Given the adopted definition of an accident and its potential confusion with incidents/serious
incidents amongst the various countries of interest, additional revision of the reported
incidents/serious incidents was required. All the incidents/serious incidents available from the
46 databases were checked, as well as those reported to the USA’s Accident/Incident Data
System (AIDS, FAA, 2012a), Canadian Civil Aviation Daily Occurrence Reporting System
(CADORS; Transport Canada, 2012), British Mandatory Occurrence Reporting (MOR)
scheme and Australian Transportation Safety Bureau (ATSB). The search words of Baker et
al. (2011) were used, complemented by ‘ditching’, ‘water landing’, ‘oil’, ‘gas’ and ‘ship’.
This led to the incorporation of 16 catastrophic ditching ‘incidents’ into the ‘accident’
dataset, all in the USA. The destruction of such helicopters was confirmed by checking the
FAA aircraft registry (FAA, 2012b).
Further searches were conducted using websites specialised in the sharing of aircraft-related
information (i.e., Flight Safety Foundation, 2012; Helihub, 2012; FlightSafe Consultants
Limited, 2012; Spender, 2012; Lippl, 2012; Dutch Aviation Society, 2009). To minimise
uncertainties, only accidents that matched the definition adopted and reported by at least two
independent sources were included. Finally, the non-specialised press was checked for non-
technical information, e.g., if the accident occurred at night.
4.3.6 Identification of variables relevant to accidents and data completeness
A total of 142 variables of potential relevance to accidents were identified. Of these, 63
variables covered the demographic characteristics of each pilot and 16 described the
operating environment. In order to minimise errors in the statistical analysis, the simple ratio
threshold for data completeness (see Section 4.2.4) was established at 90% (worldwide and
across each of the three OGP regions described in the next section). Tables 4-1 and 4-2 show
the demographic and operating scenario variables, respectively, with the results of the
completeness tests.
Given this threshold, the six variables included in the analyses, out of the 142 presented in
Tables 4-1 and 4-2, are outlined below.
124
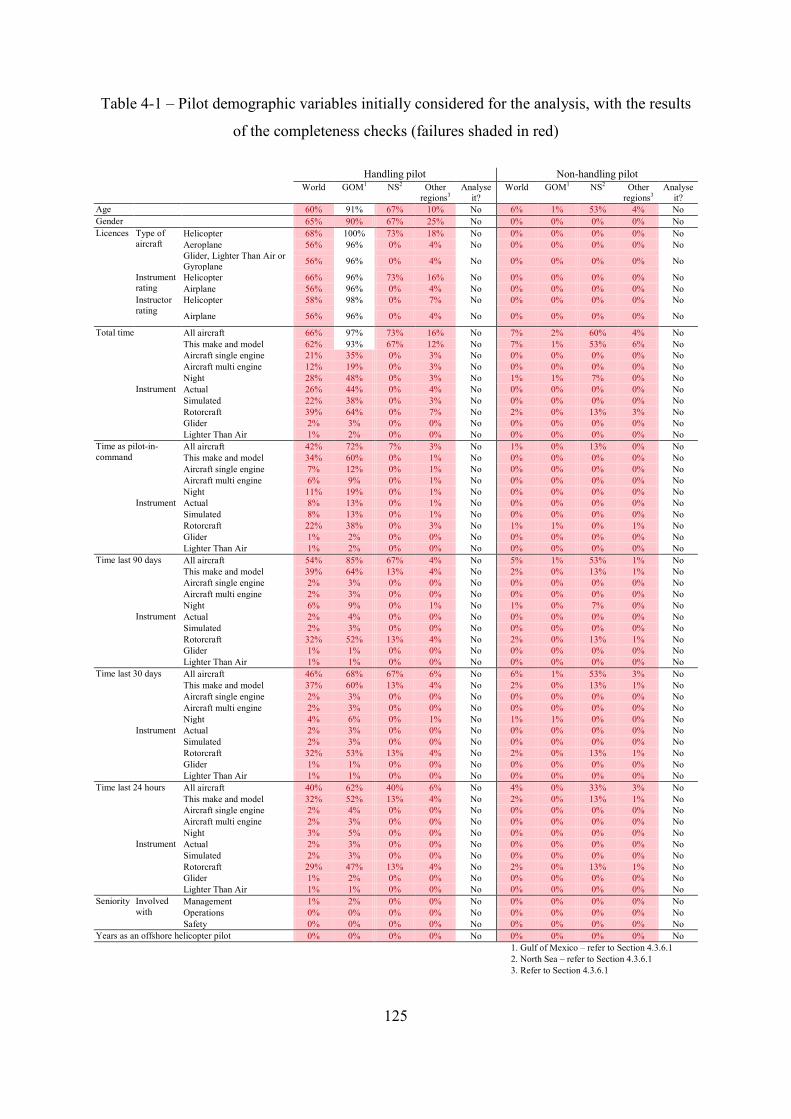
Table 4-1 – Pilot demographic variables initially considered for the analysis, with the results
of the completeness checks (failures shaded in red)
Handling pilot Non-handling pilot World GOM1 NS2 Other
regions3 Analyse
it? World GOM1 NS2 Other
regions3 Analyse
it? Age 60% 91% 67% 10% No 6% 1% 53% 4% No Gender 65% 90% 67% 25% No 0% 0% 0% 0% No Licences Type of
aircraft Helicopter 68% 100% 73% 18% No 0% 0% 0% 0% No
Aeroplane 56% 96% 0% 4% No 0% 0% 0% 0% No Glider, Lighter Than Air or
Gyroplane 56% 96% 0% 4% No 0% 0% 0% 0% No
Instrument rating
Helicopter 66% 96% 73% 16% No 0% 0% 0% 0% No Airplane 56% 96% 0% 4% No 0% 0% 0% 0% No Instructor
rating
Helicopter 58% 98% 0% 7% No 0% 0% 0% 0% No Airplane 56% 96% 0% 4% No 0% 0% 0% 0% No
Total time All aircraft 66% 97% 73% 16% No 7% 2% 60% 4% No This make and model 62% 93% 67% 12% No 7% 1% 53% 6% No Aircraft single engine 21% 35% 0% 3% No 0% 0% 0% 0% No Aircraft multi engine 12% 19% 0% 3% No 0% 0% 0% 0% No Night 28% 48% 0% 3% No 1% 1% 7% 0% No Instrument Actual 26% 44% 0% 4% No 0% 0% 0% 0% No Simulated 22% 38% 0% 3% No 0% 0% 0% 0% No Rotorcraft 39% 64% 0% 7% No 2% 0% 13% 3% No Glider 2% 3% 0% 0% No 0% 0% 0% 0% No Lighter Than Air 1% 2% 0% 0% No 0% 0% 0% 0% No Time as pilot-in-command
All aircraft 42% 72% 7% 3% No 1% 0% 13% 0% No This make and model 34% 60% 0% 1% No 0% 0% 0% 0% No Aircraft single engine 7% 12% 0% 1% No 0% 0% 0% 0% No
Aircraft multi engine 6% 9% 0% 1% No 0% 0% 0% 0% No Night 11% 19% 0% 1% No 0% 0% 0% 0% No Instrument Actual 8% 13% 0% 1% No 0% 0% 0% 0% No Simulated 8% 13% 0% 1% No 0% 0% 0% 0% No Rotorcraft 22% 38% 0% 3% No 1% 1% 0% 1% No Glider 1% 2% 0% 0% No 0% 0% 0% 0% No Lighter Than Air 1% 2% 0% 0% No 0% 0% 0% 0% No Time last 90 days All aircraft 54% 85% 67% 4% No 5% 1% 53% 1% No This make and model 39% 64% 13% 4% No 2% 0% 13% 1% No Aircraft single engine 2% 3% 0% 0% No 0% 0% 0% 0% No Aircraft multi engine 2% 3% 0% 0% No 0% 0% 0% 0% No Night 6% 9% 0% 1% No 1% 0% 7% 0% No Instrument Actual 2% 4% 0% 0% No 0% 0% 0% 0% No Simulated 2% 3% 0% 0% No 0% 0% 0% 0% No Rotorcraft 32% 52% 13% 4% No 2% 0% 13% 1% No Glider 1% 1% 0% 0% No 0% 0% 0% 0% No Lighter Than Air 1% 1% 0% 0% No 0% 0% 0% 0% No Time last 30 days All aircraft 46% 68% 67% 6% No 6% 1% 53% 3% No This make and model 37% 60% 13% 4% No 2% 0% 13% 1% No Aircraft single engine 2% 3% 0% 0% No 0% 0% 0% 0% No Aircraft multi engine 2% 3% 0% 0% No 0% 0% 0% 0% No Night 4% 6% 0% 1% No 1% 1% 0% 0% No Instrument Actual 2% 3% 0% 0% No 0% 0% 0% 0% No Simulated 2% 3% 0% 0% No 0% 0% 0% 0% No Rotorcraft 32% 53% 13% 4% No 2% 0% 13% 1% No Glider 1% 1% 0% 0% No 0% 0% 0% 0% No Lighter Than Air 1% 1% 0% 0% No 0% 0% 0% 0% No Time last 24 hours All aircraft 40% 62% 40% 6% No 4% 0% 33% 3% No This make and model 32% 52% 13% 4% No 2% 0% 13% 1% No Aircraft single engine 2% 4% 0% 0% No 0% 0% 0% 0% No Aircraft multi engine 2% 3% 0% 0% No 0% 0% 0% 0% No Night 3% 5% 0% 0% No 0% 0% 0% 0% No Instrument Actual 2% 3% 0% 0% No 0% 0% 0% 0% No Simulated 2% 3% 0% 0% No 0% 0% 0% 0% No Rotorcraft 29% 47% 13% 4% No 2% 0% 13% 1% No Glider 1% 2% 0% 0% No 0% 0% 0% 0% No Lighter Than Air 1% 1% 0% 0% No 0% 0% 0% 0% No Seniority Involved
with
Management 1% 2% 0% 0% No 0% 0% 0% 0% No Operations 0% 0% 0% 0% No 0% 0% 0% 0% No Safety 0% 0% 0% 0% No 0% 0% 0% 0% No Years as an offshore helicopter pilot 0% 0% 0% 0% No 0% 0% 0% 0% No 1. Gulf of Mexico – refer to Section 4.3.6.1 2. North Sea – refer to Section 4.3.6.1 3. Refer to Section 4.3.6.1
125
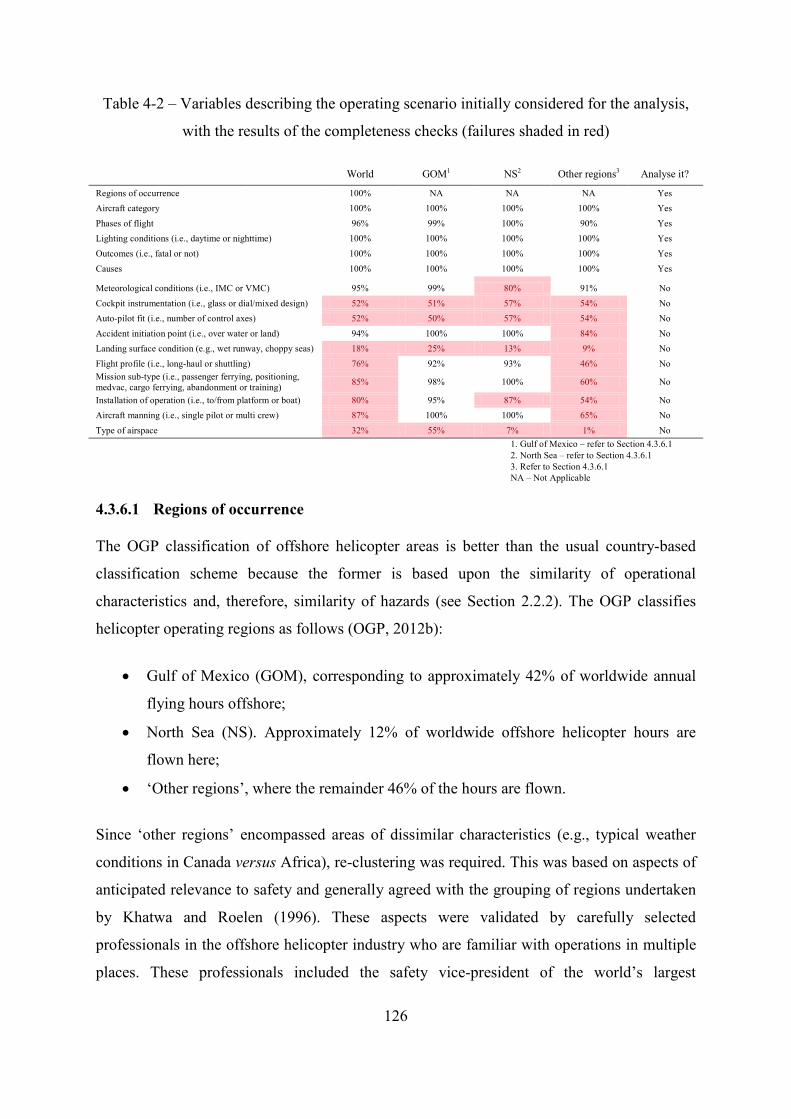
Table 4-2 – Variables describing the operating scenario initially considered for the analysis,
with the results of the completeness checks (failures shaded in red)
World GOM1 NS2 Other regions3 Analyse it?
Regions of occurrence 100% NA NA NA Yes Aircraft category 100% 100% 100% 100% Yes Phases of flight 96% 99% 100% 90% Yes Lighting conditions (i.e., daytime or nighttime) 100% 100% 100% 100% Yes Outcomes (i.e., fatal or not) 100% 100% 100% 100% Yes Causes 100% 100% 100% 100% Yes
Meteorological conditions (i.e., IMC or VMC) 95% 99% 80% 91% No Cockpit instrumentation (i.e., glass or dial/mixed design) 52% 51% 57% 54% No Auto-pilot fit (i.e., number of control axes) 52% 50% 57% 54% No Accident initiation point (i.e., over water or land) 94% 100% 100% 84% No Landing surface condition (e.g., wet runway, choppy seas) 18% 25% 13% 9% No Flight profile (i.e., long-haul or shuttling) 76% 92% 93% 46% No Mission sub-type (i.e., passenger ferrying, positioning, medvac, cargo ferrying, abandonment or training) 85% 98% 100% 60% No
Installation of operation (i.e., to/from platform or boat) 80% 95% 87% 54% No Aircraft manning (i.e., single pilot or multi crew) 87% 100% 100% 65% No Type of airspace 32% 55% 7% 1% No 1. Gulf of Mexico – refer to Section 4.3.6.1 2. North Sea – refer to Section 4.3.6.1 3. Refer to Section 4.3.6.1 NA – Not Applicable
4.3.6.1 Regions of occurrence
The OGP classification of offshore helicopter areas is better than the usual country-based
classification scheme because the former is based upon the similarity of operational
characteristics and, therefore, similarity of hazards (see Section 2.2.2). The OGP classifies
helicopter operating regions as follows (OGP, 2012b):
• Gulf of Mexico (GOM), corresponding to approximately 42% of worldwide annual
flying hours offshore;
• North Sea (NS). Approximately 12% of worldwide offshore helicopter hours are
flown here;
• ‘Other regions’, where the remainder 46% of the hours are flown.
Since ‘other regions’ encompassed areas of dissimilar characteristics (e.g., typical weather
conditions in Canada versus Africa), re-clustering was required. This was based on aspects of
anticipated relevance to safety and generally agreed with the grouping of regions undertaken
by Khatwa and Roelen (1996). These aspects were validated by carefully selected
professionals in the offshore helicopter industry who are familiar with operations in multiple
places. These professionals included the safety vice-president of the world’s largest
126
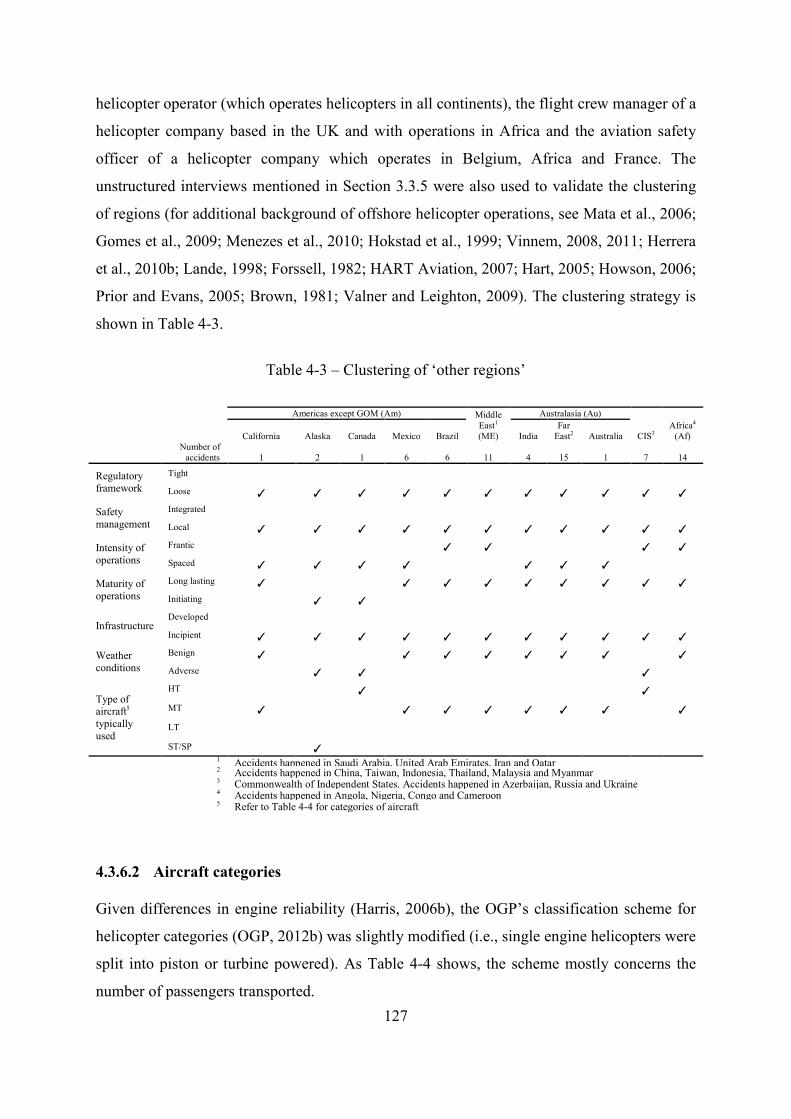
helicopter operator (which operates helicopters in all continents), the flight crew manager of a
helicopter company based in the UK and with operations in Africa and the aviation safety
officer of a helicopter company which operates in Belgium, Africa and France. The
unstructured interviews mentioned in Section 3.3.5 were also used to validate the clustering
of regions (for additional background of offshore helicopter operations, see Mata et al., 2006;
Gomes et al., 2009; Menezes et al., 2010; Hokstad et al., 1999; Vinnem, 2008, 2011; Herrera
et al., 2010b; Lande, 1998; Forssell, 1982; HART Aviation, 2007; Hart, 2005; Howson, 2006;
Prior and Evans, 2005; Brown, 1981; Valner and Leighton, 2009). The clustering strategy is
shown in Table 4-3.
Table 4-3 – Clustering of ‘other regions’
Americas except GOM (Am) Middle East1 (ME)
Australasia (Au)
CIS3 Africa4
(Af) California Alaska Canada Mexico Brazil India Far
East2 Australia
Number of accidents 1 2 1 6 6 11 4 15 1 7 14
Regulatory framework
Tight
Loose ✓ ✓ ✓ ✓ ✓ ✓ ✓ ✓ ✓ ✓ ✓
Safety management
Integrated
Local ✓ ✓ ✓ ✓ ✓ ✓ ✓ ✓ ✓ ✓ ✓
Intensity of operations
Frantic
✓ ✓
✓ ✓
Spaced ✓ ✓ ✓ ✓
✓ ✓ ✓ Maturity of
operations Long lasting ✓
✓ ✓ ✓ ✓ ✓ ✓ ✓ ✓
Initiating
✓ ✓
Infrastructure
Developed
Incipient ✓ ✓ ✓ ✓ ✓ ✓ ✓ ✓ ✓ ✓ ✓
Weather conditions
Benign ✓
✓ ✓ ✓ ✓ ✓ ✓
✓ Adverse
✓ ✓
✓
Type of aircraft5 typically used
HT
✓
✓
MT ✓
✓ ✓ ✓ ✓ ✓ ✓
✓ LT
ST/SP
✓
1 Accidents happened in Saudi Arabia, United Arab Emirates, Iran and Qatar
2 Accidents happened in China, Taiwan, Indonesia, Thailand, Malaysia and Myanmar
3 Commonwealth of Independent States. Accidents happened in Azerbaijan, Russia and Ukraine
4 Accidents happened in Angola, Nigeria, Congo and Cameroon
5 Refer to Table 4-4 for categories of aircraft
4.3.6.2 Aircraft categories
Given differences in engine reliability (Harris, 2006b), the OGP’s classification scheme for
helicopter categories (OGP, 2012b) was slightly modified (i.e., single engine helicopters were
split into piston or turbine powered). As Table 4-4 shows, the scheme mostly concerns the
number of passengers transported. 127
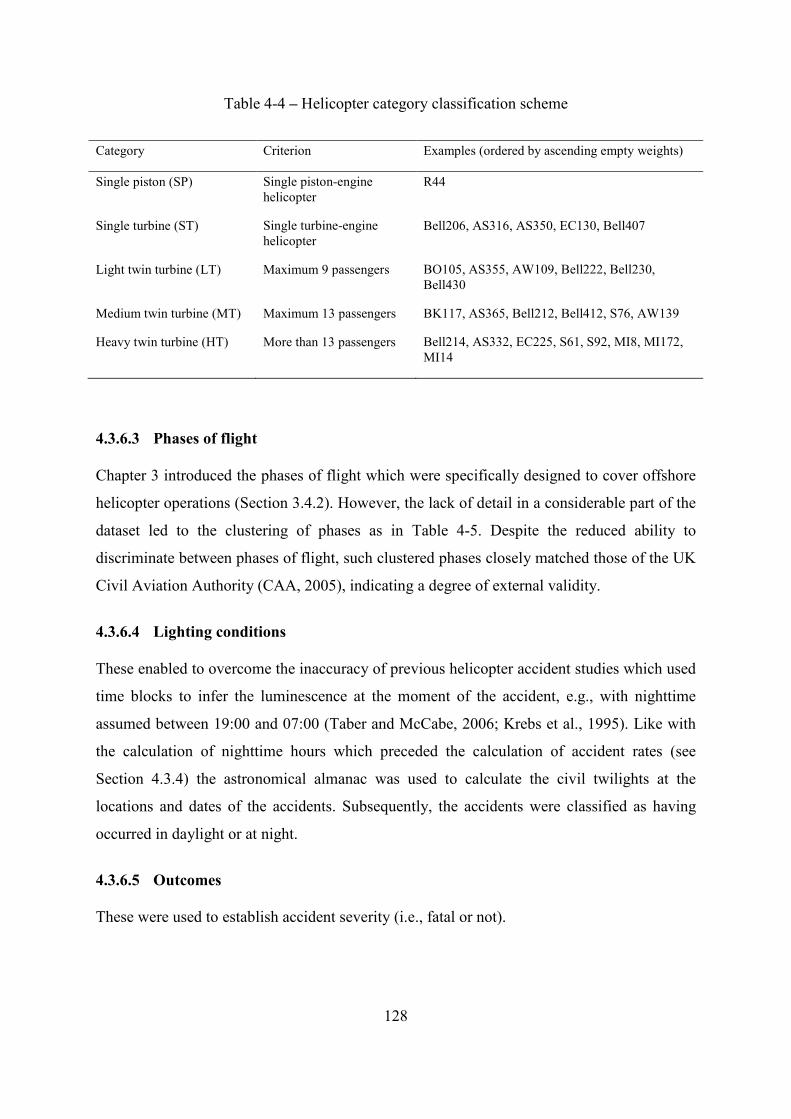
Table 4-4 – Helicopter category classification scheme
Category Criterion Examples (ordered by ascending empty weights)
Single piston (SP) Single piston-engine helicopter
R44
Single turbine (ST) Single turbine-engine helicopter
Bell206, AS316, AS350, EC130, Bell407
Light twin turbine (LT) Maximum 9 passengers BO105, AS355, AW109, Bell222, Bell230, Bell430
Medium twin turbine (MT) Maximum 13 passengers BK117, AS365, Bell212, Bell412, S76, AW139
Heavy twin turbine (HT) More than 13 passengers Bell214, AS332, EC225, S61, S92, MI8, MI172, MI14
4.3.6.3 Phases of flight
Chapter 3 introduced the phases of flight which were specifically designed to cover offshore
helicopter operations (Section 3.4.2). However, the lack of detail in a considerable part of the
dataset led to the clustering of phases as in Table 4-5. Despite the reduced ability to
discriminate between phases of flight, such clustered phases closely matched those of the UK
Civil Aviation Authority (CAA, 2005), indicating a degree of external validity.
4.3.6.4 Lighting conditions
These enabled to overcome the inaccuracy of previous helicopter accident studies which used
time blocks to infer the luminescence at the moment of the accident, e.g., with nighttime
assumed between 19:00 and 07:00 (Taber and McCabe, 2006; Krebs et al., 1995). Like with
the calculation of nighttime hours which preceded the calculation of accident rates (see
Section 4.3.4) the astronomical almanac was used to calculate the civil twilights at the
locations and dates of the accidents. Subsequently, the accidents were classified as having
occurred in daylight or at night.
4.3.6.5 Outcomes
These were used to establish accident severity (i.e., fatal or not).
128
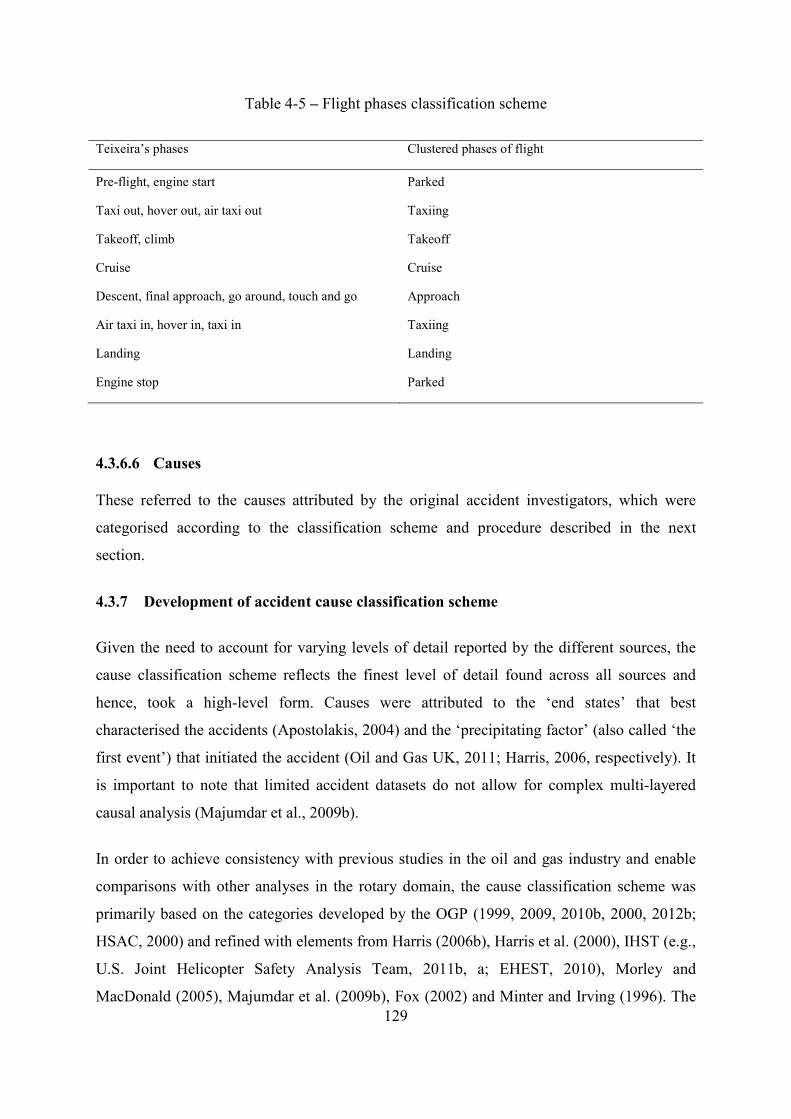
Table 4-5 – Flight phases classification scheme
Teixeira’s phases Clustered phases of flight
Pre-flight, engine start Parked
Taxi out, hover out, air taxi out Taxiing
Takeoff, climb Takeoff
Cruise Cruise
Descent, final approach, go around, touch and go Approach
Air taxi in, hover in, taxi in Taxiing
Landing Landing
Engine stop Parked
4.3.6.6 Causes
These referred to the causes attributed by the original accident investigators, which were
categorised according to the classification scheme and procedure described in the next
section.
4.3.7 Development of accident cause classification scheme
Given the need to account for varying levels of detail reported by the different sources, the
cause classification scheme reflects the finest level of detail found across all sources and
hence, took a high-level form. Causes were attributed to the ‘end states’ that best
characterised the accidents (Apostolakis, 2004) and the ‘precipitating factor’ (also called ‘the
first event’) that initiated the accident (Oil and Gas UK, 2011; Harris, 2006, respectively). It
is important to note that limited accident datasets do not allow for complex multi-layered
causal analysis (Majumdar et al., 2009b).
In order to achieve consistency with previous studies in the oil and gas industry and enable
comparisons with other analyses in the rotary domain, the cause classification scheme was
primarily based on the categories developed by the OGP (1999, 2009, 2010b, 2000, 2012b;
HSAC, 2000) and refined with elements from Harris (2006b), Harris et al. (2000), IHST (e.g.,
U.S. Joint Helicopter Safety Analysis Team, 2011b, a; EHEST, 2010), Morley and
MacDonald (2005), Majumdar et al. (2009b), Fox (2002) and Minter and Irving (1996). The 129
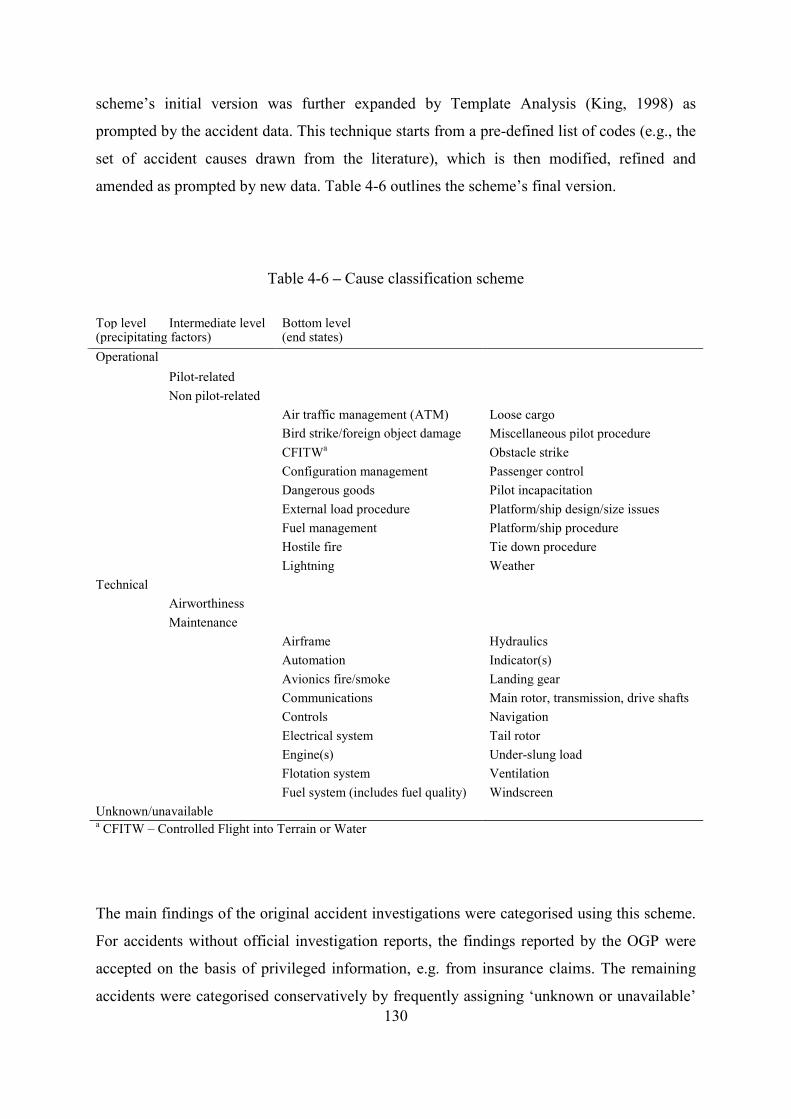
scheme’s initial version was further expanded by Template Analysis (King, 1998) as
prompted by the accident data. This technique starts from a pre-defined list of codes (e.g., the
set of accident causes drawn from the literature), which is then modified, refined and
amended as prompted by new data. Table 4-6 outlines the scheme’s final version.
Table 4-6 – Cause classification scheme
Top level Intermediate level Bottom level (precipitating factors) (end states) Operational
Pilot-related
Non pilot-related
Air traffic management (ATM) Loose cargo Bird strike/foreign object damage
Miscellaneous pilot procedure
CFITWa Obstacle strike Configuration management Passenger control Dangerous goods Pilot incapacitation External load procedure Platform/ship design/size issues Fuel management Platform/ship procedure Hostile fire Tie down procedure Lightning Weather Technical
Airworthiness
Maintenance
Airframe Hydraulics
Automation Indicator(s)
Avionics fire/smoke Landing gear Communications Main rotor, transmission, drive shafts Controls Navigation Electrical system Tail rotor Engine(s) Under-slung load Flotation system Ventilation Fuel system (includes fuel quality) Windscreen Unknown/unavailable a CFITW – Controlled Flight into Terrain or Water
The main findings of the original accident investigations were categorised using this scheme.
For accidents without official investigation reports, the findings reported by the OGP were
accepted on the basis of privileged information, e.g. from insurance claims. The remaining
accidents were categorised conservatively by frequently assigning ‘unknown or unavailable’ 130
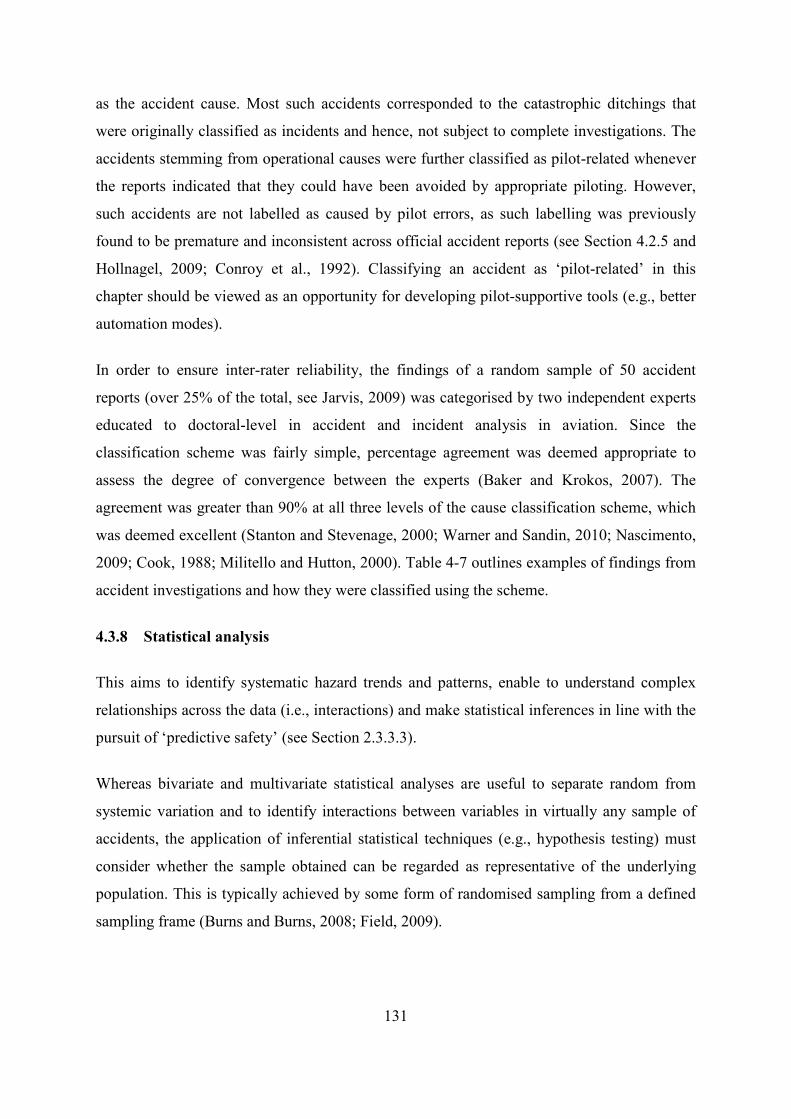
as the accident cause. Most such accidents corresponded to the catastrophic ditchings that
were originally classified as incidents and hence, not subject to complete investigations. The
accidents stemming from operational causes were further classified as pilot-related whenever
the reports indicated that they could have been avoided by appropriate piloting. However,
such accidents are not labelled as caused by pilot errors, as such labelling was previously
found to be premature and inconsistent across official accident reports (see Section 4.2.5 and
Hollnagel, 2009; Conroy et al., 1992). Classifying an accident as ‘pilot-related’ in this
chapter should be viewed as an opportunity for developing pilot-supportive tools (e.g., better
automation modes).
In order to ensure inter-rater reliability, the findings of a random sample of 50 accident
reports (over 25% of the total, see Jarvis, 2009) was categorised by two independent experts
educated to doctoral-level in accident and incident analysis in aviation. Since the
classification scheme was fairly simple, percentage agreement was deemed appropriate to
assess the degree of convergence between the experts (Baker and Krokos, 2007). The
agreement was greater than 90% at all three levels of the cause classification scheme, which
was deemed excellent (Stanton and Stevenage, 2000; Warner and Sandin, 2010; Nascimento,
2009; Cook, 1988; Militello and Hutton, 2000). Table 4-7 outlines examples of findings from
accident investigations and how they were classified using the scheme.
4.3.8 Statistical analysis
This aims to identify systematic hazard trends and patterns, enable to understand complex
relationships across the data (i.e., interactions) and make statistical inferences in line with the
pursuit of ‘predictive safety’ (see Section 2.3.3.3).
Whereas bivariate and multivariate statistical analyses are useful to separate random from
systemic variation and to identify interactions between variables in virtually any sample of
accidents, the application of inferential statistical techniques (e.g., hypothesis testing) must
consider whether the sample obtained can be regarded as representative of the underlying
population. This is typically achieved by some form of randomised sampling from a defined
sampling frame (Burns and Burns, 2008; Field, 2009).
131
Table 4-7 – Examples of accident cause classification
Accident date
Accident country
Investigation ‘authority’
Main findings of accident investigation undertaken
Causes (attributed in 3 levels when appropriate)
25-May-97 India DGCA The accident occurred due to pilot getting disoriented in the prevailing night conditions. The disorientation took place as the pilot continued to fly on an unstabilised approach till close proximity of the rig at low height [SIC ...]. Factor: pilot - disregard of standard operating procedures
Operational Pilot-related CFITWa
08-Mar-00 Indonesia OGP Technical failure - unconfirmed Unknown or unavailable
10-Nov-01 UK AAIB In high winds there was the ship's loss of steering. The lack of procedures on the ship to transmit the change in the alert status to the crew of the helicopter [...] denied the pilot an appropriate course of action to ensure the safety of the helicopter, which tumbled over on the helideck
Operational Non pilot-related Platform or ship
procedure
18-Feb-05 USA NTSB Fuel starvation due to a blocked and collapsed fuel nozzle screen, resulting from a contaminated fuel source/facility. Factors were the inadequate maintenance / inspection of fuel sources
Technical Maintenance Fuel system
12-Mar-09 Canada TSB A main gearbox pressure light illuminated. Soon after, the loss of lubricant caused a catastrophic failure of the gearbox
Technical Airworthiness Main rotor,
transmission, drive shafts
DGCA - Directorate General of Civil Aviation
AAIB - Aircraft Accident Investigation Branch
TSB - Transport Safety Board of Canada
a - Controlled Flight into Terrain or Water; see Table 4-6
Due to the lack of a sampling frame (i.e., the exact number of accidents in the period
considered was actually unknown), randomised sampling could not be undertaken. However,
the exhaustive accident search strategy and the convergence of accident information from
multiple sources generated confidence that the sampling approximated a census (i.e., a
complete enumeration of the entire defined population) at least asymptotically (Spanos, 2006;
Burns and Burns, 2008). Therefore, the accident sample was considered to be representative
of the population of accidents and the application of inferential statistical techniques was
deemed appropriate to learn about the underlying accident generation mechanism (Mayo and
Cox, 2006), i.e., the hazard trends and patterns. This is in accordance with the mainstream
accident analysis literature (e.g., Couch and Lindell, 2010; Stevens, 2013; Mapes, 2010).
132
Based on the assumption that the accident sample is representative of the underlying
population, various hypotheses were tested, as described in the Sections 4.4.1 and 4.4.2. For
all the statistical tests, the hypotheses were two-tailed and the significance was established at
p≤0.05. Given the relatively small accident and accident rate sample sizes involved, any
significant effect can be assumed to stem from large effect sizes. Therefore, effect sizes were
not calculated (Burns and Burns, 2008).
4.3.8.1 Calculation and analysis of accident rates
With the flying hours calculated in Section 4.3.4.1, the accident outcomes identified in
Section 4.3.6.5 and the categorisation of accident causes outlined in Sections 4.3.6.6 and
4.3.7, the accident rates were calculated by simple ratio (see Section 4.2.6) for each year
between 1997 and 2009, discriminated by outcomes, causes, regions of occurrence and
lighting conditions.
Given the sample sizes involved, Shapiro-Wilk and Levene’s tests were used to check the
normality of the distributions and the homogeneity of variance, respectively. Because in all
cases at least one of such assumptions of parametric data was violated, non-parametric
techniques were required. See Field (2009) and Agresti (2002) for details of the statistical
tests mentioned above and outlined below.
The Kolmogorov-Smirnov Z (KS-Z) procedure tested the null hypothesis whereby the
distributions of accident rates across two conditions (i.e., daytime and nighttime) were the
same. The test is useful with small sample sizes, i.e., N<25 per group.
The Moses Test of Extreme Reaction (MTER) was used to investigate the null hypothesis
that the extreme values observed for accident rates were equally likely to occur in both
daytime and nighttime conditions. (Sheskin, 2004; Sprent and Smeeton, 2001; IBM
Corporation, 2011).
The Kruskal-Wallis (KW) procedure tested the null hypothesis that the distributions of
accident rates across k experimental conditions (i.e., the regions of occurrence) were the
same. In case statistically significant results were found, post-hoc tests were used to identify
where the differences lied, as described in the next test.
133
The Mann-Whitney test with Bonferroni correction (MW/B) was applied to each pair-wise
combination of conditions drawn from the previous step to test the null hypothesis whereby
the two samples were from populations with the same distribution functions. The Bonferroni
correction avoided falsely rejecting the null hypothesis by using a more stringent rejection
criterion given by the initial significance level divided by the number of pairs under analysis.
Because it was anticipated that the North Sea would present the lowest and more spaced-in-
time accident rates (see Section 2.3.3.1.1.2), the North Sea was chosen as the control group
for these tests.
4.3.8.2 Bivariate accident analyses
Two types of bivariate analyses were undertaken: cross-tabulations of categorical variables
and analysis of the distributions of accident-fatalities (i.e., the number of occupants fatally
injured in each accident) per the events of the variables of relevance to accidents (described
in Section 4.3.6).
4.3.8.2.1 Cross-tabulations of categorical variables
The Pearson’s chi-square test was applied to investigate the null hypothesis whereby the
categorical variables were independent when analysed in pairs. This test requires that not less
than 80% of the cells in such tables have expected frequencies greater than five and that no
single expected frequency is lower than unity. When this was violated, Fisher’s exact test was
used. In both cases, clustering of categories was needed to avoid null cell frequencies
(Agresti, 2002; Majumdar et al., 2009b; Field, 2009).
Clustering was undertaken as follows: the Single Engine (SE) category was formed from the
fusion of SP and ST. The LT/MT was formed from the fusion between LT and MT (see
Section 4.3.6.2). Furthermore, the ‘ground manoeuvres’ category was created from the fusion
between the parked and taxiing flight phases and the ‘arrival segment’ was formed from the
fusion between approach and landing (see Section 4.3.6.3). At the intermediate level of the
cause classification scheme, causes were clustered in two different ways: pilot-related versus
all other causes and airworthiness versus all other causes. The causes were then analysed
independently against the other variables. At the bottom of the cause classification scheme,
causes were clustered as follows: CFITW, obstacles strike (OS), pilot procedure (PP), engine-
related (ER), tail rotor (TR) and all other causes (else). These causes were the most frequent
134
causes of accidents, each occurring to over 10% of the accidents worldwide. Refer to Section
4.3.7 for the cause classification scheme.
4.3.8.2.2 Distributions of accident-fatalities per variable of relevance to accidents
The normality of the distributions was tested according to the sample sizes involved in each
tests condition, i.e., the Shapiro-Wilk test was used when there were fewer than 50 cases per
category and the Kolmogorov-Smirnov test was used otherwise. The homogeneity of
variance was checked by Levene’s tests (Field, 2009). Because in all cases at least one such
assumption of parametric tests was violated, the use of non-parametric techniques was
required.
The tests mentioned in Section 4.3.8.1 were used as applicable, except for the Moses Test of
Extreme Reaction (MTER). During the post hoc analyses employing the Mann-Whitney tests
with Bonferroni correction (MW/B), the category whose mean value was closest to the
average value across all categories’ means was chosen as a control group. This intended to
compare all categories to the central tendency of each variable under test.
4.3.8.3 Multivariate accident analysis
Given the characteristics of the data, log linear analysis could not be undertaken to assess the
multi-way interactions between categorical variables. This is due to an excessively large
number of cells which did not meet the requirements for chi-square analysis in the cross-
tabulation tables produced. Therefore the exploration of possible interactions between more
than two variables was embedded in the logistic regression analysis (Field, 2009; Agresti,
2002).
Logistic regression was used to predict the events of dependent variables (i.e., causes and
outcomes of accidents) by analysing the linear relationship between the natural logarithm of
the odds (defined below) of such variables and the explanatory variables.
Causes of accidents were predicted based on regions of operation, aircraft categories, phases
of flight, lighting conditions and all possible interactions between such variables. Outcomes
of accidents were predicted based on the same variables, accident causes and all possible
interactions between these variables. The choice of number of explanatory variables were
adequate, according to the recommendations of Burns and Burns (2008) and Garson (2011),
135
both cited in Dupuy (2011). These recommendations concern the sample sizes involved.
Logistic regression is frequently used in transport research (e.g., Inglis et al., 2010; Dupuy,
2011).
In order to ensure that the standard errors of the b coefficients were not excessively large,
unobserved combinations of predictors needed to be avoided. This required further clustering
of categories, which was undertaken as follows. The three OGP regions of operations were
used (see Section 4.3.6.1). LT, MT and HT helicopters were clustered into the Multi-Engine
(ME) category (see Sections 4.3.8.2.1 and 4.3.6.2). Phases of flight were re-clustered as
arrival segment (refer to Section 4.3.8.2.1), departure segment (i.e., takeoff) and all other
phases (refer to Table 4-5). At the intermediate level of the cause classification scheme,
causes were grouped as pilot-related, airworthiness and other causes. At the bottom level of
the cause classification scheme, causes were grouped as CFITW, obstacle strike, engine-
related and other causes (see Sections 4.3.8.2.1 and 4.3.7).
Problems with multicollinearity (i.e., predictors which are too highly correlated) and
overdispersion (i.e., observed variance which is larger than the variance predicted by the
model) were assessed primarily by observation of the standard error of the b coefficients
obtained. Any standard error greater than 2 was deemed indicative of multicollinearity or
overdispersion (Field, 2009). Additional overdispersion checks were undertaken by
calculating the dispersion parameter (i.e., Ø) for each multinomial logistic regression model.
Ø is given by the quotient between the model’s goodness of fit statistic over its degrees of
freedom. This quotient should be between 1 and 2 to ensure that there is no overdispersion
(Field, 2009).
Finally, the forward stepwise model fitting strategy based on the log-likelihood statistic was
used to account for the exploratory nature of this study (Field, 2009).
4.4 Results and discussion
The sampling strategy returned 189 accidents. This corresponds to approximately 80%
statistical power for the detection of an effect size of 0.20 on the two-tailed hypothesis tested.
This is the threshold typically accepted for assured statistical utility (Burns and Burns, 2008).
136
Sixty-five per cent of the accident reports were covered by official investigations. The OGP
summaries accounted for a further 25%, leaving 10% to the judgement of the researcher. The
accidents with ‘unknown/unavailable’ information were excluded from the analysis. Accident
information was normalised by the flying hours data available (i.e., 1997-2009) and
discriminated by four regions of operations (i.e., worldwide, GOM, NS and ‘other regions’),
three lighting conditions (i.e., whole day, daytime and nighttime), seven causes (i.e., all,
operational, operational pilot-related, operational non pilot-related, technical, technical
airworthiness and technical maintenance) and two outcomes (i.e., overall and fatal). The
bivariate and multivariate analyses of accident data covered the whole (1997-2011) period.
The analyses are presented and interpreted in the following sections.
4.4.1 Calculation and analysis of accident rates
Figures 4-3 to 4-5 illustrate the worldwide overall and fatal accident rates (solid blue and
dotted red lines, respectively), calculated as described in Section 4.3.8.1. The accident rates
include all, operational and technical causes, grouped according to lighting conditions
(daytime to the left, nighttime to the right). The much higher accident rates in the nighttime
are noticeable (6-fold overall and 15-fold for fatal accidents, as compared to the daylight
rates over the same period), as well as the prevalence of operational accidents over technical
accidents. However, the sparse distribution of technical failures at night suggests that these
were caused by random effects.
The results of the statistical tests applied are summarised in Table 4-8, which also outlines the
hypotheses tested. The fact that worldwide nighttime accident rates were either significantly
greater (test of hypothesis H01, KS-Z tests) or tended towards the extreme of the distributions
(test of H02, MTER), for all combinations of causes and outcomes, confirmed the trends in
Figures 4-3 to 4-5. The GOM and other regions follow a similar pattern. However, for the NS
the distributions per lighting condition were not significantly different (KS-Z tests),
indicating comparable risk levels in this region. Nonetheless, since all the ranges were
significantly different (MTER), any helicopter accident at night inflated the accident rates,
and should therefore be addressed.
137

Figure 4-3 – Worldwide overall and fatal accident rates (solid blue and dotted red lines,
respectively) for all causes, per lighting conditions (left: daytime; right: nighttime)
Figure 4-4 – Worldwide overall and fatal accident rates (solid blue and dotted red lines,
respectively) for operational causes, per lighting conditions (left: daytime; right: nighttime)
Figure 4-5 – Worldwide overall and fatal accident rates (solid blue and dotted red lines,
respectively) for technical causes, per lighting conditions (left: daytime; right: nighttime)
138
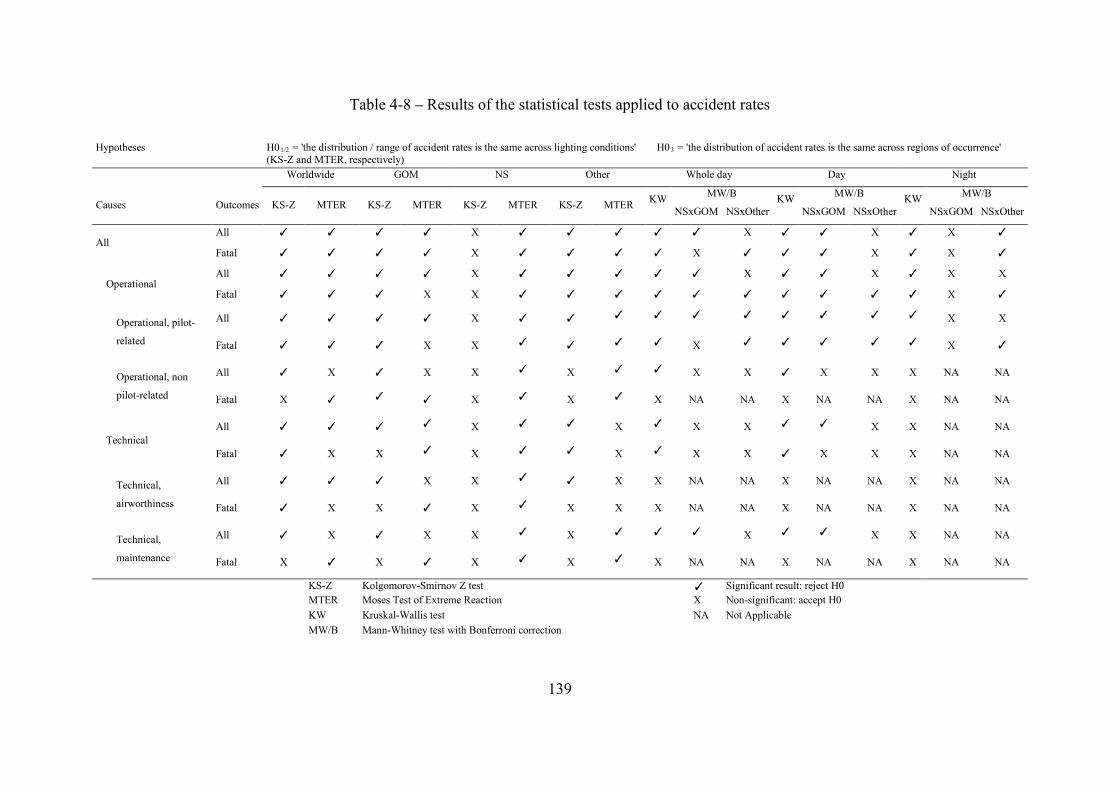
Table 4-8 – Results of the statistical tests applied to accident rates
Hypotheses H01/2 = 'the distribution / range of accident rates is the same across lighting conditions' (KS-Z and MTER, respectively)
H03 = 'the distribution of accident rates is the same across regions of occurrence'
Causes Outcomes
Worldwide GOM NS Other Whole day Day Night
KS-Z MTER KS-Z MTER KS-Z MTER KS-Z MTER KW MW/B KW MW/B KW MW/B
NSxGOM NSxOther NSxGOM NSxOther NSxGOM NSxOther
All All ✓ ✓ ✓ ✓ X ✓ ✓ ✓ ✓ ✓ X ✓ ✓ X ✓ X ✓
Fatal ✓ ✓ ✓ ✓ X ✓ ✓ ✓ ✓ X ✓ ✓ ✓ X ✓ X ✓
Operational
All ✓ ✓ ✓ ✓ X ✓ ✓ ✓ ✓ ✓ X ✓ ✓ X ✓ X X
Fatal ✓ ✓ ✓ X X ✓ ✓ ✓ ✓ ✓ ✓ ✓ ✓ ✓ ✓ X ✓
Operational, pilot-
related
All ✓ ✓ ✓ ✓ X ✓ ✓ ✓ ✓ ✓ ✓ ✓ ✓ ✓ ✓ X X
Fatal ✓ ✓ ✓ X X ✓ ✓ ✓ ✓ X ✓ ✓ ✓ ✓ ✓ X ✓
Operational, non
pilot-related
All ✓ X ✓ X X ✓ X ✓ ✓ X X ✓ X X X NA NA
Fatal X ✓ ✓ ✓ X ✓ X ✓ X NA NA X NA NA X NA NA
Technical
All ✓ ✓ ✓ ✓ X ✓ ✓ X ✓ X X ✓ ✓ X X NA NA
Fatal ✓ X X ✓ X ✓ ✓ X ✓ X X ✓ X X X NA NA
Technical,
airworthiness
All ✓ ✓ ✓ X X ✓ ✓ X X NA NA X NA NA X NA NA
Fatal ✓ X X ✓ X ✓ X X X NA NA X NA NA X NA NA
Technical,
maintenance
All ✓ X ✓ X X ✓ X ✓ ✓ ✓ X ✓ ✓ X X NA NA
Fatal X ✓ X ✓ X ✓ X ✓ X NA NA X NA NA X NA NA
KS-Z Kolgomorov-Smirnov Z test
✓ Significant result: reject H0
MTER Moses Test of Extreme Reaction
X Non-significant: accept H0
KW Kruskal-Wallis test
NA Not Applicable
MW/B Mann-Whitney test with Bonferroni correction
139
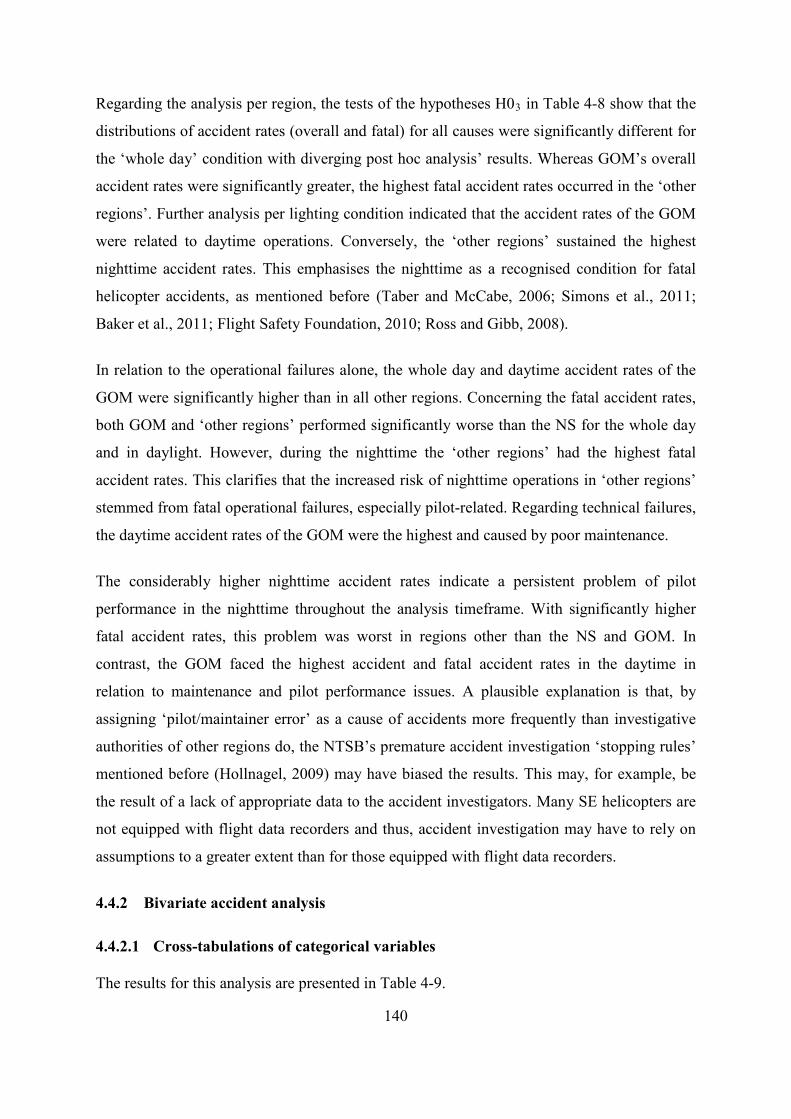
Regarding the analysis per region, the tests of the hypotheses H03 in Table 4-8 show that the
distributions of accident rates (overall and fatal) for all causes were significantly different for
the ‘whole day’ condition with diverging post hoc analysis’ results. Whereas GOM’s overall
accident rates were significantly greater, the highest fatal accident rates occurred in the ‘other
regions’. Further analysis per lighting condition indicated that the accident rates of the GOM
were related to daytime operations. Conversely, the ‘other regions’ sustained the highest
nighttime accident rates. This emphasises the nighttime as a recognised condition for fatal
helicopter accidents, as mentioned before (Taber and McCabe, 2006; Simons et al., 2011;
Baker et al., 2011; Flight Safety Foundation, 2010; Ross and Gibb, 2008).
In relation to the operational failures alone, the whole day and daytime accident rates of the
GOM were significantly higher than in all other regions. Concerning the fatal accident rates,
both GOM and ‘other regions’ performed significantly worse than the NS for the whole day
and in daylight. However, during the nighttime the ‘other regions’ had the highest fatal
accident rates. This clarifies that the increased risk of nighttime operations in ‘other regions’
stemmed from fatal operational failures, especially pilot-related. Regarding technical failures,
the daytime accident rates of the GOM were the highest and caused by poor maintenance.
The considerably higher nighttime accident rates indicate a persistent problem of pilot
performance in the nighttime throughout the analysis timeframe. With significantly higher
fatal accident rates, this problem was worst in regions other than the NS and GOM. In
contrast, the GOM faced the highest accident and fatal accident rates in the daytime in
relation to maintenance and pilot performance issues. A plausible explanation is that, by
assigning ‘pilot/maintainer error’ as a cause of accidents more frequently than investigative
authorities of other regions do, the NTSB’s premature accident investigation ‘stopping rules’
mentioned before (Hollnagel, 2009) may have biased the results. This may, for example, be
the result of a lack of appropriate data to the accident investigators. Many SE helicopters are
not equipped with flight data recorders and thus, accident investigation may have to rely on
assumptions to a greater extent than for those equipped with flight data recorders.
4.4.2 Bivariate accident analysis
4.4.2.1 Cross-tabulations of categorical variables
The results for this analysis are presented in Table 4-9.
140
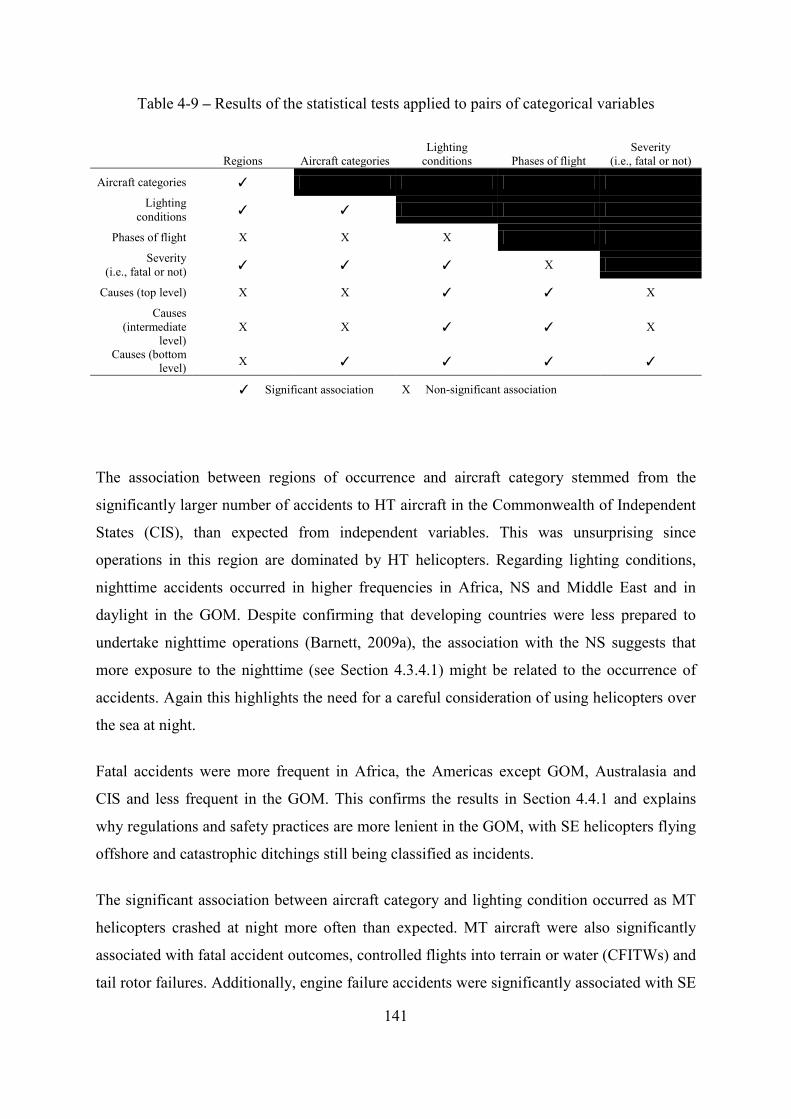
Table 4-9 – Results of the statistical tests applied to pairs of categorical variables
Regions Aircraft categories Lighting
conditions Phases of flight Severity
(i.e., fatal or not)
Aircraft categories ✓
Lighting conditions ✓ ✓
Phases of flight X X X
Severity (i.e., fatal or not) ✓ ✓ ✓ X
Causes (top level) X X ✓ ✓ X
Causes (intermediate
level) X X ✓ ✓ X
Causes (bottom level) X ✓ ✓ ✓ ✓
✓ Significant association X Non-significant association
The association between regions of occurrence and aircraft category stemmed from the
significantly larger number of accidents to HT aircraft in the Commonwealth of Independent
States (CIS), than expected from independent variables. This was unsurprising since
operations in this region are dominated by HT helicopters. Regarding lighting conditions,
nighttime accidents occurred in higher frequencies in Africa, NS and Middle East and in
daylight in the GOM. Despite confirming that developing countries were less prepared to
undertake nighttime operations (Barnett, 2009a), the association with the NS suggests that
more exposure to the nighttime (see Section 4.3.4.1) might be related to the occurrence of
accidents. Again this highlights the need for a careful consideration of using helicopters over
the sea at night.
Fatal accidents were more frequent in Africa, the Americas except GOM, Australasia and
CIS and less frequent in the GOM. This confirms the results in Section 4.4.1 and explains
why regulations and safety practices are more lenient in the GOM, with SE helicopters flying
offshore and catastrophic ditchings still being classified as incidents.
The significant association between aircraft category and lighting condition occurred as MT
helicopters crashed at night more often than expected. MT aircraft were also significantly
associated with fatal accident outcomes, controlled flights into terrain or water (CFITWs) and
tail rotor failures. Additionally, engine failure accidents were significantly associated with SE
141
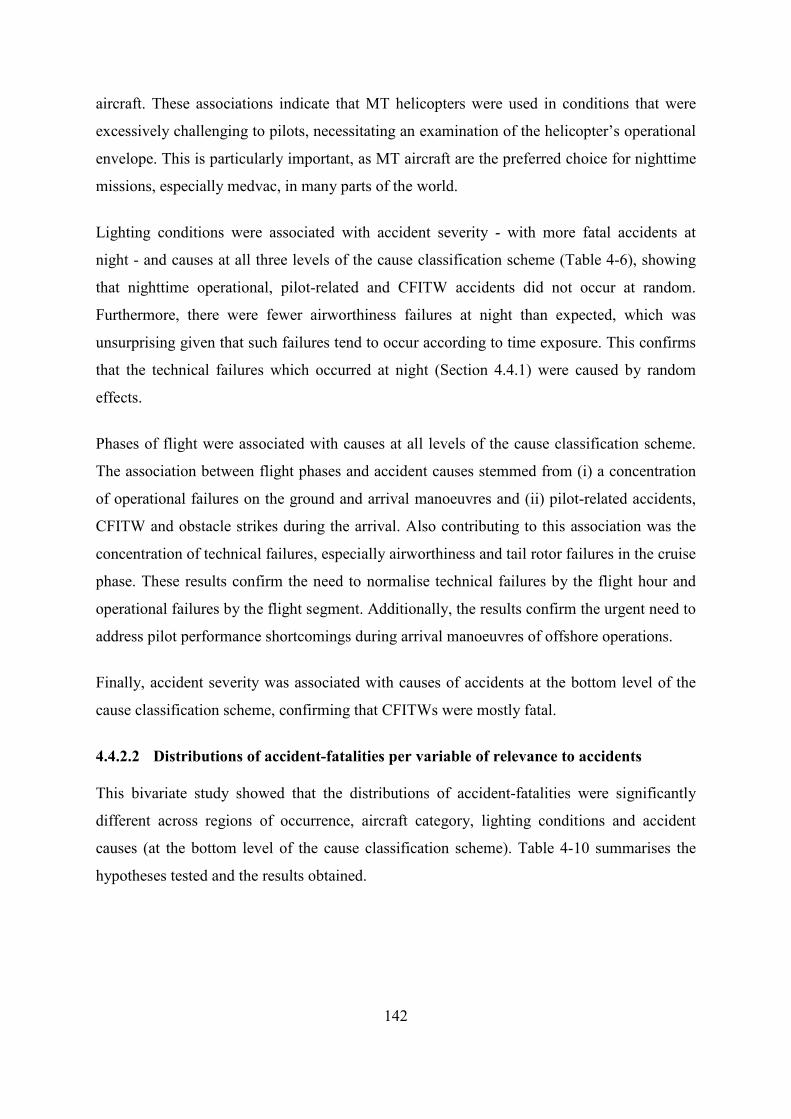
aircraft. These associations indicate that MT helicopters were used in conditions that were
excessively challenging to pilots, necessitating an examination of the helicopter’s operational
envelope. This is particularly important, as MT aircraft are the preferred choice for nighttime
missions, especially medvac, in many parts of the world.
Lighting conditions were associated with accident severity - with more fatal accidents at
night - and causes at all three levels of the cause classification scheme (Table 4-6), showing
that nighttime operational, pilot-related and CFITW accidents did not occur at random.
Furthermore, there were fewer airworthiness failures at night than expected, which was
unsurprising given that such failures tend to occur according to time exposure. This confirms
that the technical failures which occurred at night (Section 4.4.1) were caused by random
effects.
Phases of flight were associated with causes at all levels of the cause classification scheme.
The association between flight phases and accident causes stemmed from (i) a concentration
of operational failures on the ground and arrival manoeuvres and (ii) pilot-related accidents,
CFITW and obstacle strikes during the arrival. Also contributing to this association was the
concentration of technical failures, especially airworthiness and tail rotor failures in the cruise
phase. These results confirm the need to normalise technical failures by the flight hour and
operational failures by the flight segment. Additionally, the results confirm the urgent need to
address pilot performance shortcomings during arrival manoeuvres of offshore operations.
Finally, accident severity was associated with causes of accidents at the bottom level of the
cause classification scheme, confirming that CFITWs were mostly fatal.
4.4.2.2 Distributions of accident-fatalities per variable of relevance to accidents
This bivariate study showed that the distributions of accident-fatalities were significantly
different across regions of occurrence, aircraft category, lighting conditions and accident
causes (at the bottom level of the cause classification scheme). Table 4-10 summarises the
hypotheses tested and the results obtained.
142
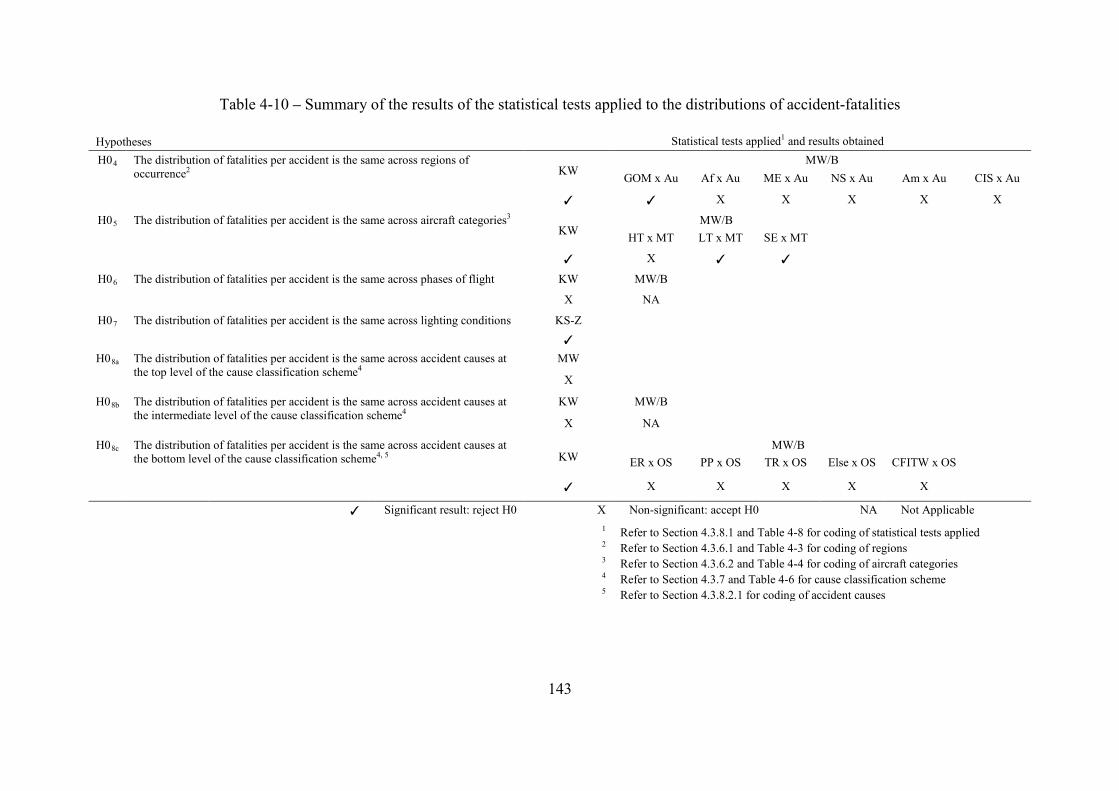
Table 4-10 – Summary of the results of the statistical tests applied to the distributions of accident-fatalities Hypotheses Statistical tests applied1 and results obtained H04 The distribution of fatalities per accident is the same across regions of
occurrence2 KW MW/B
GOM x Au Af x Au ME x Au NS x Au Am x Au CIS x Au
✓ ✓ X X X X X
H05 The distribution of fatalities per accident is the same across aircraft categories3 KW
MW/B HT x MT LT x MT SE x MT
✓ X ✓ ✓ H06 The distribution of fatalities per accident is the same across phases of flight KW MW/B
X NA H07 The distribution of fatalities per accident is the same across lighting conditions KS-Z
✓ H08a The distribution of fatalities per accident is the same across accident causes at
the top level of the cause classification scheme4 MW
X H08b The distribution of fatalities per accident is the same across accident causes at
the intermediate level of the cause classification scheme4 KW MW/B X NA
H08c The distribution of fatalities per accident is the same across accident causes at the bottom level of the cause classification scheme4, 5 KW
MW/B ER x OS PP x OS TR x OS Else x OS CFITW x OS
✓ X X X X X
✓ Significant result: reject H0 X Non-significant: accept H0 NA Not Applicable
1 Refer to Section 4.3.8.1 and Table 4-8 for coding of statistical tests applied
2 Refer to Section 4.3.6.1 and Table 4-3 for coding of regions
3 Refer to Section 4.3.6.2 and Table 4-4 for coding of aircraft categories
4 Refer to Section 4.3.7 and Table 4-6 for cause classification scheme
5 Refer to Section 4.3.8.2.1 for coding of accident causes
143
Regarding regions of occurrence, the fatalities per accident were fewer in the GOM and
similar across all remaining regions. Given that the GOM concentrates small, single-engine
helicopter operations this result was expected. However, the failure to achieve significance
across all remaining regions shows that the fatalities per accident were comparable in areas
where the typical categories of aircraft used are different (e.g., MT in the Middle East,
Americas except GOM and Africa versus HT in Australasia, CIS and NS). This might
highlight problems with poor Search and Rescue (SAR) infrastructure, more adverse
operating conditions or over-stretched flight envelopes in the regions using MT, or that MT
helicopters were less crashworthy and seaworthy than the other helicopter categories. These
are important considerations since the use of MT aircraft are a natural cost-effective choice in
lieu of HT helicopters.
The analysis across aircraft categories further endorsed the hypotheses above. The
distributions of fatalities per accident were only significantly different between SE and MT
aircraft, with fewer deaths per accident in the former category. This confirms that the
numbers of fatally-injured occupants per accident of MT and HT aircraft were comparable
throughout the study timeframe, even though the latter is meant to carry considerably more
occupants per flight than the former.
The distributions of fatalities were also significantly different across lighting condition, with
nighttime accidents consistently claiming more lives per accident than daytime accidents.
Regarding accident causes, although the Kruskal-Wallis test showed that the distributions of
fatalities per accident were different across the causes considered at the bottom level of the
cause classification scheme, post-hoc tests failed to identify where the differences stemmed
from. This might have been the result of an excessively stringent rejection criterion caused by
the application of the Bonferroni correction. Nevertheless, the extreme mean fatalities were
caused by engine-related issues and CFITWs (which were lowest and highest, respectively).
This clarifies that CFITWs were the biggest cause of death per accident in offshore helicopter
transportation. Given such findings, regression models for accident outcomes and their causes
were fitted to support the establishment of sound ‘predictive’ safety interventions (see
Section 2.3.3.3).
144
4.4.3 Multivariate accident analyses
This was used to identify multi-way interactions across the variables of relevance to accidents
and predict accident cause and outcomes given that an accident has happened (i.e.,
probability of an accident = 1). Causes were predicted using multinomial logistic regression
whereas the prediction of outcomes was based on the binomial logistic regression. The
prediction of causes was attempted at all three levels of the cause classification scheme
separately. Similarly, three predictions of accident outcomes were undertaken, corresponding
to each level of the cause classification scheme. However, the results presented focus on as
low a level as possible, to extract the maximum hazard information available.
4.4.3.1 Multinomial logistic regression
Despite further clustering, it was not possible to predict accident causes at the most detailed
level of the cause classification scheme due to an excessively large number of unobserved
combinations of predictors (50%). Using the intermediate and top levels of the scheme, the
analysis showed that multicollinearity or overdispersion were absent in the data. At the
intermediate level of the scheme, a test of the full model against a constant only model
indicated that the predictors, as a set, reliably distinguished between accidents causes
(χ2(14)=34.692, p=0.002). The overall prediction success was 61.1% (pilot-related: 82.0%;
airworthiness: 53.2%; other: 3.8%).
No multi-way interactions between the variables were found. When comparing the odds of
having technical, airworthiness failures to those of operational, pilot-related failures, the
Wald criterion showed that aircraft category, phase of flight and the interaction between
lighting condition and aircraft category made significant contributions to prediction. The use
of multi-engine aircraft produced an odds ratio that represented a 2.4% likelihood of
airworthiness-related accidents over that of single-engine aircraft. Regarding phases of flight,
the odds ratios of airworthiness failures during the arrival and departure segments indicated
likelihoods of 37.8% and 20.9% respectively, in comparison to accidents in the remaining
phases of flight (largely dominated by the cruise). Considering the interaction between
aircraft category and lighting condition, the change in the odds indicated that multi-engine
aircraft operated in daylight were 48 times more likely to be involved in airworthiness
failures than single-engine aircraft operated at night. However, given the large 95%
confidence interval obtained, this should be interpreted with care. 145
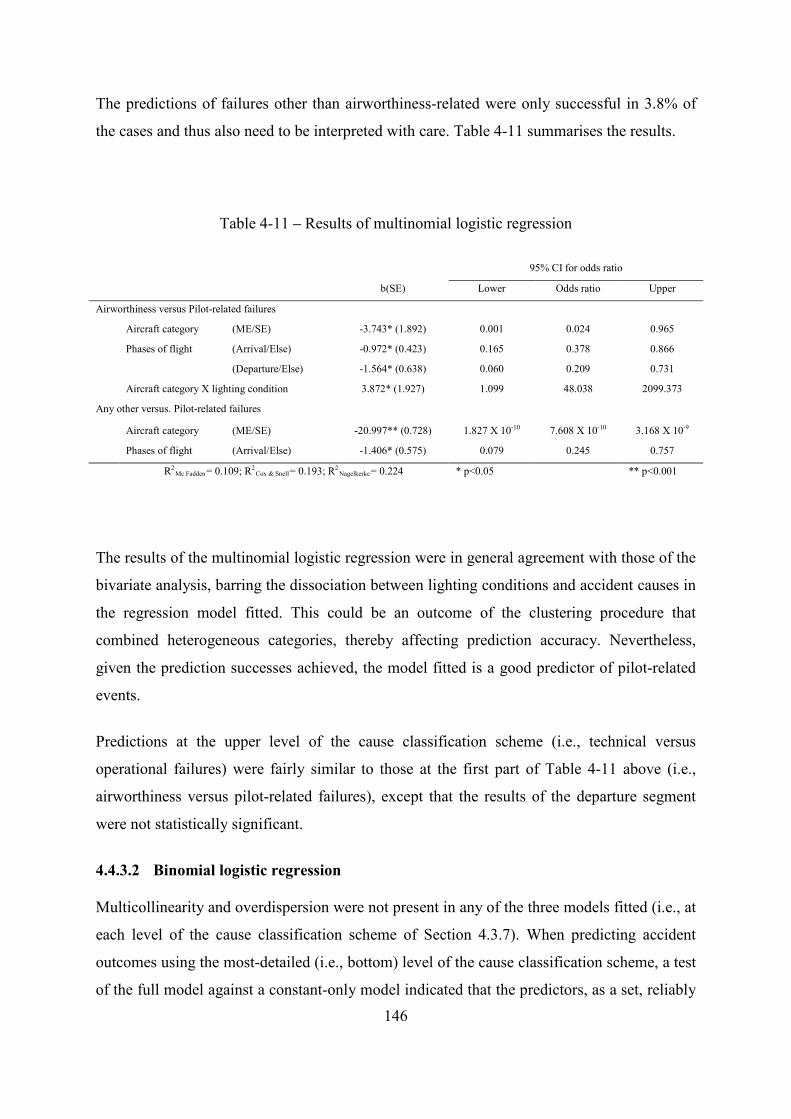
The predictions of failures other than airworthiness-related were only successful in 3.8% of
the cases and thus also need to be interpreted with care. Table 4-11 summarises the results.
Table 4-11 – Results of multinomial logistic regression
95% CI for odds ratio
b(SE) Lower Odds ratio Upper
Airworthiness versus Pilot-related failures
Aircraft category (ME/SE) -3.743* (1.892) 0.001 0.024 0.965
Phases of flight (Arrival/Else) -0.972* (0.423) 0.165 0.378 0.866
(Departure/Else) -1.564* (0.638) 0.060 0.209 0.731
Aircraft category X lighting condition 3.872* (1.927) 1.099 48.038 2099.373
Any other versus. Pilot-related failures
Aircraft category (ME/SE) -20.997** (0.728) 1.827 X 10⁻¹⁰ 7.608 X 10⁻¹⁰ 3.168 X 10⁻⁹
Phases of flight (Arrival/Else) -1.406* (0.575) 0.079 0.245 0.757
R2Mc Fadden= 0.109; R2
Cox & Snell= 0.193; R2Nagelkerke= 0.224 * p<0.05
** p<0.001
The results of the multinomial logistic regression were in general agreement with those of the
bivariate analysis, barring the dissociation between lighting conditions and accident causes in
the regression model fitted. This could be an outcome of the clustering procedure that
combined heterogeneous categories, thereby affecting prediction accuracy. Nevertheless,
given the prediction successes achieved, the model fitted is a good predictor of pilot-related
events.
Predictions at the upper level of the cause classification scheme (i.e., technical versus
operational failures) were fairly similar to those at the first part of Table 4-11 above (i.e.,
airworthiness versus pilot-related failures), except that the results of the departure segment
were not statistically significant.
4.4.3.2 Binomial logistic regression
Multicollinearity and overdispersion were not present in any of the three models fitted (i.e., at
each level of the cause classification scheme of Section 4.3.7). When predicting accident
outcomes using the most-detailed (i.e., bottom) level of the cause classification scheme, a test
of the full model against a constant-only model indicated that the predictors, as a set, reliably
146
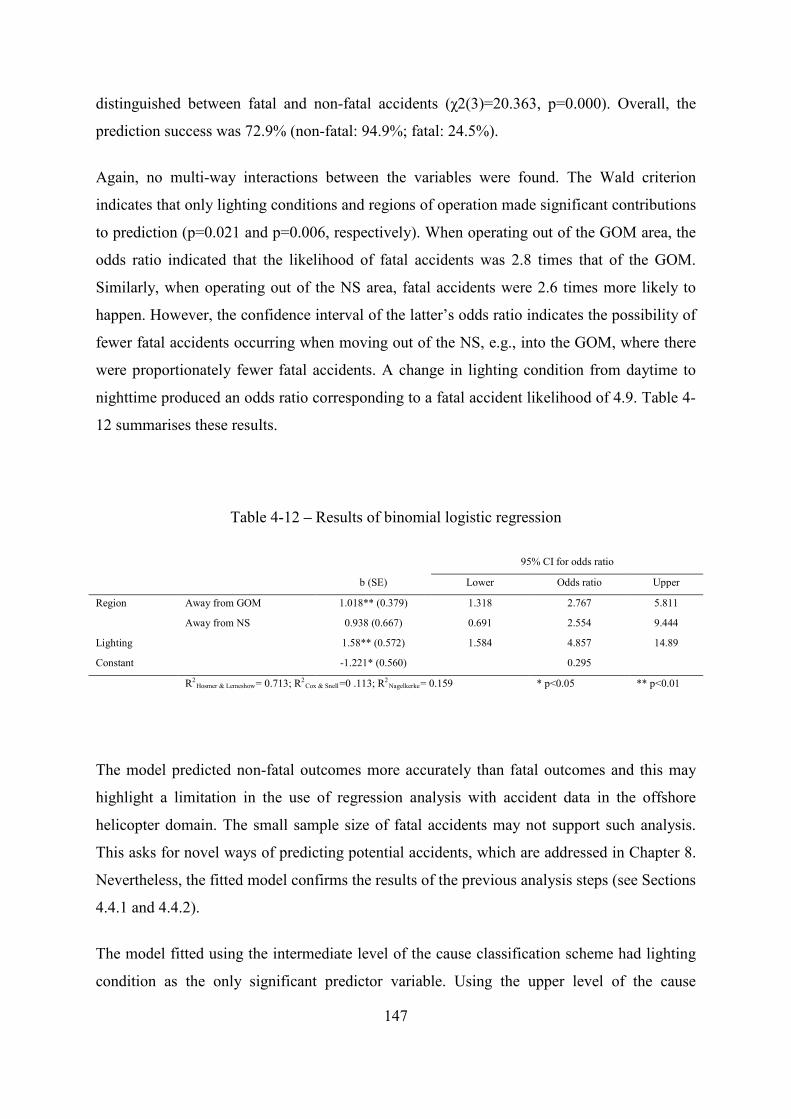
distinguished between fatal and non-fatal accidents (χ2(3)=20.363, p=0.000). Overall, the
prediction success was 72.9% (non-fatal: 94.9%; fatal: 24.5%).
Again, no multi-way interactions between the variables were found. The Wald criterion
indicates that only lighting conditions and regions of operation made significant contributions
to prediction (p=0.021 and p=0.006, respectively). When operating out of the GOM area, the
odds ratio indicated that the likelihood of fatal accidents was 2.8 times that of the GOM.
Similarly, when operating out of the NS area, fatal accidents were 2.6 times more likely to
happen. However, the confidence interval of the latter’s odds ratio indicates the possibility of
fewer fatal accidents occurring when moving out of the NS, e.g., into the GOM, where there
were proportionately fewer fatal accidents. A change in lighting condition from daytime to
nighttime produced an odds ratio corresponding to a fatal accident likelihood of 4.9. Table 4-
12 summarises these results.
Table 4-12 – Results of binomial logistic regression
95% CI for odds ratio
b (SE) Lower Odds ratio Upper
Region Away from GOM 1.018** (0.379) 1.318 2.767 5.811
Away from NS 0.938 (0.667) 0.691 2.554 9.444
Lighting
1.58** (0.572) 1.584 4.857 14.89
Constant -1.221* (0.560)
0.295
R2Hosmer & Lemeshow= 0.713; R2
Cox & Snell=0 .113; R2Nagelkerke= 0.159 * p<0.05 ** p<0.01
The model predicted non-fatal outcomes more accurately than fatal outcomes and this may
highlight a limitation in the use of regression analysis with accident data in the offshore
helicopter domain. The small sample size of fatal accidents may not support such analysis.
This asks for novel ways of predicting potential accidents, which are addressed in Chapter 8.
Nevertheless, the fitted model confirms the results of the previous analysis steps (see Sections
4.4.1 and 4.4.2).
The model fitted using the intermediate level of the cause classification scheme had lighting
condition as the only significant predictor variable. Using the upper level of the cause
147
classification scheme, the results were fairly similar to those of the bottom level. A plausible
reason for such differences might be the reduced modelling accuracy associated with the use
of more generic predictor categories. This confirms that the choice of focus on the results at
the bottom level of the cause classification scheme (described in Section 4.4.3) was adequate.
4.4.4 Validation
Validity with respect to specific criteria was assessed as follows. External validity (i.e., the
extent to which the results of the sample can be generalised to the population; see Burns and
Burns, 2008) was deemed achieved because the sampling procedure was considered to
approach a census (see Section 4.3.8).
The internal validity, which refers to the extent to which the results are valid within the
confines of the study (Burns and Burns, 2008), was assessed with respect to concurrent and
predictive validity. These refer to the extent to which the results truly reflect the current and
future status of safety performance in the industry, respectively. They may be assessed by
direct observation of the phenomenon under study or by evaluating data from other sources.
Since accidents are rare events, observations were not practical. Therefore, data was sought
from the experiences of subject matter experts (SMEs), who were invited to review the
results.
The choice of SMEs had to be done carefully since very few SMEs can comment on offshore
helicopter operations at a global level. Specific legal frameworks ensure that pilots are
licensed nationally and only fly in the regions where their national licenses are valid
(typically the country of issue). This rule limits the build-up of international experience by
most of the pilots and, therefore, their ability to assess the validity of the results obtained.
However, because some companies operate integrated safety and operations departments with
jurisdiction in many countries, SMEs who were knowledgeable on global issues could be
consulted. They were a flight crew manager of the largest offshore helicopter operator in the
world, which operates on all continents; a senior training captain and flight safety officer of a
major European offshore helicopter operator; and a flight operations manager of a major
offshore helicopter operator with headquarters in the North Sea and bases worldwide. All
such professionals agreed that the results obtained were representative of the current issues
148
faced by the industry and would remain so in the future unless decisive corrective actions are
put in place.
4.5 Conclusions
Chapter 2 established the importance of having a robust accident analysis process which
enables the systematic hazard trends and patterns of the nighttime to be identified amidst the
gamut of hazards present in the operation. In this chapter, an accident analysis process with
the required capability was, for the first time, developed and implemented.
The implementation of the process has resulted in the identification of a number of critical
areas for priority intervention both in the nighttime and beyond. These areas were validated
by carefully selected SMEs and include the need for the following:
• Improvement in the quality and sharing of accident data;
• New metrics for the normalisation of accidents (i.e., technical accidents should be
normalised by the flying hours, whereas operational accidents should be normalised
by the cycles of takeoff and landing);
• Careful analysis of pilot performance at night;
• Careful analysis of pilot performance in the arrival flight segment of flight;
• Consideration of the use of MT helicopters in more benign conditions (e.g., by
reducing the frequency of nighttime operations);
• Assessment of the seaworthiness and crashworthiness of MT helicopters;
• Careful analysis of pilot- and maintenance-related events in daylight in the Gulf of
Mexico, including from the perspective of biased attribution of accident causes;
• Consideration of terminating the use of SE helicopters in the Gulf of Mexico;
• An alternative safety paradigm that accounts for hazard prediction in the face of rare
catastrophic (i.e., fatal) accidents.
With regard to nighttime operations specifically, it was concluded that the nighttime accident
rates (fatal accident rates in particular) were significantly greater than those of the daytime
and mostly stemmed from operational issues, especially poor pilot performance. These
accident rates were highest in areas away from the North Sea and Gulf of Mexico. However,
it was concluded from the analysis of accidents by frequencies (i.e., the bivariate analysis)
149
that nighttime accidents were associated also with the North Sea. Higher nighttime accident
frequencies were additionally associated mid-twin turbine helicopters and fatal controlled
flights into terrain or water (CFITWs). Finally, the nighttime was a reliable statistical
predictor to operational as well as fatal accidents in the logistic regression models fitted to the
accident data.
These conclusions can be usefully mapped to the industry’s taxonomy of Chapter 3. Given
the higher completeness of the data and fewer clustering of categories involved, this is best
done by using the results of the bivariate analysis (Section 4.4.2.1), as shown in Figure 4-6.
During the nighttime, accidents were found to be associated with pilot performance (i.e.,
flight crew), MT aircraft (i.e., attributable to design) and region (i.e., country of operation).
The representation of these associations overlaid onto the industry’s taxonomy generates an
initial idea of where the main problems leading to nighttime accidents lie and, therefore,
where safety interventions and in-depth hazard identification efforts could concentrate for
maximum benefit. However, given the low quality of the accident data analysed and the
associated need of various compromises (e.g., clustering of categories and use of generic
causes), the results and interactions in the taxonomy can only be presented at a high level
which still requires further in-depth analysis for accurate hazard identification, risk analysis
and thence targeted mitigation actions.
Given the need of further hazard identification mentioned above, coupled with the other gaps
in reactive hazard identification processes identified in Chapter 2 (Section 2.3.3.1.2), Chapter
5 investigates the statistical utility of reported incidents as precursors of accidents (as
believed to exist in aviation) in the offshore helicopter industry. This further enables to
undertake hazard identification and risk analysis in support of nighttime offshore helicopter
operations, grounded on empirically verified data.
150
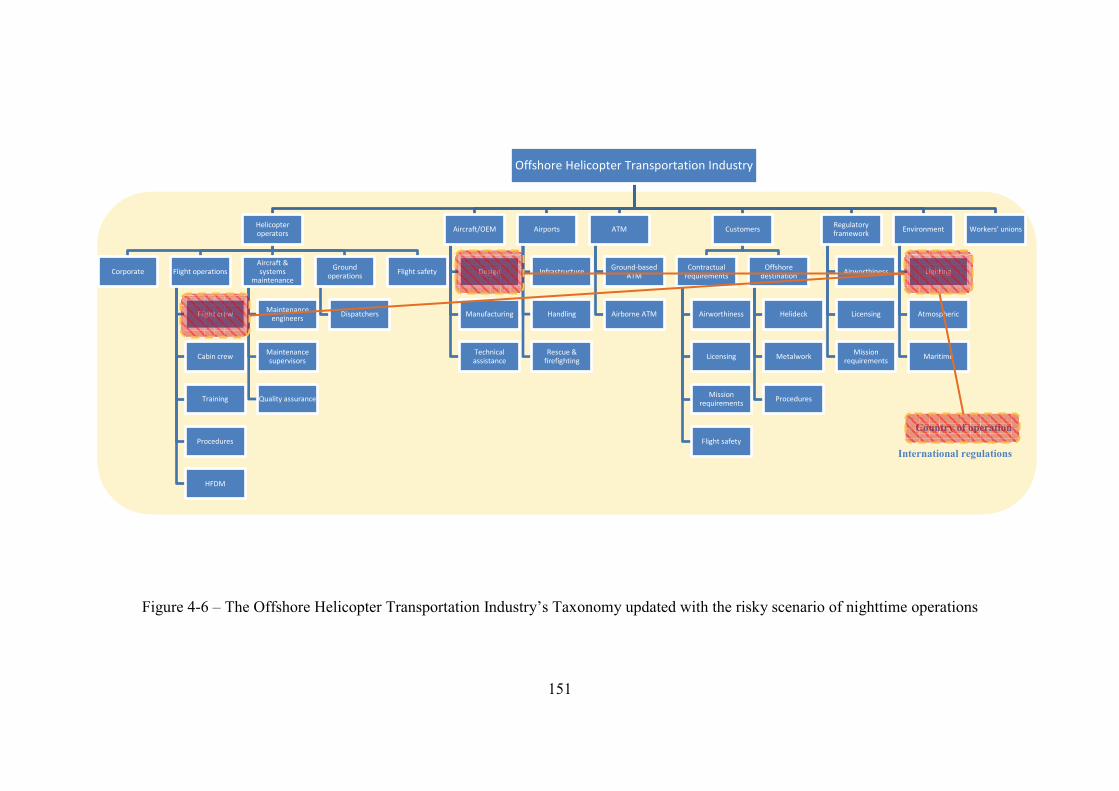
Offshore Helicopter Transportation Industry
Helicopter operators
Corporate Flight operations
Flight crew
Cabin crew
Training
Procedures
HFDM
Aircraft & systems
maintenance
Maintenance engineers
Maintenance supervisors
Quality assurance
Ground operations
Dispatchers
Flight safety
Aircraft/OEM
Design
Manufacturing
Technical assistance
Airports
Infrastructure
Handling
Rescue & firefighting
ATM
Ground-based ATM
Airborne ATM
Customers
Contractual requirements
Airworthiness
Licensing
Mission requirements
Flight safety
Offshore destination
Helideck
Metalwork
Procedures
Regulatory framework
Airworthiness
Licensing
Mission requirements
Environment
Lighting
Atmospheric
Maritime
Workers' unions
LLightighttingtinggggg gg
FliFliightightt cret creewewFliightight cret c ewew
DDDesDessignsigngg

152
CHAPTER 5 ASSESSMENT OF THE STATISTICAL UTILITY OF REPORTED INCIDENTS
Chapter 4 developed a new accident analysis process to improve the offshore helicopter
transportation industry’s awareness of its systematic hazard trends and patterns, especially in
the nighttime. An important conclusion from that chapter is that an alternative safety paradigm
is needed to ensure continuous hazard identification and risk analysis on the face of rare
catastrophic accidents. As discussed in Chapter 2, at present, continuous hazard identification
and risk analysis largely relies on the incidents reported by front-line personnel (e.g., pilots and
maintenance engineers). However, several factors may affect the validity of incident reports,
leading to the incorrect identification of hazards and thence wrong risk analysis and ineffective
prioritisation of safety interventions. In order to avoid this, it is important to empirically assess
the statistical utility of reported incidents as indicators (also referred to as ‘precursors’) of
impending accidents, as generally believed to occur in the aviation industry. This is achieved
by means of a process developed and implemented in this chapter. The first section briefly
recapitulates and expands the theoretical background underpinning incident/serious incident
data analysis. This is followed in Section 5.2 by a description of the drivers to incident data
quality, with focus on helicopter operations. In Section 5.3 the architecture of the process is
outlined and implemented in Section 5.4. Section 5.5 presents the results, which are discussed
in Section 5.6. Sections 5.7 and 5.8 discuss the validation and limitations of the process,
respectively. Section 5.9 outlines important conclusions, which enable to improve the utility of
incident reports for hazard identification, risk analysis and thereby risk mitigation in the
offshore helicopter industry, especially in the nighttime.
5.1 Theoretical background
As discussed in Sections 2.3.3.1 and 2.3.3.1.2, the importance given to reporting incidents and
serious incidents is associated with the belief that incidents, serious incidents and accidents
share the same aetiology. This belief originated from Heinrich’s factory investigation
(Heinrich, 1980) which established a statistical precursor relationship between events of
various severity levels. The belief in this relationship has endured and been accepted with an
unverified status of truism in many industries (Hollnagel, 2004; Reason, 2008) such as rail
operations (Kyriakidis et al., 2012), occupational safety (Kjellén, 2000; Bird Jr. and Germain,
153
1992) and civil aviation. Different pyramidal representations of the alleged statistical
relationship between accidents and (serious) incidents have been extensively used in safety and
training materials, with all pyramids expressing the idea that an accident is preceded by many
incidents of similar characteristics (ICAO, 2005b, 2006c, 2012c; Hernandez, 2005; FAA Air
Traffic Organization, 2008, 2009c; FAA, 2000; Pilgrim, 2010).
It results from the statistical precursor relationship that the optimal use of serious incident and
incident data for hazard identification and risk analysis is as numerical indicators of impeding
accidents. In the aviation industry, this has resulted in the belief that the incidents/serious
incidents reported to occur most frequently directly indicate the characteristic of an impending
accident. However, the pyramid itself and its specific application in the aviation industry have
been disputed on various grounds explained in Section 2.3.3.1.2. When the precursor
relationship cannot be validated, incident reports should be assessed and used individually
(Helmreich and Merritt, 1998; Harper et al., 2011), provided that specified data quality criteria
are met, as discussed in the following section.
5.2 Data quality considerations
Chapter 4 has discussed the importance of data quality for accident analysis, with the
conclusion that the generation of accident data should satisfy specified data quality criteria with
respect to defined dimensions and metrics.
Data quality is equally important to reliably identify hazards and analyse risks from reported
incidents. Given that incident data are usually stored in large databases, the factors for assured
data quality include the characteristics of the database in terms of data input, storage and
retrieval capabilities (Holt, 2009). Additionally, the stakeholders involved in all such activities
are instrumental in determining the quality of the reported incident data.
5.2.1 Stakeholders involved
Assuring quality incident data requires the identification of the stakeholders involved and the
development of appropriate data quality control mechanisms. Stakeholders can be categorised
as collectors, custodians or consumers of data (Lee and Strong, 2003). All have important roles
to play in data quality management.
154
For instance, whilst pilots and maintenance engineers (i.e., data collectors) could bias the data
collected by underreporting nighttime human factors incidents (thus compromising the ‘value-
added’ dimension of data quality), this could well be the result of insufficient guidance
provided by data custodians (e.g., the incident database designers and operators from
regulatory bodies) in relation to the types of incidents to be reported. Value-added refers to the
extent to which the incidents captured in the database are beneficial, useful and correspond to
their true real world values (Lee et al., 2002). Low value added is a recurring problem of
reported incidents in aviation in general (e.g., CAA, 2010c; Corrie, 1997; Holt, 2009).
Low quality data might also be produced by data collectors who are not sufficiently aware of
the relevance of reporting specific incidents to data consumers (e.g., the regulator’s safety
analysts). Indeed, previous research has identified that informing data collectors about the
needs of downstream data consumers, facilitates the generation of higher quality data (Lee and
Strong, 2003). This corroborates the need to educate professionals on the use of the
occurrences reported under incident reporting schemes, as well as the critical factors associated
with underreporting and biased reporting of incidents.
5.2.2 Critical factors for effective incident reporting
Many factors can influence the willingness to report incidents and serious incidents in safety-
critical industries. In the UK military for example, the time investment and effort associated
with reporting incidents, as well as fear of punishment, were found to be the main factors for
underreporting. Moreover, faulty information feedback mechanisms, which leave the reporting
individual oblivious to the associated safety actions taken, were identified. Nevertheless, when
reporting occurred, it was most often biased towards technical issues (e.g., faulty equipment).
This was attributed to greater guidance on what technical incidents consisted of and greater
event traceability (e.g., by recorded engine exceedances) than with the less tenable human
factors occurrences. From the over 4800 incident entries in 2007, only 65 were related to
human factors events (Holt, 2009).
In the USA, the reporting of incidents and serious incidents in civil operations under the
Aviation Safety Reporting System (ASRS) increased considerably after the operation of such
database was transferred from the Federal Aviation Administration (FAA, a regulatory body
with power to levy fines and revoke licences) to the National Aeronautics and Space
155
Administration (NASA, an independent body without such powers). Besides the suspicion on
the dual role of the regulatory agency, fear of litigation and breaches of the scheme’s
confidentiality by magistrates were also speculated as factors for underreporting (Corrie, 1997).
Van der Schaaf and Kanse (2004a, b) explored why workers still hesitated to disclose self-
errors at a chemical processing plant renowned for its good safety culture. Besides some of the
reasons mentioned above, they added that perceived uselessness (e.g., feeling that reports
would not be acted upon by management anyway), accepted risk (i.e., understanding that some
types of risk - e.g., own errors - are inherent to the job), sense of personal immunity and a
‘macho’ attitude could be factors affecting the will to report. These factors were also
mentioned by Stewart (2008) under various forms of ‘locus of control’.
‘Perceived dread’ (Bohm and Harris, 2010; Slovic, 2000) might also influence the reporting of
incidents. This is an effect whereby reporters tend to overestimate the frequencies of the factors
that appeal to their fears, thereby reporting such occurrences more often than the frequency
with which they actually occur. Differently, Steckel and Patankar (2012) identified that the vast
majority of errors of aircrews in the cockpit are simply not noticed, particularly if they happen
during the execution of routine procedures and when corrective actions are successful. This
endorses the need not to solely rely on reported incidents (Herrera et al., 2010a).
According to the first edition of ICAO’s Safety Management Manual (SMM; ICAO, 2006c)
some other factors for incident underreporting included embarrassment in front of peers, self-
incrimination and true sanctions, such as enforcement action by regulatory authorities. On the
other hand, the principles of good reporting systems were listed as follows:
• Trust; i.e. that the information disclosed will not be used against the reporting
individual.
• Non-punitive nature; often achieved by the regulatory authority and top management
assuring the confidentiality of the reporting individual.
• Inclusive reporting base; e.g., not only focused on capturing the flight crew’s view but
also that from ground handlers.
• Independence; e.g., the operator of the database does not possess regulatory powers; or,
in State-run databases, clear assurance is given that the information reported will be
used only for safety purposes.
156
• Ease of reporting; e.g., as many tick off questions as possible.
• Acknowledgement; i.e. some call-back capability so that reporting individuals know
what resulted from their reports.
• Promotion; e.g., disseminating the reporting scheme’s existence with maximum
exposure, using a variety of communication media.
• Timely sharing the information reported with the aviation community.
In its second edition, the SMM (ICAO, 2009c) places greater responsibility on senior managers
for fostering a safety culture in which front-line personnel (e.g., pilots and maintenance
engineers) feel compelled and protected to report their genuine mistakes. Based on Reason’s
theories (GAIN Working Group E, 2004; Reason, 1997), such safety culture (and thus effective
reporting systems) stem from five organisational traits:
• Effective sharing of information.
• Flexibility to reach the persons able to correct systemic faults directly.
• Positive learning environment.
• Clear accountabilities.
• Operators’ willingness to report.
Acknowledging the importance of such traits, Westrum (1988, 1991) defined progressive levels
of safety culture to be pursued by organisations, the most robust of which is seeing safety as an
integral part of the business. Such a safety culture (referred to as ‘generative’) would facilitate
wide reporting and proactively seek creative ways of avoiding accidents.
Given that the critical factors for effective reporting presented in this section were primarily
identified in the aviation domain, it is reasonable to expect that they may be applicable to
helicopter operations. This is discussed in the next section.
5.2.3 Reporting culture and data quality in helicopter operations
Chapter 4 has shown that the reporting of helicopter accidents is still problematic, both in
offshore operations and across the wider rotary community (Section 4.1). Problems related to
underreporting, inconsistent use of definitions and low data quality in general are still to be
157
addressed, despite the fact that accident investigations tend to be closely monitored by national
authorities and the general public.
Given that these problems largely reflect the degree of maturity of the industry with respect to
safety, aggravated by the subjective nature of reported incidents (Section 2.2.3), it is reasonable
to expect that the problems of accident reports can also exist across reported incidents. In fact,
there are very few studies related to reported incidents in helicopter operations, with all
confirming that the quality of reports remains a serious concern preventing effective hazard
identification and risk analysis.
For example, in an analysis of 3481 helicopter incidents and serious incidents reported to the
UK regulator between 1995 and 2004, Mitchell (2010) identified that only 10% of the reports
filed corresponded to private flights. However, such operations sustained 47% of all helicopter
accidents in the same period. It was also noted that human factors issues only caused 17% of
the reported occurrences, whereas they were attributed to 76% of the accidents. The opposite
applied to airworthiness failures, which corresponded to 68% of the UK regulator’s dataset but
to only 16% of the accidents. Given that technical failures are reported more frequently, the
cruise phase usually receives the majority of reports due to the greatest time exposure to wear
and tear (Harris, 2006b; Harris et al., 2000). However, as shown in Chapter 4, this could be
misleading on the impact of the phase of flight on risk (e.g., the typically larger risks associated
with the arrival and departure segments are ignored).
The reasons for the discrepancies included a lack of understanding of safety requirements and
ad hoc relationships between the smaller helicopter companies and their customers (Mitchell,
2010), both of which carry the potential to favour underreporting (CAA, 2010c) or biased
reporting of occurrences.
In the USA, a public enquiry launched after a series of accidents involving helicopters used in
Emergency Medical Services (EMS) also concluded that the scarcity of useful data severely
impaired the analysts’ full understanding of the issues involved (GAO, 2007).
Although it is generally expected that the offshore helicopter industry should be considerably
less affected by the above influences than the general aviation (see Sections 1.1 and 2.3.3.1.1.3
for the proactive role of the oil and gas industry in promoting safety in offshore helicopter
158
operations), little is known in this domain about the data stored in incident databases.
Therefore, the next section proposes a new process to explore the statistical utility of incident
information stored, as believed to exist in the aviation industry, whilst accounting for the data
quality weaknesses identified above.
5.3 Process development
The process was developed to enable the assessment of the utility of reported incidents as
statistical precursors to accidents, as applied in aviation. This is a test of the truth of Heinrich’s
pyramid, as applied in the aviation industry, which considers that the incidents reported most
frequently indicate the characteristics of the impending accident (see Sections 5.1 and
2.3.3.1.2). This is similar to a construct validity assessment exercise, i.e., a test of the extent to
which a measuring device (i.e., reported incidents) relates to the theoretical concepts
underpinning its creation (Burns and Burns, 2008), as applied in the aviation industry.
However, this chapter is written from a more flexible stance whereby the underpinning theory,
as specifically applied in the aviation industry, is also in question.
Because the problems of low data quality identified in the previous chapter can be expected to
also affect reported incidents (see Section 5.2.3), the accident analysis process developed in
Chapter 4 was adapted and complemented to realise the process involving the following tasks.
1) Define the type of reported incident to be used in the assessment (e.g., mandatory
and/or voluntary incident reports).
2) Establish criteria for the selection of a model incident databases, with a focus on data
quality.
3) Select a model incident database.
4) Define a timeframe which enables learning lessons with relevance to current operations.
5) Sample incidents from the database.
6) Extract variables of relevance to accidents/incidents (i.e., the hazards).
7) Check variables for completeness and make recommendations on improved data
collection where needed.
8) Sample accidents in the area covered by the incident database during the timeframe
selected.
9) Assess the fit of the incident data to Heinrich’s theory, as applied in the aviation
159
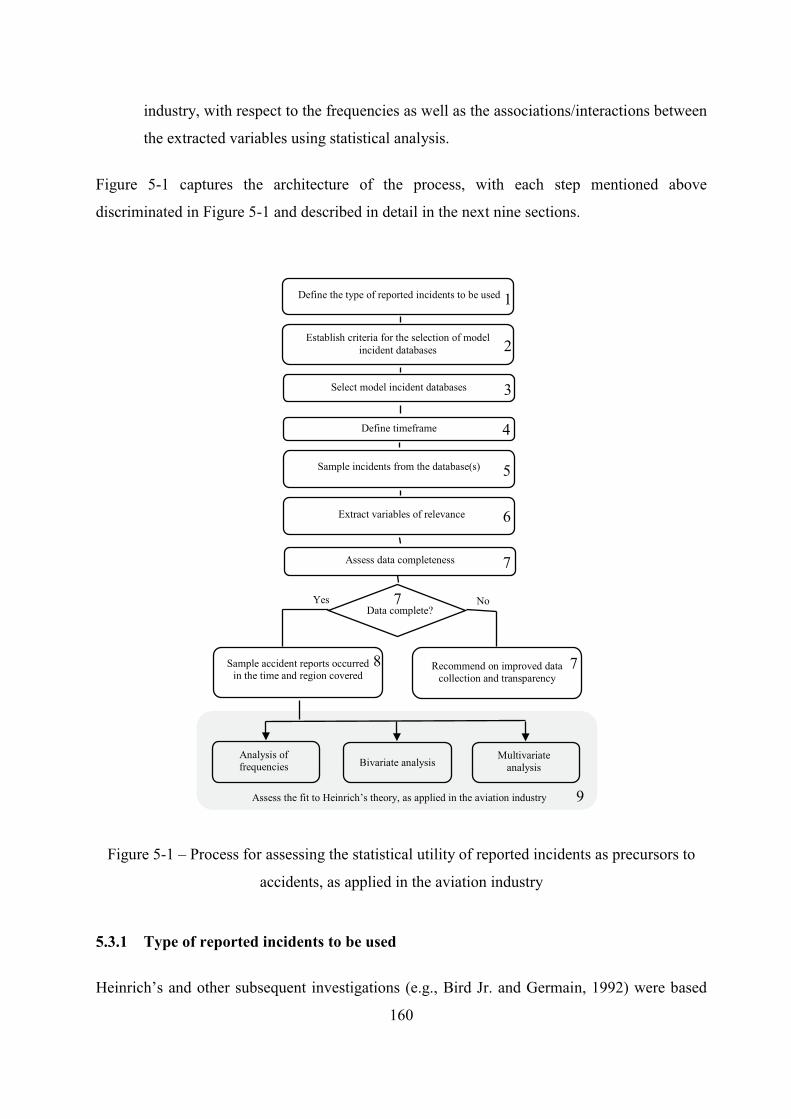
on closed-claim-file insurance records (Manuele, 2011). This entails the obligation or
compelling incentive to report. Therefore, in order to enable as accurate an assessment as
possible of the application of Heinrich’s pyramid in the aviation industry, the type of incident
data to be used in the reported incident statistical utility assessment should reflect some form of
obligation or compelling incentive to report.
5.3.2 Criteria for the selection of model incident databases
The model incident databases selected should be trustworthy in terms of the expected external
validity of the reports, i.e., the incidents stored should be a fair representation of the population
of actual incidents in the field (Burns and Burns, 2008). Section 5.2.2 outlined several factors
which promote the environment where open reporting is expected to flourish and, hence,
should satisfy the representativeness criteria. The principles of good reporting systems outlined
in ICAO (2006c) should be taken into account when selecting databases for the statistical
utility assessment.
Another indirect indicator of the trustworthiness of the database might be its assumed or
expected utility. Although reported incidents should not be used on the basis of their
frequencies unless the statistical precursor relationship is validated and representativeness is
assured, such use reveals a degree of trust on the reports. This is typically associated with an
observed positive reporting culture.
Other relevant factors include database publicity (e.g., the degree to which the associated
reporting scheme is known to the population of potential reporting individuals) and the
availability of its incident data for use in the statistical utility analysis.
5.3.3 Database selection
The selection of databases depends on the purpose of the analysis, e.g., country-based or
multiple areas. In the latter case, it may be necessary to assess specific data quality dimensions
in order to ensure that the data from different databases can be merged without loss of vital
information. In the former case, Multi-Criteria Decision Analysis (Zionts, 1979; Fischhoff et
al., 1984) could be used to select the highest quality databases.
161
5.3.4 Timeframe selection
As outlined in Chapter 4 (Section 4.2.1), in order to ensure relevance to current operations, the
timeframe selected should be representative of the current technologies and operating
conditions. However, since incident databases are typically run on a country or regional basis,
this assessment should be made with respect to the area covered by the candidate databases.
The timeframe with the characteristics above may be identified from the summaries of
helicopter activity published by national or regional institutions, e.g., the UK Civil Aviation
Authority (CAA, 2005) and teams of the International Helicopter Safety Team (IHST, e.g.,
EHEST, 2010).
5.3.5 Sampling incidents from the database
Many incident databases are not designed to be operation-specific (e.g., ASRS, 2013).
Therefore, it may be necessary to sample the incidents of interest. Since the characteristics and
capabilities of incident databases may vary considerably (e.g., in some databases the
visualisation of data may depend on search words and, in others, on selecting options from
drop-down menus), it is necessary to ensure that the data sampled from a single database or
different databases are comparable.
5.3.6 Extraction of relevant variables
Since a comparison between accident and incident reports is to be undertaken, the extraction of
relevant variables should follow the strategy outlined in Section 4.2.5 and implemented in
Section 4.3.6.
5.3.7 Completeness checks
As in Sections 4.2.5 and 4.3.6, completeness checks should be employed to avoid biased
analysis results. Although the same completeness check (i.e., simple ratio) and criterion (i.e.,
90%) could be used, less stringent criteria may be employed if essential to enable analysis, with
an acknowledgement of any associated limitations.
162

5.3.8 Sampling accident data
Accident data must be sampled over the same period and region as the incident data. The
sources and strategies outlined and implemented in Chapter 4 (Sections 4.2.5 and 4.3.5) should
be used. Additionally, the variables extracted should match the variables covered by the
incident data.
5.3.9 Procedure to assess the fit of the data to Heinrich’s theory, as applied in the
aviation industry
A three-fold analysis plan is desirable since it enables to assess the application of Heinrich’s
pyramid from complementary viewpoints. This plan differs from the statistical analysis
proposed in Chapter 4. The analysis of incident rates proposed in Chapter 4 is irrelevant to
challenging the specific application of Heinrich’s pyramid in the aviation industry, which is
solely based on the frequencies of reported incidents preceding an accident.
The three-fold analysis plan includes the analysis of the frequencies of incidents against
accidents (i.e., the test of Heinrich’s theory as applied in the aviation industry), pair-wise
associations (i.e., bivariate analysis) and multi-way interactions (e.g., through multivariate
analysis). The last two enable to assess whether the combination of events of variables
matching the characteristics of accidents significantly stand out from all possible combinations
of events, with respect to their frequencies of occurrence. This implies that the Heinrich’s
pyramid, as applied in the aviation industry, holds true with respect to combinations of
incident/accident characteristics, not only to individual characteristics. The tests to be applied
depend on the characteristics and distributions of the data (outlined in Section 5.4.7).
5.4 Process implementation
5.4.1 Type of reported incidents chosen
The reporting of serious incidents is mandatory (ICAO, 2010e) and, therefore, serious incidents
comply with the requirement established in Section 5.3.1. Voluntary reports were discarded
since, by virtue of their dependence on willingness to report, the drive to report is largely
subjective.
163
The choice of serious incidents limits the assessment of the precursor relationship, as applied in
the aviation industry, to the upper two levels of the pyramid (i.e., accidents versus serious
incidents, see Section 5.1).
5.4.2 Model database
Since in aviation serious incidents must be reported to the national accident investigation
authority (or the national civil aviation regulator; see ICAO, 2010e), in principle the databases
of national accident investigation authorities (or national civil aviation regulators) could be
used to support the assessment proposed in this chapter. However, there are usually problems
associated with data availability due to internal data handling procedures, as discussed in the
next section.
5.4.2.1 National accident investigation authorities
Upon receipt of a serious incident report, an assessment is usually made on the extent to which
the situation reported could have turned into an accident. This assessment drives the
commissioning of an investigation or the filing of the report virtually without further
consideration (The National Archives, 1996). Only the serious incidents, subjected to an
investigation, are usually published. As a consequence, the serious incident data in the public
domain fail the availability criterion established in Section 5.3.2 and most likely also fail in
terms of representativeness.
Table 5-1 illustrates the point mentioned above by comparing the numbers of accidents and
serious incidents available from the databases of the 50 national accident investigation
authorities investigated in Chapter 4, Section 4.3.3 (NB: the countries which did not display
any serious incidents publicly have been omitted).
5.4.2.2 Civil aviation regulators
The extent to which the national civil aviation regulators of the 50 countries investigated in
Chapter 4 maintain representative databases of serious incidents is not fully known. However,
since in virtually all countries the availability of serious incident data from the national
accident investigation authorities was poor (see Table 5-1) and the accident data was
incomplete in many respects (see Section 4.3.6), it is reasonable to expect that the criteria
outlined in Section 5.3.2 are not fulfilled by more than a few of the national civil aviation 164
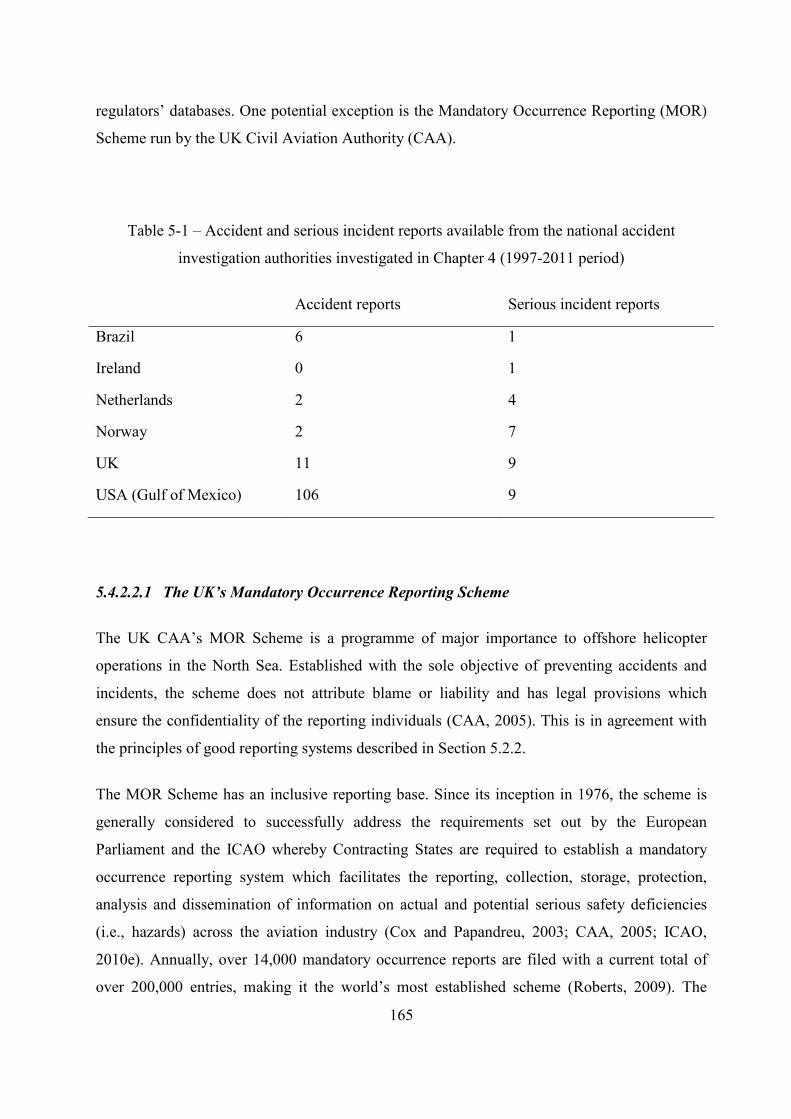
regulators’ databases. One potential exception is the Mandatory Occurrence Reporting (MOR)
Scheme run by the UK Civil Aviation Authority (CAA).
Table 5-1 – Accident and serious incident reports available from the national accident
investigation authorities investigated in Chapter 4 (1997-2011 period)
Accident reports Serious incident reports
Brazil 6 1
Ireland 0 1
Netherlands 2 4
Norway 2 7
UK 11 9
USA (Gulf of Mexico) 106 9
5.4.2.2.1 The UK’s Mandatory Occurrence Reporting Scheme
The UK CAA’s MOR Scheme is a programme of major importance to offshore helicopter
operations in the North Sea. Established with the sole objective of preventing accidents and
incidents, the scheme does not attribute blame or liability and has legal provisions which
ensure the confidentiality of the reporting individuals (CAA, 2005). This is in agreement with
the principles of good reporting systems described in Section 5.2.2.
The MOR Scheme has an inclusive reporting base. Since its inception in 1976, the scheme is
generally considered to successfully address the requirements set out by the European
Parliament and the ICAO whereby Contracting States are required to establish a mandatory
occurrence reporting system which facilitates the reporting, collection, storage, protection,
analysis and dissemination of information on actual and potential serious safety deficiencies
(i.e., hazards) across the aviation industry (Cox and Papandreu, 2003; CAA, 2005; ICAO,
2010e). Annually, over 14,000 mandatory occurrence reports are filed with a current total of
over 200,000 entries, making it the world’s most established scheme (Roberts, 2009). The
165
scheme applies to any aircraft operating under an air operator’s certificate or with a certificate
of airworthiness granted by the UK CAA.
The fact that the scheme is operated in the North Sea is an additional strength. As explained in
Chapters 2 (Section 2.3.3.1.1.2) and 4 (Section 4.3.6.1), this is an area of the world’s second
largest volume of offshore helicopter flights (OGP, 2012b), undertaken under the attentive
watch of various coordinated stakeholders. Such stakeholders have strived to ensure that the
North Sea remains a test bed for the development of novel safety infrastructure and
programmes, which subsequently benefit the wider helicopter community (Fox, 2002; Howson,
2006). Therefore, it is reasonable to expect that the local safety culture might favour the
fulfilment of the data representativeness requirement of the MOR Scheme (see Section 5.3.2).
There is also an assumed or expected utility of the scheme, which is evidenced by its recent use
in Probabilistic Risk Assessments (PRAs) that have informed the establishment of safety
interventions in the offshore helicopter industry (e.g., CAA, 2010c). Although the use of
incident data in PRAs might be inappropriate and challenging this use is at the core of this
chapter, using reported incidents in PRAs is usually associated with the assumption that a
positive reporting culture exists (see Section 5.3.2).
Finally, the data of the MOR Scheme was available to this thesis. Therefore, the MOR Scheme
was chosen for the incident statistical utility assessment.
5.4.3 Analysis timeframe
As mentioned in Section 4.3.1, the UK CAA considers that the 20 years between 1994 and
2013 are representative of current UK operations. However, data was only available in the
years between 1997 and 2010. This was an appropriate period because of the incorporation of
virtually all current aircraft models during this period (Oil & Gas UK, 2011). Therefore, the
period between 1997 and 2010 was used for the assessment.
5.4.4 Sampling of incidents
Occurrence data stored in the MOR Scheme’s database are formed by objective information
(e.g., date, time, location, route, speed, altitude, phase of flight), a title and narrative sections
for the reporter’s description of the event in their own words. Figure 5-2 shows an example of
166
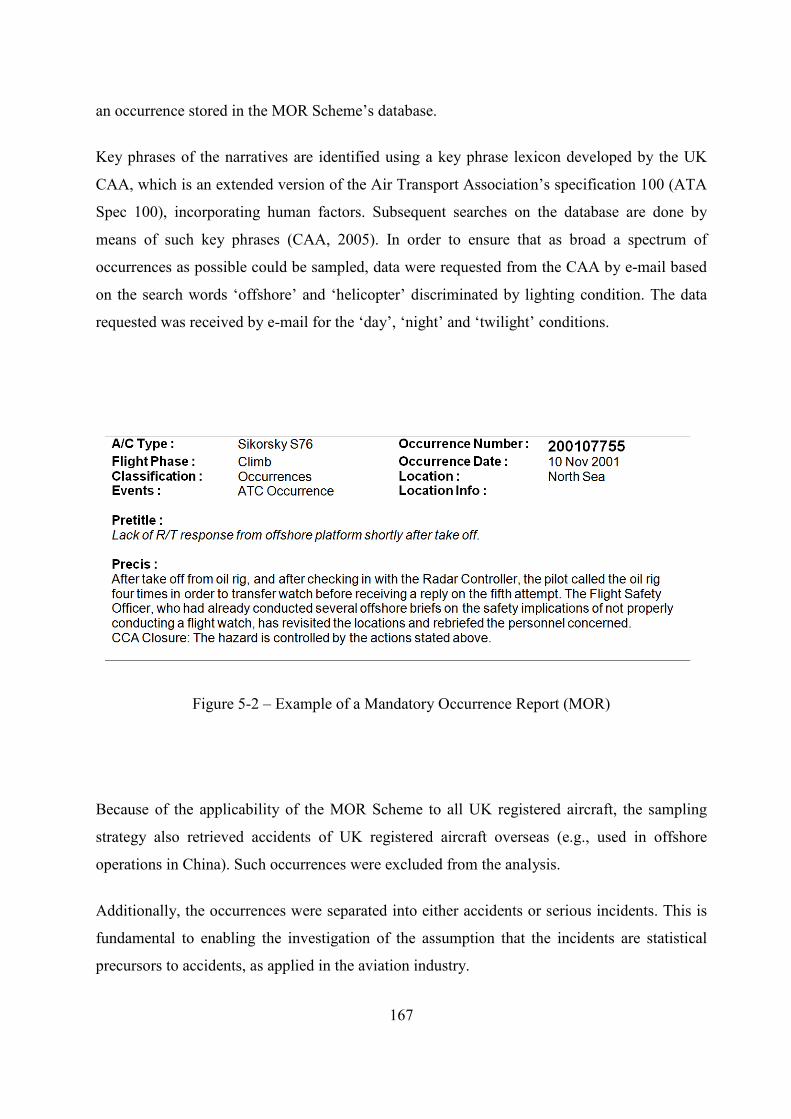
an occurrence stored in the MOR Scheme’s database.
Key phrases of the narratives are identified using a key phrase lexicon developed by the UK
CAA, which is an extended version of the Air Transport Association’s specification 100 (ATA
Spec 100), incorporating human factors. Subsequent searches on the database are done by
means of such key phrases (CAA, 2005). In order to ensure that as broad a spectrum of
occurrences as possible could be sampled, data were requested from the CAA by e-mail based
on the search words ‘offshore’ and ‘helicopter’ discriminated by lighting condition. The data
requested was received by e-mail for the ‘day’, ‘night’ and ‘twilight’ conditions.
Figure 5-2 – Example of a Mandatory Occurrence Report (MOR)
Because of the applicability of the MOR Scheme to all UK registered aircraft, the sampling
strategy also retrieved accidents of UK registered aircraft overseas (e.g., used in offshore
operations in China). Such occurrences were excluded from the analysis.
Additionally, the occurrences were separated into either accidents or serious incidents. This is
fundamental to enabling the investigation of the assumption that the incidents are statistical
precursors to accidents, as applied in the aviation industry.
167
Finally, the database covers both civil and military offshore operations. The title and narrative
of each occurrence were read, enabling to only select the civilian serious incidents for analysis
(see Section 2-1 for the scope of the thesis).
5.4.5 Variables extracted and completeness checks
Phases of flight and incident causes were extracted from the reports by applying the
classification schemes developed in Sections 4.3.6.3 and 4.3.7. Lighting conditions were
extracted based on the sampling strategy presented in the Section 5.4.4 and were categorised
according to Section 4.3.6.4 (i.e., daytime versus nighttime). The sixteen incidents
characterised as ‘twilight’ were incorporated into the ‘nighttime’ dataset for consistency.
The data quality issues discussed in Chapter 4 were also present across the reported incidents.
For example, the typically very brief narratives of the MOR Scheme’s occurrences did not
allow for a deep causal analysis including multiple factors. Therefore, the use of high level
precipitating factors and end states was necessary (see Section 4.3.7). Additionally, the phases
of flight needed clustering so that the minimum cell frequencies required by the statistical tests
could be achieved (Field, 2009; Majumdar et al., 2009b). As in Section 4.3.8.2.1, the phases of
flight were clustered as ground manoeuvres, departure segment, cruise and arrival segment.
Completeness was 100% for all variables, except for phases of flight, which achieved 77%
completeness over the whole study timeframe. Data on phases of flight were missing for the
three initial years covered by the study (i.e., 1997, 1998 and 1999). In order to avoid biasing
the results, any incidents with missing information were excluded from the relevant statistical
analyses.
5.4.6 Sampling of accident data
All accident reports published by the UK’s Aircraft Accident Investigation Branch (AAIB) in
the period of concern were gathered from AAIB (2012c). The accidents characteristics are
presented in Section 5.5.
168
5.4.7 Assessment of the fit of the data to Heinrich’s theory, as applied in the aviation
industry
Accidents and incidents were independently analysed for the three variables mentioned (i.e.,
phases of flight, lighting conditions and causes). The subsequent analyses of frequencies
verified whether the most frequent characteristics across the accidents happened for the whole
1997-2010 period were matched by the characteristics of the incidents most frequently
reported. This highlights any possible long-term trends. Additionally, it was also verified
whether the characteristics of each individual accident corresponded to those most frequently
reported across the incidents of the two years preceding each accident. For these verifications,
analysing frequencies or proportions of reported incidents achieve the same results, the latter
having the benefit of showing the representativeness of reported incidents of specific
characteristics in relation the totality of reported incidents in the period considered.
Two years prior to each accident were chosen to reflect the period in which safety management
practices were expected to have remained constant. This is because safety programmes (e.g.,
HFDM) typically take 2 to 3 years to mature (EASA, 2013c). Additionally, 2 years enabled
reasonable samples of incidents to be gathered for the statistical analysis.
The bivariate analysis was based on the non-parametric statistical tests for categorical variables
mentioned in Section 4.3.8.2.1 (i.e., the Person’s chi square and Fisher’s exact tests).
Frequency associations between pairs of variables (i.e., phases of flight and causes, phases of
flight and lighting conditions, causes and lighting conditions) across the incidents reported
under the MOR Scheme were also explored over the whole period and in the two years
preceding each accident. This was to assess if combinations of variables (instead of each
variable alone) could have indicated the characteristics of the accidents that occurred on the
basis of their frequencies (see Section 5.3.9). Significance was established at p≤0.05 (two-
tailed).
In addition to the clustering of the phases of flight explained in Section 5.4.5, the incident
causes were split into mutually exclusive categories corresponding to those of accidents (using
the bottom level of the cause classification scheme, or the next upper level if the frequency at
the bottom level is zero – see Table 4-6) or all other causes (Section 4.3.8.2.1). For the 1997-
2010 period, the most frequent causes across all accidents at all 3 levels of the causal analysis
169
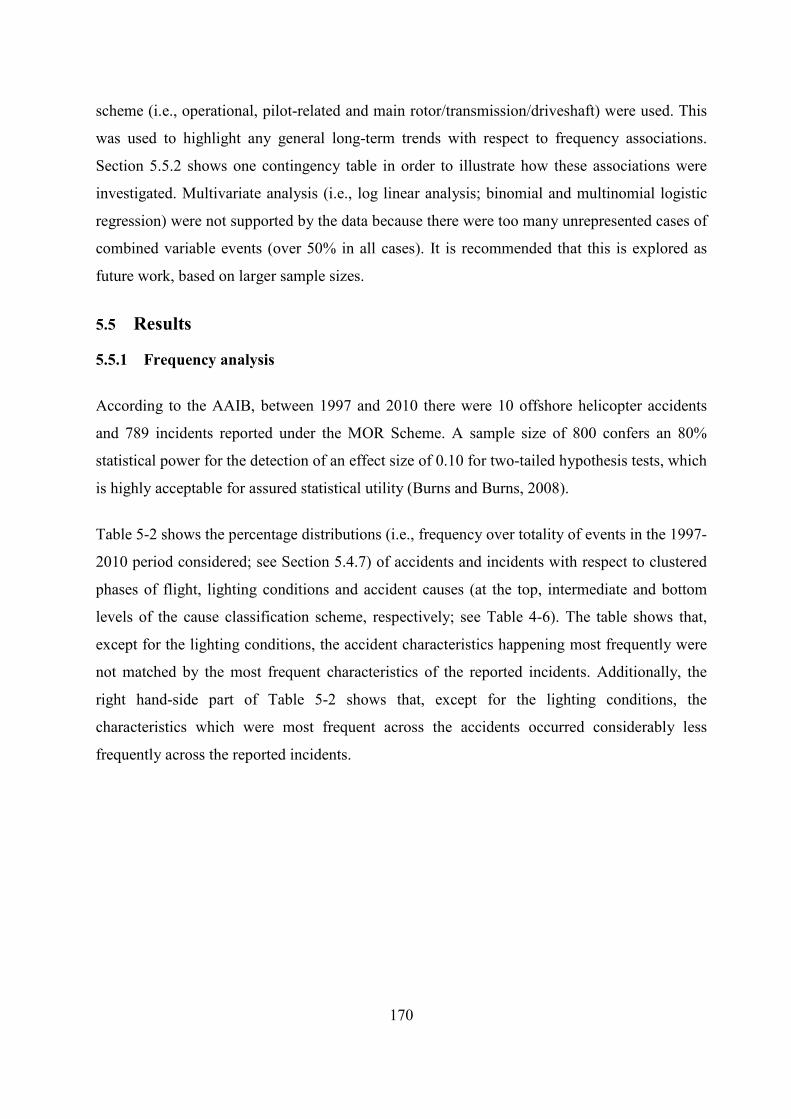
scheme (i.e., operational, pilot-related and main rotor/transmission/driveshaft) were used. This
was used to highlight any general long-term trends with respect to frequency associations.
Section 5.5.2 shows one contingency table in order to illustrate how these associations were
investigated. Multivariate analysis (i.e., log linear analysis; binomial and multinomial logistic
regression) were not supported by the data because there were too many unrepresented cases of
combined variable events (over 50% in all cases). It is recommended that this is explored as
future work, based on larger sample sizes.
5.5 Results
5.5.1 Frequency analysis
According to the AAIB, between 1997 and 2010 there were 10 offshore helicopter accidents
and 789 incidents reported under the MOR Scheme. A sample size of 800 confers an 80%
statistical power for the detection of an effect size of 0.10 for two-tailed hypothesis tests, which
is highly acceptable for assured statistical utility (Burns and Burns, 2008).
Table 5-2 shows the percentage distributions (i.e., frequency over totality of events in the 1997-
2010 period considered; see Section 5.4.7) of accidents and incidents with respect to clustered
phases of flight, lighting conditions and accident causes (at the top, intermediate and bottom
levels of the cause classification scheme, respectively; see Table 4-6). The table shows that,
except for the lighting conditions, the accident characteristics happening most frequently were
not matched by the most frequent characteristics of the reported incidents. Additionally, the
right hand-side part of Table 5-2 shows that, except for the lighting conditions, the
characteristics which were most frequent across the accidents occurred considerably less
frequently across the reported incidents.
170
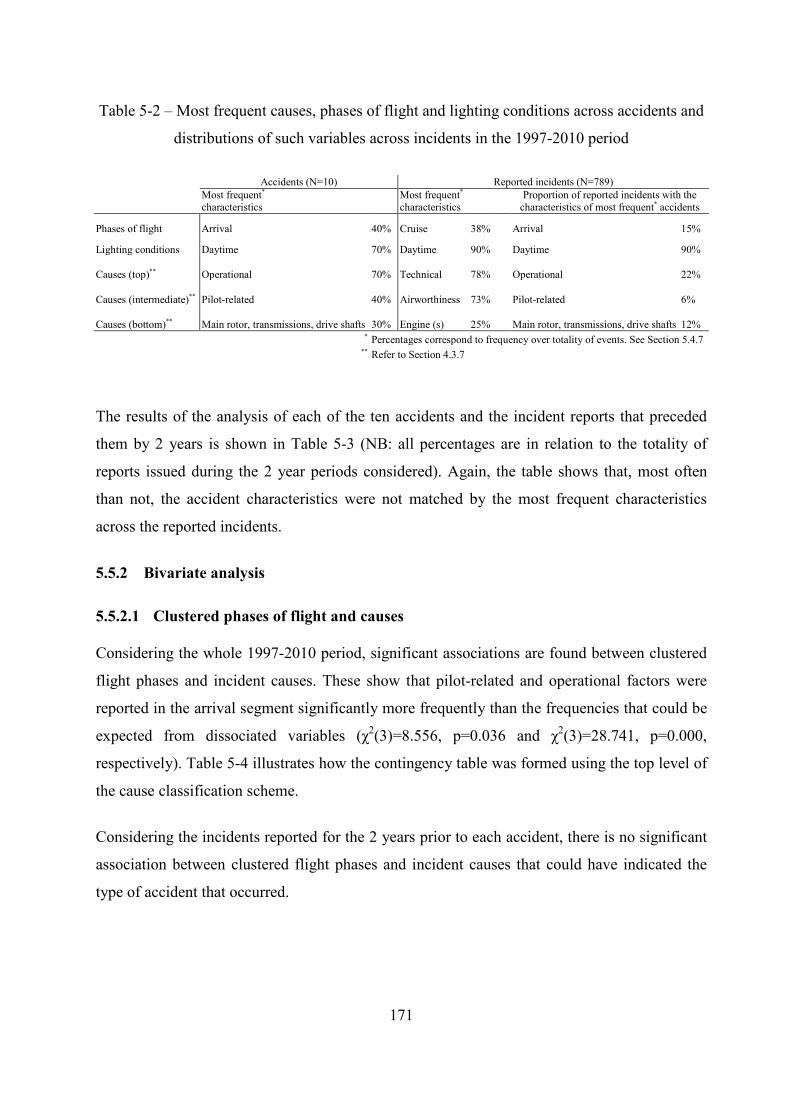
Table 5-2 – Most frequent causes, phases of flight and lighting conditions across accidents and
distributions of such variables across incidents in the 1997-2010 period
Accidents (N=10) Reported incidents (N=789)
Most frequent* characteristics
Most frequent* characteristics
Proportion of reported incidents with the characteristics of most frequent* accidents
Phases of flight Arrival 40% Cruise 38%
Arrival 15%
Lighting conditions Daytime 70% Daytime 90%
Daytime 90%
Causes (top)** Operational 70% Technical 78%
Operational 22%
Causes (intermediate)** Pilot-related 40% Airworthiness 73%
Pilot-related 6%
Causes (bottom)** Main rotor, transmissions, drive shafts 30% Engine (s) 25% Main rotor, transmissions, drive shafts 12%
* Percentages correspond to frequency over totality of events. See Section 5.4.7
** Refer to Section 4.3.7
The results of the analysis of each of the ten accidents and the incident reports that preceded
them by 2 years is shown in Table 5-3 (NB: all percentages are in relation to the totality of
reports issued during the 2 year periods considered). Again, the table shows that, most often
than not, the accident characteristics were not matched by the most frequent characteristics
across the reported incidents.
5.5.2 Bivariate analysis
5.5.2.1 Clustered phases of flight and causes
Considering the whole 1997-2010 period, significant associations are found between clustered
flight phases and incident causes. These show that pilot-related and operational factors were
reported in the arrival segment significantly more frequently than the frequencies that could be
expected from dissociated variables (χ2(3)=8.556, p=0.036 and χ2(3)=28.741, p=0.000,
respectively). Table 5-4 illustrates how the contingency table was formed using the top level of
the cause classification scheme.
Considering the incidents reported for the 2 years prior to each accident, there is no significant
association between clustered flight phases and incident causes that could have indicated the
type of accident that occurred.
171
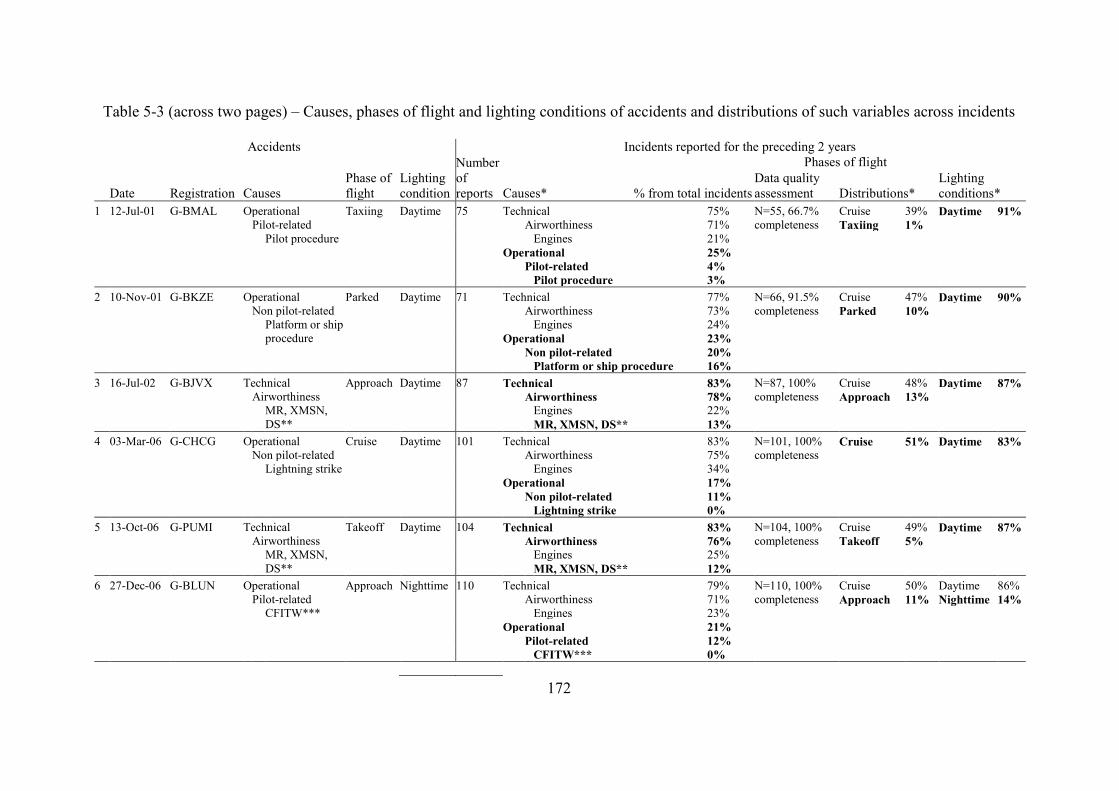
Table 5-3 (across two pages) – Causes, phases of flight and lighting conditions of accidents and distributions of such variables across incidents
Accidents Incidents reported for the preceding 2 years
Date Registration Causes Phase of flight
Lighting condition
Number of reports Causes* % from total incidents
Phases of flight Lighting conditions*
Data quality assessment Distributions*
1 12-Jul-01 G-BMAL Operational Taxiing Daytime 75 Technical 75% N=55, 66.7% completeness
Cruise 39% Daytime 91% Pilot-related Airworthiness 71% Taxiing 1% Pilot procedure Engines 21% Operational 25% Pilot-related 4% Pilot procedure 3% 2 10-Nov-01 G-BKZE Operational Parked Daytime 71 Technical 77% N=66, 91.5%
completeness Cruise 47% Daytime 90%
Non pilot-related Airworthiness 73% Parked 10% Platform or ship
procedure Engines 24%
Operational 23% Non pilot-related 20% Platform or ship procedure 16% 3 16-Jul-02 G-BJVX Technical Approach Daytime 87 Technical 83% N=87, 100%
completeness Cruise 48% Daytime 87%
Airworthiness Airworthiness 78% Approach 13% MR, XMSN,
DS** Engines 22%
MR, XMSN, DS** 13% 4 03-Mar-06 G-CHCG Operational Cruise Daytime 101 Technical 83% N=101, 100%
completeness Cruise 51% Daytime 83%
Non pilot-related Airworthiness 75% Lightning strike Engines 34% Operational 17% Non pilot-related 11% Lightning strike 0% 5 13-Oct-06 G-PUMI Technical Takeoff Daytime 104 Technical 83% N=104, 100%
completeness Cruise 49% Daytime 87%
Airworthiness Airworthiness 76% Takeoff 5% MR, XMSN,
DS** Engines 25%
MR, XMSN, DS** 12% 6 27-Dec-06 G-BLUN Operational Approach Nighttime 110 Technical 79% N=110, 100%
completeness Cruise 50% Daytime 86%
Pilot-related Airworthiness 71% Approach 11% Nighttime 14% CFITW*** Engines 23% Operational 21% Pilot-related 12% CFITW*** 0%
172
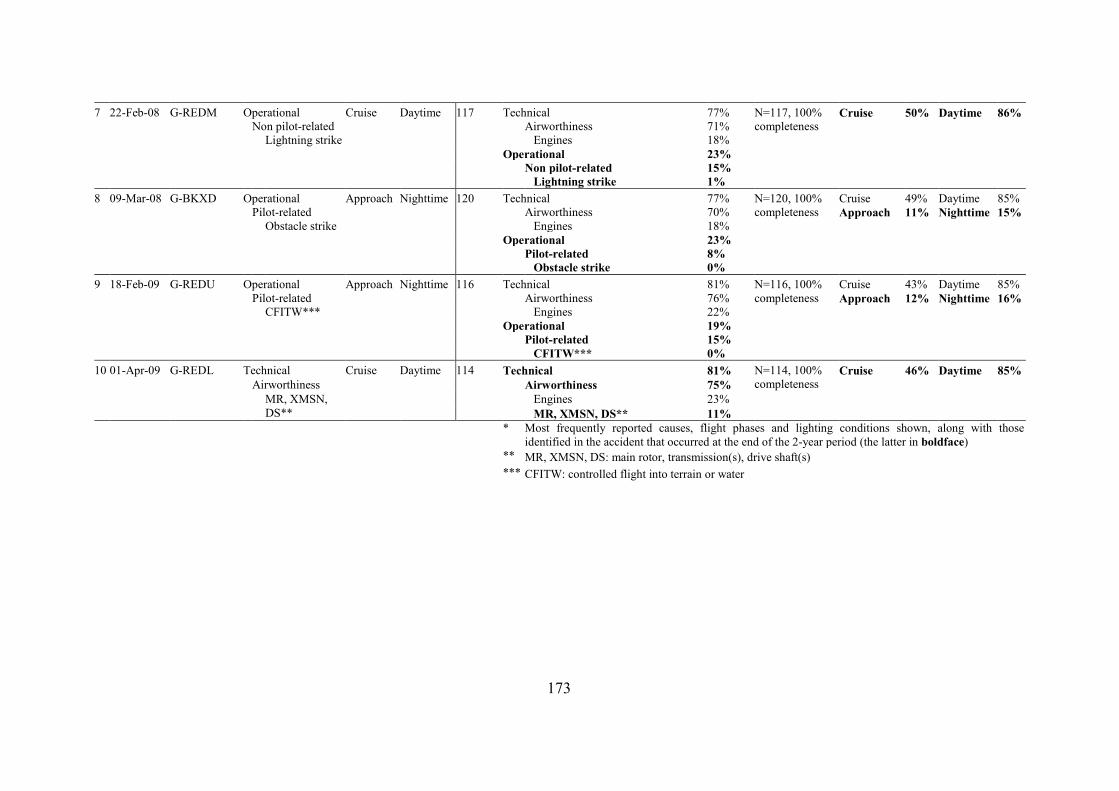
7 22-Feb-08 G-REDM Operational Cruise Daytime 117 Technical 77% N=117, 100%
completeness Cruise 50% Daytime 86%
Non pilot-related Airworthiness 71% Lightning strike Engines 18% Operational 23% Non pilot-related 15% Lightning strike 1% 8 09-Mar-08 G-BKXD Operational Approach Nighttime 120 Technical 77% N=120, 100%
completeness Cruise 49% Daytime 85%
Pilot-related Airworthiness 70% Approach 11% Nighttime 15% Obstacle strike Engines 18% Operational 23% Pilot-related 8% Obstacle strike 0% 9 18-Feb-09 G-REDU Operational Approach Nighttime 116 Technical 81% N=116, 100%
completeness Cruise 43% Daytime 85%
Pilot-related Airworthiness 76% Approach 12% Nighttime 16% CFITW*** Engines 22% Operational 19% Pilot-related 15% CFITW*** 0% 10 01-Apr-09 G-REDL Technical Cruise Daytime 114 Technical 81% N=114, 100%
completeness Cruise 46% Daytime 85%
Airworthiness Airworthiness 75% MR, XMSN,
DS** Engines 23%
MR, XMSN, DS** 11% * Most frequently reported causes, flight phases and lighting conditions shown, along with those
identified in the accident that occurred at the end of the 2-year period (the latter in boldface) ** MR, XMSN, DS: main rotor, transmission(s), drive shaft(s) *** CFITW: controlled flight into terrain or water
173
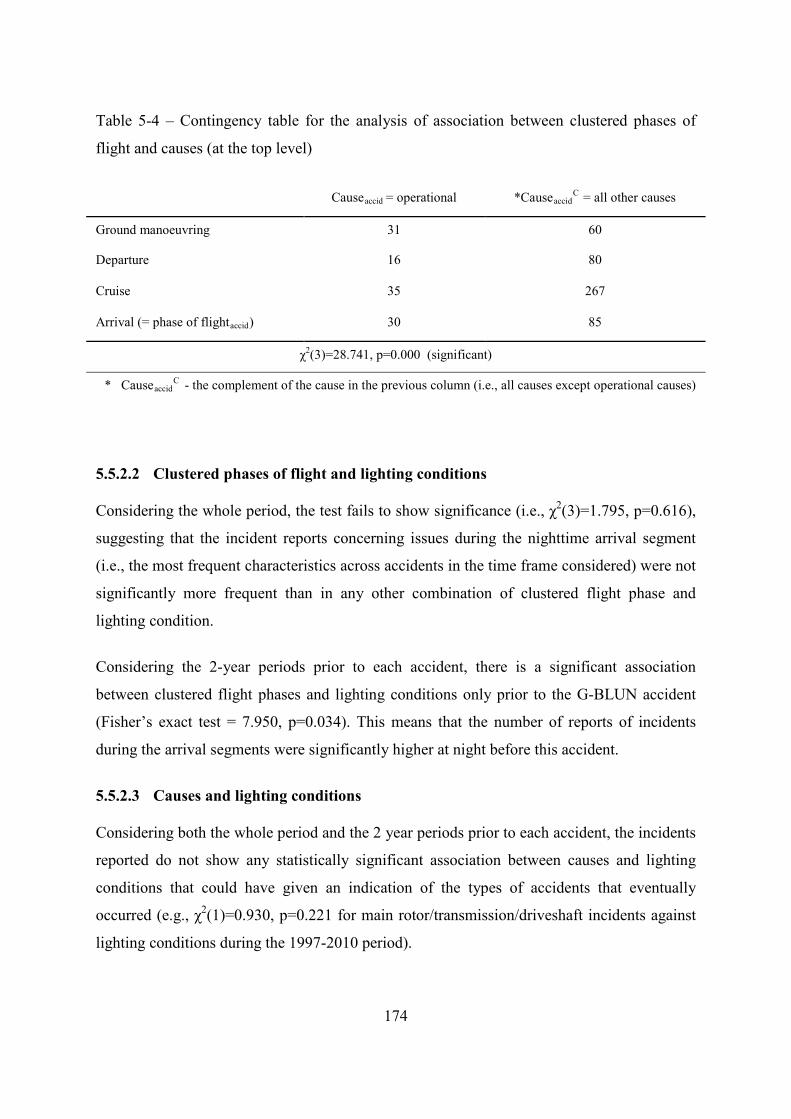
Table 5-4 – Contingency table for the analysis of association between clustered phases of
flight and causes (at the top level)
Causeaccid = operational *Causeaccid
C = all other causes
Ground manoeuvring 31 60
Departure 16 80
Cruise 35 267
Arrival (= phase of flightaccid) 30 85
χ2(3)=28.741, p=0.000 (significant)
* Causeaccid
C - the complement of the cause in the previous column (i.e., all causes except operational causes)
5.5.2.2 Clustered phases of flight and lighting conditions
Considering the whole period, the test fails to show significance (i.e., χ2(3)=1.795, p=0.616),
suggesting that the incident reports concerning issues during the nighttime arrival segment
(i.e., the most frequent characteristics across accidents in the time frame considered) were not
significantly more frequent than in any other combination of clustered flight phase and
lighting condition.
Considering the 2-year periods prior to each accident, there is a significant association
between clustered flight phases and lighting conditions only prior to the G-BLUN accident
(Fisher’s exact test = 7.950, p=0.034). This means that the number of reports of incidents
during the arrival segments were significantly higher at night before this accident.
5.5.2.3 Causes and lighting conditions
Considering both the whole period and the 2 year periods prior to each accident, the incidents
reported do not show any statistically significant association between causes and lighting
conditions that could have given an indication of the types of accidents that eventually
occurred (e.g., χ2(1)=0.930, p=0.221 for main rotor/transmission/driveshaft incidents against
lighting conditions during the 1997-2010 period).
174
5.6 Discussion
Sections 5.5.1 and 5.5.2 showed that the most frequent characteristics of the incidents
reported under the MOR Scheme between 1997 and 2010 and for 2 years preceding the
accidents could not have indicated the types of accident that happened. The exceptions could
have been the more consistent reporting of issues related to ‘platform and ship procedures’
prior to the accident of the G-BKZE (Table 5-3) and the statistical association between
clustered flight phases and lighting condition before the G-BLUN accident (section 5.5.2.2).
However, the specific circumstance of the former (i.e., loss of steering ability by the ship on
which the helicopter touched down) did not figure in any such incident reports and was
hardly predictable before the onset of the accident. Likewise, none of the incidents related to
issues in the arrival segment at night, reported prior to the G-BLUN accident, concerned
operational or pilot-related factors (i.e., all such reports were related to technical issues). This
would have frustrated any attempts to use the reported incidents to predict the characteristics
of an impending accident on the basis of the most frequent incident characteristics, as
generally believed to be the correct use of incident reports in aviation.
Tables 5-2 and 5-3 additionally show that, surprisingly similar to the findings across the
wider, general aviation-dominated British helicopter community (Mitchell, 2010), the
reported incidents are biased towards technical failures, with the issues related to limited
engine performance still dominating (see Table 5-2). This shows that the decision of the
regulators and operators in the North Sea to only employ twin engine aircraft in the offshore
environment is necessary and may be a factor in the lower accident rates compared, for
example, to operations in the USA (see Sections 4.4.2.1 and 4.5), where single engine
offshore helicopter operations are still dominant. The bias towards technical failures explains
why the cruise phase of flight consistently received the greatest number of incident reports, as
predicted in Section 5.2.3.
Failure to show any credible statistical precursor relationship between reported serious
incidents and accidents, as believe to occur in the aviation industry, raises two fundamental
arguments. Firstly, that accidents might be sudden and secondly, that there is an ongoing
underreporting of the relevant safety occurrences in the North Sea offshore helicopter
transportation industry.
175

5.6.1 Sudden failures
The results indicate that Heinrich’s pyramid, as applied in the aviation industry, does not hold
true in offshore helicopter operations, especially with respect to operational and human
factors (e.g., pilot-related) occurrences. This raises awareness for potential sudden failures,
which require an alternative theoretical framework to that of Heinrich’s, as applied in
aviation. Therefore, this chapter endorses the previous recommendation (e.g., Manuele, 2011;
Manuele, 2005) that such a framework should be based on the complete numerical
dissociation between accidents and reported incidents. This is to say that neither the pyramid
nor any geometrical figure should be used to express the statistical relationships between
accidents and reported incidents and thus influence the expectancy of an accident on the basis
of the incidents being reported most frequently (i.e., the specific application of Heinrich’s
theory in aviation). As discussed in Sections 2.3.1, 2.3.2.4 and 3.5.2, accidents in complex
socio-technical systems, such as offshore helicopter transportation, are characterised by
multiple, rare and non-linear combinations of factors which are often not evidenced in routine
reported incidents. Because the reported incidents of low severity cannot numerically indicate
the higher severity accidents to come, acceptance is required that addressing the type of
incident reported to occur most frequently does not assure avoidance of an accident.
Given that accidents may strike in unexpected ways (i.e., with virtually no precursors being
reported; see Table 5-3, especially the incident reports preceding the accidents of the G-
CHCG, G-BLUN, G-BKXD and G-REDU), safety regulators and managers ought to embrace
a safety paradigm which stimulates inventive ways of anticipating possible failures. More
than a good reporting culture, a generative safety culture (see Section 5.2.3) is necessary to
avoid accidents. This is particularly relevant in high risk, low frequency operations, such as
nighttime flying, where available experience and hazard reports are very limited (see Sections
2.1 and Tables 5-2 and 5-3). Therefore, novel processes which enable to elicit the experience
of practitioners in the field and overcome the problems associated with reported incidents, are
currently needed and developed in Chapters 6 to 8.
The virtual absence of precursors to accidents may also be a by-product of evolved safety
culture in highly mature systems. Because in such systems unsafe conditions are continuously
and swiftly identified and corrected, accidents should reflect unforeseen, uncontrollable and
rare events which seldom resemble reported incidents (see Section 2.2.2 and 4.5). Ultimately, 176
in such systems, accidents and incidents might be events that are fundamentally different,
with the former requiring deep knowledge of systemic interactions and creativity for their
avoidance. This endorses that the application of Heinrich’s theory in aviation (i.e., that the
most frequent characteristics across reported incidents indicate the characteristics of an
impending accident) is actually counter-intuitive and, therefore, should be abandoned.
However, it is acknowledged that incident reporting remains important for hazard
identification, risk analysis and, therefore, accident prevention, as discussed in Section 5.6.3.
5.6.2 Underreporting of safety occurrences
An alternative argument to that in Section 5.6.1 is that Heinrich’s premises, as applied in the
aviation industry, could still stand but were not met because there is a worrying
underreporting of the relevant occurrences in the offshore helicopter domain. This would
require a review of the MOR Scheme from the standpoint of consumers, custodians and
collectors of data.
Regarding the analysis in this chapter of the MOR Scheme’s fundamental publication (i.e., a
data consumers’ perspective), it appears that sufficient information is given to data collectors
on what should be reported, including in relation to human factors-related incidents (CAA,
2005). However, a few points for improvement are advised, especially with respect to
operations in degraded visual environments (e.g., the nighttime). For example, because pilots
are likely to suffer from decision-making impairment in such conditions (see Sections 2.3.2.2
and 2.3.2.3), any doubt as to the sufficiency of the external visual cues for visually referenced
flying should prompt the reporting of an incident. At present, only those cases which result in
the minimum descent height (MDH) or other prescribed altitude being violated are
reportable. Nonetheless, the generally adequate guidance provided by data consumers (i.e.,
the UK CAA) does not mean that promotion of the MOR Scheme is assured and the need for
increased publicity should be addressed.
From a data custodian perspective, the data collection method has still room for
improvement. For example, all the objective information regarding the flight (e.g., route,
time, flight number) could be automatically input if the MOR form operated on computer
systems integrated with companies’ flight plans. Although such objective information was
177
found to be of a generally good quality across the reports studied (e.g., good completeness of
flight phase data after the year 1999, see Table 5-3), integrating such systems would relieve
the data collectors (e.g., pilots) from the burden of seeking and writing down this
information. This would leave data collectors free to invest their time and effort on producing
a quality narrative of the facts experienced, which is especially welcome in the late nighttime
when pilots may be more tired following a complete day of work.
In relation to data collectors, there still seems to be considerable scope for improvement in
the reporting culture, especially in relation to operational and human factors-related
occurrences (see validation in Section 5.7). In light of the potential for sudden failures of
these types, developing a good reporting culture should be a priority. This chapter proposes
that this should be achieved through education (and re-education) of aviation professionals.
Good airmanship should be taught as inextricably related to an open reporting attitude, which
in turn has to be supported and facilitated by the regulators and management. This is
particularly important in the exclusively multi-crew environment of the North Sea, where
continuous crew pairing should create a positive camaraderie, which in turn might lead to
peer embarrassment and favour a sense of mutual protection when errors ought to be
disclosed.
It is important to accept that many safety issues will simply not be noticed by the aircrew
(Steckel and Patankar, 2012). Therefore, it is paramount not to solely rely on reported
incidents to detect hazards (Herrera et al., 2010a). In this respect, there are several systems at
present with excellent data collection capability, e.g., HFDM, which can be used in creative
ways. For example, with minor hardware modifications, HFDM could be coupled with
routine video recordings of flights, in and out of the cockpit, for a complete picture of the
hazards waiting to combine in various harmful ways (Steckel and Patankar, 2012). This
would also produce matched outcome and explanatory variables which could be efficiently
used for predictive hazard identification and risk analysis in the nighttime (see Section
2.3.3.3).
5.6.3 The continued importance of reporting incidents
In spite of the results of the analysis in this chapter, it is important to acknowledge that
incident data collection remains extremely important for risk mitigation. Whereas the
178
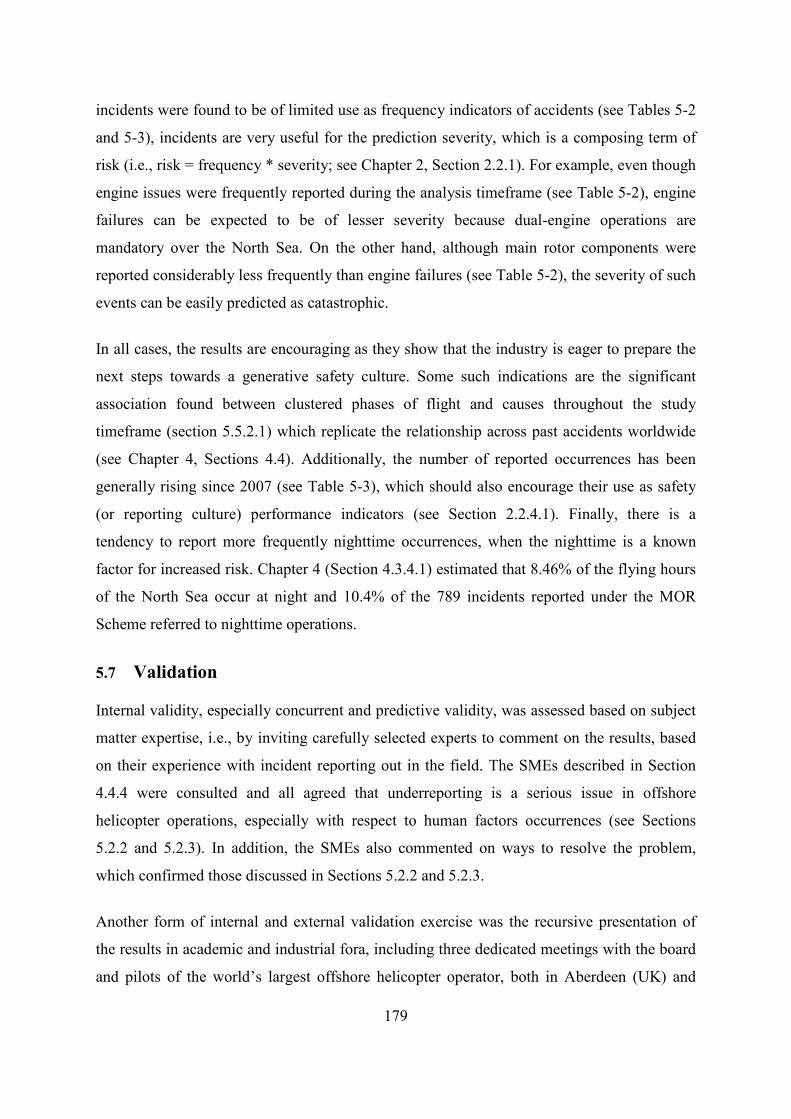
incidents were found to be of limited use as frequency indicators of accidents (see Tables 5-2
and 5-3), incidents are very useful for the prediction severity, which is a composing term of
risk (i.e., risk = frequency * severity; see Chapter 2, Section 2.2.1). For example, even though
engine issues were frequently reported during the analysis timeframe (see Table 5-2), engine
failures can be expected to be of lesser severity because dual-engine operations are
mandatory over the North Sea. On the other hand, although main rotor components were
reported considerably less frequently than engine failures (see Table 5-2), the severity of such
events can be easily predicted as catastrophic.
In all cases, the results are encouraging as they show that the industry is eager to prepare the
next steps towards a generative safety culture. Some such indications are the significant
association found between clustered phases of flight and causes throughout the study
timeframe (section 5.5.2.1) which replicate the relationship across past accidents worldwide
(see Chapter 4, Sections 4.4). Additionally, the number of reported occurrences has been
generally rising since 2007 (see Table 5-3), which should also encourage their use as safety
(or reporting culture) performance indicators (see Section 2.2.4.1). Finally, there is a
tendency to report more frequently nighttime occurrences, when the nighttime is a known
factor for increased risk. Chapter 4 (Section 4.3.4.1) estimated that 8.46% of the flying hours
of the North Sea occur at night and 10.4% of the 789 incidents reported under the MOR
Scheme referred to nighttime operations.
5.7 Validation
Internal validity, especially concurrent and predictive validity, was assessed based on subject
matter expertise, i.e., by inviting carefully selected experts to comment on the results, based
on their experience with incident reporting out in the field. The SMEs described in Section
4.4.4 were consulted and all agreed that underreporting is a serious issue in offshore
helicopter operations, especially with respect to human factors occurrences (see Sections
5.2.2 and 5.2.3). In addition, the SMEs also commented on ways to resolve the problem,
which confirmed those discussed in Sections 5.2.2 and 5.2.3.
Another form of internal and external validation exercise was the recursive presentation of
the results in academic and industrial fora, including three dedicated meetings with the board
and pilots of the world’s largest offshore helicopter operator, both in Aberdeen (UK) and
179
Vancouver (Canada; see Section 9.3.4). During these meetings, the results reported in this
chapter were presented and discussions held to unveil the likely explanations. There was
consensus that underreporting is a serious problem in the offshore helicopter industry due to
the underlying factors covered in Sections 5.2.2 and 5.2.3. Additionally, there was confidence
that the problem is not limited to the British North Sea scenario and, therefore, population
and ecological validity were likely achieved (see Burns and Burns, 2008).
These presentations and meetings (see Section 9.3.4) also enabled to receive feedback on the
validity of the process itself, which was discussed in detail with personnel from the safety
research groups of EASA and the UK CAA. It was accepted that the process is fit for the
intended test of the statistical precursor relationship, as currently believed to exist in aviation.
5.8 Limitations
It is acknowledged that, given the low accident sample sizes, the higher incidence of any
causes, clustered flight phases, or lighting conditions across the accidents (i.e., the
percentages listed in Table 5-2) could be a result of random effects. However, the
associations between clustered flight phases and causes and clustered flight phases and
lighting conditions of reported incidents (sections 5.5.2.1 and 5.5.2.2, respectively) could be
systematic instead of random. These associations were determined to be statistically
significant across helicopter accidents in worldwide offshore operations (see Section 4.4.2.1).
Nonetheless, the application in aviation of the incident-accident statistical precursor
relationship of Heinrich (1980) is claimed to remain valid for each individual accident (i.e.,
an impending accident’s characteristics are predictable from the most frequent characteristics
across reported incidents). Therefore, checking the utility of reported incidents as statistical
precursors of accidents, as applied in aviation (and conversely the truth of the application of
the theory itself), is possible from accident sample sizes as low as unity.
5.9 Conclusions
Chapter 2 established the need to assess the utility of reported incidents as statistical
precursors to accidents, especially the belief in the aviation industry whereby the hazards
most frequently reported as incidents indicate the characteristics of an impending accident.
This is an important topic at present since the offshore helicopter industry is overly reliant on
reported incidents for hazard identification and risk analysis, especially in nighttime
180
operations where other sources of hazard information are virtually absent. However, Chapter
2 also established the lack of a process to assess the truth of the incident/accident statistical
precursor relationship as believed to occur in aviation. This chapter has developed the process
and implemented it for the UK sector of the North Sea. The frequency relationships and
statistical associations between accidents and reported incidents between 1997 and 2010 were
explored using the accident investigation reports published by the UK AAIB and the
incidents filed under the British MOR Scheme. From the results of the analysis, the chapter
has raised the following safety concerns in relation to the assumptions underpinning incident
data collection in offshore helicopter transportation, as well as the process used to generate
incident data.
• The potential for sudden failures is a clear contradiction to the classic incident-
accident pyramidal relationship believed to occur in aviation. This is especially the
case in relation to operational and human performance issues, which are recurrent in
nighttime operations (see Section 4.5). Addressing sudden failures requires
acceptance of the numerical dissociation between accidents and reported incidents and
creative interventions from regulators, operators and aircraft manufacturers.
• Potential flaws in the reporting culture of the offshore helicopter industry, which
unexpectedly reflect the problems identified within the wider (general aviation-
dominated) British helicopter community, i.e., a strong bias towards reporting
technical failures and underreport operational failures.
• The need to educate operators on enhanced recognition of subtle human factor-related
occurrences and improved understanding of the relevance of reporting apparently
negligible events.
• The need to strengthen operators’ trust in the reporting scheme to lead to a generative
safety culture.
• The need to re-evaluate the occurrence reporting scheme in relation to guidance to
reporters, ease of reporting and promotion, with a view to producing quality data for
future use.
• The need to develop other means of collecting data from routine operations, not
relying only on the ad hoc reporting of occurrences.
181
This chapter has shown that the best use of reported incidents is not as statistical precursors to
accidents. Reported incidents are best used individually as indicators of early interventions
needed to ensure safety (Helmreich and Merritt, 1998; Harper et al., 2011), as raw data to
enable the assessment of possible consequences of incidents and, finally, to validate safety
issues identified through other methods (e.g., HFDM and surveys). This has a direct impact
on hazard identification and risk analysis of nighttime operations since any of the usually few
reported incident should be dealt with promptly and carefully.
Given the limitations of reported incidents identified in this chapter, the following chapters
develop novel survey methods to identify hazards and analyse risks in nighttime offshore
helicopter operations, which address the shortcomings identified in Chapter 2. This starts
from an analysis of risk experienced per phase of nighttime flights, which enables to
overcome the limitations of using clustered phases in Chapters 4 and this chapter. This in turn
enables the most critical phases of flight to be identified and selected for the development of
the Task-Based Hazard Identification Survey Process in Chapter 7 and 8.
182
CHAPTER 6 IDENTIFICATION OF THE RISKIEST PHASES OF NIGHTTIME FLIGHTS
The previous chapter developed and implemented a process to assess the statistical utility of
reported incidents, as believed to exist in the aviation industry. It was concluded that reported
incidents are poor statistical indicators of impending accidents, especially with respect to
pilot-related accidents. As shown in Chapter 4, these are extremely high-risk events when
associated with the nighttime. Therefore, there is an urgent need to establish which factors
cause the greatest difficulties to pilots during nighttime operations, beginning with a
consideration of any effect associated with the phases of flight. Given the low quality of the
taxonomies of phases of flight and safety data currently available, the assessment of pilot
difficulties per phase of flight required a novel bespoke taxonomy and a questionnaire survey
to be developed in this chapter. The survey identifies the phases posing the greatest
difficulties to pilots (hence, the riskiest phases) and assesses the impacts of pilot
demographics on the difficulties experienced. This is an important assessment in the context
of pilot-related events, which was unachievable in Chapters 4 and 5 due to the
incompleteness of the accident and reported incident data. This chapter is organised as
follows. Section 6.1 establishes the rationale supporting the assessment of pilot difficulties on
the basis of phases of flight. Section 6.2 reviews available taxonomies of phases of flight and
their limitations to support the identification of pilot difficulties in helicopter operations.
Section 6.3 provides a descriptive analysis of the nighttime accident and serious incident
reports, with the aim of extracting risk information on the basis of phases of flight at a more
detailed level than the high-level analyses of Chapters 4 and 5. The limitations of ongoing
phase-of-flight-specific safety interventions are introduced in Section 6.4. In order to address
the weaknesses identified in the previous three sections, Section 6.5 establishes the
questionnaire survey methodology. The implementation of the survey and the results
achieved are discussed in Section 6.6, which is followed by considerations over the
limitations of the survey in Section 6-7. The conclusions are outlined in Section 6-8 and form
the basis for the development of the Chapter 7.
6.1 Safety analysis on the basis of phases of flight
In aviation, well-discriminated phases of flight reflect analogous pilot activities, task
complexities, environmental factors and aerodynamic loads. Therefore, phases of flight are 183
tacitly accepted as meaningful task entities for analytical purposes. This is reflected in
virtually all accident investigation manuals, accident analyses and incident database
structures, which use phase of flight as a primary hazard variable (see, for example, Menzel,
2011; JSSI - Occurrence Data Analysis Working Group, 2006; Pang, 2011; Khatwa and
Roelen, 1996; Taber and McCabe, 2006; Harris et al., 2000; U.S. JHSAT, 2007; Jarvis and
Harris, 2008; Barroso, 2012; Helmreich and Khatwa, 1998; Ebbatson, 2009). Pilot training
syllabi also address the activities on a per-phase-of-flight basis (e.g., OGP, 2008; JAA, 2007).
Moreover, Helicopter Flight Data Monitoring (HFDM) software programmes seek to
discriminate the phases of flight precisely to monitor phase-specific exceedances which
trigger safety concerns (Pilgrim, 2010).
Being phases of flight tacit task entities, hazard identification and risk analysis on the basis of
phases of flight have the potential to address the need of factual, task-based hazard
identification and risk analysis described in Sections 2.2.3.3.2.1 and 2.4. Furthermore,
analysis based on the phases of flight enables the fit between human capabilities and task
demands to be assessed, provided that the taxonomies of phases of flight used support this
intent.
6.2 Taxonomies of phases of flight
For a taxonomy of phases of flight to be useful in identifying the fit between human
capabilities and task demands (hence, the potential for pilot performance impairment, see
Section 2.3.2), it is essential that the phases outlined are (Jarvis and Harris, 2008):
i. Well discriminated;
ii. Meaningful in the context of the operation covered;
iii. Developed from a human factors logic; and
iv. Unbiased.
However, well-known taxonomies have lacked adequate discrimination and meaningfulness,
in association with an unclear logic to their development. For example, the multi-layered
categories of the taxonomy jointly developed by the Commercial Aviation Safety Team
(CAST) and ICAO seem to describe the spatial position of the aircraft, i.e., an air traffic
controller’s point of view (CAST/ICAO, 2011). Conversely, the categories of the taxonomies
developed by the ICAO/EU and by the NTSB (European Commission - Joint Research 184
Centre, 2012; and Harris et al., 2000, respectively) apparently focus on the tasks performed
by the (fixed-wing) aircrew. Therefore, neither taxonomy describes the particular phases of
helicopter flights (see Section 3.4.2) meaningfully. Moreover, comparing the analyses based
on such taxonomies is often misleading, since the sub-phases within phases with similar
names (e.g., ‘en-route’ versus ‘cruise’) are not exactly the same.
Many other taxonomies have prescribed excessively broad phases of flight and hence, can
still be criticised for a lack of good discrimination, such as IATA’s taxonomy (mentioned in
Skybrary, 2010) and the taxonomy outlined in CAA (2005). The same criticism applies to
numerous studies which have used clustered phases to circumvent the lack of detail in their
datasets (e.g., Herrera et al., 2010a; Couch and Lindell, 2010; Ross and Gibb, 2008) or
address specific research questions that do not require a detailed discrimination of the phases
of flight (e.g., Morrison, 2001; Brooks et al., 2008).
A lack of discriminatory power and bias have also resulted from the poor adaptation of
existing fixed-wing taxonomies for use in helicopter operations (see Section 2.3.3.1.1 and
EASA, 2009; European Commission - Joint Research Centre, 2012; CAA, 2005; Majumdar
et al., 2009b; U.S. Joint Helicopter Safety Analysis Team, 2011a). Since current taxonomies
cover the phases uniquely performed by helicopters in a far from optimal manner (Taber and
McCabe, 2006; Hoh et al., 1991), the use of clustered or loose phases leads to the collection
of poor quality data, which prevents the identification of specific problem areas (e.g., Khatwa
and Roelen, 1996). For example, a phase in which accidents occur frequently may not be
identified consistently if another phase with barely any accidents composes its cluster.
Jarvis and Harris (2008) overcame the issues mentioned above by having a clear human
factors focus and applying process charting methods and high-level mission analysis (Kirwan
and Ainsworth, 1992; Stolzer et al., 2008) in order to discriminate the phases of glider flights.
This led to the categorisation of glider operations into meaningful, unbiased and independent
phases, which however are not meaningful in the context of nighttime offshore helicopter
operations.
The taxonomy in Teixeira (2006, see Section 3.4.2) is meaningful in the context of offshore
helicopter operations and was used in Chapter 3 to guide the development of the Offshore
Helicopter Transportation Industry’s Taxonomy. However, the level of detail in this
185
taxonomy also needs to be improved to enable the accurate discrimination of the human
factors task-related aspects of the phases of flight in the nighttime. Since Teixeira’s phases
were designed to reflect only those tasks detectable by helicopter flight data monitoring
(HFDM) devices, HFDM-undetectable events such as changes in pilot control strategy (e.g.,
between visual and instrument scans during decelerating approaches, see Nascimento, 2009),
were ignored. This might introduce bias in any subsequent hazard identification due to the
tacit encapsulation of tasks of different types in a single phase of flight. Improving Teixeira’s
phases might be attempted by looking specifically at the nighttime accident and incident
reports qualitatively with the aim of extracting information on phases of flight at a deeper
level of detail compared to the analysis of Chapters 4 and 5. This is also important in light of
the conclusion from Chapter 5, whereby reported incidents should be reviewed on an
individual basis for hazard identification and risk analysis.
6.3 Nighttime accidents and serious incidents re-visited
The numbers of pilot-related nighttime accidents and reported incidents (analysed in Chapters
4 and 5, respectively), together with the level of detail in such reports, were inadequate to
support the unequivocal identification of riskiest phases of nighttime flights on the basis of
statistical testing. Therefore, the following two sections assess the descriptive statistics of
nighttime accident and incident reports, with the view to improve Teixeira’s taxonomy and
support the identification of the riskiest phases of flight. In addition, the general
characteristics of the accidents and serious incidents analysed in Chapters 4 and 5 are
provided for a contextualised overview of nighttime occurrences.
6.3.1 Accidents
Between 1997 and 2011 there were 23 nighttime offshore helicopter accidents worldwide, 17
of which were caused by operational, pilot-related factors. The remainder of the accidents
were caused by unknown and technical factors (three in each case).
Amongst the pilot-related accidents, only eight were subject to an official accident
investigation with a report available in the public domain. Hence, the common level of detail
available from all 17 accidents is fairly generic. Similar to the analysis in Chapter 4 (see
Section 4.3.6), only regions of occurrence, aircraft categories, high-level causes, outcomes
186
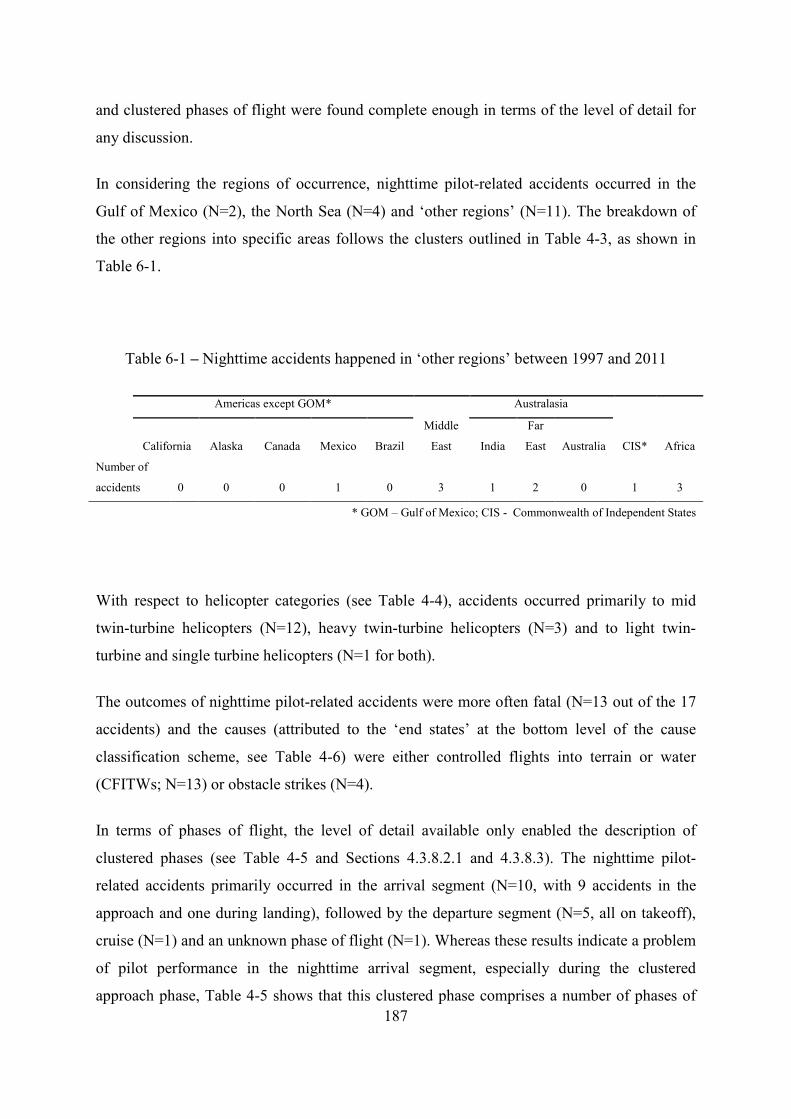
and clustered phases of flight were found complete enough in terms of the level of detail for
any discussion.
In considering the regions of occurrence, nighttime pilot-related accidents occurred in the
Gulf of Mexico (N=2), the North Sea (N=4) and ‘other regions’ (N=11). The breakdown of
the other regions into specific areas follows the clusters outlined in Table 4-3, as shown in
Table 6-1.
Table 6-1 – Nighttime accidents happened in ‘other regions’ between 1997 and 2011
Americas except GOM*
Middle
East
Australasia
CIS* Africa California Alaska Canada Mexico Brazil India
Far
East Australia
Number of
accidents 0 0 0 1 0 3 1 2 0 1 3
* GOM – Gulf of Mexico; CIS - Commonwealth of Independent States
With respect to helicopter categories (see Table 4-4), accidents occurred primarily to mid
twin-turbine helicopters (N=12), heavy twin-turbine helicopters (N=3) and to light twin-
turbine and single turbine helicopters (N=1 for both).
The outcomes of nighttime pilot-related accidents were more often fatal (N=13 out of the 17
accidents) and the causes (attributed to the ‘end states’ at the bottom level of the cause
classification scheme, see Table 4-6) were either controlled flights into terrain or water
(CFITWs; N=13) or obstacle strikes (N=4).
In terms of phases of flight, the level of detail available only enabled the description of
clustered phases (see Table 4-5 and Sections 4.3.8.2.1 and 4.3.8.3). The nighttime pilot-
related accidents primarily occurred in the arrival segment (N=10, with 9 accidents in the
approach and one during landing), followed by the departure segment (N=5, all on takeoff),
cruise (N=1) and an unknown phase of flight (N=1). Whereas these results indicate a problem
of pilot performance in the nighttime arrival segment, especially during the clustered
approach phase, Table 4-5 shows that this clustered phase comprises a number of phases of 187
flight, i.e., descent, final approach, go around and touch and go, which need to be
disentangled in order to enable the identification of pilot difficulties based on the tasks
associated with each phase of flight. Disentangling the phases was not possible due to the
lack of an official investigation in the majority of the nighttime accidents. Furthermore, the
level of description of phases of flight does not enable Teixeira’s (2006) taxonomy to be
improved.
6.3.2 Serious incidents
Chapter 5 has shown that pilot-related incidents are severely underreported in the offshore
helicopter domain thus rendering any frequency-based analysis using reported incidents as
inappropriate. Therefore, in this section frequencies are outlined for the sole purpose of
familiarisation with the type of serious incident data available in the offshore helicopter
industry for hazard identification and risk analysis.
There were no nighttime pilot-related serious incident reports available from the accident
investigation authorities of the 50 countries investigated in Chapter 4 for the period 1997-
2011. There were six serious incidents reported for the period 1997-2010 in the UK MOR
database.
The helicopter categories involved in the six serious incidents included both mid twin-turbine
helicopters (N=4) and heavy twin-turbine helicopters (N=2). With respect to causes (at the
bottom level of the cause classification scheme, see Table 4-6) two reports referred to
situations which could have turned into CFITWs (i.e., pilot disorientation), two were related
to issues of miscellaneous pilot procedure, one referred to an Air Traffic Management (ATM)
incident and the final incident referred to inadequate platform/ship procedure. Again, with
respect to the phases of flight, the phases were clustered due to the poor level of detail
available. Apart from one incident for which information on the phase of flight was
unavailable, there were two incidents during the arrival segment (i.e., approach and landing),
two incidents during departure and one incident during ground manoeuvres (i.e., parked).
As with the analysis of accidents, the level of detail reported with respect to phases of flight
does not allow for the analysis of the phases at a level that improves on the taxonomy of
Teixeira (2006) neither to unequivocally identify the riskiest phases.
188
Despite the limited utility of the accident and incident reports to, as a set, highlight the
riskiest phases of nighttime flights, Sections 2.1 and 2.3.3.2.1 highlighted that the arrival
segment has received numerous safety interventions. These interventions address operations
in the degraded visual environment, especially the nighttime. The limitations of these safety
interventions need to be acknowledged.
6.4 Limitations of ongoing phase-of-flight-specific safety interventions
The current focus of safety interventions in the arrival segment of flight (e.g., the
development of accurate instrument descent procedures and improved helideck lighting
systems; see Section 2.1) stems from safety concerns raised from individual accident reports
and pilot opinion surveys in the North Sea during the 1980s and 1990s, which were
confirmed in the USA scenario (Howson, 2006; Downey, 2010; Barbini and Davenport,
2010; CAA, 2010c, b, a).
However, safety interventions derived from individual accident reports can only improve
safety incrementally (see Section 2.3.3.1.1). Furthermore, attention has not been paid since
the 1990s to reassessing the risks levels across all the phases of flight and never before in the
areas away from the North Sea. Finally, the lack of previous research into the potential
associations between pilot demographics and the difficulties experienced per phase of flight
has prevented a holistic view to the hazards and risks associated with pilot performance in the
nighttime.
These limitations can be overcome by adopting an international pilot sampling strategy for
assessing the risk levels per phase of flight with respect to particular pilot demographic
characteristics. This enables to identify the phases causing the greatest concern and specific
pilot group facing greater difficulties. The analysis of risk levels per phase of flight and any
impacts of pilot demographic on such risk levels are addressed by the methodology described
in the next section.
6.5 Methodology
The methodology developed in this section was designed to achieve the following goals:
189
i. Redress the limitations of the current taxonomies of phases of flight, i.e., poor
discrimination of the phases of helicopter flights; lack of meaningfulness in the
context of nighttime offshore helicopter operations; lack of a human factors
development logic; and biases from uncritical transfer from other domains, see
Section 6.2);
ii. Redress the low quality of the accident and incident data currently available, i.e.,
inappropriate amount of data and data incompleteness, Sections 6.3); and
iii. Address the need to assess the risk levels across phases of flight also in the areas
away from the North Sea (Section 6.4);
In order to achieve the goals above, a taxonomy of phases of flight applicable to nighttime
offshore helicopter operations is generated and used as the basis for a questionnaire survey on
the risk levels experienced by pilots.
The questionnaire survey is designed as a balanced cross-sectional study in which pilots are
sampled from specific groups of interest in numbers which support the statistical analysis of
the risk levels that they attribute to each phase of flight captured in the taxonomy (Simons et
al., 2011; Burns and Burns, 2008). Additionally, a set of demographic questions are asked to
enable to assess the effects of pilot demographics into the risk levels experienced in the
riskiest phases of flight identified. A direct question is also included in the questionnaire to
validate the results of Chapter 8, and therefore is not dealt with in this chapter. Finally, an
open-ended question is included to capture any missing themes and essentially build rapport.
Versions of the survey were made available in three languages, which support the specific
strategies used to sample regions, companies and pilots. Careful piloting of the questions,
their translation and the sampling strategies preceded data collection. The piloting also
ensured the validity of the taxonomy of the phases of nighttime flights developed. The
methodology described above is explained in detail through its constituent steps presented in
Sections 6.5.1 to 6.5.6 below.
6.5.1 Development of the taxonomy of phases of nighttime flights
The phases proposed by Teixeira (2006) were improved and expanded with the successive
application of two task analysis techniques: high-level mission analysis and the process
190
charting technique (Jarvis and Harris, 2008). The high-level mission analysis described in
Section 3.4.1 was repeated in the context of nighttime operations, with the eight typical flight
profiles of offshore helicopter transportation remaining valid, i.e., all eight possible profiles
connecting offshore platforms, boats and land-based airfields might also be flown at night.
The process charting exercise was undertaken by assessing if the phases described by
Teixeira (2006, see Section 3.4.2) would cover all pilot-related tasks outlined in the literature.
The hierarchical tasks analysis developed by Nascimento (2009) for the airborne radar
approach (ARA) procedure of offshore helicopters highlighted the need to breakdown the
approach phase into two different segments: the visual and instrument segments. By analogy,
the takeoff and go around manoeuvres were also broken down into visual and instrument
segments (see Section 3.4.4, Table 3-1, NB 5).
The resulting phases of flight (called ‘level 1’ phases) were clustered into two higher-order
levels (labelled levels 2 and 3) according to the clustering strategies established in Sections
4.3.8.2.1 and 4.3.8.3. Additionally, categories that reflected the helicopter’s kinetic states and
pilot’s visual sampling strategies (i.e., visual versus instrument scans) were introduced to
account for the specific characteristics of nighttime operations.
The kinetic state categories build upon previous investigations that considered the impacts of
speed profiles on power and lift regimes and thereby safety. Low airspeed regimes were
associated with high engine power demands and low translational lift. Therefore, low
airspeed regimes were deemed less safe than the high speed regimes, which are characterised
by low engine power demands and high translational lift (Harris et al., 2000; and Couch and
Lindell, 2010). However, given the human factors interest of this study, the categories
included account for the impacts of speed profiles on the stability of visual cues
(environmental and within the cockpit, e.g., flight parameters) and, consequently, the crews’
ability to control the aircraft with reference to such cues. Low speeds were associated with
slow variation of cues and, therefore, improved aircraft controllability. On the other hand,
high speeds were associated with faster variation of visual cues and, therefore, more difficult
control of the aircraft with reference to the visual cues (Ebbatson, 2009). Finally, categories
which reflected the possible combination between kinetic states and the pilot’s visual
sampling strategy were introduced in the taxonomy.
191
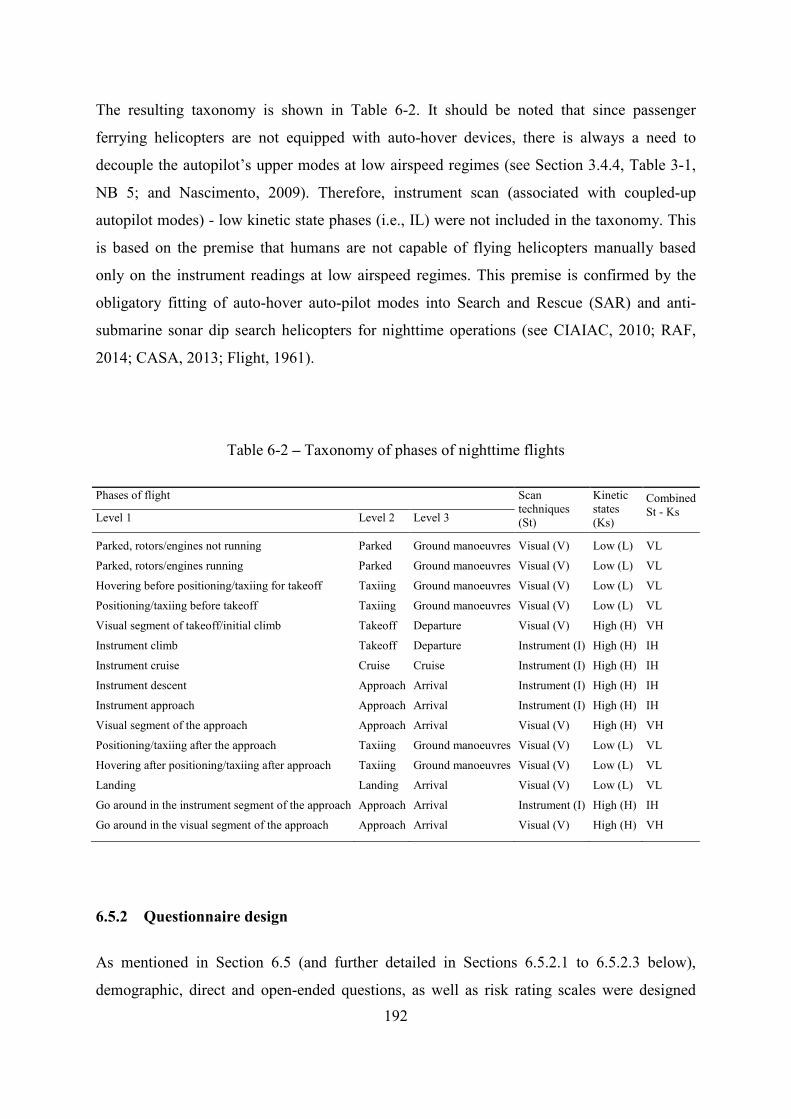
The resulting taxonomy is shown in Table 6-2. It should be noted that since passenger
ferrying helicopters are not equipped with auto-hover devices, there is always a need to
decouple the autopilot’s upper modes at low airspeed regimes (see Section 3.4.4, Table 3-1,
NB 5; and Nascimento, 2009). Therefore, instrument scan (associated with coupled-up
autopilot modes) - low kinetic state phases (i.e., IL) were not included in the taxonomy. This
is based on the premise that humans are not capable of flying helicopters manually based
only on the instrument readings at low airspeed regimes. This premise is confirmed by the
obligatory fitting of auto-hover auto-pilot modes into Search and Rescue (SAR) and anti-
submarine sonar dip search helicopters for nighttime operations (see CIAIAC, 2010; RAF,
2014; CASA, 2013; Flight, 1961).
Table 6-2 – Taxonomy of phases of nighttime flights
Phases of flight Scan techniques (St)
Kinetic states (Ks)
Combined St - Ks Level 1 Level 2 Level 3
Parked, rotors/engines not running Parked Ground manoeuvres Visual (V) Low (L) VL
Parked, rotors/engines running Parked Ground manoeuvres Visual (V) Low (L) VL
Hovering before positioning/taxiing for takeoff Taxiing Ground manoeuvres Visual (V) Low (L) VL
Positioning/taxiing before takeoff Taxiing Ground manoeuvres Visual (V) Low (L) VL
Visual segment of takeoff/initial climb Takeoff Departure Visual (V) High (H) VH
Instrument climb Takeoff Departure Instrument (I) High (H) IH
Instrument cruise Cruise Cruise Instrument (I) High (H) IH
Instrument descent Approach Arrival Instrument (I) High (H) IH
Instrument approach Approach Arrival Instrument (I) High (H) IH
Visual segment of the approach Approach Arrival Visual (V) High (H) VH
Positioning/taxiing after the approach Taxiing Ground manoeuvres Visual (V) Low (L) VL
Hovering after positioning/taxiing after approach Taxiing Ground manoeuvres Visual (V) Low (L) VL
Landing Landing Arrival Visual (V) Low (L) VL
Go around in the instrument segment of the approach Approach Arrival Instrument (I) High (H) IH
Go around in the visual segment of the approach Approach Arrival Visual (V) High (H) VH
6.5.2 Questionnaire design
As mentioned in Section 6.5 (and further detailed in Sections 6.5.2.1 to 6.5.2.3 below),
demographic, direct and open-ended questions, as well as risk rating scales were designed 192
and piloted. The questionnaire was distributed to respondents according to the sampling
strategies described in Section 6.5.4, which aimed to achieve the sample sizes described in
Section 6.5.5. Distribution was accompanied by an invitation letter which stated the not-for-
profit, safety-only purpose of the research. The invitation letter also provided general
guidance and an estimated time for survey completion. These aimed to ensure face validity
and usefulness from a respondent’s perspective, with the view to capturing honest and careful
responses (Smith and Kendall, 1963; Burns and Burns, 2008). The questionnaire instructed
the pilots to consider, based on their operational experience, typical nighttime offshore
helicopter flights prior to answering the questions and rating scales posed. In order to focus
on the risk related to suboptimal pilot performance, the pilots were also instructed to consider
perfectly serviceable aircraft. The invitation letter and questionnaire form Appendix 6.
6.5.2.1 Demographic variables
Such variables were collected in order to enable the analysis of risk ratings per demographic
groups and control for potential biases stemming from the invariably subjective nature of
surveys. The demographics were:
• Region of operation;
• Experience, as based on:
• Rank;
• Years as offshore helicopter pilot;
• Flying hours in helicopters: total, IFR and at night; and
• Number of night deck landings;
• Level of training received (i.e., category of licence held);
• Age;
• Gender; and
• Helicopter type flown.
These variables were a subset of the variables mentioned in Chapter 4 (see Sections 4.2.5 and
4.3.6 and Tables 4-1 and 4-2) and were selected for their expected relevance, based on
discussions with subject matter experts (SMEs) in the field (see Section 4.4.4). This was
important in order to keep the questions to manageable numbers and avoid non-responses.
Additionally, collecting data on the helicopter type flown enabled the widespread belief that
193
glass cockpits are inherently safer than analogic and mixed cockpit designs to be tested
(Harris, 2004; EASA, 2013c; Harris et al., 2005). This was unachievable in Chapters 4 and 5
due to data incompleteness.
6.5.2.2 Rating scales
The widespread use of rating scales in aviation is well documented (e.g., CAA, 1997; ATSB,
2006; Hunter et al., 2011). Semantically-anchored (Rollenhagen et al., 2010; Smith and
Kendall, 1963) 11-point rating scales (CAA, 1997) were employed to assess the risk levels of
each level 1 phase of flight, where 0 meant ‘no risk at all’, 5 was the mid-point (i.e.,
‘somewhat risky’) and 10 meant ‘extremely risky’. In line with the definitions of Section
2.2.1, risk was defined as ‘the likelihood that an adverse event of damaging consequences
will happen’. The level 1 phases were presented to participants in the chronological order of
uneventful flights, with the go around phases introduced at the end, as shown in Table 6-2
(also in Appendix 6). The rating scales of all the phases were presented together so that the
pilots could rank the phases relatively to each other as much as in absolute terms. This
overcomes the limitation of Likert scales (Likert, 1932), where equal intervals do not
translate into scores which can be proportionately related to each other (Burns and Burns,
2008). The level 1 phases proposed were validated by asking participants to pinpoint and rate
any phases of flight which could have been missed. Finally, since the results of the studies
reported in CAA (1997) and Herrera (2010) indicated satisfactory levels of construct,
predictive and concurrent validity of the rating scales applied to offshore helicopter pilots,
these studies were useful frames of reference to validate the scales of the present study and no
further validation was attempted (Burns and Burns, 2008; Kirwan and Ainsworth, 1992).
6.5.3 Piloting
The phases of flight, scales of risk experienced, demographic, direct and open-ended
questions were subject to peer-review, piloting and refinement by six SMEs based in three
continents. These SMEs were five senior offshore helicopter pilots involved in training and
safety within their organisations and a safety analyst who held a master’s level degree in
aviation human factors and worked for a major offshore helicopter operator. This process led
to changes in ordering, wording and the content of the questions for completeness, brevity
and ease of response. The process increased content, construct and face validity of the
194
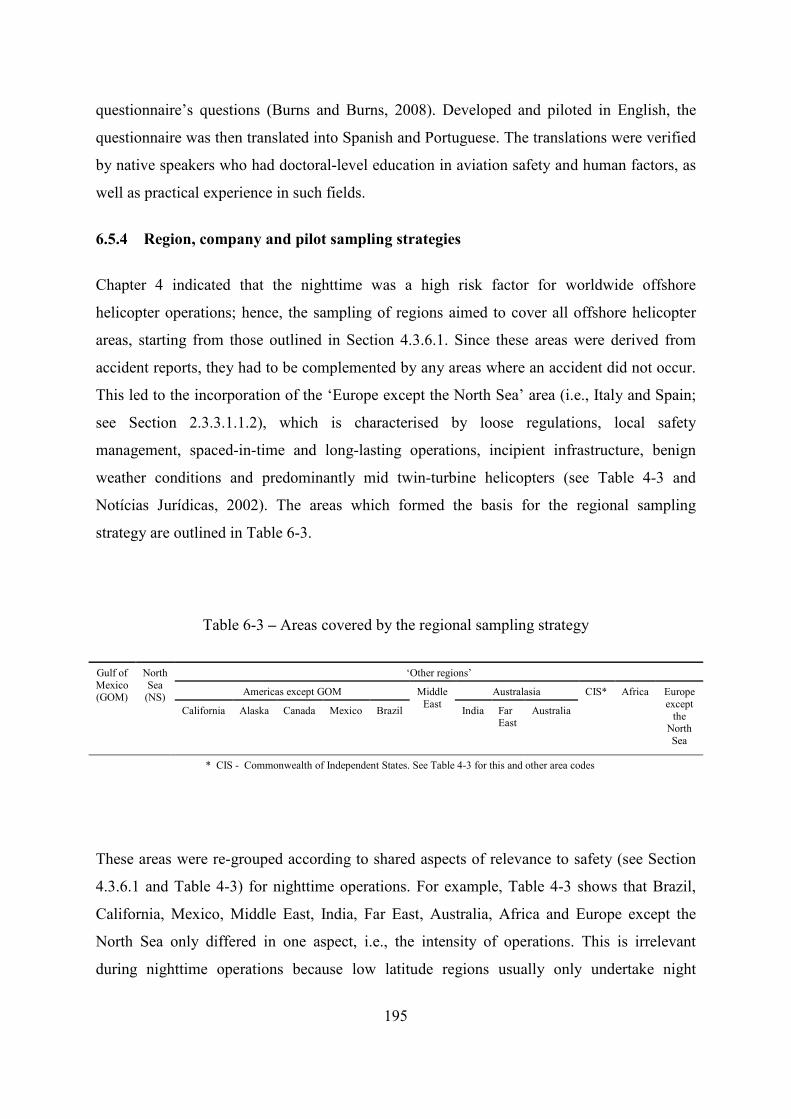
questionnaire’s questions (Burns and Burns, 2008). Developed and piloted in English, the
questionnaire was then translated into Spanish and Portuguese. The translations were verified
by native speakers who had doctoral-level education in aviation safety and human factors, as
well as practical experience in such fields.
6.5.4 Region, company and pilot sampling strategies
Chapter 4 indicated that the nighttime was a high risk factor for worldwide offshore
helicopter operations; hence, the sampling of regions aimed to cover all offshore helicopter
areas, starting from those outlined in Section 4.3.6.1. Since these areas were derived from
accident reports, they had to be complemented by any areas where an accident did not occur.
This led to the incorporation of the ‘Europe except the North Sea’ area (i.e., Italy and Spain;
see Section 2.3.3.1.1.2), which is characterised by loose regulations, local safety
management, spaced-in-time and long-lasting operations, incipient infrastructure, benign
weather conditions and predominantly mid twin-turbine helicopters (see Table 4-3 and
Notícias Jurídicas, 2002). The areas which formed the basis for the regional sampling
strategy are outlined in Table 6-3.
Table 6-3 – Areas covered by the regional sampling strategy
Gulf of Mexico (GOM)
North Sea
(NS)
‘Other regions’
Americas except GOM Middle East
Australasia CIS* Africa Europe except
the North Sea
California Alaska Canada Mexico Brazil India Far East
Australia
* CIS - Commonwealth of Independent States. See Table 4-3 for this and other area codes
These areas were re-grouped according to shared aspects of relevance to safety (see Section
4.3.6.1 and Table 4-3) for nighttime operations. For example, Table 4-3 shows that Brazil,
California, Mexico, Middle East, India, Far East, Australia, Africa and Europe except the
North Sea only differed in one aspect, i.e., the intensity of operations. This is irrelevant
during nighttime operations because low latitude regions usually only undertake night
195
operations in response to emergencies (see Section 4.3.4.1). Therefore, night flight traffic is
usually not intense in these areas. All these areas formed Group 1.
Group 2 was formed by Alaska and Canada, which only differed in the type of aircraft
typically used. This is also irrelevant since it is likely that, in both Alaska and Canada, the
helicopters used in nighttime medical evacuation (i.e., ‘medvac’; see Sections 2.1 and 4.3.4.
1.2) are multi-engine equipped. Groups 3, 4 and 5 represent areas of unique operational
characteristics: Group 3 was formed by the countries of the Commonwealth of Independent
States (CIS), which differ from the previous group because, in the CIS, the aircraft
predominantly used are manufactured by companies from the countries of the Former Soviet
Union, with potentially different airworthiness requirements (Khatwa and Roelen 1996).
Group 4 was formed by the Gulf of Mexico, which is an area dominated by single engine
operations. Finally, Group 5 was formed by the North Sea, representing an area of highly-
regulated operations (see Section 2.3.3.1.1.2).
The major companies operating helicopters in support of offshore oil- and gas-related
missions in each area listed above were identified and targeted. This strategy has already
been successfully applied in the offshore oil and gas industry, where very few large
companies usually dominate representative market shares (e.g., Vinnem, 2010). In order to
maximise the chances of reaching the relevant companies (and thereby respondents), aviation
regulators, accident investigation boards, oil and gas companies and regional teams of the
IHST (see Section 2.3.3.1.1.4) were also contacted (i.e., in the Middle East, India, Australia,
USA, Canada, Mexico and CIS) by the most convenient means (typically e-mail). The list of
parties contacted can be seen in Appendix 7.
The selection of representative companies was followed by a quota sampling strategy at the
company level which attempted to capture the experience of the following two groups: senior
and flight line-only pilots. The former were pilots who dealt with other pilots in a wide range
of flying conditions and had to display declarative knowledge (Corbet and Anderson, 1995)
as a part of the job. Flight instructors, aviation safety officer, operations and management
post-holders, e.g., chief pilots and chief operating officers (COO), were considered senior
pilots. The experience of senior pilots was anticipated to most likely synthesize that of many
pilots (Chipman et al., 2000) and be particularly useful if sample sizes were small (i.e., if the
questionnaire response rate was low). The flight line-only pilot group was formed by line 196
pilots without an administrative job and was used to control for potential professional bias of
the previous group. All pilots participating in the survey were volunteers (Dery et al., 2007).
The questionnaire, together with the invitation letter, was distributed by electronic mail
addressed to the persons in charge of the training, safety, operations and management
departments of the targeted companies. These persons had direct control over the sampling
frame and were instructed to distribute the questionnaire according to the sampling strategy
mentioned above. The language version used was the most appropriate in each case. A date
of return was stipulated at approximately two months from the date of distribution, with a
maximum of two polite reminders sent on a monthly basis. This was aimed at increasing
response rates and at the same time preserving the voluntary nature of the survey (Burns and
Burns, 2008). In four specific countries, the questionnaire was additionally applied by the
researcher in individual and confidential face-to-face sessions. Given the simplicity of the
questionnaire, any potential bias introduced by face-to-face questionnaire application, e.g.,
interviewer-interviewee interaction, interviewee acquiescence and social desirability (see
Burns and Burns, 2008) was deemed minimal and irrelevant.
6.5.5 Sample sizes
Because no sampling frame was available to the researcher (i.e., the cooperating companies
did not release a list of their pilots), the parameters of the population were actually unknown.
Therefore, the required sample sizes had to be estimated. This can be done by the formulae of
Burns and Burns (2008) and the following parameters: σ, which is an estimate of the
population’s standard deviation (SD); Z, which is the two-tailed value of the standardised
deviation of the normal distribution associated with the desired level of confidence; e, which
is the arbitrary error accepted; and π, which is an estimate of the highest proportion of
sampling units belonging to any of the categories in the population.
The variables used to estimate the required sample sizes and their rationale were as follows:
i. The number of nighttime deck landings - chosen because the flight segment is the
best variable based on which pilot-related events should be normalised (see
Sections 4.4 and 4.5);
197
ii. Risk ratings - they represent the main output of this investigation and, therefore, it
is reasonable to choose samples sizes which optimise the quality of this data; and
iii. Membership to the ‘senior pilot’ group – selected as this is at the centre of the
research problem.
With no prior study conducted amongst the target population, σ was estimated by dividing
the assumed range of the continuous variables by six. This is based on an anticipation of
normality, which spread of scores is around six SDs. Such an assumption is acceptable in the
virtual absence of information for sample size estimation (Burns and Burns, 2008).
The range of the number of night deck landings was estimated from the minimum of three
required by the OGP for nighttime currency (OGP, 2008) to a maximum of 1080. This
considers the following:
• Maximum allowable of 900 flying hours per pilot per year (e.g., JAA, 2007; ANAC,
2010);
• 3% of flying hours at night - see Sections 2.1 and 4.3.4.1;
• One deck landing per hour - average platform distance from shore at 70 nautical
miles; helicopters’ typical cruising speed of 140 knots (Farrell, 2013); and
• Pilot service life of 40 years - beginning and end of commercial flying career assumed
at the minimum and maximum ages typically allowed, i.e., 18 and 60 to 65 years-old,
respectively, with the initial years of the career in other types of operation (see
Fitzpatrick, 2013).
The range of risk ratings was estimated from the 0-10 scales used.
Z was initially set at 1.96, corresponding to 95% confidence interval. A function of the
desired precision, e was set at 50 night deck landings, 0.5 risk rating (in order to avoid
confusion between adjacent ratings) and 10% of the true proportion of senior pilots in the
population. Finally, π was estimated at 0.9, assuming that typically 10% of the pilots in any
company are senior pilots.
Based on these assumptions and the formulae of Burns and Burns (2008), the following per
group sample sizes were calculated:
198
i. 50 based on number of night deck landings;
ii. 51 based on risk ratings;
iii. 35 based on seniority membership.
Hence, responses were sought from at least 51 senior pilots, with as much representativeness
of the areas and groups outlined in Section 6.5.4 as possible.
6.5.6 Statistical analysis
Given that the risk ratings of each phase were attributed by comparison to one another, the
ratings were treated as continuous data (Frakes et al., 2009). Using statistical procedures
which fitted the characteristics and distributions the data, the following hypotheses were
initially tested (refer to Table 6-2 to the levels of phases of flight):
• H01: the distributions of risk ratings across phases of flight (level 1) are the same;
• H02: the distributions of risk ratings across phases of flight (level 2) are the same;
• H03: the distributions of risk ratings across phases of flight (level 3) are the same;
• H04: the distributions of risk ratings across combined scan technique – kinetic state
(St-Ks) categories are the same.
These procedures aimed to highlight the most critical phases of flight, according to the
experience of the sample investigated. The tests of H02 and H03 additionally indicated the
extent to which clustering flight phases could produce misleading results. Building on
previous findings of Chapter 4, which failed to find associations between regions of
operations and phases of flight (see Section 4.4.2.1 and Table 4-9), the hypotheses tested
disregarded regional differences.
With the results of the previous tests, the following hypotheses were subsequently tested:
• H05: the distributions of risk ratings across the level 1 phases forming the most
critical level 3 phase (identified from the test of H03 above) are the same;
• H06: the distributions of risk ratings across the level 1 phases forming the most
critical St-Ks category (identified from the test of H04 above) are the same.
199
Such tests confronted the test of H01 and enabled the selection of the riskiest phases for the
subsequent demographic analysis. This analysis aimed to identify regions or groups of pilots
particularly vulnerable to the riskiest phases of flight, based upon the differences in the
distributions of risk ratings per demographic variables collected.
The hypotheses tested and the statistical tests applied are shown in the next section. The
hypotheses were two-tailed and significance was established at p≤0.05.
6.6 Results and discussion
6.6.1 Descriptive statistics
A total of 61 questionnaires were returned, of which 40 were obtained following face-to-face
sessions. In the following results, the sums that did not reach the total of 61 respondents stem
from slightly incomplete questionnaires returned online. In all cases, follow-up was
attempted in vain. Incomplete fields were excluded from the statistical analyses undertaken.
The respondents were based in the areas described in Table 6-4. There were 3 female and 58
male pilots, 46 captains and 13 first officers. Fifty of respondents held air transport pilot’s
licences (ATPL) and nine held commercial pilot’s licences (CPL). 23 respondents were
‘flight line-only pilots’ and 35 were ‘senior pilots’. The former corresponds to Zs that are
representative of over 81.3% confidence intervals for both the number of night deck landings
and risk ratings outlined in Section 6.5.5. Additionally, since the sample of flight line-only
pilots roughly matched the size of the senior pilot group, it was deemed useful for statistical
comparisons (Burns and Burns, 2008). The main demographic characteristics of the pilots
sampled are summarised in Table 6-5. The pilots flew primarily the helicopter models of
Table 6-6.
Helicopter types were further categorised according to the following criteria:
• Transport capacity (see Section 4.3.6.2): heavy twin turbine (HT, i.e., EC332L,
EC332L2, EC225 and S92. N=20) and mid twin turbine (MT, i.e., all else. N=37)
helicopters.
• Cockpit generation: full glass cockpit (i.e., S76C++, EC155, AW139, EC225 and
S92. N=47) and analogic/mixed cockpit (i.e., all else. N=10).
200
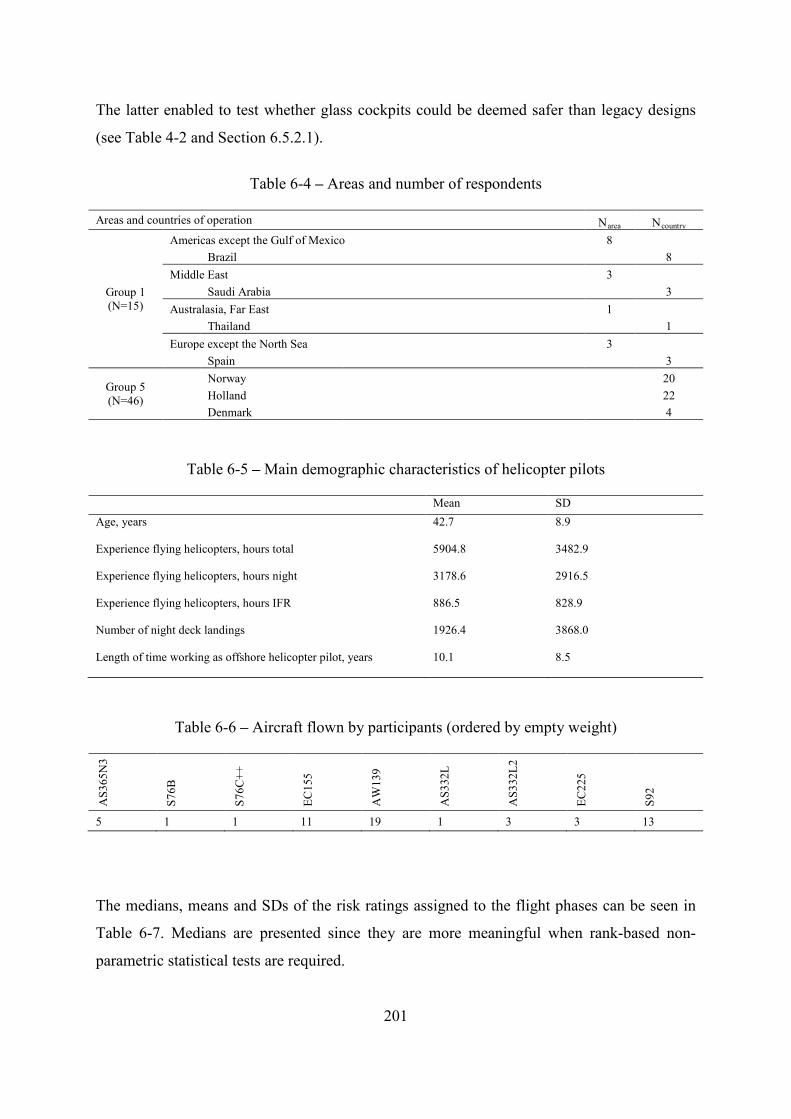
The latter enabled to test whether glass cockpits could be deemed safer than legacy designs
(see Table 4-2 and Section 6.5.2.1).
Table 6-4 – Areas and number of respondents
Areas and countries of operation Narea Ncountry
Group 1 (N=15)
Americas except the Gulf of Mexico 8
Brazil
8
Middle East 3
Saudi Arabia
3
Australasia, Far East 1
Thailand
1
Europe except the North Sea 3 Spain
3
Group 5 (N=46)
Norway
20
Holland
22
Denmark
4
Table 6-5 – Main demographic characteristics of helicopter pilots
Mean SD
Age, years 42.7 8.9
Experience flying helicopters, hours total 5904.8 3482.9
Experience flying helicopters, hours night 3178.6 2916.5
Experience flying helicopters, hours IFR 886.5 828.9
Number of night deck landings 1926.4 3868.0
Length of time working as offshore helicopter pilot, years 10.1 8.5
Table 6-6 – Aircraft flown by participants (ordered by empty weight)
AS3
65N
3
S76B
S76C
++
EC15
5
AW
139
AS3
32L
AS3
32L2
EC22
5
S92
5 1 1 11 19 1 3 3 13
The medians, means and SDs of the risk ratings assigned to the flight phases can be seen in
Table 6-7. Medians are presented since they are more meaningful when rank-based non-
parametric statistical tests are required.
201
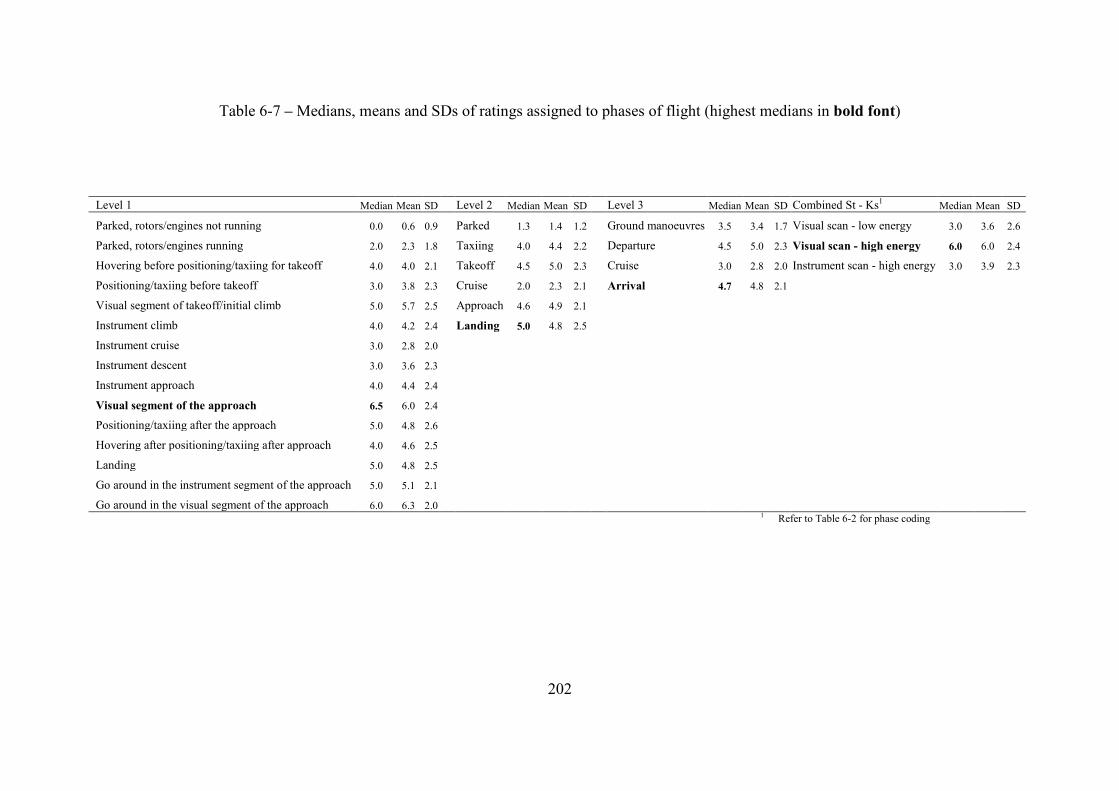
Table 6-7 – Medians, means and SDs of ratings assigned to phases of flight (highest medians in bold font)
Level 1 Median Mean SD Level 2 Median Mean SD Level 3 Median Mean SD Combined St - Ks1 Median Mean SD
Parked, rotors/engines not running 0.0 0.6 0.9 Parked 1.3 1.4 1.2 Ground manoeuvres 3.5 3.4 1.7 Visual scan - low energy 3.0 3.6 2.6
Parked, rotors/engines running 2.0 2.3 1.8 Taxiing 4.0 4.4 2.2 Departure 4.5 5.0 2.3 Visual scan - high energy 6.0 6.0 2.4
Hovering before positioning/taxiing for takeoff 4.0 4.0 2.1 Takeoff 4.5 5.0 2.3 Cruise 3.0 2.8 2.0 Instrument scan - high energy 3.0 3.9 2.3
Positioning/taxiing before takeoff 3.0 3.8 2.3 Cruise 2.0 2.3 2.1 Arrival 4.7 4.8 2.1 Visual segment of takeoff/initial climb 5.0 5.7 2.5 Approach 4.6 4.9 2.1 Instrument climb 4.0 4.2 2.4 Landing 5.0 4.8 2.5 Instrument cruise 3.0 2.8 2.0 Instrument descent 3.0 3.6 2.3 Instrument approach 4.0 4.4 2.4
Visual segment of the approach 6.5 6.0 2.4 Positioning/taxiing after the approach 5.0 4.8 2.6 Hovering after positioning/taxiing after approach 4.0 4.6 2.5 Landing 5.0 4.8 2.5 Go around in the instrument segment of the approach 5.0 5.1 2.1 Go around in the visual segment of the approach 6.0 6.3 2.0 1 Refer to Table 6-2 for phase coding
202
6.6.2 Hypothesis testing
During all subsequent tests (i.e., those in Sections 6.6.2.1 to 6.6.2.4 below), the normality of
the distributions were tested according to the sample sizes involved, i.e., Shapiro-Wilk’s test
were used when cases were fewer than 50 per category and Kolmogorov-Smirnov tests were
used otherwise. Homogeneity of variance was checked by Levene’s test (Field, 2009).
6.6.2.1 Preliminary statistical tests (i.e., the tests of H01-4)
Because in all cases at least one assumption of parametric data was violated, non-parametric
techniques were required to test H01-4. Related Samples Friedman’s Two-Way Analysis of
Variance by Ranks tests were used to account for the fact that each respondent scored every
phase of flight proposed (Field, 2009).
The results of the tests of all 4 null hypotheses (i.e., H01-4) were significant and hence, the
hypotheses were rejected. This means that there were significant differences between the risk
ratings attributed by pilots to the phases of flight at all levels of the taxonomy described in
Table 6-7.
6.6.2.2 Post hoc analysis of the preliminary statistical tests
Post hoc analysis was undertaken by application of the Related Samples Wilcoxon Signed
Rank Test with Bonferroni correction (see Section 4.3.8.1 for an explanation on the
Bonferroni correction).
In each such test, the category with highest median was chosen as the control group. This
enabled groups to be assessed against the group with potentially the highest risk ratings.
Therefore, the relevant results are the statistically insignificant results because they indicate
phases in which risk ratings are comparable to the worst of the phases.
The tests following the rejection of H01 led to fourteen pairs of level 1 phases of flight being
formed for comparison. The only ratings that failed to achieve significance (p>0.05/14) and
hence, were comparable to those attributed to the ‘visual segment of the approach’ (i.e.,
control group), were those of the ‘visual segment of the takeoff’, ‘go around in the instrument
segment of the approach’ and ‘go around in the visual segment of the approach’.
203
During the post hoc tests of H02, five pairs of level 2 phases were compared. The only ratings
that failed to achieve significance (p>0.05/5) and, hence, were comparable to those attributed
to the ‘landing’ level 2 phase (i.e., control group), were those of the ‘taxiing’, ‘takeoff’ and
‘approach’ phases. This highlights two misleading results stemming from the clustering of
phases of flight, which have major implications for helicopter safety analysis:
i. ‘Landing’ appeared as the most critical level 2 phase (i.e., highest median).
ii. ‘Taxiing’ figured as a level 2 phase of concern even though no level 1 categories
within ‘taxiing’ achieved significance during the previous tests.
Given that the level 2 phases proposed are fairly similar to the phases of widely-used
taxonomies, e.g., CAA (2005), care should be taken when interpreting the results of official
studies.
The post hoc tests of H03 were undertaken as three paired-tests of level 3 phases of flight.
Using the ‘arrival’ level 3 phase as the control group, the ‘departure’ phase failed to show
significant differences in pilot ratings (p>0.05/3). Therefore, the risk levels assigned were
comparable between the ‘arrival’ and ‘departure’ level 3 phases.
The post hoc tests of H04 compared the ratings of the VL and IH phases against those of the
VH phase (i.e., the control group). Both tests were significant and, therefore, the risk ratings
were significantly higher for the VH phases.
The results of the test of H01-4 and associated post-hoc tests indicate that any of the following
phases may be the riskiest phases of flight: ‘visual segment of the takeoff’, ‘go around in the
instrument segment of the approach’ and ‘go around in the visual segment of the approach’.
However, there are confounding information with respect to ‘landing’ and ‘taxiing’.
Furthermore, multiple statistical testing using the Bonferroni correction could have incurred
in inaccuracies. Further statistical testing enables to clarify the differences in risk ratings and
identify the riskiest phases more accurately.
6.6.2.3 Further statistical testing (i.e., the tests of H05-6)
Given the results of the test mentioned above, H05 and H06 tested the distributions of risk
ratings across the level 1 phases within the ‘arrival’ (level 3) and ‘VH’ phases, respectively
204
(see Table 6-7). The statistical tests mentioned above were applied because of similar data
characteristics and sample sizes.
The test of H05 produced a significant result. The post hoc tests revealed that the high ratings
of the ‘visual segment of the approach’ (i.e., control group) were only comparable to those of
the ‘go around in the visual segment of the approach’ (i.e., p>0.05/5). This challenges the
post hoc tests of H01, which indicated that the ‘go around in the instrument segment of the
approach’ also belonged to this population. However, the latter inclusion appears to have
been a type II error during the post hoc tests of H01, stemming from the excessively stringent
rejection criterion caused by the application of the Bonferroni correction to all 14 pairs of
phases (see Section 6.6.2.2).
Given that the test of H06 failed to produce significant results, and hence the risk ratings
assigned to all VH phases were similar, the phases rated highest for risk experienced were
those flown by reference to external visual cues at high kinetic states (i.e., VH phases, formed
by the visual segments of takeoff, approach and go around). Additionally, considering the
worldwide concentration of offshore helicopter pilot-related accidents in the arrival segment
of flight (see Sections 4.4 and 4.5), the numerous international efforts to redress this problem
outlined in Section 2.1 and given that visual approaches usually cannot be avoided (i.e., once
in flight, a helicopter necessarily has to land somewhere at some point, see Section 6.5.1), the
‘visual segment of the approach’ can be confidently considered the single riskiest phase of
nighttime offshore helicopter flights.
The demographic analysis that follows focuses, therefore, on both the visual segment of the
approach and VH category.
6.6.2.4 Risk ratings per demographic variables (i.e., the tests of H06-19)
Given that in all cases at least one assumption of parametric data was violated, non-
parametric tests were needed. The Independent Samples Mann-Whitney U Test was used to
compare the distributions of risk ratings across categories of nominal variables, whereas
Kendall’s Tau b non-parametric correlations were used against continuous variables. Table 6-
8 presents the hypotheses tested and the results obtained. The significance on the tests of H08
and H09 occurred as the risk ratings of VH phases were higher for mid twin-turbine and glass
cockpit helicopters, respectively. Given that these results were insignificant for the ‘visual 205
segment of the approach’, the significance of the VH category stems from the visual
segments of either the takeoff or go around.
6.6.2.5 Impacts of the results of the hypotheses tested (i.e., H01-19)
The tests of H01-19 mentioned in Sections 6.6.2.1 to 6.6.2.4 have a number of direct impacts
on hazard identification and risk analysis. Firstly, the results highlight that the greatest risks
of nighttime flying stem from the visual scan technique – high kinetic state (i.e., VH) phases.
Since Section 6.5.1 showed that these are the characteristic phases of nighttime offshore
helicopter flights, any hazard identification and risk analysis efforts aimed at improving
safety in the nighttime could, in principle, concentrate on the VH phases with maximum
benefit.
Furthermore, the tests of H01-19 confirmed the visual approach segment as the single riskiest
phase amongst the VH and all phases of nighttime flights. However, the results add to current
knowledge as they show, for the first time, that the difficulties of the visual approach phase
occur pandemically to the pilots of various regions of operations, not just in the North Sea.
This is virtually the world’s sole region where mitigation efforts are attempted consistently
(see Section 6.4).
The tests of H07-19 (i.e., the demographic analysis) have a specific impact on ensuing hazard
identification and risk analysis efforts, as the results show that there are no particular groups
of pilots facing greater difficulties during nighttime visual approaches offshore. Therefore,
follow-up in-depth hazard identification and risk analysis efforts should strive to be as
generic as possible with respect to regions’ and participants’ sampling strategies. This is
taken into consideration during the implementation of the processes developed in Chapters 7
and 8.
Finally, the tests of H07-19 show that the risks of the remaining VH phases (i.e., visual takeoff
and visual go around) might be related to specific helicopter categories. Therefore, priority
should be given to identify the hazards of mid-twin turbine and glass cockpit helicopters
when assessing these phases.
206
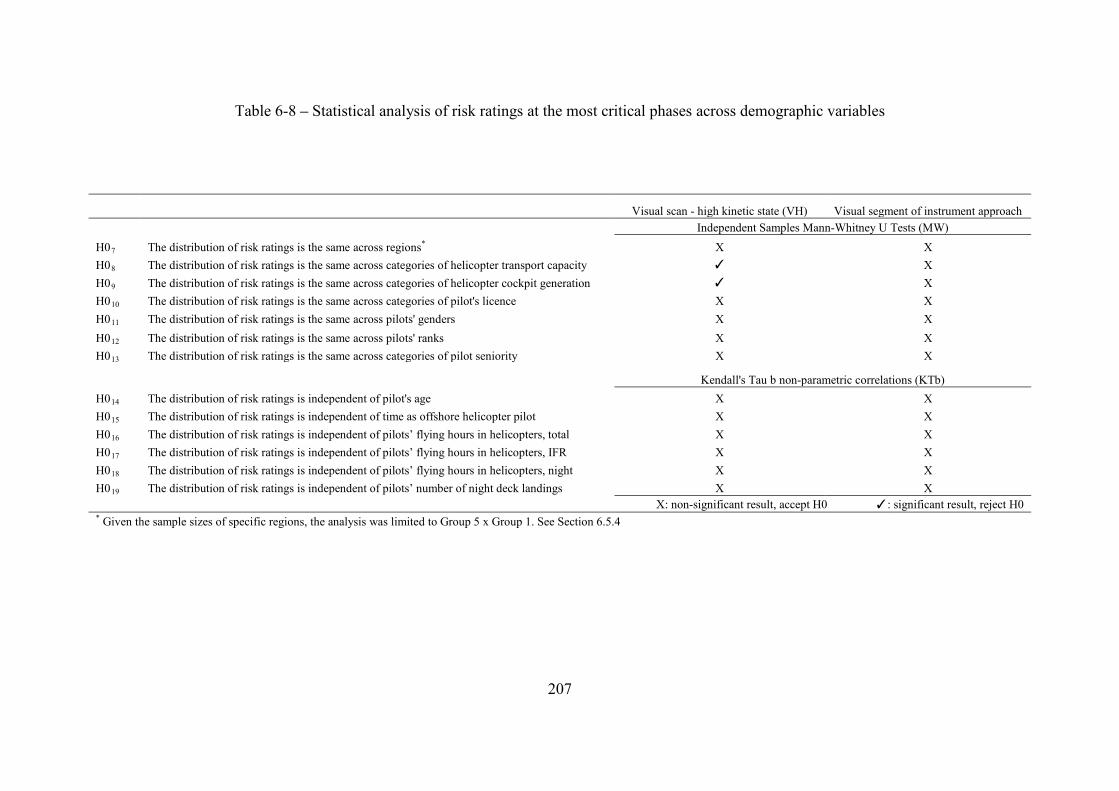
Table 6-8 – Statistical analysis of risk ratings at the most critical phases across demographic variables
Visual scan - high kinetic state (VH) Visual segment of instrument approach
Independent Samples Mann-Whitney U Tests (MW) H07 The distribution of risk ratings is the same across regions* X X H08 The distribution of risk ratings is the same across categories of helicopter transport capacity ✓ X H09 The distribution of risk ratings is the same across categories of helicopter cockpit generation ✓ X H010 The distribution of risk ratings is the same across categories of pilot's licence X X H011 The distribution of risk ratings is the same across pilots' genders X X H012 The distribution of risk ratings is the same across pilots' ranks X X H013 The distribution of risk ratings is the same across categories of pilot seniority X X
Kendall's Tau b non-parametric correlations (KTb) H014 The distribution of risk ratings is independent of pilot's age X X H015 The distribution of risk ratings is independent of time as offshore helicopter pilot X X H016 The distribution of risk ratings is independent of pilots’ flying hours in helicopters, total X X H017 The distribution of risk ratings is independent of pilots’ flying hours in helicopters, IFR X X H018 The distribution of risk ratings is independent of pilots’ flying hours in helicopters, night X X H019 The distribution of risk ratings is independent of pilots’ number of night deck landings X X
X: non-significant result, accept H0 ✓: significant result, reject H0
* Given the sample sizes of specific regions, the analysis was limited to Group 5 x Group 1. See Section 6.5.4
207
6.7 Limitations and their mitigation
Surveys are necessarily based on subjective data, such as experience, perceptions and
information recollected from memory. Hence, a degree of bias can never be discarded.
Additionally, despite the attempted rigour of the sampling strategy, it can be argued that there
was no true randomisation of the study sample. This stems from the fact that the respondents
were volunteers and, therefore, self-selection and non-responder biases might have occurred
(Dery et al., 2007). While these are fair concerns, the simplicity of the questions, the
impartiality of the invitation letter (e.g. with no mention of any phase of particular concern)
and the focus on senior pilots with declarative knowledge and considerable professional
experience (see Table 6-5) are likely to have minimised any tendentious responses.
Representativeness can also be questioned, since a sampling frame was unavailable at the
onset. However, conversations with the collaborating individuals in each company revealed
that the percentage representativeness was high in at least the North Sea countries, Brazil and
Spain (i.e., over 30% of the population of ‘senior pilots’ in each region). Hence, the results
can be expected to be a fair representation of the corresponding macro regions and companies
covered, which are in any case the main companies in the sector.
Finally, suboptimal sample sizes limited the analysis that could be undertaken, e.g., analysis
across all five regions of operations (i.e., Groups 1 to 5, see Section 6.5.4) was not possible.
However, given the ethical imperative to keep survey participation voluntary, suboptimal
sample sizes sometimes cannot be avoided.
6.8 Conclusions
Chapter 2 (Sections 2.3.2.4, 2.3.3.2.1 and 2.3.3.3) showed that even though surveys are
recommended as a fundamental process of hazard identification/risk analysis in aviation, no
guidance is provided on how to conduct surveys. This chapter develops a structured and yet
simple questionnaire survey methodology for identifying the riskiest phases of nighttime
offshore helicopter flights. As discussed in Section 6.1, this of prime importance for hazard
identification and risk analysis and a fundamental pre-requisite for the development and
implementation of a task-based hazard identification survey process in Chapters 7 and 8.
208
The identification of the riskiest phases of nighttime offshore helicopter flights were
underpinned by the development of a novel and bespoke taxonomy which overcame the
weaknesses of current taxonomies discussed in Section 6.2. The taxonomy, developed from
the application of two simple task analysis techniques, describes the phases of nighttime
offshore helicopter flights beyond any existing taxonomy and incorporates human factors
aspects which are essential to understanding the hazards and risks of nighttime offshore
helicopter operations.
The questionnaire survey that ensued was specifically designed to generate statistically useful
data which redressed the limitations of the existing information on the hazards and risks of
nighttime offshore helicopter operations. As discussed in Sections 6.3 and 6.4, these
limitations included low accident/incident data representativeness, data incompleteness, use
of clustered phases of flight (see also Sections 4.3.6.3, 4.3.8 and 5.4.5), lack of a focus on
facts in previous surveys (see Section 2.3.3.2.1) and the absence of a holistic view of the
impact of respondents’ demographic characteristics on the risk levels experienced.
Following careful design and piloting of the questionnaire, data was collected from subject
matter experts based in seven countries. This was followed by the study of the data’s
properties which defined the multiple statistical tests to be used. The results show that the
phases flown by reference to external visual cues at high kinetic states (i.e., VH), which are
the characteristic phases of nighttime flights, cause the greatest difficulties to pilots. Among
such phases, the visual segment of instrument approaches is particularly risky.
The demographic analysis of risk levels experienced during this phase failed to show any
statistical significance. This is important as the sampling strategies of follow-up hazard
identification studies (e.g., those in Chapters 7 and 8) should be based on criteria other than
the demographic variables explored in this study. However, for the remaining VH phases
(i.e., visual takeoff and visual go around), further work should focus on the mid-twin turbine
and glass cockpit helicopters.
Limitations were identified in the course of the survey and the results should be interpreted
with respect to such real-life constraints. Therefore, the results are best dealt with as the first
step towards evidence-based recommendations. Although external validity seemed assured,
especially with respect to concurrent validity (i.e., the results converge with ongoing safety
209
interventions in the approach and landing phases of flight, see Section 2.1), further work
aimed to validate and update this study is advisable.
As new safety interventions are put in place to redress the per-flight-phase safety risks (e.g.,
the approach procedures flown with the aid of satellite-based vertical guidance in the North
Sea; see Section 2.1), it will be important to detect phases accurately and reassess the changes
in associated risk levels. Precise phase discrimination might be attempted through enhancing
HFDM algorithms and by integrating HFDM data with data from other sources, e.g., from
cockpit voice and video recorders, for joint analysis.
Based upon the results of this chapter, Chapters 7 and 8 accept the nighttime visual approach
phase as the phase which is most representative of the hazards of nighttime offshore
helicopter flying and use this phase for the development and implementation of a novel Task-
Based Hazard Identification Survey Process. The process aims to achieve a holistic view of
the hazards and risks faced, as needed to mitigate the problems of unsuccessful human
performance during motor-controlled nighttime flights (see Section 2.3.2). This novel process
is of the utmost importance given the current scenario of relatively few nighttime offshore
helicopter accidents and incidents, as well as reported incidents that cannot be trusted as
statistical precursors to accidents (see Sections 2.1, 5.9 and 6.3).
210
CHAPTER 7 TASK-BASED HAZARD IDENTIFICATION SURVEY PROCESS – TEMPLATE DEVELOPMENT
The previous chapter investigated the levels of risk of well-discriminated phases of nighttime
offshore helicopter flights and concluded that the visual scan technique – high kinetic state
(i.e., VH) phases are highly representative of the risks of nighttime flights. Amongst such
phases, the visual segment of instrument approaches poses the highest level of risk.
Furthermore, it was determined that the level of risk in this critical phase of flight is
independent of helicopter category, area of operation and pilot demographic characteristics.
This chapter builds on these conclusions to develop the Task-Based Hazard Identification
Survey Process and implements it to identify the hazards associated with the visual segment
of nighttime instrument approaches. The process enables the assessment of the current level
of hazard knowledge specific to the task and to realise a factual list of hazards (i.e., a hazard
template) with two characteristics: (i) it is formed by exhaustive hazard categories and (ii) it
contains enough hazard data to enable statistical analysis. Whereas exhaustiveness is
important to ensure the transferability of the template to other similar phases and over time,
statistical analysis is the cornerstone of predictive safety and essential for assuring that the
results can be generalised to the wider population of potential survey respondents. This
chapter is organised as follows: Section 7.1 discusses the theoretical background linking task
analysis, survey methods and hazard identification. Section 7.2 reviews how a task analysis
technique should be selected for survey-based hazard identification and selects one for the
process. Section 7.3 specifies the architecture of the task-based hazard identification survey
process, with an explanation for each of its steps. Section 7.4 implements the process in the
context of nighttime visual approach segments, with the results presented and discussed in
Section 7.5. Finally, Section 7.6 presents the chapter’s conclusions on the ability of the
process to produce a hazard template with the characteristics specified and, thereby, support
the exploitation of hazard data in predictive analysis in Chapter 8.
7.1 Theoretical background
Although hazard identification through task analysis is recommended in the aviation
literature presented in Chapter 2, Sections 2.3.2.4 and 2.3.3.3 showed that this is not typically
211
associated with survey methodologies. Currently, the task analysis methods recommended are
mostly poor adaptations of analytical system decomposition techniques and associated failure
mode detection methods, both of which are designed for hardware-centred systems.
Therefore, the current methods cannot identify fully the contextual hazards embedded in
intractable human-centred operations (Dougherty, 1990; Hollnagel, 2012, 2009; 2008, 2004,
1997, 1993; Kim et al., 2006; Helmreich and Merritt, 1998; Snook, 2000; Stolzer et al., 2008;
Lewis, 2011).
Surveys are able to offer the human-centred approach missing in the task analysis-based
hazard identification methods currently recommended in aviation. However, Chapter 2
showed that most survey methodologies applied to identify hazards in aviation, including in
nighttime offshore helicopter operations, lack the factual focus which is an integral part of
task analysis techniques (see Sections 2.3.3.2.1, 2.4 and Shryane et al., 2000; Kirwan and
Ainsworth, 1992). Hence, a combination of the human-centred focus of surveys with the
factual, task-based character of task analysis should overcome the current shortcomings of
hazard identification methods. Therefore, this chapter integrates task analysis and operational
survey techniques to form the ‘Task-Based Hazard Identification Survey Process’ and apply
it in the context of nighttime offshore helicopter visual approach segments. A review of the
selection of task analysis for addressing the problem of hazard identification is presented in
section 7.2.
7.2 Task analysis and hazard identification
As mentioned in Section 3.2, there are over 100 task analysis techniques in the literature. In
order to select the appropriate techniques to address a given problem, it is widely accepted
that case-based reasoning should be used. This means studying similar cases of successful
and unsuccessful task analyses to inform the selection of an approach for a new task analysis
problem (Chipman et al., 2000).
Based on case-based reasoning, the Talk-Through task analysis techniques was chosen to
form the ‘Task-Based Hazard Identification Survey Process’. This technique is based on
retrospective interviews and was successfully applied by Nascimento (2009) to identify the
hazards of nighttime visual approaches of offshore helicopters in the North Sea (see Section
2.3.3.2.1).
212
The Talk-Through technique has an intrinsic hazard identification character because it checks
actual performance against the baseline performance stipulated during the planning of the
operation. Therefore, the technique allows for the creation of an updated, factual model of
what actually happens during the task execution (HSE, 2013; Kirwan and Ainsworth, 1992).
In Talk-Through analysis, workers who know the operation explain verbally how specific
tasks are undertaken in terms of required actions and work methods. The following three
steps are necessary for a Talk-Through exercise: (i) develop the scenario of interest, which
might be a known hazardous scenario; (i) undertake the Talk-Through session, which,
ideally, includes recording the verbal information; and (iii) debrief, during which time the
analyst facilitating the exercise pursues any particular aspects of the task of concern (Kirwan
and Ainsworth, 1992). Incorporating the Talk-Through task analysis technique, the Task-
Based Hazard Identification Survey Process was developed as described in the following
section.
7.3 Process development
The Task-Based Hazard Identification Survey Process was developed to address the problems
of previous survey processes discussed in Chapter 2 (Section 2.3.3.2.1) and enable the
identification of hazards in human-performed tasks. In this chapter, the implementation of the
processes covers the nighttime visual approach segment as this is the riskiest task identified
from the analysis presented in Chapter 6.
The focus on a specific task minimises biases introduced by personal opinions and unfounded
perceptions (Sections 2.3.3.2.1 and 2.4). Defining a geographical scope is needed for matters
of efficiency and to ensure that statistically representative samples of respondents will be
reached. This in turn ensures the results can be generalised. A preliminary hazard
identification exercise is then required to cover the state of the art in the topic area, which is
necessary in any scientific undertaking. The subsequent survey data collection is focused on
developing an exhaustive and statistically representative list of hazards (i.e., a hazard
template) because having such a template enables effective management of hazard
information (explained further in Section 7.3.2). Finally, the process includes the means to
perform statistical analysis and predictions using the template generated. Figure 7-1 captures
the architecture of the new process, which is explained further in Sections 7.3.1 to 7.3.4.
213
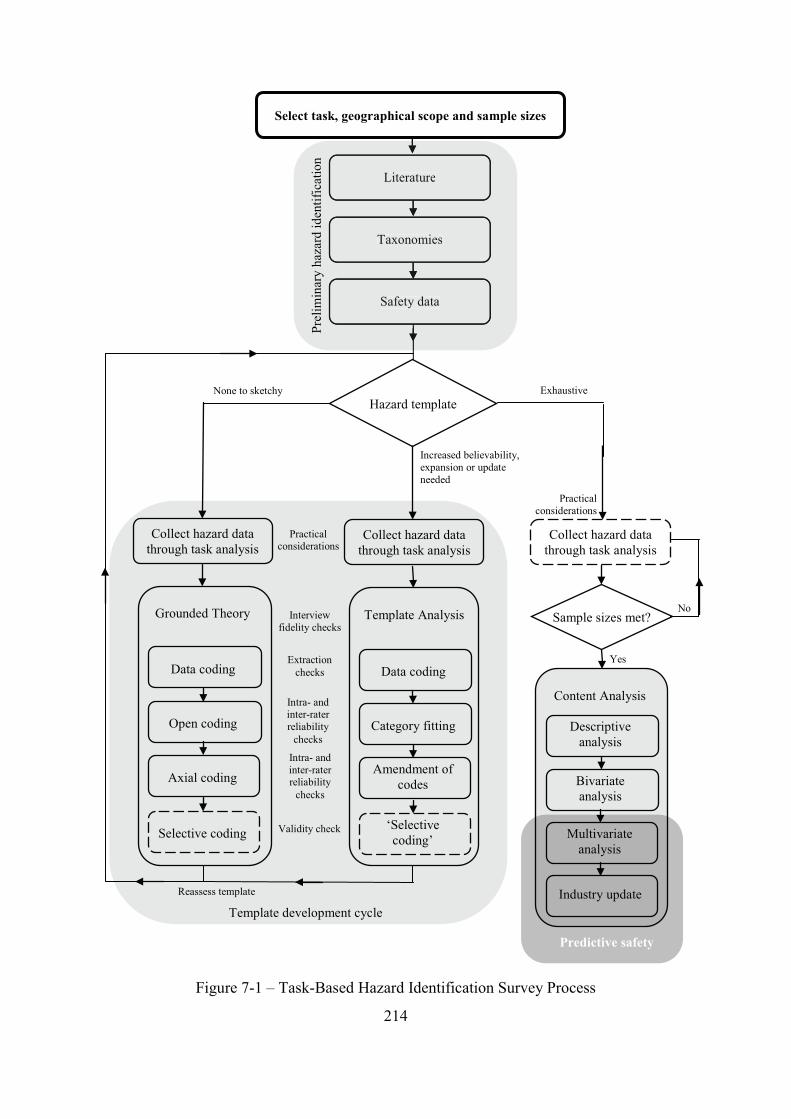
7.3.1 Select task, geographical scope and sample sizes
In the generic process, any task of safety concern (e.g., identified from the analysis of
accidents, other surveys or HFDM exceedances) can be selected for the task-based hazard
identification survey exercise. Well-discriminated phases of flight (see Sections 6.1 and 6.2)
can be used as task entities amenable to task-based hazard identification.
The geographical scope depends on the intention of the survey, i.e., the level of generalisation
intended. It is advisable to define the geographical scope as broadly as possible (e.g.,
worldwide, resources permitting) since virtually all the bounding conditions are artificial (see
Section 2.2.2).
The sample sizes required need to be considered at this stage. This is important because
predictive hazard identification (also known as predictive safety), as stipulated in Section
2.3.3.3, is built on the assumptions of regression analysis and inferential statistics. The
method outlined in Section 6.5.5 for the estimation of sample sizes, should be used. Statistical
sampling methods (e.g., random sampling or stratified sampling) should be given preference
as far as possible. However, they might prove difficult to implement due to local
circumstances (e.g., pilot availability for only a short period of time between successive
flights). Where true randomisation is impossible, representativeness should be attempted by
increasing sample sizes (e.g., over 10% of the target population) and applying quota
sampling. Quota sampling enables inferential statistical analysis when representativeness is
assured and the interviewer consciously controls for selection bias, e.g., by approaching
potential interviewees who appear both similar and dissimilar to the interviewer (Burns and
Burns, 2008).
7.3.2 Preliminary hazard identification
This stage comprises the review of the literature, applicable taxonomies and available safety
data (i.e., accident and incident reports). The review of applicable taxonomies is a literature
review focused on identifying the structure and content of current taxonomies with respect to
the known hazards of the task under study. This enables the gaps between available and
required taxonomies to be identified, which indicate the extent to which developing a
customised template may be necessary. The review of safety data is equally undertaken as a
215
literature review and enables any gaps in the seminal template being developed to be filled.
The outcome of this step is a seminal hazard template, if the knowledge available supports it.
Developing a hazard template is an important information management process, as is the
development of classification schemes in general. Such schemes help to achieve the goals of
scientific and applied research by simplifying and ordering complex and varied observations.
They allow for greater sophistication than simply descriptive accounts of hazards and enable
the development of comparisons and the classification of events according to identified
general characteristics discovered during the classification process. In order to achieve this,
the categories of the template should be (Morgan et al., 2000; Fischhoff et al., 1984):
i. Simple;
ii. Well defined;
iii. Mutually exclusive;
iv. Reflective of risk analysis objectives;
v. Logically consistent;
vi. Compatible with administrative systems;
vii. Equitable; and
viii. Compatible with human cognitive limitations.
Classification plays a vital role in the development of practical strategies for controlling the
environment, guiding policy-making (Cvetkovich and Earle, 1985) and ensuring the
consistent communication of hazards (Stolzer et al., 2008). However, in order to avoid
introducing bias in the seminal template (see Section 2.3.3.1.1), it is usually better to remain
conservative than to add all likely applicable hazards. By remaining conservative, the data
collected in the subsequent steps of the process (explained in the following section) will lead
to the development of a customised template.
The seminal template formed, if any, is then subjected to an initial qualitative assessment.
This is a value judgement that reflects the trust of the analyst on the template’s believability
(see Section 4.1.5), completeness and timeliness. The outcome of this assessment is to enter
either the template development cycle or Content Analysis procedure, as explained in the
Sections 7.3.3 and 7.3.4, respectively.
216
7.3.3 Template development cycle
The template development cycle begins with the collection of hazard data using the Talk-
Through task analysis technique. Subsequently, Grounded Theory (Strauss and Corbin, 1998)
is applied to categorise the data collected when no template can be drawn in the previous
step. When a template is drawn, Template Analysis (King, 1998; see Section 4.3.7) is used.
Data collection, Grounded Theory and Template Analysis are explained in Sections 7.3.3.1 to
7.3.3.3.
7.3.3.1 Collect hazard data through task analysis
As discussed in Section 7.2, the Talk-Through task analysis should be used. Since it is an
interview-based technique, there are a number of practical issues to consider regarding
question design, the method of conducting interviews and the need for a pilot study.
7.3.3.1.1 Question design
The requirements established in Section 7.2 must be addressed. This includes the design of
the questions supporting the Talk-Through and the debriefing in which the hazards are
identified. The hazards are best captured with open-ended questions, i.e., the participant’s
free expression facilitated by the interviewer, who intervenes to ensure that the participant
covers the area under study. Such a method of interaction is called a semi-structured
interview schedule (Denzin, 1988; Robson, 2002).
Since information from past events (i.e., the overall experience) is required, it is useful to
define a timeframe of reference. This avoids the effects of memory decay and forgetfulness,
which lead to both an underreporting of past events and inaccuracies in any reports. A period
of 12 months prior to the interview is commonly used in qualitative research (Woolsey, 1986;
Jarvis, 2009; Brenner et al., 1985; Ronan and Latham, 1974).
The demographics of the respondents are also captured. This factual information is collected
by means of direct questions, such as ‘how many flying hours do you posses?’ This
information is used to describe the sample and thereby provide credibility to the research.
Demographic data also form independent variables during the quantitative analysis of survey
data, in which the hazards identified are used as dependent variables. This is further explored
in Chapter 8. 217
7.3.3.1.2 Method of interview application
Face-to-face individual interviews are preferred since they enable the maximum amount of
information to be extracted from the participant’s answers. They also allow for participants’
privacy and well-being, as well as establishing rapport. However, it is important to control for
interviewee-interviewer biases, especially leading questions (Burns and Burns, 2008; Robson,
2002; Brenner et al., 1985).
To avoid such biases, Brenner (1985) established a set of rules that an interviewer should
follow, including rules for (i) asking questions, e.g., read the questions as they are worded in
the interview schedule, (ii) dealing with respondent’s answers, e.g., record exactly what the
respondent says, (iii) dealing with respondent problems, e.g., when the respondent requests
the interviewer to repeat an action, he/she must repeat and (iv) interacting with the
respondent, including to probe only non-directionally, e.g., avoid implying or suggesting to
the respondent a particular answer or direction of answering.
The interview recording method is selected on the basis of ethical considerations and the need
to obtain participants’ trust, keep them satisfied and to be transparent. Ideally, interviews
should be recorded; however, the analyst may have to reconsider this in the light of
participants’ unfavourable attitudes. In this case, notes should be taken, if allowed.
7.3.3.1.3 Conduct a pilot study
A pilot study was described in Section 6.5.3. Pilot studies are essential in order to remove
ambiguity, test the adequacy of the range of response categories and to trial instructions and
administration (Burns and Burns, 2008). They are also useful in correcting linguistic errors
when the survey is administered in foreign languages.
7.3.3.1.4 Obtain ethical approval
Research involving human participation is usually preceded by an analysis of ethical
considerations, with the view to ensuring the participants’ well-being. When the subject of
the research can be foreseen as potentially distressful or sensitive, a research proposal should
be elaborated and submitted to a qualified ethics board for approval (e.g., EASP, 2014).
218
7.3.3.2 Grounded Theory
Following the collection of the data and with no template for its classification, Grounded
Theory is applied. This is a structured methodology devised to enable the generation of
categories and theory from raw data, regardless of any pre-conceived theories. Therefore, the
methodology enables the creation of an unbiased list of hazards tailored to the needs of the
industry under investigation, as opposed to the adaptive fitting of identified hazards into pre-
existing taxonomies derived from other domains. Grounded Theory is commonly used in
sociology (Cooke, 1994) as well as aviation, e.g., developing pilot decision-making models
(Huddlestone and Harris, 2006) and for the establishment of glider pilot error taxonomies
(Jarvis, 2010). In nighttime offshore helicopter operations, it was used by Nascimento (2009),
as described in Section 2.3.3.2.1.
This methodology may be applied to virtually all forms of data, provided that they are
transformed into a textual format. Analysis using Grounded Theory follows four steps: data
coding, open coding, axial coding and selective coding.
Data Coding is conducted using ‘line-by-line analysis’ (Strauss and Corbin, 1998, pp. 57) of
the raw textual data (e.g., interview transcripts). In the case of hazard identification, this step
highlights phrases (or ‘statements’; Berelson, 1952) unambiguously referring to hazards.
Since these statements form entities of analysis, it is advisable that data coding is preceded by
interview fidelity and followed by statement extraction checks (Butterfield et al., 2005). The
former looks for leading questions and consistency in the application of the interview
schedule. The latter ensures that the hazards are reliably and consistently identified. The
assistance of independent and knowledgeable raters is advisable for the checks above.
Open Coding is the ‘analytical process through which concepts are identified” and during
which ‘data is [...] closely examined, and compared for similarities and differences [...] for
fine discrimination and differentiation among categories’ (Strauss and Corbin, 1998, pp. 101-
102). This is undertaken using the Constant Comparison Technique described by Partington
(2002, cited in Huddlestone and Harris, 2006, pp. 360), whereby each statement is compared
with those preceding it to check whether they describe the same phenomenon and can thus be
allocated to the same category. Subsequently, categories are assigned names by
‘conceptualization’ (Strauss and Corbin, 1998, pp. 105), i.e. labelling according to the event
219
that the statements represent. Intra-rater checks (e.g., test-retest reliability tests) and inter-
rater reliability tests may be undertaken for refinement and consistency of the categorisation.
Axial Coding is ‘the process of relating categories to their subcategories’ with the purpose of
‘reassembling data that were fractured during open coding’ (Strauss and Corbin, 1998, pp.
123-124). As a descriptive template of hazards emerges, triangulation is required. This may
be done by asking other raters to categorise random statements within and across the axial
codes. Agreement rates may then be derived using percentage agreement or Cohen’s Kappa.
The latter factors for the likelihood of random agreement into the calculation of agreement
rates (Cohen, 1960; Robson, 2002).
Selective Coding allows for presentation of categories ‘as a set of interrelated concepts, not
just a listing of themes’ (Strauss and Corbin, 1998, pp. 145). This integration is done by
‘writing a story’ (Strauss and Corbin, 1998, pp. 148), which should be validated as advised
by Strauss and Corbin (1998, pp. 159): ‘tell the story to respondents [...] and then request
that they comment on how well it seems to fit their case [...] They should be able to perceive
it as a reasonable explanation’. Another form of validation is ‘high-level comparative
analysis’ against raw data (Strauss and Corbin, 1998, pp. 159), leading to the definition of
areas of concern where appropriate and the establishment of the central theme which
underpins the relationships between categories. This central theme is called the ‘the core
category’ (Strauss and Corbin, 1998, pp. 159).
The selective coding step does not aid the development of the template directly and is
therefore marked by a dashed outline in Figure 7-1. However, doing the selective coding and
producing a story may be used as an interim validation exercise when developing the
template. If the story produced on the basis of the categories of the template is meaningful to
SMEs in the field, confidence in the ability of the template to capture the proposed content is
increased.
In order to further enhance validity, some data collected may be analysed only after the
template is developed. This checks if the story holds true in light of new data. Since a
template pre-exists the validation check, it is technically already a Template Analysis
exercise.
220
7.3.3.3 Template Analysis
Template Analysis (King, 1998) allows for the template’s believability to improve. It also
expands and updates an existing template as necessary. This technique starts from a list of
codes defined a priori (i.e., a template), which is then modified, refined and amended as
prompted by the narratives (see Section 4.3.7).
The need to improve believability, expand and update the template might be caused by a
change in theoretical sensitivity. This is commonly associated with the application of
inductive analysis methods such as Grounded Theory and Template Analysis. Theoretical
sensitivity (Glaser, 1978; Glaser and Strauss, 1967; Strauss and Corbin, 1998) refers to an
awareness of the subtleties of meaning of data and the ability to give meaning to the data. As
experience is gained in the subject through research, the researcher’s theoretical sensitivity is
expected to improve. This may lead to changes in the course of the inductive research,
resulting for example, in a change in the arrangement of categories.
Changes in the arrangement of the categories may also be deliberate, in light of multiple
research objectives (Webler et al., 1995). For example, it is common practice in the
environmental sciences to use a single set of hazards in different classification schemes
reflecting various analysis purposes, e.g., analysis of population exposed (Morgan et al.,
2000; Cvetkovich and Earle, 1985; Fischhoff et al., 1984). Other deliberate arrangements of
categories include the alignment of hazard categories with the structures of the system model
or industry taxonomy adopted (Svedung and Rasmussen, 2002) and to differentiate between
sources and manifestations of hazards (e.g., error ‘genotypes’ and ‘phenotypes’, respectively;
see Hollnagel, 2012; 2009, 2004).
The process of Template Analysis is similar to that of Grounded Theory. Data coding is also
conducted using the line-by-line analysis technique. Category fitting resembles the Open
Coding step with the difference that, since categories already exist, the raw data is primarily
fit to the categories. The ‘amendment of codes’ step of Template Analysis is equivalent to the
Axial Coding step of Ground Theory. The integration of categories is also conducted by
producing a coherent story of the phenomena investigated (King, 1998). This is analogous to
the Grounded Theory’s selective coding step (and hence, is labelled ‘selective coding’ and
represented by a dashed line in Figure 7-1). Story writing is a common form of validation in
221
qualitative research in general (Canter et al., 1985) and thus also applies to Template
Analysis. Interview fidelity, statement extraction, reliability and validity checks are also
undertaken as in Grounded Theory. Template Analysis is commonly used in aviation to
create hazard lists or categorise aircrew members’ perception of safety and security issues
(e.g., Tabary, 2006).
7.3.3.4 Template reassessment
The template produced by Grounded Theory or improved by Template Analysis is subject to
a new assessment of believability (see Section 4.1.5), scope and timeliness. For as long as the
template needs further improvement, Template Analysis is conducted recursively. When the
template is deemed exhaustive, more data are collected as in 7.3.3.1 as necessary to complete
the sample sizes calculated in Section 7.3.1, if not yet completed. When the minimum sample
sizes are achieved, quantitative hazard analysis through Content Analysis is conducted. An
exhaustive template is one in which the creation of new categories achieves clear diminishing
returns in new rounds of safety data analysis. Because an exhaustive template is a
comprehensive list of hazards, it is usually expected that it is transferable, at least partially, to
similar areas (e.g., other phases of flight with similar characteristics; see Section 6.6.1 and
Tables 6-2 and 6-7) not covered by the investigations from which the template emerged.
7.3.4 Content Analysis
Content Analysis produces quantitative summaries of responses (e.g., to the hazard
identification exercise) and enables the identification of specific characteristics of
communications in a systematic and objective manner (Brenner et al., 1985; Mostyn, 1985).
Content Analysis has a renowned heritage which includes applications in fields as diverse as
war propaganda, espionage, psychological analysis of dreams, astronaut-ground control
interactions (Smith et al., 2008; Mostyn, 1985) and the behaviour of fire fighters when
dealing with fires (Canter et al., 1980). The strength of Content Analysis lies in the statistical
analysis of the concepts embedded in the categories of a template. Content Analysis takes
unities of communication (e.g., words, themes, categories) and subjects them to scrutiny to
investigate if any regularity occurs. This process frequently leads to hypothesis testing and
reformulation of hypothesis due to the discovery of relationships among the data (Mostyn,
1985; Burns and Burns, 2008).
222
Content Analysis has several initial steps that replicate those of Grounded Theory for
developing categories from the raw data. The disadvantage of Content Analysis is that these
initial steps are less rigorous and more difficult to apply (Cooke, 1994). Therefore, Content
Analysis is best used after the successful application of Grounded Theory or Template
Analysis, thereby benefitting from an existing template. Table 7-1 outlines all the steps of
Content Analysis described by Mostyn (1985) and shows how the initial steps of the method
are either already covered or improved by the processes of Grounded Theory and Template
Analysis.
Content Analysis may be applied both to the frequencies of content (e.g., the hazard
statements), or to the presence or absence of a particular content in the survey respondents’
speeches. Because ‘what is not said may be as, or more, important than what is said’
(Berelson, 1971, cited in Mostyn, 1985, pp. 130), Content Analysis allows for the study of
participant membership in the categories of a hazard template, i.e., the analysis of the
characteristics of those who commented on particular hazards versus those who failed to
comment. This approach is called ‘Non-Frequency Content Analysis’ and has been used in
many domains, such as the production of intelligence material in the political sphere and in
psychometrical testing (Bainbridge, 1985; Berelson, 1952; Edwards and Hahn, 1980). ‘Non-
Frequency Content Analysis’ is explored in Chapter 8 to analyse survey data quantitatively.
7.4 Process implementation
7.4.1 Selection of task, geographical scope and pilot sampling considerations
7.4.1.1 Selection of task
Chapter 6 showed that the visual segment of instrument approaches is the phase of flight
which is most challenging to pilots. Additionally, Chapter 6 also showed that well-
discriminated phases of flight can be viewed as well-defined task entities. Based on these
results, the visual segment of nighttime instrument approaches is the task chosen for the
implementation of the Task-Based Hazard Identification Survey Process. This choice
coincides with the task investigated by Nascimento (2009). This is a key study for the
development of this chapter, as shown in Section 7.4.2.1.
223
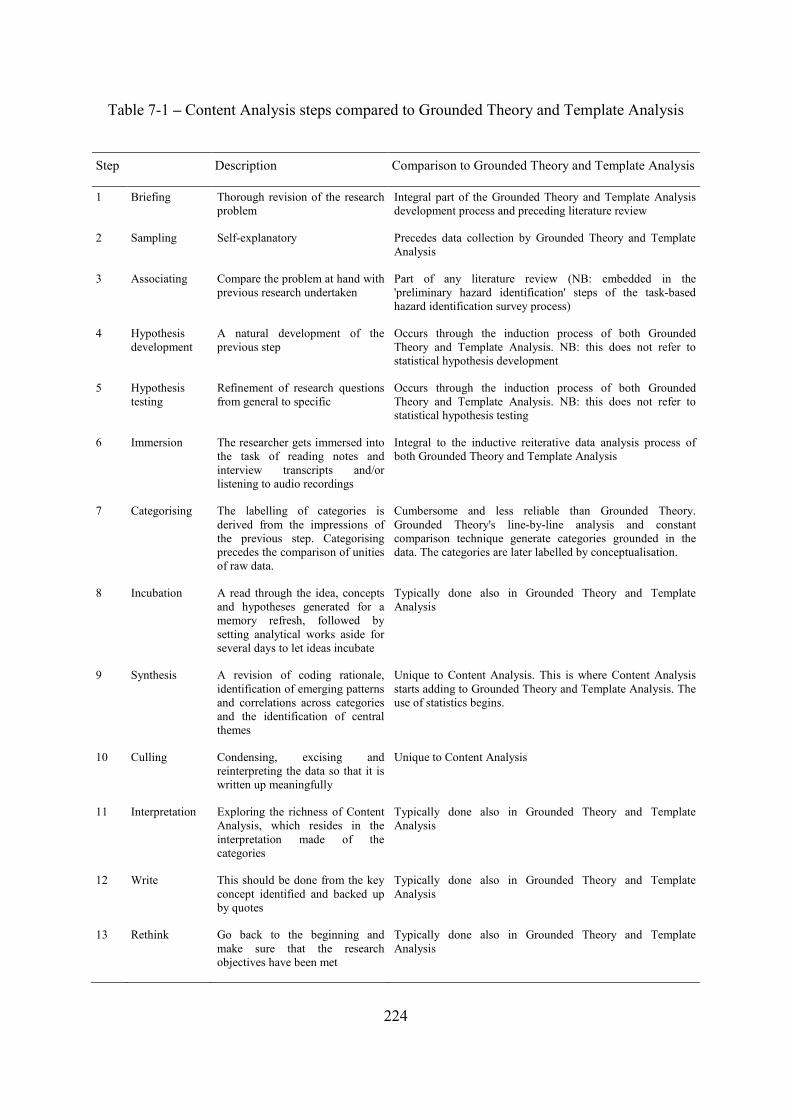
Table 7-1 – Content Analysis steps compared to Grounded Theory and Template Analysis
Step Description Comparison to Grounded Theory and Template Analysis
1 Briefing Thorough revision of the research problem
Integral part of the Grounded Theory and Template Analysis development process and preceding literature review
2 Sampling Self-explanatory Precedes data collection by Grounded Theory and Template Analysis
3 Associating Compare the problem at hand with previous research undertaken
Part of any literature review (NB: embedded in the 'preliminary hazard identification' steps of the task-based hazard identification survey process)
4 Hypothesis development
A natural development of the previous step
Occurs through the induction process of both Grounded Theory and Template Analysis. NB: this does not refer to statistical hypothesis development
5 Hypothesis testing
Refinement of research questions from general to specific
Occurs through the induction process of both Grounded Theory and Template Analysis. NB: this does not refer to statistical hypothesis testing
6 Immersion The researcher gets immersed into the task of reading notes and interview transcripts and/or listening to audio recordings
Integral to the inductive reiterative data analysis process of both Grounded Theory and Template Analysis
7 Categorising The labelling of categories is derived from the impressions of the previous step. Categorising precedes the comparison of unities of raw data.
Cumbersome and less reliable than Grounded Theory. Grounded Theory's line-by-line analysis and constant comparison technique generate categories grounded in the data. The categories are later labelled by conceptualisation.
8 Incubation A read through the idea, concepts and hypotheses generated for a memory refresh, followed by setting analytical works aside for several days to let ideas incubate
Typically done also in Grounded Theory and Template Analysis
9 Synthesis A revision of coding rationale, identification of emerging patterns and correlations across categories and the identification of central themes
Unique to Content Analysis. This is where Content Analysis starts adding to Grounded Theory and Template Analysis. The use of statistics begins.
10 Culling Condensing, excising and reinterpreting the data so that it is written up meaningfully
Unique to Content Analysis
11 Interpretation Exploring the richness of Content Analysis, which resides in the interpretation made of the categories
Typically done also in Grounded Theory and Template Analysis
12 Write This should be done from the key concept identified and backed up by quotes
Typically done also in Grounded Theory and Template Analysis
13 Rethink Go back to the beginning and make sure that the research objectives have been met
Typically done also in Grounded Theory and Template Analysis
224
7.4.1.2 Selection of geographical scope
It was shown in Chapter 4 that the worldwide pandemic nighttime offshore helicopter
accident problem is particularly acute in the North Sea, Africa and Middle East (Sections
4.4.1 and 4.4.2.1). Since Chapter 6 did not identify any regional effect on the risk levels
experienced by pilots in the visual segment of nighttime instrument approaches, the results of
Chapter 4 guided the definition of the scope of the hazard identification exercise as follows:
• Ideally: worldwide.
• Minimally: the North Sea (i.e., Group 5) and the area sharing the same characteristics
as the Middle East and Africa (i.e., Group 1 of ‘other regions’, defined in Section
6.5.4).
The ideal scope was initially pursued and attempts were made to contact the key companies
in each of the five groups of areas of offshore helicopter operations, in accordance with the
procedure outlined in Section 6.5.4. After difficulties in establishing local collaborations in
some regions coupled with logistical constraints, the minimal scope was pursued.
Regarding the North Sea, operators in the British Northern North Sea (NNS, i.e., Aberdeen),
British Southern North Sea (SNS, i.e., Blackpool) and Norwegian North Sea (i.e., Stavanger)
were keen on participating in the survey. This was acceptable because, based on the volume
of operations, the UK and Norway are the main countries for the offshore helicopter activity
in the North Sea (CAA, 2014). Regarding the areas belonging to Group 1, only in Brazil and
Europe except the North Sea (i.e., Spain) were offshore helicopter operators keen on
participating.
7.4.1.3 Pilot sampling
In association with the scope decided in Section 7.4.1.2, quota sampling was selected to
account for an element of convenience in reaching the individual pilots within each region.
This was necessary due to pilots’ individual circumstances and time availability (see Section
7.3.1).
No distinction was made between pilots flying in the right or left hand side seat (usually
captains and first officers, respectively) because the direction of approach is mostly
determined by random wind circumstances (Nascimento, 2009). Considering this and the fact 225
that Chapter 6 failed to identify any pilot demographic characteristic associated with higher
levels of risk experienced in this phase of flight (see Sections 6.6.2.5 and 6.8), all offshore
helicopter pilots in the pre-selected areas of operation formed the population of interest.
In order to ensure that sufficient variability of the characteristics of the participants was
obtained, the sample size estimation method described in Section 6.5.5 was repeated. The
number of nighttime deck landings was the variable used for the estimation based on the
explanation provided in Sections 6.5.5. Setting the ideal and tolerable Z at 1.96 and 1.645
(corresponding to 95% and 90% confidence intervals, respectively), the sample sizes required
were, ideally, 50 pilots and tolerably 34 pilots per geographical group.
7.4.2 Preliminary hazard identification
7.4.2.1 Literature
Nascimento (2009, discussed in Section 2.3.3.2.1) was the first to investigate pilot-related
hazards in the visual segment of nighttime instrument approaches of offshore helicopter
operations. Grounded Theory (Strauss and Corbin, 1998) was used to analyse the data
collected from 22 talk-through semi-structured interviews (Kirwan and Ainsworth, 1992)
with individual pilots from the British sector of the North Sea. This investigation extracted
518 hazard statements from over 10 hours of recorded interviews and produced a template
formed by 41 open codes gathered in 14 axial codes. Selective coding produced a coherent
story which represented the overall situation in the North Sea. All the reliability and validity
checks described in Section 7.3.3.2 and Figure 7-1 were successfully undertaken. However,
since only the British North Sea was covered, the level of hazard knowledge is assessed to be
in need of expansion. This is necessary in order to incorporate an updated picture of the
hazards of the areas away from the British North Sea, into the template provided by
Nascimento, 2009 (see Figure 7-1).
7.4.2.2 Taxonomies
During this step, well-known hazard taxonomies were investigated for their fitness to support
the identification of hazards related to nighttime visual approaches of offshore helicopters.
Therefore, this step investigates the structure, i.e., the hazard categories available from
current taxonomies, not any hazard data per se. Assessing the structure of current hazard
226
taxonomies is an important step since taxonomies which are unfit-for-purpose might bias the
collection of hazard data (Lundberg et al., 2009). Furthermore, Sections 4.1.1, 4.1.2 and 6.2
identified a considerable disconnect between various taxonomies currently in use and well-
known characteristics of helicopter operations.
The structures of the following well-known taxonomies were investigated: the taxonomies of
EASA, usually called ECCAIRS21 taxonomies (see Section 2.3.3.1.1.2); ADREP (see Section
2.3.3.1.1.1); ATA Spec-100 (see Section 5.4.4); Aviation Safety Reporting System (ASRS,
see Section 5.2.2); Aviation Causal Contributors for Event Reporting Systems, ACCERS;
that from the Safety Management International Collaborating Working Group, SMICG; and
HFACS (see Section 3.5.2.1).
With respect to ECCAIRS, at a meeting held at the UK CAA in December, 2013, both the
British and Norwegian regulators expressed profound dissatisfaction with the hazard
categories available (ICAO, 2006b). This was caused by the difficulties associated with
managing over 2500 categories (Section 2.3.3.1.1.2), which confer an excessive level of
granularity to the hazard data. This has an effect similar to excessively decomposing an
activity during a task analysis or human reliability analysis (HRA) exercise and analysing the
activity’s failure modes in the absence of a defined context (see Sections 2.3.2.4 and 7.1).
Ultimately, each safety event can be described by such a unique set of hazards that
comparisons between safety events become virtually impossible.
Furthermore, the hazards of nighttime operations are poorly covered in the ECCAIRS
taxonomies. Many well-known types of nighttime visual illusions, which are extensively
covered in the sources cited in Section 2.3.2, are ignored. Moreover, platform and ship
hazards are absent in the taxonomies of ECCAIRS, which additionally have dubious
categories (Joint Research Centre of the European Commission, 2010a, 2012). Given all the
shortcomings in this and previous paragraph, the ECCAIRS taxonomies fail the criteria of a
good classification scheme established by Fischhoff et al. (1984) and Morgan et al. (2000)
listed in Section 7.3.2. The ECCAIRS taxonomies fail because of their lack of simplicity,
21 ECCAIRS stands for European Co-Ordination Centre for Accident and Incident Reporting Systems. 227
poor definitions, non-mutually exclusive categories, incompatibility with administrative
systems and logical inconsistency.
Logical inconsistency is a feature of numerous taxonomies that developed in an ad hoc
fashion from the early taxonomies established to categorise fixed-wing technical accidents.
This includes ECCAIRS, the ICAO’s ADREP and the ATA Spec-100 (used by the UK CAA,
see Section 5.4.4), all of which have incorporated human factors categories over time,
frequently without any theoretical underpinning, reliability and validity testing (ICAO, 1987,
2007a; CAA, 2005). A lack of theoretical underpinning also characterises the taxonomy of
the ASRS (NASA, 2014) and the ACCERS (Baker and Krokos, 2007). The former was
developed from unstructured brainstorming sessions with non-pilot subject matter experts.
The latter is based on cluster analysis which created categories which do not intuitively match
the hazards faced by pilots (Stolzer et al., 2008).
Research on contemporary hazard taxonomies developed by the SMICG has acknowledged
these problems and recommended simplicity and a more rigorous process of category
development. This should be based on both data analysis and subject matter expertise in order
to ensure logical consistency and compatibility with administrative systems (SMICG, 2010b).
However, because these taxonomies deliberately attempt to be generic and transferable across
sectors within the aviation domain (SMICG, 2013a, 2010c), they are too simplistic for use in
task-based exercises in the complex human factors-dominated environment of nighttime
offshore helicopter operations.
With respect to human factors-specific taxonomies, the popular Human Factors Analysis and
Classification system (HFACS; Wiegmann and Shappell, 2003) has been criticised for its
lack of predictive ability (Inglis et al., 2010). Therefore, it is ill-suited to support predictive
hazard identification on the basis of statistical analysis (see Section 2.3.3.3).
It is widely acknowledged that all taxonomies represent a compromise between
standardisation and contextual richness (Stolzer et al., 2008). The level of detail required
depends on the complexity of the process being considered (SMICG, 2010c) and the
objectives of hazard identification. Considering the objective of this chapter, i.e., to create an
unbiased hazard template, current taxonomies of hazards were assessed as unsuitable, given
228
the limitations and weaknesses discussed above. This requires the use of a customised
template, which is offered by Nascimento (2009), as mentioned in Section 7.4.2.1.
7.4.2.3 Safety data
Since the investigation undertaken by Nascimento (2009), only one additional accident report
has been made available in the public domain (AAIB, 2011) and one serious incident has
been reported to the UK CAA under the MOR Scheme (see Section 6.3). These do not add
new information to the template of Nascimento (2009).
7.4.2.4 Outcome of the preliminary hazard identification
Given the background in Sections 7.4.2.1 to 7.4.2.3, the template developed by Nascimento
(2009) was accepted as suitable for the implementation of the Task-Based Hazard
Identification Survey Process. Since the hazard categories outlined in the template referred
only to a subset of the regions selected in 7.4.1.2, the template was assessed as necessitating
both an expansion and an update to improve its believability in a wider range of conditions.
Therefore, the survey implementation entered the ‘template development cycle’ through a
series of Template Analysis exercises (see Figure 7-1).
7.4.3 Template development cycle
7.4.3.1 Collection of data through task analysis – practical considerations
7.4.3.1.1 Design of questions and pilot study
The demographic questions replicated those of the questionnaire survey of Chapter 6 because
these were important questions according to subject matter experts (SMEs; see Section
6.5.2.1). The remaining questions were open-ended and replicated the questions in
Nascimento (2009), which were subjected to extensive piloting and refinement. In order to
offer further validation and address potential issues associated with changes over time, the
questions were included in a pilot study involving five senior pilots in Brazil (each with over
5,000 flying hours offshore). The pilots were the aviation safety officers of the major
Brazilian offshore helicopter operators and chartered aircraft accident investigators. The
preamble and questions were sent via e-mail along with the aim of the research (i.e., to elicit
hazards in the visual segment of nighttime instrument approaches offshore). Feedback was
requested on the ability of the questions to support the aim of the research. All five senior
229

pilots agreed that the questions supported the aim pursued. No changes were needed given
the simplicity of the interview schedule.
The preamble and open ended-questions were phrased as follows:
For this research, I am especially interested in the visual segment of offshore approaches at
night. You should consider such a segment as starting at a distance from 1.0 to 0.75 nautical
miles from the helideck and finishing on the helideck landing. Assume that the helicopter is
operating normally (i.e., there are no malfunctions) and engine performance is not an issue.
1. Considering this scenario, how would you conduct the visual approach? Describe it
please.
2. Considering your description, what difficulties might be experienced while flying
this segment?
3. Can you recall cases in which you experienced difficulties or saw difficult scenarios
happening to other pilots? What happened?
4. Can you recall any other specific episode, maybe during the past year, if you flew in
this period?
5. If you could do anything to make night visual approaches safer, with no budget
limits or time constraints, would you do anything? What would it be?
6. Do you have anything that you would like to add, such as comments or suggestions,
before we finish?
Question 1 is the Talk-Through question whereas questions 2 to 4 are the debriefing
questions (Section 7.2). Question 4 used a fixed 12-month time window to improve memory
recollection accuracy and produce an updated picture of the hazards identified (Section
7.3.3.1.1). The questions had to balance the need for factual information whilst ensuring that
participants did not feel threatened. This was extensively discussed in the piloting exercises
of Nascimento (2009) and led to considerable re-wording of the questions. Questions number
5 and 6 were introduced for a variety of reasons: to build rapport, to capture suggestions of
improvement, validate the findings and enable to rectify any unforeseen inaccuracies of the
research design, should they exist.
230
7.4.3.1.2 Method of interview application and recording
Given the sensitive nature of the subject, face-to-face individual interviews were chosen as
the method of survey application. However, in Brazil, because of operational constraints that
were imposed on the participants (i.e., shortage of time available for the interview), two
interview sessions were conducted collectively. Participants were individually consulted
beforehand for their agreement. It should be noted that given the direct relevance of the
investigation by Nascimento (2009) to this thesis, Imperial College London was satisfied
with the ethical approval obtained at Cranfield University and described in Nascimento
(2009).
All interviews followed the guidelines of Brenner (1985) to avoid biases (Section 7.3.3.1.2).
The interviews were conducted in a private room in the pilots’ companies, with the consent
and cooperation of the companies’ senior managers (e.g., by providing the room, sitting
chairs for both the interviewer and the participants and amenities such as drinking water).
Within the companies, the pilots were selected by the persons of contact, typically the chief
pilots. These persons were instructed to select pilots at random from those scheduled to fly on
the days of the interviewer’s visit. This schedule was adhered to as closely as possible but
had to balance practical constraints because pilots were only available between successive
flights.
Where possible, the interviews were recorded. Standard Microsoft Windows’ Sound
Recorded software on a portable computer was tested and found appropriate for interview
recording. However, in Stavanger and Spain recording was not possible due to local
circumstances (e.g., not to upset the participants). In these scenarios, notes were taken using a
print version of the template. The hazards mentioned by the interviewees were marked, more
added where appropriate and general notes taken (Section 7.3.3.1.2).
The process implemented thus far resulted in a template populated by hazard data. In order to
ensure it achieved the two main objectives of exhaustiveness and suitability for statistical
analysis, section 7.5 presents the results with a particular focus on the two main objectives.
231
7.5 Results and discussion
7.5.1 Interim results
The interim results of the template development cycle are described in Table 7-2, in the
chronological order of data collection and analysis. Table 7-2 also displays the reliability and
validity checks undertaken, the methods used and information regarding Nascimento (2009),
which shows the compatibility with the various stages of the process implementation.
After each round of interviews, the template was reassessed for exhaustiveness (see Section
7.3.3.4 and Figure 7-1), as described in the next section. The evolution of the template after
each new round of interview can be seen in Appendix 8 and the final version of the template
is presented in Chapter 8.
7.5.2 Template exhaustiveness
Figure 7-2 shows that the objective of developing an exhaustive template was achieved. This
is evidenced by the number of categories in the template, which progressed from the 41
hazard categories of Nascimento (2009) to 33 to 18 to nine to two and finally to no new
hazard categories being formed at each new round of interviews. The template’s
exhaustiveness was already noticeable after the round of interviews in Brazil, when only nine
categories were formed from the 704 hazard statements extracted. However, further
interviews were necessary in order to achieve statistical representativeness (Section 7.4.1.3)
and enable quantitative (i.e., predictive) hazard analysis (undertaken in Chapter 8).
7.5.3 Sample sizes for statistical analysis
In terms of sample sizes, there were a total of 17 interviews in the North Sea (i.e., Group 5)
and 34 in the Group 1 of ‘other regions’. Based on the compatibility of methods used
(explained in Section 7.4.3.1 and 7.5), the hazard statements extracted from the 22 interviews
conducted by Nascimento (2009) in Aberdeen were borrowed to complete the sample sizes
required for quantitative hazard analysis. With the 22 interviews borrowed from Nascimento
(2009), 39 interviews were obtained in the North Sea. The minimum sample sizes required
for statistical representativeness established in Section 7.4.1.3 were achieved in both regions.
Hence, the objective of generating a template suitable for statistical analysis was achieved.
232
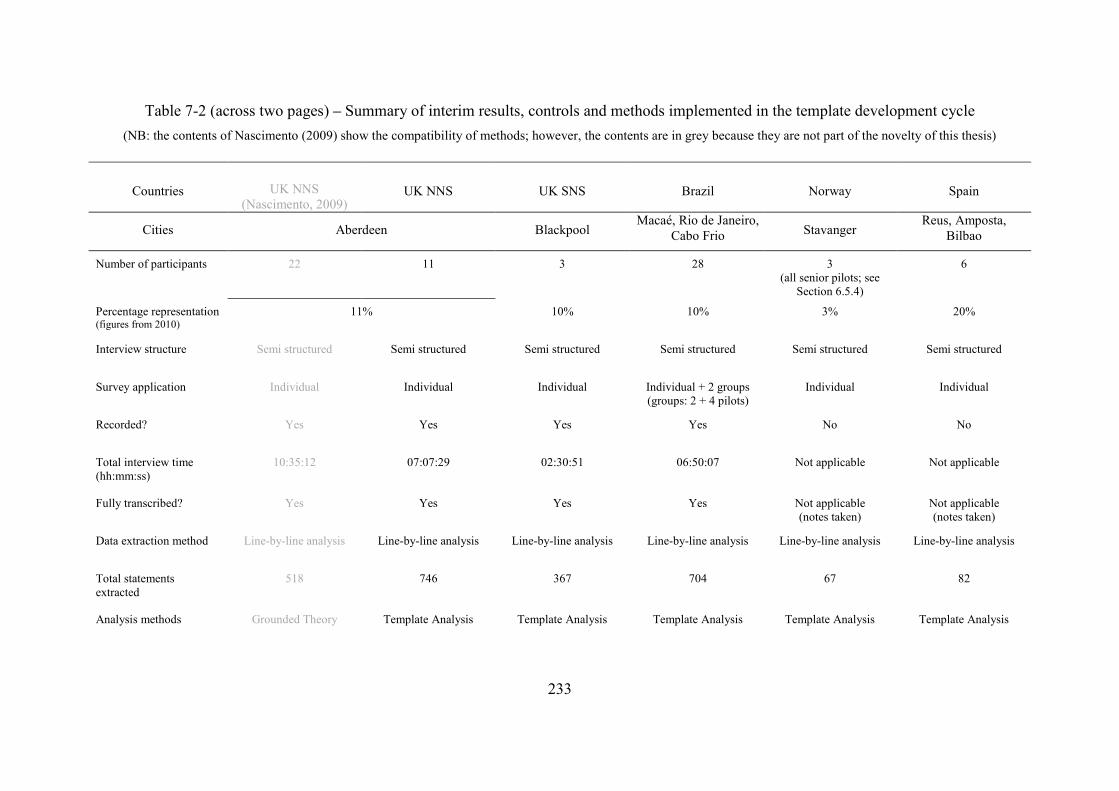
Table 7-2 (across two pages) – Summary of interim results, controls and methods implemented in the template development cycle
(NB: the contents of Nascimento (2009) show the compatibility of methods; however, the contents are in grey because they are not part of the novelty of this thesis)
Countries UK NNS (Nascimento, 2009)
UK NNS UK SNS Brazil Norway Spain
Cities Aberdeen Blackpool Macaé, Rio de Janeiro,
Cabo Frio Stavanger Reus, Amposta,
Bilbao
Number of participants 22 11 3 28 3 (all senior pilots; see
Section 6.5.4)
6
Percentage representation (figures from 2010)
11% 10% 10% 3% 20%
Interview structure Semi structured Semi structured Semi structured Semi structured Semi structured Semi structured
Survey application Individual Individual Individual Individual + 2 groups (groups: 2 + 4 pilots)
Individual Individual
Recorded? Yes Yes Yes Yes No No
Total interview time (hh:mm:ss)
10:35:12 07:07:29 02:30:51 06:50:07 Not applicable Not applicable
Fully transcribed? Yes Yes Yes Yes Not applicable (notes taken)
Not applicable (notes taken)
Data extraction method Line-by-line analysis Line-by-line analysis Line-by-line analysis Line-by-line analysis Line-by-line analysis Line-by-line analysis
Total statements extracted
518 746 367 704 67 82
Analysis methods Grounded Theory Template Analysis Template Analysis Template Analysis Template Analysis Template Analysis
233
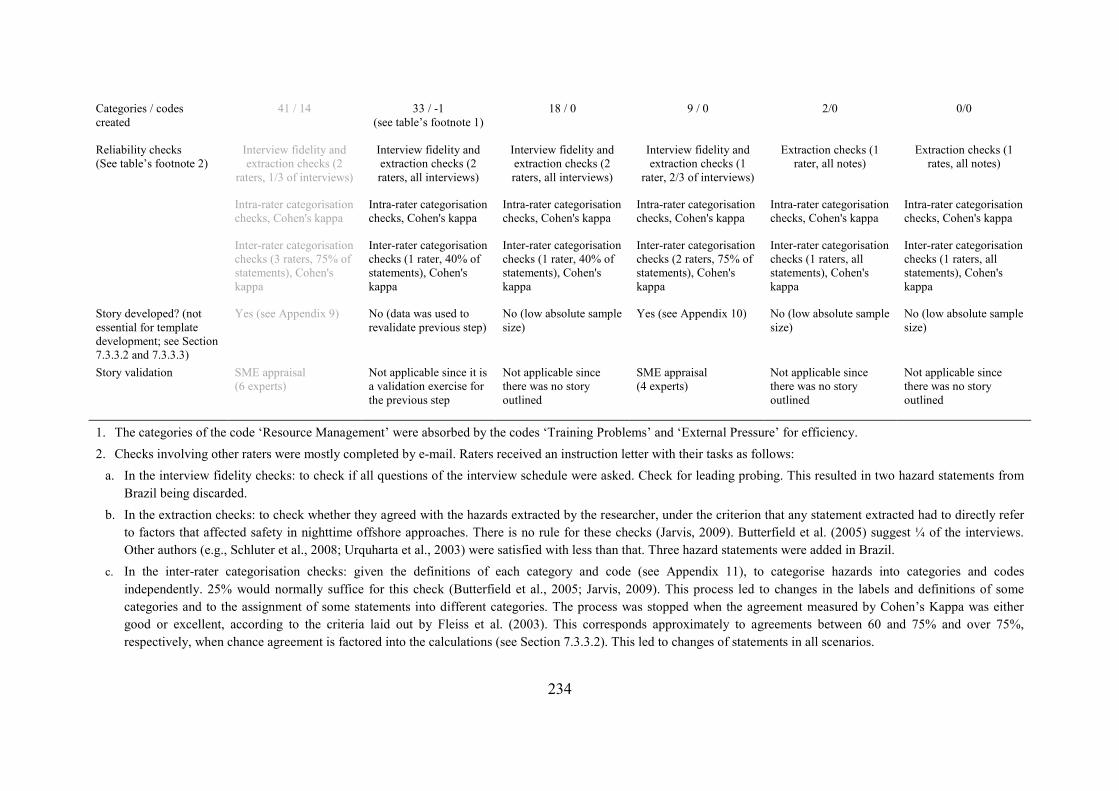
Categories / codes created
41 / 14 33 / -1 (see table’s footnote 1)
18 / 0 9 / 0 2/0 0/0
Reliability checks (See table’s footnote 2)
Interview fidelity and extraction checks (2
raters, 1/3 of interviews)
Interview fidelity and extraction checks (2 raters, all interviews)
Interview fidelity and extraction checks (2 raters, all interviews)
Interview fidelity and extraction checks (1
rater, 2/3 of interviews)
Extraction checks (1 rater, all notes)
Extraction checks (1 rates, all notes)
Intra-rater categorisation checks, Cohen's kappa
Intra-rater categorisation checks, Cohen's kappa
Intra-rater categorisation checks, Cohen's kappa
Intra-rater categorisation checks, Cohen's kappa
Intra-rater categorisation checks, Cohen's kappa
Intra-rater categorisation checks, Cohen's kappa
Inter-rater categorisation checks (3 raters, 75% of statements), Cohen's kappa
Inter-rater categorisation checks (1 rater, 40% of statements), Cohen's kappa
Inter-rater categorisation checks (1 rater, 40% of statements), Cohen's kappa
Inter-rater categorisation checks (2 raters, 75% of statements), Cohen's kappa
Inter-rater categorisation checks (1 raters, all statements), Cohen's kappa
Inter-rater categorisation checks (1 raters, all statements), Cohen's kappa
Story developed? (not essential for template development; see Section 7.3.3.2 and 7.3.3.3)
Yes (see Appendix 9) No (data was used to revalidate previous step)
No (low absolute sample size)
Yes (see Appendix 10) No (low absolute sample size)
No (low absolute sample size)
Story validation
SME appraisal (6 experts)
Not applicable since it is a validation exercise for the previous step
Not applicable since there was no story outlined
SME appraisal (4 experts)
Not applicable since there was no story outlined
Not applicable since there was no story outlined
1. The categories of the code ‘Resource Management’ were absorbed by the codes ‘Training Problems’ and ‘External Pressure’ for efficiency. 2. Checks involving other raters were mostly completed by e-mail. Raters received an instruction letter with their tasks as follows:
a. In the interview fidelity checks: to check if all questions of the interview schedule were asked. Check for leading probing. This resulted in two hazard statements from Brazil being discarded.
b. In the extraction checks: to check whether they agreed with the hazards extracted by the researcher, under the criterion that any statement extracted had to directly refer to factors that affected safety in nighttime offshore approaches. There is no rule for these checks (Jarvis, 2009). Butterfield et al. (2005) suggest ¼ of the interviews. Other authors (e.g., Schluter et al., 2008; Urquharta et al., 2003) were satisfied with less than that. Three hazard statements were added in Brazil.
c. In the inter-rater categorisation checks: given the definitions of each category and code (see Appendix 11), to categorise hazards into categories and codes independently. 25% would normally suffice for this check (Butterfield et al., 2005; Jarvis, 2009). This process led to changes in the labels and definitions of some categories and to the assignment of some statements into different categories. The process was stopped when the agreement measured by Cohen’s Kappa was either good or excellent, according to the criteria laid out by Fleiss et al. (2003). This corresponds approximately to agreements between 60 and 75% and over 75%, respectively, when chance agreement is factored into the calculations (see Section 7.3.3.2). This led to changes of statements in all scenarios.
234
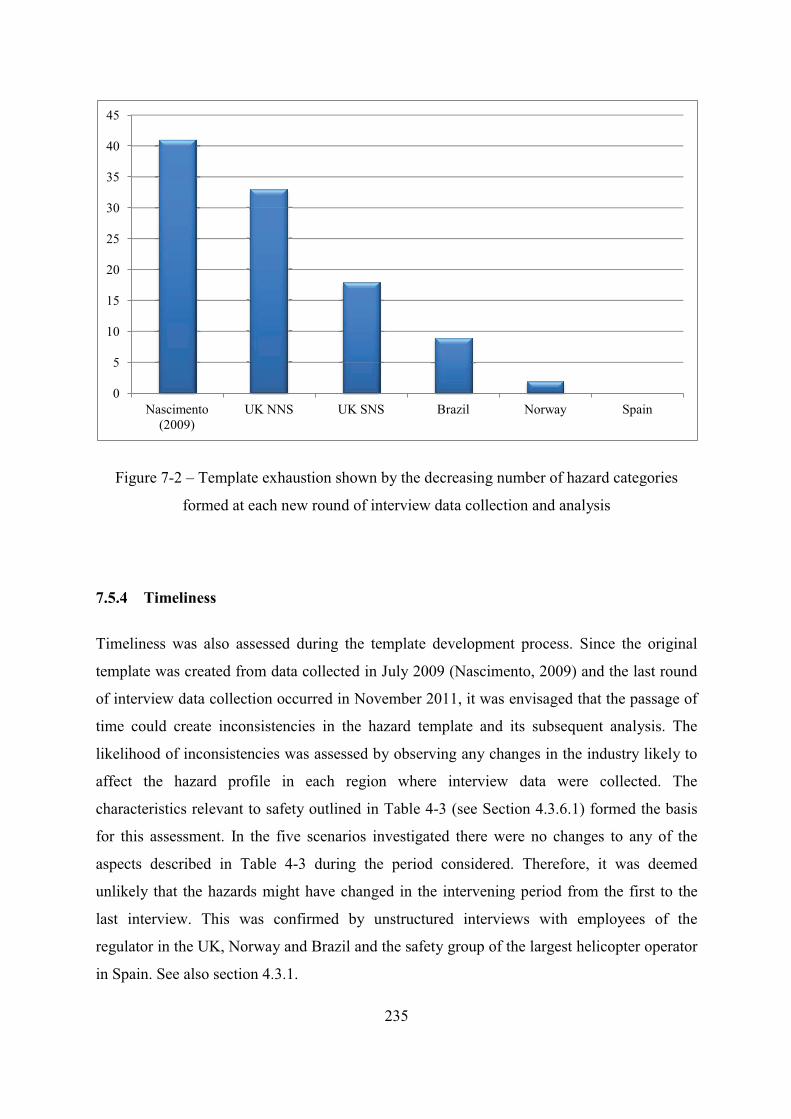
7.5.5 Final template
The final version of the template is formed of 103 hazard categories, grouped under 13 codes,
segregated into two sections: ‘Contextual Factors’ and ‘Impacts on Crews’. The former
corresponds to hazard sources and the latter refers to hazard manifestations (see Section
7.3.3.3).
The ‘Contextual Factors’ section of the template is formed by 78 hazard categories grouped
into eight codes. These codes largely reflect the structures of the Offshore Helicopter
Transportation Industry’s Taxonomy outlined in Section 3.5.3. The ‘Impacts on Crews’
section is formed by 25 hazard categories grouped into five codes.
The sections of the template are optimized to capture meaningful independent and dependent
variables (see Section 7.3.3.1.1) to be used for predictive hazard/risk analysis. This aspect is
detailed further in Chapter 8, which presents the final version of the template (Section 8.3.1).
7.6 Conclusions
Chapter 2 identified a singular lack, amongst the processes of hazard identification and risk
analysis in use in nighttime offshore helicopter operations, of a structured and factual hazard
identification survey process. This needed to be addressed urgently because other sources of
hazard data (e.g., accident and incident reports, analysed in Chapters 4 and 5, respectively)
have proved to be of limited utility in this industry.
This chapter has built on the strengths of both task analysis and survey methods to propose
the structured, joint top-down and bottom-up Task-Based Hazard Identification Survey
Process. At the top level, the process requires decisions to be taken on the critical task in need
of hazard identification, the geographical scope of the hazard identification exercise and
required sample sizes. These are followed by the exploitation of all available sources of task
hazard information in the literature, taxonomies and safety data.
Building on the outcome of this preliminary hazard identification effort, the bottom-up
process integrates rigorous surveys methods with the carefully chosen Talk-Through task
analysis technique into a recursive and multistage template development cycle. In this cycle,
data collection and analysis, together with multiple reliability and validity checks are
236
performed through two well-known and appropriate methods of qualitative research, i.e.,
Grounded Theory and Template Analysis. These produce an exhaustive and unbiased hazard
template (presented in the Chapter 8, Section 8.3.1) and ensure that the sample sizes required
for statistical analysis are obtained. Finally the third method (i.e., Content Analysis) is
employed to analyse the hazard accounts statistically and generate ‘predictive safety’.
The implementation of the qualitative elements of the process (i.e., the steps prior to Content
Analysis, see Figure 7-1) was undertaken with respect to the visual segment of nighttime
instrument approaches. As show in Chapter 6 (Sections 6.5.1, 6.6.2.5 and 6.8), this is the
riskiest phase of nighttime offshore helicopter flights and one of three phases belonging to the
group of analogous visual scan technique – high kinetic state (i.e., VH) phases which are
characteristic of nighttime offshore helicopter operations. These features of the visual
approach phase, coupled with the exhaustive nature of the template developed (see Section
7.5.2) and the numerous reliability and validity checks successfully undertaken (see Table 7-
2) are expected to ensure the transferability of the template to the other VH phases (see
Section 7.3.3.4). Therefore, it is reasonable to expect that the template covers, to a
considerable extent, the unique hazards of nighttime offshore helicopter operations.
The template developed from the qualitative implementation described in this chapter is
shown in the next chapter (Section 8.3.1). This is appropriate because the description of the
results obtained in this chapter mark the beginning of the implementation of the Content
Analysis-based quantitative analysis process developed in the next chapter.
237

238
CHAPTER 8 TASK-BASED HAZARD IDENTIFICATION SURVEY PROCESS – QUANTITATIVE ANALYSIS
The previous chapter developed the architecture of the Task-Based Hazard Identification
Survey Process and implemented it to generate an exhaustive template with the hazards of the
visual segment of nighttime instrument approaches, which is suitable for statistical analysis.
This chapter completes the implementation of the process by performing statistical analysis
on the data collected and categorised according to the template of Chapter 7. This is achieved
in six sections organised as follows. Section 8.1 outlines some preliminary considerations on
the use of the hazard template for quantitative analysis. Section 8.2 explains the procedure
developed for quantitative hazard analysis. Section 8.3 presents and discusses the results of
the analysis. Section 8.4 presents a validation exercise which includes statistical hypothesis
testing using an alternative dataset. Section 8.5 discusses the limitations of the process.
Section 8.6 concludes the chapter with comments on how the Task-Based Hazard
Identification Survey Process should be used to provide optimal results.
8.1 Preliminary considerations
Data extracted from surveys are inherently subjective. Therefore, there is always a chance
that survey data contains general opinions and unfounded perceptions rather than facts (see
Slovic, 2000; Yantiss, 2011). Since this is undesirable in hazard analysis, measures have been
taken to concentrate on relevant facts only, including: (i) the generation of the template from
the application of the Talk-Through task analysis technique, which elicits facts relating to the
task investigated (see Section 7.2); and (ii) the application of multiple reliability and validity
checks to the template. Therefore, this chapter assumes that the categories, codes and sections
of the template reflect factual hazards.
It is also assumed that the participants communicated hazards which are relevant to current
operations. A focus on current operations is a feature of the Talk-Through task analysis
technique. Furthermore, timeliness was emphasised by asking participants to recollect the
hazards of the last 12 months of operations (Section 7.3.3.1.1). Finally, this assumption is
justified by the overall assessment of the template’s timeliness in Section 7.5.4.
239
Despite the measures taken above to ensure the objectivity of the hazard data collected, the
validation of the hazards subjectively identified against some form of objective truth, e.g.,
recorded hazards, is advisable. However, this is beyond the scope of this thesis and is
recommended to be addressed as future work.
8.2 Content Analysis procedure
Content Analysis (Section 7.3.4) is used in this chapter to explore the frequencies of pilots
who identified and who did not identify a hazard belonging to the hazard categories and codes
developed in Chapter 7. To put it another way, the data analysed in this chapter are the
presence of at least one hazard statement (and conversely the absence of any statement), by
each pilot subjected to the Talk-Through interviews, regarding the hazard categories and
codes developed in Chapter 7.
Focusing on the presence and absence of a hazard statement per participant rather than on the
frequency of individual statements expressed by each participant avoids introducing biases
associated with personal communication styles, e.g., over-representativeness of a hazard
repeatedly mentioned by a single participant during the course of the interview. Since there is
no established statistical analysis procedure in Content Analysis (Berelson, 1952; Mostyn,
1985), a procedure is developed in this thesis and is summarised in Figure 8-1.
Figure 8-1 replicates the four steps of Content Analysis outlined in Figure 7-1, with additional
details on each step and two necessary support steps, i.e., the selection of the main categories
and meta-demographic analysis. All the steps are explained below.
8.2.1 Descriptive analysis
This presents and discusses the results of Chapter 7, offering an overview of the
characteristics of the (i) pilots whose statements were used to develop the template, (ii)
hazard categories and codes forming the template and (iii) frequencies of pilots who
identified a hazard belonging to each such code and category. Raw hazard statements are
presented at the code level in order to familiarise the reader with the phenomena that the
codes refer to. Additionally, the industry’s safety-critical components (see Section 3.5.3)
associated with the hazard codes are reviewed. This provides insight, at a general level, on the
240
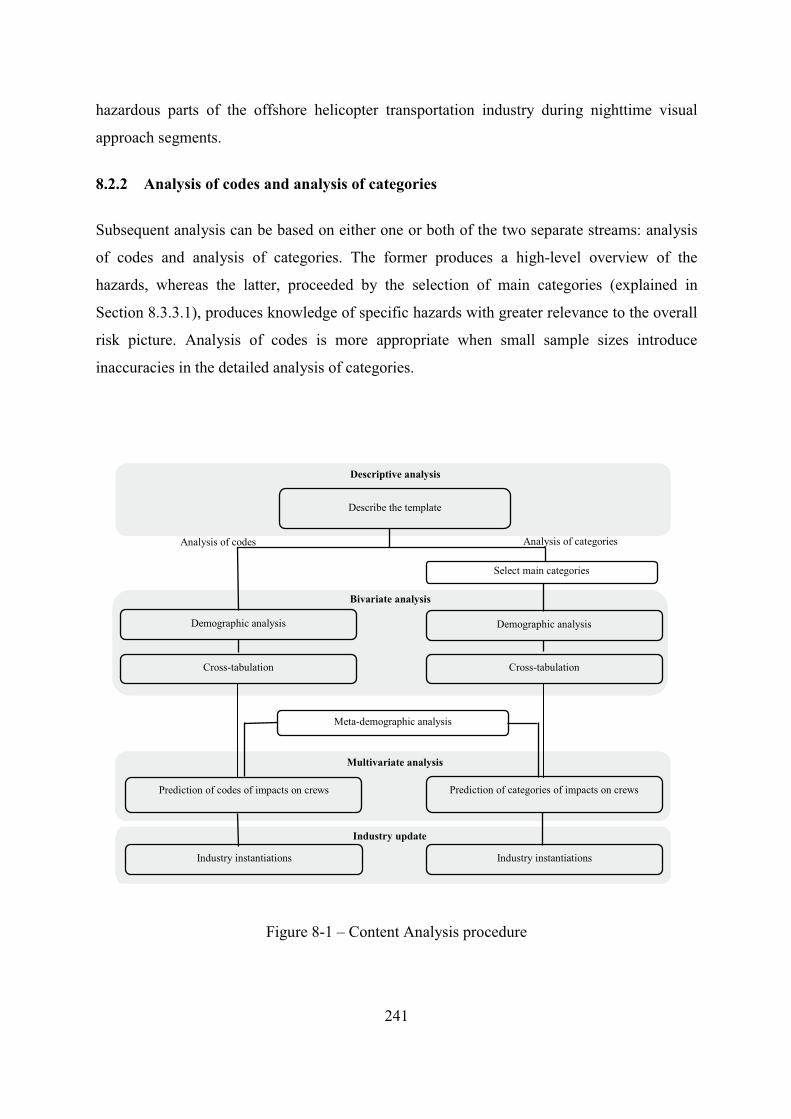
8.2.3 Bivariate analysis
In both streams of analysis, the bivariate relationships between hazards and pilots’
demographic variables are explored (see Section 7.3.3.1.1). This aims to highlight groups of
pilots facing greater problems with specific hazard codes or categories. The hazard
codes/categories are then cross-tabulated, with the aim to identify any associations between
the hazards (see Section 4.3.8.2.1).
8.2.4 Meta-demographic analysis
A meta-demographic analysis is undertaken to ensure that only the essential demographic
variables are included in the regression analyses of the subsequent step of the procedure. This
mitigates against the poor fitting of the regression models due to multicollinearity caused by
highly correlated variables.
8.2.5 Multivariate analysis
The multivariate analysis is where ‘predictive safety’ occurs (see Section 2.3.3.3). At this
stage, regression models are fitted to the data to predict the odds of ‘impacts on crews’
occurring based on the occurrence of ‘contextual factors’ and the events of demographic
variables (see Sections 7.4.3.1.1 and 7.5.5).
8.2.6 Industry instantiation and update
Finally, the occurrence of each ‘impact on crews’ represents an instantiation (i.e., a specific
case) of the operation of the industry, which is shown overlapped on the taxonomy developed
in Chapter 3. In these instantiations, the explanatory relationships found in the predictive
analyses are used to update the industry’s taxonomy on a case-by-case basis with the
probabilistic relationships between the industry’s safety-critical components. This overall
process is similar to conducting a risk assessment based on selected conflict scenarios, i.e.,
scenarios of high risk (see Section 3.3.3 and Hollnagel, 2012; NASA, 2013; CAA, 2010c;
Svedung and Rasmussen, 2002; Kaplan and Garrick, 1981; Aven and Zio, 2011). The next
section presents and discusses the results of the implementation of the procedure described
above.
242
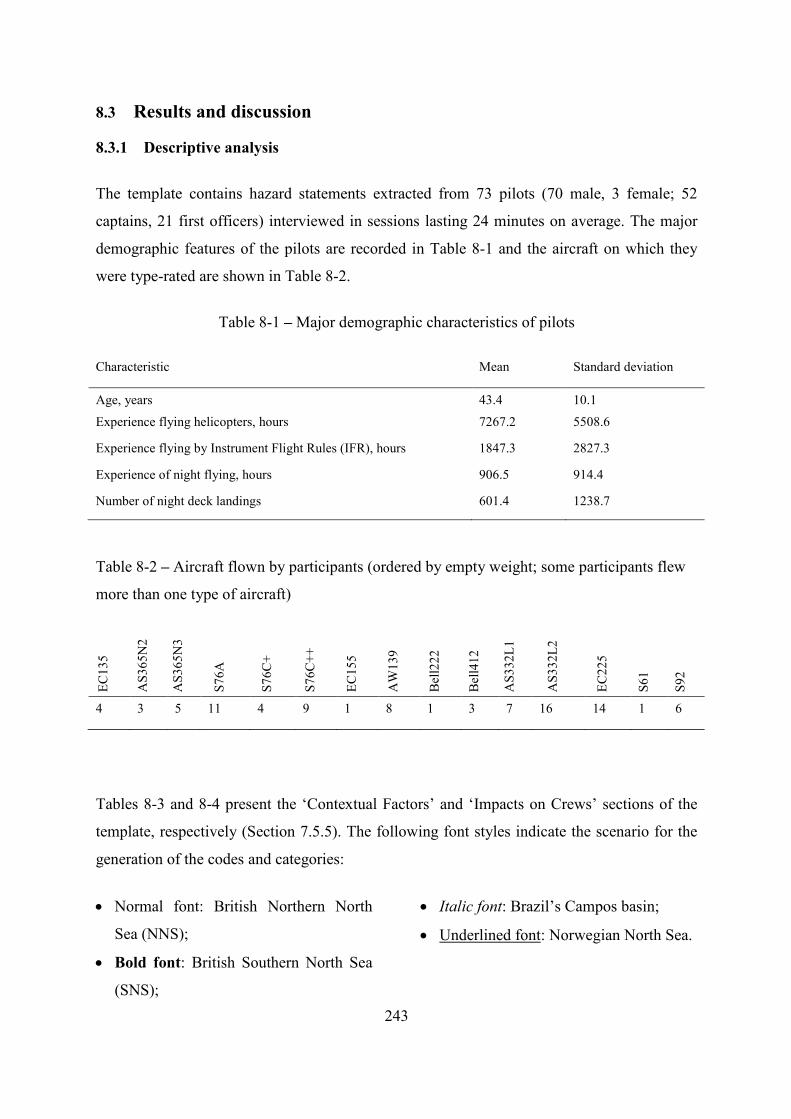
8.3 Results and discussion
8.3.1 Descriptive analysis
The template contains hazard statements extracted from 73 pilots (70 male, 3 female; 52
captains, 21 first officers) interviewed in sessions lasting 24 minutes on average. The major
demographic features of the pilots are recorded in Table 8-1 and the aircraft on which they
were type-rated are shown in Table 8-2.
Table 8-1 – Major demographic characteristics of pilots
Characteristic Mean Standard deviation
Age, years 43.4 10.1
Experience flying helicopters, hours 7267.2 5508.6
Experience flying by Instrument Flight Rules (IFR), hours 1847.3 2827.3
Experience of night flying, hours 906.5 914.4
Number of night deck landings 601.4 1238.7
Table 8-2 – Aircraft flown by participants (ordered by empty weight; some participants flew
more than one type of aircraft)
EC13
5
AS3
65N
2
AS3
65N
3
S76A
S76C
+
S76C
++
EC15
5
AW
139
Bel
l222
Bel
l412
AS3
32L1
AS3
32L2
EC22
5
S61
S92
4 3 5 11 4 9 1 8 1 3 7 16 14 1 6
Tables 8-3 and 8-4 present the ‘Contextual Factors’ and ‘Impacts on Crews’ sections of the
template, respectively (Section 7.5.5). The following font styles indicate the scenario for the
generation of the codes and categories:
• Normal font: British Northern North
Sea (NNS);
• Bold font: British Southern North Sea
(SNS);
• Italic font: Brazil’s Campos basin;
• Underlined font: Norwegian North Sea.
243
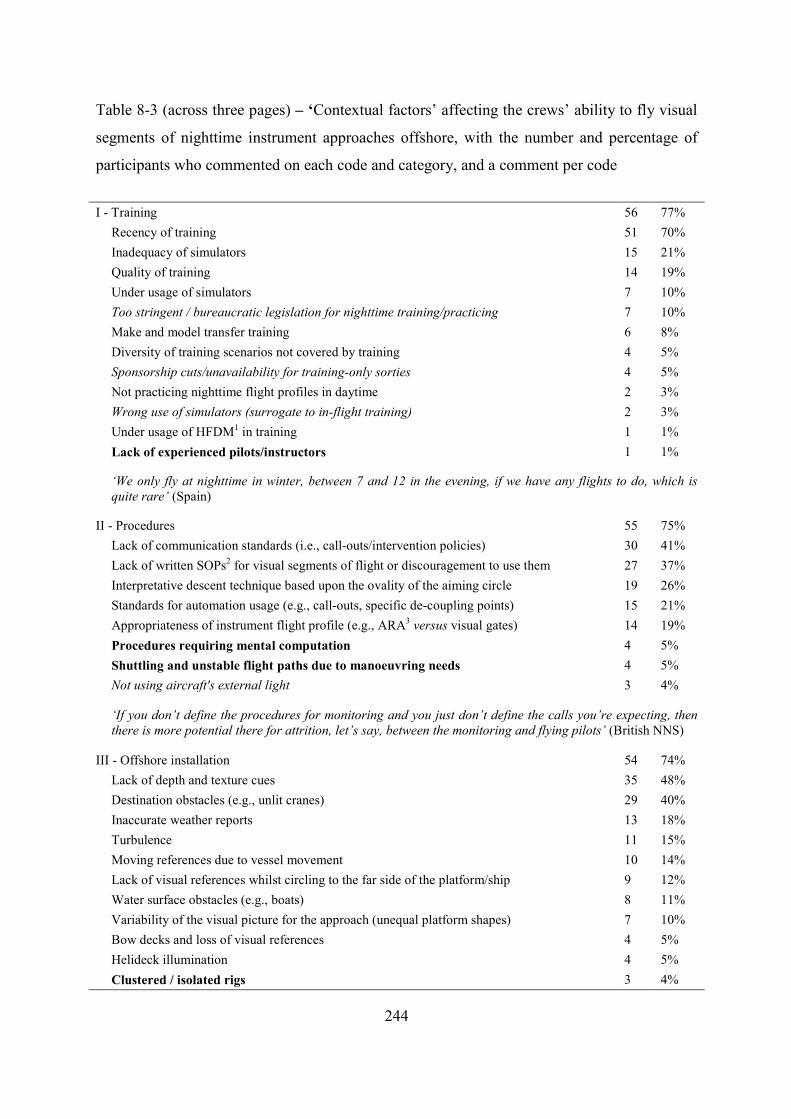
Table 8-3 (across three pages) – ‘Contextual factors’ affecting the crews’ ability to fly visual
segments of nighttime instrument approaches offshore, with the number and percentage of
participants who commented on each code and category, and a comment per code
I - Training 56 77%
Recency of training 51 70% Inadequacy of simulators 15 21% Quality of training 14 19% Under usage of simulators 7 10% Too stringent / bureaucratic legislation for nighttime training/practicing 7 10% Make and model transfer training 6 8% Diversity of training scenarios not covered by training 4 5% Sponsorship cuts/unavailability for training-only sorties 4 5% Not practicing nighttime flight profiles in daytime 2 3% Wrong use of simulators (surrogate to in-flight training) 2 3% Under usage of HFDM1 in training 1 1% Lack of experienced pilots/instructors 1 1%
‘We only fly at nighttime in winter, between 7 and 12 in the evening, if we have any flights to do, which is quite rare’ (Spain)
II - Procedures 55 75%
Lack of communication standards (i.e., call-outs/intervention policies) 30 41% Lack of written SOPs2 for visual segments of flight or discouragement to use them 27 37% Interpretative descent technique based upon the ovality of the aiming circle 19 26% Standards for automation usage (e.g., call-outs, specific de-coupling points) 15 21% Appropriateness of instrument flight profile (e.g., ARA3 versus visual gates) 14 19% Procedures requiring mental computation 4 5% Shuttling and unstable flight paths due to manoeuvring needs 4 5% Not using aircraft's external light 3 4%
‘If you don’t define the procedures for monitoring and you just don’t define the calls you’re expecting, then there is more potential there for attrition, let’s say, between the monitoring and flying pilots’ (British NNS)
III - Offshore installation 54 74%
Lack of depth and texture cues 35 48% Destination obstacles (e.g., unlit cranes) 29 40% Inaccurate weather reports 13 18% Turbulence 11 15% Moving references due to vessel movement 10 14% Lack of visual references whilst circling to the far side of the platform/ship 9 12% Water surface obstacles (e.g., boats) 8 11% Variability of the visual picture for the approach (unequal platform shapes) 7 10% Bow decks and loss of visual references 4 5% Helideck illumination 4 5% Clustered / isolated rigs 3 4%
244
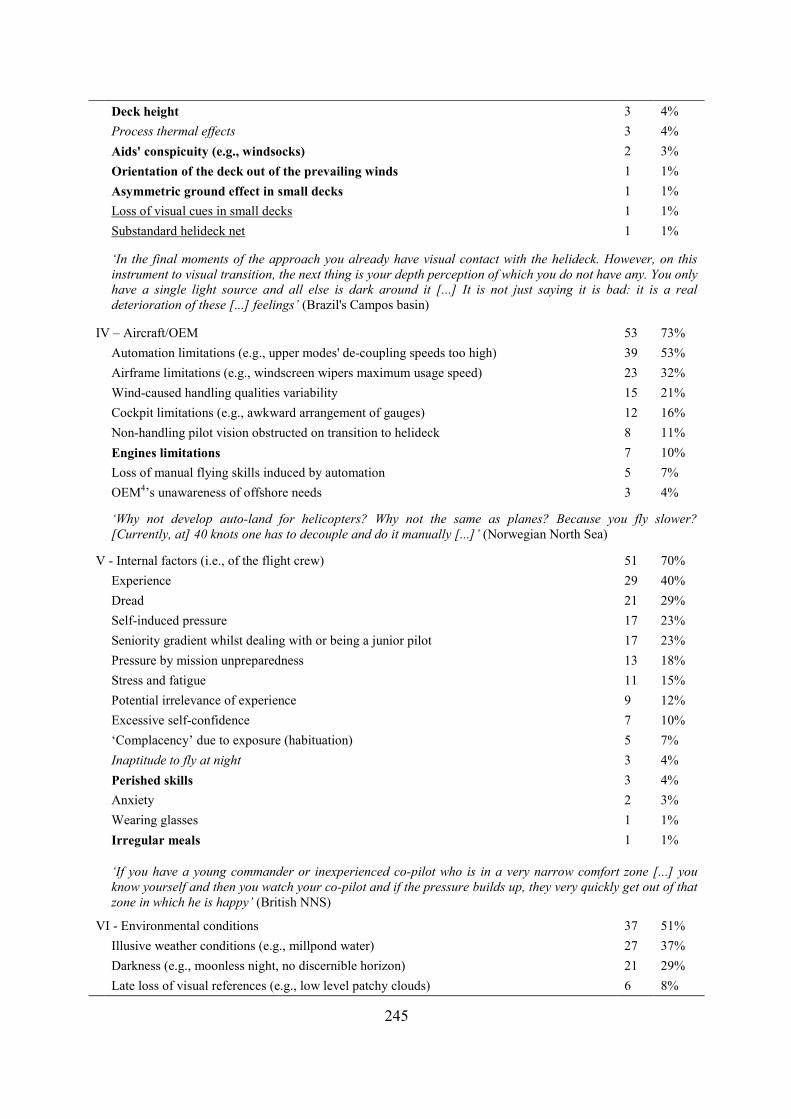
Deck height 3 4% Process thermal effects 3 4% Aids' conspicuity (e.g., windsocks) 2 3% Orientation of the deck out of the prevailing winds 1 1% Asymmetric ground effect in small decks 1 1% Loss of visual cues in small decks 1 1% Substandard helideck net 1 1%
‘In the final moments of the approach you already have visual contact with the helideck. However, on this instrument to visual transition, the next thing is your depth perception of which you do not have any. You only have a single light source and all else is dark around it [...] It is not just saying it is bad: it is a real deterioration of these [...] feelings’ (Brazil's Campos basin)
IV – Aircraft/OEM 53 73%
Automation limitations (e.g., upper modes' de-coupling speeds too high) 39 53% Airframe limitations (e.g., windscreen wipers maximum usage speed) 23 32% Wind-caused handling qualities variability 15 21% Cockpit limitations (e.g., awkward arrangement of gauges) 12 16% Non-handling pilot vision obstructed on transition to helideck 8 11% Engines limitations 7 10% Loss of manual flying skills induced by automation 5 7% OEM4’s unawareness of offshore needs 3 4%
‘Why not develop auto-land for helicopters? Why not the same as planes? Because you fly slower? [Currently, at] 40 knots one has to decouple and do it manually [...]’ (Norwegian North Sea)
V - Internal factors (i.e., of the flight crew) 51 70%
Experience 29 40% Dread 21 29% Self-induced pressure 17 23% Seniority gradient whilst dealing with or being a junior pilot 17 23% Pressure by mission unpreparedness 13 18% Stress and fatigue 11 15% Potential irrelevance of experience 9 12% Excessive self-confidence 7 10% ‘Complacency’ due to exposure (habituation) 5 7% Inaptitude to fly at night 3 4% Perished skills 3 4% Anxiety 2 3% Wearing glasses 1 1% Irregular meals 1 1%
‘If you have a young commander or inexperienced co-pilot who is in a very narrow comfort zone [...] you know yourself and then you watch your co-pilot and if the pressure builds up, they very quickly get out of that zone in which he is happy’ (British NNS)
VI - Environmental conditions 37 51%
Illusive weather conditions (e.g., millpond water) 27 37% Darkness (e.g., moonless night, no discernible horizon) 21 29% Late loss of visual references (e.g., low level patchy clouds) 6 8%
245
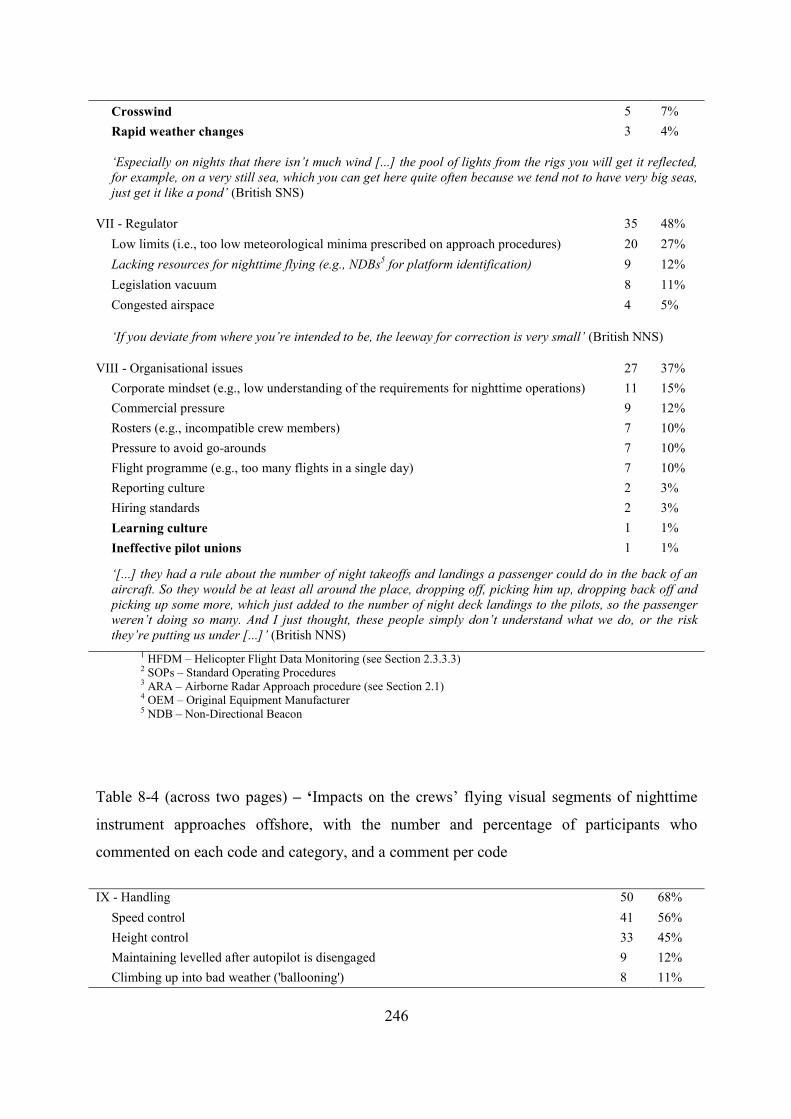
Crosswind 5 7% Rapid weather changes 3 4%
‘Especially on nights that there isn’t much wind [...] the pool of lights from the rigs you will get it reflected, for example, on a very still sea, which you can get here quite often because we tend not to have very big seas, just get it like a pond’ (British SNS)
VII - Regulator 35 48%
Low limits (i.e., too low meteorological minima prescribed on approach procedures) 20 27% Lacking resources for nighttime flying (e.g., NDBs5 for platform identification) 9 12% Legislation vacuum 8 11% Congested airspace 4 5%
‘If you deviate from where you’re intended to be, the leeway for correction is very small’ (British NNS)
VIII - Organisational issues 27 37%
Corporate mindset (e.g., low understanding of the requirements for nighttime operations) 11 15% Commercial pressure 9 12% Rosters (e.g., incompatible crew members) 7 10% Pressure to avoid go-arounds 7 10% Flight programme (e.g., too many flights in a single day) 7 10% Reporting culture 2 3% Hiring standards 2 3% Learning culture 1 1% Ineffective pilot unions 1 1%
‘[...] they had a rule about the number of night takeoffs and landings a passenger could do in the back of an aircraft. So they would be at least all around the place, dropping off, picking him up, dropping back off and picking up some more, which just added to the number of night deck landings to the pilots, so the passenger weren’t doing so many. And I just thought, these people simply don’t understand what we do, or the risk they’re putting us under [...]’ (British NNS)
1 HFDM – Helicopter Flight Data Monitoring (see Section 2.3.3.3) 2 SOPs – Standard Operating Procedures 3 ARA – Airborne Radar Approach procedure (see Section 2.1) 4 OEM – Original Equipment Manufacturer 5 NDB – Non-Directional Beacon
Table 8-4 (across two pages) – ‘Impacts on the crews’ flying visual segments of nighttime
instrument approaches offshore, with the number and percentage of participants who
commented on each code and category, and a comment per code
IX - Handling 50 68%
Speed control 41 56% Height control 33 45% Maintaining levelled after autopilot is disengaged 9 12% Climbing up into bad weather ('ballooning') 8 11%
246
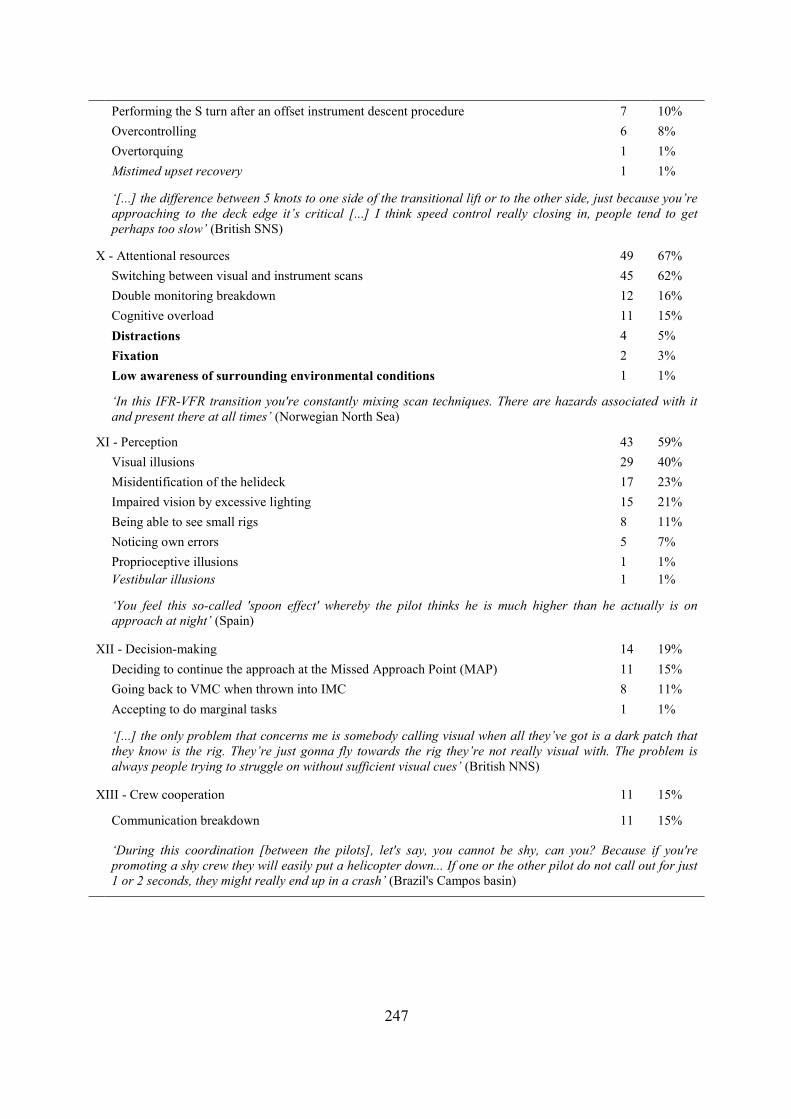
Performing the S turn after an offset instrument descent procedure 7 10% Overcontrolling 6 8% Overtorquing 1 1% Mistimed upset recovery 1 1%
‘[...] the difference between 5 knots to one side of the transitional lift or to the other side, just because you’re approaching to the deck edge it’s critical [...] I think speed control really closing in, people tend to get perhaps too slow’ (British SNS)
X - Attentional resources 49 67%
Switching between visual and instrument scans 45 62% Double monitoring breakdown 12 16% Cognitive overload 11 15% Distractions 4 5% Fixation 2 3% Low awareness of surrounding environmental conditions 1 1%
‘In this IFR-VFR transition you're constantly mixing scan techniques. There are hazards associated with it and present there at all times’ (Norwegian North Sea)
XI - Perception 43 59%
Visual illusions 29 40% Misidentification of the helideck 17 23% Impaired vision by excessive lighting 15 21% Being able to see small rigs 8 11% Noticing own errors 5 7% Proprioceptive illusions 1 1% Vestibular illusions 1 1%
‘You feel this so-called 'spoon effect' whereby the pilot thinks he is much higher than he actually is on approach at night’ (Spain)
XII - Decision-making 14 19%
Deciding to continue the approach at the Missed Approach Point (MAP) 11 15% Going back to VMC when thrown into IMC 8 11% Accepting to do marginal tasks 1 1%
‘[...] the only problem that concerns me is somebody calling visual when all they’ve got is a dark patch that they know is the rig. They’re just gonna fly towards the rig they’re not really visual with. The problem is always people trying to struggle on without sufficient visual cues’ (British NNS)
XIII - Crew cooperation 11 15%
Communication breakdown 11 15%
‘During this coordination [between the pilots], let's say, you cannot be shy, can you? Because if you're promoting a shy crew they will easily put a helicopter down... If one or the other pilot do not call out for just 1 or 2 seconds, they might really end up in a crash’ (Brazil's Campos basin)
247
Figure 8-2 illustrates the contextual factor codes from Table 8-4, with respect to the
industry’s safety-critical components outlined in Chapter 3. These factors are discussed in the
next section.
8.3.1.1 Contextual factors (Table 8-3)
The code cited by the largest number of pilots was ‘training’. This code additionally hosted
the category identified by the largest number of pilots (‘recency of training’, 70%). This
highlights the agreement among pilots from all regions that the frequency with which they
practice offshore nighttime operations is too low to ensure that the skills needed for the task
are properly developed and maintained. Investment in more advanced simulation technology
should prove beneficial, given the criticism on the limitations of current simulators
(‘inadequacy of simulators’, 21%) and their usage (‘under usage of simulators’, 10%).
Regarding the code ‘procedures’, the distribution of commentators per categories indicated a
wider spread of exposure to hazards than in the previous code. Participants commented in
fairly similar numbers on the lack of standardised communication protocols (‘lack of
communication standards’, 41%) and on the need for more formal procedural guidance on
how to fly nighttime segments visually (‘lack of written SOPs for visual segments of flight’,
37%). This was followed by comments on a desire for a descent technique less open to
individual interpretation than at present (‘interpretative descent technique based upon the
ovality of the aiming circle’, 26%), a need for greater standardisation in the usage of
automation (‘standards for automation usage’, 21%) and clearer criteria for the selection
between different procedures available for the approach task (‘appropriateness of instrument
flight profile’, 19%). This spread of issues implies the need for helicopter operators to
standardise the different aspects of operation mentioned above, a need which has already
been stressed in the industry (see Sections 2.3.2 and 2.3.3.2.1). Alternatively, it is possible
that this spread of issues was caused by the Template Analysis procedure, which
discriminated the categories within the procedure code too much in detail.
This endorses the advice to validate the results of the analysis produced in this chapter against
some form of objective hazard register (see Section 8.1).
248
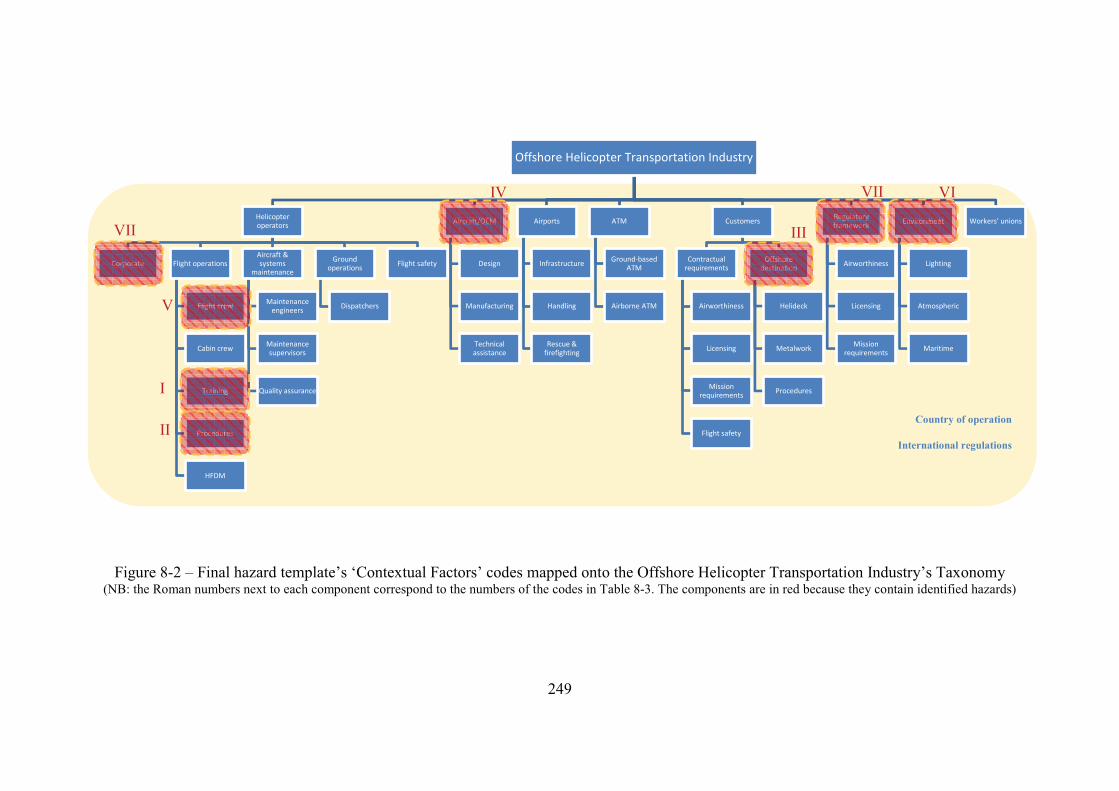
Offshore Helicopter Transportation Industry
Helicopter operators
Corporate Flight operations
Flight crew
Cabin crew
Training
Procedures
HFDM
Aircraft & systems
maintenance
Maintenance engineers
Maintenance supervisors
Quality assurance
Ground operations
Dispatchers
Flight safety
Aircraft/OEM
Design
Manufacturing
Technical assistance
Airports
Infrastructure
Handling
Rescue & firefighting
ATM
Ground-based ATM
Airborne ATM
Customers
Contractual requirements
Airworthiness
Licensing
Mission requirements
Flight safety
Offshore destination
Helideck
Metalwork
Procedures
Regulatory framework
Airworthiness
Licensing
Mission requirements
Environment
Lighting
Atmospheric
Maritime
Workers' unions
OOOffsOffsshoshore re dedestiest natnattiontion
FlFliightightt crt creewewFliF ightight cret crewew
AiAircrarcraaft/aft//OEM/OEMMM///
TTTraiTrainingninggg
ProProoceoceedurdurresres
EnEnnvirovironv onmnmo menenm nttnt
CCCorCorrporrporraterateeeCCorCorporrporateratee
lRfRfReguReguulatulatory
kory
ky kfrframrammewmewworkworkk
Next on the template is the code ‘platform and surroundings’, for which ‘lack of depth and
texture cues’ was identified by the largest number of pilots: 48%. Despite being directly
related to a poor visual environment upon arrival, it does not relate to the luminescence of the
helideck but rather to the whole segment between the end of the instrument procedure and the
landing on the helideck. This endorses the ongoing aspiration in the North Sea to make such a
segment shorter than current practices by using satellite-based guidance, favouring the
capture of visual cues closer to the offshore installations (Section 2.1). Alternatively, it
highlights the scope for improving visual guidance on this particular segment, with for
example the use of visual glideslope indicators.
Concerns about the potential for collisions with obstacles at the installations (e.g., misplaced
or unlit cranes, derricks, aerials and wires) were identified also by a large number of pilots
(‘destination obstacles’, 40%). This deserves special attention from both those who design
and those who operate platforms and ships. The remaining categories were identified by
comparatively few participants (i.e., under 20%), suggesting that, based on the experiences of
the sample investigated, these were less relevant categories.
Amidst the ‘aircraft’-related factors, participants mainly highlighted that automation levels
are still sub-standard for the task at hand (‘automation limitations’ category, 53%). This was
caused by the minimum speeds required for the use of the upper modes of the auto-pilots
(Section 3.4.4, Table 3-1, NB 5 and Section 6.5.1). The higher these speeds, the further away
from the installations the pilots have to switch to manual flight, start flying with reference to
external visual cues and suffer with the associated poorer visual references. In contrast, the
longer the aircraft can be flown using automation, the fewer the cognitive resources used by
the pilots for the stabilising and tracking tasks of flying. This allows for greater appreciation
of the external environment for the assessment of the sufficiency of the visual cues in support
of the manual/visually-referenced approach task to come. Therefore, commercially viable
auto-pilots with lower de-coupling speeds (i.e., as low as auto-hover or auto-land) should
generate significant benefits. Additionally, there seems to be scope for the development of
night visual imaging system (NVIS) technologies which can be operated in the lighting
environment of the offshore oil and gas installations.
250
Other ‘aircraft limitations’ can apparently be addressed at low cost, e.g., the quality of
windscreen wipers, the installation of a second steering light in some models of aircraft and
wider incorporation of automatic voice alerting devices (AVAD) and terrain awareness
warning systems (TAWS).
In relation to the code ‘internal issues’, conflicting information emerged from the interviews.
Although 40% of the participants agreed that the lack of pilot ‘experience’ would affect
safety during night operations, 12% were of the opinion that even the most experienced pilots
would be vulnerable to accidents in these circumstances (‘potential irrelevance of
experience’). The reasons behind this apparent contradiction deserve further investigation
since the literature endorses experience as both an asset and a liability. A potential hypothesis
is that, whilst experience favours the development of robust internal models for the approach
task, it could at the same time promote over-confidence, affecting pilot decision-making
towards more risk-taking attitudes (see Section 2.3.2). The category ‘dread’ (29%) shows that
discomfort in doing nighttime visual approaches afflicted a considerable part of the pilot
sample.
The hazards associated with the environment (‘environmental conditions’ code, 51%) seem to
be less of a problem when compared to the previous codes and have mainly concentrated on
‘illusive weather conditions’ (37%). This lower frequency of comments might be caused by
the infrequent occurrence of combinations of relevant atmospheric and sea states, such as
steady water (i.e., no waves) and misty air. Alternatively, it might reflect a ‘locus of control’
attitude amidst pilots, whereby they consider themselves capable of handling the harshest
environmental conditions (see Section 5.2.2, especially van der Schaaf and Kanse, 2004a;
Stewart, 2008). However, testing these hypotheses require further investigation beyond the
scope of this thesis.
The hazards related to the regulatory framework (‘regulator’ code) were mentioned less
frequently (48%) than in the previous codes. Likewise, ‘organisational issues’ were
mentioned relatively infrequently by the participants (37%). It could be that the pilots do not
find them relevant for task execution, for example, or that the stakeholders involved in
offshore nighttime operations have been doing a fairly good job. The latter assumption seems
supported by the general safety-proactive attitude of oil and gas contractors in relation to
helicopter operations (Sections 1.1 and 2.3.3.1.1.3). However, it is possible that the low 251
frequency of comments was caused by a combination of a task-based approach with a semi-
structured interview schedule, one of the limitations of the proposed process. This is
discussed further in Section 8.5
8.3.1.2 Impacts on crews (Table 8-4)
Regarding the impacts on crews associated with the contextual factors, Nascimento (2009,
mentioned in Section 2.3.3.2.1) pointed out that ‘handling’ the aircraft might be affected by
the coupled mechanism whereby nose-up decelerating attitudes lead to a reduction in lift and
flawed height control in helicopters flying in impoverished visual conditions (‘speed control’,
56% and ‘height control’, 45%). The other hazard categories frequently mentioned by the
pilots (‘switching between visual and instrument scans’, 62%; and ‘visual illusions’, 40%)
are all well-known problems identified in previous nighttime accidents/incidents in the wider
transport domain (see Sections 2.3.2 and 2.3.3.2.1) and thus many lessons should be
transferable across transport modes. For example, auto-pilots with auto-land capability have
been developed to support fixed-wing operations in degraded visual environments (DVE).
An interesting result, relates to the low incidence of comments in the categories within the
‘decision-making’ code. Although this contradicts the findings of recent helicopter accident-
based studies (Section 2.3.3.1.1.4), it endorses the discussion over the treacherous nature of
human decision-making mentioned in section 2.3.2.2. Accident analyses have emphasised
flawed pilot decision-making as the major cause of accidents in DVE, especially at nighttime.
However, the literature suggests that unless pilots are trained to understand their decision-
making limitations in DVE, they seldom realise that they are prone to making incorrect
decisions. This seems to justify why pilots did not confess (or realise) potentially flawed
decisions as frequently and, therefore, supports the need for ongoing efforts (Section
2.3.3.1.1.4) to enhance crews’ awareness of the potential for decision-making impairment in
DVE (Section 2.3.2).
8.3.2 Analysis of codes
8.3.2.1 Bivariate analyses
8.3.2.1.1 Demographic analysis
The demographic analysis’ results are shown in Table 8-5. The statistical tests used were
those in Section 4.3.8.1 and 4.3.8.2.1, except for the Independent Samples t-Test. This was 252
used in Table 8-5 to test the significance of the differences in pilot age between who did and
did not identify a hazard of the ‘environmental conditions’ code. This was needed as the
distributions of age were normal according to the Shapiro-Wilk test and the variance was
homogenous for each of the groups according to Levene’s test.
Table 8-5 shows that the hazards related to ‘training’, ‘offshore installations’, ‘environmental
conditions’ and the ‘regulator’ are not specific to any pilot group neither experience level.
Hence, these codes encapsulate hazards which are likely to affect all pilots to a similar extent.
Therefore, addressing these hazards should have an impact in many pilots, with the potential
to improve safety considerably.
Regarding the effects of area of operation on the hazard codes, all the significant associations
stemmed from a concentration of pilots who identified the hazards in the North Sea.
Although the reasons behind these differences require further investigation, some informed
speculation is possible. For example, with respect to ‘procedures’, it could be that the pilots
flying in the North Sea are more skeptical than those in other areas because they are more
exposed to night flying and, therefore, are more cognizant of the hazards involved and the
need for standardisation. Alternatively, this might reflect a cultural trait whereby North Sea
pilots feel a greater need for structured and clear operating procedures and, in the meantime,
face ‘decision-making’ conflicts more often. With respect to ‘handling’, ‘attentional
resources’ and ‘perception’, weather conditions are notoriously more severe in the North Sea
than in the other areas considered (i.e. basically tropical countries; see Section 6.5.4). Hence,
these may be a consequence of worse weather conditions. The scenario sampling strategy and
initial set of regional differences (Sections 7.4.1, 6.5.4 and 4.3.6.1) should form the basis for
further research, as recommended in Chapter 9.
Regarding the effects of aircraft category on hazard codes, the significant associations
stemmed from a preponderance of comments by heavy twin-turbine (HT) helicopter pilots.
This preponderance might stem from genuine controllability issues on these helicopters or
heightened awareness of such pilots with respect to their own limitations in all codes of
‘impacts on crews’. Alternatively, it might be that the HT pilots were more open to disclose
the impacts of contextual factors on their performance than medium twin-turbine (MT)
helicopter pilots. Further research beyond the scope of this thesis is needed to investigate the
likely causes of these results. 253

Table 8-5 – Demographic analysis of hazard codes
Null hypothesis: Χ2 or FET: identifying the hazard in the column is independent of membership to the categories of the row variable / MW: the distribution of the quantities of the row variable is the same across those who identified and who did not identify the hazard in the column
Contextual factors Impacts on crews
Training Procedures Offshore installations
Aircraft / OEM
Internal factors
Environmental conditions
Organisational issues Regulator Handling Attentional
resources Perception Decision-making
Crew cooperation
Χ2 or FET
Area X ✓ X X X X X X ✓ ✓ ✓ ✓ X
Licence X X X X X X X X ✓ X ✓ X X
Rank X X X ✓ ✓ X X X ✓ X X X X
Aircraft category X X X X X X X X ✓ ✓ ✓ ✓ ✓
Cockpit generation X X X X X X X X X X X X X
MW Age X X X X X X* X X X X X X X
Flying hours (FH), total X X X X X X X X ✓ X ✓ X ✓
FH IFR X ✓ X ✓ ✓ X X X ✓ ✓ ✓ ✓ ✓
FH night X X X X ✓ X X X X X ✓ X ✓
Night deck landing X X X ✓ ✓ X X X ✓ X X X X
Time as an offshore helicopter pilot in the area
X X X X ✓ X ✓ X X X X X X
Χ2 or FET Chi-square or Fisher's Exact test, as determined by the expected frequencies at the contingency tables; see Section 4.3.8.2.1 MW Independent samples Mann-Whitney U test; see Section 4.3.8.1
* Parametric data. Independent Samples t-test applied instead of MW. See explanation in Section 8.3.2.1.1. X Non-significant result: retain the null hypothesis ✓ Significant result: reject the null hypothesis
254
All other significant results referred to some measure of pilot experience (e.g., license, rank,
various types of flying hours, number of night deck landings) with a greater number of
experienced pilots commenting on the hazard codes. However, no specific pattern was
identified. This implies that the actual experience might not be a determining factor for the
identification of the hazards in any of the codes.
8.3.2.1.2 Cross-tabulation
Table 8-6 shows the results of the cross-tabulation analysis. In all significant associations
found, the identification of one column code was associated with a greater number of pilots
identifying the hazard of the row code than would be expected on the grounds of chance.
Together with Table 8-3, Table 8-6 highlights the ubiquity of the hazards related to ‘training’.
In Table 8-3, this was the code identified by the largest number of participants. At the same
time, in Table 8-6 ‘training’ was not associated with any other hazard code or specific impact
on crews. Therefore, training is a hazard that stands on its own and can be considered as the
single biggest threat to the safety of night visual approach segments offshore.
Regarding the ‘procedures’ code, Table 8-6 shows that there were significant associations
with all but two contextual factors and three impacts on crews. This highlights that the
standardisation of operations is potentially beneficial in mitigating a range of hazards. This
agrees with the observations made from the discussion of Table 8-3 (Section 8.3.1.1).
With respect to offshore installations, even though this code was only associated with the
contextual factor ‘procedures’, it was associated with three impacts on crews. This confirms
that the offshore installation is a hazardous environment and that there is a need to
standardise operations at these installations (see Section 2.3.3.2.1).
The codes significantly associated with ‘aircraft/OEM’ show that it is necessary to
standardise operational ‘procedures’ at an aircraft level, especially with a view to addressing
pilot ‘internal issues’ (e.g., level of pilot experience), ‘organisational issues’ related to the use
of the aircraft (e.g., appropriate operational flight envelopes, see Sections 4.4.2.1 and 4.4.2.2)
and regulations. ‘Aircraft/OEM’ was also significantly associated with handling problems.
255
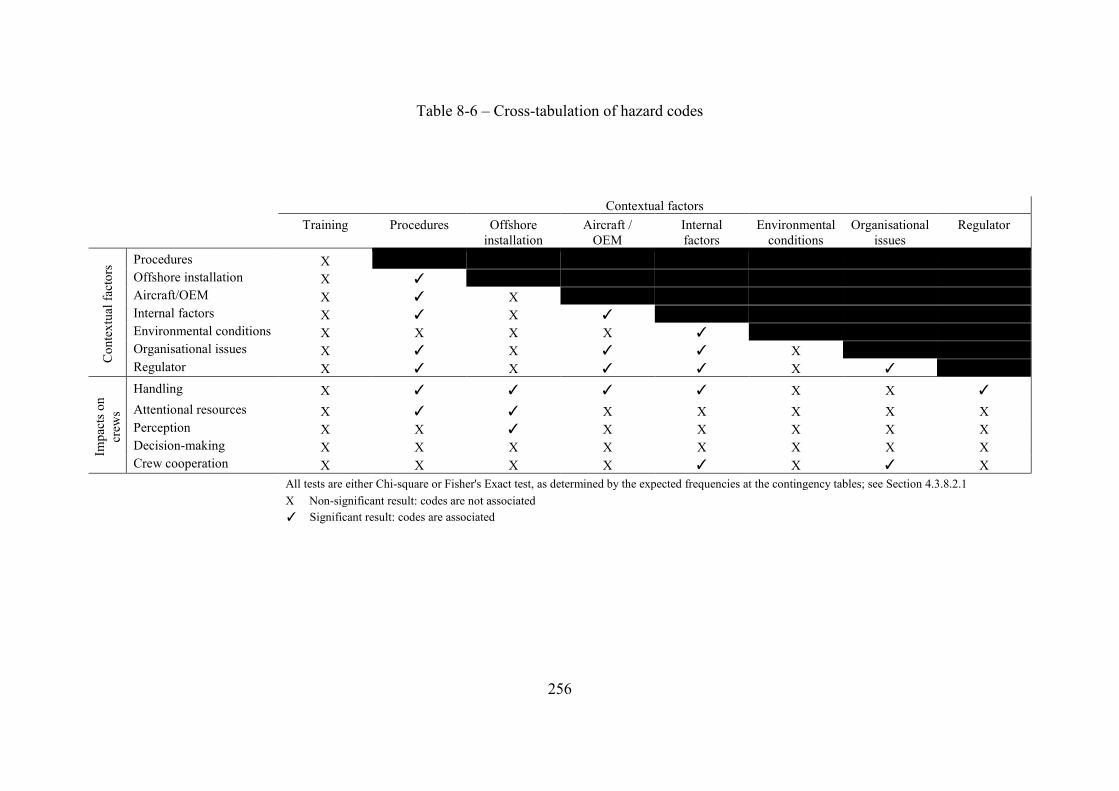
Table 8-6 – Cross-tabulation of hazard codes
Contextual factors
Training Procedures Offshore
installation Aircraft /
OEM Internal factors
Environmental conditions
Organisational issues
Regulator
Con
text
ual f
acto
rs Procedures X
Offshore installation X ✓ Aircraft/OEM X ✓ X
Internal factors X ✓ X ✓ Environmental conditions X X X X ✓
Organisational issues X ✓ X ✓ ✓ X Regulator X ✓ X ✓ ✓ X ✓
Impa
cts o
n cr
ews
Handling X ✓ ✓ ✓ ✓ X X ✓ Attentional resources X ✓ ✓ X X X X X Perception X X ✓ X X X X X Decision-making X X X X X X X X Crew cooperation X X X X ✓ X ✓ X
All tests are either Chi-square or Fisher's Exact test, as determined by the expected frequencies at the contingency tables; see Section 4.3.8.2.1
X Non-significant result: codes are not associated
✓ Significant result: codes are associated
256
Internal factors were significantly associated with a range of other contextual factors,
revealing that pilot-related issues might be one of the most difficult elements to control in
order to ensure safe operations. The ‘internal factors’ code was significantly associated with
the ‘handling’ and ‘crew cooperation’ impacts on the crews.
The ‘environmental conditions’ code was only associated with ‘internal factors’ reflecting
that, except for personal susceptibilities, the pilots are likely to generally feel safe regardless
of the environmental conditions. This is in direct agreement with the discussion in Section
8.3.1.1.
The code ‘organisational issues’ was found to be significantly associated with a number of
other contextual factors, which is expected in any complex activity, such nighttime offshore
helicopter operations (see Sections 2.3.2.4 and 3.5.2). ‘Organisational issues’ were also
significantly associated with ‘crew cooperation’. The effects of organisational issues on crew
cooperation are well-established in the literature (see Section 2.3.2.3).
The code ‘regulator’ was also significantly associated with a number of other contextual
factors and the impact on ‘handling’ the aircraft, confirming the view in the literature that any
hazards (or failures) at this level might have a widespread effect (Section 3.5.2).
‘Handling’ was associated with all codes except ‘training’, ‘environmental conditions’ and
‘organisational issues’. This reveals that an array of factors might impact a pilot’s handling
abilities. On the other hand, ‘attentional resources’ was only associated with ‘procedures’ and
‘offshore installations’. This limits the candidate contextual factor codes to be addressed for
the mitigation of attentional problems. Likewise, ‘perception’ was only associated with
‘offshore installations’ and ‘crew cooperation’ was associated with ‘internal factors’ and
‘organisational issues’. ‘Decision-making’ was not associated with any contextual factors
code and, therefore, explanations for decision-making conflicts should be sought across other
variables, for example pilot demographics.
8.3.2.2 Meta-demographic analysis
Table 8-7 shows the results of the meta-demographic analysis. It confirms the expectation
that all pilot experience variables were highly associated (or correlated in the case of
257
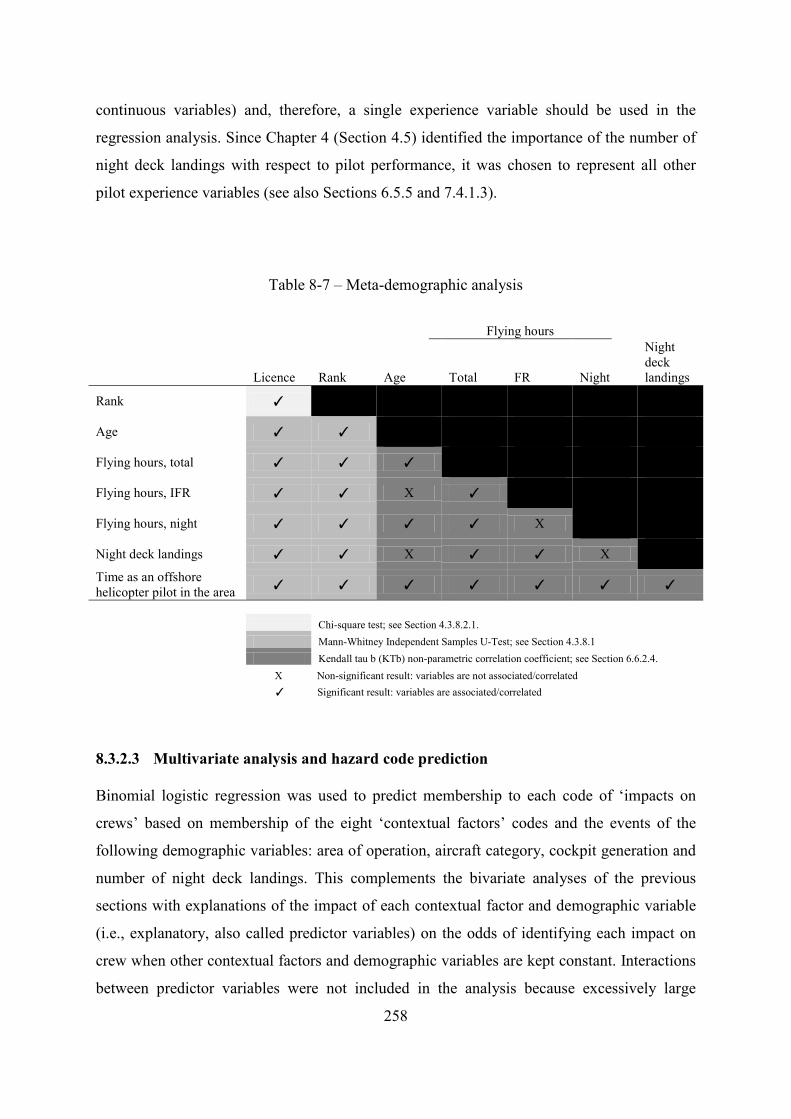
continuous variables) and, therefore, a single experience variable should be used in the
regression analysis. Since Chapter 4 (Section 4.5) identified the importance of the number of
night deck landings with respect to pilot performance, it was chosen to represent all other
pilot experience variables (see also Sections 6.5.5 and 7.4.1.3).
Table 8-7 – Meta-demographic analysis
Flying hours
Licence Rank Age Total FR Night
Night deck landings
Rank ✓
Age ✓ ✓
Flying hours, total ✓ ✓ ✓
Flying hours, IFR ✓ ✓ X ✓
Flying hours, night ✓ ✓ ✓ ✓ X
Night deck landings ✓ ✓ X ✓ ✓ X Time as an offshore helicopter pilot in the area ✓ ✓ ✓ ✓ ✓ ✓ ✓
Chi-square test; see Section 4.3.8.2.1.
Mann-Whitney Independent Samples U-Test; see Section 4.3.8.1
Kendall tau b (KTb) non-parametric correlation coefficient; see Section 6.6.2.4.
X Non-significant result: variables are not associated/correlated
✓ Significant result: variables are associated/correlated
8.3.2.3 Multivariate analysis and hazard code prediction
Binomial logistic regression was used to predict membership to each code of ‘impacts on
crews’ based on membership of the eight ‘contextual factors’ codes and the events of the
following demographic variables: area of operation, aircraft category, cockpit generation and
number of night deck landings. This complements the bivariate analyses of the previous
sections with explanations of the impact of each contextual factor and demographic variable
(i.e., explanatory, also called predictor variables) on the odds of identifying each impact on
crew when other contextual factors and demographic variables are kept constant. Interactions
between predictor variables were not included in the analysis because excessively large
258
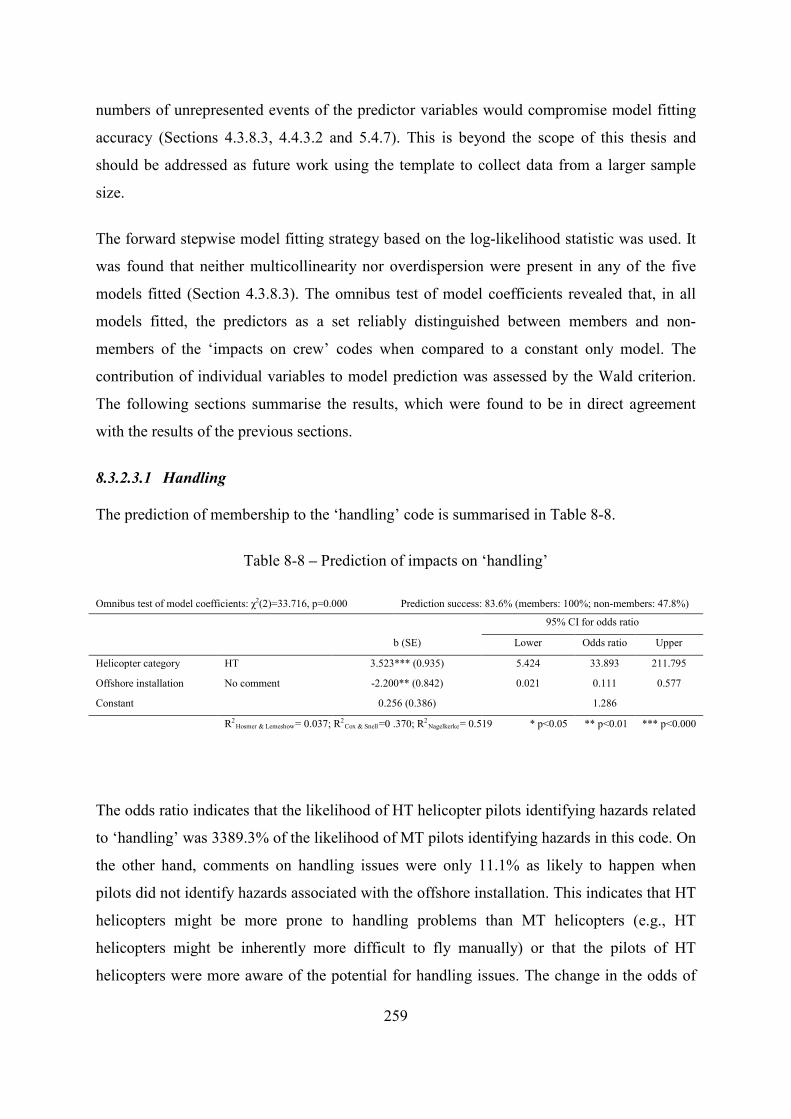
numbers of unrepresented events of the predictor variables would compromise model fitting
accuracy (Sections 4.3.8.3, 4.4.3.2 and 5.4.7). This is beyond the scope of this thesis and
should be addressed as future work using the template to collect data from a larger sample
size.
The forward stepwise model fitting strategy based on the log-likelihood statistic was used. It
was found that neither multicollinearity nor overdispersion were present in any of the five
models fitted (Section 4.3.8.3). The omnibus test of model coefficients revealed that, in all
models fitted, the predictors as a set reliably distinguished between members and non-
members of the ‘impacts on crew’ codes when compared to a constant only model. The
contribution of individual variables to model prediction was assessed by the Wald criterion.
The following sections summarise the results, which were found to be in direct agreement
with the results of the previous sections.
8.3.2.3.1 Handling
The prediction of membership to the ‘handling’ code is summarised in Table 8-8.
Table 8-8 – Prediction of impacts on ‘handling’
Omnibus test of model coefficients: χ2(2)=33.716, p=0.000 Prediction success: 83.6% (members: 100%; non-members: 47.8%)
95% CI for odds ratio
b (SE) Lower Odds ratio Upper
Helicopter category HT 3.523*** (0.935) 5.424 33.893 211.795
Offshore installation No comment -2.200** (0.842) 0.021 0.111 0.577
Constant 0.256 (0.386)
1.286
R2Hosmer & Lemeshow= 0.037; R2
Cox & Snell=0 .370; R2Nagelkerke= 0.519 * p<0.05 ** p<0.01 *** p<0.000
The odds ratio indicates that the likelihood of HT helicopter pilots identifying hazards related
to ‘handling’ was 3389.3% of the likelihood of MT pilots identifying hazards in this code. On
the other hand, comments on handling issues were only 11.1% as likely to happen when
pilots did not identify hazards associated with the offshore installation. This indicates that HT
helicopters might be more prone to handling problems than MT helicopters (e.g., HT
helicopters might be inherently more difficult to fly manually) or that the pilots of HT
helicopters were more aware of the potential for handling issues. The change in the odds of
259
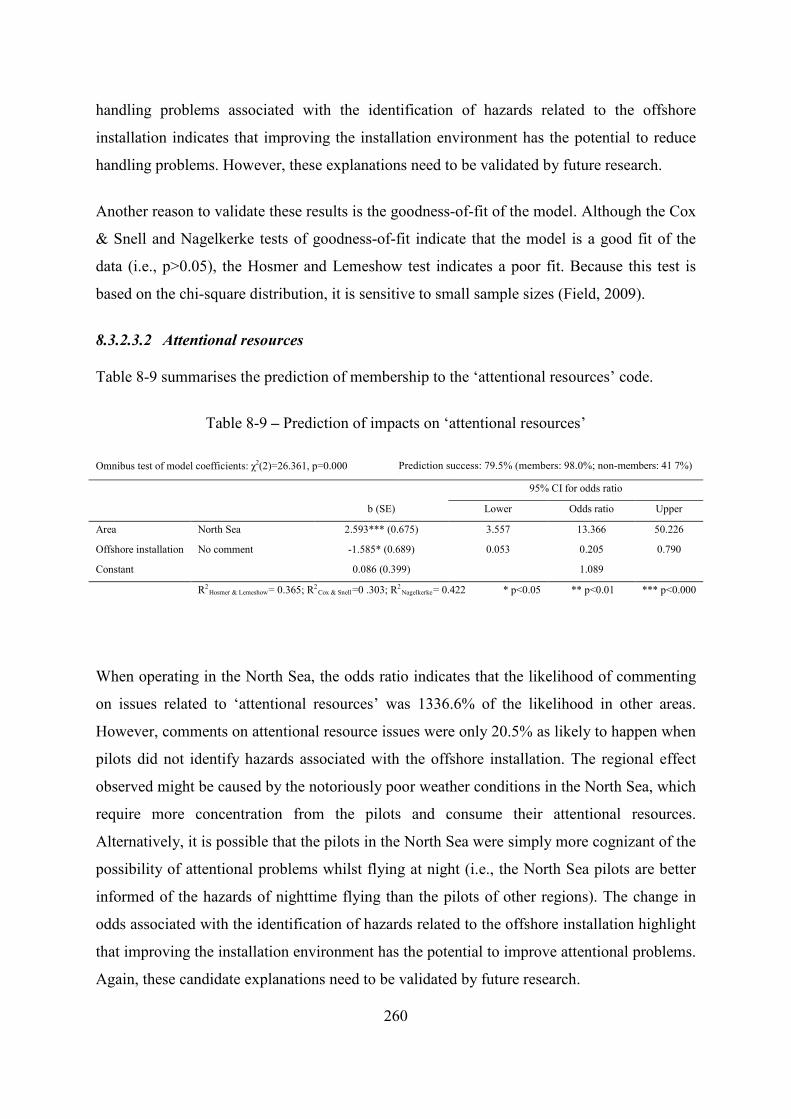
handling problems associated with the identification of hazards related to the offshore
installation indicates that improving the installation environment has the potential to reduce
handling problems. However, these explanations need to be validated by future research.
Another reason to validate these results is the goodness-of-fit of the model. Although the Cox
& Snell and Nagelkerke tests of goodness-of-fit indicate that the model is a good fit of the
data (i.e., p>0.05), the Hosmer and Lemeshow test indicates a poor fit. Because this test is
based on the chi-square distribution, it is sensitive to small sample sizes (Field, 2009).
8.3.2.3.2 Attentional resources
Table 8-9 summarises the prediction of membership to the ‘attentional resources’ code.
Table 8-9 – Prediction of impacts on ‘attentional resources’
Omnibus test of model coefficients: χ2(2)=26.361, p=0.000 Prediction success: 79.5% (members: 98.0%; non-members: 41 7%)
95% CI for odds ratio
b (SE) Lower Odds ratio Upper
Area North Sea 2.593*** (0.675) 3.557 13.366 50.226
Offshore installation No comment -1.585* (0.689) 0.053 0.205 0.790
Constant 0.086 (0.399) 1.089
R2Hosmer & Lemeshow= 0.365; R2
Cox & Snell=0 .303; R2Nagelkerke= 0.422 * p<0.05 ** p<0.01 *** p<0.000
When operating in the North Sea, the odds ratio indicates that the likelihood of commenting
on issues related to ‘attentional resources’ was 1336.6% of the likelihood in other areas.
However, comments on attentional resource issues were only 20.5% as likely to happen when
pilots did not identify hazards associated with the offshore installation. The regional effect
observed might be caused by the notoriously poor weather conditions in the North Sea, which
require more concentration from the pilots and consume their attentional resources.
Alternatively, it is possible that the pilots in the North Sea were simply more cognizant of the
possibility of attentional problems whilst flying at night (i.e., the North Sea pilots are better
informed of the hazards of nighttime flying than the pilots of other regions). The change in
odds associated with the identification of hazards related to the offshore installation highlight
that improving the installation environment has the potential to improve attentional problems.
Again, these candidate explanations need to be validated by future research.
260
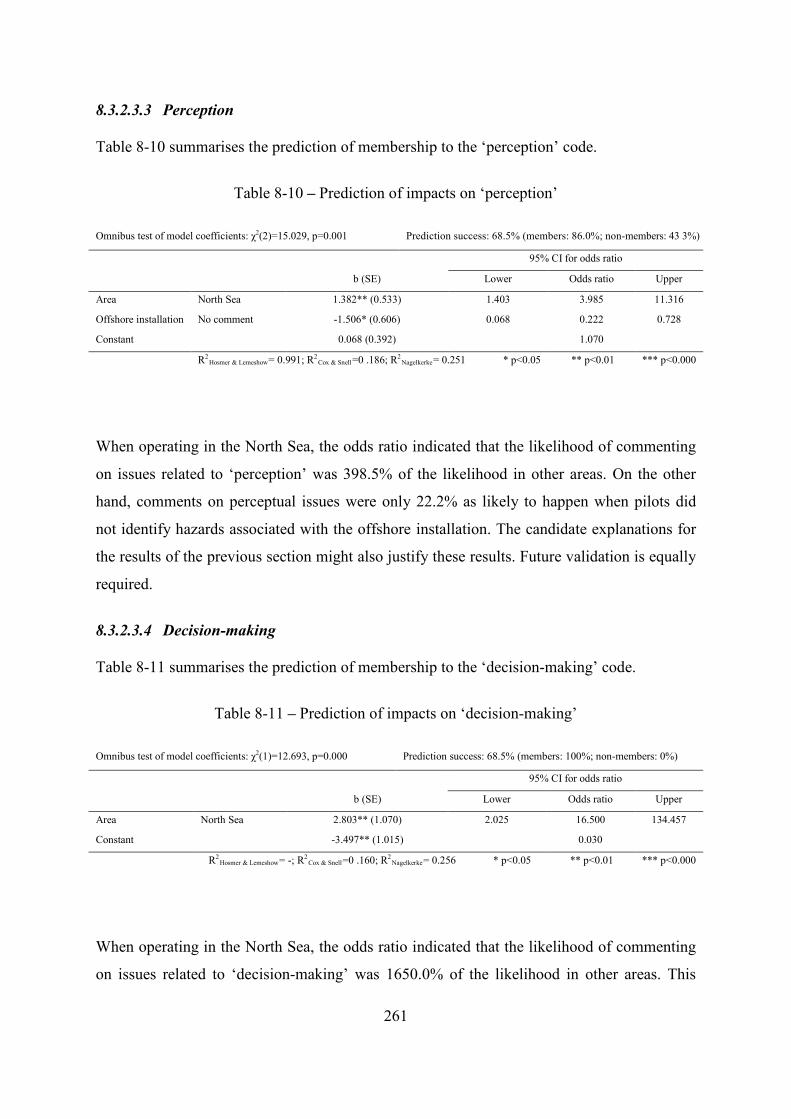
8.3.2.3.3 Perception
Table 8-10 summarises the prediction of membership to the ‘perception’ code.
Table 8-10 – Prediction of impacts on ‘perception’
Omnibus test of model coefficients: χ2(2)=15.029, p=0.001 Prediction success: 68.5% (members: 86.0%; non-members: 43 3%)
95% CI for odds ratio
b (SE) Lower Odds ratio Upper
Area North Sea 1.382** (0.533) 1.403 3.985 11.316
Offshore installation No comment -1.506* (0.606) 0.068 0.222 0.728
Constant 0.068 (0.392) 1.070
R2Hosmer & Lemeshow= 0.991; R2
Cox & Snell=0 .186; R2Nagelkerke= 0.251 * p<0.05 ** p<0.01 *** p<0.000
When operating in the North Sea, the odds ratio indicated that the likelihood of commenting
on issues related to ‘perception’ was 398.5% of the likelihood in other areas. On the other
hand, comments on perceptual issues were only 22.2% as likely to happen when pilots did
not identify hazards associated with the offshore installation. The candidate explanations for
the results of the previous section might also justify these results. Future validation is equally
required.
8.3.2.3.4 Decision-making
Table 8-11 summarises the prediction of membership to the ‘decision-making’ code.
Table 8-11 – Prediction of impacts on ‘decision-making’
Omnibus test of model coefficients: χ2(1)=12.693, p=0.000 Prediction success: 68.5% (members: 100%; non-members: 0%)
95% CI for odds ratio
b (SE) Lower Odds ratio Upper
Area North Sea 2.803** (1.070) 2.025 16.500 134.457
Constant -3.497** (1.015) 0.030
R2Hosmer & Lemeshow= -; R2
Cox & Snell=0 .160; R2Nagelkerke= 0.256 * p<0.05 ** p<0.01 *** p<0.000
When operating in the North Sea, the odds ratio indicated that the likelihood of commenting
on issues related to ‘decision-making’ was 1650.0% of the likelihood in other areas. This
261
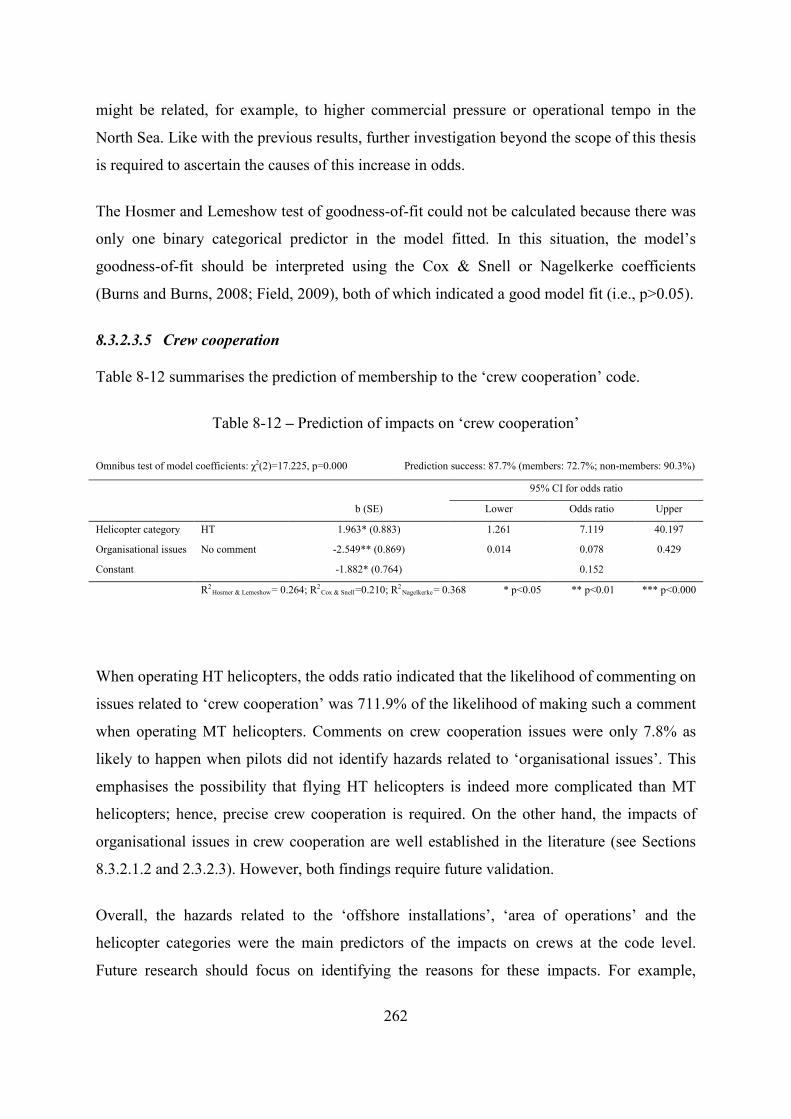
might be related, for example, to higher commercial pressure or operational tempo in the
North Sea. Like with the previous results, further investigation beyond the scope of this thesis
is required to ascertain the causes of this increase in odds.
The Hosmer and Lemeshow test of goodness-of-fit could not be calculated because there was
only one binary categorical predictor in the model fitted. In this situation, the model’s
goodness-of-fit should be interpreted using the Cox & Snell or Nagelkerke coefficients
(Burns and Burns, 2008; Field, 2009), both of which indicated a good model fit (i.e., p>0.05).
8.3.2.3.5 Crew cooperation
Table 8-12 summarises the prediction of membership to the ‘crew cooperation’ code.
Table 8-12 – Prediction of impacts on ‘crew cooperation’
Omnibus test of model coefficients: χ2(2)=17.225, p=0.000 Prediction success: 87.7% (members: 72.7%; non-members: 90.3%)
95% CI for odds ratio
b (SE) Lower Odds ratio Upper
Helicopter category HT 1.963* (0.883) 1.261 7.119 40.197
Organisational issues No comment -2.549** (0.869) 0.014 0.078 0.429
Constant -1.882* (0.764)
0.152
R2Hosmer & Lemeshow= 0.264; R2
Cox & Snell=0.210; R2Nagelkerke= 0.368 * p<0.05 ** p<0.01 *** p<0.000
When operating HT helicopters, the odds ratio indicated that the likelihood of commenting on
issues related to ‘crew cooperation’ was 711.9% of the likelihood of making such a comment
when operating MT helicopters. Comments on crew cooperation issues were only 7.8% as
likely to happen when pilots did not identify hazards related to ‘organisational issues’. This
emphasises the possibility that flying HT helicopters is indeed more complicated than MT
helicopters; hence, precise crew cooperation is required. On the other hand, the impacts of
organisational issues in crew cooperation are well established in the literature (see Sections
8.3.2.1.2 and 2.3.2.3). However, both findings require future validation.
Overall, the hazards related to the ‘offshore installations’, ‘area of operations’ and the
helicopter categories were the main predictors of the impacts on crews at the code level.
Future research should focus on identifying the reasons for these impacts. For example,
262
HFDM data can be collected from flights to platforms which the pilots consider typically
good and bad for night operations and compared. Informed criteria for good and bad
platforms can be elicited beforehand based on the experience of a sample of pilots. Likewise,
HFDM data from different regions (e.g., UK and Brazil) and helicopters of different
categories (e.g., S92 and AW139, see Table 4-4) could be compared for flights undertaken in
similar conditions (e.g., with respect to the prevailing weather).
8.3.2.4 Industry instantiation and update
Figure 8-3 provides an example of the industry’s taxonomy instantiated to the problem of
crew cooperation. The orange box indicates the system instantiation conditions, which are
connected by orange lines to their reliable predictors (i.e., helicopter category and
organisational issues). The figure also shows the associated odds ratios. This enables to
identify at a glance the predictors of particularly hazardous conditions and thereby set the
priorities for risk mitigation strategies based on unfavourable odds ratios. Each predicted
impact on crews should be used to form an instantiated industry description as in Figure 8-3.
A collection of such figures enables the critical aspects of the operation to be covered
probabilistically and manage safety systemically on the basis of the predictions established.
This improves on the industry instantiation of Section 4.5, which was based on bivariate
analysis due to the poor quality of the accident data analysed. This also corrects the lack of
understanding in the aviation community of what ‘predictive’ hazard identification means
(see Section 2.3.3.3).
8.3.3 Analysis of key categories
In order to benefit from the appraisal of hazards at a more actionable level (see Section 8.2),
the main hazard categories need to be identified.
263
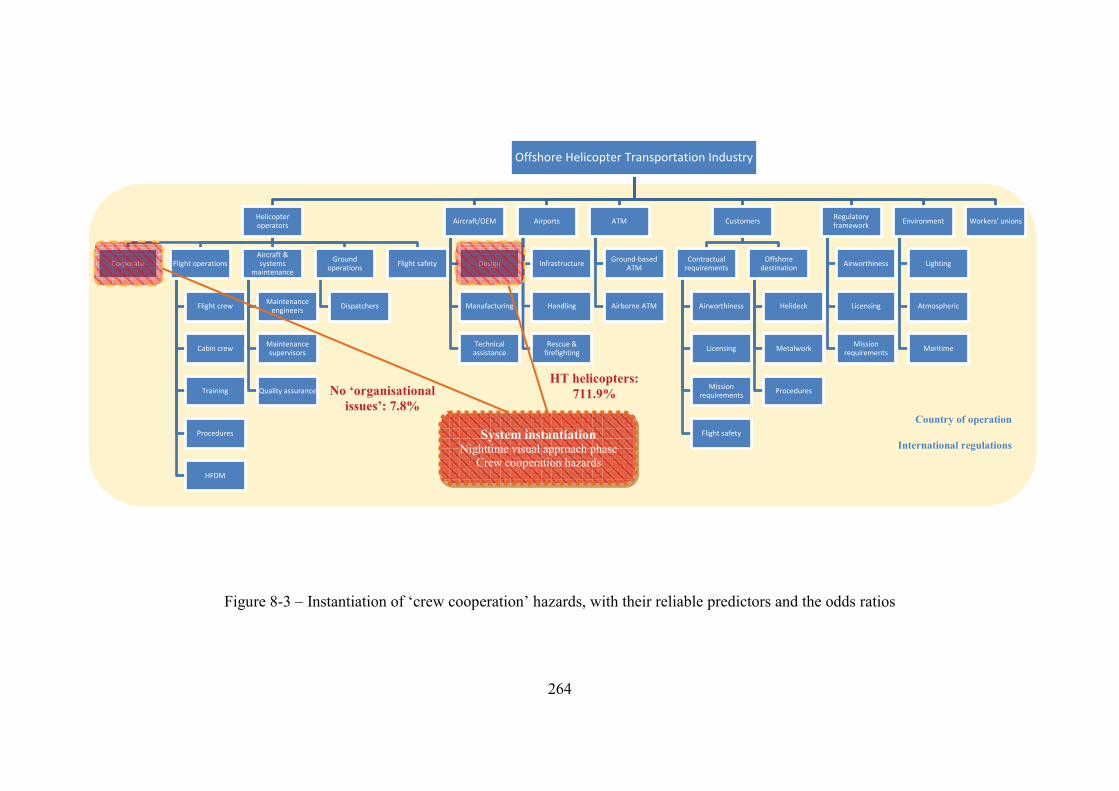
Offshore Helicopter Transportation Industry
Helicopter operators
Corporate Flight operations
Flight crew
Cabin crew
Training
Procedures
HFDM
Aircraft & systems
maintenance
Maintenance engineers
Maintenance supervisors
Quality assurance
Ground operations
Dispatchers
Flight safety
Aircraft/OEM
Design
Manufacturing
Technical assistance
Airports
Infrastructure
Handling
Rescue & firefighting
ATM
Ground-based ATM
Airborne ATM
Customers
Contractual requirements
Airworthiness
Licensing
Mission requirements
Flight safety
Offshore destination
Helideck
Metalwork
Procedures
Regulatory framework
Airworthiness
Licensing
Mission requirements
Environment
Lighting
Atmospheric
Maritime
Workers' unions
DDDesDessignsignDDesDesignsigCCCorCorrporrporraterateeeCCorCorporrporateratee
8.3.3.1 Selection of key categories
The selection of key hazard categories is necessary to avoid increased complexity and
inaccuracies when several factors are combined in immature mathematical models
(Greenberg et al., 2005). Additionally, selection is justified by the consensus that, in Content
Analysis, it is neither realistic nor necessary to treat all the data collected as relevant evidence
(Mostyn, 1985).
However, there is no rule established to select the most relevant hazard categories. For
example, Fischhoff et al. (1984) only recommend that a modest number of categories (i.e.,
N≤30) should be used. Selection criteria include SME expertise, expected data quality and
the historical impact of candidate categories into the consequences of accidents (see
Kyriakidis, 2013; JSSI - Occurrence Data Analysis Working Group, 2006).
In qualitative research, hazard categories may be selected through participation rates. These
refer to the rate of participants commenting on a theme, which is accepted as a credible
indicator of the theme’s validity (Butterfield et al., 2005; Flanagan, 1954; Jarvis, 2009).
Typically, 25% of participants are considered as the threshold for assured validity. The
participation rates principle is similar to the ‘law of large numbers’ (Bertolini, 2007, pp. 412)
used in human reliability analysis (HRA), whereby the greater the number of independent
experts agreeing on a theme the greater the credibility of the theme.
Another principle commonly used in category selection, especially in economic analysis and
quality control applications in aviation, is the Pareto principle. The principle claims that 80%
of the problems are a result of 20% of the causes, which aids reducing the choice set to those
alternatives that are efficient to solve problems (Backbaus, 1980, 1981; Stolzer et al., 2008).
In this section, the key hazard categories were selected based on 25% participation rates.
Additionally, the compatibility with the Pareto principal was verified to ensure that no
essential information was missed. This was achieved as follows: the categories selected by
participation rates (which corresponded to those identified by 75% of the participants) were
checked to determine whether they corresponded to approximately 20% of the overall hazard
categories in each section of the template (i.e., ‘contextual factors’ and ‘impacts on crews’).
265
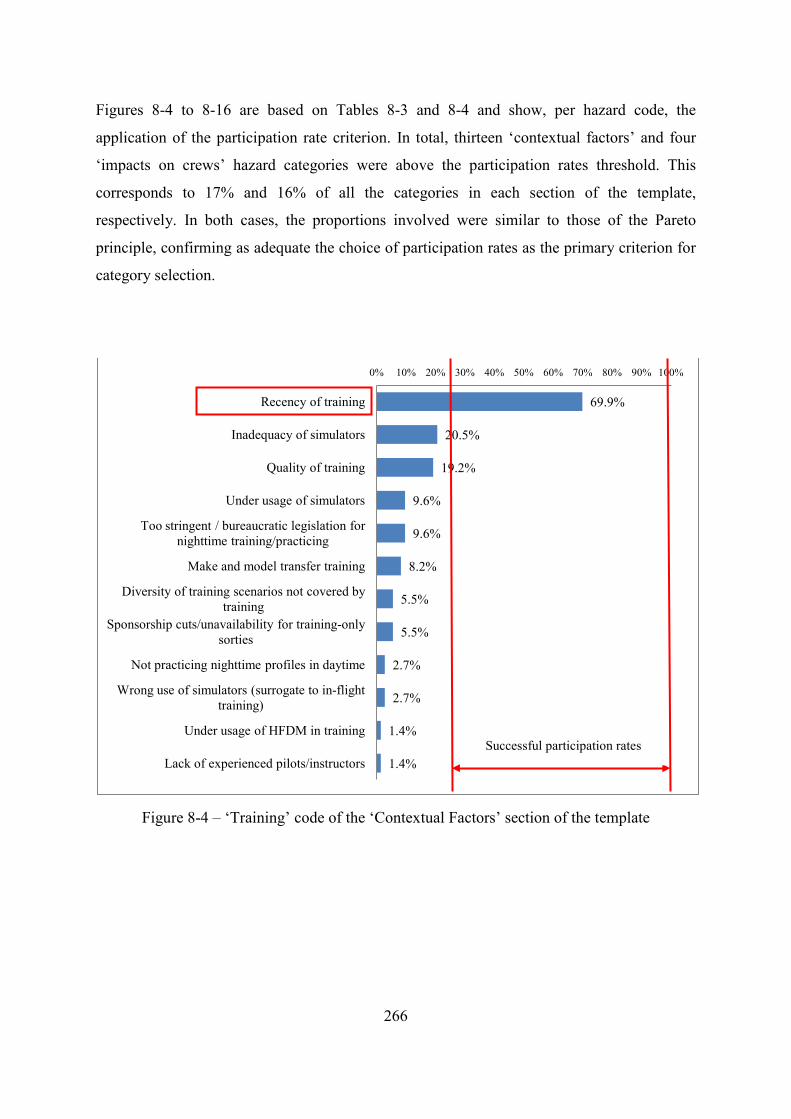
Figures 8-4 to 8-16 are based on Tables 8-3 and 8-4 and show, per hazard code, the
application of the participation rate criterion. In total, thirteen ‘contextual factors’ and four
‘impacts on crews’ hazard categories were above the participation rates threshold. This
corresponds to 17% and 16% of all the categories in each section of the template,
respectively. In both cases, the proportions involved were similar to those of the Pareto
principle, confirming as adequate the choice of participation rates as the primary criterion for
category selection.
Figure 8-4 – ‘Training’ code of the ‘Contextual Factors’ section of the template
69.9%
20.5%
19.2%
9.6%
9.6%
8.2%
5.5%
5.5%
2.7%
2.7%
1.4%
1.4%
0% 10% 20% 30% 40% 50% 60% 70% 80% 90% 100%
Recency of training
Inadequacy of simulators
Quality of training
Under usage of simulators
Too stringent / bureaucratic legislation for nighttime training/practicing
Make and model transfer training
Diversity of training scenarios not covered by training
Sponsorship cuts/unavailability for training-only sorties
Not practicing nighttime profiles in daytime
Wrong use of simulators (surrogate to in-flight training)
Under usage of HFDM in training
Lack of experienced pilots/instructors Successful participation rates
266
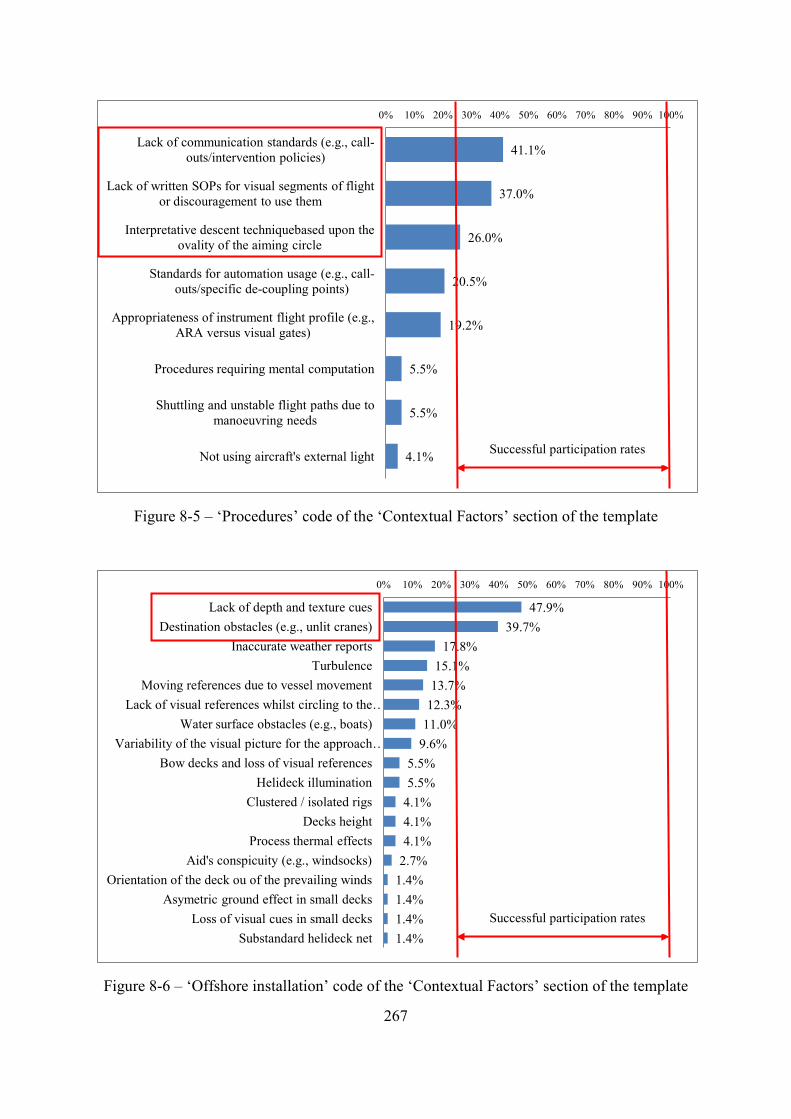
Figure 8-5 – ‘Procedures’ code of the ‘Contextual Factors’ section of the template
Figure 8-6 – ‘Offshore installation’ code of the ‘Contextual Factors’ section of the template
41.1%
37.0%
26.0%
20.5%
19.2%
5.5%
5.5%
4.1%
0% 10% 20% 30% 40% 50% 60% 70% 80% 90% 100%
Lack of communication standards (e.g., call-outs/intervention policies)
Lack of written SOPs for visual segments of flight or discouragement to use them
Interpretative descent techniquebased upon the ovality of the aiming circle
Standards for automation usage (e.g., call-outs/specific de-coupling points)
Appropriateness of instrument flight profile (e.g., ARA versus visual gates)
Procedures requiring mental computation
Shuttling and unstable flight paths due to manoeuvring needs
Not using aircraft's external light
47.9% 39.7%
17.8% 15.1%
13.7% 12.3%
11.0% 9.6%
5.5% 5.5%
4.1% 4.1% 4.1%
2.7% 1.4% 1.4% 1.4% 1.4%
0% 10% 20% 30% 40% 50% 60% 70% 80% 90% 100%
Lack of depth and texture cues Destination obstacles (e.g., unlit cranes)
Inaccurate weather reports Turbulence
Moving references due to vessel movement Lack of visual references whilst circling to the …
Water surface obstacles (e.g., boats) Variability of the visual picture for the approach …
Bow decks and loss of visual references Helideck illumination
Clustered / isolated rigs Decks height
Process thermal effects Aid's conspicuity (e.g., windsocks)
Orientation of the deck ou of the prevailing winds Asymetric ground effect in small decks
Loss of visual cues in small decks Substandard helideck net
Successful participation rates
Successful participation rates
267
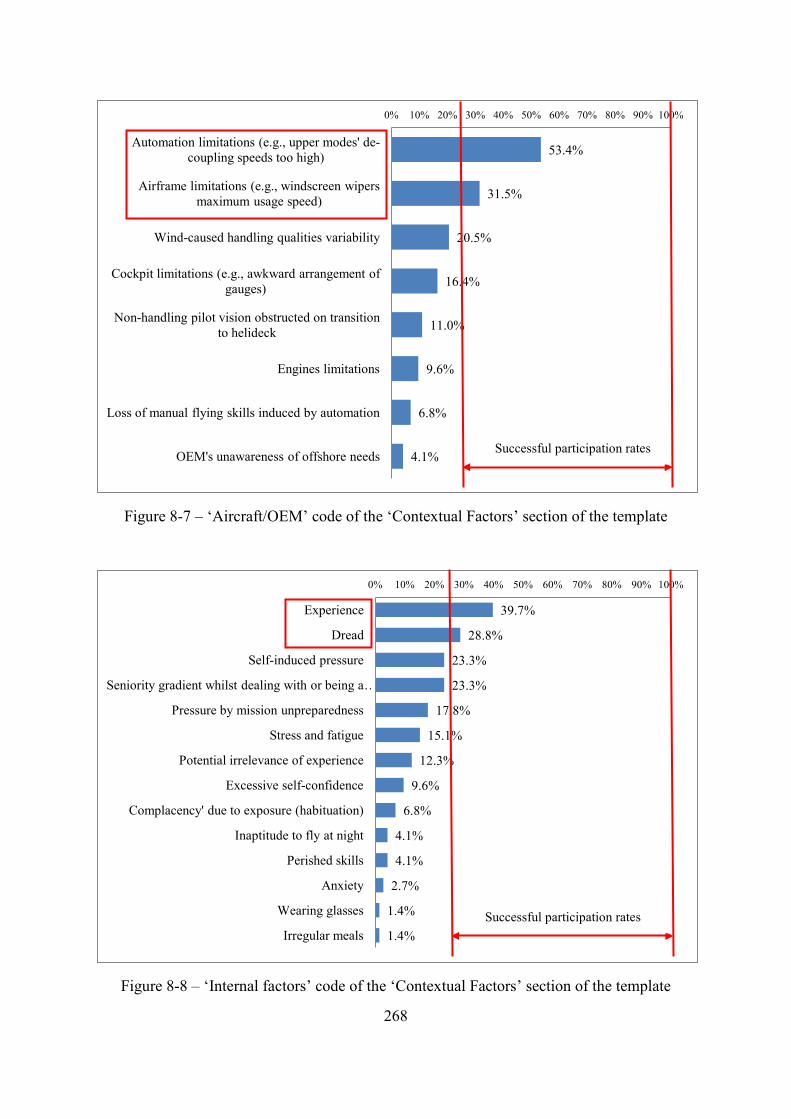
Figure 8-7 – ‘Aircraft/OEM’ code of the ‘Contextual Factors’ section of the template
Figure 8-8 – ‘Internal factors’ code of the ‘Contextual Factors’ section of the template
53.4%
31.5%
20.5%
16.4%
11.0%
9.6%
6.8%
4.1%
0% 10% 20% 30% 40% 50% 60% 70% 80% 90% 100%
Automation limitations (e.g., upper modes' de-coupling speeds too high)
Airframe limitations (e.g., windscreen wipers maximum usage speed)
Wind-caused handling qualities variability
Cockpit limitations (e.g., awkward arrangement of gauges)
Non-handling pilot vision obstructed on transition to helideck
Engines limitations
Loss of manual flying skills induced by automation
OEM's unawareness of offshore needs
39.7%
28.8%
23.3%
23.3%
17.8%
15.1%
12.3%
9.6%
6.8%
4.1%
4.1%
2.7%
1.4%
1.4%
0% 10% 20% 30% 40% 50% 60% 70% 80% 90% 100%
Experience
Dread
Self-induced pressure
Seniority gradient whilst dealing with or being a …
Pressure by mission unpreparedness
Stress and fatigue
Potential irrelevance of experience
Excessive self-confidence
Complacency' due to exposure (habituation)
Inaptitude to fly at night
Perished skills
Anxiety
Wearing glasses
Irregular meals Successful participation rates
Successful participation rates
268
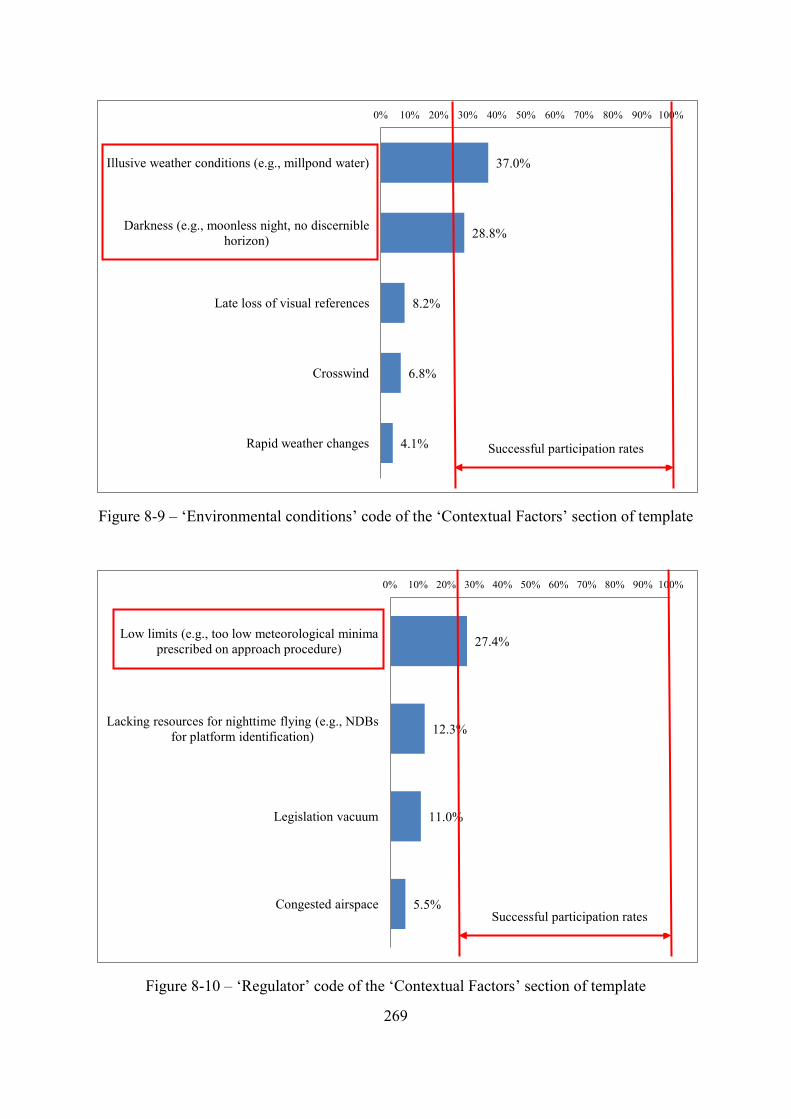
Figure 8-9 – ‘Environmental conditions’ code of the ‘Contextual Factors’ section of template
Figure 8-10 – ‘Regulator’ code of the ‘Contextual Factors’ section of template
37.0%
28.8%
8.2%
6.8%
4.1%
0% 10% 20% 30% 40% 50% 60% 70% 80% 90% 100%
Illusive weather conditions (e.g., millpond water)
Darkness (e.g., moonless night, no discernible horizon)
Late loss of visual references
Crosswind
Rapid weather changes
27.4%
12.3%
11.0%
5.5%
0% 10% 20% 30% 40% 50% 60% 70% 80% 90% 100%
Low limits (e.g., too low meteorological minima prescribed on approach procedure)
Lacking resources for nighttime flying (e.g., NDBs for platform identification)
Legislation vacuum
Congested airspace
Successful participation rates
Successful participation rates
269
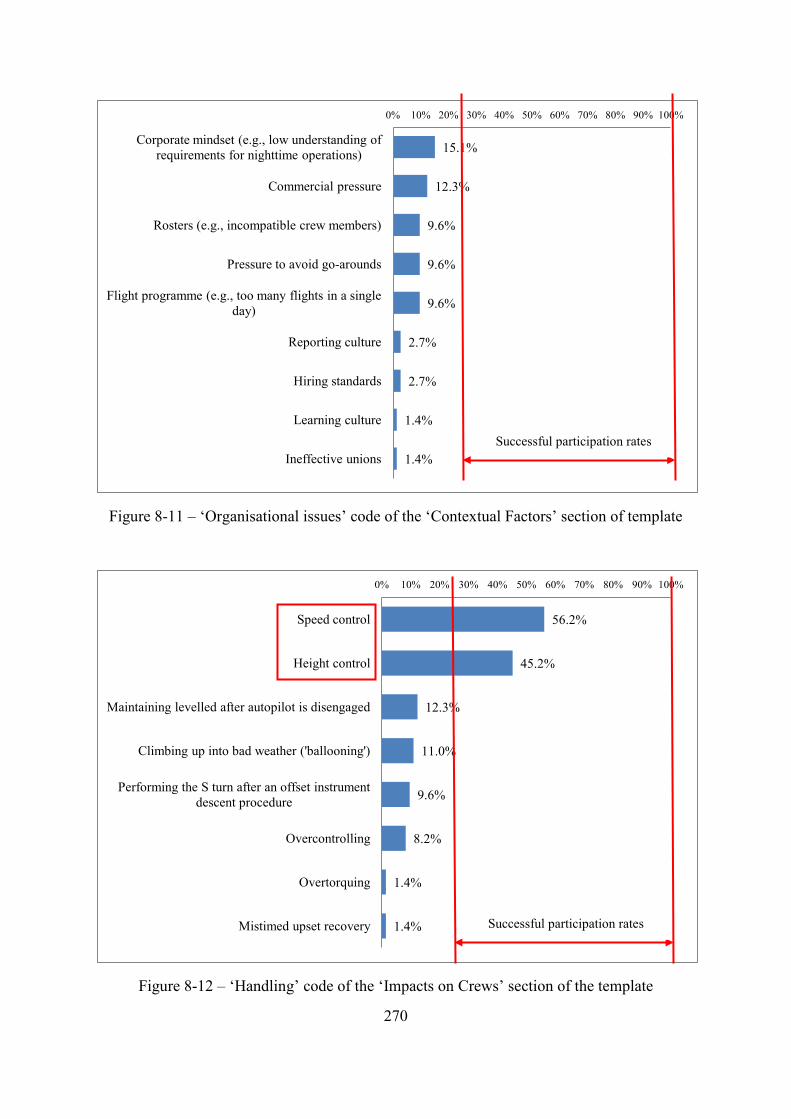
Figure 8-11 – ‘Organisational issues’ code of the ‘Contextual Factors’ section of template
Figure 8-12 – ‘Handling’ code of the ‘Impacts on Crews’ section of the template
15.1%
12.3%
9.6%
9.6%
9.6%
2.7%
2.7%
1.4%
1.4%
0% 10% 20% 30% 40% 50% 60% 70% 80% 90% 100%
Corporate mindset (e.g., low understanding of requirements for nighttime operations)
Commercial pressure
Rosters (e.g., incompatible crew members)
Pressure to avoid go-arounds
Flight programme (e.g., too many flights in a single day)
Reporting culture
Hiring standards
Learning culture
Ineffective unions
56.2%
45.2%
12.3%
11.0%
9.6%
8.2%
1.4%
1.4%
0% 10% 20% 30% 40% 50% 60% 70% 80% 90% 100%
Speed control
Height control
Maintaining levelled after autopilot is disengaged
Climbing up into bad weather ('ballooning')
Performing the S turn after an offset instrument descent procedure
Overcontrolling
Overtorquing
Mistimed upset recovery
Successful participation rates
Successful participation rates
270
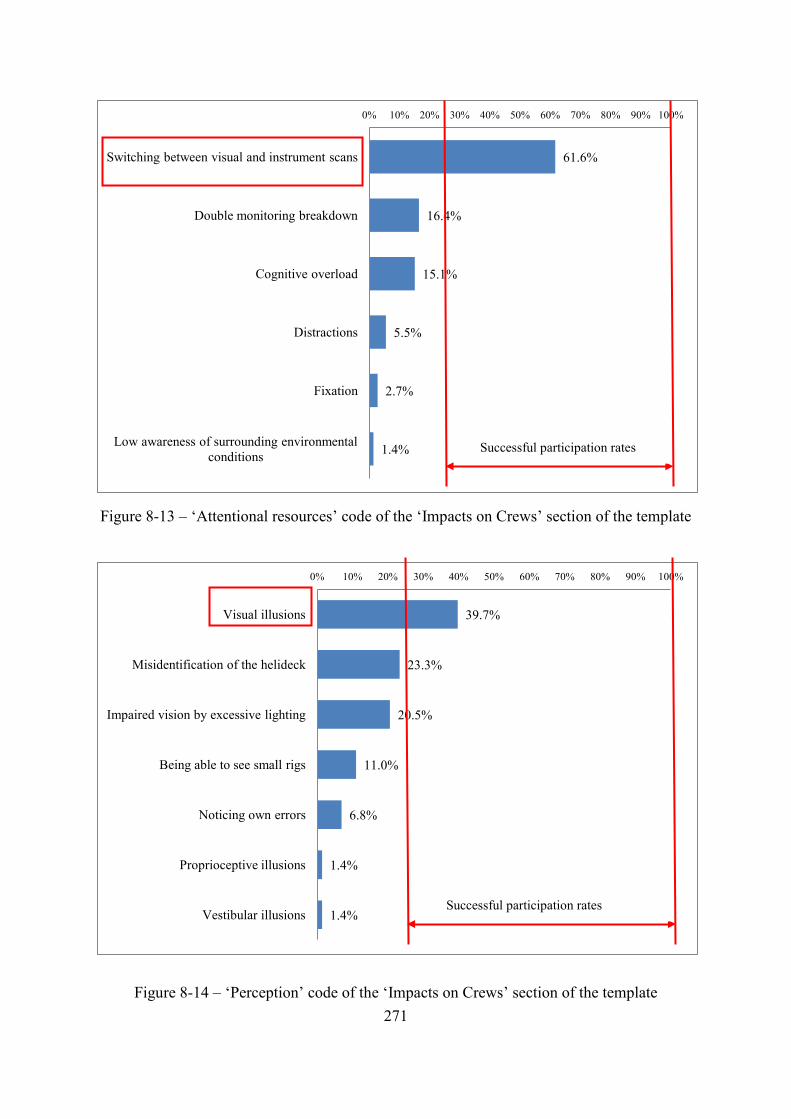
Figure 8-13 – ‘Attentional resources’ code of the ‘Impacts on Crews’ section of the template
Figure 8-14 – ‘Perception’ code of the ‘Impacts on Crews’ section of the template
61.6%
16.4%
15.1%
5.5%
2.7%
1.4%
0% 10% 20% 30% 40% 50% 60% 70% 80% 90% 100%
Switching between visual and instrument scans
Double monitoring breakdown
Cognitive overload
Distractions
Fixation
Low awareness of surrounding environmental conditions
39.7%
23.3%
20.5%
11.0%
6.8%
1.4%
1.4%
0% 10% 20% 30% 40% 50% 60% 70% 80% 90% 100%
Visual illusions
Misidentification of the helideck
Impaired vision by excessive lighting
Being able to see small rigs
Noticing own errors
Proprioceptive illusions
Vestibular illusions
Successful participation rates
Successful participation rates
271
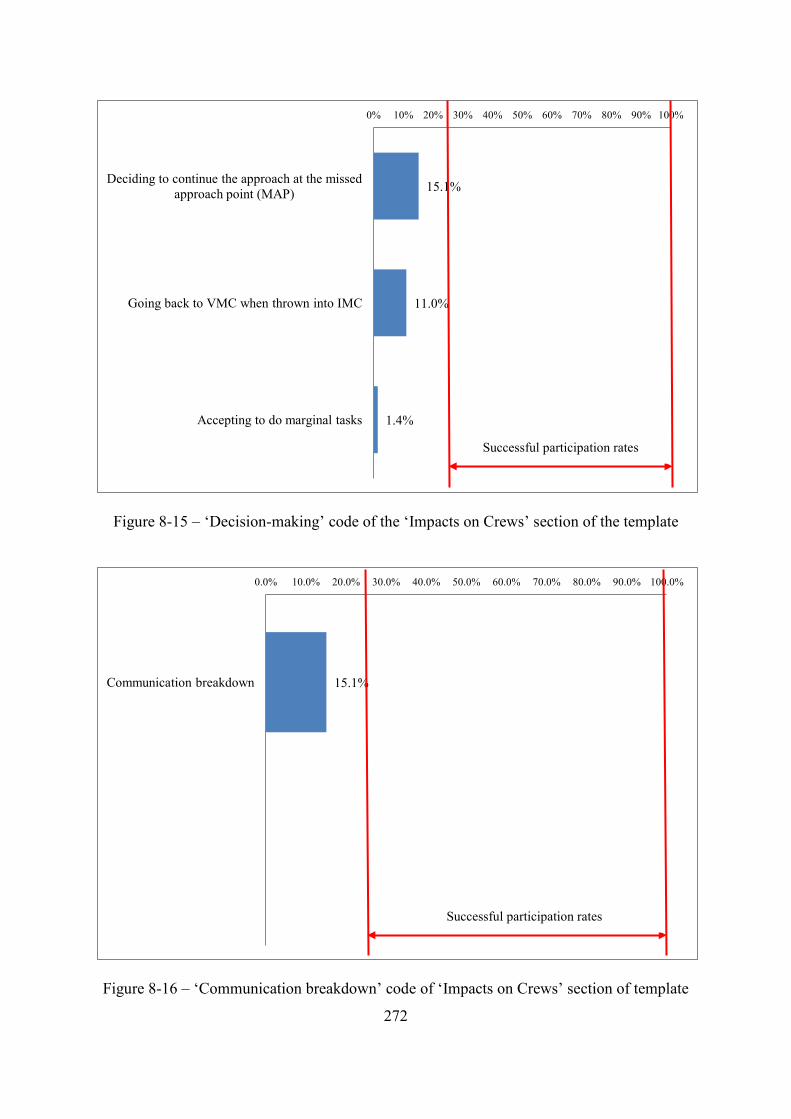
Figure 8-15 – ‘Decision-making’ code of the ‘Impacts on Crews’ section of the template
Figure 8-16 – ‘Communication breakdown’ code of ‘Impacts on Crews’ section of template
15.1%
11.0%
1.4%
0% 10% 20% 30% 40% 50% 60% 70% 80% 90% 100%
Deciding to continue the approach at the missed approach point (MAP)
Going back to VMC when thrown into IMC
Accepting to do marginal tasks
15.1%
0.0% 10.0% 20.0% 30.0% 40.0% 50.0% 60.0% 70.0% 80.0% 90.0% 100.0%
Communication breakdown
Successful participation rates
Successful participation rates
272
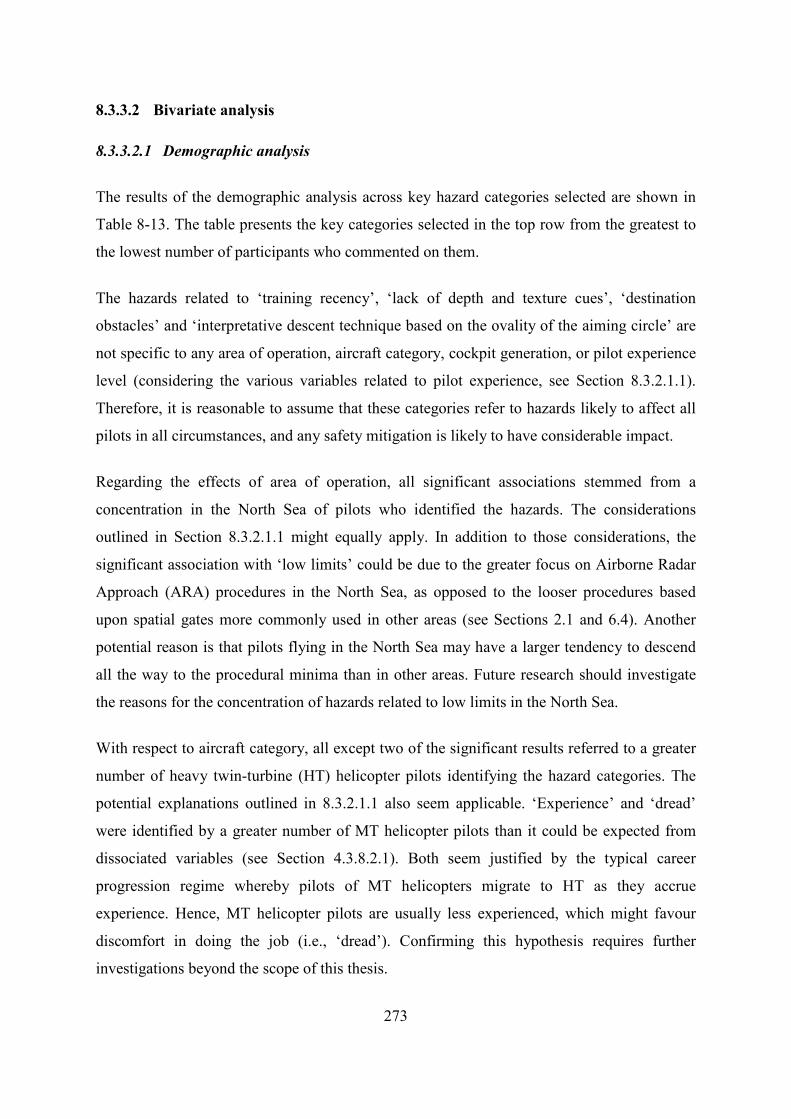
8.3.3.2 Bivariate analysis
8.3.3.2.1 Demographic analysis
The results of the demographic analysis across key hazard categories selected are shown in
Table 8-13. The table presents the key categories selected in the top row from the greatest to
the lowest number of participants who commented on them.
The hazards related to ‘training recency’, ‘lack of depth and texture cues’, ‘destination
obstacles’ and ‘interpretative descent technique based on the ovality of the aiming circle’ are
not specific to any area of operation, aircraft category, cockpit generation, or pilot experience
level (considering the various variables related to pilot experience, see Section 8.3.2.1.1).
Therefore, it is reasonable to assume that these categories refer to hazards likely to affect all
pilots in all circumstances, and any safety mitigation is likely to have considerable impact.
Regarding the effects of area of operation, all significant associations stemmed from a
concentration in the North Sea of pilots who identified the hazards. The considerations
outlined in Section 8.3.2.1.1 might equally apply. In addition to those considerations, the
significant association with ‘low limits’ could be due to the greater focus on Airborne Radar
Approach (ARA) procedures in the North Sea, as opposed to the looser procedures based
upon spatial gates more commonly used in other areas (see Sections 2.1 and 6.4). Another
potential reason is that pilots flying in the North Sea may have a larger tendency to descend
all the way to the procedural minima than in other areas. Future research should investigate
the reasons for the concentration of hazards related to low limits in the North Sea.
With respect to aircraft category, all except two of the significant results referred to a greater
number of heavy twin-turbine (HT) helicopter pilots identifying the hazard categories. The
potential explanations outlined in 8.3.2.1.1 also seem applicable. ‘Experience’ and ‘dread’
were identified by a greater number of MT helicopter pilots than it could be expected from
dissociated variables (see Section 4.3.8.2.1). Both seem justified by the typical career
progression regime whereby pilots of MT helicopters migrate to HT as they accrue
experience. Hence, MT helicopter pilots are usually less experienced, which might favour
discomfort in doing the job (i.e., ‘dread’). Confirming this hypothesis requires further
investigations beyond the scope of this thesis.
273
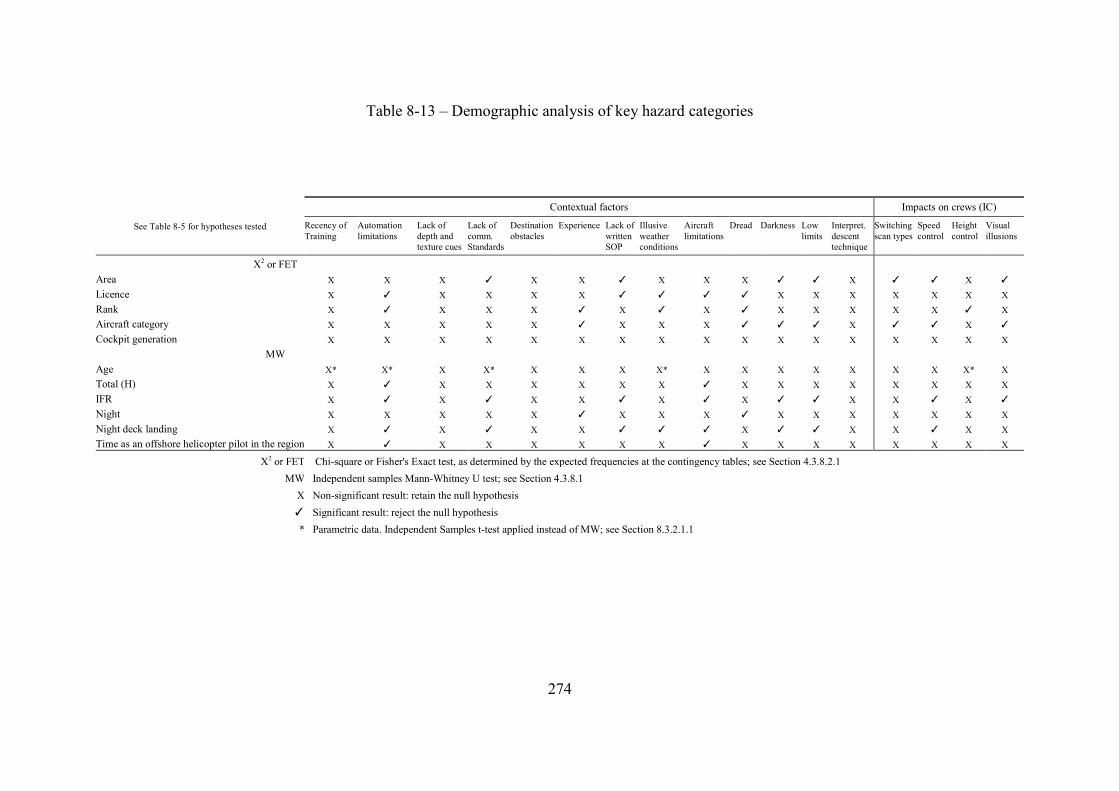
Table 8-13 – Demographic analysis of key hazard categories
See Table 8-5 for hypotheses tested
Contextual factors Impacts on crews (IC)
Recency of Training
Automation limitations
Lack of depth and texture cues
Lack of comm. Standards
Destination obstacles
Experience Lack of written SOP
Illusive weather conditions
Aircraft limitations
Dread Darkness Low limits
Interpret. descent technique
Switching scan types
Speed control
Height control
Visual illusions
Χ2 or FET
Area
X X X ✓ X X ✓ X X X ✓ ✓ X ✓ ✓ X ✓ Licence
X ✓ X X X X ✓ ✓ ✓ ✓ X X X X X X X
Rank
X ✓ X X X ✓ X ✓ X ✓ X X X X X ✓ X Aircraft category
X X X X X ✓ X X X ✓ ✓ ✓ X ✓ ✓ X ✓
Cockpit generation
X X X X X X X X X X X X X X X X X
MW
Age
X* X* X X* X X X X* X X X X X X X X* X Total (H)
X ✓ X X X X X X ✓ X X X X X X X X
IFR
X ✓ X ✓ X X ✓ X ✓ X ✓ ✓ X X ✓ X ✓ Night
X X X X X ✓ X X X ✓ X X X X X X X
Night deck landing
X ✓ X ✓ X X ✓ ✓ ✓ X ✓ ✓ X X ✓ X X Time as an offshore helicopter pilot in the region X ✓ X X X X X X ✓ X X X X X X X X
Χ2 or FET Chi-square or Fisher's Exact test, as determined by the expected frequencies at the contingency tables; see Section 4.3.8.2.1
MW Independent samples Mann-Whitney U test; see Section 4.3.8.1 X Non-significant result: retain the null hypothesis
✓ Significant result: reject the null hypothesis
* Parametric data. Independent Samples t-test applied instead of MW; see Section 8.3.2.1.1
274
Like with the results in Table 8-5, all other significant results referred to more experienced
pilots commenting on the hazard categories. The only discernible pattern is that the pilots
who commented on the ‘automation limitation’ and ‘airframe limitations’ categories were
more experienced in virtually all experience variables investigated. This might reflect a bias
whereby more experienced pilots are more critical than less experienced pilots with respect to
the limitations of the aircraft that they fly. This might also be associated with improved
judgement built over time. Further investigation, beyond the scope of this thesis, is required
to validate these candidate explanations.
8.3.3.2.2 Cross-tabulation
The results of the cross-tabulation analysis are shown in Table 8-14. Like in Section
8.3.2.1.2, the pilots who identified a hazard in a column were over represented in the
respective row. The following paragraphs discuss the significant associations according to the
codes to which the categories belong (see Tables 8-3 and 8-4).
Table 8-14 enables to identify that the ubiquitous ‘training’ problem identified in Section
8.3.2.1 actually stems from hazards related to ‘training recency’. These in turn are associated
with the ‘experience’, in the sense that the lack of training recency is aggravated by a
perceived low level of pilot experience. This is further explored in the validation exercise of
Section 8-4. The ‘training recency’ problem is not associated with any specific impact on
crews, suggesting that it is present in all impacts indistinctively.
Belonging to the code ‘procedures’, the categories ‘lack of communication standards’ and
‘lack of written SOPs’ were significantly associated with the impact on crews ‘switching
between visual and instrument scans’. The need for communication protocols and SOPs
which ensure safe visual transitions is well-documented in the literature (Sections 8.3.1.1,
2.3.2 and 2.3.3.2.1). ‘Lack of written SOP’ was additionally associated with ‘airframe
limitations’. This is related to features of the airframe requiring procedural standardisation,
e.g., the use of external lights and windscreen wipers (Table 8-3). The hazard category
‘interpretative descent technique based on the ovality of the aiming circle’ was significantly
associated with a ‘lack of depth and texture cues’, ‘speed control’ and ‘low limits’. The first
two associations are intuitive in the sense that a descent technique open to interpretation
should be more difficult to execute when the visual cues are poor, and such a descent
275
technique may also lead to speed control problems. The association with ‘low limits’ also
appears intuitive in that the effects of descending to low limits on instruments have the worst
impact on safety when the subsequent visual descent technique is such that is open to
interpretation.
Amidst the categories pertaining to the code ‘offshore installations’, ‘lack of depth and
texture cues’ was associated with ‘airframe limitations’, ‘interpretative descent technique
based on the ovality of the aiming circle’ and ‘switching between visual and instrument
scans’. Whereas the last two are again self-explanatory, the first association is justifiable
because the airframe limitations frequently referred to low quality windscreen wipers which
further distort the external visual cues (Table 8-3). For this reason, ‘destination obstacles’
was also significantly associated with ‘airframe limitations’. Additionally, ‘destination
obstacles’ was significantly associated with ‘experience’, attributed to the need to build an
accurate knowledge of the target installation, which is built primarily from experience.
Regarding the categories within the code ‘aircraft/OEM’, ‘automation limitations’ was
significantly associated with ‘experience’, ‘illusive weather conditions’, ‘airframe limitation’
and ‘dread’. This indicates that the limitations in automation levels might have a worse
impact on inexperienced pilots; that low levels of automation leave pilots more exposed to
illusive weather conditions; and that the helicopters implicated in low levels of automation
and limitations of the airframe are largely of the same type. The association with ‘dread’ is
intuitive because lower levels of automation leave pilots unassisted in the critical visual
approach task. ‘Airframe limitations’ was associated with ‘automation limitations’, ‘lack of
depth and texture cues’, ‘destination obstacles’, ‘lack of written SOP’ (all already discussed),
‘experience’ and ‘speed control’. The association with experience reflects an understanding
that the overall experience enables pilots to devise strategies to overcome the limitations of
the aircraft (e.g., flying at higher speeds to avoid water accumulation on the windscreen when
the wipers cannot be used). The association with ‘speed control’ reflects the likely error mode
resulting from difficulties in dealing with the limitations of the airframe.
276
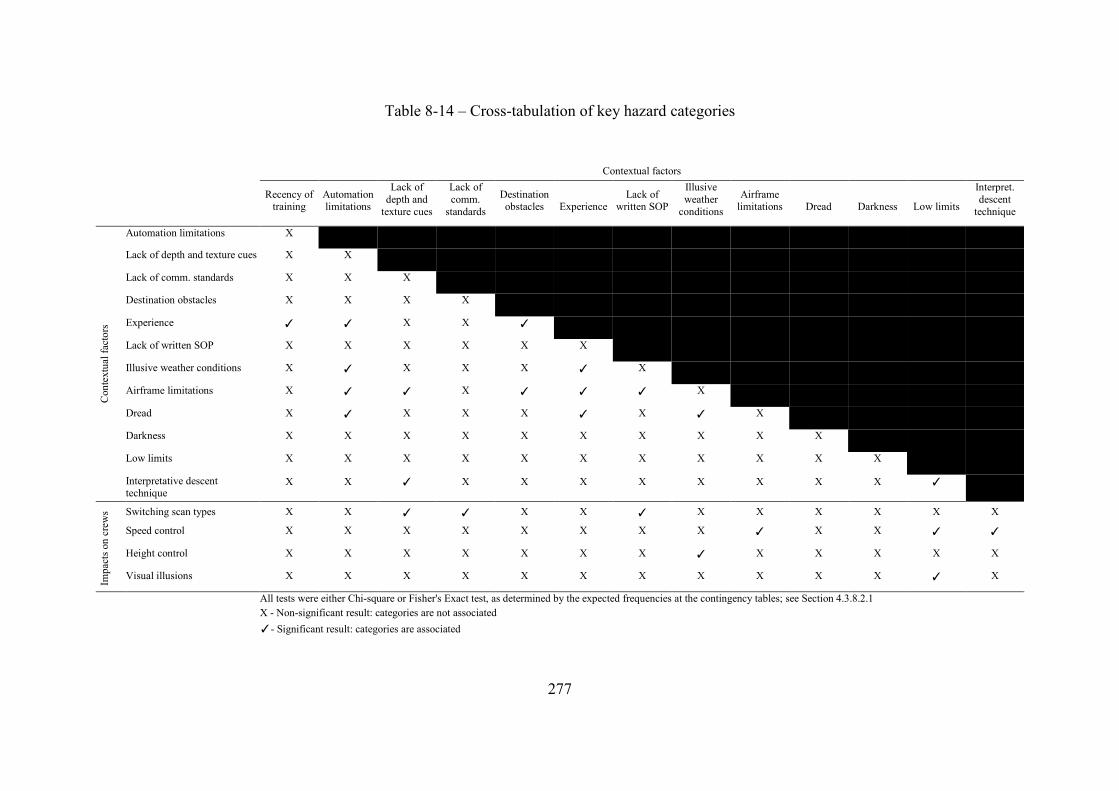
Table 8-14 – Cross-tabulation of key hazard categories
Contextual factors
Recency of training
Automation limitations
Lack of depth and
texture cues
Lack of comm.
standards Destination obstacles Experience
Lack of written SOP
Illusive weather
conditions Airframe
limitations Dread Darkness Low limits
Interpret. descent
technique
Con
text
ual f
acto
rs
Automation limitations X
Lack of depth and texture cues X X
Lack of comm. standards X X X
Destination obstacles X X X X
Experience ✓ ✓ X X ✓
Lack of written SOP X X X X X X
Illusive weather conditions X ✓ X X X ✓ X
Airframe limitations X ✓ ✓ X ✓ ✓ ✓ X
Dread X ✓ X X X ✓ X ✓ X
Darkness X X X X X X X X X X
Low limits X X X X X X X X X X X
Interpretative descent technique
X X ✓ X X X X X X X X ✓
Impa
cts o
n cr
ews Switching scan types X X ✓ ✓ X X ✓ X X X X X X
Speed control X X X X X X X X ✓ X X ✓ ✓
Height control X X X X X X X ✓ X X X X X
Visual illusions X X X X X X X X X X X ✓ X
All tests were either Chi-square or Fisher's Exact test, as determined by the expected frequencies at the contingency tables; see Section 4.3.8.2.1
X - Non-significant result: categories are not associated
✓- Significant result: categories are associated
277
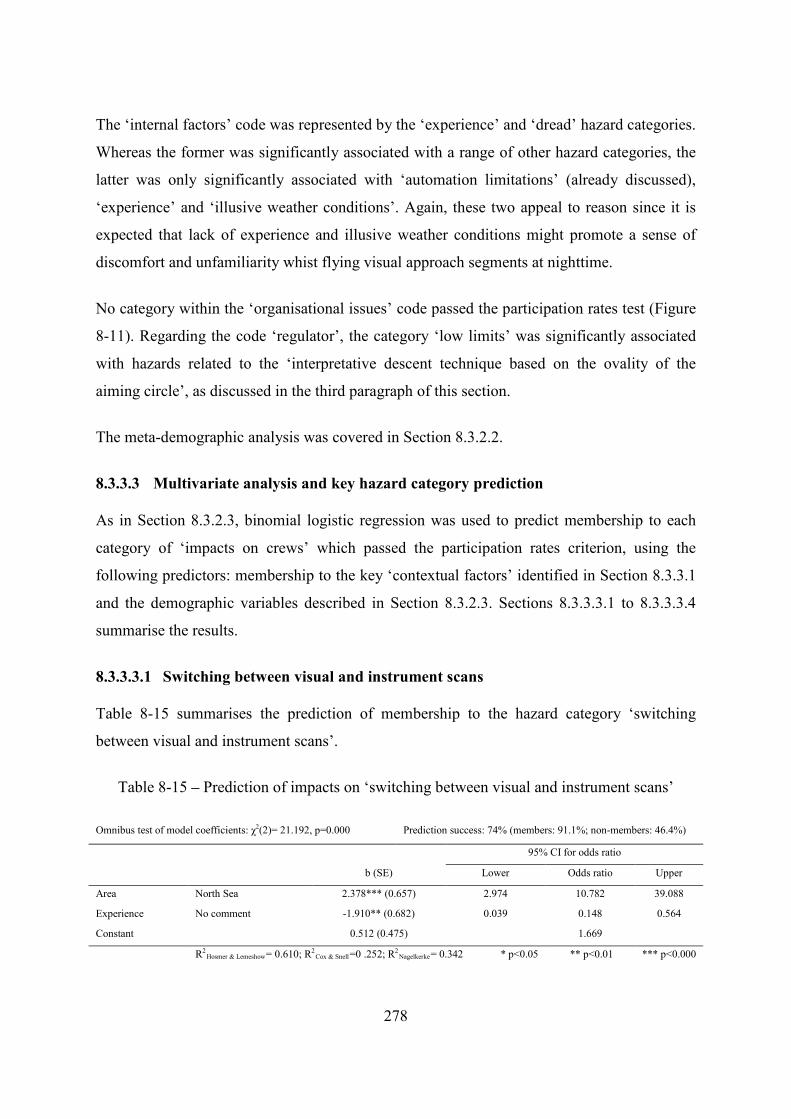
The ‘internal factors’ code was represented by the ‘experience’ and ‘dread’ hazard categories.
Whereas the former was significantly associated with a range of other hazard categories, the
latter was only significantly associated with ‘automation limitations’ (already discussed),
‘experience’ and ‘illusive weather conditions’. Again, these two appeal to reason since it is
expected that lack of experience and illusive weather conditions might promote a sense of
discomfort and unfamiliarity whist flying visual approach segments at nighttime.
No category within the ‘organisational issues’ code passed the participation rates test (Figure
8-11). Regarding the code ‘regulator’, the category ‘low limits’ was significantly associated
with hazards related to the ‘interpretative descent technique based on the ovality of the
aiming circle’, as discussed in the third paragraph of this section.
The meta-demographic analysis was covered in Section 8.3.2.2.
8.3.3.3 Multivariate analysis and key hazard category prediction
As in Section 8.3.2.3, binomial logistic regression was used to predict membership to each
category of ‘impacts on crews’ which passed the participation rates criterion, using the
following predictors: membership to the key ‘contextual factors’ identified in Section 8.3.3.1
and the demographic variables described in Section 8.3.2.3. Sections 8.3.3.3.1 to 8.3.3.3.4
summarise the results.
8.3.3.3.1 Switching between visual and instrument scans
Table 8-15 summarises the prediction of membership to the hazard category ‘switching
between visual and instrument scans’.
Table 8-15 – Prediction of impacts on ‘switching between visual and instrument scans’
Omnibus test of model coefficients: χ2(2)= 21.192, p=0.000 Prediction success: 74% (members: 91.1%; non-members: 46.4%)
95% CI for odds ratio
b (SE) Lower Odds ratio Upper
Area North Sea 2.378*** (0.657) 2.974 10.782 39.088
Experience No comment -1.910** (0.682) 0.039 0.148 0.564
Constant
0.512 (0.475)
1.669
R2Hosmer & Lemeshow= 0.610; R2
Cox & Snell=0 .252; R2Nagelkerke= 0.342 * p<0.05 ** p<0.01 *** p<0.000
278
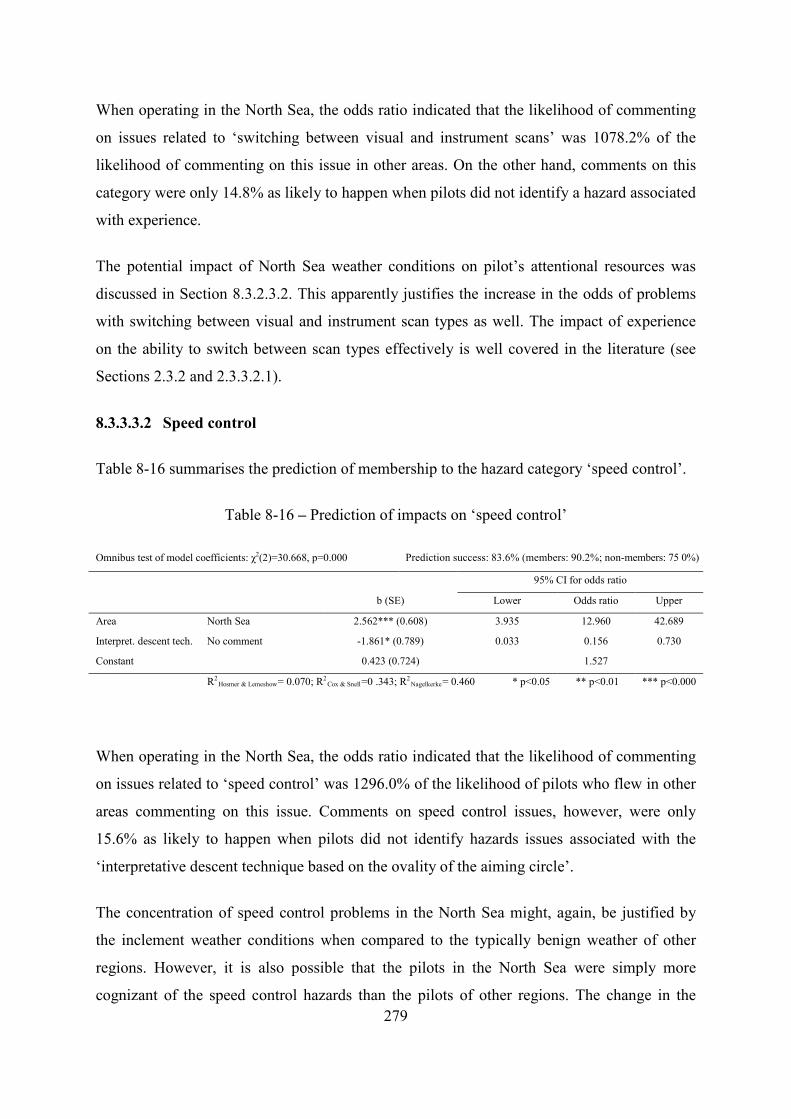
When operating in the North Sea, the odds ratio indicated that the likelihood of commenting
on issues related to ‘switching between visual and instrument scans’ was 1078.2% of the
likelihood of commenting on this issue in other areas. On the other hand, comments on this
category were only 14.8% as likely to happen when pilots did not identify a hazard associated
with experience.
The potential impact of North Sea weather conditions on pilot’s attentional resources was
discussed in Section 8.3.2.3.2. This apparently justifies the increase in the odds of problems
with switching between visual and instrument scan types as well. The impact of experience
on the ability to switch between scan types effectively is well covered in the literature (see
Sections 2.3.2 and 2.3.3.2.1).
8.3.3.3.2 Speed control
Table 8-16 summarises the prediction of membership to the hazard category ‘speed control’.
Table 8-16 – Prediction of impacts on ‘speed control’
Omnibus test of model coefficients: χ2(2)=30.668, p=0.000 Prediction success: 83.6% (members: 90.2%; non-members: 75 0%)
95% CI for odds ratio
b (SE) Lower Odds ratio Upper
Area North Sea 2.562*** (0.608) 3.935 12.960 42.689
Interpret. descent tech. No comment -1.861* (0.789) 0.033 0.156 0.730
Constant 0.423 (0.724) 1.527
R2Hosmer & Lemeshow= 0.070; R2
Cox & Snell=0 .343; R2Nagelkerke= 0.460 * p<0.05 ** p<0.01 *** p<0.000
When operating in the North Sea, the odds ratio indicated that the likelihood of commenting
on issues related to ‘speed control’ was 1296.0% of the likelihood of pilots who flew in other
areas commenting on this issue. Comments on speed control issues, however, were only
15.6% as likely to happen when pilots did not identify hazards issues associated with the
‘interpretative descent technique based on the ovality of the aiming circle’.
The concentration of speed control problems in the North Sea might, again, be justified by
the inclement weather conditions when compared to the typically benign weather of other
regions. However, it is also possible that the pilots in the North Sea were simply more
cognizant of the speed control hazards than the pilots of other regions. The change in the 279
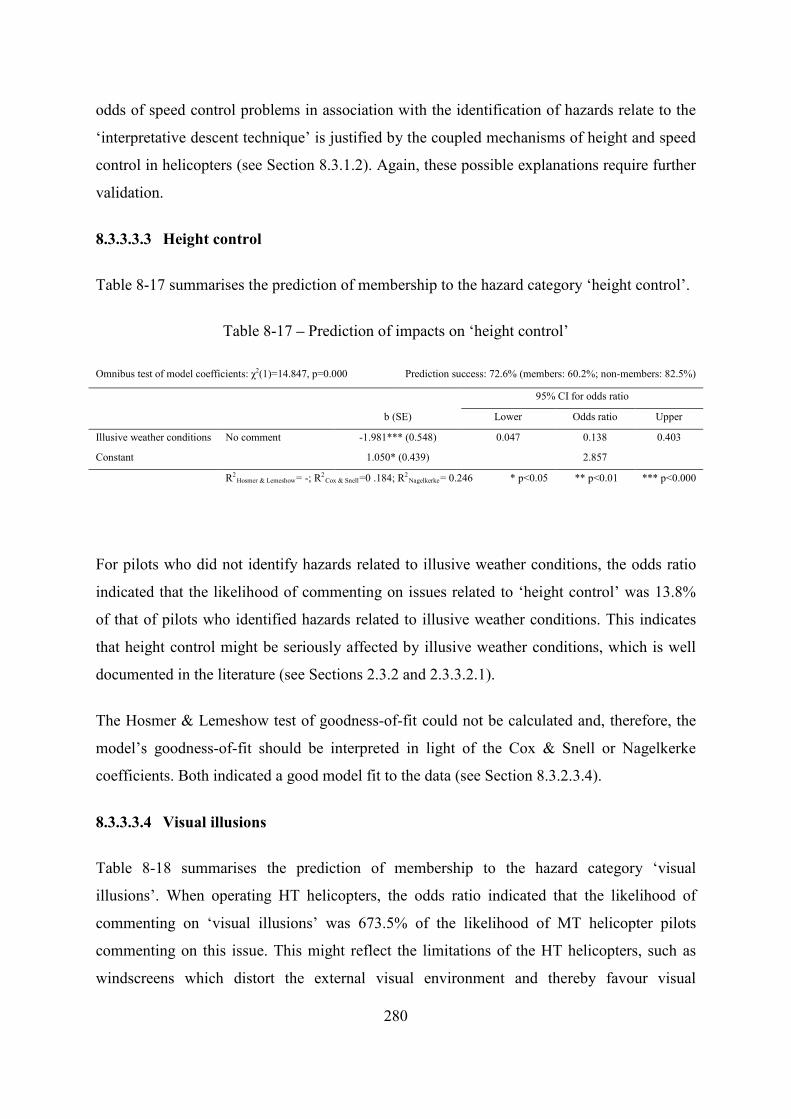
odds of speed control problems in association with the identification of hazards relate to the
‘interpretative descent technique’ is justified by the coupled mechanisms of height and speed
control in helicopters (see Section 8.3.1.2). Again, these possible explanations require further
validation.
8.3.3.3.3 Height control
Table 8-17 summarises the prediction of membership to the hazard category ‘height control’.
Table 8-17 – Prediction of impacts on ‘height control’
Omnibus test of model coefficients: χ2(1)=14.847, p=0.000 Prediction success: 72.6% (members: 60.2%; non-members: 82.5%)
95% CI for odds ratio
b (SE) Lower Odds ratio Upper
Illusive weather conditions No comment -1.981*** (0.548) 0.047 0.138 0.403
Constant
1.050* (0.439)
2.857
R2Hosmer & Lemeshow= -; R2
Cox & Snell=0 .184; R2Nagelkerke= 0.246 * p<0.05 ** p<0.01 *** p<0.000
For pilots who did not identify hazards related to illusive weather conditions, the odds ratio
indicated that the likelihood of commenting on issues related to ‘height control’ was 13.8%
of that of pilots who identified hazards related to illusive weather conditions. This indicates
that height control might be seriously affected by illusive weather conditions, which is well
documented in the literature (see Sections 2.3.2 and 2.3.3.2.1).
The Hosmer & Lemeshow test of goodness-of-fit could not be calculated and, therefore, the
model’s goodness-of-fit should be interpreted in light of the Cox & Snell or Nagelkerke
coefficients. Both indicated a good model fit to the data (see Section 8.3.2.3.4).
8.3.3.3.4 Visual illusions
Table 8-18 summarises the prediction of membership to the hazard category ‘visual
illusions’. When operating HT helicopters, the odds ratio indicated that the likelihood of
commenting on ‘visual illusions’ was 673.5% of the likelihood of MT helicopter pilots
commenting on this issue. This might reflect the limitations of the HT helicopters, such as
windscreens which distort the external visual environment and thereby favour visual
280
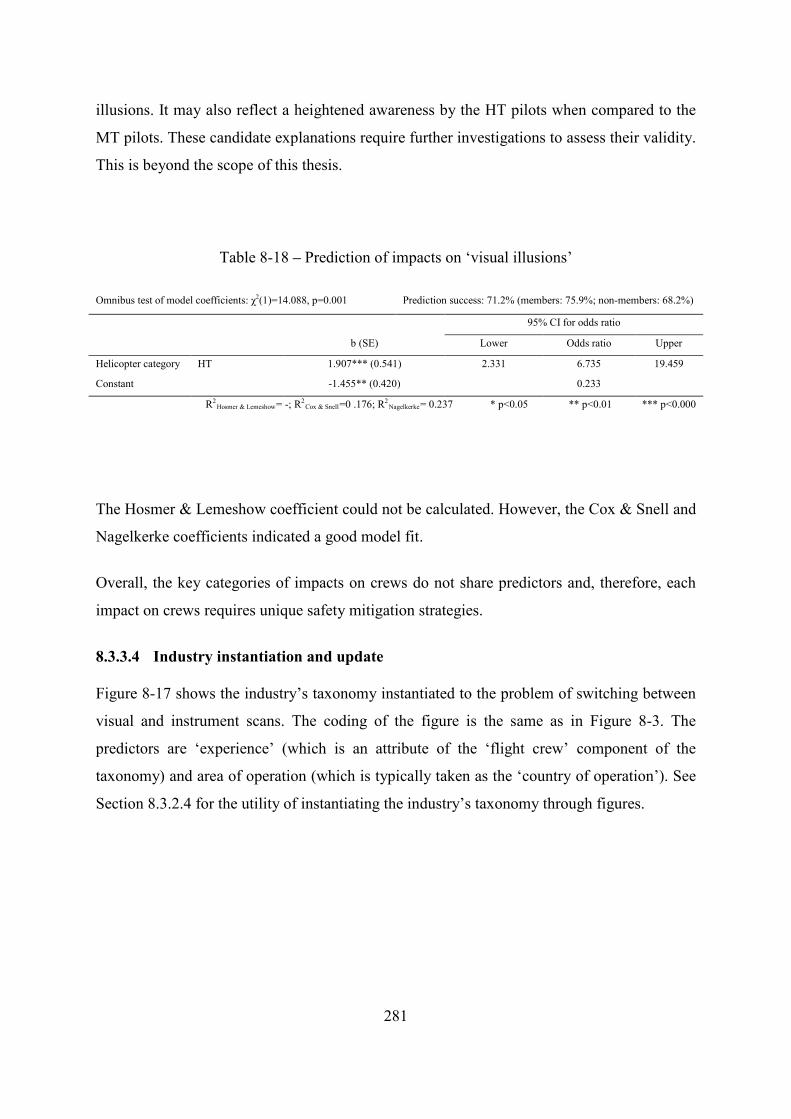
illusions. It may also reflect a heightened awareness by the HT pilots when compared to the
MT pilots. These candidate explanations require further investigations to assess their validity.
This is beyond the scope of this thesis.
Table 8-18 – Prediction of impacts on ‘visual illusions’
Omnibus test of model coefficients: χ2(1)=14.088, p=0.001 Prediction success: 71.2% (members: 75.9%; non-members: 68.2%)
95% CI for odds ratio
b (SE) Lower Odds ratio Upper
Helicopter category HT 1.907*** (0.541) 2.331 6.735 19.459
Constant
-1.455** (0.420)
0.233
R2Hosmer & Lemeshow= -; R2
Cox & Snell=0 .176; R2Nagelkerke= 0.237 * p<0.05 ** p<0.01 *** p<0.000
The Hosmer & Lemeshow coefficient could not be calculated. However, the Cox & Snell and
Nagelkerke coefficients indicated a good model fit.
Overall, the key categories of impacts on crews do not share predictors and, therefore, each
impact on crews requires unique safety mitigation strategies.
8.3.3.4 Industry instantiation and update
Figure 8-17 shows the industry’s taxonomy instantiated to the problem of switching between
visual and instrument scans. The coding of the figure is the same as in Figure 8-3. The
predictors are ‘experience’ (which is an attribute of the ‘flight crew’ component of the
taxonomy) and area of operation (which is typically taken as the ‘country of operation’). See
Section 8.3.2.4 for the utility of instantiating the industry’s taxonomy through figures.
281
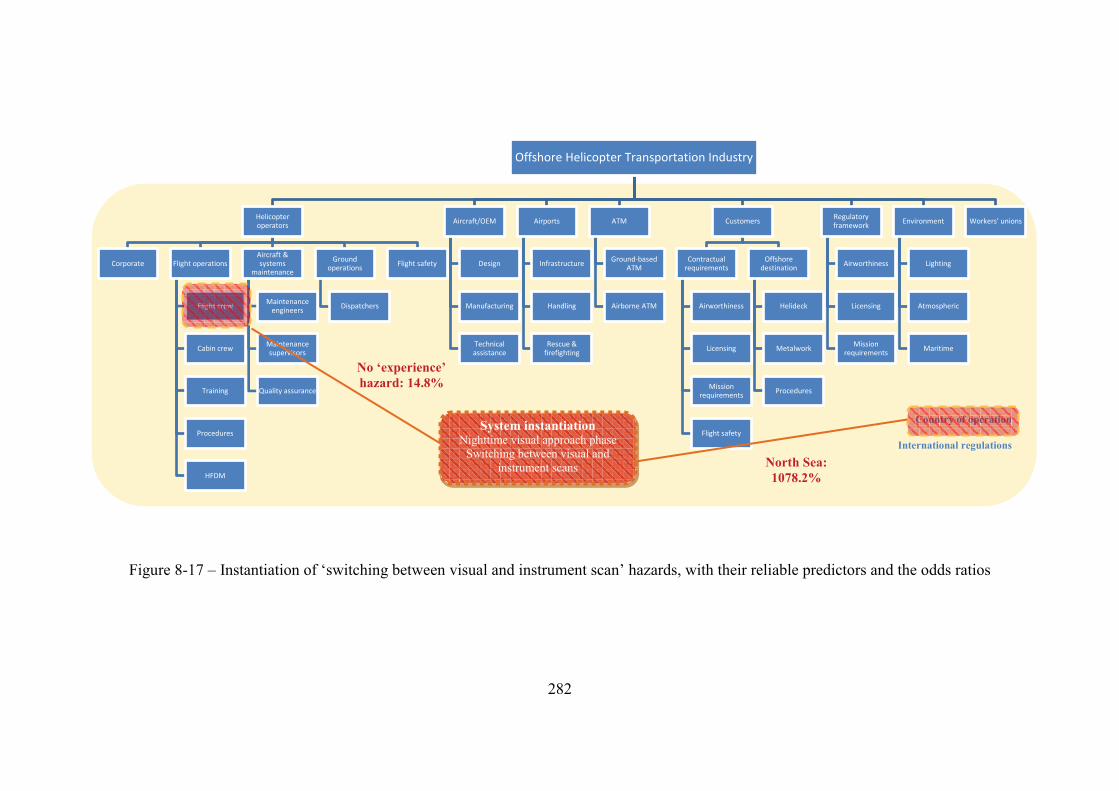
Offshore Helicopter Transportation Industry
Helicopter operators
Corporate Flight operations
Flight crew
Cabin crew
Training
Procedures
HFDM
Aircraft & systems
maintenance
Maintenance engineers
Maintenance supervisors
Quality assurance
Ground operations
Dispatchers
Flight safety
Aircraft/OEM
Design
Manufacturing
Technical assistance
Airports
Infrastructure
Handling
Rescue & firefighting
ATM
Ground-based ATM
Airborne ATM
Customers
Contractual requirements
Airworthiness
Licensing
Mission requirements
Flight safety
Offshore destination
Helideck
Metalwork
Procedures
Regulatory framework
Airworthiness
Licensing
Mission requirements
Environment
Lighting
Atmospheric
Maritime
Workers' unions
FlFliightightt crt creewewFliF ightight cret crewew
8.4 Validation
The participant sampling strategy described in Section 7.4.1.3 was designed to ensure
external, population validity. External, ecological validity (Burns and Burns, 2008) is
expected because the template development process was purposefully inclusive and executed
to exhaustiveness. Therefore, by covering the widest possible range of hazards, the template
is expected to be, to a large extent, transferable to other similar contexts not covered by the
research (e.g., other visual scan technique - high kinetic state (VH) phases of nighttime
offshore helicopter flights; see Section 6.5.1 and Table 6-2).
Internal validity is assessed in this section by means of a limited concurrent validity exercise.
Because of the large number of results of the analyses in the previous sections of this chapter,
the exercise focuses on the most important hazard identified, i.e., ‘recency of training’.
Sections 8.3.1.1, 8.3.2.1.1, 8.3.2.1.2, 8.3.3.2.1 and 8.3.3.2.2 identified ‘recency of training’ as
a stand-alone condition ubiquitously affecting the majority of the pilots. Additionally,
‘recency of training’ was significantly associated with the hazard category ‘experience’, with
the lack of recent training having a stronger impact on pilots with lower levels of experience.
These findings highlight that the standard for pilot nighttime flying recency currently applied
is unsatisfactory.
At present, in order to be deemed current, pilots are required to perform three approaches and
takeoffs within a period of 90 days, irrespectively of their experience (ANAC, 2010; OGP,
2008; JAA, 2007). This is an arbitrary legacy requirement established in the 1980s for the
helicopter types of the time. Even though there are ongoing plans to revise this requirement
(EASA, 2013c), there is still no comparative base to challenge it22.
The validation exercise created a seminal comparative base and used it to assess the
relationships between the training recency requirements perceived by pilots as adequate and
their demographic characteristics, especially experience levels. This was performed by the
inclusion of a direct question in the questionnaire developed in Chapter 6 (Section 6.5.2).
22 Private communication with experts involved in rule-making at the UK CAA and EASA in December, 2013. 283
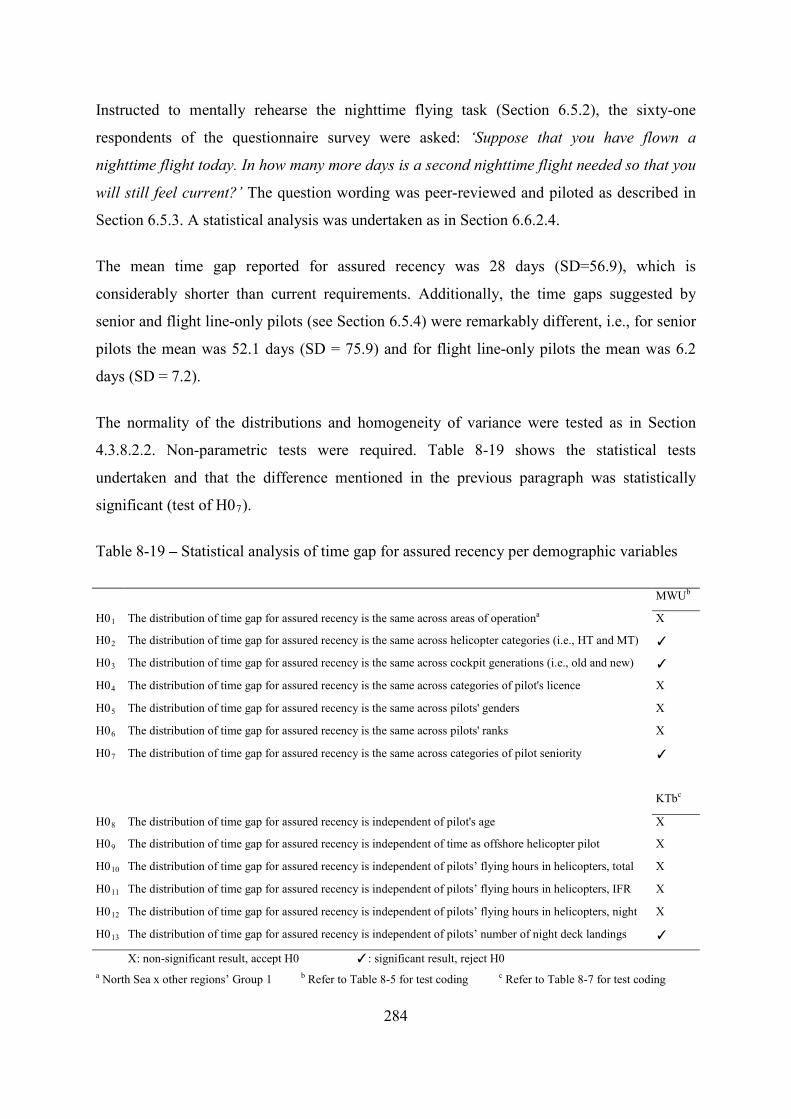
Instructed to mentally rehearse the nighttime flying task (Section 6.5.2), the sixty-one
respondents of the questionnaire survey were asked: ‘Suppose that you have flown a
nighttime flight today. In how many more days is a second nighttime flight needed so that you
will still feel current?’ The question wording was peer-reviewed and piloted as described in
Section 6.5.3. A statistical analysis was undertaken as in Section 6.6.2.4.
The mean time gap reported for assured recency was 28 days (SD=56.9), which is
considerably shorter than current requirements. Additionally, the time gaps suggested by
senior and flight line-only pilots (see Section 6.5.4) were remarkably different, i.e., for senior
pilots the mean was 52.1 days (SD = 75.9) and for flight line-only pilots the mean was 6.2
days (SD = 7.2).
The normality of the distributions and homogeneity of variance were tested as in Section
4.3.8.2.2. Non-parametric tests were required. Table 8-19 shows the statistical tests
undertaken and that the difference mentioned in the previous paragraph was statistically
significant (test of H07).
Table 8-19 – Statistical analysis of time gap for assured recency per demographic variables
MWUb
H01 The distribution of time gap for assured recency is the same across areas of operationa X
H02 The distribution of time gap for assured recency is the same across helicopter categories (i.e., HT and MT) ✓
H03 The distribution of time gap for assured recency is the same across cockpit generations (i.e., old and new) ✓
H04 The distribution of time gap for assured recency is the same across categories of pilot's licence X
H05 The distribution of time gap for assured recency is the same across pilots' genders X
H06 The distribution of time gap for assured recency is the same across pilots' ranks X
H07 The distribution of time gap for assured recency is the same across categories of pilot seniority ✓
KTbc
H08 The distribution of time gap for assured recency is independent of pilot's age X
H09 The distribution of time gap for assured recency is independent of time as offshore helicopter pilot X
H010 The distribution of time gap for assured recency is independent of pilots’ flying hours in helicopters, total X
H011 The distribution of time gap for assured recency is independent of pilots’ flying hours in helicopters, IFR X
H012 The distribution of time gap for assured recency is independent of pilots’ flying hours in helicopters, night X
H013 The distribution of time gap for assured recency is independent of pilots’ number of night deck landings ✓
X: non-significant result, accept H0 ✓: significant result, reject H0 a North Sea x other regions’ Group 1 b Refer to Table 8-5 for test coding c Refer to Table 8-7 for test coding
284
The differences in time gaps suggested per helicopter category and cockpit generation were
also significant, with larger gaps suggested by MT and old cockpit helicopter pilots (H02 and
H03, respectively). Additionally, the time gap for assured recency was positively correlated
with the number of night deck landings (H013).
The meta-demographic analysis presented in Table 8-20 clarifies that flight line-only and
senior pilots differed significantly with respect to the numbers of night deck landings, the
latter having the greatest numbers of landings (H014). Similarly, the helicopters equipped
with old cockpits were flown by the most senior pilots (H018). Altogether, the results confirm
the view of pilots that ‘recency of training’ is associated with pilot experience, with the more
experienced pilots likely being less affected by longer periods of time between night flights.
This validated the results of the Content Analysis of interview data, with respect to the
findings related to ‘recency of training’.
Table 8-20 – Meta-demographic analysis of participants of the validation exercise
MWUa
H014 The distribution of number of night deck landings is the same across categories of pilot seniority ✓
H015 The distribution of number of night deck landings is the same across categories of helicopter X
H016 The distribution of number of night deck landings is the same across cockpit generations ✓
Χ2
H017 Pilot membership to categories of seniority is independent of helicopter categories X
FET
H018 Pilot membership to categories of seniority is independent of cockpit generation ✓
H019 Helicopter category is independent of cockpit generation X a Refer to Table 8-5 for coding of all tests X: non-significant result, accept H0 ✓: significant result, reject H0
8.5 Limitations
As identified in Section 8.3.1.1, the use of the Talk-Through technique in a semi-structured
interview schedule may induce participants to concentrate on the hazards which are spatially
and temporally closer to the task, e.g., those immediately experienced in the cockpit
environment. This may lead to less consideration being paid to the diffuse and less tangible
organisational and regulatory hazards (Table 8-3). Exploring organisational and regulatory
hazards can be facilitated by a more focused interview schedule that asks participants directly
285
about their experiences with a range of pre-identified organisational and regulatory hazards
known or anticipated to have affected task execution in the past. The template developed
during this investigation should serve as such a guide in future research attempts.
It is important to note that the use of Content Analysis with interview data enables to
compare participants’ verbalised perceptions of hazards rather than the hazards themselves.
The perception of hazards might be influenced by numerous factors (see Section 8.1).
Moreover, the factors that influence the willingness to report incidents (Section 5.2.2) may
also have some impact on the openness to disclose hazards during Talk-Through sessions.
Any results should be interpreted in light of such potential influences.
It is important to notice that, in all regression analyses the 95% confidence intervals of the
odds ratios were typically large. This is understood as a product of the pilot sample sizes,
which were approximately the minimum permissible for statistical analysis (see Sections
7.4.1.3 and 7.5.3). Future research could collect data from a larger sample in order to achieve
more accurate analysis’ results.
More accurate regression analysis (and hence, better ‘predictive safety’) is ideally achieved
by populating the template on an individual event basis, i.e., with ‘Contextual Factors’ and
‘Impacts on Crews’ recorded systematically for every flight. This would increase sample
sizes leading to increased statistical rigour and better prospects of including other explanatory
variables in the models fitted, especially the interactions between ‘Contextual Factors’. This
approach is better than building a database from individuals’ overall experiences with a focus
on the previous 12 months, as done in this chapter. However, where domain knowledge is
absent or low, as it was the case prior to the investigation reported in this chapter, the process
described here is essential to provide the foundations for a more systematic data collection
and analysis in the future.
Whereas the overall process is useful to build and analyse a hazard repository out of virtually
absent domain knowledge, the process’ exploratory and inductive character may limit its
utility due to a lack of focus on specific problems. The results obtained in this chapter should
be understood as an observed set of informed hypotheses about hazards, which require further
testing and validation by focused, deductive research.
286
8.6 Conclusions
Continuing the implementation of the process developed in Chapter 7, this chapter has
analysed the contents of the template quantitatively through a novel Content Analysis-based
statistical analysis procedure (see Section 8.2). The results were fed back into the industry’s
taxonomy developed in Chapter 3 by means of instantiations of critical scenarios. These
resulted in dynamic updates to the industry’s taxonomy, with the circumstantial changes in
the odds of a safety breakdown given the occurrence of relevant contextual factors. This fits
the true spirit of ‘predictive’ hazard identification and corrects the current lack of statistical
analysis in operational safety management (Sections 2.3.3.3). Additionally, since the analysis
process combines probabilities and outcomes of safety events, the process can be viewed as
an alternative risk assessment method in its own right (see Section 2.3.3.4.2).
Because of initial limited domain knowledge, the process was developed to establish an
unbiased hazard categorising structure (i.e., the template) and populate it progressively with
knowledge elicited from experts in the field. Application of the Talk-Through task analysis
technique in a semi-structured interview schedule was the best option to ensure that expert
hazard knowledge would be elicited in an unbiased and as comprehensive as possible
manner. The whole data collection and analysis process represents a transition from the
bottom-up purely exploratory and inductive research of Grounded Theory towards a quasi-
explanatory and -deductive research with Content Analysis.
Future application of the process can be optimised by monitoring the task-specific ‘contextual
factors’ and ‘impacts on crews’ on an individual event basis (i.e., for every flight) and storing
these data systematically into a single database as much as possible by automated means. For
example, contextual factors related to weather conditions could be fed into the database
automatically from existing automated weather stations. Likewise, the impacts on crews
related to aircraft handling can be downloaded into the database straight from the HFDM
devices. This would limit the pilot survey effort almost exclusively to the ‘internal factors’
hazard categories. This survey could be optimised by presenting tick-off questions on
briefing and debriefing computerised systems, associated with the flight planning computer
programmes already in use (see Section 5.6.2). With a complete picture of the events of both
the ‘contextual factors’ and ‘impacts on crews’ associated with the tasks of each individual
flight, robust statistical analysis can be undertaken. However, it is important to realise that 287
data should be collected on a task basis, not on an outcome basis. At present, complete data
collection occurs almost exclusively in response to accidents and incidents, which limits the
ability to undertake statistical analysis and obtain predictions of hazardous outcomes. The
paradigm change from Safety-I to Safety-II will likely mitigate this problem (Section 2.2.3).
Prior to full implementation of systematic and integrated data collection, the hazard template
developed should be used to inform both data capture and processing, e.g., by using the
‘contextual factors’ (Table 8-3) during normal operations (i.e., as leading safety performance
indicators – SPI) and for incident or accident analyses. Additionally, since the codes and
categories of ‘impacts on crews’ (Table 8-4) indicate overt and covert behaviours related to
jeopardised safety, the occurrence of any such impact should be used as lagging SPIs (see
Section 2.2.4.1) which prompt the need for immediate safety interventions and the search for
the associated ‘contextual factors’. Therefore, the adoption of the template should result in
improved safety and maximum efficiency during nighttime offshore helicopter operations.
A number of critical hazards have been exhaustively identified, covering the riskiest scenario
of nighttime offshore helicopter operations, i.e., the visual approach segment. Since this
phase shares the characteristics of the other VH phases which are unique to nighttime flying,
it is expected that the template is highly representative of the hazards of nighttime operations
in general (see Section 7.6). Therefore, intervention strategies with likely maximum benefit
can be directly derived from the extensive statistical analyses performed in Section 8.3. For
example, the pandemic problem of poor pilot recency could be addressed immediately.
Overall, the Task-Based Hazard Identification Survey Process enhances hazard identification
and risk analysis in the nighttime by overcoming the current overreliance on underreported
incidents (see Sections 5.6.2, 5.6.3, 5.9 and 6.3.2) and the limited number of accidents (see
Sections 4.4.3, 4.5 and 6.3.1). Moreover, the process enables the identification of significant
statistical relationships and differences across the pilots’ hazard accounts. These relationships
and differences are not evident from simple descriptive analysis. Finally, by identifying the
probabilistic effects of hazards onto the safety of nighttime offshore helicopter operations, the
process enables targeted risk mitigation actions to be put in place. This makes the process a
unique tool of hazard identification and risk analysis.
288
CHAPTER 9 CONCLUSIONS AND RECOMMENDATIONS FOR FUTURE WORK
This chapter presents, in Section 9.1, the main findings of the research on hazard
identification and risk analysis of nighttime offshore helicopter operations. This is done with
reference to the theoretical background of Chapter 2 to enable a complete understanding of
the contributions of this thesis. In Section 9.2, avenues for future work are summarised from
the findings presented in each individual chapter. Finally, in Section 9.3 the dissemination
and uptake of this thesis are presented in the forms of publications, conference presentations,
awards and professional contributions.
9.1 Main findings of the thesis in relation to the theoretical background
Chapter 2 presented the background of nighttime offshore helicopter operations, highlighting
that this is an infrequent high-risk activity still in its infancy in terms of hazard identification
and risk analysis. However, this situation needs to be improved urgently because nighttime
operations are predicted to experience a sustained and irreversible growth worldwide in the
near future. Therefore, the aim of this thesis was formulated to develop and implement a
methodology which integrates processes to enhance hazard identification and risk analysis in
nighttime offshore helicopter operations.
The thesis has addressed the aim through six research objectives. The first involved the study
of the processes of hazard identification and risk analysis used in the offshore helicopter
industry and related safety-critical industries. Special attention was paid to the specific
requirements of human-controlled flights in degraded visual environments. At the
foundational level, it was concluded that a frame of reference, provided by a description of
the industry’s safety-critical components is a necessary pre-requisite to hazard identification
and risk analysis. However, such a description, as well as any method to generate it, was not
available in the offshore helicopter industry.
These gaps were addressed by the second research objective. This was pursued in Chapter 3,
which developed and implemented a novel process to generate a taxonomy of the safety-
critical components of the offshore helicopter industry. The process involved the sequential
application of two task analysis techniques (i.e., high-level mission analysis and hierarchical
289
task analysis), review of aviation system and risk models, as well as the review of key
accident models and performance shaping factors from the overarching safety literature.
These reviews were essential to correct any biases associated with the intra-cockpit task
analysis-based approach initially used to generate the taxonomy. The final taxonomy anchors
the main concepts of offshore helicopter operations and, therefore, provides the frame of
reference pursued. The taxonomy was used in other chapters of the thesis (i.e., Chapters 4
and 8) to support the holistic identification of hazards and analysis of risk. Both the process
and the final taxonomy produced were validated by carefully selected subject matter experts
(SMEs) during high-fidelity helicopter flight simulation exercises.
Another important finding in Chapter 2 was that the reactive, proactive and predictive
processes of hazard identification and risk analysis currently employed by the offshore
helicopter industry have serious weaknesses. These make them ineffective in the
development of effective strategies to prevent nighttime accidents from happening. Amongst
the reactive processes, previous statistical analyses of accident reports were found to employ
low quality data and apply over-simplistic statistical techniques. Low data quality was
associated with inappropriate amounts of data collected on the basis of artificially-bounded
sampling strategies, data incompleteness due to limited original accident investigations,
narrow data scope stemming from inconsistent use of terminological definitions and, finally,
untimely data sampled on the basis of convenience (i.e., data availability) with no scientific
justification. Over-simplistic statistical techniques were associated with the almost exclusive
use of descriptive statistics, frequency counts and qualitative interpretations of the data
captured. This was in addition to a general disregard for the identification of systematic
hazard trends and patterns and barely any employment of inferential statistics and
probabilistic hazard predictions.
Correcting the employment of low quality of data and application of over-simplistic statistics
mentioned above formed the thesis’ third research objective, pursued in Chapter 4 by
developing and implementing the novel Accident Analysis Process. The process comprised of
the selection of a theory-driven analysis timeframe, unequivocal definition of terms and
identification of countries of relevance where accident and operational data were collected to
an appropriate amount. Then, a cause classification scheme applicable across the whole
accident dataset was developed and the variables for the calculation of accident rates were
290
selected and those of relevance to accident (i.e., hazards) were selected. Following the
assessment of data completeness, a three-fold statistical analysis procedure took into account
the characteristics and distributions of the accident and operational data and identified the
systematic trends and patterns of nighttime hazards amidst the overall hazards associated with
offshore helicopter accidents.
From the implementation of the process, it was concluded, inter alia, that the nighttime
accident rates (i) were significantly greater than those of the daytime, especially the fatal
accident rates; (ii) largely stemmed from operational issues, especially poor pilot
performance; and (iii) were highest in areas away from the North Sea and Gulf of Mexico.
From the analysis of accident by frequencies (i.e., bivariate analysis), it was concluded that
nighttime accidents were associated with (iv) the North Sea as well as other regions; (v) mid-
twin turbine helicopters; and (vi) fatal controlled flights into terrain or water (CFITWs).
Finally, the nighttime was a reliable statistical predictor both to operational and fatal
accidents in the logistic regression models fitted to the data. The results obtained from the
implementation of the process were validated by experienced SMEs, as well as comparison
with the pre-existing literature.
Even though the process of Chapter 4 improved the shortcomings of previous analyses
considerably, the low quality of the accident data limited the analysis output produced. For
example, no significant associations could be found between any phase of flight and the
nighttime. This required further investigations to be undertaken on the hazards and risks
related to the phases of nighttime flights, which were addressed in Chapter 5 and especially in
Chapter 6. Moreover, the finest level of detail obtained on the hazards across the whole
accident dataset was still fairly broad. This prevented multi-layered hazard analysis from
being undertaken, with further research still required on the multiple hazards associated with
adverse safety events. Nevertheless, the overlay of the results of the analysis of accidents
presented in Chapter 4 onto the taxonomy of Chapter 3 offered a unique overview of the
hazardous interactions across the safety-critical components of the industry during the
nighttime accident scenarios. This aids hazard identification and risk analysis with by
providing a holistic overview of the potential cross-industry hazard interactions. Altogether,
the process developed in Chapter 4 is essential to identify broad areas of intervention and
highlight the need to improve accident data collection.
291
The statistical analysis of incidents was yet another flawed reactive process of hazard
identification employed in offshore helicopter operations. As established in Chapter 2, the
practice of investigating incident reports is built on the belief in the shared aetiology of
accidents and incidents and the statistical threshold relationship between the latter and the
former, i.e., the ratios of Heinrich’s pyramid (Heinrich, 1980). Furthermore, Chapter 2
clarified that, in aviation, a common interpretation of Heinrich’s pyramid is that the incidents
reported to occur most frequently directly indicate the characteristics of an impending
accident. This has the potential to bias hazard identification and risk analysis in nighttime
offshore helicopter operations, especially through the use of reported incidents by their
frequencies in probabilistic risk assessments (PRAs) and as safety performance indicators
(SPIs). Therefore, it was necessary to investigate the extent to which this interpretation was
justifiable on the basis of empirical data analysis. Developing and implementing a novel
process to investigate the truth of the common interpretation of Heinrich’s pyramid in
aviation formed the thesis’ fourth objective, pursued in Chapter 5.
Using elements from the process developed in Chapter 4, the required process to investigate
the utility of reported incidents as statistical precursors of accidents, as believed to occur in
the aviation industry, was developed in Chapter 5. The process addressed similar low data
quality issues which required the definition of the type of incident report which would best
replicate the original statistical precursor model and the establishment of criteria to select
trustworthy incident databases. In addition to these, the definition of a theory-driven analysis
timeframe was required, together with the assessment of data quality by completeness and the
development of a statistical analysis plan. The latter involved the descriptive analysis of
frequencies of incident versus accidents by three attributes, including lighting conditions, as
well as the exploration of the statistical associations between the attributes. Implementation
used the serious incident data from the UK Civil Aviation Authority’s Mandatory Occurrence
Reporting (MOR) Scheme’s database and the accident reports available from the UK Aircraft
Accident Investigation Branch (AAIB). The results obtained directly challenged the long-
lasting belief of the aviation industry whereby the incidents occurring most frequently
indicate the characteristics of an impending accident. Furthermore, the results led to a
heightened awareness of the persistent problems of underreporting of incidents in the British
offshore helicopter industry and beyond and low data quality. Given the results obtained, the
chapter established that the best use of incident reports for hazard identification and risk
292
analysis is not on the basis of the frequency of reporting but rather on the basis of the
contents of each report. This is achieved by using incident reports as individual indicators of
early interventions needed to ensure safety, as raw data to enable the assessment of likely
consequences of hazards and, finally, to validate any hazards identified through other
methods. These uses of reported incidents directly impact the identification of hazards in
nighttime operations since the few reports obtained from aircrew ought to be exploited
individually. This is taken into account in Chapter 6. Validation of the process and the results
was undertaken through the careful critique of experienced SMEs.
The proactive hazard identification processes (i.e., surveys) investigated in Chapter 2 were
also found to be flawed in the offshore helicopter industry. The shortcomings identified
included the identification of hazards and analysis of risks, which cannot be generalised,
neither geographically nor with respect to phases of flight, because of the use of non-
statistical data sampling strategies. Also, circumstantial survey deployments, lack of focus on
facts and disregard for demographic analysis of respondents were common weaknesses.
Addressing these weaknesses formed the thesis’ fifth research objective, which was pursued
in Chapter 6 with regard to risk analysis and Chapter 7, with hazard identification.
In Chapter 6, a questionnaire survey was created to assess the risk levels experienced by
highly experienced pilots and identify the riskiest phase of nighttime flights. In addition to
addressing the weaknesses identified in Chapter 2 mentioned above, this survey improved the
investigations in Chapters 4 and 5, where the level of detail in the datasets prevented accurate
risk analysis on a phases-of-flight basis. This was possible through a critical review of the
taxonomies of phases of flight and, as per the findings of Chapter 5, the re-analysis of
nighttime incident and accident reports individually at the greatest possible level of detail.
These led to the development of a novel, bespoke and multilevel taxonomy of phases of flight
which, for the first time, accounted for the human factors-related characteristics of nighttime
offshore helicopter operations. Using the novel taxonomy as the basis for the questionnaire
survey, pilots were sampled on the basis of statistical considerations, the properties of the
data collected were studies and multiple hypotheses were tested. These highlighted key biases
of current taxonomies and identified the visual scan technique – high kinetic state (i.e., VH)
phases, especially the visual segment of nighttime instrument approaches, as the riskiest
293
phases of nighttime offshore helicopter flights. Further testing of the demographic variables
revealed that this phase was equally problematic to virtually all pilots.
Based on these results, Chapter 7 continued to address the thesis’ fifth objective by
developing and implementing the novel Task-Based Hazard Identification Survey Process.
The process was designed to address the shortcomings identified in Chapter 2 mentioned
above and, thereby, produce a factual, exhaustive and statistically representative list of
hazards (i.e., a hazard template) uniquely related to nighttime offshore helicopter operations.
The process includes the top-down collection of all task-based hazard information available,
which is completed by the bottom-up elicitation of factual hazards directly from pilots in the
field. The requirement to be fact-based set out in Chapter 2 was met by the employment of
the Talk-Through task analysis technique in confidential interviews. Exhaustiveness, in turn,
resulted from the recursive application of Grounded Theory and Template Analysis to
categorise the hazard data collected. Finally, statistical representativeness was assured by the
collection of data to appropriate amounts of data calculated in advance on the basis of a
statistical sampling strategy. The implementation of the process was done with respect to the
riskiest phase of flight identified in Chapter 6 (i.e., nighttime visual segments of instrument
approaches), which was found to be highly representative of the overall hazards uniquely
happening in the nighttime. The categories of the template developed added to the current
and future knowledge of hazards and risks by containing a set of novel leading and lagging
safety performance indicators (SPI) which redress the pre-existing gap in hazard knowledge.
Multiple layers of reliability and validity checks were undertaken with various SMEs and
through the analysis independent raw datasets.
Finally, Chapter 2 identified that there was a complete lack of a process to generate statistical
predictions of safety critical outcomes on the basis of the hazards. Therefore, the so-called
‘predictive’ hazard identification processes were actually non-existent in the offshore
helicopter industry, even though hazard prediction is accepted as the ultimate goal of safety
management. Addressing this gap formed the sixth and final research objective of this thesis.
Exploiting the exhaustiveness and statistical representativeness of the template generated in
Chapter 7, as well as the industry’s taxonomy developed in Chapter 3, Chapter 8 developed
and implemented a novel Content Analysis-based statistical analysis procedure which
predicted the changes in the odds of critical outcomes based on the status of a set of 294
explanatory hazards and demographic variables. The predictions generated were overlaid
onto the industry’s taxonomy to enable swift appreciation and prioritisation of safety
interventions on the basis of highest probabilities of success. The statistical analysis process
developed in this chapter can be adopted as the survey-based standard for ‘predictive’ hazard
identification in nighttime offshore helicopter operations, which is currently missing. As it
combines the assessment of probabilities and critical outcomes, the process can also be
viewed as an alternative risk analysis process on its own right. The process was validated
through a limited concurrent validity exercise with encouraging results.
Overall, the development and implementation of the processes aforementioned as an
integrated methodology have enhanced hazard identification and risk analysis, and
consequently hazard and risk knowledge in nighttime offshore helicopter operations. This is
justified by the numerous high-impact achievements listed in Section 9.3. Other important
areas for further research, which were identified but not addressed in this thesis, are
suggested as avenues of future work in Section 9.2 below.
9.2 Future work
The findings presented in this thesis suggest a number of directions for future research. These
include:
• Validation of Chapter 4’s Accident Analysis Process through its implementation for the
analysis of accidents of other types of helicopter operations. This will ensure the external
validity of the process in addition to the internal validity assured by the critique of SMEs
(see Section 4.5).
• Assessing the seaworthiness and crashworthiness of mid twin-turbine (MT) helicopters,
especially in the nighttime, across various types of helicopter operations. This will enable
to determine if the relatively high number of deceased occupants per accident in this
helicopter category found in Section 4.4.2.2 is associated with the characteristics of
specific offshore missions (e.g., medical evacuation) or the helicopter category (see
Section 4.5).
• Assessing the external validity of reported incidents. Chapter 5 only assessed the validity
of the reported incidents with respect to the principle of shared aetiology with accidents
by ratio thresholds as specifically applied in the aviation industry. Because the
295
application of the principle might be inaccurate and invalid, it is useful to investigate the
extent to which reported incidents are representative of the observed incidents. This
might be attempted through statistical comparisons between reported incidents and
incidents recorded automatically, e.g., through Helicopter Flight Data Monitoring
(HFDM) devices or intra-cockpit video analysis.
• Assessing the effects of cockpit generation and helicopter transport capacity into the risk
experienced during the visual takeoff and visual go around phases of nighttime flights.
Pilots of these helicopters reported higher risk levels on these specific phases of flight
(see Section 6.8).
• A longitudinal survey to monitor the evolution of risk levels experienced by pilots per
phase of flight as new technologies are introduced (e.g., satellite-based approach
procedures; see Section 2.1) and task and flight profiles are consequently changed.
• Implementation of the Task-Based Hazard Identification Survey Process to identify and
analyse quantitatively the hazards of other tasks (e.g., other phases of flight) and in other
domains. This will ensure the external validity of the process.
• Assessing the nighttime flying recency requirements on the basis of empirical evidence.
This should use the results of the validation exercise described in Section 8.4 as a starting
point and consider the likely effect of experience on pilot skill decay.
• Predictive safety analysis based on data routinely collected on a per-flight basis. This
should build on templates developed through the implementation of process established
in Chapter 7 to various phases of flight. Subsequently, the templates should be
systematically populated with hazard data collected by surveys and means of automatic
data capture. The statistical analysis procedure of Chapter 8 should then be used to
explore the relationships across the data and analyse/model adverse outcomes
probabilistically (see Section 8.5).
• Investigating all the hypotheses generated from the exploration of the statistical
relationships across the interview dataset in Chapter 8. Since Content Analysis represents
the transition between inductive and deductive research, its main product are the various
avenues for future work discussed in Section 8.3.
9.3 High-impact achievements
The following high-impact achievements resulted from the research presented in this thesis.
296
9.3.1 Publication format: peer-reviewed journal
1) Nascimento, F. A. C., Majumdar, A., Ochieng, W.Y., Schuster, W. (2014). Nighttime
offshore helicopter operations: risk levels per phase of flight, recency requirements and
visual approach technique. Accident Analysis & Prevention, accepted by editor, in
review.
2) Nascimento, F. A. C., Majumdar, A. and Ochieng, W. Y. (2014). Helicopter Accident
Analysis. The Journal of Navigation, 67, 145-161.
3) Nascimento, F. A. C., Majumdar, A. and Ochieng, W. Y. (2013). Investigating the Truth
of Heinrich's Pyramid in Offshore Helicopter Transportation. Transportation Research
Record: Journal of the Transportation Research Board, 2336, 105-116.
4) Nascimento, F. A. C., Jarvis, S. and Majumdar, A. (2012). Factors Affecting Safety
During Night Visual Approach Segments for Offshore Helicopters. The Aeronautical
Journal, 116, 303-322.
5) Nascimento, F. A. C., Majumdar, A. and Jarvis, S. (2012). Nighttime approaches to
offshore installations in Brazil: Safety shortcomings experienced by helicopter pilots.
Accident Analysis & Prevention, 47, 64-74.
6) Nascimento, F. A. C., Majumdar, A., Ochieng, W. Y. and Jarvis, S. R. (2012). A
multistage multinational triangulation approach to hazard identification in nighttime
offshore helicopter operations. Reliability Engineering & System Safety, 108, 142-153.
9.3.2 Publication format: book chapter
1) Nascimento, F. A. C., Majumdar, A. and Ochieng, W. Y. (2013). Nighttime Offshore
Helicopter Operations - Identification of Contextual Factors Relevant to Pilot
Performance. In: LANDRY, S. J. (ed.) Advances in Human Aspects of Aviation. Boca
Raton, USA: CRC Press.
9.3.3 Publication format: conference proceedings
1) Nascimento, F.A.C., Majumdar, A., Ochieng, W. Y. and Schuster, W. (2014), Laying out
the Foundations of Safety Management: the Offshore Helicopter Transportation
Industry’s Taxonomy. 8th Australian Pacific Vertiflight Conference on Helicopter
297
Technologies/3rd Asian Australian Rotorcraft Forum. Melbourne, Australia (accepted, to
be presented in December, 2014).
2) Nascimento, F.A.C., Majumdar, A., Ochieng, W. Y. and Schuster, W. (2014), Initial
Evidence-Based Analysis of Risk Levels per Phases of Flight, Recency Requirements
and Visual Approach Design in Nighttime Offshore Helicopter Operations, 40th
European Rotorcraft Forum 2014. Southampton, UK: Royal Aeronautical Society
(accepted, to be presented in September, 2014).
3) Nascimento, F. A. C., Majumdar, A. and Ochieng, W. Y. (2013). A 15-year multivariate
analysis of worldwide offshore helicopter accidents. AHS 69th Annual Forum and
Technology Display. Phoenix, USA: American Helicopter Society.
4) Nascimento, F. A. C., Majumdar, A. and Ochieng, W. Y. (2013). Investigating the truth
of Heinrich's pyramid in offshore helicopter transportation. Transportation Research
Board 92nd Annual Meeting. Washington, D.C.:,USA: TRB.
5) Nascimento, F. A. C., Majumdar, A. and Ochieng, W. Y. (2012). Incident reporting in
offshore helicopter transportation. 38th European Rotorcraft Forum 2012. Amsterdam,
Netherlands.
6) Nascimento, F. A. C., Majumdar, A. and Ochieng, W. Y. (2012). Nighttime offshore
helicopter operations – identification of contextual factors relevant to pilot performance.
4th International Conference on Applied Human Factors and Ergonomics (AHFE). San
Francisco, USA.
7) Nascimento, F. A. C., Majumdar, A., Ochieng, W. Y. and Jarvis, S. R. (2012). Assessing
the hazards of nighttime offshore helicopter operations. Transportation Research Board
91st Annual Meeting. Washington, D.C., USA: TRB.
8) Nascimento, F. A. C., Majumdar, A., Jarvis, S. and Ochieng, W. Y. (2011). Safety
Hazards in Nighttime Offshore Helicopter Operations. 37th European Rotorcraft Forum
2011. Gallarate, Italy.
9.3.4 Key conference presentations
1) Nascimento, F. A. C., Majumdar, A. and Ochieng, W. Y. (2014). Predictive Safety:
Filling in the Gaps of Ad Hoc Incident Reports. CHC Safety and Quality Summit 2014.
Vancouver, Canada: CHC.
298
2) Nascimento, F. A. C., Majumdar, A. and Ochieng, W. Y. (2013). Analysis of Accidents
in Helicopter Operations: a New Framework. Seventh EASA Rotorcraft Symposium.
Cologne, Germany: EASA.
3) Nascimento, F. A. C., Majumdar, A. and Ochieng, W. Y. (2013). Predicting Risks in
View of Rare Occurrences. CHC Safety and Quality Summit 2013. Vancouver, Canada:
CHC.
4) Nascimento, F. A. C., Majumdar, A. and Ochieng, W. Y. (2012). Offshore helicopter
transportation: the utility of incident reporting. Sixth EASA Rotorcraft Symposium.
Cologne, Germany: EASA.
5) Nascimento, F. A. C., Majumdar, A., Jarvis, S. (2009). Factors Affecting Safety During
Night Visual Approaches for Offshore Helicopters. National Committee for Air Accident
Prevention Annual Meeting. Brasilia, Brazil: CNPAA/CENIPA
9.3.5 Awards
1) Santander International Mobility Award (2011). Santander Universities. UK –
sponsorship for research in Spain, awarded on the basis of academic merit and relevance
of research.
2) Santander International Mobility Award (2010). Santander Universities. UK –
sponsorship for research in Latin America, awarded on the basis of academic merit and
relevance of research.
9.3.6 Membership to public review
1) CAP 1145 - Safety Review of Offshore Public Transport Helicopter Operations in
Support of the Exploitation of Oil and Gas. 2014, UK Civil Aviation Authority: London
– member of the expert challenge team, independent advisor and peer-reviewer.
299

300
REFERENCES
AAIB (2011). Accident report, registration G-REDU [Online]. Aldershot: AAIB. Available: http://www.aaib.gov.uk/publications/formal_reports/1_2011_g_redu.cfm [Accessed 30/11 2011].
AAIB (2012a). Accident report, registration G-CHCN [Online]. Aldershot. Available: http://www.aaib.gov.uk/cms_resources.cfm?file=/S7-2012%20G-CHCN.pdf [Accessed 25/01 2014].
AAIB (2012b). Accident report, registration G-REDW [Online]. Aldershot. Available: http://www.aaib.gov.uk/cms_resources.cfm?file=/AAIB%20S5-2012%20G-REDW.pdf [Accessed 25/01 2014].
AAIB (2012c). Air Accident Investigation Branch - Publications [Online]. Aldershot, UK: AAIB. Available: http://www.aaib.gov.uk/publications/index.cfm [Accessed 08/07 2012].
Agresti, A. (2002). Categorical Data Analysis, Hoboken, Wiley. Ainsworth, L. and Marshall, E. (2000). Issues of quality and practicability in task analysis:
preliminary results from two surveys. In: ANNETT, J. & STANTON, N. A. (eds.) Task analysis. London: Taylor & Francis.
Alaska Department of Natural Resources (2009). Beaufort Sea Areawide Oil and Gas Lease Sale: Final Findings of the Director. Anchorage: ADNR.
Alexander, R. and Kelly, T. (2013). Supporting systems of systems hazard analysis using multi-agent simulation. Safety Science, 51, 302-318.
Almaz, O. A., Altiok, T. and Ghafoori, A. (2012). Risk Analysis of Vessel Traffic in Delaware River. Transportation Research Board’s 91th Annual Meeting. Washington, D.C.: TRB.
Amalberti, R. (2001). The paradoxes of almost totally safe transportation systems. Safety Science, 37, 109-126.
ANAC (2010). Regulamento Brasileiro de Aviação Civil RBAC no 135 Emenda no 00. Brasilia: ANAC.
Andrade, E. B. (2011). Excessive confidence in visually-based estimates. Organizational Behavior and Human Decision Processes, 116, 252-261.
Annett, J. (2003). Hierarchical Task Analysis. In: HOLLNAGEL, E. (ed.) Handbook of Cognitive Task Design. Mahwah, New Jersey: Lawrence Erlbaum Associates.
Annett, J. and Duncan, K. D. (1967). Task analysis and training design. Occupational psychology, 41, 211-221.
Annett, J. and Stanton, N. (2000a). Research and developments in task analysis. In: ANNETT, J. & STANTON, N. A. (eds.) Task Analysis. London, UK: Taylor & Francis.
Annett, J. and Stanton, N. A. (2000b). Task analysis, London, UK, Taylor and Francis. Apostolakis, G. E. (2004). How Useful Is Quantitative Risk Assessment? Risk Analysis, 24,
515-520. Arendt, D. and Adamski, A. (2011). System and Task Analysis. In: STOLZER, A. J.,
HALFORD, C. D. & GOGLIA, J. J. (eds.) Implementing Safety Management Systems in Aviation. Farnham, UK: Ashgate.
ARMS Working Group (2010). The ARMS Methodology for Operational Risk Assessment in Aviation Organisations. London: Aviation Risk Management Solutions.
ASRS (2013). ASRS Research Papers [Online]. Available: http://asrs.arc.nasa.gov/publications/research.html [Accessed 14/11 2013].
301
ATSB (2006). Perceived Pilot Workload and Perceived Safety of RNAV (GNSS)
Approaches. Canberra: ATSB. Aven, T. (1992). Reliability and risk analysis, London, UK, Elsevier Applied Science. Aven, T. (2007). On the Ethical Justification for the Use of Risk Acceptance Criteria. Risk
Analysis, 27, 303-312. Aven, T. (2008). Risk analysis : assessing uncertainties beyond expected values and
probabilities, Chichester, UK, Wiley. Aven, T. and Zio, E. (2011). Some considerations on the treatment of uncertainties in risk
assessment for practical decision making. Reliability Engineering & System Safety, 96, 64-74.
Backbaus, J. (1980). The Pareto Principle. Analyse & Kritik, 2, 146-171. Backbaus, J. (1981). The Pareto Principle and Policy Analysis. Analyse & Kritik, 3, 237-246. Bailey, S. (2010). Newfoundland Premier wants independent agency to monitor offshore oil
safety [Online]. Saint John: The Globe and Mail. Available: http://www.theglobeandmail.com/news/national/atlantic/newfoundland-premier-wants-independent-agency-to-monitor-offshore-oil-safety/article1835221/ [Accessed 06/01 2011].
Bainbridge, L. (1985). Inferring from verbal reports to cognitive processes. In: BRENNER, M., BROWN, J. & CANTER, D. (eds.) The research interview. London: Academic Press.
Baker, D. P. and Krokos, K. J. (2007). Development and validation of aviation causal contributors for error reporting systems (ACCERS). Human Factors, 49, 185-199.
Baker, S. P., Shanahan, D. F., Haaland, W., Brady, J. E. and Li, G. (2011). Helicopter Crashes Related to Oil and Gas Operations in the Gulf of Mexico. Aviation, Space and Environmental Medicine, 82.
Barbini, S. and Davenport, C. (2010). FAA Rotorcraft Experience: Copter GPS Steep Angle WAAS Approaches. 4th EASA Rotorcraft Symposium. Cologne, Germany: EASA.
BarentsObserver (2011a). Heli-pad for Shtokman [Online]. Available: http://barentsobserver.custompublish.com/heli-pad-for-shtokman.4900052-91228.html [Accessed 15/04 2011].
BarentsObserver (2011b). Rosneft and BP form strategic alliance for Kara Sea [Online]. Available: http://www.barentsobserver.com/rosneft-and-bp-form-strategic-alliance-for-kara-sea.4872391-131162.html [Accessed 15/04 2011].
Barnett, R. D. (2009a). Middle East-(GCC)-JHSAT Safety Team Overview Briefing [Online]. Available: http://www.ihst.org/portals/54/montreal/GULFOPERATION.pdf [Accessed 20/11 2010].
Barnett, R. D. 2009b. RE: Middle East-(GCC)-JHSAT Safety Team Overview Briefing. Barroso, J. M. (2012). Commission Regulation (EU) No 965/2012 of 5 October 2012 - laying
down technical requirements and administrative procedures related to air operations pursuant to Regulation (EC) No 216/2008 of the European Parliament and of the Council. Brussels: Official Journal of the European Union.
BBC News (2012). Shell drops Bond Helicopters contract plans [Online]. Available: http://www.bbc.co.uk/news/uk-scotland-scotland-business-18273824 [Accessed 02/02 2014].
BBC News (2013). Shetland helicopter crash: All UK Super Pumas grounded [Online]. Available: http://www.bbc.co.uk/news/uk-scotland-north-east-orkney-shetland-23829107 [Accessed 02/02 2014].
Berbaum, K. S., Kennedy, R. S. and Hettinger, L. J. (1991). Visual Tasks in Helicopter Shipboard Landing. Applied Ergonomics, 22, 231-239.
302
Berelson, B. (1952). Content analysis in communication research, New York, Free Press. Bertolini, M. (2007). Assessment of human reliability factors: A fuzzy cognitive maps
approach. International Journal of Industrial Ergonomics, 37, 405-413. Bird Jr., F. E. and Germain, G. L. (1992). Practical Loss Control Leadership, Loganville,
Georgia, International Loss Control Institute. Bohm, J. and Harris, D. (2010). Risk perception and risk-taking behavior of construction site
dumper drivers. International Journal of Occupational Safety and Ergonomics, 16, 55-67.
Borys, D. (2000). Seeing the Wood from the Trees - A Systems Approach to OH&S Management. In: PEARSE, W., GALLAGHER, C. & BLUFF, L. (eds.) The First National Conference on Occupational Health and Safety Management Systems. Sydney, Australia: Crown Content.
Boschert, G., Dery, M. and Hustwit, J. (2007). Pilot safety survey 2005: What pilots are saying. Air Medical Journal, 26, 34-37.
BP (2010). BP Statistical Review of World Energy. London: BP p.l.c. Braithwaite, M. G., Durnford, S. J., Crowley, J. S., Rosado, N. R. and Albano, J. P. (1998).
Spatial Disorientation in U.S. Army Rotary-Wing Operations. Aviation, Space, and Environmental Medicine, 69, 1031-1037.
Brandsæter, A. (2002). Risk assessment in the offshore industry. Safety Science, 40, 231-269. Brenner, M. (1985). Survey interviewing. In: BRENNER, M., BROWN, J. & CANTER, D.
(eds.) The research interview. London: Academic Press. Brenner, M., Brown, J. and Canter, D. (1985). Introduction. In: BRENNER, M., BROWN, J.
& CANTER, D. (eds.) The research interview. London: Academic Press. Brooker, P. (2004). Airborne Separation Assurance Systems: towards a work programme to
prove safety. Safety Science, 42, 723-754. Brooks, C. J., MacDonald, C. V., Donati, L. and Taber, M. J. (2008). Civilian Helicopter
Accidents into Water: Analysis of 46 Cases, 1979-2006. Aviation, Space, and Environmental Medicine, 79, 935-940.
Brown, E. M. (1981). The Helicopter in Civil Operations, New York, N.Y. , Granada. Burns, R. P. and Burns, R. A. (2008). Business Research Methods and Statistics Using SPSS,
London, SAGE Publications Ltd. Butterfield, L. D., Borgen, W. A., Amundson, N. E. and Maglio, A. T. (2005). Fifty Years of
the Critical Incident Technique: 1954-2004 and Beyond. Qualitative Research, 5, 475-497.
Buzek, J. and Chastel, O. (2010). Regulation (EU) No 996/2010 of the European Parliament and of the Council of 20 October 2010 - on the investigation and prevention of accidents and incidents in civil aviation and repealing Directive 94/56/EC. Strasbourg, France: Official Journal of the European Union.
CAA (1997). CAA Paper 97009 - A Questionnaire Survey of Workload and Safety Hazards Associated with North Sea and Irish Sea Helicopter Operations. London, UK: CAA.
CAA (2000). CAA Paper 99004 - Research on Offshore Helideck Environmental Issues. London: Civil Aviation Authority.
CAA (2002a). Accidents to Small Helicopters 1997-2001. Helicopter General Aviation Safety Information Leaflet. Gatwick: CAA.
CAA (2002b). Disorientation in Bad Weather. Helicopter General Aviation Safety Information Leaflet. Gatwick: CAA.
CAA (2004). Final Report on the Follow-on Activities to the HOMP Trial. Gatwick, UK: CAA.
CAA (2005). CAP 382 - The Mandatory Occurrence Reporting Scheme. Gatwick: CAA. 303

CAA (2007). Helicopter Flight in Degraded Visual Conditions, CAA Paper 2007/03. London:
CAA. CAA (2008). Impact Assessment of Proposal to Amend the Air Navigation Order 2005
Articles 42 and 155 Schedule 9 [Online]. Available: http://www.caa.co.uk/docs/1601/20080805FlightFollowingImpactAssessment.pdf [Accessed Web Page 2010].
CAA (2009). Safety Plan 2009/11. Gatwick, UK: CAA. CAA (2010a). CAA Paper 2010/01 - The SBAS Offshore Approach Procedure (SOAP).
Gatwick: CAA. CAA (2010b). CAP 437 - Offshore Helicopter Landing Areas - Guidance on Standards.
Gatwick: CAA. CAA (2010c). Hazard Analysis of the Use of GPS in Offshore Helicopter Operations.
Gatwick, UK: CAA. CAA (2010d). Safety Improvement Project Handbook. Gatwick, UK: CAA. CAA (2010e). Safety Management Systems – Guidance to Organisations. 3rd ed. Gatwick,
UK: UK Civil Aviation Authority. CAA (2013). Offshore Helicopter Operations - a joint review to improve safety [Online].
Available: http://www.caa.co.uk/application.aspx?catid=14&pagetype=65&appid=7&mode=detail&nid=2285 [Accessed 10/01 2014].
CAA (2014). CAP 1145 - Safety Review of Offshore Public Transport Helicopter Operations in Support of the Exploitation of Oil and Gas. London: UK Civil Aviation Authority.
Camargo, F. S. A. (2009). Brazilian JHSAT Update [Online]. Available: http://www.ihst.org/portals/54/montreal/COLFERNANDOCAMARGO.pdf [Accessed Web Page 2010].
Canada-Newfoundland and Labrador Offshore Petroleum Board (2010). Offshore Helicopter Safety Enquiry. St John's, Newfoundland and Labrador.
Canadian Joint Helicopter Safety Analysis Team (2011). Canadian JHSAT Report - 2000 accident data analysis [Online]. Available: http://www.ihst.org/LinkClick.aspx?fileticket=5OAxM%2fS9IgE%3d&tabid=1507&language=en-US [Accessed 04/06 2012].
Canter, D., Breaux, J. and Sime, J. (1980). Domestic, multiple occupancy, and hospital fires. In: CANTER, D. (ed.) Fires and human behaviour. Chichester, UK: John Wiley & Sons Ltd.
Canter, D., Brown, J. and Groat, L. (1985). A multiple sorting procedure for studying conceptual systems. In: BRENNER, M., BROWN, J. & CANTER, D. (eds.) The research interview. London: Academic Press.
Carrell, S. (2009). Seabed search for bodies after North Sea helicopter crash [Online]. Aberdeen. Available: http://www.guardian.co.uk/uk/2009/apr/03/scotland-helicopter-crash-victims [Accessed 26/03 2011].
Carvalho, P. V. R. d., Gomes, J. O., Huber, G. J. and Vidal, M. C. (2009). Normal people working in normal organizations with normal equipment: System safety and cognition in a mid-air collision. Applied Ergonomics, 40, 325-340.
CASA (2009). Safety Management Systems for Regular Public Transport Operations. Canberra: Civil Aviation Safety Authority - Australian Government.
CASA (2013). Instrument number CASA EX66/13. Canberra: Civil Aviation Safety Authority, Australia.
304
CAST/ICAO (2011). Phase of Flight - Definition and Usage Notes [Online]. Available:
http://www.intlaviationstandards.org/Documents/PhaseofFlightDefinitions.pdf [Accessed 10/06 2012].
Celik, M., Lavasani, S. M. and Wang, J. (2010). A risk-based modelling approach to enhance shipping accident investigation. Safety Science, 48, 18-27.
Chalmers, D. J., O'Hare, D. P. A. and McBride, D. I. (2000). The Incidence, Nature, and Severity of Injuries in New Zealand Civil Aviation. Aviation, Space and Environmental Medicine, 71, 388-395.
CHC (2010). Safety Management System [Online]. Available: http://www.chc.ca/SafetyandQuality/SafetyManagementSystem/Pages/default.aspx [Accessed 04/11 2013].
Cheung, B. (2004). Nonvisual Spatial Orientation Mechanisms. In: PREVIC, F. H. & ERCOLINE, W. R. (eds.) Spatial Disorientation in Aviation. Reston, VA: AIAA.
Cheung, B., Money, K., Wright, H. and Bateman, W. (1995). Spatial Disorientation-Implicated Accidents in Canadian Forces, 1982-92. Aviation, Space, and Environmental Medicine, 66, 579-585.
Chipman, S. F., Schraagen, J. M. and Shalin, V. L. (2000). Introduction to cognitive task analysis. In: SCHRAAGEN, J. M., CHIPMAN, S. F. & SHALIN, V. L. (eds.) Cognitive task analysis. Mahwah, NJ: Lawrence Erlbaum Associates.
CIAIAC (2010). 21-01-2010. EC-KYR. Agusta Westland AW-139. Proximidades del Aeropuerto de Almería [Online]. Available: http://www.fomento.es/MFOM/LANG_CASTELLANO/DIRECCIONES_GENERALES/ORGANOS_COLEGIADOS/CIAIAC/INVESTIGACION/2010/002_2010.htm [Accessed 05/10 2010].
Cicek, K. and Celik, M. (2013). Application of failure modes and effects analysis to main engine crankcase explosion failure on-board ship. Safety Science, 51, 6-10.
Clark, E., Edwards, C., Perry, P., Campbell, G. and Stevens, M. (2006). Helicopter Safety in the Oil and Gas Business. IADC/SPE Drilling Conference. Miami, Florida, USA: Society of Petroleum Engineers.
Cohen, J. (1960). A coefficient of agreement for nominal scales. Educational and Psychological Measurement, 20, 37-46.
Conroy, C., Russell, J. C., Crouse, W. E., Bender, T. R. and Holl, J. A. (1992). Fatal Occupational Injury Related to Helicopters in the United States 1980-1985. Aviation, Space and Environmental Medicine, 63, 67-71.
Cook, M. (1988). Personnel selection and productivity, Chichester, Wiley. Cooke, N. J. (1994). Varieties of knowledge elicitation techniques. International Journal of
Human-Computer Studies, 41, 801-849. Corbet, A. T. and Anderson, J. R. (1995). Knowledge Tracing: Modelling the Acquisition of
Procedural Knowledge. User Modelling and User-Adapted Interaction, 4, 253-278. Corrie, S. J. (1997). The US Aviation Safety Reporting System. Moffett Field, CA, USA:
NASA. Couch, M. and Lindell, D. (2010). Study on Rotorcraft Safety and Survivability. AHS 66th
Annual Forum. Phoenix, AZ: AHS. Cox, P. and Papandreu, V. (2003). Directive 2003/42/EC of the European Parliament and of
the Council of 13 June 2003 on occurrence reporting in civil aviation. Luxembourg: Official Journal of the European Union.
Cvetkovich, G. and Earle, T. C. (1985). Classifying hazardous events. Journal of Environmental Psychology, 5, 5-35.
305
Cwerner, S. B. (2006). Vertical Flight and Human Moblities: the Promise and Reality of
Helicopter Travel. Mobilities, 1, 191-215. Deacon, T., Amyotte, P. R. and Khan, F. I. (2010). Human error risk analysis in offshore
emergencies. Safety Science, 48, 803-818. Deacon, T., Amyotte, P. R., Khan, F. I. and MacKinnon, S. (2013). A framework for human
error analysis of offshore evacuations. Safety Science, 51, 319-327. Dekker, S. W. A. (2002). Reconstructing human contributions to accidents: the new view on
error and performance. Journal of Safety Research, 33, 371-385. Deming, W. (2000). The new economics for industry, government, education, Cambridge,
MA, MIT Press. Denzin, N. K. (1988). The Research Act: A Theoretical Introduction to Sociological Methods,
Englewood Cliffs, NJ, Prentice-Hall. Dery, M., Hustuit, J., Boschert, G. and Wish, J. (2007). Results and recommendations from
the helicopter EMS pilot safety survey 2005. Air Medical Journal, 26, 38-44. DNV (2013). More control - better safety: integrating barrier risk management [Online].
Available: http://www.dnv.com/industry/oil_gas/publications/updates/oil_and_gas_update/2013/01_2013/more_control__better_safety_integrated_barrier_risk_management.asp [Accessed 30/10 2013].
DoD (2012). Standard Practice MIL-STD-882E - System Safety. Washington, D.C.: Department of Defense (USA).
Donnelly, J. (2005). Price rise and new deep-water technology opened up offshore drilling [Online]. Boston: Bostom.com. Available: http://www.boston.com/news/world/articles/2005/12/11/price_rise_and_new_deep_water_technology_opened_up_offshore_drilling/ [Accessed 25/11 2013].
Doty, T. (2010). OGP Aviation Sub-Committee (ASC) Report IAGC / OGP Joint HSE & Security Forum. Gatwick, UK: International Association of Oil and Gas Producers.
Dougherty, E. M. (1990). Human reliability analysis - where shouldst thou turn? Reliability Engineering & System Safety, 29, 283-299.
Downey, D. (2010). WAAS Integration, Testing, Infrastructure Development, and Data Collection for Public Use Criteria. 4th EASA Rotorcraft Symposium. Cologne, Germany: EASA.
Drury, C. G. (1983). Task analysis methods in industry. Applied Ergonomics, 14, 19-28. Dunford, S. J., Crowley, J. S., Rosado, N. R., Harper, J. and DeRoche, S. (1995). Spatial
Disorientation: A Survey of US Army Helicopter Accidents 1987-1992, Report number 95-25. Fort Hucker, Alabama: USAARL.
Dupuy, M.-D. (2011). Framework for the analysis of separation-related incidents in aviation. PhD, Imperial College London.
Dutch Aviation Society (2009). Scramble [Online]. Available: http://www.scramble.nl/sb.htm [Accessed 05/06 2012].
EASA (2009). Annual Safety Review 2008. Cologne, Germany: EASA. EASA (2011). European Aviation Safety Programme - Manual. Cologne, Germany: EASA. EASA (2012). Specifications attached to the Invitation to Tender - EASA.2012.OP.09 - Study
on single-engined helicopter operations over a hostile environment [Online]. Available: http://easa.europa.eu/procurement/procurement.php [Accessed 01/06 2012].
EASA (2013a). 2012 Annual Safety Recommendations Review. Cologne, Germany: EASA. EASA (2013b). EASA Annual Safety Review 2012. Cologne, Germany: EASA. EASA (2013c). Notice of Proposed Amendment 2013-10 - Helicopter Offshore Operations -
RMT.0409 & RMT.0410 (OPS.093(a)&(b)) — 06/06/2013. Cologne, Germany: EASA. 306
EASA (2013d). Safety Management [Online]. Available: http://www.easa.europa.eu/sms/
[Accessed 15/10 2013]. EASP (2014). European Association of Social Psychology [Online]. Available:
http://www.easp.eu/ [Accessed 08/01 2014]. Ebbatson, M. (2009). The Loss of Manual Flying Skills in Pilots of Highly Automated
Airliners. Ph.D., Cranfield University. Edwards, D. S. and Hahn, C. P. (1980). A chance to happen. Journal of Safety Research, 12,
59-67. EHEST (2010). EHEST Analysis of 2000 – 2005 European helicopter accidents. Cologne,
Germany: EASA. Endsley, M. R. (1995). Toward a theory of situation awareness in dynamic systems. Human
Factors, 37, 32–64. EUROCONTROL (2000). Use of Safety Management Systems by ATM Service Providers.
1st ed. Brussels: Eurocontrol. European Commission - Joint Research Centre (2012). ECCAIRS 4.2.8 Data Definition
Standard: Event phases [Online]. Available: http://eccairsportal.jrc.ec.europa.eu/index.php/Products/83/0/ [Accessed 10/04 2013].
European Commission (2011). Communication from the Commission to the Council and the European Parliament - Setting up an Aviation Safety Management System for Europe. Brussels.
FAA (2000). System Safety Handbook [Online]. Available: http://www.faa.gov/regulations_policies/handbooks_manuals/aviation/risk_management/ss_handbook/ [Accessed 15/10 2013].
FAA (2006). Advisory Circular 120-92 - Introduction to Safety Management Systems for Air Operators. Federal Aviation Administration.
FAA (2012a). Accident/Incident Database System Query Form [Online]. FAA. Available: http://www.asias.faa.gov/portal/pls/portal/PORTAL.wwa_app_module.show?p_sessionid=97896 [Accessed 10/06 2012].
FAA (2012b). FAA Registry - N-Number Enquiry [Online]. FAA. Available: http://registry.faa.gov/aircraftinquiry/nnum_inquiry.aspx [Accessed 05/06 2012].
FAA Air Traffic Organization (2008). Air Traffic Organization Safety Management System Manual. 2.1 ed. Washington DC: Federal Aviation Administration.
Farrell, S. (2013). Emerging Markets and Investments: Where Will the Money Flow? London: PCF Energy.
Fernández-Muñiz, B., Montes-Peón, J. M. and Vázquez-Ordás, C. J. (2007). Safety management system: Development and validation of a multidimensional scale. Journal of Loss Prevention in the Process Industries, 20, 52-68.
Ferrante, O., Jouniaux, P., Loo, T., Nicolas, G., Cabon, P. and Mollard, R. (2004). Application of ADREP 2000 taxonomy for the analysis and encoding of aviation accidents and incidents: a human factors approach. Human Factors and Aerospace Safety, 4, 19-48.
Field, A. (2009). Discovering Statistics Using SPSS, London, SAGE. Fischhoff, B., Watson, S. R. and Hope, C. (1984). Defining Risk. Policy Sciences, 17, 123-
139. Fitzpatrick, I. (2013). Powered by People - An Overview of the Resourcing Challenge Faced
by Helicopter Operators in an Expanding Market. London: Agusta Westland. Flanagan, J. C. (1954). The Critical Incident Technique. Psychological Bulletin, 51, 327-358. Fleiss, J. L., Levin, B. and Paik, M. C. (2003). Statistical methods for rates and proportions,
Hoboken, N.J, J. Wiley. 307
Flight (1961). Helicopters, all weather [Online]. Flight. Available:
http://www.flightglobal.com/pdfarchive/view/1961/1961%20-%200237.html [Accessed 27/01 2014].
Flight Safety Foundation (2010). Basic Aviation Risk Standard, Resource Sector [Online]. Available: http://flightsafety.org/files/bars_v2.pdf [Accessed Web Page].
Flight Safety Foundation (2012). Aviation Safety Network [Online]. FSF. Available: http://aviation-safety.net/database/ [Accessed 05/06 2012].
FlightSafe Consultants Limited (2012). FlightSafe Consultants Limited [Online]. Available: http://www.flightsafe.co.uk/public/mainframe.html [Accessed 05/06 2012].
Flin, R., Mearns, K., Gordon, R. and Fleming, M. (1996). Risk perception by offshore workers on UK oil and gas platforms. Safety Science, 22, 131-145.
Forssell, B. (1982). Helicopter Operations for Norwegian Offshore Installations. The Journal of Navigation, 35, 312-318.
Fox, R. G. (2002). Civil Rotorcraft Risks. China International Helicopter Forum. Chengdu, China.
Frakes, M. A., High, K. and Stocking, J. (2009). Transport Nurse Safety Practices, Perceptions, and Experiences: The Air and Surface Transport Nurses Association Survey. Air Medical Journal, 28, 250-255.
GAIN Working Group E (2004). A Roadmap to a Just Culture: Enhancing the Safety Environment. 1st ed. McLean, Virginia, USA: Global Aviation Information Network.
GAO (2007). Aviation Safety, Improved Data Collection Needed for Effective Oversight of Air Ambulance Industry. United States Government Accountability Office.
Garson, G. D. (2011). Statnotes: Topics in Multivariate Analysis [Online]. Available: http://voyager.cbe.wwu.edu/courses/481/statnote/statnote.htm [Accessed 19/12 2012].
Gautier, D. L. (2007). Assessment of undiscovered oil and gas resources of the East Greenland Rift Basins Province. Reston, Virginia: U.S. Geological Survey.
GCAA (2010). Aircraft Accident Report 02/2008. Dubai, UAE: GCAA. Gibb, R., Gray, R. and Scharff, L. (2010). Aviation visual perception: research,
misperception and mishaps, Ashgate. Gibb, R., Schvaneveldt, R. and Gray, R. (2008). Visual Misperception in Aviation: Glide
Path Performance in a Black Hole Environment. Human Factors, 501, 699-711. Gibb, R. W. and Olson, W. (2008). Classification of Air Force Aviation Accidents: Mishap
Trends and Prevention. The International Journal of Aviation Psychology, 18, 305-325. Glaser, B. G. (1978). Theoretical Sensitivity, Mill Valley, CA, University of California -
Sociology Press. Glaser, B. G. and Strauss, A. L. (1967). The Discovery of Grounded Theory: Strategies for
Qualitative Research, Chicago, Aldine Pub. Co. Gomes, J. O., Woods, D. D., Carvalho, P. V. R., Huber, G. J. and Borges, M. R. S. (2009).
Resilience and brittleness in the offshore helicopter transportation systems: The identification of constraints and sacrifice decisions in pilots' work. Reliability Engineering & System Safety, 94, 311-319.
Goodheart, B. (2013). Probabilistic Risk Modelling in SMS: Practical Solutions. CHC Safety and Quality Summit. Vancouver, Canada.
Goud, J., Glossop, M. and Ioannides, A. (2000). Review of Hazard Identification Techniques. Sheffield, UK: HSE.
Grabowski, M., Ayyalasomayajula, P., Merrick, J., Harrald, J. R. and Roberts, K. (2007). Leading indicators of safety in virtual organizations. Safety Science, 45, 1013-1043.
Greenberg, R., Cook, S. C. and Harris, D. (2005). A civil aviation safety assessment model using a Bayesian belief network (BBN). The Aeronautical Journal, 109, 557-568.
308
Hale, A. (1997). Introduction: the goals of event analysis. In: HALE, A., WILPERT, B. &
FREITAG, M. (eds.) After the event: from accident to organisation learning. Bingley, UK: Pergamon Press.
Harper, M., Gunther, D. and Pardee, J. (2011). Perspectives on Information Sharing. In: STOLZER, A. J., CARL, D. H. & GOGLIA, J. J. (eds.) Implementing Safety Management Systems in Aviation. Farnham, UK: Ashgate.
Harris, D. (2004). Head-down flight deck display design. In: HARRIS, D. (ed.) Human Factors for Civil Flight Deck Design. Aldershot: Ashgate.
Harris, D. (2006a). The influence of human factors on operational efficiency. Aircraft Engineering and Aerospace Technology, 78, 20-25.
Harris, D. (2008). System Safety and Accident Investigation. Lecture at Cranfield University. Cranfield: Cranfield University.
Harris, D. and Smith, F. J. (1997). What can be done versus what should be done: a critical evaluation of the transfer of human engineering solutions between application domains. In: HARRIS, D. (ed.) Engineering psychology and cognitive ergonomics, Transportation systems. Aldershot: Ashgate.
Harris, D., Stanton, N. A., Marshall, A., Young, M. S., Demagalski, J. and Salmon, P. (2005). Using SHERPA to predict design-induced error on the flight deck. Aerospace Science and Technology, 9, 525-532.
Harris, F. D. (2006b). No accidents - That's the Objective. The 26th Alexander A. Nikolsky Lecture. Journal of the American Helicopter Society, 52, 3-14.
Harris, F. D., Kasper, E. F. and Iseler, L. E. (2000). U.S. Civil Rotorcraft Accidents, 1963 Through 1997. Moffett Field, CA: NASA.
HART Aviation (2007). Review of Offshore Helicopter Operations in Australia for NOPSA. Carlton, Australia: NOPSA.
Hart, J. (2005). Managing Helicopter Risk. APPEA journal, 45, 657-665. Hart, J. (2006). Human Factors in Offshore Aviation [Online]. Available:
http://www.hartaviation.com.au/content.php?region=200 [Accessed 30/08 2009]. Heinrich, H. (1980). Industrial Accident Prevention, New York, McGraw-Hill. Helihub (2012). Helihub - The Helicopter Search Engine [Online]. Available:
http://www.helihub.com/tag/accidents/ [Accessed 05/06 2012]. Helmreich, R. and Merritt, A. (1998). Culture at Work in Aviation and Medicine: National,
Cultural and Professional Influences Aldershot, Ashgate. Helmreich, R. L. and Khatwa, R. (1998). Analysis of Critical Factors During Approach and
Landing in Accidents and Incidents and Normal Flight. Flight Safety Digest, vol. 18, 1-77.
Hernandez, V. (2005). Global Safety Management System. Mexico City: ICAO. Herrera, I. A., Håbrekke, S., Kråkenes, T., Hokstad, P. R. and Forseth, U. (2010a). Helicopter
Safety Study 3, Main Report. Trondheim: SINTEF. Herrera, I. A., Hollnagel, E. and Håbrekke, S. (2010b). Proposing safety performance
indicators for helicopter offshore on the Norwegian Continental Shelf. PSAM10. Seattle, USA.
Herrera, I. A., Nordskag, A. O., Myhre, G. and Halvorsen, K. (2009). Aviation safety and maintenance under major organizational changes, investigating non-existing accidents. Accident Analysis & Prevention, 41, 1155-1163.
Hoh, R. H., Baillie, S., Kereliuk, S. and Traybar, J. J. (1991). Decision-Height Windows for Decelerating Approaches in Helicopters - Pilot/Vehicle Factors and Limitations, DOT/FAA/CT-90/14. Virginia: FAA.
309
Hokstad, P., Jersin, E., Hansen, G. K., Sneltvedt, J. and Sten, T. (1999). Helicopter Safety
Study 2. Trondheim: SINTEF. Hokstad, P., Jersin, E. and Sten, T. (2001). A risk influence model applied to North Sea
helicopter transport. Reliability Engineering & System Safety, 74, 311-322. Hollnagel, E. (1993). Human reliability analysis: Context and control, London, Academic. Hollnagel, E. (1997). Cognitive Reliability and Error Analysis Method CREAM, Halden,
Norway, Elsevier. Hollnagel, E. (2004). Barriers and accident prevention, Aldershot, Ashgate. Hollnagel, E. (2008). Risk + barriers = safety? Safety Science, 46, 221-229. Hollnagel, E. (2009). The ETTO Principle: Efficiency-Thoroughness Trade-Off, Farnham,
UK, Ashgate. Hollnagel, E. (2012). FRAM: the Functional Resonance Analysis Method - Modelling
Complex Socio-Technical Systems, Farnham, UK, Ashgate. Hollnagel, E. (2013). Is safety a subject for science? Safety Science. Hollnagel, E., Paries, J., Woods, D. D. and Wreathall, J. (2011). Resilience Engineering In
Practice: A Guidebook, Farnham, UK, Ashgate. Holt, C. (2009). Influencing the Culture of Reporting. Aviate Journal Edition RAF Northolt:
Directorate of Aviation Regulation & Safety. Hope, S., Øverland, S., Brun, W. and Matthiesen, S. B. (2010). Associations between sleep,
risk and safety climate: A study of offshore personnel on the Norwegian continental shelf. Safety Science, 48, 469-477.
Howson, D. (2009). Helicopter Offshore Approaches. 3rd EASA Rotorcraft Forum. Cologne, Germany: EASA.
Howson, D. (2012). Review and Analysis of UK and European Part 27 Helicopter Incident and Accident Data. 6th EASA Rotorcraft Symposium. Cologne: EASA.
Howson, D. (2013). Offshore Helicopter Safety. Gatwick, UK: Joint Industry/CAA Helicopter Safety Research Management Committee (HSRMC).
Howson, D. A. (2006). Research initiatives for improving the safety of offshore helicopter operations. The Aeronautical Journal, 110, 14.
Howson, D. A. (2008). Enhancing Offshore Helideck Lighting. Maritime Operations of Rotorcraft. London: RAeS.
HSAC (2000). 1999 OGP World-Wide Oil Industry Helicopter Operations and Safety Review [Online]. Available: http://www.hsac.org/docs/1999%20World-wide%20Report.pdf [Accessed 04/12 2011].
HSAC (2012). Statistics [Online]. Available: http://www5.verticalgateway.com/hsac/Statistics.aspx [Accessed 13/06 2012].
HSE (2003a). A review of Norwegian offshore based search and rescue helicopter operations. Health and Safety Executive.
HSE (2003b). UK Offshore Public Transport Helicopter Safety Record 1976-2002. London: Health and Safety Executive.
HSE (2013). Understanding the task [Online]. Available: http://www.hse.gov.uk/humanfactors/resources/understanding-the-task.pdf [Accessed 07/01 2014].
Hsu, Y.-L., Li, W.-C. and Chen, K.-W. (2010). Structuring critical success factors of airline safety management system using a hybrid model. Transportation Research Part E: Logistics and Transportation Review, 46, 222-235.
Hu, S., Fang, Q., Xia, H. and Xi, Y. (2007). Formal safety assessment based on relative risks model in ship navigation. Reliability Engineering & System Safety, 92, 369-377.
310
Huang, D. (2012). Application of Fuzzy Logic to Safety Assessment of China’s Maritime
Passage. Transportation Research Board 91th Annual Meeting. Washington, D.C.: TRB. Huber, M. (2013). Airline Safety System Comes to Helicopter Sector [Online]. AINonline.
Available: http://www.ainonline.com/aviation-news/aviation-international-news/2013-05-03/airline-safety-system-comes-helicopter-sector [Accessed 3/5 2013].
Huddlestone, J. and Harris, D. (2006). Using Grounded Theory Techniques to Develop Models of Aviation Student Performance. Human Factors and Aerospace Safety, 6, 371-382.
Hudson, P. (2000). Safety Management and Safety Culture - The Long, Hard and Winding Road. In: PEARSE, W., GALLAGHER, C. & BLUFF, L. (eds.) The First National Conference on Occupational Health and Safety Management Systems. Sydney, Australia: Crown Content.
Hudson, P. T. W., Reason, J. T. and Bentley, P. D. (1994). Tripod Delta: Proactive Approach to Enhanced Safety. Journal of Petroleum Technology, 46, 58-62.
Hunter, D. R., Martinussen, M., Wiggins, M. and O’Hare, D. (2011). Situational and personal characteristics associated with adverse weather encounters by pilots. Accident Analysis & Prevention, 43, 176-186.
IBM Corporation (2011). Two-Independent-Samples Test Types [Online]. Available: http://publib.boulder.ibm.com/infocenter/spssstat/v20r0m0/index.jsp?topic=%2Fcom.ibm.spss.statistics.help%2Ftwo_independent_samples_test_types.htm [Accessed 06/03 2013].
ICA (2008). AIRAC AIP Supplement N092-099/08. Rio de Janeiro: Serviço de Informações Aeronáuticas.
ICAO (1987). Accident/Incident Reporting (ADREP) Manual - Chapter 1. Montréal: ICAO. ICAO (2001). The Convention on International Civil Aviation - Annex 11 - Air Traffic
Services. Montréal: ICAO. ICAO (2003). Manual of Aircraft Accident and Incident Investigation - Part VI Reporting.
Montréal: International Civil Aviation Organisation. ICAO (2004). The Convention on International Civil Aviation - Annex 12 - Search and
Rescue. Montréal: ICAO. ICAO (2005a). The Convention on International Civil Aviation - Annex 2 - Rules of the Air.
Montreal: ICAO. ICAO (2005b). ICAO Accident Prevention Programme. 1st ed. Montréal: ICAO. ICAO (2006a). The Convention on International Civil Aviation. 9th ed. Montréal: ICAO. ICAO (2006b). ECCAIRS 4.2.6 Data Definition Standards - Explanatory Factors [Online].
ICAO. Available: http://legacy.icao.int/anb/aig/Taxonomy/R4CDExplanatoryFactors.pdf [Accessed 20/07 2013].
ICAO (2006c). Safety Management Manual (SMM). 1st ed. Montréal: ICAO. ICAO (2007a). Comprehensive Regional Implementation Plan for Aviation Safety in Africa -
Initial Data Analysis - ADREP [Online]. Available: http://legacy.icao.int/osg/isd/afi/Reference%20Material/Accident%20Information/Initial%20Data%20Analysis%20ADREP.pdf [Accessed 13/10 2013].
ICAO (2007b). The Convention on International Civil Aviation - Annex 10 - Aeronautical Telecommunications. Montréal: ICAO.
ICAO (2009a). The Convention on International Civil Aviation - Annex 4 - Aeronautical Charts. Montréal: ICAO.
ICAO (2009b). The Convention on International Civil Aviation - Annex 14 - Aerodromes. 3rd ed. Montreal: ICAO.
ICAO (2009c). Safety Management Manual (SMM). 2nd ed. Montréal: ICAO. 311
ICAO (2010a). The Convention on International Civil Aviation - Annex 3 - Meteorological
Services for International Air Navigation. Montréal: ICAO. ICAO (2010b). The Convention on International Civil Aviation - Annex 5 - Units of
Measurement to be Used in Air and Ground Operations. Montréal: ICAO. ICAO (2010c). The Convention on International Civil Aviation - Annex 6 - Operation of
Aircraft. 7th ed. Montréal: ICAO. ICAO (2010d). The Convention on International Civil Aviation - Annex 8 - Airworthiness of
Aircraft. 11th ed. Montréal: ICAO. ICAO (2010e). The Convention on International Civil Aviation - Annex 13 - Aircraft
Accident and Incident Investigation. Montreal: ICAO. ICAO (2010f). The Convention on International Civil Aviation - Annex 15 - Aeronautical
Information Services. Montréal: ICAO. ICAO (2011a). The Convention on International Civil Aviation - Annex 1 - Personnel
Licensing. Montréal: ICAO. ICAO (2011b). The Convention on International Civil Aviation - Annex 9 - Facilitation.
Montréal: ICAO. ICAO (2011c). The Convention on International Civil Aviation - Annex 16 - Environmental
Protection. Montréal: ICAO. ICAO (2011d). The Convention on International Civil Aviation - Annex 17 - Security.
Montréal: ICAO. ICAO (2011e). The convention on International Civil Aviation - Annex 18 - The Safe
Transport of Dangerous Goods by Air. Montréal: ICAO. ICAO (2011f). Manual of Aircraft Accident and Incident Investigation - Part III
Investigation. Montréal: ICAO. ICAO (2012a). The Convention on International Civil Aviation - Annex 7 - Aircraft
Nationality and Registration Marks. Montréal: ICAO. ICAO (2012b). The Convention on International Civil Aviation - Annexes 1 to 18 [Online].
Montréal: ICAO. Available: http://www.icao.int/safety/AirNavigation/NationalityMarks/annexes_booklet_en.pdf. [Accessed 17/07 2013].
ICAO (2012c). Safety Management Manual (SMM). 3rd ed. Montréal: ICAO. ICAO (2013). 2013 Safety Report. Montréal: ICAO. IHST (2011). The developing history of an accident-free future [Online]. Available:
http://www.ihst.org/Default.aspx?tabid=1780&language=en-US [Accessed 04/11 2013]. Ikeagwuani, U. M. and John, G. A. (2013). Safety in maritime oil sector: Content analysis of
machinery space fire hazards. Safety Science, 51, 347-353. Inglis, M., Smithson, M. J., Cheng, K., Stanton, D. R. and Godley, S. T. (2010). Evaluation
of the Human Factors Analysis and Classification System as a predictive model. Canberra: ATSB.
International Chamber of Shipping (1989). Guide to helicopter/ship operations, London, Witherby & Co. ltd.
ISO (2009). ISO Guide 73:2009 - Risk management - Vocabulary. Geneva: International Organization for Standardization.
ISO/IEC (1999). ISO/IEC Guide 51:1999. Geneva: International Organization for Standardization / International Eletrotechnical Commission.
JAA (2007). JAR-OPS 3: Commercial Air Transportation (Helicopters). Netherlands: JAA. Jarvis, S. (2009). Misjudged Approach to a High Accident Rate: Exploration of Accident
Causes and Instructor Decisions Relating to Inexperienced Glider Pilots. Ph.D., Cranfield University.
312
Jarvis, S. (2010). Development of a bespoke human factors taxonomy for gliding accident
analysis and its revelations about highly inexperienced UK glider pilots. Ergonomics, 53, 9.
Jarvis, S. and Harris, D. (2008). Investigation into Accident Initiation Events by Flight Phase, for Highly Inexperienced Glider Pilots. International Journal of Applied Aviation Studies, 8, 211-224.
Joint Research Centre of the European Commission (2005). ECCAIRS Reporting System - User Manual. Ispra, Italy.
Joint Research Centre of the European Commission (2010a). ECCAIRS 4.2.8 Data Definition Standard - Descriptive Factors [Online]. Skybrary. Available: http://www.skybrary.aero/bookshelf/books/1813.pdf [Accessed 14/10 2013].
Joint Research Centre of the European Commission (2010b). ECCAIRS 4.2.8 Data Definition Standard - Modifiers [Online]. Skybrary. Available: http://www.skybrary.aero/bookshelf/books/1818.pdf [Accessed 14/10 2013].
Joint Research Centre of the European Commission (2012). ECCAIRS 4.2.8 Data Definition Standard - Event phases [Online]. Available: http://eccairsportal.jrc.ec.europa.eu/index.php/Products/83/0/ [Accessed 10/04 2013].
JSSI - Occurrence Data Analysis Working Group (2006). Analysis Capabilities Specification Document - Mandatory Occurrence Data. Amsterdam: European Commission Joint Research Centre.
Kaiser, M. J. (2007). World offshore energy loss statistics. Energy Policy, 35, 3496-3525. Kaplan, S. and Garrick, B. J. (1981). On The Quantitative Definition of Risk. Risk Analysis,
1, 11-27. Kazaras, K., Kontogiannis, T. and Kirytopoulos, K. (2014). Proactive assessment of breaches
of safety constraints and causal organizational breakdowns in complex systems: A joint STAMP–VSM framework for safety assessment. Safety Science, 62, 233-247.
Kern, T. (2002). Approach and Landing, New York, MacGraw-Hill. Khatwa, R. and Roelen, A. L. C. (1996). An Analysis of Controlled-Flight-into-Terrain
Accidents of Commercial Operations, 1988 through 1994. Flight Safety Digest, 17, 166-212.
Kim, M. C., Seong, P. H. and Hollnagel, E. (2006). A probabilistic approach for determining the control mode in CREAM. Reliability Engineering & System Safety, 91, 191-199.
King, N. (1998). Template Analysis. In: SYMON, G. & CASSELL, C. (eds.) Qualitative Methods and Analysis in Organizational Research - A Practical Guide. London: SAGE.
Kirwan, B. and Ainsworth, L. K. (1992). A Guide to Task Analysis, London, Taylor and Francis.
Kjellén, U. (2000). Prevention of accidents through experience feedback, London, UK, Taylor & Francis.
Kontogiannis, T. (2012). Modeling patterns of breakdown (or archetypes) of human and organizational processes in accidents using system dynamics. Safety Science, 50, 931-944.
Kontogiannis, T. and Malakis, S. (2011). A systemic analysis of patterns of organizational breakdowns in accidents: A case from Helicopter Emergency Medical Service (HEMS) operations. Reliability Engineering & System Safety, 99, 193-208.
Kontovas, C. A. (2005). Formal Safety Assessment - Critical Review and Future Role. Postgraduate Diploma, National Technical University of Athens.
Krebs, M. B., Li, G. and Baker, S. P. (1995). Factors Related to Pilot Survival in Helicopter Commuter and Air Taxi Crashes. Aviation, Space and Environmental Medicine, 66, 99-103.
313
Kyriakidis, M. (2013). Developing a Human Performance Railway Operational Index to
Enhance Safety of Railway Operations. PhD, Imperial College London. Kyriakidis, M., Hirsch, R. and Majumdar, A. (2012). Metro railway safety: An analysis of
accident precursors. Safety Science, 50, 1535-1548. Labib, A. and Read, M. (2013). Not just rearranging the deckchairs on the Titanic: Learning
from failures through Risk and Reliability Analysis. Safety Science, 51, 397-413. Lande, K. (1998). Modified Automatic Dependent Surveillance System (M-ADS) For North
Sea Helicopters. The Journal of Navigation, 51, 304-311. Lee, Y. W., Pipino, L. L., Funk, J. D. and Wang, R. Y. (2006). Journal of Data Quality,
Cambrige, MA, USA, MIT Press. Lee, Y. W. and Strong, D. M. (2003). Knowing-Why About Data Processes and Data
Quality. Journal of Management Information Systems, 20, 13-39. Lee, Y. W., Strong, D. M., Kahn, B. K. and Wang, R. Y. (2002). AIMQ: a methodology for
information quality assessment. Information & Management, 40, 133-146. Lenné, M. G., Ashby, K. and Fitzharris, M. (2008). Analysis of General Aviation Crashes in
Australia Using the Human Factors Analysis and Classification System. The International Journal of Aviation Psychology, 18, 340-352.
Leveson, N. (2004). A new accident model for engineering safer systems. Safety Science, 42, 237-270.
Leveson, N. G. (1995). Safeware : system safety and computers, Wokingham, UK, Addison-Wesley
Levitin, A. and Redman, T. (1995). Quality dimensions of a conceptual view. Information Processing & Management, 31, 81-88.
Lewis, K. (2011). Practical Risk Management. In: STOLZER, A. J., HALFORD, C. D. & GOGLIA, J. J. (eds.) Implementing Safety Management Systems in Aviation. Farnham, UK: Ashgate.
Li, G. and Baker, S. P. (1993). Crashes of commuter aircraft and air taxi crashes: what determines pilot survival? Journal of Occupational Medicine, 35, 1244-1249.
Li, G. and Baker, S. P. (1999). Correlates of Pilot Fatality in General Aviation. Aviation, Space and Environmental Medicine, 70, 305-309.
Li, W. C., Harris, D. and Chen, A. (2007). Eastern minds in western cockpits: meta-analysis of human factors in mishaps from three nations. Aviation, Space & Environmental Medicine, 78, 420-425.
Likert, R. (1932). A Technique for the Measurement of Attitudes. Archives of Psychology, 140, 1-55.
Lindøe, P. H., Engen, O. A. and Olsen, O. E. (2011). Responses to accidents in different industrial sectors. Safety Science, 49, 90-97.
Lippl, J. (2012). Helionline.de [Online]. Available: http://www.helionline.net/templates/sites/casualties.html [Accessed 05/06 2012].
Lu, C.-t., Przetak, R. and Wetmore, M. (2005). Discovering the Non-Flight Hazards and Suggesting a Safety Training Model. International Journal of Applied Aviation Studies, 5, 135-152.
Lundberg, J., Rollenhagen, C. and Hollnagel, E. (2009). What-You-Look-For-Is-What-You-Find – The consequences of underlying accident models in eight accident investigation manuals. Safety Science, 47, 1297-1311.
Majumdar, A., Buckley, M. and Nalder, P. (2009a). Helicopter Safety Analysis in South Africa: a preliminary study [Online]. IHST. Available: http://www.ihst.org/portals/54/montreal/ARNABMAJUMDAR.pdf [Accessed Web Page 2010].
314
Majumdar, A., Mak, K., Lettington, C. and Nalder, P. (2009b). A causal factors analysis of
helicopter accidents in New Zealand 1996-2005 and the United Kingdom 1986-2005. The Aeronautical Journal, 113, 647-660.
Manuele, F. A. (2005). Heinrich Revisited: Truisms or Myths. In: HAZARDS LIMITED UK (ed.) On the Practice of Safety. Third Edition ed. Hoboken, NJ, USA: John Wiley & Sons, Inc.
Manuele, F. A. (2011). Reviewing Heinrich: Dislodging Two Myths From the Practice of Safety. Professional Safety, 56, 52-61.
Mapes, P. (2010). DoD Helicopter Mishaps FY85-05: Recommendations. IHSS 2010. Cascais, Portugal: IHST.
Marinha do Brasil (2009). Normas da Autoridade Marítima para Embarcações Empregadas em Navegação de Mar Aberto - NORMAN-01/DPC Mod8. Rio de Janeiro: Marinha do Brasil.
Marinha do Brasil (2011). Normas da Autoridade Marítima para a Homologação de Helipontos Instalados em Embarcações e Plataformas Marítimas. Rio de Janeiro: Marinha do Brasil.
Marti, P. (2000). Structured task analysis in complex domains. In: ANNETT, J. & STANTON, N. A. (eds.) Task analysis. London: Taylor and Francis.
Masson, M., Hijum, M. V., Bernandersson, M. and Evans, A. (2009). The European Helicopter Safety Team (EHEST): 2008/2009 Achievements. International Helicopter Safety Symposium. Hamburg, Germany: EASA.
Mata, T. F., Gajewski, D. W., Hall, C. K., Lacerda, M. C., Santos, A. G., Gomes, J. O. and Woods, D. D. (2006). Application of Resilience Engineering on Safety in Offshore Helicopter Transportation. 2006 IEEE Systems and Information Engineering Design Symposium. Charlottesville.
Maurino, D. (2007). Safety in perspective. ICAO Journal, 62, 22–25. Mayo, D. G. and Cox, D. (2006). New Perspectives on (Some Old) Problems of Frequentist
Statistics. The Second Erich L. Lehmann Symposium: Optimality. Institute of Mathematical Statistics - Virginia Polytechnic Institute and State University.
McAdams, T. (2009). Hover Power [Online]. Aircraft Owners and Pilots Association (AOPA). Available: http://blog.aopa.org/helicopter/?p=197 [Accessed 26/01 2014].
McCarroll, L. (2011). SMS Training: An Overview. In: STOLZER, A. J., HALFORD, C. D. & GOGLIA, J. J. (eds.) Implementing Safety Management Systems in Aviation. Farham, UK: Ashgate.
McGinnes, J. and Sims, P. (2012). 'One spark and we'll have another Piper Alpha on our hands': Naked flame that threatens repeat of Britain's deadliest rig disaster is still alight on 'well from hell' [Online]. Mail Online. Available: http://www.dailymail.co.uk/news/article-2121457/North-Sea-gas-leak-threatens-repeat-Piper-Alpha-oil-rig-disaster-Aberdeen.html [Accessed 24/05 2012].
Menezes, F., Porto, O., Reis, M. L., Moreno, L., Poggi De Aragão, M., Uchoa, E., Abeledo, H. and Carvalho Do Nascimento, N. (2010). Optimizing Helicopter Transport of Oil Rig Crews at Petrobras. Interfaces, 40, 408-416.
Menzel, R. (2011). ECCAIRS SC 2011 - EASA update. Cologne: EASA. Merrick, J. R. W. and Van Dorp, R. (2006). Speaking the Truth in Maritime Risk
Assessment. Risk Analysis, 26, 223-237. Militello, L. G. and Hutton, R. J. B. (2000). Applied cognitive task analysis (ACTA): a
practitioner's toolkit for understanding cognitive task demands. In: ANNETT, J. & STANTON, N. A. (eds.) Task analysis. London: Taylor & Francis.
315
Minter, R. G. and Irving, P. E. (1996). An Analysis of Accidents Involving UK Civil
Registered Helicopters During the Period 1976-1995. 1996 European Rotorcraft Forum. Brighton, UK.
Mitchell, S. J. and Braithwaite, G. R. (2008). Perceptions of safety and offshore helicopter travel. International Journal of Energy Sector Management, 2, 479-498.
Mitchell, S. J. l. M. (2010). Helicopter Safety Reporting Culture. 4th EASA Rotorcraft Symposium. Cologne, Germany: EASA.
Mohaghegh, Z., Kazemi, R. and Mosleh, A. (2009). Incorporating organizational factors into Probabilistic Risk Assessment (PRA) of complex socio-technical systems: A hybrid technique formalization. Reliability Engineering & System Safety, 94, 1000-1018.
Morgan, M. G., Florig, H. K., DeKay, M. L. and Fischbeck, P. (2000). Categorizing Risks for Risk Ranking. Risk Analysis, 20, 49-58.
Morley, J. and MacDonald, B. (2005). Lessons Learned from Transportation Safety Board Investigations of Helicopter Accidents (1994-2003). International Helicopter Safety Symposium. Montreal, Canada.
Morrison, G. (2001). Helicopter Safety Offshore, 2000/089. Aberdeen: Health and Safety Executive.
Mostyn, B. (1985). The content analysis of qualitative research data: a dynamic approach. In: BRENNER, M., BROWN, J. & CANTER, D. (eds.) The Research Interview: Uses and Approaches. London: Academic Press.
Moussas, C. (2010). European Central Repository – Two Years of Aviation Safety Data Integration. Ispra, Italy: The Joint Research Centre of the European Commission.
NASA (2002). Fault Tree Handbook with Aerospace Applications. 1.1 ed. Hampton, USA: National Aeronautics and Space Administration.
NASA (2004). Aviation Safety and Security Program (AvSSP) - 2.1Aviation System Monitoring and Modeling (ASMM) Sub-Project Plan. 4.0 ed. Washington, D.C.: National Aeronautics and Space Administration.
NASA (2009). NASA National Aviation Operations Monitoring Service (NAOMS) Information Release [Online]. National Aeronautics and Space Administration. Available: http://www.nasa.gov/news/reports/NAOMS.html [Accessed 13/11 2013].
NASA (2013). NASA General Safety Program Requirements. Washington, D.C.: National Aeronautics and Space Administration.
NASA (2014). Aviation Safety Reporting System [Online]. Available: http://asrs.arc.nasa.gov/ [Accessed 10/01 2014].
Nascimento, F. A. C. (2009). An Initial Exploration into Factors Affecting Safety During Visual Night Approaches for Offshore Helicopters, as Perceived by Pilots. M.Sc., Cranfield University.
National Research Council of the National Academies (2009a). An Assessment of NASA's National Aviation Operations Monitoring Service. Washington, D.C.: National Research Council of the National Academies.
National Research Council of the National Academies (2009b). NASA's pilot survey yields unreliable data [Online]. Washington, D.C. Available: http://www8.nationalacademies.org/onpinews/newsitem.aspx?RecordID=12795 [Accessed 13/11 2013].
Newman, D. G. (2007). An overview of spatial disorientation as a factor in aviation accidents and incidents. Canberra: ATSB.
Nielsen, D. S. (1974). Use of cause-consequence charts in practical system analysis. Reliability and Fault Tree Analysis. Philadelphia: Society for Industrial and Applied Mathematics.
316
Nielsen, K. J., Carstensen, O. and Rasmussen, K. (2006). The prevention of occupational
injuries in two industrial plants using an incident reporting scheme. Journal of Safety Research, 37, 479-486.
Nikitinskaya, A. (2011). "Prirazlomnaya" off to work in the Pechora Sea [Online]. Murmansk: Sevmash. Available: http://www.sevmash.ru/rus/news/601-lr-.html [Accessed 19/12 2011].
Notícias Jurídicas (2002). Real Decreto 57/2002, de 18 de enero, por el que se aprueba el Reglamento de Circulación Aérea [Online]. Madrid. Available: http://noticias.juridicas.com/base_datos/Admin/rd57-2002.html [Accessed 29/11 2011].
Nouvel, D., Travadel, S. and Hollnagel, E. (2007). Introduction of the Concept of Functional Resonance in the Analysis of a Near-Accident in Aviation. 33rd ESReDA Seminar. Ispra, Italy.
O'Hare, D., Chalmers, D. and Scuffham, P. (2003). Case-Control Study of Risk Factors for Fatal and Non-Fatal Injury in Crashes of Civil Aircraft. Aviation, Space and Environmental Medicine, 74, 1061-1066.
O'Hare, D., Chalmers, D. and Scuffham, P. (2006). Case-control study of risk factors for fatal and non-fatal injury in crashes of rotary-wing aircraft. Journal of Safety Research, 37, 293-298.
O’Collard, S. (2010). Offshore Operations (PC2 e/d). 4th EASA Rotorcraft Symposium. Cologne, Germany: EASA.
OGP (1999). Safety performance of helicopter operations in the oil & gas industry – 1998 data. London: International Association of Oil & Gas Producers.
OGP (2000). Safety performance of the global E&P industry - 1999. London: International Association of Oil & Gas Producers.
OGP (2008). Aircraft Management Guidelines. London, UK: International Association of Oil & Gas Producers.
OGP (2009). Safety Performance Indicators - 2008 data. London: International Association of Oil & Gas Producers.
OGP (2010a). Aviation transport accident statistics. International Association of Oil & Gas Producers.
OGP (2010b). Safety Performance Indicators - 2009 data. International Association of Oil & Gas Producers.
OGP (2011). Human Factors Engineering in Projects. London: International Association of Oil & Gas Producers.
OGP (2012a). Safety Performance Indicators - 2011 data. International Association of Oil & Gas Producers.
OGP (2012b). Safety performance of helicopter operations [Online]. 2012. Available: http://www.ogp.org.uk/publications/safety-committee/safety-performance-of-helicopter-operations/ [Accessed 09/02 2013].
OGP (2013a). Aircraft Management Guidelines. London, UK: International Association of Oil & Gas Producers.
OGP (2013b). Environmental management in Arctic oil and gas operations: Good practice guide. London, UK: International Association of Oil & Gas Producers.
Oil & Gas UK (2007). UK Offshore Public Transport Helicopter Safety Record 1977-2006. London: Oil & Gas UK.
Oil & Gas UK (2010). Economic Report 2010. Aberdeen, UK: Oil & Gas UK. Oil & Gas UK (2011). UK Offshore Commercial Air Transport Helicopter Safety Record
(1981-2010). London: Oil & Gas UK.
317
Okstad, E., Jersin, E. and Tinmannsvik, R. K. (2012). Accident investigation in the
Norwegian petroleum industry – Common features and future challenges. Safety Science, 50, 1408-1414.
Olsen, O. E. and Lindøe, P. H. (2009). Risk on the ramble: The international transfer of risk and vulnerability. Safety Science, 47, 743-755.
Oxford Dictionaries (2013). Helicopter [Online]. Oxford, UK: Oxford University Press. Available: http://oxforddictionaries.com/definition/english/helicopter [Accessed 07/06/ 2013].
Padfield, G. D., Lee, D. N. and Bradley, R. (2001). How Do Helicopter Pilots Know When to Stop, Turn or Pull Up? (Developing guidelines for vision aids). AHS 57th Annual Forum. Washington, DC: American Helicopter Society.
Paltrinieri, N., Dechy, N., Salzano, E., Wardman, M. and Cozzani, V. (2012). Lessons Learned from Toulouse and Buncefield Disasters: From Risk Analysis Failures to the Identification of Atypical Scenarios Through a Better Knowledge Management. Risk Analysis, 32, 1404-1419.
Pang, M. (2011). Aviation Safety Data Collection and Processing (SDCP) - ECCAIRS Software [Online]. Aviation Safety Council, Republic of China. Available: http://www.asc.gov.tw/media_files/31_pap.pdf [Accessed 11/10 2013].
Partington, D. (2002). Essential Skills for Management Research, London, Sage. Pasztor, A. and Connect, D. M. (2013). North Sea Crash Underscores Poor Progress in
Helicopter Safety [Online]. The Wall Street Journal. Available: http://online.wsj.com/news/articles/SB10001424127887323893004579057260259169156 [Accessed 02/02 2014].
Pasztor, A. and Michaels, D. (2013). Helicopters Fail to Make Progress on Safety Issue [Online]. The Wall Street Journal. Available: http://online.wsj.com/news/articles/SB40001424127887323893004579057260259169156 [Accessed 02/02 2014].
Paté-Cornell, E. (2002). Finding and Fixing Systems Weaknesses: Probabilistic Methods and Applications of Engineering Risk Analysis. Risk Analysis, 22, 319-334.
Pilgrim, M. (2010). Global HFDM Community. Heli-Expo IHST HFDM Workshop. Houston, USA.
Pipino, L. L., Lee, Y. W. and Wang, R. Y. (2002). Data Quality Assessment. Communications of the ACM. New York, N.Y., USA: ACM.
Preece, J., Rogers, Y., Sharp, H., Benyon, D., Holland, S. and Carey, T. (1994). Human-computer interaction, Wokingham, Addison Wesley.
Prince, A. (1999). The effect of experience on the perception of decision scenarios: a field study. PhD, University of South Florida.
Prior, M. and Evans, A. (2005). Selection of aircraft for operations in hostile environments. In: RAES (ed.) Helicopter operations in natural hostile environments. London: RAeS.
Qian, F., Gribkovskaia, I., Laporte, G. and Halskau sr, Ø. (2012). Passenger and pilot risk minimization in offshore helicopter transportation. Omega, 40, 584-593.
Quintão, V. B. (2010). Viability of Nighttime Offshore Operations in Brazil. Postgraduate Diploma Dissertation, University of Brasilia.
RAF (2014). RAF Helicopters in Search and Rescue [Online]. Available: http://www.raf.mod.uk/rafsearchandrescue/22squadronassociation/rafhelicoptersinsearchandrescue.cfm [Accessed 27/01 2014].
Rasmussen, J. (1997). Risk management in a dynamic society: a modelling problem. Safety Science, 27, 183-213.
318
Rasmussen, J. and Svedung, I. (2000). Proactive risk management in a dynamic society.
Swedish Rescue Services Agency. Reason, J. (1997). Managing the Risks of Organisational Accidents, Aldershot, Ashgate. Reason, J. (2008). The human contribution: unsafe acts, accidents and heroic recoveries,
Aldershot, Ashgate. Ren, J., Jenkinson, I., Wang, J., Xu, D. L. and Yang, J. B. (2008). A methodology to model
causal relationships on offshore safety assessment focusing on human and organizational factors. Journal of Safety Research, 39, 87-100.
Roberts, S. (2009). Safety Management Systems - A regulator's perspective. Lecture at Cranfield University. Cranfield, UK: UK Civil Aviation Authority.
Robson, C. (2002). Real World Research: a Resource for Social Scientists and Practitioner-Researchers, Oxford, Blackwell.
Roland, H. E. and Moriarty, B. (1990). System Safety Engineering and Management, Mississauga, Ontario, John Wiley and Sons.
Rollenhagen, C., Westerlund, J., Lundberg, J. and Hollnagel, E. (2010). The context and habits of accident investigation practices: A study of 108 Swedish investigators. Safety Science, 48, 859-867.
Ronan, W. W. and Latham, G. P. (1974). The Reliability and Validity of the Critical Incident Technique: a Closer Look, Spring.
Rosqvist, T. and Tuominen, R. (2004). Qualification of Formal Safety Assessment: an exploratory study. Safety Science, 42, 99-120.
Ross, C. and Gibb, G. (2008). A Risk Management Approach to Helicopter Night Offshore Operations [Online]. Available: http://asasi.org/papers/2008/Risk%20Approach%20to%20Night%20Offshore%20Operations%20Presented%20by%20Gerry%20Gibb%20&%20Cameron%20Ross.pdf [Accessed 15/10 2010].
Rowe, S. J., Howson, D. and Turner, G. (2006). A turbulence criterion for safe helicopter operations to offshore installations. The Aeronautical Journal, 110, 749-758.
Rundmo, T. and Sjöberg, L. (1996). Employee risk perception related to offshore oil platform movements. Safety Science, 24, 211-227.
Saleh, J. H., Marais, K. B., Bakolas, E. and Cowlagi, R. V. (2010). Highlights from the literature on accident causation and system safety: Review of major ideas, recent contributions, and challenges. Reliability Engineering & System Safety, 95, 1105-1116.
Salminen, S., Saari, J., Saarela, K. L. and Räsänen, T. (1992). Fatal and non-fatal occupational accidents: identical versus differential causation. Safety Science, 15, 109-118.
Salmon, P. M., Stanton, N. A., Lenné, M., Jenkins, D. P., Rafferty, L. and Walker, G. H. (2011). Human Factors Methods and Accident Analysis - Practical Guidance and Case Study Applications, Farnham, UK, Ashgate.
Schenk, C. J., Viger, R. J. and Anderson, C. P. (2009). Maps Showing Geology, Oil and Gas Fields and Geologic Provinces of the South America Region. Denver, USA: USGS.
Schluter, J., Seaton, P. and Chaboyer, W. (2008). Critical incident technique: a user’s guide for nurse researchers. Journal of Advanced Nursing, 61, 107-114.
Schmidt, R. T. (1999). Reduce Risk of Inducing Spatial Disorientation Using Physiological Compatible Ground Lighting. Aviation, Space, and Environmental Medicine, 70, 598-603.
Selvi, O. (2011). Monitoring the Status of the European Central Repository (ECR). Ispra, Italy: European Commission - Joint Research Centre.
319
Shanon, H. S. and Manning, D. P. (1980). Differences between lost-time and non-lost-time
industrial accidents. Journal of Occupational Accidents, 2, 265-272. Shepherd, A. (2000). HTA as a framework for task analysis. In: ANNETT, J. & STANTON,
N. A. (eds.) Task analysis. London: Taylor & Francis. Sheskin, D. J. (2004). Handbook of Parametric and Nonparametric Statistical Procedures,
Boca Raton, Florida, CRC Press. Shorrock, S. T. and Kirwan, B. (2002). Development and application of a human error
identification tool for air traffic control. Applied Ergonomics, 33, 319–336. Shryane, N. M., Westerman, S. J., Crawshaw, C. M., Hockey, G. R. J. and Saur, J. (2000).
Task analysis for the investigation of human error in safety-critical software design: a convergent methods approach. In: ANNETT, J. & STANTON, N. A. (eds.) Task analysis. London: Taylor and Francis.
Simons, R., Wilschut, E. S. and Valk, P. J. L. (2011). Sleep and Alertness in North Sea Helicopter Operations. Aviation, Space and Environmental Medicine, 82.
Skjerve, A. B. (2008). The use of mindful safety practices at Norwegian petroleum installations. Safety Science, 46, 1002-1015.
Sklet, S. (2004). Comparison of some selected methods for accident investigation. Journal of Hazardous Materials, 111, 29-37.
Skogdalen, J. E. and Vinnem, J. E. (2011). Quantitative risk analysis offshore - Human and organizational factors. Reliability Engineering & System Safety, 96, 468-479.
Skybrary (2010). Flight Phase Taxonomy [Online]. 2012. Available: http://www.skybrary.aero/index.php/Flight_Phase_Taxonomy [Accessed 05/06 2012].
Slovic, P. (2000). The Perception of Risk, London and Sterling, VA., Earthscan Publications Ltd.
SMICG (2010a). A Common Approach to Safety Performance Measurement [Online]. Safety Management International Collaboration Group. Available: http://www.skybrary.aero/bookshelf/books/1780.pdf [Accessed 06/11 2013].
SMICG (2010b). Development of a Common Taxonomy for Hazards [Online]. Safety Management International Collaborating Working Group. Available: http://www.skybrary.aero/bookshelf/books/1779.pdf [Accessed 06/11 2013].
SMICG (2010c). Risk Based Decision Making Principles [Online]. Safety Management International Collaboration Group. Available: http://www.skybrary.aero/bookshelf/books/2077.pdf [Accessed 06/11 2013].
SMICG (2013a). Hazard Taxonomy Examples [Online]. Safety Management International Collaboration Group. Available: http://www.skybrary.aero/bookshelf/books/2301.pdf [Accessed 06/11 2013].
SMICG (2013b). Measuring Safety Performance - Guidelines for Service Providers [Online]. Safety Management International Collaboration Group. Available: http://www.skybrary.aero/bookshelf/books/2395.pdf [Accessed 06/11 2013].
SMICG (2013c). Risk Based Decision Making Principles [Online]. Safety Management International Collaboration Group. Available: http://www.skybrary.aero/bookshelf/books/2077.pdf [Accessed 06/11 2013].
Smith, A. J. and Foster, H. J. (1995). Helicopter Pilot View, CAA Paper 95014. London: CAA.
Smith, C. A., Cummings, M. L. and Sim, L. (2008). Developing Lunar Landing Vehicle Display Requirements through Content Analysis of Apollo Lunar Landing Voice Communications. International Journal of Aviation Psychology, 18p, 237-254.
320
Smith, C. L. and Borgonovo, E. (2007). Decision Making During Nuclear Power Plant
Incidents—A New Approach to the Evaluation of Precursor Events. Risk Analysis, 27, 1027-1042.
Smith, P. C. and Kendall, L. M. (1963). Retranslation of expectations: an approach to the construction of unambiguous anchors for rating scales. Journal of Applied Psychology, 47, 149-155.
Snook, S. A. (2000). Friendly Fire: The Accidental Shootdown of U.S. Black Hawks over Northern Iraq, Princeton, NJ, USA, Princeton University Press.
Soares, C. G. and Teixeira, A. P. (2001). Risk assessment in maritime transportation. Reliability Engineering & System Safety, 74, 299-309.
Sosa, L. A. C. (2010). Implementation of Helicopter Regular Air Transport at Santos Basin: Consequences for the Rio - Sao Paulo Terminal Area. Conexão SIPAer, 1, 146 - 158.
Spanos, A. (2006). Where do statistical models come from? Revisiting the problem of specification. The Second Erich L. Lehmann Symposium – Optimality. Institute of Mathematical Statistics - Virginia Polytechnic Institute and State University.
Spender, G. (2012). Griffin Helicopters [Online]. Available: http://www.griffin-helicopters.co.uk/accidents.aspx [Accessed 05/06 2012].
Sprent, P. and Smeeton, N. C. (2001). Applied Nonparametric Statistical Methods, Boca Raton, Florida, CRC Press.
Stanton, N. A. and Annett, J. (2000). Future directions in task analysis. In: ANNETT, J. & STANTON, N. A. (eds.) Task analysis. London: Taylor and Francis.
Stanton, N. A. and Stevenage, S. V. (2000). Learning to predict human error: issues of acceptability, reliability and validity. In: ANNETT, J. & STANTON, N. A. (eds.) Task analysis. London: Taylor and Francis.
Steckel, R. J. and Patankar, M. S. (2012). The Application of Line Operation Safety Assessment (LOSA) and Flight Data Management Technologies to General Aviation Flight Training. 4th International Conference on Applied Human Factors and Ergonomics (AHFE). San Francisco, USA.
Stevens, M. (2013). Aviation safety in the oil & gas business. Vancouver, Canada: CHC Safety and Quality Summit.
Stewart, J. E. (2008). Locus of Control and Self-Attribution as Mediators of Hazardous Attitudes among Aviators: Review and Suggested Applications. International Journal of Applied Aviation Studies, 8, 263-279.
Stolte, W., Vogt, J. and Weber, C. (2010). Controlling Practical Drift in High Reliability Organizations. International Journal of Applied Aviation Studies, 10, 30-49.
Stolzer, A. J., Halford, C. D. and Goglia, J. J. (2008). Safety Management Systems in Aviation, Aldershot, Ashgate.
Stolzer, A. J., Halford, C. D. and Goglia, J. J. (2011). Introduction by Alan Stolzer, Carl Halford and John Goglia. In: STOLZER, A. J., HALFORD, C. D. & GOGLIA, J. J. (eds.) Implementing Safety Management Systems in Aviation. Farnham, UK: Ashgate.
Strauss, A. L. and Corbin, J. (1998). Basics of Qualitative Research: Techniques and Procedures for Developing Grounded Theory, London, Sage.
Subotic, B., Ochieng, W. and Majumdar, A. (2005). Equipment Failure in ATC: Finding an appropriate safety target. The Aeronautical Journal, 109, 277-284.
Subotic, B., Ochieng, W. Y. and Straeter, O. (2007). Recovery from equipment failures in ATC: Determination of contextual factors. Reliability Engineering & System Safety, 92, 858-870.
Svedung, I. and Rasmussen, J. (2002). Graphic representation of accident scenarios: mapping system structure and the causation of accidents. Safety Science, 40, 397-417.
321
Swartz, K. I. (2014). Offshore Canada. Vertiflight. Alexandria, USA: American Helicopter
Society. Tabary, D. (2006). An Initial Investigation into the Implications for the Cockpit and Cabin
Crews of Locking the Cockpit Door. M.Sc., Cranfield University. Taber, M. and McCabe, J. (2006). Helicopter Ditching: Time of Crash and Survivability.
SAFE Journal, 34, 5-10. Talbot, N. and Webber, M. L. (1988). Helicopter Fog Flying Trials. Gatwick, England: CAA. Taneja, N. and Wiegmann, D. A. (2003). Analysis of Injuries among Pilots Killed in Fatal
Helicopter Accidents. Aviation, Space and Environmental Medicine, 74, 337-341. Teixeira, S. (2006). Helicopter Flight Operational Quality Assurance (HFOQA):
Development of HFOQA Analysis Software. M.Sc., Embry-Riddle Aeronautical University.
Tharaldsen, J. E., Olsen, E. and Rundmo, T. (2008). A longitudinal study of safety climate on the Norwegian continental shelf. Safety Science, 46, 427-439.
The National Archives (1996). The Civil Aviation (Investigation of Air Accidents and Incidents) Regulations 1996 [Online]. [Accessed 14/10 2013].
Tormes, F. R. and Guedry, F. E. (1975). Disorientation Phenomena in Naval Helicopter Pilots. Aviation, Space, and Environmental Medicine, 46, 387-393.
Transport Canada (2008). Advisory Circular 107-001 - Guidance on Safety Management System Development. Transport Canada.
Transport Canada (2012). Civil Aviation Daily Occurrence Reporting System (CADORS) : Query [Online]. Available: http://wwwapps.tc.gc.ca/Saf-Sec-Sur/2/cadors-screaq/qs.aspx?lang=eng [Accessed 10/06 2012].
Trbojevic, V. M. and Carr, B. J. (2000). Risk based methodology for safety improvements in ports. Journal of Hazardous Materials, 71, 467-480.
Trucco, P. and Leva, M. C. (2007). A probabilistic cognitive simulator for HRA studies (PROCOS). Reliability Engineering & System Safety, 92, 1117-1130.
TSB Canada (2011). Aviation Investigation Report A09A0016. Quebec: TSB Canada. U.S. JHSAT (2007). Calendar Year 2000 Report to the International Helicopter Safety Team.
USA: U.S. Joint Helicopter Safety Analysis Team. U.S. JHSAT (2009). Calendar Year 2001 Report to the International Helicopter Safety Team.
USA: U.S. Joint Helicopter Safety Analysis Team. U.S. Joint Helicopter Safety Analysis Team (2011a). The Compendium Report: The U.S.
JHSAT Baseline of Helicopter Accident Analysis, Volume I (CY2000, CY2001, CY2006). IHST.
U.S. Joint Helicopter Safety Analysis Team (2011b). The Compendium Report: The U.S. JHSAT Baseline of Helicopter Accident Analysis, Volume II (CY2000, CY2001, CY2006). IHST.
U.S.JHSAT (2010). Calendar Year 2006 Report to the International Helicopter Safety Team. USA: U.S. Joint Helicopter Safety Analysis Team.
Urquharta, C., Lightb, A., Thomasa, R., Barkera, A., Yeomana, A., Coopera, J., Armstrongc, C., Fentonc, R., Lonsdalea, R. and Spinka, S. (2003). Critical incident technique and explicitation interviewing in studies of information behavior. Library & Information Science Research, 25, 63-88.
USNO (2012). Complete Sun and Moon Data for One Day [Online]. USNO. Available: http://aa.usno.navy.mil/data/docs/RS_OneDay.php [Accessed 11/06 2012].
Valner, J. and Leighton, S. J. (2009). Validation of EGNOS Helicopter Approach Procedures to North Sea Oil Platforms. The Journal of Navigation, 62, 189-201.
322
van der Schaaf, T. and Kanse, L. (2004a). Biases in incident reporting databases: an empirical
study in the chemical process industry. Safety Science, 42, 57-67. van der Schaaf, T. and Kanse, L. (2004b). Checking for Biases in Incident Reporting. In:
PHIMISTER, J. R., BIER, V. M. & KUNREUTHER, H. C. (eds.) Accident Precursor Analysis and Management: Reducing Technological Risk Through Diligence. Washington, D.C.: National Academy of Engineering.
Ventikos, N. P. and Psaraftis, H. N. (2004). Spill accident modeling: a critical survey of the event-decision network in the context of IMO’s formal safety assessment. Journal of Hazardous Materials, 107, 59-66.
Vinnem, J. E. (1998). Evaluation of methodology for QRA in offshore operations. Reliability Engineering & System Safety, 61, 39-52.
Vinnem, J. E. (2008). On the risk to personnel in the offshore industry. PSAM 9. Hong Kong. Vinnem, J. E. (2010). Risk indicators for major hazards on offshore installations. Safety
Science, 48, 770-787. Vinnem, J. E. (2011). Evaluation of offshore emergency preparedness in view of rare
accidents. Safety Science, 49, 178-191. Vinnem, J. E., Aven, T., Husebø, T., Seljelid, J. and Tveit, O. J. (2006). Major hazard risk
indicators for monitoring of trends in the Norwegian offshore petroleum sector. Reliability Engineering & System Safety, 91, 778-791.
Vinnem, J. E., Seljelid, J., Haugen, S., Sklet, S. and Aven, T. (2009). Generalized methodology for operational risk analysis of offshore installations. Proceedings of the Institution of Mechanical Engineers, Part O: Journal of Risk and Reliability, 223, 87-97.
Wand, Y. and Wang, R. Y. (1996). Anchoring data quality dimensions in ontological foundations. Commun. ACM, 39, 86-95.
Wang, J. (2002). Offshore safety case approach and formal safety assessment of ships. Journal of Safety Research, 33, 81-115.
Wang, R. W. and Strong, D. M. (1996). Beyond Accuracy: What Data Quality Means to Data Consumers. Journal of Management Information Systems, 12, 5-33.
Warner, H. W. and Sandin, J. (2010). The intercoder agreement when using the Driving Reliability and Error Analysis Method in road traffic accident investigations. Safety Science, 48, 527-536.
Webb, R. D. G. and Lamoureux, T. M. (2003). Human Reliability and Ship Stability. Ontario, Canada: Department of National Defence.
Webler, T., Rakel, H., Renn, O. and Johnson, B. (1995). Eliciting and Classifying Concerns: A Methodological Critique. Risk Analysis, 15, 421-436.
Weick, K. E. (1987). Organizational Culture as a Source of High Reliability. California Management Review, 29, 112-127.
Westrum, R. (1988). Organisational and inter-organisational thought. World Bank Workshop on Safety, Control and Risk Management. Washington, D.C.
Westrum, R. (1991). Cultures with requisite imagination. In: WISE, J., STAGER, P. & HOPKIN, J. (eds.) Verification and Validation in Complex Man–Machine Systems. New York: Springer.
Westrum, R. (2006). A typology of resilience situations. In: HOLLNAGEL, E., WOODS, D. D. & LEVESON, N. G. (eds.) Resilience Engineering: Concepts and Precepts. Aldershot, UK: Ashgate.
Wheatcroft, P. (2010). The Next Crisis: Prepare for Peak Oil [Online]. New York: The Wall Street Journal. Available: http://online.wsj.com/news/articles/SB10001424052748704140104575057260398292350 [Accessed 25/11 2013].
323
Wickens, C. D. and Carswell, C. M. (2006). Information Processing. In: SALVENDY, G.
(ed.) Handbook of Human Factors and Ergonomics. 3rd ed. Hoboken, NJ. Wiegmann, D. A. and Shappell, S. A. (2003). A Human Error Approach to Aviation Accident
Analysis: the Human Factors Analysis and Classification System, Aldershot, Ashgate. Wilke, S., Majumdar, A. and Ochieng, W. Y. (2014). Airport surface operations: A holistic
framework for operations modeling and risk management. Safety Science, 63, 18-33. Williams, B. (2012). 2011 Helicopter Safety Advisory Conference (HSAC) Gulf of Mexico
Offshore Helicopter Operations and Safety Review [Online]. Available: http://www5.verticalgateway.com/portals/45/hsac2011.pdf [Accessed 16/05 2012].
Williams, R. (2000). Worldwide Oil Industry Helicopter Operations and Safety Review. SPE International Conference on Health, Safety and the Environment in Oil and Gas Exploration and Production. Stavanger: Society of Petroleum Engineers.
Woo, D. M. and Vicente, K. J. (2003). Sociotechnical systems, risk management, and public health: comparing the North Battleford and Walkerton outbreaks. Reliability Engineering & System Safety, 80, 253-269.
Woolsey, L. K. (1986). The Critical Incident Technique. An Innovative Qualitative Method of Research. Canadian Journal of Counselling, 20, 242-254.
Yantiss, B. (2011). SMS Implementation. In: STOLZER, A. J., CARL, D. H. & GOGLIA, J. J. (eds.) Implementing Safety Management Systems in Aviation. Farnham, UK: Ashgate.
Young, L. R. (2003). Spatial Orientation. In: TSANG, P. S. & VIDULICH, M. A. (eds.) Principles and Practice of Aviation Psychology. Mahwah, N.J.: Lawrence Erlbaum.
Zionts, S. (1979). MCDM - if not a Roman numeral, then what? Interfaces, 9, 94-101. Zoers, R. (2005). Helicopter Safety in the Oil and Gas Business (OGP version of Shell's 7 in
7 = 1) [Online]. OGP. Available: http://info.ogp.org.uk/tpes/Programmes/aviation/Breakout2/HeliSafety.pdf [Accessed Web Page 2010].
324
APPENDIX 1
Summary of the safety aspects of the Annexes of the Convention on International Civil Aviation (ICAO, 2006a) and their limitations in offshore helicopter transportation
Annex 1 – Personnel Licensing (ICAO, 2011a)
This annex provides the international standards and recommended practices for the licensing
of flight crew members, aircraft maintenance engineers, air traffic controllers, flight
dispatchers, aeronautical station operators and aeronautical meteorological personnel. With a
view to ensuring confidence in safe air travel, the annex establishes the age, knowledge, skill,
medical fitness and experience requirements for each such profession. For example,
exercising the privileges of professional helicopter pilot requires considerable flight
experience (i.e., minimum of 150 and 1000 hours of flight time for commercial and air
transport pilots, respectively) and demonstrated knowledge and skills in relation to air law,
aircraft characteristics, flight performance, planning and loading, human performance,
meteorology, navigation, operational procedures, principles of flight and radiotelephony.
However, there are no provisions in the annex for the closed-loop control (Hollnagel, 2009)
of the effectiveness of the proposed requirements and their update where needed. Likewise,
there are no provisions which focus on pilot currency and recency in the mission that they
intend to perform. Existing currency and recency provisions are only established for the
aircraft type used.
Annex 2 – Rules of the Air (ICAO, 2005a)
This annex establishes a set of internationally agreed rules devised to ensure safe and
efficient air travel. The rules consist of general rules (which apply to all aircraft at all times
and mostly concern right-of-way provisions), instrument and visual flight rules (IFR and
VFR, respectively).
325
Prevailing visibility, distance from clouds and ceiling at the time of the flight primarily
dictate which one of the latter two rules (i.e., IFR or VFR) shall be applied by pilots, in
addition to the general rules. However, this IFR/VFR dichotomous classification has been
disputed, given that a range of perceptual states exists which cannot be expressed exclusively
by these two rules. For example, there are cases in which, while the prescribed VFR limits
might have been met, there are nonetheless insufficient visual cues in the external
environment to allow for human spatial orientation. Hence, adopting a visually-guided
aircraft control strategy (i.e., VFR) would be inappropriate. Such conditions are collectively
labelled degraded visual environments (DVE) and include nighttime flights over water
(‘black-out’ condition); daytime flights over water in horizon-less conditions, still water
surface and no atmospheric formation (i.e., when the sea and sky blend to form a ‘grey-out’
condition); flights over icy surfaces (i.e., ‘white-out’ condition); and flights over desert
regions (brown-out conditions). DVE render helicopter pilots to be especially susceptible to
spatial disorientation (CAA, 2007). Yet, DVE cannot be identified based on Annex 2’s
provisions.
Annex 3 – Meteorological Services for International Air Navigation (ICAO, 2010a)
This annex aims to ensure that pilots, operators, air traffic service units, search and rescue
units, airport management and others concerned with aviation will be informed about the
meteorological conditions along the routes to be flown and at the destination aerodromes.
This annex addresses offshore helicopter operations specifically when it recommends the
establishment of aeronautical meteorological stations on offshore structures or at points
where support to offshore helicopter operations can be provided. Additionally, the annex
recommends that sea surface temperature, sea state, visibility, cloud cover, barometric
pressure, icing and turbulence information be incorporated into the messages communicated
to the crews engaged in helicopters missions to offshore structures. This is an important
acknowledgement that the standard meteorological services, which are designed to support
aviation in general, are suboptimal in the offshore helicopter context.
Annex 4 – Aeronautical Charts (ICAO, 2009a)
This annex defines the obligations of States to make available aeronautical charts and specify
chart coverage, format, identification and content. The goal is to satisfy the need for
326
uniformity and consistency in the provision of aeronautical charts that contain appropriate
information of a defined quality (ICAO, 2012b).
Under the provisions of Chapter 13 - Aerodrome/Helicopter Chart – ICAO, the charts used in
helideck23 operations shall show, with metre-level accuracy, the final approach and take-off
(FATO) and touchdown and lift-off (TLOF) areas, as well as declared take-off, rejected take-
off and landing distances and types and elevations of obstacles. Safety areas and helicopter
clearways must also be shown, along with visual aids for approach, touchdown, lift-off and
take-off. Additionally, the annex establishes the data integrity requirements needed for the
proposed operation, based upon the potential risk resulting from the corruption of the data.
Whereas the helideck reference point must comply with a ‘routine’ 1 x 10⁻³ integrity
criterion, a tighter ‘essential’ 1 x 10⁻⁵ level of integrity is required from data on helideck
elevation and magnetic variation. However, the most stringent level of integrity (i.e., ‘critical’
1 x 10⁻⁸) only applies to the geometric centre of the FATO and TLOF areas (ICAO, 2009a).
This is very important in the context of offshore helicopter operations to variable height and
moving installations.
Annex 5 – Units of Measurement to be Used in Air and Ground Operations (ICAO,
2010b)
This annex relates to safety only to the extent that it standardises the units to be used in
aviation. However, no provisions address safety in offshore helicopter operations especially.
Annex 6 – Operation of Aircraft (ICAO, 2010c)
This annex contributes to efficiency and regularity of international air travel by encouraging
contracting States to facilitate the passage over their territories of commercial aircraft
belonging to other signatory States. Regarding safety, this annex provides specific criteria for
safe operating practices in air navigation (ICAO, 2012b). For example, the annex’s definition
of operation establishes the need to understand aircraft use from a hazard perspective (see
Section 2.2.2).
23 Helideck is a heliport located on a floating or fixed offshore structure ICAO (2010c). The Convention on International Civil Aviation - Annex 6 - Operation of Aircraft. 7th ed. Montréal: ICAO.
327
With particular relevance to safety of offshore helicopter operations, this annex regulates the
use of helidecks as alternative heliports, especially in relation to the need for assured deck
availability, reliable and accurate weather information, one engine inoperative performance
capability prior to arrival and a preference for onshore landing options, especially when
operating in hostile environments24. The annex also requires offshore helicopters to be
certificated for ditching25 (i.e., that the helicopter be suitable for landing on water,
considering the anticipated sea states), fitted with permanent or rapidly deployable means of
flotation and their occupants to constantly wear life jackets and survival suits when the water
temperature is below 10o C.
Annex 7 – Aircraft Nationality and Registration Marks (ICAO, 2012a)
This annex aims to turn the registration of various types of aircraft possible and simple. This
annex does not address any issue particularly relevant to safety in offshore helicopter
operations.
Annex 8 – Airworthiness of Aircraft (ICAO, 2010d)
This annex establishes the high level requirements that underpin the creation of detailed,
quantitative airworthiness specifications at a national level and facilitate mutual recognition
by States of Certificates of Airworthiness for the purpose of flight of aircraft of other State
into and over their territories.
With respect to the provisions of interest to offshore helicopter safety, this annex establishes
that maximum practical assurance shall be built into the design of helicopters certificated for
ditching conditions, so that safe evacuation of the passengers and crew is achievable.
Additionally, the annex states that the design of a helicopter shall not have any features or
characteristics that render it unsafe given the anticipated operating conditions. These are
conditions known from experience or which can be envisaged to occur during the operational
24 Hostile environments are such on which a) a forced landing cannot be accomplished because the surface and surrounding environment are inadequate, or b) the helicopter occupants cannot be adequately protected from the elements, or c) search and rescue response/capability is not provided consistent with anticipated exposure, or d) there is an unacceptable risk of endangering persons or properties on the ground. Ibid. 25 The forced landing of an aircraft on water ICAO (2004). The Convention on International Civil Aviation - Annex 12 - Search and Rescue. Montréal: ICAO.
328
life of the helicopter, taking into account the operation for which the aircraft is made eligible
with respect to, at least, atmospheric meteorological conditions, configuration of terrain,
functioning of the aircraft and efficiency of personnel. This is very important in the context of
offshore helicopter operations in novel scenarios, which might not have been anticipated
when the aircraft certification occurred.
Annex 9 – Facilitation (ICAO, 2011b)
This annex contains international standards and recommended practices which pertain
specifically to facilitation of landside formalities for clearance of aircraft and commercial
traffic through the requirements of customs, immigration, public health and agriculture
authorities (ICAO, 2012b). Therefore, this annex is not relevant to safety in offshore
helicopter operations.
Annex 10 – Aeronautical Telecommunications (ICAO, 2007b)
This annex contains the technical specifications for use of telecommunication equipments in
aeronautics. With respect to subjects of relevance to offshore helicopter transportation, the
annex emphasizes the potentially ineffective coverage of non-directional beacon (NDB) in
presence of night effects, stemming from the interaction between the components of the NDB
signal which are propagated in the horizontal plane and by reflection at the ionosphere. When
there is interaction between these components, which arrive at the automatic direction finder
(ADF) receiver with a different phase, bearing errors are introduced. Due to such errors,
NDBs are unreliable over the sea at distances greater than 320 kilometres (i.e., 172 nautical
miles), regardless of the transmission power. This is very important in regions where oil and
gas operations are executed at long distances from shore, mainly if local aeronautical
infrastructure is limited and other navigational aids are unavailable (e.g., Brazil, see
Appendix 11).
The annex additionally outlines ICAO’s strategy for the introduction and application of radio
navigation aids to support safe, efficient and flexible all-weather approach and landing
operations with vertical and both vertical and lateral guidance (i.e., APV and precision
approach and landing operations, respectively). The strategy must be applicable until, at
maximum, the year 2020 and shall be based on improvements on the following technologies:
329
instrument landing system (ILS), microwave landing system (MLS), global navigation
satellite system (GNSS) with augmentation (i.e., recipient of correcting signals from aircraft-,
ground- or satellite-based differentiating stations), head-up displays and enhanced synthetic
vision systems. This strategy has had a direct impact in ongoing offshore helicopter
operations (see Section 2.1).
Annex 11 – Air Traffic Services (ICAO, 2001)
This annex sets out standards and recommended practices which prevent collisions of aircraft
and expedite and maintain and orderly flow of air traffic. There is none but one provision in
the annex which is specific to offshore helicopter operations. This is a recommendation
whereby, when warranted by density, complexity or nature of traffic, special routes should be
established for low-level helicopter flights to and from helidecks on the high seas. The
establishment of such routes should take due account of the navigational means and
equipment available onboard when determining the lateral spacing between such routes.
Since offshore helicopter traffic can be significantly dense, in the interests of safety this
recommendation has been applied in a number of regions (e.g., Brazil, see Appendix 11).
The annex additionally establishes the accuracy and integrity requirements for determination
and reporting of air traffic-related aeronautical data, with direct applicability to helicopter
operations offshore. Obstacles, in particular, have to stem from surveyed data, comply with
an ‘essential’ 1 x 10⁻⁵ integrity level, as well as with 3 and 5 metres accuracy in terms of
geographical coordinates and height, respectively. As with the requirements outlined in annex
4, such provision of annex 11 are very important in the context of offshore helicopter
operations to variable height and moving installations.
Annex 12 – Search and Rescue (ICAO, 2004)
This annex sets forth the provisions for the establishment, maintenance and operation of
search and rescue (SAR) services by Contracting States, within their territories and over those
portions of the high seas as determined in regional air navigation agreements (ICAO, 2012b).
This is directly relevant to offshore helicopter operations as the minimum units and facilities
necessary for the provision of SAR services should, ideally, consider the anticipated exposure
330
of helicopter occupants in case of ditching and helicopter traffic density over sea areas.
However, this might not always be the case (see Appendix 11).
Annex 13 – Aircraft Accident and Incident Investigation (ICAO, 2010e)
This annex provides the international requirements for the investigation of accidents and
incidents, with the objective of prevention. The investigation process includes the gathering,
recording and analysis of all relevant information; the determination of the causes;
formulating appropriate safety recommendations and the completion of the final report.
The applicability of one fundamental provision of this annex has been particularly disputed in
the offshore helicopter industry, i.e., the definition of accident26. According to annex 13, an
accident is:
‘an occurrence associated with the operation of an aircraft which [...] takes place between
the time any person boards the aircraft with the intention of flight until such time when all
such persons have disembarked, [...] in which:
a) a person is fatally or seriously injured as a result of:
- being in the aircraft, or
- direct contact with any parts of the aircraft, including parts which have become detached from the aircraft, or
- direct exposure to jet blast,
[...]; or
b) the aircraft sustains damage or structural failure which:
- adversely affects the structural strength, performance or flight characteristics of the aircraft, and
- would normally require major repair or replacement of the affected component,
26 This argument apparently started in April, 2011 at the Professional Pilots Rumours Network (PPRUNE) at http://www.pprune.org/rotorheads/176803-gom-yet-another-ditching-10.html.
331
[...]; or
c) the aircraft is missing, or is completely inaccessible’ (pp. 1-1).
Note 1. – Regarding aircraft damage which adversely affects structural strength,
performance or flight characteristics, the aircraft may have landed safely, but cannot be
safely dispatched on a further sector without repair.
Note 2.- If the aircraft can be safely dispatched after minor repairs and subsequently
undergoes more extensive work to effect a permanent repair, then the occurrence would
not be classified as an accident. Likewise, if the aircraft can be dispatched under the CDL
[i.e., configuration deviation list] with the affected component removed, missing or
inoperative, the repair would not be considered a major repair and consequently the
occurrence would not be considered an accident’ (pp., ATT G-1).
Given the requirement for one of three conditions (i.e., a, b, or c above) and the presence of at
least one person onboard when the safety occurrence happens, the definition of accident
devised for aviation in general fails to properly cover the particular (and yet frequent) case of
catastrophic helicopter ditching. Ditchings in which uninjured occupants manage to evade the
helicopter before the environment destroys it (e.g., by wave impact, followed by inversion,
submersion and sinking) violate the definition of accident proposed by ICAO. Having no
persons onboard when the helicopter is destroyed, such occurrences can still be classified as
incidents, oblivious to the fact that the damage sustained prevents the aircraft from being
dispatched on a further sector.
Given the permissiveness of the definition mentioned above, problems of understated
accident statistics have been reported in the Gulf of Mexico (HSAC, 2012). In this area, many
catastrophic helicopter ditchings were officially classified as incidents (as opposed to
accidents), arguably to satisfy commercial or public conveniences27.
The intrinsic value of accident causes and the assumptions underpinning the accident
investigation process advocated in annex 13 have also been disputed. According to the annex,
27 http://www.pprune.org/rotorheads/176803-gom-yet-another-ditching-11.html 332

accident causes are actions, omissions, events, conditions, or combinations thereof, which led
to the accident and hence, can be determined through properly conducted accident
investigations. However, other authors (e.g., Hollnagel, 2009; Dekker, 2002; Saleh et al.,
2010) advocate that accident causes are constructed, rather than determined, according to
tacit or explicit accident investigation stop rules which satisfy social and psychological needs.
For example, during the course of an accident investigation, the investigators might be
convinced that they found the causes of the accident (and hence, that the investigation should
stop) when they reach the bottom of a taxonomy, highlight generally accepted causes (e.g.,
pilot error), comply with political, institutional or moral convenience, provide psychological
relief or exhaust the resources available for the investigation. In this case, accident
investigation is not a strictly objective and technical process. It actually is a (technically-
driven) social and psychological process which enables ‘the identification, after the fact, of a
limited set of factors or conditions that provide the necessary and sufficient conditions for the
effects to have occurred’ (Hollnagel, 2009, pp.9) when attending the prevailing stop rules. In
summary, accident causes are relative, rather than absolute, and accident investigation is a
constructive, rather than a deterministic process.
Other provisions of annex 13 are both important to and well accepted across the offshore
helicopter industry. For example, contracting States are required to establish mandatory and
voluntary occurrence reporting systems that facilitate collection of information on actual and
potential safety deficiencies. Additionally, the annex recommends that contracting States
facilitate the establishment of information sharing networks which enable the free exchange
of standardised safety-relevant content (from accident/incident investigations or otherwise)
across the industry. However, with barely any guidance provided as to how all such data
should be analysed, the implementation of these provisions vary considerably between
countries (see Section 2.3.3.1).
Finally, annex 13 recommends on the format of accident reports, the fields of which indicate
drivers to safety (and, conversely, threats to safety, i.e., hazards) in aviation to be studied
during the investigation of accidents in aviation, including nighttime offshore helicopter
operations (see Section 4.3.6).
Annex 14 - Aerodromes (ICAO, 2009b)
333
This annex establishes the international standards and recommended practices applicable to
planning, designing, constructing, operating, maintaining and managing aerodromes. Volume
II of this annex is dedicated to heliports and includes provisions specifically applicable to the
helidecks used by the offshore oil and gas industry.
Regarding offshore helidecks, the standard and recommended practices cover the physical
characteristics of touchdown and lift-off (TLOF) and final approach and take-off (FATO)
areas; geometry and markings of obstacle free, obstacle limitation and prohibited landing
sectors and surfaces; helideck dimensions needed to ensure the operability of the intended
helicopter models; maximum obstacle height permitted within the FATO area (e.g., light
fittings); structural strength and aerodynamic characteristics of the FATO area; need for and
location of safety nets and shelves at the helideck’s outer perimeter; specifications for water
repellent, skid-resistant (to both persons and helicopters) helideck surfaces; specifications for
wind direction indicators; stabilisation requirements for helicopter approach path indicators
(HAPI); and texture-rich, glare-avoiding helideck lighting specifications.
The annex additionally lists safety critical aspects of operations at offshore structures, namely
potential turbulence due to airflow direction, prevailing wind velocity and high temperatures
from gas turbine exhausts or flare radiated heat on the location of the FATO. Overall, annex
14 highlights that the offshore installations are very important drivers to the safety of
helicopter operations.
Annex 15 – Aeronautical Information Services (ICAO, 2010f)
This annex establishes the international standards and recommended practices for essential
aeronautical information. The annex reflects the increased need for timely provision of
quality aeronautical and terrain information/data as they have become critical components of
data-dependent on board navigation systems. Therefore, the annex contains many provisions
aimed at preventing erroneous or corrupt information/data which can potentially affect safety.
For example, the quality requirements for aeronautical and terrain information/data
mentioned in previous annexes (i.e., accuracy and integrity) are replicated in this annex
(ICAO, 2012b).
334
Additionally, annex 15 requires States to establish a data quality system with which all stages
of the aeronautical information/data process shall be managed.
Annex 16 – Environmental Protection (ICAO, 2011c)
This annex deals with the protection of the environment from the effects of aircraft noise and
aircraft engine emissions (ICAO, 2012b). Although the annex has specific provisions for
helicopters, safety is not dealt with in this annex. Therefore, it is not relevant for this thesis.
Annex 17 – Security (ICAO, 2011d)
This annex is mainly concerned with administrative and co-ordination aspects, as well as with
technical measures for the protection of the security of international air transport (ICAO,
2012b). This annex has no provisions specifically related to helicopters, neither to safety.
Therefore, it is not relevant for this thesis.
Annex 18 – The Safe Transport of Dangerous Goods by Air (ICAO, 2011e)
This annex specifies standard and recommended practices to be followed to enable dangerous
good to be carried safely. This annex also has no provisions specifically related to
helicopters, neither to operational safety. Therefore, it is not so relevant for this thesis.
Annex 19 – Integrated Safety Management
This is a new annex (released in November, 2013) which is not discussed in this Appendix.
However, the annex provisions are embedded into the provisions of the annexes discussed
above.
335

336
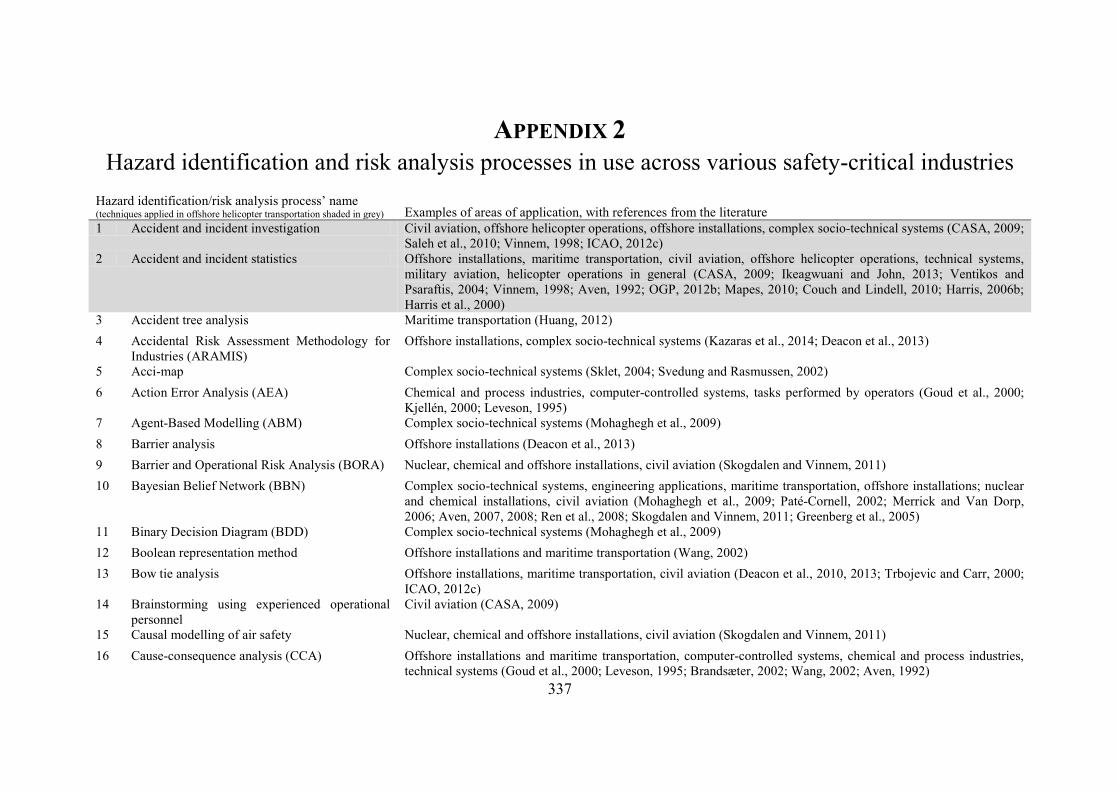
APPENDIX 2 Hazard identification and risk analysis processes in use across various safety-critical industries
Hazard identification/risk analysis process’ name (techniques applied in offshore helicopter transportation shaded in grey) Examples of areas of application, with references from the literature 1 Accident and incident investigation Civil aviation, offshore helicopter operations, offshore installations, complex socio-technical systems (CASA, 2009;
Saleh et al., 2010; Vinnem, 1998; ICAO, 2012c) 2 Accident and incident statistics Offshore installations, maritime transportation, civil aviation, offshore helicopter operations, technical systems,
military aviation, helicopter operations in general (CASA, 2009; Ikeagwuani and John, 2013; Ventikos and Psaraftis, 2004; Vinnem, 1998; Aven, 1992; OGP, 2012b; Mapes, 2010; Couch and Lindell, 2010; Harris, 2006b; Harris et al., 2000)
3 Accident tree analysis Maritime transportation (Huang, 2012) 4 Accidental Risk Assessment Methodology for
Industries (ARAMIS) Offshore installations, complex socio-technical systems (Kazaras et al., 2014; Deacon et al., 2013)
5 Acci-map Complex socio-technical systems (Sklet, 2004; Svedung and Rasmussen, 2002) 6 Action Error Analysis (AEA) Chemical and process industries, computer-controlled systems, tasks performed by operators (Goud et al., 2000;
Kjellén, 2000; Leveson, 1995) 7 Agent-Based Modelling (ABM) Complex socio-technical systems (Mohaghegh et al., 2009) 8 Barrier analysis Offshore installations (Deacon et al., 2013) 9 Barrier and Operational Risk Analysis (BORA) Nuclear, chemical and offshore installations, civil aviation (Skogdalen and Vinnem, 2011) 10 Bayesian Belief Network (BBN) Complex socio-technical systems, engineering applications, maritime transportation, offshore installations; nuclear
and chemical installations, civil aviation (Mohaghegh et al., 2009; Paté-Cornell, 2002; Merrick and Van Dorp, 2006; Aven, 2007, 2008; Ren et al., 2008; Skogdalen and Vinnem, 2011; Greenberg et al., 2005)
11 Binary Decision Diagram (BDD) Complex socio-technical systems (Mohaghegh et al., 2009) 12 Boolean representation method Offshore installations and maritime transportation (Wang, 2002) 13 Bow tie analysis Offshore installations, maritime transportation, civil aviation (Deacon et al., 2010, 2013; Trbojevic and Carr, 2000;
ICAO, 2012c) 14 Brainstorming using experienced operational
personnel Civil aviation (CASA, 2009)
15 Causal modelling of air safety Nuclear, chemical and offshore installations, civil aviation (Skogdalen and Vinnem, 2011) 16 Cause-consequence analysis (CCA) Offshore installations and maritime transportation, computer-controlled systems, chemical and process industries,
technical systems (Goud et al., 2000; Leveson, 1995; Brandsæter, 2002; Wang, 2002; Aven, 1992) 337
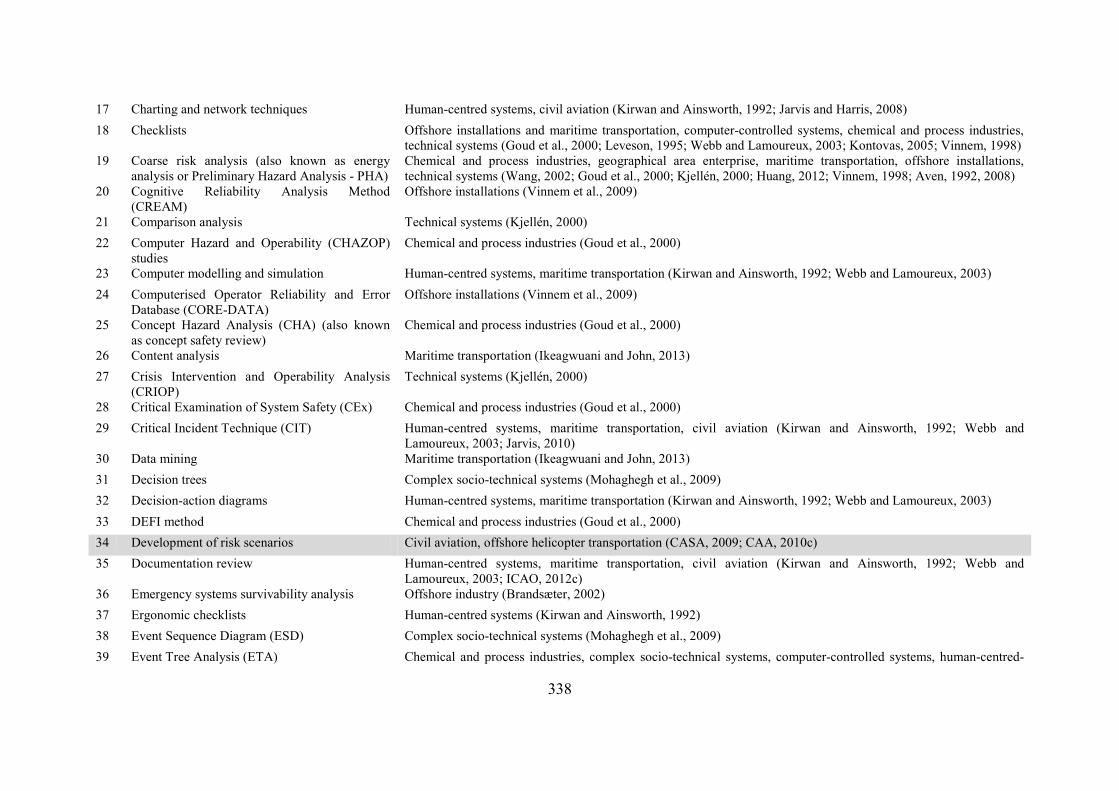
17 Charting and network techniques Human-centred systems, civil aviation (Kirwan and Ainsworth, 1992; Jarvis and Harris, 2008) 18 Checklists Offshore installations and maritime transportation, computer-controlled systems, chemical and process industries,
technical systems (Goud et al., 2000; Leveson, 1995; Webb and Lamoureux, 2003; Kontovas, 2005; Vinnem, 1998) 19 Coarse risk analysis (also known as energy
analysis or Preliminary Hazard Analysis - PHA) Chemical and process industries, geographical area enterprise, maritime transportation, offshore installations, technical systems (Wang, 2002; Goud et al., 2000; Kjellén, 2000; Huang, 2012; Vinnem, 1998; Aven, 1992, 2008)
20 Cognitive Reliability Analysis Method (CREAM)
Offshore installations (Vinnem et al., 2009)
21 Comparison analysis Technical systems (Kjellén, 2000) 22 Computer Hazard and Operability (CHAZOP)
studies Chemical and process industries (Goud et al., 2000)
23 Computer modelling and simulation Human-centred systems, maritime transportation (Kirwan and Ainsworth, 1992; Webb and Lamoureux, 2003) 24 Computerised Operator Reliability and Error
Database (CORE-DATA) Offshore installations (Vinnem et al., 2009)
25 Concept Hazard Analysis (CHA) (also known as concept safety review)
Chemical and process industries (Goud et al., 2000)
26 Content analysis Maritime transportation (Ikeagwuani and John, 2013) 27 Crisis Intervention and Operability Analysis
(CRIOP) Technical systems (Kjellén, 2000)
28 Critical Examination of System Safety (CEx) Chemical and process industries (Goud et al., 2000) 29 Critical Incident Technique (CIT) Human-centred systems, maritime transportation, civil aviation (Kirwan and Ainsworth, 1992; Webb and
Lamoureux, 2003; Jarvis, 2010) 30 Data mining Maritime transportation (Ikeagwuani and John, 2013) 31 Decision trees Complex socio-technical systems (Mohaghegh et al., 2009) 32 Decision-action diagrams Human-centred systems, maritime transportation (Kirwan and Ainsworth, 1992; Webb and Lamoureux, 2003) 33 DEFI method Chemical and process industries (Goud et al., 2000) 34 Development of risk scenarios Civil aviation, offshore helicopter transportation (CASA, 2009; CAA, 2010c) 35 Documentation review Human-centred systems, maritime transportation, civil aviation (Kirwan and Ainsworth, 1992; Webb and
Lamoureux, 2003; ICAO, 2012c) 36 Emergency systems survivability analysis Offshore industry (Brandsæter, 2002) 37 Ergonomic checklists Human-centred systems (Kirwan and Ainsworth, 1992) 38 Event Sequence Diagram (ESD) Complex socio-technical systems (Mohaghegh et al., 2009) 39 Event Tree Analysis (ETA) Chemical and process industries, complex socio-technical systems, computer-controlled systems, human-centred-
338
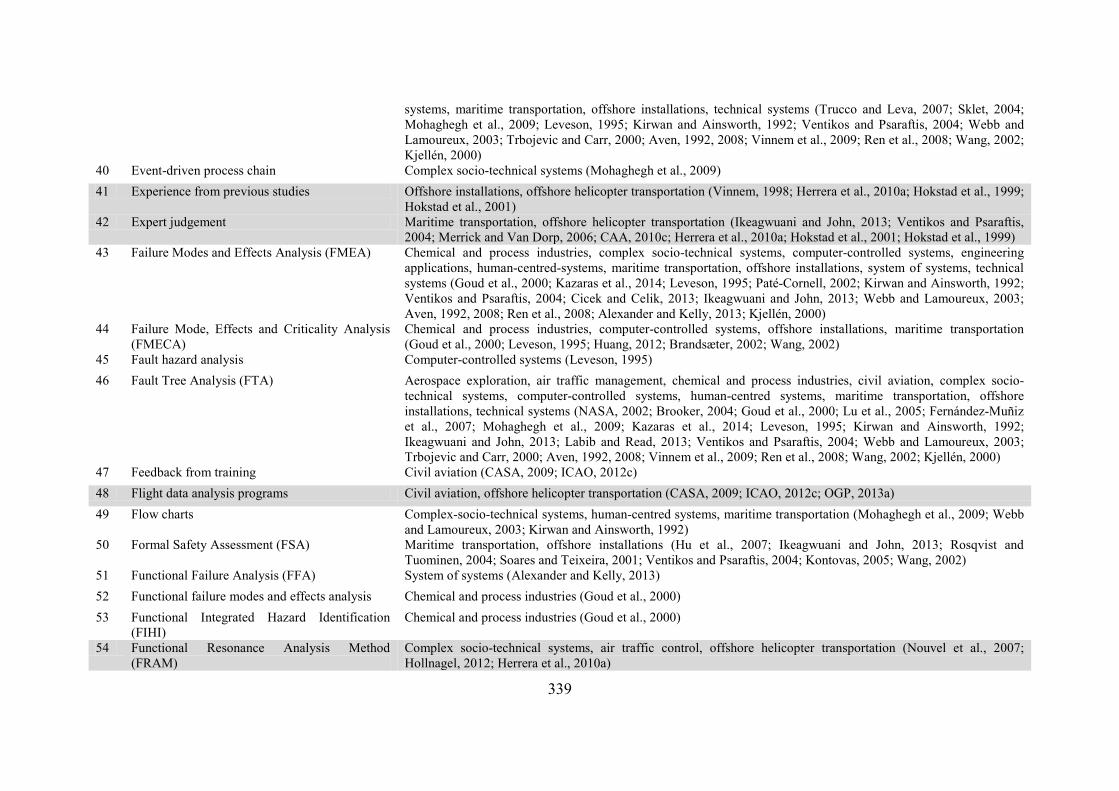
systems, maritime transportation, offshore installations, technical systems (Trucco and Leva, 2007; Sklet, 2004; Mohaghegh et al., 2009; Leveson, 1995; Kirwan and Ainsworth, 1992; Ventikos and Psaraftis, 2004; Webb and Lamoureux, 2003; Trbojevic and Carr, 2000; Aven, 1992, 2008; Vinnem et al., 2009; Ren et al., 2008; Wang, 2002; Kjellén, 2000)
40 Event-driven process chain Complex socio-technical systems (Mohaghegh et al., 2009) 41 Experience from previous studies Offshore installations, offshore helicopter transportation (Vinnem, 1998; Herrera et al., 2010a; Hokstad et al., 1999;
Hokstad et al., 2001) 42 Expert judgement Maritime transportation, offshore helicopter transportation (Ikeagwuani and John, 2013; Ventikos and Psaraftis,
2004; Merrick and Van Dorp, 2006; CAA, 2010c; Herrera et al., 2010a; Hokstad et al., 2001; Hokstad et al., 1999) 43 Failure Modes and Effects Analysis (FMEA) Chemical and process industries, complex socio-technical systems, computer-controlled systems, engineering
applications, human-centred-systems, maritime transportation, offshore installations, system of systems, technical systems (Goud et al., 2000; Kazaras et al., 2014; Leveson, 1995; Paté-Cornell, 2002; Kirwan and Ainsworth, 1992; Ventikos and Psaraftis, 2004; Cicek and Celik, 2013; Ikeagwuani and John, 2013; Webb and Lamoureux, 2003; Aven, 1992, 2008; Ren et al., 2008; Alexander and Kelly, 2013; Kjellén, 2000)
44 Failure Mode, Effects and Criticality Analysis (FMECA)
Chemical and process industries, computer-controlled systems, offshore installations, maritime transportation (Goud et al., 2000; Leveson, 1995; Huang, 2012; Brandsæter, 2002; Wang, 2002)
45 Fault hazard analysis Computer-controlled systems (Leveson, 1995) 46 Fault Tree Analysis (FTA) Aerospace exploration, air traffic management, chemical and process industries, civil aviation, complex socio-
technical systems, computer-controlled systems, human-centred systems, maritime transportation, offshore installations, technical systems (NASA, 2002; Brooker, 2004; Goud et al., 2000; Lu et al., 2005; Fernández-Muñiz et al., 2007; Mohaghegh et al., 2009; Kazaras et al., 2014; Leveson, 1995; Kirwan and Ainsworth, 1992; Ikeagwuani and John, 2013; Labib and Read, 2013; Ventikos and Psaraftis, 2004; Webb and Lamoureux, 2003; Trbojevic and Carr, 2000; Aven, 1992, 2008; Vinnem et al., 2009; Ren et al., 2008; Wang, 2002; Kjellén, 2000)
47 Feedback from training Civil aviation (CASA, 2009; ICAO, 2012c) 48 Flight data analysis programs Civil aviation, offshore helicopter transportation (CASA, 2009; ICAO, 2012c; OGP, 2013a) 49 Flow charts Complex-socio-technical systems, human-centred systems, maritime transportation (Mohaghegh et al., 2009; Webb
and Lamoureux, 2003; Kirwan and Ainsworth, 1992) 50 Formal Safety Assessment (FSA) Maritime transportation, offshore installations (Hu et al., 2007; Ikeagwuani and John, 2013; Rosqvist and
Tuominen, 2004; Soares and Teixeira, 2001; Ventikos and Psaraftis, 2004; Kontovas, 2005; Wang, 2002) 51 Functional Failure Analysis (FFA) System of systems (Alexander and Kelly, 2013) 52 Functional failure modes and effects analysis Chemical and process industries (Goud et al., 2000) 53 Functional Integrated Hazard Identification
(FIHI) Chemical and process industries (Goud et al., 2000)
54 Functional Resonance Analysis Method (FRAM)
Complex socio-technical systems, air traffic control, offshore helicopter transportation (Nouvel et al., 2007; Hollnagel, 2012; Herrera et al., 2010a)
339
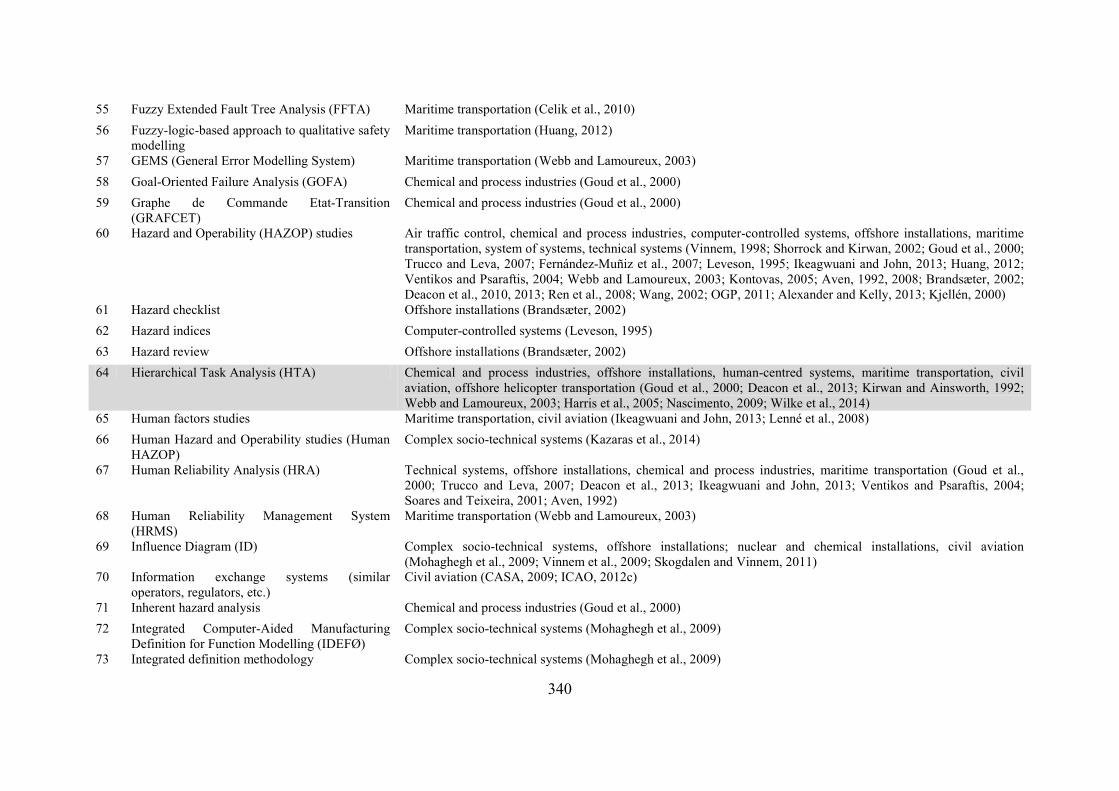
55 Fuzzy Extended Fault Tree Analysis (FFTA) Maritime transportation (Celik et al., 2010) 56 Fuzzy-logic-based approach to qualitative safety
modelling Maritime transportation (Huang, 2012)
57 GEMS (General Error Modelling System) Maritime transportation (Webb and Lamoureux, 2003) 58 Goal-Oriented Failure Analysis (GOFA) Chemical and process industries (Goud et al., 2000) 59 Graphe de Commande Etat-Transition
(GRAFCET) Chemical and process industries (Goud et al., 2000)
60 Hazard and Operability (HAZOP) studies Air traffic control, chemical and process industries, computer-controlled systems, offshore installations, maritime transportation, system of systems, technical systems (Vinnem, 1998; Shorrock and Kirwan, 2002; Goud et al., 2000; Trucco and Leva, 2007; Fernández-Muñiz et al., 2007; Leveson, 1995; Ikeagwuani and John, 2013; Huang, 2012; Ventikos and Psaraftis, 2004; Webb and Lamoureux, 2003; Kontovas, 2005; Aven, 1992, 2008; Brandsæter, 2002; Deacon et al., 2010, 2013; Ren et al., 2008; Wang, 2002; OGP, 2011; Alexander and Kelly, 2013; Kjellén, 2000)
61 Hazard checklist Offshore installations (Brandsæter, 2002) 62 Hazard indices Computer-controlled systems (Leveson, 1995) 63 Hazard review Offshore installations (Brandsæter, 2002) 64 Hierarchical Task Analysis (HTA) Chemical and process industries, offshore installations, human-centred systems, maritime transportation, civil
aviation, offshore helicopter transportation (Goud et al., 2000; Deacon et al., 2013; Kirwan and Ainsworth, 1992; Webb and Lamoureux, 2003; Harris et al., 2005; Nascimento, 2009; Wilke et al., 2014)
65 Human factors studies Maritime transportation, civil aviation (Ikeagwuani and John, 2013; Lenné et al., 2008) 66 Human Hazard and Operability studies (Human
HAZOP) Complex socio-technical systems (Kazaras et al., 2014)
67 Human Reliability Analysis (HRA) Technical systems, offshore installations, chemical and process industries, maritime transportation (Goud et al., 2000; Trucco and Leva, 2007; Deacon et al., 2013; Ikeagwuani and John, 2013; Ventikos and Psaraftis, 2004; Soares and Teixeira, 2001; Aven, 1992)
68 Human Reliability Management System (HRMS)
Maritime transportation (Webb and Lamoureux, 2003)
69 Influence Diagram (ID) Complex socio-technical systems, offshore installations; nuclear and chemical installations, civil aviation (Mohaghegh et al., 2009; Vinnem et al., 2009; Skogdalen and Vinnem, 2011)
70 Information exchange systems (similar operators, regulators, etc.)
Civil aviation (CASA, 2009; ICAO, 2012c)
71 Inherent hazard analysis Chemical and process industries (Goud et al., 2000) 72 Integrated Computer-Aided Manufacturing
Definition for Function Modelling (IDEFØ) Complex socio-technical systems (Mohaghegh et al., 2009)
73 Integrated definition methodology Complex socio-technical systems (Mohaghegh et al., 2009)
340

74 Integrated Safety Model (ISM) Nuclear, chemical and offshore installations, civil aviation (Skogdalen and Vinnem, 2011) 75 Interface analysis Computer-controlled systems (Leveson, 1995) 76 Interface hazard analysis technique System of systems (Alexander and Kelly, 2013) 77 Interface surveys Human-centred systems (Kirwan and Ainsworth, 1992) 78 Interviews Human-centred systems, maritime transportation, civil aviation, offshore helicopter transportation (Kirwan and
Ainsworth, 1992; Webb and Lamoureux, 2003; ICAO, 2012c; Nascimento, 2009) 79 I-Risk model Complex socio-technical systems, offshore installations; nuclear and chemical installations, civil aviation (Kazaras
et al., 2014; Vinnem et al., 2009; Skogdalen and Vinnem, 2011) 80 Job safety analysis Individual jobs and equipments, technical systems (Kjellén, 2000; Aven, 1992, 2008) 81 Link analysis Human-centred systems, maritime transportation (Kirwan and Ainsworth, 1992; Webb and Lamoureux, 2003) 82 Maintenance analysis Chemical and process industries (Goud et al., 2000) 83 Maintenance and Operability Study (MOp) Chemical and process industries (Goud et al., 2000) 84 Management Oversight and Risk Tree (MORT)
Analysis Complex socio-technical systems, computer-controlled systems, technical systems (Sklet, 2004; Leveson, 1995; Aven, 1992)
85 Man-Technology-Organisation (MTO) Analysis Complex socio-technical systems (Sklet, 2004) 86 Method Organised Systematic Analysis of Risk
(MOSAR) Chemical and process industries (Goud et al., 2000)
87 Model Based on Relative Risk Assessment (MRRA)
Maritime transportation (Hu et al., 2007)
88 Model of Accident Causation using Hierarchical Influence Network (MACHINE)
Nuclear, chemical and offshore installations, civil aviation (Skogdalen and Vinnem, 2011)
89 Monitoring of normal operations Civil aviation (CASA, 2009; ICAO, 2012c) 90 Monte Carlo simulation System of systems, civil aviation (Alexander and Kelly, 2013; Aven, 2008; Stolzer et al., 2008) 91 Network modelling Maritime transportation (Webb and Lamoureux, 2003) 92 Observation Human-centred systems, maritime transportation (Kirwan and Ainsworth, 1992; Webb and Lamoureux, 2003) 93 Omega factor model Nuclear, chemical and offshore installations, civil aviation (Skogdalen and Vinnem, 2011) 94 Operational Conditional Safety (OTS) Nuclear, chemical and offshore installations, civil aviation (Skogdalen and Vinnem, 2011) 95 Operational Sequence Diagrams (OSD) Human-centred systems, maritime transportation (Kirwan and Ainsworth, 1992; Webb and Lamoureux, 2003) 96 Operator task analysis Computer-controlled systems (Leveson, 1995) 97 Optimum risk analysis Complex process industries (Fernández-Muñiz et al., 2007)
341
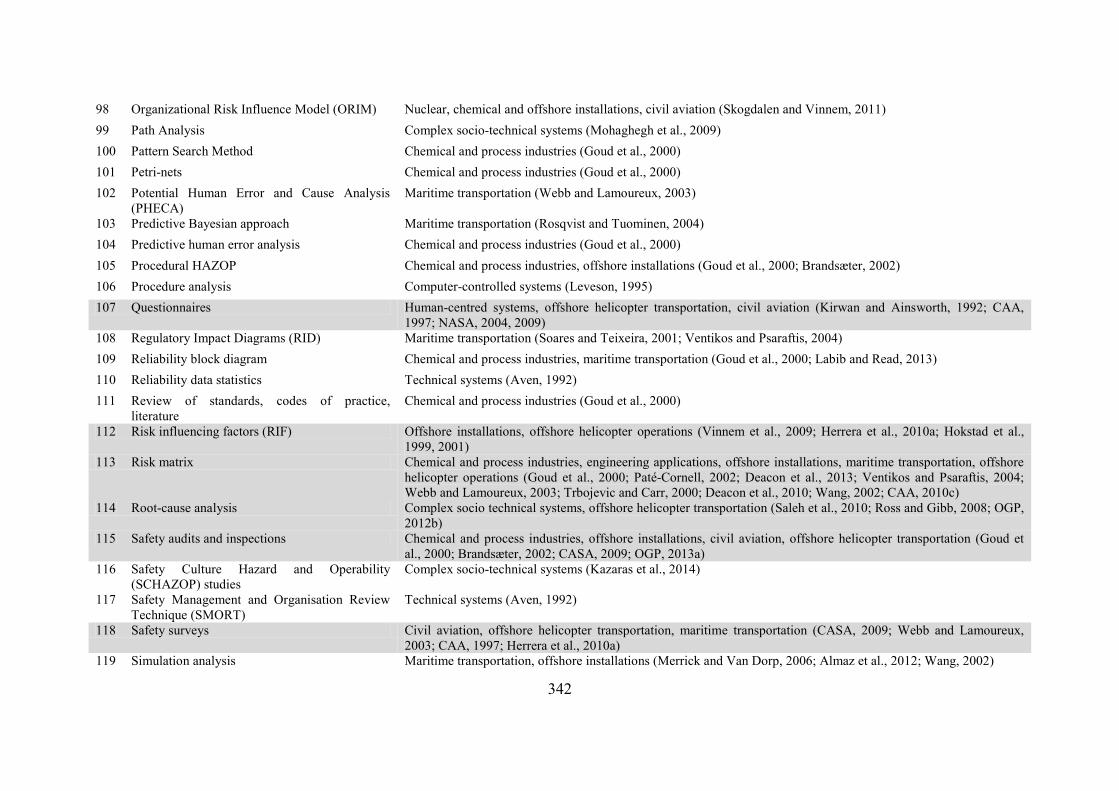
98 Organizational Risk Influence Model (ORIM) Nuclear, chemical and offshore installations, civil aviation (Skogdalen and Vinnem, 2011) 99 Path Analysis Complex socio-technical systems (Mohaghegh et al., 2009) 100 Pattern Search Method Chemical and process industries (Goud et al., 2000) 101 Petri-nets Chemical and process industries (Goud et al., 2000) 102 Potential Human Error and Cause Analysis
(PHECA) Maritime transportation (Webb and Lamoureux, 2003)
103 Predictive Bayesian approach Maritime transportation (Rosqvist and Tuominen, 2004) 104 Predictive human error analysis Chemical and process industries (Goud et al., 2000) 105 Procedural HAZOP Chemical and process industries, offshore installations (Goud et al., 2000; Brandsæter, 2002) 106 Procedure analysis Computer-controlled systems (Leveson, 1995) 107 Questionnaires Human-centred systems, offshore helicopter transportation, civil aviation (Kirwan and Ainsworth, 1992; CAA,
1997; NASA, 2004, 2009) 108 Regulatory Impact Diagrams (RID) Maritime transportation (Soares and Teixeira, 2001; Ventikos and Psaraftis, 2004) 109 Reliability block diagram Chemical and process industries, maritime transportation (Goud et al., 2000; Labib and Read, 2013) 110 Reliability data statistics Technical systems (Aven, 1992) 111 Review of standards, codes of practice,
literature Chemical and process industries (Goud et al., 2000)
112 Risk influencing factors (RIF) Offshore installations, offshore helicopter operations (Vinnem et al., 2009; Herrera et al., 2010a; Hokstad et al., 1999, 2001)
113 Risk matrix Chemical and process industries, engineering applications, offshore installations, maritime transportation, offshore helicopter operations (Goud et al., 2000; Paté-Cornell, 2002; Deacon et al., 2013; Ventikos and Psaraftis, 2004; Webb and Lamoureux, 2003; Trbojevic and Carr, 2000; Deacon et al., 2010; Wang, 2002; CAA, 2010c)
114 Root-cause analysis Complex socio technical systems, offshore helicopter transportation (Saleh et al., 2010; Ross and Gibb, 2008; OGP, 2012b)
115 Safety audits and inspections Chemical and process industries, offshore installations, civil aviation, offshore helicopter transportation (Goud et al., 2000; Brandsæter, 2002; CASA, 2009; OGP, 2013a)
116 Safety Culture Hazard and Operability (SCHAZOP) studies
Complex socio-technical systems (Kazaras et al., 2014)
117 Safety Management and Organisation Review Technique (SMORT)
Technical systems (Aven, 1992)
118 Safety surveys Civil aviation, offshore helicopter transportation, maritime transportation (CASA, 2009; Webb and Lamoureux, 2003; CAA, 1997; Herrera et al., 2010a)
119 Simulation analysis Maritime transportation, offshore installations (Merrick and Van Dorp, 2006; Almaz et al., 2012; Wang, 2002)
342
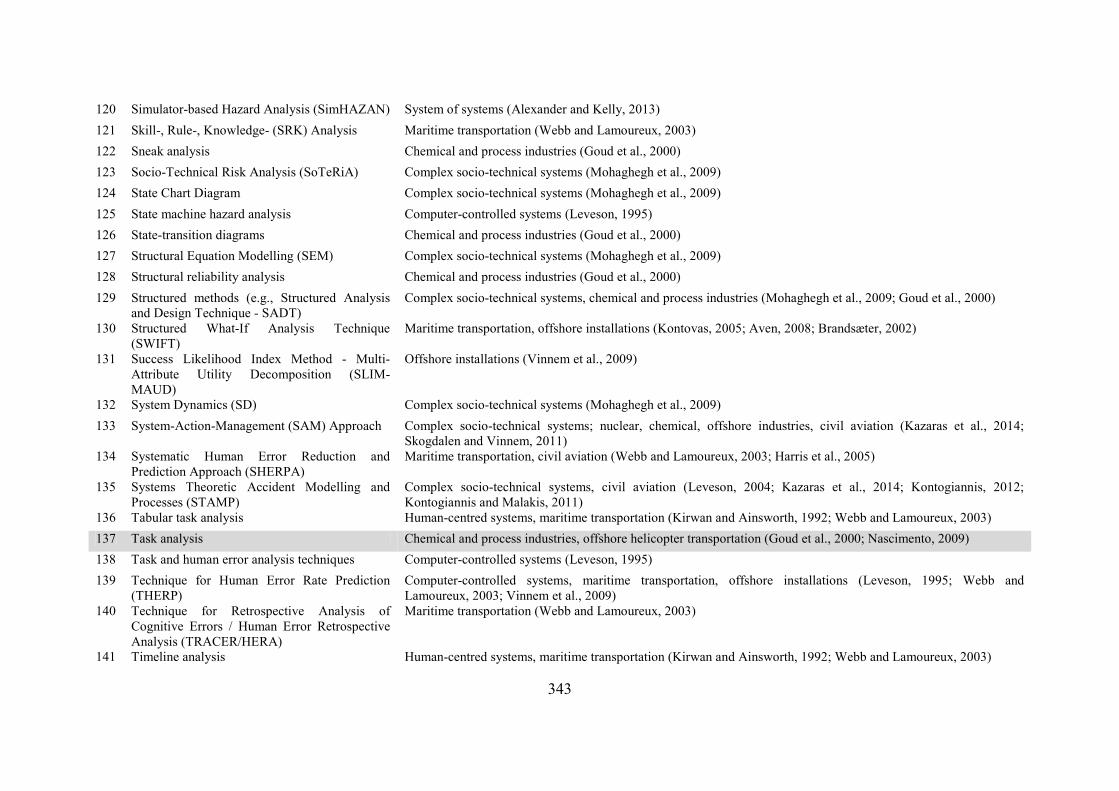
120 Simulator-based Hazard Analysis (SimHAZAN) System of systems (Alexander and Kelly, 2013) 121 Skill-, Rule-, Knowledge- (SRK) Analysis Maritime transportation (Webb and Lamoureux, 2003) 122 Sneak analysis Chemical and process industries (Goud et al., 2000) 123 Socio-Technical Risk Analysis (SoTeRiA) Complex socio-technical systems (Mohaghegh et al., 2009) 124 State Chart Diagram Complex socio-technical systems (Mohaghegh et al., 2009) 125 State machine hazard analysis Computer-controlled systems (Leveson, 1995) 126 State-transition diagrams Chemical and process industries (Goud et al., 2000) 127 Structural Equation Modelling (SEM) Complex socio-technical systems (Mohaghegh et al., 2009) 128 Structural reliability analysis Chemical and process industries (Goud et al., 2000) 129 Structured methods (e.g., Structured Analysis
and Design Technique - SADT) Complex socio-technical systems, chemical and process industries (Mohaghegh et al., 2009; Goud et al., 2000)
130 Structured What-If Analysis Technique (SWIFT)
Maritime transportation, offshore installations (Kontovas, 2005; Aven, 2008; Brandsæter, 2002)
131 Success Likelihood Index Method - Multi-Attribute Utility Decomposition (SLIM-MAUD)
Offshore installations (Vinnem et al., 2009)
132 System Dynamics (SD) Complex socio-technical systems (Mohaghegh et al., 2009) 133 System-Action-Management (SAM) Approach Complex socio-technical systems; nuclear, chemical, offshore industries, civil aviation (Kazaras et al., 2014;
Skogdalen and Vinnem, 2011) 134 Systematic Human Error Reduction and
Prediction Approach (SHERPA) Maritime transportation, civil aviation (Webb and Lamoureux, 2003; Harris et al., 2005)
135 Systems Theoretic Accident Modelling and Processes (STAMP)
Complex socio-technical systems, civil aviation (Leveson, 2004; Kazaras et al., 2014; Kontogiannis, 2012; Kontogiannis and Malakis, 2011)
136 Tabular task analysis Human-centred systems, maritime transportation (Kirwan and Ainsworth, 1992; Webb and Lamoureux, 2003) 137 Task analysis Chemical and process industries, offshore helicopter transportation (Goud et al., 2000; Nascimento, 2009) 138 Task and human error analysis techniques Computer-controlled systems (Leveson, 1995) 139 Technique for Human Error Rate Prediction
(THERP) Computer-controlled systems, maritime transportation, offshore installations (Leveson, 1995; Webb and Lamoureux, 2003; Vinnem et al., 2009)
140 Technique for Retrospective Analysis of Cognitive Errors / Human Error Retrospective Analysis (TRACER/HERA)
Maritime transportation (Webb and Lamoureux, 2003)
141 Timeline analysis Human-centred systems, maritime transportation (Kirwan and Ainsworth, 1992; Webb and Lamoureux, 2003)
343
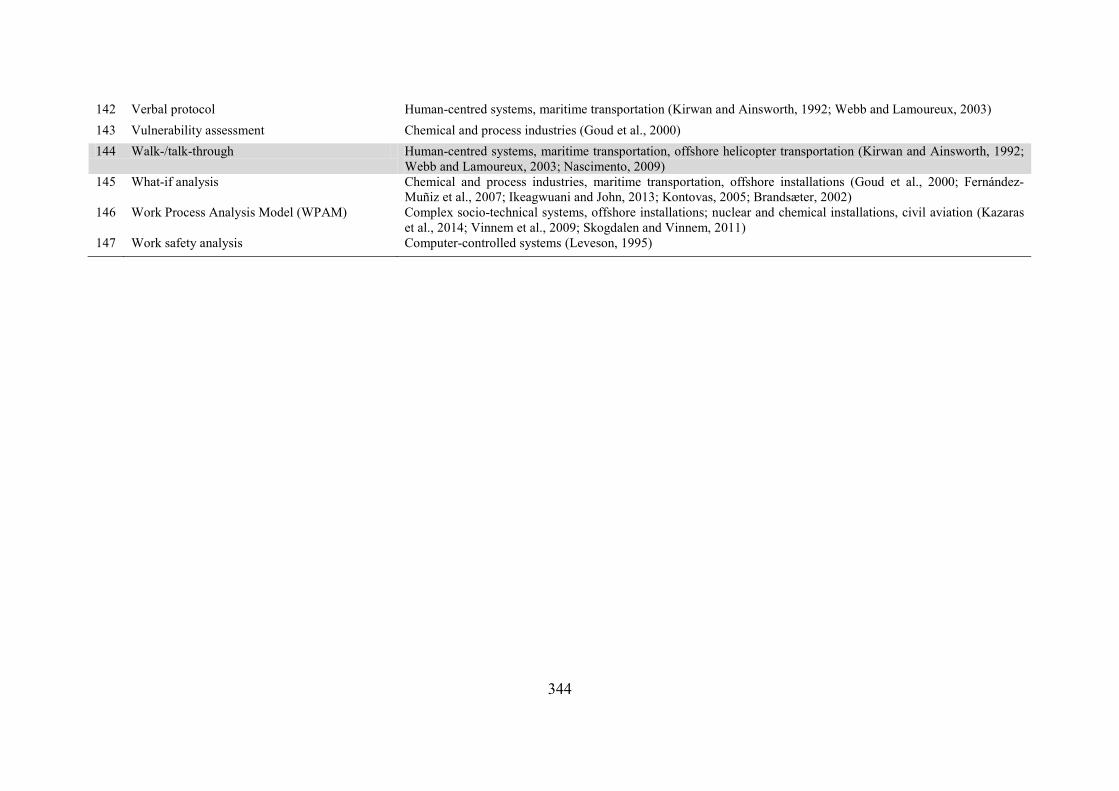
142 Verbal protocol Human-centred systems, maritime transportation (Kirwan and Ainsworth, 1992; Webb and Lamoureux, 2003) 143 Vulnerability assessment Chemical and process industries (Goud et al., 2000) 144 Walk-/talk-through Human-centred systems, maritime transportation, offshore helicopter transportation (Kirwan and Ainsworth, 1992;
Webb and Lamoureux, 2003; Nascimento, 2009) 145 What-if analysis Chemical and process industries, maritime transportation, offshore installations (Goud et al., 2000; Fernández-
Muñiz et al., 2007; Ikeagwuani and John, 2013; Kontovas, 2005; Brandsæter, 2002) 146 Work Process Analysis Model (WPAM) Complex socio-technical systems, offshore installations; nuclear and chemical installations, civil aviation (Kazaras
et al., 2014; Vinnem et al., 2009; Skogdalen and Vinnem, 2011) 147 Work safety analysis Computer-controlled systems (Leveson, 1995)
344
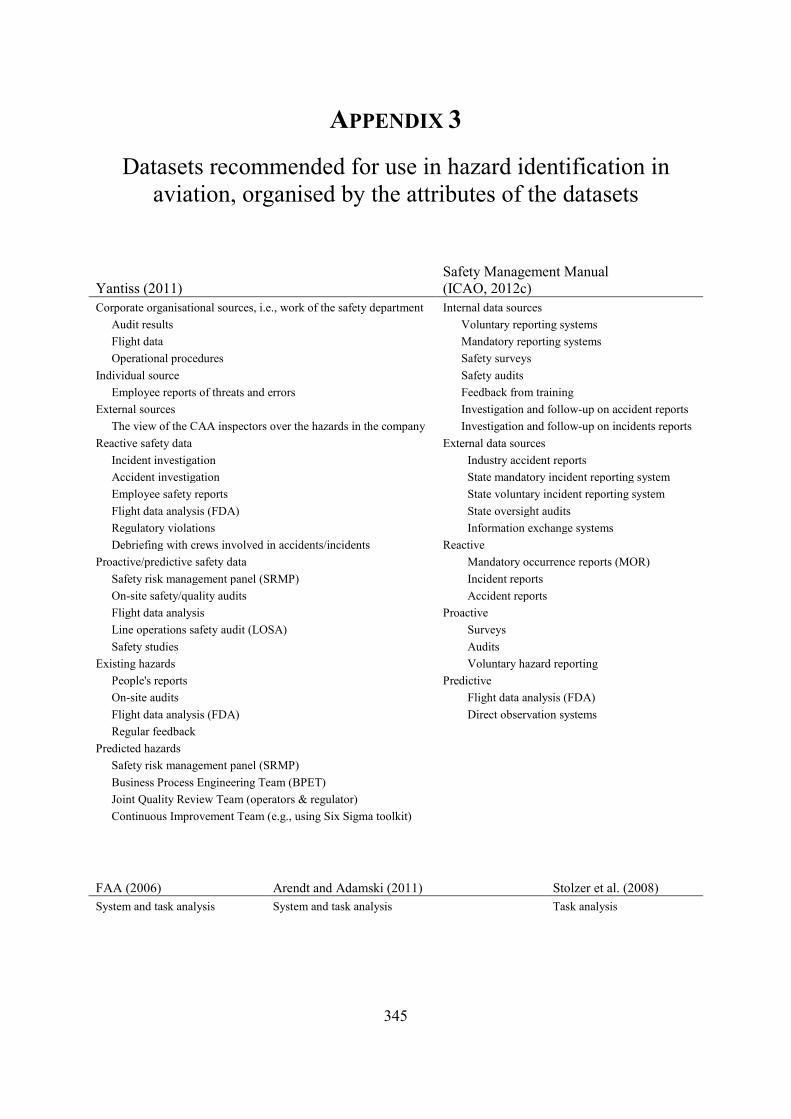
APPENDIX 3
Datasets recommended for use in hazard identification in aviation, organised by the attributes of the datasets
Yantiss (2011) Safety Management Manual (ICAO, 2012c)
Corporate organisational sources, i.e., work of the safety department Internal data sources
Audit results
Voluntary reporting systems
Flight data
Mandatory reporting systems
Operational procedures
Safety surveys
Individual source
Safety audits
Employee reports of threats and errors
Feedback from training
External sources
Investigation and follow-up on accident reports
The view of the CAA inspectors over the hazards in the company
Investigation and follow-up on incidents reports
Reactive safety data External data sources
Incident investigation
Industry accident reports
Accident investigation
State mandatory incident reporting system
Employee safety reports
State voluntary incident reporting system
Flight data analysis (FDA)
State oversight audits
Regulatory violations
Information exchange systems
Debriefing with crews involved in accidents/incidents Reactive
Proactive/predictive safety data
Mandatory occurrence reports (MOR)
Safety risk management panel (SRMP)
Incident reports
On-site safety/quality audits
Accident reports
Flight data analysis Proactive
Line operations safety audit (LOSA)
Surveys
Safety studies
Audits
Existing hazards
Voluntary hazard reporting
People's reports Predictive
On-site audits
Flight data analysis (FDA)
Flight data analysis (FDA)
Direct observation systems
Regular feedback
Predicted hazards
Safety risk management panel (SRMP)
Business Process Engineering Team (BPET)
Joint Quality Review Team (operators & regulator)
Continuous Improvement Team (e.g., using Six Sigma toolkit)
FAA (2006) Arendt and Adamski (2011) Stolzer et al. (2008) System and task analysis System and task analysis Task analysis
345
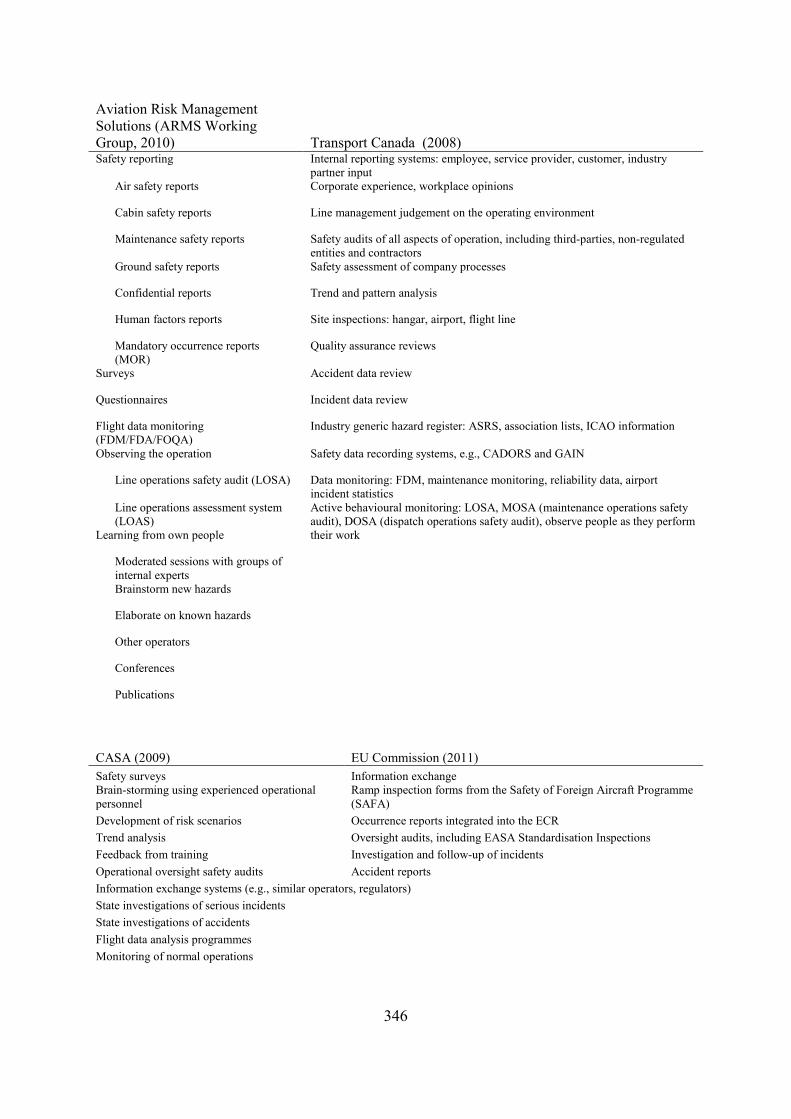
Aviation Risk Management Solutions (ARMS Working Group, 2010) Transport Canada (2008) Safety reporting Internal reporting systems: employee, service provider, customer, industry
partner input Air safety reports Corporate experience, workplace opinions
Cabin safety reports Line management judgement on the operating environment
Maintenance safety reports Safety audits of all aspects of operation, including third-parties, non-regulated entities and contractors
Ground safety reports Safety assessment of company processes
Confidential reports Trend and pattern analysis
Human factors reports Site inspections: hangar, airport, flight line
Mandatory occurrence reports (MOR)
Quality assurance reviews
Surveys Accident data review
Questionnaires Incident data review
Flight data monitoring (FDM/FDA/FOQA)
Industry generic hazard register: ASRS, association lists, ICAO information
Observing the operation Safety data recording systems, e.g., CADORS and GAIN
Line operations safety audit (LOSA) Data monitoring: FDM, maintenance monitoring, reliability data, airport incident statistics
Line operations assessment system (LOAS)
Active behavioural monitoring: LOSA, MOSA (maintenance operations safety audit), DOSA (dispatch operations safety audit), observe people as they perform their work Learning from own people
Moderated sessions with groups of internal experts
Brainstorm new hazards
Elaborate on known hazards
Other operators
Conferences
Publications
CASA (2009) EU Commission (2011) Safety surveys Information exchange Brain-storming using experienced operational personnel
Ramp inspection forms from the Safety of Foreign Aircraft Programme (SAFA)
Development of risk scenarios Occurrence reports integrated into the ECR Trend analysis Oversight audits, including EASA Standardisation Inspections Feedback from training Investigation and follow-up of incidents Operational oversight safety audits Accident reports Information exchange systems (e.g., similar operators, regulators) State investigations of serious incidents
State investigations of accidents Flight data analysis programmes Monitoring of normal operations
346
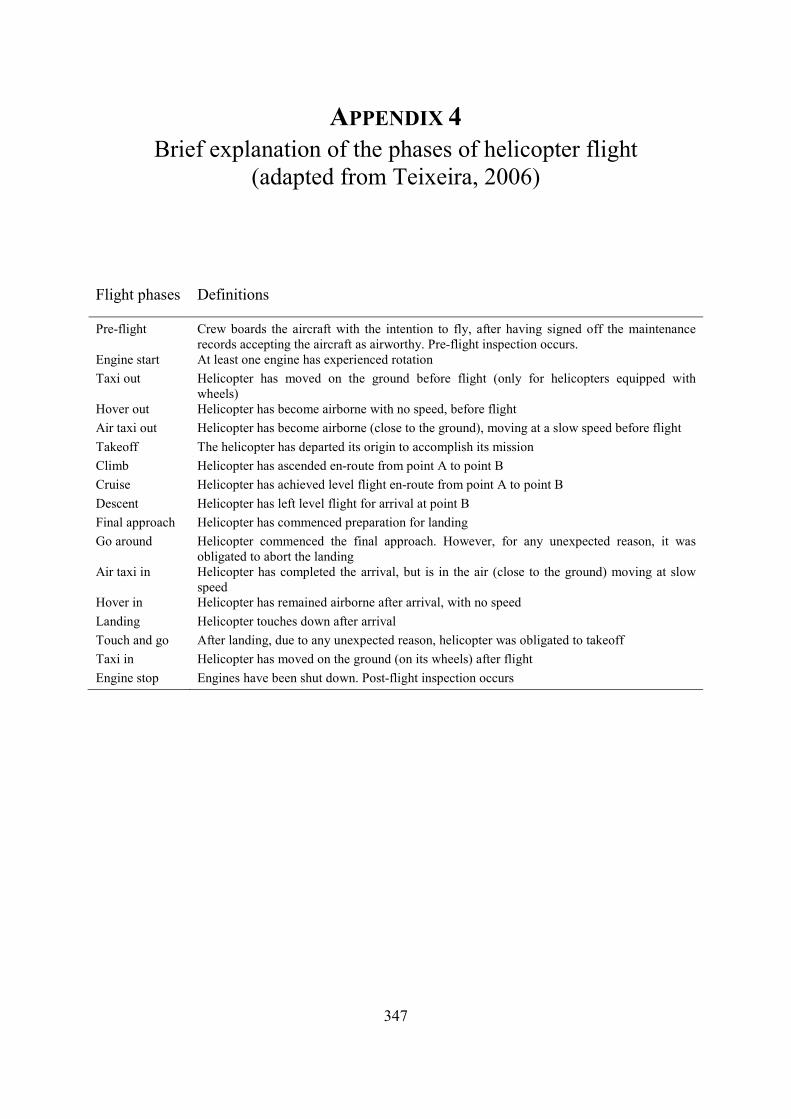
APPENDIX 4 Brief explanation of the phases of helicopter flight
(adapted from Teixeira, 2006)
Flight phases Definitions
Pre-flight Crew boards the aircraft with the intention to fly, after having signed off the maintenance records accepting the aircraft as airworthy. Pre-flight inspection occurs.
Engine start At least one engine has experienced rotation Taxi out Helicopter has moved on the ground before flight (only for helicopters equipped with
wheels) Hover out Helicopter has become airborne with no speed, before flight Air taxi out Helicopter has become airborne (close to the ground), moving at a slow speed before flight Takeoff The helicopter has departed its origin to accomplish its mission Climb Helicopter has ascended en-route from point A to point B Cruise Helicopter has achieved level flight en-route from point A to point B Descent Helicopter has left level flight for arrival at point B Final approach Helicopter has commenced preparation for landing Go around Helicopter commenced the final approach. However, for any unexpected reason, it was
obligated to abort the landing Air taxi in Helicopter has completed the arrival, but is in the air (close to the ground) moving at slow
speed Hover in Helicopter has remained airborne after arrival, with no speed Landing Helicopter touches down after arrival Touch and go After landing, due to any unexpected reason, helicopter was obligated to takeoff Taxi in Helicopter has moved on the ground (on its wheels) after flight Engine stop Engines have been shut down. Post-flight inspection occurs
347

348
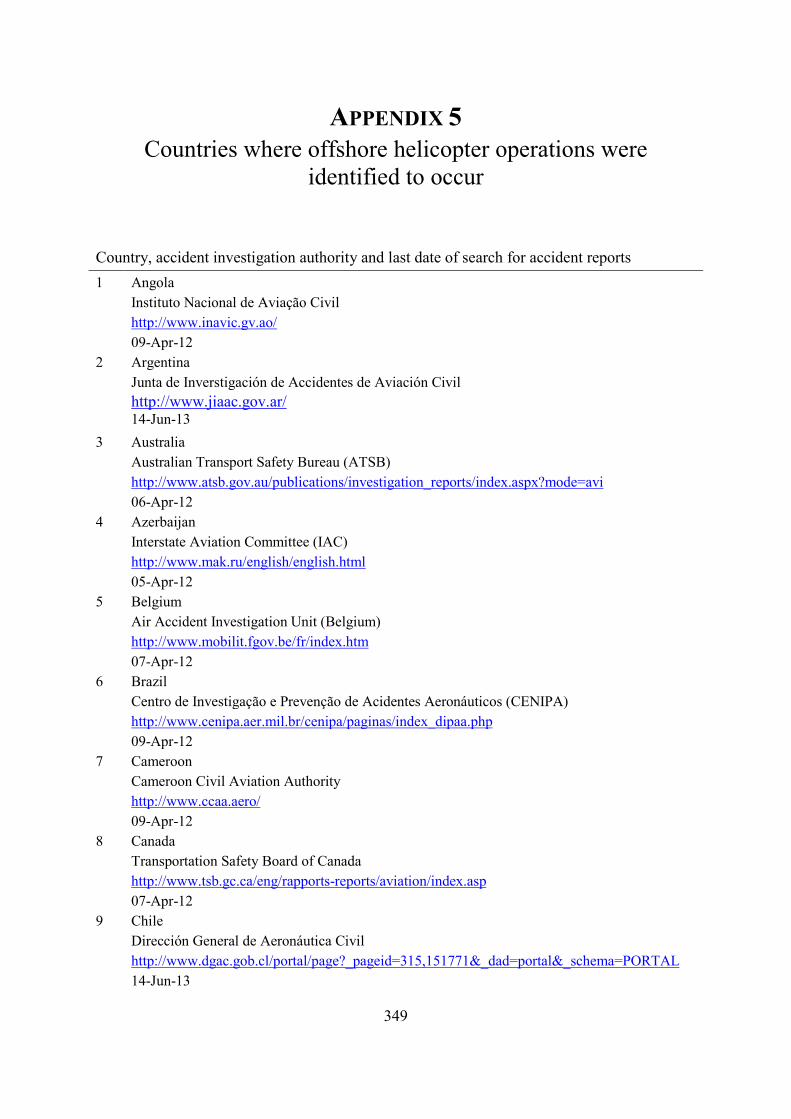
APPENDIX 5 Countries where offshore helicopter operations were
identified to occur
Country, accident investigation authority and last date of search for accident reports 1 Angola
Instituto Nacional de Aviação Civil
http://www.inavic.gv.ao/
09-Apr-12
2 Argentina
Junta de Inverstigación de Accidentes de Aviación Civil
http://www.jiaac.gov.ar/
14-Jun-13
3 Australia
Australian Transport Safety Bureau (ATSB)
http://www.atsb.gov.au/publications/investigation_reports/index.aspx?mode=avi
06-Apr-12
4 Azerbaijan
Interstate Aviation Committee (IAC)
http://www.mak.ru/english/english.html
05-Apr-12
5 Belgium
Air Accident Investigation Unit (Belgium)
http://www.mobilit.fgov.be/fr/index.htm
07-Apr-12
6 Brazil
Centro de Investigação e Prevenção de Acidentes Aeronáuticos (CENIPA)
http://www.cenipa.aer.mil.br/cenipa/paginas/index_dipaa.php
09-Apr-12
7 Cameroon
Cameroon Civil Aviation Authority
http://www.ccaa.aero/
09-Apr-12
8 Canada
Transportation Safety Board of Canada
http://www.tsb.gc.ca/eng/rapports-reports/aviation/index.asp
07-Apr-12
9 Chile
Dirección General de Aeronáutica Civil
http://www.dgac.gob.cl/portal/page?_pageid=315,151771&_dad=portal&_schema=PORTAL
14-Jun-13
349
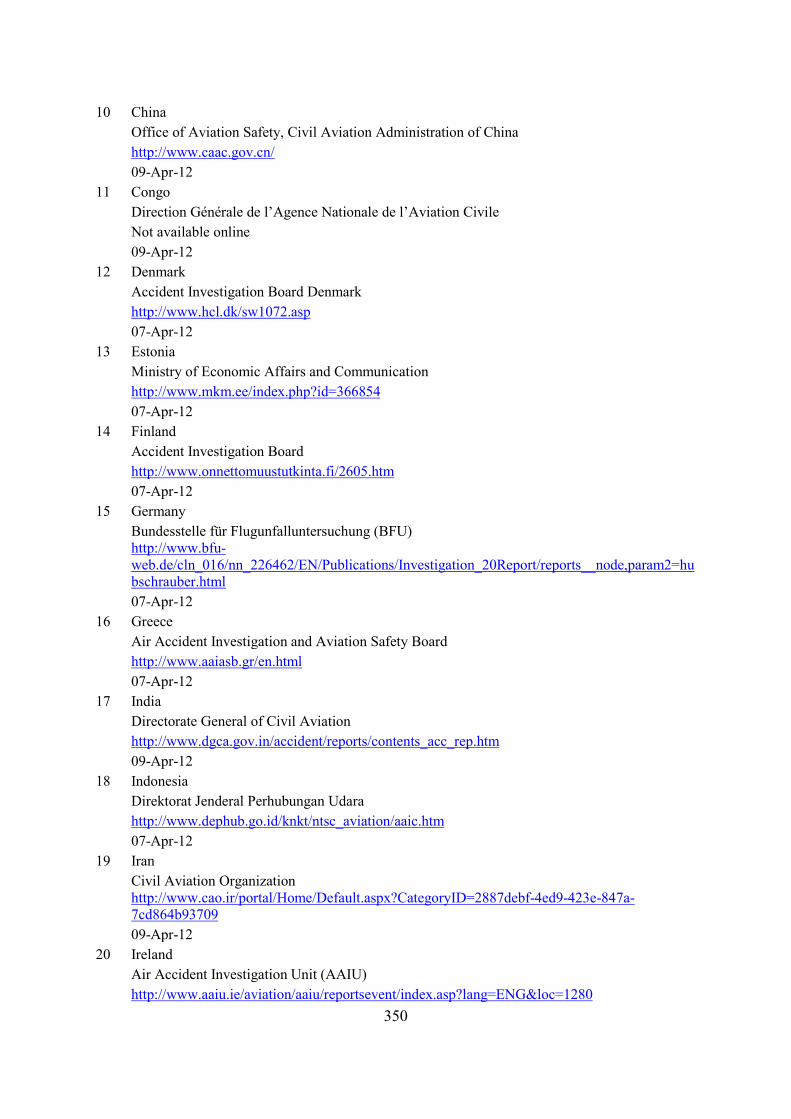
10 China
Office of Aviation Safety, Civil Aviation Administration of China
http://www.caac.gov.cn/
09-Apr-12
11 Congo
Direction Générale de l’Agence Nationale de l’Aviation Civile
Not available online
09-Apr-12
12 Denmark
Accident Investigation Board Denmark
http://www.hcl.dk/sw1072.asp
07-Apr-12
13 Estonia
Ministry of Economic Affairs and Communication
http://www.mkm.ee/index.php?id=366854
07-Apr-12
14 Finland
Accident Investigation Board
http://www.onnettomuustutkinta.fi/2605.htm
07-Apr-12
15 Germany
Bundesstelle für Flugunfalluntersuchung (BFU)
http://www.bfu-web.de/cln_016/nn_226462/EN/Publications/Investigation_20Report/reports__node,param2=hubschrauber.html
07-Apr-12
16 Greece
Air Accident Investigation and Aviation Safety Board
http://www.aaiasb.gr/en.html
07-Apr-12
17 India
Directorate General of Civil Aviation
http://www.dgca.gov.in/accident/reports/contents_acc_rep.htm
09-Apr-12
18 Indonesia
Direktorat Jenderal Perhubungan Udara
http://www.dephub.go.id/knkt/ntsc_aviation/aaic.htm
07-Apr-12
19 Iran
Civil Aviation Organization
http://www.cao.ir/portal/Home/Default.aspx?CategoryID=2887debf-4ed9-423e-847a-7cd864b93709
09-Apr-12
20 Ireland
Air Accident Investigation Unit (AAIU)
http://www.aaiu.ie/aviation/aaiu/reportsevent/index.asp?lang=ENG&loc=1280
350
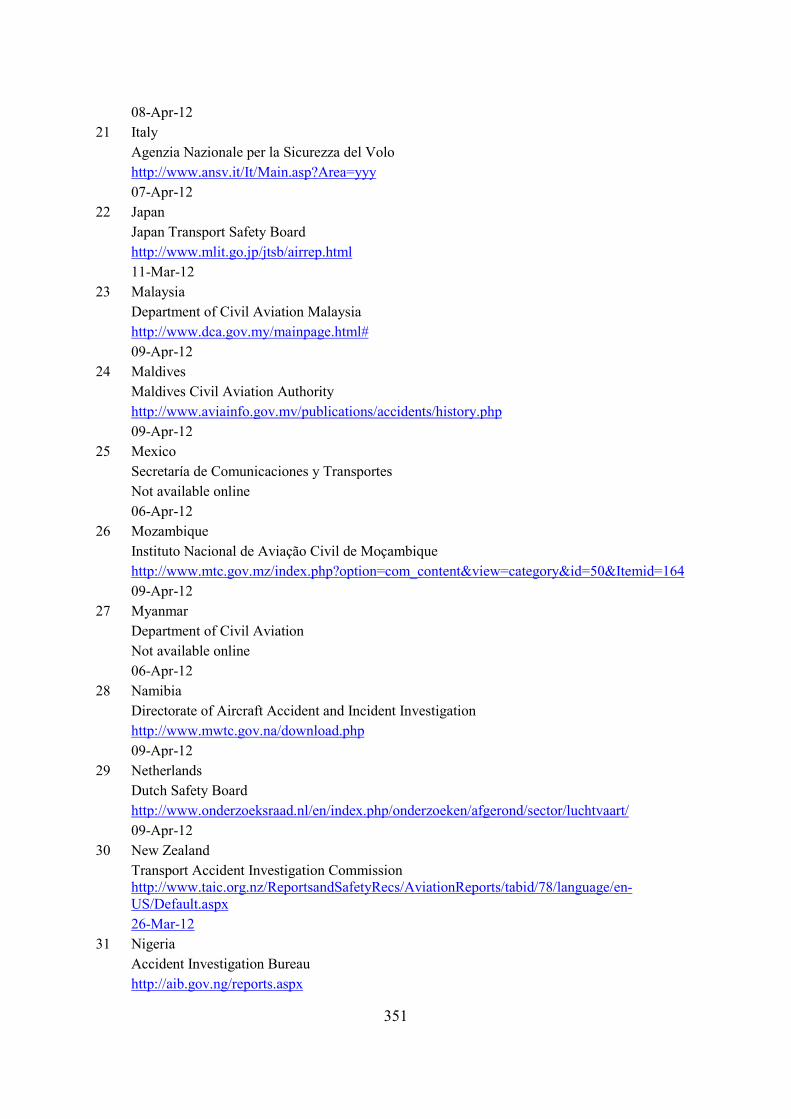
08-Apr-12
21 Italy
Agenzia Nazionale per la Sicurezza del Volo
http://www.ansv.it/It/Main.asp?Area=yyy
07-Apr-12
22 Japan
Japan Transport Safety Board
http://www.mlit.go.jp/jtsb/airrep.html
11-Mar-12
23 Malaysia
Department of Civil Aviation Malaysia
http://www.dca.gov.my/mainpage.html#
09-Apr-12
24 Maldives
Maldives Civil Aviation Authority
http://www.aviainfo.gov.mv/publications/accidents/history.php
09-Apr-12
25 Mexico
Secretaría de Comunicaciones y Transportes
Not available online
06-Apr-12
26 Mozambique
Instituto Nacional de Aviação Civil de Moçambique
http://www.mtc.gov.mz/index.php?option=com_content&view=category&id=50&Itemid=164
09-Apr-12
27 Myanmar
Department of Civil Aviation
Not available online
06-Apr-12
28 Namibia
Directorate of Aircraft Accident and Incident Investigation
http://www.mwtc.gov.na/download.php
09-Apr-12
29 Netherlands
Dutch Safety Board
http://www.onderzoeksraad.nl/en/index.php/onderzoeken/afgerond/sector/luchtvaart/
09-Apr-12
30 New Zealand
Transport Accident Investigation Commission
http://www.taic.org.nz/ReportsandSafetyRecs/AviationReports/tabid/78/language/en-US/Default.aspx
26-Mar-12
31 Nigeria
Accident Investigation Bureau
http://aib.gov.ng/reports.aspx
351
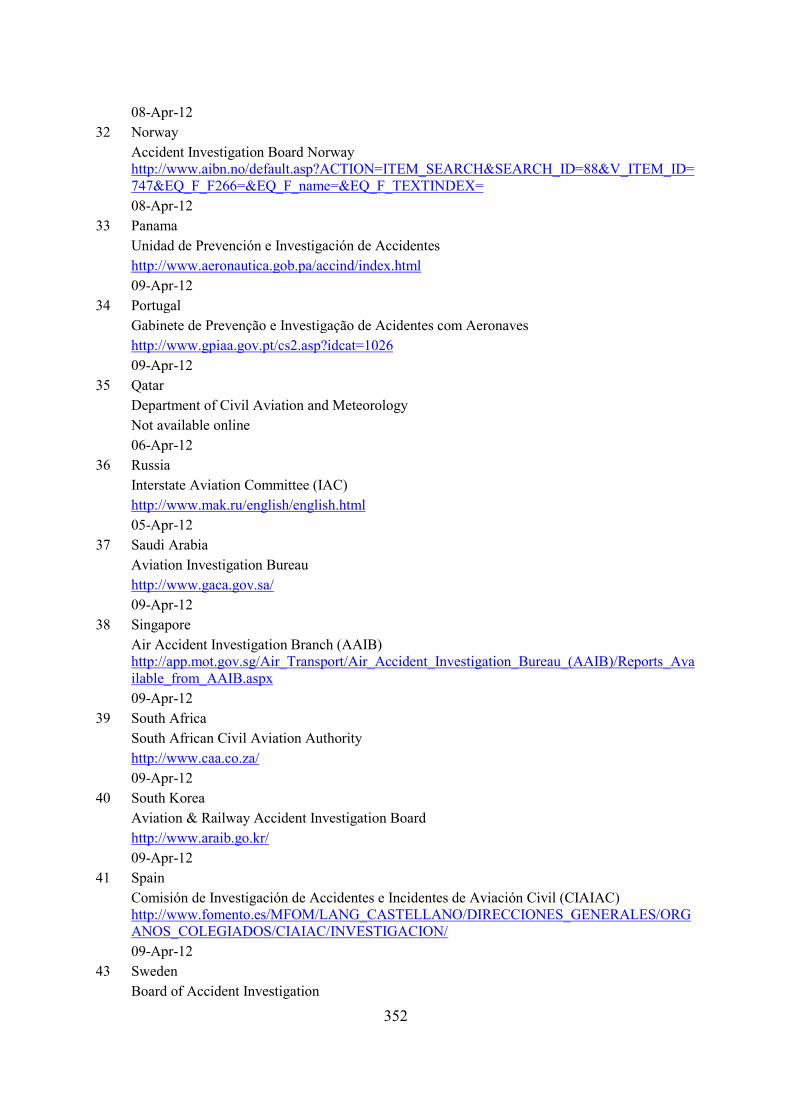
08-Apr-12
32 Norway
Accident Investigation Board Norway
http://www.aibn.no/default.asp?ACTION=ITEM_SEARCH&SEARCH_ID=88&V_ITEM_ID=747&EQ_F_F266=&EQ_F_name=&EQ_F_TEXTINDEX=
08-Apr-12
33 Panama
Unidad de Prevención e Investigación de Accidentes
http://www.aeronautica.gob.pa/accind/index.html
09-Apr-12
34 Portugal
Gabinete de Prevenção e Investigação de Acidentes com Aeronaves
http://www.gpiaa.gov.pt/cs2.asp?idcat=1026
09-Apr-12
35 Qatar
Department of Civil Aviation and Meteorology
Not available online
06-Apr-12
36 Russia
Interstate Aviation Committee (IAC)
http://www.mak.ru/english/english.html
05-Apr-12
37 Saudi Arabia
Aviation Investigation Bureau
http://www.gaca.gov.sa/
09-Apr-12
38 Singapore
Air Accident Investigation Branch (AAIB)
http://app.mot.gov.sg/Air_Transport/Air_Accident_Investigation_Bureau_(AAIB)/Reports_Available_from_AAIB.aspx
09-Apr-12
39 South Africa
South African Civil Aviation Authority
http://www.caa.co.za/
09-Apr-12
40 South Korea
Aviation & Railway Accident Investigation Board
http://www.araib.go.kr/
09-Apr-12
41 Spain
Comisión de Investigación de Accidentes e Incidentes de Aviación Civil (CIAIAC)
http://www.fomento.es/MFOM/LANG_CASTELLANO/DIRECCIONES_GENERALES/ORGANOS_COLEGIADOS/CIAIAC/INVESTIGACION/
09-Apr-12
43 Sweden
Board of Accident Investigation
352
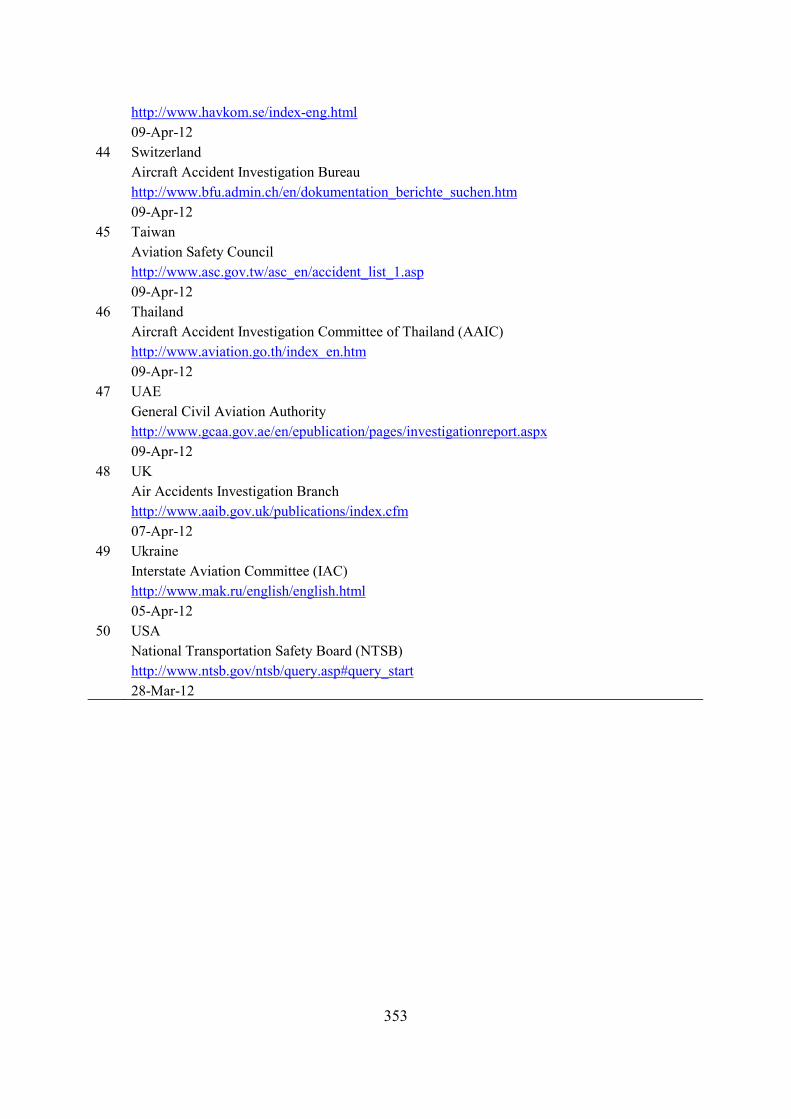
http://www.havkom.se/index-eng.html
09-Apr-12
44 Switzerland
Aircraft Accident Investigation Bureau
http://www.bfu.admin.ch/en/dokumentation_berichte_suchen.htm
09-Apr-12
45 Taiwan
Aviation Safety Council
http://www.asc.gov.tw/asc_en/accident_list_1.asp
09-Apr-12
46 Thailand
Aircraft Accident Investigation Committee of Thailand (AAIC)
http://www.aviation.go.th/index_en.htm
09-Apr-12
47 UAE
General Civil Aviation Authority
http://www.gcaa.gov.ae/en/epublication/pages/investigationreport.aspx
09-Apr-12
48 UK
Air Accidents Investigation Branch
http://www.aaib.gov.uk/publications/index.cfm
07-Apr-12
49 Ukraine
Interstate Aviation Committee (IAC)
http://www.mak.ru/english/english.html
05-Apr-12
50 USA
National Transportation Safety Board (NTSB)
http://www.ntsb.gov/ntsb/query.asp#query_start
28-Mar-12
353

354

APPENDIX 6
Questionnaire survey
Imperial College of Science, Technology and Medicine
London-UK, October the 18th, 2011
Nighttime Offshore Helicopter Operations Questionnaire
Dear Sir/Madam,
Thank you for participating on this survey.
Nighttime offshore helicopter operations are predicted to increase worldwide in the near future. However, little scientific knowledge exists on the risks associated with such an activity. This questionnaire was created to obtain information on nighttime offshore helicopter operations from key people actively involved in it.
Answering this questionnaire is expected to take approximately 30 minutes of your time. You should address the questions based on your operational experience, however large or little it might appear to you. The information you provide us will be used solely to enhance understanding of the issues associated with nighttime offshore helicopter operations needed for the PhD dissertation developing in this area.
All your answers will be treated confidentially. As it is our intention that you return this questionnaire to us by e-mail ([email protected]), the e-mail box you use to return it to us and your affiliations (e.g., the company you work for) will also be treated as confidential information.
If you wish to make any comments, complaints or suggestions, please use the relevant spaces on the questionnaire, or feel free to contact us directly. We will be delighted to receive your communication and will answer you promptly.
Finally, should you accepted being contacted in case further clarifications are desired, or if you wish to know of the outcome of this survey, please leave your contact details at the end of the questionnaire.
Once more, thank you very much for your time and effort.
Best regards,
Felipe A. C. Nascimento, CPL(H) CPL(A) MSc PhD Candidate in Transport Risk Management The Lloyd's Register Educational Trust Transport Risk Management Centre Centre for Transport Studies Department of Civil and Environmental Engineering Imperial College London South Kensington campus London SW7 2AZ U.K.
355

PART 1: PARTICIPANT'S CREDENTIALS
Age
Gender Male
Female
License ATPL(H)
CPL(H)
Other (please specify):
Rank Captain
First officer
Other (please specify):
Instructors TRI
TRE
Other (please specify): (please consider offshore training only)
Time as an offshore instructor:
Flying hours Total (H):
IFR (H):
Night (H):
Other (please specify):
Number of night deck landings:
Time since last nighttime flight offshore:
Time working as an offshore helicopter pilot (continuously or not):
Are you currently employed to any of the following positions?
Safety
Operations
Management
356
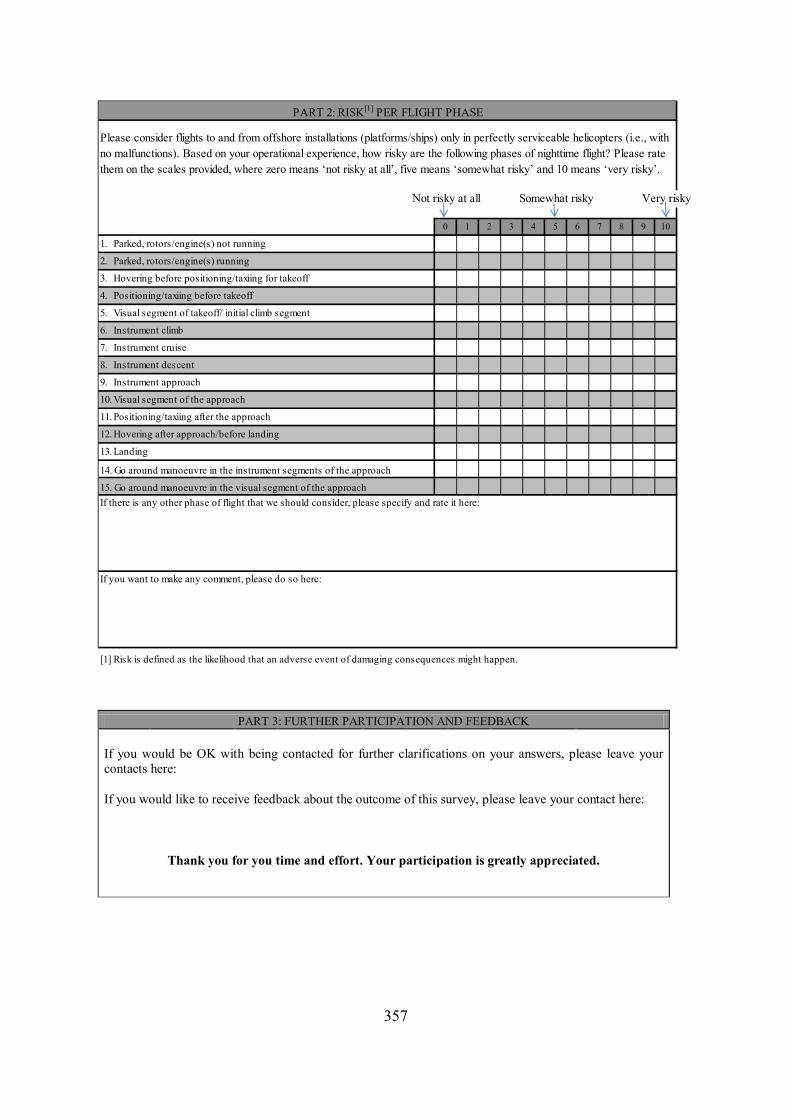
Not risky at all Somewhat risky Very risky
0 1 2 3 4 5 6 7 8 9 10
1. Parked, rotors/engine(s) not running
2. Parked, rotors/engine(s) running
3. Hovering before positioning/taxiing for takeoff
4. Positioning/taxiing before takeoff
5. Visual segment of takeoff/ initial climb segment
6. Instrument climb
7. Instrument cruise
8. Instrument descent
9. Instrument approach
10. Visual segment of the approach
11. Positioning/taxiing after the approach
12. Hovering after approach/before landing
13. Landing
14. Go around manoeuvre in the instrument segments of the approach
15. Go around manoeuvre in the visual segment of the approach
PART 2: RISK[1] PER FLIGHT PHASE
Please consider flights to and from offshore installations (platforms/ships) only in perfectly serviceable helicopters (i.e., with no malfunctions). Based on your operational experience, how risky are the following phases of nighttime flight? Please rate them on the scales provided, where zero means ‘not risky at all’, five means ‘somewhat risky’ and 10 means ‘very risky’.
If there is any other phase of flight that we should consider, please specify and rate it here:
If you want to make any comment, please do so here:
[1] Risk is defined as the likelihood that an adverse event of damaging consequences might happen.
PART 3: FURTHER PARTICIPATION AND FEEDBACK If you would be OK with being contacted for further clarifications on your answers, please leave your contacts here:
If you would like to receive feedback about the outcome of this survey, please leave your contact here:
Thank you for you time and effort. Your participation is greatly appreciated.
357

358
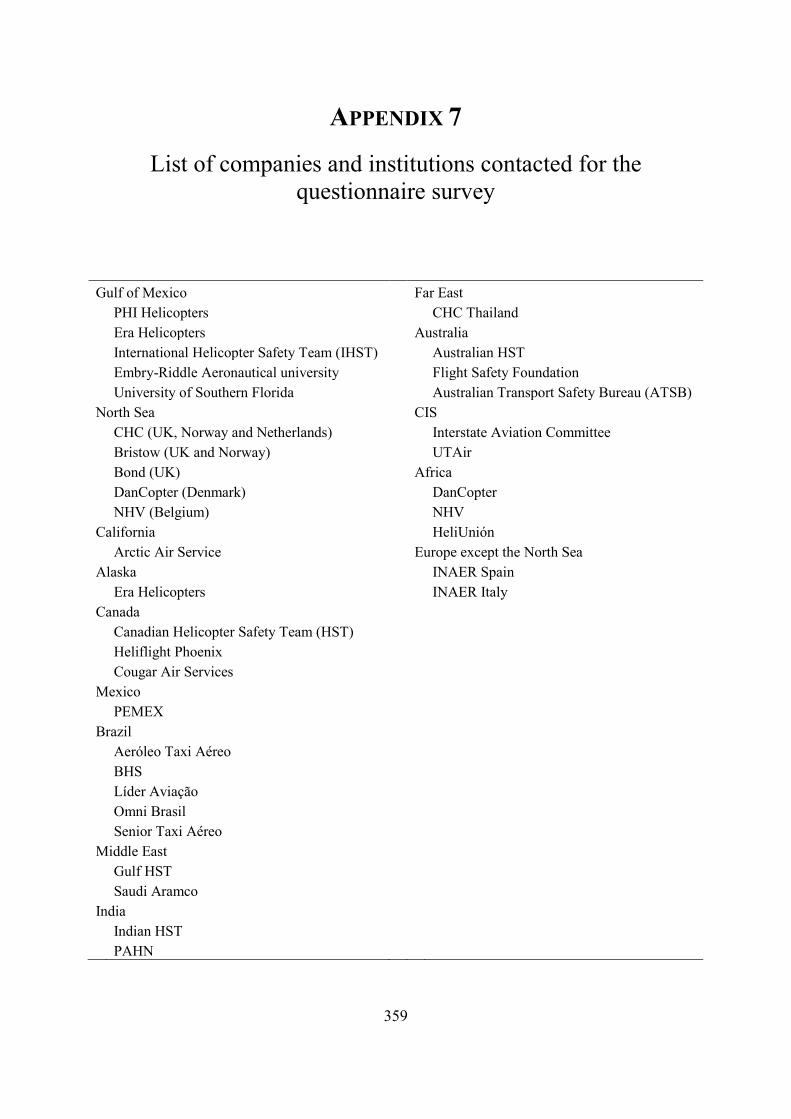
APPENDIX 7
List of companies and institutions contacted for the questionnaire survey
Gulf of Mexico
Far East
PHI Helicopters
CHC Thailand
Era Helicopters
Australia
International Helicopter Safety Team (IHST)
Australian HST
Embry-Riddle Aeronautical university
Flight Safety Foundation
University of Southern Florida
Australian Transport Safety Bureau (ATSB)
North Sea
CIS
CHC (UK, Norway and Netherlands)
Interstate Aviation Committee
Bristow (UK and Norway)
UTAir
Bond (UK)
Africa
DanCopter (Denmark)
DanCopter
NHV (Belgium)
NHV
California
HeliUnión
Arctic Air Service
Europe except the North Sea
Alaska
INAER Spain
Era Helicopters
INAER Italy
Canada
Canadian Helicopter Safety Team (HST)
Heliflight Phoenix
Cougar Air Services
Mexico
PEMEX
Brazil
Aeróleo Taxi Aéreo
BHS
Líder Aviação
Omni Brasil
Senior Taxi Aéreo
Middle East
Gulf HST
Saudi Aramco India
Indian HST
PAHN
359

360
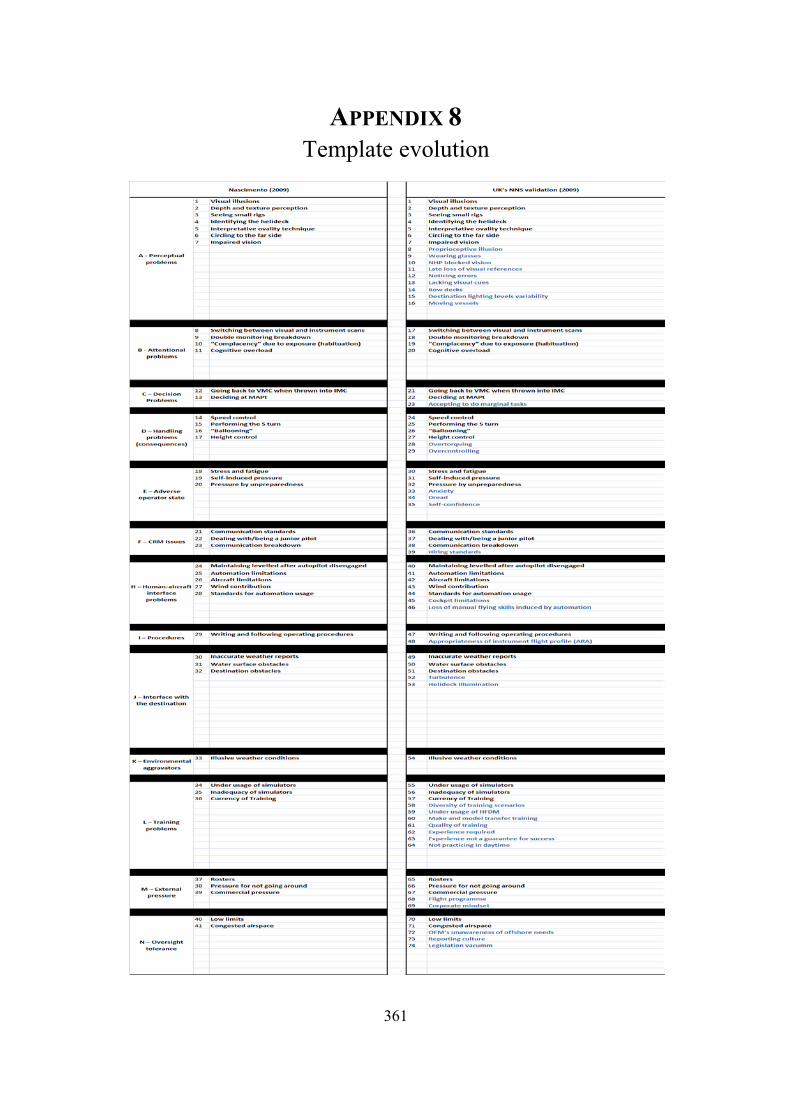
APPENDIX 8 Template evolution
361
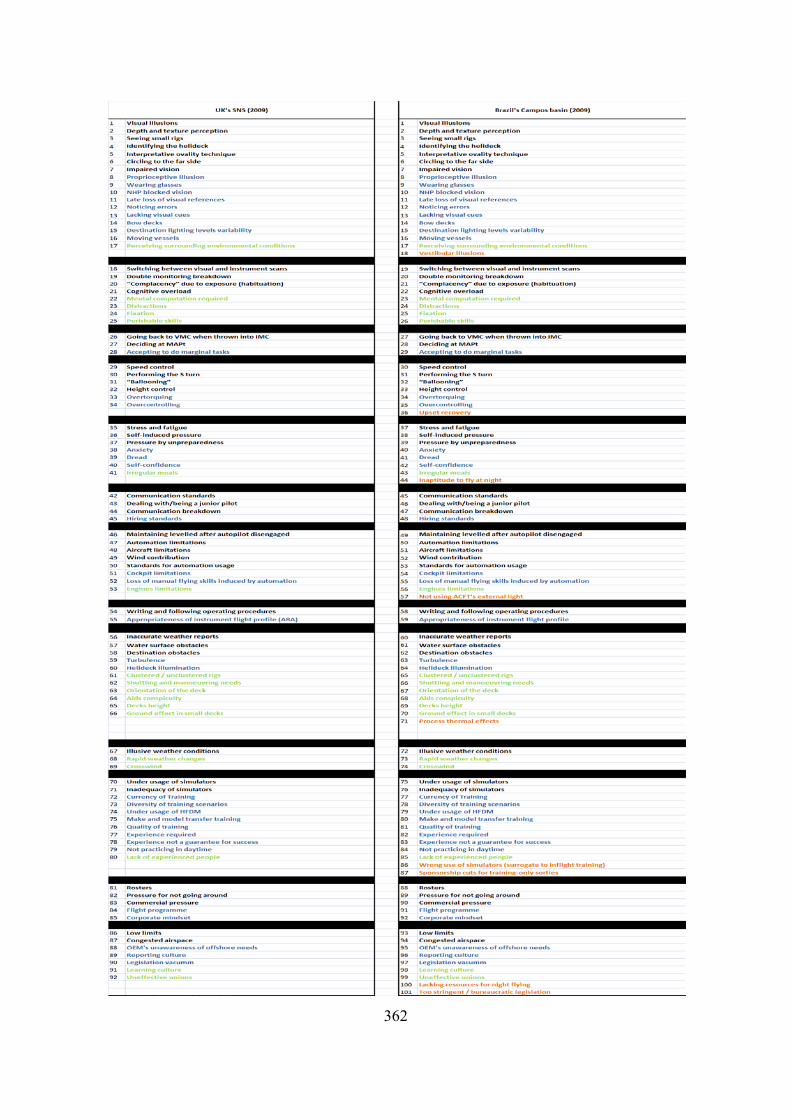
362
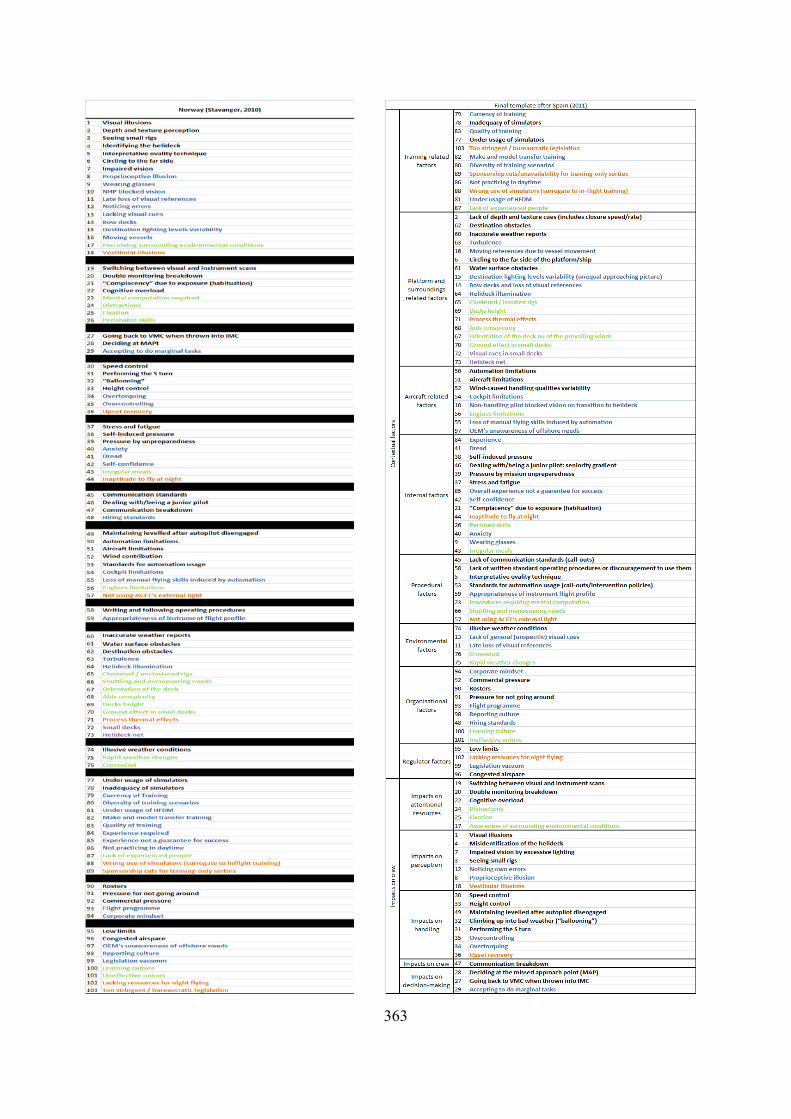
363

364
APPENDIX 9
Story integrating the hazards of helicopter night visual approach segments in the North Sea (Nascimento, 2009)
The problems that offshore helicopter pilots face while flying visual night approaches over the sea relate to perceptual constraints caused by illusive, insufficient or absent visual cues to support flight conducted with external references. These conditions can be worsened by some particular environmental states.
Perceptual constraints can result in handling difficulties, mainly in the form of flawed speed control, or height mishandling, most often causing the aircraft to descend excessively. However, there are strategies to overcome perceptual sets. These are adequate attention allocation and/or automation usage, though they can also be flawed.
Attention allocation takes the form of switching between instrument and visual scans. This practice is regarded as a non-intuitive skill and has to be learned. However, due to the seasonal characteristics of night flying over the North Sea, coupled with the low frequency of night flights even in winter, those skills perish and have to be re-learned every winter season. Other training resources, in particular simulators, might be either inadequate or not explored in a consistent manner.
The strategy concerning automation usage is to keep the autopilot upper modes engaged beyond the DR [i.e., decision range]. This requires only de-coupling the autopilot and assuming manual control of the aircraft in such a position whereby visual cues are deemed enough for an approach with reference to the external features of the installation.
Attention allocation strategy is to be assisted by the NHP [i.e., non-handling pilot, also known as the monitoring pilot] giving a talk-down of the aircraft’s flying state (height, speed, rate of climb or descent, and distance to destination), in order to enhance the HP‘s awareness of the ongoing situation. This talk-down, in turn, is grounded in one of two factors:
• Experience, i.e. through repetition and observation over time pilots get to know what is appropriate to be talked-down and in what frequency; and/or
• Standard calls coupled with standard flight profiles, in the form of “gates” to be met in space, which are specified heights and speeds as a function of distance to the destination. The latter though, is not always present across the operators or consistently followed by the pilots.
Crew cooperation issues might therefore contribute to attentional problems by insufficient, excessive or unfamiliar talking-down. Furthermore, should intervention on flight controls be needed by the NHP in order to keep a safe flight profile, transfer of control might suffer.
365
The automation use strategy is constrained by autopilot limitations due to the minimum coupling speeds required for use of its upper modes. For example often the helicopters used in the NNS [i.e., Northern North Sea] cannot maintain coupled modes at the slow speeds required for visually referenced manoeuvring in proximity to the installation. This means that the transfer to manual flight has by necessity to take place at a higher speed, and hence, at a greater distance from the offshore installation, with the associated reduction in visual reference. In this case, the available option for approach reverts to the attention switching strategy aided by NHP talk-down.
Occasionally, pilots seem to face problems with decision-making in being tempted to reduce altitude when inadvertently thrown into IMC (either by mishandled height or lowering ceiling), and trying to regain VMC. Another issue might be delaying the decision at the MAP [i.e., the missed approach point, which coincides with the DR], when reaching such position under IMC, in the hope of getting visual contact later, so as to proceed visually to land. The consequence might be the onset of perceptual problems which may cause handling difficulties. Reasons for such decisions seem to lie beyond the cockpit, on operators’ adverse state or some external pressure.
Some problems are due to the rig and its surroundings, mainly in the form of inaccurate weather reports which lead to wrongly prepared visual segments (e.g., approaching out of the wind, or not getting visual when expected due to lower cloud base and/or worse visibility than reported). In addition, unlit or wrongly positioned obstacles can interfere with the helicopter’s path, as can boats in the safe sector beneath the aircraft’s trajectory.
Finally, pilots also have concerns about the limits which they must abide by while approaching offshore installations, i.e. 0.75 nautical miles and 300 feet (or helideck height plus 50 feet, whichever is greater) for the nighttime ARA, which some deem excessively low for non-precision approaches.
366
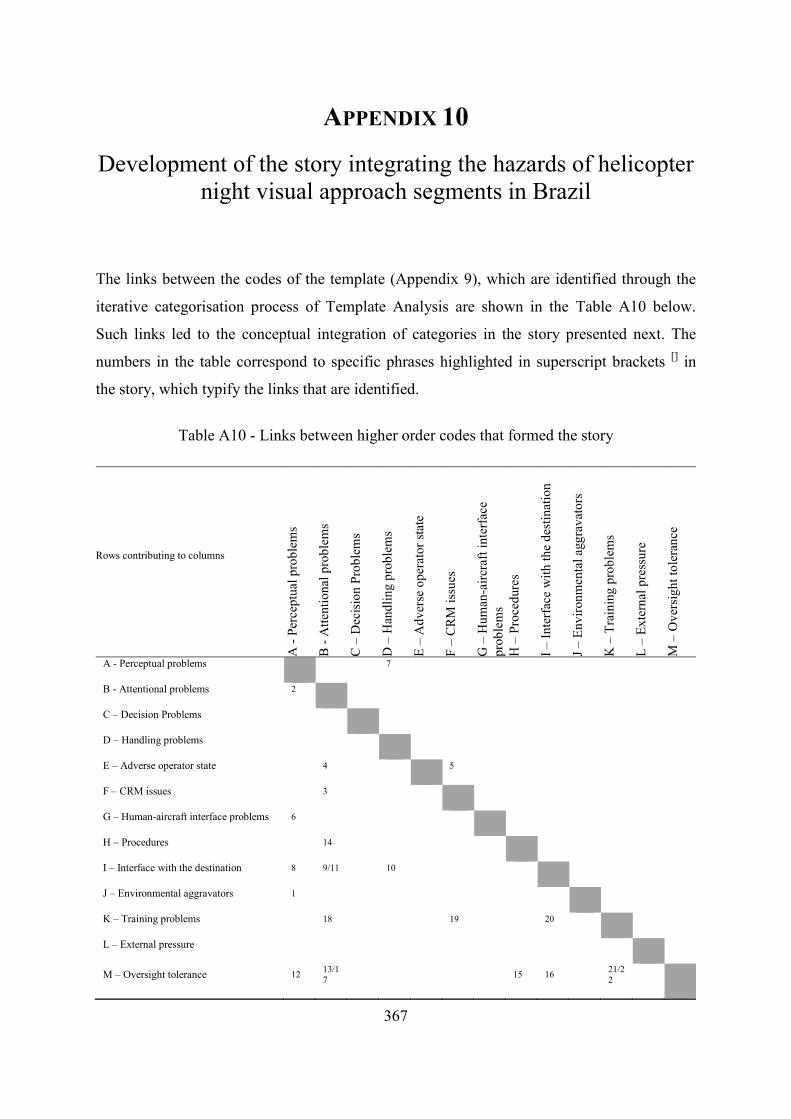
APPENDIX 10
Development of the story integrating the hazards of helicopter night visual approach segments in Brazil
The links between the codes of the template (Appendix 9), which are identified through the
iterative categorisation process of Template Analysis are shown in the Table A10 below.
Such links led to the conceptual integration of categories in the story presented next. The
numbers in the table correspond to specific phrases highlighted in superscript brackets [] in
the story, which typify the links that are identified.
Table A10 - Links between higher order codes that formed the story
Rows contributing to columns
A -
Perc
eptu
al p
robl
ems
B -
Atte
ntio
nal p
robl
ems
C –
Dec
isio
n Pr
oble
ms
D –
Han
dlin
g pr
oble
ms
E –
Adv
erse
ope
rato
r sta
te
F –
CR
M is
sues
G –
Hum
an-a
ircra
ft in
terf
ace
prob
lem
s H
– P
roce
dure
s
I – In
terf
ace
with
the
dest
inat
ion
J – E
nviro
nmen
tal a
ggra
vato
rs
K –
Tra
inin
g pr
oble
ms
L –
Exte
rnal
pre
ssur
e
M –
Ove
rsig
ht to
lera
nce
A - Perceptual problems
7
B - Attentional problems 2
C – Decision Problems
D – Handling problems
E – Adverse operator state
4
5
F – CRM issues
3
G – Human-aircraft interface problems 6
H – Procedures
14
I – Interface with the destination 8 9/11
10
J – Environmental aggravators 1
K – Training problems
18
19
20
L – External pressure
M – Oversight tolerance 12 13/17
15 16
21/22
367
Story
Pilots perceive that the problems that they face while flying offshore nighttime approaches
in south-eastern Brazil result from three main issues: visual spatial disorientation,
destination issues and flawed safety oversights.
Visual Spatial Disorientation
Because of illusory, absent or insufficient visual cues at the Missed Approach Point
(MAP) of their instrument descent procedures, pilots could find that flying strictly using
external visual references is not truly feasible after that point. These perceptual
constraints can be aggravated by specific environmental conditions, such as rain, drizzle,
patchy low level clouds or a lack of celestial illumination[1].
Against such perceptual limitations, pilots often employ two strategies: ‘adequate
attention allocation’ and/or an ‘extended usage of aircraft capabilities’. The latter refers
to the continued use of IFR instrumentation and automation (i.e., the auto-pilot’s ‘upper
modes’) beyond the missed approach point.
‘Adequate attention allocation’ means that if external visual cues are still deemed
insufficient for a visually referenced flight after the aircraft reaches the MAP, pilots may
engage in a process of switching between visual and instrument scan techniques while
assessing how supportive the external environment is for visual flying. This practice,
however, is perceived by pilots as requiring a wealth of mental resources[2], and, as such,
there are concerns over its potential to contribute to flaws in the task execution.
An effective attention allocation strategy requires, in turn, adequate CRM [i.e., crew
resource management] practices. Ideally, the non-handling pilot monitors the aircraft
flight instruments and calls out the parameters that deserve immediate
attention/intervention. When this task is completed, the handling pilot can then,
presumably, focus his/her visual scan at the external environment for a longer period than
at the cockpit instrumentation. This practice, however, requires a set of finely tuned crew
interaction procedures, the absence of which could result in an increased attentional
burden to the handling pilot[3], as he/she must continue with internal and external cockpit
scan techniques at higher rates.
368
Some adverse operator states have been assessed as negatively affecting attentional
capabilities[4] and CRM practices[5]. Stress, fatigue and dread could decrease pilots’
concentration for adequate attention allocation, whereas any excessive self-confidence on
the part of the pilots could impede proper CRM practices onboard.
The exploration of aircraft capabilities mainly concerns the use of automation for as long
as possible on the approach, such that the stabilization and tracking tasks do not add to
the pilot workload. By keeping the autopilot’s upper modes engaged for a longer time
period, pilots can put more resources into monitoring visual cues rather than actively
flying the aircraft. Once closer to their destinations, visual cues should be sufficient for
pilots to revert to manual flying. This strategy, however, is constrained by the autopilots’
capabilities[6], given the speed that is required to disengage its upper modes. A manually
controlled flight phase is a necessity because current technologies do not provide auto-
land or auto-hover for either passenger ferrying or for medical evacuation (i.e., ‘medvac’)
offshore helicopters. Other perceptual problems could also occur from high nose-up
rotorcraft attitudes at low approach speeds, obscuring the view ahead[6], and from
ineffective windscreen wipers[6], which cause external visual cues to degrade further.
In any case, unconstrained perceptual sets could translate into handling difficulties[7],
often in the form of flawed height and/or speed control, which pilots perceive as capable
of leading to an accident.
Destination Issues
The destinations themselves pose additional problems to pilots, primarily because of
misplaced unlit obstacles that they may not be aware of, improper helideck illumination
that blends with other lights on the structure, and/or by excessively lit platforms,
potentially causing visual impairment[8].
Unknown obstacles and unclear helidecks consume additional attentional resources[9],
because pilots must maintain extra vigilance while flying their aircraft. There are
concerns about near misses with obstacles that could have led to accidents.
369
In addition, some platforms offer few approach path options that are free from turbulent
airflow or obstacles, potentially leading to aircraft controllability issues[10] and an extra
attentional burden[11] in terms of the search for obstacles.
Flawed safety oversight
The operational problems that are mentioned above are perceived by pilots to stem from
flawed safety provisions and enforcement, emanating from a combination of insufficient
infrastructure for properly supporting night flights together with shortcomings in training.
Lack of infrastructure for night flying
Only two certified non-directional beacon (NDB) instrument approach procedures
exist to serve more than 80 platforms within the Campos basin. Therefore, whenever
pilots need to reach one of the remaining 78 or so platforms that are not fitted with an
NDB, they are supposed to execute an instrument descent procedure at either of these
two NDB-equipped platforms, reach their MAP under VMC and then proceed under
visual flight rules (VFR) to their final destination. However, the distances involved
often preclude such a procedure at night, because, in effect, the pilots are faced with
external black-out conditions[12][see Appendix 1]. Hence, pilots must blend
instrument and visual scan techniques during the navigation task toward their
intended destination [13] or revert to instrument flying with no formal procedures
outlined by the regulator[14]. Procedures for this scenario are often developed at a
company level or on the basis of experience, with practical techniques passed on by
senior colleagues[15].
Because there are no formal platform charts, pilots rely on company-provided
photographs or past experience to know their destinations’ layouts, their helideck
location and obstacles to the approach[16]. This procedure is believed to contribute to
‘close calls’ as well as to add to the attentional burden of having to maintain an
active external search for obstacles [17].
Training shortcomings
Training is deemed to be fundamental to both the attentional allocation strategy and
the crew interaction procedures that are mentioned in section above. However,
370
training was assessed by the pilots as being too infrequent for developing the
attentional[18] and crew interaction[19] skills that are required by the task. This result
arises from on-demand medvac sorties as well as from service contractual clauses,
both of which imply that there are few opportunities for training and practicing the
approach task at offshore installations.
Training is also deemed to be an important element in developing the awareness of
the various platform layouts, helideck and obstacle locations. Again, it is assessed as
too infrequent for such purposes[20].
Although deemed to be of paramount importance for both avoiding spatial
disorientation and for recognizing platform layout, in-flight training is perceived as
having declined in recent years in favour of simulator-based training. This result
however, relies on allocating financial resources for hiring simulators abroad and
requires appropriate simulators to be available. As a consequence, scenario-based
training for offshore installations appears to be kept to a minimum (annual line
checks)[21], and even then, it is often unreflective of the environment found in the
Campos basin, because few foreign platforms are replicated by existing simulator
databases. Additionally, unrealistic handling qualities appear in some aircraft
simulation models in low altitude–low airspeed flying regimes.
Finally, from a managerial viewpoint, planning for training-only sorties over the
Campos Basin is a bureaucratic ordeal, because the different stakeholders (e.g., the
air traffic control services, the oil companies that run the destinations, and the
airports from which the aircraft will operate) must be engaged and coordinated
before any such sorties can occur[22].
All 4 SMES asked to validate the story (see Section 7.5.1 and Table 7-2) were satisfied that
the story developed was a credible representation of reality in the Brazilian offshore scenario.
These SMEs were very experienced pilots, each with over 5000 flying hour accrued in the
Campos basin and over 5 years of experience as the aviation safety officer of their respective
companies.
371
Discussion
In common with Nascimento’s (2009) findings for the UK Northern North Sea scenario,
pilots flying offshore nighttime missions in Brazil also felt prone to spatial disorientation in
the visual portion of the task, because of a similar interplay of hazards. This observation is
also in accord with the wider helicopter accident-based research (CAA, 2007; Masson et al.,
2009; Smith and Foster, 1995; Talbot and Webber, 1988; U.S. Joint Helicopter Safety
Analysis Team, 2011b, a), which emphasizes the hazards of the IFR-VFR transition in
degraded visual environments. Additionally, there has been prior mention of the problems at
the interface with the destination (Morrison, 2001; Hart, 2006).
While decision making was mentioned as one of the emerging codes (Table 8-4), it was
populated solely by a comment from a single participant and hence, it was not mentioned in
the story. Further discussions with the collaborating SMEs indicated the possibility that few
pilots would experience decision-making conflicts under such circumstances, because they
would tend to opt for safer behaviour by quitting approach attempts in such cases. This result
also led to filtering out the ‘external pressure’ code of the template because pilots seemed to
ignore it, as shown by the low frequency of comments and SME input. Alternatively, it was
speculated that pilots may not have felt keen on disclosing the existence of decision-making
conflicts during the course of the research. This is commonly associated with the
underreporting of incidents and serious incidents (see Section 5.2.2).
The issues encompassed by the ‘flawed safety oversight’ heading (‘training shortcomings’
and ‘lack of infrastructure for night flying’) were the focus of the participants’ concerns.
Indeed, inadequacies of the Brazilian helideck design standards (Marinha do Brasil, 2009)
that were in force during the course of this investigation have previously been highlighted
(Quintão, 2010) and identified during the preliminary hazard identification implemented in
Section 7.4.2. Such inadequacies established a link between participants’ comments on
‘destination issues’ and ‘lack of infrastructure for night flying’. More recently, however,
updated helideck design standards were published by the Brazilian regulator (Marinha do
Brasil, 2011). Whereas such standards are expected to improve safety in nighttime offshore
helicopter operations, it is important to realize that they can only address a small subset of the
areas that are in need of intervention. This is confirmed by the plethora of hazards in the
template developed (Tables 8-3 and 8-4) and investigations in other areas (see Section 2.3.2).
372
With regard to training, although the Brazilian regulation has recently been changed to
account for the rehearsal of offshore nighttime medvac missions (ICA, 2008), in practice, this
scenario does not seem to be encouraged, given the interplay of two conditions. First, pilots’
nighttime flying currency can be achieved by performing three approaches and take-offs
within a 90-day period to onshore installations (ANAC, 2010; OGP, 2008). Second, operators
are required to request the regulator’s permission 15 days in advance if they want to train
offshore at night (ICA, 2008). As a consequence, planning for offshore nighttime training
could prove to be an ordeal, as commented upon by the participants:
‘You have to ‘leave no stone unturned’ to do some training. They [the regulator and oil
companies] won’t admit it, but this is the truth. You need authorization from the
regulator. You need authorization from the airport authority. You have to arrange it
with the person on duty at the airdrome flight information service, because this person
will have to stay for longer than normal working hours and might have already gone
home. There is the team on the platform for helicopter operations, which also has other
assignments and might not be on their rest times. [...] In summary, you have to arrange
so many things that it becomes a really difficult thing. It should be easier.’
Ultimately, scenario-based training may be relegated to annual simulator flights, with the
drawbacks mentioned in the story, together with the additional load of check rides where
pilot performance is under evaluation, as opposed to skills-development training-only sorties.
Participants perceive training and infrastructure as latent conditions that set the stage for both
visual spatial disorientation and issues with the destination, as follows: existing flaws in
terms of the infrastructure for nighttime flights have the potential to lead both to spatial
disorientation on the approach and undesirable near misses when closer to the destination.
Both of these scenarios increase the need for training. Therefore, it is of concern that training
was perceived by crews to be in decline. Flawed infrastructure and training shortcomings
apparently stem from inadequate safety oversight mechanisms. These relationships are
summarised in the Figure A10 below.
373
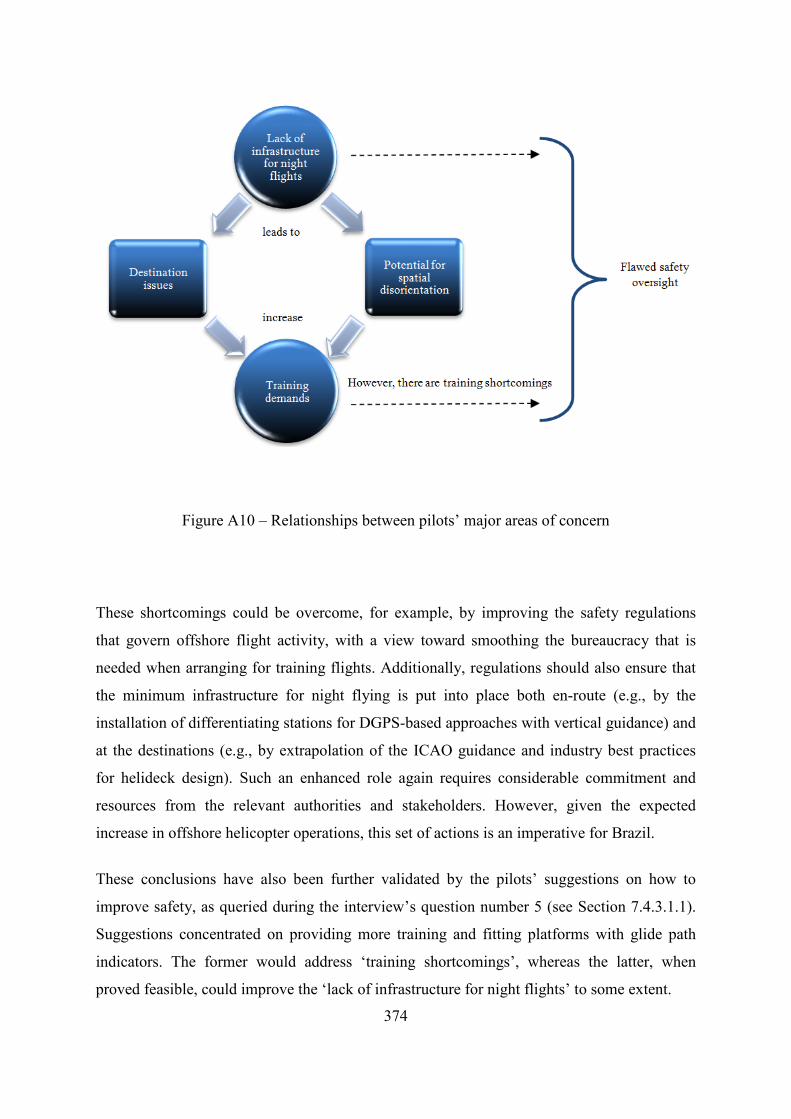
Figure A10 – Relationships between pilots’ major areas of concern
These shortcomings could be overcome, for example, by improving the safety regulations
that govern offshore flight activity, with a view toward smoothing the bureaucracy that is
needed when arranging for training flights. Additionally, regulations should also ensure that
the minimum infrastructure for night flying is put into place both en-route (e.g., by the
installation of differentiating stations for DGPS-based approaches with vertical guidance) and
at the destinations (e.g., by extrapolation of the ICAO guidance and industry best practices
for helideck design). Such an enhanced role again requires considerable commitment and
resources from the relevant authorities and stakeholders. However, given the expected
increase in offshore helicopter operations, this set of actions is an imperative for Brazil.
These conclusions have also been further validated by the pilots’ suggestions on how to
improve safety, as queried during the interview’s question number 5 (see Section 7.4.3.1.1).
Suggestions concentrated on providing more training and fitting platforms with glide path
indicators. The former would address ‘training shortcomings’, whereas the latter, when
proved feasible, could improve the ‘lack of infrastructure for night flights’ to some extent.
374

Although similar shortcomings were previously individually mapped by other authors
(Gomes et al., 2009; Hart, 2006; Mata et al., 2006; Morrison, 2001), studies uncovering the
interplay between these factors are absent, despite its importance for effective safety
promotion. Unveiling the interplay of hazards, as opposed to the hazards in isolation, is a
unique product of the Task-Based Hazard Identification Survey Process (see Section 7.3).
375

376
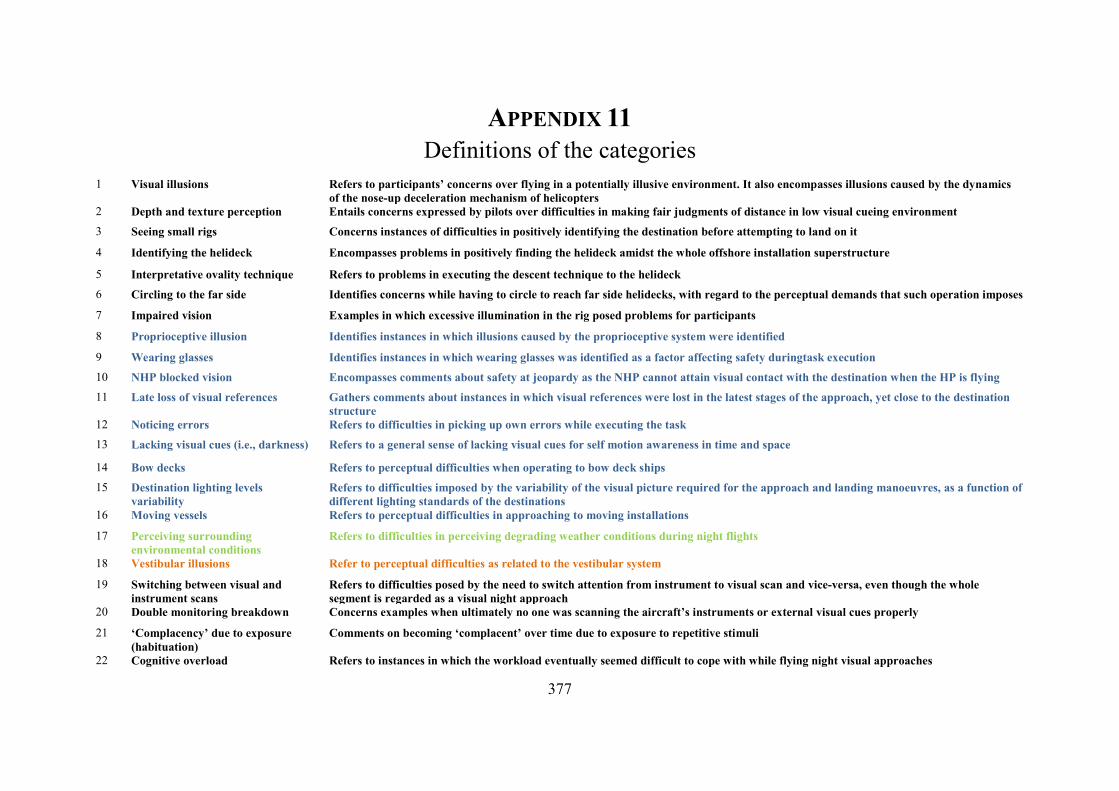
APPENDIX 11 Definitions of the categories
1 Visual illusions Refers to participants’ concerns over flying in a potentially illusive environment. It also encompasses illusions caused by the dynamics of the nose-up deceleration mechanism of helicopters
2 Depth and texture perception Entails concerns expressed by pilots over difficulties in making fair judgments of distance in low visual cueing environment 3 Seeing small rigs Concerns instances of difficulties in positively identifying the destination before attempting to land on it
4 Identifying the helideck Encompasses problems in positively finding the helideck amidst the whole offshore installation superstructure
5 Interpretative ovality technique Refers to problems in executing the descent technique to the helideck 6 Circling to the far side Identifies concerns while having to circle to reach far side helidecks, with regard to the perceptual demands that such operation imposes
7 Impaired vision Examples in which excessive illumination in the rig posed problems for participants
8 Proprioceptive illusion Identifies instances in which illusions caused by the proprioceptive system were identified
9 Wearing glasses Identifies instances in which wearing glasses was identified as a factor affecting safety duringtask execution 10 NHP blocked vision Encompasses comments about safety at jeopardy as the NHP cannot attain visual contact with the destination when the HP is flying 11 Late loss of visual references Gathers comments about instances in which visual references were lost in the latest stages of the approach, yet close to the destination
structure 12 Noticing errors Refers to difficulties in picking up own errors while executing the task 13 Lacking visual cues (i.e., darkness) Refers to a general sense of lacking visual cues for self motion awareness in time and space
14 Bow decks Refers to perceptual difficulties when operating to bow deck ships 15 Destination lighting levels
variability Refers to difficulties imposed by the variability of the visual picture required for the approach and landing manoeuvres, as a function of different lighting standards of the destinations
16 Moving vessels Refers to perceptual difficulties in approaching to moving installations
17 Perceiving surrounding environmental conditions
Refers to difficulties in perceiving degrading weather conditions during night flights
18 Vestibular illusions Refer to perceptual difficulties as related to the vestibular system
19 Switching between visual and instrument scans
Refers to difficulties posed by the need to switch attention from instrument to visual scan and vice-versa, even though the whole segment is regarded as a visual night approach
20 Double monitoring breakdown Concerns examples when ultimately no one was scanning the aircraft’s instruments or external visual cues properly
21 ‘Complacency’ due to exposure (habituation)
Comments on becoming ‘complacent’ over time due to exposure to repetitive stimuli
22 Cognitive overload Refers to instances in which the workload eventually seemed difficult to cope with while flying night visual approaches
377
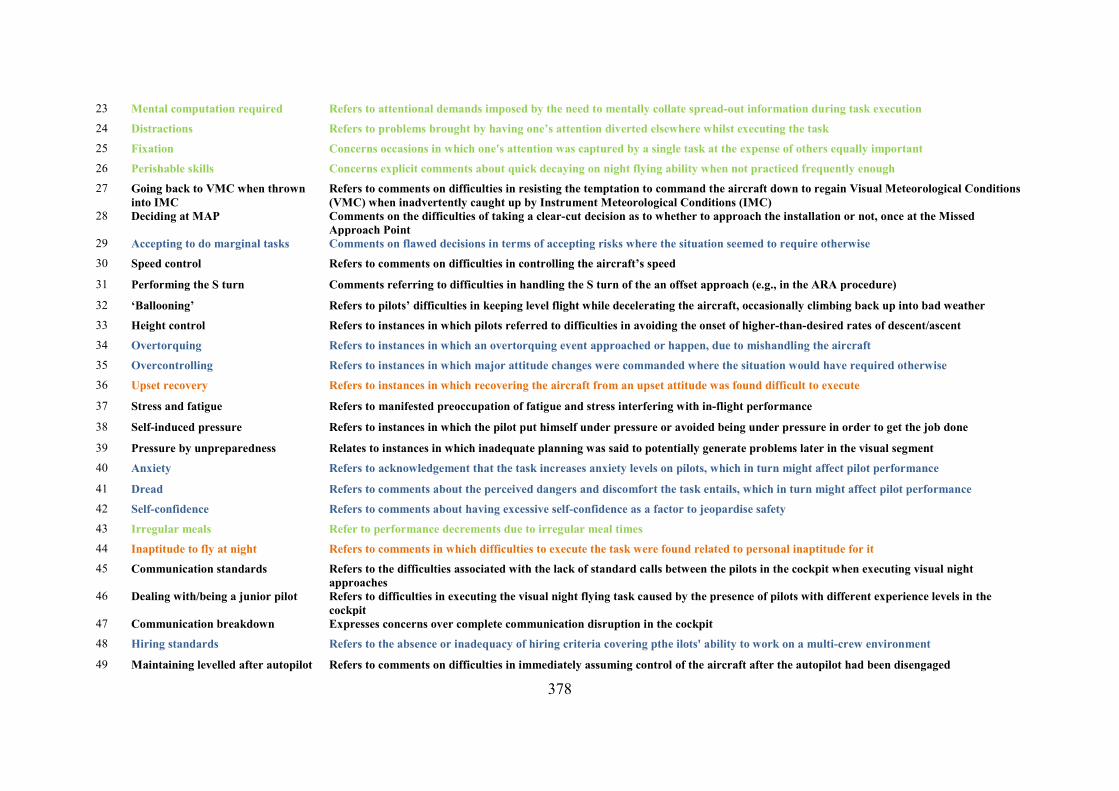
23 Mental computation required Refers to attentional demands imposed by the need to mentally collate spread-out information during task execution 24 Distractions Refers to problems brought by having one’s attention diverted elsewhere whilst executing the task 25 Fixation Concerns occasions in which one's attention was captured by a single task at the expense of others equally important 26 Perishable skills Concerns explicit comments about quick decaying on night flying ability when not practiced frequently enough 27 Going back to VMC when thrown
into IMC Refers to comments on difficulties in resisting the temptation to command the aircraft down to regain Visual Meteorological Conditions (VMC) when inadvertently caught up by Instrument Meteorological Conditions (IMC)
28 Deciding at MAP Comments on the difficulties of taking a clear-cut decision as to whether to approach the installation or not, once at the Missed Approach Point
29 Accepting to do marginal tasks Comments on flawed decisions in terms of accepting risks where the situation seemed to require otherwise 30 Speed control Refers to comments on difficulties in controlling the aircraft’s speed
31 Performing the S turn Comments referring to difficulties in handling the S turn of the an offset approach (e.g., in the ARA procedure)
32 ‘Ballooning’ Refers to pilots’ difficulties in keeping level flight while decelerating the aircraft, occasionally climbing back up into bad weather 33 Height control Refers to instances in which pilots referred to difficulties in avoiding the onset of higher-than-desired rates of descent/ascent 34 Overtorquing Refers to instances in which an overtorquing event approached or happen, due to mishandling the aircraft 35 Overcontrolling Refers to instances in which major attitude changes were commanded where the situation would have required otherwise 36 Upset recovery Refers to instances in which recovering the aircraft from an upset attitude was found difficult to execute
37 Stress and fatigue Refers to manifested preoccupation of fatigue and stress interfering with in-flight performance
38 Self-induced pressure Refers to instances in which the pilot put himself under pressure or avoided being under pressure in order to get the job done
39 Pressure by unpreparedness Relates to instances in which inadequate planning was said to potentially generate problems later in the visual segment 40 Anxiety Refers to acknowledgement that the task increases anxiety levels on pilots, which in turn might affect pilot performance
41 Dread Refers to comments about the perceived dangers and discomfort the task entails, which in turn might affect pilot performance 42 Self-confidence Refers to comments about having excessive self-confidence as a factor to jeopardise safety 43 Irregular meals Refer to performance decrements due to irregular meal times 44 Inaptitude to fly at night Refers to comments in which difficulties to execute the task were found related to personal inaptitude for it 45 Communication standards Refers to the difficulties associated with the lack of standard calls between the pilots in the cockpit when executing visual night
approaches 46 Dealing with/being a junior pilot Refers to difficulties in executing the visual night flying task caused by the presence of pilots with different experience levels in the
cockpit 47 Communication breakdown Expresses concerns over complete communication disruption in the cockpit 48 Hiring standards Refers to the absence or inadequacy of hiring criteria covering pthe ilots' ability to work on a multi-crew environment
49 Maintaining levelled after autopilot Refers to comments on difficulties in immediately assuming control of the aircraft after the autopilot had been disengaged
378
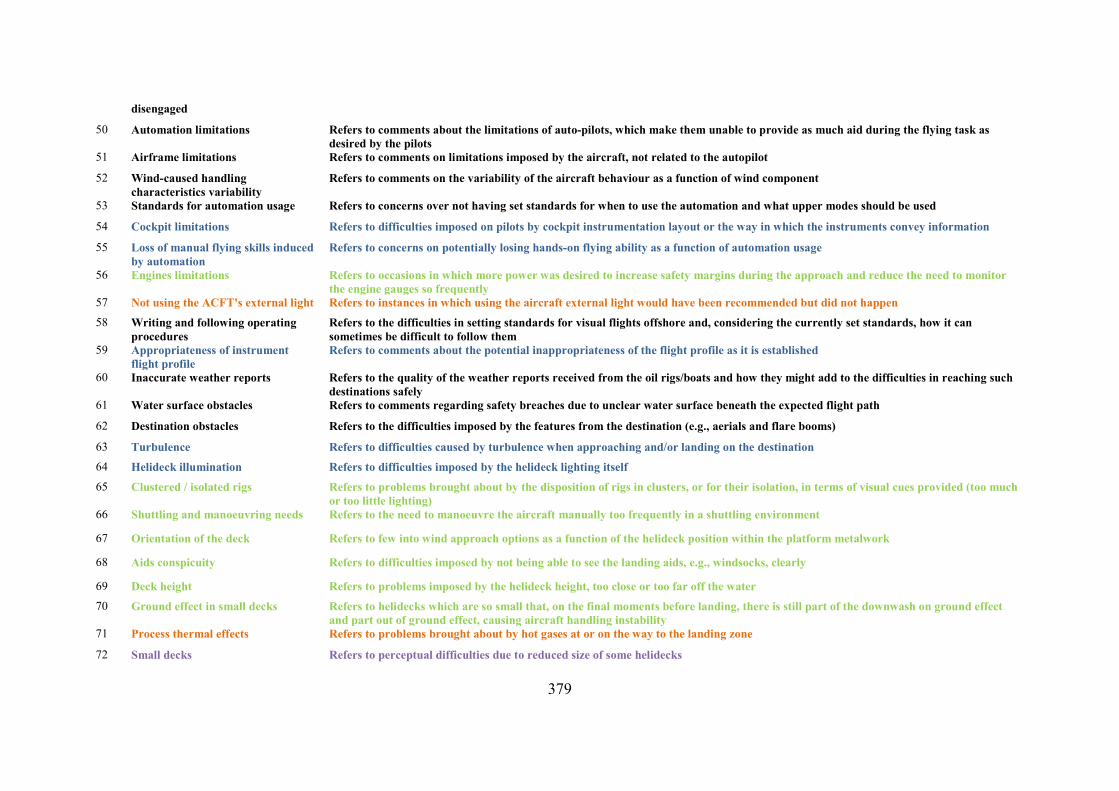
disengaged
50 Automation limitations Refers to comments about the limitations of auto-pilots, which make them unable to provide as much aid during the flying task as desired by the pilots
51 Airframe limitations Refers to comments on limitations imposed by the aircraft, not related to the autopilot
52 Wind-caused handling characteristics variability
Refers to comments on the variability of the aircraft behaviour as a function of wind component
53 Standards for automation usage Refers to concerns over not having set standards for when to use the automation and what upper modes should be used
54 Cockpit limitations Refers to difficulties imposed on pilots by cockpit instrumentation layout or the way in which the instruments convey information
55 Loss of manual flying skills induced by automation
Refers to concerns on potentially losing hands-on flying ability as a function of automation usage
56 Engines limitations Refers to occasions in which more power was desired to increase safety margins during the approach and reduce the need to monitor the engine gauges so frequently
57 Not using the ACFT's external light Refers to instances in which using the aircraft external light would have been recommended but did not happen 58 Writing and following operating
procedures Refers to the difficulties in setting standards for visual flights offshore and, considering the currently set standards, how it can sometimes be difficult to follow them
59 Appropriateness of instrument flight profile
Refers to comments about the potential inappropriateness of the flight profile as it is established
60 Inaccurate weather reports Refers to the quality of the weather reports received from the oil rigs/boats and how they might add to the difficulties in reaching such destinations safely
61 Water surface obstacles Refers to comments regarding safety breaches due to unclear water surface beneath the expected flight path
62 Destination obstacles Refers to the difficulties imposed by the features from the destination (e.g., aerials and flare booms)
63 Turbulence Refers to difficulties caused by turbulence when approaching and/or landing on the destination 64 Helideck illumination Refers to difficulties imposed by the helideck lighting itself 65 Clustered / isolated rigs Refers to problems brought about by the disposition of rigs in clusters, or for their isolation, in terms of visual cues provided (too much
or too little lighting) 66 Shuttling and manoeuvring needs Refers to the need to manoeuvre the aircraft manually too frequently in a shuttling environment
67 Orientation of the deck Refers to few into wind approach options as a function of the helideck position within the platform metalwork
68 Aids conspicuity Refers to difficulties imposed by not being able to see the landing aids, e.g., windsocks, clearly
69 Deck height Refers to problems imposed by the helideck height, too close or too far off the water 70 Ground effect in small decks Refers to helidecks which are so small that, on the final moments before landing, there is still part of the downwash on ground effect
and part out of ground effect, causing aircraft handling instability 71 Process thermal effects Refers to problems brought about by hot gases at or on the way to the landing zone
72 Small decks Refers to perceptual difficulties due to reduced size of some helidecks
379
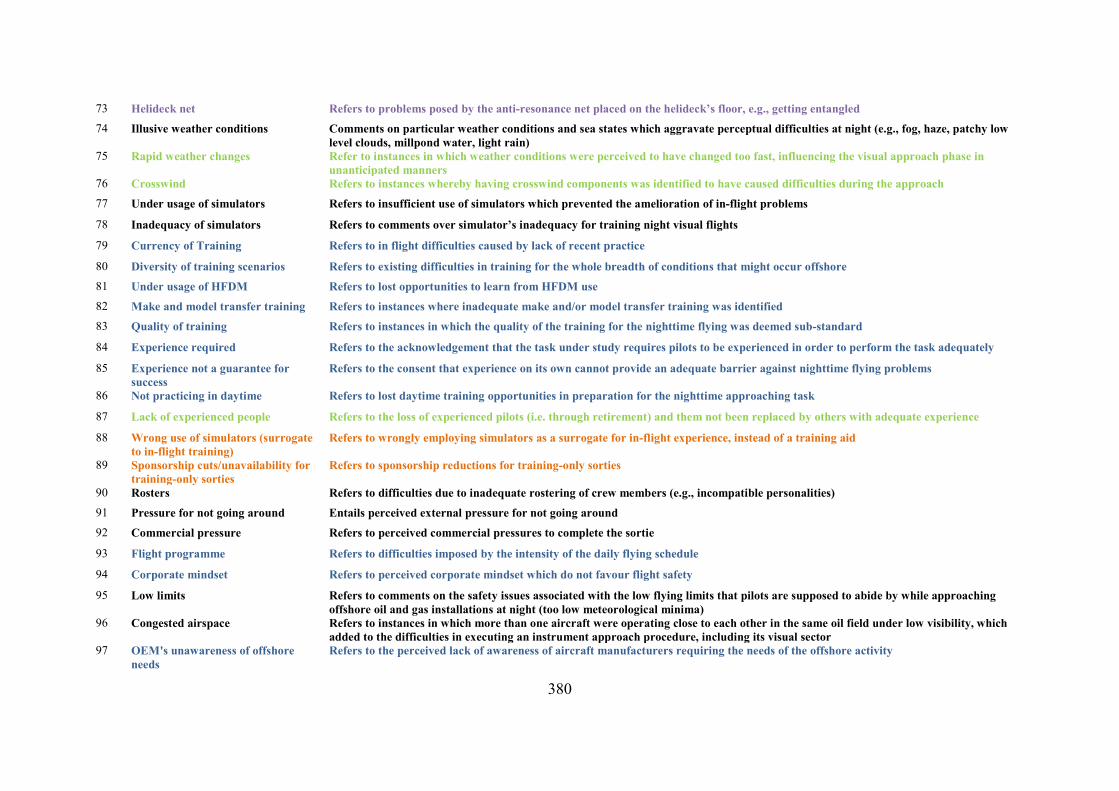
73 Helideck net Refers to problems posed by the anti-resonance net placed on the helideck’s floor, e.g., getting entangled 74 Illusive weather conditions Comments on particular weather conditions and sea states which aggravate perceptual difficulties at night (e.g., fog, haze, patchy low
level clouds, millpond water, light rain) 75 Rapid weather changes Refer to instances in which weather conditions were perceived to have changed too fast, influencing the visual approach phase in
unanticipated manners 76 Crosswind Refers to instances whereby having crosswind components was identified to have caused difficulties during the approach 77 Under usage of simulators Refers to insufficient use of simulators which prevented the amelioration of in-flight problems
78 Inadequacy of simulators Refers to comments over simulator’s inadequacy for training night visual flights
79 Currency of Training Refers to in flight difficulties caused by lack of recent practice
80 Diversity of training scenarios Refers to existing difficulties in training for the whole breadth of conditions that might occur offshore 81 Under usage of HFDM Refers to lost opportunities to learn from HFDM use 82 Make and model transfer training Refers to instances where inadequate make and/or model transfer training was identified 83 Quality of training Refers to instances in which the quality of the training for the nighttime flying was deemed sub-standard
84 Experience required Refers to the acknowledgement that the task under study requires pilots to be experienced in order to perform the task adequately
85 Experience not a guarantee for success
Refers to the consent that experience on its own cannot provide an adequate barrier against nighttime flying problems
86 Not practicing in daytime Refers to lost daytime training opportunities in preparation for the nighttime approaching task
87 Lack of experienced people Refers to the loss of experienced pilots (i.e. through retirement) and them not been replaced by others with adequate experience
88 Wrong use of simulators (surrogate to in-flight training)
Refers to wrongly employing simulators as a surrogate for in-flight experience, instead of a training aid
89 Sponsorship cuts/unavailability for training-only sorties
Refers to sponsorship reductions for training-only sorties
90 Rosters Refers to difficulties due to inadequate rostering of crew members (e.g., incompatible personalities) 91 Pressure for not going around Entails perceived external pressure for not going around 92 Commercial pressure Refers to perceived commercial pressures to complete the sortie
93 Flight programme Refers to difficulties imposed by the intensity of the daily flying schedule
94 Corporate mindset Refers to perceived corporate mindset which do not favour flight safety
95 Low limits Refers to comments on the safety issues associated with the low flying limits that pilots are supposed to abide by while approaching offshore oil and gas installations at night (too low meteorological minima)
96 Congested airspace Refers to instances in which more than one aircraft were operating close to each other in the same oil field under low visibility, which added to the difficulties in executing an instrument approach procedure, including its visual sector
97 OEM's unawareness of offshore needs
Refers to the perceived lack of awareness of aircraft manufacturers requiring the needs of the offshore activity
380
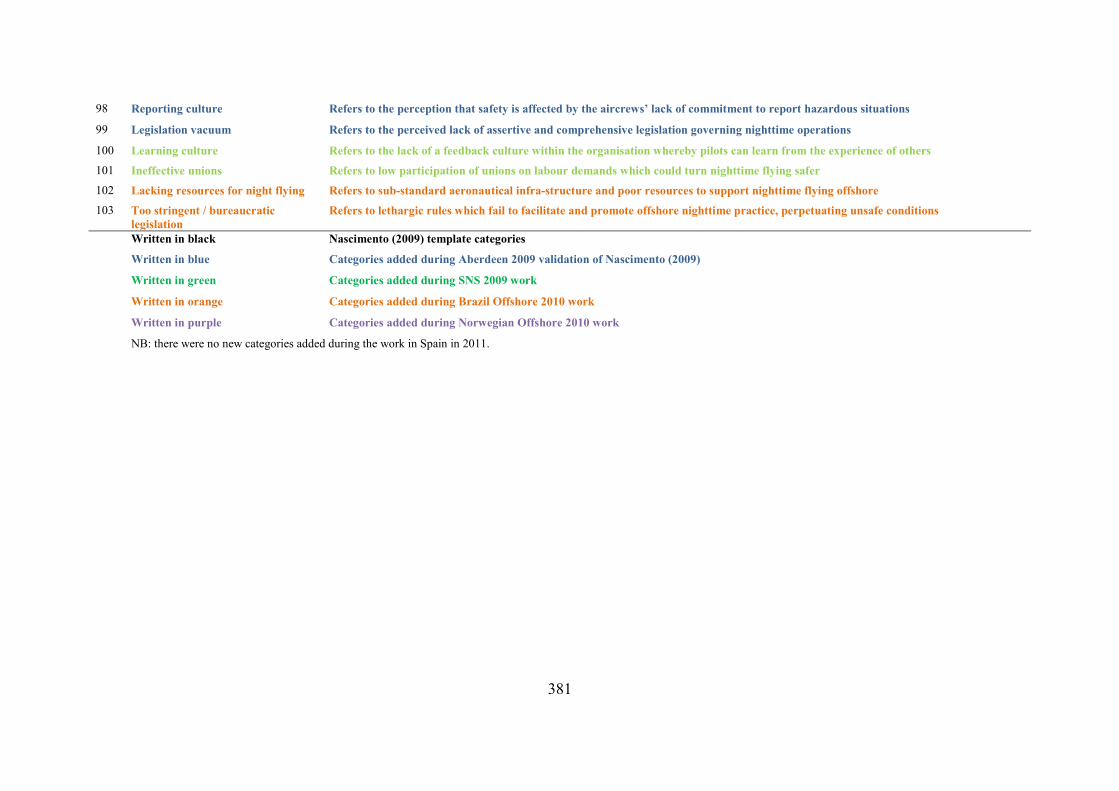
98 Reporting culture Refers to the perception that safety is affected by the aircrews’ lack of commitment to report hazardous situations
99 Legislation vacuum Refers to the perceived lack of assertive and comprehensive legislation governing nighttime operations
100 Learning culture Refers to the lack of a feedback culture within the organisation whereby pilots can learn from the experience of others 101 Ineffective unions Refers to low participation of unions on labour demands which could turn nighttime flying safer 102 Lacking resources for night flying Refers to sub-standard aeronautical infra-structure and poor resources to support nighttime flying offshore 103 Too stringent / bureaucratic
legislation Refers to lethargic rules which fail to facilitate and promote offshore nighttime practice, perpetuating unsafe conditions
Written in black
Nascimento (2009) template categories
Written in blue
Categories added during Aberdeen 2009 validation of Nascimento (2009)
Written in green
Categories added during SNS 2009 work
Written in orange
Categories added during Brazil Offshore 2010 work
Written in purple
Categories added during Norwegian Offshore 2010 work
NB: there were no new categories added during the work in Spain in 2011.
381