EI Research report Hazard analysis for offshore carbon ...
178
EI Research report Hazard analysis for offshore carbon capture platforms and offshore pipelines
-
Upload
khangminh22 -
Category
Documents
-
view
4 -
download
0
Transcript of EI Research report Hazard analysis for offshore carbon ...

EI Research report
Hazard analysis for offshore carbon capture platformsand offshore pipelines

RESEARCH REPORT
HAZARD ANALYSIS FOR OFFSHORE CARBON CAPTURE PLATFORMS AND OFFSHORE PIPELINES
September 2013
Published byENERGY INSTITUTE, LONDON
The Energy Institute is a professional membership body incorporated by Royal Charter 2003Registered charity number 1097899

The Energy Institute (EI) is the chartered professional membership body for the energy industry, supporting over 16 000 individuals working in or studying energy and 250 energy companies worldwide. The EI provides learning and networking opportunities to support professional development, as well as professional recognition and technical and scientific knowledge resources on energy in all its forms and applications.
The EI’s purpose is to develop and disseminate knowledge, skills and good practice towards a safe, secure and sustainable energy system. In fulfilling this mission, the EI addresses the depth and breadth of the energy sector, from fuels and fuels distribution to health and safety, sustainability and the environment. It also informs policy by providing a platform for debate and scientifically-sound information on energy issues.
The EI is licensed by: − the Engineering Council to award Chartered, Incorporated and Engineering Technician status; − the Science Council to award Chartered Scientist status, and − the Society for the Environment to award Chartered Environmentalist status.
It also offers its own Chartered Energy Engineer, Chartered Petroleum Engineer and Chartered Energy Manager titles.
A registered charity, the EI serves society with independence, professionalism and a wealth of expertise in all energy matters.
This publication has been produced as a result of work carried out within the Technical Team of the EI, funded by the EI’s Technical Partners. The EI’s Technical Work Programme provides industry with cost-effective, value-adding knowledge on key current and future issues affecting those operating in the energy sector, both in the UK and internationally.
For further information, please visit http://www.energyinst.org
The EI gratefully acknowledges the financial contributions towards the scientific and technical programmefrom the following companies
BG Group Phillips 66BP Exploration Operating Co Ltd Premier OilBP Oil UK Ltd RWE npowerCentrica Saudi AramcoChevron Scottish PowerConocoPhillips Ltd Shell UK Oil Products LimitedDONG Energy Shell U.K. Exploration and Production LtdEDF Energy SSEENI StatkraftE. ON UK StatoilExxonMobil International Ltd Talisman Energy (UK) LtdInternational Power Total E&P UK LimitedKuwait Petroleum International Ltd Total UK LimitedMaersk Oil North Sea UK Limited ValeroMurco Petroleum Ltd VattenfallNexen World Fuel Services
However, it should be noted that the above organisations have not all been directly involved in the development of this publication, nor do they necessarily endorse its content.
Copyright © 2013 by the Energy Institute, London.The Energy Institute is a professional membership body incorporated by Royal Charter 2003.Registered charity number 1097899, EnglandAll rights reserved
No part of this book may be reproduced by any means, or transmitted or translated intoa machine language without the written permission of the publisher.
ISBN 978 0 85293 650 4
Published by the Energy Institute
The information contained in this publication is provided for general information purposes only. Whilst the Energy Institute and the contributors have applied reasonable care in developing this publication, no representations or warranties, express or implied, are made by the Energy Institute or any of the contributors concerning the applicability, suitability, accuracy or completeness of the information contained herein and the Energy Institute and the contributors accept no responsibility whatsoever for the use of this information. Neither the Energy Institute nor any of the contributors shall be liable in any way for any liability, loss, cost or damage incurred as a result of the receipt or use of the information contained herein.
Further copies can be obtained from: Portland Customer Services, Commerce Way, Whitehall Industrial Estate, Colchester CO2 8HP, UK. t: +44 (0)1206 796 351 e: [email protected]
Electronic access to EI and IP publications is available via our website, www.energypublishing.org.Documents can be purchased online as downloadable pdfs or on an annual subscription for single users and companies.For more information, contact the EI Publications Team.e: [email protected]
RESEARCH REPORT: HAZARD ANALYSIS FOR OFFSHORE CARBON CAPTURE PLATFORMS AND OFFSHORE PIPELINES
i
CONTENTSPage
Foreword . . . . . . . . . . . . . . . . . . . . . . . . . . . . . . . . . . . . . . . . . . . . . . . . . . . . . . . . . . . . . . . iii
Acknowledgements . . . . . . . . . . . . . . . . . . . . . . . . . . . . . . . . . . . . . . . . . . . . . . . . . . . . . . . . . . v
1 Introduction . . . . . . . . . . . . . . . . . . . . . . . . . . . . . . . . . . . . . . . . . . . . . . . . . . . . . . . . . . . 1 1.1 Purpose . . . . . . . . . . . . . . . . . . . . . . . . . . . . . . . . . . . . . . . . . . . . . . . . . . . . . . . . . . . 1 1.2 Scope . . . . . . . . . . . . . . . . . . . . . . . . . . . . . . . . . . . . . . . . . . . . . . . . . . . . . . . . . . . 1 1.3 Application . . . . . . . . . . . . . . . . . . . . . . . . . . . . . . . . . . . . . . . . . . . . . . . . . . . . . . . . 2
2 Understanding CO2. . . . . . . . . . . . . . . . . . . . . . . . . . . . . . . . . . . . . . . . . . . . . . . . . . . . . . 3 2.1 The properties of CO2 . . . . . . . . . . . . . . . . . . . . . . . . . . . . . . . . . . . . . . . . . . . . . . . . 3 2.1.1 General thermodynamics . . . . . . . . . . . . . . . . . . . . . . . . . . . . . . . . . . . . . . 3 2.1.2 Effect of impurities . . . . . . . . . . . . . . . . . . . . . . . . . . . . . . . . . . . . . . . . . . . 9 2.2 CO2 and water. . . . . . . . . . . . . . . . . . . . . . . . . . . . . . . . . . . . . . . . . . . . . . . . . . . . . 15 2.2.1 CO2-in-pure water . . . . . . . . . . . . . . . . . . . . . . . . . . . . . . . . . . . . . . . . . . 15 2.2.2 CO2-in-sea water . . . . . . . . . . . . . . . . . . . . . . . . . . . . . . . . . . . . . . . . . . . 16 2.2.3 Water-in-CO2 . . . . . . . . . . . . . . . . . . . . . . . . . . . . . . . . . . . . . . . . . . . . . . 16 2.2.4 Hydrate formation: pure CO2 and pure water . . . . . . . . . . . . . . . . . . . . . . 17 2.2.5 Hydrate formation: impure CO2 and pure water . . . . . . . . . . . . . . . . . . . . 20 2.2.6 CO2 solubility in sea water . . . . . . . . . . . . . . . . . . . . . . . . . . . . . . . . . . . . 22 2.3 Other properties of CO2. . . . . . . . . . . . . . . . . . . . . . . . . . . . . . . . . . . . . . . . . . . . . . 23 2.3.1 The density of CO2 . . . . . . . . . . . . . . . . . . . . . . . . . . . . . . . . . . . . . . . . . . 23 2.3.2 The speed of sound in liquid CO2 . . . . . . . . . . . . . . . . . . . . . . . . . . . . . . . 25 2.3.3 CO2 BLEVE . . . . . . . . . . . . . . . . . . . . . . . . . . . . . . . . . . . . . . . . . . . . . . . . 25
3 Hazards associated with CO2 for offshore CCS applications . . . . . . . . . . . . . . . . . . . . 26 3.1 Introduction . . . . . . . . . . . . . . . . . . . . . . . . . . . . . . . . . . . . . . . . . . . . . . . . . . . . . . 26 3.2 General hazards associated with CO2. . . . . . . . . . . . . . . . . . . . . . . . . . . . . . . . . . . . 26 3.2.1 Health hazards and effects . . . . . . . . . . . . . . . . . . . . . . . . . . . . . . . . . . . . 26 3.2.2 Occupational exposure limits . . . . . . . . . . . . . . . . . . . . . . . . . . . . . . . . . . 29 3.2.3 Physical hazards associated with CO2 releases . . . . . . . . . . . . . . . . . . . . . . 29 3.2.4 Dispersion in open spaces . . . . . . . . . . . . . . . . . . . . . . . . . . . . . . . . . . . . 29 3.2.5 Hazards associated with phase change and the JT effect . . . . . . . . . . . . . 29 3.2.6 Solid CO2 dispersion . . . . . . . . . . . . . . . . . . . . . . . . . . . . . . . . . . . . . . . . . 30 3.3 Hazards associated with CO2 from carbon capture sources. . . . . . . . . . . . . . . . . . . . 30 3.3.1 Gaseous impurities: general . . . . . . . . . . . . . . . . . . . . . . . . . . . . . . . . . . . 31 3.3.2 Hydrogen sulfide (H2S) . . . . . . . . . . . . . . . . . . . . . . . . . . . . . . . . . . . . . . . 31 3.3.3 H2S-in-CO2 . . . . . . . . . . . . . . . . . . . . . . . . . . . . . . . . . . . . . . . . . . . . . . . . 33 3.3.4 Hydrogen (H2) . . . . . . . . . . . . . . . . . . . . . . . . . . . . . . . . . . . . . . . . . . . . . 33 3.3.5 Carbon monoxide (CO) . . . . . . . . . . . . . . . . . . . . . . . . . . . . . . . . . . . . . . 34 3.3.6 Toxicity of CO. . . . . . . . . . . . . . . . . . . . . . . . . . . . . . . . . . . . . . . . . . . . . . 34 3.3.7 Oxides of nitrogen and sulfur dioxide . . . . . . . . . . . . . . . . . . . . . . . . . . . . 35 3.3.8 Indirect impacts of impurities within CO2 . . . . . . . . . . . . . . . . . . . . . . . . . 36 3.3.9 Fluid hammer. . . . . . . . . . . . . . . . . . . . . . . . . . . . . . . . . . . . . . . . . . . . . . 39 3.3.10 Downstream impacts . . . . . . . . . . . . . . . . . . . . . . . . . . . . . . . . . . . . . . . . 40 3.4 Requirements under the CCS directive. . . . . . . . . . . . . . . . . . . . . . . . . . . . . . . . . . . 40 3.5 Specifying CO2 for storage. . . . . . . . . . . . . . . . . . . . . . . . . . . . . . . . . . . . . . . . . . . . 41 3.6 Dynamis specification for CO2 . . . . . . . . . . . . . . . . . . . . . . . . . . . . . . . . . . . . . . . . . 41 3.6.1 CO2 content. . . . . . . . . . . . . . . . . . . . . . . . . . . . . . . . . . . . . . . . . . . . . . . 42 3.6.2 Non-condensable gases (excluding hydrogen). . . . . . . . . . . . . . . . . . . . . . 42

RESEARCH REPORT: HAZARD ANALYSIS FOR OFFSHORE CARBON CAPTURE PLATFORMS AND OFFSHORE PIPELINES
ii
3.6.3 Hydrogen. . . . . . . . . . . . . . . . . . . . . . . . . . . . . . . . . . . . . . . . . . . . . . . . . 43 3.6.4 Oxygen content . . . . . . . . . . . . . . . . . . . . . . . . . . . . . . . . . . . . . . . . . . . . 43 3.6.5 Methane content . . . . . . . . . . . . . . . . . . . . . . . . . . . . . . . . . . . . . . . . . . . 44 3.6.6 H2S content . . . . . . . . . . . . . . . . . . . . . . . . . . . . . . . . . . . . . . . . . . . . . . . 44 3.6.7 CO content . . . . . . . . . . . . . . . . . . . . . . . . . . . . . . . . . . . . . . . . . . . . . . . 45 3.6.8 Water content . . . . . . . . . . . . . . . . . . . . . . . . . . . . . . . . . . . . . . . . . . . . . 46 3.6.9 SOx and NOx content. . . . . . . . . . . . . . . . . . . . . . . . . . . . . . . . . . . . . . . . 46 3.7 Hazards associated with CO2 releases . . . . . . . . . . . . . . . . . . . . . . . . . . . . . . . . . . . 46 3.7.1 Hazard analysis. . . . . . . . . . . . . . . . . . . . . . . . . . . . . . . . . . . . . . . . . . . . . 46 3.7.2 Hazard analysis for offshore CCS . . . . . . . . . . . . . . . . . . . . . . . . . . . . . . . 47 3.7.3 Dispersion modelling . . . . . . . . . . . . . . . . . . . . . . . . . . . . . . . . . . . . . . . . 47 3.7.4 Hazard modelling examples . . . . . . . . . . . . . . . . . . . . . . . . . . . . . . . . . . . 49 3.7.5 Dispersion modelling results . . . . . . . . . . . . . . . . . . . . . . . . . . . . . . . . . . . 54
4 Offshore CO2 transport and storage system components. . . . . . . . . . . . . . . . . . . . . . 62 4.1 Introduction . . . . . . . . . . . . . . . . . . . . . . . . . . . . . . . . . . . . . . . . . . . . . . . . . . . . . . 62 4.2 Offshore CO2 transport and storage system components . . . . . . . . . . . . . . . . . . . . . 63 4.2.1 Transporting CO2 . . . . . . . . . . . . . . . . . . . . . . . . . . . . . . . . . . . . . . . . . . . 63 4.2.2 Injection of CO2 . . . . . . . . . . . . . . . . . . . . . . . . . . . . . . . . . . . . . . . . . . . . 67 4.3 Offshore facilities for the use of CO2 for enhanced oil recovery (EOR). . . . . . . . . . . . 71 4.3.1 Introduction . . . . . . . . . . . . . . . . . . . . . . . . . . . . . . . . . . . . . . . . . . . . . . . 71 4.3.2 Hazards associated with EOR operation . . . . . . . . . . . . . . . . . . . . . . . . . . 72 4.3.3 CO2 release sources and monitoring in EOR applications. . . . . . . . . . . . . . 73 4.4 Reuse of existing infrastructure . . . . . . . . . . . . . . . . . . . . . . . . . . . . . . . . . . . . . . . . 75 4.4.1 Fitness-for-purpose. . . . . . . . . . . . . . . . . . . . . . . . . . . . . . . . . . . . . . . . . . 75 4.4.2 Implications for storage . . . . . . . . . . . . . . . . . . . . . . . . . . . . . . . . . . . . . . 77
5 General conclusions . . . . . . . . . . . . . . . . . . . . . . . . . . . . . . . . . . . . . . . . . . . . . . . . . . . . 79 5.1 Further research . . . . . . . . . . . . . . . . . . . . . . . . . . . . . . . . . . . . . . . . . . . . . . . . . . . 80 5.2 Other work . . . . . . . . . . . . . . . . . . . . . . . . . . . . . . . . . . . . . . . . . . . . . . . . . . . . . . . 80
AnnexesAnnex A Hazard analysis: Credible events . . . . . . . . . . . . . . . . . . . . . . . . . . . . . . . . . . . . . . . 81Annex B Summary of key potential environmental impacts of offshore CCS activities. . . . . . 101Annex C Example dispersion modelling exercise. . . . . . . . . . . . . . . . . . . . . . . . . . . . . . . . . . 107Annex D Description of typical offshore transportation and injection system components . . 143Annex E Composition of CO2 from different sources . . . . . . . . . . . . . . . . . . . . . . . . . . . . . . 149Annex F CO2 BLEVE . . . . . . . . . . . . . . . . . . . . . . . . . . . . . . . . . . . . . . . . . . . . . . . . . . . . . . 156Annex G Glossaries of acronyms and terms used in this publication . . . . . . . . . . . . . . . . . . . 158Annex H References. . . . . . . . . . . . . . . . . . . . . . . . . . . . . . . . . . . . . . . . . . . . . . . . . . . . . . . 165

RESEARCH REPORT: HAZARD ANALYSIS FOR OFFSHORE CARBON CAPTURE PLATFORMS AND OFFSHORE PIPELINES
iii
FOREWORD
The intention of this publication is to:
− Provide a basic guide for the health and safety hazard analysis for offshore management of CO2 pipelines and platforms, where CO2 will be present as a part of carbon capture and storage (CCS) installations; communicate existing knowledge on pipeline and offshore facility design and operation; and identify areas of uncertainty where existing knowledge cannot be applied with sufficient confidence, considering the scale and nature of expected CCS operations in the future.
− Allow engineers and project managers involved in CCS projects to widen their knowledge base to ensure that procurement of equipment and operational guidelines are using current knowledge.
− Supplement the Technical Guidance on hazard analysis for onshore carbon capture installations and onshore pipelines which has previously been published.
However, this publication purposely does not include CO2 storage, nor does it address in the same level of detail, the possible environmental hazards.
It is appreciated that work is continuing in a number of areas to extend the understanding of the properties and behaviour of impure CO2 in dense phase and as a gas. This publication is intended to represent a summary of current knowledge and good practice.
The publication initially provides an understanding of the thermodynamics of pure CO2, particularly liquid CO2 (dense phase), since the majority of offshore applications will involve CO2 in this state. In dense phase conditions, typical of those that would be expected in offshore pipelines and on platforms, the thermodynamic and physical properties of CO2 are affected by impurities, and the implications of these impurities on the underlying properties are therefore addressed.
The impact of the different properties of CO2 on the hazards associated with carbon capture and storage applications are described. Some are hazards associated with CO2 itself, whereas others are associated with impurities found within CCS CO2 streams. However, designers can draw upon the considerable experience of both the offshore oil and gas industries worldwide to understand these hazards, and to minimise their impact. This publication provides guidance and references to assist with this.
There is an introduction to hazard analysis, and some of the hazards associated with CO2 for offshore CCS applications are presented, together with how these can be used in conjunction with a hazard analysis. The potential hazards to personnel, both from CO2 and the possible impurities likely to be found from the capture processes, are described. These are set in the context of how they might apply to offshore CO2 transport and injection facilities. There is an example of the composition of captured CO2, and the risks associated with operating outside of the limits described are outlined.
The publication includes simplified examples of release modelling from a number of different possible offshore scenarios to demonstrate the use of an integral programme. The scenarios chosen are low-probability high-impact events, which demonstrate the capabilities of dispersion modelling. Overall, the majority of the release scenarios chosen indicate that the potential could exist for some degree of adverse impact either for persons on the platform deck or for those close to sea level (for example, ships or rescue vessels), but they also highlight the need for additional work to be carried out in some areas.
To enable the reader to understand typical design considerations for ensuring safe offshore CO2 systems and the risk potential with respect to failure modes, some of the main system components associated with CO2 transport, injection, offshore EOR processing of

RESEARCH REPORT: HAZARD ANALYSIS FOR OFFSHORE CARBON CAPTURE PLATFORMS AND OFFSHORE PIPELINES
iv
CO2, and re-injection are described. This document also describes some typical mitigation techniques available to minimise the potential for failure.
This publication should supplement rather than substitute regulatory requirements, many of which are referenced within the text. The intention is to allow project developers and designers to meet their statutory obligations with increased certainty.
The existing Energy Institute (EI) documents relating to Good plant design and operation for onshore carbon capture installations and onshore pipelines should be reviewed and, if appropriate, updated, in view of the information assembled in the production of this publication. It is also recommended that some of the conclusions from the dispersion modelling exercise should be brought to the attention of the vendors so that issues discovered during the work can be considered in future releases of their programmes.

RESEARCH REPORT: HAZARD ANALYSIS FOR OFFSHORE CARBON CAPTURE PLATFORMS AND OFFSHORE PIPELINES
v
ACKNOWLEDGEMENTS
The Energy Institute wishes to record its appreciation of the work carried out by the individuals and companies who supported the development of this publication.
We thank the work of the Steering Group (SG) in guiding the project:
Mike Austell Progressive EnergySam Botterill Energy InstituteAndy Brown (Chairman) Progressive EnergyTony Byrne MMIRussell Cooper National GridMeade Harris Global Carbon Capture and Storage InstituteTim Hill E.ONHamish Holt DNV KEMAMartin Maeso Energy InstitutePrakash Patel (former Chairman) Air ProductsJudith Shapiro Carbon Capture and Storage AssociationJames Watt AMECRosemary Whitbread Health and Safety Laboratory

RESEARCH REPORT: HAZARD ANALYSIS FOR OFFSHORE CARBON CAPTURE PLATFORMS AND OFFSHORE PIPELINES
1
1 INTRODUCTION
This section explains who this publication is intended for, what this publication covers, what it does not cover, and why it has been produced.
1.1 PURPOSE
This publication has been prepared to: − Provide a basic guide for the health and safety hazard analysis for offshore
management of CO2 pipelines and platforms, where CO2 will be present as a part of carbon capture and storage (CCS) installations.
− Communicate existing knowledge on pipeline and offshore facility design and operation and identify areas of uncertainty where existing knowledge cannot be applied with sufficient confidence, considering the scale and nature of expected CCS operations in the future.
− Set out existing knowledge on pipeline, offshore facilities, design, operation, for CO2 operations.
− Identify areas of uncertainty where existing knowledge cannot be applied with sufficient confidence.
− Allow engineers and project managers involved in CCS projects to widen their knowledge base to ensure that procurement of equipment and operational guidelines are using the current knowledge.
1.2 SCOPE
This publication provides information on: − CO2 hazard analysis, for both offshore facilities and pipelines. − Some design and operational considerations for offshore installations. − Some design and operational considerations for offshore pipelines.
Figure 1.1 CCS process flow showing (in red) the section covered by this publication

RESEARCH REPORT: HAZARD ANALYSIS FOR OFFSHORE CARBON CAPTURE PLATFORMS AND OFFSHORE PIPELINES
2
The scope is indicated by the red items in Figure 1.1. This includes CO2 at a point on a landfall at or just above the high water mark (starting at the beachhead), the offshore pipeline, any pieces of equipment attached to the pipeline (such as manifolds and tees), platforms where the CO2 is brought to the surface, and any other features up to the wellhead, but excluding the ‘Christmas Tree’ itself.
Use of the phrases ‘upstream’ and ‘downstream’, within the context of the CCS space should be treated with caution. In this document the phrase ‘stream’ is used in the context of the flow direction of the CO2.
This publication should supplement regulatory requirements (many of which are referenced within the text), and not substitute for them.
This publication does not cover: − Onshore installations or transportation. − Design and operating information for non-CCS related uses of CO2.
1.3 APPLICATION
This publication provides information for: − Project engineers and managers who are procuring new CCS installations and
pipelines. − Engineering designers involved in the design of offshore CCS installations. − CCS industry participants who wish to widen their knowledge of CCS technology
and the properties of CO2 relevant to offshore installations. − Safety advisers and professionals who need to understand the pertinent properties
and health and safety hazards of CO2 .

RESEARCH REPORT: HAZARD ANALYSIS FOR OFFSHORE CARBON CAPTURE PLATFORMS AND OFFSHORE PIPELINES
3
2 UNDERSTANDING CO2
This section sets out: − The thermodynamics of CO2 including understanding the implications of impurities
on the underlying thermodynamics. − The key properties of liquid CO2. − The impact of the properties of CO2 on the associated hazards.
2.1 THE PROPERTIES OF CO2
CO2 gas is found in small proportions in the atmosphere (about 385 ppmvd1); it is assimilated by plants which in turn produce oxygen by photosynthesis. It is produced from the combustion of coal or hydrocarbons, the fermentation of liquids and the breathing of humans and animals. CO2 is also found beneath the earth’s surface and emerges during volcanic activity, in hot springs and other places where the earth’s crust is thin. It is found in lakes, and at great depth under the sea2. It is also commingled with oil and gas deposits.
CO2 comprises two oxygen atoms covalently bonded to a single carbon atom, with an O-C-O angle of 180°. As such, it is very stable with no known natural process other than photosynthesis capable of reducing CO2 to oxygen.
CO2 is widely used commercially. It is employed in the chemical processing industries to control reactor temperatures, to neutralise alkaline effluents, and used under supercritical conditions for purifying or dyeing polymer, animal or vegetable fibres.
In the food and beverage industries, CO2 is used for the carbonation of beverages such as soft drinks, mineral water or beer; for packaging of foodstuffs; as a cryogenic fluid in chilling or freezing operations; or as dry ice for temperature control during the distribution of foodstuffs. Caffeine can be removed from coffee using supercritical CO2.
In the medical field, CO2 produces close to physiologic atmospheres for the operation of artificial organs. CO2 is used as a component in a mixture of oxygen or air as a respiratory stimulant to promote deep breathing. It is also used for surgical dilation by intra-abdominal insufflations.
In industry, CO2 is typically used for environment protection, examples of which include its use of CO2 for red fume suppression during scrap and carbon charging, for nitrogen pick-up reduction during electric arc-furnace tapping and for bottom-stirring. In non-ferrous metallurgy, CO2 is used for fume suppression during ladle transfer of matte (copper/nickel production) or bullion (zinc/lead production). CO2 is used to enhance the recovery of oil and gas from wells where primary and secondary methods are no longer cost-effective on their own.
CO2 is also used in fire extinguishers and as ‘dry ice’ for stage and other effects.
2.1.1 General thermodynamics
2.1.1.1 Physical properties of pure CO2 Pure CO2 exhibits triple-point behaviour dependent on the temperature and pressure, as shown in Figure 2.1:
1 ppmvd is ‘volume parts per million dry’2 Lakes of CO2 in the deep sea, Kenneth Nealson, Department of Earth Sciences, University of Southern California,
19th September 2006.

RESEARCH REPORT: HAZARD ANALYSIS FOR OFFSHORE CARBON CAPTURE PLATFORMS AND OFFSHORE PIPELINES
4
Figure 2.1 CO2 phase diagram
The triple point (at a pressure 5,11 bar and temperature of -56,7 °C) is defined as the temperature and pressure where three phases (gas, liquid and solid) can exist simultaneously in thermodynamic equilibrium. The solid-gas phase boundary is called the sublimation line, as a solid evaporating directly into a gas is called sublimation. Physically, this boundary implies that the gas and solid can co-exist and transform back and forth without the presence of liquid as an intermediate phase.
Above the critical point (73,8 bar and 31,1 °C), the liquid and gas phases cannot exist as separate phases, and CO2 develops supercritical properties, where it has some characteristics of a gas and others of a liquid.
In the event of an uncontrolled release of CO2 (e.g. damage to a pipe containing liquid CO2), a portion of the escaping fluid will quickly expand to CO2 gas. The temperature of the released gas will fall rapidly due to the pressure drop (Joule Thompson effect, see 2.1.1.2) and phase changes. In above ground applications some of the released CO2 will form CO2 ‘snow’: as a result of the low temperature of the CO2, the surrounding air will also be cooled down. This could cause the water vapour in the air to condense locally, which will resemble a thick fog.
The situation for most subsea applications is different: most of the CO2 will expand to a gas as a result of expanding into the lower pressure of the water. Heat from the water will quickly be absorbed, and CO2 gas, being less dense than seawater3 (see 2.2.6) will tend to rise toward the surface. As the gas rises some of it will dissolve in the seawater (see 2.2.2), and the liquid portions will usually expand and emerge as a gas. This gas will be relatively cold, in spite of having absorbed heat from the surrounding water, and may give rise to local fogging, dependent on local climactic and wind conditions. Section 3 contains a modelled example of this dispersion.
The phase diagram, as shown in Figure 2.1, is a common way to represent the various phases of a substance and the conditions under which each phase exists. However, the graphic suggests little regarding how the changes of state for CO2 occur during transition. The CO2 pressure-enthalpy diagram (P-H), shown in Figure 2.2, or temperature-entropy (T-S) diagrams provide insight into transient conditions such as phase changes, energy transfers, and density, pressure and temperature changes during depressurisation, e.g. for a leak of CO2 from a vessel or a pipeline.
3 CO2 at 200 bar and 4 °C has a density of 1 050 kg/m3. Seawater does not reach this density until a depth of approximately 3 400 m, at which point the pressure would be 350 bar, and any leak in the pipeline would result in seawater ingress, not CO2 spilling on to the ocean floor.

RESEARCH REPORT: HAZARD ANALYSIS FOR OFFSHORE CARBON CAPTURE PLATFORMS AND OFFSHORE PIPELINES
5
Figure 2.2 Pressure/enthalpy diagram for pure CO2
In order to understand and interpret such a diagram some basic thermodynamic theory and terms need to be established. The adiabatic (no heat exchanged) expansion of a gas may occur in a number of ways. The change in temperature experienced by the gas during expansion depends not only on the initial and final pressures, but also on the manner in which the expansion is carried out.
Isenthalpic expansion is a theoretical expansion which takes place without any change in enthalpy. In a free expansion, the gas does no work and absorbs no heat, so the internal energy is conserved. Expanded in this manner, the temperature of an ideal gas would remain constant, but the temperature of a real gas may either increase or decrease, depending on the initial temperature and pressure. This is called the Joule Thompson (JT) effect, and although usually the effect is referred to for gases, it applies equally to liquids.
2.1.1.2 Joule Thompson EffectThe JT effect refers to the change in temperature observed when a gas expands while flowing through a restriction without any heat entering or leaving the system. The change may be positive or negative and can involve a phase change as, for instance, a liquid flashes off to a gas. For each gas, there is an inversion point that depends on temperature and pressure, below which it is cooled and above which it is heated.
The amount by which the fluid cools on expansion (measured in °C/bar) is called the JT coefficient, µJT. Gaseous CO2 (taken to be at 4°C) has a particularly high µJT compared with other common gases, as shown in Table 2.14.
4 Parameters are 4 °C at the 10 – 30 bar range, assembled from National Institute of Standards and Technology Material Measurement Laboratory standard reference data.

RESEARCH REPORT: HAZARD ANALYSIS FOR OFFSHORE CARBON CAPTURE PLATFORMS AND OFFSHORE PIPELINES
6
Gas CO H2 O2 N2 CH4 CO2
µJT1
(°C/bar) 0,27 0,02 0,3 0,2 0,5 1,4
Table 2.1 JT coefficient for a number of fluids
Figure 2.3 Changes in temperature as a result of the JT effect for pure CO2 at 4 °C
The cooling effect of dense phase CO2 is a combination of both the phase change and flashing of the liquid to a gas. Figure 2.3 gives some examples of the change in temperature that might be expected from a differential pressure change (CO2 is taken to be liquid at 4 °C).
The value of µJT varies with the temperature of the CO2, with the higher values at lower temperatures. The effect of higher pressures at 4 °C, typical of offshore CCS applications, is shown in Figure 2.4, which indicates that the value of µJT for liquid CO2 at 4 ° varies slightly with pressure (for small changes in differential pressure). This section of the graph is exaggerated as Figure 2.5.

RESEARCH REPORT: HAZARD ANALYSIS FOR OFFSHORE CARBON CAPTURE PLATFORMS AND OFFSHORE PIPELINES
7
Figure 2.4 Changes in isothermal JT coefficient (µJT) for pure CO2 at 4 °C
Figure 2.5 Changes in isothermal JT coefficient (µJT) for pure liquid CO2 at 4 °C
For CO2 the inversion temperature, at atmospheric pressure, is 1 500 K5 (1 226,85 °C), which means that CO2 gas always cools by isenthalpic expansion for all conditions relevant for CCS applications.
Isentropic expansion takes place if the expansion process is reversible, (meaning that the gas is in thermodynamic equilibrium at all times). In this scenario, the gas does positive work during the expansion, and its temperature decreases. Here, the temperature drop will be greater than for isenthalpic expansion.
Figure 2.6 shows the pressure-density behaviour of pure CO2 during rapid decompression from 130 bar (13,1 MPa) and 5 ˚C, and it can be seen that solid, liquid and gas phases are all present.
5 Perry’s Chemical Engineering Handbook, McGraw-Hill, 2007.

RESEARCH REPORT: HAZARD ANALYSIS FOR OFFSHORE CARBON CAPTURE PLATFORMS AND OFFSHORE PIPELINES
8
Figure 2.6 Pressure-density behaviour during rapid decompression of pure CO2
However, impurities within the CO2 can change both the shape of the diagram and the location of the critical point (see 2.1.2).
2.1.1.3 Gaseous phase CO2 CO2 gas is colourless, heavier than air (1,521 times as heavy, with a density of about 1,98 g/litre), has an unpleasant odour, and freezes at -78,5 °C to form CO2 snow. Sub-cooling of the CO2 below this level is possible in some circumstances.
The effects of inhaling CO2 and the limit values for working when there is CO2 in the atmosphere are described in 3.2.
An escape of CO2 gas, because it is heavier than air, can accumulate in depressions in the ground and in basements or sumps. However, high pressure releases tend to become neutrally buoyant very quickly due to air entrainment. The release will disperse as a result of air movements, and models that assist in the prediction of this are described in Annex C.
2.1.1.4 Liquid phase CO2
CO2 cannot exist as a liquid at atmospheric pressure. At a pressure of anything above 5,11 bar and at a temperature between -56,6 °C and 31,1 °C it becomes liquid (see Figure 2.1). Within this ‘bracket’ or ‘envelope’ its density can rise up to 1 180 kg/m3. Were a cubic metre of liquid CO2 from a subsea pipeline at 4 °C and 200 bara to be released and expand to 1,013 bar (atmospheric pressure) and 4 °C it would occupy a volume of about 520 m3.
In practical terms the majority of the CO2 in offshore CCS applications will be in liquid form (i.e. still sub-supercritical, although close to supercritical), since it will be at high pressure (>100 bar) and low temperature (<31 °C): as a result, pipes to export it from the production to the storage sites can be much smaller than if the CO2 had been transported as a gas.
Liquid CO2 at 4 °C has a high density (~950 kg/m3) and a low viscosity (~0,11 cp), as described in 2.1.2.2. It also has a low surface tension (approx. 1,5 mN/m).
2.1.1.5 Supercritical phaseAbove its critical temperature (31,1 °C) and pressure (72,9 bar), pure CO2 takes on the properties of a supercritical fluid. These properties include expanding to fill its container like a gas but with a density similar to that of a liquid. As it approaches the supercritical condition, the meniscus between liquid and gaseous CO2 disappears.

RESEARCH REPORT: HAZARD ANALYSIS FOR OFFSHORE CARBON CAPTURE PLATFORMS AND OFFSHORE PIPELINES
9
The properties of supercritical fluids lie between those of gases and liquids; a supercritical fluid has densities similar to that of liquids, while the viscosities and diffusivities are closer to that of gases. A supercritical fluid can diffuse in a solid matrix faster than a liquid, yet possess a solvent strength to extract the solute from the solid matrix.
Supercritical CO2, with a high degree of purity, is becoming an important commercial and industrial solvent due to its role in chemical extraction. This is aided by its low toxicity and relatively benign environmental impact. The solubility of solids in supercritical CO2 can be 3-10 orders of magnitude higher than in liquid CO2. The relatively low temperature of the processes, and the stability of CO2, also allow most compounds to be extracted with little damage or denaturing. This is particularly useful when extracting volatile oils and fragrances for the perfumery industry. The amount of CO2 used in these applications is very small compared to the volumes that will be produced during CCS. Whilst the fundamental physics of supercritical CO2 is understood, work is in hand to assess the impact of large releases such as might be encountered in CCS applications.
When transporting CO2 offshore for CCS applications, the CO2 will not usually be in the supercritical phase, because its temperature will be below that at which supercritical properties apply, i.e. 31,1 °C for pure CO2 (see Figure 2.1).
2.1.1.6 Solid CO2
If liquid CO2 is cooled to -78,5 °C at atmospheric pressure, it becomes solid (see Figure 2.1), and its density rises to 1 562 kg/m3. Solid CO2 has a snow-like appearance, and can be compressed into blocks to form ‘dry ice’.
Once formed, solid CO2 can take a significant length of time to thaw out, at which point it vaporises to form CO2 gas.
2.1.2 Effect of impurities
2.1.2.1 Effect on phase diagram2.1 refers to the properties of pure CO2. CO2 from CO2-capture plants will generally not be pure, and some of the impurities affect the properties of the liquid. Hydrogen, for instance, a possible impurity arising from pre-combustion capture plants, affects the triple point, and does not dissolve in the liquid until the pressure is quite high (>92 bar at 30 °C). Undissolved hydrogen may, for instance, cause cavitation in CO2 booster pumps, as two-phase flow could be experienced, where there is the potential for a loss in containment. As such, hydrogen may be seen to have the greatest potential for impact when it makes up part of the impurities in a CO2 gas stream. This might have formed in a pre-combustion capture process, for instance, in an integrated gasification combined cycle (IGCC) facility.
Modelling6 has indicated that these impurities will change both the shape of the phase diagram, shown as Figures 2.1 and 2.2, and the location of the critical point. Instead of the transition between vapour and solid being sharp, represented by a line, it becomes more gradual. This area is sometimes referred to as an ‘envelope’ or ‘phase change envelope’, in which solid, vapour and liquid CO2 co-exist.
However, other impurities may also be present. Figure 2.7 shows an extreme example of this effect for a 95 % CO2/5 % N2, a 90 % CO2/5 % N2/5 %CH4 mix, a 90 % CO2/5 % N2/5 % NO2 mix, and a 90 % CO2/5 % N2/5 % NO2 mix, compared to pure CO2. These kinds of mixtures are possible from IGCC, pre-combustion natural gas, pulverised coal and steam methane reforming (SMR) applications respectively, although commercial operations would
6 Transporting the Next Generation of CO2 for Carbon, Capture and Storage: The Impact of Impurities on Supercritical CO2 Pipelines P Seevam, J Race, M Downie, Newcastle University; P Hopkins, Penspen Ltd., 7th International Pipeline Conference, 29 September - 3 October, 2008, Calgary, Canada
RESEARCH REPORT: HAZARD ANALYSIS FOR OFFSHORE CARBON CAPTURE PLATFORMS AND OFFSHORE PIPELINES
10
not normally have these levels of impurities. The arrows indicate the critical point for each mixture. The results shown are indicative only.
2.1.2.2 Effect on density and viscosity of CO2
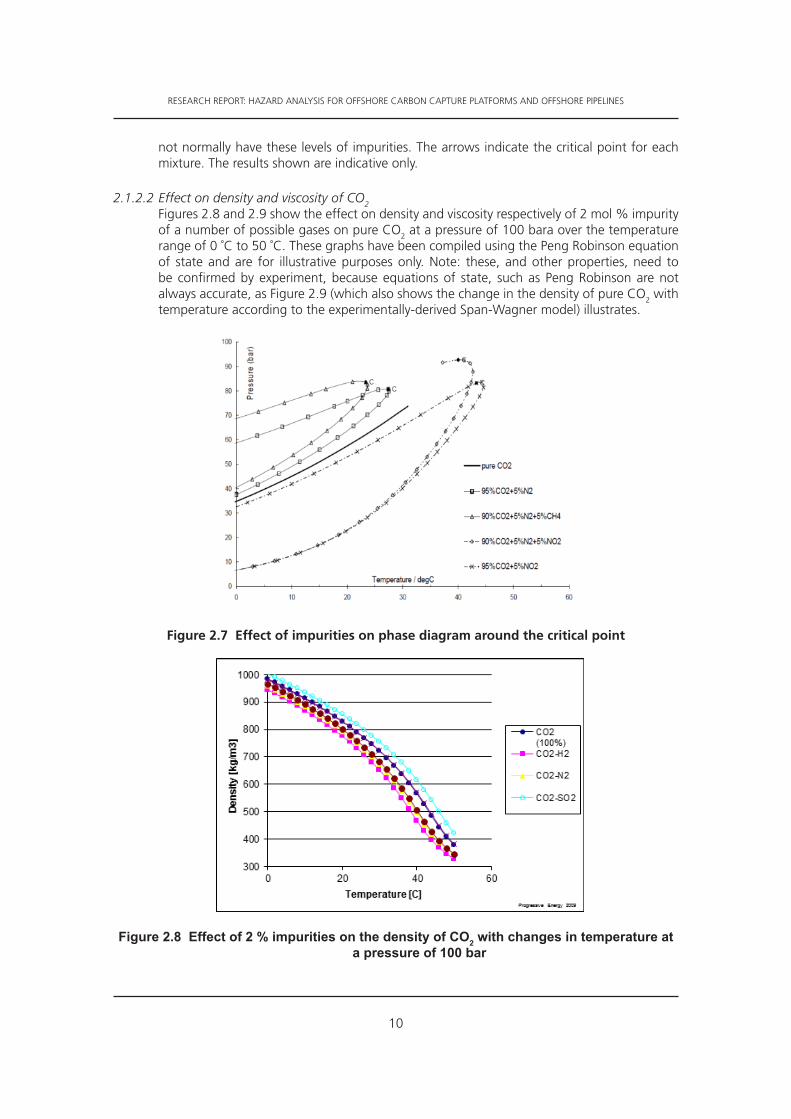
Figures 2.8 and 2.9 show the effect on density and viscosity respectively of 2 mol % impurity of a number of possible gases on pure CO2 at a pressure of 100 bara over the temperature range of 0 ˚C to 50 ˚C. These graphs have been compiled using the Peng Robinson equation of state and are for illustrative purposes only. Note: these, and other properties, need to be confirmed by experiment, because equations of state, such as Peng Robinson are not always accurate, as Figure 2.9 (which also shows the change in the density of pure CO2 with temperature according to the experimentally-derived Span-Wagner model) illustrates.
Figure 2.7 Effect of impurities on phase diagram around the critical point
Figure 2.8 Effect of 2 % impurities on the density of CO2 with changes in temperature at a pressure of 100 bar

RESEARCH REPORT: HAZARD ANALYSIS FOR OFFSHORE CARBON CAPTURE PLATFORMS AND OFFSHORE PIPELINES
11
It may be seen in Figure 2.8 that H2S has a minimal impact on density, whereas the effect of hydrogen is significant. Sulfur dioxide (SO2) also has a significant effect, often pulling the properties in the opposite direction from hydrogen.
0.02
0.03
0.04
0.05
0.06
0.07
0.08
0.09
0.1
0.11
0.12
0 10 20 30 40 50 60
Temperature [C]
Visc
osity
[cp]
CO2 (100%)CO2-H2CO2-N2CO2-SO2CO2-H2SCO2-O2
Progressive Energy 2009
Figure 2.9 Effect of 2 % impurities on viscosity of CO2 with changing temperature at a constant pressure of 100 bar
It may be seen from Figure 2.9 that: − Non-linearities appear in the 25 - 35 ˚C range, because the program used (ProMax)
models the supercritical fluid as a vapour. Generally, computer models do not deal well with the phase transition around the critical point. Real data are available in this region.
− H2S has a minimal impact on viscosity, whereas the effect of hydrogen is significant.
Another factor in predicting the behaviour of CO2 is the source term used. Figure 2.10 shows the same parameters (density against temperature for pure CO2 at a pressure of 100 bar) using two different equations of state, Span-Wagner and Peng-Robinson. Whilst these give generally consistent answers, it does underline the need to validate models with experimental measurements.

RESEARCH REPORT: HAZARD ANALYSIS FOR OFFSHORE CARBON CAPTURE PLATFORMS AND OFFSHORE PIPELINES
12
Figure 2.10 Effect of different models of equation of state on the density of pure CO2 at 100 bar
Graphs indicating the modelled effect (using ProMax) of impurities on the density and viscosity of CO2 with varying temperature and pressure at a fixed temperature of 4 ˚C are shown as Figures 2.11 and 2.12 respectively. Comparing this with the conclusion from Figure 2.8, it may be seen in Figure 2.9 that adding 2 mol% of H2S has a minimal impact on density, whereas the effect of hydrogen is significant. In all cases except for SO2 the effect is to reduce the density. The same conclusion may be drawn about viscosity from Figure 2.12.
860
880
900
920
940
960
980
1000
1020
1040
1060
70 90 110 130 150 170 190
Pressure/ bar
Dens
ity, k
g/m
3
CO2 (100%)
CO2-H2
CO2-N2
CO2-SO2
CO2-H2S
CO2-O2
Progressive Energy 2009
Figure 2.11 Effect of 2 % impurities on the density of CO2 with differences in pressure at 4 ˚C

RESEARCH REPORT: HAZARD ANALYSIS FOR OFFSHORE CARBON CAPTURE PLATFORMS AND OFFSHORE PIPELINES
13
0.09
0.095
0.1
0.105
0.11
0.115
0.12
0.125
0.13
0.135
50 70 90 110 130 150 170 190
Pressure, bar
Visc
osity
, cp
CO2 (100%)
CO2-H2
CO2-N2
CO2-SO2
CO2-H2S
CO2-O2
Progressive Energy 2009
Figure 2.12 Effect of 2 % impurities on viscosity of CO2 with differences in pressure at 4 ˚C
The presence of hydrogen as an impurity has the greatest potential to produce two-phase flow in pumps. As the pressure reduces, or as the temperature increases, the hydrogen starts to come out of solution (the bubble point7), and the fluid being transported becomes two-phase. This situation should be avoided, because pumping the liquid CO2 becomes difficult, as cavitation will take place. As the hydrogen bubbles collapse they will cause very large local pressure transients which over time will cause damage to the impeller and possibly catastrophic failure.
Figure 2.13 shows the bubble point for a mixture of hydrogen and liquid CO2 over a range of temperatures that is appropriate to offshore CCS applications. It can be concluded that two-phase flow will not take place over a range of hydrogen concentrations at pressures above 80 bara.
Figure 2.13 Bubble point for hydrogen in CO2 for a range of hydrogen contents
Notes:The hydrogen contents are not intended to represent the expected levels, but are chosen to demonstrate the phenomenon of theoretical changes to the bubble point.
7 The ‘bubble point’ is defined as the conditions (in terms of temperature and pressure) at which the first bubble of vapour forms within a liquid and begins to rise to the top.

RESEARCH REPORT: HAZARD ANALYSIS FOR OFFSHORE CARBON CAPTURE PLATFORMS AND OFFSHORE PIPELINES
14
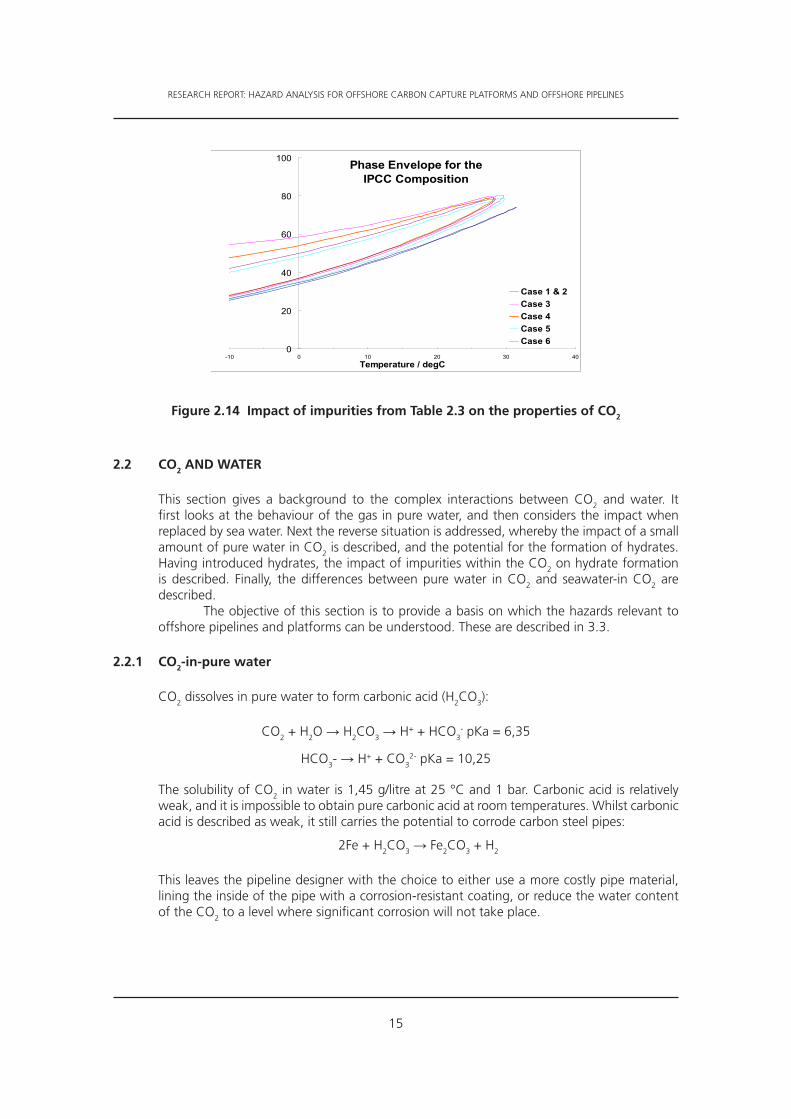
2.1.2.3 Effect of multiple impuritiesFigures 2.8 – 2.9 and 2.11 – 2.13 have considered the impact of a single impurity on the characteristics of pure CO2. Some work on the impact of multiple impurities has been carried out by Newcastle University8, further to the work shown in Figure 2.7. Six different cases were examined (see Table 2.2), as being typical of some possible compositions of CO2 (see Table 2.3, based on IPCC compositions) from the different processes. Table 6.2 also includes the Dynamis project assumed CO2 composition9, which is intended to be a practical level which could reasonably be expected to be achieved for CCS.
Fuel/capture route Post-combustion
Pre-combustion
Oxy-fuel
Coal Case 1 Case 3 Case 5
Natural gas Case 2 Case 4 Case 6
Table 2.2 Case definition for reference 8
Case 1 Case 2 Case 3 Case 4 Case 5 Case 6
SO2 0,01 0,01 0,5 0,01 <0,01
NOx 0,01 0,01 0,01 0,01 <0,01
N2/Ar/O2 0,01 0,01 0,6 1,3 3,7 4,1 <4
H2S 0,6 0,01 <0,02
H2 2 1,0 With O2
CO 0,4 0,04 <0,2
CH4 0,01 2,0 <4
H2O <0,05
Table 2.3 Impurities assumed (vol %)
The impact of these impurities on the phase envelope is shown in Figure 2.14, in addition, the result for pure CO2 is included. It may be seen that the effect of the impurities of cases 1 and 2 have little effect on the CO2, whereas those in case 3 have a significant impact, both in terms of the critical point, and opening up the phase envelope to a large two-phase area containing liquid and gaseous CO2.
8 CO2 Transport UKCCSC Progress Report, Seevam, Race, Downie, Newcastle University, 2008. 9 Towards Hydrogen and Electricity Production with CO2 Capture and Storage Dynamis project thematic
priority:6.1.3.2.4 Capture and sequestration of CO2, associated with cleaner fossil fuels, de Visser and Hendriks et al, Ecofys, July 2007
RESEARCH REPORT: HAZARD ANALYSIS FOR OFFSHORE CARBON CAPTURE PLATFORMS AND OFFSHORE PIPELINES
15
Phase Envelope for the IPCC Composition
0
20
40
60
80
100
-10 0 10 20 30 40Temperature / degC
Case 1 & 2Case 3Case 4Case 5Case 6
Figure 2.14 Impact of impurities from Table 2.3 on the properties of CO2
2.2 CO2 AND WATER
This section gives a background to the complex interactions between CO2 and water. It first looks at the behaviour of the gas in pure water, and then considers the impact when replaced by sea water. Next the reverse situation is addressed, whereby the impact of a small amount of pure water in CO2 is described, and the potential for the formation of hydrates. Having introduced hydrates, the impact of impurities within the CO2 on hydrate formation is described. Finally, the differences between pure water in CO2 and seawater-in CO2 are described.
The objective of this section is to provide a basis on which the hazards relevant to offshore pipelines and platforms can be understood. These are described in 3.3.
2.2.1 CO2-in-pure water
CO2 dissolves in pure water to form carbonic acid (H2CO3):
CO2 + H2O → H2CO3 → H+ + HCO3- pKa = 6,35
HCO3- → H+ + CO32- pKa = 10,25
The solubility of CO2 in water is 1,45 g/litre at 25 °C and 1 bar. Carbonic acid is relatively weak, and it is impossible to obtain pure carbonic acid at room temperatures. Whilst carbonic acid is described as weak, it still carries the potential to corrode carbon steel pipes:
2Fe + H2CO3 → Fe2CO3 + H2
This leaves the pipeline designer with the choice to either use a more costly pipe material, lining the inside of the pipe with a corrosion-resistant coating, or reduce the water content of the CO2 to a level where significant corrosion will not take place.

RESEARCH REPORT: HAZARD ANALYSIS FOR OFFSHORE CARBON CAPTURE PLATFORMS AND OFFSHORE PIPELINES
16
2.2.2 CO2-in-sea water
CO2 is also soluble in seawater; this is important for offshore pipelines, the environmental impacts of which are described in Annex B. About 89 % of the CO2 normally dissolved in seawater takes the form of bicarbonate ions, about 10 % as carbonate ions, and 1 % as dissolved gas.
2.2.3 Water-in-CO2
The solubility of pure water in liquid CO2 is difficult to measure at low temperatures: at 10 °C it is approximately 1 000 ppm, and at -21 °C it is 180 ppm10. There are a number of models that can be used to describe the solubility of water in CO2, and a number of these have been analysed with reference to experimental observations11. A graphical presentation of the conclusions of this for water-in-CO2 is provided in Figure 2.15.
Figure 2.15 Solubility of H2O in pure CO2(source: Choi & Nesic 2011)
Figure 2.1512 indicates that at pressures above ~ 80 bar range, there is reasonable confidence that whichever model is chosen for use, up to 2,1 vol % of water will dissolve in CO2 at 30 °C (i.e. 21 000 ppmv). Whilst it seems that any concentration less than this would not allow free water to appear in pure CO2 such that corrosion of carbon steel pipes would not take place, however, CO2 would cool rapidly in either the ground or on the sea floor, thereby reducing the solubility of water in pure CO2 to less than the 1 000 ppm described.
10 SPE formation evaluation, Kyoo Y Song and Riki Kobayyashi, Society of Petroleum Engineers, 1987.11 Thermodynamic models for calculating mutual solubilities in H2O-CO2-CH4 mixtures A. Austegard, M. J. Mølnvik,
SINTEF Energy Research, Trondheim, Norway and E. Solbraa, G. De Koeijer, Statoil Research & Technology, Trondheim, Norway, The Institution of Chemical Engineers, September 2006.
12 From Determining the corrosive potential of CO2 transport pipeline in high pressure CO2–water environments, Yoon-Seok Choi, Srdjan Nešic, Institute for Corrosion and Multiphase Technology, Department of Chemical and Biomolecular Engineering, Ohio University, Athens, OH47501, USA. International Journal of Greenhouse Gas Control 5 (2011) pp788–797.

RESEARCH REPORT: HAZARD ANALYSIS FOR OFFSHORE CARBON CAPTURE PLATFORMS AND OFFSHORE PIPELINES
17
Another consideration is that CO2 also forms hydrates with water (CO2.6H2O), and as such, water that might normally be dissolved uniformly throughout a liquid can become concentrated at particular points. Likewise, some impurities in a CO2 mixture further impact the ability to hold water in solution resulting in the potential formation of hydrates.
2.2.4 Hydrate formation: pure CO2 and pure water
The small amount of water that might normally be dissolved uniformly throughout liquid can become concentrated at particular points because the CO2 liquid is not bonded to the water molecules, but supports the lattice structure surrounding it. The molecules can agglomerate to form hydrates in the presence of the CO2 (CO2.6H2O). Physically, hydrates are solid, and have the appearance of ice (see Figure 2.16).
Figure 2.16 CO2 hydrate
CO2 hydrates are Type 1 clathrate, and the molecular structure is shown diagrammatically in Figure 2.17. Clathrates are crystalline water-based solids in which small molecules with large hydrophobic collections are trapped inside ‘cages’ of hydrogen-bonded water molecules. In other words, CO2 clathrate hydrates are compounds in which the host molecule is water and the guest molecule is liquid CO2. Without the support of the trapped molecules, the lattice structure of the CO2 hydrates would collapse into conventional liquid water and dissolve.
Figure 2.17 Type 1 clathrate structure, CO2 hydrate

RESEARCH REPORT: HAZARD ANALYSIS FOR OFFSHORE CARBON CAPTURE PLATFORMS AND OFFSHORE PIPELINES
18
The generic diagram presented as Figure 2.18 explains where these are predicted to exist for pure CO2. The black squares show experimental data13, and the lines of the CO2 phase boundaries are calculated according to thermodynamic tables. The dark grey region (V-I-H) represents the conditions at which CO2 hydrate is stable together with gaseous CO2 and water as ice.
Key:CO2 (S): Solid CO2 CO2(L): Liquid CO2
CO2(V): CO2 Vapour H2O(V): Water vapourH2O(S): Solid water (ice) H2O(L): Liquid waterV-I-H: Vapour-ice-hydrate envelope CO2 (SC): CO2 in the supercritical phase
Figure 2.18 Hydrate diagram for pure CO2
13 Clathrate hydrates of natural gases, second edition, E.D. Sloan Jr, 1998

RESEARCH REPORT: HAZARD ANALYSIS FOR OFFSHORE CARBON CAPTURE PLATFORMS AND OFFSHORE PIPELINES
19
The formation of hydrates in pipelines containing CO2 is an important issue to consider when developing the operational methodology for CCS projects. Modelling and experimental work14 has been carried out to confirm and establish the conditions where hydrates can develop in pure CO2. Two experiments were conducted using pure CO2.
The first test used pure CO2 in a saturated environment to show the effect of the presence of free water on the formation of hydrates across a range of temperatures and pressures. The results of the experiments are shown in Figure 2.19 (a) where the grey dotted lines define the boundaries of the hydrate/ice stability zones and non-hydrate zones for saturated conditions. To show the necessity and impact of drying the CO2, a further experiment demonstrated the benefit of using pure CO2 dried to less than 250 ppmv. Figure 2.19 (b) depicts these results showing the hydrate/ice stability zones superimposed over the grey dotted lines of the boundaries under saturated conditions.
In both figures, the yellow triangles represent the range of operating pressures for an offshore pipeline in the winter (100 bar to 190 bar at 4 °C). Note in Figure 2.19 (a) the operating conditions are inside the hydrate zone while in Figure 2.19 (b) the operating conditions are significantly to the right and above of the hydrate zones.
Figure 2.19 (a) Hydrate formation in pure saturated CO2
Notes: − Below the blue line the CO2 exists in vapour form − Above the blue line the CO2 exists as a liquid − Zones to the right of the grey dotted lines (shaded light green) are non-hydrate zones
14 SPE 123778, Effect of Common Impurities on the Phase Behaviour of Carbon Dioxide Rich Systems: Minimizing the Risk of Hydrate Formation and Two-Phase Flow, A Chapoy, R Burgass, B Tohidi (Hydrafact Ltd & Centre for Gas Hydrate Research, Institute of Petroleum Engineering, Heriot-Watt University), and J M Austell, C Eickhoff (Progressive Energy Ltd). Society of Petroleum Engineers, 2009

RESEARCH REPORT: HAZARD ANALYSIS FOR OFFSHORE CARBON CAPTURE PLATFORMS AND OFFSHORE PIPELINES
20
Figure 2.19 (b) Pure CO2 hydrate/ice stability zones for a 250 ppmv system
Key:H: area where hydrates are presentVCO2: rich CO2 vapour phaseLCO2: rich CO2 liquid phaseI: area where ice will form
: Typical offshore pipeline operating rangeGrey dotted line: hydrate/ice stability zones in saturated conditions (i.e. in the presence of free water)Red lines: Pure CO2 hydrate stability lines: hydrates (or ice) will form in any area to the left shaded blue, with ice hydrates shaded the darker blue
The regions to the left of the red lines in (b) represent the hydrate and ice stability zones for the drier 250 ppmv pure CO2. The dotted lines in this graph have been superimposed from figure (a) to show the difference between drying the CO2 and leaving it saturated and were not a part of this second experiment.
As already mentioned, the second experiment took place at a selected moisture level that would allow for a level of dryness. If the experiment were to take place under dryer conditions the boundaries for the hydrate/ice stability zones would move further to the left.
Figure 2.19 (b) also shows that a typical winter operating range for a cold water offshore pipeline of 100 bar to 190 bar at 4 °C, as indicated by the two triangles, is significantly to the right and well above the 250 ppmv hydrate stability zones.
Drying the CO2 is critical for corrosion management; however, as shown in (a), if there is free water in the CO2 or the system is not dried sufficiently, the system conditions are inside the hydrate stability zone as defined by the grey dotted line. The predicted water content required for hydrate formation at 190 bar is higher than 1 000 ppmv but lower for 100 bar and 4 °C.
2.2.5 Hydrate formation: impure CO2 and pure water
Impurities within CO2 will further affect the point at which hydrates form. The above experiment was repeated with an unsaturated impure mixture of CO2 dried to 250 ppmv. Figure 2.20 shows a more complex structure within the hydrate/ice stability zones for a mixture of 95,8 % CO2, 2 % H2, 2 % N2, 0,2 % CO. The presence of hydrogen within a mixture indicates that at least one source of CO2 was from a pre-combustion capture facility.

RESEARCH REPORT: HAZARD ANALYSIS FOR OFFSHORE CARBON CAPTURE PLATFORMS AND OFFSHORE PIPELINES
21
Notes: − Below the blue line the CO2 exists in vapour form − Above the blue line the CO2 exists as both a liquid and a vapour − The blue/red line defines the bubble points for the mixture and the upper boundary for the
two-phase region. Above this the CO2 exists as a liquid
Key:H: the area where hydrates are presentV: area where CO2 is in the vapour phaseLC: area where CO2 is in the liquid phaseI: area where ice will form
: Typical offshore pipeline operating rangeGrey dotted line: hydrate/ice stability zone in saturated condition (i.e. in the presence of free water)Red lines: Pure CO2 hydrate stability lines: hydrates will form in any area to the left shaded blue, with ice hydrates shaded the darker blue
Figure 2.20 Hydrate stability zones for 250 ppmv system and impure CO2 typical of a pre-combustion source
Comparing Figures 2.19 and 2.20, it may be observed that the effect of impurities is to move the point at which hydrates will form to the right (i.e. at higher temperature) for the impurities concerned. Other impurities can have the reverse effect. As previously seen in Figures 2.7, 2.13 and 2.14, the presence of hydrogen significantly impacts the bubble point and phases within the different zones.
There is both a vapour/hydrate region and a liquid/vapour/hydrate region (two-phase region) as predicted by Figure 2.7. In Figure 2.20 the blue/red liquid/vapour line which represents the bubble points for the mixture is relatively flat across a wide temperature range and close to 80 bar. The increase in pressure, for the bubble points of the mixture, not only increases the possibility of hydrate formations in lower pressure pipelines, but also increases the potential for two-phase flow and destructive cavitation within CO2 pumps. Again Figure 2.7 indicates that higher levels of hydrogen would have an even greater impact on these bubble points and must be considered in the design of CO2 capture systems and CO2 specifications for offshore pipelines.
In Figure 2.20, it is important to note as previously stated that where impurities like hydrogen are present, the bubble point pressure is increased such that if the pressure

RESEARCH REPORT: HAZARD ANALYSIS FOR OFFSHORE CARBON CAPTURE PLATFORMS AND OFFSHORE PIPELINES
22
drops below this higher level, the first substance to vaporise is the water which in turn will immediately combine with the CO2 to form hydrates. Maintaining the pressure avoids this and the presence of two-phase flow. Re-establishing the pressure will dissolve the hydrates formed and re-establish single phase flow.
The potential for hydrate formation in liquid CO2 is of particular importance when considering the corrosion potential of liquid CO2 from CCS applications at low air and water temperatures (3 °C15), such as will be experienced offshore. The variables in hydrate formation are temperature, pressure, gaseous impurities within the CO2, and the water concentration.
In conclusion it can be stated that, of the variables, the operator can exercise little control over offshore temperatures or the pressure necessary to transmit the CO2to the sub-sea storage. However, the upstream producers can be required to deliver the CO2 with a controlled level of key impurities, and water content sufficiently low for hydrates not to form.
2.2.6 CO2 solubility in seawater
The processes by which a rising bubble of CO2 will dissolve in seawater are complex and described in detail in technical publications16. Reference 18 provides a phase diagram for a CO2 – seawater mix, reproduced here as Figure 2.21.
Figure 2.21 Phase diagram of the CO2 system and the CO2-seawater system.
In Figure 2.21, the dashed black curves mark phase boundaries for pure CO2 (see Figure 2.2). The phases in the pure CO2 system are marked in black (solid CO2, LCO2, and GCO2 for solid, liquid and gaseous CO2 respectively). The dashed blue curves (and the blue squares and dotted circles almost overlapping the horizontal axis) show the phase boundaries of a CO2- free ‘pure’ seawater system. The phases in ‘pure’ seawater system (ice and water) are marked in blue. The double blue near-vertical lines are as a result of the variability of the melting point from pure water to seawater. The solid red-purple curves mark phase boundaries in the CO2-H2O system, and the phases in the CO2-H2O system are marked in red.
15 Ocean Climate Status Report 1999, Fisheries Research Services Report 06/00.16 Fate of rising CO2 droplets in seawater, Youxue Zhang, Department of Geological Sciences, The University of
Michigan, Ann Arbor, Michigan 48109-1005, USA; and Key Laboratory of Orogenic Belts and Crustal Evolution, MOE, School of Earth and Space sciences, Peking University, Beijing, 100871, China. Environmental Science Technology, 2005 pp 7719 – 7724.

RESEARCH REPORT: HAZARD ANALYSIS FOR OFFSHORE CARBON CAPTURE PLATFORMS AND OFFSHORE PIPELINES
23
Between the double blue lines and the solid red-purple curve, there are two phases: hydrate and liquid water (H&W). Between the red solid curve and the dashed black curve, there are two phases, liquid water and liquid CO2 (W&LCO2). To the right of the purple curve, the two phases are liquid water and gas CO2 (W&GCO2). The green curve shows a measured temperature-depth profile in the ocean.
From Figure 2.21 it can also be seen that for the temperatures (275 K, 1,85 °C) and ocean depths up to 150 m the potential exists for the CO2 to be in the gaseous or liquid phase and for hydrates to form on the outer surface of the bubble. Slightly different mechanisms take place for CO2 in the gas and liquid states dissolving in seawater, complicated by the presence of a thin hydrate layer.
Reference 17 also explains that a rising bubble of CO2 will dissolve in whole or in part in seawater dependent on:
− the temperature of the seawater; − the amount of CO2 already dissolved in the seawater (Le Chatalier’s principle17)
To a lesser extent: − the size of the bubble18, and − the depth (pressure) of the seawater.
Because rising bubbles of CO2 will dissolve readily in seawater, the amount of CO2 reaching the surface will be reduced, and this will lessen slightly the potential impact on the surface.
2.3 OTHER PROPERTIES OF CO2
2.3.1 Density of CO2
The density of liquid CO2 and liquid CO2 admixed with other gases in water has already been discussed in 2.1.2. From Figure 2.11 it can be seen that for the pressure ranges that could be expected for offshore pipelines (80 – 200 bar), the CO2 may, or may not, be denser than water at the point that it emerges, dependent on the gaseous impurities.
The density of seawater increases with depth down to about 1 km, as shown in Figure 2.2219. Offshore UK CO2 pipelines are unlikely to be below 300 m, thus the seawater density will be in the range 1,0250 – 1,0264 g/cm3. Superimposing this range on to Figure 2.11 shows how the density of liquid CO2 compares to that of seawater (see Figure 2.23). In theory, this shows the potential that pure CO2, and with the inclusion of SO2 and H2S as impurities, will make the liquid CO2 denser than seawater. In practice, where there is a loss of containment, the liquid CO2 will absorb heat from the surrounding water, which will precipitate a phase change. Depending on the depth of the release and the size of the rising liquid, some of the CO2 may reach the surface in vapour form.
17 The principle that if any change is imposed on a system that is in equilibrium then the system tends to adjust to a new equilibrium counteracting the change
18 Reference 17 states that the dissolution rate (or the boundary layer thickness) does not vary significantly with the radius of a CO2 droplet. For example, for a given T and P (278 K and 670 m depth), when the radius of a CO2
droplet varies by a factor of 10 from 5 to 0,5 mm, the boundary layer thickness decreases from 44,2 to 31,6 µm, and the dissolution rate increases by only 40 % from 1,26 to 1,77 µm/s. Hence, if T and P were kept constant, the dissolution rate may be regarded as roughly constant and the radius of a droplet varies roughly linearly with time.
19 Density of sea water, Windows to the Universe, National Earth Science Teachers Association

RESEARCH REPORT: HAZARD ANALYSIS FOR OFFSHORE CARBON CAPTURE PLATFORMS AND OFFSHORE PIPELINES
24
Figure 2.22 Changes in the density of sea water with depth
Figure 2.23 Density of CO2 and that of seawater
Because the pressure of seawater at a depth of 300 m is only 30,2 bar, it may be concluded that any liquid CO2 released at depth will rapidly depressurise, become less dense, and rise towards the surface.

RESEARCH REPORT: HAZARD ANALYSIS FOR OFFSHORE CARBON CAPTURE PLATFORMS AND OFFSHORE PIPELINES
25
2.3.2 Speed of sound in liquid CO2
Two-phase flow in CO2 pumping and pipeline systems has the potential to cause water hammer. Water hammer can also result from valves closing too quickly. Modelling this (see 3.3.9) requires the speed of sound in the CO2 as a source term. The speed of sound in CO2 at 4 °C is shown in Figure 2.24 which shows the CO2 in both the liquid and vapour phases20.
Figure 2.24 Speed of sound in CO2 at 4 °C(source: National Institute of Science and Technology)
In a CCS application at a pressure of 200 bar, the speed of sound is 717 47 m/s. For comparison, the speed of sound in water under the same physical conditions is 1 454 m/s.
2.3.3 CO2 BLEVE
Boiling Liquid Expanding Vapour Explosion (BLEVE) is an explosion resulting from the failure of a liquid container at a temperature above its boiling point at atmospheric pressure. A further explanation of CO2 BLEVE is included as Annex F. The term was first applied to steam explosions, but often and incorrectly, it is thought to relate only to flammable materials. BLEVE involving non-flammable liquids produce only two effects: a blast due to the expansion of the vapour in the container combined with the flashing of the liquid, and fragmentation of the container (whether that container is a vessel or pipe).
A BLEVE can be caused by a number of events: − an external fire; − external impact; − corrosion of the pressure containment; − excessive internal pressure, and − metallurgical failure of the pressure containment.
20 National Institute of Science and Technology

RESEARCH REPORT: HAZARD ANALYSIS FOR OFFSHORE CARBON CAPTURE PLATFORMS AND OFFSHORE PIPELINES
26
3 HAZARDS ASSOCIATED WITH CO2 FOR OFFSHORE CCS APPLICATIONS
This section sets out: − Some of the hazards associated with CO2 for offshore CCS applications and how
they can be used in conjunction with a hazard analysis (Annex A). − Significant likelihood of death (SLOD) and significant level of toxicity (SLOT) and how
they apply to offshore CO2 transport and injection facilities. − The risks associated with an example CO2 composition that may be associated with
a CCS project and the potential hazards and risks. − The results of some example release modelling.
3.1 INTRODUCTION
CO2 has been recognised as a significant workplace hazard for over 100 years, resulting in many standards and legislative controls that have been established to maintain an acceptable level of risk for those who could be harmed by it. There are long-established approaches for evaluating dangers from hazardous substances that involve an estimation of the consequences of exposure to a level of harmful agent, and the safe time before harm is caused.
The advent of CCS will result in CO2 being handled in large volumes. For example, a coal-fired power station consuming 2 000 te/day of coal (in the region of 500 MW power generation) could produce up to 7 500 te/day of CO2 to be captured and transported to long-term storage facilities. Whereas, for existing CO2 handling facilities an inadvertent release of CO2 may have created a hazard potentially only affecting those in the vicinity, a very large release of CO2 from a CCS operation has the potential to extend the hazard over a greater area. Such a release would constitute a major accident hazard (MAH), where currently one may not exist.
It is possible to build on the experiences already gained, together with work that has been carried out more recently, to predict the hazards of bulk CO2 inventories and in different situations, large scale plants and projects. Annex A is an introduction to hazard analysis and provides a context for this section.
3.2 GENERAL HAZARDS ASSOCIATED WITH CO2
3.2.1 Health hazards and effects
CO2 is present in the atmosphere at a concentration of approximately 385 ppm, and serves as an essential trigger in the human body for respiration. CO2 produced by the human body exists at a slightly higher partial pressure than that inhaled, allowing the diffusion of CO2into the lungs ready for exhaling. However, an increase in the concentration of CO2 by just a percentage point alters the partial pressure of the CO2 in the inhaled air; the concentration gradient is reversed and more CO2 diffuses into the blood, increasing its acidity. The subject is likely to begin to breathe more frequently and/or deeply as the respiratory system mechanisms react to stabilise this imbalance. If the subject is in an asphyxiating atmosphere, an increase in the depth or rate of breathing will only serve to worsen the situation as the subject takes in more and more CO2. The effect of CO2 on the human body according to level of exposure is documented in Table 3.1. At concentrations of 1 500 ppm CO2 subjects are likely to suffer symptoms such as headaches, tiredness and increased breathing rate as CO2 is absorbed into

RESEARCH REPORT: HAZARD ANALYSIS FOR OFFSHORE CARBON CAPTURE PLATFORMS AND OFFSHORE PIPELINES
27
the bloodstream and increases its acidity. A further increase in CO2 concentration can induce visual impairment and/or loss of consciousness. Above 100 000 ppm (10 % by volume) rapid unconsciousness will occur.
Concentration in air
Symptoms
1 % Slight increase in breathing rate.
2 % Breathing rate increases to 50 % above normal level. Prolonged exposure can cause headache, tiredness.
3 % Breathing increases to twice normal rate and becomes laboured. Weak narcotic effect.Impaired hearing, headache, increase in blood pressure and pulse rate.
4 % – 5 % Breathing increases to approximately four times normal rate; symptoms of intoxication become evident and slight choking may be felt
5 % – 10 % Characteristic sharp odour noticeable. Very laboured breathing, headache, visual impairment, and ringing in the ears. Judgment may be impaired, followed within minutes by loss of consciousness.
10 % – 15 % Within a few minutes’ exposure, dizziness, drowsiness, severe muscle twitching, unconsciousness.
17 % – 30 % Within one minute, loss of control, unconsciousness, convulsions, death
>50 % Unconsciousness occurs more rapidly above 10 % level. Prolonged exposure to high concentrations may eventually result in death from asphyxiation.
Table 3.1 Exposure reactions to CO2
Given the large quantities and flow rates which will be used for CCS, major releases could produce significant hazard ranges at concentrations high enough to have toxic effects. This has caused UK HSE to set both offshore impairment criteria (HSE, 2009: Indicative human vulnerability to the hazardous agents present offshore for application in risk assessment of major accidents, SPC/Tech/OSD/30, http://www.hse.gov.uk/foi/internalops/hid/spc/spctosd30.htm) and major hazards toxic dose criteria (HSE, 2008: Assessment of the dangerous toxic load (DTL) for specified level of toxicity (SLOT) and significant likelihood of death (SLOD), http://www.hse.gov.uk/hid/haztox.htm, revised 21.10.08) for CO2.
The Netherlands have also set major hazards criteria in terms of concentration (RIVM, 2009: Evaluation of the acute toxicity of CO2, http://www.rivm.nl/milieuportaal/images/20091002 Evaluation_toxicity_CO2.pdf).
The offshore impairment criteria were established to enable consistent risk assessments within the offshore safety case regime. They are expressed in terms of survivability (the maximum exposure (dose) that may be received with a negligible statistical probability of fatality and without impairment of an individual’s ability to escape) and fatality (the exposure levels expected to statistically produce the onset of fatality and approximately 50 % fatalities for an exposed group). The levels for CO2 are given in Table 3.2.

RESEARCH REPORT: HAZARD ANALYSIS FOR OFFSHORE CARBON CAPTURE PLATFORMS AND OFFSHORE PIPELINES
28
Survivability criteria Fatality criteria
Short term exposure(15 minutes)
Long term exposure(30 minutes)
LC1 (ppm)(five min exposure)
LC50 (ppm)(30 min exposure)
30 000 ppm(3 %)
20 000 ppm(2 %)
86 028 91 700
Table 3.2 Suggested survivability and fatality criteria for CO2 offshore
The major hazard toxic dose criteria - SLOT and SLOD - were established to facilitate land-use planning around hazardous installations onshore and as such they are not relevant in an offshore context. However, they do allow for easy comparisons to be made on the relative harm of different substances, therefore the levels representing SLOT and SLOD for CO2 are given in Table 3.3.
Exposure period
(minutes)
CO2 concentration producing the …
SLOT as a % SLOT in ppm SLOD as a % SLOD in ppm
0,5 11,5 115 000 15,3 153 000
1 10,5 105 000 14,0 140 000
10 7,9 79 000 10,5 105 000
30 6,8 68 000 9,2 92 000
60 6,3 63 000 8,4 84 000
120 5,5 55 000 7,7 77 000
Table 3.3 SLOT and SLOD values for CO2
It has yet to be established how these should be applied to offshore situations. SLOT is described as:
− Causing severe distress to almost everyone in the area. − Substantial fraction of exposed population requiring medical attention. − Some people seriously injured, requiring prolonged treatment. − Possibly proving fatal to highly susceptible individuals.
These criteria are fairly broad in scope, reflecting the fact that: − There is likely to be considerable variability in the responses of different individuals
affected by a major accident. − There may be pockets of high and low concentrations of a toxic substance in the toxic
cloud release, so that not everyone will get exactly the same degree of exposure. − The available toxicity data are not usually adequate for predicting precise dose-
response effects.
Importantly, the criteria are also relatively easy for non-scientists to understand in terms of the overall health impact.
SLOD is defined as the mortality of 50 % of an exposed population.

RESEARCH REPORT: HAZARD ANALYSIS FOR OFFSHORE CARBON CAPTURE PLATFORMS AND OFFSHORE PIPELINES
29
3.2.2 Occupational exposure limits
In the UK, CO2 has short-term and long-term occupational exposure limits assigned to it21 as given in Table 3.4.
Workplace exposure limit Concentration (ppmv) Concentration (%)
Short term exposure limit (STEL) 15 000 1,5
Long term exposure limit (LTEL) 5 000 0,5
Table 3.4 STEL and LTEL for CO2
3.2.3 Physical hazards associated with CO2 releases
The expansion ratio of CO2 is significantly large, and high pressures can be generated very quickly in confined spaces. It has already been stated in 2.1.1 that 1 volume of liquid CO2 will yield approximately 520 volumes of gas (given typical subsea pipeline conditions, and at the same temperature and pressure). Systems should therefore be designed to have capacity in order to accommodate the expansion of CO2 and be examined for any areas where liquid CO2 may become trapped due to equipment isolation or other operational issues.
Insufficient pressure protection can result in uncontrolled loss of containment, which could lead to further hazards such as propelling vessel debris or forming asphyxiating atmospheres. As well as applying sound engineering practice, cryogenic relief devices can also be installed to relieve rapidly expanding cryogenic fluids to a safe location.
3.2.4 Dispersion in open spaces
Upon the release of cold dense CO2, fog clouds can form reducing visibility and making emergency operations extremely hazardous. Fog clouds comprising tiny moisture droplets can form as moisture in the air cools on contact with the CO2. The extent and density of the fog cloud formed varies according to ambient conditions. For example, in humid atmospheres water vapour in the air can freeze into ice crystals as a result of the expanding CO2 release cooling the air. The fog is likely to be denser and more visible in these circumstances, but the dimensions of the easily-visible fog do not necessarily correspond to the complete dimensions of the underlying CO2 vapour cloud (for instance when the temperature of the CO2 is above the dew-point of the air).
Since CO2 gas is heavier than air, it can accumulate at low levels, unlike natural gas, which will usually rise quickly to higher levels and disperse. This is of importance where there are unventilated spaces into which CO2 can drift, or areas underneath a CO2 installation to which personnel have access.
3.2.5 Hazards associated with phase change and the JT effect
The JT effect has been described in 2.1.1.2. Rapidly reducing the pressure of gas or liquid CO2 can produce low temperatures upon release. Dependent on the initial conditions, pressure, temperature, and the volume released, the fluid will expand to atmospheric pressure, unless otherwise contained, and cool.
21 Health and Safety Executive EH40/2005 Workplace Exposure Limits,2005, p.14.

RESEARCH REPORT: HAZARD ANALYSIS FOR OFFSHORE CARBON CAPTURE PLATFORMS AND OFFSHORE PIPELINES
30
For high pressure pipelines, gas or liquid, the extent of cooling can reach -78 °C or lower, at which point solids may form. This low temperature can have a consequential effect on both humans (e.g. cold burns on skin contact) and the facility. As discussed earlier, CO2
sublimes and the vapours coming from CO2 snow can be almost as cold.If a mass of gaseous or liquid CO2 experiences sudden depressurisation, it will cool
rapidly as a result of the JT effect combined with a phase change to gas (‘flashing off’). Some impurities in the CO2 stream may ‘freeze out’ and CO2 solids in the form of a snow-like precipitate may also be formed. The resulting solids can cause blockages in process lines or plug valves which may cause system over-pressurisation.
The potentially low temperature at which CO2 may need to be managed also creates the need for good operating practices, appropriate instrumented trips and alarms. Construction materials can change properties at low temperatures, and brittle rather than plastic properties tend to control failure mechanisms. Materials with guaranteed low temperature properties should be used for vessels, pipes and fittings in order that their integrity can be demonstrated. Some materials such as aluminium become tougher at lower temperatures but many, including carbon steel, will become more brittle.
Many elastomers commonly used for seals in the power generation and oil and gas industries cannot be used for liquid CO2 as it diffuses gradually into the molecular structure during pressurisation. During a rapid depressurisation the gas expands within the structure and blistering or an explosion follows. Problems have been reported with the use of standard nitrile, polyethylene, some fluorelastomers, chloroprene, and ethylene-propylene compounds.
3.2.6 Solid CO2 dispersion
Solid CO2, once formed, can take a long time to thaw22 (see 2.1.1.6): this in itself can become a hazard:
− The solid remains on the surface where it could result in cold burn injuries to human skin.
− The slow vaporisation of the CO2 could mean that there is a harmful concentration particularly close to grade or if the solid has formed in a depression.
− Solid CO2,if formed can take a prolonged period of time to evaporate.
On the positive side, the solid CO2 could represent a significant part of the escape inventory that is not dispersed with the rest, reducing the concentration of the cloud that is formed immediately. The solid occupies approximately 0,2 % of the volume of gas at the same temperature and pressure.
3.3 HAZARDS ASSOCIATED WITH CO2 FROM CARBON CAPTURE SOURCES
The hazards described in 3.2 have been noted following experience with CO2 used in the industrial context; for instance, food processing, fertiliser production and as a nuclear reactor coolant. These situations all require CO2 with a high degree of purity, whereas for CCS applications, as has already been described, there will be impurities within the CO2. Not only will these affect the thermodynamic properties of the CO2, they will also affect the hazards associated with it.
22 An example of this is provided in the EIGA Training Package, released February 2012 http://www.eiga.eu/fileadmin/docs_pubs/Info_28_12_Operation_of_Carbon_Dioxide_Road_Tankers_and_
Equipment_while_Loading_and_Unloading.pdf Please contact EIGA for further information regarding training package

RESEARCH REPORT: HAZARD ANALYSIS FOR OFFSHORE CARBON CAPTURE PLATFORMS AND OFFSHORE PIPELINES
31
3.3.1 Gaseous impurities: general
Most work carried out to examine the hazards associated with CO2 and its interactions with other chemicals or compounds have focused on the use of pure CO2 . However, because the CO2 produced in CCS applications cannot always be assumed to be pure, the nature and hazardous impact of the impurities should be understood. The operator of a storage site is mandated only to accept CO2 streams following an analysis of the composition. A hazard analysis should also have been carried out, and a storage operator is at liberty to inject only if the risk assessment has shown that the impurity levels of the CO2 stream are in line with the composition criteria referred to in the relevant EU directive23.
The additional costs for purifying CO2 from the source point may not be affordable. For this reason significant effort has been directed toward finding a CO2 composition which meets the simultaneous requirements of being:
− Secure (in that it has a minimal negative impact on its containment). − Safe (potential effects on humans are understood and minimised). − Sustainable (affordable costs to process the raw gas and extract the CO2 in a form
that meets applicable legislation).
In addition to changing the thermodynamic properties of the CO2, which can lead to changes in the bubble point and cavitation in pumps (see phase changes, 2.2), gaseous impurities also have the potential to present hazards greater than the CO2 itself. A number of impurities warrant specific attention in the context of offshore CCS pipelines, and these are addressed in the following sections.
3.3.2 Hydrogen sulfide (H2S)
Hydrogen sulfide is a hazardous substance: if inhaled it has the potential to cause harm, and a high enough concentration can be responsible for stress corrosion cracking (SCC) in steel pipelines, which can lead to a loss of pipeline containment.
3.3.2.1 Impact of H2S on the properties of steelThe presence of a fluid containing H2S within a carbon steel pipeline can lead to crack initiation. Two mechanisms are possible:
− SCC: the cracking of metal involving anodic processes of localised corrosion and tensile stress (residual and/or applied) in the presence of water and H2S.
− Sulfide stress cracking (SSC): the cracking of metal involving corrosion and tensile stress (residual and/or applied) in the presence of water and H2S.
Factors, other than material properties, known to affect the susceptibility of metallic materials to cracking in H2S service include the H2S partial pressure, the in situ pH, the concentration of dissolved chloride or other halide, the presence of elemental sulfur or other oxidant, temperature, galvanic effects, mechanical stress, and length of time after exposure to contact with a liquid water phase.
23 Directive 2009/31/EC of the European Parliament and of the Council of 23 April 2009 on the geological storage of carbon dioxide and amending Council Directive 85/337/EEC, European Parliament and Council Directives 2000/60/EC, 2001/80/EC, 2004/35/EC, 2006/12/EC, 2008/1/EC and Regulation (EC) No 1013/2006

RESEARCH REPORT: HAZARD ANALYSIS FOR OFFSHORE CARBON CAPTURE PLATFORMS AND OFFSHORE PIPELINES
32
3.3.2.2 Impact of H2S on personnelAn escape of CO2 on a platform or other structure where CO2 is present as a result of CCS operations, creates a potential hazard to personnel working in the area. Notwithstanding the hazard associated with the CO2 itself, there are also potential hazards as a result of the other gases present in the CO2 as impurities.
H2S is likely to be present in CO2 produced in pre-combustion (IGCC) facilities and in petrochemical processing, and is amongst the more toxic of impurities (metal carbonyls, for example, are more toxic, but are found in much lower quantities). Table 3.5 shows the toxic effects of H2S concentration in air.
Concentration in air, ppm
Symptoms
0,03 Can smell. Safe for eight hours’ exposure
4 May cause eye irritation. Respiratory protection equipment must be used as it damages metabolism.
10 Maximum exposure 10 minutes. Impairs sense of smell in three to 15 minutes. Causes ‘gas eye’ and throat injury. Reacts violently with dental mercury amalgam fillings.
20 Exposure for more than one minute causes severe injury to eye nerves.
30 Loss of smell, injury to blood brain barrier through olfactory nerves.
100 Respiratory paralysis in 30 to 45 minutes. Needs prompt artificial resuscitation. Will become unconscious quickly (15 minutes maximum).
200 Serious eye injury and permanent damage to eye nerves. Stings eye and throat.
250 Prolonged exposure at about 250 ppm may cause the lung tissue to swell and fill up with water (pulmonary oedema).
300 Loses sense of reasoning and balance. Respiratory paralysis in 30 to 45 minutes.
500 Respiratory distress24. Needs prompt artificial resuscitation. Will become unconscious in three to five minutes. Immediate artificial resuscitation is required.
700 Breathing will stop and death will result if not rescued promptly, immediate unconsciousness. Permanent brain damage may result unless rescued promptly.
Table 3.5 Toxicity effects of H2S in air(source: Alken Murray Corporation)
The most widely recognised standards for H2S reference an eight-hour time-weighted average (TWA), long term exposure limit (LTEL) of either 5 ppm or 10 ppm in air, and a 15-minute short term exposure limit (STEL) of 15 ppm in air.25 Many monitoring programmes use instruments which set the alarms to sound if the concentration reaches 10 ppm, in which case the workers should leave the affected area immediately.
24 Hydrogen Sulfide: Human health aspects Concise International Chemical Assessment Document 53, World Health Organisation, Geneva, 2003
25 HSE EH40/2005 Workplace Exposure Limits
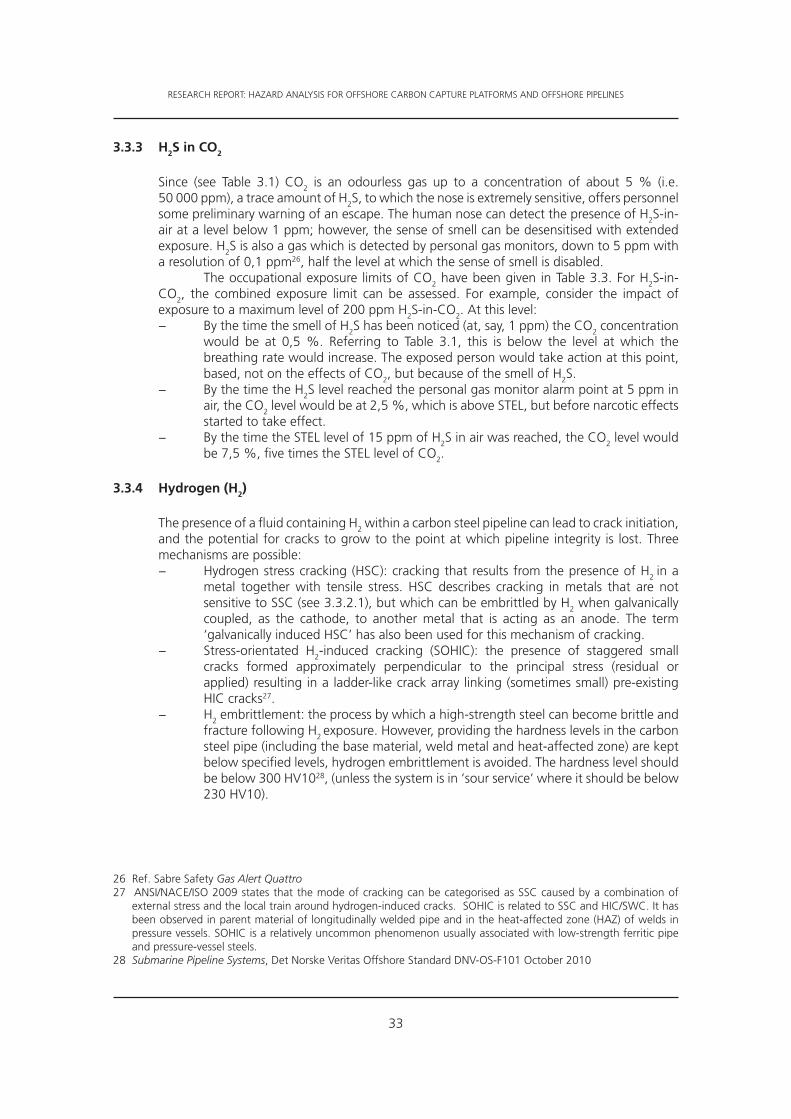
RESEARCH REPORT: HAZARD ANALYSIS FOR OFFSHORE CARBON CAPTURE PLATFORMS AND OFFSHORE PIPELINES
33
3.3.3 H2S in CO2
Since (see Table 3.1) CO2 is an odourless gas up to a concentration of about 5 % (i.e. 50 000 ppm), a trace amount of H2S, to which the nose is extremely sensitive, offers personnel some preliminary warning of an escape. The human nose can detect the presence of H2S-in-air at a level below 1 ppm; however, the sense of smell can be desensitised with extended exposure. H2S is also a gas which is detected by personal gas monitors, down to 5 ppm with a resolution of 0,1 ppm26, half the level at which the sense of smell is disabled.
The occupational exposure limits of CO2 have been given in Table 3.3. For H2S-in-CO2, the combined exposure limit can be assessed. For example, consider the impact of exposure to a maximum level of 200 ppm H2S-in-CO2. At this level:
− By the time the smell of H2S has been noticed (at, say, 1 ppm) the CO2 concentration would be at 0,5 %. Referring to Table 3.1, this is below the level at which the breathing rate would increase. The exposed person would take action at this point, based, not on the effects of CO2, but because of the smell of H2S.
− By the time the H2S level reached the personal gas monitor alarm point at 5 ppm in air, the CO2 level would be at 2,5 %, which is above STEL, but before narcotic effects started to take effect.
− By the time the STEL level of 15 ppm of H2S in air was reached, the CO2 level would be 7,5 %, five times the STEL level of CO2.
3.3.4 Hydrogen (H2)
The presence of a fluid containing H2 within a carbon steel pipeline can lead to crack initiation, and the potential for cracks to grow to the point at which pipeline integrity is lost. Three mechanisms are possible:
− Hydrogen stress cracking (HSC): cracking that results from the presence of H2 in a metal together with tensile stress. HSC describes cracking in metals that are not sensitive to SSC (see 3.3.2.1), but which can be embrittled by H2 when galvanically coupled, as the cathode, to another metal that is acting as an anode. The term ‘galvanically induced HSC’ has also been used for this mechanism of cracking.
− Stress-orientated H2-induced cracking (SOHIC): the presence of staggered small cracks formed approximately perpendicular to the principal stress (residual or applied) resulting in a ladder-like crack array linking (sometimes small) pre-existing HIC cracks27.
− H2 embrittlement: the process by which a high-strength steel can become brittle and fracture following H2 exposure. However, providing the hardness levels in the carbon steel pipe (including the base material, weld metal and heat-affected zone) are kept below specified levels, hydrogen embrittlement is avoided. The hardness level should be below 300 HV1028, (unless the system is in ‘sour service’ where it should be below 230 HV10).
26 Ref. Sabre Safety Gas Alert Quattro27 ANSI/NACE/ISO 2009 states that the mode of cracking can be categorised as SSC caused by a combination of
external stress and the local train around hydrogen-induced cracks. SOHIC is related to SSC and HIC/SWC. It has been observed in parent material of longitudinally welded pipe and in the heat-affected zone (HAZ) of welds in pressure vessels. SOHIC is a relatively uncommon phenomenon usually associated with low-strength ferritic pipe and pressure-vessel steels.
28 Submarine Pipeline Systems, Det Norske Veritas Offshore Standard DNV-OS-F101 October 2010

RESEARCH REPORT: HAZARD ANALYSIS FOR OFFSHORE CARBON CAPTURE PLATFORMS AND OFFSHORE PIPELINES
34
3.3.5 Carbon monoxide (CO)
CO is a colourless, odourless and toxic gas. It is absorbed in the blood preferentially to oxygen to form carboxyhaemoglobin in humans, thus depriving the cells of necessary oxygen. CO is a possible impurity in CO2 from CCS applications resulting from incomplete combustion, for instance of distillate gas in a CCGT (where CO can be present in concentrations up to 1 500 ppmv), but are more normally less than 50 ppmv, less still for large modern CCGTs burning natural gas. CO2 sourced from these installations will lead to the presence of CO in the CO2, therefore its impact should be assessed.
The table of the impacts of CO inhalation is given as Table 3.5. The UK Health and Safety Executive Workplace Exposure Limits (WELs) from HSE EH 40 for CO are: 30 ppm for an eight-hour TWA LTEL; and 200 ppm for the 15 minute reference period STEL.
The table of the impacts of CO inhalation indoors is given as Table 3.629.
ppm CO Symptoms
30 On TWA acceptable working exposure.
200 Headache in two - seven hours.
400 Nausea and headache in one – two hours, possible collapse.
1 200 Irregular heartbeat in 10 – 30 minutes.
2 000 Collapse and unconciousness in 10 – 30 minutes.
4 000 Death within one hour.
Table 3.6 Physiological effects of CO(source Advantica Technologies Limited)
3.3.6 Toxicity of CO
Using the methodology recommended by HSE30 to calculate SLOT and SLOD, the CO concentrations in air can be calculated, as shown in Table 3.7
Exposure period (min) SLOT in (ppm) SLOD in (ppm)
0,5 80 250 ~1 000 000
1 40 125 570 000
10 4 013 57 000
30 1 338 19 000
60 669 9 500
120 334 4 750
Table 3.7 SLOD and SLOT values for CO
29 Joint Industry Programme on carbon monoxide issues, prepared by Advantica Technologies Limited (formerly BG Technology) for the Health and Safety Executive, Contract research report 383/2001
30 Assessment of the Dangerous Toxic Load (DTL) for Specified Level of Toxicity (SLOT) and Significant Likelihood of Death (SLOD), HSE, updated to 3 October 2011

RESEARCH REPORT: HAZARD ANALYSIS FOR OFFSHORE CARBON CAPTURE PLATFORMS AND OFFSHORE PIPELINES
35
Applying the same logic as for H2S in 3.3.3, for example, with a CO in CO2 concentration of 2 000 ppmv, the SLOD/SLOT data would be as shown in Table 3.8.
Exposure period (minutes)
SLOT CO2 (ppm)
Equivalent CO concentration
SLOD in (ppm) for CO2
Equivalent CO concentration
0,5 115 000 160 153 000 228
1 105 000 80 140 000 114
10 79 000 8 105 000 11,4
30 68 000 2.7 92 000 3,8
60 63 000 1.3 84 000 1,9
120 55 000 0.67 77 000 0,95
Table 3.8 SLOD and SLOT values for CO2 and equivalent CO concentration at 2 000 ppmv
From Table 3.8 it can be seen that the dangers associated with CO2 dominate, even with a high level of CO in the CO2.
3.3.7 Oxides of nitrogen and sulfur dioxide
NOx is a generic term for the nitrogen monoxides (NO) and nitrogen dioxide (NO2) (nitric oxide and nitrogen dioxide). They are produced from the reaction of nitrogen and oxygen gases in the air during combustion; especially at the high temperatures that are experienced in the burning of coal and natural gas for steam and electricity production. NO2 is the more stable form, and very often NOx is treated as wholly NO2 since NO may react in the air to form NO2. NO2 is a yellowish-orange to reddish-brown gas with a pungent, unpleasant odour.
NO is not an irritant itself but it does react with haemoglobin, giving meta-haemoglobin which can be lethal. NO, at lower concentrations, is involved in many physiological and pathological processes vital to the human body. NO2 is an irritant gas and if inhaled can cause severe damage to the lungs. The lethal concentration is about 200 ppm. Typical power station flue gas concentrations are 10 to 20 ppm prior to dilution by the atmosphere. Due to its high solubility in fat, NO2 can penetrate deep in the lungs where it damages capillaries and inflammes tissues. Concentrations higher than 60-150 ppm can cause coughing, and a burning sensation deep inside the lungs. Lung damage can be apparent after two to 24 hours. Continuous exposure at a low concentration of NO2 can cause severe coughing, headache, loss of appetite, and stomach pain. Environmental studies have shown that continuous exposure to NO2 at much lower ambient concentrations may cause an increase in breathing diseases and reduced breathing efficiency.
NO2 is classified as highly toxic, and inhalation may be fatal. A typical prolonged exposure limit is 5 ppm31.
SO2 gas is colourless, has a pungent, sharp smell, and forms the majority of sulfur oxides normally referred to as SOx. It is corrosive and reacts easily with other substances to form potentially harmful compounds, such as sulfuric acid, sulfurous acid and sulfate particles. The main source of SO2 in the air is industrial activity which processes materials that contain sulfur as an impurity, such as the generation of electricity from coal, oil or gas. Some mineral ores also contain sulfur, and SO2 is released when they are processed.
31 MSDS Data sheet Safety data for nitrogen dioxide

RESEARCH REPORT: HAZARD ANALYSIS FOR OFFSHORE CARBON CAPTURE PLATFORMS AND OFFSHORE PIPELINES
36
SO2 affects human health when inhaled. It irritates the nose, throat, and airways to cause coughing, wheezing, shortness of breath, or tightness around the chest. The effects of SO2 inhalation are felt rapidly and the worst symptoms would become apparent within 10 or 15 minutes. Those most likely to be affected are people with asthma or similar conditions.
SO2 is classified as toxic, and high concentrations are fatal. A typical exposure limit is 2 ppm for an eight-hour TWA, and 5 ppm for a 10 minute TWA32.
The SLOT and SLOD values for NO2 and SO2 in air (calculated using the UK HSE methodology33) are given in Table 3.9.
Exposure period(minutes)
NO2 SO2
SLOT (ppm) SLOD (ppm) SLOT (ppm) SLOD (ppm)
0,5 438 1 117 3 051 12 205
1 310 790 2 158 8 630
10 98 250 682 2 729
30 57 144 394 1 576
60 40 102 279 1 114
120 28 72 197 788
Table 3.9 SLOT and SLOD values for NO2 and SO2 in air
3.3.8 Indirect impacts of impurities within CO2
3.3.8.1 Oxygen in CO2
The hazards associated with oxygen in CO2 are not those that impact human health, but are relevant to the subsequent use or storage of the CO2. Oxygen, fully dissolved in liquid CO2 will present no hazard with regard to the corrosion of a carbon steel pipeline. Only when oxygen becomes ‘free’, will it have the potential to cause the formation of corrosion products (iron oxides), but only if water is present in sufficient amounts. The permitted maximum quantity of oxygen in water to avoid corrosion is discussed in 2.2.3.
However, there are other potential effects of oxygen in CO2. The purity of CO2 required for enhanced oil recovery (EOR) is greater than that required for other geological storage sinks due the requirement to minimise oxygen content as this would react with the hydrocarbons within the oil field. The standard used by the EOR industry in the USA is 10 ppm34. This is further discussed in 3.6.4.
Additionally, there is concern that oxygen at a higher concentration may lead to the growth of algae; knowledge of this phenomenon is developing.
3.3.8.2 Water in CO2
Pure liquid CO2 is not corrosive, as there are no loosely bonded oxygen atoms available to form oxides. If CO2 contains water, then the potential exists for oxygen to initiate corrosion. Water will dissolve in liquid CO2 up to a certain degree (see 2.2.4 and 2.2.5), so the first priority for the process designer should be to ensure that existence of acid CO2/water compounds
32 MSDS Data sheet Safety data for sulfur dioxide33 Assessment of the Hazardous Toxic Load (DTL) for Specified Level of Toxicity (SLOT) and Significant Likelihood of
Death (SLOD), HSE, updated to 03.10.1134 Purification of Oxyfuel-Derived CO2 for Sequestration or EOR, Vince White, Rodney Allam (Air Products PLC) and
Edwin Miller (Air Products and Chemicals)

RESEARCH REPORT: HAZARD ANALYSIS FOR OFFSHORE CARBON CAPTURE PLATFORMS AND OFFSHORE PIPELINES
37
in the levels is such that no free water is present. The corrosion potential presented by this leaves the designer with the choice of either using a more costly pipe material, lining the inside of the pipe with a corrosion-resistant coating, or reducing the amount of water in the CO2 to a level where significant internal corrosion will not take place. The offshore operator is not able to exercise any direct control over this, but will be in a position to specify the composition of the CO2 entering their pipes to ensure that internal corrosion does not take place. This is at <500 ppm H2O-in-pure CO2. If this is achieved, then uncoated carbon steel can be used with confidence.
A recent experimental study35 supports the conclusion that corrosion does not take place in pure CO2 or CO2 with oxygen when the water content is far below the reported water solubility limit for pure CO2 (approximately 500 ppm).
Noting the required water content cited in 2.2.4 and 2.2.5 to reduce the risk of hydrate formation, <250 ppmv, the potential for corrosion of the internal pipeline surfaces in CCS applications is very small unless there is water ingress from outside. This is unlikely during normal operation, as the pressure of the CO2 in the pipeline will usually be significantly above the hydrostatic pressure of the sea water. Under the aforementioned levels of moisture, the pressure of the CO2 should be maintained in excess of 80 bar to avoid the risk of hydrate formation.
3.3.8.3 Hydrate formationIt is possible for all of the water to be dissolved within liquid CO2 in the land-based sections of a CCS system (where the temperatures will probably be in the 10 - 25 ˚C range), but once the CO2 reaches an equilibrium temperature offshore (approximately 4 ̊ C), the potential then exists for hydrates to then form.
Hydrate formation should be avoided, because it introduces problems (not necessarily hazards) such as:
− Having the potential to prevent valves from closing, obstruct the movement of pumps, and block instrument lines.
− The hydrate forms a local water/pipeline wall interface, increasing the potential for corrosion.
− Hydrate lodging in the pipeline will constitute a flow restriction and the potential for erosion associated with higher flows through the unrestricted cross-section.
− During inspections (e.g. with a pipeline pig), or during pipeline movements (as a result of anchor-dragging or sea bed movement), any hydrate formed could become dislodged and form a downsteam blockage.
− Blocking the tappings of safety-critical instruments and relief valves.
The operator should have a clear understanding of those factors which can contribute to hydrate formation and how it can be avoided. Onshore, the moisture content should be controlled to a level which will not give rise to issues offshore.
3.3.8.4 Impact on adjacent structuresA leak of CO2 from a pipe under pressure on a platform above the water-line would result in the CO2 expanding. A cold gas will form; even solid CO2 (CO2 snow) could form, dependent on the specific circumstances. This cold gas has the potential to impact structural steelwork, cooling it as a result. Because the escaping CO2 gas may be at temperatures lower than -78,5 °C (see 2.1.1.3), the structural steelwork may be cooled to much lower than its design temperature.
35 Corrosion of transport pipelines for CO2 – effect of water ingress, A. Dugstad, B. Morland (Institute for Energy Technology, Norway) S. Clausen (Gassco AS, Norway, presented at GHGT-10 Amsterdam 19 - 23 September 2010

RESEARCH REPORT: HAZARD ANALYSIS FOR OFFSHORE CARBON CAPTURE PLATFORMS AND OFFSHORE PIPELINES
38
A leak of CO2 from a subsea pipe would absorb heat from the surrounding water to form a gas. Some solid CO2 may also form; this would float away on the surface of the sea. The gas has the potential to impact structural steelwork, cooling it as a result. Dependent on how close the steelwork is to the source of the leak, it may be cooled to much lower than its design temperature, but it would also absorb heat from the surrounding water (and also from the escaping CO2, which will be at about 4 °C). Whilst this situation should be evaluated on a case-by-case basis, it is unlikely that structural steelwork would be cooled significantly.
However, the potential phenomenon should not be ignored.
3.3.8.5 CO2 BLEVEIt is possible that the conditions necessary for BLEVE (see 2.3.3) incidents to take place could arise on platforms where the CO2 is brought to the surface, for instance in EOR operations. The thermodynamic conditions under which a BLEVE might arise are described in more detail in Annex F.
Guidelines for Evaluating the Characteristics of Vapour Cloud Explosions, Flash Fires and BLEVEs36 provide more guidance on how to evaluate the consequences of BLEVEs and gives further details of two known incidents where CO2 BLEVEs resulted in fatalities. Much has been learned from similar incidents and this experience has been incorporated into design practices used by the industrial gases industry. It is worth reiterating the issue of ice and hydrate formation (see 2.2.4 and 2.2.5). In one of the incidents described (at Repcelak, Hungary, 2 January 1969), it is suspected that ice or hydrate formation caused the failure of a level instrument, which in turn resulted in the overfilling and eventual BLEVE of a vessel. This incident, together with operational experience of CO2 liquefaction plant in the UK, indicates that even with good control of moisture within a CO2 process, there should be regular blow-downs of instrument level legs and other ‘stagnant’ sections of a process plant. This is to eliminate the potential for ice and hydrate build-up in critical sections of a CO2 process.
3.3.8.6 Methane-in CO2
Methane (CH4) is a possible impurity in CO2 from CCS applications where there is incomplete combustion or reaction of natural gas. Modelling has shown that CH4 has the effect of lowering the solubility of water in liquid CO2, and thus raising the temperature at which hydrates will form. For pure CO2, this effect is demonstrated in Figure 3.1.
Figure 3.1 Impact of CH4 impurity within liquid CO2
36 Guidelines for Evaluating the Characteristics of Vapour Cloud Explosions, Flash Fires and BLEVEs, ISBN 0-8169-0474-X, Centre for Chemical Process Safety of the American Institute of Chemical Engineers, 1994

RESEARCH REPORT: HAZARD ANALYSIS FOR OFFSHORE CARBON CAPTURE PLATFORMS AND OFFSHORE PIPELINES
39
Referring to Figure 3.1, whilst levels of 10 % CH4 are probably unrealistic, since they represent a waste of energy, the impact of CH4 as an impurity on the temperature at which hydrates may form is a factor that should be considered in the design of offshore CCS systems.
3.3.8.7 SO2-in-CO2
A recent study37 supports the view that corrosion can occur at very low water concentration (200 ppm) when the system is contaminated with SO2. When SO2, H2O and O2 are present, sulfuric acid (H2SO4) might form. The minimum water concentration required for H2SO4
formation is not known.
3.3.8.8 Amine carryoverCarryover of amine solution from chemical solvent processes is likely unless precautions are taken. Amine content in the CO2 is a health and safety matter. A variety of amines can be used in post-combustion CO2 capture, and some of these can degrade to different harmful substances such as aldehydes, amides, nitrosamines, and nitramines, some of which have found to be carcinogenic38. Release of these substances to the air, drinking water or the aquatic ecosystems may need to be limited; however, work is still in progress to assess the severity of this.
3.3.8.9 ParticulatesThe particulate content of the CO2 is unlikely to present a hazard to offshore pipelines or platforms, and is therefore not considered in this publication. However, it is noted that it is a factor that should be taken into consideration when assessing the impact of the CO2 when injecting it into subsea geological structures.
3.3.9 Fluid hammer
3.3.9.1 Fluid hammer– general descriptionFluid hammer is a pressure or wave resulting when a fluid (usually a liquid but sometimes also a gas) in motion is forced to stop or change direction suddenly (momentum change). Fluid hammer commonly occurs when the flow is suddenly interrupted, such as when a valve is closed, and a pressure wave propagates in the pipe. It may also be known as hydraulic shock. This pressure wave travels within the fluid at the speed of sound in that fluid (for liquid CO2, see 2.3.2) at the specific conditions of temperature and pressure for that fluid, and can cause operational concerns, from noise and vibration to fracture of the pressure containment or valve paddle. In many applications it is possible to reduce the effects of fluid hammer pulses, for instance by fitting accumulators.
3.3.9.2 Fluid hammer in offshore installationsIn onshore CCS situations the installation of rapid shut-off valves in pipelines may be proposed to limit the potential inventory of CO2 that would escape in the event of a significant breach of the pipe. Measures to mitigate the generation of a fluid hammer will need to be included, but for subsea applications involving long pipelines these may not be a practical solution because of the inspection and maintenance difficulties of these devices.
37 Corrosion of transport pipelines for CO2 – effect of water ingress, A. Dugstad, B. Morland (Institute for Energy Technology, Norway) S. Clausen (Gassco AS, Norway, presented at GHGT-10 Amsterdam 19 -23 September 2010.
38 Health effects of possible degradation products of different amines relevant for CO2 capture, Låg, M., Instanes, C., Lindemann, B. and Andreassen, Å. 2009, Final report Norwegian Institute of Public Health (FHI), Oslo.

RESEARCH REPORT: HAZARD ANALYSIS FOR OFFSHORE CARBON CAPTURE PLATFORMS AND OFFSHORE PIPELINES
40
The impact of any fluid hammer would be experienced upstream (i.e. between a rapid shut-off valve and a pump or compressor), and the downstream section, including the offshore section, will not experience sudden pressure surges. Offshore infrastructure will include control and isolating valves, therefore there is still the potential for a fluid hammer situation, albeit under the control of the designer and operator.
The excess pressure generated as a result of fluid hammer can be calculated using the Joukowsky equation, with the main variables being:
− The volumetric flow of the CO2 (m3/s).
− The hydraulic impedance of the pipe (kg/m4/s): this depends on a number of variables, including the density of the CO2 (kg/m3), the cross-sectional area of the pipe (m2) and the effective modulus of compressibility of the CO2 in the pipe (Pa).
Typically the maximum pressure swing in the pipe as a result of fluid hammer is 1,8 times the steady state pressure over a time of about 0,06 seconds; if this is 200 bar, a pressure swing of 360 bar has the potential to cause a significant amount of damage. For pumped pipelines the design would include a factor of 1,25 x the normal head to allow for pressure transients (such as shut-in), and for compressors the factor is 1,5 to accommodate surge. This is clearly less than the 1,8 described above; to avoid costly over-design, the fluid hammer situation can be avoided by ensuring that in-line valves are always closed slowly.
3.3.10 Downstream impacts
Whilst strictly outside of the scope of this publication, the potential impact of impurities within CO2 produced by CCS applications on downstream components should be considered.
IEAGHG has published a report39 on the potential effects of impurities on CO2
geological storage. The report considers the chemical effects on rocks, with the greatest impacts resulting from SOx, NOx and H2S. The study finds that concentrations of SOx and NOx below 200 ppm would be unlikely to affect caprock integrity, and that the chemical effects of CO and H2 are not expected to be as important as SO2, NOx and H2S.
3.4 REQUIREMENTS UNDER THE CCS DIRECTIVE
Article 12 of the CCS Directive40 addresses the criteria for CO2 streams for geological storage. It notes the following:
− A CO2 stream should consist ‘overwhelmingly of CO2’. − No ‘waste or other matter’ may be added to the CO2 stream for the purpose of
disposing of this waste or other matter underground. − In addition to CO2, there are two other types of matter that may be present in the
CO2 stream: (a) incidental substances that are associated with the source (i.e. the CO2 source, which is dependent on the used feedstock and the industrial process), capture or injection process; (b) trace substances that may be added to assist in monitoring and verification of CO2 migration.
39 Effects of Impurities on Geological Storage of CO2, IEAGHG, report 2011/4, June 201140 Directive 2009/31/EC of 23 April 2009 on the geological storage of carbon dioxide and amending Council Directive
85/337/EEC, European Parliament and Council Directives 2000/60/EC, 2001/80/EC, 2004/35/EC, 2006/12/EC, 2008/1/EC and Regulation (EC) No 1013/2006

RESEARCH REPORT: HAZARD ANALYSIS FOR OFFSHORE CARBON CAPTURE PLATFORMS AND OFFSHORE PIPELINES
41
The CCS Directive requires that concentrations of all incidental and added substances should be below levels that would:
a. Adversely affect the integrity of the storage site or the relevant transport infrastructure.
b. Pose a significant risk to the environment or human health.c. Breach the requirements of applicable EU legislation.
The current legal understanding of the requirements under points b) and c) is that they should be interpreted as meaning that the concentration of pollutants regulated under the Integrated Pollution Prevention and Control (IPPC) Directive, the Large Combustion Plants Directive (LCPD) or the Industrial Emissions Directive (IED) shall comply with the limit values and other requirements of those directives, including concerning the use of Best Available Techniques (BAT).
Installations should only accept CO2 streams for storage if their composition is analysed for corrosive substances, and if a hazard assessment has been carried out indicating that the levels of incidental and trace substances in the CO2 stream are acceptable.
3.5 SPECIFYING CO2 FOR STORAGE
It has previously been stated that the CO2 arising from carbon capture facilities will not be pure, and some of the more common impurities have been described, together with their impact on the thermodynamic properties of the CO2 and their hazard potential. Annex E lists some of the expected sources of CO2 for CCS and provides calculated estimates for the levels of impurities that might be expected in the CO2. Given the range of possible compositions, a specification that addresses the minimum requirements with regard to potential hazards, downstream effects, and cost is required.
In deciding the appropriate level of impurity for offshore CO2 transport for CCS applications, the following factors should be considered:
− The impurities should reflect the hazard assessments carried out and vice versa. − The acceptance level of each impurity should be science-based. − Unnecessary conservatism should be avoided. − The hazards associated with CO2 should take precedence over those of the impurities.
3.6 DYNAMIS SPECIFICATION FOR CO2
The EU Dynamis project41 was set up to prepare the ground for large-scale European facilities producing hydrogen and electricity from fossil fuels with CO2 capture and permanent storage. It drew on expertise from the 12 member states taking part, and gave careful consideration to a CO2 specification, because it was important that the design of the facilities would deliver CO2 that met the described factors. The project embraced oxyfuel, pre- and post-combustion electricity generation using both hard and lignitic coal and natural gas CCGT, and as such, covered a wide range of possible impurities.
It is outside of the scope of this publication to provide a CO2 specification: this matter is currently receiving consideration by an ISO Committee and the British Standards Institute.
41 EU Dynamis project Towards Hydrogen and Electricity Production with Carbon Dioxide Capture and Storage, Project number 019672, March 2006 – October 2009.

RESEARCH REPORT: HAZARD ANALYSIS FOR OFFSHORE CARBON CAPTURE PLATFORMS AND OFFSHORE PIPELINES
42
The CO2 specification that the Dynamis team produced42 is shown as Table 3.10. Because it represents the conclusion of a science-based consideration of the various hazards and impacts of CCS, both on- and offshore, it is a good starting point to consider the impact of deviating from the levels specified, and each of the impurities are discussed in order in this section.
Component Limit Reason
CO2 >95 % Maximise pipeline efficiency
N2 <4 % for all non-condensible gases and hydrocarbons
Minimise effect on thermodynamic propertiesAr
H2
CH4
O2 ≤10 ppmv Potential for use in EOR
H2S ≤200 ppmv An odoriser, below STEL
CO <2 000 ppmv Health and safety
H2O ≤200 ppmv Avoid hydrates and corrosion
SOx <100 ppmv Health and safety
NOx <100 ppmv
Table 3.10 Dynamis specification for CO2
3.6.1 CO2 content
The CO2 content is set at >95 % to maximise the pipeline efficiency, recognising that some of the processes that could use the CCS network may not be able to achieve higher levels of purity. This is of particular relevance to some industrial processes where there is a significant amount of nitrogen carried over with the CO2 in the flue gas.
3.6.2 Non-condensable gases
The non-condensable gases are nitrogen, argon, hydrogen, methane and oxygen. Hydrogen, methane and oxygen will be discussed in 3.6.3, 3.6.5 and 3.6.4 respectively). All of these non-condensable gases have an impact on the thermodynamic properties of the CO2 (see 2.1.2.1), and in order to minimise this effect the levels should be constrained.
Nitrogen is an inevitable impurity from many processes. As an inert gas forming just over 78 % of the earth’s atmosphere, its presence within the CO2 does not present any hazard. Were the CO2 to be used for EOR purposes, the nitrogen content would be considered an asset. However, the objective of the exercise is to capture and store anthropomorphic CO2, and compressing and transporting nitrogen into an offshore storage location represents unnecessary use of both capital and energy. Deviating from the <4 % figure probably indicates that there are efficiency gains to be made upstream. This recognises that there may be a cost benefit analysis to be carried out to reduce the nitrogen content from some non-electricity processes that could deliver CO2 to a CCS infrastructure.
42 Dynamis document 3.1.3 CO2 quality recommendations, 21 June 2007

RESEARCH REPORT: HAZARD ANALYSIS FOR OFFSHORE CARBON CAPTURE PLATFORMS AND OFFSHORE PIPELINES
43
Existing US pipeline guidelines indicate a maximum of 4 % for N2 and 5 % for hydrocarbons. The competent authority may allow the pipeline operator to propose a maximum limit based on economic pipeline operation limit, taking into account the necessary safety considerations. Recent work has indicated that non-condensable components in the CO2 stream have significant economic impacts for longer pipelines, and that cost of CO2
purification can have a significant role for the total cost of CCS, as one needs to balance the cost of purification with other costs (such as storage and transportation)43.
3.6.3 Hydrogen
Hydrogen is present only as a result of pre-combustion CO2 separation and is an unavoidable product of solvent washing equilibria. H2 and CH4 in the CO2 both represent energy lost to whichever process is producing the CO2, and for this reason, if no other, the levels should be controlled as far as possible.
3.6.3.1 Thermodynamic considerationsThe presence of H2 within the CO2 has an impact on its thermodynamic properties (see 2.1.2.1), and in order to minimise this effect the levels should be constrained low.
Existing US pipeline guidelines indicate no specific limits for H2.
3.6.3.2 Metallurgical considerationsThe possibility for H2 within a pipeline to initiate stress corrosion has been described in 3.3.4. The potential for stress corrosion or sulphide stress cracking has been described in ANSI/NACE MR0175/ISO 15156 (see 3.6.6.2), which also addresses HSC, commenting44 that very high-strength steels can suffer HSC in aqueous environments without H2S, and warns that attention should be given when using materials with a yield strength above about 965 MPa to ensure that either the partial pressure of the H2S is low (below about 0,1 kPa), or that the pH is above about 3,5 (a graph is provided). This would not apply, for instance, to the use of X65 pipeline material (sy =440 MPa) or EN10208-2 L555MB (sy =555 MPa), but may do to other pipeline materials.
The same reference also advises45 that the hardness of parent materials and of welds and their heat-affected zones play important roles in determining the stress corrosion cracking resistance of carbon and low alloy steels. Steels with a hardness below 250 HV46 are suitable. For X65 pipeline material, hardness values in the range 171 – 206 are typical47.
3.6.4 Oxygen content
Oxyfuel combustion is the process that produces the highest levels of O2-in CO2. Oxygen in the CO2 does not present a personnel hazard per se, but keeping the oxygen content to <10 ppm would allow the use of the CO2 for EOR, since most pipeline operators in the US specify this limit, which has become an ‘industrial standard’. The normal concern about oxygen in pipeline fluids containing free water is associated with corrosion. However, the small amount of O2, that is likely to be present as a result of CO2 capture processes will fully dissolve in CO2 and is therefore not a threat to corrosion in the absence of free water.
43 Impacts of Non-condensable Components on CCS, J. Yan et al., Presentation at Working Group on Quality of CO2
Captured from Oxyfuel Combustion Power Plant, 22 October 2008, Stockholm, Sweden. 44 ANSI/NACE MR0175/ISO 15156 Part 1 section 7.2.1.345 Section 7.3 Hardness requirements46 Table A.1 Maximum acceptable hardness values for carbon steel, carbon-manganese steel and low-alloy steel
welds: figures taken for base metal.47 Conditions of Hydrogen-Induced Corrosion Occurrence of X65 Grade Line Pipe Steels in Sour Environments, T.
Hara, H. Asahi and H. Ogawa, CORROSION—Vol. 60, No. 12, NACE International, 2004

RESEARCH REPORT: HAZARD ANALYSIS FOR OFFSHORE CARBON CAPTURE PLATFORMS AND OFFSHORE PIPELINES
44
The presence of even small levels of O2 can lead to the growth of facultative aerobic species in an oil well, where the biomass generated can be used as both a habitat and a nutrient source by sulfate reducing bacteria (SRB). To avoid this, and the unknown hazards that could follow, it would appear sensible to maintain the low levels of O2 specified by the petroleum industry48.
Larger amounts, above about 10 %, of O2 can also react with oil to form oxides, and this can cause overheating in CO2 booster pumps, and also downstream, in injection pumps, for example in EOR applications.
Transporting CO2 with a higher level is a waste of O2 which will typically have been produced from a cryogenic air separation process and thus also represents a waste of energy and a loss in overall plant efficiency.
3.6.5 Methane content
The impact of CH4 as an impurity has been described in 3.3.8.6, and should be kept at a low level, not only because it represents a waste of useful primary energy resource, but also because it can raise the temperature at which hydrates may form within the liquid CO2. Were all of the non-condensable gases to be CH4, hydrates could form above 9 °C, requiring water levels to be reduced to ppb levels within the CO2 at 4 °C in order to avoid the hazard.
3.6.6 H2S content
3.6.6.1 Impact on personnelThe Dynamis team argued that there was no merit in reducing the H2S level below 200 ppm, since the effects of exposure in the event of an escape would be dominated by the CO2 (see 3.3.2).
3.6.6.2 Potential for SCCThe potential for stress corrosion or sulphide stress cracking (which can ultimately lead to failure), in pipelines containing a fluid that contains water and a significant amount of H2S has been described in ANSI/NACE MR0175/ISO 1515649. This standard was written to establish limits of H2S partial pressure above which precautions against sulphide stress corrosion cracking were considered necessary, following failures of metallic oil and gas field components associated with their exposure to H2S-containing production fluids.
The H2S limit of 200 ppmv used in the Dynamis represents a partial pressure of 0,00015 MPa (0,15 kPa) when calculated according to Annex C of part 1.
Annex D of part 1 provides a method of calculating the pH of the fluid, in this case CO2, and this results in a value of 2,8. However, the water content of the CO2 used for the Dynamis exercise is such that there is no free water, hence there are no H3O+ ions available, so it does not have a pH.
The Stress Corrosion Cracking (SCC) potential of the H2S is therefore a function of its partial pressure. ANSI/NACE MR0175/ISO 15156 advises (Part 1, section 7.1.1), that for an H2S partial pressure of <0,3 kPa (0,003 bar), normally no special precautions are required for the selection of steels, noting that highly susceptible steels can still crack. H2S in an offshore pipeline operating at 200 bar and 4 °C is below its bubble point, and it will not come out of solution. To set these figures into context, at 200 bar and 4 °C, the bubble point at
48 Selection of an Active Souring Management Solution for a Gulf of Mexico Waterflood, L.C. Jordan, Gibson Applied Technology and Engineering LLC, J.M. Walsh, Shell Exploration and Production, 2004, Corrosion 2004, 04759
49 Petroleum and natural gas industries – Materials for use in H2S-containing environments in oil and gas production, ANSI/NACE MR0175/ISO 15156, part 1(2009), parts 2 and 3(2011)

RESEARCH REPORT: HAZARD ANALYSIS FOR OFFSHORE CARBON CAPTURE PLATFORMS AND OFFSHORE PIPELINES
45
(50,1 bar) changes little between 60 ppmv and 200 ppmv, and as a result, according to the calculation method described in the ANSI/NACE document, the partial pressure of the H2S (pH2S, according to Annex C) remains below the 0,3 kPa threshold.
Therefore, it can be concluded that, provided there is no free water, SCC would not take place were the CO2 to contain H2S with a concentration of 200 ppmv. This conclusion can be supported by the composition of the CO2 used in the pipeline between the Dakota Gasification Company in Beulah, and the Weyburn oilfield in Canada, which is given in Table 3.1150.
Component Concentration
CO2 96 mol %
N2 <300 ppmv
CH4 0,7 mol %
O2 <50 ppmv
H2S 0,9 (90 000 ppmv)
CO 0,1 mol %
H2O <20 ppmv
C2+ 2,3 mol %
Table 3.11 CO2 composition for the Weyburn project
3.6.6.3 Experimental evidenceExperimental evidence51 is available to demonstrate that carbon steel pipeline material (X-60) was not susceptible to corrosion failure mechanisms in supercritical CO2, and that corrosion rates were less than 0,02 mils (5,08 x 10⁻⁴ mm) penetration per year. Pessimistically, these tests used CO2 at 2 000 psig (138 barg) containing up to 1 000 ppm of water vapour and 800 ppm of H2S at a temperature of 72 °F (22 °C). The low corrosion rates were attributed to the absence of liquid water (free water) in the test environment.
3.6.6.4 Possible impact on oilfieldsAn H2S content of 200 ppmv could, in the extreme, have an impact upon oil fields producing EOR oil by souring the field. As a result, the platform, which may have not had H2S monitoring equipment and personal dosimeters to detect the gas, may have to provide additional equipment and staff training, and revise its emergency procedures. It may also have a secondary impact with respect to transportation restrictions.
3.6.7 CO content
The hazard associated with CO is that of inhalation. The maximum concentration of CO (as well as SOx and NOx) in CO2 is set to such level that the component exceeds its STEL with the same factor as CO2 and reaches its threshold value in the dilution process at the same time as CO2 does.
50 CO2 Transport, N. Riley, British Geological Survey51 Effect of Supercritical Carbon Dioxide on Construction Materials, FW Schremp, GR Robinson, Chevron, presented
at the Society of Petroleum Engineers - American Institute of Mining 48th Annual Fall Meeting, 30 September - 3 October 1973
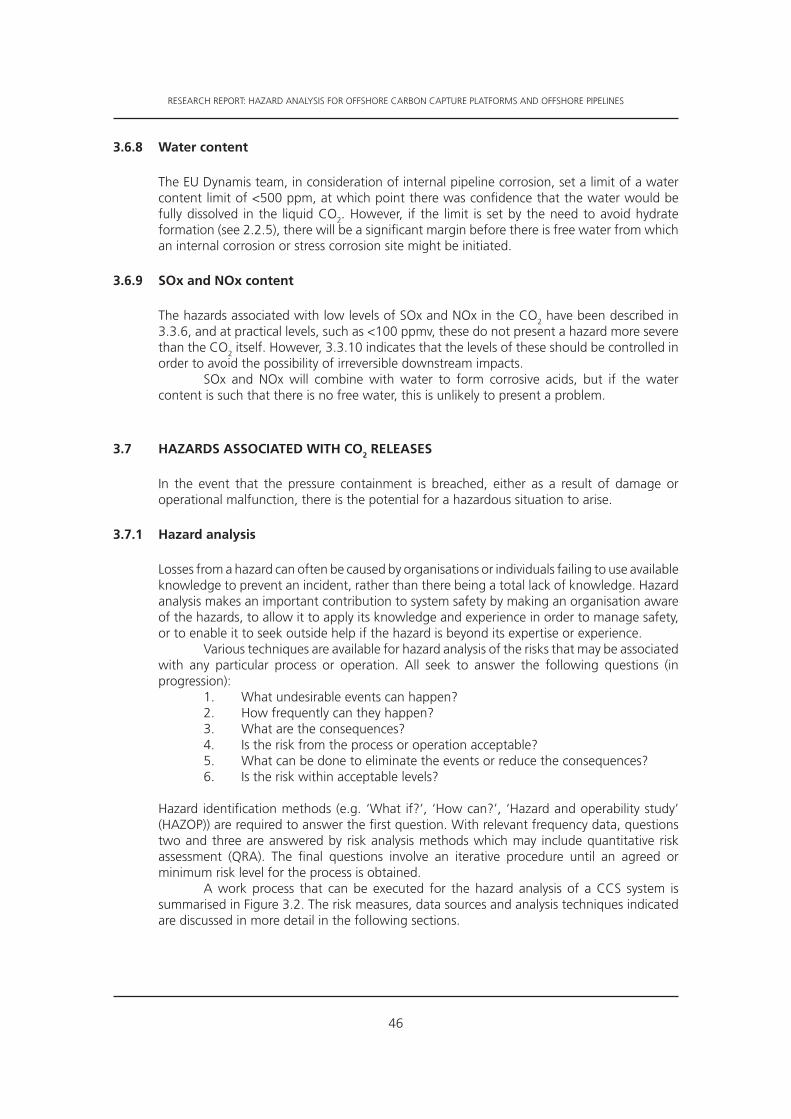
RESEARCH REPORT: HAZARD ANALYSIS FOR OFFSHORE CARBON CAPTURE PLATFORMS AND OFFSHORE PIPELINES
46
3.6.8 Water content
The EU Dynamis team, in consideration of internal pipeline corrosion, set a limit of a water content limit of <500 ppm, at which point there was confidence that the water would be fully dissolved in the liquid CO2. However, if the limit is set by the need to avoid hydrate formation (see 2.2.5), there will be a significant margin before there is free water from which an internal corrosion or stress corrosion site might be initiated.
3.6.9 SOx and NOx content
The hazards associated with low levels of SOx and NOx in the CO2 have been described in 3.3.6, and at practical levels, such as <100 ppmv, these do not present a hazard more severe than the CO2 itself. However, 3.3.10 indicates that the levels of these should be controlled in order to avoid the possibility of irreversible downstream impacts.
SOx and NOx will combine with water to form corrosive acids, but if the water content is such that there is no free water, this is unlikely to present a problem.
3.7 HAZARDS ASSOCIATED WITH CO2 RELEASES
In the event that the pressure containment is breached, either as a result of damage or operational malfunction, there is the potential for a hazardous situation to arise.
3.7.1 Hazard analysis
Losses from a hazard can often be caused by organisations or individuals failing to use available knowledge to prevent an incident, rather than there being a total lack of knowledge. Hazard analysis makes an important contribution to system safety by making an organisation aware of the hazards, to allow it to apply its knowledge and experience in order to manage safety, or to enable it to seek outside help if the hazard is beyond its expertise or experience.
Various techniques are available for hazard analysis of the risks that may be associated with any particular process or operation. All seek to answer the following questions (in progression):
1. What undesirable events can happen?2. How frequently can they happen?3. What are the consequences?4. Is the risk from the process or operation acceptable?5. What can be done to eliminate the events or reduce the consequences?6. Is the risk within acceptable levels?
Hazard identification methods (e.g. ‘What if?’, ‘How can?’, ‘Hazard and operability study’ (HAZOP)) are required to answer the first question. With relevant frequency data, questions two and three are answered by risk analysis methods which may include quantitative risk assessment (QRA). The final questions involve an iterative procedure until an agreed or minimum risk level for the process is obtained.
A work process that can be executed for the hazard analysis of a CCS system is summarised in Figure 3.2. The risk measures, data sources and analysis techniques indicated are discussed in more detail in the following sections.

RESEARCH REPORT: HAZARD ANALYSIS FOR OFFSHORE CARBON CAPTURE PLATFORMS AND OFFSHORE PIPELINES
47
Figure 3.2 Flow diagram of basic hazard analysis process which is also relevant for a CCS installation
3.7.2 Hazard analysis for offshore CCS
Following the logic described in Figure 3.2, a list of possible events has been drawn up and a coarse assessment made of their frequency and the consequences (low, medium or high: in producing a hazard assessment, statistical data sets, such those described in A.2.3 should be used). These possible events (which are not intended to be exhaustive), are provided in Annex A. From the scenarios listed, those assessed as presenting either a medium or high likelihood or severity were selected as candidates; for example, dispersion modelling, in order to make the models as relevant as possible.
3.7.3 Dispersion modelling
3.7.3.1 Airborne releasesAt the initial point of release in air, CO2 will be released in a high velocity jet. This will be a mixture of gaseous CO2 and some fine particles of solid CO2. The characteristics of the initial jet are known as the source terms. They comprise pressure, density, temperature and velocity, which are then used to calculate the mass flow rate and the initial jet momentum within the ‘development zone’, where the gas expands to atmospheric pressure.
The cloud contains a certain amount of momentum, related to the initial release velocity, which ensures that the cloud starts to move away from the point of release. As it moves, air is entrained into the CO2 cloud, reducing the concentration. Some of the fine solid particles entrained in the cloud of CO2 may rain out onto the ground and form a pile of CO2 snow. Some of the solid could evaporate in the cloud as it takes in heat from the surrounding area. The prevailing wind will also increase the movement of the cloud away from the release point. This may build up when blown towards enclosed and low-lying areas on the platform;

RESEARCH REPORT: HAZARD ANALYSIS FOR OFFSHORE CARBON CAPTURE PLATFORMS AND OFFSHORE PIPELINES
48
it may also spill off the deck of the platform, as a gas, and accumulate in the area below used by ships, and most importantly, the escape pods. As mentioned, fog-like clouds can be formed by the CO2 cooling water from the air, and forming small droplets, which can seriously reduce visibility (this is described more fully in 3.2.4).
As the initial cloud moves away from the release point, further CO2 is released from the pipeline, adding to the cloud. The flow rate from the pipeline decays over time as the inventory is used up. The total inventory released will depend on the pipe from which the release occurs (length, pressure, diameter) and any inventory mitigation in place. During this phase, the cloud is getting larger in overall length and diameter and air entrainment continues around the surface area of the cloud. Rain out of solid CO2 (snow) increases as the release pressure approaches the solid formation pressure, which is approximately 7 barg.
Eventually, the flow rate from the release point decreases and then stops as the total inventory is exhausted. The cloud continues to move downwind, entraining air and eventually dispersing.
A number of different dispersion modelling programmes are available, and guidelines are available to aid the designer to choose one that is suitable52.
When modelling the dispersion of CO2, the models provide different views of the dispersion of the cloud which, when examined together, give a total picture of the cloud. The individual snapshots give the following information:
1. The mass flow rate over time, demonstrating how the rate of flow of CO2 decays.
2. The maximum extent of the cloud, which shows for particular concentrations how far the cloud travels in total before it is finally dispersed. As a maximum extent, it gives no indication of the duration of that concentration.
3. The lethality of the cloud, which combines ‘probit figures’ with the duration of exposure. This gives an indication of the impact on human health of the cloud at various distances from the release.
It is only by understanding the combined information produced by dispersion models and matching it with a probit function that the likely impact of the scenario can be modelled and understood.
3.7.3.2 Subsea releasesIn this situation, at the initial point of release, CO2 will be released into the seawater at depth in a high velocity jet. This will be mostly in the liquid form, but as heat is absorbed from the surrounding water it will form a mixture of gaseous CO2 bubbles and possibly some fine particles of solid CO2.
Dependent on the orientation, the bubbles will have a little horizontal momentum, related to the initial release velocity, but this may be damped rapidly by the presence of the surrounding water. The density of both the liquid droplets and the bubbles is lower than that of seawater and they will start to move upwards from the point of release, and soon become gaseous bubbles. As they move upward, some of the CO2 will dissolve into the seawater (see 2.2.6); the rest will probably emerge at the surface as a relatively cold ‘gas pool’.
This will warm as it takes in heat from the sea beneath and the air in the surrounding area, at which point air flow from wind will also increase the movement of the cloud away from the release point.
52 Guidelines for Use of Vapor Cloud Dispersion Models (2nd edition), S. R. Hanna, P. J. Drivas, and J. J. Chang , AIChE/CCPS, 1996

RESEARCH REPORT: HAZARD ANALYSIS FOR OFFSHORE CARBON CAPTURE PLATFORMS AND OFFSHORE PIPELINES
49
3.7.4 Hazard modelling examples
This section describes the input and results for a small hazard modelling exercise intended to illustrate several techniques used to predict the consequences of dense phase CO2 pipeline rupture. It also provides a basic guide to understanding the output from dispersion models.
3.7.4.1 Scenarios modelledAs previously described in 3.7.2, the scenarios outlined in Annex A.2.3 were used as a basis for examples to demonstrate the modelling of CO2 releases. Five scenarios were modelled, as shown in Table 3.12.
Scenario Pipe diameter (inches)
(mm)
Hole size
inches (mm)
Angle Ambient temp.
Wind speed m/s
1 Platform pipe 12” 300 4” 100 mm Horizontal 0 °C 1,5
2 Platform pipe 12” 300 4” 100 mm Horizontal 0 °C 5
3 Platform pipe 12” 300 Full bore +ESDV Vertical 0 °C 1,5
4 Platform pipe 12” 300 Full bore +ESDV Vertical 0 °C 5
5 Platform pipe 12” 300 Full bore –ESDV Vertical 0 °C 1,5
6 Platform pipe 12” 300 Full bore –ESDV Vertical 0 °C 5
7 Subsea pipe 28” 710 12” 300 mm Vertical 0 °C 1,5
8 Subsea pipe 28” 710 12” 300 mm Vertical 0 °C 5
9 Platform pipe 3/8” 10 Full bore Horizontal 15 ˚C n/a
Table 3.12 Summary of the scenarios modelled
Note 1 ESDV is emergency shutdown valve.Note 2 + with the ESDV shutting and in working order. Note 3 – with the ESDV means that it fails and does not shut as it is supposed to.
3.7.4.2 Scenarios 1 and 2, platform pipe leakFigures 3.3 and 3.4 depict the scenarios.
The assumed conditions are:
− A vertical riser pipe 12” (300 mm) in bore has developed a horizontal leak from a 100 mm (4”) hole, a height of 1 m above the platform deck.
− The pipe is located 20 m from the edge of the platform. − The leak is pointing along the platform deck which measures 80 m x 80 m and is 25
m above sea level. − The pipe contains pure dense phase CO2 at a temperature of 4 ˚C and a pressure
of 150 barg, and has an internal roughness consistent with drawn steel, Ra = 40 microns (Rubert N6).
− Any ongoing flow in the pipeline, prior to rupture, can be ignored as it is negligible compared to the initial flow rates following the rupture.
− The inventory within the riser pipe is sufficient for steady state conditions to be reached.

RESEARCH REPORT: HAZARD ANALYSIS FOR OFFSHORE CARBON CAPTURE PLATFORMS AND OFFSHORE PIPELINES
50
− Ambient air temperature is 0 °C. − Atmospheric stability is Pasquill Class D. − The relative humidity is 70 %. − Two wind speeds, 1,5 m/s and 5 m/s, are modelled, with the wind direction blowing
across the platform deck. − The surface roughness value for the deck was chosen to take account of the level of
floor equipment on a typical production rig installation.
Figure 3.3 Platform pipeline leak scenario, wind speed 1,5 m/s
Figure 3.4 Platform pipeline leak scenario, wind speed 5 m/s
3.7.4.3 Scenarios 3 and 4: sea surface pipeline leak, ESDV operates (limited inventory)Figure 3.5 shows an artist’s impression of the scenarios. The conditions assumed are:
− A vertical riser pipe 12” (300 mm) in bore suffered a guillotine fracture at, or close to, the surface of the water, such that an unimpeded vertical jet is produced.
− The pipe is located 20 m from the edge of the platform. − The subsea pipe contains pure dense phase CO2 at a temperature of 4 ˚C and a
pressure of 150 barg, and has an internal roughness consistent with drawn steel, Ra = 40 microns (Rubert N6).

RESEARCH REPORT: HAZARD ANALYSIS FOR OFFSHORE CARBON CAPTURE PLATFORMS AND OFFSHORE PIPELINES
51
− Any ongoing flow in the pipeline, prior to rupture, can be ignored as it is negligible compared to the initial flow rates following the rupture.
− The inventory within the riser pipe is sufficient for steady state conditions to be reached.
− Ambient air temperature is 0 °C. − Atmospheric stability is Pasquill Class D. − The relative humidity is 70 %. − There is an ESDV, 600 m away from the guillotine fracture, and that this closes two
minutes after the guillotine fracture takes place (in other words, a limited inventory discharge).54
− Dispersion at two wind speeds, 1,5 m/s and 5 m/s, are modelled. − The surface roughness value chosen was that appropriate to the sea at the two wind
conditions.
Figure 3.5 Sea surface pipeline leak scenario: constrained inventory
53 An ESDV on a natural gas pipeline will typically initiate closure following detection of a 10bar pressure differential in the pipe and take about 20 seconds to close fully. More rapid closing increases the risk of damage resulting from fluid hammer effects (see 3.3.9.2). On a CO2 pipeline this initiation may take longer because of the pressure-loss initiated flashing effect within the pipe, which will mean that the pressure front that triggers the ESDV closure may take more time to travel down the pipeline.

RESEARCH REPORT: HAZARD ANALYSIS FOR OFFSHORE CARBON CAPTURE PLATFORMS AND OFFSHORE PIPELINES
52
3.7.4.4 Scenarios 5 and 6: Sea surface pipeline leak, ESDV failure caseThis scenario was the same as for the sea surface pipeline leak, scenarios 3 and 4, except that it considers the situation where the ESDV fails to close and the whole inventory of the CO2 pipeline is available to allow the establishment of steady state conditions. Figure 3.6 depicts this scenario.
Figure 3.6 Sea surface pipeline leak scenario: unconstrained inventory
In addition to the direct hazard to personnel resultant from a pipeline leak close to the platform, there exists the possibility that the cooling effect of the expanding liquid CO2
flashing off to gas and cooling as a result (see JT effect, 2.1.1.2), impacts personnel. The cool gas could potentially impact the legs of the platform or other structural components to the point at which their material properties change (see A.1). This would represent a ‘worst case scenario’, and was not considered further within the modelling exercise, but it is a phenomenon that should be addressed in actual hazard assessments.
3.7.4.5 Scenarios 7 and 8: subsea pipeline leakFigure 3.7 shows the scenario. The conditions assumed are:
− A subsea pipeline with a 28” (711 mm) bore54 55 56, 150 km long, completely level and straight, develops a leak from a 12” (300 mm) hole in the top of the pipe, 2 km from the landfall at a sea depth of 50 m.
− The subsea pipe contains pure dense phase CO2 at a temperature of 4 ˚C and a pressure of 150 barg, and has an internal roughness consistent with drawn steel, Ra = 40 microns (Rubert N6).
− Any ongoing flow in the pipeline, prior to rupture, can be ignored as it is negligible compared to the initial flow rates following the rupture.
− The inventory within the pipe is sufficient for steady state conditions to be reached. − Ambient air temperature is 0 °C. − Atmospheric stability is Pasquill category D.
54 This is an extremely pessimistic scenario as demonstrated by the robustness of the CATS gas pipeline when the anchor from the Young Lady snagged the pipeline 25 June 2007.
55 Full bore ruptures of large diameter pipelines are rare events according to the available failure rate data56 A single pipeline diameter has been chosen because smaller pipelines are unlikely to be used offshore: the 28” size
has been assumed so that it can be compared with work carried out by Mahgerefteh on onshore natural gas and carbon dioxide pipelines (Pressurised CO2 Pipeline Rupture, I.Chem.E Symposium series No. 154, 2008).

RESEARCH REPORT: HAZARD ANALYSIS FOR OFFSHORE CARBON CAPTURE PLATFORMS AND OFFSHORE PIPELINES
53
− The relative humidity is 70 %. − The CO2 pool size at the sea surface can be calculated using Guide to quantitative
risk assessments for offshore installations57.
The liquid CO2 was further assumed to float toward the surface (since its density is less than that of seawater), absorbing heat from the water to form bubbles of gas, as described in 2.3.1. Although some of the CO2 will most probably dissolve in the seawater, some may form solids or hydrates. These effects were ignored, as the objective of the exercise was to demonstrate dispersion modelling, rather than provide an accurate worked example. The existence of the hydrate was also assumed to have no impact on the dispersion of the CO2.
Dispersion at two wind speeds, 1,5 m/s and 5 m/s, were modelled, and the surface roughness value chosen was that appropriate to the sea at the two wind conditions; the wind direction was not relevant, but it was to be clearly shown in the pictorial representations.
Figure 3.7 Subsea pipeline leak scenario
3.7.4.6 Scenario 9: Enclosed space releaseThe following configuration is assumed:
− The enclosed space is a 40’ (12 m) container, with cross-section dimensions 2,4m x 2,4m.
− The leak is a full bore guillotine fracture of a 3/8” (10 mm) instrument line containing pure dense phase CO2 at a temperature of 4 ˚C and a pressure of 150 barg located in the centre of one end of the container.
− The instrument line internal roughness is assumed to be consistent with drawn steel, Ra = 40 microns, Rubert N6.
57 Guide to Quantitative Risk Assessment for Offshore Installations. New ISBN 9781870553360. Old ISBN 1870553365, published 1999

RESEARCH REPORT: HAZARD ANALYSIS FOR OFFSHORE CARBON CAPTURE PLATFORMS AND OFFSHORE PIPELINES
54
− Ambient air temperature taken is 15 °C. − Relative humidity is 70 %. − No isolation of the CO2 takes place so that steady state conditions will be reached.
3.7.5 Dispersion modelling results
The modelling was subcontracted to HSL, who carried it out using PHAST version 6.7. Their report included a commentary on the dispersion of the CO2 releases and of the visibility of the plume and any other aspects considered relevant as a result of the modelling. The commentary also included an assessment of the consequences of acute exposure in terms of impairment and survivability of persons (human vulnerability assessment) exposed to the CO2 with reference to the guidelines given in SPC/Tech/OSD/3058.
The report of the modelling work is included as Annex C; the following sections summarise the conclusions therein.
3.7.5.1 Scenarios 1 and 2, platform pipe leakScenario 1, which could be similar to a hole in a riser pipe, assumes that steady state conditions are reached. The dispersion modelling results show that there is the potential for fatalities on the platform deck, but since the maximum width of the cloud on deck up to 20 m away from the release point is approximately 1,3 m, the areas where fatal concentrations of CO2 are predicted (the area within the red line) are likely to be quite narrow (see Figure 3.8). There are unlikely to be fatalities at sea level. (see Figure 3.9).
Figure 3.8 Lethality plots on the platform deck for Scenario 1
58 SPC/Tech/OSD/30, Indicative human vulnerability to the hazardous agents present offshore for application in risk assessment of major accidents, Health and Safety Executive, Version 3, issued 1 November 2010

RESEARCH REPORT: HAZARD ANALYSIS FOR OFFSHORE CARBON CAPTURE PLATFORMS AND OFFSHORE PIPELINES
55
Figure 3.9 Concentration plots at sea level for scenario 1
In this type of situation, a computational fluid dynamics (CFD) program might be a better method of accurately determining the concentration of the CO2, particularly since these have the ability to model obstructions, such as deck-mounted equipment that would perturb the movement of the cloud away from the release point. However, CFD modelling is slow and complex compared to integrated dispersion programs, and so it may be better to accept the more general predictions of the integrated dispersion program and design around them, rather than to follow the more complex route of a full CFD analysis.
The higher wind speed used in scenario 2, as might be expected, produces a longer, thinner and more elliptical shaped plume than in scenario 1, since low wind speeds tend to produce clouds which spread more laterally. Consequentially, the lethality footprint (indicated by the red line) obtained at deck height is slightly longer but narrower than that in scenario 1, as shown in Figure 3.10.
Figure 3.10 Lethality plots on the platform deck for scenario 2
RESEARCH REPORT: HAZARD ANALYSIS FOR OFFSHORE CARBON CAPTURE PLATFORMS AND OFFSHORE PIPELINES
56
Again, there is the potential for ships to be in the vicinity of the platform, particularly during an evacuation. In this scenario, the area where the concentration of the CO2 is at a toxic lethality level of 1 (indicated by the red line) does not extend to sea level, thus personnel on the ship would be exposed to non-lethal levels of CO2. In the area in which ships (even rescue tenders) would be present, the CO2 concentration would be 3x10⁴ ppm, or 3 %, which is below the SLOT value for exposure of workers (see Table 3.2). At sea level (see Figure 3.11) there is a small area (shown by the green contour line) where the CO2 concentration is 20 000 ppm (2 %) at which level there would be discomfort, but no permanent effects, even following prolonged exposure (see Table 3.1), and there is a larger area (shown by the blue contour), where the CO2 concentration is 5 000 ppm (0,5 %), at which point the physical effects of the CO2 would be barely noticeable. Loss of life at sea level would not be expected, based on these results.
Figure 3.11 Concentration plots at sea level for scenario 2
3.7.5.2 Scenarios 3 and 4: sea surface pipeline leak, ESDV operates (limited inventory)Scenario 3 could represent a vessel colliding with an unprotected riser pipe. Since, at 1,5 m/s, the wind speed is quite low, the plume remains almost exactly vertical before momentum reduces and the plume begins to slump. The most hazardous concentrations are local to the source (see Figure 3.12). On the platform deck above the fracture the potential for serious injury or fatalities does exist, but the plume at this point is quite narrow (3 m to 5 m downwind, 1 m to 4 m upwind), so personnel would need to be in the immediate area to experience the effects (see Figure 3.13). The modelling has assumed there are no obstructions in the path of the plume. Therefore, in practice, the plume may be more diffuse than is suggested.

RESEARCH REPORT: HAZARD ANALYSIS FOR OFFSHORE CARBON CAPTURE PLATFORMS AND OFFSHORE PIPELINES
57
Figure 3.12 CO2 concentration plot (side view) for scenario 3, prior to closure of ESDV
Figure 3.13 Lethality footprint at platform level for scenario 3 at low wind speed
Away from the platform, by the time the CO2 has slumped to sea level, the concentration is such that it would not present a hazard to personnel. Once the release has stopped the concentration of CO2 at platform level quickly decays, and within about two minutes has fallen below the fatal level.
The higher wind speed modelled in scenario 4 produces a bending in the plume of CO2, so that it is angled from the vertical. The higher wind velocity also dilutes the cloud of CO2 before it starts to slump significantly. Again, the most hazardous concentrations are local to the source ,as shown in Figure 3.14 but away from the fracture point. The concentration is such that it would not present a hazard to personnel.

RESEARCH REPORT: HAZARD ANALYSIS FOR OFFSHORE CARBON CAPTURE PLATFORMS AND OFFSHORE PIPELINES
58
Figure 3.14 Lethality footprint for scenario 3 (at platform height) at higher wind speed
3.7.5.3 Scenarios 5 and 6: Sea surface pipeline leak, ESDV failure case (unconstrained inventory)The unconstrained release modelled in scenarios 5 and 6 means that the CO2 inventory from the entire 150 km pipeline is available for dispersion, allowing the plume to reach steady state conditions. For scenario 5, within 3¾ seconds, following the start of the release, the shape of the CO2 cloud is the same as scenario 3 (see 3.7.5.2), because the release conditions are the same; steady state conditions are reached after 3,86 minutes. The lethality footprint at platform level then extends downwind just over 4,4 m and has a maximum width of approximately 3 m with no upwind extent.
Surprisingly, the concentration at sea level for scenario 5 is shown as only slightly larger than the maximum concentration footprint for scenario 3, and the dimensions are shown as slightly smaller than for scenario 3. This seems contradictory because operating the ESDV is supposed to be a form of mitigation. According to the results, the lethality when operating the ESDV is worse than if there were no ESDV. This is due to the fact that short releases are somewhat conservatively modelled as instantaneous clouds, and continuous releases as jets. This is a limitation of most integral models, and not just the program that was used by HSL.
The conclusions for scenario 6 are the same as for scenario 4. This is because both plumes reach steady state conditions before the release stops, or in the case of scenario 4, before the ESDV is assumed to operate.
3.7.5.4 Scenarios 7 and 8: subsea pipeline leakTwo different modelling steps are involved in these scenarios. The first step is to establish a source term, i.e. the manner in which the CO2 reaches the surface of the sea. The second step is to demonstrate how the CO2 subsequently disperses. For example, DNV’s PHAST will only model the latter, therefore the source term was assessed separately59 as a pool 10 m in diameter.
The PHAST modelling of the low wind case (scenario 7) indicates lethality as being over a significant area, up to 4,8 km away downwind from the source of the leak and up to 8,6 km in width (see Figure 3.15). Personnel up to 8 km away may be expected to experience harmful effects.
59 As 20 % of the depth of the release point (50 m), based on work carried out in A guide to quantitative risk assessment for offshore installations, J. Spounge, DNV Technica, Publication 99/100a, Centre for Marine and Petroleum Technology, 1999.

RESEARCH REPORT: HAZARD ANALYSIS FOR OFFSHORE CARBON CAPTURE PLATFORMS AND OFFSHORE PIPELINES
59
Figure 3.15 Lethality footprint for scenario 7 at low wind speed
For the higher wind scenario (8) the lethality area is still large, as shown in Figure 3.15 (1,8 km downwind and 1,4 km wide), and the area over which harmful effects might be expected is up to 2,7 km downwind and 2,1 km wide.
Figure 3.16 Lethality footprint for scenario 8 at higher wind speed
The lethality footprints shown in Figures 3.14 and 3.15 are at 0 m (sea level). Whilst there are local ‘high spots’, for instance immediately above the source of the leak, the majority of the lethal concentration is at a height of below 2 m. In reality, the larger ships which are likely to be in the deeper sea areas where CO2 pipelines are laid will have decks higher than 5 m, so the degree of hazard is probably less than what might appear to be the case.
In practice the areas over which the modelling indicates that lethal levels of CO2
might be reached may not be realised, because the factors that were ignored for simplicity (see 3.7.4.5) will have a significant impact in reducing the inventory of the CO2 reaching the surface:
− CO2 will dissolve in the seawater to form carbonic acid (see 2.2.1). This will not desorb to gaseous CO2, but increase the local seawater acidity

RESEARCH REPORT: HAZARD ANALYSIS FOR OFFSHORE CARBON CAPTURE PLATFORMS AND OFFSHORE PIPELINES
60
− As the pressure of the liquid CO2 drops at the leak point, it will flash off and its temperature will drop as a result of the JT effect (see 2.1.1.2). Some of the CO2
will absorb heat from the surrounding water, but some will form solids, which will float to the surface of the sea (because the density of solid CO2 is less than that of water, see 2.3.1). As solid, it will contain a volume equivalent of over 500 times (see 2.1.1.4), which would be released over a longer period of time as it absorbed heat from the surrounding seawater.
− CO2 hydrates will be formed, which will capture CO2. This CO2 will be released over a longer period of time as the hydrates absorb heat from the surrounding seawater.
The phenomena described are not well-understood, nor have they been quantified, and their impact in reducing the hazard associated with subsea leaks should be investigated more carefully. Whilst this is clearly a high consequence event, it should also be appreciated that this is expected to be a low frequency event, since subsea pipeline penetration events are statistically very unlikely, due to the preventative measures applied during the design (see 4.2.4), and by close inspection of incident data from North Sea operations over more than 3 decades.
3.7.5.5 Scenario 9: Enclosed space releaseHere, 12 air changes per hour were assumed. Steady state conditions are reached when the concentration reaches about 13,3 % (see Figure 3.17), at which point personnel within the containment would probably be severely affected. The potential impact of the postulated leak may be related to the exposure reactions to pure CO2 that are given in Table 3.1, and reiterated in Table 3.13.
Figure 3.17 CO2 concentration vs. time graph for scenario 9

RESEARCH REPORT: HAZARD ANALYSIS FOR OFFSHORE CARBON CAPTURE PLATFORMS AND OFFSHORE PIPELINES
61
Approximate time after leak commences
Symptoms
25 seconds Slight increase in breathing rate.
55 seconds Breathing rate increases to 50 % above normal level. Prolonged exposure can cause headache, tiredness.
85 seconds Breathing increases to twice normal rate and becomes laboured. Weak narcotic effect. Impaired hearing, headache, increase in blood pressure and pulse rate.
2 - 2½ minutes Breathing increases to approximately four times normal rate; symptoms of intoxication become evident and slight choking may be felt.
2½ - 7 minutes Characteristic sharp odour noticeable. Very laboured breathing, headache, visual impairment, and ringing in the ears. Judgment may be impaired, followed within minutes by loss of consciousness.
7 minutes onwards Within a few minutes’ exposure, dizziness, drowsiness, severe muscle twitching, unconsciousness.
Table 3.13 Exposure reactions to scenario 9
The modelling predicts CO2 concentrations of 2 million ppmv, which is an apparent contradiction in arithmetic, but indicates a pressure build-up within the containment, should there not be any means of pressure relief.
There is guidance; for example, EIGA Safety Info 24/11/E60 provides guidance on the design of enclosed spaces where CO2 will be present. Good ventilation should be provided, and, when that is not enough, well specified and maintained gas detection. There should also be employee training on the hazards of CO2.
3.7.5.6 General observations on the use of Integral dispersion models The intention of the modelling exercise was to demonstrate what was possible. The results from the scenarios considered have been used to provide guidance on which the hazards described in this publication have been based.
The modelling exercise in this document demonstrates the limitations of integral models; this information can be used in the development of future versions of PHAST and similar commercial integral models. The modelling exercise also demonstrates that integral models should be used together with other models, such as CFD-based models, in order to obtain a more accurate picture of potential hazards. Annex C further expands on these observations.
60 Carbon Dioxide Physiological Hazards not just an asphyxiant! EIGA Safety Info 24/11/E, prepared by the Safety Advisory Council, 2011

RESEARCH REPORT: HAZARD ANALYSIS FOR OFFSHORE CARBON CAPTURE PLATFORMS AND OFFSHORE PIPELINES
62
4 OFFSHORE CO2 TRANSPORT AND STORAGE SYSTEM COMPONENTS
This section sets out: − The main system components associated with CO2 transport, injection, offshore EOR
processing of CO2, and re-injection. − The risk potential with respect to failure modes. − Some typical mitigation techniques available in the offshore environment to minimise
the potential for failure. − Typical design considerations for ensuring safe offshore CO2systems.
4.1 INTRODUCTION
Much of the last 50 years of global offshore oil and gas experience can be applied to an offshore CCS project. However, it is as important to understand what cannot be transferred, as it is to understand what can.
Oil and gas operations involve producing, processing, and exporting fluids which are essentially hydrocarbon mixtures together with a saline water phase. CCS involves handling a relatively pure component having distinctly differing phase behaviour characteristics and injecting it into a reservoir formation.
Section 2 explains some of the peculiarities of CO2 from a CCS perspective, and the reasons for the importance of the differences between this and natural gas, especially with regard to safety. Section 4 addresses this point and highlights some of the existing deep sea features that can be applied directly to offshore CCS pipelines and facilities.
Helpfully, many of the existing guidance documents, manuals and regulations originally produced for the offshore oil and gas industries have direct relevance to CCS applications. These include:
− Status of technical guidance and information on design, construction and operation of offshore installations61
− Prevention of Fire and Explosion and Emergency Response (PFEER) on offshore installations62
− Safety Case Regulations63
− Guidance note 2/200664
− Guidance note 3/200665
− Assessment Principles for Offshore Safety Cases (APSOC)66
− Guidance for the Topic Assessment of the Major Accident Hazard Aspects of Safety Cases (GASCET)67
61 Status of technical guidance and information on design, construction and operation of offshore installations HSE Operations Notice 27, issued September 2003, revised October 2010
62 Prevention of Fire and Explosion and Emergency Response (PFEER) on offshore installations (1995) SPC/Enforcement/155
63 The Offshore Installations (Safety Case) Regulations 2005, 2005 No. 311764 Guidance note 2/2006 (Offshore Installations (Safety Case) Regulations 2005, Regulation 12 Demonstrating
compliance with the relevant statutory provisions), Health and Safety Executive 2006.65 Guidance note 3/2006 (Offshore Installations (Safety Case) Regulations 2005, Guidance on Risk Assessment for
Offshore Installations’), Health and Safety Executive 2006.66 Assessment Principles for Offshore Safety Cases (APSOC), Health and Safety Executive, March 200667 Guidance for the topic assessment of the major accident hazard aspects of safety cases, Health and Safety Executive,
April 2006.

RESEARCH REPORT: HAZARD ANALYSIS FOR OFFSHORE CARBON CAPTURE PLATFORMS AND OFFSHORE PIPELINES
63
− Safety Case Assessment Manual (SCAM)68
− HID/OSD/Tech/SPC3069
− HVAC guidelines70
− ISSO Standard 31000: Risk Management – Principles and Guidelines71
− Design and Construction Regulations (DCR)72
− Pipeline Safety Regulations (PSR)73
− Provision and Use of Work Equipment Regulations (PUWER)74
Caution needs to be applied when using these guidance documents, manuals and regulations, because unless their use is coupled with an understanding of the differences between CO2
and the fluids associated with offshore production, designers can end up applying these codes out of context. This can lead to unnecessary expenditure, over-restrictive operating practices or inappropriate design margins.
4.2 OFFSHORE CO2 TRANSPORT AND STORAGE SYSTEM COMPONENTS
Offshore installations adapted or newly built for CCS purposes will have many important components. Those deemed of significant interest to a CCS project in particular include:
− Pig launchers and pig receivers; − Carbon steel pipe – high pressure liquid pipe; − Pressure boosting pumps; − Pre-installed pipeline tees and connection manifolds; − Risers; − Emergency shutdown valves; − Seals; − Isolation valves; − Compressors and pumps, and − Venting systems
4.2.1 Transporting CO2
4.2.1.1 Pig launcher at shore point and in relation to platform receiverThe design of the pig launcher vessel and receiver forming part of the CO2 transmission system should be to the appropriate standards (e.g. DNV OSF-101)75 taking into consideration the CO2 stream composition, pressure and temperature.
68 Safety Case Assessment Manual, Gas Safety Management Regulations 1996, HSE Hazardous Installations Directorate Gas & Pipelines Unit, Version 6, 03 June 2011.
69 HID/OSD/Tech/SPC30, Indicative human vulnerability to the hazardous agents present offshore for application in risk assessment of major accidents, Health and Safety Executive, Version 3, issued 1 November 2010.
70 ISO 16813:2006 Building environment design, Indoor environment, General principles71 ISO 31000:2009: Risk Management – Principles and Guidelines72 Offshore Installations and Wells (Design and Construction, etc) Regulations 1996 SI 1996/913 HMSO 1996 ISBN
0 11 054451 X.73 A guide to the Pipelines Safety Regulations 1996, L82, ISBN 0-7176-1182-5.74 Provision and Use of Work Equipment Regulations 1998. Approved Code of Practice and guidance L22 (Third
edition) HSE Books 2008 ISBN 978 0 7176 6295 1.75 Offshore Standard Det Norske Veritas DNV-OS-F101,Submarine Pipeline Systems October 2010

RESEARCH REPORT: HAZARD ANALYSIS FOR OFFSHORE CARBON CAPTURE PLATFORMS AND OFFSHORE PIPELINES
64
Pigging should mainly be for commissioning new or re-commissioning existing pipelines. Following installation or conversion of an existing pipeline to CO2 service, however, integrity of the pipelines should need to be demonstrated from time to time through the use of pipeline pigging. A new or reconditioned pipeline should need to be hydrotested to assure pressure integrity. This should be followed by a series of pigging runs needed to displace the bulk of the water. Further drying can be accomplished by using slugs of methanol between two pigs to absorb any remaining water before vacuum-drying the line and filling with dry nitrogen.
As for the reuse of an existing gas or oil pipeline, it is likely that pigging operations will be used initially to establish the baseline conditions for the pipeline. Subsequent checks for any degradation, and proof of the low impact of dry CO2 stream on the pipeline should be carried out. However, since the CO2 will be very dry, it is likely future pigging operations will be less frequent as subsea experience is obtained. Therefore, if the pig traps are not already fitted, as an option, arrangements for attaching portable pig traps can be made in the design.
Related hazards: − Leaks − Explosive decompression (see 4.3.3.2)
Hazard mitigation: − Careful component design with CO2 specifically in mind, especially with respect to
elastomeric material in contact with CO2, coupled with component testing at full scale and pressure. Operator training should ensure that pigging operations are possible without consequences.
4.2.1.2 Steel pipeline – high pressure liquid pipe Projects are likely to use standard piping diameters and thicknesses, examples of which can be found in the modelling scenario given in section 3. For the purposes of CCS, the pipeline could have two different design requirements. If the intended storage complex is already pressurised above the level required to maintain CO2 as a liquid in the injection wells, then the project might opt to use high pressure liquid pipe. However, in some cases, for instance, the E.ON Hewitt Field model76, the pressure within the field would gradually be increased using gaseous CO2 in the transport system until the field pressure could support a liquid column of CO2 in the injection wells. At that time, the transport system would be converted to a higher pressure liquid pipeline. This would necessitate a pipeline designed for both operating conditions.
It is possible that the pressures in the offshore CO2 pipeline systems could be much higher than the comparable liquid onshore systems (typically <120 bar). In offshore systems, the CO2 is being pumped long distances without any easy opportunities to boost a decaying pressure along the length of the pipeline until a distribution line reaches a platform. With trunkline pressures more likely to be 150 to 250 bar, it may also be possible to inject directly into a geological formation offshore without further boosting the pressure of the CO2. Offshore boosting of CO2 pressure should be avoided if possible, as this can add considerable complexity and cost to the operation.
A number of key factors influence the safe design of offshore pipeline systems. The distance from onshore facilities to offshore storage complexes can impact the pressure and capacity which may, in turn, influence the wall thicknesses and pipeline diameters.
76 Kingsnorth CCS Demonstration Project - Key Knowledge Reference Book, Feb 2011, E.ON UK, Section 7.15 Technical Design – Wells and Storage; Injectivity – Refine Well Development Plan

RESEARCH REPORT: HAZARD ANALYSIS FOR OFFSHORE CARBON CAPTURE PLATFORMS AND OFFSHORE PIPELINES
65
Where existing pipelines are being converted there are other considerations. Those pipelines that have been deployed for gas transportation are likely to be damaged the least, whereas those used for oil are likely to have incurred losses in wall thickness as a result of localised corrosion especially at the ‘6 o’clock’ position. The condition of an export oil pipeline may vary in accordance with operational history; the concern being the extent of actual water in the stream, the period of time it has been there, and the corrosion management regime (i.e. use of chemical corrosion inhibition) put in place over the lifetime of the pipeline. Finally, many oil pipelines are not designed for the pressures needed to maintain CO2 in the liquid phase over the length of the pipeline and therefore, would be less appropriate for conversion to CO2 transport.
Hazards to offshore pipelines: − Ships could damage pipelines by either dropping or dragging their anchors. − Pipeline pressures offshore should begin typically higher than in onshore systems in
order to avoid boosting pipeline pressure offshore. The pressure should be maintained well above the bubble point for the CO2 mixture along the entire pipeline to its furthest delivery point to avoid two-phase flow and potential hydrate formation (see 2.3.2).
Hazard mitigation: − Burying pipelines within designated anchorages. − Understanding where pipelines are shown on marine charts. − Designing the pipeline system to maintain the CO2 mixture pressure well above the
bubble point by using onshore booster pumps. − Establishing protocols to restrict off-take flows whenever pressure is close to the
bubble point (minimum operating pressure) at the end of each branch pipeline.
4.2.1.3 Onshore pressure booster The transport of any high pressure fluid, including CO2 is hazardous. The degree of the hazard is, in part, related to the pressure of the fluid being transported. In the case of CO2 for CCS applications, as has already been stated, this will usually be in dense phase (i.e. liquid) and, given the temperatures involved, usually sub-supercritical. In order to reduce the risks associated with onshore pipelines, it is likely that these will be at a pressure lower than that needed for offshore transport, as described in 4.2.1.2. Onshore pressures should be above the bubble point by a margin, but this pressure should be increased at a coastal booster station before the CO2 goes offshore.
Offshore pressure boosting may also be required if there is too great a drop in pressure between an onshore booster station and the offshore storage sites, or if the delivery pressure is insufficient to inject directly into the geological structures. It will be critical to maintain the pressure downstream of an offshore booster pump significantly above the bubble point. This should avoid two-phase flow within the pump, which would cause cavitation and significant damage.
CO2 booster pumps have been specifically designed with special mechanical seals that are flooded with high pressure nitrogen. A very small portion of nitrogen leaks into the CO2 at all times keeping CO2 away from the elastomeric external seal that retains the nitrogen. This eliminates the risk of explosive decompression of the elastomeric seal when the unit is shut off and the pump pressure is allowed to decline.
Hazards: − Pump failure from cavitation leading to a breach of the pressure containment, and
an uncontrolled escape of CO2. − Pump seal leaks due to explosive decompression.

RESEARCH REPORT: HAZARD ANALYSIS FOR OFFSHORE CARBON CAPTURE PLATFORMS AND OFFSHORE PIPELINES
66
− Inappropriate CO2 venting arrangements.
Hazard mitigation: − Careful design with CO2 specifically in mind, coupled with component testing at full
scale and pressure along with operator training should ensure that booster stations could be operated and maintained without consequences.
− Locating the booster station away from normally occupied buildings or in a well-ventilated space on an offshore platform.
4.2.1.4 Pre-installed pipeline tees and connection manifoldsIncreased use of these components should give the project greater development potential; however, depending on the type of project under consideration these may or may not be included in the design. Some pipeline systems should have been pre-designed to enable connection to other oil and gas projects, and it is quite likely that future CCS operations both on- and offshore will seek to link up. Pre-installed pipeline tees and connection manifolds therefore need to be considered to facilitate these connections.
A pre-installed tee is a stub on the outside of a pipeline which is fully exposed internally to the fluid in the pipeline. The stub is followed by two installed closed ball valves in a double block and bleed configuration. The outside valve is flanged closed to protect it from the elements. The spool piece between the valves should be filled through the bleed line with methanol until such time as a future connection is made to the outside valve. The connection to a new line should be made between the pipeline tee and a connection manifold at the beginning of the new line using a ‘jumper’ pipeline segment. The connection manifold should be another double block and bleed valve arrangement, with a pig launcher connection included. Using this design, the two double block and bleed valves can be used to fill the ‘jumper’ line with methanol removing all water. The new line can then be pigged and dried as normal. Finally, the ball valves can be opened allowing dry CO2 into a new dried connecting pipeline. This is achieved without allowing water into the fluid in the main pipeline, or release of the CO2 into the seawater.
Hazards: − Introduction of moisture: the prime concern is to be able to make these future
connections without the risk of introducing any moisture, particularly seawater, into the operating pipeline system.
− Third party damage: any subsea components attached to the trunkline or installed subsea over a storage complex should be protected from fishing operations. Other potential modes of failure include items being dropped from vessels or platforms onto offshore system components, and the support structures should be designed to protect against this possibility of damage leading to possible fracture should this occur (see also, 4.4.2).
Hazard mitigation: − Tees and connection manifolds most likely to require a ‘double block and bleed’
valve arrangement with a minimum of a 2” ‘hot stab’ so that the dead leg pipe work can be injected with methanol/glycol, and so that future connections can be made without the risk of in-leakage of any water or escape of CO2.
− Seabed components are normally surrounded by a structure and then buried in a gravel dump, profiled to permit trawl boards to slide over the top. Typical connections and offshore facilities, protection structures and components are further described in Annex D.

RESEARCH REPORT: HAZARD ANALYSIS FOR OFFSHORE CARBON CAPTURE PLATFORMS AND OFFSHORE PIPELINES
67
4.2.1.5 Offshore pipeline design expansion ‘hubs and clusters’While initial pipeline systems may be developed on a point-to-point basis for demonstration purposes, if CCS is to be a key solution for the decarbonisation of power plants and industrial facilities, newly built networks of pipelines each capable of transporting tens of millions of tonnes of CO2 per year will be required. Clusters of onshore gathering systems may be developed to bring CO2 to coastal hubs where the pressure can be boosted before pumping the liquid CO2 down a trunk line into a region of offshore depleted oil and gas fields or saline formations.
4.2.1.6 Safe design Trunk lines of CO2 could be connected to form greater networks of CO2 that may cross national boundaries, opening up storage capacities to regions that do not have favourable geological formations for the storage of CO2. Expansion of these networks may enable the formation of loops or ring mains like those seen for the onshore gas networks that may facilitate future expansion and maintenance of the network. In developing the initial CO2
trunk lines, the means for future connectivity for both additional pipe and additional spur lines to distribute CO2 to future storage complexes should be taken into account. It also indicates the need to establish a common standard for the impurities within the CO2 stream and to design cost effectively a pipeline system capable of handling as wide a range of impurities as possible without compromising the integrity of the system. Failure to anticipate this at the design stage would inhibit the potential for such expansion without increasing the risks of moisture ingress or escape of CO2 gas.
Typical connections and offshore facilities, protection structures and components are further described in Annex D.
4.2.1.7 Protection from third party damageConnections in the form of pipeline tees and manifolds as well as subsea injection facilities are all potential points of failure with respect to CO2 leakage. All tees, manifolds and injection facilities should be protected against third party damage.
4.2.2 Injection of CO2
CO2 may be injected into a geological formation provided the CO2 transport pipeline pressure is sufficient. In addition, it may be desirable to bring CO2 onto a platform for control purposes or to boost its pressure before injection. However, certain design considerations should be taken into account when CO2 is brought onto a platform.
4.2.2.1 Risers ‘Risers’ are any piping responsible for transporting the fluid between the offshore platform and the seabed.
Many oil and gas developments use flexible hoses to achieve either part or the whole of the satellite well or tie-in and often, flexible risers are deployed especially on floating production installations. It is likely that the materials used for existing systems will not be suitable for CO2 service and will need to be replaced. Flexible systems may not be suitable at all for handling CO2 at high pressure and/or remain serviceable at very low operating temperatures. Suppliers of flexible systems are currently addressing these concerns to establish what may work.
Hazards: − Rupture: A significant area for concern is a rupture in the riser above the water line or
between the low and high tide mark. Such a release may result in high concentrations of CO2 in the platform area above the break. If the contents of the riser pipe are in
RESEARCH REPORT: HAZARD ANALYSIS FOR OFFSHORE CARBON CAPTURE PLATFORMS AND OFFSHORE PIPELINES
68
liquid form, the resulting pressure difference may cause an extreme temperature change which could cause embrittlement to the surrounding steel structure (see 3.3.8.4).
Hazard mitigation: − Risers designed specifically for CO2 service. − Protective structures around risers. − Effective checks of structure in line with ‘inspecting structure for ongoing integrity’.
4.2.2.2 Emergency shut down valve (ESDV) The ESDV sits between the transporting pipe infrastructure and the riser to the platform. This isolation valve is a fail-safe device to ensure that a failure on a platform does not lead to the evacuation of the CO2 from the whole pipeline network. These are normally found on the seabed, just inside the defined safety zone of the platform so that they avoid zones in which ships operate lifting operations where the possibility exists for heavy items to be dropped on to pipelines beneath. This also mitigates against any structural failure of the platform (platform collapse on top of the pipeline). The ESDV is designed such that upstream failure causes the valve to close.
Hazards: − ESDV fails to close when required to do so by loss of upstream pressure.
Hazard mitigation: − Using ESDV designed specifically for CO2 service. − Type testing at normal and fault conditions.
4.2.2.3 SealsAlthough contained within many of the components already mentioned, special consideration should be given to seals deployed on any piece of equipment which could come into contact with liquid CO2, both onshore and offshore. Changes to the state of the CO2 as a result of a rapid pressure change, can cause the seals to burst or crack. This is called ‘explosive decompression’, which is discussed in more detail in 4.3.3.2.
Hazards: − Loss of pressure or an emergency blowdown may lead to damaged components,
which may fail if they are not designed for appropriate CO2 service. − Explosive decompression can present a hazard to personnel carrying out routine
maintenance or operational activities.
Hazard mitigation: − Where an escape of CO2 cannot be tolerated, nitrogen-flooded mechanical seals
have been developed to prevent seepage from taking place. These are typically applied to high pressure CO2 pumps.
− Careful design of seals and gaskets with CO2 specifically in mind, coupled with component testing at full scale and pressure, alongside operator training should ensure that equipment containing seals can be operated and maintained without the hazards associated with explosive decompression.

RESEARCH REPORT: HAZARD ANALYSIS FOR OFFSHORE CARBON CAPTURE PLATFORMS AND OFFSHORE PIPELINES
69
4.2.2.4 Compressors and pumpsDifferent compressors and pumps may be found on a platform or even the seabed, depending on the nature of the installation. As has been mentioned, compression issues relating to CCS projects may require additional pumping units to maintain the higher pressures required over long distances. As established in an earlier EI publication77, transporting the gas in a liquid form is most likely to be at high pressures (>100 bar) and low temperature (<31 ̊ C). However, once the pressure has been boosted to form a liquid, only a small amount of supplementary pressure should be required to maintain the product in liquid phase.
If the pressure drop along an offshore pipeline is such that boosting becomes necessary, it is likely that the pumps would be located on an offshore platform. The primary reason is that the power units to supply the pumps or compressors would need to be housed above water.
Recently, new seabed compressors have been developed to work with wet acid gas applications.
Hazards: − Blowdowns: as mentioned in 4.2.2.3, compressors may contain seals that can
degrade or shatter when exposed to rapid loss of pressure. − Pump failure leading to a breach of a pressure containment vessel, and an uncontrolled
escape of CO2. − Cavitation within a pump could destroy the internal components and lead to
excessive vibration which could damage the bearings, wearing rings and seals, possibly resulting in a CO2 escape.
− Inappropriate CO2 venting arrangements.
Hazard mitigation: − Pumps and compressors can be fitted with nitrogen-filled mechanical seals to prevent
the CO2 from seeping into the elastomeric seal. The seal leaks a little higher pressure nitrogen through the mechanical seal into the CO2 stream while blanketing the external elastomeric seal, isolating it from the CO2 stream.
− Cavitation can be avoided by maintaining the inlet pressure to pump significantly above the bubble point of the CO2 mixture.
4.2.2.5 Platform isolating valves Due to the large liquid-to-gas expansion factor of CO2, care should be taken in the design of any platform isolating valve. Engineers should be mindful of this when considering the management of pressure and expansion in CO2 systems. Figure 4.1 shows the modification required to a standard ball valve which is in CO2 service, being used to isolate a pipeline. Upon closing, the ball valve will trap a small amount of liquid CO2 within its housing. If heated, the CO2 will expand and the resulting pressure will exert a force so great that the ball valve may fail catastrophically. Cryogenic valves are designed with ‘cavity pressure relief holes’ so that the liquid is not trapped but can either expand back upstream into the pipeline from which it came or discharge to a safe location.
Particular care should be taken when blowing down an installation which contains CO2, because it is important that rapid depressurisation to the triple point is avoided, such that the CO2 forms a solid. Appropriate procedures, that include monitoring of the pressure during blowdown, should be established.
77 Good plant design and operation for onshore carbon capture installations and onshore pipelines, Energy Institute September 2010

RESEARCH REPORT: HAZARD ANALYSIS FOR OFFSHORE CARBON CAPTURE PLATFORMS AND OFFSHORE PIPELINES
70
Figure 4.1 Design of ball valve for CO2 service
4.2.2.6 Venting If liquid CO2 is held within a static vessel it will tend to reach an equilibrium where the vapour phase at the top of the tank is just above boiling point and the liquid phase just below; in effect, the liquid in the tank reaches its saturation point. If the pressure or temperature in the vessel is altered this equilibrium will reset. Industry tends to maintain the pressure of the vessel by drawing liquid from the bottom of the tank, thereby maintaining the vessel pressure and hence the condition of the CO2 within.
For example, it can be seen that if the pressure is rapidly reduced below 7 barg the CO2 within the tank will become solid. Blowdown should be from the liquid side of the tank (and an uninsulated length of pipe is normally provided so that heat can be absorbed from the atmosphere to boil off the CO2 to gas prior to atmospheric venting). If it is necessary to blow down the vessel to atmospheric pressure, then this should take place very slowly, so that rapid depressurisation of the gas in the vessel is prevented, and solid formation is also avoided. There is a danger that the blowdown pipe itself can become plugged with solid, and the operator, observing that no further CO2 is exiting from the pipe, could believe that the vessel is drained. As the plug warms and subsequently melts, some or all of the remnant CO2 could escape and either asphyxiate or harm personnel in the vicinity.
Venting components will be found on both the onshore and offshore sections of the product delivery system. Venting small quantities of CO2 can be carried out relatively safely, particularly in an environment where high wind speeds aid its rapid dispersion. Venting larger quantities of CO2 has the potential to lead to higher concentrations, which may appear beneath the platforms or even downwind of the deck area at sea level (for example, see 3.7.4.2).
A detailed discussion of the issues surrounding venting CO2 both onshore and offshore can be found in the document produced by E.ON as part of their FEED Study for the now abandoned Kingsnorth CCS Demonstration Project78.
Hazards associated: − Valves not designed for liquid CO2 service can explode when trapped CO2 warms
and vaporises. − Improperly controlled blowdowns can cause solids to form and create blockages
around valves and vents. − The CO2 gas arising from a blowdown can produce high atmospheric concentrations
which can be a hazard to personnel.
78 http://www.decc.gov.uk/assets/decc/11/ccs/chapter4/4.44-full-system-carbon-dioxide-relief-vent-and-blowdown-system-design-philosophy.pdf

RESEARCH REPORT: HAZARD ANALYSIS FOR OFFSHORE CARBON CAPTURE PLATFORMS AND OFFSHORE PIPELINES
71
Hazard mitigation: − Specify valves with vented interspaces for CO2 service at the design stage. − Considering, in operational procedures, blowing down a vessel containing CO2 such
that it is kept away from the triple point, and avoiding freezing. − Leaving unlagged a portion of the pipework of a vent so that it can absorb heat from
the atmosphere (or trace heaters can be used) on the platform where vents or release valves are present to prevent temperature falling and ‘snow’ forming.
− Locating vents where dispersion is likely to be at a maximum, and controlling discharge rates to avoid atmospheric concentrations that present a hazard to personnel.
4.3 OFFSHORE FACILITIES FOR THE USE OF CO2 FOR ENHANCED OIL RECOVERY (EOR)
4.3.1 Introduction
To date, no offshore facilities have incorporated CO2 into an EOR programme; however, some offshore oil regions like the North Sea actually may have more potential in the use of CO2 for EOR than they have left in the form of primary and secondary production combined.
To implement CO2 for EOR offshore, it is necessary to make major modifications to the means of processing the produced fluids. Not only is it necessary to separate out oil from water and produced gas, but also to decide whether it is economic to separate the produced gas into CO2 for re-injection and hydrocarbon gas for export or to simply re-inject all produced gases. While each project will require its own evaluation, Figure 4.2 provides a schematic of the components for two potential options for the process systems for produced EOR fluids.
The process schematic illustrates two options: − Option 1: oil and natural gas recovery, indicated by the blue dashed polygon
(which excludes component 11 and flow B) and includes the additional mol sieve dehydration, CO2/natural gas membrane separator, export of natural gas, and a higher compression ratio high pressure compressor for re-injection of produced CO2 into reservoir. Alternatively, the membrane separator could be replaced with an amine separation system to remove CO2 from the natural gas.
− Option 2: oil with no natural gas recovery, indicated by the green dashed box (which includes flow B and a lower compression ratio HP compressor (11)) and re-injects all produced gases.

RESEARCH REPORT: HAZARD ANALYSIS FOR OFFSHORE CARBON CAPTURE PLATFORMS AND OFFSHORE PIPELINES
72
Components for Option 1
Components for Option 2
Key: A Produced fluids 5 Glycol drying unit B Combined re-injection 6 H2S scavenger C Export natural gas 7 Mol sieve drying unit D CO2 for re-injection 8 Membrane separator 0 HP separator (vertical) 9 LP compressor 1 HP separator (horizontal) 10 MP compressor 2 MP separator (horizontal) 11 HP compressor 3 LP separator (horizontal) 12 HP compressor 4 CO2/water separator (vertical) 13 Gas cooler
Figure 4.2 Process schematic for two options
In the event of there being little to no economically recoverable associated gas for either the platform or for sale-to-market, option 2 is the simpler and less costly option. However, if there is sufficient recoverable gas to supply the platform with fuel gas and potentially have some left for market, then option 1 is preferred. Additionally, option 1 should not require a constant supply of diesel oil for power generation but will require more compression power for the lower pressure CO2 out of the membrane separator.
4.3.2 Hazards associated with EOR operation
If an EOR operation is proposed, the designer should be aware that the associated hazards increase compared to those associated purely with storage of the CO2. The main factors in this are:
− Bringing the CO2 to the surface and processing it (in conjunction with other fluids) on the platform.
− The presence of other chemicals (amines and glycol drying agents are mentioned). − Coincident mixtures of oil and/or natural gas. − The normal offshore hazards associated with converting the platform from one mode
of operation to another.

RESEARCH REPORT: HAZARD ANALYSIS FOR OFFSHORE CARBON CAPTURE PLATFORMS AND OFFSHORE PIPELINES
73
It is worth noting that the level of equipment required for EOR operations and its additional weight may preclude such a process being installed on an existing platform. It may be more practical to have a new process platform fabricated on shore and brought to site for connection up to the existing platform. The existing platform could be reused for power generation, accommodation, process control and export of produced oil and gas through existing methods. However, it will be necessary to re-route all produced fluids to the initial separation vessel, either by a single pipeline from existing dry trees or by having the wells reconnected to dry trees on the new platform. Redundant process equipment on the platform could be removed, thereby reducing the weight loading and assisting in the overall life extension of the existing platform. Again, conversions of this nature are not unfamiliar to the offshore industry.
4.3.3 CO2 release sources and monitoring in EOR applications
A licensed CO2 storage complex must monitor all emissions of CO2. In an EOR application, this will include not only the emissions from any associated power generation on the platform(s), but also any emissions of CO2 derived from the produced EOR fluids. This is why the Figure 4.2 process schematic concentrates on CO2 separation from the oil and water, before the system dries the CO2, recompresses it, then re-injects it back into the field. While this may appear complicated compared to a number of the amine systems offshore and onshore that vent the captured CO2 to atmosphere, the recycled CO2 is the cheapest CO2 available to a CO2 EOR operator. This is especially true if the operator is penalised for every tonne of CO2
emitted under a trading scheme as part of the CO2 storage operating licence. Additionally, the quantity re-circulated through the field is considerably larger than that removed from gas streams currently on offshore platforms.
In addition to monitoring the escape of CO2 for commercial reasons both fixed and personal monitoring equipment should be provided on platforms where EOR operations are taking place.
4.3.3.1 CO2 release sources from EOR operationsBringing the CO2 to the surface and subjecting it to a number of processing operations provides the potential for CO2 releases, since the facilities for offshore EOR and reprocessing of the CO2 for reinjection into the oil field are quite extensive and subject to a number of failure modes described in section 3. The additional concerns with respect to releases include:
1. Small process releases.2. Process emissions following the emergency decompression of facilities on the
platform.3. Accidental releases.4. Well leaks (operating and decommissioned).5. Releases from the geological formation.
Small process releases can be typified by Figure 4.3. When high pressure CO2 escapes in small quantities, it is quite visible, as it forms an ice ball of CO2 and moisture around the leak and becomes self-sealing. Corrosion as a potential cause for creating leakage pathways is always a concern within the process upstream of the dehydration unit and for this reason stainless steel is normally used in areas where moisture is still present. To mitigate this hazard, wells, production pipelines and risers may be protected using stainless steel liners and corrosion inhibiters.

RESEARCH REPORT: HAZARD ANALYSIS FOR OFFSHORE CARBON CAPTURE PLATFORMS AND OFFSHORE PIPELINES
74
Figure 4.3 Solid CO2/Ice formation around a pressure gauge with CO2 following release
4.3.3.2 Platform decompression and elastomer choiceIn the case of an emergency offshore, it may become necessary to rapidly reduce the pressure of all fluids on the platform. However, one of the concerns with CO2 is that there are certain seals that are used that, while made out of specific elastomeric materials suitable for CO2 under normal operational conditions, may behave differently if subjected to rapid decompression. Liquid CO2 will permeate any seal to some extent, and if it is subject to rapid decompression, the liquid CO2 within the seal material may expand rapidly and result in an explosive decompression within the seal. Figure 4.4 is a picture of such a seal that has undergone explosive decompression, and it is clear that this seal will not function properly over time. In order to manage the hazards associated with this phenomenon, the special nitrogen-flooded mechanical seal was developed for the high pressure CO2 pumps as they could not risk such a result each time the pump was turned off79. However, there are some services where an elastomeric seal is required and this may be subject to future leaks of small quantities of CO2 over time in the event of explosive decompression.
Figure 4.4 Explosive decompression of a seal causing blistering or fracturing
4.3.3.3 Accidental discharges and impact of small process escapesSmall process emissions due to the emergency decompression of facilities on the platform are manageable and minor. They usually provide visible evidence of the CO2. However, CO2
releases, even from small instrument lines, may rapidly result in hazardous levels in confined or unventilated spaces, as indicated by the modelling work described in 3.7.4.6.
79 Table 2.1 shows that CO2 has seven times the µJT of nitrogen, hence expands considerably more when moving from the liquid to the gaseous state.

RESEARCH REPORT: HAZARD ANALYSIS FOR OFFSHORE CARBON CAPTURE PLATFORMS AND OFFSHORE PIPELINES
75
Accidental escapes could be significant and life threatening and the hazards associated with inhaling the CO2 have been covered in 3.2.1. Further indications of the sort of hazards associated with CO2 escaping from a riser pipe have been given as a result of the dispersion modelling work described in 3.7.4.3 and 3.7.4.4.
The hazards associated with an escape or rupture associated with equipment at a well or subsea manifold or tee connection were also discussed in section 3.2.1 of this report. Protective structures provide the best defence of these system components, and these are described in Annex A.4. The final forms of escape from a decommissioned well or a deep geological formation are excluded from the scope of this publication but have been addressed in numerous articles and reports80.
4.4 REUSE OF EXISTING INFRASTRUCTURE
4.4.1 Fitness-for-purpose
4.4.1.1 PipelinesNumerous studies have been completed focusing on the reuse of existing pipelines and platforms for offshore applications of transport and storage of CO2
81, 82. The key issues here are the timely availability of such a piece of infrastructure and transporting a fluid for which the original equipment was not designed.
With respect to availability, pipeline owners prefer an additional high value supply they can contract to deliver rather than a low value commodity such as CO2. If available, then any plan to use an existing pipeline will require extensive investigation into the suitability of the pipeline and an assessment level of degradation. Additionally, pipelines may not have been originally designed for the high pressures desired for a CO2 transport infrastructure. However, if it is practical to use such a facility, it could significantly reduce the overall cost associated with transportation of CO2 to a specific area.
4.4.1.2 PlatformsObtaining an existing platform for use in storing CO2 is more difficult. Platforms are subject to stringent decommissioning rules. In some countries, transferring these obligations to new owners may require changes to rules, regulations and even laws. There may need to be a change in purpose and a re-allocation of risks, responsibilities and liabilities.
The life expectancy of platforms will also be a key factor in assessing their suitability. Most offshore platforms were designed for their initial field development. Many have had additional loads added to bring on board satellite well operations, thereby increasing the economic usefulness of the platform. If significant amounts of process equipment are able to be removed from an existing platform, thereby reducing the loading on the structure, it may be possible to extend further the useful service life of a platform that has already exceeded its original design life. As with the reuse of pipeline infrastructure, this will have to be carefully assessed but may be a significant means of reducing the costs of CCS. In addition, it may provide an income stream to help fund future ‘decommissioning costs’.
80 EG, Carbon Dioxide Capture and Storage in Underground Geologic Formations, Dr Sally Benson 200581 Report of the North Sea Basin Task Force, Development of a CO2 Transport and Storage Network in the North Sea,
November 2007.82 Rotterdam Climate Initiative, CO2 Capture, Transport and Storage in Rotterdam, 2009.

RESEARCH REPORT: HAZARD ANALYSIS FOR OFFSHORE CARBON CAPTURE PLATFORMS AND OFFSHORE PIPELINES
76
The possibilities for deploying offshore installations for CCS service are varied, with some of the main scenarios being the use of:
− An existing installation which is still producing (especially those that are close to end of field economic life and would benefit from EOR).
− An existing installation which has a fixed decommissioning date. − New installation specifically designed for storage service. − As above but adjacent to an existing platform. − Tie-in to an existing CCS system or facility.
However, there are many associated factors that need to coalesce successfully, including, reservoir type, condition of wells, location relative to onshore carbon capture plant, water depth (especially for a new-build) and the availability of power, should this be required.
Existing installations offer a number of potential advantages: − The ability to install equipment and power for pumping facilities. − Potential availability of process heating. − Ease of performing well maintenance and work-over operations.
In the UK offshore sector, clearly the platforms closest to shore, such as those located in the southern North Sea, will have significant advantages over those in the northern North Sea which are further from shore and in deeper waters. However, for EOR purposes, oil production is generally from central and northern North Sea sectors.
Most of the older installations and their equipment are currently subjected to life extension programmes involving equipment review and repainting programmes in order to maintain structural and process integrity, as is required to be demonstrated to the UK HSE. Should such facilities be taken over for CCS service, then this regime will need to be continued, albeit with less process equipment, especially if hydrocarbon production has ceased. Where EOR is to be implemented, the normal production facilities will be retained; hence, the platform will need to be able to accommodate additional equipment requiring any attendant weight, space and structural challenges to be overcome.
Redevelopment, of a particular platform will require a thorough review of the safety case and if required, modifications should be made to address any revealed reduction in operational safety or structural integrity. Another major consideration is whether the installation needs to be normally attended. Guidance on such installations is available83.
The safety case review should cover many aspects and the following are examples of the additional CO2-related items likely to be included:
− Identification of credible CO2 release scenarios. − CO2 dispersion modelling studies. − Ventilation of enclosed spaces. − Review of safety critical elements. − Emergency plans and evacuation procedures. − Deployment of gas detection equipment and personal dosimeters. − Suitability of safe refuges. − Proximity of pipelines (e.g. risers) to safety-critical equipment. − The potential for CO2 leaks to result in the cooling and consequential embrittlement
of structural components. − Arrangements for venting of CO2, both routinely and in an emergency. − Operator training.
83 Energy Institute Guidelines for offshore oil and gas installations that are not permanently attended
RESEARCH REPORT: HAZARD ANALYSIS FOR OFFSHORE CARBON CAPTURE PLATFORMS AND OFFSHORE PIPELINES
77
4.4.2 Implications for storage
The pipeline designer should be aware of the type of store into which the CO2 will be injected, since failure to appreciate the differences in these can lead to an increased hazard in the overall chain.
4.4.2.1 Depleted gas fieldsThere are two approaches to the storage of CO2 in depleted gas fields which will require very different operational management. One favours liquid CO2 injection from the outset when depleted gas field pressures allow it. The other approach starts with gaseous injection of CO2 until field pressure is sufficient to maintain a liquid column of CO2 in the well bore.
While the first case can easily receive liquid CO2, in the second case some projects have proposed gaseous transport of the CO2 to offshore facilities during these early periods. However, this involves large diameter pipelines and maintaining the CO2 pressure at less than 35 bar to avoid the risk of hydrate formation even with extremely dry CO2. The alternative is to let down the pressure of the liquid CO2 to gaseous conditions offshore which will most likely require offshore reheating of the CO2 to overcome the JT cooling effects (see 2.1.1.2), and may prove to be costly with respect to energy demands. Again, hydrate formation may occur from the offshore platform to the injection well due to pressure and temperature conditions within the injection line. However, in gas fields where field pressure has been depleted to very low levels, gaseous injection may be the only alternative until higher field pressures are established84, 85, 86. The pipeline designer will need to be aware that the pipeline may be required to handle both liquid and gaseous CO2, and have to cope with the transition between the two, with their very different properties and hazards
4.4.2.2 Depleted oil fieldsThe storage of CO2 in depleted oil fields does not raise the same concerns as for a depleted gas field, because the field pressures are never reduced to such levels as to be unable to maintain a liquid leg of CO2 within the well bore. While it may be cost effective to use existing platform facilities and existing wells for injection into a depleted oil field, decommissioned oil fields have a greater potential to be satisfactory storage complexes for CO2 and may require only a subsea facility monitored from shore or another platform or minimum facilities platform to control the flows of CO2 stored.
In using existing oil field platforms, the issues mentioned in section 4.3.3 should be taken into account. While hydrocarbon platform operators may be familiar with handling highly flammable produced fluids, CO2 has an entirely different hazard potential and the modifications to the platform and operating procedures should accommodate such factors.
If properly considered and implemented, whether the platform is attended or unattended, existing injection facilities offer a number of positive aspects:
− The ability to raise the pressure from delivered trunkline pressures if it is required to pump CO2 into the respective field.
− Existing utilities would be available to power any CO2 pumps. − Working from a platform, it should be easier to complete any maintenance on wells
and to complete any required workovers for existing wells.
84 SPE 123788, CO2 Injection into Depleted Gas Reservoirs, September 2009.85 UK Carbon Capture and Storage Demonstration Competition, UKCCS - KT - S7.18 - Shell – 003, Flowline Well
Interactions, April 2011, Scottish Power CCS Consortium86 Kingsnorth CCS Demonstration Project - Key Knowledge Reference Book, Feb 2011, E.ON UK, Section 7.15
Technical Design – Wells and Storage; Injectivity – Refine Well Development Plan

RESEARCH REPORT: HAZARD ANALYSIS FOR OFFSHORE CARBON CAPTURE PLATFORMS AND OFFSHORE PIPELINES
78
4.4.2.3 Saline formationsLike the storage of CO2 in depleted oil fields, the reuse of existing facilities to store CO2 in saline formations does not raise the same concerns as for a depleted gas field. This is because the pressures within the formations are at or above the hydrostatic head for the depth of the formation, or approximately 1 bar for each 10 m, and provided the formation is below 800 m, the pressure should be sufficient to maintain the CO2 in the dense or supercritical phase within the well bore and formation. Again, it should be cost effective to use existing platform facilities to reach a nearby formation for CO2 injection for the reasons mentioned, but many saline formations will not have existing platforms nearby. These facilities will require subsea connections with control tie backs to existing facilities or minimum facilities platforms87 on top of the saline formation to safely support and control CO2 injections.
87 A platform similar to that shown in Figure A.4.7

RESEARCH REPORT: HAZARD ANALYSIS FOR OFFSHORE CARBON CAPTURE PLATFORMS AND OFFSHORE PIPELINES
79
5 GENERAL CONCLUSIONS
This publication was designed to be used by non-expert readers looking at the storage or use of CO2 in the offshore environment.
Sections 1 and 2 explain the general properties of CO2, and briefly describe its thermodynamic and chemical behaviour, including phase changes. It concludes that the designer should gain a more detailed understanding of these properties and make allowances as a result. In particular attention should be given to:
− The very low temperatures that can be reached as the result of the depressurisation of the CO2 when released rapidly from a vessel or pipeline.
− The impurities present in the CO2 will have an impact on the thermodynamic, physical and corrosive properties of the mixture.
− The most significant property affected is the raising of the mixture’s bubble point and its impact on the potential for two-phase flow, the reduced solubility of water in the mixture and the formation of CO2 hydrates.
Section 3 notes that inhalation of the CO2 itself, leading to asphyxiation, is the primary human health hazard of which the designer should be aware. However, it should be understood that accident frequency prediction and associated calculations did not form a part of the work carried out to develop this publication. In the case of a real project, risk analyses should be carried out, and these should include attributable consequences (severity) as well. Example consequence indications are alluded to in Annex C. Generally, it is thought that CO2 releases due to containment failure have a greater likelihood of being small in size and high in pressure rather than large volume small pressure escapes.
Impacts are described in terms of SLOD and SLOT, but it is worth reiterating that these are land based calculations. This points towards a need for further work in this area to produce equivalent data for CO2 concentrations at sea. In addition, this section concludes that it is possible to structure the specification, that is the make-up of the impurities within the CO2, to allow that the health and safety impact of the CO2 itself should outweigh the health impacts of the individual impurities.
Section 3’s discussion of the modelling exercise, and Annex C draws attention to the limitations of simplistic dispersion modelling. However, it should be remembered that the software used was not specifically designed with offshore situations in mind. More accurate CFD modelling should be used in real dispersion modelling exercises, so that the appropriate degree of confidence can be obtained. In addition, there are areas where solids are likely to form (sublimation) as a result of rapid cooling of the CO2 when pipes depressurise, and these cannot currently be modelled.
Small high pressure unplanned releases are likely to be neutrally buoyant in sea water. However, modelling shows that clouds are likely to change shape under differing conditions. In some cases, closing the ESDV associated with a platform was shown to make the dispersion slightly more hazardous locally while reducing the duration during a full bore release.
In the final section, specific hazards are identified alongside mitigation techniques. In conclusion, the approach demonstrates problems can be designed around and the risks handled in a safe and acceptable manner in accordance with the UK HSE’s As Low As Reasonably Practicable (ALARP) principle. The platform designer should carefully develop process designs and layouts to avoid the potential for CO2 riser pipes and flow lines to impinge on steel jacket legs and structural members in the event of a rupture or leak. This should reduce the risk of steel embrittlement and failure resulting from extreme cooling during an escape.

RESEARCH REPORT: HAZARD ANALYSIS FOR OFFSHORE CARBON CAPTURE PLATFORMS AND OFFSHORE PIPELINES
80
The designer is also able to draw on many existing areas of knowledge with respect to transporting fluids and gases. These are referenced, but include the BSI, EIGA, CCSA and the HSE. The publication then concludes that there are other risks involved that should be considered in the changing of the design of an offshore platform to use CO2 in enhanced oil recovery especially with respect to introducing an acid gas within the produced fluids on to an existing or additional platform.
5.1 FURTHER RESEARCH
Work to fill in knowledge gaps in the behaviour of dense phase impure CO2 should continue. These gaps include:
− Defining the thermodynamic and physical properties for specific mixtures of CO2and the impurities associated with CO2 production and the associated CCS capture techniques
− Where precise information does not exist, or is not available to the designer, providing tools or guidelines to enable the situation to be enveloped in a manner that allows the risks to be reduced to an acceptable minimum without escalating the costs to an unaffordable level.
The ‘worst case’ is the low probability, high impact scenario of a subsea release. Work should be put in hand to quantify the impact of the mitigating effects that, for the sake of simplicity, were omitted in the modelling carried out. These effects will have an impact on the inventory and/or rate of the CO2 reaching the surface, and thus how far downwind the concentration will reach lethal or hazardous levels. Such effects will include:
− The formation of solid CO2 at depth (and under pressure). − The formation of hydrates around the CO2 bubbles. − The dissolving of CO2 in seawater.
Emergency responses to an uncontrolled release of CO2.
5.2 OTHER WORK
The existing EI publication relating to good plant design and operation for onshore carbon capture installations and onshore pipelines, should be reviewed and, if appropriate, updated, in view of the information assembled in the production of this publication.
The conclusions from the dispersion modelling exercise (Annex C) should be brought to the attention of the vendors so that issues discovered during the work can be considered in future releases of the programme.
The concepts of SLOD and SLOT, originally defined in the context of land use planning, should be developed and defined for offshore applications.

RESEARCH REPORT: HAZARD ANALYSIS FOR OFFSHORE CARBON CAPTURE PLATFORMS AND OFFSHORE PIPELINES
81
ANNEX AHAZARD ANALYSIS: CREDIBLE EVENTS
A.1 INTRODUCTION
Credible events should be identified that reflect the range of loss of containment, so as to evaluate issues that might occur. A loss of containment incident on an offshore pipeline or carbon dioxide processing plant may result in the release of a gas cloud or an uncontrollable release of energy. Injury can be caused to the human body by the inhalation of the gas, low temperatures in the vicinity of the release or the effects of the physical blast. Damage to adjacent equipment, structures such as offshore rigs, and the environment should also be considered where appropriate, especially if collateral damage produces further knock-on results such as fires or explosions, release of stored material, or missiles (blast fragments). Failures may range from small, transient leaks through to large scale vessel or pipe ruptures, and the potential consequences may vary from inconsequential or reversible health effects through to fatal or serious injury. There may also be major financial repercussions.
Credible event selection:Suitable hazard identification techniques and information of known incidents should be used to identify credible loss of containment events. These may then need to be developed for further detailed analysis.
In order to determine the risks from an accidental loss of containment of carbon dioxide being transported by pipeline or processed (e.g. for enhanced oil recovery), various failure cases for the processes involved will need to be considered. Release scenarios may then be determined and dispersion modelling carried out to evaluate the consequences of such events taking place.
Classical hazard analysis of chemical processes would attempt to cover the whole range of hazardous events to obtain a model for the total risk from the process being considered, whereas, studies to determine the worst case events need only model the consequences of the perceived largest failure cases. Either way, the use of appropriate commercial computer codes to model release cases and obtain dispersion results is undeniably the best way of carrying out the consequence calculations. If the total process risk is to be considered, the data to be processed to obtain a result will generally be so large that only computer-aided mathematical calculations will be practical. A number of commercial dispersion modelling programmes combine the risk calculations with the consequence modelling in the same software package for the addition of appropriate frequency, probability and physical data.
For worst case events (including, where required, estimation of frequency and maximum potential numbers of fatalities), manual or spreadsheet calculation from the consequence modelling is a practical alternative.
The risk here, in a general sense, is that failure to analyse the potentially large number of smaller events may result in overlooking some hazards. This might be with reference to a single person or group of individuals (such as operators or itinerant workers) much closer to the process or offshore pipeline transportation system.
Depending on the risk evaluation required, the credible events may need to cover the whole range of possible cases from relatively small continuous releases (representing undetected or irremediable leaks from the processes) through to line ruptures or catastrophic failure of vessels where large but finite inventories of hazardous material could be released.
An intermediate case that could be of interest because of the particular physical properties of carbon dioxide is a ‘running crack’, where an initial small failure in the pipe

RESEARCH REPORT: HAZARD ANALYSIS FOR OFFSHORE CARBON CAPTURE PLATFORMS AND OFFSHORE PIPELINES
82
steadily propagates into an extensive crack running along the length of a section of line. An ultimate scenario from this type of failure might be a release which is equivalent in total flow-rate to a line break. However, it may not necessarily have the impact of the corresponding full bore pipeline rupture. Alternatively, a running crack may result in the equivalent of a full bore line rupture with CO2 flowing from both sides of the resulting rupture; i.e. upstream and downstream.
Surface effects and impingement:Particular scenarios may need to be modelled due to project-specific characteristics. For example, where projects propose the CO2 being brought above sea level, such as on to an oil rig to facilitate enhanced oil recovery, the structure of the rig, its platforms and indoor modules would affect the dispersion of the cloud, and additional modelling may be required to understand fully the dispersion of the cloud.
In many cases, further modelling techniques such as CFD modelling should be used to evaluate the concentrations in the gaseous cloud. These well-known modelling procedures are not covered in this publication. In particular, attention should be drawn to any possible impingement near the source of the release (i.e. near the source term), which may reduce the cloud momentum and hence air entrainment into the cloud, which will increase the resultant CO2 concentration in the resultant cloud. Where any impingement occurs (for example on offshore rigs with compact layouts), additional analysis should be applied to ensure that concentrations and gas flows are modelled adequately.
Cooling structural steelwork to a temperature lower than that for which it has been designed can lead to failure if it is cooled below its fracture appearance transition temperature (FATT). This is the temperature at which 50 % of the fracture surface of a test specimen becomes brittle (the other 50 % being ductile). Thereafter the properties of the metal are dominated by brittle properties. Thus, if there is an impact load applied to the metal, instead of deforming in a plastic manner, it will fail in a brittle manner.
On an offshore platform this could be serious, as there would be reduced protection of collision from nearby vessels and waves. Impact loads applied to structural members caused by wave action are commonplace, and in harsher environments, similar to the North Sea, platforms have to be able to withstand extreme wave conditions.
Physical blast:A rupture may result in a physical blast close to the site caused by the expansion ratio of the liquid to gas. The effect of the physical blast can be calculated using a TNT equivalent88 or similar models. The discussion of this reaction known as BLEVE is discussed in 2.3.3.
A.2 FREQUENCY ANALYSIS
A.2.1 Need for failure rate data
One result of risk being defined in mathematical terms of frequency or probability is the necessity of having (or being able to estimate) failure rate data for the cause of the originally specified undesired event. Ideally, historical data for the exact causes of events encountered would produce the most accurate risk predictions for an activity. However, assembling such data in sufficient detail is notoriously difficult except in specialised industries or situations
88 ‘TNT equivalent’ is a method of quantifying the energy released in explosions. The ton (or tonne) of TNT is a unit of energy released in the detonation of one ton of TNT, approximately equal to 4,184 GJ.

RESEARCH REPORT: HAZARD ANALYSIS FOR OFFSHORE CARBON CAPTURE PLATFORMS AND OFFSHORE PIPELINES
83
(e.g. the nuclear industry or aircraft crash investigation), where the value of such data to the owners or operators is clear. Recourse often has to be made to more generalised sources of data in order to carry out risk calculations.
Examples of data sources that could be pertinent to the separation, compression and transmission of CO2 are given in A.2.2.
Although such data may not represent the exact failure mechanisms likely to be encountered for carbon dioxide, data can be adjusted to account for known variations in physical conditions. They can also be, used to calculate the likelihoods of ‘worst case’ outcomes. Normally, acceptability of risk criteria are defined in terms of orders of magnitude or conservatively-set bands of tolerability. Thus, generic data may be adequate to screen out which risks are likely to be unacceptable, without further detailed consideration of avoidance, protection or mitigation; for this more accurate use of data may be required. In the UK, the concept of having to demonstrate that the detrimental effects are being kept ALARP, means that additional cost-effective improvements to reduce risk should be considered under the UK health and safety regime.
A.2.2 Introduction to failure frequency data sources
Failure rate data may be obtained in a number of ways:
− By sample testing - usually of mechanical or electrical components in a specific test environment.
− From plant experience – by companies from reliability based data collection, or by organisations collating and analysing industry or nationwide incident reports.
− From data banks and literature sources – much of the plant experience data and component information (as above) is reported in this way.
− By predictive techniques – appropriately combining component data on constituent parts of a complex system, e.g. by using fault tree analysis.
Generally, the usable working data for risk assessment will be from data banks and literature sources. However, there are potential drawbacks with their use in that much of the information may come from sources such as the nuclear, aerospace or defence industries. Here the necessary high quality of installation, maintenance and testing may require a ‘negative’ allowance when used in conjunction with data collected from less stringently controlled industrial areas. Essentially, it may be optimistic to suggest that all industrial areas have the same approach to maintaining machinery, and are bound by the same regulations.
In addition, literature sources will inevitably be historical compilations and can suffer from being incomplete or out of date for modern applications. For example, Lees’ Loss Prevention in the Process Industries89 although currently published as the third edition in 2005 contains pipeline event and failure data references (Table 23.1) for only up to the end of the 20th century. Lees’ list of principal reliability data sources (Table A14.1) cites Davison90
published in 1994. (Note: Tables 23.1 and A14.1 are not reproduced in this document.)Published data considered appropriate as sources for QRA of CO2 separation,
compression and pipeline transmission systems are given in the following sections. However, care will be required even in the use of such selective data because of the potential effects of differences between CCS systems and the source industries.
89 Lees’ Loss Prevention in the Process Industries 3rd edition Mannon S. (ed), 2005 (Elsevier Butterworth – Heinemann, Oxford UK)
90 Reliability of Mechanical Systems, Davidson J.(ed), 1994 (IMechE, London UK)

RESEARCH REPORT: HAZARD ANALYSIS FOR OFFSHORE CARBON CAPTURE PLATFORMS AND OFFSHORE PIPELINES
84
A.2.3 Example data sources for pipeline failure rates
There have been only a small number of pipeline failures in total (relative to the lengths installed worldwide), and the number of failures of pipelines of the diameters that are likely to be associated with CCS applications is much smaller. Relevant data for gas pipelines are a subset of this and, given that CCS is an emergent technology, the data on CO2 pipelines are less still. In assembling a data set of pipeline failures, the whole sample size of both onshore and offshore is relevant, as it provides a context. One general conclusion is that by far the most common cause of failure is third party damage. Caution is urged when projecting the statistics for onshore pipelines to offshore pipelines, as this main failure mechanism is much less likely under water, even if it might remain the most likely cause of failure.
A.2.3.1 PARLOC 2001There are a number of well-established international failure databases for gas pipelines. Probably the most comprehensive database for offshore gas pipelines is available in the report published by UK HSE entitled PARLOC 2001 (Pipeline And Riser Loss Of Containment). The most recent version of this database91 covers incidents from the 1960s until 2000. The information in this database is based on data obtained from the regulatory authorities in the UK, Norway, the Netherlands, Denmark and Germany, operators in the UK, Dutch and Danish sectors of the North Sea, and published sources.
The total number of pipelines (steel and flexible) is over 1 500, and the total length is almost 25 000km to the end of 2000.
The main causes of pipeline failure, as identified from a review of the PARLOC 2001 data, are listed in Table A.1. The PARLOC data suggest that anchor/impact, followed by internal corrosion, are the main contributors to subsea pipeline failures. Since internal corrosion is usually considered negligible for these pipelines, the likelihood of a loss of containment from subsea pipelines can be assessed primarily based on the potential for external or third party damage (TPD) along the pipeline route.
This factor has been considered in drawing up and allocating likelihood and severity to the list of failure scenarios in A.8.
Cause Platform safety zone[2]
Subsea well safety zone
Mid-line[3] Total
Anchor/impact 26 (62 %) 3 (33 %) 52 (63 %) 81 (60 %)
Corrosion (internal) 8 (19 %) 4 (44 %) 8 (10 %) 20 (15 %)
Corrosion (external & other causes)
2 (5 %) - 4 (5 %) 6 (4 %)
Material defect 4 (10 %) 1 (11 %) 3 (4 %) 8 (6 %)
Others 2 (5 %) 1 (11 %) 16 (19 %) 19 (14 %)
Total 42 9 83 134
Table A.1 Causes of subsea pipeline incidents from PARLOC 2001
91 PARLOC 2001: The Update of Loss of Containment Data for Offshore Pipelines

RESEARCH REPORT: HAZARD ANALYSIS FOR OFFSHORE CARBON CAPTURE PLATFORMS AND OFFSHORE PIPELINES
85
A.2.3.2 European Gas Pipeline Incident Data Group (EGIG)EGIG is a cooperation of 12 major European gas transmission system operators and is the owner of an extensive data base of pipeline incident information collected since 1970.
EGIG has maintained and expanded the European gas pipeline data base. The transmission companies now collect data on more than 122 000 km of pipeline each year. The total exposure, which expresses the length of a pipeline and its period of operation, is 2,77 million km.yr.
The statistics of all incidents collected in the database give failure frequencies. The seventh report92 gives an overall incident frequency equal to 0,37 incidents per year per 1 000 km over the period 1970 to 2007. The five-year moving average, which represents the average incident frequency over the last five years reported equals 0,14 per year per 1 000 km. This frequency is almost six times lower that that reported in the first years of the data base. Failure frequencies have been reducing regularly year by year although the rate of change has fallen in recent years.
The reported major cause of incidents remains external interference (third party damage) (50 % of all incidents), followed by construction defects/material failures (16 %) and corrosion (15 %).
A.2.3.3 UKOPAThe latest UKOPA93 report presents collaborative pipeline and product loss incident data from onshore Major Accident Hazard Pipelines (MAHPs) operated by National Grid, Scotia Gas Network, Northern Gas Network, Wales and West Utilities, Shell UK, BP, Huntsman and E-ON UK, covering operating experience up to the end of 2006. The data cover reported incidents on unfenced pipelines (i.e. not within a compound), where there was an unintentional loss of product from the pipeline. Unlike the Europe-wide EGIG, this UKOPA database contains extensive data on pipeline failures and on part-wall damage, allowing prediction of failure frequencies for pipelines for which inadequate failure data exist. It is worth noting that these data are in the ‘public domain’ as the assets were deemed accessible to the public.
The overall failure frequency over the period 1962 to 2006 is 0,248 incidents per 1 000 km.year, whilst for the EGIG data in the previous section this figure was 0,263 incidents per 1 000km.year (covering the period from 1962 to 2004).
The failure frequency over the five-year period up to the end of 2006 is 0,028 incidents per 1 000 km.year, which remains unchanged from the figure in the previous report (covering the five-year period up to the end of 2004).
A.2.3.4 CONCAWEAt over 35 000 km the inventory covered currently includes the vast majority of such pipelines in Europe, transporting around 800 million m3 per year of crude oil and refined products. The latest CONCAWE report94 covers the performance of these pipelines in 2006 and a full historical perspective since 1971. The performance over the whole 36 years is analysed in various ways including gross and net spillage volumes The causes are grouped into five main categories: mechanical failure, operational, corrosion, natural hazard and third party.
Twelve spillage incidents were reported in 2006, corresponding to 0,34 spillages per 1 000 km of line, slightly above the five-year average but well below the long-term running average of 0,56, which has been steadily decreasing over the years from a value of 1,2 in the mid 1970s.
92 Seventh report of the European Gas Pipeline Incident Data Group Gas Pipeline Incidents 1970-2007 Published Dec 2008
93 Document 07/0050 - UKOPA Pipeline Fault Database - Pipeline Product Loss Incidents (1962 - 2006)94 CONCAWE Report No. 7/08 Performance of European cross-country oil pipelines - statistical summary of reported
spillages in 2006 and since 1971

RESEARCH REPORT: HAZARD ANALYSIS FOR OFFSHORE CARBON CAPTURE PLATFORMS AND OFFSHORE PIPELINES
86
Half the incidents were related to mechanical failures, four incidents to third party activities and two to corrosion. Over the long term, third party activities remain the main cause of spillage incidents.
A.2.3.5 Pipeline and Hazardous Material Administration (U.S. Department of Transport)Statistics on pipeline incidents in the United States can be found at the Office of Pipeline Safety (OPS) within the U.S. Department of Transportation, Pipeline and Hazardous Materials Safety Administration.
CO2 pipeline failure data95 are contained within the hazardous liquid accident data despite CO2 being both a gas when released at ambient conditions and classed as non-hazardous under DOT regulations. These data are the only specifics related to transmission of compressed supercritical CO2. The CO2 is used for enhanced oil recovery through a system of onshore pipelines over approximately 5 000 km of network.
Det Norske Veritas (DNV) has analysed the data96 for CO2, and reports corrosion to be the major single cause of failure for the US system through the period 1986-2008. A separate analysis97 of the same data through to 2002 reported an incident rate of 0,33 per 1 000 km.year, which is higher than pipeline failure data reported from the US hydrocarbon pipeline transmission system. However, the authors caution on drawing conclusions from such a comparison because the CO2 system sample size is small.
A.2.3.6 Overall summary of failure data
A summary of the pipeline failure data in incidents per 1 000 km.year is given in Table A.2. Of these, the PARLOC 2001 data are probably the most relevant, as they relate solely to offshore incidents.
PARLOC 2001
EGIG UKOPA CONCAWE US DoT
Overall 0,21 0,37 0,25 0,56 0,33
Latest five-year rolling average
Not provided
0,14 0,028 0,34 NA*
* Evaluated data are for early period of operation only. Reported failures of past five years indicate that the rolling average will be higher than the overall value given.
Table A.2 Pipeline failure data summary (incidents per 1 000 km.year)
A.2.4 Selecting appropriate failure rate data for pipelines
Whilst there is a small body of failure rate data for CO2 pipelines and a larger body of data for other pipelines, it is important to understand the likely failure modes for CO2 versus other pipelines. This will help to ensure that appropriate comparisons are being drawn.
95 Office of Pipeline Safety (OPS) within the U.S. Department of Transportation, Pipeline and Hazardous Materials Safety Administration (http://ops.dot.gov/stats/IA98.htm)
96 Mapping of potential HSE issues related to large-scale capture, transport and storage of CO2, Johnson,K. et al, DNV report number 2008-1993, 2009 (Det Norske Veritas , Horvik. Norway)
97 Gale, J. and Davidson, J. Transmission of CO2—safety and economic considerations, Energy, 29, 2004: pp.1319-1328

RESEARCH REPORT: HAZARD ANALYSIS FOR OFFSHORE CARBON CAPTURE PLATFORMS AND OFFSHORE PIPELINES
87
A.2.4.1 Third party interferenceFor CO2 pipelines, failure by third party interference is likely to be comparable with all pipeline types. It remains possible that future pipelines of this nature, constructed in Europe, could follow routes similar to those of existing buried petrochemical pipelines. On this basis it can be suggested that third party interference is of a similar likelihood.
This suggestion has supporting data that can be found from the EGIG, which cites third party interference as the largest failure mechanism. Where pipelines are running over ground it may be better to draw upon US data, as North America has more uncovered pipelines carrying CO2. Offshore pipelines are different, but the frequency of outside interference in relation to failure remains the same.
A.2.4.2 CorrosionCorrosion is a common failure mode for pipelines and is the largest single cause cited for US CO2 pipelines. The applicability of corrosion data will depend on the design and operation of the pipeline. Corrosion risk should be mitigated through the rigorous control of moisture, ensuring that there is no free water and insufficient dissolved water to reduce hydrate formation across the range of operating conditions within the pipeline. Control and inspection in the event of water ingress should be included in the operating procedures.
The design of the pipeline, such as the material selected and methods of construction, has a direct bearing on the likelihood of failure by corrosion mechanisms.
When screening projects in the early design phase, using a range of failure frequency data should develop an understanding of how design criteria and operating techniques may impact on the likelihood and severity of a failure.
A.2.4.3 Other failure modesOther failure modes for pipelines can be designed out or considered specifically. This includes appropriate selection of seals and valves for CO2 service and in particular the careful use of elastomers designed for carbon dioxide service. These are designed against failure from explosive decompression, and will mitigate against failure at valve locations alongside an appropriate maintenance regime. The design should take into account the possibility of different chemical compositions which the dense phase product may contain. The pipeline should also be able to withstand these differences whilst operating in abnormal conditions. Secondary effects of a failure should also be considered. These could include: further brittle failure through local cold temperature effects; ground movement giving rise to movement of the pipeline or displacement of its supports; secondary damage to surrounding equipment from the effects of a rapidly cooling high pressure release, and movement of any debris during the initial moments of release.
A.2.5 Plant equipment failure data
Lees’ Loss Prevention in the Process Industries98, and the Offshore Reliability Data Handbook 4th Edition99, (OREDA) contain references to plant equipment failure rate data from numerous sources. As previously discussed component data from such sources could be synthesised into appropriate plant failure data if the nature and size of the plant (process) was available.
98 Loss Prevention in the Process Industries, Frank P Lees, Third Edition edited by Sam Mannan, 200599 Offshore Reliability Data Handbook 5th Edition, Volume 1 – Topside Equipment, Volume 2 – Subsea Equipment
(OREDA 2009)
RESEARCH REPORT: HAZARD ANALYSIS FOR OFFSHORE CARBON CAPTURE PLATFORMS AND OFFSHORE PIPELINES
88
A convenient ,though dated, compilation of plant equipment leak data is given in Appendix 8 of Cox, Lees and Ang100. Cox et al demonstrate how to put together leak frequency and size data for a defined ‘standard plant’. This is dealing specifically with the problem of estimating frequencies of ignition of flammable leaks for hazardous area classification. However, it has relevance to QRA for the risks from loss of containment of any physical process, such as for CO2, even though flammability is not an issue.
A.2.6 Selecting appropriate failure rate data for plant
There are less data available for failure rates at plants, although existing data sources provide a valuable starting point. There would be benefit in gathering further data on CO2/CCS specific equipment failure rates (for equipment in service in CCS and other applications); this should be gathered in a systematic way to improve failure rate estimations.
A.3 EVENT CONSEQUENCES
A.3.1 Introduction
In order to understand the consequences of an event, it is necessary to understand the concentrations of CO2 and the duration of the escape. In addition, it is necessary to model the dispersion of the CO2 (giving the concentrations) combined with the lethality of the varying concentrations. Beyond the effects to human health there may be physical effects to include blast and cooling.
The following sections continue with a discussion of release scenarios, the dispersion programmes available to model a compressed dense/supercritical fluid release, plus the specifics required to model CO2. There then follows a review of the data that are required to complete a hazard analysis with specifics on the dose-response relationship for probability of fatality from exposure to CO2.
In order adequately to discuss model outputs and inputs a common software product was used by the authors. Numerous software packages and codes are available. The use and referencing of DNV PHAST101 here does not represent an an official endorsement. Modellers should refer to their software provider to discuss limitations and validity for use with CO2.
A.3.2 Introduction to commercial dispersion models available
A great number of computer models have been prepared to enable prediction of the results of accidental release of dense gases or fluids, drawing on established data from agencies such as NIST102. However, only a small number in common use have been evaluated for accuracy of result against feed test data obtained by experiments for dense gas releases. The
100 Classification of Hazardous Locations published 1990, Cox, Lees and Ang, (Institution of Chemical Engineers, Rugby UK)
101 PHAST is a hazard analysis computer package, used to identify situations which present potential hazards to life, property or the environment.
102 The National Institute of Standards and Technology (NIST) is based in Gaithersburg, (Maryland) and Boulder (Colorado), and provides thermochemical, thermophysical, and ion energetics data compiled under the Standard Reference Data Program.

RESEARCH REPORT: HAZARD ANALYSIS FOR OFFSHORE CARBON CAPTURE PLATFORMS AND OFFSHORE PIPELINES
89
American Center for Chemical Process Safety103 has researched on 22 models, some which are publicly available and others that are proprietary products. Of these models only 10 have been tested against selected field test data for the accuracy of predicted results.
PHAST as a widely used proprietary package of predictive risk and consequence calculation programmes was included in the evaluation.At the time, it performed well against the measured data104. For this reason and its general availability, PHAST has been used to carry out the example calculations for the rupture cases described in 3.7.4.1.
The outputs of dispersion CO2 dispersion modelling can be expected to include (not exclusively):
− Mass flow rate vs. time graphs. − Total mass remaining in the pipe vs. time graphs. − Pressure at the ‘orifice’ vs. time graphs. − Vertical and horizontal view isopleths. − Limits of lethality from the gas cloud and probability of fatality. − Release temperature vs. time graphs. − Post-expansion solid mass fraction. − Blast-distance relationship.
A.3.3 Modelling source terms for CO2 hazard analysis using commercially available models (excluding PHAST)
Many models allow the source term data to be input directly into the model. This allows the user to place correct physical properties for carbon dioxide within the models and obtain dispersion modelling results.
The selection of the source term parameters used for dispersion modelling should be done with care; Table A.3 sets out bounding assumptions that should be used when carrying out screening calculations.
A.3.4 Combination of dispersion modelling and SLOT/SLOD data to give fatal area predictions
Consequence modelling from the dispersion calculations involves determining the effect distances for any given level of harm which can be caused for each failure case that has been considered for analysis. The effect distances may vary depending on the weather conditions and orientation of release. Unless the worst case effect distance found for all calculated failure cases and release variables is small enough to determine by inspection that the risk is already tolerable (usually because of adequate separation of possible hazard sources from potentially exposed populations), further calculations are required. These calculations should take into account the risk that each failure case, and its effects, can have on any local population. These risks can then be added together from the cases and conditions being considered in order to produce, as appropriate, either the individual or societal risk measures discussed in Annex A.4.2 and Annex A.4.3. Such calculations comprise the QRA as also discussed in Annex A.2.2.
103 Guidelines for Use of Vapor Cloud Dispersion Models, 2nd Edition 1996 (American Institute of Chemical Engineers, Center for Chemical Process Safety – NewYork, USA).
104 See Figure 8.3 in CCPS reference.

RESEARCH REPORT: HAZARD ANALYSIS FOR OFFSHORE CARBON CAPTURE PLATFORMS AND OFFSHORE PIPELINES
90
Source term component
Modelling method Notes
Initial flow rate Use two-phase flashing flow models for the liquid flow rate ignoring solid formation.
Solid formation and entrainment
All solid entrained and contributes to the cloud.
This is based on observations of liquid CO2 jets at about 15 barg on operational CO2 production faculties. When the pressure of the source reduces to a value close to the triple point, solid CO2 ‘snow’ will ‘rain out’ rather than remain entrained in the jet, but by this time a substantial amount of inventory may have been released and the mass emission rate will be relatively small.
Momentum jet velocity
Assume jet velocity does not exceed the sonic velocity.
Care should to be taken: some models use a ‘pseudo velocity’ as a ‘calibration factor’ in the initial jet phase calculation. If in doubt consult the supplier of the model105.
Initial CO2 density Use data available from various well-known sources, e.g. NIST (National Institute of Standards & Technology).
Other physical properties data (JT coefficient, cp, vcv, entropy, enthalpy, etc.)
Use data available from various well-known sources, e.g. NIST.
Table A.3 Example source term assumptions
The frequency for each failure case is required, and has to be estimated or obtained from sources such as those in Annex A.2.3. Population data for the potentially exposed area will be required: in the offshore context, this should include shipping movements and/or platform occupancy. Unless the release mechanisms in the individual failure cases are independent of the weather conditions (i.e. they are directional through equipment orientation or extreme terrain effects), probability data on weather conditions and wind directions should be inputted. These latter data may need to be divided between day and night depending on
105 For choked flow the orifice speed (before atmospheric expansion) equals the sonic speed, while for the subsequent atmospheric expansion ‘supersonic’ flow may occur. As indicated, some models presume a ‘pseudo velocity’ as input to the dispersion model. It should be realised that it is more important that the near-field jet entrainment is predicted accurately (and therefore the concentrations in the near-field), rather than that the correct value of the post-expansion velocity is chosen.

RESEARCH REPORT: HAZARD ANALYSIS FOR OFFSHORE CARBON CAPTURE PLATFORMS AND OFFSHORE PIPELINES
91
whether the exposed population also varies. Probability data or event trees may need to be constructed to account for possible measures in place, as mitigations of the consequences of the cases considered. This could be the likelihood that release durations are restricted by activation of emergency shutoff valves, or protection available to exposed populations by timely evacuation.
All of the above can be obtained straightforwardly by QRA analysts. However, data for the level of harm to be considered,which in the case of a carbon dioxide release is the risk of death or irreversible serious injury, are more specialised. Furthermore, they are dependent on the available toxicological research information.
Table 3.1 gives observed exposure reactions of the human body to various concentrations of pure CO2 in air. Section 3.5 describes the benefits of excluding impurities which would allow the effects of CO2 to be masked by those of other gases. However, individuals will have varying responses to concentration levels and the duration of exposure. There can be no discrete predictable point where all individuals will have the identical reaction to any given gas exposure. A more appropriate method is to use probability distribution mathematics on observed or experimental data for exposure of large populations to specific doses. This can be used to obtain a statistical model for assessing a dose-response relationship for a typical population. The probit (probability unit) method is a customary analysis technique used to obtain a generalised time-dependent relationship for any variable that has a probabilistic outcome defined by a normal distribution. (See Lees or similar standard texts for detailed discussion on probit106).
The relationship would be of the form:
Probit = a + b log(dose) where a, b are constants characteristic of the gas (or any other agent).
HSE’s SLOT and SLOD levels for CO2 can be used (through the definitions of SLOT and SLOD) to set the threshold and 50 % mortality levels of any exposed population for CO2. The HSE data are given in Table 3.2 text, noting that these have been derived for land use planning, and not for offshore situations.
The UK HSE107 gives the dangerous toxic load (DTL) values for SLOT and SLOD from which the following probit for fatality from exposure to CO2 can be derived. This assumes that SLOT is equivalent (conservatively) to a 1 % probability of mortality in an exposed population.
Y = ln C8.t – 89,8
Y is the probit value, C is concentration of CO2 in air in parts per million by volume, and t is exposure time in minutes.
The probit variable is normally distributed between 2 (zero probability) and 8 (100 % probability of outcome) with a mean value of 5, and a standard deviation of 1. The derived Probit for CO2 gives the following probability results (see Table A.4) that fit the data for SLOT and SLOD.
106 Loss Prevention in the Process Industries (ibid) Chapter 9 Section 9.18.3107 From http://hse.gov.uk/hid/haztox.htm

RESEARCH REPORT: HAZARD ANALYSIS FOR OFFSHORE CARBON CAPTURE PLATFORMS AND OFFSHORE PIPELINES
92
Probit Probability of death (%)
Concentration for one minute exposure (%)
Concentration for 10-minute exposure (%)
Concentration for 60-minute exposure (%)
7,85 99,75 20 15 12
6,06 85,5 16 12 9,5
5,00 50 14 10,5 8,4
3,76 11 12 9 7,2
2,67 1 10,5 7,9 6,3
Table A.4 Derived probability of fatality for CO2
Graphically, the Probit result is as shown in Figure A.1.
Figure A.1 CO2 dose-fatality relationship
A.3.5 The impact of impurities on CO2 consequence modelling
It is unlikely that CCS facilities will be processing or transporting pure CO2. Gas processing of CO2 is an expensive operation, and if the impurities are set at too low a level, removing them will make the CCS process too costly, and producers will choose either to emit or to move their operations elsewhere. Neither of these would deliver the required reduction in global CO2 emissions.
This means that the impact of the impurities on the source term should be assessed. Of particular importance is the change to the predicted mass flow rate. If the impurities are likely to reduce the mass flowrate then, for the purposes of risk assessment, they can be ignored unless the chosen risk criteria cannot be met.
In addition to the impact on the source term, impurities that may be toxic, such as hydrogen sulfide or CO, could be present within a CCS facility or pipeline. It is imperative to check that such impurities do not constitute the ‘defining’ hazard in terms of consequence modelling from CO2-containing equipment. This aspect has been discussed in 3.5.

RESEARCH REPORT: HAZARD ANALYSIS FOR OFFSHORE CARBON CAPTURE PLATFORMS AND OFFSHORE PIPELINES
93
A.4 RISK TOLERABILITY
Once a scenario is modelled and a percentage likelihood of fatality is calculated, it is necessary to determine if that risk is acceptable. This section discusses the issue of acceptable risk.
A.4.1 The concept of risk and its definition
The terms risk and hazard should be differentiated.
Hazard is a physical situation with a potential for human injury, damage to property, damage to the environment, or some combination of these.
Risk is the likelihood of a specified undesired event occurring within a specified period. It may either be a frequency (the number of specified events in a given period) or a probability (the chance of the specified event following a prior event). Mathematically, risk is a function combining both the failure events and the consequences of them.
Risk occurs in every human activity and is virtually impossible to eliminate totally without avoiding the activity completely. As a generality for industry, if the activity is to take place at all, the risk should be kept ALARP, and the remaining risk has in any event to be at a level that is acceptable to workers in the workplace, the public at large and, the appropriate regulatory authorities or a standard internal to an organisation. These authorities will usually define the criteria for acceptability of any risk as well as policing compliance with measures necessary to manage the risk at the levels intended.
A.4.2 Introduction to the elements of risk
Some hazards by their nature result only in a risk to individuals (i.e. one person is affected at any one time). It can be appropriate to express the level of risk simply in terms of likelihood of death in a year. Examples of such measures would be:
− The risk of death by falling from a ladder or scaffolding108. − The risk of being fatally struck by lightning in the UK (per year)109 is 1 in 10 000 000. − The risk of being killed by a meteor impact large enough to produce a 1 km2 crater110
is 1 in 768 000 000.
Comparison of levels of risk by this method is generally unsatisfactory, because the likelihood of exposure of the affected population is seldom clear. Such measures can, however, be useful in establishing the tolerability criteria111 to be applied to risk since the example is a generally unavoidable (involuntary) risk taken without question by the general public.
Better measures of individual risk include statistics based on death (or serious injury) per unit of activity. This takes into consideration the exposure time of the individual to the hazardous activity. The UK chemical industry developed the statistic of fatal accident rate (FAR) that has been extended to cover a wide range of industrial and other activities.
108 The odds of serious risks that people can relate to, 2002, http://riskcomm.com/visualaids/riskscale/datasources.pho109 Process Safety Analysis – An Introduction, Skelton, R., 1997 (IChemE, Rugby UK)110 Damage by impact, the case at Meteor Crater, Arizona, LMV Martel, Hawaii Institute of Geophysics and Planetology,
11 December, 1997111 The basis for establishing risk criteria is not fully discussed here. General references on the subject such as Lees’
Loss Prevention in the Process Industries should be consulted.

RESEARCH REPORT: HAZARD ANALYSIS FOR OFFSHORE CARBON CAPTURE PLATFORMS AND OFFSHORE PIPELINES
94
The FAR is the number of deaths expected per 100 million exposed hours. Put more descriptively, the number of deaths expected in a workforce of 1 000 during a working lifetime.
A commonly published example of this measure is: − The FAR for the Chemical and Allied Industries in the period 1987-1990 was 1,2112
− The FAR for a commercial airliner in 2006 was 0,6113
Again there can be difficulty in using and comparing statistics on this basis. In this example, the scope of the data source, The Chemical and Allied Industries is not disclosed. Given that the great proportion of fatal accidents within the chemical industry are not particularly related to the process hazards is not shown; trips, falls from heights and contact with objects predominate. The chemical industry can show progressive improvements in the FAR over time, due to safety management techniques. However, the publication of such data in the literature lags far behind this reduction, and can affect views on risk criteria acceptability.
QRA calculations for a particular hazardous process or activity can generally produce risk results expressed or illustrated in the following terms:
− Individual risk. − FN curves.
Both of these could be relevant to the hazard analysis of a CO2 separation, compression and distribution system, and are detailed in the following sections. Risk contours and a prediction of societal risk are also an output from assessments, but these are not relevant to offshore installations.
A.4.3 Individual risk
The IChemE (Jones) definition for individual risk is the frequency at which an individual may be expected to sustain a given level of harm, from specified hazards. Such a risk is location-specific (e.g. on a specific platform), and also is dependent on the fraction of time a person is likely to be at each hazard location in question. Assuming the ‘level of harm’ is defined as fatality, the individual risk is equivalent to the FAR term defined above, except that it will usually be expressed as fatalities per year, rather than per hour of exposure.
A.4.4 FN curves
The total risk associated with a pipeline or facility is obtained by calculating the value for each consequence, and then adding all the individual risk values together. The result of this can be expressed as an FN curve as shown in Figure A.2. F is the cumulative frequency of fatalities (or other serious events), N being the consequence term (usually expressed as numbers (N) fatalities). Because the values of F and N typically extend across several orders of magnitude, both axes on an FN curve are frequently logarithmic. Plots of the results of various alternative risk reduction strategies can easily be placed on the same graph. After plotting a known tolerability limit on the diagram, decisions on the acceptability of the predicted risk may be made.
112 Mannon S. (ed), Lees’ Loss Prevention in the Process Industries 3rd edition 2005 (Elsevier Butterworth – Heinemann, Oxford UK)
113 Helicopter Safety in the Oil and Gas Business, B. Tender, Shell Aircraft International, May 2006

RESEARCH REPORT: HAZARD ANALYSIS FOR OFFSHORE CARBON CAPTURE PLATFORMS AND OFFSHORE PIPELINES
95
A hypothetical FN curve114 along with illustrative tolerability limits (yellow and green lines) is shown as Figure A.2.
Figure A.2 Example FN curve
A.5 ENVIRONMENTAL RISKS
The preceding sections have focused exclusively on the risks to personnel. It is important to recognise that offshore CCS installations also present risks to the wider environment. Annex B is a preliminary and generic environmental assessment covering the various stages of the offshore section of a CCS project.
A.6 RISK ELIMINATION AND REDUCTION
If risk levels are found to be unacceptable when compared to risk tolerability criteria, there are further strategies which can be employed to reduce risks further. There are two areas: reducing the frequency of an event, and reducing the severity of an event, either or both of which can be used to reduce overall risk. This section provides a non-exhaustive list of possible mitigation strategies.
A.6.1 Reducing event frequency
By understanding possible causes of failure, it is possible to reduce the likely frequency of an event. For example through:
− Protecting against third party interference (e.g. thicker pipe or protective overburden at vulnerable pipeline locations – in the offshore context, this could include major shipping routes).
114 Managing Risk DNV

RESEARCH REPORT: HAZARD ANALYSIS FOR OFFSHORE CARBON CAPTURE PLATFORMS AND OFFSHORE PIPELINES
96
− Protecting against corrosive failure of equipment (e.g. designing appropriately for wet environments, moisture control, thicker materials, suitable inspection regimes).
− Protecting against blockages and other operational issues (e.g. appropriate design of blowdown vessels and vents to prevent blockages).
− Proactive prevention of leaks (e.g. onsite and pipeline walk-arounds for small leaks on platforms; QA procedures, change management procedures for plant).
A.6.2 Reducing event severity
Once an incident has occurred, the severity of that incident can be reduced by a number of mitigation strategies. Examples include:
− Appropriate staff training and procedures (e.g. emergency plans, confined space entry procedures, low temperature awareness).
− Reducing the inventory released (e.g. isolating inventory using block valves, appropriate monitoring).
− Appropriate emergency plans (e.g. including how to inform potentially impacted individuals of a potential hazard, etc).
A.7 SUMMARY OF HAZARD AND RISK ANALYSIS
Table A.5 Summary of hazard and risk analysis
Issue Key points
Credible events Suitable hazard identification techniques and information of known incidents should be used to identify credible scenarios that should be modelled. Scenario setting should take into account topography, impingement, proximity to populations and the case by case assessment of whether additional detailed CFD modelling is required. Scenarios should also assess whether any impurities cause a hazard that has a more severe consequence than CO2 alone.
Frequency analysis There are sources of failure rate data which could be applied to CCS installations and pipelines. Care must be taken when using this data because either sample sizes are small or from a comparable industry but not CCS. Examples of data given in this document are not exhaustive, and other options should be explored.
With the limited CCS related failure data, participants should ensure that suitable mechanical integrity programmes are put in place.

RESEARCH REPORT: HAZARD ANALYSIS FOR OFFSHORE CARBON CAPTURE PLATFORMS AND OFFSHORE PIPELINES
97
Table A.5 continued
Issue Key points
Event consequences
The consequence of an event is the likely fatality rate at specified locations, based on a time duration and dose of CO2. Fatality probability can be calculated using probit functions for carbon dioxide combined, with CO2 concentrations calculated through dispersion modelling.
Reminder: Scenarios should also assess whether any impurities cause a hazard that has a more severe consequence than CO2 alone.
Risk tolerability Societal risks set a framework for understanding whether the risk is acceptable or not, as no activity is completely risk free. Risk levels should be discussed with health and safety regulators and company safety specialists.
Risk reduction Mitigation strategies should focus on reducing frequency of an event and/or reducing the severity of the event.
A.8 FAILURE SCENARIOS
This section lists a number of possible failure scenarios that might be expected for offshore carbon capture platforms and pipelines. It is not intended to be exhaustive, but it is intended to cover the whole offshore transport chain. In producing this, it is appreciated that not all failure scenarios are of equal likelihood; indeed, some are very unlikely in the North Sea. It is also appreciated that not all of the failures would lead to incidents of equal severity.Some comment on both the likelihood and severity of the scenario is included, but only at a relatively coarse level of small, medium and large.
The main hazard associated with a subsea pipeline is loss of containment resulting in a gas release, which could be initiated by a vessel in the vicinity (third party interference, see A.2.4.1). The principal immediate causes for loss of containment from a subsea pipeline are as follows:
− TPD due to anchor drop/drag, vessel sinking/grounding, objects dropped by passing vessels (e.g. construction tubulars and shipping containers).
− Corrosion: internal corrosion is not expected for the proposed pipelines; however, external corrosion could occur due to failure or breakdown of the corrosion protection system.
− Mechanical failure, including material defect, weld failure, seal leakage, etc. − Construction related damage, e.g. from failure of equipment on the pipeline laying
barge, dropped/dragged anchors, dropped objects, pipe buckle and soil breakdown leading to mis-positioning of the pipeline.
− Natural hazards, such as subsidence, earthquake and typhoon.
As for the offshore pipelines, failure in the subsea pipelines could manifest as a pinhole leak, hole or a rupture.
The offshore chain has been divided into two main sections, as follows:
A.8.2: Pipeline between the beachhead and the wellhead.A.8.3: Platforms onto which CO2 has been brought.

RESEARCH REPORT: HAZARD ANALYSIS FOR OFFSHORE CARBON CAPTURE PLATFORMS AND OFFSHORE PIPELINES
98
A ‘traffic light’ annotation has been used (green, low; amber, medium; red, high) to highlight both the likelihood and severity of possible failure scenarios. Many of these have been described as having a historically low frequency rate (HLFR).
Table A.6 General observations on credible events
Failure scenario Likelihood Severity
A.8.2 Pipeline between beachhead and wellheadMinor pipeline breach caused by e.g. anchor dragging
Low, HLFR, pipeline wall thickness is probably too large for flukes to penetrate
Medium
Pipeline being displaced by dragging anchor
Medium, HLFR the example CATS line incident, June 2007 (see A.2.3.1)
Low
Minor pipeline breach caused by debris falling overboard
Low, HLFR pipeline wall thickness is probably too large for debris to penetrate
Low
Minor pipeline breach caused by e.g. Navy submarine grounding
Low, HLFR pipeline wall thickness is probably too large for hull to penetrate
Medium
Minor pipeline breach caused by exploding naval munitions
Low HLFR because pipelines will be marked on naval charts
Low
Major pipeline breach caused by exploding naval munitions
Low, HLFR pipeline wall thickness is probably too large for explosives to penetrate
Medium
External corrosion leading to pipeline breach
Low HLFR because of: − Corrosion prevention measures employed in
pipeline design − Corrosion monitoring by pigs
Low
Internal corrosion leading to pipeline breach
Low because probability of: − Low water content of CO2
− Low oxygen content of the CO2
− Corrosion monitoring by pigs
Low
Internal corrosion by ‘out of spec’ CO2 leading to pipeline breach
Low because: − Conservative CO2 water content specification − Corrosion is time dependent and departure from
‘spec’ would be picked up by instruments
Low
Blockage caused by hydrate formation during upset conditions
Low because blockage does not equate to pipeline damage until corrosion starts
Low
Minor pipeline valve damage caused by e.g. anchor dragging
Low, because valves will be in protective structure Low
Minor valve damage caused by debris being jettisoned overboard
Low, because valves will be in protective structure Low
Minor valve damage caused by e.g. submarine grounding
Low, because valves will be in protective structure Low
Minor valve damage caused by exploding naval munitions
Low, because valves will be in protective structure Low
Major valve damage caused by exploding naval munitions
Medium
External corrosion of valves leading to loss of pressure integrity
Low because of corrosion prevention measures employed in valve design
Low

RESEARCH REPORT: HAZARD ANALYSIS FOR OFFSHORE CARBON CAPTURE PLATFORMS AND OFFSHORE PIPELINES
99
Table A.6 continued
Failure scenario Likelihood SeverityInternal corrosion of valves leading to loss of pressure integrity
Low because of: − Low water content of CO2
− Low oxygen content of the CO2
Low
Minor pipeline breach caused by terrorist activity
Low because pipelines are at depth: there are more accessible targets
Low
Major pipeline breach caused by terrorist activity
Low, due to : − Pipeline wall thickness is too large for explosives to
penetrate − Offshore pipelines are at depth − Near-shore segments are buried
High
Minor pipeline breach caused by pipeline weld failure
Low because pipelines are subject to QA and NDT during construction
Low
Major pipeline breach caused by pipeline weld failure
High
Minor pipeline breach caused by pipe manufacturing defect
Low because: − Pipelines are subject to QA and NDT during
construction − Over-pressure test of pipeline
Low
Major pipeline breach caused by pipe manufacturing defect
High
Subsea earthquake Low in the North Sea Low
Pipeline loses support following seabed movement, then failing
Medium High
Maintenance incident whilst working on subsea valve
Low, as procedures are well established based on oil/natural gas pipelines
Low
Subsea incident whilst carrying out ‘hot tap’
Low, as procedures are well established based on oil/ natural gas pipelines
Medium
Subsea incident whilst accessing ‘hot stab’
Low, as procedures are well established based on oil/ natural gas pipelines
Medium
Overpressure incident Low because CO2 pump or compressor shut-in pressure is less than pipe design
High
Construction of new pipeline crossing damages pipeline
Low because construction methodology will have procedures to prevent this
Low
Release as a result of failure of an adjacent pipeline
Low because: − Pipeline will have proximity distance (except for at
crossings, see above) − Wall thickness is too large
Medium
Pipeline failure as a result of damage to electric power cable crossing it
Low because: − Seawater will conduct away most of the current − The pipeline will be concrete covered − Wall thickness is too large
Low
A.8.3 Platforms onto which CO2 has been broughtMinor riser failure caused by ship collision
Medium, even with riser pipe protection Low
Major riser failure caused by ship collision
Low because of riser pipe protection High
Minor leak as a result of valve seal failure on platform
High Medium

RESEARCH REPORT: HAZARD ANALYSIS FOR OFFSHORE CARBON CAPTURE PLATFORMS AND OFFSHORE PIPELINES
100
Table A.6 continued
Failure scenario Likelihood SeverityMajor leak as a result of valve failure on platform
Low High
Minor leak as a result of pipe failure on platform
Low because of good system design Medium
Major leak as a result of pipe failure on platform
Low because of good system design High
Minor leak as a result of other equipment failure on platform
Low because of good system design Medium
Major leak as a result of other equipment failure on platform
Low because of good system design High
Platform emergency blow-down Low: part of platform blow-down design Medium
Earthquake/tsunami damage to platform
Low in the North Sea High
Fire on platform Low because of platform design High
Minor pipeline breach caused by terrorist activity
Low because platforms are remote: there are more accessible targets
Low
Major pipeline breach caused by terrorist activity
High
Minor pipeline breach caused by aircraft hitting platform
Low because aircraft would try to avoid impact with platform
Low
Major pipeline breach caused by aircraft hitting platform
High
Minor pipeline breach caused by helicopter hitting platform
Medium, HLFR, e.g. the Rashid incident (Dubai), 3 September 2008.
Low
Major pipeline breach caused by helicopter hitting platform
High
Minor CO2 venting by operator error
High: fallible operators employed in spite of training, procedures and safety culture
Low
Major CO2 venting by operator error
Medium: human interface failure is possible and not an incredible possibility
High
Minor CO2 escape as a result of separation equipment failure
High: all platform equipment may be prone to occasional failure
Low
Major CO2 escape as a result of separation equipment failure
Low: appropriate equipment design High

RESEARCH REPORT: HAZARD ANALYSIS FOR OFFSHORE CARBON CAPTURE PLATFORMS AND OFFSHORE PIPELINES
101
ANNEX BSUMMARY OF KEY POTENTIAL ENVIRONMENTAL IMPACTS OF OFFSHORE CCS ACTIVITIES
This annex considers the environmental impact of offshore activities, but excludes the health and safety impact of CO2 as this has been addressed previously. It focuses on impacts on the aquatic environment including associated fauna and flora sediments. The marine environment can be divided into shallow and deep-sea areas. Offshore pipelines transporting CO2 are expected to pass both environments, but for most UK situations the pipelines will not enter the deep sea areas; however, some consideration is included here for completeness.
The potential environmental impact of offshore pipelines should be assessed during both the construction and operation phases. The risk of disturbance of trawling fishery during operation is also discussed.
B.1 DESCRIPTION OF THE MARINE ENVIRONMENT
The shallow marine bottoms are defined as covering the area from the shore line to the edge of the continental shelf at a depth of about 200 m. The areas with vegetation close to the shore will have the highest diversity of species and biomass production. These areas are also used as spawning, and nursery areas for many fish species. Unvegetated subtidal soft bottom environments have lower species diversity and biomass production compared to rocky subtidal areas.
‘Deep-sea’ covers all of the areas deeper than the continental shelves. The ‘Deep-sea’ was, for many years, considered to be a biological desert because of the low density of organisms found there. More recently, this idea has proved to be unfounded, and the deep-sea is now considered a highly diverse community. In contrast to the benthic fauna living in the shallow areas, the majority of organisms in the deep sea are depositing feeders, ingesting the organic-rich sediment115.
B.2 APPROACH TO ENVIRONMENTAL ASSESSMENT
In 2002 the Environment Agency issued a set of scoping guidelines for environmental impact assessments116 (EIA) updating the 1996 guidance, to incorporate a wider range of impacts and development types. It also suggested appropriate mitigation measures,whilst including a ‘handbook of scoping guidelines’ and project specific ‘guidance notes’.
There are 76 guidance notes for specific projects, which were chosen to reflect projects within EIA and other environmental legislation. The guidance notes provide relevant information on the legal requirements of EIA, potentially significant environmental effects and mitigation measures. However, whilst CCS has been included in SEA2117, there are presently no existing scoping guidelines specifically for CCS projects. Thus a ‘common sense’ approach has been followed in this publication, based on the principles recommended for other applications.
115 Marine biology – an ecological approach JW Nybakken, Harper Collins College Publishers, New York, 1993116 Environmental agency scoping guidance on the environmental impact assessment of projects, Impact Assessment
and Project Appraisal, A Bond and G Stewart, 2002117 Offshore SEA2, http://offshore-sea.org.uk/site/index.phphttp://offshore-sea.org.uk/site/index.php

RESEARCH REPORT: HAZARD ANALYSIS FOR OFFSHORE CARBON CAPTURE PLATFORMS AND OFFSHORE PIPELINES
102
Many of the categories recommended are not appropriate for offshore CCS, such as the impacts on landscape, freshwater ecology, and on ground waterflows. However, many others are relevant, and these have been summarised in Table B.1118.
Following the possible failure scenarios given in A.8, some specific aspects of the construction and operational phases were highlighted for more detailed consideration.
B.2.1 Construction phase
The potential effects on the marine environment during construction of carbon dioxide offshore pipelines or platforms will not be significantly different from the construction of conventional hydrocarbon installations. The UK has excellent experience in managing the environmental impacts of such projects, because of the considerable infrastructure in the sea on its continental shelf.
Subsea pipeline construction is associated with high turbidity, and the temporary destruction of the local benthic environment. High turbidity is an inevitable short-term consequence of digging activities when covering pipelines. This may result in avoidance reactions in fish. The subsequent sedimentation of suspended material also has the potential to cause eggs, mortality along with juvenile deaths in sensitive fish species.
B.2.1.1 Shallow areasThe construction of CO2 pipelines or platforms should be avoided in shallow areas where there is aquatic vegetation. Such areas lend themselves to high species richness, in general, from both a fish spawning and nursery area perspective.
B.2.1.2 ‘Deep sea’ areasDeep-sea areas containing cold water corals should also be avoided since they will recover slowly after disturbance.
B.2.1.3 GeneralOther long-term environmental impacts are not expected on benthic fauna and flora, since the areas that have been disturbed will quickly be recolonised by marine organisms.
B.2.2 Operational phase
All subsea pipelines carry a degree of operational risk. However, with regard to the environment, the operational history of subsea pipelines in the waters surrounding the UK has been good, as indicated by PARLOC data.
There are very few subsea pipelines carrying CO2, and there is currently no held history of accidental discharge from an offshore CO2 pipeline. It should also be remembered that the environmental ‘regime’ would be the same as that of the oil and gas industry, including all existing industry standards.
The main environmental risks with the operation of offshore carbon dioxide pipelines are disturbance to sea bottom trawling and an accidental leakage. The potential effect on the marine environment of an accidental escape from an offshore pipeline can only be discussed in qualitative terms. There are three different aspects of CO2; pH reduction, carbonate dissolution and direct toxic effects.
118 Scoping Guidelines on Carbon Capture and Storage Developments, C. O’Leary, Master of Science University of East Anglia School of Environmental Sciences, August 2010

RESEARCH REPORT: HAZARD ANALYSIS FOR OFFSHORE CARBON CAPTURE PLATFORMS AND OFFSHORE PIPELINES
103
B.2.2.1 Sea bottom trawlingThe presence of offshore pipelines may have the potential to affect seabed trawler fishing. This is because the trawl doors may get stuck in the pipeline, or the trawl net can be damaged when crossing the pipeline.
The corollary to this is pipelines being damaged as a result of sea bottom trawling, or anchor dragging. The latter was responsible for an incident on the 36” diameter CATS natural gas pipeline. On 25 June 2007, the tanker Young Lady was dragging her anchor in Tees Bay, and the anchor flukes snagged the pipeline. The vessel was caught on the pipeline for about 10 minutes, until wave action caused it to free. A subsequent survey of the pipeline showed that the pipeline had been lifted out of its trench and dragged about 6 m laterally. The pipeline suffered damage to the concrete coating and impact damage to the steel surface; a local repair was undertaken using a grouted repair sleeve, following which three fabric formworks were installed to support the pipeline on completion of the repair. No gas from the CATS line, which operates at 180,3 bara, escaped, demonstrating the robustness of modern pipeline designs to extreme incidents.
B.2.2.2 pH reduction A massive release of CO2 into seawater could cause a reduction in the pH values that have the potential to result in impacts on marine organisms (see 2.2.2 in the main text). CO2 dissolving in the water will cause acidification not only in the water itself, but also in the tissues and body fluids of marine organisms. This may cause acute effects on survival but may also have chronic metabolic and reproductive impacts. However, work at Plymouth Marine Laboratory119 has indicated that the impacts of an escape will be local and short-lived, and that the pH changes may be similar to those experienced as a result of natural causes.
The effects of pH reduction will probably be less severe on organisms in shallow areas compared to those living in the deep-sea. This is because organisms in shallow areas have adapted to changing water chemistry conditions, such as those caused by agricultural water run-off during periods of heavy rain. In contrast, deep-sea organisms have adapted to a very stable physical and chemical environment.
B.2.2.3 Carbonate dissolutionA number of groups of marine animals have shells or skeletal structures based around calcium carbonate. They can be softened or even dissolved by reaction with CO2 in water. Some deep-sea-living corals and bivalve molluscs could be particularly vulnerable to this process. In addition, the neutralisation of carbon dioxide by reaction with calcareous sediments could provoke changes in the sedimentary of fauna120.
B.2.2.4 Direct toxic effectsHigh concentrations of CO2 may also have direct toxic effects on marine organisms. An increase in the concentration of CO2 in seawater will cause a reduction in the oxygen affinity of haemoglobin. This can reduce oxygen uptake in fish and other aquatic gas-ingesting animals.
119 The UK Ocean Acidification Research Programme, http://www.oceanacidification.org.uk/pdf/OA.english.web.pdf120 Carbon capture and sequestration: Potential environmental impacts, P. Johnston, P. and D. Santillo, IPCC workshop
on carbon dioxide capture and storage, 2002
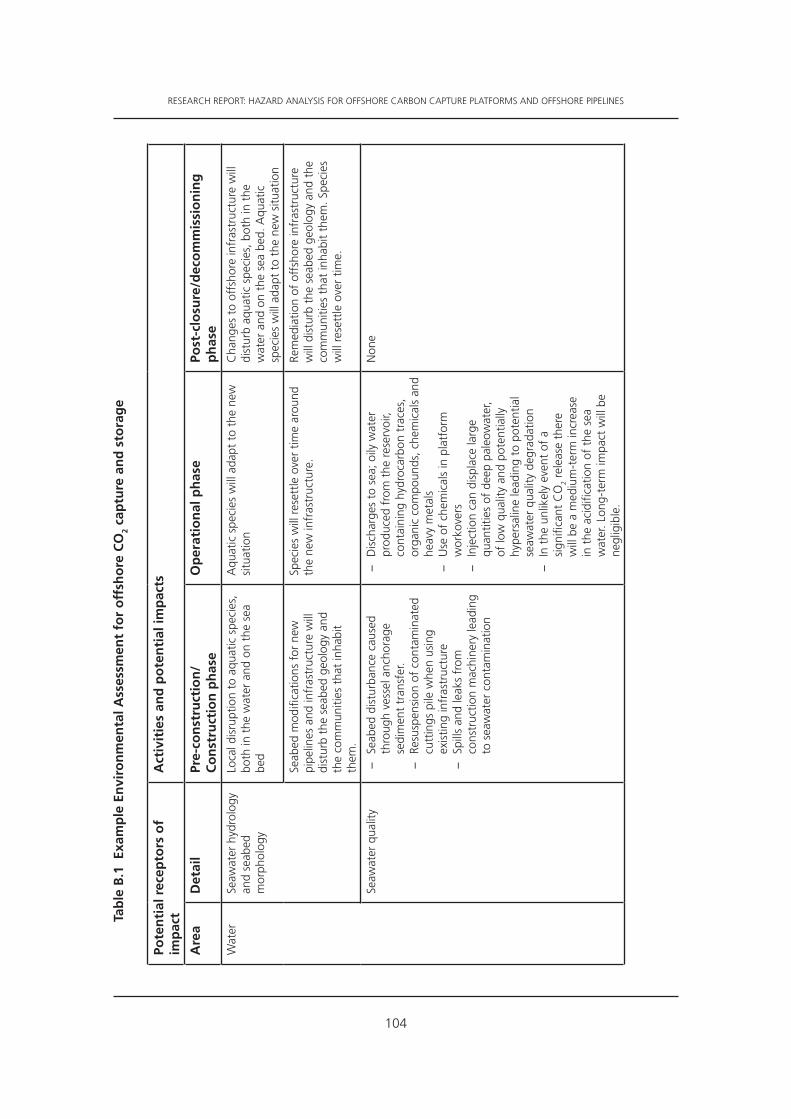
RESEARCH REPORT: HAZARD ANALYSIS FOR OFFSHORE CARBON CAPTURE PLATFORMS AND OFFSHORE PIPELINES
104
Tab
le B
.1 E
xam
ple
En
viro
nm
enta
l Ass
essm
ent
for
off
sho
re C
O2
cap
ture
an
d s
tora
ge
Pote
nti
al r
ecep
tors
of
imp
act
Act
ivit
ies
and
po
ten
tial
imp
acts
Are
aD
etai
lPr
e-co
nst
ruct
ion
/C
on
stru
ctio
n p
has
eO
per
atio
nal
ph
ase
Post
-clo
sure
/dec
om
mis
sio
nin
g
ph
ase
Wat
erSe
awat
er h
ydro
logy
an
d se
abed
m
orph
olog
y
Loca
l dis
rupt
ion
to a
quat
ic s
peci
es,
both
in t
he w
ater
and
on
the
sea
bed
Aqu
atic
spe
cies
will
ada
pt t
o th
e ne
w
situ
atio
nC
hang
es t
o of
fsho
re in
fras
truc
ture
will
di
stur
b aq
uatic
spe
cies
, bot
h in
the
w
ater
and
on
the
sea
bed.
Aqu
atic
sp
ecie
s w
ill a
dapt
to
the
new
situ
atio
n
Seab
ed m
odifi
catio
ns f
or n
ew
pipe
lines
and
infr
astr
uctu
re w
ill
dist
urb
the
seab
ed g
eolo
gy a
nd
the
com
mun
ities
tha
t in
habi
t th
em.
Spec
ies
will
res
ettle
ove
r tim
e ar
ound
th
e ne
w in
fras
truc
ture
.Re
med
iatio
n of
off
shor
e in
fras
truc
ture
w
ill d
istu
rb t
he s
eabe
d ge
olog
y an
d th
e co
mm
uniti
es t
hat
inha
bit
them
. Spe
cies
w
ill r
eset
tle o
ver
time.
Seaw
ater
qua
lity
−
Seab
ed d
istu
rban
ce c
ause
d th
roug
h ve
ssel
anc
hora
ge
sedi
men
t tr
ansf
er.
−
Resu
spen
sion
of
cont
amin
ated
cu
ttin
gs p
ile w
hen
usin
g ex
istin
g in
fras
truc
ture
−
Spill
s an
d le
aks
from
co
nstr
uctio
n m
achi
nery
lead
ing
to s
eaw
ater
con
tam
inat
ion
−
Dis
char
ges
to s
ea; o
ily w
ater
pr
oduc
ed f
rom
the
res
ervo
ir,
cont
aini
ng h
ydro
carb
on t
race
s,
orga
nic
com
poun
ds, c
hem
ical
s an
d he
avy
met
als
−
Use
of
chem
ical
s in
pla
tfor
m
wor
kove
rs
−In
ject
ion
can
disp
lace
larg
e qu
antit
ies
of d
eep
pale
owat
er,
of lo
w q
ualit
y an
d po
tent
ially
hy
pers
alin
e le
adin
g to
pot
entia
l se
awat
er q
ualit
y de
grad
atio
n
−In
the
unl
ikel
y ev
ent
of a
si
gnifi
cant
CO
2 re
leas
e th
ere
will
be
a m
ediu
m-t
erm
incr
ease
in
the
aci
dific
atio
n of
the
sea
w
ater
. Lon
g-te
rm im
pact
will
be
negl
igib
le.
Non
e
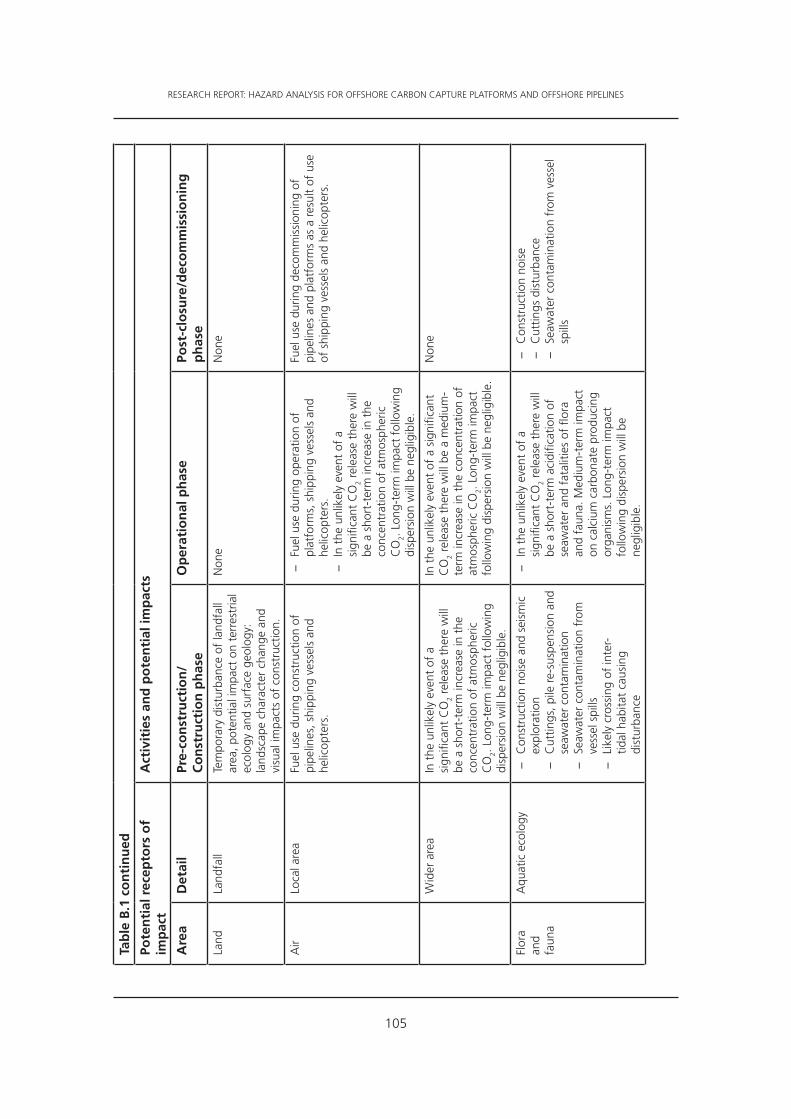
RESEARCH REPORT: HAZARD ANALYSIS FOR OFFSHORE CARBON CAPTURE PLATFORMS AND OFFSHORE PIPELINES
105
Tab
le B
.1 c
on
tin
ued
Pote
nti
al r
ecep
tors
of
imp
act
Act
ivit
ies
and
po
ten
tial
imp
acts
Are
aD
etai
lPr
e-co
nst
ruct
ion
/C
on
stru
ctio
n p
has
eO
per
atio
nal
ph
ase
Post
-clo
sure
/dec
om
mis
sio
nin
g
ph
ase
Land
Land
fall
Tem
pora
ry d
istu
rban
ce o
f la
ndfa
ll ar
ea, p
oten
tial i
mpa
ct o
n te
rres
tria
l ec
olog
y an
d su
rfac
e ge
olog
y:
land
scap
e ch
arac
ter
chan
ge a
nd
visu
al im
pact
s of
con
stru
ctio
n.
Non
eN
one
Air
Loca
l are
aFu
el u
se d
urin
g co
nstr
uctio
n of
pi
pelin
es, s
hipp
ing
vess
els
and
helic
opte
rs.
−
Fuel
use
dur
ing
oper
atio
n of
pl
atfo
rms,
shi
ppin
g ve
ssel
s an
d he
licop
ters
.
−In
the
unl
ikel
y ev
ent
of a
si
gnifi
cant
CO
2 re
leas
e th
ere
will
be
a s
hort
-ter
m in
crea
se in
the
co
ncen
trat
ion
of a
tmos
pher
ic
CO
2. L
ong-
term
impa
ct f
ollo
win
g di
sper
sion
will
be
negl
igib
le.
Fuel
use
dur
ing
deco
mm
issi
onin
g of
pi
pelin
es a
nd p
latf
orm
s as
a r
esul
t of
use
of
shi
ppin
g ve
ssel
s an
d he
licop
ters
.
Wid
er a
rea
In t
he u
nlik
ely
even
t of
a
sign
ifica
nt C
O2
rele
ase
ther
e w
ill
be a
sho
rt-t
erm
incr
ease
in t
he
conc
entr
atio
n of
atm
osph
eric
C
O2.
Lon
g-te
rm im
pact
fol
low
ing
disp
ersi
on w
ill b
e ne
glig
ible
.
In t
he u
nlik
ely
even
t of
a s
igni
fican
t C
O2
rele
ase
ther
e w
ill b
e a
med
ium
-te
rm in
crea
se in
the
con
cent
ratio
n of
at
mos
pher
ic C
O2.
Lon
g-te
rm im
pact
fo
llow
ing
disp
ersi
on w
ill b
e ne
glig
ible
.
Non
e
Flor
a an
d fa
una
Aqu
atic
eco
logy
−
Con
stru
ctio
n no
ise
and
seis
mic
ex
plor
atio
n
−C
uttin
gs, p
ile r
e-su
spen
sion
and
se
awat
er c
onta
min
atio
n
−Se
awat
er c
onta
min
atio
n fr
om
vess
el s
pills
−
Like
ly c
ross
ing
of in
ter-
tidal
hab
itat
caus
ing
dist
urba
nce
−
In t
he u
nlik
ely
even
t of
a
sign
ifica
nt C
O2
rele
ase
ther
e w
ill
be a
sho
rt-t
erm
aci
dific
atio
n of
se
awat
er a
nd f
atal
ities
of
flora
an
d fa
una.
Med
ium
-ter
m im
pact
on
cal
cium
car
bona
te p
rodu
cing
or
gani
sms.
Lon
g-te
rm im
pact
fo
llow
ing
disp
ersi
on w
ill b
e ne
glig
ible
.
−
Con
stru
ctio
n no
ise
−
Cut
tings
dis
turb
ance
−
Seaw
ater
con
tam
inat
ion
from
ves
sel
spill
s

RESEARCH REPORT: HAZARD ANALYSIS FOR OFFSHORE CARBON CAPTURE PLATFORMS AND OFFSHORE PIPELINES
106
Tab
le B
.1 c
on
tin
ued
.
Pote
nti
al r
ecep
tors
of
imp
act
Act
ivit
ies
and
po
ten
tial
imp
acts
Are
aD
etai
lPr
e-co
nst
ruct
ion
/C
on
stru
ctio
n p
has
eO
per
atio
nal
ph
ase
Post
-clo
sure
/dec
om
mis
sio
nin
g
ph
ase
Hum
an
envi
ron-
men
t
Soci
o-ec
onom
ics
−
Empl
oym
ent
gain
−
Pres
ence
of
nove
l tec
hnol
ogy
will
att
ract
oth
er in
dust
ries
into
th
e ar
ea
−Pr
essu
re o
n lo
cal s
ervi
ces
−
Shor
t-te
rm m
arin
e ve
ssel
pr
esen
ce
−Po
tent
ial e
xclu
sion
of
vess
els
durin
g co
nstr
uctio
n pr
oduc
es
inte
rfer
ence
with
oth
er s
hipp
ing
and
fishi
ng g
roun
ds
−A
ccid
enta
l dro
p of
con
stru
ctio
n m
ater
ials
may
cau
se d
amag
e to
fis
hing
net
s
−
Pres
ence
of
nove
l tec
hnol
ogy
will
at
trac
t ot
her
indu
strie
s in
to t
he
area
−
Serv
ice
indu
stry
will
ince
ntiv
ise
new
bus
ines
ses
−
Shor
t-te
rm m
arin
e ve
ssel
pre
senc
e
−A
ccid
enta
l dro
p of
mat
eria
ls m
ay
caus
e da
mag
e to
fish
ing
nets
−
In t
he u
nlik
ely
even
t of
a
sign
ifica
nt C
O2
rele
ase
ther
e w
ill
be a
sho
rt-t
erm
exc
lusi
on z
one
set
up, p
oten
tially
aff
ectin
g sh
ippi
ng,
fishi
ng a
nd o
ther
act
iviti
es in
the
ar
ea. M
ediu
m-t
erm
inte
rfer
ence
du
ring
rem
edia
l wor
ks. L
ong-
term
im
pact
fol
low
ing
disp
ersi
on w
ill b
e ne
glig
ible
.
−
Empl
oym
ent
−
Pres
sure
on
loca
l ser
vice
s
−Sh
ort-
term
mar
ine
vess
el p
rese
nce
−
Acc
iden
tal d
rop
of m
ater
ials
may
ca
use
dam
age
to fi
shin
g ne
ts

RESEARCH REPORT: HAZARD ANALYSIS FOR OFFSHORE CARBON CAPTURE PLATFORMS AND OFFSHORE PIPELINES
107
ANNEX CEXAMPLE DISPERSION MODELLING EXERCISE
This annex comprises a research study of example dispersion modelling using PHAST for nine CO2 release scenarios on offshore installations.
This annex is largely based on (but technically identical to) HSL report FP/12/05.
PHAST dispersion modelling of CO2 releases associated with offshore transport This work was commissioned by Progressive Energy Ltd. on behalf of the EI to develop the overall publication. The lead author was Alison McGillivray. The technical reviewer and editorial reviewer was Jill Wilday. THe report was authorised for issue by Stuart Hawksworth on 30 January 2012.
Note that contents, including any opinions and/or conclusions expressed or recommendations made in this annex, do not necessarily reflect policy or views of the Health and Safety Executive.
CONTENTS:
C.1 Executive summary..............................................................................................107C.2 Introduction........................................................................................................108C.3 Scenarios and inputs............................................................................................108C.4 Results.................................................................................................................111C.5 Conclusions.........................................................................................................142
C.1 EXECUTIVE SUMMARY
C.1.1 Objectives
The EI commissioned Progressive Energy to develop a hazard analysis technical publication applicable to offshore CCS. HSL was asked to contribute to the publication by performing dispersion modelling using PHAST for a set of nine offshore CO2 release scenarios chosen by Progressive Energy; these include:
− Modelling of a release at different locations on the platform’s vertical riser pipeline. − Modelling of a release from a large diameter long pipeline located on the seabed. − Modelling of a release from an instrument line into an enclosed space.
C.1.2 Main findings
PHAST version 6.7 was used to perform the modelling. Results graphs were produced, together with commentary about the applicability of PHAST to the scenario modelled, and the implications of the model results.
Some limitations in the ability of PHAST to model the scenarios were identified.
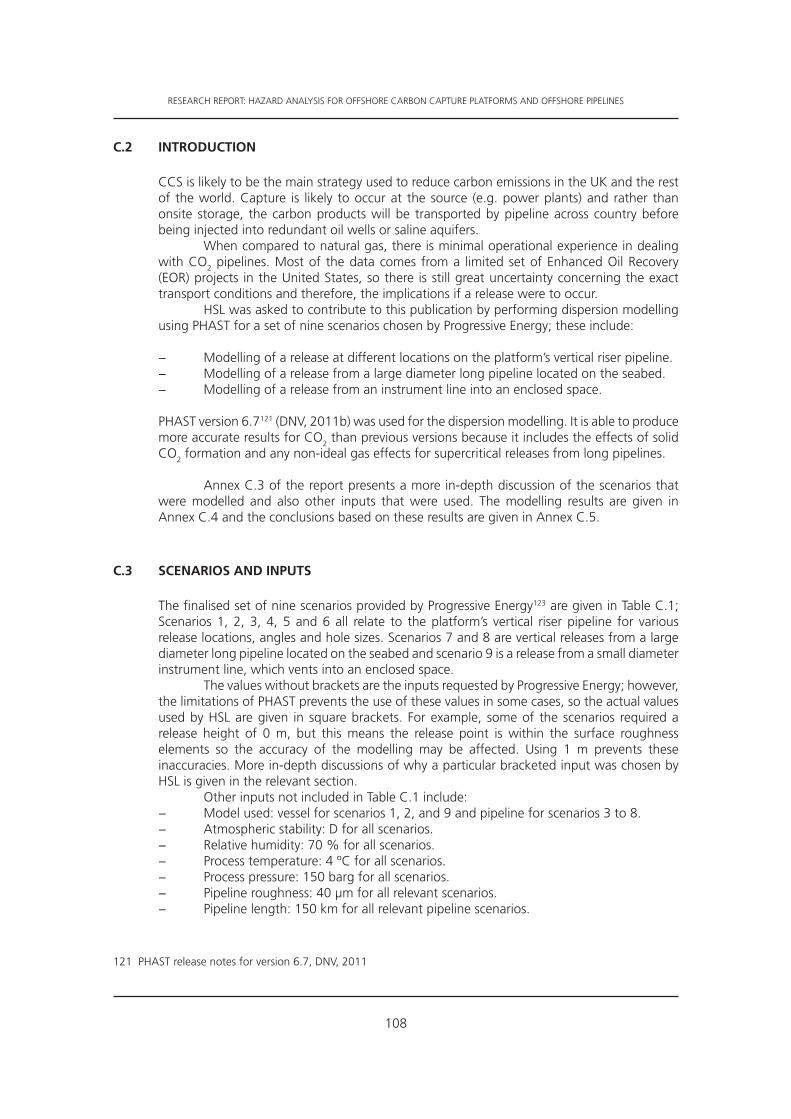
RESEARCH REPORT: HAZARD ANALYSIS FOR OFFSHORE CARBON CAPTURE PLATFORMS AND OFFSHORE PIPELINES
108
C.2 INTRODUCTION
CCS is likely to be the main strategy used to reduce carbon emissions in the UK and the rest of the world. Capture is likely to occur at the source (e.g. power plants) and rather than onsite storage, the carbon products will be transported by pipeline across country before being injected into redundant oil wells or saline aquifers.
When compared to natural gas, there is minimal operational experience in dealing with CO2 pipelines. Most of the data comes from a limited set of Enhanced Oil Recovery (EOR) projects in the United States, so there is still great uncertainty concerning the exact transport conditions and therefore, the implications if a release were to occur.
HSL was asked to contribute to this publication by performing dispersion modelling using PHAST for a set of nine scenarios chosen by Progressive Energy; these include:
− Modelling of a release at different locations on the platform’s vertical riser pipeline. − Modelling of a release from a large diameter long pipeline located on the seabed. − Modelling of a release from an instrument line into an enclosed space.
PHAST version 6.7121 (DNV, 2011b) was used for the dispersion modelling. It is able to produce more accurate results for CO2 than previous versions because it includes the effects of solid CO2 formation and any non-ideal gas effects for supercritical releases from long pipelines.
Annex C.3 of the report presents a more in-depth discussion of the scenarios that were modelled and also other inputs that were used. The modelling results are given in Annex C.4 and the conclusions based on these results are given in Annex C.5.
C.3 SCENARIOS AND INPUTS
The finalised set of nine scenarios provided by Progressive Energy123 are given in Table C.1; Scenarios 1, 2, 3, 4, 5 and 6 all relate to the platform’s vertical riser pipeline for various release locations, angles and hole sizes. Scenarios 7 and 8 are vertical releases from a large diameter long pipeline located on the seabed and scenario 9 is a release from a small diameter instrument line, which vents into an enclosed space.
The values without brackets are the inputs requested by Progressive Energy; however, the limitations of PHAST prevents the use of these values in some cases, so the actual values used by HSL are given in square brackets. For example, some of the scenarios required a release height of 0 m, but this means the release point is within the surface roughness elements so the accuracy of the modelling may be affected. Using 1 m prevents these inaccuracies. More in-depth discussions of why a particular bracketed input was chosen by HSL is given in the relevant section.
Other inputs not included in Table C.1 include: − Model used: vessel for scenarios 1, 2, and 9 and pipeline for scenarios 3 to 8. − Atmospheric stability: D for all scenarios. − Relative humidity: 70 % for all scenarios. − Process temperature: 4 ºC for all scenarios. − Process pressure: 150 barg for all scenarios. − Pipeline roughness: 40 µm for all relevant scenarios. − Pipeline length: 150 km for all relevant pipeline scenarios.
121 PHAST release notes for version 6.7, DNV, 2011

RESEARCH REPORT: HAZARD ANALYSIS FOR OFFSHORE CARBON CAPTURE PLATFORMS AND OFFSHORE PIPELINES
109
− Inventory: enough to produce a steady state release rate for scenarios 1, 2 and 5 to 9. For scenarios 3 and 4, the total inventory released is approximately 65 te (based on a pipeline with the ESDV 600 m from guillotine fracture, and which operates two minutes after the release occurs).
To model the effects of CO2 more appropriately some of the default values in PHAST were changed. The atmospheric expansion method was changed from ‘closest to initial conditions’ to ‘conservation of energy’ and the core averaging time in PHAST was set to 600 seconds, the same as the toxic averaging time. These changes were recommended by DNV for CO2.
PHAST has an integrated pipeline model which is able to calculate the pressure drop through the pipeline once it has failed. Inputs such as the pipeline length, internal diameter, pipeline roughness and the distance to the break are required. The user cannot directly input the required hole size into PHAST, instead the relative aperture, which is the ratio of the area of the hole to the internal cross-section area of the pipeline, should be specified. The upper limit of the relative aperture is 1, which is equivalent to a full bore rupture and the lower limit is 0,2.

RESEARCH REPORT: HAZARD ANALYSIS FOR OFFSHORE CARBON CAPTURE PLATFORMS AND OFFSHORE PIPELINES
110
Tab
le C
.1 T
he
mai
n in
pu
ts u
sed
in P
HA
ST. S
ee t
he
rele
van
t se
ctio
n f
or
scen
ario
-sp
ecifi
c in
pu
ts.
Scen
ario
Pip
elin
e b
ore
d
iam
eter
(m
m)
Ho
le s
ize
(mm
)A
ng
leA
mb
ien
t te
mp
erat
ure
(º
C)
Win
d
spee
d
(m/s
)
Rel
ease
h
eig
ht
(m)
Surf
ace
rou
gh
nes
s (m
)
1Pl
atfo
rm p
ipe
300
(12”
)10
0 (4
”)H
oriz
onta
l0
1,5
26Eq
uiva
lent
to
pro
cess
eq
uipm
ent
(0,2
m
m)
230
0 (1
2”)
100
(4”)
Hor
izon
tal
05
260,
2 m
m -
ope
n w
ater
3Pl
atfo
rm p
ipel
ine
at t
he s
ea s
urfa
ce –
co
nstr
aine
d
300
(12”
)Fu
ll bo
reVe
rtic
al0
1,5
0 [1
] N
ote
10,
2 m
m -
ope
n w
ater
430
0 (1
2”)
Full
bore
Vert
ical
05
0 [1
]0,
2 m
m -
ope
n w
ater
5Pl
atfo
rm p
ipel
ine
at t
he s
ea s
urfa
ce –
un
cons
trai
ned
300
(12”
)Fu
ll bo
reVe
rtic
al0
1,5
0 [1
]0,
2 m
m -
ope
n w
ater
630
0 (1
2”)
Full
bore
Vert
ical
05
0 [1
]0,
2 m
m -
ope
n w
ater
7Su
bsea
pip
elin
e71
0 (2
8”)
300
(12”
)Ve
rtic
al0
1,5
N/A
[1]
0,2
mm
- o
pen
wat
er
871
0 (2
8”)
300
(12”
)Ve
rtic
al0
5N
/A [1
]0,
2 m
m -
ope
n w
ater
9En
clos
ed s
pace
10 (3
/8”)
Full
bore
Hor
izon
tal
15N
/AN
/AN
/A
Not
e: A
ctua
l rel
ease
hei
ght
mod
elle
d, q
uote
d in
bra
cket
s; P
HA
ST is
una
ble
to m
odel
acc
urat
ely
at 0
m (s
ee e
xpla
natio
n un
der
scen
ario
s an
d in
puts
C.3
).

RESEARCH REPORT: HAZARD ANALYSIS FOR OFFSHORE CARBON CAPTURE PLATFORMS AND OFFSHORE PIPELINES
111
Small holes in pipelines normally fall below the 0,2 relative aperture lower limit, so a hole in a vessel of equivalent size can be assumed. Using the vessel model means that no pressure drop calculation takes place, so the initial exit conditions, e.g. the release rate, remain throughout the release. The pressure drop for small holes in large pipelines is not expected to be significant so using the vessel model for these cases is a reasonable assumption.
Caution should be applied when interpreting the maximum concentration and footprint dispersion results for vertical releases, because the graphs are not always representative. There is a bug in the graphical display where PHAST is unable to find enough data points to display the correct shape. The number of data points has been amended in each case to obtain a horizontal view with contour distances similar to those in the vertical view. In some cases, the maximum concentration footprint produces the best fit but for others the concentration contour produces the best fit. Unless otherwise stated, the horizontal view with the best fit was used.
All the dispersion results were obtained using relevant offshore human vulnerability criteria (HSE, 2010) as shown in Table C.2.
Hazard Comments Criteria
Toxic Short term exposure limit survivability criteria
30 000 ppm (3 %) for 15 minutes
Toxic Long term exposure limit survivability criteria
20 000 ppm (2 %) for 30 minutes
Toxic LC01 86 028 ppm (8,6 %) for five minutes
Toxic LC50 91 700 ppm (9,2 %) for 30 minutes
Overpressure (outside) Short term exposure limit survivability criteria
0,21 barg
Overpressure (outside) Onset of fatality 0,25 – 0,35 barg
Overpressure (outside) Estimated 50 % fatality 0,5 barg
Table C.2 Human vulnerability to CO2 for offshore applications
As the LC01 and LC50 (lethal concentration) are similar, a value of 10 % was used to represent both in the concentration graphs to prevent the plots becoming too crowded with information. The concentration graphs were terminated using a low concentration of 0,5 %, mainly to show the shape of the plume as it disperses. It is not always clear how materials behave in the far field if the focus is on larger concentrations which are present closer to the release point.
C.4 RESULTS
This section presents the discharge results, where appropriate, and dispersion results for all the scenarios in Table C.1. For the dispersion results, the wind direction is from left to right.
Each scenario has a diagram showing the dimensions of the pipeline and the location of failure as an indication of how the release was set up in PHAST. These diagrams should be used for information purposes only as they are not to scale and may not be representative of the actual layout.

RESEARCH REPORT: HAZARD ANALYSIS FOR OFFSHORE CARBON CAPTURE PLATFORMS AND OFFSHORE PIPELINES
112
C.4.1 Scenarios 1 and 2
Scenarios 1 and 2 are releases from a 300 mm bore vertical riser pipe at a release point of 26 m (25 m high platform plus an extra 1 m above the platform). The hole size is assumed to be 100 mm in diameter. Figure C.1 shows the layout of scenarios 1 and 2.
Figure C.1 Riser pipe model for scenarios 1 and 2
The relative aperture for this particular pipeline is 0,11, which is much smaller than the lower limit within PHAST of 0,2, so it is not possible to use the long pipeline model for this particular scenario. Instead, a 300 mm diameter hole in a vessel with equivalent mass to that of a 150 km pipeline was assumed122. The inventory was sufficient to reach steady state and last for a considerable length of time.
The release rates calculated were assumed to be from the riser end of the pipeline only because it was assumed that non-return valves were present on the injection end, which prevents significant backflow of injected CO2. The mass released after the non-return valves were activated was assumed to be much smaller, and therefore negligible, when compared to the mass flow from the riser end.
The release occurs 26 m above sea level, on a platform deck with numerous obstacles (process equipment and pipes etc.) in the vicinity of the leak. Different surface roughnesses (i.e. obstacle heights) can greatly affect the dispersion of the release; high values promoting more turbulence and more dilute clouds and low values reducing turbulence and dilution. The surface roughness associated with process equipment on deck is approximately 0,5 m, and for open water (without waves) it is approximately 0,2 mm. PHAST is not able to take into account more than one surface roughness for a particular release, and it assumes that the obstacles are located at ground level. For scenarios 1 and 2, the release would have to be relocated to 0 m for PHAST to use the surface roughness which would reproduce conditions on the deck. However, this would mean that the slumping of the cloud from the deck would not be taken in account, and there would be more impingement of the cloud on the sea,
122 The mass in the pipeline was assumed to be 9,6 × 10⁶ kg. This was based on a liquid density of 901 kg/m3 for CO2 at 4 ºC and 150 barg.
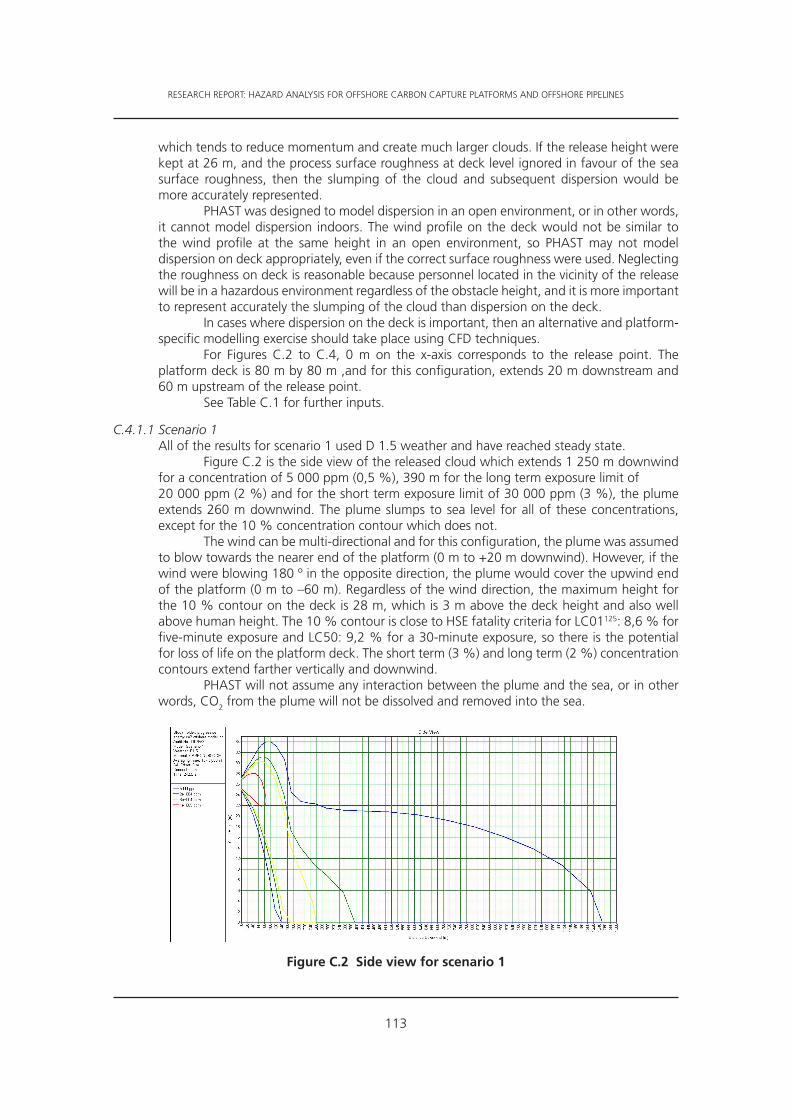
RESEARCH REPORT: HAZARD ANALYSIS FOR OFFSHORE CARBON CAPTURE PLATFORMS AND OFFSHORE PIPELINES
113
which tends to reduce momentum and create much larger clouds. If the release height were kept at 26 m, and the process surface roughness at deck level ignored in favour of the sea surface roughness, then the slumping of the cloud and subsequent dispersion would be more accurately represented.
PHAST was designed to model dispersion in an open environment, or in other words, it cannot model dispersion indoors. The wind profile on the deck would not be similar to the wind profile at the same height in an open environment, so PHAST may not model dispersion on deck appropriately, even if the correct surface roughness were used. Neglecting the roughness on deck is reasonable because personnel located in the vicinity of the release will be in a hazardous environment regardless of the obstacle height, and it is more important to represent accurately the slumping of the cloud than dispersion on the deck.
In cases where dispersion on the deck is important, then an alternative and platform-specific modelling exercise should take place using CFD techniques.
For Figures C.2 to C.4, 0 m on the x-axis corresponds to the release point. The platform deck is 80 m by 80 m ,and for this configuration, extends 20 m downstream and 60 m upstream of the release point.
See Table C.1 for further inputs.
C.4.1.1 Scenario 1All of the results for scenario 1 used D 1.5 weather and have reached steady state.
Figure C.2 is the side view of the released cloud which extends 1 250 m downwind for a concentration of 5 000 ppm (0,5 %), 390 m for the long term exposure limit of 20 000 ppm (2 %) and for the short term exposure limit of 30 000 ppm (3 %), the plume extends 260 m downwind. The plume slumps to sea level for all of these concentrations, except for the 10 % concentration contour which does not.
The wind can be multi-directional and for this configuration, the plume was assumed to blow towards the nearer end of the platform (0 m to +20 m downwind). However, if the wind were blowing 180 º in the opposite direction, the plume would cover the upwind end of the platform (0 m to –60 m). Regardless of the wind direction, the maximum height for the 10 % contour on the deck is 28 m, which is 3 m above the deck height and also well above human height. The 10 % contour is close to HSE fatality criteria for LC01125: 8,6 % for five-minute exposure and LC50: 9,2 % for a 30-minute exposure, so there is the potential for loss of life on the platform deck. The short term (3 %) and long term (2 %) concentration contours extend farther vertically and downwind.
PHAST will not assume any interaction between the plume and the sea, or in other words, CO2 from the plume will not be dissolved and removed into the sea.
Figure C.2 Side view for scenario 1

RESEARCH REPORT: HAZARD ANALYSIS FOR OFFSHORE CARBON CAPTURE PLATFORMS AND OFFSHORE PIPELINES
114
Figure C.3 shows the footprint of the plume at sea level (0 m). As shown by Figure C.2, only the 5 000 ppm (0,5 %), 20 000 ppm (2 %) and 30 000 ppm (3 %) contours reach sea level. In terms of toxicity to personnel on the platform, a footprint at around 26 m may be more instructive; however, there is the potential for ships in the vicinity of the platform particularly during an evacuation. In this situation, the personnel in the ships would need an exposure duration of 15 mins at 3 % to reach the short term exposure limit and be approximately 160 m to 260 m away from the platform. Immediate loss of life (at LC1 or LC50) at sea level is not expected based on the results.
Figure C.3 Footprint for scenario 1 at sea level height
Figure C.4 shows the corresponding lethality footprints, which were obtained at 26,6 m (25 m high platform deck plus a recipient height of 1,6 m) and confirms that there is the potential for significant loss of life. A toxic lethality of 1 corresponds to 100 % fatalities, and the corresponding contour extends 52 m downwind. However, the maximum width of the cloud on deck (up to + 20 m) is approximately 1,3 m, so the fatal cloud is predicted to be quite narrow. The dimensions of the lethal cloud for lethality down to 0,001 are also quite narrow and approximately double in length. The lethality graph at 0 m (sea level – not reproduced here) showed 0 fatalities.
Figure C.4 Lethality footprint for scenario 1 at 26,6 m in height

RESEARCH REPORT: HAZARD ANALYSIS FOR OFFSHORE CARBON CAPTURE PLATFORMS AND OFFSHORE PIPELINES
115
As the vessel model option was used, it was not possible to obtain the post-expansion solid mass fraction as requested for scenario 1, or the plots of the exit conditions. It was possible to obtain the overpressure results for the pressure system failure, based on PHAST’s BLEVE model. However, this model is likely to significantly overestimate the true overpressure.
Overpressure versus distance was obtained for scenario 1 based on a spherical vessel containing the entire contents of the pipeline (9,6 ×10⁶ kg). However, this is equivalent to catastrophic failure of the entire pipeline, rather than a 100 mm hole in a pipeline. Therefore this model is expected to grossly overestimate the overpressure. The blast was assumed to occur at ground level, which doubles the explosion energy to account for the reflection of the shock waves against the ground, or in this case, the platform structure. CO2 was assumed to behave as a real gas (i.e. non-ideal behaviour).
The modelling indicates that overpressure remains at the storage pressure of 150 barg 15 m from the release point. After this the model predicts that overpressure falls rapidly over the next 100 m. Approximately 200 m from the source, the effects from the overpressure are reduced.
An overpressure of 0,5 barg is expected to cause 50 % fatalities and an overpressure between 0,25 to 0,35 barg is estimated to be the onset of fatality123. The 0,5 barg overpressure occurs at approximately 240 m and the 0,25 barg overpressure at 340 m. However, as stated above, these are gross overestimates for a 100 mm hole.
Figure C.5 Overpressure vs. distance for scenario 1
123 Indicative human vulnerability to the hazardous agents present offshore for application in risk assessment of major accidents HSE, SPC/Tech/OSD/30, 2010

RESEARCH REPORT: HAZARD ANALYSIS FOR OFFSHORE CARBON CAPTURE PLATFORMS AND OFFSHORE PIPELINES
116
C.4.1.2 Scenario 2All the results for scenario 2 used D5 weather, but were set up in the same manner as scenario 1.
Figure C.6 shows the side view for scenario 2 obtained for D5 weather. The 0,5 % plume extends 1 625 m downwind, which is slightly larger than the 1 250 m shown in Figure C.2 for the same concentration but different weather. For this case, D5 weather produces a larger cloud than D1.5 weather when measured to 0,5 %. The distances for the 2 % cloud and the 10 % cloud are much more comparable to D1.5 weather. However, this time the 3 % cloud does not reach sea level as it did for D1.5 weather, but its maximum downwind distance is still similar. The maximum vertical heights are similar for both weather conditions.
Comparing Figures C.3 and C.7 shows that the plume for D1.5 weather is much wider (250 m) than D5 (180 m) at the maximum extent. Also, the plume reaches sea level at approximately 125 m, which is slightly larger than the results for D1.5 weather.
D5 weather produces a longer, thinner and more elliptical-shaped plume than D1.5, which is shorter, wider and shaped more like a teardrop. The momentum behind the D5 wind is larger than D1.5 which produces the more streamlined shape, whereas low wind speeds tend to produce clouds which spread more laterally.
Again, there is the potential for ships to be in the vicinity of the platform, particularly during an evacuation. In this situation the personnel in the ships would need an exposure duration of 15 minutes at 3 % to reach the short term exposure limit, and be in a relatively small ‘envelope’ approximately 150 to 230 m away from the platform riser. Immediate loss of life (at LC1 or LC50) at sea level is not expected based on these results.
Figure C.6 Side view for scenario 2

RESEARCH REPORT: HAZARD ANALYSIS FOR OFFSHORE CARBON CAPTURE PLATFORMS AND OFFSHORE PIPELINES
117
Figure C.7 Footprint for scenario 2 at sea level height, i.e. 0 m
Figure C.7 shows the lethality footprint obtained at 26,6 m (25 m deck height plus 1,6 m recipient height). The contours for D5 weather are slightly longer but narrower than those for D1.5 weather, for the lower lethality values.
Figure C.8 Lethality footprint for scenario 2 at 26,6 m
C.4.2 Scenarios 3 and 4
Scenarios 3 and 4 were based on a 300 mm bore vertical riser pipe, which underwent guillotine rupture at the surface of the water. The release direction was assumed to be vertical and unimpeded. A sea surface roughness equivalent to open water (0,2 mm) was used. Other inputs can be found in Table C.1 and a simple layout of the scenarios can be found in Figure C.9.

RESEARCH REPORT: HAZARD ANALYSIS FOR OFFSHORE CARBON CAPTURE PLATFORMS AND OFFSHORE PIPELINES
118
Figure C.9 Layout of scenarios 3 and 4 (the arrows show the direction of flow)
The vertical riser pipe was taken to be 150 km long with the guillotine rupture located at the far end of the pipe, because it was assumed that non-return valves were located on the downstream end of the pipe preventing backflow. The ESDV was located 600 m from the end of the pipe and closed 120 seconds after the release occurred.
As scenarios 3 and 4 were full bore ruptures, PHAST’s long pipeline model was used because the relative aperture was greater than 0,2. The pumped inflow was ignored because it was considered to be negligible compared to the initial flow rates following the rupture.
The release height was assumed to be 1 m to avoid the release being located within the surface roughness elements, which can affect dispersion. As scenarios 3 and 4 are vertical releases, this should not affect the subsequent dispersion.
The long pipeline model uses a time varying discharge as opposed to the vessel option used for scenarios 1 and 2, which assumes a steady state release based on the initial exit conditions. For scenarios 3 and 4, the release rate was averaged between 0 and 20 seconds as recommended by DNV. The time varying nature of the release means that graphs of a particular exit condition (e.g. pressure) versus time were obtainable, and are given at C.4.2.1. The dispersion results are given in 3.3.5.2.
C.4.2.1 Discharge resultsThe discharge conditions for scenarios 3 and 4 are the same because the only difference between the two is the wind speed, which affects how the released CO2 disperses and not how it exits the pipeline. (Note, the graphs say D1.5 on the legend but this should be ignored.)
The following time varying graphs were obtained: − mass flow rate vs. time (Figure C.10); − total mass remaining in the pipeline vs. time (Figure C.11); − pressure at the orifice vs. time (Figure C.12); and − release temperature vs. time (Figure C.13).
Figure C.10 shows the mass flow rate vs. time, where the pink line shows conditions at the orifice and the blue line shows the conditions upstream. The blue line is equal to 0 kg/s because the pumped inflow was assumed to be negligible when compared to the initial flow rates following the rupture. At the orifice, the pressure drop in the pipeline means the flow rate reduces rapidly over the first five seconds from 2 400 kg/s to 800 kg/s then to approximately 0 kg/s after 205 seconds. The ESDV operates at 120 seconds preventing

RESEARCH REPORT: HAZARD ANALYSIS FOR OFFSHORE CARBON CAPTURE PLATFORMS AND OFFSHORE PIPELINES
119
material further upstream being released. After 120 seconds, only material within the 600 m section of pipe can be released, so there is a much larger drop off in flow rate, as the pipe section empties quickly.
Figure C.11 shows how the mass varies with time. The red line represents the mass of material that has been released, and at 205 seconds, this is equivalent to approximately 65 te. The unified dispersion model (UDM) used by PHAST cannot model a fully time varying set of discharge results, so for the long pipeline cases, the release rate was averaged between 0 seconds and 20 seconds. The total amount of mass expelled over the 20 seconds was calculated (in this case just over 15 500 kg) and then divided by this time to give the representative release rate to be used in the UDM (in this case 775 kg/s). PHAST then scans through the time varying discharge results to identify the point at which the actual release rate equals the representative release rate (at around seven seconds according to Figure C.10) and uses the conditions at this point (temperature and velocity, etc.) to represent the release.
Note: The dark blue line is the upstream flow rate and the pink line is the orifice flow rate.
Figure C.10 Scenarios 3 and 4: mass flow rate vs. time
Note: The black line represents the ‘active mass’ (the mass in the pipeline at a given time), and the red line is the expelled mass and the blue line is the total (sum of the active and expelled masses).
Figure C.11 Scenarios 3 and 4: mass vs. time

RESEARCH REPORT: HAZARD ANALYSIS FOR OFFSHORE CARBON CAPTURE PLATFORMS AND OFFSHORE PIPELINES
120
The black line represents the ‘active’ mass in the pipeline, and for the first 120 seconds, this is equal to the mass left in the 150 km pipeline at a particular time (at 0 seconds the available mass calculated by PHAST is approximately 9,2 × 10⁶ kg, based on the storage conditions of 150 barg at 4 ºC). Over this time period, the black line reduces as the red line (expelled mass) increases, but the scale of Figure C.11 is too large to show distinct changes. After 120 seconds the ESDV operates, and the initial ‘active’ mass is equivalent to approximately 10 000 kg, which is the amount of CO2 estimated to be in the 600 m section of pipeline at this time. The amount of material rapidly drops off and at 205 seconds the ‘active mass’ is approximately 300 kg.
The blue line represents the reduction in mass over 205 seconds for the entire (‘total’) 150 km pipeline inventory. Between 0 and 120 seconds, the ‘active’ mass is equal to the ‘total’ mass; this is because the material available for release is the same as the amount of material present in the entire pipeline. The ‘expelled’ mass summed with the ‘total’ mass left in the pipeline at a given time equals the mass that was available at the initial event, (9.2 × 10⁶ kg). After 120 seconds, the blue line still represents how the mass reduces over time for the entire 150 km pipe, and as before the ‘total’ mass plus the ‘expelled’ mass equals the mass that was available at 0 seconds. The blue line appears to be constant but it does reduce after 205 seconds by 65 te.
Figure C.12 describes the relationship between the pipeline pressure and the time. Prior to rupture, the CO2 was being stored at 150 barg and after rupture, the pressure drops rapidly to the saturation vapour pressure for CO2 at 4 ºC (38,76 bar absolute) along the entire length of the pipeline. Next, a two-phase flash front travels from the orifice towards the upstream end of the pipeline (from Figure C.9, this means the front propagates downwards). The ‘upstream’ point is considered to be just ahead of the flashing front where the flow is undisturbed and behind the flashing front, the liquid CO2 begins to evaporate which causes cooling (PHAST will not consider formation of solids within the pipeline, it will only do this once the flow has passed through the orifice). Eventually, the flashing front will reach the end of the 150 km pipeline (assuming the ESDV remains open) and the pipeline will be fully depressurised.
Note: The pink line represents the orifice pressure and the blue line represents the upstream pressure.
Figure C.12 Scenarios 3 and 4: pressure vs. time
Upstream of the release the pressure inside the pipeline remains constant at the saturation vapour pressure until 120 seconds when the ESDV operates. Before 120 seconds, ‘upstream’ is considered to be just ahead of the flash front where the pressure is 38,76 bar absolute. However, the flash front spreads rapidly through the pipeline and at 120 seconds it is well

RESEARCH REPORT: HAZARD ANALYSIS FOR OFFSHORE CARBON CAPTURE PLATFORMS AND OFFSHORE PIPELINES
121
beyond the ESDV at 600 m. Directly before closure, say at 119 seconds, at 600 m the material is no longer in single phase and the pressure has dropped. On closure, ‘upstream’ is now considered to be at the end of the 600 m section and the condition of the CO2 stream at this point (25 barg) is plotted on Figure C.12. If the ESDV was located at a distance greater than 600 m, to an extent that the valve closed before the flash front reached it, then the initial pressure drop would not be as sudden. The upstream pressure then tails off gradually until 205 seconds when the pipeline has fully depressurised to ambient pressure (1 bar absolute) and the flow rate equals just above 0 kg/s. After closure, it takes the upstream end of the 600 m pipeline 85 seconds to depressurise to ambient pressure.
The pink line shows what occurs at the orifice, and over the first five seconds there is a rapid reduction in pressure from 38,76 bar absolute to 14 bar absolute. The depressurisation occurs less rapidly until 120 seconds, when the ESDV operates. After this the depressurisation is much more rapid because there is less CO2 available and after 165 seconds, the orifice has reached ambient pressure approximately 35 seconds before the upstream section of the pipeline.
The PHAST temperature plot (Figure C.13) follows a similar pattern to the pressure plot (Figure C.12) because the two parameters are related, and as such, the dynamics of the flashing front also affect the upstream temperature. Before the valve closes the pipeline is at 4 ºC, the same as its initial storage conditions (though the pressure has fallen to the saturation vapour pressure for this temperature as shown by Figure C.12). The flashing front is well beyond the location of the ESDV when it shuts so the ‘upstream’ location shifts from ahead of the front directly before closure to 600 m on closure, and hence the rapid drop in temperature. The upstream temperatures plotted in Figure C.13 after 120 seconds are approximately the saturation temperatures for the corresponding pressures in Figure C.12 (at 120 seconds, the saturation vapour temperature at 25.7 bar absolute is –11,10 ºC). The CO2
follows the saturation line on its temperature pressure diagram for another 45 seconds (165 seconds in total), and after this it has reached its triple point temperature. Above the triple point temperature liquid properties are assumed and below the triple point temperature solid properties are assumed. Solid properties are assumed from 165 seconds and last for the remainder of the release. However, PHAST is not able to model upstream solid effects so less accurate results may occur.
Note: The blue line represents the upstream temperature and the pink line represents the orifice temperature.
Figure C.13 Scenarios 3 and 4: temperature vs. time

RESEARCH REPORT: HAZARD ANALYSIS FOR OFFSHORE CARBON CAPTURE PLATFORMS AND OFFSHORE PIPELINES
122
The pink line shows that the orifice temperature falls from +4 ºC to -55 ºC over the initial 120 seconds. These are the saturation vapour temperatures for the orifice pressures given in Figure C.12. PHAST does not model heat absorbed from the CO2 itself, from adjacent pipe material, or the atmosphere, so this temperature may not be realised in practice.
Just prior to 120 seconds, the CO2 in the pipeline is just above the triple point, and is therefore in its liquid phase, but after this point PHAST assumes solid phase properties. The temperature drop at the orifice is much more rapid after the valve shuts because the pressure drop is more rapid due to the lower pipeline length (volume) considered. The temperature falls to the minimum of –88 ºC after 165 seconds, and remains at this temperature for the next 30 seconds, until the pipeline has fully depressurised. However, the graphs suggest the formation of solids within the pipeline but PHAST cannot currently model solids effects from stagnation conditions to orifice conditions. It may be possible for the solid CO2 to plug the hole preventing further escape of CO2 but this would not be modelled in PHAST.
C.4.2.2 and C.4.2.3 give the dispersion results for scenarios 3 and 4 respectively.
C.4.2.2 Scenario 3 – dispersion modellingThe details of scenario 3 are given in more detail at the start of section C.4.2. Scenarios 3 and 4 are the same except for the wind speed; the former uses 1,5 m/s and the latter uses 5 m/s.
Scenario 3 does not reach steady state before the release stops and Figure C.14 shows the progression of the cloud over four time snapshots; graph (i) at 83,77 seconds, graph (ii) at 85,97 seconds, graph (iii) at 134,5 seconds and graph (iv) at 218,2 seconds. Using Figure C.9, the release rate for scenarios 3 and 4 was calculated to be 775 kg/s, and because approximately 65 te of material was released, the duration of the release was calculated to be 83,39 seconds. The dispersion graphs are based on this release rate and duration, which is why the timing for the time varying graphs (release estimated to last 205 seconds for a variable release rate) for the releases do not match those in Figure C.14 and C.15. The conditions of the plume (i.e. temperature) were taken at the point where the actual release equalled the representative 775 kg/s as discussed in section C.4.2.
Graph (i) shows the state of the cloud around the time that the 600 m section of pipeline (using 775 kg/s for 83,39 seconds) has emptied, and at this point the release from the orifice has stopped even though the plume will be present for much longer. The discontinuity at 127 m is the transition point between Phast’s elevated jet and grounded jet models.
Graph (ii) shows the state of the cloud directly after (85,97 seconds) the release from the orifice has finished. As the release is not steady state, PHAST models the initial short release as continuous (graph (i)), and once the release stops, it selects the quasi-instantaneous model, which replaces the continuous plume with an equivalent instantaneous cloud. Note that the back edge of the cloud has jumped from 87 m in graph (i) to 37 m in graph (ii).
In between graphs (ii) and (iii), the ESDV operates at 120 seconds even though the release from the orifice, using the representative flow rate and duration, has already stopped. The closure of the ESDV is not directly taken into account in the dispersion modelling. PHAST estimates the total mass released, and uses the 775 kg/s release rate to estimate a duration, and it is this duration which affects the dispersion distance. For example, if the ESDV operated at 200 seconds, the release rate would still be 775 kg/s, but over the 200 seconds, more CO2
would be released which would give a duration larger than 83,39 seconds and subsequently the plume would be larger. It should be realised that increasing the duration will only affect the cloud size if the plume has not reached steady state. Once the plume has reached steady state the release duration could be infinite and it would not increase the size of the footprints.
Graph (iii) shows that the equivalent instantaneous cloud has slumped from 75 m to 15 m after 134,5 seconds. The front edge of the cloud has travelled almost 430 m.

RESEARCH REPORT: HAZARD ANALYSIS FOR OFFSHORE CARBON CAPTURE PLATFORMS AND OFFSHORE PIPELINES
123
Graph (iv) shows that the cloud continues to slump, spread and dilute, and after 218,2 seconds, the plume is at the point of complete dilution.
At 1,5 m/s the wind speed is quite low so the plume remains almost exactly vertical before momentum reduces and the plume begins to slump. Figure C.14 shows that the most hazardous concentrations remain local to the source and do not follow the slumping effects of the 0,5 % contour. The riser fails at sea level, and as the platform is 25 m in height, there is the potential for serious injury or fatalities on the platform deck. However, the plume at this point is quite narrow so personnel would need to be in the surrounding area to experience the effects.

RESEARCH REPORT: HAZARD ANALYSIS FOR OFFSHORE CARBON CAPTURE PLATFORMS AND OFFSHORE PIPELINES
124
Graph
(i)
Graph
(ii)
Graph
(iii)
Graph
(iv)
Not
e: T
he p
rogr
essi
on o
f th
e cl
oud
is s
how
n at
: 83,
77 s
econ
ds -
gra
ph (i
), 85
,97
seco
nds
- gr
aph
(ii),
134,
5 se
cond
s -
grap
h (ii
i) an
d 21
8,2
seco
nds
- gr
aph
(iv).
The
blac
k lin
es in
dica
te t
he a
ppro
xim
ate
heig
ht a
nd w
idth
of
the
plat
form
.
Fig
ure
C.1
4 S
ide
view
fo
r sc
enar
io 3

RESEARCH REPORT: HAZARD ANALYSIS FOR OFFSHORE CARBON CAPTURE PLATFORMS AND OFFSHORE PIPELINES
125
PHAST is not able to show a complete picture of the side view and for non-steady state releases, showing the plume as time progresses is the best way to present the behaviour of the cloud. For the footprint, PHAST is able to determine how it varies over time to form a composite maximum concentration footprint showing the widest and longest extent of the plume.
Figure C.15 shows the maximum footprint for scenario 3. Measured to the 0,5 % concentration, the plume extends to a maximum of 560 m downwind and is 300 m at its widest. None of the larger concentrations (2 %, 3 % and 10 %) reach sea level.
Figure C.15 Maximum concentration footprint for scenario 3 at sea level height, i.e. 0 m
Figure C.16 shows the lethality footprint, which was obtained at 26,6 m (the assumed height of the platform deck above). The lethality footprints range from 3 m to 5 m downwind and 1 m to 4 m upwind. The maximum width is approximately 3 m for them all.
The jet was assumed to be unimpeded; in practice the deck itself will present a restriction to the upward flow of the CO2 jet, and there may be other restrictions as well.
However, the long pipeline model used to calculate the conditions within the pipeline and at the orifice suggests that the formation of solids is possible. PHAST cannot model solids within the pipeline so any dispersion results may be less accurate.
C.4.2.3 Scenario 4 – dispersion modellingThe results for scenario 4 were obtained in the same way as scenario 3, but this time a wind speed of 5 m/s was used. Figure C.17 shows how different the shape of the plume is just by increasing the wind speed from 1,5 m/s (Figure C.14) to 5 m/s. This time the wind is sufficient to begin bending the plume, which can be seen to start at around 20 m vertically. The wind enhances turbulent mixing within the plume, and by 43,71 seconds, well before the release stops at 83,39 seconds and operation of the ESDV at 120 seconds, the plume has reached a steady state.

RESEARCH REPORT: HAZARD ANALYSIS FOR OFFSHORE CARBON CAPTURE PLATFORMS AND OFFSHORE PIPELINES
126
Figure C.16 Lethality footprint for scenario 3 at 26,6 m
Figure C.17 Side view for scenario 4
For scenario 4, the wind velocity is sufficiently high that it dilutes the cloud before significant slumping, and even though this begins around 100 m (0,5 % contour), it does not impinge on the sea. As with scenario 3, the most hazardous concentrations remain local to the release. Even though the scenario 4 plume does not reach as high as the scenario 3 plume, it is still sufficient to reach platform level and potentially cause significant harm.
The plume does not become grounded, so the footprint (Figure C.18) and lethality (Figure C.19) graphs were obtained at 26,6 m (25 m high platform, 1,6 m receiver). The maximum footprint concentration footprint shows that the 0,5 % contour extends approximately 6 m downwind and 4 m upwind. The 10 % contour extends 3 m downwind and 1,4 m upwind. The contours indicate that there is the potential to cause serious harm at platform level.

RESEARCH REPORT: HAZARD ANALYSIS FOR OFFSHORE CARBON CAPTURE PLATFORMS AND OFFSHORE PIPELINES
127
Figure C.18 Maximum concentration footprint for scenario 4 at 26,6 m
The lethality graph is shown in Figure C.19. The 0 001 and 0 01 lethality contours have a similar shape and extend approximately 8,4 m downwind. The 0,1 contour extends 8 m downwind and the 1 lethality contour extends 2,8 m downwind. All contours have a maximum width between 6 and 7 m. All these contours will cover a limited area of platform, but there is some potential to cause serious harm and death to personnel local to the release point.
However, the long pipeline model used to calculate the conditions within the pipeline and at the orifice suggests that the formation of solids is possible. PHAST cannot model solids within the pipeline so any dispersion results may be less accurate.
Figure C.19 Lethality footprint for scenario 4 at 26,6 m
C.4.3 Scenarios 5 and 6
Scenarios 5 and 6 were set up in a similar manner to scenarios 3 and 4, except the ESDV was removed. This meant the inventory of the entire 150 km pipeline was available, resulting in an unconstrained release which reached steady state. The configuration for scenarios 5 and 6 is shown in Figure C.20. The shaded downstream end of the riser was ignored because it was assumed that non-return valves were present on the re-injection end, preventing backflow from the well.

RESEARCH REPORT: HAZARD ANALYSIS FOR OFFSHORE CARBON CAPTURE PLATFORMS AND OFFSHORE PIPELINES
128
Figure C.20 Layout of scenarios 5 and 6
Note: the arrows show the direction of flow.
The wind speed was the only difference between the scenarios, 5 used 1,5 m/s and 6 used 5 m/s.
C.4.3.1 Discharge resultsThe long pipeline model was used for scenarios 5 and 6 so the full range of pipeline results requested were obtained:
− mass flow rate vs. time (Figure C.21); − total mass remaining in the pipeline vs. time (Figure C.22); − pressure at the orifice vs. time (Figure C.23).
The discharge conditions were the same for scenarios 5 and 6, the wind speed only affects the dispersion and not how the CO2 exits the pipe. The graph legends state D1.5 weather but this should be ignored as the results are applicable to both weather conditions. Both scenarios were unconstrained and there was sufficient CO2 within the 150 km pipeline for the release to last many hours, assuming there were no valves over the entire length of the pipeline to limit the flow. Figures C.21 to C.23 were obtained over a time period of 100 000 seconds (28 hours approx) and as a result, all the x axes are logarithmic and the y axis in Figure C.22 is also logarithmic.
Figure C.21 illustrates the behaviour of the mass flow rate with time. Over the first 100 seconds, there is a rapid reduction in flow rate from 2 300 kg/s to approximately 350 kg/s. After 100 seconds, the reduction in flow rate is much less rapid and is approximately 40 kg/s at 100 000 seconds. As with scenarios 3 and 4, there is no modelling of pumped inflow through the pipeline because it is considered to be negligible when compared to the initial flow rate, and as a result the upstream flow rate reads as 0 kg/s.

RESEARCH REPORT: HAZARD ANALYSIS FOR OFFSHORE CARBON CAPTURE PLATFORMS AND OFFSHORE PIPELINES
129
Note: The dark blue line is the upstream flow rate and the pink line is the orifice flow rate.
Figure C.21 Scenarios 5 and 6: Mass flow rate vs. time
Figure C.22 is more straightforward to interpret than its counterpart Figure C.11 (scenarios 3 and 4) because there is no ESDV to limit the flow. This time the ‘total’ amount of material is equal to the ‘active’ material in the pipeline for the whole release because both are being measured over 150 km, and there are no valves to split the pipeline into sections (the ‘active’ line overlays the ‘total’ line). As before the ‘total’ and ‘active’ decrease over time but for the first 10 000 seconds, the decrease is too small to be apparent, though after this time, the decrease is more noticeable.
The red line indicates how much material was released over 100 000 seconds (approximately 5,4 × 10⁶ kg). The red line and black line converge at approximately 76 000 seconds, and after this there is more expelled mass than mass remaining in the pipeline.
The release rate used for the dispersion calculations was averaged over the first 20 seconds, by calculating the amount of material released over this time and then dividing by 20. Scenarios 5 and 6 have a release rate of 775 kg/s, the same as scenarios 3 and 4 because all of the storage conditions are the same.
Figure C.23 shows how the pressure behaves upstream in the pipeline and at the orifice. For scenarios 5 and 6, the flash front discussed in C.4.2 travels along the pipeline and the ‘upstream’ position does not need to be reset because there are no valves. The ‘flash front’ hits the end of the 150 km pipeline at 69 000 seconds (19,17 hours), which explains the sudden drop in upstream pressure.

RESEARCH REPORT: HAZARD ANALYSIS FOR OFFSHORE CARBON CAPTURE PLATFORMS AND OFFSHORE PIPELINES
130
Note: The black line represents the ‘active mass’ (the mass in the pipeline at a given time) the red line is the expelled mass and the blue line is the total (sum of the active and expelled masses).
Figure C.22 Scenarios 5 and 6: mass vs. time
The initial upstream and orifice pressures are both 38,76 bar absolute (saturation vapour pressure at 4 ºC), but the orifice pressure appears to be lower because the logarithmic time scale does not start at exactly the 0 seconds point. The orifice pressure falls rapidly over the first 10 seconds before reaching ambient pressure at 18 000 seconds (five hours).
Note: The pink line represents the orifice pressure and the blue line represents the upstream pressure.
Figure C.23 Scenarios 5 and 6: pressure vs. time
The dispersion modelling results for scenarios 5 and 6 are given in 3.7.5.3.The temperature diagram was not requested for this scenario so solid formation
cannot be confirmed at the orifice even though the pressure does fall below the triple point pressure. PHAST assumes solid behaviour for temperatures below the triple point temperature. The upstream pressure remains above 34 bar absolute for the entire release so PHAST did not predict solid formation.

RESEARCH REPORT: HAZARD ANALYSIS FOR OFFSHORE CARBON CAPTURE PLATFORMS AND OFFSHORE PIPELINES
131
C.4.3.2 Scenario 5 – dispersion modellingThe entire 150 km pipeline inventory was available for dispersion so the plume was able to reach steady state, which it did after 231,9 seconds, according to Figure C.24. Up to 207 seconds, the shape of the cloud is the same as scenario 3 because the release conditions were the same. After this point, the scenario 3 plume became quasi-instantaneous due to the ESDV operating, but for scenario 5, this did not occur and the cloud was able to reach steady state.
The 0,5 % contour reaches a maximum height of 170 m and extends 670 m downwind. The slight discontinuity at 128 m is the transition point between Phast’s elevated jet and grounded jet models. The 2 %, 3 % and 10% contours are the same as scenario 3, and do not impinge on the sea. These concentrations remain local to the source but all extend above deck level so there is the potential to harm workers on the rig at platform level.
In terms of downwind distance, the similarities between Figures C.14 and C.24 indicate that for the most hazardous concentrations, operation of the ESDV has no effect on the height or downwind extent of the plume. The dimensions are determined at 83,39 seconds, well before the ESDV shuts and just before scenario 3 stops. Removal of the ESDV as in scenarios 5 and 6, affects the size and shape of the plume for low concentrations only.
Figure C.24 Side view for scenario 5
Figure C.25 shows the extent of the concentration footprint at 0 m for scenario 5 which extends 660 m downwind and has a maximum width of approximately 360 m. This footprint is only slightly larger than the maximum concentration footprint for scenario 3 (560 m), even though the unconstrained scenario 5 release was expected to be much larger. For modelling scenario 5, PHAST used the continuous release models for the entire duration but for scenario 3, PHAST used a combination of continuous and quasi-instantaneous models, which explains some of the discrepancies.

RESEARCH REPORT: HAZARD ANALYSIS FOR OFFSHORE CARBON CAPTURE PLATFORMS AND OFFSHORE PIPELINES
132
Figure C.25 Footprint for scenario 5 at sea level height, i.e. 0 m
Figure C.26 shows the lethality footprint for Scenario 5. The footprint (0,5 %) extends just over 4,4 m and has a maximum width of approximately 3 m with no upwind extent. The dimensions for scenario 5 lethality are slightly smaller than for scenario 3 lethality, which seems contradictory because operating the ESDV is supposed to be a form of mitigation. According to the results, the lethality when operating the ESDV is worse than if there were no ESDV.
The discrepancy in these results arises because PHAST uses the quasi-instantaneous model for scenario 3 (with ESDV) when the release stops which influences the lethality calculation, whereas the continuous release model is used when there is no ESDV (scenario 5). For the quasi-instantaneous release, PHAST needs to ‘stitch’ together the results from the initial continuous release and the subsequent instantaneous puff and this is where discrepancies can arise. From graph (i) in Figure C.14, the point of touch down is approximately 87 m, but in graph (ii), this point moves upwind to 37 m before moving downwind again.
C.4.3.3 Scenario 6 – dispersion modellingThe results for scenario 6 (Figure C.17) are the same as for scenario 4 (Figure C.27). This is because both plumes reached steady state before the release stopped, and in the case of scenario 4, before the ESDV operated. If the ESDV operated before 83 seconds, then the results for scenario 4 and 6 would be different.
To avoid repetition, see 3.7.5.2 for the full discussion of scenario 4, which also applies to scenario 6.
Figure C.26 Lethality footprint for scenario 5 at 26,6 m

RESEARCH REPORT: HAZARD ANALYSIS FOR OFFSHORE CARBON CAPTURE PLATFORMS AND OFFSHORE PIPELINES
133
Figure C.27 Side view for scenario 6
C.4.4 Scenarios 7 and 8
Figure C.28 shows the configuration for scenarios 7 and 8. These scenarios were based on an underwater pipeline 150 km in length, with a guillotine failure 2 km from land. The pipeline was 710 mm bore diameter with a hole size of 300 mm which was assumed to be located at the top of the pipeline as shown.
The relative aperture (ratio of hole size area to the internal cross sectional area of the pipeline) for this scenario was 0,18, which is close to the lower limit of 0,2. As the hole is located 2 km from the end and not at one end of the pipeline, flow from both sections needs to be considered. The 2 km section will contain a considerable amount of CO2 - too much to be excluded from the discharge calculation. The flow will be from both sections until the shorter 2 km pipeline empties, and then the flow will be from one end. Normally if the break is located in the middle of the pipeline it is appropriate to use the vessel model as long as the release rate is double to account for both ends of the pipeline. However, for scenarios 7 and 8, the flow rate and duration from the two ends will be different so doubling the release rate estimated by the vessel model would not be appropriate as the dispersion results would be over conservative. If the release rate were not doubled then this would also not be representative because the initial flow would be too low, and the results may be under conservative. As the relative aperture is slightly under the lower limit of 0,2, it was considered more appropriate to use a slightly larger hole size to bring the relative aperture from 0,18 to 0,2, so that the mechanics of the release from both ends of the pipeline can be modelled appropriately.
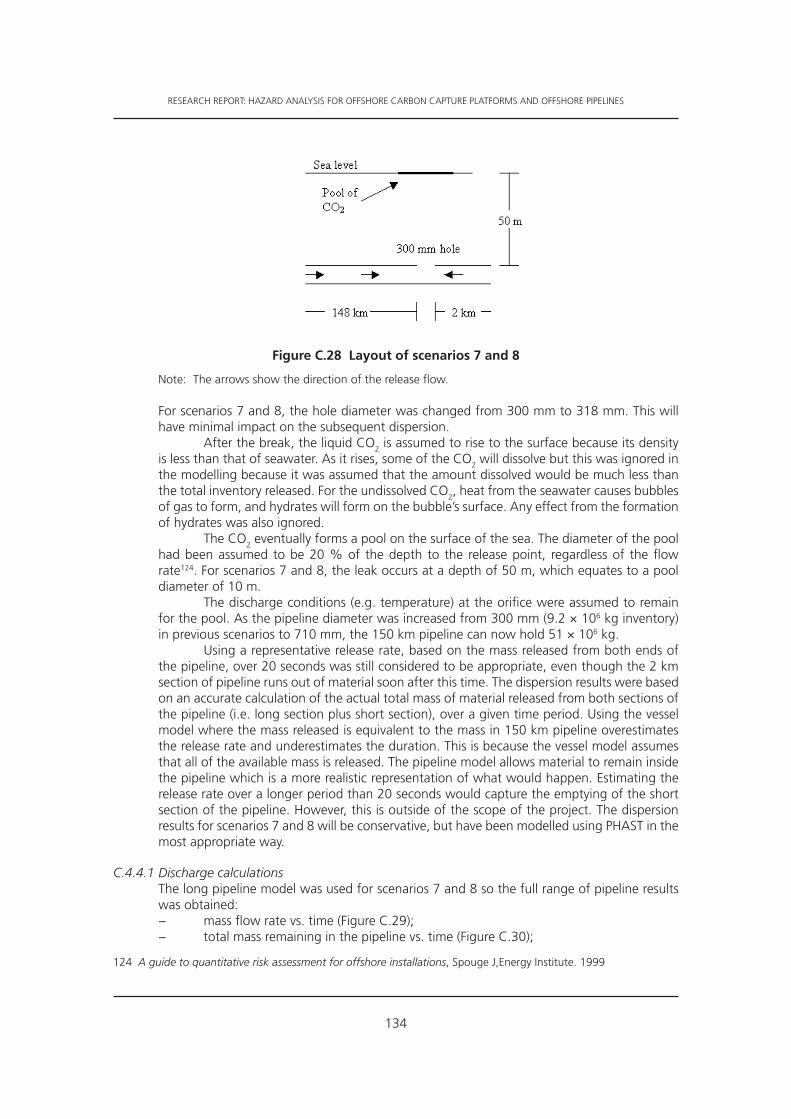
RESEARCH REPORT: HAZARD ANALYSIS FOR OFFSHORE CARBON CAPTURE PLATFORMS AND OFFSHORE PIPELINES
134
Figure C.28 Layout of scenarios 7 and 8
Note: The arrows show the direction of the release flow.
For scenarios 7 and 8, the hole diameter was changed from 300 mm to 318 mm. This will have minimal impact on the subsequent dispersion.
After the break, the liquid CO2 is assumed to rise to the surface because its density is less than that of seawater. As it rises, some of the CO2 will dissolve but this was ignored in the modelling because it was assumed that the amount dissolved would be much less than the total inventory released. For the undissolved CO2, heat from the seawater causes bubbles of gas to form, and hydrates will form on the bubble’s surface. Any effect from the formation of hydrates was also ignored.
The CO2 eventually forms a pool on the surface of the sea. The diameter of the pool had been assumed to be 20 % of the depth to the release point, regardless of the flow rate124. For scenarios 7 and 8, the leak occurs at a depth of 50 m, which equates to a pool diameter of 10 m.
The discharge conditions (e.g. temperature) at the orifice were assumed to remain for the pool. As the pipeline diameter was increased from 300 mm (9.2 × 10⁶ kg inventory) in previous scenarios to 710 mm, the 150 km pipeline can now hold 51 × 106 kg.
Using a representative release rate, based on the mass released from both ends of the pipeline, over 20 seconds was still considered to be appropriate, even though the 2 km section of pipeline runs out of material soon after this time. The dispersion results were based on an accurate calculation of the actual total mass of material released from both sections of the pipeline (i.e. long section plus short section), over a given time period. Using the vessel model where the mass released is equivalent to the mass in 150 km pipeline overestimates the release rate and underestimates the duration. This is because the vessel model assumes that all of the available mass is released. The pipeline model allows material to remain inside the pipeline which is a more realistic representation of what would happen. Estimating the release rate over a longer period than 20 seconds would capture the emptying of the short section of the pipeline. However, this is outside of the scope of the project. The dispersion results for scenarios 7 and 8 will be conservative, but have been modelled using PHAST in the most appropriate way.
C.4.4.1 Discharge calculationsThe long pipeline model was used for scenarios 7 and 8 so the full range of pipeline results was obtained:
− mass flow rate vs. time (Figure C.29); − total mass remaining in the pipeline vs. time (Figure C.30);
124 A guide to quantitative risk assessment for offshore installations, Spouge J,Energy Institute. 1999

RESEARCH REPORT: HAZARD ANALYSIS FOR OFFSHORE CARBON CAPTURE PLATFORMS AND OFFSHORE PIPELINES
135
− pressure at the orifice vs. time (Figure C.31).
As with the other plots, the discharge conditions apply to both scenarios 7 and 8, and the weather condition of the legend should be ignored as it is used for the dispersion not the discharge.
As there are two sections of pipeline involved, Figures C.29 to C.31 contain more information on the legend than previous examples. The ‘A’ term, for example ‘A-Upstream’ stands for section A – the 150 km section of pipeline, the ‘B’ term stands for section B - the 2 km section of pipeline and ‘T’ stands for the summed total for sections A and B.
Figure C.29 shows how the flow rate is affected for both sections of the pipeline. The pale blue line shows the overall contribution from the two sections of the pipeline. At 0 seconds, the flow rate from sections A and B are the same because initially the release conditions are the same. Each is 2 700 kg/s, and when summed, yields an overall release rate of 5 400 kg/s. At just before 100 seconds, the inventory of the 2 km section B begins to run out, the flow rate begins to tail off, and stops completely at 700 seconds. The flow rate for section A (black line) is visible for as long as the two rates are different (i.e. between 100 seconds and 700 seconds). At 700 seconds, the black line joins up with the pale blue line as only section A contributes to the total release rate. The upstream lines for section A (dark blue line) and section B (yellow line) are 0 kg/s throughout because the pumped inflow was set to zero because it was assumed to be negligible when compared to the initial flow rates.
At 100 000 seconds (just under 28 hours), the flow rate has reduced to 200 kg/s, which is still a reasonably large flow rate.
Note: Upstream and downstream sections are considered as well as the total.
Figure C.29 Scenarios 7 and 8: mass flow rate vs. time
Figure C.30 illustrates how the mass varies with time for both ends of the pipeline and overall. The dark blue line represents the total amount of active mass left in the entire pipeline and is the sum of the green line (active mass in section A) and the pale blue line (active mass in section B). The mass in section A dominates the total mass and the logarithmic scale of Figure C.30 means the dark green line is underneath the dark blue line, though they are in fact different. The dark blue and pale blue lines look constant initially, but they are decreasing though this effect is not captured, again, because of the scale of the graph and the reduction in mass involved. After 700 seconds (just under 12 minutes), section B is essentially empty (only 4 500 kg remaining) so only section A contributes to the total mass. Then, after approximately 10 000 seconds (just under three hours), the total active mass in the pipeline begins to fall more rapidly.
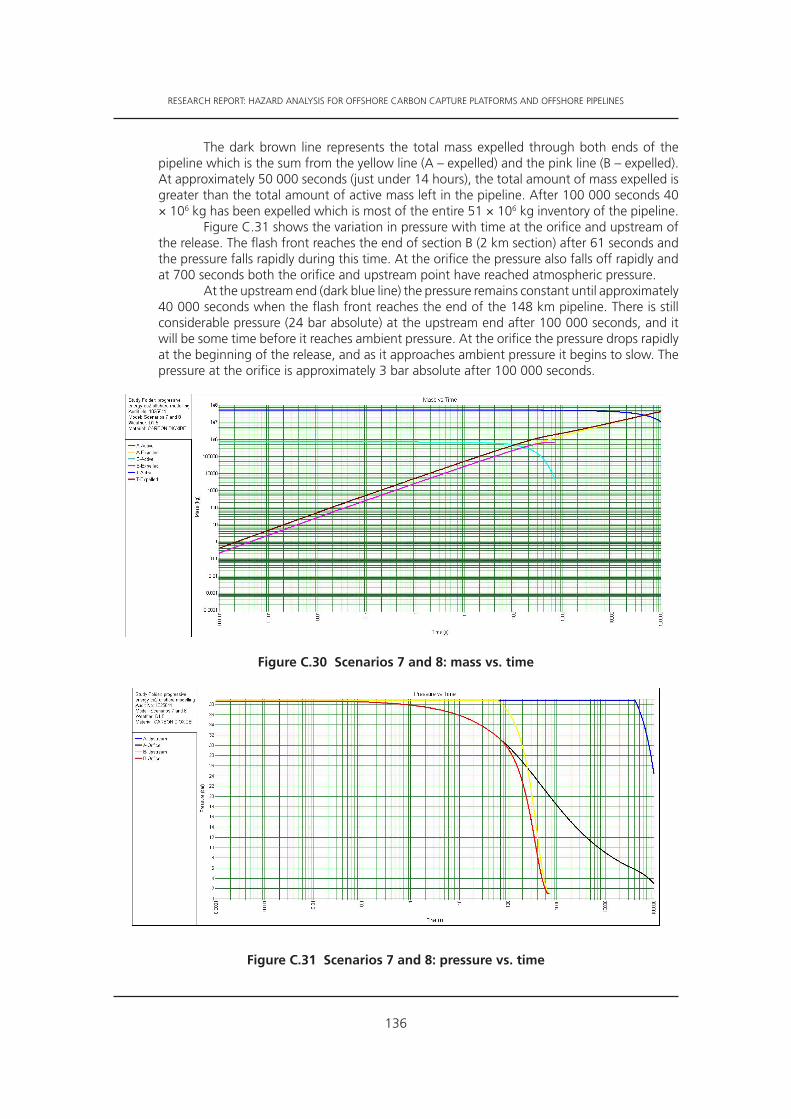
RESEARCH REPORT: HAZARD ANALYSIS FOR OFFSHORE CARBON CAPTURE PLATFORMS AND OFFSHORE PIPELINES
136
The dark brown line represents the total mass expelled through both ends of the pipeline which is the sum from the yellow line (A – expelled) and the pink line (B – expelled). At approximately 50 000 seconds (just under 14 hours), the total amount of mass expelled is greater than the total amount of active mass left in the pipeline. After 100 000 seconds 40 × 106 kg has been expelled which is most of the entire 51 × 106 kg inventory of the pipeline.
Figure C.31 shows the variation in pressure with time at the orifice and upstream of the release. The flash front reaches the end of section B (2 km section) after 61 seconds and the pressure falls rapidly during this time. At the orifice the pressure also falls off rapidly and at 700 seconds both the orifice and upstream point have reached atmospheric pressure.
At the upstream end (dark blue line) the pressure remains constant until approximately 40 000 seconds when the flash front reaches the end of the 148 km pipeline. There is still considerable pressure (24 bar absolute) at the upstream end after 100 000 seconds, and it will be some time before it reaches ambient pressure. At the orifice the pressure drops rapidly at the beginning of the release, and as it approaches ambient pressure it begins to slow. The pressure at the orifice is approximately 3 bar absolute after 100 000 seconds.
Figure C.30 Scenarios 7 and 8: mass vs. time
Figure C.31 Scenarios 7 and 8: pressure vs. time
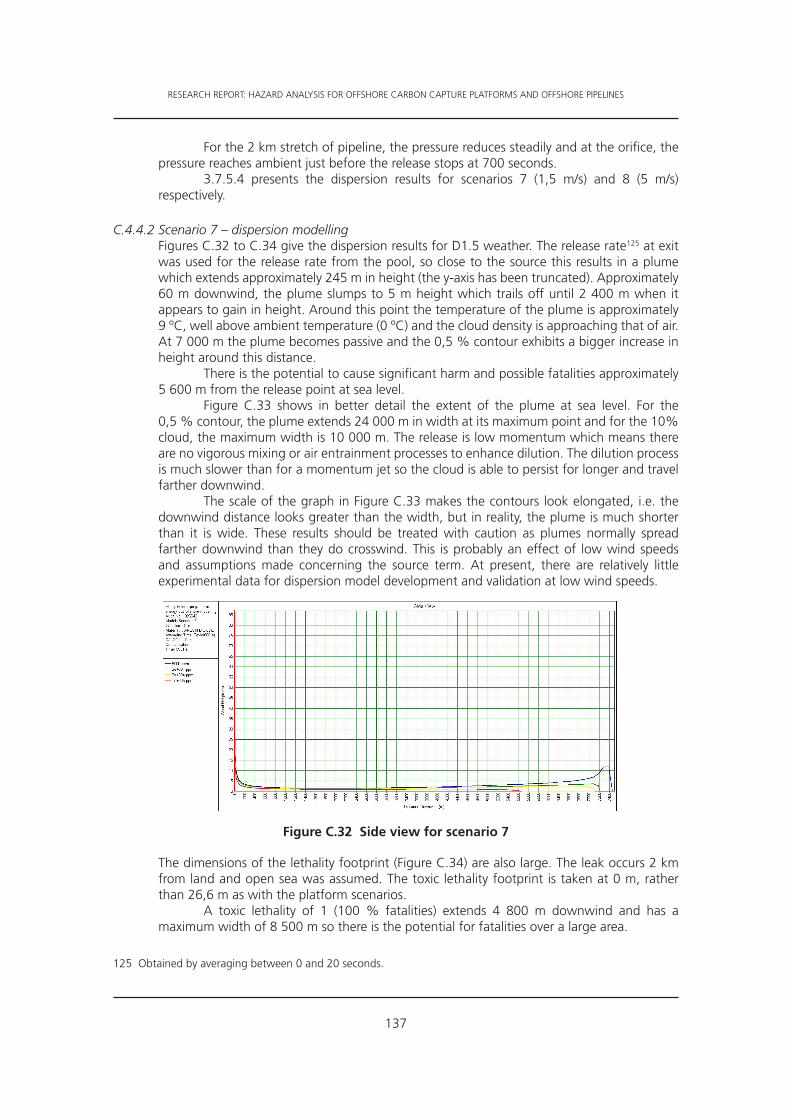
RESEARCH REPORT: HAZARD ANALYSIS FOR OFFSHORE CARBON CAPTURE PLATFORMS AND OFFSHORE PIPELINES
137
For the 2 km stretch of pipeline, the pressure reduces steadily and at the orifice, the pressure reaches ambient just before the release stops at 700 seconds.
3.7.5.4 presents the dispersion results for scenarios 7 (1,5 m/s) and 8 (5 m/s) respectively.
C.4.4.2 Scenario 7 – dispersion modellingFigures C.32 to C.34 give the dispersion results for D1.5 weather. The release rate125 at exit was used for the release rate from the pool, so close to the source this results in a plume which extends approximately 245 m in height (the y-axis has been truncated). Approximately 60 m downwind, the plume slumps to 5 m height which trails off until 2 400 m when it appears to gain in height. Around this point the temperature of the plume is approximately 9 ºC, well above ambient temperature (0 ºC) and the cloud density is approaching that of air. At 7 000 m the plume becomes passive and the 0,5 % contour exhibits a bigger increase in height around this distance.
There is the potential to cause significant harm and possible fatalities approximately 5 600 m from the release point at sea level.
Figure C.33 shows in better detail the extent of the plume at sea level. For the 0,5 % contour, the plume extends 24 000 m in width at its maximum point and for the 10% cloud, the maximum width is 10 000 m. The release is low momentum which means there are no vigorous mixing or air entrainment processes to enhance dilution. The dilution process is much slower than for a momentum jet so the cloud is able to persist for longer and travel farther downwind.
The scale of the graph in Figure C.33 makes the contours look elongated, i.e. the downwind distance looks greater than the width, but in reality, the plume is much shorter than it is wide. These results should be treated with caution as plumes normally spread farther downwind than they do crosswind. This is probably an effect of low wind speeds and assumptions made concerning the source term. At present, there are relatively little experimental data for dispersion model development and validation at low wind speeds.
Figure C.32 Side view for scenario 7
The dimensions of the lethality footprint (Figure C.34) are also large. The leak occurs 2 km from land and open sea was assumed. The toxic lethality footprint is taken at 0 m, rather than 26,6 m as with the platform scenarios.
A toxic lethality of 1 (100 % fatalities) extends 4 800 m downwind and has a maximum width of 8 500 m so there is the potential for fatalities over a large area.
125 Obtained by averaging between 0 and 20 seconds.

RESEARCH REPORT: HAZARD ANALYSIS FOR OFFSHORE CARBON CAPTURE PLATFORMS AND OFFSHORE PIPELINES
138
Figure C.33 Footprint for scenario 7 at sea level height, i.e. 0 m
Figure C.34 Lethality footprint for scenario 7 at 0 m
The dispersion modelling for scenario 8 is given in C.4.4.3.
C.4.4.3 Scenario 8 – dispersion modellingFigures C.35 to C.37 give the dispersion modelling for scenario 8 which was based on D5 weather conditions.
For Figure C.35, the plume extends to 85 m (0,5 % contour) in height, which is not as high as for D1.5 weather. The higher wind speed causes the plume to be more thoroughly mixed resulting in quicker dilution. It has also caused the plume to bend over and slump quicker than its D1.5 counterpart. The 0,5 % contour extends approximately 4 800 m which is less than for D1.5. The plume becomes passive at 3 100 m which causes the increase in height.
Figure C.36 shows the footprint for scenario 8 at 0 m. The 0,5 % contour extends 4 800 m and is approximately 3 800 m wide at its largest point. The 10 % contour is also significantly large; it extends 2 100 m downwind and is 1 600 m wide at its widest.

RESEARCH REPORT: HAZARD ANALYSIS FOR OFFSHORE CARBON CAPTURE PLATFORMS AND OFFSHORE PIPELINES
139
Figure C.35 Side view for scenario 8
Figure C.36 Footprint for scenario 8 at sea level height, i.e. 0 m
The lethality footprint (Figure C.37) was also obtained at 0 m because it was assumed that no population was present above sea level. The toxic lethality of 1 contour extends 1 600 m and is a maximum of 1 400 m wide so there would be the potential for large numbers of fatalities if there were people in the surroundings.
Figure C.37 Lethality footprint for scenario 8 at 0 m

RESEARCH REPORT: HAZARD ANALYSIS FOR OFFSHORE CARBON CAPTURE PLATFORMS AND OFFSHORE PIPELINES
140
C.4.5 Scenario 9
Scenario 9 was based on a full bore guillotine failure of a 10 mm instrument line which vents into one end of an enclosed container as shown by Figure C.38.
Figure C.38 Layout of scenario 9
Note: The arrows show the direction of the release flow.
The most appropriate way to model this scenario is to assume a 10 mm hole in a vessel. This is because the long pipeline method assumes a time varying release rate, whereas in reality, the release rate is likely to be constant.
PHAST cannot be used to model dispersion within an enclosed space so the horizontal, vertical and lethal footprint views cannot be obtained. However, equations can be used to calculate the concentration build-up against time inside the box. This is on the proviso that the air change rates, the flow rate (calculated by PHAST – 8.5 kg/s) and the dimensions of the box are known. Once the release has stopped, the reduction in concentration can also be estimated.
For the concentration build-up, equations from the PHAST documentation126 were used. For the decrease in concentration once the release has stopped, one equation from the PHAST documentation was used and as a check, an equation from Cox, Lees and Ang127. These equations assume complete mixing throughout the container.
For scenario 9, the release was set up in PHAST using the vessel model with the inputs given in Table C.1. The air change rate was assumed to be 12 air changes per hour (natural ventilation and not forced). The inventory of the instrument line was assumed to be sufficient to reach steady state conditions, so the corresponding release duration may be very large. The release was assumed to occur for 1 800 seconds and the subsequent concentration reduction was also assumed to occur for 1 800 seconds.
126 INBU Theory document, Revision 5, PHAST documentation, DNV 2011127 Classification of Hazardous Locations, A Cox, F Lees, and M Ang, 1993

RESEARCH REPORT: HAZARD ANALYSIS FOR OFFSHORE CARBON CAPTURE PLATFORMS AND OFFSHORE PIPELINES
141
Figure C.39 Scenario 9: CO2 concentration vs. time graph
Figure C.39 shows the concentration build-up and decay for scenario 9. The y axis is measured in volume fractions so 2 corresponds to 200 % (or 2 000 000 ppm).
The concentration builds up rapidly over the first 600 seconds, but it begins to level off around 900 seconds, by 1 800 seconds it has reached 1 300 % (13 282 347 ppm). After 900 seconds, the concentration reaches steady state as the build-up is being equally matched by the rate of removal. If the release were to occur for much longer than 1 800 seconds, the concentration would still be approximately 1 300 %. After the release, the concentration drops off rapidly over the first 600 seconds (2 400 seconds in total time) and after 1 200 seconds (3 000 seconds in total time) the concentration is almost 0 %.
Clearly, concentrations greater than 100 % are not physically realistic. Where concentrations exceeding 100 % have been predicted, it means that the enclosed space would begin to be pressurised. A concentration of 1 300% implies a pressure of 13 bar which could potentially cause failure of the enclosure.
From Table C.2, the long term exposure limit for CO2 is 2 % for 30 minutes and the short term exposure limit is 3 % for 15 minutes. Both these concentrations are reached soon after the release commences and remains higher than these values for almost the entire release.
For the fatality criteria, the limits are 8,6 % for five minutes (LC01) or 9,2 % for 30 minutes (LC50). These criteria are also met soon after the release and remain for almost the entire duration.

RESEARCH REPORT: HAZARD ANALYSIS FOR OFFSHORE CARBON CAPTURE PLATFORMS AND OFFSHORE PIPELINES
142
C.5 CONCLUSIONS
Overall, the majority of the release scenarios chosen indicate that they have the potential to cause harm either to persons on the platform deck or to those at sea level, i.e. in ships such as support or rescue vessels.
The following issues with PHAST modelling have been identified:
1. The use of quasi-instantaneous models to represent releases which do not reach steady state before the release stops can cause unexpected results.
2. The use of the quasi-instantaneous model causes the releases constrained by use of an ESDV to have larger concentration and lethality footprints than a similar unconstrained release. This is contradictory because use of the ESDV is a mitigation measure. Results for scenario 3 should therefore be treated with caution.
3. For vertical releases, the maximum concentration and footprint plots are not always representative. There is a ‘bug’ in the graphical display which prevents PHAST from finding enough data points to display the shape correctly. The horizontal view graphs for vertical releases should therefore be treated with caution.
4. PHAST cannot model dispersion within a container. For scenario 9, the concentration build-up plot is based on the assumption that there is complete mixing throughout the container, but this is unlikely to occur in reality.
5. The dispersion results for scenarios 7 and 8 are likely to be conservative because the release rate was averaged over the first 20 seconds. Using a wider time range might be more appropriate so that the effects from one end of the pipeline emptying much quicker than the other are captured. However, this was outside the scope of the project.
6. The downwind distance for scenario 7 is shorter than it is wide. This is probably due to low wind speed combined with the assumptions made regarding the source term.
7. The BLEVE model in PHAST is not suitable for estimating the overpressure due to pressure system burst which would result from a pipeline rupture.

RESEARCH REPORT: HAZARD ANALYSIS FOR OFFSHORE CARBON CAPTURE PLATFORMS AND OFFSHORE PIPELINES
143
ANNEX DDESCRIPTION OF TYPICAL OFFSHORE TRANSPORTATION AND INJECTION SYSTEM COMPONENTS
The offshore transportation and injection system components for CCS are typical of those to be found in the offshore oil and gas industry. While the items described do not represent an exhaustive list, the following description of equipment should indicate concerns with respect to modes of failure and their consequential leakage potential. Damage to components could be catastrophic both to the system and operating personnel. Protective structures are the main line of defence for these assets.
Connections for simple spur lines to CO2 storage complexes to develop manifolds for current and future connections may be part of the design concept for any CO2 network.
Figure D.1 illustrates the simplest and most economical of in-line T-connections for a future distribution take off to a storage sink including a future connection for a supply from another pipeline. In this solution the tees for the future CO2 source and the future storage sink flow line connections are laid as an integral part of the main trunkline. When the storage complex is to be connected, a tie-in manifold (TIM) as shown in Figure D.2 would be installed.
Figure D.3 illustrates an example of an 18” tee that may be installed as an integral part of the main pipeline. In this arrangement it has two 18” valves and a ‘double block and bleed’ arrangement with chemical injection points, to ensure that all dead legs are filled with methanol or glycol and enable the flushing of future connections.
Figure D.1 Tie-in schematic (option 1)

RESEARCH REPORT: HAZARD ANALYSIS FOR OFFSHORE CARBON CAPTURE PLATFORMS AND OFFSHORE PIPELINES
144
Figure D.2 Tie-in manifold schematic (option 2)
Figure D.3 Typical tee arrangement
Another potential option in an expanding network is that the initial pipeline terminates at the off-take for a spur line to a storage complex. To allow for future expansion, a TIM is used to terminate the line and provide this future capability by:
a) Commissioning the main pipeline from the onshore booster station to the distribution spur.
b) Connecting and commissioning the 18” flow line to the initial storage sink.c) Connecting and commissioning a future pipeline connection from another
source.d) Connecting and commissioning the future pipeline from the initial storage
sink to a further storage sink.e) Future inspection pigging between the onshore booster station and future
storage sink.

RESEARCH REPORT: HAZARD ANALYSIS FOR OFFSHORE CARBON CAPTURE PLATFORMS AND OFFSHORE PIPELINES
145
Figure D.4 shows a schematic of this TIM with the initial ‘jumpers’ shown as solid lines and future jumpers and pigging loops shown dotted. This TIM will have an over-trawlable structure128 and will have a piled foundation. All blind pipe ends will have a double barrier against the CO2 injection stream with ‘double block and bleed’ arrangements with chemical injection points, to ensure that all dead legs are filled with methanol or glycol and enable the flushing of future connections.
The future connection for the CO2 input from an additional source pipeline has been included in the TIM to simplify the main pipeline installation.
Figure D.4 Tie-in manifold schematic (option 3)
Any subsea components attached to the trunkline or installed subsea over a storage complex will need to be protected from fishing operations. Exposed assets should be surrounded by a structure and then buried in a gravel dump, which will be profiled to permit trawl boards to slide over the top. Figure D.5 shows a typical gravel dump arrangement for an in-line tee, and Figure D.6 shows a typical protection structure for a manifold associated with a subsea injection site. The foundations of the structures are most likely to have piles driven through the four corner columns, but this will depend on the soil conditions at the location of the individual structures.
128 An over-trawlable structure may be defined as one that does not snag the fishing gear causing either the stopping of the vessel or breaking its warp line during over-trawling. The structure should also be able to withstand any loads or impacts experienced during over-trawling.

RESEARCH REPORT: HAZARD ANALYSIS FOR OFFSHORE CARBON CAPTURE PLATFORMS AND OFFSHORE PIPELINES
146
Figure D.5 Tee protection – typical gravel dump arrangement
Figure D.6 Manifold protection structure
Ideally, the pressure within the CO2 trunkline should enable subsea connections to underwater structures associated with storage complexes without further pressure boosting. However, this presents an additional complication in the ability to install, control and maintain the proposed facilities. Subsea systems should be designed with ease of change-out and replacement of those items that cannot be expected to last the design life without maintenance. The water depths at the location of the various subsea facilities in the UKCS are expected to be suitable for diving, and so this is the preferred option for primary installation. Commissioning and operations should be diver-less, where possible.
Subsea CO2 storage complexes present their own set of problems with respect to controlling, measuring, monitoring and verification of the CO2 stored. The Snøhvit Project in Norway has demonstrated the use of onshore control systems connected to the storage

RESEARCH REPORT: HAZARD ANALYSIS FOR OFFSHORE CARBON CAPTURE PLATFORMS AND OFFSHORE PIPELINES
147
complex through a 165 km electro/hydraulic multiplex control umbilical, but this is near the limit of such a control system. Many proposed offshore facilities may be significantly further from shore than that and may need to be serviced from a closer existing platform. Alternatively, two companies have developed and installed all-electric ‘Christmas trees’129 that would enable a longer and more expandable control system, but these systems are relatively new and less proven than a conventional electro/hydraulic system. Another alternative would be the use of a minimum facilities platform130 or buoy system to provide communications and electro/hydraulic control of the subsea systems. This would require additional attention to maintain these surface facilities but the ability to reach offshore further with more reliability may be the deciding factor.
Figure D.7 shows a typical normally unattended platform and Figure D.8 shows an unmanned buoy system.
Figure D.7 Typical unmanned platform
Figure D.8 Unmanned buoy
129 In petroleum and natural gas production, an Xmas tree is an assembly of valves, spools, and fittings used for an oil well, gas well, water injection well, water disposal well, gas injection well, condensate well and other types of wells which are likely to include CO2 injection.
130 Minimum facility platforms are an alternative to subsea systems that allow for the incorporation of a platform extension without the need for additional costly subsea solutions.

RESEARCH REPORT: HAZARD ANALYSIS FOR OFFSHORE CARBON CAPTURE PLATFORMS AND OFFSHORE PIPELINES
148
If CO2 is brought up on to a minimum facilities platform or an existing oil and gas platform or future EOR platform, there should be the ability to isolate the platform from the trunkline. Isolation valves at the in-line tee should be considered. In addition, a subsea isolation valve (SSIV) set in a failsafe shut mode should be located at a safe distance from the platform. This is so it is not subject to damage from dropped objects. Equally, an anchor could interfere with it. At the same time, the distance from the platform to the SSIV should not be so great as to increase the inventory of CO2 within the pipeline in the event of a line break on the platform side of the SSIV. These factors should be considered for each platform, to set the safe distance, but will typically be 100 to 500 metres from the platform.
One other aspect of bringing CO2 up onto a platform, with the correct facilities, is that the pressure of the CO2 can be further boosted prior to injection. This will require additional power, but may be required to get the CO2 into deeper and higher pressure geological formations, for instance in EOR applications.

RESEARCH REPORT: HAZARD ANALYSIS FOR OFFSHORE CARBON CAPTURE PLATFORMS AND OFFSHORE PIPELINES
149
ANNEX ECOMPOSITION OF CO2 FROM DIFFERENT SOURCES
E.1 INTRODUCTION
The composition of CO2 streams can vary due to the specific components in the feedstock, the type of process that is used to convert the feedstock into usable energy, the capture process, and any post-capture processing. Furthermore, the amounts and proportions of various components removed from a raw flue gas stream before CO2 capture (e.g. through de-NOx and/or desulfurisation processes) will affect the relative concentrations of components remaining in the gas stream. Removal of air pollutants from a raw flue gas may already be required in order to comply with the Integrated Pollution Prevention and Control (IPPC), LCP and Industrial Emissions Directives. The concentration of incidental substances in most cases can be decreased by adding additional stages of purification (subject to process limits), albeit at higher costs.
The influence of the different kinds of CO2 capture processes on the composition of the CO2 stream is discussed in the following sections131.
E.2 POST-COMBUSTION CAPTURE
Post-combustion capture of CO2 involves its separation from the flue gas stream after combustion of the fuel with air, and the subsequent release of the captured CO2 into a concentrated CO2 stream. Post-combustion capture systems may be used on systems burning coal, natural gas, oil and biomass. The flue gases coming from direct combustion of coal will contain nitrogen (N2), oxygen (O2), water (H2O), sulfur oxides (SOx), nitrogen oxides (NOx), particulates, and chemical compounds containing chlorine (Cl), fluorine (F), mercury, other metals and other trace organic and inorganic chemicals. Compared to a flue gas from coal combustion, the flue gas from a gas fired combined cycle plant will contain more water relative to CO2, and it will have lower concentrations of other components in the flue gas.
In order to operate the capture process economically, many of the substances in the flue gas (especially SOx and NOx) will mostly be removed prior to reaching the capture unit to limit degradation of solvents132. The requirements of the IPPC, LCP and IE Directives may also constrain the amount of some of these substances in the flue gas, and therefore, the composition of CO2 stream will nearly be the same regardless of the fossil fuel feedstock used. Furthermore, post-capture processes will, therefore, result in streams that are overwhelmingly CO2. The water-saturated CO2 stream after the CO2 capture process is likely to contain small amounts of nitrogen, oxygen, and argon. It is expected that very small amounts of ash, trace metals, SO2 and NOx present in the solvent will not be found in the waste stream of CO2. The specific amount of the incidental substances is dependent on the degree of clean-up before exposure to the solvent, and the number of condensation stages within the compression plant.
131 Based on Implementation of Directive 2009/31/EC on the Geological Storage of Carbon Dioxide, Guidance Document 2, Characterisation of the Storage Complex, CO2 Stream Composition, Monitoring and Corrective Measures, European Communities, 2011.
132 IPCC 2005
RESEARCH REPORT: HAZARD ANALYSIS FOR OFFSHORE CARBON CAPTURE PLATFORMS AND OFFSHORE PIPELINES
150
E.3 PRE-COMBUSTION CAPTURE
In pre-combustion capture, CO2 is removed from a gasification stream or a natural gas stream before combustion. The composition of the CO2 stream depends upon the type of capture process and the type of fossil fuel. The steam reforming process is a common process used to convert gaseous fuels (such as natural gas, propane, or other light hydrocarbons) to hydrogen, CO2 and CO. For solid fuels, the gasification process produces a synthetic gas (syngas) containing mostly CO and H2, which can then be converted to CO2 using a water-shift reactor. In the reducing atmospheres of pre-combustion processes, the sulfur in the fuel mainly yields hydrogen sulfide (H2S), although some other compounds such as carbonyl sulfide (COS) are also formed. This is different to the oxidising atmosphere of post-combustion and oxy-fuel processes, where sulfur in the fuel mainly yields SOx.
However, natural gas and propane are mostly sulfur-free except for sulfur-containing odorisers with mercaptans that must be removed from the gas to prevent contamination of the reformer catalyst. Thus, the CO2 product stream from steam reforming is essentially free of sulfur components. Other incidental substances include hydrogen, CO, methane, nitrogen, argon, and oxygen.
When liquid or solid fuels are gasified,such as in the integrated gasification combined cycle (IGCC) process, particulates H2S, NH3, COS and HCN are also formed. Pre-combustion capture from the gasification stream (syngas) involves the removal of some fraction of these species in the ‘water-gas’ shift reactors, followed by cooling stages and acid-gas removal stages prior to combustion. H2S could be removed together with CO2 or during pre-treatment133. If a purer CO2 stream is required, then a selective process is required using physical solvents134. Nonetheless, H2S remains an inevitable part of the CO2 stream.
Other incidental substances include CH4, C2+ (hydrocarbons), H2, CO, and other organic and inorganic residues135.
E.4 OXY-FUEL COMBUSTION
In an oxy-fuel combustion process, nearly-pure oxygen is used as the oxidant, instead of air. Flue gas recirculation is needed to keep temperatures on the flue gas side and the water/steam side below slagging and material constraints, making the raw flue gas stream from oxy-fuel combustion predominantly CO2, O2 and water. Water is typically removed from the stream in a dehydration process. The amount of incidental substances present in the CO2 stream is primarily dependent on the type of fossil fuel used in the combustion process. The incidental substances include SOx, NOx, HCl and Hg derived from the fuel, and nitrogen, argon and oxygen, derived from the oxygen feed or air leakage into the system. The concentrations of incidental substances in the raw wet flue gas from oxy-fuel combustion are at least three to four times higher than in conventional air combustion, since the combustion product’s flow volume is three to four times lower due to the lack of nitrogen (coal-air combustion products contain over 70 % N2, while oxy-fuel combustion products contain less than 2 % N2).
133 For example, by using a Sulfinol process.134 For example, by using a Rectisol or Selexol process.135 Some of these chemicals include methanol (from Rectisol®), N-methyl-2-pyrolidone (NMP, from Purisol®),
dimethyl ethers of polyethylene glycol (DMPEG, from Selexol®), and tetrahydrothiophene-1,1-dioxide (Sulfolane, from Sulfinol®).

RESEARCH REPORT: HAZARD ANALYSIS FOR OFFSHORE CARBON CAPTURE PLATFORMS AND OFFSHORE PIPELINES
151
Meanwhile, the amount of sulfur compounds in the CO2 stream from oxy-fuel combustion is dependent on the amount of sulfur in the coal and the downstream CO2 processing units employed, which are contingent to the purity specification required for the CO2 stream. Depending on the sulfur content in coal, a flue gas desulfurisation (FGD) may or may not be used to meet air emission requirements136, although it will probably be required to control the concentration of SOx recycled to the boiler. There can be significant amounts of nitrogen, argon and oxygen (3,7 - 10 % dry volume in total) present in the CO2 stream before any CO2
processing units, depending on the purity of the oxygen coming from the air separation unit and the leak air flow into the boiler and the downstream ductwork. The amount of nitrogen, argon and oxygen present in the CO2 stream could be as low as < 0,01 % or as high as 15 % depending on the CO2 processing unit employed.
Moisture is another critical component of the stream; prior to drying, water can account for more than 30 % of the flue gas volume. After water removal during compression, the CO2 stream consists of less than 0,1 % water (typical for oxy-fuel combustion), but less than 1 000 ppm of moisture could also be achieved during compression. However, if a refrigeration cycle and flash column based inert separation process is used to increase the CO2 content in the stream, then the moisture content from oxy-fuel combustion could be below 10 ppm.
Also air ingress (tramp air) downstream of the oxy-fuel combustion influences the resulting flue gas composition. About 1 % (based on the total mass of flue gas from boiler) of air ingress is reported to yield about 3-5 % decrease in CO2 concentration (depending on the amount of flue gas recirculation, excess oxygen for combustion and oxygen purity)137.
E.5 CO2 STREAMS FROM INDUSTRIAL PROCESSES
Broadly, there are three categories of industrial processes that can be distinguished based on their CO2 concentration in the raw flue gas:
− Low CO2 concentration (0 to 15 %): this category includes boilers and process heaters in which the CO2 in the exhaust stream is only from the fuel combustion. The treatment of these emissions is mostly similar to the treatment of those from power plants.
− Medium CO2 concentration (15 % to 75 %): some industrial processes generate CO2
from non-combustion chemical processes or biological processes. Prime examples include cement and lime production, iron and steel production, and fermentation to produce ethanol. These processes may be more amenable to carbon capture due to their concentrations of CO2 in flue gas/waste gas streams, but they may have other complications, as discussed.
− High CO2 concentration (≥75 %): some industrial processes produce an exhaust stream containing nearly pure CO2 plus water (e.g. hydrogen and ammonia production and some natural gas processing). Some natural gas streams that contain CO2 also have H2S. Depending on what processes are used, the captured waste stream could contain both CO2 and H2S or just CO2.
136 Furthermore, a FGD could be placed either within the flue gas recycle loop or outside it.137 Development in Carbon Capture Technologies for Power Generation Industry, Stanley Santos, IEA GHG R&D
Programme: Presentation at the Institute of Air Quality Management (IAQM) Workshop on CCS, London, UK, 14 November 2007.

RESEARCH REPORT: HAZARD ANALYSIS FOR OFFSHORE CARBON CAPTURE PLATFORMS AND OFFSHORE PIPELINES
152
Some of the industrial processes with their associated raw flue gas CO2 concentrations are outlined in Table E.1. Note that these concentrations do not include a specific CO2 capture plant. Other industrial processes include lower/varying CO2 content streams such as from oil sands.
CO2 concentration Industrial category CO2 concentration (vol %)
High (>75 %) Ammonia process138 >90
Ethylene oxide >90
Hydrogen >80
Ethanol 90
Natural gas processing >80
Medium (15 % to 75 %) Cement manufacture 20
Lime139 15 – 17
Iron and steel 15 – 17
Low (<15 %) Oil sands Main stack & boilers, 10 %;
Coker, 15 %
Air-based combustion 3 – 14
Ethylene 12
Soda ash140 9 – 10
Source: ICF International
Table E.1 Industrial process CO2 concentration in the raw flue gas
Whilst there are only a few combustion technologies for electricity generation, the industrial sector has dozens of different combustion applications as well as CO2 emitting processes that can be considered for capture. This diversity of sources makes capture, and the CO2 stream composition from these industries, more complex but can also create some opportunities. Unlike power generation from fossil fuels, there are little measured data on the composition of flue gas/waste gas streams from most industrial applications. The composition of CO2
streams from industrial sources will vary greatly depending on the process and the feedstock used. In many cases, much of the incidental substances are derived from the feedstock itself rather than measurements made from the industrial process. The requirements of the IPPC, LCP and IE directives will often constrain the amount of air pollutants in the flue gas.
Furthermore, some industrial processes include CO2 capture as part of the standard practice, including ammonia and hydrogen production. In these cases, any incidental substances (such as particulates, SOx, and NOx) must be removed in order to prevent the poisoning of catalysts. Captured CO2 from the medium and high concentration category may utilise oxy-fuel or post combustion capture processes, such as amine
138 CO2 concentrations associated for ammonia and natural gas processing are based on IPCC, 2005.139 CO2 concentration for the lime industry was estimated based on concentrations from the cement industry since
both industries have similar process streams.140 CO2 concentrations for soda ash process gas came from US EPA’s technical support document for the proposed
Greenhouse Gas Mandatory Reporting Rule, specifically from the document for Soda Ash Manufacturing, see http://www.epa.gov/climatechange/emissions/archived/ghg_tsd.html.

RESEARCH REPORT: HAZARD ANALYSIS FOR OFFSHORE CARBON CAPTURE PLATFORMS AND OFFSHORE PIPELINES
153
scrubbing, and the incidental substances must be removed to minimise the solvent degradation. The iron and steel industry could also use an in-process capture. Streams from natural gas processing will likely contain methane, non-methane hydrocarbons (C2+), and H2S.
E.6 SUMMARY OF CO2 STREAM COMPOSITION
Based on theoretical calculations, indicative compositions of CO2 streams generated from the three main capture technologies, as well as a cement plant and process heaters feeding a combined stack at a refinery, are summarised in Table E.2. It should be noted that the real behaviour of heavy metals and other trace elements cannot be predicted in a laboratory or from calculations, because coal combustion is conditioned by highly complex processes, such as combustion temperatures, halogen species concentrations, redox conditions, and interaction between different species. The capture process used to produce the CO2 stream is listed in the second row of the Table. In these processes, sulfur has been removed as needed to extend the life of the process step which removes CO2 from the stream; and water has been removed as needed from the stream to meet a CO2 pipeline specification of 0,064 % by volume (30 lbs/MMscf). Oxy-fuel combustion has the highest level of contamination for many of these constituents, as the oxy-fuel combustion has no stack emissions. Furthermore, the oxy-fuel system modelled in Table E.2 does not have a flue gas desulfurisation (FGD) in order to consider a worst case scenario for SOx in the CO2 stream. If FGD is included in the oxy-fuel plant, or if the CO2 were treated, the SOx concentration in the stream would be reduced.
The CO2 streams captured from coal combustion by all three basic processes can have significant heavy metals content, although most of the heavy metals from coal combustion are typically collected in the fly ash and other waste streams. In post-combustion capture, the remainder travels up the stack, although the proportion of the heavy metal content may vary.
In pre-combustion capture (IGCC process), the heavy metals will mostly be collected in the ash and slag and waste water filtrand, with the remainder going up the stack. In oxy-fuel processes, particulate filters will also remove most of the metals, and, in combination with an FGD plant, and other processes required to remove mercury, it is again expected that the concentration of heavy metals in the CO2 stream will be nearly zero.

RESEARCH REPORT: HAZARD ANALYSIS FOR OFFSHORE CARBON CAPTURE PLATFORMS AND OFFSHORE PIPELINES
154
Species Post-combustion sub-supercritical coal
IGCC coal (pre-combustion)
Supercritical oxy-fuel coal
Cement plant
Refinery stack
CO2 source MEA Selexol Stack gas MEA MEA
CO2 99,7 % 98,1 % 81,8 % 99,8 % 99,6 %
CO 0,13 % 1,2 ppmv
O2 61 ppmv 3,5 % 35 ppmv 121 ppmv
H2O 640 ppmv 376 ppmv 640 ppmv 640 ppmv 640 ppmv
Ash 11,5 ppm 1,2 ppm 23 ppm 5,7 ppm
Ar 22 ppmv 178 ppmv 3,6 % 11 ppmv 38 ppmv
CH4 112 ppmv 0,026 ppmv
N2 0,18 % 195 ppmv 9,5 % 893 ppmv 0,29 %
H2 1,5 %
H2S 0,17 % 7,9 ppmv
COS 1,7 ppmv
NH3 38 ppmv
Cl 0, 85 ppmv 17,5 ppmv 0,07 ppmv 0,41 ppmv 0,4 ppmv
NOx as NO2 1,5 ppmv 0,2 % 0,86 ppmv 2,5 ppmv
SOx as SO2 <1 ppmv 1,2 ppmv <0,1 ppmv 1,3 ppmv
Hg 0,69 ppbv 0,068 ppbv 11 ppbv 0,73 ppbv
As 5,5 ppbv 3,3 ppbv 26 000 ppbv 2 900 ppbv
Se 17 ppbv 10 ppbv 80 ppbv
Table E.2 Illustrative calculated examples of composition of CO2 streams (after dehydration, but before compression)
Source: ICF International
Notes: − These estimates are based on engineering calculations performed by ICF based on
a typical US bituminous coal (Illinois #6) with 2,5 % sulfur by weight. The actual amount of substances in a CO2 stream could vary widely depending on flue gas pre-treatment and capture processes.
− The calculations for the pre-combustion IGCC plant are based on Case 2 scenario analysis in the DOE/NETL-2007/1281 report.
− The calculations for the oxyfuel combustion plant are based on Case 5 scenario analysis in the DOE/NETL-2007/1291 (revision 2) report.
− The concentrations of mercury, arsenic, and selenium are based on stack gas measurements at a coal-fired power plant in Spain burning a ‘mixture of two types of coal’ (Otero-Rey et al., 2003). However, the concentrations of heavy metals in the

RESEARCH REPORT: HAZARD ANALYSIS FOR OFFSHORE CARBON CAPTURE PLATFORMS AND OFFSHORE PIPELINES
155
CO2 stream from an IGCC plant may be different from the assumptions in Otero-Rey et al., 2003, particularly if a GAC filter is fitted before the AGR plant. This would also reduce the ash levels.
− For post-combustion capture, sulfur was removed as needed for economic operation of the capture step (e.g. to limit amine degradation) from the stream.
− Water was removed from the CO2 streams to meet US CO2 pipeline specification of 640 ppm (see penultimate point), using glycol-based dehydration. Note, that during the compression stage, water, as well as SOx, NOx, and Hg, can be removed from the CO2 stream141.
− Heavy metals are typically removed with the particulate matter (fly ash), and therefore more stringent particulate emission standards would further reduce heavy metal content in the CO2 stream. Furthermore, Hg can be removed during the compression stage along with nitric acid.
− Oxy-fuel combustion has the highest level of contamination for many of these constituents in these examples, because ICF assumed for these calculations that the flue gas is not treated except for particle removal by electrostatic precipitation and for water removal to 640 ppm.
− The lack of an FGD allows the sulfur concentration to be high in this calculation; however, this high sulfur content would adversely impact boilers and heat exchangers due to corrosion, and hence a low sulfur coal (<1 %) would need to be used to prevent corrosion. If an FGD is included in the oxy-fuel plant, or if the CO2 were treated after capture, SOx, HCl, and heavy metal content (e.g. mercury) in the CO2
stream would be reduced.
The concentrations of all incidental substances can be decreased by adding additional stages of purification. This will result in higher costs of the capture process and affect overall plant efficiency. Furthermore, given that different capture plants will have different compositions of CO2 streams, it will be important to consider the impact of mixing these streams into the CO2 pipeline networks, especially when combining CO2 streams with reducing and oxidising properties.
141 CO2 Processing Unit - Challenges in Meeting the Required CO2 Quality, Stanley Santos and Jinying Yan, Presentation at the Oxy-Fuel Combustion Network - 2nd Working Group Meeting on CO2 Quality and other Relevant Issues, 7 September 2009, Cottbus, Germany.

RESEARCH REPORT: HAZARD ANALYSIS FOR OFFSHORE CARBON CAPTURE PLATFORMS AND OFFSHORE PIPELINES
156
ANNEX FCO2 BLEVE
BLEVE can occur when a vessel containing a pressurised gas is ruptured or being blown down in an inappropriate manner. BLEVEs occur with a number of gases, notably with propane at higher temperatures, usually as a result of fire impingement.
BLEVEs are very unusual, but catastrophic events can occur with CO2 under pressure. An example of a severe explosion with CO2 occurred at Worms, Germany.
There is a range of conditions of pressure and temperature where BLEVEs can theoretically occur, and even under these conditions a BLEVE is unlikely. However, because of the potential size of BLEVE explosions, a CO2 plant should be operated in a manner that would avoid these conditions arising.
A theory has been developed142, 143, 144, a simplified version of which is provided. Figure F.1 shows a pressure of the CO2 and the volume it occupies as liquid, gas and fluid phases.
Figure F.1 Theoretical pressure/volume graph for CO2, showing spinodal curve
Imagine liquid CO2 in a large pipe, such that the volume is significant. The pipe is being depressurised, for example, blown down for maintenance. The blue line A-B-C-D shows the behaviour of the CO2 at a constant temperature and at thermodynamic equilibrium. Along the line A-B, the CO2 is a liquid, and as the volume it occupies is expanded the pressure falls rapidly. Eventually the pressure falls to the vapour pressure of the liquid at the particular temperature at B. The liquid CO2 then starts to evaporate to become a liquid-gas mixture, and the pressure stays constant at the vapour pressure. Eventually it reaches C, where the liquid has been completely converted to gas. The pressure then drops as it is expanded further as a gas (to D).
142 The rapid depressurization of hot, high pressure liquids or supercritical fluids Kim and Reid, Chemical engineering at supercritical fluid conditions, Paulaitis, Anne Arbor Science,1983
143 BLEVE and its importance in Enhanced Gas Recovery and Carbon Capture and Storage, AA Clifford, Leeds University Department of Chemistry.
144 CO2 BLEVE, W.Ke, Telemark University College, Norway, 2009.

RESEARCH REPORT: HAZARD ANALYSIS FOR OFFSHORE CARBON CAPTURE PLATFORMS AND OFFSHORE PIPELINES
157
However, if, having reached the vapour pressure line (B-C), the CO2 pressure falls suddenly, (for example, due to a failure in the containment, or a valve being rapidly opened), the CO2 can become an unstable liquid along the path B-X, the solid red line. Along this line the CO2 is metastable, and could at any time boil to return to the equilibrium horizontal line B-C. Were this to happen, a sudden and a violent disturbance would take place, although it would not become a BLEVE until it reached the point X.
X is called the spinodal point: here the slope of the solid red line is zero. The dashed line (spinodal curve) indicates the loci of spinodal points with changing temperature. Along the spinodal curve large, because the slope of the line approaching it is zero, density changes can take place because pressure can increase without any volume increase.
Once the spinodal curve is reached, the CO2 (which is an equilibrium of liquid and gas) gas will separate into gas and liquid states. This occurs homogeneously throughout the whole of the mass of the CO2. The rise in pressure to (X’) on the vapour pressure line B-C may not be not large, but takes place very quickly145, and the pressure shock to the vessel in which the CO2 is contained is significant, and failure (BLEVE) is likely to occur.
145 On a time scale of molecular motions, ref. Calculation of BLEVE conditions for carbon dioxide, Critical Processes Ltd

RESEARCH REPORT: HAZARD ANALYSIS FOR OFFSHORE CARBON CAPTURE PLATFORMS AND OFFSHORE PIPELINES
158
ANNEX GGLOSSARIES OF ACRONYMS AND TERMS USED IN THIS PUBLICATION
G.1 INTRODUCTION
For the purpose of this publication, the interpretations of acronyms in Annex G.2 and terms in Annex G.3 apply, irrespective of their meanings elsewhere.
G.2 ABBREVIATIONS USED IN THIS PUBLICATION
µJT Joule Thompson coefficientALARP as low as reasonably practicableAr argonAs arsenicABS absoluteBAT best available techniquesBLEVE boiling liquid expanding vapour explosioncm3 cubic centimetre°C Centigrade (celsius)Cl chlorineCATS central area transmission systemCCGT combined cycle gas turbineCCPS Centre for Chemical Process SafetyCCS carbon (dioxide) capture and storageCFD computational fluid dynamicsCH4 methaneCO carbon monoxideCO2 carbon dioxideCONCAWE Conservation of Clean Air and Water in EuropeCOS carbonyl sulfideDNV Det Norske VeritasDOT Department of TransportationDTL dangerous toxic loadEGIG European Gas Pipeline Incident Data GroupEI Energy InstituteEIA environmental impact assessmentEIGA European Industrial Gases AssociationEOR enhanced oil recoveryESDV emergency shut-down valveEU European Union°F FahrenheitF fluorineFe ironFe2CO3 iron (III) carbonateFAR fatal accident rateFATT fracture appearance transition temperature

RESEARCH REPORT: HAZARD ANALYSIS FOR OFFSHORE CARBON CAPTURE PLATFORMS AND OFFSHORE PIPELINES
159
FGD flue gas desulfurisationFN frequency/N-fatality (graph)g gramGJ giga-jouleGCCSI Global Carbon Capture and Storage Institute H2 hydrogenH2CO3 carbonic acidH2O waterH2S hydrogen sulfideHAZ heat affected zoneHAZOP hazard and operability (study)HCl hydrochloric acidHg mercuryHIC hydrogen-induced crackingHLFR historically low frequency rate HP high pressureHSC hydrogen stress crackingHSE Health and Safety ExecutiveHSL Health and Safety Laboratory HV Vickers hardness test (number)IChemE Institution of Chemical EngineersIEAGHG International Energy Authority Greenhouse GasIED Industrial Emissions DirectiveIGCC Integrated Gasification Combined CycleIP Intellectual propertyIPCC Integrated Pollution Prevention and ControlISO International Organization for StandardizationJT Joule-Thompsonkg kilogramkPa kilo pascalK degrees kelvinLCPD Large Combustion Plant DirectiveLP low pressureLTEL long term exposure limitm metrem/s metre per secondMAH major accident hazardMAHP major accident hazard pipelineMEA monoethanolamineMMscf millions of standard cubic feetMP medium pressureMPa megapascalMSDS material safety data sheetMW megawattN2 nitrogenN newtonN/A not applicableNDT non-destructive testing NIST National Institute of Science and TechnologyNO nitric oxideNO2 nitrogen dioxideNOx oxides of nitrogen (collective name)

RESEARCH REPORT: HAZARD ANALYSIS FOR OFFSHORE CARBON CAPTURE PLATFORMS AND OFFSHORE PIPELINES
160
O2 oxygenO-C-O oxygen-carbon-oxygen molecular structureOPS Office of Pipeline SafetyOREDA Offshore Reliability Data Handbookpdf portable document formatP-H pressure-enthalpy (diagram)PARLOC Pipeline And Riser Loss of ContainmentQA quality assuranceQRA quantitative risk assessmentRa average roughnessSC supercriticalSCC stress corrosion crackingSCUBA self-contained underwater breathing apparatusSe seleniumSG steering groupSLOD significant likelihood of deathSLOT specified level of toxicitySMR steam methane reformingSOx sulfur oxides (collective name)SO2 sulfur dioxide SOHIC stress-orientated hydrogen-induced crackingSRB sulfate reducing bacteriaSSC sulfide stress crackingSSIV sub-sea isolation valveSTEL short term exposure limitT-S temperature-entropy (diagram)Te tonneTIM tie-in manifoldTNT tri nitro tolueneTPD third party damageTWA time-weighted averageUK United KingdomUKOPA United Kingdom Onshore Pipeline Operators’ AssociationUSA United States of America
G.3 GLOSSARY OF TERMS
anthropomorphic An action, event, or observation of something normally resultant from ‘natural causes’ that happens as a consequence of the actions of human beings.
caprock A harder or more resistant rock type. Typically overlying a weaker or less resistant (more porous) rock type.
cavitation The effect of cavities forming in the liquid being pumped at the low pressure or suction side of the pump, causing noise, vibration, and damage to many of the components as the cavities or bubbles collapse when they pass into the higher regions of pressure, and a loss in pump capacity (pressure head and efficiency).

RESEARCH REPORT: HAZARD ANALYSIS FOR OFFSHORE CARBON CAPTURE PLATFORMS AND OFFSHORE PIPELINES
161
clathrates Crystalline water-based solids in which small molecules with large hydrophobic collections are trapped inside ‘cages’ of hydrogen bonded water molecules.
computational fluid dynamics A numerical method that uses computers to analyse complex
problems that involve fluid flows. Algorithms are used to simulate the interaction of liquids and gases with surfaces defined by boundary conditions.
control tie back Connection between a sub-sea installation and a surface vessel or platform that enables remote operation and monitoring of the equipment within the sub-sea installation from the surface. It may also provide motive power.
cryogenic Low temperature, usually significantly below 0 °C.
downstream/upstream For the purposes of this document it should refer to the simple direction of flow, from where the product is produced to where it is stored or used for the purpose of further oil recovery.
enthalpy A measure of the total energy of a thermodynamic system. It includes the internal energy (the energy required to create a system), and the amount of energy required to make room for it by displacing its environment and establishing its volume and pressure.
entropy A thermodynamic property that can be used to determine the energy not available for work in a thermodynamic process, such as in energy conversion devices, engines, or machines. Such devices can only be driven by convertible energy, and have a theoretical maximum efficiency when converting energy to work. During this work, entropy accumulates in the system, which then dissipates in the form of waste heat.
emergency shut-down valve (ESDV) Equipment intended to limit the potential inventory of CO2 that
might escape, closing automatically upon, for instance, a rapid rate-of-fall of pressure upstream.
filtrand The material captured as a result of filtration (the material passing through the filter being called the filtrate).
flashing (synonymous with partial evaporation)
The partial vapour that occurs when a saturated liquid stream undergoes a reduction in pressure by passing through a throttling valve or other throttling device, which would include a hole in a pipe. If the saturated liquid is a single-component liquid (for example, pure CO2), a part of the liquid immediately ‘flashes’ into a vapour. Both the vapour and the residual liquid are cooled to the saturation temperature of the liquid at the reduced pressure. This is often referred to as ‘auto-refrigeration’ and is the basis of most conventional vapour compression refrigeration systems.
RESEARCH REPORT: HAZARD ANALYSIS FOR OFFSHORE CARBON CAPTURE PLATFORMS AND OFFSHORE PIPELINES
162
fracture appearance transition (FATT) Temperature at which the mechanical properties (usually of
a piece of steel) change from being predominantly ductile to predominantly brittle.
hazard analysis The identification of a hazard, the analysis of the mechanisms by which these undesired events could occur and (usually) the estimation of the extent, magnitude and the likelihood of any harmful effects. Replicated from IChemE Nomenclature for Hazard and Risk Assessment in the Process Industries 2nd edition 1992.
hot stab A type of fluid coupling used to connect two or more systems together, to allow the transfer of fluids between those systems. Before the pipeline can be used, it should be ‘pre-commissioned’. Pre-commissioning activities include cleaning the inside of the pipe, pressurising it with water to ensure that there are no leaks, and dewatering it (blowing out the test water and drying it). Long pipelines are sometimes laid and tested in sections: this requires the operator to plug into the end of a pipeline section (to ‘hot stab’146), to pump the pre-commissioning fluids. Due to the large volume of pipeline sections it may take many weeks to fill and empty the pipeline, so the hot stab needs to be big enough to allow the fluid to pass through quickly, to minimise the time it takes to perform this operation.
hydrogen stress cracking Cracking which results from the presence of hydrogen in a metal together with tensile stress.
intra-abdominal insufflations Deliberate gaseous dilation of abdominal cavities (typically to
permit endoscopic examination or non-intrusive surgery).
isenthalpic A thermodynamic process that takes place without any heat change.
isothermal A thermodynamic process that takes place at constant temperature.
Le Chatalier’s Principle The principle that if any change is imposed on a system that is in equilibrium then the system tends to adjust to a new equilibrium counteracting the change.
Long Term Exposure Limit (LTEL) A work place exposure limit intended to control the effects due to
exposure to substances hazardous to health by workers restricting the total intake by inhalation over one or more work shifts. The LTEL is typically expressed in terms of an eight-hour time weighted average.
146 Generally, hot stabs are inserted using a Remote Operating Vehicle (ROV). A hot stab larger than 2” diameter poses a challenge to the strength and dexterity of the ROV arms. Rather than rely on the strength of the ROV arms to insert the hot stab, modern hot stabs have been designed so that they can install (and remove) themselves. The ROV will locate the hot stab at a receptacle on the end of the pipeline, where it will be latched. Once latched, the hot stab will pull itself into the receptacle. The power for the hot stab to pull itself in is normally supplied by another (smaller) hot stab, an off-the-shelf piece of equipment that supplies hydraulic oil from the ROV to the main hot stab mechanism.

RESEARCH REPORT: HAZARD ANALYSIS FOR OFFSHORE CARBON CAPTURE PLATFORMS AND OFFSHORE PIPELINES
163
Parts per million by volume (ppmv) 1 ppmv = 0,00001 volume %.
Pasquill The Pasquill method is the oldest and, for a great many years, the most commonly used for categorising atmospheric turbulence. Turbulence is described in terms of six stability classes, A – F, class A being very unstable (or most turbulent), class F being the most stable. Table G.1 provides the meteorological conditions that define each class, noting that Class D applies to heavily overcast skies at any wind speed, day or night.
Surface wind speed
Daytime incoming solar radiation
Night-time cloud cover
m/s mph Strong Moderate Slight >50 % <50 %
<2 <5 A A – B B E F
2 – 3 5 – 7 A – B B C E F
3 – 5 7 – 11 B B – C C D E
5 – 6 11 – 13 C C D D D
>6 >13 C C D D D
Table G.1 Pasquill stability classes for atmospheric stability
photosynthesis The process of converting light energy to chemical energy and storing it in the bonds of sugar. This process occurs in plants and some algae (kingdom Protista). The process takes place in the chloroplasts, specifically using chlorophyll, the green pigment.
phytoplankton The plant portion of the tiny microscopic animals and plants (collectively called plankton) that live in the oceans, composed mostly of single-celled algae and bacteria. They are the basis for the oceanic food chain, and the most abundant are the diatoms (representing some 20 000 species).
Pipeline Inspection Gauge (PIG) An engineering tool sent through a pipeline to conduct inspections
of the condition of the walls or clean the pipe itself without interrupting the normal flow of products such as liquid, oil, or gas. A camera and lighting are often fitted in a swivelling head attached to the cylindrical body.
probit function A probability unit, defined as the inverse of the cumulative Gaussian distribution, or the probability that an event will not happen.
stress corrosion cracking (SCC) The cracking of metal involving anodic processes of localised
corrosion and tensile stress (residual and/or applied) in the presence of water and H2S.
steam methane reforming (SMR) The most common method of producing commercial bulk hydrogen, usually from natural gas. At high temperatures (700 – 1 100 °C) and in the presence of a metal-based catalyst (usually nickel), steam reacts with methane to yield carbon monoxide and hydrogen: CH4 + H2O → CO + 3H2.

RESEARCH REPORT: HAZARD ANALYSIS FOR OFFSHORE CARBON CAPTURE PLATFORMS AND OFFSHORE PIPELINES
164
short term exposure limit (STEL) The concentration to which workers can be exposed continuously
for a short period (typically 15 minutes), of time without suffering from irritation, chronic or irreversible tissue damage or narcosis of sufficient degree to increase the likelihood of accidental injury, impair self-rescue or materially reduce work efficiency. Where long-term limits also apply, the short-term limits can restrict the magnitude of excursion above the average concentration during longer exposures.
specified level of toxicity (SLOT) A toxicity level applied to hazardous substances and health impacts
on people in the general population such that: − There is severe distress to almost everyone in the area. − Substantial fraction of exposed population requiring medical
attention. − Some people seriously injured, requiring prolonged treatment. − Highly susceptible people possibly being killed.
solid matrix An atomic structure, usually a polymer, which, although in solid form, contains partially interconnected voids, or pores. Because the voids are interconnected, some fluids can pass into, or through, the matrix. The void fraction in the solid matrix is most frequently referred to as the porosity, ε.
sonic velocity Sonic velocity occurs when the pressure ratio of a fluid passing through an orifice exceeds 0,528, i.e. when the downstream pressure exceeds 52,8 % of the upstream pressure. Beyond this point the flow is described as ‘choked’, thus if the upstream pressure is increased, there is no consequential increase in the velocity of the fluid downstream.
stress-orientated hydrogen-induced cracking (SOHIC)
The presence of staggered small cracks formed approximately perpendicular to the principal stress (residual or applied) resulting in a ladder-like crack array linking (sometimes small) pre-existing HIC cracks.
sulfide stress cracking The cracking of metal involving corrosion and tensile stress (residual and/or applied) in the presence of water and H2S.
tramp air Unplanned air ingress resulting from, for instance, imperfect joints in ducting, drawn in as a result of the contents being at a pressure lower than that of the surrounding atmosphere.
Vickers hardness (HV) test A method of measuring the hardness of materials. The unit of
hardness given by the test is known as the Vickers Pyramid Number.
workplace exposure limits(WELs) British occupational exposure limits, set in order to help protect
the health of workers. WELs are concentrations of hazardous substances in the air, averaged over a specified period of time, referred to as a time weighted average (TWA).

RESEARCH REPORT: HAZARD ANALYSIS FOR OFFSHORE CARBON CAPTURE PLATFORMS AND OFFSHORE PIPELINES
165
ANNEX HREFERENCES
H.1 INTRODUCTION
The information provided in this Annex is divided into research papers, conference papers, etc. (Annex H.2); and publications, internet sites, etc. (Annex H.3) referenced in this publication. All were current at the time of writing. Users should verify their ongoing availability and determine whether additional information sources are available.
H.2 LIST OF PAPERS REFERENCED
Lakes of CO2 in the deep sea, Kenneth Nealson, Department of Earth Sciences, University of Southern California, 19 September 2006.
Transporting the Next Generation of CO2 for Carbon, Capture and Storage: The Impact of Impurities on Supercritical CO2 Pipelines P Seevam, J Race, M Downie, Newcastle University; P Hopkins, Penspen Ltd., 7th International Pipeline Conference, 29 September - 3 October, 2008, Calgary, Canada.
CO2 Transport UKCCSC Progress Report, Seevam, Race, Downie, Newcastle University, 2008.
Towards Hydrogen and Electricity Production with Carbon Dioxide Capture and Storage Dynamis project thematic priority : 6.1.3.2.4 Capture and sequestration of CO2, associated with cleaner fossil fuels, de Visser and Hendriks et al, Ecofys, July 2007.
SPE formation evaluation, Kyoo Y Song and Riki Kobayyashi, Society of Petroleum Engineers, 1987.
Thermodynamic models for calculating mutual solubilities in H2O-CO2-CH4 mixtures A. Austegard, M. J. Mølnvik, SINTEF Energy Research, Trondheim, Norway and E. Solbraa, G. De Koeijer, STATOIL Research & Technology, Trondheim, Norway, The Institution of Chemical Engineers, September 2006.
From Determining the corrosive potential of CO2 transport pipeline in high pressure CO2–water environments, Yoon-Seok Choi, Srdjan Nešic, Institute for Corrosion and Multiphase Technology, Department of Chemical and Biomolecular Engineering, Ohio University, Athens, OH47501, USA, International Journal of Greenhouse Gas Control 5 (2011) pp788–797.
SPE 123778, Effect of Common Impurities on the Phase Behaviour of Carbon Dioxide Rich Systems: Minimizing the Risk of Hydrate Formation and Two-Phase Flow, A Chapoy, R Burgass, B Tohidi (Hydrafact Ltd & Centre for Gas Hydrate Research, Institute of Petroleum Engineering, Heriot-Watt University), and J M Austell, C Eickhoff (Progressive Energy Ltd). Society of Petroleum Engineers, 2009.
Fate of rising CO2 droplets in seawater, Youxue Zhang, Department of Geological Sciences, The University of Michigan, Ann Arbor, Michigan 48109-1005, USA; and Key Laboratory of Orogenic Belts and Crustal Evolution, MOE, School of Earth and Space sciences, Peking University, Beijing, 100871, China. Environmental Science Technology, 2005 pp 7719 – 7724.

RESEARCH REPORT: HAZARD ANALYSIS FOR OFFSHORE CARBON CAPTURE PLATFORMS AND OFFSHORE PIPELINES
166
Purification of Oxyfuel-Derived CO2 for Sequestration or EOR, Vince White, Rodney Allam (Air Products PLC) and Edwin Miller (Air Products and Chemicals).
Corrosion of transport pipelines for CO2 – effect of water ingress, A. Dugstad, B. Morland (Institute for Energy Technology, Norway) S. Clausen (Gassco AS, Norway, presented at GHGT-10 Amsterdam 19 - 23 September 2010.
Impacts of Non-condensable Components on CCS, J. Yan et al., Presentation at Working Group on Quality of CO2 Captured from Oxyfuel Combustion Power Plant, 22 October 2008, Stockholm, Sweden.
Conditions of Hydrogen-Induced Corrosion Occurrence of X65 Grade Line Pipe Steels in Sour Environments, T. Hara, H. Asahi and H. Ogawa, Corrosion, Vol. 60, No. 12, NACE International, 2004.
Selection of an Active Souring Management Solution for a Gulf of Mexico Waterflood, L.C. Jordan, Gibson Applied Technology and Engineering LLC, J.M. Walsh, Shell Exploration and Annual Fall Meeting, 30 September – 3 October 1973.
Gale, J. and Davidson, J. Transmission of CO2—safety and economic considerations, Energy, 29, 2004 pp.1319-1328.
Development in Carbon Capture Technologies for Power Generation Industry, Stanley Santos, IEA GHG R&D Programme: Presentation at the Institute of Air Quality Management (IAQM) Workshop on CCS, London, UK, 14 November 2007.
CO2 Processing Unit - Challenges in Meeting the Required CO2 Quality, Stanley Santos and Jinying Yan, Presentation at the Oxy-Fuel Combustion Network - 2nd Working Group Meeting on CO2 Quality and other Relevant Issues, 7 September 2009, Cottbus, Germany.
BLEVE and its importance in Enhanced Gas Recovery and Carbon Capture and Storage AA Clifford, Leeds University Department of Chemistry.
CO2 BLEVE, W.Ke, Telemark University College, Norway, 2009.
SPE 123788, CO2 Injection into Depleted Gas Reservoirs, September 2009.
Carbon capture and sequestration: Potential environmental impacts, P. Johnston, P. and D. Santillo, IPCC workshop on carbon dioxide capture and storage, 2002.
H.3 PUBLICATIONS REFERENCED
Basic Principles of Membrane Technology 2nd Edition, May 1996, Marcel Mulder.
Perry’s Chemical Engineering Handbook, Robert Perry and Don Green, Mc Graw Hill, 2007.
Ocean Climate Status Report 1999, Fisheries Research Services Report 06/00.
Clathrate hydrates of natural gases second edition, E D Sloan Jr, 1998.
Health and Safety Executive EH40/2005 Workplace Exposure Limits, 2005.
Submarine Pipeline Systems, Det Norske Veritas Offshore Standard DNV-OS-F101 October 2010.

RESEARCH REPORT: HAZARD ANALYSIS FOR OFFSHORE CARBON CAPTURE PLATFORMS AND OFFSHORE PIPELINES
167
Joint Industry Programme on carbon monoxide issues, prepared by Advantica Technologies Limited (formerly BG Technology) for the Health and Safety Executive, Contract Research Report 383/2001.
Assessment of the Dangerous Toxic Load (DTL) for Specified Level of Toxicity (SLOT) and Significant Likelihood of Death (SLOD), HSE, updated to 3 October 2011.
Hydrogen Sulfide: Human health aspects Concise International Chemical Assessment Document 53, World Health Organisation, Geneva, 2003.
Guidelines for Evaluating the Characteristics of Vapour Cloud Explosions, Flash Fires and BLEVEs’, ISBN 0-8169-0474-X, Centre for Chemical Process Safety of the American Institute of Chemical Engineers, 1994.
Health effects of possible degradation products of different amines relevant for CO2 capture, Låg, M., Instanes, C., Lindemann, B. and Andreassen, Å. 2009, Final report Norwegian Institute of Public Health (FHI), Oslo.
Effects of Impurities on Geological Storage of CO2, IEAGHG, report 2011/4, June 2011.
Directive 2009/31/EC of 23 April 2009 on the geological storage of carbon dioxide and amending Council Directive 85/337/EEC, European Parliament and Council Directives 2000/60/EC, 2001/80/EC, 2004/35/EC, 2006/12/EC, 2008/1/EC and Regulation (EC) No 1013/2006.
EU Dynamis project Towards Hydrogen and Electricity Production with Carbon Dioxide Capture and Storage, Project number 019672, March 2006 – October 2009.
ANSI/NACE MR0175/ISO 15156 Part 1 section 7.2.1.3.
Petroleum and natural gas industries – Materials for use in H2S-containing environments in oil and gas production, ANSI/NACE MR0175/ISO 15156, part 1(2009), parts 2 and 3(2011).
Guidelines for Use of Vapor Cloud Dispersion Models (2nd edition), S. R. Hanna, P. J. Drivas, and J. J. Chang , AIChE/CCPS, 1996.
Pressurised CO2 Pipeline Rupture, IChemE Symposium series No. 154, 2008.
Guide to Quantitative Risk Assessment for Offshore Installations. New ISBN 9781870553360, 1999.
SPC/Tech/OSD/30, Indicative human vulnerability to the hazardous agents present offshore for application in risk assessment of major accidents, Health and Safety Executive, Version 3, issued 1 November 2010.
Carbon Dioxide Physiological Hazards not just an asphyxiant! EIGA Safety Info 24/11/E, prepared by the Safety Advisory Council, 2011.
DCS05 Status of technical guidance and information on design, construction and operation of offshore installations HSE Operations Notice 27, issued September 2003, revised October 2010.
Prevention of Fire and Explosion and Emergency Response (PFEER) on Offshore Installations (1995) SPC/Enforcement/155.
The Offshore Installations (Safety Case) Regulations 2005, 2005 No. 3117.

RESEARCH REPORT: HAZARD ANALYSIS FOR OFFSHORE CARBON CAPTURE PLATFORMS AND OFFSHORE PIPELINES
168
Guidance note 2/2006 (Offshore Installations (Safety Case) Regulations 2005, Regulation 12 Demonstrating compliance with the relevant statutory provisions), Health and Safety Executive 2006.
Guidance note 3/2006 (Offshore Installations (Safety Case) Regulations 2005, Guidance on Risk Assessment for Offshore Installations), Health and Safety Executive 2006.
Assessment Principles for Offshore Safety Cases (APSOC), Health and Safety Executive, March 2006.
Guidance for the topic assessment of the major accident hazard aspects of safety cases, Health and Safety Executive, April 2006.
Safety Case Assessment Manual, Gas Safety Management Regulations 1996, HSE Hazardous Installations Directorate Gas & Pipelines Unit, Version 6, 03 June 2011.
HID/OSD/Tech/SPC30, Indicative human vulnerability to the hazardous agents present offshore for application in risk assessment of major accidents, Health and Safety Executive, Version 3, issued 1 November 2010.
Building environment design, Indoor environment, General principles ISO 16813:2006.
Offshore Installations and Wells (Design and Construction, etc) Regulations 1996 SI 1996/913 HMSO 1996 ISBN 0 11 054451 X. 31000:2009: Risk Management – Principles and Guidelines.
A guide to the Pipelines Safety Regulations HSE, 1996, L82, ISBN 0-7176-1182-5.
Provision and Use of Work Equipment Regulations 1998. Approved Code of Practice and guidance L22 (Third edition) HSE Books 2008 ISBN 978 0 7176 6295 1.
Offshore Standard Det Norske Veritas DNV-OS-F101,Submarine Pipeline Systems October 2010.
Kingsnorth CCS Demonstration Project - Key Knowledge Reference Book, Feb 2011, E.ON UK.
Good plant design and operation for onshore carbon capture installations and onshore pipelines, The Energy Institute, September 2010.
Report of the North Sea Basin Task Force, Development of a CO2 Transport and Storage Network in the North Sea, November 2007.
Rotterdam Climate Initiative, CO2 Capture, Transport and Storage in Rotterdam, 2009.
Guidelines for offshore oil and gas installations that are not permanently attended, Energy Institute
UK Carbon Capture and Storage Demonstration Competition, UKCCS - KT - S7.18 - Shell – 003, Flowline Well Interactions, April 2011, Scottish Power CCS Consortium.
Lees’ Loss Prevention in the Process Industries 3rd edition Mannon S. (ed), 2005 (Elsevier Butterworth – Heinemann, Oxford UK).
Reliability of Mechanical Systems, Davidson J.(ed), 1994 (IMechE, London UK).
PARLOC 2001: The Update of Loss of Containment Data for Offshore Pipelines, Energy Institute.

RESEARCH REPORT: HAZARD ANALYSIS FOR OFFSHORE CARBON CAPTURE PLATFORMS AND OFFSHORE PIPELINES
169
Seventh report of the European Gas Pipeline Incident Data Group Gas Pipeline Incidents 1970-2007 Published Dec 2008.
UKOPA Pipeline Fault Database - Pipeline Product Loss Incidents Document 07/0050 (1962 - 2006).
CONCAWE Report No. 7/08 Performance of European cross-country oil pipelines - statistical summary of reported spillages in 2006 and since 1971.
Mapping of potential HSE issues related to large-scale capture, transport and storage of CO2, Johnson,K. et al, DNV report number 2008-1993, 2009 (Det Norske Veritas, Horvik. Norway).
Offshore Reliability Data Handbook 5th Edition, Volume 1 – Topside Equipment, Volume 2 – Subsea Equipment (OREDA 2009).
Classification of Hazardous Locations published 1990, Cox, Lees and Ang, The IChemE, Rugby UK).
Guidelines for Use of Vapor Cloud Dispersion Models, 2nd Edition 1996 (American Institute of Chemical Engineers, Center for Chemical Process Safety – New York, USA).
Nomenclature for Hazard and Risk Assessment in the Process Industries Jones, D.A. (ed.), 2nd edition 1992 (IChemE, Rugby, UK).
Process Safety Analysis – An Introduction, Skelton, R., 1997 (IChemE, Rugby UK).
Damage by impact, the case at Meteor Crater, Arizona, LMV Martel, Hawaii Institute of Geophysics and Planetology, 11 December 1997.
Helicopter Safety in the Oil and Gas Business, B. Tender, Shell Aircraft International, May 2006.
Marine biology – an ecological approach JW Nybakken, Harper Collins College Publishers, New York, 1993.
Environmental Agency scoping guidance on the environmental impact assessment of projects, Impact Assessment and Project Appraisal, A Bond and G Stewart, 2002.
Scoping Guidelines on Carbon Capture and Storage Developments, C. O’Leary, Master of Science University of East Anglia School of Environmental Sciences, August 2010.
Indicative human vulnerability to the hazardous agents present offshore for application in risk assessment of major accidents HSE, SPC/Tech/OSD/30, 2010.
Marine biology – an ecological approach JW Nybakken, Harper Collins College Publishers, New York, 1993.
Classification of Hazardous Locations, A Cox, F Lees, and M Ang, 1993.
The rapid depressurization of hot, high pressure liquids or supercritical fluids Kim and Reid, Chemical engineering at supercritical fluid conditions, Paulaitis, Anne Arbor Science,1983.

Energy Institute61 New Cavendish Street
London W1G 7AR, UK
t: +44 (0) 20 7467 7100
f: +44 (0) 20 7255 1472
www.energyinst.org
This publication has been produced as a result of
work carried out within the Technical Team of the
Energy Institute (EI), funded by the EI’s Technical
Partners. The EI’s Technical Work Programme
provides industry with cost effective, value adding
knowledge on key current and future issues
affecting those operating in the energy sector,
both in the UK and beyond.
Registered Charity Number 1097899
ISBN 978 0 85293 650 4


![OF THE EI[]8[E$ - The Croppie](https://static.fdokumen.com/doc/165x107/631f0b275ff22fc74506fa44/of-the-ei8e-the-croppie.jpg)