Handbook on meat production statistics - CIRCABC - European Union
72
Handbook on meat production statistics Handbook Draft version 1
-
Upload
khangminh22 -
Category
Documents
-
view
0 -
download
0
Transcript of Handbook on meat production statistics - CIRCABC - European Union
Handbook on meat production statistics
Handbook Draft version 1

Table of contents
2 Draft Handbook on meat statistics
TABLE OF CONTENTS
1 Introduction ................................................................................................................................. 9 1.1 Aim ........................................................................................................................................ 9 1.2 History ................................................................................................................................... 9 1.3 User needs .......................................................................................................................... 10 1.4 Legal basis .......................................................................................................................... 10 1.5 Structure of the handbook ................................................................................................... 10 1.6 Changes from previous versions......................................................................................... 10
1.6.1 Changes in structure ................................................................................................... 11 1.6.2 Changes in classification ............................................................................................. 11
1.7 Contacts .............................................................................................................................. 11
2 Methodology ............................................................................................................................. 12 2.1 General information ............................................................................................................. 12
2.1.1 Meat statistics .............................................................................................................. 12 2.2 Coverage ............................................................................................................................. 13
2.2.1 Statistical frame ........................................................................................................... 13 2.2.2 Slaughtering statistics .................................................................................................. 14 2.2.3 Gross indigenous production (GIP) forecast ............................................................... 15
2.3 Data sources ....................................................................................................................... 15 2.3.1 Meat statistics .............................................................................................................. 15 2.3.2 Slaughtering in slaughterhouses ................................................................................. 17 2.3.3 Other slaughtering ....................................................................................................... 18 2.3.4 Gross indigenous production (GIP) forecast ............................................................... 20
2.4 Particular national situations ............................................................................................... 21 2.4.1 Non-existing and non-significant variables .................................................................. 21 2.4.2 Non-mandatory data collection .................................................................................... 21
2.5 Precision requirements ....................................................................................................... 22 2.5.1 Slaughtering in slaughterhouses ................................................................................. 22 2.5.2 Other slaughtering ....................................................................................................... 23 2.5.3 Gross indigenous production (GIP) forecast ............................................................... 23
2.6 Reference area ................................................................................................................... 23 2.7 Reference period ................................................................................................................. 23
2.7.1 Slaughtering in slaughterhouses ................................................................................. 23 2.7.2 Other slaughtering ....................................................................................................... 23 2.7.3 Gross indigenous production (GIP) forecast ............................................................... 23
2.8 Reporting frequencies ......................................................................................................... 24 2.8.1 Slaughtering in slaughterhouses ................................................................................. 24 2.8.2 Other slaughtering ....................................................................................................... 24 2.8.3 Gross indigenous production (GIP) forecast ............................................................... 24
2.9 Units of measurement ......................................................................................................... 25 2.9.1 Number of slaughtered animals ................................................................................... 25 2.9.2 Carcass weight ............................................................................................................ 25 2.9.3 Gross indigenous production (GIP) forecast ............................................................... 25
2.10 Classification ....................................................................................................................... 26
Table of contents
3 Draft Handbook on meat statistics
2.10.1 Concepts and definitions ............................................................................................. 26 2.10.2 Variables ...................................................................................................................... 27 2.10.3 Categories ................................................................................................................... 27
3 Data processing ........................................................................................................................ 35 3.1 Introduction [NEW] .............................................................................................................. 35 3.2 Data integration ................................................................................................................... 35
3.2.1 Slaughtering in slaughterhouses ................................................................................. 35 3.2.2 Other slaughtering ....................................................................................................... 35 3.2.3 Calculation of GIP forecast [ANI/REF/2016/M/GIP-1] ................................................. 36
3.3 Revision .............................................................................................................................. 39 3.4 Validation ............................................................................................................................ 39 3.5 Editing and imputation ......................................................................................................... 39 3.6 Aggregation [NEW] ............................................................................................................. 40
3.6.1 Aggregation of regional data ....................................................................................... 40 3.6.2 Aggregation of data per categories of slaughtering statistics ...................................... 40 3.6.3 Data confidentiality issues ........................................................................................... 41
4 Data structure ........................................................................................................................... 42 4.1 Introduction ......................................................................................................................... 42 4.2 Dataset structure definition ................................................................................................. 42 4.3 Data types ........................................................................................................................... 42 4.4 File formats ......................................................................................................................... 42
5 Data transmission..................................................................................................................... 43 5.1 Deadlines for data submission ............................................................................................ 43
5.1.1 Slaughtering statistics .................................................................................................. 43 5.1.2 GIP forecast ................................................................................................................. 43
5.2 Templates for data transmission ......................................................................................... 44 5.3 Completeness ..................................................................................................................... 45 5.4 Flags for data transmission ................................................................................................. 45
5.4.1 Observation status flag ................................................................................................ 45 5.4.2 Confidentiality flags ..................................................................................................... 46
5.5 File naming conventions ..................................................................................................... 46 5.6 Transmission method .......................................................................................................... 46
5.6.1 How to access EDAMIS .............................................................................................. 47 5.7 Revision .............................................................................................................................. 47
6 Data validation .......................................................................................................................... 48 6.1 Introduction ......................................................................................................................... 48 6.2 Validation procedure ........................................................................................................... 49
6.2.1 Structural validation ..................................................................................................... 50 6.2.2 Content validation ........................................................................................................ 50 6.2.3 Further validation performed ....................................................................................... 50
6.3 Validation rules .................................................................................................................... 50
Table of contents
4 Draft Handbook on meat statistics
6.4 Validation outcomes and report .......................................................................................... 50 6.4.1 EDAMIS validation feedback ....................................................................................... 51 6.4.2 MDT validation feedback ............................................................................................. 51
6.5 Eurostat assessment ........................................................................................................... 51 6.6 Data storage ........................................................................................................................ 51
7 Quality reports .......................................................................................................................... 52 7.1 Introduction ......................................................................................................................... 52 7.2 Communication on methodological changes ...................................................................... 53 7.3 Quality reports ..................................................................................................................... 53
7.3.1 ESS Standard for Quality Reports ............................................................................... 54 7.3.2 Report structure ........................................................................................................... 54
7.4 Transmission method (ESS-MH) ........................................................................................ 55 7.4.1 Logging in with EU Login ............................................................................................. 55 7.4.2 Creating an EU Login account ..................................................................................... 56 7.4.3 Editing the metadata handler template ........................................................................ 56 7.4.4 Validating the quality report ......................................................................................... 60 7.4.5 ESS-MH support .......................................................................................................... 60
8 Data dissemination ................................................................................................................... 62 8.1 Confidentiality ...................................................................................................................... 62 8.2 Flags for data dissemination ............................................................................................... 62 8.3 Codes in data dissemination ............................................................................................... 62 8.4 Calculation of EU aggregates ............................................................................................. 62 8.5 Additional disseminated variables ....................................................................................... 62 8.6 Dissemination of tabular data .............................................................................................. 63 8.7 Interpretation of results ....................................................................................................... 63
Annex I: Monthly data collection on other slaughtering - History and terminology.................. 64
1 Purpose ..................................................................................................................................... 64
2 Summary history ...................................................................................................................... 64 2.1 CPSA meeting on 12-13 November 2009 ........................................................................... 64 2.2 CPSA meeting on 17-18 May 2010..................................................................................... 65 2.3 CPSA meeting on 10-11 May 2012..................................................................................... 65 2.4 CPSA meeting on 28-29 April 2014 .................................................................................... 65
3 Resulting agreement ................................................................................................................ 65

Preface
5 Draft Handbook on meat statistics
PREFACE
The animal production statistics are essential for market management/monitoring, production forecasts and policy-making in agriculture and food. The legal basis of the data collection on livestock and meat production is Regulation (EC) No 1165/2008 establishing a common legal framework for statistics on livestock (bovine, pig, sheep and goat), slaughtering (bovine animals, pigs, sheep, goats and poultry) and production forecasts (bovine, pig, sheep and goat meat).

Acknowledgements
6 Draft Handbook on meat statistics
ACKNOWLEDGEMENTS

Abbreviations and acronyms
7 Draft Handbook on meat statistics
ABBREVIATIONS AND ACRONYMS
Code Description
COMEXT Intra- and Extra-European trade database
CPSA Standing Committee for Agriculture
CV Coefficient of variation
DGAS Directors' Group on Agricultural Statistics
ESS European Statistical System
EU European Union
eWA EDAMIS Web Application
eWP EDAMIS Web Portal
FSS Farm Structure Survey
GIP Gross indigenous production
MoA Ministry of Agriculture
MS Member State(s)
NSI National Statistical Institute
TRACES Trade Control and Expert System
WG ANIPROD Working Group on Animal Production Statistics
References
8 Draft Handbook on meat statistics
REFERENCES Doc. ASA/TE/704 rev4, Annex 1 – Concepts and definitions in Animal Production Statistics, 2016 [TE/704]
Doc. ANI/REF/2016/M/GIP-1 – Handbook on GIP forecast, 2015 [ANI/REF/2016/M/GIP-1]
Doc. ASA/TE/719, Annex I – Eurostat report on the quality of livestock and meat statistics, 18/02/2013 [TE/719]
Doc. ASA/TE/758 – Data validation in animal production statistics, 2015 [TE/758]
Doc. ASA/TE/754 – Quality reports 2013 under Regulation (EC) no 1165/2008, 2015 [TE/754]
Quality reports in animal production statistics (reference year 2016), 2018 [QR2016]
Doc. ASA/TE/673, Annex – Proposal for amending a Gentlemen’s agreement on Collection of monthly information on other slaughtering, 2014 [TE/673]
Regulation (EC) No 1165/2008 of the European Parliament and of the Council of 19 November 2008 concerning livestock and meat statistics and repealing Council Directives 93/23/EEC, 93/24/EEC and 93/25/EEC [R1165]
Doc. CPSA/722 and ASA/TE/673 rev.4 – CPSA agreement on collection of monthly information on other slaughtering [CPSA/722]
Doc. ASA/TE/F/655 – Manual on meat supply balance sheets, 2009 [TE/655]
Regulation (EU) No 2018/1091 of the European Parliament and of the Council of 18 July 2018 on integrated farm statistics and repealing Regulations (EC) No 1166/2008 and (EU) No 1337/2011 [R1091]

1
1 Introduction
9 Draft Handbook on meat statistics
1 Introduction 1.1 Aim The overall purpose of the present handbook is to provide methodological and practical guidance for compiling and disseminating statistics on livestock and meat production to all national authorities involved in the compilation of animal production statistics and for the data users.
The handbook compiles the legal elements, common concepts and definitions used in Animal Production Statistics and provides further clarification, working arrangements and tool procedures relating to data collection, processing and dissemination. It is intended to contribute to a better understanding and application of commonly agreed methods, to improve the quality and comparability of Animal Production Statistics, as well as to provide the data users with methodological and conceptual clarifications for improving data interpretation.
The present version focuses on only one part of the animal producion subdomain, Meat Statistics, covering slaughtering statistics and Gross indigenous production (GIP) forecast.
1.2 History In March 2009, the last manual on meat supply balance sheets was agreed by the Working Group on Animal Production Statistics (Doc. ASA/TE/F/655). The corresponding data collection was phased out in 2010.
Annex 1 to Doc. ASA/TE/704 was approved by the Working Party on Animal Production Statistics on 13-14 March 2012, covering the definitions and concepts used in Animal Production Statistics and drawn from the legislation. The latest version from 2016 (ASA/TE/704.rev4) integrated several revisions by the Working Group.
Furthermore, a draft handbook on Gross Indigenous Production (GIP) forecast has enabled the Working Group (WG) on Animal Production Statistics (Aniprod) to agree on a recommended methodology (Doc. ANI/REF/2016/M/GIP-1).
These documents provide methodology of animal production statistics compiling the legal elements, further interpretations, working arrangements and tool procedure for these statistics. They were compiled to contribute to a better understanding and application of commonly agreed concepts and methods and to improve the quality of Animal Production Statistics.
The present handbook integrates these pieces of methodology regarding meat statistics, including the quality reports on livestock and meat statistics provided meanwhile by the Member States. In the present version, these sources of information are indicated between squared brackets using the abbreviations provided at the end of each document listed under “References”.
1 Introduction

1 Introduction
10 Draft Handbook on meat statistics
When new text has been drafted for better coverage of the methods by the handbook, it is indicated as [NEW].
1.3 User needs In order to ensure that the common agricultural policy (CAP) is properly administered, particularly where the beef, veal, pig meat, sheep meat, goat meat and poultry meat markets are concerned, the Commission requires regular statistics on trends in livestock and meat production.
The main users are other Directorates General of the European Commission, especially DG Agriculture and rural development, including the meat market observatory, and DG Health and food safety. However, there are other major users such as other European institutions, national administration services, national statistical institutes, other international organisations, agro-industry, producer groups, research institutes, journalists, third countries and the public in general. The objectives of these users are diverse, but animal production statistics are especially useful for market management/monitoring, production forecasts and policy-making in agriculture and food.
1.4 Legal basis Livestock and meat statistics are based on one EU Regulation and one CPSA agreement.
• Livestock and meat statistics are collected under Regulation (EC) No 1165/20081. They cover meat production, as activity of slaughterhouses (monthly) and as other slaughtering (annual), meat production (gross indigenous production) forecast (semi-annual or quarterly), livestock statistics, including regional statistics. A quality report is also collected every third year.
• Monthly estimates on other slaughtering are delivered from those Member States that have signed the CPSA agreement on collection of monthly information on other slaughtering (Doc. CPSA/722 and ASA/TE/673 rev.4)
The Agreement between the European Community and the Swiss Confederation on cooperation in the field of statistics2 states that Switzerland must provide Eurostat with livestock and meat statistics, after 2013.
The same statistics are requested from the candidate and potential candidate countries as EU acquis.
1.5 Structure of the handbook The current Handbook is based on an Eurostat template for agriculture and fisheries statistics and a standard table of content.
1.6 Changes from previous versions There was no previous version.
The present handbook compiles information that was spread across several documents with focus on methodology and Member states practices on meat production statistics.
1 Regulation (EC) No 1165/2008 of the European Parliament and of the Council of 19 November 2008 concerning livestock and meat
statistics and repealing Council Directives 93/23/EEC, 93/24/EEC and 93/25/EEC
2 Agreement between the European Community and the Swiss Confederation on cooperation in the field of statistics. Final Act – Declarations OJ L 90, 28.3.2006, p. 2–20 (ES, CS, DA, DE, ET, EL, EN, FR, IT, LV, LT, HU, MT, NL, PL, PT, SK, SL, FI, SV)
1
1 Introduction
11 Draft Handbook on meat statistics
The handbook includes revised guidelines, interpretation of relevant legislation, examples of best practice, explanations of the existing concepts, and other information.
1.6.1 CHANGES IN STRUCTURE Not relevant.
1.6.2 CHANGES IN CLASSIFICATION Not relevant.
1.7 Contacts For further questions, please contact Eurostat at: [email protected]

2 Methodology
12 Draft Handbook on meat statistics
2 Methodology 2.1 General information Animal production statistics cover three main sub-domains:
• Livestock and meat statistics
• Milk and milk product statistics
• Poultry statistics.
The present handbook focuses on meat statistics.
2.1.1 MEAT STATISTICS The meat statistics organisation that defines the data sets to be transmitted by Member States to Eurostat reflects the relevant legal frame:
1. Slaughtering in slaughterhouses (including poultry) Regulation (EC) No 1165/2008),
2. Slaughtering carried out other than in slaughterhouses (other slaughtering) (excluding poultry)
a. Annual estimates (Regulation (EC) No 1165/2008)
b. Monthly estimates (CPSA agreement)
3. Gross indigenous production (GIP) forecast (excluding poultry) Regulation (EC) No 1165/2008.
The methods for data collection and production of slaughtering statistic and GIP are not set out in the legislation. In practice, Member States developed various statistical processes applying different methods or combination of them depending on the specific system for animal production statistics at national level. The system may include specialised industry surveys, annual or bi-annual farm surveys, use of administrative registers or veterinary information, expert estimations, assessments, compilations as well as modelling. [NEW- based on QR2016]
2.1.1.1 Slaughtering in slaughterhouses For slaughtering in slaughterhouses usually one process is used where statistics are:
• Produced from direct data collection in slaughterhouses, or
• Derived from the administrative reports on slaughtering activity (national veterinary information systems).
Additional information from registers of individual animals may complete the picture, e.g. to establish the share of animals by age. [QR2016, table 4]
2 Methodology

1
2 Methodology
13 Draft Handbook on meat statistics
2.1.1.2 Other slaughtering The way of estimating other slaughtering is left to Member States under subsidiarity and the same level of comparability between them is not expected. Estimations of other slaughtering may be based on:
• data collection from livestock rearing farms
• administrative reports on slaughtering activity (national veterinary information systems or other administrative data sources)
• expert assessments of the market, extrapolation of known results on slaughtering, estimates or modelling using the estimation of the total slaughtering.
[TE/719, II4B]
2.1.1.3 Gross indigenous production (GIP) forecast The production of forecasts for the national supply of bovine animals, pigs, sheep and goats is based on the livestock and slaughtering statistics, as well as on other available information. This supply is the gross indigenous production (GIP), which is described in the legislation as the number of bovine animals, pigs, sheep and goats slaughtered plus the balance of intra-Community and external trade in these live animals [R1165, Art13]. This description refers to meat production (live animals subject to slaughter after a given time) and to trade (live animals imported and exported at a given time), but comparability of both measurements is limited.
Gross indigenous production (GIP) is the number of live animals delivered by agriculture (to slaughterhouses or abroad) for a reference area (the territory of a Member State). Achieved GIP is understood as follows:
• when the reporting entity is a net exporter (it exports more than it imports) of these animals, it is the sum of the number of animals slaughtered and of the net number of animals exported alive or,
• when the reporting entity is a net importer (it imports more than it exports) of these animals, it is the discrepancy between the number of animal slaughtered and the net number of animals imported alive [ANI/REF/2016/M/GIP-1].
Whereas afterwards measurement of GIP compiles trade and slaughtering statistics, GIP forecasts are based on the freshest statistics on livestock populations. A model is necessary to establish forecast, designed and validated against historical series of achieved GIP and of livestock statistics [ANI/REF/2016/M/GIP-1]. The type of information depends on the species:
• for bovine GIP, age categories and contribution to either meat or dairy production are the main factors;
• for pig GIP, optimised production fits well with forecasting;
• for sheep and goats, the female breeding livestock is the reference variable. [NEW- based on ANI/REF/2016/M/GIP-1].
2.2 Coverage 2.2.1 STATISTICAL FRAME
A statistical frame is a list of all the individuals in the target population. For the purposes of livestock and meat data collection the population might be composed of agricultural (agricultural holdings) as well as non-agricultural units (slaughterhouses) undertaking economic activities within the economic territory of the European Union either as primary or secondary activity. In general, thresholds apply. A sample can then be drawn from this frame. [NEW]
2 Methodology
14 Draft Handbook on meat statistics
A good frame includes all the units in the target population, excludes all units not in the target population and has accurate information on the units (e.g. information allowing identifying or contacting them). Ideally each unit should have a unique identifier. [NEW]
Since the Regulation (EC) 1165/2008 does not foresee any cut-offs of the coverage, the statistics to be produced shall describe 100% of the animals slaughtered in slaughterhouses or other than in slaughterhouses, or forecasted. [R1165, Art 9]
2.2.2 SLAUGHTERING STATISTICS As set out in Article 9 of Regulation (EC) 1165/2008, the statistics on slaughtering (in slaughterhouses) cover all bovine animals, pigs, sheep and goats and poultry slaughtered in slaughterhouses on the territory of each Member State, as well as the estimation of slaughtering carried out other than in slaughterhouses (also called 'other slaughtering'). [R1165, Art 9]
The frame can be broken down in two subframes: slaughterhouses and other units. [NEW]
2.2.2.1 Slaughtering (in slaughterhouses) The statistical unit is the slaughterhouse as defined in chapter 2.10.1.1. The whole frame consists of the list of all registered slaughterhouses on the territory of the Member State. It may be extended, where applicable (e.g. non-EU countries), to those slaughterhouses that are approved by the country but not by the EU and operate on the national market. [NEW]
It excludes points of slaughtering other than slaughterhouses, such as agricultural holdings, households, butcher shops, restaurants etc. even if officially registered for slaughtering. Whereas slaughtering carried out other than in slaughterhouses is forbidden by the EU hygiene law, except for small numbers of poultry or for emergency cases, exceptions may be met for transitional periods, for traditional and religious purposes, and out of the EU. [NEW]
In some Member States, poultry slaughterhouses constitute a specific frame, as their activity is exclusive. [NEW]
2.2.2.2 Other slaughtering Other slaughtering is intended to complete comparable information on slaughtering from the slaughterhouses with heterogenous data to better catch the whole slaughtering phenomenon. [NEW]
Other slaughtering can be defined as the difference between total slaughtering and slaughtering in slaughterhouses. [NEW]
If the method used for the estimation of other slaughtering is a sample survey, the sampling frame can be defined as the list of units from which the information on slaughtered animals can be collected. Other slaughtering in the EU is in general due to own-consumption, traditional slaughter and statistics from slaughterhouses not efficiently connected for transmitting information. Slaughtering on the farm, if not in an agreed workshop, is illegal and tends to disappear in the EU Member States. Out of the EU, it can be also done by households, butcher shops, restaurants etc., which are, or not, officially registered as establishments for slaughtering of animals . The complete list of these units forms the whole frame for estimation of the other slaughtering. Finally other slaughtering may cover slaughter in remote areas, where the information system does not enable to provide timely information. [NEW]
Agricultural holdings as defined in chapter 2.10.1.2. may be part of the frame (farm slaughtering). [NEW]
1
2 Methodology
15 Draft Handbook on meat statistics
Significance of other slaughtering [TE/673]
Regulation (EC) 1165/2008 does not foresee any alleviation from the obligation for producing statistics of monthly slaughtering in slaughterhouses and annual other slaughtering.
Whereas other slaughtering is marginal in most of the Member States, it is still important in the others. To limit burden on the respondents and the national administrations, the agreement on collection of monthly information on other slaughtering is based on an assessment of significance of other slaughtering.
"Significance" of other slaughtering is assessed based on the annual statistics for each of the following groups of animal categories: bovine animals (except calves), calves, pigs, sheep and goats.
If other slaughtering in a Member State is taken as significant for a group of animal categories according to the defined criteria (chapter 2.4.2.2), the concerned Member State agrees to provide Eurostat with detailed monthly estimates concerning this group for 12 successive monthly periods.
If other slaughtering in a Member State is not regarded as significant, a Member State can provide monthly figures, for instance because of national interest or to improve the current estimates.
2.2.3 GROSS INDIGENOUS PRODUCTION (GIP) FORECAST Gross indigenous production covers production of animals, excluding losses and removals and changes in (live) stock. [ANI/REF/2016/M/GIP-1]
Gross indigenous production (GIP) forecast is a statistical process not involving any statistical unit and, therefore, coverage is not relevant. [NEW]
2.3 Data sources 2.3.1 MEAT STATISTICS Regulation (EC) No 1165/2008 does not define the data sources to be used for meat statistics. According to the specific country context and the statistical system, Member States use some of the following sources or a combination of them:
• statistical surveys;
• administrative data sources;
• other sources or methods.
One of the sources is identified by each Member State as the main source. In addition to that one, the Member States can use additional sources to improve the quality of the data drawn from the main source, for instance in terms of coverage, accuracy or completeness. [TE/719, II3A]
2.3.1.1 Statistical survey Many Member States conduct a statistical survey of slaughterhouses. No binding requirement of representativeness or reliability is laid down in Regulation (EC) No 1165/2008.
Some Member States and most of the Candidate countries use sample surveys to estimate the other slaughtering. [TE/719, table7]
2.3.1.2 Administrative data sources 2.3.1.2.1 Access to administrative data
In the EU, national authorities responsible for fulfilling the requirements of this Regulation shall have the right to access and use, promptly and free of charge, data, including individual data on agricultural holdings and personal data on their holders contained in administrative files compiled on
2 Methodology
16 Draft Handbook on meat statistics
their national territory pursuant to Article 17a of Regulation (EC) No 223/2009. The national authorities and the owners of the administrative records shall establish the necessary cooperation mechanisms.
Frequently the owner of the administrative data is not the same entity that needs to provide the statistical data. Therefore the co-operation between the statistical authorities and administrative data holders has to be in place from the set-up of the register onwards to make sure that statistical needs are met by the register and that the data are available for statistics.
Where close cooperation between the statistical and administrative authority is efficient, the administrative database design may even integrate that statistical needs, especially by foreseeing necessary information for statistical use.
Regulation (EC) No 223/2009 Article 17a - Access, use and integration of administrative records
In order to reduce the burden on respondents, the NSIs, other national authorities as referred to in Article 4, and the Commission (Eurostat) shall have the right to access and use, promptly and free of charge, all administrative records and to integrate those administrative records with statistics, to the extent necessary for the development, production and dissemination of European statistics, which are determined in the European Statistical Programme in accordance with Article 1.
The NSIs and the Commission (Eurostat) shall be consulted on, and involved in, the initial design, subsequent development and discontinuation of administrative records built up and maintained by other bodies, thus facilitating the further use of those records for the purpose of producing European statistics. They shall be involved in the standardisation activities concerning administrative records that are relevant for the production of European statistics.
2.3.1.2.2 Quality of administrative data [NEW]
Administrative sources are considered a useful source specially for reducing the burden on respondents. At its best, data collection from administrative source can be a win-win situation: high quality statistics produced at a low cost without asking anything again from the respondents. At its worst, the statistical obligation may not be met at all (no data) or the quality of the delivered data fails to meet most statistical quality criteria. The ESS supports the EU Member States in developping use of administrative data sources for the production of official statistics, and in promoting quality of the statistics based on administrative sources.
When using an administrative register for statistics, one should keep in mind that:
• Statistics need to meet strict pre-defined quality criteria;
• Quality criteria may or may not be applicable to administrative registers and the register metadata needed for quality assessment are not always available;
• The registers may be not properly updated if there is no quality assurance and checking mechanism in place
• Quality assessment tools are needed to analyse the quality of register data and to assess whether they are fit-for-purpose for statistics [NEW]
2.3.1.2.3 Systems for the animal identification and registration
Since April 1997 a system of permanent identification of individual bovine animals enables reliable traceability from birth to death3.
3 https://ec.europa.eu/food/animals/identification/bovine_en
1
2 Methodology
17 Draft Handbook on meat statistics
The system includes a computerised national database with a future voluntary interoperability of bovine databases.
A computerised national database is also required for sheep and goats4. Member States with populations of less than 600 000 sheep and goats or less than 160 000 goats can make electronic tagging voluntary for animals not entering intra-EU trade, but individual traceability and application of two conventional ear tags is mandatory everywhere.
Animal registers exist also for pigs, for equine animals and, in some countries, for beehives.
2.3.1.3 Other sources The Member States are allowed to use other sources than those listed above, as far as the required quality of statistics is provided, among others for example expert estimates, modelling, technical coefficients, etc. [NEW]
2.3.1.3.1 Expert estimates
Expert estimates are made by one or several experts based on their knowledge and observation of the context (available information). Estimates are used to set up technical coefficients, to replace missing data collection (statistical survey or administrative data source) or to estimate more complex indicators. In meat statistics they may include assessment of the trend in slaughtering or in meat market and can be done by internal or external to the NSI experts. Expert assessment is used by Member States in more sophisticated statistical processes for the check or elaboration of complex indicators such as GIP forecast. Since expert estimates require significant input of human expertise they may be replaced or supported by more objective methods of data collection and models. [NEW]
Expert estimate cannot be the single opinion of one person on a phenomenon, but must either be based on a group of experts with various interests or on a single expert contributing to data interpretation. [NEW]
2.3.1.3.2 Modelling
Models are based on a combination of statistical data and coefficients. According to their design they can use large set of coefficients (e.g. demographic model of GIP forecast) or more limited number of coefficients (e.g. integrated model of GIP forecast). In practice, the coefficients are fine-tuned either on historical series if available, or on the current data. The role of human expert at this stage is strategic. Based on a sufficient number of periods, feedback can be used for improving the set of coefficients. [ANI/REF/2016/M/GIP-1]
2.3.1.3.3 Technical coefficients
Coefficients are usually used to produce indicators at the margin of the statistical system. They can be integrated in more complex expert assessments and models for estimation of indicators which are subject to dissemination. Such coefficients in meat statistics refer to the herd demography (fertility and mortality rates, duration of growing and fattening processes, etc.), animal weight (average weight per livestock category, live weight to carcass weigh conversion ratio, etc.), self-consumption of meat (share of other slaughtering), etc. Quality of the coefficients used for statistics is a general concern. To be reliable, they have to be based on sufficiently long timeseries and regularly revised and up-dated. [NEW]
2.3.2 SLAUGHTERING IN SLAUGHTERHOUSES 2.3.2.1 Statistical surveys
Data on the number and carcass weight of animals slaughtered in slaughterhouses can be collected with statistical surveys carried out on monthly basis. Considering the relatively small number of statistical units at national level, data collection may be carried out as an exhaustive survey (census)
4 https://ec.europa.eu/food/animals/identification/ovine_caprine_en

2 Methodology
18 Draft Handbook on meat statistics
or as a sample survey. In the case of sample surveys, the Member States shall ensure that the weighted survey results are statistically representative for their territory. [NEW]
The sampling frame corresponds to the list of officially registered slaughterhouses and includes all the establishments on the territory of the Member State regardless of their slaughtering capacity. [NEW]
2.3.2.2 Administrative sources To reduce the burden on respondents and increase efficiency of national administrations the data collection can be replaced by administrative sources, provided that these sources are of at least equal quality to information obtained from statistical surveys. [NEW]
Information on the number of slaughtered animals can be derived from the national veterinary information systems as described above (chapter 2.3.1.2.3). All slaughtered animals are subject to veterinary control and are registered in the relevant system. The quality of the administrative source needs to be assessed in terms of coverage, completeness and accuracy before choosing it as a main source. [NEW]
The information required by Regulation (EC) 1165/2008 (e.g. carcass weight of slaughtered animals) is not always available in the administrative sources used as the main data source for slaughtering statistics in some Member States. In such a case, additional data sources (e.g. sample surveys, expert estimates) have to be used to estimate the missing variables and complete the slaughtering data sets.
For instance, in Ireland the number of pigs and poultry slaughtered in slaughterhouses is provided by the Department of Agriculture, Food and the Marine (DAFM, Ministry of Agriculture), but the carcass weight of pigs is estimated based on the survey of the main pig slaughterhouses, and experts provide the average carcass weight for the various poultry categories. Similarly in the Czech Republic, the number of slaughtered poultry from the Veterinary services database is completed by the average weight of poultry categories from an exhaustive survey of slaughterhouses.
Summary of QR2010 on the data sources [TE/719] About half of the countries used an administrative source as the main source for monthly data on slaughterhouses. In two Member States, a slaughterhouse survey was used as an additional source (annual or monthly). Five Member States used additional administrative sources, in two cases as an adjunct to a main administrative source. Three Member States used coefficient sets as an additional source to link the numbers and weights for poultry or to separate marginal sub-categories.
All eight Member States that identified a specific process for poultry slaughtering conduct a specific survey. Additional coefficients are used in two cases and administrative sources in another case.
2.3.3 OTHER SLAUGHTERING Meat production is measured by the activity of slaughterhouses, as described by surveys or administrative sources. Nevertheless, meat production also includes slaughtering carried out other than in slaughterhouses (‘other slaughtering’), if any. The way of estimating such production is left to Member States under subsidiarity and comparability is not expected to be at the same level as for slaughtering in slaughterhouses. [TE/719, II4B]
The similarity with milk produced on the farm (discrepancy between production and industrial activity) makes a farm-animal production survey, or even a farm production survey, relevant. [TE/719, II4B]
The sources for data collection on other slaughtering (slaughtering not carried out in slaughterhouses) vary depending on their nature, on their significance and on the available data sources. The Commission does not give any recommendation to the Member States on the data source to be used. Veterinary service reports and farm surveys (specific production surveys or production items in the livestock survey) are the main primary source for information. [TE719, II4B]
1
2 Methodology
19 Draft Handbook on meat statistics
2.3.3.1 Statistical surveys Farm production survey or production section in the annual livestock/farm survey is one of the sources of information on delivery other than to slaughterers, own-consumption and farm slaughtering, in particular for many non-EU countries. [NEW]
The sampling frame and the sample design of the survey depend on the specific survey objectives, often covering all aspects of the animal production and utilisation on the farm. The sub-frame related to farm slaughtering consists of all agricultural holdings that have bread livestock in the reference year. [NEW]
Respondents of the farm surveys may be asked to report the number of animals slaughtered on the farm, delivered to butchers, restaurants, or own-consumed. Other data sources are used to estimate the carcass weight per head of livestock category as the quality of this variable is generally low. [NEW]
Estimation of other slaughtering in EU Candidate countries [NEW] Other slaughtering in the EU Candidate countries is significant, due to own-consumption and traditional slaughter.
A part from farm slaughtering, other slaughtering may also occur at the households, the market places, and other units which are neither defined as slaughterhouses nor as agricultural holdings. Countries, where the share of such slaughtering is significant have to foresee additional methods of estimation in order to ensure the required coverage of slaughtering statistics.
Farm production survey or production section in the annual livestock/farm survey is the main source of information on slaughtering on the farm. Farms included in the sample are asked questions on the number of heads and carcass weight of animals slaughtered on the farm per category. Other sales, including to slaughterhouses and to other persons for slaughter may be also included in the questionnaire.
Survey of tanneries and accounting of the number of skins (where such market exists) are also used to complete the picture of slaughtering.
Balance sheets can be used for estimating other slaughtering if the technical coefficients (productivity, death rate, fattening duration) are known.
In most of the EU Candidate Countries the adoption of the EU acquis is in progress. The national veterinary system related registers are under development and face quality issues (in terms of definitions and classifications, coverage, regular up-date, accessibility). Administrative sources are either used only for cross-checking and imputation or not used at all.
2.3.3.2 Administrative sources Veterinary service reports are one of the main source of information on other slaughtering. [TE/719, table 7]
The information required by Regulation (EC) 1165/2008 (e.g. carcass weight of slaughtered animals) is not always available in the administrative sources used as the main data source for slaughtering statistics in some Member States. In such a case, additional data sources (e.g. sample surveys, expert estimates) have to be used to estimate the missing variables and complete the slaughtering data sets. [NEW]
2.3.3.3 Other sources Expert estimates or coefficients are used to complete the main sources and rarely as the main data source. They can be used to estimate the missing variables from administrative sources and
2 Methodology
20 Draft Handbook on meat statistics
variables for which the quality of reporting from the farm is considered unreliable (e.g. carcass weight) or to estimate the total slaughtering in order to derive from it the other slaughtering. Other sources also face quality issues as they may be based on relatively old technical coefficients. [NEW]
2.3.4 GROSS INDIGENOUS PRODUCTION (GIP) FORECAST An important element of GIP calculation is availability of data sources, which quality limits forecast quality, and therefore makes useless increase in efficiency of the calculation. The quality in forecast is directly dependant of this in GIP achieved. The favoured calculation way for GIP achieved consists in grounding estimates on statistics on slaughtering and of foreign trade, whatever is the source. One shall notice that the GIP is also the total production of animals minus the share dedicated to the change in population size. [ANI/REF/2016/M/GIP-1]
For setting up the GIP forecasting model there are 3 basic historical data series that need to be established:
• livestock population (number of livestock at a given time), latest results and historical time series;
• slaughtering data (in slaughterhouses and other slaughtering), historical time series;
• external trade data (trade balance of live animals), historical time series.
The statistics on livestock population and on slaughtering (including other slaughtering) are harmonized and therefore the source of foreign trade statistics is one of the main quality factors. The Working Party on Animal Production Statistics has often discussed on quality of the Extrastat but especially of the Intrastat statistics. The Member States have various approaches, either based on the national results grounding these foreign trade statistics (but selected or corrected for the purpose of GIP calculation) or in using other data sources, like TRACES or specific data series on exchange of agricultural goods. [ANI/REF/2016/M/GIP-1]
In some countries estimate of other slaughtering may also be an issue. If this contributes significantly to production, it is recommended estimating it, at least in a first time, on reliable statistics, e.g. drawn from a farm survey. [ANI/REF/2016/M/GIP-1]
Finally the overall combination of data sources should be checked by building a supply balance sheet, which establishes (or does not) coherence amongst the various variables. [ANI/REF/2016/M/GIP-1]
Additional information can also be used further to core information on livestock, slaughtering and foreign trade. It refers especially to economic context information, which contributes to orient meat production, like prices of various meats, of milk, of cereals and foodstuff, availability of fodder. It can also enable to take benefit of structural change, like the share of the various types of farming or of various herd sizes. Finally non-statistical information this concerns especially diseases, consumer behaviour, market significant events or bankrupt or new export contract of an important stakeholder. Change in the policy measures may also play a role. [ANI/REF/2016/M/GIP-1]
Where the main data are missing, technical coefficients are calculated in cooperation with field experts and used by some countries to generate forecasts. This method is more appropriate for the small statistical production systems, compared to the EU level and for those systems in process of harmonization (e.g. in Candidate Countries).[NEW]
In addition, the experts use background information for checking the forecasted data (meat price, production conditions, seasonal changes, diseases, feed price, interests, regulatory events etc.).
Expert role Most of the Member States use expert models assessments and the final forecasted figures are communicated and evaluated by groups of experts from various institutions and organisations.
1
2 Methodology
21 Draft Handbook on meat statistics
The basic principle of the GIP assessment leans on the knowledge of the farming system as well as of the market, and the results are validated either as a simple check or as a parallel forecast which is compared with those of the model. This approach of human expertise improves forecast efficiency. [ANI/REF/2016/M/GIP-1]
The calculation of GIP forecast is described under chapter 3.2.3.
2.4 Particular national situations 2.4.1 NON-EXISTING AND NON-SIGNIFICANT VARIABLES The statistics collected at EU level are not necessary relevant at national level. For instance, buffaloes or milk ewes may provide important economic production in some places, but not everywhere. Similarly, duck fattening or horse meat consumption are not overall shared practices. Furthermore, seasonal productions may be intense at a given time in the year and low or null at another time. Therefore the concerned Member States are not bound to collect this information.
As a general rule in tabular data collection, when a value reflects a non-existing phenomenon (e.g. no turkey is slaughtered at all in August in a given Member State), the Member State is expected to transmit value zero.
If the phenomenon is of low intensity, resulting in less than half of the measurement unit, the Member State is allowed to transmit a ‘zero by rounding’, i.e. value zero and status N (non-significant, see 5.4.1. Observation status flag).
When a whole table would be transmitted with only zero values (e.g. Other slaughtering in some Member States), a working arrangement enables the Member State not to transmit the data. Those concerned data sets are listed in the Handbook for data validation in Animal Production Statistics. [NEW]
2.4.2 NON-MANDATORY DATA COLLECTION 2.4.2.1 Slaughtering in slaughterhouses
The Regulation does not define any exemption for statistics on slaughtering in slaughterhouses. Member States shall produce and transmit monthly data about all categories listed in Annex IV of Regulation (EC) 1165/2008. [R1165, Art 9, 10 and 11]
2.4.2.2 Other slaughtering Like for slaughtering in slaughterhouses, no exemption is foreseen in the Regulation regarding annual estimates of other slaughtering. [R1165, Art 9, 10 and 11]
The monthly statistics on other slaughtering are optional, based on the CPSA agreement on collection of monthly information for other slaughtering, i.e. some, but not all, Member States commit to provide certain information. The agreement defines significance thresholds based on the share of other slaughtering in the total annual national and EU slaughtering. [TE/673, Annex 1]
Table 1 shows the thresholds per livestock group expressed in the share of other slaughtering in the national and EU total slaughtering. It is considered significant if the carcass weight of other slaughtering expressed as a percentage of total slaughtering reaches the national or EU threshold set out in Table 1. Nevertheless, if other slaughtering does not reach 6000 tonnes per year, its significance is only relative and it is regarded as non significant in absolute terms. [TE/673, Annex 1]

2 Methodology
22 Draft Handbook on meat statistics
Table 1: Groups of animal categories to be assessed
Annual percentage of other slaughtering (% weight)
Group of animal categories National level EU level
Bovine animals (except calves) 5
1 Calves 5
Pigs 5
Sheep 10
Goats 25 1%,<6000 t* *National slaughter of goats of at least 6 000 tonnes (12 times half of the measurement unit) per year would automatically
reach 1% of EU production.
Eurostat assesses significance based on the data received from mandatory data transmission, on monthly slaughtering and on annual other slaughtering. [NEW]
2.4.2.3 Gross indigenous production (GIP) forecast Member States shall produce forecasts of their supply for bovine animals, pigs, sheep and goats. [R1165, Art 13]
• The forecasts for bovine animals shall be produced twice a year by each Member State. Member States whose bovine-animal populations are below 1 500 000head may produce these forecasts only once a year.
• The forecasts for pigs shall be produced twice a year by each Member State. Member States whose pig populations are below 3 000 000 head may produce these forecasts only once a year.
• The forecasts for sheep shall be produced once a year by Member States whose sheep populations are 500 000 head or above.
• The forecasts for goats shall be produced once a year by Member States whose goat populations are 500 000 head or above. [R1165, Art 13]
2.5 Precision requirements Regulation (EC) 1165/2008 does not define any precision requirements for meat statistics.
2.5.1 SLAUGHTERING IN SLAUGHTERHOUSES In the frame of quality reporting, the Member States are requested to provide the coefficient of variation (CV) of the variables "Number of animals" for the slaughtering statistics (slaughtered bovine animals, pigs, sheep, goats and poultry), where the data are drawn from a sample survey. A large majority of Member States used other sources than sample surveys. For the Member States that used sample survey to collect data on slaughtering in slaughterhouses the CV per livestock types varied from close to 0% to up to 26% in 2016. [QR2016, table 6]
1
2 Methodology
23 Draft Handbook on meat statistics
2.5.2 OTHER SLAUGHTERING Regulation (EC) 1165/2008 requires an estimate of the extend of other slaughtering in order to cover all slaughtered animals. The agreement states that the expected quality of monthly estimates cannot be higher than that of annual figures. The burden on the respondents should not be increased by the collection of monthly estimates of other slaughtering, unless is not possible otherwise, or if such estimates are clearly not of a sufficient quality. [TE/673, Annex 1, para10]
The quality must be such that the values to be provided must reflect the monthly changes in other slaughtering. [TE/673, Annex 1, para11]
2.5.3 GROSS INDIGENOUS PRODUCTION (GIP) FORECAST Meat production forecasts are not subject to precision requirements.
2.6 Reference area The reference area is the territory of the Member States as defined by Regulation (EC) No 1059/20035.
Meat statistics are delivered per country form all Member States, according to Regulation (EC) 1165/2008 and Switzerland.
2.7 Reference period In general, the collected information shall refer to a single reference period that is common to all Member States by referring to the situation during a specified timeframe or date. [NEW]
2.7.1 SLAUGHTERING IN SLAUGHTERHOUSES The statistics on slaughtering in slaughterhouses shall be produced monthly by each Member State. The reference period is the calendar month. [R1165, Art 10, 1]
2.7.2 OTHER SLAUGHTERING The statistics on slaughtering carried out other than in slaughterhouses are produced with the following reference periods:
• For annual statistics the reference period is the calendar year; [R1165, Art 10, 2]
• For monthly statistics the reference period is the calendar month; [TE/673, Annex 1, para2]
• For quarterly statistics (Candidate Countries) the reference period is the calendar quarter. [TE/673, Annex 1, para2]
2.7.3 GROSS INDIGENOUS PRODUCTION (GIP) FORECAST 2.7.3.1 Bovine
The forecasts for bovine animals shall be produced twice a year by each Member State. Member States whose bovine-animal populations are below 1 500 000 head may produce these forecasts only once a year.
• For Member states that produce bovine forecasts twice a year, three semesters shall be covered.
5 Regulation (EC) No 1059/2003 of the European Parliament and of the Council of 26 May 2003 on the establishment of a common
classification of territorial units for statistics (NUTS)
2 Methodology
24 Draft Handbook on meat statistics
• For Member states that produce bovine forecasts once a year, four semesters shall be covered. [R1165, Art 14]
2.7.3.2 Pigs The forecasts for pigs shall be produced twice a year by each Member State. Member States whose pig populations are below 3 000 000¤head may produce these forecasts only once a year.
• For Member States that produce pig forecasts twice a year, four quarters shall be covered.
• For Member States that produce pig forecasts once a year, six quarters shall be covered. [R1165, Art 14]
2.7.3.3 Sheep The forecasts for sheep shall be produced once a year by Member States whose sheep populations are 500 000 head or above.
• Two semesters shall be covered for sheep. [R1165, Art 14]
2.7.3.4 Goats The forecasts for goats shall be produced once a year by Member States whose goat populations are 500 000 head or above.
• Two semesters shall be covered for goats. [R1165, Art 14]
2.8 Reporting frequencies 2.8.1 SLAUGHTERING IN SLAUGHTERHOUSES The statistics on slaughtering in slaughterhouses for all categories set out in Annex IV of Regulation (EC) 1165/2008 are produced monthly by each Member State. [R1165, Art 10, 1]
2.8.2 OTHER SLAUGHTERING The statistics on slaughtering carried out other than in slaughterhouses are produced:
• Annually for all categories set out in Annex IV of Regulation (EC) 1165/2008 (except poultry) by each Member State. [R1165, Art 10, 2]
• Monthly for categories with significant slaughtering by those Member States that have signed the CPSA agreement on collection of monthly information on other slaughtering. [TE/673, Annex 1, para2]
The Candidate Countries, where other slaughtering is systematically significant, are expected to produce quarterly statistics on other slaughtering where monthly statistics cannot be produced. [TE/673, Annex 1, para2]
2.8.3 GROSS INDIGENOUS PRODUCTION (GIP) FORECAST GIP forecasts for meat are collected twice a year or, for countries with a limited livestock population, annually. [R1165, Art 16]
NOTE: Deadlines for data submission are provided under chapter 5.1 of the handbook.
1
2 Methodology
25 Draft Handbook on meat statistics
2.9 Units of measurement 2.9.1 NUMBER OF SLAUGHTERED ANIMALS The number of slaughtered animals whose meat is deemed fit for human consumption are given for a period of a calendar month/calendar year. The unit of measure used for data transmission and dissemination is 1000 heads. [NEW]
2.9.2 CARCASS WEIGHT The carcass weight of slaughtered animals whose meat is deemed fit for human consumption are given for a period of a calendar month/calendar year. The unit of measure used for data transmission and dissemination is 1000 tonnes. [NEW]
The term ‘carcass weight’ means the weight of the cold carcass. [R1165, Annex I]
Measuring the carcass weight Carcass weight of cattle [R1165, Annex I]
For cattle, the cold carcass weight is obtained by subtracting 2% from the warm weight recorded 60 minutes, at the latest, after the animal is bled.
Carcass weight of pigs [R1165, Annex I]
The weight of the cold carcass for pigs is obtained by subtracting 2% from the warm weight recorded 45 minutes, at the latest, after the pig is bled.
Deviations in the definition [TE/719, V3C]
When the collected data do not fit the concept (e.g. definition of variables in a data source), a correction must be applied, e.g. applying coefficients.
Measurement errors in other slaughtering [NEW]
As mentionned under chapter 2.3.3.1 the quality of carcass weight reported by agricultural holdings is assessed as unreliable. Indeed, the animals slaughtered on the farm are not systematically weighted and registered, and the collected information about the live or carcass weight represents the farmer’s opinion. Different approaches are used in the practice to overcome this quality issue:
1. Use of the average carcass weight per head of livestock category as obtained from slaughterhouses survey;
2. Use of the average carcass weight per head of livestock category obtained from slaughterhouses survey and corrected with a coefficient to account for differences in slaughtering practices (e.g. in some countries farm slaughtering of pigs is generally when the pigs reach a live weight much above 110 kg);
3. Direct measuring of live and/or carcass weight in selected small sample of farms.
2.9.3 GROSS INDIGENOUS PRODUCTION (GIP) FORECAST The unit of measure used for data transmission and dissemination of the GIP forecasts is 1000 heads. [NEW]
2 Methodology
26 Draft Handbook on meat statistics
2.10 Classification 2.10.1 CONCEPTS AND DEFINITIONS
2.10.1.1 Slaughterhouse A slaughterhouse is an officially registered and approved establishment used for slaughtering and dressing animals whose meat is intended for human consumption. [R1165, Art 2]
In countries in which ‘hygiene package’ is not fully implemented some slaughterhouses may not be registered or not approved by the EU but they produce for the local market. [NEW]
2.10.1.2 Agricultural holding [R1165, Art 2, new reference to IFS - R1091]
The definition of agricultural holding for the purposes of animal production statistics is set in Regulation (EU) 2018/1091 of the European Parliament and of the Council of 18 July 2018 on integrated farm statistics6, Article 2 (a).
• An agricultural holding, or holding, or farm is a single unit, both technically and economically, operating under a single management and which undertakes economic activities in agriculture in accordance with Regulation (EC) No 1893/2006 within the economic territory of the European Union either as its primary or secondary activity.
For the purposes of slaughtering statistics, in particular for the estimation of other slaughtering, agricultural holdings breeding any type of the following animals are included in the statistical population, regardless of their size and presence of other types of activity:
• Agricultural holdings rearing bovine animals
• Agricultural holdings rearing pigs
• Agricultural holdings rearing sheep
• Agricultural holdings rearing goats
2.10.1.3 Carcass Carcasses of bovine animals, pigs, sheep, goats and poultry are defined in point 3 of Annex I of Regulation (EC) No 1165/2008 concerning livestock and meat statistics.
2.10.1.3.1 Bovine carcass
Means the whole body of a slaughtered animal as presented after bleeding, evisceration and skinning, presented without the head (separated from the carcass at the tabloid-occipital joint); without the feet (severed at the carp metacarpal or tars metatarsal joints); without the organs contained in the thoracic and abdominal cavities with or without the kidneys, the kidney fat and the pelvic fat; and without the sexual organs and the attached muscles and without the udder or the mammary fat. [R1165, Annex I]
2.10.1.3.2 Pig carcass
Means the body of a slaughtered pig, bled and eviscerated, whole or divided down the mid-line, without tongue, bristles, hooves, sexual organs, flare fat, kidneys and diaphragm. [R1165, Annex I]
2.10.1.3.3 Sheep and goats carcass
For sheep and goats a carcass means the whole body of a slaughtered animal as presented after bleeding, evisceration and skinning, presented without the head (separated at the tabloid-occipital 6 Regulation (EU) 2018/1091 of the European Parliament and of the Council of 18 July 2018 on integrated farm statistics and repealing
Regulations (EC) No 1166/2008 and (EU) No 1337/2011 (Text with EEA relevance.)
OJ L 200, 7.8.2018, p. 1–29 (BG, ES, CS, DA, DE, ET, EL, EN, FR, GA, HR, IT, LV, LT, HU, MT, NL, PL, PT, RO, SK, SL, FI, SV)

1
2 Methodology
27 Draft Handbook on meat statistics
joint); without the feet (severed at the carp metacarpal or tarsometatarsal joints); without the tail (severed between the sixth and seventh caudal vertebrae); without the organs contained in the thoracic and abdominal cavities (except the kidneys and kidney fat); and without the udder and sexual organs; the kidneys and kidney fat are part of the carcass. [R1165, Annex I]
2.10.1.3.4 Poultry carcass
For poultry a carcass means the animal plucked and drawn, without head and feet and without neck, heart, liver and gizzard, known as ‘65 % chicken’, or otherwise presented. [R1165, Annex I]
2.10.2 VARIABLES 2.10.2.1 Carcass weight
The term ‘carcass weight’ is defined in Annex I (4) of Regulation (EC) 1165/2008 and it “means the weight of the cold carcass which, for pigs, notably, is obtained by subtracting 2% from the weight recorded warm 45 minutes, at the latest, after the pig is bled, and which for cattle is obtained by subtracting 2% from the weight recorded warm 60 minutes, at the latest, after the animal is bled”. [R1165, Annex I]
For the purposes of meat statistics the carcass weight of slaughtered animals for a given reference period (calendar month or calendar year) is transmitted in 1000 tonnes. [NEW]
Deviations in the definition The term “carcass” per livestock type and “carcass weight” are defined in Annex I of Regulation (EC) 1165/2008.
In the quality reports 2016 some deviation from the definitions were reported. In particular, the definition of poultry carcass weight refers to the animal plucked and drawn, without head and feet and without neck, heart, liver and gizzard, known as ‘65 % chicken’, or otherwise presented. The latter wording allows some deviations that should be reported. In the case of piglets, national concepts and market uses vary. Also, dairy ewes are not defined everywhere. Other deviations have not been explained. [QR2016]
2.10.2.1.1 Slaughtering in slaughterhouses
Slaughtering in slaughterhouses refers to the bovine animals, pigs, sheep, goats and poultry slaughtered in slaughterhouses on the territory of the Member State for a given reference period. [R1165, Art 9]
2.10.2.1.2 Slaughtering other than in slaughterhouses
Slaughtering other than in slaughterhouses refers to the bovine animals, pigs, sheep and goats slaughtered outside the slaughterhouses on the territory of the Member State for a given reference period. [R1165, Art 9]
2.10.3 CATEGORIES Categories of livestock
Slaughtering statistics, broken down in animal categories and aggregated as slaughtering in slaughterhouses and other slaughtering, refers to the meat production from the following livestock types:
• bovine animals,
• pigs,
• sheep,
• goats and
2 Methodology
28 Draft Handbook on meat statistics
• poultry.
slaughtered on the Member State’s territory for a given reference period. [R1165, Annex IV]
For the purposes of slaughtering statistics the same categories of livestock are used for slaughtering in slaughterhouses and other slaughtering, but slaughtering of poultry is only expected for slaughtering in slaughterhouses. [R1165, Art 9
Annex I of Regulation (EC) 1165/2008 sets the definitions of the livestock categories for which the slaughtering statistics are to be produced.
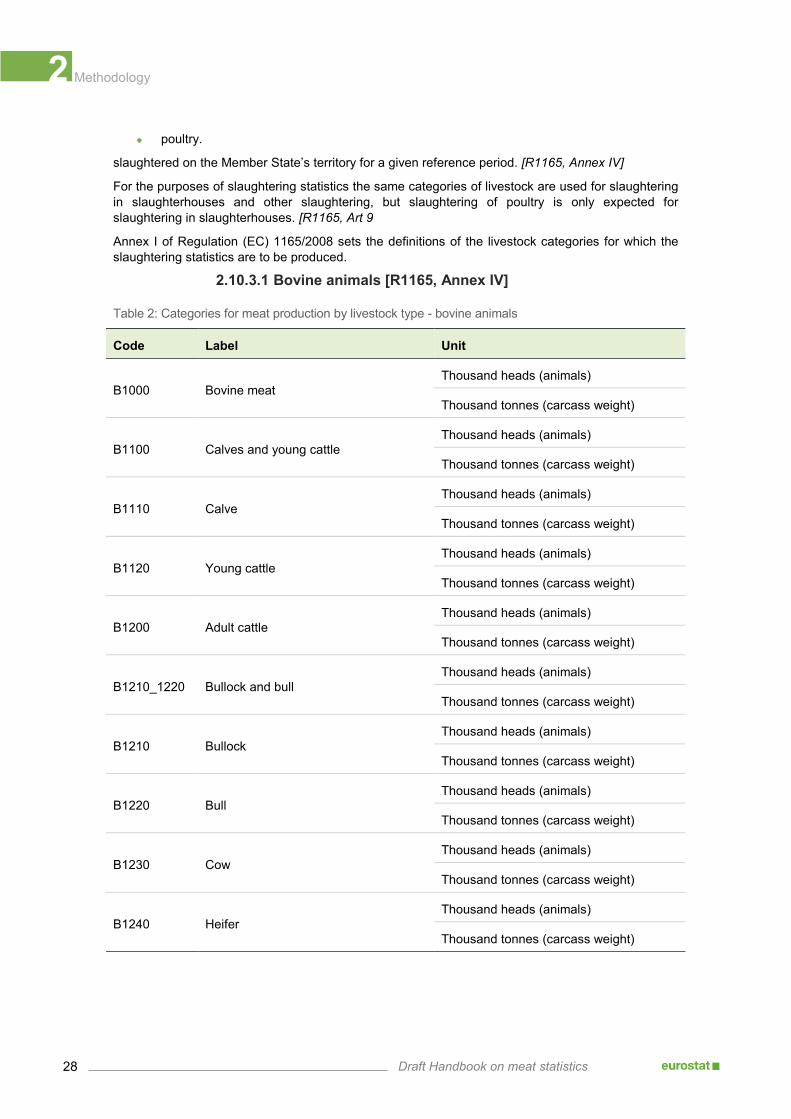
2.10.3.1 Bovine animals [R1165, Annex IV]
Table 2: Categories for meat production by livestock type - bovine animals
Code Label Unit
B1000 Bovine meat Thousand heads (animals)
Thousand tonnes (carcass weight)
B1100 Calves and young cattle Thousand heads (animals)
Thousand tonnes (carcass weight)
B1110 Calve Thousand heads (animals)
Thousand tonnes (carcass weight)
B1120 Young cattle Thousand heads (animals)
Thousand tonnes (carcass weight)
B1200 Adult cattle Thousand heads (animals)
Thousand tonnes (carcass weight)
B1210_1220 Bullock and bull Thousand heads (animals)
Thousand tonnes (carcass weight)
B1210 Bullock Thousand heads (animals)
Thousand tonnes (carcass weight)
B1220 Bull Thousand heads (animals)
Thousand tonnes (carcass weight)
B1230 Cow Thousand heads (animals)
Thousand tonnes (carcass weight)
B1240 Heifer Thousand heads (animals)
Thousand tonnes (carcass weight)
1
2 Methodology
29 Draft Handbook on meat statistics
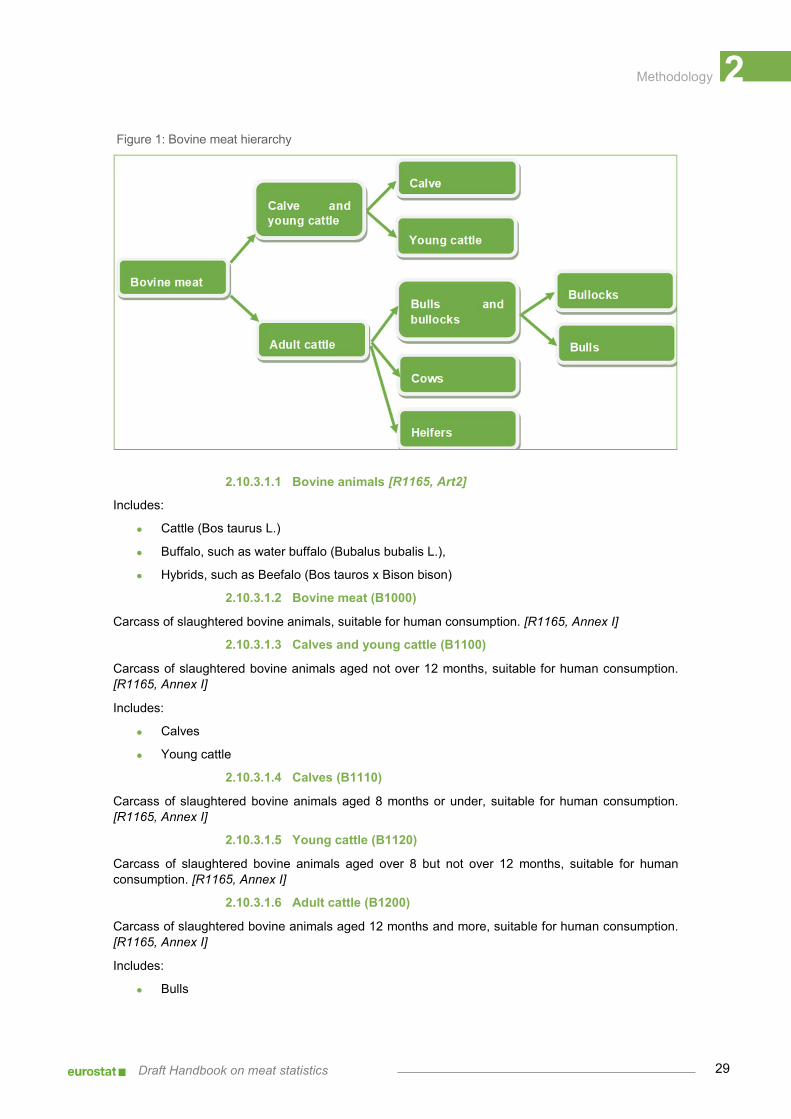
Figure 1: Bovine meat hierarchy
2.10.3.1.1 Bovine animals [R1165, Art2]
Includes:
• Cattle (Bos taurus L.)
• Buffalo, such as water buffalo (Bubalus bubalis L.),
• Hybrids, such as Beefalo (Bos tauros x Bison bison)
2.10.3.1.2 Bovine meat (B1000)
Carcass of slaughtered bovine animals, suitable for human consumption. [R1165, Annex I]
2.10.3.1.3 Calves and young cattle (B1100)
Carcass of slaughtered bovine animals aged not over 12 months, suitable for human consumption. [R1165, Annex I]
Includes:
• Calves
• Young cattle
2.10.3.1.4 Calves (B1110)
Carcass of slaughtered bovine animals aged 8 months or under, suitable for human consumption. [R1165, Annex I]
2.10.3.1.5 Young cattle (B1120)
Carcass of slaughtered bovine animals aged over 8 but not over 12 months, suitable for human consumption. [R1165, Annex I]
2.10.3.1.6 Adult cattle (B1200)
Carcass of slaughtered bovine animals aged 12 months and more, suitable for human consumption. [R1165, Annex I]
Includes:
• Bulls
2 Methodology
30 Draft Handbook on meat statistics
• Bullocks
• Heifers
• Cows
Excludes:
• Calves
• Young cattle
2.10.3.1.7 Bulls and bullocks (B1210_B1220)
Carcass of slaughtered castrated and non-castrated male bovine animals not included under calves and young cattle, suitable for human consumption. [R1165, Annex I]
Includes:
• Bulls
• Bullocks
2.10.3.1.8 Bullock (B1210)
Carcass of slaughtered castrated male bovine animals not included under calves and young cattle, suitable for human consumption. [R1165, Annex I]
2.10.3.1.9 Bull (1220)
Carcass of slaughtered non-castrated male bovine animals not included under calves and young cattle, suitable for human consumption. [R1165, Annex I]
2.10.3.1.10 Cow (B1230)
Carcass of slaughtered female bovine animals that have calved, suitable for human consumption. [R1165, Annex I]
Includes:
• Female bovine animals regardless of their age that have already calved
• Buffalo cows
• Cull cows regardless of their dairy/meat use
Excludes:
• Female bovine animals of 2 years and over which have not yet calved
• Female calves, young cattle and heifers
2.10.3.1.11 Heifer (B1240)
Carcass of slaughtered female bovine animals that have not yet calved and which are not included under calves and young cattle, suitable for human consumption. [R1165, Annex I]
Includes:
• Female bovine animals of 2 years and over which have not yet calved
Excludes:
• Female bovine animals regardless of their age that have already calved
• Female calves and young cattle

1
2 Methodology
31 Draft Handbook on meat statistics
2.10.3.2 Pigmeat [R1165, Annex IV]
Table 3: Categories for meat production by livestock type - pigs
Code Label Unit
B3100 Pig meat Thousand heads (animals)
Thousand tonnes (carcass weight)
2.10.3.2.1 Pig animals
Pigs are domestic animals of the species Sus scrofa domesticus. [R1165, Art2]
2.10.3.2.2 Pigmeat (B3100)
Carcass of all slaughtered pigs regardless of their weight and breading/fattening purpose, suitable for human consumption. [NEW]
2.10.3.3 Sheep and goats [R1165, Annex IV]
Table 4: Categories for meat production by livestock type - sheep and goats
Code Label Unit
B4000 Meat of sheep and goats Thousand heads (animals)
Thousand tonnes (carcass weight)
B4100 Sheepmeat Thousand heads (animals)
Thousand tonnes (carcass weight)
B4110 Lambs Thousand heads (animals)
Thousand tonnes (carcass weight)
B4120 Mutton Thousand heads (animals)
Thousand tonnes (carcass weight)
B4200 Goatmeat Thousand heads (animals)
Thousand tonnes (carcass weight)
2.10.3.3.1 Meat of sheep and goats (B4000)
Carcass of slaughtered sheep and goats regardless of their age and milk/meat purpose, suitable for human consumption. [NEW - aggregation]
Includes:
• Lamb
• Mutton
• Goat
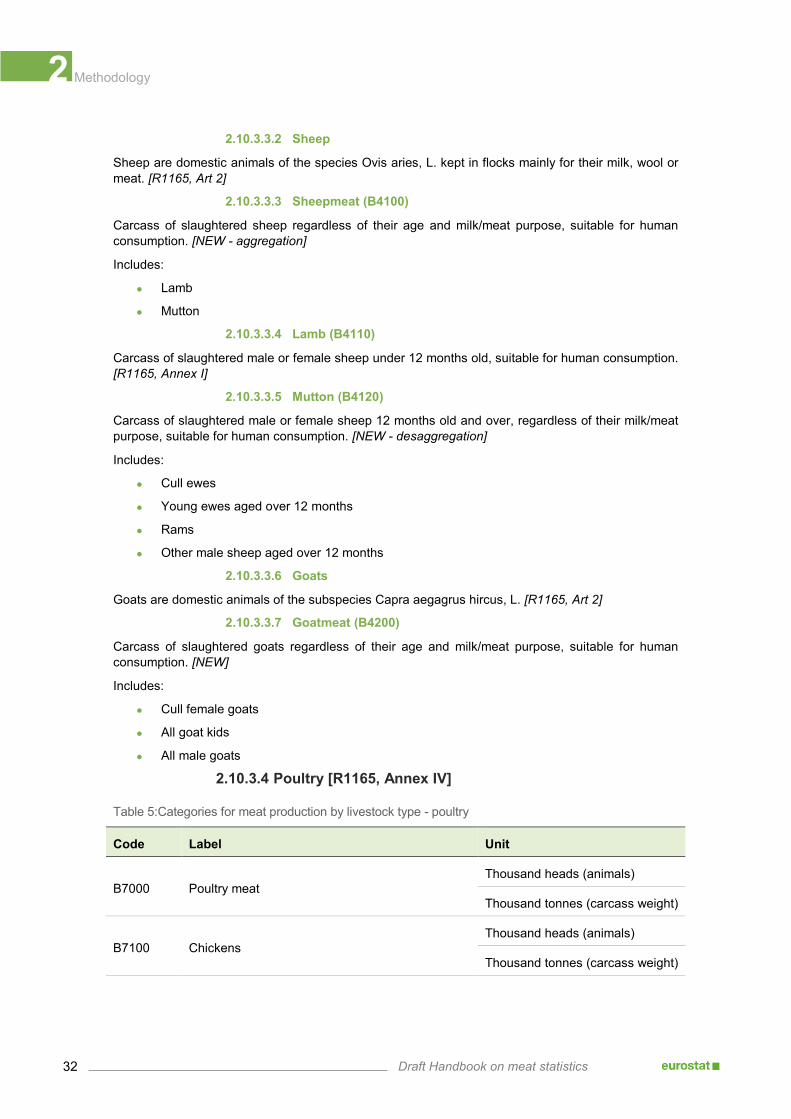
2 Methodology
32 Draft Handbook on meat statistics
2.10.3.3.2 Sheep
Sheep are domestic animals of the species Ovis aries, L. kept in flocks mainly for their milk, wool or meat. [R1165, Art 2]
2.10.3.3.3 Sheepmeat (B4100)
Carcass of slaughtered sheep regardless of their age and milk/meat purpose, suitable for human consumption. [NEW - aggregation]
Includes:
• Lamb
• Mutton
2.10.3.3.4 Lamb (B4110)
Carcass of slaughtered male or female sheep under 12 months old, suitable for human consumption. [R1165, Annex I]
2.10.3.3.5 Mutton (B4120)
Carcass of slaughtered male or female sheep 12 months old and over, regardless of their milk/meat purpose, suitable for human consumption. [NEW - desaggregation]
Includes:
• Cull ewes
• Young ewes aged over 12 months
• Rams
• Other male sheep aged over 12 months
2.10.3.3.6 Goats
Goats are domestic animals of the subspecies Capra aegagrus hircus, L. [R1165, Art 2]
2.10.3.3.7 Goatmeat (B4200)
Carcass of slaughtered goats regardless of their age and milk/meat purpose, suitable for human consumption. [NEW]
Includes:
• Cull female goats
• All goat kids
• All male goats
2.10.3.4 Poultry [R1165, Annex IV]
Table 5:Categories for meat production by livestock type - poultry
Code Label Unit
B7000 Poultry meat Thousand heads (animals)
Thousand tonnes (carcass weight)
B7100 Chickens Thousand heads (animals)
Thousand tonnes (carcass weight)
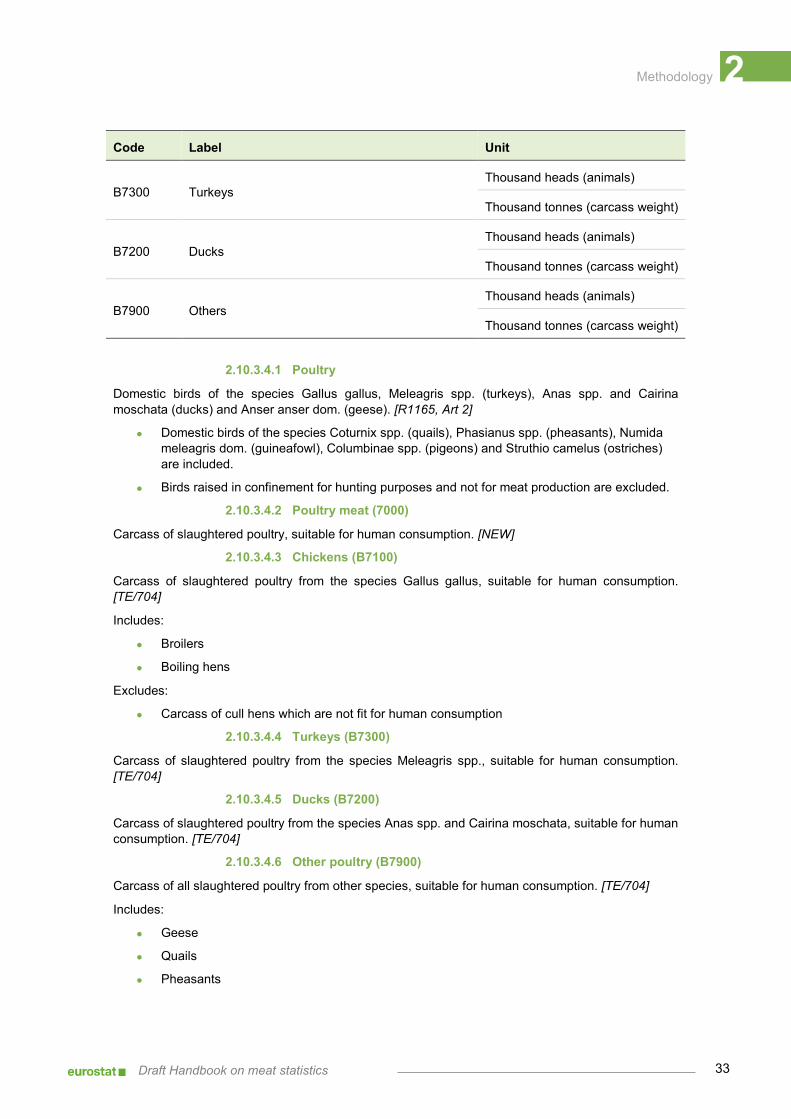
1
2 Methodology
33 Draft Handbook on meat statistics
Code Label Unit
B7300 Turkeys Thousand heads (animals)
Thousand tonnes (carcass weight)
B7200 Ducks Thousand heads (animals)
Thousand tonnes (carcass weight)
B7900 Others Thousand heads (animals)
Thousand tonnes (carcass weight)
2.10.3.4.1 Poultry
Domestic birds of the species Gallus gallus, Meleagris spp. (turkeys), Anas spp. and Cairina moschata (ducks) and Anser anser dom. (geese). [R1165, Art 2]
• Domestic birds of the species Coturnix spp. (quails), Phasianus spp. (pheasants), Numida meleagris dom. (guineafowl), Columbinae spp. (pigeons) and Struthio camelus (ostriches) are included.
• Birds raised in confinement for hunting purposes and not for meat production are excluded.
2.10.3.4.2 Poultry meat (7000)
Carcass of slaughtered poultry, suitable for human consumption. [NEW]
2.10.3.4.3 Chickens (B7100)
Carcass of slaughtered poultry from the species Gallus gallus, suitable for human consumption. [TE/704]
Includes:
• Broilers
• Boiling hens
Excludes:
• Carcass of cull hens which are not fit for human consumption
2.10.3.4.4 Turkeys (B7300)
Carcass of slaughtered poultry from the species Meleagris spp., suitable for human consumption. [TE/704]
2.10.3.4.5 Ducks (B7200)
Carcass of slaughtered poultry from the species Anas spp. and Cairina moschata, suitable for human consumption. [TE/704]
2.10.3.4.6 Other poultry (B7900)
Carcass of all slaughtered poultry from other species, suitable for human consumption. [TE/704]
Includes:
• Geese
• Quails
• Pheasants

2 Methodology
34 Draft Handbook on meat statistics
• Ostriches
• Guineafowls
• Pigeons, etc.
Excludes:
• Chickens
• Turkeys
• Ducks
Deviations in the definition The categories of slaughtering statistics are set in Annex IV and their definitions are given in point 1 and 2 of Annex I of Regulation (EC) 1165/2008.
Whereas these definitions are not relevant everywhere, the Member States are supposed to adjust their data if collected information does not follow the EU defintions. The deviations should otherwise be reported in their quality reports.
These deviations have been inventoried in the handbook on definitions and concepts. [TE/704]
3 Data processing
35 Draft Handbook on meat statistics
3 Data processing 3.1 Introduction [NEW] This chapter describes the processes that are run by the Member States. Data processing, including data editing and validation, integration and aggregation prior to the transmission of the data sets to Eurostat is left to subsidiarity. Member State implement different processes according to their specific statistical systems.
The statistics of individual respondents are collected with tools designed for their usability by the respondents, possibly supported by interviewers, guidelines, or pre-validation. They are usually designed for compatibility with the national statistical system, but they must be checked for their completeness, eventually imputed when no additional information can be obtained, or left aside if they are obviously erroneous.
When the data are received from other information systems, they need to be converted to become compatible with the national statistical system, and possibly completed, in their content or their extent, based on other data sources.
All these operations are not independent one from the others and they may be called differently, e.g. ‘data editing’, depending on the major work conducted.
3.2 Data integration Data integration consist in putting together and aligning information into a single tool, either because the data sources are diverse and provide heteroigenous information or because information should simply be converted to become usable.[NEW]
3.2.1 SLAUGHTERING IN SLAUGHTERHOUSES This part will be developed with the input of Member States
3.2.2 OTHER SLAUGHTERING This part will be developed with the input of Member States
3 Data processing

3 Data processing
36 Draft Handbook on meat statistics
3.2.3 CALCULATION OF GIP FORECAST [ANI/REF/2016/M/GIP-1] Gross indigenous production (GIP) forecast is a statistical process requiring integration of various data sources for producing statistics (time series) on GIP achieved, on the changes in livestock population, and clear understanding of decision making in the sector.
3.2.3.1 Statistical models for GIP forecast Two approaches are used regarding forecast, which have both their strengths and weaknesses, forecasting directly the expected production or forecasting the expected changes. The role of GIP achieved, and therefore sensitivity to its quality, is the main difference between both.
In all the Member States, distinction is done between the three main animal categories of animals which forecast is requested by EU legislation.
• Bovine GIP forecast refers to various types of meat production, from calves to adult cattle, with a faster or slower growing and fattening period, referring to the meat and milk sector and the statistical model is the most complex.
• For pig, production is only meat-oriented and the technical parameters well identified, but GIP forecast is sensitive to accuracy of these coefficients and of the livestock statistics.
• For sheep and goats, GIP forecast is directly based on the number of breeding females, the performance in meat production being usually homogeneous within regions, and often within countries, as the share of dairy production is also homogeneous at this level.
Six types of GIP forecast can be identified, standard and simplified forecast of the numbers or of their changes, the two other methods, (the backward way and the human expert), cannot be considered as good practices and are reported for completeness of the description.
3.2.3.1.1 Standard model
The standard GIP forecasting draws benefit of the freshness and level of details in the livestock statistics. It simply foresees possible becoming of animals of each category after one or several steps in time. The assumptions are first based on knowledge of the various production systems and are refined on the data.
The sum of coefficients for a given category is 100 %, including losses, except for the breeding females. For them, the sum of coefficients over a year is 100*(1+p) where p in the average number of viable birth per breeding female and per year. By introducing seasonality of production the coefficients can also refer to a period in the year.
Initially based on a large set of coefficients, the forecast model provides the results for each animal category (Figure 2) and is called demographic model. But GIP forecasted for a given category of animals is a linear combination of the livestock numbers and coefficients by category. In an integrated model, the interim results disappear, which reduces the number of coefficients, but also downgrades transparency. Some of the coefficients can (should) be considered as null. In practice, the coefficients are fine-tuned either on historical series if available, or on the current data. The role of human expert at this stage is strategic. Based on a sufficient number of periods, feedback can be used for improving the set of coefficients. If really different production systems coexist (e.g. intensive and extensive, dairy and meat sector), splitting GIP may be efficient, especially if their share in production changes.

3 Data processing
37 Draft Handbook on meat statistics
Figure 2: Coefficients for bovine animals
Usual Breeding Rare
Stays in category Not foreseen
Legend
Bovinepopulation >2 years 1-2 years slaught
for slaughter for slaughter for slaughter other for slaughter other dairy cows other cows or sold Total>2 years 100%1-2 years 100%
for slaughter 100%
for slaughter 100%for slaughter 100%other 100%for slaughter 100%other 100%dairy cows >100%other cows >100%
100%
Male
< 1 yearMale Female
< 1 year 1-2 years not calved >2 year not calved cows
< 1 year
out
lostother
other
Female
< 1 year
1-2 years not calved
>2 yearsnot calved
cows
The coefficients enable to forecast the becoming of each category after a time step (1, 3 or 6 months). Some coefficients (grey) are set to zero. Some other ones (yellow) can be considered or not, depending on accuracy.
Stability of the coefficients and comparability of the figures for GIP achieved and accuracy of the livestock statistics are important factors for quality of the forecasts.
3.2.3.1.2 Simplified model
Depending on diversity amongst the production systems in a country, the forecasting model may also be simplified and based, especially for sheep and goats, on the breeding female population. Some countries follow this approach. The model is more robust, but it does not draw benefit of available information on the stocks of fattening animals, and therefore has a lower relevance. Such an approach by default states insufficient quality of the livestock statistics or high volatility of the coefficients for the standard model. Clarity of this model makes also it usable out of a well-developed statistical environment. Let’s call this method simplified forecasting.
3.2.3.1.3 Backward model
Due to the role of GIP achieved and to the weight of foreign trade balance in the calculation, countries with low self-sufficiency may take a backward way. Note that a country in deficit can have a share of foreign trade balance in the GIP really higher than a country in surplus. Whereas Regulation (EC) No 1165/2008 refers to statistics on slaughtering, on livestock and on foreign trade, using estimate of GIP as the total of animals produced by agriculture (biological production) minus the changes in livestock appears a reasonable approach in this (and only this) case. But this should remain an exception.
3.2.3.1.4 Expert estimates
In 2015, an inventory of practices identified one Member State that uses expert estimates method which looks sound in the light of its modest production, i.e. an expert interpreting a framework of data tables and graphs (dashboard). Nevertheless such a method with a heavy weight of human expertise should be implemented with either a panel of experts of with several independent expert evaluation conducted in parallel in order to limit the risk of human error.
3.2.3.2 Choosing GIP forecast methods Eurostat could not assess the performance of the various methods. This would have required for instance checking the GIP forecast against the GIP achieved, which Eurostat had no mandate for collecting. As well the data collection was not designed for this and the statistical process was not designed for identifying and managing two time series with different levels of certainty (forecast and achievement). Therefore none of the above design is promoted or definitely rejected. Whereas the legislation does not clearly prohibit the forecast based exclusively on expert estimates, such a practice falls out of the normal statistical activities and Eurostat would not like to promote it.

3 Data processing
38 Draft Handbook on meat statistics
The strengths and weaknesses of various models, considering the impact of available quality statistics, are described hereafter.
3.2.3.2.1 Change-based models
The models based on the changes enables to split the GIP forecast in two components which accuracy is assessed as different: GIP forecast = GIP achieved + changes in GIP Let’s consider that the change in GIP is about + 5 %, with accuracy at 10 % it will result in accuracy of the forecast at 0.48 % (100 % x 0.10 x 0.05 / 1.05) Another strength of the method is their robustness to biased measurement of GIP achieved, which does not impact quality of the forecasted changes.
Their weakness is their sensitivity to the quality of the livestock statistics. Especially they must clearly consider the changes in the reference dates, the dependence amongst variables (estimated share of use for meat), sampling error and coverage error (under-coverage). They are also sensitive to structural changes, e.g. conversion of dairy herds into meat herds and the reverse.
3.2.3.2.2 Absolute-number-based models
The models based on the absolute numbers of animals have their strength on the opposite side. They are more dependent on the quality of GIP achieved, which is an advantage when the share of foreign trade balance and of other slaughtering in the GIP is limited, both statistics being or limited quality compared with slaughtering statistics.
Impact of insufficient quality of the input data and parameters on the final result is heavier and therefore every factor limiting quality of the results has a heavier impact, like volatile coefficients or weak assumptions.
3.2.3.2.3 Standard vs. simplified models
The standard models are more complex and require more knowledge and more detailed data than the simplified models. They are also more accurate and more sensitive. Their interim results can also be checked against the detailed livestock data.
Finally a good practice is in an evolving mix of both models. Splitting the model in blocks enable a better control of plausibility and quality, concentrating on some part the most certain knowhow and on other parts the most probabilistic calculations. For instance a part of the model can consider the dairy farms and another the meat farms, this second one being split into two parts, a simplified approach for the longer term and a standard approach for the shorter term.
3.2.3.2.4 Starting with forecast
Several steps need to be followed to develop GIP forecasting, i.e. analysing the methodology already implemented if relevant, inventorying the available primary data sources and their strengths and weaknesses, establishing the primary data collection system (if needed), choosing a proper GIP calculation model and setting up an expert group (if realistic).
Based on the above description, elements are given for understanding and analysing the existing forecast methods. The potential data sources were also listed. No explanation is provided here on establishing a primary data collection. This does not mean setting up a survey. If the livestock survey or the data collection from slaughterhouses is not yet established, setting up production forecast is probably not yet the priority. Foreseeing the possible sources for foreign trade statistics or for technical parameters is also covered here.
Whereas the order is important, meeting early the potential stakeholders, including the experts, may help to understand the constraints and limits of the exercise.
The limits expressed above about the various methods should be taken into account. Implementing a standard model on the total production without historical series, on livestock or GIP achieved statistics, is risky. Even supported by a good knowledge of the technical parameters in a sector with

3 Data processing
39 Draft Handbook on meat statistics
homogenous farming systems (sometimes for pig production), it remains challenging. Interaction with the experts of the domain is more than necessary in this case.
Basic technical information needed for pre-supposing coefficients refers to percentage of use for each category and duration of each stage of the process (age of first breeding, age of weaning, duration of growth and fattening, age of selection of the future breeders, etc.). Limit of plausibility for these parameters can be used later for defining valid ranges for the coefficients. Here especially, analysis by farming system will help to assess these various technical parameters.
The next stage of development consists checking this model against historical data, checking the coefficient behaviour during optimization process and defining a sound schedule so that the forecast is available when needed.
3.3 Revision Data revision consists in changing the values of data already integrated. Data revision may concern incoming (the respondents or the other data source) or the outgoing (publications) data. Revision of the already published data may therefore either reflect revisions of the entering data or a change in the way the data are treated (e.g. correcting a mistake). [NEW]
There are no specific instructions related to data revision to be run by the Member States. At national level, the revisions of previously published statistics are implemented according to the adopted national revision policy. The Member States should always update Eurostat’s data when they revise them. [TE/719, V3I]
The monthly statistics on slaughtering are more often revised, and by all the Member States. As calculated by Eurostat for the purposes of QR 2010 summary (expressed as a percentage of the applicable cells), the revision rate is 31% for slaughtering in slaughterhouses and 4% for other slaughtering. [TE/719, V3I]
They result usually of further availability of primary information, increasing accuracy and representativeness of the revised outcome (usual revisions) or, exceptionally, they may reflect a change in the methods or the data sources (major revisions). [NEW]
3.4 Validation Member states apply different sets of validation rules during the data validation of individual and aggregated data corresponding to their national procedures. [NEW]
When handling aggregated data, in addition to the national control procedures, Member states are supposed to run a set of validation rules, before sending the data to Eurostat. [TE/758]
Other validation rules are applied during or after the data transmission by Eurostat. For more information on the the validation process run in Eurostat see chapters 5.3 and 6.
3.5 Editing and imputation Unit and item non-response are not relevant for statistics based on administrative registers or legal obligation for reporting (e.g. slaughterhouses). In QR 2010 most of the Member States report unit response rate above 95% for slaughtering statistics. Item non-response was not reported by half of the countries and, for those reporting such, it was quite rare. All countries that reported non-response in slaughtering statistics used imputation by previous data of the same unit for treatement of the non-responses. [TE/719, V3F to H]

3 Data processing
40 Draft Handbook on meat statistics
3.6 Aggregation [NEW] Data aggregation in meat statistics is compilation of individual data to be disseminated in a given format. During this process, confidentiality of the information from individual respondents is guaranteed. Aggregation can be direct or by steps, e.ggg. aggregation of regional data at country level, aggregation of sub-categories of livestock, aggregation of data from reporting enterprises at country level,etc.
3.6.1 AGGREGATION OF REGIONAL DATA In most of the Member States, almost the same data collection methods and instruments are used in every region. However, in some Member States, the statistical process is regionalised, which requires harmonisation of concept and definitions, and coherence of the regional variables and indicators.
3.6.2 AGGREGATION OF DATA PER CATEGORIES OF SLAUGHTERING STATISTICS
The animal categories for slaughtering statistics to be estimated and transmitted to Eurostat as set in the Regulation (EC) No 1165/2008 are slightly more disaggregated than those for GIP forecast. The coherence between the two is however ensured (Table 6). [R1165, Annexes IV and V]
Table 6: Comparison of categories in livestock and meat statistics as set in annexes of Regulation (EC) No 1165/2008
Annex IV Annex V Annex II
Slaughtering GIP forecast Livestock
Calves
Calves and young cattle
Bovine animals aged not over 1 year (all categories)
- For slaughter - Other
Young cattle
Heifers Heifers
Bovine animals aged over 1 year but under 2 years (except females that have calved) (females)
- For slaughter - Other
Bovine animals of 2 years and over (heifers) - For slaughter - Other
Cows Cows Cows (bovine animals that have calved, including those that are under 2 years old) (dairy cows and other cows)
Bulls Bulls and bullocks
Bovine animals aged over 1 year (males) - Aged over 1 year but under 2 years - Of 2 years and over Bullocks
Pigs Pigs All categories
Lambs Sheep Other sheep
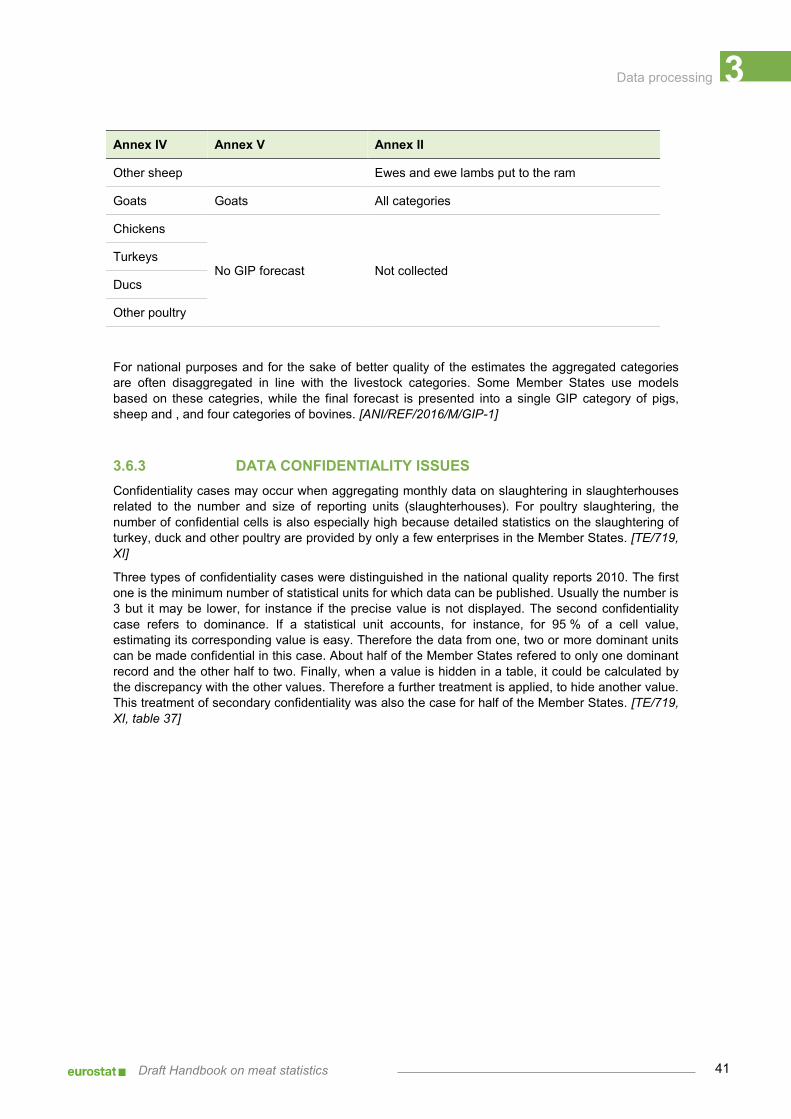
3 Data processing
41 Draft Handbook on meat statistics
Annex IV Annex V Annex II
Other sheep Ewes and ewe lambs put to the ram
Goats Goats All categories
Chickens
No GIP forecast Not collected Turkeys
Ducs
Other poultry
For national purposes and for the sake of better quality of the estimates the aggregated categories are often disaggregated in line with the livestock categories. Some Member States use models based on these categries, while the final forecast is presented into a single GIP category of pigs, sheep and , and four categories of bovines. [ANI/REF/2016/M/GIP-1]
3.6.3 DATA CONFIDENTIALITY ISSUES Confidentiality cases may occur when aggregating monthly data on slaughtering in slaughterhouses related to the number and size of reporting units (slaughterhouses). For poultry slaughtering, the number of confidential cells is also especially high because detailed statistics on the slaughtering of turkey, duck and other poultry are provided by only a few enterprises in the Member States. [TE/719, XI]
Three types of confidentiality cases were distinguished in the national quality reports 2010. The first one is the minimum number of statistical units for which data can be published. Usually the number is 3 but it may be lower, for instance if the precise value is not displayed. The second confidentiality case refers to dominance. If a statistical unit accounts, for instance, for 95 % of a cell value, estimating its corresponding value is easy. Therefore the data from one, two or more dominant units can be made confidential in this case. About half of the Member States refered to only one dominant record and the other half to two. Finally, when a value is hidden in a table, it could be calculated by the discrepancy with the other values. Therefore a further treatment is applied, to hide another value. This treatment of secondary confidentiality was also the case for half of the Member States. [TE/719, XI, table 37]
4 Data structure
42 Draft Handbook on meat statistics
4 Data structure 4.1 Introduction The dataset structure definition (DSD) describes how information in a specific dataset is structured. Knowledge of the structure is important, because it allows to later filter out desired information very precisely based on criteria to limit specific dimensions.
4.2 Dataset structure definition This part will be developed after the ESS data collection system has changed.
4.3 Data types This part will be developed after the ESS data collection system has changed.
4.4 File formats This part will be developed after the ESS data collection system has changed.
4 Data structure

5 Data transmission
43 Draft Handbook on meat statistics
5 Data transmission 5.1 Deadlines for data submission 5.1.1 SLAUGHTERING STATISTICS Member States shall transmit to the Commission:
• (a) the statistics on slaughtering in slaughterhouses within 60 days following the reference period;
• (b) the monthly estimates of slaughtering carried out other than in slaughterhouses within 4 months following the reference period;
• (c) the annual estimates of slaughtering carried out other than in slaughterhouses before 30 June of the following year.
Table 7: Transmission deadlines for slaughter statistics
Data collection
Slaughtering in slaughterhouses (month M) M + 60 days
Other slaughtering (month M) M + 4 months
Other slaughtering (year N) 30 June year N+1
5.1.2 GIP FORECAST Member States shall transmit to the Commission the meat production forecasts:
• (a) before 15 February for forecasts for bovine animals from the beginning of the first semester of the current year to the end of the first semester of the following year, and before 15 September for forecasts from the beginning of the second semester of the current year to the end of the second semester of the following year for Member States that produce forecasts twice a year;
• (b) before 15 February for forecasts for bovine animals from the beginning of the first semester of the current year to the end of the second semester of the following year for Member States that produce forecasts once a year;
• (c) before 15 February for forecasts for pigs from the beginning of the first quarter to the end of the fourth quarter of the current year, and before 15 September for forecasts from the
5 Data transmission
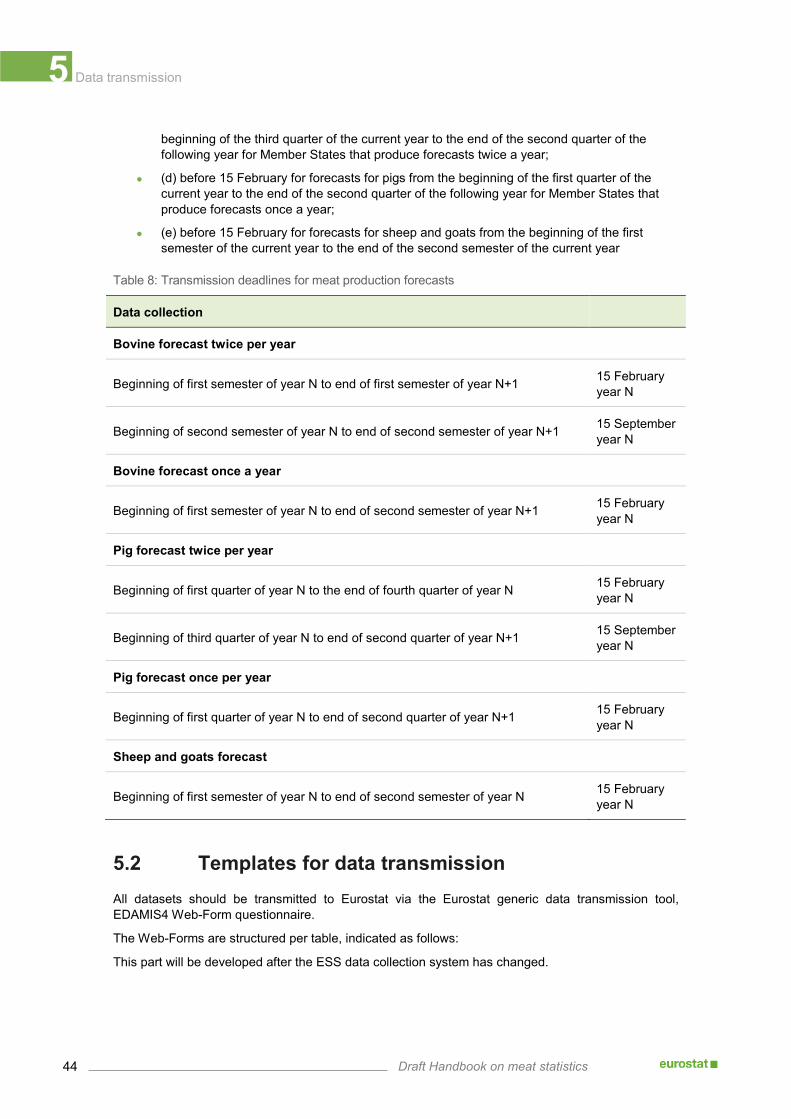
5 Data transmission
44 Draft Handbook on meat statistics
beginning of the third quarter of the current year to the end of the second quarter of the following year for Member States that produce forecasts twice a year;
• (d) before 15 February for forecasts for pigs from the beginning of the first quarter of the current year to the end of the second quarter of the following year for Member States that produce forecasts once a year;
• (e) before 15 February for forecasts for sheep and goats from the beginning of the first semester of the current year to the end of the second semester of the current year
Table 8: Transmission deadlines for meat production forecasts
Data collection
Bovine forecast twice per year
Beginning of first semester of year N to end of first semester of year N+1 15 February year N
Beginning of second semester of year N to end of second semester of year N+1 15 September year N
Bovine forecast once a year
Beginning of first semester of year N to end of second semester of year N+1 15 February year N
Pig forecast twice per year
Beginning of first quarter of year N to the end of fourth quarter of year N 15 February year N
Beginning of third quarter of year N to end of second quarter of year N+1 15 September year N
Pig forecast once per year
Beginning of first quarter of year N to end of second quarter of year N+1 15 February year N
Sheep and goats forecast
Beginning of first semester of year N to end of second semester of year N 15 February year N
5.2 Templates for data transmission All datasets should be transmitted to Eurostat via the Eurostat generic data transmission tool, EDAMIS4 Web-Form questionnaire.
The Web-Forms are structured per table, indicated as follows:
This part will be developed after the ESS data collection system has changed.
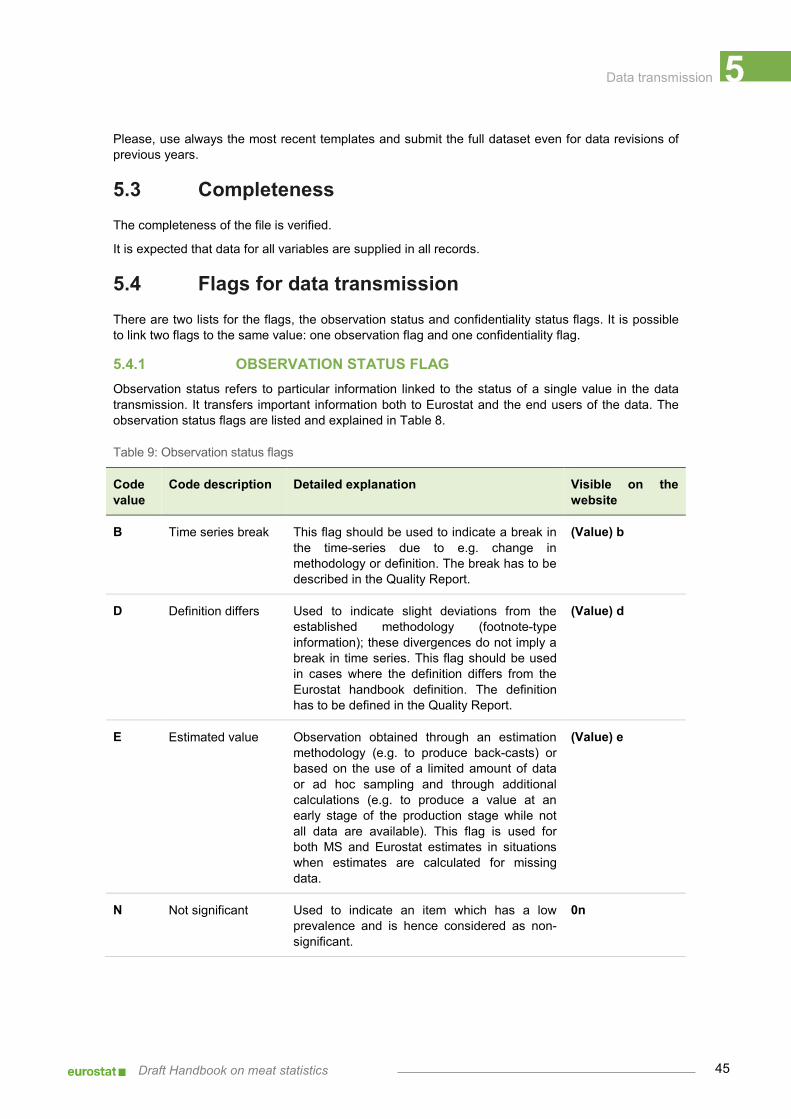
5 Data transmission
45 Draft Handbook on meat statistics
Please, use always the most recent templates and submit the full dataset even for data revisions of previous years.
5.3 Completeness The completeness of the file is verified.
It is expected that data for all variables are supplied in all records.
5.4 Flags for data transmission There are two lists for the flags, the observation status and confidentiality status flags. It is possible to link two flags to the same value: one observation flag and one confidentiality flag.
5.4.1 OBSERVATION STATUS FLAG Observation status refers to particular information linked to the status of a single value in the data transmission. It transfers important information both to Eurostat and the end users of the data. The observation status flags are listed and explained in Table 8.
Table 9: Observation status flags
Code value
Code description Detailed explanation Visible on the website
B Time series break This flag should be used to indicate a break in the time-series due to e.g. change in methodology or definition. The break has to be described in the Quality Report.
(Value) b
D Definition differs Used to indicate slight deviations from the established methodology (footnote-type information); these divergences do not imply a break in time series. This flag should be used in cases where the definition differs from the Eurostat handbook definition. The definition has to be defined in the Quality Report.
(Value) d
E Estimated value Observation obtained through an estimation methodology (e.g. to produce back-casts) or based on the use of a limited amount of data or ad hoc sampling and through additional calculations (e.g. to produce a value at an early stage of the production stage while not all data are available). This flag is used for both MS and Eurostat estimates in situations when estimates are calculated for missing data.
(Value) e
N Not significant Used to indicate an item which has a low prevalence and is hence considered as non-significant.
0n
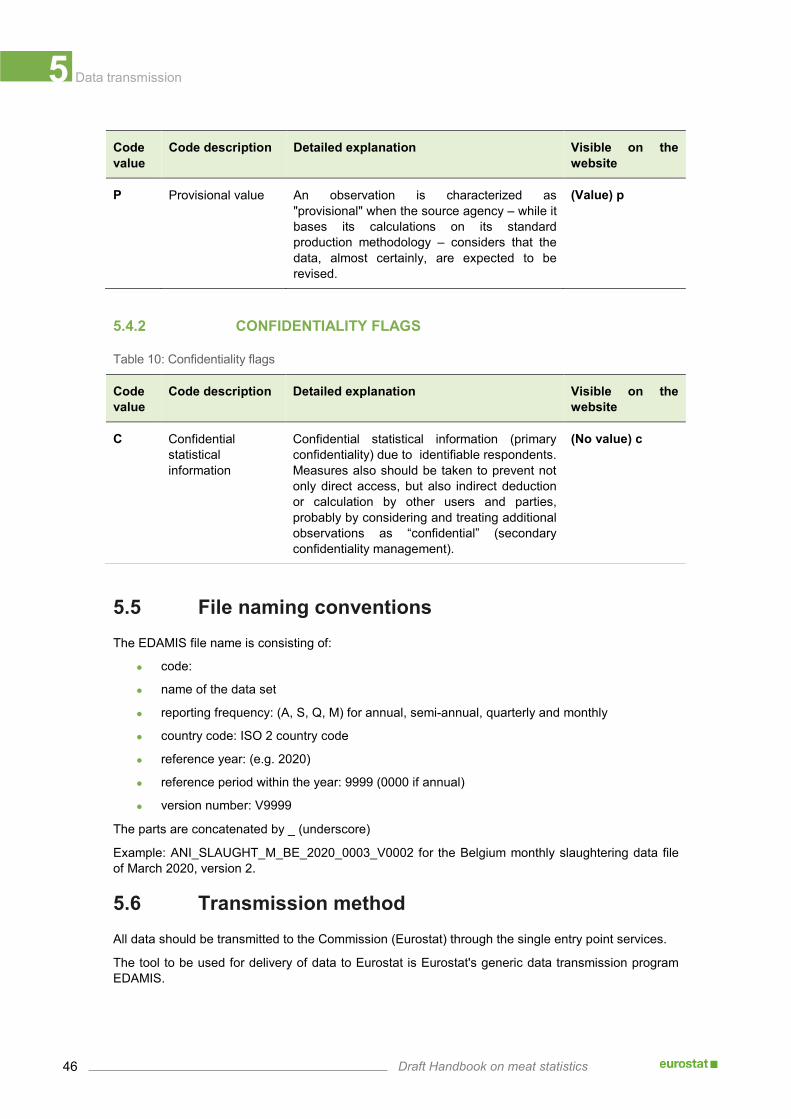
5 Data transmission
46 Draft Handbook on meat statistics
Code value
Code description Detailed explanation Visible on the website
P Provisional value An observation is characterized as "provisional" when the source agency – while it bases its calculations on its standard production methodology – considers that the data, almost certainly, are expected to be revised.
(Value) p
5.4.2 CONFIDENTIALITY FLAGS
Table 10: Confidentiality flags
Code value
Code description Detailed explanation Visible on the website
C Confidential statistical information
Confidential statistical information (primary confidentiality) due to identifiable respondents. Measures also should be taken to prevent not only direct access, but also indirect deduction or calculation by other users and parties, probably by considering and treating additional observations as “confidential” (secondary confidentiality management).
(No value) c
5.5 File naming conventions The EDAMIS file name is consisting of:
• code:
• name of the data set
• reporting frequency: (A, S, Q, M) for annual, semi-annual, quarterly and monthly
• country code: ISO 2 country code
• reference year: (e.g. 2020)
• reference period within the year: 9999 (0000 if annual)
• version number: V9999
The parts are concatenated by _ (underscore)
Example: ANI_SLAUGHT_M_BE_2020_0003_V0002 for the Belgium monthly slaughtering data file of March 2020, version 2.
5.6 Transmission method All data should be transmitted to the Commission (Eurostat) through the single entry point services.
The tool to be used for delivery of data to Eurostat is Eurostat's generic data transmission program EDAMIS.

5 Data transmission
47 Draft Handbook on meat statistics
The EDAMIS Web Application (eWA) is installed in all National Statistical Institutes and a number of other organisations. A local coordinator is available in each NSI who can provide access to eWA and offer any assistance that might be necessary.
Where an EDAMIS Web Application is not available, data providers can use the EDAMIS Web Portal (eWP). This is an internet-based solution, available through an internet browser, which does not require a local installation. The Eurostat EDAMIS support team will provide access.
For information concerning EDAMIS, or data transmission to Eurostat in general, you can contact the support team directly ([email protected]).
5.6.1 HOW TO ACCESS EDAMIS This part will be developed after the ESS data collection system has changed.
5.7 Revision No calendar for data revision exists. The usual revisions of the data are due to additional answers received from the respondents during the next months. Major revisions are due to methodological changes and are subject to approval. The revised data are transmitted to Eurostat through the same chanel as the current data, but together with the justification of the revision. After validation of new received data, the dissemination database is updated.

6 Data validation
48 Draft Handbook on meat statistics
6 Data validation This chapter aims at presenting the validation process run on the transmitted data file; i.e. it deals with the validation process run on data once they get into EDAMIS. Thus, it deals with the validation process run in Eurostat.
6.1 Introduction Validation is a key task performed in all statistical domains.
Data validation is implemented at several stages in the process:
• During data entry by the data providers (use of EDAMIS webforms);
• Before data loading in the Eurostat production database, manual validation supported by Excel worksheet formulas;
• In the Eurostat production database (MDT);
• Out of the data process, compliance of the national methodology is checked against the EU requirements.
Efficient data validation is essential for high quality statistics. Guidelines for assigning validation responsibilities within the whole production chain, standard validation levels, a good selection of validation rules, standards for validation reports and error/warning messages and common documentation standards of the validation process are important elements of a good data validation policy.
In principle all data validation processes share a common approach, which is shown in the diagram below.
6 Data validation
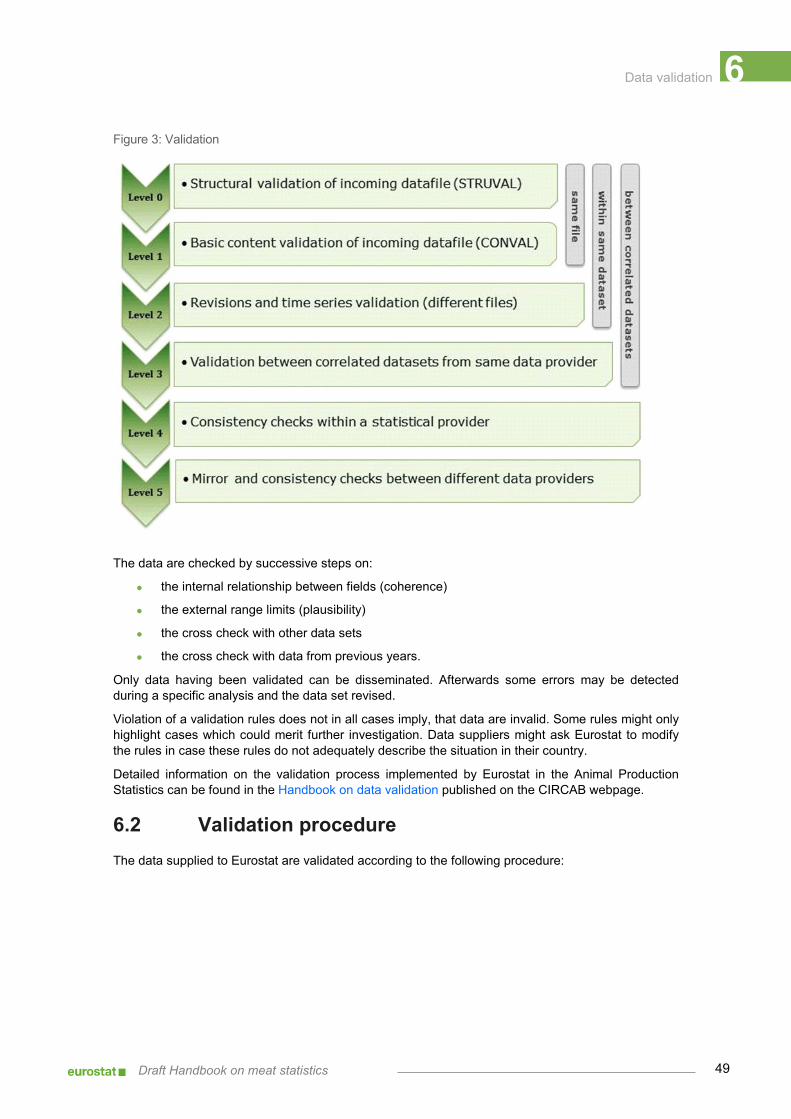
6 Data validation
49 Draft Handbook on meat statistics
Figure 3: Validation
The data are checked by successive steps on:
• the internal relationship between fields (coherence)
• the external range limits (plausibility)
• the cross check with other data sets
• the cross check with data from previous years.
Only data having been validated can be disseminated. Afterwards some errors may be detected during a specific analysis and the data set revised.
Violation of a validation rules does not in all cases imply, that data are invalid. Some rules might only highlight cases which could merit further investigation. Data suppliers might ask Eurostat to modify the rules in case these rules do not adequately describe the situation in their country.
Detailed information on the validation process implemented by Eurostat in the Animal Production Statistics can be found in the Handbook on data validation published on the CIRCAB webpage.
6.2 Validation procedure The data supplied to Eurostat are validated according to the following procedure:

6 Data validation
50 Draft Handbook on meat statistics
Figure 4: Validation process (GSBPM notation)
Step 4.3 is the first sub process of GSBPM where validation checks are done. Those checks are purely related to one instance of a dataset.
Eurostat's EDAMIS web portal uses the corresponding SDMX files, therefore the data files are created automatically and this implies that they are syntactically correct and well formed. This corresponds to a level 0 structural validation.
Closely linked is a level 1 validation, which is a basic content validation. There, a basic check of the values within the data file and a first intra-file check are performed.
Step 5.3 is the part of the process where a level 2 validation takes place. In GSBPM this sub-process is specifically referred to validation, it is in fact named ‘review & validate’. This sub-process examines data to try to identify potential problems, errors and discrepancies. It can also be referred to as input data validation. At this stage of the process the new data file is checked against the corresponding time series. The new data are checked using predefined validation rules in a set order. In case problems are found, suspicious or erroneous data are marked for manual inspection. At this stage it is also checked whether all data for the reference year were reported, i.e. a check for completeness.
Step 6.2 is named 'Validate outputs'. In this sub-process statisticians validate the quality of the outputs produced in accordance with a general quality framework and with expectations.
In practice this is an iterative process. After those validation steps, data are disseminated.
6.2.1 STRUCTURAL VALIDATION No structural validation is required with EDAMIS-webforms.
6.2.2 CONTENT VALIDATION The handbook on data validation7 in Animal Production Statistics provides the details of the validation rules and procedures agreed between Eurostat and the Member States.
6.2.3 FURTHER VALIDATION PERFORMED The Working Group on Animal Production Statistics also proceeds with annual data review. Even if unwanted, comments from the data users are considered
6.3 Validation rules The handbook on data validation in Animal Production Statistics provides the details of the validation rules and procedures agreed between Eurostat and the Member States.
6.4 Validation outcomes and report Start drafting your text here: 7
6 Data validation
51 Draft Handbook on meat statistics
6.4.1 EDAMIS VALIDATION FEEDBACK The feedback of EDAMIS Webforms is interactive. When a rule is broken, data transfer is disabled. For serious errors, valid data must be entered, for basic errors (warning), providing an explanation unlocks the data transfer.
6.4.2 MDT VALIDATION FEEDBACK MDT validation is run by a human operator. If non-critical errors are detected, the Member State is asked to check and either explain or revise its data. If a serious error is reported, the file is rejected and the data provider is notified.
6.5 Eurostat assessment Eurostat conducts regular assessments of the collection (availability and timeliness of the data) and validation (requests for revisions) in the domains as a part of the process management.
The expert groups (Working Group, DGAS) are also informed about compliance of the Member States to the legislation, in order to highlight the possible issues they may face and also to anticipate possible future legal actions.
Where evidence of non-compliance with the methodology is found, Eurostat might consider the received data as non-publishable. Especially, if these data are not comparable/coherent with other countries data sets, and therefore non-usable for aggregation of the EU results.
6.6 Data storage Data on livestock and meat are received from the Member States, processed and stored in a production database. Access to this database is restricted to staff members doing data validation and processing. When ready, data are transferred to the public database. The public database can be consulted by the external users free of charge via the Eurostat web site (https://ec.europa.eu/eurostat/web/agriculture/data/database).
7 Quality reports
52 Draft Handbook on meat statistics
7 Quality reports 7.1 Introduction Regulation (EC) No 223/2009 provides a reference framework for European statistics and requires Member States to comply with the statistical principles and quality criteria specified in that Regulation. Quality reports are essential for assessing, improving and communicating on the quality of European statistics. The ESSC has endorsed a European Statistical System (ESS) standard for Quality Reports Structure, in accordance with Article 12 of Regulation (EC) No 223/2009. That ESS standard should contribute to the harmonisation of quality reporting under this Regulation.
The quality criteria set in Regulation (EC) No 223/20098, article 12 (1) apply to livestock and meat statistics:
"...Article 17 Quality assessment and reports
1. For the purposes of this Regulation, the following quality assessment dimensions shall apply
to the data to be transmitted:
a. ‘relevance’ shall refer to the degree to which statistics meet current and potential needs of the users;
b. ‘accuracy’ shall refer to the closeness of estimates to the unknown true values;
c. ‘timeliness’ shall refer to the time lag between the availability of the information and the event or phenomenon it describes;
d. ‘punctuality’ shall refer to the time lag between the date of the release of the data and the target date when it should have been delivered;
e. ‘accessibility’ and ‘clarity’ shall refer to the conditions and modalities by which users can obtain, use and interpret data;
f. ‘comparability’ shall refer to the measurement of the impact of differences in applied statistical concepts and measurement tools and procedures when statistics are compared between geographical areas, sector domains or over time; and
g. ‘coherence’ shall refer to the adequacy of the data to be reliably combined in different ways and for various uses.
8 Regulation (EC) No 223/2009 of the European Parliament and of the Council of 11 March 2009 on European statistics and repealing
Regulation (EC, Euratom) No 1101/2008 of the European Parliament and of the Council on the transmission of data subject to statistical confidentiality to the Statistical Office of the European Communities, Council Regulation (EC) No 322/97 on Community Statistics, and Council Decision 89/382/EEC, Euratom establishing a Committee on the Statistical Programmes of the European Communities (Text with relevance for the EEA and for Switzerland) OJ L 87, 31.3.2009, p. 164–173 (BG, ES, CS, DA, DE, ET, EL, EN, FR, GA, IT, LV, LT, HU, MT, NL, PL, PT, RO, SK, SL, FI, SV)
7 Quality reports

7 Quality reports
53 Draft Handbook on meat statistics
2. Every three years, and for the first time by 1 July 2011, Member States shall provide the Commission (Eurostat) with a report on the quality of the data transmitted.
3. The quality reports shall describe:
o the organisation of the surveys covered by this Regulation and the methodology applied;
o the level of precision achieved for the sample surveys referred to in this Regulation;
o the quality of sources other than surveys which are used; and
o the quality of the forecasts referred to in this Regulation.
4. Member States shall inform the Commission of any methodological or other change which would have a considerable effect on the statistics. This shall be done not later than three months after such change enters into force.
The principle that additional costs and burdens remain within reasonable limits shall be taken into account.
7.2 Communication on methodological changes Each Member State shall inform the Commission (Eurostat) of any methodological or other change, including any deviation from the rules provided in the ESS Agreement and/or Handbook that could have a considerable effect on the statistics.
The questions supporting the various quality dimensions and items still need to be decided by the Working Party on Animal Production Statistics
7.3 Quality reports In accordance with Article 17 of Regulation 1165/2008 the Member States will provide every three years, and for the first time by 1 July 2011, the Commission (Eurostat) with a report on the quality of the data transmitted. The latest reports being submitted on the data collected with the 2019 reference year.
Member States shall provide the Commission (Eurostat) with reference metadata in accordance with the exchange standard specified by the Commission (Eurostat), i.e. the Euro SDMX Metadata Structure.
Member States shall provide the required metadata (including quality) in accordance with an exchange standard specified by the Commission (Eurostat). The metadata shall be provided to Eurostat through the single entry point.
The reports are published on Eurostat website(http://ec.europa.eu/eurostat/cache/metadata/EN/xxx) which follows the ESS Standard for quality reports.

7 Quality reports
54 Draft Handbook on meat statistics
Figure 5: High level business process for reporing SDMX compliant reference metadata
7.3.1 ESS STANDARD FOR QUALITY REPORTS The ESS Standard for Quality Reports Structure (ESQRS) contains the description and representation of statistical metadata concepts to be used for providing detailed information for assessing data quality. The broad concepts used are compatible with the SDMX cross-domain concepts and with the common terminology as published within the SDMX Glossary (2016). The detailed quality concepts are based on the ESS Standard for Quality Reports (ESQR) from 2009.
The ESQRS is addressed to the European Statistical System. It is implemented at Eurostat and at national level: the application of the concepts and sub concepts at European level and at national level are provided in the ESS Handbook for Quality Reports (EHQR) from 2014 and the ESS Guidelines for the implementation of the ESS Quality and Performance Indicators from 2014.
The Single Integrated Metadata Structure v2.0 combines both underlying reporting structures (ESMS 2.0 and ESQRS 2.0), and is the standard for quality reporting according to Article 12 of Regulation 223/2009 on European statistics.
7.3.2 REPORT STRUCTURE The proposed structure of metadata file is based on the version of EURO-SDMX Metadata Structure (ESMS) 2.0 adapted for the collection of methodological information on animal production statistics.
The 2020 questionnaire for the collection of metadata on 2019 data collection has been split into two types of metadata files, one file related to general questions and one or more specific questionnaire(s) on the statistical processes run to meet Regulation (EC) No 1165/2008.
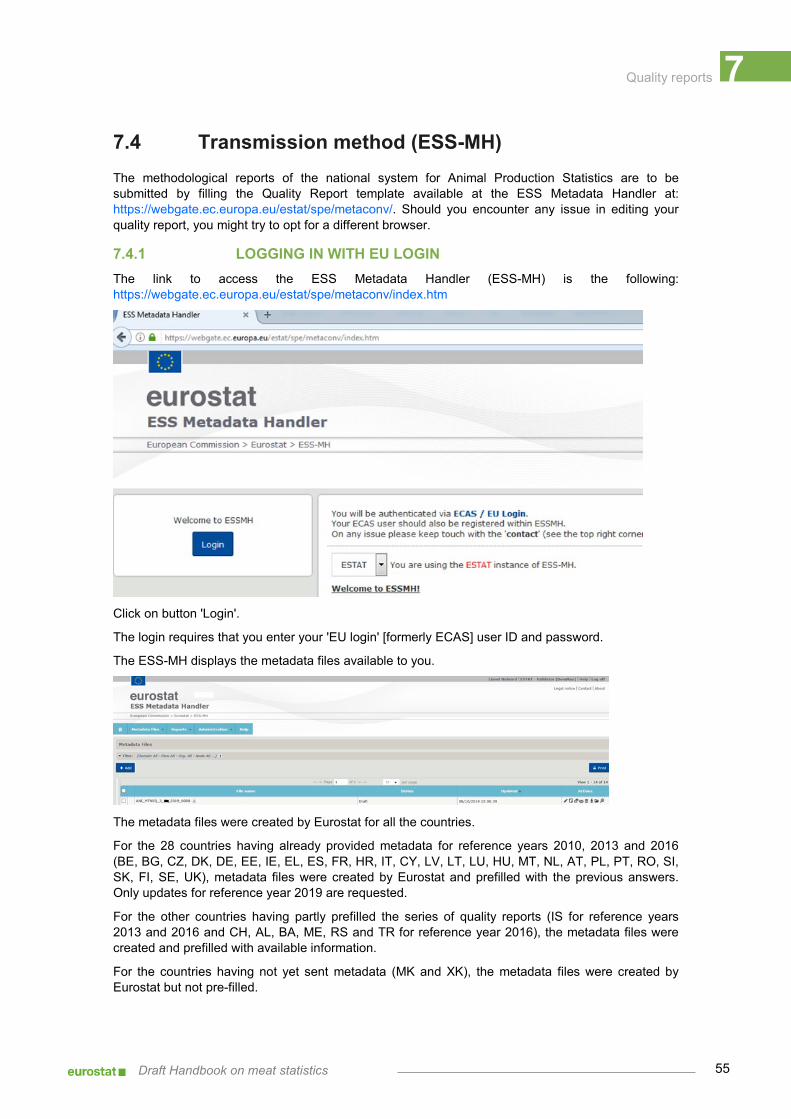
7 Quality reports
55 Draft Handbook on meat statistics
7.4 Transmission method (ESS-MH) The methodological reports of the national system for Animal Production Statistics are to be submitted by filling the Quality Report template available at the ESS Metadata Handler at: https://webgate.ec.europa.eu/estat/spe/metaconv/. Should you encounter any issue in editing your quality report, you might try to opt for a different browser.
7.4.1 LOGGING IN WITH EU LOGIN The link to access the ESS Metadata Handler (ESS-MH) is the following: https://webgate.ec.europa.eu/estat/spe/metaconv/index.htm
Click on button 'Login'.
The login requires that you enter your 'EU login' [formerly ECAS] user ID and password.
The ESS-MH displays the metadata files available to you.
The metadata files were created by Eurostat for all the countries.
For the 28 countries having already provided metadata for reference years 2010, 2013 and 2016 (BE, BG, CZ, DK, DE, EE, IE, EL, ES, FR, HR, IT, CY, LV, LT, LU, HU, MT, NL, AT, PL, PT, RO, SI, SK, FI, SE, UK), metadata files were created by Eurostat and prefilled with the previous answers. Only updates for reference year 2019 are requested.
For the other countries having partly prefilled the series of quality reports (IS for reference years 2013 and 2016 and CH, AL, BA, ME, RS and TR for reference year 2016), the metadata files were created and prefilled with available information.
For the countries having not yet sent metadata (MK and XK), the metadata files were created by Eurostat but not pre-filled.
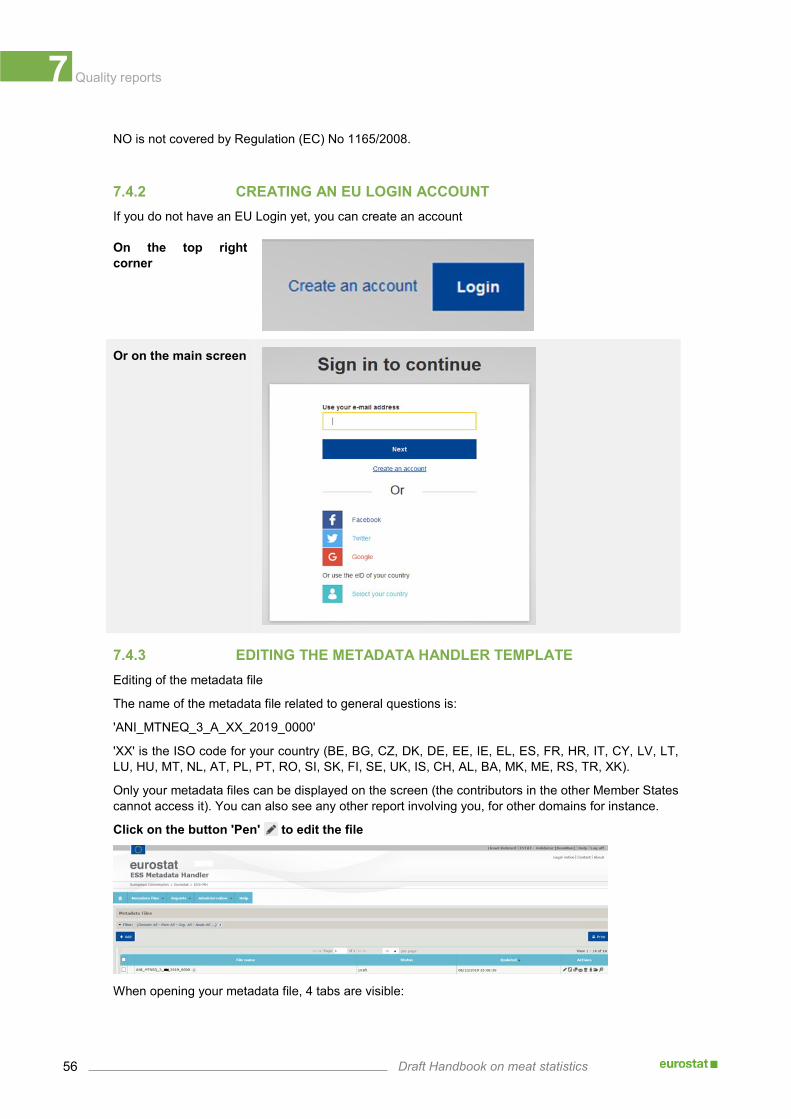
7 Quality reports
56 Draft Handbook on meat statistics
NO is not covered by Regulation (EC) No 1165/2008.
7.4.2 CREATING AN EU LOGIN ACCOUNT If you do not have an EU Login yet, you can create an account
On the top right corner
Or on the main screen
7.4.3 EDITING THE METADATA HANDLER TEMPLATE Editing of the metadata file
The name of the metadata file related to general questions is:
'ANI_MTNEQ_3_A_XX_2019_0000'
'XX' is the ISO code for your country (BE, BG, CZ, DK, DE, EE, IE, EL, ES, FR, HR, IT, CY, LV, LT, LU, HU, MT, NL, AT, PL, PT, RO, SI, SK, FI, SE, UK, IS, CH, AL, BA, MK, ME, RS, TR, XK).
Only your metadata files can be displayed on the screen (the contributors in the other Member States cannot access it). You can also see any other report involving you, for other domains for instance.
Click on the button 'Pen' to edit the file
When opening your metadata file, 4 tabs are visible:

7 Quality reports
57 Draft Handbook on meat statistics
No further metadata is expected under Tab '1 – Info'.
Select Tab '2 – Content'
The list of concepts/sub-concepts is presented in a tree which can be expanded or collapsed, displaying always the concepts (level 1) and hiding or not some or all sub-concepts (level 2).
Answer a question
1. Select the concept or sub-concept that you want to fill in on the left pan (red frame on the below picture)
You can start from the first item (1.1. Contact organisation) and continue with the next ones (1.2, 1.3, 1.4, etc.) by using the button 'Next' or select a particular concept or sub-concept in the left pan list, e.g. after having interrupted your work.
The main buttons to be used are:
• Display guidelines (definition / instructions)
• Edit to answer a question
• Save to save your work
2. Provide an answer
By clicking on button edit, the below window is popped up and you can type directly your answer or paste your text from various formats by using the appropriate button (plain text, MSWord, MSExcel), displayed in a red frame on the below picture.
The answers must be in English only.
Concepts and sub-concepts
Button 'Save'
Button 'Save'
Questions
Buttons 'Next'/'Previous' sub-concept Button Guidelines'
Button 'Edit'
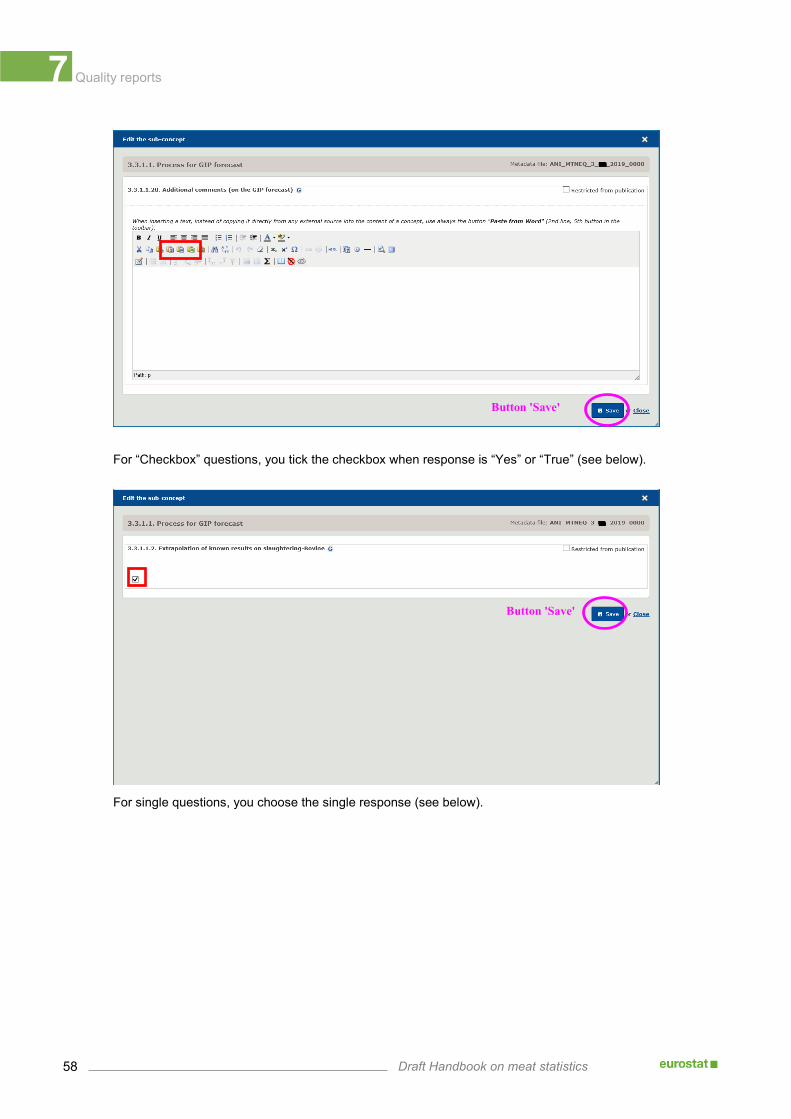
7 Quality reports
58 Draft Handbook on meat statistics
For “Checkbox” questions, you tick the checkbox when response is “Yes” or “True” (see below).
For single questions, you choose the single response (see below).
Button 'Save'
Button 'Save'

7 Quality reports
59 Draft Handbook on meat statistics
For multiple choice questions, you can select pre-defined answers in a list (see below).
3. Save your answer.
Tab '3 – Annexes'
You can attach the survey questionnaire(s) (other languages than English are allowed).
Tab '4 - Summary'
Two different views of your report are available through the two tabs:
• Tab 'Full view': the whole report is displayed.
• Tab 'Disseminated view': only non-restricted information is displayed, like for dissemination.
Button 'Save'
Button 'Save'

7 Quality reports
60 Draft Handbook on meat statistics
Only some item on '1. Contact' are automatically hidden. For the other items, you can tick the box "Restricted from publication" if appropriate (picture below).
Save your work
At each step, and especially before leaving your PC (your session is automatically closed quite fast) or before sending it for validation, save your file.
7.4.4 VALIDATING THE QUALITY REPORT Send your metadata file for validation
Click on button 'Send'.
The file is pre-checked and missing or invalid content is reported.
The status of the metadata file is updated and switch from 'Draft' to 'Ready for validation'.
After validation, your national statistics quality report will be published on the Eurostat public database.
For any information that you do not want to be published, you must tick the appropriate box
7.4.5 ESS-MH SUPPORT Should you experience difficulties with the ESS MH tool, please contact [email protected].

7 Quality reports
61 Draft Handbook on meat statistics
The general user guide of the ESS-MH can be found on the 'Help' page of the tool
Eurostat will check it and contact you for any problem or question.
8 Data dissemination
62 Draft Handbook on meat statistics
8 Data dissemination 8.1 Confidentiality Only non-confidential data are disseminated
The Commission is to respect the confidentiality of the data transmitted in line with Regulation (EC) No 223/2009 of the European Parliament and of the Council. The necessary protection of confidentiality of data should be ensured, among other means, by limiting the use of the location parameters to spatial analysis of information and by appropriate aggregation when publishing statistics. For that reason a harmonised approach for the protection of confidentiality and quality aspects for data dissemination should be developed.
8.2 Flags for data dissemination The flags used for data dissemination by Eurostat are the same as for the data transmission by the Member States. The confidentiality flag ("C"), cannot be combined with any other flag (e.g. with P) which would be meaningless.
8.3 Codes in data dissemination As much as possible, the codes which are used for data collection are also used in data dissemination. But there are many cases where exceptions need to be applied. For example, the term sole holder holding is replaced by "natural person" in the disseminated data, and instead of legal type or legal personality, the term chosen for dissemination was "legal form".
8.4 Calculation of EU aggregates Not relevant.
8.5 Additional disseminated variables Start drafting your text here:
8 Data dissemination

8 Data dissemination
63 Draft Handbook on meat statistics
8.6 Dissemination of tabular data Data on meat statistics are stored in the Eurostat dissemination database and can be consulted by external users free of charge via the Eurostat web site, under theme Agriculture, forestry and fisheries (https://ec.europa.eu/eurostat/web/agriculture/data/database).
8.7 Interpretation of results Start drafting your text here:
Annex I: Monthly data collection on other slaughtering - History and terminology
64 Draft Handbook on meat statistics
Annex I: Monthly data collection on other slaughtering - History and terminology 1 Purpose The status of the monthly data collection of slaughtering, carried other than in slaughterhouses, commonly called other slaughtering, needs to be supported by clear documentation. Indeed, some elements may introduce confusion:
• The text of the agreement refers to a revised 2010 document of the working Group on Animal Production Statistics while it has been endorsed by the CPSA in 2014, as a rare piece of CPSA governance.
• Eurostat does not present it on its website together with the ESS agreements whereas it has almost the same force.
Anybody interested in the grounding and applicability of this agreement needs chaining the various CPSA and Working Group documents to trace its history. The outcome of such a work is presented hereafter.
2 Summary history On 1 January 2009, Regulation (EC) No 1165/2008 became applicable. It introduced a change in slaughtering, referring to those carried in agreed slaughterhouses (monthly statistics) and to an annual estimate of slaughtering carried out other than in slaughterhouses. The Standing Committee on Agricultural Statistics (CPSA) expressed several times on the weakness in the Regulation regarding monthly other slaughtering.
2.1 CPSA meeting on 12-13 November 2009 The minutes of the meeting (ESTAT/CPSA/578) report the following about item 3.3. (Doc. ESTAT/CPSA/569) on Implementation of Regulation (EC) No 1165/2008 on livestock and meat statistics.
“Eurostat reported on the implementation of the new legislation on livestock and meat statistics, especially the breaks in the time series of slaughtering statistics due to the dropping of domestic slaughtering (i.e. slaughtering outside approved and certified slaughterhouses).” […/…]
“Most delegations expressed their preference for a provisional gentlemen's agreement. This last option was thus chosen and additional monthly data on domestic slaughtering will be collected for the species and countries where it is significant. The technical implementation of this gentlemen's
Annex I: Monthly data collection on other slaughtering History and terminology
Annex I: Monthly data collection on other slaughtering - History and terminology
65 Draft Handbook on meat statistics
agreement will be more precisely defined by the Working Party on Animal Production Statistics (March 2010).”
2.2 CPSA meeting on 17-18 May 2010 The minutes of the meeting (CPSA/593-rev1) report the following about item 3.4. (Doc. CPSA/586) on Implementation of Regulation (EC) No 1165/2008 on livestock and meat statistics.
“The Committee took note of the report presented by Eurostat on the state of play with respect to the implementation of the Regulation (EC) No 1165/2008. The Working Group on Animal Production Statistics which met in March 2010 had defined the technical details of a gentlemen's agreement to collect monthly estimates on other slaughtering, following the guidelines given by the SCAS in November 2009. This agreement focuses on the most significant figures.”
2.3 CPSA meeting on 10-11 May 2012 The minutes of the meeting (CPSA/664) report, about item 3.6. (Doc. CPSA/652) on the Report on the implementation of the gentlemen's agreement on "other slaughtering", that:
“The extension to the agreement was requested for two years instead of one year initially foreseen so that the Member States could better organise the statistical processes.”
and conclude that:
“It was agreed to extend the convention with two further years to gain more experience with other slaughtering statistics.”
2.4 CPSA meeting on 28-29 April 2014 The minutes of the meeting (CPSA/730) report the following about item 3.6. (Doc. CPSA/722) on Activities of the working groups in agricultural statistics.
“The working group on Animal production statistics was held on 13-14 March 2014. The four following issues were discussed by the CPSA:
• The report on data collection of monthly statistics on slaughtering carried out other than in slaughterhouses (other slaughtering) was well received. Amending Regulation (EC) No 1165/2008 appeared as irrelevant because the question is not of major importance for most Member States. However, continuity of data collection was considered as useful and the CPSA decided extending the gentlemen’s agreement in addition to the requirements of the Regulation.”
3 Resulting agreement Doc. ASA/TE/673-rev2, Annex I, integrated the comment of the Working Group on Animal Production Statistics after its meeting in March 2010. It was presented as Annex I of Doc. CPSA/586 for its implementation. It has been revised twice for its extensions by the CPSA in 2012 (-rev3) and 2014 (-rev4, see hereafter).
Whereas it was named gentlemen’s agreement as long as the CPSA existed, the wording CPSA agreement has been preferred since, as explicit on its particular governance and as distinguishing it from the non-written gentlemen’s agreements.
Annex I: Monthly data collection on other slaughtering - History and terminology
66 Draft Handbook on meat statistics

Annex I: Monthly data collection on other slaughtering - History and terminology
67 Draft Handbook on meat statistics

Annex I: Monthly data collection on other slaughtering - History and terminology
68 Draft Handbook on meat statistics

Annex I: Monthly data collection on other slaughtering - History and terminology
69 Draft Handbook on meat statistics
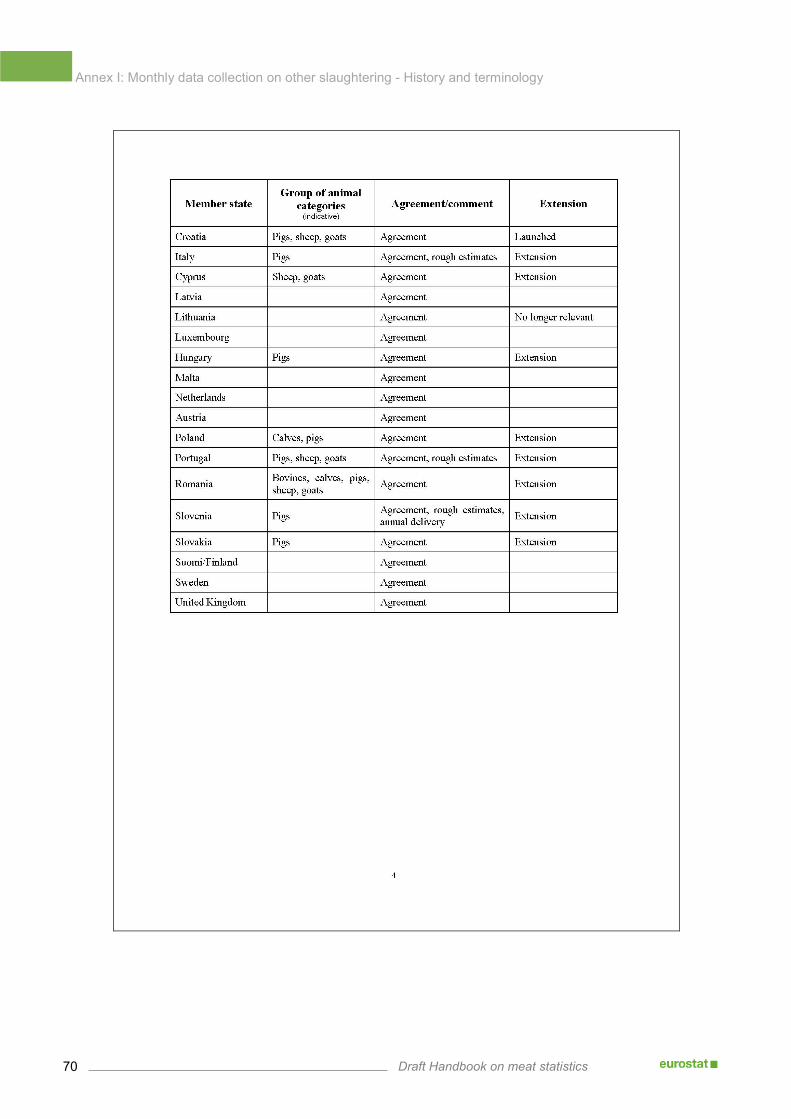
Annex I: Monthly data collection on other slaughtering - History and terminology
70 Draft Handbook on meat statistics
Annex I: Monthly data collection on other slaughtering - History and terminology
71 Draft Handbook on meat statistics
INDEX OF FIGURES
Figure 1: Bovine meat hierarchy ......................................................................................................... 29
Figure 2: Coefficients for bovine animals ............................................................................................ 37
Figure 3: Validation ............................................................................................................................. 49
Figure 4: Validation process (GSBPM notation).................................................................................. 50
Figure 5: High level business process for reporing SDMX compliant reference metadata ................. 54
Index of tables
72 Draft Handbook on meat statistics
INDEX OF TABLES
Table 1: Groups of animal categories to be assessed ........................................................................ 22
Table 2: Categories for meat production by livestock type - bovine animals ...................................... 28
Table 3: Categories for meat production by livestock type - pigs ........................................................ 31
Table 4: Categories for meat production by livestock type - sheep and goats .................................... 31
Table 5:Categories for meat production by livestock type - poultry .................................................... 32
Table 6: Comparison of categories in livestock and meat statistics as set in annexes of Regulation (EC) No 1165/2008 .................................................................................................................... 40
Table 7: Transmission deadlines for slaughter statistics ..................................................................... 43
Table 8: Transmission deadlines for meat production forecasts ......................................................... 44
Table 9: Observation status flags ........................................................................................................ 45