HANDBOOK OF ALTERNATIVE FUEL TECHNOLOGIES - Liu ...
525
Handbook of Alternative Fuel Technologies © 2007 by Taylor & Francis Group, LLC
-
Upload
khangminh22 -
Category
Documents
-
view
1 -
download
0
Transcript of HANDBOOK OF ALTERNATIVE FUEL TECHNOLOGIES - Liu ...

Handbook ofAlternative
FuelTechnologies
© 2007 by Taylor & Francis Group, LLC

Handbook ofAlternative
FuelTechnologies
Sunggyu LeeJames G. Speight
Sudarshan K. Loyalka
CRC Press is an imprint of theTaylor & Francis Group, an informa business
Boca Raton London New York
© 2007 by Taylor & Francis Group, LLC

CRC Press
Taylor & Francis Group
6000 Broken Sound Parkway NW, Suite 300
Boca Raton, FL 33487-2742
© 2007 by Taylor & Francis Group, LLC
CRC Press is an imprint of Taylor & Francis Group, an Informa business
No claim to original U.S. Government works
Printed in the United States of America on acid-free paper
10 9 8 7 6 5 4 3 2 1
International Standard Book Number-10: 0-8247-4069-6 (Hardcover)
International Standard Book Number-13: 978-0-8247-4069-6 (Hardcover)
This book contains information obtained from authentic and highly regarded sources. Reprinted
material is quoted with permission, and sources are indicated. A wide variety of references are
listed. Reasonable efforts have been made to publish reliable data and information, but the author
and the publisher cannot assume responsibility for the validity of all materials or for the conse-
quences of their use.
No part of this book may be reprinted, reproduced, transmitted, or utilized in any form by any
electronic, mechanical, or other means, now known or hereafter invented, including photocopying,
microfilming, and recording, or in any information storage or retrieval system, without written
permission from the publishers.
For permission to photocopy or use material electronically from this work, please access www.
copyright.com (http://www.copyright.com/) or contact the Copyright Clearance Center, Inc. (CCC)
222 Rosewood Drive, Danvers, MA 01923, 978-750-8400. CCC is a not-for-profit organization that
provides licenses and registration for a variety of users. For organizations that have been granted a
photocopy license by the CCC, a separate system of payment has been arranged.
Trademark Notice: Product or corporate names may be trademarks or registered trademarks, and
are used only for identification and explanation without intent to infringe.
Library of Congress Cataloging-in-Publication Data
Lee, Sunggyu.
Handbook of alternative fuel technologies / Sunggyu Lee, James G. Speight,
and Sudarshan K. Loyalka.
p. cm.
Includes bibliographical references and index.
ISBN-13: 978-0-8247-4069-6 (alk. paper)
1. Fuel--Handbooks, manuals, etc. 2. Fuel switching--Handbooks, manuals,
etc. 3. Power resources--Handbooks, manuals, etc. I. Speight, J. G. II. Loyalka, S.
K. III. Title.
TP318.L388 2007
662’.6--dc22 2006024771
Visit the Taylor & Francis Web site at
http://www.taylorandfrancis.com
and the CRC Press Web site at
http://www.crcpress.com
© 2007 by Taylor & Francis Group, LLC

Contents
Preface.....................................................................................................................vii
Authors...................................................................................................................xiii
Contributors ........................................................................................................... xv
Chapter 1Global Energy Overview ........................................................................................... 1Sunggyu Lee
Chapter 2Gasification of Coal................................................................................................. 25Sunggyu Lee
Chapter 3Clean Liquid Fuels from Coal ................................................................................ 81Sunggyu Lee
Chapter 4Coal Slurry Fuel .................................................................................................... 125Sunggyu Lee
Chapter 5Liquid Fuels from Natural Gas ............................................................................. 153James G. Speight
Chapter 6Resids..................................................................................................................... 171James G. Speight
Chapter 7Liquid Fuels from Oil Sand .................................................................................. 197James G. Speight
Chapter 8Shale Oil from Oil Shale....................................................................................... 223Sunggyu Lee
© 2007 by Taylor & Francis Group, LLC

Chapter 9Methanol Synthesis from Syngas.......................................................................... 297Sunggyu Lee
Chapter 10Ethanol from Corn................................................................................................. 323Sunggyu Lee
Chapter 11Ethanol from Lignocellulosics .............................................................................. 343Sunggyu Lee
Chapter 12Energy from Biomass Conversion ........................................................................ 377Sunggyu Lee
Chapter 13Energy Generation from Waste Sources ............................................................... 395Sunggyu Lee
Chapter 14Geothermal Energy................................................................................................ 421Sunggyu Lee and H. Bryan Lanterman
Chapter 15Nuclear Energy ...................................................................................................... 443Sudarshan K. Loyalka
Chapter 16Fuel Cells ............................................................................................................... 493Mihaela F. Ion and Sudarshan K. Loyalka
© 2007 by Taylor & Francis Group, LLC

PrefaceEnergy has always been the foremost resource that humans have relied on for survivaland productive activities. Industrialization and technological advancement of modernsociety have also been possible through the effective use of energy. There is a strongcorrelation between the index for quality of life and energy consumption. Heightenedeconomic strength of a country, technological prosperity of a society, higher pro-duction output of an industry, improved finances of a household, and increasedactivities of an individual are also realized by effective utilization of energy.
A number of important factors have historically dominated the trend, market,and type of energy utilization. These factors are: (1) resource availability, (2) con-venience of energy utilization, (3) efficiency of conversion, (4) technological feasi-bility, (5) portability and ease of transportation, (6) sustainability, (7) renewability,(8) cost and affordability, (9) safety and health effects, and (10) environmentalacceptance and impact. The technological success and prosperity of petrochemicalindustries in the 20th and early 21st centuries can largely be attributed to the vastutilization of fossil fuels, especially petroleum, as well as technological break-throughs and innovations by process industries. Industry and consumers have seenand come to expect a wide array of new and improved polymeric materials and otherchemical and petrochemical products. However, the fossil fuel resources upon whichindustry is heavily dependent are limited in available quantities and are expected tobe close to depletion in the near future.
The unprecedented popularity and successful utilization of petroleum resourcesobserved in the 20th century may have to decline in the 21st century owing to a lackof resource availability, thus making prospects for future sustainability seem grim.Public appetites for convenient fuel sources and superior high-performance materialsare, however, growing. Therefore, additional and alternative sources for fuels andpetrochemical feedstocks are not only to be developed further but are also neededfor immediate commercial exploitation. Use of alternative fuels is no longer a matterfor the future; it is a realistic issue of the present.
Additional and alternative sources for intermediate and final products, whetherfuels or petrochemicals, directly contribute to the conservation of petroleumresources of the world by providing additional raw material options for generatingthe same products for consumers. Examples may include wood alcohol for methanol,corn fermentation for ethanol, biodiesel from soybean or algae, BTX (benzene,toluene, and xylenes) from coal, biogas or bioliquid from agricultural wastes, hydro-gen as transportation fuel, bio-hydrogen from a variety of biological sources, jet fuelfrom shale oil or crop oil, Fischer–Tropsch fuel from coal or biomass, bisphenolsfrom agricultural sources, liquid transportation fuels from a natural gas source byZSM-type catalysis, ethylene/propylene via conversion of synthesis gas, use of coal-derived acetylene for petroleum-derived ethylene as a building block chemical, andliquid fuels from spent tires or mixed wastes, etc.
© 2007 by Taylor & Francis Group, LLC

If usable energy or deliverable power is the final product to be desired, alternatesources for energy may strongly and directly affect the lifestyle of consumers, aswell as their energy consumption patterns. A good example can be found in electriccars that are powered by powerful rechargeable batteries. These powerful batteriesserve no use for conventional gasoline motors, whereas, in turn, premium gasolineis not needed in these electric cars. Another good example is the solar house whoseclimate control inside the house is provided only by solar energy. Other examplesinclude LPG vehicles, dimethylether (DME) buses, hybrid cars, E-85 vehicles,hydrogen vehicles, solar-powered equipment and vehicles, wind energy poweredequipment, and geothermal heating and cooling, etc.
During the past several decades, there has been a considerable increase inresearch and development in areas of environmentally acceptable alternative fuels.Synthetic fuels were of prime interest in the 1970s, due to a sudden shortage ofpetroleum supply kindled by an oil embargo in 1973, as well as public concern aboutdwindling petroleum reserves. Although synfuels seemed to be a most promisingsolution to the conservation of petroleum resources (or, at least, frugal use of theresources) and the development of additional sources for conventional liquid fuels,some of the focus has been shifted toward environmental acceptance of the fuel andthe long-term sustainability of world prosperity in the last decade of the 20th century.Efforts have been made to reduce emissions of air pollutants associated with com-bustion processes whose sources include electric power generation and vehiculartransportation. Air pollutants that have been targeted for minimization or eliminationinclude SOx, NOx, COx, VOCs, particulate matters (PM), mercury, and selenium.These efforts have significantly contributed to the enhancement of air quality andassociated technologies.
Concerns of global warming via greenhouse gases have further intensified the issueof environmental acceptance of fuel consumption. Combustion of fossil fuels inevitablygenerates carbon dioxide due to an oxidation reaction of hydrocarbon and carbon-aceous materials. Carbon dioxide is known as a major greenhouse gas with emissionsthat need to be significantly reduced. Therefore, new developments in alternative fuelsand energy have focused more on nonfossil sources or on mitigation and fixation ofcarbon dioxide in fossil fuel utilization. Renewable energy sources are certainly verypromising due to their long-term sustainability and environmental friendliness. Ofparticular interest are solar (solar thermal and photovoltaic), wind, hydropower, tidal,and geothermal energies, in addition to biomass (wood, wood waste, plant/crop-basedrenewables, agricultural wastes, food wastes, and algae) and biofuels including bio-ethanol, biohydrogen, and biodiesel. It should be noted that hydropower is alsoregarded as a “conventional” energy source, as it has provided a significant amount ofelectrical energy for over a century. Government mandates, tax incentives, and stricterenforcement of environmental regulations are pushing environmentally friendly alter-native fuels into the marketplace at an unprecedented rate.
The number of alternative-fueled vehicles in use in the world is expected to increasesharply. These alternative-fueled vehicles are powered by liquefied petroleum gas(LPG), liquefied natural gas (LNG), ethanol 85% (E85), methanol 85% (M85), elec-tricity, neat methanol (M100), ethanol 95% (E95), dimethylether (DME), and hydro-gen, among which hydrogen presently accounts for very little but is considered the
© 2007 by Taylor & Francis Group, LLC

most promising by many. It should be noted that this list of alternative fuels in vehiclesonly represents the successful results of previous developments and does not includerecent advances and breakthroughs in the field. Research and development efforts inalternative-fueled vehicles and utilization of renewable energy sources have intensifiedin the past few years. Alternative-fueled vehicles and emission-free cars are expectedto gain more popularity, due in part to enforcement of stricter emission standards, theunmistakable fate of depletion for conventional transportation fuels, and numerous taxincentives for such vehicles. This intensified interest is coupled with the record-highprices of gasoline- and petroleum-based products experienced all over the world.Perhaps the key difference between the 1973 oil embargo era and the present is thatthis time around, efforts are likely to firmly latch-on to the roster of ongoing prioritiesmost exigent to mankind.
Energy from wastes cannot be neglected as a valuable energy source. If effec-tively harnessed, energy from wastes, including municipal solid waste (MSW),agricultural refuses, plastics and spent tires, and mixed wastes can be employed toalleviate the current burden for energy generation from fossil fuel sources. Moreover,energy generation from wastes bears extra significance in reducing the volume ofwastes, thus saving landfill space and utilizing resources otherwise of no value.Environmental aspects involving waste energy generation are to be fully addressedin commercial exploitation.
A great number of research articles, patents, reference books, textbooks, mono-graphs, government reports, and industry brochures are published and referencedeveryday. However, these literary sources are not only widely scattered and massivein volume, but they are also lacking in scientific consistency and technological com-prehensiveness. Further, most of the published articles focus on the justification andpotential availability of alternative fuel sources rather than environmental and technicalreadiness of the fuel as a principal energy source for the future postpetroleum era.
This handbook aims to present comprehensive information regarding the scienceand technology of alternative fuels and their processing technologies. Special empha-sis has been placed on environmental and socioeconomic issues associated with theuse of alternative energy sources, such as sustainability, applicable technologies,mode of utilization, and impacts on society.
Chapter 1 focuses on the current concerns in the area of consumption of con-ventional energy sources and highlights the importance of further development andutilization of alternative, renewable, and clean energy sources. This chapter presentspast statistics as well as future predictions for each of the major conventional andalternative energy sources of the world.
Chapter 2 deals with the science and technology of coal gasification to producesynthesis gas. Synthesis gas is a crucially important petrochemical feedstock andalso serves as an intermediate for other valuable alternative fuels such as methanol,dimethylether, ethanol, gasoline, diesel, and hydrogen. As the technology developedfor gasification of coal has been widely modified and applied to processing of otherfuel sources such as oil shale and biomass, details of various gasifiers and gasificationprocesses are presented in this chapter.
Chapter 3 covers the science and technology of coal liquefaction for productionof clean liquid fuels. All aspects of pyrolysis, direct liquefaction, indirect liquefaction,
© 2007 by Taylor & Francis Group, LLC

and coal–oil coprocessing liquefaction are addressed in detail. This chapter has sig-nificant relevance to the production of alternative transportation fuels that can replaceor supplement the conventional transportation fuels. The scientific and technologicalconcepts developed for coal liquefaction serve as foundations for other fuel processes.
Chapter 4 deals with the science and technology of coal slurry fuels. Majortopics in this chapter include slurry properties, hydrodynamics, slurry types, trans-portation, and environmental issues.
Chapter 5 discusses the liquid fuels obtained from natural gas. Special emphasisis also placed upon the Fischer–Tropsch synthesis whose chemistry, catalysis, andcommercial processes are detailed.
Chapter 6 presents the science and technology of resids. Properties and charac-terization of resids as well as conversion of resids are detailed in this chapter.
Chapter 7 describes the occurrence, production, and properties of oil sand bitu-men and the methods used to convert the bitumen to synthetic crude oil. Propertiesof the synthetic crude oil are also discussed.
Chapter 8 explores the science and technology of oil shale utilization. In particular,occurrence, extraction, and properties of oil shale kerogen are discussed. A variety ofoil shale retorting processes as well as shale oil upgrading processes are described.
Chapter 9 focuses on the synthesis of methanol from synthesis gas. Chemicalreaction mechanisms, catalysis, and process technologies of methanol synthesis aredescribed.
Chapter 10 deals with the production of fuel ethanol from corn. The chapterelucidates the chemistry, fermentation, and unit operations involved in the productionprocess. Moreover, the chapter discusses the environmental benefits of the use ofethanol as internal combustion fuel or as oxygenated additives.
Chapter 11 discusses the detailed process steps and technological issues that areinvolved in the conversion of lignocellulosic materials into fuel ethanol.
Chapter 12 deals with a variety of process options for energy generation frombiomass. Biomass characterization, environmental benefits, and product fuel prop-erties are also discussed.
Chapter 13 focuses on the energy generation from waste materials. Particularemphasis is placed on beneficial utilization of municipal solid wastes, mixed wastes,polymeric waste, and scrap tires.
Chapter 14 describes the occurrence, renewability, and environmentally benefi-cial utilization of geothermal energy. Geothermal power plants, district heating, andgeothermal heat pumps are also discussed.
Chapter 15 deals with the science and technology of nuclear energy. The chapterdescribes nuclear reactor physics, nuclear fuel cycles, types of reactors, and elec-tricity generation from nuclear reactors. Public concerns of safety and health arealso discussed.
Chapter 16 presents the basic concepts of fuel cells. This chapter also describesa number of different types of fuel cells and their characteristics. Hydrogen produc-tion and storage are also discussed in this chapter.
This book is unique in its nature, scope, perspectives, and completeness. Detaileddescription and assessment of available and feasible technologies, environmental healthand safety issues, government regulations, issues for research and development, and
© 2007 by Taylor & Francis Group, LLC

alternative energy network for production, distribution, and consumption are coveredthroughout the book. For R & D scientists and engineers, this handbook serves as asingle-volume comprehensive reference that will provide necessary informationregarding chemistry, technology, and alternative routes as well as scientific foundationsfor further enhancements and breakthroughs.
This book can also be used as a textbook for a three credit-hour course entitled“Alternative Fuels,” “Renewable Energy,” or “Fuel Processing.” The total numberof chapters coincides with the total number of weeks in a typical college semester.This book may also be adapted as a reference book for a more general subject onfuel science and engineering, energy and environment, energy and environmentalpolicy, and others. Professors and students may find this book a vital source bookfor their design or term projects for a number of other courses.
All chapters are carefully authored for scientific accuracy, style consistency,notational and unit consistency, and cross-reference convenience so that readers willenjoy the consistency and comprehensiveness of this book.
Finally, the authors are deeply indebted to their former graduate students,colleagues, and family members for their assistance, encouragement, and helpfulcomments.
Sunggyu LeeJames G. Speight
Sudarshan K. Loyalka
© 2007 by Taylor & Francis Group, LLC

Authors
Sunggyu Lee is professor of chemical and biological engineering at the Universityof Missouri–Rolla. He is the author or coauthor of six books and over 400 archivalpublications. He received 23 U.S. patents in the field of chemical process technolo-gies. He has advised more than 80 graduate students for their doctoral and master’sdegrees. He is also the editor of the Encyclopedia of Chemical Processing, publishedby Taylor & Francis. A specialist in chemical reaction kinetics and process engi-neering, and an active member of the American Institute of Chemical Engineers, Dr.Lee has designed more than 25 pilot, commercial, and demonstration plants, andadvised companies such as B.F. Goodrich, Water Technologies Limited, and NorthernTechnology International Corporation. He received his B.S. (1974) and M.S. (1976)degrees in chemical engineering from Seoul National University, Korea, and hisPh.D. degree (1980) in chemical engineering from Case Western Reserve University,Cleveland, Ohio. He taught at the University of Akron for 17 years and also at theUniversity of Missouri–Columbia for 9 years before joining the University of Mis-souri–Rolla in 2006.
James G. Speight has more than 38 years of experience in areas associated withthe properties and recovery of reservoir fluids; the refining of conventional petroleum,heavy oil, and tar sand bitumen; the properties of fuels and synthetic fuels, includinggas-to-liquids; natural gas; coal; and oil shale. He received his B.S. degree inchemistry and his Ph.D. in organic chemistry from the University of Manchester,England, where he was a research fellow in chemistry from 1965 to 1967. He servedon the Alberta (Canada) Research Council from 1967 to 1980, and for the next fouryears was with Exxon Research and Engineering Company. At Western ResearchInstitute he was chief scientific officer and executive vice president from 1984 to1990 and chief executive officer from then until 1998, when he began focusing onconsulting with CD&W, Inc., giving lectures on energy and environmental issues,and authoring work in his field. He has taught over 60 courses and has preparedmore than 400 publications, reports, and presentations, including more than 25 booksand bibliographies related to fossil fuel processing and environmental issues. He hasbeen editor of Petroleum Science and Technology (founding editor); Energy Sources.Part A: Recovery, Utilization, and Environmental Effects; and Energy Sources. PartB: Economics, Planning, and Policy.
Academic posts include adjunct professor of chemical and fuels engineering,University of Utah and visiting professor at the University of Trinidad and Tobago,Technical University of Denmark (Lyngby), University of Petroleum (Beijing, China),University of Regina (Saskatchewan, Canada), and University of Akron (Ohio).
His awards include the Diploma of Honor, National Petroleum EngineeringSociety, 1995, for outstanding contributions to the petroleum industry; the GoldMedal, Russian Academy of Sciences, 1996, for outstanding work in the area of
© 2007 by Taylor & Francis Group, LLC
petroleum science, 1996; Specialist Invitation Program Speakers Award, NEDO(New Energy Development Organization, Government of Japan), 1987 and 1996,for contributions to coal research; Doctor of Sciences degree, Scientific ResearchGeological Exploration Institute (VNIGRI), St. Petersburg, Russia, 1997, for excep-tional work in petroleum science; Einstein Medal, Russian Academy of Sciences,2001, in recognition of outstanding contributions and service in the field of geologicsciences; and the Gold Medal — Scientists Without Frontiers, Russian Academy ofSciences, 2005, in recognition of his continuous encouragement of scientists to worktogether across international borders.
Sudarshan K. Loyalka was educated at the Birla College of Engineering (now BirlaInstitute of Science and Technology), Pilani, India (B.S. Mech., 1964) and StanfordUniversity, Palo Alto, California (M.S., 1965; Ph.D., 1967, in nuclear engineering).He has been on the faculty of the University of Missouri–Columbia since 1967 andis Curators’ Professor of Nuclear and Chemical Engineering. His research interestsare in transport theory, aerosol mechanics, the kinetic theory of gases, and neutronreactor physics and safety. He is a Fellow of both the American Physical Society(since 1982) and the American Nuclear Society (since 1985). He has published about200 papers and has advised approximately 80 graduate students. Dr. Loyalka hasreceived the David Sinclair Award (1995) of the American Association for AerosolResearch and the Glenn Murphy Award (1998) of the American Association forEngineering Education.
© 2007 by Taylor & Francis Group, LLC

Contributors
Mihaela F. IonNuclear Science and EngineeringUniversity of Missouri–ColumbiaColumbia, MO
H. Bryan LantermanDRS Technologies, Inc.Alexandria, VA
Sunggyu LeeChemical and Biological EngineeringUniversity of Missouri–RollaRolla, MO
Sudarshan K. LoyalkaNuclear Science and EngineeringUniversity of Missouri–ColumbiaColumbia, MO
James G. SpeightCD&W Inc.Laramie, WY
© 2007 by Taylor & Francis Group, LLC

1
1 Global Energy Overview
Sunggyu Lee
CONTENTS
1.1 World Energy Consumption ............................................................................ 11.2 U.S. Energy Consumption ............................................................................... 31.3 Petroleum ......................................................................................................... 51.4 Natural Gas .................................................................................................... 101.5 Coal ................................................................................................................ 131.6 Nuclear Energy .............................................................................................. 161.7 Renewable Energy ......................................................................................... 17References................................................................................................................ 23
1.1 WORLD ENERGY CONSUMPTION
World energy consumption has been steadily increasing for a variety of reasons,which include enhancements in quality of life, population increase, industrialization,rapid economic growth of developing countries, increased transportation of peopleand goods, etc. There are many types of fuel available worldwide, the demand forwhich strongly depends on application and use, location and regional resources, cost,“cleanness” and environmental impact factors, safety of generation and utilization,socioeconomic factors, global and regional politics, etc. The energy utilization cycleconsists of three phases: generation, distribution, and consumption, all of which mustbe closely balanced for an ideal energy infrastructure. Any bottlenecking or shortagewould immediately affect the entire cycle as a limiting factor. If there is a decreasein production of a certain type of fuel, the distribution and consumption of thisspecific fuel would also decrease; so that fuel switching from this type to another,as well as forced conservation becomes inevitable. Further, based on the supply anddemand principle, the consumer price of this fuel type would undoubtedly rise. Evena breakdown in the transportation system of a certain fuel type would affect theconsumer market directly, and consequences such as fuel shortage and price hikewould be realized at least for a limited time in the affected region.
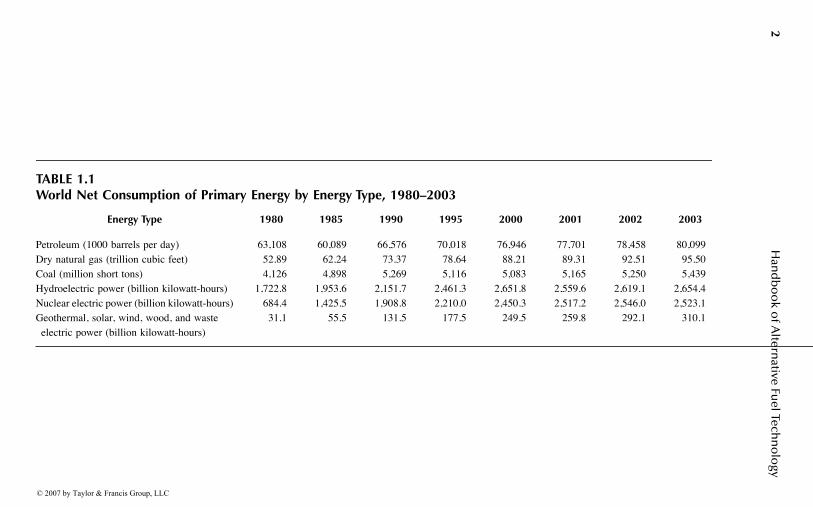
Table 1.1 summarizes world energy consumption for each of the principal fueltypes from 1980 to 2003.1 As shown, all these types have recorded steady increasesfor the period. Coal and hydroelectric power show the slowest increase in consump-tion for the period, whereas renewable and nuclear energy have recorded the steepestincreases, indicating that these are the emerging energy sources with the greatest
© 2007 by Taylor & Francis Group, LLC
2H
and
bo
ok o
f Altern
ative Fuel Tech
no
logy
TABLE 1.1World Net Consumption of Primary Energy by Energy Type, 1980–2003
Energy Type 1980 1985 1990 1995 2000 2001 2002 2003
Petroleum (1000 barrels per day) 63,108 60,089 66,576 70,018 76,946 77,701 78,458 80,099Dry natural gas (trillion cubic feet) 52.89 62.24 73.37 78.64 88.21 89.31 92.51 95.50Coal (million short tons) 4,126 4,898 5,269 5,116 5,083 5,165 5,250 5,439Hydroelectric power (billion kilowatt-hours) 1,722.8 1,953.6 2,151.7 2,461.3 2,651.8 2,559.6 2,619.1 2,654.4Nuclear electric power (billion kilowatt-hours) 684.4 1,425.5 1,908.8 2,210.0 2,450.3 2,517.2 2,546.0 2,523.1Geothermal, solar, wind, wood, and waste electric power (billion kilowatt-hours)
31.1 55.5 131.5 177.5 249.5 259.8 292.1 310.1
© 2007 by Taylor & Francis Group, LLC

Global Energy Overview 3
future in the world energy market. Coal and hydroelectric power, however, are moreconventional and established, and the world will still have to depend on these for along time. The higher rates of growth for renewable and nuclear energy consumptionalso show their strong potential as alternative fuels that ultimately will replace andsupplement the conventional fuel types in a variety of applications and end uses.
Among the conventional fossil fuels, the increased consumption of natural gasoutpaced the other fossil fuel types, i.e., coal and petroleum, for the period reportedin Table 1.1. This is attributable to stronger demands for natural gas in industrialand residential heating, increased installations of natural-gas-based electric powerplants, and new discoveries of large natural gas deposits. Several times in the 21stcentury, the world has experienced significant shortages and price hikes of naturalgas, mainly due to imbalances between supply and demand.
1.2 U.S. ENERGY CONSUMPTION
Figure 1.1 shows the total U.S. energy consumption2 in quadrillion Btu's. Onequadrillion is 10,15 which is equal to 1000 trillion. Based on the data, it is noted thatU.S. total energy consumption has tripled over the past 50 years, i.e., from 1950 to2000. Over the first 25 years of this period the increase was about 2.4 times, whereasit was about 1.3 times over the following 25 years. The slowdown of the pace ofU.S. energy consumption was noticed immediately after the oil crisis of 1973. Manyfactors may have contributed to this: to name a few, increase in energy conversionefficiency, energy conservation across the board, energy efficient products, and evenclimates becoming milder due to global warming. However, if we consider separatelythe period from 1973 to 1988, for which total U.S. energy consumption was fairly
FIGURE 1.1 Total U.S. energy consumption. (From Web site by Maxwell School of SyracuseUniversity, U.S. Energy Consumption, accessible through http://wilcoxen.cp.maxwell.syr.edu/pages/804.html. With permission.)
© 2007 by Taylor & Francis Group, LLC

4 Handbook of Alternative Fuel Technology
stable and did not change much, the recent rate of increase for the period from 1988to 2000 was as steep as that for the initial 25 years, i.e., from 1950 to 1975. Theperiod from 1973 to 1988 also coincides with the years when energy process devel-opment efforts in the U.S. were very active and public awareness of energy conser-vation was quite strong. During the 1990s, energy prices were stable, and researchin energy process development took a backseat, partly due to the lack of immediatemarket competitiveness of alternative fuels. This was also the time when energyconsumption sharply increased again in the U.S. as there was little fear of globalenergy crisis in the consumers’ minds.
Figure 1.2 shows the past and projected data for U.S. energy consumption form1980 to 2030.15 The data are reported in quadrillion Btus. The information is obtainedfrom the database developed by the Energy Information Administration (EIA), U.S.Department of Energy. The future projections show the following general trends:
1. Petroleum and coal will have steady increases in annual consumption.2. Increases in consumption of natural gas and nuclear energy are likely to
be mild.3. Hydropower will remain at the current level.4. Nonhydro renewable energy consumption will increase, but its market
share will be still low.
The energy consumption pattern for the U.S. has been quite different from therest of the world. Table 1.1 shows stronger growth was realized in renewable andnuclear energy sectors, which was not the case for the U.S. as shown in Figure 1.2.It should be also noted that the projections presented in Figure 1.2 were made in2004 before another major crisis in petroleum. The record high petroleum crude oilprice of 2006, as well as Hurricane Katrina of 2004 and its aftermath, will undoubt-edly change the predictions of energy consumption in the U.S. from those presented
FIGURE 1.2 U.S. energy consumption by fuel types (1980–2030). (From Forecasts andAnalyses, Energy Information Administration (EIA), U.S. Department of Energy, accessiblethrough the Web site, http://www.eia.doe.gov/oiaf/forecasting.html. With permission.)
History
Hydropower
Nonhydro renewablesNuclear
Natural gas
Coal
Projections
Petroleum
1980 1990 2004 2010 2020 2030
60
50
40
30
20
10
0
© 2007 by Taylor & Francis Group, LLC

Global Energy Overview 5
in Figure 1.2. In March 2003, the petroleum crude oil price on the global marketwas $31/bbl, whereas the price of crude oil topped $78/bbl in July 2006. In addition,the growth rate of ethanol as transportation fuel has been faster than anticipated.Further, a stronger case has recently been made for major R&D investments in thedirection of a hydrogen economy. Therefore, a slower pace of petroleum consumptioncoupled with a substantially accelerated pace of renewable energy consumption willbe part of the more likely scenarios for the future.
The energy crises of 1973 and 2005 were triggered by a shortage of petroleumcrude supply in the global market, mainly driven by increased transportation fuelneeds. The demand for alternative transportation fuels is growing stronger than ever.Cleaner-burning and more efficient fuels are going to be in high demands. Renewableenergy that does not get depleted over the years will also receive strong attention.As an indication of this, ethanol from corn is gaining popularity very rapidly in theU.S. In 2006, many U.S. gas stations carry E85 (85% ethanol fuel) as a regularlyavailable fuel product. People refer to this as a trend toward an ethanol economy.
1.3 PETROLEUM
Worldwide petroleum consumption data are summarized in Table 1.2 for the periodfrom 1980 to 2003.3 For this period, world petroleum consumption has grown at anaverage rate of 1.04% a year. Although this rate of increase may appear to be mild,it must be noted that petroleum resources are finite and can be depleted over years.Estimation of the years for which petroleum can be supplied and consumed at thecurrent consumption rate has often been made by professionals and policymakers,but the numbers have been inconsistent and fluctuating from year to year. Thisuncertainty comes from the difficulty of estimating the future recoverable amountof petroleum from all the proved and unproved reserves. The Society of PetroleumEngineers (SPE) and the World Petroleum Council (WPC) have developed andapproved several definitions of petroleum reserve-related terms to facilitate consis-tency among professionals using these terms4:
Proved reserves are those quantities of petroleum that, by analysis of geo-logical and engineering data, can be estimated with reasonable certainty tobe commercially recoverable, from a given date forward, from knownreservoirs and under current economic conditions, operating methods, andgovernment regulations. Proved reserves can be further categorized asdeveloped or undeveloped.
Unproved reserves are based on geologic and engineering data similar to thatused in estimates of proved reserves, but technical, contractual, economic,or regulatory uncertainties preclude such reserves being classified as proved.Unproved reserves may be further classified as probable reserves and pos-sible reserves.
Probable reserves are those unproved reserves that an analysis of geologicaland engineering data suggests are more likely to be recoverable than not.If a probabilistic interpretation is to be given, there should be at least a
© 2007 by Taylor & Francis Group, LLC

6H
and
bo
ok o
f Altern
ative Fuel Tech
no
logy
TABLE 1.2World Petroleum Consumption, 1980–2003
Region/Country 1980 1985 1990 1995 2000 2001 2002 2003
Canada 1,873.0 1,526.0 1,746.5 1,818.5 2,027.0 2,042.9 2,079.4 2,193.3Mexico 1,270.0 1,476.0 1,753.9 1,818.6 2,035.9 1,990.2 1,938.1 2,015.2U.S. 17,056.0 15,726.0 16,988.5 17,724.6 19,701.1 19,648.7 19,761.3 20,033.5North America 20,203.8 18,732.4 20,495.0 21,369.3 23,771.8 23,689.7 23,786.7 24,250.3Argentina 499.0 415.1 413.0 453.4 510.9 474.4 438.3 450.0Brazil 1,148.0 1,079.4 1,466.5 1,788.4 2,166.3 2,206.1 2,131.6 2,100.0Venezuela 400.0 383.2 395.6 448.5 499.7 544.5 570.7 530.0Central and South America 3,613.4 3,225.7 3,760.6 4,459.1 5,230.0 5,343.2 5,261.6 5,243.4France 2,256.0 1,753.0 1,826.1 1,919.3 2,000.5 2,050.7 1,982.8 2,059.8Germany NA NA NA 2,882.2 2,771.8 2,814.6 2,721.2 2,677.4East Germany 375.0 313.1 299.8 NA NA NA NA NAWest Germany 2,707.0 2,337.9 2,382.0 NA NA NA NA NAItaly 1,934.0 1,705.0 1,873.8 1,942.1 1,853.8 1,836.8 1,870.1 1,874.4Netherlands 792.0 610.0 734.5 767.3 855.4 893.1 899.2 920.0Spain 990.0 858.0 1,010.1 1,189.4 1,433.2 1,492.3 1,506.9 1,544.3Sweden 527.0 357.0 322.1 355.5 343.3 337.5 337.3 346.1Turkey 314.0 359.0 477.0 608.3 666.9 618.6 657.7 652.9U.K. 1,725.0 1,617.0 1,776.0 1,815.0 1,757.7 1,724.2 1,767.7 1,722.4Western Europe 14,322.0 12,295.1 13,306.2 14,160.7 14,667.8 14,833.1 14,819.1 14,950.6
© 2007 by Taylor & Francis Group, LLC

Glo
bal En
ergy Overview
7
Former Czechoslovakia 355.0 300.1 284.3 NA NA NA NA NAFormer USSR 8,995.0 8,950.0 8,392.0 NA NA NA NA NARussia NA NA NA 2,976.1 2,578.5 2,590.2 2,636.4 2,675.0Eastern Europe and former USSR 10,707.0 10,424.6 9,731.6 5,707.2 5,095.5 5,154.8 5,269.9 5,407.9Iran 590.0 790.0 1,002.5 1,140.2 1,248.3 1,285.3 1,350.3 1,425.0Saudi Arabia 610.0 939.0 1,107.0 1,254.5 1,537.1 1,606.3 1,676.2 1,775.0Middle East 2,058.1 2,853.9 3,494.2 4,159.0 4,775.6 4,984.5 5,135.1 5,288.1Egypt 260.0 430.0 465.0 458.5 560.8 564.7 554.7 566.0South Africa 312.0 350.0 375.0 421.1 457.9 458.2 475.4 484.0Africa 1,474.1 1,826.5 2,069.6 2,251.6 2,507.4 2,617.9 2,650.2 2,702.9Australia 594.0 639.0 736.8 814.1 871.9 877.9 875.8 875.6China 1,765.0 1,885.0 2,296.4 3,363.2 4,795.7 4,917.9 5,160.7 5,550.0India 643.0 894.9 1,168.3 1,574.7 2,127.4 2,183.7 2,263.4 2,320.0Indonesia 408.0 465.0 651.1 807.3 1,036.7 1,077.0 1,125.6 1,155.0Japan 4,960.0 4,436.0 5,218.1 5,676.1 5,607.0 5,530.0 5,464.6 5,578.4South Korea 537.0 552.0 1,048.3 2,007.7 2,135.3 2,132.0 2,149.2 2,168.1Singapore 202.0 227.0 363.0 512.2 660.3 686.6 698.0 705.0Taiwan 380.0 378.0 541.5 736.9 865.3 881.7 893.7 915.0Thailand 224.0 224.8 406.5 678.7 724.9 701.6 763.3 810.0Asia and Oceania 10,729.1 10,730.5 13,718.8 17,910.9 20,897.8 21,078.2 21,535.2 22,255.5World total 63,107.6 60,088.8 66,576.0 70,017.8 76,945.9 77,701.3 78,457.7 80,098.8
Note: In 1000 barrels per day; NA = not applicable.
© 2007 by Taylor & Francis Group, LLC

8 Handbook of Alternative Fuel Technology
50% probability that the quantities actually recovered will equal or exceedthe sum of estimated proved plus probable reserves.
Possible reserves are those unproved reserves that an analysis of geologicaland engineering data suggests are less likely to be recoverable than probablereserves. If a probabilistic interpretation is to be given, there should be atleast a 10% probability that the quantities actually recovered will equal orexceed the sum of estimated proved plus probable plus possible reserves.
The Oil and Gas Journal (OGJ) estimates that at the beginning of 2004, world-wide reserves of petroleum was 1.27 trillion barrels.5 This estimate is 53 billionbarrels higher than the prior year (2003), which reflected additional discoveries,improving technology, and changing economics.5 If we use the world petroleumconsumption rate of 2003 as a fixed rate, the worldwide petroleum reserve wouldbe able to sustain the current level of consumption for an additional 43.4 years. Table1.3 shows distribution of major petroleum reserves by countries.5
Currently, transportation, fuel, and petrochemical industries depend very heavilyupon petroleum-based feedstocks. Therefore, alternative fuels replacing petrochem-ical feedstocks and supplementing petroleum derived materials must be developedand utilized more. Necessary infrastructure also needs to be developed and changedto make a transition from the current petroleum economy.
Table 1.2 also provides regionwide petroleum consumption data. It shows thatconsumption of petroleum in Western Europe for the past 23 years has been steadilyconstant, whereas in Asia, Oceania, and the Middle East, consumption has increasedvery rapidly, with the Asian and Oceanic regions alone accounting for 64.1%. This is
TABLE 1.3Distribution of Major Petroleum Reserves
Nation Reserve (billion barrels)
Saudi Arabia 262Canadaa 179Iran 126Iraq 115Kuwait 99United Arab Emirates 98Venezuela 78Russia 60Libya 36Nigeria 25U.S. 22China 18Mexico 16Qatar 15World total 1265
a Mostly available in oil sands.
© 2007 by Taylor & Francis Group, LLC

Global Energy Overview 9
obviously due to the large number of rapidly developing economies in the region.As most of these countries are not major oil producers, this region will have tobe most sensitive to the future of petroleum energy. The U.S. accounted for about27% of the world total consumption in 1980, whereas for 2003 its portiondecreased to 25%. On the other hand, consumption in Asia and Oceania increasedform 17% in 1980 to 28% in 2003. Energy economists use the following termsfor grouping nations based on their economic trends: mature market economies(western Europe, North America, and Japan), emerging economies (many Asianand African countries), and transitional economies (former Soviet Union [FSU]nations, eastern Europe).
Figure 1.3 shows the world petroleum crude oil production data in million barrelsper day.6 It also shows the breakdown of petroleum crude oil production between theOrganization of Petroleum Exporting Countries (OPEC) nations and non-OPECnations. It is worth noting that the production trends between the two groups duringthe period 1979 to 1993 were quite opposite, whereas from 1993 they are parallel.
In the U.S., 97% of the energy used in the transportation sector, which includescars, trucks, trains, ships, and airplanes, comes from petroleum-based fuels. As such,petroleum is by far the most important transportation fuel. Serious R & D effortsare being made in many countries to develop vehicles that run on alternative energy,such as electricity, ethanol, and hydrogen.
FIGURE 1.3 World petroleum crude oil production (in million barrels/day).
75
50
25
0
World
Non-OPEC
OPEC
Persian Gulf Nations
1975 1980 1985 1990 1995 2000
© 2007 by Taylor & Francis Group, LLC

10 Handbook of Alternative Fuel Technology
1.4 NATURAL GAS
In recent years, natural gas has gained popularity among many industrial sectors. Itburns cleaner than coal or petroleum, thus providing environmental benefits. It isdistributed mainly via pipelines and in a liquid phase (called liquefied natural gas[LNG]) transported across oceans by tankers.
Table 1.4 shows the worldwide consumption of dry natural gas by regions andcountries for the period from 1980 to 2003.7 As shown, the worldwide consumptionof natural gas steadily increased at the rate of 2.6% per year. According to the Oiland Gas Journal (OGJ)5 the world natural gas reserve as of January 1, 2004 is 6079trillion cubic feet. Assuming that the current level of natural gas consumption forthe world is maintained, the reserve would be enough to last for another 64 years,provided factors such as increased yearly consumption, discovery of new deposits,and advances in technology, such as utilization of natural gas hydrates, are notincluded. Even though this rough estimate may look somewhat better than that ofpetroleum, the fate of natural gas is more or less the same as that of petroleum.
Table 1.5 shows the worldwide distribution of natural gas for countries with majorreserves.5,8 Projection of the world reserves of natural gas has generally increased, atleast by numbers due to new discoveries of major natural gas fields, whose estimatedreserves offset more than the annual consumption. As shown in Table 1.5, Russia hasabout 27.6% of the world natural gas reserves, whereas the combined total for theMiddle East accounts for 41.4% (at 2518 trillion cubic feet).5,8 In terms of natural gasconsumption, the U.S. accounts for 23.4% (based on statistics for 2003), whereas Asiaand Oceania account for 13%. This is quite different from the consumption patternfor petroleum, which is the globally preferred transportation fuel. Energy provided bynatural gas can be obtained by other sources or replaced by other types of energydepending upon a region’s infrastructure and supply-and-demand system.
Natural gas is the third most-used energy source in the U.S. (23%) after petro-leum and coal. The major consumers of natural gas are: manufacturers, publicutilities, residential consumers (heating homes and cooking), and commercial users,mainly for heating buildings, as shown in Figure 1.4. Natural gas helps manufacturea wide variety of goods including plastics, fertilizers, photographic films, inks,synthetic rubber, fibers, detergents, glues, methanol, ethers, insect repellents, andmuch more.9 It is also used in electric power generation as it burns cleaner andmore efficiently than coal, and has less emission-related problems than other popularfossil fuels. However, natural gas has only a limited market share as a transportationfuel, even though it can be used in regular internal combustion engines. This ismainly due to its low energy density per volume unless it is compressed under veryhigh pressure. Over half of U.S. homes use natural gas as the main heating fuel.Any major disruption in the natural gas supply would bring out unique but quitegrave consequences in the nation’s energy management, at least for the short termand for a certain affected region, as natural gas is heavily utilized by both electricpower generating utilities and homes. The regional energy dependence problem hasbeen somewhat mitigated by deregulation of utilities, which altered the businesspractices of electric utilities and natural gas industry. Deregulation allows customers
© 2007 by Taylor & Francis Group, LLC

Global Energy Overview 11
TABLE 1.4World Dry Natural Gas Consumption (1980–2003)
Region/Country 1980 1985 1990 1995 2000 2001 2002 2003
Canada 1,883 2,165 2,378 2,791 2,952 2,912 3,060 3,212
U.S. 19,877 17,281 19,174 22,207 23,333 22,239 23,007 22,375
North America 22,559 20,436 22,470 26,040 27,683 26,547 27,565 27,410Argentina 359 578 717 953 1,173 1,103 1,069 1,221
Venezuela 517 618 761 890 961 1,120 1,052 1,049
Central andSouth America
1,241 1,755 2,024 2,581 3,304 3,537 3,557 3,820
Belgium 371 306 341 443 554 547 563 547
France 981 1,110 997 1,183 1,403 1,473 1,586 1,545
Germany NA NA NA 3,172 3,098 3,239 3,204 3,315
East Germany 493 580 357 NA NA NA NA NA
West Germany 2,128 1,966 2,312 NA NA NA NA NA
Iceland 0 0 0 0 0 0 0 0
Ireland 32 87 82 102 142 148 151 152
Italy 972 1,151 1,674 1,921 2,498 2,505 2,485 2,715
Netherlands 1,493 1,624 1,535 1,701 1,725 1,769 1,765 1,780
U.K. 1,702 1,991 2,059 2,690 3,373 3,338 3,313 3,360
Western Europe 8,665 9,476 10,496 12,761 15,126 15,515 15,868 16,427Former
Czechoslovakia325 407 532 NA NA NA NA NA
Former USSR 13,328 20,302 24,961 NA NA NA NA NA
Hungary 344 395 394 407 425 472 473 515
Poland 418 443 427 416 473 482 479 528
Romania 1,251 1,336 1,261 901 600 696 646 636
Russia NA NA NA 14,507 14,130 14,412 14,567 15,291
Eastern Europeand former USSR
15,856 23,112 27,825 23,043 22,802 23,299 23,680 24,970
Iran 232 600 837 1,243 2,221 2,478 2,798 2,790
Saudi Arabia 334 716 1,077 1,343 1,759 1,896 2,002 2,121
Middle East 1,311 2,273 3,599 4,735 6,822 7,052 7,633 7,862Algeria 460 584 681 742 726 722 722 753
Egypt 30 175 286 439 646 867 941 954
Africa 735 1,072 1,351 1,689 2,038 2,284 2,446 2,554Australia 322 463 625 710 797 841 839 886
China 505 457 494 582 933 1,046 1,128 1,181
Indonesia 195 513 547 1,061 1,081 1,182 1,197 1,229
Japan 903 1,468 1,851 2,207 2,845 2,843 2,943 3,055
Pakistan 286 365 482 646 856 774 809 840
Asia and Oceania 2,523 4,120 5,605 7,790 10,433 11,078 11,756 12,462World total 52,890 62,244 73,370 78,642 88,208 89,312 92,505 95,504
Note: In billion cubic feet; NA = not applicable.
© 2007 by Taylor & Francis Group, LLC

12 Handbook of Alternative Fuel Technology
to purchase their natural gas from suppliers other than their local utility, thus pro-viding choices for consumers and eventually resulting in a better value for them.
Natural gas is distributed mainly via pipelines. In the U.S., more than one millionmiles of underground pipelines are connected between natural gas fields and majorcities. This gas can be liquefied by cooling to 260°F (162°C), and is much morecondensed in volume (615 times) when compared to natural gas at room temperature,making it easier to store or transport. LNG in special tanks can be transported bytrucks or by ships as LNG has the fluidity and volume compactness of other liquid
TABLE 1.5Natural Gas Reserves
Nation Reserves (trillion cubic feet)
Russia 1680Iran 940Qatar 917Saudi Arabia 231United Arab Emirates 212U.S. 189Algeria 160Nigeria 159Iraq 110Australia 29a
World total 6079
a Downward adjustment made from 90 to 29 trillion ft3, basedon Australian government’s report in 2005.
FIGURE 1.4 Principal uses of natural gas in the U.S.
Residential, 22.7
Electric Power,23.0
Commercial,14.4
Oil & GasIndustry
Operation, 5.0
Pipeline Fuel, 3.0Transportation
Fuel, 0.1
Industrial, 31.9
© 2007 by Taylor & Francis Group, LLC

Global Energy Overview 13
fuels. In this regard, it has some of the necessary qualities for a transportation fuel.As a result, more than 100 LNG storage facilities are currently being operated inthe U.S. and the number is still increasing.
Like all other fossil fuels, natural gas also generates carbon dioxide (a majorgreenhouse gas) upon combustion. Also, natural gas by itself is a greenhouse gas.9,19
Therefore, in all phases of generation, storage, and transportation, preventive mea-sures must be undertaken to ensure that accidental release of natural gas does notoccur due to any leakages.
1.5 COAL
Coal is primarily consumed in electric power generation and in industrial sectors.In 2002, coal consumption accounted for 24% of the total energy consumption inthe world.10,11 About 65% of coal consumption was used for electric power genera-tion, 31% for industrial consumers such as steel manufacturers and steam generators,and much of the remaining 4% for consumers in residential and commercial sectors.Coal was once an important transportation fuel for powering steam engines; however,coal nowadays is rarely used in transportation. Table 1.6 shows worldwide consump-tion of coal by regions and countries for the period from 1980 to 2003.10
According to the prediction for 2025 by the Energy Information Administration(EIA),10 worldwide consumption of coal for electric power generation and industrialuse would remain relatively stable, as shown in Table 1.7.11 The slight increase inconsumption by the industrial sector is mainly due to the rapid industrial growth ofChina, which has an abundant reserve and supply of coal, but limited reserve of oiland natural gas. International coal trade is projected to increase from 714 milliontons in 2003 to 969 million tons in 2025, accounting for approximately 12 to 13%of total worldwide consumption of coal over this period.11
Total recoverable reserves of coal around the world are estimated at 1001 billiontons,11 which would be enough to last approximately 184 years if maintained at the2003 consumption level of 5.439 billion tons. The reserve amount was recentlyadjusted downward after applying more restrictive criteria, i.e., safe and economicalrecoverability. Even though coal deposits are distributed widely throughout theworld, about 57% of the world recoverable coal reserves are located in three coun-tries: U.S. (27%), Russia (17%), and China (13%). After these three, six countriesaccount for 33% of the total reserves: India, Australia, South Africa, Ukraine,Kazakhstan, and Yugoslavia. Coal is also very unequally and unevenly distributed,just as are other fossil fuels such as petroleum and natural gas.
The U.S. consumed 1066 million tons of coal in 2002.10,11 Consumption isprojected to rise steadily to 1505 million tons in 2025. The strong dependence ofthe U.S. on coal for electric power generation is expected to continue. Dependenceon coal consumption for U.S. electricity generation declined from 56% in the mid-1990s to 52% in 2002. It is projected to decline slightly from 52% in 2002 to 51%in 2015 and then return to 53% in 2025.11 This prediction takes into account theexpected addition of new coal-fired power plants, as well as the expected increasein the average utilization rate of coal-fired power generation capacity, from 70%in 2002 to 83% in 2025.11
© 2007 by Taylor & Francis Group, LLC

14H
and
bo
ok o
f Altern
ative Fuel Tech
no
logy
TABLE 1.6World Coal Consumption, 1980–2003
Region/Country 1980 1985 1990 1995 2000 2001 2002 2003
Canada 41.32 54.30 59.08 58.46 69.62 69.58 68.22 69.43U.S. 702.73 818.05 904.50 962.10 1,084.09 1,060.15 1,066.35 1,094.13North America 749.33 880.12 972.17 1,032.86 1,168.91 1,146.33 1,151.38 1,183.97Central and South America 19.40 28.36 26.54 32.94 37.10 35.47 34.22 35.07Germany NA NA NA 297.52 269.81 278.15 280.12 273.05East Germany 297.20 351.51 315.20 NA NA NA NA NAWest Germany 238.28 227.08 212.42 NA NA NA NA NAGreece 25.63 41.91 58.95 64.43 72.41 75.49 76.81 76.04Spain 36.08 53.71 52.08 47.83 49.72 45.63 50.53 45.62Turkey 19.84 45.61 59.99 67.27 88.67 80.11 72.50 71.02U.K. 133.56 116.29 119.38 78.97 63.91 70.09 64.16 68.76Western Europe 937.45 1,065.26 1,037.19 737.53 717.21 718.54 717.04 712.54Bulgaria 40.74 43.65 41.67 32.77 32.26 34.69 31.72 34.59Czechoslovakia NA NA NA 79.15 70.09 68.03 64.65 65.34Former Czechoslovakia 134.05 140.29 119.48 NA NA NA NA NAFormer USSR 751.33 778.87 848.47 NA NA NA NA NA
© 2007 by Taylor & Francis Group, LLC

Glo
bal En
ergy Overview
15
Kazakhstan NA NA NA 72.36 54.82 63.01 65.71 58.50Poland 221.12 238.41 202.18 184.90 158.71 152.00 149.45 152.58Romania 44.97 60.35 51.97 49.85 35.65 38.17 38.38 40.31Russia NA NA NA 270.04 252.51 241.65 240.17 250.73Ukraine NA NA NA 109.60 72.64 70.62 68.79 67.17Eastern Europe and former USSR 1,225.11 1,294.08 1,289.06 855.11 724.04 715.16 704.21 717.52Middle East 1.08 4.81 5.68 9.28 13.84 14.84 15.96 15.55South Africa 104.77 141.77 139.08 162.26 176.06 173.52 172.11 187.76Africa 112.50 150.72 151.70 174.90 189.56 188.16 186.80 202.60Australia 74.30 86.29 103.72 112.24 141.00 140.98 145.25 144.08China 678.52 920.95 1,124.13 1,494.74 1,282.29 1,356.60 1,412.96 1,531.09India 129.83 193.47 255.79 331.92 406.07 413.56 430.63 430.62Japan 98.11 119.38 126.43 141.56 156.88 166.88 171.92 175.58North Korea 49.34 60.08 53.67 35.51 32.71 33.76 31.99 33.53South Korea 25.68 45.19 47.80 56.01 72.48 76.04 79.71 81.38Taiwan 6.59 12.10 18.94 29.03 49.49 52.87 56.32 60.67Asia and Oceania 1,081.61 1,474.41 1,786.93 2,273.06 2,231.89 2,346.18 2,440.53 2,572.08World Total 4,126.48 4,897.76 5,269.29 5,115.68 5,082.54 5,164.68 5,250.14 5,439.33
Note: In million short tons; NA = not applicable.
© 2007 by Taylor & Francis Group, LLC

16 Handbook of Alternative Fuel Technology
Coal has been studied extensively for conversion into gaseous and liquid fuels,as well as hydrocarbon feedstocks. Largely thanks to its relative abundance andstable fuel price on the market, coal has been a focal target for synthetic conversioninto other forms of fuels, i.e., synfuels. R&D work has seen research ups and downsdue to external factors, including the comparative fossil fuel market, as well as theinternational energy outlook of the era. Coal can be gasified, liquefied, pyrolyzed,and coprocessed with other fuels including oil, biomass, scrap tires, and municipalsolid wastes.12 Secondary conversion of coal-derived gas and liquids can generate awide array of petrochemical products, as well as alternative fuels.
In 2003, coal was the second largest leading source of carbon dioxide emissionsfrom the consumption and flaring of fossil fuels, accounting for 37% of the total.17
The leading primary source of carbon dioxide emission was from the consumptionof petroleum, accounting for 42% of the total. In third place was natural gas at 21%.17
1.6 NUCLEAR ENERGY
Table 1.8.13 shows worldwide nuclear electric power generation data and Table 1.9shows worldwide electricity generation data, from 1980 to 2003. Approximately30.3% of the world nuclear electric power generation in 2003 was in the U.S.,followed by France (16.6%), Japan (9.4%), Germany (6.2%), Russia (5.5%), andSouth Korea (4.9%). The market share of world electric power generation in 2003by nuclear energy is 15.9%, while that for the U.S. is 19.6%. Dependence ofelectric power generation on nuclear energy in 2003 was by far the heaviest forFrance at 78%. It should be also noted during the same period that there were 19countries which had more than 20% of their electric power generated using nuclearpower plants.
According to the International Energy Outlook 2005, electric power generationusing nuclear power plants from around the world is projected to increase from 2560billion kilowatt-hours in 2002 to 3032 billion kilowatt-hours in 2015 and 3270 billionkilowatt-hours in 2025.14 The outlook for nuclear energy in general improved sub-stantially over recent years, due to a number of reasons that include:
1. Higher fossil fuel prices2. Higher capacity utilization rates reported for many existing nuclear facilities
TABLE 1.7Projected Energy Market Share of Coal (as percentages)
Market 2002 2015 2025
Electric power generation 39 39 38Industrial sector 20 22 22Other sectors 4 3 3Total energy market 24 25 24
© 2007 by Taylor & Francis Group, LLC

Global Energy Overview 17
3. Expectation that most existing plants in the mature markets and transi-tional economies will be granted extensions in operating lives
4. Enforcement of Kyoto protocol5. Anticipation for hydrogen economy and need for cost-effective electrical
energy
However, predicting the trend for nuclear energy is still very difficult, owing toconsiderable uncertainties originating from political and socioeconomic factors.
1.7 RENEWABLE ENERGY
All fossil fuels are nonrenewable, and as such they will eventually be depleted. Asthey are based on finite resources and their distributions are heavily localized incertain areas of the world, they will become expensive. Further, energy generationfrom fossil fuels require combustion, thus damaging the environment with pollutantsand greenhouse gas emission. In order to sustain the future of the world with a cleanenvironment and nondepletive energy resources, renewable energy is the obviouschoice. Renewable energy sources include: solar energy, wind energy, geothermalenergy, biomass, and hydrogen. Most renewable energy, except for geothermalenergy, comes directly or indirectly from the sun.16 Benefits of renewable energyare numerous and they include:
1. Environmental cleanness without pollutant emission2. Nondepletive nature3. Availability throughout the world4. No cause for global warming5. Waste reduction6. Stabilization of energy costs7. Creation of jobs
Table 1.10 shows U.S. energy consumption by energy source from 2000 to2004.18 As can be seen in this comparative listing, the share of renewable energy isstill very minute, about 6% of the total energy consumption. With increases in theprices of petroleum and natural gas, as was experienced in 2005 and 2006, therelative competitiveness of renewable and alternative fuels is drastically improving.Further, technological advances in the alternative renewable energy areas, as wellas public awareness backed by strong governmental supports and incentives, makethe outlook of alternative and renewable energy very promising.
Worldwide generation of geothermal, solar, wind, wood, and waste electricpower increased at an average annual rate of 6.8% from 1993 to 2003.17 The U.S.led the world with 94 billion kilowatt-hours, followed by Germany with 31 billion,Japan with 28 billion, Spain with 16.3 billion, and Brazil with 16.2 billion.17 Thesefive countries accounted for about 60% of the world geothermal, solar, wind, wood,and waste electric power generation in 2003.
© 2007 by Taylor & Francis Group, LLC

18H
and
bo
ok o
f Altern
ative Fuel Tech
no
logy
TABLE 1.8World Net Nuclear Electric Power Generation for 1980–2003
Region/Country 1980 1985 1990 1995 2000 2001 2002 2003
Canada 35.88 57.10 69.24 92.95 69.16 72.86 71.75 70.79U.S. 251.12 383.69 576.86 673.40 753.89 768.83 780.06 763.73North America 287.00 440.79 648.89 774.38 830.86 849.97 861.07 844.49Argentina 2.22 5.43 7.03 7.07 5.99 6.54 5.39 7.03Brazil 0 2.92 1.94 2.39 4.94 14.27 13.84 13.40Central and South America 2.22 8.36 8.97 9.46 10.93 20.81 19.23 20.43Belgium 11.91 32.69 40.59 39.29 45.75 44.03 44.99 45.01Finland 6.63 17.98 18.26 18.26 21.36 21.63 21.18 21.60France 63.42 211.19 298.38 358.37 394.40 400.02 414.92 419.02Germany NA NA NA 145.44 161.13 162.74 156.60 157.00East Germany 11.89 12.74 5.33 NA NA NA NA NAWest Germany 43.70 125.90 139.82 NA NA NA NA NAItaly 2.07 6.60 0 0 0 0 0 0Netherlands 3.95 3.67 3.33 3.82 3.73 3.78 3.72 3.82Slovenia NA NA NA 4.56 4.55 5.04 5.31 4.96Spain 5.19 28.04 51.56 52.68 59.10 60.52 59.87 58.79Sweden 25.33 55.81 64.78 66.44 54.45 68.50 64.20 62.16Switzerland 12.88 20.06 22.42 23.65 25.12 25.47 25.87 26.12U.K. 32.29 53.77 62.46 84.52 80.81 85.38 83.64 84.49Western Europe 219.25 572.49 711.29 797.01 850.39 877.11 880.30 882.96
© 2007 by Taylor & Francis Group, LLC

Glo
bal En
ergy Overview
19
Armenia NA NA NA 0 1.84 1.99 2.09 1.82Bulgaria 5.81 12.38 13.53 16.40 17.27 18.24 20.22 16.04Czechoslovakia NA NA NA 11.62 12.91 14.01 17.80 24.58Former Czechoslovakia 4.50 11.90 23.40 NA NA NA NA NAFormer USSR 72.88 169.96 201.31 NA NA NA NA NAHungary 0 6.11 13.04 13.32 13.47 13.42 13.26 10.46Lithuania NA NA NA 10.64 8.42 11.36 14.14 15.48Romania 0 0 0 0 5.23 5.04 5.11 4.54Russia NA NA NA 94.34 122.46 125.36 134.14 138.39Slovakia NA NA NA 10.87 15.67 16.25 17.06 16.97Ukraine NA NA NA 66.98 71.06 71.67 73.38 76.70Eastern Europe and USSR 83.19 200.34 251.28 224.26 268.32 277.33 297.19 304.98Middle East 0 0 0 0 0 0 0 0South Africa 0 5.32 8.45 11.30 13.01 10.72 11.99 12.66Africa 0 5.32 8.45 11.30 13.01 10.72 11.99 12.66China 0 0 0 12.38 15.90 16.60 25.17 41.66India 3.00 4.70 5.61 6.46 14.06 18.23 17.76 16.37Japan 78.64 149.66 192.16 276.69 305.95 303.87 280.34 237.19South Korea 3.28 15.78 50.24 63.68 103.52 106.53 113.15 123.19Pakistan 0.002 0.33 0.36 0.50 0.38 1.98 1.80 1.81Taiwan 7.81 27.79 31.55 33.93 37.00 34.09 38.01 37.37Asia and Oceania 92.73 198.25 279.93 393.64 476.80 481.30 476.22 457.58World total 684.38 1,425.54 1,908.81 2,210.04 2,450.31 2,517.24 2,546.01 2,523.11
Note: In billion kilowatt-hours; NA = not applicable.
© 2007 by Taylor & Francis Group, LLC

20H
and
bo
ok o
f Altern
ative Fuel Tech
no
logy
TABLE 1.9World Net Electricity Generation for 1980–2003
Region/Country 1980 1985 1990 1995 2000 2001 2002 2003
Canada 367.91 448.07 468.65 544.11 587.86 570.87 582.15 566.28Mexico 63.60 93.13 116.57 144.91 193.91 198.63 203.66 209.20U.S. 2,289.60 2,473.00 3,041.50 3,356.21 3,807.64 3,745.47 3,867.20 3,891.72North America 2,721.60 3,014.78 3,627.43 4,046.01 4,590.30 4,515.91 4,653.94 4,668.11Argentina 41.85 45.50 48.29 64.92 85.26 86.50 81.15 83.29Brazil 138.28 190.64 219.62 271.79 342.45 323.04 340.07 359.19Venezuela 32.01 46.22 57.61 71.60 83.24 87.73 85.05 87.44Central and South America 308.23 405.36 497.17 626.75 781.10 767.55 790.31 828.66Austria 40.73 43.32 48.09 53.76 58.73 59.19 62.01 55.75Belgium 50.75 53.43 66.52 69.55 78.31 74.40 76.52 78.77Finland 38.71 47.32 51.85 60.97 66.84 70.96 71.30 79.61Former Yugoslavia 57.15 72.09 78.69 NA NA NA NA NAFrance 250.81 325.04 397.58 469.05 511.82 522.30 529.09 536.92Germany NA NA NA 503.93 536.07 549.48 548.63 558.14East Germany 98.81 113.83 104.01 NA NA NA NA NAWest Germany 371.05 407.93 422.00 NA NA NA NA NAItaly 176.37 173.31 202.06 225.05 256.04 258.01 261.14 270.06Netherlands 62.94 59.60 67.70 76.19 84.35 88.21 91.12 91.00Norway 82.85 101.80 120.37 120.80 138.18 117.96 128.85 105.56Portugal 14.97 18.60 27.12 31.59 41.35 44.12 43.44 44.32Spain 109.18 125.51 143.92 157.42 211.07 221.98 230.08 247.31Sweden 94.34 134.33 141.55 143.52 141.37 157.07 140.66 127.92Turkey 23.32 34.37 55.25 82.85 118.97 116.57 123.33 133.63U.K. 265.14 275.22 298.95 308.24 353.20 361.39 360.14 369.87Western Europe 1,844.50 2,106.19 2,355.89 2,527.95 2,847.47 2,901.62 2,922.53 2,973.66
© 2007 by Taylor & Francis Group, LLC

Glo
bal En
ergy Overview
21Czechoslovakia NA NA NA 57.56 68.77 70.04 71.76 78.18Estonia NA NA NA 8.17 8.00 7.98 8.02 9.02Former Czechoslovakia 72.70 76.83 81.88 NA NA NA NA NAFormer USSR 1,294.00 1,545.01 1,636.14 NA NA NA NA NAPoland 113.77 128.13 126.67 129.26 134.69 135.22 133.98 141.25Russia NA NA NA 817.30 832.98 842.63 864.69 883.35Ukraine NA NA NA 183.37 160.13 163.27 163.87 169.92Eastern Europe and former USSR 1,603.19 1,886.24 1,974.79 1,569.24 1,564.12 1,590.83 1,624.61 1668.18Iran 21.26 35.32 55.86 80.23 114.28 122.53 132.68 142.35Saudi Arabia 20.45 44.31 64.90 97.85 120.70 129.14 136.89 145.11Middle East 92.41 164.98 229.85 325.49 439.53 462.95 491.65 506.19Egypt 18.26 32.30 41.41 52.68 72.08 76.60 81.62 84.26South Africa 93.07 133.26 156.03 176.07 196.46 197.82 205.67 215.88Africa 189.18 251.92 307.40 354.28 417.29 431.80 451.63 471.06Australia 87.72 111.02 146.36 164.08 195.80 204.67 209.62 215.76China 285.47 390.68 590.34 956.09 1,300.37 1,409.62 1,570.38 1,806.76India 119.26 174.93 275.49 396.02 529.12 548.02 563.53 556.80Indonesia 12.79 26.40 43.02 56.83 87.63 96.08 102.27 109.46Japan 549.11 639.60 821.78 947.55 1,010.89 989.31 1,036.21 1,017.50South Korea 34.57 54.14 100.40 189.83 249.15 265.88 287.99 326.16Malaysia 10.19 15.00 23.95 43.02 65.41 67.45 70.01 79.28Pakistan 14.51 26.49 36.35 51.85 63.40 68.86 72.44 76.92Taiwan 42.01 52.55 83.34 113.24 149.78 151.11 158.54 165.96Thailand 13.58 22.91 43.65 75.58 90.53 96.60 102.87 114.71Asia and Oceania 1,268.05 1,646.47 2,337.58 3,184.25 3,973.10 4,139.41 4,428.40 4,736.56World total 8,027.15 9,475.96 11,330.10 12,633.97 14,612.92 14,810.07 15,363.07 15,852.41
Note: In billion kilowatt-hours; NA = not applicable.
© 2007 by Taylor & Francis Group, LLC

22 Handbook of Alternative Fuel Technology
Ethanol from corn has been increasingly used as gasoline-blending fuel. Onenew brand is E85, which contains 85% ethanol and 15% gasoline. Many gas stationsin the U.S. have started to stock E85 fuels regularly and many automakers areoffering multiple lines of automobiles that can be operated on either conventionalgasoline or E85. Phase-down of MTBE (methyl tertiary–butyl ether), once the mostpopular oxygenated blend fuel, in many U.S. states also accelerated the use ofethanol as an oxygenated gasoline blend fuel. Public awareness of clean burningand energy efficient hydrogen has also propelled unprecedented interest in hydrogentechnology and fuel cell research and development. Many experts predict the futureto be a hydrogen economy. For the hydrogen economy to be realized, a long listof technological advances must be accomplished, which include technologies forinexpensive generation, safe distribution and storage, safe and efficient materialsfor hydrogen handling, hydrogen internal combustion engine, hydrogen fuel cells,loss prevention, etc.
Energy generation utilizing biomass and municipal solid wastes (MSW) are alsopromising in regions where landfill spaces are very limited. Technological advancesin the fields have made this option efficient and environmentally safe.
TABLE 1.10U.S. Energy Consumption by Energy Source for 2000–2004
Energy Source 2000 2001 2002 2003 2004P
Total a 98.961 96.464 97.952 98.714 100.278Fossil fuels 84.965 83.176 84.070 84.889 86.186Coal 22.580 21.952 21.980 22.713 22.918Coal coke net imports 0.065 0.029 0.061 0.051 0.138Natural gasb 23.916 22.861 23.628 23.069 23.000Petroleumc 38.404 38.333 38.401 39.047 40.130Electricity net imports 0.115 0.075 0.078 0.022 0.039Nuclear electric power 7.862 8.033 8.143 7.959 8.232Renewable energy 6.158 5.328 5.835 6.082 6.117Conventional hydroelectric 2.811 2.242 2.689 2.825 2.725Geothermal energy 0.317 0.311 0.328 0.339 0.340Biomassd 2.907 2.640 2.648 2.740 2.845Solar energy 0.066 0.065 0.064 0.064 0.063Wind energy 0.057 0.070 0.105 0.115 0.143
Note: In quadrillion British thermal units (Btus).
a Ethanol blended into motor gasoline is included in both Petroleum and Biomass, but is counted onlyonce in total consumption.b Includes supplemental gaseous fuels.c Petroleum products supplied, including natural gas plant liquids and crude oil burned as fuel.
© 2007 by Taylor & Francis Group, LLC

Global Energy Overview 23
REFERENCES
1. International Energy Annual 2003 posted in May–June 2005, Energy InformationAdministration (EIA), U.S. Department of Energy, accessible through the Web site,http://www.eia.doe.gov/pub/international/iealf/table11.xls.
2. Web site by Maxwell School of Syracuse University, U.S. Energy Consumption,accessible through http://wilcoxen.cp.maxwell.syr.edu/pages/804.html.
3. International Energy Annual 2003 posted on June 28, 2005, Energy InformationAdministration (EIA), U.S. Department of Energy, accessible through the Web site,http://www.eia.doe.gov/pub/international/iealf/table12.xls.
4. Society of Petroleum Engineers (SPE), Petroleum Reserve Definitions, accessiblethrough the Web site, http://www.spe.org/spe/jsp/basic/01104_1216900.html.
5. Oil and Gas Journal, Worldwide Report, December 22, 2003.6. Web site by Energy Information Administration (EIA), International Section, accessi-
ble through http://www.eia.doe.gov/emeu/international/contents.html.7. International Energy Annual 2003 posted on May 25, 2005, Energy Information
Administration (EIA), U.S. Department of Energy, accessible through the Web site,http://www.eia.doe.gov/pub/international/iealf/table13.xls.
8. International Energy Annual 2003 posted on May 25, 2005, Energy InformationAdministration (EIA), U.S. Department of Energy, accessible through the Web site,http://www.eia.doe.gov/pub/international/iea2003/table81.xls.
9. Lee, S., Methane and Its Derivatives, Marcel Dekker, New York, 1997.10. International Energy Outlook 2005 (IEO2005), Coal, posted in July 2005, Energy
Information Administration (EIA), U.S. Department of Energy, accessible throughthe Web site, http://www.eia.doe.gov/oiaf/ieo/coal.html.
11. International Energy Annual 2002, DOE/EIA-0219, Energy Information Administra-tion (EIA), U.S. Department of Energy, Washington, D.C., March 2004.
12. Speight, J.G., The Chemistry and Technology of Coal, revised edition, Marcel Dekker,New York, 1994.
13. International Energy Annual 2003 posted on June 24, 2005, Energy InformationAdministration (EIA), U.S. Department of Energy, accessible through the Web site,http://www.eia.doe.gov/pub/international/iealf/table27.xls.
14. International Energy Outlook 2005 (IEO2005), Electricity, posted in July 2005,Energy Information Administration (EIA), U.S. Department of Energy, accessiblethrough the Web site, http://www.eia.doe.gov/oiaf/ieo/electricity.html.
15. Forecasts and Analyses, Energy Information Administration (EIA), U.S. Department ofEnergy, accessible through the Web site, http://www.eia.doe.gov/oiaf/forecasting.html.
16. National Renewable Energy Laboratory (NREL), Renewable Energy Basics, acces-sible through the Web site, http://www.nrel.gov/learning/re_basics.html.
17. International Energy Annual 2003, World Energy Overview: 1993–2003, posted inMay–July 2005, Energy Information Administration (EIA), U.S. Department ofEnergy, accessible through the Web site, http://www.eia.doe.gov/iea/overview.html.
18. Fuel Overview, Energy Information Administration (EIA), U.S. Department of Energy,accessible through the Web site, http://www.eia.doe.gov/fueloverview.html#C.
19. Speight, J.G. and Lee, S., Environmental Technology Handbook, 2nd Edition, Taylor& Francis, Philadelphia, PA, 2000.
© 2007 by Taylor & Francis Group, LLC

25
2 Gasification of Coal
Sunggyu Lee
CONTENTS
2.1 Background .................................................................................................... 262.2 Syngas Classification Based on its Heating Value ........................................ 28
2.2.1 Low-Btu Gas ...................................................................................... 292.2.2 Medium-Btu Gas................................................................................ 292.2.3 High-Btu Gas ..................................................................................... 29
2.3 Coal Gasification Reactions........................................................................... 302.3.1 Steam Gasification ............................................................................. 312.3.2 Carbon Dioxide Gasification ............................................................. 332.3.3 Hydrogasification ............................................................................... 342.3.4 Partial Oxidation ................................................................................ 352.3.5 Water Gas Shift (WGS) Reaction...................................................... 36
2.4 Syngas Generation via Coal Gasification...................................................... 382.4.1 Classification of Gasification Processes ............................................ 382.4.2 Historical Background of Coal Gasification and Its
Commercialization ............................................................................. 392.4.3 General Aspects of Gasification ........................................................ 402.4.4 Gasification Processes........................................................................ 41
2.4.4.1 Lurgi Gasification ............................................................... 412.4.4.1.1 Lurgi Dry-Ash Gasifier .................................... 422.4.4.1.2 Slagging Lurgi Gasifier .................................... 44
2.4.4.2 Koppers-Totzek Gasification .............................................. 442.4.4.2.1 Koppers-Totzek Gasifier................................... 452.4.4.2.2 Features of the Koppers-Totzek Process.......... 462.4.4.2.3 Process Description of Koppers-Totzek
Gasification....................................................... 472.4.4.3 Shell Gasification................................................................ 492.4.4.4 Texaco Gasification ............................................................ 502.4.4.5 In Situ Gasification ............................................................. 51
2.4.4.5.1 Potential Possibility of Using MicrobialProcesses for In Situ Gasification .................... 53
2.4.4.5.2 Underground Gasification System ................... 532.4.4.5.3 Methods for Underground Gasification ........... 552.4.4.5.4 Potential Problem Areas with In Situ
Gasification....................................................... 56
© 2007 by Taylor & Francis Group, LLC

26 Handbook of Alternative Fuel Technology
2.4.4.5.5 Monitoring of Underground Processes ............ 572.4.4.5.6 Criteria for an Ideal Underground
Gasification System.......................................... 572.4.4.6 Winkler Process .................................................................. 57
2.4.4.6.1 Process Description .......................................... 582.4.4.6.2 Gasifier (Gas Generator) .................................. 582.4.4.6.3 Features of the Winkler Process ...................... 59
2.4.4.7 Wellman-Galusha Process .................................................. 612.4.4.8 The U-GAS Process ........................................................... 622.4.4.9 Catalytic Coal Gasification................................................. 642.4.4.10 Molten Media Gasification................................................. 68
2.4.4.10.1 Kellogg Molten Salt Process............................ 682.4.4.10.2 Atgas Molten Iron Coal Gasification............... 70
2.4.4.11 Plasma Gasification ............................................................ 702.5 Mathematical Modeling of Coal Gasifiers .................................................... 722.6 Future of Coal Gasification ........................................................................... 76References................................................................................................................ 76
2.1 BACKGROUND
Conversion of coal by any of the processes to produce a mixture of combustible gasesis termed coal gasification, even though a large number of chemical reactions otherthan so-called gasification reactions are involved. Even though the product gases ofcoal gasification involve combustible chemical species, the purpose of gasification isnot limited to generation of gaseous fuel, because the product gas can be easilyprocessed to generate other valuable chemical and petrochemical feedstock. Commer-cial gasification of coal generally entails the controlled partial oxidation of the coal toconvert it into desired gaseous products. The coal can be heated either directly bycombustion or indirectly by another heat source. A gasifying medium is typicallypassed over (or through) the heated coal to provide intimate molecular contact forchemical reaction. The gaseous reactants react with carbonaceous matters of coal (i.e.,coal hydrocarbons) or with other primary decomposition products of coal to producegaseous products. Not all the gaseous products generated by such processes are desir-able from the standpoints of fuel quality, further processing, and environmental issues.Therefore, coal gasification is always performed in connection with downstream pro-cesses, not only for final applications but also for gas-cleaning purposes. The primaryemphases of coal gasification may be on electricity generation via integrated gasifi-cation combined cycle (IGCC) types, on syngas production for pipeline applications,on hydrogen production, or on synthesis of liquid fuels and petrochemicals as alterna-tive sources of raw materials. With the advent of a hydrogen economy, the role of coalgasification in generation of hydrogen may become even more important.75
Conversion of coal from its solid form to a gaseous fuel (or, gaseous chemical) iswidely practiced today. During earlier years (1920–1940), coal gasification was beingemployed to produce manufactured gas in hundreds of plants worldwide, and suchplants were called manufactured gas plants (MGPs). This technology became obsolete
© 2007 by Taylor & Francis Group, LLC

Gasification of Coal 27
in the post–World War II era because of the abundant supply of petroleum and naturalgas at affordable prices. With the advent of the oil embargo in the early 1970s andsubsequent increases and fluctuations in petroleum prices, as well as the natural gasand petroleum shortage experienced during the beginning of the 21st century, theinterest in coal gasification as well as its further commercial exploitation was revived.Recently, surging interest in fuel cell technology also prompted keen interest in coalgasification as a means of obtaining reliable and inexpensive hydrogen sources. Manymajor activities in research, development, and the demonstration of coal gasificationhave recently resulted in significant improvements in conventional technology, andthus made coal gasification more competitive in modern fuel markets.1
The concept of electric power generation based on coal gasification received itsbiggest boost in the 1990s when the U.S. Department of Energy’s Clean CoalTechnology Program provided federal cost sharing for the first true commercial-scale IGCC plants in the U.S. Tampa Electric Company’s Polk Power Station nearMulberry, FL, is the nation’s first “greenfield” (built as a brand new plant, not aretrofit) commercial gasification combined cycle power station.75 The plant, dedi-cated in 1997, is capable of producing 313 MW of electricity and removing morethan 98% of sulfur in coal that is converted into commercial products. On the otherhand, the Wabash River Coal Gasification Repowering Project was the first full-sizecommercial gasification combined cycle plant built in the U.S., located outside WestTerre Haute, IN. The plant started full operations in November 1995. The plant iscapable of producing 292 MW of electricity and is still one of the world’s largestsingle-train IGCCs operating commercially.75
Coal gasification includes a series of reaction steps that convert coal containingC, H, and O, as well as impurities such as S and N, into synthesis gas and other formsof hydrocarbons. This conversion is generally accomplished by introducing a gasify-ing agent (air, oxygen, and/or steam) into a reactor vessel containing coal feedstockwhere the temperature, pressure, and flow pattern (moving bed, fluidized, or entrainedbed) are controlled. The proportions of the resultant product gases (CO, CO2, CH4,H2, H2O, N2, H2S, SO2, etc.) depend on the type of coal and its composition, thegasifying agent (or gasifying medium), and the thermodynamics and chemistry of thegasification reactions as controlled by the process operating parameters.
Coal gasification technology can be utilized in the following energy systems ofpotential importance:
1. Production of fuel for use in electric power generation units2. Manufacturing synthetic or substitute natural gas (SNG) for use as pipeline
gas supplies3. Producing hydrogen for fuel cell applications4. Production of synthesis gas for use as a chemical feedstock5. Generation of fuel gas (low-Btu or medium-Btu gas) for industrial purposes
Coal is the largest recoverable fossil fuel resource in the U.S. as well as in theworld. Synthesis gas production serves as the starting point for production of avariety of chemicals. The success of the Tennessee Eastman Corp. in producingacetic anhydride from coal shows the great potential of using coal as petrochemical
© 2007 by Taylor & Francis Group, LLC

28 Handbook of Alternative Fuel Technology
feedstock.2 A major concern for such a technology involves the contaminants in coal.Coal contains appreciable amounts of sulfur, which is of principal concern to thedownstream processes because many catalysts that might be used in the productionof chemicals are highly susceptible to sulfur poisoning. Coals also contain nonneg-ligible amounts of alkali metal compounds that contribute to the fouling and corro-sion of the reactor vessels in the form of slag. Further, coal also contains a numberof trace elements that may also affect downstream processes and potentially createenvironmental and safety risks. If coal gasification is to be adopted to produce certaintarget chemicals, the choice of the specific gasification technology becomes verycritical because a different process will produce a different quality (or composition)of synthesis gas as well as alter the economics of production.
Synthesis gas (SG) is a very important starting material for both fuels andpetrochemicals. Synthesis gas is also called syn gas or syngas. It can be obtainedfrom various sources including petroleum, natural gas, coal, biomass, and evenmunicipal solid wastes (MSWs). Syngas is conveniently classified, based on itsprincipal composition, as: (1) H2-rich gas, (2) CO-rich gas, (3) CO2-rich gas, (4)CH4-rich gas, etc. Principal fuels and chemicals directly made from syngas includehydrogen, carbon monoxide, methane, ammonia, methanol, dimethylether, gasoline,diesel fuel, ethylene, isobutylene, mixture of C2-C4 olefins, C1-C5 alcohols, ethanol,ethylene glycol, etc.74
Secondary fuels and chemicals synthesized via methanol routes include formal-dehyde, acetic acid, gasoline, diesel fuel, methyl formate, methyl acetate, acetalde-hyde, acetic anhydride, vinyl acetate, dimethylether, ethylene, propylene, isobuty-lene, ethanol, C1-C5 alcohols, propionic acid, methyl tert-butyl ether (MTBE), ethyltert-butyl ether (ETBE), tert-amyl methyl ether (TAME), benzene, toluene, xylenes,ethyl acetate, a methylating agent, etc. The synthesis route of such chemicals viamethanol as an intermediate is called indirect synthesis.
2.2 SYNGAS CLASSIFICATION BASED ON ITS HEATING VALUE
Depending on the heating values of the resultant synthesis gases produced by gasifi-cation processes, product gases are typically classified as three types of gas mixtures3:
1. Low-Btu gas consisting of a mixture of carbon monoxide, hydrogen, andsome other gases with a heating value typically less than 300 Btu/scf.
2. Medium-Btu gas consisting of a mixture of methane, carbon monoxide,hydrogen, and various other gases with a heating value in the range of300–700 Btu/scf.
3. High-Btu gas consisting predominantly of methane with a heating valueof approximately 1000 Btu/scf. It is also referred to as SNG.
Coal gasification involves the reaction of coal carbon (precisely speaking, macro-molecular coal hydrocarbons) and other pyrolysis products with oxygen, hydrogen,and water to provide fuel gases.
© 2007 by Taylor & Francis Group, LLC

Gasification of Coal 29
2.2.1 LOW-BTU GAS
For production of low-Btu gases, air is typically used as a combusting (or gasifying)agent. As air, instead of pure oxygen, is used, the product gas inevitably contains alarge concentration of undesirable constituents such as nitrogen or nitrogen-contain-ing compounds. Therefore, it results in a low heating value of 150–300 Btu/scf.Sometimes, this type of gasification of coal may be carried out in situ, i.e., under-ground, where mining of coal by other techniques is not economically favorable.For such in situ gasification, low-Btu gas may be a desired product. Low-Btu gascontains 5 principal components with around 50% v/v nitrogen, some quantities ofhydrogen and carbon monoxide (combustible), carbon dioxide, and some traces ofmethane. The presence of such high contents of nitrogen classifies the product gasas low Btu. The other two noncombustible components (CO2 and H2O) further lowerthe heating value of the product gas. The presence of these components limits theapplicability of low-Btu gas to chemical synthesis. The two major combustiblecomponents are hydrogen and carbon monoxide; their ratio varies depending on thegasification conditions employed. One of the most undesirable components is hydro-gen sulfide (H2S), which occurs in a ratio proportional to the sulfur content of theoriginal coal. It must be removed by gas-cleaning procedures before product gas canbe used for other useful purposes such as further processing and upgrading.
2.2.2 MEDIUM-BTU GAS
In the production of medium-Btu gas, pure oxygen rather than air is used as com-busting agent, which results in an appreciable increase in the heating value, by about300–400 Btu/scf. The product gas predominantly contains carbon monoxide andhydrogen with some methane and carbon dioxide. It is primarily used in the synthesisof methanol, higher hydrocarbons via Fischer–Tropsch synthesis, and a variety ofother chemicals. It can also be used directly as a fuel to generate steam or to drivea gas turbine. The H2-to-CO ratio in medium-Btu gas varies from 2:3 (CO-rich) tomore than 3:1 (H2-rich). The increased heating value is attributed to higher contentsof methane and hydrogen as well as to lower concentration of carbon dioxide, inaddition to the absence of nitrogen in the gasifying agent.
2.2.3 HIGH-BTU GAS
High-Btu gas consists mainly of pure methane (>95%) and, as such, its heating valueis around 900–1000 Btu/scf. It is compatible with natural gas and can be used as asynthetic or substitute natural gas (SNG). This type of syngas is usually producedby catalytic reaction of carbon monoxide and hydrogen, which is called the metha-nation reaction. The feed syngas usually contains carbon dioxide and methane insmall amounts. Further, steam is usually present in the gas or added to the feed toalleviate carbon fouling, which alters the catalytic effectiveness. Therefore, thepertinent chemical reactions in the methanation system include:
3H2 + CO = CH4 + H2O2H2 + 2CO = CH4 + CO2
© 2007 by Taylor & Francis Group, LLC

30 Handbook of Alternative Fuel Technology
4H2 + CO2 = CH4 + 2H2O2CO = C + CO2
CO + H2O = CO2 + H2
Among these, the most dominant chemical reaction leading to methane is thefirst one. Therefore, if methanation is carried out over a catalyst with a syngas mixtureof H2 and CO, the desired H2-to-CO ratio of the feed syngas is around 3:1. The largeamount of H2O produced is removed by condensation and recirculated as processwater or steam. During this process, most of the exothermic heat due to the meth-anation reaction is also recovered through a variety of energy integration processes.Whereas all the reactions listed above are quite strongly exothermic except theforward water gas shift (WGS) reaction, which is mildly exothermic, the heat releasedepends largely on the amount of CO present in the feed syngas. For each 1% ofCO in the feed syngas, an adiabatic reaction will experience a 60°C temperaturerise, which may be termed as adiabatic temperature rise.
A variety of metals exhibit catalytic effects on the methanation reaction. In theorder of catalytic activity, Ru > Ni > Co > Fe > Mo. Nickel is by far the most com-monly used catalyst in commercial processes because of its relatively low cost andalso of reasonably high catalytic activity. Nearly all the commercially availablecatalysts used for this process are, however, very susceptible to sulfur poisoning andefforts must be taken to remove all hydrogen sulfide (H2S) before the catalyticreaction starts. It is necessary to reduce the sulfur concentration in the feed gas tolower than 0.5 ppm in order to maintain adequate catalyst activity for a long periodof time. Therefore, the objective of the catalyst development has been aimed atenhancing the sulfur tolerance of the catalyst.
Some of the noteworthy commercial methanation processes include Comflux,HICOM, and direct methanation. Comflux is a Ni-based, pressurized fluidized bed(PFB) process converting CO-rich gases into SNG in a single stage, where both meth-anation and WGS reaction take place simultaneously. The HICOM process developedby British Gas Corporation is a fixed bed process, which involves a series of methanationstages using relatively low H2-to-CO ratio syngas. Direct methanation is a processdeveloped by the Gas Research Institute (GRI), which methanates equimolar mixturesof H2 and CO, producing CO2 rather than H2O (steam) in addition to methane:
2 H2 + 2 CO = CH4 + CO2
The catalyst developed is claimed to be unaffected by sulfur poisoning and, as such,the process can be used to treat the raw, quenched gas from a coal gasifier with noor little pretreatment.76
2.3 COAL GASIFICATION REACTIONS
In coal gasification, four principal reactions are crucial:
1. Steam gasification2. Carbon dioxide gasification
© 2007 by Taylor & Francis Group, LLC

Gasification of Coal 31
3. Hydrogasification4. Partial oxidation reaction
In most gasifiers, several of these reactions, along with the WGS reaction, occursimultaneously. Table 2.1 shows the equilibrium constants for these reactions asfunctions of temperature. The same data are plotted in Figure 2.1, as log10 Kp vs. 1/T.From the figure, the following are evident and significant:
1. The plots of log10 Kp vs. 1/T are nearly linear for all reactions.2. The exothermicity of reaction is on the same order as the slope of the plot
of log10 Kp vs. 1/T for each reaction.3. By the criterion of Kp > 1 (i.e., log10 Kp > 0), it is found that hydrogasifi-
cation is thermodynamically favored at lower temperatures, whereas CO2
and steam gasification reactions are thermodynamically favored at highertemperatures.
4. The equilibrium constant for the WGS reaction is the weakest functionof the temperature among all the compared reactions, as clearly evidencedin the plot. This also means that the equilibrium of this reaction can bereversed relatively easily by changing the imposed operating conditions.
2.3.1 STEAM GASIFICATION
The steam gasification reaction is endothermic, i.e., requiring heat input for thereaction to proceed in its forward direction. Usually, an excess amount of steam isalso needed to promote the reaction.
TABLE 2.1Equilibrium Constants for Gasification Reactions
T, K
Log10 Kp
1/T I II III IV V VI
300 0.003333 23.93 68.67 15.86 20.81 4.95 8.82400 0.0025 19.13 51.54 10.11 13.28 3.17 5.49500 0.002 16.26 41.26 6.63 8.74 2.11 3.43600 0.001667 14.34 34.4 4.29 5.72 1.43 2700 0.001429 12.96 29.5 2.62 3.58 0.96 0.95800 0.00125 11.93 25.83 1.36 1.97 0.61 0.15900 0.001111 11.13 22.97 0.37 0.71 0.34 0.49
1000 0.001 10.48 20.68 0.42 0.28 0.14 1.011100 0.000909 9.94 18.8 1.06 1.08 0.02 1.431200 0.000833 9.5 17.24 1.6 1.76 0.16 1.791300 0.000769 9.12 15.92 2.06 2.32 0.26 2.11400 0.000714 8.79 14.78 2.44 2.8 0.36 2.36
Note: Reaction I: C + 1⁄2 O2 = CO; Reaction II: C + O2 = CO2; Reaction III: C + H2O = CO + H2; ReactionIV: C + CO2 = 2 CO; Reaction V: CO + H2O = CO2 + H2; Reaction VI: C + 2 H2 = CH4.
© 2007 by Taylor & Francis Group, LLC

32 Handbook of Alternative Fuel Technology
C (s) + H2O (g) = CO (g) + H2 (g) ∆H°298 = 131.3 kJ/mol
However, excess steam used in this reaction hurts the thermal efficiency of theprocess. Therefore, this reaction is typically combined with other gasification reac-tions in practical applications. The H2-to-CO ratio of the product syngas dependson the synthesis chemistry as well as process engineering. Two reactionmechanisms77,78 have received most attention for the carbon-steam reactions over awide range of practical gasification conditions.
Mechanism A77
Cf + H2O = C(H2O)A
C(H2O)A → CO + H2
Cf + H2 = C(H2)B
In the given equations, Cf denotes free carbon sites that are not occupied, C(H2O)A
and C(H2)B denote chemisorbed species in which H2O and H2 are adsorbed onto thecarbon site, “=” means the specific mechanistic reaction is reversible, and “→” meansthe reaction is predominantly irreversible. In Mechanism A, the overall gasificationrate is inhibited by hydrogen adsorption on the free sites, thus reducing the avail-ability of the unoccupied active sites for steam adsorption. Therefore, this mechanismmay be referred to as inhibition by hydrogen adsorption.
FIGURE 2.1 Equilibrium constant (Kp) for gasification reactions.
-30
-20
-10
0
10
20
30
40
50
60
70
80
0 0.0005 0.001 0.0015 0.002 0.0025 0.003 0.0035
1/T, K-1
log 1
0 Kp
C + O2 = CO2
C + O2 = CO
C + 2 H2 = CH4
CO + H2O = CO2 + H2
C + H2O = CO + H2
C + CO2 = 2 CO
© 2007 by Taylor & Francis Group, LLC

Gasification of Coal 33
Mechanism B78
Cf + H2O = C(O)A + H2
C(O)A → CO
On the other hand, in Mechanism B, the gasification rate is affected by competitivereaction of chemisorbed oxygen with hydrogen, thus limiting the conversion ofchemisorbed oxygen into carbon monoxide. Therefore, this mechanism may bereferred to as inhibition by oxygen exchange.
Both mechanisms are still capable of producing the rate expression for steamgasification of carbon in the form of4:
r = k1pH2O/(1 + k2pH2 + k3pH2O )
which was found to correlate with the experimental data quite well. This type ofrate expression can be readily derived by taking pseudo–steady state approximationon the adsorbed species of the mechanism.
It has to be clearly noted here that the mechanistic chemistry discussed in thissection is based on the reaction between carbon and gaseous reactants, not forreactions between coal and gaseous reactants. Even though carbon is the dominantatomic species present in coal, its reactivity is quite different from that of coal orcoal hydrocarbons. In general, coal is more reactive than pure carbon, for a numberof reasons, including the presence of various reactive organic functional groups andthe availability of catalytic activity via naturally occurring mineral ingredients. Itmay now be easy to understand why anthracite, which has the highest carbon contentamong all ranks of coal, is most difficult to gasify or liquefy. Alkali metal salts areknown to catalyze the steam gasification reaction of carbonaceous materials, includ-ing coals. The order of catalytic activity of alkali metals on coal gasification reactionis Cs > Rb > K > Na > Li. In the case of catalytic steam gasification of coal, carbondeposition reaction may affect the catalysts’ life by fouling the catalyst active sites.This carbon deposition reaction is more likely to take place whenever the steamconcentration is lacking.
2.3.2 CARBON DIOXIDE GASIFICATION
The reaction of coal with CO2 may be approximated or simplified as the reactionof carbon with carbon dioxide, for modeling purposes. Carbon dioxide reacts withcarbon to produce carbon monoxide and this reaction is called Boudouard reaction.This reaction is also endothermic in nature, similar to the steam gasification reaction.
C (s) + CO2 (g) = 2 CO (g) ∆H°298 = 172.5 kJ/mol
The reverse reaction is a carbon deposition reaction that is a major culprit ofcarbon fouling on many surfaces, such as process catalyst deactivation. This gasifi-cation reaction is thermodynamically favored at high temperatures (T > 680°C),
© 2007 by Taylor & Francis Group, LLC

34 Handbook of Alternative Fuel Technology
which is also quite similar to the steam gasification. The reaction, if carried outalone, requires high temperature (for fast reaction) and high pressure (for higherreactant concentrations) for significant conversion. However, this reaction in practicalgasification applications is almost never attempted as a solo chemical reaction,because of a variety of factors including low conversion, slow kinetic rate, lowthermal efficiency, unimpressive process economics, etc.
There is general agreement that experimental data on the rate of carbon gasifi-cation by CO2 fit an empirical equation of the form4:
r = k1pCO2/(1 + k2pCO + k3pCO2)
where pCO and pCO2 are partial pressures of CO and CO2 in the reactor. This rateequation is shown to be consistent with at least two mechanisms whereby carbonmonoxide retards the gasification reaction.4
Mechanism A
Cf + CO2 → C(O)A + CO
C(O)A → CO
CO + Cf = C(CO)B
Mechanism B
Cf + CO2 = C(O)A + CO
C(O)A → CO
In both mechanisms, carbon monoxide retards the overall reaction rate. Theretardation is via carbon monoxide adsorption to the free sites in the case of Mech-anism A, whereas it is via reaction of chemisorbed oxygen with gaseous carbonmonoxide to produce gaseous carbon dioxide in Mechanism B.
As mentioned earlier when discussing steam gasification, the CO2 gasificationrate of coal is different from that of the carbon-CO2 rate for the very same reason.Generally, the carbon-CO2 reaction follows a global reaction order on the CO2 partialpressure that is around one or lower, i.e., 0.5 < n < 1, whereas the coal-CO2 reactionfollows a global reaction order on the CO2 partial pressure that is one or higher, i.e.,1 < n < 2. The observed higher reaction order for the coal reaction is also based onthe high reactivity of coal for the multiple reasons described earlier.
2.3.3 HYDROGASIFICATION
Direct addition of hydrogen to coal under high pressure forms methane. This reactionis called hydrogasification and may be written as:
Coal + H2 = CH4 + Carbonaceous matter
© 2007 by Taylor & Francis Group, LLC

Gasification of Coal 35
Or,
C (s) + 2 H2 (g) = CH4 (g) ∆H°298 = –74.8 kJ/mol
This reaction is exothermic and is thermodynamically favored at low tempera-tures (T < 670°C), unlike both steam and CO2 gasification reactions. However, atlow temperatures, the reaction rate is inevitably too slow. Therefore, high temperatureis always required for kinetic reasons, which in turn requires high pressure ofhydrogn, which is also preferred from equilibrium considerations. This reaction canbe catalyzed by K2CO3, nickel, iron chlorides, iron sulfates, etc. However, use ofcatalyst in coal gasification suffers from serious economic constraints because ofthe low raw material value, as well as difficulty in recovering and reusing the catalyst.Therefore, catalytic coal gasification has not been practiced much.
2.3.4 PARTIAL OXIDATION
Combustion of coal involves reaction with oxygen, which may be supplied as pureoxygen or as air, and forms carbon monoxide and carbon dioxide. Principal chemicalreactions between carbon and oxygen involve:
C (s) + O2 (g) = CO2 (g) ∆H°298 = –393.5 kJ/mol
C (s)+ 1/2 O2 (g) = CO (g) ∆H°298 = –111.4 kJ/mol
If sufficient air or oxygen is supplied, combustion proceeds sequentially throughvapor-phase oxidation and ignition of volatile matter to eventual ignition of theresidual char. Certainly, it is not desirable to allow the combustion reaction tocontinue too long, because it is a wasteful use of carbonaceous resources.
Even though the combustion or oxidation reactions of carbon may be expressedin terms of simple stoichiometric reaction equations, partial oxidation involves acomplex reaction mechanism that depends on how fast and efficiently combustionprogresses. The reaction pathway is further complicated because of the presence ofboth gas-phase homogeneous reactions and heterogeneous reactions between gaseousand solid reactants. The early controversy involving the carbon oxidation reactioncentered on whether carbon dioxide is a primary product of the heterogeneous reactionof carbon with oxygen or a secondary product resulting from the gas-phase oxidationof carbon monoxide.4 Oxidation of carbon involves at least the following four carbon-oxygen interactions, of which only two are stoichiometrically independent:
C + 1/2 O2 = CO
CO + 1/2 O2 = CO2
C + CO2 = 2 CO
C + O2 = CO2
Based on a great deal of research work, including isotope labeling studies, it isgenerally agreed concerning the carbon-oxygen reaction that4:
© 2007 by Taylor & Francis Group, LLC

36 Handbook of Alternative Fuel Technology
1. CO2, as well as CO, is a primary product of carbon oxidation.2. The ratio of the primary products, CO to CO2, is generally found to
increase sharply with increasing temperature.3. There is disagreement in that the magnitude of the ratio of the primary
products is a sole function of temperature and independent of the type ofcarbon reacted.
Further details on the carbon oxidation can be found from a classical work done byWalker et al.4
Combustion or oxidation of coal is much more complex in its nature thanoxidation of carbon. Coal is not a pure chemical species; rather, it is a multifunc-tional, multispecies, heterogeneous macromolecule that occurs in a highly porousform (typical porosity of 0.3–0.5) with a very large available internal surface area(typically in the range of 250–700 m2/g). The internal surface area of coal is usuallyexpressed in terms of specific surface area, which is an intensive property that is ameasure of the internal surface area available per unit mass. Therefore, coal com-bustion involves a very complex system of chemical reactions that occur bothsimultaneously and sequentially. Further, the reaction phenomenon is further com-plicated by transport processes of simultaneous heat and mass transfer. The overallrate of coal oxidation, both complete and partial, is affected by a number of factorsand operating parameters, including the reaction temperature, O2 partial pressure,coal porosity and its distribution, coal particle size, types of coal, types and contentsof specific mineral matter, heat and mass transfer conditions in the reactor, etc.
Kyotani et al.5 determined the reaction rate of combustion for 5 different coals ina very wide temperature range between 500 and 1500°C to examine the effects of coalrank (i.e., carbon content) and catalysis by coal mineral matter. Based on their exper-imental results, the combustion rates were correlated with various char characteristics.It was found that in a region where chemical reaction rate is controlling the overallrate, i.e., typically in a low-temperature region where the kinetic rate is much slowerthan the diffusional rate of reactant, the catalytic effect of mineral matter is a deter-mining factor for coal reactivity. It was also found that for high-temperature regionswhere the external mass transfer rate controls the overall rate, the reactivity of coaldecreased with increasing coal rank. When the external mass transfer rate limited (orcontrolled) the overall rate of reaction, the mechanistic rate of external mass transferis the slowest of all mechanistic rates, including the surface reaction rate and the porediffusional rate of reactant and product. Such a controlling regime is experiencedtypically at a high-temperature operation, as the intrinsic kinetic rate is far morestrongly correlated against the temperature than the external mass transfer rate is.
2.3.5 WATER GAS SHIFT (WGS) REACTION
Even though the WGS reaction is not classified as one of the principal gasificationreactions, it cannot be omitted in the analysis of chemical reaction systems thatinvolve synthesis gas. Among all reactions involving synthesis gas, this reactionequilibrium is least sensitive to the temperature variation. In other words, its equi-librium constant is least strongly dependent on the temperature. Therefore, this
© 2007 by Taylor & Francis Group, LLC

Gasification of Coal 37
reaction equilibrium can be reversed in a variety of practical process conditions overa wide range of temperatures. WGS reaction in its forward direction is mildlyexothermic as:
CO (g) + H2O (g) = CO2 (g) + H2 (g) ∆H°298 = –41.2 kJ/mol
Even though all the participating chemical species are in the form of a gas,scientists believe that this reaction predominantly takes place at the heterogeneoussurfaces of coal and also that the reaction is catalyzed by carbon surfaces. As theWGS reaction is catalyzed by many heterogeneous surfaces and the reaction canalso take place homogeneously as well as heterogeneously, a generalized under-standing of the WGS reaction has been very difficult to achieve. Even the kineticrate information in the literature may not be immediately useful or applicable to apractical reactor situation.
Syngas product from a gasifier contains a variety of gaseous species other thancarbon monoxide and hydrogen. Typically, they include carbon dioxide, methane,and water (steam). Depending on the objective of the ensuing process, the compo-sition of syngas may need to be preferentially readjusted. If the objective of thegasification were to obtain a high yield of methane, it would be preferred to havethe molar ratio of hydrogen to carbon monoxide at 3:1, based on the followingmethanation reaction stoichiometry:
CO (g) + 3 H2 (g) = CH4 (g) + H2O (g)
If the objective of generating syngas is the synthesis of methanol via vapor-phaselow-pressure process, the stoichiometrically consistent ratio between hydrogen and carbonmonoxide would be 2:1. In such cases, the stoichiometrically consistent syngas mixtureis often referred to as balanced gas, whereas a syngas composition that is substantiallydeviated from the principal reaction’s stoichiometry is called unbalanced gas.
If the objective of syngas production is to obtain a high yield of hydrogen, it wouldbe advantageous to increase the ratio of H2 to CO by further converting CO (and H2O)into H2 (and CO2) via WGS reaction. However, if the final gaseous product is to be usedin fuel cell applications, carbon monoxide and carbon dioxide must be removed toacceptable levels by a process such as acid gas removal or other adsorption processes.In particular, for hydrogen proton exchange membrane (PEM) fuel cell operation, carbonmonoxide and sulfurous species must be thoroughly removed from the hydrogen gas.
The WGS reaction is one of the major reactions in the steam gasification process,where both water and carbon monoxide are present in ample amounts. Even thoughall four chemical species involved in the WGS reaction are gaseous compounds atthe reaction stage of most gas processing, the WGS reaction, in the case of steamgasification of coal, predominantly takes place heterogeneously, i.e., on the solidsurface of coal. If the product syngas from a gasifier needs to be reconditioned bythe WGS reaction, this reaction can be catalyzed by a variety of metallic catalysts.Choice of specific kinds of catalysts has always depended on the desired outcome,the prevailing temperature conditions, composition of gas mixture, and processeconomics. Many investigators have studied the WGS reaction over a variety of
© 2007 by Taylor & Francis Group, LLC

38 Handbook of Alternative Fuel Technology
catalysts including iron, copper, zinc, nickel, chromium, and molybdenum. Signifi-cant efforts have been made in developing a robust catalyst system that has superiorsulfur tolerance and wider applicable temperature range.
2.4 SYNGAS GENERATION VIA COAL GASIFICATION
2.4.1 CLASSIFICATION OF GASIFICATION PROCESSES
In the earlier section, the different types of synthesis gas were classified. Similarly,there are a large number of widely varying gasification processes. The gasificationprocesses can be classified basically in two general ways: (1) by the Btu content ofthe product gas,6 and (2) by the type of the reactor hardware configuration, as wellas by whether the reactor system is operated under pressure or not.
The following processes for conversion of coal to gases are grouped accordingto the heating value of the product gas.
Medium- or High-Btu Gas Gasification Processes1. Lurgi gasifier2. Synthane gasifier3. Atgas molten iron coal gasifier
Low- or Medium-Btu Gas Gasification Processes1. Koppers-Totzek gasifier2. Texaco gasifier3. Shell gasifier4. Kellogg’s molten salt gasifier5. CO2-acceptor gasification process6. U-gas process
Low-Btu Gas Only Gasification Process1. Underground in situ gasification process
Based on the reactor configuration, as well as by the method of contactinggaseous and solid streams, gasification processes can also be categorized into thefollowing four types3:
1. Fixed or moving bed: In the fixed bed reactor, coal is supported by a grateand the gasifying media (steam, air, or oxygen) pass upward through thesupported bed, whereby the product gases exit from the top of the reactor.Only noncaking coals can be used in the fixed bed reactor. On the otherhand, in the moving bed reactor, coal and gaseous streams move counter-currently, i.e., coal moves downward by gravity while gas passes upwardthrough the coal bed. The temperature at the bottom of the reactor ishigher than that at the top. Because of the lower temperature at the topfor coal devolatilization, relatively large amounts of liquid hydrocarbonsare also produced in this type of gasifier. In both types of reactor, the
© 2007 by Taylor & Francis Group, LLC

Gasification of Coal 39
residence time of the coal is much longer than that in a suspension reactor,thus providing ample contact time between reactants. Ash is removed fromthe bottom of the reactor as dry ash or slag. Lurgi and Wellman-Galushagasifiers are examples of this type of reactor. It should be clearly under-stood that a moving bed reactor is classified as a kind of fixed bed reactor,because solids in the bed stay together regardless of the movement of thehardware that supports the bed.
2. Fluidized bed: It uses finely pulverized coal particles. The gas (or gasify-ing medium) flows upward through the bed and fluidizes the coal particles.Owing to the ascent of particles and fluidizing gas, larger coal surfacearea is made available, which positively promotes the gas-solid chemicalreaction, which in turn results in enhancement in carbon conversion. Thistype of reactor allows intimate contact between gas and solid coal fines,at the same time providing relatively longer residence times than entrainedflow reactor. Dry ash is either removed continuously from the bed, or thegasifier is operated at such a high temperature that it can be removed asagglomerates. Such beds, however, have limited ability to handle cakingcoals, owing to operational complications in fluidization characteristics.Winkler and Synthane processes use this type of reactor.
3. Entrained bed: This type of reactor is also referred to as entrained flowreactor, because there is no bed of solids. This reactor system uses finelypulverized coal particles blown into the gas stream before entry into thereactor, with combustion and gasification occurring inside the coal particlessuspended in the gas phase. Because of the entrainment requirement, highspace velocity of gas stream and fine powdery coal particles are very essentialto the operation of this type of process. Because of the very short residencetime (i.e., high space velocity) in the reactor, a very high temperature isrequired to achieve good conversion in such a short period of reaction time.This can also be assisted by using excess oxygen. This bed configuration istypically capable of handling both caking and noncaking coals without muchoperational difficulty. Examples of commercial gasifiers that use this type ofreactor include the Koppers-Totzek gasifier and Texaco gasifier.
4. Molten salt bath reactor: In this reactor, coal is fed along with steam oroxygen in the molten bath of salt or metal operated at 1,000–1,400ºC.Ash and sulfur are removed as slag. This type of reactor is used in Kelloggand Atgas processes.7
2.4.2 HISTORICAL BACKGROUND OF COAL GASIFICATION AND ITS COMMERCIALIZATION
It was known as early as the 17th century that gas could be produced by simplyheating the coal, i.e., pyrolysis of coal in modern terms. Around 1750, in England,coal was subjected to pyrolysis to form gases that were used for lighting.8 With theinvention of the Bunsen gas burner (at atmospheric pressure), the potential of heatingwas opened to gas combustion. In 1873, cyclic carbureted water gas process wasdeveloped by Thaddeus S. C. Lowe for gas production. In this process, water gas
© 2007 by Taylor & Francis Group, LLC

40 Handbook of Alternative Fuel Technology
(H2 + CO) was produced by reacting hot coke (i.e., smokeless char) with steam viaa simplified reaction of C + H2O = CO + H2. Heat for the reaction was supplied bycombustion energy by introducing air intermittently to burn a portion of the coke. Thedevelopment of coal-to-gas processes was a major breakthrough in Europe during thosedays, because coal was the principal fuel available besides wood. By the early 1920s,there were at least five Winkler fluid bed processes being operated, all of which wereair-blown, producing 10 million scf/h of producer gas. Some of them were laterconverted to use oxygen instead of air in order to produce nitrogen-free syngas.
The Lurgi process was developed to manufacture town gas by complete gasifi-cation of brown coal in Germany. In 1936, the first commercial plant based on thisprocess went operational. It produced 1 million scf/d of town gas from low-ranklignite coal. By 1966, there were at least ten Lurgi plants at a number of places inEurope and Asia producing synthesis gas.
In 1942, Heinrich Koppers in Germany developed the Koppers-Totzek (K-T)suspension gasification process based on the pilot plant work initiated four yearsearlier. The first industrial plant was built in France around 1949, which produced5.5 million scf/d of synthesis gas that was later used to produce ammonia andmethanol. By the early 1970s, there were at least 20 K-T plants built all over theworld. All of them used oxygen as primary gasification medium, thus producingnitrogen-free syngas.
Winkler, Lurgi, and Koppers-Totzek processes all employed steam and oxygen(or air) to carry out gasification. Most of these developments were originated andperfected in Europe. However, very little development of these processes had takenplace in the U.S. until the energy crisis of the 1970s, mainly because of the discoveryof natural gas as a convenient fuel and also because of the relatively stable supplyof liquid petroleum until then. After the oil embargo of 1973, very active researchand development efforts were conducted for cleaner use of coal resources in coalgasification, coal liquefaction, clean coal technology, IGCC, etc. Since then, mostcoal power plants have significantly upgraded their quality of operation in terms ofenergy efficiency, by-products, emission control, and profitability.
2.4.3 GENERAL ASPECTS OF GASIFICATION
The kinetic rates and extents of conversion for various gasification reactions aretypically functions of temperature, pressure, gas composition, and the nature of thecoal being gasified. The rate of reaction is intrinsically higher at higher temperatures,whereas the equilibrium of the reaction may be favored at either higher or lowertemperatures depending on the specific type of gasification reaction. The effect ofpressure on the rate also depends on the specific reaction. Thermodynamically, somegasification reactions such as carbon-hydrogen reaction producing methane arefavored at high pressures (>70 atm) and relatively lower temperatures (760–930°C),whereas low pressures and high temperatures favor the production of syngas (i.e.,carbon monoxide and hydrogen) via steam or carbon dioxide gasification reaction.
Supply and recovery of heat is a key element in the gasification process fromthe standpoints of economics, design, and operability. Partial oxidation of char withsteam and oxygen leads to generation of heat and synthesis gas. Another way to
© 2007 by Taylor & Francis Group, LLC

Gasification of Coal 41
produce a hot gas stream is via the cyclic reduction and oxidation of iron ore. Thetype of coal being gasified is also important to the gasification and downstreamoperations. Only suspension-type gasifiers such as entrained flow reactor can handleany type of coal, but if caking coals are to be used in fixed or fluidized bed, specialmeasures must be taken so that coal does not agglomerate (or cake) during gasifi-cation. If such agglomeration does happen, it would adversely affect the operabilityof the gasification process. In addition to this, the chemical composition, the volatilematter (VM) content, and the moisture content of coal also play important roles inthe coal processing during gasification. The S and N contents of coal seriously affectthe quality of the product gas, as well as the gas-cleaning requirements. The sulfurcontent of coal typically comes from three different sources of coal sulfur, namely,pyritic sulfur, organic sulfur, and sulfatic sulfur. The first two are more dominantsulfur forms, whereas weathered or oxidized coals have more sulfatic forms thanfresh coals. Sulfurous gas species can be sulfur dioxide, hydrogen sulfide, or mer-captans, depending on the nature of the reactive environment. If the reactive envi-ronment is oxidative, the sulfur dioxide is the most dominant sulfur-containingspecies in the product gas.
2.4.4 GASIFICATION PROCESSES
2.4.4.1 Lurgi Gasification
The Lurgi gasification process is one of the several processes for which commercialtechnology has been fully developed.9
Since its development in Germany before World War II, this process has beenused in a large number of commercial plants throughout the world. This processproduces low- to medium-Btu gas as product gas. It may be classified as a fixed bedprocess in which the reactor configuration is similar to that of a typical fixed bedreactor. The older version of Lurgi process is dry ash gasification process that differssignificantly from the more recently developed slagging gasification process.
The dry ash Lurgi gasifier is a pressurized vertical reactor that accepts crushednoncaking coals only.10 The coal feed is supported at the base of the reactor by arevolving grate through which the steam and oxygen mixture is introduced and theash removed. This process takes place at around 24 to 31 atm and in the temperaturerange of 620 to 760°C. The residence time in the reactor is about 1 h. Steamintroduced from the bottom of the reactor provides the necessary hydrogen species,and the heat is supplied by the combustion of a portion of the char. The productgas from a high-pressure reactor has a relatively high methane content comparedto a nonpressurized gasifier. The high methane content of the product gas is a resultof the relatively low gasification temperature. If oxygen is used as an injecting (andgasifying) medium, the exiting gas has a heating value of approximately 450 Btu/scf.The crude gas leaving the gasifier contains a substantial amount of condensableproducts including tar, oil, phenol, etc., which are separated in a devolatilizer, wheregas is cleaned to remove unsaturated hydrocarbons and naphtha. The gas is thensubjected to methanation (CO + 3H2 = CH4 + H2O) to produce a high-Btu gas (pipe-line quality).
© 2007 by Taylor & Francis Group, LLC

42 Handbook of Alternative Fuel Technology
Recent modification of the Lurgi process called slagging Lurgi gasifier has beendeveloped to process caking coals.3 Therefore, the operating temperature of thisgasifier is kept higher and the injection ratio of steam is reduced to 1–1.5 mol/molof oxygen. These two factors cause the ash to melt easily and, therefore, the moltenash is removed as a slag. Coal is fed to the gasifier through a lock hopper systemand distributor. It is gasified with steam and oxygen injected into the gasifier nearthe bottom. The upward movement of hot product gases provides convective heattransfer and makes the preheating and devolatilization of coal easier. Both volatilematter liberated from coal and devolatilized char react with gasifying media, i.e.,steam and oxygen. The molten slag formed during the process passes through theslag tap hole. It is then quenched with water and removed through a slag lock hopper.The amount of unreacted steam passing through the system has to be minimized inthis process for high energy efficiency. Also, the high operating temperature and fastremoval of product gases lead to higher output rates in a slagging Lurgi gasifier thana conventional dry ash Lurgi unit.
The conventional Lurgi gasification is widely recognized for its role as thegasifier technology for South Africa’s Sasol complex. A typical product compositionfor oxygen-blown operation is given in Table 2.2. As can be seen, the H2-to-CO ratiois higher than 2:1. It is also noted that a relatively large amount of CO2 is present.
2.4.4.1.1 Lurgi Dry-Ash GasifierIn this gasifier, coal sized between 1.5 in. and 4 mesh reacts with steam and oxygenin a slowly moving bed. The process is operated semicontinuously. A schematic ofa Lurgi pressure gasifier is shown in Figure 2.2.11 The gasifier is equipped with thefollowing hardware parts12:
1. An automated coal lock chamber for feeding coal from a coal bin to thepressurized reactor. This device is often called a coal lock hopper.
2. A coal distributor through which coal is uniformly distributed into themoving bed.
3. A revolving grate through which the steam and oxygen are introducedinto the reacting zone (coal bed) and the ash is removed.
4. An ash lock chamber for discharging the ash from the pressurized reactorinto an ash bin, where the ash is cooled by water quenching.
5. A gas scrubber in which the hot gas is quenched and washed before itpasses through a waste heat boiler.
The gasifier shell is water-cooled and steam is produced from the water jacket.A motor-driven distributor is located at the top of the coal bed, which evenlydistributes the feed coal coming from the coal lock hopper. The grate at the bottomof the reactor is also driven by a motor to discharge the coal ash into the ash lockhopper. The section between the inlet and outlet grates has several distinct zones.The topmost zone preheats the feed coal by contacting with the hot crude productgas that is ready to leave the reactor. As the coal gets heated, devolatilization andgasification reactions proceed at temperatures ranging from 620 to 760°C. Devola-tilization of coal is accompanied by gasification of the resulting char. The interaction
© 2007 by Taylor & Francis Group, LLC

Gasification of Coal 43
between devolatilization and gasification is a determining factor in the kinetics ofthe process, as well as of the product compositions.
The bottom of the bed is the combustion zone, where coal carbon reacts withoxygen to yield mainly carbon dioxide. The exothermic heat generated by thisreaction provides the heat for gasification and devolatilization, both of which areendothermic reactions. By utilizing the exothermic heat of combustion in the gas-ification and devolatilization, both of which are endothermic, energy integrationwithin the gasifier is accomplished. More than 80% of the coal fed is gasified, the
TABLE 2.2Typical Lurgi Gas Products
Species Mole Percentage
CO 16.9 H2 39.4CH4 9.0C2H6 0.7C2H4 0.1CO2 31.5H2S + COS 0.8N2 +Ar 1.6
Source: From Lloyd, W.G., The Emerging Synthetic FuelIndustry, Thumann, A., Ed., Atlanta, GA: Fairmont Press,1981, pp.19–58. With permission.
FIGURE 2.2 Lurgi nonslagging pressure gasifier.
Water Jacket
Steam/O2
Coal Distributor
Recycle Tar
Steam
Tar Liquor
Water
Gas To
Waste Heat Boiler
Ash Lock Hopper
Ash
Pulverized Coal
Coal Lock Hopper
Drive for
Coal Distributor
Grate
Scrubbing Cooler
© 2007 by Taylor & Francis Group, LLC

44 Handbook of Alternative Fuel Technology
remainder being burned in the combustion zone. The portion of feed coal burnedfor in situ heat generation may be called sacrificial coal. The temperature of thecombustion zone must be selected in such a way that it is below the ash fusion pointbut high enough to ensure complete gasification of coal in subsequent zones. Thistemperature is also determined by the steam-to-oxygen ratio.
The material and energy balance of the Lurgi gasifier is determined by thefollowing process variables:
1. Pressure, temperature, and steam-to-oxygen ratio.2. The nature of coal: The type of coal determines the nature of gasification
and devolatilization reaction. Lignite is the most reactive coal, for whichreaction proceeds at 650°C. On the other hand, coke is the least reactive,for which minimum temperature required for chemical reaction is around840°C. Therefore, more coal is gasified per unit mole of oxygen for lignitecompared to other types (ranks) of coal. The higher the coal rank (i.e.,the carbon content of coal), the lower the coal reactivity.
3. The ash fusion point of the coal, which limits the maximum operabletemperature in the combustion zone, which in turn determines the steam-to-oxygen ratio.
4. Both the amount and chemical composition of the volatile matter of thecoal, which influence the quality and quantity of tar and oils produced.
The Lurgi gasifier has relatively high thermal efficiency because of its medium-pressure operation and the countercurrent gas-solid flow. At the same time, it con-sumes a lot of steam and the concentration of carbon dioxide in the crude productgas is high, as shown in Table 2.2. Also, the crude gas leaving the gasifier containsa substantial amount of carbonization products such as tar, oil, naphtha, ammonia,etc. These carbonization products are results of devolatilization, pyrolytic reactions,and secondary chemical reactions involving intermediates. This crude product gas ispassed through a scrubber, where it is washed and cooled down by a waste heat boiler.
2.4.4.1.2 Slagging Lurgi GasifierThis gasifier is an improved version of the Lurgi dry-ash gasifier. A schematic11 ofslagging Lurgi gasifier is shown in Figure 2.3. The temperature of the combustionzone is kept higher than the ash fusion point. This is achieved by using a smalleramount of steam than dry-ash Lurgi gasifier, thus lowering the steam/oxygen ratio.The ash is removed from the bottom as slag, not as dry ash. Therefore, the processcan handle caking coals, unlike the conventional dry-ash gasifier. The main advan-tage of this gasifier over the conventional dry-ash gasifier is that the yield of carbonmonoxide and hydrogen is high and the coal throughput also increases many times.The steam consumption is also minimized.13
2.4.4.2 Koppers-Totzek Gasification
This gasification process uses entrained flow technology, in which finely pulverizedcoal is fed into the reactor with steam and oxygen.14,15 The process operates at
© 2007 by Taylor & Francis Group, LLC

Gasification of Coal 45
atmospheric pressure. As with all entrained flow reactors, the space time in the reactoris very short. The gasifier itself is a cylindrical, refractory-lined coal burner with atleast two burner heads through which coal, oxygen, and steam are charged. The burnerheads are spaced either 180° (with the two-headed design) or 90° apart (with the four-headed arrangements) and are designed such that steam covers the flame and preventsthe reactor refractory walls from becoming excessively hot. The reactor typicallyoperates at a temperature of about 1400–1500°C and atmospheric pressure. At thishigh temperature, the reaction rate of gasification is extremely high, i.e., by orders ofmagnitude higher than that at a temperature in a typical fixed bed reactor. About 90%of carbonaceous matter is gasified in a single pass, depending on the type of coal.Lignite is the most reactive coal, for which reactivity approaches nearly 100%.3
In contrast to moving bed or fluidized bed reactors, this gasifier has very fewlimitations on the nature of feed coal in terms of caking behavior and mineral matter(ash) properties. Because of very high operating temperatures, the ash agglomeratesand drops out of the combustion zone as molten slag and subsequently gets removedfrom the bottom of the reactor. The hot effluent gases are quenched and cleaned.This gas product contains no tar, ammonia, or condensable hydrocarbons and ispredominantly synthesis gas. It has a heating value of about 280 Btu/scf and can befurther upgraded by reacting with steam to form additional hydrogen and carbondioxide via WGS reaction.
2.4.4.2.1 Koppers-Totzek GasifierThis gasifier is one of the most significant entrained bed gasifiers in commercial oper-ation today. It accepts almost any type of coal, including caking coal, without any majoroperational restrictions. It has the highest operating temperature (around 1400–1500°C)of all the conventional gasifiers. There are two versions in terms of process equipmentdesign, a two-headed and a four-headed burner type. A schematic of a Koppers-Totzek
FIGURE 2.3 A schematic of slagging Lurgi gasifier.
Coal DistributorRefractory Lining
Steam/O2
Outlet Gas
QuenchingWater
Slag Tap
Coal Feed
Coal Lock Hopper
Water JacketGas Quench
Slag Lock Hopper
Slag Quench Chamber Outlet Water
© 2007 by Taylor & Francis Group, LLC

46 Handbook of Alternative Fuel Technology
two-headed gasifier16 is shown in Figure 2.4. The original version designed in 1948in Germany was two-headed, with the heads mounted at the ends, i.e., 180° apart.The gasifier as such is ellipsoidal in shape and horizontally situated. Each headcontains two burners. The shell of the gasifier is water-jacketed and has an innerrefractory lining. Design of four-headed gasifiers began in India around 1970. Inthis design, burner heads are spaced 90°, instead of 180° as in two-headed ones. Allthe burner heads are installed horizontally. The capacity of a four-headed burnergasifier is larger than its two-headed counterpart.17
2.4.4.2.2 Features of the Koppers-Totzek ProcessThe Koppers-Totzek process has been very successfully operated commercially andsome of the process features are summarized as follows:
1. High capacity: These process units are designed for coal feed rates up to800 tons per day, or about 42 million scf/d of 300-Btu gas.
2. Versatility: The process is capable of handling a variety of feedstocks,including all ranks of solid fuels, liquid hydrocarbons, and pumpableslurries containing carbonaceous materials. Even feedstocks containinghigh sulfur and ash contents can be readily used in this process. Therefore,this process is not limited only to coal.
3. Flexibility: The changeover from solid fuel feed to liquid fuels involves onlya change in the burner heads. Multiple feed burners permit wide variations inturndown ratio (defined as the numeric ratio between the highest and the lowesteffective system capacity). This process is capable of instantaneous shutdownwith full production resumable in a remarkably short time, only 30 min.
FIGURE 2.4 A schematic of Koppers-Totzek gasifier (two-headed burner design).
Waste HeatBoiler System
OffgasCoalSteamO2
Burner Head
Slag
Slag Quench Tank
Slag Extractor
CoalSteamO2
© 2007 by Taylor & Francis Group, LLC

Gasification of Coal 47
4. Simplicity of construction: There is no complicated mechanical equip-ment or pressure-scaling device required. The only moving parts in thegasifiers are the moving screw feeders for solids or pumps for liquidfeedstocks.
5. Ease of operation: Control of the gasifiers is achieved primarily by main-taining carbon dioxide concentration in the clean gas at a reasonablyconstant value. Slag fluidity at high process temperatures may be visuallymonitored. Gasifiers display good dynamic responses.
6. Low maintenance: Simplicity of design and a minimum number of movingparts require little maintenance between the scheduled annual maintenanceevents.
7. Safety and efficiency: The process has a track record of over 50 years ofsafe operation. The overall thermal efficiency of the gasifier is 85 to 90%.The time on stream (TOS) or availability is better than 95%.
2.4.4.2.3 Process Description of Koppers-Totzek GasificationThe Koppers-Totzek gasification process, whose flow schematic is shown in Figure2.5, employs partial oxidation of pulverized coal in suspension with oxygen andsteam. The gasifier is a refractory-lined steel shell encased with a steam jacket forproducing low-pressure process steam as an energy recovery scheme. A two-headedgasifier is capable of handling 400 tons per day of coal. Coal, oxygen, and steamare brought together in opposing gasifier burner heads spaced 180° apart (in the two-headed case). In the case of four-headed gasifiers, these burners are 90° apart. The
FIGURE 2.5 A schematic of the Koppers-Totzek gasification process.
Steam
Pulverized Coal
Coal Supply Bin
ScrewFeeder
OxygenCooler &Gas Cleaner
WasteHeatBoiler
Slag Quench Tank
High Pressure Steam
Coal FeedBin
ElectrostaticPrecipitator
ProductSyngasGasifier
© 2007 by Taylor & Francis Group, LLC
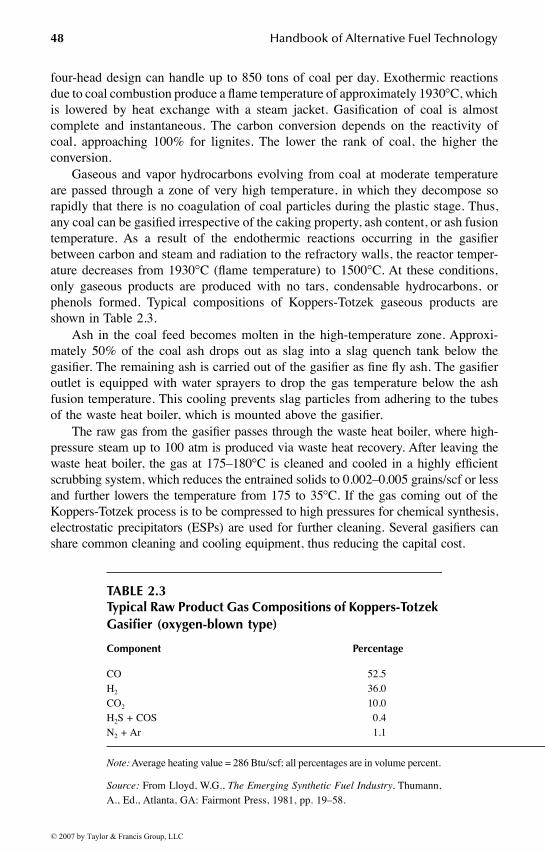
48 Handbook of Alternative Fuel Technology
four-head design can handle up to 850 tons of coal per day. Exothermic reactionsdue to coal combustion produce a flame temperature of approximately 1930°C, whichis lowered by heat exchange with a steam jacket. Gasification of coal is almostcomplete and instantaneous. The carbon conversion depends on the reactivity ofcoal, approaching 100% for lignites. The lower the rank of coal, the higher theconversion.
Gaseous and vapor hydrocarbons evolving from coal at moderate temperatureare passed through a zone of very high temperature, in which they decompose sorapidly that there is no coagulation of coal particles during the plastic stage. Thus,any coal can be gasified irrespective of the caking property, ash content, or ash fusiontemperature. As a result of the endothermic reactions occurring in the gasifierbetween carbon and steam and radiation to the refractory walls, the reactor temper-ature decreases from 1930°C (flame temperature) to 1500°C. At these conditions,only gaseous products are produced with no tars, condensable hydrocarbons, orphenols formed. Typical compositions of Koppers-Totzek gaseous products areshown in Table 2.3.
Ash in the coal feed becomes molten in the high-temperature zone. Approxi-mately 50% of the coal ash drops out as slag into a slag quench tank below thegasifier. The remaining ash is carried out of the gasifier as fine fly ash. The gasifieroutlet is equipped with water sprayers to drop the gas temperature below the ashfusion temperature. This cooling prevents slag particles from adhering to the tubesof the waste heat boiler, which is mounted above the gasifier.
The raw gas from the gasifier passes through the waste heat boiler, where high-pressure steam up to 100 atm is produced via waste heat recovery. After leaving thewaste heat boiler, the gas at 175–180°C is cleaned and cooled in a highly efficientscrubbing system, which reduces the entrained solids to 0.002–0.005 grains/scf or lessand further lowers the temperature from 175 to 35°C. If the gas coming out of theKoppers-Totzek process is to be compressed to high pressures for chemical synthesis,electrostatic precipitators (ESPs) are used for further cleaning. Several gasifiers canshare common cleaning and cooling equipment, thus reducing the capital cost.
TABLE 2.3Typical Raw Product Gas Compositions of Koppers-Totzek Gasifier (oxygen-blown type)
Component Percentage
CO 52.5H2 36.0CO2 10.0H2S + COS 0.4N2 + Ar 1.1
Note: Average heating value = 286 Btu/scf; all percentages are in volume percent.
Source: From Lloyd, W.G., The Emerging Synthetic Fuel Industry, Thumann,A., Ed., Atlanta, GA: Fairmont Press, 1981, pp. 19–58.
© 2007 by Taylor & Francis Group, LLC

Gasification of Coal 49
The cool, cleaned gas leaving the gas cleaning system still contains sulfur com-pounds that must be removed to meet the final gas specifications. The type of thedesulfurization system chosen depends on the end uses and the pressure of the productgas. For low pressures and low-Btu gas applications, there are a number of chemicallyreactive processes, such as amine and carbonate processes. At higher pressures, physicalabsorption processes such as Rectisol process can be used. The choice of the processalso depends on the desired purity of the product gas and its selectivity with respect tothe concentration of carbon dioxide and sulfides. Advances in gas cleaning have beenquite significant in recent years, owing to more stringent environmental regulations.18
2.4.4.3 Shell Gasification
The Shell coal gasification process was developed by Royal Dutch and Shell groupin the early 1970s. It uses a pressurized, slagging entrained flow reactor for gasifyingdry pulverized coal.19 Similar to the Koppers-Totzek process, it has the potential togasify widely different ranks of coals, including low-rank lignites with high moisturecontent. Unlike other gasifying processes, it uses pure oxygen as the gasifyingmedium, for gasification via partial oxidation. Shell Global Solutions licenses twoversions of gasification technologies, i.e., one for liquid feedstock applications andthe other for coal and petroleum coke. A schematic of the Shell coal gasificationprocess is given in Figure 2.6. The process has the following features20:
1. Almost 100% conversion of a wide variety of coals, including high-sulfurcoals, lignites, and coal fines
FIGURE 2.6 A schematic of shell gasification process.
Gasifier
GasQuench
N2
PulverizedCoal
BFW High Purity Gas
SeparatorVenturi Scrubber
Packed BedScrubber
LowPurityGas
Steam
Sour WaterStripper
Separator
Recycle GasCompressor
BufferVessel
Condenser
Cyclone
BottomSolids
Water Bath
SlagChar
BleedWater
Oxygen
Steam
Nitrogen
Air
© 2007 by Taylor & Francis Group, LLC

50 Handbook of Alternative Fuel Technology
2. High thermal efficiency in the range of 75 to 80%3. Efficient heat recovery through production of high-pressure superheated steam4. Production of clean gas without any significant amount of by-products5. High throughput6. Environmental compatibility
Coal before feeding to the gasifier vessel, is crushed and ground to less than 90-µm size. This pulverized and dried coal is fed through diametrically opposite diffuserguns into the reaction chamber.21 The coal is then reacted with the pure oxygen andsteam, where flame temperature reaches as high as 1800–2000°C. A typical operatingpressure is around 30 atm. Raw product gas typically consists of mainly carbonmonoxide (62–63%) and hydrogen (28%), with some quantities of carbon dioxide.A water-filled bottom compartment is provided in which molten ash is collected.Some amount of ash is entrained with the synthesis gas, which is then recycled alongwith the unconverted carbon. A quench section is provided at the reactor outlet tolower the gas temperature. Removal of particulate matter from the raw product gasis integrated with the overall process. This removal system typically consists ofcyclones and scrubbers. The main advantage of this section is elimination of solid-containing wastewater, thus eliminating the need for filtration.
2.4.4.4 Texaco Gasification
The Texaco process also uses entrained flow technology for gasification of coal. Itgasifies coal under relatively high pressure by injection of oxygen (or air) and steamwith concurrent gas/solid flow. Fluidized coal is mixed with either oil or water tomake it into pumpable slurry. This slurry is pumped under pressure into a verticalgasifier, which is basically a pressure vessel lined inside with refractory walls. Theslurry reacts with either air or oxygen at high temperature. The product gas containsprimarily carbon monoxide, carbon dioxide, and hydrogen with some quantity ofmethane. Because of high temperature, oil or tar is not produced. This process isbasically used to manufacture CO-rich synthesis gas.3 A schematic of the Texacogasification process is shown in Figure 2.7.
This gasifier evolved from the commercially proven Texaco partial oxidationprocess10 used to gasify crude oil and hydrocarbons. Its main feature is the use ofcoal slurry feed, which simplifies the coal-feeding system and operability of thegasifier. The gasifier is a simple, vertical, cylindrical pressure vessel with refractorylinings in the upper partial oxidation chamber. It is also provided with a slag quenchzone at the bottom, where the resultant gases and molten slag are cooled down. Inthe latter operation, large amounts of high-pressure steam can be obtained, whichboosts the thermal efficiency of the process. Another important factor that affectsthe gasifier thermal efficiency is the water content of the coal slurry. This watercontent should be minimized because a large amount of oxygen must be used tosupply the heat required to vaporize the slurry water. This gasifier favors high-energydense coals so that the water-to-energy ratio in the feed is small. Therefore, easternU.S. bituminous coals are preferable to lignites for this gasifier. The gasifier operatesat around 1100–1370°C and a pressure of 20–85 atm.
© 2007 by Taylor & Francis Group, LLC

Gasification of Coal 51
The product gases and molten slag produced in the reaction zone pass downwardthrough a water spray chamber and a slag quench bath, where the cooled gas andslag are then removed for further treatment. The gas, after being separated from slagand cooled, is treated to remove carbon fines and ash. These fines are then recycledto the slurry preparation system, while the cooled gas is treated for acid gas removaland elemental sulfur is recovered from the hydrogen sulfide (H2S)-rich stream.
2.4.4.5 In Situ Gasification
In situ gasification, or underground gasification, is a technology for recovering theenergy content of coal deposits that cannot be exploited either economically or techni-cally by conventional mining (or ex situ) processes. Coal reserves that are suitable forin situ gasification have low heating values, thin seam thickness, great depth, high ashor excessive moisture content, large seam dip angle, or undesirable overburden proper-ties. A considerable amount of investigation has been performed on underground coalgasification (UCG) in the former USSR and in Australia, but it is only in recent years,that the concept has been revived in Europe and North America as a means of fuel gasproduction. In addition to its potential for recovering deep, low-rank coal reserves, theUCG process may offer some advantages with respect to its resource recovery, minimalenvironmental impact, operational safety, process efficiency, and economic potential.The aim of in situ gasification of coal is to convert coal hydrocarbons into combustiblegases by combustion of coal seam in the presence of air, oxygen, or steam.
The basic concepts of underground coal gasification may be illustrated by Figure2.8.22 The basic principles of in situ gasification are still very similar to those involved
FIGURE 2.7 A schematic of Texaco gasification process.
O2
Coal
Water
Coal-waterSlurry
Ash Lock
Waste WaterTreatment
Water
Raw Syngas
Steam
Settler
Water Supply
Gas
ifica
tion
Que
nch
Mill
Coal Slurry Gasification Waste HeatRecovery
Gas Purification
© 2007 by Taylor & Francis Group, LLC

52 Handbook of Alternative Fuel Technology
in the above-ground (ex situ) gasification of coal. Combustion process itself couldbe handled in either forward or reverse mode. Forward combustion involves move-ment of the combustion front and injected air in the same direction, whereas inreverse combustion, the combustion front moves in the opposite direction to theinjected air. The process involves drilling and subsequent linking of the two boreholesto enable gas flow between the two. Combustion is initiated at the bottom of oneborehole called injection well and is maintained by the continuous injection of air.
As illustrated in Figure 2.8, in the initial reaction zone, carbon dioxide isgenerated by reaction of oxygen (air) with the coal, which further reacts with coalto produce carbon monoxide by the Boudouard reaction (CO2 + C = 2CO) in thereduction zone. Further, at such high temperatures, the moisture present in the seammay also react with carbon to form carbon monoxide and hydrogen via the steamgasification reaction (C + H2O = CO + H2). In addition to all these basic gasificationreactions, coal decomposes in the pyrolysis zone owing to high temperatures toproduce hydrocarbons and tars, which also contribute to the product gas mix. Theheating value from the air-blown in situ gasifier is roughly about 100 Btu/scf. Thelow heat content of the gas makes it uneconomical for transportation, making itnecessary to use the product gas on site. An extensive discussion on in situ gasifi-cation can be found in references by Thompson23 and by Gregg and Edgar.24 Anoteworthy R&D effort in underground coal gasification has also been conductedby the Commonwealth Scientific and Industrial Research Organization (CSIRO),Australia. CSIRO researchers have developed a model to assist with the implemen-tation of this technology.25 A number of other trials and trial schemes were evaluatedin Europe, China, India, South Africa, and the U.S.
FIGURE 2.8 A schematic of in situ underground gasification process.
Combustion ZoneReducing Zone
Devolatilization and Pyrolysis Zone
200-550oC 550-900oC 900 + oC
Overburden
Gas Blast In
Product Gas Out
Production Well Injection Well
Coal Seam
© 2007 by Taylor & Francis Group, LLC

Gasification of Coal 53
2.4.4.5.1 Potential Possibility of Using Microbial Processesfor In Situ Gasification
Juntgen26 in his review article has explored the possibilities of using microbiologicaltechniques for in situ conversion of coal into methane. Microorganisms have beenfound that grow on coal as a sole carbon source. Both forms of sulfur, namely organicand inorganic (pyritic and sulfatic), are claimed to be removable by biochemicaltechniques, and microorganisms are able to grow, in principle, in narrow porestructures of solids. The conversion of large-molecular-weight aromatics, includingpolynuclear aromatics (PNAs), is also potentially feasible. An important precursorof developing such new process techniques for in situ coal conversion in deep seamsis the knowledge of coal properties, both physical and chemical, under the prevailingconditions. The two most important coal properties, which dictate the in situ pro-cesses, are the permeability of coal seam, including the overburden and the rank ofcoal. For microbial conversion of coal, microporosity also becomes an importantparameter. The permeability of coal seam in great depths is usually quite small dueto high rock overburden pressure. However, accessibility is very important for per-forming in situ processes. There are several ways to increase the permeability of thecoal seams at great depths.26 Some of these ideas are very similar to those used inin situ oil shale retorting as discussed in Chapter 8.
The main advantage of using microbiological techniques is that the reactiontakes place at ambient temperatures. Progress made in developing these types ofprocesses is quite notable. A remarkable effect of such reactions in coal is that themicroorganisms can penetrate into fine pores of the coal matrix, and can also createnew pores if substances contained in the coal matrix are converted into gaseouscompounds.
However, the most difficult and complex problem associated with microorganism-based reactions is the transition from solely oxidative processes to methane-formingreactions. There are at least three reaction steps involved: (1) the aerobic degradationof coal to biomass and high-molecular-weight products, (2) an anaerobic reactionleading to the formation of acetate, hydrogen, and carbon monoxide, and (3) theconversion of these products to methane using methanogenic bacteria. Methanogenicbacteria belong to a group of primitive microorganisms, the Archaea. They give offmethane gas as a by-product of their metabolism, and are common in sewage treatmentplants and hot springs, where the temperature is warm and oxygen is absent. Advantagesof these processes over other conversion processes are lower conversion temperatureand more valuable products.26 However, an intensive investigation must be conductedto adapt reaction conditions and product yields to conditions prevailing in coal seamsat great depth, where transport processes play a significant role in the overall reaction.
2.4.4.5.2 Underground Gasification SystemThe underground gasification system involves three distinct sets of operations: pre-gasification, gasification, and further processing and utilization. Pregasification oper-ations provide access to the coal deposit and prepare it for gasification. Connectionbetween the inlet and outlet through the coal seam is achieved via shafts andboreholes. Linking can be achieved through several means, such as pneumatic,hydraulic, or electric linking, and using explosives, etc. Sometimes, partial linking
© 2007 by Taylor & Francis Group, LLC

54 Handbook of Alternative Fuel Technology
may also be accomplished by taking advantage of the natural permeability of thecoal seam. Among all the linking methods, only directionally drilled boreholesprovide positive connections between inlet and outlet sections and all other methodspermit a certain degree of uncertainty to play a role in the system. A schematic viewof a linked-vertical-well underground gasification plant operated near Moscow22 isshown in Figure 2.9.
The gasification operations that allow reliable production of low-Btu gas consistof input of gasifying agents such as air or oxygen and steam (or alternating air andsteam), followed by ignition. Ignition can be managed either by electrical means orby burning solid fuels. Ignition results in contact between gasifying agents and coalorganics at the flame front. The flame front may advance in the direction of gas flow(forward burning) or in the direction opposite to the gas flow (backward burning).During these operations, the major technical difficulties and challenges are in thearea of process control. Owing to the unique nature of underground gasification,there inherently exists problems of controllability and observability.
The next, and most important, operation is the utilization of the product gas,and it requires a coupling between the gas source and the energy demand. Theproduct gas can be either used as an energy source to produce electricity on site orcan be upgraded to a high-Btu pipeline-quality gas for transmission. In some otherapplications, it could be utilized near the deposit as a hydrogen source, as a reducingagent, or as a basic raw material for manufacture of other chemicals. With realizationof the hydrogen economy, the product gas may have good potential as a hydrogen
FIGURE 2.9 Plane view of linked-vertical-well underground gasification plant operated nearMoscow.
25 m 25 m 25 m
Row 1
Row 2
Row 3
Row 4
Row 5
ProducingGas
Linking
Drilling &Preparing
Air InletManifold
Product GasManifold
Wells
25 m
© 2007 by Taylor & Francis Group, LLC

Gasification of Coal 55
source. Generally speaking, there are no major technical problems involved with theutilization of product gas, apart from potential environmental concerns.
2.4.4.5.3 Methods for Underground GasificationThere are two principal methods that have been tried successfully, shaft methodsand shaftless methods (and combinations of the two).24,25,27 Selection of a specificmethod to be adopted depends on such parameters as the natural permeability of thecoal seam, the geochemistry of the coal deposit, the seam thickness, depth, widthand inclination, closeness to metropolitan developments, and the amount of miningdesired. Shaft methods involve driving of shafts and drilling of other large-diameteropenings that require underground labor, whereas shaftless methods use boreholesfor gaining access to the coal seam and do not require labor to work underground.
2.4.4.5.3.1 Shaft Methods
1. Chamber or warehouse method: This method requires the preparation ofunderground galleries and the isolation of coal panels with brick wall.The blast of air for gasification is applied from the gallery at the previouslyignited face of one side of the panel, and the gas produced is removedthrough the gallery at the opposite side of the panel. This method relieson the natural permeability of the coal seam for airflow through the system.Gasification and combustion rates are usually low, and the product gasmay have variable composition from time to time. To enhance the effec-tiveness, coal seams are precharged with dynamites to rubblize them inadvance of the reaction zone by a series of controlled explosions.
2. Borehole producer method: This method typically requires the develop-ment of parallel underground galleries and are located about 500 ft. apartwithin the coal bed. From these galleries, about 4-in.-diameter boreholesare drilled about 15 ft. apart from one gallery to the opposite one. Electricignition of the coal in each borehole can be achieved by remote control.This method was originally designed to gasify substantially flat-lyingseams. Variations of this technique utilize hydraulic and electric linkingas alternatives to the use of boreholes.
3. Stream method: This method can be applied to steeply pitched coal beds.Inclined galleries following the dip of the coal seam are constructedparallel to each other and are connected at the bottom by a horizontalgallery or “fire-drift.” A fire in the horizontal gallery initiates the gasifi-cation, which proceeds upward with air coming down one inclined galleryand gas leaving through the other. One obvious advantage of the streammethod is that ash and roof material drop down, tend to fill void space,and do not tend to choke off the combustion zone at the burning coalfront. However, this method is structurally less suitable for horizontal coalseams because of roof collapse problems.
2.4.4.5.3.2 Shaftless MethodsIn shaftless methods, all development, including gasification, is carried out through aborehole or a series of boreholes drilled from the surface into the coal seam. A general
© 2007 by Taylor & Francis Group, LLC

56 Handbook of Alternative Fuel Technology
approach has been to make the coal bed more permeable between the inlet and outletboreholes by a chosen linking method, ignite the coal seam, and then gasify it bypassing air and other gasifying agents from the inlet borehole to the outlet borehole.
2.4.4.5.3.3 Percolation or Filtration MethodsThis is the most direct approach to accomplish shaftless gasification of a coal seamusing multiple boreholes. The distance required between boreholes depends on the seampermeability. Lower-rank coals such as lignites have a considerable natural permeabilityand, as such, can be gasified without open linking. However, higher-rank coals such asanthracites are far less permeable, and it becomes necessary to connect boreholes bysome efficient linking techniques that will increase the permeability and fracture of thecoal seam so that an increased rate of gas flow can be attained. Air or air/steam is blownthrough one borehole, and product gas is removed from another borehole. Either forwardor reverse combustion can be permitted by this method. As the burn-off (a combinationof combustion and gasification) progresses, the permeability of the seam also increasesand compressed air blown through the seam helps enlarge cracks or openings in theseam. When the combustion of a zone nears completion, the process is transferred tothe next pair of boreholes and continues. In this operation, coal ash and residues shouldbe structurally strong enough to prevent roof collapse.
2.4.4.5.4 Potential Problem Areas with In Situ GasificationThere are several issues why the in situ gasification processes may not be able toproduce a high-quality and constant quantity of product gas, recover a high percent-age of coal energy in the ground, and control the groundwater contamination.Potential problem areas in commercial exploitation of this technology are discussedin the following text.
2.4.4.5.4.1 Combustion ControlCombustion control is essential for controlling the product gas quality as well as theextent of coal conversion. The reactive contacting between the coal and the gasifyingagent should be such that the coal is completely in situ gasified, all oxygen in theinlet gas is consumed, and the production of fully combusted carbon dioxide andwater is minimized. In a typical in situ coal gasification process, as the processingtime goes by, the heating value of the product gas decreases. This may be attributableto increasingly poor contact of gas with the coalface, because of large void volumesand from roof collapse. The problem of efficient contacting needs to be solvedsatisfactorily in this process.
2.4.4.5.4.2 Roof Structure ControlAfter the coal is burned off, a substantial roof area is left unsupported. Uncontrolledroof collapse causes nontrivial problems in the combustion control, and also seriouslyhinders successful operation of the overall gasification process. Further, it potentiallyresults in the leakage of reactant gases, seepage of groundwater into the coal seam,loss of product gas, and surface subsidence above the coal deposit.
2.4.4.5.4.3 Permeability, Linking, and FracturingAn underground coal bed usually does not have a sufficiently high permeability topermit the passage of oxidizing gases through it without a serious pressure drop.
© 2007 by Taylor & Francis Group, LLC

Gasification of Coal 57
Also, intentional linking methods such as pneumatic, hydraulic, and electric, as wellas fracturing with explosives, do not result in a uniform increase in permeabilitythroughout the coal bed. They also tend to disrupt the surrounding strata and worsenthe leakage problems. Therefore, the use of boreholes is proved to provide a morepredictable method of linking and is a preferred technique.
2.4.4.5.4.4 Leakage ControlThis is one of the most important problems because the loss of substantial amountof product gas can adversely affect the recovered amount of the product gas as wellas the gasification economics. Further, the inlet reactant gases should not be wasted.Influx of water can also affect the control of the process. Leakage varies from siteto site and also depends on a number of factors including geological conditions,depth of coal seam, types of boreholes and their seals, and permeability of coal bed.
Based on the above considerations, it is imperative that in situ gasification neverbe attempted in a severely fractured area, in shallow seams, or in coal seams adjoiningporous sedimentary layers. It is also essential to prevent roof collapse and to properlyseal inlet and outlet boreholes after operation.
2.4.4.5.5 Monitoring of Underground ProcessesProper monitoring of the underground processes is a necessary component of suc-cessful operation and design of an underground gasification system. A priori knowl-edge of all the parameters affecting the gasification is required so that adequateprocess control philosophy can be adopted and implemented for controlling theoperation. These factors include the location, shape, and temperature distribution ofthe combustion front, the extent and nature of collapsed roof debris, the permeabilityof coal seam and debris, the leakage of reactant and product gases, the seepage ofgroundwater, and the composition and yield of the product gases.
2.4.4.5.6 Criteria for an Ideal Underground Gasification SystemThe following are the criteria for successful operation of an ideal underground coalgasification system:
1. The process must be operable on a large scale.2. The process must ensure that no big deposits of coal are left ungasified
or partially gasified.3. The process must be controllable so that desired levels, in terms of quality
and quantity, of product gases are consistently produced.4. The mechanical features must ensure that they should be able to control
undesirable phenomena such as groundwater inflow and leakage (as out-flow) of reactants and products.
5. The process should require little or no underground labor, either duringoperation or even during the installation of the facilities.
2.4.4.6 Winkler Process
This is the oldest commercial process employing fluidized bed technology.28 Theprocess was developed in Europe in the 1920s. There are more than 15 plants in
© 2007 by Taylor & Francis Group, LLC

58 Handbook of Alternative Fuel Technology
operation today all over the world with the largest having an output of 1.1 million scf/d.In this process, pulverized coal is dried and fed into a fluidized bed reactor by meansof a variable speed screw feeder. The gasifier operates at atmospheric pressure and atemperature of 815–1000°C. Coal particles react with oxygen and steam to produceoffgas rich in carbon monoxide and hydrogen. The relatively high operating temperatureleaves very little tar and liquid hydrocarbons in the product gas stream. The gas streamthat may carry up to 70% of the generated ash is cleaned by water scrubbers, cyclones,and electrostatic precipitators (ESPs). Unreacted char carried over by the fluidizing gasstream is further converted by secondary steam and oxygen in the space above thefluidized bed. As a result the maximum temperature occurs above the fluidized bed.To prevent ash fines from melting at a high temperature and forming deposits in theexit duct, gas is cooled by a radiant boiler before it leaves the gasifier. Raw hot gasleaving the gasifier is passed through a waste heat recovery section. The gas is thencompressed and goes through WGS reaction. The product gas has a heating value ofabout 275 Btu/scf. The thermal efficiency of the process runs approximately 75%.
2.4.4.6.1 Process DescriptionIn the early 1920s, Winkler, an employee of Davy Power Gas Inc., conceived theidea of using a fluidized bed for gasifying the coal. The first commercial unit wasbuilt in 1926. Since then, more than 30 producers and 15 installations have put thisprocess into operation for coal gasification.
In earlier facilities, dryers were used, prior to the introduction of coal into the gasgenerator, to reduce the coal moisture to less than 8%. It was later realized that as longas the feed coal could be sized, stored, and transported without plugging, dryers couldbe omitted. Without dryers, moisture in the coal is vaporized in the generator with theheat provided by using additional oxygen for combustion reaction. Drying the coal inthe generator also offers an additional advantage, i.e., elimination of an effluent stream,the dryer stack, which would require further treatment of particulate and sulfur removal.
2.4.4.6.2 Gasifier (Gas Generator)A schematic of a Winkler fluidized bed gasifier22 is shown in Figure 2.10. Pulverizedcoal is fed to the gasifier through variable-speed feeding screws. These screws not onlycontrol the coal feed rate, but also serve to seal the gasifier by preventing steam fromwetting the coal and blocking the pathway by agglomeration. A high-velocity gas streamflows upward from the bottom of the gasifier. This gas stream fluidizes the bed of coal,as well as intimately mixes the reactants, thus bringing them into close contact. Fluid-ization helps the gas-to-solid mass transfer. This also helps in attaining an isothermalcondition between the solid and the gas stream, which permits the reactions to reachequilibrium in the shortest possible time. Gasification chemistry in the Winkler gasifieris based on a combination of combustion reaction and WGS reaction.
C + O2 = CO2
C+ 1/2 O2 = CO
C + H2O = H2 + CO
CO + H2O = CO2 + H2
© 2007 by Taylor & Francis Group, LLC

Gasification of Coal 59
In the preceding reactions, carbon was used instead of coal only for illustrativepurposes. Therefore, the actual reactions in the gasifier are much more complex.Owing to the relatively high temperatures of the process, nearly all the tars andheavy hydrocarbons are reacted.29
As a result of the fluidization, the ash particles get segregated according to particlesize and specific gravity. About 30% of the ash leaves through the bottom, whereas 70%is carried overhead. The lighter particles carried upward along with the produced gas arefurther gasified in the space above the bed. Therefore, the quantity of gasifying mediuminjected into this bed must be adjusted proportionally to the amount of unreacted carbonbeing carried over. If it is too little, ungasified carbon gets carried out of the generator,resulting in a slightly lower thermal efficiency, and if it is too much, product gas isunnecessarily consumed by combustion. The maximum temperature in the generatoroccurs in the space above the fluidized bed because of this secondary (further) gasification.
A radiant boiler installed immediately above the bed cools the hot product gasdown to 150–205°C before it leaves the generator. This helps prevent the fly ash fromgetting sintered on the refractory walls of the exit duct. The sensible heat recoveredby the radiant boiler generates superheated steam and is used to preheat the boiler feedwater (BFW), as an energy integration scheme. The typical gas composition from aWinkler gasifier is shown in Table 2.4. As can be seen from the data, the product gasis rich in carbon monoxide, making the resultant gas a CO-rich syngas.
2.4.4.6.3 Features of the Winkler ProcessThe following are the chief characteristics of the Winkler process:
1. A variety of coal feeds of widely different ranks, ranging from lignite tocoke, can be gasified. Petrologically, younger lignite is more reactive thanolder counterparts of bituminous and anthracite. With more reactive coal,
FIGURE 2.10 A schematic of Winkler gasification process.
Coal
Steam
O2Ash
Ash
SyngasTo Cyclone
BFW
WinklerGasifier
HeatExchanger
SuperheatedSteamWaste Heat
Recovery
© 2007 by Taylor & Francis Group, LLC

60 Handbook of Alternative Fuel Technology
the required gasification temperature decreases, whereas the overall gasi-fication efficiency increases. For less reactive coals, however, the energylosses through unburned solids inevitably increase.
2. Coal with high ash content can be gasified without difficulty. Althoughhigh-ash-content coals result in increased residues and incombustiblematerials, usually they are less expensive; and thus, sources of feed coalcan be greatly expanded. Winkler gasifier is not sensitive to variations inthe ash content during operation.
3. Winkler gasifier can also gasify liquid fuels in conjunction with coalgasification. The addition of supplementary liquid feeds results in anincrease in production and heating value of the product gas, therebyboosting the process economics favorably.
4. Winkler gasification is very flexible in terms of the capacity and turndownratio. It is limited at the lower end by the minimum flow required forfluidization and at the upper end by the minimum residence time requiredfor complete combustion of residues.
5. Shutdown can be very easily facilitated by stopping the flows of oxygen,coal, and steam, and can be achieved within minutes. Even for hard coals(with low permeability), which are difficult to ignite, the heat loss duringshutdown may be reduced by brief injection of air into the fuel bed.
6. Maintenance of the gas generator is straightforward, because it consistsonly of a brick-lined reactor with removable injection nozzle for thegasification medium.
From a more recent study, the high-temperature Winkler (HTW) process waschosen to be well suited for gasification of the lignite found in the Rhine area ofGermany. The suitability was based on its temperature for gasification and the fluidizedbed reactor configuration.71 The study also discusses the selection criteria of gasifica-tion processes. Rhinebraun AG has operated a demonstration plant of HTW processat Berrenrath, Germany since 1986.79 A variety of feedstocks other than coal, namelyplastic wastes, household refuse, and sewage sludge, were successfully processed.79
TABLE 2.4Typical Winkler Gas Products
Component O2-Blown (%) Air-Blown (%)
CO 48.2 22.0H2 35.3 14.0CH4 1.8 1.0CO2 13.8 7.0N2 + Ar 0.9 56.0
Note: Heating value, Btu/scf: O2-blown = 288; air-blown = 126.
Source: From Lloyd, W.G., The Emerging Synthetic Fuel Industry, Thumann,A., Ed., Atlanta, GA: Fairmont Press, 1981, pp.19–58.
© 2007 by Taylor & Francis Group, LLC

Gasification of Coal 61
2.4.4.7 Wellman-Galusha Process
This process has been in commercial use for more than 40 years. It is capable ofproducing low-Btu gas; to be specific, using air (as a gasifying medium) for fuelgas or using oxygen (as a gasifying medium) for synthesis gas. There are two typesof gasifiers for this process, namely, the standard type without agitator and themodified type with agitator. The rated capacity of the agitated type is about 25%more than that of a standard type gasifier of the same size. The agitated type canhandle volatile caking bituminous coals, whereas the nonagitated type would havetechnical difficulties with this type of coal.3 A schematic of a Wellman-Galushaagitated gasifier11 is shown in Figure 2.11.
This gasifier can be classified under the categories of a fixed bed or moving bedtype reactor. The gasifier shell is water-jacketed and, hence, the inner wall of thereactor vessel does not require a refractory lining. The gasifier operates at about540–650°C and at atmospheric pressure. Pulverized coal is fed to the gasifier fromthe top through a lock hopper and vertical feed pipes, whereas steam and oxygenare injected at the bottom of the bed through tuyeres. The fuel valves are operatedto maintain constant flow of coal to the gasifier, which also helps in stabilizing thebed, thus maintaining the quality of the product gas. The injected air or oxygenpasses over the water jacket and generates the steam required for the process. Arotating grate is located at the bottom of the gasifier to remove ash from the beduniformly. An air-steam mixture is introduced underneath the grate and is evenlydistributed through the grate into the bed. This gasifying medium passes throughthe ash, combustion, and gasifying zones in this specific order, while undergoing avariety of chemical reactions. The product gas contains hydrogen, carbon monoxide,carbon dioxide, and nitrogen (if air is used as an injecting medium), which being
FIGURE 2.11 A schematic of agitated Wellman-Galusha gasifier.
:: .. .... .... .... ........ .. .... .. ...... ......
..
.
. .. . .
...
....
.....
..
. ..... ... .... ......
….. ... . .. .. .. ..... .......
.... .:. :. .. .....
. ..
..
VentPulverized Coal
Slide Valve .:: ::Agitator
Water Jacket
Revolving Grate
Combustion
Gasification
Ash Bin
Ash
Ash
Fines
Air
Raw
Product
Gas
Cyclone
Coal Bin
Coal Feeding
© 2007 by Taylor & Francis Group, LLC

62 Handbook of Alternative Fuel Technology
hot, dries and preheats the incoming coal before leaving the gasifier. The typicalproduct composition of a Wellman-Galusha gasifier is presented in Table 2.5.
The product gas is passed through a cyclone separator, where char particles andfine ash are removed. It is then cooled and scrubbed in a direct-contact countercurrentwater cooler and treated for sulfur removal. If air is used as an oxidant as illustratedin Table 2.5, low-Btu gas is obtained owing to the presence of a large amount ofnitrogen; if oxygen is used, then medium-Btu gas would be produced.
Unlike the standard Wellman-Galusha gasifier, the agitated version is equippedwith a slowly revolving horizontal arm that spirals vertically below the surface ofthe coal bed to minimize channeling. This arm also helps in providing a uniformbed for gasification.
2.4.4.8 The U-GAS Process
The process was developed by the Institute of Gas Technology (IGT), Des Plaines,IL, to produce gaseous product from coal in an efficient and environmentally accept-able manner. The product gas may be used to produce low-Btu gas, medium-Btugas, and SNG for use as fuels, or as chemical feedstocks for ammonia, methanol,hydrogen, oxo-chemicals, etc., or for electricity generation via an IGCC. Based onextensive research and pilot plant testing, it has been established that the process iscapable of handling large volumes of gas throughput, achieving a high conversionof coal to gas without producing tar or oil, and causing minimum damage to theenvironment.
The U-GAS process is based on a single-stage, fluidized bed gasifier, as shown inFigure 2.12. The gasifier accomplishes four principal functions in a single stage,namely: (1) decaking coal, (2) devolatilizing coal, (3) gasifying coal, and (4) agglom-erating and separating ash from char. Coal of about 0.25-in. diameter is dried andpneumatically injected into the gasifier through a lock hopper system. In the fluidizedbed reactor, coal reacts with steam and oxygen at a temperature of 950–1100°C. Thetemperature of the bed is determined based on the type of coal feed and is controlled
TABLE 2.5Typical Wellman-Galusha Products (air-blown)
Component Percentage
CO 28.6H2 15.0CH4 2.7N2 50.3CO2 3.4
Note: Heating value (dry) = 168 Btu/scf.
Source: From Lloyd, W.G., The Emerging Synthetic Fuel Indus-try, Thumann, A., Ed., Atlanta, GA: Fairmont Press, 1981,pp.19–58.
© 2007 by Taylor & Francis Group, LLC

Gasification of Coal 63
to prevent slagging conditions of ash. The pressure may be flexible, typically rangingfrom 50 to 350 psi, and is largely determined based on the ultimate use of the finalproduct gas. Oxygen may be substituted with air. In the gasifier, coal is rapidlygasified producing H2, CO, CO2, and small amounts of CH4. The fluidized bed isalways maintained under reducing conditions and, as such, all sulfur species presentin coal is converted into H2S. Simultaneously with gasification, the ash is agglom-erated into spherical particles that grow in size and are separated from the bed intowater-filled ash hoppers, from which they are withdrawn as slurry. A portion offluidizing gas enters the gasifier section through an inclined grid, whereas most ofthe remaining entering gas flows upward at a high velocity through the ash-agglom-erating zone and forms a relatively hot zone within the bed.
Coal fines elutriated from the bed are collected by two external cyclones. Finesfrom the first cyclone are returned to the bed, whereas those from the second cycloneare sent to the ash-agglomerating zone. Raw product gas is virtually free of tar andoils, thus simplifying the ensuing energy recovery and gas purification steps. Thepilot plant operated by the IGT has a gasifier made of a mild-steel, refractory-linedvessel with an I.D. of 3 ft. and a height of about 30 ft.
An IGCC process based on the IGT U-GAS process was developed by TampellaPower Company, Finland, which later became Carbona Inc. The choice of the IGTprocess is based on its excellent carbon conversion, as well as its versatility with awide range of coals and peat. Enviropower Inc. originally licensed the U-gas tech-nology and developed it as Enviropower gasification technology. Later, Enviro-power’s gasification business was taken over by Carbona Inc. Carbona has developed
FIGURE 2.12 A schematic of U-gas process.
Raw Product Gas
Steam &Air/O2
FinesRecycle
Fines
1
23
Fines Collectors (1,2,3)
WaterWater
Water
Wastewater
Clean gas
Incinerator
Coal Feed
FinesRecycle
Ash
Lock Hopper
VenturiScrubber
Quencher(Dry) Quencher
(Dry)
© 2007 by Taylor & Francis Group, LLC

64 Handbook of Alternative Fuel Technology
the technology applicable to biomass gasification and is developing a pressurizedfluidized bed gasification plant for the 55 MW cogeneration project with IgnifluidBoilers India Ltd. (IBIL), Chennai, India. The plant is designed for multifuel oper-ation, including biomass.70
2.4.4.9 Catalytic Coal Gasification
In recent years, the study of catalytic gasification has received attention because itrequires less thermal energy input but yields higher carbon conversion. Studies onthe catalysis of coal gasification have twofold objectives: (1) to understand thekinetics of coal gasification that involves active mineral matter and (2) to designpossible processes using these catalysts. The use of catalysts lowers the gasificationtemperature, which favors product composition under equilibrium conditions as wellas high thermal efficiency. However, under normal conditions a catalytic processcannot compete with a noncatalytic one unless the catalyst is quite inexpensive orhighly active at low temperatures. Recovery and reuse of catalyst in the process isundesirable and unattractive in coal gasification because of the expensive separationefforts and the low cost of coal and coal gas. Research on catalysis covers mainlythree subjects: basic chemistry, application-related problems, and process engineer-ing. Juntgen30 published an extensive review article on catalytic gasification.Nishiyama31 also published a review article, which features some possibilities for awell-defined catalytic research effort. The article contains the following observations:
1. Salts of alkali and alkaline earth metals as well as transition metals areactive catalysts for gasification.
2. The activity of a particular catalyst depends on the gasifying agent as wellas the gasifying conditions.
3. The main mechanism of catalysis using alkali and alkaline earth metalsalts in steam and carbon dioxide gasification involves the transfer ofoxygen from the catalyst to carbon through the formation and decompo-sition of the C-O complex, i.e., C(O).
The mechanism of hydrogasification reactions catalyzed by iron or nickel is stillnot very clear. But a possible explanation is that the active catalyst appears to be inthe metallic state and there are two main steps for the mechanism. These are hydrogendissociation and carbon activation.32–36 For the latter case, carbon dissolution intoand diffusion through a catalyst particle seems logical. Gasification proceeds in twostages, each of which has a different temperature range and thermal behavior, sothat a single mechanism cannot explain the entire reaction. Thus, the catalyst is stillassumed to activate the hydrogen.
Calcium as a catalyst has also been studied by several investigators.37–45 Thiscatalyst has a very high activity in the initial period when it is well dispersed in theother promoter catalyst, but with increasing conversion, the activity drops. The chem-ical state and dispersion are studied by chemisorption of carbon dioxide, x-ray dif-fraction (XRD), and some other analytical techniques. They confirmed the existence
© 2007 by Taylor & Francis Group, LLC

Gasification of Coal 65
of two or more states of calcium compounds, as well as the formation of a surfaceoxygen complex.
Compared to other heterogeneous catalytic systems, the catalysis in gasificationis complex because the catalyst is very short-lived and effective only while in contactwith the substrate, which itself changes during the course. As such, the definitionof the activity for such systems is not very straightforward. For an alkali metalcatalyst, the rate increases owing to the change in the catalyst dispersion and alsoto the increase in the ratio of catalyst/carbon in the later stage of gasification. Otherpossible explanations for the rate increase could be the change in surface area bypore opening, and the change in chemical state of the catalyst. At the same time,there are some changes that deactivate the catalyst, for example, agglomeration ofcatalyst particles, coking, and chemical reaction with sulfur or other trace elements.Coking causes fouling on the catalyst surface as well as sintering the catalyst,whereas reaction with sulfur poisons the catalytic activity.
The activity of the catalyst also depends on the nature of the substrate andgasifying conditions. The main properties of the substrate related to the activity are:(1) reactivity of the carbonaceous constituents, (2) catalytic effect of minerals, and(3) effect of minerals on the activity of added catalyst. The following general trendshave been observed in reference to the factors affecting the activity of the catalysts:
1. Nickel catalysts are more effective toward lower-rank coals because theycan be more easily dispersed into the coal matrix owing to higher perme-ability of the coal, whereas the efficiency of potassium catalyst is inde-pendent of the rank. In any case, the coal rank alone, as given by thecarbon content, cannot predict catalyst activity.
2. The internal surface area of coal char relates to the overall activity of thecatalyst. It can be related to the number of active sites in cases when theamount of catalyst is large enough to cover the available surface area. Foran immobile catalyst, the conversion is almost proportional to the initialsurface area.
3. Pretreatment of coal before the catalytic reaction often helps in achievinghigher reaction rates. Although the pretreatment of coal may not bedirectly applicable as a practical process, a suitable selection of coal typesor processing methods could enhance the activity of catalysts.
4. The effect of coal mineral matter on the catalyst effectiveness is twofold.Some minerals such as alkali and alkaline-earth metals catalyze the reac-tion, whereas others such as silica and alumina interact with the catalystand deactivate it. In general, demineralization results in enhancement ofactivity for potassium catalysts, but only slightly so for calcium and nickelcatalysts.
The method of catalyst loading is also important for activity management. Thecatalyst should be loaded in such a way that a definite contact between both solidand gaseous reactants is ensured. It was observed that when the catalyst was loadedfrom an aqueous solution, a hydrophobic carbon surface resulted in finer dispersionof the catalyst when compared to a hydrophilic surface.
© 2007 by Taylor & Francis Group, LLC

66 Handbook of Alternative Fuel Technology
The most common and effective catalysts for steam gasification are oxides andchlorides of alkali and alkaline-earth metals, separately or in combination.46 Xiang etal. studied the catalytic effects of the Na–Ca composite on the reaction rate, methaneconversion, steam decomposition, and product gas composition, at reaction tempera-tures of 700–900°C and pressures from 0.1 to 5.1 MPa. A kinetic expression wasderived with the reaction rate constants and the activation energy determined at elevatedpressures. Alkali metal chlorides such as NaCl and KCl are very inexpensive, andhence preferred as catalyst raw materials for catalytic gasification. However, theiractivities are quite low compared to the corresponding carbonates because of the strongaffinity between alkali metal ion and chloride ion. Takarada et al.47 have attempted tomake Cl-free catalysts from NaCl and KCl by an ion exchange technique. The authors'ion-exchanged alkali metals to brown coal from an aqueous solution of alkali chlorideusing ammonia as a pH-adjusting agent. Cl ions from alkali chloride were completelyremoved by water washing. This Cl-free catalyst markedly promoted the steam gas-ification of brown coal. This catalyst was found to be catalytically as active as alkalicarbonate in steam gasification. During gasification, the chemical form of active specieswas found to be in the carbonate form and was easily recovered. Sometimes, aneffective way of preparing the catalyst is physical mixing K-exchanged coal with thehigher-rank coals.48 This direct contact between K-exchanged and higher-rank coalresulted in enhancement of gasification rate. Potassium was found to be a highlysuitable catalyst for catalytic gasification by the physical mixing method. Weeda etal.49 studied the high-temperature gasification of coal under product-inhibited condi-tions whereby they used potassium carbonate as a catalyst to enhance the reactivity.They performed temperature-programmed experiments to comparatively characterizethe gasification behavior of different samples. However, the physical mixing methodis likely to be neither practical nor economical for large-scale applications. Someresearchers50 have recovered the catalysts used, in the form of a fertilizer of economicsignificance. They used a combination of catalysts consisting of potassium carbonateand magnesium nitrate in the steam gasification of brown coal. The catalysts alongwith coal ash were recovered as potassium silicate complex fertilizer.
In addition to the commonly used catalysts such as alkali and alkaline-earthmetals for catalytic gasification, some less-known compounds made of rare earthmetals as well as molybdenum oxide (MoO2) have been successfully tried for steamand carbon dioxide gasification of coal.51–53 Some of the rare earth compounds usedwere La(NO3)3, Ce(NO3)3, and Sm(NO3)3. The catalytic activity of these compoundsdecreased with increasing burn-off (i.e., conversion) of the coal. To alleviate thisproblem, coloading with a small amount of Na or Ca was attempted and the loadingof rare earth complexes was done by the ion exchange method.
Coal gasification technology could benefit from the development of suitable andeffective catalysts that will help catalyze steam decomposition and carbon/steamreaction. Batelle Science & Technology International54 has developed a process inwhich calcium oxide was used to catalyze the hydrogasification reaction. It was alsoshown that a reasonably good correlation exists between the calcium content andthe reactivity of coal chars with carbon dioxide. Other alkali metal compounds,notably chlorides and carbonates of sodium and potassium, can also enhance thegasification rate by as much as 35–60%. In addition to the oxides of calcium, iron,
© 2007 by Taylor & Francis Group, LLC

Gasification of Coal 67
and magnesium, zinc oxides are also found to substantially accelerate gasificationrates by 20–30%.
Some speculative mechanisms have been proposed by Murlidhara and Seras54
as to the role of calcium oxide in enhancing the reaction rate. For instance, coalorganic matter may function as a donor of hydrogen, which then may be abstractedby calcium oxide by a given mechanism as described in Scheme 1. Scheme 2 explainsthe mechanism of generating oxygen-adsorbed CaO sites and subsequent desorptionof nascent oxygen, which in turn reacts with organic carbon of coal to form carbonmonoxide. Scheme 3 explains direct interaction between CaO and coal organics,which results in liberation of carbon monoxide. The scheme further explains anoxygen exchange mechanism that brings the reactive intermediates back to CaO.
Scheme 1:
Organic → Organic * + H2
CaO + 2H2 → CaH2 + H2O
Organic* + CO2 → 2CO
CO2 + CaH2 → CaO + CO + H2
Scheme 2:
CaO + CO2 → CaO(O) + CO
CaO(O) → CaO + (O)
C + (O) → CO
Scheme 3:
CaO + 2C → CaCx + CO
CaCx + Organic (oxygen) → CaO + Organic*
Exxon (currently, ExxonMobil) has reported that impregnation of 10–20% ofpotassium carbonate lowers the optimum temperature and pressure for steam gas-ification of bituminous coals, from 980 to 760°C and from 68 to 34 atm, respec-tively.55 In their commercial-scale plant design, the preferred form of make-upcatalyst was identified as potassium hydroxide. This catalyst aids the overall processin several ways. First, it increases the rate of gasification, thereby allowing a lowergasification temperature. Second, it prevents swelling and agglomeration whenhandling caking coals, which is another benefit of a lower gasification temperature.Most importantly, it promotes the methanation reaction because it is thermodynam-ically more favored at a lower temperature. Therefore, in this process, the productionof methane is thermodynamically and kinetically favored in comparison to synthesisgas. A catalyst recovery unit is provided after the gasification stage to recover theused catalyst.
© 2007 by Taylor & Francis Group, LLC

68 Handbook of Alternative Fuel Technology
2.4.4.10 Molten Media Gasification
Generally speaking, molten media may mean one of the following: molten salt,molten metal, or molten slag. When salts of alkali metals and iron are used as amedium to carry out the coal gasification, it is referred to as molten media gasifica-tion. The molten medium not only catalyzes the gasification reaction, but alsosupplies the necessary heat and serves as a heat exchange medium.3,56 There havebeen several distinct commercial processes developed over the years:
1. Kellogg-Pullman molten salt process2. Atgas molten iron gasification process3. Rockwell molten salt gasification4. Rummel-Otto molten salt gasification
Schematics of a Rockwell molten salt gasifier and a Rummel–Otto single-shaftgasifier are shown in Figure 2.1311 and Figure 2.14,22 respectively.
2.4.4.10.1 Kellogg Molten Salt ProcessIn this process, gasification of coal is carried out in a bath of molten sodium carbonate(Na2CO3) through which steam is passed.57 The molten salt produced by this processoffers the following advantages:
1. The steam–coal reaction, being basic in nature, is strongly catalyzed bysodium carbonate, resulting in complete gasification at a relatively lowtemperature.
2. Molten salt disperses coal and steam throughout the reactor, therebypermitting direct gasification of caking coals without carbonization.
3. A salt bath can be used to supply heat to the coal undergoing gasification.4. Owing to the uniform temperature throughout the medium, the product
gas obtained is free of tars and tar acids.
Crushed coal is picked up from lock hoppers by a stream of preheated oxygenand steam and carried into the gasifier. In addition, sodium carbonate recycled fromthe ash rejection system is also metered into the transport gas stream and thecombined coal, salt, and carrier are admitted to the gasifier. The main portion of thepreheated oxygen and steam is admitted into the bottom of the reactor for passagethrough the salt bath to support the gasification reactions. Along with the usualgasification reactions, sulfur entering with the coal accumulates as sodium sulfide(Na2S) to an equilibrium level. At this level, it leaves the reactor according to thefollowing reaction:
Na2CO3 + H2S → Na2S + CO2 + H2O
Ash accumulates in the melt and leaves along with the bleed stream of salt,where it is rejected and sodium carbonate is recycled. The bleed stream of salt is
© 2007 by Taylor & Francis Group, LLC

Gasification of Coal 69
quenched in water to dissolve sodium carbonate (Na2CO3) and permit rejection ofcoal ash by filtration. The dilute solution of sodium carbonate is further carbonatedfor precipitation and recovery of sodium bicarbonate (NaHCO3). The filtrate isrecycled to quench the molten salt stream leaving the reactor. The sodium bicarbonatefiltrate cake is dried and heated to regenerate to sodium carbonate for recycle to thegasifier. The gas stream leaving the gasifier is processed to recover the entrained saltand the heat, and is further processed for conversion to the desired product gas suchas synthesis gas, pipeline gas, or SNG.
FIGURE 2.13 A schematic of Rockwell molten salt gasifier.
FIGURE 2.14 Rummel-Otto single-shaft gasifier.
Melt Regeneration& Recycle
Coal
NaCO3Recycle
Air orOxygen
Low-Btu Gas (w/ N2)Med-Btu Gas (w/ O2)
Ash &Sulfur
Pretreated Coal
O2
Steam
Raw Gas
Water
Slag
Dust Removal
Waste Heat Boiler
Gas Cleaning
© 2007 by Taylor & Francis Group, LLC

70 Handbook of Alternative Fuel Technology
2.4.4.10.2 Atgas Molten Iron Coal GasificationThis process is based on the molten iron gasification concept in which coal is injectedwith steam or air into a molten iron bath. Steam dissociation and thermal crackingof coal volatile matter generate hydrogen and carbon monoxide, i.e., principal ingre-dients of synthesis gas. The coal sulfur is captured by the iron and transferred to alime slag from which elemental sulfur can be recovered as a by-product. The coaldissolved in the iron is removed by oxidation to carbon monoxide with oxygen orair injected near the molten iron surface. The Atgas process uses coal, steam, oroxygen to yield product gases with heating values of about 900 Btu/scf.
The Atgas molten iron process has several inherent advantages over the gas-solid contact gasification in either fixed or fluidized bed reactors.58 They are:
1. Gasification is carried out at low pressures; hence, the mechanical diffi-culty of coal feeding in a pressurized zone is eliminated.
2. Coking properties, ash fusion temperatures, and generation of coal finesare not problematic.
3. The sulfur content of coal does not cause any environmental problem asit is retained in the system and recovered as elemental sulfur from theslag. Elemental sulfur by-product helps the overall process economics.
4. The system is very flexible with regard to the physical and chemicalproperties of the feed coal. Relatively coarse size particles can be handledwithout any special pretreatment.
5. Formation of tar is suppressed owing to very high-temperature operation.6. The product gas is essentially free of sulfur compounds.7. Shutdown and start-up procedures are greatly simplified compared to fixed
bed or fluidized bed reactors.
Coal and limestone are injected into the molten iron through tubes using steamas a carrier gas. The coal goes through devolatilization with some thermal decom-position of the volatile constituents, leaving the fixed carbon and sulfur to dissolvein iron whereupon carbon is oxidized to carbon monoxide. The sulfur, in both organicand pyritic forms (FeS2), migrates from the molten iron to the slag layer where itreacts with lime to produce calcium sulfide (CaS).
The product gas, which leaves the gasifier at approximately 1425°C, is cooled,compressed, and fed to a shift converter (WGS reactor) in which a portion of carbonmonoxide is reacted with steam via WGS reaction to attain a CO-to-H2 ratio of 1:3.The carbon dioxide produced is removed from the product gas, and the gas is cooledagain. It then enters a methanator in which carbon monoxide and hydrogen react toform methane via CO + 3H2 = CH4 + H2O. Excess water is removed from the methane-rich product. The final gaseous product has a heating value around 900 Btu/scf.
2.4.4.11 Plasma Gasification
Plasma gasification is a nonincineration thermal process that uses extremely hightemperatures in an oxygen-free or oxygen-deprived environment to completelydecompose input material into very simple molecules. The extreme heat, aided by
© 2007 by Taylor & Francis Group, LLC

Gasification of Coal 71
the absence of an oxidizing agent such as oxygen, decomposes the input materialinto basic molecular structure species. The plasma gasification or plasma pyrolysisprocess was originally developed for treatment of waste materials. However, theprocess can be very effectively applied to coal gasification or oil shale pyrolysis,capitalizing on its high thermal efficiency, as long as the input energy for plasmageneration can be obtained effectively via energy integration or some other inex-pensive source of energy. When the plasma gasification is applied to carbonaceousmaterials such as coal and oil shale kerogen, by-products are normally a combustiblegas and an inert slag. Product gas can be cleaned by conventional technologies,including cyclone, scrubbers, and ESPs. Cyclone/scrubber effluents can normallybe recycled for further processing.
Plasma is often mentioned as the fourth state. Electricity is fed to a plasma torchthat has two electrodes, creating an arc through which inert gas is passed. The inertgas heats the process gas to a very high temperature, as high as 25,000°F. Thetemperature at a location several feet away from the torch can be as high as5,000–8,000°F, at which temperature the carbonaceous materials are completelydestroyed and broken down into their elemental forms. Furthermore, there is no taror furan involved or produced in this process. Ash or mineral matter would becomecompletely molten and flow out of the bottom of the reactor. Therefore, the plasmareactor is not specific to any particular kind of coal for gasification. Figure 2.15illustrates how the plasma torch operates.59
When applied to waste materials such as municipal solid waste (MSW), plasmagasification possesses unique advantages for the protection of air, soil, and waterresources through extremely low limits of air emissions and leachate toxicity.Because the process is not based on combustion of carbonaceous matters, generationof greenhouse chemicals, in particular carbon dioxide, is far less than from any otherconventional gasification technology. Furthermore, air emissions are typically ordersof magnitude below the current regulations. The slag is monolithic and the leachate
FIGURE 2.15 Plasma torch. (From Recovered Energy, Inc. Web site, http:www.recoveredenergy.com/d_plasma.html, 2004. With permission.)
Entering Process Gas
Entering Process Gas
Hot Process Gas
Electrodes
Plasma Column
© 2007 by Taylor & Francis Group, LLC

72 Handbook of Alternative Fuel Technology
levels are orders of magnitude lower than the current EP-toxicity standard, whichis one of the four criteria for hazardous waste classification.72 Slag weight and volumereduction ratios are typically very large; for example, in the case of biomedicalwastes they are 9:1 and 400:1, respectively. Even though the data for a variety ofcoals are not readily available in the literature, both the mass reduction ratio and thevolume reduction ratio for coals are believed to be significantly higher than thosefor nonplasma gasification technology, thus substantially reducing the burden ofwaste and spent ash disposal problem.
Activities in Canada and Norway are noteworthy in the technology developmentof plasma gasification. Resorption Canada Limited (RCL)60 is a private Canadianentity that was federally incorporated to develop and market industrial processesbased on plasma arc technology. They have amassed extensive operating experiencein this technology, covering a wide variety of input materials including environmental,biomedical, and energy-related materials and resources.
2.5 MATHEMATICAL MODELING OF COAL GASIFIERS
As research and development continues on new and efficient coal gasification con-cepts, mathematical modeling provides insight into their operation and commercialpotential. The influence of design variables and processing conditions on the gasifierperformance must be a priori determined before any commercial processes aredesigned. Such models are then used as tools for design modifications, scaling, andoptimization.
Coal gasification is performed in different types of reactors in which, dependingon the type of gas–solid contact, the bed can be moving, fluidized, entrained, ormade up of molten salts. Of these, a moving bed configuration may be the mostwidely used because of its high coal conversion rates and thermal efficiency.
Different approaches have been used to model various types of reactors. Thereare mainly two kinds of models. The first kind is the thermodynamic or equilibriummodel, which is easier to formulate; but it generates only certain restrictive infor-mation such as offgas compositions in a limiting case. The other type of model isthe kinetic model, which predicts kinetic behavior inside the reactor. The time-dependent behavior of the process can be either steady state or dynamic in nature.Adanez and Labiano61 have developed a mathematical model of an atmosphericmoving bed countercurrent coal gasifier and studied the effect of operating conditionson the gas yield and composition, process efficiency, and longitudinal temperatureprofiles. The model was developed for adiabatic reactors. It assumes that the gasifierconsists of four zones with different physical and chemical processes taking place.They are the zones for: (1) coal preheating and drying, (2) pyrolysis, (3) gasification,and (4) combustion, followed by the ash layer, which acts as a preheater of thereacting (i.e., entering) gases. In reality, however, there is no physical distinctionbetween the zones, and the reactions occurring in each zone vary considerably. Themodel uses the unreacted shrinking core model to define the reaction rate of the coalparticles.73 The unreacted shrinking core model assumes that the dimension (as oftenrepresented by the particle size) of unreacted core (of the remaining coal particle)is progressively shrinking as the coal gets reacted. The most critical parameter in
© 2007 by Taylor & Francis Group, LLC
Gasification of Coal 73
the operation of these moving bed gasifiers with dry ash extraction is the longitudinaltemperature profile, because the temperature inside the reactor must not exceed theash-softening (or ash-oozing) point at any time, in order to avoid ash fusion oroozing. The model also takes into account the effect of coal reactivity, particle size,and steam/oxygen ratio. To partially check the validity of the model, predicted dataon the basis of the model were compared to real data on the product gas compositionfor various coals, and good agreement was attained. The authors have concludedthat the reactivity of the coals and the emissivity of the ash layer must be knownaccurately, as they have a strong influence on the temperature profiles, the maximumtemperature in the reactor, and its capacity for processing coal.
Lim et al.62 have developed a mathematical model of a spouted bed gasifierbased on simplified first-order reaction kinetics for the gasification reactions. Thespouted bed gasifier has been under development in Canada and Japan.63,64 Thespout is treated as a plug flow reactor (PFR) of a fixed diameter with cross-flowinto the annulus. The annulus is treated as a series of steam tubes, each being aplug flow reactor with no axial dispersion. The model calculates the compositionprofile of various product gases in the spout as a function of the height, radialcomposition profiles, and average compositions in the annulus at different heights,the average compositions exiting the spout and annulus, and the flow rates andlinear velocities in the spout and annulus. The model has been further developedas a two-region model including an enthalpy balance.80
Monazam et al.65 have developed a similar model for simulating the performanceof a cross-flow coal gasifier. Gasification in a cross-flow gasifier is analogous to thebatch gasification in a combustion pot. Therefore, the model equations for kineticsas well as mass and energy balances formulated were based on a batch process. Inthe cross-flow coal gasifier concept, operating temperatures are much higher than1000°C and, as such, the diffusion through the gas film and ash layer is a criticalfactor. The model also assumes shrinking unreacted core model for kinetic formu-lations. Simulation results of the model were compared to the experimental dataobtained in batch and countercurrent gasification experiments, and good agreementwas attained. It was also concluded that the performance of the gasifier depends onthe gas-solid heat transfer coefficient, whereas the particle size and the bed voidagehad a significant effect on the time required for complete gasification.
Watkinson et al.66 have developed a mathematical model to predict the gascomposition and yield from coal gasifiers. Gas composition depends on the con-tacting pattern of blast and fuel, temperature and pressure of the operation, com-position of the blast, and form of fuel feeding. The authors have presented acalculation method and the predicted data have been compared to the operatingdata from nine different types of commercial and pilot-scale gasifiers, includingTexaco, Koppers-Totzek, and Shell, Winkler-fluidized bed, and Lurgi dry ash aswell as Lurgi slagging moving bed gasifier. The model consists of elemental massbalances for C, H, O, N, and S, chemical equilibria for four key chemical reactions,and an optional energy balance. The four key reactions were partial oxidation, steamgasification, Boudouard reaction, and WGS reaction. Predictions were most accu-rate for entrained flow systems, less accurate for fluidized bed gasifiers, and uncer-tain for moving bed reactors. This was due to the lower temperatures and uncertain
© 2007 by Taylor & Francis Group, LLC

74 Handbook of Alternative Fuel Technology
volatile yields in the latter ones resulting in deviation between the calculated andexperimentally reported values.
Lee et al.67 developed a single-particle model to interpret kinetic data of coalchar gasification with H2, CO2, and H2O. Their model yields asymptotic analyticalsolutions taking into account all the major physical factors that affect and contributeto the overall gasification rate. Some of the factors taken into account involvedchanging magnitudes of internal surface area, porosity, activation energy, and effec-tive diffusivity as functions of conversion (or burnoff). Their model closely describesthe characterizing shape of the conversion vs. time curves as determined by CO2
gasification studies. The curve shape under certain restrictions leads to a “universalcurve” of conversion vs. an appropriate dimensionless time. The model developedis mathematically very simple, and all the parameters in the model equation havephysical significance. Therefore, the model is applicable to a wide variety of coalshaving different physicochemical and petrological properties. The number of adjust-able parameters in this model is only two. Their model predictions were comparedagainst experimental data obtained using a novel thermobalance reactor, and excel-lent agreement was attained.67
Gururajan et al.68, in their review, critically examined many of the mathematicalmodels developed for fluidized bed reactors. The review is primarily concerned withthe modeling of bubbling fluidized bed coal gasifiers. They also discuss the rateprocesses occurring in a fluidized bed reactor and compare some of the reportedmodels in the literature with their presentation.
When a coal particle is fed into a gasifier, it undergoes several physicochemicaltransformations, which include: (1) drying, (2) devolatilization, and (3) gasification ofthe residual char in different gaseous atmospheres. These heterogeneous reaction-transport phenomena are accompanied by a number of supplementary reactions thatare homogeneous in nature. Detailed kinetic studies are an important prerequisite forthe development of a mathematical model. Mathematical models for a bubbling flu-idized bed coal gasifier can be broadly classified into two kinds, i.e., thermodynamic(or equilibrium) and kinetic (or rate) models. Thermodynamic models predict theequilibrium compositions and temperature of the product gas based on a given set ofsteam/oxygen feed ratios, the operating pressure, and the desired carbon conversion.These models are independent of the type of the gasifier and based on the assumptionof complete oxygen consumption. Therefore, they cannot be used to investigate theinfluence of operating parameters on the gasifier performance. The kinetic model, onthe other hand, predicts the composition and temperature profiles inside the gasifierfor a given set of operating conditions and reactor configurations and hence can beused to evaluate the performance of the gasifier. They are developed by combining asuitable hydrodynamic model for the fluidized bed with appropriate kinetic schemesfor the reactive processes occurring inside the gasifier. Various rate models may beclassified into four groups on the basis of hydrodynamic models used.68 They are:
1. Simplified flow models2. Davidson-Harrison type models3. Kunii-Levenspiel type models4. Kato-Wen type models
© 2007 by Taylor & Francis Group, LLC

Gasification of Coal 75
The same review68 also examined and compared the different types of models.Although many investigators have compared their model predictions with experi-mental data, a detailed evaluation of the influence of model assumptions on itspredictions has not been reported. Although efforts have been made to compare thepredictions of different models, an attempt to evaluate the model with experimentaldata from different sources has not been made.
Gururajan et al. in their review article68 have developed a model of their ownfor a bottom feeding bubbling fluidized bed coal gasifier based on the followingassumptions:
1. The bubble phase is in plug flow and does not contain any particles,whereas the emulsion phase is completely mixed and contains the particlesin fluidized conditions.
2. Excess gas generated in the emulsion phase passes into the bubble phase.The rate of this excess per unit bed volume is constant.
3. The coal particles in the feed are spherical, homogeneous, and uniformin size.
4. Only WGS reaction occurs in the homogeneous gas phase.5. External mass transfer and intraparticle diffusion are assumed to be neg-
ligible in the char gasification reactions.6. Entrainment, abrasion, agglomeration, or fragmentation of the bed parti-
cles is assumed to be negligible.7. The gasifier is at a steady state and is isothermal.
All the model equations are derived on the basis of the preceding assumptions.The model predictions were compared with the experimental data from three pilot-scale gasifiers reported in the literature.68 They concluded that the predictions weremore sensitive to the assumptions regarding the combustion/decomposition of thevolatiles and the products of char combustion than to the rate of char gasification.Hence, in pilot-scale gasifiers, owing to the short residence time of coal particles,the carbon conversion and the product gas yields are mainly determined by the fast-rate coal devolatilization, volatiles combustion/decomposition and char combustion,and also by the slow-rate char gasification reactions. This explains why modelsbased on finite-rate char gasification reactions are able to fit the same pilot-scalegasification data.
A better understanding of coal devolatilization, decomposition of the volatiles,and char combustion under conditions prevailing in a fluidized bed coal gasifier isvery important for the development of a model with good predictive capability. Thereis a strong need to investigate the kinetics of gasification of coal and char in synthesisgas atmospheres and to obtain experimental data for the same coal and char in apilot-scale plant.
It is well known that there are many physical changes occurring when the coalchar particles are gasified. There have been many attempts to unify these dynamicchanges through various normalizing parameters such as half-life, coal rank, reac-tivity, or surface area. According to the study by Raghunathan and Yang,69 theexperimental char conversion vs. time data from different experiments can be unified
© 2007 by Taylor & Francis Group, LLC

76 Handbook of Alternative Fuel Technology
into a single curve where time is considered to be normalized time, t/t1/2, t1/2 beingthe half-life of the char-gas reaction. This unification curve with only one parameteris then fitted into the rate models commonly used, e.g., the grain model and therandom pore model. With the aid of reported correlations for unification curves, amaster curve is derived to approximate the conversion–time data for most of thegasification systems. Also, as the half-life (more precisely, half-conversion time) issimply related to the average reactivity, it can be generally used as a reactivity indexfor characterizing various char-gas reactions. Further, conversions up to 70% can bepredicted with reasonable accuracy over a wide range of temperatures.
A great deal of effort has been devoted to mathematically modeling a variety ofgasifiers and reaction conditions in order to obtain design- and performance-relatedinformation. Numerous simplified models and asymptotic solutions have beenobtained for coal gasification reactors along with a large database of digital simu-lation of such systems.
2.6 FUTURE OF COAL GASIFICATION
The roles of coal gasification have been changing constantly based on the societaldemands of the era. We observed in the past century that the principal roles and fociof coal-derived syngas shifted from domestic heating fuel, to feedstock for Fis-cher–Tropsch (F-T), to petrochemical feedstocks, to starting materials for alternativefuels, to IGCC, and to hydrogen sources. With the advent of hydrogen economy,coal gasification has again taken center stage as a means for producing hydrogenfor fuel cell applications.75 Further, coal gasification technology can also be easilyapplied to biomass and solid waste gasification with minor modifications. Unlikecoal, biomass is not only renewable, but also available inexpensively, often free ofcharge. Coal can also be coprocessed together with a variety of other materials,including petroleum products, scrap tires, biomass, municipal wastes, sewage sludge,etc. With advances in flue gas desulfurization, coal gasification can be more widelyutilized in process industries. In electric power generation, IGCC has contributedtremendously to improvement of power generation efficiency, thus keeping the costof electric power competitive against all other forms of energy. Keen interest inmethanol and dimethylether is rekindled due to the ever-rising cost of conventionalclean liquid fuel. In order to use coal gasification technology in hydrogen production,the steam gasification process, which is essentially very similar to the hydrocarbonreformation process, needs to be refined further. Therefore, more advances areexpected in the areas of product gas cleaning, separation and purification, feedstockflexibility, and integrated or combined process concepts.
REFERENCES
1. Howard-Smith, I. and Weimer, G., Coal conversion technology, Chem. Technol. Rev.,66: 1–333, 1976, Park Ridge, NJ: Noyes Data Corp.
2. Wilson, J., Halow, J., and Ghate, M.R., CHEMTECH, 123–128, February 1988.
© 2007 by Taylor & Francis Group, LLC

Gasification of Coal 77
3. Speight, J.G., The Chemistry and Technology of Coal, New York: Marcel Dekker,1983, pp. 461–516.
4. Walker, P.L., Rusinko, F., and Austin, L.G., Gas reactions in carbon, Advances inCatalysis, Eley, D.D., Selwood, P.W., and Weisz, P.B., Eds., Vol. XI, New York:Academic Press, 1959, pp. 133–221.
5. Kyotani, T., Kubota, K., and Tomita, A., Fuel Process. Technol., Vol. 36, 209–217,1993.
6. Bodle, W.W. and Vyas, K.C., Clean Fuels from Coal, Symposium Papers, Chicago,IL: Institute of Gas Technology, September 10–14, 1973, pp. 49–91.
7. Braunstein, H.M. and Pfuderer, H.A., Environmental Health and Control Aspects ofCoal Conversion: An Information Overview, Report ORNL-EIS-94, Oak RidgeNational Laboratory, Oak Ridge, TN, 1977.
8. Vyas, K.C. and Bodle, W.W., Clean Fuels from Coal — Technical Historical Back-ground and Principles of Modern Technology, Symposium II papers, IIT ResearchInstitute, 1975, pp. 53–84.
9. Rudolph, P.E.H, The Lurgi Process — The Route to SNG from Coal, presented atthe Fourth Pipeline Gas Symposium, Chicago, IL, October 1972.
10. Cooper, B.R. and Ellington, W.A., The Science and Technologies of Coal and CoalUtilization, New York: Plenum, 1984, pp.163–230.
11. Lloyd, W.G., Synfuels technology update, in The Emerging Synthetic Fuel Industry,Thumann, A., Ed., Atlanta, GA: Fairmont Press, 1981, pp.19–58.
12. Moe, J.M., SNG from Coal via the Lurgi Gasification Process, in Clean Fuels fromCoal, Symposium Papers, Chicago, IL: Institute of Gas Technology, September10–14, 1973, pp. 91–110.
13. Johnson, B.C., The Grand Forks slagging gasifier, in Coal Processing Technology,Vol. IV, A CEP technical manual, New York: AIChE, 1978, pp. 94–98.
14. Michels, H.J. and Leonard, H.F., Chem. Eng. Prog., 74(8): 85, 1978.15. Van der Bergt, M.J., Hydrocarbon Process., 58(1): 161, 1979.16. Sams, D.A. and Shadman, F., AIChE J., 32(7): 1132–1137, 1986.17. Farnsworth, J., Leonard, H.F., and Mitsak, M., Production of Gas from Coal by the
Koppers-Totzek Process, in Clean Fuels from Coal, Symposium Papers, Chicago, IL:Institute of Gas Technology, September 10–14, 1973, pp. 143–163.
18. Gas Processing Developments, Hydrocarbon Process., 41–65, May 2001.19. EPRI J., 41–44, December 1983.20. Oil Gas J., 51, April 29, 1985.21. Hydrocarbon Processing, 96, April 1984.22. Probstein, R.F. and Hicks, R.E., Synthetic Fuels, New York: McGraw-Hill, 1982.23. Thompson, P.N., Endeavor, 2: 93, 1978.24. Gregg, D.W. and Edgar, T.F., AIChE J., 24: 753, 1978.25. Commonwealth Scientific and Industrial Research Organization Web site, http://www.
em.csiro.au/ 2004.26. Juntgen H., Fuel, 66: 443–453, April 1987.27. Nadkarni, R.M., Underground Gasification of Coal, in Clean Fuels from Coal,
Symposium papers, Chicago, IL: Institute of Gas Technology, September 10–14,1973, pp. 611–638.
28. Odell, W., U.S. Bureau of Mines Information, 7415, 1974.29. Banchik, I.N., The Winkler Process for the Production of Low Btu Gas from Coal,
in Clean Fuels from Coal, Symposium II Papers, IIT Research Institute, 1975, pp.359–374.
© 2007 by Taylor & Francis Group, LLC

78 Handbook of Alternative Fuel Technology
30. Juntgen, H., Application of catalysts to coal gasification processes, incentives andperspectives, Fuel, 62: 234–238, 1983.
31. Nishiyama, Y., Fuel Process. Technol., 29: 31–42, 1991.32. Asami, K. and Ohtuska, Y., Ind. Eng. Chem. Res., 32: 1631–1636, 1993.33. Yamashita, H., Yoshida, S., and Tomita, A., Energy Fuels, 5: 52–57, 1991.34. Matsumoto, S., Energy Fuels, 5: 60–63, 1991.35. Srivastava, R.C., Srivastava, S.K., and Rao, S.K., Fuel, 67: 1205–1207, 1988.36. Haga, T. and Nishiyama, Y., Fuel, 67: 748–752, 1988.37. Ohtuska, Y. and Asami, K., Steam gasification of high sulfur coals with calcium
hydroxide, Proc. 1989 Int. Conf. Coal Sci., 1: 353–356, 1989.38. Salinas Martinez, C. and Lineras-Solano, A., Fuel, 69: 21–27, 1990.39. Joly, J.P., Martinez-Alonso, A., and Marcilio, N.R., Fuel, 69: 878–894, 1990.40. Muhlen, H.J., Fuel Process. Technol., 24: 291–297, 1990.41. Levendis, Y.A., Nam, S.W., and Gravalas, G.R., Energy Fuels, 3: 28–37, 1989.42. Zheng, Z.G., Kyotani, T., and Tomita, A., Energy Fuels, 3: 566–571, 1989.43. Muhlen, H.J., Fuel Process. Technol., 24: 291–297, 1986.44. Haga, T., Sato, M., and Nishiyama, Y., Energy Fuels, 5: 317–322, 1991.45. Pareira, P., Somorajai, G.A., and Heinemann, H., Energy Fuels, 6: 407–410, 1992.46. Xiang, R., You, W., and Shu-fen, L., Fuel, 66: 568–571, 1987.47. Takarada, T., Nabatame, T., and Ohtuska, Y., Ind. Eng. Chem. Res., 28: 505–510, 1989.48. Takarada, T., Ogirawa, M., and Kato, K., J. Chem. Eng. Jpn., 25: 44–48, 1992.49. Weeda, M., Tromp, J.J., and Moulijn, J.A., Fuel, 69: 846–850, 1990.50. Chin, G., Liu, G., and Dong, Q., Fuel, 66: 859–863.1987.51. Carrasco-Marin, F., Rivera, J., and Moreno, C., Fuel, 70: 13–16, 1991.52. Lopez, A., Carrasco-Marin, F., and Moreno, C., Fuel, 71: 105–108, 1992.53. Toshimitsu, S., Nakajima, S., and Watanabe, Y., Energy Fuels, 2: 848–853, 1988.54. Murlidhara, H.S. and Seras, J.T., Effect of calcium on gasification, in Coal Processing
Technology, Vol. IV, A CEP technical manual, New York: AIChE, 1978, pp. 22–25.55. Gallagher, J.E. and Marshall, H.A., SNG from coal by catalytic gasification, in Coal
Processing Technology, Vol. V, A CEP technical manual, New York: AIChE, 1979,pp. 199–204.
56. Cover, A.E. and Schreiner, W.C., in Clean Fuels from Coal, Symposium Papers,Chicago, IL: Institute of Gas Technology, September 10–14, 1973, pp. 273–279.
57. Cover, A.E., Schreiner, W.C., and Skaperdas, G.T., Kellogg's coal gasification process,Chem. Eng. Prog. 69(3): 31–36, 1973.
58. LaRosa, P. and McGarvey, R.J., in Clean Fuels from Coal, Symposium Papers,Chicago, IL: Institute of Gas Technology, September 10–14, 1973, pp. 285–300.
59. Recovered Energy, Inc. Web site, http:www.recoveredenergy.com/d_plasma.html,2004.
60. Resorption Canada Limited (RCL) Web site, http://www.plascoenergygroup.com.61. Adanez, J. and Labiano, F.G., Ind. Eng. Chem. Res., 29: 2079–2088, 1990.62. Lim, C.J., Lucas, J.P., and Watkinson, A.P., Can. J. Chem. Eng., 69: 596–606, 1991.63. Foong, S.K., Cheng, G., and Watkinson, A.P., Can. J. Chem. Eng., 59: 625–630, 1981.64. Watkinson, A.P., Lim, C.J., and Cheng, G., Can. J. Chem. Eng., 65: 791–798, 1987.65. Monazam, E., Johnson, E., and Zondlo, J., Fuel Sci. Technol. Int., 10(1): 51–73, 1992.66. Watkinson, A.P., Lucas, J.P., and Lim, C.J., Fuel, 70: 519–527, April 1991.67. Lee, S., Angus, J.C., Gardner, N.C., and Edwards, R.V., AIChE J., 30(4): 583–593,
1984.68. Gururajan, V.S., Agarwal, P.K., and Agnew, J.B., Trans. IChemE., 70(Part A):
211–238, 1992.
© 2007 by Taylor & Francis Group, LLC

Gasification of Coal 79
69. Raghunathan, K. and Yang, Y.K., Ind. Eng. Chem. Res., 28: 518–523, 1989.70. Skrifvars, B.-J. and Kilpinen, P., Biomass Combustion Technology in Finland, The
IFRF (Int. Flame Research Foundation), Industrial Combustion Magazine, Tech 02,March 1999, also accessible through http://www.magazine.ifrf.net/9903biomass1/turku/.
71. Teggers, H. and Schrader, L., The high-temperature Winkler process — a way forthe generation of synthesis gas from lignite, Energiewirtschaftliche Tagesfragen, 31:397–399, 1981.
72. Speight, J.G. and Lee, S., Environmental Technology Handbook, Philadelphia, PA:Taylor & Francis, 2000.
73. Levenspiel, O., Chemical Reaction Engineering, 3rd ed., New York: John Wiley &Sons, 1999.
74. Lee, S., Methane and Its Derivatives, New York: Marcel Dekker, 1997.75. U.S. Department of Energy, Fossil Energy homepage, Gasification Technology R&D,
April 2006, accessible through http://www.fossil.energy.gov/programs/powersystems/gasification/index.html.
76. Lee, A.L., Evaluation of Coal Conversion Catalysts, Final Report submitted to U.S.Department of Energy, GRI-87-0005, Gas Research Institute, Chicago, IL, 1987.
77. Gadsby, J., Hinshelwood, C.N., and Skykes, K.W., Proc. R. Soc., A187, 129, 1946.78. Johnstone, H.F., Chen, C.Y., and Scott, D.S., Ind. Eng. Chem., 44: 1564, 1952.79. Addhoch, W., Sato, H., Wolff, J., and Radtke, K., High Temperature Winkler Gasifi-
cation of Municipal Solid Waste, paper presented at 2000 Gasification TechnologiesConference, San Francisco, CA, October 8–11, 2000, accessible through http://www.gasification.org/docs/2000_Papers/Gtc00320.pdf.
80. Lucas, J.P., Lim, C.J., and Watkinson, A.P., Fuel, 77(7): 683–694, 1998.
© 2007 by Taylor & Francis Group, LLC

81
3 Clean Liquid Fuelsfrom Coal
Sunggyu Lee
CONTENTS
3.1 Background .................................................................................................... 823.2 Coal Pyrolysis For Liquid Fuel ..................................................................... 82
3.2.1 COED Process ................................................................................... 833.2.2 TOSCOAL Process ............................................................................ 853.2.3 Lurgi–Ruhrgas Process ...................................................................... 873.2.4 Occidental Flash Pyrolysis Process ................................................... 883.2.5 Clean Coke Process ........................................................................... 893.2.6 Coalcon Process ................................................................................. 89
3.3 Direct Liquefaction of Coal........................................................................... 893.3.1 Bergius-IG Hydroliquefaction Process .............................................. 923.3.2 H-Coal Process................................................................................... 923.3.3 Solvent Refined Coal (SRC-I) ........................................................... 943.3.4 Exxon Donor Solvent (EDS) Process................................................ 963.3.5 SRC-II Process................................................................................... 973.3.6 Nonintegrated Two-Stage Liquefaction (NTSL) ............................... 973.3.7 Thermal Integrated Two-Stage Liquefaction (ITSL)......................... 99
3.3.7.1 Lummus ITSL (1980–1984)............................................. 1003.3.7.2 Wilsonville ITSL (1982–1985)......................................... 102
3.3.8 Catalytic Two-Stage Liquefaction (CTSL)...................................... 1053.3.8.1 HRI’s CTSL Process ........................................................ 1063.3.8.2 Wilsonville CTSL ............................................................. 107
3.3.9 Evolution of Liquefaction Technology............................................ 1083.4 Indirect Liquefaction of Coal ...................................................................... 108
3.4.1 Fischer–Tropsch Synthesis (FTS) for Liquid Hydrocarbon Fuels .....1093.4.1.1 Reaction Mechanism and Chemistry ............................... 1093.4.1.2 Fischer–Tropsch Catalysis................................................ 1123.4.1.3 Fischer–Tropsch Processes Other than SASOL............... 113
3.4.2 Conversion of Syngas to Methanol ................................................. 1143.4.3 Conversion of Methanol to Gasoline or Target Hydrocarbons ....... 1163.4.4 Higher Alcohol Synthesis ................................................................ 119
3.5 Coal and Oil Coprocessing.......................................................................... 120References.............................................................................................................. 121
© 2007 by Taylor & Francis Group, LLC

82 Handbook of Alternative Fuel Technology
3.1 BACKGROUND
There are three principal routes by which liquid fuels can be produced from solidcoal: coal pyrolysis, direct liquefaction, and indirect liquefaction. Liquid-like fuelscan also be obtained via coal slurry technology.
Even though coal has a reasonably high heating value of approximately8,000–14,000 Btu/lb, its solid state is one of the main reasons it is inconvenient tohandle as a consumer fuel. To make this solid fuel user-friendlier, research has beenongoing to convert it into pipeline-quality gaseous fuel or clean liquid fuel. DuringWorld War II, production of approximately 100,000 bbl/d of liquid fuel from coalwas reported for the German war effort. The German liquefaction process used ahigh-temperature and high-pressure technology, and the product liquid fuels wereof environmentally poor quality by modern environmental standards as cleaning andrefining was minimal.
The current process objectives of coal liquefaction are mainly focused on easingthe severity of operating conditions, minimizing the hydrogen requirement, and mak-ing the liquid product more environmentally acceptable. Due to the recent trendtoward higher and fluctuating petroleum prices in the world market, the relativeprocess economics of coal liquefaction are changing much more favorably. Consid-ering the vast amount of coal reserves throughout the world and the global distributionof major deposits, this alternative is even more attractive and also very practical.
There are inherent technological advantages with coal liquefaction, as coalliquefaction can produce clean liquid fuels that can be sold as transportation fuels.It had long been believed that if the crude oil price stays at a level higher than about$35 per barrel for a sustainably long period, production of gasoline and diesel byliquefaction of coal would become economically competitive. Such a claim wasmade when the crude oil price was substantially lower than $35 per barrel. The crudeoil price has been sharply rising in the 21st century, and it hit the $78 mark in July2006.41 Financial experts are warning that such a high crude oil price is here to stay,rather than a temporary phenomenon. Even after considering the changes in variouseconomic factors involving energy industries, production of transportation fuels orfuel oils via coal liquefaction is certainly an outstanding option for the future. Further,the products of coal liquefaction can be refined and formulated to possess theproperties of conventional transportation fuels, requiring neither major infrastruc-tural changes in distribution nor lifestyle changes for consumers.
3.2 COAL PYROLYSIS FOR LIQUID FUEL
Pyrolysis of coal yields condensable tar, oil, and water vapor and noncondensablegases, through a process called destructive distillation, which involves cleavages ofC–C bonds in coal macromolecular structure. The C–C bond cleavage reactions arelargely responsible for the molecular weight reduction in coal hydrocarbons thatultimately converts solid fuel into liquid or gas. The solid residue of coal pyrolysisthat is left behind is called char. Therefore, char contains substantially less amountsof volatile hydrocarbons than coal and is lower in H contents as well. As implied, theratio of H/C is an effective indicator of the nature of coal product. For instance,
© 2007 by Taylor & Francis Group, LLC

Clean Liquid Fuels from Coal 83
formation of coal char from coal is in the direction of the H/C ratio decreasing, whereasconversion of coal into coal liquid is in the direction of the H/C ratio increasing. Thecondensed pyrolysis product must be further hydrogenated to remove sulfur and nitro-gen species as well as to improve the liquid fuel quality. Nitrogen and sulfur speciesnot only generate air pollutants (in forms of NOx and SOx) when combusted but alsopoison and deactivate the upgrading catalyst. As the term implies, pyrolysis involvesthermal decomposition reactions that induce mainly the cleavage of C–C bonds andpartial breakdown of C–S and C–H bonds inside the macromolecular structure of coal,thus producing lower molecular weight products such as liquid hydrocarbons.
A number of coal pyrolysis processes are commercially available. Table 3.1 listsvarious coal pyrolysis processes and their process operating conditions and yields.1
The factors affecting the process efficiency and product yield include the coal rank,coal particle size, reactor type, process mechanics, hydrogen partial pressure, reactorpressure, processing temperature, coal residence time, etc. A quick glance at Table 3.1implies that higher liquid yields are obtained with shorter residence times, and alsothat hydrogen atmosphere helps the liquid product yield.2 A shorter residence time, ifproperly managed, does not allow a sufficient reaction time to thermally crack theliquid hydrocarbons further (to gaseous hydrocarbons), thereby leaving more liquidhydrocarbons in the product stream. Adding hydrogen to coal hydrocarbons improvesthe H/C ratio high enough to increase the fluidity and to produce a liquid fuel. Hightar content in supercritically extracted coal products may be attributable to the super-critical solvent’s excellent low-temperature solubility that extracts and dissolves thetar as is. In this special case of low-temperature operation, extraction of large molecularweight hydrocarbons is taking place mainly due to the superior solvent properties ofsupercritical fluids, rather than the C–C bond breakage reaction of coal pyrolysis.
3.2.1 COED PROCESS
The COED (Char-Oil-Energy-Development) process was originally developed by theFMC Corporation. The process has been improved, and the improved version hasbecome the COED/COGAS process. The process is based on a fluidized bed tech-nology that is carried out in four successive fluidized bed pyrolysis stages at progres-sively higher temperatures. Figure 3.1 shows a schematic of the COED/COGASprocess.1 The optimal temperatures for four stages vary, depending on the propertiesof the feed coal. The temperatures of the stages are selected to be just below themaximum temperature to which the particular feed coal can be heated withoutagglomerating and plugging the fluid bed.1 Typical operating temperatures are315–345°C, 425–455°C, 540°C, and 870°C in the first, second, third, and fourth stage,respectively.2 Heat for the process is provided by combusting a portion of the productchar with a steam-oxygen mixture in the fourth stage. Hot gases flow countercurrentlyto the char and provide the hot fluidizing medium for pyrolysis stages. The gasesleaving both the first and second stages are passed to cyclones that remove the fines,but the vapors leaving the cyclones are quenched in a Venturi scrubber to condensethe oil, and the gases and oil are separated in a decanter. The gas is desulfurized andthen steam-reformed to produce hydrogen and fuel gas. The oil from the decanter is
© 2007 by Taylor & Francis Group, LLC

84H
and
bo
ok o
f Altern
ative Fuel Tech
no
logy
TABLE 3.1A Comparative Summary of Pyrolysis and Hydropyrolysis Processes
Process Developer Reactor Type
ReactionTemperature
(°C)
ReactionPressure
(psi)
CoalResidence
Time
Yield (%)
Char Oil Gas
Lurgi–Ruhrgas Lurgi–Ruhrgas Mechanical mixer 450–600 15 20 sec 45–55 15–25 30COED FMC Corp. Multiple fluidized bed 290–815 20–25 1–4 h 60.7 20.1 15.1Occidental coal pyrolysis Occidental Entrained flow 580 15 2 sec 56.7 35.0 6.6TOSCOAL Tosco Kiln-type retort vessel 425–540 15 5 min 80–90 5–10 5–10Clean coke U.S. Steel Corp. Fluidized bed 650–750 100–150 50 min 66.4 13.9 14.6Union Carbide process Union Carbide Fluidized bed 565 1000 5–11 min 38.4 29.0 16.2
© 2007 by Taylor & Francis Group, LLC
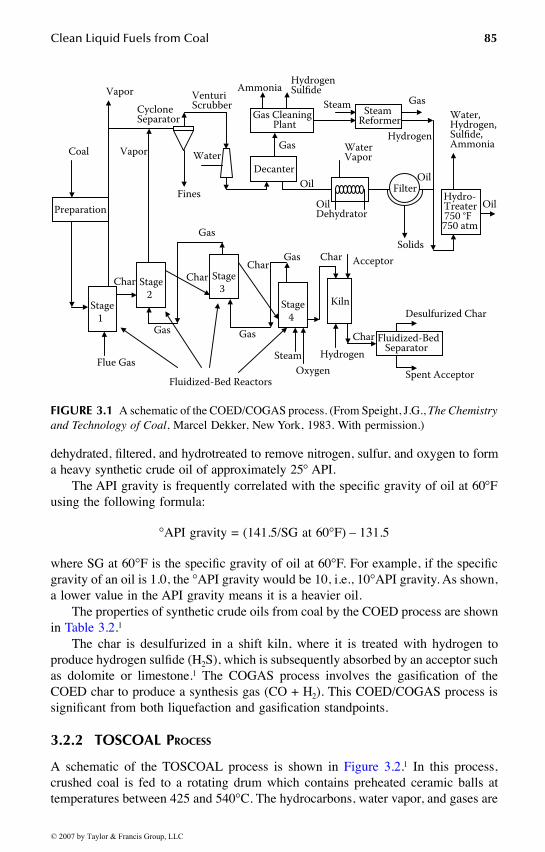
Clean Liquid Fuels from Coal 85
dehydrated, filtered, and hydrotreated to remove nitrogen, sulfur, and oxygen to forma heavy synthetic crude oil of approximately 25° API.
The API gravity is frequently correlated with the specific gravity of oil at 60°Fusing the following formula:
°API gravity = (141.5/SG at 60°F) – 131.5
where SG at 60°F is the specific gravity of oil at 60°F. For example, if the specificgravity of an oil is 1.0, the °API gravity would be 10, i.e., 10°API gravity. As shown,a lower value in the API gravity means it is a heavier oil.
The properties of synthetic crude oils from coal by the COED process are shownin Table 3.2.1
The char is desulfurized in a shift kiln, where it is treated with hydrogen toproduce hydrogen sulfide (H2S), which is subsequently absorbed by an acceptor suchas dolomite or limestone.1 The COGAS process involves the gasification of theCOED char to produce a synthesis gas (CO + H2). This COED/COGAS process issignificant from both liquefaction and gasification standpoints.
3.2.2 TOSCOAL PROCESS
A schematic of the TOSCOAL process is shown in Figure 3.2.1 In this process,crushed coal is fed to a rotating drum which contains preheated ceramic balls attemperatures between 425 and 540°C. The hydrocarbons, water vapor, and gases are
FIGURE 3.1 A schematic of the COED/COGAS process. (From Speight, J.G., The Chemistryand Technology of Coal, Marcel Dekker, New York, 1983. With permission.)
CycloneSeparator Gas Cleaning
Plant
Preparation
Decanter
Fluidized-BedSeparator
SteamReformer
Stage
4
Kiln
Hydro-Treater750 °F750 atm
Stage
3Stage
2Stage
1
Filter
Coal
Flue Gas
Vapor VenturiScrubber
Water
Fines
Vapor
Gas Gas
Steam
Oxygen
Char
Char
Spent Acceptor
Desulfurized Char
Acceptor
OilDehydrator
WaterVapor
Steam Gas
Hydrogen
Oil
Solids
Oil
Water,Hydrogen,Sulfide,Ammonia
Hydrogen
Gas
AmmoniaHydrogenSulfide
Gas
Gas
CharChar
Fluidized-Bed Reactors
Oil
Char
© 2007 by Taylor & Francis Group, LLC

86 Handbook of Alternative Fuel Technology
TABLE 3.2Synthetic Crude Oil Products from Coal by COED Process
Properties
Coal
Illinois No.6 Utah King
Analysis of hydrocarbon types (vol%)Paraffins 10.4 23.7Olefins — —Naphthenes 41.4 42.2Aromatics 48.2 34.1
°API gravity 28.6 28.5ASTM distillation (°F)
Initial boiling point (IBP) 108 26050% distilled 465 562End point 746 868
Fractionation yields (wt%)IBP–180°F 2.5180–390°F 30.2 5390–525°F 26.7 35390–650°F 51.0 65650–EP 16.3 30390–EP 67.3 95
Source: From Speight, J.G., The Chemistry and Technology of Coal, MarcelDekker, New York, 1983. With permission.
FIGURE 3.2 A schematic of TOSCOAL process.
Cooler
CoalPreparation
Cold Balls
Coal
SurgeHopper
Separator BallHeater
Lif
tP
ipe
Char
PreheatedCoal
Hot Balls
Accumulator
TrommelS creen
Pyrolysis Drum
Hot Char
Bal
l E
leva
tor
WarmBalls
Fractionator
PyrolysisVapors
Residue
GasOil
Naphtha
Gas
Air
© 2007 by Taylor & Francis Group, LLC

Clean Liquid Fuels from Coal 87
drawn off, and the residual char is separated from the ceramic balls in a revolvingdrum which has holes in it. The ceramic balls are reheated in a separate furnace byburning some of the product gas.2 The TOSCOAL process is analogous to theTOSCO process for producing overhead oil from oil shale.38 In this process analogy,the char replaces the spent shale, whereas the raw coal replaces raw oil shale.1,38 Itis noted that TOSCO is an acronym of the Oil Shale Corporation.
Table 3.3 shows the properties of liquids produced by the TOSCOAL processfrom Wyodak coal (as mined). As shown, the recovery efficiency is nearly 100%. Itshould be noted that the recovery efficiency is from the total material balanceconcept, not the conversion efficiency toward coal liquid or coal gas. As such, thehigh recovery rate of water comes from the nature of the feed coal. Wyodak coal isthe coal from the Tongue River Member of the Fort Union Formation, Powder RiverBasin, WY. It is subbituminous in rank and has a typical heating value of 8,200–8,300Btu/lb. It contains on the average 5–6% ash and less than 0.5% sulfur. It is not acoincidence that the processing temperature for the TOSCOAL process is similar tothat for the TOSCO oil shale process.38
3.2.3 LURGI–RUHRGAS PROCESS
The Lurgi–Ruhrgas (L–R) process was developed as a low-pressure process for liquidproduction from lower rank coals. This process developed in Europe is currently incommercial use. A schematic of this process is given in Figure 3.3.1
In the L–R process, crushed coal is fed into a mixer and heated rapidly to450–600°C by direct contact with hot recirculating char particles which have beenpreviously heated in a partial oxidation process in an entrained-flow reactor.1 Cycloneremoves the fines from the product gases and the liquid products are collected by aseries of condensers. The liquid products are hydrotreated to yield upgraded products.The high gas yield is due to the relatively long residence time, and the gaseousproducts include both primary and secondary products. The term secondary productis used here to clearly indicate that the product is not formed directly from the coal,
TABLE 3.3Liquid Products from Wyodak Coal (as Mined) via TOSCOAL Process
Temperature°C 425 480 520
Yield (wt%)Gas (≤C3) 6.0 7.8 6.3Oil (≥C4) 5.7 7.2 9.3Char 52.5 50.6 48.4Water 35.1 35.1 35.1
Recovery percentage 99.3 100.7 99.1
Source: From Carlson, F.B. et al., Reprints of Clean Fuels fromCoal II Symposium, Institute of Gas Technology, Chicago, IL, 1975,p. 504.
© 2007 by Taylor & Francis Group, LLC

88 Handbook of Alternative Fuel Technology
but rather by thermal decomposition of other primary products that are deriveddirectly from coal. Therefore, the reactions involved in the secondary product for-mation include gas-phase, gas-liquid, and gas-solid reactions.
3.2.4 OCCIDENTAL FLASH PYROLYSIS PROCESS
A schematic of the occidental flash pyrolysis process is given in Figure 3.4.1 In thisprocess, hot recycle char provides the heat for the flash pyrolysis of pulverized coalin an entrained flow reactor at a temperature not exceeding 760°C. The processoperates with a short residence time, thereby increasing the coal throughput and alsoincreasing the production of liquid products while minimizing the production ofgaseous products. At a short residence time at a high temperature, pyrolytic decom-position of coal hydrocarbons into liquid-range hydrocarbons actively takes place,but their further conversion into gaseous hydrocarbons is less appreciable. Like otherprocesses, cyclones remove fine char particles from the pyrolysis overhead beforequenching in the two-stage collector system.1 The first stage consists of quenchingat approximately 99°C to remove the majority of heavier hydrocarbons, whereas thesecond stage is for quenching at approximately 25°C to cause water and light oils(i.e., lower molecular weight hydrocarbons) to be removed.
FIGURE 3.3 A schematic of the Lurgi-Ruhrgas process.
CoalPreparation
Collecting
Bin
Cyclone
Flue Gas
Surge
Hopper
Product Char
Air
Mixer-Carbonizer
Char
Cyclone
Char
HeatRecovery
Condensor Product Gases
Product Oil
© 2007 by Taylor & Francis Group, LLC

Clean Liquid Fuels from Coal 89
3.2.5 CLEAN COKE PROCESS
A schematic of the clean coke process is shown in Figure 3.5.1 The process involvesfeeding oxidized clean coal into a fluidized bed reactor at temperatures up to 800°Cwhen the coal reacts to produce tar, gas, and low-sulfur char. Alternatively, the coalcan be processed by noncatalytic hydrogenation at 455–480°C and pressures of upto 340 bars of hydrogen. With direct hydrogenation of coal, the process accomplishesthe addition of hydrogen to the coal hydrocarbons while cracking the high-molecular-weight hydrocarbons into lower molecular hydrocarbons, thus increasing the H/Cratio of the fuel to a level of the liquid hydrocarbon fuel. The liquid products fromboth the carbonization and hydrogenation stages are combined for further processingto yield synthetic liquid fuels.
3.2.6 COALCON PROCESS
A schematic of the Coalcon process is shown in Figure 3.6.1 This process is based ona dry noncatalytic fluidized bed of coal particles suspended in hydrogen gas. Hot,oxygen-free flue gas is used to heat the coal to approximately 325°C and also to carrythe coal to a feed hopper. A fractionator is employed to subdivide the overhead streaminto four streams, viz., (1) gases (H2, CO, CO2, and CH4), (2) light oil, (3) heavy oil,and (4) water. Most of the char is removed from the bottom of the reactor, quenchedwith water, and cooled.1 The char can then be used as a feed to a Koppers-Totzekgasifier and reacted with oxygen and steam to produce hydrogen for the process.1
3.3 DIRECT LIQUEFACTION OF COAL
Direct liquefaction of coal is defined to mean hydroliquefaction, to distinguish itfrom pyrolysis, coprocessing, and indirect liquefaction. Hydroliquefaction more
FIGURE 3.4 A schematic of the occidental flash pyrolysis process. (From Speight, J.G., TheChemistry and Technology of Coal (Rev. Ed.), Marcel Dekker, New York, 1994.
Product Gas
SyntheticCrude Oil
Tar
Air
Flue Gas
ProductChar
H2
Preparation(Crushing)
Entrained bedCarbonizer
Hydrotreater HydrogenPlant
Cyclone Gas Cooler& Scrubber
Gas-LiquidSeparator
GasClean-Up
CharHeater
Coal
© 2007 by Taylor & Francis Group, LLC

90H
and
bo
ok o
f Altern
ative Fuel Tech
no
logy
FIGURE 3.5 A schematic of the clean coke process. (From Speight, J.G., The Chemistry and Technology of Coal (Rev. Ed.), Marcel Dekker,New York, 1994.)
Vap
orSt
irrer
Flui
dize
d-B
edC
arbo
nize
r
Ref
orm
er
Still
GasTreatment
Section
LiquidProcessing
Section
CoalPreparation
Pelletizer ContinuousCoking
Kiln
AmmoniaSulfur
EthylenePropyleneFuel Gas
Liquid FuelBenzeneNaphthaleneTars
MetallurgicalCoke
Hydrogen-richgas
Dryer
AshHot gasMedium Oil Light Oil
Liquid
Char
Gas
Gas
Liquid Liquid
Heavy OilCoal
Slurry VaporCondenser
Preheater
Light Oil
Hydrogen-RichRecycle Gas
Non
-Cat
alyt
icH
ydro
gena
tor
© 2007 by Taylor & Francis Group, LLC

Clean
Liqu
id Fu
els from
Co
al91
FIGURE 3.6 A schematic of Coalcon process. (From Speight, J.G., The Chemistry and Technology of Coal (Rev. Ed.), Marcel Dekker, New York, 1994.)
Hydrogen
LightFuel Oil
Hydrogen
Ammonia
LPG TypeFuel
CryogenicSystem
AmmoniaRecoverySystem
Acid-GasRemovalSystem
Hydrogen Sulfideto Claus Plant
Carbon Dioxide
Fractionator
Con-denser
Water
Decanter
Hydro-carbon-izationReactor
Heavy Oil
CycloneSeparator
Coal and Gas
Coal
Hydrogen
Flue Gas
Heater
Flue Gas
PulverizedCoal
Char
To CharGasifier
Fuel OilSynthesis Gasto Methanation
© 2007 by Taylor & Francis Group, LLC

92 Handbook of Alternative Fuel Technology
specifically means that liquefaction process is carried out under hydrogen environ-ment. Direct liquefaction may be categorized into single or two stages. In two-stageprocesses, the coal is first hydrogenated in a liquid-phase stage transforming it intoa deashed, liquid product; and then in a second vapor-phase hydrogenation stage,the liquid products are catalytically converted to clean, light distillate fuels. Directliquefaction has a relatively long history, and various processes have been success-fully operated on large scales. Large-scale operations of coal liquefaction, in turn,contributed tremendously to the advances of chemical process industries in allaspects of machinery, design, and knowledge. Recent processes that are ready fordemonstration or full commercialization include H-Coal, SRC-I, SRC-II, EDS, ITSL,CC-ITSL, and CTSL. In this section, several significant direct coal liquefactionprocesses are reviewed.
3.3.1 BERGIUS-IG HYDROLIQUEFACTION PROCESS
The Bergius process was operated very successfully in Germany before and duringWorld War II and was a two-stage process.2 It is currently not in use, but it contributedimmensely to the development of catalytic coal liquefaction technology. The processinvolves the catalytic conversion of coal (slurried with heavy oil) in the presence ofhydrogen and an iron oxide catalyst, at 450–500°C and 200–690 bars (197–681 atm,or 20–69 MPa). The products were usually separated into light oils, middle distillates,and residuum. Middle distillates, or mid-distillates, are a general classification ofrefined petroleum products that includes heating oil, distillate fuel oil, jet aviationfuel, and kerosene. Generally speaking, the typical boiling range of mid-distillatesis 300–750°F, and that for residuum is 600–1000°F.
These oils, except for residuum, were catalytically cracked to motor fuels andlight hydrocarbons in a vapor-phase hydrogenation stage, which serves as the secondstage of the process. Some argue that the severe conditions used in the originalprocess might have been due to the fact that German coals are much more difficultto liquefy than U.S. coals. It is truly remarkable, from a technological standpoint,that the process, under the severe process conditions of a hydrogen atmosphere, wasvery successfully operated on a large scale in the 1940s.
The residence time for catalytic conversion was about 80–85 min., which wasquite long, and hydrogen consumption was also quite significant — approximately11% by mass of the daf (dry ash-free) coal.
3.3.2 H-COAL PROCESS
The H-Coal process is a direct catalytic coal liquefaction process developed in 1963by Hydrocarbon Research, Inc. (HRI), currently Hydrocarbon Technologies Inc.(HTI). The process development proceeded through several stages from conceptual,to bench-scale (25 lb/d), to process development unit (PDU) (3 tons/d), and to apilot plant in Catlettsburg, KY (200–600 tons/d).42 This pilot plant project received$300 million in funds from the U.S. Department of Energy (DOE), the Common-wealth of Kentucky, EPRI, Mobil, AMOCO, CONOCO, Ruhrkohle, Ashland Oil,SUN Oil, Shell, and ARCO.
© 2007 by Taylor & Francis Group, LLC

Clean Liquid Fuels from Coal 93
A schematic of the H-Coal process is shown in Figure 3.7.1,4 Pulverized coal,recycle liquids, hydrogen, and catalyst are brought together in the ebullated-bedreactor to convert coal into hydrocarbon liquids and gaseous products. The catalystpellets are 0.8 to 1.5-mm diameter extrudates, and pulverized coal is of –60 mesh.The term –60 mesh denotes the particle fraction that passes through the 60-meshscreen, i.e., the particle size in this fraction is smaller than the hole opening of the60-mesh screen. Coal slurried with recycle oil is pumped to a pressure of up to 200bars and introduced into the bottom of the ebullated-bed reactor. The H-Coal processdevelopment has contributed very significantly to the field of chemical reactionengineering in the areas of multiple phase reactions as well as design of ebullatedand liquid-entrained reactors. The ebullated bed reactor is similar to a liquidentrained reactor, but much larger gas bubbles help fluidize the solid particles in agas–liquid–solid fluidized bed reactor. Therefore, relatively large coal particles canbe used in the ebullated bed reactor.
The process temperature conditions, 345–370°C, may be altered appropriatelyto produce different product slates.1 Table 3.4 shows typical product compositionsfrom the H-Coal process.1 A higher reaction temperature of 445–455°C has alsobeen successfully demonstrated for the process.4
Advantages and disadvantages of the H-Coal process are summarized in Table3.5. Like most other single-stage processes, H-Coal process is best suited for high-volatile bituminous coal.
FIGURE 3.7 A schematic of the H-coal process.
Condenser
FlashSeparator
Still
Liquid-Solid
Separator
VacuumStill
CoalPreparation
HydrogenRecovery
Preheater
Recycle Heavy Distillate
ResidualFuel
HeavyDistillateto FurtherRefining
UnreactedCarbonLiquidto Wasteor HydrogenManufacture
LightDistillateto FurtherRefining
Hydrocarbon GasHydrogen Sulfideand Ammonia toSeparation andSulfur Recovery
Hydrogen
RegeneratedCatalyst
SpentCatalyst
Solid, Liquid
SlurryLevel
CatalystLevel
RecycleTube
ImpellerShaft
Vapor
Gas
Liquid
Hydro-clone
OilEbullient BedCatalyticReactor
DistributorPlate
© 2007 by Taylor & Francis Group, LLC

94 Handbook of Alternative Fuel Technology
3.3.3 SOLVENT REFINED COAL (SRC-I)
In 1962, the Spencer Chemical Co. began to develop a process that was later takenup by Gulf Oil Co., which in 1967 designed a 50-ton/d SRC pilot plant at FortLewis, WA.4 The plant was operated in the SRC-I mode from 1974 until late 1976.In 1972, Southern Services Co. (SSC) and Edison Electric Institute (EEI) designedand constructed a 6-ton/d SRC-I pilot plant at Wilsonville, AL.
TABLE 3.4Product Compositions from the H-Coal Process
Illinois WyodakSynthetic CrudeSynthetic Crude Low-sulfur Fuel Oil
Product (wt%)C1–C3 hydrocarbons 10.7 5.4 10.2C4–200°C Distillate 17.2 12.1 26.1200–340°C Distillate 28.2 19.3 19.8340–525°C Distillate 18.6 17.3 6.5525°C + Residual Oil 10.2 29.5 11.1Unreacted ash-free coal 5.2 6.8 9.8Gases 15.0 12.8 22.7
Total (100+H2 reacted) 104.9 103.2 106.2Conversion (%) 94.8 93.2 90.2H2 consumption (scf/ton) 18,600 12,200 23,600
Source: From Speight, J.G., The Chemistry and Technology of Coal (Rev. Ed.), Marcel Dekker, NewYork, 1994.
TABLE 3.5Advantages and Shortcomings of the H-Coal Process
Advantages Disadvantages
1. Coal dissolution and upgrading to distillates are accomplished in one reactor.
1. High reaction temperature (445–455°C) results in high gas yields (12–15%) due to excessive thermal cracking.
2. Products have a high H/C ratio and low heteroatom content.
2. Hydrogen consumption is relatively high. Some distillate product is gasified to supplement hydrogen need.
3. High throughput of coal occurs due to fast reaction rates of catalytic hydrogenation.
3. Product contains considerable vacuum gas oil (345–525°C, bp), which is difficult to upgrade by standard refinery process.
4. Ash is removed by vacuum distillation, followed by gasification of vacuum tower bottoms to generate the hydrogen required for the process.
4. Due to the considerable amount of vacuum gas oil, it has utility solely as a boiler fuel.
© 2007 by Taylor & Francis Group, LLC

Clean Liquid Fuels from Coal 95
The principal objective of the original SRC-I process was to produce a solidboiler fuel with a melting point of about 150°C and a heating value of 16,000 Btu/lb.In the interest of enhancing commercial viability, the product slate was expanded toinclude liquids that were products of a Coker/Calciner, an Expanded-Bed Hydroc-racker, and a Naphtha Hydrotreater.4
SRC-I is a thermal liquefaction process in which solvent, coal, and hydrogenare reacted in a “dissolver” reactor to produce a nondistillable resid, which upondeashing can be used as a clean boiler fuel. Reaction conditions are slightly lesssevere than H-Coal process. The absence of a catalyst diminishes the hydrogenationrates and the resid has an H/C ratio about the same as the coal feed. Again, thisprocess is also ideally suited for bituminous coals, especially those containing highconcentrations of pyrite. The pyrite is considered to be the liquefaction catalyst. Aschematic of SRC-I process is shown in Figure 3.8.1
Advantages and disadvantages of SRC-I are given in Table 3.6.Nondistillable SRC-I resid products cannot be deashed by vacuum distillation.
Extraction-type separation processes were developed specifically for this process.4
Typical of these is Kerr–McGee’s Critical Solvent Deashing (CSD). This deashingprocess uses a light aromatic solvent to precipitate the heaviest (toluene-insoluble)fraction of the resid, all of the ash, and unconverted coal. This process recovers aheavy but solid-free recycle solvent. The CSD was also used for the two-stageliquefaction (TSL) processing that is discussed later in this chapter.
FIGURE 3.8 A schematic of SRC-I process. (From Speight, J.G., The Chemistry and Tech-nology of Coal (Rev. Ed.), Marcel Dekker, New York, 1994. With permission.)
Dried
Pulverized
CoalSlurry
Mixing
Tank
Pump
Dissolver
Vapor Liquid
Separators
Acid Gas
Removal
Naptha
Scrubbing
Plant Fuel
Gas
Sulfur
Vacuum
Tower
Product
SlurrySlurry
Preheater
Oxygen
PlantSteam
Gasifier
Inert Slag
Shift Conversion
and Purification
Make-up
Hydrogen
Purified Hydrogen
Light
LiquidLight
Distillate
Preheater
Wash Solvent
Filter
Product
Solidification
Solvent
Refined
Coal
Process Solvent
© 2007 by Taylor & Francis Group, LLC

96 Handbook of Alternative Fuel Technology
3.3.4 EXXON DONOR SOLVENT (EDS) PROCESS
A schematic of the EDS process is shown in Figure 3.9.1 The EDS process utilizesa noncatalytic hydroprocessing step for the liquefaction of coal to produce liquidhydrocarbons. Its salient feature is the hydrogenation of the recycle solvent, whichis used as a hydrogen donor to the slurried coal in a high-pressure reactor. Thisprocess is also considered to be a single-stage process, as both coal dissolution andresid upgrading take place in one thermal reactor. The liquefaction reaction is carriedout noncatalytically. The recycle solvent, however, is catalytically hydrogenated ina separate fixed-bed reactor.4 This solvent is responsible for transferring hydrogento the slurried coal in the high-pressure liquefaction reactor. Reaction conditions aresimilar to those of SRC-I and H-Coal.
TABLE 3.6Advantages and Disadvantages of SRC-I
Advantages Disadvantages
1. A good boiler fuel with high heating value is obtained.
2. Reaction conditions are less severe.3. The process is noncatalytic and easy to operate.
1. Distillate solvent is of poor quality.2. Solvent is frequently incorporated into the
resid product.3. Due to 2, solvent balance cannot be achieved.4. Nondistillable SRC-I resid cannot be recovered
by vacuum distillation.
FIGURE 3.9 A schematic of the Exxon Donor Solvent (EDS) process.
UnreactedCoal, Ash &
Solvent
Spent Catalysts& Oil to Filters Ash, Char
& Oil toFilters
Donor
© 2007 by Taylor & Francis Group, LLC

Clean Liquid Fuels from Coal 97
EDS solvent must be well hydrogenated to be an effective hydrogen donor. Therecycle solvent “donates” hydrogen to effect rapid hydrogenation of primary lique-faction products. Thermal hydrogenation and cracking follow this step to producedistillates.4 The product quality is slightly inferior to that of H-Coal, due to theabsence of a hydrotreating catalyst. Distillate yields are also lower than the H-Coalprocess. Overall, its process economics are still about equal to the H-Coal processbecause of the less expensive thermal reactor and the simple solids removal process.
The EDS process development started with bench-scale research in the mid-1960sand then progressed to a pilot plant study in the 1970s and 1980s with a 1 ton/d scale.The initial program of process development was completely under Exxon’s ownresponsibility, whereas the later part of development was cosponsored as a jointventure between Exxon and the U.S. DOE. In 1980, a large-scale (250 tons/d)demonstration type of installation, which was named the Exxon Coal LiquefactionPlant (ECLP), was constructed and put in operation. The plant was shut down anddismantled in 1982.
3.3.5 SRC-II PROCESS
The SRC-II process uses direct hydrogenation of coal in a reactor at high pressureand temperature to produce liquid hydrocarbon products instead of the solid productsin SRC-I. The 50-ton/d pilot plant at Fort Lewis, WA, which operated in the SRC-Imode from 1974 to 1976, was modified to run in the SRC-II mode, producing liquidproducts for testing.4 The pilot plant was successfully operated from 1978 until 1981.
The SRC-II process is a thermal process, and uses the mineral matter in the coalas the only catalyst. The mineral matter concentration in the reactor is kept high byrecycle of the heavy oil slurry. The recycled use of mineral matter and the more severereaction conditions distinguish the SRC-II operation from the SRC-I process and alsoaccount for the lighter products. The net product is –540°C distillate, which isrecovered by vacuum distillation. The term, –540°C distillate, denotes the fractionwhich comes out below 540°C of distillation temperature. The vacuum bottomsincluding ash are sent to gasification to generate process hydrogen. The SRC-IIprocess is limited to coals that contain catalytic mineral matter and therefore excludesall lower-rank coals and some bituminous coals. Pulverized coal of particle sizesmaller than 0.125 in., and the solvent-to-coal ratio of 2.0 are used for SRC-II, whereasthe solvent-to-coal ratio is 1.5 for SRC-I. The liquid product quality is inferior to thatof the H-coal process. A schematic of the SRC-II process is shown in Figure 3.10.
3.3.6 NONINTEGRATED TWO-STAGE LIQUEFACTION (NTSL)
Even though single-stage processes like EDS, SRC-I, SRC-II, and H-coal, are tech-nologically sound, their process economics suffers for the following reasons:
1. The reaction severity is high, with temperatures of 430–460°C and liquidresidence times of 20–60 min. These severe operating conditions wereconsidered necessary to achieve coal conversions of over 90% (to tetrahy-drofuran (THF) or quinoline solubles).
© 2007 by Taylor & Francis Group, LLC

98 Handbook of Alternative Fuel Technology
2. Distillate yields are low, only about 50% for mmaf (mineral matter andash free) bituminous coals and even lower for subbituminous coals.
3. Hydrogen efficiency is low due to high yields of hydrocarbon gases.4. The costs associated with the SRC-I process or the like may be too high
to produce a boiler fuel.
Based on these reasons, a coal liquefaction process is best applied to make highervalue-added products, such as transportation fuels.4 To produce higher value-addedproducts from the SRC-I process, the resid must first be hydrocracked to distillateliquids. Efforts made by Mobil and Chevron on fixed-bed hydrocracking were notentirely successful, due to the plugging of the fixed bed ashes and rapid deactivationof the catalyst by coking.
The SRC-I resid was successfully hydrotreated by LC-Fining (Lummus–Cities–Fining), a variation of ebullated-bed technology developed by Cities Services R&D.5
As a result, hydrocracking part was added to the SRC-I process to form NonintegratedTwo-Stage Liquefaction (NTSL). This rather unique name was given, because thehydrocracking part did not contribute solvent to the SRC-I part. In other words, theNTSL process was a combination of two separate processes, viz., coal liquefactionand resid upgrading. A schematic of NTSL process is shown in Figure 3.11. Evenwith the addition of the hydrocracking section, NTSL was a somewhat inefficient
FIGURE 3.10 A schematic of the SRC-II process. (From Speight, J.G., The Chemistry andTechnology of Coal (Rev. Ed.), Marcel Dekker, New York, 1994.)
Coal
Preparation(Crushing& Drying)
SlurryMixingTank
Pump
Dissolver
Vapor LiquidSeparators
AcidGas
Removal
CryogenicSeparation
PipelineGas
LPG
Sulfur
Naptha
Fuel Oil
VacuumTower
Fractionator
ProductSlurry
SlurryPreheater
OxygenPlant
Steam
Gasifier
MineralResidueSlurry
Inert Slag
Shift Conversion and Purification
Make upHydrogen
Purified Hydrogen
LightLiquid
© 2007 by Taylor & Francis Group, LLC

Clean Liquid Fuels from Coal 99
process due to the shortcomings listed earlier. SRC-I product is a less reactive feedto hydrocracking, thus requiring high-temperature (over 430°C) and low-space veloc-ity (i.e., low productivity) for complete conversion to distillates. In order to keepthe temperature and reactor size at reasonable levels, resid conversion was held below80%. NTSL operation data at the Wilsonville facility are presented in Table 3.7.Yields were higher than those for H-coal, but hydrogen consumption was still highdue to the extensive thermal hydrogenation step in the SRC-I dissolver, which wasrenamed the Thermal Liquefaction Unit (TLU).4 NTSL was short-lived and a newerintegrated approach was later developed.
3.3.7 THERMAL INTEGRATED TWO-STAGE LIQUEFACTION (ITSL)
Thermal coal dissolution studies by Consol, Mobil, and Wilsonville in the late 1970shad shown that coal conversion to tetrahydrofuran-solubles is essentially completein an extremely short time, 1–5 min. Within this short dissolution period, hydroge-nation from the gas phase is negligible, and almost all hydrogen comes from thesolvent in the liquid phase.4 If hydrogen transfer from the solvent is insufficient tosatisfy the liquefaction needs, the product will have a high concentration of toluene-insolubles, causing precipitation and plugging in the reactor or in downstreamequipment. With a well-hydrogenated solvent, however, short contact time (SCT)
FIGURE 3.11 A block diagram of NTSL process. (From Schindler, H.D., Coal Liquefaction— A Research and Development Needs Assessment, COLIRN Panel Assessment, DOE/ER-0400,UC-108, Final Report, Vol. II., March 1989.)
Slurry Preparation
Thermal Liquefaction
Distillate Solvent Recovery
Catalytic Hydrogenation
Hydrotreated Solvent Recovery
Pulverized Coal
Hydrogen
ThermalDistillate
AshConcentrate
HydrogenHydrotreatedResid (HR)
HydrotreatedDistillate
ProcessSolvent
HydrotreatedSolvent
Treated Resid
Critical Solvent Deashing
LightFractionTreatedResid
© 2007 by Taylor & Francis Group, LLC

100 Handbook of Alternative Fuel Technology
liquefaction is the preferred thermal dissolution procedure because it eliminates theinefficient thermal hydrogenation inherent in the SRC-I. Cities Services R&D suc-cessfully hydrocracked the SRC-I resids by LC-Fining at relatively low temperaturesof 400–420°C. Gas yield was low and hydrogen efficiency was high. A combinationof this process with SCT is certainly a good idea and provides a successful exampleof process integration. The low-temperature LC-Fining provides the liquefactionsolvent to the first stage SCT, thus the two stages become integrated. This combi-nation has the potential to liquefy coal to distillate products in a more efficientprocess than any of the single stage processes.4
3.3.7.1 Lummus ITSL (1980–1984)
A combination of SCT and LC-Fining was made by Lummus in the ITSL process.6
A process flow diagram of Lummus ITSL process is given in Figure 3.12. Coal isslurried with recycled solvent from LC-Fining and is converted to quinoline-solubles(or THF-solubles) in the SCT reactor. The resid is hydrocracked to distillates in theLC-Fining stage, where recycle solvent is also generated. The ash is removed by the
TABLE 3.7NTSL at Wilsonville Facility (Illinois No. 6 Coal)
Operating Conditions
Run ID 241CDConfiguration NTSLCatalyst ArmakThermal stage
Average reactor temperature (°F) 805Coal space velocity (lb/h/ft3 @ > 700°C) 20Pressure (psig) 2170
Catalytic stageAverage reactor temperature (°F) 780Space velocity (lb feed/h/lb catalyst) 1.7Catalyst age (lb resid/lb catalyst) 260–387
Yields (wt% mmaf coal)C1– C3 gas 7C4 + distillate 40Resid 23Hydrogen consumption 4.2
Hydrogen efficiencylb C4 + distillate/lb H2 consumed 9.5
Distillate selectivitylb C1-C3/lb C4 + distillate 0.18
Energy content of feed coal rejected to ash concentrate (%) 20
Source: From Schindler, H.D., Coal Liquefaction — A Research and Development Needs Assess-ment, COLIRN Panel Assessment, DOE/ER-0400,UC-108, Final Report, Vol. II., March 1989.
© 2007 by Taylor & Francis Group, LLC

Clean Liquid Fuels from Coal 101
Lummus Antisolvent Deashing (ASDA) process, which is similar to deasphaltingoperation with petroleum. The net liquid product is either –340°C or –450°C distil-late. The recycle solvent is hydrogenated +340°C atmospheric bottoms. It is therecycle of these full-range bottoms, including resid, that couples the two reactionstages and results in high yields of all distillate product.4
Some of the features of the Lummus ITSL are summarized as follows:
1. The SCT reactor is actually the preheater for the dissolver in the SRC-Iprocess, thus eliminating a long residence-time high-pressure thermaldissolution reactor.
2. Coal conversion in the SCT reactor was 92% of mmaf coal for bituminouscoals and 90% for subbituminous coals.
3. Molecular hydrogen gas consumption was essentially zero, and the hydro-gen transferred from the solvent was equivalent to 1.2–2.0% of the coalweight. Gaseous hydrocarbon yield was reduced to 1% for bituminouscoal and to 5–6% for subbituminous coal.
4. The SCT resid was more reactive to hydrocracking than SRC-I resid.5. The LC-Fining second reactor as a hydrotreater (HTR) accomplishes two
principal tasks: (1) to make essentially all of the distillate product and (2)to generate recycle solvent capable of supplying the hydrogen requiredby the SCT reactor.
6. All distillate products were produced as a result of full recycle of uncon-verted resid to the first stage.
7. A second-stage HTR temperature of 400°C provides sufficient hydroge-nation and cracking activity to accomplish both tasks.
8. Catalyst deactivation was much slower than other processes operated athigher temperatures.
9. The SCT resid was more reactive, not only for conversion to distillate,but also for heteroatom removal. Product quality surpassed those achieved
FIGURE 3.12 A schematic of integrated two-stage liquefaction (ITSL). (From Speight, J.G.,The Chemistry and Technology of Coal, Marcel Dekker, New York, 1983.)
650 °F+
850 °F+ to Gasification
Light Distillate
C5-390 Naphtha
C1-C4 Gases
H2S, NH3, H2O, COx
Hydrogen
500 – 850 °F+
650 °F+500 °F+
Recycle Solvent
Hydrogen
CoalShort Contact Time
Reaction (SCT)AntisolventDeashing
L-C Fining
AntisolventMakeup
MediumDistillate
Heavy Distillate
© 2007 by Taylor & Francis Group, LLC

102 Handbook of Alternative Fuel Technology
by the preceding processes. Chevron successfully refined the ITSL prod-ucts for specification transportation fuels.
10. The ash was removed by antisolvent deashing (ASDA), which used pro-cess-derived naphtha as antisolvent to precipitate the heaviest componentsof the resid and the solids.
11. The ASDA had the advantage of low pressure (100–1000 psi) and lowtemperature (260–282°C) operation.
Data for typical product yields by the Lummus ITSL process are given in Table3.8,4 and the product quality of the Lummus ITSL distillates is shown in Table 3.9.4
3.3.7.2 Wilsonville ITSL (1982–1985)
The Advanced Coal Liquefaction R&D Facility at Wilsonville, AL, sponsored bythe DOE, the Electric Power Research Institute (EPRI), and AMOCO, was operatedby Catalytica, Inc. under the management of Southern Company Services, Inc. TheHydrotreater (HTR) design was supplied by Hydrocarbon Research, Inc., and thedeashing technology was provided by Kerr–McGee.
The Wilsonville facility began operations as a 6-ton/d single-stage plant for SRC-I in 1974. In 1978, a Kerr-McGee Critical Solvent Deashing (CSD) unit replacedthe filtration equipment that had been used for solids removal from the SRC product.In 1981, an H-Oil ebullated-bed hydrotreater was installed for upgrading the recyclesolvent and product. In 1985, a second ebullated-bed reactor was added in thehydrotreater area to allow operation with close-coupled reactors. A schematic forthe Integrated Two-Stage Liquefaction (ITSL) configuration used at Wilsonvillefacility for bituminous coal runs is shown in Figure 3.13. A distillate yield of 54–59%of mmaf coal was confirmed, as shown in Table 3.10. It is noted that the hydrogen
TABLE 3.8Lummus ITSL Product Yields
Product
lb/100 lb mmaf Coal
Illinois 6 Wyodak
H2S, H2O, NH3, COx 15.08 23.08C1–C4 4.16 7.30
Total gas 19.24 30.38C5–390°F 6.92 1.25390–500°F 11.46 8.49500–650°F 17.26 22.46650–850°F 23.87 21.36
Total distillate product 59.51 53.56Organics rejected with ash 26.09 20.22
Grand total 104.84 104.16Molecular hydrogen consumption 4.84 4.16Hydrogen efficiency, lb distillates/lb H2 12.28 12.86Distillate yield, bbl/ton mmaf coal 3.52 3.08
© 2007 by Taylor & Francis Group, LLC

Clean Liquid Fuels from Coal 103
TABLE 3.9Lummus ITSL Distillate Product Quality (Illinois No. 6 Coal)
°API C H O N S HHV, Btu/lb
Naphtha36.8 86.79 11.15 1.72 0.18 0.16 19,41145.4 86.01 13.16 0.62 0.12 0.09 20,628
Light distillates (390–500°F)15.5 88.62 9.51 1.50 0.28 0.09 18,67322.9 87.75 11.31 0.73 0.13 0.08 19,724
Medium distillates (500–650°F)7.5 90.69 8.76 0.27 0.25 0.03 18,604
12.9 89.29 10.26 0.28 0.12 0.05 19,331Heavy distillates (650–850°F)
–1.5 91.47 7.72 0.26 0.50 0.05 18,0741.8 90.77 8.47 0.45 0.23 0.08 18,424
Source: From Schindler, H.D., Coal Liquefaction — A Research and DevelopmentNeeds Assessment, COLIRN Panel Assessment, DOE/ER-0400,UC-108, FinalReport, Vol. II., March 1989.
FIGURE 3.13 A block diagram of the ITSL process. (From Schindler, H.D., Coal Liquefaction— A Research and Development Needs Assessment, COLIRN Panel Assessment, DOE/ER-0400,UC-108, Final Report, Vol. II., March 1989. With permission.)
Slurry Preparation
Thermal Liquefaction
Distillate Solvent Recovery
Catalytic Hydrogenation
Hydrotreated Solvent Recovery
Pulverized Coal
Hydrogen
ThermalDistillate
AshConcentrate
Hydrogen
HydrotreatedDistillate
ProcessSolvent
Treated Resid
Critical Solvent Deashing
© 2007 by Taylor & Francis Group, LLC

104H
and
bo
ok o
f Altern
ative Fuel Tech
no
logy
TABLE 3.10ITSL and NTSL Operation Data at Wilsonville Facility (Illinois No. 6 Coal)
Operating ConditionsRun ID 241CD 7242BC 243JK/244B 247D 250D 250G(a)Configuration NTSL ITSL ITSL RITSL CC-ITSL CC-ITSLCatalyst Armak Shell324M Shell324M Shell324M Amocat IC Amocat ICThermal Stage
Average reactor temperature (°F) 805 860 810 810 824 829Coal space velocity, lb/h/ft3 @ > 700°C 20 43 28 27 20 20Pressure, psig 2170 2400 1500–2400 2400 2500 2500
Catalytic stageAverage reactor temperature (°F) 780 720 720 711 750 750Space velocity, lb feed/h/lb catalyst 1.7 1.0 1.0 0.9 2.08 2.23Catalyst usage, lb resid/lb catalyst 260–387 278–441 380–850 446–671 697–786 346–439
Yields (wt% mmaf Coal)C1–C3 gas 7 4 6 6 7 8C4+ distillate 40 54 59 62 64 63Resid 23 8 6 3 2 5Hydrogen consumption 4.2 4.9 5.1 6.1 6.1 6.4Hydrogen efficiency
lb C4+ distillate/lb H2 consumed 9.5 11 11.5 10.2 10.5 9.8Distillate selectivity
lb C1–C3/lb C4+ distillate 0.18 0.07 0.10 0.10 0.11 0.12Energy content of feed coal rejected to Ash Concentrate (%)
20 24 20–23 22 23 16
Source: From Schindler, H.D., Coal Liquefaction — A Research and Development Needs Assessment, COLIRN Panel Assessment, DOE/ER-0400,UC-108, Final Report, Vol. II., March 1989.
© 2007 by Taylor & Francis Group, LLC

Clean Liquid Fuels from Coal 105
efficiency for the ITSL based on the distillate productivity per hydrogen consumptionis substantially increased from that for the NTSL result.
Lummus enhanced the ITSL process by increasing the distillate yield by placingthe deasher after the second stage, with no detrimental effect of ashy feed on catalystactivity. This enhanced process is called reconfigured two-stage liquefaction(RITSL), as illustrated in Figure 3.14. The process improvements were experimen-tally confirmed at Wilsonville facility. The enhancements included higher distillateyield, lower resids, and less energy rejects.
With the deasher placed after the second stage reactor and the two stagesoperating at about the same pressure, the two reactors were close-coupled to mini-mize holding time between the reactors and to eliminate pressure letdown andrepressurizing between stages.4 This enhancement was called close-coupled ITSL(or CC-ITSL). The improved results were evidenced by higher distillate yield, lowerresids, and lower energy reject.
3.3.8 CATALYTIC TWO-STAGE LIQUEFACTION (CTSL)
Beginning in 1985, all PDU programs in the U.S. have used two catalyst stages. Thetwo-stage liquefaction was found much more effective than the single stage. Asmentioned earlier, all single-stage liquefaction processes have faced difficulties inconverting subbituminous coal into soluble liquids, though they can handle bitumi-nous coals satisfactorily.
FIGURE 3.14 A block diagram of the RITSL process. (From Schindler, H.D., Coal Lique-faction — A Research and Development Needs Assessment, COLIRN Panel Assessment,DOE/ER-0400,UC-108, Final Report, Vol. II., March 1989.)
Slurry Preparation
Thermal Liquefaction
Distillate Solvent Recovery
Hydrotreated Solvent Recovery
Critical Solvent Deashing
Hydrogen
ThermalDistillate
Hydrogen
HydrotreatedDistillateHydrogen
AshConcentrate
ProcessSolvent
Hydrotreated Resid
Catalytic Hydrogenation
© 2007 by Taylor & Francis Group, LLC

106 Handbook of Alternative Fuel Technology
3.3.8.1 HRI’s CTSL Process
In 1982, Hydrocarbon Research, Inc. (currently, Hydrocarbon Technologies, Inc. (HTI),a division of Headwaters, Inc.) initiated the development of a catalytic two-stage con-cept, overcoming the drawbacks of H-coal, which is inherently a high-temperaturecatalytic process.42 The first-stage temperature was lowered to 400°C to more closelybalance hydrogenation and cracking rates and to allow the recycle solvent to be hydro-genated in situ to facilitate hydrogen transfer to coal dissolution. The second stage wasoperated at higher temperatures (435–440°C) to promote resid hydrocracking and gen-erate an aromatic solvent, which is then hydrogenated in the first stage.4 The lower first-stage temperature provides better overall management of hydrogen consumption andreduced hydrocarbon gas yields.4,7 A schematic of this process is shown in Figure 3.15.4
The HRI’s CTSL had three major changes in comparison to the H-coal process.The first was the two-stage processing; the second was incorporation of a pressurefilter to reduce resid concentration in the reject stream (filter cake) below the 45–50%in the vacuum tower bottoms of the H-coal process; and the third change is in thecatalyst itself. The H-coal process used a cobalt-molybdenum (CoMo)-on-aluminacatalyst, American Cyanamid 1442 B, which had been effective in hydrocrackingpetroleum resids. In coal liquefaction, hydrogenation must occur first, followed bythermal cracking of hydroaromatics, whereas in petroleum applications the contraryis true. Therefore, the H-coal catalyst was found unsuitable due to its porosity distri-bution, which was designed for smaller molecules. For CSTL, the H-coal catalyst wasreplaced by a nickel-molybdenum (NiMo) catalyst of a bimodal pore distribution with
FIGURE 3.15 A schematic of HRI’s CTSL.
First-StageEbullated-
BedReactor
Second-Stage
Ebullated-Bed Cold Separator
Condensor
WaterSeparation
AtmosphericStill
Overhead
AtmosphericStill Bottom
Cold SeparatorCollection Pot
Flash Gas
SlurryFeed
Separator BottomCollection Pit
ContinuousAtmospheric
Still
Recycle OilCoal
SampleSystem
H2
H2
HotSeparator
Vent Gas
© 2007 by Taylor & Francis Group, LLC

Clean Liquid Fuels from Coal 107
larger micropores (115–125 Angstroms) as opposed to 60–70 Angstroms for the H-coal catalyst. The nickel promoter is also more active for hydrogenation than cobalt.Table 3.11 shows a comparison between H-coal and HRI CTSL.4
As shown in the table, the two-stage catalytic reaction produces a liquid withlow heteroatom concentrations and a high H/C ratio, thus making the product closerto petroleum than other coal liquids made by earlier processes. Their later-versionenhanced process is named the HTI coal process.42 The modern version of thisprocess uses HTI’s proprietary GelCatTM catalyst, which is a dispersed, nano-scale,iron-based catalyst.42
3.3.8.2 Wilsonville CTSL
A second ebullated-bed reactor was added at the Wilsonville Advanced Coal Lique-faction Facility in 1985. Since then, the plant has been operated in the CTSL mode.As in ITSL, Wilsonville preferred to have most of the thermal cracking take placein the first reactor and solvent hydrogenation in the second reactor.4 Therefore, thefirst reactor was at higher temperature (426–438°C), whereas the second reactor waskept lower at 404–424°C. A flow diagram of Wilsonville CTSL is shown in Figure
TABLE 3.11CTSL vs. H-Coal Demonstration Runs on Illinois No.6 Coal
H-Coal CSTL
PDU-5 (227-20) (227-47) Yields (wt% mmaf coal)
C1–C3 11.3 6.6 8.6C4–390°F 22.3 18.2 19.7390–650°F 20.5 32.6 36.0650–975°F 8.2 16.4 22.2975°F + Oil 20.8 12.6 2.7
Hydrogen consumption (wt% mmaf coal) 6.1 6.3 7.3Coal conversion (wt% mmaf coal) 93.7 94.8 96.8975°F+ conversion (wt% mmaf coal) 72.9 82.2 94.1C4-975°F (wt% mmaf coal) 51.0 67.2 77.9Hydrogen efficiency 8.4 10.7 10.7C4 + distillate product quality
EP (°F) 975 975 750°API 26.4 23.5 27.6% Hydrogen 10.63 11.19 11.73% Nitrogen 0.49 0.33 0.25% Sulfur 0.02 0.05 0.01bbl/ton 3.3 4.1 5.0
Source: From Speight, J.G., The Chemistry and Technology of Coal, Marcel Dekker,New York, 1983.
© 2007 by Taylor & Francis Group, LLC

108 Handbook of Alternative Fuel Technology
3.16.4 Run data of Wilsonville CTSL are summarized in Table 3.12. Distillate yieldsof up to 78% and reduced organic rejection to 8–15% were achieved at Wilsonvilleoperating over 4 tons of coal per day.
3.3.9 EVOLUTION OF LIQUEFACTION TECHNOLOGY
An extensive review by COLIRN (Coal Liquefaction Research Needs) panelassessment4 was published by the DOE. Substantial technological innovations andenhancements have been realized for the last several decades of the 20th century,especially in the areas of process configurations and catalysts. Table 3.13 summa-rizes the history of process development improvements in the form of yields anddistillate quality.4,8
Distillate yields have increased from 41 to 78%, resulting in equivalent liquidyields of about 5 bbl/ton of mmaf bituminous coal. The distillate quality wascomparable to or better than No. 2 fuel oil with good hydrogen content and lowheteroatom content.
3.4 INDIRECT LIQUEFACTION OF COAL
The indirect liquefaction of coal involves the production of synthesis gas mixturefrom coal as a first stage and the subsequent catalytic production of hydrocarbonfuels and oxygenates from the synthesis gas as a second stage. Indirect liquefactioncan be classified into two principal areas9:
FIGURE 3.16 A flow diagram of CSTL with a solids recycle at Wilsonville.
Pulverized Coal
Slurry Preparation
Thermal Liquefaction
Catalytic Hydrogenation
Critical Solvent Deashing
HydrotreatedSolvent Recovery
Ash Concentrate
Solvent/Resids/Solids
H2
H2
HydrotreatedDistillates
Hydrotreated Resids+ Ash
© 2007 by Taylor & Francis Group, LLC

Clean Liquid Fuels from Coal 109
1. Conversion of syngas to light hydrocarbon fuels via Fischer–Tropschsynthesis (FTS).
2. Conversion of syngas to oxygenates such as methanol, higher alcohols,dimethylether (DME), and other ethers.
3.4.1 FISCHER–TROPSCH SYNTHESIS (FTS) FOR LIQUID HYDROCARBON FUELS
The FTS process is currently being operated commercially. The SASOL plant inSouth Africa has been in operation since 1956. A generalized flowsheet for theSASOL plant is shown in Figure 3.17.44
3.4.1.1 Reaction Mechanism and Chemistry
FTS follows a simple polymerization reaction mechanism, the monomer being a C1-species derived from CO. This polymerization reaction follows a molecular-weightdistribution (MWD) described mathematically by Anderson,10 Schulz,11 and Flory.12
TABLE 3.12CTSL Operation Data at Wilsonville Facility
Operating Conditions
Run ID 253A 254G 251-IIIBConfiguration CTSL CTSL CTSLCoal Illinois No.6 Ohio No. 6 WyodakCatalyst Shell 317 Shell 317 Shell 324First stage
Average reactor temperature (°F) 810 811 826Inlet hydrogen partial pressure (psi) 2040 2170 2510Feed space velocity (lb/h/lb catalyst) 4.8 4.3 3.5Pressure (psig) 2600 2730 2600Catalyst age (lb resid/lb catalyst) 150–350 1003–1124 760–1040
Catalytic stageAverage reactor temperature (°F) 760 790 719Space velocity (lb feed/h/lb catalyst) 4.3 4.2 2.3Catalyst age (lb resid/lb catalyst) 100–250 1166–1334 371–510
Yield (wt.% of mmaf Coal)C1–C3 gas 6 8 11C4+ distillate 70 78 60Resid ~1 ~1 2Hydrogen consumption 6.8 6.9 7.7
Hydrogen efficiencylb C4+ distillate/lb H2 consumed 10.3 11.3 7.8
Distillate selectivitylb C1–C3/lb C4+ distillate 0.08 0.11 0.18
Energy content of feed coal rejected to ash concentrate (%) 20 10 15
© 2007 by Taylor & Francis Group, LLC

110H
and
bo
ok o
f Altern
ative Fuel Tech
no
logy
TABLE 3.13History of Liquefaction Process Development for Bituminous Coal
Process Configuration
Distillate(wt%
mmaf Coal)
Yield(bbl/ton
mmaf Coal) °API Gravity
Nonhydrocarbon (wt%)
S O N
SRC II (1982) One-stage noncatalytic 41 2.4 12.3 0.33 2.33 1.0H-Coal (1982) One-stage catalytic 52 3.3 20.2a 0.20 1.0 0.50RITSL, Wilsonville (1985) Integrated two-stage, thermal–catalytic 62 3.8 20.2b 0.23 1.9 0.25CTSL, Wilsonville (1986) Integrated close-coupled two-stage
catalytic–catalytic70 4.5 26.8b 0.11 < 1 0.16
CTSL, Wilsonville (1987) Integrated close-coupled two-stage low–ash coal
78 5.0 —c —c —c —c
CTSL, HRI (1987) Catalytic–catalytic 78 5.0 27.6 0.01 — 0.25
a Light product distribution, with over 30% of product in gasoline boiling range; less than heavy turbine fuel.b Higher boiling point distribution, with 30% of product in gasoline fraction and over 40% in turbine fuel range.c Data unavailable
Source: From Schindler, H.D., Coal Liquefaction — A Research and Development Needs Assessment, COLIRN Panel Assessment, DOE/ER-0400,UC-108, FinalReport, Vol. II., March 1989.
© 2007 by Taylor & Francis Group, LLC

Clean Liquid Fuels from Coal 111
Recognizing these two independent groups’ work, the description of the FTS productdistribution is usually referred to as the Anderson–Schulz–Flory (ASF) distribution,which is generally accepted and frequently used. The ASF distribution equation iswritten as:
FIGURE 3.17 A generalized flowsheet for the SASOL plant. (From Hoogendorn, J.C. andSalomon, J.M., Br. Chem. Eng., 2: 238, 1957. With permission.)
Nitrogen
Water
Coal
Toluol
Liquor
Air Oxygen PlantOxygen
Crude Phenols
Ammonium SulfatePhenosolvan
Tar Distillation
Road Prime
Creosote
Pitch
Tar
Gasifier Condensates
ProcessOxygen
Raw Gas
Gasification
Rectisol-GasPurifcation
NaphthaHydrogentation
Batch Distillation ofNaphtha
Entrainer Benzene
Motor Benzole
Xylol
Light Naphtha
Heavy Naphtha
Raw NaphthaRaw Naphtha
Pure Gas,Low Ratio
Pure Gas,High Ratio
Reactor WaxFixed-bedSynthesis
VacuumDistillation
Wax Hydrogenation
Wax Deoiling
Paraforming
ReactorWax
Hard Waxes
Soft Waxes
Medium Waxes
Superhard Wax
Fuel Oil, CrackingStock, Etc.
Distillation andRefining
Bottoms
Hot CondensateC3+C4
Diesel Oil
Gasoline
ParaffinPetroleumFraction
Rectisol Wash
Cold CondensateTail Gas
Gas Re-forming Tail Gas
CatalyticPolymerization
Olefins
Gas Absorption Olefins
External Recycle
Fluid-BedSynthesis
Tail Gas Light Oil
Liquid Hydrocarbon Recovery
Light Oil
Heavy Oil
Primary ChemicalsRecovery
Secondary Recovery andBatch Distillation
Alcohols
Solvents
NeutralizationEvaporation
Water-SoluableChemicals
Power Station
Process Water, Steam,and Electricity
Fly Ash
Higher Ketones
Acetone
Methyl Ethyl Ketone
Methanol
Motor Alcohol
Ethanol
C3 and Higher Alcohols
Salts of Lower Fatty Acids
Lower Petroleum Gases
© 2007 by Taylor & Francis Group, LLC

112 Handbook of Alternative Fuel Technology
log(wn /n) = n log x + log[(1 – x)2 / x]
where wn, n, and x are the mass fraction, the carbon number, and the probability ofchain growth, respectively. This equation can predict the maximum selectivity attain-able by an FTS with an optimized process and catalyst, as shown in Table 3.14.
From a linear plot of log (wn /n) versus n, the chain growth probability can becomputed either from the slope (log x) or from the intercept, log ((1 – x)2 /x). Thesepredicted values are valid whether the products are hydrocarbons only (i.e., par-affins and olefins) or hydrocarbons plus alcohols (i.e., a mixture of paraffins,olefins, and alcohols).
3.4.1.2 Fischer–Tropsch Catalysis
According to the ASF equation, catalysts with a small value of x (i.e., a lower chaingrowth probability) produce a high fraction of methane. On the other hand, a largex value indicates the production of heavier hydrocarbons. The latest FTS processesaim at producing high-molecular-weight products and very little methane, and thencracking these high MW substances to yield lower hydrocarbons. There have beennumerous attempts to surpass or exceed the ASF distribution so that one couldproduce liquid fuels in yields that exceed those predicted by the ASF equation.
Inexpensive iron catalysts are used for the FTS. These catalysts are prepared byfusing iron oxides such as millscale oxides. In practice, either an alkali salt or oneor more nonreducible oxides are added to the catalyst.4 A great deal of literaturedata are available; however, very few share the common grounds in their catalystpretreatment, catalyst ingredients, catalyst preparation, and reactor design and con-figuration, making direct comparison of the results very difficult, if not impossible.
In FTS, removal of wax formed by the reaction is crucial as it can disable thecatalytic activity. The SASOL plants furnish a major portion of South Africa’srequirements for fuels and chemicals. Data on the existing SASOL plants are givenin Table 3.15.
An approximate distribution of products from SASOL-2 operation is given inTable 3.16.13
TABLE 3.14Maximum Selectivities Attainable by FTS
Product Maximum Selectivity (wt%)
Methane 100Ethylene 30Light olefins (C2-C4) 50Gasoline (C5-C11) 48
Source: From Schindler, H.D., Coal Liquefaction — A Research and Devel-opment Needs Assessment, COLIRN Panel Assessment, DOE/ER-0400,UC-108, Final Report, Vol. II., March 1989.
© 2007 by Taylor & Francis Group, LLC

Clean Liquid Fuels from Coal 113
3.4.1.3 Fischer–Tropsch Processes Other than SASOL
There have been a great number of publications and patents on other FTS catalysts,mainly cobalt, ruthenium, nickel, rhodium, and molybdenum. However, none ofthese has been commercially verified either by SASOL or by other efforts.
Modern gasifiers, as discussed in Chapter 2, produce syngas with low (0.6–0.7)H2/CO ratios. Iron is known as a good water gas shift (WGS) catalyst, whereasneither cobalt nor ruthenium is active for the reaction. In the absence of water gasshift reaction, the oxygen in CO is rejected as water gas so that a syngas with anH2/CO ratio of two is needed to produce olefins or alcohols.13 For synthesis ofparaffins, an H2/CO ratio of larger than two is required. When water is formed inthe FTS, it can react with CO to form more H2 by the WGS reaction, so that syngaswith a low H2/CO ratio can still be used with these catalysts. This is the reason whythe water gas shift reaction is very important in the FTS.
Recent efforts involve slurry Fischer–Tropsch (F-T) reactors. Mobil, in the 1980s,studied upgrading a total vaporous F-T reactor effluent over ZSM-5 catalyst. Shell,
TABLE 3.15SASOL Plants
Plant Location Start DateCoalt/d
Liquidsbbl/d
Cost$ billion
SASOL-1 Sasolburg, S. Africa 1935 6,600 6,000 —SASOL-2 Secunda, S. Africa 1981 30,000 40,000 2.9SASOL-3 Secunda, S. Africa 1982 30,000 40,000 3.8
Source: From Schindler, H.D., Coal Liquefaction — A Research and Development Needs Assess-ment, COLIRN Panel Assessment, DOE/ER-0400,UC-108, Final Report, Vol. II., March 1989.
TABLE 3.16Product Distribution of SASOL-2
Product Tons/Year
Motor fuels 1,650,000Ethylene 204,000Chemicals 94,000Tar products 204,000Ammonia (as N) 110,000Sulfur 99,000Total saleable products 2,361,000
Source: From Wender, I., Review of Indirect Liquefaction, in Coal Lique-faction, USDOE Contract DE-AC01-87-ER 30110, Ed., Schindler, H.D.(Chairman of COLIRN), Final Report, March 1989.
© 2007 by Taylor & Francis Group, LLC

114 Handbook of Alternative Fuel Technology
in 1985, announced its SMDS (Shell Middle-Distillate Synthesis) process for theproduction of kerosene and gas oil from natural gas.14 This two-stage process involvesthe production of long-chain hydrocarbon waxes and subsequent hydroconversionand fractionation into naphtha, kerosene, and gas oil. UOP characterized F-T waxand its potential for upgrading.14 Dow has developed molybdenum catalysts with asulfur tolerance up to about 20 ppm. The catalyst system is selective for the synthesisof C2-C4 hydrocarbons, especially when promoted with 0.5–4.0 wt% potassium.13
Using a precipitated iron catalyst, the slurry F-T reactor operating with a finelydivided catalyst suspended in an oil reactor medium, has been shown to yield highsingle-pass syngas conversion with low H2/CO ratios.13–16 A great number of studiesinvolving three-phase slurry reactors have been published. Development of F-Tsynthesis process has scientifically contributed to the design and analysis of multi-phase reactor systems.
Most recently, China and South Africa announced a major collaborative projectin indirect coal liquefaction.43 Shenhua group, China’s largest coal producer, andSASOL of South Africa are main entities involved in this venture. The new Chineseplants, once completed, would have a total annual production capacity of 60 milliontons of oil.43
3.4.2 CONVERSION OF SYNGAS TO METHANOL
The synthesis of methanol from syngas is a well-established technology. Becauseliquid hydrocarbon of methanol is synthesized from coal via syngas as an interme-diate, the coal-to-methanol synthesis process is classified as an indirect coal lique-faction process. Synthesis gas is produced via gasification of coal, by biomassgasification, or via steam reforming of natural gas. Therefore, the profitability of amethanol plant is made on a case-by-case basis to account for location-specificfactors such as energy resources, consumption infrastructure, environmental impact,and capital cost. Methanol plants exist where there are large reserves of competitivelypriced natural gas or coal, or where there are large captive uses for product methanolby neighboring chemical plants.
The advent of methanol synthesis has given a boost to the value of natural gas.Conventional steam reforming produces hydrogen-rich syngas at low pressure. How-ever, this process is well suited to the addition of carbon dioxide, which utilizes theexcess hydrogen and hence increases the methanol productivity.17
The global methanol demand increased about 8%/year from 1991 to 1995, then3–4%/year over the next 10-year period following 1995. In 2005, the global demandfor methanol amounted to about 32 million tons per year, with growth rates at or nearGDP. Due to the decline and phaseout of MTBE in recent years, the regional demandfor methanol has suffered in some countries, especially in North America and Europe.Nonetheless, the global demand of methanol is still expected to grow steadily at ornear the GDP growth rate. Asia, especially China, will be the main driver for growthregarding the demand of methanol and its derivatives. Average growth rates for Asiaare expected to be 3.8% for methanol, 4.8% for acetic acid, and 4.4% for formalde-hyde.39 The breakdown of the methanol demand is given in Table 3.17.39 A detailedanalysis of methanol market is published annually by Chemical Market Associates,
© 2007 by Taylor & Francis Group, LLC

Clean Liquid Fuels from Coal 115
Inc. (CMAI).40 This report provides information on supply, demand, production, his-tory, and forecasts for methanol capacity, trade, and pricing.
All industrially produced methanol is made by the catalytic conversion of syn-thesis gas containing carbon monoxide, carbon dioxide, and hydrogen as the maincomponents. Modern commercial methanol processes can be classified into vapor-phase low-pressure synthesis and liquid-phase low-pressure synthesis.17,18,20 Theformer is more conventional and dominates in the current marketplace. This low-pressure vapor-phase process replaced its earlier version of high-pressure technologyand is more suited for H2 -rich synthesis gas of typical H2/CO ratio ranging between2 and 3.17,19 The latter technology of liquid-phase synthesis is more recent in itsdevelopment and more suitable for CO-rich synthesis gas of the typical H2/CO ratioranging from 0.6 to 0.9. As discussed in Chapter 2, CO-rich syngas is producedtypically by modern coal gasifiers.
Methanol productivity can be enhanced by synthesis gas enrichment with addi-tional carbon dioxide to a certain limit.17 There is an optimal concentration of carbondioxide, which is dependent upon the process type (vapor phase vs. liquid phase),synthesis gas feed compositions, and operating temperature and pressure conditions.However, if too much CO2 is present in the syngas, it accelerates catalyst deactiva-tion, shortens its lifetime, and produces water, which adversely affects the catalystmatrix stability resulting in crystallite growth via hydrothermal synthesis phenom-ena.17 Although this statement is generally true for vapor phase synthesis of methanol,it was also found that a high concentration of CO2 helps the catalyst structuralstability by formation of ZnCO3 on the original Cu/ZnO/Al2O3 catalyst. As a differentapproach, a special catalyst has also been designed to operate under high CO2
conditions. The catalyst’s crystallites are located on energetic stable sites that lowerthe tendency to migrate. This stability also minimizes the influence of water formedon the catalyst matrix, which is only slightly affected. This catalyst preserves its
TABLE 3.17Methanol Demand by Chemicals and End Uses
Chemicals and End Uses %
Formaldehyde 36Methyl t-butyl ether (MTBE) 25Acetic acid 11Solvents 4Methyl methacrylate (MMA) 3Gas and fuels 3Dimethyl terephthalate (DMT) 2Others (manufacturing other chemicals) 16Total 100
Source: From a Web site by Lurgi on Methanol market and Technology, 2006; accessiblethrough http://www.lurgi.de/lurgi_headoffice_kopie/english/nbsp/menu/products/gas_to_petrochemicals_and_fuels/methanol/markets/index.html. With permission.
© 2007 by Taylor & Francis Group, LLC

116 Handbook of Alternative Fuel Technology
higher activity due to a lower deactivation rate over long-term operations.17 Thebasic reactions involved in methanol synthesis are:
CO2 + 3H2 = CH3OH + H2O ∆H°298 = 52.81 kJ/mol (3.1)
CO + 2H2 = CH3OH ∆H°298 = 94.08 kJ/mol (3.2)
CO + H2O = CO2 + H2 ∆H°298 = 41.27 kJ/mol (3.3)
Of the three reactions, only two are stoichiometrically independent. In otherwords, material balance of the above reaction system would only require any twoof the three stoichiometric equations. The chemical mechanism of the methanolsynthesis over the Cu/ZnO/Al2O3 catalyst has been somewhat controversial.13,15,17
The controversy involved whether the synthesis of methanol over the Cu/ZnO/Al2O3
goes predominantly via CO2 hydrogenation (Equation 3.1) or via CO hydrogenation(Equation 3.2). Along with the synthesis reaction, the second companion reactionwas automatically in the middle of the controversy. In this case, the controversy waswhether water gas shift reaction proceeds forward or backward under normal syn-thesis conditions over the very same catalyst. However, more experimental evidencespoint toward the theory that methanol synthesis over the Cu/ZnO/Al2O3 proceedspredominantly via the CO2 hydrogenation and the forward water gas shift reac-tion,14,17,18,21,22 as:
CO2 + 3H2 = CH3OH + H2O
CO + H2O = CO2 + H2
More detailed discussions on the methanol synthesis technology are availablein Chapter 9.
3.4.3 CONVERSION OF METHANOL TO GASOLINE OR TARGET HYDROCARBONS
Methanol itself can be used as a transportation fuel just as liquefied petroleum gas(LPG) and ethanol. However, direct use of methanol as a motor fuel in passengervehicles would require nontrivial engine modifications and substantial changes inthe lubrication system. Even though methanol has a high octane rating and is bymolecular formula an excellent candidate of oxygenated hydrocarbon, its use asgasoline blending chemical is also limited due to its high Reid vapor pressure (RVP)that is a measure of affected volatility of blended gasoline. This is one of the reasonswhy the conversion of methanol to gasoline is quite appealing.23,24
The Mobil Research and Development Corporation developed the methanol-to-gasoline (MTG) process. The process technology is based on the catalytic reactionsusing the zeolites of the ZSM-5 class.25,26 MTG reactions can be written as:
n CH3OH → ( −CH2− )n + nH2O
© 2007 by Taylor & Francis Group, LLC

Clean Liquid Fuels from Coal 117
The detailed reaction path is described in Reference 26. The following simplifiedsteps describe the overall reaction path:
2CH3OH = (CH3)2O + H2O
(CH3)2O → light olefins + H2O
light olefins → heavy olefins
heavy olefins → paraffins
aromatics
naphthenes
The MTG reactions are exothermic and go through the dimethylether (DME) inter-mediate route. As shown, the conversion of methanol to dimethylether is via dehy-dration process.
Based on the shape-selective pore structure of the ZSM-5 class catalysts, theproduct hydrocarbons can be tailor-made to fall predominantly in the gasoline boilingrange. The product distributions are influenced by the temperature, pressure, thespace velocity, the reactor type, and Si /Al ratio of the catalyst.27 Paraffins aredominated by isoparaffins, whereas aromatics are dominated by highly methyl-substituted aromatics. C9
+ aromatics are dominated by symmetrically methylatedisomers, reflecting the shape selective nature of the catalyst. The C10 aromatics aremostly durene (1,2,4,5- tetramethylbenzene), which has an excellent octane numberbut the freezing point is very high at 79°C. Too high a durene content in the gasolinemay impair automobile driving characteristics, especially in cold weather, due to itstendency to crystallize at a low temperature.9 Mobil’s test found no drivability lossat minus 18°C using a synthetic gasoline containing 4 wt% of durene.9 Mobil alsodeveloped a heavy gasoline treating (HGT) process to convert durene into otherhigh-quality gasoline components by isomerization and alkylation.27
Basically, three types of chemical reactors were developed for the MTG process:(1) adiabatic fixed bed, (2) fluidized bed, and (3) direct heat exchange. The first twowere developed by Mobil and the last by Lurgi.
The adiabatic fixed-bed concept uses a two-stage concept, viz., (1) the first stageDME reactor and (2) the second stage DME conversion to hydrocarbons. The firstcommercial plant of 14,500 bbl/d gasoline capacity was constructed in New Zealand.The plant had been running successfully from its 1985 start-up until its recent shut-down. The synthesis gas is generated via steam reforming of natural gas obtained fromthe offshore Maui fields. This plant was also successfully run in New Zealand andreduced the durene content to 2 wt%. The successful operation of MTG in New Zealandwas a very important milestone in history, as it made possible the chemical synthesisof gasoline from unlikely fossil fuel sources like natural gas and coal. Petroleum crudeis no longer the sole source for gasoline. Although the plant for methanol-to-gasolinein New Zealand ceased its operation in the late 1990s, a major plant complex formethanol-to-olefins is being planned in Nigeria for 2009 operation.40
© 2007 by Taylor & Francis Group, LLC

118 Handbook of Alternative Fuel Technology
A fluidized bed MTG concept was concurrently developed by Mobil. The heatof reaction can be removed from the reactor either directly using a cooling coil orindirectly using an external catalyst cooler. The process research went through severalstages involving a bench-scale fixed fluidized bed, 4 bpd, 100 bpd cold-flow models,and a 100 bpd semiwork plant. Table 3.18 shows typical MTG process conditionsand product yields.9
TABLE 3.18Typical Process Conditions and Product Yields for the MTG Process
Conditions Fixed Bed Reactor Fluid Bed Reactor
Methanol/water charge (w/w) 83/17 83/17Dehydration reactor inlet T (°C) 316 —Dehydration reactor outlet T (°C) 404 —Conversion reactor inlet T (°C) 360 413Conversion reactor outlet T (°C) 415 413P (kPa) 2170 275Recycle ratio (mol/mol charge) 9.0 —Space velocity (WHSV) 2.0 1.0
Yields (wt% of MeOH charged)MeOH + dimethyl ether 0.0 0.2HCs 43.4 43.5Water 56.0 56.0CO, CO2 0.4 0.1Coke, other 0.2 0.2
Total 100.0 100.0
Hydrocarbon product (wt%)Light gas 1.4 5.6Propane 5.5 5.9Propylene 0.2 5.0Isobutane 8.6 14.5n-Butane 3.3 1.7Butenes 1.1 7.3C5+ Gasoline 79.9 60.0
Total 100.0 100.0
Gasoline (including alkylate), RVP-62kPa (9 psi) 85.0 88.0LPG 13.6 6.4Fuel gas 1.4 5.6Total 100.0 100.0
Gasoline octane number (RON) 93 97
Source: From U.S. DOE Working Group on Research Needs for Advanced Coal GasificationTechniques (COGARN) (S.S. Penner, Chairman), Coal Gasification: Direct Application and Syn-thesis of Chemicals and Fuels, DOE Contract No. DE-AC01-85 ER30076, DOE Report DE/ER-0326, June 1987.
© 2007 by Taylor & Francis Group, LLC
Clean Liquid Fuels from Coal 119
During the MTG development, Mobil researchers found that the hydrocarbonproduct distribution can be shifted to light olefins by increasing the space velocity,decreasing the methanol partial pressure, and increasing the reaction temperature.28
Typical yields9 from 4 bpd operation were: C1-C3 paraffins, 4 wt%; C4 paraffins, 4wt%; C2–C4 olefins, 56 wt%; and C5
+ gasoline, 35 wt%. Using olefins from themethanol-to-olefins (MTO) or F-T processes, diesel and gasoline can be made viaa process converting olefins to diesel and gasoline. Using acid catalysts, catalyticpolymerization is a standard process and is being used at SASOL to convert C3-C4
olefins into gasoline and diesel (G+D). Recently, Mobil developed an olefins-to-gasoline-and-diesel (MOGD) process using their commercial zeolite catalyst.29,30
Lurgi also developed its own version of the methanol-to-propylene (MTP) process.4
Recently, an innovative process enhancement has been made by Lee and cowork-ers under the sponsorship of the Electric Power Research Institute (EPRI).31 Theirprocess, called the DTG (DTH, DTO) process, is based on the conversion of dime-thylether (DME) to hydrocarbon over ZSM-5 type catalyst.31,32 This process is basedon the novel, economical, single-stage synthesis process of dimethylether (DME)from syngas, which produces methanol as an intermediate for dimethylether. Byproducing DME in a single stage, the intermediate methanol formation is no longerlimited by chemical equilibrium, thus increasing the reactor productivity, in terms oftotal hydrogenation extent, substantially. This is especially true for the synthesis ofmethanol in the liquid phase. Furthermore, by feeding DME directly to the ZSM-5reactor instead of methanol, the stoichiometric conversion and hydrocarbon selectivityincrease substantially due to less water formation and involvement. The differencebetween MTG and DTG, therefore, is in the placement of methanol dehydrationreaction step (i.e., DME formation reaction). In the MTG, methanol-to-DME conver-sion takes place in the gasoline reactor, whereas methanol-to-DME conversion, in theDTG, takes place in the syngas reactor. Therefore, methanol is an intermediate of thesyngas conversion reactor for DTG, whereas DME is an intermediate for gasolinesynthesis reactor for MTG. The DTG process is not yet tested on a large scale.
The Topsoe Integrated Gasoline Synthesis Process (TIGAS) uses combinedsteam reforming and autothermal reforming for syngas production with a multifunc-tional catalyst system to produce an oxygenates mixture rather than methanol.13
3.4.4 HIGHER ALCOHOL SYNTHESIS
Mixtures of C1-C6 alcohols can be used as transportation fuels either as is or as anadditive to gasoline. In the U.S., however, selling new unleaded fuels or fuel additivesin unleaded fuels has been prohibited by the Clean Air Act. Exceptions have beengranted in the form of EPA waivers, and good examples have been the waiversgranted to requests by DuPont, ARCO, SUN, and American Methyl in the late 1970sthrough the mid-1980s. Some of the more significant ones that are still impactingthe current fuel market in the U.S. are related to the MTBE blending and the use of10% ethanol in gasoline. Due to the public health and environmental problems citedin a number of states in the U.S. and Europe, MTBE is going to be phased outcompletely in these countries by 2007.
© 2007 by Taylor & Francis Group, LLC

120 Handbook of Alternative Fuel Technology
Technical advantages of using C1-C6 alcohol blends with gasoline can be sum-marized as:
1. Enhancement of octane number2. Enhancement in hydrocarbon solubility in comparison to methanol-gaso-
line blends3. Enhanced water tolerance compared to unblended gasoline4. Enhanced control of fuel volatility
Despite some obvious technological benefits, certain EPA restrictions, especiallyvolatility specifications (evaporative index [EI] or Reid vapor pressure [RVP]), haveimposed serious economic penalties on alcohol blends (except ethanol), thus makingthem difficult to be accepted by refiners and blenders. Fuels containing higher alcoholblends have been in use in Germany at ca. 3–5 mol% for automobile transportation.
Higher alcohol synthesis (HAS) has been practiced in Germany since 1913 afterBASF successfully developed cobalt- or osmium-catalyzed synthesis of a mixtureof alcohols and other oxygenates at 10–20 MPa and 300–400°C.4 This was followedby the F-T Synthol process for alcohol mixtures in 1923–1924. It was also foundthat higher alcohols were coproducts of methanol synthesis over ZnO/Cr2O3 cata-lysts, alkalized ZnO/Cr2O3 catalysts, and alkalized Cu-based catalysts. Later, theSynthol process was further developed and enhanced to a process at a lower tem-perature of <200°C, medium pressure of 20 MPa, and inexpensive but potent ironcatalysts. Later, the process incorporated several additional reactor stages with inter-mediate CO2 removal and gas recycle.33 In 1984, Dow Chemical Co. announced anew process for higher alcohol synthesis based on MoS2 catalysis, and Union CarbideCorporation also revealed a new process.4 [The two companies merged in 2000 forunrelated business reasons.] The Dow Chemical process is also known as Dow HAS.On the other hand, the technology for higher alcohol based on alkali-promotedZnO/Cr2O3 methanol synthesis catalysts for the high-pressure methanol synthesiswas further developed by Snamprogetti, Enichem, and Haldor Topsoe A/S (SEHT).This is often referred to as the SEHT HAS process.
3.5 COAL AND OIL COPROCESSING
Coprocessing is defined as the simultaneous reaction treatment of coal and petroleumresid, or crude oil, with hydrogen to produce distillable liquids. More strictly speak-ing, this technology should be classified under direct liquefaction as a variation.Petroleum liquids have been often used as a liquefaction solvent, mainly for start-up or whenever coal-derived liquids were unavailable. However, some serious con-siderations have been recently given to the processing possibilities of hydrocrackingpetroleum resid while liquefying coal in the same reactor. In this sense, coprocessinghas an ultimate objective of cobeneficiation.
An early coprocessing patent was granted to UOP, Inc. in 1972 for a processwhereby coal is solvent extracted with petroleum.34 Another early patent on copro-cessing was issued to Hydrocarbon Research, Inc. (HRI) in 1977 for the single-stageebullated-bed COIL process based on the HRI’s H-Oil and H-Coal technology.35
© 2007 by Taylor & Francis Group, LLC

Clean Liquid Fuels from Coal 121
Consol R & D tested the use of a South Texas heavy oil for coal hydroextractionbut found that, even after hydrogenation, the petroleum made a very poor liquefactionsolvent.9 The Canada Centre for Mineral and Energy Technology (CANMET) devel-oped the CANMET hydrocracking process for petroleum resids. They found thatsmall additions of coal (<5 wt%) to the petroleum feedstock significantly improveddistillate product yields. A 5000 bpd plant using this process was started up in 1985by Petro-Canada near Montreal, Quebec.36,37
In summary, coprocessing has several potential economic and technologicaladvantages relative to coal liquefaction or hydroprocessing of heavy petroleumresidua. Synergisms and cobeneficiating effects can be obtained, especially in thearea of: (1) replacement of recycle oil, (2) sharing hydrogen between hydrogen-richand hydrogen-deficient materials, (3) aromaticity of the product, (4) demetalation andcatalyst life extension, and (5) overall energy efficiency.37 For the current technology,temperatures of 400–440°C, 2000 psig hydrogen pressure, and alumina-supportedcobalt, molybdenum, nickel, or disposable iron catalysts are frequently used. Variousefforts in developing more selective and resilient catalysts are being executed.
REFERENCES
1. Speight, J.G., The Chemistry and Technology of Coal (Rev. Ed.), Marcel Dekker,New York, 1994.
2. Probstein, R.F. and Hicks, R.E., Synthetic Fuels, McGraw-Hill, New York, 1982.3. Carlson, F.B., Yardumian, L.H., and Atwood, M.T., Reprints of Clean Fuels from
Coal II Symposium, Institute of Gas Technology, Chicago, IL, 1975, p. 504.4. Schindler, H.D., Coal Liquefaction — A Research and Development Needs Assess-
ment, COLIRN Panel Assessment, DOE/ER-0400,UC-108, Final Report, Vol. II.,March 1989.
5. Potts, J.D., Hastings, K.E., Chillingworth, R.S., and Unger, K., Expanded-Bed Hydro-processing of Solvent Refined Coal (SRC) Extract, Interim Technical Report FE-2038-42, February 1980.
6. Schindler, H.D., Chen, J.M., and Potts, J.D., Integrated Two-Stage Liquefaction, FinalTech. Report, DOE Contract DE-AC22-79 ET14804, June 1993.
7. Comolli, A.G. and McLean, J.B., The Low-Severity Catalytic Liquefaction of IllinoisNo. 6 and Wyodak coals, Pittsburgh Coal Conference, Pittsburgh, PA, September16–20, 1985.
8. Weber, W. and Stewart, N., EPRI Monthly Review, January 1987.9. U.S. DOE Working Roup on Research Needs for Advanced Coal Gasification Tech-
niques (COGARN) (S.S. Penner, Chairman), Coal Gasification: Direct Applicationand Synthesis of Chemicals and Fuels, DOE Contract No. DE-AC01-85 ER30076,DOE Report DE/ER-0326, June 1987.
10. Anderson, R.B., The Fischer-Tropsch Synthesis, Academic Press, Orlando, FL, 1984.11. Schulz, G.V., Z. Phys. Chem., 32, 27, 1936.12. Flory, P.J., J. Am. Chem. Soc., 58, 1877, 1936.13. Wender, I., Review of Indirect Liquefaction, in Coal Liquefaction, USDOE Contract
DE-AC01-87-ER 30110, Schindler, H.D., Ed., (Chairman of COLIRN), Final Report,March 1989.
© 2007 by Taylor & Francis Group, LLC

122 Handbook of Alternative Fuel Technology
14. van der Burgt, M.J., The Shell Middle Distillate Synthesis Process, the 5th SynfuelsWorldwide Symposium, Washington, D.C., McGraw-Hill, New York, November1985.
15. Humbach, J. and Schoonover, N.W., Proc. Ind. Liquefaction Contractor’s Meeting,Pittsburgh, PA, PETC, 1985, pp. 29–38.
16. Koelbel, H. and Ralek, M., Catal. Rev.: Sci. Eng., 21, 225, 1980.17. Lee, S., Methanol Synthesis Technology, CRC Press, Boca Raton, FL, 1990.18. Cybulski, A., Catal. Rev.: Sci. Eng., 36(4), 557–615, 1994.19. Oxturk, S. and Shah, Y., Comparison of gas and liquid methanol synthesis process,
Chem. Eng. J., 37, 177–192, 1988.20. Lee, S., Research Support for Liquid Phase Methanol Synthesis Process Development,
EPRI Report AP-4429, Palo Alto, CA, February 1986, pp. 1–312.21. Chanchlanii, K., Hudgins, R., and Silveston, P., Methanol synthesis from H2, CO,
and CO2 over Cu/ZnO catalysts, J. Catal., 136, 59–75, 1992.22. Sizek, G., Curry-Hyde, H., and Wainwright, M., Methanol synthesis over ZnO pro-
moted copper surfaces, Appl. Catal. Gen., 115, 15–28, 1994.23. Mills, G.A., Fuel, 73(8), 1243–1279, 1994.24. Fox, J.M., Catal. Rev.: Sci. Eng., 35(20), 169–212, 1993.25. Chang, C.D., Catal. Rev.: Sci. Eng., 25, 1, 1983.26. Chang, C.D. and Silvestri, A.J., J. Catal., 47, 249, 1977.27. Chang, C.D. and Silvestri, A.J., The MTG Process: Origin and Evolution, presented
at the 21st State-of-the-Art ACS Symposium on Methanol as a Raw Material forFuels and Chemicals, Marco Island, FL, June 1986, pp. 115–18.
28. Socha, R.F., Chu, C.T.W., and Avidan, A.A., An Overview of Methanol-to-OlefinsResearch at Mobil: from Conception to Demonstration Plant, presented at the 21stState-of-the-Art ACS Symposium on Methanol as a Raw Material for Fuels andChemicals, Marco Island, FL, June 1986, pp. 115–18.
29. Tabak, S.A., Avidan, A.A., and Krambeck, F.J., MTO-MOGD Process, presented atthe 21st State-of-the-Art ACS Symposium on Methanol as a Raw Material for Fuelsand Chemicals, Marco Island, FL, June 1986, pp. 115–118.
30. Tabak, S.A. and Krambeck, F.J., Hydrocarbon Process., 64, 72, September 1985.31. Lee, S., Gogate, M.R., Fullerton, K.L., and Kulik, C.J., U.S. Patent No. 5,459,166,
October 17, 1995.32. Lee, S., Gogate, M.R., and Kulik, C.J., Fuel Sci. Technol. Int., 13(8), 1039–1058,
1995.33. Xiaoding, X., Doesburg, E.B.M., and Scholten, J.J.F., Catalysis Today, Vol. 2, 1987,
pp. 125–170.34. Gatsis, J.G., U.S. Patent No. 3,705,092, December 5, 1972.35. Chervenak, M.C. and Johanson, E.S., U.S. Patent No. 4,054,504, October 18, 1977.36. Kelly, J.F. and Fouda, S.A., CANMET Coprocessing: An Extension of Coal Lique-
faction and Heavy Oil Hydrocracking Technology, presented at the DOE DirectLiquefaction Contractors’ Review Meeting, Albuquerque, NM, October 1984.
37. Lee, S., Alternative Fuels, Taylor & Francis, Philadelphia, PA, 1997.38. Lee, S., Oil Shale Technology, CRC Press, Boca Raton, FL, 1991.39. A Web site by Lurgi on Methanol market and Technology, 2006; accessible through
http://www.lurgi.de/lurgi_headoffice_kopie/english/nbsp/menu/products/gas_to_petrochemicals_and_fuels/methanol/markets/index.html.
40. Chemical Market Associates, Inc., 2006 World Methanol Analysis, CMAI, Houston,TX, 2006.
41. USA Today, July 14, 2006.
© 2007 by Taylor & Francis Group, LLC

Clean Liquid Fuels from Coal 123
42. A Web site by Hydrocarbon Technologies Inc., HTI Direct Coal Liquefaction Tech-nology, 2006; accessible through http://www.htigrp.com/data/upfiles/pdf/DCL%20Technology%2023Feb05.pdf.
43. Silverstein, K., Coal Liquefaction Plants Spark Hope, Daily Issue Alert, November1, 2004; accessible through http://www.utilipoint.com/issuealert/article.asp?id=2314.
44. Hoogendom, J.C. and Salomon, J.M., Br. Chem. Eng., 2:238, 1957.
© 2007 by Taylor & Francis Group, LLC

125
4 Coal Slurry Fuel
Sunggyu Lee
CONTENTS
4.1 Introduction .................................................................................................. 1254.2 Coal Slurry Characterization ....................................................................... 127
4.2.1 Particle Size Distribution ................................................................. 1284.2.2 Rheology .......................................................................................... 1304.2.3 Stability ............................................................................................ 1324.2.4 Suspension Types ............................................................................. 1324.2.5 Interparticle Interactions .................................................................. 132
4.3 Coal-Water Slurry ........................................................................................ 1374.4 Coal-Oil Slurry............................................................................................. 1394.5 Advanced Transportation of Coal Slurry..................................................... 1404.6 Environmental Issues ................................................................................... 1434.7 Combustion .................................................................................................. 1454.8 Recent Advances and the Future ................................................................. 147References.............................................................................................................. 148
4.1 INTRODUCTION
Coal slurry fuels consist of finely ground coal dispersed into one or more liquids suchas water, oil, or methanol. Slurry fuels have the advantages of being convenient tohandle (similar to heavy fuel oil) as liquid fuel and processing high energy density, asillustrated in Table 4.1.1,2 Coal slurries have been investigated as potentially efficientreplacement for oil in boilers and furnaces, fuel in internal combustion engines, andrecently energy feedstock for cofiring of coal fines in utility boilers. Coal slurry isused around the world in countries such as the U.S., Russia, Japan, China, and Italy.
Coal slurry fuels have been investigated since the 19th century, but economicconstraints have kept it from becoming a major energy source. Typically, interest incoal slurry develops whenever regional or short-term oil availability is in doubt, suchas periods during both world wars and again in the energy crises of 1973 and 1979.3
Much of the work during these time periods was focused on coal-oil fuels, whichcould quickly and readily replace oil or liquid fuel in furnaces and boilers. However,recent research, since 1980, has concentrated more on coal-water slurry fuels(CWSFs) for the complete replacement of oil in industrial steam boilers, utilityboilers, blast furnaces, process kilns, and diesel engines.4,34
© 2007 by Taylor & Francis Group, LLC

126 Handbook of Alternative Fuel Technology
The initial development of coal slurry was noted over a hundred years ago bySmith and Munsell.5 By World War I, a full-scale slurry test was successfully madeon a U.S. Navy Scout ship. The test revealed some technical problems such as highash content (of raw material coal), visible fluid track left in the ship’s wake, andstability problems with the slurry (such as settling and sedimentation).6
In the 1930s, the Cunard ship company used coal-oil slurries on both land andsea trials in an attempt to reduce oil imports and further develop new markets forcoal.7–9 At about the same time in Japan, tests were conducted on coal-in-oil fuelsat their National Fuel Laboratory.10 Similar tests were also performed in Germanyon a mixture of powdered coal (55 wt%) and tar oil (45 wt%) called “Fliesskhloe.”The German tests showed that the coal-oil mixture burned well and had thermalefficiencies of 70–75%.11 Although the systems worked well from technologicalstandpoints, economic limitations hindered further development.
Development during the Second World War consisted of two comprehensiveprograms at the Bureau of Mines and Kansas State College. The programs exploredmethods of preparation, flow, stability, and burning processes of coal-oil slurry.6
After the war, development on coal-oil slurries ceased until the 1970s. On the otherhand, work on coal-water fuels started in the USSR in the 1950s,12,13 and similarwork was conducted in the U.S. and Germany on storage, pumping, and combustionproperties.14
The energy crisis of 1973 again propelled research and development of coal-oilslurry. A consortium of companies led by General Motors (GM) was formed in 1973to develop the technology.15 In 1975, the Department of Energy (DOE) joined supportof the project, and by 1976 the program had expanded into switching utility gas andoil boilers to coal-oil mixtures. The initial comprehensive investigations were com-pleted in 1977, and the DOE transferred GM projects to places such as New EnglandPower and Service Co. (NEPSCO) and Pittsburgh Energy Technology Center (PETC).6
However, recent research, since 1980, has centered on coal-water slurry fuelsfor replacement of oil.4,75 The economic incentive for replacing oil with coal-oilslurries disappeared as oil prices stabilized in 1980s and 1990s. This spurred devel-opment of coal-water slurries for complete replacement of oil or coburning of coalfines in a slurry. Record-high oil prices in the 21st century will rekindle interest incoal slurry fuel as a potential transportation fuel and as an alternative fuel for diverse
TABLE 4.1Fuel Energy Densities
Fuel Density (lb/gal) Btu/lb Btu/gal Btu/ft3
Coal in bulk (7% moisture) 6.2–9.4 12,500 76,000–116,500 573,000–872,000Residual oil 8.2 18,263 150,000 1,122,00060% Coal/40% water blend 9.8 8,000 78,700 589,00070% Coal/30% water blend 10.2 9,373 95,600 715,000
Source: From Kesavan, S., Stabilization of Coal Particle Suspensions using Coal Liquids, M.S. thesis,University of Akron, 1985. With permission.
© 2007 by Taylor & Francis Group, LLC

Coal Slurry Fuel 127
applications. A significant amount of development has been accomplished on coalslurry rheology, characterization, atomization, combustion mechanisms, and trans-port techniques.34
4.2 COAL SLURRY CHARACTERIZATION
Coal-slurry mixtures can be made from a combination of various liquids, the mostcommon liquid ingredients being oil, water, and methanol. Detailed descriptions forvarious types of coal slurries are as follows:
1. Coal-Oil Mixtures (COM): a suspension of coal in fuel oil, also referredto as coal-oil dispersions (COD).
2. Coal-Oil-Water (COW): a suspension of coal in fuel oil with less than 10wt% water in which oil is the main ingredient.
3. Coal-Water-Oil (CWO): a suspension of coal in fuel oil with more than10 wt% water in which water is the main ingredient.
4. Coal-Water Fuels (CWF), Coal-Water Mixtures (CWM), Coal-Water Slurries(CWS), or Coal-Water Slurry Fuels (CWSF): a suspension of coal in water.
5. Coal-Methanol Fuel (CMF): a suspension of coal in methanol.6. Coal-Methanol-Water (CMW): a suspension of coal in methanol and water.
The CMF and CMW slurries possess favorable properties; however, the cost ofmethanol has all but eliminated them from further development. COM, once activelyinvestigated, has now been shelved for economic reasons. CWF has been investigatedfor complete oil replacement in boilers and furnaces and internal combustion engines,but low oil prices in the past decades have reduced the economic advantage andsomewhat cooled the interest. However, CWF developed from waste streams andtailings were being investigated for cofiring in boilers and furnaces.16 The compar-ative economics of coal-water slurry against the conventional fuel in the 21st centuryis undoubtedly far more favorable.34 Furthermore, CWF provides a valuable modeof coal transportation through a long pipeline.
Important slurry characteristics are stability, pumping, atomizability, and com-bustion characteristics. These properties control the hydrodynamics and rheology ofthe coal slurry system. A coal slurry must have low viscosity at pumping shear rates(10–200 sec1) and at atomization shear rates (5,000–30,000 sec1). This allows forlow pumping power requirements and increased boiler and furnace efficienciesthrough smaller droplets sizes.17 There are several types of pumps that are developedfor coal slurry pumping.
In order to understand coal slurry hydrodynamics and rheology, an understandingof dispersed systems is required. Solid-liquid dispersed systems are classified intotwo, based on their particle sizes, namely, colloidal and coarse-particle systems.Colloidal dispersed systems consist of particles smaller than 1 µm and coarse particledispersion systems (suspension) consist of particles larger than 1 µm. In colloidaldispersion systems, sedimentation is prevented by Brownian motion (thermal activ-ity). However, suspensions are thermodynamically unstable and will tend to precip-itate owing to the overwhelming gravitational force on large-size particles.
© 2007 by Taylor & Francis Group, LLC

128 Handbook of Alternative Fuel Technology
4.2.1 PARTICLE SIZE DISTRIBUTION
Typical coal slurry fuels have a particle size distribution (PSD) with 10–80% of theparticles smaller than 74 µm (-200 mesh). Micronized CWF has a PSD with a meanparticle diameter of less than 15 µm and 98% of the particles are smaller than 44µm (-325 mesh). This type of slurry is typically produced by coal beneficiationsystems in the removal of mineral matter, mainly pyrites (FeS2) and ash.
The sizing of coal is a multistep process consisting of coal crushing, pulverization,and finishing steps. Finishing steps encompass coarse, fine, and ultrafine crushing ofcoal. Coal crushing reduces the coal size to 20–7.6 cm and 5–3.2 cm, depending onthe application, and coarse pulverization further reduces the coal size to <3.2 mm.The finishing processes can be carried out by wet or dry grinding. They reduce theparticle size to <1 mm for coarse, <250 µm for fine, and <44 µm for ultrafine grinding.In slurry preparation, wet grinding is often used to minimize oxidation of the coal,which is normally detrimental to many beneficiation or treatment processes.
Coal slurries are most economical when they have the maximum amount of coal(i.e., highest solid loading) at the lowest possible viscosity. To obtain the highestpossible loading, a bimodal or multimodal PSD is utilized, as shown in Figure 4.1.2
The finer coal particles fit into the interstices of the larger coal particles, forming ahigher concentrated network of particles. These particles may also act as a lubricant,leading to a lower viscosity.18 A unimodal slurry has a peak solid loading of ~65%at which time the viscosity becomes infinite, whereas idealized multimodal systemsoffer a theoretically possible loading in excess of 80%, as shown in Figure 4.2.19 Thelowest viscosity of a coal-water mixture occurs at a fine-to-coarse ratio of 35 ± 5:65± 5, regardless of the ratio of the mean diameters.18 Multimodal systems are commonlyused, because they can easily be generated by a common grinding scheme. A typicalmultimodal distribution formulated for minimum viscosity is shown in Figure 4.3.19
The settling of coal particles is a complex phenomenon from a theoretical pointof view, involving hydrodynamic and physiochemical forces. The falling movementof fine coal in slurries has a Reynolds number (Re) <<1, which leads to the use ofStokes’ equation for hindered settling rate as shown in Equation 4.1 and Equation 4.2.3
(4.1)
≤1 (4.2)
wherev = hindered settling ratevt = single-particle settling velocityµ = viscosity of dispersing medium
ρ1 = density of dispersed mediumρ2 = density of dispersing mediumd = diameter of dispersed particlesg = gravitational acceleration
f(φ) = is a function of volume fraction of suspended solids
vd g
f=−( ) ( )
21 2
18
ρ ρµ
φ
fv
vt
φ( ) =
© 2007 by Taylor & Francis Group, LLC
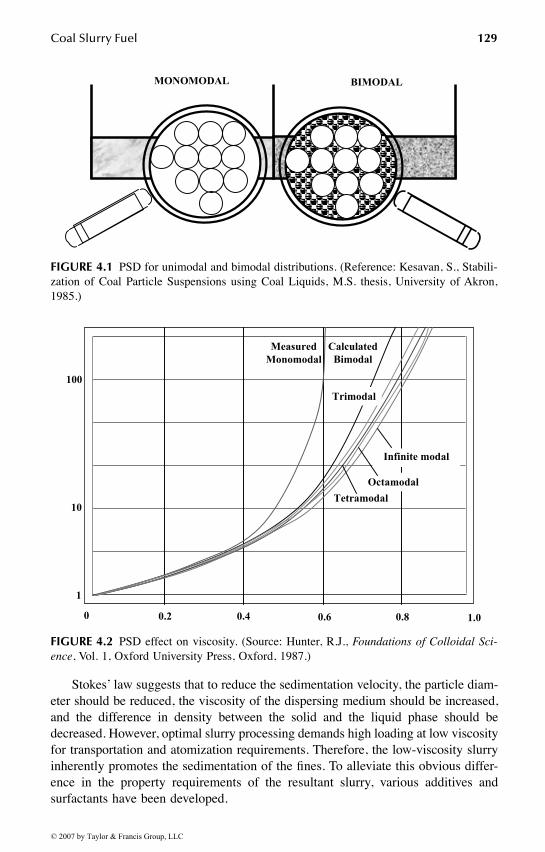
Coal Slurry Fuel 129
Stokes’ law suggests that to reduce the sedimentation velocity, the particle diam-eter should be reduced, the viscosity of the dispersing medium should be increased,and the difference in density between the solid and the liquid phase should bedecreased. However, optimal slurry processing demands high loading at low viscosityfor transportation and atomization requirements. Therefore, the low-viscosity slurryinherently promotes the sedimentation of the fines. To alleviate this obvious differ-ence in the property requirements of the resultant slurry, various additives andsurfactants have been developed.
FIGURE 4.1 PSD for unimodal and bimodal distributions. (Reference: Kesavan, S., Stabili-zation of Coal Particle Suspensions using Coal Liquids, M.S. thesis, University of Akron,1985.)
FIGURE 4.2 PSD effect on viscosity. (Source: Hunter, R.J., Foundations of Colloidal Sci-ence, Vol. 1, Oxford University Press, Oxford, 1987.)
MONOMODAL BIMODAL
1
10
100
MeasuredMonomodal
CalculatedBimodal
Trimodal
TetramodalOctamodal
Infinite modal
0 0.2 0.4 0.6 0.8 1.0
© 2007 by Taylor & Francis Group, LLC

130 Handbook of Alternative Fuel Technology
4.2.2 RHEOLOGY
Rheology is the study of a system’s response to a mechanical perturbation in termsof elastic deformations and viscous flow.20,21 In most rheological systems, elasticresponse is associated with solids, whereas viscous response is associated withliquids. Therefore, a suspension system such as coal slurry exhibits behaviors ofboth elastic and viscous responses. These responses in coal slurry are a functionof the type of coal, coal concentration, PSD, properties of dispersing phase, andadditive package.4,22
Coal slurries, in general, exhibit non-Newtonian behavior; however, they doexhibit a wide range of responses including Newtonian, dilatant, pseudoplastic (shearthinning), and plastic flow characteristics. Each of these responses is shown graph-ically in Figure 4.4, as a plot of the shear stress vs. the rate of shear.23 Newtonianis the simplest response and exhibits a linear functionality between shear stress andshear rate. Typically, slurries exhibit pseudoplastic or shear-thinning behaviors,meaning that as the shear stress is increased, the shear rate increases at a slowerrate. This behavior is typical of a material that has a fragile internal structure thatdegrades with shearing stresses. The material does not have a yield point, but theapparent viscosity continually decreases with applied stress. An extension of thisbehavior is thixotropy, which exhibits shear thinning that requires significant periodsof time to reform the internal structure. The period of time can range anywhere fromminutes to several days. Dilatant behavior is the opposite of shear thinning, as theresistance to flow increases with the shear stress. In plastic behavior, a sufficientstress, higher than the yield stress, must be applied for flow to begin. Once thesuspension yields, then the shear stress is linear with shearing rate. The importantrheological characteristics are yield stress, viscosity, and plasticity (thixotropy).24
These values are determined experimentally.
FIGURE 4.3 PSD formulated for minimal viscosity. (From Hunter, R.J., Foundations ofColloidal Science, Vol. 1, Oxford University Press, Oxford, 1987.)
0
10
20
30
40
50
60
70
80
90
100
1 10 100 1000
Particle Size, microns
Cu
mu
lati
ve P
erce
nt
Sm
alle
rT
han
PSD f rom Far r is
PSD f rom Furnas
© 2007 by Taylor & Francis Group, LLC

Coal Slurry Fuel 131
Viscosity has proved to be very difficult to model because it exhibits both elasticand viscous responses. The Einstein equation for viscosity in dilute suspensions isgiven by Equation 4.3.
(4.3)
whereµ0 = viscosity of dispersing phaseµr = relative viscosityµ = absolute viscosityφ = volume fraction of solids
This equation works well for dilute systems. To describe higher concentrations,a number of investigators have developed relations in the form of µr = f(φ) thatasymptotically reduce to Einstein’s equation at low concentrations.4 Modeling ofthese systems, however, utilizes only one parameter, the volume fraction of solids.This type of model is called a one-parameter model. This assumes that the particlesare inert and, as such, interactions between particles are negligible.
The viscosity of the suspending medium not only affects the sedimentation velocitybut also the rate of agglomeration. An empirical expression for f(φ) is given by:
(4.4)
FIGURE 4.4 Rheograms of various flow behaviors. (Reference: Evans, D.F. and Wenner-strom, H., The Colloidal Domain Where Physics, Chemistry, Biology, and Technology Meet,VCH, New York, 1994.)
Shea
r R
ate
Shear Stress
Dilatant Flow
Newton
ianFlow
Pseudop
lastic
Flow
Plas
ticFl
ow
Yield-value Intercept
µ µµ
φr = = +0
1 2 5.
f eφ φ( ) = −5 9.
© 2007 by Taylor & Francis Group, LLC

132 Handbook of Alternative Fuel Technology
This equation illustrates how rapidly an increase in solids’ volume fraction, φ,can reduce the sedimentation rate. However, the increased stability compromisesslurry properties such as viscosity, combustion characteristics, and overall handling.25
Physicochemical forces are important in coal slurry, because of the small sizeof the particles (most coal particles in slurry are smaller than 50 µm). Although bulkproperties such as density and viscosity of coal and water are important, surfaceproperties have a large effect on the slurry properties.
4.2.3 STABILITY
Slurry stability is classified into three broad categories, namely, sedimentative(static), mechanical (dynamic), and aggregative. The stability of a slurry is a crucialfactor in its processability and applicability, which ultimately determine the valueof the slurry. The factors that affect slurry stability are density, particle size, solidconcentration, surface properties (relative hydrophilic nature), surface charge (zetapotential), morphology of coal, and type of slurrying liquid.26
The stability of a slurry against gravity is called “sedimentative stability.” Astatically unstable slurry will settle, but as the system becomes more stable, thedegree of settling decreases. Static stability in a fluid requires a yield stress in thefluid sufficient to support the largest particle. The stability in a dynamic system iscalled dynamic stability. Dynamic stability involves the superposition of mechanicalstresses; some examples are pumping and mixing.27 The third stability type, aggre-gative stability, is a function of interparticle forces.
4.2.4 SUSPENSION TYPES
A suspension can be classified into three broad categories, namely, aggregativelystable, flocculated, and coagulated, as shown in Figure 4.5.3 In an aggregativelystable suspension, repulsion forces do not allow particles to adhere to each other.They tend to settle owing to gravity, leading to a highly classified and compactsediment with coarse particles at the bottom and finest particles on the top.
In the second suspension type, flocculated, the particles weakly interact to formporous clusters called flocs. They tend to settle slowly because of increased dragforces from the floc structure. The formed sediments are very loose and occupy alarge fraction of the original slurry volume. The slurry is easily brought back tooriginal uniform concentrations with mild agitation.
In the last suspension type, coagulated, the particles interact strongly. The strongattractive interparticle forces promote the formation of compact and tightly boundclusters, which are difficult to break loose without significant agitation. These unstableslurries have fast settling rates and often display non-Newtonian behavior like thixo-tropic (time-dependent behavior), pseudoplasticity (shear thinning), or plastic behavior.
4.2.5 INTERPARTICLE INTERACTIONS
Recent studies have shown that stability in slurries is achieved by promoting net-works through weak interparticle interactions.26 The properties of coal slurries aregoverned by the nature of the forces between particles. Six important particle–particle
© 2007 by Taylor & Francis Group, LLC

Coal Slurry Fuel 133
interactions may exist in aqueous dispersions.26 A more comprehensive analysis ofthese phenomena can be found in literature.28,29
1. Interaction between electrical double layers (EDL)2. van der Waals (VDW) attraction3. Steric interactions4. Polymer flocculation5. Hydration- and solvation-induced interactions6. Hydrophobic interactions
When a substance is brought into contact with an aqueous polar medium, itacquires a surface electrical charge through mechanisms such as ionization, ionadsorption, or ion dissolution. The surface charge influences the distribution of nearbyions in solution, i.e., ions of opposite charge are attractive whereas ions of like chargesare repulsive. This, coupled with the mixing effects of thermal motion, leads to theformation of the EDL. The EDL consists of a surface charge with a neutralizingexcess of counterions, and, further from the surface, co-ions distributed in a diffusemanner as shown in Figure 4.6.26 The EDL is important because the interaction
FIGURE 4.5 Illustrations of suspension types. (From Papachristodoulou, G. and Trass, O.,Can. J. Chem. Eng., 65, 177–201, 1987.)
Agglomeration
Flocculation
Deflocculation (Dispersion)
© 2007 by Taylor & Francis Group, LLC

134 Handbook of Alternative Fuel Technology
between charged particles is governed by the overlap of their diffuse double layers.This creates a potential (Stern potential) at the interface of the Stern plane andthe diffuse layer. Unfortunately, direct measurement of the Stern potential isimpossible; however, it is possible to measure the zeta potential (ζ), which corre-sponds to the shear plane adjacent to the Stern plane as shown in Figure 4.7.26
Although the zeta potential may not necessarily give a good indication of Sternpotential, in certain cases an expression such as Equation 4.5 can be formulatedfor the repulsive energy (VR) of interaction between particles based on surfaceroughness, shape, and other factors.30
(4.5)
wherea = radius of two particlesζ = zeta potentialκκκκ = inverse Debye lengthε = permissivity of the mediumh = distance between particles
FIGURE 4.6 A schematic representation of EDL in the vicinity of a liquid–solid interface.(Source: Rowell, R.L., The Cinderella Synfuel, CHEMTECH, April 1989, pp. 244–248.)
-
-
-
-
-
= 6= 32= 8 = 78
Counter-ion
Specificallyadsorbed
co-ion CoCC uoo nuu tnn ett ree -ionoo
= 7877
Stern Layer
Solid
Gouy (Diffuse) Layer
ShearBoundary
Inner HelmholtzPlane
SternPlane
DielectricConstant for
Water
Bulk Solution
Gouy Plane
Solvent molecule (i.e.,water) with dipole
V a eRh= −( )2 2πε ζ κ
© 2007 by Taylor & Francis Group, LLC

Coal Slurry Fuel 135
The attractive force, van der Waals force, encourages aggregation betweenparticles when the distance between particles is very small. These forces are dueto spontaneous electric and magnetic polarizations giving a fluctuating electro-magnetic field within the dispersed solids and aqueous medium separating theparticles.26 Two common methods are used for predicting these forces, namely,Hamaker approach and Lifshitz approach. The Hamaker approach adds up theforces pairwise between the two bodies, whereas the Lifshitz method directlycomputes the attractive forces based on the electromagnetic properties of themedia. Fundamental concepts of the Hamaker approach are explained in thischapter, though the more rigorous Lifshitz method is not covered.
The simpler method, Hamaker, for identical spheres is represented by:
(4.6)
where A12 is the Hamaker constant.Now, it is possible to predict the interactions of the EDL and van der Waals
forces by:
(4.7)
FIGURE 4.7 Distribution of electric potential in the double-layer region surrounding acharged particle. (Reference: Rowell, R.L., The Cinderella Synfuel, CHEMTECH, April 1989,pp. 244–248.)
Bulk Solution
NetNegativeParticle
Potential
Distance FromParticle Surface
Surface Potential
Stern Potential
Zeta Potential
Double-Layer Thickness(reciprocal Debye length)
Guoy Plane
Diffuse Layer
Shear Plane
Stern Plane
Particle Surface
1/k
VA a
hA = − 12
12
V V VT A R= +
© 2007 by Taylor & Francis Group, LLC

136 Handbook of Alternative Fuel Technology
This forms the basis of the DVLO (Derjaguin–Landua–Verwey–Overbeek) the-ory of colloid stability.24 The energy interactions for EDL and van der Waals forcesare shown in Figure 4.8.26 The subsequent total energy curve allows for predictionof aggregation at close distances (primary minimum) and the possibility of a weakand reversible aggregation in the secondary minimum.26 The form of the curvedepends on the size of the particles and surface charge.31 For example, coarseparticles are more likely to be vulnerable to aggregation at the secondary minimum.
Kinetic effects are important, because thermodynamic prediction may not yieldsufficient information. Coagulation rates are described in terms of the stability ratio.The stability ratio, W, can be thought of as the efficiency of interparticle collisionsresulting in coagulations as shown in Equation 4.8 for two identical particles broughttogether by diffusion.26
(4.8)
where s = h/a.The other types of interparticle interactions (steric interactions, polymer floccu-
lation, hydration- and solvent-induced interactions, and hydrophobic interactions)represent special cases. The most significant of these are steric interactions andpolymer flocculations. Steric interactions develop when molecules (usually polymersor macromolecues) are adsorbed onto the particle surface at high coverages. Thepolymer molecules protrude from the surface of the particle into solution. When
FIGURE 4.8 Particle–particle interaction potential energy. (From Rowell, R.L., The Cinder-ella Synfuel, CHEMTECH, April 1989, pp. 244–248.)
VMAX
Vrepulsion +
Vattraction-
Pote
ntia
l Ene
rgy
Double layerrepulsion force VR
Total potentialenergy VT
Secondaryminimum
van der Waalsattraction force VA
Primaryminimum
W
V
kT
sds
T
=
+( )∞
∫22
2
0
exp
© 2007 by Taylor & Francis Group, LLC

Coal Slurry Fuel 137
particles approach one another, the polymer chains overlap and often dehydrate,increasing the stability of the slurry.32 Polymer flocculation occurs when the particlesurface has low coverage of a high-molecular-weight polymer. The polymers bridgethe particles and form flocs.32,34
Hydration- and solvation-induced interactions become important when interpar-ticle distance is on the order of a solvent molecule, i.e., very short. For aqueoussystems, these solvation effects are clearly visible in structuring of the water nearthe interfacial surface (with their bound water), which interacts with hydrated ionsfrom solution. The net effect is an increased stability or net repulsion betweenparticles as it becomes necessary for the ions to lose their bound water to allow theapproach to continue.26
Hydrophobic interactions are analogous to hydration and solvation effects,because stability can be enhanced by the attraction between two hydrophobic par-ticles. Therefore, hydrophobic particles tend to associate with each other. The hydro-phobic forces are greater than the van der Waals force and have a longer range.26
4.3 COAL-WATER SLURRY
Coal-water slurries attracted technologists’ attention initially as a replacement fuelfor oil in furnaces and boilers and recently for cofiring of boilers and furnaces inthe use of coal fines.34 CWM and CWSF have received a great deal of attention foruse as a fuel because of the relative ease of handling (similar to fuel oil and notexplosive, unlike coal dust), storage in tanks, and injection into furnaces and boilers.CWMs typically have extremely high loadings in the range of 60–75 wt% coal,which leads to high energy densities per unit mass. Possible applications includegas turbines, diesel engines, fluid bed combustors, blast furnaces, and gasificationsystems.2 CWM with a lower coal loading of 50 wt% may be used for the internalcombustion engine, especially when nonexplosive fuel is needed, for example, inmilitary vehicles and helicopters. However, coal slurries for cofiring purposes arelimited by economics to the use of minimal additives as well as lower coal concen-trations (50 wt%).35
The physical properties of coal slurry are extremely important in the processingof the fuel. A slurry must be stable and exhibit low viscosity in the shear rates ofpumping and atomization. The flow characteristics of coal-water slurry depend on:(1) physicochemical properties of the coal, (2) the volume fraction, φ, of the sus-pended solids, (3) the particle size range and distribution (PSD), (4) interparticleinteractions (affected by the nature of surface groups, pH, electrolytes, and chemicaladditives), and (5) temperature.36,75 Rheological and hydrodynamic behavior of coal-water slurries varies from coal to coal. Each coal has a unique package of PSD,concentration, and additives to reach the desired processability.
A parameter that measures how well a coal will slurry, i.e., slurry capability (or,slurriability), is the equilibrium moisture content of coal. The equilibrium moisturecontent is a measure (index) of the hydrophilic nature of the coal. The equilibriummoisture content of a coal sample can be readily determined by proximate analysis.The more hydrophilic a coal is, the more water it will hold and the less likely it isto produce a highly concentrated slurry.37,75 The coal-water slurry viscosity increases
© 2007 by Taylor & Francis Group, LLC

138 Handbook of Alternative Fuel Technology
with the hydrophilicity of the coal. Therefore, a hydrophobic coal can more easilyform a slurry of low viscosity at high solid loadings.
Conventional high-rank coals (black coal), except anthracite, have a hydrophobicnature from the lack of acid groups and will form a slurry of ~80 wt% (dry coalweight basis). Anthracite coals have low reactivity and are not very volatile, leadingto poor ignition stability.2 However, low-rank coals (brown coal) are hydrophilicfrom an abundance of oxygen functional groups and will form slurries of only20–25 wt% (dry coal weight basis).38 These slurries have low concentrations butform slurries that are nonagglomerating and have high reactivities. Difference incoal slurry stability between types of coals is a function of the relative balancebetween acid and base groups on the coal surface.39
CWMs are loaded to the highest possible concentration at acceptable viscosities.However, viscosity increases with coal concentration (loading), though reducing theviscosity compromises the stability of the slurry.3 The viscosity of the slurry increasesgradually with increasing solid loading until a critical point is reached at whichinterparticle friction becomes important. Beyond this point, the viscosity increasesvery sharply until the slurry ceases to flow.34,75 To properly stabilize coal-waterslurries, i.e., to enhance the stability of the coal dispersion, additives such as sur-factants and electrolytes are added.
Surfactants are used as dispersants to wet and separate coal particles by reducingthe interfacial tension of the coal-water system. Surfactants are short-chain moleculescontaining both a hydrophobic group and a hydrophilic oxide (nonionic) or a chargedionic group (ionic). These molecules attach themselves to the coal particles throughadsorption or ionic interaction. Generally speaking, dispersants are ionic. Someexamples of such dispersants are sodium, calcium, and ammonium lignosulfates,and the sodium and ammonium salts of naphthalene formaldehyde sulfonates.4
Ionic surfactants adsorb onto the alkyl groups at hydrophobic sites on the coalparticle. This gives the coal particles a negative charge, which affects the EDL,enhancing the repulsive forces and thus preventing agglomeration.17 Anionic surfac-tants decrease the viscosity of the slurry up to a critical loading. At this point thecoal adsorption sites are saturated and the remaining surfactant forms micelles inthe slurry, leading to an enhanced structure and increased viscosity.
Nonionic surfactants function by two different methods depending on the natureof the coal. On a hydrophilic coal surface the hydrophobic end of the surfactant istoward the aqueous phase. The water then acts as a lubricating material betweencoal particles. The second method is via attachment of surfactant on a hydrophiliccoal. The hydrophilic end of the surfactant attaches to the coal molecule, leavingthe hydrophobic end into the aqueous medium. This increases the amount of waternear the surface of the coal particle, producing a hydration layer or solvation shell.This prevents agglomeration by cushioning coal particles and lowers the viscosity.17
The ionic strength of water in the CWM is an important parameter in therheological and hydrodynamic characteristics of a slurry. Because coal is a mixtureof macromolecular carbonaceous materials and mineral matters rather than a uni-formly homogeneous substance, the ionic strength of the water will affect the inter-action with coal. In a hydrophobic colloidal system dispersed by electrically repulsiveforces, the electrolyte concentration (and its ionic strength) has a considerable effect
© 2007 by Taylor & Francis Group, LLC

Coal Slurry Fuel 139
on the stability against flocculation of particles.17 The cation concentration causesan increase in the viscosity of the slurry with decreasing pH.40 Electrolytes stronglyaffect the degree of particle dispersion and, thus, rheology in CWM that uses anionicdispersant.40 The addition of electrolyte to a slurry using nonionic dispersants hasno appreciable effect on the viscosity.40
In highly concentrated slurries,76 minimal settling is expected, but viscosity-reducing additives increase the settling rate. To stabilize the dispersion, flocculatingagents are added, which produce a gel. Some examples of this are nonionic ampho-teric polymers of polyoxyethylene, starches, natural gums, salts, clays, and water-soluble polymeric resins.2,76
Polymers have been used for drag reduction, i.e., viscosity reduction.41,76 Bothionic and nonionic polymer solutions show reduction in viscosity, although thereduction is more pronounced for anionic polymers.
4.4 COAL-OIL SLURRY
Coal-oil slurries have been investigated for over 100 years. Typically, interest peaksin times of high prices and shortages of oil. The most recent interest was fueled bythe energy crises of 1973 and 1979, when tremendous effort was expended in findinga quick viable alternative to oil in boilers and furnaces. Since the mid 1980s, however,most slurry investigation has been directed toward CWM.
In general, coal-oil slurries exhibit non-Newtonian behavior, mostly pseudoplasticexcept at low coal loadings where the slurry is Newtonian (provided the oil is alsoNewtonian). The viscoelastic properties of the dispersion depend on coal concen-tration, PSD, coal type, oil type, and chemical additives. Rheological properties ofCOM are highly sensitive to coal concentration. At this critical concentration, adramatic increase in viscosity occurs with incremental changes in concentration.
The standard PSD in COMs is listed in Table 4.2.3 COMs are classified aslyophobic because the dispersed particles are not compatible with the dispersionmedium. These systems are thermodynamically unstable and will separate into twocontinuous phases.
TABLE 4.2COM Particle Size Distribution (PSD)
Percentagea Particle Size (µµµµm)
100 < 20080 < 7465 < 4415 < 10–20
1 < 1 (colloidal)
a Passing through mesh size.
Source: From Papachristodoulou, G. and Trass, O., Can.J. Chem. Eng., 65, 177–201, 1987. With permission.
© 2007 by Taylor & Francis Group, LLC

140 Handbook of Alternative Fuel Technology
Ultrafine COMs with 95% of particles smaller than 325 mesh (44 µm) and slurryconcentrations of 50 wt% have been investigated. These slurries reduce abrasiveness,exhibit improved combustion characteristics, and do not contain additives.4,42 How-ever, the grinding cost becomes higher, and coal concentration is typically limitedto 50 wt%.
Common chemical additives for COMs are surfactants and polymers. The sur-factants add stability to the mixture by preventing agglomeration and enhancingflocculation. Cationic polymers are the most effective surfactants for stabilization,43
though anionic polymers are used more frequently to reduce the drag.44,76
In many instances, water is added to coal-oil slurries forming COW or CWO,depending on the water concentration. Water, a flocculating agent, is added toincrease the stability of the slurry as well as for cost savings. Water increases theviscosity of the resultant slurry through the formation of aggregates and particlebridging,44 although the combustion properties are more or less retained.
4.5 ADVANCED TRANSPORTATION OF COAL SLURRY
The transportation of coal slurries can be accomplished by truck and railroad tanks,slurry tankers, and slurry pipelines. Historically, transportation schemes of coal-water slurries have received the most attention and development. Although all trans-portation schemes and options have been investigated, few new processing develop-ments have occurred in truck, railroad, or slurry tankers. In these cases, the slurrystability has been enhanced to minimize settling during transportation or the slurryhas been dewatered to maximize energy density and cost-effectiveness of transpor-tation. On the other hand, coal-water pipeline systems across the world have under-gone almost constant development since the 1950s. Coal pipelines can be brokeninto four different systems: (1) conventional fine coal, (2) conventional coarse coal,(3) stabilized flow, and (4) coal-water mixture. These systems differ by the particlesize of coal in the slurry, as shown in Table 4.3.45
Only two systems in the U.S. are conventional fine-coal slurry pipelines. Thefirst was the Ohio pipeline by the Consolidation Coal Company, which was built in1957 and operated for several years until another competitive transportation mode,the unit train, became available. The slurry traveled at moderate velocities and had
TABLE 4.3Summary of Particles Sizes in Coal-Water Slurry Pipeline Systems
Coal-Water Slurry Systems Particle Sizes
Conventional fine coal Less than 1 mmConventional coarse coal 50–150 mmCoal-water mixtures –30 and –150 µm (less than 200 mesh)Stabilized-flow coal Less than 0.2 mm (fine) and less than 50 mm (coarse)
Source: From Hsu, B.D., Leonard, G.L., and Johnson, R.N., J. Eng. Gas Turbines Power,110, 516–520, July 1988. With permission.
© 2007 by Taylor & Francis Group, LLC

Coal Slurry Fuel 141
a coal content of 50 wt%. The second pipeline system built, Black Mesa pipeline,followed the same basic design of the earlier Consolidation pipeline. The pipelinebegan operation in 1970 and is still operating today. The pipeline operates at 4–6mph, and is optimized for minimal erosion and settling at a 50% coal loading.45,46
The success of this pipeline has significantly impacted other solid transporting slurrypipelines in the world.
In conventional coarse-coal slurry transportation, run of mine (ROM) coal istransported at high velocities in coal loadings ranging from 35 to 60%, dependingon the coal particle size (50–150 mm).45 In this pipeline, coal slurry preparationcosts are minimal; however, energy requirements for the pipeline transportation arehigh. This type of system is limited to short distances where other transportationmodes such as rail, barge, truck, or conveyor can be used.
Stabilized flow coal slurry systems use smaller particles to support the coarsecoal particles. The particle size distribution for the fine coal is <0.2 mm and for thecoarse coal, <50 mm.45 This PSD was utilized to enhance the stability of the slurryfor long transportation distances. Coal concentrations of up to 70 wt% can be used.The coarse coal is easier to dewater than fine coals because of the particle size.
Coal-water mixture pipeline systems are designed for direct use at the finaldestination site, most likely in utility boilers and furnaces. The coal concentrationis between 70 and 75 wt% with bimodal and polymodal particle size distributionsof coal particles smaller than 200 mesh.45 CWMs use approximately 1% surfactantsand dispersants for slurry stability. These pipelines have yet to be investigated overlong distances.
Many different coal processing configurations exist for coal use at the end of acoal slurry pipeline. The options include direct use of CWM, dewatering and con-veying to a plant (Figure 4.9), piping to an offshore platform and dewatering intoship (Figure 4.10), dewatering into a railcar or truck, and piping into an offshorebuoy system into a ship.33–48
Table 4.4 is a comparison of coal content in coal slurries for the pipeline systemsdiscussed.45 Each coal transportation mode has its own merits, and therefore a decisionhas to be made on an individual basis. The transport systems are evaluated in Table 4.5.45
As mentioned earlier, one of the most significant and successful coal slurry pipe-lines is the Black Mesa Pipeline, which is a 273-mi. (440-km) long, 18-in. (457-mm)
FIGURE 4.9 Domestic combustion pipeline scheme. (From Hsu, B.D., Leonard, G.L., andJohnson, R.N., J. Eng. Gas Turbines Power, 110, 516–520, July 1988.)
CoalPreparation
Water
Slurry
Water
Dewatering
PowerPlant
Storage Tanks
PipelineTransport
© 2007 by Taylor & Francis Group, LLC

142 Handbook of Alternative Fuel Technology
diameter coal-water slurry pipeline, originating from Black Mesa in northeasternArizona. The system transports coal from Peabody Western Coal Company’s open pitmine to the Mohave Generating Station, which is a 1580-MW steam-powered electricgenerating plant located in Laughlin, NV. Black Mesa Pipeline began its commercialoperation in November 1970 and has transported over 120 million tons (as-mined)with an availability factor of 98%. The pipeline delivers coal at a rate of 570 to 600M/T (or, 630–660 short tons) per hour, and the nominal capacity is over 5 million tons(4.5 million tonnes) per year. Black Mesa Pipeline has helped development of othersolid transportation pipelines in the world, which include slurry pipeline transportationof limestone, copper concentrates, iron concentrates, gilsonite, and phosphate. Some
FIGURE 4.10 Offshore coarse coal pipeline scheme with dewatering. (From Hsu, B.D., Leonard,G.L., and Johnson, R.N., J. Eng. Gas Turbines Power, 110, 516–520, July 1988.)
TABLE 4.4Comparison of Coal Content in Coal Slurries
Coal-Water Slurry Systems Percentage of Coal in Mixture
Conventional fine coal 50 (overland and ship loading)75 (aboard ship)
Conventional coarse coal 30–60 (overland-short distances only and ship loading)90–92 (aboard ship)
Coal-water mixtures 70 (overland)85–90 (ship loading and aboard ship)
Stabilized-flow coal 70–75 (overland, ship loading, and aboard ship)
Source: From Hsu, B.D., Leonard, G.L., and Johnson, R.N., J. Eng. Gas Turbines Power,110, 516–520, July 1988. With permission.
ConventionalTransport
Slurry Prep atNearby Mine
or Pier
OffshoreDewatering
System
Conveyor toShip
Ship Loading
Ocean Transport
UnderseaPiping
WaterReturn
COARSE COAL(only short distances)
© 2007 by Taylor & Francis Group, LLC
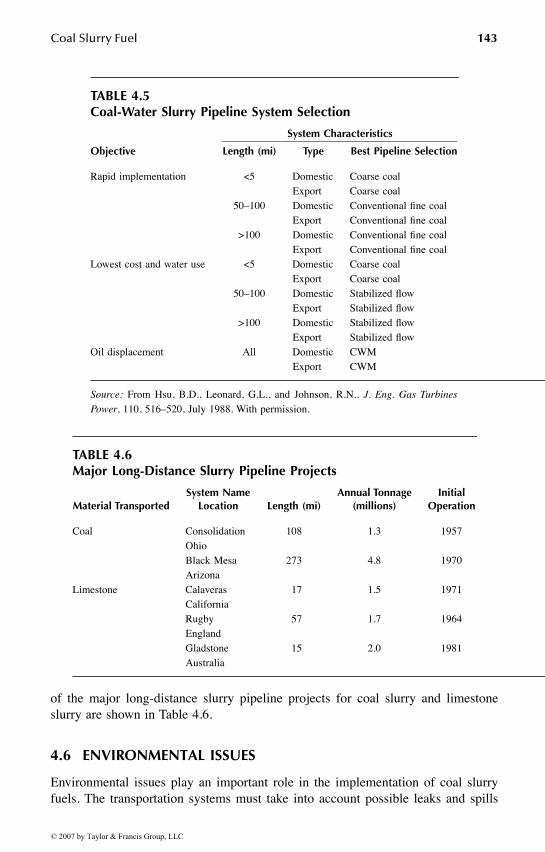
Coal Slurry Fuel 143
of the major long-distance slurry pipeline projects for coal slurry and limestoneslurry are shown in Table 4.6.
4.6 ENVIRONMENTAL ISSUES
Environmental issues play an important role in the implementation of coal slurryfuels. The transportation systems must take into account possible leaks and spills
TABLE 4.5Coal-Water Slurry Pipeline System Selection
Objective
System Characteristics
Length (mi) Type Best Pipeline Selection
Rapid implementation <5 DomesticExport
Coarse coalCoarse coal
50–100 DomesticExport
Conventional fine coalConventional fine coal
>100 DomesticExport
Conventional fine coalConventional fine coal
Lowest cost and water use <5 DomesticExport
Coarse coalCoarse coal
50–100 DomesticExport
Stabilized flowStabilized flow
>100 DomesticExport
Stabilized flowStabilized flow
Oil displacement All DomesticExport
CWMCWM
Source: From Hsu, B.D., Leonard, G.L., and Johnson, R.N., J. Eng. Gas TurbinesPower, 110, 516–520, July 1988. With permission.
TABLE 4.6Major Long-Distance Slurry Pipeline Projects
Material TransportedSystem Name
Location Length (mi)Annual Tonnage
(millions)Initial
Operation
Coal ConsolidationOhio
108 1.3 1957
Black MesaArizona
273 4.8 1970
Limestone CalaverasCalifornia
17 1.5 1971
RugbyEngland
57 1.7 1964
GladstoneAustralia
15 2.0 1981
© 2007 by Taylor & Francis Group, LLC

144 Handbook of Alternative Fuel Technology
encountered with slurry handling. Combustion processes must be thoroughly inves-tigated to find the differing combustion mechanisms in coal slurry, specifically, themineral matter and sulfur content of the coal.
In the transportation of coal slurries, spills, leaks, and catastrophic disasters areimportant factors in safe handling. Transportation of CWMs has been widely inves-tigated for both short and long distances. Slurries of water are considered nontoxicand nonhazardous. Historically, in the U.S. when there have been handling accidentsin pipeline systems, cleanup of the coal has not been necessary. The coal has beenallowed to reenter the ground naturally. CWMs have the distinct advantage in thatthey are not readily combustible in accidents.
In the combustion of slurries many processes will not be able to handle the highsulfur and mineral matter content of coal. Therefore, combustion processes in utilityboilers and furnaces may exhibit slagging, fouling, and erosion. Other applicationssuch as cement and asphalt kilns and fluid bed combustors are able to easily handlethe increases in inorganic material. The amount of ash that induces fouling in boilersvaries from boiler to boiler. Table 4.7 shows the predicted acceptable ash levels fordiffering types of boilers.2
An important constituent in the coal is sulfur both in organic and inorganic forms.Sulfur is a precursor for ash formation and can form SOx , precursor to acid rain,which has regulated emissions. In many instances, coal beneficiation techniques areused to clean the coal after grinding. These processes are broken into physical andchemical cleaning methods. Physical cleaning methods are based on differences incoal and mineral matter density or surface properties. Examples of physical cleaningprocesses are gravitational separation,49 froth flotation,50 selective agglomeration,51
heavy medium separation,52 high-gradient magnetic separation,53 microbubble flota-tion,54 and biological method.55 Chemical cleaning methods have been widely inves-tigated at the laboratory scale but are not commonly used on an industrial scale.56
Other environmentally regulated emissions from combustion of coal slurries areNOx, hydrocarbons (VOCs), and particulate matter (PM). The burning of coal slurriesreduces the amount of hydrocarbon emissions significantly in oil-designed boilers andfurnaces. NOx emissions are a function of fuel’s nitrogen content, fuel composition,combustion temperature, and amount of excess air.4 NOx emissions are controllableby conventional methods such as low excess air, stage combustion, low-temperature
TABLE 4.7Permissible Coal Ash Content for Utility Boilers
Ash Content (%) Boiler Type
5–7 Coal designed/coal capable2–3 Liberal oil design<0.5 Compact oil designed
Source: From Kesavan, S., Stabilization of Coal Particle Suspen-sions using Coal Liquids, M.S. thesis, University of Akron, 1985.With permission.
© 2007 by Taylor & Francis Group, LLC

Coal Slurry Fuel 145
combustion, and flue gas recirculation.2 The particulate emissions are directly relatedto the ash content in the coal slurry and can be significantly higher than oil-burningfurnaces. However, conventional particle control techniques are effective in removingthe particulates.4 Further, low-ash content coal is preferred as a slurry coal.
4.7 COMBUSTION
The combustion of coal in utility boilers (and furnaces) and internal combustionengines has been widely investigated throughout the 1970s and 1980s. The bulk ofcombustion research and development has been in the area of CWSFs.
Generally, COM combustion occurs in three stages: (1) heating of droplet, (2)combustion of volatile matter, and (3) combustion of char. For coal, char combustionrate is controlled (or limited) by the mass transfer rate of oxygen for particles largerthan 100 µm, whereas smaller ones are limited by the kinetic reaction rate.4 In otherwords, the rate-limiting step for char combustion reaction is the mass transfer rateof oxygen to coal-reactive sites for large coal particles, whereas that for smallerparticles is the surface reaction rate. Carbon conversions in coal slurry combustionare comparable to those of fuel oil combustion.
COM and CWSF differ in burning characteristics such that CWSF heat is onlygenerated by the coal, unlike COM, whose energy is provided by combustion ofboth coal and oil. There are potential problems associated with CWSF combustionsuch as flame stability, incomplete combustion, erosion, and slagging. Flame stabilityis a function of atomized droplet size, fuel stability, agglomeration properties, burnerswirl, burner throat construction, and preheat air temperature.2 Incomplete combus-tion is a result of inadequate preheating, delayed ignition (vaporization of water),insufficient excess oxygen supply, and agglomeration. Erosion occurs through excessvelocities of particle-laden gases. Slagging is a function of inorganic content andslow char particle burnout. In cases of using CWSF in oil boilers and furnaces, theboiler duty is derated, unless modifications are made to the unit.
The combustion mechanism for CWSF shown in Figure 4.1157 is similar to thatof pulverized coal with the additional stage of water evaporation. The coal slurrydroplet is injected into a hot gas stream and quickly dries. The particles in the dropletagglomerate from surface forces and become tightly bound while undergoing plasticdeformation during pyrolysis. Ignition occurs and devolatilization produces frag-mentation. The char further fragments during burnout.
Coal combustion is considered slow when compared to the combustion of oil.58
The flame temperature is lowered because of the energy absorbed in order to vaporizethe water. The atomization of the slurry strongly influences the combustion effi-ciency.59 Fine atomization increases the rate of evaporation through surface areaincrease and reduces the size of the agglomerates. Smaller droplets produce morestable flames and greater carbon burnout.2
Coal-water slurry firing of conventional boilers has been performed overextended periods of time with few operational problems. The boilers were success-fully started, reliably and safely operated, and complied with emission norms. Thecombustion efficiency was 95%, and thermal efficiency was 79%. However, in order
© 2007 by Taylor & Francis Group, LLC

146 Handbook of Alternative Fuel Technology
to increase efficiency to over 99%, costly modification must be made and anticipatedmaintenance schedules are up to 6 times/year.60,61
Until recently, coal has only been used in external combustion engines (Rankinecycles). Attempts at coal utilization, dating back to the development of the dieselengine during the 1920s, on large-bore diesel engines were investigated. Problemssuch as fuel introduction, combustion efficiency, and engine wear could not beresolved at the time and the work was halted.62
Investigation in CWSF has brought about renewed interest in coal-fired internalcombustion engines. Recent feasibility studies have shown that slurry engines havethermal efficiencies similar to those of oil engines, and the use of new materials haslimited the erosive effects.63 The presence of water in the fuel allows for controllingof NOx emissions. Hydrocarbon and CO emissions are low, although CO2 emissionis higher than oil because of the high carbon content of the coal.64,65 The particulatesgenerated can easily be handled with particulate traps.65
The difficulties in the utilization of CWSF in diesel engines are fuel injection(atomization), ignition, erosion, and corrosion.66 The fuel injection system efficiencyis dependent on slurry properties, combustion chamber layout, fuel compatibility,ignition delays, and erosion. Initial ignition of CWM is difficult because the watermust first be evaporated from the coal.67 Operating combustion temperatures are
FIGURE 4.11 CWSF combustion mechanism. (Reference: Miller, S.F., Morrison, J.L., andScaroni, A.W., The formulation and combustion of coal water slurry fuels from impoundedcoal fines, Proc. 19th Int. Tech. Conf. on Coal Utilization and Fuel Systems, 1994, pp.643–650.)
Coal Water FuelDroplet
Dry Agglomerate
Fused Agglomerate
Corner Ignited,Ignition Spreading
Volatile Evolution InduceRotation of ParticleFragmentation and Rotation
Due to Devolatilization
Fragmentation DuringChar Burn-Out
Char Burn-Out andAsh Shedding
© 2007 by Taylor & Francis Group, LLC

Coal Slurry Fuel 147
higher, the optimal range being 1000–1100 K.62,67 This is to limit the ignition delayof coal from the evaporative effects of water and the slower burning of coal.50,67
Erosion of parts in the injection system as well as in the cylinders is a major concernfor the life of the engine. Engine wear is 6 times higher in a CWM-fired engine thana diesel-fired one, but can be reduced significantly to twice as much with specialalloys and redesigned parts.65 These findings hold great promise for the success ofefforts to operate an internal combustion engine on CWSF.
4.8 RECENT ADVANCES AND THE FUTURE
Coal-water fuels have received the most process development recently. Coal slurryfacilities have been built in Australia, Canada, China, Italy, Japan, Sweden, and theU.S. The most active countries have been Japan, China, and Russia. China has builtseveral slurry production facilities and boiler units. Japan has done considerableresearch and technological development on slurry processes and has converted sev-eral boilers. Russia has built several pipelines, production facilities, and boilers.
In Australia, a group of companies comprising Ube Industries, Nissho Iwai Corp.,and Coal & Allied Industries have been working since 1987 on developing theproduction, transportation, and marketing of CWM from Australia to Japan.68 In1991, the first bilateral trading of coal slurry began between China and Japan.69 Acoal-water slurry plant was built in Rizhao located in Shandong province by YanzhouCoal Mining Bureau, Nisshon Iwai Corp., and JWG Corporation. The plant has acapacity of 250,000 tons/year. The coal is mined, and then transported by train toRizhao. The coal is processed into CWM and shipped to an overseas terminal. Oncein the relay terminal, the CWM is transferred to coastal shipping and then finally toend users. The manufacture, transportation, and combustion of coal slurry haveinvolved only minimal technical problems.69
In the U.S., the greatest potential use for CWM may be in the utilization of coalfines for cofiring boilers. Over 40 million tons of coal fines are discarded annuallyin the U.S. into slurry ponds, and some 2.3 billion tons of coal fines are estimatedto reside in ponds in 1994.16 Coal fines (-100 mesh) production has increased overthe years with the increase in demand of cleaner coal. Increased demand for high-quality coal (often beneficiated) has led to rejecting 20–50% of coal mined as coalfines.70 The environmental impact of coal fines is nonproductive use of land, loss ofaesthetics, danger of slides, dam failure, significant permitting costs, and possiblewater pollution.70
Recently, GPU Energy (PENELEC), New York State Electric and Gas Corpo-ration (NYSEG), Pennsylvania Electric Energy Development Authority (PEEDA),Pennsylvania Electric Energy Research Council (PEERC), and the Electric PowerResearch Institute (EPRI) commissioned a project to investigate the utilization ofCWM developed for coal fines. The project investigated laboratory-scale as well asfull-scale cofiring of a 32-MW boiler.72
CWM will reduce the coal-handling problems and eliminate the need for costlydryers and their associated environmental hazards. CWM will also eliminate theneed for addition of oil at start-up, which is used to stabilize the combustion.Moreover, the equipment life of pulverizer will also be extended by reducing the
© 2007 by Taylor & Francis Group, LLC

148 Handbook of Alternative Fuel Technology
equipment load. Using CWM from coal fines has the ability to stabilize the cost offuel to the boiler because it is a lower-cost fuel, and fuel ratio can be controlled upto 50%.71,74 Environmentally, the addition of coal slurry reduces the NOx emissions.74
To be economically more competitive, the lowest-cost slurry must be developed,which may lead to a “low-tech slurry,” i.e., one without stabilizers, dispersants, orthe need for further grinding. This slurry can be developed from coal pond fines,from fine coal fraction of existing coal supplies, or using advanced coal technologiesin the future to deep-clean fine coal.65 The slurry has been tested with solid loadingsranging between 54 and 67 wt% coal, and the test has demonstrated excellenthandling and storage properties.73
However, slurry developed from coal fines is highly variable. The slurriability is afunction of PSD, ash level, and extent of oxidation. Therefore, slurry preparation canvary from a minimal processing to a significant processing. Minimal processing is fromcoals derived from wet, fine coal that has been cleaned. Significant processing can comefrom coal fines that have high ash content and oxidation levels. High oxidation makesthe coals more wettable through oxygen bonds, which in turn increases the viscosityand stability of the slurry. Typically, weathered coals are more oxidized.
Currently, slurry produced from coal fines at Homer City is being cofired alongwith powdered coal in the 32-MW boiler #14 of the Seward Station. The plant hasbeen operating without disruption. The NOx production has decreased by 10–20%,while CO2, SO2, and particulates have remained essentially the same as for powdercoal, but the CO level is highly variable.73
Coal slurry development finds itself adjusting once again to process economics.Since the mid 1980s, COM, once the most investigated slurry, has become uneco-nomical and development has focused on CWM. In regions where coal is plentifulbut transportation is lacking, such as China and Russia, slurry development continueson production, pipelines, and combustion. In other places such as Japan where naturalresources and storage spaces are limited, the ease of transportation that CWM makespossible is now being exploited. In the U.S., coal slurry development is now centeredon coal utilization. CWM enables the use of higher amounts of coal after benefici-ation and greatly reduces the environmental liability in discarded coal fines. Coalslurry development continues in internal combustion engines in injection systems,atomizer design, and materials for construction.74 Coal slurry process developmentwill continue and may be poised to represent a major form of coal energy.
REFERENCES
1. Choudhury, R., Slurry fuels, Prog. Energy Combust. Sci., 18, 409–427, 1992.2. Kesavan, S., Stabilization of Coal Particle Suspensions using Coal Liquids, M.S.
thesis, University of Akron, Akron, OH, 1985.3. Papachristodoulou, G. and Trass, O., Coal slurry fuel technology, Can. J. Chem. Eng.,
65, 177–201, 1987.4. Smith, H.R. and Munsell, H.M., Liquid Fuels, U.S. Patent No. 219181, 1879.5. Lord, N.W., Ouellette, R.P., and Farah, O.G., Coal-Oil Mixture Technology, Ann Arbor
Science, Ann Arbor, MI, 1982.6. Manning, A.B. and Taylor, R.A.A., Colloidal fuel, J. Inst. Fuel, 9, 303, 1936.
© 2007 by Taylor & Francis Group, LLC

Coal Slurry Fuel 149
7. Manning, A.B. and Taylor, R.A.A., Colloidal fuel, Trans. Inst. Chem. Eng., 14, 45,1936.
8. Adams, R.A., Holmes, F.C.V., and Perrin, A.W., Colloidal Fuel Using Cracked Oiland High Carbon Residue, U.K. Patent No. 396,432 August 2, 1933.
9. Barkley, J.F., Hersberger, A.B., and Burdick, L.R., Trans. Am. Soc. Mech. Eng., 66,185, 1944.
10. Nakabayashi, Y., Outline of COM R&D in Japan, Proc. 1st Int. Symp. on Coal-OilMixture Combustion, M78-97, St. Petersburg, FL, May 1978.
11. Basta, N. and D’Anastaio, M., The Pulse Quickens For Coal-Slurry Projects, Chem-ical Engineering, September 17, 1984, pp. 22–25.
12. Bergman, P.D., Kirkland, L., and George, T.J., Why Coal Slurries Stir WorldwideInterest, Coal Mining and Processing, 19, 10, 1982, pp. 24–42.
13. Marnell, P., Direct firing of coal water suspensions, state of the art review, Proc. CoalTechnol. ‘80, Industrial Presentation Inc., Houston, TX, 1980.
14. Brown, A., Jr., Powdered COM Program, Final Report of the General Motors Cor-poration, October 1977.
15. Miller, B.G., Coal-water slurry fuel utilization in utility and industrial boilers, Chem.Eng. Prog., 85(3), 29–38, March 1989.
16. Meyer, C.W., Stabilization of coal/fuel oil slurries, Proc. 2nd Int. Symp. on coal-OilMixture Combustion, Vol. 2, CONF-791160, Danvers, MA, November 1979.
17. Williams, R.A., Characterization of process dispersions, Colloid and Surface Engi-neering: Applications in the Process Industries, Williams, R.A., Ed., ButterworthHeinemann, Boston, MA, 1992.
18. Barnes, H.A., Hutton, J.F., and Walters, K., An Introduction to Rheology, Elsevier,New York, 1989.
19. Hunter, R.J., Foundations of Colloidal Science, Vol. 1, Oxford University Press,Oxford, U.K., 1987.
20. Shaw, D.J., Introduction to Colloid and Surface Chemistry, 4th ed., ButterworthHeinemann, Boston, MA, 1991.
21. Napper, D.H., Polymeric Stabilization of Colloidal Dispersions, Academic Press,1983.
22. Gregory, J., Flocculation of polymers and polyelectrolytes, Solid Liquid Dispersions,Tadros, T.F., Ed., Academic Press, pp. 163–181, 1987.
23. Evans, D.F. and Wennerstrom, H., The Colloidal Domain Where Physics, Chemistry,Biology, and Technology Meet, VCH, New York, 1994.
24. Vossoughi, S., and Al-Husaini, O.S., Rheological characterization of thecoal/oil/water slurries and the effect of polymer, Proc. 19th Int. Tech. Conf. on CoalUtilization and Fuel Systems, Clearwater, FL, March 21–24, 1994, pp. 115–122.
25. Ross, S. and Morrison, I.D., Colloidal Systems and Interfaces, John Wiley & Sons,New York, 1988.
26. Rowell, R.L., The Cinderella Synfuel, CHEMTECH, April 1989, pp. 244–248.27. Turian, R.M., Fakhreddine, M.K., Avramidis, K.S., and Sung, D.-J., Yield stress of
coal-water mixtures, Fuel, 72, 9, 1305–1315, 1993.28. Roh, N.-S., Shin, D.-H., Kim, D.-C., and Kim, J.-D., Rheological behavior of coal-
water mixtures 1. Effects of coal type, loading and particle size, Fuel, 74, 8,1220–1225, 1995.
29. Woskoboenko, F., Siemon, S.R., and Creasy, D.E., Rheology of Victorian brown coalslurries, 1. Raw coal-water, Fuel, 66, 1299–1304, September 1987.
30. Roh, N.-S., Shin, D.-H., Kim, D.-C., and Kim, J.-D., Rheological behavior of coal-water mixtures 2. Effect of surfactants and temperature, Fuel, 74, 9, 1313–1318, 1995.
© 2007 by Taylor & Francis Group, LLC

150 Handbook of Alternative Fuel Technology
31. Kaji, R., Muranaka, Y., Miyadera, H., and Hishinuma, Y., Effect of electrolyte on therheological properties of coal-water mixtures, AIChE J., 33, 1, 11–18, 1987.
32. Rowell, R.L., Vasconcellos, S.R., Sala, R.J., and Farinato, R.S., Coal-oil mixtures 2.Surfactant effectiveness on coal oil mixture stability with a sedimentation column,Ind. Eng. Chem., Proc. Des. Dev., 20, 283–288, 1981.
33. Veal, C.J. and Wall, D.R., Coal-oil dispersions — overview, Fuel, 60, 873–882, 1982.34. Kawatra, S.K., Coal-water slurries, in Encyclopedia of Chemical Processing, Lee, S.,
Ed., Vol. 1, Taylor & Francis, New York, 2005, pp. 495–503.35. Bertram, K.M. and Kaszynski, G.M., A comparison of coal-water slurry pipeline
systems, Energy, 11, 11/12, 1167–1180, 1986.36. Brolick, H.J. and Tennant, J.D., Innovative transport modes: coal slurry pipelines,
ASME Fuels and Combustion Division Pub. FACT, 8, 85–91, 1990.37. Manford, R.K., Coal-water slurry: a status report, Energy, 11, 11/12, 1157–1162,
1986.38. Ng, K.L., Coal Unloading System Using a Slurry System, 281–287.39. Hapeman, M.J., Review and Update of the Coal Fired Diesel Engine, 47–50.40. Likos, W.E. and Ryan, III, T.W., Experiments with coal fuels in a high-temperature
diesel engine, J. Eng. Gas Turbines Power, 110, 444–452, July 1988.41. Rao, A.K., Melcher, C.H., Wilson, R.P., Jr., Balles, E.N., Schaub, F.S., and Kimberly,
J.A., Operating results of the cooper-bessemer JS-1 engine on coal-water slurry, J.Eng. Gas Turbines Power, 110, 431–436, July 1988.
42. Urban, C.M., Mecredy, H.E., Ryan, III, T.W., Ingalls, M.N., and Jetss, B.T., Coal-water slurry operation in an EMD diesel engine, J. Eng. Gas Turbines Power, 110,437–443, July 1988.
43. Hsu, B.D., Progress on the investigation of coal-water slurry fuel combustion in amedium speed diesel engine: Part 1 — ignition studies, J. Eng. Gas Turbines Power,110, 415–422, July 1988.
44. Hsu, B.D., Progress on the investigation of coal-water slurry fuel combustion in amedium speed diesel engine: Part 2 — preliminary full load test, J. Eng. Gas TurbinesPower, 110, 423–430, July, 1988.
45. Hsu, B.D., Leonard, G.L., and Johnson, R.N., Progress on the investigation of coal-water slurry fuel combustion in a medium speed diesel engine: Part 3 — accumulatorinjector performance, J. Eng. Gas Turbines Power, 110, 516–520, July 1988.
46. Wenglarz, R.A. and Fox, R.G., Jr., Physical aspects of deposition from coal-water fuelsunder gas turbine conditions, J. Eng. Gas Turbines Power, 112, 9–14, January 1990.
47. Wenglarz, R.A. and Fox, R.G., Jr., Chemical aspects of deposition/corrosion fromcoal-water fuels under gas turbine conditions, J. Eng. Gas Turbines Power, 112, 1–8,January 1990.
48. Dwyer, J.G., Australian coal water mixtures (CWM) plant development at Newcastle,NSW, Proc. 19th Int. Tech. Conf. on Coal Utilization and Fuel Systems, 1994, pp.35–38.
49. Hamieh, T., Optimization of the interaction energy between particles of coal watersuspensions, Proc. 19th Int. Tech. Conf. on Coal Utilization and Fuel Systems, 1994,pp. 103–114.
50. Vossoughi, S. and Al-Husaini, O.S., Rheological characterization of the coal/oil/waterslurries and the effect of polymer, Proc. 19th Int. Tech. Conf. on Coal Utilization andFuel Systems, 1994, pp. 123–131.
51. Tobori, N., Ukigia, T., Sugawara, H., and Arai, H., Optimization of additives forCWM commercial plant with a production rate of 500 thousand tons per year, Proc.19th Int. Tech. Conf. on Coal Utilization and Fuel Systems, 1994, pp. 123–133.
© 2007 by Taylor & Francis Group, LLC
Coal Slurry Fuel 151
52. Addy, S.N. and Considine, T.J., Retrofitting oil-fired boilers to fire coal water slurry:an economic evaluation, Proc. 19th Int. Tech. Conf. on Coal Utilization and FuelSystems, 1994, pp. 341–352.
53. Kaneko, S., Suganuma, H., and Kabayashi, Y., Fundamental study on the combustionprocess of CWM, Proc. 19th Int. Tech. Conf. on Coal Utilization and Fuel Systems,1994, pp. 403–414.
54. Takahashi, Y. and Shoji, K., Development and scale-up of CWM preparation process,Proc. 19th Int. Tech. Conf. on Coal Utilization and Fuel Systems, 1994, pp. 485–495.
55. Tu, J., Cefa, K., Zhou, J., Yao, Q., Fan, H., Cao, X., Qiu, Y., Huang, Z., Wu, X., and Liu,J., The comparing research on the ignition of the pulverized coal and the coal water slurry,Proc. 19th Int. Tech. Conf. on Coal Utilization and Fuel Systems, 1994, pp. 517–528.
56. Battista, J.J., Bradish, T., and Zawadzki, E.A., Test results from the co-firing of coalwater slurry fuel in a 32 MW pulverized coal boiler, Proc. 19th Int. Tech. Conf. onCoal Utilization and Fuel Systems, 1994, pp. 619–630.
57. Miller, S.F., Morrison, J.L., and Scaroni, A.W., The formulation and combustion ofcoal water slurry fuels from impounded coal fines, Proc. 19th Int. Tech. Conf. onCoal Utilization and Fuel Systems, 1994, pp. 643–650.
58. Schimmeller, B.K., Jacobsen, P.S., and Hocko, R.E., Industrial use of technologiespotentially applicable to the cleaning of slurry pond fines, Proc. 19th Int. Tech. Conf.on Coal Utilization and Fuel Systems, 1994, pp. 805–817.
59. Crippa, E.R., 50,000 HP coal slurry diesel engine, Proc. 19th Int. Tech. Conf. on CoalUtilization and Fuel Systems, 1994, pp. 821–828.
60. Bradish, T.J., Battista, J.J., and Zawadzki, E.A., Co-firing of water slurry in a 32 MWpulverized coal boiler, Proc. 18th Int. Tech. Conf. on Coal Utilization and FuelSystems, 1993, pp. 303–313.
61. Yanagimacho, H., Matsumoto, O., and Tsuri, M., CWM production in China andCWM properties in all stages from production to combustion in the world’s firstbilateral CWM trade, Proc. 18th Int. Tech. Conf. on Coal Utilization and Fuel Systems,1993, pp. 327–337.
62. Morrison, D.K., Melick, T.A., and Sommer, T.M., Utilization of coal water fuels infire tube boilers, Proc. 18th Int. Tech. Conf. on Coal Utilization and Fuel Systems,1993, pp. 339–347.
63. Pisupati, S.V., Britton, S.A., Miller, B.G., and Scarani, A.W., Combustion perfor-mance of coal water slurry fuel in an off-the -shelf 15,000 lb steam/h fuel oil designedindustrial boiler, Proc. 18th Int. Tech. Conf. on Coal Utilization and Fuel Systems,1993, pp. 349–360.
64. Morrison, J.L., Miller, B.G., and Scaroni, A.W., Preparing and handling coal waterslurry fuels: potential problems and solutions, Proc. 18th Int. Tech. Conf. on CoalUtilization and Fuel Systems, 1993, pp. 361–368.
65. Battista, J.J. and Zawadzki, E.A., Economics of coal water slurry, Proc. 18th Int.Tech. Conf. on Coal Utilization and Fuel Systems, 1993, pp. 455–466.
66. Ohene, F., Luther, D., and Simon, U., Fundamental investigation of non-Newtonianbehavior of coal water slurry on atomization, Proc. 18th Int. Tech. Conf. on CoalUtilization and Fuel Systems, 1993, pp. 607–617.
67. Kihm, K.D. and Kim, S.S., Investigation of dynamic surface tension of coal waterslurry (CWS) fuels for application to atomization characteristics, Proc. 18th Int. Tech.Conf. on Coal Utilization and Fuel Systems, 1993, pp. 637–648.
68. Tu, J., Yao, Q., Cao, X., Cen, K., Ren, J., Huang, Z., Liu, J., Wu, X., and Zhao, X.,Studies on thermal radiation ignition of coal water slurry, Proc. 18th Int. Tech. Conf.on Coal Utilization and Fuel Systems, 1993, pp. 659–668.
© 2007 by Taylor & Francis Group, LLC

152 Handbook of Alternative Fuel Technology
69. Hamich, T. and Siffert, B., Physical-chemical properties of coals in aqueous medium,Proc. 18th Int. Tech. Conf. on Coal Utilization and Fuel Systems, 1993, pp. 771–782.
70. Fullerton, K.L., Lee, S., and Kesavan, S., Laboratory scale dynamic stability testingfor coal slurry fuel development, Proc. 18th Int. Tech. Conf. on Coal Utilization andFuel Systems, 1993, pp. 799–808.
71. Hamich, T. and Siffert, B., Rheological properties of coal water highly concentratedsuspensions, Proc. 18th Int. Tech. Conf. on Coal Utilization and Fuel Systems, 1993,pp. 809–820.
72. Zang, Z.-X., Zhang, L., Fu, X., and Jiang, L., Additive for coal water slurry madefrom weak slurrability coal, Proc. 18th Int. Tech. Conf. on Coal Utilization and FuelSystems, 1993, pp. 821–833.
73. Everett, D.H., Basic Principles of Colloid Science, Royal Society of Chemistry,London, 1988.
74. Sadler, L.Y. and Sim, K.G., Minimize Solid-Liquid Mixture Viscosity By OptimizingParticle Size Distribution, Chemical Engineering Progress, 87(3), 1991, pp. 68–71.
75. Kawatra, S.K. and Bakshi, A.K., The on-line pressure vessel rheometer for concen-trated coal slurries, Coal Prep., 22(1), 2002.
76. Zakin, J., Zhang, Y., and Yunying, Q., Drag reducing agents, in Encyclopedia ofChemical Processing, Lee, S., Ed., Vol. 2, Taylor & Francis, New York, 2005, pp.767–785.
© 2007 by Taylor & Francis Group, LLC

153
5 Liquid Fuels fromNatural Gas
James G. Speight
CONTENTS
5.1 Introduction .................................................................................................. 1535.2 Occurrence and Resources........................................................................... 1555.3 Composition ................................................................................................. 1555.4 Natural Gas Liquids ..................................................................................... 1565.5 Conversion of Natural Gas to Liquids......................................................... 157
5.5.1 Syngas Production ........................................................................... 1585.5.2 Fischer–Tropsch Process.................................................................. 160
5.5.2.1 General Process Description ............................................ 1605.5.2.2 Chemistry.......................................................................... 1615.5.2.3 Products ............................................................................ 1635.5.2.4 Catalysts............................................................................ 1635.5.2.5 Commercial Processes...................................................... 163
5.5.3 Other Processes ................................................................................ 1675.6 The Future .................................................................................................... 169References.............................................................................................................. 170
5.1 INTRODUCTION
Natural gas is the gaseous mixture found in petroleum reservoirs. It consists predom-inantly of methane. Similar to petroleum and coal, this gas is derived from the remainsof plants, animals, and microorganisms that lived millions and millions of years ago.
Natural gas, in itself, might be considered very uninteresting as it is colorlessand odorless in its pure form. This gas is a combustible mixture of hydrocarbongases, and although the major constituent is methane, ethane (C2H6), propane (C3H8),butane (C4H10), and pentane (C5H12) are also present. However, its composition varieswidely. It is combustible and, when burned, produces energy. Unlike other fossilfuels, however, natural gas is clean burning and emits lower levels of potentiallyharmful by-products into the air.
Liquid fuels, on the other hand, are usually more complex mixtures of hydro-carbons than natural gas. Thus, for the purposes of this chapter, the term liquid fuelincludes all liquids ordinarily and practically usable in internal combustion engines.Diesel and all types of aviation fuels also come under this definition.
© 2007 by Taylor & Francis Group, LLC

154 Handbook of Alternative Fuel Technology
Natural gas can also be used to produce alternative fuels. The term alternativefuel includes methanol, ethanol, and other alcohols; mixtures containing methanoland other alcohols with gasoline or other fuels; biodiesel; fuels (other than alcohol)derived from biological materials; and any other fuel that is substantially not apetroleum product.
The production of liquid fuels from sources other than petroleum broadly coversthose produced from tar sand (oil sand), bitumen, coal, oil shale, and natural gas.These so-called synthetic liquid fuels (termed synfuels) have characteristics similarto those of petroleum-generated liquid fuels, but differ because the constituents ofsynfuels do not occur naturally in the source materials used for their production(Han and Chang, 1994). Thus, liquid fuels that are derived from sources other thannatural crude petroleum are synfuels. For much of the 20th century, the emphasiswas on liquid products derived from coal upgrading or by extraction or hydrogenationof organic matter in coke liquids, coal tars, tar sands, or bitumen deposits. It is onlyrecently that potential of natural gas as a source of liquid fuels has been recognized,and attention is now focused on this new source of liquid fuel.
Projected shortages of petroleum make it clear that in the present century alter-native sources of liquid fuels are necessary. Although such sources (for example,natural gas) are available, the exploitation technologies are in general not as matureas for petroleum. The feasibility of upgrading natural gas to valuable chemicals,especially liquid fuels, has been known for years. However, the high cost of steamreforming and the partial oxidation processes used for the conversion of natural gasto synthesis gas has hampered the widespread exploitation of natural gas. Otherviable sources of liquid fuels include tar sand (also called oil sand or bituminoussand) (Berkowitz and Speight, 1975; Speight, 1990 and references cited therein) andcoal (Speight, 1994 and references cited therein).
Natural gas, which typically has 85–95% methane, has been recognized as aplentiful and clean alternative feedstock to crude oil. Currently, the rate of discoveryof proven natural gas reserves is increasing faster than the rate of natural gasproduction. Many of the large natural gas deposits are located in areas whereabundant crude oil resources are located, such as the Middle East. However, hugereserves of natural gas are also found in many other regions of the world, providingoil-deficient countries access to a plentiful energy source. It is frequently located inremote areas far from any consumption centers, and pipeline costs can account foras much as one third of the total cost. Thus, tremendous strategic and economicincentives exist for gas conversion into liquids, especially if this can be accomplishedon-site or at a point close to the wellhead so that transportation costs are minimized.
However, despite reduced prominence, coal continues to be a viable option forthe production of liquid fuels in the future. World petroleum production is expectedultimately to level off and then decline, and despite the apparent surplus natural gas,its production too is expected to suffer a similar decline. Gasification of coal intosynthesis gas (syngas) is utilized to synthesize liquid fuels in much the same manneras natural gas steam-reforming technology. It is more important, however, to exploitthe available natural gas reserves to the maximum and by conversion of natural gasto liquid fuels.
© 2007 by Taylor & Francis Group, LLC

Liquid Fuels from Natural Gas 155
Liquid fuels possess certain inherent advantages in terms of being more readilystored, transported, and metered than natural gas. They are also generally easy toprocess or clean by chemical and catalytic means, and are more compatible with20th century fuel infrastructures, because most fuel-powered conveyances aredesigned to function only with relatively clean, low-viscosity liquids. Therefore,production of synfuels from alternative feedstocks is based on adjusting the hydro-gen–carbon ratio to the desired intermediate level.
Thus, the purpose of this chapter is to describe the occurrence and productionof liquid fuels from natural gas.
5.2 OCCURRENCE AND RESOURCES
Natural gas occurs in the porous rock of the earth’s crust either alone or withaccumulations of petroleum (Speight, 1993 and references cited therein). In the lattercase, the gas forms the gas cap, which is the mass of gas trapped between the liquidpetroleum and the impervious cap rock of the petroleum reservoir. When the pressurein the reservoir is sufficiently high, natural gas may be dissolved in the petroleumand is released upon penetration of the reservoir during drilling operations.
It is a fossil fuel and, similar to petroleum, is produced by the transformationof the remains of plants, animals, and microorganisms that lived millions and millionsof years ago.
There is an abundance of natural gas in North America, but it is a nonrenewableresource and essentially irreplaceable. Therefore, understanding the availability ofnatural gas supply is important as the use of natural gas is increased. The BritishPetroleum (BP) report of 2003 shows the current estimates of natural gas availabilityworldwide (BP Statistical Review of World Energy, 2003). Thus, there is a vastamount of natural gas estimated to be still underground.
However, it is important to compare the different methodologies and systems ofclassification used in such estimates, as it is important to delve into the assumptionsbehind each study in order to gain a complete understanding of the estimate itselfwith a particular focus on proven and potential resources.
Constant revisions are being made to these estimates. New technology combinedwith increased knowledge of particular areas or reservoirs mean that these estimatesare in a constant state of flux. Further complicating the scenario is the fact that thereare no universally accepted definitions for the terms used differently by geologists,engineers, and resource accountants.
Most of the natural gas found in North America is concentrated in relativelydistinct geographical areas, or basins. States located on top of a major basin havethe highest level of natural gas reserves. U.S. natural gas reserves are mostly con-centrated around Texas and the Gulf of Mexico.
5.3 COMPOSITION
Natural gas is colorless and odorless in its pure form. It is a combustible mixtureof hydrocarbon gases. Although natural gas is formed primarily of methane, it can
© 2007 by Taylor & Francis Group, LLC

156 Handbook of Alternative Fuel Technology
also include ethane, propane, butane, and pentane. The composition of natural gascan vary widely (Table 5.1) before it is refined. In its purest form, natural gas isalmost pure methane (CH4). Ethane, propane, and the other hydrocarbons are alsocommonly associated with natural gas (Table 5.1).
Natural gas is considered dry when it is almost pure methane, with most of theother commonly associated hydrocarbons having been removed. When other hydro-carbons are present it is considered wet.
Natural gas is commonly associated with petroleum reservoirs. Once brought tothe surface from underground, the gas is refined to remove impurities such as water,other gases, sand, and various other compounds. Some of the constituent hydrocar-bons (such as propane and butane) are removed and sold separately. After refining,the clean natural gas is transmitted through a network of pipelines to its point ofconsumption.
5.4 NATURAL GAS LIQUIDS
The term natural gas liquid, often referred to as natural gasoline, is used to designatethe hydrocarbons having higher molecular weight than methane that also occur innatural gas (Speight, 1993, p. 141). Mixtures of liquefied petroleum gas, pentanes,and higher-molecular-weight hydrocarbons fall into this category. Care should betaken not to confuse natural gasoline with the term straight-run gasoline (often alsoincorrectly referred to as natural gasoline), which is gasoline distilled unchangedfrom petroleum.
Current estimates (December 2001) of natural gas liquids in the U.S. indicatethat the reserves total up to 7993 million barrels.
TABLE 5.1Typical Composition of Natural Gas
Constituent Formula v/v (%)
Methane CH4 70–90Ethane C2H6 0–5Propane C3H8 0–5Butane C4H10 0–5Pentane C5H12 0–5Hexane (and higher) ≥C6H14 Trace–5Benzene (and higher) ≥C6H6 TraceCarbon dioxide CO2 0–8Oxygen O2 0–0.2Nitrogen N2 0–5Hydrogen sulfide H2S 0–5Rare gases He, Ne, A, Kr, Xe TraceWater H2O Trace–5
© 2007 by Taylor & Francis Group, LLC

Liquid Fuels from Natural Gas 157
5.5 CONVERSION OF NATURAL GAS TO LIQUIDS
Two routes can be used for the conversion of natural gas to liquid fuels via indirecttechnology, once the synthesis gas has been produced (Figure 5.1); both routes havebeen commercialized. One route involves use of the Fischer–Tropsch technology toproduce liquid fuels directly or by further processing. The other route involvesproduction of methanol, which is then converted to liquid fuels.
In general, the proven technology to upgrade methane is via steam reforming toproduce syngas (carbon monoxide plus hydrogen). Such a gas mixture is clean, andwhen converted to liquids produces liquid fuels free of heteroatom compounds(except for some trace amount) that contain sulfur and nitrogen.
The direct methane conversion technology, which has received considerableattention, involves the oxidative coupling of methane to produce higher hydrocarbonssuch as ethylene. These olefin products (i.e., hydrocarbons containing the –C=C-function) may be upgraded to liquid fuels via catalytic oligomerization processes,as currently practiced in the petroleum and petrochemical industries (Speight, 1999and references cited therein).
A second trend in synfuels is the increased attention to oxygenate compoundsas alternative fuels, as a result of the growing environmental concern about burningfossil-based fuels. The environmental impact of the oxygenates, such as methanol,ethanol, and methyl tert-butyl ether (MTBE) requires very serious consideration, asthe environmental issues regarding their use are not fully understood or resolved.
Thus, the use of natural gas for production of synfuels and chemicals offers aclean and economic alternative to conventional fuels and chemicals. For productionof chemicals, the most promising scenarios involve manufacturing olefins, and alsothe resulting polymer products, at a remote location and shipping them to developedmarkets.
FIGURE 5.1 Natural gas to liquid fuels.
© 2007 by Taylor & Francis Group, LLC

158 Handbook of Alternative Fuel Technology
There are approximately 5500 trillion cubic feet (tcf) of proven natural gasreserves in the world (Table 5.2). The Middle East, Europe, and Asia together accountfor approximately 75% of these reserves.
Indirect liquefaction of coal and conversion of natural gas to synfuels is definedby technology that involves an intermediate step to generate syngas. Several tech-nologies have been, and continue to be, evaluated by various companies, whichinclude gas-to-liquids (GTL), methanol-to-gasoline (MTG), methanol-to-olefins(MTO), methanol-to-propylene (MTP), olefins-to-gasoline and distillates (MOGD),dimethyl ether (DME) processes, large-scale methanol processes, and power gener-ation from methanol.
The commercially proven technologies by Shell (middle distillate synthesisprocess [MDS process]) and Sasol for the production of middle distillates via GTLprocesses show great potential for fuel alternatives and higher-value products.
Fischer–Tropsch naphtha and gas oils produced by various GTL processes areattractive for steam-cracking applications because of their high concentration ofnormal paraffin components. The high paraffinic content of the Fischer–Tropschliquids allows them to be cracked at very high severities that are not usual forconventional feedstocks. When compared to conventional naphtha-cracking yields,the yields for Fischer–Tropsch naphtha show a higher selectivity to ethylene andless to heavier products such as butanes.
5.5.1 SYNGAS PRODUCTION
Syngas is a mixture of carbon monoxide (CO) and hydrogen (H2) that is manufac-tured by steam-reforming natural gas. A certain amount of carbon dioxide (CO2) isalso almost always produced.
CH4 + H2O → CO + 3H2
This gas is an extremely important precursor for the synthesis of methanol,hydrogen, ammonia, and other products. In particular, methane can be converted tosyngas and gasoline produced from this mixture by the Fischer–Tropsch process.
TABLE 5.2Occurrence of Natural Gas
Trillion Cubic Feet(ft3 × 109) Percentage (%)
South and Central America 250.00 4.55North America 252.47 4.59Africa 418.07 7.60Asia Pacific 445.26 8.10Middle East 1979.49 35.98Europe and Asia 2155.33 39.18Total 5500.61 100.00
© 2007 by Taylor & Francis Group, LLC

Liquid Fuels from Natural Gas 159
Using this technology, gasoline is currently produced at Sasol, South Africa, andMalaysia. Methanol can be produced from syngas using the MTG process.
CO + 2H2 → CH3OH
Syngas produced using existing methods account for about 60% of the totalconversion cost of natural gas to gasoline. Thus, natural gas is an excellent choicefor an abundant alternative energy source.
The trend to increase the number of hydrogenation (hydrocracking and/orhydrotreating) processes in refineries, coupled with the need to process the heavieroils, which require substantial quantities of hydrogen for upgrading, has resulted invastly increased demands for this gas. A part of the demand for hydrogen can besatisfied by hydrogen recovery from catalytic reformer product gases, but otherexternal sources are required (Bland and Davidson, 1967). Most of the externalhydrogen is manufactured either by steam-methane reforming or by oxidation pro-cesses (Campbell, 1997). However, other processes, such as steam-methanol inter-action or ammonia dissociation, may also be used as sources of hydrogen. Electrol-ysis of water produces high-purity hydrogen, but the power costs may be prohibitive.
Steam-methane reforming is a continuous catalytic process that has beenemployed for syngas production, and in some refineries for hydrogen production,over a period of several decades. The major reaction is the formation of carbonmonoxide and hydrogen from methane and steam:
CH4 + H2O → CO + 3H2
But higher-molecular-weight feedstocks (such as propane and other hydrocarbonconstituents of natural gas) may also yield carbon monoxide and hydrogen, whichcan be adjusted to fit the required ratio for syngas:
C3H8 + 3H2O → 3CO + 7H2
that is,
CnHm + nH2O → nCO + (0.5m + n)H2
In the actual process, the feedstock is first desulfurized by passing it throughactivated carbon, which may be preceded by caustic and water washes. The desulfu-rized material is then mixed with steam and passed over a nickel-based catalyst(730–845°C [1350–1550°F] and 400 psi). Effluent gases are cooled by the additionof steam or condensate to about 370°C (700°F), at which point (if hydrogen is thedesired product) carbon monoxide reacts with steam in the presence of iron oxidein a shift converter to produce carbon dioxide and hydrogen. The carbon dioxide isremoved by amine washing and the remaining hydrogen is usually a high-purity(>99%) material.
Another syngas generation process is a continuous, noncatalytic process thatproduces carbon monoxide and hydrogen by partial oxidation of gaseous or liquid
© 2007 by Taylor & Francis Group, LLC

160 Handbook of Alternative Fuel Technology
hydrocarbons. A controlled mixture of preheated feedstock and oxygen is fed tothe top of the reactor, where carbon dioxide and steam are the primary products.A secondary reaction between the feedstock and the gases forms carbon monoxideand hydrogen.
If necessary for hydrogen production only, the effluent is then led to a shiftconverter with high-pressure steam, where carbon monoxide is converted to carbondioxide with the concurrent production of hydrogen at the rate of 1 mol of hydrogenfor every mole of carbon dioxide. Reactor temperatures vary from 1095 to 1480°C(2000–2700°F) and pressures from atmospheric to more than 1500 psi. Gas purifi-cation depends on the use of the gas.
5.5.2 FISCHER–TROPSCH PROCESS
The hydrocarbon resources of the world are not evenly distributed. Substantialproportion of known reserves are situated in remote locations far from areas of highconsumption. Transportation of liquid hydrocarbons from source to consumer is atask for which a large and flexible infrastructure exists. However, when natural gasdeposits in remote locations are to be exploited, the transportation task becomes amajor challenge, particularly if geography, economics, or a combination of bothprecludes the possibility of a pipeline.
There are two routes for the production of synfuels from natural gas (via syngas):(1) the hydrocarbon route and (2) the methanol route. Both routes are often referredto as the Fischer–Tropsch synthesis (Friedel and Anderson, 1950). The first step forboth routes is the conversion of natural gas into syngas (a mixture of hydrogen andcarbon monoxide with some carbon dioxide). The proportions of these componentsin the mixture vary according to the individual synthesis process selected, and alsoaccording to the product slate desired. Typical values of the principal characteristic,the H2-to-CO ratio, for different processes cover a wide range from below 1 to nearly3. The range of H2-to-CO ratios required for the different synthesis processes meansthat considerable effort is required to match the syngas generation and synthesisprocess so as to ensure the optimum overall conversion rate. In addition, varyingamounts of pure hydrogen may be required for hydrogenation of the crude productfrom the synthesis.
5.5.2.1 General Process Description
Fischer–Tropsch synthesis is a well-known process for conversion of syngas tosynfuels and raw materials for the chemical industry. The process is versatile in itsraw materials consumption, i.e., it can use any type of coal, natural gas, or similartypes of carbon-containing feedstock as its material, and similarly the product dis-tribution can also be changed. The increase of mineral oil prices has caused intenseefforts to develop the Fischer–Tropsch process on a commercial scale. The detailsof the Fischer–Tropsch reactions and process are still not completely understood,even though the reaction was discovered 90 years ago.
Synfuels produced by the Fischer–Tropsch process are nowadays more expensivethan natural-oil-based hydrocarbon fuels. However, under certain conditions and in
© 2007 by Taylor & Francis Group, LLC

Liquid Fuels from Natural Gas 161
the next century, the process economics may become favorable. The process deservesspecial attention where: (1) coal reserves are significant and available at a cheaperrate and (2) natural gases are abundant. In the long run, production of hydrocarbonsynthesis based on coal will exceed that of oil.
Syngas (a mixture of CO and H2) can be obtained from coal or coke, naturalgas, or similar type of carbon containing feedstock by steam-reforming or gasifica-tion processes (as described earlier). Catalysts are used for the production of hydro-carbons. Metals such as ruthenium (Ru), iron (Fe), and cobalt (Co) are usuallydeposited on an inert support, such as silica, alumina, or aluminosilicates, to increasethe surface area of the catalyst (Espinoza et al., 1999; Steynberg et al., 1999).Addition of promoters to improve properties of the catalyst or selectivity are mostlyapplied. Typical reaction conditions of the Fischer–Tropsch process are P = 10–40bar and T = 200–300°C.
5.5.2.2 Chemistry
In the Fischer–Tropsch synthesis, hydrocarbons (CxHy) are synthesized from carbonmonoxide (CO) and hydrogen (H2) (in other words, syngas). The Fischer–Tropschprocess is an established technology and already applied on a large scale.
The number of chemical reactions involved in the manufacture of syngas is verylarge. The most important of these (limited to methane because it is the majorconstituent of natural gas), given the objective of producing carbon monoxide andhydrogen from the methane, are reforming (reaction 1) and partial oxidation (reaction3), resulting in hydrogen-to-carbon-monoxide ratios of 3 and 2, respectively. If asource of carbon dioxide is available (or for natural gas rich in carbon dioxide),reforming with carbon dioxide (reaction 2) provides a hydrogen-to-carbon-monoxideratio of 1. The figures for higher hydrocarbons in natural gas are correspondinglylower. The final hydrogen to carbon monoxide ratio is influenced further by thecarbon monoxide shift reaction (reaction 5).
1. Reforming (strongly endothermic)
CH4 + H2O → CO + 3H2 (1)
CH4 + CO2 → 2CO + 2H2 (2)
2. Combustion (strongly exothermic)
2CH4 + O2 → 2CO + 4H2 (3)
CH4 + 2O2 → CO2 + 2H2O (4)
3. Shift conversion (mildly exothermic)
CO + H2O → CO2 + H2 (5)
© 2007 by Taylor & Francis Group, LLC

162 Handbook of Alternative Fuel Technology
Carbon
CH4 → 2H2 + C (6)
2 CO → CO2 + C (7)
The reforming reactions (reaction 1 and reaction 2) are strongly endothermic andmust be supported by the strongly exothermic reactions of partial oxidation (reaction3) and/or complete combustion (reaction 4). The latter reaction is, however, inprinciple less desirable as neither H2 nor CO is produced.
Thus, in the Fischer–Tropsch reaction (exothermic) 1 mol of carbon monoxidereacts with 2 mol of hydrogen to form a hydrocarbon chain extension (–CH2–). Theoxygen from the CO is released as product water:
CO + 2H2 → –CH2 + H2O ∆H = –165 kJ/mol
The reaction implies a hydrogen to carbon monoxide ratio of at least 2 for thesynthesis of the hydrocarbons. When the ratio is lower, it can be adjusted in thereactor with the catalytic water gas shift reaction:
CO + H2O → CO2 + H2 ∆H= –42 kJ/mol
When catalysts with water gas shift activity are used, water produced in the reactioncan react with carbon monoxide to form additional hydrogen. In this case a minimalH2 to CO ratio of 0.7 is required and the oxygen from the CO is released as CO2:
2CO + H2 → CH2 + CO2 ∆H = –204 kJ/mol
The reaction affords mainly aliphatic straight-chain hydrocarbons (CxHy). Besidesthese straight-chain hydrocarbons, branched hydrocarbons, unsaturated hydrocar-bons (olefins), and primary alcohols are also formed in minor quantities. The kindof liquid obtained is determined by the process parameters (temperature, pressure,etc.), the kind of reactor, and the catalyst used. Typical operation conditions for theFischer–Tropsch synthesis are a temperature range of 200–350°C and pressures of15–40 bar, depending on the process.
The Fischer–Tropsch process is a very complicated process that requires a well-defined choice of reactors, catalysts, and operating conditions to synthesize the desiredproducts. Even then, a mixture of compounds is obtained. The Fischer–Tropschsynthesis was originally operated in packed-bed reactors. These reactors have severaldrawbacks that can be overcome by a slurry reactor. In these slurry reactors, thesynthesis gas is bubbled through a suspension of catalyst particles (typically 30–50µm) in an inert liquid. The heat of reaction is removed by circulating the slurry throughexternal or internal heat exchangers. The slurry reactor can be operated at highertemperatures and at low H2 to CO ratios without any problems due to efficient heattransfer and uniform temperatures. The application of very small catalyst particlescaused no occurrence of intraparticle heat and mass transfer resistances.
© 2007 by Taylor & Francis Group, LLC

Liquid Fuels from Natural Gas 163
Economic studies have shown that the Fischer–Tropsch synthesis in a slurrybubble column has several advantages over the fixed bed reactors. As the Fis-cher–Tropsch process offers a number of advantages in slurry phase over the two-phase processes, special attention is paid to the effects of an inert-liquid phase onthe reaction rate, mass transfer, and product distribution.
5.5.2.3 Products
The subsequent chain growth in the Fischer–Tropsch process is comparable with apolymerization process, resulting in a distribution of chain lengths of the products.In general, the product range includes the light hydrocarbons methane (CH4), ethane(C2H6), propane (C3H8), and butane (C4H10); naphtha (C5H12 to C12H26); kerosene-diesel fuel (C13H28 to C22H46); low-molecular-weight wax (C23H48 to C32H66); andhigh-molecular-weight wax (>C33H68). Linear alpha-olefins are also produced, butthe distribution of the products depends on the catalyst and the process operationconditions (temperature, pressure, and residence time).
The (theoretical) chain length distribution can be described by means of theAnderson–Schulz–Flory equation (Schulz, 1935, 1936; Flory, 1936; Friedel andAnderson, 1950),
Log Wn/n = 2 log (ln α) + nlog α
where Wn is the weight fraction of chains with n carbon atoms and the chain growthprobability factor (α) that is defined by
α = kp/(kp + kt)
where kp is the propagation rate and kt is the termination rate.
5.5.2.4 Catalysts
Several types of catalysts can be used for the Fischer–Tropsch synthesis (Ponec,1982; Snel, 1987; van der Laan and Beenackers, 1999). The most important catalystsare based on iron (Fe) or cobalt (Co). Cobalt catalysts have the advantage of a higherconversion rate and a longer life (over 5 years). It is more reactive for hydrogenationand produces less unsaturated hydrocarbons and alcohols compared to iron catalysts.Iron catalysts on the other hand, have a higher tolerance for sulfur, are cheaper, andproduce more olefin products and alcohols. The lifetime of the iron catalysts is,however, short and in some commercial installations may be measured in weeks.
5.5.2.5 Commercial Processes
The three main industrially proven processes involve various versions of tubularsteam reforming, catalytic autothermal reforming, and noncatalytic partial oxidation.
In tubular steam reforming, the methane–steam reaction (reaction 1) takes placeover a catalyst in a tube that is externally heated. A large steam surplus is requiredto suppress carbon formation in the catalyst. This tends to drive the carbon monoxideshift reaction (reaction 5) to the right, resulting in a hydrogen-rich syngas. The heat
© 2007 by Taylor & Francis Group, LLC
164 Handbook of Alternative Fuel Technology
is supplied largely by the undesirable complete combustion reaction of methane tocarbon dioxide and water (reaction 4) outside the tubes.
In catalytic autothermal reforming, oxygen is added to the feed. The heat require-ment for the methane–steam reaction (reaction 1) is largely met by the methane–oxy-gen partial oxidation reaction (reaction 3), thus producing a lower hydrogen-to-carbon-monoxide ratio in the syngas. As in tubular reforming, considerable amountsof steam are required to suppress carbon formation. The absence of the metallurgicallimitations of the catalyst tubes of a steam reformer allows higher operating tem-peratures, thus reducing methane slip. At these higher temperatures, the carbonmonoxide shift equilibrium is also more favorable to carbon monoxide than in thecase of the tubular steam reformer.
In noncatalytic partial oxidation, the reaction of methane with oxygen (reaction3) is dominant. The absence of any catalyst means that the process is tolerant of asmall degree of carbon formation and allows even higher operating temperatures. Itis thus possible to operate partial oxidation without any steam addition, and theresulting syngas is rich in carbon monoxide.
The art of selecting the right syngas generation process (or combination ofprocesses) consists of ensuring correct gas specification as required by the selectedsynthesis, and simultaneously minimizing certain inherent inefficiencies of the indi-vidual processes. In case of tubular reforming, this inherent inefficiency lies in theuse of external complete combustion, requiring an expensive heat recovery train andstill involving substantial losses in the stack gas. In the case of autothermal reformingand partial oxidation, the inefficiency lies in the energy requirement and investmentfor the oxygen plant (Fleshman, 1997).
Lurgi GmbH is currently involved in the design and supply of syngas productionunits for two major synfuel projects: one based on Sasol’s Synthol process and theother using Shell’s SMDS synthesis (Sie et al., 1991). There is a substantial differencein the hydrogen to carbon monoxide ratios required by the two processes, and thishas led to the selection of different syngas production routes.
The Synthol process has been operated on a commercial scale since the 1950sby Sasol and has undergone some evolution. The initial process, the Arge Process,involved low temperatures (200–250°C), medium pressures, and a fixed catalyst bed.This process primarily produced a linear paraffin wax, which had use as petrochem-ical feedstock and also for transport fuels after further processing. This was the onlyprocess available until the 1950s and 1960s. Subsequently, the Sasol Synthol processwas developed; it involved higher temperatures (300–360°C) and medium pressures,but used a circulating fluidized bed to produce light olefins for production of chem-icals and gasoline components. This process has recently been updated to theAdvanced Synthol process.
The latest development of Fischer–Tropsch technology is the Sasol slurry-phasereactor, an integral part of the Sasol slurry-phase distillate (SSPD) process, whichconducts the synthesis reaction at low temperatures (200–250°C) and pressures. Theprocess involves bubbling hot syngas through a liquid slurry of catalyst particles andliquid reaction products. Heat is removed from the reactor via coils within the bed,producing steam. Liquid products are removed from the reactor, and the liquidhydrocarbon wax separated from the catalyst. The gas streaming from the top of the
© 2007 by Taylor & Francis Group, LLC

Liquid Fuels from Natural Gas 165
reactor is cooled to recover light hydrocarbons and reaction water. The Sasol slurry-phase technology has undergone several developments primarily concerned withcatalyst formulations. Initial development used an iron-based catalyst, but recentdevelopments have used a cobalt-based catalyst, giving greater conversion.
The Shell middle-distillate synthesis (SMDS) process is a two-step process(Figure 5.2) that involves Fischer–Tropsch synthesis of paraffinic wax called theheavy paraffin synthesis (HPS). The wax is subsequently hydrocracked and isomer-ized (in the presence of hydrogen) to yield a middle-distillate boiling-range productin the heavy paraffin conversion (HPC) (Sie et al., 1991; Eisenberg et al., 1998). Inthe heavy paraffin synthesis stage, wax is maximized by using a proprietary catalysthaving high selectivity toward heavier products and by the use of a tubular, fixedbed reactor. The heavy paraffin conversion stage employs a commercial hydrocrack-ing catalyst in a trickle flow reactor. The heavy paraffin conversion step allows forproduction of narrow-range hydrocarbons not possible with conventional Fis-cher–Tropsch technology.
The products manufactured are predominantly paraffinic, free from sulfur, nitro-gen, and other impurities; and have excellent combustion properties. The very highcetane number and smoke point indicate clean-burning hydrocarbon liquids havingreduced harmful exhaust emissions. This process has also been proposed for producingchemical intermediates, paraffinic solvents, and extra-high-viscosity-index lube oils.
The Lurgi combined reforming process was originally developed for large-scalemethanol production, and it is this application that is described here. In the contextof production of liquid fuels, it is suitable as a building block for the MTG or theMOGD process. For the high-pressure Synthol process, carbon dioxide needs to bepurged from the system. The conventional tubular steam-reforming process as usedfor methanol syngas production produces a hydrogen to carbon monoxide ratio ofover 4 and a stoichiometric ratio of 2.6–2.9 (i.e., a hydrogen-rich gas) dependingon the quality of the natural gas feedstock.
FIGURE 5.2 Shell middle-distillate synthesis (SMDS) process.
© 2007 by Taylor & Francis Group, LLC

166 Handbook of Alternative Fuel Technology
Autothermal reforming or partial oxidation produces carbon-monoxide-richgases with hydrogen to carbon monoxide ratios in the range 1.5–3.5 and a stoichi-ometric number of about 1.8.
Approximately half the feed is processed in the tubular primary reformer. Theother half, together with the primary reformer effluent, is autothermally reformedwith pure oxygen in the secondary reformer. Besides matching hydrogen-rich andcarbon-monoxide-rich process steps to produce an optimum stoichiometric ratio, thecombined reforming process has other beneficial effects, such as the following:
• The methane slip of the overall reforming process is governed by thetemperature of the secondary reformer, which is not subject to the samelimitations of tube metallurgy as the tubular reformer. The combinedprocess can thus provide a lower methane slip.
• Less syngas of the optimized quality is required per ton of methanol,reducing both the syngas compressor load and the capital cost of thesynthesis unit.
• The operating temperature of the primary reformer need no longer bechosen to minimize methane slip. The reformer can also be operated undermild conditions. The higher operating pressure thus made possible enablesthe syngas compressor load to be further reduced.
• The reduced throughput through the primary reformer together with thelower operating temperature combine to reduce the tubular reformer toabout 25% of the size required for the single-stage process. This reducesthe stack gas losses referred to earlier by the same amount.
The Shell Gasification Process (SGP) process is a much older process, the basicdevelopment having been made in the 1950s. More than 150 units have been builtin the last 50 years. With natural gas feedstock, the unit produces synthesis gas witha hydrogen-to-carbon-monoxide ratio of 1.7–1.8 and a carbon dioxide content of1.7–3 volume percent, depending on the steam addition rate.
In the unit, the gas feed is preheated with the raw gas to a temperature of about380°C for desulfurization prior to being fed to the SGP reactor with oxygen. Thepartial oxidation reaction takes place at about 1300–1400°C in the refractory-linedreactor. The sensible heat of the hot gas is used to generate high-pressure steam,with or without superheat as required. The noncatalytic partial oxidation reactorproduces small amounts of soot that are washed out in a scrubber. The carbon isconcentrated in the reaction water, which is discharged for wastewater treatment.
Comparison of the syngas quality with that produced by combined reformingshows a considerably lower hydrogen to carbon monoxide ratio of 1.86 with against3.14 for combined reforming, making the SGP process a better match than, forinstance, the SMDS process. Also, the amount of natural gas required to producesyngas is about 3.5% in this case. These advantages may be offset by higher oxygenrequirements.
One feature common to all Fischer–Tropsch processes is the inherent lack ofselectivity. The actual selectivity depends on the desired product slate, as well as on
© 2007 by Taylor & Francis Group, LLC

Liquid Fuels from Natural Gas 167
the catalyst and the operating conditions. In all cases, however, substantial quantitiesof gaseous hydrocarbons, including methane, are produced.
In principle, it is desirable to recycle these gaseous hydrocarbons to produce moresyngas. On the other hand, it is necessary to purge inert gases, principally argon andnitrogen. The other aspect of selectivity that requires recognition is that a proportionof higher-molecular-weight products, including waxes, is produced and may requirehydrotreating for conversion to a saleable product (Dickenson et al., 1997).
The Syntroleum process is a cost-effective refinement of GTL technology thathas been in use for several decades. A major advantage is that the process usescompressed air instead of pure oxygen to facilitate the conversion reaction, substan-tially reducing the capital costs and vastly improving the safety of the process plants.
The Syntroleum process consists of three major reaction steps: (1) natural gasis first partially oxidized with air to produce syngas, (2) syngas is then reacted in aFischer–Tropsch reactor to produce liquid hydrocarbons of various chain lengths,and (3) higher-boiling fraction of the products is separated and hydrocracked toproduce transportation fuels. The synfuels produced are middle distillates consistingof naphtha, kerosene, diesel, and other hydrocarbon-based products.
5.5.3 OTHER PROCESSES
In the ExxonMobil AGC-21 process, there are three key steps (Lopez et al, 2003):
1. In the first step, syngas is generated by contacting methane with steamand a limited amount of oxygen in a high-capacity catalytic reactor.
2. Hydrocarbons are synthesized in the second step at high alpha as describedby a Shulz-Flory distribution in a novel slurry reactor using new, high-productivity catalysts operating at high levels of syngas conversion. Thefull-range, primarily normal paraffin product contains significant 650°F+waxy material that is solid at room temperature and melts above 250°F, andis unsuitable for pipelining or transporting in conventional crude carriers.
3. The final step, accomplished with proprietary catalysts in a packed bedreactor, converts wax to high-quality liquids that make excellent feeds forrefineries and chemical plants, and directly marketable products in someinstances, such as lube basestocks or specialty solvents.
The chemistry of each step is straightforward, yet becomes more complex asprocesses go to high yield and selectivity. Oxygen, methane, and steam ratios arecarefully controlled to produce syngas (carbon monoxide and hydrogen) at stoichi-ometric proportions of about 2.1 to 1, hydrogen to carbon monoxide.
Methanol is produced catalytically from syngas and by-products, such as ethersand formic acid esters, and higher hydrocarbons, are formed during side reactionsand are found in the crude methanol product. For many years methanol was producedfrom coal, but after World War II low-cost natural gas and light petroleum fractionsreplaced coal as the feedstock. Following this, one of the most significant develop-ments in synfuels technology, since the discovery of the Fischer–Tropsch process,is the Mobil MTG process (Chang, 1983). Methanol is efficiently transformed into
© 2007 by Taylor & Francis Group, LLC

168 Handbook of Alternative Fuel Technology
hydrocarbons ranging from ethane to decane by a reaction that is catalyzed bysynthetic zeolites.
nCH3OH → CnH2n+2 + nH2O
Olefins and aromatic compounds are also produced, but the reaction chemistry ismore complex than suggested by this simple equation. For accuracy and economics,chemical equations should be derived for each particular aspect of the process.
In the process (which can use a fixed bed reactor or a fluid bed reactor), themethanol feed, vaporized by heat exchange with reactor effluent gases, is convertedin a first-stage reactor containing an alumina catalyst to an equilibrium mixture ofmethanol, dimethyl ether (DME), and water. This is combined with recycled lightgas, which serves to remove reaction heat from the highly exothermic MTG reaction,and enters the reactors containing zeolite catalyst, where reaction temperature con-ditions are 360–415°C at a pressure of approximately 300–350 psi.
As the MTG process produces primarily gasoline, a variation of that process hasbeen developed that allows for production of gasoline and distillate fuel. The com-bined process (MTO and MOGO) produces gasoline and distillate in various pro-portions and, if needed, can be terminated at a point to produce olefin by-products.
In the MTO process, methanol is converted over a zeolite catalyst to give highyields of olefins with some ethylene and low-boiling light saturated hydrocarbons.Generally, catalyst and process variables that increase methanol conversion decreaseolefins yield. In the MTO process, typical conversions exceed 99.9%. The cokedcatalyst is continuously withdrawn from the reactor and burned in a regenerator.
The MOGD-process, low-molecular-weight olefins produce oligomers in thegasoline-boiling range using a zeolite catalyst. Other distillate products are alsoproduced. Gasoline to distillate product ratios can vary, depending on process con-ditions, from 0.2 to >100.
The direct conversion of natural gas (methane) to liquid fuels involves conversionof methane to the desired liquid fuels while bypassing the syngas step. Direct upgradingroutes that have been extensively studied include direct partial oxidation to oxygenates,oxidative coupling to higher hydrocarbons, and pyrolysis to higher hydrocarbons.
In a series of patents, the Rentech process takes advantage of the synergismbetween iron-based Fischer–Tropsch synthesis and plasma-based syngas production.For example, in one process (Yakobson et al., 2002), the plasma-based syngasproduction is a front-end conversion process in which hydrocarbon feedstock, suchas natural gas, is fed to a high-or low-temperature plasma torch or electrical arcreactor. The arc converts the feedstock into a hydrogen and carbon monoxide syngas.This syngas can then be converted by the Fischer–Tropsch process into liquidhydrocarbons. During Fischer–Tropsch synthesis using iron-based catalysts, a por-tion of the syngas is converted into carbon dioxide. By recycling the carbon dioxideextracted from the process, tail gas is returned to the plasma torch, where it can beefficiently converted into carbon monoxide, which in turn is fed to the Fischer–Trop-sch reactor. The plasma can reform natural gas with only the addition of carbondioxide from the Fischer–Tropsch reactor, producing a syngas consisting almostexclusively of carbon monoxide and hydrogen. In addition to the carbon dioxide
© 2007 by Taylor & Francis Group, LLC

Liquid Fuels from Natural Gas 169
produced in the Fischer–Tropsch reactor, the reactor tail gas components can beconverted into additional carbon monoxide and hydrogen for the Fischer–Tropschreactor feedstock. This synergy between iron-based Fischer–Tropsch synthesis andplasma-based syngas production allows for significantly improved carbon conversionefficiency and is an excellent technique for reducing carbon dioxide emissions whileproducing cleaner fuels that are sulfur and aromatic free. Additionally, plasma-basedsyngas production offers distinct advantages over other methods of producing syngasas it does not need an air separation plant and has essentially no moving parts.
Oxygen-permeable membranes can potentially replace the expensive cryogenicoxygen plants for oxygen production. When combined with an appropriate catalyston the oxygen-lean side, the membrane can be used to convert natural gas to synthesisgas via a partial oxidation reaction:
2CH4 + O2 → CO + 2H2
5.6 THE FUTURE
Fischer–Tropsch diesel has a high cetane number and can be manufactured free ofboth aromatics and sulfur. It can be used in existing distribution infrastructure anddiesel engines, and compared to petroleum diesel has lower emissions of oxides ofnitrogen and particulate matter. The near-zero sulfur content of Fischer–Tropschdiesel may also enable exhaust aftertreatment, resulting in further emission reduc-tions. Thus, this diesel could help displace the diesel fuel that is typically used topower medium- and heavy-duty vehicles and meet specifications for extremely low-sulfur diesel fuel. If approved, Fischer–Tropsch diesel could be designated as analternative fuel as early as winter 2004.
The syngas production routes described earlier are based on proven technologiesand provide us with reliable starting points for the development of processes thatoffer the potential for further reduction of both capital and operating costs.
For some syntheses, the use of straight catalytic autothermal reforming can be anadvantage. Lurgi has used this process both for methanol production and treatingFischer–Tropsch tail gases. Whereas in a secondary reformer configuration the hothydrogen-rich primary reformer effluent is self-igniting, ignition of a straight autother-mal reformer requires the use of a noble-metal-promoted ignition catalyst. Velocities inthe ignition-catalyst area must be kept high to eliminate any possibility of backburning.These high velocities lead over a period of time to mechanical attrition of the expensiveignition catalyst. As part of the ongoing development of its reforming processes, theprocess arrangement has been modified to bring the operating conditions closer to thatof a secondary reformer, thus dispensing with the need for the ignition catalyst.
The HCT reforming technology is based on the use of the so-called HCTreformer tube. In principle, this is a normal centrifugally cast reformer tube, catalystfilled, heated from outside, and normally designed for downflow of the process gasthrough the catalyst bed. But on the inside it encloses a double helix made of tubesof suitable material embedded in the catalyst. The reformed process gas passes thisdouble helix in a counterflow to the process gas flow through the catalyst bed, thus
© 2007 by Taylor & Francis Group, LLC

170 Handbook of Alternative Fuel Technology
transferring a part of its sensible heat to the reforming process. Calculations andpractical experience have shown that based on an inlet temperature of 450°C andreaction-end temperature of 860°C, this internal heat transfer covers up to 20% ofsensible and reaction heat of the process gas. In addition to the resultant saving offuel, an investment saving of about 15% can be expected, the bulk of which isattributable to the smaller convection bank required.
REFERENCES
Anderson, R.B., The Fischer Tropsch Synthesis, Academic Press, New York, 1984.Berkowitz, N. and Speight, J.G., Fuel, 54:138, 1975.Bland, W.F. and Davidson, R.L., Petroleum Processing Handbook, McGraw-Hill, New York, 1967.BP (British Petroleum), BP Statistical Review of World Energy, British Petroleum, London,
see also http://www.bp.com/centres/energy/index.asp, 2003.Campbell, W.M., in Handbook of Petroleum Refining Processes, Meyers, R.A., Ed., McGraw-
Hill, New York, 1997, chap. 6.1.Chang, C.D., Catal. Rev.: Sci. Eng., 25: 1, 1983.Dickenson, R.L., Biasca, F.E., Schulman, B.L., and Johnson, H.E, Hydrocarbon Process.,
76(2): 57, 1997.Eisenberg, B., Fiato, R.A., Mauldin, C.H., Ray, G.R., and Soled, R.L., Stud. Surf. Sci. Catal.,
119: 943, 1998.Espinoza, R.L., Steynberg, A.P., Jager, B., and Vosloo, A.C., Appl. Catal. Gen., 186: 13, 1999.Fleshman, J.D., in Handbook of Petroleum Refining Processes, Meyers, R.A., Ed., McGraw-
Hill, New York, 1997, chap. 6.2.Flory, P.J., J. Am. Chem. Soc., 58: 1877, 1936.Friedel, R.A. and Anderson, R.B., J. Am. Chem. Soc., 72: 2307, 1950.Han, S. and Chang, C.D., Synthetic (liquid) fuels, in Kirk-Othmer Encyclopaedia of Chemical
Technology, Kroschwitz, J.I. and Howe-Grant, M., Eds., 4th ed., Vol. 12, John Wiley& Sons, New York, 1994, p. 155.
Lopez, A.M., Fiato, R.A., Ansell, I.L., Quinlan, C.W., and Ramage, M.P., Hydrocarbon Asia,July/August, 2003, p. 56.
Ponec, V., in Metal Support and Metal Additive Effects in Catalysis, Imelik, B., Ed., Elsevier,Amsterdam, The Netherlands, 1982, p. 63 et seq.
Schulz, G.V., Z. Phys. Chem., B30: 379, 1935.Schulz, G.V., Z. Phys. Chem., B32: 27, 1936.Sie, S.T., Senden, M.M.G., and van Wechum, H.M.H., Catalysis Today, 8, 1991, p. 371.Snel, R., Catal. Rev.: Sci. Eng., 29: 361, 1987.Speight, J.G., in Fuel Science and Technology Handbook, Speight, J.G., Ed., Part V, Marcel
Dekker, New York, 1990.Speight, J.G., Gas Processing: Environmental Aspects and Methods, Butterworth-Heinemann,
Oxford, 1993.Speight, J.G., The Chemistry and Technology of Coal, 2nd ed., Marcel Dekker, New York, 1994.Speight, J.G., The Chemistry and Technology of Petroleum, 3rd ed., Marcel Dekker, New
York, 1999.Steynberg, A.P., Espinoza, R.L., Jager, B., and Vosloo, A.C., Appl. Catal. Gen., 186: 41, 1999.Van der Laan, G.P. and Beenackers, A.A.C.M., Catal. Rev.: Sci. Eng., 41: 255, 1999.Yakobson, D.L., Vavruska, J.S., Bohn, E., and Blutke, A., U.S. Patent No. 6,380,268, April
30, 2002.
© 2007 by Taylor & Francis Group, LLC

171
6 Resids
James G. Speight
CONTENTS
6.1 Introduction .................................................................................................. 1726.2 Resid Production .......................................................................................... 1756.3 Properties...................................................................................................... 176
6.3.1 Elemental (Ultimate) Analysis......................................................... 1776.3.2 Metallic Content............................................................................... 1786.3.3 Density and Specific Gravity........................................................... 1796.3.4 Viscosity ........................................................................................... 1796.3.5 Carbon Residue ................................................................................ 1806.3.6 Heat of Combustion ......................................................................... 1816.3.7 Molecular Weight............................................................................. 1816.3.8 Other Properties ............................................................................... 182
6.4 Composition ................................................................................................. 1836.4.1 Chemical Composition..................................................................... 183
6.4.1.1 Hydrocarbon Compounds................................................. 1836.4.1.2 Sulfur Compounds............................................................ 1846.4.1.3 Nitrogen Compounds........................................................ 1846.4.1.4 Oxygen Compounds ......................................................... 1856.4.1.5 Metallic Compounds......................................................... 185
6.4.2 Fractionation..................................................................................... 1856.4.2.1 Asphaltene Separation ...................................................... 187
6.4.2.1.1 Carbon-Disulfide-Insoluble Constituents ....... 1886.4.2.2 Fractionation of Deasphaltened Oil ................................. 188
6.5 Use of Data .................................................................................................. 1896.6 Resid Conversion ......................................................................................... 191
6.6.1 Visbreaking....................................................................................... 1916.6.2 Coking .............................................................................................. 1916.6.3 Resid Catalytic Cracking ................................................................. 1926.6.4 Hydroconversion .............................................................................. 192
6.6.4.1 Fixed Bed Units................................................................ 1936.6.4.2 Ebullating Bed Units ........................................................ 1936.6.4.3 Dispersed Catalyst Processes ........................................... 193
6.6.5 Solvent Deasphalting ....................................................................... 1946.6.6 Future Processes............................................................................... 194
References.............................................................................................................. 195
© 2007 by Taylor & Francis Group, LLC

172 Handbook of Alternative Fuel Technology
6.1 INTRODUCTION
Approximately 2000 years ago, Arab scientists developed methods for the distillationof petroleum, and interest in the thermal product of petroleum (nafta; naphtha) wasaroused when it was discovered that this material could be used as an illuminantand as a supplement to asphalt incendiaries in warfare. The discovery also led tothe production of resids, which may have been used when the supply of bitumen ornatural asphalt from natural seepages became limited.
A residuum (plural residua, also shortened to resid, plural resids) is the residueobtained from petroleum after nondestructive distillation has removed all the volatilematerials. The temperature of the distillation is usually maintained below that atwhich the rate of thermal decomposition of petroleum constituents is minimal.
Residua are black, viscous materials and are obtained by distillation of a crudeoil under atmospheric pressure (atmospheric residuum) in an atmospheric distillationunit (atmospheric tower, atmospheric pipe still) or under reduced pressure (vacuumresiduum) in a vacuum distillation unit (vacuum tower, vacuum pipe still) (Figure6.1). They may be liquid at room temperature (generally, atmospheric residua) oralmost solid (generally, vacuum residua), depending on the nature of the petroleumfrom which the resid was obtained (Table 6.1) or depending on the cut point of thedistillation (Table 6.2).
Resids contain very-high-molecular-weight molecular polar species calledasphaltenes that are soluble in carbon disulfide, pyridine, aromatic hydrocarbons,and chlorinated hydrocarbons (Gruse and Stevens, 1960; Speight, 1999; VanGooswilligen, 2000). They are the nonvolatile fractions of petroleum that are isolatedfrom the atmospheric distillation unit and form the vacuum distillation unit. Resids
FIGURE 6.1 Schematic of resid production.
© 2007 by Taylor & Francis Group, LLC

Resid
s173
TABLE 6.1Properties of Atmospheric and Vacuum Resids from Different Crude Oils
Crude oil origin Kuwait Khafji Bachaquero West Texas SafaniyaAlaska
(North Slope)Tia Juana
(ight)
Residuum typeAtmos-pheric Vacuum
Atmos-pheric Vacuum
Atmos-pheric Vacuum
Atmos-pheric Vacuum
Atmos-pheric Vacuum
Atmos-pheric Vacuum
Atmos-pheric Vacuum
Fraction of crude, vol% 42 21 — — 34 — — — 40 22 58 22 49 18
Gravity, °API 13.9 5.5 14.4 6.5 17 2.8 9.4 18.4 11.1 2.6 15.2 8.2 17.3 7.1
Viscocity SUS, 210°F — — — — — — — — — — 1281 — 165 —
SPS, 122°F 553 500,000 — — — — 313 86 — — — — 172 —
SPS, 210°F — — 429 — — — — — — — — — — —
cSt, 100°F — — — — — — — — — — — — 890 —
cSt, 210°F 55 1900 — — — — — — — — 42 1950 35 7959
Pour Point, °F 65 — — — — — — — — — 75 — — —
Sulfur, wt% 4.4 5.45 4.1 5.3 2.4 3.7 3.3 2.5 4.3 5.3 1.6 2.2 1.8 2.6
Nitrogen, wt% 0.26 0.39 — — 0.3 0.6 0.5 0.6 0.4 0.4 0.36 0.63 0.3 0.6
Metals, ppm
Nickel 14 32 37 53 450 100 27 11 26 46 18 47 25 64
Vanadium 50 102 89 178 — 900 57 20 109 177 30 82 185 450
Asphaltenes, wt%
Pentane insolubles — 11.1 — 12.0 10 — — — 17.0 30.9 4.3 8.0 — —
Hexane insolubles — — — — — — — — — — — — — —
Heptane insolubles 2.4 7.1 — — — — — — — — 31.5 — — —
Resin, wt% — 39.4 — — — — — — — — — — — —
Carbon residue, wt%
Ramsbottom 9.8 — — — — — — — — — 8.4 17.3 — —
Conradson 12.2 23.1 — 21.4 12 27.5 16.9 6.6 14.0 25.9 — — 9.3 21.6
Source: From Speight, J.G., The Desulfurization of Heavy Oils and Residua, 2nd ed., Marcel Dekker, New York, 2000. With permission.
© 2007 by Taylor & Francis Group, LLC

174H
and
bo
ok o
f Altern
ative Fuel Tech
no
logy
TABLE 6.2Properties of Tia Juana Crude Oil and Resids Produced Using Deferent Cut Points
Boiling range°F Whole crude >430 >565 >650 >700 >750 >850 >950 >1050°C Whole crude >220 >295 >345 >370 >400 >455 >510 >565
Yield on crude, vol% 100.0 70.2 57.4 48.9 44.4 39.7 31.2 23.8 17.9Gravity, °API 31.6 22.5 19.4 17.3 16.3 15.1 12.6 9.9 7.1Specific gravity 0.8676 0.9188 0.9377 0.9509 0.9574 0.9652 0.9820 1.007 1.0209Sulfur, wt% 1.08 1.42 1.64 1.78 1.84 1.93 2.12 2.35 2.59Carbon residue(Conradson), wt%
— 6.8 8.1 9.3 10.2 11.2 13.8 17.2 21.6
Nitrogen, wt% — — — 0.33 0.36 0.39 0.45 0.52 0.60Pour point, °F –5 15 30 45 50 60 75 95 120Viscosity:
Kinematic, cSt 10.2 83.0 315 890 1590 3100 — — —@ 100°F 10.2 83.0 315 890 1590 3100 — — —@ 210°F — 9.6 19.6 35.0 50.0 77.0 220 1010 7959
Furol (SFS) sec@ 122°F — — 70.6 172 292 528 — — —@ 210°F — — — — 25.2 37.6 106 484 3760
Universal (SUS)sec @ 210°F
— 57.8 96.8 165 234 359 1025 — —
Metals:Vanadium, ppm — — — 185 — — — — 450
— — — 25 — — — — 64— — — 28 — — — — 48
Source: From Speight, J.G., The Desulfurization of Heavy Oils and Residua, 2nd ed., Marcel Dekker, New York, 2000. With permission.
© 2007 by Taylor & Francis Group, LLC

Resids 175
derive their characteristics from the nature of their crude oil precursor, with somevariation possible by choice of the end point of the distillation.
When a residuum is obtained from a crude oil and thermal decomposition hascommenced, it is more usual to refer to this product as pitch. The differences betweenparent petroleum and the residua are due to the relative amounts of various constitu-ents present, which are removed or remain by virtue of their relative volatility.
The chemical composition of a residuum from an asphaltic crude oil is complexand subject to the method of production (i.e., the temperature at which the distillationis carried out). Physical methods of fractionation usually indicate high proportionsof asphaltenes and resins, even in amounts up to 50% (or higher) of the residuum.In addition, the presence of ash-forming metallic constituents, including such orga-nometallic compounds as those of vanadium and nickel, is also a distinguishingfeature of residua and heavy oils. Furthermore, the deeper the cut into the crude oil,the greater the concentration of sulfur and metals in the residuum and the greaterthe deterioration in physical properties (Speight, 2000, and references cited therein).
Even though a resid is a manufactured product, the constituents do occur natu-rally as part of the native petroleum, assuming that thermal decomposition has nottaken place during distillation. Resids are specifically produced during petroleumrefining, and the properties of the various residua depend upon the cut point orboiling point at which the distillation is terminated.
6.2 RESID PRODUCTION
Resid production involves distilling everything possible from crude petroleum untila nonvolatile residue remains. This is usually done by stages (Speight and Ozum,2002) in which distillation at atmospheric pressure removes the lower-boiling frac-tions and yields an atmospheric residuum (reduced crude) that may contain higher-boiling (lubricating) oils, wax, and asphalt.
The atmospheric distillation tower is divided into a number of horizontal sectionsby metal trays or plates, and each is the equivalent of a still. The greater the numberof trays, the greater the degree of redistillation and, hence, the better the fractionationor separation of the mixture fed into the tower. A tower for fractionating crudepetroleum may be 13 ft. in diameter and 85 ft. high with 16 to 28 trays. The feed toa typical tower enters the vaporizing or flash zone, an area without trays. The majorityof the trays are usually located above this area. The feed to a bubble tower, however,may be at any point from top to bottom with trays above and below the entry point,depending on the kind of feedstock and the characteristics desired in the products.
However, the usual permissible temperature in the vaporizing zone to which thefeedstock can be subjected is usually considered to be 350°C (660°F). The rate ofthermal decomposition increases markedly above this temperature; if decompositionoccurs within a distillation unit, it can lead to coke deposition in the heater pipes orin the tower itself with the resulting failure of the unit. Some distillation units usetemperatures in the vaporizing zone up to 393°C (740°F) and reduce the residencetime in the hot zone. Caution is advised when using a higher temperature becauseunits that are unable to continually attain the petroleum flow-through as specified
© 2007 by Taylor & Francis Group, LLC
176 Handbook of Alternative Fuel Technology
in the design can suffer from resid decomposition (owing to longer residence timesin the vaporizing zone) and poorer-quality asphalt.
Distillation of the reduced crude under vacuum removes the oils (and wax) asoverhead products, and the asphalt remains as a bottom (or residual) product. Themajority of the polar functionalities and high-molecular-weight species in the originalcrude oil, which tend to be nonvolatile, are concentrated in the vacuum residuum(Speight, 2000), thereby conferring desirable or undesirable properties on the asphalt.
At this stage, the residuum is frequently and incorrectly referred to as pitch andhas a softening point (ASTM D-36, ASTM D-61, ASTM D-2319, ASTM D-3104,ASTM D-3461) related to the amount of oil removed, and increases with increasingoverhead removal. In character with the elevation of the softening point, the pourpoint is also elevated: the more the oil distilled from the residue, the higher thesoftening point.
Vacuum distillation has seen wide use in petroleum refining because the boilingpoint of the heaviest cut obtainable by distillation at atmospheric pressure is limitedby the temperature in the vaporizing zone (about 350–390°C [660–740°F]) at whichthe residue starts to decompose or crack, unless cracking distillation is preferred.When the feedstock is required for the manufacture of lubricating oils, furtherfractionation without cracking is desirable, and this can be achieved by distillationunder vacuum conditions.
The fractions obtained by vacuum distillation of reduced crude include:
1. Heavy gas oil, an overhead product, used as catalytic cracking stock or,after suitable treatment, a light lubricating oil
2. Lubricating oil (usually three fractions: light, intermediate, and heavy),obtained as a sidestream product
3. Vacuum residuum, the nonvolatile product that may be used directly asasphalt or to asphalt
The residuum may also be used as a feedstock for a coking operation or blendedwith gas oils to produce a heavy fuel oil.
6.3 PROPERTIES
Resids exhibit a wide range of physical properties, and there are several relationshipsbetween various physical properties (Speight, 1999). Whereas properties such asviscosity, density, boiling point, and color of petroleum may vary widely, the ultimateor elemental analysis varies, as already noted, over a narrow range for a large numberof samples. The carbon content is relatively constant, though the hydrogen andheteroatom contents are responsible for the major differences between petroleum.The nitrogen, oxygen, and sulfur can be present in only trace amounts in somepetroleum, which as a result consists primarily of hydrocarbons.
The properties of resids are defined by a variety of standard tests that can beused to define quality (Table 6.3). And remembering that the properties of residuavary with cut point (Table 6.2), i.e., the vol% of the crude oil helps the refinerproduce asphalt of a specific type or property.
© 2007 by Taylor & Francis Group, LLC

Resids 177
Properties such as the API gravity and viscosity also help the refinery operatorto gain an understanding of the nature of the material that is to be processed. Theproducts from high-sulfur feedstocks often require extensive treatment to remove(or change) the corrosive sulfur compounds. Nitrogen compounds and the variousmetals that occur in crude oils will cause serious loss of catalyst life. The carbonresidue indicates the amount of thermal coke that may be formed to the detrimentof the liquid products.
6.3.1 ELEMENTAL (ULTIMATE) ANALYSIS
The analysis of resids for the percentages of carbon, hydrogen, nitrogen, oxygen,and sulfur is perhaps the first method used to examine the general nature and performan evaluation. The atomic ratios of the various elements to carbon (i.e., H/C, N/C,O/C, and S/C) are frequently used for indications of the overall character of theresid. It is also of value to determine the amounts of trace elements, such as vanadiumand nickel, in a resid because these materials can have serious deleterious effectson process and product performance.
Resids are not composed of a single chemical species, but are rather complexmixtures of organic molecules that vary widely in composition and are composedof carbon, hydrogen, nitrogen, oxygen, and sulfur as well as trace amounts of
TABLE 6.3Analytical Inspections for Petroleum and Resids
Petroleum Heavy Feedstocks
Density (specific gravity) Density (specific gravity)API gravity API gravityCarbon (wt%) Carbon (wt%)Hydrogen (wt%) Hydrogen (wt%)Nitrogen (wt%) Nitrogen (wt%)Sulfur (wt%) Sulfur (wt%)
Nickel (ppm)Vanadium (ppm)Iron (ppm)
Pour point Pour pointWax contentWax appearance temperatureViscosity (various temperatures) Viscosity (various temperatures)Carbon residue of residuum Carbon residuea
Ash (wt%)Distillation profile Fractional composition
All fractions plus vacuum residue Asphaltenes, wt%Resins (wt%)Aromatics (wt%)Saturates (wt%)
a Conradson carbon residue or microcarbon residue.
© 2007 by Taylor & Francis Group, LLC

178 Handbook of Alternative Fuel Technology
metals, principally vanadium and nickel. The heteroatoms, although a minor com-ponent compared to the hydrocarbon moiety, can vary in concentration over a widerange depending on the source of the asphalt and hence can be a major influenceon asphalt properties.
Generally, most resids contain 79–88% w/w carbon, 7–13% w/w hydrogen,trace–8% w/w sulfur, 2–8% w/w oxygen, and trace–3% w/w nitrogen. Trace metalssuch as iron, nickel, vanadium, calcium, titanium, magnesium, sodium, cobalt, cop-per, tin, and zinc occur in crude oils. Vanadium and nickel are bound in organiccomplexes and, by virtue of the concentration (distillation) process by which asphaltis manufactured, are also found in resids.
Thus, elemental analysis is still of considerable value in determining the amountsof elements in resids, and the method chosen for the analysis may be subject to thepeculiarities or character of the resid under investigation and should be assessed interms of accuracy and reproducibility. The methods that are designated for elementalanalysis are:
1. Carbon and hydrogen content (ASTM D-1018, ASTM D-3178, ASTMD-3343, ASTM D-3701, ASTM D-5291, ASTM E-777, IP 338)
2. Nitrogen content (ASTM D-3179, ASTM D-3228, ASTM D-3431, ASTME-148, ASTM E-258, ASTM D-5291, and ASTM E-778)
3. Oxygen content (ASTM E-385)4. Sulfur content (ASTM D-124, ASTM D-129, ASTM D-139, ASTM D-
1266, ASTM D-1552, ASTM D-1757, ASTM D-2622, ASTM D-2785,ASTM D-3120, ASTM D-3177, ASTM D-4045 and ASTM D-4294,ASTM E-443, IP 30, IP 61, IP 103, IP 104, IP 107, IP 154, IP 243)
The most pertinent property in many contexts is the sulfur content which, alongwith the API gravity, represents the two properties that have the greatest influenceon the value of a resid.
The sulfur content varies from about 2% to about 6% for residua (Speight, 2000and references cited therein). In fact, the nature of the distillation process by whichresidua are produced (i.e., removal of distillate without thermal decomposition)dictates that the majority of the sulfur, which is predominantly in the higher-molec-ular-weight fractions, be concentrated in the resid (Gary and Handwerk, 1984).
6.3.2 METALLIC CONTENT
Resids contain relatively high proportions of metals either in the form of salts or asorganometallic constituents (such as the metallo-porphyrins), which are extremelydifficult to remove from the feedstock. Indeed, the nature of the process by whichresidua are produced virtually dictates that all the metals in the original crude oilbe concentrated in the residuum (Speight, 1999). Those metallic constituents thatmay actually volatilize under the distillation conditions and appear in the higher-boiling distillates are the exceptions here.
Determination of metals can be carried out by direct methods (ASTM, 2003)and also by indirect methods in which the sample is combusted so that only inorganic
© 2007 by Taylor & Francis Group, LLC
Resids 179
ash remains. The ash can then be digested with an acid, and the solution examinedfor metal species by atomic absorption (AA), spectroscopy, or by inductively coupledargon plasma (ICP) spectrometry.
6.3.3 DENSITY AND SPECIFIC GRAVITY
Density is defined as the mass of a unit volume of material at a specified temperatureand has the dimensions of grams per cubic centimeter (a close approximation tograms per milliliter). Specific gravity is the ratio of the mass of a volume of thesubstance to the mass of the same volume of water and is dependent on twotemperatures, namely, those at which the masses of the sample and the water aremeasured. The API gravity is also used.
For clarification, it is necessary to understand the basic definitions that are used:(1) density is the mass of liquid per unit volume at 15.6°C (60°F), (2) relative densityis the ratio of the mass of a given volume of liquid at 15.6°C (60°F) to the mass ofan equal volume of pure water at the same temperature, and (3) specific gravity isthe same as the relative density, and the terms are used interchangeably.
Although there are many methods for the determination of density owing to thedifferent nature of petroleum itself, the accurate determination of the API gravity ofpetroleum and its products (ASTM D-287) is necessary for the conversion of mea-sured volumes to volumes at the standard temperature of 60°F (15.56°C). Gravityis a factor governing the quality of crude oils. However, the gravity of a petroleumproduct is an uncertain indication of its quality. Correlated with other properties,gravity can be used to give approximate hydrocarbon composition and heat ofcombustion. This is usually accomplished though use of the API gravity that isderived from the specific gravity:
API gravity, deg = (141.5/sp gr 60/60°F) –131.5
and is also a critical measure of the quality of petroleum.API gravity or density or relative density can be determined using one of two
hydrometer methods (ASTM D-287, ASTM D-1298). The use of a digital analyzer(ASTM D-5002) is finding increasing popularity for the measurement of densityand specific gravity.
Most resids have a specific gravity of petroleum higher than 1.0 (10 API), withmost resids having an API gravity on the order of 5 to 10 API.
6.3.4 VISCOSITY
Viscosity is the single most important fluid characteristic governing the motion ofresids and is actually a measure of the internal resistance to motion of a fluid byvirtue of the forces of cohesion between molecules or molecular groupings. It isgenerally the most important property for monitoring resid behavior in pipes whenthe resid is moved from one unit to another.
A number of instruments are commonly used with resids for this purpose. Thevacuum capillary (ASTM D-2171) is commonly used to classify paving asphalt at
© 2007 by Taylor & Francis Group, LLC

180 Handbook of Alternative Fuel Technology
60°C (140°F). Kinematic capillary instruments (ASTM D-2170, ASTM D-4402) arecommonly used in the 60 to 135°C (140 to 275°F) temperature range for both liquidand semisolid asphalts in the range of 30 cSt to 100,000 cSt. Saybolt tests (ASTMD-88) are also used in this temperature range and at higher temperatures (ASTM E-102). At lower temperatures, the cone-and-plate instrument (ASTM D-3205) hasbeen used extensively in the viscosity range 1,000 P to 1,000,000 P.
The viscosity of resids varies markedly over a very wide range and is dependenton the cut point at which the distillation is terminated. Values vary from less than severalhundred centipoises at room temperature to many thousands of centipoises at the sametemperature. In the present context, the viscosity of vacuum resids is at the higher endof this scale, where a relationship between viscosity and density has been noted.
6.3.5 CARBON RESIDUE
The carbon residue presents indications of the coke-forming propensity of a resid.There are two older well-established methods for determining the carbon residue: theConradson method (ASTM D-189) and the Ramsbottom method (ASTM D-524). Athird, more modern, thermogravimetric method (ASTM D-4530) is also in use.
Resids have high carbon residues, and resids that contain metallic constituentswill have erroneously high carbon residues. The metallic constituents must first beremoved from the resid, or they can be estimated as ash by complete burning of thecoke after carbon residue determination.
The carbon residue of a resid serves as an indication of the propensity of thesample to form carbonaceous deposits (thermal coke) under the influence of heat.The produced are also often used to provide thermal data that give an indication ofthe composition of the asphalt (Speight, 1999; Speight, 2001).
Tests for Conradson carbon residue (ASTM D-189, IP 13), the Ramsbottomcarbon residue (ASTM Test Method D524, IP 14), the microcarbon carbon residue(ASTM D4530, IP 398), and asphaltene content (ASTM D-2006, ASTM D-2007,ASTM D-3279, ASTM D-4124, ASTM D-6560, IP 143) are often included ininspection data for resids. All three methods are applicable to resids. The data givean indication of the amount of coke that will be formed during thermal processesas well of the amount of asphaltenes in the resid.
The produced by the microcarbon test (ASTM D4530, IP 398) are equivalentto those by Conradson Carbon method (ASTM D-189 IP 13). However, this micro-carbon test method offers better control of test conditions and requires a smallersample. Up to 12 samples can be run simultaneously.
Other test methods (ASTM D-2416, ASTM D-4715) that indicate the relative coke-forming properties of tars and pitches might also be applied to resids. Both test methodsare applicable to resids having an ash content ≤0.5% (ASTM D-2415). The formertest method (ASTM D-2416) gives results close to those obtained by the Conradsoncarbon residue test (ASTM D-189 IP 13). However, in the latter test method (ASTMD-4715), a sample is heated for a specified time at 550 ± l0°C (1022 ± 18°F) in anelectric furnace. The percentage of residue is reported as the coking value.
Resids that contain ash-forming constituents will have an erroneously highcarbon residue, depending on the amount of ash formed.
© 2007 by Taylor & Francis Group, LLC

Resids 181
6.3.6 HEAT OF COMBUSTION
The gross heat of combustion of crude oil and its products is given with fair accuracyby the equation:
Q = 12,400 – 2100d2
where d is the 60/60°F specific gravity; deviation is generally less than 1%.For thermodynamic calculation of equilibria useful in petroleum science, com-
bustion data of extreme accuracy are required because the heats of formation ofwater and carbon dioxide are large in comparison to those in the hydrocarbons. Greataccuracy is also required of the specific heat data for the calculation of free energyor entropy. Much care must be exercised in selecting values from the literature forthese purposes because many of those available were determined before the devel-opment of modern calorimetric techniques.
6.3.7 MOLECULAR WEIGHT
For resids that have little or no volatility, vapor pressure osmometry (VPO) has beenproved to be of considerable value.
The molecular weights of resids are not always (in fact, rarely) used in thedetermination of process behavior. Nevertheless, there may be occasions when themolecular weight of asphalt is desired.
Currently, of the methods available, several standard methods are recognized asbeing useful for determining the molecular weight of petroleum fractions, and thesemethods are:
ASTM D-2224: Test Method for Mean Molecular Weight of Mineral Insu-lating Oils by the Cryoscopic Method (discontinued in 1989 but still usedby some laboratories for determining the molecular weight of petroleumfractions up to and including gas oil).
ASTM D-2502: Test Method for Estimation of Molecular Weight (RelativeMolecular Mass) of Petroleum Oils from Viscosity Measurements.
ASTM D-2503: Test Method for Estimation of Molecular Weight (RelativeMolecular Mass) of Hydrocarbons by Thermoelectric Measurement ofVapor Pressure.
ASTM D-2878: Method for Estimating Apparent Vapor Pressures and Molec-ular Weights of Lubricating Oils.
ASTM D-3593: Test Method for Molecular Weight Averages or Distributionof Certain Polymers by Liquid Size Exclusion (Gel Permeation Chroma-tography — GPC) Using Universal Calibration has also been adapted tothe investigation of molecular weight distribution in petroleum fractions.
Each method has proponents and opponents because of assumptions made inthe use of the method or because of the mere complexity of the sample and thenature of the inter- and intramolecular interactions. Before application of any one
© 2007 by Taylor & Francis Group, LLC

182 Handbook of Alternative Fuel Technology
or more of these methods, consideration must be given to the mechanics of themethod and the desired end result.
Methods for molecular weight measurement are also included in other more com-prehensive standards (ASTM D-128, ASTM D-3712), and there are several indirectmethods that have been proposed for the estimation of molecular weight by correlationwith other, more readily measured physical properties (Speight, 1999, 2001).
The molecular weights of the individual fractions of resids have received moreattention and have been considered to be of greater importance than the molecularweight of the resid itself (Speight, 1999, 2001). The components that make up theresid influence the properties of the material to an extent that is dependent on therelative amount of the component, the molecular structure of the component, andthe physical structure of the component that includes the molecular weight.
Asphaltenes have a wide range of molecular weights, from 500 to at least 2500,depending on the method (Speight, 1994). Asphaltenes associate in dilute solution innonpolar solvents, giving higher molecular weights than is actually the case on anindividual-molecule basis. The molecular weights of the resins are somewhat lowerthan those of the asphaltenes and usually fall within the range of 500 to 1000. This isdue not only to the absence of association but also to a lower absolute molecular size.The molecular weights of the oil fractions (i.e., the resid minus the asphaltene fractionand minus the resin fraction) are usually less than 500, often 300 to 400.
A correlation connecting molecular weight, asphaltene content, and heteroatomcontent with the carbon residues of whole residua has been developed and has beenextended to molecular weight and carbon residue (Schabron and Speight, 1997a, 1997b).
6.3.8 OTHER PROPERTIES
Resids may be liquid or solid at ambient temperature and, in the latter case, themelting point is a test (ASTM D-87 and D-127) that is widely used to know themelting point to prevent solidification in pipes.
The softening point of a resid is the temperature at which the resid attains aparticular degree of softness under specified conditions of test.
There are several tests available to determine the softening point of resids (ASTMD-36, ASTM D-61, ASTM D-2319, ASTM D-3104, ASTM D-3461, IP 58). In thetest method (ASTM D-36, IP 58), a steel ball of specified weight is laid on the layerof sample contained in a ring of specified dimensions. The softening point is thetemperature, during heating under specified conditions, at which the asphalt sur-rounding the ball deforms and contacts a base plate.
The pour point is the lowest temperature at which the resid will pour or flowunder prescribed conditions. For residua, the pour points are usually high (above0°C; 32°F) and are more an indication of the temperatures (or conditions) requiredto move the material from one point in the refinery to another.
The thermal cracking of resid is a first-order reaction, but there is an inductionperiod before the coke begins to form.
The focus in such studies has been on the asphaltene constituents and the resinconstituents (Speight, 2002, and references cited therein). Several chemical models(Wiehe, 1993, 1994, and references cited therein; Gray, 1994, and references cited
© 2007 by Taylor & Francis Group, LLC

Resids 183
therein; Speight, 1994, and references cited therein) describe the thermal decompo-sition of asphaltene constituents and, by inference, the constituents of the resinfraction. The prevalent thinking is that the polynuclear aromatic fragments becomeprogressively more polar as the paraffinic fragments are stripped from the ringsystems by scission of the bonds (preferentially) between the carbon atoms alphaand beta to the aromatic rings.
6.4 COMPOSITION
Determination of the composition of resids has always presented a challenge becauseof the complexity and high molecular weights of the molecular constituents. Theprinciple behind composition studies is to evaluate resids in terms of compositionand process behavior.
Physical methods of fractionation usually indicate high proportions of asphalt-enes and resins even in amounts up to 50% (or higher) of the residuum. In addition,the presence of ash-forming metallic constituents, including such organometalliccompounds as those of vanadium and nickel, is also a distinguishing feature of resids.Furthermore, the deeper the cut into the crude oil, the greater the concentration ofsulfur and metals in the residuum, and the greater the deterioration in physicalproperties (Speight 2000, and references cited therein).
6.4.1 CHEMICAL COMPOSITION
The chemical composition of resids is, in spite of the large volume of work performedin this area, largely speculative (Altgelt and Boduszynski, 1994; Speight, 1999).Acceptance that petroleum is a continuum of molecular types that continues fromthe low-boiling fractions to the nonvolatile fractions (Speight, 1999, and referencescited therein) is an aid to understanding the chemical nature of the heavy feedstocks.
6.4.1.1 Hydrocarbon Compounds
On a molecular basis, resids contain hydrocarbons as well as the organic compoundsof nitrogen, oxygen, and sulfur; and metallic constituents. Even though free hydro-carbons may be present and the hydrocarbon skeleton of the various constituentsmay appear to be the dominating molecular feature, it is, nevertheless, the nonhy-drocarbon constituents (i.e., nitrogen, oxygen, and sulfur) that play a large part indetermining the nature and, hence, the processability of resids.
In the asphaltene fraction (a predominant fraction of resids), free condensednaphthenic ring systems may occur, but general observations favor the occurrenceof combined aromatic–naphthenic systems that are variously substituted by alkylsystems. There is also general evidence that the aromatic systems are responsiblefor the polarity of the asphaltene constituents. Components with two aromatic ringsare presumed to be naphthalene derivatives, and those with three aromatic rings maybe phenanthrene derivatives. Currently, and because of the consideration of thenatural product origins of petroleum, phenanthrene derivatives are favored overanthracene ones. In addition, trace amounts of pericondensed polycyclic aromatic
© 2007 by Taylor & Francis Group, LLC

184 Handbook of Alternative Fuel Technology
hydrocarbons such as methylchrysene, methyl- and dimethylperylenes, and benzof-luorenes have been identified in crude oil. Chrysene and benzofluorene homologuesseem to predominate over those of pyrene.
The polycyclic aromatic systems in the asphaltene fraction are complex mole-cules that fall into a molecular weight and boiling range where very little is knownabout model compounds (Speight, 1994, 1999). There has not been much successin determining the nature of such systems in resids. In fact, it has been generallyassumed that as the boiling point of a petroleum fraction increases, so does thenumber of condensed rings in a polycyclic aromatic system. To an extent, this istrue, but the simplicities of such assumptions cause omission of other importantstructural constituents of the petroleum matrix, the alkyl substituents, the heteroat-oms, and any polycyclic systems that are linked by alkyl chains or by heteroatoms.
6.4.1.2 Sulfur Compounds
Sulfur compounds are perhaps the most important nonhydrocarbon constituents ofresids and occur as a variety of structures (Speight, 1999, and references citedtherein). During the refining sequences involved in converting crude oils to salableproducts, a great number of the sulfur compounds that occur in petroleum areconcentrated in the resids.
The major sulfur species are alkyl benzothiophene, dibenzothiophene, ben-zonaphtho-thiophene, and phenanthro-thiophene derivatives.
6.4.1.3 Nitrogen Compounds
The presence of nitrogen in resids is of much greater significance in refinery oper-ations than might be expected from the relatively small amounts present.
Nitrogen in resids may be classed arbitrarily as basic and nonbasic. The basicnitrogen compounds (Speight, 1999, and references cited therein), which are com-posed mainly of pyridine homologues and occur throughout the boiling ranges, havea decided tendency to exist in the higher-boiling fractions and residua (Gary andHandwerk, 1984). The nonbasic nitrogen compounds, which are usually of the pyr-role, indole, and carbazole types, also occur in the higher-boiling fractions and residua.
Typically, about one third of the compounds are basic, i.e., pyridine and itsbenzologs, whereas the remainder are present as neutral species (amides and carba-zole derivatives). Although benzo- and dibenzoquinoline derivatives found in petro-leum are rich in sterically hindered structures, hindered and unhindered structureshave also been found.
Porphyrins (nitrogen–metal complexes) are also constituents of petroleum andusually occur in the nonbasic portion of the nitrogen-containing concentrate (Rey-nolds, 1991 and 1997). Pyrrole, the chief constituent of the porphyrin molecule, ismarked by high stability because of its aromatic character.
The presence of vanadium and nickel in resids, especially as metal porphyrincomplexes, has focused much attention in the petroleum refining industry on theoccurrence of these metals in feedstocks (Reynolds, 1991 and 1997). Only a part ofthe total nickel and vanadium in crude oil is recognized to occur in porphyrin structures.
© 2007 by Taylor & Francis Group, LLC

Resids 185
6.4.1.4 Oxygen Compounds
The total oxygen content of petroleum is usually less than 2% w/w, although largeramounts have been reported, and it does increase with the boiling point of thefractions. In fact, resids may have oxygen contents of up to 8% w/w. Although thesehigh-molecular-weight compounds contain most of the oxygen, little is known con-cerning their structure, but those of lower molecular weight have been investigatedwith considerably more success and have been shown to contain carboxylic acids(R-CO2H) and phenols (Ar-OH, where Ar is an aromatic moiety).
6.4.1.5 Metallic Compounds
The occurrence of metallic constituents in crude oil is of considerably greater interestto the petroleum industry than might be expected from the very small amounts present.
Distillation concentrates the metallic constituents in the resids (Table 6.2); somecan appear in the higher-boiling distillates but the latter may, in part, be due toentrainment. The majority of the vanadium, nickel, iron, and copper in resids maybe precipitated along with the asphaltenes by low-boiling alkane hydrocarbon sol-vents. Thus, removal of the asphaltenes with n-pentane reduces the vanadium contentof the oil by up to 95%, with substantial reductions in the amounts of iron and nickel.
6.4.2 FRACTIONATION
Understanding the chemical transformations of the macromolecular constituentsduring conversion is limited by the diversity (over a million chemical structures) ofthe complex macromolecules in a resid.
One way to sample this molecular diversity is to separate the resid and itsconversion products into fractions using solubility or insolubility in low-boilingliquid hydrocarbons as well as adsorption followed by desorption on solids such assilica gel, alumina, or clay (Figure 6.2). Following the application of such a proce-dure, it can be shown that, in the simplest sense, resids from the same crude differin the relative amounts of these fractions that are present (Figure 6.3), as they oftendo when produced from different crude oil. Thus, the physical composition (or bulkcomposition), refers to the composition of a resid, is determined by these variousphysical techniques (Speight, 1999, and references cited therein).
There are also two other operational definitions that should be noted at this point,and these are the terms carbenes and carboids. Both these fractions are by definitioninsoluble in benzene (or toluene), but the carbenes are soluble in carbon disulfidewhereas the carboids are insoluble in carbon disulfide. Only traces, if any, of thesematerials occur in natural resids. On the other hand, resids that have received somethermal treatment (such as visbroken resids) may have considerable quantities ofthese materials present as they are also considered to be precursors to coke.
Resids, especially vacuum resids (vacuum bottoms), are the most complex fractionsof petroleum. Few molecules are free of heteroatoms and the molecular weight of theconstituents extends from 400 to >2000 and, at the upper end of this molecular weightrange, characterization of individual species is virtually impossible. Separations by
© 2007 by Taylor & Francis Group, LLC

186 Handbook of Alternative Fuel Technology
group type become blurred by the shear frequency of substitution and by the presenceof multiple functionalities in single molecules.
Resids can be separated into a variety of fractions using a myriad of differenttechniques that have been used since the beginning of petroleum science (Speight,1999). In general, the fractions produced by these different techniques are calledsaturates, aromatics, resins, and asphaltenes (Figure 6.2). And much of the focushas been on the asphaltenes fraction because of its high sulfur content and highcoke-forming propensity (Speight, 1994, 1999).
The methods employed can be conveniently arranged into a number of categories:(1) fractionation by precipitation; (2) fractionation by distillation; (3) separation bychromatographic techniques; (4) chemical analysis using spectrophotometric tech-niques (infrared, ultraviolet, nuclear magnetic resource, x-ray fluorescence, emission,neutron activation), titrimetric and gravimetric techniques, elemental analysis; and
FIGURE 6.2 Resid fractionation.
FIGURE 6.3 Comparison of petroleum and resid composition showing the asphaltene content.
Asphaltenes
(Soluble in toluene)
Carbenes
(Soluble in CS2)
Carboids
(Insoluble in CS2)
Carbenes/Carboids
(Insoluble in toluene)
Asphaltenes
(Insolubles)
3: Resins
(Pyridine wash)
2: Aromatics
(Toluene wash)
1: Saturates
(n-Heptane wash)
Deasphaltened oil
(Percolate through alumina)
Feedstock
(n-Heptane)
0
100
Composition,wt.%
Wholecrudeoil
Atm
osphericresiduum
Vacuum
residuum
C5-asphaltenes
C7-asphaltenes
S = Saturates
A = AromaticsS
AS
S
AA
Propaneasphalt
© 2007 by Taylor & Francis Group, LLC

Resids 187
(5) molecular weight analysis by mass spectrometry, vapor pressure osmometry, andsize exclusion chromatography.
6.4.2.1 Asphaltene Separation
By definition, the asphaltene fraction is that portion of the feedstock that is precip-itated when a large excess (40 volumes) of a low-boiling liquid hydrocarbon (e.g.,n-pentane or n-heptane) is added to 1 volume of the crude oil (Speight, 1994, 1999).n-Heptane is the preferred hydrocarbon, with n-pentane still being used (Speight, etal., 1984; Speight, 1994; ASTM, 2003).
The asphaltene fraction (ASTM D-2006, ASTM D-2007, ASTM D-3279, ASTMD-4124, ASTM D-6560, IP 143) has the highest molecular weight and is the mostcomplex fraction in petroleum. The asphaltenes content gives an indication of theamount of coke that can be expected during processing (Speight, 1999; Speight,2001, Speight and Ozum, 2002).
In any of the methods for the determination of the asphaltene content, the residsmixed with a large excess (usually >30 volumes hydrocarbon per volume of sample)of low-boiling hydrocarbon such as n-pentane or n-heptane. For an extremely heavyresiduum, a solvent such as toluene may be used prior to the addition of the low-boiling hydrocarbon, but an additional amount of the hydrocarbon (usually >30volumes hydrocarbon per volume of solvent) must be added to compensate for thepresence of the solvent. After a specified time, the insoluble material (the asphaltenefraction) is separated (by filtration) and dried. The yield is reported as a percentage(% w/w) of the original sample.
It must be recognized that, in any of these tests, different hydrocarbons (such asn-pentane or n-heptane) will give different yields of the asphaltene fraction, and ifthe presence of the solvent is not compensated by use of additional hydrocarbon, theyield will be erroneous. In addition, if the hydrocarbon is not present in large excess,the yields of the asphaltene fraction will vary and will be erroneous (Speight, 1999).
The precipitation number is often equated to the asphaltene content, but there areseveral obvious issues that argue against this. For example, the method to determinethe precipitation number (ASTM D-91) advocates the use of naphtha for use withblack oil or lubricating oil, and the amount of insoluble material (as a % v/v of thesample) is the precipitating number. In the test, 10 ml of sample is mixed with 90 mlof ASTM precipitation naphtha (that may or may not have a constant chemicalcomposition) in a graduated centrifuge cone and centrifuged for 10 min at 600 to 700rpm. The volume of material on the bottom of the centrifuge cone is noted until repeatcentrifugation gives a value within 0.1 ml (the precipitation number). Obviously, thiscan be substantially different in regard to asphaltene content.
In another test method (ASTM D-4055), pentane insoluble materials above0.8 µm in size can be determined. In the test method, a sample of oil is mixed withpentane in a volumetric flask, and the oil solution is filtered through a 0.8-µm-membrane filter. The flask, funnel, and the filter are washed with pentane to com-pletely transfer the particulates onto the filter, which is then dried and weighed togive the yield of pentane-insoluble materials.
© 2007 by Taylor & Francis Group, LLC

188 Handbook of Alternative Fuel Technology
Another test method (ASTM D-893) that was originally designed for the deter-mination of pentane- and toluene-insoluble materials in used lubricating oils canalso be applied to resids. However, the method may need modification by first addinga solvent (such as toluene) to the resid before adding pentane.
6.4.2.1.1 Carbon-Disulfide-Insoluble ConstituentsThe component of highest carbon content is the fraction termed carboids and consistsof species that are insoluble in carbon disulfide or in pyridine. The fraction calledcarbenes contains molecular species that are soluble in carbon disulfide and solublein pyridine but are insoluble in toluene (Figure 6.2).
Resids are hydrocarbonaceous materials composed of constituents (containingcarbon, hydrogen, nitrogen, oxygen, and sulfur) that are completely soluble in carbondisulfide (ASTM D-4). Trichloroethylene and 1,1,1-trichloroethane have been usedin recent years as solvents for the determination of asphalt solubility (ASTM D-2042).
The carbene and carboid fractions are generated by thermal degradation or byoxidative degradation and are not considered to be naturally occurring constituentsof asphalt. The test method for determining the toluene-insoluble constituents of tarand pitch (ASTM D-4072 and ASTM D-4312) can be used to determine the amountof carbenes and carboids in resids.
6.4.2.2 Fractionation of Deasphaltened Oil
After removal of the asphaltene fraction, further fractionation of resids is alsopossible by variation of the hydrocarbon solvent.
However, fractional separation has been the basis of most resid compositionanalysis (Figure 6.2). The separation methods that have been used divide a resid intooperationally defined fractions. Three types of resid separation procedures are nowin use: (1) chemical precipitation in which n-pentane separation of asphaltenes isfollowed by chemical precipitation of other fractions with sulfuric acid of increasingconcentration (ASTM D-2006); (2) adsorption chromatography using a clay-gelprocedure in which, after removal of the asphaltenes, the remaining constituents areseparated by selective adsorption or desorption on an adsorbent (ASTM D-2007 andASTM D-4124); and (3) size-exclusion chromatography, in which gel permeationchromatographic (GPC) separation of asphalt constituents occurs based on theirassociated sizes in dilute solutions (ASTM D-3593).
The fractions obtained in these schemes are defined operationally or procedur-ally. The solvent used for precipitating them, for instance, defines the amount andtype of asphaltenes in a resid. Fractional separation of a resid does not provide well-defined chemical components. The materials separated should only be defined interms of the particular test procedure (Figure 6.2). However, these fractions generatedby thermal degradation are not considered to be naturally occurring constituents ofresid. The test method for determining the toluene-insoluble constituents of tar andpitch (ASTM D-4072, ASTM D-4312) can be used to determine the amount ofcarbenes and carboids in resid.
Many investigations of relationships between composition and properties takeinto account only the concentration of the asphaltenes, independently of any quality
© 2007 by Taylor & Francis Group, LLC

Resids 189
criterion. However, a distinction should be made between the asphaltenes that occurin straight-run residua and those that occur in cracked residua. Because asphaltenesare a solubility class rather than a distinct chemical class, vast differences occur inthe makeup of this fraction when it is produced by different processes.
For example, liquefied gases, such as propane and butane, precipitate as much as50% by weight of the resid. The precipitate is a black, tacky, semisolid material, incontrast to the pentane-precipitated asphaltenes, which are usually brown, amorphoussolids. Treatment of the propane precipitate with pentane then yields the insoluble,brown, amorphous asphaltenes and soluble, near-black, semisolid resins, which are,as near as can be determined, equivalent to the resins isolated by adsorption techniques.
Separation by adsorption chromatography essentially commences with the prep-aration of a porous bed of finely divided solid, the adsorbent. The adsorbent is usuallycontained in an open tube (column chromatography); the sample is introduced atone end of the adsorbent bed and induced to flow through the bed by means of asuitable solvent. As the sample moves through the bed, the various components areheld (adsorbed) to a greater or lesser extent depending on the chemical nature ofthe component. Thus, those molecules that are strongly adsorbed spend considerabletime on the adsorbent surface rather than in the moving (solvent) phase, but com-ponents that are slightly adsorbed move through the bed comparatively rapidly.
There are three ASTM methods that provide for the separation of a feedstockinto four or five constituent fractions (Speight, 2001, and references cited therein).It is interesting to note that as the methods have evolved, there has been a changefrom the use of pentane (ASTM D-2006 and D-2007) to heptane (ASTM D-4124)to separate asphaltenes. This is, in fact, in keeping with the production of a moreconsistent fraction that represents the higher-molecular-weight complex constituentsof petroleum (Girdler, 1965; Speight et al., 1984).
Two of the methods (ASTM D-2007 and D-4124) use adsorbents to fractionatethe deasphaltened oil, but the third method (ASTM D-2006) advocates the use ofvarious grades of sulfuric acid to separate the material into compound types. Cautionis advised in the application of this method because the method does not work wellwith all feedstocks. For example, when the sulfuric acid method (ASTM D-2006)is applied to the separation of heavy feedstocks, complex emulsions can be produced.
6.5 USE OF DATA
It has been asserted that more needs to be done in correlating analytical data obtainedfor resids with processability (Speight et al., 1984; Boduszynski, 1988; Reynolds,1991). Currently, used coke yield predictors are simplistic and feedstock specific(Beret and Reynolds, 1990; Gary and Handwerk, 1984).
Standard analyses on resids, such as determinations of elemental compositionsand molecular weight, have not served to be reliable predictors of processability,and determining average structural features also does not appear to be very helpful.
The data derived from any one, or more, of the evaluation techniques describedhere give an indication of resid behavior. The data can also be employed to give therefiner a view of the differences between different residua, thereby indicating themeans by which the resids should be processed, as well as for the prediction of
© 2007 by Taylor & Francis Group, LLC

190 Handbook of Alternative Fuel Technology
product properties (Dolbear et al., 1987; Adler and Hall, 1988; Wallace and Carrigy,1988; Al-Besharah et al., 1989).
Because of resid complexity, there are disadvantages in relying on the use ofbulk properties as the sole means of predicting behavior. Therefore, fractionation ofresids into components of interest and study of the components appears to be a betterapproach than obtaining data on whole residua. By careful selection of a character-ization scheme, it may be possible to obtain a detailed overview of feedstockcomposition that can be used for process predictions.
The use of composition data to model resid behavior during refining is becomingincreasingly important in refinery operations (Speight, 1999).
In the simplest sense, resids can be considered composites of four major operationalfractions and this allows different resids to be compared on a relative basis to providea very simple but convenient feedstock map (Figure 6.4). However, such a map doesnot give any indication of the complex interrelationships of the various fractions,although predictions of feedstock behavior are possible using such data. It is necessaryto take the composition studies one step further using subfractionation of the majorfractions to obtain a more representative indication of petroleum composition.
Further development of this concept (Long and Speight, 1989, 1990, 1997)involved the construction of a different type of compositional map, using the molecularweight distribution and the molecular-type distribution as coordinates. The separationinvolved the use of an adsorbent such as clay, and the fractions were characterized bysolubility parameter as a measure of the polarity of the molecular types. The molecularweight distribution can be determined by gel permeation chromatography.
FIGURE 6.4 Simplified representation and resid composition.
Paraffins
Naphthenes
AromaticsHeteroatomiccompounds
Carbon number, % of feedstock
Naphtheno-aromatics
Com
posit
ion,
wt.
%
Vacuum residuum
Gas
oil
Asp
halte
nes,
Res
ins
Atmospheric residuum
© 2007 by Taylor & Francis Group, LLC

Resids 191
Using these two distributions, a map of composition can be prepared withmolecular weight and solubility parameter as the coordinates for plotting the twodistributions. Such a composition map can provide insights into many separationand conversion processes used in resid processing.
6.6 RESID CONVERSION
Resid quality is a relevant issue with regard to the selection and efficiency of theconversion technology. High levels of metals (vanadium and nickel) are a well-known characteristic of many resids. The Conradson carbon and asphaltene contentof resids are also high, and so represent challenges for the upgrading technology.
6.6.1 VISBREAKING
Visbreaking is a low-conversion thermal process, used originally to reduce the residviscosity to meet the specification for heavy fuel oil applications. Currently, thevisbreaking process converts resids (15–20% v/v conversion) to produce some liquidfuel boiling range liquids, with visbroken resid being used to meet heavy fuel oilspecifications.
The process is not designed to produce coke formation and therefore operateswith the induction period prior to coke formation.
A visbreaker reactor may be similar to a delayed coker with a furnace tube followedby a soaker drum. However, the drum is much smaller in volume to limit the residencetime, with the entire liquid product flowing overhead. Alternatively, the entire visbreakermay be a long tube coiled within a furnace. Differences in resid properties can causecoke to form in the vessel, and some coke removal protocols may be necessary.
Visbreaking may be applied to atmospheric resids, vacuum resids, and also tosolvent deasphalter bottoms (asphalt). A common operation involved visbreakingthe atmospheric residue in combination with a thermal cracker to minimize fuel oilwhile producing additional light distillates.
However, visbreaking is typically applied to vacuum resids and is frequentlyused as a mild vacuum residue conversion process when feedstock for fluid catalyticcracking is sought. The lower-boiling distillates are recovered for processing totransportation fuels, and the higher-boiling distillates are recovered as feedstock forthe fluid catalytic cracking unit. A high-temperature coil visbreaker allows a high-boiling distillate to be recovered from the fractionator. For lower-boiling distillatesand with soaking drum technology, a separate vacuum flasher is usually required.
Conversion in a visbreaker is limited by the requirement to produce a stable fueloil. As the resid is thermally cracked, reactions occur which increase the asphaltenecontent which, coupled with the reduction (by thermal cracking) of the resins holdingthe asphaltene constituents in solution, leads to precipitation of the asphaltenes.
6.6.2 COKING
Coking is a high-temperature (450–500°C [842–932°F]) process and is the mostpopular conversion choice for resids that usually have a high content of polynuclear
© 2007 by Taylor & Francis Group, LLC

192 Handbook of Alternative Fuel Technology
aromatic systems (low hydrogen, high heteroatoms, high Conradson carbon). Cokingconverts the polynuclear aromatic systems to coke (a relatively low-value product)and overhead (relatively high-value distillates) that can be upgraded further to liquidfuels and other products.
Delayed coking is the oldest and most popular choice for resid conversion. Theresid is heated by flow through a long tube in a furnace and then reacted by flowinto the bottom of a high, cylindrical, insulated drum. The drums are used in pairswith one onstream and the other offstream. Volatile (overhead) products pass to afractionator and coke accumulates in the drum. High-boiling liquid products maybe recycled to the furnace and pass through the coke drum again.
When the drum fills up with coke, the hot feed is switched offstream and thesecond drum is switched onstream. The coke is removed from the offstream drumusing high-pressure water, after which time the onstream–offstream cycle (usuallyabout 16 h) will be reversed.
The fluid coking and flexicoking processes are also employed for resid conversion.In the fluid coking process, the hot resid is sprayed on a hot, fluidized bed of cokeparticles in a reactor. The volatile products (overhead) pass to a fractionator while thecoke particles are removed from the bottom of the reactor and transferred to anothervessel, the burner or regenerator. Here the excess coke is partially burned with air toprovide the heat for the process, and the coke then is recirculated back to the reactor.
In the flexicoking process, which is very similar to the fluid coking process, a thirdvessel (the gasifier) is added to the fluid coking flow. The gasifier coke is used to gasifyexcess coke with steam and air to produce a low-Btu gas containing hydrogen, carbonmonoxide, nitrogen, and hydrogen sulfide. After removal of the hydrogen sulfide, thelow-Btu gas is burned as a clean fuel within the refinery or in a nearby power plant.
6.6.3 RESID CATALYTIC CRACKING
Resid catalytic cracking has much better selectivity to desired products (high-gaso-line and low-gas yields) than for coking or hydroconversion.
In fluid catalytic cracking, feed is sprayed on zeolite catalyst in a short-contact-time riser reactor. The vaporized product flows to a fractionator while the catalystwith coke and adsorbed hydrocarbons flows to a fluidized bed regenerator in whichthe coke and hydrocarbons are burned off the catalyst. Fluid catalytic crackingrequires much more higher-quality feeds than coking or hydroconversion. This isbecause of expensive zeolite catalysts, intolerance to sodium, nickel, vanadium, andbasic nitrogen, as well as limitations on the amount of coke that can be burned inthe regeneration step by cooling capacity. As a result, the feed in resid catalyticcracking is at worst an excellent-quality atmospheric resid, but mixtures of vacuumgas oil and atmospheric resids are more common. The total feed is limited toConradson Carbon Residues of 3 to 8 wt%, depending on the cooling capacity.
6.6.4 HYDROCONVERSION
Hydroconversion combines thermal cracking with hydrogenation. The addition ofhydrogen increases the coke induction period by lowering the solubility parameter
© 2007 by Taylor & Francis Group, LLC

Resids 193
by hydrogenating polynuclear aromatic systems, but primarily by terminating freeradicals and reducing the frequency of aromatics from combining to form largerpolynuclear aromatic systems. Thus, hydroconversion of vacuum resids to volatileliquids can be over 85% as opposed to 50–60% for coking. However, one has todeal with the cost of hydrogen and catalyst, high-pressure vessels, poisoning ofcatalysts, the difficulty of asphaltenes in diffusing through small pores, and theintolerance to coke and sediment formation. The active catalyst needs to be atransition metal sulfide because the high level of sulfur in resid feeds will poisonother hydrogenation catalysts.
Atmospheric and vacuum residue desulfurization units are commonly operatedto desulfurize the residue as a preparatory measure for feeding low-sulfur vacuumgas-oil feed to cracking units (fluid catalytic cracking units and hydrocracking units),low-sulfur residue feed to delayed coker units, and low-sulfur fuel oil to powerstations. Two different types of processing units are used for the direct catalytichydroprocessing of residue.
These units are either (1) a down-flow, trickle phase reactor system (fixed catalystbed) or (2) liquid recycle and back mixing system (ebullating bed).
6.6.4.1 Fixed Bed Units
Because metal removal is one of the fastest reactions and as the metals accumulatein the pores of supported catalysts, it is common to have a guard bed in front of thefixed bed. When insufficient metal removal occurs in the guard bed, the feed isswitched to a second guard bed with fresh catalyst and the catalyst is replaced inthe first guard bed. Thus, the fixed bed is protected from metal deposition. Tohydrogenate the largest macromolecules in the resid, the asphaltenes, some or all ofthe catalysts need to have pores 50–100 µm in diameter. Even with these precautions,it is difficult to get longer than 1-year run lengths on fixed bed hydroconversionunits with vacuum resid feeds and conversions to volatile liquids of 50% or more.This is because of catalyst deactivation with coke or by coke and sediment formationdownstream of the reactor.
6.6.4.2 Ebullating Bed Units
The LC Finer and H-Oil units use the mechanically ebullate the catalyst so that itcan be mixed and replaced onstream. The conversion is greatly dependent on thefeed, but conversions of vacuum resids to volatile liquids on the order of 70% arepossible. Often, these units are limited by the deposition of coke and sedimentdownstream of the reactor in hot and cold separators.
6.6.4.3 Dispersed Catalyst Processes
If one cannot diffuse the asphaltenes to the catalyst, why not diffuse the catalyst toasphaltenes? Dispersed catalysts also can be continuously added in low enoughamounts (i.e., 100 ppm) to consider them throwaway catalysts with the carbonaceousby-product. However, economics usually dictates some form of catalyst recycle tominimize catalyst cost. Nevertheless, by designing the reactor to maximize the
© 2007 by Taylor & Francis Group, LLC

194 Handbook of Alternative Fuel Technology
solubility of the converted asphaltenes, the conversion of vacuum resids to gas andvolatile liquids can be above 95%, with greater than 85% volatile liquids. However,the last 5 to 10% conversion may not be worth the cost of hydrogen and reactorvolume to produce hydrocarbon gases and very aromatic liquids from this incremen-tal conversion.
6.6.5 SOLVENT DEASPHALTING
Solvent deasphalting, though not strictly a conversion process, is a separation processthat represents a further step in the minimization of resid production.
The process takes advantage of the fact that maltenes are more soluble in lightparaffinic solvents than asphaltenes. This solubility increases with solvent molecularweight and decreases with temperature. As with vacuum distillation, there are con-straints with respect to how deep a solvent deasphalting unit can cut into the residueor how much deasphalted oil can be produced.
In the case of solvent deasphalting, these constraints are typically: (1) the qualityof the deasphalted oil required by conversion units, and (2) the residual fuel oilstability and quality.
Solvent deasphalting has the advantage of processing the flexibility to meet awide range of deasphalted oil quality. The process has very good selectivity for therejection of asphaltene constituents and metal constituents, along with varied selec-tivity (depending on the feedstock) for other coke precursors, but less selectivity forsulfur constituents and for nitrogen constituents. The disadvantages of the processare that it performs no conversion, produces a very high-viscosity by-product pitch,and where high-quality deasphalted oil is required, the solvent deasphalting processis limited in the quality of feedstock that can be economically processed.
The viability of the solvent deasphalting process is dependent on the potentialfor upgrading the deasphalted oil and the differential between the value of the cutterstocks and the price of high-sulfur residual fuel oil. If there is an outlet for asphalt(from the unit) and the conversion capacity exists to upgrade the deasphalted oil,solvent deasphalting can be a highly attractive option for resid conversion.
6.6.6 FUTURE PROCESSES
We are still on the steep part of the learning curve as to the characterization, phasebehavior, and conversion chemistry of petroleum resids. As a result, there is muchroom for improvement in regard to resid conversion processes. However, the rate ofconstruction of new resid conversion units in refineries has been decreasing. Futuregrowth appears to be at or near heavy crude production sites, to decrease heavycrude viscosity and improve the quality to ease transportation, and open markets forcrude oils or resids that are of marginal value. There remains room for improvingcoking and hydroconversion processes by reducing hydrocarbon gas formation, byinhibiting the formation of polynuclear aromatic systems not originally present inthe resid, and by separating an intermediate quality (low in cores) fraction beforeor during conversion. Both these processes would benefit if a higher-valued by-product, such as carbon fibers or needle coke, could be formed from the polynuclear
© 2007 by Taylor & Francis Group, LLC

Resids 195
aromatic systems. In addition, the challenge for hydroconversion is to take advantageof the nickel and vanadium in the resid to generate an in situ dispersed catalyst andto eliminate catalyst cost. Finally, resid catalytic cracking needs to move to poorer-quality and lower-cost feeds by making more tolerant catalysts, by processing onlythe saturates and small-ring aromatics portion, and by improved methods to removeheat from the regenerator.
REFERENCES
Adler, S.B. and Hall, K.R., Hydrocarbon Process., 71(11): 71, 1988.Al-Besharah, J.M., Mumford, C.J., Akashah, S.A., and Salman, O., Fuel, 68: 809, 1989.Altgelt, K.H. and Boduszynski, M.M., Compositional Analysis of Heavy Petroleum Fractions,
Marcel Dekker, New York, 1994.ASTM, ASTM Annual Book of Standards, American Society for Testing and Materials, West
Conshohocken, Pennsylvania, 2003.Beret, S. and Reynolds, J.G., Fuel Sci. Technol. Int., 8: 191, 1990.Boduszynski, M.M., Energy Fuels, 2: 597, 1988.Boduszynski, M.M., Liquid Fuel Technol., 2: 211, 1984.Dolbear, G.E., Tang, A., and Moorehead, E.L., in Metal Complexes in Fossil Fuels, Filby,
R.H. and Branthaver, J.F., Eds., Symposium Series No. 344, American ChemicalSociety, Washington, D.C., 1987, p. 220.
Gary, J.H. and Handwerk, G.E., Petroleum Refining: Technology and Economics, 2nd ed.,Marcel Dekker, New York, 1984.
Girdler, R.B., Proc. Assoc. Asphalt Paving Technologists, 34: 45, 1965.Gray, M.R., Upgrading Petroleum Residues and Heavy Oils, Marcel Dekker, New York, 1994.Gruse, W.A., and Stevens, D.R., Chemical Technology of Petroleum, McGraw-Hill, New York,
1960, chap. 15.Long, R.B. and Speight, J.G., Revue de l’Institut Français du Pétrole, 44: 205, 1989.Long, R.B. and Speight, J.G., Revue de l’Institut Français du Pétrole, 45: 553, 1990.Long, R.B. and Speight, J.G., in Petroleum Chemistry and Refining, Taylor & Francis,
Washington, D.C., 1997, chap. 1.Reynolds, J.G., Fuel Sci. Technol. Int., 9: 613, 1991.Reynolds, J.G., in Petroleum Chemistry and Refining, Speight, J.G., Ed., Taylor & Francis,
Washington, D.C., 1997, chap. 3.Schabron, J.F. and Speight, J.G., Revue de l’Institut Français du Pétrole, 52: 73, 1997a.Schabron, J.F. and Speight, J.G., Prepr. Div. Fuel Chem. Am. Chem. Soc., 42(2): 386, 1997b.Speight, J.G., in Asphaltenes and Asphalts, I. Developments in Petroleum Science, 40, Yen, T.F.
and Chilingarian, G.V., Eds., Elsevier, Amsterdam, The Netherlands, 1994, chap. 2.Speight, J.G., The Chemistry and Technology of Petroleum, 3rd ed., Marcel Dekker, New
York, 1999.Speight, J.G., The Desulfurization of Heavy Oils and Residua, 2nd ed., Marcel Dekker, New
York, 2000.Speight, J.G., Handbook of Petroleum Product Analysis, John Wiley & Sons, New York, 2002.Speight, J.G. and Ozum, B., Petroleum Refining Processes, Marcel Dekker, New York, 2002.Speight, J.G., Long, R.B., and Trowbridge, T.D., Fuel, 63: 616, 1984.Van Gooswilligen, G., in Modern Petroleum Technology, Vol. 1 and 2: Downstream, Lucas,
A.G., Ed., John Wiley & Sons, New York, 2000.
© 2007 by Taylor & Francis Group, LLC

196 Handbook of Alternative Fuel Technology
Wallace, D., and Carrigy, M.A., Proceedings of the Third UNITAR/UNDP InternationalConference on Heavy Crude and Tar Sands, Meyer, R.F., Ed., Alberta Oil SandsTechnology and Research Authority, Edmonton, Alberta, Canada, 1988.
Wiehe, I.A., Ind. Eng. Chem. Res., 32: 2447, 1993.Wiehe, I.A., Energy Fuels, 8: 536, 1994.
© 2007 by Taylor & Francis Group, LLC

197
7 Liquid Fuelsfrom Oil Sand
James G. Speight
CONTENTS
7.1 Introduction .................................................................................................. 1977.2 Occurrence and Reserves............................................................................. 2007.3 Bitumen Properties....................................................................................... 202
7.3.1 Elemental (Ultimate) Composition.................................................. 2027.3.2 Chemical Composition..................................................................... 2037.3.3 Fractional Composition.................................................................... 2047.3.4 Thermal Reactions ........................................................................... 2047.3.5 Physical Properties........................................................................... 204
7.4 Bitumen Recovery........................................................................................ 2057.5 Liquid Fuels from Oil Sand......................................................................... 207
7.5.1 Coking Processes ............................................................................. 2117.5.2 Product Upgrading ........................................................................... 2147.5.3 Other Processes ................................................................................ 2157.5.4 The Future ........................................................................................ 217
References.............................................................................................................. 221
7.1 INTRODUCTION
Liquid fuels are produced from several sources, the most common being petroleum.However, other sources such as oil sand (Berkowitz and Speight, 1975; Speight,1990, and references cited therein) and coal are also viable sources of liquid fuels.Coal, to a lesser extent, can also be used as a source of liquid fuels (Speight, 1994,and references cited therein).
When liquid fuels are produced from a source such as oil sand, the initial productis often referred to as synthetic crude oil or syncrude, which is, in the present context,a liquid fuel that does not occur naturally.
The purpose of this chapter is to describe the occurrence, production, andproperties of oil sand bitumen, and the methods used to convert the bitumen tosynthetic crude oil. Properties of the synthetic crude oil are also given.
Oil sand (also known as tar sand and bituminous sand) is a sand deposit that isimpregnated with an organic material called bitumen. The term natural asphalt is
© 2007 by Taylor & Francis Group, LLC

198 Handbook of Alternative Fuel Technology
also used for the organic material that impregnates various sand deposits, but theterm is less precise than bitumen.
The names oil sand and tar sand are scientifically incorrect because oil sanddoes not contain oil and tar is most commonly produced from bituminous coal,besides being generally understood to refer to the product from coal, although it isadvisable to specify coal tar if there is the possibility of ambiguity.
Thus, technically, oil sand should be called bituminous sand because the hydro-carbonaceous material is bitumen (soluble in carbon disulfide) and not oil. The termoil sand is used in reference to the synthetic crude oil that can be manufactured fromthe bitumen.
Oil sand is a mixture of sand, water, and bitumen, and the sand component ispredominantly quartz in the form of rounded or subangular particles, each of which(as far as is known for the Athabasca deposit) is wet with a film of water. Sur-rounding the wetted sand grains and somewhat filling the void among them is afilm of bitumen. The balance of the void volume is filled with connate water andsometimes, a small volume of gas. High-grade oil sand contains about 18% byweight of bitumen, which may be equivalent in consistency (viscosity) to an atmo-spheric or vacuum petroleum residuum.
The definition of bitumen has been very loosely and arbitrarily based on API gravityor viscosity; it is quite arbitrary and too general to be technologically accurate. Therehave been attempts to rationalize the definition based on viscosity, API gravity, anddensity, but they also suffer from a lack of technical accuracy. For example, 10° API isthe generally used line of demarcation between oil sand bitumen and heavy oil. Butone must ask if the difference between 9.9° API gravity oil and 10.1° API oil is reallysignificant. Both measurements are within the limits of difference for standard laboratorytest methods. Similarly, the use of viscosity data is also open to question because thedifference between oil having a viscosity of 9,950 cp and oil having a viscosity of10,050 cp is minimal and, again, both measurements are within the limits of differencefor standard laboratory test methods.
More appropriately, oil sand bitumen in oil sand deposits is a highly viscoushydrocarbonaceous material, and it is not recoverable in its natural state through awell by conventional oil well production methods, including currently used enhancedrecovery techniques, as specified in the U.S. government regulations. Thus, it is notsurprising that the properties of bitumen from oil sand deposits are significantlydifferent from those of conventional crude oil (recoverable by primary and secondarytechniques) and heavy oil (recoverable by enhanced oil recovery techniques).
Chemically, the material should perhaps be called bituminous sand rather thanoil sand because the organic matrix is bitumen, a hydrocarbonaceous material thatconsists of carbon and hydrogen, with smaller amounts of nitrogen, oxygen, sulfur,and metals (especially nickel and vanadium).
The bitumen in various oil sand deposits represents a potentially large supplyof energy. However, many of the reserves are available only with some difficulty,and optional refinery scenarios will be necessary for conversion of these materialsto liquid products because of the substantial differences in character between con-ventional petroleum, heavy oil, and oil sand bitumen (Table 7.1). On the other hand,because of the diversity of available information and the continuing attempts to
© 2007 by Taylor & Francis Group, LLC

Liquid Fuels from Oil Sand 199
delineate the various world oil sand deposits, it is virtually impossible to presentaccurate numbers that reflect the extent of the reserves in terms of the barrel unit.Indeed, investigations into the extent of many of the world’s deposits are continuingat such a rate that the numbers vary from one year to the next. Accordingly, the dataquoted here are approximate.
Current commercial recovery operations of bitumen in oil sand formationsinvolve use of a mining technique. This is followed by bitumen upgrading andrefining to produce a synthetic crude oil. Other methods for the recovery of bitumenfrom oil sand are based either on mining, combined with some further processingor operation on the oil sands in situ.
The API gravity of oil sand bitumen varies from 5° API to approximately 10°API, depending on the deposit; viscosity is very high, and volatility is low. Theviscosity of bitumen is high, being on the order of several thousand to one millioncentipoises, with higher viscosities being recorded. Bitumen volatility is low, andthere are very little of the naphtha and kerosene constituents present.
The lack of mobility of bitumen requires a mining step followed by the hot waterprocess that is, to date, the only successful commercial process to be applied to
TABLE 7.1The Properties of Bitumen and Conventional Crude Oil
Property BitumenConventional
Crude Oil
Gravity, °API 8 35Viscosity
Centipoise @ 100°F (38°C) 500,000 10Centipoise @ 210°F (99°C) 1,700SUS @ 100°F (38°C) 35,000 30SUS @ 210°F (99°C) 500
Pour point (°F) 50 0Elemental analysis (percentage by weight)
Carbon 83 86Hydrogen 10.6 13.5Sulphur 4.8 0.1Nitrogen 0.4 0.2Oxygen 1 0.2
Fractional composition (percentage by weight)Asphaltenes 19 5Resins 32 10Aromatics 30 25Saturates 19 60
Metals (parts per million)Vanadium 250 10Nickel 100 5
Carbon residue (percentage by weight) 14 5Heating value Btu/lb 17,500 19,500
© 2007 by Taylor & Francis Group, LLC

200 Handbook of Alternative Fuel Technology
bitumen recovery from mined oil sand. Many process options have been tested withvarying degrees of success, and one of these options may even supersede the hotwater process at some future date.
In addition, bitumen is relatively hydrogen deficient and therefore requires sub-stantial hydrogen addition during refining. Bitumen is currently commerciallyupgraded by a combination of carbon rejection (coking) and product hydrotreating.Coking, the process of choice for residua, is also the process of choice for bitumenconversion. Bitumen is currently converted commercially by delayed coking andfluid coking. In each case, the bitumen is converted to distillate oils, coke, and lightgases. The coker distillate is a partially upgraded material and is a suitable feed forhydrodesulfurization to produce a low-sulfur synthetic crude oil.
Over the next decades, the potential for the production of liquid fuels from oilsand is high, and the liquid fuels produced from these reserves offer a means ofalleviating shortfalls in the supply of liquid fuels.
The only commercial operations for the recovery and upgrading of bitumenoccur in northeast Alberta, Canada, near the town of Fort McMurray, where bitumenfrom the Athabasca deposit is converted to a synthetic crude oil. Therefore, most ofthe data available for inspection of bitumen and determination of behavior originatefrom studies of these Canadian deposits. The work on bitumen from other sourcesis fragmented and spasmodic. The exception is the bitumen from deposits in Utah,where ongoing programs have been in place at the University of Utah for more thanthree decades. The data for the bitumen show a very wide range of properties (Smith-Magowan et al., 1982).
7.2 OCCURRENCE AND RESERVES
The occurrence and reserves of oil sand bitumen that are available for production ofliquid fuels are known to an approximation, but the definitions by which these reservesare estimated need careful consideration. Best estimates are all that are available.
Thus, the world reserves of conventional petroleum (arbitrarily defined as havinga gravity equal to or greater than 20° API) are reported to be composed of approx-imately 1,195 billion barrels (1,195 × 109 bbl) or 30% by volume of the total reserves(of petroleum plus heavy oil plus bitumen). Heavy oil (arbitrarily defined as havinga gravity greater than 10° API but less than 20° API) is reported to be 690 billionbarrels (690 × 109 bbl) or 15% by volume of the total reserves. Oil sand bitumen(arbitrarily defined as having a gravity equal to or less than 10° API) is reported tobe 1,920 billion barrels (1,920 × 109 bbl) or 55% by volume of the total reserves.However, the bitumen reserves contain extra heavy oil, which term is sometimesused to describe bitumen. The API gravity of this material is less than 10° API, butthe viscosity may fall into a different range when compared to bitumen viscosity.And in such reserves estimations, there is often no mention of the method of recoveryon which the definition of oil sand bitumen hinges.
Therefore, estimations of bitumen availability must be placed in the correct defi-nitional context and, more particularly, in the context of the available recovery method.
Oil sand deposits are widely distributed throughout the world in a variety ofcountries, and the various deposits have been described as belonging to two types:
© 2007 by Taylor & Francis Group, LLC

Liquid Fuels from Oil Sand 201
(1) stratigraphic traps and (2) structural traps, although gradations between the typesof deposit invariably occur (Walters, 1974; Phizackerley and Scott, 1978; Meyer andDietzman, 1981). In terms of specific geological and geochemical aspects of theformation, the majority of the work has, again, been carried out on the Athabascadeposit. For this reason, the focus of this chapter is on the work carried out on theCanadian oil sand deposits.
Nationally, the largest oil sand deposits are in Alberta and Venezuela, withsmaller oil sand deposits occurring in the U.S. (mainly in Utah), Peru, Trinidad,Madagascar, the former Soviet Union, the Balkan states, and the Philippines. Oilsand deposits in northwestern China (Xinjiang Autonomous Region) are larger; atsome locations, the bitumen appears on the land surface around the town of Karamay.
In Canada, the Athabasca deposit along with the neighboring Wabasca, PeaceRiver, and Cold Lake deposits have been estimated to contain approximately 2 trillionbarrels (2 × 10¹² bbl) of bitumen. The Venezuelan deposits may at least contain 1trillion barrels (1.0 × 10¹² bbl) of bitumen. Deposits of oil sand, each containingapproximately 20 million barrels (20 × 106 bbl) of bitumen, have also been locatedin the U.S., Albania, Italy, Madagascar, Peru, Romania, Trinidad, Zaire, and theformer USSR. The oil sand deposits in the U.S. are contained in a variety of separatedeposits in various states (Marchant and Koch, 1984) but, as many of these depositsare small, information on most is limited.
The Californian deposits are concentrated in the coastal region west of the SanAndreas Fault. The largest deposit is the Edna deposit, which is located midwaybetween Los Angeles and San Francisco. The deposit occurs as a stratigraphic trap,extends over an area of about 7000 acres, and occurs from outcrop to 100-ft (30-m)depth. The Sisquoc deposit (Upper Pliocene) is the second largest in California, andthe total thickness of the deposit is about 185 ft (56 m), occurring over an area ofabout 175 acres with an overburden thickness between 15 and 70 ft (4.6 and 21 m).The third California deposit at Santa Cruz is located approximately 56 m (90 km)from San Francisco. The Kentucky oil sand deposits are located at Asphalt, Davis-Dismal Creek, and Kyrock. Oil sand deposits in New Mexico occur in the TriassicSanta Rosa sandstone. Finally, the oil sand deposits in Missouri occur over an areaestimated at 2000 mi2, and the individual bitumen-bearing sands are approximately50 ft (15 m) in thickness, except where they occur in channels that may actually beas much as 250 ft (76 m) thick.
Oil sand deposits in Venezuela occur in the Officina/Tremblador tar belt, whichis believed to contain bitumen-impregnated sands of a similar extent to those ofAlberta, Canada. The organic material is bitumen having an API gravity less than 10°.
The Bemolanga (Madagascar) deposit is the third largest oil sand deposit pres-ently known and extends over some 150 mi2 in western Madagascar with a recordedoverburden from 0 to 100 ft (0 to 30 m). The average pay zone thickness is 100 ft(30 m) with a total bitumen in-place quoted at approximately 2 billion barrels(approximately 2 × 10⁹ bbl).
The largest oil sand deposit in Europe is that at Selenizza, Albania. This regionalso contains the Patos oil field, throughout which there occurs extensive bitumenimpregnation.
© 2007 by Taylor & Francis Group, LLC

202 Handbook of Alternative Fuel Technology
The Trinidad Asphalt Lake (situated on the Gulf of Paria, 12 mi west-south-westof San Fernando and 138 ft [43 m] above sea level) occupies a depression in theMiocene sheet sandstone.
The Romanian deposits are located at Derna and occur (along with Tataros andother deposits) in a triangular section, east and northeast of Oradia between theSebos Koros and Berrettyo rivers.
Oil sands occur at Cheildag, Kobystan, and outcrop in the south flank of theCheildag anticline; there are approximately 24 million barrels (24 × 106 bbl) ofbitumen in place. Other deposits in the former USSR occur in the Olenek anticline(northeast of Siberia), and it has been claimed that the extent of bitumen impregnationin the Permian sandstone is on the same order of magnitude (in area and volume)as that of the Athabasca deposits. Oil sands have also been reported from sands atSubovka, and the Notanebi deposit (Miocene sandstone) is reputed to contain 20%bitumen by weight. On the other hand, the Kazakhstan occurrence, near the Shubar-Kuduk oil field, is a bituminous lake with a bitumen content that has been estimatedto be of the order of 95% by weight of the deposit.
Oil sand occurrences also exist in the southern Llanos of Colombia, Burgan inKuwait, and at the Inciarte and Bolivar coastal fields of the Maracaibo Basin, butvery little is known about the deposits. There are also small deposits in the LeyteIslands (Philippines), the Mefang Basin in Thailand, Chumpi, and near Lima (Peru).Oil sand deposits have also been recorded in Spain, Portugal, Cuba, Argentina,Thailand, and Senegal, but most are poorly defined and are considered to contain(in-place) less than 1 million barrels (1 × 10⁶ bbl) of bitumen.
The fact that commercialization has taken place in Canada does not mean thatcommercialization is imminent for other oil sand deposits. There are considerabledifferences between the Canadian deposits and the deposits in the U.S. and the restof the world that could preclude across-the-board application of the principles appliedto the Canadian oil sand deposits to the other oil sand deposits.
7.3 BITUMEN PROPERTIES
Bitumen can be assessed in terms of sulfur content, carbon residue, nitrogen content,and metals content. Properties such as the API gravity and viscosity also help therefinery operator to gain an understanding of the nature of the material that is to beprocessed. The products from high-sulfur feedstocks often require extensive treat-ment to remove (or change) the corrosive sulfur compounds. Nitrogen compoundsand the various metals that occur in crude oils will cause serious loss of catalystlife. The carbon residue presents an indication of the amount of thermal coke thatmay be formed to the detriment of the liquid products.
7.3.1 ELEMENTAL (ULTIMATE) COMPOSITION
The elemental analysis of oil sand bitumen has been widely reported and of the datathat are available, the proportions of the elements vary over fairly narrow limits(Speight, 1990, and references cited therein):
© 2007 by Taylor & Francis Group, LLC

Liquid Fuels from Oil Sand 203
Carbon, 83.4 ± 0.5%Hydrogen, 10.4 ± 0.2%Nitrogen, 0.4 ± 0.2%Oxygen, 1.0 ± 0.2%Sulfur, 5.0 ± 0.5%Metals (Ni and V), >1000 ppm
Bitumen from oil sand deposits in the U.S. has a similar ultimate compositionto the Athabasca bitumen. However, to note anything other than the hydrogen-to-carbon atomic ratio (which is an indicator of the relative amount of hydrogen neededfor upgrading), or the amount of nitrogen, is beyond the scope of general studies.
7.3.2 CHEMICAL COMPOSITION
The precise chemical composition of bitumen, despite the large volume of workperformed in this area, is largely speculative. In very general terms (and as observedfrom elemental analyses), heavy oil and bitumen are complex mixtures of (1) hydro-carbons, (2) nitrogen compounds, (3) oxygen compounds, (4) sulfur compounds,and (5) metallic constituents. However, this general definition is not adequate todescribe the composition of bitumen as it relates to conversion to liquid products.
It is therefore convenient to divide the hydrocarbon components of bitumen intothe following four classes:
1. Paraffins, which are saturated hydrocarbons with straight or branchedchains, but without any ring structure. The occurrence of such chemicalspecies in heavy oil and bitumen is rare.
2. Naphthenes, which are saturated hydrocarbons containing one or morerings, each of which may have one or more paraffinic side chains (morecorrectly known as alicyclic hydrocarbons).
3. Aromatics, which are hydrocarbons containing one or more aromaticnuclei, such as benzene, naphthalene, and phenanthrene ring systems,which may be linked up with (substituted) naphthene rings and paraffinicside chains.
4. Heteroatom compounds, which include organic compounds of nitrogen,oxygen, sulfur, and porphyrins (metallo-organic compounds). These areby far the major class of compound contained in bitumen and play a majorrole in conversion processes.
On a molecular basis, bitumen is a complex mixture of hydrocarbons withvarying amounts of organic compounds containing sulfur, oxygen, and nitrogen,as well as compounds containing metallic constituents, particularly vanadiumnickel, iron, and copper (Reynolds, 2000). Compared to the more conventionalcrude oils in which the hydrocarbon content may be as high as 97% by weight,bitumen (depending upon the source) may contain as little as 50% by weighthydrocarbons, with the remainder being compounds that contain nitrogen, oxygen,sulfur, and metals.
© 2007 by Taylor & Francis Group, LLC

204 Handbook of Alternative Fuel Technology
7.3.3 FRACTIONAL COMPOSITION
Fractional composition is an important property of bitumen, and bitumen can beseparated into a variety of fractions called saturates, aromatics, resins, and asphalt-enes (Speight, 1999, 2000, and references cited therein). Much of the focus has beenon the constituents of the asphaltene fraction because of its high sulfur content, highcoke-forming propensity, and the complexity of the cracking reactions (Chakma,2000; Yen, 2000).
Data that define the composition are extremely important to refining processes.The data give the refiner an indication of the potential behavior of the bitumen inrefinery processes and the potential yields of products that might be expected. Thedata also provide guidelines for the mining operation that is deigned to produce anaverage feedstock for further processing and so maintain a product balance.
7.3.4 THERMAL REACTIONS
The thermal reactions of bitumen have received considerable attention and providevaluable information about the potential chemical conversion that can be performed(Speight, 1970, 1978, and references cited therein).
Bitumen constituents can be thermally decomposed under conditions similar tothose employed for visbreaking (viscosity breaking; about 470°C [880°F]) to afford,on the one hand, light oils that contain higher paraffins and, on the other hand, coke:
Bitumen → H2, + CO, + CO2, + H2S, + SO2, + H2O,+ CH2=CH2, + CH4, + CH3 CH3,+ (CH3)3CH, + CH3(CH2)nCH3, etc.
The reaction paths are extremely complex; spectroscopic investigations indicatean overall dealkylation of the aromatics to methyl (predominantly) or ethyl (minority)groups. In fact, the thermal decomposition of heavy oil and bitumen constituentsaffords a light oil and a hydrocarbon gas composed of the lower paraffins. Coke isalso produced. The constituents of bitumen may also be hydrogenated to produceresins and oils at elevated temperatures (>250°C).
7.3.5 PHYSICAL PROPERTIES
The specific gravity of bitumen shows a fairly wide range of variation. The largestdegree of variation is usually due to local conditions that affect material lying closeto the faces, or exposures, occurring in surface oil sand deposits. There are alsovariations in the specific gravity of the bitumen found in beds that have not beenexposed to weathering or other external factors.
Bitumen gravity primarily affects the upgrading requirements needed becauseof the low hydrogen content of the produced bitumen. The API gravity of knownU.S. oil sand bitumen ranges downward from about 14° API (0.973 specific gravity)to approximately 2° API (1.093 specific gravity). Although only a vague relationshipexists between density (gravity) and viscosity, very-low-gravity bitumen generallyhas very high viscosity.
© 2007 by Taylor & Francis Group, LLC
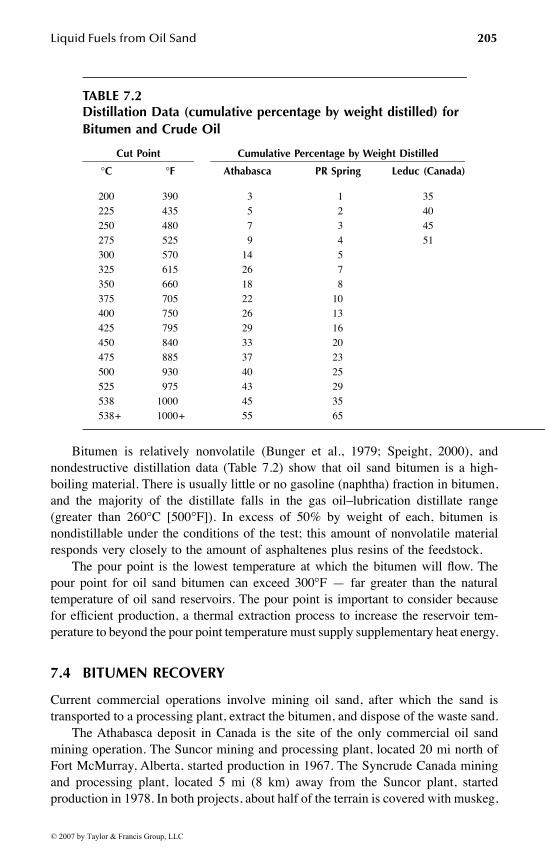
Liquid Fuels from Oil Sand 205
Bitumen is relatively nonvolatile (Bunger et al., 1979; Speight, 2000), andnondestructive distillation data (Table 7.2) show that oil sand bitumen is a high-boiling material. There is usually little or no gasoline (naphtha) fraction in bitumen,and the majority of the distillate falls in the gas oil–lubrication distillate range(greater than 260°C [500°F]). In excess of 50% by weight of each, bitumen isnondistillable under the conditions of the test; this amount of nonvolatile materialresponds very closely to the amount of asphaltenes plus resins of the feedstock.
The pour point is the lowest temperature at which the bitumen will flow. Thepour point for oil sand bitumen can exceed 300°F — far greater than the naturaltemperature of oil sand reservoirs. The pour point is important to consider becausefor efficient production, a thermal extraction process to increase the reservoir tem-perature to beyond the pour point temperature must supply supplementary heat energy.
7.4 BITUMEN RECOVERY
Current commercial operations involve mining oil sand, after which the sand istransported to a processing plant, extract the bitumen, and dispose of the waste sand.
The Athabasca deposit in Canada is the site of the only commercial oil sandmining operation. The Suncor mining and processing plant, located 20 mi north ofFort McMurray, Alberta, started production in 1967. The Syncrude Canada miningand processing plant, located 5 mi (8 km) away from the Suncor plant, startedproduction in 1978. In both projects, about half of the terrain is covered with muskeg,
TABLE 7.2Distillation Data (cumulative percentage by weight distilled) for Bitumen and Crude Oil
Cut Point Cumulative Percentage by Weight Distilled
°C °F Athabasca PR Spring Leduc (Canada)
200 390 3 1 35225 435 5 2 40250 480 7 3 45275 525 9 4 51300 570 14 5325 615 26 7350 660 18 8375 705 22 10400 750 26 13425 795 29 16450 840 33 20475 885 37 23500 930 40 25525 975 43 29538 1000 45 35538.+ 1000.+ 55 65
© 2007 by Taylor & Francis Group, LLC

206 Handbook of Alternative Fuel Technology
an organic soil resembling peat moss, which ranges from a few inches to 23 ft (7 m)in depth. The major part of the overburden, however, consists of Pleistocene glacialdrift and Clearwater Formation sand and shale. The total overburden varies from 23to 130 ft (7 to 40 m) in thickness. The underlying oil sand strata averages about 150ft (45 m), although typically 16 to 33 ft (5 to 10 m) must be discarded because ofa bitumen content below the economic cut-off grade designated by either plant andgenerally on the order of 5% by weight.
Both Suncor and Syncrude are individually projecting production targets of500,000 bbl/d of synthetic crude oil (mostly in the liquid fuel boiling range) withinthe next 5 to 10 years.
There are two approaches to open-pit mining of oil sand. The first uses a fewmining units of custom design, e.g., bucket-wheel excavators and large draglines inconjunction with belt conveyors. In the second approach, a multiplicity of smallermining units of conventional design is employed, e.g., scrapers and truck-and-shoveloperations have been considered. Each method has advantages and risks. BothSuncor and Syncrude Canada, Ltd., with Suncor converting to large-scale truck andshovel technology in 1993, originally adopted the first approach.
Underground mining options have also been proposed but for the moment havebeen largely discarded because of the fear of collapse of the formation onto anyoperators or equipment. This particular option should not, however, be rejected outof hand because a novel aspect or the requirements of the developer (which removethe accompanying dangers) may make such an option acceptable.
Once the oil sand is mined, there remains the issue of recovering the bitumen.This is accomplished by application of the hot water process. To date, the hot waterprocess is the only successful commercial process to be applied to bitumen recoveryfrom mined oil sand in North America. Many process options have been tested withvarying degrees of success, and one of these options may even supersede the hotwater process. The hot water process utilizes the linear and nonlinear variation ofbitumen density and water density, respectively, with temperature so that the bitumen,which is heavier than water at room temperature, becomes lighter than water atapproximately 80°C (180°F). Surface-active materials in the oil sand also contributeto the process.
The oil sands deposits in the U.S. and the rest of the world have receivedconsiderably less attention than the Canadian deposits. Nevertheless, approaches torecover the bitumen from the U.S. oil sands have been made. In the present context,an attempt has been made to develop the hot water process for the Utah sands(Hatfield and Oblad, 1982; Miller and Misra, 1982). The process differs significantlyfrom that used for the Canadian sands because of the oil-wet Utah sands, in contrastto the water-wet Canadian sands. This necessitates disengagement by hot waterdigestion in a high-shear force field under appropriate conditions of pulp densityand alkalinity. The dispersed bitumen droplets can also be recovered by aeration andfroth flotation.
The other above-ground method of separating bitumen from oil sands after themining operation involves direct heating of the oil sand without previous separationof the bitumen (Gishler, 1949). Thus, the bitumen is not recovered as such but is anupgraded overhead product. Although several processes have been proposed to
© 2007 by Taylor & Francis Group, LLC

Liquid Fuels from Oil Sand 207
accomplish this, the common theme is to heat the oil sand to separate the bitumenas a volatile product. At this time, however, it must be recognized that the volatilityof the bitumen is extremely low, and what actually separates from the sand is acracked product with the coke remaining on the sand.
The coke that is formed as a result of the thermal decomposition of the bitumenremains on the sand, which is then transferred to a vessel for coke removal by burningin air. The hot flue gases can be used either to heat incoming oil sand or as refinery fuel.
A later proposal suggested that the Lurgi process might have applicability tobitumen conversion (Rammler, 1970). A more modern approach has also beendeveloped, which also cracks the bitumen constituents on the sand (Taciuk, 1981).The processor consists of a large, horizontal, rotating vessel that is arranged in aseries of compartments. The two major compartments are a preheating zone and areaction zone. Product yields and quality are reported to be high.
7.5 LIQUID FUELS FROM OIL SAND
Liquid fuels are produced from oil sand bitumen in the form of synthetic crude oil(syncrude) that undergoes further refining at a conventional refinery to produce theliquid fuels.
Synthetic crude oil is a complex mixture of hydrocarbons, somewhat similar topetroleum but differing in composition from petroleum insofar as the constituentsof synthetic crude oil are not found in nature.
As a feedstock, the quality of oil sand bitumen is low compared to that ofconventional crude oil and heavy oil. The high carbon residue of bitumen dictatesthat considerable amounts of coke will be produced during thermal refining (Table7.3, Figure 7.3). Thus, production of liquid fuels from oil sand bitumen has includedoptions for coke use.
Technologies for the production of liquid fuels from bitumen can be broadlydivided into carbon rejection processes and hydrogen addition processes (Figure 7.1).
Carbon rejection processes redistribute hydrogen among the various components,resulting in fractions with increased hydrogen-to-carbon atomic ratios and fractionswith lower hydrogen-to-carbon atomic ratios. On the other hand, hydrogen addition
TABLE 7.3Predicted Coke Yields from Various Feedstocks
API Gravityof Feedstock
Carbon ResiduePercentage by Weight
Coke Yield
Delayed Coking
Fluid Coking
2 30 45 356 20 36 23
10 15 28 1716 10 18 1226 5 9 3
© 2007 by Taylor & Francis Group, LLC

208 Handbook of Alternative Fuel Technology
processes involve reaction heavy crude oils with an external source of hydrogen andresult in an overall increase in hydrogen-to-carbon ratio. Within these broad ranges,all upgrading technologies can be subdivided as follows:
1. Carbon rejection: for example, visbreaking, steam cracking, fluid catalyticcracking, and coking. Carbon rejection processes offer attractive methodsof conversion of bitumen because they enable low operating pressure,though involving high operating temperature, without requiring expensivecatalysts.
2. Hydrogen addition: Catalytic hydroconversion (hydrocracking), hydrovis-breaking, and donor solvent processes. Bitumen hydrotreating processes(with the attendant process parameters; Table 7.4) offer desulfurization tolow-sulfur feedstocks for other processes or hydrocracking to keroseneand gas oil.
3. Separation processes: Distillation and deasphalting. Solvent deasphaltingallows removal of sulfur and nitrogen compounds as well as metallicconstituents in the high-carbon asphalt and would be more appropriatefor use in combination with other processes.
Currently, the overall upgrading process by which bitumen is converted to liquidfuels is accomplished in two steps. The first step is the primary upgrading or primaryconversion process (Figure 7.2), which improves the hydrogen-to-carbon ratio byeither carbon removal or hydrogen addition, cracking bitumen to produce distillableproducts that are more easily processed downstream to liquid fuels.
The secondary upgrading process involves hydrogenation of the primary prod-ucts and is the means by which sulfur and nitrogen are removed from the primary
FIGURE 7.1 Production of liquid fuels from oil bitumen by carbon rejection processes andhydrogen addition processes.
Liquid Fuels
Coke plusLiquids
CokingBitumen
Hydrogenation/Hydrocracking
Distillates
Liquid Fuels
Extraction
© 2007 by Taylor & Francis Group, LLC

Liquid Fuels from Oil Sand 209
products. The upgraded or synthetic crude can then be refined to a variety of liquidfuels such as gasoline, diesel fuel, and jet fuel.
Bitumen is hydrogen deficient, and is upgraded by carbon removal (coking) orhydrogen addition (hydrocracking). There are two methods by which bitumen con-version can be achieved: (1) by direct heating of mined oil sand and (2) by thermaldecomposition of separated bitumen. The latter is the method used commercially,but the former deserves mention here because the potential for commercializationremains open.
Although this improvement in properties may not appear to be dramatic, itusually leads to major advantages for refinery operators. Any incremental increasein the units of hydrogen-to-carbon ratio can save amounts of costly hydrogen duringupgrading. The same principles are also operative for reductions in the nitrogen,sulfur, and oxygen contents. This latter occurrence also improves catalyst life and
TABLE 7.4Hydrotreating Processing Parameters
Parameter Naphtha Bitumen
Temperature (°C) 300–400 340–450Pressure (atm.) 35–70 50–200LHSV 4.0–10.0 0.2–1.0H2 recycle rate (scf/bbl) 400–1000 3000–5000Catalysts’ life (years) 3.0–10.0 0.5–1.0Sulfur removal (%) >95 <80Nitrogen removal (%) >95 <40
FIGURE 7.2 Bitumen conversion to liquid fuels by primary upgrading and secondaryprocesses.
© 2007 by Taylor & Francis Group, LLC

210 Handbook of Alternative Fuel Technology
activity as well as reducing the metals content. In short, in situ recovery processes(although less efficient in terms of bitumen recovery relative to mining operations)may have the added benefit of leaving some of the more obnoxious constituents(from the processing objective) in the ground.
The low proportion of volatile constituents (i.e., those constituents boiling below200°C [392°F]) in bitumen precludes refining by distillation, and it is recognizedthat refining by thermal means is necessary to produce liquid fuel streams. A numberof factors have influenced the development of facilities that are capable of convertingbitumen to a synthetic crude oil.
Visbreaking has been considered as one process for the primary upgrading step(Table 7.5). However, a visbreaking product is still high in sulfur and nitrogen, withsome degree of unsaturation. This latter property enhances gum formation with theaccompanying risk of pipeline fouling and similar disposition problems in storagefacilities and fuel oil burners. A high-sulfur content in finished products is environ-mentally unacceptable. In addition, high levels of nitrogen cause problems in thedownstream processes, such as in catalytic cracking, where nitrogen levels in excessof 3000 parts per million will cause rapid catalyst deactivation; metals (nickel andvanadium) cause similar problems.
The higher-boiling constituents (i.e., those boiling in the range 200 to 400°C[390 to 750°F]) can be isolated by distillation but, in general terms, more than 40%by weight of oil sand bitumen boils above 540°C (1000°F). Nevertheless, the lowproportion of volatile constituents (i.e., those constituents boiling below 200°C
TABLE 7.5Examples of Product Yields and Properties for Visbreaking Athabasca Bitumen and Similar API Feedstocks
ArabianLight
VacuumResiduum
ArabianLight
VacuumResiduum
IranianLight
VacuumResidue
AthabascaBitumen
FeedstockAPI gravity 7.1 6.9 8.2 8.6Carbon residuea 20.3 22.0 13.5Sulfur (wt%) 4.0 4.0 3.5 4.8
Product yieldsb (vol%)Naphtha (<425 °F, <220 °C) 6.0 8.1 4.8 7.0Light gas oil (425–645 °F, 220–340 °C) 16.0 10.5 13.1 21.0Heavy gas oil (645–1000 °F, 340–540 °C) 20.8 b 35.0Residuum 76.0 60.5 79.9 34.0
API gravity 3.5 0.8 5.5 Carbon residuea
Sulfur (wt%) 4.7 4.6 3.8
a Conradsonb A blank product yield line (or cell) indicates that the yield of the lower-boiling product has been includedin the yield of the higher-boiling product.
© 2007 by Taylor & Francis Group, LLC

Liquid Fuels from Oil Sand 211
[390°F]) in bitumen precludes complete refining by distillation although a vacuumdistillation unit has been included in the latest plant (Syncrude) operation. However,it is recognized that refining by thermal means (i.e., thermal cracking) is necessaryto produce liquid fuel streams. A number of factors have influenced the developmentof facilities that are capable of converting bitumen to a synthetic crude oil. Avisbreaking product would be a hydrocarbon liquid that was still high in sulfur andnitrogen with some degree of unsaturation.
Thus, a product of acceptable quality could be obtained by distillation to anappropriate cut point, but the majority of the bitumen would remain behind to berefined by whichever means would be appropriate, remembering, of course, the needto balance fuel requirements and coke production. It is, therefore, essential that anybitumen-upgrading program convert the nonvolatile residuum to a lower-boiling, low-viscosity, low-molecular-weight product that also has a high hydrogen-to-carbon ratio.
7.5.1 COKING PROCESSES
Coking processes are the primary upgrading processes by which bitumen conversionto distillable products is accomplished.
In the early stages of oil sand development, coking became the process of choicefor bitumen conversion, and bitumen is currently converted commercially by delayedcoking (Suncor) and by fluid coking (Syncrude). In each case, the charge is convertedto distillate oils, coke, and light gases. The coke fraction and product gases can beused for plant fuel. The coker distillate is a partially upgraded material in itself andis a suitable feed for hydrodesulfurization to produce a low-sulfur synthetic crude oil.
Delayed coking (Table 7.6) is a semibatch process in which feed bitumen isheated before being fed to coking drums that provide sufficient residence time forthe cracking reactions to occur.
The Suncor plant (in operation since 1967) involves a delayed coking techniquefollowed by hydrotreating of the distillates to produce synthetic crude oil that hasproperties which are substantially different from the original bitumen and which areclose to the properties of conventional petroleum (Table 7.7). The selection ofdelayed coking over less severe thermal processes, such as visbreaking, was based(at the time of planning, from 1960 to 1964) on the high yields of residuum producedin these alternate processes. The yields of coke from the residuum would haveexceeded the plant fuel requirements, especially if the distillate had to be shippedelsewhere for hydrogen treating as well as a more favorable product distribution andproperties. Alternate routes for the disposal of the excess coke would be needed.
In the Suncor operation, bitumen conversion to liquids is on the order of 75%by volume, with fluid coking giving a generally higher yield of liquids compared todelayed coking (Table 7.3, Figure 7.3). The remainder appears as coke (approxi-mately 15% by weight) and gases.
Fluid coking is a continuous process employing two vessels with fluid coke. Itprovides a better yield of overhead products than delayed coking. Feed oil flows tothe reactor vessel, where cracking and formation of coke occur; coke is combustedin the burner. Fluid transfer lines between these vessels provide the coke circulation
© 2007 by Taylor & Francis Group, LLC

212H
and
bo
ok o
f Altern
ative Fuel Tech
no
logy
TABLE 7.6Examples of Product Yields and Product Properties for Delayed Coking of Athabasca Bitumen and Similar API Feedstocks
KuwaitResiduum
West TexasResiduum
Tia JuanaResiduum
Alaska NSResiduum
Arabian LightResiduum
AthabascaBitumen
FeedstockAPI gravity 6.7 8.9 8.5 7.4 6.9 7.3 Carbon residuea 19.8 17.8 22.0 18.1 17.9 Sulfur (wt%) 5.2 3.0 2.9 2.0 4.0 5.3
Product yields (vol%)Naphtha (95–425°F, 35–220°C) 26.7 28.9 25.6 12.5 19.1 20.3 Light gas oil (425–645°F, 220–340°C) 28.0 16.5 26.4 b b b
Heavy gas oil (645–1000°F, 340–540°C) 18.4 26.4 13.8 51.2 48.4 58.8 Coke 30.2 28.4 33.0 27.2 32.8 21.0
Sulfur (wt%) 7.5 4.5 2.6 5.6 8.0
a Conradson.b A blank product line (or cell) indicates that the yield of the lower-boiling product has been included in the yield of the higher-boiling product.
© 2007 by Taylor & Francis Group, LLC

Liquid Fuels from Oil Sand 213
necessary for heat balance. The proportion of coke burned is just sufficient to satisfyheat losses and provide the heat for the cracking reactions.
In the fluid coking process, whole bitumen (or topped bitumen) is preheated andsprayed into the reactor, where it is thermally cracked in the fluidized coke bed attemperatures typically between 510 and 540°C (950 and 1000°F) to produce light
TABLE 7.7Properties of Synthetic Crude Oil from Athabasca Bitumen
Property BitumenSyntheticCrude Oil Crude Oil
Gravity, °API 8 32 35Sulfur (percentage by weight) 4.8 0.2 0.1Nitrogen (percentage by weight viscosity)
0.4 0.1 0.2
Centipoise @ 100°F 500,000 10 10Distillation profile (percentage by weight; cumulative)
°C °F
0 30 0 5 530 85 0 30 30
220 430 1 60 40345 650 17 90 70550 1020 45 100 90
Residuum 100 100
FIGURE 7.3 Comparison of coke produced by delayed coking and fluid coking processes.
API Gravity v. Coke Yield
0
5
10
15
20
25
30
35
40
45
50
0 5 10 15 20 25 30API gravity
Cok
e yi
eld,
%w
/w
Delayed CokingFluid coking
© 2007 by Taylor & Francis Group, LLC

214 Handbook of Alternative Fuel Technology
products and coke. The coke is deposited on the fluidized coke particles while thelight products pass overhead to a scrubbing section in which any high-boilingproducts are condensed and recombined with the reactor fresh feed. The uncondensedscrubber overhead passes into a fractionator, in which liquid products of suitableboiling ranges for downstream hydrotreating are withdrawn. Cracked reactor gasescontaining butanes and lower-molecular-weight hydrocarbon gases pass overhead toa gas recovery section. The propane material ultimately flows to the refinery gassystem, and the condensed butane and butenes may (subject to vapor pressurelimitations) be combined with the synthetic crude. The heat necessary to vaporizethe feed and to supply the heat of reaction is supplied by hot coke that is circulatedback to the reactor from the coke heater. Excess coke that has formed from the freshfeed and deposited on hot circulating coke in the fluidized reactor bed is withdrawn(after steam stripping) from the bottom of the reactor.
Sulfur is distributed throughout the boiling range of the delayed coker distillate,as with distillates from direct coking. Nitrogen is more heavily concentrated in thehigher-boiling fractions but is present in most of the distillate fractions. Raw cokernaphtha contains significant quantities of olefins and diolefins that must be saturatedby downstream hydrotreating. The gas oil has a high aromatic content typical ofcoker gas oils.
7.5.2 PRODUCT UPGRADING
The primary liquid product is then hydrotreated (secondary conversion or refining)to remove sulfur and nitrogen (as hydrogen sulphide and ammonia, respectively)and to hydrogenate the unsaturated sites exposed by the conversion process. It maybe necessary to employ separate hydrotreaters for light distillates and medium-to-heavy fractions; for example, the heavier fractions require higher hydrogen partialpressures and operating temperatures to achieve the desired degree of sulfur andnitrogen removal. Commercial applications have therefore been based on the separatetreatment of two or three distillate fractions at the appropriate severity to achievethe required product quality and process efficiency.
Hydrotreating is generally carried out in down-flow reactors containing a fixedbed of cobalt molybdate catalysts. The reactor effluents are stripped of the producedhydrogen sulfide and ammonia. Any light ends are sent to the fuel gas system, andthe liquid products are recombined to form synthetic crude oil.
Finishing and stabilization (hydrodesulfurization and saturation) of the liquidproducts is achieved by hydrotreating the liquid streams as two or three separatestreams. This is necessary because of the variation in conditions and catalystsnecessary for treatment of a naphtha fraction relative to the conditions necessary fortreatment of gas oil. It is more efficient to treat the liquid product streams separatelyand then to blend the finished liquids to a synthetic crude oil. To take advantage ofoptimum operating conditions for various distillate fractions, the Suncor coker dis-tillate is treated as three separate fractions: naphtha, kerosene, and gas oil. In theoperation used by Syncrude, the bitumen products are separated into two distinctfractions: naphtha and mixed gas oils. Each plant combines the hydrotreated fractionsto form synthetic crude oil, which is then shipped by pipeline to a refinery. The
© 2007 by Taylor & Francis Group, LLC

Liquid Fuels from Oil Sand 215
upgraded or synthetic crude oil has properties that are quite different from the originalfeedstock and are closer to the properties of a conventional high-API gravity crudeoil (Table 7.7), and the product can be sent by pipeline to a refinery for furtherupgrading.
7.5.3 OTHER PROCESSES
There are several other processes that have received some attention for bitumenupgrading. These processes include partial upgrading (a form of thermal deasphalt-ing), flexicoking, the Eureka process, and various hydrocracking processes.
Direct coking of tar sand with a fluid bed technique has also been tested (Gishler,1949). In this process, tar sand is fed to a coker or still, where the tar sand is heated toapproximately 480°C (approximately 895°F) by contact with a fluid bed of clean sandfrom which the coke has been removed by burning. Volatile portions of the bitumenare distilled. Residual portions are thermally cracked, resulting in the deposition of alayer of coke around each sand grain. Coked solids are withdrawn down a standpipe,fluidized with air, and transferred to a burner or regenerator (operating at approxi-mately 800°C, approximately 1470°F), where most of the coke is burned off thesand grains. The clean, hot sand is withdrawn through a standpipe. A portion (20 to40%) is rejected, and the remainder is recirculated to the coker to provide the heatfor the coking reaction. The products leave the coker as a vapor, which is condensedin a receiver. Reaction off-gases from the receiver are recirculated to fluidize theclean, hot sand that is returned to the coker.
An early process involved a coker for bitumen conversion and a burner to removecarbon from the sand. A later proposal suggested that the Lurgi process might beapplicable to bitumen conversion (Rammler, 1970). Another approach has also beendeveloped that also cracks the bitumen constituents on the sand. The processorconsists of a large, horizontal, rotating vessel that is arranged in a series of com-partments. The two major compartments are a preheating zone and a reaction zone(Taciuk, 1981).
Partial coking or thermal deasphalting process provides a minimal upgrading ofbitumen. In partial coking, the hot water process froth is distilled at atmosphericpressure, and minerals and water are removed. A dehydrated mineral-free bitumenproduct is obtained that contains most of the asphaltenes and coke precursors. Theprocess has been carried out in batch equipment in laboratory tests over periodsranging from 30 min to 4 h. Thermal cracking begins as the liquid temperature passes340°C (645°F). The distillation is continued into the range 370 to 450°C (700 to840°F). With slow heating (10°C [50°F] temperature rise per hour), the coke pro-duction rate is approximately 1% by weight of feed per hour. As the coke formsabout the entrained mineral particles, 1 to 4% by weight coke up to 50% by volumeof the feed is recovered as distillate. After this treatment, the residue may be filteredto yield an essentially ash-free production suitable for applications such as meta-llurgical coke or production of bituminous paints, for which the original mineralcontent would have disqualified it.
In flexicoking, a gasifier vessel is added to the system to gasify excess coke witha gas-air mixture to a low-heating-value gas that can be desulfurized and used as a
© 2007 by Taylor & Francis Group, LLC

216 Handbook of Alternative Fuel Technology
plant fuel. The Eureka process is a variant of delayed coking and uses steam strippingto enhance yield and produce a heavy pitch rather than coke by-product.
Another option includes the presence of steam as an agent to reduce cokeformation. For example, thermal cracking of Athabasca bitumen at various reactionconditions with and without the presence of steam showed that the presence of steamdecreased coke yield and decreased sulfur removal, and reduced the H/C ratio ofthe liquid products (Dutta et al., 2000).
Hydrocracking has also been proposed as a means of bitumen upgrading, i.e.,asphaltene conversion to liquid fuels (Solari, 2000). The overall liquid yield of directhydrogenation or hydrocracking of bitumen is substantially higher than that ofcoking, and significant amounts of sulfur and nitrogen are removed. Currently,however, large quantities of external fuel or hydrogen plant feedstock are required.
Most hydrocracking processes start with an upflow reactor system in which the524°C (975°F) material is cracked or converted. To prevent coking, the processesoperate at high pressure with direct contact between bitumen feed and circulatinghydrogen. Hydrocracking processes include, predominantly, the H-Oil process (Table7.8) and the LC-Fining process (Table 7.9). In fact, LC-Fining is now an onstreamprocess for bitumen conversion to liquid fuels.
TABLE 7.8H-Oil Process Feedstock and Product Data for Athabasca Bitumen and Low-API Feedstocks
ArabianMediumVacuum
Residuum
ArabianMediumVacuum
ResiduumAthabascaBitumen
FeedstockAPI gravity 4.9 4.9 8.3Sulfur (wt%) 5.4 5.4 4.9Nitrogen (wt%) 0.5Carbon residue (wt%)Metals (ppm) 128.0 128.0
NiV
Residuum (>525°C, >975°F) wt% 50.3% conversion 0.7 0.9Products (wt%)
Naphtha (C5–204°C, 400°F) 17.6 23.8 16.0Sulfur (wt%) 1.0
Distillate (204–343°C, 400–650°F) 22.1 36.5 43.0Sulfur (wt%) 2.0
Vacuum gas oil (343–534°C, 650–975°F) 34.0 37.1 26.4Sulfur (wt%) 3.5
Residuum (>534°C, >975°F) 33.2 9.5 16.0Sulfur (wt%) 5.7
© 2007 by Taylor & Francis Group, LLC
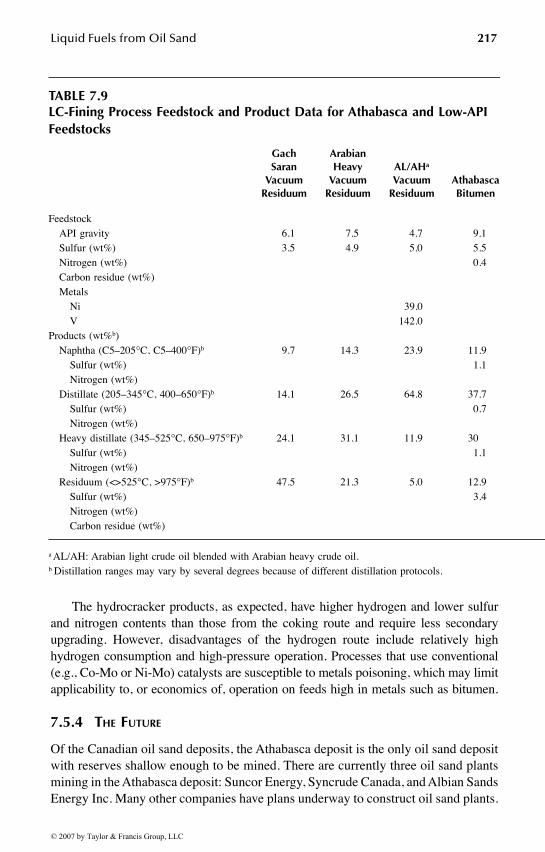
Liquid Fuels from Oil Sand 217
The hydrocracker products, as expected, have higher hydrogen and lower sulfurand nitrogen contents than those from the coking route and require less secondaryupgrading. However, disadvantages of the hydrogen route include relatively highhydrogen consumption and high-pressure operation. Processes that use conventional(e.g., Co-Mo or Ni-Mo) catalysts are susceptible to metals poisoning, which may limitapplicability to, or economics of, operation on feeds high in metals such as bitumen.
7.5.4 THE FUTURE
Of the Canadian oil sand deposits, the Athabasca deposit is the only oil sand depositwith reserves shallow enough to be mined. There are currently three oil sand plantsmining in the Athabasca deposit: Suncor Energy, Syncrude Canada, and Albian SandsEnergy Inc. Many other companies have plans underway to construct oil sand plants.
TABLE 7.9LC-Fining Process Feedstock and Product Data for Athabasca and Low-API Feedstocks
GachSaran
VacuumResiduum
ArabianHeavy
VacuumResiduum
AL/AHa
VacuumResiduum
AthabascaBitumen
FeedstockAPI gravity 6.1 7.5 4.7 9.1Sulfur (wt%) 3.5 4.9 5.0 5.5Nitrogen (wt%) 0.4Carbon residue (wt%)Metals
Ni 39.0V 142.0
Products (wt%b)Naphtha (C5–205°C, C5–400°F)b 9.7 14.3 23.9 11.9
Sulfur (wt%) 1.1Nitrogen (wt%)
Distillate (205–345°C, 400–650°F)b 14.1 26.5 64.8 37.7Sulfur (wt%) 0.7Nitrogen (wt%)
Heavy distillate (345–525°C, 650–975°F)b 24.1 31.1 11.9 30Sulfur (wt%) 1.1Nitrogen (wt%)
Residuum (<>525°C, >975°F)b 47.5 21.3 5.0 12.9Sulfur (wt%) 3.4Nitrogen (wt%)Carbon residue (wt%)
a AL/AH: Arabian light crude oil blended with Arabian heavy crude oil.b Distillation ranges may vary by several degrees because of different distillation protocols.
© 2007 by Taylor & Francis Group, LLC

218 Handbook of Alternative Fuel Technology
As of May 2003, there had been 23 billion dollars (Cdn $23 × 109) spent on oil sanddevelopment with another 30 billion dollars forecast over the next 10 years. If allof those projects carry through to completion, bitumen production should be2,000,000 bbl/d (a conservative estimate of 1,500,000 bbl of liquid fuels).
Because 90% of the Canadian oil sand deposits lie deep below the surface andcannot be recovered by open pit (surface) mining techniques, in situ processes arebeing developed to access the deeper deposits. One of the most promising in situtechniques is referred to as SAG-D (steam-assisted gravity drainage). This involvesinjecting steam though a series of wells into the deposit, after which the hot bitumenmigrates by draining to the production wells.
The future of upgrading bitumen lies in the development of new processes andthe evolution of refinery operations to meet the challenge of these heavy feedstocks.In fact, the essential step required of refineries is the upgrading of heavy oil andbitumen, particularly residua. In fact, the increasing supply of heavy crude oil is amatter of serious concern for the petroleum industry. To satisfy the changing patternof product demand, significant investments in refining conversion processes will benecessary to profitably utilize these heavy crude oils. The most efficient and econom-ical solution to this problem will depend to a large extent on individual country andcompany situations. However, the most promising technologies will likely involvethe conversion of vacuum bottom residual oils, asphalt from deasphalting processes,and superheavy crude oils into useful low-boiling and middle-distillate products.
New processes for bitumen conversion will probably be used in place of thecurrent visbreaking (or hydrovisbreaking) and coking processes, with some degreeof hydrocracking as a primary conversion step. Other processes may replace oraugment the deasphalting processes in many refineries. An exception, which maybecome the rule, is the upgrading of bitumen from oil sand deposits in Canada. Thebitumen is subjected to either delayed coking (Suncor) or fluid coking (Syncrude)as the primary upgrading step, without prior distillation or topping. After primaryupgrading, the product streams are hydrotreated and combined to form a syntheticcrude oil that is shipped to a conventional refinery for further processing. Conceiv-ably, other heavy oils and bitumen might be upgraded in the same manner and,depending on the upgrading facility, upgraded further for sales.
The limitations of processing these heavy oil and bitumen depend to a largeextent on the amount of higher-molecular-weight constituents (i.e., asphaltene con-stituents) that contain the majority of the heteroatom constituents. These constitu-ents are responsible for high yields of thermal and catalytic coke. The majority ofthe metal constituents in crude oils are associated with asphaltenes. Some of thesemetals form organometallic complexes. The rest are found in organic or inorganicsalts that are soluble in water or in crude. In recent years, attempts have been madeto isolate and to study the vanadium present in petroleum porphyrins, mainly inasphaltene fractions.
When catalytic processes are employed, complex molecules (such as those thatmay be found in the original asphaltene fraction) or those formed during the processare not sufficiently mobile (or are too strongly adsorbed by the catalyst) to besaturated by hydrogenation. The chemistry of the thermal reactions of some of theseconstituents dictates that certain reactions, once initiated, cannot be reversed, and
© 2007 by Taylor & Francis Group, LLC

Liquid Fuels from Oil Sand 219
they proceed to completion. Coke is the eventual product. These deposits deactivatethe catalyst sites and eventually interfere with the hydroprocess.
For future oil sand development, the government of the Province of Alberta,Canada, has announced a standard royalty formula for the oil sand industry, havingembraced the principles and, to a large degree put into the practice, the fiscalrecommendations of the National Task Force on Oil Sands Strategies. The CanadianGovernment plans to extend the mining tax regulation to include in situ operations.More than $3.4 billion ($3.4 × 10⁹) in new projects and expansions have been waitingfor the resolution of fiscal terms to allow the industry to move forward with a numberof projects that are in the initial stages of development. It is anticipated that such amove will encourage further development of the Canadian oil sand resources.
In another move to the future, Shell has constructed an upgrader at Scotford,near Fort Saskatchewan, Alberta. The upgrader uses hydrogenation technology toprocess bitumen into a wide range of premium-quality low-sulfur liquid fuels.Diluted bitumen is transported by pipeline to the upgrader.
There have been numerous forecasts of world production and demand for con-ventional crude, all covering varying periods of time. However, even after consid-ering the impact of the conservation ethic, the development of renewable resources,and the possibility of slower economic growth, nonconventional sources of liquidfuels could well be needed to make up for the future anticipated shortfalls inconventional supplies.
This certainly applies to North America, which has additional compelling reasonsto develop viable alternative fossil fuel technologies. Those reasons include, ofcourse, the security of supply and the need to quickly reduce the impact of energycosts on the balance of payments. There has been the hope that the developingtechnology in North America will eventually succeed in applying the new areas ofnuclear and solar energy to the energy demands of the population. However, theoptimism of the 1970s has been succeeded by the reality of the 1980s, and it is nowobvious that these energy sources will not be the answer to energy shortfalls for theremainder of the present century. Energy demands will most probably need to bemet by the production of more liquid fuels from fossil fuel sources.
In the U.S., oil sand economics is still very much a matter for conjecture. Theestimates that have been published for current and proposed Canadian operationsare, in a sense, not applicable to operations in the U.S. because different productiontechniques may be required.
There is very little doubt that unlocking energy from oil sand is a complex andexpensive proposition. With conventional production, the gamble is taken in thesearch, and the expenses can be high with no guarantee of a commercial find. Withoil sand deposits, the bitumen is known to be there, but getting it out has been theproblem and has required gambling on the massive use of untried technology. Thereis no real market for the bitumen extracted from the oil sand, and the oil sand itselfis too bulky to be shipped elsewhere with the prospect of any degree of economicreturn. It is therefore necessary that the extraction and upgrading plants be con-structed in the immediate vicinity of the mining operation.
To develop the present concept of liquid fuels from oil sands, it is necessary tocombine three operations, each of which contributes significantly to the cost of the
© 2007 by Taylor & Francis Group, LLC

220 Handbook of Alternative Fuel Technology
venture: (1) a mining operation capable of handling 2 million tons, or more, of oilsand per day, (2) an extraction process to release the bitumen from the sand, and(3) an upgrading plant to convert the bitumen oil to a synthetic crude oil.
For Suncor (formerly Great Canadian Oil Sands Ltd.), being the first of thepotential oil sand developers carried with it a variety of disadvantages. The technicalproblems were complex and numerous, with the result that Suncor (on stream: 1967)had accumulated a deficit of $67 million by the end of 1976, despite having reporteda $12 million profit for that year. Since that time, Suncor has reported steady profitsand has even realized the opportunity to expand operations to 60,000 bbl/day ofsynthetic crude oil. However, with hindsight it appears that such a situation mayhave some distinct advantages. The early start in oil sand processing gave Suncor arelatively low capital cost per daily barrel for a nonconventional synthetic crude oiloperation. Total capital costs were about $300 million that, at a production rate of50,000 bbl/d, places the capital cost at about $6000 per daily barrel.
It is perhaps worthy of mention here that a conventional refinery (150 to300 × 103 bbl/d) may have cost at that time $100 to 400 million and have an energybalance (i.e., energy output/energy input) in excess of 90%. An oil sand refinery ofthe Suncor-Syncrude type may have an energy balance of the order of 70 to 75%.
The second oil sand processing plant, erected by the Syncrude Canada Ltd.,faced much stiffer capital costs. In fact, it was the rapidly increasing capital coststhat nearly killed the Syncrude project. Originally estimated at less than $1 billion(i.e., $1 × 10⁹), capital needs began to escalate rapidly in early 1975. The cost wasmore than one of the four partners wanted to pay, and the number of participantsdropped to three. Because the company dropping out held one of the largest interests,the loss was keenly felt and for a while the project was in jeopardy. It was finallykept alive through the participation of the Canadian government and the governmentsof the provinces of Ontario and Alberta. The Canadian government took a 15%interest in the project, the Province of Alberta a 10% interest, and the Province ofOntario a 5% interest. The balance remained with three of the original participants:Imperial Oil Ltd., Gulf Oil Canada Ltd., and Canada-Cities Service Ltd. After thatinitial setback, progress became rapid, and the project (located a few miles north ofthe Suncor plant) was brought to completion (onstream: 1978). The latest estimateof the cost of the plant is in the neighborhood of $2.5 billion. At a design level of120,000–130,000 bbl/days, the capital cost is in excess of $20,000 per daily barrel.
For both the Suncor and Syncrude plants, the investment is broken down intofour broad areas: (1) mining (28 to 34%), (2) bitumen recovery (approximately12%), (3) bitumen upgrading (28 to 30%), and (4) offsites, including the powerplant (16 to 24%).
Obviously, there are many features to consider when development of oil sandresources for the production of liquid fuels is given consideration. It is more impor-tant to recognize that what are important features for one resource might be lessimportant in the development of a second resource. Recognition of this facet of oilsand development is a major benefit that will aid in the production of liquid fuelsin an economic and effective manner.
© 2007 by Taylor & Francis Group, LLC

Liquid Fuels from Oil Sand 221
REFERENCES
Berkowitz, N. and Speight, J.G., Fuel, 54: 138, 1975.Bunger, J.W., Thomas, K.P., and Dorrence, S.M., Fuel, 58: 183, 1979.Chakma, A., Kinetics and mechanisms of asphaltene cracking during petroleum recovery and
processing operations, in Asphaltenes and Asphalts 2. Developments in PetroleumScience, 40B, Yen, T.F. and Chilingarian, G.V., Eds., Elsevier, Amsterdam, TheNetherlands, 2000, chap. 6.
Dutta, R.P., McCaffrey, W.C., Gray, M.R., and Muehlenbachs, K., Energy Fuels, 14: 671, 2000.Gishler, P.E., Can. J. Res., 27: 104, 1949.Gray, M.R., Upgrading Petroleum Residues and Heavy Oils, Marcel Dekker, New York, 1994.Hatfield, K.E. and Oblad, A.G., Proceedings of the 2nd International Conference on Heavy
Crude and Tar Sands, Meyer, R.F., Wynn, J.C., and Olson, J.C., Eds., McGraw-Hill,New York, 1982, p. 1175.
Marchant, L.C. and Koch, C.A., Proceedings of the 3rd International Conference on theFuture of Heavy Crude and Tar Sands, Meyer, R.F., Wynn, J.C., and Olson, J.C.,Eds., McGraw-Hill, New York, 1984, p. 1029.
Meyer, R.F., Ed., Heavy Crude and Oil sands — Hydrocarbons for the 21st Century, Petróleosde Venezuela S.A., Caracas, Venezuela, 1991.
Meyer, R.F. and Dietzman, W.D., in The Future of Heavy Crude Oil and Tar Sands, Meyer,R.F. and Steele, C.T., Eds., McGraw-Hill, New York, 1981, p. 16.
Miller, J.C. and Misra, M., Fuel Process. Technol., 6: 27, 1982.Phizackerley, P.H. and Scott, L.O., in Bitumens, Asphalts, and Tar Sands, Chilingarian, G.V.
and Yen, T.F., Eds., Elsevier, Amsterdam, The Netherlands, 1978, p. 57.Rammler, R.W., Can. J. Chem. Eng., 48: 552, 1970.Reynolds, J.G., Understanding metals in fossil fuels: a perspective of contributions by Yen, T.F.,
in Asphaltenes and Asphalts 2. Developments in Petroleum Science, 40B, Yen, T.F. andChilingarian, G.V., Eds., Elsevier, Amsterdam, The Netherlands, 2000, chap. 3.
Smith-Magowan, D., Skauge, A., and Hepler, L.G., Can. J. Pet. Technol., 21(3): 28, 1982.Solari, R.B., Asphaltene hydroconversion, in Asphaltenes and Asphalts 2. Developments in
Petroleum Science, 40B, Yen, T.F. and Chilingarian, G.V., Eds., Elsevier, Amsterdam,The Netherlands, 2000, chap. 7.
Speight, J.G., Fuel, 49: 134, 1970.Speight, J.G., The thermal cracking of athabasca bitumen, in Bitumens, Asphalts and Tar
Sands: Developments in Petroleum Science, 7, Chilingarian, G.V. and Yen, T.F., Eds.,Elsevier, Amsterdam, The Netherlands, 1978, chap. 6.
Speight, J.G., in Fuel Science and Technology Handbook, Speight, J.G., Ed., Part II, MarcelDekker, New York, 1990, chap. 12–16.
Speight, J.G., The Chemistry and Technology of Coal, 2nd ed., Marcel Dekker, New York, 1994.Speight, J.G., The Chemistry and Technology of Petroleum, 3rd ed., Marcel Dekker, New
York, 1999.Speight, J.G., The Desulfurization of Heavy Oils and Residua, 2nd ed., Marcel Dekker, New
York, 2000.Taciuk, W., Energy Proc. Canada., 74(4): 27, 1981.Walters, E.J., in Oil Sands: Fuel of the Future, Hills, L.V., Ed., Canadian Society of Petroleum
Geologists, Calgary, Alberta, Canada, 1974, p. 240.Yen, T.F., The realms and definitions of asphaltenes, in Asphaltenes and Asphalts 2. Devel-
opments in Petroleum Science, 40B, Yen, T.F. and Chilingarian, G.V., Eds., Elsevier,Amsterdam, The Netherlands, 2000, chap. 3.
© 2007 by Taylor & Francis Group, LLC

223
8 Shale Oil from Oil Shale
Sunggyu Lee
CONTENTS
8.1 Oil Shale as a Synthetic Fuel (Synfuel) Source.......................................... 2258.2 Constraints in Commercial Production of Shale Oil .................................. 230
8.2.1 Technological Constraints................................................................ 2308.2.2 Economic and Financial Constraints ............................................... 2328.2.3 Environmental and Ecological Constraints ..................................... 233
8.2.3.1 Region of Oil Shale Field and Population....................... 2348.2.3.2 Water Availability ............................................................. 2348.2.3.3 Other Fossil Energy and Mineral Resources ................... 2348.2.3.4 Regional Ecology ............................................................. 2348.2.3.5 Fugitive Dust Emission and Particulate Matter
Control .............................................................................. 2348.2.3.6 Hazardous Air Pollutants (HAPs) .................................... 2358.2.3.7 Outdoor Recreation and Scenery ..................................... 2358.2.3.8 Groundwater Contamination ............................................ 235
8.3 Research and Development Needs in Oil Shale ......................................... 2358.3.1 Chemical Characterization............................................................... 2368.3.2 Correlation of Physical Properties................................................... 2368.3.3 Mechanisms of Retorting Reactions................................................ 2378.3.4 Heat and Mass Transfer Problems................................................... 2378.3.5 Catalytic Upgrading of Shale Oil Crudes ....................................... 2378.3.6 By-Product Minerals from U.S. Oil Shale ...................................... 2388.3.7 Characterization of Inorganic Matters in Oil Shale ........................ 238
8.4 Properties of Oil Shale and Shale Oil ......................................................... 2388.4.1 Physical and Transport Properties of Oil Shale .............................. 239
8.4.1.1 Fischer Assay.................................................................... 2398.4.1.2 Porosity ............................................................................. 2398.4.1.3 Permeability ...................................................................... 2408.4.1.4 Compressive Strength ....................................................... 2428.4.1.5 Thermal Properties ........................................................... 243
8.4.1.5.1 Thermal Conductivity..................................... 2448.4.1.5.2 Heat Capacity of Oil Shale ............................ 2488.4.1.5.3 Enthalpy and Heat of Retorting ..................... 2498.4.1.5.4 Density or Specific Gravity............................ 2508.4.1.5.5 Self-Ignition Temperature (SIT)..................... 250
© 2007 by Taylor & Francis Group, LLC

224 Handbook of Alternative Fuel Technology
8.4.2 Thermal Characteristics of Oil Shale and Its Minerals .................. 2538.4.2.1 Thermoanalytical Properties of Oil Shale........................ 2538.4.2.2 Thermochemical Properties of Oil Shale Minerals ......... 255
8.4.3 Electric Properties of Oil Shale....................................................... 2578.4.3.1 Electric Resistivity............................................................ 2578.4.3.2 Dielectric Constants.......................................................... 258
8.4.4 Molecular Characterization of Kerogen .......................................... 2608.4.4.1 Derivation of Stoichiometric Coefficient ......................... 2608.4.4.2 Relation between Fischer Assay and Mass Fraction
of Kerogen ........................................................................ 2628.4.4.3 Nitrogen Compounds in Shale Oil................................... 262
8.4.5 Boiling Range Distributions of Various Shale Oils ........................ 2638.4.5.1 Analytical Methods........................................................... 263
8.4.5.1.1 ASTM D2887 Procedure ............................... 2648.5 Oil Shale Extraction and Retorting Processes............................................. 265
8.5.1 Ex Situ Retorting Processes ............................................................. 2678.5.1.1 U.S. Bureau of Mines’ Gas Combustion Retort .............. 2688.5.1.2 The TOSCO II Oil Shale Process .................................... 269
8.5.1.2.1 Process Description ........................................ 2698.5.1.2.2 Process Yield of TOSCO................................ 2718.5.1.2.3 Gaseous and Crude Shale Oil Product
from TOSCO Process..................................... 2718.5.1.2.4 TOSCO Process Units.................................... 2728.5.1.2.5 Spent Shale Disposal...................................... 273
8.5.1.3 The Union Oil Retorting Process..................................... 2748.5.1.4 The Lurgi-Ruhrgas Process .............................................. 2768.5.1.5 Superior’s Multimineral Process ...................................... 2778.5.1.6 The Paraho Gas Combustion Process .............................. 2788.5.1.7 Petrosix Retorting Process................................................ 2808.5.1.8 Chevron Retort System..................................................... 2818.5.1.9 Moving Bed Retorting Process ........................................ 2828.5.1.10 The Carbon Dioxide Retorting Process ........................... 282
8.5.2 In Situ Retorting Processes.............................................................. 2828.5.2.1 Sinclair Oil and Gas Company Process ........................... 2858.5.2.2 Equity Oil Co. Process ..................................................... 2858.5.2.3 Occidental Petroleum Process .......................................... 2868.5.2.4 LETC Process (LERC Process) ....................................... 2878.5.2.5 Dow Chemical Co.’s Process ........................................... 2878.5.2.6 Talley Energy Systems Process........................................ 2888.5.2.7 Geokinetics Process.......................................................... 2898.5.2.8 Osborne’s In Situ Process................................................. 2898.5.2.9 Shell Oil’s Thermally Conductive In Situ
Conversion Process........................................................... 2908.5.2.10 True In Situ (TIS) and Modified In Situ (MIS)
Retorting ........................................................................... 291
© 2007 by Taylor & Francis Group, LLC

Shale Oil from Oil Shale 225
8.5.3 Shale Oil Refining and Upgrading .................................................. 2918.5.3.1 Thermal Cracking Process................................................ 2928.5.3.2 Moving Bed Hydroprocessing Reactor ............................ 2928.5.3.3 Fluidized Bed Hydroretort Process .................................. 2938.5.3.4 Hydrocracking Process ..................................................... 293
References.............................................................................................................. 294
8.1 OIL SHALE AS A SYNTHETIC FUEL (SYNFUEL) SOURCE
Interest in retorting oil from oil shale to produce a competitively priced synfuel hadintensified since the oil embargo of the 1970s. Commercial interest, once very highin the 1970s and 1980s, substantially declined in the 1990s owing to the stable andlow oil price. However, interest in oil shale as a clean liquid fuel source is beingrenewed in the 21st century, mainly triggered by the sky-rocketing petroleum pricesas well as the shortage of oil in the global market. However, it should be noted thatoil shales have been used as liquid and solid fuels in certain areas for a long time,and its research also has quite a long history.
Mixed with a variety of sediments over a lengthy geological time period, shaleforms a tough, dense rock ranging in color from light tan to black. Shales are oftencalled black shale or brown shale, depending on the color. Oil shales have also beengiven various names in different regions. For example, the Ute Indians, on observingthat some outcroppings burst into flames upon being hit by lightning, referred to itas the rock that burns.
Oil shales are widely distributed throughout the world, with known deposits inevery continent. In this regard, oil shale is quite different from petroleum, which ismore concentrated in certain regions of the world. Table 8.1 shows some publishedinformation regarding worldwide oil shale reserves.65 Depending on the data sourceand the year of reporting, the statistical values vary somewhat. Shales have beenused in the past as a source of liquid fuel throughout the world, including Scotland,Sweden, France, South Africa, Australia, the USSR, China, Brazil, and the U.S.However, the oil shale industry has experienced several fluctuations on account ofpolitical, socioeconomic, market, and environmental reasons.
It is believed (evidence is lacking though supporting) that oil shales have beenused directly as solid fuels in various regions, especially in areas with rich shalesreadily available near the earth’s surface. For instance, an oil shale deposit at Autun,France, was commercially exploited as early as 1839.62 As early as the 1850s, shaleoil was being promoted as a replacement for wood, which America depended on forits energy. Logically, the oil shale industry in the U.S. was an important part of theU.S. economy prior to the discovery of crude oil in 1859. As Colonel Drake drilledhis first oil well in Titusville, Pennsylvania, shale oil and its commercial productionwere gradually forgotten about and virtually disappeared with the availability of vastsupplies of inexpensive liquid fuel, i.e., petroleum. Similarly, Scotland had a viableshale industry from 1850 to 1864, when the low price of imported crude oil forcedit to cease operation. It is interesting to note that British Petroleum (BP) was
© 2007 by Taylor & Francis Group, LLC

226 Handbook of Alternative Fuel Technology
originally formed as a shale oil company. Likewise in Russia, oil shale from Estoniaonce supplied fuel gas for Leningrad.
In 1912, the president of the U.S., by executive order, established the Naval Petro-leum and Oil Shale Reserves. The Office of Fossil Energy of the U.S. Department ofEnergy has been overseeing U.S. strategic interests in oil shale since that time. U.S.interest in oil shale revived briefly in the 1920s as domestic reserves of crude oildeclined. But, subsequent discoveries of large quantities of oil deposits in Texas againkilled the hopes of an embryonic oil shale industry. Serious interest in oil shale com-mercialization and development revived once again in the 1970s and the 1980s, as theArab oil embargo affected world energy supply and, consequently, the world economy.
In 1974, Unocal developed their Union B retort process, and in 1976 planned fora commercial-scale plant at Parachute Creek to be built when investment would beeconomical. Many other companies, like Exxon, Shell, Dow Chemical, Sohio, TOSCOARCO, AMOCO, Paraho, and others, initiated their own versions of oil shale devel-opment. In 1981, Unocal began construction of their Long Ridge 50,000 bbl/d plantbased on their Union B retorting technology. AMOCO completed their in situ retortingdemonstration of 1,900 and 24,400 bbl of shale oil in 1980 and 1981, respectively. In1980, Exxon purchased ARCO’s Colony interest and in 1981 began Colony II con-struction, aiming at a production level of 47,000 bbl/d based on the TOSCO II process.In 1982, Exxon announced the closure of their Colony II project due to low demandand high cost. This event was known as Exxon Black Sunday. Meanwhile, Shellcontinued with their in situ experiments at Red Pinnacle until 1983. To make mattersworse, Congress abolished the Synthetic Liquid Fuels Program after 40 years of
TABLE 8.1Oil Shale Reserves of the World
IFP (1973) BP (1978) WEC (2002) USGS (2003) USDOE (2005)
U.S. 66 U.S. 63 U.S. 78 U.S. 70 U.S. 72Brazil 24 Brazil 23 Russia 7.4 Russia 15 Brazil 5.4USSR 3.4 USSR 3.3 Brazil 2.5 Zaire 3.3 Jordan 4.2Congo 3.0 Zaire 2.9 Jordan 1.0 Brazil 2.7 Morocco 3.5Canada 1.3 — — Australia 1.0 Italy 2.4 Australia 2.1Italy 1.1 — — Estonia 0.5 Morocco 1.8 China 1.5China 0.8 — — China 0.5 Jordan 1.1 Estonia 1.1Sweden 0.1 — — France 0.2 Australia 1.0 Israel 0.3Germany 0.1 — — — — Estonia 0.5 — —Burma 0.1 — — — — China 0.5 — —
— — — — — — Canada 0.5 — —— — — — — — France 0.2 — —
Note: Figures are percentages; IFP = Institut Français du PÈtrole, BP = British Petroleum, WEC = WorldEnergy Council, USGS = United States Geological Survey.
Source: From Laherrere, J., Review on Oil Shale Data, September 2005, www.oilcrisis.com/laherrere/OilShaleReview200509.pdf.
© 2007 by Taylor & Francis Group, LLC

Shale Oil from Oil Shale 227
operation and an investment of $8 billion. Paraho reorganized itself as New Parahoand began SOMAT asphalt production. In 1991, Occidental closed their C-b (RioBlanco County, Colorado) tract project without actual operation. Unocal operated theirlast large-scale experimental mining and retorting facility in western U.S. from 1980until the shutdown of its Long Ridge (San Miguel County, Colorado) project in 1991.Unocal produced a total of 4.5 million barrels of shale oil from oil shale with anaverage of about 34 gal of shale oil per ton of rock over the life of the project.62 AfterUnocal’s shutdown in 1992, there has been no oil shale production in the U.S. In the1980s and 1990s, the stable crude oil price once again served as the principal reasonfor the diminishing interest in oil shale. Shell continued with some efforts in oil shale,particularly in the area of in situ heating technology at their property in Mahogany,Colorado. A notable experiment on in situ heating was done in 1997. Although oilshale activities in the U.S. have all but halted, some significant efforts continued inother countries such as Estonia, Australia, and Brazil.
There is again a sign of renewed interest in oil shale in the 21st century, asunstable and high energy prices, including those for natural gas and petroleumproducts, were experienced in most developed regions of the world at the onset ofthe new century. Examples of energy-related crises are: (1) California blackouts in2001, (2) gasoline price surges in various regions of the U.S. in 2000 and 2001, (3)very high gasoline price owing to short supply of crude oil in 2004, (4) very highcrude oil price in 2005 and 2006, and (5) sharp increases in residential energy costsin 2000, 2001, 2005 and 2006. However, it remains to be seen if the desire for energyself-sufficiency or independence will again swing the balance in favor of develop-ment of western U.S. oil shales.
At present, oil shale is commercially exploited in several countries, such asBrazil, China, Estonia, and Australia. Brazil has a long history of oil shale develop-ment and exploitation since the late 19th century. In 1935, shale oil was producedat a small plant in São Mateus do Sul in the state of Paraná.63 A more seriousdevelopmental effort was imitated by Petrobras, which developed the Petrosix pro-cess for oil shale retorting. The Semiworks retort was developed in 1972 and operatedon a limited commercial scale, and then a larger Industrial Module Retort wasbrought into service for commercial production in December 1991. The total annualproduction of shale oil in Brazil was 195,200 tons in 1999.63
In China, the total annual production of shale oil in Fushun, Liaoning province,amounted to 80,000 tons in 2001.61 They used 80 new retorts, which are known asFushun retorts. Fushun used to produce as much as 780,000 tons of shale oil a yearusing the earlier retorts, and the production was peaked in 1959.61 Another majordevelopmental effort is also being planned at Jilin province by China Power Invest-ment Corp (CPIC), one of the country’s major power producers. The estimated oilshale deposit in Jilin province is 17 billion tons, which is about 56% of the totaldeposits in China. Some reports61 claim that China has the fourth largest oil shaledeposits in the world after the U.S., Brazil, and Russia.
Estonia also has a long history of oil shale development and commercial exploi-tation. Its deposits are situated in the west of the Baltic Oil Shale Basin, and theiroil shale is of high quality. Permanent mining of oil shale began in 1918 and continuesto date.63 The oil shale output in Estonia peaked at 31.35 million tons in 1980. In
© 2007 by Taylor & Francis Group, LLC

228 Handbook of Alternative Fuel Technology
1999, output was 10.7 million metric tons, out of which 1.3 million tons were retortedto produce 151,000 tons of shale oil.63
In the U.S., the Energy Security Act, S.932, was legislated under the Carteradministration on June 30, 1980. This legislation was intended to help create 70,000jobs a year to design, build, operate, and supply resources for synfuel plants and forproduction of biomass fuels. The act established the Synthetic Fuels Corporation.New directions under President Reagan along with relatively stable oil prices madethe synfuel industry less attractive to the public. Under President Bush’s administra-tion, production and development of synfuels became strategically less important thanclean coal technology (CCT) and acid rain control. Under the Clinton administration,when energy prices were very stable and low, this de-emphasizing trend furtherintensified in favor of national budget deficit reduction, which received public supportand was based on projected long-term stability in energy supply and cost. Environ-mental protection received strong governmental and public support. In the 21st cen-tury, under President Bush, because of record-high energy prices and frequentlyexperienced shortages, a renewed interest in energy self-sufficiency and developmentof commercial oil fields has been revived, but at the expense of some potentialenvironmental disturbances. In 2004, the Office of Naval Petroleum and Oil ShaleReserves of the U.S. Department of Energy initiated a study on the significance ofAmerica’s oil shale resources. The U.S. government also launched a new oil shaleprogram with the Oil Shale Development Act of 2005 to establish a leasing programin 2006. Likewise, interest in alternative energy also intensified worldwide.
Oil and gas, i.e., fluids from fossil fuels, accounted for one third of the totalenergy consumed in U.S. by the late 1920s. By the mid-1940s, oil and gas began toprovide half of U.S. energy needs. They account for three fourths of U.S. energyneeds today. The strong demand for oil and gas is likely to persist for a while, eventhough bioenergy and hydrogen fuels are rapidly gaining popularity, and are generallyperceived as the principal energy sources for the future. Consequently, modernsociety's unprecedented appetite for fluid-type energy sources — without any newdiscoveries of major petroleum deposits in sight — will make it necessary to sup-plement supplies of domestic energy with synfuels such as those derived from oilshale or coal, as well as alternative fuel sources such as biomass, crops (e.g., soyand corn), and recycled materials. Hydrogen and ethanol will undoubtedly play veryimportant roles as new gaseous and liquid fuels in the future energy market.
Market forces based on supply and demand will greatly affect the commercialdevelopment of oil shale. Besides competing with conventional crude oil and naturalgas, shale oil will have to compete with coal-derived fuels for a similar market.1
Liquid fuels derived from coal are methanol, additional products of indirect lique-faction, Fischer–Tropsch hydrocarbons, or oxygenates. Table 8.2 shows synfuelproducts and their corresponding market characteristics.
Table 8.3 summarizes various countries involved in major types of synfueldevelopment.
Depending on the relative level of success in synfuel or alternative energy devel-opment, the energy consumption patterns in the 21st century may be significantlyaffected. More emphasis will be undoubtedly placed on clean and renewable energydevelopment, as well as environmentally clean utilization of conventional fuel.
© 2007 by Taylor & Francis Group, LLC

Shale O
il from
Oil Sh
ale229
TABLE 8.2Synfuel Products and Markets
Product Technology Status Market Commercialization
Shale oil Pilot plants up to 2000 tons/d Mid-distillates (jet fuel; diesel fuel) Regionally operatedTar sands Small; medium-scale plants Synthetic crudes (transportation fuels) In commercial production; production
increases sharplyCoal liquids Direct liquefaction in pilot plants
(250 tons/d)Light and mid-distillates; petrochemical feedstocks
Small-scale; specific application oriented; large-scale plants planned
Coal hydrocarbons Indirect liquefaction of coal via Fischer– Tropsch synthesis; technology proved on large scales by SASOL
Petrochemical feedstocks In commercial production
Methanol from natural gas Low-pressure methanol synthesis technology actively used worldwide
Chemical and petrochemical feedstocks;gas turbine; MTBE/ETBE/TAME production; dimethylether production;fuel gasoline market; off-peak energy generation and storage
Very active and in large capacities; commercially used since the 1920s;in commercial production
Methanol from coal Coal gasification proved in large-scale plants; liquid-phase methanol (LPMeOH) process proved for coal-derived syngas; single-stage synthesis process of dimethyether (DME) from coal-derived syngas developed
Chemical and petrochemical feedstock; dimethylether (DME) synthesis; once-through methanol (OTM); IGCC application
Large-scale plant commercialized in mid-1990s; large-scale plants are being planned
© 2007 by Taylor & Francis Group, LLC

230 Handbook of Alternative Fuel Technology
8.2 CONSTRAINTS IN COMMERCIAL PRODUCTION OF SHALE OIL
During commercial exploitation of shale oils, one can be faced with various constraintsthat represent possible deterring factors. These constraints originate from a variety ofsources: technological, economical (or financial), institutional, environmental, socio-economical, political, and water availability. The Office of Technology Assessment(OTA) analyzed the requirements for achieving each of the production goals by 1990,given the state of knowledge and the regulatory structure of the early 1980s.2 Table 8.4shows the factors that could hinder attainment of the goals, as assessed by OTA. In thistable, their original target year of 1990 has been used without any alteration. Takinginto consideration the fact that no serious commercialization activity was realized inthe 1990s for a variety of reasons, the readers should use their own discretion ininterpreting the given information. The constraints judged to be “moderate” will hamper,but not necessarily preclude, development; those judged to be “critical” could becomemore serious barriers; and when it was unclear whether or to what extent certain factorswould impede development, they were called “possible” constraints. Even though theinformation contained in this table may be currently outdated, it is still relatively accurateand applicable to the present situation, considering the relative inactivity in this fieldduring the last decade of the 20th century. Due to the high and fluctuating prices ofenergy, especially those of liquid fuels, in the 21st century, there is rekindled interestin our commercialization of oil shale processes throughout the world.
8.2.1 TECHNOLOGICAL CONSTRAINTS
Oil shale can be retorted by either aboveground (ex situ) or underground (in situ)processing. In aboveground processing, shale is mined, transported to a processing
TABLE 8.3Synfuel Developmental Efforts in Various Countries
Nation Coal Oil Shale Tar Sand Biomass
Australia
Brazil
Canada
China
Europe
Israel
Japan
Korea
Russia
South Africa
U.S.A.
Note: A prediction of production and development cannot be made, becauseof the high uncertainty in this field. More effort in synfuel production fromagricultural sources (e.g., crops) are expected in various regions of the world.
© 2007 by Taylor & Francis Group, LLC

Shale Oil from Oil Shale 231
facility, and then heated in retorting vessels. Underground retorting processes canbe classified into two large categories: (1) In true in situ (TIS) processing, an oilshale deposit is first fractured by explosives and then retorted underground, and (2)A modified in situ (MIS) processing is a more advanced in situ technology in whicha portion of the deposit is mined and the rest rubblized by explosives and retortedunderground. The crude shale oil can be burned as a boiler fuel, or it can be furtherconverted into syncrude by adding hydrogen.
Critical issues that need to be answered include:
1. What are the advantages and disadvantages of different mining and pro-cessing methods?
2. Are the technologies ready for large-scale commercial applications?3. What are the major areas of uncertainty in these technologies?4. Are the technologies for process optimization available?5. Are there sufficient scale-up data obtained from pilot and demonstration-
scale plant operation?6. What is the possibility of further technological breakthroughs in the process?7. Are there sufficient data regarding the physical, chemical, and geological
properties of oil shale and shale oil?
TABLE 8.4Constraints to Implementing Shale Oil Production Targets (as of 1981)
Potential Deterring Factors
Severity of Impediment to 1990 Production Target (bbl/d)
100,000 200,000 400,000 1,000,000
TechnologicalReadiness None None None CriticalEconomicAvailability of private capital None None None ModerateMarketability of shale oil Possible Possible Possible PossibleInvestor participation None Possible Possible PossibleInstitutionalAvailability of land None None Possible CriticalPermitting procedures None None Possible CriticalMajor pipeline capacity None None None CriticalDesign and construction services None None Moderate CriticalEquipment availability None None Moderate CriticalEnvironmentalCompliance with regulations None None Possible CriticalWater availabilityAvailability of surplus surface water None None None PossibleAdequacy of existing supply systems None None Critical CriticalSocioeconomicAdequacy of community facilitiesand services
None Moderate Moderate Critical
Source: From Office of Technology Assessment.
© 2007 by Taylor & Francis Group, LLC

232 Handbook of Alternative Fuel Technology
8.2.2 ECONOMIC AND FINANCIAL CONSTRAINTS
Even though an oil shale plant having a significant capacity is quite costly to build,the product oil will have to be competitive for the current and future energy pricestructure. World petroleum prices have been fluctuating for the past four decades,and the crude oil price has been sharply rising in the early part of the 21st century.However, long-term profitability of the industry could be impacted by future pricingstrategies of competing fuels. This concern elevates the risk level of an oil shaleindustry. Considering the shortage of clean liquid fuel sources in the world energymarket and the general trend of increasing prices, marketability of oil shale isimproving, with good future prospects. This may be especially true in countries thatdo not produce sufficient petroleum but possess vast deposits of oil shale. In thisregard, there are three issues possible: First, the involvement of the government canimprove the economic scenario by providing the industry with incentives and creditsin a variety of forms and tying the industry to the economic development of a region;second, specialization of products and diversification of by-products can contributeto the profitability of the industry; and third, securing captive use of shale oil instrategically developed energy-intensive industries also can contribute to the stabilityof the industry.
Even though a generalized cost breakdown of shale oil production is very difficultto make, a typical cost distribution for an oil shale project may be estimated as shownin Table 8.5. It can be seen from the table that the mining cost takes up a good shareof the total operating cost. The cost to obtain shale oil crude, which includes the miningand retorting cost, is approximately 70% of the total operating cost. Energy efficienciesof most oil shale processes range from 58 to 63%, which can be further improved byutilizing efficient motors, adopting creative energy integration schemes, and exploitingwaste energy. Table 8.6 shows some comparative information regarding the energyefficiencies of various synfuel processes. It should be noted that the efficiencies arevery difficult to compare on a fair basis because efficiencies reported for the sameprocess can be quite different from one another, depending on who reports it, how itis measured, on what basis it is calculated, etc. Improving energy efficiency withoutincreasing the capital and operational cost is, therefore, a very important task that hasto be undertaken by the process development team.
TABLE 8.5Typical Cost Distribution for an Oil Shale Project
Cost Factor Construction (%) Operation (%)
Mining (shale crushing and spent shale disposal) 16 43Retorting 37 28Upgrading 22 29Utilities and off-sites 25 —Total 100 100
Source: From Taylor, R.B. Chemical Engineering, September 7, 1981.
© 2007 by Taylor & Francis Group, LLC

Shale Oil from Oil Shale 233
Issues related to the economics of oil shale processing are:
1. What are the economic and energy-supply benefits of oil shale development?2. What are the environmental and ecological impacts of oil shale development?3. What are the economic impacts of establishing an oil shale industry?4. How many shale oil products can be used in the local region?5. Is there enough capacity for pipeline transportation of shale oil?6. Is there an upgrading facility operating in the vicinity, or is a separate
upgrading facility going to be built as part of the project?7. How much will an oil shale facility cost?8. For how many years can the facility be operated in the original location?9. What is the return on investment, especially for the long term?
10. At what level of petroleum crude price is shale oil competitive?11. When the petroleum crude price goes up, what is the impact on the
production cost of shale crude oil? Is it going to be more competitive? Isthere any threshold value for the petroleum crude price for shale oil to bea strong competitor?
12. Overall, is oil shale economically competitive without any tax credits andincentives and at what level?
8.2.3 ENVIRONMENTAL AND ECOLOGICAL CONSTRAINTS
The oil shale deposits found in the Green River Formation in the states of Colorado,Wyoming, and Utah are the largest in terms of size of deposit and most studiedin the U.S. The oil contained in these deposits is estimated at about l800 billionbarrels of recoverable shale oil. Owing to the vast resources and high oil contentof shales, this region has long been the most attractive to oil shale industries.However, the technology used in mining and processing oil shale has arousedenvironmental and ecological concerns. The Devonian-Mississippian eastern blackshale deposits are widely distributed between the Appalachian and Rocky Moun-tains. Even though these oil shales also represent a vast resource of fossil fuel,they are generally lower in grade (oil content per unit mass of shale rock) thanGreen River Formation oil shales.9
TABLE 8.6Energy Efficiencies of Various Synfuel Processes
Process Efficiency (%)
Lurgi pressure gasification 70Lurgi pressure gasification followed by shift methanation 63Shale oil processes 58–63Combined cycle 57Fischer–Tropsch synthesis 40Low-pressure methanol synthesis 49Methanol synthesis followed by methanol-to-gasoline (MTG) 45
© 2007 by Taylor & Francis Group, LLC

234 Handbook of Alternative Fuel Technology
Several factors affecting the environmental constraints in commercially exploit-ing Green River Formation oil shale are discussed hereafter. This analysis is providedas an example and may also serve as a guideline for other similar projects. Therefore,similar analyses can be conducted for other oil shale deposits worldwide.
8.2.3.1 Region of Oil Shale Field and Population
The Upper Colorado region, which is the upper half of the Colorado River Basin,is traditionally “western rural” and consists of sparsely vegetated plains. The pop-ulation density is also low, approximately three persons per square mile. The regionis therefore less sensitive to disturbances on land, changes in traffic patterns, andconstruction and operation noises.
8.2.3.2 Water Availability
A rate-limiting factor in further development of the area is the availability of water,which may not be a problem in other regions. Water of the Colorado River couldbe made available for depletion by oil shale. An important factor that must be takeninto consideration in any water use plan is the potential salt loading of the ColoradoRiver. With oil shale development near the river, the average annual salinity isanticipated to increase, unless some preventive measures or treatment methods areimplemented. The ecological damages associated with these higher salinity levelscould be significant, and have been the subject of extensive ecological studies.
8.2.3.3 Other Fossil Energy and Mineral Resources
The Green River Formation oil shale area has extensive fossil fuel resources otherthan oil shale. Natural gas recoverable from this area is estimated at 85 trillion ft3,crude oil reserves are estimated at 600 million barrels, and coal deposits at 6–8billion tons. These nonshale energy resources are not trivial, and they can also bedeveloped together with oil shale. Furthermore, 27 billion tons of alumina and 30billion tons of nahcolite are present in the central Piceance Creek Basin. Theseminerals may be mined in conjunction with oil shale. Such an effort can potentiallyenhance the profitability of the combined venture.
8.2.3.4 Regional Ecology
Ecologically, the tristate region is very valuable. Owing to the sparse populationdensity, the region has retained its natural character, of which the community isproud. Fauna include antelopes, bighorn sheep, mule deer, elks, black bears, moose,and mountain lions. However, there is little fishery habitat in the oil shale areas,even though the Upper Colorado region includes 36,000 acres in natural lakes.
8.2.3.5 Fugitive Dust Emission and Particulate Matter Control
Operations such as crushing, sizing, transfer conveying, vehicular traffic, and winderosion are typical sources of fugitive dust. Control of airborne particulate matters
© 2007 by Taylor & Francis Group, LLC
Shale Oil from Oil Shale 235
(PM) could pose a challenge. Compliance with regulations regarding particulatematter control must be factored in.
8.2.3.6 Hazardous Air Pollutants (HAPs)
Gaseous emissions such as H2S, NH3, CO, SO2, NOx, and trace metals are sourcesof air pollution. Such emissions are at least conceivable in oil-shale-processingoperations. However, the level of severity is far less than that of other types of fossilfuel processing. The same argument can be made for the emission of carbon dioxide,which is a major greenhouse gas.
8.2.3.7 Outdoor Recreation and Scenery
Outdoor recreation in the tristate oil shale region has always been considered of highquality, because of the vastness of the essentially pristine natural environment andthe scenic and ecological richness of the area. Maintaining the beauty of the areaand preserving the high-quality natural resources must be taken into serious consid-eration, when oil shale in the region is commercially exploited. Such considerationsgenerally hold true for other oil shale regions in the world.
8.2.3.8 Groundwater Contamination
Control of groundwater contamination is an important and nontrivial task. It isgenerally true for all types of oil shale operations including ex situ retorting, in situpyrolysis, spent shale disposal and reburial, and upgrading. Without appropriatepreventive measures, the groundwater could be contaminated by heavy metals,inorganic salts, organics such as polycyclic aromatic hydrocarbons (PAHs), etc. Bothprevention and treatment must be fully investigated.
8.3 RESEARCH AND DEVELOPMENT NEEDSIN OIL SHALE
The synthetic crude reserves in oil shale, in terms of their crude oil productionpotential, are sufficient to meet U.S. consumption for several centuries at the currentrate of liquid fuel utilization. Raw shale oil is the crude oil product of the retortingprocess and is highly paraffinic, i.e., containing mostly straight-chained hydrocar-bons. However, it also contains fairly high levels of sulfur, nitrogen, and oxygen, aswell as olefins; and it requires substantial upgrading before it can be substituted forrefinery feed. Sulfur removal down to a few parts per million (ppm) is necessary toprotect multimetallic reforming catalysts. Removing nitrogen from condensed het-erocyclics, which also poisons cracking catalysts, requires an efficient technologythat uses less hydrogen. The technologies developed for petroleum crude upgradingcan be adopted for oil shale upgrading with relatively minor or no modifications.
This problem stresses the need for understanding the properties of oil shale andshale oil on a molecular level. Research needs can be broadly classified into six generalcategories: (1) chemical characterization of the organic and inorganic constituents,
© 2007 by Taylor & Francis Group, LLC

236 Handbook of Alternative Fuel Technology
(2) correlations of physical properties, (3) enhanced recovery processes of synfuels,(4) refining of crude shale oil, (5) process design with efficient energy integrationschemes, and (6) environmental and toxicological problems.
8.3.1 CHEMICAL CHARACTERIZATION
Improved analytical techniques must be developed to obtain the information neededto better understand oil shale chemistry, as well as to develop new technologies forutilizing shale. Most analytical methods developed and used for petroleum analyticalchemistry have a long history of successful application, but their validity to the shaleapplication is often questionable. Basic questions that need to be answered include:
1. In what forms do the organic heteroatoms exist?2. How are they bonded into the basic carbon structure?3. What can serve as the model compounds for sulfur and nitrogen sources
in oil shale?4. What is the aromaticity level of shale oil?5. What is the ratio of alkanes to alkenes?6. What are the effects of different retorting processes on the boiling range
distribution of the shale oil crude?7. What are the inorganic ingredients in oil shale and shale oil?
One way of characterizing oil shale is via separation of organics by extraction. Themost commonly used techniques include gel permeation chromatography (GPC) formolecular weight distribution, gas chromatography (GC) using both packed column andglass capillary column for product oil distribution, simulated distillation using GC forboiling range determination, and molecular identification by liquid chromatography (LC).
Mass spectrometry (MS) can be extremely useful. In particular, GC–MS is goodfor product identification and model compound studies. Pyrolysis GC–MS can alsobe used for examining shale decomposition reactions.
Elemental analysis of oil shale is quite similar to that of petroleum and coal.More stringent requirements for C, H, O, N, and S analysis are needed for oil shale,as organic carbon in the shale should be distinguished from inorganic carbon incarbonate materials. Analysis for C, H, N, and S, which are very frequently usedfor coal analysis, can also be used for oil shale.
8.3.2 CORRELATION OF PHYSICAL PROPERTIES
Physical properties of oil shale should be characterized via electrical and conductivemeasurements, scanning microscopy, spectroscopic probes, and all other conven-tional methods. Especially, the correlation between physical properties and pyrolysisconversion is useful for designing a pilot-scale or commercial retort. The 13C-NMRwork should be expanded to provide a detailed picture of the various chemical formsencountered. Electron spin resonance (ESR) studies of carbon radicals in oil shalecould also provide invaluable clues about the conversion process.
© 2007 by Taylor & Francis Group, LLC

Shale Oil from Oil Shale 237
Correlations of physical properties that can be used for a variety of oil shalesare especially useful. Predictive forms of correlation are a powerful tool in engi-neering design calculations, as well.
8.3.3 MECHANISMS OF RETORTING REACTIONS
Kinetics of oil shale retorting has been studied by various investigators. However,the details of reaction mechanism have not been generally agreed upon. This maybe one of the reasons why problems associated with in situ pyrolysis require,primarily field experiments rather than small laboratory-scale experiments. Theretorting process itself can be improved and optimized when its chemical reactionmechanisms are fully elucidated. Similarly, more efficient retort design can beaccomplished.
8.3.4 HEAT AND MASS TRANSFER PROBLEMS
Oil shale rocks are normally low in both porosity and permeability. Therefore, it isvery important to know the combined heat and mass transfer processes of a retortsystem. The processes of heat and mass transfer in a retort operation affect theprocess operating cost significantly, because the thermal efficiency is directly relatedto the total energy requirement and mass transfer conditions directly affect therecovery of oil and gas from a retort. The various process technologies may differfrom one another only in their method of heat and mass transfer, and there is alwaysroom for further improvement. Therefore, understanding the transport processes inoil shale retorting is essential in mathematical modeling of a retort system, as wellas in design of an efficient retort system. The analysis of heat and mass transferrequires a vast amount of information, such as physical properties of inorganic andorganic ingredients of oil shale, bed and rock porosity, and its distribution; perme-ability; dolomite and other carbonate compositions in the shale, etc.
8.3.5 CATALYTIC UPGRADING OF SHALE OIL CRUDES
As mentioned earlier, prerefining of crude shale oil is necessary to reduce sulfur andnitrogen levels, and contamination by mineral particulates. Because large portionsof nitrogen and sulfur species in shale oil are present as heteroaromatics, researchopportunities of great significance exist in the selective removal of heteroaromatics,final product quality control, and molecular weight reduction.
Raw shale oil has a relatively high pour point of 75 to 80°F, compared to 30°Ffor Arabian Light. Olefins and diolefins may account for as much as one half of thelow-boiling fraction of 600°F or lower, and lead to the formation of gums.
Raw shale oil typically contains 0.5 to l.0% oxygen, l.5 to 2.0% nitrogen, and0.15 to l.0% sulfur. As can be seen, the nitrogen level in shale oil is very high,whereas the sulfur level is in a similar range to other fossil fuel liquids. Sulfur andnitrogen removal must be very complete as their compounds poison most of thecatalysts used in refining; their oxides (SOx and NOx ) are well-known air pollutants.
© 2007 by Taylor & Francis Group, LLC

238 Handbook of Alternative Fuel Technology
As raw shale oil is a condensed overhead product of pyrolysis, it does not containthe same kinds of macromolecules found in petroleum and coal residuum. Conven-tional catalytic cracking, however, is an efficient technique for molecular weightreduction. It is crucially important to develop a new cracking catalyst that is moreresistant to basic poisons (nitrogen and sulfur compounds).73 At the same time,research should also focus on reduction of molecular weight of shale oil crude withlow consumption of hydrogen.
8.3.6 BY-PRODUCT MINERALS FROM U.S. OIL SHALE
Many different kinds of carbonate and silicate minerals occur in oil shale formations.Trona beds [Na5(CO3)(HCO3)3] in Wyoming are a major source of soda ash (sodiumcarbonate [Na2CO3]), whereas nahcolite (NaHCO3) is a potential by-product of oilshale mining from Utah and Colorado.
Precious metals and uranium are contained in good amounts in eastern U.S.shales. It is unlikely that in the near future recovery of these mineral resources willbe possible as a commercially favorable recovery process has not yet been developed.However, it should be noted that there are many patents on recovery of aluminafrom Dawsonite-bearing beds by leaching, precipitation, calcination, etc. The chem-ical formula for dawsonite is NaAl(CO3)(OH)2.
8.3.7 CHARACTERIZATION OF INORGANIC MATTERS IN OIL SHALE
The analytical techniques applied to the characterization of inorganic constituentsin oil shale include x-ray powder diffraction (XRD), thermogravimetric analysis(TGA), scanning electron microscopy (SEM), and transmission electron microscopy(TEM). Further, electron microprobe analysis (EMPA) may provide a useful tool forstudying crystals at the molecular level and generate valuable information on thephases encountered. Most oil shale is also rich in inorganic matter, and these inor-ganic ingredients also go through the same process treatment as the organic constit-uents of the shale. The most significant of this inorganic matter include dolomite(CaCO3·MgCO3) and calcite (CaCO3), both of which decompose upon heating andliberate gaseous carbon dioxide. This carbonate decomposition reaction is endother-mic in nature, i.e., absorbing heat thereby reducing the process thermal efficiencyof kerogen (oil shale hydrocarbon) pyrolysis.
8.4 PROPERTIES OF OIL SHALE AND SHALE OIL
To develop efficient retorting processes as well as to design a cost-effective com-mercial-scale retort, physical, chemical, and physicochemical properties of oil shales(raw material) and shale oils (crude liquid products) must be fully known. However,difficulties exist in the measurement of various physical and chemical properties ofa variety of oil shales on a consistent basis. In this section, the properties that areessential in designing an efficient retort, as well as in understanding the oil shaleretorting process, will be discussed. Even though a good deal of literature and datahave been presented in this section, it is not solely intended to build a data bank of
© 2007 by Taylor & Francis Group, LLC

Shale Oil from Oil Shale 239
oil shale properties; rather, appropriate utilization (and interpretation) of data andtheir measurements are stressed. More extensive treatment of property data can befound in References 7–9,12, and 26 given at the end of this chapter.
8.4.1 PHYSICAL AND TRANSPORT PROPERTIES OF OIL SHALE
8.4.1.1 Fischer Assay
The nominal amount of condensable oil that can be extracted from oil shale iscommonly denoted by the term Fischer assay of the oil shale. The Fischer assay isa simple and representative quantity that can be obtained quite easily for all kindsof oil shale by following the standardized retorting procedure under nitrogen atmo-sphere. The actual oil content in the oil shale, both theoretically and nominally,exceeds the Fischer assay. Depending on the treatment processes as well as the typeof oil shale, oil yield from oil shale often exceeds the Fischer assay value by asmuch as 50%. Examples of such extraction processes include retorting in a hydrogen-rich environment, retorting in a CO2 sweep gas environment, supercritical fluidextraction of oil shale, etc. The procedure for Fischer assay of oil shale is modifiedfrom a Fischer assay procedure for carbonization of coal at a low temperature. Abrief description of the Fischer assay procedure is as follows: Take a crushed sampleof oil shale of 100 g and subject it to a preprogrammed (such as linear ramping)heating schedule in an inert (such as nitrogen) environment. The oil shale is heatedfrom 298 to 773 K very linearly over a 50-min. period while being purged withnitrogen. The linear heating rate is 9.5°C/min. Following the heat-up period, thesample is held at 773 K for an additional 20 to 40 min. and the oil collected, typicallyin a condenser tube, is measured. This recovered oil amount is then recorded in aunit of liters per ton (l/ton) or gallons per ton (gal/ton).
This procedure cannot recover all the organic matter originally contained inshale and leaves char associated with ash in the rock matrix, as well as larger-molecular-weight hydrocarbons blocking the pores. Nevertheless, the Fischer assayis used as a very convenient measure of recoverable organic hydrocarbon contentand provides a common basis for comparison among various oil shales. If this valueis higher than 100 l/ton, it is typically considered a rich shale; if less than 30 l/ton,a lean shale.
8.4.1.2 Porosity
Porosity of porous materials can be defined in a number of different ways, dependingon what specific pores are looked at and how the void volumes are measured. Theyinclude: interparticle porosity, intraparticle porosity, internal porosity, porosity byliquid penetration, porosity by saturable volume, porosity by liquid absorption,superficial porosity, total open porosity, bed porosity (bed void fraction), packingporosity, etc.
Porosity of the mineral matrix of oil shale cannot be determined by the methodsused for determining porosity of petroleum reservoir rocks, because the organicmatter in the shale exists in solid form and is essentially insoluble. However, theresults of a laboratory study at the Laramie Center3 (currently, Western Research
© 2007 by Taylor & Francis Group, LLC

240 Handbook of Alternative Fuel Technology
Institute, Laramie, WY) have shown that inorganic particles contain a microporestructure, about 2.36 to 2.66 vol%. Although the particles have an appreciable surfacearea, about 4.24 to 4.73 m2/g for shale assaying of about 29 to 75 gal/ton, it seemsto be limited mainly to the external surface rather than the pore structure. Measuredporosities of the raw oil shales are shown in Table 8.7.4
As noted, except for the two low-yield oil shales, naturally occurring porositiesin the raw oil shales are almost negligible, and they do not afford access to gases.Porosity may exist to some degree in the oil shale formation where fractures, faults,or other structural defects occurred. It is also believed that a good portion of thepores are either blind or very inaccessible. Crackling and fractures, or other structuraldefects often create new pores and also break up some of the blind pores. It shouldbe noted here that closed or blind pores are normally not accessible by mercuryporosimetry even at high pressures. Owing to the severity of mercury poisoning, theinstrument based on pressurized mercury penetration through pores is no longer used.
8.4.1.3 Permeability
Permeability is the ability, or measurement of a rock’s ability, to transmit fluids andis typically measured in darcies or millidarcies. Permeability is part of the propor-tionality constant in Darcy’s law, which relates the flow rate of the fluid and thefluid viscosity to a pressure gradient applied to the porous media. Darcy’s law is a
TABLE 8.7Porosities and Permeabilities of Raw and Treated Oil Shale
Fischer Assay
Porosity
Plane
Permeability
RawHeated
to 815°C RawHeated
to 815°C
1.0a 9.0b 11.9 Ac — 0.36d
B — 0.566.5 5.5 12.5 A — 0.21
B — 0.6513.5 0.5 16.4 A — 4.53
B — 8.0220.0 <0.03 25.0 A — —
B — —40.0 <0.03 50.0 A — —
B — —
a Fischer assay in gal/ton.b Numbers in percentages of the initial bulk volume. Porosity was taken as an isotropicproperty, i.e., property that is independent of measurement direction.c Plane A is perpendicular to the bedding plane, Plane B is parallel to the bedding plane.d Units in milidarcy.
Source: From Chilingarian, G.V. and Yen, T.F., Bitumens, Asphalts, and Tar Sands, Elsevier,Amsterdam, 1978, chap. 1.
© 2007 by Taylor & Francis Group, LLC

Shale Oil from Oil Shale 241
phenomologically derived constitutive equation based on the conservation of momen-tum that describes the flow of a fluid through a porous medium. A simple relationshiprelates the instantaneous discharge rate (local volumetric flow rate) through a porousmedium to the local hydraulic gradient (change in hydraulic head over a distance,i.e., ∆h/L, dh/dL, or ∇h ) and the hydraulic conductivity (k) at that point.
Or, dividing both sides by the area (A) yields,
q = –k ∇h
where q is the Darcy flux, i.e., that is the discharge rate per unit area, expressed interms of [length/time]. Even though the final unit of the Darcy flux is the same asthat of velocity, a clear conceptual difference between the two must be understood.Based on the analogy between Darcy’s and Poiseuille’s law, the hydraulic conduc-tivity term can be factored out in terms of intrinsic permeability and the fluidproperties as:
k = (k′)•(ρg/µ))
where k ′ is the intrinsic permeability, which has the dimension of [length2]. Whereasthe term [ρg/µ] describes the penetrating fluid properties, the intrinsic permeability(k ′) summarizes the properties of the porous medium. The usual unit for permeabilityis the darcy (D), or more commonly the milli darcy or mD (1 darcy ≈ 10–12 m2).Converted to SI units, precisely speaking, 1 D is equivalent to 0.986923 µm2. Thediscussion presented here is a simplified one, in which unidirectional homogeneousfluid permeation without explicit inclusion of any external force terms is considered.However, it may be still evident that permeability should be expressed in a multi-directional manner; in other words, it is most adequately expressed as a permeabilitytensor. Exhaustive discussions about Darcy’s law can be found in most textbookson transport phenomena,66 fluid mechanics, and hydraulogy.
The permeability of raw oil shale is essentially zero because the pores are filledwith a nondisplaceable organic material. Tisot4 showed that gas permeability, eitherperpendicular or parallel to the bedding plane, was not detected in most oil shalesamples at a pressure differential across the cores of 3 atm of helium for l min. Ingeneral, oil shale constitutes a highly impervious system. Thus, one of the majorchallenges of any in situ retorting project is the creation of a suitable degree ofpermeability in the formation. This is why an appropriate rubblization technique isessential to the success of an in situ pyrolysis project.
Of practical interest is the dependency of porosity or permeability on temperatureand organic content. Upon heating to 510°C, an obvious increase in oil shale porosityis noticed. These porosities, which vary from 3 to 6 l vol%4 of the initial bulk oil shalevolume, represented essentially the volumes occupied by the organic matter before the
Q kAh h
La b= − −
© 2007 by Taylor & Francis Group, LLC

242 Handbook of Alternative Fuel Technology
retorting treatment. Therefore, oil shale porosity increases as the pyrolysis reactionproceeds. In the low-Fischer-assay oil shales, i.e., lean oil shales, structural breakdownof the cores is insignificant and the porosities are those of intact porous structures.However, in the high-Fischer-assay oil shales, i.e., rich oil shales, this is not the casebecause structural breakdown and mechanical disintegration due to retorting treatmentbecome extensive and the mineral matrices no longer remain intact. Thermal decom-position of the mineral carbonates, such as magnesium and calcium carbonates(MgCO3 and CaCO3), actively occurring around 380-900°C also results in an increasein porosity. The increase in porosity from low- to high-Fischer-assay oil shales variesfrom 2.82 to 50%, as shown in Table 8.7.75 These increased porosities constituteessentially the combined spaces represented by the loss of the organic matter and thedecomposition of the mineral carbonates. Crackling of particles is also due to thedevolatilization of organic matter, which increases the internal vapor pressure of largenonpermeable pores to such an extent that the mechanical strength of the particle canno longer retain the gas. Liberation of carbon dioxide from mineral carbonate decom-position also contributes to the pressure buildup in the oil shale pores.
Gas permeability4 is low in both planes of the mineral matrices from the threelow-Fischer-assay oil shales heated to 815°C. As noted in Table 8.l, the mineral matrixfrom the 13.5 gal/ton oil shale has the highest permeability of 8.02 mD. This valuemay be somewhat higher than the primary permeability of the mineral matrix as thepermeabilities created by removing the organic matter via devolatilization and pyrol-ysis, as well as by thermally decomposing the mineral carbonates, are also included.Even though the oil shale cores used for these measurements have no visible fractures,minute fractures may have formed during heating up to 815°C, which probably con-tributed to some secondary permeability. Permeabilities after heating up to 815°C, forthe oil shales that exceeded 13.5 gal/ton, are not given. In these oil shales, structuralbreakdown of the mineral matrices under a stress-free environment was so extensiveas to preclude measurements of the permeabilities in high-Fischer-assay oil shales.4
Dolomite (CaCO3·MgCO3) decomposition via half-calcination and full-calcinationreactions becomes very active at temperatures higher than 380°C, when magnesiumcarbonate (MgCO3) starts to decompose readily, releasing carbon dioxide. Once thetemperature is raised beyond 890°C, decomposition of calcite (CaCO3) via calcinationreaction becomes quite active and thermodynamically favored. At these two tempera-tures (380 and 890°C), the equilibrium constant for decomposition of magnesiumcarbonate and calcium carbonate respectively becomes unity, or Kp = 1.
In the case of eastern U.S. shales, especially Devonian oil shales, decompositionof kerogen produces lighter hydrocarbons than those from other shales. This oftenresults in a substantial increase in volatile pressure in the solid matrix, which leadsto cracking and mechanical disintegration of solid structure. This is also the reasonwhy the oil yield from eastern oil shale pyrolysis via a procedure similar to Fischerassay is not necessarily an accurate measure of the organic content of the shale.
8.4.1.4 Compressive Strength
The raw oil shales have high compressive strength, both perpendicular and parallel tothe bedding plane.2 After heating, the inorganic matrices of low-Fischer-assay oil shales
© 2007 by Taylor & Francis Group, LLC

Shale Oil from Oil Shale 243
retain high compressive strength in both perpendicular and parallel planes. This indicatesthat a high degree of inorganic cementation exists between the mineral particles com-prising each lamina and between adjacent laminae. With an increase in organic matterof oil shale, the compressive strength of the respective organic-free mineral matricesdecreases and it becomes very low in those rich oil shales, as shown in Figure 8.1.5
It is also noteworthy that a structural transition point exists. Gradual expansion(volume swelling) of oil shale under a stress-free environment was noted immediatelyupon application of heat. Around 380°C, the samples are seen to undergo drasticchanges in compressive strength. The greater loss of compressive strength at theyield point and the low recovery on reheating for the richer oil shales are bothattributed to extensive plastic deformation effects. The degree of plastic deformationthus seems to be directly proportional to the amount of organic matter in oil shale.The discontinuities in the pressure plot at temperatures below the yield point pre-sumably arise from the evolution of pore water from the oil shale matrix. The well-defined transition point at 380°C, therefore, represents a pronounced change in thecompressive strength of richer oil shale. It is interesting to note that near thistemperature most coals also exhibit similar plastic properties. Similarity in plasticproperties between oil shale and coal may be attributed to the macromolecularstructure of their organic matter.
8.4.1.5 Thermal Properties
The term thermal is used here to represent those parameters that are directly orindirectly related to the transport, absorption, or release of heat, i.e., thermal energy.Properties such as thermal conductivity, thermal diffusivity, enthalpy, density, and
FIGURE 8.1 Variation of compressive strength of oil shale as a function of Fischer assay of oilshale. (From Wang, Y., M.S. thesis, University of Akron, Akron, OH, 1982.)
0
2
4
6
8
0 100 200 300 400 500
Temperature [°C]
Nor
mal
ized
Pre
ssur
e
FISCH=117.6
FISCH=85.1
FISCH=43.4 L/T
© 2007 by Taylor & Francis Group, LLC

244 Handbook of Alternative Fuel Technology
heat capacity fall into this category. For materials that undergo thermal decomposi-tion or phase transformation (this is the case with oil shales in general), it is necessaryto characterize their thermal behavior by thermoanalytical techniques such as ther-mogravimetric analysis (TGA)64 and differential thermal analysis (DTA).
8.4.1.5.1 Thermal ConductivityMeasurements of thermal conductivity of oil shale show that blocks of oil shaleare anisotropic about the bedding plane. The measurements were made by tech-niques such as the transient probe method,4 the thermal comparator technique,7 andthe line source method.8 The range of temperature and shale grades investigated insome instances is, however, quite limited.9,10 Some earlier studies did not focus onthe anisotropic nature of the heat conduction. However, later studies have shownthat the thermal conductivity as a function of temperature, oil shale assay anddirection of heat flow, parallel to the bedding plane (parallel to the earth's surfacefor a flat oil shale bed), was slightly higher than with thermal conductivity perpen-dicular to the bedding plane. As layers of material were laid to form the oil shalebed over a long period of geological years, the resulting continuous strata haveslightly higher resistance to heat flow perpendicular to the strata than parallel tothe strata. A summary of the literature data on the thermal conductivity of GreenRiver oil shale is given in Table 8.8.
TABLE 8.8Comparison between Thermal Conductivity Values for Green River Oil Shales
TemperatureRange (°C)
Fischer Assay,gal/ton Plane
Thermal Conductivity(J/m-sec-°C) Reference
38–593 7.2–47.9 — 0.69–l.56 8(raw shales)
0.26–l.38(retorted shales)
0.16–l.21(burnt shales)
25–420 7.7–57.5 A 0.92–l.92 6Average l.00–l.82
(burnt shales)
38–205 10.3–45.3 A 0.30–0.47 11B 0.22–0.28
20–380 5.5–62.3 A l.00–l.42 7(raw shales)
B 0.25–l.75(raw shales)
Note: A = Parallel to the bedding plane; B = Perpendicular to the bedding plane; Average = Average ofboth directions.
© 2007 by Taylor & Francis Group, LLC

Shale Oil from Oil Shale 245
The results shown in Table 8.7 indicate that the thermal conductivities ofretorted and burnt shales are lower than those of the raw shales from which theyare obtained. This is attributable to the fact that mineral matter is a better conductorof heat than the organic matter; on the other hand, organic matter is still a far betterconductor than the voids created by its removal.8 Whereas the first of these hypoth-eses is well justified when one takes into account the contribution of the latticeconductivity to the overall value, the effect of the amorphous carbon formed fromthe decomposition of the organic matter could also be important in explaining thedifferences in thermal conductivity values for retorted shales and the correspondingburnt samples. The role of voids in determining the magnitude of the effectivethermal conductivity is likely to be significant only for samples with high organiccontent. The data for thermal conductivity measured by Tihen8 are presented inFigure 8.2. Other measurements12 were made of the effect of oil shale assay onthermal conductivity. These data also show that thermal conductivity decreases withan increase in oil shale assay.32
The thermal conductivities of oil shales are, in general, only weakly dependenton temperature,32 most studies report a gradual decrease with increasing tempera-ture.10,24 However, extreme caution needs to be exercised in the interpretation ofresults at temperatures close to the decomposition temperature of the shale organicmatter. This is because the kerogen decomposition reaction (or pyrolysis reaction)
FIGURE 8.2 Thermal conductivity of raw, spent, and burnt oil shale (1 gal/t = 4.18 cm3/kg).(From Smith, J.W., U.S. Bur. Mines Rep. Invest., 7248, 1969.)
RAWSHALE
SPENT SHALE
BURNED SHALE
*Probe perpendicular tobedding plane
0 6050403020100
1.383
1.556
0.865
0.692
0.519
0.346
0.173
1.211
1.038
© 2007 by Taylor & Francis Group, LLC

246 Handbook of Alternative Fuel Technology
is endothermic in nature and, as such, the temperature transients can be confoundedbetween the true rate of heat conduction and the rate of heat of reaction.
For example, thermal conductivity values reported at temperatures around 400°Cnormally include the thermal effects of decomposition of the shale organic matterand, therefore, they may not be the intrinsic values.
The thermal conductivity values of oil shales show an inverse dependence onorganic matter content.6,8 Equations that have been proposed by various authors,relating thermal conductivity to the three parameters, namely, temperature, organiccontent, and extent of kerogen conversion, are shown as follows:
K = c1 + c2x1 + c3x2 + c4x3+ c5x1x2 + c6x2x3 + c7x3x1 + c8x1x2x3 (8.1)
where x1, x2, and x3 denote the organic content, kerogen conversion, and temperature,respectively. The equation by Tihen et al.,8 which was taken as the average for theperpendicular and parallel thermal conductivities of raw and spent shales, is given by:
K = (l – x2) l.9376 – 4.739 × 10–2x1
+ l.776 × 10–3 (x3 – 273) + 4.371 × 10–4 x12
– 4.885 × 10⁻⁶ (x3 – 273)2
– l.671 × 10–5 x1 (x3 – 273) + x2 l.680 – 5.204 × 10–2 x1
– l.003 × 10–4 (x3 – 273) + 4.951 × 10–4 x12
– l.468 × 10–9 (x3 – 273)2
+ 0.667 × 10–5 x1 (x3 – 273), J/sec-m-°C (8.2)
where x1 and x2 are the organic content and kerogen conversion in fractions, and x3
is in degrees Kelvin.Prats and O’Brien6 proposed a second-order polynomial in (x3 – 25) of the form
K = c1[l – D1(x3 – 25) + D2(x3 – 25)2] exp(c2F) (8.3)
where F is Fischer assay in liters per ton, K is thermal conductivity in W/m-°C, andx3 is the shale temperature in degrees Celsius. In Equation 8.3, c1, c2, D1, and D2 areempirically determined. By Equation 8.3, the thermal conductivity is a relativelysimple function of the temperature and the organic content of shale. An even simplerequation was proposed for Baltic shales38as:
K = l.30/F + 0.06 + 0.003 T (8.4)
where F is Fischer assay in liters per ton, T is temperature in degrees Celsius, andK is thermal conductivity in W/m-°C.
When using simple correlations, one has to realize their limitations, especiallyin the case of extrapolation or interpolation of experimental data. Most simpleexpressions normally have narrower ranges of validity.
© 2007 by Taylor & Francis Group, LLC

Shale Oil from Oil Shale 247
The problem of thermal conduction through a bed of oil shale rubble is quitecomplex. It is similar to that of packed beds of randomly sized and oriented particles.It is also difficult to generalize the size distribution of fractured underground bedsof oil shale as well as to accurately control the size and shape of particles when insitu, underground rubblization takes place. To improve process efficiency, variousprocess ideas of rubblization and heating shales have been generated.
Thermal diffusivity, α, is defined as:
(8.5)
where k, ρ, and Cp denote the thermal conductivity, density, and heat capacity,respectively. Therefore, the thermal diffusivity has a dimension of L2t–1 (as in theunit of cm2/sec), similar to mass and momentum diffusivities. For an oil shale particleto reach a predetermined temperature throughout the particle dimension, the requiredtime may be estimated by9:
× 0.3 (8.6)
where Lch is the characteristic length of the oil shale particle. Equation 8.6 is basedon the isothermality criterion of t*ch = 0.3, in which the characteristic time becomes0.3. The underlying idea for the characteristic length may be explained by thepenetration depth, or a representative linear dimension for conduction. For a sphere,the characteristic length may be calculated by:
(8.7)
The same calculation can be carried out for a regular cylinder whose diameteris the same as its length:
(8.8)
An analogous calculation can be made for determination of a characteristicdimension for other geometries.9
As can be readily seen from Equation 8.6, the heat-up time required is propor-tional to the square of the characteristic dimension. In other words, a successfuloperation of in situ retort using the combustion retorting process depends quitestrongly on how finely the rubblization of oil shale bed can be achieved. If theparticle size of rubblized oil shale is large, the heat-up period would be quite long,thus making the retort inefficient.
αρ
= kCp
tC L
kp ch=
ρ 2
Lvolume
surface areach = = = =
434 3 6
3
2
π
π
R
RR D
Lvolume
surface areach = =
+=2
2 2 2
3
2
ππ π
RR R R
R[ ( ) ] 33 6
= D
© 2007 by Taylor & Francis Group, LLC

248 Handbook of Alternative Fuel Technology
The dependence of the thermal diffusivity of Green River oil shale perpendicularto the bedding plane on temperature and Fischer assay was measured by Dubow etal.,12 and is shown in Figure 8.3. The thermal diffusivity values show the same broadtrends as the thermal conductivities, with variations in temperature and shale grade.32
As expected, the thermal diffusivity decreases with increasing temperature andorganic content in the oil shale. Thus, the retorted and burnt shales show reducedthermal diffusivities relative to those for the raw shales,32 as shown in Table 8.9. Oilshale samples containing large amounts of pyrites (FeS2) are likely to show highthermal diffusivities, as the thermal diffusivity of pyrite itself is quite high.
8.4.1.5.2 Heat Capacity of Oil ShaleEarlier work by McKee and Lyder (1921)14 on specific heat of U.S. oil shales isrestricted to limited ranges of temperatures and shale grades. Later studies by Wang
FIGURE 8.3 Dependence of oil shale thermal diffusivity perpendicular to the bedding planeon temperature and Fischer assay. (From Dubow, J. et al., 11th Oil Shale Symposium Proc.,Colorado School of Mines, Golden, CO, 1978, p. 350.)
TABLE 8.9Thermal Diffusivity of Green River Oil Shale
Temp Range(°C)
Fischer Assay(gal/ton) Shale Type
ThermalDiffusivity
(cm2/s)Measurement
Technique Reference
38–260 6.7–48.4 Raw shale 0.26–0.98 Transient line probe 838–482 Low Retorted shale 0.13–0.88 Transient line probe 838–593 ~ 0 Burnt shale 0.10–0.72 Transient line probe 825–350 5.0–82.2 Raw shale 0.10–0.90 Laser flash 33
0
0.2 x 10⁻²
0.4 x 10⁻²
0.6 x 10⁻²
0.8 x 10⁻²
20 100 180 260 340
43.5 cm3/kg
43.5 cm3/kg313.1 cm3/kg
145 cm3/kg
438.1 cm3/kg
Temperature [oC ]
ThermalDiffu
sivity
[cm2 /s
]
© 2007 by Taylor & Francis Group, LLC

Shale Oil from Oil Shale 249
et al. (1979)15 reported heat capacity dependencies on temperatures and shale grade,characterized by the following type of equation:
(8.9)
Again, it is very difficult to generalize the heat capacity of oil shale in any simplefunctional form, because of the vast heterogeneity of oil shales even within the sameformation, as well as among different formations.
Considerable increases in the values of heat capacity with increasing organiccontent have been observed,14,15 although relative contributions of various oil shaleconstituents to the overall values are somewhat uncertain. Values of heat capacityfor most oil shales are not available readily. Although actual measurement of heatcapacity of a solid sample is not a complicated task, it may not be a bad idea tomeasure it when the information is needed.
The heat capacity correlation given by Sohn and Shih16 is:
Cpx = (907.09 + 505.85 x1) (1 – x2) + 827.06 x2
+ (0.6184 + 5.561 x1) (1 – x2) + 0.92 x2(x3 – 298) J/kg°C (8.10)
where x1 is the organic content of shale in mass fraction, x2 is the fractional conversionof kerogen, and x3 is the temperature in degrees Kelvin.
8.4.1.5.3 Enthalpy and Heat of RetortingWise et al.17 measured the enthalpy of raw, spent, and burnt oil shale from theGreen River formation. Oil was removed from the spent shale by conventionalretorting, but it still retained small amounts of char residue. However, virtually allorganic matter was removed from the burnt shale, as shown in Figure 8.4. The
FIGURE 8.4 Heat capacity of raw, spent, and burnt oil shale. (From Johnson, W.F. et al., Q.Colo. Sch. Mines, 70(3), 237, 1975.)
c c c x c x c x x= + + +1 2 1 3 2 4 1 2
SpentShale
BurnedShale
62.7 cm3/kgRaw Shale
135 cm3/kgRaw Shale
800
600
400
200
0300 500 700
Temperature [K]
HeatC
ontent
Abo
ve29
8K
[kJ/kg
]
© 2007 by Taylor & Francis Group, LLC

250 Handbook of Alternative Fuel Technology
enthalpy data may be represented by a function of temperature and Fischer assayof oil shale as:
∆H = a + bT + cT2 + dT3 + eT4 + fT2F (8.11)
where T is the temperature and F is the oil shale Fischer assay. All the coefficientsfrom a to f are also given Reference 17. The specific heat can be determined bydifferentiation of the enthalpy with respect to the temperature:
Cpx = [∂Hs/∂T]p (8.12)
These data are in good agreement with earlier data by Shaw18 and by Sohns et al.19
The available data for heat of retorting of Green River oil shales are listed inTable 8.10. The reported values for the heat of retorting (endothermic) show theexpected increase with increasing shale assay and temperature. The disparity in therange of values observed by different investigators possibly reflects differences inthe composition of shale samples. It should be borne in mind that the presence ofminerals, which decompose at temperatures below the range at which the organicmatter is thermally extracted, would increase the energy requirements for processingshales. Thus, it has been estimated that shales containing nahcolite and dawsonitewould require an additional 117 cal/g (490 J/g) and 215 cal/g (890 J/g), respectively.20
Heat requirements for retorting oil shales containing 17% analcite would be increasedby about 6%.21
8.4.1.5.4 Density or Specific GravityThe density of Green River oil shale was measured by Tisot4 and found to be in therange of l.8 to 2.0 g/cm3. Later, some efforts were made to correlate the oil yieldfrom oil shale (such as the Fischer assay) with the specific gravity.24 This idea mayhave some practical significance, as the oil yield is usually a constant fraction of theorganic content and the oil shale density is dependent upon the organic content.
8.4.1.5.5 Self-Ignition Temperature (SIT)The self-ignition temperature (SIT) is the temperature at which an oil shale samplespontaneously ignites in the presence of atmospheric oxygen, or under any otherprescribed oxidative conditions. There is no standardized procedure generally
TABLE 8.10Values Reported for Heat of Retorting of Green River Oil Shales
Heat of Retorting (kJ/kg) Fischer Assay (gal/ton) Ref.
238–878 23.5–46.7 19581–699 8.0–32.8 20
335 25.6 22
Source: From Wang, Y., M.S. thesis, University of Akron, Akron, OH, 1982.
© 2007 by Taylor & Francis Group, LLC

Shale Oil from Oil Shale 251
adopted for this measurement. However, if a consistent measurement of this tem-perature is made for oil shale, it can provide very valuable information regardingthe fuel characteristics of the shale.
The spontaneous ignition temperature of oil shale has been measured and char-acterized under a variety of conditions by Allred.25 The information regarding SITis very important, as it governs not only the initiation of the combustion retortingprocess, but also the dynamics of oil shale retorting by the advancing oxidation zone.Branch also explains its importance in his article.26 In the countercurrent combustionretorting process, the combustion front moves toward the injected oxidizer, whereasin the cocurrent process the front moves in the same direction as the oxidizer.Therefore, the spontaneous ignition temperature of the raw oil shale should be belowthe oil shale retorting temperature in the countercurrent process. In the cocurrentcombustion process, char remaining in the shale after retorting is burned to sustainthe retort by providing the necessary thermal energy.
The SITs of Colorado oil shale have been measured over a wide range of totalpressure and oxygen partial pressure.25 With nitrogen as a diluent, the ignitiontemperature was found to depend on the oxygen partial pressure, but not significantlyon the total pressure. The temperature at which ignition could occur was also foundto correlate to the temperature at which methane and other light hydrocarbons aredevolatilized from the oil shale. As shown in Figure 8.5, in the case for raw Coloradooil shale, higher ignition temperatures were required for lower oxygen partial pres-sures, and the lowest ignition temperature of 450 K was considerably lower than theoil production temperature of about 640 K. More detailed information is availablefrom the original text24 or from other sources.9,25,26 This experimental evidencestrongly suggests that ignition of oil shale may be associated with oxidation ofgaseous hydrocarbons that evolved from oil shale.
Joshi27 took a different approach to studying the SIT. He defined the SIT as thetemperature at which the shale bursts into flames in air within 360 sec of introduction
FIGURE 8.5 Self-ignition temperature of raw oil shale, i-octane, n-octane, and propane.(From Smith, J.W., U.S. Bur. Mines Rep. Invest., 7248, 1969.)
1
10
100
1000
400 600 800 1000Temperature, degrees K
Par
tial
Pre
ssu
reo
fO
xyg
en,k
Pa
n-Octane
Iso-Octane
Propane
Colorado RawOil Shale
© 2007 by Taylor & Francis Group, LLC

252 Handbook of Alternative Fuel Technology
into a preheated isothermal retorter. His SIT measurements were made at an oxygenpartial pressure of 0.21 atm, i.e., under atmospheric conditions. Joshi's approach wasdifferent from that of Allred’s in the sense that different oil shales can be character-ized by the SIT. In other words, the SIT defined by Joshi can be used more like aphysical property that is easy to measure. It was found that the SIT depends verystrongly on the Fischer assay of oil shale. Generally speaking, the higher the Fischerassay, the lower the SIT. Figure 8.6 graphically illustrates the relation between SITand Fischer assay for several different shales.
Joshi’s results also suggest that the ignition of oil shale is associated with theoxidation of gaseous hydrocarbons evolved from oil shale. The ignition of the shalesamples were always preceded by a slight exploding (crackling) sound, which stronglysuggests that ignition occurred only when the vapor pressure of the gaseous hydrocarbonsevolved reached a certain level. Further tests by Joshi27 revealed that the SIT is also afunction of particle size. Tests were carried out on particles of size –4 + 8 mesh to –60mesh. It was also found that Colorado shale particles of size –40 + 60 mesh and smallerdid not burst into flames under the defined conditions. The same phenomenon wasobserved for Cleveland shale no. 2 with the limiting particle size being –20 + 40 mesh,which did not burst into flames. It has been stated that as the particle size becomessmaller, the diffusional limitations of the product vapor decrease substantially in magni-tude. As a result, there is a continuous diffusion of product vapor (gaseous hydrocarbons)from the rock matrix to the surface and from the surface to the boundary layer.
Consequently, heating induces a buildup of gaseous hydrocarbons inside therock matrix, which ultimately causes cracking of the shale particles. The concentra-tion of the gaseous hydrocarbons near the surface immediately after internal crackingis high enough to stimulate ignition. As mentioned earlier, the SIT data can be veryuseful, as ignition temperature governs the initiation of the combustion process andalso the dynamics of in situ oil shale retorting. Further, these data are also valuablebecause they provide an indication of the explosivity of oil shale dust during oilshale-mining operations. However, this hazard is considerably less likely to takeplace in oil shale mining than during coal mining.4,6
FIGURE 8.6 Self-ignition temperature of oil shale as a function of Fischer assay. (FromJoshi, R., M.S. thesis, University of Akron, Akron, OH, 1983.)
11
2258 107
0
100
200
300
400
500
600
700
0 20 40 60 80 100 120
Fischer Assay, Liters/metric ton
Self
-ig
nit
ion
Tem
p.,
deg
.C
© 2007 by Taylor & Francis Group, LLC

Shale Oil from Oil Shale 253
8.4.2 THERMAL CHARACTERISTICS OF OIL SHALE AND ITS MINERALS
Thermal or thermoanalytical methods, such as thermogravimetric analysis (TGA)and differential thermal analysis (DTA), are particularly useful for characterizationof thermal behavior of oil shales and oil shale minerals. The use of both TGA andDTA has been well established in the areas of coal and polymer research, as arelatively simple procedure generates valuable information about the sample’s ther-mal behavior.
8.4.2.1 Thermoanalytical Properties of Oil Shale
Figure 8.7 and 8.8 shows the effects of the surrounding atmosphere on the thermalbehavior of Green River oil shale.32 Figure 8.7 shows the DTA curve in an inertatmosphere of flowing N2, whereas Figure 8.8 shows the DTA curve in the presenceof air, i.e., in an oxidative atmosphere.
The peak corresponding to kerogen decomposition is seen to be endothermic innature, i.e., absorbing heat. This endothermic nature is very much expected, as allpyrolysis reactions require input of thermal energy. In the presence of air, however,two exotherms are apparent as shown in Figure 8.8, the first peak at 439°C and thesecond at 500°C. Whereas the first exothermic peak may be attributed to the com-bustion of light hydrocarbon fractions from the shale organic matter, the secondexotherm appears to be from the burn-off of carbonaceous char.32
Figure 8.9 shows the TGA curve of Stuart oil shale of Queensland, Australia.78
The sample used in this experiment was obtained from Kerosene Creek member and
FIGURE 8.7 Effect of the surrounding atmosphere on the thermal behavior of Green Riveroil shale — DTA in an inert atmosphere of flowing nitrogen. (From Rajeshwar, K. et al., J.Mater. Sci., 14, 2025–2052, 1979.)
Exothermic
Endothermic
TREF
Oil Shale SampleGrade: 32 gal/tHeating Rate: 2.5˚C/minAtmosphere: Flowing N2Thermocouples: Ch-Al
∆T=0.5°C
425°C
∆T
Time10 min
© 2007 by Taylor & Francis Group, LLC

254 Handbook of Alternative Fuel Technology
supplied by Southern Pacific Petroleum NL. The total mass loss of the raw shale bythe TGA from 25 to 600°C was 12.2%, which includes: (1) evaporative loss of moisture,(2) kerogen decomposition and devolatilization, and (3) thermal decomposition of
FIGURE 8.8 Effect of the surrounding atmosphere on the thermal behavior of Green Riveroil shale — DTA in the presence of air. (From Rajeshwar, K. et al., J. Mater. Sci., 14,2025–2052, 1979.)
FIGURE 8.9 Thermogravimetric analysis of stuart shale before and after oil extraction. (FromKesavan, S.K. and Lee, S., Fuel Sci. Technol. Int., 6(5), 505, 1988.)
439oC
500oC
TREF
Exothermic
Endothermic
Oil Shale SampleGrade: 32.6 gal/tHeating Rate: 2.5oC/minAtmosphere: AirThermocouple: Ch-Al
∆T10 min.
∆T=1°C
Time
0
20
40
60
80
100
120
0 100 200 300 400 500 600 700 800 900 1000Temperature [oC]
Perc
ent W
eigh
t
Raw Shale
Extracted Shale
© 2007 by Taylor & Francis Group, LLC
Shale Oil from Oil Shale 255
mineral carbonates and resultant CO2 liberation. It is not surprising to observe afurther mass loss from preextracted shale, which is attributable principally to decom-position of mineral carbonates.
8.4.2.2 Thermochemical Properties of Oil Shale Minerals
The identification and quantification of various carbonates existing in the GreenRiver oil shales, such as ferroan (or ferroan dolomite), ankerite [calcium iron mag-nesium manganese carbonate, or Ca(Fe, Mg, Mn)(CO3)2], and dawsonite, wereaccomplished using thermal analysis techniques.34 A quantitative determinationmethod for nahcolite [NaHCO3] and trona [Na3 (CO3) ((HCO3 )·2H2O)] in Coloradooil shales was proposed by Dyni et al.35
Rajeshwar et al.32 summarized the thermochemical properties of minerals com-monly found in oil shale deposits, and their results are shown in Table 8.11.
DTA involves heating or cooling a test sample and an inert reference underidentical conditions and recording any temperature difference between the sampleand reference. This differential temperature (∆T) is then plotted against time, oragainst temperature. Changes in the sample that lead to the absorption or release ofheat can be detected relative to the inert reference. The DTA peak temperature isthe temperature indicated at the time of maximum peak value of DTA curve, whichis a characteristic property of the material76 and is not dependent on the size of thematerial sample.
Regarding the decomposition of dawsonite, there are some conflicting theories.32
One belief is that dawsonite decomposes at 370°C according to the following reaction:
NaAl(OH)2CO3 → H2O + CO2 + NaAlO2 (8.13)
Another is based on the investigation of thermal behavior of dawsonite at tem-peratures between 290 to 330°C, and the chemical reaction that is taking place isbelieved to be36:
2NaAl(OH)2CO3 → Na2CO3 + Al2O3 + H2O + CO2 (8.14)
Yet another belief is that dawsonite decomposes in two steps.37 In the first step,it has been found that between 300 to 375°C, crystalline dawsonite decomposes withthe evolution of all the hydroxyl groups and two thirds of the carbon dioxide, leavingan amorphous residue. In the second step, the balance CO2 is released between 360to 650°C, producing crystalline NaAlO2.
Plagioclase is a form of feldspar that has a chemical composition of NaAlSi3O8.Plagioclase is usually white in color, but can also be gray and greenish white. Thismineral was found to be abundant in the moon rock samples.
The dominant mineral constituent of oil shale is dolomite. Dolomite is approxi-mately a one-to-one mixture of magnecite (MgCO3) and calcite (CaCO3). Therefore,the chemical formula of dolomite is often expressed by either CaCO3·MgCO3 orCaMg(CO3)2. Upon heating, dolomite undergoes a two-stage thermal decompositionreaction generally known as calcination.
© 2007 by Taylor & Francis Group, LLC

256 Handbook of Alternative Fuel Technology
(8.15)
(8.16)
The first reaction is called half-calcination of dolomite, whereas the entire reactioncombining both reaction 15 and reaction 16 is called full calcination of dolomite.Equilibrium decomposition temperature, i.e., where Ka = 1, is 380°C for magnecitedecomposition and 890°C for calcite decomposition, respectively.9 It can be readilyseen that dolomite decomposes quite actively in typical retorting conditions.
TABLE 8.11Thermochemical Properties of Common Minerals in Oil Shale Deposits
Minerals Chemical Formula
Type ofChemicalReaction
DTA PeakTemperature
(°C)
Calcite CaCO3 Dissociation 860–1010Dolomite CaCO3 ⋅MgCO3 Dissociation 790, 940Analcite NaAlSi2O6 ⋅H2O Dehydration;
dissociation150–400
Shortite Na2Ca2(CO3)3 Dissociation 470Trona Na2CO3 ⋅NaHCO3 ⋅2H2O Dissociation;
dehydration170
Pyrite FeS2 Oxidation; dissociation
550
Potassiumfeldspar
KAlSi3O8 Dissociation —
Gaylussite CaNa2(CO3)2 ⋅5H2O Dehydration; crystallographic transformation; melting
145, 175, 325, 445, 720–982
Illite K0.6(H3O)0.4Al1.3Mg0.3Fe2+0.1Si3.5O10(OH)2 ⋅(H2O)
(empirical formula)Dehydroxylation 100–150,
550, 900Plagioclase NaAlSi3O8–CaAl2Si2O8 Dissociation —Nahcolite NaHCO3 Dissociation 170Dawsonite NaAl(OH)2CO3 Dehydroxylation;
dissociation300, 440
Gibbsite γ-Al(OH)3 Dehydroxylation 310, 550Ankerite Ca(Mg, Mn, Fe)(CO3)2 Dissociation 700, 820, 900Siderite FeCO3 Oxidation;
dissociation500–600, 830
Albite NaAlSi3O8 Dissociation —Quartz SiO2 Crystallographic
transformation~575
Source: From Branch. M.C., Prog. Energy Combust. Sci., 5, 193, 1979.
CaCO MgCO CaCO MgO CO3 3 3 2⋅ ← → ⋅ +∆
CaCO MgO CaO MgO CO3 2⋅ ← → ⋅ +∆
© 2007 by Taylor & Francis Group, LLC

Shale Oil from Oil Shale 257
8.4.3 ELECTRIC PROPERTIES OF OIL SHALE
Electric properties also change as functions of temperature and other variables. Bothalternating current (AC) and direct current (DC) methods can be employed inmeasuring electric properties of oil shale. In general, AC techniques are preferablein view of their capability to detect and resolve various polarization mechanisms inthe material.
8.4.3.1 Electric Resistivity
Measurements on various types of oil shales in DC electric fields have shown anexponential decrease in resistivity values as a function of temperature.5,32,39 The trendis typically characteristic of ionic solids, which conduct current by a thermally activatedtransport mechanism. The presence of various minerals in the oil shale rock matrixmakes it difficult to conclusively identify the current-carrying ions in the material.However, the close correspondence of activation energies at high temperatures(>380°C) with those typically observed for carbonate minerals seems to indicate thatcarbonate ions could be a major current-carrying species.5,32 However, estimates madefrom such data are at best speculative and must be used with due caution.32 Thechemical change in oil shale material due to heating could also influence its conductionproperty. Thus, changes in the resistivity (from 1010 Ω-cm at room temperature to 10Ω-cm at 900°C) of Russian shales were attributed to the thermal decomposition of oilshale kerogen.38,39 Figure 8.10 shows the frequency-dependent behavior of electricresistivity as a function of reciprocal temperature (1/T) for a sample (117 l/ton Fischerassay) of raw Green River oil shale. The minima in the resistivity curves are observedat temperatures ranging from 40 to 210°C, and are due to the gradual loss of freemoisture and bonded water molecules to the clay particles in the shale matrix. Figure
FIGURE 8.10 Frequency-dependent behavior of electrical resistivity as a function of recip-rocal temperature for a 117 l/t shale sample. (From Rajeshwar, K. et al., J. Mater. Sci., 14,2025–2052, 1979.)
1
10
100
1000
10000
0 1 2 3
1/kT x 10- 20, joule-1
Res
isti
vity
x 1
0-5 ,
Oh
m-c
m
1,000,000 Hz
750,000 Hz
250,000 Hz
100,000 Hz
25,000 Hz
© 2007 by Taylor & Francis Group, LLC
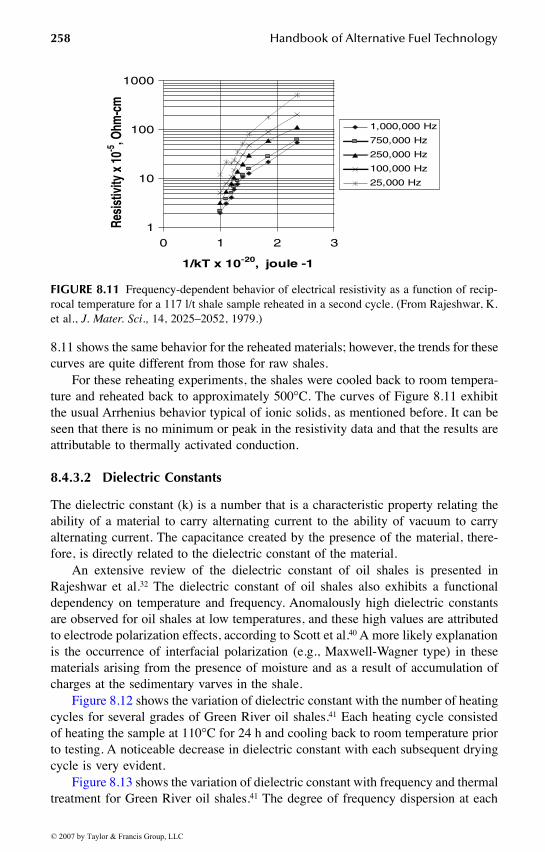
258 Handbook of Alternative Fuel Technology
8.11 shows the same behavior for the reheated materials; however, the trends for thesecurves are quite different from those for raw shales.
For these reheating experiments, the shales were cooled back to room tempera-ture and reheated back to approximately 500°C. The curves of Figure 8.11 exhibitthe usual Arrhenius behavior typical of ionic solids, as mentioned before. It can beseen that there is no minimum or peak in the resistivity data and that the results areattributable to thermally activated conduction.
8.4.3.2 Dielectric Constants
The dielectric constant (k) is a number that is a characteristic property relating theability of a material to carry alternating current to the ability of vacuum to carryalternating current. The capacitance created by the presence of the material, there-fore, is directly related to the dielectric constant of the material.
An extensive review of the dielectric constant of oil shales is presented inRajeshwar et al.32 The dielectric constant of oil shales also exhibits a functionaldependency on temperature and frequency. Anomalously high dielectric constantsare observed for oil shales at low temperatures, and these high values are attributedto electrode polarization effects, according to Scott et al.40 A more likely explanationis the occurrence of interfacial polarization (e.g., Maxwell-Wagner type) in thesematerials arising from the presence of moisture and as a result of accumulation ofcharges at the sedimentary varves in the shale.
Figure 8.12 shows the variation of dielectric constant with the number of heatingcycles for several grades of Green River oil shales.41 Each heating cycle consistedof heating the sample at 110°C for 24 h and cooling back to room temperature priorto testing. A noticeable decrease in dielectric constant with each subsequent dryingcycle is very evident.
Figure 8.13 shows the variation of dielectric constant with frequency and thermaltreatment for Green River oil shales.41 The degree of frequency dispersion at each
FIGURE 8.11 Frequency-dependent behavior of electrical resistivity as a function of recip-rocal temperature for a 117 l/t shale sample reheated in a second cycle. (From Rajeshwar, K.et al., J. Mater. Sci., 14, 2025–2052, 1979.)
1
10
100
1000
0 1 2 3
1/kT x 10-20, joule -1
Resi
stiv
ityx
10-5
,Ohm
-cm
1,000,000 Hz
750,000 Hz
250,000 Hz
100,000 Hz
25,000 Hz
© 2007 by Taylor & Francis Group, LLC
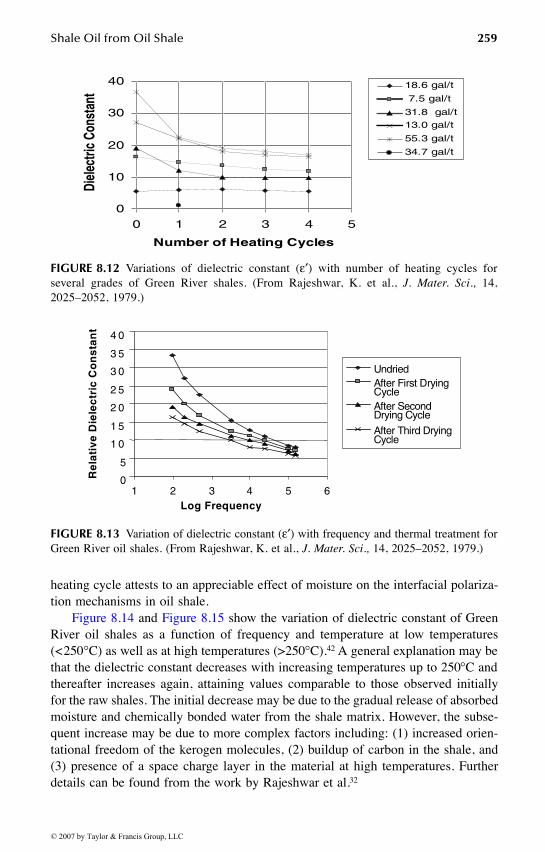
Shale Oil from Oil Shale 259
heating cycle attests to an appreciable effect of moisture on the interfacial polariza-tion mechanisms in oil shale.
Figure 8.14 and Figure 8.15 show the variation of dielectric constant of GreenRiver oil shales as a function of frequency and temperature at low temperatures(<250°C) as well as at high temperatures (>250°C).42 A general explanation may bethat the dielectric constant decreases with increasing temperatures up to 250°C andthereafter increases again, attaining values comparable to those observed initiallyfor the raw shales. The initial decrease may be due to the gradual release of absorbedmoisture and chemically bonded water from the shale matrix. However, the subse-quent increase may be due to more complex factors including: (1) increased orien-tational freedom of the kerogen molecules, (2) buildup of carbon in the shale, and(3) presence of a space charge layer in the material at high temperatures. Furtherdetails can be found from the work by Rajeshwar et al.32
FIGURE 8.12 Variations of dielectric constant (ε′) with number of heating cycles forseveral grades of Green River shales. (From Rajeshwar, K. et al., J. Mater. Sci., 14,2025–2052, 1979.)
FIGURE 8.13 Variation of dielectric constant (ε′) with frequency and thermal treatment forGreen River oil shales. (From Rajeshwar, K. et al., J. Mater. Sci., 14, 2025–2052, 1979.)
0
10
20
30
40
0 1 2 3 4 5
Number of Heating Cycles
Diel
ectri
cCo
nsta
nt18.6 gal/t
7.5 gal/t
31.8 gal/t
13.0 gal/t
55.3 gal/t
34.7 gal/t
0
5
1 0
1 5
2 0
2 5
3 0
3 5
4 0
1 2 3 4 5 6Log Frequency
Rel
ativ
eD
iele
ctri
cC
on
stan
t
UndriedAfter First DryingCycleAfter SecondDrying Cycle
After Third DryingCycle
© 2007 by Taylor & Francis Group, LLC

260 Handbook of Alternative Fuel Technology
8.4.4 MOLECULAR CHARACTERIZATION OF KEROGEN
In applying chemical and engineering principles to the decomposition of oil shale,difficulties are encountered owing to the lack of structural and molecular understand-ing of kerogen. A chemical model of kerogen structure has been proposed by Yen28
as C220H330O18N2S4. If we use this formula as a representative chemical formula forkerogen molecule, its molecular weight becomes 3,414. Kerogen has a macromo-lecular structure that gives a fairly large molecular (formula) weight.
8.4.4.1 Derivation of Stoichiometric Coefficient
As the structure of kerogen cannot be represented as a uniquely defined chemicalspecies, a stoichiometric equation for kerogen decomposition is often impractical.The kerogen decomposition reaction is frequently expressed by the followingdescriptive equation:
Kerogen → condensable oil vapors + gaseous products + residual char (8.17)
This equation cannot be taken as a stoichiometric equation, as the atomic balanceon constituent atoms is not established. The following analysis is therefore intendedto provide a theoretical bridge between a qualitative expression and a stoichiometricequation.23
FIGURE 8.14 Frequency and temperature dependence of dielectric constant (ε′) at low temper-atures (<250°C). (From Rajeshwar, K. et al., J. Mater. Sci., 14, 2025–2052, 1979.)
450
180
135
90
45
0
270
315
360
405
225
101 102 103 104 105 106
Frequency [Hz]
85oC
125oC
164oC
209oC
250oC
‘
© 2007 by Taylor & Francis Group, LLC

Shale Oil from Oil Shale 261
The initial mass of organic carbon per cubic meter of particle volume is:
, kg/m3
, mol/m3 (8.18)
where ρs is the density of oil shale particle in kg/m3, ω is the mass fraction of kerogenin the particle, and Mk is the molecular weight (or formula weight) of kerogen ingrams per mole. The total mass of oil recoverable (conventionally) from oil shaleper cubic meter of particle volume is:
= mol/m3 (8.19)
where F is the Fischer assay of oil shale in liters per metric ton, is the density ofshale oil (not oil shale) in g/cm3, and Mp is the average molecular weight of con-densable product in g/mol.
FIGURE 8.15 Frequency and temperature dependence of dielectric constant (ε′) at hightemperatures (>250°C). (From Rajeshwar, K. et al., J. Mater. Sci., 14, 2025–2052, 1979.)
450
180
135
90
45
0
270
315
360
405
225
‘
101 102 103 104 105 106
Frequency [Hz]
265oC
327oC
299oC
412oC
m s1 = ρ ω
= ρ ωs kM. /1000
m Fl
M T
kg
m
g
cmFs o2 3 3
=
⋅
⋅
= ⋅ρ ρ ρss o
g
m⋅
ρ
3
F Ms o p⋅ ⋅ρ ρ /
ρo
© 2007 by Taylor & Francis Group, LLC

262 Handbook of Alternative Fuel Technology
Assume that the kerogen decomposes into oil vapors and gaseous productscompletely at moderate decomposition temperatures. Then, the stoichiometric co-efficient equivalent may be expressed by:
(8.20)
where α is a theoretically obtained stoichiometric coefficient (or its equivalent) forreaction (8.17).
8.4.4.2 Relation between Fischer Assay and Mass Fractionof Kerogen
An empirical correlation between the Fischer assay of oil shale and the weightpercentage of kerogen is proposed by Cook29:
F = 2.216 wp – 0.7714, gal/ton (8.21)
where F is the Fischer assay estimated in gallons of oil recoverable per ton of shaleand wp is the weight percentage of kerogen in the shale. However, caution must beexercised in using this equation, as the mass fraction of kerogen in oil shale isstrongly dependent on the measurement technique. For certain oil shales, the maxi-mum recoverable oil amount via supercritical extraction or CO2 retorting is signifi-cantly higher than the Fischer assay value.9
It is also conceivable that such a correlation can be sensitive to the types of oilshale retorted, as well. Nonetheless, there is little doubt that the Fischer assay ofany oil shale is strongly correlated against the kerogen content of the shale.
8.4.4.3 Nitrogen Compounds in Shale Oil
Nitrogen compounds in shale oil cause technological difficulties in the downstreamprocessing of shale oil, in particular, poisoning the refining catalysts. Needless tosay, these nitrogen compounds originate from oil shale and the amount and typedepend heavily on the petrochemistry of the oil shale deposits. Although directanalysis and determination of molecular forms of nitrogen containing compoundsin oil shale rock is very difficult, analysis of the shale oil extracted by retortingprocesses provides valuable information regarding the organonitrogen species in theoil shale. Poulson70 reported the breakdown of organonitrogen compounds in shaleoil based on a preliminary study of shale oil light distillates, and the results areshown in Table 8.12. The major compound classes Poulson identified were pyridines,quinolines, pyrroles, and indoles.70
αρ ρ
ρ ω=
⋅ ⋅⋅ ⋅
F M
Ms o p
s k1000
= ⋅ ⋅⋅ ⋅
F M
Ms k
p
ρω 1000
© 2007 by Taylor & Francis Group, LLC

Shale Oil from Oil Shale 263
8.4.5 BOILING RANGE DISTRIBUTIONS OF VARIOUS SHALE OILS
Shale oils or oil shale crudes are obtained by various oil shale processes. Thecharacteristics of shale oils are very important in devising a process for upgradingshale oils, as well as in identifying the market for them. In particular, distillationproperties of shale oil are crucially important for its refining and upgrading.
8.4.5.1 Analytical Methods
In characterizing hydrocarbon mixtures for specification or for other purposes, aprecise analytical distillation may be needed. Actual distillation may require 25 to100 plates. It is extremely costly and tedious to carry out such a distillation on areasonable scale. Instead, gas chromatography (GC) with a separating column at aconstant temperature can be effectively used to obtain a boiling point analysis.However, this technique is somewhat restricted to a rather narrow boiling range, aslighter components elute too soon and tend to overlap, and heavy components emergevery late, producing relatively wide bands or still remain in the column.
A newer technique of temperature programming of the separating column makesa wide-range, single-stage analysis possible.30 By using a column packing thatseparates according to the boiling point and by precise programming of the columntemperature, the boiling range for various peaks can be determined from elutiontimes or temperatures of emergence.
A standard method for boiling range distribution of petroleum fractions by gaschromatography has been adopted by the American Society for Testing and Materials,
TABLE 8.12Predominant Classes of Nitrogen Compounds in a Shale Oil Light Distillate
Nitrogen Type Total Nitrogen
Alkylpyridines 42Alkylquinolines 21Alkylpyrroles (N-H) 8Alkylindoles (N-H) 7Cyclic amides (pyridones, quinolines) 3Anilides 2Unclassified very weak bases (N-alkylpyrroles and N-alkylindoles?) 4Other unclassified very weak bases
(reduced to nontitratable types and not sulfoxides)3
Nonbasic (nontitratable) nitrogen in original light distillate 8Analytical loss 2Total 100
Source: From Poulson, R.E. et al., ACS Div. Pet. Chem. Prepr., 15(1), A49–A55, 1971.
© 2007 by Taylor & Francis Group, LLC

264 Handbook of Alternative Fuel Technology
West Conshohocken, PA (ASTM) and is given in the ASTM D288731 Procedure,which is briefly described in the following section:
8.4.5.1.1 ASTM D2887 Procedure31
1. Scope: This standard method determines the boiling range distribution ofpetroleum products. It is generally applicable to petroleum fractions witha final boiling point of 1000°F (538°C) or lower at atmospheric pressure.
2. Summary of the method: The sample is introduced into a gas chromato-graphic column, which separates hydrocarbons in the order of their boilingpoints. The column temperature is raised at a reproducible (prepro-grammed) rate and the area under the chromatogram is recorded through-out the run. Boiling temperatures are assigned to the elution time axisfrom a calibration curve obtained under the same conditions by runninga known mixture of hydrocarbons (ranging from Cm to Cn) covering theboiling range expected from the sample. From these data, the boiling rangedistribution of the sample may be obtained.
3. Initial and final boiling points: The initial boiling point (IBP) is the pointat which a cumulative area count equals 0.5% of the total area under thechromatogram. On the other hand, the final boiling point (FBP) is thepoint at which a cumulative area count equals 99.5% of the total areaunder the chromatogram. The normal boiling point (NBP) is the point atwhich the vapor pressure reaches 760 mmHg, or l atm.
4. Apparatus for boiling range distribution: A gas chromatograph equippedwith a thermal conductivity detector (TCD) is typically used for theexperiment of gasoline fractions. For all other types of samples, either aTCD or a flame ionization detector (FID) may be used. The detector musthave sufficient sensitivity to detect l% dodecane (C12H26) with a peakheight of at least 10% of full scale on the recorder under the conditionsprescribed in this method and without loss of resolution. Practically anycolumn can be used, provided that under the conditions of the test, sep-arations are in order of boiling points and the column resolution (R) is atleast 3 and not more than 8. As a stable baseline is essential for theaccuracy of this method, matching dual columns are required to compen-sate for column bleed, which cannot be eliminated completely by condi-tioning alone.
The temperature programming must be done over a range that is sufficient toestablish a retention time of at least l min for the IBP to elute the entire sample. Amicrosyringe is needed for sample injection and a flow controller is also requiredfor holding carrier gas flow constant to ± l% over the full operating temperaturerange. The carrier gas used is either helium or hydrogen for a TCD; whereas nitrogen,helium, or argon may be used with an FID. The calibration mixture to be used is amixture of hydrocarbons of known boiling point covering the boiling range of thesample. At least one compound in the mixture must have a boiling point lower thanthe initial boiling point (IBP) of the test sample in order to obtain an accurate
© 2007 by Taylor & Francis Group, LLC

Shale Oil from Oil Shale 265
distribution of boiling range. Both integral and differential plots can be constructedfrom the chromatographic data. Most shale oils show density functions that are closeto a normal distribution.
To test column resolution, a mixture of l% each of C16 and C18 n-paraffin in asuitable solvent such as octane (C8) needs to be prepared. Inject the same volumeof this mixture as used in analyses of samples and obtain the chromatogram. Asshown in Figure 8.16, calculate resolution (R) from the distance between the C16
and C18 n-paraffin peaks at the peak maxima (d) and the width of the peaks at thebaseline (Y1 and Y2).
R = [2(d1 – d2)]/(Y1 + Y2) (8.22)
Resolution (R), based on Equation 8.22, must be at least 3 but not more than 8.Table 8.13 and Table 8.14 show the typical operating conditions and the boiling
points of n-paraffins, respectively. These tables provide very valuable informationregarding the boiling range properties of paraffinic hydrocarbons.
8.5 OIL SHALE EXTRACTION AND RETORTING PROCESSES
The organic matter in oil shale typically contains both bitumen and kerogen. Thebitumen fraction is soluble in most organic solvents, and it is not difficult to extractdirectly from oil shale. The readily soluble bitumen content in oil shale occupies
FIGURE 8.16 Column resolution (R). (Source: ASTM Standards D2887-73.)
Sam
ple
Inje
ctio
n
0
Y2 Y1
Peak Width [mm]
d1 [mm]
d2 [mm]
HEXADECANE OCTADECANE
© 2007 by Taylor & Francis Group, LLC

266 Handbook of Alternative Fuel Technology
only a minor portion, whereas insoluble kerogen accounts for the major portion ofoil shale organic matter. Furthermore, kerogen is nearly inert to most chemicalsowing to its macromolecular and complex structure, therefore making most reactiveprocesses less effective and making extraction more difficult.
Several different approaches are possible for the extraction of oil (organic matter)from the mineral matrix (inorganic rock matrix): (l) to drastically break the chemicalbonds of the organics, (2) to mildly degrade or depolymerize the organics, and (3)to use solvents that have extraordinarily strong solvating power. The first approachis widely used in industrial applications, as high-temperature pyrolysis decisivelycleaves the bonds of the organics. Retorting processes belong to this category andhave a long history. The second approach may be achieved by a biochemical processor a controlled oxidative process. The third approach can be accomplished by potentextraction methods, such as a supercritical fluid extraction process that is based onthe strong solvating power of a fluid in its supercritical region.
During the process of extraction of shale oil from oil shale, both chemical andphysical properties of oil shale play important roles. The low porosity, low perme-ability, and tough mechanical strength of the oil shale rock matrix make the extraction
TABLE 8.13Typical Operating Conditions
1 2 3 4
Column length (ft) 4 5 2 2Column ID (in) 0.188 0.090 0.188 0.188Liquid phase OV-1 SE-30 UC-W98 SE-30Percent liquid phase (%) 3 5 10 10Support material Sa Gb Gb Pc
Support mesh size 60/80 60/80 60/80 60/80Initial column temperature (°C) 20 40 50 50Final column temperature (°C) 360 350 350 390Programming rate (°C/min) 10 6.5 8 7.5Carrier gas He He N2 HeCarrier gas flow rate (ml/min) 40 30 60 60Detector TCD FID FID TCDDetector temperature (°C) 360 360 350 390Injection port temperature (°C) 360 370 200 390Sample size (µl) 4 0.3 1 5Column resolution (R) 5.3 6.4 6.5 3
Note: OV-1 = methyl silicone polymer liquid phase; SE-30 = dimethyl silicone elastomer liquidphase; UC-W98 = silicone liquid phase; TCD = thermal conductivity detector; FID = flameionization detector.a Diatoport S, silane-treated.b Chromosorb G (AW-DMS); AW = acid washed; DMS = treated with dimethylchlorosilane.C Chromosorb P, acid-washed.
Source: From ASTM Standards D2887.
© 2007 by Taylor & Francis Group, LLC

Shale Oil from Oil Shale 267
process less efficient by making the mass transport of reactants and products muchharder. Both heat and mass transfer conditions of a process also crucially affect theprocess economics as well as process efficiency.
The oil shale retorting processes can be classified as ex situ (or, above ground,off the sites) and in situ (or subsurface, within the existing formation) processes. Asthe names imply, ex situ processes are carried out above the ground after the shaleis mined and crushed, whereas in situ processes are carried out under the ground,thus not requiring mining of shale entirely.
In this section, various processes developed and demonstrated for oil shaleextraction are reviewed in terms of engineering and technological aspects.
8.5.1 EX SITU RETORTING PROCESSES
In an ex situ process, oil shale rock is mined, either surface or underground,crushed, and then conveyed to a retorter that is subjected to temperatures around500 to 550°C. At this temperature, chemical bonds of the organic compounds arebroken and the kerogen molecules are pyrolyzed, yielding simpler and lightermolecules.
TABLE 8.14Boiling Points of n-Paraffins
CarbonNumber
Boiling Point(°C)
CarbonNumber
Boiling Point(°C)
CarbonNumber
Boiling Point(°C)
2 89 17 302 32 4683 42 18 317 33 4764 0 19 331 34 4835 36 20 344 35 4916 69 21 356 36 4987 98 22 369 37 5058 126 23 380 38 5129 151 24 391 39 518
10 174 25 402 40 52511 196 26 412 41 53112 216 27 422 42 53713 235 28 432 43 54314 253 29 441 44 54815 271 30 45016 287 31 459
Note:C1 to C20 values taken from Selected Values of Hydrocarbons and Related Compounds, APIProject 44, Loose-Leaf data sheet: Table 20a–e (Part 1), April 30, 1956.C21 to C44 values taken from Vapor Pressures and Boiling Points of High Molecular WeightHydrocarbons, C21 to C100, report of Investigation of API Project 44, August 15, 1965.
Source: From ASTM Standards D2887.
© 2007 by Taylor & Francis Group, LLC

268 Handbook of Alternative Fuel Technology
The advantages of ex situ processes are:
1. Efficiency of organic matter recovery has been demonstrated to be high,about 70 to 90% of the total organic content of the shale. Therefore, theamount of wasted organic matter, i.e., the unextracted portion or theorganic residue, can be minimized by keeping the efficiency high.
2. Control of process operating variables is relatively straightforward. There-fore, the effects of undesirable process conditions can be minimized.
3. Once oil is formed, product recovery becomes relatively simple.4. Process units can be used repeatedly for a large number of retorting
operations.
However, the disadvantages of ex situ processes are:
1. Operating cost is usually high, as oil shale has to be first mined, crushed,transported, and then heated. Mining and transportation costs may becomequite significant.
2. Spent shale disposal, underground water contamination, and revegetationproblems are yet to be solved convincingly and effectively.
3. The process is somewhat limited to rich shale resources accessible tosurface mining. In this regard, process economics plays an important role.
4. The capital investment for large-scale units may become very high asreusability is typically limited. Once the mine is depleted, a part of theinvestment may be lost forever.
The liberated compounds from oil shale retorting include gas and oil, which iscollected, condensed, and upgraded into a liquid product that is roughly equivalentto crude oil. This oil can be transported by a pipeline or by a tanker to a refinery,where it is refined into the final product.
Various ex situ retorting processes are discussed in the following sections.
8.5.1.1 U.S. Bureau of Mines’ Gas Combustion Retort
The first major experimental retort was built and operated by the U.S. Bureau ofMines (USBM). From 1944 to 1956, pilot plant investigations of oil shale retortingwere carried out by USBM at facilities several miles west of Rifle, CO. Among thenumerous types of retorts, the gas combustion retort gave the most promising resultsand was studied extensively.43 This retort is made of a vertical, refractory-lined vesselthrough which crushed shale moves downward by gravity, countercurrent to theretorting gases. Recycled gases enter the bottom of the retort and are heated by thehot retorted shale as they pass upward through the vessel. Air and additional recyclegas (labeled as dilution gas) are injected into the retort through a distributor systemat a location approximately one third of the way up from the bottom and are mixedwith rising hot recycled gas. Figure 8.17 shows a schematic of a gas combustionretort. Combustion of the gases and of some residual carbon provides thermal energyto heat the shale immediately above the combustion zone to the retorting temperature.
© 2007 by Taylor & Francis Group, LLC

Shale Oil from Oil Shale 269
The incoming shale cools oil vapors and gases, and the oil leaves the top of theretort as a mist. The oil vapors and mists are subsequently chilled to produce liquidoil products that have to be upgraded.
This retort is similar to a moving bed reactor popularly used for coal gasificationin its operating concepts.
8.5.1.2 The TOSCO II Oil Shale Process
The TOSCO II oil shale retorting process was developed by The Oil Shale Corp.An article by Whitcombe and Vawter44 describes the process in detail and alsopresents economic projections for production of crude shale oil and hydrotreatedshale oil. As an oil shale process, the TOSCO process is one of the few completeprocesses for production of shale oil.
8.5.1.2.1 Process DescriptionOil shale is crushed and heated to approximately 480°C by direct contact with heatedceramic balls. At this temperature, the organic material (kerogen and bitumen) inoil shale rapidly decomposes to produce hydrocarbon vapor. Subsequent cooling ofthis vapor yields crude shale oil and light hydrocarbon gases. Figure 8.18 representsa schematic diagram of the process.
The pyrolysis reaction takes place in a retorting kiln (also referred to as thepyrolysis reactor or retort) shown in the central portion of the schematic. The feedstreams to the retort are l/2-in. diameter ceramic balls heated to about 600°C and
FIGURE 8.17 A gas combustion retort.
Separator
HeatRecovery
ProductCooling
Combustion
Retorting
∩
∩
Spent Shale
Raw Oil Shale
ProductOil
LowBTU Gas
Vent Gas
Air
Recycle Gas
Dilution Gas
Gaseous Effluent
© 2007 by Taylor & Francis Group, LLC

270 Handbook of Alternative Fuel Technology
preheated (substantially lower than 450οC) shales crushed to a size of l/2 in. orsmaller. The rotation of the retort mixes the feed materials and facilitates a high rateof heat transfer from the ceramic balls to the shale. At the discharge end of the retort,the ceramic balls and shale are at an isothermal (or near-isothermal) temperature bythe time the shale is fully retorted.
The hydrocarbon vapor formed by the pyrolysis reaction flows through a cycloneseparator to remove entrained solids, and then into a fractionation system, which issimilar to the primary fractionator of a catalytic cracking unit. From this stage onwards,oil vapor produces heavy oil, distillate oils, naphtha, and light hydrocarbon gases.
The ceramic balls and spent shale are moved from the retort into a cylindricaltrammel screen. Spent shale passes through the screen openings into a surge hopper.The ceramic balls move across the screen and into a bucket elevator for transport tothe ball heater, where they are reheated by direct contact with flue gas. The ceramicballs are then recycled back to the retort.
Spent shale, discharged from the retort at 480°C, is first cooled in a rotatingvessel containing tubes in which water is vaporized to produce high-pressure steam.The shale then flows into another rotating vessel in which it is further cooled bydirect contact with water. The water flow is controlled so that the spent shale fromthe vessel contains 12% moisture by mass. The moisture is added to control dustemissions to make the spent shale suitable for compaction before disposal.
The preheating of oil shale is achieved by direct contact between the crushedshale and the flue gas effluent from the ball heater. The gaseous effluent from theprocess is the flue gas used to heat the ceramic balls and to preheat the shale. The
FIGURE 8.18 The TOSCO II process.
Separator
Trommel
Fractionator
Raw
Crushed
ShaleDilutePhaseFluidBedPreheater
Warm
Balls
CeramicBallElevator
Preheated Shale
SurgeHopper
Hot Flue Gas
Sludge
Flue Gas
VenturiWetScrubber
Fuel Air
Recycle Balls
HC Vapors
Hot Balls
CeramicBall
Heater
PyrolysisDrum
Accumulator
HotProcessed
ShaleSteam
Cooler
Water SpentShale toDisposal
Moisturizer
BottomOils
Gas
Naphtha
Gas Oil
© 2007 by Taylor & Francis Group, LLC

Shale Oil from Oil Shale 271
process includes a wet scrubber system to control the particulate content of the gasand an incinerator to control its hydrocarbon content in the flue gas. Emission ofSOx and NOx are controlled by the choice of fuels used in the process, as well asthe firing temperatures of process heaters. The process effectively uses the conceptof energy integration for minimization of energy cost (in particular, heating shalesby contacting hot ceramic balls, producing steam using the residual heat of the spentshale, and managing and recovering flue gas energy).
8.5.1.2.2 Process Yield of TOSCOTests in a pilot plant and semiworks have shown that the TOSCO II process recoversnearly 100% of the recoverable hydrocarbon in oil shale, as determined by the Fischerassay procedure. It is remarkable that the TOSCO process may be regarded as aneffective scale-up of the Fischer assay procedure. Table 8.15 shows results from a7-day, continuous operation of the semiworks plant.44
The average plant yield during this period was 161.1 kg of hydrocarbons permetric ton of oil shale processed, approximately l.7% higher than by Fischer assayof the average shale sample used for the period.44
8.5.1.2.3 Gaseous and Crude Shale Oil Product from TOSCO Process
Table 8.16 shows a typical analysis of the C4 and higher hydrocarbons produced bythe TOSCO II retort. The effluent gas is practically free of nitrogen and contains agood amount of carbon dioxide produced by pyrolysis. However, a relatively highamount of hydrogen sulfide is also present, which has to be removed in the gascleanup stage.
Table 8.17 shows the properties of shale oil (C5 and heavier fractions) producedby the TOSCO II retorting process. The average sulfur level in the liquid oil productis 0.7%, whereas the average nitrogen content is l.9%, which is high compared tothat of conventional crude oils. The nitrogen content of conventional crude oil veryseldom exceeds l.0 percent by mass. The high level of nitrogen in shale oil may beattributed to the geological reason based on the original formation of this fossil fuel,
TABLE 8.15TOSCO II Semiworks Plant Yield Data
HydrocarbonsPlant Yield
(kg/t)Fischer Assay Yield
(kg/t)
Total hydrocarbons 161.1 158.3C1–C4 24.8 12.1C5 and heavier fractions 136.3 146.2Other gaseous products
H2 + CO 2.25 1.85CO2 + H2O 16.35 15.65
Source: From Whitcombe, J.A., and Vawter, R.G., Science and Technology
© 2007 by Taylor & Francis Group, LLC
of Oil Shale, Yen, Y.F., Ed., Ann Arbor Science MI, 1976, P.51, Table 4.l.

272 Handbook of Alternative Fuel Technology
i.e., oil shale deposits having come from protein-containing sources. The principalobjective of the hydrotreating process is removal of nitrogen compounds that arepoisonous to catalysts of many upgrading processes; including reforming, cracking,and hydrocracking.
8.5.1.2.4 TOSCO Process UnitsFigure 8.19 represents a schematic of the TOSCO II process for commercial oper-ation.44 The commercial plant involves two hydrotreating units. The first one is the
TABLE 8.16Typical Analysis of C4 and Lighter Gases from the TOSCO Semiworks Plant
Component/Fraction Mass%
H2 1.50CO 3.51CO2 33.08H2S 5.16CH4 11.93C2H4 8.67C2H6 8.43C3H6 11.08C3H8 5.45C4′s 11.19Total 100.00
Source: From Whitcombe, J.A. and Vawter, R.G., TheTOSCO-II oil shale process, in Science and Technol-ogy of Oil Shale, Yen, Y.F., Ed., Ann Arbor Science,Ann Arbor, MI, 1976, chap. 4.
TABLE 8.17Properties of Crude Shale Oil from TOSCO II Retorting Process
Boiling Rangesand Components Vol% °API
Mass%
S N
C5–204 17 51 0.7 0.4204–510 60 20 0.8 2.0510 + 23 6.5 0.7 2.9Total 100 21 0.7 l.9
Note: Boiling ranges are given in °C.
Source: From Whitcombe, J.A. and Vawter, R.G., The TOSCO-II oil shale process,in Science and Technology of Oil Shale, Yen, Y.F., Ed., Ann Arbor Science, AnnArbor, MI, 1976, chap. 4.
© 2007 by Taylor & Francis Group, LLC

Shale Oil from Oil Shale 273
distillate hydrotreater that processes the 200–500°C oil formed in the retorter plussimilar boiling range components formed in the coker. The second hydrotreater pro-cesses C5 to 200°C naphtha formed in the retort, the coker, and the distillate hydrotreater.The distillate hydrotreater is designed to reduce the nitrogen content of the 200°C-plusproduct from the unit to a level lower than 1000 ppm. The naphtha hydrotreater isdesigned to reduce the nitrogen content about 1 ppm or below. Sulfur removal is nearlycomplete in each of the hydrotreating units.44 The product compositions shown in Table8.14 can be altered by changing the fuels chosen for burning in the process facilities.The production of C5
+ fractions can be increased by burning the C3– products instead
of hydrotreated oil. Table 8.18 shows the properties of the C5–510°C fractions ofhydrotreated shale oil, which is a blend of sulfur-free distillate products.
Refining such hydrotreated oils is relatively straightforward and requires anatmospheric distillation unit and a reformer. It would produce gasoline, sulfur-freelight distillate fuels (No. l and No. 2 heating oils, as well as diesel fuel), and a sulfur-free heavier distillate fuel oil that is suitable for use as industrial fuel oil.44
8.5.1.2.5 Spent Shale DisposalThe typical spent shale produced by the TOSCO II process is a fine-grained darkmaterial comprising approximately 80 mass% of the raw oil shale fed. It contains anaverage 4.5% of organic carbon via char formation in a hydrogen-deficient environ-ment. The mineral constituents of spent shale consisting of principally dolomite,calcite, silica, and silicates are mostly unchanged by the retorting process treatment,except that some carbonate minerals such as dolomite decompose to oxides, liberating
FIGURE 8.19 A block flow diagram — shale oil hydrotreating plant. (Source: Thumann, A.,The Emerging Synthetic Fuel Industry, Fairmont Press, 1981.)
66,0
00 tp
d R
aw S
hale
950+
o F R
esid
Nap
htha
+Gas
Sour water
Hydrogen
H2S/CO2
H2S
Mining &Crushing
Shale
TOSCO IIProcess
Spent ShaleDisposal
Plant Fuel
GasRecovery
RetortVapor
OilRecovery
DelayedCoker
800 tpdCoke
Naphtha
Gas Oil
GasTreating
NaphthaHydrotreating
Gas OilHydrotreating
Plant Fuel
3.000 bpd LPG
SulfurPlant
180 tpd S
HydrogenPlant
45.000 tpdHydrotreated
Shale Oil
150 tpdNH3Byproduct
Separation
© 2007 by Taylor & Francis Group, LLC

274 Handbook of Alternative Fuel Technology
carbon dioxide. During the retorting process, significant size reduction also takesplace, yielding the particle (grain) size of most spent shale finer than 8 mesh.
The technology for spent shale disposal was seriously tested in 1965 after com-pletion of the 1000 ton/d semiworks plant at Parachute Creek. Small revegetation testplots were constructed in 1966 to evaluate both plant growth factors and plant species.In 1967, the first field demonstration revegetation plot was constructed and seeded.Extensive off-site investigations have been carried out, including the spent shalepermeability, quality analysis of water runoff from spent shale embankments, etc.
8.5.1.3 The Union Oil Retorting Process
In the Union Oil process, the heat needed for retorting is provided by combustionof coke inside the retort. The shale is fed from the bottom of the retort and conveyed(pumped) upward by means of a specially developed rock pump. The product oil issiphoned out from the bottom of the retort and fully recovered. The process is quiteunique and innovative, utilizing well-designed rock pumps and adopting a numberof designs for heating shales in the retort. According to a process described byDeering,45 coke-containing spent shale derived from a gas-heated reduction zone ispassed through a combustion-gasification zone countercurrently to an upflowingmixture of steam and oxygen-containing gas to effect partial combustion of the cokeon the spent shale, i.e., C + 1⁄2 O2 = CO. The resulting heat (exothermic heat) ofcombustion is used to support concurrent endothermic gasification reactions betweensteam and unburnt coke, i.e., C + H2O = CO + H2. Figure 8.20 shows a schematicof the Union Oil process. The oil shale feed rate can be varied considerably dependingon the size of the retort and the desired retention time.
The recycled water gas (CO + H2O + H2 + CO2) contains hydrogen, and it mustpass through the combustion-gasification zone in which hydrogen-burning temper-atures prevail. A significant aspect of the process is that the overall yield of hydrogen,even with such passage, is still not significantly affected. This retort uses lump shalesof about the same size range that the Gas Combustion Retort uses. Another importantfeature of the process is that it does not require cooling water.
TABLE 8.18Properties of Typical Hydrotreated Shale Oil
Boiling Rangesand Components Vol% °API
Nitrogen(ppm)
C5 –204 43 50 1204–361 34 35 800361–EP 23 30 1200Total 100 40a
Note: Boiling ranges are given in °C.
a °API for the total amount of the product.
Source: From Whitcombe, J.A. and Vawter, R.G., The TOSCO-II oil shale process, in Scienceand Technology of Oil Shale, Yen, Y.F., Ed., Ann Arbor Science, Ann Arbor, MI, 1976, chap. 4.
© 2007 by Taylor & Francis Group, LLC

Shale Oil from Oil Shale 275
The Union Oil Co. developed three different process designs as follows:
1. The A retort is the one in which internal combustion of gas and residualchar from shale provides the energy required for the process. This designis based on direct heating.
2. The B retort is the one in which the oil shale is heated indirectly by arecycled stream of externally heated gas.
3. The Steam-Gas Recirculation (SGR) retort is the one in which the heatcarrier for the process is generated in a separate vessel by gasifying theresidual char with air and steam.
Union Oil had accumulated pilot plant experiences with the preceding threedesigns; which included a 2-ton/d prototype and a 50-ton/d pilot plant using the Aretort design at Wilmington, CA, and a nominal 6-ton/d pilot retort using the B modeand a pilot using the SGR mode at the Union Research Center, Brea, CA. A larger-scale pilot plant was built near Parachute Creek in Western Colorado, where the oilshale could be mined readily from an outcrop of the Mahogany zone. The pilot planthad a capacity of l000 tons/d, and its operation was completely successful. Unocalceased operation in 1991. This operational experience is undoubtedly very valuablefor future commercialization of the process.
FIGURE 8.20 The Union Oil’s retorting-gasification process (Based on U.S. patent 4,010,092).
© 2007 by Taylor & Francis Group, LLC

276 Handbook of Alternative Fuel Technology
8.5.1.4 The Lurgi-Ruhrgas Process
The Lurgi-Ruhrgas (LR) process distills hydrocarbons from oil shale by bringingraw shale in contact with hot fine-grained solid heat carrier. The ideal heat carrierfor this process is the spent shale. However, if rich shales are used in the process asraw shales, they typically deteriorate into a fine powder during process treatmentand must be supplemented by more durable materials like sand for use as heatcarriers. A schematic of the L-R process is presented in Figure 8.21.
The pulverized oil shale and heat carriers are brought into contact in a mechani-cal mixer such as a screw conveyer. In pilot plant tests, the shale was first crushedto a maximum size of one fourth to one third of an inch, but larger commercialunits might process particles as large as half an inch.45 The oil vapor and gaseousproducts are cleaned of dust in a hot cyclone, and the liquid oil is separated bycondensation.
Retorted shale from the mixer passes through a hopper to the bottom of a liftpipe with the dust from the cyclone. Preheated air introduced at the bottom of thepipe carries the solids up to the surge bin. Solids are heated by the combustion ofthe residual char in the shale to approximately 550°C. In case residual char is notsufficient for this process, fuel gas is also added. In the surge bin, the hot solidsseparate from the combustion gases and return to the mixer, where they are broughtin contact with fresh oil shale, completing the cycle. As an improvement, a new designof surge bin was introduced by Kennedy and Krambeck.68 This improved surge binhas baffles that facilitate uniform flow of feed material through the surge bin.
FIGURE 8.21 The Lurgi-Ruhrgas retort system (Source: Matar, S., Synfuels: Hydrocarbonsof the Future, Pennwell Publishing Co., Tulsa, OK, 1982.)
Feed
Stack
Steam
Residue, 10% WaterMoistening Water
Boiler Feedwater DustyHeavy
Oil
HeavyOil
MiddleOil
GasLiquor
Washing Oiland Naphtha
SurplusGas
WashingOil
© 2007 by Taylor & Francis Group, LLC

Shale Oil from Oil Shale 277
Pilot plant tests have produced high yields, exceeding the Fischer assay valueof the raw Colorado shale, at approximately 30 gal/ton of shale. As no combustionoccurs in the mixer retort during this process, the product gas from the mixer has arelatively high calorific value (CV). The L-R process can operate with a wide rangeof particle sizes (very fine to medium) and, therefore, it can be modified for a varietyof shale feedstocks. The process hardware is mechanically simple except for themixer, which may be difficult to design because it must operate reliably in a harshenvironment. However, the movement of dust through the system potentially causestwo major problems of concern. One is the accumulation of combustible dust in thetransfer lines, increasing the likelihood of fires and plugging. The other is entrain-ment of dust in the oil produced. (Even though most of the dust is removed in thehot cyclone, some is inevitably carried over to the retort product.) When the crudeoil from the process is fractionated, the dust concentrates in the heaviest fraction,requiring an additional processing step. This heavy fraction can be diluted and filteredor recycled to the mixer.
The L-R process, originally developed in the 1950s for the low-temperatureflash-carbonization of coal, was tested on European and Colorado oil shale in a 20ton/d pilot plant at Herten, Germany. Two 850 ton/d pilot plants for carbonizingbrown coal were built in Yugoslavia in 1963, and a large plant that uses the L-Rprocess to produce olefins by cracking light oils was built in Japan.45,46
As an improvement over this process, time domain reflectometry (TDR) wasevaluated and developed by Reeves and Elgezawi67 to monitor volumetric watercontent (θv) in oil shale solid waste retorted and combusted by the Lurgi-Ruhrgasprocess. A TDR probe was designed and tested that could be buried and compactedin waste embankments and provide in situ measurements for θv in the high-salineand high-alkaline conditions exhibited by the spent oil shale solid waste.67
8.5.1.5 Superior’s Multimineral Process
The multimineral process was developed by the Superior Oil Co. In addition tosynthetic gas (syngas) and oil, it also produces minerals such as nahcolite (NaHCO3),alumina (Al2O3), and soda ash.47 A schematic of Superior Oil’s multimineral retortprocess is shown in Figure 8.22. The process is basically a four-step operation foroil shale that contains recoverable concentrations of oil, nahcolite, and dawsonite (asodium-aluminum salt [Na3Al(CO3)3··Al(OH)3]). Superior Oil had operated a pilotplant of this process in Cleveland, OH.
Nahcolite is in the form of discrete nodules that are more brittle than shale. Itis recovered by secondary crushing and screening, followed by a specialized processcalled photosorting that recovers nahcolite product of >80% purity. After removalof nahcolite, shale is retorted using the McDowell-Wellman process.45 The processwas originally developed as a stirred-bed, low-Btu coal gasifier. The unique, con-tinuously fed, circular-moving grate retort used in this process is a proven, reliablepiece of hardware that provides accurate temperature control, separate process zones,and a water seal that eliminates environmental contamination.
Nahcolite has been tested as a dry scrubbing agent to absorb sulfurous andnitrous oxides. Dawsonite in shale is decomposed in the retort to alumina and soda
© 2007 by Taylor & Francis Group, LLC

278 Handbook of Alternative Fuel Technology
ash. After shale is leached with recycled liquor and makeup water from the salinesubsurface aquifer, the liquid is seeded and pH is lowered to recover the alumina.This alumina can be extracted and recovered at a competitive price with aluminafrom bauxite. Soda ash is recovered by evaporation, and can be used for a varietyof industrial applications, such as neutralizing agents. The leached spent shale isthen returned to the process. The by-products that this process generates may makethe process economically even more attractive.
8.5.1.6 The Paraho Gas Combustion Process
The Paraho retort is a stationary, vertical, cylindrical, and refractory-lined kiln ofmild steel developed by Paraho Development Corp. Raw shale enters at the top andis brought to the retorting temperature by a countercurrent flow of hot combustiongases. A schematic of the Paraho gas combustion retort system is shown in Figure8.23. Shale is fed at the top along a rotating “pantsleg” distributor and movesdownward through the retort. The rising stream of hot gas breaks down the kerogento oil, gas, and residual char. The oil and gas are drawn off, and the residual charburns in the mixture of air and recycled gas. By injecting a part of the gas–air mixturethrough the bottom of the kiln, much of the sensible heat in the spent shale isrecovered. The retort temperature is controlled by adjusting the compositions of thegas–air mixtures to the preheat and combustion zones.45 Shale oil vapors flow upwardand pass at a moderate temperature to an oil recovery unit. The end products areshale oil and low-Btu gas. A typical analysis of crude shale oil from this process isshown in Table 8.19. The shale oil produced can be upgraded to a crude feedstock.
The heavy naphtha cut (88–178°C) from the treated oil has a higher octane ratingand lower sulfur than a comparable Arabian crude fraction. The diesel fraction(178–341°C) is identical to comparable fractions from other sources, so the heavycut can be used as a feedstock for cracking units.47
FIGURE 8.22 Superior oil’s multimineral retort system.
C O2
Fresh Water
Utilities Processing Products Mining
Condensate
Gas
Mined Oil Shale/Minerals
NahcoliteBeneficiation
Oil ShaleProcessing
Alumina &Soda AshRecovery
Oil Shale
Processed Shale
Spent Shale
Nahcolite
Oil
Alumina
Soda Ash Und
ergr
ound
min
ing
of O
il Sh
ale
and
Spen
t Sh
ale
Dis
posa
l
© 2007 by Taylor & Francis Group, LLC

Shale Oil from Oil Shale 279
Research and development on the Paraho retort, initiated by the company inAugust 1973, continued until April 1976 under the sponsorship of 17 energy andengineering companies. In 1978, Paraho delivered 100,000 bbl of raw shale oil tothe U.S. Navy for defense testing purposes.45
The Paraho process can handle shale particle sizes of at least 3 in., keepingcrushing and screening costs to a minimum, yet achieving a high conversion of betterthan 90% of Fischer assay. By burning the residual char and also recovering sensibleheat from the spent shale, a high thermal efficiency can be achieved. The process ismechanically simple, requiring little auxiliary equipment. Also, no water is requiredfor product cooling.
FIGURE 8.23 The Paraho process for shale oil extraction.
TABLE 8.19Typical Analysis of Paraho Retort Shale Oil
API gravity (°API) 19.70Nitrogen (wt%) 2.18Conradson carbon (wt%) 4.50Ash (wt%) 0.06Sulfur (wt%) 0.74Pour point (°C) 26.0Viscosity, cp, 38°C 256.0
Separator
Fresh Shale
Preheating& Mist
Formation
Pyrolysis
Stripping &Water Gas
Shift
PartialCombustion
Combustion
ResidueCooling
GrateSpeed
Controller
Air Blower
Spent Shale
Gas Blower
Shale Oil
Low-Btu Gas
© 2007 by Taylor & Francis Group, LLC

280 Handbook of Alternative Fuel Technology
In 1987, Paraho reorganized as New Paraho Corp. at Boulder, CO, and beganproduction of shale oil modified asphalt66 (SOMAT) asphalt additives, which is usedin test strips in five states in the U.S. In 1991, New Paraho reported successful testsof SOMAT shale oil asphalt additives.
8.5.1.7 Petrosix Retorting Process
The Petrosix retorting process was developed in Brazil by Petrobras to use oil shaledeposits in the Irati belt, which extends up to l200 km.47 The estimated deposit forthis area is 630 billion barrels of oil, 10 million tons of sulfur, 45 million tons ofliquefied gas and 22 billion m3 of fuel gas.
This process has an external heater that raises the recycle gas temperature toapproximately 700°C. The fuel for the heater can be gas, liquid, or solid. Shale iscrushed in a two-stage stem that incorporates a fine rejection system. This retort hasalso three zones, i.e., high, middle, and low.
Crushed shale is fed by desegregation feeders to the retort top and then it isforced downward by gravity, countercurrent to the hot gas flow. In the middle zone,hot recycle gas is fed at 700°C. Shale oil in mist form is discharged from the upperzone and is passed to a battery of cyclones and onto an electric precipitator tocoalesce. The shale is then recovered and some gas is recycled to the lower zone toadjust the retort temperature.47 The remaining gas is treated in a light-ends recoverysection sweetened (desulfurized), and discharged as liquefied petroleum gas (LPG).Figure 8.24 shows a schematic of the Petrosix retort process, and Table 8.20 showssome properties of shale oil produced by this process.47
FIGURE 8.24 The Petrosix retort system.
Spent Shale
Feed Shale
Retort
Water
Gas Seal
Cyclone
Precipitator
Compressor
Cool Recycle
Hot Recycle
Heater
To LP-gas, FuelGas, SulfurRecovery
© 2007 by Taylor & Francis Group, LLC

Shale Oil from Oil Shale 281
The most up-to-date version of the Petrosix process has the primary characteristicof being easy to operate.69 After the oil shale is taken out by open-cut mining, theshale goes to the grinder to reduce the particle size of the rocks (shales) that varybetween 6 to 70 mm. These ground shale rocks (stones) are then transferred to aretort, where they are heated at a temperature of approximately 500°C, therebyreleasing organic matter from the shale in the form of oil and gas.69
8.5.1.8 Chevron Retort System
A small pilot unit with a shale-feed capacity of l ton/d was developed by ChevronResearch. This process used a catalyst and a fractionation system. The pilot operatedon a staged, turbulent-flow bed process that reportedly used the shale completely. Figure8.25 shows a schematic of this process, which is also called shale oil hydrofining process.The heart of this process is in the shale oil upgrading part rather than in the retorting part.
TABLE 8.20Typical Shale Oil Properties by Petrosix47
Gravity (°API) 19.60Sulfur (wt%) l.06Nitrogen (wt%) 0.86Pour Point (°F) 25.0
Source: From Matar, S., Synfuels: Hydrocarbons of the Future,Pennwell Publishing Co., Tulsa, OK, 1982.
FIGURE 8.25 The Chevron shale oil hydrotreating system.
Whole OilHydrofining
MiddleDistillate
Hydrofining
FluidCatalyticCracking
CatalyticReforming
Ble
ndin
g
Atm
osph
eric
Dist
illat
ion
Atm
osph
eric
Dist
illat
ion
C4-
C4-
C5 & C6
180-350 oF
350-650 oF
650+ oF
430-625oF
625+oF
C4-H2
C4-
LightGasolineHeavyGasoline
RefineryFuel
DieselFuel
MotorGasoline
DewateredRaw Feed
© 2007 by Taylor & Francis Group, LLC

282 Handbook of Alternative Fuel Technology
8.5.1.9 Moving Bed Retorting Process
A U.S. patent by Barcellos60 describes a moving bed retorting process for obtainingoil, gas, sulfur, and other products from oil shale. The process comprises drying,pyrolysis, gasification, combustion, and cooling of pyrobituminous shale or similarrocks in a single passage of the shale continuously in a moving bed. The charge anddischarge of oil shale is intermittent, and the maximum temperature of the bed ismaintained within a range of about 1050–1200°C or even higher. The temperatureemployed in this process is much higher than any other retorting processes discussedin this chapter. At this high temperature, the shale is essentially completely freedfrom the organic matter, fixed carbon, and sulfur resulting in a clean solid residue,which can be disposed of without harming the ecology, according to the inventor'sclaim. The advantage of this process is claimed to be in its retorting efficiency, asthe process operates at high temperatures. However, a main concern may be in itsenergy efficiency and minimization of waste energy. No pilot plant research datahas been published for this process. No large-scale demonstration has been done onthis process.
8.5.1.10 The Carbon Dioxide Retorting Process
Lee and Joshi48 developed a retorting process that differs from other retortingprocesses in its chemistry by use of a different sweep gas, i.e., carbon dioxide.They claim that pyrolysis products of kerogen can be swept out far better in thecarbon dioxide medium and, therefore, the richest oil shales can be retorted withsignificantly higher yields than their Fischer assay values when carbon dioxide isused as a process gas. Other advantages of the processes include the suppressionof dolomite and calcite decomposition reaction because of the higher partial pres-sure of CO2 in the system.
The carbon dioxide retorting process can be adopted in various retort designswith little or no system configuration change. The preliminary experimental datashow that the CO2 retorting process substantially enhances the oil yields fromColorado and Australian shales over the conventional process (Fischer assay). How-ever, if the CO2 retorting process is applied to a lean, low-permeability shale, likeOhio Devonian shale, the swollen kerogen blocks the porepaths, resulting in pooreroil yields than the case with nitrogen as sweep gas as in Fischer assay. This processis scientifically interesting in the sense that kerogen swells and softens in bothsubcritical and supercritical CO2 medium. No large-scale demonstration has beendone on this process concept.
8.5.2 IN SITU RETORTING PROCESSES
Oil shale retorting can also be achieved underground, i.e., without mining the shale.Such a process is called an in situ oil shale retorting process or subsurface retorting.In a typical in situ process, the shale is fractured by either explosives or hydrostaticpressure. A portion of the oil shale organic matter is then burned to obtain heatnecessary for retorting. The retorted shale oil is pumped out of the production zonein a manner similar to the extraction of crude petroleum.
© 2007 by Taylor & Francis Group, LLC

Shale Oil from Oil Shale 283
The advantages of in situ processing include:
1. Oil can be recovered from deep deposits of oil shale formation.2. Mining costs can be eliminated, or minimized.3. There is no solid waste disposal problem, as all operations are conducted
through well bores. Therefore, the process may be environmentally moredesirable, as long as mineral leaching or harmful side effects of theprocessed shales are absent or controlled.
4. Shale oil can be extracted from leaner shale, e.g., deposits containing <15gal/ton of oil.
5. The process is ultimately more economical owing to elimination or reduc-tion of mining, transportation, and crushing costs.
However, the disadvantages of in situ processing are:
1. It is difficult to control subsurface combustion because of insufficientpermeability within the shale formation.
2. Drilling cost is still high.3. Recovery efficiencies are generally low.4. It is difficult to establish the required permeability and porosity in the
shale formation.5. There is a concern for possible contamination of aquifers. If not controlled
or treated, effects may linger for an extended period of time even afterthe project completion. Tests and control may require extensive efforts.
The in situ technology for production of shale oil from shales, in general,optimizes recovery process economics while minimizing environmental impact. Thisis why considerable emphasis has also been placed on these processes.
In situ retorting processes can be roughly classified into two types, i.e., modifiedin situ (MIS) and true in situ (TIS). MIS retorting, the brainchild of OccidentalPetroleum, involves partial mining of the oil shale deposit to create a void space andrubblizing the rest into this space so as to increase the overall permeability of theshale. The underground rubblized shale is then ignited using an external or internalfuel source.22 TIS retorting is similar to MIS, but no mining is done in this process.The shale deposits are rubblized to increase the permeability, and then the under-ground burning is begun.
A review of the oil shale literature indicates that all in situ oil shale processescan be classified into the following categories49:
1. Subsurface chimneyA. Hot gasesB. Hot fluidsC. Chemical extraction
2. Natural fracturesA. UnmodifiedB. Enlargements by leaching
© 2007 by Taylor & Francis Group, LLC

284 Handbook of Alternative Fuel Technology
3. Physical inductionA. No subsurface voids
Other ways of classifying the in situ oil shale retorting processes are:
1. Formation of retort cavitiesA. Horizontal sill pillarB. Columnar voidsC. Slot-shaped columnar voidsD. Multiple zone designE. Multiple horizontal unitsF. Multiple adjacent production zonesG. Multiple gallery-type retort zonesH. Spaced-apart upright retort chambersI. Permeability control of rubble pileJ. Formation of rich and lean zonesK. Successive rubblization and combustionL. Thermomechanical fracturingM.Water leaching and explosive fracturingN. Inlet gas meansO. Fluid communicationP. Cementation to minimize plastic flowQ. Near-surface cavity preparationR. Dielectric heating
2. Retorting techniquesA. Ignition techniquesB. Multistage operationC. Steam leaching and combustionD. Pressure swing recoveryE. Multistratum reservoirF. Production well throttlingG. Combined combustion techniquesH. Laser retortingI. Low-heat fans for frontal advance unitsJ. Gas introduction and blockageK. Water injectionL. Oil collection systemM.Handling system for feed and productsN. Uniform gas flowO. Postretorting flowP. Sound monitoringQ. Underground weir separatorR. Emulsion breaking techniqueS. Offgas recyclingT. Prevention of offgas leakage
© 2007 by Taylor & Francis Group, LLC

Shale Oil from Oil Shale 285
3. OthersA. Molecular sulfur and benzene recoveryB. Hydrogen sulfide and carbon dioxide treatmentC. Hot-fluid injection into solvent-leached shaleD. Steam treatment and extended soak periodE. Steam-driven excavating unitF. Anaerobic microorganismsG. Hot aqueous alkaline liquids and fluid circulationH. Plasma arc
In the second half of the 20th century, extensive research and development effortswere devoted to the commercialization of the in situ pyrolysis of oil shale. However,most of these efforts were either shelved, halted, or scaled down in the late 20thcentury because of the unfavorable process economics in the short term. As men-tioned earlier in the chapter, the comparative economics of shale oil has becomesubstantially more favorable in the 21st century. Several noteworthy processes aredescribed in the following sections.
8.5.2.1 Sinclair Oil and Gas Company Process
In 1953, Sinclair Oil and Gas Co. performed one of the earliest experiments on insitu oil shale retorting. Their process concept was similar to that shown in Figure8.26. Their study found that: (1) communication between wells could be establishedthrough induced or natural fracture systems, (2) wells could be ignited successfully,and (3) combustion could be established and maintained in the oil shale bed. Theyalso realized that high pressures were required to maintain injection rates during theheating period. These tests were conducted near the outcrop in the southern part ofthe Piceance Creek Basin.50 Additional tests were done several years later at a depthof about 365 m in the north-central part of the Piceance Creek Basin with somelimited success, which was believed to be due to the inability to obtain the requiredsurface area for the heat transfer. However, their experiments established the basictechnology required for in situ retorting of oil shale and suggested further study areas.
8.5.2.2 Equity Oil Co. Process
The Equity Oil Co. of Salt Lake City51 studied an in situ process that is somewhatdifferent from the Sinclair process. This process involves injecting hot natural gasinto the shale bed to retort the shale. One injecting well and four producing wellswere drilled into the oil shale formation in an area of the Piceance Creek Basin. Thenatural gas was compressed to about 85 atm, heated to approximately 480°C, anddelivered through insulated tubing to the retorting zone. Based on the experimentalresults and a mathematical model developed from them, it was concluded that thistechnique was feasible and potentially an economically viable method for extractingshale oil. However, the process economics is undoubtedly strongly dependent on thecost of natural gas and the amount required for makeup of natural gas. The costfluctuations of natural gas experienced at the beginning of the 21st century maymake this process less attractive than in the previous decades.
© 2007 by Taylor & Francis Group, LLC

286 Handbook of Alternative Fuel Technology
8.5.2.3 Occidental Petroleum Process
Occidental Petroleum developed a MIS process in which conventional explosivesare used to expand solid blocks of shale into a vertical mined-out cavity, creatingunderground chimneys of fractured shale. Figure 8.27 shows a schematic of thisretort design. To improve the fluid communication, about 10 to 25% of the shale inthe chimney is removed. Air is then blown down through the remaining crushedshale, and the top ignited with a burner that can be fueled with shale oil or offgasfrom other retorts. On ignition, the burner is withdrawn and the steam is mixed withthe inlet air to control the process.45 The liquid and gaseous products flow to thebottom of the chimney, leaving the char in the shale behind as the main source offuel for the slowly advancing flame front.
Occidental Petroleum did a series of field tests on this process at Logan’s Washin Debeque, CO, with 3 retorts — 30 ft. across and 72 ft. deep — each containing6,000 to 10,000 tons of oil shale. Based on their experimental success, full-scaleproduction of 57,000 bbl/d was very seriously considered.
FIGURE 8.26 An in situ oil shale retorting process.
CompressedAir Injection
Well
Overburden
Oil and GasProducing
Well
Raw ShaleRetortingZone
RetortedShale
Combustion ZoneBurned Shale
© 2007 by Taylor & Francis Group, LLC

Shale Oil from Oil Shale 287
8.5.2.4 LETC Process (LERC Process)
Laramie Energy Technology Center (LETC), currently Western Research Institute,has been sponsoring several field projects to demonstrate the technical and economicfeasibility of shale oil recovery by in situ technology.
LETC initiated their study on in situ retorting in the early 1960s with laboratorytests, simulated pilot plant tests on 10-ton and 150-ton retorts, and field tests at RockSpring, WY. The test results demonstrated that it was possible to move a self-sustaining combustion zone through an oil shale formation and to produce shale oil.
The underground shale bed is prepared for the LETC process by first boringinjection and production wells into the shale, and then increasing the permeability offormation by conventional fracturing techniques. Based on the LETC tests, the sequen-tial use of hydraulic fracturing and explosives worked best. Once the formation isfractured, hot gases are forced into it to heat the area surrounding the injection point.As the desired temperature is reached and air is substituted for the hot gas, combustionbegins and becomes self-sustaining across a front that gradually moves through thebed. As retorting progresses, oil and gas products are pumped out through the predrilledproduction wells. A schematic52 for the LETC process is shown in Figure 8.28.
8.5.2.5 Dow Chemical Co.’s Process
The Dow Chemical Co., under contract with the U.S. DOE, conducted a 4-yearresearch program to test the feasibility of deep in situ recovery of low-heat contentgas from Michigan Antrim Shale.53
FIGURE 8.27 A modified in situ retort of Occidental Petroleum.
Pillar
Pillar
Air and SteamGas
Overburden
Oil
Pillar
Pillar
Burned-out zone
Combustion Zone
FrontMovement
Retorting and Vaporization Zone
Vapor Condensation Zone
Oil, Water, and Gases
© 2007 by Taylor & Francis Group, LLC

288 Handbook of Alternative Fuel Technology
The Antrim shale is part of the eastern and midwestern oil shale deposits, formedsome 260 million years ago during the Devonian and Mississippian ages. These oilshales underlie an area of 400,000 mi2 (l.07 × 1012). In Michigan, the oil shale isapproximately 61 m thick and is in a basin at depths ranging from about 0.8 km tooutcroppings in three northern counties. The Michigan Antrim shale is believed tocontain an equivalent hydrocarbon volume of 2,500 bbl barrels. Even applying a 10%recovery factor, this resource is about 9 times the amount of the U.S. proven oil reserves.
Extensive fracturing (rubblizing) of the oil shale is considered essential foradequate in situ retorting and recovery of energy from the Antrim shale. Two wellswere explosively fractured using 19,000 kg of metalized ammonium nitrate slurry.Their test facility was located 75 mi north east of Detroit, MI, over 1 acre of field.The process used was TIS retorting.
Combustion of the shale was started using a 440-V electric heater (52 kW) anda propane burner (250,000 Btu/h). The special features of this process include shalegasification and tolerance to severe operating conditions. Their tests also showedthat explosive fracturing in mechanically underreamed wells did not produce exten-sive rubblization. They also tested hydrofracturing, chemical underreaming, andexplosive underreaming.
8.5.2.6 Talley Energy Systems Process
Talley Energy Systems Inc. carried out a U.S. DOE-Industry Cooperative oil shaleproject at 11 mi. west of Rock Springs, WY. The shale in this area is part of the
FIGURE 8.28 The Laramie Energy Technology Center (LETC) in situ retorting process.(From Cook, W.E., Q. Colo. Sch. Mines, 65(4), 133, 1970.)
CompressedAir
Injection Well Production Well
Overburden
Oil and Gas
Hot Gases Cool Gases
Oil
Burned Out Fire Distillation Water and Gas DriveTemperature
Profile
Water
© 2007 by Taylor & Francis Group, LLC

Shale Oil from Oil Shale 289
Green River shale formation, which is about 50 million years old. This process isalso based on TIS processing, and uses explosive fracturing, additional hydraulicfracturing, and no mining.
8.5.2.7 Geokinetics Process
Geokinetics Inc. developed an in situ process that may be best described by modifiedhorizontal technology. Explosive fracturing is used and the process can be used evenfor the shallow thin-seam recovery. This was one of the U.S. DOE–industry coop-erative oil shale projects, and was located 61 mi. northwest of Grand Junction, CO.The geological formation used for this process study was Green River formation,Parachute Creek member, and Mahogany zone, which was the same as for theOccidental Oil process. The only difference between the two is that the Geokineticsprocess is modified horizontal, whereas the Occident oil process is modified vertical.Therefore, the Geokinetics process is good for shallow thin-seam recovery, whereasthe Occidental Oil process is better suited for deep thick-seam recovery.
8.5.2.8 Osborne’s In Situ Process
This process was developed by Osborne in 1983; a U.S. patent54 describing theprocess has been assigned to Synfuel (an Indiana limited partnership). The processis unique, and enhanced oil recovery is achieved by forming generally horizontalelectrodes from the injection of molten metal into preheated or unheated fracturesof formation. A nonconductive spacing material is positioned in the casing of theborehole between the electrodes. A fracture horizontally intermediate between themetallic electrodes is propped up with a nonconductive granular material. Untermi-nated standing waves from a radio frequency (RF) generator are passed between theelectrodes to heat the oil shale formation. The hydrocarbons in the formation arevaporized and recovered at the surface by their transport through the intermediatefracture and tubing. By this method, radial metallic electrodes can be formed atvarious depths throughout a subterranean oil shale formation to devolatilize thehydrocarbons contained within the oil shale formation.54
One advantage of this process is in the uniform heating of the rock formationthat can be achieved by using RF electrical energy that corresponds to the dielectricabsorption characteristics of the rock formation. An example of such techniques isdescribed in U.S. Patent numbers 4,140,180 and 4,144,935, in which many verticalconductors are inserted into the rock formation and bound to a particular volume ofthe formation. A frequency of electrical excitation is selected to attain a relativelyuniform heating of the rock formation. The energy efficiency of the process is verygood; however, the economics of the process strongly depends on the cost of theelectrodes and RF generation. The other merits of the process include the relativeease of controlling the retort size.
The difficulty, however, with this process is in the necessity of implanting anelectrode within the subterranean rock formation at a precise distance. A schematicof this process is shown in Figure 8.29.
© 2007 by Taylor & Francis Group, LLC

290 Handbook of Alternative Fuel Technology
8.5.2.9 Shell Oil’s Thermally Conductive In Situ Conversion Process
Shell Oil is currently developing an in situ retorting process known as thermallyconductive in situ conversion.71 This process involves in situ heating of undergroundoil shale using electric heaters placed in deep vertical holes drilled through a sectionof oil shale. The entire volume of oil shale is heated over a period of 2 to 3 yearsuntil it reaches 650 to 700°F, at which point oil is released from the shale. Thereleased product is gathered in collection wells positioned within the heated zone.Shell’s current plan also involves use of ground-freezing technology to establish anunderground barrier called a freeze wall around the perimeter of the extraction zone.The freeze wall is created by pumping refrigerated fluid through a series of wellsdrilled around the extraction zone. The freeze wall prevents groundwater fromentering the extraction zone, and keeps hydrocarbons and other products generatedby the in situ retorting from leaving the project perimeter and contaminating thesurrounding soil.
In 1997, Shell Oil successfully conducted small-scale field tests of this novel insitu process based on slow underground heating via thermal conduction, on Mahoganyproperty. After deferring further tests because of economic reasons, Shell returned toMahogany for further tests in 2000, and the R & D program is currently in operation.Larger-scale operations need to be conducted to establish technical viability, espe-
FIGURE 8.29 A vertical sectional view of a borehole penetrating a subterranean oil shaleformation in completed condition for the recovery of hydrocarbons from oil shale — the Osborneprocess. (From Osborne, J., U.S. Patent No. 4,401,162, August 30, 1983.)
Terminals
Generator
Vaporized Product
Dielectric Pressure Seal
Bore Holes
Cement Coating
Metal Casing
Tubing
OIL SHALE FORMATION
FractureCut Slots
Pyrolysis Product
Electrode
Cement Base
© 2007 by Taylor & Francis Group, LLC

Shale Oil from Oil Shale 291
cially with regard to eliminating or alleviating any adverse impacts on groundwaterquality.71 The process has a number of merits that can contribute to lowering theprocessing cost of oil shale, as well as toward environmentally benign processing ofthis vast energy resource. The Shell Oil process is technologically classified as oneof the TIS retorting processes, as there is no mining of shale involved.
8.5.2.10 True In Situ (TIS) and Modified In Situ (MIS) Retorting
In situ retorting of oil shale is often classified into TIS and MIS cases, as brieflymentioned earlier. In this section, these two terms are further clarified.
TIS retorting involves drilling wells and fracturing oil shale rock to increase itspermeability. It, however, does not involve any mining of oil shale. Typically, a hotgas mixture is used to heat the oil shale rubble. Forced air then helps burn the oilshale. A flame front is formed and gradually moves through the bed, and the producedoil and gas are drawn through the production wells to the surface. As mentionedearlier, the Shell in situ process does not use a hot-gas heating technique to initiateretorting, but is classified as TIS process.
In TIS modified underground retorting, a blocked-out area is mined to removeapproximately 10 to 25% of the oil shale. Vertical or horizontal wells are drilledthrough the remaining portion and are detonated. The produced voids help fractureand rubblize the oil shale. This is a modification of the TIS conversion process andwas first developed by Occidental Oil.
8.5.3 SHALE OIL REFINING AND UPGRADING
As the demand for light hydrocarbon fractions constantly increases, there is muchinterest in developing economical methods for recovering liquid hydrocarbons fromoil shale on a commercial scale. However, the recovered hydrocarbons from oil shaleare not yet economically competitive against the petroleum crude produced. Further-more, the value of hydrocarbons recovered from oil shale is diminished because ofthe presence of undesirable contaminants. The major contaminants are sulfurous,nitrogenous, and metallic (and organometallic) compounds, which cause detrimentaleffects to various catalysts used in the subsequent refining processes. These contami-nants are also undesirable because of their disagreeable odor, corrosive characteristics,and combustion products that further cause environmental problems.
Accordingly, there is great interest in developing more efficient methods forconverting the heavier hydrocarbon fractions obtained in a form of shale oil intolighter-molecular-weight hydrocarbons. The conventional processes include catalyticcracking,73,74 thermal cracking,72 coking, etc.
It is known that heavier hydrocarbon fractions and refractory materials can beconverted to lighter materials by hydrocracking. These processes are most commonlyused on liquefied coals or heavy residual or distillate oils for the production ofsubstantial yields of low-boiling saturated products, and to some extent on interme-diates that are used as domestic fuels, and still heavier cuts that are used as lubricants.These destructive hydrogenation or hydrocracking processes may be operated on astrictly thermal basis or in the presence of a catalyst. Thermodynamically speaking,
© 2007 by Taylor & Francis Group, LLC

292 Handbook of Alternative Fuel Technology
larger hydrocarbon molecules are broken into lighter species when subjected to heat.The H-to-C ratio of such molecules is lower than that of saturated hydrocarbons,and abundantly supplied hydrogen improves this ratio by saturating reactions, thusproducing liquid species. These two steps may occur simultaneously.
However, the application of hydrocracking process has been hampered by thepresence of certain contaminants in such hydrocarbons. The presence of sulfur- andnitrogen-containing compounds along with organometallics in crude shale oils andvarious refined petroleum products has long been considered undesirable. Desulfu-rization and denitrification processes have been developed for this purpose.
8.5.3.1 Thermal Cracking Process
Gulf Research & Development55,56 developed a process for the noncatalytic thermalcracking of shale oil in the presence of a gaseous diluent and an entrained stream ofinert heat carrier solids. The cracking process is directed toward the recovery ofgaseous olefins as the primarily desired cracked product, in preference to gasoline-range liquids. By this process, it is claimed that at least 15 to 20% of the feed shaleoil is converted to ethylene, which is the most common gaseous product. Most of thefeed shale oil is converted to other gaseous and liquid products. Other importantgaseous products are propylene, l,3-butadiene, ethane, and other C4’s. Hydrogen isalso recovered as a valuable nonhydrocarbon gaseous product. Liquid products cancomprise 40 to 50 wt% or more of the total product. Recovered liquid products includebenzene, toluene, xylene, gasoline-boiling-range liquids, and light and heavy oils.
Coke is a solid product of the process and is produced by polymerization ofunsaturated materials. Coke is typically formed in an oxygen-deficient environmentvia dehydrogenation and aromatization.72 Most of the formed coke is removed fromthe process as a deposit on the entrained inert heat carrier solids.
The thermal cracking reactor does not require a gaseous hydrogen feed. In thereactor, entrained solids flow concurrently through the thermal riser at an averageriser temperature of 700 to 1400°C. The preferred high L-to-D ratio is in the rangeof a high 4:l to 40:l, or 5:l to 20:l preferably.
8.5.3.2 Moving Bed Hydroprocessing Reactor
This process was developed by Universal Oil Products Co.57 for deriving crude oilfrom oil shale or tar sands containing large amounts of highly abrasive particulatematter, such as rock dust and ash. The hydroprocessing takes place in a dual-functionmoving bed reactor, which simultaneously removes particulate matter by the filteraction of the catalyst bed. The effluent from the moving bed reactor is then separatedand further hydroprocessed in fixed bed reactors with fresh hydrogen added to theheavier hydrocarbon fraction to promote desulfurization.
A preferred way of treating the shale oil involves using a moving bed reactorfollowed by a fractionation step to divide the wide-boiling-range crude oil producedfrom the shale oil into two separate fractions. The lighter fraction is hydrotreated forthe removal of residual metals, sulfur, and nitrogen, whereas the heavier fraction iscracked in a second fixed bed reactor normally operated under high-severity conditions.
© 2007 by Taylor & Francis Group, LLC

Shale Oil from Oil Shale 293
Hydrotreating (HDT) reactions are generally carried out at high pressures(100–3000 psi) and high temperatures (270–350°C). During hydrotreating, the fol-lowing reactions take place: hydrodesulfurization,77 hydrodenitrogenation, hydrode-metalization, hydrodeoxygenation, and hydrogenation.73
8.5.3.3 Fluidized Bed Hydroretort Process
This process was developed by Cities Service Co.58 in 1978. The process eliminatesthe retorting stage of conventional shale upgrading, by directly subjecting crushedoil shale to a hydroretorting treatment in an upflow, fluidized bed reactor such asthat used for the hydrocracking of heavy petroleum residues. This process is a single-stage retorting and upgrading process. Therefore, the process involves: (1) crushingoil shale, (2) mixing the crushed oil shale with a hydrocarbon liquid to provide apumpable slurry, (3) introducing the slurry along with a hydrogen-containing gasinto an upflow, fluidized bed reactor at a superficial fluid velocity sufficient to movethe mixture upwardly through the reactor, (4) hydroretorting the oil shale, (5) remov-ing the reaction mixture from the reactor, and (6) separating the reactor effluent intoseveral components.59
The mineral carbonate decomposition is minimized, as the process operatingtemperature is lower than that used in retorting. Therefore, the gaseous product ofthis process has a greater heating value than that of other conventional methods. Inaddition, owing to the exothermic nature of the hydroretorting reactions, less energyinput is required per barrel of product obtained. Furthermore, there is practically noupper or lower limit on the grade of oil shale that can be treated.
8.5.3.4 Hydrocracking Process
Hydrocracking is essentially a cracking process in which higher-molecular-weighthydrocarbons pyrolyze to lower-molecular-weight paraffins and olefins in the pres-ence of hydrogen.74 The hydrogen saturates the olefins formed during the crackingprocess. Hydrocracking is used to process low-value stocks with a high heavy metalcontent. It is also suitable for highly aromatic feeds that cannot be processed easilyby conventional catalytic cracking. Shale oils are not highly aromatic, whereas coalliquids are very highly aromatic.
Middle-distillate (often called mid-distillate) hydrocracking is carried out witha noble metal catalyst. The average reactor temperature is 480°C, and the averagepressure is around 130 to 140 atm. The most common form of hydrocracking iscarried out as a two-stage operation.74 The first stage is to remove nitrogen com-pounds and heavy aromatics from the raw crude, whereas the second stage is tocarry out selective hydrocracking reactions on the cleaner oil from the first stage.Both stages are processed catalytically. Once the hydrocracking stages are over, theproducts go to a distillation section that consists of a hydrogen sulfide stripper anda recycle splitter. Commercial hydrocracking processes include Gulf HDS, H-Oil,IFP Hydrocracking, Isocracking, LC-Fining, Microcat-RC (also known as M-Coke),Mild Hydrocracking, Mild Resid Hydrocracking (MRH), Residfining, Unicracking,and Veba Combi-Cracking (VCC).74
© 2007 by Taylor & Francis Group, LLC

294 Handbook of Alternative Fuel Technology
REFERENCES
1. Taylor, R.B., Oil Shale Commercialization: The Risks and the Potential, ChemicalEngineering, September 7, 1981.
2. Thumann, A., The Emerging Synthetic Fuel Industry, Fairmont Press, Lilburn, GA,1981.
3. Tisot, P.R. and Murphy, W.I.R., Chem. Eng. Prog. Symp. Ser., 61(54), 25, 1965.4. Tisot, P.R., J. Chem. Eng. Data, 12(3), 405, 1967.5. Nottenburg, R., Rajeshwar, K., Rosenvold, R., and Dubow, J., Fuel, 58, 144, 1979.6. Prats, M. and O'Brien, S.M., J. Pet. Technol., 97, 1975.7. Nottenburg, R., Rajeshwar, K., Rosenvold, R., and Dubow, J., Fuel, 57, 789, 1978.8. Tihen, S.S., Carpenter, H.C., and Sohns, H.W., Thermal Conductivity and Thermal
Diffusivity of Green River Oil Shale, Conf. Thermal Conductivity Proc. 7th, NBSSpecial Publ. 302, p. 529, Sept. 1968.
9. Lee, S., Oil Shale Technology, CRC Press, Boca Raton, FL, 1991.10. Barnes, A.L. and Ellington, R.T., Q. Colo. Sch. Mines, 63(4), 827, 1968.11. Sladek, T., Ph.D. thesis, A Determination of the Composition and Temperature Depen-
dencies of Thermal Conductivity Factors for Green River Oil Shale, Colorado Schoolof Mines, Golden, CO, 1970.
12. Dubow, J., Nottenburg, R., Rajeshwar, K., and Wang, Y., The Effects of Moisture andOrganic Content on the Thermophysical Properties of Green River Oil Shale, 11thOil Shale Symposium Proc., Colorado School of Mines, Golden, CO, 1978, p. 350.
13. Johnson, W.F., Walton, D.K., Keller, H.H., and Couch, E.J., Q. Colo. Sch. Mines,70(3), 237, 1975.
14. McKee, R.H. and Lyder, E.E., J. Ind. Eng. Chem., 13, 613, 1921.15. Wang, Y., Rajeshwar, K., Rosenvold, R., and Dubow, J., Thermochim. Acta, 30, 141,
1979.16. Shih, S.-M. and Sohn, H.Y., Fuel, 57, 662, 1978.17. Wise, R.L., Miller, R.C., and Sohns, H.W., U.S. Bur. Mines Rep. Invest., 7482, 1971.18. Shaw, R.J., U.S. Bur. Mines Rep. Invest., 4151, 1947.19. Sohns, H.W., Mitchell, L.E., Cox, R.J., Burnet, W.I., and Murphy, W.I.R., Ind. Eng.
Chem., 43, 33, 1951.20. Cook, W.E., Q. Colo. Sch. Mines, 65(4), 133, 1970.21. Johnson, P.R., Young, N.B., and Robb, W.A., Fuel, 54, 249, 1975.22. Gregg, M.L., Campbell, J.H., and Taylor, J.R., Fuel, 60, 179, 1981.23. Wang, Y., M.S. thesis, A Single Particle Model for Pyrolysis of Oil Shale, University
of Akron, Akron, OH, 1982.24. Smith, J.W., U.S. Bur. Mines Rep. Invest., 7248, 1969.25. Allred, V.D., Q. Colo. Sch. Mines, 59(3), 47, 1964.26. Branch. M.C., Prog. Energy Combust. Sci., 5, 193, 1979.27. Joshi, R., M.S. thesis, A Comparative Study between the Kinetics of Retorting of
Ohio and Colorado Shale, University of Akron, Akron, OH, 1983.28. Yen, Y.F., Structural investigations on Green River oil shale, in Science and Technol-
ogy of Oil Shale, Yen, Y.F., Ed., Ann Arbor Publishers, Ann Arbor, MI, 1976.29. Cook, E.W., Fuel, 53, 16, 1976.30. Eggertsen, F.T., Groennings, S., and Holst, J.J., Anal. Chem., 32(8), 904, 1960.31. ASTM Standards D2887-06, Standard Test Method for Boiling Range Distribution
of Petroleum Fractions of Gas Chromatography, ASTM International, 2006.32. Rajeshwar, K., Nottenburg, R., and Dubow, J., J. Mater. Sci., 14, 2025–2052, 1979.
© 2007 by Taylor & Francis Group, LLC

Shale Oil from Oil Shale 295
33. Wang, Y., Dubow, J., Rajeshwar, K., and Nottenburg, R., Thermochim. Acta, 28, 23,1979.
34. Johnson, D.R., Young, N.B., and Smith, J.W., LERC/Rl, Laramie Energy ResearchCenter, Laramie, Wyoming, June 1977.
35. Dyni, J.R., Mountjoy, W., Hauff, P.L., and Blackman, P.D., U.S. Geological Survey,Professional Paper No. 750B, 1971.
36. Loughman, F.C. and See, G.T., Am. Miner., 52, 1216, 1967.37. Huggins, C.W. and Green, T.E., Am. Miner., 58, 548, 1973.38. Skrynnikova, G.N., Avdonina, E.S., Golyand, M.M., and Akhmedova, L. Ya., Trudy
Vsesoyuz Nauch-Issledovatel Inst. Pererab. Slants., 7, 80, 1959.39. Agroskin, A.A. and Petrenko, I.G., Zavodskaya Lab., 14, 807, 1948.40. Scott, J.H., Carroll, R.D., and Cunningham, D.R., J. Geophys. Res., 72, 5101, 1967.41. Nottenburg, R., Rajeshwar, K., Freeman, M., and Dubow, J., Thermochim. Acta, 31,
39, 1979.42. Rajeshwar, K., Nottenburg, R., Dubow, J., and Rosenvold, R., Thermochim. Acta, 27,
357, 1978.43. Matzick, A., Dannenburg, R.O., Ruark, J.R., Phillips, J.E., Lankford, J.D., and Guth-
rie, B., U.S. Bureau of Mines Bulletin, 635, 99, 1966.44. Whitcombe, J.A. and Vawter, R.G., The TOSCO-II oil shale process, in Science and
Technology of Oil Shale, Yen, Y.F., Ed., Ann Arbor Science, Ann Arbor, MI, 1976,chap. 4.
45. National Research Council (U.S.), Panel on R&D Needs in Refining of Coal andShale Liquids, Refining Synthetic Liquids from Coal and Shale, National AcademyPress, Washington, D.C., 1980, chap. 5, pp. 78–135.
46. Rammler, R.W., Q. Colo. Sch. Mines, 65(4), 141–168, 1970.47. Matar, S., Synfuels: Hydrocarbons of the Future, Pennwell Publishing Co., Tulsa,
OK, 1982.48. Lee, S. and Joshi, R., U.S. Patent No. 4,502,942, March 5, 1985.49. Yen, T.F., Oil shales of United States: a review, in Science and Technology of Oil
Shale, Yen, T.F., Ed., Ann Arbor Science, Ann Arbor, MI, 1976, pp. 1–17.50. Dinneen, G.U., Retorting technology of oil shale, in Oil Shale, Yen, T.F. and Chilin-
garran, G.V., Eds., Elsevier, Amsterdam, Netherlands, 1976, chap. 9, pp. 181–197.51. Dougan, P.M., Reynolds, F.S., and Root, P.J., The potential for in situ retorting of oil
shale in the Piceance Creek Basin of northwestern Colorado, Q. Colo. Sch. Mines,65(4), 57–72, 1970.
52. Sladek, T.A., Recent Trends in Oil Shale — Part 2: Mining and Shale Oil ExtractionProcesses, Colorado School of Mines Mineral Industries Bulletin, 18(1), pp. 1–20, 1975.
53. McNamara, P.H. and Humphrey, J.P., Hydrocarbons from Eastern Oil Shale, ChemicalEngineering Progress, September 1979, p. 88.
54. Osborne, J., U.S. Patent No. 4,401,162, August 30, 1983.55. Wynne, F.E., Jr., U.S. Patent No. 4,057,490, November 8, 1977.56. McKinney, J.D., Sebulsky, R.T., and Wynne, F.E., Jr., U.S. Patent No. 4,080,285,
March 21, 1978.57. Anderson, R.F., U.S. Patent No. 3,910,834, October 7, 1975.58. Gregoli, A.A., U.S. Patent No. 4,075,081, February 21, 1978.59. Ranney, M.W., Oil Shale and Tar Sands Technology-Recent Developments, Noyes
Data Corporation, NJ, 1979, p. 238.60. Barcellos, E.D., U.S. Patent No. 4,060,479, November 29, 1977.61. Qian, J., Wang, J., and Li, S., Oil shale development in China, Oil Shale, Vol. 20,
No. e Special, 356–359, 2003.
© 2007 by Taylor & Francis Group, LLC

296 Handbook of Alternative Fuel Technology
62. Web site of Energy Minerals Division, American Association of Petroleum Geolo-gists, http://emd.aapg.org/technical_areas/oil_shale.cfm.
63. Web site of World Energy Council, Survey of Energy Resources, http://www.worlden-ergy.org/wec-geis/publications/reports/ser/shale/shale.asp.
64. Hill, J.O., Thermogravimetric analysis, in Encyclopedia of Chemical Processing(EChP), Lee, S., Ed., Vol. 5, Taylor & Francis, New York, 2005, pp. 3017–3029.
65. Laherrere, J., Review on Oil Shale Data, September 2005, www.oilcrisis.com/laher-rere/OilShaleReview200509.pdf.
66. Lukens, L.A., Asphalt Rejuvenater and Recycled Asphalt Composition, U.S. PatentNo. 5,755,865, May 1998.
67. Reeves, T.L. and Elgezawi, S.M., Time domain reflectometry for measuring volu-metric water content in processed oil shale waste, Water Resources Research, 28(3),769–776, 1992.
68. Kennedy, C.R. and Krambeck, F.J., Surge Bin Retorting Solid Feed Material, U.S.Patent No. 4,481,100, 1984.
69. Petrobras Web site about Petrosix process (2006), http://www2.petrobras.com.br/minisite/refinarias/ingles/six/conheca/ProcPetrosix.html.
70. Poulson, R.E., Jensen, H.B., and Cook, G.L., ACS Div. Pet. Chem. Prepr., 15(1),A49–A55, 1971.
71. Bartis, J.T., LaTourrette, T., Dixon, L., Peterson, D.J., and Cecchine, G., Oil ShaleDevelopment in the United States: Prospects and Policy Issues, MG-414-NETL,report prepared for National Energy Technology Laboratory, U.S. Department ofEnergy, part of RAND Corporation Monograph Series, 2005.
72. Tsai, T.C. and Albright, L.F., Thermal cracking of hydrocarbons, in Encyclopedia ofChemical Processing (EChP), Lee, S., Ed., Vol. 5, Taylor & Francis, New York, 2006,pp. 2975–2986.
73. Kundu, A., Dwivedi, N., Singh, A., and Nigam, K.D.P., Hydrotreating catalysts andprocesses — current status and path forward, in Encyclopedia of Chemical Processing(EChP), Lee, S., Ed., Vol. 2, Taylor & Francis, New York, 2006, pp.1357–1366.
74. Speight, J.G., Hydrocracking, in Encyclopedia of Chemical Processing (EChP), Lee,S., Ed., Vol. 2, Taylor & Francis, New York, 2005, pp.1281–1288.
75. Chilingarian, G.V. and Yen, T.F., Bitumens, Asphalts, and Tar Sands, Elsevier, Amster-dam, 1978, chap. 1.
76. Hill, J.O., Thermal analysis techniques, in Encyclopedia of Chemical Processing(EChP), Lee, S., Ed., Vol. 5, Taylor & Francis, New York, 2005, pp. 2965–2974.
77. Song, C. and Turaga, U.T., Desulfurization, in Encyclopedia of Chemical Processing(EChP), Lee, S., Ed., Vol. 1, 2005, pp.651–661.
78. Kesavan, S.K. and Lee, S., Fuel Sci. Technol. Int., 6(5), 505, 1988.
© 2007 by Taylor & Francis Group, LLC

297
9 Methanol Synthesisfrom Syngas
Sunggyu Lee
CONTENTS
9.1 Introduction .................................................................................................. 2979.2 Chemistry of Methanol Synthesis ............................................................... 299
9.2.1 Conversion of Syngas to Methanol ................................................. 2999.2.1.1 CO Hydrogenation as Principal Reaction for Synthesis
of Methanol....................................................................... 3009.2.1.2 CO2 Hydrogenation as Principal Reaction for Methanol
Synthesis ........................................................................... 3019.2.1.3 Chemical Reactions under Extreme Syngas Conditions .... 301
9.2.1.3.1 CO-Free Syngas Feed .................................... 3019.2.1.3.2 CO2-Free Syngas Feed Conditions ................ 3029.2.1.3.3 H2O-Free Syngas Feed Conditions ................ 303
9.2.2 Active Form of Methanol Synthesis Catalyst ................................. 3049.2.3 Chemical Equilibrium...................................................................... 3059.2.4 Properties of Methanol .................................................................... 3069.2.5 Reaction with Methanol................................................................... 308
9.3 Methanol Synthesis Technology.................................................................. 3109.3.1 The Conventional ICI’s 100-atm Methanol Synthesis Process........ 3129.3.2 Haldor Topsoe A/S Low-Pressure Methanol Synthesis Process ...... 3139.3.3 Kvaerner Methanol Synthesis Process ............................................ 3159.3.4 Krupp Uhde’s Methanol Synthesis Technology.............................. 3159.3.5 Lurgi Öl-Gas-Chemie GmbH Process............................................. 3169.3.6 Synetix LPM Process....................................................................... 3179.3.7 Liquid-Phase Methanol Process ...................................................... 319
9.4 Future of Methanol ...................................................................................... 320References.............................................................................................................. 320
9.1 INTRODUCTION
The catalytic synthesis of methanol has continuously attracted substantial interest fromindustry, academia, and government, even though the technology for commercialsynthesis of methanol has been quite mature and readily available since the 1920s.
© 2007 by Taylor & Francis Group, LLC

298 Handbook of Alternative Fuel Technology
Over the decades, scientists and engineers have tried to develop better catalysts thatwould enable the synthesis reaction to be carried out at less severe conditions withhigher efficiencies. Efforts have also been made to diversify the raw material sourcesfrom mainly natural gas to coal and others, including biomass. Owing to the enor-mous volume of methanol demands in a variety of industrial sectors, the size ofcommercial production units has been ever increasing, thus making process effi-ciency of utmost importance for process economics and viability. The environmentalconstraints on the process have also played a major role in the production andutilization of methanol.1
Even though methanol is very widely used in chemical, petrochemical, pharma-ceutical, and polymer industries as raw materials for synthesis reactions as well assolvents for other chemicals, market demand and interest have long been tied to globalpolitics and contemporary issues. It is also true that whenever the petroleum price isuncontrollably high, interest in methanol becomes more intense. It may be recalledthat the movement toward oxygenated fuel for cleaner air pushed methanol demandvery high, for the manufacture of methyl-tert-butyl ether (MTBE)12; however, this boomdid not last too long after the harmful health effects of MTBE were discovered andchallenged. This chemical, MTBE, as a gasoline-blending oxygenate, was once thefastest-growing chemical commodity of the world market, in the 1990s.
Methanol is very toxic and fatal if taken internally by humans or animals.Methanol is far more toxic than ethanol, which is a homologue of the former. Eventhough the methanol molecule contains only one carbon and has a low molecularweight (of only 32) that is about the same as oxygen, its synthesis chemistry isquite complex and controversial. Methanol itself has a high octane value, 105, andburns cleanly. Similar to ethanol, methanol raises the octane rating of gasoline andreduces engine “knock” or “ping” without affecting the efficiency of the conven-tional catalytic converter. A 5% blend of methanol in unleaded gasoline may raisethe octane rating at the pump by 1–1.5. However, its use as a gasoline-blendingfuel to enhance the oxygenate content of gasoline has not been popular, owing tothe relatively high volatility of the methanol-blended gasoline. Methanol has out-standing chemical properties as an excellent solvent as well as chemical reactantin a number of important chemical syntheses. In recent years, it has become apopular choice for the development of fuel cell technologies, in particular, directmethanol fuel cells (DMFCs).4
The methanol economy is a hypothetical future economy in which methanol fuelwould have replaced fossil fuels as a means of transportation of energy. It offers analternative to the hydrogen economy and the ethanol economy. Many arguments areoffered for preferring the methanol economy against the hydrogen economy, in termsof the cost of energy generation, cleanness of conversion processes, continueddependence on fossil fuel sources, volumetric power density, infrastructural cost,safety associated with the fuel in various aspects of synthesis, distribution, storage,etc. DMFCs are being very actively developed to power portable electronics. Theycan be a very viable power source in many applications if their power density andenergy conversion efficiency can be increased.4 As such, methanol in DMFC can bea contributing player in consumer electronics and many other domestic applications.
© 2007 by Taylor & Francis Group, LLC

Methanol Synthesis from Syngas 299
Methanol synthesis is also a good subject for academic research and teaching.A number of process design problems have been developed for students as well asfor textbook examples. Methanol synthesis involves a great deal of model andpractical problems in a variety of topics including classical thermodynamics, con-densed phase thermodynamics, reaction mechanisms, reactor design, reactor mod-eling, reactor configuration, catalyst design, catalyst life management, pore diffusionand external mass transfer, recycling of unreacted feed stream, separation, energyintegration, process integration, process economics, environmental engineering, andcost accounting.
In this chapter, a comprehensive overview of methanol chemistry and synthesistechnology is presented with a particular emphasis placed on its value as an alter-native fuel and petrochemical feedstock.
9.2 CHEMISTRY OF METHANOL SYNTHESIS
The catalytic synthesis of methanol has been commercially available since 1923,when the first commercial plant for the synthesis of methanol from syngas was builtby BASF.1 The technology of manufacturing methanol has gone through constantimprovements and major modifications, among which the biggest change wasundoubtedly a transition from high-pressure synthesis to low-pressure synthesis.Both process technologies adopted heterogeneous catalytic conversion to methanolfrom synthesis gas typically originated from natural gas or, alternatively, from coal.The quality and composition of synthesis gas differ very widely, depending on theprocess of conversion as well as the type and quality of the feedstock. Therefore, avariety of commercial process designs reflected and encompassed these differences.Accordingly, it is imperative that the chemistry of synthesis gas conversion be fullyelucidated in the synthesis of methanol and further conversion of methanol into otherpetrochemicals, including alternative hydrocarbon fuels.
9.2.1 CONVERSION OF SYNGAS TO METHANOL
Synthesis gas is a mixture that contains hydrogen, carbon monoxide, and carbondioxide as principal components, and methane and steam (moisture) as secondarycomponents. Synthesis gas is also called syngas. Syngas is typically produced viasteam reforming of natural gas, gasification or partial oxidation of coal, gasificationof biomass, gasification of municipal solid wastes (MSWs), coke oven gas, etc. Thesynthesis of methanol from syngas is typically conducted over a heterogeneouscatalyst system, most popularly coprecipitated Cu/ZnO/Al2O3, which is a reducedform of CuO/ZnO/Al2O3. In such a catalyst formulation, alumina (Al2O3) is a supportthat can be replaced by other similar supports such as ThO2. The principal stoichi-ometric reactions involved in this chemical conversion are:
CO2 + 3H2 = CH3OH + H2O
CO + 2H2 = CH3OH
CO + H2O = CO2 + H2
© 2007 by Taylor & Francis Group, LLC

300 Handbook of Alternative Fuel Technology
As can be seen from the preceding stoichiometric representation, only two ofthese three reaction equations are stoichiometrically independent. Stoichiometricindependence can be very easily verified either by Gauss elimination type of math-ematical procedure as well as by derivability of the third equation from a linearcombination of the other two. In this specific case, a linear combination of any twostoichiometric equations would result in the third equation, thus leaving the systemwith only two independent stoichiometric reactions. If the stoichiometry and materialbalances are the only problems, there is very little difference with regard to whichtwo are to be chosen as principal reactions. However, if the mechanistic view of theprocess synthesis is involved, then the choice of the two principal reactions needsto be in line with real-world situations. This is where a controversy exists regardingthe synthesis of methanol over a Cu/ZnO/Al2O3 catalyst system.1,5,7,9,19
There are twomajor mechanistic views regarding the principal reactions in methanol synthesisfrom syngas over a Cu/ZnO/Al2O3 system.
9.2.1.1 CO Hydrogenation as Principal Reaction for Synthesis of Methanol
In this mechanistic view, the principal reactions have been taken as:
CO + 2H2 = CH3OH
CO2 + H2 = CO + H2O
According to this view, methanol is predominantly synthesized via direct hydro-genation of carbon monoxide. The second reaction is the reverse water gas shiftreaction (RWGS), which proceeds in the reverse direction. Thus, the direction of theWGS reaction is determined from material balance considerations, not necessarilyfrom chemical thermodynamic considerations. Experimental reaction data involvingtypical syngas mixtures that contain 3 to 9% CO2 show a decrease in carbon dioxideconcentration in the reactor effluent stream; thus, we intuitively infer that the WGSreaction proceeds in the direction of reducing carbon dioxide concentration, i.e., inthe reverse direction. However, it must be noted that this explanation is consistentonly when the principal reaction is believed to be hydrogenation of carbon monoxide.
It should also be noted that the first reaction of the methanol synthesis isexothermic, whereas the second reaction of reverse water gas shift is endothermic.According to this mechanism, via depletion of carbon dioxide in the reverse WGSreaction, more reactant carbon monoxide is produced to boost the synthesis ofmethanol. The role of carbon dioxide in the overall synthesis was crucially importantfor reasons other than participation in the WGS reaction, as evidenced consistentlyby various investigators in the laboratory as well as engineers in the field. Deficiencyof carbon dioxide in the feed composition can be extremely detrimental to the overallsynthesis, very rapidly deactivating the catalysts and immediately lowering methanolproductivity by the process. Typically, 2 to 4% of carbon dioxide is present in thesyngas mixture for the vapor-phase synthesis of methanol, whereas this value issomewhat higher, 4 to 8%, for the liquid-phase synthesis.1,5
© 2007 by Taylor & Francis Group, LLC

Methanol Synthesis from Syngas 301
9.2.1.2 CO2 Hydrogenation as Principal Reaction for Methanol Synthesis
In this view, the principal chemical reactions that lead to the synthesis of methanol are:
CO2 + 3H2 = CH3OH + H2O
CO + H2O = CO2 + H2
It should be noted that according to this view, the synthesis of methanol proceedspredominantly via direct hydrogenation of carbon dioxide, not carbon monoxide. Itshould also be noted that the WGS reaction proceeds in the forward direction,consuming carbon monoxide to produce the principal reactant of carbon dioxide andhydrogen, thus boosting the eventual methanol productivity. A number of differentauthors have tried a variety of reaction experiments to elucidate the true reactionpathways or mechanistic pathways, including isotope labeling studies and kineticstudies involving complete absence of one of the syngas components.1,5–7,9
9.2.1.3 Chemical Reactions under Extreme Syngas Conditions
As a case study, the following extreme conditions are examined using the aforemen-tioned mechanistic postulates.19
9.2.1.3.1 CO-Free Syngas FeedIf the feed syngas is free of carbon monoxide, experimental observations show thatthe methanol productivity is very low and slowly decreases even further. This reactionphenomenon can be explained, using the CO2 hydrogenation reaction mechanism as:
CO2 + 3H2 = CH3OH + H2O
CO2 + H2 = CO + H2O
Owing to the total absence of CO, the WGS reaction proceeds in the reversedirection, i.e., in the direction that will generate more CO. Thus, the main reactant,CO2, is wanted by both reactions. Considering that the RWGS reaction is a fasterreaction than methanol synthesis reaction, the methanol production rate will have tosuffer. Furthermore, both the RWGS reaction and the methanol synthesis reactionproduce H2O, whose concentration buildup in the system adversely affects theconversion of CO2 toward methanol by pushing the chemical system closer to theequilibrium condition. Moreover, too high a water concentration in the catalyst poreis detrimental to the longevity of the catalyst.13 Therefore, methanol productivityfurther decreases.
The same observation can also be explained by the CO hydrogenation mecha-nism as:
CO + 3H2 = CH3OH
CO2 + H2 = CO + H2O
© 2007 by Taylor & Francis Group, LLC

302 Handbook of Alternative Fuel Technology
In this case, the WGS reaction proceeds also in the reverse direction, becauseof the total lack of carbon monoxide. According to the CO hydrogenation mecha-nism, carbon monoxide is the essential reactant for methanol formation; however,the only source for this reactant would be coming from the RWGS reaction, becausethere is no CO in the feed. Therefore, the reaction is very seriously limited by lackof the essential reactant. As shown, both the mechanisms can explain the situationmore or less properly. Therefore, the experiments conducted under these conditionsalone do not confirm which of the two mechanisms is the right one for the synthesisof methanol over the Cu/ZnO/Al2O3
catalyst.
9.2.1.3.2 CO2-Free Syngas Feed ConditionsIf methanol synthesis is practiced over the Cu/ZnO/Al2O3 catalyst system using theCO2-free syngas, methanol productivity is also significantly lower than under normalsyngas feed conditions, and it rapidly decreases even further.19
According to the CO2 hydrogenation mechanism, the following stoichiometricequations can be written:
CO2 + 3H2 = CH3OH + H2O (1)
CO + H2O = CO2 + H2 (3)
Owing to the total absence of CO2 in the feed syngas, the WGS reaction proceedsin the forward direction, resulting in carbon dioxide, which is the essential reactant forthe methanol synthesis reaction utilizing this mechanism. Because of the unavailabilityand limited supply of carbon dioxide, the principal reaction of methanol synthesis doesnot proceed properly, resulting in poor methanol productivity. Further, the lack of carbondioxide makes the Boudouard reaction also proceed in its reverse direction as:
2 CO(g) = CO2(g) + C (s)
As can be expected, this reaction takes place on heterogeneous surfaces andinvolves carbon deposition. This reaction is responsible for catalyst deactivation viafouling by carbon deposition. This may be the reason for the rapid decrease ofmethanol productivity. However, the conditions promoting carbon deposition maybe quite different between vapor-phase and liquid-phase synthesis. In this regard,carbon dioxide is a crucially important ingredient of the syngas mixture for thestability of catalytic activity. It is also found that the CO2 deficiency in the feedsyngas composition can be supplemented by H2O input to a certain degree. BecauseH2O is directly involved in generation of CO2 in CO2-starved conditions, this is alsoexplainable. Complete absence of CO2 in the feed syngas has been known to resultin irreversible damage to the catalyst.
If CO hydrogenation is taken as the mechanism, the reaction of CO2-free syngaswould be represented by:
CO + 2H2 = CH3OH (2)
CO + H2O = CO2 + H2 (3)
© 2007 by Taylor & Francis Group, LLC

Methanol Synthesis from Syngas 303
As can be seen, carbon monoxide is required by both reactions. The WGSreaction is faster under these conditions and proceeds in the forward direction aslong as there is some H2O in the system. Because carbon monoxide is abundantlyavailable in the system, this alone would not explain the low methanol productivity.However, the explanation using the Boudouard reaction holds for this mechanism.When there is no CO2 in the feed gas, carbon deposition via Boudouard reactioncan be more active. Water promotes and participates in the WGS reaction, therebyproducing H2, which is a key reactant methanol synthesis, and CO2, which inhibitsthe carbon deposition reaction.
9.2.1.3.3 H2O-Free Syngas Feed ConditionsIn this case, let us assume that the syngas mixture still contains typical amounts ofH2, CO, and CO2. Then, if we adopt CO2 hydrogenation as the principal reaction formethanol formation, the reaction system may be described as follows:
CO2 + 3H2 = CH3OH + H2O
CO2 + H2 = CO + H2O
As written, the WGS reaction proceeds in the reverse direction, at least in thebeginning, when H2O is totally absent in the feed. Accordingly, CO2 is the reactantfor both the methanol synthesis reaction via CO2 hydrogenation as well as the RWGSreaction. The two reactions occur in a competitive manner, thus resulting in a lowerproductivity of CH3OH. Further, both reactions generate H2O, whose concentrationbuilds up in the reactor and eventually approaches the reaction equilibrium of thetwo reactions. Once the H2O concentration reaches a certain level in the system, theWGS reaction is likely to go in the forward rather than the reverse direction. Thesystem will quickly restore order.
The same phenomenon can also be explained by the CO hydrogenation mech-anism.
CO + 2H2 = CH3OH
CO2 + H2 = CO + H2O
In this case, it is rather obvious that the WGS reaction proceeds in the reversedirection, at least in the beginning, until it reaches WGS equilibrium and, eventually,the two-reaction equilibrium. Other than that, hydrogen is a reactant for both reac-tions, at least in the initial stage, and it is not very clear how the final methanolproductivity will be impacted. The reaction is likely to proceed without muchdifficulty.
Water in the reformer effluent gas needs to be removed for initiation of and highconversion in the methanol synthesis reaction. As implied by the reaction chemistry,water in the reactant mixture is detrimental to conversion, regardless of whichevermechanism we may choose to explain the chemistry. However, if the CO2 level inthe syngas is excessively low, water does exhibit some compensating and comple-menting functions.1,13
© 2007 by Taylor & Francis Group, LLC

304 Handbook of Alternative Fuel Technology
Therefore, there are several factors of significance among most of the low-pressure methanol synthesis technologies. They are1,7:
1. The presence of carbon dioxide in the feed syngas mixture is essential.Different designs and processes may set this CO2 concentration differently.However, there is a minimum threshold value of this concentration for theprocess to be functional. If CO2 is absent or deficient in the system, thecatalyst deactivation is greatly promoted.
2. The presence of carbon monoxide in the syngas feed composition is alsovery important. Lack of CO in the syngas feed not only results in lowmethanol productivity, but also in a continuous decrease in productivity.
3. There is an optimal value for the temperature of methanol synthesisreaction from the standpoint of optimal conversion of syngas as well asthe kinetic reaction rate. The rate of reaction is increased with an increasein the temperature by following the Arrhenius-type of temperature depen-dency, whereas the equilibrium conversion is thermodynamically unfa-vored with an increase in the reaction temperature. Furthermore, there isalso a limit for the maximum temperature at which the process can beoperated. This ceiling is mostly governed by the temperature tolerance ofcatalyst ingredients, in particular, the copper component of the catalyst.This temperature is about 280–300°C. Beyond this temperature, the cat-alyst would be subjected to sintering and fusing, which would result inpermanent damage to the catalyst.
Even though the sensitivity of overall methanol productivity to CO2 concentra-tion variation is not as pronounced as that of a typical principal reactant of generalchemical reaction systems, it has to be noted that the true picture regarding the roleof carbon dioxide is inevitably masked by the presence of very active WGS reaction.Conversely, a total lack of CO2 in the feed syngas would cause irreversible damageto the catalyst. There are different views regarding the mechanism of catalyst deac-tivation in cases when carbon dioxide is lacking in the syngas feed.5
9.2.2 ACTIVE FORM OF METHANOL SYNTHESIS CATALYST
The commercial methanol synthesis catalyst is prepared by a coprecipitation tech-nique in which both CuO and ZnO are precipitated onto porous structure of support,typically alumina, Al2O3. The formula of this catalyst is most frequently expressedas CuO/ZnO/Al2O3. This is in an oxidized form that is stable upon exposure to airor other oxidizing environments, and a reason why all catalysts of this type areshipped in oxidized form for safety and storage. Therefore, this catalyst must bereduced before use in a hydrogenation reaction such as methanol synthesis.8 If not,hydrogen as a reactant in the hydrogenation reactor would be first consumed inreduction of this oxidized form of catalyst. During this process, which is highlyexothermic, sintering of catalyst would occur and induce irreversible damage. Mostcatalyst manufacturers provide their customers with the detailed reduction procedure.
© 2007 by Taylor & Francis Group, LLC

Methanol Synthesis from Syngas 305
However, reduction of this catalyst also provides a couple of possibilities thatare the source of another controversy regarding which is the active phase of thecatalyst, Cu0 or Cu+1, i.e., Cu/ZnO/Al2O3 vs. Cu2O/ZnO/Al2O3.
Reduction of the methanol synthesis catalyst is described in Lee’s work.1,8 The basicprocedure follows a stepwise reduction strategy, thereby preventing the exothermic heatof reaction for reduction treatment from sintering or thermally annealing the catalyst.The procedure is basically the same for the vapor-phase or the liquid-phase process.Many pieces of evidence and counterevidence have been presented in the literatureregarding the active form of copper in the reduced catalyst. Among them, the moststriking evidence may be the one obtained by Lee and his coworkers.10 They used aliquid-phase reduction treatment on their CuO/ZnO/Al2O3 catalyst in a mechanicallyagitated slurry reactor, and the active catalyst was analyzed by x-ray diffraction (XRD)technique. Because the analyzed catalyst was coated by the protective film of high-boilingwhite mineral oil (Witco-70 or Freezene-100 oil), the catalyst analyzed was not allowedto go through any atmospheric reoxidation to either CuO or Cu2O before the intendedanalysis. They found ample presence of Cu0 and, at the same time, total absence of Cu+1.
Deactivation of methanol synthesis catalysts may be attributed to the followingfour principal causes, namely: (1) poisoning by sulfur or carbonyls; (2) sintering,thermal deactivation, or annealing; (3) copper crystallite size growth;11 and (4)catalyst fouling by carbon deposition. Advances have been made, and all or most ofthese causes are avoidable in well-designed processes. A regeneration process wasdeveloped for the deactivated catalyst whose crystallite size has grown. The regen-eration process is based on repeated oxidation and reduction steps that constituterenucleation and redispersion of catalyst crystallites via successive phase changes.Lee and his coworkers reported that their process is able to recover most of the lostactivity due to crystallite size growth via the repeated oxidation–reduction cycles.11
9.2.3 CHEMICAL EQUILIBRIUM
Methanol synthesis reactions, both CO and CO2 hydrogenation, are thermodynam-ically not favored at low pressure and high temperature, as shown by a plot of Kp
vs. T in Figure 9.1. Reducing the temperature of reaction is kinetically undesirable,because it significantly reduces the reaction rate. Therefore, the synthesis reactionmust be carried out at a relatively high temperature, which further pushes the pressurerequirement even higher. Higher-pressure operation, on the other hand, may representhigher capital investment, greater energy demands, and more severe operationalconditions. Furthermore, a higher temperature increases the potential likelihood forthermal deactivation of the catalyst, and the risk is further complicated by theexothermic heat of the reaction. Owing to the unfavorable equilibrium nature, theonce-through conversion (or single-pass conversion) of the synthesis reaction istypically low, thus making recycle duty higher. All the commercial processes recyclethe unconverted syngas back to the methanol converter for enhancement of overallconversion, thus improving the process economics. The typical operating conditionsfor the methanol synthesis reaction are 220 to 270°C and 50 to 100 bars. It is quiteinteresting to note that the low-pressure process conditions are in the vicinity of thecritical points of pure methanol, i.e., about 240°C and 80 atm.
© 2007 by Taylor & Francis Group, LLC

306 Handbook of Alternative Fuel Technology
The WGS reaction is particularly worthy of note in all processes dealing withany syngas mixture in reactive environments. It has been understood that the reactiontakes place predominantly on the heterogeneous surfaces of the catalyst, whenevera catalytic system is employed. It should be also noted that the WGS reaction hasa relatively flat functional relation between the equilibrium constant and the tem-perature, i.e., the temperature dependency of equilibrium constant for the WGSreaction is weak compared to other syngas reactions, as shown in Figure 9.1. Thismeans that the WGS reaction has a very wide temperature range of significance,namely, from room temperature to as high as 1000°C, thus affecting nearly allsyngas-related processes. Another significance of its relatively low equilibrium con-stant over a wide range of temperatures is that the reaction equilibrium can be easilyreversed in direction by changing the compositions (or partial pressures) of theinvolved species. More than often, this fact obscures the true picture of the intrinsicmechanism of process chemistry.
Furthermore, typical WGS reaction catalysts also have very similar compositionsto those of the methanol synthesis reaction. This also means that the catalysts usedfor methanol synthesis will also catalyze the WGS reaction. Owing to its reversibilityover a wide range of process conditions as well as its high impact on the final productcompositions, the WGS reaction equilibrium is an important issue in designing bothsteam reformer as well as methanol synthesis reactors.
9.2.4 PROPERTIES OF METHANOL
Methanol is also known as methyl alcohol, carbinol, methyl hydroxide, methylol, mono-hydroxymethane, wood alcohol, colonial spirit, Columbian spirit, hydroxymethane, or
FIGURE 9.1 Temperature dependence of equilibrium constants for principal reactions.
0 200 400 600 800 1000-10
-6
-2
2
6
10
log K
CO + H2O = CO2 + H2CO + 2 H2 = CH3OHCO2 + 3 H2 = CH3OH + H2O
Equilibrium Constants
Temperature, degrees K
© 2007 by Taylor & Francis Group, LLC

Methanol Synthesis from Syngas 307
wood naphtha. The CAS number for methanol is 67-56-1. The RCRA (Resource Con-servation and Recovery Act) waste number of methanol is U154 and UN 1230.
The density of methanol at room temperature, of 25°C, is 0.7918 g/cm3. Theheat of formation for methanol as gas (∆H°f, gas) is –201.1 ± 0.2 kJ/mol, whereasthat for liquid methanol (∆H°f, liquid) is –239.5 ± 0.2 kJ/mol. The constant-pressureheat capacity of methanol as gas (Cp, gas) at room temperature is 44 J/K-mol, whereasthat for liquid methanol is 80 ± 1 J/K-mol. The Henry’s law constant (K°H) forsolubility of methanol in water at 298.15 K is 210 ± 10 mol/kg-bar.
The critical temperature and pressure of methanol are 513 ± 1.2 K and 81 ± 1.0bars, respectively, whereas the normal boiling and melting temperatures are 337.8± 0.3 K and 176.0 ± 1.0 K, respectively. The triple point of methanol is 175.5 ± 0.5K. The flash point of methanol is 11°C. The enthalpy of vaporization2 of methanolat room temperature (∆H°vap) is 37.83 kJ/mol. Methanol can be used as a supercriticalsolvent or cosolvent for a variety of modern processes. The hydroxyl group in itsmolecular structure makes possible unique properties that are normally not attainablefrom carbon dioxide. Its critical point is harsher than CO2’s, but milder than H2O’s.
Methanol’s acidity is pKa = ~15.5, and viscosity is 0.59 mPa·sec at 20°C. Owingto its low freezing point, methanol has been popularly used as a cold-weather wind-shield washer fluid. A concentration of 30% by weight can provide antifreezing pro-tection of –20°C. Because of the hydroxyl group in methanol, it has a strong tendencyto hydrogen-bond. A hydrogen bond is not a true bond, but a particularly strong formof dipole–dipole interaction. The O-H bonds are strongly polarized, leaving the hydro-gen atom with a partially positive charge, which is electrophilic hydrogen. This hydro-gen has a strong affinity for nonbonding electrons and, as such, it forms intermolecularattachments with the nonbonding electrons on the oxygen atom. Comparing the twoisomers between ethanol (C2H5OH) and dimethylether (CH3OCH3), both of whichhave a formulation of C2H6O, a striking fact emerges: ethanol has a much higherboiling point (78°C) than dimethylether (–25°C). This significant difference of about100°C in their boiling points is because ethanol has O-H hydrogen, which is extensivelyhydrogen-bonded, whereas dimethylether has no O-H hydrogen.
Methanol also reacts easily with carboxylic acids to produce esters, from whichwater is a by-product of the condensation-type reaction. Methanol is an importantreactant in the manufacture of biodiesel via transesterification reaction. The presenceof the methyl group in the formula provides chemical affinity toward hydrocarbons and,as such, methanol shows excellent solubility toward a variety of organic materials, andthe hydroxyl group promotes excellent water miscibility. The dual nature of solubilitymakes methanol a good candidate for oxygenate fuel as well as a water remover fromgasoline. As a water remover in gasoline fuel systems, methanol creates a miscibleternary mixture [gasoline-methanol-water] instead of an immiscible binary mixture[gasoline-water].
Methanol has an octane rating of 105 (Research Octane Number, RON) and can beused as an octane enhancer. Because high performance with a higher compression ratiorequires a higher octane rating than its regular counterparts, methanol is used as a racingfuel. Because of the high oxygen content (50% by mass) in the methanol molecular
© 2007 by Taylor & Francis Group, LLC

308 Handbook of Alternative Fuel Technology
structure, it appears to be an excellent oxygenate fuel. However, it should be noted thatits blending vapor pressure increase is substantially higher than other competing oxy-genate blends such as MTBE (methyl-t-butylether) and ethanol, thus making it unpopularas a gasoline-blending fuel. The vapor pressure increase due to gasoline blending istypically measured by Reid vapor pressure. High vapor pressure of blended gasoline canincrease the chances for evaporative emission of the fuel as well as the risk of having“vapor lock” in the fuel line. Furthermore, methanol, if inhaled or consumed, is far moretoxic than ethanol. Evaporative fuel emission is particularly of concern to environmentalair quality during summer months, when the emitted hydrocarbon is directly linked withthe environmental health problem of “high ozone level in the air.”
The common method of measuring vapor pressure of petroleum products is theReid vapor pressure test, or Rvp test. There are basically two methods approvedby ASTM, i.e., Reid method (ASTM D323-99a) and Dry method (ASTM D4953-99a). The Reid method covers experimental measurements of vapor pressure ofgasoline, volatile crude oil, and other volatile petroleum products, which includepetroleum crude, gasoline, MTBE-blended gasoline, aviation fuel, and other petro-leum products. There are four procedures provided by this method, depending onthe types and vapor pressure ranges of the tested fuel. However, this method is notapplicable to liquefied petroleum gas (LPG) and oxygenated gasoline exceptMTBE-blended gasoline. Determination of the vapor pressure of LPG is coveredin ASTM D1267, whereas determination of the vapor pressure of gasoline-oxygen-ate blends is treated in ASTM D4953. The latter method is referred to as Drymethod, which is applicable to most oxygenated gasoline, except MTBE-blendedgasoline, with a vapor pressure range from 35 to 100 kPa (5 to 15 psi). There arethermodynamic algorithms developed for estimation of Rvp without performingactual measurement. An algorithm developed by Vazquez-Esparragoza et al.3 usedGas Processors Association Soave-Redlich-Kwong equation of state and assumedthat liquid and gas volumes are additive. They found excellent agreement betweenmodel prediction and experimental data.
9.2.5 REACTION WITH METHANOL
Methanol is used to produce formaldehyde via oxidation reaction:
CH3OH + 1⁄2 O2 = HCHO + H2O
About 40% of methanol is converted to formaldehyde (HCHO), and from thereinto products as diverse as thermosetting polymers, plywood, paints, explosives, andpermanent press textiles.
Methanol is also used for making a variety of ethers including MTBE (methyl-t-butylether), ETBE (ethyl-t-butylether), TAME (t-amyl-methylether), DME (dime-thylether), etc. The first three are normally synthesized by catalytic distillation (CD),whereas the fourth is produced by catalytic dehydration. As the name implies,catalytic distillation is a hybrid process between a well-established unit operationof distillation and a catalytic chemical reaction. Methanol also readily reacts withcarboxylic acids to produce methyl esters of these acids. These esters, in particular
© 2007 by Taylor & Francis Group, LLC

Methanol Synthesis from Syngas 309
fatty acid esters, are quite important as ingredients for biodiesel, fuel additives, fuelsystem cleaners, octane enhancers, biodiesel formulations, etc.
Dimethylether (DME) is gaining importance as an alternative fuel. Dimethyletherhas always been considered a major derivative of methanol and its synthesis is basedon the following stoichiometric equation:
2 CH3OH = CH3OCH3 + H2O
Methanol serves as a direct reactant or as an intermediate in the synthesis ofdimethylether, depending on the reaction routes.18 The first process route is basedon conventional dehydration of methanol over a dehydration catalyst, where meth-anol is a direct reactant, and dimethylether and water are recovered as products. Thisprocess is carried out as a stand-alone type of process. In recent years, however, thesecond process option, in which methanol is an intermediate in the conversion ofsyngas to dimethylether, i.e., single-stage synthesis of dimethylether from synthesisgas, has attracted a great deal of attention.
CO2 + 3H2 = CH3OH + H2O
CO + H2 = CO2 + H2
2 CH3OH = CH3OCH3 + H2O
The process benefits have been twofold: one, the direct synthesis of dimethyletherfrom syngas can overcome the equilibrium limitation imposed by methanol synthesisreaction, and two, the reaction converting methanol into dimethylether is an importantprecursor step for methanol-to-hydrocarbon conversion processes16,17 represented byMTO (Methanol-to-Olefin), MTG (Methanol-to-Gasoline), etc. Even if dimethyletheritself is considered a final product, the direct route via single-stage synthesis is farmore advantageous from the standpoints of both production cost and process efficiency.The single-stage DME synthesis exploits the equilibrium-unlimited dehydration ofmethanol to DME to its fullest extent by alleviating the equilibrium-limited natureof the methanol synthesis reaction.15,18,19 This is accomplished via a dual catalyticsystem in which methanol produced in situ is selectively removed from the reactionequilibrium by converting the product methanol to dimethylether. In this process,methanol concentration in the reactor is kept low, thus keeping the methanolsynthesis portion of the overall conversion process far from its chemical equilib-rium. Catalyst 1, such as Cu/ZnO/Al2O3, catalyzes the first reaction of methanolsynthesis, whereas Catalyst 2, e.g., γ-Al2O3, catalyzes dehydration of methanol.Both reactions are carried out in the very same reactor and, therefore, such a reactionsystem is called a dual catalytic system.18 Obviously, as an advantage, a higheronce-through conversion of syngas to dimethylether can be attained. This enhance-ment can also be successfully exploited for realignment of the syngas-to-hydrocar-bon synthesis process.20
Consider MTG’s alignment, which is basically composed of syngas conversionreactor and gasoline synthesis reactor as:
© 2007 by Taylor & Francis Group, LLC

310 Handbook of Alternative Fuel Technology
Syngas-to-Methanol + Methanol-to-DME-to-GasolineSyngas Conversion Gasoline Synthesis
where methanol-to-DME conversion takes place in the second reactor, i.e., thegasoline reactor. This methanol-to-DME reaction generates water, which is detri-mental to gasoline synthesis. However, the reaction step of methanol-to-DME con-version can be very beneficially moved from the gasoline reactor to the syngasreactor; thereby, the methanol conversion step can be synergistically exploited toalleviating the equilibrium limitation of methanol synthesis. The resultant reactionalignment for syngas to gasoline20 becomes as follows:
Syngas-to-Methanol-to-DME + DME-to-GasolineSyngas Conversion Gasoline Synthesis
This process concept was introduced by Lee et al.15,20 Other benefits includecatalyst life management, especially for zeolites catalysts such as ZSM-5. Eventhough the MTG plant in New Zealand terminated its successful commercial pro-duction in the late 1990s, the idea of production of clean liquid motor fuel via thesynthesis route is remarkable. It not only diversifies the feedstock for gasoline, butalso provides additional options for energy policy and planning.
DMFCs are unique in their low-temperature, atmospheric-pressure operation,allowing them to be miniaturized to an unprecedented degree. DMFC, combinedwith the relatively easy and safe storage and handling of methanol, may open thepossibility of fuel-cell-powered consumer electronics.
9.3 METHANOL SYNTHESIS TECHNOLOGY
Pure methanol was first isolated as a chemical form in 1661 by Robert Boyle, whocalled it spirit of box, because he produced it via the distillation of boxwood.
However, the systematic synthesis of methanol has a history of about 100 yearsdating back to the early 1900s, when methanol was almost exclusively produced bythe destructive distillation of wood wastes. This is why methanol was called woodalcohol. On the other hand, ethanol and isopropyl alcohol are called grain alcoholand rubbing alcohol, respectively. In 1923, BASF developed a catalytic synthesisprocess based on ZnO/Cr2O3 catalyst. Ever since, this commercial synthesis tech-nology termed high-pressure methanol synthesis technology has been very popularlyadopted by a number of industries for about 50 years. This process was quitesuccessfully operated at a pressure of 250 to 350 atm and a temperature of 350 to450°C. Because the operating pressure required by this catalytic process was sub-stantially higher than that for the later version of the synthesis process using adifferent catalytic system, the process was called high-pressure methanol synthesis.
In 1963, ICI developed a new methanol synthesis technology termed low-pressuremethanol synthesis technology, which has become an industrial successor to high-pressure synthesis.1 This process is operated at a pressure of 50 to 100 atm and atemperature of 225 to 275°C over a catalyst of Cu/ZnO/Al2O3. The catalyst systemused for this process is often referred to as Cu-based catalyst.
© 2007 by Taylor & Francis Group, LLC
Methanol Synthesis from Syngas 311
A number of different versions of low-pressure methanol synthesis technologyhave also been developed and are being successfully operated; however, most ofthese are based on very similar process concepts in terms of catalysts, synthesischemistry, incorporation of steam reforming, etc. It should be noted that conventionallow-pressure synthesis of methanol is carried out under conditions close to the criticaltemperature and pressure of methanol.
The reactants for methanol synthesis are carbon dioxide, carbon monoxide, andhydrogen. These species constitute the main ingredients of synthesis gas. Synthesisgas may be obtained from diverse sources including natural gas, coal, municipalwastes, coke oven gas, biomass, other hydrogen sources, etc. Industries have beenpredominantly using the steam reforming of methane to generate hydrogen andcarbon monoxide in a proportion of H2/CO = 2–3, as shown in the followingstoichiometry:
CH4 + H2O = 3H2 + CO
It should be noted here that hydrogen produced by steam reforming comes fromboth water and hydrocarbon. To synthesize methanol over a Cu-based catalyticsystem, carbon dioxide (CO2) may have to be added to the syngas originating fromthe steam reforming of methane. The presence of carbon dioxide in the syngascomposition is crucial, because it directly affects the catalytic activity and life. Inthe steam reformer, WGS reaction also takes place:
CO + H2O = CO2 + H2
As mentioned earlier, the WGS reaction is typically limited by chemical equilib-rium over a wide range of temperatures, thus affecting the reformer product compo-sitions significantly. The optimal percentage of CO2 in the syngas for methanol syn-thesis varies from process to process. However, it is generally in the range of 2 to 8%,with some exceptions that use substantially higher CO2 contents in the feed syngas.
In methanol synthesis, scientists and engineers often use a term called balancedgas in referring to a 2:1 mixture of H2 and CO. This 2:1 mixture is not an endorsementof a CO hydrogenation mechanistic path, rather a stoichiometric assessment ofspecies balance that methanol as product has a molecular formula of direct additionof 1 molecule of CO and 2 molecules of H2. This is also consistent with theexperimental facts that the number of moles of hydrogen consumed vs. the numberof moles of carbon monoxide consumed is slightly more than 2.1,5 Although naturalgas is an excellent source for such syngas, owing to its high hydrogen content, othercarbonaceous and hydrocarbon-rich resources can also be viable sources, dependingon the availability and local economy.
Some of the newer processes for methanol synthesis adopt CO-rich syngas ratherthan H2-rich syngas. The CO-rich syngas is typically generated from a resource thatis low in the H-to-C ratio, such as coal. Depending on the geological region, thisoption may prove to be an economically better option. This type of syngas is oftentermed as unbalanced gas, which means the H2-to-CO ratio is much lower than 2:1.Second-generation coal gasifiers such as Texaco and Shell gasification processes, as
© 2007 by Taylor & Francis Group, LLC

312 Handbook of Alternative Fuel Technology
well as Koppers-Totzek gasifiers, yield syngas with low H2-to-CO ratios, typically,0.75–1.0. The liquid-phase methanol synthesis process, also known as the LPMeOHTM
process, originally developed by Chem Systems Inc. in 1975, is a good example ofthe processes that are targeting CO-rich syngas as the feed stream. Owing to its lowH2 content in the feed gas, its H2 conversion per pass has to be relatively high, thusmaking such a process more suitable for a once-through synthesis technology such asonce-through methanol (OTM) process. As the name implies, this process is based onthe synthesis of methanol without any recycling of unreacted syngas.
The pressure and temperature of the synthesis reaction are obviously two of themost important operating parameters from chemical kinetics and equilibrium con-version considerations. If the temperature is raised for the synthesis reaction, thekinetic rate of reaction increases while the conversion of carbon monoxide decreases.If the pressure of the reaction is increased, the conversion of CO also increases; butthe increase is not very substantial above the pressure of 80 atm. The situation isalso further complicated by the presence of WGS reaction, which is also limited bychemical equilibrium at a typical methanol synthesis reaction condition. This WGSequilibrium can be very easily reversed in terms of its direction by the concentrationof water in the reactor feed stream. Even 5 mol% of water in the feed syngas streamof H2/CO = 3:1 is more than sufficient to affect the direction of WGS reaction at250ºC and 75 atm. Under this specific circumstance, the WGS reaction proceeds inthe forward direction. In the case of H2O-free feed, otherwise under nominally thesame condition, the WGS reaction proceeds in the reverse direction.
A typical methanol process technology in the modern era involves several commonprocess steps, namely: (1) feed purification, (2) steam reforming, (3) syngas compres-sion, (4) catalytic synthesis, (5) crude methanol distillation, and (6) recycle and recov-ery. If the syngas is prepared from coal, as in the case of the liquid-phase methanolsynthesis process, coal gasification becomes an important step for the overall processdesign and economics. Although the Lurgi gasifier yields hydrogen-rich syngas, Tex-aco, Shell, and Koppers-Totzek gasifiers yield carbon-monoxide-rich syngas.
As for the steam reforming, there are typically two types of processes, i.e., two-stage reforming and autothermal reforming (ATR). Although the two processes arevery similar to each other, the ATR has a thermal balance over the reactor by adoptinga hybrid combination of sacrificial partial oxidation with the subsequent steamreformation reaction. The former reaction of partial combustion generates exothermicheat, which can be utilized by the endothermic reforming reaction; as such, an energybalance is achieved for the reactor.
The process design varies largely based on the availability of feedstocks ofdifferent types, process energy efficiency and local energy economics, and financialrestrictions related to capital investment. In the ensuing subsections, a number ofmethanol synthesis process technologies are explained and compared.
9.3.1 THE CONVENTIONAL ICI’S 100-ATM METHANOL SYNTHESIS PROCESS
Even though it had long been desired in the mid-1900s to reduce the operatingpressure of the methanol synthesis process, it was found that a process with a much
© 2007 by Taylor & Francis Group, LLC

Methanol Synthesis from Syngas 313
lower pressure would not be ideal for large-capacity units. A simple reason for thisfinding may be that under low-pressure conditions, the equipment has to be verylarge, and the chemical reaction is not as fast as desired. With the advancement anddevelopment of better materials and equipment design, a newly focused objectivewas the search for a catalytic synthesis system that would be more active at about100 atm. The result of this effort was highlighted by the ICI’s announcement of aCu/ZnO/Al2O3 catalyst system. This novel process was tried in August 1972 withgreat success. This milestone process has been enhanced and modified with subse-quent designs, especially in the areas of energy efficiency of the process as well asprocess optimization. A schematic of this process is given in Figure 9.2.
The original flowsheet includes two parts of the process, namely, reforming andsynthesis sections. Even though unelaborated in Figure 9.2, process economics dependsvery heavily on the heat recovery and energy integration, recycle schemes, and refiningand separation. Along with the efficient design, management of catalyst life has alwaysbeen the principal issue of process maintenance and enhancement. Needless to say,catalyst life and efficiency are directly tied to the productivity of the plant.
9.3.2 HALDOR TOPSOE A/S LOW-PRESSURE METHANOL SYNTHESIS PROCESS
This process is designed to produce methanol from natural or associated gas feed-stocks, utilizing a two-step reforming process to generate feed syngas mixture forthe methanol synthesis.21 Associated gas is natural gas produced with crude oil fromthe same reservoir. It is claimed that the total investment for this process is lower
FIGURE 9.2 A schematic of ICI’s low-pressure methanol synthesis process.
∩∩
∩
∩∩
∩
∩∩ ∩∩
∩
PrimaryReformer
HeatRecovery
HeatRecovery
HeatRecovery High Temp.
Shift Reactor
LP Steam
Stack
275 PSISteamMain
Steam
NG Feed
Hyd
rode
sulfu
rizer
Compressor
HeatExchanger
Turbine Turbine
MeOHConverter
RecycleCompressor
CoolingWaterCondenser
RefinedMeOH
High BoilingImpurities
ExportCrude MeOH
Low BoilingImpurities
Topp
ing
Col
umm
Ref
inin
gC
olum
n
Sep
arat
or
Fla
shVe
ssel
CrudeMeOHTank
© 2007 by Taylor & Francis Group, LLC

314 Handbook of Alternative Fuel Technology
than with the conventional flow scheme based on straight steam reforming of naturalgas by approximately 10%, even after considering an oxygen plant.
As shown in Figure 9.3, the two-stage reforming is conducted by primaryreforming, in which a preheated mixture of natural gas and steam is reacted,followed by secondary reforming, which further converts the exit gas from theprimary reformer with the aid of oxygen that is fed separately. The amount ofoxygen required as well as the balance of conversion between the primary andsecondary reformers need to be properly adjusted so that a balanced syngas, i.e.,in a stoichiometric ratio (2:1) of H2/CO is obtained with a low inert content.
As an energy integration step, the heat content of flue gas is recovered forpreheating reformer feed. Similarly, the heat content of the process gas is utilizedfor producing superheated high-pressure steam, preheating boiler feed water(BFW), and preheating process condensate before its entry into the saturator andreboiler of the distillation section. The synthesis section is composed of threeadiabatic reactors with heat exchangers between the reactors; thus, exothermic heatof reaction is recovered and used for heating saturator water. Another energyintegration is accomplished by cooling the effluent from the last reactor by pre-heating the feed to the first reactor. The total energy consumption for the processis claimed to be about 7.0 Gcal/ton of product methanol, including oxygen produc-tion. The process technology is suited for smaller as well as very large methanolplants up to 10,000 tpd. However, it has to be noted here that it is often very difficultto compare flowsheets for methanol synthesis among various commercial processes,because it is difficult to establish the common unbiased bases to compare reporteddesign and operating data.
FIGURE 9.3 A schematic of Haldor Topsoe A/S methanol synthesis process.
BFW
Process SteamOxygen
Superheated Steam
PrimaryReformer
SecondaryReformer
HP Steam
Distillation
Stack
Desulfurizer
MethanolSynthesisReactor
Saturator
Recirc.Compressor
Product MEOH
Makeup Water
Fuel
Recycle GasC.W.
CompressorNG Feed
© 2007 by Taylor & Francis Group, LLC

Methanol Synthesis from Syngas 315
9.3.3 KVAERNER METHANOL SYNTHESIS PROCESS
This process developed by Kvaerner Process Technology/Synetix, U.K., is based ona low-pressure methanol synthesis process and two-stage steam reforming, similar tothe Haldor-Topsoe process. Figure 9.4 shows a schematic of the Kvaerner methanolsynthesis process. The feed gas stock may be natural or associated gas. In this process,however, carbon dioxide can be used as a supplementary feedstock to adjust thestoichiometric ratio of the syngas. Recent plants based on this process have an energyefficiency of 7.2–7.8 Gcal/ton of product methanol,31 which is lower than the Topsoe’spublished energy efficiency. However, this process is more suited for regions withhigh availability of low-cost gas such as CO2-rich natural gas and financial restrictionsof low capital investment. There are a number of commercial plants currently inoperation based on this design and their typical sizes range from 2000 to 3000 mtpd.
9.3.4 KRUPP UHDE’S METHANOL SYNTHESIS TECHNOLOGY
The process, developed by Krupp Uhde GmbH, is based on the low-pressure syn-thesis chemistry of methanol as well as steam reforming for synthesis gas generation.A unique feature of this process is its flexibility of feedstock choice, which includesnatural gas, liquefied petroleum gas, or heavy naphtha.21
The steam reformer is uniquely designed by Krupp Uhde and is a top-fired box-type furnace with a cold outlet header system. The steam reforming reaction takes placeheterogeneously over a nickel catalyst system. The reformer effluent gas containing H2,CO, CO2, and CH4 is cooled from 880°C to ambient temperature eventually, and mostof the heat content is recovered by steam generation, BFW preheating, preheating ofdemineralized water, and heating of crude methanol for three-column distillation.
FIGURE 9.4 A schematic of the Kvaerner methanol synthesis process.
Des
ulfu
rizer
Reformer
Distillation
HeatRecovery
BFW
BFWSteam
CirculatorSat
urat
or
Pre
-re
form
er
ReactionHeat
Recovery
MeO
HR
eact
or
NG
Water fromDistillation
CO (Optional)2
Syngas
Compressor
Fuel toReformer
Crude Methanol
Pure Methanol
HP Steam
© 2007 by Taylor & Francis Group, LLC

316 Handbook of Alternative Fuel Technology
The typical energy consumption, including feed and fuel, ranges from 7 to 8Gcal per metric ton of methanol, and is very much dependent on individual plantconcepts and designs. Eleven plants have been built until 2005, using this technology.Figure 9.5 shows a schematic of Krupp Uhde’s methanol synthesis process.
9.3.5 LURGI ÖL-GAS-CHEMIE GMBH PROCESS
This process is meant to produce methanol in a single-train plant starting fromnatural gas or oil-associated gas with capacities up to 10,000 mtpd.21 It can beused to increase the existing methanol plant based on steam reforming. Figure 9.6shows a schematic of this process. Steam reforming of natural gas is accomplishedin two stages, i.e., prereforming and ATR. In the prereformer, the mixture gas ofdesulfurized natural gas and steam is converted to H2, CO2, and CH4, whereas inthe autothermal reformer the gas is reformed with oxygen and steam, producingproduct gas containing H2, CO, CO2, and a small amount of unconverted CH4 inaddition to low-pressure steam. Oxygen is involved in this reaction scheme togenerate exothermic heat by partial oxidation of sacrificial natural gas to providethe necessary endothermic heat for the subsequent reforming reaction.
The reformed gas, i.e., syngas, is mixed with hydrogen from the pressure swingadsorption (PSA) to increase the H2-to-CO ratio. The produced synthesis gas ispressurized and mixed with recycled gas from the synthesis loop. The reaction takes
FIGURE 9.5 A schematic of Krupp Uhde’s methanol synthesis process.
Desulfurizer
MeOH
Dis
tilla
tion
Dis
tilla
tion
Dis
tilla
tion
IntermediateStorage
Condenser
FeedFuel
Feed
BFW
MUG
CrudeMeOH
Syngas
CirculatorCompressor
Separator
MeOH Reactor
© 2007 by Taylor & Francis Group, LLC

Methanol Synthesis from Syngas 317
place under near-isothermal conditions in the Lurgi water-cooled methanol reactor,which houses a fixed bed of catalyst in vertical tubes surrounded by boiling water.The reactor effluent gas is cooled to 40°C to separate methanol and water from theunreacted syngas. Methanol and water are separated in distillation units, whereasthe major portion of the gas is recycled back to the methanol synthesis reactor forhigher overall conversion. As mentioned in the earlier subsection, the once-throughconversion is typically low; therefore, recycling of the gas is imperative. Enhance-ments have been made, especially in the efficiency of the Lurgi combined converter(LCC), to reduce the recycle ratio down to about 2. The process water is preheatedin a fired heater and used as a makeup water for the saturator, thus minimizingunnecessary water usage and treatment.
The reformed gas from the second-stage reformer contains a considerableamount of thermal energy that is recovered as high-pressure steam for energyrequired for preheater and reboiler. The energy consumption for the process includingutilities and oxygen plant is about 7.1–7.2 Gcal/t of product methanol.
9.3.6 SYNETIX LPM PROCESS
This is an improved version of the ICI’s original low-pressure methanol (LPM)process.21 This process is designed to produce a refined, high-purity methanol fromnatural gas, but it can also handle a variety of other hydrocarbon feedstocks, includingnaphtha, coal, and other petrochemical offgas streams. This process is ideal for largecapacities where conventional processes may not be suitable. Figure 9.7 shows aschematic of the Synetix LPM process.
FIGURE 9.6 A schematic of the Lurgi Öl-Gas-Chemie GmbH process.
DistillationReboiler
Distillation
PressureSwing
Absorption
ProcessCondensate
HP Steam to O2 Plant
LP Steam
H2
BFW
GasCooledReactorWater
CooledReactor
NG
PureMeOH
O2
AutothermalReformer
Pre-Reformer
Fuel
FiredHeater
Saturator
Fuel
Des
ulfu
rizer
© 2007 by Taylor & Francis Group, LLC

318 Handbook of Alternative Fuel Technology
The process consists of three principal sections, namely: (1) syngas preparation,(2) methanol synthesis, and (3) methanol purification. The process used for generationof syngas is the steam reforming process, whose product gas contains steam, hydrogen,carbon monoxide, and carbon dioxide. The reforming catalyst is nickel based and,therefore, the feed gas must be desulfurized before entering the reformer. The reformingcatalyst is very sensitive to sulfur poisoning. The syngas leaving the reformer istypically at 880°C and up to 20 atm, similar to the Lurgi process. The peak temperatureof the gas mixture in the reformer is significantly higher than this temperature.
The methanol synthesis section involves a circulator, methanol reactor, heatrecovery and cooling unit, and methanol separator. The synthesis catalyst is copperbased and typical operating conditions are 200 to 290°C and 50 to 100 atm. In thesense of reaction engineering, a temperature of close to 200°C is too low for ameaningful rate of chemical reaction, whereas a temperature of 290°C may be toohigh and too close to the potential catalyst-sintering range. As mentioned earlier,methanol formation is limited by chemical equilibrium, thus limiting the exit con-centration only up to 7%. This value is higher at a lower reaction temperature, ascan be predicted by the equilibrium constant for the conversion reaction. Aftercondensing product methanol out by chilling, the unreacted syngas is recycled backto the methanol reactor for higher overall conversion.
The crude product methanol contains water and small amounts of undesired by-products, which are separated in a two-column distillation system. The two columnsare a topping and a refining column. The former removes all light ends includingdissolved gases, light hydrocarbons, low-molecular-weight ethers, esters, and acetone,
FIGURE 9.7 A schematic of Synetix LPM process.
2
2
BFW
Desulfurizer
NaturalGas
H O from Distillation
CO (Optional)
Saturator
Steam
Prereformer
Reformer
ReactionHeatRecovery
Reformed Gas
HeatRecovery
BFW
HP Steam
Methanol Product
Distillation
Fuel toReformer
MeOH Converter
Crude MeOH
Syngas
© 2007 by Taylor & Francis Group, LLC

Methanol Synthesis from Syngas 319
whereas the latter separates methanol from water and also eliminates higher hydro-carbons and alcohols by a side discharge from the column.
The total energy consumption for a self-contained plant is typically around 7.8Gcal/t. The figure depends on the type of feedstock used.
9.3.7 LIQUID-PHASE METHANOL PROCESS
The liquid-phase methanol process was originally developed by Chem Systems Inc. in1975. The R & D of this process was sponsored by the U.S. Department of Energy andElectric Power Research Institute. Commercialized by Air Products and Chemicals Inc.and Eastman Chemical Co. in the 1990s, the process is based on the low-pressuremethanol synthesis process concept. The chemical reaction is carried out in a slurryreactor using Cu/ZnO/Al2O3 catalyst at 230 to 260°C and 50 to 100 atm. The commercialreactor used is a liquid entrained reactor in which fine powder catalyst is slurried in inerthigh-boiling oil, typically white mineral oil such as Witco-70 and Freezene-100. Fedgaseous reactants are dissolved in the oil, and the dissolved molecular species are reactedon the catalytic surface in a slurry. The process has enhanced heat transfer characteristicsowing to the higher thermal mass of inert oil when compared to comparable vapor phaseprocesses. To enhance the mass transfer properties of the process, specially developed,fine-powder catalysts are used. Special features of this process include its capability tohandle unbalanced CO-rich syngas and high single-pass conversion of syngas. As a result,the process can be ideally packaged with advanced oxidation gasification technology.Figure 9.8 shows a schematic of the liquid-phase methanol synthesis process.
FIGURE 9.8 A schematic of the liquid-phase methanol synthesis process.
H2Feed Gas
Balanced Syngas
CO Guard Bed
Cyclone
Oil
Ret
urn
Syngas
N2
Slurry Addition& Withdrawal
SteamDrum
MeO
HR
eact
or
OilSeparator
MethanolDistillationSection
DayStorage
Refined
To VentScrubber
To Fuel
Refined
Methanol
Crude MethanolCondensate Return
Steam Import/ExportBFW
Fresh CatalystOil Feed
Hot OilCatalyst
ReductionVessel
Spent CatalystTo Reclamation
Recycle Syngas Purge GasUnreactedSyngasCondenser
Compressor
Economizer
MethanolMethanolSeparator
© 2007 by Taylor & Francis Group, LLC

320 Handbook of Alternative Fuel Technology
9.4 FUTURE OF METHANOL
Methanol can be produced from natural gas, coal, and biomass. The process tech-nology is very mature and practiced on a large scale. The starting material for syngasproduction is expected to change at least partially from natural gas to coal, biomass,and mixed cofeed. In addition, comprehensive multifuel generation as well as cogen-eration process concepts including methanol synthesis are becoming more attractive.Methanol can also be used efficiently as an IGCC (Integrated Gasification CombinedCycle) companion fuel as well. Development of efficient engines utilizing methanolor methanol blends is also highly conceivable. With advances in internal combustionengines based on methanol fuel, it is also conceivable that methanol can be usedmore popularly as transportation fuel for passenger vehicles, not just for race cars.Following development of the efficient dimethylether (DME) synthesis process aswell as utilization of DME in internal combustion engines, methanol has goodpotential in the alternative fuel market. In the context of ever-rising cost of gasolinefuel throughout the world, processes like MTG16,17 and MTO make much more sensenow and in the future than before, thus making methanol a more valuable chemicalcommodity. As a result of recent developments in DMFC and its suggested use inconsumer electronics, methanol has great potential in the future consumer electronicsmarket. Further, methanol can play a more important role in the petrochemicalindustry as a building-block chemical of nonpetroleum origin.
REFERENCES
1. Lee, S., Methanol Synthesis Technology, CRC Press, Boca Raton, FL, 1990.2. Majer, V. and Svoboda, V., Enthalpies of Vaporization of Organic Compounds: A
Critical Review and Data Compilation, Blackwell Scientific Publications, Oxford,1985, p. 300.
3. Vazquez-Esparragoza, J.J., Iglesias-silva, G.A., Hlavinka, M.W., and Bullin, J.A.,How to estimate Reid vapor pressure (RVP) of blends, Encyclopedia of ChemicalProcessing and Design, Vol. 47, McKetta, J.J., Ed., Marcel Dekker, New York, 1994,pp. 415–424.
4. Larminie, J. and Dicks, A., Fuel Cell Systems Explained, 2nd ed., John Wiley &Sons, New York, 2003.
5. Cybulski, A., Liquid-phase methanol synthesis: catalysts, mechanism, kinetics,chemical equilibria, vapor-liquid equilibria, and modeling — review, Catal. Rev.:Sci. Eng., 36(4), 557–615, 1994.
6. Klier, K., Adv. Catal., 31, 243–313, 1982.7. Lee, S., Parameswaran, V., Wender, I., and Kulik, C.J., The roles of carbon dioxide
in methanol synthesis, Fuel Sci. Technol. Int., 7(8), 1021–1057, 1989.8. Sawant, A., Parameswaran, V., Lee, S., and Kulik, C.J., In-situ reduction of a methanol
synthesis catalyst in a three-phase slurry reactor, Fuel Sci. Technol. Int., 5(1), 77–88,1987.
9. Chinchen, G.C., Mansfield, K., and Spencer, M.S., CHEMTECH, 29(11), 1990, pp.692–699.
10. Lee, S., Sawant, A., and Kulik, C.J., Phases in the active liquid phase methanolsynthesis catalyst, Fuel Sci. Technol. Int., 6(2), 151–164, 1988.
© 2007 by Taylor & Francis Group, LLC

Methanol Synthesis from Syngas 321
11. Lee, S., Sawant, A., and Kulik, C.J., Process for Methanol Catalyst RegenerationUsing Crystallite Redispersion, U.S. Patent No. 5,004,717, April 2, 1991.
12. Lee, S., Methane and Its Derivatives, Marcel Dekker, New York, 1997.13. Sawant, A., Rodrigues, K., Kulik, C.J., and Lee, S., The effects of carbon dioxide
and water on the methanol synthesis catalyst, Energy Fuels, 3(1), 2–7, 1989.14. Lee, S. and Sardesai, A., Liquid phase methanol and dimethylether synthesis from
syngas, Top. Catal., 33(1–2), 2005.15. Gogate, M.R., Kulik, C.J., and Lee, S., A novel single-step dimethyl ether (DME)
synthesis in a three-phase slurry reactor from CO-rich syngas, Chem. Eng. Sci.,47(13–14), 3769–3776, 1992.
16. Chang, C.D., Hydrocarbons from methanol, Catal. Rev.: Sci. Eng., 25(1), 1–118,1983.
17. Chang, C.D. and Silvestri, A.J., MTG Origin, Evolution, Operation, CHEMTECH,10, 1987, pp. 624–631.
18. Lee, S. and Gogate, M.R., Development of a Single-Stage Liquid-Phase SynthesisProcess of Dimethylether from Syngas, EPRI-TR-100246, 1–179, Electric PowerResearch Institute, Palo Alto, CA, 1992.
19. Lee, S. and Parameswaran, V., Reaction Mechanism in Liquid-Phase Methanol Syn-thesis, EPRI-ER/GS-6715, 1–206, Electric Power Research Institute, Palo Alto, CA,1990.
20. Lee, S., Gogate, M.R., and Fullerton, K.L., Catalytic Process for Production ofGasoline from Synthesis Gas, U.S. Patent 5,459,166, 1995.
21. Petrochemical Processes Special Report, Hydrocarbon Processing, Vol. 82, No. 3,105, 2003.
© 2007 by Taylor & Francis Group, LLC

323
10 Ethanol from Corn
Sunggyu Lee
CONTENTS
10.1 Fuel Ethanol from Corn............................................................................... 32310.2 Ethanol As Alternative Fuel......................................................................... 326
10.2.1 Industrial Significances of Grain Ethanol ....................................... 32610.2.2 Clean Air Act Amendments of 1990 ............................................... 32710.2.3 Ethanol Production from Corn ........................................................ 328
10.3 Chemistry of Ethanol Fermentation ............................................................ 33110.3.1 Sugar Contents of Biological Materials .......................................... 33110.3.2 Conversion of Sugars to Ethanol..................................................... 332
10.4 Corn-to-Ethanol Process Technology .......................................................... 33310.5 Ethanol As Oxygenated Fuel ....................................................................... 33610.6 Ethanol Vehicles........................................................................................... 33810.7 Use of Ethanol Other Than As Renewable Fuel ......................................... 340References.............................................................................................................. 341
10.1 FUEL ETHANOL FROM CORN
Ethanol is one of the simplest alcohols, which has long been used in human history.Ethanol can be readily produced by fermentation of simple sugars that are convertedfrom starch crops. This has long been practiced throughout the world. Feedstocksfor such fermentation include corn, barley, potato, rice, and wheat. This type ofethanol may be called grain ethanol, whereas ethanol produced from cellulosebiomass such as trees and grasses is called bioethanol or biomass ethanol. Bothgrain ethanol and bioethanol are produced via biochemical processes, whereaschemical ethanol is synthesized by chemical synthesis routes that do not involvefermentation.
Ethanol, ethyl alcohol [C2H5OH], is a clear and colorless liquid. Ethanol has asubstituted structure of ethane, with one hydrogen atom replaced by a hydroxylgroup, -OH. Ethanol is a clean-burning fuel because of its oxygen content and hasa high octane rating by itself. Therefore, ethanol is most commonly used to increasethe octane rating of blend gasoline as well as to improve the emission quality of thegasoline engine. Owing to the presence of oxygen in its molecular structure, ethanolis classified as an oxygenated fuel. In many regions of the U.S., ethanol is blendedup to 10% with conventional gasoline. The blend of 10% ethanol and 90% conven-tional gasoline is called E10 blend or simply E10. Ethanol is quite effective as an
© 2007 by Taylor & Francis Group, LLC

324 Handbook of Alternative Fuel Technology
oxygenated blending fuel, because its Reid vapor pressure (RVP) is low, i.e., it doesnot increase the volatility of the blend gasoline, unlike methanol.
As implied earlier, ethanol can be produced from any biological materials thatcontain appreciable amounts of sugar or feedstocks that can be converted into sugar.The former include sugar beets and sugar canes, whereas the latter include starchand cellulose. For example, corn contains starch that can be easily converted intosugar and is, therefore, an excellent feedstock for ethanol fermentation. Becausecorn can be grown and harvested repeatedly, this feedstock eminently qualifies as arenewable feedstock; i.e., this feedstock will not be easily depleted.
Fermentation of sugars produces ethanol, and this process technology has beenpracticed for well over 2000 years in practically all regions of the world. Sugars canalso be derived from a variety of sources. In Brazil, as an example, sugar from sugarcane is the primary feedstock for the country’s ethanol industry, which is very active.In North America, the sugar for ethanol production is usually obtained via enzymatichydrolysis of starch-containing crops such as corn or wheat. The enzymatic hydrolysisof starch is a simple, inexpensive, and effective process, and is a mature commercialtechnology. Therefore, this process is used as a baseline or a benchmark that otherhydrolysis processes can be compared against. Although the principal merit of ethanolproduction by fermentation of sugar and starch is in its technological simplicity andefficiency, its disadvantage is that the feedstock tends to be expensive and alsocompetitively used for other applications. However, this high cost of feedstock canbe favorably offset by the sale of by-products or coproducts such as distillers’ driedgrains. Many corn refineries produce both ethanol and other corn by-products suchas starches and sweeteners so that the capital and manufacturing costs can be keptas low as possible, by increasing the overall process revenue. While manufacturingethanol, corn refiners also produce valuable coproducts such as corn oil and corngluten feed. The North American ethanol industry is, therefore, investing significantefforts in developing new by-products (coproducts) that are higher in value andminimize waste, thus making the grain ethanol industry more cost-competitive.
Corn refining in the U.S. has a relatively long history going back to the time ofthe civil war, with the development of cornstarch hydrolysis process. Before thisevent, the main sources for starch were wheat and potatoes. In 1844, the Wm. Colgate& Co.’s wheat starch plant in Jersey City, NJ, unofficially became the first dedicatedcornstarch plant in the world. By 1857, the cornstarch industry accounted for asignificant portion of the U.S. starch industry. However, for this era, cornstarch wasthe only principal product of the corn-refining industry, and its largest customer wasthe laundry business.
The industrial production of dextrose from cornstarch started in 1866. Thisindustrial application and subsequent developments in the chemistry of sugars servedas a major breakthrough in starch technology. Other product developments in cornsweeteners followed and occurred more than 15 years later with the first manufactureof refined corn sugar, or anhydrous sugar, in 1882.
In the 1920s, corn syrup technology advanced significantly with the introductionof enzyme-hydrolyzed products. Even though the production of ethanol by cornrefiners had begun as early as after World War II, major quantities of ethanol viathis process route were not produced until the 1970s, when several corn refiners
© 2007 by Taylor & Francis Group, LLC

Ethanol from Corn 325
began fermenting dextrose to make beverage and industrial alcohol. Corn refiners’entry into the fermentation business has become a notable milestone for the majorchanges and transformation of the industry, especially in the fuel ethanol industry.The industry began to develop expertise in industrial microbiology, fermentationtechnology, and separation technology.
As of today, starch, glucose, and dextrose are still important products of the cornwet milling industry. However, the products of microbiology and biochemical engi-neering, including ethanol, fructose, food additives, and chemicals, have graduallyovershadowed them. New R&D has significantly expanded the industry’s product/by-product/coproduct portfolio, thus making the industry more profitable, competitive,and futuristic.
Lignocellulosic materials such as agricultural, hardwood, and softwood residuesare also potential sources of sugars for ethanol production. The cellulose and hemi-cellulose components of these materials are essentially long and high-molecular-weight chains of sugars. They are protected by lignin, which functions more like“glue” that holds all of these materials together in the structure. Details of lignocel-lulosic ethanol technology are covered in Chapter 11, and therefore, not repeated here.
Ethanol plays three principal roles in today’s economy and environment, andthey are:
1. Ethanol replaces more than a billion dollars’ worth of imported oil witha renewable domestic fuel. This value is also directly related to the importcrude oil price.
2. Ethanol is an important oxygenated component of gasoline reformulationto reduce air pollution in many U.S. metropolitan areas, which are notachieving air quality standards mandated by the Clean Air Act Amend-ments (CAAA) of 1990. Ethanol is a cleaner-burning fuel because of itsoxygen-containing molecular formula, and is also an excellent gasolineblend fuel owing to its low RVP.
3. Ethanol provides significant income to farmers and agricultural commu-nities where most ethanol feedstock is produced.
Ethanol, blended with gasoline at a 10% level, or in the form of ethyl tertiary-butyl ether (ETBE) synthesized from ethanol, is effective in reducing carbon monoxide(CO) emission levels, ozone pollution, and NOx emissions from automobile exhaust.
The U.S. ethanol industry is capable of expanding to meet the increased demandfor oxygenated fuel that would result if there were a withdrawal of methyl-t-butylether (MTBE) from the domestic gasoline marketplace. In response to sharply risingnational concerns about the presence of MTBE in groundwater as well as potentialrisk to public health and the environment, the U.S. Environmental Protection Agency(EPA) convened a Blue Ribbon Panel to assess policy options regarding MTBE. TheBlue Ribbon Panel recommended that the use of MTBE be dramatically reduced oreliminated. EPA has subsequently stated that MTBE should be removed from allgasoline. Many U.S. states including California and New York mandated their ownschedules of MTBE phase-outs and bans. It is a remarkable turnaround in thechemical and petrochemical marketplace, considering that MTBE used to be the
© 2007 by Taylor & Francis Group, LLC

326 Handbook of Alternative Fuel Technology
fastest-growing chemical in the U.S. in the 1990s. Recovering or retrofitting MTBEplant investments would become an issue to this industry for years to come.
According to the Renewable Fuels Association (RFA), U.S. ethanol productionin 2002, 2003, and 2004 was 2.13, 2.80, and 3.40 billion gallons, respectively.10
Considering that the production level of 2000 was 1.63 billion gallons, this is a morethan twofold increase over 4 years. The replacement of MTBE with ethanol willincrease the demand for ethanol even more. The increased national capacity willhave to come principally from three sources, namely: (1) improvement in productionefficiency leading to increased utilization of existing plants, (2) expansion of existingproduction facilities, and (3) construction of new plants.
In terms of product value, corn sweeteners are the most important refined cornproduct. In 2003, corn sweeteners supplied more than 55% of the U.S. nutritivesweetener market. The second major refined corn product was ethanol as blend fuelfor gasoline. The third most important corn product, a very important part of thecorn industry and also of the U.S. economy, is starch, i.e., cornstarch. Corn refinersfill more than 90% of the U.S. demand for starch. With the ever-increasing demandfor fuel-grade ethanol from corn, changes in rankings for corn product utilizationappear inevitable.
Corn refining has also become America’s premier by-products industry.Increased production of amino acids, proteins, antibiotics, and biodegradable plasticshas added further value to the U.S. corn crop.1 In addition to cornstarches, sweet-eners, and grain ethanol, corn refiners also produce corn oils as well as a variety ofimportant feed products.
10.2 ETHANOL AS ALTERNATIVE FUEL
10.2.1 INDUSTRIAL SIGNIFICANCES OF GRAIN ETHANOL
Ethanol production and its utilization as automotive fuel received a major boost withthe enforcement of the Clean Air Act Amendments (CAAA) of 1990. Blending gasolinewith ethanol has become a popular method for gasoline producers to meet the newoxygenate requirements mandated by the CAAA. Provisions of the CAAA establishedthe Oxygenated Fuels Program (OFP) and the Reformulated Gasoline Program(RGP) in an attempt to control carbon monoxide (CO) emission and ground-levelozone problems. Both programs require certain oxygen levels in gasoline, namely,2.7% by weight for oxygenated fuel and 2.0% by weight for reformulated gasoline.Public policies aimed at encouraging ethanol development and production are largelymotivated by the nation’s desire to improve air quality as well as to enhance futureenergy supply security. In addition, agricultural policymakers keenly see the expan-sion of the ethanol industry as a means of stabilizing farm income and reducing farmsubsidies. Increasing ethanol production stimulates a higher demand for corn cropsand raises the average corn price. Higher corn prices and stronger demand of cornsreduce farm commodity program payments and the participation rate in the AcreageReduction Program. From technical and scientific viewpoints, use of ethanol as motorfuel or blend fuel makes sense, because corn ethanol can be produced in a renewablemanner, i.e., as a nondepletable energy source.
© 2007 by Taylor & Francis Group, LLC

Ethanol from Corn 327
10.2.2 CLEAN AIR ACT AMENDMENTS OF 1990
The Clean Air Act Amendments of 1990 target automobile emissions as a majorsource of air pollution. The Act mandates the use of cleaner-burning fuels in U.S.cities with smog and air pollution problems. The oxygen requirements of CAAAspurred a market for oxygenates and created new market opportunities for ethanol.The Oxygenated Fuels Program (OFP) targets 39 cities that do not meet NationalAmbient Air Quality Standards (NAAQS) for carbon monoxide (CO). CAAAmandates the addition of oxygen to gasoline to reduce CO emissions. It requiresan oxygen level in gasoline of 2.7% by weight. Control periods vary by city becausemost CO violations occur during the winter. The average control period is about4 months. The most widely used oxygenate in the market has been a methanol-derived ether, MTBE, which is made mostly from natural gas and is being phasedout in the 2000s.
Most major gasoline refiners are increasingly using ethanol to meet gasolineoxygenate content requirements. In 1993, about 300–350 million gallons of ethanolwere blended with gasoline and sold in markets covered by the Oxygenated FuelsProgram (OFP). In 2004, fuel ethanol consumption reached 3.4 billion gallons inthe U.S. In about 10 years, U.S. production of grain ethanol has seen a tenfoldincrease. The CAAA also requires the use of oxygenated fuels as part of thereformulated gasoline (RFG) program for controlling ground-level ozone formation.This program requires an oxygen level in gasoline of 2.0% by weight. Beginningin January 1995, reformulated gasoline was required to be sold in 9 ozone nonat-tainment areas year-round. Other provisions in the act allow as many as 90 othercities with less severe ozone pollution to “opt in” to the RFG program. Under atotal opt-in scenario, as much as 70% of the nation’s gasoline could be reformulated.
An oxygen level of 2.0% by weight in gasoline means that at least 5.75% byweight of ethanol needs to be blended in gasoline, based on the stoichiometriccalculation of 2.0 × (46/16) = 5.75. Therefore, 2.7% oxygen requirement pushes therequired level of ethanol in gasoline to 7.76% as a minimum. Thus, 10% ethanol-blended gasoline, E10, sold in gas stations is consistent with this calculation. Eventhough ethanol is clean burning and has a low RVP of blending, it has substantiallylower heating value than conventional gasoline. However, at a level of 10% blending,the reduced energy output is much less appreciable and could be compensated forby better engine performance.
Higher corn yields of modern agricultural industry, lower energy consumptionper unit of output in the fertilizer industry, and recent advances in fuel conversiontechnologies have significantly enhanced the economic and technical feasibility ofproducing ethanol from corn, when compared with just a decade ago. Therefore,studies based on the older data may tend to overestimate energy use because theefficiency of growing corn as well as converting it to fuel ethanol has improvedsignificantly over the past decade.2 According to this study, the net energy value(NEV) of corn ethanol is calculated as 16,193 Btu/gal, assuming that: fertilizers areproduced by modern processing plants, corn is converted in modern ethanol facilities,farmers achieve normal corn yields, and energy credits are allocated to coproducts.
© 2007 by Taylor & Francis Group, LLC

328 Handbook of Alternative Fuel Technology
10.2.3 ETHANOL PRODUCTION FROM CORN
Ethanol production facilities can be classified into two broad groups, i.e., wet millingand dry milling operations. Dry mills are usually smaller in size (capacity) and arebuilt primarily to manufacture ethanol only. Wet mill facilities are called corn refineries,also producing a list of high-valued coproducts such as high-fructose corn syrup(HFCS), dextrose, and glucose syrup. Both wet and dry milling operations are usedto convert corn to ethanol. Wet milling accounts for about two thirds of U.S. ethanolproduction from corn, whereas dry milling accounts for the remaining one third.
Thermal energy and electrical power are the main types of energy used in bothtypes of milling plants. Currently, most corn-processing plants generate both elec-trical and thermal energy from burning coal. A few plants generate steam only, andelectricity is also purchased from a utility. Electrical energy is used mostly forgrinding and drying corn, whereas thermal energy is used for fermentation, ethanolrecovery, and dehydration. On the other hand, flue gas is used for drying and stillageprocessing.
A large number of studies have been conducted to estimate the net energy value(NEV) of ethanol production. However, variations in data and model assumptionsresulted in a wide range of estimated values, ranging from a very positive to anegative value. A net negative energy value would mean that it takes more energyto produce the energy content of ethanol. A recent comprehensive study conductedby Argonne National Laboratory shows that ethanol produces 35% more energy thanit takes to generate.11
According to a study by Shapouri et al.,2 modern wet milling plants are able toproduce 1 gal of ethanol, while consuming 35,150 Btu of thermal energy and2.134 kWh of electricity. If molecular sieves are used, the thermal input drops to32,150 Btu/gal. DeSpiegelaere3 reported that of the total thermal energy, 7,000 Btu/galand 1.16 kWh were related to drying high-grade germ, fiber, and gluten. On average,wet mills produce 2.5 gal of ethanol per bushel. One U.S. bushel is equivalent to35.23907 l.
A new dry milling plant requires 37,000 Btu of thermal energy and 1.2 kWh ofelectricity per gallon of ethanol produced.2 The typical dry mill facility produces2.6 gal of ethanol per bushel of corn. The total energy used for converting ethanol,weighted by milling process and adjusted by EPA’s input efficiency factor12 for theenergy used to mine and transport coal, is 53,277 Btu/gal.2
Modern corn ethanol facilities use coal-based cogeneration. It has become com-mon for modern wet and dry mill ethanol plants to employ cogeneration technologyto produce steam and in-house power. In addition, in many operations, flue gasdrying of products is also practiced as an energy integration scheme.
The ethanol fuel manufacturing process is a combination of biochemical andphysical processes based on traditional unit operations. Ethanol is produced byfermentation of sugars with yeast. The fermentation crude product is concentratedto fuel-grade ethanol by distillation.
Feedstocks for ethanol fermentation are either sugar or starch-containing crops.These biomass fuel crops (tubers and grains) typically include sugar beets, potatoes,corn, wheat, barley, Jerusalem artichokes, and sweet sorghum. Sugar crops such as
© 2007 by Taylor & Francis Group, LLC

Ethanol from Corn 329
sugar cane, sugar beets, or sweet sorghum are extracted to produce a sugar-containingsolution or syrup that can be directly fermented by yeast. Starch feedstocks, however,must go through an additional step that involves starch-to-sugar conversion, as isthe case for grain ethanol.
Starch may be regarded as a long-chain polymer of glucose (i.e., many glucosemolecular units are bonded in a polymeric chain similar to a condensation polymer-ization product). As such, macromolecular starches cannot be directly fermented toethanol by conventional fermentation technology. They must first be broken downinto simpler and smaller glucose units through a chemical process called hydrolysis.In the hydrolysis step, starch feedstocks are ground and mixed with water to producea mash typically containing 15 to 20% starch. The mash is then cooked at or aboveits boiling point and treated subsequently with two enzyme preparations. The firstenzyme hydrolyzes starch molecules to short-chain molecules, and the secondenzyme hydrolyzes the short chains to glucose. The first enzyme is amylase. Amylaseliberates “maltodextrin” by the liquefaction process. Such maltodextrins are not verysweet as they contain dextrins and oligosaccharides. The dextrins and oligosaccha-rides are further hydrolyzed by enzymes such as pullulanase and glucoamylase in aprocess known as saccharification. Complete saccharification converts all the limitdextrans to glucose, maltose, and isomaltose. The mash is then cooled to 30ºC, andyeast is added for fermentation.
Yeasts are capable of converting sugar into alcohol by a biochemical process calledfermentation. The yeasts of primary interest to industrial fermentation of ethanolinclude Saccharomyces cerevisiae, Saccharomyces uvarum, Schizosaccharomycespombe, and Kluyveromyces sp. Under anaerobic conditions, yeasts metabolize glucoseto ethanol primarily via the Embden–Meyerhof pathway. The Embden–Meyerhof path-way of glucose metabolism is the series of enzymatic reactions in the anaerobicconversion of glucose to lactic acid (or ethanol in this case), resulting in energy in theform of adenosine triphosphate (ATP).13 The overall net reaction represented by astoichiometric equation involves the production of 2 mol of ethanol from each moleof glucose as shown in the following text. However, the yield attained in practicalfermentations does not usually exceed 90 to 95% of the theoretical value. In this case,the theoretical value, i.e., 100% of yield, means that exactly 2 mol of ethanol isproduced from each mole of glucose input to the fermenter. Therefore, this 100% yieldis equivalent to the mass conversion efficiency of 51%, which is defined later in thissubsection. The following equation shows the basic biochemical reaction in the con-version by fermentation of glucose to ethanol, carbon dioxide, and endothermic heat.
C6H12O6 = 2 C2H5OH + 2 CO2 ∆Ho298 = 92.3 kJ/mol
Theoretically, the maximum conversion efficiency of glucose to ethanol is 51%on a weight basis, which comes from a stoichiometric calculation of 2 × (MolecularWeight of Ethanol)/(Molecular Weight of Glucose) = (2 × 46)/(180) = 0.51. However,some glucose is inevitably used by the yeast for production of cell mass and formetabolic products other than ethanol, thus reducing the conversion efficiency fromits theoretical maximum. In practice, between 40 and 48% of glucose is actuallyconverted to ethanol. With 46% fermentation efficiency, 1000 kg of fermentable
© 2007 by Taylor & Francis Group, LLC

330 Handbook of Alternative Fuel Technology
sugar would produce about 583 l of pure ethanol, after taking into account the densityof ethanol (specific gravity at 20°C = 0.789). Or,
(1000 kg sugar) × (0.46 kg ethanol/kg sugar)/(0.789 kg ethanol/l) = 583 l
Conversely, about 1716 kg of fermentable sugar are required to produce 1000 lof ethanol, when 46% mass conversion efficiency is assumed. Mash typically con-tains between 50 and 100 g of ethanol per liter (about 5 to 10% by weight) whenthe fermentation step is complete. This is called distilled mash or stillage, whichstill contains a large amount of nonfermentable portions of fibers or proteins.
Ethanol is subsequently separated from mash by distillation, in which the compo-nents of a solution (in this case, water and ethanol) are separated by differences inboiling point (or individual vapor pressure). Separation is technically limited by the factthat ethanol and water form an azeotrope, or a constant boiling solution, of about 95.4%alcohol and 4.6% water. This azeotrope is of maximum boiling kind, for which theboiling temperature of the azeotrope is higher than that of the individual pure compo-nents, i.e., water and ethanol.
The 5%, more precisely 4.6 %, water cannot be separated by conventional distillation,because the maximum boiling temperature is attainable at the azeotropic concentration,not at the pure water concentration. Therefore, production of pure, water-free (anhydrous)ethanol requires an additional unit operation step following distillation. Dehydration, arelatively complex step in ethanol fuel production, is accomplished by one of twomethods. The first method uses a third liquid, most commonly benzene, which is addedto the ethanol-water mixture. This third component changes the boiling characteristicsof the solution (now, a ternary instead of a binary system), allowing separation ofanhydrous ethanol. In other words, this third component is used to break the azeotrope,thereby enabling conventional distillation to achieve the desired goal of separation. Thistype of distillation is also called azeotropic distillation, because the operation targetsseparating mixtures that form azeotropes. The second method employs molecular sievesthat selectively absorb water based on the molecular size difference between water andethanol. Molecular sieves are crystalline metal aluminosilicates having a three-dimen-sional interconnecting network of silica and alumina tetrahedra. Molecular sieves havelong been known for their drying capacity (even to 90°C). There are different forms ofmolecular sieves that are based on the dimension of effective pore opening, and theyinclude 3A, 4A, 5A, and 13X. Commercial molecular sieves are typically available inpowder, bead, granule, or extrudate forms. Pressure Swing Adsorption (PSA) usingmolecular sieve offers economical and environmental advantages over the conventionalternary system distillation, and is gaining popularity in the field of ethanol dehydration.
The nonfermentable solids in distilled mash (stillage) contain variable amounts offiber and protein, depending on the feedstock. The liquid also contains soluble proteinand other nutrients and, as such, is still valuable. The recovery of the protein and othernutrients in stillage for use as livestock feed can be essential for the overall economicand profitability analysis of ethanol fuel production. Protein content in stillage varieswith feedstock. Some grains such as corn and barley yield solid by-products calleddistiller’s dried grains (DDG). Protein content in DDG typically ranges from 25 to30% by mass and makes an excellent feed for livestock.
© 2007 by Taylor & Francis Group, LLC

Ethanol from Corn 331
The production of ethanol also generates liquid effluent, which may give rise topollution concerns. About 9 l of liquid effluents are generated for each liter of ethanolproduced. Some of the liquid effluent may be recycled. Effluent can have a highlevel of biological oxygen demand (BOD), which is a measure of organic waterpollution potential, and it is also acidic. Therefore, the liquid effluent must be treatedbefore being discharged into water stream. Specific treatment requirements dependon both feedstock quality (and type) as well as local pollution control regulations.Owing to the acidity of the effluent, precautions and care must be also taken if it isdirectly spread over fields.4
10.3 CHEMISTRY OF ETHANOL FERMENTATION
10.3.1 SUGAR CONTENTS OF BIOLOGICAL MATERIALS
Figure 10.1 shows a highly generalized view of plant cell wall composition. Thebase molecules that give plants their structure can be processed to produce sugars,which can be subsequently fermented to ethanol.
The principal components of most plant materials are commonly described aslignocellulosic biomass. This type of biomass is mainly composed of the compounds,cellulose, hemicellulose, and lignin. Cellulose is a primary component of most plantcell walls and is made up of long chains of the 6-carbon sugar, glucose, that arearranged in bundles (often described as crystalline bundles). The cellulose moleculesin the plant cell wall are interconnected by another molecule called hemicellulose.The hemicellulose is primarily composed of the 5-carbon sugar, xylose. Besides cellu-lose and hemicellulose, another molecule called lignin is also present in significant
FIGURE 10.1 A generalized description of a plant cell wall.
CelluloseBundles
Hemicellulose
Lignin
© 2007 by Taylor & Francis Group, LLC

332 Handbook of Alternative Fuel Technology
amounts and provides the structural strength for the plant. Technological developmentshave recently introduced a variety of processes for extracting and dissolving the celluloseand hemicellulose to produce sugars in a form that can be readily fermented to ethanol.Generally speaking, appropriate pretreatment can liberate the cellulose and hemicellu-lose from the plant material. Further treatment using chemicals, enzymes, or microor-ganisms can also be applied to liberate simple sugars from the cellulose and hemi-cellulose, thus making them available to microorganisms for fermentation to ethanol.
10.3.2 CONVERSION OF SUGARS TO ETHANOL
Figure 10.2 illustrates the hydrolysis of cellulose.5 The first step involves cellulosehydrolysis, which is essentially cleaving the chemical bonds in the cellulose toproduce glucose.
Once the large molecules are extracted from plant cells, they can be brokendown into their component sugars, using enzymes or acids. The sugars can besubsequently converted to ethanol, using appropriately selected microorganisms viafermentation. The fermentation of ethanol from 6-carbon sugars is represented bythe following stoichiometric equation:
According to the stoichiometric equation, 1 mol of glucose produces 2 mol ofethanol and 2 mol of carbon dioxide. Considering the molecular weights of glucose,ethanol, and carbon dioxide, which are 180, 46, and 44, respectively, the maximum
FIGURE 10.2 Hydrolysis of cellulose.
H
CH2OH
OH
H
H
OH
H OH
OH
O
2 CH3CH2OH + 2 CO2
Fermentation
Glucose
OO OHOH
HH
OH
CH2OH
O
O HOH
HH
OH
CH2OH
O
HOH
H
OH
CH2OH
O
O HOH
HH
OH
CH2OH
O
Glucose Glucose
Hydrolysis
Cellulose
H
CH2OH
OH
H
H
OHH
H OH
OH
O H
CH2OH
OH
H
H
OHH
H OH
OH
O
+
© 2007 by Taylor & Francis Group, LLC

Ethanol from Corn 333
theoretical yield of ethanol by wt% from the process would be 92/180 = 51%. Nearlyhalf the weight of the glucose (88/180 [49%]) is converted to carbon dioxide.
Hemicellulose is made up of the 5-carbon sugar, xylose, arranged in chains withother minor 5-carbon sugars interspersed as side chains. Similar to the cellulosecase, the hemicellulose can also be extracted from the plant material and treated toliberate xylose that in turn can be fermented to produce ethanol. However, xylosefermentation is not as straightforward as glucose fermentation. Depending on themicroorganism and conditions employed, a number of different fermentation pathsare possible. The array of products can include ethanol, carbon dioxide, and water as:
Actually, three different reactions have been documented with yields of ethanolranging from 30 to 50% of the weight of xylose as the starting material (i.e., weightethanol produced/weight xylose). They are:
3 Xylose → 5 Ethanol + 5 Carbon Dioxide
3 Xylose → 4 Ethanol + 7 Carbon Dioxide
Xylose → 2 Ethanol + Carbon Dioxide + Water
The first reaction yields a maximum of 51% (5 × 46/(3 × 150)), the second 41%(4 × 46/(3 × 150)), and the third 61% (2 × 46/150), respectively. Although the maxi-mum theoretical ethanol yields from these fermentation reactions range between 41and 61%, the practical yields of ethanol from xylose as starting material are in therange of 30–50%.
In the discussion of potential yields of ethanol from various starting materials,two different ranges of efficiencies of hemicellulose-to-xylose conversion andxylose-to-ethanol conversion have been combined to provide an overall conversionefficiency of hemicellulose to ethanol of about 50%. Just as with glucose fermenta-tion, the conversion of carbon dioxide to value-added products would vastly improvethe economics of ethanol production, because the yield of carbon dioxide is not onlysignificant in amounts but also inevitable. It must be noted that even though xylosefermentation to ethanol is also mentioned in this chapter, the main focus of discussionfor this chapter is on glucose fermentation. As conveyed earlier indirectly, ethanol-from-corn technology involves glucose fermentation, not xylose fermentation.
10.4 CORN-TO-ETHANOL PROCESS TECHNOLOGY
Fermentation of sugars to ethanol, using commercially available fermentation technol-ogy, provides a fairly simple, straightforward means of producing ethanol with littletechnological risk. The system modeled assumes that the molasses are clarified, and
H
H
OH
H
H
OH
H
OH
O 2CH3CH2OH + CO2 + H2O
Fermentation
Xylose
© 2007 by Taylor & Francis Group, LLC

334 Handbook of Alternative Fuel Technology
then fermented via cascade fermentation with yeast recycle. The stillage is concentratedby multiple-effect evaporation, and a molecular sieve is used to dehydrate the ethanol.
For more than 150 years in the U.S., corn refiners have been perfecting theprocess of separating corn into its component parts to create a myriad of value-addedcorn products. The corn wet milling process separates corn into its four basiccomponents, namely: starch, germ, fiber, and protein. There are eight basic stepsinvolved in accomplishing this corn refining and alcohol fermentation process.6
These are:
1. The corn is visually inspected and cleaned. Refinery people inspect incom-ing corn shipments and clean them two or three times to remove cob,dust, chaff, and any other foreign materials before the next processingstage, steeping. Effective screening processes can save a great deal oftrouble in the subsequent stages.
2. The corn is steeped to initiate bond breaking of starch and protein. Steep-ing is typically carried out in stainless steel tanks. Each steep tank (orsteeping tank) holds about 3000 bushels of corn soaked in water at 50°Cfor 30–40 h. During steeping, the kernels absorb water, thereby increasingtheir moisture levels from 15 to 45% by weight and also more thandoubling in size. The addition of 0.1% sulfur dioxide (SO2) to the watersuppresses excessive bacterial growth in the warm environment. As thecorn swells and softens, the mild acidity of the steeping water begins toloosen the gluten bonds within the corn and eventually releases the starch.A bushel is a unit of volume measure used as a dry measure of grains andproduce. A bushel of corn or milo weighs 56 lb, a bushel of wheat orsoybeans weighs 60 lb, and a bushel of sunflowers weighs 25 lb. That is,a U.S. bushel is equivalent to 35.23907 l as a volume unit.
3. A coarse grind separates the germ from the rest of the kernel. Germ isthe embryo of a kernel of grain. This is accomplished in cyclone separa-tors, which spin the low-density corn germ out of the slurry. Therefore,this cyclone separator is called a germ separator. The germs, whichcontain about 85% of corn’s oil, are pumped onto screens and washedrepeatedly to remove any starch left in the mixture. A combination ofmechanical and solvent processes extracts the oil from the germ. The oilis then refined and filtered into finished corn oil. The germ residue issaved as another useful component of animal feeds. Both corn oil andgerm residue are important by-products of this process.
4. As the fourth step, the remaining slurry, consisting of fiber, starch, andprotein, is finely ground and screened to separate the fiber from the starchand protein. After the germ separation step (step 3), corn and water slurrygoes through a more thorough grinding in an impact or attrition-impactmill to release the starch and gluten from the fiber in the kernel. Thesuspension of starch, gluten, and fiber flows over fixed concave screens,which catch fiber but allow starch and gluten to pass through. The fiberis collected, slurried, and screened again to reclaim any residual starch orprotein, then piped or sent to the feed house as a major ingredient of
© 2007 by Taylor & Francis Group, LLC
Ethanol from Corn 335
animal feeds. The starch-gluten suspension, called mill starch, is piped orsent to the starch separators.
5. Starch is separated from the remaining slurry in hydrocyclones. By cen-trifuging mill starch, the gluten is readily spun out owing to the densitydifference between starch and gluten. Starch is denser than gluten. Sepa-rated gluten can be used for animal feeds. The starch, with just 1 to 2%protein remaining, is diluted, washed 8 to 14 times, rediluted and rewashedin hydrocyclones to remove the last trace of protein and produce high-quality starch, typically more than 99.5% pure. Some of the starch is driedand marketed as unmodified cornstarch, some is modified into specialtystarches, but most is converted into corn syrups and dextrose. Cornstarchhas a variety of industrial and domestic uses. All these are important by-products of the process, which improve the corn distillers’ profitability.
6. The cornstarch then is converted to syrup, and this stage is called starchconversion step. Starch-water suspension is liquefied in the presence of acidand enzymes. Enzymes help convert the starch to dextrose, which is solublein water as an aqueous solution. Treatment with another enzyme is usuallycarried out, depending on the desired process outcome. The process of acidand enzyme reactions can be stopped or terminated anytime throughout theprocess to produce a right mixture of sugars such as dextrose and maltosefor syrups to meet desired specifications. For example, in some cases, theconversion of starch to sugars can be halted at an early stage to producelow- to medium-sweetness syrups. In other cases, however, the starch con-version process is allowed to proceed until the syrup becomes nearly alldextrose. After this conversion process, the syrup is refined in filters, cen-trifuges or ion-exchange columns, and excess water is evaporated, producingconcentrated syrup. Syrup can be sold directly as is, crystallized into puredextrose, or processed further to produce high-fructose corn syrup.
7. Syrups can be made into several other products through a fermentationprocess. Dextrose is one of the most fermentable forms of all the sugars.Dextrose is also called corn sugar and grape sugar, and dextrose is anaturally occurring form of glucose. Dextrose is better known today asglucose. Following the conversion of starch to dextrose, corn refiners pipeand send dextrose to fermentation units and facilities, where dextrose isconverted to ethanol by traditional yeast fermentation. Using a continuousprocess, the fermenting mash is allowed to flow, or cascade, through severalfermenters in series until the mash is fully fermented and then leaves thefinal tank. In a batch fermentation process, the mash stays in one fermenterfor about 48 h before the distillation process is initiated. Generally speaking,a continuous mode is more effective with a higher fermenter throughput,whereas higher-quality product may be obtained from a batch mode.
8. Ethanol separation follows the fermentation step. The resulting broth isdistilled to recover ethanol or concentrated through membrane separationto produce other by-products. Carbon dioxide generated from fermenta-tion is recaptured for sale, and nutrients still remaining in the broth afterfermentation are used as components of animal feed ingredients. Theseby-products also help the overall economics of the corn refineries.
© 2007 by Taylor & Francis Group, LLC

336 Handbook of Alternative Fuel Technology
Even though the term by-product was used throughout the process description,coproduct may be a better term, because these products are not only valuable butalso targeted in the master plan of corn distillers. The corn-to-alcohol processdetailed earlier can be summarized in a schematic process diagram, as shown inFigure 10.3.
10.5 ETHANOL AS OXYGENATED FUEL
Oxygenated fuel is conventional gasoline that has been blended with an oxygenatedhydrocarbon to achieve a certain concentration level of oxygen in the blended fuel.Oxygenated fuel is required by the CAAA of 1990 for areas that do not meet federalair quality standards, especially for carbon monoxide. The oxygen present in theblended fuel helps the engine burn the fuel more completely, thus emitting lesscarbon monoxide. Extra oxygen already present in situ in the fuel formulation helpsefficient conversion into carbon dioxide rather than carbon monoxide.
Reformulated gasoline (RFG) is a new formulation of gasoline that has lowercontrolled amounts of certain chemical compounds that are known to contribute tothe formation of ozone and toxic air pollutants. It is less evaporative than conven-tional gasoline during the summer months, thus reducing evaporative fuel emissionand leading to reduced volatile organic compound (VOC) emission. It also containsoxygenates, which increase the combustion efficiency of the fuel and reduce carbonmonoxide emission. The CAAA of 1990 require RFG to contain oxygenates andhave a minimum oxygen content of 2.0% oxygen by weight. RFG is required in themost severe ozone nonattainment areas of the U.S. Other areas with ozone problemshave voluntarily opted into the program. The EPA has implemented the RFG programin two phases, i.e., Phase I for 1995 to 1999 and Phase II, which began in 2000.
To be more specific, the CAAA mandated the sale of reformulated gasoline (RFG)in the nine worst ozone nonattainment areas beginning January 1, 1995. Initially, theEPA determined the nine regulated areas to be the metropolitan areas of Baltimore,
FIGURE 10.3 A typical schematic of corn-to-alcohol process.
CO2
SO 2
Corns
Inspection & Cleaning
Steeping
CycloneSeparationCob, Dust,
and Chaff(Rejects)
Cornstarch
Dextrose
Water
Hydrocycloning
StarchConversion
Fermentation
Separation
AnimalFeed
Byproducts
ProductEthanol
© 2007 by Taylor & Francis Group, LLC

Ethanol from Corn 337
Chicago, Hartford, Houston, Los Angeles, Milwaukee, New York City, Philadelphia,and San Diego. The important parameters for RFG by the CAAA of 1990 are:
1. At least 2% oxygen by weight 2. A maximum benzene content of 1% by volume3. A maximum of 25% by volume of aromatic hydrocarbons
Methyl-tert-butyl ether (MTBE) was the most commonly used oxygenate, untilrecent claims of health problems associated with MTBE use as a blending fuelemerged. Tertiary-amyl methyl ether (TAME), ethyl tertiary-butyl ether (ETBE), andethanol have also been used in reformulated fuels. Among these, ethanol has beengaining popularity as a blending fuel, based on its clean-burning nature, low Reidvapor pressure, renewability, minimal or no health concerns, and relatively low cost.
The RFG should have no adverse effects on vehicle performance or the durabilityof engine and fuel system components. However, there may be a slight decrease infuel mileage (1–3% or 0.2–0.5 mi/gal) with well-tuned automobiles owing to thehigher concentrations of oxygenates that have lower heating values. Nevertheless,RFG burns more completely, thereby reducing formation of engine deposits andoften boosting the actual gas mileage.
The RVP is crucially important information for blended gasoline from practicaland regulatory standpoints. Evaporated gasoline compounds combine with otherpollutants on hot summer days to form ground-level ozone, commonly referred toas smog. Ozone pollution is of particular concern because of its harmful effects onlung tissue and breathing passages. Therefore, the government, both federal andstate, imposes an upper limit as a requirement, which restricts the maximum levelreformulated gasoline can have as its Reid vapor pressure. By such regulations, thegovernment not only controls the carbon monoxide emission level, but also limitsthe evaporative emission of the fuel. Because of this limit, certain oxygenates maynot qualify as a gasoline-blending fuel even if they possess excellent combustionefficiency and high octane rating. Further, the legal limits for the Reid vapor pressuredepend on many factors, including current environmental conditions, geographicalregions, climates, time of the year (such as summer months vs. winter months), etc.It should be also noted that ground-level ozone is harmful to humans, whereasstratospheric ozone is essential for global environmental safety.
The oxygenated fuel program (OFP) is a winter-time program for areas withproblems of carbon monoxide air pollution. The oxygenated winter fuel programuses normal gasoline with oxygenates added. On the other hand, the reformulatedgasoline program is for year-round use to help reduce ozone, CO, and air toxins.Although both programs use oxygenates to reduce CO, RFG builds on the benefitof oxygenated fuel and uses improvements in the actual formulation of gasoline toreduce pollutants, including volatile organic compounds (VOCs).
Although MTBE was widely credited with significantly improving the nation’sair quality, it has been found to be a major contributor to groundwater pollution.Publicity about the leaking of MTBE from gasoline storage tanks into aquifers, aswell as its adverse health effects, has prompted legislators from the Midwest to pushfor a federal endorsement of corn-derived ethanol as a substitute oxygenate. Oil
© 2007 by Taylor & Francis Group, LLC

338 Handbook of Alternative Fuel Technology
refineries in the state of California have been required to phase out MTBE, andreplace it by ethanol, by the year 2004. This may serve as an incentive for cornethanol industries, as they can market their products as being environmentally moreacceptable than other alternatives and at the same time, it is renewable.
Ethanol can be used directly as fuel for internal combustion engines. In thiscase, the ethanol content is far more than that for blended fuel. In the U.S., theNational Ethanol Vehicle Coalition (NEVC) is actively promoting expanded use of85% ethanol (E85) motor fuel. NEVC is advocating E85, based on its clean burningas well as renewability of the fuel. E85 fuel can achieve a very high octane ratingof 105. The major automakers of the world are producing vehicles that are E85compatible. They include Daimler Chrysler, Ford, General Motors, Isuzu, Mazda,Mercedes, Mercury, and Nissan. Many of their late-model pick-up trucks are com-patible with E85, and more passenger cars are being added to the list of E85-compatible vehicles. As an extra incentive plan for the E85 users, the U.S. federalgovernment provides federal income tax credits for the use of E85 as a form ofalternative transportation fuel. The E85 vehicles undoubtedly help alleviate thepetroleum dependence of the world by using a renewable alternative fuel source.
10.6 ETHANOL VEHICLES
Fuel ethanol is most commonly used as a fuel for internal combustion, four-cycle,spark-ignition engines in transportation and agriculture. It can be used as a directreplacement for gasoline, or can be blended with gasoline as an extender and octaneenhancer. The research octane number (RON) of ethanol is about 113 and, as such,ethanol blending enhances the octane rating of the fuel. The octane number is aquantitative measure of the maximum compression ratio at which a particular fuelcan be utilized in an engine without some of the fuel-air mixture “knocking.” Bydefining octane number of 100 for iso-octane and 0 for n-heptane, linear combi-nations of these two components are used to measure the octane number of aparticular fuel. Therefore, a fuel with octane number of 90 would have the sameignition characteristics at the same compression ratio as a 90/10 mixture of iso-octane and n-heptane. It should be noted that there are several different ratingschemes for octane numbers of fuels, namely, research octane number (RON),motor octane number (MON), and the average of the two ((R + M)/2). The RON,or F1, simulates fuel performance under low-severity engine operation, whereasthe MON, or F2, simulates more severe operation that might be incurred at highspeed or high load. Therefore, RON is nearly always higher in value than MONfor the same fuel. In practice, the octane of a gasoline is reported as the averageof RON and MON, or (R + M)/2.
The use of ethanol to replace gasoline requires modifications to the carburetor,fuel injection system components and, often, the compression ratio. Therefore,efficient and safe conversion of existing gasoline engines is a complex matter.Engines specifically designed and manufactured to operate on ethanol fuel, or pre-dominantly ethanol fuel, will generally be more efficient than modified gasoline
© 2007 by Taylor & Francis Group, LLC

Ethanol from Corn 339
engines. Ethanol concentrations of between 80 and 95% can be used as fuel, whicheliminates the need for a cumbersome dehydration processing step, thus simplifyingthe distillation step. This complication comes from the fact that an ethanol-watersolution makes an azeotropic mixture at 95.4% of ethanol (by mass), i.e., a maximumboiling mixture. In many cases, the conversion of engines for azeotropic ethanoloperation may be simpler and more cost-effective than ethanol dehydration as aneffort to produce 99+% purity ethanol.
In the U.S., E85 is a federally designated alternative fuel that contains 85%ethanol and 15% gasoline. As of 2003, there are hundreds of thousands of E85vehicles on the roads in the U.S. E85 vehicles are flexible-fuel vehicles, which canrun on a very wide range of fuels, ranging from 100% gasoline to 85% ethanol;however, they run best on E85.7 Nearly all the major automobile makers offer manymodels of passenger cars and sports utility vehicles (SUVs) with E85 engines.
In unmodified engines, ethanol can replace up to 20% of the gasoline. In theU.S., up to 10% blend of ethanol is quite popularly used. Blending ethanol withgasoline extends the gasoline supply, and improves the quality of gasoline by increas-ing its octane value as well as adding clean-burning properties of oxygenates. Thereare advantages to using gasoline–ethanol blends rather than pure (or very-high-concentration) ethanol. Blends do not require engine modification. Therefore, ethanolcan be integrated rapidly with existing gasoline supply and distribution systems.
Even though the use of ethanol in specially designed two-cycle engines has beendemonstrated on a number of occasions, it is not yet commercialized. One of themajor issues has been in the fact that ethanol does not mix well with the lubricatingoil typically used for such engines. Therefore, development of lubricating oils thatare not affected by ethanol is an important step for this application.
Similarly, the use of ethanol in diesel-fueled engines is quite feasible but is notpracticed much, because of a number of technical difficulties. These limitations arebased on ethanol’s inability to ignite in compression ignition engines and poormiscibility with diesel. However, ethanol can be used in supercharged diesel enginesfor up to about 25% of the total fuel, the rest preferably being diesel. This can beachieved by delivering ethanol from a separate fuel tank and injecting it into thediesel engine through a supercharger air stream. This mode of fuel delivery systemmay be called dual fuel system in comparison to blended fuel, which is deliveredpreblended from a single fuel tank. Ethanol can also replace aviation fuel in aircraftengines, even though this potential is not commercially exploited.
As a recent effort, a dual-fuel internal combustion engine technology has beendeveloped and demonstrated, in which ethanol is used as a cofuel with acetylene,which is the principal fuel. The dual-fuel system has been very favorably demon-strated on modified gasoline and diesel engines originally designed for cars, trucks,fork lifts, tractors, and power generators. Up to 25% of ethanol in acetylene-baseddual-fuel systems has been successfully tested. Ethanol was found to be very effectivein eliminating knocking/pinging and lowering the combustion temperatures, thusreducing NOx emissions.8,9
© 2007 by Taylor & Francis Group, LLC

340 Handbook of Alternative Fuel Technology
10.7 USE OF ETHANOL OTHER THAN ASRENEWABLE FUEL
In the presence of an acid catalyst (typically sulfuric acid) ethanol reacts with carbox-ylic acids to produce ethyl esters: the two largest-volume ethyl esters are ethyl acrylate(from ethanol and acrylic acid) and ethyl acetate (from ethanol and acetic acid).
Ethyl acetate is used as a common solvent used in paints, coatings, and in thepharmaceutical industry. The most familiar application of ethyl acetate in the house-hold is as a solvent for nail polish. The typical reaction that synthesizes ethyl acetateis based on esterification:
C2H5OH + CH3COOH = C2H5OOCCH3 + H2O
This chemical reaction very closely follows second-order reaction kinetics, andis often used as an example problem in chemical reaction engineering textbooks.Recently, Kvaerner Process Technology developed a process that produces ethylacetate directly from ethanol without acetic acid or other cofeeds. Considering thatboth acetic acid and formaldehyde can also be produced from ethanol, this inno-vative process idea is not only understandable, but also quite significant. Further,the process elegantly combines both dehydrogenation and selective hydrogenationin its process scheme, thus producing hydrogen as a process by-product, whichmakes the process economics even better.
Ethyl acrylate, which is synthesized by reacting ethanol and acrylic acid, is amonomer used to prepare acrylate polymers for use in coatings and adhesives.
Ethanol is a reactant for ETBE, as is the case for methanol to MTBE. ETBE isproduced by reaction between isobutylene and ethanol as:
C2H5OH + CH3C(CH3)=CH2 I C(CH3)3 OC2H5
Vinegar is a dilute aqueous solution of acetic acid prepared by the action ofAcetobacter bacteria on ethanol solutions. Ethanol is used to manufacture ethyl-amines by reacting ethanol and ammonia over a silica- or alumina-supported nickelcatalyst at 150–220°C. First, ethylamine with a single amino group in the moleculeis formed, and further reactions create diethylamine and triethyamine. The ethy-lamines are used in the synthesis of pharmaceuticals, agricultural chemicals, andsurfactants.
Ethanol can also be used as feedstock to synthesize petrochemicals that are alsoderived from a petroleum source. Such chemicals include ethylene and butadiene,but are not limited to these. This option may become viable for regions and countrieswhere petrochemical infrastructure is weak, but agricultural produce is vastly abun-dant. This is particularly true for the times when the petroleum price is very high.Ethanol can also be converted into hydrogen via a reforming reaction, i.e., chemicalreaction with water at an elevated temperature, typically with the aid of a catalyst.Even though this method of generation may be economically less favorable thaneither steam reforming of methane or electrolysis, it can be used for special appli-cations, where specialty demands exist, or where other infrastructure is lacking.
© 2007 by Taylor & Francis Group, LLC

Ethanol from Corn 341
REFERENCES
1. National Corn Growers Association, homepage, http://www.ncga.com/WorldOf-Corn/main/, 2005.
2. Shapouri, H., Duffield, J.A., and Graboski, M.S., Estimating the Net Energy Balanceof Corn Ethanol, U.S. Department of Agriculture, Agricultural Economic ReportNumber 721, July 1995.
3. DeSpiegelaere, T., Energy Consumption in Fuel Alcohol Production for a Corn WetMilling Process, IBIS 1992 Fuel Ethanol Workshop, Wichita, Kansas, June 1992.
4. Bradley, C. and Runnion, K., Understanding Ethanol Fuel Production and Use,Technical Paper #3, Understanding Technology Series, Volunteers in Technical Assis-tance (VITA), Arlington, VA, 1984.
5. Ethanol Production in Hawaii Report, http://www.state.hi.us/dbedt/ert/ethanol/ethano94.html, 1994.
6. Corn Refiners Association, homepage, http://www.corn.org/, 2005.7. American Coalition for Ethanol, homepage, http://www.ethanol.org/, 2004.8. Wulff, J.W., Hulett, M., and Lee, S., Internal Combustion System Using Acetylene
Fuel, U.S. Patent No. 6,076,487, 2000.9. Wulff, J.W., Hulett, M., and Lee, S., A Dual Fuel Composition Including Acetylene
for Use with Diesel and Other Internal Combustion Engines, U.S. Patent No.6,287,351, 2001.
10. Renewable Fuels Association Web site, http://www.ethanolrfa.org/industry/statistics,November 2005.
11. Office of Energy Efficiency and Renewable Energy, U.S. Department of Energy,http://www.ncga.com/public_policy/PDF/03_28_05ArgonneNatlLabEthanolStudy.pdf, 2005.
12. Spurr, M., Comments of the International District Energy Association on the NES-CAUM Draft Model Rule on Generation Performance Standards, April 21, 1999,http://www.nescaum.org/pdf/energy_GPScommp/IntlDistrictEnergy.pdf [NESCAUM:Northeast States for Coordinated Air Use Management].
13. Dorland, W.A.N., Dorland’s Illustrated Medical Dictionary, 30th ed., W.B. SaundersCompany, Elsevier Health Sciences Division, Philadelphia, PA, 2003.
© 2007 by Taylor & Francis Group, LLC

343
11 Ethanol from Lignocellulosics
Sunggyu Lee
CONTENTS
11.1 Introduction .................................................................................................. 34411.1.1 Ethanol ............................................................................................. 34511.1.2 Manufacture of Industrial Alcohol .................................................. 34511.1.3 Fermentation Ethanol....................................................................... 34611.1.4 Sugars ............................................................................................... 34611.1.5 Starches ............................................................................................ 34711.1.6 Alcohol without Pollution................................................................ 34811.1.7 Cellulosic Materials ......................................................................... 349
11.2 Conversion of Agricultural Lignocellulosic Feedstocks ............................. 35011.2.1 Acid or Chemical Hydrolysis .......................................................... 352
11.2.1.1 Process Description .......................................................... 35311.2.2 Enzymatic Hydrolysis ...................................................................... 354
11.2.2.1 Enzyme System ................................................................ 35511.3 Enzymatic Processes .................................................................................... 355
11.3.1 Pretreatment ..................................................................................... 35511.3.1.1 Autohydrolysis Steam Explosion ..................................... 35711.3.1.2 Dilute Acid Prehydrolysis ................................................ 35711.3.1.3 Organosolv Pretreatment .................................................. 35811.3.1.4 Combined RASH and Organosolv Pretreatment ............. 359
11.3.2 Enzyme Production and Inhibition.................................................. 36011.3.3 Cellulose Hydrolysis ........................................................................ 361
11.3.3.1 Cellulase Adsorption......................................................... 36111.3.3.2 Mechanism of Hydrolysis ................................................ 362
11.3.4 Fermentation..................................................................................... 36311.3.4.1 Separate Hydrolysis and Fermentation ............................ 36311.3.4.2 Simultaneous Saccharification
and Fermentation .............................................................. 36411.3.4.3 Comparison between SSF and SHF Processes ................ 36511.3.4.4 Xylose Fermentation......................................................... 36611.3.4.5 Ethanol Extraction during Fermentation.......................... 367
11.4 Lignin Conversion........................................................................................ 367
© 2007 by Taylor & Francis Group, LLC
344 Handbook of Alternative Fuel Technology
11.5 Coproducts ................................................................................................... 37011.6 Energy Balance for Ethanol Production from Biomass.............................. 37011.7 Process Economics and Strategic Direction................................................ 372References.............................................................................................................. 372
11.1 INTRODUCTION
Developing countries with characteristically weak economies and precarious indus-trial infrastructures have been seriously hit by the energy crisis. To fully tap thepotential of fossil-based fuels and other new renewable sources, huge capital outlaysare required that these countries do not have. The trend has thus been toward thesmall-scale utilization of resources. One area in which developing countries cansucceed relatively quickly is fossil fuel supplementation with alternative fuelsderived from food and agricultural crops such as sugarcane, cassava, maize, andsorghum. Although the focus has primarily been on the petroleum products as aprimary source of transportation fuels, ethanol has attracted a great deal of attentionall over the world as an alternative source to petrol or as a blend with petrol toreduce the consumption of petrol. In Brazil, all cars are run on either a 22 to 25%mixture of ethanol with gasoline or pure ethanol. In Brazil, the National Programof Alcohol, PROALCOOL, started in November 1975, was created in response tothe first petroleum crisis of 1973. This program effectively changed the profile oftransportation fuels in the country. For the period 1979–2004, about 5.4 millionethanol-powered cars were produced. In 1998, these ethanol-powered cars con-sumed about 2 billion gallons of ethanol per year and about 1.4 billion gallons ofethanol was additionally used for producing gasohol (22% ethanol and 78% gaso-line) for other cars.46 Brazil produces about 4 billion gallons of ethanol annually,1
whereas the U.S produces just over 3.5 billion gallons (as of 2004). The U.S.production of ethanol is increasing very sharply. The Brazilian program has suc-cessfully demonstrated large-scale production of ethanol from sugarcanes and suc-cessful use of ethanol as a motor fuel.
Regarding the atmospheric concentrations of so-called greenhouse gases, theNational Research Council (NRC), responding to a request from Congress and withfunding from the U.S Department of Energy, emphasizes substantially increasedresearch on renewable energy sources, improved methods of employing fossil fuels,energy conservation, and energy-efficient technologies.28 The Energy Policy Act of1992 (EPAct) was passed by Congress to reduce the nation’s dependence on importedpetroleum by requiring certain fleets to acquire alternative-fuel vehicles, which arecapable of operating on nonpetroleum fuels. Alternative fuels for vehicular purposes,as defined by the Energy Policy Act, include ethanol, natural gas, propane, hydrogen,biodiesel, electricity, methanol, and p-series fuels.
It is not that the U.S. suffers from a lack of energy resources; it has plenty ofcoal and oil shale reserves, but it needs transportation fuels. The market for trans-portation fuels has been dominated by petroleum-based fuels until very recently.Gaddy13 and his colleagues have worked on the biological production of liquid fuelsfrom biomass and coal. They have found microorganisms that can produce ethanol
© 2007 by Taylor & Francis Group, LLC

Ethanol from Lignocellulosics 345
from biomass, convert natural gas into ethanol, and convert syngas from coal gasi-fication into liquid fuels. These microorganisms, Gaddy says, are very energy effi-cient. The microbial process works at ordinary temperature and pressure and offerssignificant advantages over chemical processes for production of liquid fuels fromcoal. Naae (1990)30 focuses on using a renewable resource, lignin, to recover anonrenewable resource, oil. Lignins are produced in large quantities, approximately250 billion pounds per year in the U.S., as by-products of the paper and pulp industry.As a consequence, the prices of some lignin products, such as lignosulfonates, areas low as 2 to 3 cents a pound.
11.1.1 ETHANOL
Ethanol, C2H5OH, is one of the most significant synthetic oxygen-containing organicchemicals because of its unique combination of properties as a solvent, fuel, germi-cide, beverage, antifreeze, and especially because of its versatility as an intermediateto other chemicals. Ethanol is one of the largest-volume chemicals used in industrialand consumer products. The main uses for ethanol are as an intermediate in theproduction of other chemicals and as a solvent. As a solvent, ethanol is second onlyto water. Ethanol is a key raw material in the manufacture of plastics, lacquers,polishes, plasticizers, perfume, and cosmetics. The physical and chemical propertiesof ethanol are primarily dependent on the hydroxyl group, which imparts polarityto the molecule and also gives rise to intermediate hydrogen bonding. In the liquidstate, hydrogen bonds are formed by the attraction of the hydroxyl hydrogen of onemolecule and the hydroxyl oxygen of another.18 This makes liquid alcohol behaveas though it were largely dimerized. Its association is confined to the liquid state;in the vapor state it is monomeric.
11.1.2 MANUFACTURE OF INDUSTRIAL ALCOHOL
Industrial alcohol can be produced either: (1) synthetically from ethylene, (2) as aby-product of certain industrial operations, or (3) by the fermentation of sugars,starch, or cellulose. There are two main processes for the synthesis of alcohol fromethylene. The earlier one (in the 1930s by Union Carbide) was the indirect hydrationprocess, otherwise called the strong sulfuric acid-ethylene process, the ethyl sulfateprocess, the esterification hydrolysis process, or the sulfation hydrolysis process. Theother synthetic process designed to eliminate the use of sulfuric acid is the directhydration process. In the direct hydration process, ethanol is manufactured by react-ing ethylene with steam. The hydration reaction is exothermic and reversible, i.e.,the maximum conversion is limited by chemical equilibrium.
CH2=CH2(g) + H2O(g) I CH3CH2OH(g) ∆H = –45kJmol–1
Only about 5% of the reactant ethylene is converted into ethanol per pass throughthe reactor. By selectively removing ethanol from the equilibrium product mixtureand recycling the unreacted ethylene, it is possible to achieve an overall 95%conversion. Typical reaction conditions are 300°C, 6–7 MPa, and phosphoric (V)acid catalyst.
© 2007 by Taylor & Francis Group, LLC

346 Handbook of Alternative Fuel Technology
In addition to the direct hydration process, the sulfuric acid process, and fermen-tation routes to manufacture, several other processes have been suggested.11,22,26,29 Noneof these have been successfully implemented on a commercial scale.
11.1.3 FERMENTATION ETHANOL
Fermentation, one of the oldest and most widely practiced chemical processes knownto humans, is used to make a variety of useful products and chemicals. At present,however, many of the products that can be produced by fermentation are alsosynthesized from petroleum feedstocks, often at lower costs. The future of thefermentation industry, therefore, depends on its ability to utilize the high efficiencyand specificity of enzymatic catalysis to synthesize complex products and also onits ability to overcome variations in the quality and availability of the raw materials.
Ethanol can be derived by fermentation processes from any material that containssugars or sugar precursors. The raw materials used in the manufacture of ethanolvia fermentation are classified as sugars, starches, and cellulosic materials.2 Sugarscan be directly converted to ethanol, as discussed in detail in Chapter 10. Starchesmust first be hydrolyzed to fermentable sugars by the action of enzymes. Cellulosemust likewise be converted to sugars, generally by the action of mineral acids (i.e.,inorganic acids). Once the simple sugars are formed, enzymes from yeasts can readilyferment them to ethanol.
11.1.4 SUGARS
The most widely used form of sugar for ethanol fermentation is the black-strapmolasses, which contain about 30–40 wt% sucrose, 15–20 wt% invert sugars suchas glucose and fructose, and 28–35 wt% of nonsugar solids. The direct fermenta-tions of sugarcane juice, sugarbeat juice, beat molasses, fresh and dried fruits,sorghum, whey, and skim milk have been considered, but none of these couldcompete economically with molasses. As far as industrial ethanol production isconcerned, sucrose-based substances such as sugarcane and sugarbeat juices offermany advantages, including their relative abundance and renewable nature. Molas-ses, the noncrystallizable residue that remains after the sucrose purification, hasadditional advantages: it is relatively inexpensive raw material, readily available,and already used for industrial ethanol production. Park and Baratti34 have studiedthe batch fermentation kinetics of sugar beat molasses by zymomonos mobilis.This bacterium has several interesting properties that make it competitive with theyeasts, the most important being higher ethanol yields and specific productivity.However, when cultivated on molasses, Z. mobilis generally shows poor growthand low ethanol production in comparison to those in glucose media.34 The lowethanol yield is explained by the formation of by-products such as levan andsorbital. Other components of molasses such as organic salts, nitrates, or thephenolic compounds could also be inhibitory for growth. Park and Baratti foundthat in spite of good growth and prevention of levan formation, the ethanol yieldand concentration were not sufficient for the development of an industrial process.34
Yeasts of the saccharomyces genus are mainly used in industrial processes. However,
© 2007 by Taylor & Francis Group, LLC

Ethanol from Lignocellulosics 347
there are continued efforts to develop mutant strains of Z. mobilis to avoid thecostly addition of yeast extract.
11.1.5 STARCHES
The grains generally provide cheaper ethanol feedstocks, and the conversion is lessexpensive because they can be stored more easily than most sugar crops, which oftenmust be reduced to a form of syrup prior to the storage. Furthermore, grain distillationproduces a by-product that can be used for protein meal in the animal feeds.41
Fermentation of starch from grains is somewhat more complex than sugars becausethe starch must first be converted to sugar and then to ethanol. The simplifiedequations for the conversion of starch to ethanol can be written as:
As shown in Figure 11.1, in making grain alcohol, the distiller produces a sugarsolution from feedstock, ferments the sugar to ethanol, and then separates the ethanolfrom water through distillation. A more detailed discussion can be found in Chapter 10.
Among the disadvantages of the use of grain are the fluctuations in its price.Whenever the price of grain falls, there is intense interest in the use of grain alcohol
FIGURE 11.1 Synthesis of ethanol from grains and sugar crops. (From U.S. Congress,Energy from Biological Processes, Vol. 2, Office of Technology Assessment, Washington,D.C., 1980, 142–177.)
C H O + H O C H6 10 5 2Enzyme
Fungal amylase 6 12 → OO 2C H OH + 2CO6Yeast
2 5 2 →
GRAIN
Conversion ofsugar
Fermentation
Distill to 95%EtOH
Storage
ETHANOL
Dilute withwater
Storage
ANIMAL FEED
SUGAR CROP
Removesugar
Concentrate tosyrup for storage
Dry byproducts
Byproduct(sugars)disposal
© 2007 by Taylor & Francis Group, LLC

348 Handbook of Alternative Fuel Technology
as an automotive fuel additive. Obviously, a very similar trend is also observedwhenever petroleum crude price goes up. Ethanol in the petrol boosts the fuel'soctane rating and also helps cleaner burning. More detailed discussions can be foundin Chapter 10.
European farms produce more food than they can consume. Farmers and oilcompanies have been lobbying9 in the European parliament for a scheme to blendpetrol with 5% bioethanol. They insist that farmers grow energy crops so that alcoholcan replace petrol. In Western Europe and the U.S., agricultural policies no longerconcern themselves with the problem of producing enough food. Instead, they strugglewith the problem of storing the food from increasingly abundant harvests. It coststhem as much to store as it would to promote ethanol as a fuel. In producing ethanolfrom crops, the European Community may have several advantages over the U.S. andJapan. Europe has more land than Japan and unlike the U.S., there is no shortage ofwater. Furthermore, Europe now has the highest yields of grain in the world.
11.1.6 ALCOHOL WITHOUT POLLUTION
Alfa-Laval’s ethanol fermenter in Sweden has brewed 20,000 l of ethanol a day fromsurplus grain since 1983. In the 1990s, Alfa-Laval refined the wide-gap heatexchanger for ethanol plants, and set industry standards for a variety of processingequipment, from welded heat exchangers to wide-gap heat exchangers
All the products from Alfa-Laval’s process, which runs continuously, are recov-ered and most are solids. The products include animal feed, bran, and CO2. Thecompany reports that this process does not pollute the environment, because it requiresonly a little amount of water to keep functioning.9 A schematic flowsheet of theprocess system is shown in Figure 11.2. The process begins when the weak beer andthe process water from the fermenter and the still are mixed with the ground grain.The starch of liquid feed is converted into fermentable sugars by the enzymes inlarge-sized stirred tank reactors. The reactors operate at a temperature of about 60 to90°C. The effluent stream now consists of suspended solids and fibers. This streamis continuously fed to the fermenter. On its way to the fermenter, it heats up the freshfeed to the reactors, as an energy integration scheme. The air enters the reactor toenable growth of yeast. The beer is continuously removed from the fermenter by aprocess that keeps the level of beer in the fermenter at about 7% by volume. Thisconstant concentration of ethanol helps prevent unwanted by-product formation andsuppresses bacterial growth, obviating the need for feedstock pasteurization.
The beer from the fermenter passes through a sieve that removes the fibers. Thefibers are washed and sent straight to the bottom part of the still, where steamremoves any remaining ethanol. The beer then enters a centrifuge that removes theyeast and passes the cells back to the fermenter. The recycled yeast consumessignificantly less sugar to stay alive and to grow than the fresh yeast.
Newly fermented beer passes through the still. A 40% solution of ethanol exitsthe top of the still and leaves the weak beer behind. The weak beer passes out ofthe side of the still, warms up the newly fermented one, and then moves to the startof the process. The weak beer is already pasteurized, which means it is better thanthe fresh water for mixing with the feedstock. Heat for the distillation comes from
© 2007 by Taylor & Francis Group, LLC
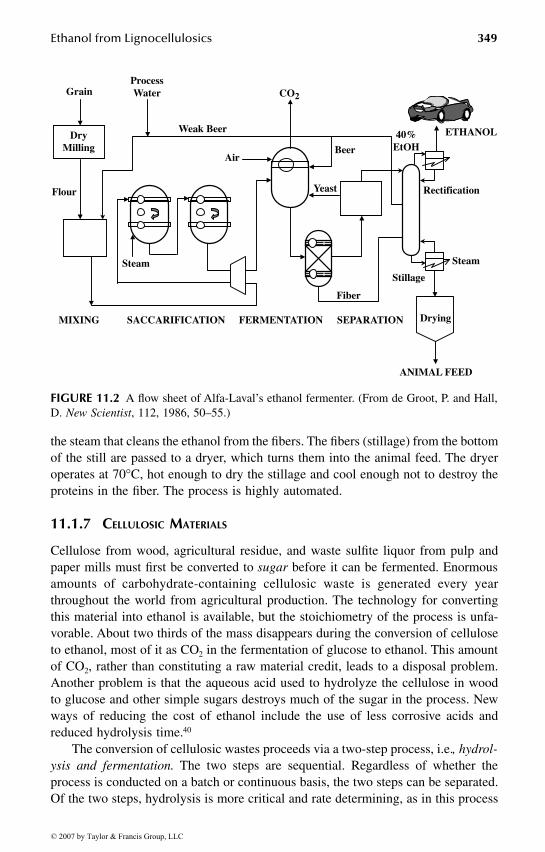
Ethanol from Lignocellulosics 349
the steam that cleans the ethanol from the fibers. The fibers (stillage) from the bottomof the still are passed to a dryer, which turns them into the animal feed. The dryeroperates at 70°C, hot enough to dry the stillage and cool enough not to destroy theproteins in the fiber. The process is highly automated.
11.1.7 CELLULOSIC MATERIALS
Cellulose from wood, agricultural residue, and waste sulfite liquor from pulp andpaper mills must first be converted to sugar before it can be fermented. Enormousamounts of carbohydrate-containing cellulosic waste is generated every yearthroughout the world from agricultural production. The technology for convertingthis material into ethanol is available, but the stoichiometry of the process is unfa-vorable. About two thirds of the mass disappears during the conversion of celluloseto ethanol, most of it as CO2 in the fermentation of glucose to ethanol. This amountof CO2, rather than constituting a raw material credit, leads to a disposal problem.Another problem is that the aqueous acid used to hydrolyze the cellulose in woodto glucose and other simple sugars destroys much of the sugar in the process. Newways of reducing the cost of ethanol include the use of less corrosive acids andreduced hydrolysis time.40
The conversion of cellulosic wastes proceeds via a two-step process, i.e., hydrol-ysis and fermentation. The two steps are sequential. Regardless of whether theprocess is conducted on a batch or continuous basis, the two steps can be separated.Of the two steps, hydrolysis is more critical and rate determining, as in this process
FIGURE 11.2 A flow sheet of Alfa-Laval’s ethanol fermenter. (From de Groot, P. and Hall,D. New Scientist, 112, 1986, 50–55.)
GrainProcessWater
Weak Beer
CO2
ETHANOL40%EtOH
DryMilling
Flour
Steam
AirBeer
Yeast Rectification
Fiber
Steam
Stillage
DryingMIXING SEPARATIONFERMENTATIONSACCARIFICATION
ANIMAL FEED
© 2007 by Taylor & Francis Group, LLC

350 Handbook of Alternative Fuel Technology
cellulose is transformed into the glucose that is made available to the microbesresponsible for the ethanol fermentation.
Among the several forms of cellulose hydrolysis (saccharification), the chemicaland biological types are the most commonly applied. Because the actual hydrolysis isaccomplished enzymatically, the biological hydrolysis is termed enzymatic hydrolysis.Although the use of enzymes avoids the corrosion problems and the loss of fuelproduct associated with acid hydrolysis, enzymes have their own drawbacks. Enzy-matic hydrolysis slows as the glucose product accumulates in the reactor vessel. Theend product inhibition eventually halts the hydrolysis unless some way is found todraw off the glucose as it is formed.
In 1978, Gulf Oil researchers40 designed a commercial-scale plant producing95 × 106 liters per year of ethanol by simultaneous enzymatic hydrolysis of celluloseand fermentation of resulting glucose as it is formed and overcoming the problemof product inhibition. The method consists of a pretreatment developed for thisprocess that involves the grinding and heating of the feedstock followed by hydrolysiswith a mutant bacterium, also specially developed for this purpose. Mutated strainsof the common soil mold Trichoderma viride can process 15 times as much glucoseas natural strains. Simultaneous hydrolysis and fermentation reduces the timerequirement for the separate hydrolysis step, thus reducing the cost and increasingthe yield. Also, the process does not use acids, which would increase the equipmentcosts. The sugar yields from the cellulose are about 80% of what is theoreticallyachievable, but the small amount of hemicellulose in the sawdust does not getconverted.
11.2 CONVERSION OF AGRICULTURAL LIGNOCELLULOSIC FEEDSTOCKS
One reason that the world has depended so heavily up to now on natural gas andpetroleum for energy and for the manufacture of most organic materials is that thegases and liquids are relatively easy to handle. Solid materials like wood, on theother hand, are difficult to collect, transport, and process into components that canmake desired products for energy.
In simple terms, agricultural lignocellulose is inexpensive and renewable becauseit is made with the aid of solar energy. In addition, the quantity of biological materialsavailable for conversion to fuel, chemicals, and other materials is virtually unlimited.Greater biomass utilization can also help ameliorate solid waste disposal problems.About 180 million tons of municipal waste is generated annually in the U.S. About50% of this is cellulosic and could be converted to useful chemicals and fuels.16
Although lignocellulose is inexpensive, it is difficult to convert it to fermentablesugars. Furthermore, as shown in Figure 11.3, lignocellulose has a complex chemicalstructure with three major components, each of which must be processed separatelyto make the best use of high efficiencies inherent in the biological process. The threemajor components of lignocellulose are crystalline cellulose, hemicellulose, andlignin. A general scheme for the conversion of lignocellulose to ethanol is shown inFigure 11.4. The lignocellulose is pretreated to separate the xylose and, sometimes,
© 2007 by Taylor & Francis Group, LLC

Ethanol from Lignocellulosics 351
the lignin from the crystalline cellulose. The xylose can then be fermented to ethanol,and the lignin can be further processed to produce other liquid fuels. The crystallinecellulose, the largest (around 50%) and most difficult fraction, remains behind as asolid after the pretreatment and is sent to an enzymatic hydrolysis process that breaks
FIGURE 11.3 Major polymeric components of plant materials (C&EN., Sept. 10, 1990).
FIGURE 11.4 Conversion of lignocellulose to ethanol. (From Wright, J.D. Chem. Eng. Prog.,84, 62–74, 1988.)
CH3O
O
CH3OOH
CH
HC
C
O
HCOH
CH2OH
CH
O
OCH3
HCOH
HOCH2HC
OCH3
OHC
HOCH2CH
CH3O
HC
H2CHC
O
CH3O
O
CH3OOH
CH
HC
C
O
HCOH
CH2OH
CH
O
OCH3
HCOH
HOCH2HC
OCH3
OHC
HOCH2CH
OCH3
O
CH
RHC
R
O
OCH2
CHCH
OH
OCH3
OCH3
OH
OCH3
C = O
HOCH2HC
PARTIAL LIGNINGSTRUCTURE
R=CHO or CH2OHR’=OH or OC
Beer
Lignocellulose PrehydrolysisPretreatment
Acid orEnzymaticHydrolysis
GlucoseTermination Distillation
Ethanol
Xylose
Lignin
XyloseTermination
LigninProcessing
© 2007 by Taylor & Francis Group, LLC

352 Handbook of Alternative Fuel Technology
the cellulose down into glucose. Enzymes, the biological catalysts, are highly specificand, hence, the hydrolysis of cellulose to sugar does not further break down thesugars. Enzymatic processes are capable of achieving a nearly 100% yield. Theglucose is then fermented to ethanol and combined with the ethanol from xylosefermentation. This dilute beer, i.e., an ethanol–water solution, is then concentratedto fuel-grade ethanol via distillation.
The hemicellulose fraction, the second major component at around 25%, isprimarily composed of xylan, which is simple to convert to the simple sugar xylose;but the xylose is difficult to convert to ethanol. Methods have been identified usingnew yeasts, bacteria, and processes combining enzymes and yeasts. Although noneof these fermentation processes are yet fully ready for commercial use, considerableprogress has been made.
Lignin, the third major component of lignocellulose (around 25%), is a large,random phenolic polymer. In lignin processing, the polymer is broken down intofragments containing one or two phenolic rings. Extra oxygen and side chains arestripped from the molecules by catalytic methods and the resulting phenol groupsare reacted with methanol to produce methyl aryl ethers. Methyl-aryl ethers are high-value octane enhancers that can be blended with gasoline.
11.2.1 ACID OR CHEMICAL HYDROLYSIS
Among the important specific factors in chemical hydrolysis are surface-to-volumeratio, acid concentration, temperature, and time. The surface-to-volume ratio isespecially important in that it also determines the magnitude of the yield of glucose.Therefore, the smaller the particle size, the better the hydrolysis in terms of theextent and rate of reaction.10 With respect to the liquid-to-solids ratio, the higher theratio, the faster the reaction. A trade-off must be made between the optimum ratioand economic feasibility because the increase in the cost of equipment parallels theincrease in the ratio of liquid to solids. For chemical hydrolysis, a ratio of 10:1seems to be most suitable.10
In a typical system for chemically hydrolyzing cellulosic wastes, the wastes aremilled to micron-sized particles. The milled material is immersed in a weak acid(0.2 to 10%), the temperature of the suspension is elevated to 180 to 230°C, andmoderate pressure is applied. Eventually, the hydrolyzable cellulose is transformedinto sugar. However, this reaction has no effect on the lignin that may be present.The yield of glucose varies depending on the nature of raw waste. For example, 84to 86% of kraft paper or 38 to 53% of the weight of the ground refuse may berecovered as sugar. The sugar yield increases with the acid concentration as well asthe elevation of temperature. A suitable concentration of acid (H2SO4) is about 0.5%of the charge.
A two-stage low-temperature and ambient-pressure acid hydrolysis process thatutilizes separate unit operations to convert the hemicellulose and cellulose to fer-mentable sugars is being developed12 and tested by the Tennessee Valley Authority(TVA) and the U.S. Department of Energy (DOE). Laboratory- and bench-scaleevaluations showed more than 90% recovery and conversion efficiencies of sugarfrom corn stover. Sugar product concentrations of more than 10% glucose and 10%
© 2007 by Taylor & Francis Group, LLC

Ethanol from Lignocellulosics 353
xylose were achieved. The inhibitor levels in the sugar solutions never exceeded0.02 g/100 ml, which is far below the level shown to inhibit fermentation. Anexperimental plant was designed and built in 1984. The acid hydrolysis plant providesfermentable sugars to a 38 l/h fermentation and distillation facility built in 1980.The results of their studies are summarized as follows:
• Corn stover ground to 2.5 cm was adequate for the hydrolysis of hemi-cellulose.
• The time required for optimum hydrolysis in 10% acid at 100°C was 2 h.• Overall xylose yields of 86 and 93% were obtained in a bench-scale study
at 1- and 3-h reaction times, respectively.• Recycled leachate, dilute acid, and prehydrolysis acid solutions were
stable during storage for several days.• Vacuum drying was adequate in the acid concentration step.• Cellulose hydrolysis was successfully accomplished by cooking stover
containing 66 to 78% acid for 6 h at 100°C. Yields of 75 to 99% celluloseconversion to glucose were obtained in the laboratory studies.
• Vinyl ester resin fiberglass-reinforced plastics were used for constructionof process vessels and pipings.
11.2.1.1 Process Description
The process involves two-stage sulfuric acid hydrolysis, relatively low temperature,and a cellulose prehydrolysis treatment with concentrated acid. Figure 11.5 is a flowdiagram of the TVA process. Corn stover is ground and mixed with dilute sulfuricacid (about 10% by weight). The hemicellulose fraction of the stover is convertedto pentose sugars by heating the solution to 100°C for 2 h in the first hydrolysisreactor. Raw corn stover contains, on a dry basis, about 40% cellulose, 25% hemi-cellulose, and 25% lignin. Sulfuric acid for the hydrolysis reaction is provided byrecycling the product stream from the second hydrolysis step, which contains thesulfuric acid and hexose sugars. The pentose and hexose sugars, which are primarilyxylose and glucose, respectively, are leached from the reactor with warm water. Thesugar-rich leachate is then neutralized with lime, filtered to remove precipitatedmaterial, and fermented to produce ethanol.
Residue stover from the first hydrolysis step (hemicellulose conversion) isdewatered and prepared for the second hydrolysis step (cellulose conversion) bysoaking (prehydrolysis treatment step) in sulfuric acid (about 20 to 30% concentra-tion) from 1 to 2 h. The residue is then screened, mechanically dewatered, andvacuum-dried to increase the acid concentration to 75 to 80% in the liquid phasebefore entering the cellulose reactor. The second hydrolysis reactor operates at 100°Cand requires a time of 4 h. The reactor product is filtered to remove solids (primarilylignin and unreacted cellulose). As the second hydrolysis reactor product streamcontains about 10% acid, it is used in the first hydrolysis step to supply the acidrequired for hemicellulose hydrolysis. Residue from the reactor is washed to recoverthe remaining sulfuric acid and the sugar not removed in the filtration step.
© 2007 by Taylor & Francis Group, LLC
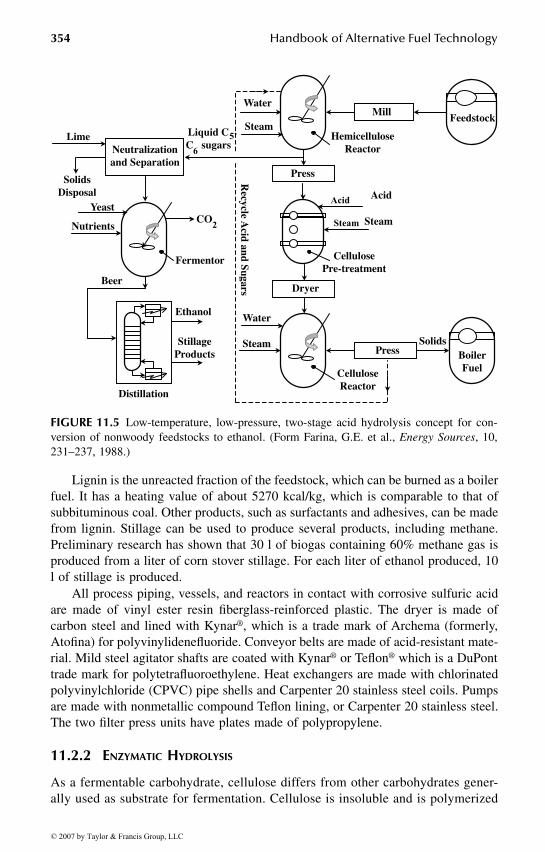
354 Handbook of Alternative Fuel Technology
Lignin is the unreacted fraction of the feedstock, which can be burned as a boilerfuel. It has a heating value of about 5270 kcal/kg, which is comparable to that ofsubbituminous coal. Other products, such as surfactants and adhesives, can be madefrom lignin. Stillage can be used to produce several products, including methane.Preliminary research has shown that 30 l of biogas containing 60% methane gas isproduced from a liter of corn stover stillage. For each liter of ethanol produced, 10l of stillage is produced.
All process piping, vessels, and reactors in contact with corrosive sulfuric acidare made of vinyl ester resin fiberglass-reinforced plastic. The dryer is made ofcarbon steel and lined with Kynar®, which is a trade mark of Archema (formerly,Atofina) for polyvinylidenefluoride. Conveyor belts are made of acid-resistant mate-rial. Mild steel agitator shafts are coated with Kynar® or Teflon® which is a DuPonttrade mark for polytetrafluoroethylene. Heat exchangers are made with chlorinatedpolyvinylchloride (CPVC) pipe shells and Carpenter 20 stainless steel coils. Pumpsare made with nonmetallic compound Teflon lining, or Carpenter 20 stainless steel.The two filter press units have plates made of polypropylene.
11.2.2 ENZYMATIC HYDROLYSIS
As a fermentable carbohydrate, cellulose differs from other carbohydrates gener-ally used as substrate for fermentation. Cellulose is insoluble and is polymerized
FIGURE 11.5 Low-temperature, low-pressure, two-stage acid hydrolysis concept for con-version of nonwoody feedstocks to ethanol. (Form Farina, G.E. et al., Energy Sources, 10,231–237, 1988.)
Acid
Steam2
5’6
Lime
SolidsDisposal
Yeast
Nutrients
Distillation
Neutralizationand Separation
Liquid CC sugars
CO
Fermentor
Beer
Ethanol
StillageProducts
Water
SteamMill
Feedstock
HemicelluloseReactor
Press
Acid
Steam
CellulosePre-treatment
Dryer
Water
Steam
CelluloseReactor
PressSolids
BoilerFuel
Recycle A
cid and Sugars
© 2007 by Taylor & Francis Group, LLC
Ethanol from Lignocellulosics 355
as 1,4-β-glucosidic linkage. Cellulose is solubilized so that an entry can be madeinto cellular metabolic pathways. Solubilization is brought about by enzymatichydrolysis catalyzed by the cellulase system of certain bacteria and fungi.
11.2.2.1 Enzyme System
Each cellulolytic microbial group has an enzyme system unique to it. The enzymesrange from those that can hydrolyze only soluble derivatives of cellulose to thosethat can disrupt a cellulose complex. Based on the enzymatic capability, the cellulaseis characterized into two groups: C1 enzyme or factor, and CX enzyme or factor.10
The C1 factor is regarded as an affinity or prehydrolysis factor that transforms cottoncellulose into linear and hydroglucose chains. Raw cotton is composed of 91% purecellulose. As such, it serves as an essential precursor to the action of the CX factor.The CX (hydrolytic) factor breaks down the linear chains into soluble carbohydrates,usually cellobiose (a disaccharide) and glucose (a monosaccharide).
Microbes rich in C1 are more useful in the production of glucose from thecellulose. Moreover, as the C1 phase proceeds more slowly than the subsequent step,it is the rate-determining step. Among the many microbes, Trichoderma reeseisurpasses all others in the possession of the C1 complex. Trichoderma reesei is anindustrially important cellulolytic filamentous fungus and is capable of secretinglarge amounts of cellulases and hemicellulases. The site of action of cellulolyticenzymes is important in the design of hydrolytic systems (the CX factor). If theenzyme is within the cell mass, material to be reacted must diffuse into it. Therefore,enzymatic hydrolysis of cellulose usually takes place extracellularily, where enzymeis diffused from the cell mass into the external medium.
Another important factor in the enzymatic reaction is whether the enzyme isadaptive or constitutive. A constitutive enzyme is the one that is present in the cellall the time. Adaptive enzymes are found only in the presence of a given substance,and the synthesis of the enzyme is triggered by an inducing agent. Most of the fungalcellulases are adaptive.2,10
Cellobiose is an inducing agent with respect to Trichoderma reesei. In fact,depending on the circumstances, cellobiose can be either an inhibitor or an inducingagent. It is inhibitory when its concentration exceeds 0.5 to 1.0%. Cellobiose is anintermediate product and is generally present in concentrations low enough to permitit to serve as a continuous inducer.42
11.3 ENZYMATIC PROCESSES
All enzymatic processes consist of four major steps that may be combined in avariety of ways: pretreatment, enzyme production, hydrolysis, and fermentation asrepresented in Figure 11.6.
11.3.1 PRETREATMENT
It has long been recognized that some form of treatment is necessary to achievereasonable rates and yields in the enzymatic hydrolysis of biomass. Pretreatment has
© 2007 by Taylor & Francis Group, LLC

356 Handbook of Alternative Fuel Technology
generally been practiced to reduce the crystallinity of cellulose, to lessen the averagepolymerization of the cellulose and the lignin–hemicellulose sheath that surround thecellulose, and to increase available surface area for the enzymes to attack.
Mechanical pretreatments such as intensive ball milling and roll milling havebeen investigated as means of increasing the surface area, but they require exorbitantamounts of energy. The efficiency of a chemical process can be understood byconsidering the interaction between the enzymes and the substrate. The hydrolysisof cellulose into sugars and other oligomers is a solid-phase reaction in which theenzymes must bind to the surface to catalyze the reaction. Cellulase enzymes arelarge proteins, with molecular weights ranging from 30,000 to 60,000 and are thoughtto be ellipsoidal with major and minor dimensions of 30 to 200 Å. The internalsurface area of wood is very large, but only 20% of the pore volume is accessibleto cellulase-sized molecules. By breaking down the hemicellulose–lignin matrix,hemicellulose or lignin can be separated and the accessible volume greatly increased.This removal of material greatly enhances enzymatic digestibility.
The hemicellulose–lignin sheath can be disrupted by either acidic or basiccatalysts. Basic catalysts simultaneously remove both lignin and hemicellulose, butsuffer large consumption of base through neutralization by ash and acid groups inthe hemicellulose. In recent years attention has been focused on acidic catalysts.They can be mineral acids or organic acids generated in situ by autohydrolysis ofhemicellulose.
Various types of pretreatments are used for biomass conversion. The pretreat-ments that have been studied in recent years are steam explosion autohydrolysis,wet oxidation, organosolv, and rapid steam hydrolysis (RASH). The major objectiveof most pretreatments is to increase the susceptibility of cellulose and lignocellulosematerial to acid and enzymatic hydrolysis. Enzymatic hydrolysis is a very sensitiveindicator of lignin depolymerization and cellulose accessibility. Cellulose enzymesystems react very slowly with untreated material; however, if the lignin barrieraround the plant cell is partially disrupted, then the rates of enzymatic hydrolysisare increased dramatically.
Most pretreatment approaches are not intended to actually hydrolyze celluloseto soluble sugars, but rather to generate a pretreated cellulosic residue that is morereadily hydrolyzable by cellulase enzymes than native biomass. Dilute acid hydroly-sis processes are currently being proposed for several near-term commercialization
FIGURE 11.6 Fungal enzyme hydrolysis. (From Wright, J.D. Chem. Eng. Prog., 84, 62–74, 1988.)
LignocellulosePretreatment Hydrolysis Fermentation
Ethanol
EnzymeProduction
© 2007 by Taylor & Francis Group, LLC
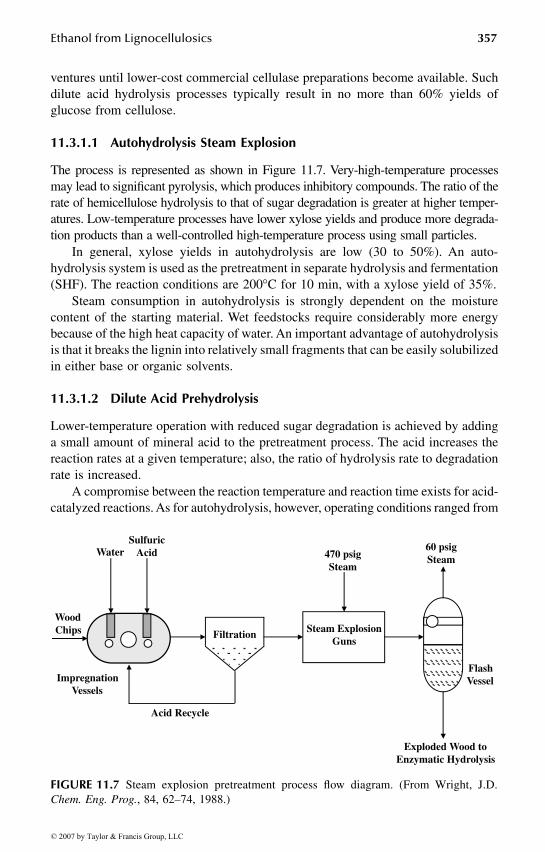
Ethanol from Lignocellulosics 357
ventures until lower-cost commercial cellulase preparations become available. Suchdilute acid hydrolysis processes typically result in no more than 60% yields ofglucose from cellulose.
11.3.1.1 Autohydrolysis Steam Explosion
The process is represented as shown in Figure 11.7. Very-high-temperature processesmay lead to significant pyrolysis, which produces inhibitory compounds. The ratio of therate of hemicellulose hydrolysis to that of sugar degradation is greater at higher temper-atures. Low-temperature processes have lower xylose yields and produce more degrada-tion products than a well-controlled high-temperature process using small particles.
In general, xylose yields in autohydrolysis are low (30 to 50%). An auto-hydrolysis system is used as the pretreatment in separate hydrolysis and fermentation(SHF). The reaction conditions are 200°C for 10 min, with a xylose yield of 35%.
Steam consumption in autohydrolysis is strongly dependent on the moisturecontent of the starting material. Wet feedstocks require considerably more energybecause of the high heat capacity of water. An important advantage of autohydrolysisis that it breaks the lignin into relatively small fragments that can be easily solubilizedin either base or organic solvents.
11.3.1.2 Dilute Acid Prehydrolysis
Lower-temperature operation with reduced sugar degradation is achieved by addinga small amount of mineral acid to the pretreatment process. The acid increases thereaction rates at a given temperature; also, the ratio of hydrolysis rate to degradationrate is increased.
A compromise between the reaction temperature and reaction time exists for acid-catalyzed reactions. As for autohydrolysis, however, operating conditions ranged from
FIGURE 11.7 Steam explosion pretreatment process flow diagram. (From Wright, J.D.Chem. Eng. Prog., 84, 62–74, 1988.)
Water
WoodChips
ImpregnationVessels
Acid Recycle
SulfuricAcid
Filtration
470 psigSteam
Steam ExplosionGuns
60 psigSteam
FlashVessel
Exploded Wood toEnzymatic Hydrolysis
© 2007 by Taylor & Francis Group, LLC

358 Handbook of Alternative Fuel Technology
several hours at 100°C to 10 sec at 200°C with sulfuric acid concentration of 0.5 to4.0%. Acid catalysts have also been used in steam explosion systems with similar results.Xylose yields generally range from 70 to 95%. However, sulfuric acid processes producelignin that is more condensed (52% of the lignin extractable in dilute NaOH) than thatproduced by autohydrolysis system. Sulfur dioxide has also been investigated as acatalyst to improve the efficiency of the pretreatments. Use of excess water increasesenergy consumption and decreases the concentration of xylose in the hydrolysate, thusdecreasing the concentration of ethanol that can be produced in the xylose fermentationstep. In a recent study by Ojumu and Ogunkunle,47 production of glucose was achievedin batch reactors from hydrolysis of lignocellulose under extremely low acid (ELA)and high-temperature conditions by pretreating the sawdust by autohydrolysis ab initio.
11.3.1.3 Organosolv Pretreatment
In this type of pretreatment, an organic solvent (ethanol or methanol) is added to thepretreatment reaction to dissolve and remove the lignin fraction. In the pretreatmentreactor, the internal lignin and hemicellulose bonds are broken and both fractions aresolubilized, whereas the cellulose remains as a solid. After leaving the reactor, theorganic fraction is removed by evaporation in the liquid phase, and the lignin precipitatesand can be removed by filtration or centrifugation. Thus, this process cleanly separatesthe feedstock into a solid cellulose residue, a solid lignin that has undergone a fewcondensation reactions, and a liquid stream containing xylon, as shown in Figure 11.8.
FIGURE 11.8 Organosolv pretreatment process. (From Wright, J.D. Chem. Eng. Prog., 84,62–74, 1988.)
HemicelluloseSolution
Water
Water
Water
Water
Sulfuric Acid
MeOH MeOHMeOHMeOHMeOH
DigesterFeed Storage
WoodChips Steam
Digester
Wood FeedPreparation
Steam vessels
BlowTank
FlashDrum
VacuumStill
SolidsSep’n
SolidsSep’n
SolidsSep’n
Repulper
SteamStripper
Cellulose (90%)
LigninPrec/slurry
Lignin
Cellulose toEnzyme
Production
WasteWater
WastePaper
Storage
© 2007 by Taylor & Francis Group, LLC

Ethanol from Lignocellulosics 359
Results have shown36 that there are some reactions occurring during the Organosolvprocess that strongly affect the enzymatic rate. These reactions could be due to thephysical or chemical changes in lignin or cellulose. In general, Organosolv processeshave higher xylose yields than the other processes because of the influence of organicsolvent on hydrolysis kinetics. However, a major concern in these processes is thecomplete recovery of the solvent, which affects the process economics.
11.3.1.4 Combined RASH and Organosolv Pretreatment
Attempts have been made to improve the overall process efficiency by combiningthe two individual pretreatments. Rughani and McGinnis36 have studied the effectof a combined RASH–Organosolv process on the rate of enzymatic hydrolysis andthe yield of solubilized lignin and hemicellulose. A schematic diagram of the processis shown in Figure 11.9. For the Organosolv pretreatment, the steam generator isdisconnected and the condensate valve closed. The rest of the reactor setup is similarto the RASH procedure. The Organosolv processes at low temperature are generallyineffective in removing lignin; however, combining the two processes leads toincreased solubilization of lignin and hemicellulose. RASH temperature is the majorfactor in maximizing the percentage of cellulose in the final product. The maximumyield of solubilized lignin was obtained at a temperature of 240°C for RASH and160°C for the Organosolv process.
FIGURE 11.9 RASH and Organosolv pretreatment scheme. (From Rughani, J. and McGin-nis, G.D., Biotechnol. Bioeng., 33, 681–686, 1989.)
RASH PRETREATMENT
PressureGauge
Water
STEAMGENERATOR
ORGANOSOLV PRETREATMENT
Pressure Gauge
Steam Transfer LineSteamVent
Pressure Gauge Thermometer
Water
Water
Water
Water
Condensate
ThermometerTemperature
Controller
WoodGround
Thermometer
RASH REACTOR
Water, WoodGround, Organic
Solvent
REACTOR
© 2007 by Taylor & Francis Group, LLC

360 Handbook of Alternative Fuel Technology
11.3.2 ENZYME PRODUCTION AND INHIBITION
The enzyme of interest is the cellulase, which is needed for the hydrolysis of thecellulose. Cellulase is a multicomponent enzyme system consisting of: endo-β-1,4-glycanases; exo-β-1,4-glucan gluco hydrolases; and exo-β-1,4-glucan cellobiohy-drolase. Cellobiose is the dominant product of this system but is highly inhibitoryto the enzymes and is not usable by most organisms. Cellobiase hydrolyzes cellobioseto glucose, which is much less inhibitory and highly fermentable. Many of the fungiproduce this, and most of the work that is presently going on is on Trichodermareesei (viride). This cellulase is much less inhibited than other cellulases, which isa major advantage for industrial purposes.20
The type of inhibition exhibited by cellulases is the subject of much confusion.Although most researchers favor competitive inhibition,5,6,17,31,32,37 some cellulasesare noncompetitively19,32,44 inhibited.5 Trichoderma reesei enzyme on substrates likesolka floc (purified cellulose), wheat straw, and bagasse (biomass remaining aftersugarcane stalks are crushed to extract their juice) is competitively inhibited byglucose and cellobiose. On the other hand, some enzyme is noncompetitively inhib-ited by cellobiose, using other substrates like rice straw and avicel. Trichodermaviride is uncompetitively inhibited by glucose in a cotton waste substrate.5
Many mutants have been produced following Trichoderma reesei. The mostprominent among these is the Rut C-30, the first mutant with β-glucosidase produc-tion.45 0ther advantages of the strain are that it is hyperproducing and is carbo-lite-repression resistant.
Cellulases from thermophilic bacteria have also been extensively examined.Among these, Clostridium thermocellum is perhaps the most extensively character-ized organism; it is an anaerobic, thermophilic, cellulolytic, and ethanogenic bacte-rium capable of directly converting cellulosic substrate into ethanol. The enzymesisolated from thermophilic bacteria may have superior thermostability and hencewill have longer half-lives at high temperatures. Although this is not always the case,cellulases isolated from Clostridium thermocellum have high specific activities,3
especially against crystalline form of cellulose that have proved to be resistant toother cellulase preparations.
Enzyme production with trichoderma reesei is difficult because cellulase pro-duction terminates in the presence of easily metabolizable substrates. Thus, mostproduction work has been carried out on insoluble carbon sources such as steam-exploded biomass or Solka-Floc®. In such systems, the rate of growth and cellulaseproduction is limited because the fungi must secrete the cellulase and carry out slowenzymatic hydrolysis of the solid to obtain the necessary carbon. Average produc-tivities have been approximately l00 IU/l/h (Hydrolytic activity of cellulose is gen-erally in terms of international filter unit [IU]. This is a unit defined in terms of theamount of sugar produced per unit time from a strip of Whatman filter paper.) Thefilter paper unit is a measure of the combined activities of all three enzymes on thesubstrate. High productivities have been reported with Trichoderma reesei mutantin a fed-batch system using lactose as carbon source and steam-exploded aspen asan inducer. Although lactose is not available in quantities required to supply a large
© 2007 by Taylor & Francis Group, LLC

Ethanol from Lignocellulosics 361
ethanol industry, this does suggest that it may be possible to develop strains that canproduce cellulases with soluble carbon sources such as xylose and glucose
Increases in productivities dramatically reduce the size and cost of the fermentersused to produce the enzyme. More rapid fermentations would also decrease the riskof contamination and might allow for less expensive construction. Alternatively,using a soluble substrate may allow simplification of fermenter design or allow thedesign of a continuous enzyme production system.
Low-cost but efficient enzymes for lignocellulosic ethanol technology must bedeveloped to reduce the operational cost and improve the productivity of the process.
11.3.3 CELLULOSE HYDROLYSIS
11.3.3.1 Cellulase Adsorption
The enzymatic hydrolysis of cellulose proceeds by adsorption of cellulase enzymeon the lignacious residue as well as the cellulose fraction. The adsorption on thelignacious residue is an attractive factor from the viewpoint of the recovery of enzymeafter the reaction and recycling it for use on the fresh substrate. Obviously, therecovery is reduced by the adsorption of enzyme on lignacious residue, an importantconsideration, because a large fraction of the total operating cost is due to theproduction of enzyme. As the capacity of lignacious residue to adsorb the enzymeis influenced by the pretreatment conditions, the pretreatment should be evaluated,in part, by how much enzyme adsorbs on the lignacious residue at the end ofhydrolysis, as well as its effect on the rate and extent of the hydrolysis reaction.
The adsorption of cellulase on cellulose and lignacious residue has been inves-tigated by Ooshima et al.33 using cellulase from Trichoderma reesei and hardwoodpretreated by dilute sulfuric acid with explosive decomposition. The cellulase wasfound to adsorb on the lignacious residue as well as on the cellulose during hydrolysisof the pretreated wood. A decrease in the enzyme recovery in the liquid phase withan increase in the substrate concentration has been reported owing to the adsorptionon the lignacious residue. The enzyme adsorption capacity of the lignacious residuedecreases as the pretreatment temperature is increased, whereas the capacity of thecellulose increases. The reduction of the enzyme adsorbed on the lignacious residueas the pretreatment temperature increases is important in increasing the ultimaterecovery of the enzyme, as well as enhancing the enzyme hydrolysis rate and extent.
An enzymatic hydrolysis process involving solid lignocellulosic materials canbe designed in many ways. The common features are that the substrates and theenzyme are fed into the process, and the product stream (sugar solution) along witha solid residue leaves it at various points. The residue contains adsorbed enzymesthat are lost when the residue is removed from the system.
To ensure that the enzymatic hydrolysis process is economically efficient, acertain degree of enzyme recovery is essential. Both the soluble enzymes and theenzyme adsorbed onto the substrate residue must be reutilized. It is expected thatthe loss of enzyme is influenced by the selection of the stages at which the enzymesin the solution and adsorbed enzymes are recirculated and the point at which theresidue is removed from the system. Vallander and Erikkson43 defined an enzymeloss function, L, assuming that no loss occurs through filtration:
© 2007 by Taylor & Francis Group, LLC

362 Handbook of Alternative Fuel Technology
They developed a number of theoretical models, finally concluding that increasedenzyme adsorption leads to increased enzyme loss. The enzyme loss decreases ifthe solid residue is removed late in the process. Both the adsorbed and dissolvedenzymes should be reintroduced at the starting point of the process. This is particu-larly important for the dissolved enzymes. Washing of the entire residue is likely toresult in significantly lower recovery of adsorbed enzymes than if a major part (60%or more) of the residue with adsorbed enzymes is recirculated. Uninterrupted hydrol-ysis over a given time period leads to a lower degree of saccharification than whenhydrolysate is withdrawn several times. Saccharification is also favored if the residueis removed at a late stage. Experimental investigations of the theoretical hydrolysismodels have recovered more than 70% of the enzymes.43
11.3.3.2 Mechanism of Hydrolysis
The overall hydrolysis is based on the synergistic action of three distinct cellulaseenzymes, depending on the concentration ratio and the adsorption ratio of the componentenzymes: endo-β-gluconases, exo-β-gluconases, and β-glucosidases. Endo-β-gluconasesattack the interior of the cellulose polymer in a random fashion,45 exposing new chainends. Because this enzyme catalyzes a solid-phase reaction, it adsorbs strongly butreversibly to the microcrystalline cellulose (also known as avicel). The strength of theadsorption is greater at lower temperatures. This enzyme is necessary for the hydrolysisof crystalline substrates. The hydrolysis of cellulose results in a considerable accumu-lation of reducing sugars, mainly cellobiose, because the extracellular cellulase complexdoes not possess cellobiose activity. Sugars that contain aldehyde groups that are oxi-dized to carboxylic acids are classified as reducing sugars.
Exo-β-gluconases remove cellobiose units (two glucose units) from the non-reducing ends of cellulose chains. This is also a solid-phase reaction, and theexogluconases adsorb strongly on both crystalline and amorphous substrates. Themechanism of the reaction is complicated because there are two distinct forms ofboth endo- and exo-enzymes, each with a different type of synergism with the othermembers of the complex. As these enzymes continue to split off cellobiose units, theconcentration of cellobiose in solution may increase. The action of exo-gluconasesmay be severely inhibited or even stopped by the accumulation of cellobiose in thesolution.
The cellobiose is hydrolyzed to glucose by action of β-glucosidase. Glucosidaseis any enzyme that catalyzes hydrolysis of glucoside. β-Glucosidase catalyzes thehydrolysis of terminal, nonreducing beta-D-glucose residues with release of beta-D-glucose. The effect of β-glucosidase on the ability of the cellulase complex todegrade avicel has been investigated by Kadam and Demain.23
They determined the substrate specificity of the β-glucosidase and demonstratedthat its addition to the cellulase complex enhances the hydrolysis of avicel specifi-cally by removing the accumulated cellobiose. A thermostable β-glucosidase form,Clostridium thermocellum, which is expressed in Escherichia coli, was used to
L = The amount of enzyme lost through removal
of residueThe amount of enzyme at the starrt of hydrolysis
© 2007 by Taylor & Francis Group, LLC

Ethanol from Lignocellulosics 363
determine the substrate specificity of the enzyme. The hydrolysis of cellobiose toglucose is a liquid-phase reaction, and β-glucosidase absorbs either quickly or notat all on cellulosic substrates. The action can be slow or halted by the inhibitiveaction of glucose accumulated in the solution. The accumulation may also inducethe entire hydrolysis to a halt as inhibition of the β-glucosidase results in a buildupof cellobiose, which in turn inhibits the action of exo-gluconases. The hydrolysis ofthe cellulosic materials depends on the presence of all three enzymes in properamounts. If any one of these enzymes is present in less than the required amount,the others will be inhibited or will lack the necessary substrates to act upon.
The hydrolysis rate increases with increasing temperature. However, because thecatalytic activity of an enzyme is related to its shape, the deformation of the enzymeat high temperature can inactivate or destroy the enzyme. To strike a balance betweenincreased activity and increased deactivation, it is preferable to run fungal enzymatichydrolysis at approximately 40 to 50°C.
Researchers at the National Renewable Energy Laboratory reported results fora dilute acid hydrolysis of softwoods in which the conditions of the reactors wereas follows52:
1. Stage 1: 0.7% sulfuric acid, 190°C, and a 3-min residence time2. Stage 2: 0.4% sulfuric acid, 215°C, and a 3-min residence time
Their bench-scale tests also confirmed the potential of achieving yields of 89% formannose, 82% for galactose, and 50% for glucose, respectively. Fermentation withSaccharomyces cerevisiae achieved ethanol conversion of 90% of the theoretical yield.53
11.3.4 FERMENTATION
Cellulose hydrolysis and fermentation can be achieved by two different processschemes, depending on where the fermentation is carried out: (l) separate hydrolysisand fermentation (SHF) or (2) simultaneous saccharification and fermentation (SSF).
11.3.4.1 Separate Hydrolysis and Fermentation
In SHF, the hydrolysis is carried out in one vessel and the hydrolysate is thenfermented in a second reactor. The most expensive items in the overall process costare the cost of feedstock, enzyme production, hydrolysis, and utilities. The feedstockand utility costs are high because only about 73% of the cellulose is converted toethanol in 48 h, whereas the remainders of the cellulose, hemicellulose and lignin,are burned. Enzyme production is a costly step because of the large amount of theenzyme used in an attempt to overcome the end product inhibition, as well as itsslow rate of production. The hydrolysis step is also expensive, owing to the largecapital and operating costs associated with large-size tanks and agitators. The mostimportant parameters are the hydrolysis section yield, product quality, and therequired enzyme loading, which are all interrelated. Yields are typically higher inmore dilute systems, where inhibition of enzymes by glucose and cellobiose isminimized. Increasing the amount of enzyme loading can help overcome inhibition
© 2007 by Taylor & Francis Group, LLC

364 Handbook of Alternative Fuel Technology
and increase yield and concentration. Increased reaction time also leads to higheryields and concentrations. Cellulase enzymes from different organisms can result inmarkedly different performances. Figure 11.10 shows the effect of yield at constantsolid and enzyme loading and the performance of different enzyme loadings. Increasein enzyme loading beyond a particular point is of no value. It would be economicalto operate at a minimum enzyme loading level, or the enzyme could be recycled byappropriate methods. As the cellulose is hydrolyzed, the endo- and exogluconasecomponents are released back into the solution. Because of their affinity for cellulose,these enzymes can be recovered and reused by contacting the hydrolysate with freshfeed. The amount of recovery is limited because of β-glucosidase, which does notadsorb on the feed. Some of the enzyme remains attached to the lignin, and unreactedcellulose and enzymes are thermally denatured during hydrolysis. A major difficultyin this type of process is maintaining the sterility, which would otherwise be con-taminated. The power consumed in agitation is also significant and does affect theeconomics of this process.45
11.3.4.2 Simultaneous Saccharification and Fermentation
The operating cost of this process is generally lower than that of SHF. As the nameimplies, both hydrolysis and fermentation are carried out in the same vessel. In thisprocess, yeast ferments the glucose to ethanol as soon as the glucose is produced,preventing the sugars from accumulating and inhibiting the end product. Using theyeast, Candida brassicae and the Genencor enzyme (by Genencor International),the yield is increased to 79% and the ethanol concentration produced is 3.7%.45
FIGURE 11.10 Effect of yield on selling price of ethanol (βG, β-Gluconase). (From Wright,J.D. Chem. Eng. Prog., 84, 62–74, 1988.)
0
0.5
1
1.5
2
2.5
3
50 55 60 65 70 75 80 85 90 95 100
QM 9414
Rut C30
Meicelase
Rut C30 w/supplemental
BG
% Yield in Cellulose
$ p
er G
allo
n o
f E
than
ol
© 2007 by Taylor & Francis Group, LLC

Ethanol from Lignocellulosics 365
Even in SSF, cellobiose (the soluble sugar) inhibition occurs to an appreciableextent. The enzyme loading for SSF is only 7 IU/g of cellulose, compared to 33IU/g in SHF. The cost of energy and feedstock is somewhat reduced because of theimproved yield, and the increased ethanol concentration significantly reduces thecost of distillation and utilities. The cost of SSF process is slightly less than thecombined cost of hydrolysis and fermentation in the SHF process. The decreasingfactor of the reactor volume due to the higher concentration of ethanol offsets theincreasing factor in the reactor size caused by the longer reaction times (7 d for SSFvs. 2 d for hydrolysis and 2 d for fermentation). Experiments show that fermentationis the rate-controlling step and not the enzymatic hydrolysis process. The hydrolysisis carried out at 37°C and increasing the temperature increases the reaction rate;however, the ceiling temperature is limited by yeast cell viability. The concentrationof ethanol is also a limiting factor. (This was tested by connecting a flash unit tothe SSF reactor and removing the ethanol periodically. This technique showed higherproductivities up to 44%.) Recycling the residual solids may also increase processyield. However, the most important limitation in enzyme recycling comes from thepresence of lignin, which is inert to the enzyme. High recycling rates increase thefraction of lignin in the reactor and cause handling difficulties.
Two major types of enzyme-recycling schemes have been proposed, one in whichenzymes are recovered in the liquid phase and the other in which enzymes are recoveredby recycling unreacted solids.45 Systems of the first type have been recommended forSHF processes, which operate at 50°C. These systems are favored at such a hightemperature because increasing temperature increases the proportion of enzyme thatremains in the liquid phase. Conversely, as the temperature is decreased, the amountof enzyme adsorbed on the solid increases. Therefore, at the lower temperaturesencountered in SSF processes, solid recycling appears to be more effective.
11.3.4.3 Comparison between SSF and SHF Processes
SSF systems offer large advantages over SHF processes, thanks to their reduction ofend product inhibition of the cellulase enzyme complex. The SSF process shows ahigher yield (88% vs. 73%) and greatly increases product concentrations (equivalentglucose concentration of 10% vs. 4.4%). The most significant advantage is the enzymeloading, which can be reduced from 33 to 7 IU/g cellulose, and this cuts down thecost of ethanol appreciably. With constant development of low-cost enzymes, thecomparative analysis of the two processes is in flux. A comparative study of theapproximate costs of the two processes was reported in Wright’s article.45 The resultsshow that based on the estimated ethanol selling price from a production capacity of25,000,000 gallons per year, SSF is more cost-effective than SHF by a factor of1:1.49, i.e., $SHF/$SSF = 1.49. It has to be clearly noted that the number quoted hereis the ratio of the two prices, not the direct dollar value of the ethanol selling price.
From the very same process for economic reasons, it is anticipated that a hybridhydrolysis and fermentation (HHF) process configuration is going to be widelyaccepted as a process of choice for production of lignocellulosic fuel ethanol,which begins with a separate hydrolysis step and ends with simultaneous saccha-rification (hydrolysis) and fermentation (SSF) step. In the first stage of hydrolysis,
© 2007 by Taylor & Francis Group, LLC

366 Handbook of Alternative Fuel Technology
higher-temperature enzymatic cellular saccharification takes place, whereas in thesecond stage of SSF, mesophilic enzymatic hydrolysis and biomass sugar fermen-tation occur simultaneously.
11.3.4.4 Xylose Fermentation
As xylose accounts for 30 to 60% of the fermentable sugars in hardwood andherbaceous biomass, it becomes an important issue to ferment it to ethanol. Theefficient fermentation of xylose and other hemicellulose constituents is essential forthe development of an economically viable process to produce ethanol from biomass.Xylose fermentation using pentose yeasts has proved to be difficult, owing to therequirement for O2 during ethanol production, acetate toxicity, and production ofxylitol as a by-product. Xylitol (or xyletol) is a naturally occurring low-calorie sugarsubstitute with anticariogenic (preventing production of dental caries) properties.
Other approaches to xylose fermentation include the conversion of xylose toxylulose (a pentose sugar that is a part of carbohydrate metabolism and is found inthe urine in pentosuria50) using xylose isomerase prior to fermentation by Saccha-romyces cerevisiae and the development of genetically engineered strains.38
The method of integrating xylose fermentation into the overall process is shownin Figure 11.11. The liquid stream is neutralized to remove any mineral acids or organicacids liberated in the pretreatment process and then sent to xylose fermentation. Wateris added before the fermentation, if necessary, so that organisms can make full use ofthe substrate without having the yield limited by end-product inhibition. The diluteethanol stream from xylose fermentation is then used to provide the dilution water forthe cellulose-lignin mixture entering SSF. Thus, the water that enters during the pre-treatment process is used in both xylose fermentation and the SSF process.
FIGURE 11.11 Integration of xylose fermentation and SSF. (From Wright, J.D. Chem. Eng.Prog., 84, 62–74, 1988.)
Pretreatment(Dilute Acid)
Cellulose-Lignin
Water (if necessary)Enzyme
Ethanol
Water
SSFLime
Hydrolyzatewater, acid, xylose
Water-xylose
Gypsum
Water, ifneeded
XyloseFermentation
Water-ethanol
© 2007 by Taylor & Francis Group, LLC

Ethanol from Lignocellulosics 367
The conversion of xylose to ethanol by recombinant E. coli has been investigatedin pH-controlled batch fermentations.4 Relatively high concentrations of ethanol (56g/l) were produced from xylose with excellent efficiencies. In addition to xylose, allother sugar constituents of biomass can be efficiently converted to ethanol by recom-binant E. coli.4 Neither oxygen nor strict maintenance of anaerobic conditions isrequired for ethanol production by E. coli. However, the addition of base to preventexcessive acidification is essential. Although less base is needed to maintain low-pH conditions, poor ethanol yields and slower fermentations are observed below apH of 6. Also, the addition of metal ions stimulates ethanol production. In general,xylose fermentation does not require precise temperature control, provided the brothtemperature is maintained between 25 and 40°C. Xylose concentrations as high as140 g/l have been positively tested to evaluate the extent to which this sugar inhibitsthe growth and fermentation. Higher concentrations considerably slow down growthand fermentation.
11.3.4.5 Ethanol Extraction during Fermentation
In spite of the considerable efforts given to the fermentative alcohols, industrialapplications have been delayed because of the high cost of production, whichdepends primarily on the energy input to the purification of dilute end products andon the low productivities of cultures. These two points are directly linked to inhibitionphenomena.
Along with the conventional unit operations, liquid–liquid extraction with bio-compatible organic solvents, distillation under vacuum, and selective adsorption onthe solids have demonstrated the technical feasibility of the extractive fermentationconcept. Of late, membrane separation processes, which decrease biocompatibilityconstraints, have been proposed. These include dialysis,25 and reverse osmosis.14 Morerecently, the concept of supported liquid membranes has also been reported. Thismethod minimizes the amount of organic solvents involved and permits simultaneousrealization of the extraction and recovery phases. Enhanced volumetric productivityand high substrate conversion yields have been reported,7 using a porous Teflon sheetas support (soaked with isotridecanol) for the extraction of ethanol during semicon-tinuous fermentation of Saccharomyces bayanus. This selective process results inethanol purification and combines three operations: fermentation, extraction, andreextraction (stripping), as schematically represented in Figure 11.12.
11.4 LIGNIN CONVERSION
Lignin is produced in large quantities, approximately 250 billion pounds per yearin the U.S., as by-products of the paper and pulp industry. Lignins are complexamorphous phenolic polymers, not sugar based, and hence cannot be fermented intoethanol. Lignin is a random polymer made up of phenyl propane units, where thephenol unit may be either a guaiacyl or syringyl unit (Figure 11.13). These units arebonded together in many ways, the most common of which are α- or β-ether linkages.A variety of C–C linkages are also present, but are less common (Figure 11.14).The distribution of linkage in lignin is random because lignin formation is a free
© 2007 by Taylor & Francis Group, LLC

368 Handbook of Alternative Fuel Technology
FIGURE 11.12 Extractive fermentation system: (1) fermenter, (2) permeation cell, (3) supportedliquid membrane, (4) extracted phase, (5) gaseous stripping phase, (6) cold trap, (7) condensedpermeate. (From Christen, P. et al., Biotechnol. Bioeng., 36, 116–123, 1990.)
FIGURE 11.13 Monomer units in lignin. (From Wright, J.D. Chem. Eng. Prog., 84, 62–74,1988.)
Extracted Phase
PermeationCell
Gaseous StrippingPhase
Cold Trap
CondensedPermeate
Supported LiquidMembrane
Fermenter
C C C
α β γ3 2
165
4
CH3O
HOGUAIACYL
CH3O
HO
CH3O
SYRINGYL
PHENYLPROPANE UNIT
© 2007 by Taylor & Francis Group, LLC

Ethanol from Lignocellulosics 369
radical reaction that is not under enzymatic control. Lignin is highly resistant tochemical, enzymatic, or microbial hydrolysis, owing to extensive cross-linking.Therefore, lignin is frequently removed simply to gain access to cellulose.
Lignin monomer units are similar to gasoline, which has a high octane number;thus, breaking the lignin molecules into monomers and removing the oxygen makesthem useful as liquid fuels. The process for lignin conversion consists of mildhydrotreating to produce a mixture of phenolic and hydrocarbon materials, followedby reaction with methanol to produce methyl aryl ether. The first step usually consistsof two parts: (1) hydrodeoxygenation (removal of oxygen and oxygen-containinggroups from the phenol ring) and (2) dealkylation (removal of ethyl or large sidechains from the rings). One must be careful in carrying out these reactions to removethe unwanted chains without carrying the reaction too far, which would lead toexcessive consumption of hydrogen and produce saturated hydrocarbons, which arenot as good octane enhancers as the aromatic compounds. Catalysts that carry outthese reactions have dual functions. Metals such as molybdenum and molybde-num/nickel catalyze the deoxygenation, whereas the acidic alumina support promotesthe carbon–carbon bond cleavage.
Although lignin chemicals have many applications such as in drilling muds, asbinders for animal feed, and as the base for artificial vanilla, they have not beenpreviously used as surfactants for oil recovery. According to Naae,30 lignin chemicalscan be used in two ways in chemical floods for enhanced oil recovery. In one method,lignosulfonates are blended with tallow amines and conventional petroleum sulfonates
FIGURE 11.14 Ether and C–C bonds in lignin. (From Wright, J.D. Chem. Eng. Prog., 84,62–74, 1988.)
OCH3O
C
CC
O
CH3O
CC
C
OCH3O
CCC
OCH3O
CCC
OCH3O
CCC
OCH3O
CC
C
OOCH3
C
OOCH3
CC
CCC
OOCH 3
C OOCH 3C
C
CCC
OOCH3
CCC
O
OCH3
CCC
O
β-4’ β-β’ 5-5’
α- α- α’β-5’
Ether Bonding Bonding
Bonding
Bonding
BondingAlkyl Ether
© 2007 by Taylor & Francis Group, LLC

370 Handbook of Alternative Fuel Technology
to form a unique mixture that costs about 40% less to use than chemicals made solelyfrom petroleum or petroleum-based products. In the second method, lignin is reactedwith hydrogen or carbon monoxide to form a new class of chemicals called ligninphenols. These phenols, because they are soluble in organic solvents, but not in water,are good candidates for further conversion to chemicals useful in enhanced oil recovery.
11.5 COPRODUCTS
To reduce ethanol production cost, it is imperative to expand the market for theprocess coproducts. Unlike the mature corn ethanol industry, the by-product (orcoproduct) industry for lignocellulosic ethanol industry is not yet very well definedor established. Potential coproducts include hemicellulose hydrolysate (xylose), cel-lulose hydrolysate (glucose of mixed sugars), cell mass, enzymes, soluble andinsoluble lignins, solid residues, etc.
11.6 ENERGY BALANCE FOR ETHANOL PRODUCTIONFROM BIOMASS
Biomass process development depends on the economics of the conversion pro-cesses, be it chemical, enzymatic, or a combination of both. A number of estimateshave been computed based on existing or potential technologies. One obvious factoris that, regardless of the process, transportation of the biomass material from itssource to the site of conversion must be kept to an absolute minimum. Approximately35% of the expected energy is consumed in transporting the substrate a distance of15 mi.3 This considerable expenditure of energy just to transport the starting materialdictates that any conversion plant be of moderate size in close proximity to theproduction source of the starting material.
There are some objections to the production and use of ethanol as a fuel. Mostimportant is the criticism that producing ethanol can consume more energy than ispresent in finished ethanol. The European analysis takes wheat as the feedstock andincludes estimates of the energy expended in growing the wheat, transporting it to thedistillery, making the alcohol, and transporting it to a refinery for blending with petrol.It allows credit for by-product, such as animal feed from wheat, for savings on petrolthat comes from replacing 5% with alcohol, and from the energy gained from theincrease of 1.25 octane points. Yet, to confine debates on biomass fuels solely to energybalance is misleading. At least 13 plants of a variety of designs, like the Swedish one,are working or are under construction in Europe, South America, and Asia.9
The greatest opposition to bioethanol, not surprisingly, comes from the oilindustry, where the preference is to produce low-octane petrol together with octaneboosters based on oil. This would reduce the investment needed at the refinery. Theywould also sell more petrol because the reduction of 1 octane point increases a car'sfuel consumption by 1 to 1.5%.9
Energy requirements to produce ethanol from different crops were evaluated byDa Silva et al.8 The industrial phase is always more energy intensive, consumingfrom 60 to 75% of the total energy. The energy expended in crop production includes
© 2007 by Taylor & Francis Group, LLC

Ethanol from Lignocellulosics 371
all the forms of energy used in agricultural and industrial processing, except thesolar energy that plants use for growth. The industrial stage, including extractionand hydrolysis, alcohol fermentation, and distillation, requires about 6.5 kg of steamper liter of alcohol. It is possible to furnish the total industrial energy requirementsfrom the by-products of some of the crops. Thus, it is also informative to considera simplified energy balance in which only agricultural energy is taken as input andonly ethanol is taken as the output, the bagasse supplying energy for the industrialstage, for example. Furthermore, it is often very difficult, or nearly impossible, tocompare data associated with different technologies, because of the wide variety offeedstock crops as starting lignocellulose. Therefore, the U.S. Department ofEnergy–sponsored projects chose corn stover as the model feedstock.49 This selectionis based on the fact that corn stover is the most abundant and concentrated biomassresource in the U.S., and its collection can leverage the existing corn ethanol infra-structure, including corn harvesting and ethanol production.49
There have been several energy analyses for ethanol production from food crops,and they have been characterized by confusion. For example, results from Brazilshow that sugarcane has a very favorable energy balance for ethanol production.8 Incontrast, at Iowa State University,35 it was concluded: “It cannot be claimed thatethanol fermentation produces energy, the opposite is instead true.” The dichotomousnature of these analyses shows the need for more site-specific studies. It is alsoimportant to resolve this matter as the very existence of alcohol plants in somecountries could be threatened.
The energy balance results in Zimbabwe have shown that the energy ratio is1.52 if all the major outputs are considered, and 1.15 if ethanol is considered as theonly output. The reported values of the net energy ratio in Brazil8 is 2.41 and inLouisiana21 is 1.85. The low ratio in Zimbabwe is due to: (1) the large energy inputin the agricultural phase, arising from a large fertilizer need and (2) the largefossil-based fuel consumption in the sugarcane processing.
Generally speaking, the cost of production of ethanol decreases with an increasein capacity of the production facility. However, the minimum total cost correspondsto a point of inflection, at which point an increase in the production cost for everyincrease in the plant capacity is seen. The possibility of existence of an empiricalrelationship between the plant size or output and the production costs has also beenexamined using various production functions and the computed F values at level ofsignificance taken as 5%.15 It is also conceivable that if the average distance of rawmaterial transportation and acquisition becomes excessively long owing to theincreased plant capacity, then the production cost can be adversely affected by theplant size.
Xylose fermentation is being carried out by bacteria, fungi, yeast, or enzyme-yeast systems. This would reduce the cost by 25% or more in the case of herbaceous-type materials. Efforts are being made to achieve the yield of 100% and an increasedethanol concentration.
Lignin, another major component of the biomass, accounts for the large energycontents of biomass because it has much higher energy per pound than the carbohy-drates. As it is a phenolic polymer, it cannot be fermented to sugar and converted tomaterials like methyl-aryl ethers, which are compatible with gasoline as a high-octane
© 2007 by Taylor & Francis Group, LLC

372 Handbook of Alternative Fuel Technology
enhancer. The combination of the preceding processes has the potential to producefuels for a competitive price.
11.7 PROCESS ECONOMICS AND STRATEGIC DIRECTION
McAloon et al.51 studied the cost of ethanol production from lignocellulosic materialsin comparison to that from corn starch. As correctly pointed out in their study, thecost comparison was made between the mature corn-ethanol industry and the emerg-ing lignocellulosic ethanol industry. Based on the fixed price of year 2000, the costof fuel ethanol production from lignocellulose processes was determined to be$1.50/gal, whereas that from corn processes was $0.88/gal.89 Needless to say, thecost values determined in year 2000 cannot be considered to be still valid for thecurrent year because of significant changes during the period in infrastructural costsas well as variable operating costs.
To make the lignocellulosic biorefinery technology a success, the following mustbe resolved:
1. Lignocellulose feedstock and delivery system has to be established on aneconomically sound basis.
2. Each step of the process technology needs to be separately investigatedfor various options, and the interactions and connectivity between thesteps must be completely evaluated.
3. An exhaustive database for a variety of different feedstocks must be estab-lished. For issue 2, the idea of model feedstock such as corn stover is avery good idea. A different feedstock can be chosen as a model feedstockfor different countries and regions, depending on local availability andinfrastructural benefits. Further, conversion technologies should be adapt-able to other lignocellulosic feedstocks and agricultural residues.87
4. Large-scale demonstration is crucially important for commercial opera-tional experience as well as for minimized risk involved in scale-up efforts.Further, such an operation on a large scale helps demonstrate environ-mental life cycle benefits.
5. Low-cost but efficient enzymes for the technology must be developed toreduce operational cost and improve productivity. Current efforts byGenencor International and Novozymes Biotech are very significant andnoteworthy in this regard.
REFERENCES
1. Web site http://www.earth-policy.org/Updates/2005/Update49_data.htm.2. Bailey, J.E. and Ollis, D.F., Biochemical Engineering Fundamentals, 2nd ed.,
McGraw-Hill, New York, 1986.3. Batt, C.A., Moses, V., and Cape, R.E., Biotechnology, The Science and The Business,
Harwood Academic, Chur, Switzerland, 1991, pp. 521–536.
© 2007 by Taylor & Francis Group, LLC

Ethanol from Lignocellulosics 373
4. Beall, D.S., Ohta, K., and Ingram, L.O., Parametric studies of ethanol productionfrom xylose and other sugars by recombinant Escherichia coli, Biotechnol. Bioeng.,38, 296–303, 1991.
5. Beltrame, P.L., Carniti, P., Focher, B., Marzetti, A., and Sarto, V., Enzymatic hydrol-ysis of cellulosic materials: a kinetic study, Biotechnol. Bioeng., 26, 1233–1238, 1984.
6. Blotkamp, P.J., Takagi, M., Pemberton, M.S., and Emert, G.H., Biochemical Engi-neering: Renewable Sources of Energy and Chemical Feedstocks, Nystrom, J.M. andBarnett, S.M., Eds., AICHE Symposium Series No.181, 74, AICHE, New York, 1978.
7. Christen, P., Minier, M., and Renon, H., Ethanol extraction by supported liquidmembrane during fermentation, Biotechnol. Bioeng., 36, 116–123, 1990.
8. Da Silva, J.G., Serra, G.E., Moreira, J.R., Concalves, J.C., and Goldenberg, J., Energybalance for ethyl alcohol production from crops, Science, 201, 903–906, 1978.
9. de Groot, P. and Hall, D., Power from the Farmers, New Scientist, 112, 1986, pp.50–55.
10. Diaz, L.F., Savage, G.M., and Golueke, C.G., Critical review of energy recovery fromsolid wastes, CRC Crit. Rev. Environ. Control, 14(3), 285–288, 1984.
11. Ellis, C., Chemistry of Petroleum Derivatives, Vol. 2, Reinhold Publishing Corp.,New York, 1937.
12. Farina, G.E., Barrier, J.W., and Forsythe, M.L., Fuel alcohol production from agri-cultural lignocellulosic feedstocks, Energy Sources, 10, 231–237, 1988.
13. Gaddy, J.L., Renewable energy sources and improved methods of employing fossilfuels, Proceedings of the 200th National Meeting of ACS, in Symposium on FuelChemistry, Washington, D.C., August 1990.
14. Garcia, A., Lannotti, E.L., and Fischer, J.L., Butanol fermentation liquor productionand separation by reverse osmosis, Biotechnol. Bioeng., 28, 785–791, 1986.
15. Gladius, L., Some aspects of the production of ethanol from sugar cane residues inZimbabwe, Solar Energy, 33(3/4), 379–382, 1984.
16. Goldstein, I.S., Department of Wood and Paper Science, North Carolina State Uni-versity, Chemical and Engineering News, 68, 20, September 10, 1990.
17. Gonzales, G., Caminal, G., de Mas, C., and Santin, J.L., J. Chem. Technol. Biotechnol.,44, 275, 1989.
18. Hodzi, D., Hydrogen Bonding, Pergamon Press, London, 1957.19. Holtzapple, M.T., Caram, H.S., and Humphrey, A.E., The HCH-1 model of enzymatic
cellulose hydrolysis, Biotechnol. Bioeng., 26, 775–780, 1984.20. Holtzapple, M.T., Cognata, M., Shu, Y., and Hendrickson, C., Inhibition of Trichoderma
reesei cellulase by sugars and solvents, Biotechnol. Bioeng., 38, 296–303, 1991.21. Hopkinson, C.S. and Davy, J.W., Net energy analysis of alcohol production from
sugarcane, Science, 207, 302–304, 1980.22. Judice, C.A. and Pirkle, L.E., U.S. Patent No. 3,095,458, June 25, 1963, to Esso
Research and Eng. Co.23. Kadam, S. and Demain, A., Addition of cloned β-glucosidase enhances the degrada-
tion of crystalline cellulose by the clostridium thermocellum cellulase comolex,Biochem. Biophvs. Res. Commun., 161(2), 706–711, 1989.
24. Kirk-Othmer Encyclopedia of Chemical Technology, 3rd ed., Vol. 9, John Wiley &Sons, 1978, pp. 342–351.
25. Kyung, K.H. and Gerhardt, P., Continuous production of ethanol by yeast "immobi-lized" in membrane-contained fermentor, Biotechnol. Bioeng., 26, 252, 1984.
26. Lewis, W.K., U.S. Patent No. 2,045,785, June 30, 1936, to Standard Oil Dev. Co.27. L'Italien, Y., Thibault, J., and Le Duy, A., Improvement of ethanol fermentation under
hyperbaric conditions, Biotechnol. Bioeng., 33, 471–476, 1989.
© 2007 by Taylor & Francis Group, LLC

374 Handbook of Alternative Fuel Technology
28. Long, J.R., More Energy Research Called for to Stem Oil, Climate Change Crises,Chemical and Engineering News, 68, 16–17, September 10, 1990.
29. Miller, S.A., Ethylene and Its Industrial Derivatives, Ernest Benn Std., London, 1969.30. Naae, D.G., ACS Press Conference, 200th National Meeting of the ACS, August,
1990, Washington D.C., Chemical and Engineering News, 68, 17, September 10,1990.
31. Ohmine, K., Ooshima, H., and Harano, Y., Kinetic study on enzymatic hydrolysis ofcellulose by cellulase from Trichoderma viride, Biotechnol. Bioeng., 25, 2041–2053,1983.
32. Okazaki, M. and Young, M., Kinetics of enzymatic hydrolysis of cellulose: analyticaldescription of mechanistic model, Biotechnol. Bioeng., 20, 637–663, 1978.
33. Ooshima, H., Burns, D.S., and Converse, A.O., Adsorption of cellulase from Tricho-derma reesei on cellulose and Lignacious residue in wood pretreated by dilute sulfuricacid with explosive decompression, Biotechnol. Bioeng., 36, 446–452, 1990.
34. Park, S.C. and Baratti, J., Batch fermentation kinetics of sugar beet molasses byZymomonas mobilis, Biotechnol. Bioeng., 38, 304–313, 1991.
35. Reilly, P., Economics and Energy Requirements for Ethanol Production, Departmentof Chemical and Nuclear Engineering, Iowa State University, Ames, IA, 1978.
36. Rughani, J. and McGinnis, G.D., Combined rapid–steam hydrolysis and organosolvpretreatment of mixed southern hardwoods, Biotechnol. Bioeng., 33, 681–686, 1989.
37. Ryu, D.Y. and Lee, S.B., Enzymatic hydrolysis of cellulose: determination of kineticparameters, Chem. Eng. Commun., 45, 119–134, 1986.
38. Sarthy, A., McConaughy, L., Lobo, Z., Sundstorm, A., Furlong, E., and Hall, B.,Expression of the Escherichia coli xylose isomerase gene in Saccharomyces cerevi-siae, Appl. Environ. Microbiol., 53, 1996–2000, 1987.
39. Sperling, D., An analytical framework for siting and sizing biomass fuel plants,Energy, 9(11–12), 1033–1040, 1984.
40. Szamant, H., Big push for a biomass bonanza, Chem. Week, 122(14), 40, 1978.41. U.S. Congress, Energy from Biological Processes, Vol. 2, Office of Technology
Assessment, Washington, D.C., 1980, pp. 142–177.42. Vallander, L. and Erikkson, K., Enzymatic hydrolysis of lignocellulosic materials: I.
Models for the hydrolysis process — a theoretical study, Biotechnol. Bioeng., 38,35–138, 1991.
43. Vallander, L. and Erikkson, K., Enzymatic hydrolysis of lignocellulosic materials: II.Experimental investigations of theoretical hydrolysis process models for an increasedenzvme recovery, Biotechnol. Bioeng., 38, 139–144, 1991.
44. Wald, S., Wilke, C.R., and Blanch, H.W., Kinetics of the enzymatic hydrolysis ofcellulose, Biotechnol. Bioeng., 26, 221–230, 1984.
45. Wright, J.D., Ethanol from biomass by enzymatic hydrolysis, Chem. Eng. Prog., 84,62–74, 1988.
46. La Rovere, E. L., The Brazilian Ethanol Program: Biofuels for Transport, a paperpresented at International Conference for Renewable Energies, Bonn, Germany, June1–4, 2004. Presentation view graphs are available through http://www.renewables2004.de/ppt/Presentation4-SessionIVB(11-12.30h)-LaRovere.pdf.
47. Ojumu, T.V. and Ogunkunle, O.A., Production of glucose from lignocellulosic underextremely low acid and high temperature in batch process, auto-hydrolysis approach,J. Appl. Sci., 5(1), 15–17, 2005.
48. Torget, R., Kim, J.S., and Lee, Y.Y., Fundamental aspects of dilute acid hydroly-sis/fractionation kinetics of hardwood carbohydrates. 1. Cellulose hydrolysis, Ind.Eng. Chem. Res., 39, 2817–2825, 2000.
© 2007 by Taylor & Francis Group, LLC

Ethanol from Lignocellulosics 375
49. Web site http://www.eere.energy.gov/biomass/pdfs/sugar_enzyme.pdf.50. The American Heritage® Stedman's Medical Dictionary, 2nd ed., Houghton Mifflin
Company, New York, 2004.51. McAloon, A., Taylor, F., Yee, W., Ibsen, K., and Wooley, R., Determining the Cost
of Producing Ethanol from Corn Starch and Lignocellulosic Feedstocks, TechnicalReport, NREL/TP-580-28893, National Renewable Energy Laboratory, Golden, CO,October 2000.
52. Torget, R., Milestone Completion Report: Process Economic Evaluation of the TotalHydrolysis Option for Producing Monomeric Sugars Using Hardwood Sawdust forthe NREL Bioconversion Process for Ethanol Production, Internal Report, NationalRenewable Energy Laboratory, Golden, CO, 1996.
53. Nguyen, Q., Milestone Completion Report: Evaluation of a Two-Stage Dilute SulfuricAcid Hydrolysis Process, Internal Report, National Renewable Energy Laboratory,Golden, CO, 1998.
54. C&EN, Vol. 68, Sept. 10, 1990.
© 2007 by Taylor & Francis Group, LLC

377
12 Energy from Biomass Conversion
Sunggyu Lee
CONTENTS
12.1 Introduction .................................................................................................. 37712.2 Thermal Conversion..................................................................................... 381
12.2.1 Direct Combustion ........................................................................... 38112.2.2 Gasification....................................................................................... 38112.2.3 Liquefaction ..................................................................................... 38612.2.4 Pyrolysis ........................................................................................... 387
12.3 Biological Conversion: Anaerobic Digestion .............................................. 389References.............................................................................................................. 391
12.1 INTRODUCTION
The term biomass is defined as “different materials of biological origin that can beused as a primary source of energy.”1,2 Merriam-Webster OnLine Dictionary38 definesbiomass as “plant materials and animal waste used especially as a source of fuel.”An attractive aspect of biomass utilization is its renewability, which ultimatelyguarantees that the source will not be depleted. With plant and plant-derived mate-rials, all energy is originally captured by photosynthesis. Going by these definitionsof biomass, it can be safely said that energy from biomass has been exploited byhumans for a very long time. The burning, or incineration, of biological substancessuch as wooden materials has long been used to provide warmth. It has beenestimated that, in the late 1700s, approximately two thirds of the volume of woodremoved from the American forest was for energy generation.3 Because wood wasone of the few renewable energy sources readily exploitable at the time, its usecontinued to grow. During the 1800s, single households consumed 70 to 145 m3 ofwood annually for heating and cooking.4,5 A small percentage of the rural commu-nities in the U.S. still use biomass for these purposes. Other countries such as Finlanduse the direct combustion of wood for a percentage of their total energy use.6 Finlandand the U.S. are not the only countries that use biomass consumption to supplementtheir total energy usage. In fact, the share of biomass energy in the total energyconsumption of a country is far greater in African nations and many other developingcountries. Table 12.1 shows the percentages of biomass consumption by several
© 2007 by Taylor & Francis Group, LLC

378 Handbook of Alternative Fuel Technology
“developed” countries.7 The data shown include all biomass consumption forenergy generation, which includes, for example, corn for ethanol as well as woodfor combustion.
On a larger scale, biomass is currently the primary fuel in the residential sectorin many developing countries. For instance, it accounts for over 90% of total house-hold use in the poorer countries of Africa and Central America8 and 35% in LatinAmerica and Asia.9 The biomass resource may be in the form of wood, charcoal,crop waste, or animal waste. For these countries, its most critical function is cooking,with the other principal uses being lighting and heating. The dependence on biomassfor critical energy supply for these countries is generally decreasing, whereas thatfor developed countries is strategically refocused.
Figure 12.1 shows a pie chart for U.S. renewable energy consumption in thenational energy supply for the year 2004.40 As shown, biomass accounts for about2.8% of the total energy supply, which is the largest among all renewable energysources.40 This percentage also tops the hydroelectric contribution, and the gapbetween the two is expected to grow. Further, biomass consumption increased by
TABLE 12.1Biomass Utilization for Energy in Various Countries
Country Energy from Biomass Utilization (%)
Austria 4.0Belgium 0.2Canada 3.0Denmark 1.0Ireland 13.0New Zealand 0.4Norway 4.0Sweden 13.0Switzerland 1.6U.S. 2.8
FIGURE 12.1 U.S. renewable energy consumption for the year 2004.
Total = 100.278 Quadrillion Btu
Natural Gas23%
Coal23%
Petroleum40%
NuclearEnergyPower
8%
RenewableEnergy
6%
Total = 6.117 Quadrillion Btu
Solar 1%
Biomass 47%
Geothermal 6%
Hydroelectric 45%
Wind 2%
© 2007 by Taylor & Francis Group, LLC

Energy from Biomass Conversion 379
4%, or 105 trillion Btu, in 2004, whereas the total renewable energy consumptionincreased slightly less than 1%.40 This faster rate of increase for biomass is attributedto rapid usage growth of fuel ethanol in transportation sectors owing to the phaseoutof MTBE as well as regulatory demand of oxygenated fuel.
Although the direct combustion of charcoal and animal waste is extensively usedin developing countries, this usage of biomass may not be generally considered“suitable” or “efficient” for direct energy applications.10 There are three broad cate-gories of biomass feedstocks that have been deemed suitable for energy productionapplications as well as for industrial processing:
1. Vegetable oils2. Pure carbohydrates, such as sugar and starch3. Heterogeneous “woody” materials, collectively termed lignocelluloses
Typically targeted fuel products from the preceding feedstocks are biodieseland ethanol. The annual world production of biomass for these three categories isestimated at 146 billion metric tons. Approximately 80% of this amount is attributedto uncontrolled plant growth. Trees and farm crop wastes can produce 10 to 20tons/acre/year of dry biomass. Certain genera of algae and grass can produce upto 50 metric tons/year of biomass, whose heating value is 5000 to 8000 Btu/lb.11
This heating value per unit mass is lower than that for typical bituminous coal byabout 30 to 50%. Compared to coal, however, fuel from biomass has essentiallyno or very little sulfur (0.1 to 0.2%) or ash content.12,13 In addition, it does not addany significant net CO2 to the atmosphere, because CO2 is consumed for renewablegeneration of biomass.14
Meeting U.S. demands for oil and gas by the direct combustion of lignocellulosematerials would require 6–8% of the land area of the 50 states to be cultivated solelyfor biomass production.15 Although the direct combustion of biomass is not anefficient or economical alternative, the conversion of biomass feedstocks into agaseous or liquid fuel is not only feasible, but also quite promising. Biomass couldbe used to replace the very large amounts of petroleum and natural gas currentlyconsumed in the manufacture of primary chemicals in the U.S. annually. Especiallyfor the countries that depend heavily on imported petroleum and petroleum products,this option may be even more valuable for both short- and long-term future. Amongthe sources of biomass that could be used for chemical production are grains andsugar crops for ethanol manufacture, oil seeds for oil extraction, soy beans for soyoil and soy alcohol, animal by-products and wastes, manure and sewage for methanegeneration, and wood and straw for biogas and liquid fuel generation. Biomass canbe used for generation of synthesis gas (hydrogen and carbon monoxide) and hydro-gen by pyrolysis or gasification. These options are becoming even more attractiveowing to the very high market price of natural gas that has been prevailing in the21st century. Significant R & D accomplishments have been made in Europe, espe-cially in Germany and Sweden, through a variety of industrial efforts to generatesyngas and liquid fuels. Many of these efforts have resulted in commercial-scaledemonstration plants that are currently in operation. It is particularly noteworthy
© 2007 by Taylor & Francis Group, LLC
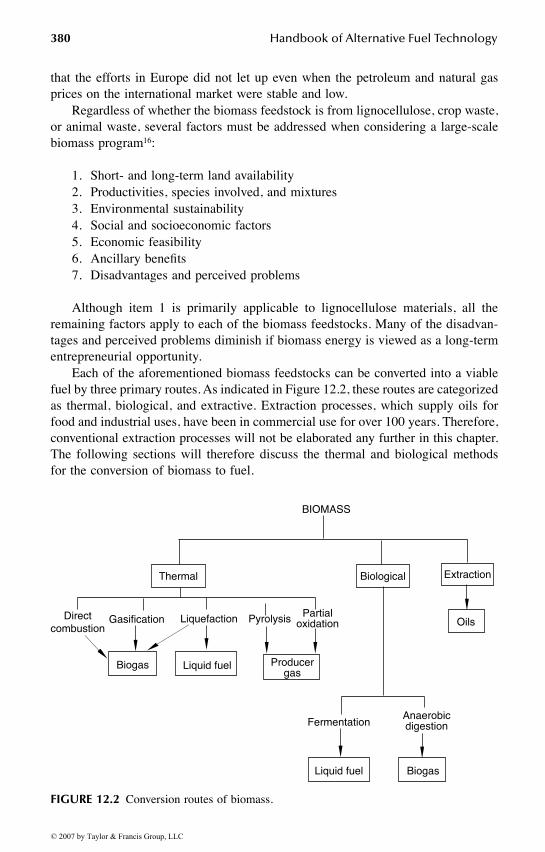
380 Handbook of Alternative Fuel Technology
that the efforts in Europe did not let up even when the petroleum and natural gasprices on the international market were stable and low.
Regardless of whether the biomass feedstock is from lignocellulose, crop waste,or animal waste, several factors must be addressed when considering a large-scalebiomass program16:
1. Short- and long-term land availability2. Productivities, species involved, and mixtures3. Environmental sustainability4. Social and socioeconomic factors5. Economic feasibility6. Ancillary benefits7. Disadvantages and perceived problems
Although item 1 is primarily applicable to lignocellulose materials, all theremaining factors apply to each of the biomass feedstocks. Many of the disadvan-tages and perceived problems diminish if biomass energy is viewed as a long-termentrepreneurial opportunity.
Each of the aforementioned biomass feedstocks can be converted into a viablefuel by three primary routes. As indicated in Figure 12.2, these routes are categorizedas thermal, biological, and extractive. Extraction processes, which supply oils forfood and industrial uses, have been in commercial use for over 100 years. Therefore,conventional extraction processes will not be elaborated any further in this chapter.The following sections will therefore discuss the thermal and biological methodsfor the conversion of biomass to fuel.
FIGURE 12.2 Conversion routes of biomass.
BIOMASS
Thermal Biological Extraction
OilsDirect
combustionGasification Liquefaction Pyrolysis
Biogas Liquid fuel Producergas
Partialoxidation
FermentationAnaerobicdigestion
Liquid fuel Biogas
© 2007 by Taylor & Francis Group, LLC

Energy from Biomass Conversion 381
12.2 THERMAL CONVERSION
There are five thermal approaches that are commonly used to convert biomass intoan alternative fuel: direct combustion, gasification, liquefaction, pyrolysis, and partialoxidation.
When biomass is heated under oxygen-deficient conditions, it generates synthesisgas, or syngas, which consists primarily of hydrogen and carbon monoxide. Thissyngas can be directly burned or further processed for other gaseous or liquidproducts. In this sense, thermal or chemical conversion of biomass is very similarto that of coal.
12.2.1 DIRECT COMBUSTION
Indoor combustion of biomass fuels in unvented cooking and heating spaces hascaused considerable health problems to the direct users, primarily the women andchildren of developing countries.17 Biomass fuels, when used improperly in thismanner, release considerable amounts of toxic or hazardous gases into the unventedarea. These gases are, typically, carbon monoxide (CO), nitrogen oxides (NOx),hydrocarbons, organics, aldehydes, and trace amounts of aromatics and ketones. Asthe moisture content of the wood increases, and as other biomass fuels of lowerenergy content (such as animal and crop waste) are used, the emissions increase.The woody components of biomass burn much more efficiently during completecombustion. In the earthen kilns of developing countries, the wood undergoes incom-plete combustion, which causes the release of carbon monoxide, carbon dioxide,and nitrous oxide.
When the direct combustion of biomass is conducted in a well-vented area,biomass burning used for domestic stoves and boilers can be a sound substitute forcombustion of conventional fossil fuel.17 Sulfur emissions (0.05 to 0.2 wt%) aremuch lower and the formation of particulates can be controlled at the source.18 Ona larger scale, the biomass is reduced into fine pieces for combustion in a close-coupled turbine. In a close-coupled system, the turbine is separated from the com-bustion chamber by a filter. Energy Performance Systems Inc. of Minneapolis hasdemonstrated 87% efficiency with a close-coupled system using lignocellulose mate-rial. The company states that the process is feasible for 25 to 400 MW plants.39
Most electrical power generation systems are relatively inefficient, owing to theloss of a significant portion of energy, as much as half to two thirds, in a form ofwaste heat. If this heat is used efficiently for industrial manufacture, space heating,district heating, or other purposes, the overall efficiency can be greatly enhanced.Therefore, smaller biopower systems are more suitable for cogeneration-type pro-cesses than much larger counterparts.
12.2.2 GASIFICATION
Gasification is not a new technology; however, its use for the conversion of biomassinto a viable fuel has only been investigated for the past 30 years.19,20 Production ofsyngas from biomass can be accomplished by basically two broad categories of thechemical and thermal processes, namely, catalytic routes and noncatalytic processes.
© 2007 by Taylor & Francis Group, LLC

382 Handbook of Alternative Fuel Technology
Typically, noncatalytic processes require a very high temperature of operation, ashigh as 1300°C, whereas catalytic processes can be operated at substantially lowertemperatures. With advances in catalysis, the temperature requirement is expectedto go downward further from the current value of about 900°C.
The first system to be investigated at the pilot scale was a fluidized bed thatincorporated dry ash-free (DAF) corn stover as the feed. Corn stover has been selectedas the feed since 1977, when the annual production of “corn crop wastes” exceeded300 million tons.20 The corn stover, if treated properly, has the potential to be convertedinto an energy source that would supply up to 2% of the U.S. energy needs. Thepilot-scale system, shown in Figure 12.3, has a 45.5-kg bed capacity.21 Fluidizing gasand heat for the gasification were supplied by the combustion of propane in theabsence of air. The particulates and char were removed using a high-temperaturecyclone. A Venturi scrubber was then used to separate the volatile material intononcondensable gas, a tar-oil fraction, and an aqueous waste fraction. Raman et al.21
conducted a series of tests with temperatures ranging from 840 to 1020 K. The optimalgas production was obtained using a feed rate of 27 kg/h and a temperature of 930 K.At these conditions, 0.25 × 10⁶ BTU/h of gas was produced. This is enough to operatea 25-hp internal combustion engine operating at 25% efficiency.21
Another extensively studied gasification system for biomass conversion is Swe-den’s VEGA gasification system. Skydkraft AB, a Swedish power company, decidedin June 1991 to build a cogeneration power plant in Vämamo, Sweden, to demon-strate integrated gasification combined cycle (IGCC) technology. Bioflow wasformed in 1992 as a joint venture between Skydkraft and Alstrom to develop pres-surized air-blown circulating fluidized bed gasifier technology for biomass. Thebiomass integrated gasification combined cycle (BIGCC) was commissioned in 1993
FIGURE 12.3 Pilot-plant fluidized bed for the gasification of corn stover.
Feed
Fluidized bedreactor
Overflow
Air
Air
Air
CH4
CH4H O2
H O2
C3
CycloneVenturi
scrubber
Waste
Afterburner
© 2007 by Taylor & Francis Group, LLC

Energy from Biomass Conversion 383
and fully completed in 1995. VEGA is a biomass-fuel-based IGCC system thatcombines heat and power (CHP) for a district heating system.22 It generates 6.0 MWand 9.0 MWth for district heating of the city of Vämamo, Sweden. As indicated inFigure 12.4, the moisture of the entering biomass feedstock is removed via a “biofueldryer” to decrease gaseous emissions.22 The dried biomass is then converted into a“biofuel” in a combined cycle gasifier. The resulting gas is cooled before it entersthe heat recovery boiler and distribution to the district heating. The gasifier is knownas the Bioflow Gasifier.
The most common method of gasifying biomass is using an air-blown circulatingfluidized bed gasifier with a catalytic reformer, though there are many differentvariations. Most fluidized bed gasification processes use closed-coupled combustionwith very little or no intermediate gas cleaning.42 This type of process is typicallyoperated at around 900°C, and the product gas from the gasifier contains H2, CO,CO2, H2O, and CH4, C2H4, benzene, and tars. Gasification uses oxygen (or air) andsteam to help the process conversion, similar to coal gasification. The effluent gasfrom the fluidized bed gasifier contains a decent amount of syngas compositions,and the hydrocarbon content is also quite substantial. Therefore, the gasifier effluentgas cannot be directly used as syngas for further processing for other liquid fuelsor chemicals without major purification steps. This is the reason why the gasifier iscoupled with a catalytic reformer, where hydrocarbons are further reformed tosynthesis gas. In this stage, the hydrocarbon content including methane is reducedby 95% or better. A very successful example is Chrisgas, an EU-funded project,which operates an 18-MWth circulating fluidized gasifier reactor at Värnamo, Swe-den. They use a pressurized circulating fluidized bed gasifier operating on oxy-gen/steam, a catalytic reformer, and a water gas shift (WGS) conversion reactor thatenriches hydrogen content of the product gas. The process also uses a high-temper-ature filter. The project has been carried out by the VVBGC (Växjö Värnamo
FIGURE 12.4 Schematic of Vega process gasification of biomass.
CondenserDistrictHeating
Steamturbine
DistrictHeating
GasifierGasCooler
Heatrecoveryboiler
Air
Gasturbine
cleaner
DistrictHeating
Fueldryer
Biofuel
© 2007 by Taylor & Francis Group, LLC

384 Handbook of Alternative Fuel Technology
Biomass Gasification Centre). The use of oxygen instead of air is to avoid nitrogendilution that, if not avoided, would add the additional burden of nitrogen removalto downstream processing.
Indirect gasification is another gasification process technology that takes advan-tage of the unique properties associated with biomass. As such, indirect gasificationof biomass is substantially different from most coal-based gasification process tech-nologies. For example, biomass is low in sulfur and ash, and highly reactive andvolatile. In an indirect gasification process, biomass is heated indirectly using anexternal means such as heated sands in Battelle’s process. A typical gaseous productfrom an indirect gasifier is close to medium-Btu gas, explained in Chapter 2. Battellebegan this process R&D in 1980 and has continued up to the present, accumulatingvery valuable data regarding biomass gasification and utilization through long hoursof their demonstration plant operation. Battelle’s process is known as FERCO Sil-vaGas process, which is commercialized by FERCO Enterprise. A commercial-scaledemonstration plant of the SilvaGas process was constructed in 1997 at Burlington,VT, at a Burlington Electric Department (BED) McNeil Station.43 The design capac-ity of this plant is 200 tons/d of biomass feed (dry basis). McNeil station usesconventional biomass combustion technology, a stoker gate, conventional steampower cycle, and electrostatic precipitator (ESP)-based particulate matter removalsystem. The gas produced by the SilvaGas gasifier is used as a cofired fuel in theexisting McNeil power boilers.43 The product gas has a heating value of about 450to 500 Btu/scf.
CUTEC, a German institute, recently constructed an oxygen-blown circulatingfluidized bed gasifier of 0.4-MWth capacity coupled with a catalytic reformer. Partof their product gas is after compression directly sent to a Fischer–Tropsch reactorfor liquid hydrocarbon synthesis. This process, once fully developed, has goodpotential for a single-train biomass-to-liquid fuel conversion process.44
Another important process option for biomass gasification for syngas productioninvolves the use of an entrained flow reactor. This type of process is operated at avery high temperature, around 1300°C, and without the use of a catalyst. The hightemperature is necessary because of the fast reaction rate required for an entrainedreactor whose reactor residence time is inherently very short. If a specific biomassfeed has high ash content, which is not very typical for biomass, slag can be formedat such a high temperature. Learning from the research developments in coal gas-ification, a slagging entrained flow gasifier may be adopted for high-ash biomassconversion. Another important process requirement besides high temperature andshort residence time is the particle size of solid feed, which must be very fine forefficient entrainment as well as for better conversion without mass transfer limita-tions. However, pulverization or milling of biomass is energy intensive and costly.To facilitate efficient size reduction of biomass feed, two options are most commonlyadopted, namely, torrefaction and pyrolysis. Torrefaction is a mild thermal treatmentat a temperature of 250 to 300°C, which converts solid biomass into a more brittleand easily pulverizable material that can be treated and handled just like coal. Thistorrefied product is often called biocoal. Thus, pulverized torrefied biomass can betreated like coal, and most entrained flow gasifiers designed for coal can be smoothlyconverted for torrefied biocoal without much adaptation. Torrefaction as a process
© 2007 by Taylor & Francis Group, LLC

Energy from Biomass Conversion 385
has long been utilized in many applications, including the coffee industry. However,more study is needed by the biomass industry to tune the process for biomass andoptimize it as an efficient pretreatment technique. Gases produced during the tor-refaction process may be used for torrefaction, thus accomplishing a self-energysupply cycle. An example of entrained flow biomass gasification can be found fromthe Buggenum IGCC plant, whose capacity is 250 MWe.45 NUON has operated thisprocess, and their test program used for a period of 2001 through 2004, 6000 M/Tof sewage sludge, 1200 M/T of chicken litter, 1200 M/T of wood, 3200 M/T ofpaper pulp, 50 M/T of coffee, and 40 M/T of carbon black as cofeeds with coal.A typical particle size of biomass feed was smaller than 1 mm, and pulverizingwood was more difficult than pulverizing chicken litter and sewage.45 In their testprogram, they also mention torrefaction as a pretreatment option. Their experiencewith a variety of biomass feedstocks provides valuable operational data for futuredevelopment in this area.
Pyrolysis of biomass is an important process option, either as a pretreatment forgasification or as an independent process treatment. Pyrolysis takes place actively ataround 500°C and produces a liquid product, which is called bio-oil. As can be seenfrom the prevailing pyrolysis temperature, pyrolysis of biomass is quite similar, as aprocess treatment, to oil shale pyrolysis and coal pyrolysis. Bio-oil production viabiomass pyrolysis is typically carried out via flash pyrolysis. The produced oil canbe mixed with char to produce a bioslurry. Bioslurry can be more easily fed to thegasifier for efficient conversion. A viable example is the FZK process.46 FZK (Fors-chungszentrum Karlsruhe) developed a process that produces syngas from agriculturalwaste feeds such as straws. They developed a flash pyrolysis process that includestwin screws for pyrolysis. The process concept is based on the Lurgi-Ruhrgas coalgasification process, as discussed in Chapter 2. A 5–10 kg/h PDU (process develop-ment unit) is available at the FZK company site. In this process, straw is flash-pyrolyzed into a liquid that is mixed with char to form a bio-oil/char slurry. The slurryis pumpable and alleviates technical difficulties involved in solid biomass handling.This slurry is transported and added to a pressurized oxygen-blown entrained gasifier.The operating conditions of the gasifier at Freiberg involve a slurry throughput of0.35 to 0.6 tons/d, 26 bars, and 1200 to 1600°C. The current FZK process conceptsinvolve gasification of flash-pyrolyzed wood products, slow-pyrolyzed straw charslurry (with water condensate), and slow-pyrolyzed straw char slurry (with fast pyrol-ysis oil).46 Slurries from straws have been efficiently converted into syngas with highconversion and near-zero methane content.42 Their ultimate objective is developmentof an efficient biomass-to-liquid (BtL) plant. A schematic representation of the FZKprocess concept leading to BtL is shown in Figure 12.5.
FIGURE 12.5 FZK process concept of BtL synfuel.
Biomassfeed
FTSproduct
Flashpyrolysis
Entrained flowgasification
Fischer-Tropschsynthesis
Separation
Condensate-char slurry
Syngas BtL synfuel
© 2007 by Taylor & Francis Group, LLC

386 Handbook of Alternative Fuel Technology
Canadian developments in biomass gasification for the production of medium- andhigh-Btu gases have also received worldwide technical acclaim. The BIOSYN gasifi-cation process was developed by Biosyn Inc., a subsidiary of Nouveler Inc., a divisionof Hydro-Quebec. The process is based on a bubbling fluidized bed gasifier containinga bed of silica (or alumina) and can be operated at a pressure as high as 1.6 MPa.They tested the process extensively from 1984 to 1988 on a 10 ton/h demonstrationplant comprising a pressurized air- or oxygen-fed fluidized bed gasifier.23 The systemhas the ability to utilize a diversified array of feedstock including whole biomass,fractionated biomass, peat, and MSW. The primary end use for biogas is replacing theoil currently used in industrial boilers. It also has the added capability of producingsynthesis gas for methanol or low-energy gas production. In the following years, theyused a 50 kg/h BIOSYN gasification PDU, and it has also proved the feasibility ofgasifying a variety of other feedstocks, such as primary sludges, RDF, rubber residuescontaining 5–15% Kevlar, granulated polyethylene, and polypropylene.41
12.2.3 LIQUEFACTION
During the mid-to-late 1980s, commercial interest of the thermochemical conversionof biomass focused on liquefaction. Unlike the initial gasification studies, the pre-liminary liquefaction studies utilized woody biomass, or lignocellulose material, asthe feedstock. Woody biomass was considered superior to corn stover biomass owingto its potentially lower cost and greater availability.24
The first documented “successful” production of ethanol from the liquefactionof woody material was at McGill University in Canada. Researchers at McGill usedaqueous hydrogen iodide at mild conditions for the ethanol production. Because theoperating temperatures were mild (125°C), char production was minimal.23 Dr.Boocock and associates from the University of Toronto have also contributed to theunderstanding of biomass liquefaction. Their research determined that the size ofthe wood chips used for liquefaction was directly related to the amount of ethanolproduced. As chip size increased, the product yield also increased.23 This led toresearch of the combined process of liquefaction, fermentation, and distillation.
The pilot plant process, shown in Figure 12.6, was designed based on a feedrate of 579,270 Mg/year of wood chips. The mixed wood feedstock comprises
FIGURE 12.6 Combined wood-to-ethanol process.
WoodChips Liquefaction
XyloseNeutralization
Liquidsolid
separationFermentation
Celllulose/lignin
Celluloseproduction
Ligninremoval
DistillationEthanol
© 2007 by Taylor & Francis Group, LLC

Energy from Biomass Conversion 387
cellulose, xylose, and lignin. Liquefaction converts the wood chips into a liquid andsolid fraction. The liquid fraction, comprising xylose, is passed through a neutral-ization unit before it enters the fermentation step. The solid fraction, cellulose andlignin material, is sent directly to the fermentation unit. After leaving the fermenta-tion unit, the lignin components are removed for the generation of process heat andelectricity. The remaining material is then sent to the distillation unit. From the pilotplant results, the yield of ethanol from cellulose and hemicellulose feedstocks isapproximately 110 gal of ethanol per ton of wood.25 A more detailed discussion onthe liquefaction of lignocellulosic materials is presented in Chapter 11.
12.2.4 PYROLYSIS
Biomass can be converted into gas, liquid, and char via pyrolysis. The exact pro-portion of the end products is dependent on the pyrolysis process used (i.e., tem-perature, pressure, etc.).26 During the early 1980s, the National Renewable EnergyLaboratory (NREL) investigated the use of ablative pyrolysis for biomass conversion.The technology behind the biomass pyrolysis is identical to that used in the petroleumindustry.
The first biocrude was produced at a 30 kg/h scale.18 At operating conditions of500°C and a residence time of 1 sec, the biocrude had the same oxygen and energycontent as its “natural crude” counterpart. Since then, Canadian researchers haveconverted woody biomass into fuel via pyrolysis in a 200 kg/h pilot plant.27 The fueloil substitute was produced (on 1000 ton/d dry basis) at approximately $3.4/GJ. Atthe time, the cost for light fuel oil was $4.0–4.6/GJ,28 thus indicating that thepyrolyzed biomass fuel was a more economical alternative. However, the apprehen-sion that high transportation costs of the biomass to the pyrolyzer would outweighpotential profits limited research funding for the next 2 years. This was when thepetroleum-based liquid fuel price was considerably lower than that in the 21stcentury. To circumvent this problem, the Energy Resources Company (ERCO) inMassachusetts developed a mobile pyrolysis prototype for the U.S. EPA.
ERCO’s unit was designed to accept biomass with a 10% moisture content at arate of 100 tons/d. At this rate, the system had a minimal net energy efficiency of70% and produced gaseous, liquid, and char end products. The process, which isinitially started using an outside fuel, is completely self-sufficient shortly after start-up. This was achieved by implementing a cogeneration system to convert the pyrol-ysis gas into the electricity required for operation. A small fraction of the pyrolysisgas is also used to dry the entering feedstock to the required 10% moisture. Asimplified version of ERCO's mobile unit is shown in Figure 12.7.
The end products are pyrolytic oil and pyrolytic char, both of which are moreeconomical to transport than the original biomass feedstock. The average heatingvalues for the pyrolytic oil and char are 10,000 Btu/lb and 12,000 Btu/lb, respec-tively.29 The pyrolysis gas, which has a nominal heating value of 150 Btu/scf, is notconsidered an end product because it is directly used in the cogeneration system.The mobility, self-sufficiency, and profitability of the system removed some of thehesitancy of funding research on the pyrolysis of biomass. In addition, ERCO'ssuccess led to the additional investigation of “dual,” or cogeneration systems.
© 2007 by Taylor & Francis Group, LLC

388 Handbook of Alternative Fuel Technology
The most widely studied dual gasification-pyrolysis system is the Hydrocarbprocess.29–31 The Hydrocarb process focuses on the configuration of gasification andpyrolysis systems to convert a mixed biomass and natural gas feedstock into meth-anol, gasoline, and char. The process combines three basic steps: (1) a hydropyrolyzerin which the biomass is gasified with a recycled hydrogen-rich gas to form a methane-rich gas, (2) a methane pyrolyzer in which methane is decomposed to carbon andhydrogen, and (3) a methanol synthesis reactor in which carbon monoxide is cata-lytically combined with hydrogen to form methanol.32 Preliminary studies main-tained the gasifier at 800°C, the methanol converter at 260°C, and the pyrolysisreactor at 1100°C. When process step 3 had a system pressure of 50 atm at thecorresponding temperatures, the equilibrium compositions shown in Figure 12.8were obtained. For every 100 kg of biomass and 18 kg of methane fed to the gasifier,approximately 67 kg of methanol and 40 kg of char were produced.33
One advantage of this process is that the char produced is essentially “pure”carbon. In other words, it is free of sulfur, ash, and nitrogen. Therefore, it can beused as a clean fuel by the industrial sector. Second, the conversion of methane tomethanol in the presence of biomass decreases the carbon dioxide emissions typicallyassociated with the gasification of methane. Another advantage is the potential toreplace the feedstocks with other materials. The biomass component can be replacedwith other carbonaceous materials, such as MSW. Methane could be replaced withcoal. Although feedstock replacement is still in the preliminary stages, researchersat Brookhaven National Lab (BNL) anticipate similar results.
FIGURE 12.7 Simplified schematic and material balance for ERCO's mobile pyrolysis unit.(From Skelley, W.W. et al., The Energy Resources Fluidized Bed Process for ConvertingBiomass to Electricity, symposium on Energy from Biomass and Wastes VI, January 25–29,1982, pp. 665–705.)
Pyro
lyze
r
Cyclone
Air5204 lb/hr
Biomass8334 lb/hr
Oil, Gas,Char, & Ash13,538 lb/hr
Air6758 lb/hr
OilCooler
GasTurbine
OilScrubber
Oil toStorage
1292 lb/hr
1022 lb/hr Char146 lb/hr Ash
Oil & Gas12s12,370 lb/hr
low BTU Gas11,078 lb/hr
To Dryer
Generator
© 2007 by Taylor & Francis Group, LLC

Energy from Biomass Conversion 389
12.3 BIOLOGICAL CONVERSION: ANAEROBIC DIGESTION
Although the process of anaerobic digestion has been well known for the past 100years, researchers have been recently reinvestigating the process for use as a potentialfuel source.9,10 Specifically, the focus is on hastening the natural process of biomassconversion to a gaseous fuel referred to as biogas. Since 1977, universities andresearch institutes have been conducting experiments to ascertain the optimal con-ditions (feedstock, temperature, pressure, etc.) for the most efficient operations. Mostof the biomass feedstocks studied have produced a biogas rich in methane. Thismedium-to-high-BTU gas can, in some instances, be upgraded to a substitute naturalgas (SNG).34 However, depending on the feedstock, nonnegligible amounts of sulfurare also produced.35 Table 12.2 contains a listing of different feedstocks, initial sulfurcontent, final sulfur percentage, and the projected power generation for studiesconducted in Germany.
The first anaerobic digester studies, conducted at Penn State University, utilizedcow manure for biogas production. During the anaerobic process, organically boundmaterials are mineralized to methane and carbon dioxide. The Penn State Universitydigester was operated for a total of 450 d to treat 1200 tons of manure. The digester
FIGURE 12.8 Typical equilibrium compositions for the Hydrocarb process. (From Borg-wardt, R.H. et al., Biomass and Fossil Fuel to Methanol and Carbon via the Hydrocarb Process:A Potential New Source of Transportation and Utility Fuels, presented at: Energy fromBiomass and Wastes XV, IGT, Washington, D.C., 1991.)
MethanolConverter
PyrolysisReactor
G asifier
BiomassNatural
Gas
4.65% CO1.54% CO39.76% CH12.6% H O41.43% H
2
24
3.89% CO 0.27% CO18.76% CH 0.06% H O76.11% H 0.91% CH OH
2
2
4
12.09% CO 0.194% CO12.83% CH 2.17% H O72.12% H
224
2
2
2
3
Purge
Char
Char Methanol
© 2007 by Taylor & Francis Group, LLC

390 Handbook of Alternative Fuel Technology
was started up using activated municipal sludge, then fed twice a day with manure.Digester retention times were varied to determine the optimal biogas production, asshown in Table 12.3.
The biogas produced was approximately 60% methane, 32–34% carbon dioxide,6–8% nitrogen, and trace amounts of hydrogen sulfide.36 Based on a methane contentof 60%, the biogas had a total energy generation of 44 kW. This preliminary successled to the investigation of other feedstocks for anaerobic digesters.
Ghosh and Klass conducted a series of anaerobic digestion experiments using amixed biomass waste feedstock.37 The mixed waste contained various ratios ofEichhornia crassipies (water hyacinth), Cynodon dactylon (Bermuda grass), sewagesludge, and MSW. All the experiments were conducted in cylindrical Plexiglassdigesters. The optimal “blend” was determined to be 32.3:32.3:32.3:3.1 of hya-cinth:grass:sludge:MSW. Once the optimal waste blend had been determined, studieswere conducted that varied the temperature and pH of the digester. Their final resultsare given in Table 12.4.
At first glance, the results indicate that varying the temperature and pH had verylittle effect on the amount of methane produced. However, the thermophilic digesterhad a higher pH and approximately 3 times the loading rate of its mesophiliccounterpart. This indicates that additional experiments are required to determine the
TABLE 12.2Comparison of Different Biogas Feedstocks
FeedstockPower Generation
(MWe/ton of biomass)Original Sulfur Content
(mg/m3)Final SulfurPercentage
Liquid and solid manure 0.2–0.5 300–500 0.5Organic waste 0.5–2.0 100–300 0.3Wood chips 5–50 300–1000 0.3Sewage sludge 100–500 300–500 0.6
Source: From Ellegard, A. and Egenéus, H., Energy Policy, 21(5): 625–622, 1993; Wendt, H. et al.,Conversion of Biomass-Obtained Gases in Solid Oxide Fuel Cells, Luxembourg Report No. 13564, 1991.
TABLE 12.3Capacity Tests for 100 m3 Digester
Manure Inputkg/d
Retention Timed
Total Biogasm3/d
Production (m3/m3)digester/d
346 35 67 0.67554 21 129 1.29
1030 11 202 2.02
Source: From Bartlett, H.D., Biomass as a Nonfossil Fuel Source I, American ChemicalSociety, Washington, D.C., 1981.
© 2007 by Taylor & Francis Group, LLC

Energy from Biomass Conversion 391
“optimal” operating conditions. Regardless of the operating conditions used, theanaerobic digestion of biomass is a promising alternative for supplementing theworld's energy needs.
REFERENCES
1. Sampson, R.N. et al., Biomass management and energy, Water Air Soil Pollut.,70(1–4): 139–159, 1993.
2. Trebbi, G., Power-production options from biomass: The vision of a southern Euor-pean utility, Bioresour. Technol., 46: 23–29, 1993.
3. MacCleery, D.W., American Forests: A History of Resiliency and Recovery, U.S.Department of Agriculture Forest Service, 1993, p. 59.
4. Reese, R.A. et al., Herbaceous biomass feedstock production, Energy Policy, 21(7):726–734, 1993.
5. Sampson, R.N., Forest management and biomass in the U.S., Water Air Soil Pollut.,70(1–4): 519–532, 1993.
6. Nurmi, J., Heating values of the above ground biomass of small-sized trees, Acta For.Fenn., 236: 2–30, 1993.
7. Sipilä, K., New power-production technologies: various options for biomass andcogeneration, Bioresour. Technol., 46: 5–12, 1993.
8. Ramsay, W., Biomass energy in developing countries, Energy Policy, 326–329, August1985.
9. Elliot, P., Biomass-energy overview in the context of Brazilian biomass powereddemonstration, Bioresour. Technol., 46: 13–22, 1993.
10. Ellegard, A. and Egenéus, H., Urban energy: exposure to biomass fuel pollution inLusaka, Energy Policy, 21(5): 625–622, 1993.
11. Bylinsky, G., Biomass: The Self-Replacing Energy Source, Fortune, 100(6): 78–81,1979.
12. Lapidus, A. et al., Synthesis of liquid fuels from products of biomass gasification,Fuel, 73(4): 583–589, 1994.
TABLE 12.4Mesophilic (35°C) and Thermophilic (55°C) Digestion of Mixed Biomass Waste
Mesophilic(pH not measured)
Digester Feed(pH = 8.0–8.4)
Thermophilic(pH = 9.0)
Digester Feed(pH = 10.0)
Operating conditionsLoading (lb/ft3 d) 0.1 0.1 0.4 0.43Detention time (d) 12 12 6.0 5.5
Gas production rate(vol/vol/d)
0.61 0.67 2.85 2.91
CH4 content (mol%) 59.5 58.1 56.4 56.0CH4 yield (scf/lb) 4.10 3.92 4.00 3.68% CH4 collected 46.1 44.1 45.0 41.4
Source: From Ghosh, S. and Klass, D.L., Biomass as a Nonfossil Fuel Source I, American ChemicalSociety, Washington, D.C., 1981.
© 2007 by Taylor & Francis Group, LLC

392 Handbook of Alternative Fuel Technology
13. Randolph, J.C. and Fowler, G.L., Energy policies and biomass resources in the Asia-Pacific region, Public Adm. Rev., 43(6): 528–536, 1983.
14. Wright, L.L. and Hughes, E.E., U.S. carbon offset potential using biomass energysystems, Water Air Soil Pollut., 70(1–4): 483–497, 1993.
15. Rahmer, B.A., Alternative Energy: towards Fuel Farming, Petroleum Economist,1978, pp. 59–60.
16. Scurlock, J.M.O., Hall, D.O., House, J.I., and Howes, R., Utilizing biomass crops as anenergy source: A European perspective, Water Air Soil Pollut., 70(1–4): 499–518, 1993.
17. Pastor, J. and Kristoferson, L., Bioenergy and the Environment — the Challenge,Westview Press, Boulder, CO, 1990.
18. Bain, R.L., Electricity from biomass in the United States: status and future direction,Bioresour. Technol., 46(1–2): 86–93, 1993.
19. Freeman, H.M., Ed., Standard Handbook of Hazardous Waste Treatment and Dis-posal, McGraw-Hill, New York, 1989.
20. Benson, W.R., Biomass potential from agricultural production, Proceedings: Biomass— A Cash Crop for the Future?, Midwest Research Institute, Kansas City, MO, 1977.
21. Raman, K.P., Walawender, W.P., Shimizu, Y., and Fan, L.T., Gasification of CornStover in a Fluidized Bed, presented at Bio-Energy 80, Atlanta, GA, April 1980.
22. Bodland, B. and Bergman, J., Bioenergy in Sweden: potential, technology, and appli-cation, Bioresour. Technol., 46(1–2): 31–36, 1993.
23. Hayes, R.D., Overview of thermochemical conversion of biomass in Canada, inBiomass Pyrolysis Liquids: Upgrading and Utilization, Elsevier Science, New York,1991.
24. Farrell, K., Fighting OPEC with Biomass: The European Counteroffensive, Europe,May–June, 1981, pp. 18–20.
25. Bergeron, P.W. and Hinman, N.D., Fuel Ethanol Usage and Environmental CarbonDioxide Production, in Energy From Biomass and Wastes XIV, Klass, D.L., Ed.,Institute of Gas Technology, Chicago, IL, 14, 1991, pp. 153–167.
26. Borgwardt, R.H., Steinberg, M., and Grohse, E.W., Biomass and Fossil Fuel toMethanol and Carbon Via the Hydrocarb Proces: A Potential New Source of Trans-portation and Utility Fuels, in Energy From Biomass and Wastes XIV, Klass, D.L.,Ed., Institute of Gas Technology, Chicago, IL, 15, 1991, pp. 823–853.
27. Solantausta, Y. et al., Wood-pyrolysis oil as fuel in a diesel-power plant, Bioresour.Technol., 46: 177–188, 1993.
28. Rick, F. and Vix, U., Product standards for pyrolysis products for use as a fuel, inBiomass Pyrolysis Liquids Upgrading and Utilization, Bridgwater, A.V. and Grassi,G., Eds., Elsevier, London, 1991, pp. 177–218.
29. Skelley, W.W., Chrostowki, J.W., and Davis, R.S., The Energy Resources FluidizedBed Process for Converting Biomass to Electricity, symposium on Energy fromBiomass and Wastes VI, January 25–29, 1982, pp. 665–705.
30. Brown, R.F. et al., Economic Evaluation of the Coproduction of Methanol andElectricity with Texaco Gasification-Combined-Cycle Systems, EPRI AP-2212, 1983.
31. Ismail, A. and Quick, R., Advances in Biomass Fuel Technologies, presented at:Energy from Biomass and Wastes XV, IGT, Washington, D.C., 1991.
32. Keuster, J.L., Liquid hydrocarbons fuels from biomass, in Biomass as a NonfossilFuel Source, American Chemical Society, Washington, D.C., 1991, pp. 163–184.
33. Borgwardt, R.H., Steinberg, M., Grohse, E.W., and Tung, Y., Biomass and Fossil Fuelto Methanol and Carbon via the Hydrocarb Process: A Potential New Source ofTransportation and Utility Fuels, presented at: Energy from Biomass and Wastes XV,IGT, Washington, D.C., 1991.
© 2007 by Taylor & Francis Group, LLC
Energy from Biomass Conversion 393
34. Schaefer, G.P., Industrial development of biomass energy sources, in Biomass as aNonfossil Fuel Source -I, Symposium by Division of Petroleum Chemistry, AmericanChemical Society, Washington, D.C., 1981, pp. 1–17.
35. Wendt, H., Plzak, V., and Rohland, B., Conversion of Biomass-Obtained Gases inSolid Oxide Fuel Cells, Luxembourg Report No. 13564, 1991.
36. Bartlett, H.D., Energy production of a 100 m3 biogas generator, in Biomass as aNonfossil Fuel Source -I, Symposium by Division of Petroleum Chemistry, AmericanChemical Society, Washington, D.C., 1981, pp. 373–378.
37. Ghosh, S. and Klass, D.L., Advanced digestion process development for methaneproduction from biomass — waste blends, in Biomass as a Nonfossil Fuel Source -I,Symposium by Division of Petroleum Chemistry, American Chemical Society, Wash-ington, D.C., 1981, pp. 251–278.
38. Merriam and Webster On-line Dictionary, 2006.39. Ragland, K.W., Ostlie, L.D., and Berg, D.A., WTE Biomass Power Plant in Central
Wisconsin, Grant No. 89029, Final Report submitted to Wisconsin Energy Bureau,November 2000.
40. Energy Information Administration, Renewable Energy Trends 2004 Edition, U.S.Department of Energy, release date: August 2005.
41. Babu, S., Biomass Gasification for Hydrogen Production — Process Description andResearch Needs, www.ieahia.org/pdfs/gasification_report_sureshbabu.pdf, accessedApril 2006.
42. van der Drift, A. and Boerrigter, H., Synthesis Gas from Biomass for Fuels andChemicals, Report of Workshop on Hydrogen and Synthesis Gas for Fuels andChemicals, Organized IEA Bioenergy Task 33, SYNBIOS Conference, Stockholm,Sweden, May 2005, published January 2006, available through http://www.gastech-nology.org/webroot/downloads/en/IEA/syngasFromBiomassvanderDrift.pdf.
43. FERCO homepage, The Vermont Gasification Project, http://www.fercoenter-prises.com/proj-vgp.htm, accessed on April 23, 2006.
44. Claussen, M. and Vodegel, S. The CUTEC concept to produce BtL-fuels for advancedpower trains, a paper presented at International Freiberg Conference on IGCC andXtL TECHNOLOGIES, Freiberg, Germany, June 16–18, 2005.
45. Wolters, C., Canaar, M., and Kiel, J., Co-gasification of Biomass in 250 MWe IGCCPlant ‘Willem-Alexander-Centrale’, a paper presented at Biomass Basification Work-shop at Rome, Italy, May 10, 2004, available through http://www.gastechnol-ogy.org/webroot/downloads/en/IEA/IEARomeWSKiel.pdf.
46. Dinjus, E., German Developments in Biomass Gasification, a paper presented at IEARenewable Working Party Bioenergy Task 33: Thermal Gasification, Innsbruck, Austria,September 26, 2005, also available through http://www.gastechnology.org/webroot/downloads/en/IEA/Fall05AustriaTaskMeeting/GermanyGasificationActivities.pdf.
© 2007 by Taylor & Francis Group, LLC

395
13 Energy Generationfrom Waste Sources
Sunggyu Lee
CONTENTS
13.1 Introduction .................................................................................................. 39513.2 Energy Recovery from MSW ...................................................................... 397
13.2.1 Introduction ...................................................................................... 39713.2.2 Gasification of MSW ....................................................................... 39713.2.3 Anaerobic Digestion of MSW......................................................... 39813.2.4 Pyrolysis of MSW............................................................................ 398
13.3 Energy Generation from Polymeric Wastes ................................................ 40213.3.1 Introduction ...................................................................................... 40213.3.2 Mechanical Recycling...................................................................... 40313.3.3 Waste-To-Energy Processes ............................................................. 404
13.3.3.1 Pyrolysis............................................................................ 40413.3.3.2 Thermal Cracking ............................................................. 40513.3.3.3 Catalytic Cracking ............................................................ 40613.3.3.4 Degradative Extrusion ...................................................... 408
13.4 Fuel Production from Spent Tires ............................................................... 40913.4.1 Introduction ...................................................................................... 40913.4.2 Pyrolysis of Spent Tires................................................................... 409
13.4.2.1 Occidental Flash Pyrolysis ............................................... 41013.4.2.2 Fluidized Thermal Cracking............................................. 41113.4.2.3 Carbonization.................................................................... 411
13.4.3 Cocombustion of Scrap Tires and TDFs ......................................... 41213.4.4 IFP Spent Tire Depolymerization Process ...................................... 41313.4.5 Dry Distillation of Spent Tires ........................................................ 41413.4.6 Goodyear’s Devulcanization Process............................................... 41413.4.7 Hydrogenation of Spent Tire Rubber .............................................. 415
References.............................................................................................................. 416
13.1 INTRODUCTION
Solid wastes are by definition, any wastes other than liquids or gases that are nolonger deemed valuable, and therefore discarded.1 Such wastes typically originate
© 2007 by Taylor & Francis Group, LLC

396 Handbook of Alternative Fuel Technology
from either the residential community (i.e., municipal solid waste or MSW) or com-mercial and light-industrial communities. Wastes generated from manufacturing activ-ities of heavy-industrial and chemical industries are typically classified as hazardouswastes. As regulations continue to get stricter with decreasing land availability, alter-native uses for the waste must be found in order to recover the residual heating valuesas well as to alleviate landfill-overburdening problems. As indicated from the heatingvalues listed in Table 13.1, the generation of waste-derived fuels appears to be verypromising from both the environmental and energy points of view.2,3
In a landfill, the biodegradable components of the MSW decompose over timeand emit methane. Methane is a very potent greenhouse gas that is known to be23 times more potent than carbon dioxide. Therefore, the biodegradable compo-nents in MSW, such as food and paper wastes that end up in landfills, must bereduced in a good waste management plan. Many nations have implementedregulations and specific efforts to significantly reduce this level. A good exampleis the European Union’s (EU’s) landfill directive of 1999, which targets reducingthe amount of biodegradable materials going to landfills by 65% of the 1995 levelby 2016. From this perspective, energy generation from MSW is regarded as oneof the very few options to efficiently cope with the greenhouse gas emissionproblem from landfills.
Although refuse-derived fuel (RDF) is attractive from the standpoints of resourceconservation as well as waste reduction, there are serious concerns that waste treat-ment for energy generation may cause new environmental problems. Most of theprocessing difficulties arise from the heterogeneous and nonuniform nature of thewaste feed itself, which in turn generates a very widely varying spectrum of treatedintermediates and by-products.
This chapter will address the development of alternative energy sources fromvarious solid waste classifications, except biological and agricultural wastes, whichare covered separately in Chapter 12.
TABLE 13.1Comparison of Heating Values of Various Waste-Derived Fuels
Fuel Source Btu/lb
Yard wastes 3,000Municipal solid waste 6,000Combustible paper products 8,500Textiles and plastics 8,000Bituminous coal (average) 11,300Anthracite coal (average) 12,000Spent tires 13,000–15,000Crude oil (average) 17,000Natural gas (425 ft3) 13,500
© 2007 by Taylor & Francis Group, LLC

Energy Generation from Waste Sources 397
13.2 ENERGY RECOVERY FROM MSW
13.2.1 INTRODUCTION
The recovery of energy from MSW has been practiced for centuries. The burning,or incineration, of wastes such as wooden planks and miscellaneous householdproducts was first used to produce warmth. This idea has become the basis for energygeneration from today's MSW. For instance, each year Sweden burns 1.5 milliontons of MSW to meet approximately 15% of its district heating requirements.4 Theheating value of this MSW incineration is approximately one-third the heating valueof coal combustion. Besides incineration, “gaseous fuels” can also be obtained byanaerobic digestion in conjunction with landfill gas recovery. Anaerobic digestionis discussed in detail in Chapter 12.
13.2.2 GASIFICATION OF MSW
One method of recovering usable energy from MSW is gasification. The U.S. EPAis currently investigating the use of the Texaco gasification process for generating amedium-Btu gas from MSW.5 A simplified Texaco process (Figure 13.1) gasifies theMSW under high pressure by the injection of air and steam with concurrent gas/solidflow. After separation of the noncombustible waste, water or oil is added to thecombustible MSW to form a pumpable slurry. This is then pumped under pressureto the gasifier. In the gasifier, the slurry is reacted with air at high temperatures. Theresultant gaseous product is then sent to a scrubbing system to remove any pollutantsand impurities.
The Texaco gasification process was originally developed for gasification of coal(refer to Chapter 2). Recently it has been modified to treat soils contaminated withhydrocarbons, as well as to recover usable energy from MSW and polymeric wastes.
FIGURE 13.1 Simplified Texaco gasification process for the conversion of MSW to amedium-Btu gas.
Vent FlueGas
MSWThickener
MSW Water
Heaters
Air &Fuel
Gasifier
CondensateAsh &Water
Settler
Coolant
Steam
Cyclone
MediumBTU Ga
Scrubber
© 2007 by Taylor & Francis Group, LLC

398 Handbook of Alternative Fuel Technology
Although the process has demonstrated 85% remediation efficiency for contaminatedsoils, it is still in the preliminary experimental stages for the MSW-to-energy appli-cation.5 A demonstration of the MSW-to-energy process has been scheduled for July1995 at Texaco's Montebello Research Laboratory in South El Monte, CA.5
13.2.3 ANAEROBIC DIGESTION OF MSW
Anaerobic digestion of solid wastes is a process very similar to that used at waste-water treatment facilities and also to that used in biogas production. Anaerobicbacteria, in the absence of oxygen, are used to break down the organic matter of thewaste. Frequently, the MSW is mixed with sewage sludge from the treatment plantto enhance the efficiency of the digestion. During the “conversion,” a mixture ofmethane and carbon dioxide gases is produced. The typical ratio of the gas mixtureis 70% methane and 30% carbon dioxide. Even without further treatment, the offgashas a heating value of 650 to 750 Btu/ft3. It should be noted that the principalingredients of the offgas are major greenhouse gases. Therefore, its efficient captureand recovery is very important from the environmental standpoint.
With rising energy costs and diminishing landfill space, the use of anaerobicdigestion to generate a potential fuel source from MSW is an attractive alternative.A relatively new technology of landfill gas recovery has been developed to aid inthe collection of gases generated from the anaerobic digestion of solid wastes. In1980, 23 landfills were used as a source of methane production.6 However, the vastmajority of current research focuses on the generation of liquid fuels instead of thegaseous fuels from anaerobic digestion owing to the high capital cost associatedwith methane collection.
Production of liquid fuels has several advantages. First, low-sulfur, low-ash fuelscan be made for commercial use.7 Second, liquid fuels are traditionally much easierto store, handle, and transport than their gaseous counterparts. Finally, the productionof the fuel aids in the battle against pollution by municipal wastes.8,9 By utilizingthe waste as an alternative source to generate fuel, less MSW will have to be disposedof in landfills. Although this statement holds true for the production of gaseous fuel,the generation of liquid fuels utilizes more MSW. In fact, processes have beendeveloped that are capable of producing over a barrel of pyrolytic fuel oil from aton of MSW.7
13.2.4 PYROLYSIS OF MSW
Figure 13.2 contains typical material distribution data for MSW generation in theU.S. in the early 1990s. Figure 13.3 shows more recent data for the early 2000s onMSW distribution in the U.S. by relative percentages. Because raw MSW containsboth noncombustible and combustible components, the first step in producing a liquidfuel is to concentrate the combustible components. This is usually achieved with arotating screen to remove noncombustible materials such as glass and dirt. An airclassifier is used to remove the “light-ends” such as plastics, wood, and small metals.Heavier components, ceramics, heavy metals, and aluminum are routed for disposalin the landfill. By removing these noncombustible materials, the heating value of
© 2007 by Taylor & Francis Group, LLC

Energy Generation from Waste Sources 399
the raw MSW becomes approximately 7000 Btu/lb on a wet basis. The combustiblecomponents are sent to a shredder to reduce their size, and then to a pyrolysis unitto generate the fuel by pyrolysis reactions.
In the past, pyrolysis of MSW was mainly used to generate a gaseous fuel.However, recent research has found that pyrolyzing a cellulose-based waste at 116ºC
FIGURE 13.2 Material distribution of MSW collected in the U.S. by weight (tons) in theearly 1990s.
FIGURE 13.3 Breakdown of material distribution of MSW collected in the U.S. in 2002.
31.6 million
15.3 million
12.5 million
14.4 million
20.8 million
13.2 million
71..8 million
Paper, 40.0%Food Wastes, 7.4%Other, 11.1%Plastics, 8.5%Glass, 7.0%Metals, 8.5%Yard Wastes, 17.6%
Cardboard8%
Food8%
Plastics9%
FerrousMetal11%
YardWaste22%
Paper 28%
Leather1%
Rubber1%
Textiles1%
Wood3%
Glass8%
© 2007 by Taylor & Francis Group, LLC

400 Handbook of Alternative Fuel Technology
and atmospheric pressure will generate a liquid fuel. In 1988, approximately 80%of the 180 million tons of waste generated in the U.S. had a cellulose base.10 Theestimated percentages of cellulosic components of MSW did not change much inthe 1990s and 2000s, as shown in Figure 13.2 and Figure 13.3. Pober et al.7 wasable to utilize this particular type of waste to obtain a fuel that contained 77% ofthe heating value of typical petroleum fuels. The cellulosic components of the refusecomprise papers, newsprints, packing materials, wood clippings, and yard wastes.11
A typical pyrolytic reaction for the cellulose component of MSW may be written as:
(1)
where C6H8O represents a “family” of liquid products. The exact composition ofC6H8O is dependent on feedstock composition and reaction temperature. Researchconducted by the U.S. Bureau of Mines has further demonstrated the successfulpyrolysis of 1 ton of MSW at temperatures ranging from 500 to 900°C.12 At theseconditions, the end product composition is similar to that given in Table 13.2.
The light oil primarily comprises benzene, whereas the liquor contains dissolvedorganics in water. The gaseous product resembles that of a typical town gas. Theheating value of the gas is 447 Btu/ft3, which translates into a heat recovery of 82%.13
Town gas is also known as manufactured gas, which typically contains hydrogen,carbon monoxide, methane, and volatile hydrocarbons. Prior to natural gas suppliesand transmission in the U.S., town gas played a major role in providing gaseous fuelfor lighting and heating in both residential and industrial sectors.
When the pyrolysis temperature is higher than 350°C, small quantities of poly-ethylene chips can be added to the cellulose feedstock. Operating temperaturesranging from 100 to 400°C decrease the amount of gaseous product and increasethe formation of the liquid product (i.e., C6H8O family).
In addition to the liquid fuel or oil, pyrolysis generates a medium-BTU gasstream that, after purification, can be recycled as a supplemental fuel within theplant. Process water and char are also generated. The process water may have to betreated before discharge or can be used in the plant as heat exchanger water. All thepyrolysis products have the potential of being useful fuels or intermediates for
TABLE 13.2Final Product Composition from the Pyrolysis of 1 Ton of MSW
Component Mass or Volume
Char 154–424 lbTar 0.5–6 galLight oil 1–4 galLiquor 97–133 galGas 7.38–18 scf
Source: From Bell, P.R. and Varjavandi, J.J., Waste Management, Control, Recoveryand Reuse, Ann Arbor Science, MI, 1974.
C H O H O CO CO CH H C C H O8 10 5 2 2 4 2 6 88 2 2 7∆ → + + + + + +
© 2007 by Taylor & Francis Group, LLC

Energy Generation from Waste Sources 401
producing other valuable products for use in the petrochemical industry. A simplifiedschematic of the pyrolysis process such as the one developed by Pober et al. andthe full-scale plant in Ames, IA, is shown in Figure 13.4. A schematic of the pilotplant used to demonstrate the pyrolysis of MSW, which generated the results pre-sented in Table 13.2, is shown in Figure 13.5.12
An example of a successful commercial-scale MSW pyrolysis plants in full oper-ation is the Müllpyrolyseanlage (MPA) MSW pyrolysis plant, which is located outsideof the City of Burgau, Germany.65 The plant is on a 3-acre lot adjacent to a closedlandfill, surrounded by farmlands. The plant was commissioned in mid-1984 and iscurrently in full operation, serving 120,000 residents and processing about 38,580tons/year of MSW, which include both residential and industrial wastes as well assewage sludge. The process utilizes a thermal pyrolysis process designed by WasteGenU.K. Ltd. The process is typically operated at 400–900°C in the complete absence ofoxygen. The produced syngas mainly contains hydrogen, carbon monoxide, carbondioxide, and methane, and the air emission control system removes most of the airpollutants. The syngas is used in boilers, gas turbines, and internal combustion engines
FIGURE 13.4 A simplified process schematic for the pyrolysis of MSW.
FIGURE 13.5 A solid waste pyrolysis system. (From Bell, P.R. and Varjavandi, J.J., WasteManagement, Control, Recovery and Reuse, Ann Arbor Science, Ann Arbor, MI, 1974.)
PyrolysisRemoval of
Non-Combustibles
Raw MSW
MetalsCeramicsGlass
Char
Oil
Water
Gas(to purifier& recycle)
Cyclone
Condenser
Pyrolysis Tube
FeedConveyor
FeedHopper
Tars
Oils &Solubles
GasGas
PackedTower
ExhaustGases
ProductGas
SolidsExtractor
© 2007 by Taylor & Francis Group, LLC

402 Handbook of Alternative Fuel Technology
to generate electricity, or it is used for the manufacture of chemicals. The solid charmaterial is used as an absorbent and the inorganic ash is for disposal. The process doesnot require any special presegregation or pretreatment of MSW feedstock. However,MSW must be shredded to maximum size of 12 in. The average heating value of MSWfeedstock is about 3660 Btu/lb, ranging between 2150 Btu/lb and about 6000 Btu/lb.A schematic of the MPA MSW Pyrolysis Process is shown in Figure 13.665
Although there are a number of MSW-derived fuel systems in full operation orbeing started up throughout the world, there are still developmental issues in regardto process design and engineering, pollution control and monitoring, equipmentdesign and selection, and application-related information.14 The cost–benefit analysisalong with the environmental impact analysis must be carefully conducted for anychosen process and site.
13.3 ENERGY GENERATION FROM POLYMERIC WASTES
13.3.1 INTRODUCTION
A significantly important component of MSW is polymeric materials. Althoughpolymer waste only accounts for 8.5% by mass of the total MSW disposed of in theU.S., plastics represent over 28% by volume.15 Furthermore, most plastic wastes arenot biodegradable and constitute a long-term waste management problem. The highvolume-to-mass ratio and the inertness to biological reactions make plastics andpolymeric wastes the most important target for recycling, not for disposal. Polymericwastes range from packaging materials used in the food industry to various parts inautomobiles to high-density polyethylene (HDPE) containers such as pop bottles,laundry detergent bottles, milk jugs, etc. In 1993, over 50% of all the food packaged
FIGURE 13.6 A schematic of the Müllpyrolyseanlage (MPA) MSW pyrolysis process.
PyrolysisKiln
Natural Gas
Air
Shredded MSW
Pyrolysis Gas
Pyrolysis Gas
Cyclone CombustionChamber
Water
Water
Indirect Cooler Pyrolysis Coke
Inerts, Metals
Steam Generator& WasteHeat Boiler
FabricFilter
Stack
Water Tank
Spray Dryer
TurbineElectricityGeneration
Condenser
© 2007 by Taylor & Francis Group, LLC

Energy Generation from Waste Sources 403
in Europe for distribution utilized plastics.4 It is estimated that over 65% of the foodpackaging in the U.S. is from plastics. As of 1978, the Ford Motor Companyestimated that the average junked car contained 80 kg of plastic and nontire rubber.16
The Ford Motor Co. also stated that the number was expected to rise at the rate of4% per year. Metallic parts were replaced by plastic ones to reduce the vehicleweight as well as the component cost. About 7.5% by weight of an automobilecomes from plastic components in 1998, which is a substantial increase from 4.6%in 1977.66 The same trend is also observed in the computer and electronics industry,which depends very heavily on plastics for their fabrication materials. Moreover, theexpected usable life of electronic or computer components is typically quite short,thus generating an enormous amount of scrap polymeric wastes.
Over the next few decades, the use of polymeric materials will continue toincrease, owing to their versatility, functional values, and low energy requirementsfor production. Current technology enables over 200 million kg of plastic and rubbermaterials (excluding tire rubber) to be recovered from shredded automobiles.16 Theimpetus to reuse polymeric wastes instead of disposing of them in landfills isprimarily owing to the inability of polymers to rapidly degrade once dumped orburied at landfills.
13.3.2 MECHANICAL RECYCLING
The manufacture of bottle containers from HDPE, is perhaps the largest use ofpolymeric materials. Some of the more common items manufactured from HDPEare soft drink bottles, juice containers, milk jugs, laundry detergent bottles, springwater bottles, and motor oil cans. Austria introduced a regulation in October 1993stating that over 90% of all HDPE containers must be recycled instead of placed inlandfills.17 Germany has been the most aggressive in its demand for plastics recycling.In 1993, over 12% of all German municipalities were active in collecting 12,000tons of polymeric containers.18,19 Officials have projected that this number willincrease to 80,000 tons of containers from 62% of the municipalities by 1996, andnearly 100% by the early 2000s.
Most other countries have also jumped on the recycling bandwagon. The Neth-erlands plans to recycle 35% of all plastics and to recover energy by incineratinganother 45%.20 Italy currently recycles over 40% of its containers. Several stateswithin the U.S. have also enforced mandatory recycling of HDPE. In order to ensureconsumer involvement, states such as Michigan impose a deposit “tax” on all theirHDPE bottles. The consumer is able to recover the deposit only if the item is returnedto designated stores or distributors. Other states have developed a recycling “lottery.”1
Sanitary officials randomly pick an area and check for proper recycling of domesticwaste. The homeowners complying with all recycling guidelines receive $200.
There are a great many different types of plastics. The American Society ofPlastics Industry (SPI) has developed a standard code system to help consumersidentify and sort the main types of plastics. There are seven designated types andeach type is represented by a number: “1” for polyethylene terephthalate (PET), “2”for high-density polyethylene (HDPE), “3” for polyvinyl chloride (PVC), “4” for
© 2007 by Taylor & Francis Group, LLC

404 Handbook of Alternative Fuel Technology
low-density polyethylene (LDPE), “5” for polypropylene (PP), “6” for polystyrene(PS), and “7” for all others, such as melamine and polycarbonate (PC).
However, recycling alone is not the solution to polymeric waste. Researchconducted at DOW Chemical Co. has shown that more than 52% of all HDPE bottleswould have to be recovered before mechanical recycling could save more energythan employing a waste-to-energy process such as incineration.21 For this reason,scientists are striving to develop processes to generate fuel from polymeric wastes.
13.3.3 WASTE-TO-ENERGY PROCESSES
There are a number of technologies available for the generation of fuel energy, eitherin gaseous or liquid form, from polymeric waste. These technologies include pyroly-sis, thermal cracking, catalytic cracking, and degradative extrusion followed bypartial oxidation. Brief descriptions of these technologies follow. However, it isimportant to note that these are not the only processes available. As the technologyadvances, so do the processes used for the recovery of energy from wastes.
13.3.3.1 Pyrolysis
Pyrolysis of polymers is, by definition, the thermal decomposition of plastic wasteback into oil or gas using heating processes in oxygen-starved or oxygen-deprivedenvironments. This is the process typically used for waste-to energy generationbecause it has several advantages. Besides being a proven technology, pyrolysis hasrelatively good adaptability to fluctuations in the quality of the feedstock, is simpleto operate, and is also economical. In addition, refineries, which will utilize thechemically recycled polymers, already have pyrolysis units in operation. SPI’s Coun-cil for Solid Waste Solutions originally comprised three of the leading petroleumcompanies, Amoco, Mobil, and Chevron, even though all these companies wentthrough corporate mergers with other leading companies. The council investigatedthe use of oil refineries equipped with pyrolysis units for the conversion of mixedplastics into hydrocarbons.22 Ideally, these hydrocarbons would be identical to thosesplit from petroleum oils.
Research conducted by Chambers et al.16 implements the pyrolysis of polymericwastes in the presence of molten salts. The molten salts are used to enhance the productionof a particular desired oil–gas mix based on their excellent heat transfer properties. Forinstance, when a mixture of LiCl-KCl and 10% CuCl was used as the pyrolysis mediumat 520°C, over 35% of the shredded polymer was converted to fuel oil.16
Molten salts have also been successful at slightly lower operating temperatures.When the salts are used during a standard pyrolysis operation at 420°C, the gaseousfraction is minimized. This enables higher liquid and solid fractions to be recovered.Although the nature of chemical reactions between the molten salts and polymericwaste is not yet completely understood, it does appear that production of a particularproduct mix is optimized by the presence of the salts. Typically, the recoveredfractions consist of light oils, aromatics, paraffin waxes, and monomers.23 Whenpyrolysis utilizes molten salts, care must be taken to decrease the amount of corrosionand contamination of the pyrolysis chamber due to the salts.
© 2007 by Taylor & Francis Group, LLC

Energy Generation from Waste Sources 405
In 1980, researchers at Germany’s Federal Ministry of Research and Technology(FMRT) demonstrated the success of pyrolyzing polymeric wastes in a 10 kg/h pilotplant. Figure 13.7 shows a simplified flow diagram of the laboratory test plant used inthe development of the full-scale pilot plant. The main body of the FMRT pilot plantis a fluidized bed reactor with a space–time ratio of 0.4 kg/h/l. Preliminary experimentswith the pilot plant enabled 40 to 60% of polymeric feed to be recovered as a usableliquid product.24 The major components of this liquid product were benzene, toluene,styrene, and C3-C4 hydrocarbons. Table 13.3 presents the data for all of the end productsfor two pyrolysis experiments. These experiments utilized waste polyethylene and spentsyringes as the feed at pyrolysis temperatures of 810°C and 720°C, respectively.
As of 1981, the pilot plant had accumulated over 600 h of successful operation.The researchers at FMRT have also demonstrated that the plant was self-sufficientin regard to energy needs. In other words, FMRT's facility was able to utilize onehalf of the pyrolysis gas produced.24
13.3.3.2 Thermal Cracking
Thermal cracking is similar to pyrolysis in that it is a high-temperature process.When polymeric wastes are cracked in an oxygen-free environment at temperaturesabove 480°C, a mixture of gas-liquid hydrocarbon is produced. At higher tempera-tures (650 to 760°C), more of the gaseous product is generated. Conversely, at lowertemperatures, up to 85% of the product is a liquid hydrocarbon.25 Both the gas andliquid form of the converted mixed-polymeric waste can be utilized as a feed streamby petroleum facilities.
FIGURE 13.7 A simplified flow diagram of the FMRT laboratory test plant — 1: feed hopper,2: downpipe and cooling jacket, 3: fluidized bed reactor, 4: heater, 5: electrostatic precipitator,6: intensive cooler, 7: cyclone, 8: gas sampler, 9: compressor. (From Kaminsky, W., Resour.Recovery Conserv., 5: 205–216, 1980.)
1
2
34
5 66
777
N2
O29
8
© 2007 by Taylor & Francis Group, LLC

406 Handbook of Alternative Fuel Technology
13.3.3.3 Catalytic Cracking
Scientifically speaking, catalytic cracking is an extrapolation of thermal cracking.The same operating principles apply; the primary difference is the addition of acatalyst to enhance the cracking process. A typical catalytic cracker consists of twolarge reactor vessels, one to react the feed over the hot catalyst and the other toregenerate the spent catalyst by burning off carbon (fouled carbon on the catalyticsurface) with air. Using two catalytic reactors enables the process to be run on acontinuous basis. Figure 13.8 is a simplified schematic of Mobil Oil’s process forthe generation of gasoline from polymeric wastes via catalytic cracking.26 Becausethe theory behind catalytic cracking is not new, the main focus of research is todetermine the optimum catalyst for the cracking of the waste polymers.
TABLE 13.3Composition of Pyrolysis Products from Preliminary Pilot Plant Studies
Polyethylene Spent SyringesIdentified Products (wt%) (wt%)
Hydrogen 1.2 0.49Methane 18.8 18.82Ethane 6.2 7.75Ethylene 17.9 13.73Propane 0.2 0.08Propene 7.2 10.67Butene 1.0 3.32Butadiene 1.5 1.39Cyclopentadiene 0.8 2.79Other aliphatics 1.3 3.46Benzene 21.6 13.62Toluene 3.8 3.84Xylene, ethylbenzene 0.2 TraceStyrene 0.4 0.43Indane, indene 0.6 0.46Naphthalene 3.7 2.46Methylnaphthalene 0.6 0.92Diphenyl 0.3 0.33Fluorene 0.1 0.14Phenanthrene 0.6 0.33Other aromatics 0.7 1.15Carbon dioxide 0.0 TraceCarbon monoxide 0.0 TraceWater 0.0 TraceAcetonitrile 0.0 TraceWaxes, tars 9.3 5.07Carbon residue, fillers 1.8 5.80Balance 99.8 97.05
© 2007 by Taylor & Francis Group, LLC

Energy Generation from Waste Sources 407
Studies using organotin compounds have shown promise for generation of fuelfrom polyurethanes. However, the highest activity was exhibited when used forglycolysis (oxidation of glucose), not cracking.27 The use of chromium compoundshas also been investigated. Sheirs and associates have demonstrated the feasibilityof the use of chromium to aid in the cracking and pyrolysis of HDPE.28 Althoughchromium compounds appear to be relatively effective, more research needs to bedone to determine the optimum solubility of the catalyst for each polymeric com-pound. The addition of platinum and iron over activated carbon has also beeninvestigated. Specifically, the activity of the catalysts for the degradation of polypro-pylene (PP) waste into aromatic hydrocarbons was studied. The addition of thesemetals increased the yield of the aromatics from polypropylene. It has been specu-lated that the increase in activity is influenced by the methyl branching of thepolypropylene. However, the exact mechanism is still not clearly understood. Espe-cially, aromatization from aliphatic polymeric materials needs to be investigatedmechanistically.
Perhaps the most widely studied classification of catalysts for cracking opera-tions is that of solid acid catalysts.29–31 Specifically, HZSM-5, HY, and rare earthmetal-exchanged Y-type (REY) zeolites and silica-alumina have been investigated.31
Only HZSM-5 was found to be unsuitable for cracking polymeric wastes. HY, REY,and silica-alumina were all capable of producing at least 30% gasoline (or gasoline-range hydrocarbons) and 20% heavy oil. The differences between the catalysts arisein the production of the coke and gas fractions. Formation of coke is not desirable,because it causes catalytic deactivation by fouling and plugging the pore paths.Songip et al. found that the incorporation of rare-earth metals in HY zeolite increasedthe gasoline yield and decreased coke formation.31 Regardless of the catalyst used,
FIGURE 13.8 A simplified schematic of the Mobil Oil Corp. process for gasoline productionfrom polymeric waste.
Distillation
Gas
Gasoline
Light oil
Heavy Oil
Char
Reactor
Grinder &Separator
MixerScrapR
ubber
Metals
HeavyOils
SolidsSeparator
CarbonBlack
CatalystRegen-eration
© 2007 by Taylor & Francis Group, LLC

408 Handbook of Alternative Fuel Technology
catalytic cracking, owing to lower-temperature operation, appears to be more tech-nologically sound than pyrolysis. However, catalytic processes are often costlier thannoncatalytic counterparts because of the costs involved in catalysts, catalytic reactors,and catalyst regeneration steps.
13.3.3.4 Degradative Extrusion
Degradative extrusion is, in principle, not a new technology; however, its use as aprocess for energy generation is a new technology. The basis of the technology isthat at high temperatures, under the simultaneous effect of shearing, it is possible tobreak down complex mixtures of plastics into homogeneous low-molecular weightedpolymer melts.32 These polymer melts could replace the heavy oils used in theproduction of synthesis gas. The polymer-derived heavy oil would be fed directlyinto a partial-oxidation fluidized bed chamber. The end product from the extrudedwaste at 800°C would include methanol, one of the primary feedstocks for thechemical industry.33 Depending on the operating conditions, the methanol could besent directly to a chemical plant as feedstock without undergoing any subsequenttreatment. However, if the gas undergoes low-temperature decomposition, then carbondioxide and hydrogen would be the end products. Figure 13.9 contains a possibleprocess schematic for the generation of methanol from polymeric wastes. Degradativeextrusion is the reverse of reactive extrusion, in which a specially desired chemicalreaction is carried out on the polymeric backbone, such as graft copolymerization.
FIGURE 13.9 A process scheme for the degradative extrusion and partial oxidation of poly-meric wastes for methanol generation.
DegradativeExtrusion
WastePolymer
PolymerMelt
Gasification
Purification CO , S,Salts
2
Oxygen
Methanol synthesiswith CO
conservation
Methanol synthesiswith H addition
Low temperaturedecompostion
Syngas MethanolMethanol CO & H2
2
© 2007 by Taylor & Francis Group, LLC

Energy Generation from Waste Sources 409
13.4 FUEL PRODUCTION FROM SPENT TIRES
13.4.1 INTRODUCTION
Scrap tire disposal has become a global problem of epidemic proportions. In 1977,the number of tires scrapped in Japan was 47 million a year.34 More alarming is thefact that this number has doubled over the past 5 years. In 1992, the U.K. scrappedover 25 million tires per year.35 Add the annual scrapping of 250 million passengertires in the U.S., and the outlook becomes even grimmer.36
Traditional handling of the scrap tires was by landfills; however, the acuteshortage of viable landfills has all but eliminated this as a means of disposal. In fact,several of the midwestern U.S. states have issued laws that close landfills to tires.37
State-registered private collectors must dispose of the tires at approved, legal dumpsand recyclers. But even the number of legal landfills is dwindling. This has forcedresearchers to find an economical and efficient alternative for the spent tires.
Currently there are four key areas for “marketing” the spent tires. The first usesshredded tires as a “clean dirt” for road embankments and landfill liners.38 Thesecond use is as a rubber-modified asphalt. The asphalt, or tire crumb, can be usedfor playgrounds, running tracks, or as an ingredient of highway-paving material. Thethird use of spent tires is for electric power generation by combusting ground tirechips together with coal. The fourth, and most important area, is for tire-derivedfuels (TDFs).39 Although this may seem far-fetched, under proper conditions, spenttires are a clean fuel with a 15% higher Btu value than coal.40 In fact, it was estimatedthat by 1997, over 150 million scrap tires would be used for the generation of TDFs.41
TDFs can be obtained by several methods. The first is by incineration.39,42
Britain's tire incinerator burns approximately 90,000 tons of rubber a year. With thisamount, the Wolverhampton facility will generate 25 MW of energy, which is enoughto power a small town.43 In the U.S., Illinois Power incinerates shredded tire chipsto supplement their soft coal. This cocombustion of tire chips and coal is practicedwidely in the U.S. The direct incineration of the chips will utilize approximately15.6 million tires per year and will make up 2% of the total fuel consumed at theplant. Other processes, such as thermal cracking and depolymerization, recover theoil, char, and gases from the tires as separate “product” streams.44,45 However, themost well-known method for the generation of TDFs is from pyrolysis.36,38,46–49
13.4.2 PYROLYSIS OF SPENT TIRES
The recovery of energy from spent tires is not a new process. In 1974, the U.K.Department of Industry's Warren Spring Laboratory conducted the first tests torecover energy from spent passenger tires.47 These initial experiments demonstratethat it was possible to break the tires down into oil and gas by heating it in a closedretort, followed by distillation of the gaseous products. As research continued, it wasfound that the final bottoms product, or char, could be further treated for the manu-facture of activated carbon (as shown in Figure 13.10).50 During the late 1980s, theuse of pyrolysis for making TDFs became common. A number of U.S. and Europeanpatents have been granted for the pyrolysis of scrap tires.51–54 Although each patentis somewhat different, the main operating principles and conditions are quite similar.
© 2007 by Taylor & Francis Group, LLC

410 Handbook of Alternative Fuel Technology
In each instance, the scrap tires are first reduced in size, either by grinding,chipping, or pelletizing, then sent to a clarifier for the removal of the scrap metal.The method presented by Williams et al. represents the basic process utilized as the“starting block” by most research.55 The temperature is initially at 100°C while therubber is loaded into the reactor. After 1 h, the temperature is ramped up to300–500°C, depending on the process. The reactor is held at the final temperaturefor a minimum of 2 h. The gas fraction is sent to a distillation apparatus forsubsequent purification and analysis. The oil and char are separated using a secondcolumn. The slight variations on the pyrolysis process and their end products arepresented in the following sections.
13.4.2.1 Occidental Flash Pyrolysis
Occidental Chemical’s flash pyrolysis system was first demonstrated in late 1971.The process was able to produce a high-quality fuel oil at a moderate temperatureand pressure. The advantage of the process was that the pyrolysis reaction wasachieved without having to introduce hydrogen or using a catalyst. The process wasdivided into three main sections: feed preparation, flash pyrolysis, and productcollection. A simplified schematic of the overall process is shown in Figure 13.11.55
The most time-consuming aspect of Occidental’s process is the feed preparation.During this stage, the tires are debeaded and shredded to approximately 3 in. Amagnet is then used to remove all the metal components. The remaining material isfurther shredded to 1 in. before being ground to -24 mesh. The grinding of the tiresto such fine particles enabled the flash pyrolysis to occur at a quicker rate. The quickvulcanization of the ground rubber enabled a shorter residence time, which in turndecreased product cracking.57
After leaving the pyrolysis reactor, the gaseous stream was sent to a quenchtower to separate the two end products. The product oil was collected and sent to astorage facility. The recovered gas was recycled to the char fluidizer and pyrolysisreactor as a supplemental process fuel. The solid components that remained in thebottom of the pyrolysis reactor were sent through three cyclones. The cyclones wereused to separate the solid particles by size, as well as to cool the material back downto room temperature. At the end of the process, a 35 wt% carbon black was obtained.Analysis conducted on the carbon black showed that it had high enough quality fordirect reuse in the rubber industry.55
FIGURE 13.10 Possible end products from the pyrolysis of scrap tires.
OFF GAS
PRODUCT OIL
CHAR
FUEL OIL
ACTIVATED CARBONOR FILLER
PYROLYSIS
SCRAPTIRES
INCINERAATION
CARBONBLACK
© 2007 by Taylor & Francis Group, LLC

Energy Generation from Waste Sources 411
13.4.2.2 Fluidized Thermal Cracking
The first commercial use for fluidized thermal cracking (FTC) dates back to the1930s for coal gasification. Similar to other pyrolysis processes, the FTC processburns waste with high combustion efficiency; however, it has a few other addedadvantages. Because it is a fluidized bed process, there is a rapid mixing of solidparticles, which enables uniform temperature distribution; thus, the operation canbe simply controlled. Fluidization also enhances the heat and mass transfer rates,which in turn decreases the amount of CO emitted. Researchers have been able toadjust the FTC operating conditions to decrease the SOx and NOx emissions.58
The Nippon Zeon Company has conducted extensive studies on TDFs via thermalcracking. The precommercial process feeds crushed tire chips to the fluidized bed usinga screw feeder. Air heated by a preheating furnace is fed to the reactor bottom to elevatethe reactor temperature near cracking conditions, 400 to 600°C, before the chips areintroduced. This enables the tire chips themselves to maintain the cracking temperature.A continuous cyclone is used to remove the char. The cracked gases are brought intocontact with the recovered oil from the quench tower. Part of the recovered oil is recycledto the quench tower and the remainder sent to an oil storage tank for further purification.The uncondensed gas is sent to a treatment process to remove the hydrogen sulfide. Asimplified flowchart of the Nippon Zeon plant in Tokuyama is shown in Figure 13.12.The estimated break-even cost of the pyrolysis plant is $0.25 per tire.59
The preliminary studies used for the development of the Tokuyama plant had verypromising results. All the end products produced could either be used directly as asupplemental fuel source at the plant or sent off-site for petroleum and chemical indus-tries. A typical end product distribution of the FTC process is given in Table 13.4.60
13.4.2.3 Carbonization
Carbonization is another form of pyrolysis, which can convert over one half of ascrap tire into usable products. Carbonization processes operate at much highertemperatures than typical pyrolysis units. At this higher-temperature condition, the
FIGURE 13.11 A simplified schematic of Occidental’s flash pyrolysis system.
GroundRubber
Air
Recycle Gas
ProductChar
CharCooler
Cyclones
QuenchTower
Fuel &Recycle Gas
ProductOil
CharFluidizer
PyrolysisReactor
© 2007 by Taylor & Francis Group, LLC

412 Handbook of Alternative Fuel Technology
main product is char. The char is purified into carbon black, one of the maincomponents in the manufacture of tires. In 1974, the cost of carbonization wasapproximately 3 times the cost of making carbon black from standard petroleumoperations.61 Although this number decreased by only 15% in the next decade, theincentive of utilizing a waste material offsets the remaining cost.62
13.4.3 COCOMBUSTION OF SCRAP TIRES AND TDFS
Tire rubber can be combusted together with other fossil fuels as well as biomasswithout major alteration of an existing combustion facility. Energy generation usingscrap tires and TDFs as a supplemental fuel to coal is of particular interest and isbeing practiced throughout the world. The rationale behind the use of tire rubber asa supplemental fuel to conventional coal in power generation is based on thefollowing64,69,70:
1. Excellent combustion characteristics and high heating value2. Lower cost and good availability
FIGURE 13.12 Nippon Zeon scrap tire fluidized cracking process. (From Saeki, Y. andSuzuki, G., Rubber Age, 108(2), 33–40, 1976.)
TABLE 13.4End Product Distribution for Tires Cracked at 450°C
Product Amount Produced (kg) Percent
Oil 257 52.0Char 166 33.6Gas 72 14.4Total 495 100.0
Tire Chips
Hopper
Feeder
Cyclone
CharPreheater
Reactor
Gas Treatment
Separator
QuenchCondenser
OilTank
© 2007 by Taylor & Francis Group, LLC

Energy Generation from Waste Sources 413
3. Relatively low sulfur content, especially on a Btu basis4. Reducing the environmental burden and health effects of tire stockpiles
Typical heating values of tires are 15,000 to 16,000 Btu/lb, whereas typicalbituminous coal (washed) has a heating value of 12,000 to 13,000 Btu/lb. Further,both carbon and hydrogen contents69 are excellent, namely, 89 to 90 wt% for C and7.5 wt% for H. These values are substantially better than those for coals. Typically,the sulfur content of scrap tires and TDFs is 1.5 to 2%. Considering the sulfur dioxide(SO2) emission potential per fuel’s generated energy value (pound SO2 produced permillion Btu generated), the result is closer to that for low-sulfur-containing coals.
However, cocombustion of tire and TDF may alter the emission characteristicsof the combustion facility.64,69,70 Some studies showed that using TDF resulted inslight increases in pollutant emissions, whereas others showed slight decreases inthe mass emission rates of these pollutants.69 There is no consistent trend. Based onthe Purdue University Wade Utility Plant Facility test runs64 comparing pure coalcombustion and combustion of coal (95%) + TDF(5%), the atmospheric emissionsof most trace metals increase when TDF is cocombusted with coal. In particular,zinc and cadmium emissions were drastically higher with TDF-blended fuel feed,whereas mercury emission was about the same. A comprehensive recent study ofthe effect of TDF supplement to fuel on air emissions was performed at RiversideCement Inc. in Oro Grande, CA.69 Based on the testing of 41 specific air toxinspotentially emitted from a cement kiln, the average of three runs with and withoutTDF supplement (about 4.5% TDF by weight) showed that the mass emission ratesof 22 air toxics were lower with TDF supplement, whereas the mass emission ratesof only two compounds, zinc and anthracene, were higher with TDF-supplementedcoal feed.69 The two compounds are not classified as hazardous air pollutants (HAPs).
As can be seen, results of the effects on pollutant emission with TDF-supple-mented fuel can be quite conflicting and point toward different directions.69 Therefore,results of one plant study should not be generalized to another, because the prevailingconditions may differ very widely. Environmental impacts and health effects of tirecocombustion need to be carefully assessed for each plant with all relevant factorstaken into account, namely, the combustion process itself, combustion conditions,plant design, control equipment and its efficiency with respect to specific trace ele-ments, feed material properties, blend ratios, and analysis techniques.
13.4.4 IFP SPENT TIRE DEPOLYMERIZATION PROCESS
A relatively new approach to the decomposition of used tires is the IFP processdeveloped by the French Institute of Petroleum.35 Unlike the other process, IFP doesnot require pretreatment of the scrap tire. The whole tires are placed in a basket andlowered into a 600-l reactor. Hot oil at 380°C is sprinkled onto the tire’s surface. Achemical reaction between the hot oil and tires causes the depolymerization of therubber. After the tires have been completely depolymerized, the reactor is cooled to100°C. The offgases are sent to a distillation column. The column separates the gasand light hydrocarbon fractions. The resultant gas is sent for further purification intoa C4-C6 fraction and gasoline (C8-C10), and the light hydrocarbons are recycled to
© 2007 by Taylor & Francis Group, LLC

414 Handbook of Alternative Fuel Technology
the reactor. The recycled hydrocarbon fraction is used to dilute the viscous fuel oilgenerated during the depolymerization process. Upon evacuating the reactor, thescrap metal is removed and sent off-site for salvage.
The IFP process is different in that it is a batch process.44 Because it is operatedbatchwise, the concern over having enough tires for continuous feed is eliminated.Depolymerizing 4000 tons per year of waste tires has been estimated to generateover 15,200 tons of fuel oil, 360 tons of gasoline, 560 tons of gas, and 600 tons ofmetallic waste.
13.4.5 DRY DISTILLATION OF SPENT TIRES
Researchers have investigated the use of a specialty dry distillation apparatus for pro-ducing a gaseous fuel from spent tires. The process can be operated with either shreddedor whole tires without removing metallic wires. The tires enter the top of the distillationtower via a conveyor belt. Once filled, the tower is sealed to prevent the gaseous productfrom escaping. Combustion is initiated by burners located at the bottom of the towerand then sustained by the introduction of process air. As combustion continues, the hotgas rises to the top of the tower. The rising gas has a dual purpose. The first is to assistin the combustion of the tires located at the top of the tower. Second, the rising of thegas acts in the same manner as a traditional distillation column for the separation ofthe end products. The gas is cooled down by the gas cooler. Part of the gas is liquefiedand recovered in the form of oil. Recovered oil is equivalent to Class B heavy oil.71
The residue (char and tire cord) is removed from the bottom tower by a conveyor. Oncecooled, the residue is separated into individual components.
Hiroshi and Haruhiko63 operated a pilot plant scale of the tower continuouslyfor 250 h. At the end of the process time, it was found that approximately 40 wt%of the tires were converted into usable gaseous fuel. The remaining 60% was com-posed of char and tire cord. Research is being conducted on improving the amountand purity of the recovered gas. In addition, Hiroshi and Haruhiko are also investi-gating the potential uses for the recovered char.
A process schematic of the Direct Dry Distillation of Tire by Fujikasui Engi-neering Co. is shown in Figure 13.13.71
13.4.6 GOODYEAR’S DEVULCANIZATION PROCESS
Goodyear Rubber and Tire Co. has developed a unique process for devulcanizingscrap tire rubber using a novel supercritical fluid technology.67,68 The technologyuses sec-butanol as a supercritical fluid, which functions as a pyrolysis medium andalso as a chain cleavage agent.67 The solvent is unique in the sense that it not onlyfacilitates C-S and C-C bond cleavage reaction in a near-homogeneous state, butalso dissolves the reacted fragments and takes them away from other reactive inter-mediates. The solvent, sec-butanol, is fully recoverable and reusable in the process.Furthermore, the objective of the process is quite different from that of other pro-cesses in the sense that the product of the process treatment is intended for use inmanufacturing tires as a tread-compounding ingredient. Laboratory test of 20 phr(parts per hundred parts of rubber) of the process reclaimed materials has shown
© 2007 by Taylor & Francis Group, LLC
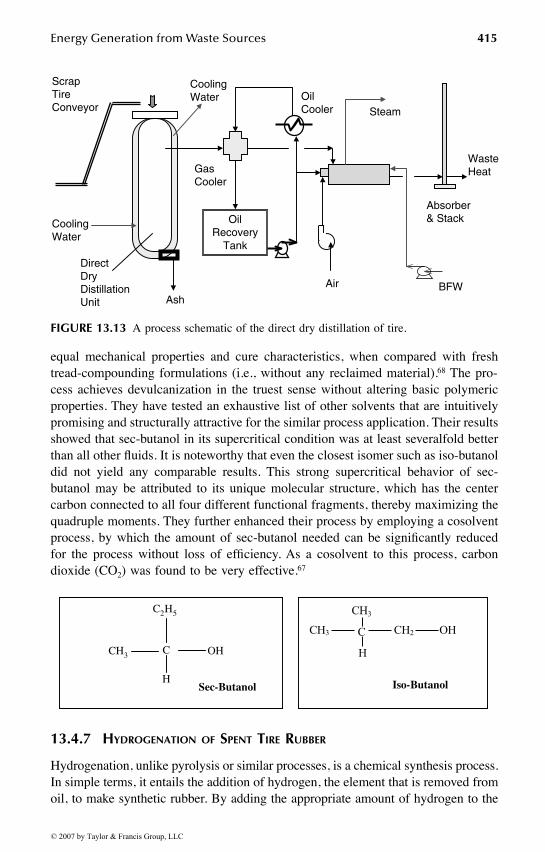
Energy Generation from Waste Sources 415
equal mechanical properties and cure characteristics, when compared with freshtread-compounding formulations (i.e., without any reclaimed material).68 The pro-cess achieves devulcanization in the truest sense without altering basic polymericproperties. They have tested an exhaustive list of other solvents that are intuitivelypromising and structurally attractive for the similar process application. Their resultsshowed that sec-butanol in its supercritical condition was at least severalfold betterthan all other fluids. It is noteworthy that even the closest isomer such as iso-butanoldid not yield any comparable results. This strong supercritical behavior of sec-butanol may be attributed to its unique molecular structure, which has the centercarbon connected to all four different functional fragments, thereby maximizing thequadruple moments. They further enhanced their process by employing a cosolventprocess, by which the amount of sec-butanol needed can be significantly reducedfor the process without loss of efficiency. As a cosolvent to this process, carbondioxide (CO2) was found to be very effective.67
13.4.7 HYDROGENATION OF SPENT TIRE RUBBER
Hydrogenation, unlike pyrolysis or similar processes, is a chemical synthesis process.In simple terms, it entails the addition of hydrogen, the element that is removed fromoil, to make synthetic rubber. By adding the appropriate amount of hydrogen to the
FIGURE 13.13 A process schematic of the direct dry distillation of tire.
OilRecovery
Tank
Ash
ScrapTireConveyor
CoolingWater
CoolingWater
GasCooler
OilCooler
Air BFW
Steam
Absorber& Stack
DirectDryDistillationUnit
WasteHeat
H
C2H5
CH3 C OH
Sec-Butanol
CH3 C
CH3
CH2 OH
H
Iso-Butanol
© 2007 by Taylor & Francis Group, LLC

416 Handbook of Alternative Fuel Technology
waste tires, the rubber can be returned to its original form. By adding hydrogen,devulcanization, saturation, and carbon–carbon bond cleavage reactions are induced. Ina sense, the process is quite similar to the hydrotreating process of heavy oil and resids.
REFERENCES
1. Corbitt, R.A., Ed., Standard Handbook of Environmental Engineering, McGraw-Hill,New York, 1990.
2. Fisher, P.M. and Evans, L.R., Jr., Whole tyre recycling: the elm energy approach,Rubber Europe Conference Proceedings, No. 6.012, June 1993, pp. 1–6.
3. Frederick, W.J. et al., Energy and Materials from Recycled Paper Sludge, AIChESummer National Meeting, Denver Co., August 14–17, 1994.
4. Association of Plastics Manufacturers in Europe, Plastics: A Vital Ingredient for theFood Industry, RAPRA Technology, Ltd., 1993, pp. 12–30.
5. Richards, M.K., USEPA's evaluation of a texaco gasification technology, Proceed-ings: ACS Emerging Technologies in Hazardous Waste Management, VI, Atlanta,GA., September 1994, pp. 19–21.
6. Stearns, R.P., Landfill methane: 23 sites are developing recovery systems, Solid WastesManage./Resour. Recovery J., 1980, pp. 56–59.
7. Pober, K. and Bauer, H., From Garbage — Oil, CHEMTECH, 1(3), 1977, pp.164–169.
8. Kagayama, M., Igarashi, M., Hasegawa, M., and Fukuda, J., Gasification of SolidWaste in Dual Fluidized-Bed Reactors, ACS Symposium, Ser. No. 130, 38, 1980, pp.525–540.
9. Henry, J.G. and Heinke, G.W., Environmental Science and Engineering, PrenticeHall, NJ, 1989, p. 560.
10. Green, A.E.S., Overview of fuel conversion, Fuel Combust. Technol., 12: 3–15, 1991.11. Helt, J.E. and Mallya, N., Pyrolysis experiments with municipal solid waste compo-
nents, Proceedings of 23rd Intersociety Energy Conversion Engineering, IEEE Ser-vice Society, NJ, 1988.
12. Bell, P.R. and Varjavandi, J.J., Pyrolysis — Resource from Solid Waste, Proceeds,Waste Management, Control, Recovery and Reuse, Ann Arbor Science, MI, 1974, pp.207–210.
13. Schlesinger, M.D. et al., Pyrolysis of waste materials from urban and rural sources,Proceedings of Third Mineral Waste Utilization Symposium, Chicago, IL, March14–16, 1972, pp. 423–428.
14. Davis, M.L. and Cornwell, D.A., Introduction to Environmental Engineering, 2nded., McGraw-Hill, New York, 1991.
15. Scott, D.S., Czernik, S.R., Piskorz, J., and Radlein, A.G., Fast pyrolysis of plasticwastes, Energy Fuels, 4: 407–411, 1990.
16. Chambers, C., Larsen, J.W., Li, W., and Wiesen, B., Polymer waste reclamation bypyrolysis in molten salts, Ind. Eng. Chem. Process Des. Dev., 23: 648–654, 1984.
17. Producer Responsibility for Packaging Waste in Austria, ENDS Rep., 224: 18, 1993.18. Baker, J., Unravelling the Recycling Targets, European Chemical News, 60(1596),
1993, pp. 16–17.19. Topfer Extends Plastics Recycling Deadlines, European Chemical News, 60(1595),
1993, p. 25.20. McMahon, P., Plastics Reborn, Chemical Engineering, 1992, pp. 37–43.
© 2007 by Taylor & Francis Group, LLC

Energy Generation from Waste Sources 417
21. Hunt, J., LCA Endorses Use of HDPE Waste, Packaging Week, 9(22), 1993, p.1.22. Leaversuch, R.D., Chemical recycling brings real versatility to solid-waste manage-
ment, Mod. Plast., July 1991, pp. 40–43.23. Bertolini, G.E. and Fontaine, J., Value recovery from plastics wastes by pyrolysis in
molten salts, Conserv. Recycling, 10(4): 331–343, 1987.24. Kaminsky, W., Pyrolysis of plastic waste and scrap tires in a fluid bed reactor, Resour.
Recovery Conserv., 5: 205–216, 1980.25. Romanow-Garcia, S., Plastics-planning for the future, Hydrocarbon Processing,
72(10): 15, 1993.26. Sittig, M., Organic and Polymer Waste Reclaiming Encyclopedia, Noyce Data Corp.,
NJ, 1981, p. 178.27. Vohwinkel., F., Approach to recycling polyurethane waste, Tin and Its Uses, 149:
7–10, 1986.28. Scheirs, J., Bigger, S.W., and Billingham, N.C., Effect of chromium on the oxidative
pyrolysis of gas-phase HDPE as determined by dynamic thermogravimetry, Polym.Degradation Stability, 38(2): 139–145, 1992.
29. Venuto, P.B. and Habib, E.T., Jr., Fluid Catalytic Cracking with Zeolite Catalysts,Marcel Dekker, New York, 1979.
30. Hashimoto, K. et al., New Developments in Zeolite Science and Technology, Elsevier,Amsterdam, 1986, pp. 505–510.
31. Songip, A.R., Masuda, T., Kuwahara, H., and Hashimoto, K., Test to screen catalystsfor reforming heavy oil from plastic wastes, Appl. Catal. B: Environ., 2: 153–164,1993.
32. Menges, G., Basis and technology for plastics recycling, Int. Polym. Sci. Technol.,20(8):10–15, 1993.
33. Semel, G., Study of Gasification of Plastic Waste, UAPG Symposium, Ser. No. 19,9, 1991.
34. Kawakami, S., Inoue, K., Tanaka, H., and Sakai, T., Pyrolysis Process for Scrap Tires,ACS Symposium Ser. No. 130, 40, 557–572, 1980.
35. Used Tyres: A Crumb of Comfort, Recycling and Resource Management, 1992, pp.25–26.
36. English, D., Scrap Tire Problem Could Be Gone by 2003, Tire Business, 11(7), 1993,pp. 34–35.
37. Greenhut, S., Dealers, Retreaders Confront Growing Scrap Tire Problem, NTDRADealer News, 49(1), 1986, pp. 36–40.
38. Clark, T., Scrap Tyres: Energy for the Asking, British Plastics and Rubber, 1985, pp.35–37.
39. McCarron, K., Maker of Scrap-Tire Boilers Sees Bright Future, Tire Business, 11(17),1993, p. 14.
40. Sikora, M.C., Ed., Whitewall Cement Fires Kiln with Scrap Tires: Tires-to-Fuel ProcessBecomes a Reality at LaFarge Cement, Scrap Tire News, 7(11), 1993, pp. 1–10.
41. Kokish, B., Organization Seeks Scrap Tire Solutions, Rubber Plastics News, 23(6),1993, pp. 44–46.
42. SSI: Lucas Furnaces — Tyres Disposal by Incineration, Tyres and Accessories, 11,1992, pp. 68–69.
43. Pearce, F., Scrap Tyres: A Burning Issue, New Scientist, 140(1900), 1993, pp. 13–14.44. Audibert, F. and Beaufils, J.P., Thermal Depolymerization of Waste Tires by Heavy
Oils: Conversion into Fuels, Final Report EUR 8907 EN, Commission of EuropeanCommunities: Energy, 1984.
© 2007 by Taylor & Francis Group, LLC
418 Handbook of Alternative Fuel Technology
45. Saeki, Y. and Suzuki, G., Fluidized Thermal Cracking Processes for Waste Tires,Rubber Age, 108(2), 1976, pp. 33–40.
46. Braslaw, J., Gealar, R.L., and Wingfield, R.C., Jr., Hydrocarbon generation duringthe inert gas pyrolysis of automobile shredder waste, Polym. Prep., 24(2): 434–435,1983.
47. Reed, D., Tyre pyrolysis comes on stream, Eur. Rubber J., 166(6): 29–33, 1984.48. Earle, B.A., Dallas Investors Purchase Tire Pyrolysis Plant, Rubber Plastic News,
23(2), 1993, p. 3.49. Wyman, V., Turning a Profit from Old Tyres, The Engineer, 273(7066/7), 1991, p. 36.50. Jackson, D.V., Resource Recovery, Warren Spring Laboratory Report No. C95/85,
1985.51. Apffel, F., Recovery Process, U.S. Patent No. 4,647,443, 1987.52. Reu, R.A., Pyrolyric Conversion System, European Patent No. 446,930,A1, 1991.53. Grispin, C.W., Jr., Pyrolytic Process and Apparatus, European Patent No. 162,802,
1984.54. Roy, C., Vacuum Pyrolysis of Scrap Tires, U.S. Patent No. 4,740,270, 1988.55. Williams, P.T., Besler, S., and Taylor, D.T., The pyrolysis of scrap automotive tires:
influence of temperature and heating rate on product composition, Fuel, 69,1474–1481, 1990.
56. Che, S.C., Deslate, W.D., and Duraiswamy, K., The Occidental Flash PyrolysisProcess for Recovering Carbon Black and Oil from Scrap Rubber Tires, ASME, 76-ENAs-42, 1976.
57. Nag, D.P., Nath, K.C., Mitra, D.C., and Raja, K., A laboratory study on the utilizationof waste tire for the production of fuel oil and gas of high calorific value, J. MinesMet. Fuels, 473–476, 1983.
58. Chang, Y.M. and Chen, M.Y., Industrial waste to energy by circulating fluidized bedcombustion, Resour. Conserv. Recycling, 9(4): 281–294, 1993.
59. Kroschwitz, J.I., Ed., Encyclopedia of Polymer Science and Engineering, Vol. 14,Wiley & Sons, New York, 1988, pp. 787–904.
60. Saeki, Y. and Suzuki, G., Fluidized Thermal Cracking Process For Waste Tires, RubberAge, 108(2), 1976, pp. 33–40.
61. Kiefer, I., U.S. EPA Report No. SW-32c.1, 1974.62. Jarrell, J., International Patent, WO 93/12198, 1993.63. Hiroshi, K. and Haruhiko, A., Process and Apparatus for Dry Distillation of Discarded
Rubber Tires, European Patent No. 0,072,387, 1982.64. Carleton, L.E., Giere, R., Lafree, S.T., and Tishmack, J.K., Investigation of Atmo-
spheric Emissions from Co-combustion of Tire and Coal, paper presented at theAnnual Meeting of the Geological Society of America, Seattle, WA, November 2–5,2003.
65. Official Web site of the City of Los Angeles, accessed in May 2006, http://www.lac-ity.org/council/cd12/pdf/Landfilling_Resources_MPA_Pyrolysis_Facility.pdf.
66. Web site of automotive learning center, accessed in May 2006, http://www.drivingin-novation.com/glossary/faq.html.
67. Benko, D.A., Beers, R.N., Lee, S., and Clark, K., Devulcanization of Cured Rubber,U.S. Patent No. 6,992,116, January 31, 2006.
68. Beers, R.N. and Benko, D.A., Recycling of spent tires, Encyclopedia of ChemicalProcessing, Lee, S., Ed., Taylor & Francis, New York, 2005, pp. 2613–2623.
69. Karell, M., Regulation Impacts on Scrap Tire Combustion: Part II, MALCOMPIRNIE Web site, http://www.pirnie.com/resources_pubs_air_feb00_3.html.
© 2007 by Taylor & Francis Group, LLC

Energy Generation from Waste Sources 419
70. Alvarez, R., Callén, M.S., Clemente, C., Gómez-Limón, D., López, J.M., Mastral,A.M., and Murillo, R., Soil, water, and air environmental impact from tire rubber/coalfluidized-bed cocombustion, Energy Fuels, 18(6), 1633–1639, 2004.
71. Web site by Japanese Advanced Environment Equipment, Waste Tires Direct DryDistillation System; accessed May 2006, http://nett21.gec.jp/JSIM_DATA/WASTE/WASTE_6/html/Doc_541.html.
© 2007 by Taylor & Francis Group, LLC

421
14 Geothermal Energy
Sunggyu Lee and H. Bryan Lanterman
CONTENTS
14.1 Introduction .................................................................................................. 42214.2 Geothermal Energy As Renewable Energy ................................................. 422
14.2.1 Need for Geothermal Energy........................................................... 42214.2.2 Renewability and Sustainability of Geothermal Energy ................. 42314.2.3 Occurrence of Geothermal Energy .................................................. 42314.2.4 Advantages of Geothermal Energy.................................................. 42514.2.5 Global Geothermal Energy .............................................................. 426
14.3 History of Geothermal Energy Developments ............................................ 42814.4 Geothermal Processes and Applications...................................................... 430
14.4.1 Geothermal Power Plants................................................................. 43014.4.1.1 Direct Steam Cycle........................................................... 43114.4.1.2 Flash Steam Cycle ............................................................ 43114.4.1.3 Binary Cycle ..................................................................... 43214.4.1.4 Hot Dry Rock (Dry Geothermal Sources) Systems......... 43314.4.1.5 Fresh Water Production .................................................... 434
14.4.2 Direct Use of Geothermal Heat....................................................... 43514.4.2.1 Space and District Heating............................................... 43514.4.2.2 Agricultural Applications ................................................. 43614.4.2.3 Balneology ........................................................................ 43614.4.2.4 Industrial Process Heat..................................................... 436
14.4.3 Geothermal Heat Pumps .................................................................. 43714.5 Scientific and Technological Developments................................................ 438
14.5.1 Major Research Efforts .................................................................... 43814.5.2 Technology Updates......................................................................... 439
14.5.2.1 Exploration Technology.................................................... 43914.5.2.2 Brine-Handling Technology ............................................. 43914.5.2.3 Environmental Issues of Geothermal Energy
Utilization ......................................................................... 44014.6 Conclusion.................................................................................................... 440References.............................................................................................................. 441
© 2007 by Taylor & Francis Group, LLC

422 Handbook of Alternative Fuel Technology
14.1 INTRODUCTION
The natural heat of the earth is called geothermal energy. Geothermal is a hybridword, combining geo (earth) and thermal (of heat). The term geothermal energydenotes the total thermal energy contained beneath the relatively thin and compar-atively cool outer surface of the earth. This represents about 260 billion cubic milesof rocks and metallic alloys at or near their melting temperatures. Geothermalresources range from shallow ground to hot rock and water several miles below theearth’s outer surface, and even farther down toward the earth’s core, in the regionof extremely high temperatures of molten rock called magma.
Geothermal energy, the second most abundant source of heat on earth after solarenergy, is accessible using current technology, and is concentrated in undergroundreservoirs, usually in the forms of steam, hot water, and hot rocks. The threeapplicable technology categories are geothermal heat pumps, direct-use applications,and electric power plants. Geothermal heat pumps use the earth’s surface as a heatsink and heat source for both heating and cooling. Direct-use applications utilizethe naturally occurring geothermally heated water for heating. Electric power plantsuse electric turbines fed by geysers to generate electricity. As in solar energy, theutility of geothermal energy is hampered by the extent of its distribution over theearth’s surface in amounts that are often too small or too dispersed.1 This is especiallyserious for the generation of electricity.
The most obvious forms of geothermal energy are geysers, boiling pools of mud,fumaroles, and hot springs. However, a greater potential does exist in regions notyet recognized for their energy possibilities — they are hot dry rocks (HDRs).
Besides the vast availability and the unique distribution pattern of these resources,geothermal energy is very clean and environmentally friendly. Geothermal energygenerates no (or minimal) greenhouse gases because the conversion or utilizationprocess does not involve any chemical reaction, in particular, combustion. Geothermalfields produce only about one sixth of the carbon dioxide that a natural-gas-fueledpower plant produces and very little, if any, of the nitrous oxide or sulfur-bearing gases.Furthermore, geothermal energy is available 24 hours a day, and 365 days a year,whatever the external weather conditions may be. This is in sharp contrast to othergreen energy technologies such as wind and solar. In fact, geothermal power plantstypically have average availabilities of 95% or higher, much higher than most coal andnuclear plants. Even this high availability can be further enhanced to a level that ispractically near 100%, with advances and enhancements in the process technology.
14.2 GEOTHERMAL ENERGY AS RENEWABLE ENERGY
14.2.1 NEED FOR GEOTHERMAL ENERGY
The development and importance of new, clean energy sources such as geothermalenergy gather pace because of not only the depletion of petroleum resources butalso the environmental problems associated with conventional energy processes.Environmental problems associated with the utilization of fossil fuel sources involve:(1) emission of greenhouse gases such as CO2, CH4, and N2O; (2) emission of SOx
© 2007 by Taylor & Francis Group, LLC

Geothermal Energy 423
and H2S; (3) discharge of nitrogen oxides; (4) potential emission of mercury andselenium; (5) emission of volatile and semivolatile organic compounds (VOCs andSVOCs)22; (6) emission of particulate matter (PM); and (7) contamination of soilsand groundwater resources with hazardous wastes.
At a depth of about 6 mi from the earth’s surface, the temperature is higher than100°C; thus, the total amount of geothermal energy in storage far exceeds, by severalorders of magnitude, the total thermal energy accountable in all forms of nuclearand fossil fuel resources of this planet. Solar energy is the only comparable resourcein terms of such vast quantities. Therefore, it is very logical, if not imperative, thatour energy priorities incorporate a vital resource such as geothermal energy.
14.2.2 RENEWABILITY AND SUSTAINABILITY OF GEOTHERMAL ENERGY
The U.S. Department of Energy classifies geothermal energy as renewable. Its sourceis the continuously emanating thermal energy generated by the earth’s core. Eachyear, rainfall and snowmelt maintain the supply of requisite water to geothermalreservoirs, and production from individual geothermal fields can be sustained fordecades and perhaps centuries. An accurate prediction of the sustainable service lifeof each field is, however, very difficult.
14.2.3 OCCURRENCE OF GEOTHERMAL ENERGY
The occurrence of geothermal heat (also known as geoheat) can be explained byone of the following theories2:
1. The first theory is that about 6 billion years ago the earth was a hot moltenmass of rock, and this mass has been cooling through the epochs of time,with the outer crust formed as a result of a faster cooling rate.
2. The second theory presupposes that the earth is like a giant furnace. Thedecaying of radioactive material within the earth provides a constant heatsource.
3. The third theory is based on the presumption that geothermal heat originatesfrom the earth’s fiery consolidation of dust and gas over 4 billion years ago.
Even though a generally agreed explanation for the natural occurrence of geothermalenergy is unavailable, a combination of the aforementioned theories is widely offered.
The interior of the earth consists of a molten fluid of extremely high-temperaturerocks called magma, which cools and expels heat to the earth’s surface accordingto the second law of thermodynamics. The flow of heat is from the hot source (earthcore) toward the cold sink (earth surface). The cold sink (i.e., heat sink in thermo-dynamics) consists of the earth’s crust, surface, and atmosphere. This may be con-sidered a very slow process of heat transfer.
Figure 14.1 shows a typical geological setting of a geothermal energy source.Thermal energy from the earth’s core continuously flows outward. The heat transferfrom the core to the surrounding layers of rock, the mantle, is principally viaconduction. As the temperature and pressure of the system become high enough,
© 2007 by Taylor & Francis Group, LLC

424 Handbook of Alternative Fuel Technology
some mantle rocks melt and form magma. Because the magma as a liquid phase isless dense and more fluidlike than the surrounding rock, it slowly rises and movestoward the earth’s crust, thus convecting the heat from the core. This is why a slowconvective heat transfer often represents the overall heat transfer process. Sometimes,the hot molten magma reaches all the way to the earth’s surface, where it is knownas lava. However, in most cases, the magma remains well below the earth’s crust,heating neighboring rocks and water, which originates from rainwater seepage deepinto the earth. The temperature of the water can be as hot as 380°C, which is evenhigher than the critical temperature of water, 374°C.
The water at this depth is subjected to high pressure and temperature. Dependingon the imposed conditions, it may exist as a supercritical fluid. It then rises to thesurface through fissures as a result of its density change and, in effect, it vents fromthe system, thereby reducing the pressure of the system. When the pressure decreases,the water boils, turns into steam and rises to the surface through fissures and wells.Some of the best-known examples of hot geothermal water are hot springs or geysers.However, most of the hot geothermal water remains deep underground, typicallytrapped in cracks and porous rocks. This natural collection of hot underground wateris called a geothermal reservoir.
The gross quantity of geothermal energy cannot be properly determined. Thetotal energy content of the rocks down to a depth of 10 km has been estimated tobe 3 × 1026 cal. At the earth’s core, i.e., 6400 km deep, the temperature may reachover 5000°C. However, based on current technology, only a fraction of this heat isavailable as a recoverable resource. A mere 0.03%, or 1023 cal, of this energy isconsidered hot enough and near enough to the earth’s surface to be recoverable; therest of the energy is too widely dispersed over the crust or too deep to be practical.
FIGURE 14.1 Geothermal energy source.
Molten Magma
Semi-permeableRock
NaturalSteamVent
GeothermalSteam Wells
Crystalline Rock
WaterintoFissure
Porous Rock &Circulation of Hot Water
© 2007 by Taylor & Francis Group, LLC

Geothermal Energy 425
Geothermal resources may be classified into several categories, principally basedon their phases and forms, as shown in Table 14.1.
Although all resources shown in the table cannot be used to produce electricity,they can still be utilized in many industrial, agricultural, and domestic areas.Research conducted by the U.S. Geological Survey3 has identified the significantresearch problems that need to be solved for full utilization of geothermal resources.
14.2.4 ADVANTAGES OF GEOTHERMAL ENERGY
Geothermal energy resources are continuous, reliable, sustainable, clean, and can becost-competitive in meeting baseload capacity needs. Specific advantages of geo-thermal systems include:
1. Indigenous energy — Geothermal energy helps reduce dependence on fossilor nuclear fuels and, as such, helps boost the economic benefits in the region.
2. Clean energy — Use of geothermal energy helps reduce combustion-related emissions.
3. Diversity of use — Geothermal energy has three common economic uses:electricity generation, direct use of heat, and geothermal heat pumps.
4. Long-term resource potential — With optimum development strategies,geothermal energy can provide a significant portion of a nation’s long-term energy needs.
5. Flexible system sizing — Current power generation projects range incapacity from a 200-kW system in China to 1200-MW at The Geysers inCalifornia. Additional units can be installed in increments depending onthe growth of the electricity demand.
6. Power plant longevity — Geothermal power plants are designed for a lifespan of 20 to 30 years. With proper resource management strategies, lifespans can exceed design periods.
7. High availability and reliability — “Availability” is defined as the per-centage of the time that a system is capable of producing electricity.
TABLE 14.1Classification of Geothermal Resources
Types of Geothermal Resources Temperature
(approximate; °C)
(a) Convective hydrothermal resourceVapor-dominated 240Hot-water-dominated 30–350
(b) Other hydrothermal resourcesSedimentary basins/regional aquifers (hot fluid in sedimentary rocks) 30–150Geopressured (hot fluid under pressure that is greater than hydrostatic) 90–200Radiogenic (heat generated by radioactive decay) 30–150
(c) Hot rock resourcesPart still molten (magma) >600Solidified (hot, dry rock) 90–650
© 2007 by Taylor & Francis Group, LLC

426 Handbook of Alternative Fuel Technology
Availability of 95 to 99% is typical for modern geothermal plants, com-pared to a maximum 80 to 85% for coal and nuclear plants.6
8. Combined use — Geothermal energy can be simultaneously used for bothpower generation and direct-use applications.
9. Low operating and maintenance costs — The annual operation and main-tenance costs of a geothermal electric system are typically 5 to 8% of thecapital cost.
10. Land area requirement — The land area required for geothermal powerplants is smaller per megawatt than for almost every other type of powergeneration plant.
11. Enhanced standard of living — Geothermal systems can be installed atremote locations without requiring other industrial infrastructure. Theregion can prosper without pollution.
14.2.5 GLOBAL GEOTHERMAL ENERGY
The current total installed capacity of geothermal power stations throughout theworld is over 8200 MW.4 The U.S. remains the biggest producer of electricity fromgeothermal energy, as shown in Table 14.2. The developing countries accounted for
TABLE 14.2Installed Geothermal Electricity Generation Capacity
Country 1990 1995 1998
Argentinaa 0.67 0.67 0Australia 0 0.17 0.4China 19.2 28.78 32Costa Rica 0 55 120El Salvador 95 105 105France (Guadeloupe) 4.2 4.2 4.2Greecea 0 0 0Guatemala 0 0 5Iceland 44.6 49.4 140Indonesia 144.75 309.75 589.5Italy 545 631.7 768.5Japan 214.6 413.7 530Kenya 45 45 45Mexico 700 753 743New Zealand 283.2 286 345Nicaragua 70 70 70Philippines 891 1191 1848Portugal (Azores) 3 5 11Russia 11 11 11Thailand 0.3 0.3 0.3Turkey 20.4 20.4 20.4U.S. 2774.6 2816.7 2850Total 5866.72 6796.98 8240
a Argentina and Greece closed their pilot plants.
© 2007 by Taylor & Francis Group, LLC

Geothermal Energy 427
35% of the total for 1995, and 46% for 1999. About 2850 MW of electricitygeneration capacity is available from geothermal power plants in the western U.S.The major geothermal fields along with their capacities are shown in Table 14.3.5
Direct-use geothermal technologies utilize naturally hot geothermal water for com-mercial greenhouses, crop dehydration, fish farming, bathing, and district communityheating. Geothermal heat pumps (GHPs) use the constant temperature of the top 50ft of the earth’s surface to heat buildings in winter and cool them in summer. Table14.4 shows the direct-use of geothermal heat in various categories in the U.S.6,7
Fossil fuels, namely oil, coal, and gas, provide 86% of all the energy used inthe U.S. In 2004, renewable energy sources supplied just 6.1% of the total U.S.energy consumption. Most of the renewable energy consumption was provided byhydroelectric power (44.5%) and biomass utilization (46.5%), whereas only 5.6%came from geothermal sources. Figure 14.2 shows the history and projections forU.S. energy consumption from fuel sources during the period 1980–2030.23
As shown in the figure, the projected future growth in the area of nonhydro andnonnuclear renewable energies is substantial. When the relative cost of electricitygeneration from geothermal sources decreases, the popularity of geothermal powergeneration will undoubtedly increase. Figure 14.3 shows a cost comparison amongvarious modes of power generation.
TABLE 14.3Major Geothermal Power Plants in the U.S.
Location Capacity Installed (MW)
The Geysers, CA 2115East Mesa, CA 119Salton Sea 198Heber, CA 94Mammoth, CA 7Coso. CA 225Amadee, CA 2Wendel, CA 0.6Puna, HI 18Steamboat, NV 31Beowave, NV 17Brady, NV 6Desert Peak, NV 9Wabuska, NV 1.2Soda Lake, NV 3.6Stillwater, NV 14Empire Farms, NV 4.8Roosevelt, UT 20Cove Fort, UT 4.2Total 2889.4
Source: From Wright, P.M., The American Association ofPetroleum Geologists Bulletin, Vol. 23, No. 12, 366, October1989.
© 2007 by Taylor & Francis Group, LLC

428 Handbook of Alternative Fuel Technology
14.3 HISTORY OF GEOTHERMAL ENERGY DEVELOPMENTS
Ancient people regarded the depths of the earth with horror as hell, the seat ofmalignant gods, who were responsible for natural phenomena like earthquakes andvolcanic eruptions. Nevertheless, in ancient times the Romans, and in modern timesthe Icelanders, Japanese, Turks, Koreans, and others, have used its potential for bathsand space heating.
The Larderello field in Tuscany, Italy, first began to produce electricity in 1904,which developed over the next 10 years to a capacity of 250 KW. In Japan, Beppuwas the first site for experimental geothermal work in 1919, and these experimentsled to a pilot plant in 1924 producing 1 KW of electricity. Somewhat earlier thanthis, the Japanese had begun to use geoheat to warm their greenhouses. In Iceland,municipal heating was provided using hot thermal waters in the 1930s, and it is stillthe major source of heating today.
TABLE 14.4U.S. Geothermal Direct-Use Projects
ApplicationsNumberof Sites
Thermal Capacity(MW)
Annual Energy(GWh)
Geothermal heat pumps most states 2072 2402Space and district heating 126 188 433Greenhouses 39 66 166Aquaculture 21 66 346Resorts/pools 115 68 426Industrial processes 13 43 216Total 2503 3989
FIGURE 14.2 U.S. energy consumption by fuel sources: past, current, and future forecast.Unit used is in quadrillion Btus. (From U.S. Department of Energy, 2006.)
History Projections
Pretroleum
Coal
Natural Gas
NuclearNonhydro renewables
Hydropower
1980 1990 2004 2010 2020 2030
60
50
40
30
20
10
0
© 2007 by Taylor & Francis Group, LLC

Geothermal Energy 429
It was not until the early 1920s that the U.S. examined the possibilities ofcommercial usage of geothermal steam. However, the competition from hydroelectricpower was too keen to promote further development at that time. Today, the largestgeothermal power plant in the world is located in California at The Geysers, whichis probably the largest reservoir of geothermal steam in the world.8 In recent years,U.S. DOE’s GeoPowering the West (GPW) program has been working to furthergeothermal energy efforts.9
Growing concerns about the environmental effects of increasing CO2 and meth-ane in the atmosphere are working to enhance the role of geothermal resourcesworldwide. Hence, the utilization of geothermal energy to generate electric powerdominates all other applications.
A number of factors that have boosted the production of geothermal energy are10:
1. The economics of geothermal energy became more favorable, owing tothe increase in petroleum and natural gas prices.
FIGURE 14.3 Cost comparison of electricity generation between (a) geothermal energy and(b) solar thermal energy.
0123456789
1975 1980 1985 1990 1995 2000 2005
Year
0
10
20
30
40
50
60
1975 1980 1985 1990 1995 2000 2005
Year
Cen
ts p
er k
ilow
att-
ho
ur
Cen
ts p
er k
ilow
att-
ho
ur
(a) Geothermal Energy
(b) Solar Thermal Energy
© 2007 by Taylor & Francis Group, LLC

430 Handbook of Alternative Fuel Technology
2. The cost of producing geothermal energy decreased during 1980–2000.3. Legislative actions and measures encouraging geothermal developments
have been in place for many countries. Examples in the U.S. include theEnergy Policy Act and the National Geologic Mapping Act in the early1990s.11
4. The implementation of the Clean Air Act Amendments of 1990 alsoprovides an economic benefit because of the well-developed technologyfor control of gas emissions from geothermal power plants.
5. Amendment of the Public Utilities Regulatory Act removed the 80-MWlimit from independent power plants selling electricity to utilities and isexpected to improve the competitiveness of geothermal energy.
14.4 GEOTHERMAL PROCESSES AND APPLICATIONS
14.4.1 GEOTHERMAL POWER PLANTS
Geothermal resources may be described as hydrothermal, hot dry rock, or geopres-sured. Hydrothermal resources contain hot water, steam, or a mixture of water andsteam. Although research into ways of efficiently extracting and using the energycontained in hot dry rock and geopressured resources continues, virtually all currentgeothermal power plants operate on hydrothermal resources.
The characteristics of the hydrothermal resource determine the power cycle ofthe geothermal power plant. A resource that produces dry steam uses a direct steam
FIGURE 14.4 Direct steam cycle geothermal power plant.
Moistureseparator
Coolingwater
Condenser
Steam
Noncondensablegas-removal
system
Coolingwaterandcondensedsteam Noncondensable
gas-treatmentsystem
Evaporation, drift,and treated gasSteam
condensate
Brine
Injectionwells
Electricity generation
Cooling tower
Spent brine
Noncondensable gas
Productionwells
Steam turbinegenerator
© 2007 by Taylor & Francis Group, LLC

Geothermal Energy 431
cycle. A power plant for a liquid-dominated resource with a temperature above 165°Ctypically uses a flash steam cycle. For liquid-dominated resources with temperaturesbelow 165°C, a binary cycle is the best choice for power generation. Power plantson liquid-dominated resources often benefit from combined cycles, using both flashand binary energy-conversion cycles.
14.4.1.1 Direct Steam Cycle12
Direct steam is also referred to as dry steam. As the term implies, steam is routeddirectly to the turbines, thus eliminating the need for the boilers used by conventionalnatural gas and coal power plants. Figure 14.4 shows a schematic of a direct steamcycle power generation process. In a direct steam cycle power plant, a geothermalturbine can operate with steam that is far from pure. Chemicals and compounds insolid, liquid, and gaseous phases are transported with the steam to the power plant.At the power plant, the steam passes through a separator that removes water dropletsand particulate before it is delivered to the steam turbine. The turbines are ofconventional design with special materials, such as 12Cr steel and precipitation-hardened stainless steel, to improve reliability in geothermal services.
The other components present in the direct steam geothermal cycle include:
1. A condenser used to condense turbine exhaust steam. Both direct-contactand surface condensers are used in direct-steam geothermal power plants.
2. Noncondensable gas-removal system, to remove and compress the non-condensable gases. A typical system uses two stages of compression. Thefirst stage is a steam jet ejector. The second stage is another steam jetejector, a liquid ring vacuum pump, or a centrifugal compressor.
3. The cooling tower employs a multicell wet mechanical draft design. Cool-ing is accomplished primarily by evaporation. Water that is lost from thecooling system to evaporation and drift is replaced by steam condensatefrom the condenser.
4. An injection well: Excess water is returned to the geothermal resource inan injection well.
The direct steam cycle is typical of power plants at The Geysers in northernCalifornia, the largest geothermal field in the world. The primary operator of TheGeysers is Calpine Corporation.
14.4.1.2 Flash Steam Cycle12
Flash steam is the steam produced when the pressure on a geothermal fluid is reduced.A flash steam cycle for a high-temperature liquid-dominated resource is shown inFigure 14.5. This dual-flash cycle is typical of most larger flash steam geothermalpower plants. Single-flash cycles are frequently selected for smaller facilities.
Geothermal brine, or a mixture of brine and steam, is delivered to a flash vesselat the power plant by either natural circulation or pumps in the production wells. Atthe entrance to the flash vessel, the pressure is reduced to produce flash steam. Thesteam is delivered to the high-pressure inlet to the turbine. The remaining brine
© 2007 by Taylor & Francis Group, LLC

432 Handbook of Alternative Fuel Technology
drains to another flash vessel in which the pressure is again reduced to produce low-pressure flash steam.
The other components present in the double-flash steam geothermal cycle include:
1. Direct-contact condenser: As hydrogen sulfide is not produced in largequantities.
2. A cooling tower: This cycle also uses a multicell wet mechanical draftcooling tower. The water lost because of evaporation and drift is replacedby steam condensate.
3. The excess water and spent brine from the flash vessels are injected backinto the geothermal resource in an injection well.
14.4.1.3 Binary Cycle4
A binary-cycle geothermal power plant employs a closed-loop heat exchange systemin which the heat of geothermal fluid (primary fluid) is transferred to a lower-boilingheat transfer fluid (secondary fluid) that is thereby vaporized and used to drive aturbine or generator set. In other words, a binary cycle uses a secondary heat transferfluid instead of steam in the power generation equipment. Binary geothermal plantshave been in service since the late 1980s. A binary cycle is the economic choice forhydrothermal resources, with temperatures below approximately 165°C. A typicalbinary cycle is shown in Figure 14.6.
The binary cycle shown in Figure 14.6 uses isobutane (i-C4H10) as the binaryheat transfer fluid. Heat from geothermal brine vaporizes the binary fluid in the brine
FIGURE 14.5 Double-flash steam cycle geothermal power plant.
Steam turbinegenerator
Productionwells
Brine High-pressure
flash tank
High-pressure steam
Low-pressureflash tank
Brin
Injectionwells
Evaporationand drift
Low pressuresteam
Gasvent to
atmosphere
Condenser
Coolingwater
Spentbrine
Cooling waterand condensed steam
Cooling tower
Electricity generation
© 2007 by Taylor & Francis Group, LLC

Geothermal Energy 433
heat exchanger. Spent brine is returned to the resource in injection wells, and thebinary fluid vapor drives a turbine generator. The turbine exhaust vapor is deliveredto an air-cooled condenser, in which the vapor is condensed. Liquid binary fluiddrains to an accumulator vessel before being pumped back to the brine heat exchang-ers to repeat the cycle. The brine heat exchangers are typically shell-and-tube unitsfabricated from carbon steel.
14.4.1.4 Hot Dry Rock (Dry Geothermal Sources) Systems2,13,14
Because the vast majority of the geothermal heat resources of the world exist as hotdry rocks (HDR) sources rather than water (hydrothermal) systems, it is only naturalfor this energy source to receive more attention from geothermalists. The moreaccessible HDR resources in the U.S. alone would provide an estimated 650,000quads of heat, one quad (one quadrillion Btu's) being equivalent to the amount ofenergy contained in 171.5 million barrels of oil. Because annual U.S. energy con-sumption is approximately 84 quads, whoever figures out how to economically tapeven a fraction of the potential in HDR could earn a place in history.
HDR is a deeply buried crystal rock at a usefully high temperature. Currentengineering designs plan to tap its heat by drilling a wellbore, fracturing or stimu-lating pre-existing joints around the wellbore, and directionally drilling anotherwellbore through the fracture network. Cold water then flows down one wellbore,pushes through the fractured rock, warms, returns up the other wellbore, and drivesa power plant. The major technical uncertainty is establishing the fracture networkbetween the two wellbores. If adequate connectivity can be established and a suffi-ciently large fracture surface area can be exposed between the two welbores, HDRcan be a very competitive source of energy.
FIGURE 14.6 Binary cycle geothermal power plant.
Brine
Productionwells
Brine heatexchangers
Spentbrine
Accumulator
Warm air
Condenser
Binary fluid
Feedpumps
Injection wells
Binaryfluid
Binary turbinegenerator
Binary fluid vapor
© 2007 by Taylor & Francis Group, LLC

434 Handbook of Alternative Fuel Technology
Figure 14.7 is a schematic diagram of the experimental Los Alamos System inNew Mexico. Water at 65°C and 1000 psia is pumped into the hydraulic fracturenetwork, approximately 3000 ft in diameter and circulated at 7500 ft, where tem-peratures range between 260 and 320°C. The pressure is around 4100 psia. Thewater is then pumped out of the ground, and when it reaches the surface, itstemperature is 230°C at 1250 psia.
In this experimental system, the hot water is circulated through an air-cooledheat exchanger with the extracted heat dissipated to the atmosphere.
14.4.1.5 Fresh Water Production
Less than 2% of the earth’s retained water supply is available for drinking. Theoceans, atmosphere, rocks or rock formations, and polluted resources contain theremaining 98%. From the standpoint of water shortage, all the systems recognizedto date (desalination, recycling, and transportation over long distances) consumeenormous amounts of energy and have also proved to be uneconomical. Geothermalresources, on the other hand, contain vast reservoirs of hot water and steam, andsome of these produce electricity and fresh water as by-products. The geothermalresource satisfies two main criteria for alleviating water shortages, namely:
FIGURE 14.7 Experimental configuration and operating conditions Los Alamos hydraulicfracture network.
2250feet
100 MW Heatexchanger
1500 feet
266 oC, 4100 psia
233 oC3330 psia
Volcanic and sediments
Pressurized waterFlow Rate = 2300 gpm
Control valve
Pressurizer
65 oC, 1000 psia 230 oC, 1250 psia
7500 feet
Crystalline rocks
Heat dissipated into air
© 2007 by Taylor & Francis Group, LLC

Geothermal Energy 435
1. An energy source for distillation process such as multistage flash (MSF)and vertical tube evaporator (VTE)
2. An ample supply of water
14.4.2 DIRECT USE OF GEOTHERMAL HEAT
Direct-heat use is one of the oldest, most versatile, and also the most common formof utilization of geothermal energy. The term direct use means that geothermal heatis used directly without first converting it to electricity. The warm water or steamexiting the ground will be piped into the dwelling or structure to provide warmth.Direct heating is obviously an older technology than geothermal power generationand is widely practiced.
14.4.2.1 Space and District Heating
Direct heating can be applied in what are known as either district or space heatingsystems, the distinction being that space heating systems serve only one building,whereas district heating systems serve many structures from a common set of wells.Direct heating has made the greatest progress and development in Iceland, wherethe total capacity of the operating geothermal district heating system is 800 MW.15
Figure 14.8 shows an example of a district heating system.Each system has to be adapted to the local situation, depending on the type of
geothermal resource available, the population density of the area and the predictedpopulation growth, the type of buildings requiring heating or cooling and, above all,the local climate. Geothermal district heating pumps are capital intensive in the early
FIGURE 14.8 A schematic of Hitaveita Reykjavikur (Reykjavik district heating system).
890C
Vent
Pumping Station
Storage Tank Peaking Station
HeatingMixing
Drains
Line Shaft Pump
ReykirField 1500 kg/s
Ellidoar Field 180 kg/s
Laugarnes Field 290 kg/s
800C 350C
950C
1250C
Line ShaftPump
Line Shaft Pump
© 2007 by Taylor & Francis Group, LLC

436 Handbook of Alternative Fuel Technology
stages. The principal costs are initial investments for production and injection wells,down-hole and circulation pumps, heat exchangers, and pipelines, as well as the distri-bution network. A high load density usually makes district heating economically morefeasible, because the cost of the distribution network transporting hot water to consumersis shared. Importantly, operating costs are comparatively low, thus making the long-termcost much more favorable. Geothermal district heating systems offer significant life cyclecost savings to consumers, as much as 30 to 50% of the cost of using natural gas or oil.
At present, a very successful district heating system exists in San Bernardino,CA. The water production system, consisting of two wells, yields an average flowof 5200 l/min at 54°C water. The system currently serves 33 buildings, includinggovernment centers, a prison, a new blood bank facility, and other private buildings.
14.4.2.2 Agricultural Applications
One specific application of direct heating is greenhouse heating. This is one of themost common worldwide applications of geothermal energy. Fruits, vegetables,flowers, and ornamental plants are successfully grown year-round, in geothermallyheated greenhouses using low-temperature sources (<38°C). Geothermal energy canextend short growing seasons and significantly reduce fuel costs. One example is a650-m2 greenhouse in California, utilizing a geothermal well 150 m deep thatsupplies 67°C water. The well is capable of supplying heat for an additional1800–3700 m2 of greenhouse. It is noteworthy that the energy crisis experienced inCalifornia in 2001 posed a very severe threat to greenhouse farmers who relied onelectricity or natural gas heating. As of 2003, there were at least 37 greenhouseoperations based on the geothermal energy in the United States.24
Another direct-heating application involves aquaculture, which is the raising offreshwater or marine organisms in a controlled environment. Geothermally heatedwater produces excellent yields of high-quality fish and crustaceans under acceler-ated growth conditions. Furthermore, geothermal aquaculture permits breeding inthe winter, allowing fish farmers to harvest their products when product availabilityis low, and market prices are high. As of 2003, there were at least 58 aquaculturesites using geothermal energy in the U.S.24 About 15 aquaculture operations wereclustered in the southern California area.
14.4.2.3 Balneology
Balneology involves the use of geologically heated water/brine/mud sources forbathing purposes and is also said to possess healing and prophylactic properties.Balneology is centuries old and has been practiced by Etruscans, Romans, Greeks,Turks, Mexicans, Japanese, Koreans, Americans and, undoubtedly, others.
14.4.2.4 Industrial Process Heat
Industrial processes can be heat intensive, and commonly use either steam or super-heated water with temperatures of 150°C or higher. This makes industrial processesthe highest-temperature users of geothermal direct-heat applications. However, lowertemperatures can suffice in some cases, especially for some drying applications. Two
© 2007 by Taylor & Francis Group, LLC

Geothermal Energy 437
of the largest industrial users of geothermal heat are a diatomaceous-earth dryingplant in Iceland and a paper and pulp processing plant in New Zealand.
14.4.3 GEOTHERMAL HEAT PUMPS
The geothermal heat pump (GHP), also referred to as the ground source heat pump(GSHP), uses the earth as a heat source for heating and as a heat sink for cooling.The GSHP uses a reversible refrigeration cycle combined with a circulating groundloop to efficiently provide either heating or cooling from electricity. The basicmechanism is the same as that of an air source heat pump but operates moreefficiently because the temperature of the ground is more favorable than that of theair, i.e., the ground is warmer in the winter and cooler in the summer than the air.Additionally, the ground temperature is fairly constant throughout the year, even atdepths of as little as 5 to 10 ft.
The typical components of a residential GSHP during heating and cooling cyclesare shown in Figure 14.9 and Figure 14.10. The major components of the system arethe ground loop and a refrigeration unit composed of the compressor, primary heatexchanger, expansion valve, and secondary heat exchanger. The refrigeration cycleutilizes the same unit operation steps as an air source heat pump or typical home airconditioning unit. In what is referred to as a closed-loop system, a water and antifreezemixture circulates through a pipe buried in the ground and transfers thermal energybetween the ground and the primary heat exchanger in the heat pump. Depending onthe mode of operation, either heating or cooling is provided based on the reversiblevalve that allows the refrigerant to reverse the order of the operations of the cycle.Therefore, the primary heat exchanger, which consists of a water-to-refrigerant loop,can act as an evaporator or condenser. Also included in this system is a heat exchanger
FIGURE 14.9 GSHP during heating cycle.
GroundLoop
PrimaryHeat Exchanger
ExpansionValve
ReversingValve
Compressor
Thermal Energy Thermal Energy
Heat Exchanger and Home Blower
HomeWaterHeater
ThermalEnergy
Ground as Heat Source
CoolerAntifreeze Warmer
Antifreeze
ColdRefrigerant
HotRefrigerant
© 2007 by Taylor & Francis Group, LLC

438 Handbook of Alternative Fuel Technology
following the compressor that provides heat to a hot water heater; this is often referredto as a de-superheater. The Geothermal Heat Pump Consortium Inc. offers technical,educational, and promotional support for Geoexchange systems.16
Geothermal heat pumps offer a distinct advantage over the use of air as a sourceor sink, because the ground is at a more favorable temperature. Compared to atmo-spheric air, the ground is warmer in winter and cooler in summer. Therefore, GHPsdemonstrate better performance over air-source heat pumps. GHPs also reduceelectricity consumption by approximately 30% compared to air-source heat pumps.Aided by utility-sponsored programs, GHPs are becoming increasingly popularthroughout the world. In the U.S., the GHP industry is expanding at a growth rateof 10 to 20% annually. As of 2004, more than 200,000 GHPs are being operated inU.S. homes, schools, and commercial buildings.17
The industrial and other potential applications of geothermal energy suggest thatgreat economic advantages could be gained from dual or multipurpose plants com-bining power production with one or more other applications. Such plants wouldenable the costs of exploration drilling and certain other items to be shared amongtwo or more end users.
14.5 SCIENTIFIC AND TECHNOLOGICAL DEVELOPMENTS
14.5.1 MAJOR RESEARCH EFFORTS
The following major activities are examples of U.S.-Government-funded researchbeing conducted in accordance with its R&D strategy:6,9
FIGURE 14.10 GSHP during cooling cycle.
GroundLoop
PrimaryHeat Exchanger
ExpansionValve
ReversingValve
Compressor
Thermal Energy Thermal Energy
Heat Exchanger and Home Blower
HomeWaterHeaterThermal
Energy
Ground as Heat Sink
ColdRefrigerant
WarmerAntifreeze Cooler
Antifreeze
HotRefrigerant
© 2007 by Taylor & Francis Group, LLC

Geothermal Energy 439
1. Advanced techniques to detect and delineate hidden geothermal resourcesare being developed, including remote-sensing techniques and improve-ments of various electric and acoustic methods.
2. Slim-hole drilling and coring, a cost-effective option for exploratory drill-ing, needs to be improved. This research includes developing slim-holereservoir engineering techniques and logging tools.
3. Improved materials that are capable of withstanding the high temperatureand corrosive nature of geothermal brines are being developed.
4. Methods to increase the net brine effectiveness of geothermal power plantsare being pursued, as are ways to reduce power plant costs.
Significant research activities in progress at national laboratories and universitiesin the U.S. and the world include those of Sandia National Laboratory,18,9 LawrenceBerkeley National Laboratory,9 Brookhaven National Laboratory,4,9 National Renew-able Energy Laboratory,17 Los Alamos National Laboratory,19,20,21 The Geysers,10
Camborne School of Mines,4 European Hot Dry Rock Industries,4 Stanford Universityand Leningrad’s Mining Institute,4 Electric Power Research Institute (EPRI), Geo-Heat Center of the Oregon Institute of Technology, Southern Methodist UniversityGeothermal Laboratory, and Virginia Polytechnic Institute and State University.
14.5.2 TECHNOLOGY UPDATES
The development of a successful geothermal energy project relies on a variety ofspecialized technologies as well as their cost-effectiveness.
14.5.2.1 Exploration Technology
Exploration is key to the discovery of new geothermal resources. It identifies geo-thermal resources, estimates resource potential, and establishes resource size, depth,and potential production. It relies on surface measurements of subsurface geological,geochemical, and geophysical conditions to develop a conceptual model of thesystem. Geothermal exploration of unmapped regions typically proceeds in two basicphases, reconnaissance and detailed exploration. During the reconnaissance phase,regional geology and fracture systems are studied, such as young volcanic features,tectonically active fault zones (as deduced from seismic information), and overt orsubtle geothermal manifestations. If the reconnaissance phase confirms that theprovince has geothermal potential and that specific sites in the province should beexplored further, the second phase focuses on one or more individual prospectscovered in the reconnaissance phase.
14.5.2.2 Brine-Handling Technology
Brine is a geothermal solution containing appreciable concentrations of sodiumchloride or other salts. The chemical composition, including the salinity of geother-mal fluids, varies greatly from one reservoir to another. Variations in chemistry andsalinity affect the design, maintenance, and longevity of wells and surface equip-ments. Recent advances in this area include6:
© 2007 by Taylor & Francis Group, LLC
440 Handbook of Alternative Fuel Technology
1. Use of scale-inhibiting chemicals to reduce carbonate scaling of flashingwells
2. Development of pH modification to control silica scaling in power plants3. Development of highly effective computer programs to estimate and pre-
dict chemistry effects in geothermal systems4. Continued development of polymeric cement coating to reduce corrosion
in heat exchangers and process piping
14.5.2.3 Environmental Issues of Geothermal Energy Utilization
Even though geothermal energy is one of the cleanest and safest means of generatingelectric power, its effects on water resources, air quality, and noise during geothermaldevelopment and operation must be understood and mitigated. Among these areemissions to air (particularly of hydrogen sulfide), land use, and disposal of solidwastes. Effects can vary greatly from site to site.
Steam and flash plants emit mostly water vapor (steam). Binary power plantsrun on a closed-loop system, therefore zero discharge of gases is accomplished.Geothermal industries have developed advanced technologies to recycle minerals ingeothermal fluid so that little or no disposal or emissions occur. The examples arefound from The Geysers power plants in northern California that separate and usesulfur for sulfuric acid production, and also from the Salton Sea power plants insouthern California recycling salts from geothermal brine, recovering silica frommineralized brine for use as fillers in concrete, and extracting zinc for additionalplant profitability.
14.6 CONCLUSION
Geothermal resources are continuously renewable sources of energy regardless ofclimate or weather conditions, unlike wind or solar energy. Reliability, sustainability,and cleanness make geothermal energy especially attractive as a source of baseloadelectricity generation or for direct-use applications that need constant heat or energy.Geothermal power plants compete economically with coal, oil, and nuclear plantsin meeting baseload capacity needs, with significant environmental advantages. Thenext generation of geothermal power plants will be designed using long-term pro-jections for resource production as the basis for cycle selection, optimization, andsystem design.
Current HDR technology is competitive with modern coal-fired plants in regionswith geothermal gradients exceeding 60°C/km.13 Reasonable improvements in res-ervoir performance or reductions in drilling and completion costs may substantiallylower the effective cost of HDR power. In areas with steep geothermal gradients,the use of HDR may demonstrate a substantial cost advantage over coal. Thisadvantage may increase over time, allowing the use of HDR to produce a significantportion of the future electricity of the world.
Owing to its practicality and low operating costs, direct application of geothermalenergy is expected to grow in popularity, especially in geothermally favored regions.
© 2007 by Taylor & Francis Group, LLC

Geothermal Energy 441
Diverse applications are expected to be developed in this field, and more advancesin geothermal heat pump technology are also expected. Advances in materials,process integration and design, resource management, instrumentation, and drillingtechnology will undoubtedly enhance the global utilization of geothermal energy.
REFERENCES
1. Geothermal Resource Group, Geothermal Resource and Technology in the UnitedStates, National Academy of Sciences, Washington, D.C., 1, 1979.
2. Chermisinoff, P.N. and Morresi, A.C., Geothermal Energy Technology Assessment,Technomic Publishing Co., CT, 1970.
3. Griffin, R.D., CQ Researcher, Vol. 2, No. 25, July 10, 1992, pp. 575–588.4. Lynn, M. and Reed, M.J., Energy Sources, Vol. 14, 443, 1992.5. Wright, P.M., The American Association of Petroleum Geologists Bulletin, Vol. 23,
No. 12, 366, October 1989.6. U.S. Department of Energy, United States Geothermal Energy — Equipment and Ser-
vices for Worldwide Application, 1994, DOE/EE — 0044.7. U.S. Department of Energy, Geothermal Energy: 1992 Program Overview, 1992.8. Hadfield, P., New Scientist, February 17, 1990, p. 58.9. Web site of Geothermal Technologies Program, Energy Efficiency and Renewable
Energy, U.S. Department of Energy, 2004, http://www.eere.energy.gov/geothermal/deployment_gpw.html.
10. Reed, M.J., Geotimes, Vol. 36, No. 2, 1991, p.16.11. Reed, M.J., Geotimes, Vol. 38, No. 2, February 1993, p. 12.12. Phair, K.A., Mechanical Engineering, September 1994, p. 76.13. Harden, J., Energy, Vol. 17, No. 8, 777, 1992.14. Tenenbaum, D., Technology Review, Vol. 98, January 1995, p. 38.15. Dickson, M.H. and Fanelli, M., Energy Sources, Vol. 6, 349, 1994.16. Web site of Geothermal Heat Pump Consortium, Inc., 2004, http://www.geoexchange
.org/about/how.html.17. Web site of National Renewable Energy Laboratory, 2004, http://www.nrel.gov/
documents/geothermal_energy.html.18. Feature Article, Power Engineering, Vol. 93, October 1989, p. 50.19. Joyce, C., New Scientist, February 4, 1989, p. 58.20. Anderson, I., New Scientist, Vol. 111, July 24, 1986, p. 22.21. Feature Article, Mechanical Engineering, Vol. 113, January 1991, p. 10.22. Speight, J.G. and Lee, S., Handbook of Environmental Technology, 2nd ed., Taylor
& Francis, New York, 2000.23. Annual Energy Outlook 2006, Energy Information Administration, U.S. Department
of Energy, Washington, D.C., 2006.24. Boyd, T.L. and Lund, J.W., Geothermal Heating of Greenhouses and Aquaculture
Facilities, paper presented at International Geothermal Conference, Session #14,Reykjavik, Iceland, September 2003: accessible through http://jardhitafelag.is/papers/PDF_Session_14/S14Paper029.pdf.
© 2007 by Taylor & Francis Group, LLC

443
15 Nuclear Energy
Sudarshan K. Loyalka
CONTENTS
15.1 Nuclear Fission and Nuclear Reactor Physics ............................................ 44315.2 Electricity Generation from Nuclear Reactors ............................................ 451
15.2.1 Reactor Control and a Toy Model ................................................... 45515.3 Nuclear Fuel Cycle ...................................................................................... 45815.4 Types of Reactors......................................................................................... 462
15.4.1 Advanced Reactors and Concepts ................................................... 46715.4.2 Hydrogen Production ....................................................................... 475
15.5 Public Concerns of Safety and Health ........................................................ 47515.5.1 Nuclear Weapons Proliferation ........................................................ 48215.5.2 Nuclear Waste Disposal ................................................................... 48315.5.3 Terrorism .......................................................................................... 484
15.6 Nuclear Fusion ............................................................................................. 484References.............................................................................................................. 489
15.1 NUCLEAR FISSION AND NUCLEAR REACTOR PHYSICS
The neutron was discovered in 1932. The following years witnessed intense studiesof its properties and interactions with matter. This neutral particle is about 2000times the mass of an electron, and is scattered and absorbed by different materials.The nature and rate of its reaction are determined by the nuclei of the host materialand the energy of the neutron. Moreover, the nuclei that absorb neutrons can becomeradioactive and be transmuted to other types of nuclei, through radioactive decays.Neutrons can also split (fission) some nuclei (the fissile isotopes such as U-233, U-235, and Pu-239). Such fission is a complex process that produces new nuclei, betaand gamma radiation, and a few neutrons themselves. The products are energetic(the kinetic energy of fission products, energy of the radiation), deriving their energyfrom the binding energy of the nucleus. Consequently, the new neutrons (2 to 3 onaverage) released in fission provide the basis for a chain reaction. This chain reactioncan be sustained (each successive generation has the same number of neutrons) ormultiplied (each successive generation has more neutrons), and it can be used for acontrolled and a sustained as well as an explosive release of energy.1–21
© 2007 by Taylor & Francis Group, LLC

444 Handbook of Alternative Fuel Technology
Fission of a single nucleus releases about 200 MeV (3.2 10–11 J) of energy. Thisenergy is distributed, in a power reactor of modern design, approximately as shownin Table 15.1 and Figure 15.1.
Of this 200 MeV, about 190 MeV, or 95%, is recoverable energy, as the neutrinosdo not interact with matter, and escape from the system without depositing energy.One kilogram of U-235 contains 2.563 × 1024 U-235 nuclei, and its fission wouldrelease energy of about 78 × 106 MJ (which is the same as 21.6 × 10⁶ kWh or2.47 MWyr).
The fission products and beta and alpha particles are mostly deposited within afraction of centimeter from the point of birth (in a solid or a liquid), whereas neutronsand gammas travel a greater distance depending on their energy and the material.The prompt radiation is emitted within 10–17 to 10–6 sec from an interaction, whereasthe delayed radiation can be emitted within a few milliseconds to thousands of years(e.g., the long-lived isotopes).
The U-235 and neutron fission reaction can thus be described as:
(15.1)
in which A and B can be, for example, nuclei of cesium and strontium, and ν is thenumber of neutrons produced. The reaction is in accordance with generalized laws ofconservation, but A, B, and ν are not necessarily the same for each fission. In fact, a
TABLE 15.1Distribution of Fission Generated Energy in Time and Position
Type Process
Percentof totalreleasedenergy
Principal positionof energy deposition
FissionI: instantaneous energy Kinetic energy of fission fragments 80.5 Fuel material
Kinetic energy of newly born fast neutrons
2.5 Moderator
γ energy released at time of fission 2.5 Fuel and structuresII: delayed energy Kinetic energy of delayed neutrons 0.02 Moderator
β-decay energy of fission products 3.0 Fuel materialsNeutrinos associated with β decay 5.0 Nonrecoverableγ-decay energy of fission products 3.0 Fuel and structures
Neutron captureIII: instantaneous and
delayed energyNonfission reactions due to excess
neutrons plus β- and γ-decay energy of (n, γ) products
3.5 Fuel and structures
Total 100
Source: From El-Wakil, M.M., Nuclear Heat Transport, International Textbook Company, now availablefrom the American Nuclear Society, 1971. With permssion.
U n A B n235 + → + + ν
© 2007 by Taylor & Francis Group, LLC

Nuclear Energy 445
number of species are produced, and both ν and the energy (kinetic) of product neutronsvary. Furthermore, the fission reaction rate is strongly dependent on the energy (kinetic)of the reacting neutron (and also on the kinetic energy of the reacting U-235 in certainenergy ranges). Figure 15.2 and Figure 15.3 show, respectively, the distribution offission products and the distribution in energy of the neutrons produced in fission.
It is useful to note here that in a nuclear reactor the overall neutron density(#/cm3) is smaller than the nuclei density (#/cm3) by about 10 orders of magnitude.Thus, the nuclei distribution is determined by nuclei–nuclei interactions, and theneutron distribution in space, direction, energy, and time is determined by neu-tron–nuclei interaction. In the long term, the fission products, actinides, and latticesuffer damage because the energetic products and neutrons affect the nuclei–nucleiinteractions. Incidentally, both microscopic and macroscopic experiments have been
FIGURE 15.1 Distribution of fission energy in energy and time. (From Ott, K.O. and Neuhold,R.J., Introductory Nuclear Reactor Dynamics, American Nuclear Society, 1985. With permission.)
Fission
FissionFragments
Fast Neutrons
Scattering
PromptFission
Slow Neutrons
Fission Capture
InelasticScattering
Excited Nuclei
Radioactive Nuclei
DelayedNeutrons
Decay Neutrinos Decay
Capture Capture
© 2007 by Taylor & Francis Group, LLC

446 Handbook of Alternative Fuel Technology
used to study neutron–nuclei interactions, and a wealth of information on the natureof these interactions and their rates is now available. The rate Ri(#/sec) for a reactionof type “i” (absorption, fission, scattering) is expressed as:
(15.2)
in which,
FIGURE 15.2 Fission product distribution. (From Weinberg, A.M. and Wigner, E.P., The Phys-ical theory of Neutron Chain Reactors, University of Chicago Press, 1958. With permission.)
76 82 88 94 100 106 112 118 124 130 136 142 148 154 160MASS NUMBER
10
5
2
5
5
1
2
2
5
2
5
2
10-1
10-2
10-3
10-4
U233
U235
Pu239
FIS
SIO
N Y
IELD
(%
)
R E t d d dE E t E t d d dEi ir r r r r, , , , , , , ,Ω Ω Σ Ω Ω( ) = ( ) ( )φ
Σi E t Macroscopicr, ,( ) = cross section (1/lengtth) at at at time
“Ne
r
r
E t
E t dEd
,
, , ,φ Ω Ω( ) = uutron Flux,” (#/area time) at at in dr E E at in at time Ω Ωd t,
© 2007 by Taylor & Francis Group, LLC

Nuclear Energy 447
dr is a volume element at location r, and dΩ is an elemental solid angle in directionΩ. E indicates energy, and t is the time. A neutron balance equation can thus beconstructed as:
(15.3)
This is often known as the Linear Boltzmann Equation for neutron transport, orjust the Transport Equation, as it follows directly from the Nonlinear BoltzmannEquation for molecular distribution in the kinetic theory of gases. Note that v is thespeed of neutrons, the integral includes scattering as well as neutrons born in fission,and S is a source term. Subscript t indicates “total.” The gradient is with respect tor, and the gradient term indicates free streaming or drift. The boundary conditionsfor this equation are usually those of no inward neutron flow for a convex surfacefor a body situated in a vacuum. The initial conditions just prescribe the initial flux.
We should note that the neutron flux is related to the neutron density n by
and that the flux in the nuclear nomenclature is a scalar quantity. Thus,
FIGURE 15.3 Energy distribution of neutrons produced in fission (the fission spectrum).
0 1 2 3 4 5 6 7 8
NEUTRON ENERGY (MeV)
0.4
0.3
0.2
0.1
0
FR
AC
TIO
N O
F F
ISS
ION
NE
UT
RO
NS
PE
R M
eV
1v
E t
tE t E tt
∂ ( )∂
= − ∇ ( ) − ( )φφ φ
rr r r
, , ,. , , , , , ,
ΩΩ Ω Σ EE t
dE d E E t Es
, ,
, , , , , ,
Ω
Ω Σ Ω Ω Ω
( )
+ ′ ′ ′ → ′ →( ) ′ ′∫ ∫ r rφ tt
S E t
( )
+ ( )r, , ,Ω
φ r r, , , , , ,E t vn E tΩ Ω( ) = ( )
φ r r, , ,E t d dE dΩ Ω( )
© 2007 by Taylor & Francis Group, LLC

448 Handbook of Alternative Fuel Technology
should be understood as the path length traveled per unit time by neutrons in theelemental phase space volume . Thus, the inverse of the macroscopic crosssection is the neutron mean free path for that particular reaction, and we have
.Progress of the last few years enables us now to compute the neutron flux for
complicated geometries and reactor configurations by using combinations of ana-lytical, deterministic, and Monte Carlo methods,11–18 and this task has been greatlyaided by advances in computational hardware. In a simplified picture, we note thatfor any given mass, the neutron multiplication factor (the ratio of neutrons in ageneration to the previous generation) can be written as:
(15.4)
and is a measure of the criticality of the mass (k > 1, supercritical; k = 1, critical;k < 1, subcritical. k >= 1 is needed to sustain a chain reaction). The associated rateequation can be written as:
(15.5)
where n(t) is the number density of neutrons (#/cm3), is known as the neutronlifetime (~10–3 to10–6 sec) , and “s” (#/cm3 sec) is a source of neutrons. For a non-re-entrant mass (surface), the factor k is approximately expressed as:
(15.6)
Here, the second term in the denominator relates to the leakage from the system,with rs a point on the surface, and n(rs) a unit normal to the surface directed outwardto vacuum. This term is more important for small assemblies (with respect to theneutron mean free path) and less so for larger assemblies. Small assemblies generallycorrespond to weapons and research reactors, and the larger assemblies to cores ofnuclear power plants. The macroscopic cross section is represented (we suppress theposition dependence) as:
(15.7)
where N, the number density of the nuclei (#/cm3) in the mass, is expressed as:
(15.8)
d dEdr Ω
= ∑1 /
kneutrons produced
neutrons absorbed neutrons=
+ llost due to leakage
dn t
dt= n t +s(t)
k-1( ) ( )
kd dE d E E E
d dE d E
f
a
=( ) ( ) ( )
( )∫∫∫ r r r
r r
Ω Σ Ω
ΩΣ
ν φ, , ,
, φφ φr r r rr
, , . ( ) , ,. ( )
E d dE d n Es s
n s
Ω ΩΩ ΩΩ
( ) + ( )∫∫∫>00
∫∫∫
Σ E N E( ) = ( )σ
NM
= ×0 6023 1024. ρ
© 2007 by Taylor & Francis Group, LLC

Nuclear Energy 449
in which ρ is the density of the mass (gm/cm3), and M is the molecular weight(gm/gmol). σ(cm2) is known as the microscopic cross section for interaction withneutrons. It is different for different processes (fission, absorption, scattering) andgenerally has a complex dependence on the material and the energy. We have showna typical cross section in Figure 15.4 (note, a barn = 10–24 cm2).
For large reactors and design purposes, k can be approximately expressed as:
(15.9)
where an integral on the solid angle is understood. Further, it is convenientlyexpressed as:
where the four factors are defined in Table 15.2.We also define Ec as some cutoff energy (about 1 eV), below which neutrons
are regarded as “thermal” in that they have kinetic energy comparable to those ofthe nuclei, and both gain and lose energy while interacting with nuclei (above thecutoff, the analysis can be simplified by assuming that the neutrons lose energy in
FIGURE 15.4 U-235 total cross section. (ENDFB-VI cross-section files, obtained fromwww.nndc.bnl.gov.)
10-9 10-8 10-7 10-6 10-5 10-4 10-3 10-2 10-110-1
100 101
103
102
101
100
Energy (MeV)
Cro
ss S
ectio
n (b
)
kd dE E E E
d dE E
fall
a
∞
∞
=( ) ( ) ( )
( )∫∫ r r r
r r
ν φ
φ
Σ
Σ
, ,
,
0
rr, Eall
( )∞
∫∫ 0
k fp∞ = εη
© 2007 by Taylor & Francis Group, LLC
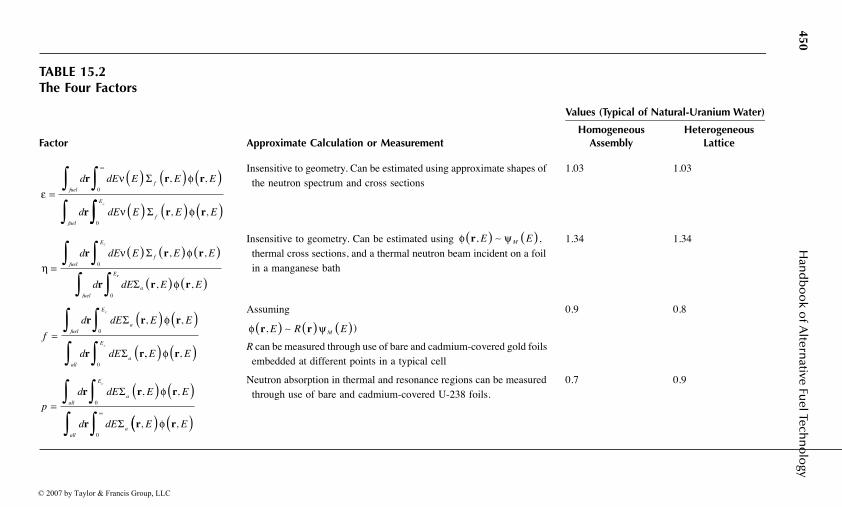
450H
and
bo
ok o
f Altern
ative Fuel Tech
no
logy
TABLE 15.2The Four Factors
Factor Approximate Calculation or Measurement
Values (Typical of Natural-Uranium Water)
HomogeneousAssembly
HeterogeneousLattice
Insensitive to geometry. Can be estimated using approximate shapes of the neutron spectrum and cross sections
1.03 1.03
Insensitive to geometry. Can be estimated using , thermal cross sections, and a thermal neutron beam incident on a foil in a manganese bath
1.34 1.34
Assuming
)
R can be measured through use of bare and cadmium-covered gold foils embedded at different points in a typical cell
0.9 0.8
Neutron absorption in thermal and resonance regions can be measured through use of bare and cadmium-covered U-238 foils.
0.7 0.9
εν φ
=∫ ∫∫
∞
( ) ( ) ( )d dE E E E
d dE
fuelf
fuel
Ec
r r r
r
0
0
Σ , ,
∫∫ ( ) ( ) ( )ν φE E EfΣ r r, ,
ην φ
=∫ ∫∫
( ) ( ) ( )d dE E E E
d dE
fuel
E
f
fuel
E
c
r r r
r
0
0
Σ , ,
cc
a E E∫ ( ) ( )Σ r r, ,φ
φ ψr, E EM( ) ( )∼
f
d dE E E
d dE
fuel
E
a
all
E
a
c
c
=∫ ∫∫ ∫
( ) ( )r r r
r r
0
0
Σ
Σ
, ,φ
,, ,E E( ) ( )φ r
φ ψr r, E R EM( ) ( ) ( )∼
p
d dE E E
d dE E
all
E
a
alla
c
=∫ ∫∫ ∫
( ) ( )∞
r r r
r r
0
0
Σ
Σ
, ,
,
φ
(( ) ( )φ r, E
© 2007 by Taylor & Francis Group, LLC

Nuclear Energy 451
collisions, scattering, with nuclei, but do not gain energy). Each of these four factors(known as the fast fission factor, reproduction factor, thermal utilization factor, and theresonance escape probability, respectively) can be experimentally measured or estimated(computed). They aid greatly in understanding the role of various nuclear and materialproperties, thermal conditions, and geometrical arrangements of fuel (UO2, etc.) andmoderators, absorbers, and coolants in influencing k. Use of these four factors was quiteimportant in early design of heterogeneous reactors, and it is still useful today. Forexample, it was found that arrangement of fuel in lumps or lattices leads to a highervalue of k over a homogeneous distribution. Also, whereas a critical reactor cannot beconstructed with just natural uranium (of enrichment currently available) and light watereven in the most favorable geometry, it is possible to construct critical reactors withnatural uranium and graphite or heavy water as moderators, and with a gas, heavy water,or light water as coolants. Indeed, the earliest reactors were constructed with just naturaluranium. We have shown typical values of the four factors in Table 15.2, and notedhow each of these can be measured or calculated approximately.
Clearly, knowledge of the neutron flux is crucial to the design of a reactor asthe criticality and heat generation are directly dependent on it. The flux can becalculated if the geometry and material distribution are defined, and the relevantneutron cross sections are known (from experiments or theory). The nuclear enter-prise has paid detailed and careful attention to the cross sections from the beginningof the nuclear age, and extensive and carefully assessed values are available foralmost all materials of interest in the open literature and through government-sponsored research centers (for example, the National Nuclear Data Center at theBrookhaven National Laboratory). The geometry and material information can beused to create an input file for a Monte Carlo computer program such as MCNP24
that has the cross sections libraries integral to it, and one can obtain the fluxdistribution in the reactor as well as compute the reactor’s multiplication factor,power distribution, and other needed quantities. Computer programs are also avail-able for computation of space–time variation of the fission products that accumulatein the reactor core, and for devising fuel management strategies to obtain optimumpower from the fuel consistent with applicable safety standards and regulations.
15.2 ELECTRICITY GENERATION FROM NUCLEAR REACTORS
As we have noted earlier, the energy released in a nuclear reactor is that associatedwith fission of fissile nuclei by neutrons, and also by emissions of beta, gamma,alpha, and neutrons by radioactive or unstable nuclei that are created by fission orabsorption of neutrons by nuclei. Not all neutrons are released at the moment offission; some are released later from the fission products, and some are also emittedby the actinides or because of photon or alpha particle reactions. The rate of thisenergy release (that is, the power, P) can be expressed as:
(15.10)P t G dE E t E t G d df p f i ir r r r, , , , ,,( ) ( ) ( )= + ′ ′∞
∫0
Σ φ λ tt K t t N tt
i
i i0∫∫∑ ′ ′ ′ ′( ) ( )r r r, ; , ,
© 2007 by Taylor & Francis Group, LLC

452 Handbook of Alternative Fuel Technology
in which we have made the simplifying assumption that a part of the energy isdeposited locally (the first term) and is directly related to the local and instantaneousvalue of the neutron flux, and the rest is from the decays of the radioactive isotopes.The kernel K is a measure of the contribution to power at r at time t from a decayat r and t. In practice, computer programs are used to calculate space–time distri-butions of all important isotopes and the power production. For our purposes, it issufficient to note that in an operating reactor 95% or more of the energy is depositedin nuclear fuel, and the rest in reactor coolant and structural material. In a steadystate, this energy is continuously removed to produce electricity and maintain thereactor at the desired neutronic, thermophysical, and structural conditions. We shouldalso note that for a reactor that has operated for some time, not all the powerproduction will stop if the neutron flux is reduced to a zero value (reactor shutdown)at the end of the operation, in that the radioactive isotopes would have accumulatedand these will continue to produce power (the decay heat). This accumulation ofisotopes depends on the reactor power history. The decay power after reactor shut-down for a reactor that has been operated for a long time at some steady state powerP0 can be approximately represented as:
(15.11)
in which t is the time in seconds after the shutdown. We have shown a plot of thedecay power in Figure 15.5.
FIGURE 15.5 Decay heat after shutdown for a reactor that had been operated for a very longtime. (From American Nuclear Society Standard, ANS 5.1.)
P t /P =0.066 t00.2( ) −
10-1
10-1
10-2
10-3
10-4
101 102 103 104 105 106 107 108 109
Time After Shutdown (s)
Dec
ay P
ower
to R
eact
or P
ower
Rat
io, P
/Po
© 2007 by Taylor & Francis Group, LLC

Nuclear Energy 453
Thus, the decay power is a significant factor in that adequate cooling must bemaintained even after the reactor is shut down, as otherwise the reactor fuel couldmelt and fission products may be released.
Nuclear reactor power plants typically have three essential parts:
a. Nuclear reactor core, where the nuclear fuel is fissioned, and energy andassociated radiation is produced. The core must be designed to containthe radiation and fission products.
b. A coolant system (the primary), which removes energy from the core.c. A coolant system (the secondary), which transfers the energy (removed
by the primary from the core) to an electricity generator through a turbine,and to the environment through a condenser and associated cooling toweror system. Some designs do not use a secondary coolant system at all andtransfer energy from the primary to the turbine directly, whereas otherdesigns require use of a tertiary system. Generally, about 1 ⁄3 of the energygenerated in the core is converted to electricity and about 2 ⁄3 is dissipated(lost) to the environment.
We have shown a typical nuclear power plant schematic in Figure 15.6.A considerable portion of “b” and all of “c” are similar to those in coal-fired
steam plants, and do not require any special elaboration here. We will hence focusmore on part “a,” and we will also discuss parts of “b.”
The reactor core of a modern 1000-MWe reactor is generally composed of about250 reactor fuel assemblies (“bundle”), with each assembly consisting of about 200fuel rods. Thus, there may be about 50,000 fuel rods in the reactor core. Generally,the fuel is UO2, in which the fresh fuel, the uranium, has been enriched to 2 to 4%(by weight) in U-235. The pencil-thin fuel rods are each about 4 m long, and arecontained in individual Zircaloy cans. There is some small spacing (filled with heliumat the beginning) between a rod and its Zircaloy can (“cladding”) to hold xenon,krypton, iodine, and other gases that are released during fission in the fuel. The coreis placed in a thick pressure vessel, and coolant (water) is pumped through the coreat high velocities. Each fuel rod can thus be envisaged as central to a cooling channel,in which the colder water (~573 K) enters the bottom, is heated by the fuel, andexits relatively hot (~610 K) at the top. The high coolant temperature at exit isrequired by 2-T Carnot cycle thermal efficiency considerations, and this in turndictates the choice of coolants, the fuel material, the operating pressure (which canbe as high as 15 MPa to prevent boiling), structural materials, etc. Once the coolantand the fuel are chosen, other design aspects depend on these choices.
During steady operation, there are typical drops in temperature of about 500,200, 30, and 30 K (radial), respectively, across the fuel (from its centerline to surface),the gap, the clad, and the coolant. Obviously, these drops depend on thermophysicalproperties (thermal conductivity) of the materials, the structural conditions of thefuel and clad, the hydrodynamic conditions (the Reynolds and Prandtl numbers),and the heat generation rate in the fuel, and are different at different locations in the
© 2007 by Taylor & Francis Group, LLC

454 Handbook of Alternative Fuel Technology
core. A useful quantity here is the linear heat generation rate, which is typicallyabout 15 to 20 kW/m of a fuel rod. Thus, each fuel rod generates 60 to 80 kW, and50,000 or so fuel rods generate 3,000 to 4,000 MWth (Mega Watt thermal) power.With an overall thermal efficiency of 33% or so, this corresponds to 1000 to 1300MWe (Mega Watt electric) of power generation, with the rest rejected to the atmo-sphere via cooling towers, etc.
We have shown a view of a PWR core and pressure vessel in Figure 15.7, andschematics of a fuel assembly and rod in Figure 15.8. Typical fuel rod arrangementand the temperature drop across a fuel rod are shown in Figure 15.9.
As a nuclear reactor generates power, U-233, U-235, Pu-239, and other fissileisotopes are fissioned (consumed), and fertile isotopes such as Th-232 and U-238 areconverted to fissile isotopes U-233 and Pu-239. The space–time concentrations of allthe isotopes are controlled through reactor designs and fuel management strategies.Typically, because of neutronic and structural considerations, one third of the fuelassemblies are replaced with fresh fuel assemblies each year, requiring reactor shut-downs for the refueling period. In a typical pressurized water reactor (PWR) that hasbeen operating for a longtime, most of the power is generated from U-235, whereasthe rest derives from Pu-239 that is continuously generated from U-238. Some reactordesigns also permit online refueling of reactors, and shutdowns for refueling are thennot necessary. There is considerable interest at this time to design and employ highand ultrahigh burn-up fuels that have refueling times of 10 to 15 years.
FIGURE 15.6 Schematic of a pressurized water reactor (PWR) plant. (From LANL report.)
StorageTank
To Drain Tank
Pressurizer
PilotOperated
Relief Valve
AccumulatorControlRods
Core
Pump
Pump
Sump
PrimarySystem
SecondarySystem
SteamGenerator
TurbineGenerator
CondenserCoolingWater
2
1
3
© 2007 by Taylor & Francis Group, LLC

Nuclear Energy 455
15.2.1 REACTOR CONTROL AND A TOY MODEL
The reactor control requires careful attention to details. Equation 15.5 does not tellthe entire story in that not all neutrons are emitted at the same time, and someneutrons are born “delayed” through some fission products. Also, some fission
FIGURE 15.7 A view of a pressurized water reactor (PWR) core and pressure vessel. (West-inghouse, from Connolly, T.J., Foundations of Nuclear Engineering, John Wiley & Sons,1978. With permission.)
Lifting Lug
Deep Beam
Upper SupportPlate
InternalsSupport Ledge
Core Barrel
Support Column
Inlet Nozzle
Upper Core Plate
Thermal Shield
Reactor Vessel
Access Port
Radial Support
Bottom SupportForging
Control RodDrive Mechanism
Instrumentation PortsThermocouples
Closure HeadAssembly
Thermal Sleeve
Control RodShroud TubeHold–down SpringAligment Pin
Control Rod Guide Tube
Control Rod Drive ShaftControl Rod Cluster(withdrawn)Outer Nozzle
Baffle Former
Former
Fuel Assemblies
Lower Core Plate
Flow Mixer PlateCore Support Columns
Instrumentation ThimbleGuide–neutron Detectors
© 2007 by Taylor & Francis Group, LLC

456 Handbook of Alternative Fuel Technology
products (such as xenon) are strong neutron absorbents, and they have both localand global effects on the reactor criticality, as they are both born (through fissionproducts and their transmutation) and destroyed (through decay and neutron cap-ture) continuously during the reactor operation. The multiplication factor k isfurther dependent on the reactor temperature (for example, there is an increase inneutron absorption in U-238 resonances as the temperature goes up, leading to adecrease in k) and coolant conditions (an increase in temperature leads to lowerdensity or phase change from liquid to vapor, and these changes known as thedensity and void effects, respectively, both lead to a decrease in k). A simple model(a point kinetics, or a toy model) that captures effects of some of these phenomenacould be written as:
FIGURE 15.8 Schematic of a fuel assembly and rod. (From LANL report.)
ControlRod
Cluster
Top Nozzle
Control Rod
Fuel Rod
Spring ClipAssembly
BottomNozzle
FUEL ROD ASSEMBLY
FUEL ROD
FissionGas
Plenum
ZircaloyCladding
Gas-Filled Gap
UO2 Fuel Pellets
3.7 m
1.0 cm
© 2007 by Taylor & Francis Group, LLC

Nuclear Energy 457
(15.12)
with appropriate initial conditions. Here, U is the internal energy of the core, isthe coolant mass flow rate through the core, h is the enthalpy of the coolant, and Pis the power generation in the core. We have,
(15.13)
in which V is the total volume of the core (assuming the cross sections are for thehomogenized core in some sense). Also, βs are fractional coefficients that indicategeneration due to fissions of the delayed neutron precursor “c” (actually there areseveral, but we have shown only one), iodine-135 (I), and xenon-135 (Xe). The
FIGURE 15.9 Fuel rod arrangement with coolant channels in a PWR, and typical temperaturedrop across a fuel rod.
dn t
dt=
k t,U t -1 -n t + c t Xe tc
aXe( ) ( )( )( ) ( ) ( ) −
βλ σ
(( ) ( )
( ) ( ) − ( )
( )
vn t +s(t)
dc t
dt= n t c t
dI t
dt=
ccβ λ
ββ λ
λ λ σ
II
I XeaX
n t I t
dXe t
dt= I t Xe t
( ) − ( )
( ) ( ) − ( ) − ee
out in
Xe t vn t
dU t
dt=P t m t h t h t
( ) ( )
( ) ( ) − ( ) ( ) − ( ))( )
m
P t =VG vn tf f( ) ∑ ( )
Space GridFuel Rod
D
(Dimensions are typicalof PWR designs)
UO2GapCladdingWater
0.0265˝0.0035˝
0.185˝
TemperatureProfile
P
t1
t/2
g
3 2
D
© 2007 by Taylor & Francis Group, LLC

458 Handbook of Alternative Fuel Technology
delayed neutron effects are most important for the routine short-term control of thereactor, whereas other effects are important for both short-term and long-term controlof the reactor.
The multiplication factor k has a complex dependence on the internal energy ofthe core, but this dependence can be expressed in some simple ways through use ofa summation of contributions from separate effects via coefficients that provide ameasure of the change in k with respect to these effects. For example, one constructsthe equation:
(15.14)
and develops it as dictated by insights and measurements or calculations. Thenonlinear system of ordinary differential equations then can be numerically solved,and considerable insights can be gained in the overall working of the system throughsimulations. In fact, simulators based on similar principles have played a verysignificant role in reactor operator training, just as they have been crucial in theaircraft industry.
15.3 NUCLEAR FUEL CYCLE
Natural uranium and thorium, and their compounds and transmuted products (Pu-239 and U-233, respectively) are the fuel resources for nuclear reactors. At present,natural uranium contains 99.3% U-238 and 0.7% U-235 in its compounds. Naturalthorium occurs mainly as Th-232 in its compounds. Th-232 is not fissile, but throughneutron absorption and subsequent decays of products, it can be converted to U-233,which is fissile. As we have noted earlier, through similar processes U-238 isconverted to Pu-239, which is also fissile. Thus, fertile materials such as U-238 andTh-232 can be converted or “bred” into fissile materials. Because both U-238 andTh-232 are plentiful in the earth’s crust, the nuclear fuel resource can be expanded100-fold or more through breeding over the ones that are naturally available in thefissile form. Although all nuclear reactors convert fertile materials into fissile mate-rials, special designs can enhance the breeding ratio (BR), which is defined as:
(15.15)
And it is possible to achieve BR > 1, guaranteeing long-term nuclear fuel supply(thousands of years). BR depends on the neutron spectrum (thermal, epithermal orfast) in the reactor, and the fuel (mainly the fertile content of uranium and thorium,that is U-238 or Th-232 content in the fuel). Note that fast neutrons produce alarger number of neutrons per fission as compared to thermal neutrons, as shownin Figure 15.10.
dk t,U t
dt=
kU
dUdt
( )( ) ∂∂
+ ..
BR=Average rate of production of fissile isotopees
Average rate of loss of fissile isotopes
© 2007 by Taylor & Francis Group, LLC
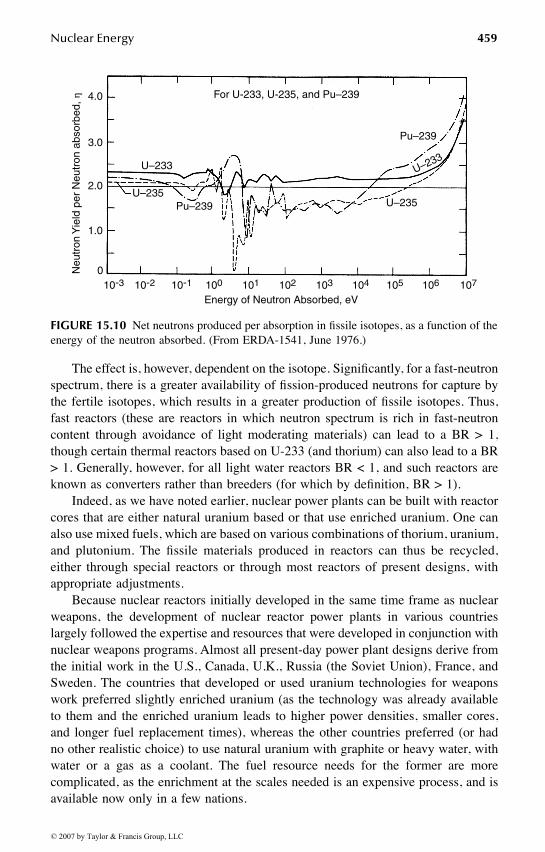
Nuclear Energy 459
The effect is, however, dependent on the isotope. Significantly, for a fast-neutronspectrum, there is a greater availability of fission-produced neutrons for capture bythe fertile isotopes, which results in a greater production of fissile isotopes. Thus,fast reactors (these are reactors in which neutron spectrum is rich in fast-neutroncontent through avoidance of light moderating materials) can lead to a BR > 1,though certain thermal reactors based on U-233 (and thorium) can also lead to a BR> 1. Generally, however, for all light water reactors BR < 1, and such reactors areknown as converters rather than breeders (for which by definition, BR > 1).
Indeed, as we have noted earlier, nuclear power plants can be built with reactorcores that are either natural uranium based or that use enriched uranium. One canalso use mixed fuels, which are based on various combinations of thorium, uranium,and plutonium. The fissile materials produced in reactors can thus be recycled,either through special reactors or through most reactors of present designs, withappropriate adjustments.
Because nuclear reactors initially developed in the same time frame as nuclearweapons, the development of nuclear reactor power plants in various countrieslargely followed the expertise and resources that were developed in conjunction withnuclear weapons programs. Almost all present-day power plant designs derive fromthe initial work in the U.S., Canada, U.K., Russia (the Soviet Union), France, andSweden. The countries that developed or used uranium technologies for weaponswork preferred slightly enriched uranium (as the technology was already availableto them and the enriched uranium leads to higher power densities, smaller cores,and longer fuel replacement times), whereas the other countries preferred (or hadno other realistic choice) to use natural uranium with graphite or heavy water, withwater or a gas as a coolant. The fuel resource needs for the former are morecomplicated, as the enrichment at the scales needed is an expensive process, and isavailable now only in a few nations.
FIGURE 15.10 Net neutrons produced per absorption in fissile isotopes, as a function of theenergy of the neutron absorbed. (From ERDA-1541, June 1976.)
For U-233, U-235, and Pu–239
Pu–239
U–233
U–235
U–233
U–235Pu–239
10-3 10-2 10-1 100 101 102 103 104 105 106 107
Energy of Neutron Absorbed, eV
4.0
3.0
2.0
1.0
0Neu
tron
Yie
ld p
er N
eutr
on a
bsor
bed,
η
© 2007 by Taylor & Francis Group, LLC

460 Handbook of Alternative Fuel Technology
The nuclear fuel cycle initially involves exploration and mining of uranium andthorium ores. These ores are widely available, and the principal resources are inthe U.S., Russia, China, Australia, South Africa, Gabon, Congo, Niger, India, etc.After mining (through open pit mining or in situ leaching from the ground or rocks),the uranium ore (~0.1% uranium oxide content) is milled (and leached and precip-itated out in an acid solution) to an oxide powder. In this form, the powder is knownas yellowcake (~80% uranium oxide content). The remainder of the ore is knownas the tailings; it is slightly radioactive and toxic, and is a waste that must beproperly disposed of.
At a conversion facility, the yellowcake is first refined to uranium dioxide, whichcan be used as the fuel in reactors that use natural uranium. Further processing,however, is needed if this uranium were to be enriched in U-235 for the reactorsthat require such uranium. For enrichment, the yellowcake is converted into uraniumhexafluoride gas through use of hydrogen fluoride and is shipped in containers toan enrichment facility where either a diffusion or a centrifuge process is used (othermethods such as Laser Isotope Separation are still not in commercial use). The firstprocess relies on a slight difference in the diffusion of the U-235 hexafluoridemolecule from that of the U-238 hexafluoride molecule through a membrane (thediffusion coefficient is inversely proportional to the square root of the molecularmass), whereas the second method relies on the mass difference (inertia) betweenthe two molecules.
In practice, thousands of stages are used. The diffusion process is highly energyintensive because of the pumping requirements, whereas the centrifuge processrequires special rotor materials, motors, bearings, etc. (the practical details are notin the public domain but are reported to have been clandestinely disseminated to anumber of countries in the last few years). The enriched uranium hexafluoride isnext reconverted to produce enriched uranium oxide. This oxide then is sintered(baked) at a high temperature (over 1400°C) to produce pellets, which are then usedin fuel rods and assemblies. In all this processing, great care is taken to ensurequality control with respect to content of fuel and its size and shape. Extensiveefforts are also made to avoid accidental criticality.
As the reactor fuel is used in a reactor, it undergoes enormous transformations.The fissile isotopes are fissioned and lead to fission products, neutrons, other radi-ation, and heat (as discussed earlier). The neutrons transmute the fission productsand also produce many actinide species through absorption in the fertile isotopes(some of which will fission again). The fuel cracks because of heat and stresses, thefission products migrate within the fuel, and gases such as xenon and iodine accu-mulate in the gap between a fuel rod and its cladding. The degradation in the fuelthermophysical properties requires that the fuel be taken out of the reactor after acertain time period, and that fresh fuel replace it. This generally is a batch processin that in most reactors, this “refueling” is done once a year when a reactor is shutdown for a couple of weeks, and approximately one third of the reactor core isreplaced. The fuel that is taken out of the reactor would have been generally usedfor a period of about 3 years, and is known as the spent fuel. There are certainreactors in operation (the CANDU reactor, which we will discuss later) in whichthe refueling is done online, and a shutdown is not required.
© 2007 by Taylor & Francis Group, LLC

Nuclear Energy 461
The spent fuel contains fission products, actinides (both minor and major), originalfissile isotopes, and other material. It is both radioactive and hot, and is stored at thereactor site in concrete-lined and cooled water pools for 6 months or longer. Thisstorage is temporary, as eventually the fuel must be reprocessed for extraction of thefissile isotopes (chiefly U-235 and Pu-239) and shipped for longer-term storage anddisposal at remote sites. Figure 15.11 is a schematic of the fuel cycle.
The reprocessing permits recycling of unused U-235, enables use of Pu in a reactor,and reduces the volume of the waste that needs to be disposed. Although these actionsare very desirable from an economic viewpoint and the technology has been demon-strated, both the recycling of Pu and waste disposal issues have been very controversial.It has been contended that the availability of Pu can lead to weapons proliferation, andthat it is very difficult to demonstrate long-term safe storage of the nuclear waste (evenin geological sites such as the Yucca mountain site in the U.S.).
FIGURE 15.11 Nuclear fuel cycle. (From http://www.infokreis-kernenergie.org/e/brennst-offkreislauf.cfm.)
Supply
Uranium FuelElements
Nuclear Power PlantDisposal
Mixed-oxideFuel Elements
Spent Fuel Elements
Prod. of UraniumFuel Elements
EnrichedUranium
DepletedUranium
Uranium Plutonium
Production of Mixed-Oxide Fuel Elements
Interim Storage ofSpent Fuel Elements
Reprocessing Plant Conditioning PlantConversionEnrichment
Uranium-OreProcessing
Waste Treatment
RadioactiveWaste Material
Uranium
NaturalUranium
LeachedOre
Uranium-OreDeposit
Shaft
Repository
© 2007 by Taylor & Francis Group, LLC

462 Handbook of Alternative Fuel Technology
We have shown a typical material balance for the fuel needed for the annualoperation of a 1000 MWth reactor in Figure 15.12.
15.4 TYPES OF REACTORS
We have discussed the PWR design earlier. Other types of reactors in present useare as follows:
The boiling water reactor (BWR): This type of reactor differs from a PWR inthat water is allowed to boil fully in the upper portions of the reactor core,and no heat exchanger loop (the secondary) is used. The water is maintainedat about 6–7 MPa (instead of 15.5 MPa as in a PWR). The steam passesthrough a separator at the top of the core and then goes on to drive turbines;the condensed water is pumped back to the core. The steam does containsome radioactive material, and so a modest shielding on the turbine side isrequired. Lower pressures and avoidance of steam generators simplify theplant design, but then there is the additional complication of two phase flowsin the core. Also, the pressure vessel is larger (it needs to accommodate theseparator) and the control blades are inserted from the bottom, therebyprecluding gravitational insertion of control rods in an emergency. Severaldifferent designs of BWRs and their containments are presently in existence,but in the U.S. these reactors are designed only by the General Electric Co.We have shown a schematic of a BWR in Figure 15.13.
FIGURE 15.12 Uranium ore needed for annual operation of a 1000-MWth reactor and theassociated material balance and waste.
Ore146,000 MT
Tailings145,800 MT
Yellowcake150 MT
Depleted Uranium117 MT
Enriched UF633 MT
UO2 Fuel33 MT
Spent Fuel
31.5 MT of depleted U1.2 MT of fission products
300 Kg of Pu
© 2007 by Taylor & Francis Group, LLC
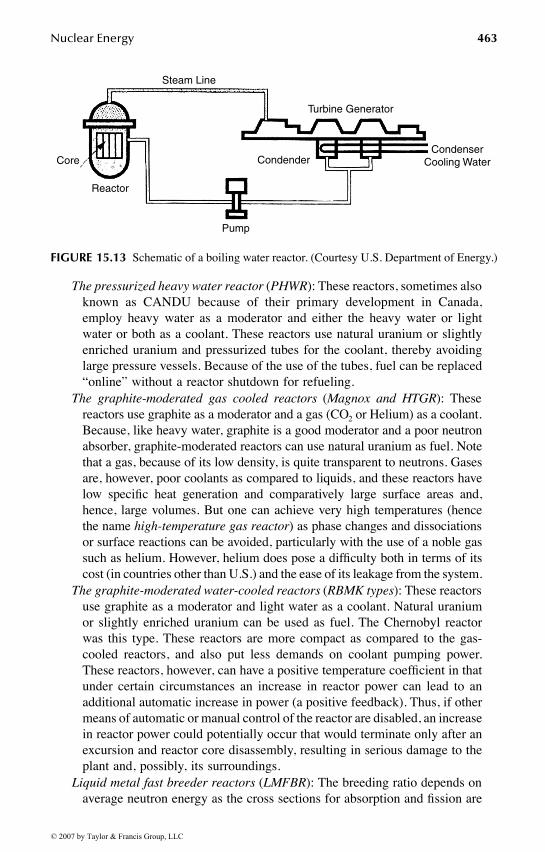
Nuclear Energy 463
The pressurized heavy water reactor (PHWR): These reactors, sometimes alsoknown as CANDU because of their primary development in Canada,employ heavy water as a moderator and either the heavy water or lightwater or both as a coolant. These reactors use natural uranium or slightlyenriched uranium and pressurized tubes for the coolant, thereby avoidinglarge pressure vessels. Because of the use of the tubes, fuel can be replaced“online” without a reactor shutdown for refueling.
The graphite-moderated gas cooled reactors (Magnox and HTGR): Thesereactors use graphite as a moderator and a gas (CO2 or Helium) as a coolant.Because, like heavy water, graphite is a good moderator and a poor neutronabsorber, graphite-moderated reactors can use natural uranium as fuel. Notethat a gas, because of its low density, is quite transparent to neutrons. Gasesare, however, poor coolants as compared to liquids, and these reactors havelow specific heat generation and comparatively large surface areas and,hence, large volumes. But one can achieve very high temperatures (hencethe name high-temperature gas reactor) as phase changes and dissociationsor surface reactions can be avoided, particularly with the use of a noble gassuch as helium. However, helium does pose a difficulty both in terms of itscost (in countries other than U.S.) and the ease of its leakage from the system.
The graphite-moderated water-cooled reactors (RBMK types): These reactorsuse graphite as a moderator and light water as a coolant. Natural uraniumor slightly enriched uranium can be used as fuel. The Chernobyl reactorwas this type. These reactors are more compact as compared to the gas-cooled reactors, and also put less demands on coolant pumping power.These reactors, however, can have a positive temperature coefficient in thatunder certain circumstances an increase in reactor power can lead to anadditional automatic increase in power (a positive feedback). Thus, if othermeans of automatic or manual control of the reactor are disabled, an increasein reactor power could potentially occur that would terminate only after anexcursion and reactor core disassembly, resulting in serious damage to theplant and, possibly, its surroundings.
Liquid metal fast breeder reactors (LMFBR): The breeding ratio depends onaverage neutron energy as the cross sections for absorption and fission are
FIGURE 15.13 Schematic of a boiling water reactor. (Courtesy U.S. Department of Energy.)
Steam Line
Core
Reactor
Pump
Turbine Generator
CondenderCondenser
Cooling Water
© 2007 by Taylor & Francis Group, LLC

464 Handbook of Alternative Fuel Technology
functions of neutron energy. For uranium-fueled reactors, a fast spectrum(that is, the neutrons are mostly at energies higher than 100 keV or so) canlead to a breeding higher than unity. The need for a fast spectrum precludesuse of low atomic mass materials in the reactor core (excepting gases,which, because of their low density, have large mean free paths for neutronsat all energies). This requires consideration of liquid metals or their alloys.Sodium, lead-bismuth, and mercury have all merited consideration, andseveral power reactors have been built, tested, and extensively used withsodium as a coolant. Generally, the cores are designed with zones of dif-ferent fuel compositions (seed and blanket) to maximize breeding andfacilitate fuel reprocessing. Sodium does pose challenges because of itscorrosiveness and high melting point (it is solid at room temperature), butit is an excellent coolant. One of the earliest reactors to produce electricpower was the Experimental Breeder Reactor-I. The Experimental BreederReactor-II (EBR-II) operated for a long time. The Fast Fuel Test Facility(FFTF) was a sodium-cooled test reactor, and so is the Kalpakkam reactorin India. The French Phoenix and Super Phoenix reactors both have beenLMFBRs, and have produced power. In the U.S., the experience has beenmixed. The Fermi-I, the first commercial LMFBR built near Detroit, waseventually shut down because of a flow blockage and consequent temper-ature rise that damaged the core. The Clinch River reactor was abortedbecause of economic and political considerations. We have shown a sche-matic of a LMFBR in Figure 15.14.
We have summarized the basic features of these reactor types and their thermo-dynamic parameters in Table 15.3 and Table 15.4, respectively.
The nationwide distribution of nuclear power plants is shown in Table 15.5.Table 15.6 shows the distribution of reactors by their types. These data are currentas of April 2003.
FIGURE 15.14 Schematic of a liquid metal fast breeder reactor. (Courtesy U. S. Departmentof Energy.)
PrimarySodium Coolant
SecondarySodium Coolant Steam Line
Core
ReactorHeat
ExchangerSteam
Generator
Condenser
Turbine Generator
CondenserCooling Water
Pump Pump Pump
© 2007 by Taylor & Francis Group, LLC

Nu
clear Energy
465
TABLE 15.3Basic Features of Major Power Reactor Types
Fuel
Reactor type Neutron spectrum Moderator Coolant Chemical form
Approximatefissile content
(all 235U except LMFBR)
Water-cooled ThermalPWR H2O H2O UO2 ~3% enrichmentBWR H2O H2O UO2 ~3% enrichmentPHWR (CANDU) D2O D2O UO2 NaturalSGHWR D2O H2O UO2 ~3% enrichment
Gas-cooled Thermal GraphiteMagnox CO2 U metal NaturalAGR CO2 UO2 ~3% enrichmentHTGR Helium UC ThO2 ~7–20% enrichmenta
Liquid-metal-cooled Fast None SodiumLMR U/Pu metal; UO2/PuO2 ~15–20% PuLMFBR UO2/PuO2 ~15–20% Pu
a Older operating plants have enrichments of more than 90%.
Source: From Ott, K.O. and Neuhold, R.J., Introductory Nuclear Reactor Dynamics, American Nuclear Society, 1985. With permission.
© 2007 by Taylor & Francis Group, LLC

466H
and
bo
ok o
f Altern
ative Fuel Tech
no
logy
TABLE 15.4Typical Characteristics of the Thermodynamic Cycles for Six Reference Power Reactor Types
Characteristic BWR PWR(W) PHWR HTGR AGR LMFBR
Reference designManufacturer General Electric Westinghouse Atomic Energy of Canada, Ltd. General Atomic National Nuclear Corp. NovatomeSystem (reactor station) BWR/6 (Sequoyah) CANDU-600 (Fulton) HEYSHAM 2 (Superphenix)Steam-cycle
No. coolant systems 1 2 2 2 2 3Primary coolant H2O H2O D2O He CO2 Liq. NaSecondary coolant — H2O H2O H2O H2O Liq. Na/H2O
Energy conversionGross thermal power, MW(th) 3579 3411 2180 3000 1550 3000Net electric power, MW(e) 1178 1148 638 1160 618 1200
Efficiency (%) 32.9 33.5 29.3 38.7 40.0 40.0Heat transport system
No. primary loops and pumps 2 4 2 6 8 4No. intermediate loops — — — — 8No. steam generators — 4 4 6 4 8Steam generator type — U tube U tube Helical coil Helical coil Helical coil
Thermal hydraulicsPrimary coolant
Pressure (MPa) 7.17 15.5 10.0 4.90 4.30 ~0.1Inlet temp. (°C) 278 286 267 318 334 395Average outlet temp. (°C) 288 324 310 741 635 545Core flow rate (Mg/s) 13.1 17.4 7.6 1.42 3.91 16.4Volume (L) or mass (kg) — 3.06 × 10⁵ 1.20 × 10⁵ (9550 kg) 5.3 × 10⁶ (3.20 × 10⁶ kg)
Secondary coolantPressure (MPa) — 5.7 4.7 17.2 16.0 ~0.1/17.7Inlet temp. (°C) — 224 187 188 156.0 345/235Outlet temp. (°C) — 273 260 513 541.0 525/487
© 2007 by Taylor & Francis Group, LLC

Nuclear Energy 467
15.4.1 ADVANCED REACTORS AND CONCEPTS
Over the past 60 years, many nuclear reactor designs have been considered. Manyhave been utilized for commercial and routine production of electric power. Con-sidering that France produces almost 70% of its electric power needs through existingnuclear reactor designs, it should be clear that given the political will and publicacceptance, power plants based on the existing designs can provide electric powerto most countries in the immediate future.
TABLE 15.5Nuclear Power Units by Nation
In operation Total
Nation # units Net MWs # units Net MWs
Argentina 2 1,018 3 1,710Belgium 7 5,680 7 5,680Brazil 2 1,901 3 3,176Bulgaria 4 2,722 4 2,722Canada 22 15,113 22 15,113China 7 5,426 11 8,764China (Taiwan) 6 4,884 8 7,584Czech Republic 4 1,648 6 3,610Finland 4 2,656 4 2,656France 59 63,203 59 63,203Germany 20 22,594 20 22,594Hungary 4 1,755 4 1,755India 14 2,548 22 6,128Iran 0 0 1 916Japan 53 44,041 58 48,883Lithuania 2 2,370 2 2,370Mexico 2 1,364 2 1,364Netherlands 1 452 1 452North Korea 0 0 2 2,000Pakistan 2 425 2 425Romania 1 655 5 3,135Russia 27 20,799 33 26,074Slovakia 6 2,512 8 3,392Slovenia 1 656 1 656South Africa 2 1,800 2 1,800South Korea 18 14,970 22 18,970Spain 9 7,565 9 7,565Sweden 11 9,460 11 9,460Switzerland 5 3,220 5 3,220Ukraine 13 11,195 18 15,945United Kingdom 31 11,802 31 11,802United States 104 99,034 107 102,637Totals 443 363,468 493 405,761
© 2007 by Taylor & Francis Group, LLC

468 Handbook of Alternative Fuel Technology
However, from a long-range technical point of view, as well as current andanticipated socioeconomic and political viewpoints, it is important to consider newreactor designs. The historical development of nuclear power plants is well depictedby Figure 15.15.
A major consideration in the new developments is the desire to extend theutilization of fuel resources through breeding of fertile material (which are plentifulbut do not directly produce energy) to fissile material (which are not plentiful butproduce energy), and minimization of nuclear waste material. Figure 15.16 showshow the advancements would lead to less waste and more sustainable energyproduction.
TABLE 15.6Nuclear Power Units by Reactor Type
In operation Total
Reactor type # unitsNet MWe # units
Net MWe
Pressurized light-water reactors (PWR) 262 236,236 293 264,169Boiling light-water reactors (BWR) 93 81,071 98 87,467Gas-cooled reactors, all types 30 10,614 30 10,614Heavy-water reactors, all types 44 22,614 54 27,818Graphite-moderated light-water reactors (LGR) 13 12,545 14 13,470Liquid metal-cooled fast-breeder reactors (LMFBR) 2 793 5 2,573Totals 444 363,873 494 406,111
FIGURE 15.15 Historical progression of nuclear reactor development. (From A TechnologyRoad Map for Generation IV Nuclear Energy Systems, USDOE, 2002.)
Generation IGeneration II
Generation IIIGeneration III+
Generation IV
Early PrototypeReactors Comercial Power
Reactors AdvancedLWRs Evolutionary
Design OfferingImprovedEconomics forNear-TermDeployment
– Shippingport– Dresden, Fermi I– Magnox – LWR-PWR, BWR
– CANDU– AGR
– ABWR– System 80+
Gen I Gen II Gen III Gen III+ Gen IV1950 1960 1970 1980 1990 2000 2010 2020 2030
– Highly Economical– Enhanced Safety– Minimal Waste– Proliferation Resistant
© 2007 by Taylor & Francis Group, LLC

Nuclear Energy 469
Two types of initiatives have received broad industrial and government supportin this regard:
1. The first initiative consists of some incremental but important modificationsof the existing designs. These modifications are based on the criteria ofcredible plans for regulatory acceptance, existence of industrial infrastructure,commercialization, cost-sharing between industry and government, demon-stration of economic competitiveness, and reliance on existing fuel cycleindustrial structure. The reactor designs that have emerged are the AdvancedBoiling Water Reactor (ABWR-1000, ESBWR), the Advanced PressurizedWater Reactor (AP600, AP1000, SWR-1000), Pebble Bed Modular Reactor(PBMR), International Reactor and Innovative and Secure (IRIS), and Gas-Turbine Modular Helium Reactor (GT-MHR). These reactors, and the dem-onstration plants, could come in operation by the year 2010.
2. The second initiative,22 known as the Generation IV Initiative (the GEN-IV Initiative), has the goals of sustainability (the ability to meet the needsof present generations while enhancing and not jeopardizing the abilityof future generations to meet society’s needs indefinitely into the future),Safety and Reliability, Economics, and Proliferation Resistance and Phys-ical Protection. The emphasis here is on reactor concepts and associatednuclear energy systems that will satisfy the following criteria:a. Meet clean air objectivesb. Promote long-term availability of systems and effective fuel utilization
for worldwide energy productionc. Excel in safety and reliabilityd. Have very low likelihood and degree of reactor core damagee. Eliminate the need for off-site emergency responsef. Have a clear life-cycle cost advantage over other energy sourcesg. Have a level of financial risk comparable to other energy sourcesh. Provide assurance against diversion or theft of weapons-usable materialsi. Provide physical security of the reactor and facilities
FIGURE 15.16 Gain in sustainable nuclear resources with Pu-recycling. (From A TechnologyRoad Map for Generation IV Nuclear Energy Systems, USDOE, 2002.)
© 2007 by Taylor & Francis Group, LLC

470 Handbook of Alternative Fuel Technology
Nearly 100 concepts that can be generally classified in the broad categories ofwater cooled, gas cooled, liquid metal cooled, and nonclassical (molten salt, gas-core, heat pipe, and direct energy conversion) have been proposed and considered.Six leading candidates that have been identified for research funding by the U.S.Department of Energy are:
• Gas-cooled fast reactor (GFR)• Lead-cooled fast reactor (LFR)• Molten salt reactor (MSR)• Sodium-cooled fast reactor (SFR)• Supercritical water-cooled reactor (SWCR)• Very-high-temperature reactor (VHTR)
We have shown their schematics in Figure 15.17 and summarized importantparameters in Table 15.7.
FIGURE 15.17A Schematics of GEN-IV reactors. (a) Gas-cooled fast reactor (GFR) (FromA Technology Road Map for Generation IV Nuclear Energy Systems, USDOE, 2002.)
Gas-Cooled Fast Reactor
Helium
Generator
Turbine
ElectricalPower
ReactorCore
Reactor
ControlRods
Heat Sink
Recuperator
Compressor
PreCooler
HeatSink
Compressor
Intercooler
© 2007 by Taylor & Francis Group, LLC

Nuclear Energy 471
FIGURE 15.17B Schematics of GEN-IV reactors. (b) Lead-cooled fast reactor (LFR) (FromLapeyre, B., Pardoux, E., and Sentis, R., Introduction to Monte-Carlo Methods for Transportand Diffusion Equations, Oxford, 2003, original in French, 1998. With permission.)
FIGURE 15.17C Schematics of GEN-IV reactors. (c) Molten salt reactor (MSR) (FromLapeyre, B., Pardoux, E., and Sentis, R., Introduction to Monte-Carlo Methods for Transportand Diffusion Equations, Oxford, 2003, original in French, 1998. With permission.)
Lead-Cooled Fast Reactor
ControlRods
Header
U-Tube HeatExchangerModules (4)
Reactor Module/Fuel Cartridge(Removable)
CoolantModuleCoolant
InletDistributor Reactor
ReactorCore
Generator
Turbine
ElectricalPower
Recuperator
Compressor
Heat Sink
IntercoolerCompressor
Heat SinkPreCooler
Molten Salt ReactorControlRods
ReactorCoolant Salt
PurifiedSalt
FuelSalt
ChemicalProcessing
Plant
Pump
FreezePlug
Pump
HeatExchange
HeatExchange
Emergency Dump Tanks
Compressor
Intercooler
PreCooler Heat Sink
Recuperator
Turbine
Generator ElectricalPower
Compressor
HeatSink
© 2007 by Taylor & Francis Group, LLC

472 Handbook of Alternative Fuel Technology
FIGURE 15.17D Schematics of GEN-IV reactors. (d) Sodium-cooled fast reactor (SFR)(From Lapeyre, B., Pardoux, E., and Sentis, R., Introduction to Monte-Carlo Methods forTransport and Diffusion Equations, Oxford, 2003, original in French, 1998. With permission.)
FIGURE 15.17E Schematics of GEN-IV reactors. (e) Supercritical water-cooled reactor(SWCR) (From Lapeyre, B., Pardoux, E., and Sentis, R., Introduction to Monte-Carlo Methodsfor Transport and Diffusion Equations, Oxford, 2003, original in French, 1998. With permission.)
© 2007 by Taylor & Francis Group, LLC

Nuclear Energy 473
Interesting as these concepts are, they do not constitute a radical departure fromthe reactor designs of the past. The research and development issues with theseGEN-IV reactors are mostly related to long-term operations at high temperatures,and thus concern materials compatibility, corrosion and damage, safety (particularlyfor fast spectra), and fuel processing and recycling. But basically, the GEN-IVreactors are recycles of old designs, and no new physics is involved.
An interesting design concept under exploration is the accelerator-driven reac-tor.34 In this design a proton beam is used to strike a lead or other heavy target,creating high-energy (fast) neutrons (known as spallation neutrons). These neutronsdrive an otherwise subcritical reactor, and a steady state of neutron population ismaintained in a subcritical (k < 1) reactor (see Equation 15.5, where dn/dt = 0, buts ≠ 0, leads to ). These reactors avoid any chances of large reactivityinsertions and, hence, large reactor accidents. These reactors can use any fissilematerial and have breeding ratios because of fast spallation neutrons. These designsare receiving some attention in the international community.
We should also note that all the preceding designs rely on conversion of fissionheat through a thermodynamic steam or gas cycle to electricity and thus have lowconversion efficiencies (maximum of about 50%). There are research efforts under-way to explore direct conversion schemes in which the fission energy can be first
FIGURE 15.17F Schematics of GEN-IV reactors. (f) Very-high-temperature reactor. (From ATechnology Road Map for Generation IV Nuclear Energy Systems, USDOE, 2002.)
ControlRods
GraphiteReactor
Core
GraphiteReflector
Pump
Blower
Reactor HeliumCoolant
HeatExchange
Heat Sink
HydrogenProduction Plant
Hydrogen
Oxygen
Water
Very-High-Temperature Reactor
n k= −( ) / ( )s 1
© 2007 by Taylor & Francis Group, LLC

474H
and
bo
ok o
f Altern
ative Fuel Tech
no
logy
TABLE 15.7Some Technical Specifications of GEN-IV Reactors
Reactor Parameter
Reactor Type
GFR LFR MSR SFR SCWR VHTR
Power 600 MWth 125–400 MWth 1000 MWe 1000–5000 MWth 1700 MWe 600 MWth
Net plant efficiency % 48 44 to 50 44 >50Reference fuel compound UPuC/SiC with
about 20% PuMetal alloy or
nitrideU or Pu fluorides
dissolved in Na/ZR fluorides
Oxide or metal alloy
UO2 with stainless-steel or Ni-alloy
cladding
ZrC-coated particles in blocks,
pins or pebblesModerator N/A N/A Graphite N/A Water GraphiteCoolant Helium Lead-eutectic Sodium Water HeliumCoolant inlet/outlettemperature °C
490/850 NA/550 565/700(850) NA/550 280/510 640/1000
Coolant pressure (bar) 90 1 1 250 VariableNeutron spectrum Fast Fast Thermal Fast Thermal/fast ThermalConversion (breeding) ratio Self-sufficient 1.0 Burner 0.5–1.30Average power density (MWth/m3)
100 22 350 100 6–10
Burnupa Damage 5% FIMA:60 dpa
100GWD/MTHM
150–200GWD/MTHM
45 GWD/MTH10–30 dpa
Earliest deployment 2025 2025 2025 2015 2025 2020
a GWD = Giga Watt days; MTHM = metric tonne heavy metal; dpa = displacements per atom; FIMA = fissions of initial metal atoms; N/A = not applicable; NA = not available.
Source: From A Technology Road Map for Generation IV Nuclear Energy Systems, USDOE, 2002.
© 2007 by Taylor & Francis Group, LLC

Nuclear Energy 475
converted to photonic energy through formation of excimers and photonic emissionsby these excimers, and then the conversion of this photon energy to electric energythrough the use of photoelectronic devices. In principle, one might then be able toget higher conversion efficiencies as a 2T Carnot cycle is avoided.36
15.4.2 HYDROGEN PRODUCTION
Fuel cells for automotive transport will require hydrogen. It has been suggested thatnuclear energy (reactors) may provide a very effective means of generating hydrogen.The schemes under consideration include37:
• Steam methane reforming, using nuclear energy for the endothermic heatof reaction
• Conventional electrolysis, using nuclear-generated electricity• Thermochemical cycles for water splitting• Hybrid cycles combining thermochemical and electrolytic steps• High-temperature electrolysis using nuclear electricity and heat
The steam–methane reformation is based on the reaction
(15.16)
The advantage of using nuclear energy to produce steam for this above processis that the process itself has been extensively studied. The use of nuclear energy toproduce steam avoids the need of methane combustion to produce steam, and theCO2 so produced is easier to sequester than CO2 resulting from methane burning.The disadvantages are that the CO2 is nevertheless produced and needs to be seques-tered. Also, a large amount of methane (natural gas) is used.
In the thermochemical cycle under consideration (see Figure 15.18), the nuclear-generated heat is used to split hydrogen from water through use of sulfur dioxideand iodine reactions. The process has the advantage that the raw stocks (iodine andsulfur dioxide) are not consumed, and are recycled. Its disadvantages are that a high-temperature reactor must be built to test the idea.
The high-temperature electrolysis process is quite straightforward as shown inFigure 15.19, but it has a lower conversion efficiency than that of the thermochemi-cal cycle.
Note that both the VHTR of the GEN-IV designs would also be quite suitablefor hydrogen production because of the high temperature of the exiting helium.
15.5 PUBLIC CONCERNS OF SAFETY AND HEALTH
Public concerns regarding safety and health issues associated with the operation ofnuclear reactors have their genesis in the dread of nuclear weapons, and the fact thatthe developments of the weapons and the nuclear reactors have overlapped andproceeded in a coincident time frame. Fission weapons are, however, characterizedby small size; the explosive part is only a few centimeters in diameter. Power density
CH + 2H O + 185 kJ CO + 4H4 2 2 2→
© 2007 by Taylor & Francis Group, LLC
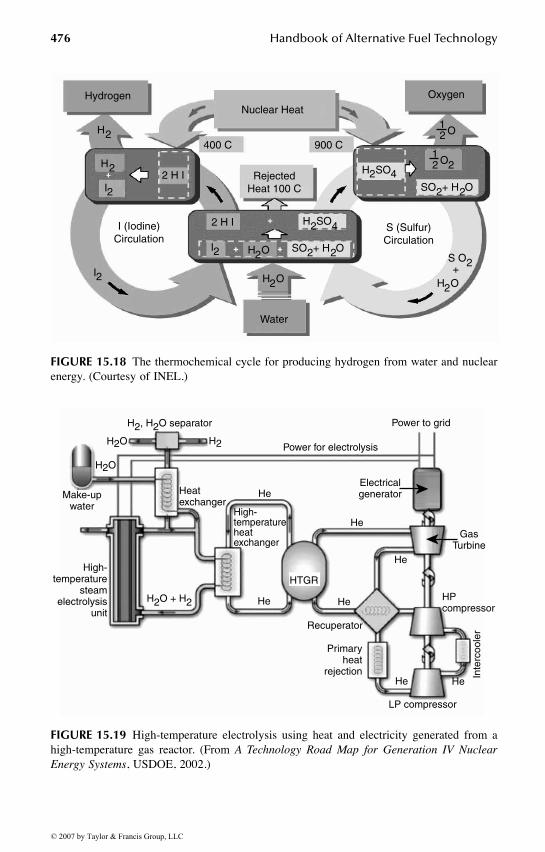
476 Handbook of Alternative Fuel Technology
FIGURE 15.18 The thermochemical cycle for producing hydrogen from water and nuclearenergy. (Courtesy of INEL.)
FIGURE 15.19 High-temperature electrolysis using heat and electricity generated from ahigh-temperature gas reactor. (From A Technology Road Map for Generation IV NuclearEnergy Systems, USDOE, 2002.)
HydrogenNuclear Heat
Oxygen
H2
H2
2I
2
2 2 2
2 4
2 4
I
2I
2 H I
2 H II (Iodine)Circulation
400 C 900 C
RejectedHeat 100 C
H SO
H O
2H O2H O
Water
SO + H O
2 2SO + H O
S (Sulfur)Circulation
S O2
H SO
12 2O
12
+
O
High-temperatureheatexchanger
He
He
He
He
HeHe
He
H2, H2O separator
H2O
H2O
H2
Make-upwater
Heatexchanger
High-temperature
steamelectrolysis
unitH2O + H2
Recuperator
Primaryheat
rejection
LP compressor
HPcompressor
GasTurbine
Electricalgenerator
Power to grid
Power for electrolysis
HTGR
Inte
rcoo
ler
© 2007 by Taylor & Francis Group, LLC
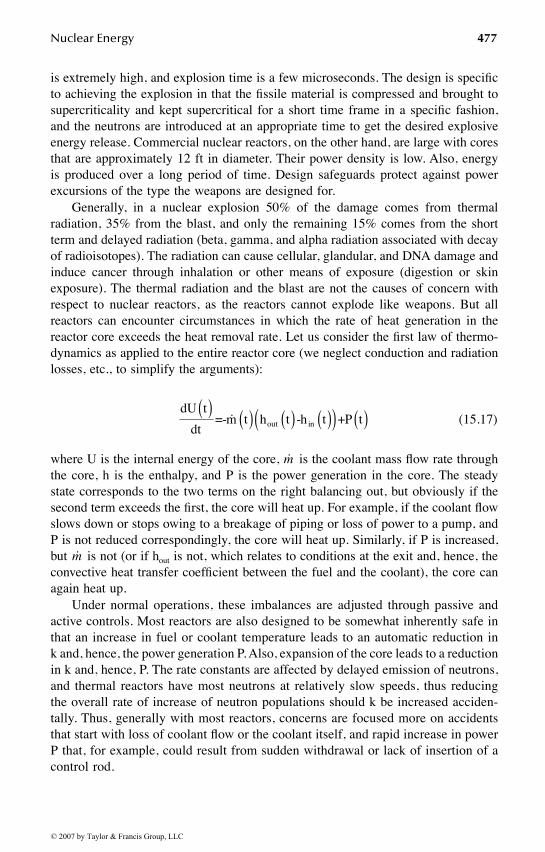
Nuclear Energy 477
is extremely high, and explosion time is a few microseconds. The design is specificto achieving the explosion in that the fissile material is compressed and brought tosupercriticality and kept supercritical for a short time frame in a specific fashion,and the neutrons are introduced at an appropriate time to get the desired explosiveenergy release. Commercial nuclear reactors, on the other hand, are large with coresthat are approximately 12 ft in diameter. Their power density is low. Also, energyis produced over a long period of time. Design safeguards protect against powerexcursions of the type the weapons are designed for.
Generally, in a nuclear explosion 50% of the damage comes from thermalradiation, 35% from the blast, and only the remaining 15% comes from the shortterm and delayed radiation (beta, gamma, and alpha radiation associated with decayof radioisotopes). The radiation can cause cellular, glandular, and DNA damage andinduce cancer through inhalation or other means of exposure (digestion or skinexposure). The thermal radiation and the blast are not the causes of concern withrespect to nuclear reactors, as the reactors cannot explode like weapons. But allreactors can encounter circumstances in which the rate of heat generation in thereactor core exceeds the heat removal rate. Let us consider the first law of thermo-dynamics as applied to the entire reactor core (we neglect conduction and radiationlosses, etc., to simplify the arguments):
(15.17)
where U is the internal energy of the core, is the coolant mass flow rate throughthe core, h is the enthalpy, and P is the power generation in the core. The steadystate corresponds to the two terms on the right balancing out, but obviously if thesecond term exceeds the first, the core will heat up. For example, if the coolant flowslows down or stops owing to a breakage of piping or loss of power to a pump, andP is not reduced correspondingly, the core will heat up. Similarly, if P is increased,but is not (or if hout is not, which relates to conditions at the exit and, hence, theconvective heat transfer coefficient between the fuel and the coolant), the core canagain heat up.
Under normal operations, these imbalances are adjusted through passive andactive controls. Most reactors are also designed to be somewhat inherently safe inthat an increase in fuel or coolant temperature leads to an automatic reduction ink and, hence, the power generation P. Also, expansion of the core leads to a reductionin k and, hence, P. The rate constants are affected by delayed emission of neutrons,and thermal reactors have most neutrons at relatively slow speeds, thus reducingthe overall rate of increase of neutron populations should k be increased acciden-tally. Thus, generally with most reactors, concerns are focused more on accidentsthat start with loss of coolant flow or the coolant itself, and rapid increase in powerP that, for example, could result from sudden withdrawal or lack of insertion of acontrol rod.
dU t
dt=-m t h t -h t +P tout in
( ) ( ) ( ) ( )( ) ( )
m
m
© 2007 by Taylor & Francis Group, LLC

478 Handbook of Alternative Fuel Technology
Under normal conditions, radioactive isotopes are contained in the fuel rods. Thecladding, water coolant system, piping and pressure vessel, containment, and engi-neered safety features (sprays, ice condensers, suppression pools, etc.) are designed tolimit the release of radioactive isotopes during accidents (see Figure 15.20). Naturalprocesses (physicochemical reactions, deposition, settling, coagulation, fragmentation,aerosol growth, etc.) may act to reduce or enhance the release fractions.
Overall, there are several aspects of the nuclear fuel cycle that have been causesof public concern:
• Release of radioactive material to the environment during the mining,processing, and transport (shipping) of fresh or used nuclear fuel
FIGURE 15.20 Cross section of a typical containment building for a pressurized waterreactor (PWR). The concrete building houses the entire primary system, the pressure controlsystem, ventilation equipment, and part of the emergency core-cooling system. The variouscomponents are encased in concrete and surrounded by a 0.63 cm thick steel liner. (FromLos Alamos Science, Vol. 2, No. 2., Los Alamos Scientific Laboratory, 1981. With permission.)
Steel Liner
ReactorsCoolant Pumps
ReactorVessel
SteamGenerators
Sump
Overhead Crane
170’
© 2007 by Taylor & Francis Group, LLC

Nuclear Energy 479
• Releases of radioactive material during normal operation or accidents atnuclear power plants
• Short-term and long-term storage of nuclear waste, and releases from thestorage sites
• Proliferation of technology and the attendant risk of terrorism
Nuclear industry, utility groups, national governments, and the InternationalAtomic Energy Agency (IAEA) have all addressed these issues in depth, and stringentregulations at national levels, as well as guidance at international levels, have beenformulated. These are enforced or followed to reduce risks to the public from postu-lated or real accidents. Yet, it must be realized that accidents have occurred, and willoccur, and neither accidents nor releases of radionuclides can be completely pre-vented. The best one can do is reduce the probabilities of accidents, and then whenthe accidents do occur, reduce the consequences associated with them. But riskmanagement is expensive, and good risk–benefit and cost–benefit analysis are neededto arrive at regulatory requirements that would find public and institutional sup-port.38–45 This support has varied greatly in different countries and at different times.
Table 15.8 gives the half-lives and radioactive inventories of some importantisotopes that are produced in a nuclear power plant. Health hazards are largelyassociated with the longer-lived, volatile isotopes of I, Cs, Sr, Pu, Ru, and Te, whichemit beta and gamma radiation, and Pu and other actinides that emit alpha particlesand neutrons also.
Accident sequences that can cause vaporization of reactor inventory are thoseinitiated by a loss of coolant, accidents, and severe transients (primary coolant pipebreak, main steam line break in a PWR, control rod ejection, pressure vessel failure,etc.). Details of such sequences are discussed in Reactor Safety Study (WASH-1400).
The amount and timing of the release of radioactive substances from a reactorplant to the environment is referred to as a nuclear source term. More broadly, sourceterms are characterized by the radionuclides that are released to the environment aswell as the time dependence of the release, the size distributions of the aerosolsreleased, the location (elevation) of the release, the time of containment failure, thewarning time, and the energy and momentum released with the radioactive material.The definition of the source term is slightly loose as different computer programsmay require different inputs. Still, it is clear that source terms will be closely relatedto the vapors, gases, and particles in suspension in the reactor containment (orbuilding) at a given time, and the states of this suspension and the containment. Ifa containment does not fail (and is not bypassed) then, regardless of the complicatedphenomenology that takes place inside the containment during the accident, thesource term would be zero, and no direct harmful effects to the public would result.
The determination of source terms within well-defined bounds is not simple. First,a range of severe accident scenarios, with corresponding initiating events, must bestudied. Using probabilistic methods (fault and event trees), a probability of occur-rence can then be assigned to the given accident scenario. Next, an integrated analysisof all that occurs in the plant needs to be carried out. Detailed physicochemical,neutronic, and thermal hydraulic models with an extensive database (separate effects)and integrated computer programs (as verified against a range of integral experiments)
© 2007 by Taylor & Francis Group, LLC

480 Handbook of Alternative Fuel Technology
are required. This task can be quite overwhelming as the number of molecular speciesinvolved is large, temperatures and pressures can be high, and the associated flowscan be quite complex. High radiation fields are also present and, depending on thespecific type of accident, the situation can be very dynamic.
Note that in 1957, the WASH-740 reports recommended an exclusion zone ofradius R (miles) around a nuclear plant of power P (MWth), based on the formula:
This formula is not based on realistic estimates. Rather, all material from the plantis assumed to disperse without any mitigating mechanisms. In 1957, the Windscaleaccident occurred, in which 100% of the noble gases, 12% of the I inventory, and 10%of Cs inventory of the core were released to the environment. This accident was the
TABLE 15.8Important Radioactive Nuclides (in a 3412-MWth PWR operated for 3 years, as predicted by computations)
RadionuclideHalf-Life
(days)Inventory (Ci × 10–8) Radionuclide
Half-Life(days)
Inventory (Ci × 10–8)
Iodine isotopes
I-131 8.05 0.87 I-133 0.875 1.8I-132 0.0958 1.3 I-135 0.280 1.7
Noble gases
Kr-85 3.950 0.0066 Kr-88 0.117 0.77Kr-85m 0.183 0.32 Xe-133 5.28 1.8Kr-87 0.0528 0.57 Xe-135 0.384 0.38
Cesium isotopes
Cs-134 7.5 × 10² 0.13 Cs-137 1.1 × 10⁴ 0.065
Other fission products
Sr-90 1.103 × 10⁴ 0.048 Ba-140 1.28 × 101 1.7Ru-106 3.66 × 10² 0.29 Ce-144 2.84 × 10² 0.92Te-132 3.25 1.3
Actinide isotopes
Pu-238 3.25 × 10⁴ 0.0012 Pu-241 5.35 × 10³ 0.052Pu-239 8.9 × 10⁶ 0.00026 Cm-242 1.63 × 10² 0.014Pu-240 2.4 × 10⁶ 0.00028 Cm-244 6.63 × 10³ 0.0084
Note: A Curie, Ci, signifies 3.7 × 10¹⁰ emissions of a radioactive particle per second, and is often usedin describing radioactivity.
Source: From Williams, M.M.R. and Loyalka, S.K., Aerosol Science: Theory and Practice with SpecialApplications to the Nuclear Industry, Pergamon, Oxford, 1991. With permission.
R =P10
17 mi for a 3000-MW plant1/2
th
∼
© 2007 by Taylor & Francis Group, LLC

Nuclear Energy 481
basis for the TID-14844 criteria for licensing ([1962], regulatory guides 1.3 and 1.4),which stipulates that release from the core to the environment will consist of 100%of noble gas, 50% of I (in gaseous form), and 10% of the nonvolatile (solids)inventory. It was also specified that the containment would retain half of the I (ofthat released), and all of the solids. Further retentions could occur because ofparticular containment designs and engineered safety features. In these guidelines,containment is assumed not to fail, but to leak.
The year 1975 was significant in the history of reactor safety analysis and thesource term. The WASH-1400 report provided estimates on frequency of accidentsand related consequences. The analysis was specific to a PWR and a BWR. Thereport showed that reactors are very safe and pose only an extremely small risk.
The March 28, 1979, accident at the Three Mile Island-2 (TMI-2) plant nearHarrisburg, PA was rather serious. In the WASH-1400 nomenclature, the accidentsequence was TMLQ (transient with loss of flow), initiated by a pressure relief valvestuck in an open position, and later exacerbated by operator actions that shut downemergency cooling water. The source terms, however, were a matter of great surprise.Whereas all the noble gases were released (no surprise), the releases of volatiles (I,Cs) were 3 to 4 orders of magnitude smaller than predicted by a TID-14844 type ofanalysis. These observations and their implications for safety analysis were notedin a series of papers. It was argued that in wet reducing environments, iodine andcesium are quite reactive and do not stay in the vapor phase but either plate out orreact with aerosols that settle or deposit on the walls. Thus, the chemistry of theenvironment and the aerosol dynamics clearly play a vital role in the estimation ofsource terms.
The Chernobyl accident (April 26, 1986) was characterized by a large sourceterm (large releases). At Chernobyl, however, the situation was quite different in thatthe reactor design was not inherently safe (there could be a rapid increase in power),and the building was not designed to be a containment. Also, chemical explosionsrendered any containment possibilities ineffective.
In the past, several nuclear reactors (SL-1, SNAPTRAN, Crystal River-3, Wind-scale-1, KIWI-TNT, HTRE-3, SPERT-1, TMI-2) have, unintentionally or otherwise,experienced core damage accidents. A common observation is that large releases tothe atmosphere occurred only when “dry” situations prevailed (Windscale-1, a graph-ite-moderated reactor, and HTRE-3, a zirconium-hybrid-moderated reactor). In alllight water reactor accidents, releases to the atmosphere were rather small.
The Chernobyl accident is in contrast to the other accidents mentioned earlier.The RBMK reactor #4 was destroyed, lives were lost, and sizeable releases ofradioactivity occurred, extending over a period of several days. The Chernobylreactor started operating in December 1983 and by April 1986 had an average fuelburnup of 10.3 MWd/kgU. The accident on April 26, 1986, was caused by operatorerrors that led to a prompt critical excursion exacerbated by positive void coefficients.It is estimated that within a second (1:23:44 a.m. to 1:23:45 a.m. local time) the fuelwent from about 330°C to 2000°C and, during the next second, a substantial partof the fuel melted and vaporized (above 2760°C). The reactor core then disassembledviolently and the excursion was terminated. In the following hours, the heat fromthe excursion and the radioactive decay was redistributed in the fuel and the relatively
© 2007 by Taylor & Francis Group, LLC

482 Handbook of Alternative Fuel Technology
cooler graphite. Eventually, the graphite began to burn and continued to burn forseveral days. This exothermic reaction heated the core further. Sand and othermaterials (boron carbide, dolomite, Pb, etc.) were dropped on the core and eventually,by May 6, the fire was effectively extinguished, and the release terminated. Theviolent disassembly of the core and the graphite fire led to some 30 additional firesin and around the reactor. Firefighting efforts were carried out in a radioactiveenvironment, leading to 2 immediate and 29 subsequent deaths of site personnel.The radioactive releases occurred over a 10-d period. The releases contained noblegases, fuel and core debris including fuel fragments and large chunks of metal andgraphite, a large number of large-sized particles (tens to hundreds of micrometers),and an even larger number of submicron aerosol particles. The latter were transportedthrough the air over large distances within the northern hemisphere.
Since the Chernobyl accident, there has been no reactor accident worldwide.There was, however, an accident in Japan at the Tokaimura fuel processing facility,where some fissile materials in solution were poured in excess in a tank. The tankbecame critical, and a small nuclear excursion and radiation release took place. Aworker lost his life because of radiation exposure, and a few other workers werealso affected. Release of radiation external to the plant was small. There have beenadditional instances, for example, in the U.S., which have shown that reactor pressurevessels and their components can suffer greater structural damage during operationthan previously envisaged, but so far it has been possible to detect major problemsin time and to take corrective actions.
15.5.1 NUCLEAR WEAPONS PROLIFERATION
Fission of 1 kg of U-235 or Pu-239 releases an energy equivalent to that obtainedin explosion of about 20 kT of TNT. World War II imperatives led to the ManhattanProject in the U.S. and construction, testing, and use of the first nuclear weapon in1945. There has been no other combat use of nuclear weapons, but there have beenmany other detonations, both aboveground and underground. The fission bombs havebeen surpassed with vastly more powerful (~50 MT, 1 MT = 1000 kT) hydrogen orthermonuclear bombs where a fission bomb is used to create a fusion reaction. TheU.S., Russia (Soviet Union), U.K., France, China, India, and Pakistan have testednuclear weapons. It is also widely accepted that Israel has produced and stockpilednuclear weapons and that South Africa had also produced nuclear weapons andperhaps detonated one. Many other nations (Argentina, Brazil, Iraq, Iran, Libya, andNorth Korea) have pursued nuclear weapons technology clandestinely at one timeor another, and several of them are currently pursuing it (it detonated one in October,2006). It is also widely accepted that North Korea has a few nuclear weapons, andit is working on more. Nuclear weapons are comparatively compact, and these canbe delivered by airplanes, missiles, ships, barges, or even trucks. There is speculationthat suitcase-size nuclear weapons exist.
Nuclear weapons technology was born in wartime, and many of its practicalaspects have since been well guarded (classified) not only by the U.S. but by othernations also. Many Manhattan Project documents, and the subsequent nuclear liter-ature, however, provide considerable insights into the basic technology. Aspects of
© 2007 by Taylor & Francis Group, LLC

Nuclear Energy 483
the technology acquired with respect to power production, including uranium enrich-ment, fuel processing for plutonium production, experience with radiation and itsdetection, neutronics, metallurgy, specialized electronics, and theoretical understand-ing and computational capabilities have direct applications in the weapons area.Although it is far-fetched to imagine homemade nuclear bombs, a determined nationor a well-financed group can hide a weapons program under the guise of a powerprogram and, indeed, some nations have already done so. Concerns remain thatnuclear material and weapons can be stolen also, or nuclear shipments can behijacked. These are all legitimate concerns, and similar concerns now surroundbiotechnology and aspects of chemical technology. The most effective means ofalleviating concerns here can only be international understanding and control, andarms reduction. There are, however, no simple answers to the issue of proliferation,as the political parts of it overwhelm any technical fixes one might attempt. Also,the knowledge (for example, with respect to the centrifuge technology) has diffusedto an extent that the proliferation is occurring from secondary and tertiary sourcesover which little control is being exercised.
15.5.2 NUCLEAR WASTE DISPOSAL
As challenging as the problems of reactor safety and the nuclear weapons prolifer-ation are, nothing has caught the public attention more than the problems of nuclearwaste disposal, whether it be the uranium mill tailings or the spent reactor fuel. Thisis a bit unfortunate as good technical solutions to the waste disposal problems areeither available, or can be formulated. Uranium (together with several of its decayproducts) is naturally radioactive, and it is possible to reduce much of the fuel cycleproducts to a radioactive state that has a life span of about 1000 years only. This,for example, can be done by separating major actinides from the spent fuel andrecycling them for fission (power production) in the standard or specialized reactors.The Integrated Fast Reactor (IFR) is an example of such a reactor concept, whereinpyroprocessing (electrolytic separation at high temperatures) can be used to processspent fuel on site. Mixed oxide fuel reactors are another example, where Pu-basedfuel is used together with U-based fuel.
The problem, however, is presently being addressed through two stages:
1. On-site storage, for several years, of the spent fuel2. Relocation to temporary or permanent storage sites in the future
These permanent sites are to be geologically stable, and safe from water perco-lation and other climactic factors that might lead to radioactive material dispersal.In the U.S., a site is being constructed at Yucca Mountains in the State of Nevada,and spent reactor fuel (assemblies) will be transported via trucks from nuclear powerplant fuel storage pools to this site contingent on the results of a drawn-out regulatoryand public or political process.
Other nations have made progress, both with respect to reprocessing and recy-cling of the spent fuel in reactors, as well as long-term storage and disposal. Forexample, in France, the fuel is reprocessed and recycled, as well as stored after
© 2007 by Taylor & Francis Group, LLC

484 Handbook of Alternative Fuel Technology
reprocessing (wherein the waste is encapsulated in vitreous material that is imper-vious to fluids and is environmentally stable) in salt formations.
15.5.3 TERRORISM
Most recently, there has been considerable concern regarding “dirty bombs,” orradioactive material dispersion, in which, for example, a reactor fuel assembly isexploded with dynamite, and the material is dispersed in a dense population. Sabo-tage of nuclear reactor power plants is also feared. These aspects have required, andwill require, enhanced security at nuclear power plants, and improved safeguards onnuclear materials.46
In conclusion, we should note that at least one natural reactor had existed millionsof years ago in Africa. As Lammarsh2 has stated,
. . . Oklo is the name of a uranium mine in the African nation of Gabon, where Franceobtains much of the uranium for her nuclear program. When uranium from this minewas introduced into a French gaseous diffusion plant, it was discovered that the feeduranium was already depleted below the 0.711 wt% of ordinary natural uranium. Itwas as if the uranium had already been used to fuel some unknown reactor.
And so it had. French scientists found traces of fission products and Trans Uranic(TRU) waste at various locations within the mine. These observations were puzzlingat first, because it is not possible to make a reactor go critical with natural uranium,except under very special circumstances with a graphite or heavy water moderator,neither of which could reasonably be expected to have ever been present in the vicinityof Oklo. The explanation of the phenomenon is to be found in the fact that the half-life of U-235, 7.13E8 years, is considerably shorter than the half-life of U-238, 4.51E9years. Since the original formation of the Earth, more U-235 has therefore decayedthan U-238. This, in turn, means that the enrichment of natural uranium was greateryears ago than it is today. Indeed . . . about 3 billion years ago this enrichment was inthe neighborhood of 3 wt%, sufficiently high to form a critical assembly with ordinarywater, which is known to have been present near Oklo at that time. . . .
Thus, nuclear energy from fission is really not that new! Our challenge is torecognize that we have an amazing source of energy that with good institutionalsafeguards can provide, in environmentally safe ways, abundant energy to humankindfor thousands of years to come.
15.6 NUCLEAR FUSION
Fusion is the inverse of fission in that certain light nuclei can combine together tocreate a pair of new nuclei that have a greater stability than the reactants. Fusionreactions are the primary source of power in stars, including the sun.47–50 To understandconditions under which fusion can occur, let us look at a much-studied1,47–58 reaction:
(15.18)D+T He +n+17.6MeV4→
© 2007 by Taylor & Francis Group, LLC

Nuclear Energy 485
where D indicates a deuteron or deuterium nucleus ( ), T indicates a triton ortritium nucleus ( ), and “n” indicates a neutron. Because 1 kg of D contains3.0115 × 1026 D nuclei, its fusion with an equal number of T nuclei (1.5 kg) wouldrelease about 8.5 × 10⁸ MJ (or expressed differently, 2.36 × 10⁸ kWh or 26.9 MWyr).This is about 10 times the energy released from the fission of 1 kg U-235.
Note that both D and T are positively charged particles; their interaction isgoverned by repulsive coulombic forces. Large gravitational or inertial (acceleration)forces, or high temperatures are needed to overcome this repulsion for any significantfusion reaction to occur. This is a crucial difference from fission, where such specialconditions for the reaction are not needed. The 17.6 MeV that is released in thisreaction, is associated with the kinetic energy of the neutron (14.1 MeV) and the
(3.5 MeV). The rate equations for this reaction, and the associated energybalance (the first law of thermodynamics) can be approximately described by a pointkinetics model as:
(15.19)
Here N indicates the concentration of the subscripted species, U the internalenergy of the system, V its volume, f the fraction of energy G (14.1 MeV or 3.5MeV) that is deposited in the system, and Qloss the power removed from the systemthrough losses or that is removed through cooling to drive a turbine and generateelectricity. R (m3/sec) is a measure of the reaction rate (here T indicates the temper-ature, and it should not cause any confusion with the symbol for triton, as they areused in different contexts), and it is approximately given by1,53:
(15.20)
in which kT has been expressed in units of keV (note that the Boltzmann constant,kB = 0.861735 × 10⁻⁷ keV/K). We have shown in Figure 15.21 a plot of this expression.
Note that R is significant only at very high temperatures that are not realizable.But, because at the high temperatures that are needed, the material will be in a state
H12
H13
He4
dNdt
=-R (T)N N +N
dNdt
=-R (T)N
DDT D T D,netgain
TDT DD T T,netgain
HeDT D T He ,ne
N +N
dN
dt=R (T)N N N
4
4−ttloss
nDT D T n,netloss
n
dNdt
=R (T)N N -N
dUdt
=V f G nnn
He HeHe
loss
dNdt
+f GdN
dt-Q4 4
4
R T =3.7 10exp 20/ k T
k TDT
18B
1/3
B2/3( ) ×
− ( )( )( )
−
© 2007 by Taylor & Francis Group, LLC

486 Handbook of Alternative Fuel Technology
of plasma (mixture of ions, electrons, and neutrals) with very low densities, theperfect gas equation of state applies, and we have:
(15.21)
A plot of the expression RDTnDnT (Figure 15.22), shows that the D + T reactionhas a maximum at about 45 × 106 K.
FIGURE 15.21 The reaction parameter as a function of temperature.
FIGURE 15.22 The normalized reaction rate as a function of temperature.
1.x 10-22
1.x 10-25
1.x 10-28
1.x 10-31
1.x 10-34
1.x 106 5.x 106 1.x 107 5.x 107 1.x 108 5.x 108 1.x 109
RD
T
Temperature T (K)
n1T
, n1TD T∼ ∼
1.x 10-11
1.x 10-09
1.x 10-13
1.x 10-15
1.x 10-17
1.x 106 5.x 106 1.x 107 5.x 107 1.x 108 5.x 108 1.x 109
RD
Tn D
n T
Temperature T (K)
© 2007 by Taylor & Francis Group, LLC

Nuclear Energy 487
It also turns out that for a D + D reaction, the reaction rate is about 1/25 of thatfor the D + T reaction for a given temperature. Overall then, the focus has been onthe D + T reaction. What is clear is that we need temperatures in the millions ofdegrees to get reaction rates that would enable significant energy generation. Thedeuterium needed for the system can be obtained from heavy water, whereas thetritium can be generated from a reaction of the neutrons with lithium.
The physics and engineering challenges of achieving such high temperaturesand still confining the plasma for any significant time in a fusion reactor are enormous(the ions that move at very high speeds, are light, and leak). Note that the plasma(because of its very low density) is essentially transparent to neutrons, and only thealpha energy is available for the plasma heating and maintenance of a high temper-ature in the plasma. A schematic of the fusion power plant is given in Figure 15.23,and it shows some of the engineering concepts involved.
Although there have been efforts to investigate engineering designs of the fusionplants, much of the focus so far has been on achieving plasma confinement, andtoward investigations of conditions that could lead to break even (that is dU/dt = 0,at a significant temperature with external energy input for plasma heating). Thereare two concepts that are playing the major role in current research:
1. Magnetic confinement (Mirror and Tokamak)2. Laser-driven inertial fusion
FIGURE 15.23 A schematic of a fusion power plant.
Fusionreactionsoccur in thehot plasmafuel
Hot fluid
FusionFuel
(Plasma)Heat
Exchanger
Fusion Power Plant
TurbineGenerator
ElectricalPowerOutput
Cool Fluid
Fastneutronsfrom fusionreactionsheat themoderator
© 2007 by Taylor & Francis Group, LLC

488 Handbook of Alternative Fuel Technology
In magnetic confinement, the charged particles are sought to be confined throughthe use of high magnetic fields. The fields alter ion trajectories, and in a mirror (anopen system) reflect the particles back towards the plasma at the two ends. In thetokamak (which comprises a toroidal geometry and is a closed system), the ionsmove in loops within the plasma. Because of the high temperature of the plasma, itis essential to keep the plasma away from surfaces. Schematics of the tokamakconcept are shown in Figure 15.24. At present, there is a substantial internationaleffort (known as the ITER program) on tokamaks.
Laser-driven inertial confinement uses laser ablation and resulting compressionof a small hollow glass sphere to create very high densities for the reactants (D +T, where the sphere is filled with D and some T, and most of the T is obtained from
FIGURE 15.24 Toroidal confinement.
Relatively Constant Electric Current
ToroidalFieldCoils
Constant Toroidal Field
TransientPoloidal
Field–due toplasmacurrent
Transient Plasma Current
PlasmaCurrent
ResultantTransient Field
Toroidal FieldComponent
TransientPoloidal
Field
© 2007 by Taylor & Francis Group, LLC
Nuclear Energy 489
Li + n reaction. Li is coated on the inside surface of the hollow sphere). Very-high-energy lasers and precise focusing of the laser beams (from several directions) onthe sphere are needed to achieve uniform compression.
The challenges of controlled fusion for electricity generation are enormous:plasma confinement, high temperatures, very-high-powered lasers, precise and eco-nomic target fabrication, damage from high-energy neutrons, etc. But the promisesare also huge: unlimited raw material supply, very little stored energy in the system,and negligible possibilities of catastrophic accidents, lower radioactive material andwaste, etc., as compared to fission-based reactors. We hope that eventually the chal-lenges will be met, as every year there is some progress in our understanding of thephysics and engineering of fusion. There has been, however, a significant reductionin government research funding in this area as the realizable benefits are distant.
REFERENCES
1. Connolly, T.J., Foundations of Nuclear Engineering, John Wiley & Sons, New York,NY, 1978.
2. Lamarsh, J., Introduction to Nuclear Engineering, Addison-Wesley, Reading, MA,1983, p. 181.
3. Glasstone, S. and Sesonske, A., Nuclear Reactor Engineering, Van Nostrand Rein-hold, New York, NY, 1981.
4. Lamarsh, J., Nuclear Reactor Theory, Addison-Wesley, Reading, MA, 1966.5. Henry, A., Nuclear Reactor Analysis, MIT Press, Cambridge, MA, 1975.6. Duderstadt, J., Nuclear Reactor Theory, John Wiley & Sons, New York, NY, 1976.7. Ott, K.O. and Bezella, W.A., Introductory Nuclear Statistics, American Nuclear
Society, La Grange Park, IL, 1989.8. Ott, K.O. and Neuhold, R.J., Introductory Nuclear Reactor Dynamics, American
Nuclear Society, La Grange Park, IL, 1985.9. Stacey, W.M., Nuclear Reactor Physics, John Wiley & Sons, New York, NY, 2001.
10. El-Wakil, M.M., Nuclear Heat Transport, International Textbook Company, nowavailable from the American Nuclear Society, La Grange Park, IL, 1971.
11. Todreas, N.E. and Kazimi, M.S., Nuclear Systems, Vol. I, Hemisphere, New York,NY, 1990.
12. Lahey, R.T. and Moody, F.J., The Thermal Hydraulics of a Boiling Nuclear Reactor,American Nuclear Society, La Grange Park, IL, 1977.
13. Weinberg, A.M. and Wigner, E.P., The Physical Theory of Neutron Chain Reactors,University of Chicago Press, Chicago, IL, 1958.
14. Reactor Physics Constants, ANL-5800, U.S. Govt., Washington, DC, 1963.15. Davison, B., Neutron Transport Theory, Oxford University Press, London, UK, 1957.16. Bell, G.I. and Glasstone, S., Nuclear Reactor Theory, Van Nostrand, New York, NY,
1974.17. Williams, M.M.R., The Slowing Down and Thermalization of Neutrons, John Wiley
& Sons, New York, NY, 1966.18. Willaims, M.M.R., Mathematical Methods in Particle Transport Theory, Butter-
worths, London, UK, 1971.
© 2007 by Taylor & Francis Group, LLC

490 Handbook of Alternative Fuel Technology
19. Case, K.M. and Zweifel, P.F., Linear Transport Theory, Addison-Wesley, Reading,MA, 1967.
20. Duderstadt, J. and Martin, W., Transport Theory, John Wiley & Sons, New York, NY,1982.
21. Lewis, E.E. and Miller, W.F., Computational Methods of Neutron Transport, AmericanNuclear Society, La Grange Park, IL, 1993.
22. Lapeyre, B., Pardoux, E., and Sentis, R., Introduction to Monte-Carlo Methods forTransport and Diffusion Equations, Oxford University Press, London, UK, 2003,original in French, 1998.
23. Loyalka, S.K., Transport theory, in Encyclopedia of Physics, Vol. 2, 3rd ed., Trigg,L. and Lerner, R., Eds., Wiley-VCH, Weinheim, Germany, 2005.
24. MCNP — A General Monte Carlo N-Particle Transport Code, Version 5, Los AlamosNational Laboratory, Los Alamos, NM 2003.
25. Wirtz, K., Lectures on Fast Reactors, American Nuclear Society, La Grange Park, IL1982.
26. Controlled Nuclear Chain Reaction: The First Fifty Years, American Nuclear Society,La Grange Park, IL, 1992.
27. Glasstone, S., The Effects of Nuclear Weapons, U.S. Atomic Energy Commission,Washington, DC, first published 1950, 1964.
28. Till, C.E., Nuclear fission reactors, in More Things in Heaven and Earth: A Celebra-tion of Physics at the Millennium, Bederson, B., Ed., Springer, New York, NY, 1999.
29. Los Alamos Science, Vol. 2, No. 2., Los Alamos Scientific Laboratory, Las Alamos,NM, 1981.
30. Knief, R., Nuclear Energy Technology: Theory and Practice of Commercial NuclearPower, McGraw-Hill, New York, NY, 1981.
31. Melese, G. and Katz, R., Thermal and Flow Design of Helium Cooled Reactors,American Nuclear Society, La Grange Park, IL, 1984.
32. Simpson, J.W., Nuclear Power from Underseas to Outer Space, American NuclearSociety, La Grange Park, IL, 1994.
33. Serber, R., The Los Alamos Primer, U.S. Govt., first published as LA-1, April 1943,declassified 1965, annotated book, University of California Press, Berkeley, CA,1992.
34. Garwin, R.L. and Charpak, G., Megawatts and Megatons, Knopf, New York, NY, 2001.35. A Technology Roadmap for Generation IV Nuclear Energy Systems, U.S. DOE
Nuclear Energy Research Advisory Committee and the Generation IV InternationalForum, December, 2002.
36. Steinfelds, E.V., Ghosh, T.K., Prelas, M.A., Tompson, R.V., Loyalka, S.K., Develop-ment of radioisotope energy conversion systems, ICAPP Conference Proceeding,Space Nuclear Power, 2003.
37. Lake, J.A., Nuclear Hydrogen Production, Idaho National Engineering and Environ-mental Laboratory, paper available at http://nuclear.inel.gov, 2003.
38. Cochran, R. and Tsoulfanidis, N., The Nuclear Fuel Cycle: Analysis and Management,American Nuclear Society, La Grange Park, IL, 1999.
39. Faw, R.E. and Shultis, J.K., Radiological Assessment: Sources and Doses, AmericanNuclear Society, La Grange Park, IL, 1999.
40. Shultis, J.K. and Faw, R.E., Radiation Shielding, American Nuclear Society,La Grange Park, IL, 2000.
41. U.S. Nuclear Regulatory Commission, Reactor Safety Study: An Assessment ofAccident Risks in U.S. Power Plants, Report No. WASH-1400, NUREG-75/014,1975.
© 2007 by Taylor & Francis Group, LLC

Nuclear Energy 491
42. McCormick, N.J., Reliability and Risk Analysis: Methods and Nuclear Power Appli-cations, Academic Press, New York, NY, 1981.
43. Wilson, R., Araj, A., Allen, O., Auer, P., Boulware, D.G., Finlayson, F., Goren, S.,Ice, C., Lidofsky, L., Seesoms, A.L., Shoaf, M.L., Spiewak, I., and Tombrello, T.,Report to the American Physical Society of the study group on radionuclide releasefrom severe accidents at nuclear power plants, Rev. Mod. Phys., 57(3), Part II,S1–S154, 1985.
44. U.S. Nuclear Regulatory Commission, Severe Accident Risks: An Assessment ForFive U.S. Nuclear Power Plants, (Final Summary Report) NUREG-1150, Vol. 1–2,1990.
45. Williams, M.M.R. and Loyalka, S.K., Aerosol Science: Theory and Practice withSpecial Applications to the Nuclear Industry, Pergamon, Oxford, UK, 1991.
46. Ghosh, T.K., Prelas, M.A., Viswanath, D.S., and Loyalka, S.K., Science and Tech-nology of Terrorism and Counter-Terrorism, Marcel Dekker, New York, NY, 2002.
47. von Weizsacker, C.F., Phys. Z., 38, 176, 1937.48. Gamow, G. and Teller, E., Phys. Rev., 53, 608, 1938.49. Bethe, H.A. and Critchfield, C.H., Phys. Rev., 54, 248, 1938.50. Bethe, H.A., Energy production in stars, Phys. Rev., 55, 434, 1939.51. Rose, D.J. and Clarke, M., Plasma and Controlled Fusion, MIT Press, Cambridge,
MA, 1961.52. Glasstone, S., Controlled Nuclear Fusion, U.S. Atomic Energy Commission, Wash-
ington, DC, 1965.53. Kamash, T., Fusion Reactor Physics, Ann Arbor Science, Ann Arbor, MI, 1973.54. Miley, G.H., Fusion Energy Conversion, American Nuclear Society, La Grange Park,
IL, 1976.55. Dolan, T.J., Fusion Research: Principles, Experiments and Technology, Pergamon,
Oxford, UK, 1982.56. Stacey, W.M., Fusion: An Introduction to the Physics and Technology of Magnetic
Confinement Fusion, John Wiley & Sons, New York, NY, 1984.57. Duderstadt, J.E. and Moses, G.R., Inertial Confinement Fusion, John Wiley & Sons,
New York, NY, 1982.58. Fowler, T.K., Nuclear power: fusion, in More Things in Heaven and Earth: A Cele-
bration of Physics at the Millennium, Bederson, B., Ed., Springer, New York, NY,1999.
© 2007 by Taylor & Francis Group, LLC

493
16 Fuel Cells
Mihaela F. Ion and Sudarshan K. Loyalka
CONTENTS
16.1 Introduction .................................................................................................. 49416.2 Basic Concepts............................................................................................. 494
16.2.1 Design Characteristics ..................................................................... 49416.2.2 Operation.......................................................................................... 49416.2.3 Thermal Efficiency........................................................................... 496
16.2.3.1 Heat Absorption from a Reservoir to Usefor Operation..................................................................... 496
16.2.3.2 Energy Losses to the Surroundings.................................. 49716.2.4 Cell Voltage ...................................................................................... 497
16.3 Fuel Cell System.......................................................................................... 49816.3.1 General Description ......................................................................... 49816.3.2 Fuel Cells Classification .................................................................. 499
16.4 Low-Temperature Fuel Cells ....................................................................... 50216.4.1 Proton Exchange Membrane Fuel Cells.......................................... 502
16.4.1.1 Design Characteristics ...................................................... 50216.4.1.1.1 Electrolyte....................................................... 50216.4.1.1.2 Electrodes ....................................................... 50416.4.1.1.3 Teflon Masks and Current Collectors ............ 505
16.4.1.2 Operation Characteristics ................................................. 50616.4.2 Alkaline Fuel Cells .......................................................................... 50816.4.3 Phosphoric Acid Fuel Cells ............................................................. 510
16.5 High Temperature Fuel Cells....................................................................... 51116.5.1 Molten Carbonate Fuel Cells........................................................... 51116.5.2 Solid Oxide Fuel Cells..................................................................... 512
16.6 Hydrogen Production and Storage............................................................... 51416.6.1 Hydrogen Production ....................................................................... 514
16.6.1.1 Fossil Fuels ....................................................................... 51416.6.1.2 Water Electrolysis............................................................. 51616.6.1.3 Other Sources ................................................................... 516
16.6.2 Hydrogen Storage ............................................................................ 51616.7 Current Performances .................................................................................. 518
16.7.1 Operational Issues ............................................................................ 51816.7.1.1 Water and Heat Management ........................................... 51816.7.1.2 CO Poisoning.................................................................... 51816.7.1.3 Hydrogen Safety ............................................................... 518
© 2007 by Taylor & Francis Group, LLC

494 Handbook of Alternative Fuel Technology
16.7.2 Cost .................................................................................................. 51816.7.3 Environmental Impact...................................................................... 519
16.8 Research and Development Issues............................................................... 520References.............................................................................................................. 521
16.1 INTRODUCTION
Fuel cells are devices that produce electrical energy through electrochemical pro-cesses, without combusting fuel and generating pollution of the environment. Theyrepresent a potential source of energy for a wide variety of applications.
Sir William Robert Grove invented the fuel cell in 1839, and further improvementshave been added over the years by many investigators, a significant contribution beingmade by Francis Bacon in the 1930s. By the 1960s, fuel cells were already being usedin NASA’s space exploration missions. Over the next few decades, the interest in fuelcells declined considerably due to their extremely high associated costs and relativelypoor performance for daily applications. More recently, the increasing demand forcleaner energy sources has brought the fuel cells back into public attention. At present,there is a major push for commercialization of fuel cells, with a potential for applica-tions from portable to automotive and even power-generating stations.
16.2 BASIC CONCEPTS
16.2.1 DESIGN CHARACTERISTICS
The core structure of a generic fuel cell includes two thin electrodes (anode andcathode), located on the opposite sides of an electrolyte layer (Figure 16.1).
The electrochemical reactions occur at the electrodes. For most fuel cells, thecatalytic fuel decomposition occurs at the anode, where ions and electrons split.They recombine at the cathode, where by-products of the reaction are created (i.e.,water or CO2). As high rates of reaction are desired in functioning of the fuel cell,thin layers of catalysts are applied to the electrodes. Furthermore, materials used forelectrodes require specific properties such as high conductivity and high ionizationand deionization properties, and they must have sufficient permeability to thefuel/oxidant and electrolyte (i.e., they have to be made of porous materials).
The electrolyte layer is made of either a solute or a solid material and plays animportant role during operation, as a conductor for the ions between the two elec-trodes. Characterized by strong insulating properties, the electrolyte does not allowthe transfer of electrons. These are conducted through one of the electrodes via anexternal pathway to the other electrode, closing the electric circuit of the cell.
16.2.2 OPERATION
Fuel cells are a type of galvanic cell, and they operate similarly to conventionalbatteries, converting the chemical energy of the reactants directly into electricalenergy. However, there is an important difference between them, which lies in theway the chemical energy is transformed into electrical energy. A battery uses the
© 2007 by Taylor & Francis Group, LLC

Fuel Cells 495
chemical energy stored within the reactants inside the battery, whereas a fuel cellconverts the chemical energy provided by an external fuel/oxidant mixture intoelectrical energy. Thus, batteries use chemical energy until the reactants are com-pletely depleted and, at the end of their lifetime, they can either be recharged or justthrown away. Fuel cells, on the other hand, can provide electrical output as long asthe supply of fuel and oxidant is maintained.
Typically, hydrogen-rich fuels are used for operation, and the most commonfuels include gases (i.e., hydrogen, natural gas, or ammonia), liquids (i.e., methanol,hydrocarbons, hydrazine), or coal. A preliminary conversion (reforming) process isrequired for all fuels, except for direct hydrogen. The oxidant used at the cathodeis usually oxygen or air.1,2
During operation, both hydrogen-rich fuel and oxygen/air are supplied to theelectrodes. Hydrogen undergoes catalytic oxidation at one of the electrodes and splitsinto ions and electrons. Oxygen undergoes a reduction reaction at the other electrode.Both ions and electrons travel from one electrode to the other, using differentpathways. Ions travel through the electrolyte and electrons are forced through aseparate pathway via the current collectors to the other electrode, where they combinewith oxygen to create water or other by-products, such as CO2.
FIGURE 16.1 Design of a generic fuel cell (EG&G Services, Parsons Inc. and ScienceApplications International Corporation, Fuel Cell Handbook (Fifth Edition), ContractNo. DE−AM26−99FT40575, for U.S. Department of Energy, October 2000.)
Fuel In
2eLoad
H2
Depleted Fuel andProduct Gases Out
Anode
H2O
H2O
Positive Ionor
Negative Ion
Oxidant In
1/2O2
Depleted Oxidant andProduct Gases Out
Cathode
Electrolyte(Ion Conductor)
© 2007 by Taylor & Francis Group, LLC

496 Handbook of Alternative Fuel Technology
16.2.3 THERMAL EFFICIENCY
Although the input (chemical energy, Ech) and output (electrical energy, Ee) of theoperation are the same for fuel cells and heat engines, the conversion process is different.Heat engines use chemical energy to produce intermediate heat, which is subsequentlytransformed into mechanical energy, which in turn leads to electrical energy. Fuel cellsuse a direct conversion process, transforming the chemical energy directly into electricalenergy (see Figure 16.2). Thus, when comparing fuel cells with heat engines, two aspectsof the second law of thermodynamics have to be considered: heat absorption from areservoir to use for operation, and energy losses to the surroundings.
16.2.3.1 Heat Absorption from a Reservoir to Use for Operation
Fuel cell operation does not require two different temperature reservoirs, and thusany temperature restrictions associated with the Carnot cycle are eliminated. Incomparison, heat engines operate between a hot source and a cold sink. Their thermalefficiency (η) is calculated as the amount of net work (W) done for the heat (Qin)absorbed by the engine. The amount of net work is determined as the differencebetween the absorbed (Qin) and the rejected (Qout) heat. In case of an ideal, reversibleheat engine, the entropy remains constant, and
.
The maximum efficiency of such an engine is given by
.
A high value is therefore obtained using either a very low Tout (for an ideal machine,this can be zero) or a very high combustion temperature, Tin. In reality, Tout isapproximately 300 K, which is the ambient temperature. At the other end, the
FIGURE 16.2 Energy conversion processes for heat engine and fuel cell.
ChemicalEnergy
ElectricalEnergy
HEATENGINE
Qin W
Qout
ThermalEnergy
MechanicalEnergy
EchEel
ChemicalEnergy
ElectricalEnergy
FUELCELL
Ech Eel
Q
Q
T
Tout
in
out
in
=
ηHEout
in
T
T,max = −1
© 2007 by Taylor & Francis Group, LLC

Fuel Cells 497
combustion temperature cannot be too high (i.e., 2000–3000 K), owing to temper-ature restrictions of the materials.
16.2.3.2 Energy Losses to the Surroundings
Processes in real heat engines or fuel cells are irreversible, and losses occur. The realefficiency is always less than the theoretical efficiency. To properly compare theefficiency of heat engines and fuel cells, the theoretical values have to be consideredin each case. For fuel cells, this is calculated as the maximum electrical work (Wel)done for the total thermal energy available or the enthalpy of the fuel (∆H0). Wel isgiven by the change in the chemical energy, or the Gibbs free energy of the electro-chemical process, and it is calculated as the difference between the total heat availableand the heat produced during operation. The maximum efficiency can be written as:
where ∆S0 represents the entropy change of the system.
16.2.4 CELL VOLTAGE
Under ideal conditions, operation of fuel cells is performed without any losses. This canbe seen in Figure 16.3, which presents the cell voltage and current characteristics forideal and real situations. The most important losses that occur during normal operation are:
• Activation losses, which are directly dependent on the reaction rates• Ohmic losses, caused by resistance to flows of ions and electrons through
media• Concentration losses, due to changes in the concentration of reactants
FIGURE 16.3 Fuel cell voltage/current characteristic. (From EG&G Services, Parsons Inc.and Science Applications International Corporation, Fuel Cell Handbook (Fifth Edition),Contract No. DE−AM26−99FT40575, for U.S. Department of Energy, October 2000.)
ηFC
T S
H,max = −1 0
0
∆∆
Theoretical EMF or Ideal Voltage
Region of Activation Polarization(Reaction Rate Loss)
Total Loss
Region ofConcentration Polarization
(Gas Transport Loss)
Operation Voltage, V, Curve
Current Density (mA/cm2)
Region of Ohmic Polarization(Resistance Loss)
1.0
0.5
0
Cel
l Vol
tage
© 2007 by Taylor & Francis Group, LLC
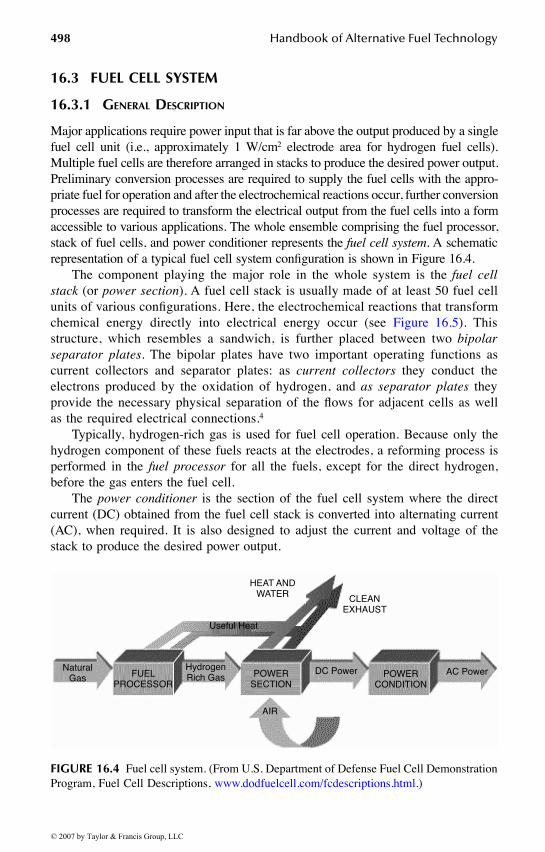
498 Handbook of Alternative Fuel Technology
16.3 FUEL CELL SYSTEM
16.3.1 GENERAL DESCRIPTION
Major applications require power input that is far above the output produced by a singlefuel cell unit (i.e., approximately 1 W/cm2 electrode area for hydrogen fuel cells).Multiple fuel cells are therefore arranged in stacks to produce the desired power output.Preliminary conversion processes are required to supply the fuel cells with the appro-priate fuel for operation and after the electrochemical reactions occur, further conversionprocesses are required to transform the electrical output from the fuel cells into a formaccessible to various applications. The whole ensemble comprising the fuel processor,stack of fuel cells, and power conditioner represents the fuel cell system. A schematicrepresentation of a typical fuel cell system configuration is shown in Figure 16.4.
The component playing the major role in the whole system is the fuel cellstack (or power section). A fuel cell stack is usually made of at least 50 fuel cellunits of various configurations. Here, the electrochemical reactions that transformchemical energy directly into electrical energy occur (see Figure 16.5). Thisstructure, which resembles a sandwich, is further placed between two bipolarseparator plates. The bipolar plates have two important operating functions ascurrent collectors and separator plates: as current collectors they conduct theelectrons produced by the oxidation of hydrogen, and as separator plates theyprovide the necessary physical separation of the flows for adjacent cells as wellas the required electrical connections.4
Typically, hydrogen-rich gas is used for fuel cell operation. Because only thehydrogen component of these fuels reacts at the electrodes, a reforming process isperformed in the fuel processor for all the fuels, except for the direct hydrogen,before the gas enters the fuel cell.
The power conditioner is the section of the fuel cell system where the directcurrent (DC) obtained from the fuel cell stack is converted into alternating current(AC), when required. It is also designed to adjust the current and voltage of thestack to produce the desired power output.
FIGURE 16.4 Fuel cell system. (From U.S. Department of Defense Fuel Cell DemonstrationProgram, Fuel Cell Descriptions, www.dodfuelcell.com/fcdescriptions.html.)
NaturalGas FUEL
PROCESSOR
HydrogenRich Gas
Useful Heat
POWERSECTION
AIR
HEAT ANDWATER CLEAN
EXHAUST
POWERCONDITION
DC Power AC Power
© 2007 by Taylor & Francis Group, LLC

Fuel Cells 499
16.3.2 FUEL CELLS CLASSIFICATION
Fuel cells can be classified according to various criteria, based on electrolyte, operatingtemperature, fuel or oxidant used, reforming process, etc. The most common criterion,also used to name these devices, is the type of the electrolyte used for operation. Fivemajor categories can be identified, based on the type of the electrolyte:
• Proton exchange membrane fuel cells (PEMFC).• Alkaline fuel cells (AFC).• Phosphoric acid fuel cells (PAFC).• Molten carbonate fuel cells (MCFC).• Solid oxide fuel cells (SOFC), can be further divided into two subcatego-
ries, respectively the intermediate temperature solid oxide fuel cells(ITSOFC), with operating temperatures less than 800°C, and the tubularsolid oxide fuel cells (TSOFC), with temperatures over 800°C (EG&GServices, Parsons Inc. and Science Applications International Corporation,Fuel Cell Handbook (Fifth Edition), Contract No. DE−AM26−99FT40575,for U.S. Department of Energy, October 2000).
A summary of the characteristics of fuel cells is presented in Table 16.1. ThePEMFC and AFC operate at lower temperatures and are mainly developed fortransportation and small utilities. The PAFC operate at higher temperatures, beingdesigned for medium-scale power applications. The MCFC and SOFC operate athigh temperatures and are intended for large power utilities.5
FIGURE 16.5 Fuel cell stack components. (From Energy Center of Wisconsin Fuel Cellsfor Distributed Generation. A Technology and Marketing Summary Report, 193-1, 2000.)
RepeatingUnit
OxidantFlow
Fuel Flow
Current Flow
End Plate
Anode
Electrolyte Matrix
Cathode
Bipolar SeparatorPlate
Anode
© 2007 by Taylor & Francis Group, LLC

500H
and
bo
ok o
f Altern
ative Fuel Tech
no
logy
TABLE 16.1Fuel Cell Characteristics
Characteristics PEMFC AFC PAFC MCFC
SOFC
ITSOFC TSOFC
Operating Parameters
Temperaturea (°C) 80 65–220 150–220 ~ 650 600–800 800–1000Pressureb (atm) 1–5 1–8 1–3 1–15Efficiencye (%) 40–50 40–50 40–50 50-60 45–55Power densityf (kW/kg) 0.1–1.5 0.1–1.5 0.12 — 1–8
Cell Componentsc
Electrolyte Proton exchange membrane (solid)
Potassium hydroxide (liquid)
Phosphoric acid (liquid)
Molten carbonate salt (liquid)
Ceramic (solid)
Electrodes Carbon-based Carbon-based Graphite-based Nickel and stainless steel-based
Ceramic
Catalyst Platinum Platinum Platinum Nickel Perovskites
Reactantsd
Charge carrier H+ OH− H+ CO32– O2–
Fuel H2
(reformate)H2
(pure)H2
(reformate)H2/CO/CH4
(reformate)H2/CO/CH4
(reformate)Reforming process External — External External/internal External/internalOxidant O2/air O2 O2/air CO2/O2/air O2/air
Operation
Water managementg Evaporative Evaporative Evaporative Gaseous product Gaseous productHeat managementg Process gas
Independent cooling medium
Process gasElectrolyte calculation
Process gasIndependent cooling medium
Internal reformingProcess gas
Internal reformingProcess gas
© 2007 by Taylor & Francis Group, LLC

Fuel C
ells501
Advantages/Disadvantagesh
Advantages High current and power density; long operating life
High current and power density; high efficiency
Advanced technology
High efficiency; internal fuel processing; high-grade waste heat
Internal fuel processing; high-grade waste heat; potentially inexpensive
Disadvantages CO intolerance; water management; noble metal catalyst
CO2 intolerance Efficiency; lifetime; noble metal catalyst
Electrolyte instability; lifetime
High temperature; efficiency; low ionic conductivity
Applicationsi
Type Motive/small utility Aerospace Small utility Utility UtilityScale 0.1 kW–10 MW 0.1–20 kW 200 kW–10 MW >100 MW >100 MW
Source: aAdapted from EG&G Services, Parsons Inc. and Science Applications International Corporation, Fuel Cell Handbook (Fifth Edition), Contract No. DE−AM26−99FT40575, for U.S. Department of Energy, October 2000.bAdapted from Penner, S.S., Ed., Commercialization of fuel cells, Energy: Int. J., 20(5), Pergamon Press, New York, 1995; Energy Center of Wisconsin Fuel Cells for DistributedGeneration. A Technology and Marketing Summary Report, 193-1, 2000.cAdapted from EG&G Services, Parsons Inc. and Science Applications International Corporation, Fuel Cell Handbook (Fifth Edition), Contract No. DE−AM26−99FT40575,for U.S. Department of Energy, October 2000; Mehta, S.K. and Bose, T.K., Ed., Proceedings of the Workshop on Hydrogen Energy Systems, presented at the Official Openingof the Hydrogen Research Institute, in collaboration with Canadian Hydrogen Association, Canada, 1996; Energy Center of Wisconsin Fuel Cells for Distributed Generation.A Technology and Marketing Summary Report, 193-1, 2000.dAdapted from EG&G Services, Parsons Inc. and Science Applications International Corporation, Fuel Cell Handbook (Fifth Edition), Contract No. DE−AM26−99FT40575,for U.S. Department of Energy, October 2000; Mehta, S.K. and Bose, T.K., Ed., Proceedings of the Workshop on Hydrogen Energy Systems, presented at the Official Openingof the Hydrogen Research Institute, in collaboration with Canadian Hydrogen Association, Canada, 1996. With permission.eAdapted from European Commission, A Fuel Cell Research, Development and Demonstration Strategy for Europe up to 2005, 1998 ed., Belgium, 1998. With permission.fAdapted from Norbeck, J.M., Hydrogen Fuel for Surface Transportation, Society of Automotive Engineers, Warrendale, PA, 1996..gAdapted from EG&G Services, Parsons Inc. and Science Applications International Corporation, Fuel Cell Handbook (Fifth Edition), Contract No. DE−AM26−99FT40575,for U.S. Department of Energy, October 2000.hAdapted from Decher, R., Direct Energy Conversion — Fundamentals of Electric Power Production, Oxford University Press, 1997. With permission.iAdapted from Mehta, S.K. and Bose, T.K., Ed., Proceedings of the Workshop on Hydrogen Energy Systems, presented at the Official Opening of the Hydrogen ResearchInstitute, in collaboration with Canadian Hydrogen Association, Canada, 1996. With permission.
© 2007 by Taylor & Francis Group, LLC

502 Handbook of Alternative Fuel Technology
16.4 LOW-TEMPERATURE FUEL CELLS
16.4.1 PROTON EXCHANGE MEMBRANE FUEL CELLS
The PEMFCs were developed originally by General Electric in the 1960s for NASA’sspace explorations. Over the years, these fuel cells have been known under variousnames, such as ion exchange membrane, solid polymer electrolyte, proton exchangemembrane, or simply, polymer electrolyte fuel cells. They use hydrogen as fuel,oxygen or air as oxidant, and a solid polymer membrane as electrolyte.
16.4.1.1 Design Characteristics
The core of the PEMFC design consists of a proton conducting membrane (the electro-lyte), located between two platinum-impregnated porous electrodes. Teflon gaskets andcurrent collectors are added to these components to complete a single fuel cell unit. Thecore of the fuel cell is usually less than a millimeter thick and is referred to as themembrane-electrode assembly (MEA). Depending on the mode of fabrication, MEA caninclude either the membrane along with the catalyst layers only, or the whole ensembleof the previously mentioned components plus the carbon electrodes. Figure 16.6 showsa schematic representation of the PEMFC manufactured by Ballard Power Systems. Ageneral view of the cell hardware and its cross section are presented in Figure 16.7.
16.4.1.1.1 ElectrolyteVarious electrolyte materials have been developed over the years for use in PEMFC,and there is still extensive ongoing research focused on improving the materialscurrently used or finding new solutions. Currently, the thickness of the membraneis approximately 50–175 µm, and recent developments show that stable operationconditions can be obtained with membranes only 10–25 µm thick.10
FIGURE 16.6 PEMFC, Ballard Power systems. (From Ballard Power Systems, How theBallard® fuel cell works, www.ballard.com.)
OxidantFlow Field Plate
ExhaustWater Vapor(No Pollution)
Heat (90°C)Water-cooled
Air
PEM (Proton ExchangeMembrane)Fuel Flow Field Plate
Fuel to Recirculate
Low TemperatureElectrochemicalProcess (90°C)
Fuel (Hydrogen)
© 2007 by Taylor & Francis Group, LLC

Fuel Cells 503
Most of the membranes used to date in PEMFC have a fluorocarbon-polymer-based structure to which sulfonic acid groups are attached. The key characteristicof these materials is that, although the acid molecules are fixed to the polymer, theprotons on these acid groups are free to travel through the membrane. The most wellknown are the Nafion membranes, which have been developed by DuPont overmore than three decades. These types of membranes are thin, nonreinforced filmsbased on the Nafion resin, a perfluorinated polymer.11 The structure of the Nafionmembranes is given in Figure 16.8.
This type of membrane is usually prepared by modifying a basic polymer(polyethylene) through a process called perfluorination, where the hydrogen issubstituted with fluorine. The modified polymer is the polytetrafluoroethylene(PTFE) or Teflon. A side chain of sulphonic acid HSO3 is then added to PTFEthrough the “sulphonation” process. The end of the chain is an SO3
− ion, and the
FIGURE 16.7 PEMFC design. (Gottesfeld, S., “The Polymer Electrolyte Fuel Cell, MaterialsIssues in a Hydrogen Fueled Power Source,” Los Alamos National Laboratory, MaterialsScience and Technology Division, White Paper on LANL Hydrogen Education Web site:http://education.lanl.gov/RESOURCES/h2/gottesfeld/education.html.
FIGURE 16.8 Structural characteristics of PEMFC membranes. (Bloemen, L.J. andMugerwa, M.N., (Eds.), “Fuel Cell Systems,” Plenum Press, New York, 1994)
SINGLE CELL HARDWARE
Gas DiffusionBackings
GraphiteBlock
TeflonMask
CatalyzedMembrane
TeflonMask
GraphiteBlock
CROSS SECTION OF POLYMER ELECTROLYTE FUEL CELL
AnodeVent
CathodeVent ANODE: H2 2H+ +2 ELECTRONS
CATHODE: 02 + 4 ELECTRONS + 4 H+ 2 H2O
Gas Diffusion Backing
0.7 VAnode
Feed, H2CathodeFeed, O2
CF2
CF3CF
O
CF2
CF2
SO3H
(CF2CF2)x(CF-CF2)y
O
(CF2CF2)x(CF-CF2)y
O
CF2
CF2
SO3H
Nafion
Membrane
DowMembrane
© 2007 by Taylor & Francis Group, LLC

504 Handbook of Alternative Fuel Technology
HSO3 group is ionically bonded. The resulting structure combines strong hydropho-bic properties of the fluorocarbon polymer backbone with strong hydrophilic prop-erties of the terminal sulfonic acid function. It is an excellent proton conductor,durable (owing to strong bonds between the fluorine and carbon) and shows goodchemical resistance.2,9
Tests showed that the PEMFC performance levels improved with the membranedeveloped by Dow Chemical.13,14 Although this membrane remains a perfluorosul-fonic acid membrane, its structure is characterized by a shorter side chain and thusa lower equivalent weight compared to Nafion®. Conductivity and hydrophilic prop-erties are slightly enhanced, and durability is still maintained. The Dow membranewas tested in 1987–1988 at Ballard Power Systems, and the results showed signif-icant increases in PEMFC performance levels (Figure 16.9).
16.4.1.1.2 ElectrodesThe anode and cathode have an identical structure, consisting of two layers in closecontact with each other and with the membrane. The roles of the electrodes inoperation of the fuel cell are summarized in Table 16.2.
The layer situated adjacent to the membrane is the catalyst layer, which providesthe area where the electrochemical reactions occur (Figure 16.7). It is a platinum carbon
FIGURE 16.9 PEMFC performance using Nafion and Dow membranes. (EG&G Services,Parsons Inc. and Science Applications International Corporation, Fuel Cell Handbook (FifthEdition), Contract No. DE−AM26−99FT40575, for U.S. Department of Energy, October 2000.)
6 CELL STACKAVERAGE CELL VOLTAGEDOW EXPERIMENTAL MEMBRANE1987 MEA
OPERATING CONDITIONS
MK 4 HARDWAREELECTRODE AREA 0.054 FT2
TEMPERATURE 185 FHYDROGEN PRESSURE 50 PSIGOXYGEN PRESSURE 50 PSIG
NAFION 1171987 MEA
1.0
0.9
0.8
0.7
0.6
0.8
4.4
0.3
0.2
0.1
VOLTSPER CELL
500 1000 1500 2000 2500 3000 3500 4000
CURRENT DENSITY (mA/cm2)
© 2007 by Taylor & Francis Group, LLC

Fuel Cells 505
composite film, about 5–10 µm thick, used to increase the reaction rates. Becauseof the high cost of platinum, sustained technological efforts were focused on reduc-tion of the platinum load, originally about 4 mg Pt/cm2, but currently almost 0.2 mgPt/cm2 and even lower values, with high performance levels.15,16
Typically, carbon paper is used when a compact design of fuel cells is desired;the most used brand is Toray paper. However, if only a simple assembly is preferred,carbon cloth is sufficient. Thickness of the backing layer is typically between 100and 300 µm. Figure 16.10 shows details of the MEA structure with the catalyst andbacking layers.17
16.4.1.1.3 Teflon Masks and Current CollectorsThe single-cell structure is completed by two Teflon masks and two high-densitygraphite plates. The Teflon masks are gaskets that confine the gas flow to the activearea, providing an effective seal along the periphery of the membrane. The graphiteplates are current collectors, and they also contain gas flow fields at the same time.In a fuel cell stack, the current collector plates contain gas flow fields on both sides,and they become bipolar plates.
TABLE 16.2Roles of Electrodes in PEMFC Operation
Electrode Layer Role
Anode Catalyst Catalysis of anode reactionProton conduction into membraneElectron conduction into gas-diffusion layerWater transportHeat transport
Gas diffusion Fuel supply and distribution (hydrogen/fuel gas)Electron conductionHeat removal from reaction zoneWater supply (vapor) into electrocatalyst
Cathode Catalyst Catalysis of cathode reactionOxygen transport to reaction sitesProton conduction from membrane to reaction sitesElectron conduction from gas-diffusion layer to reaction zoneWater removal from reactive zone into gas-diffusion layerHeat generation/removal
Gas diffusion Oxidant supply and distribution (air/oxygen)Electron conduction towards reaction zoneHeat removalWater transport (liquid/vapor)
Source: Adapted from Hoogers, G., Ed., Fuel Cell Technology Handbook, CRC Press, Boca Raton, FL,2003. With permission.
© 2007 by Taylor & Francis Group, LLC

506 Handbook of Alternative Fuel Technology
16.4.1.2 Operation Characteristics
Hydrogen gas is supplied to the anode, where it dissociates into hydrogen atoms inthe presence of the platinum catalyst. The atoms further split into protons andelectrons, which travel separate ways from the anode to the cathode. Protons areconducted through the electrolyte membrane, and electrons are forced to go via anexternal circuit to the cathode, producing electricity. Oxygen is supplied to thecathode, where a reduction process occurs and water and heat are created as by-products. Figure 16.11 shows an illustration of the PEMFC principle of operation.The basic reactions for the PEMFC are:
Anode: 2 H2 → 4 H+ + 4 e−
Cathode: O2 + 4 H+ +4 e− → 2 H2O
Cell reaction: 2H2 + O2 → 2 H2O
Continuous research efforts over the years have led to significant improvementsin the performance levels of the PEMFC (Figure 16.12).
The typical output is approximately 0.7 V per cell unit, and the power densityis usually higher compared to other fuel cells, which translates into a smaller sizeof the fuel cell stack. For transport applications, Asia Pacific Fuel Technologiesproduces 3-kW 64-cell stacks, which are 25 cm high and have an active area of 150cm2. The Mark 902 fuel cell module produced by Ballard Power Systems has thedimensions of 80.5 × 37.5 × 25.0 cm and yields an 85-kW rated net output.19 TheNexaTM power module, Ballard’s first volume-produced PEMFC designed to beintegrated into stationary and portable applications, is 56 × 25 × 33 cm, with a ratednet output of 1200 W (see Figure 16.13).
PEMFCs are intended to be used also in small applications, such as portabledevices (i.e., laptops; see Figure 16.14) and electronics, etc.
FIGURE 16.10 MEA structure design details. (From Thomas, S., and Zalbowitz, M., Fuel Cells— Green Power, LA−UR−99−3231, Los Alamos National Laboratory, 1999. With permission.)
PolymerElectrolyteMembrane
PolymerElectrolyteMembrane
Pathway(s) allowingconduction ofhydrogen ions
Pathway(s) allowingconduction ofelectrons
Pathway(s) allowingaccess of gas tocatalyst surface
CarbonPlatinum
Pathways forgas accessto electrode Electrode
Backing layer Membrane/electrodeassembly
Backing layer
© 2007 by Taylor & Francis Group, LLC

Fuel Cells 507
FIGURE 16.11 PEMFC and PAFC operation principle. (U.S. Department of Defense FuelCell Test and Evaluation Center, “Fuel Cell Basics,” www.fctec.com/index.html.)
FIGURE 16.12 PEMFC performances. (EG&G Services, Parsons Inc. and Science Applica-tions International Corporation, Fuel Cell Handbook (Fifth Edition), Contract No. DE−AM26−99FT40575, for U.S. Department of Energy, October 2000)
Phosphoric Acid andPEM Fuel Cells
Electron Flow
Load
Hydrogen
HydrogenIons
Oxygen
Water
AnodeElectrolyte Cathode
1991 (5 atm, 95°C)1975
1988 (4.4 atm, 70°C)1984 (1 atm,70°C)
1988 (4 atm, 75°C)
1986 (2 atm, 75°C)
0 500 1000 1500 2000
Current Density (mA/cm2)
1
0.9
0.8
0.7
0.6
0.5
0.4
Cel
l Vol
tage
(V
)
© 2007 by Taylor & Francis Group, LLC

508 Handbook of Alternative Fuel Technology
16.4.2 ALKALINE FUEL CELLS
The development of the AFC started almost seven decades ago, when researchersstarted to realize that hydrogen fuel cells with alkaline electrolytes can be used incommercial applications. The first notable solution was the high-power-density AFCdeveloped by Sir Francis Bacon, with an output of 0.6 V at 1.11 A/cm2 currentdensity and 240°C operating temperature.20 AFCs have been used by NASA on theirspace explorations during the 1960s and 1970s.
The AFCs utilize potassium hydroxide (KOH) as an electrolyte of variableconcentration, either in aqueous solution or stabilized matrix form. The KOH con-centration varies with the operating temperature, increasing from 35 wt% for lowtemperatures to about 85 wt% for high temperatures. The electrolyte is contained in
FIGURE 16.13 NexaTM power module. (Ballard Power Systems, “Ballard® Fuel Cell PowerModule Nexa™,” www.ballard.com, 2002.)
FIGURE 16.14 Ballard fuel cell. (Fuel Cells 2000, “Transportation Fuel Cells — TechnicalInfo,” www.fuelcells.org.)
© 2007 by Taylor & Francis Group, LLC

Fuel Cells 509
a porous asbestos matrix, and the catalysts are typically made of nickel (Ni) andsilver (Ag). Noble metals, metal oxides, or spinels are also considered among thematerials used to fabricate the catalysts.21 Further details of the AFC componentsused for the space applications are given in EG&G Services, Parsons Inc. and ScienceApplications International Corporation, Fuel Cell Handbook (Fifth Edition), ContractNo. DE−AM26−99FT40575, for U.S. Department of Energy, October 2000.
Hydrogen and oxygen are supplied to the electrodes similarly to PEMFCs. TheKOH electrolyte is extremely sensitive to potential poisoning with CO or reaction withCO2 and, thus, only pure hydrogen and oxygen can be used as reactants for the elec-trochemical processes. The carrier in this case is the hydroxyl ion (OH), which travelsfrom the cathode to the anode, where it combines with H2 and creates water and electrons(Figure 16.15). If the electrolyte is in a solution form, it mixes up with the water createdat the anode. To ensure proper operation of the fuel cell unit, it is required that waterbe continuously removed from the electrolyte. Electrons formed at the anode are con-ducted to the external circuit to create the electrical output and then forced to the cathode,closing the circuit. The basic electrochemical reactions for the AFC are:
Anode: 2 H2 + 4 OH– → 4 H2O + 4 e−
Cathode: O2 + 2 H2O + 4 e− → 4 OH-
Cell reaction: 2H2 + O2 → 2 H2O
Owing to the fact that only pure fuel or oxidant can be used in operation, theAFC is used for specialized applications. Space explorations, military use, andresearch are among the few areas in which these fuel cells are utilized. Efforts are
FIGURE 16.15 AFC operation principle. (U.S. Department of Defense Fuel Cell Test andEvaluation Center, “Fuel Cell Basics,” www.fctec.com/index.html.)
AlkaliFuel Cell
Electron Flow
Load
Hydrogen
Water
Oxygen
HydroxylIons
AnodeElectrolyte
Cathode
© 2007 by Taylor & Francis Group, LLC

510 Handbook of Alternative Fuel Technology
being made to broaden the spectrum of terrestrial daily applications. Tests anddemonstrations have shown that AFC hybrid vehicles are potential technologicalsolutions for the near future in transportation. In the 1970s, an AFC-based hybridvehicle was tested for 3 years, using liquid hydrogen and oxygen, and KOH liquidelectrolyte.22 The improved version of this vehicle was tested again in 1998, usinga system consisting of AFC and rechargeable alkaline manganese dioxide-zinc(RAMTM) batteries. The operating lifetime of these AFCs is anticipated to be about4000 h, and the mass production cost is expected to become comparable to the costof the currently used heat engines ($50 to $100 per kW).23
16.4.3 PHOSPHORIC ACID FUEL CELLS
These cells have been developed for medium-scale stationary applications and arethe only commercialized type of fuel cells. The technology employed for the PAFCis the most well-known technology developed to date for fuel cells.
The PAFC have a similar design with the PEMFC. The electrolyte used for PAFCis concentrated phosphoric acid (H3PO4), allowing operation at temperatures higherthan the PEMFC (i.e., over 100°C). This electrolyte is contained in a silicon carbidematrix, and catalysts are typically made of Pt. Technological advances of the com-ponents of this type of fuel cells have been extensively documented over the last 40years, and a brief summary is presented in Table 16.3.
Operation of PAFC is similar to PEMFC, as can be seen in Figure 16.11.Hydrogen-rich fuel is supplied to the anode, where protons and electrons split andstart traveling to the cathode, following different pathways through the membranelayer (protons) and via an external circuit, producing electricity (electrons). At the
TABLE 16.3PAFC Component Characteristics
Component ca. 1965 ca. 1975 Current Status
Anode PTFE-bonded Pt black PTFE-bonded Pt/C PTFE-bonded Pt/CVulcan XC-72a Vulcan XC-72a
9 mg/cm2 0.25 mg Pt/cm2 0.1 mg Pt/cm2
Cathode PTFE-bonded Pt black PTFE-bonded Pt/C PTFE-bonded Pt/CVulcan XC-72a Vulcan XC-72a
9 mg/cm2 0.5 mg Pt/cm2 0.5 mg Pt/cm2
Electrode Support Ta mesh screen Carbon paper Carbon paperElectrolyte Support Glass fiber paper PTFE-bonded SIC PTFE-bonded SICElectrolyte 85% H3PO4 95% H3PO4 100% H3PO4
aConductive oil furnace black, product of Cabot Corp. (Typical properties: 002 d-spacing of 3.6 Å by x-ray diffusion, surface area of 220 m2/g by nitrogen adsorption, and average particle size of 30 µm byelectron microscopy.)
Source: aAdapted from EG&G Services, Parsons Inc. and Science Applications International Corporation,Fuel Cell Handbook (Fifth Edition), Contract No. DE−AM26−99FT40575, for U.S. Department of Energy,October 2000.
© 2007 by Taylor & Francis Group, LLC

Fuel Cells 511
cathode, they will combine with oxygen, and water and heat are obtained as by-products. The basic reactions for PAFC are the same as for PEMFC.
Currently, the only commercially available fuel power system is the 200 kWPC25TM system, produced by UTC Fuel Cells, which is a unit of United TechnologiesCorporation. Each unit of this system provides more than 900,000 Btu’s per hourof heat, and more than 250 are already being used throughout the world. Table 16.4presents performance data of this system.24
16.5 HIGH TEMPERATURE FUEL CELLS
16.5.1 MOLTEN CARBONATE FUEL CELLS
The electrolyte is a mixture of lithium carbonate (~68%) and potassium carbonate(~32%), contained in a lithium-aluminum oxide (LiAlO2) matrix. Hydrogen and COare used for the electrochemical reactions, and water and CO2 result as by-products.Catalysts are typically made of nickel.
Operation of MCFC is shown in Figure 16.16. CO2 and O2 are supplied atcathode, and they react with the available electrons. The resulting carbonate ionstravel to the anode, where they combine with the hydrogen to produce water, CO2,and electrons. These electrons are then forced to go back to the cathode through theexternal pathway to create electricity. The basic reactions for MCFC are:
TABLE 16.4PC25 System Performance Data
Feature Characteristics
Rated electrical capacity 200 kW/235kVAVoltage and frequency 480/277 V, 60 Hz, 3 phase
400/230 V, 50 Hz, 3 phaseFuel consumption Natural gas: 2,050 cft/h @ 4–14" water pressure
Anaerobic digester gas: 3200 cft/hr at 60% CH4
Efficiency (LHV basis) ~90% Total: 40% Electrical, 50% ThermalEmissions <2 ppmv CO, <1 ppmv NOx and negligible SOx (on 15% O2, dry basis)Thermal energy available
standard 900,000 Btu/hr @ 140°Fhigh heat options 450,000 Btu/hr @ 140°F and 450,000 Btu/hr @ 250°F
Sound profile Conversational level (60dBA @ 30 ft.), acceptable for indoor installation.Modular power Flexibility to meet redundancy requirements as well as future growth in
power requirements.Flexible siting options Indoor or outdoor installation, small footprintPower module
Dimensions and weight 10' × 10' × 18'; 40,000 lbs.Cooling module
Dimensions and weight 4' × 14' × 4'; 1,700 lbs.
© 2007 by Taylor & Francis Group, LLC

512 Handbook of Alternative Fuel Technology
Anode: CO32– + H2 → H2O + CO2 + 2 e−
Cathode: CO2 + 1⁄2 O2 +2 e− → CO32–
Cell reaction: H2 + 1⁄2 O2 + CO2 (cathode) → H2O + CO2 (anode)
The MCFC operates at much higher temperatures (about 650°C) compared toPEMFC and PAFC, which makes it possible to process the fuel internally, thusincreasing the overall efficiency of the fuel cell and minimizing emissions. They areintended to be used for power plant applications. Over the years, various attemptshave been made to commercially develop plants based on MCFC. In the 1990s,companies such as MC Power and FuelCell Energy (formerly known as EnergyResearch Corp.) installed MCFC power plants for testing and development purposes.For example, a 2-MW unit was installed in 1996 in California by FuelCell Energyto test the design of commercial units. FuelCell Energy has recently signed a numberof agreements to build several MCFC systems in the U.S., Europe, and Japan.25
16.5.2 SOLID OXIDE FUEL CELLS
The least mature technology of the fuel cells, SOFCs are characterized by extremelyhigh operating temperatures. The fuel/oxidant mixture is less restricted, comparedto all the other fuel cells, owing to the high operating temperature of the cell, whichallows for more combinations. Fuel can be hydrogen, CO, or CH4, and the oxidantcan be CO2, O2, or air; catalysts are made of perovskites materials. A solid coatedzirconia oxide ceramic (Y2O3-stabilized ZrO2) is used as electrolyte.
FIGURE 16.16 MCFC operation principle. (U.S. Department of Defense Fuel Cell Test andEvaluation Center, “Fuel Cell Basics,” www.fctec.com/index.html.)
Molten CarbonateFuel Cell
Electron Flow
Load
Hydrogen Oxygen
Water
AnodeElectrolyte
Cathode
CarbonDioxide
CarbonTrioxide
Ions
© 2007 by Taylor & Francis Group, LLC

Fuel Cells 513
Operation of SOFC is shown in Figure 16.17. In this case, oxygen ions formedat the cathode from reaction of oxygen and electrons travel through the electrolyteto the anode. There they combine with fuel, creating by-products (i.e., water) andelectrons. These electrons travel to the cathode through an external circuit, producingelectricity. The basic reactions are:
Anode: 2 H2 + 2 O2– → 2 H2O + 4 e−
Cathode: O2 + 4 e− → 2 O2–
Cell reaction: 2H2 + O2 → 2 H2O
SOFCs are intended to be used for large power and cogeneration utilities. Anumber of 25-kW SOFC-based systems are already in testing, such as those devel-oped by Siemens Westinghouse Power Corp., which operated for more than 9,000and 13,000 h continuously. The longest operating time of more than 16,600 h wasobtained in 2000 by Siemens Westinghouse with a 100-kW SOFC. After the testingperiod ended, the prototype was moved and restarted; it continues to operate at theFuel Cell Pavilion at the Meteorit Park site in Germany.26
Currently, separate tests are being performed at the National Fuel Cell ResearchCenter in California on a 220-kW hybrid system, which would be used in cogen-eration plants. This system is based on a combination of a 200-kW fuel cell anda 20-kW gas turbine, and it is anticipated that the electrical efficiency will bearound 55%.26
FIGURE 16.17 SOFC operation principle. (U.S. Department of Defense Fuel Cell Test andEvaluation Center, “Fuel Cell Basics,” www.fctec.com/index.html.)
Solid OxideFuel Cells
Electron Flow
Load
Hydrogen Oxygen
Water
AnodeElectrolyte
Cathode
OxygenIons
© 2007 by Taylor & Francis Group, LLC

514 Handbook of Alternative Fuel Technology
16.6 HYDROGEN PRODUCTION AND STORAGE
16.6.1 HYDROGEN PRODUCTION
Fuel cells operate with hydrogen-rich fuels, and either direct hydrogen or reformedfuels are typically used. Currently, industrial production of hydrogen is designed toaccommodate the required supply for producing ammonia, which is largely used inagriculture as fertilizer and in oil refineries to produce automotive fuels. A number ofmethods can be used to obtain hydrogen, as illustrated in Figure 16.18; the most notableexample is extraction from fossil fuels. Other technologies, such as water electrolysis,are employed only on a much smaller scale because of their high costs, etc.
16.6.1.1 Fossil Fuels
Hydrogen is extracted from fossil fuels through various techniques, such as steamreforming, partial oxidation (or a combination of them), and gasification.
FIGURE 16.18 Hydrogen production sources.
Fossil Energy
Geothermal Energy
Nuclear Energy
Solar Energy
Water Power
Wind, waves, oceancurrents
Heat
Heat
Heat
HeatElectricity
Electricity
Electricity
Electricity
Electricity
Electricity
ChemicalConversion
Thermochem.Cycles
Electrolysis
Thermochem.Cycles
Electrolysis
Thermochem.Cycles
Electrolysis
Thermochem.Cycles
Electrolysis
ChemicalConversion
BiochemicalConversion
Electrolysis
Electrolysis
PhotoEnergy
HYDROGEN
© 2007 by Taylor & Francis Group, LLC

Fuel Cells 515
Steam reforming is a well-established technology, which uses natural gas asfeedstock. This process takes place at temperatures between 750 and 1000°C. Meth-ane reacts with water over a catalyst (usually nickel, supported by alumina) andproduces the hydrogen-rich gas that is further used by fuel cells. The overall processtakes place in two steps:
• Steam reforming: CH4 + HO2 → CO + 3 H2
• Shift reaction: CO + H2O → CO2 + H2
Methanol is also used for producing hydrogen, and the reaction takes place attemperatures between 200 and 300°C, the catalyst being made of copper, supportedby zinc oxide:
• Steam reforming: CH3OH + H2O → CO2 + 3 H2
• Shift reaction: CO + H2O → CO2 + H2
Partial oxidation is typically used to process heavy oil fractions; the exothermicreaction in this case does not require the presence of a catalyst. If applied to naturalgas or methane, presence of a catalyst becomes necessary. The following reactionsfor methane are given as an example:
• Partial oxidation: CH4 + 1⁄2 O2 → CO + H2
• Shift reaction: CO + H2O → CO2 + H2
The advantage of steam reforming technology is that its output has the highesthydrogen concentration compared to other technologies based on fossil fuel. How-ever, it does not offer fast start-up and dynamic response. Partial oxidation, on theother hand, produces only low concentrations of hydrogen combined with a faststart-up and dynamic response. A natural question is thus, what would happen if wetry to combine both these technologies, using the advantages of each of them? Thiscombination is known as autothermal reforming, and efforts have been made todevelop various reformers, such as the HotSpot fuel processor developed by JohnsonMatthey.27 Table 16.5 shows a comparison of the gas compositions obtained afterusing different options for the reforming process, using methanol as fuel.
TABLE 16.5Gas Composition of Reformer Outputs
Composition(dry gas, %) Steam Reforming Partial Oxidation
AutothermalReforming
H2 67 45 55CO2 22 20 22N2 — 22 21CO — — 2
Source: From Hoogers, G., Ed., Fuel Cell Technology Handbook, CRC Press, Boca Raton, FL, 2003.With permission.
© 2007 by Taylor & Francis Group, LLC

516 Handbook of Alternative Fuel Technology
The third technology, coal gasification, is achieved through coal reaction withoxygen and steam at high temperatures, and uses all types of coals for the process.
A disadvantage common to all these technologies is that one of the by-productsof the reforming reactions is CO2, a significant contributor to the environmentpollution. To eliminate this, various other technologies are being developed aspotential solutions for “CO2-free” hydrogen production from fossil fuels, such asthe pyrolytic cracking of natural gas28:
CH4 → C + 2 H2
16.6.1.2 Water Electrolysis
Another way of obtaining hydrogen is through water electrolysis. This technologyis based on decomposition of water into hydrogen and oxygen with the help ofelectricity. Although its development began with the 19th century, water electrolysishas never reached the level of large-scale production because it uses electricity asinput, and this has a direct impact on the overall cost of producing hydrogen. Costsassociated with this technology are considerably higher than for obtaining hydrogendirectly from the fossil fuels.3 The contribution of water electrolysis technology tothe total production of hydrogen represents only about 0.5%.
16.6.1.3 Other Sources
Nuclear or renewable energies are also considered potentially “CO2-free” sourcesof hydrogen production.
16.6.2 HYDROGEN STORAGE
Hydrogen storage represents one of the difficult issues associated with operation ofthe fuel cell systems. This is because hydrogen is characterized by low energy densityand high specific energy. There are a number of technologies currently used forstorage, such as liquefaction or compression. Other storage methods based on carbonnanofibers, metal hydrides, or glass microspheres are currently under investigation.
Hydrogen liquefaction can be done through several techniques. For small-scalesystems, the Stirling process is considered an important solution. An alternative tothe Stirling refrigerator is the magnetocaloric refrigeration process, based on theisentropic demagnetization of a ferromagnetic material near its Curie point temper-ature. For large-scale applications, the Claude process represents a viable economicsolution.37
Different types of pressure cylinders or tanks are currently used for storingcompressed hydrogen with a typical maximum pressure up to 30 MPa. Cylindersare made of lightweight composite materials, which reduce the overall weight of thestorage. It is also proposed to design pressure cylinders or tanks with better spacefilling of hydrogen compared to the current solutions. A “conformable technology”has been developed by Sleegers and Thiokol Propulsion’s Group, which allowsstoring more fuel in pressure tanks while reducing the overall tank weight. This
© 2007 by Taylor & Francis Group, LLC

Fuel Cells 517
technology uses a combination of multicell conformable tanks located such thatmaximum fuel storage is obtained.29
Other technologies, such as hydrogen storage in solid forms, are being researched,and recent results have been reported using carbon (nanotubes, activated carbon,Fullerenes), metal hydrides, and glass microspheres. Carbon storage is a very attrac-tive technology, which provides the overall system with high energy density, reli-ability, and safety. This technology is based on gas-on-solids adsorption of hydrogen,and it is being developed for small applications, in which safety and weight of thedevice are key characteristics.30 Metal hydrides are another interesting option cur-rently explored for hydrogen storage, where hydrogen reacts chemically with a metal.Table 16.6 shows the characteristics of a number of metal hydride systems. The thirdoption, glass microspheres, takes advantage of the variation of glass permeabilitywith temperature, and fills the microspheres with hydrogen to trap it inside.
TABLE 16.6Hydrogen Storage Properties of Metal Hydrides
Metal HydrideSystem Mg/MgH2 Ti/TiH2 V/VH2
Mg2Ni/Mg2NiH4
FeTi/FeTiH1.95
LaNi5/LaNi5H5.9 LH2
Hydrogen content as mass fraction (%)
7.7 4.0 2.1 3.2 1.8 1.4 100.0
Hydrogen content by volume (kg/dm3)
0.101 0.15 0.09 0.08 0.096 0.09 0.077
Energy content (based on HHV) (MJ/kg)
9.9 5.7 3.0 4.5 2.5 1.95 143.0
Energy content (based on LHV) (MJ/kg)
8.4 4.8 2.5 3.8 2.1 1.6 120.0
Heat of reaction (kJ/Nm3)
3360 5600 — 2800 1330 1340 —
Heat of reaction (kJ/mol)
76.3 127.2 — 63.6 30.2 30.4 —
Heat of reaction (as fraction of HHV) (%)
26.7 44.5 — 22.2 10.6 10.6 —
Heat of reaction (as fraction of LHV) (%)
31.6 52.6 — 26.3 12.5 12.6 —
Source: From Hoogers, G., Ed., Fuel Cell Technology Handbook, CRC Press, Boca Raton, FL, 2003.With permission.
© 2007 by Taylor & Francis Group, LLC

518 Handbook of Alternative Fuel Technology
16.7 CURRENT PERFORMANCES
16.7.1 OPERATIONAL ISSUES
16.7.1.1 Water and Heat Management
Although good results have been obtained using solid polymers as membranes, thereare a number of issues that require special attention during PEMFC operation, suchas the water and heat management. Conductivity properties are extremely sensitive tothe level of hydration of membranes, and maintaining adequate humidity conditionsis a challenging task. A fine balance of equilibrium has to be maintained to avoid eitherflooding or dehydration of the membrane. Water management depends on severalfactors, such as operating parameters (temperature and pressure), water content, andthe presence of the impurity ions in the membranes. PEMFC typically operate effi-ciently at approximately 80°C at atmospheric pressure; if increased above 100°C,dehydration of the membrane occurs, and conductivity of the membrane decreasessignificantly. The water content depends on the water transport, which is a complexphenomenon still not very well understood. Diffusion and electro-osmosis are consid-ered to be the processes responsible for the water transport, and various models havebeen developed describing the mechanism and the factors influencing it.31–34 Impuritiesin membranes are due to the impurities present in the fuel or oxidant, or to the corrosionof materials, and water management can be seriously affected by their presence.35,36
16.7.1.2 CO Poisoning
Hydrogen-rich fuels used for fuel cells are either pure hydrogen or reformed fuel. Asbriefly described in Subsection 16.6.1, during the reforming process CO is produced,and trace amounts of carbon monoxide remain present in the flow fed to the electrodes.For low-temperature fuel cells using platinum catalysts, the presence of carbon monoxideeven in trace levels is detrimental, with CO having an affinity for platinum and thuspoisoning the catalysts. The overall performance of fuel cells deteriorates as hydrogenis blocked from reaching the catalysts. Although further fuel processing with completeremoval of CO is critical for fuel cell operation, these additional processes require designmodifications of the system which, in the end, translate into higher overall costs.
16.7.1.3 Hydrogen Safety
Handling of hydrogen, similar to any other flammable fuel, entails a number ofhazards. Although since the Hindenburg incident in 1937 the public has consideredhydrogen to be extremely dangerous, it has been demonstrated that risks associatedwith it are manageable and are similar to those with other gaseous fuels. Hydrogenis indeed characterized by high volatility and flammability, but it also has very lowdensity, which means that it disperses extremely rapidly, and the ignition and deto-nation levels are not easily reached.
16.7.2 COST
Despite numerous improvements over the years (i.e., reducing of the membranethickness), the cost of the PEMFC membranes remains high, the price of Nafion
© 2007 by Taylor & Francis Group, LLC

Fuel Cells 519
membranes, for example, being $500 to $1000 per m2 based on quantity acquired, orapproximately $100 per kW electric power.27,37 It is estimated, however, that the cost ofthe membranes will decrease with the increasing of the production volume; their relativetrends are shown in Figure 16.19. To achieve lower costs and improve performance ofthe membranes, different technologies have been investigated during the last few years.Summary descriptions of these investigations are presented in Reference 27 and 38.
16.7.3 ENVIRONMENTAL IMPACT
The most attractive feature of fuel cells is their minimum impact on the environmentduring operation. An interesting comparison is shown in Figure 16.20, where drasticreductions in greenhouse gas emissions can be observed when comparing fuel cellswith internal combustion engines. If direct hydrogen is used as primary fuel for fuelcell operation, greenhouse gas emissions are practically zero.
FIGURE 16.19 Price/volume trends for Nafion membranes. (From DuPont Fuel Cells, DuPontTM
Nafion® Membranes and Dispersions, http://www.dupont.com/fuelcells. With permission.)
FIGURE 16.20 Greenhouse gas emissions. (Industry Canada, “Canadian Fuel Cell Commer-cialization Roadmap,” March, 2003.
Price Reduction of Nafion Membranesfor Fuel Cells
15
10
5
0
15
10
5
01998 2001 2010
Rel
ativ
eM
arke
t Pric
e
Rel
ativ
e V
olum
e
ReformulatedGasoline(2000)
ReformulatedGasoline(2010)
ReformulatedGasoline
Methanelfrom
Natural GasReformedOn-Board
DirectHydrogen
fromNatural Gas
DirectHydrogenfrom Water(Electrolysisfrom AverageElectricity Mix)
DirectHydrogenfrom Water(Electrolysis
fromRenewables–
Hydro, Nuclear,Biomass)Vehicle operationUpstream emissions
Internal Combustion Engine Fuel Cells
Zero
25% emission reduction
600
500
400
300
200
100
0CO
2-Equ
ival
ent E
mis
sion
s (g
/mile
)
© 2007 by Taylor & Francis Group, LLC

520 Handbook of Alternative Fuel Technology
As mentioned previously, the 200-kW PC25™ system produced by UTC Fuel Cellsis the only commercially available fuel power system. It is estimated that after 1 yearof operation this system will generate less than half of the total CO2 emissions comparedto an average fossil fuel plant. The remaining greenhouse emissions are estimated tobe negligible compared to the same average fossil fuel plant (see Figure 16.21).
16.8 RESEARCH AND DEVELOPMENT ISSUES
Extensive efforts are currently underway to improve fuel cell performance alongwith a reduction of the overall cost. To achieve this, issues like theoretical modeling,finding material and design alternatives for components or the entire fuel cell, andfinding viable solutions for hydrogen storage are under intense scrutiny worldwide.
The diffusion mechanism of protons through water or the membrane of PEMFCis one of the theoretical aspects that has been under evaluation over the years,numerous attempts being made to identify the best model describing the phenome-non. These models are either deterministic39,40 or statistical approaches.38,41 The porestructure of the membranes is assumed to have different geometries. For example,a cylindrical pore structure is used in the model described in Reference 40, witheither a uniform or variable pore radius and pore-wall distribution of fixed-charges.This model is an ion/solvent model that predicts the multicomponent salt separationby ion exchange membranes. Another example of the theoretical modeling develop-ments is the mechanism describing the transport of the proton in water (Grotthussmechanism), which considers that transport is done through consecutive proton
FIGURE 16.21 PC25 greenhouse emissions after 1 year of operation. (From UTC Fuel Cells,Commercial Power Systems, Experience and Proven Performance in Fuel Cell Power,http://www.utcfuelcells.com/commercial/pc25summary.shtml. With permission.)
(Pounds of emissionsper 1650 MWh)
(Pounds of carbondioxide emissions)
45,000
30,000
15,000
AverageU.S. fossil
fueled plant
Fuel cell AverageU.S. fossil
fueled plant
Fuel cell
4,500,000
3,600,000
2,700,000
1,800,000
900,000
4,044,000
1,860,000
0
41,427
CO
NOx
SOx
ParticulatesOrganic
compounds72
© 2007 by Taylor & Francis Group, LLC

Fuel Cells 521
migration steps between adjacent water (H2O) molecules.42 Other models assumethat the diffusion process of the proton is facilitated through formation of complexstructures, such as H5O2
+ (two H2O molecules sharing the same proton) and H9O4+
(three H2O molecules strongly bonded to the H3O+ core).43–45
New types of membranes for PEMFC that would allow operation of the fuelcells at higher temperatures are also being investigated. Improved cathodes, advancedcatalysts, and optimized gas diffusion layers are among the objectives of presentcontracts awarded in the U.S. and elsewhere.
New types of cells are being developed, such as direct methanol fuel cells(DMFC). The DMFCs (see Figure 16.22) are basically PEMFCs with a slightlymodified anode catalyst made of platinum-ruthenium, and using methanol as fuel.These fuel cells eliminate the reforming process of the hydrogen-rich fuel of PEMFCbut do not eliminate the CO2 emissions produced through chemical reactions, whichare greenhouse gas contributors.
REFERENCES
1. Appleby, A.J. and Foulkes, F.R., Fuel Cell Handbook, Van Nostrand Reinhold, NewYork, 1989.
2. Larminie, J. and Dicks, A., Fuel Cell Systems Explained, John Wiley & Sons, Chich-ester, U.K., 2000.
3. Norbeck, J.M., Hydrogen Fuel for Surface Transportation, Society of AutomotiveEngineers, Warrendale, PA, 1996.
4. Stobart, R., Ed., Fuel Cell Technology for Vehicles, PT-84, Society of AutomotiveEngineers, Warrendale, PA, 2001.
FIGURE 16.22 Direct methanol fuel cell stack (30 units). (Department of Energy, “DirectMethanol Fuel Cell,” http://www.ott.doe.gov.)
© 2007 by Taylor & Francis Group, LLC

522 Handbook of Alternative Fuel Technology
5. Holcomb, F.H., How a Fuel Cell Operates, U.S. Department of Defense ConstructionEngineering Research Laboratories, www.dodfuelcell.com/paper2.html.
6. Penner, S.S., Ed., Commercialization of fuel cells, Energy: Int. J., 20(5), PergamonPress, New York, 1995.
7. Mehta, S.K. and Bose, T.K., Ed., Proceedings of the Workshop on Hydrogen EnergySystems, presented at the Official Opening of the Hydrogen Research Institute, incollaboration with Canadian Hydrogen Association, Canada, 1996.
8. European Commission, A Fuel Cell Research, Development and Demonstration Strat-egy for Europe up to 2005, 1998 ed., Belgium, 1998.
9. Decher, R., Direct Energy Conversion — Fundamentals of Electric Power Production,Oxford University Press, 1997.
10. Gottesfeld, S. and Wilson, M.S., Polymer electrolyte fuel cells as potential powersources for portable electronic devices, in Energy Storage Systems for Electronics,Osaka, T. and Datta, M., Eds., Gordon and Breach Science Publishers, The Nether-lands, 2000.
11. DuPont Fluoroproducts, DuPontTM Nafion® PSFA Membranes N-112, N-1135, N-115, N-117, N-1110 Perfluorosulfonic Acid Polymer, Product Information NAE101,November 2002.
12. Kreuer, K.D., On the development of proton conducting materials for technologicalapplications, Solid State Ionics, 97(1–15), 1997.
13. Dow Chemical, http://www.dow.com/homepage/index.html.14. Dow Chemical, DOWEX Ion Exchange Resins — Fundamentals of Ion Exchange,
Dow Liquid Separations, June 2000.15. Wakizoe, M. et al., Analysis of proton exchange membrane fuel cell performance
with alternate membranes, Electrochim. Acta, 40(3), 335, 1995.16. Wilson, M.S., Valerio, J.A., and Gottesfeld, S., Low platinum loading electrodes for
polymer electrolyte fuel cells fabricated using thermoplastic ionomers, Electrochim.Acta, 40(3), 355, 1995.
17. Thomas, S., and Zalbowitz, M., Fuel Cells — Green Power, LA−UR−99−3231, LosAlamos National Laboratory, 1999.
18. Hoogers, G., Ed., Fuel Cell Technology Handbook, CRC Press, Boca Raton, FL, 2003.19. Fuel Cells 2000, Transportation Fuel Cells — Technical Info, www.fuelcells.org.20. Perry, M.L. and Fuller, T.F., A historical perspective of fuel cell technology in the
20th century, J. Electrochem. Soc., 149(7), S59, July 2002.21. Cabot, P.L., Guezala, E., Calpe, J.C., García, M.T., and Casado, J., Application of
Pd-based electrodes as hydrogen diffusion anodes in alkaline fuel cells, J. Electro-chem. Soc., 147(1), 43, January 2000.
22. Kordesch, K. and Simader, G., Fuel Cells and Their Applications, John Wiley &Sons, New York, March 1996.
23. Kordesch, K. et al., Intermittent use of a low-cost alkaline fuel cell-hybrid systemfor electric vehicles, J. Power Sources, 80, 190, 1999.
24. UTC Fuel Cells, Commercial Power Systems, Experience and Proven Performancein Fuel Cell Power, http://www.utcfuelcells.com/commercial/pc25summary.shtml.
25. U.S. Department of Energy, Fuel Cell Technology — Molten Carbonate Fuel Cells,http://www.fe.doe.gov/coal_power/fuelcells/fuelcells_moltencarb.shtml.
26. U.S. Department of Energy, Fuel Cell Technology — Solid Oxide Fuel Cells,http://www.fe.doe.gov/coal_power/fuelcells/fuelcells_sofc.shtml.
27. Hoogers, G., Ed., Fuel Cell Technology Handbook, CRC Press, Boca Raton, FL, 2003.28. Pohl, H.W., Ed., Hydrogen and Other Alternative Fuels for Air and Ground Trans-
portation, John Wiley & Sons, Germany, 1995.
© 2007 by Taylor & Francis Group, LLC

Fuel Cells 523
29. Sleegers Group, http://www.sleegers.on.ca/index.htm.30. Workshop on Storage of Hydrogen on Carbon Nanostructured Materials: held at
Institut de Recherche sur l’Hydrogene Trois-Rivieres, Canada, 2000.31. Janssen, G.J.M., A phenomenological model of water transport in a proton exchange
membrane fuel cell, J. Electrochem. Soc., 148(12), A1313, 2001.32. Motupally, S. et al., Diffusion of water in Nafion 115 membranes, J. Electrochem.
Soc., 147(9), 3171, 2000.33. Zawodzinski, T.A., Jr., Springer, T.E., Davey, J., Lopez, R.C., Valerio, J., and Got-
tesfeld, S., A comparative study of water uptake by and transport through ionomericfuel cell membranes, J. Electrochem. Soc., 140(7), 1981, July 1993.
34. Nguyen, T.V. and White, R.E., A water and heat management model for proton-exchange-membrane fuel cells, J. Electrochem. Soc., 140(8), 2178, August 1993.
35. Okada, T., Theory for water management in membranes for polymer electrolyte fuelcells — Part 1: The effect of impurity ions at the anode side on the membraneperformances, J. Electroanal. Chem., 465, 1, 1999.
36. Okada, T., Theory for water management in membranes for polymer electrolyte fuelcells — Part 2: The effect of impurity ions at the cathode side on the membraneperformances, J. Electroanal. Chem., 465, 18, 1999.
37. DuPont Fuel Cells, DuPontTM Nafion® Membranes and Dispersions, http://www.dupont.com/fuelcells.
38. Paddison, S.J., The modeling of molecular structure and ion transport in sulfonic acidbased ionomer membranes, J. New. Mater. Electrochem. Syst., 4, 197, 2001.
39. Thampan, T., Malhotra, S., Tang, H., and Datta, R., Modeling of conductive transportin proton−exchange membranes for fuel cells, J. Electrochem. Soc., 147(9), 2000.
40. Pintauro, P.N. and Yang, Y., Mathematical Analysis of Transport in Ion−ExchangeMembranes, in Tutorials in Electrochemical Engineering — Mathematical Modeling,Electrochemical Society Proceedings Vol. 99−14, Eds., Savinell, R.F., Fenton, J.M.,West, A., Scanlon, S.L., and Weidner, J.W., The Electrochemical Society, Inc., 1999.
41. Paddison, S.J., Paul, R., and Zawodzinski, T.A., Jr., A statistical mechanical modelof proton and water transport in a proton exchange membrane, J. Electrochem. Soc.,147, 2000.
42. de Grotthuss, C.J.T., Sur la Décomposition de l'Eau et des Corps qu'Elle Tient enDissolution à l'Aide de l'Électricité Galvanique, Ann. Chim., LVIII, 1806.
43. Zundel, G., The Hydrogen Bond — Recent Developments in Theory and Experiments.II. Structure and Spectroscopy, Schuster, P., Zundel, G., and Sandorfy, C., Eds., North-Holland, Amsterdam, 1976.
44. Eigen, M., Proton transfer, acid-base catalysis and enzymatic hydrolysis, Angew.Chem. Int. Ed. Engl., 3, 1964.
45. Marx, D., Tuckerman, M.E., Hutter, J., and Parrinello, M., The nature of the hydratedexcess proton in water, Nature, 397, 1999.
46. EG&G Services, Parsons, Inc. and Science Applications International Corporation,Fuel Cell Handbook (Fifth Edition), Contract No. DE−AM26−99FT40575, for U.S.Department of Energy, October 2000.
© 2007 by Taylor & Francis Group, LLC