Habitat quality and connectivity in agricultural landscapes: The role of land use systems at various...
9
Habitat quality and connectivity in agricultural landscapes: The role of land use systems at various scales in time Franc ¸oise Burel a, * , Jacques Baudry b a UMR Ecobio CNRS – Universite ´ de Rennes 1, Campus de Beaulieu, 35042 Rennes Cedex, France b INRA SAD Armorique, 65 rue de Saint Brieuc, 35042 Rennes Cedex, France Accepted 1 April 2005 Abstract Connectivity is a key concept of landscape ecology as it relates to flows and movements of organisms as driven by landscape structure. More and more aspects of landscape heterogeneity are considered in measuring connectivity, as the diversity of crops in agricultural landscapes. In this paper, we explored the value of considering changes and cumulated effects of connectivity over time. As an example, we analysed connectivity among patches influenced by maize over 7 years in an agricultural landscape in Brittany, France. Clear temporal patterns appeared: maize is concentrated in certain parts of the landscape, but over the period the whole area, 70% of the landscape, used for maize was connected. Instead of discrete patches, maize may produce large clusters allowing movement from patch to patch from year to year. This reinforces the importance of understanding land use allocation rules within farms and landscapes to evaluate the ecological effects of agriculture. # 2005 Elsevier Ltd. All rights reserved. Keywords: Connectivity; Agriculture; Landscape; Dynamics 1. Introduction In fragmented and heterogeneous agricultural landscapes, movement is a key process for survival of plants and animals (Wiens et al., 1993). For mobile species, daily movements are for food search and for predator avoidance. For all species, individuals or propagules disperse among local populations or colonize new habitats, at time scale of a year or more. Before the period of land use intensification from the 1950s onward, patches and linear elements of semi-natural habitats facilitated the movements of several species. Since then, these habitats have decreased dramatically in intensively farmed regions (Leonard and Cobham, 1977; Meeus, 1990). Nevertheless, numerous forest species continue to thrive in these environments (Burel, 1996). Survival of these population is due to continuing landscape connectivity that, in this paper, is defined as ‘‘the This article is also available online at: www.elsevier.com/locate/ecolind Ecological Indicators 5 (2005) 305–313 * Corresponding author. Tel.: +33 223236145; fax: +33 223235026. E-mail address: [email protected] (F. Burel). 1470-160X/$ – see front matter # 2005 Elsevier Ltd. All rights reserved. doi:10.1016/j.ecolind.2005.04.002
Transcript of Habitat quality and connectivity in agricultural landscapes: The role of land use systems at various...
Habitat quality and connectivity in agricultural landscapes:
The role of land use systems at various scales in time
Francoise Burel a,*, Jacques Baudry b
a UMR Ecobio CNRS – Universite de Rennes 1, Campus de Beaulieu, 35042 Rennes Cedex, Franceb INRA SAD Armorique, 65 rue de Saint Brieuc, 35042 Rennes Cedex, France
Accepted 1 April 2005
Abstract
Connectivity is a key concept of landscape ecology as it relates to flows and movements of organisms as driven by landscape
structure. More and more aspects of landscape heterogeneity are considered in measuring connectivity, as the diversity of crops
in agricultural landscapes. In this paper, we explored the value of considering changes and cumulated effects of connectivity over
time. As an example, we analysed connectivity among patches influenced by maize over 7 years in an agricultural landscape in
Brittany, France.
Clear temporal patterns appeared: maize is concentrated in certain parts of the landscape, but over the period the whole area,
70% of the landscape, used for maize was connected. Instead of discrete patches, maize may produce large clusters allowing
movement from patch to patch from year to year. This reinforces the importance of understanding land use allocation rules
within farms and landscapes to evaluate the ecological effects of agriculture.
# 2005 Elsevier Ltd. All rights reserved.
Keywords: Connectivity; Agriculture; Landscape; Dynamics
This article is also available online at:www.elsevier.com/locate/ecolind
Ecological Indicators 5 (2005) 305–313
1. Introduction
In fragmented and heterogeneous agricultural
landscapes, movement is a key process for survival
of plants and animals (Wiens et al., 1993). For
mobile species, daily movements are for food search
and for predator avoidance. For all species,
individuals or propagules disperse among local
* Corresponding author. Tel.: +33 223236145;
fax: +33 223235026.
E-mail address: [email protected] (F. Burel).
1470-160X/$ – see front matter # 2005 Elsevier Ltd. All rights reserved
doi:10.1016/j.ecolind.2005.04.002
populations or colonize new habitats, at time scale of
a year or more. Before the period of land use
intensification from the 1950s onward, patches and
linear elements of semi-natural habitats facilitated
the movements of several species. Since then, these
habitats have decreased dramatically in intensively
farmed regions (Leonard and Cobham, 1977; Meeus,
1990).
Nevertheless, numerous forest species continue to
thrive in these environments (Burel, 1996). Survival of
these population is due to continuing landscape
connectivity that, in this paper, is defined as ‘‘the
.
F. Burel, J. Baudry / Ecological Indicators 5 (2005) 305–313306
degree to which the landscape facilitates or impedes
movement among resource patches’’ (Taylor et al.,
1993) is one of the main controls for populations of
these species (Bennett, 1999).
A direct measure of landscape connectivity, there-
fore, must incorporate a measure of some aspect of
organism movement through the landscape. Several
authors have developed the idea that ‘‘connectivity’’
of a landscape depends not only on the distance
between habitat patches, but also on the presence of
corridors and stepping stones and on the resistance of
the surrounding matrix (Fahrig and Merriam, 1994;
Moilanen and Hanski, 1998; Pain et al., 2000;
Ricketts, 2001). In agricultural landscapes, the mosaic
of crops and uncultivated patches, woodlots, heath
land, wetlands and hedgerows, influences individual
movements for carabid beetles (Martin et al., 2001),
butterflies (Ricketts, 2001), badgers (Schippers et al.,
1996) and damselflies (Pither and Taylor, 1998).
Interactions among individual movements of a species
and a given land use depend on its phenological state
(Ouin et al., 2000), available resources and/or refuge
effect (Henein et al., 1998). Millan-Pena et al. (2003)
find in Brittany, France, that in landscapes showing
similar organization of woodlands and hedgerows,
communities of carabids differ according to farming
systems. In landscapes with few woods remaining,
carabid communities in dairy farms, with a high
proportion of maize, differ markedly from the ones in
landscapes, where pig production, characterized by a
high proportion of cereals, are dominant. The first
ones have communities’ characteristic of still dense
hedgerow network landscapes. A crop such as maize
may in some instance be a substitute for woodland.
Nevertheless, measures of connectivity must
involve spatial heterogeneity of the land as well as
individual species area requirement and dispersal
distance (Vos et al., 2001) and may act as a refuge for
wildlife (Bro et al., 2004).
Agricultural landscapes are dynamic at several
temporal levels. On long-temporal scales, changes in
farming systems induce durable changes that affect the
size and the shape of cropping areas and of natural or
extensively farmed areas (Baudry et al., 2000; Le
Coeur et al., 2002). Within year growth and harvest of
crops change the mosaic of resources, among years
crop succession in a given farming system changes the
spatial arrangement of the mosaic, with no or few
effects on the shape and size of the fields (Baudry and
Papy, 2001).
Farming systems generate specific landscape
patterns for several reasons. Good agronomic prac-
tices imply that in a given landscape different annual
crops are implemented from year to year to save
nutrients and prevent diseases (Colbach et al., 1997).
Hence, as different farming systems differ by the type
of crops, the different crops of a system form a specific
pattern. Field size, topography and soil diversity also
participate to the production of landscape patterns
(Deffontaines et al., 1995).
Due to the growing interest in sustaining biodi-
versity in agricultural areas and for conservation of
integrated pest management (Altieri, 1980), it is now
important to do more than consider habitats in a binary
world that reduces a landscape to two basic categories,
suitable habitats and uninhabitable matrix (Levins,
1970; Gilpin and Hanski, 1991; Hanski, 1997). Rather
the heterogeneity of the whole matrix and its
variability through time must be included (Baudry
et al., 2003).
Therefore, measures of connectivity integrate more
and more land use heterogeneity, but usually consider
only one state of the landscape that can be past (Petit
and Burel, 1998) or most of the time current
(Tischendorf and Fahrig, 2000). We hypothesize that
organization of the shifting crop mosaic through time
may influence connectivity over years, from mechan-
isms of a step by step movement through the
landscapes using suitable habitats, which contiguity
or adjacency varies according to the farmer’s rules
from year to year. A crop mosaic is typically a shifting
mosaic from year to year. The pattern a given year may
permit the displacement of individuals of a species on
part of the landscape, the movement continues the year
after as new opportunities to move across the
landscape as a new crop pattern appears. It may then
be that after a few years the species has the opportunity
to spread out over all the landscape or only on part of
it.
In this paper, we considered the effects of a few
years’ crop successions on the measure of connectiv-
ity. The analysis is done on a set of data from a long-
term ecological research site, where land use maps are
available since 1996. The aim is to explore the
relevance of considering crop succession data at
different time steps to measure connectivity in
F. Burel, J. Baudry / Ecological Indicators 5 (2005) 305–313 307
agricultural landscapes. The question is the incorpora-
tion of time in ecological indicators. How different is
an indicator of connectivity measured over a single
year or over several years?
Previous simulations (Baudry et al., 2003) show
that over a single year connectivity as related to
cropping patterns is similar in random patterns and
patterns produced by using land allocation rules. Only
when cumulated over several years do the two patterns
differ.
2. Study sites
The research was carried out in a hedgerow
network landscape 60 km north of Rennes, Brittany,
France. This is a typical ‘‘bocage’’ landscape used for
milk production. Meadows (grazed or mowed), maize
for silage, forage and a few cereals make up 90% of
the land cover, with the remainder being hedges, field
margins and road verges, see a detailed description in
Baudry et al. (2000). Even where the land cover was
meadow, farming techniques and social factors have
led to differences in land use and land management.
The analysis of land use in our study area shows a
significant relationship between landscape patterns
and types of farming systems (Thenail, 2002). Within
farms, a general pattern of land use allocation to fields
is found (Thenail and Baudry, 2004), but the authors
also find deviation according to landscape structure.
The general pattern is that pastures for dairy cows are
close to farmstead, fodder for winter (maize) further
and even further cereals. Crop succession leads to a
mixture of crops; the general pattern only indicates
dominance of crops. Field size and soil hydromorphy
also influence land use (Thenail and Baudry, 2004).
Deviations in different landscapes are due to
difference in field patterns, in landscapes with a
dense network of hedgerows, fields are more scattered
and distance to farms is only relative, the mixture of
fields from different farms further blurs patterns.
3. Methods
We used the land cover maps of a 630 ha area from
1996 to 2002 to measure connectivity induced by
maize and it’s cumulating over years.
3.1. Land cover mapping
Land cover maps were digitized using both the 1/
25,000 map of the Institut National Geographique as a
background to provide the placement of roads, etc. and
air photos at the 1/10,000 scale to draw field limits.
Those air photos also provided the information of the
crops present in the different fields. The photos were
taken each year (1996–2002) in June to have a
maximum of contrast between crops, especially as
maize fields are almost bare ground.
3.2. Measures of connectivity
In this paper, we considered a habitat-specific
forest species, which moves between suitable forest
patches either for supplementation or complementation
(Dunning et al., 1992). Individuals move from patch to
patch in continuously varying elements, within spatially
explicit landscapes. Data from the literature and
previous research on our study sites underlined the role
ofmaizeasasurrogatefor forestconditionswhengrown.
So, we concentrated here our assessment of landscape
connectivity on the part due to maize fields over years
within the five surveyed years.
We looked at the spatial distribution of habitat
patches at the landscape level. Hence, the measure of
connectivity is the total size of habitat patches. To create
the patches, we used the notion of a critical distance
representing an organism ability to move between
resource patches. We considered 100 m � 100 m
windows, the average maize field size and centred on
each pixel of the map. A pixel is considered as a suitable
habitat if an individual of the target species can
move everywhere within the surrounding window.
Contiguous ‘‘habitat pixels’’ form a habitat patch.
We took the example of forest small mammals,
using methods and data provided by Sutherland et al.
(2000). The median and probable dispersal between
suitable patches is approximately 60 m; these small
mammals may use pixels as habitat, with at least 50%
of maize in the surrounding 100 m � 100 m window.
By overlaying patches of suitable habitats of the
different years, we obtain clusters representing the
frequency of connection for the different areas in the
landscape. From these maps, we extracted the area of
the different clusters formed by connected woods and
hedgerows and connected pieces of farmland.
F. Burel, J. Baudry / Ecological Indicators 5 (2005) 305–313308
4. Results
4.1. Dynamics of land cover and dynamics of
connectivity
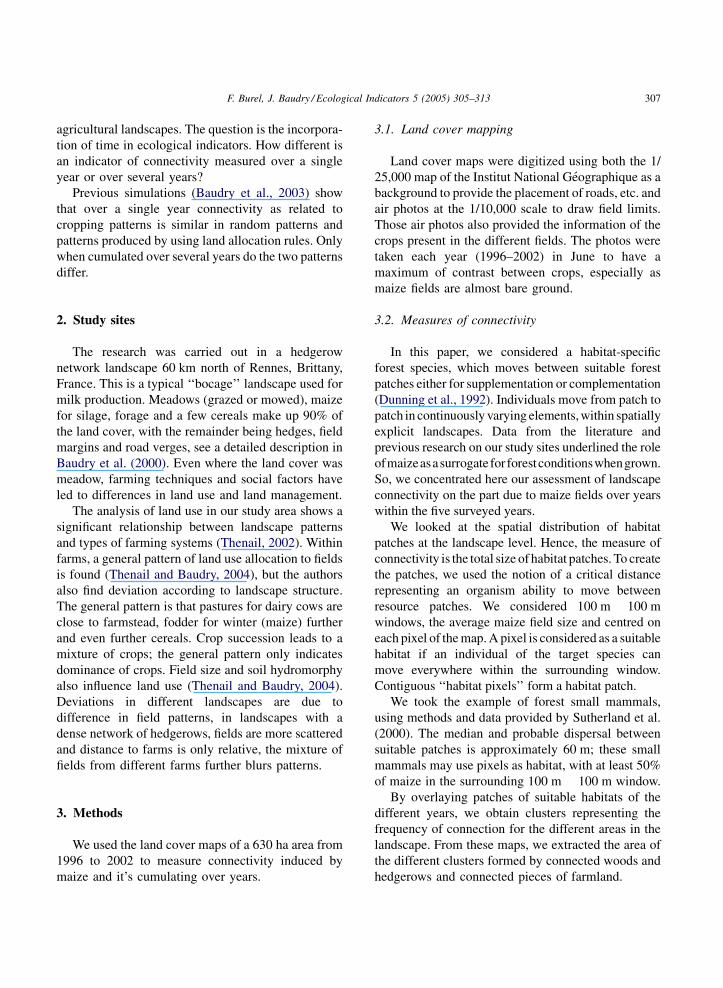
Fig. 1 gives the area of maize per year, the total area
decreased of more than 10% over the period.
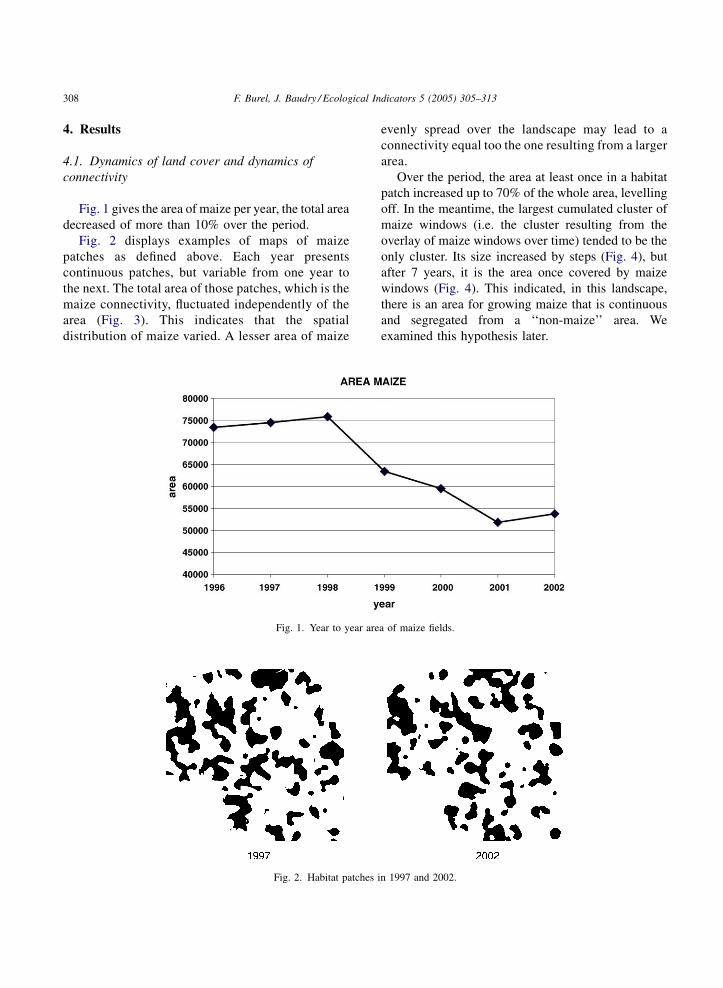
Fig. 2 displays examples of maps of maize
patches as defined above. Each year presents
continuous patches, but variable from one year to
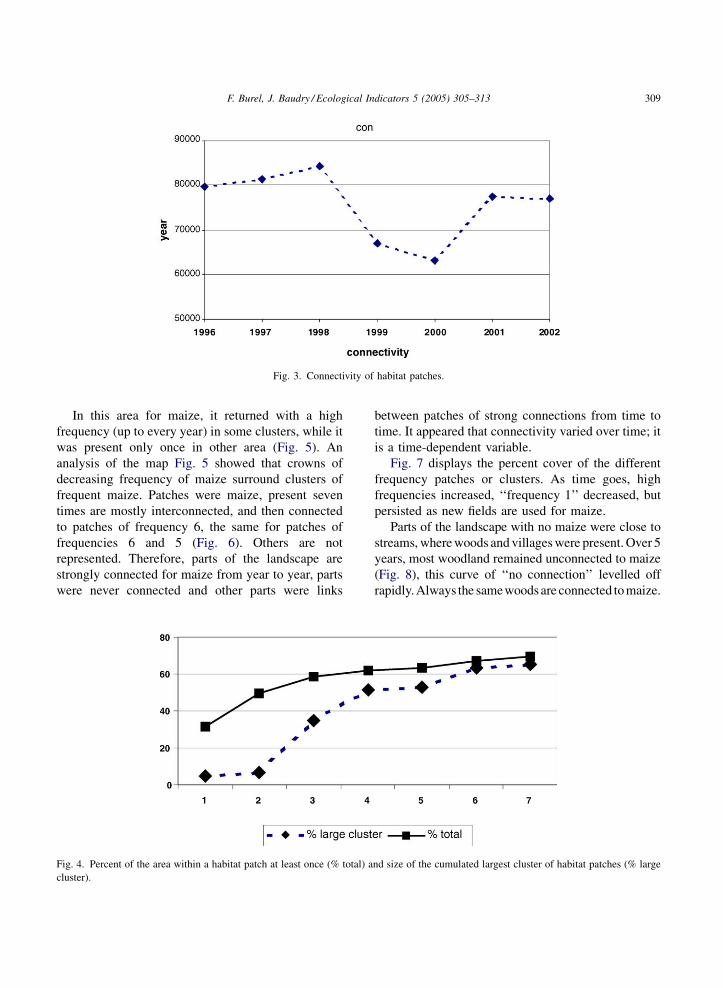
the next. The total area of those patches, which is the
maize connectivity, fluctuated independently of the
area (Fig. 3). This indicates that the spatial
distribution of maize varied. A lesser area of maize
Fig. 1. Year to year are
Fig. 2. Habitat patches i
evenly spread over the landscape may lead to a
connectivity equal too the one resulting from a larger
area.
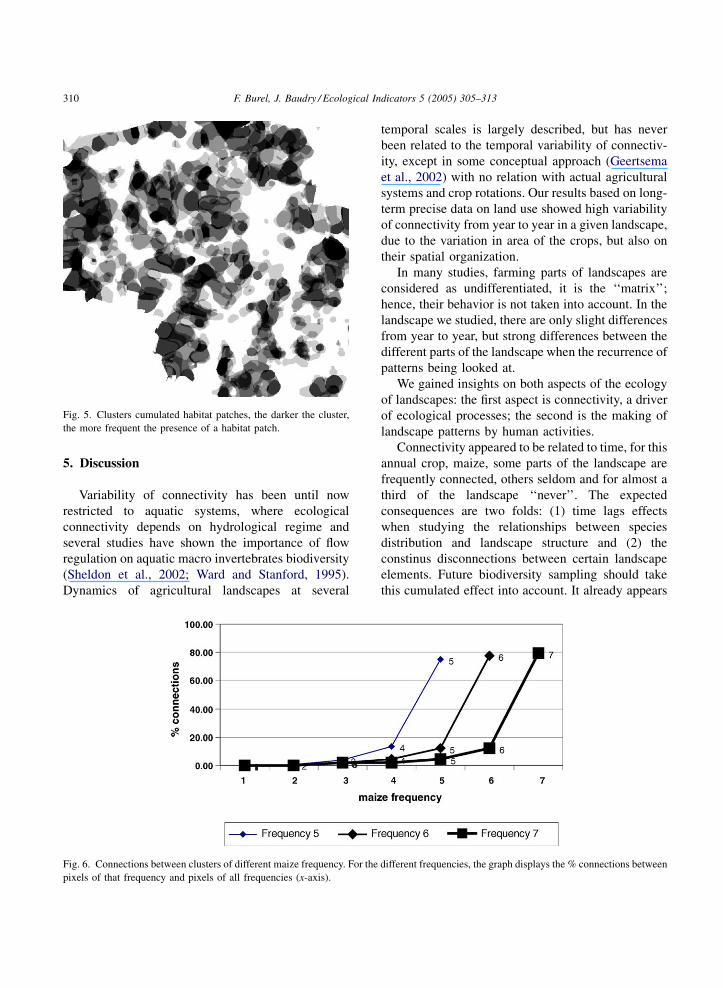
Over the period, the area at least once in a habitat
patch increased up to 70% of the whole area, levelling
off. In the meantime, the largest cumulated cluster of
maize windows (i.e. the cluster resulting from the
overlay of maize windows over time) tended to be the
only cluster. Its size increased by steps (Fig. 4), but
after 7 years, it is the area once covered by maize
windows (Fig. 4). This indicated, in this landscape,
there is an area for growing maize that is continuous
and segregated from a ‘‘non-maize’’ area. We
examined this hypothesis later.
a of maize fields.
n 1997 and 2002.
F. Burel, J. Baudry / Ecological Indicators 5 (2005) 305–313 309
Fig. 3. Connectivity of habitat patches.
In this area for maize, it returned with a high
frequency (up to every year) in some clusters, while it
was present only once in other area (Fig. 5). An
analysis of the map Fig. 5 showed that crowns of
decreasing frequency of maize surround clusters of
frequent maize. Patches were maize, present seven
times are mostly interconnected, and then connected
to patches of frequency 6, the same for patches of
frequencies 6 and 5 (Fig. 6). Others are not
represented. Therefore, parts of the landscape are
strongly connected for maize from year to year, parts
were never connected and other parts were links
Fig. 4. Percent of the area within a habitat patch at least once (% total) a
cluster).
between patches of strong connections from time to
time. It appeared that connectivity varied over time; it
is a time-dependent variable.
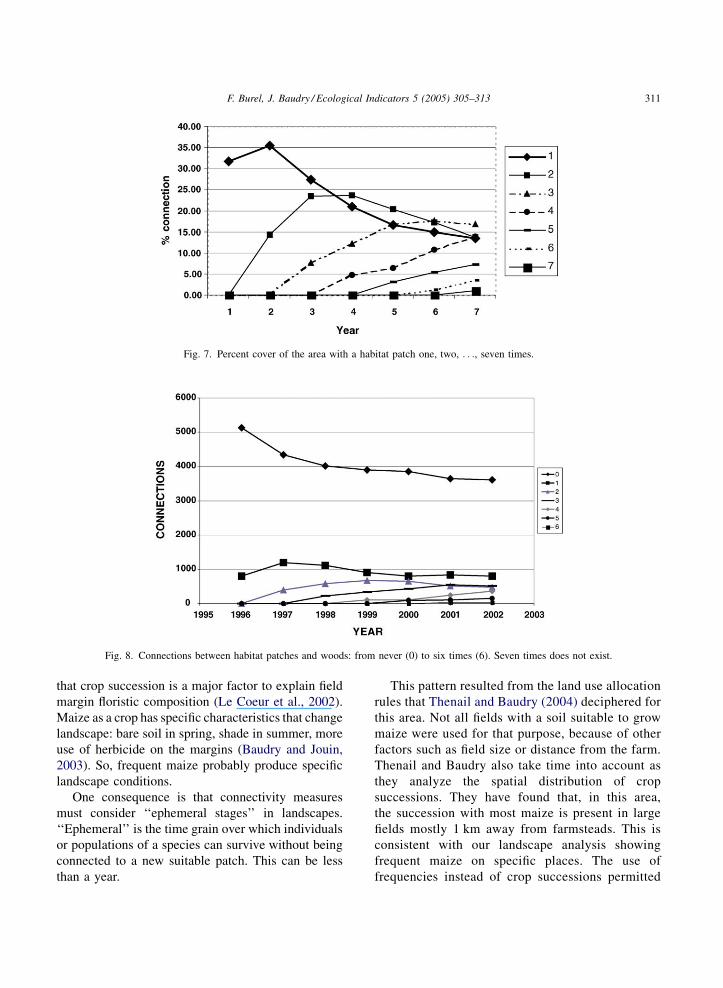
Fig. 7 displays the percent cover of the different
frequency patches or clusters. As time goes, high
frequencies increased, ‘‘frequency 1’’ decreased, but
persisted as new fields are used for maize.
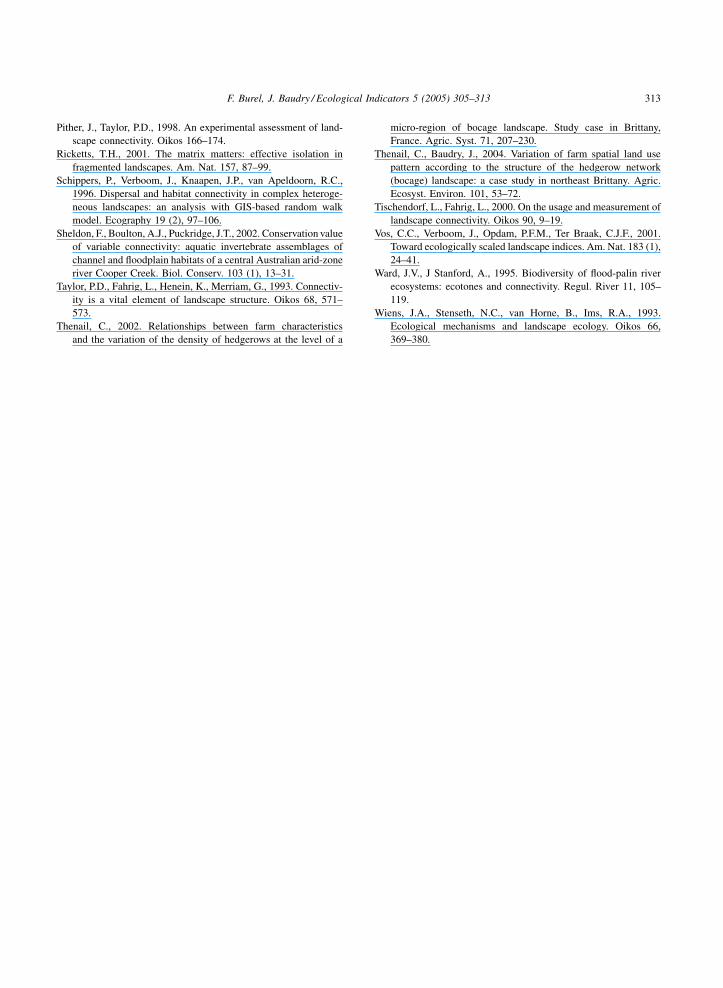
Parts of the landscape with no maize were close to
streams, where woods and villages were present. Over 5
years, most woodland remained unconnected to maize
(Fig. 8), this curve of ‘‘no connection’’ levelled off
rapidly. Always the samewoods are connected to maize.
nd size of the cumulated largest cluster of habitat patches (% large
F. Burel, J. Baudry / Ecological Indicators 5 (2005) 305–313310
Fig. 5. Clusters cumulated habitat patches, the darker the cluster,
the more frequent the presence of a habitat patch.
5. Discussion
Variability of connectivity has been until now
restricted to aquatic systems, where ecological
connectivity depends on hydrological regime and
several studies have shown the importance of flow
regulation on aquatic macro invertebrates biodiversity
(Sheldon et al., 2002; Ward and Stanford, 1995).
Dynamics of agricultural landscapes at several
Fig. 6. Connections between clusters of different maize frequency. For the
pixels of that frequency and pixels of all frequencies (x-axis).
temporal scales is largely described, but has never
been related to the temporal variability of connectiv-
ity, except in some conceptual approach (Geertsema
et al., 2002) with no relation with actual agricultural
systems and crop rotations. Our results based on long-
term precise data on land use showed high variability
of connectivity from year to year in a given landscape,
due to the variation in area of the crops, but also on
their spatial organization.
In many studies, farming parts of landscapes are
considered as undifferentiated, it is the ‘‘matrix’’;
hence, their behavior is not taken into account. In the
landscape we studied, there are only slight differences
from year to year, but strong differences between the
different parts of the landscape when the recurrence of
patterns being looked at.
We gained insights on both aspects of the ecology
of landscapes: the first aspect is connectivity, a driver
of ecological processes; the second is the making of
landscape patterns by human activities.
Connectivity appeared to be related to time, for this
annual crop, maize, some parts of the landscape are
frequently connected, others seldom and for almost a
third of the landscape ‘‘never’’. The expected
consequences are two folds: (1) time lags effects
when studying the relationships between species
distribution and landscape structure and (2) the
constinus disconnections between certain landscape
elements. Future biodiversity sampling should take
this cumulated effect into account. It already appears
different frequencies, the graph displays the % connections between
F. Burel, J. Baudry / Ecological Indicators 5 (2005) 305–313 311
Fig. 7. Percent cover of the area with a habitat patch one, two, . . ., seven times.
Fig. 8. Connections between habitat patches and woods: from never (0) to six times (6). Seven times does not exist.
that crop succession is a major factor to explain field
margin floristic composition (Le Coeur et al., 2002).
Maize as a crop has specific characteristics that change
landscape: bare soil in spring, shade in summer, more
use of herbicide on the margins (Baudry and Jouin,
2003). So, frequent maize probably produce specific
landscape conditions.
One consequence is that connectivity measures
must consider ‘‘ephemeral stages’’ in landscapes.
‘‘Ephemeral’’ is the time grain over which individuals
or populations of a species can survive without being
connected to a new suitable patch. This can be less
than a year.
This pattern resulted from the land use allocation
rules that Thenail and Baudry (2004) deciphered for
this area. Not all fields with a soil suitable to grow
maize were used for that purpose, because of other
factors such as field size or distance from the farm.
Thenail and Baudry also take time into account as
they analyze the spatial distribution of crop
successions. They have found that, in this area,
the succession with most maize is present in large
fields mostly 1 km away from farmsteads. This is
consistent with our landscape analysis showing
frequent maize on specific places. The use of
frequencies instead of crop successions permitted

F. Burel, J. Baudry / Ecological Indicators 5 (2005) 305–313312
us to capture infrequent events that may be
ecologically important.
We see that there may be different standpoints
when analyzing a landscape phenomenon. From a
farming systems point of view, the question is ‘‘What
are the general rules for land use allocation?’’ and
from an ecological standpoint, the question is ‘‘How
often parts of landscape under the influence of maize
are connected?’’ The two approaches are needed to
understand landscape processes. Models of agricul-
tural landscapes must incorporate land use allocation
mechanisms to simulate landscapes considering the
heterogeneity due to cropping systems and to measure
the dynamic patterns of connectivity.
Acknowledgments
We thank the ministry in charge of the environment
(DIVA programme) and the CNRS (Zone Atelier
project) for their financial support. We are grateful to
Nicolas Schermann for preparing the original land use
maps.
References
Altieri, M.A., 1980. The need for an agroecological approach to pest
management. Environ. Manage. 4, 467–468.
Baudry, J., Burel, F., Aviron, S., Martin, M., Ouin, A., Pain, G.,
Thenail, C., 2003. Temporal variability of connectivity in agri-
cultural landscapes: Do farming activities help? Landscape
Ecol. 18 (3), 303–314.
Baudry, J., Burel, F., Thenail, C., Le Coeur, D., 2000. A holistic
landscape ecological study of the interactions between farming
activities and ecological patterns in Brittany, France. Landscape
Urban Plan 50 (1–3), 119–128.
Baudry, J., Jouin, A. (Eds.), 2003. De la haie aux bocages:
organisation, fonctionnement et gestion. INRA ed. Ministere
de l’Ecologie et du Developpement Durable, Paris.
Baudry, J., Papy, F., 2001. The role of landscape heterogeneity in the
sustainability of cropping systems. In: Nosberger, J., Geiger,
H.H., Struik, P.C. (Eds.), Crop Science—Progress and Pro-
spects, Cabi Publishing, Oxon, pp. 243–259.
Bennett, A.F., 1999. Linkages in The Landscape: The Role of
Corridors and Connectivity in Wildlife Conservation. IUCN,
Gland, Switzerland and Cambridge.
Bro, E., Mayot, P., Mayuot, P., Corda, E., Reitz, F., 2004. Impact of
habitat management on grey partridge population dynamics on
cereals ecosystems in France: assessing a wildlife cover scheme
using a multi-site B.A.C.I. experiment. J. Appl. Ecol. 41 (5),
846–857.
Burel, F., 1996. Hedgerows and their role in agricultural landscapes.
Crit. Rev. Plant Sci. 15 (2), 169–190.
Colbach, N., Duby, C., Cavelier, A., Meynard, J.M., 1997. Influence
of cropping systems on foot and root diseases of winter wheat:
fitting of a statistical model. Eur. J. Agron. 6 (1–2), 61–77.
Deffontaines, J.P., Thenail, C., Baudry, J., 1995. Agricultural sys-
tems and landscape patterns: how can we built a relationship?
Landscape Urban Plan 31 (1–3), 3–10.
Dunning, J.B., Danielson, B.J., Pulliam, H.R., 1992. Ecological
processes that affect populations in complex landscapes. Oikos
65, 169–175.
Fahrig, L., Merriam, G., 1994. Conservation of fragmented popula-
tions. Conserv. Biol. 8, 50–59.
Geertsema, W., Opdam, P., Kropff, M.J., 2002. Plant strategies and
agricultural landscapes: survival in spatially and temporally
fragmented habitat. Landscape Ecol. 17 (3), 263–279.
Gilpin, M., Hanski, I. (Eds.), 1991. Metapopulation Dynamics:
Empirical and Theoretical Investigations. Academic Press, Lon-
don.
Hanski, I., 1997. Metapopulation dynamics: from concepts and
observations to predictive models. In: Hanski, I., Gilpin, M.
(Eds.), Metapopulation Biology: Ecology, Genetics and Evolu-
tion, Academic Press, San Diego, pp. 69–92.
Henein, K., Wegner, J., Merriam, G., 1998. Population effects of
landscape model manipulation on two behaviourally different
woodland small mammals. Oikos 81 (1), 168–186.
Le Coeur, D., Baudry, J., Burel, F., Thenail, C., 2002. Why and how
we should study field boundaries biodiversity in an agrarian
landscape context. Agric. Ecosyst. Environ. 89 (1–2), 23–40.
Leonard, P.L., Cobham, R.O., 1977. The farming landscape of
Englandand Wales: a changing scene. Landscape Plan4,205–216.
Levins, R., 1970. Extinctions. Some mathematical questions in
biology Providence, Rhode Island. Am. Math. Soc. 2, 77–107.
Martin, M., Bastardie, F., Richard, R., Burel, F., 2001. Studying
boundary effects on animal movement in heterogeneous land-
scapes: the case of Abax ater (Coleoptera, carabidae) in hedge-
row network landscapes. Comptes Rendus Acad. Sci. Paris,
Serie III, Sciences de la vie 324, 1029–1035.
Meeus, J.H.A., 1990. The transformation of agricultural landscapes
in western Europe. Milieu 6, 225–236.
Millan-Pena, N., Butet, A., Delettre, Y., Morant, P., Burel, F., 2003.
Landscape context and carabid beetles (Coleoptera: Carabidae)
communities of hedgerows in western France. Agric. Ecosyst.
Environ. 94 (1), 59–72.
Moilanen, A., Hanski, I., 1998. Metapopulation dynamics: effects of
habitat quality and landscape structure. Ecology 79 (7), 2503–
2515.
Ouin, A., Paillat, G., Butet, A., Burel, F., 2000. Spatial dynamics of
wood mouse (Apodemus sylvaticus) in an agricultural landscape
under intensive use in the Mont Saint Michel Bay (France).
Agric. Ecosyst. Environ. 78 (2), 159–165.
Pain, G., Baudry, J., Burel, F., 2000. Landpop: un outil d’etude de la
structure spatiale des populations animales fragmentees. Geo-
matique 10, 89–106.
Petit, S., Burel, F., 1998. Effects of landscape dynamics on the
metapopulation of a ground beetle (Coleoptera, carabidae) in a
hedgerow network. Agric. Ecosyst. Environ. 69, 243–252.
F. Burel, J. Baudry / Ecological Indicators 5 (2005) 305–313 313
Pither, J., Taylor, P.D., 1998. An experimental assessment of land-
scape connectivity. Oikos 166–174.
Ricketts, T.H., 2001. The matrix matters: effective isolation in
fragmented landscapes. Am. Nat. 157, 87–99.
Schippers, P., Verboom, J., Knaapen, J.P., van Apeldoorn, R.C.,
1996. Dispersal and habitat connectivity in complex heteroge-
neous landscapes: an analysis with GIS-based random walk
model. Ecography 19 (2), 97–106.
Sheldon, F., Boulton, A.J., Puckridge, J.T., 2002. Conservation value
of variable connectivity: aquatic invertebrate assemblages of
channel and floodplain habitats of a central Australian arid-zone
river Cooper Creek. Biol. Conserv. 103 (1), 13–31.
Taylor, P.D., Fahrig, L., Henein, K., Merriam, G., 1993. Connectiv-
ity is a vital element of landscape structure. Oikos 68, 571–
573.
Thenail, C., 2002. Relationships between farm characteristics
and the variation of the density of hedgerows at the level of a
micro-region of bocage landscape. Study case in Brittany,
France. Agric. Syst. 71, 207–230.
Thenail, C., Baudry, J., 2004. Variation of farm spatial land use
pattern according to the structure of the hedgerow network
(bocage) landscape: a case study in northeast Brittany. Agric.
Ecosyst. Environ. 101, 53–72.
Tischendorf, L., Fahrig, L., 2000. On the usage and measurement of
landscape connectivity. Oikos 90, 9–19.
Vos, C.C., Verboom, J., Opdam, P.F.M., Ter Braak, C.J.F., 2001.
Toward ecologically scaled landscape indices. Am. Nat. 183 (1),
24–41.
Ward, J.V., J Stanford, A., 1995. Biodiversity of flood-palin river
ecosystems: ecotones and connectivity. Regul. River 11, 105–
119.
Wiens, J.A., Stenseth, N.C., van Horne, B., Ims, R.A., 1993.
Ecological mechanisms and landscape ecology. Oikos 66,
369–380.