Habitat-patch occupancy in the common goldeneye ( Bucephala clangula ) at different stages of the...
12
Habitat-patch occupancy in the common goldeneye (Bucephala clangula) at different stages of the breeding cycle: implications to ecological processes in patchy environments Antti Paasivaara and Hannu Po ¨ ysa ¨ Abstract: We studied the pattern of habitat-patch occupancy of radio-tagged common goldeneye (Bucephala clangula (L., 1758)) females in two sequential stages of the breeding season, the nest stage and the brood stage, and whether the resour- ces needed in nesting and brood-rearing are spatially inter-related as revealed by patch occupation rate of goldeneye fe- males in these stages. We also studied patch-specific factors potentially explaining the rate of patch occupation separately during the nest stage and the brood stage. There was no association in patch occupation rate between the nest stage and the brood stage, indicating that all the critical resources needed to complete a successful breeding cycle were not met within the same habitat patch. At the nest stage, patch occupation rate increased with nest-site availability and decreased with nest predation rate but was not affected by vegetation luxuriance or patch size. Vegetation luxuriance had a positive effect on patch occupation rate at the brood stage, whereas nesting success of the focal patch had no effect. Results sug- gest that nest-site selection and brood-stage habitat selection are governed by different ecological factors. We conclude that breeding-stage-specific resource requirements redistributed individuals among habitat patches across the landscape, im- plying dynamic distribution of ducks between nesting and brooding stage. Re ´sume ´: Nous avons e ´tudie ´ les patrons d’occupation des parcelles d’habitat par des femelles du garrot a ` œil d’or (Buce- phala clangula (L., 1758)) durant deux pe ´riodes successives de la saison de reproduction, soit la nidification et l’e ´levage de la couve ´e; nous voulions voir si les ressources ne ´cessaires pour la nidification et l’e ´levage sont relie ´es spatialement, d’apre `s les taux d’occupation des parcelles par les garrots femelles durant ces pe ´riodes. Nous avons aussi e ´tudie ´ les fac- teurs spe ´cifiques aux parcelles qui pourraient expliquer le taux d’occupation des parcelles diffe ´remment durant les stades de nidification et d’e ´levage. Il n’y a pas d’association dans les taux d’occupation des parcelles entre les stades de nidifi- cation et d’e ´levage, ce qui indique que les ressources essentielles requises pour comple ´ter avec succe `s un cycle de re- production ne se retrouvent pas toutes dans une me ˆme parcelle de l’habitat. Durant la nidification, le taux d’occupation des parcelles est fonction directe de la disponibilite ´ des sites de nidification et fonction inverse du taux de pre ´dation au nid, mais il n’est pas affecte ´ par la luxuriance de la ve ´ge ´tation, ni la taille des parcelles. La luxuriance de la ve ´ge ´tation a un effet positif sur le taux d’occupation des parcelles au stade de l’e ´levage, alors que le succe `s de la nidification dans la parcelle conside ´re ´e n’a aucun effet. Nos re ´sultats laissent croire que la se ´lection du site de nidification et que la se ´- lection de l’habitat durant l’e ´levage sont re ´gies par des facteurs e ´cologiques diffe ´rents. Nous concluons que les besoins en ressources spe ´cifiques a ` la pe ´riode de reproduction re ´partissent les individus parmi les parcelles d’habitat dans l’en- semble du paysage, ce qui indique qu’il y a une re ´partition dynamique des canards entre les stades de nidification et d’e ´levage. [Traduit par la Re ´daction] Introduction Many animal species live in environments in which essen- tial habitats and resources have a naturally patchy distribu- tion. In such circumstances, species may have evolved appropriate behavioural strategies to minimize risks and to maximize fitness while utilizing and moving among patches (Levin et al. 1984; Nichols 1996; Wilbur 1996). Many highly mobile species, such as migratory birds, exhibit movements among patches (Haig et al. 1998). Short-term changes in spatial distribution of these species are likely due to distribution of critical resources and not due to dem- ographic processes (e.g., Johnson and Sherry 2001; Telleria and Pe ´res-Tris 2003). In these species, the arrangement of resources among different habitat patches may have influ- ence on populations through habitat preference and move- Received 2 October 2007. Accepted 7 April 2008. Published on the NRC Research Press Web site at cjz.nrc.ca on 25 June 2008. A. Paasivaara. 1 Finnish Game and Fisheries Research Institute, Oulu Game and Fisheries Research, Tutkijantie 2E, FIN-90570 Oulu, Finland. H. Po ¨ysa ¨. Finnish Game and Fisheries Research Institute, Joensuu Game and Fisheries Research, Yliopistokatu 6, FIN-80100 Joensuu, Finland. 1 Corresponding author (e-mail: [email protected]). 744 Can. J. Zool. 86: 744–755 (2008) doi:10.1139/Z08-051 # 2008 NRC Canada
-
Upload
independent -
Category
Documents
-
view
1 -
download
0
Transcript of Habitat-patch occupancy in the common goldeneye ( Bucephala clangula ) at different stages of the...

Habitat-patch occupancy in the commongoldeneye (Bucephala clangula) at differentstages of the breeding cycle: implications toecological processes in patchy environments
Antti Paasivaara and Hannu Poysa
Abstract: We studied the pattern of habitat-patch occupancy of radio-tagged common goldeneye (Bucephala clangula (L.,1758)) females in two sequential stages of the breeding season, the nest stage and the brood stage, and whether the resour-ces needed in nesting and brood-rearing are spatially inter-related as revealed by patch occupation rate of goldeneye fe-males in these stages. We also studied patch-specific factors potentially explaining the rate of patch occupation separatelyduring the nest stage and the brood stage. There was no association in patch occupation rate between the nest stage andthe brood stage, indicating that all the critical resources needed to complete a successful breeding cycle were not metwithin the same habitat patch. At the nest stage, patch occupation rate increased with nest-site availability and decreasedwith nest predation rate but was not affected by vegetation luxuriance or patch size. Vegetation luxuriance had a positiveeffect on patch occupation rate at the brood stage, whereas nesting success of the focal patch had no effect. Results sug-gest that nest-site selection and brood-stage habitat selection are governed by different ecological factors. We concludethat breeding-stage-specific resource requirements redistributed individuals among habitat patches across the landscape, im-plying dynamic distribution of ducks between nesting and brooding stage.
Resume : Nous avons etudie les patrons d’occupation des parcelles d’habitat par des femelles du garrot a œil d’or (Buce-phala clangula (L., 1758)) durant deux periodes successives de la saison de reproduction, soit la nidification et l’elevagede la couvee; nous voulions voir si les ressources necessaires pour la nidification et l’elevage sont reliees spatialement,d’apres les taux d’occupation des parcelles par les garrots femelles durant ces periodes. Nous avons aussi etudie les fac-teurs specifiques aux parcelles qui pourraient expliquer le taux d’occupation des parcelles differemment durant les stadesde nidification et d’elevage. Il n’y a pas d’association dans les taux d’occupation des parcelles entre les stades de nidifi-cation et d’elevage, ce qui indique que les ressources essentielles requises pour completer avec succes un cycle de re-production ne se retrouvent pas toutes dans une meme parcelle de l’habitat. Durant la nidification, le taux d’occupationdes parcelles est fonction directe de la disponibilite des sites de nidification et fonction inverse du taux de predation aunid, mais il n’est pas affecte par la luxuriance de la vegetation, ni la taille des parcelles. La luxuriance de la vegetationa un effet positif sur le taux d’occupation des parcelles au stade de l’elevage, alors que le succes de la nidification dansla parcelle consideree n’a aucun effet. Nos resultats laissent croire que la selection du site de nidification et que la se-lection de l’habitat durant l’elevage sont regies par des facteurs ecologiques differents. Nous concluons que les besoinsen ressources specifiques a la periode de reproduction repartissent les individus parmi les parcelles d’habitat dans l’en-semble du paysage, ce qui indique qu’il y a une repartition dynamique des canards entre les stades de nidification etd’elevage.
[Traduit par la Redaction]
Introduction
Many animal species live in environments in which essen-tial habitats and resources have a naturally patchy distribu-tion. In such circumstances, species may have evolvedappropriate behavioural strategies to minimize risks and tomaximize fitness while utilizing and moving among patches(Levin et al. 1984; Nichols 1996; Wilbur 1996). Many
highly mobile species, such as migratory birds, exhibitmovements among patches (Haig et al. 1998). Short-termchanges in spatial distribution of these species are likelydue to distribution of critical resources and not due to dem-ographic processes (e.g., Johnson and Sherry 2001; Telleriaand Peres-Tris 2003). In these species, the arrangement ofresources among different habitat patches may have influ-ence on populations through habitat preference and move-
Received 2 October 2007. Accepted 7 April 2008. Published on the NRC Research Press Web site at cjz.nrc.ca on 25 June 2008.
A. Paasivaara.1 Finnish Game and Fisheries Research Institute, Oulu Game and Fisheries Research, Tutkijantie 2E, FIN-90570 Oulu,Finland.H. Poysa. Finnish Game and Fisheries Research Institute, Joensuu Game and Fisheries Research, Yliopistokatu 6, FIN-80100 Joensuu,Finland.
1Corresponding author (e-mail: [email protected]).
744
Can. J. Zool. 86: 744–755 (2008) doi:10.1139/Z08-051 # 2008 NRC Canada
ment of individuals tracking patchily distributed resources(e.g., Turchin 1991; Diffendorfer et al. 1995; Kozakiewicz1995; Lima and Zollner 1996; Haig et al. 1998).
One important aspect that has been neglected when study-ing the effects of distribution of resources in patchy environ-ments is the requirement of multiple habitats during a lifecycle by many species (e.g., Wilbur 1996; Law and Dick-man 1998). Effect of patch characteristics, quality, and land-scape spatial pattern on the occurrence and density of agiven species have been studied usually during only onestage of the life cycle (e.g., Andren 1994; Bender et al.1998; Mazerolle and Villard 1999; Fahrig 2003). There arefew studies in which habitat-patch occupation has been ex-amined during two or more life-cycle stages.
Breeding environments of waterbirds can be divided intosuitable patches (wetlands, lakes, ponds, etc., which are re-ferred to as patches, and we use these words interchangeablyin this paper) and unsuitable matrix (terrestrial habitat).These species are dependent on these patches for most oftheir life cycle, and within-season movements among differ-ent habitats within a breeding landscape may be widespread(Haig et al. 1998; Poysa and Paasivaara 2006). Short-termchanges in the spatial distribution of local populations ofthese species may stem from the distribution of resourcesamong habitat patches and the behavior of individuals inter-acting with these spatially varying resources.
For this study, we focused on the distribution of a cavity-nesting diving duck, the common goldeneye (Bucephalaclangula (L., 1758)), in different stages of the breedingcycle. Goldeneye females require two distinct resources dur-ing the breeding season: a suitable cavity for nesting (neststage) and productive wetlands for rearing the young (broodstage). Goldeneye females prefer safe nest sites, and suc-cessful nesting of the same or other female affects the futureuse of a given nest site (Dow and Fredga 1983, 1985).Hence, during periods of decreased predation nesting at-tempts may accumulate across years in certain patches orclusters of patches (Dow and Fredga 1985; Poysa 1999,2006). Productivity and size of patches may also affectthe distribution of individuals in the nest stage because egg-laying and incubation are costly in terms of energy andnutrients.
At the brood stage, the main factor affecting habitat selec-tion is food, and it has been suggested that food shortagemay initiate between-patch movements (Eriksson 1978,1983; Eadie and Keast 1982; Poysa and Virtanen 1994;Wayland and McNicol 1994; Paasivaara and Poysa 2004).Although broods may use their environment in a flexibleway (Poysa and Paasivaara 2006), their habitat use is con-strained by energy demands of ducklings or environmentallimitations (Nummi et al. 2000; Poysa et al. 2000). There-fore, critical resources for the whole breeding cycle shouldsituate in appropriate proximity within the same patch oranother patch (Grand et al. 1997). Indeed, the limited move-ment ability of small ducklings, coupled with the differentialneeds of safe nesting and successful brood-rearing, may gen-erate a complex pattern of patch occupancy of individuals.
The objectives of our study were to (i) examine the rateof patch occupation at the nest stage and the brood stageseparately based on data from individually known radio-marked females, (ii) evaluate the rate of patch occupation
separately at the nest stage and at the brood stage for boththe female and young, and (iii) examine whether patch occu-pation at the nest stage is correlated with that at the broodstage.
Materials and methods
Study area and nest boxesThe study was conducted in the barren forested watershed
area (about 100 km2) surrounding the Evo Game ResearchStation in Lammi and Padasjoki (specifically Evo and Sipe-ria areas), southern Finland (61813’N, 26806’E), during thebreeding seasons of 1989–2001. The area is dominated byScotch pine (Pinus sylvestris L.) or mixed forests (Scotchpine, birch (genus Betula L.) and Norway spruce(Picea abies (L.) Karst.)), interspersed with small lakes andponds (size ranged between 0.014 and 49.5 ha) that composeabout 7% of the total area. The network of lakes with nestboxes in our study area is shown in Fig. 1. The lakes aresituated 125–155 m above sea level, and their shore typesvary from oligotrophic bog and forest without emergentplants to more eutrophic lakes with lush stands of horsetail(Equisetum L.) and cattail (Typha L.) (Rask and Metsala1991).
During the breeding seasons of 1989–2001, there were172 artificial nest boxes available to goldeneye in the studyarea (Fig. 1). Because the study area has been under inten-sive forest management, only few natural nest holes may beavailable, and the majority of goldeneye females breed innest boxes. Most of the nest boxes (120) were alreadyerected before our study began, and 52 additional nest boxeswere erected during the study (see Poysa et al. 1997). Mostof the nest boxes were placed on the shores of 82 differentlakes. Four nest boxes were placed at rivers, the distance ofthese boxes to the nearest shoreline of a lake ranged be-tween 500 and 1000 m.
Habitat characteristics of the patchesWe characterized each lake with respect to the amount
and development of shore vegetation (vegetation density) toprovide a patch-specific measure of habitat type and overallquality (we assume that dense shore vegetation means goodquality; Nummi and Poysa 1993). Vegetation density ofeach lake was indexed as follows (hereafter referred to asvegetation luxuriance index): 1 — barren forested or marshyshoreline with no distinct zones of emergent vegetation ex-tending to the water and no cover of floating vegetation(poor habitat); 2 — marshy or forested shoreline with a dis-tinct zone (width less than 1 m) of emergent vegetation(reeds (Phragmites Adans.). or sedges (Carex L.)) withsmall cover of floating vegetation (1%–10%) and vegetationzone covering less than 30% of the shoreline (average habi-tat); 3 — lakes with wide zones (1–100 m) of emergent veg-etation (Phragmites spp., Carex spp., Equisetum spp., orTypha spp.) with large cover of floating vegetation and veg-etation zone covering over 30% of the shoreline (luxurianthabitat). The index of vegetation luxuriance was providedby P. Timonen of the Evo Game and Fisheries Research Sta-tion; the index assessed the characteristics of vegetation lux-uriance in mid-summer (July).
Because the vegetation luxuriance index was based on a
Paasivaara and Poysa 745
# 2008 NRC Canada

rather crude classification, we tested its validity by compar-ing it with the vegetation structure index by Nummi andPoysa (1993) for a subsample of the lakes in the same studyarea (the vegetation structure index of Nummi and Poysa1993 was not available for all the lakes included in thepresent study). Nummi and Poysa (1993) mapped and ana-lysed the vegetation structure of the lakes each year between1988 and 1990 (see also Poysa and Nummi 1992). In brief,18 different variables were measured to describe the struc-ture of shore vegetation in each lake. A principal componentanalysis (PCA; Pimental 1979) was used to arrange thepatches on gradient based on the correlation matrix of the18 variables. First principal component axis (PC1) explained27% of the variance and represented a biologically soundhabitat gradient, i.e., from the lakes with barren shore vege-tation (negative end of the PC1) to those with luxuriantshore vegetation (positive end of PC1). The componentscores of the lakes on the gradient were used as an index ofvegetation structure of the lakes. The constancy of vegeta-tion structure of the lakes was found to be high across the3 years (Elmberg et al. 2003; Paasivaara and Poysa 2004).The correlation between the vegetation luxuriance indexused in the present study and the mean (from years 1988 to1990) component score used to index vegetation structure inNummi and Poysa (1993) was high (rS = 0.89, n = 44, P <0.001). We conclude that the vegetation luxuriance index is
valid and robust for the purpose of the present study (Paasi-vaara and Poysa 2004). Finally, vegetation luxuriance indexdid not correlate with patch size (rS = –0.04, n = 82, P =0.741; patch size was measured from digital maps; ESRI,Inc. 1999).
Patch occupancy at the nest stage and nesting successDuring the breeding seasons of 1989–2001, the nest boxes
were systematically surveyed every year three or four timesin spring and early summer to establish all nesting attempts.The first survey was usually conducted in the first week ofMay during the breakup of ice cover and the last surveyusually in the middle of June. A record of at least one eggin a nest box was considered a nesting attempt. Since wewere interested in examining the patch occupancy pattern,we recorded all nesting attempts within each patch andsummed all the nesting attempts for each patch through1989–2001; we used the total number of nesting attemptsper patch in the analyses (i.e., patch-specific frequency ofthe nesting attempts).
Each nesting attempt was classified as successful (one ormore young left the nest box) or unsuccessful (no young leftthe nest box). Unsuccessful nesting attempts were sub-divided in three categories: depredated, deserted, and failedfor other reason. A nest was considered depredated when allor some eggs had disappeared or were found broken in the
Fig. 1. Map of the study area used by common goldeneyes (Bucephala clangula). Lakes and ponds (referred to as patches in the text) arerepresented in gray and nest boxes with black points. Permanent rivers and large ditches are shown by meandering lines.
746 Can. J. Zool. Vol. 86, 2008
# 2008 NRC Canada
nest. The major predator of goldeneye eggs in our study areais the pine marten (Martes martes (L., 1758)) (Poysa et al.1997), which did not usually leave any eggs in the nestbox. Also American mink (Neovison vison (Schreber,1777)) and great spotted woodpecker (Dendrocopos major(L., 1758)) may cause nest failure, but after their visit,some deserted broken or untouched eggs were left in thenest box. Because the number of depredated nests may de-pend on the number of nesting attempts, we used two meas-ures of nest predation in our analyses. First, we summed upall predation events for each patch during 1989–2001 (i.e.,number of depredated nesting attempts). Second, we calcu-lated nest predation rate per patch by dividing the numberof depredated nests by the total number of nesting attempts(i.e., patch-specific nest predation rate was the proportion ofnesting attempts that were depredated).
Because the availability of nest boxes varied among thepatches during the study (maximum 13 years per nest boxbetween 1989 and 2001), we calculated nest-box availabilityfor each patch by taking into account the presence of eachnest box in each year, and the total number of years foreach nest box was summed. For example, if a nest box in apatch was erected in winter 1992–1993, it was available for9 years and constituted 9 nest-box-years in that patch. Foreach patch, all nest-box-years were summed and used as anindex of nest-box availability in the analyses. The nest-box-years were equally distributed among the three types ofpatches with respect of vegetation luxuriance (�2
½2� = 0.8187,P = 0.6641).
Patch occupancy at the brood stageWhen clutches began to hatch, incubating females were
caught at nest boxes and equipped with a radio transmitterand wing tags; females also received a steel band (Poysaand Virtanen 1994; Paasivaara and Poysa 2004, 2007). Ra-dio-equipped females were located at varying intervals atleast once per day (1.4 d, SD = 1.1, intervals from the firstweek) and brood size was determined. Brood relocationswere used to identify patches that were used only tempora-rily (only one relocation) or were used consistently by thebrood (two or more relocations). If a patch was consistentlyused by a brood, it was referred to as an occupied patch(one occupancy event). Because the first week is the mostcritical period in terms of brood movements and ducklingmortality (Paasivaara and Poysa 2004, 2007), we focus onthe patch-use pattern during the first week. Since we wereinterested in examining the pattern of habitat-patch use ofgoldeneye broods, we summed up all the brood occupancyevents for each patch during our study period in 1989–2001; we used the total number of brood occupancies perpatch in the analyses. During the study, only radio-markedfemales and their broods were included in the analyses.
Geographic analysesAll wetlands, nest boxes, nesting attempts, broods, move-
ments, distances, and wetland use were located and meas-ured with digital maps with ArcView GIS version 3.2(ESRI, Inc. 1999). Based on the radio-marked females, weconstructed several maps to visualize and exemplify theexplicit spatial distribution of patch occupation rate at thenest stage, the spatial distribution of nest predation risk, the
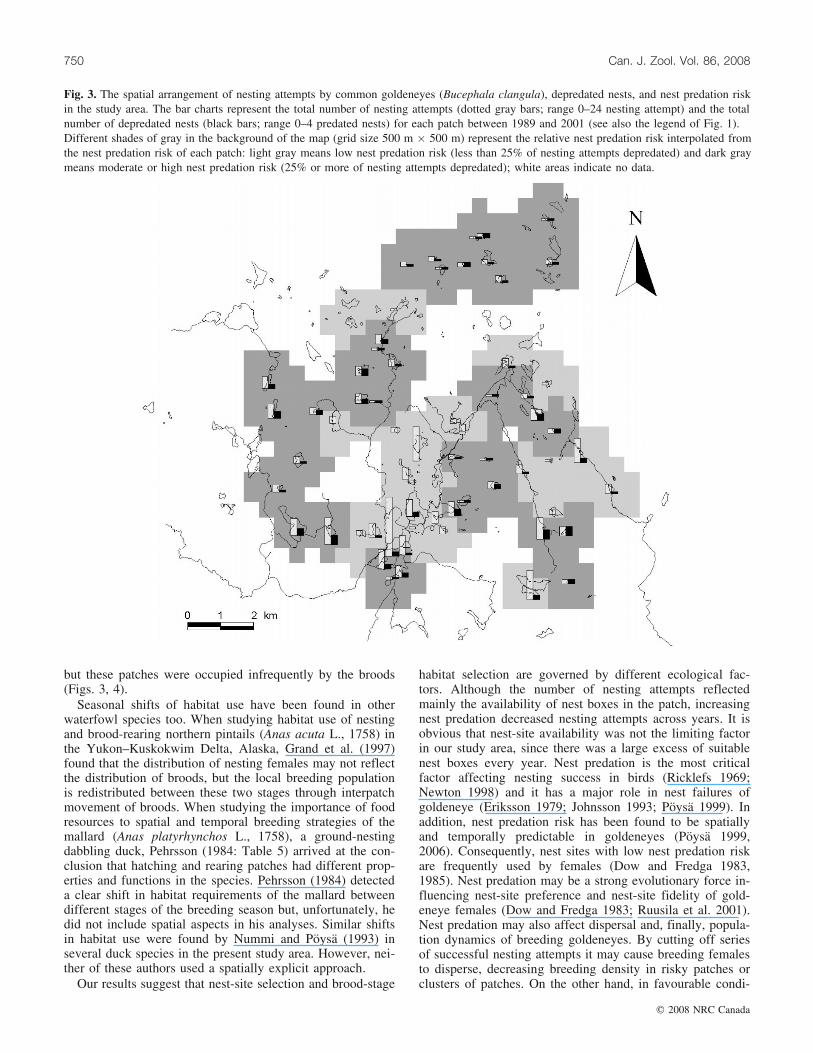
pattern of patch occupancy at the brood stage, and generalmovement pattern of individual females with broods be-tween nesting and brood-rearing patches. We constructedspatial bar charts to present absolute frequencies of nestingattempts and depredated nests for each patch during 1989–2001. In addition, we divided the landscape of the studyarea arbitrarily to grids (grid size = 500 m � 500 m) andfor each grid we interpolated the value of nest predationrate of each nesting patch and using the inverse distanceweight (IDW) method with a fixed search radius of 1000 m(ESRI, Inc. 1999). That is, the value of each grid representsthe probability of nest predation interpolated from the valuesof nesting patches within a radius of 1000 m. Finally, thegrids were classified in two categories using median (25%)of nest predation rate as a cut point (Table 1): grids withlow nest predation rate (under 25%) and grids with highnest predation rate (equal to or higher than 25%).
Statistical analysesA patch (lake or pond with one or several nest box) was
the sampling unit in all statistical analyses. We used gener-alized linear models (GLM) (McCullagh and Nelder 1989;Crawley 2006) to study factors affecting patch-specific num-ber of nesting attempts and patch-specific number of broodoccupancies separately (summary statistics of all variablesused is given in Table 1). In the candidate model set ad-dressing the number of nesting attempts, explanatory varia-bles included the nest-box availability (nest-box-years perpatch), nest predation (both the number of depredatednesting attempts and the proportion of depredated nestingattempts), vegetation luxuriance index, and patch size apriori simultaneous additive effects of all combinations ofdifferent covariates without interactions. Nest-box availabil-ity was included in all models addressing the nest-stagepatch occupation, as it is intuitively the primary factoraffecting patch occupation (see also Dow and Fredga 1985).In the candidate model set addressing the number of broodoccupancies, explanatory variables included vegetation luxu-riance index, patch size, and the number of successful nest-ing attempts a priori simultaneous additive effects of allcombinations of different covariates without interactions.Because the number of nesting attempts and the number ofbrood occupancies were counts with highly skewed distribu-tion, we assumed negative binomial distribution of errorsand used logarithmic-link function.
Akaike’s information criterion adjusted for small samplesize (AICc) was used to evaluate the fit of the models(Burnham and Anderson 2002). The selection of the bestapproximating model(s) was based on the DAICc valuescalculated as the differences between current and minimumobserved values of AICc (i.e., AICc – minimum AICc). Mod-els with DAICc > 2 were considered not to fit the data(Burnham and Anderson 2002). We also calculated Akaikeweights (wi); models with larger wi better approximate thedata. The slopes (b) of individual covariates and their stand-ard errors (SE) are reported. We used also likelihood ratiotest to evaluate the effects of single covariates betweennested models with one degree of freedom (Crawley 2006).
To study whether patch use at the nest stage and at thebrood stage were correlated, we used nonparametric correla-tion analyses (Kendall rank-order correlation coefficient, t),
Paasivaara and Poysa 747
# 2008 NRC Canada
because the distribution of the nesting attempts and broodoccupancies did not meet the assumptions of parametricanalyses (see above). All significance levels are two-tailed.Statistical analyses were carried out using R version 2.6.1.(R Development Core Team 2006).
ResultsThere were 271 nesting attempts in our study area during
1989–2001. In the pooled data, only 47.2% of the nestingattempts were successful and produced at least one hatchedduckling. The most common reasons for nesting failure werenest predation (32.1%) and nest desertion (13.7%). Thenumber of nesting attempts varied considerably among thepatches (Fig. 2).
The best model to approximate variation in the patch-specific number of nesting attempts included the termsnest-box availability (nest-box-years), number of predatednests, and nest predation rate (Table 2). This model re-vealed that the number of nesting attempts increased withnest-box availability (b = 0.016, SE = 0.003) and the num-ber of predated nests (b = 0.503, SE = 0.075), but de-creased with nest predation rate (b = –0.762, SE = 0.299).The second and third models approximated the data aswell as the best model (DAICc < 2; Table 2), but inclusionof vegetation luxuriance index (b = –0.088, SE = 0.108) orpatch size (b = 0.003, SE = 0.011) to the best model hadno significant effect on the change of deviance (vegetationluxuriance: �2
½1� = 0.657, P = 0.418; patch size: �2½1� =
0.066, P = 0.797). In addition, the models that includedonly patch size or vegetation luxuriance without inclusionof nest predation were not well supported by the data(DAICc > 33.23; Table 2), indicating that vegetation luxu-riance and patch size did not affect the patch-specific num-ber of nesting attempts. Also note that nest-box availabilityincreased with patch size (t = 0.260, Z = 3.464, P =0.0005, n = 82). The sum of Akaike weights for the mod-els that included the variables nest-box-years, predated
nests, and nest predation rate was 1.0, providing furtherevidence that these were the only important factors in ourdata. Consequently, the minimum adequate model includedthe intercept, nest-box availability, the number of depre-dated nests and predation rate, and explained 60.6% of theoriginal deviance.
The most frequently occupied nesting lakes situated in thecentre of the study area, which was also the area of low nestpredation risk (Fig. 3). On the other hand, large areas in theperiphery of the study area, especially in the northern part,contained patches with high nest predation rate and infre-quently occupied patches by nesting females (Fig. 3).
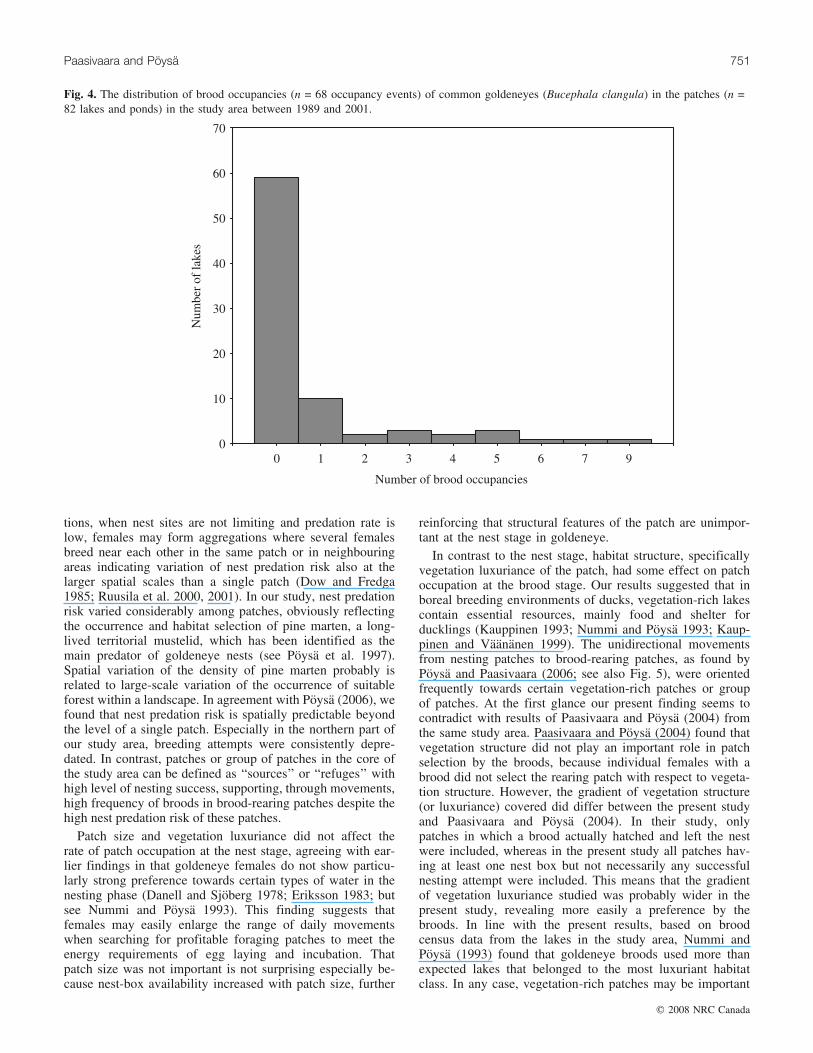
We followed successfully 83 different broods in their firstweek until they selected their rearing patch. From these, 63broods (75.5%) left their hatching patch and most of themreached their first rearing patch within a couple of days(mean = 1.5, range = 0–6.5). The broods occupied 23 differ-ent patches where nest boxes were available. The distribu-tion of brood occupancies among the patches was highlyskewed (Fig. 4). The majority of the patches (59/82) werenot used by the broods; the highest numbers of brood occu-pancies were concentrated on a few patches (Fig. 5). Con-sidering the brood stage, only the vegetation luxurianceindex was associated with the patch-specific number ofbrood occupancies (Table 3); the best fitting model revealedthat the number of broods increased with vegetation luxuri-ance index (b = 1.237, SE = 0.357). The second and thirdmodels approximated the data as well as the best model(DAICc < 2; Table 3), but inclusion of nesting success (b =0.091, SE = 0.095) or patch size (b = –0.021, SE = 0.030) tothe best model had no significant effect on the change of de-viance (nesting success: �2
½1� = 0.5577, P = 0.4552; patchsize: �2
½1� = 0.5188, P = 0.4713). In addition, the modelsthat included only nesting success or patch size withoutinclusion of vegetation luxuriance were not well supportedby the data (DAICc > 11.75; Table 3), indicating that nestingsuccess and patch size did not affect the patch-specific num-
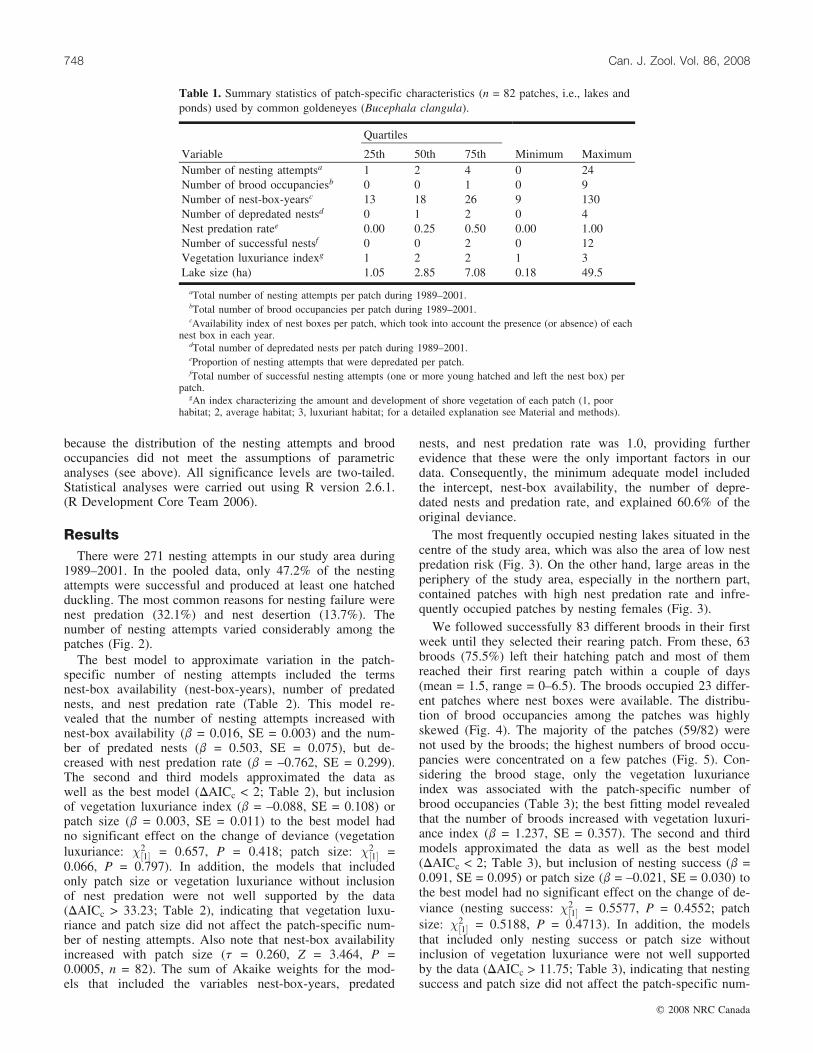
Table 1. Summary statistics of patch-specific characteristics (n = 82 patches, i.e., lakes andponds) used by common goldeneyes (Bucephala clangula).
Quartiles
Variable 25th 50th 75th Minimum MaximumNumber of nesting attemptsa 1 2 4 0 24Number of brood occupanciesb 0 0 1 0 9Number of nest-box-yearsc 13 18 26 9 130Number of depredated nestsd 0 1 2 0 4Nest predation ratee 0.00 0.25 0.50 0.00 1.00Number of successful nestsf 0 0 2 0 12Vegetation luxuriance indexg 1 2 2 1 3Lake size (ha) 1.05 2.85 7.08 0.18 49.5
aTotal number of nesting attempts per patch during 1989–2001.bTotal number of brood occupancies per patch during 1989–2001.cAvailability index of nest boxes per patch, which took into account the presence (or absence) of each
nest box in each year.dTotal number of depredated nests per patch during 1989–2001.eProportion of nesting attempts that were depredated per patch.fTotal number of successful nesting attempts (one or more young hatched and left the nest box) per
patch.gAn index characterizing the amount and development of shore vegetation of each patch (1, poor
habitat; 2, average habitat; 3, luxuriant habitat; for a detailed explanation see Material and methods).
748 Can. J. Zool. Vol. 86, 2008
# 2008 NRC Canada

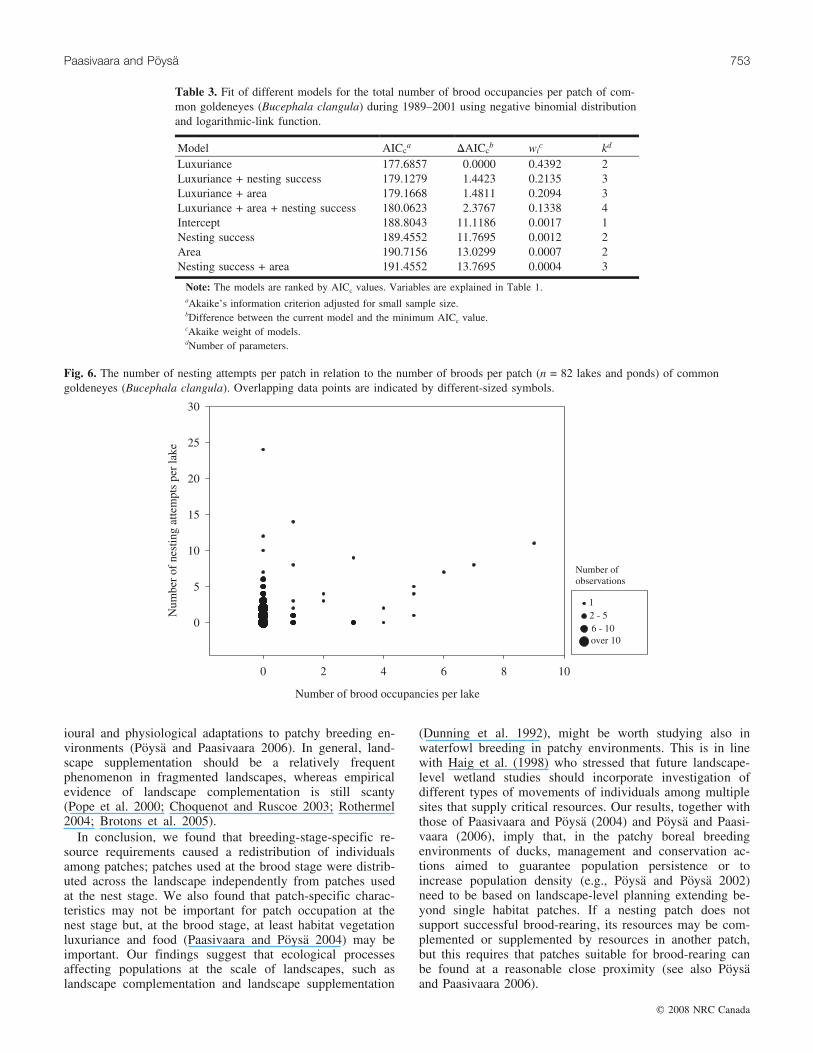
ber of brood occupancies. The minimum adequate modelincluded the intercept and the vegetation luxuriance index,and it explained 22.9% of the original deviance. There wasno correlation between the patch-specific number of nestingattempts and the patch-specific number of brood occupan-cies (t = 0.070, Z = 0.90, P = 0.366, n = 82; Fig. 6).
Discussion
Our results revealed differences in patch occupancy pat-terns between two sequential stages of the breeding cycle inthe goldeneye. Patches with low nest predation risk werefrequently used for nesting, but despite the high number ofnesting attempts over the years, broods tended to show anaggregated pattern of patch use independent of the occur-rence of nesting attempts. Most important, patch-specificnesting success did not influence the spatial distribution of
broods. We would like to emphasize that because we useddata from individually known females and broods, it wasreally a question of habitat-tracking and between-patchmovements of individuals, and not of disproportional mor-tality of broods (see also Poysa and Paasivaara 2006). Alsothe fact that the movement of broods from the hatchingpatch to the rearing patch was unidirectional (Fig. 5; seealso Poysa and Paasivaara 2006) suggests that hatchingpatches usually did not provide the necessary resourcesrequired by broods. The spatial arrangement of patch occu-pancy rates at different stages of the breeding season mostprobably reflects the spatial pattern of different resourcesamong the patches in the landscape. Some patches were oc-cupied frequently in both stages, but most frequently usednesting patches were usually not used in brood-rearing. Forexample, clusters of high-quality patches in terms of suc-cessful nesting were situated in the core of the study area,
Fig. 2. The distribution of nesting attempts (n = 271 nesting attempts) by common goldeneyes (Bucephala clangula) in the patches (n = 82lakes and ponds) in the study area between 1989 and 2001.
Table 2. Fit of different models for the total number of nesting attempts per patch by common goldeneyes (Bucephalaclangula) during 1989–2001 using negative binomial distribution and logarithmic-link function.
Model AICca DAICc
b wic kd
Nest-box-years + predated nests + nest predation rate 309.9753 0.0000 0.4786 4Nest-box-years + predated nests + nest predation rate + luxuriance 311.3181 1.3428 0.2446 5Nest-box-years + predated nests + nest predation rate + area 311.9089 1.9337 0.1819 5Nest-box-years + predated nests + nest predation rate+ luxuriance + area 313.2116 3.2363 0.0949 6Nest-box-years 341.3976 31.4223 0.0000 2Nest-box-years + luxuriance 343.2137 33.2385 0.0000 3Nest-box-years + area 343.3811 33.4058 0.0000 3Intercept only 377.3326 67.3573 0.0000 1
Note: The models are ranked by AICc values. Variables are explained in Table 1.aAkaike’s information criterion adjusted for small sample size.bDifference between the current model and the minimum AICc value.cAkaike weight of models.dNumber of parameters.
Paasivaara and Poysa 749
# 2008 NRC Canada
but these patches were occupied infrequently by the broods(Figs. 3, 4).
Seasonal shifts of habitat use have been found in otherwaterfowl species too. When studying habitat use of nestingand brood-rearing northern pintails (Anas acuta L., 1758) inthe Yukon–Kuskokwim Delta, Alaska, Grand et al. (1997)found that the distribution of nesting females may not reflectthe distribution of broods, but the local breeding populationis redistributed between these two stages through interpatchmovement of broods. When studying the importance of foodresources to spatial and temporal breeding strategies of themallard (Anas platyrhynchos L., 1758), a ground-nestingdabbling duck, Pehrsson (1984: Table 5) arrived at the con-clusion that hatching and rearing patches had different prop-erties and functions in the species. Pehrsson (1984) detecteda clear shift in habitat requirements of the mallard betweendifferent stages of the breeding season but, unfortunately, hedid not include spatial aspects in his analyses. Similar shiftsin habitat use were found by Nummi and Poysa (1993) inseveral duck species in the present study area. However, nei-ther of these authors used a spatially explicit approach.
Our results suggest that nest-site selection and brood-stage
habitat selection are governed by different ecological fac-tors. Although the number of nesting attempts reflectedmainly the availability of nest boxes in the patch, increasingnest predation decreased nesting attempts across years. It isobvious that nest-site availability was not the limiting factorin our study area, since there was a large excess of suitablenest boxes every year. Nest predation is the most criticalfactor affecting nesting success in birds (Ricklefs 1969;Newton 1998) and it has a major role in nest failures ofgoldeneye (Eriksson 1979; Johnsson 1993; Poysa 1999). Inaddition, nest predation risk has been found to be spatiallyand temporally predictable in goldeneyes (Poysa 1999,2006). Consequently, nest sites with low nest predation riskare frequently used by females (Dow and Fredga 1983,1985). Nest predation may be a strong evolutionary force in-fluencing nest-site preference and nest-site fidelity of gold-eneye females (Dow and Fredga 1983; Ruusila et al. 2001).Nest predation may also affect dispersal and, finally, popula-tion dynamics of breeding goldeneyes. By cutting off seriesof successful nesting attempts it may cause breeding femalesto disperse, decreasing breeding density in risky patches orclusters of patches. On the other hand, in favourable condi-
Fig. 3. The spatial arrangement of nesting attempts by common goldeneyes (Bucephala clangula), depredated nests, and nest predation riskin the study area. The bar charts represent the total number of nesting attempts (dotted gray bars; range 0–24 nesting attempt) and the totalnumber of depredated nests (black bars; range 0–4 predated nests) for each patch between 1989 and 2001 (see also the legend of Fig. 1).Different shades of gray in the background of the map (grid size 500 m � 500 m) represent the relative nest predation risk interpolated fromthe nest predation risk of each patch: light gray means low nest predation risk (less than 25% of nesting attempts depredated) and dark graymeans moderate or high nest predation risk (25% or more of nesting attempts depredated); white areas indicate no data.
750 Can. J. Zool. Vol. 86, 2008
# 2008 NRC Canada
tions, when nest sites are not limiting and predation rate islow, females may form aggregations where several femalesbreed near each other in the same patch or in neighbouringareas indicating variation of nest predation risk also at thelarger spatial scales than a single patch (Dow and Fredga1985; Ruusila et al. 2000, 2001). In our study, nest predationrisk varied considerably among patches, obviously reflectingthe occurrence and habitat selection of pine marten, a long-lived territorial mustelid, which has been identified as themain predator of goldeneye nests (see Poysa et al. 1997).Spatial variation of the density of pine marten probably isrelated to large-scale variation of the occurrence of suitableforest within a landscape. In agreement with Poysa (2006), wefound that nest predation risk is spatially predictable beyondthe level of a single patch. Especially in the northern part ofour study area, breeding attempts were consistently depre-dated. In contrast, patches or group of patches in the core ofthe study area can be defined as ‘‘sources’’ or ‘‘refuges’’ withhigh level of nesting success, supporting, through movements,high frequency of broods in brood-rearing patches despite thehigh nest predation risk of these patches.
Patch size and vegetation luxuriance did not affect therate of patch occupation at the nest stage, agreeing with ear-lier findings in that goldeneye females do not show particu-larly strong preference towards certain types of water in thenesting phase (Danell and Sjoberg 1978; Eriksson 1983; butsee Nummi and Poysa 1993). This finding suggests thatfemales may easily enlarge the range of daily movementswhen searching for profitable foraging patches to meet theenergy requirements of egg laying and incubation. Thatpatch size was not important is not surprising especially be-cause nest-box availability increased with patch size, further
reinforcing that structural features of the patch are unimpor-tant at the nest stage in goldeneye.
In contrast to the nest stage, habitat structure, specificallyvegetation luxuriance of the patch, had some effect on patchoccupation at the brood stage. Our results suggested that inboreal breeding environments of ducks, vegetation-rich lakescontain essential resources, mainly food and shelter forducklings (Kauppinen 1993; Nummi and Poysa 1993; Kaup-pinen and Vaananen 1999). The unidirectional movementsfrom nesting patches to brood-rearing patches, as found byPoysa and Paasivaara (2006; see also Fig. 5), were orientedfrequently towards certain vegetation-rich patches or groupof patches. At the first glance our present finding seems tocontradict with results of Paasivaara and Poysa (2004) fromthe same study area. Paasivaara and Poysa (2004) found thatvegetation structure did not play an important role in patchselection by the broods, because individual females with abrood did not select the rearing patch with respect to vegeta-tion structure. However, the gradient of vegetation structure(or luxuriance) covered did differ between the present studyand Paasivaara and Poysa (2004). In their study, onlypatches in which a brood actually hatched and left the nestwere included, whereas in the present study all patches hav-ing at least one nest box but not necessarily any successfulnesting attempt were included. This means that the gradientof vegetation luxuriance studied was probably wider in thepresent study, revealing more easily a preference by thebroods. In line with the present results, based on broodcensus data from the lakes in the study area, Nummi andPoysa (1993) found that goldeneye broods used more thanexpected lakes that belonged to the most luxuriant habitatclass. In any case, vegetation-rich patches may be important
Fig. 4. The distribution of brood occupancies (n = 68 occupancy events) of common goldeneyes (Bucephala clangula) in the patches (n =82 lakes and ponds) in the study area between 1989 and 2001.
Paasivaara and Poysa 751
# 2008 NRC Canada

for successful population persistence in goldeneyes. First,patches of this type may be more predictable with respectto food acquisition of different-aged ducklings, i.e., for theentire brood-rearing period. Second, also females may easilyfind suitable invertebrates for feeding in the luxuriantpatches to restore the energy shortage caused by nesting.However, patches of other types were frequently occupiedby goldeneye broods, as suggested by the rather low fit ofthe final model. Goldeneye broods occupied also someacidic, fishless, and oligotrophic patches (see also Poysaand Virtanen 1994), and areas recently flooded by beavers(Castor canadensis Kuhl, 1820), which are not necessarilyrich in vegetation. We did not explore the relationship be-tween duckling survival and predation risk of brood-rearingpatches, but presumably, in stable boreal environments veg-etation-rich wetlands usually hold abundant fish populationsincluding northern pike (Esox lucius L., 1758), decreasingthe quality and suitability of wetlands of this type. Paasi-vaara and Poysa (2004) found that increasing predation riskby northern pike decreased the quality of foraging patchesand that females may be imperfect in predicting predationrisk during habitat selection at the brood stage. Clearly, in-
terplay among space use, distribution of resources and qual-ity of patches with respect to survival of offspring should beinvestigated further to improve our understanding of ecolog-ical processes affecting ducks in patchy borealenvironments.
Extending the findings of the present study and ofPoysa and Paasivaara (2006) to the landscape level, wesuggest that the density and persistence of goldeneye pop-ulations in a network of habitat patches is constrained bythe distance and connectivity between nesting patches andbrood-rearing patches. For example, local breeding popula-tion density might decrease if the distance between suit-able nesting and brood-rearing patches increases in thelandscape. This outcome would apply in the case of bothlandscape complementation and landscape supplementation(see Dunning et al. 1992). That is, to maintain the viablepopulation of breeding ducks in heterogeneous environ-ments, different resources should be spatially correlated atthe landscape level within the perceptual ranges of indi-viduals (Lima and Zollner 1996). However, goldeneyebroods can move long distances without any particularconsequences of survival, suggesting considerable behav-
Fig. 5. The occupancy and movement pattern of common goldeneye (Bucephala clangula) broods among the patches in the study areabetween 1989 and 2001. Different shades of the gray in the polygons (patches, i.e., lakes and ponds) represent the total number of broodoccupancies for each patch: white, no broods; light gray, 1–3 broods; dark gray, 4–7 broods; black, 8–10 broods. Arrows of different thick-ness represent schematically direction and intensity of brood movements during the first week after hatching: thin arrow, movement of onebrood; medium-thick arrow, movements of two broods; thick arrow, movements of 3–5 broods.
752 Can. J. Zool. Vol. 86, 2008
# 2008 NRC Canada
ioural and physiological adaptations to patchy breeding en-vironments (Poysa and Paasivaara 2006). In general, land-scape supplementation should be a relatively frequentphenomenon in fragmented landscapes, whereas empiricalevidence of landscape complementation is still scanty(Pope et al. 2000; Choquenot and Ruscoe 2003; Rothermel2004; Brotons et al. 2005).
In conclusion, we found that breeding-stage-specific re-source requirements caused a redistribution of individualsamong patches; patches used at the brood stage were distrib-uted across the landscape independently from patches usedat the nest stage. We also found that patch-specific charac-teristics may not be important for patch occupation at thenest stage but, at the brood stage, at least habitat vegetationluxuriance and food (Paasivaara and Poysa 2004) may beimportant. Our findings suggest that ecological processesaffecting populations at the scale of landscapes, such aslandscape complementation and landscape supplementation
(Dunning et al. 1992), might be worth studying also inwaterfowl breeding in patchy environments. This is in linewith Haig et al. (1998) who stressed that future landscape-level wetland studies should incorporate investigation ofdifferent types of movements of individuals among multiplesites that supply critical resources. Our results, together withthose of Paasivaara and Poysa (2004) and Poysa and Paasi-vaara (2006), imply that, in the patchy boreal breedingenvironments of ducks, management and conservation ac-tions aimed to guarantee population persistence or toincrease population density (e.g., Poysa and Poysa 2002)need to be based on landscape-level planning extending be-yond single habitat patches. If a nesting patch does notsupport successful brood-rearing, its resources may be com-plemented or supplemented by resources in another patch,but this requires that patches suitable for brood-rearing canbe found at a reasonable close proximity (see also Poysaand Paasivaara 2006).
Fig. 6. The number of nesting attempts per patch in relation to the number of broods per patch (n = 82 lakes and ponds) of commongoldeneyes (Bucephala clangula). Overlapping data points are indicated by different-sized symbols.
Table 3. Fit of different models for the total number of brood occupancies per patch of com-mon goldeneyes (Bucephala clangula) during 1989–2001 using negative binomial distributionand logarithmic-link function.
Model AICca DAICc
b wic kd
Luxuriance 177.6857 0.0000 0.4392 2Luxuriance + nesting success 179.1279 1.4423 0.2135 3Luxuriance + area 179.1668 1.4811 0.2094 3Luxuriance + area + nesting success 180.0623 2.3767 0.1338 4Intercept 188.8043 11.1186 0.0017 1Nesting success 189.4552 11.7695 0.0012 2Area 190.7156 13.0299 0.0007 2Nesting success + area 191.4552 13.7695 0.0004 3
Note: The models are ranked by AICc values. Variables are explained in Table 1.aAkaike’s information criterion adjusted for small sample size.bDifference between the current model and the minimum AICc value.cAkaike weight of models.dNumber of parameters.
Paasivaara and Poysa 753
# 2008 NRC Canada

AcknowledgementsWe thank the staff of Evo Game Research Station, espe-
cially Juha Virtanen, Markku Milonoff, Petri Timonen, andnumerous students for help in the fieldwork. Special thanksgo to Petri Timonen for kindly making available the vegeta-tion luxuriance data. We also thank two anonymous re-viewers for their useful comments on the manuscript. Thiswork was financially supported by the Finnish Game andFisheries Research Institute, Finnish Natural Resources Re-search Foundation, Finnish Cultural Foundation, Faculty ofScience in Oulu University, and Nornet (Northern Environ-mental Research Network) Multidisciplinary EnvironmentalGraduate Net School.
ReferencesAndren, H. 1994. Effects of habitat fragmentation on birds and
mammals in landscapes with different proportions of suitablehabitat: a review. Oikos, 71: 355–366. Available from http://www.jstor.org/pss/3545823 [accessed 23 June 2008].
Bender, D.J., Contreras, T.A., and Fahrig, L. 1998. Habitat lossand population decline: a meta-analysis of the patch sizeeffect. Ecology, 79: 517–533. doi:10.1890/0012-9658(1998)079[0517:HLAPDA]2.0.CO;2.
Brotons, L., Wolff, A., Guillaume, P., and Martin, J.-L. 2005. Ef-fect of adjacent agricultural habitat on the distribution of passer-ines in natural grasslands. Biol. Conserv. 124: 407–414. doi:10.1016/j.biocon.2005.01.046.
Burnham, K.P., and Anderson, D.R. 2002. Model selection andmultimodel inference: a practical information–theoretic ap-proach. Springer-Verlag, New York.
Choquenot, D., and Ruscoe, W.A. 2003. Landscape complementa-tion and food limitation of large herbivores: habitat-related con-straints on the foraging efficiency of wild pigs. J. Anim. Ecol.72: 14–26. doi:10.1046/j.1365-2656.2003.00676.x.
Crawley, M.J. 2006. Statistics. An introduction using R. John Wi-ley & Sons, Ltd., West Sussex, England.
Danell, K., and Sjoberg, K. 1978. Habitat selection by breedingducks in boreal lakes in northern Sweden. Viltrevy (Stockh.),10: 161–190.
Diffendorfer, J.E., Gaines, M.S., and Holt, R.D. 1995. Habitat frag-mentation and movements of three small mammals (Sigmodon,Microtus, and Peromyscus). Ecology, 76: 827–839. Availablefrom http://www.jstor.org/pss/1939348 [accessed 23 June 2008].
Dow, H., and Fredga, S. 1983. Breeding and natal dispersal of theGoldeneye, Bucephala clangula. J. Anim. Ecol. 52: 681–695.Available from http://www.jstor.org/pss/4447 [accessed 23 June2008].
Dow, H., and Fredga, S. 1985. Selection of nest sites by a hole-nesting duck, the Goldeneye Bucephala clangula. Ibis, 127: 16–30. doi:10.1111/j.1474-919X.1985.tb05034.x.
Dunning, J.B., Danielson, B.J., and Pulliam, H.R. 1992. Ecologicalprocesses that affect populations in complex landscapes. Oikos,65: 169–175. Available from http://www.jstor.org/pss/3544901[accessed 23 June 2008].
Eadie, J.M., and Keast, A. 1982. Do goldeneye and perch competefor food? Oecologia (Berl.), 55: 225–230. doi:10.1007/BF00384491.
Elmberg, J., Nummi, P., Poysa, H., and Sjoberg, K. 2003. Breedingsuccess of sympatric dabbling ducks in relation to populationdensity and food resources. Oikos, 100: 333–341. doi:10.1034/j.1600-0706.2003.11934.x.
Eriksson, M.O.G. 1978. Lake selection by goldeneye ducklings inrelation to the abundance of food. Wildfowl, 29: 81–85.
Eriksson, M.O.G. 1979. Aspects of the breeding biology of thegoldeneye Bucephala clangula. Holarct. Ecol. 2: 186–194.doi:10.1111/j.1600-0587.1979.tb00700.x.
Eriksson, M.O.G. 1983. The role of fish in the selection of lakes bynon-piscivorous ducks: mallard, teal and goldeneye. Wildfowl,34: 27–32.
ESRI, Inc.. 1999. ArcView GIS. Version 3.2 [computer program].ESRI, Inc., Redlands, Calif.
Fahrig, L. 2003. Effects of habitat fragmentation on biodiversity.Annu. Rev. Ecol. Syst. 34: 487–515. doi:10.1146/annurev.ecolsys.34.011802.132419.
Grand, J.B., Flint, P.L., and Heglund, P.J. 1997. Habitat use bynesting and brood rearing northern pintails on the Yukon-Kuskokwim delta, Alaska. J. Wildl. Manag. 61: 1199–1207.Available from http://www.jstor.org/pss/3802117 [accessed 23June 2008].
Haig, S.M., Mehlman, D.W., and Oring, L.W. 1998. Avian move-ments and wetland connectivity in landscape conservation. Con-serv. Biol. 12: 749–758. doi:10.1046/j.1523-1739.1998.97102.x.
Johnson, M.D., and Sherry, T.W. 2001. Effects of food availabilityon the distribution of migratory warblers among habitats in Ja-maica. J. Anim. Ecol. 70: 546–560. doi:10.1046/j.1365-2656.2001.00522.x.
Johnsson, K. 1993. The black woodpecker Dryocopus martius as akeystone species in forest. Ph.D. thesis, Swedish University ofAgricultural Sciences, Uppsala.
Kauppinen, J. 1993. Densities and habitat distribution of breedingwaterfowl in boreal lakes in Finland. Finnish Game Res. 48:24–45.
Kauppinen, J., and Vaananen, V.-M. 1999. Factors affectingchanges in waterfowl populations in eutrophic wetlands in theFinnish lake district. Wildl. Biol. 5: 73–81. Available fromhttp://www.wildlifebiology.com/Articles/en/View-242.aspx [ac-cessed 23 June 2008].
Kozakiewicz, M. 1995. Resource tracking in space and time. InMosaic landscapes and ecological processes. Edited by L. Hans-son, L. Fahrig, and G. Merriam. Chapman & Hall, London.pp. 136–148.
Law, B.S., and Dickman, C.R. 1998. The use of habitat mosaics byterrestrial vertebrate fauna: implications for conservation andmanagement. Biodivers. Conserv. 7: 323–333. doi:10.1023/A:1008877611726.
Levin, S.A., Cohen, D., and Hasting, A. 1984. Dispersal strategiesin patchy environments. Theor. Popul. Biol. 26: 165–191.doi:10.1016/0040-5809(84)90028-5 .
Lima, S.L., and Zollner, P.A. 1996. Towards a behavioral ecologyof ecological landscapes. Trends Ecol. Evol. 11: 131–135.doi:10.1016/0169-5347(96)81094-9.
Mazerolle, M.J., and Villard, M.-A. 1999. Patch characteristics andlandscape context as predictors of species presence and abun-dance: a review. Ecoscience, 6: 117–124.
McCullagh, P., and Nelder, J.A. 1989. Generalized linear models.Chapman & Hall, London.
Newton, I. 1998. Population limitation in birds. Academic Press,London.
Nichols, J.D. 1996. Sources of variation in migratory movements ofanimal populations: statistical inference and selective review ofempirical results for birds. In Population dynamics in ecologicalspace and time. Edited by O.E. Rhodes, R.K. Chesser, andM.H. Smith. The University of Chicago Press, Chicago.pp. 147–197.
Nummi, P., and Poysa, H. 1993. Habitat associations of ducksduring different phases of the breeding season. Ecography, 16:319–328. doi:10.1111/j.1600-0587.1993.tb00221.x.
754 Can. J. Zool. Vol. 86, 2008
# 2008 NRC Canada

Nummi, P., Sjoberg, K., Poysa, H., and Elmberg, J. 2000. Indivi-dual foraging behavior indicates resource limitation: an experi-ment with mallard ducklings. Can. J. Zool. 78: 1891–1895.doi:10.1139/cjz-78-11-1891.
Paasivaara, A., and Poysa, H. 2004. Mortality of common golde-neye (Bucephala clangula) broods in relation to predation riskby northern pike (Esox lucius). Ann. Zool. Fenn. 41: 513–523.Available from http://www.sekj.org/PDF/anz41-free/anz41-513.pdf [accessed 23 June 2008].
Paasivaara, A., and Poysa, H. 2007. Survival of common goldeneye(Bucephala clangula) ducklings in relation to weather, timing ofbreeding, brood size, and female condition. J. Avian Biol. 38:144–152. doi:10.1111/j.0908-8857.2007.03602.x.
Pehrsson, O. 1984. Relationships of food to spatial and temporalbreeding strategies of mallards in Sweden. J. Wildl. Manag. 48:322–339. Available from http://www.jstor.org/pss/3801164 [ac-cessed 23 June 2008].
Pimental, R.A. 1979. Morphometries: the multivariate analysis ofbiological data. Kendall/Hunt Publishing Company, Dubuque,Iowa.
Pope, S.E., Fahrig, L.E., and Merriam, H.G. 2000. Landscapecomplementation and metapopulation effects on leopard frogpopulations. Ecology, 81: 2498–2508. doi:10.1890/0012-9658(2000)081[2498:LCAMEO]2.0.CO;2.
Poysa, H. 1999. Conspecific nest parasitism is associated with in-equality in nest predation risk in the common goldeneye (Buce-phala clangula). Behav. Ecol. 10: 533–540. doi:10.1093/beheco/10.5.533.
Poysa, H. 2006. Public information and conspecific nest parasitismin goldeneyes: targeting safe nests by parasites. Behav. Ecol. 17:459–465. doi:10.1093/beheco/arj049.
Poysa, H., and Nummi, P. 1992. Comparing two methods of datacollection in waterfowl habitat use studies. Bird Study, 39:124–131.
Poysa, H., and Paasivaara, A. 2006. Movements and mortality ofcommon goldeneye (Bucephala clangula) broods in a patchy en-vironment. Oikos, 115: 33–42. doi:10.1111/j.2006.0030-1299.15036.x.
Poysa, H., and Poysa, S. 2002. Nest-site limitation and densitydependence of reproductive output in the common goldeneyeBucephala clangula: implications for the management of cav-ity-nesting birds. J. Appl. Ecol. 39: 502–510. doi:10.1046/j.1365-2664.2002.00726.x.
Poysa, H., and Virtanen, J. 1994. Habitat selection and survival ofcommon goldeneye (Bucephala clangula) broods — preliminary
results. Hydrobiologia, 279–280: 289–296. doi:10.1007/BF00027862.
Poysa, H., Milonoff, M., and Virtanen, J. 1997. Nest predation inhole-nesting birds in relation to habitat edge: an experiment.Ecography, 20: 329–335. doi:10.1111/j.1600-0587.1997.tb00377.x.
Poysa, H., Elmberg, J., Sjoberg, K., and Nummi, P. 2000. Nestingmallards (Anas platyrhynchos) forecast brood-stage food limita-tion when selecting habitat: experimental evidence. Oecologia(Berl.), 122: 582–586. doi:10.1007/PL00008858.
Rask, M., and Metsala, T.-R. 1991. Mercury concentrations innorthern pike, Esox lucius L., in small lakes of Evo area south-ern Finland. Water Air Soil Pollut. 56: 369–378. doi:10.1007/BF00342284.
R Development Core Team. 2006. R: a language and environmentfor statistical computing. R. Foundation for Statistical Comput-ing, Vienna, Austria. Available from http://www.R-project.org[accessed 23 June 2008].
Ricklefs, R.E. 1969. An analysis of nesting mortality in birds.Smithson. Contrib. Zool. 9: 1–48.
Rothermel, B.B. 2004. Migratory success of juveniles: a potentialconstraint on connectivity for pond-breeding amphibians. Ecol.Appl. 14: 1535–1546. doi:10.1890/03-5206.
Ruusila, V., Poysa, H., and Runko, P. 2000. Characteristics ofmaternal family lineages in a Common GoldeneyeBucephala clangula breeding population. Ornis Fenn. 77: 77–82. [Available from http://www.birdlife.fi/julkaisut/of/of-english.shtml [accessed 23 June 2008].
Ruusila, V., Poysa, H., and Runko, P. 2001. Costs and benefits offemale-biased natal philopatry in the common goldeneye.Behav. Ecol. 12: 686–690. doi:10.1093/beheco/12.6.686.
Telleria, J.L., and Peres-Tris, J. 2003. Seasonal distribution of a mi-gratory bird: effects of local and regional resource tracking. J. Bio-geogr. 30: 1583–1591. doi:10.1046/j.1365-2699.2003.00960.x.
Turchin, P. 1991. Translating foraging movements in heteroge-neous environments into the spatial distribution of foragers.Ecology, 72: 1253–1266. Available from http://www.jstor.org/pss/1941099 [accessed 23 June 2008].
Wayland, M., and McNicol, D.K. 1994. Movements and survival ofcommon goldeneye broods near Sudbury, Ontario, Canada. Can.J. Zool. 72: 1252–1259. doi:10.1139/z94-167.
Wilbur, H.M. 1996. Multistage life cycles. In Population dynamicsin ecological space and time. Edited by O.E. Rhodes,R.K. Chesser, and M.H. Smith. The University of ChicagoPress, Chicago. pp. 75–108.
Paasivaara and Poysa 755
# 2008 NRC Canada