H-alpha Equivalent Width Variations across the Face of a Microlensed K Giant in the Galactic Bulge
15
arXiv:astro-ph/0011380v2 25 Mar 2001 Hα Equivalent Width Variations across the Face of a Microlensed K Giant in the Galactic Bulge 1 M. Albrow 2 , J. An 3 , J.-P. Beaulieu 4 , J. A. R. Caldwell 5 , M. Dominik 6 , J. Greenhill 7 , K. Hill 7 , S. Kane 7 , R. Martin 8 , J. Menzies 5 , K. Pollard 9 , P. D. Sackett 6 , K. C. Sahu 2 , P. Vermaak 4 , R. Watson 7 , A. Williams 8 (The PLANET Collaboration) and P.H. Hauschildt 10 ABSTRACT We present VLT FORS1 spectroscopy that temporally resolves the second caustic crossing of the Bulge K giant source of microlensing event EROS 2000- BLG-5, the first time this has been accomplished for several phases of a caustic transit. The ∼1 ˚ AHα equivalent width of the source star increases slightly as the center of the star egresses the caustic and then plummets by 30% during the final limb crossing. These changes are not seen in contemporaneous spectra of control stars in the FORS1 slit, but are qualitatively consistent with expectations from stellar atmosphere models as the caustic differentially magnifies different portions of the stellar face of the target. Observations such as these in a variety of stellar lines are equivalent to atmospheric tomography and are expected to provide a direct test of stellar models. Subject headings: gravitational lensing — stars: atmospheres — stars: fundamental parameters — stars: individual (EROS 2000-BLG-5) 1 Based on observations at the European Southern Observatory (Programs 265.C-5728 & 265.C-5729) 2 Space Telescope Science Institute, 3700 San Martin Drive, Baltimore, MD 21218, USA 3 Department of Astronomy, Ohio State University, 140 W. 18th Avenue, Columbus, OH 43210, USA 4 Institut d’Astrophysique de Paris, INSU CNRS, 98 bis Boulevard Arago, F-75014, Paris, France 5 South African Astronomical Observatory, P.O. Box 9, Observatory 7935, South Africa 6 Kapteyn Astronomical Institute, Postbus 800, 9700 AV Groningen, The Netherlands 7 Univ. of Tasmania, Physics Dept., G.P.O. 252C, Hobart, Tasmania 7001, Australia 8 Perth Observatory, Walnut Road, Bickley, Perth 6076, Australia 9 Physics Department, Gettysburg College, Gettysburg, PA, 17325-1493, USA 10 Department of Physics and Astronomy & Center for Simulational Physics, University of Georgia, Athens, GA 30602-2451, USA
Transcript of H-alpha Equivalent Width Variations across the Face of a Microlensed K Giant in the Galactic Bulge

arX
iv:a
stro
-ph/
0011
380v
2 2
5 M
ar 2
001
Hα Equivalent Width Variations across the Face of a
Microlensed K Giant in the Galactic Bulge1
M. Albrow2, J. An3, J.-P. Beaulieu4, J. A. R. Caldwell5, M. Dominik6,
J. Greenhill7, K. Hill7, S. Kane7, R. Martin8, J. Menzies5, K. Pollard9,
P. D. Sackett6, K. C. Sahu2, P. Vermaak4, R. Watson7, A. Williams8
(The PLANET Collaboration)
and P.H. Hauschildt10
ABSTRACT
We present VLT FORS1 spectroscopy that temporally resolves the second
caustic crossing of the Bulge K giant source of microlensing event EROS 2000-
BLG-5, the first time this has been accomplished for several phases of a caustic
transit. The ∼1 A Hα equivalent width of the source star increases slightly
as the center of the star egresses the caustic and then plummets by 30%
during the final limb crossing. These changes are not seen in contemporaneous
spectra of control stars in the FORS1 slit, but are qualitatively consistent
with expectations from stellar atmosphere models as the caustic differentially
magnifies different portions of the stellar face of the target. Observations such
as these in a variety of stellar lines are equivalent to atmospheric tomography
and are expected to provide a direct test of stellar models.
Subject headings: gravitational lensing — stars: atmospheres — stars:
fundamental parameters — stars: individual (EROS 2000-BLG-5)
1 Based on observations at the European Southern Observatory (Programs 265.C-5728 & 265.C-5729)
2Space Telescope Science Institute, 3700 San Martin Drive, Baltimore, MD 21218, USA
3Department of Astronomy, Ohio State University, 140 W. 18th Avenue, Columbus, OH 43210, USA
4Institut d’Astrophysique de Paris, INSU CNRS, 98 bis Boulevard Arago, F-75014, Paris, France
5South African Astronomical Observatory, P.O. Box 9, Observatory 7935, South Africa
6Kapteyn Astronomical Institute, Postbus 800, 9700 AV Groningen, The Netherlands
7Univ. of Tasmania, Physics Dept., G.P.O. 252C, Hobart, Tasmania 7001, Australia
8Perth Observatory, Walnut Road, Bickley, Perth 6076, Australia
9Physics Department, Gettysburg College, Gettysburg, PA, 17325-1493, USA
10Department of Physics and Astronomy & Center for Simulational Physics, University of Georgia, Athens,
GA 30602-2451, USA
– 2 –
1. Introduction
The steep magnification gradient near the caustics11 generated by a binary microlens
both magnifies and resolves the background star as the sharply peaked lensing “beam”
sweeps across the source. The finite size of the source and its wavelength-dependent surface
brightness profile leave their signatures on the shape of the resulting microlensing light
curve. The largest effect is the broadening and decrease in amplitude of the caustic peaks
in the light curve which is related to the size of the source compared to that of the Einstein
ring and can be used to measure the relative proper motion of the lens and source (Alcock
et al. 1997, 2000; Albrow et al. 1999a, 1999b, 2000, 2001a). The next highest order term is
that due to broadband limb darkening: at most wavelengths, the stellar disk is brighter at
center than at limb, which steepens the slope of the light curve when the caustic transits
the stellar limb. These effects were predicted several years ago (Schneider & Wagoner 1987;
Witt & Mao 1994; Witt 1995; Bogdanov & Cherepashchuk 1995; Gould & Welch 1996) and
have now been used to measure wavelength dependent limb-darkening coefficients for three
Bulge giants (Albrow et al. 1999b, 2000, 2001a) and one A dwarf in the Small Magellanic
Cloud (Afonso et al. 2000). Such measurements are important to stellar atmosphere physics
since very few techniques are available to extract reliable limb-darkening coefficients for
typical stars other than the Sun.
Time-resolved spectroscopic monitoring with large aperture telescopes now offers the
means to go one step further. Measurements of the changes in the equivalent width and
line shape of individual emission and absorption lines in the source star during a caustic
crossing are now feasible (Loeb & Sasselov 1995; Valls-Gabaud 1998) and can be expected
to yield detailed information about the chemothermal structure of the atmosphere as a
function of depth (Heyrovsky, Sasselov & Loeb 2000). Starspots and the polarization and
kinetic structure of the stellar envelopes may also be detectable with the aid of microlensing
caustics (Simmons, Newson & Willis 1995; Simmons, Willis & Newsam 1995; Igance &
Hendry 1999, Bryce & Hendry 2000, Heyrovsky & Sasselov 2000).
Fold (line) caustics, such as the one that transited the source star of EROS 2000-BLG-5,
would be expected to produce somewhat smaller differential signals (∼1%) than direct
transits by (single-lens) point caustics (Gaudi & Gould 1999) because they have a broader
“beam pattern”. On the other hand, fold caustic transits are observed much more frequently
than are direct point transits. Detection of the differential signal in individual spectral lines
thus requires not only large apertures and efficient spectrographs to achieve the high S/N,
but also control or understanding of systematics at the ∼1% level.
11 A caustic is a locus of positions in the source plane for which the magnification is formally infinite.
– 3 –
Following a real-time electronic microlensing alert issued by the EROS group, the
PLANET collaboration (Albrow et al. 1998) commenced intense photometric monitoring of
the event EROS 2000-BLG-5. A secondary alert issued by the MPS collaboration announced
an unexpected, sudden, and significant brightening of the object; PLANET increased its
sampling rate immediately. The resulting dense coverage allowed characterization of the
first caustic crossing of this binary event by a technique advocated by Albrow et al. (1999c).
Together with subsequent high precision photometry in the caustic trough, a prediction
for the timing of the second caustic crossing could then be made, which was announced
electronically by PLANET12 a few days in advance, facilitating the VLT observations
reported here. The exceptionally long duration of this crossing (due to the glancing angle at
which the source left the caustic region) allowed PLANET spectroscopic monitoring from
Paranal to be spread over several nights, during which time the source was differentially
resolved as the caustic passed over the center and then the limb of the exiting source.
In this Letter, we describe the changes in the equivalent width of the Hα line
observed during our VLT FORS1 spectroscopic monitoring of the K-giant source star
of EROS 2000-BLG-5, the first time that full temporal coverage has been obtained of a
caustic crossing at such high spectral resolution. We show that these changes in Hα are
qualitatively consistent with those expected from stellar atmosphere models for a star
of this type; more detailed comparisons with theory over the complete spectrum will be
presented elsewhere (Albrow et al. 2001b).
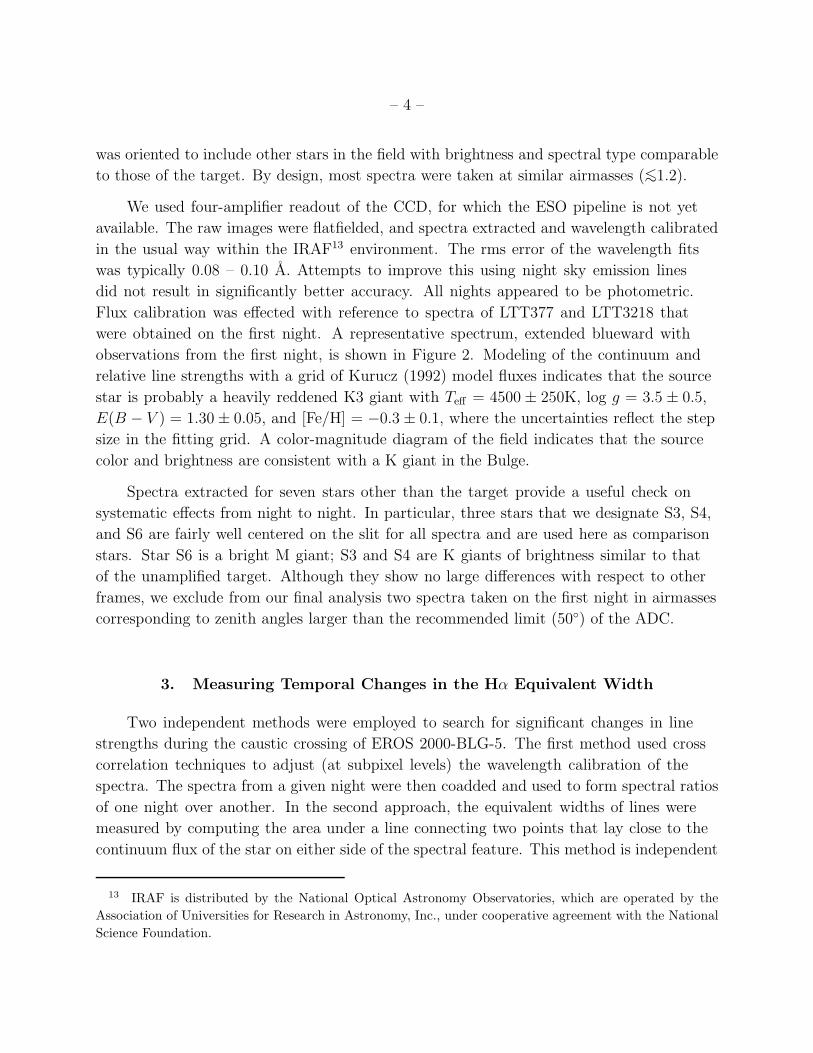
2. FORS1 Observations of EROS 2000-BLG-5
The ∼four-day duration of the second caustic crossing of EROS 2000-BLG-5 allowed
PLANET to spread its allocation of 9.5 hours of Director’s discretionary time on the
VLT over several nights; one pre-caustic night when the source star was magnified, but
unresolved, and about two hours observation on each of four nights during the caustic
crossing. Figure 1 shows the times at which the spectra were obtained relative to model
light curves; other details are given in Table 1. The FORS1 spectrograph on UT1 (Antu)
was used with the atmospheric dispersion compensator (ADC) and a long slit of projected
width 1′′ (∼5 pixels). The 600R (5380−7530 A) and 600I (7050−9180 A) gratings provided
a dispersion of ∼1 A per pixel, so that in periods of 0.6′′ seeing the spectral resolution was
∼3A. On the first night, spectra were also taken with the 600B (3900 − 5800 A) grism. At
peak, the source reached IC ∼ 12.6 mag. As a means of studying systematic effects, the slit
12 See http://www.astro.rug.nl/∼planet/EB2K005.html
– 4 –
was oriented to include other stars in the field with brightness and spectral type comparable
to those of the target. By design, most spectra were taken at similar airmasses (∼<1.2).
We used four-amplifier readout of the CCD, for which the ESO pipeline is not yet
available. The raw images were flatfielded, and spectra extracted and wavelength calibrated
in the usual way within the IRAF13 environment. The rms error of the wavelength fits
was typically 0.08 – 0.10 A. Attempts to improve this using night sky emission lines
did not result in significantly better accuracy. All nights appeared to be photometric.
Flux calibration was effected with reference to spectra of LTT377 and LTT3218 that
were obtained on the first night. A representative spectrum, extended blueward with
observations from the first night, is shown in Figure 2. Modeling of the continuum and
relative line strengths with a grid of Kurucz (1992) model fluxes indicates that the source
star is probably a heavily reddened K3 giant with Teff = 4500 ± 250K, log g = 3.5 ± 0.5,
E(B − V ) = 1.30 ± 0.05, and [Fe/H] = −0.3 ± 0.1, where the uncertainties reflect the step
size in the fitting grid. A color-magnitude diagram of the field indicates that the source
color and brightness are consistent with a K giant in the Bulge.
Spectra extracted for seven stars other than the target provide a useful check on
systematic effects from night to night. In particular, three stars that we designate S3, S4,
and S6 are fairly well centered on the slit for all spectra and are used here as comparison
stars. Star S6 is a bright M giant; S3 and S4 are K giants of brightness similar to that
of the unamplified target. Although they show no large differences with respect to other
frames, we exclude from our final analysis two spectra taken on the first night in airmasses
corresponding to zenith angles larger than the recommended limit (50◦) of the ADC.
3. Measuring Temporal Changes in the Hα Equivalent Width
Two independent methods were employed to search for significant changes in line
strengths during the caustic crossing of EROS 2000-BLG-5. The first method used cross
correlation techniques to adjust (at subpixel levels) the wavelength calibration of the
spectra. The spectra from a given night were then coadded and used to form spectral ratios
of one night over another. In the second approach, the equivalent widths of lines were
measured by computing the area under a line connecting two points that lay close to the
continuum flux of the star on either side of the spectral feature. This method is independent
13 IRAF is distributed by the National Optical Astronomy Observatories, which are operated by the
Association of Universities for Research in Astronomy, Inc., under cooperative agreement with the National
Science Foundation.

– 5 –
of slight changes in the wavelength calibration from night to night, but may depend on
the choice of the continuum points. Both approaches indicate a significant temporal signal
of comparable size in the equivalent width of the Hα line of the target. The control stars
showed no or very much smaller marginal signatures (∼< 2σ) when analyzed in the same way.
The nightly ratios resulting from the spectral ratio analysis are shown in Figure 3 for
the source star and for comparison stars S3, S4 and S6. The target shows a clear nightly
change in equivalent width. More flux is present at Hα (i.e., the absorption line is less deep)
on Night 5 than on any another night; the difference between Nights 3 and 5 is the greatest.
Ratios formed from Night 4 rather than Night 5 show the same trend, confirming that the
strong temporal signal seen in the target is not an artifact in the data of the last night of
observation. Differences in equivalent width relative to Night 5 are given in Table 1.
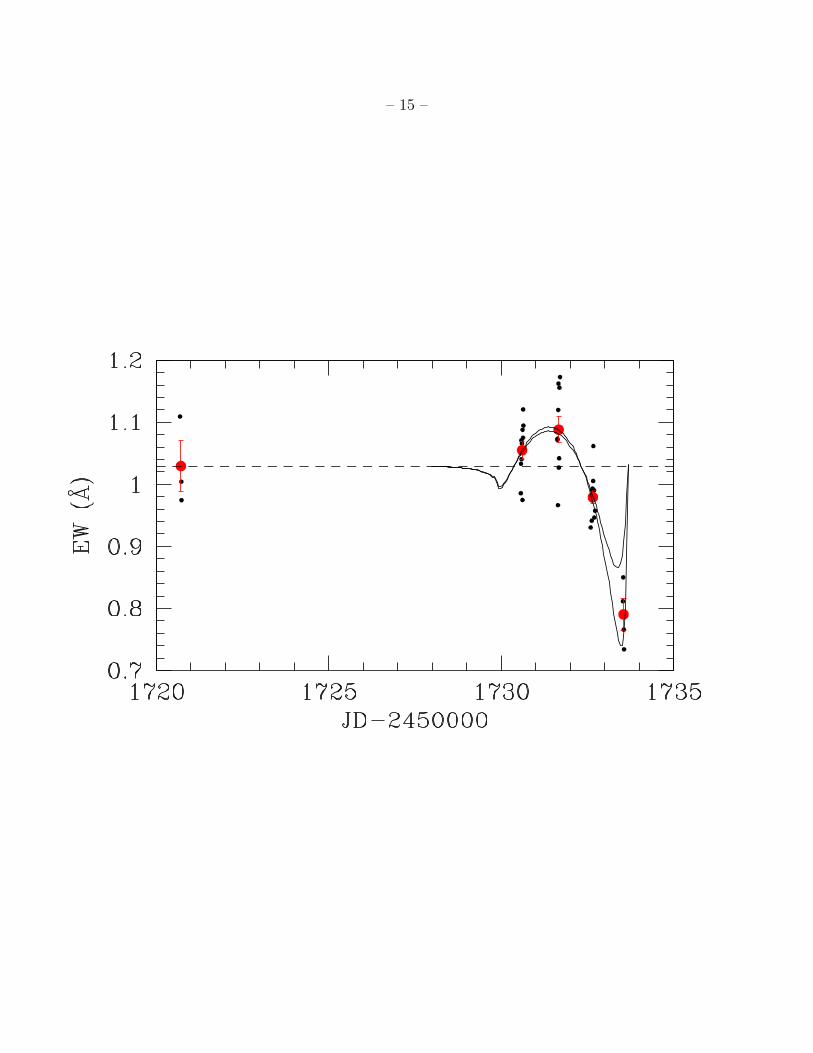
In Figure 4, the directly-determined Hα equivalent widths of the target are plotted as
a function of the Julian date at mid-exposure. Nightly averages are shown with error bars
reflecting the standard error in the mean of the measured values. The equivalent width of
the target increases slightly as the (hotter) center of the star passes over the caustic and
clearly decreases as the trailing limb exits, a difference of 30 ±3% is measured between these
two nights. These trends are seen in individual spectra as well as in the nightly averages; no
single spectrum or subgroup of spectra dominates the signal. Within the uncertainties, the
decrease in Hα equivalent width between Nights 3 and 5 found in the spectral ratio analysis
is the same as that found by direct computation of the equivalent widths (Table 1).
4. Comparison to a K Giant Atmosphere Model
We conclude that the changes in Hα equivalent width observed by FORS1 in the K
giant source of EROS 2000-BLG-5 are due to spatial resolution of the star’s atmosphere
during the caustic crossing, and proceed to compare them with expectations from
atmospheric models. For the demonstration purposes in this Letter, we choose one example
roughly matching the spectral characterization of our target (solar metallicity, M = 1M⊙,
log g = 3.5 and Teff = 4400K) from a set of high-resolution, spherically-symmetric model
atmospheres for giants (Hauschildt et al. 1999; Orosz & Hauschildt 2000). Spectra derived
from differing annuli across the face of such a star vary rather dramatically: those near the
limb are generally redder and exhibit emission line features that are in absorption near the
center of the star. The caustic samples these differences as it sweeps across the source.
We model the magnification pattern across the face of the microlensing source as
that given by rectilinear motion across a simple fold caustic (with constant background

– 6 –
magnification). Near such a fold and inside the caustic structure itself, the magnification
grows as x−1/2, where x is the perpendicular distance from the source element to the fold
caustic. The height and width of the resulting light curve are adjusted to match, as closely
as possible within these models, our independent photometric data over the second crossing
of this event. This determines the mapping from x to time, so that the timing of our FORS1
spectra can be related to a specific beam magnification pattern over the source. Integrating
these changing magnification patterns over the model atmosphere for all wavelengths near
Hα allows us to compute the evolution of the Hα line expected during this caustic crossing.
In particular, we have calculated the temporal change in the equivalent width for two
simple fold models with differing caustic strength and background magnification (Fig. 1)
that mimic the general features of the observed light curve on Nights 2 though 5. The
results are plotted over our observations in Figure 4. The two dips in the models mark the
times at which the leading and trailing limbs exit the caustic. The only free parameter
is an overall scale factor of 0.81 applied to match the equivalent width of the fiducial
model to that of the unresolved source. These simple models agree qualitatively with the
spectral data, producing quite similar equivalent widths for all nights but the last. The
model with the higher background magnification – more similar in this respect to the
observed light curve – produces the larger equivalent width on Night 5. However, the
observed light curve also exhibits a feature not modeled by any fold caustic: a fast rise
to large magnification directly after Night 5 that is characteristic of the source trajectory
passing near a caustic cusp. More physically-realistic models are thus needed before a more
quantitative comparison with stellar models can be made.
The CaII triplet would also be expected to exhibit changes in equivalent width
during the caustic transit. We see indications of such changes in our FORS1 spectra, but
narrowness of the lines and contamination from sky emission complicates the analysis of
the Ca II equivalent widths; these will be presented elsewhere (Albrow et al. 2001b).
5. Discussion
Center-to-limb variations are expected in many strong absorption lines of cool giants,
including Hα. Such lines are expected to be deeper just before and during the egress of the
center of a giant microlensed star from a fold caustic. Since the line is in emission at the
coolest portions of the outer atmosphere, the observed line should become shallower (smaller
equivalent width) as the limb egresses and becomes magnified differentially with respect to
the rest of the star. This behavior is confirmed by our observations of EROS 2000-BLG-5
throughout the final transit of the K giant source star by the caustic.

– 7 –
Previous attempts to measure spectral line changes during caustic crossings have been
encouraging, but hampered by the lack of temporal coverage during those phases of the
caustic transit that most significantly resolve source structure. The real-time alert provided
by the MACHO team (Alcock et al. 2000) allowed Lennon et al. (1996) to take NTT
spectra over the peak of the fold crossing in MACHO 96-BLG-3, but these did not extend
far enough temporally to detect spectral differences due to source resolution. A difference
in Hα equivalent width during and after the grazing point-caustic transit of the M giant
source of event MACHO 95-BLG-30 was reported by Alcock et al. (1997), and appears to
be qualitatively compatible with 1-D stellar models (Sasselov 1998). The reported changes
in TiO equivalent width for this event (Alcock et al. 1997) are difficult to interpret as they
are as large in the several days after the crossing as during and just after the transit.
Our spectroscopic monitoring of EROS 2000-BLG-5 with FORS1 on the VLT is the
first to be carried out through all phases of a microlensing caustic crossing. Significant
changes in the equivalent width of Hα were detected throughout the transit. A fiducial K
giant model atmosphere convolved with simple fold caustic magnification models exhibits
changes in equivalent width that are in qualitative agreement with the observed changes. At
the time of this writing, PLANET continues photometric monitoring of EROS 2000-BLG-5
which, although far past the caustic structure, is still declining in brightness. Modeling
indicates that the source star passed quite close to a caustic cusp during the second crossing,
altering the temporal and spatial behavior of the microlensing magnification “beam”. A
quantitative confrontation with atmospheric models requires proper treatment of the effect
of the cusp over the whole stellar disk, and is now in progress (Albrow et al. 2001b).
Stellar tomography using microlensing caustics is now feasible; adequate alert
mechanisms combined with modeling and dense, precise follow-up photometry enable
prediction of caustic transits days in advance. Spectra of the source and field control stars
of EROS 2000-BLG-5 demonstrate that equivalent width changes as small as 0.1A and
relative spectral differences of ∼1% per resolution element can be observed in two hours
(per temporal sampling element) with FORS on the VLT for microlensed Bulge sources.
These characteristics are well-matched to monitoring the equivalent width of many lines
during a (typical) 8-24 hour caustic transit. The evolution of spectral line shape, an even
more sensitive indicator of stellar atmosphere conditions, will require the higher resolution
provided by Echelle instruments. If large aperture telescopes with such spectroscopic
ability, especially those in the southern hemisphere, can be flexibly scheduled in real-time,
microlensing can meaningfully test theories of stellar atmospheres in the next few years.
PLANET thanks EROS for the public real-time alert of EROS 2000-BLG-5 that
allowed us to begin photometric monitoring and MPS for the anomaly alert that resulted

– 8 –
in our increased sampling over the first caustic. We also thank Malcolm Hartley, Quentin
Parker, and Tom Lloyd Evans, for taking spectra at MSSSO and SAAO that are not
included in this analysis. PLANET is especially grateful to the ESO directorship for
awarding discretionary time and to the ESO scientific and technical staff for their skilled,
unflagging and cheerful help during these necessarily hurried service observations. This
work was supported by award GBE 614-21-009 from the Dutch Organization for Scientific
Research (NWO) and by a donation to the University of Tasmania by Mr. David Warren.
Note Added in Proof: After preprint circulation of this work (astro-ph/0011380) and
receipt of the referee’s report of our submitted manuscript, we became aware of the work of
Castro et al. (astro-ph/0101025) from Nights 3 and 4, which confirms our results.
REFERENCES
Afonso, C., et al. (EROS, MACHO, MPS, OGLE & PLANET) 2000, ApJ, 532, 340
Albrow, M.D., et al. (PLANET Collaboration), 1998, ApJ, 509, 687
Albrow, M.D., et al. (PLANET Collaboration) 1999a, ApJ, 512, 672
Albrow, M.D., et al. (PLANET Collaboration) 1999b, ApJ, 522, 1011
Albrow, M.D., et al. (PLANET Collaboration) 1999c, ApJ, 522, 1022
Albrow, M.D., et al. (PLANET Collaboration) 2000, ApJ, 534, 894
Albrow, M.D., et al. (PLANET Collaboration) 2001a, ApJ, 549, 000 (astro-ph/0004243)
Albrow, M.D., et al. (PLANET Collaboration) 2001b, in preparation
Alcock, C. et al. (MACHO Collaboration) 1997, ApJ, 491, 436
Alcock, C. et al. (MACHO Collaboration) 2000, ApJ, 541, 270
Bogdanov M.B. & Cherepashchuk A.M. 1995, Astronomy Letters, 21, 505
Bryce, H.M., & Hendry, M.A. 2000, in A New Era in Microlensing Astrophysics, eds.
J.W. Menzies & P.D. Sackett, ASP Conf. Series, in press (astro-ph/0004250)
Gaudi, B. S. & Gould, A. 1999, ApJ, 513, 619
Gould, A. & Welch, D. L. 1996, ApJ, 464, 212

– 9 –
Gray, N. 2000, MNRAS, submitted (astro-ph/0001359)
Hauschildt, P.H., Allard, F., Ferguson, J., Baron, E., & D.R. Alexander, 1999, ApJ, 525, 871
Heyrovsky, D., & Sasselov, D. 2000, ApJ, 529, 69
Heyrovsky, D, Sasselov, D., & Loeb, A. 2000, ApJ, 543, 406
Ignace, R., & Hendry, M.A. 1999, A&A, 341, 201
Kurucz, R.L. 1992, in The Stellar Populations of Galaxies, eds. B. Barbuy & A. Renzini,
IAU Symp. 149, 225
Lennon, D.J., Mao, S. Fuhrmann, K. Gehren, T., 1996, ApJ, 471, L23
Loeb, A. & Sasselov, D. 1995, ApJ, 491, L33
Orosz, J.A. & Hauschildt, P.H., 2000, A&A, in press
Sasselov, D., 1998 in Cool Stars, Stellar Systems and the Sun, eds. R. A. Donahue and J.A.
Bookbinder, ASP Conf. Ser. 154, 383
Schneider, P. & Wagoner, R.V. 1987, ApJ, 314, 154
Simmons, J.F.L, Willis, J.P., & Newsam, A.M. 1995, A&A, 293, L46
Simmons, J.F.L, Newsam, A.M., & Willis, J.P. 1995, MNRAS, 276, 182
Valls-Gabaud, D. 1998, MNRAS, 294, 747
Witt, H.J. 1995, ApJ, 449, 42
Witt, H.J. & Mao, S. 1994, ApJ, 430, 505
This preprint was prepared with the AAS LATEX macros v4.0.

– 10 –
Table 1: Log of R-band Spectroscopic Observations of EROS 2000-BLG-5
Date No. of Typical Seeing Hα Equiv. Width (in A)
Spectra Exp. time FWHM Method 1 Method 2
(sec) (arcsec) (Relative) (Absolute)
25-Jun-00 5 300 0.8 − 1.5 0.27 ± 0.04 1.03 ± 0.04
4-Jul-00 10 360 0.6 − 0.75 0.25 ± 0.03 1.06 ± 0.01
5-Jul-00 10 360 0.5 − 0.75 0.28 ± 0.03 1.09 ± 0.02
6-Jul-00 12 540 0.6 0.17 ± 0.02 0.98 ± 0.01
7-Jul-00 4 540 0.6 — 0.79 ± 0.03

– 11 –
Figure Captions
Fig. 1.— Simple fold caustic model light curves of EROS 2000-BLG-5 showing the phase
intervals, marked by pairs of arrows, during which the caustic-crossing spectra discussed here
were obtained. The peak of the light curve occurs before the time at which the center of the
star exits the caustic, which in these models is indicated by the dashed line. The trailing
limb exits near JD = 2451733.7.
Fig. 2.— A representative spectrum of EROS 2000-BLG-5 taken with FORS1 on the
VLT. The insert shows a 100 A region around the Hα line using the same vertical scale.
Dereddening has not been applied.
Fig. 3.— Ratios of the average flux measured on two different nights shown as a function of
wavelength in the region around Hα. Top panel is for the target, lower panels for comparison
stars S3, S4, and S6. The ratios are (from top to bottom): Night 5/Night 1; Night 5/Night 2;
Night 5/Night 3; Night 5/Night 4; and Night 4/Night 3. Gaussian smoothing of 3 pixels
(FWHM) was performed before the ratios were formed, which were then divided by their
mean (indicated by the dashed line) before display. Results are offset from one another for
clarity. The first ratio is the noisiest primarily due to poor seeing on the first night.
Fig. 4.— The equivalent width of Hα for the source star of EROS 2000-BLG-5 as a function
of Julian date at mid-exposure. Nightly means are shown as the larger filled dots. The
broken line passes through the mean value of the first night. Also shown (solid lines) are the
predicted relative changes in equivalent width for a fiducial model atmosphere transited by
two different simple fold caustic models (see Fig. 1 and §4).
– 12 –

– 13 –

– 14 –
– 15 –