Gulf of Trieste: A changing ecosystem
10
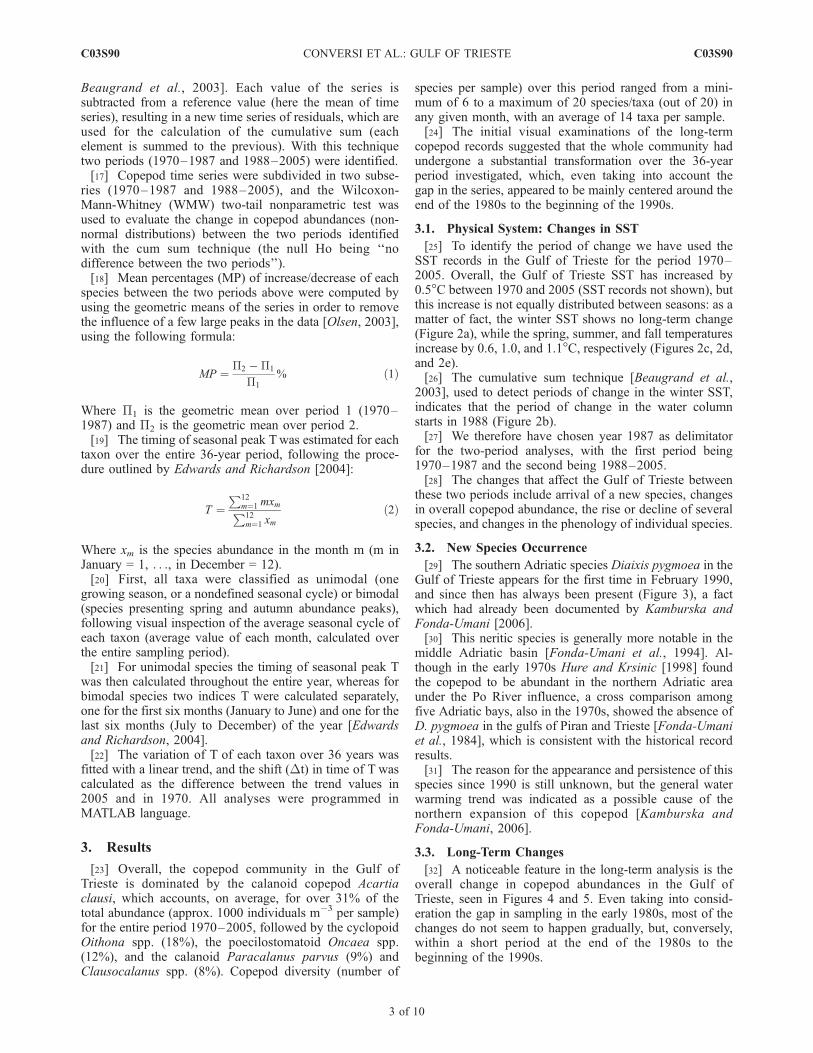
Gulf of Trieste: A changing ecosystem A. Conversi, 1,2 T. Peluso, 1 and S. Fonda-Umani 3 Received 6 February 2008; revised 22 December 2008; accepted 12 January 2009; published 26 March 2009. [1] Understanding the impact of climate change on zooplankton populations is of major importance, as they represent the basis for higher trophic levels in the marine food web. In this study we analyze the 36-year copepod abundance time series in the Gulf of Trieste, northern Adriatic, to investigate its interannual variability, with particular attention to species trends and phenology. Following the analysis of the local winter sea surface temperature, two periods are identified: 1970–1987 and 1988–2005. These periods are characterized by ecosystem-wide changes: an approximate doubling in total copepod abundance, the arrival of a new species (Diaixis pygmoea), the rise (Paracalanus parvus, Oncaea spp., Oithona spp., and Euterpina acutifrons) or decline (Pseudocalanus elongatus, Clausocalanus spp.) of several taxa, and changes in the phenology in several species, with predominantly forward shifts in the timing of the maximum peak. While Acartia clausi remains the dominant species, there is a general trend toward smaller species in the second period. Our results also indicate the large, possibly critical, reduction in the abundance of the species Pseudocalanus elongatus. We hypothesize that the changes in copepod abundances and community composition in the Gulf of Trieste are related to the general warming in the sea surface temperature and associated northerly displacement of the ecosystem and to the changes in the Mediterranean circulation that began at the end of the 1980s and affected the whole basin in the following years as part of the phenomenon called the Eastern Mediterranean Transient. Citation: Conversi, A., T. Peluso, and S. Fonda-Umani (2009), Gulf of Trieste: A changing ecosystem, J. Geophys. Res., 114, C03S90, doi:10.1029/2008JC004763. 1. Introduction [2] Worldwide, the mesozooplankton community is dom- inated mainly by copepods. Copepods play a key role in the diet of juvenile stages of many fish species, and thus they are responsible for transferring phytoplankton carbon to higher trophic levels, such as fish, birds, and marine mammals [Bonnet et al., 2005]. [3] This role is particularly important in the northern Adriatic, as this is one of the few regions of high permanent production in the Mediterranean Sea [Buljan, 1964; Franco, 1973; Fonda-Umani et al., 1992, 2004]. It is indeed also one of the most productive areas in the Mediterranean, with mesozooplankton biomass ranging as dry weight from 2.5 to 177.2 mg m 3 [Benovic et al., 1984], as opposed to the typical oligotrophic values of 3 mg m 3 usually found elsewhere [Gaudy and Champalbert, 1998; Deudero and Morales-Nin, 2001]. [4] The Gulf of Trieste (Figure 1) is the northernmost section of the Adriatic Sea, with a surface area of about 600 km 2 [Malej and Malac ˇic ˇ , 1995], and a volume of 9.5 km 3 [Olivotti et al., 1986]. It is characterized by an overall shallowness, with maximum depth around 23 m in the southern part, and 10% of the average bottom depth being less than 10 m; and by large and variable freshwater inputs [Fonda-Umani et al., 1992; Russo and Artegiani, 1996]. The main freshwater input is through the Isonzo River from the northwest coast. Hydrodynamical conditions are forced by the wind regime, characterized by strong, abrupt wind events, by the interaction with the general circulation of the Adriatic Sea, and by the seasonal alternance of stratification and mixing [Cossarini et al., 2002; Cossarini and Solidoro, 2007]. [5] The copepod community in the Gulf of Trieste is characterized by a few (approximately 30) coastal and estuarine species, which in turn can exhibit high dominance. Copepods dominate in all months except for June and July, when cladocerans (especially Penilia avirostris) take over [Cataletto et al., 1995]. In particular, the copepod Acartia clausi dominates most of the year, composing at some points >80% of the total biomass, followed by P. avirostris, which can account for >37% in summer [Fonda-Umani, 1985]. Other species of copepods like Oithona, Clausocala- nus, Temora, Paracalanus, and more recently Oncaea, can be considered relevant [Specchi et al., 1981; Fonda-Umani and Cocchietto, 1988; Fonda-Umani and Ghirardelli, 1988; Fonda-Umani et al., 2005; Kamburska and Fonda-Umani, 2006]. [6] Much of our knowledge on the Gulf of Trieste mesozooplankton is owed to the monthly time series col- JOURNAL OF GEOPHYSICAL RESEARCH, VOL. 114, C03S90, doi:10.1029/2008JC004763, 2009 Click Here for Full Articl e 1 ISMAR, CNR, Lerici, Italy. 2 Marine Institute, University of Plymouth, Plymouth, UK. 3 Department of Life Sciences, University of Trieste, Trieste, Italy. Copyright 2009 by the American Geophysical Union. 0148-0227/09/2008JC004763$09.00 C03S90 1 of 10
Transcript of Gulf of Trieste: A changing ecosystem
Gulf of Trieste: A changing ecosystem
A. Conversi,1,2 T. Peluso,1 and S. Fonda-Umani3
Received 6 February 2008; revised 22 December 2008; accepted 12 January 2009; published 26 March 2009.
[1] Understanding the impact of climate change on zooplankton populations is of majorimportance, as they represent the basis for higher trophic levels in the marine foodweb. In this study we analyze the 36-year copepod abundance time series in the Gulf ofTrieste, northern Adriatic, to investigate its interannual variability, with particular attentionto species trends and phenology. Following the analysis of the local winter sea surfacetemperature, two periods are identified: 1970–1987 and 1988–2005. These periods arecharacterized by ecosystem-wide changes: an approximate doubling in total copepodabundance, the arrival of a new species (Diaixis pygmoea), the rise (Paracalanus parvus,Oncaea spp., Oithona spp., and Euterpina acutifrons) or decline (Pseudocalanuselongatus, Clausocalanus spp.) of several taxa, and changes in the phenology in severalspecies, with predominantly forward shifts in the timing of the maximum peak. WhileAcartia clausi remains the dominant species, there is a general trend toward smallerspecies in the second period. Our results also indicate the large, possibly critical, reductionin the abundance of the species Pseudocalanus elongatus. We hypothesize that thechanges in copepod abundances and community composition in the Gulf of Trieste arerelated to the general warming in the sea surface temperature and associated northerlydisplacement of the ecosystem and to the changes in the Mediterranean circulation thatbegan at the end of the 1980s and affected the whole basin in the following years as part ofthe phenomenon called the Eastern Mediterranean Transient.
Citation: Conversi, A., T. Peluso, and S. Fonda-Umani (2009), Gulf of Trieste: A changing ecosystem, J. Geophys. Res., 114,
C03S90, doi:10.1029/2008JC004763.
1. Introduction
[2] Worldwide, the mesozooplankton community is dom-inated mainly by copepods. Copepods play a key role in thediet of juvenile stages of many fish species, and thus theyare responsible for transferring phytoplankton carbon tohigher trophic levels, such as fish, birds, and marinemammals [Bonnet et al., 2005].[3] This role is particularly important in the northern
Adriatic, as this is one of the few regions of high permanentproduction in the Mediterranean Sea [Buljan, 1964; Franco,1973; Fonda-Umani et al., 1992, 2004]. It is indeed alsoone of the most productive areas in the Mediterranean, withmesozooplankton biomass ranging as dry weight from 2.5to 177.2 mg m�3 [Benovic et al., 1984], as opposed to thetypical oligotrophic values of 3 mg m�3 usually foundelsewhere [Gaudy and Champalbert, 1998; Deudero andMorales-Nin, 2001].[4] The Gulf of Trieste (Figure 1) is the northernmost
section of the Adriatic Sea, with a surface area of about600 km2 [Malej and Malacic, 1995], and a volume of9.5 km3 [Olivotti et al., 1986]. It is characterized by an overall
shallowness, with maximum depth around 23 m in thesouthern part, and 10% of the average bottom depth beingless than 10 m; and by large and variable freshwater inputs[Fonda-Umani et al., 1992; Russo and Artegiani, 1996].The main freshwater input is through the Isonzo River fromthe northwest coast. Hydrodynamical conditions are forcedby the wind regime, characterized by strong, abrupt windevents, by the interaction with the general circulation of theAdriatic Sea, and by the seasonal alternance of stratificationand mixing [Cossarini et al., 2002; Cossarini and Solidoro,2007].[5] The copepod community in the Gulf of Trieste is
characterized by a few (approximately 30) coastal andestuarine species, which in turn can exhibit high dominance.Copepods dominate in all months except for June and July,when cladocerans (especially Penilia avirostris) take over[Cataletto et al., 1995]. In particular, the copepod Acartiaclausi dominates most of the year, composing at somepoints >80% of the total biomass, followed by P. avirostris,which can account for >37% in summer [Fonda-Umani,1985]. Other species of copepods like Oithona, Clausocala-nus, Temora, Paracalanus, and more recently Oncaea, can beconsidered relevant [Specchi et al., 1981; Fonda-Umaniand Cocchietto, 1988; Fonda-Umani and Ghirardelli, 1988;Fonda-Umani et al., 2005; Kamburska and Fonda-Umani,2006].[6] Much of our knowledge on the Gulf of Trieste
mesozooplankton is owed to the monthly time series col-
JOURNAL OF GEOPHYSICAL RESEARCH, VOL. 114, C03S90, doi:10.1029/2008JC004763, 2009ClickHere
for
FullArticle
1ISMAR, CNR, Lerici, Italy.2Marine Institute, University of Plymouth, Plymouth, UK.3Department of Life Sciences, University of Trieste, Trieste, Italy.
Copyright 2009 by the American Geophysical Union.0148-0227/09/2008JC004763$09.00
C03S90 1 of 10

lected at station C1 (Figure 1) since 1970. This is thelongest-lasting zooplankton collection in Italy and one ofthe longest in the Mediterranean Sea, providing a picture,spanning more than three decades, of the mesozooplanktonspecies composition, its diversity, and its temporal variabil-ity, at scales from intraannual to interannual.[7] Previous studies on this time series have focused on
group associations. Cataletto et al. [1995] found, during thefirst decade of monitoring (1970–1980), a regular latespring-summer appearance in a group characterized byAcartia clausi and Temora longicornis, and a regularautumn-winter appearance in a group characterized byTemora stylifera and Oncaea spp. Two main groups relatedto spring-summer and winter-autumn prevalence are alsoidentified by Kamburska and Fonda-Umani [2006], whofind several differences in patterns of abundance between1970 and 1980 and 1986–1999 and attribute them to climatechanges (North Atlantic Oscillation, El Nino/SouthernOscillation, Eastern Mediterranean Transient, sea surfacetemperature (SST) increase) in the northern hemispherefrom 1987.[8] Recent studies point out to the importance of linking
the long-term variations of the individual species abundanceto more specific endogenic factors. In particular, phenology,the study of periodic events in the life cycles of animals orplants, such as the timing of migrations and reproduction,has received definite attention as a possible indicator ofclimate change [Parmesan and Yohe, 2003; Edwards andRichardson, 2004; Molinero et al., 2005; Cleland et al.,2007].[9] In this article, we review the interannual variations of
the dominant copepod species in the Gulf of Trieste, with
particular attention to interannual changes, trends and shiftsin the phenology.[10] We begin by identifying changes in the physical
system, as represented by winter SST, then test whetherthere are corresponding changes in the biological system,and finally in the Discussion we link these back to theinterannual variations that happened at the end of the 1980sin the Ionian Sea and in the eastern Mediterranean circula-tion [Roether et al., 1996; Pinardi et al., 1997; Malanotte-Rizzoli et al., 1999; Korres et al., 2000; Pinardi et al., 2005;Roether et al., 2007].[11] SST is used as an indicator of physical change in the
ocean because organisms respond physiologically to tem-perature and it has been found to be important in manyterrestrial phenological studies [Hughes, 2000]. In addition,long-term changes is SST have been found to be concurrentto widespread changes in the marine system, which rangefrom benthos to plankton [Kirby et al., 2007]. For the Gulfof Trieste, we have chosen winter SST as indicator becausethe Mediterranean circulation is mostly forced by the winterclimate [Korres et al., 2000].
2. Methods
2.1. Data
[12] Mesozooplankton were collected by vertical haulsfrom bottom (18 m) to surface, with a WP2 net, at a 200 moffshore station (C1) located at 45�4200300N, 13�4203600E(Figure 1). The use of a 200 mm mesh probably determineda significant underestimation of small copepods (e.g.,onceids, oithonids) [Krsinic and Lucic, 1994; PaffenhoferandMazzocchi, 2003; Turner, 2004;Williams andMuxagata,2006], but the bias remained the same over time. The sampleswere fixed in 4% buffered formaldehyde. Taxonomic anal-yses were performed on subsamples composing 1/2 to 1/8 ofthe original sample, on at least 1000 individuals [Kamburskaand Fonda-Umani, 2006].[13] Thirty-six years (April 1970 to December 2005, with
a 5-year gap from January 1981 to February 1986, inclu-sive) of monthly copepod abundances (number of individ-uals m�3), comprising 20 copepod species and taxa, havebeen used for this work. In addition, total copepod abun-dance was computed as the sum of the abundance of allspecies per sample, and copepod diversity was computed asthe number of taxa per sample, for a total of 22 biologicalvariables and 8064 data points.[14] Monthly sea surface temperature (SST) for the Gulf
of Trieste region from January 1970 to December 2005 wasderived from the long-term meteorological station of CNR-ISMAR-Trieste, located at 45�3803400N, 13�4501400E andsampled daily at noon at 2 m depth [Caterini et al., 2007].
2.2. Statistical Analyses
[15] Seasonal SST averages were calculated over thefollowing months: winter (January, February, and March),spring (April, May, and June), summer (July, August, andSeptember) and autumn (October, November, and December).[16] The cumulative sums technique was used to detect
changes in the mean winter SST. The cumulative sums isa simple method, which allows a graphical detection oflocal changes in a time series and an assessment of theintensity and duration of these changes [Ibanez et al., 1993;
Figure 1. The Gulf of Trieste, northern Adriatic Seashowing location of the mesozooplankton sampling station(C1) and of the SST measuring site (S1).
C03S90 CONVERSI ET AL.: GULF OF TRIESTE
2 of 10
C03S90
Beaugrand et al., 2003]. Each value of the series issubtracted from a reference value (here the mean of timeseries), resulting in a new time series of residuals, which areused for the calculation of the cumulative sum (eachelement is summed to the previous). With this techniquetwo periods (1970–1987 and 1988–2005) were identified.[17] Copepod time series were subdivided in two subse-
ries (1970–1987 and 1988–2005), and the Wilcoxon-Mann-Whitney (WMW) two-tail nonparametric test wasused to evaluate the change in copepod abundances (non-normal distributions) between the two periods identifiedwith the cum sum technique (the null Ho being ‘‘nodifference between the two periods’’).[18] Mean percentages (MP) of increase/decrease of each
species between the two periods above were computed byusing the geometric means of the series in order to removethe influence of a few large peaks in the data [Olsen, 2003],using the following formula:
MP ¼ P2 �P1
P1
% ð1Þ
Where P1 is the geometric mean over period 1 (1970–1987) and P2 is the geometric mean over period 2.[19] The timing of seasonal peak Twas estimated for each
taxon over the entire 36-year period, following the proce-dure outlined by Edwards and Richardson [2004]:
T ¼P12
m¼1 mxmP12m¼1 xm
ð2Þ
Where xm is the species abundance in the month m (m inJanuary = 1, . . ., in December = 12).[20] First, all taxa were classified as unimodal (one
growing season, or a nondefined seasonal cycle) or bimodal(species presenting spring and autumn abundance peaks),following visual inspection of the average seasonal cycle ofeach taxon (average value of each month, calculated overthe entire sampling period).[21] For unimodal species the timing of seasonal peak T
was then calculated throughout the entire year, whereas forbimodal species two indices T were calculated separately,one for the first six months (January to June) and one for thelast six months (July to December) of the year [Edwardsand Richardson, 2004].[22] The variation of T of each taxon over 36 years was
fitted with a linear trend, and the shift (Dt) in time of T wascalculated as the difference between the trend values in2005 and in 1970. All analyses were programmed inMATLAB language.
3. Results
[23] Overall, the copepod community in the Gulf ofTrieste is dominated by the calanoid copepod Acartiaclausi, which accounts, on average, for over 31% of thetotal abundance (approx. 1000 individuals m�3 per sample)for the entire period 1970–2005, followed by the cyclopoidOithona spp. (18%), the poecilostomatoid Oncaea spp.(12%), and the calanoid Paracalanus parvus (9%) andClausocalanus spp. (8%). Copepod diversity (number of
species per sample) over this period ranged from a mini-mum of 6 to a maximum of 20 species/taxa (out of 20) inany given month, with an average of 14 taxa per sample.[24] The initial visual examinations of the long-term
copepod records suggested that the whole community hadundergone a substantial transformation over the 36-yearperiod investigated, which, even taking into account thegap in the series, appeared to be mainly centered around theend of the 1980s to the beginning of the 1990s.
3.1. Physical System: Changes in SST
[25] To identify the period of change we have used theSST records in the Gulf of Trieste for the period 1970–2005. Overall, the Gulf of Trieste SST has increased by0.5�C between 1970 and 2005 (SST records not shown), butthis increase is not equally distributed between seasons: as amatter of fact, the winter SST shows no long-term change(Figure 2a), while the spring, summer, and fall temperaturesincrease by 0.6, 1.0, and 1.1�C, respectively (Figures 2c, 2d,and 2e).[26] The cumulative sum technique [Beaugrand et al.,
2003], used to detect periods of change in the winter SST,indicates that the period of change in the water columnstarts in 1988 (Figure 2b).[27] We therefore have chosen year 1987 as delimitator
for the two-period analyses, with the first period being1970–1987 and the second being 1988–2005.[28] The changes that affect the Gulf of Trieste between
these two periods include arrival of a new species, changesin overall copepod abundance, the rise or decline of severalspecies, and changes in the phenology of individual species.
3.2. New Species Occurrence
[29] The southern Adriatic species Diaixis pygmoea in theGulf of Trieste appears for the first time in February 1990,and since then has always been present (Figure 3), a factwhich had already been documented by Kamburska andFonda-Umani [2006].[30] This neritic species is generally more notable in the
middle Adriatic basin [Fonda-Umani et al., 1994]. Al-though in the early 1970s Hure and Krsinic [1998] foundthe copepod to be abundant in the northern Adriatic areaunder the Po River influence, a cross comparison amongfive Adriatic bays, also in the 1970s, showed the absence ofD. pygmoea in the gulfs of Piran and Trieste [Fonda-Umaniet al., 1984], which is consistent with the historical recordresults.[31] The reason for the appearance and persistence of this
species since 1990 is still unknown, but the general waterwarming trend was indicated as a possible cause of thenorthern expansion of this copepod [Kamburska andFonda-Umani, 2006].
3.3. Long-Term Changes
[32] A noticeable feature in the long-term analysis is theoverall change in copepod abundances in the Gulf ofTrieste, seen in Figures 4 and 5. Even taking into consid-eration the gap in sampling in the early 1980s, most of thechanges do not seem to happen gradually, but, conversely,within a short period at the end of the 1980s to thebeginning of the 1990s.
C03S90 CONVERSI ET AL.: GULF OF TRIESTE
3 of 10
C03S90

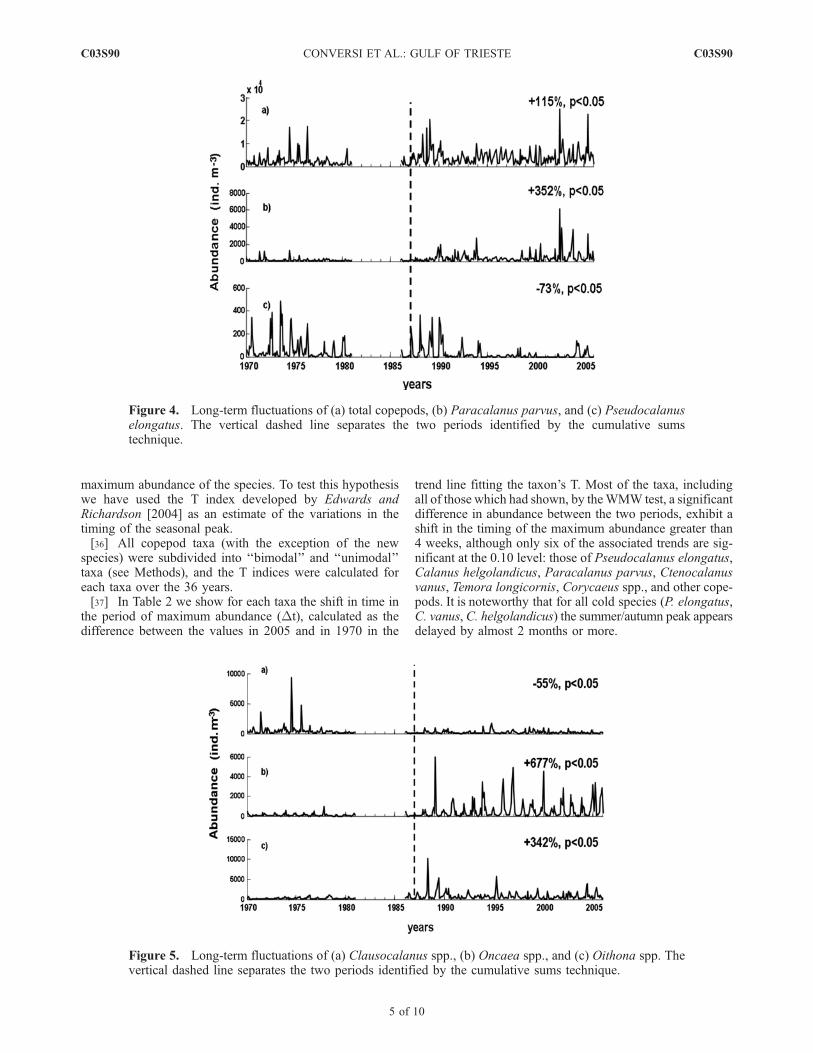
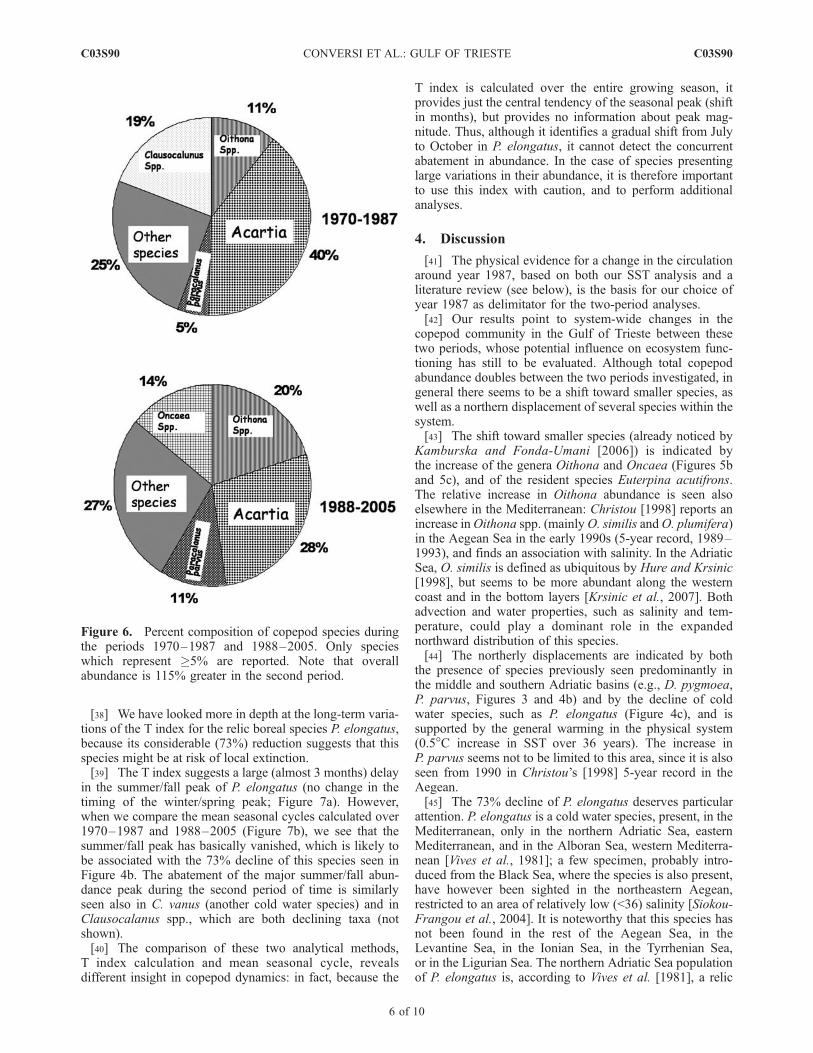
[33] We have therefore tested the hypothesis of no changebetween the two periods 1970–1987 and 1988–2005 withthe nonparametric Wilcoxon-Mann-Whitney test. The testresults confirm a significant (p < 0.05) change betweenthese periods for total copepods, Paracalanus parvus,Oncaea spp., Oithona spp., and Euterpina acutifrons (allincreasing), Pseudocalanus elongatus, Clausocalanus spp.and Ctenocalanus vanus (declining). More specifically, inthe second period relative to the first one, while the totalcopepod abundance increases overall by 115% (Figure 4aand Table 1), there is a reduction in the abundance of the largecopepods P. elongatus, which undergoes a 73% reduction(Figure 4c), andClausocalanus spp., which halves (Figure 5a).On the other hand, P. parvus (Figure 4b), Oithona spp.(Figure 5c), and Euterpina acutifrons (not shown) increaseapproximately fourfold, and Oncaea sevenfold (Figure 5b).[34] The net result of the aforesaid changes is a substan-
tial difference in the composition of the copepod commu-
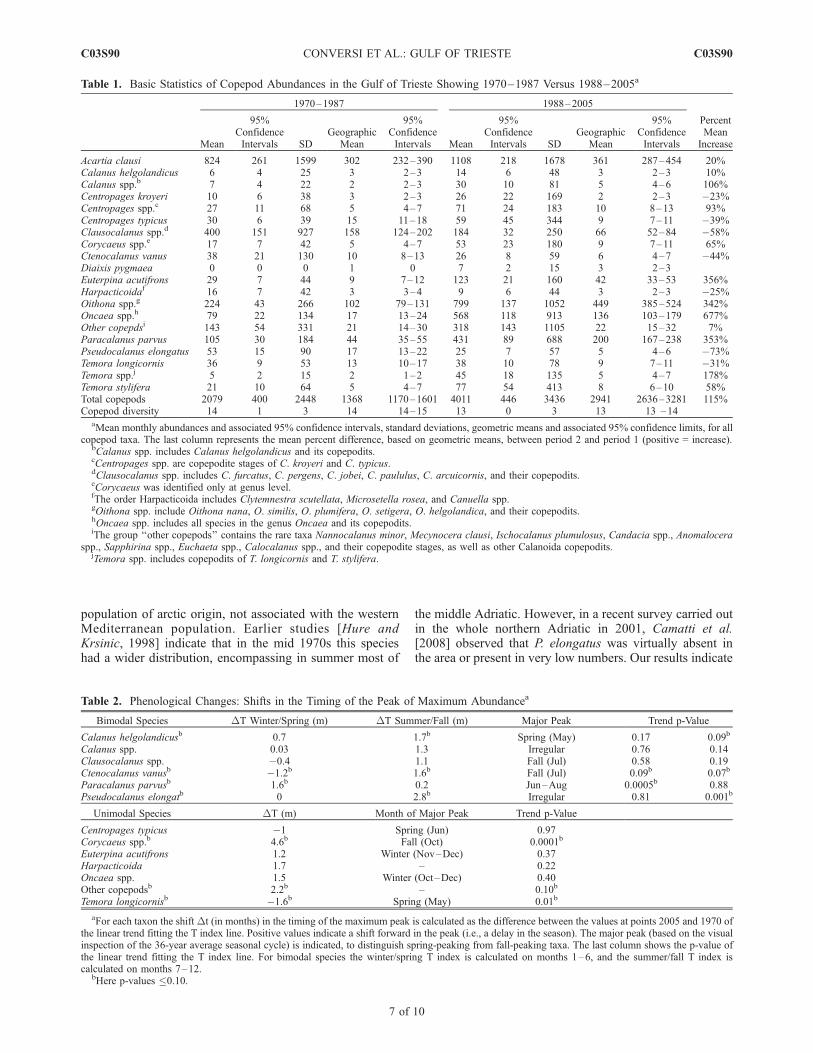
nity in the second period (Figure 6): during the years 1970–1987 A. clausi represented 40% of the total copepodpopulation, followed by Clausocalanus spp. (19%; in thesecond period becomes 4.6%), Oithona spp. (11%), andP. parvus (5%). On the other hand, in the period 1988–2005 A. clausi, while still undoubtedly the most abundantspecies, represents just 28% of the total copepod population,and the second most abundant taxon becomes Oithona spp.(20%), followed byOncaea spp. (14%; during the first periodwas 4%), and P. parvus (11%). The mean copepod diversity(number of species/sample), on the other hand, did notchange significantly between the two periods, which suggeststhat this simple index is not suitable for this area.
3.4. Changes in the Phenology of the Species
[35] In this work we have hypothesized that the changesin abundance seen between the periods 1970–1987 and1988–2005 entail changes in the timing of the peak of
Figure 2. (a) Winter SST with long-term mean (dotted line) and (b) winter SST cumulative sums. Forcomparison, the (c) spring, (d) summer, and (e) fall SST values are reported with respective long-termmean (dotted line) and trend (solid lines). The vertical dashed line separates the two periods identified bythe cumulative sums technique.
Figure 3. Long-term variations of Diaixis pygmoea. The vertical dashed line separates the two periodsidentified by the cumulative sums technique. Ind., individuals.
C03S90 CONVERSI ET AL.: GULF OF TRIESTE
4 of 10
C03S90
maximum abundance of the species. To test this hypothesiswe have used the T index developed by Edwards andRichardson [2004] as an estimate of the variations in thetiming of the seasonal peak.[36] All copepod taxa (with the exception of the new
species) were subdivided into ‘‘bimodal’’ and ‘‘unimodal’’taxa (see Methods), and the T indices were calculated foreach taxa over the 36 years.[37] In Table 2 we show for each taxa the shift in time in
the period of maximum abundance (Dt), calculated as thedifference between the values in 2005 and in 1970 in the
trend line fitting the taxon’s T. Most of the taxa, includingall of those which had shown, by theWMW test, a significantdifference in abundance between the two periods, exhibit ashift in the timing of the maximum abundance greater than4 weeks, although only six of the associated trends are sig-nificant at the 0.10 level: those of Pseudocalanus elongatus,Calanus helgolandicus, Paracalanus parvus, Ctenocalanusvanus, Temora longicornis, Corycaeus spp., and other cope-pods. It is noteworthy that for all cold species (P. elongatus,C. vanus, C. helgolandicus) the summer/autumn peak appearsdelayed by almost 2 months or more.
Figure 5. Long-term fluctuations of (a) Clausocalanus spp., (b) Oncaea spp., and (c) Oithona spp. Thevertical dashed line separates the two periods identified by the cumulative sums technique.
Figure 4. Long-term fluctuations of (a) total copepods, (b) Paracalanus parvus, and (c) Pseudocalanuselongatus. The vertical dashed line separates the two periods identified by the cumulative sumstechnique.
C03S90 CONVERSI ET AL.: GULF OF TRIESTE
5 of 10
C03S90
[38] We have looked more in depth at the long-term varia-tions of the T index for the relic boreal species P. elongatus,because its considerable (73%) reduction suggests that thisspecies might be at risk of local extinction.[39] The T index suggests a large (almost 3 months) delay
in the summer/fall peak of P. elongatus (no change in thetiming of the winter/spring peak; Figure 7a). However,when we compare the mean seasonal cycles calculated over1970–1987 and 1988–2005 (Figure 7b), we see that thesummer/fall peak has basically vanished, which is likely tobe associated with the 73% decline of this species seen inFigure 4b. The abatement of the major summer/fall abun-dance peak during the second period of time is similarlyseen also in C. vanus (another cold water species) and inClausocalanus spp., which are both declining taxa (notshown).[40] The comparison of these two analytical methods,
T index calculation and mean seasonal cycle, revealsdifferent insight in copepod dynamics: in fact, because the
T index is calculated over the entire growing season, itprovides just the central tendency of the seasonal peak (shiftin months), but provides no information about peak mag-nitude. Thus, although it identifies a gradual shift from Julyto October in P. elongatus, it cannot detect the concurrentabatement in abundance. In the case of species presentinglarge variations in their abundance, it is therefore importantto use this index with caution, and to perform additionalanalyses.
4. Discussion
[41] The physical evidence for a change in the circulationaround year 1987, based on both our SST analysis and aliterature review (see below), is the basis for our choice ofyear 1987 as delimitator for the two-period analyses.[42] Our results point to system-wide changes in the
copepod community in the Gulf of Trieste between thesetwo periods, whose potential influence on ecosystem func-tioning has still to be evaluated. Although total copepodabundance doubles between the two periods investigated, ingeneral there seems to be a shift toward smaller species, aswell as a northern displacement of several species within thesystem.[43] The shift toward smaller species (already noticed by
Kamburska and Fonda-Umani [2006]) is indicated bythe increase of the genera Oithona and Oncaea (Figures 5band 5c), and of the resident species Euterpina acutifrons.The relative increase in Oithona abundance is seen alsoelsewhere in the Mediterranean: Christou [1998] reports anincrease inOithona spp. (mainlyO. similis andO. plumifera)in the Aegean Sea in the early 1990s (5-year record, 1989–1993), and finds an association with salinity. In the AdriaticSea, O. similis is defined as ubiquitous by Hure and Krsinic[1998], but seems to be more abundant along the westerncoast and in the bottom layers [Krsinic et al., 2007]. Bothadvection and water properties, such as salinity and tem-perature, could play a dominant role in the expandednorthward distribution of this species.[44] The northerly displacements are indicated by both
the presence of species previously seen predominantly inthe middle and southern Adriatic basins (e.g., D. pygmoea,P. parvus, Figures 3 and 4b) and by the decline of coldwater species, such as P. elongatus (Figure 4c), and issupported by the general warming in the physical system(0.5�C increase in SST over 36 years). The increase inP. parvus seems not to be limited to this area, since it is alsoseen from 1990 in Christou’s [1998] 5-year record in theAegean.[45] The 73% decline of P. elongatus deserves particular
attention. P. elongatus is a cold water species, present, in theMediterranean, only in the northern Adriatic Sea, easternMediterranean, and in the Alboran Sea, western Mediterra-nean [Vives et al., 1981]; a few specimen, probably intro-duced from the Black Sea, where the species is also present,have however been sighted in the northeastern Aegean,restricted to an area of relatively low (<36) salinity [Siokou-Frangou et al., 2004]. It is noteworthy that this species hasnot been found in the rest of the Aegean Sea, in theLevantine Sea, in the Ionian Sea, in the Tyrrhenian Sea,or in the Ligurian Sea. The northern Adriatic Sea populationof P. elongatus is, according to Vives et al. [1981], a relic
Figure 6. Percent composition of copepod species duringthe periods 1970–1987 and 1988–2005. Only specieswhich represent �5% are reported. Note that overallabundance is 115% greater in the second period.
C03S90 CONVERSI ET AL.: GULF OF TRIESTE
6 of 10
C03S90
population of arctic origin, not associated with the westernMediterranean population. Earlier studies [Hure andKrsinic, 1998] indicate that in the mid 1970s this specieshad a wider distribution, encompassing in summer most of
the middle Adriatic. However, in a recent survey carried outin the whole northern Adriatic in 2001, Camatti et al.[2008] observed that P. elongatus was virtually absent inthe area or present in very low numbers. Our results indicate
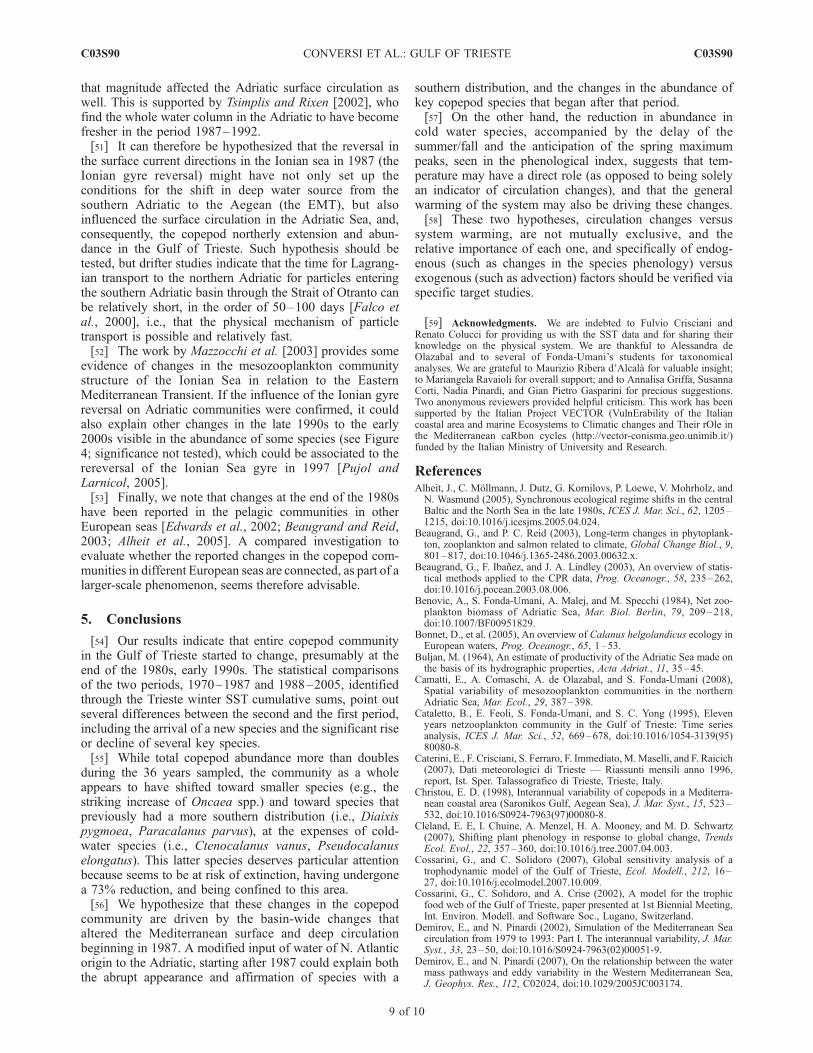
Table 2. Phenological Changes: Shifts in the Timing of the Peak of Maximum Abundancea
Bimodal Species DT Winter/Spring (m) DT Summer/Fall (m) Major Peak Trend p-Value
Calanus helgolandicusb 0.7 1.7b Spring (May) 0.17 0.09b
Calanus spp. 0.03 1.3 Irregular 0.76 0.14Clausocalanus spp. �0.4 1.1 Fall (Jul) 0.58 0.19Ctenocalanus vanusb �1.2b 1.6b Fall (Jul) 0.09b 0.07b
Paracalanus parvusb 1.6b 0.2 Jun–Aug 0.0005b 0.88Pseudocalanus elongatb 0 2.8b Irregular 0.81 0.001b
Unimodal Species DT (m) Month of Major Peak Trend p-Value
Centropages typicus �1 Spring (Jun) 0.97Corycaeus spp.b 4.6b Fall (Oct) 0.0001b
Euterpina acutifrons 1.2 Winter (Nov–Dec) 0.37Harpacticoida 1.7 – 0.22Oncaea spp. 1.5 Winter (Oct–Dec) 0.40Other copepodsb 2.2b – 0.10b
Temora longicornisb �1.6b Spring (May) 0.01b
aFor each taxon the shiftDt (in months) in the timing of the maximum peak is calculated as the difference between the values at points 2005 and 1970 ofthe linear trend fitting the T index line. Positive values indicate a shift forward in the peak (i.e., a delay in the season). The major peak (based on the visualinspection of the 36-year average seasonal cycle) is indicated, to distinguish spring-peaking from fall-peaking taxa. The last column shows the p-value ofthe linear trend fitting the T index line. For bimodal species the winter/spring T index is calculated on months 1–6, and the summer/fall T index iscalculated on months 7–12.
bHere p-values �0.10.
Table 1. Basic Statistics of Copepod Abundances in the Gulf of Trieste Showing 1970–1987 Versus 1988–2005a
1970–1987 1988–2005
PercentMean
IncreaseMean
95%ConfidenceIntervals SD
GeographicMean
95%ConfidenceIntervals Mean
95%ConfidenceIntervals SD
GeographicMean
95%ConfidenceIntervals
Acartia clausi 824 261 1599 302 232–390 1108 218 1678 361 287–454 20%Calanus helgolandicus 6 4 25 3 2–3 14 6 48 3 2–3 10%Calanus spp.b 7 4 22 2 2–3 30 10 81 5 4–6 106%Centropages kroyeri 10 6 38 3 2–3 26 22 169 2 2–3 �23%Centropages spp.c 27 11 68 5 4–7 71 24 183 10 8–13 93%Centropages typicus 30 6 39 15 11–18 59 45 344 9 7–11 �39%Clausocalanus spp.d 400 151 927 158 124–202 184 32 250 66 52–84 �58%Corycaeus spp.e 17 7 42 5 4–7 53 23 180 9 7–11 65%Ctenocalanus vanus 38 21 130 10 8–13 26 8 59 6 4–7 �44%Diaixis pygmaea 0 0 0 1 0 7 2 15 3 2–3Euterpina acutifrons 29 7 44 9 7–12 123 21 160 42 33–53 356%Harpacticoidaf 16 7 42 3 3–4 9 6 44 3 2–3 �25%Oithona spp.g 224 43 266 102 79–131 799 137 1052 449 385–524 342%Oncaea spp.h 79 22 134 17 13–24 568 118 913 136 103–179 677%Other copepdsi 143 54 331 21 14–30 318 143 1105 22 15–32 7%Paracalanus parvus 105 30 184 44 35–55 431 89 688 200 167–238 353%Pseudocalanus elongatus 53 15 90 17 13–22 25 7 57 5 4–6 �73%Temora longicornis 36 9 53 13 10–17 38 10 78 9 7–11 �31%Temora spp.j 5 2 15 2 1–2 45 18 135 5 4–7 178%Temora stylifera 21 10 64 5 4–7 77 54 413 8 6–10 58%Total copepods 2079 400 2448 1368 1170–1601 4011 446 3436 2941 2636–3281 115%Copepod diversity 14 1 3 14 14–15 13 0 3 13 13 –14
aMean monthly abundances and associated 95% confidence intervals, standard deviations, geometric means and associated 95% confidence limits, for allcopepod taxa. The last column represents the mean percent difference, based on geometric means, between period 2 and period 1 (positive = increase).
bCalanus spp. includes Calanus helgolandicus and its copepodits.cCentropages spp. are copepodite stages of C. kroyeri and C. typicus.dClausocalanus spp. includes C. furcatus, C. pergens, C. jobei, C. paululus, C. arcuicornis, and their copepodits.eCorycaeus was identified only at genus level.fThe order Harpacticoida includes Clytemnestra scutellata, Microsetella rosea, and Canuella spp.gOithona spp. include Oithona nana, O. similis, O. plumifera, O. setigera, O. helgolandica, and their copepodits.hOncaea spp. includes all species in the genus Oncaea and its copepodits.iThe group ‘‘other copepods’’ contains the rare taxa Nannocalanus minor, Mecynocera clausi, Ischocalanus plumulosus, Candacia spp., Anomalocera
spp., Sapphirina spp., Euchaeta spp., Calocalanus spp., and their copepodite stages, as well as other Calanoida copepodits.jTemora spp. includes copepodits of T. longicornis and T. stylifera.
C03S90 CONVERSI ET AL.: GULF OF TRIESTE
7 of 10
C03S90

the large, possibly critical, reduction in the abundance ofthis species. We are unaware of whether the Alboran Seapopulation has also decreased at the end of the 1980s.However, in the Baltic Sea, where this species has animportant role in the food web, its strong decline in thelast two decades originates in this same late 1980s to theearly 1990s period [Hinrichsen et al., 2002]; this suggeststhat this species could be driven by factors that operate at ascale larger than regional. From our results it can behypothesized that the 1�C increase seen in the summerand fall SST (Figure 2) can be associated with the disruptionof the summer peak in this cold-water species (Figure 7b).[46] The several changes that took place in the copepod
community measured in the Gulf of Trieste at the end of the1980s to the beginning of the 1990s (although we cannotexactly pin down the period because of the lack of samplingin the early 1980s) suggest an ecosystem wide response tosome type of large-scale physical forcing. A literaturereview indicates, in fact, the existence of peculiar physicalconditions at the end of the 1980s, which preconditioned abasin-wide alteration in the 1990s.[47] Demirov and Pinardi’s [2002] work on the interan-
nual Mediterranean circulation (from 1979 to 1993) distin-guishes two periods (1981–1987 and 1988–1993), whichdiffer in precipitation and winter wind regimes. These twoperiods are very consistent with those identified in here.[48] Utilizing data-validated simulations, Pinardi et al.
[1997] and Korres et al. [2000], describe the dramaticchanges that occur in the surface circulation in the summerof 1987. In particular, they show a reversal in the surface
current directions in the Ionian Sea, with the Atlantic/Ionianstream branching northward at 35.5�N, reversing both thesouthward flow along the Italian coast of the previous years,and the cyclonic Ionian gyre, which became anticyclonic.Pinardi et al. [1997] link the surface circulation changes tothe previous winter anomalies in the winds and heat fluxes.The alteration lasted approximately 10 years, until 1997,when the gyre rereversed, as shown by altimetry data [Pujoland Larnicol, 2005; Pinardi et al., 2005; Gertman et al.,2006; Demirov and Pinardi, 2007].[49] In effect, the exceptionally cold winter of 1987 and
the Ionian gyre reversal are considered to have set up theinitial conditions for the shift of the source of deep watersfrom its usual southern Adriatic source to a new Aegeansource [Lascaratos et al., 1999]. This phenomenon, calledthe Eastern Mediterranean Transient (EMT), peakedapproximately between 1988 and 1995 [Roether et al.,1996; Malanotte-Rizzoli et al., 1999; Lascaratos et al.,1999; Josey, 2003], and started relaxing at the end the1990s; however, in 2003 the water mass structure was stillfar different from pre-EMT conditions [Roether et al., 2007].[50] The link between the Ionian gyre reversal and the
North Atlantic Water (NAW) northward flow of 1987 andthe Adriatic Sea surface circulation is not completelyarticulated, as most of the subsequent studies have focusedon the understanding the switch of the formation of densewater from the Adriatic to the Aegean. However, theincrease of NAW in the northern Ionian Sea from 1987 isshown by the data of Malanotte-Rizzoli et al. [1999] andManca et al. [2003], and we can deduce that an alteration of
Figure 7. Changes in the seasonal peak of Pseudocalanus elongatus. Phenological changes: (a) changesin the timing of the seasonal peak (T index) over the entire 36-year period and (b) differences in the meanseasonal cycle: periods 1970–1987 versus 1988–2005. The vertical bars indicate the standard errors ofthe monthly means.
C03S90 CONVERSI ET AL.: GULF OF TRIESTE
8 of 10
C03S90
that magnitude affected the Adriatic surface circulation aswell. This is supported by Tsimplis and Rixen [2002], whofind the whole water column in the Adriatic to have becomefresher in the period 1987–1992.[51] It can therefore be hypothesized that the reversal in
the surface current directions in the Ionian sea in 1987 (theIonian gyre reversal) might have not only set up theconditions for the shift in deep water source from thesouthern Adriatic to the Aegean (the EMT), but alsoinfluenced the surface circulation in the Adriatic Sea, and,consequently, the copepod northerly extension and abun-dance in the Gulf of Trieste. Such hypothesis should betested, but drifter studies indicate that the time for Lagrang-ian transport to the northern Adriatic for particles enteringthe southern Adriatic basin through the Strait of Otranto canbe relatively short, in the order of 50–100 days [Falco etal., 2000], i.e., that the physical mechanism of particletransport is possible and relatively fast.[52] The work by Mazzocchi et al. [2003] provides some
evidence of changes in the mesozooplankton communitystructure of the Ionian Sea in relation to the EasternMediterranean Transient. If the influence of the Ionian gyrereversal on Adriatic communities were confirmed, it couldalso explain other changes in the late 1990s to the early2000s visible in the abundance of some species (see Figure4; significance not tested), which could be associated to therereversal of the Ionian Sea gyre in 1997 [Pujol andLarnicol, 2005].[53] Finally, we note that changes at the end of the 1980s
have been reported in the pelagic communities in otherEuropean seas [Edwards et al., 2002; Beaugrand and Reid,2003; Alheit et al., 2005]. A compared investigation toevaluate whether the reported changes in the copepod com-munities in different European seas are connected, as part of alarger-scale phenomenon, seems therefore advisable.
5. Conclusions
[54] Our results indicate that entire copepod communityin the Gulf of Trieste started to change, presumably at theend of the 1980s, early 1990s. The statistical comparisonsof the two periods, 1970–1987 and 1988–2005, identifiedthrough the Trieste winter SST cumulative sums, point outseveral differences between the second and the first period,including the arrival of a new species and the significant riseor decline of several key species.[55] While total copepod abundance more than doubles
during the 36 years sampled, the community as a wholeappears to have shifted toward smaller species (e.g., thestriking increase of Oncaea spp.) and toward species thatpreviously had a more southern distribution (i.e., Diaixispygmoea, Paracalanus parvus), at the expenses of cold-water species (i.e., Ctenocalanus vanus, Pseudocalanuselongatus). This latter species deserves particular attentionbecause seems to be at risk of extinction, having undergonea 73% reduction, and being confined to this area.[56] We hypothesize that these changes in the copepod
community are driven by the basin-wide changes thataltered the Mediterranean surface and deep circulationbeginning in 1987. A modified input of water of N. Atlanticorigin to the Adriatic, starting after 1987 could explain boththe abrupt appearance and affirmation of species with a
southern distribution, and the changes in the abundance ofkey copepod species that began after that period.[57] On the other hand, the reduction in abundance in
cold water species, accompanied by the delay of thesummer/fall and the anticipation of the spring maximumpeaks, seen in the phenological index, suggests that tem-perature may have a direct role (as opposed to being solelyan indicator of circulation changes), and that the generalwarming of the system may also be driving these changes.[58] These two hypotheses, circulation changes versus
system warming, are not mutually exclusive, and therelative importance of each one, and specifically of endog-enous (such as changes in the species phenology) versusexogenous (such as advection) factors should be verified viaspecific target studies.
[59] Acknowledgments. We are indebted to Fulvio Crisciani andRenato Colucci for providing us with the SST data and for sharing theirknowledge on the physical system. We are thankful to Alessandra deOlazabal and to several of Fonda-Umani’s students for taxonomicalanalyses. We are grateful to Maurizio Ribera d’Alcala for valuable insight;to Mariangela Ravaioli for overall support; and to Annalisa Griffa, SusannaCorti, Nadia Pinardi, and Gian Pietro Gasparini for precious suggestions.Two anonymous reviewers provided helpful criticism. This work has beensupported by the Italian Project VECTOR (VulnErability of the Italiancoastal area and marine Ecosystems to Climatic changes and Their rOle inthe Mediterranean caRbon cycles (http://vector-conisma.geo.unimib.it/)funded by the Italian Ministry of University and Research.
ReferencesAlheit, J., C. Mollmann, J. Dutz, G. Kornilovs, P. Loewe, V. Mohrholz, andN. Wasmund (2005), Synchronous ecological regime shifts in the centralBaltic and the North Sea in the late 1980s, ICES J. Mar. Sci., 62, 1205–1215, doi:10.1016/j.icesjms.2005.04.024.
Beaugrand, G., and P. C. Reid (2003), Long-term changes in phytoplank-ton, zooplankton and salmon related to climate, Global Change Biol., 9,801–817, doi:10.1046/j.1365-2486.2003.00632.x.
Beaugrand, G., F. Ibanez, and J. A. Lindley (2003), An overview of statis-tical methods applied to the CPR data, Prog. Oceanogr., 58, 235–262,doi:10.1016/j.pocean.2003.08.006.
Benovic, A., S. Fonda-Umani, A. Malej, and M. Specchi (1984), Net zoo-plankton biomass of Adriatic Sea, Mar. Biol. Berlin, 79, 209–218,doi:10.1007/BF00951829.
Bonnet, D., et al. (2005), An overview of Calanus helgolandicus ecology inEuropean waters, Prog. Oceanogr., 65, 1–53.
Buljan, M. (1964), An estimate of productivity of the Adriatic Sea made onthe basis of its hydrographic properties, Acta Adriat., 11, 35–45.
Camatti, E., A. Comaschi, A. de Olazabal, and S. Fonda-Umani (2008),Spatial variability of mesozooplankton communities in the northernAdriatic Sea, Mar. Ecol., 29, 387–398.
Cataletto, B., E. Feoli, S. Fonda-Umani, and S. C. Yong (1995), Elevenyears netzooplankton community in the Gulf of Trieste: Time seriesanalysis, ICES J. Mar. Sci., 52, 669–678, doi:10.1016/1054-3139(95)80080-8.
Caterini, E., F. Crisciani, S. Ferraro, F. Immediato, M.Maselli, and F. Raicich(2007), Dati meteorologici di Trieste — Riassunti mensili anno 1996,report, Ist. Sper. Talassografico di Trieste, Trieste, Italy.
Christou, E. D. (1998), Interannual variability of copepods in a Mediterra-nean coastal area (Saronikos Gulf, Aegean Sea), J. Mar. Syst., 15, 523–532, doi:10.1016/S0924-7963(97)00080-8.
Cleland, E. E, I. Chuine, A. Menzel, H. A. Mooney, and M. D. Schwartz(2007), Shifting plant phenology in response to global change, TrendsEcol. Evol., 22, 357–360, doi:10.1016/j.tree.2007.04.003.
Cossarini, G., and C. Solidoro (2007), Global sensitivity analysis of atrophodynamic model of the Gulf of Trieste, Ecol. Modell., 212, 16–27, doi:10.1016/j.ecolmodel.2007.10.009.
Cossarini, G., C. Solidoro, and A. Crise (2002), A model for the trophicfood web of the Gulf of Trieste, paper presented at 1st Biennial Meeting,Int. Environ. Modell. and Software Soc., Lugano, Switzerland.
Demirov, E., and N. Pinardi (2002), Simulation of the Mediterranean Seacirculation from 1979 to 1993: Part I. The interannual variability, J. Mar.Syst., 33, 23–50, doi:10.1016/S0924-7963(02)00051-9.
Demirov, E., and N. Pinardi (2007), On the relationship between the watermass pathways and eddy variability in the Western Mediterranean Sea,J. Geophys. Res., 112, C02024, doi:10.1029/2005JC003174.
C03S90 CONVERSI ET AL.: GULF OF TRIESTE
9 of 10
C03S90

Deudero, S., and B. Morales-Nin (2001), Surface mesozooplankton in openwaters of the Western Mediterranean, Ophelia Suppl., 54, 1–13.
Edwards, M., and A. J. Richardson (2004), Impact of climate change onmarine pelagic phenology and trophic mismatch, Nature, 430, 881–884,doi:10.1038/nature02808.
Edwards, M., G. Beaugrand, P. C. Reid, A. A. Rowden, and M. B. Jones(2002), Ocean climate anomalies and the ecology of the North Sea, Mar.Ecol. Prog. Ser., 239, 1–10, doi:10.3354/meps239001.
Falco, P., A. Griffa, P. M. Poulain, and E. Zambianchi (2000), Transportproperties in the Adriatic Sea as deduced from drifter data, J. Phys.Oceanogr., 30, 2055–2071, doi:10.1175/1520-0485(2000)030<2055:TPITAS>2.0.CO;2.
Fonda-Umani, S. (1985), Contributo quantitativo di Acartia clausiGIESBRECHT e Penilia avirostris DANA alla biomassa zooplanctonicadel Golfo di Trieste, Soc. Ital. Ecol. Atti, 5, 235–237.
Fonda-Umani, S., and M. Cocchietto (1988), Tasso di filtrazione ed’ingestione di Acartia clausi nel Golfo di Trieste, Proc. Assoc. Ital.Oceanol. Limnol., 8, 383–395.
Fonda-Umani, S., and E. Ghirardelli (1988), Caratteristiche chimiche ebiologiche del sistema pelagico del Golfo di Trieste, Hydrores, 5, 71–82.
Fonda-Umani, S., M. Specchi, A. Malej, and A. Benovic (1984), Cinquebaie dell’Adriatico; la loro comunita zooplanctonica, Nova Thalassia, 6,37–44.
Fonda-Umani, S., P. Franco, E. Ghirardelli, and A. Malej (1992), Outline ofoceanography and the plankton of the Adriatic Sea, in Marine Eutrophi-cation and Population Dynamics, edited by G. Colombo et al., pp. 347–365, Olsen and Olsen, Fredensborg, Denmark.
Fonda-Umani, S., M. Specchi, B. Cataletto, and A. de Olazabal (1994),Distribuzione stagionale del mesozooplancton nell’Adriatico Settentrio-nale e Centrale, Boll. Soc. Adriatica Sci. Trieste, 75, 145–176.
Fonda-Umani, S., A. Beran, S. Parlato, D. Virgilio, T. Zollet, A. De Olazabal,B. Lazzarini, and M. Cabrini (2004), Noctiluca scintillansMACARTNEYin the northern Adriatic Sea: Long-term dynamics, relationship withtemperature and eutrophication, and role in the food web, J. PlanktonRes., 26, 1–17, doi:10.1093/plankt/fbh045.
Fonda-Umani, S., et al. (2005), Inter-annual variations of planktonic foodwebs in the northern Adriatic Sea, Sci. Total Environ., 353, 218–231,doi:10.1016/j.scitotenv.2005.09.016.
Franco, P. (1973), L’influenza del Po sui caratteri oceanografici e sulladistribuzione della biomassa planctonica nell’Adriatico Settentrionale,Ann. Univ. Ferrara, 1, 95–117.
Gaudy, R., and G. Champalbert (1998), Space and time variations in zoo-plankton distribution south of Marseilles, Oceanol. Acta, 21, 793–802.
Gertman, I., N. Pinardi, Y. Popov, and A. Hecht (2006), Aegean sea watermasses during the early stages of the easternMediterranean climatic transient(1988–90), J. Phys. Oceanogr., 36, 1841–1859, doi:10.1175/JPO2940.1.
Hinrichsen, H. H., C. Mollmann, R. Voss, F. W. Koster, and G. Kornilovs(2002), Biophysical modeling of larval Baltic cod (Gadus morhua)growth and survival, Can. J. Fish. Aquat. Sci., 59, 1858 – 1873,doi:10.1139/f02-149.
Hughes, L. (2000), Biological consequence of global warming: Is the signalalready apparent?, Trends Ecol. Evol., 15, 56–61, doi:10.1016/S0169-5347(99)01764-4.
Hure, J., and F. Krsinic (1998), Planktonic copepods of the Adriatic Sea.Spatial and temporal distribution, Nat. Croatica, 7, 1–133.
Ibanez, F., J. M. Fromentin, and J. Castel (1993), Application de la methodedes sommes cumulees a l’analyse des series chronologiques en oceano-graphie, C. R. Acad. Sci., Ser. Gen. Vie Sci., 316, 745–748.
Josey, A. S. (2003), Changes in the heat and freshwater forcing of theeastern Mediterranean and their influence on deep water formation,J. Geophys. Res., 108(C7), 3237, doi:10.1029/2003JC001778.
Kamburska, L., and S. Fonda-Umani (2006), Long-term copepod dynamicin the Gulf of Trieste (Northern Adriatic Sea). Recent changes and trends,Clim. Res., 31, 195–203, doi:10.3354/cr031195.
Kirby, R. R., G. Beaugrand, J. A. Lindley, A. J. Richardson, M. Edwards,and P. Reid (2007), Climate effects and benthic-pelagic coupling in theNorth Sea, Mar. Ecol. Prog. Ser., 330, 31–38, doi:10.3354/meps330031.
Korres, G., N. Pinardi, and A. Lascaratos (2000), The ocean response tolow-frequency interannual atmospheric variability in the MediterraneanSea. Part II: Empirical Orthogonal Function Analysis, J. Clim., 13, 732–745, doi:10.1175/1520-0442(2000)013<0732:TORTLF>2.0.CO;2.
Krsinic, F., and D. Lucic (1994), Mesozooplankton sampling experimentswith the ‘‘Adriatic’’ sampler: Difference of catch between 250 and 125um mesh netting gauze, Estuarine Coastal Shelf Sci., 38, 113–118,doi:10.1006/ecss.1994.1007.
Krsinic, F., D. Bojanic, R. Precali, and R. Kraus (2007), Quantitative varia-bility of the copepod assemblages in the northern Adriatic Sea from 1993to 1997, Estuarine Coastal Shelf Sci., 74, 528 – 538, doi:10.1016/j.ecss.2007.05.036.
Lascaratos, A., W. Roether, K. Nittis, and B. Klein (1999), Recent changesin deep water formation and spreading in the eastern Mediterranean Sea,Prog. Oceanogr., 44, 5–36, doi:10.1016/S0079-6611(99)00019-1.
Malanotte-Rizzoli, P., B. B. Manca, M. Ribera d’Alcala, A. Theocharis,S. Brenner, G. Budillon, and E. Ozsoy (1999), The eastern Mediterraneanin the 80s and in the 90s: The big transition in the intermediate and deepcirculations, Dyn. Atmos. Oceans, 29, 365–395, doi:10.1016/S0377-0265(99)00011-1.
Malej, A., and V. Malacic (1995), Factors affecting bottom layer oxygendepletion in the Gulf of Trieste (Adriatic Sea), Annales, 7, 33–42.
Manca, B. B., G. Budillon, P. Scarazzato, and L. Ursella (2003), Evolutionof dynamics in the eastern Mediterranean affecting water mass structuresand properties in the Ionian and Adriatic seas, J. Geophys. Res., 108(C9),8102, doi:10.1029/2002JC001664.
Mazzocchi, M. G., D. Nervegna, G. D’Elia, I. Di Capua, L. Aguzzi, andA. Boldrin (2003), Spring mesozooplankton communities in the epipe-lagic Ionian Sea in relation to the Eastern Mediterranean Transient,J. Geophys. Res., 108(C9), 8114, doi:10.1029/2002JC001640.
Molinero, J. C., F. Ibanez, S. Sammi, M. Chifflet, and P. Nival (2005),Phenological changes in the northwestern Mediterranean copepodsCentropages typicus and Temora stylifera linked to climate change,Oecologia, 145, 640–649, doi:10.1007/s00442-005-0130-4.
Olivotti, R., J. Faganelli, and A. Malej (1986), Impact of ‘organic’ pollulantson coastal waters, Gulf of Trieste, Water Sci. Technol., 18, 57–68.
Olsen, C. H. (2003), Review of the use of statistics in Infection and Immunity,Infect. Immun., 71, 6689–6692, doi:10.1128/IAI.71.12.6689-6692.2003.
Paffenhofer, G. A., and M. G. Mazzocchi (2003), Vertical distribution ofsubtropical epiplanktonic copepods, J. Plankton Res., 25, 1139–1156,doi:10.1093/plankt/25.9.1139.
Parmesan, C., and G. Yohe (2003), A globally coherent fingerprint ofclimate change impacts across nature systems, Nature, 421, 37–42,doi:10.1038/nature01286.
Pinardi, N, G. Korres, A. Lascaratos, V. Roussenov, and E. Stanev (1997),Numerical simulation of the interannual variability of the MediterraneanSea upper ocean circulation, Geophys. Res. Lett., 24, 425 – 428,doi:10.1029/96GL03952.
Pinardi, N., C. Coppini, A. Grezio, and P. Oddo (2005), Ocean climatevariability in the Mediterranean Sea: Climate events and marine forecast-ing activities, edited by C. Fletcher and T. Spencer, in Flooding andEnvironmental Challenges for Venice and Its Lagoon: State of Knowledge,pp. 41–52, Cambridge Univ. Press, New York.
Pujol, M. I., and G. Larnicol (2005), Mediterranean Sea eddy kinetic energyvariability from 11 years of altimetric data, J. Mar. Syst., 58, 121–142,doi:10.1016/j.jmarsys.2005.07.005.
Roether,W., B. B.Manca, B. Klein, D. Bregant, D. Georgopoulos, V. Beitzel,V. Kovacevic, and A. Luchetta (1996), Recent changes in easternMediterranean deep waters, Science, 271, 333 – 335, doi:10.1126/science.271.5247.333.
Roether, W., B. Klein, B. B. Manca, A. Theocharis, and S. Kioroglou(2007), Transient Eastern Mediterranean deep water response to themassive dense-water output of the Aegean in the 1990s, Prog. Oceanogr.,74, 540–571, doi:10.1016/j.pocean.2007.03.001.
Russo, A., and A. Artegiani (1996), Adriatic Sea hydrography, Sci. Mar.,60, 3–43.
Siokou-Frangou, I., T. Shiganova, E.D. Christou, I.Kamburska, A.Gubanova,A. Konsulov, E. Musaeva, V. Skryabin, and V. Khoroshilov (2004),Mesozooplankton communities in the Aegean and Black seas: A compara-tive study, Mar. Biol. Berlin, 144, 1111–1126, doi:10.1007/s00227-003-1277-3.
Specchi, M., S. Fonda-Umani, and G. Radini (1981), Les fluctuations duzooplancton dans une station fixe du Golfe de Trieste (Haute Adriatique),Rapp. P.-V., Reun. Comm. Int. Mer Mediter., 27, 121–122.
Tsimplis, M. N., and M. Rixen (2002), Sea level in the Mediterranean Sea:The contribution of temperature and salinity changes, Geophys. Res.Lett., 29(23), 2136, doi:10.1029/2002GL015870.
Turner, J. T. (2004), The importance of small copepods and their roles inpelagic marine food webs, Zool. Stud., 43, 255–266.
Vives, F., V. Rodriguez, and I. Rodriguez (1981), Sobre la presencia dePseudocalanus elongatus Boeck (Copepoda, Calanoida) en el mar deAlboran, Invest. Pesq., 45, 337–344.
Williams, J. A., and E. Muxagata (2006), The seasonal abundance andproduction of Oithona nana (Copepoda: Cyclopoida) in SouthamptonWater, J. Plankton Res., 28, 1055–1065, doi:10.1093/plankt/fbl039.
�����������������������A. Conversi and T. Peluso, ISMAR, CNR, Forte Santa Teresa, loc.
Pozzuola, I-19036 Lerici, Italy. ([email protected])S. Fonda-Umani, Department of Life Sciences, University of Trieste,
I-34127 Trieste, Italy.
C03S90 CONVERSI ET AL.: GULF OF TRIESTE
10 of 10
C03S90