Gujarat Journal of Extension Education
152
1 «Mkkh Society of Extension Education, Anand (Gujarat) Directorate of Extension Education Anand Agricultural University Anand-388 110, Gujarat, India Gujarat Journal of Extension Education Vol. : 24 Year : 2013
-
Upload
khangminh22 -
Category
Documents
-
view
2 -
download
0
Transcript of Gujarat Journal of Extension Education

1
«Mkkh
Society of Extension Education, Anand (Gujarat)Directorate of Extension Education
Anand Agricultural UniversityAnand-388 110, Gujarat, India
Gujarat Journal of
Extension EducationVol. : 24Year : 2013

2
EDITORIAL BOARD(Gujarat Journal of Extension Education )
Chief Editor : Dr. M. R. Prajapati Professor, C. P. College of Agriculture Sardarkrushinagar Dantiwada Agricultural University SK Nagar-385506 Mo. : 99249 77250 Email: [email protected]
Associate Editors : Dr. M. R. Bhatt(Southern Gujarat Region) Associate Professor, Dept. of Extension Education N.M. College of Agriculture, NAU, Navsari-396450 Mo. : 99980 12219 Email: [email protected] Dr. V. T. Patel Associate Professor, Dept. of Extension Education C.P. College of Agriculture Sardarkrushinagar Dantiwada Agricultural University SK Nagar-385506 Mo. : 99985 53060 Email: [email protected] Dr. J. B. Patel Associate Editor (Middle Gujarat Region & Other State) Associate Professor, Dept. of Extension Education B.A., College of Agriculture, Anand Agricultural University Anand – 388 110 Mo. : 94273 85081 Email: [email protected] Dr. V. J. Savaliya Assistant Professor, Dept. of Extension Education College of Agriculture, Junagadh Agricultural Univeristy Junagadh-362001 Mo. : 94277 41952 Email: [email protected] Joint Secretary : Dr. N. V. Soni Associate Extension Educationist Publication Dept., DOEE, Anand Agricultural University Anand – 388 110 Mo. : 94278 56045 Email: [email protected] Secretary : Dr. J. K. Patel Associate Professor, Dairy Vigyan Kendra Dairy Science College, Anand Agricultural University Anand-388110 Mo. : 96012 79243 Email: [email protected]

3
It would be no in exaggeration when I say that there is a phenomenal growth in the discipline of Extension Education during the past five decades. There is a dire need to meet the expectations of the public, through new technologies and new improved process and methods. The process through which these expectations are met is called ‘technology transfer’. Existing agricultural system is suffering from constraints like – multiplicity of technology transfer system, narrow focus on agricultural extension system, lack of farmer focus & feedback, inadequate technical capability and caliber of acute assessment, refinement and validation of technology, poor research-extension linkage, non-effective communication skills, inadequate system operation & financial constraints and much more.
Considering all these factors, the goals of technology dissemination components have been set forth to develop a unique technology transfer system which is built on certain inter-related concepts viz., firstly to develop an effective public extension system that is farmers demand driven and accountable, thorough integration with research and economically viable, secondly to strengthen research and extension capacity to disseminate location specific system based & sustainable technology; and finally to utilize the expertise and capacity of NGOs to organize & empower farmers, specially resource poor farmers.
We, the extension professionals, need to probe into the issue and find a plausible solution answer through deliberations and research so that efficiency, accountability and cost effectiveness of extension system is maintained ensuring equity and social justice. The Society of Extension Education, Gujarat published the Gujarat journal of Extension Education is a multidisciplinary national journal that publishes scientific articles concerned with all aspects of extension education in general and agricultural extension in particular. The Journal is peer reviewed and committed to timely publication of original research and reviewed articles. The journal is designed mainly to serve researchers, dealing with extension research.
The current issue of the journal contains 38 research papers covering a wide spectrum of topics ranging from development of diffusion models to effectiveness of extension services. I hope that the readers will find them useful and interesting. At this juncture, I congratulate all extension educationists and members of the editorial board for their sincere efforts and hard work for quality publication of this issue.
(P. P. Patel)
MESSAGE
President SEEG & Director of Extension EducationAnand Agricultural University, Anand
Dr. P. P. Patel

4
For the Authors....
Guidelines for Authors
Gujarat Journal of Extension Education is the official publication of Gujarat Society of Extension Education. It publishes original research paper in the field of extension education and allied fields.
Submission of manuscript :
An author belongs to Gujarat state would like to publish his/her paper in Gujarat Journal of Extension Education should be submitted his/her manuscript to associate editor of their Western /Northern / Southern or Middle Gujarat region and for the authors out side of the Gujarat state should be submitted his/her manuscript directly to Chief Editor. Two hard copies of the manuscript should be submitted along with the soft copy preferably in the form of CD, Rich Text Format or Microsoft Word format. The length of the manuscript should be typed in double space and not exceed than 10 typed pages with the year of research actually done.
Submission of final manuscript:
The submitted manuscript will be evaluated by the editorial members and referees for their suitability. The manuscript will be sent back to the author to carry out the changes or modifications as suggested by the editorial members. The final manuscript has to be submitted only through e-mail to following e-mail address:[email protected]
Arrangement of manuscript :
Title, Name of author/s (Complete address with e-mail address), Abstract (About in 150 words), Introduction, Methodology, Findings & Discussion, Conclusion and References. The manuscript should be printed on A4 size paper format with a provision of top, right and bottom of 2.5 cm space. The left margin must be of 4 cm. Title and all major heading should be centre aligned, capital and in 14 point size while, running matter should be justified and typed in Times New Roman font of 12 point size. Table should be prepared by using the table facility of Microsoft word and should not more than five tables. Only computer generated charts/graphs/ figure or photographs which must be submitted in JPEG files will be accepted.
Policies:
Author must append the certificate along with his/her manuscript about the matter has not been sent for publication in other journal/magazine. Article forwarded to the editor for publication are understood to be offered to the Gujarat Journal of Extension Education exclusively. It is also understood that the authors have obtained the necessary approval of their concerns department, institution, faculty or even co-author/s. The Editorial board takes no responsibility for facts or opinion express in the journal, which rest entirely with the author/s thereof.

5
From Chief Editor’s Desk......
It is gratify to note that the publication of Gujarat Journal of Extension Education is being brought out as a sincere commitment to the farmers’ community and the contributors of research papers. The contributors are to be commended for bestowing their attention, which is time consuming, towards contributing high quality research papers.
There is increasing recognition in India that agricultural research and extension must be more responsive to the needs and constraints of the farming community. Moreover, the need for empowering farmers and linking rural people to research, extension and to reach other through information technology for facilitating access to crucial information is highly emphasized.
The country recorded impressive achievements in agriculture during three decades since the onset of green revolution in late sixties. This enabled the country to overcome widespread hunger and starvation; achieve self sufficiency in food; reduce poverty and bring economic transformation in millions of rural families. The situation, however started turning adverse for the sector around mid nineties, with slowdown in growth rate of output, which then resulted in stagnation or even decline in farmers’ income leading to agrarian distress, which is spreading and turning more and more serious.
We are extremely grateful to the contributors for their sincere dedication in contributing to the journal. We do hope that the keen interest shall be sustained in making the journal grow from strengthen to strengthen. We are sure that the journal shall be of significant help to all the readers. At the same time , we request our readers to provide a feedback for further improvement in the quality of the journal.
We would like to place on record my thanks to Dr.P.P.Patel, Director of Extension Education and President of the Gujarat Society of Extension Education and all the members of the society for providing us this opportunity. I appreciate the efforts of my colleagues and associate editors s/s Dr.N.V.Soni, Dr.V.T.Patel, Dr.M.R.Bhatt, Dr.J.B.Patel, Dr. V.J.Savalia and Dr.J.K.Patel after their extensive efforts and available different sources finalized the articles. I would like to express my sincere thank to Dr.N.B.Chauhan, Dr.R.D.Pandya and Dr. P.R.Kanani for sharing their valuable experiences, insights and knowledge to make our journal recognized.
We hope this publication will achieve its heights in disseminating information as well as evoking a feedback from the scientists, extension workers and academicians interested in prosperity of farmers.
Once again, we thank all of them who have contributed and helped us in publication of this journal . Your suggestions and comments are always welcome .
(M.R.Prajapati) Chief Editor

6
Society of Extension Education, Anand Gujarat
HAPPY TO ANNOUNCESHRI KHUSHALBHAI REVABHAI PATEL
MEDAL -CUM -CASH PRIZE(FROM: APRIL – 1992)
For the Students of B. Sc. (Agri.) of SAUs of Gujarat
: Contact : Seceretary
Society of Extension Education, Anand (Gujarat)Directorate of Extension Education, University Bhavan
Anand Agricultural University, Anand-388110, Gujarat, IndiaPhone : 02692-261921, 225987
Statement showing the details for the award of “Khushalbhai Revabhai Patel Medal / cash Prize” for B.Sc. (Agri.) degree course examination of State Agricultural Universities of Gujarat in the subject of Extension Education for Securing Highest Grade Point in the Academic year 1992-2013.
Year Name of the Students University Centre1992 Solanki Gunvantsinh Hirasinh GAU Sardarkurshinagar1993 Upadhyay Jayeshkumar Babulal GAU Sardarkurshinagar1994 Marvanya Ajay Maganlal GAU Junagadh1994 Patel Shailesh Dalpatbhai GAU Navsari1995 Patel Dipakkumar Mafatbhai GAU Anand1996 Pandya Sandipkumar Bhanuprasad GAU Sardarkurshinagar1997 Surendrasinh Krshrisinh Chauhan GAU Anand1998 Moumita Nag GAU Anand1999 Chauhan Dilipsinh Arjunsinh GAU Sardarkurshinagar2000 Dixit Shital Anilkumar GAU Anand2001 Lakhana Rameshkumar Bhimaji GAU Junagadh2002 Kodapully Vikas Chandran GAU Sardarkurshinagar2004 Nair Santosh Parmeshwar GAU Navsari2005 Vikram Budharaja SDAU Sardarkurshinagar2006 Vinja Ranavaya JAU Junagadh2007 Abhishek Kumar SDAU Sardarkurshinagar2008 Jasani Himal Kamleshkumar JAU Junagadh2009 Dheeraj Singh Rathore JAU Junagadh2010 Deepa B. Hiremath AAU Anand2011 Tanvi Pal AAU Anand2012 Chauhan Surabhi Surendrasinh SDAU Sardarkurshinagar2013 Kavita Kumari SDAU Sardarkurshinagar

7
CONTENTS
Sr. No.
Title Page No.
1 Development of Scale to Measure Attitude of Farmers towards Holstein Friesian
J. K. Patel, J. B. Patel, Onima V. T. and N. B. Chauhan
1
2 Perception of the College Students Regarding Various Aspects of Computer Applications
P.S. Parsania, Krunal C Kamani and X. U. Shukla
4
3 Extent of Adoption of the Market Intelligence Among the Summer Cabbage Growers
J.D. Desai and K.D. Solanki
9
4 Appraisal of Training Needs of Members of Tribal Women SHGs for Agriculture Management
N. M. Chauhan and S.M. Kshirsagar
14
5 Relationship between Profile of the Maize Growers and their Socio-Techno-Economic Changes
J . Matwa, N. V. Soni, P.M.Bhatt and B. H. Patel
20
6 Knowledge of Farmers Regarding Green Manuring for Sustainable Agriculture
Krunal P. Patel and Meena C. Patel
23
7 Use of Agricultural Information by KRUSHIGOVIDYA subscriber’s on their Farming
N.V. Soni, P.M. Bhatt, Mahesh R. Patel and Krunal C. Kamani
25
8 Attitude of farmers towards Agro processing
Priyanka M. Parmar and Meena C. Patel
29
9 Development of Scale to Measure Attitude of Farmers towards Gir Cow
J. K. Patel, J. B. Patel, Krunal Gulkari and N. B. Chauhan
32
8
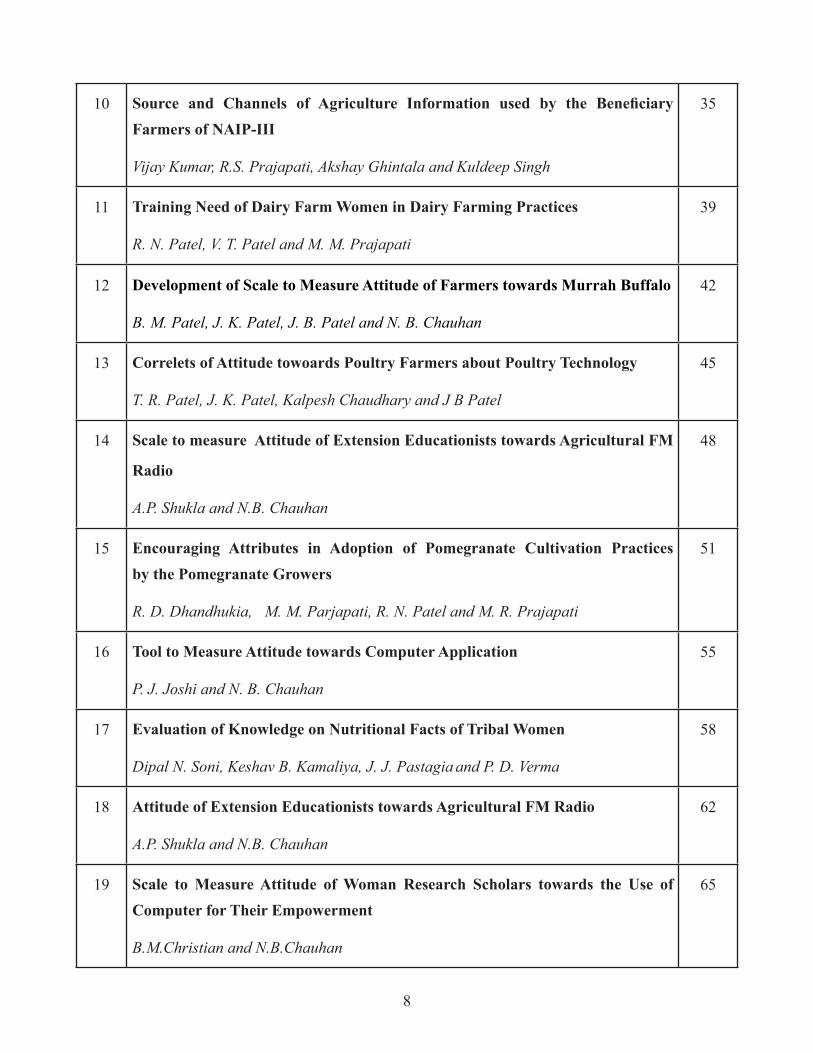
10 Source and Channels of Agriculture Information used by the Beneficiary Farmers of NAIP-III
Vijay Kumar, R.S. Prajapati, Akshay Ghintala and Kuldeep Singh
35
11 Training Need of Dairy Farm Women in Dairy Farming Practices
R. N. Patel, V. T. Patel and M. M. Prajapati
39
12 Development of Scale to Measure Attitude of Farmers towards Murrah Buffalo
B. M. Patel, J. K. Patel, J. B. Patel and N. B. Chauhan
42
13 Correlets of Attitude towoards Poultry Farmers about Poultry Technology
T. R. Patel, J. K. Patel, Kalpesh Chaudhary and J B Patel
45
14 Scale to measure Attitude of Extension Educationists towards Agricultural FM
Radio
A.P. Shukla and N.B. Chauhan
48
15 Encouraging Attributes in Adoption of Pomegranate Cultivation Practices by the Pomegranate Growers
R. D. Dhandhukia, M. M. Parjapati, R. N. Patel and M. R. Prajapati
51
16 Tool to Measure Attitude towards Computer Application
P. J. Joshi and N. B. Chauhan
55
17 Evaluation of Knowledge on Nutritional Facts of Tribal Women
Dipal N. Soni, Keshav B. Kamaliya, J. J. Pastagia and P. D. Verma
58
18 Attitude of Extension Educationists towards Agricultural FM Radio
A.P. Shukla and N.B. Chauhan
62
19 Scale to Measure Attitude of Woman Research Scholars towards the Use of Computer for Their Empowerment
B.M.Christian and N.B.Chauhan
65
9
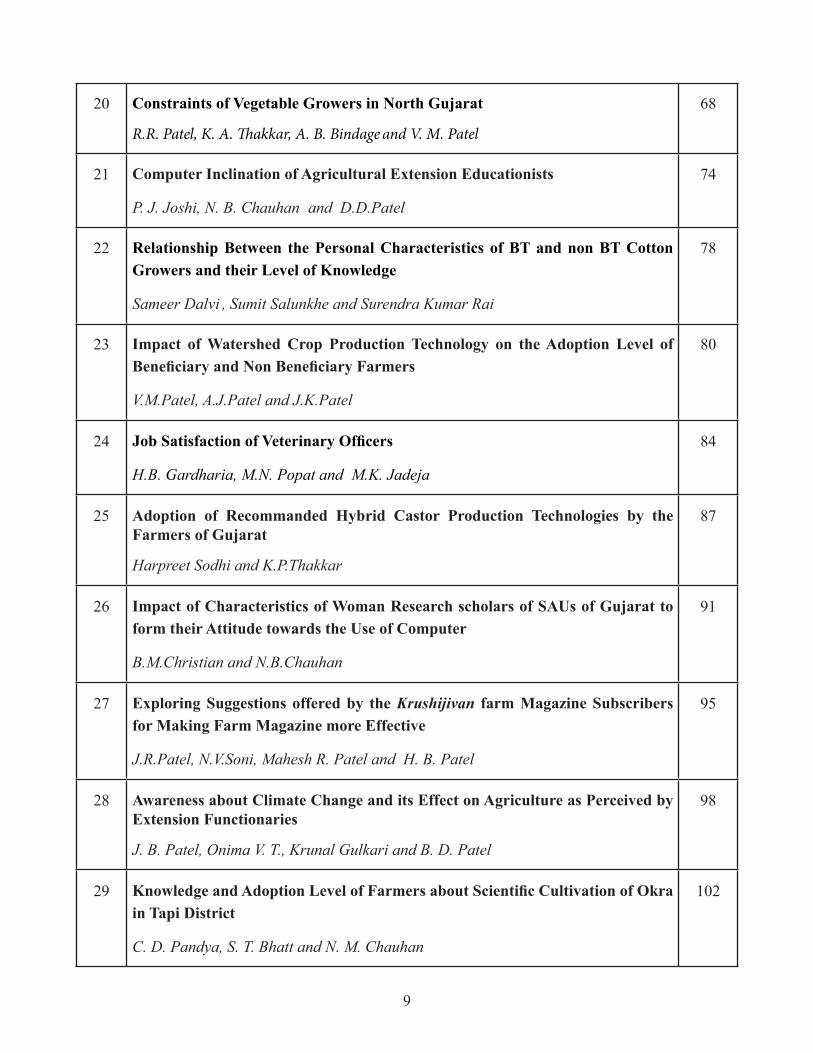
20 Constraints of Vegetable Growers in North Gujarat
R.R. Patel, K. A. Thakkar, A. B. Bindage and V. M. Patel
68
21 Computer Inclination of Agricultural Extension Educationists
P. J. Joshi, N. B. Chauhan and D.D.Patel
74
22 Relationship Between the Personal Characteristics of BT and non BT Cotton Growers and their Level of Knowledge
Sameer Dalvi , Sumit Salunkhe and Surendra Kumar Rai
78
23 Impact of Watershed Crop Production Technology on the Adoption Level of Beneficiary and Non Beneficiary Farmers
V.M.Patel, A.J.Patel and J.K.Patel
80
24 Job Satisfaction of Veterinary Officers
H.B. Gardharia, M.N. Popat and M.K. Jadeja
84
25 Adoption of Recommanded Hybrid Castor Production Technologies by the Farmers of Gujarat
Harpreet Sodhi and K.P.Thakkar
87
26 Impact of Characteristics of Woman Research scholars of SAUs of Gujarat to form their Attitude towards the Use of Computer
B.M.Christian and N.B.Chauhan
91
27 Exploring Suggestions offered by the Krushijivan farm Magazine Subscribers for Making Farm Magazine more Effective
J.R.Patel, N.V.Soni, Mahesh R. Patel and H. B. Patel
95
28 Awareness about Climate Change and its Effect on Agriculture as Perceived by Extension Functionaries
J. B. Patel, Onima V. T., Krunal Gulkari and B. D. Patel
98
29 Knowledge and Adoption Level of Farmers about Scientific Cultivation of Okra in Tapi District
C. D. Pandya, S. T. Bhatt and N. M. Chauhan
102

10
30 Factors affecting Adoption of No-cost and Low-cost Technologies of Animal Husbandry Practices by Tribal Dairy Farmwomen in Gujarat
J. V. Prajapati, P. M. Bhatt and J. B. Patel
105
31 Inspiring Personality of Farmers to have Positive Attitude towards Green Manuring for Sustainable Agriculture
Krunal P. Patel and Meena C. Patel
111
32 Awareness among Farmers about Krishi Vigyan Kendra - Knowledge Resource Centre in Tapi district
C. D. Pandya, Arti N. Soni and N. M. Chauhan
114
33 Attitude of Cotton Growers towards Bt and Non Bt cotton
Sameer Dalvi , Sumit Salunkhe and Surendra Kumar Rai
120
34 Constraints Faced by the Mango Growers Towards Scientific Cultivation in Mango Orchards
Pradip A. Baria, N. V. Soni and D. D. Patel
123
35 Attitude Towards Application of Distance Education in Agriculture Field
Kaushik. G. Khadayta, P.M.Bhatt and H. B. Patel
125
36 Agribusiness Anxiety and Constraints Perceived in Acceptance of Agribusiness by Postgraduate Students of SAUs of Gujarat
B. G. Gadhvi and Meena C. Patel
128
37 Development of Scale to Measure Attitude of the Farmers towards Agro-Processing
Priyanka M. Parmar and Meena C. Patel
131
38 Market-Led-Extension activities of APMCs
S. D. Kavad and R. D. Pandya
134

11
Form for enrollment
Society of Extension Education, Anand (Gujarat)Proposal of Membership
• Name in full (Block letter) :
• Address :
Phone/Email :
• Date of Birth :
• Profession and present employment :
• Academic qualification :
• Societies of which already member :
• Amount paid :
Fee: Life Member : ` 1000, Corporate/Institutional Member : ` 2000/- for 10 years, Patrons (Individual or Institutional): ` 5000/-
Declaration by the Nominee
I hereby declare that I shall abide by the Statutes and Regulations of the Society of Extension Education and offer my cooperation in promoting its objectives.
Date:------------------------------- Signature----------------------------------------
I propose that _ _ _ _ _ _ _ _ _ _ _ _ ___ _ _ _ _ _ _ _ _ _ __ _ _ _ _ be admitted as Life member of the Society of Extension Education.Signature :
Name in full :
Address :
Date :I second the above proposal for admission of _ _ _ _ _ _ _ _ _ __ _ _ _ _ _ _ __ _ __ to the Society of Extension Education.
Signature :
Name in full :
Address :Date :All remittances and correspondence relating to subscription, membership, advertisement etc. should be addressed to Secretary-cum-Treasurer, Society of Extension Education, Office of Director of Extension Education, University Bhavan, Anand Agricultural University, Anand - 388 110, Gujarat. The Demand Draft should be issued in favour of ‘SOCIETY OF EXTENSION EDUCATION, ANAND, (GUJARAT)’ payable at Anand OR through money transfer to Central Bank of India A/c No. 1215785307, IFSC No. : CBIN0281262, at Institute of Agri. Campus, Anand Branch, Anand
website : www.gjoee.org
email : [email protected]

12
SEMINARS / INTERNATIONAL CONFERENCE ORGANISED BY SOCIETY OF EXTENSION EDUCATION ANAND (GUJARAT)
Sr. No.
Date Title Place
1 20 May 1990 Seminar on “Future Challenges and Strategies of Extension Education”
Navsari
2 8 February 1992 Seminar on “Role of Rural Women in Development
Anand
3 23 October 1994 Seminar on “Role of Farm Literature in Agricultural Development”
Sardarkrushinagar
4 27 January 1996 Seminar on “Role of Co-operative Organization in Rural Development”
Navsari
5 30 April 1997 Seminar on “Challanges of Extension Education in 21st Century”
Anand
6 9 January 1998 Seminar on “Distance Extension Education in Electronic Era”
Junagadh
7 27 April 2001 Seminar on “Human Resource Development in Agriculture”
Sardarkrushinagar
8 27 February 2003 Seminar on “Transfer of Agricultural Technology in 21st Century”
Navsari
9 5-7 December 2003 International Conference on “Agricultural Policies and Strategies for Profitable Farming: Field Realities, Needed Reforms and Interventions”
Anand
10 25 February 2007 Seminar on “Extension Strategy for Agricultural Development”
Navsari
11 31 August 2009 Seminar on “Participatory Approach and Recent Trends in Rural Development”
Junagadh
12 18 August 2012 Seminar on “Innovative Avenues of Extension Education
Sardarkrushinagar
: Visit Our Website :www.gjoee.org
Gujarat Journal of Extension Education Vol. 24 : (December 2013)
1
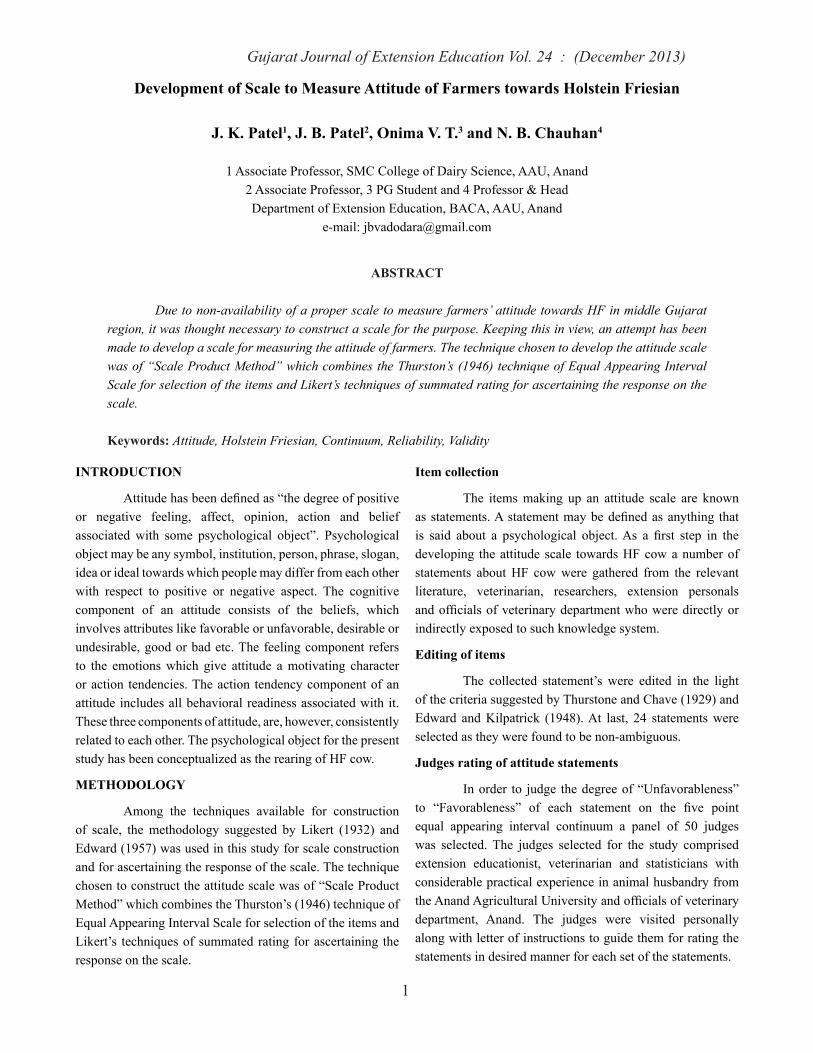
Development of Scale to Measure Attitude of Farmers towards Holstein Friesian
J. K. Patel1, J. B. Patel2, Onima V. T.3 and N. B. Chauhan4
1 Associate Professor, SMC College of Dairy Science, AAU, Anand2 Associate Professor, 3 PG Student and 4 Professor & HeadDepartment of Extension Education, BACA, AAU, Anand
e-mail: [email protected]
ABSTRACT
Due to non-availability of a proper scale to measure farmers’ attitude towards HF in middle Gujarat region, it was thought necessary to construct a scale for the purpose. Keeping this in view, an attempt has been made to develop a scale for measuring the attitude of farmers. The technique chosen to develop the attitude scale was of “Scale Product Method” which combines the Thurston’s (1946) technique of Equal Appearing Interval Scale for selection of the items and Likert’s techniques of summated rating for ascertaining the response on the scale.
Keywords: Attitude, Holstein Friesian, Continuum, Reliability, Validity
INTRODUCTION
Attitudehasbeendefinedas“thedegreeofpositiveor negative feeling, affect, opinion, action and belief associated with some psychological object”. Psychological object may be any symbol, institution, person, phrase, slogan, idea or ideal towards which people may differ from each other with respect to positive or negative aspect. The cognitive component of an attitude consists of the beliefs, which involves attributes like favorable or unfavorable, desirable or undesirable, good or bad etc. The feeling component refers to the emotions which give attitude a motivating character or action tendencies. The action tendency component of an attitude includes all behavioral readiness associated with it. These three components of attitude, are, however, consistently related to each other. The psychological object for the present study has been conceptualized as the rearing of HF cow.
METHODOLOGY
Among the techniques available for construction of scale, the methodology suggested by Likert (1932) and Edward (1957) was used in this study for scale construction and for ascertaining the response of the scale. The technique chosentoconstructtheattitudescalewasof“ScaleProductMethod” which combines the Thurston’s (1946) technique of Equal Appearing Interval Scale for selection of the items and Likert’s techniques of summated rating for ascertaining the response on the scale.
Item collection
The items making up an attitude scale are known asstatements.Astatementmaybedefinedasanything thatis said about a psychological object.As a first step in thedeveloping the attitude scale towards HF cow a number of statements about HF cow were gathered from the relevant literature, veterinarian, researchers, extension personals andofficialsofveterinarydepartmentwhoweredirectlyorindirectly exposed to such knowledge system.
Editing of items
The collected statement’s were edited in the light of the criteria suggested by Thurstone and Chave (1929) and Edward and Kilpatrick (1948). At last, 24 statements were selected as they were found to be non-ambiguous.
Judges rating of attitude statements
Inorder to judge thedegreeof“Unfavorableness”to “Favorableness” of each statement on the five pointequal appearing interval continuum a panel of 50 judges was selected. The judges selected for the study comprised extension educationist, veterinarian and statisticians with considerable practical experience in animal husbandry from theAnandAgriculturalUniversityandofficialsofveterinarydepartment, Anand. The judges were visited personally along with letter of instructions to guide them for rating the statements in desired manner for each set of the statements.
Gujarat Journal of Extension Education Vol. 24 : (December 2013)
2
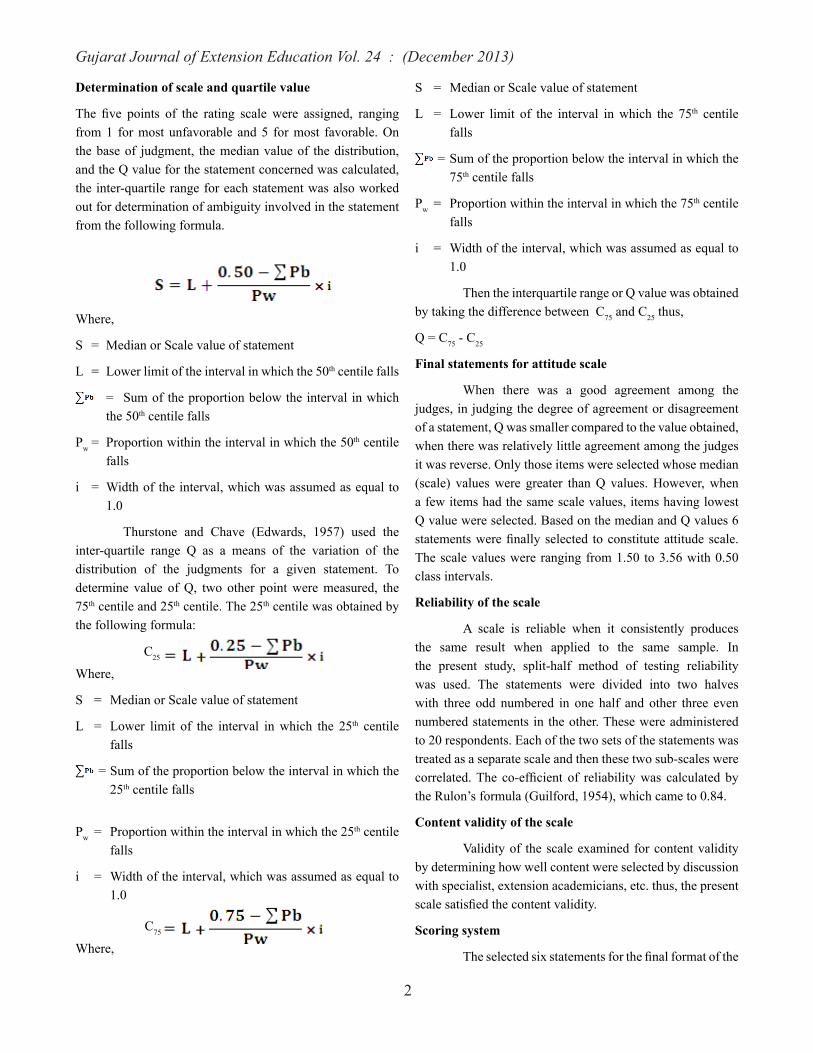
Determination of scale and quartile value
The five points of the rating scale were assigned, rangingfrom 1 for most unfavorable and 5 for most favorable. On the base of judgment, the median value of the distribution, and the Q value for the statement concerned was calculated, the inter-quartile range for each statement was also worked out for determination of ambiguity involved in the statement from the following formula.
Where,
S = Median or Scale value of statement
L = Lower limit of the interval in which the 50th centile falls
= Sum of the proportion below the interval in which the 50th centile falls
Pw = Proportion within the interval in which the 50th centile falls
i = Width of the interval, which was assumed as equal to 1.0
Thurstone and Chave (Edwards, 1957) used the inter-quartile range Q as a means of the variation of the distribution of the judgments for a given statement. To determine value of Q, two other point were measured, the 75th centile and 25th centile. The 25th centile was obtained by the following formula:
C25
Where,
S = Median or Scale value of statement
L = Lower limit of the interval in which the 25th centile falls
= Sum of the proportion below the interval in which the 25th centile falls
Pw = Proportion within the interval in which the 25th centile falls
i = Width of the interval, which was assumed as equal to 1.0
C75
Where,
S = Median or Scale value of statement
L = Lower limit of the interval in which the 75th centile falls
= Sum of the proportion below the interval in which the 75th centile falls
Pw = Proportion within the interval in which the 75th centile falls
i = Width of the interval, which was assumed as equal to 1.0
Then the interquartile range or Q value was obtained by taking the difference between C75 and C25 thus,
Q = C75 - C25
Final statements for attitude scale
When there was a good agreement among the judges, in judging the degree of agreement or disagreement of a statement, Q was smaller compared to the value obtained, when there was relatively little agreement among the judges it was reverse. Only those items were selected whose median (scale) values were greater than Q values. However, when a few items had the same scale values, items having lowest Q value were selected. Based on the median and Q values 6 statementswerefinallyselected toconstituteattitudescale.The scale values were ranging from 1.50 to 3.56 with 0.50 class intervals.
Reliability of the scale
A scale is reliable when it consistently produces the same result when applied to the same sample. In the present study, split-half method of testing reliability was used. The statements were divided into two halves with three odd numbered in one half and other three even numbered statements in the other. These were administered to 20 respondents. Each of the two sets of the statements was treated as a separate scale and then these two sub-scales were correlated.The co-efficient of reliabilitywas calculated bythe Rulon’s formula (Guilford, 1954), which came to 0.84.
Content validity of the scale
Validity of the scale examined for content validity by determining how well content were selected by discussion with specialist, extension academicians, etc. thus, the present scalesatisfiedthecontentvalidity.
Scoring system
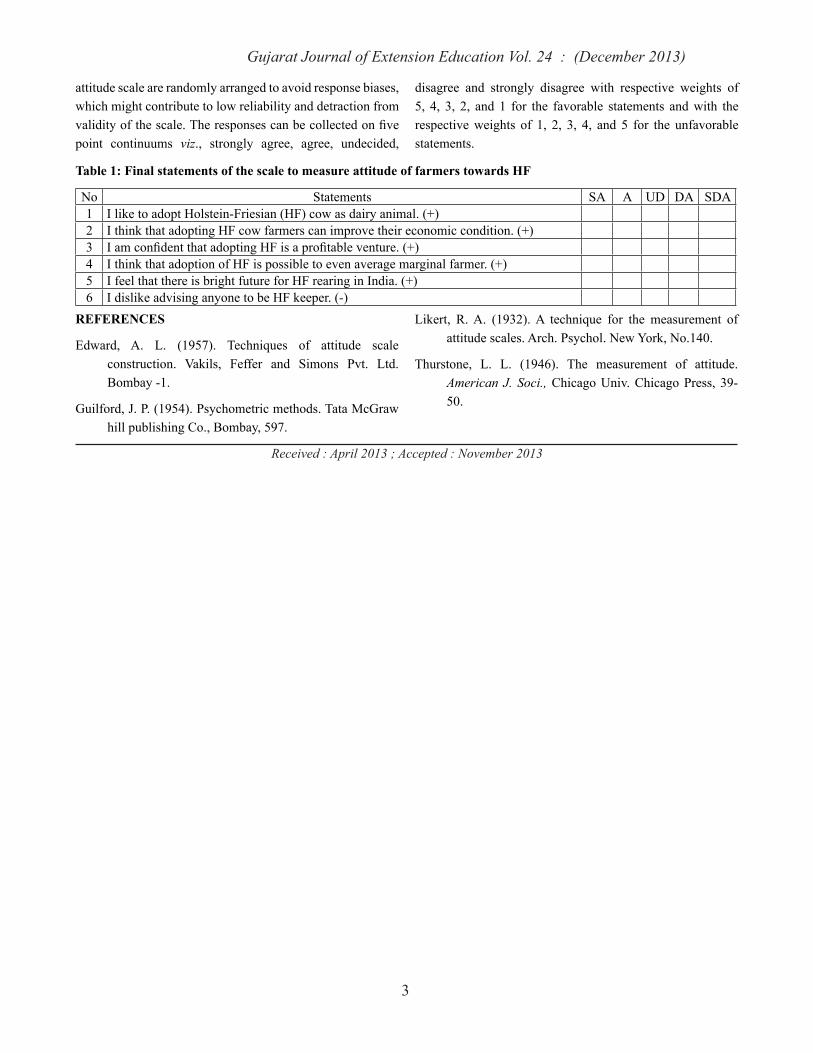
Theselectedsixstatementsforthefinalformatofthe
Gujarat Journal of Extension Education Vol. 24 : (December 2013)
3
attitude scale are randomly arranged to avoid response biases, which might contribute to low reliability and detraction from validityofthescale.Theresponsescanbecollectedonfivepoint continuums viz., strongly agree, agree, undecided,
disagree and strongly disagree with respective weights of 5, 4, 3, 2, and 1 for the favorable statements and with the respective weights of 1, 2, 3, 4, and 5 for the unfavorable statements.
Table 1: Final statements of the scale to measure attitude of farmers towards HF
No Statements SA A UD DA SDA1 I like to adopt Holstein-Friesian (HF) cow as dairy animal. (+)2 I think that adopting HF cow farmers can improve their economic condition. (+) 3 IamconfidentthatadoptingHFisaprofitableventure.(+)4 I think that adoption of HF is possible to even average marginal farmer. (+)5 I feel that there is bright future for HF rearing in India. (+)6 I dislike advising anyone to be HF keeper. (-)
REFERENCES
Edward, A. L. (1957). Techniques of attitude scale construction. Vakils, Feffer and Simons Pvt. Ltd. Bombay -1.
Guilford, J. P. (1954). Psychometric methods. Tata McGraw hill publishing Co., Bombay, 597.
Likert, R. A. (1932). A technique for the measurement of attitude scales. Arch. Psychol. New York, No.140.
Thurstone, L. L. (1946). The measurement of attitude. American J. Soci., Chicago Univ. Chicago Press, 39-50.
Received : April 2013 ; Accepted : November 2013

Gujarat Journal of Extension Education Vol. 24 : (December 2013)
4
Perception of the College Students Regarding Various Aspects of Computer Applications
P.S. Parsania1, Krunal C Kamani2 and X. U. Shukla3
1 Assistant Professor (Computer Science)College of Food Processing Technology & Bio energy, Anand Agricultural University, Anand
2 Assistant Professor (Computer Science)Sheth M. C. College of Dairy Science, Anand Agricultural University, Anand
Email : [email protected]
ABSTRACT
This paper focuses upon describing and understanding the responses of a small case of undergraduate teacher education students (n=76) in Anand Agricultural University, Anand towards a planned information communication technology (ICT) interaction. As a human being, there is an adaptation process of the new developments and implications as well. Therefore; the research based study handled the attitudes of students towards computers and its new trends. Computer and Information Technology have always mattered in agricultural sector. Computer applications are used and toughed in higher secondary as a secondary subject as a part of their curricula. Our aim is to check the perception of students regarding various aspects of computer applications when they entered into the college. As a faculty member of Anand Agricultural University, Anand to know this status of student. Based on findings we can work accordingly to improve their computer skill.
Keywords: Preception, Computer application
INTRODUCTION
Technology is the main support for the students learning developments nowadays. This research represents a pilot study which was undertaken in 2012 at Anand Agricultural University. Data were from a small group of undergraduate students in this higher education setting in order to determine their attitudes towards their use of and engagement in computer application being used in agricultural interactions. The college of Food Processing Technology and Bio Energy in Anand Agricultural University, Anand runs four years B.Tech (FPT) and two years M.Tech (FPT) courses. The intake capacity for B.Tech is 35. The College offers subjects related food production, processing, food technology, agriculture, statistics, information technology etc.
Throughout the world, information and communications technologies (ICTs) are changing the face of education. It has been argued that the transformation of education may be the most important of the many practical revolutions sparked by computer technology. Just as
computers are about to replace books as our main source of information globally, computers will come to occupy the central position in education once occupied by books. The efficientuseofInformationTechnologycanhelpstudentsinhigher education for their independent learning and research activities. In this regard, this research study is conducted to know the perception of the students of College of Food Processing Technology and Bio Energy regarding various aspects of Computer Applications.
OBJECTIVES
1 To study the profile of students of College of FoodProcessing Technology and Bio Energy
2 To study the Perception of the students of College of Food Processing Technology and Bio Energy regarding various aspects of Computer Applications.
3 To find out relations between the students profile andthe perception regarding various aspects of Computer Applications.

Gujarat Journal of Extension Education Vol. 24 : (December 2013)
5
METHODOLOGY
Study was conducted on 76 graduate students of college of food processing technology and bio energy. Data were collected through question. The collected data were classified,tabulatedandanalyzedwithfrequency,percentageandcoefficientcorrelation.
RESULTS AND DISCUSSION
Table 1: Profile of the Student n=76
Sr.No. Response Frequency Per centHSC Score
1 High 76 91.272 Low 76 45.003 Average 76 69.27
Computer Subject in HSC1 Yes 40 52.632 No 36 47.37
Gender1 Male 38 50.002 Female 38 50.00
Native1 Rural 34 44.742 Urban 42 55.26
Family Type1 Nuclear 48 63.162 Joint 28 36.84
Father’s Education1 Std. I to X 18 23.682 HSC 21 27.633 Graduate 25 32.894 Post Graduate 9 11.845 Doctorate 3 3.95
Father’s Occupation1 Govt. Job 33 43.422 Private Job 21 27.633 Business 18 23.684 Other 4 5.26
Family Income ( Yearly)1 Less than One Lack 30 39.472 One to Two Lacks 3 3.953 Two to Five Lacks 20 26.324 More than Five
Lacks 23 30.26Personal Computer/Laptop at Home
1 Yes 23 30.262 No 53 69.74
Sr.No. Response Frequency Per centPersonal Mobile with Internet Facilities
1 Yes 56 73.682 No 20 26.32
Usage of Computer per week in hours1 Zero 4 5.262 1 to 10 31 40.793 10 to 20 26 34.214 above 20 15 19.74
Training / Certificate course on Computer Application1 Less than or equal
7 days 3 3.952 Between 8 to 15 days 0 0.003 Above 15 days 6 7.89
The data represented in table 1 indicates that the students taking admission in to the college of food processing technology and bio energy have 91.27 percentage as the highest score, 45.00 percentage as lowest score while average score of the students are 69.27. More than half the students (52.63 percent) were having computer as a subject in HSC. Gender wise ratio of all the students is exactly 50 percent. Slightly more than half (55.26 percent) of the students are from urban area followed by (44.58percent) students from rural area. Similarly more than half of the students (63.16 percent) were from nuclear family followed by the joint family (36.84 percent). Educational background regarding the students’ father indicates that majority are graduate (32.89 percent) followed by HSC (27.63 percent) followed by std. I to X (23.68 percent) followed by post graduate (11.84 percent) and Doctorate by (3.95 percent). Majority of the students were not having their own personal computer or laptop (69.74 percent) while only (30.26 percent) having personal computer or laptop. Majority of the students (73.68 percent) of the students were having mobile with Internet facility while (26.32 percent) of the students were either not using a mobile or were not having a mobile with internet facility. Majority of the students(40.79 percent) are using personal computer between 1 to 10 hours per week followed by 10 to 20 hours per week (34.21 percent) followed by 20 and more hours per week (19.74 percent) while 5.26 percent of the students were not using computer .Of all the students only(3.95percent)ofthestudentshaveTraining/Certificatecourse on computer application with less than or equal to 7 days period and (7.89 percent) with above 15 days period.

Gujarat Journal of Extension Education Vol. 24 : (December 2013)
6
Table 2 : Perception regarding Microsoft Word with the following components n=76
Sr.No.
Components Full Partial Preliminary Not at all
No. Per cent No. Per cent No. Per cent No. Per cent1 Formatting Text 53 69.74 17 22.37 03 03.95 03 03.952 Paragraph Formatting and Line spacing 52 68.42 18 23.68 04 05.26 02 02.633 Using Find and Replace Tool 42 55.26 23 30.26 04 05.26 07 09.214 Creating Tables 58 76.32 13 17.11 01 01.32 04 05.265 Inserting Header and Footers 42 55.26 22 28.95 05 06.58 07 09.216 Inserting Pictures, Clipart and Shapes 55 72.37 15 19.74 01 01.32 05 06.587 Using Spelling and Grammar checking 56 73.68 14 18.42 01 01.32 05 06.588 Setting Page layout Options 46 60.53 20 26.32 06 07.89 04 05.269 Using Mail Merge tool 27 35.53 22 28.95 12 15.79 15 19.7410 Creating and Using Macro 11 14.47 22 28.95 21 27.63 22 28.95
The data stated in Table 2 indicates that most of the students are fully aware with Microsoft word components such as Formatting Text, Paragraph formatting and line spacing,Usingfindandreplacetool,creatingtables,inserting
header and footers, Using spelling and grammar, Page layout setting.Whilemajorityofthestudentswerefacingdifficultyin using mail merge and creating and using macro.
Table 3 : Perception regarding Microsoft Excel with the following components n=76
Sr. No.
Components Full Partial Preliminary Not at allNo. Per cent No. Per cent No. Per cent No. Per cent
1 Insert, delete rows and columns 62 81.58 11 14.47 01 01.32 02 02.632 Selecting range of data 49 64.47 19 25.00 04 05.26 04 05.263 Merge Cell 39 51.32 19 25.00 08 10.53 10 13.16
4 Use of Sort and Filter tool 22 28.95 28 36.84 13 17.11 13 17.115 Functions 36 47.37 27 35.53 07 09.21 06 07.896 Page Orientation 33 43.42 26 34.21 08 10.53 09 11.84
7 Creating Charts 46 60.53 21 27.63 06 07.89 03 03.958 Setting Password to Excel 21 27.63 23 30.26 09 11.84 23 30.269 Using Freeze Pan tool 08 10.53 23 30.26 14 18.42 31 40.7910 Pivot Table tool 14 18.42 15 19.74 13 17.11 34 44.74
The data stated in table 3 indicates that most of the students are fully aware with Microsoft excel components such as Insert/delete rows and columns, selecting range of data,
merge cell, functions, Page orientation, Creating Charts. While majorityofthestudentswerefacingdifficultyinusingSortandfiltertool,Settingpassword,UsingFreezePanandPivottable.
Table 4 : Perception regarding Microsoft PowerPoint with the following components. n=76
Sr. No.
Components Full Partial Preliminary Not at all
No. Per cent No. Per cent No. Per cent No. Per cent1 Open, Close, Save Presentation 53 69.74 17 22.37 03 3.95 03 03.952 Create a new Presentation 52 68.42 18 23.68 04 5.26 02 02.633 Adding and deleting slides from Presentation 42 55.26 23 30.26 04 5.26 07 09.214 Appling Design and Animation to different slides 58 76.32 13 17.11 01 1.32 04 05.265 Inserting Slide number and Date to all slides 42 55.26 22 28.95 05 6.58 07 09.216 Appling Auto pay and Transition time to slide 55 72.37 15 19.74 01 1.32 05 06.587 Rotate and Flip Pictures -shapes 56 73.68 14 18.42 01 1.32 05 06.588 Print Presentation, Handouts and notes 46 60.53 20 26.32 06 7.89 04 05.269 Use and modify tables on slides 27 35.53 22 28.95 12 15.79 15 19.7410 Linking movie clip to slide show 11 14.47 22 28.95 21 27.63 22 28.95

Gujarat Journal of Extension Education Vol. 24 : (December 2013)
7
The data stated in Table 4 indicates that most of the students are fully aware with Microsoft PowerPoint components such as Open/Close/Save Presentation, Creating a new presentation, Adding and deleting slides, Appling design and animation to slides, Inserting number and date to
slide, Appling Auto play and transition time to slide, Rotate and flip pictures, Print presentation/handouts and notes.While majority of the students were facing little trouble in using and modifying tables on slides and linking movie clip to slide show.
Table 5 : Perception regarding Internet with the following components n=76
Sr. No.
Components Full Partial Preliminary Not at all
No. Per cent No. Per cent No. Per cent No. Per cent1 Creating E-mail Account 17 92.11 03 3.95 02 02.63 01 01.322 Check, send, Replay to E-mail 66 86.84 07 9.21 03 03.95 0 00.003 Attach - download Files 60 78.95 09 11.84 03 03.95 04 05.264 Using Social Network website such as Face-
book and Orkut62 81.58 11 14.47 02 02.63 01 01.32
5 Downloading Content from website 63 82.89 10 13.16 02 02.63 01 01.326 Connecting your computer/laptop to internet 61 80.26 10 13.16 04 05.26 01 01.327 Accessing Internet from your mobile 63 82.89 8 10.53 04 05.26 01 01.328 Creating Web content using HTML/DHTML 19 25.00 18 23.68 13 17.11 26 34.219 Developing Dynamic website 05 6.58 16 21.05 09 11.84 46 60.5310 Animations Using Photoshop /Coral Draw/
PageMaker/ Flash22 28.95 17 22.37 12 15.79 25 32.89
The data stated in Table 5 indicates that most of the students are fully aware with Internet components such as Creating e-mail account, Check/Send/Replay to e-mail, Attaching and downloading files to email, Using socialnetwork website such as Facebook and Orkut, Downloading content from website, Connecting computer/laptop to
internet, Accessing Internet from mobile. While majority of the studentswere facingdifficulty inCreatingwebcontentusing HTML/DHTML, Developing dynamic website and Developing Pictures/Animations using Photoshop /Coral Draw / Page Maker/ Flash.
Table 6 : Perception regarding C language with the following components n=76
Sr. No.
Components Full Partial Preliminary Not at allNo. Per cent No. Per cent No. Per cent No. Per cent
1 Developing and Running simple C Program 38 50.00 29 38.16 07 9.21 02 2.632 Using Variable, Constant, Operators in C Pro-
gram30 39.47 32 42.11 11 40.47 03 3.95
3 Using Decision Making Statements (if ,switch etc) 28 36.84 28 36.84 12 15.79 08 10.534 Using Loops 28 36.84 32 42.11 12 15.79 04 5.265 Using Array 22 28.95 29 38.16 18 23.68 07 9.216 UserDefinedfunctions 14 18.42 31 40.79 22 28.95 09 11.847 Using Structure and Union 09 11.84 27 35.53 24 31.58 16 21.05
8 Using Pointer 17 22.37 22 28.95 21 27.63 16 21.059 Workingwithfiles 15 19.74 27 35.53 10 13.16 24 31.5810 Dynamic Memory Allocation 07 9.21 17 22.37 10 13.16 42 55.26
The data stated in Table 6 indicates that most of the students are partially aware with C language components such as Developing and running simple program, using variable/Constant/Operators in C program, Using decision making
statements, loops, Array, Creating user defined functions,Using structures and pointer. While majority of the students were facing difficulty inWorking with files and Dynamicmemory allocation.

Gujarat Journal of Extension Education Vol. 24 : (December 2013)
8
Table 7 : Perception regarding MATLAB with the following components n=76
Sr.No Components Full Partial Preliminary Not at allNo. Per cent No. Per cent No. Per cent No. Per cent
1 Working with MATLAB environment 09 11.84 12 15.79 02 02.63 53 69.742 Using Library Functions 08 10.53 10 13.16 04 05.26 54 71.053 Using Curve Fitting Tool 11 14.47 09 11.84 03 03.95 53 69.754 Creating scripts and Function in MATLAB 10 13.16 10 13.16 03 03.95 53 69.755 Importing and Exporting Data 06 07.89 09 11.84 06 07.89 55 72.37
The data stated in table 7 indicates that most of the students are not at all aware with MATLAB Components. Only few
students were either fully or partially aware with MATLAB components.
Table 8 : Relationship between variables.
X1 X2 X3 X4 X5 X6
X1 − − − − − −
X2 -0.12076 − − − − −
X3 0.104898 0.092634 − − − −
X4 0.028347 0.25675* 0.130094 − − −
X5 0.00169 0.08219 -0.1017 0.055567 − −
X6 0.050675 0.300927* -0.08843 0.26207* 0.175084 −X1 = Computer in HSC; X2 = Personal computer/laptop; X3 = Computer Usage; X4 = Personal Mobile with internet Facility; X5 = Training / Course on Computer Application; X6 = Perception of the students on various aspects of Computer Application
The data stated in table 8 indicates that there is some significant relationship between Personal computer/laptop(X2) and Perception of the students on various aspects of computer application(X6), Personal computer/laptop(X2) and Personal Mobile with internet Facility(X4), Personal Mobile with internet Facility(X4) and Perception of the students on various aspects of computer application (X6).
CONCLUSION
The research represents a study that has provided some interesting insights into the attitudes of students enrolled in a B.Tech. program towards their use of and engagement in computer applications. 52.63 percent of the students were having compute as subject in HSC which helped them to gain perception on various aspects of computer applications. 69.74 percent of the students are having their own personal computer or laptop which helped them to get awareness on computer applications. Most of the students are fully aware with Microsoft word, Microsoft Excel, Microsoft PowerPoint
and Internet applications. Majority of the students are partially aware with C language and MATLAB applications. More efforts should be given towards the advance topics on various computer applications improve students’ knowledge. MATLAB and other statistical package should be given more importance to improve students’ data analysis skill.
REFERENCES
Aytenkin,I.(2004).“AttitudesofStudentstowardComputers”,The Turkish Online Journal of Educational Technology, TOJET January vol.:(1) Article 2.
Christensen,R.andKnezek,G.(1998).“ParallelFormsforMeasuring Teachers’ Attitudes Toward Computers”, Presented at Society of Information Technology & Teacher Education (SITE)’s 9th International Conference, Washington, DC.
Creswell, J. and Plano Clark, V. (2007). “Designing andconducting mixed methods research” California, USA: Sage Publications.
Received : July 2013 ; Accepted : November 2013

Gujarat Journal of Extension Education Vol. 24 : (December 2013)
9
Extent of Adoption of the Market Intelligence Among the Summer Cabbage Growers
J.D. Desai1 and K.D. Solanki 2
1 P.G. student, M.Sc (Agri.) Extension Education., C.P.C.A., S.D. Agril. University, Sardarkrushinagar – 385 5062 Associate Extension Educationist, Directorate of Extension Education, S.D. Agril. University,
Sardarkrushinagar – 385 506E-mail : [email protected]
ABSTRACT
Post harvest losses of fruits and vegetable are high in our country which accounts for about 25 to 35% of the total horticultural produce. India have to focus on market oriented Agriculture. Commodity marketing research is an essential item in the marketing continuum. Price forecasts, preferences for consumers and industries, cost of storage, transport, etc. collectively known as market intelligence and to be disseminated at the time of sowing and harvesting. Market intelligence is life blood of the market, therefore, it has great importance in market oriented cultivation. In vegetables, prime position in the production of cauliflower, second in onion and in third cabbage in the world. Cabbage is a widely popular vegetable. It occupies an area of 0.27 m ha with a 5.45% share in total vegetable production. The average productivity of cabbage in India is 22.0 tonnes / ha which is too low as compare to the hectare production of cabbage 55.3 tonnes in Korea Republic. It is cultivated mainly in winter season. In last one decade cabbage production has multiplied 2.02 times. Due to the availability of potential and high temperature resistant varieties. The highest price during the summer season is the driving force within the farmers of Sabarkantha district of Gujarat state to cultivate the cabbage as a summer crop. A well structured interview schedule prepared and the data were collected through personal interview method. Majority (79.27 per cent) of the respondents had medium to high level of overall adoption of market intelligence. More than half of the respondents had adopted grading, transportation and marketing channel practices, while demand, source to know selling price and packaging practices were less adopted by the respondents. The independent variables viz., education, education of family, land holding, annual income and level of knowledge of the summer cabbage growers were established positively and highly significant association with their extent of adoption of market intelligence.
Keywords: Extent of adoption, Market intelligence, Summer cabbage cultivation, Cabbage growers
INTRODUCTION
The cultivation of vegetables, which is done mainly for marketing purpose, is known as commercial vegetable cultivation. Having achieved self-sufficiency inproduction led agriculture, India have to focus on market oriented Agriculture, which generate additional value to the farm produce, income and employment for farmers. Market oriented agriculture means adding value may be in terms of on-farm and off-farm income and employment generation by the production of agriculture and product. As described by Verma (2008), Value addition to farm produce can be done at three level viz., post harvest primary processing, post harvest secondary processing and High end processing. Post-harvest
primary processing included cleaning, grading, storing and packaging. This is mainly applicable for fruits and vegetables which are perishable nature and available only for a short period of time. In India less than 2% of the fruits and vegetable produced are processed as against 65% in the US, 70% in Brazil, 78% in the Philippines, 80% in South Africa and 83% in Malaysia. Post harvest losses of fruits and vegetable are high in our country which accounts for about 25 to 35% of the total horticultural produce (Kokate - 2011).
Among the cole crops only cabbage (Brassica oleracea L. var capitata)andcauliflower(Brassica oleracea L. var botrytis) are grown in winter within India and produce good yield between 50 C to 300 C day temperature. The
Gujarat Journal of Extension Education Vol. 24 : (December 2013)
10
cabbage is normally used in social events and festivals as a “SALAD” and therefore, there is a demand of cabbage during round the year. The average productivity of cabbage in India is 22.0 tonnes / ha which is too low as compare to the hectare production of cabbage 55.3 tonnes in Korea Republic (Gopalakrishnan, 2007). Cabbage is a widely popular vegetable. It occupies an area of 0.27 m ha with a 5.45% share in total vegetable production (Ahuja et.al - 2010).
In last one decade cabbage production has multiplied 2.02 times, due to the availability of potential and high temperature resistant varieties (Singh and Malhotra - 2010). Cabbage crop is harvesting during December, January and February as a traditionally in Gujarat, so the cabbage production supply is not uniform through out the year. Also, the concept of marketing is not focus on the product, but to focus on the users. Hence user needs are vital in marketing. Owing to this, the average wholesale price of cabbage was also recorded highest during the period of April to August. The highest price during the summer season is the driving force within the farmers of the Sabarkantha district and they are motivated to cultivate the cabbage as a summer crop. Commodity marketing research is an essential item in the marketing continuum. Price forecasts, preferences for consumers and industries, cost of storage, transport, etc. collectively known as market intelligence and to be disseminated at the time of sowing and harvesting. Market intelligence is life blood of the market, therefore, it has great importance in market oriented cultivation.
It is therefore felt necessary to study the adoption of market intelligence among the summer cabbage growers and the association between selected personal and socio-economic attributes of summer Cabbage growers. Taking this fact in view, the present study entitled “Extent of Adoption of the Market Intelligence Among the Summer Cabbage Growers.” wasundertakenwithfollowingspecificobjectives.
1 To find out the extent of adoption of the marketintelligence among the summer cabbage growers.
2 To ascertain the association between selected personal and socio-economic attributes of the summer cabbage growers and their extent of adoption of the market intelligence.
METHODOLOGY
Considering the highest area and production of cabbage crop Sabarkantha district, was purposively selected
for the study. Prantij taluka was also purposively selected, because this taluka have the highest cabbage growing area as compared to other talukas. Twelve villages form taluka were selected purposively. Using random sampling techniques, equal number of respondents i.e., Ten from each village were selected. Thus, total 120 respondents were selected.
Thepresentstudywasconfinedto“Ex-Postfacto”research design. To measure the extent of adoption of market intelligence regarding market oriented cultivation of summer cabbage teacher made tests were developed. Various packages of value addition techniques and marketing of the cabbage production were listed to know their adoption by the cabbage growers. Finally six practices in market intelligence namely, grading, packaging, transportation, demand, sources to know selling price and marketing channel were selected for adoption. Each practice has given score by conference method of the teachers and the total score of adoption of market intelligence was 73 determined. The farmers were asked to indicate the practices, they adopted in obtained market intelligence. Then, final score was calculated bysimple addition of all the scores obtained.
Using the procedure suggested by Sengupta (1967), the adoption quotient for each respondent was calculated to measure his adoption of market intelligence regarding summer cabbage cultivation. The formula for calculating adoption quotient is as under.
Adoption quotient =
Number of techniques usedNumber of production technology
Based on the adoption quotient the cabbage growers wereclassifiedintothreelevelsviz., low, medium and high adoption of market intelligence regarding summer cabbage production on the basis of pooled mean (X) and standard deviation as under. Further, the comparison of practice-wise adoption of market intelligence regarding summer cabbage cultivation among the cabbage growers was also made. Practice-wise obtained mean scores were worked out against the practice-wise extent of adoption then ranked on the basis of obtained higher mean score in ascending order.
The data were collected with the help of structural and pre-tested interview schedule. The collected data were than analysis, tabulated and interpreted in the light of objectives for arriving at meaningful interpretation and findings.

Gujarat Journal of Extension Education Vol. 24 : (December 2013)
11
RESULTS AND DISCUSSION
The extent of adoption of market intelligence of the summer cabbage growers
Adoption is a decision making mental process to continue use of an innovation. In this study it means acceptance of full use of market intelligence by cabbage growers. It is rigidly stated that the adoption of practices of market intelligence is an instrument for making agriculture a betterandmoreprofitableenterprise.Considering this fact,anattempthasbeenmadetofindouttheextentofadoptionofmarket intelligence by the cabbage growers. The respondents wereclassified into threecategorieson thebasisof+ S.D. fromthemean.Theclassificationinthisrespectispresentedin Table 1.
Table 1 : Distribution of cabbage growers according to their overall adoption of market intelligence n=120
Sr. No. Extent of adoption quotient Number Percent
1 Low adoption (below 26.74 score) 25 20.83
2 Medium adoption (between 26.75 to 50.38 score) 73 60.84
3 High adoption (above 50.38 score) 22 18.33
Mean= 38.56 S.D. = 11.82
ItisclearfromTable1thatmorethanthree-fifthofthe respondents (60.84 per cent) had medium level of overall adoption quotient regarding market intelligence, followed by 20.83 per cent and 18.33 per cent of the respondents had low and high extent of overall adoption quotient of market intelligence, respectively.
The probable reason might be that there is growing awareness about the cultivation of cabbage, which is done mainly for economic gain or for marketing purpose is known as commercial cultivation of cabbage.
Practice wise extent of adoption of market intelligence of the cabbage growers
The practice wise adoption of market intelligence of summer cabbage is depicted in Table 2.
Table 2 : Practice wise adoption of market intelligence of the respondents. n = 120
Sr. No
Practices of market
intelligence
Total maxi-mum score
Total ob-
tained score
ob-tained mean score index
Rank
1 Grading 840 507 60.35 I
2 Packaging 1200 291 24.25 VI
3 Transportation 720 418 58.05 II
4 Demand 720 271 37.63 IV
5 Sources to know selling Price
4320 1423 32.93 V
6 Marketing channel 720 467 55.59 III
The data presented in Table 2 reveal that in practice wise adoption of market intelligence grading practice, transportation facility and marketing channel had obtained 60.35 mean score index, 58.05 mean score index and 55.59mean score index and ranked first, second and thirdrespectively. Rest of the practices viz. Demand, sources to know selling price and packaging had obtained 37.63, 32.93 and24.25meanscoreindexandrankedfourth,fifthandsixthrank, respectively.
It was observed from the above discussion that more than half of the respondents had adopted grading, transportation and marketing channel practices, while demand, source to know selling price and packaging practices were less adopted by the respondents. This indicated that there is a need for strengthening the training and extension services for cabbage grower farmers at the village level especially in respect to the market intelligence practices.
Association between selected personal and socio-economic attributes of the summer cabbage growers and their extent of adoption of market intelligence
The adoption or acceptance of market oriented agricultural is a unit act but a complex process involving sequence and thought of action. The action of individual farmers is governed by personal and socio-economical attributes with their level of knowledge and extent of adoption of market intelligence for market oriented cultivation of summer cabbage were worked out by calculating correlation of coefficient. The results in thisregard are depicted as under.
Gujarat Journal of Extension Education Vol. 24 : (December 2013)
12
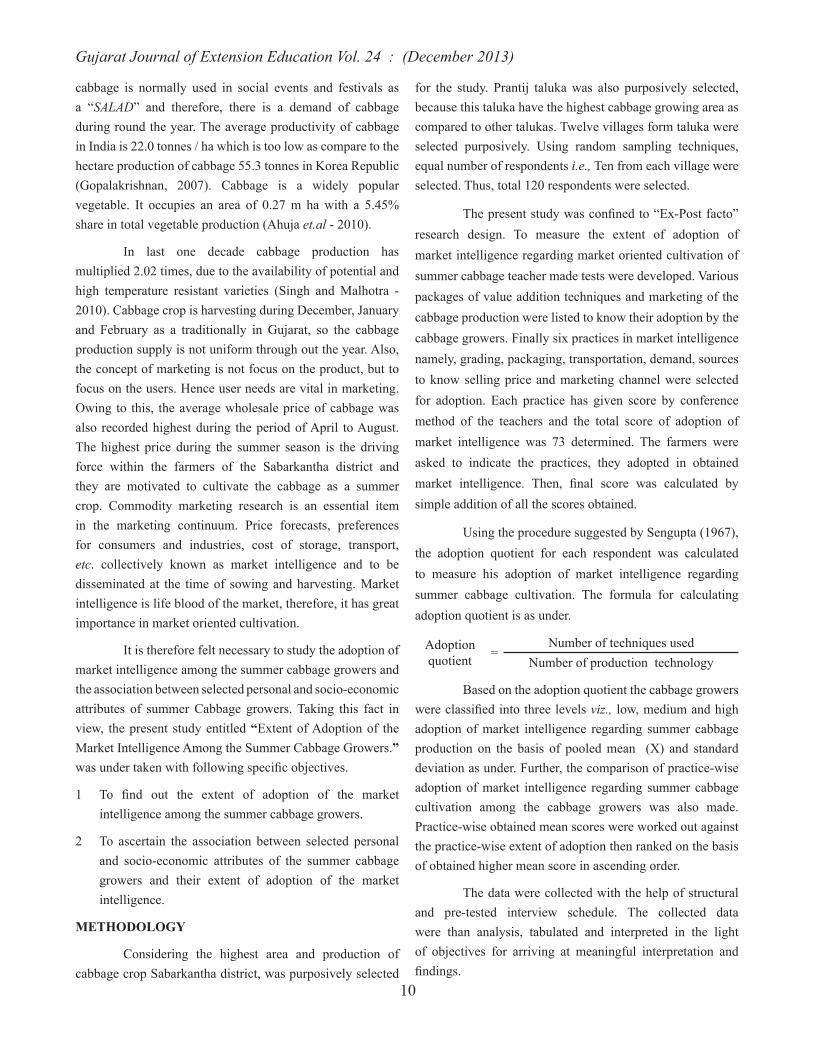
Table 3 : Association between the attributes of cabbage growers and their extent of adoption of market intelligence n = 120
Sr. No.
Independent Variables Correlation-Coefficient(‘r’ value)
1 Age - 0.23403**2 Education 0.39108**3 Size of family 0.09742 NS4 Education of family 0.38260**5 Land holding 0.30409**6 Annual income 0.23901**7 Level of knowledge 0.85714**
*=significantat0.05level**=significantat0.01level
NS=nonsignificant
Age and extent of adoption
It is apparent from the data presented in the Table 3 that the age of the cabbage growers had negative and highlysignificantcorrelation(-0.23403**)withtheirextentthe adoption of market intelligence for market oriented cultivation of summer cabbage. Which reveal that the young farmers are more motivated and enthusiastic for adopting new technology on their farms. They are also take more risk as an agripreneur in agriculture enterprise.
Education and extent of adoption
ThedatapresentedinTable3reflectthattheextentof adoption of market intelligence of the cabbage growers regarding market oriented cultivation of summer cabbage had positive and highly significant (0.39108**) correlationwith their level of education, which indicate that education play an important role in influencing the adoption of newtechnology by cabbage growers.
Size of family and the extent of adoption
As reveal from data presented in Table 3 that there wasnon-significantassociation(0.09742NS) between size of family and extent of adoption of market intelligence.
Education of family and the extent adoption
ThedatapresentedinTable3reflectthattheextentof adoption of market intelligence of the cabbage growers regarding market oriented cultivation of summer cabbage had positive and highly significant (0.38260**) correlationwith their Education of family, which indicate that education
offamilyplayanimportantroleininfluencingtheadoptionof new technology by cabbage growers.
Size of land holding and the extent of adoption
The data presented in Table 3 clearly indicate that size of land holding of the cabbage grower’s had positive and highly significant association (0.30409**) with theirextent of adoption of market intelligence of market oriented cultivation of summer cabbage.
Thus the study established the fact that size of land holding had influence on adoption level of marketintelligence of cabbage cultivation. Majority of the cabbage growers were semi-medium to medium land holder farmers with good education and motivational sources might be the properreasonforsignificantassociationwithadoption.
Annual income and the extent adoption
It is apparent from the data presented in the Table 3 that annual income of the cabbage growers had positive and highly significant correlation (0.23901**) with theirextent of adoption of market intelligence of market oriented cultivation of summer cabbage. The probable reason might bethatsufficientincomeforpurchasingequipment,manure,fertilizer, insecticides, weedicides etc. which leads them to adopt new cultivation of summer cabbage.
The level of knowledge and extent of adoption
It is obvious from the data presented in Table 3 that the extent of adoption of market intelligence of cabbage growers regarding market oriented cultivation of summer cabbage had positive and highly significant correlation(0.85714**) with their level of knowledge. It indicates that knowledge level of cabbage growers increases, the adoption level also increases.
Thus it can be concluded that the level of knowledge should be consider as non monitoring input for profitablecrop production as it is directly encourage the farmers for promotion and use of recent agricultural technology leads themtowardsprofitmaximizationresultedintoadoption.
CONCLUSION
From the above overall discussion, it can be concluded that majority (79.27 per cent) of the respondents had medium to high level of overall adoption of market intelligence. More than half of the respondents had adopted grading, transportation and marketing channel practices, while demand, source to know selling price and packaging practices were less adopted by the respondents.

Gujarat Journal of Extension Education Vol. 24 : (December 2013)
13
The independent variables viz., education, education of family, land holding, annual income and level of knowledge of the summer cabbage growers were established positively and highly significant association with their extent ofadoption of market intelligence. Age of the summer cabbage growerswasassociatednegativeandhighlysignificantwiththeir extent of adoption of market intelligence. The size of family of the summer cabbage growers was failed to establish anysignificantassociationwithextentofadoptionofmarketintelligence regarding market oriented cultivation of summer cabbage.
REFERENCES
Ahuja, D.B., Singh, S.K., Sharma, P., Singh, S., Yadav, S.K. and Bambawale, O.M. (2010). Technology for getting disease- free cabbage. Ind. Horticulture 55 (5) : 53.
Gopalakrishnan, T.R. (2007). Vegetable Crops. New India Publishing Agency, Pitampura, New Delhi, 34 .
Kokate, K.D. (2011). Paradigm Shift from Primary to Secondary Agriculture. (Souvenir), 6th National Conference on KVK-2011, JNKVV, Jabalpur (MP). p. II .
Sengupta, T. (1967). A Simple Adoption Scale used for Farmers for High Yielding Varieties Programme in Rice. Indian Journal of Extension Education. 3 (3) : 107-115.
Singh., H.P., and Malhotra, S.K. (2010) Research and development in vegetable – issue and strategies. Ind. Horticulture 55 (1) : 4.
Verma, D.P.S. (2008). Report on Secondary Agriculture: Value Addition to Primary Agriculture submitted to Planning Cimmition of India.
Received : January 2013 ; Accepted : October 2013
Gujarat Journal of Extension Education Vol. 24 : (December 2013)
14
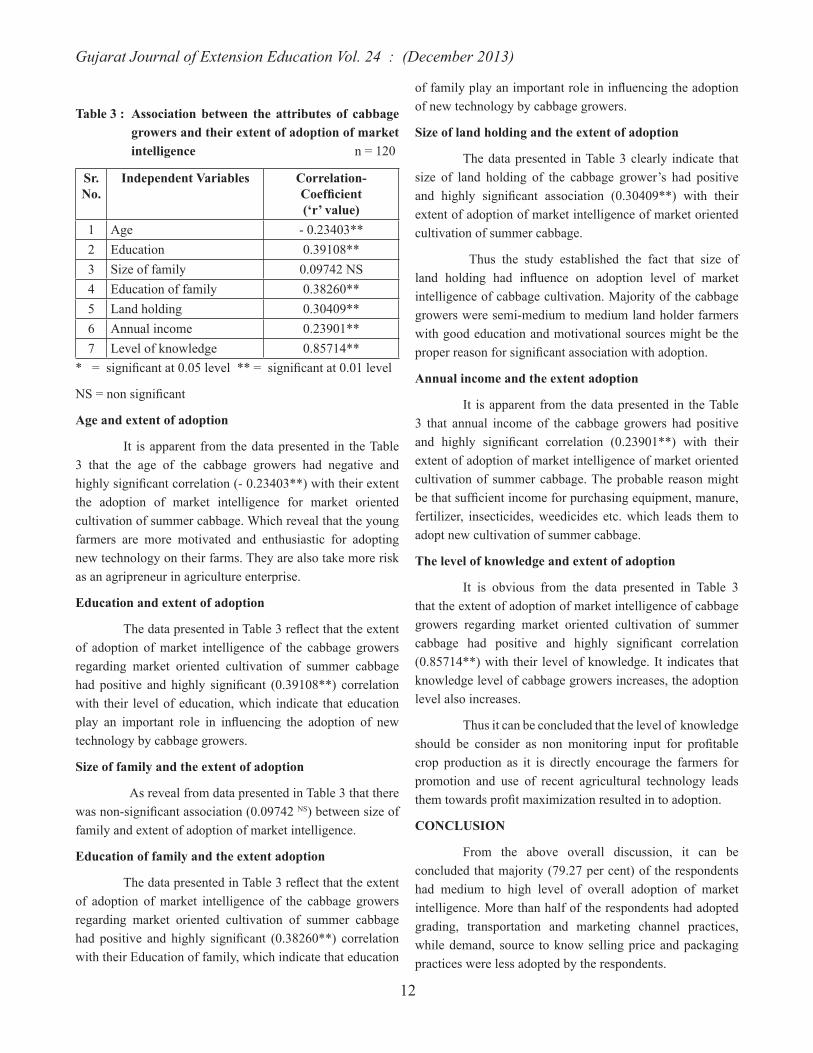
Appraisal of Training Needs of Members of Tribal Women SHGs for Agriculture Management
N. M. Chauhan1 and S.M. Kshirsagar2
1 Programme Coordinator2 Subject Matter Specialist
Krushi Vigyan Kendra, NAU, VyaraEmail : [email protected]
ABSTRACT
The study of 100 members of the Tribal Women SHGs from Sinnar taluka of Nashik district revealed that the members in general are not conscious in full of the SHG concepts and latest crop production and marketing technology. The study further revealed that 81 per cent of the respondents suggested providing information on SHG concepts and linkage programme. Seventy-nine per cent suggested arranging village level training programmes on crop production technology of soybean crop, which is now widely accepted short duration high yielding oilseeds crop followed by onion, garlic and tomato cultivation technology by organic farming methods. Marketing of produce attained the top most priority in assessing training needs (76 per cent), followed by plant protection (66 per cent) and manures and fertilizers (61 per cent). Vermicompost, its preparation and application methods accorded highest response (87 per cent) from the members followed by ITKs (81 per cent) being used in organic farming. Poultry farming ranked first (78 per cent) followed by agro-processing units (71 per cent) in the assessment of training needs. The respondents also desired to have training on priority in the field of agro-processing, dairy and kitchen yard gardening. The respondents felt the training needs on HRD and managerial aspects too. Communication skills ranked first (84 per cent) followed by access to infrastructural facilities like transport, water supply, school, marketing etc (81 per cent). Almost more than two third respondents indicated the training needs on the subjects like, conflict management, self confidence and self worth, participation in local affairs and meetings and community health and sanitation. The relational analysis showed that the selected variables like age, size of family, caste, income, land holding and social participation had positive and significant relationship with the training needs of the respondents while two variables namely education and type of family had negative relationship with training needs. The multiple regression analysis showed that out of eight independent variables, only age, and land holding contributed significantly towards the variation in the training needs of the respondents. The extent of variation was 52.88 per cent as the Co-efficient of Determination being 0.5288. The unexplained variation to the extent of 47.12 per cent may be attributed to the variables not included in the study.
Keywords: Training need, Tribal women, Agriculture Managment
INTRODUCTION
Following the success of Grameen Bank experiment in Bangla Desh, the strategy of forming Self Help Groups (SHGs) and extending micro-credit through them has been successfully adopted in India. SHG Bank Linkage Programme launched by NABARD in 1991-92, as an experiment in providing hassle free institutional credit to rural poor has achieved phenomenal success over last 15 years and is now acclaimed as largest micro credit
programme in the world. The programme received further boost during 2003-04 in the country and Maharashtra is no exception to this.Maharashtra is the first state of thecountrytoexpandtheCentralSectorSchemeon“WomeninAgriculture”, which started on a pilot basis in Thane District to “One Taluka in each District”. This scheme is beingimplemented by Mahila Arthic Vikas Mandal (MAVIM) and NGOs. The Department of Agriculture of Maharashtra State has been implementing the centrally sponsored scheme of Women in Agriculture through this innovative approach

Gujarat Journal of Extension Education Vol. 24 : (December 2013)
15
of SHGs, with the help of NGO in Sinnar Taluka of Nashik District since 2003-04. The main objective of the scheme is to enhance women’s participation in agriculture in a very effective manner through technology transfer. Hence, village level training to the members of the women SHGs has been the major component of the scheme. Therefore, to impart the training inaveryeffectivemanner the identificationoftraining needs of the tribal women SHG members has been of prime importance. Thus the present study was focused to identify training needs of the members of tribal women SHGs in the field of agriculture and to examine the relationshipbetween training needs and personal, psychological and socio-economic characteristics of the members of women SHGs.
METHODOLOGY
Since this study was confined to the operationalarea of the centrally sponsored scheme viz “Women inAgriculture”, the Sinnar Taluka of Nashik District has been purposively selected for the same. A survey design involving observations at single time has been used for conducting this investigation. Thus Ex-post-facto research design was used for the study, since the researcher has no control over the independent variables. In view of the objectives of the study the Researcher has relied mainly on primary data collected from the randomly selected 100 members of the 50 Tribal Women SHGs through specially prepared interview schedule. The respondents were contacted personally. Data collected were tabulated and analyzed by using various statistical tools. Thestatisticalmethodsusedwerecorrelationcoefficientandmultipleregressioncoefficients.
RESULTS AND DISCUSSION
Assessment of training needs
For sustainable development of the group and individuals, the members should receive the training in almost all the fields like SHG orientation, agricultural activities,allied activities to agriculture, cottage industries, small business and services, access to infrastructural facilities, Human Resource Management and social development. In view of this and in order to priorities the training needs in thesefieldstheresponsesofthememberswerecollectedina specially designed interview schedules. The data has been compiled and analyzed and presented as follows:
Training Needs in SHG Orientation
Table 1: Assessment of Training Needs in SHG Orientation n =100
Training Needs Very Much Needed
Some What Needed
Least Needed
No. Per cent
No. Per cent
No. Per cent
Concept of SHG 76 76.00 21 21.00 03 03.00
Role and responsibilities of Members, Group Leaders
77 77.00 17 17.00 06 06.00
Conduct Group Meetings
78 78.00 18 18.00 04 04.00
Banking Operations
73 73.00 24 24.00 03 03.00
Internal Lending Rules and Roles
77 77.00 21 21.00 02 02.00
SHG-Bank Linkage
79 79.00 18 18.00 03 03.00
Record Keeping 81 81.00 16 16.00 03 03.00
It can be revealed from the Table 1, that almost more three fourth members prioritized their training needs in all the aspects of SHG orientation. Record keeping was most important training need since 81 per cent of the members opined it very much needed followed by training on SHG-Bank linkage programme (79 per cent). The members also desired to have training on conduct of group meetings, internal lending and role and responsibilities of the group leaders for successful running of SHGs.
Training needs on crop production
It can be seen from the Table 2 that, the production techniques of food grains crops by and large stabilized in the area and hence the respondents have not indicated any urgent training need on these crops. However, more than three fourth (79 per cent) respondent have shown interest in knowing the production technology of soybean crop, which is now widely accepted short duration high yielding oilseeds crop. Similarly the Sinnar Taluka being pioneer in Onion and Garlic production the members have indicated the training needs for these crops by 83 and 63 per cent respectively. Tomato also seems to be very important cash crop, since 76 per cent of respondents wanted to know the latest production techniques of the same.

Gujarat Journal of Extension Education Vol. 24 : (December 2013)
16
Extent of training needs in the subject matter areas
Table 2: Training Needs on Crop Production Technology: n = 100
Training Needs Very Much Needed
Some What Needed
Least Needed
Crop Production Technology
No. % No. % No. %
Bajra 51 51.00 21 21.00 28 28.00Jowar 33 33.00 13 13.00 54 54.00Paddy 19 19.00 18 18.00 63 63.00Groundnut 39 39.00 36 36.00 25 25.00Soybean 79 89.00 11 11.00 10 10.00Wheat 53 53.00 38 38.00 09 09.00Gram 36 36.00 17 17.00 47 47.00Onion 83 83.00 17 17.00 00 00.00Garlic 63 63.00 33 33.00 04 04.00Tomato 76 76.00 24 24.00 00 00.00
The Table 3 shows that that marketing of produce attained the top most priority in assessing training needs (76 per cent), followed by plant protection (66 per cent) and Manures and fertilizers (61 per cent).
Table 3: Extent of Training Needs in the important Subject Matter Areas of Crop Production: n = 100
Training Needs Very Much
Needed
Some What Needed
Least Needed
Crop Production Tech.
No. Per cent
No. Per cent
No. Per cent
Land Preparation 31 31.00 44 44.00 25 25.00Improved Varieties 56 56.00 41 41.00 03 03.00Seeds and sowing 37 37.00 41 41.00 22 22.00Manures & Fertilizers
61 61.00 32 32.00 07 07.00
Plant Protection 66 66.00 28 28.00 06 06.00Irrigation 36 36.00 34 34.00 40 40.00Weed Management 40 40.00 44 44.00 16 16.00Use of Farm Implements & Machinery
60 60.00 33. 33.00 07 07.00
Harvesting of produce
56 56.00 43 43.00 01 01.00
Marketing 76 76.00 21 21.00 03 03.00
Assessment of Training Needs on Organic Farming and its Certification
Table 4: Assessment of Training Needs on Organic Farming and Its Certification n = 100
Training Needs Very Much Needed
Some What
Needed
Least Needed
Crop Production Technology
No. Per cent
No. Per cent
No. Per cent
Concepts of Organic Farming
67 67.00 21 21.00 12 12.00
Organic farming systems
76 76.00 23 23.00 01 01.00
Indian local knowledge used in organic farming
81 81.00 19 19.00 00 00.00
Vermicompost 87 87.00 13 13.00 00 00.00
Biological control of pests
74 74.00 21 21.00 05 05.00
Certificationprocess of organic farming system
76 76.00 13 13.00 11 11.00
Marketing of organic products
78 78.00 18 18.00 04 04.00
It can be observed from the Table 4 that, the Vermi-compost, its preparation and application methods accorded highest response (87 per cent) from the members followed by ITKs (Indigenous Technical Knowledge, 81 per cent) being used in organic farming. This might only to reduce the ever increasing cost of production of different crops. By and large Training Needs in Organic farming methods and ItsCertificationwasseenthetopmostpriorityamongstthemembers.

Gujarat Journal of Extension Education Vol. 24 : (December 2013)
17
Assessment of Training Needs in Allied Activities to Agriculture and agro based enterprises
Table 5: Assessment of Training Needs in Allied Activities to Agriculture and Agro-based Enterprises: n = 100
Training Needs Very Much
Needed
Some What
Needed
Least Needed
Crop Production
Tech.
No. Per cent
No. Per cent
No. Per cent
Animal Husbandry and Dairy
62 62.00 29 29.00 09 09.00
Poultry Farming 78 78.00 19 19.00 03 03.00Sheep and Goat Rearing
56 56.00 32 32.00 12. 12.00
Agro-processing Units
71 71.00 26 26.00 03 03.00
Agro-based small business and Services
55 55.00 36 36.00 09 09.00
Kitchen Yard Gardening
61 61.00 33 33.00 06 06.00
It can be revealed from the Table 5 that the Poultry farming ranked first (78 per cent) followed by Agro-processing units (71 per cent) in the assessment of training needs. In Sinnar taluka establishment of broiler poultry farms with the help of leading poultry industrial units like C & M. and Venkateshwara Hatcheries got very good momentum. Therefore, majority of the respondents have given priority in training needs in poultry. Similarly the training on agro-processing like cashew processing, masala making, papad and chatani making also accorded priority in the assessment in training needs. The respondents also desired to have training on priority in the field ofDairy andKitchen yardgardening.
Assessment of training needs in human resource development and conflict management in social participation
It could be observed from the Table 6 that the respondents felt the Training Needs on HRD and Managerial aspectstoo.Communicationskillsrankedfirst(84percent)followed by access to infrastructural facilities like transport, water supply, school, marketing etc (81 per cent). Almost more than two third respondents indicated the Training Needs
on thesubjects like,ConflictManagement,Selfconfidenceand Self Worth, Participation in Local Affairs and Meetings and Community Health and Sanitation.
Table 6: Assessment of Training Needs in Human Resource Development and Managerial Aspects: n = 100
Training Needs Very Much
Needed
Some What
Needed
Least Needed
No. Per cent
NO Per cent
No. Per cent
Communication Skills
84 84.00 16 16.00 00 00.00
Participation in local affairs and meetings
67 67.00 24 24.00 09 09.00
Resolving conflicts
79 79.00 19 19.00 02 02.00
Access to Infrastructural facilities
81 81.00 17 17.00 02 02.00
Community health and sanitation
78 78.00 18 18.00 04 04.00
Recognizing self worth
68 68.00 21 21.00 11 11.00
Relationship of selected independent variables with Training Needs
To ascertain the relationship between Training Needs of the respondents and their selected socio-economic characteristics, thecorrelationco-efficient testwasapplied.The correlation co-efficient between Training Needs andvarious independent variables are presented in the following Table 7.
Table 7: Relationship between respondent’s Training Needs and selected independent variables
Independent Variables Correlation Co-efficient (r)Age 0.607 **Education - 0.458 NSSize of Family 0.410 **Type of Family 0.088 NSLand Holding 0.322 **Caste 0.210 **Social Participation - 0.083 NSAnnual Income 0.164 NS
** Significance at 0.01 level of probability NS: Non Significant

Gujarat Journal of Extension Education Vol. 24 : (December 2013)
18
The results in Table 1 indicated that dependent variable“TrainingNeed”exhibitednonsignificantcorrelationwith the independent variables namely education, type of family, social participation and annual income. However the dependentvariable trainingneedhadsignificantcorrelationwith age, size of family and caste, at 0.01 level of probability
Multiple Linear Regressions of Training Needs with the selected Independent Variables
Table 8: The multiple linear regression of Training Needs with the selected independent variables
Sr. No.
Independent Variables
Regression Co-efficient (b)
‘t’ value of ‘b’
1 Age 0.2196 5.09 **2 Education - 0.2802 - 1.37 NS3 Size of Family 0.1063 0.45 NS4 Type of Family 0.1000 0.21 NS5 Land Holding 0.5066 2.19 *6 Caste 0.5959 1.87 NS7 Social Participation - 0.1253 - 0.56 NS8 Annual Income 0.0000 0.76 NS
R2 = 0.5288 Multiple Correlation = 0.6866 *Significanceat0.05levelofprobability **Significanceat0.01levelofprobability NS:Non-significant
It could be seen from above Table 8 that out of eight independent variables, only age, and land holding contributedsignificantlytowardsthevariationintheTrainingNeeds of the respondents. The extent of variation was 47.12 per cent as the co-efficientofDeterminationbeing0.4712.The unexplained variation to the extent of 52.88 per cent may be attributed to the variables not included in the study.
Thus, the Training Needs of the respondents about the various aspects of SHG functioning, farm and non-farm activities, Human Resource Development etc, were determined by the selected socio-economic characteristics. Among them, age and land holding were more prominent to decide requirement of the training needs of the respondents.
CONCLUSION
It can be concluded from the study that almost more three fourth members prioritized their training needs in all the aspects of SHG orientation. Record keeping was most important training need since 81 per cent of the members opined it very much needed followed by training on SHG-Bank linkage programme (79 per cent). More than three fourth (79 per cent) respondent have shown interest in
knowing the production technology of soybean crop, which is now widely accepted short duration high yielding oilseeds crop. Similarly the Sinnar Taluka being pioneer in Onion and Garlic production the members have indicated the training needs for these crops by 83 and 63 per cent respectively. Tomato also seems to be very important cash crop, since 76 per cent of respondents wanted to know the latest production techniques of the same.
The Vermi-compost, its preparation and application methods accorded highest response (87 per cent) from the members followed by ITKs (Indigenous Technical Knowledge, 81 per cent) being used in organic farming. By and large Training Needs in Organic farming methods and Its Certification. The Poultry farming ranked first (78 percent) followed by Agro-processing units (71 per cent) in the assessment of training needs. The dependent variable training needhadsignificantcorrelationwithage,sizeoffamilyandcaste. It could be seen that out of eight independent variables, onlyage,andlandholdingcontributedsignificantlytowardsthe variation in the Training Needs of the respondents. In short, tribal farm women engaged with SHGs are needed trainings in each and every aspect of agriculture and Animal husbandry along with organic farming as a whole.
SUGGESTIONS
On the basis of findings and general observationsemerged from the analysis of data, the following suggestions can be made in formulation of Training Curriculum for members of women Self Help Groups in agriculture.
(1) SHG Orientation : SHG concept, Need of mutual help and working together with people’s participation, Role and responsibilities of members and group leaders,Conduct of Group Meetings,Banking Operations and Nature of Transactions,Internal Lending : Rules and Roles,SHG-Bank Credit linkage, procedures and principles and Record Keeping.
(2) Crop Production: Soybean cultivation practices,Onion production techniques, Garlic production and Tomato production and marketing.
(3) Subject Matter Areas: Organic Farming methods,Vermi-compost, it’s preparation and application,Bio-logical control of pests and diseases for CropProtection,ITKsinOrganicFarming,Certificationprocedures and Marketing of an organic produce.
(4) Non-farm Activities : Poultry keeping,Animal

Gujarat Journal of Extension Education Vol. 24 : (December 2013)
19
Husbandry and Dairy,Sheep and Goat Keeping,Agro-processing,Agro-based Enterprises and Services and Kitchen Yard Gardening.
(5) Human Resource Development and Managerial Skills : Communication Skills,Leadership Skills,Participation in Local Affairs and Meetings,Recognizing Self Worth,ResolvingConflicts,AccesstotheInfrastructuralFacilities and Community Health and Sanitation.
REFERENCES
Chaudhari, N. (2005), Breaking the Barriers (Sustainability of SHGs), Need for an Effective Facilitation, Theory and Practice of Micro-Finance, Department of Commerce and Management, Shivaji University, Kolhapur.
Chauhan, N.M. and Kshirsagar, S.M. (2012). Assessment of Training Needs of Members of tribal Women SHGs for Agriculture Development. Ind. Res. J. of Ext. Edu. Special Issue (II), 2012. 193-198.
Farooqui, H.F. (1992), Training Needs of Farm women. Maharashtra Journal of Agricultural Extension, 11, 257-262.
Harper, M. (2002), Promotion of Self Help Groups under the SHG-Bank Linkage Programme. Oxford/IBH New Delhi, ITDG Publications London.
Mangala Rai, (2004), Women in Agriculture, Annual Report of ICAR, Department of Agricultural Research and Education, 175-178.
NABARD, Maharashtra Regional Office, Pune (2005),Status Paper of Regional Workshop on Micro Finance at Shivaji University Kolhapur on 29th and 30th Jan, 2005
Puhazhendhi V, Badatya K.C. (2002), Self Help Groups Bank Linkage Programme for Rural Poor in India, An Impact Assessment. NABARD, Mumbai.
Puhazhendhi V, Satyasai K.J.S. (2000), Microfinance forrural people, NABARD, Mumbai.
Puhazhendhi V. (2000), Evaluation Study of Self Help Groups in Tamil Nadu NABARD, Mumbai.
Puhazhendhi, V and K.J.S.Satyasai (2000), Micro Finance for Rural people- An Impact Study, National Bank for Agriculture and Rural Development, Mumbai.
Received : Novmber 2012 ; Accepted : September 2013

Gujarat Journal of Extension Education Vol. 24 : (December 2013)
20
INTRODUCTION
ATMA is a society of key stakeholders involved in agricultural activities for sustainable agricultural development in the district. It is a focal point for integrating research and extension activities and decentralizing day-to-day management of the public Agricultural Technology System (ATS). It is a registered society responsible for technology dissemination at the district level. As a society, it would be able to receive and expend project funds, entering into contracts and agreements and maintaining revolving accounts that can be used to collect fees and thereby recovering operating cost. Farmer Interest Groups (FIGs) are a new model of learning and innovation for farmers despite the remarkable benefitsthat farmers have gained by joining these groups, their
sustainability is a major concern of extension bodies, relevant organizations and farmers. Examine the roles of extension officersinsupportingfarmerstosetupandruntheirinterestgroups. Inspite of the challenges that each group faced during the development phase, these groups shared factors that contributed to success. There can be 10-20 members in one group.
Therefore, itwas considerednecessary tofindoutwhether there is any relationship between maize growers socio- personal, economic, psychological and communicational factors with their socio-techno-economic changes due to ATMA project. Therefore to know the consequences study was conducted with following objectives: 1. study the socio-techno-economic changes of maize growers 2. on know the
Relationship between Profile of the Maize Growers and their Socio-Techno-Economic Changes
J . Matwa1, N. V. Soni2, P.M.Bhatt3 and H.B. Patel4
1 P.G.Student, B.A.C.A.,Dept. of Ext.Edu., AAU, Anand2&4Assoc.Ext.Edun’st,DOEEOffice,AAU,Anand
3 Director, Institute of Distance Education Anand (IDEA), AAU, AnandEmail : [email protected]
ABSTRACT The present investigation was undertaken in Dahod district which comes under the jurisdiction of Anand Agricultural University, Anand. This district is comprised of eight talukas. Out of these, three talukas namely Dahod, Zalod and Limkheda was purposively selected for the study as they have maximum number of farmer interest groups (FIGs) than other talukas. Total 8 FIGS were randomly selected from eight village of each talukas. Thus, total 24 FIGs were selected from 24 villages. From each FIGs of village, five farmers were randomly selected. Hence, total 120 farmers were selected and were interviewed with a structural pre-tested Gujarati version interview schedule with a aim to study the socio-personal, economic, psychological and communicational characteristics of the maize growers and their relationship with their socio-techno-economic changes. Majority (77.50 per cent) of the maize growers were medium to high level of socio-techno-economic changes. Then we can conclude that this result show the positive consequences of ATMA project on FIGs of maize growers. The independent variables like education, social participation, size of land holding, occupation, economic motivation, scientific orientation, market intelligence, innovativeness, knowledge of maize cultivation technology, mass media exposure and extension participation had positive and highly significant correlation with socio-techno-economic changes of maize growers except age. Keywords: Socio-techno-economic change, Maize growers
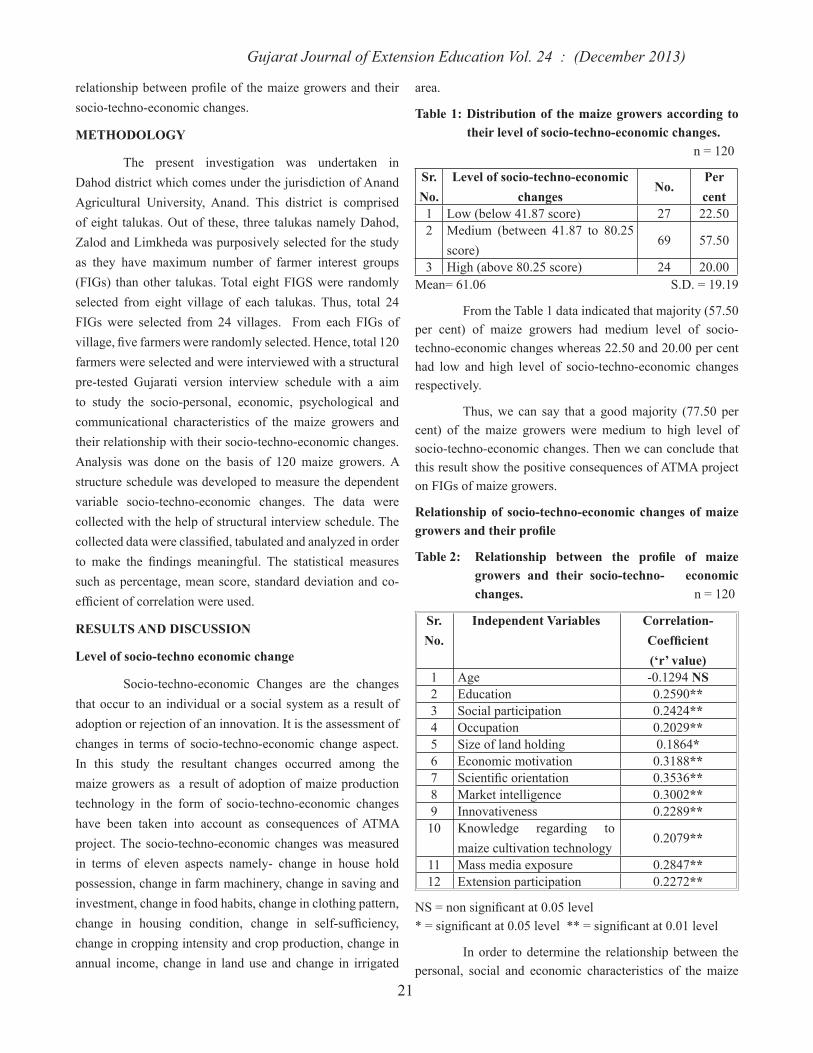
Gujarat Journal of Extension Education Vol. 24 : (December 2013)
21
relationshipbetweenprofileof themaizegrowersandtheirsocio-techno-economic changes.
METHODOLOGY
The present investigation was undertaken in Dahod district which comes under the jurisdiction of Anand Agricultural University, Anand. This district is comprised of eight talukas. Out of these, three talukas namely Dahod, Zalod and Limkheda was purposively selected for the study as they have maximum number of farmer interest groups (FIGs) than other talukas. Total eight FIGS were randomly selected from eight village of each talukas. Thus, total 24 FIGs were selected from 24 villages. From each FIGs of village,fivefarmerswererandomlyselected.Hence,total120farmers were selected and were interviewed with a structural pre-tested Gujarati version interview schedule with a aim to study the socio-personal, economic, psychological and communicational characteristics of the maize growers and their relationship with their socio-techno-economic changes. Analysis was done on the basis of 120 maize growers. A structure schedule was developed to measure the dependent variable socio-techno-economic changes. The data were collected with the help of structural interview schedule. The collecteddatawereclassified,tabulatedandanalyzedinorderto make the findings meaningful. The statistical measuressuch as percentage, mean score, standard deviation and co-efficientofcorrelationwereused.
RESULTS AND DISCUSSION
Level of socio-techno economic change
Socio-techno-economic Changes are the changes that occur to an individual or a social system as a result of adoption or rejection of an innovation. It is the assessment of changes in terms of socio-techno-economic change aspect. In this study the resultant changes occurred among the maize growers as a result of adoption of maize production technology in the form of socio-techno-economic changes have been taken into account as consequences of ATMA project. The socio-techno-economic changes was measured in terms of eleven aspects namely- change in house hold possession, change in farm machinery, change in saving and investment, change in food habits, change in clothing pattern, change in housing condition, change in self-sufficiency,change in cropping intensity and crop production, change in annual income, change in land use and change in irrigated
area.
Table 1: Distribution of the maize growers according to their level of socio-techno-economic changes. n = 120
Sr. No.
Level of socio-techno-economic changes
No.Per cent
1 Low (below 41.87 score) 27 22.502 Medium (between 41.87 to 80.25
score)69 57.50
3 High (above 80.25 score) 24 20.00Mean= 61.06 S.D. = 19.19
From the Table 1 data indicated that majority (57.50 per cent) of maize growers had medium level of socio-techno-economic changes whereas 22.50 and 20.00 per cent had low and high level of socio-techno-economic changes respectively.
Thus, we can say that a good majority (77.50 per cent) of the maize growers were medium to high level of socio-techno-economic changes. Then we can conclude that this result show the positive consequences of ATMA project on FIGs of maize growers.
Relationship of socio-techno-economic changes of maize growers and their profile
Table 2: Relationship between the profile of maize growers and their socio-techno- economic changes. n = 120
Sr. No.
Independent Variables Correlation-Coefficient (‘r’ value)
1 Age -0.1294 NS2 Education 0.2590**3 Social participation 0.2424**4 Occupation 0.2029**5 Size of land holding 0.1864*6 Economic motivation 0.3188**7 Scientificorientation 0.3536**8 Market intelligence 0.3002**9 Innovativeness 0.2289**10 Knowledge regarding to
maize cultivation technology0.2079**
11 Mass media exposure 0.2847**12 Extension participation 0.2272**
NS=nonsignificantat0.05level *=significantat0.05level**=significantat0.01level
In order to determine the relationship between the personal, social and economic characteristics of the maize

Gujarat Journal of Extension Education Vol. 24 : (December 2013)
22
growers with their socio-techno-economic changes. It could be observed from the above table that out of the 12 variables, onevariableagehadanegativeandnon-significantcorrelationwith their socio-techno-economic changes and rest eleven variableshadpositiveandsignificantrelationshipwiththeirsocio-techno-economic changes. This was determined and testedwithhelpofKarlPearson’scoefficientcorrelationtestand results obtained is presented in Table 2 and depicted in Figure 1.
The independent variables like education, social participation, size of land holding, occupation, economic motivation, scientific orientation, market intelligence,
innovativeness, knowledge of maize cultivation technology, mass media exposure and extension participation had positive and highly significant correlation with socio-techno-economic changes of maize growers. The variables like age shows negative but non-significant relationshipwith socio-techno-economic changes of maize growers. Thenegativelynon-significantassociationbetweenageandsocio-techno-economic changes indicates that the young and oldagedbeneficiaryfarmersweresimilarintheireconomicconsequences. This might be fact that younger generation could pick up farmers’ experience and farming knowledge by exposing themselves to the technically sound innovations.
CONCLUSION
Majority (77.50 per cent) of the maize growers were medium to high level of socio-techno-economic changes. Then we can conclude that this result showed the positive consequences of ATMA project on FIGs of maize growers. The independent variables like education, social participation, size of land holding, occupation, economic motivation, scientific orientation, market intelligence, innovativeness,knowledge of maize cultivation technology, mass media exposure and extension participation had positive and highly significant correlationwith socio-techno-economic changesof maize growers expect age.
REFERENCES
Desai C. P. (1997) A study on techno-economic consequences
in adoption of drip irrigation system by mango growers of Junagadh district in Gujarat state.(Ph. D.) Thesis (Unpublished), GAU, Anand.
Karl, Pearson. (1978). Hand Book of Agricultural Statistics .284-285.
Kerlinger, F.N. (1976). Foundation of behavioral research, surjeet publication, Delhi-7, pp.129.
Patel, N. R., Pandya, D. N. and Patel B. T. (1995) Techno-economic changes among beneficiaries farmers inwatershed area. Maha. J. Ext. Edu., 14:25-32.
Patel B. S. (2005) Peasantry modernization in integrated tribal development area of Dahod district of Gujarat state. (Ph. D.) Thesis (unpublished) A.A.U. Anand.
Received : December 2012 ; Accepted : October 2013
1

Gujarat Journal of Extension Education Vol. 24 : (December 2013)
23
Knowledge of Farmers Regarding Green Manuring for Sustainable Agriculture
Krunal P. Patel 1 and Meena C. Patel 2
1 Ex PG Scholar, Department of Extension Education, AAU, Anand2 Assistant Professor, Institute of Distance Education, AAU, Anand
Email : [email protected]
ABSTRACT
Green manuring is the ploughing under or soil incorporation of any green manure crops while they are green or soon after they start the flowering. The soil nitrogen is associated with the organic matter and the decay of this organic matter influences the availability of the soil nutrients. For these reasons, it has seemed advisable to know the amount of organic matter in soils, its source and the influences, which operate for the increase of organic matter, as well as the part it plays in the soil. Such knowledge is a necessary preliminary to understand the need of green manuring. Thus a study was conducted on randomly selected 120 farmers having at least one year of experience in green manuring at their own land from 10 villages of Anand and Petlad taluka of Anand district of Gujarat state to find out the knowledge of farmers regarding green manuring for sustainable agriculture. The data were collected by personal interview schedule and analyze with the help of frequency and percentage. Slightly more than two third (66.67per cent) of the farmers had medium level of knowledge regarding green manuring.
Keywords: Knowledge, Green Manuring
INTRODUCTION
The green manuring is an economical, practical, and even aesthetically pleasing method of restoring productivity of overworked land. A large number of plants both legumes and non-legumes are used as green manure. The choice of a particular green manure crop has to be made based on the soil type, the time available to raise the crop and the facility for irrigation. Green manuring is biological farming practice that receives special attention on the biodynamic farm. (Sathyan and Naika, 2008). The UN millennium goals towards sustainable development include food, bio energy and livelihood as integral components and the most vital concern of our planet earth. Issues like production and supply of food for caloric and nutritional security for ever increasing population, biomass production for biofuels to meet energy needs of industry and household and generation of employment opportunities, both on farm and off farm for livelihood security have been focusing attention of policy planners and researchers globally also land use for agriculture without jeopardizing natural resource base poses a formidable challenge to the agricultural scientists to devise appropriate agriculture production technology to
ensure sustainability of production systems and to harness favourable linkages among productivity-profitability andsustainability. It is believable that to motivate farmers to adopt green manuring practices positivism of farmers in terms of their skill and knowledge towards green manuring practices for sustainable agricultural development is very much essential. Thefinaldecisionoffarmerstouseanewpractice is usually the result of their knowledge of the practice and attitude. Therefore, it was felt necessary to study knowledge of farmers regarding green manuring for sustainable agriculture.
METHODOLOGY
The study was carried out in Anand district of Gujarat state. A random sample of total 120 farmers having at least one year of experience in green manuring at their own land were selected from 10 villages of two taluka, namely Anand and Petlad from Anand district of middle Gujarat. To measure that knowledge of farmers about green manuring, a suitable questionnaire was developed and the data were collected by personally interviewing the selected respondents. Knowledge of the respondents about green
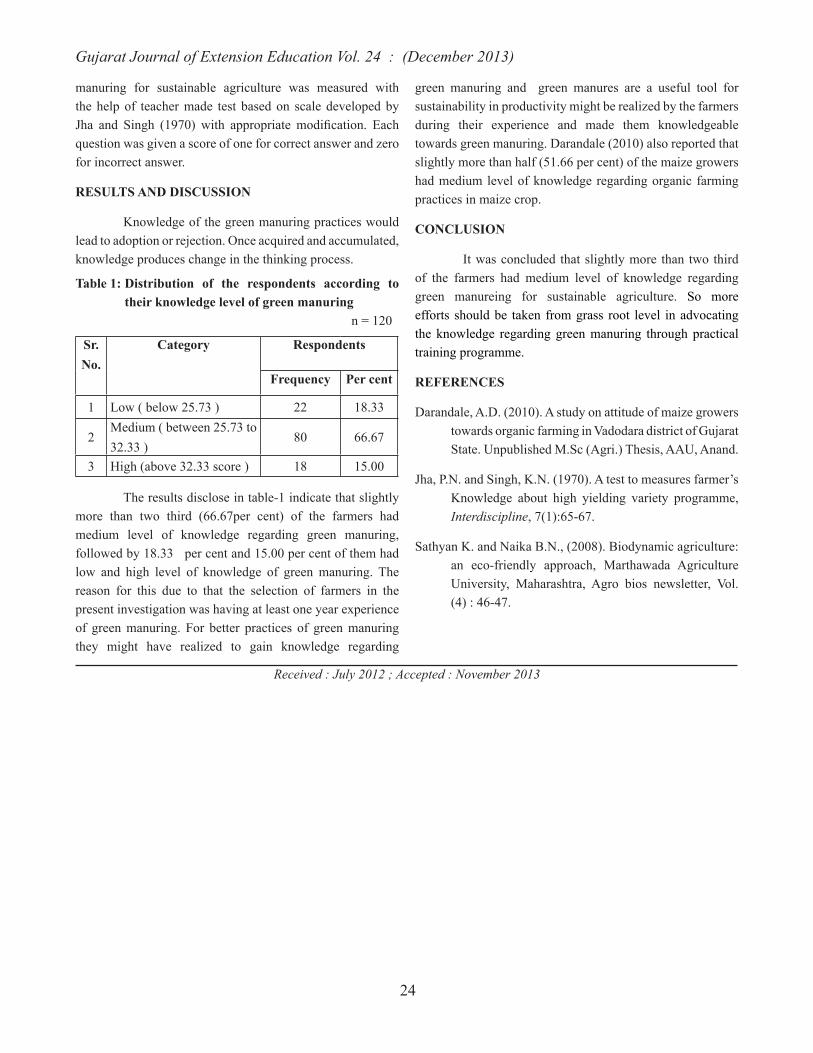
Gujarat Journal of Extension Education Vol. 24 : (December 2013)
24
manuring for sustainable agriculture was measured with the help of teacher made test based on scale developed by Jha and Singh (1970) with appropriate modification. Eachquestion was given a score of one for correct answer and zero for incorrect answer.
RESULTS AND DISCUSSION
Knowledge of the green manuring practices would lead to adoption or rejection. Once acquired and accumulated, knowledge produces change in the thinking process.
Table 1: Distribution of the respondents according to their knowledge level of green manuring
n = 120
Sr. No.
Category Respondents
Frequency Per cent
1 Low ( below 25.73 ) 22 18.33
2Medium ( between 25.73 to 32.33 )
80 66.67
3 High (above 32.33 score ) 18 15.00
The results disclose in table-1 indicate that slightly more than two third (66.67per cent) of the farmers had medium level of knowledge regarding green manuring, followed by 18.33 per cent and 15.00 per cent of them had low and high level of knowledge of green manuring. The reason for this due to that the selection of farmers in the present investigation was having at least one year experience of green manuring. For better practices of green manuring they might have realized to gain knowledge regarding
green manuring and green manures are a useful tool for sustainability in productivity might be realized by the farmers during their experience and made them knowledgeable towards green manuring. Darandale (2010) also reported that slightly more than half (51.66 per cent) of the maize growers had medium level of knowledge regarding organic farming practices in maize crop.
CONCLUSION
It was concluded that slightly more than two third of the farmers had medium level of knowledge regarding green manureing for sustainable agriculture. So more efforts should be taken from grass root level in advocating the knowledge regarding green manuring through practical training programme.
REFERENCES
Darandale, A.D. (2010). A study on attitude of maize growers towards organic farming in Vadodara district of Gujarat State. Unpublished M.Sc (Agri.) Thesis, AAU, Anand.
Jha, P.N. and Singh, K.N. (1970). A test to measures farmer’s Knowledge about high yielding variety programme, Interdiscipline, 7(1):65-67.
Sathyan K. and Naika B.N., (2008). Biodynamic agriculture: an eco-friendly approach, Marthawada Agriculture University, Maharashtra, Agro bios newsletter, Vol. (4) : 46-47.
Received : July 2012 ; Accepted : November 2013

Gujarat Journal of Extension Education Vol. 24 : (December 2013)
25
INTRODUCTION
The agricultural prosperity is directly connected with the publication and use of agricultural literature through dissemination of new technology among farming community. In Gujarat, only Krushigovidya farm magazine is publishing from Anand Agricultural University, Anand among four SAUs since May 1948. The present circulation is 21,900. Moreover, farm magazine is playing an important role in increasing the knowledge regarding agriculture technology. By reading the articles, naturally it is expected that farmers may be motivated to adopt the agriculture technology on their farm. In this farm magazine, the information of agriculture technology are published as per the need and time of the farmers, So, looking to it’s popularity, it is necessary to ascertain the use of agriculture information by KRUSHIGOVIDHYA subscribers their farming.
METHODOLOGY
The questionnaire was constructed with respect to collect the information regarding the use of agricultural information by KRUSHIGOVIDYA subscriber’s on their farming. The questionnaire was mailed to all the subscribers in the issue of October-2012, November-2012 and December-2012 on page No. 39-40. Among them, only 141 subscribers were responded. Thus, the total sample size of respondents was 141 they were from Banaskantha (14.98 percent) followed by Anand (9.93 percent), Junagadh (7.80 percent) and other districts (68.29 percent). Among them, majority were from life members (43.97 percent) followed by yearlysubscribers(34.04percent)andfiveyearsubscribers(21.99 percent). The data were analyzed in the light of the objectives with frequency, percentage, mean, sd. and correlation.
Use of Agricultural Information by KRUSHIGOVIDYA subscriber’s on their Farming
N.V. Soni1, P.M. Bhatt2, Mahesh R. Patel3 and Krunal C. Kamani4
1 Asso. Ext. Edu.,Publication Dept., DOEE, AAU, Anand2 Director, Institute of Distance Education, AAU, Anand
3 Assoc. Extension Education Institute, AAU, Anand4 Assit. Prof., M. C. College of Dairy Sicence, AAU, Anand
Email : [email protected]
ABSTRACT The agricultural prosperity is directly connected with the publication and use of agricultural literature through dissemination of new technology among farming community. In Gujarat, only Krushigovidya farm magazine is publishing from Anand Agricultural University, Anand which is playing an important role in increasing the knowledge regarding agriculture technology. By reading the articles, naturally it is expected that farmers may be motivated to adopt the agriculture technology on their farm. Looking to it’s popularity, it is necessary to ascertain the use of agriculture information by KRUSHIGOVIDHYA subscribers on their farming. The questionnaire was constructed and mailed to all the subscribers in the issue of October to December-2012. Among them, only 141 subscribers were responded. The great majority of the subscribers had medium to high level of reading behaviour. The great majority of the subscribers used the selected agriculture information on their farming viz, high yielding varieties, disease control methods, keep of farm account, improved agricultural implements and machinery, fertilizer as per recommended dose, weed control methods, irrigation at critical stage, bio-fertilizer, use of fertilizer as per soil testing report, micronutrient and vermicompost. The annual income and reading behavior of the subscribers had significant correlation whereas age of the subscribers had negative and significant correlation with extent of use of selected agriculture information on their farming had significant correlation with reading behavior of the subscribers.
Keywords: Agricultural information, reading behaviour

Gujarat Journal of Extension Education Vol. 24 : (December 2013)
26
OBJECTIVES
1 Toknowtheprofileofsubscribers
2 To know the reading behavior of subscribers
3 To know the use of agricultural information by subscribers on their farming
RESULTS AND DISCUSSION
Profile of subscribers
Table 1 : Profile of subscribers n=141
Sr. No.
Characteristics of subscribers No. Per cent
1 AgeYoung Age (Up to 35 Years) 17 12.06Middle Age (35 to 50 Years) 64 45.39Old Age (Above 50 Years) 60 42.55
2 EducationPrimary 19 13.47Secondary 39 27.66Graduate 25 17.73Post Graduate 58 41.14
3 Size of holdingMarginal farmer (Below 1.0 ha) 08 5.67Small farmer (1.01 to 2.0 ha) 23 16.31Medium farmer (2.01 to 4.0 ha) 21 14.90Big farmer (Above 4 ha) 89 63.12
4 Cropping intensityUp to 100 per cent 45 31.91101 to 125 per cent 15 10.64126 to 150 per cent 21 14.89151 to 175 per cent 14 9.93Above 176 per cent 46 32.63
5 OccupationFarming alone 38 26.95Farming and others(service/busi-ness)
13 9.22
Farming and animal Husbandry 69 48.94Farming, Animal Husbandry and others (service/business)
21 14.89
6 Annual IncomeUp to Rs. 50,000/- 19 13.48` 50,001 to ` 1,00,000/- 22 15.60` 1,00,000/- to `1,50,000/- 13 9.22` 1,50,001/- to ` 2,00,000/- 25 17.73Above ` 2,00,001/- 62 43.97
The Table-1 shows that the majority (57.45 per cent) were from young to middle age subscribers. The majority of the subscribers (58.87 percent) were educated up to graduate to post graduate level and the great majority of the subscribers (63.12 per cent) were big farmers. Among them, one third (32.63 per cent) of the subscribers had above 176
per cent cropping intensity. Nearly half (48.94 per cent) of the subscribers had farming and animal husbandry occupation as main source of livelihood and 61.70 per cent had above Rs. 1,50,000 per annum income.
Reading Behaviour
(a) Characteristics of the Reading Behaviour
Table 2 Disribution of respondents according to their reading behaviour n= 141
Sr. No.
Item Number Per cent
1 Duration of reading farm literature
A Up to 5 years 53 37.59
B 6 to 10 years 26 18.44
C 11 to 15 years 15 10.64
D 16 to 20 years 22 15.60
E Above 20 years 25 17.73
2 Time spared for reading
A Daily 78 55.32
B Weekly 49 34.75
C Monthly 14 9.93
3 Store of old issues 127 90.07
4 Subscribe other farm magazine 121 85.82
5 Read agriculture news in newspaper
131 92.91
6 Use of farm literature in their farming
134 95.04
7 Hear agriculture news in radio 75 53.19
8 Watch agriculture news in television
117 82.98
9 Got agriculture information through internet
37 26.24
TheTable 2 reported thatmore than fifty percentsubscribers (56.03 percent) read farm literature from 5 to 10 years and 55.32 percent subscribers read farm literature daily. While the great majority of the subscribers had store had old issues, subscribe other farm magazine, read agriculture news in newspaper and use of farm literature in their farming. Further 53.19 percent of the subscribers hear agriculture news in radio whereas 82.98 percent subscribers watch agriculture news in television and only 26.24 percent subscribers got agriculture information through internet.

Gujarat Journal of Extension Education Vol. 24 : (December 2013)
27
(b) Level of reading behavior
Table 3: Disribution Of Respondents According To Their Level Of Reading Behaviour n= 141
Sr. No.
Level of reading behaviour Number Per-cent
1 Low (below 7 score) 15 10.642 Medium (8 to 12 score) 89 63.123 High (Above 12 score) 37 26.24
Mean = 10.25 SD = 2.28
The Table 3 indicated that great majority (89.36 per cent) of the subscribers had medium to high level of reading behavior.
Use of agricultural information by subscribers
Table 4 : Disribution of respondents according to the use of selected agricultural information n=141
Sr. No.
Use of selected Agriculture Information
Number Per-cent
1 Soil testing 106 75.182 Use of fertilizer as per soil test-
ing report90 63.83
3 High yielding varieties 133 94.334 Seed Treatment 116 82.275 Vermicompost 82 58.16
(a) Self prepared vermicompost 23 16.31(b) Purchase vermicompost 39 27.66(c) Self prepared and purchase vermicompost
20 14.18
6 Bio- fertilizers 99 70.217 Micronutrient 88 62.418 Fertilizer as per recommended
dose 120 85.11
9 Irrigation at critical stage 101 71.6310 Drip irrigation 44 31.2111 Mulching 43 30.0512 Recommended weed control
methods118 83.69
13 Biological control method 105 74.47a Pheromone trap 42 29.79b NPV 28 19.86c Tricoderma 45 31.92d Bio-pesticide 92 65.25
14 Disease control method 129 91.4915 pest control method 102 72.3416 Grading of farm produce 64 45.39
17 Packaging of farm produce 39 27.6618 Value addition 09 6.3919 Green house technology 08 5.67
(a) Green house 01 0.71(b) Poly house 00 0.00(c) Net house 07 4.96
20 Intercropping 59 41.8421 Mixed farming 42 29.7922 Relay cropping 21 14.8923 Improved agricultural imple-
ments and machinery123 87.23
24 Keep of farm account 125 88.65
The Table 4 indicated that the great majority of the respondents’ use the selected agriculture information in their farming viz, high yielding varieties (94.33 per cent), disease control methods (91.49 percent), keep of farm account (88.65 percent), improved agricultural implements and machinery (87.23 percent), fertilizer as per recommended dose (85.11 percent), weed control method (83.69 percent) and seed treatment (82.27 percent) followed by soil testing (75.18 percent), biological control (74.47 percent), pest control methods (72.14 percent), irrigation at critical stage (71.63 percent), bio-fertilizer (70.21 percent), use of fertilizer as per soil testing report (63.83 percent), micronutrient (62.41 percent), vermicompost (58.61 percent). While only 6.39 percent subscribers used value addition followed by green house technology 5.67 percent.
Level of subscribers according to use of selected agriculture information
Table 5 Disribution Of Respondents Accordingto Level Of Subscribers About The Use Of Selected Agricultural Information n=141
Sr. No.
Level of subscribers according to use of selected
agriculture information
Number Per cent
1 Low (Below 11 score) 22 15.60
2 Medium (11 to 18 score) 10 70.92
3 High (Above 18 score) 19 13.48
Mean = 14.40 SD = 4.07
The Table 5 indicated that the great majority of the respondents (84.40 percent) had medium to high level of about the use of selected agriculture information on their farming.

Gujarat Journal of Extension Education Vol. 24 : (December 2013)
28
Relationship Between Selected Characteristics Of Respondents and Extent Of Use O Selected Agriculture Information On Their Farming And Reading Behaviour
(a) Relationship between independent variables and exent of use of selected agriculture information.
Table 6 : Relationship of independent variable with extent of use of selected agriculture information n=141
Sr. No.
Independent variable Coefficient Correlation
1 Age -0.202*2 Education -0.071 NS3 Land holding 0.162 NS4 Cropping intensity 0.128 NS5 Occupation 0.165 NS6 Annual income 0.204*7 Reading behavior 0.285*
*significantat0.05levelofprobability NS=Non-significant
The Table 6 reported that annual income and reading behaviour of the subscribers had significant correlationwhereasageofthesubscribershadnegativeandsignificantcorrelation with extent of use of selected agriculture information. The reason might be that the subscribers were young to middle age group, had more annual income and medium to high level of reading behaviour.
(b) Relationship between independent variables and extent reading behavior
Table 7 Relationship of independent variable with extent of reading behavior n=141
Sr. No.
Independent variable Coefficient Correlation
1 Age 0.240**2 Education 0.135 NS3 Land holding 0.304**4 Cropping intensity 0.127 NS5 Occupation 0.019 NS6 Annual income 0.388**7 use of selected agriculture
information0.285**
**significantat0.01levelofprobability NS=Non-significant
The Table 7 indicated that the reason might to be that the subscribers read the farm literature since long time as daily habit as well as subscribe KRUSHIGOVIDHYA and other farm magazine and use radio and television for got more information. The another reason might be that the subscribers
were well educated ,possessed more land holding means big farmers and had more annual income.
CONCLUSION
The majority of subscribers were young to middle aged group, educated up to graduate and post graduate level, big farmers, farming and animal husbandry as their main occupation and had annual income about 1,50,000 per annum whereas the great majority of the subscribers had medium to high level of reading behavior due to read farm literature since long time as daily habit.
The great majority of the subscribers used the selected agriculture information on their farming viz, high yielding varieties, disease control methods, keep of farm account, improved agricultural implements and machinary, fertilizer as per recommended dose, weed control methods, irrigation at critical stage, bio-fertilizer, use of fertilizer as per soil testing report, micronutrient and vermicompost.
The annual income and reading behaviour of the subscribers had significant correlation whereas age of thesubscribers had negative and significant correlation withextent of use of selected agriculture information on their farminghadsignificantcorrelationwithreadingbehaviorofthe subscribers age, land holding, while annual income and use of selected agriculture information on their farming had highly significant correlation with reading behavior of thesubscribers
REFERANCES
Bharad, N.D. and Trivedi, J.C. (1990). Farmer’s Reading Behaviour of ‘Krushi-Go-Vidya’. Guj. J. of Ext. Edn., 1: 53-56.
Chavda, M.G. an Dave, D.H. (1993 & 1994). Farmers Reading Behaviour of Farm Literature. Guj. J. Extn. Edu., 4&5 : 5-10.
Gupta, S.P.; Amardeep and Vir, K. (2003). Utilization of information sources by farmers under different production systems in Uttaranchal and Uttar Pradesh MANAGE. Extn. Res. Review, 70-85.
Hingu, N.J. and Patel, N.R. (1997 & 1998). Gain in Knowledge by the Life Member Farmers’ Through Krushi-Go-Vidya Farm Magazine. Guj. J. Extn. Edu. 8&9 : 19-22.
Prajapati, M.R. and Jadhao, D.L. (2001 & 2002). Correlates of Modernization of Farmers. Guj. J. Extn. Edu., 12 & 13 : 48-49.
Received : May 2012 ; Accepted : June 2013

Gujarat Journal of Extension Education Vol. 24 : (December 2013)
29
Attitude of farmers towards Agro processing
Priyanka M. Parmar1 and Meena C. Patel2
1 Ex. PG Scholar (Extn. Edu.), B.A. College of Agriculture, AAU, Anand2 Assistant professor, Institute of Distance Education, AAU. Anand
Email : [email protected]
ABSTRACT
Agro processing in India derives its strength from its high potential for entrepreneurship development at low capital cost, the high supply elasticity of local resources, the tremendous scope for forward and backward linkages and the potential to meet the growing domestic and export demand for the finished products. To convince and motivate farmers to accomplish agro processing as an endeavor, positivism towards agro processing in terms of their skill, knowledge and attitude is very much essential. Hence the study was conducted on 100 respondent farmers from randomly selected 10 villages of Anand taluka of Anand district of middle Gujarat to know the attitude of farmers towards agro processing with the help of reliable and valid developed scale. Majority (87.00 per cent) of the farmers had neutral to positive attitude towards agro-processing. The level of attitude of the respondents towards agro-processing was observed positively significant with their education, experience in farming, size of family, extension contact, land holding, annual income, economic motivation and risk orientation
Keywords: Attitude, Agro processing
INTRODUCTION
Agriculture is the cornerstone of most developing countries’ economics. Unfortunately, agriculture alone is no longer able to provide a reliable livelihood for the growing populations in these countries. Alternative or additional income generating opportunities are needed to support the millions of poor families who can no longer support their livelihoods from the land alone. As increased agricultural production is envisaged, there is need to have proportionate improvement in the agro-processing industry. Agro-processing industries refer to those activities that transform agricultural commodities into different forms that add value to the product. (Sharma and Tiwari, 2011)
Agro-processing activities comprise two major categories; primary and secondary operations. Primary processing operations involve activities such as crop drying, shelling/threshing, cleaning, grading, and packaging. Secondary processing operations entail increasing nutritional or market value of the commodity and the physical form or appearance of the commodity is often totally changed from the original. (Anonymous, 2005). But the relevance of agro processing and its value in the post harvest value added technology may not be fully cherished by farmers. The
intensive motivation to make them positive in attitude and up-to-date knowledge of agro processing however, require constant updating with current information and collaboration with all stakeholders for successful implementation to be realized. Thus, to understand positivism towards agro processing at grass root level, the study was conducted and attitude of farmers towards agro processing was measured with the help of reliable and valid scale developed by Parmar (2012).
METHODOLOGY
The present study was carried out on a random sample of total 100 farmers having at least five years ofexperience of farming from 10 villages of Anand taluka of Anand district of middle Gujarat. The data were collected through the personal interview. The reliable and valid attitude scale with 16 statements was administered on the selected sample farmers and the responses were collected in five continuum viz. strongly agree, agree, undecided,disagree and strongly disagree with weight of 5, 4, 3, 2 and 1, respectively for positive statements and reverse scoring for negative statements. The total attitude score for each respondent was obtained by adding all the scores of their responses of all the statements and on the basis of mean and

Gujarat Journal of Extension Education Vol. 24 : (December 2013)
30
S.D., the respondents were grouped into three categories viz. negative attitude (below mean – 0.5 S.D.), neutral attitude (between mean + 0.5 S.D.) and positive attitude (above mean + 0.5 S.D.).
RESULTS AND DISCUSSION
Table 1: Farmers according to their attitude towards agro-processing n=100
Sr.No.
Types of Attitude
CategorizationFreq uency
Per cent
1 NegativeBelow mean - 0.5 SD
13 13.00
2 NeutralBetween mean + 0.5 SD
30 30.00
3 PositiveAbove mean + 0.5 SD
57 57.00
The data given in Table and Fig.- 1 illustrated that more than half (57.00 per cent) of the farmers had positive attitude towards agro-processing, While 30.00 and 13.00 per cent of the respondents had neutral and negative attitude towards agro-processing. It was concluded that more than half of the farmers had positive feeling towards agro processing. It is understood that the practicability of taking up agro processing techniques in thefieldwhichwouldharness thebest of the available resources and acquired agricultural post product expertise of the farmers and also the sense of agricultural entrepreneurial development through the agro processing concepts like this must have made the majority of the farmers with medium to high level of favourable attitude towards agro processing. Patel and Chauhan (2004) indicated that majority (55.00 per cent) of the farmers had neutral attitude towards IPM strategy
Fig 1: The Farmers according to their attitude towards agro-processing
Relationship between the characteristics of the respondents and their attitude towards agro- processing n = 100
Sr. No.
Independent VariablesCorrelation Coefficient
(‘r’ value)
1 Age -0.04 NS
2 Education 0.219*
3 Experience in farming 0.201*
4 Type of family 0.155NS
5 Size of family 0.199*
6 Mass media exposure 0.074 NS
7 Extension contact 0.207 *
8 Social participation 0.007 NS
9 Training received -0.022 NS
10 Land holding 0.353**
11 Annual income 0.215*
12 Occupation -0.068 NS
13 Scientificorientation 0.195 NS
14 Economic motivation 0.267**
15 Risk orientation 0.213*
The level of attitude of the respondents towards agro-processingwasobservedpositivelysignificantwiththeireducation, experience in farming, size of family, extension contact, land holding, annual income, economic motivation and risk orientation, while the variables age, training received and occupation had negative and non-significantrelationship with attitude of the respondents towards agro-processing and type of family, mass media exposure, social participation and scientific orientation were found to benon-significantlycorrelatedwiththelevelofattitudeof therespondents towards agro-processing. The farmers who were educated, experienced in their farming, with more number of family members, with high level of extension contacts, land holing, income, economic motivation and risk bearing capacity had positivism towards the agro processing. Patel and Chauhan (2004) observed that education was positively

Gujarat Journal of Extension Education Vol. 24 : (December 2013)
31
andsignificantlyrelatedwithattitudetowardsIPMstrategy.
CONCLUSION
The findings of this study revealed that majorityof the farmers had medium to high level of favourable attitude towards agro processing. Government and extension functionary should conduct vocational trainings at grass root level in order to create awareness about agro-processing technology. Efforts should be made to manipulate the attitude in desirable direction by providing trainings as per their felt needs.
REFERENCES
Anonymous (2005). Agro-processing Practical Answers to Poverty.
www.itdg.org/agroprocessing.
Parmar, P.M. (2012). Development of scale to measure attitude of the farmers towards agro-processing. Unpublished M.Sc (Agri.) Thesis, AAU, Anand.
Patel, M. C. and Chauhan, N. B. (2004). Corollary of the profileoffarmersontheirattitudetowardsintegratedpest management strategy. Guj. J. Ext. Edu., 15:5-9.
Sharma,M.C.andTiwari,R.(2011).Atextbookof“Agro-enterprises for Rural Development and Livelihood Security”. New India Publishing Agency, New Delhi, Chapter-19, pp: 223.
Received : September 012 ; Accepted : August 2013

Gujarat Journal of Extension Education Vol. 24 : (December 2013)
32
Development of Scale to Measure Attitude of Farmers towards Gir Cow
J. K. Patel1, J. B. Patel2, Krunal Gulkari3 and N. B. Chauhan4
1 Associate Professor, SMC College of Dairy Science, AAU, Anand2 Associate Professor, 3 PG Student and 4 Professor & HeadDepartment of Extension Education, BACA, AAU, Anand
E-mail: [email protected]
ABSTRACT
Due to non-availability of a proper scale to measure farmers’ attitude towards Gir cow in middle Gujarat region, it was thought necessary to construct a scale for the purpose. Keeping this in view, an attempt has been made to develop a scale for measuring the attitude of farmers. The technique chosen to develop the attitude scale was of “Scale Product Method” which combines the Thurston’s (1946) technique of Equal Appearing Interval Scale for selection of the items and Likert’s techniques of summated rating for ascertaining the response on the scale.
Keywords: Attitude, Gir cow, Continuum, Reliability, Validity
INTRODUCTION
Attitudehasbeendefinedas“thedegreeofpositiveor negative feeling, affect, opinion, action and belief associated with some psychological object”. Psychological object may be any symbol, institution, person, phrase, slogan, idea or ideal towards which people may differ from each other with respect to positive or negative aspect. The cognitive component of an attitude consists of the beliefs, which involves attributes like favorable or unfavorable, desirable or undesirable, good or bad etc. The feeling component refers to the emotions which give attitude a motivating character or action tendencies. The action tendency component of an attitude includes all behavioral readiness associated with it. These three components of attitude, are, however, consistently related to each other. The psychological object for the present study has been conceptualized as the rearing of Gir cow.
METHODOLOGY
Among the techniques available for construction of scale, the methodology suggested by Likert (1932) and Edward (1957) was used in this study for scale construction and for ascertaining the response of the scale. The technique chosentoconstructtheattitudescalewasof“ScaleProductMethod” which combines the Thurston’s (1946) technique of Equal Appearing Interval Scale for selection of the items and Likert’s techniques of summated rating for ascertaining the response on the scale.
Item collection
The items making up an attitude scale are known asstatements.Astatementmaybedefinedasanything thatis said about a psychological object.As a first step in thedeveloping the attitude scale towards Gir cow a number of statements about Gir cow were gathered from the relevant literature, veterinarian, researchers, extension personals andofficialsofveterinarydepartmentwhoweredirectlyorindirectly exposed to such knowledge system.
Editing of items
The collected statement’s were edited in the light of the criteria suggested by Thurstone and Chave (1929) and Edward and Kilpatrick (1948). At last, 24 statements were selected as they were found to be non-ambiguous.
Judges rating of attitude statements
Inordertojudgethedegreeof“Unfavorableness”to “Favorableness” of each statement on the five pointequal appearing interval continuum a panel of 50 judges was selected. The judges selected for the study comprised extension educationist, horticulturist, and statisticians with considerable practical experience in animal husbandry from theAnandAgricultural University and officials ofveterinary department, Anand. The judges were visited personally along with letter of instructions to guide them for rating the statements in desired manner for each set of the statements.

Gujarat Journal of Extension Education Vol. 24 : (December 2013)
33
Determination of scale and quartile value
The five points of the rating scale were assigned, rangingfrom 1 for most unfavorable and 5 for most favorable. On the base of judgment, the median value of the distribution, and the Q value for the statement concerned was calculated, the inter-quartile range for each statement was also worked out for determination of ambiguity involved in the statement from the following formula.
Where,
S = Median or Scale value of statement
L = Lower limit of the interval in which the 50th centile falls
= Sum of the proportion below the interval in which the 50th centile falls
Pw = Proportion within the interval in which the 50th centile falls
i = Width of the interval, which was assumed as equal to 1.0
Thurstone and Chave (Edwards, 1957) used the inter-quartile range Q as a means of the variation of the distribution of the judgments for a given statement. To determine value of Q, two other point were measured, the 75th centile and 25th centile. The 25th centile was obtained by the following formula:
C25
Where,
S = Median or Scale value of statement
L = Lower limit of the interval in which the 25th centile falls
= Sum of the proportion below the interval in which the 25th centile falls
Pw = Proportion within the interval in which the 25th centile falls
i = Width of the interval, which was assumed as equal to 1.0
C75
Where,
S = Median or Scale value of statement
L = Lower limit of the interval in which the 75th centile falls
= Sum of the proportion below the interval in which the 75th centile falls
Pw = Proportion within the interval in which the 75th centile falls
i = Width of the interval, which was assumed as equal to 1.0
Then the interquartile range or Q value was obtained by taking the difference between C75 and C25 thus,
Q = C75 - C25
Final statements for attitude scale
When there was a good agreement among the judges, in judging the degree of agreement or disagreement of a statement, Q was smaller compared to the value obtained, when there was relatively little agreement among the judges it was reverse. Only those items were selected whose median (scale) values were greater than Q values. However, when a few items had the same scale values, items having lowest Q value were selected. Based on the median and Q values 8 statementswerefinallyselected toconstituteattitudescale.The scale values were ranging from 1.46 to 3.50 with 0.5 class intervals.
Reliability of the scale
A scale is reliable when it consistently produces the same result when applied to the same sample. In the present study, split-half method of testing reliability was used. The eight statements were divided into two halves with four odd numbered in one half and other four even numbered statements in the other. These were administered to 20 respondents. Each of the two sets of the statements was treated as a separate scale and then these two sub-scales were correlated.The co-efficient of reliabilitywas calculated bythe Rulon’s formula (Guilford, 1954), which came to 0.79.
Content validity of the scale
Validity of the scale examined for content validity by determining how well content were selected by discussion with specialist, extension academicians, etc. thus, the present scalesatisfiedthecontentvalidity.
Scoring system
Theselectedeightstatementsforthefinalformatof

Gujarat Journal of Extension Education Vol. 24 : (December 2013)
34
the attitude scale are randomly arranged to avoid response biases, which might contribute to low reliability and detraction from validity of the scale. The responses can be collected on fivepointcontinuumsviz., strongly agree, agree, undecided,
disagree and strongly disagree with respective weights of 5, 4, 3, 2, and 1 for the favorable statements and with the respective weights of 1, 2, 3, 4, and 5 for the unfavorable statements.
No Statements SA A UD DA SDA1 GIR cow is a prospective resource of high milk production for farmers. (+)2 I understand that GIR cow keeping is expensive. (-)3 I think that there are limited scopes of GIR as compared to foreign breeds. (-)4 I think that adoption of GIR is a risky venture. (-)5 I understand that raising GIR cow; animal growers can grow economically. (+)6 Raising GIR cow possible in the entire Indian situation. (+)7 There is more misinformation about GIR than reality. (+)8 I think that adoption of Gir opens and enhances new export market opportunity. (+)
SA=Strongly Agree A=Agree UD=Undecided DA=Disagree SDA=Strongly Disagree
REFERENCES
Edward, A. L. (1957). Techniques of attitude scale construction. Vakils, Feffer and Simons Pvt. Ltd. Bombay -1.
Guilford, J. P. (1954). Psychometric methods. Tata McGraw hill publishing Co., Bombay, 597.
Likert, R. A. (1932). A technique for the measurement of attitude scales. Arch. Psychol. New York, No.140.
Thurstone, L. L. (1946). The measurement of attitude, American J. Soci., Chicago Univ. Chicago Press, 39-50.
Received : April 2012 ; Accepted : August 2013

Gujarat Journal of Extension Education Vol. 24 : (December 2013)
35
INTRODUCTION
The India is a country of diversities. The diversity particularly acute among agricultural communities varies from well mechanism and resourceful farmers of Punjab to landless tribal farmers of Gujarat. Transfer of recommended crop technology from research stations to farmers is very important for developing these farming communities.
Communication plays key role in development process. According Berlo (1960), the sole purpose of communication is to influence. People communicate toinfluencetoeffectwithintent.Hesaysthatallcommunicationbehavior has its purpose, its goal, as production of response. Lass well (1948) described communication sequence as who says; what, to whom, when, in what manner, under what circumstances and with what effect. The dissemination of any
improved technology depends on how best the information regarding the particular technology is communicated. Today is the era of information explosion. Innumerable information is generated, synthesized and disseminated in each and every moment. Information technology has revolutionized the transfer of information through new ways, i.e., internet, e-mail etc. Information from any part of the world could be easily made available through information technology there by changing the world into global village. Therefore, farmers should be also equally privileged to get informed of farm related information without delay.
Research studies have also shown the importance of effective communication in promoting technological change in farming. The success of agricultural information sources and channels largely depends on their effectiveness
Source and Channels of Agriculture Information used by the Beneficiary Farmers of NAIP-III
Vijay Kumar1, R.S. Prajapati2, Akshay Ghintala3 and Kuldeep Singh4
1 M.Sc. Student, 3 & 4 Ex. PG Student, Department of Extension EducationC.P. College of Agriculture, SDAU, Sardarkrushinagar
2 Asst. Prof., Dept. of Ext. Edu., CPCA, SDAU, SardarkrushinagarEmail:[email protected]
ABSTRACT
The adoption requires many kind of information at different stages. Although there are many sources and channels through which people get information about technological change in farming, some of these sources or channels are not efficient comparing the others. So, there is a need to know more about different sources and channels of information through which farmers become aware about the agricultural technologies. The study was conducted to analyze agriculture information utilized by NAIP III beneficiary farmers of Banaskantha district of Gujarat. One hundred twenty respondents were identified based on proportionate random sampling method and data were collected from them using a well-structured and pre-tested interview schedule. The collected data were analysedand tabulated. The finding of the study revealed that there was found that friends and neighbors and progressive farmers were the major personal contact sources of agriculture information utilized It was also found that Training programmes were the major group contact sources of agriculture information utilized and radio, television and krushi mahotsav were the major mass media contact sources of agriculture information utilized by the NAIP beneficiary farmers for seeking information.
Keywords: Channels, Agriculture information, NAIP
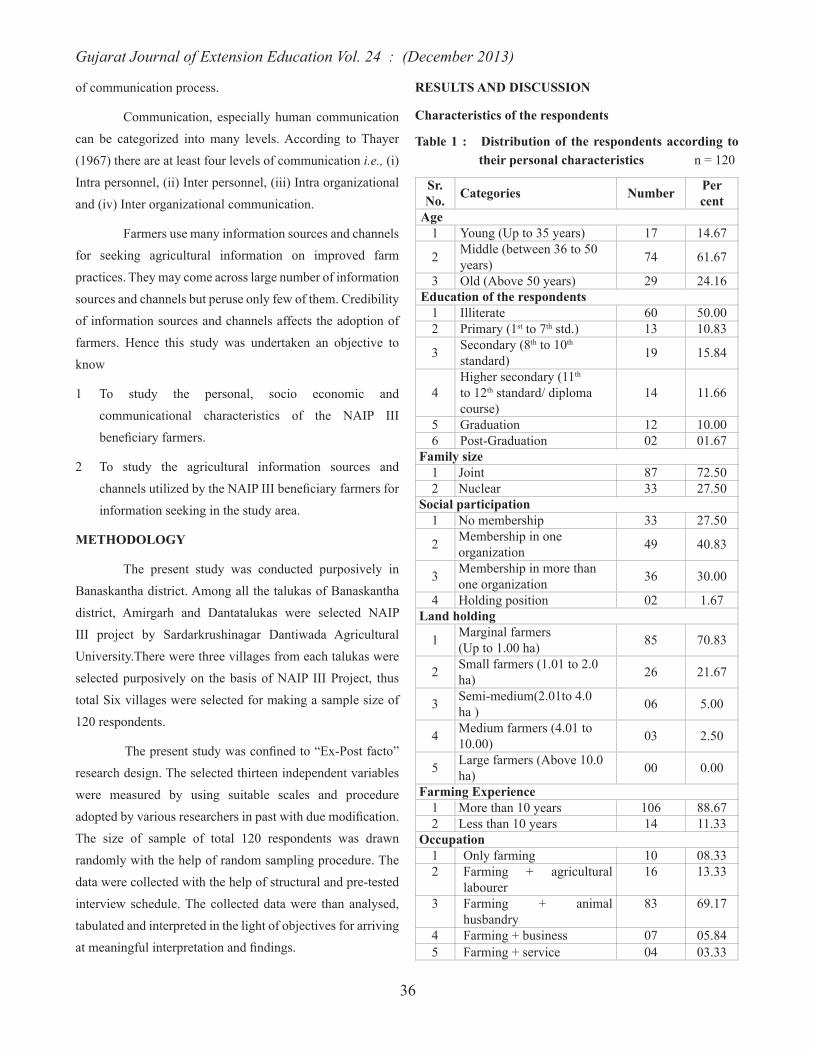
Gujarat Journal of Extension Education Vol. 24 : (December 2013)
36
of communication process.
Communication, especially human communication can be categorized into many levels. According to Thayer (1967) there are at least four levels of communication i.e., (i) Intra personnel, (ii) Inter personnel, (iii) Intra organizational and (iv) Inter organizational communication.
Farmers use many information sources and channels for seeking agricultural information on improved farm practices. They may come across large number of information sources and channels but peruse only few of them. Credibility of information sources and channels affects the adoption of farmers. Hence this study was undertaken an objective to know
1 To study the personal, socio economic and communicational characteristics of the NAIP III beneficiaryfarmers.
2 To study the agricultural information sources and channelsutilizedbytheNAIPIIIbeneficiaryfarmersforinformation seeking in the study area.
METHODOLOGY
The present study was conducted purposively in Banaskantha district. Among all the talukas of Banaskantha district, Amirgarh and Dantatalukas were selected NAIP III project by Sardarkrushinagar Dantiwada Agricultural University.There were three villages from each talukas were selected purposively on the basis of NAIP III Project, thus total Six villages were selected for making a sample size of 120 respondents.
Thepresentstudywasconfinedto“Ex-Postfacto”research design. The selected thirteen independent variables were measured by using suitable scales and procedure adoptedbyvariousresearchersinpastwithduemodification.The size of sample of total 120 respondents was drawn randomly with the help of random sampling procedure. The data were collected with the help of structural and pre-tested interview schedule. The collected data were than analysed, tabulated and interpreted in the light of objectives for arriving atmeaningfulinterpretationandfindings.
RESULTS AND DISCUSSION
Characteristics of the respondents
Table 1 : Distribution of the respondents according to their personal characteristics n = 120
Sr. No. Categories Number Per
centAge
1 Young (Up to 35 years) 17 14.67
2 Middle (between 36 to 50 years) 74 61.67
3 Old (Above 50 years) 29 24.16Education of the respondents
1 Illiterate 60 50.002 Primary (1st to 7th std.) 13 10.83
3 Secondary (8th to 10th standard) 19 15.84
4Higher secondary (11th to 12th standard/ diploma course)
14 11.66
5 Graduation 12 10.006 Post-Graduation 02 01.67
Family size1 Joint 87 72.502 Nuclear 33 27.50
Social participation1 No membership 33 27.50
2 Membership in one organization 49 40.83
3 Membership in more than one organization 36 30.00
4 Holding position 02 1.67Land holding
1 Marginal farmers (Up to 1.00 ha) 85 70.83
2 Small farmers (1.01 to 2.0 ha) 26 21.67
3 Semi-medium(2.01to 4.0 ha ) 06 5.00
4 Medium farmers (4.01 to 10.00) 03 2.50
5 Large farmers (Above 10.0 ha) 00 0.00
Farming Experience1 More than 10 years 106 88.672 Less than 10 years 14 11.33
Occupation 1 Only farming 10 08.332 Farming + agricultural
labourer16 13.33
3 Farming + animal husbandry
83 69.17
4 Farming + business 07 05.845 Farming + service 04 03.33

Gujarat Journal of Extension Education Vol. 24 : (December 2013)
37
Sr. No. Categories Number Per
centAnnual income
1 Low (up to ` 76,000/-) 17 14.17
2 Medium (between ` 76,001/- to Rs 2,44,000/-) 82 68.33
3 High (above ` 2,44,000/-) 21 17.50
The data depicted in Table 1 show that maximum number of beneficiary respondents (61.67 per cent) werefound in middle age group, followed by old age (24.16 per cent) beneficiary. Remaining 14.67 per cent beneficiaryfarmers were found in young age, respectively.
Education
The data presented in Table 1 indicated that half of (50.00percent)beneficiaryfarmerswerehavingilliterates,while 15.84 per cent respondents were found having educated up to middle school level. On the other hand 10.83 per cent of them were found educated up to primary education. A very meager number of respondents were having educated up to high school 11.66 per cent, and 10.00 per cent were found having education graduation level. There were only 1.67 per centbeneficiaryfarmerseachwhowerehavingpostgraduatedegree.
Type of family
The data presented in Table 1 reveal that above half ofthebeneficiary(55.83percent)werehavingbelongedtomedium size of family followed by small size of family 28.33 per cent and large family size 15.84 per cent.
Family size
The data presented in Table 1 indicate that near to one third of beneficiary (72.50 per cent) were having belonged tojointfamiliesandrest27.50percentbeneficiarybelongedtothe nuclear families.
Social participation
The data depicted in Table 2 show that maximum number of beneficiary respondents (40.83 per cent) weremembership in one organization, followed by membership in more than one organization (30.00 per cent) and 27.50 per cent beneficiary farmers were not associated with anysocialorganization.Remainingonly1.67percentbeneficiaryfarmers were found holding position in various social organization.
Land holding
The data presented in Table 1 indicate that majority
(70.83percent)ofthebeneficiaryfarmerswereinmarginalfarmer categories having up to 1.00 ha. of cultivable land. On theotherhand,21.67percentbeneficiaryweresmallfarmerscategories having 1.01 to 2.00 ha. The percentage of semi-medium farmers (2.01to 4.0 ha) and medium farmers (4.01 to10.00)beneficiaryfarmerswere5.00percentand2.50percent respectively. There were no found large farmers (0.00).
Farming Experience
The data presented in Table 1 revealed that majority of 88.67 per cent of the respondents were having more than 10 years farming experience and 11.33 per cent of the respondents were having less than 10 years farming experience.
Occupation
Data presented in Table 1 indicate that 69.17 per cent of the respondents were having farming plus animal husbandry as their main occupation followed by 13.33 per cent havingFarming + agricultural labourer as their occupation and 8.33 per cent having only farming occupation. Remaining 5.84 per cent farmers were having farming plus business as their occupation and 3.33 per cent respondents were having farming plus serviceas their occupation.
Annual income
The data depicted in Table 1 show that maximum number of beneficiaryrespondents(68.33percent)hadmediumannualincome between ` 76,001/- to ` 2,44,000/-.Nearlyonefifthnumber of respondents (17.50 per cent) had high income i.e. above ` 2,44,000/-.Remaining14.17per centbeneficiaryfarmers had low annual income of up to ` 76,000/-.
Table: 2 : Sources of agriculture information utilized by respondents for seeking information n = 120
Sr. No. Personal Contact Sources M P S Rank
1 Personal contact with AA/AAO 38.33 VI2 Personal contact AHO/ HA 37.50 VII3 Personal letter 11.66 X4 Officecall 11.66 X5 Telephone call 17.50 IX
6 Contact with progressive farmers 65.83 III
7 Contact with agro Service Centers 59.16 IV
8 Friends 95.00 I9 Neighbors 82.50 II10 University scientist 23.33 VIII11 Privateextensionofficer 42.50 V
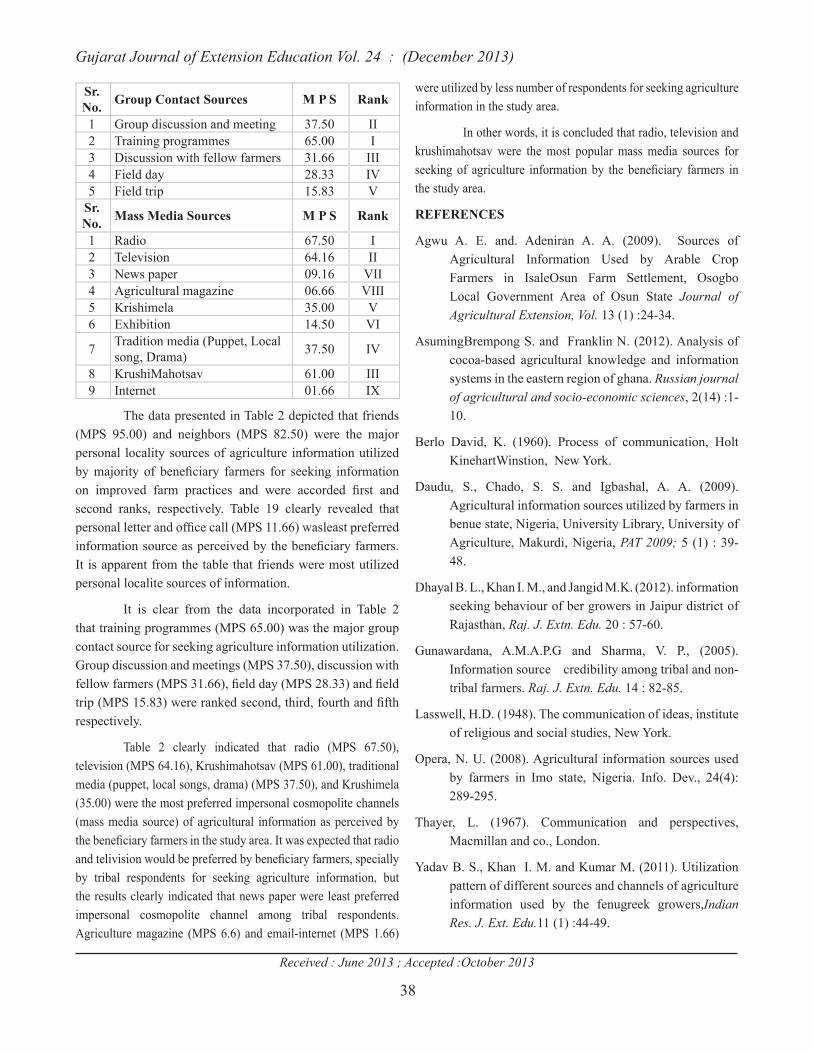
Gujarat Journal of Extension Education Vol. 24 : (December 2013)
38
Sr. No. Group Contact Sources M P S Rank
1 Group discussion and meeting 37.50 II2 Training programmes 65.00 I3 Discussion with fellow farmers 31.66 III4 Field day 28.33 IV5 Field trip 15.83 V
Sr. No. Mass Media Sources M P S Rank
1 Radio 67.50 I2 Television 64.16 II3 News paper 09.16 VII4 Agricultural magazine 06.66 VIII5 Krishimela 35.00 V6 Exhibition 14.50 VI
7 Tradition media (Puppet, Local song, Drama) 37.50 IV
8 KrushiMahotsav 61.00 III9 Internet 01.66 IX
The data presented in Table 2 depicted that friends (MPS 95.00) and neighbors (MPS 82.50) were the major personal locality sources of agriculture information utilized bymajority of beneficiary farmers for seeking informationon improved farm practices and were accorded first andsecond ranks, respectively. Table 19 clearly revealed that personalletterandofficecall(MPS11.66)wasleastpreferredinformationsourceasperceivedbythebeneficiaryfarmers.It is apparent from the table that friends were most utilized personal localite sources of information.
It is clear from the data incorporated in Table 2 that training programmes (MPS 65.00) was the major group contact source for seeking agriculture information utilization. Group discussion and meetings (MPS 37.50), discussion with fellowfarmers(MPS31.66),fieldday(MPS28.33)andfieldtrip(MPS15.83)wererankedsecond,third,fourthandfifthrespectively.
Table 2 clearly indicated that radio (MPS 67.50), television (MPS 64.16), Krushimahotsav (MPS 61.00), traditional media (puppet, local songs, drama) (MPS 37.50), and Krushimela (35.00) were the most preferred impersonal cosmopolite channels (mass media source) of agricultural information as perceived by thebeneficiaryfarmersinthestudyarea.Itwasexpectedthatradioandtelivisionwouldbepreferredbybeneficiaryfarmers,speciallyby tribal respondents for seeking agriculture information, but the results clearly indicated that news paper were least preferred impersonal cosmopolite channel among tribal respondents. Agriculture magazine (MPS 6.6) and email-internet (MPS 1.66)
were utilized by less number of respondents for seeking agriculture information in the study area.
In other words, it is concluded that radio, television and krushimahotsav were the most popular mass media sources for seekingof agriculture informationby the beneficiary farmers inthe study area.
REFERENCES
Agwu A. E. and. Adeniran A. A. (2009). Sources of Agricultural Information Used by Arable Crop Farmers in IsaleOsun Farm Settlement, Osogbo Local Government Area of Osun State Journal of Agricultural Extension, Vol. 13 (1) :24-34.
AsumingBrempong S. and Franklin N. (2012). Analysis of cocoa-based agricultural knowledge and information systems in the eastern region of ghana. Russian journal of agricultural and socio-economic sciences, 2(14) :1-10.
Berlo David, K. (1960). Process of communication, Holt KinehartWinstion, New York.
Daudu, S., Chado, S. S. and Igbashal, A. A. (2009). Agricultural information sources utilized by farmers in benue state, Nigeria, University Library, University of Agriculture, Makurdi, Nigeria, PAT 2009; 5 (1) : 39-48.
Dhayal B. L., Khan I. M., and Jangid M.K. (2012). information seeking behaviour of ber growers in Jaipur district of Rajasthan, Raj. J. Extn. Edu. 20 : 57-60.
Gunawardana, A.M.A.P.G and Sharma, V. P., (2005). Information source credibility among tribal and non-tribal farmers. Raj. J. Extn. Edu. 14 : 82-85.
Lasswell, H.D. (1948). The communication of ideas, institute of religious and social studies, New York.
Opera, N. U. (2008). Agricultural information sources used by farmers in Imo state, Nigeria. Info. Dev., 24(4): 289-295.
Thayer, L. (1967). Communication and perspectives, Macmillan and co., London.
Yadav B. S., Khan I. M. and Kumar M. (2011). Utilization pattern of different sources and channels of agriculture information used by the fenugreek growers,Indian Res. J. Ext. Edu.11 (1) :44-49.
Received : June 2013 ; Accepted :October 2013

Gujarat Journal of Extension Education Vol. 24 : (December 2013)
39
INTRODUCTION
Dairy farming is an integral part of the rural agriculturaleconomy.Theword“training”, isacceptedasa synonym for all of the forms of knowledge, skill, and attitudinal development which one need to keep pace with the accelerating life involvement and the enlarging concepts of man’s capabilities. Training need in dairy farming practices like breeding, feeding, fodder, management, animal health care, are necessary to improve the productivity of dairy cattle and thereby making dairy-farming a more profitable enterprise. However, the training need in dairyfarming practices by the cattle owners does not appear to be satisfactory. Dairy industry is toward modernization since last three decades. However, the livestock production and productivity is yet to be boosted to meet the felt need.
After several years of planning the picture in the area of the milk production is not so good. In fact, in India the milk production is carried out still in a traditional way. There is a considerable gap between the present practices of dairy farming and available dairy farming technologies. Their feeding, breeding, health coverage, hygienic milk production practices etc., require some technological
changes to make dairy industry a sustainable one in modern era. Therefore research study entitled “Trainingneed assessment in dairy farming among farm women of adopted villages under RKVY project” was under taken with following objectives :
To determine the training needs of dairy farm women in dairy farming practices.
METHODOLOGY
The RKVY project is an operation in sixteen villages of Dantiwada block of Banaskantha district. All the villages were selected purposively. One hundred and fourteen dairy farm women were selected in proportion with number of dairy farm women at random. An interview schedule was prepared for data collection and respondents were interviewed personally.
RESULTS AND DISCUSSION
Training needs in breeding practices
The milk production depends largely on type of breed and breeding practices. The data presented in Table 1 indicate that according to the need hierarchy, the respondents
Training Need of Dairy Farm Women in Dairy Farming Practices
R. N. Patel1, V. T. Patel2 and M. M. Prajapati3
1 Senior Research Assistant, KVK, SDAU, Deesa2 Asso. Prof. Dept of Ext. Edu., CPCA, SDAU, Sardarkrushinagar
3 Ph.D Scholar, Dept. of Ext. Edu., CPCA, SDAU, SardarkrushinagarE-mail: [email protected]
ABSTRACT
Rural women play a great role in decision making process of farm matter, perform many of the farm operations and undertake many responsibilities concerning care and management of farm animals. Therefore research study entitled “Train-ing need assessment in dairy farming among farm women of adopted villages under RKVY project was under taken with an objectives to assess to determine the training need of dairy farm women in dairy farming practices. On the basis of mean score obtained for various areas under study show that farmers have shows interest in training regarding breeding, feeding, management, fodder production where as they shown less interest in animal health care practices as it is highly technical in nature and require expert advice.
Keyword : Training, Breeding, Feeding, Management, Dairy farming, Dairy farm women

Gujarat Journal of Extension Education Vol. 24 : (December 2013)
40
assignedfirstrankto‘selectionofbreed’(2.58meanscore)followed by ‘selection of adult and dairy heifer’ (1.96 mean score) and ‘heat detection’ (1. 92 mean score), respectively. The sub-items vis., ‘rearing the calves’ (1.73 mean score), ‘reproductiveefficiencyofdairyanimal’(1.64meanscore),and ‘pregnancy diagnosis’ (1.61 mean score) were ranked as fourth,fifthandsixth.
Table 1: Training need of the dairy farm women with respect to breeding practices n=140
Sr. No Sub – items of training Mean
score Rank
1 Selection of breed 2.58 I
2 Selection of adult animal and dairy heifer
1.96 II
3 Breeding programme 1.36 VII
4 Reproductiveefficiencyofdairy animal
1.64 V
5 Heat detection 1.92 III
6 Artificialinsemination 1.27 VIII
7 Pregnancy diagnosis 1.61 VI
8 Post – partum coverage 1.12 XI
9 Rearing the calves 1.73 IV
Remaining sub-items of the feeding practices were perceived by the dairy farm women as less important as their mean scores were less than 1.50.
Training need in feeding practices
Feeding practices play a vital role in dairy farming as feeds affect milk production. So far as training needs in this aspect are concerned, some of the items are utmost important. The data depicted in Table 2 reveal that according to the need hierarchy, the highest mean score for training as desired by dairy farm women was feeding schedule of pregnantanimal(2.16meanscore)rankedfirstfollowedbytime and frequency of feeding (1.90 mean score) and feeding schedule of dry animal (1.77 mean score ), respectively.
The mean score for the sub- items compounded homemade livestock feed and manufactured by district union was 1.72 and 1.69 respectively.
Table 2: Training need of the dairy farm women with respect to feeding practices n=140
Sr. No
Sub – items of training Mean score
Rank
1 Selection of feed 47 VI2 Feeding schedule of young calves 47 VI3 Feeding schedule of young heifer 1.55 VIII4 Feeding schedule of pregnant animal 2.16 I5 Feeding schedule of dry animal 1.77 III6 Feeding of milch animal 1.45 IX7 Time and frequency of feeding 1.90 II8 Advantage of compounded
(a) Home made 1.72 IV(b) Manufactured by district unions 1.69 V
Training need in fodder production
Fodder crops are the important sources of animal food supply. The data presented in Table 21 reveal that, among the various sub-items of fodder production, ‘silage making’ wasthemostimportantitemandrankedfirstbyrespondentsfor the purpose of training. The mean score for this aspect was 2.94. The second rank was assigned by the respondents to the sub-area of ‘selection of fodder crops’ with a mean score of 1.37. The mean scores for the sub-items cultivation of fodder crops, selection of varieties of fodder crops and drying of fodder crops 1.30, 1.25 and 1.22 respectively. Thus, it can be concluded that ‘silage making’ was the major area in which respondents asked for training.
Table 3: Training need of the dairy farm women with respect to fodder production n=140
Sr. No
Sub – items of training Mean score
Rank
1 Selection of varieties of fodder crops
1.25 IV
2 Selection of fodder crops 1.37 II3 Cultivation of fodder crops 1.30 III4 Drying of fodder crops 1.22 V5 Silage making 2.94 I
Training need in management practices
Management practice is one of the important aspects of dairy farming. The data presented in Table 4 revealed that among the various sub-items of management practices, raisingthereplacementstockathomeby‘artificialsystem’wasthemostimportantareasrankedfirstbytherespondent
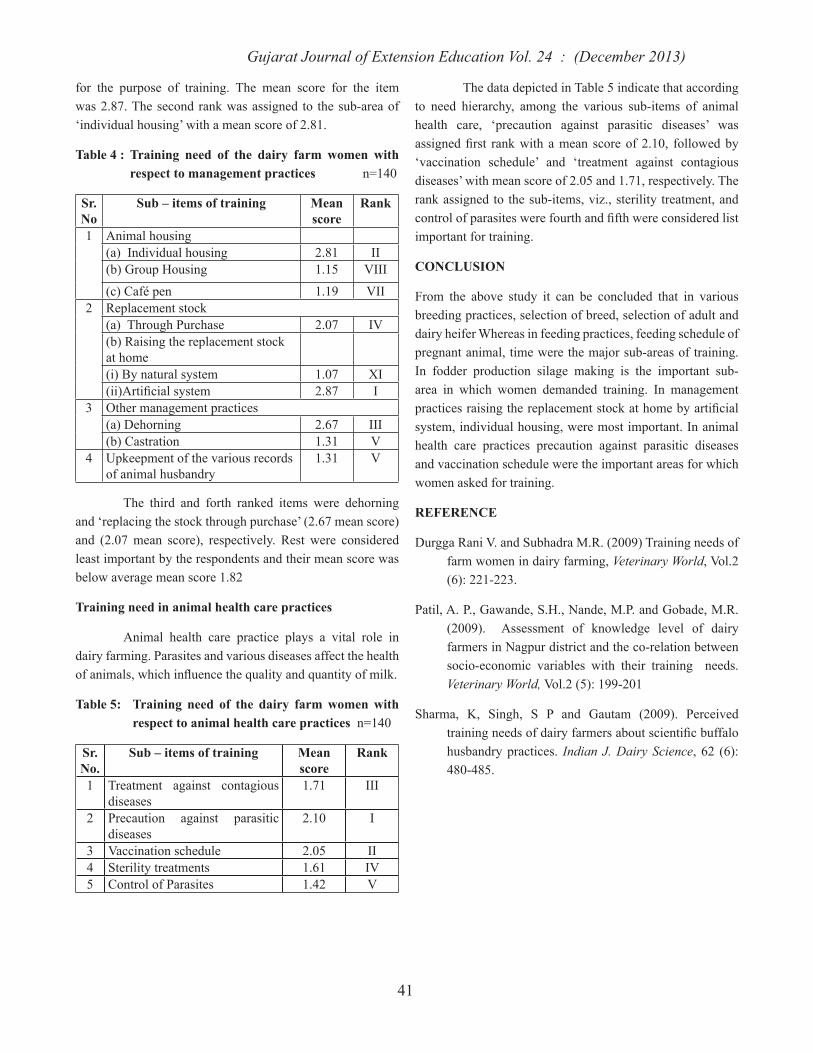
Gujarat Journal of Extension Education Vol. 24 : (December 2013)
41
for the purpose of training. The mean score for the item was 2.87. The second rank was assigned to the sub-area of ‘individual housing’ with a mean score of 2.81.
Table 4 : Training need of the dairy farm women with respect to management practices n=140
Sr.No
Sub – items of training Mean score
Rank
1 Animal housing(a) Individual housing 2.81 II(b) Group Housing 1.15 VIII
(c) Café pen 1.19 VII2 Replacement stock
(a) Through Purchase 2.07 IV(b) Raising the replacement stock at home(i) By natural system 1.07 XI(ii)Artificialsystem 2.87 I
3 Other management practices(a) Dehorning 2.67 III(b) Castration 1.31 V
4 Upkeepment of the various records of animal husbandry
1.31 V
The third and forth ranked items were dehorning and ‘replacing the stock through purchase’ (2.67 mean score) and (2.07 mean score), respectively. Rest were considered least important by the respondents and their mean score was below average mean score 1.82
Training need in animal health care practices
Animal health care practice plays a vital role in dairy farming. Parasites and various diseases affect the health ofanimals,whichinfluencethequalityandquantityofmilk.
Table 5: Training need of the dairy farm women with respect to animal health care practices n=140
Sr.No.
Sub – items of training Mean score
Rank
1 Treatment against contagious diseases
1.71 III
2 Precaution against parasitic diseases
2.10 I
3 Vaccination schedule 2.05 II4 Sterility treatments 1.61 IV5 Control of Parasites 1.42 V
The data depicted in Table 5 indicate that according to need hierarchy, among the various sub-items of animal health care, ‘precaution against parasitic diseases’ was assignedfirst rankwith amean scoreof2.10, followedby‘vaccination schedule’ and ‘treatment against contagious diseases’ with mean score of 2.05 and 1.71, respectively. The rank assigned to the sub-items, viz., sterility treatment, and controlofparasiteswerefourthandfifthwereconsideredlistimportant for training.
CONCLUSION
From the above study it can be concluded that in various breeding practices, selection of breed, selection of adult and dairy heifer Whereas in feeding practices, feeding schedule of pregnant animal, time were the major sub-areas of training. In fodder production silage making is the important sub-area in which women demanded training. In management practicesraisingthereplacementstockathomebyartificialsystem, individual housing, were most important. In animal health care practices precaution against parasitic diseases and vaccination schedule were the important areas for which women asked for training.
REFERENCE
Durgga Rani V. and Subhadra M.R. (2009) Training needs of farm women in dairy farming, Veterinary World, Vol.2 (6): 221-223.
Patil, A. P., Gawande, S.H., Nande, M.P. and Gobade, M.R. (2009). Assessment of knowledge level of dairy farmers in Nagpur district and the co-relation between socio-economic variables with their training needs. Veterinary World, Vol.2 (5): 199-201
Sharma, K, Singh, S P and Gautam (2009). Perceived trainingneedsofdairyfarmersaboutscientificbuffalohusbandry practices. Indian J. Dairy Science, 62 (6): 480-485.

Gujarat Journal of Extension Education Vol. 24 : (December 2013)
42
Development of Scale to Measure Attitude of Farmers towards Murrah Buffalo
B. M. Patel1, J. K. Patel2, J. B. Patel3 and N. B. Chauhan4
1 Professor, 3 Associate Professor and 4 Professor & HeadDepartment of Extension Education, BACA, AAU, Anand -388 110
2 Associate Professor, SMC College of Dairy Science, AAU, Anand -388 110e-mail: [email protected]
ABSTRACT
Due to non-availability of a proper scale to measure farmers’ attitude towards murrah buffalo in middle Gujarat region, it was thought necessary to construct a scale for the purpose. Keeping this in view, an attempt has been made to develop a scale for measuring the attitude of farmers. The technique chosen to develop the attitude scale was of “Scale Product Method” which combines the Thurston’s (1946) technique of Equal Appearing Interval Scale for selection of the items and Likert’s techniques of summated rating for ascertaining the response on the scale.
Keywords: Attitude, Murrah buffalo, Continuum, Reliability, Validity
INTRODUCTION
Attitudehasbeendefinedas“thedegreeofpositiveor negative feeling, affect, opinion, action and belief associated with some psychological object”. Psychological object may be any symbol, institution, person, phrase, slogan, idea or ideal towards which people may differ from each other with respect to positive or negative aspect. The cognitive component of an attitude consists of the beliefs, which involves attributes like favorable or unfavorable, desirable or undesirable, good or bad etc. The feeling component refers to the emotions which give attitude a motivating character or action tendencies. The action tendency component of an attitude includes all behavioral readiness associated with it. These three components of attitude, are, however, consistently related to each other. The psychological object for the present study has been conceptualized as the rearing of murrah buffalo.
METHODOLOGY
Among the techniques available for construction of scale, the methodology suggested by Likert (1932) and Edward (1957) was used in this study for scale construction and for ascertaining the response of the scale. The technique chosentoconstructtheattitudescalewasof“ScaleProductMethod” which combines the Thurston’s (1946) technique of Equal Appearing Interval Scale for selection of the items and
Likert’s techniques of summated rating for ascertaining the response on the scale.
Item collection
The items making up an attitude scale are known as statements. A statement may be defined as anythingthat is said about a psychological object.As a first step inthe developing the attitude scale towards murrah buffalo a number of statements about murrah buffalo were gathered from the relevant literature, veterinarian, researchers, extension personals and officials of veterinary departmentwho were directly or indirectly exposed to such knowledge system.
Editing of items
The collected statements were edited in the light of the criteria suggested by Thurstone and Chave (1929) and Edward and Kilpatrick (1948). At last, 21 statements were selected as they were found to be non-ambiguous.
Judges rating of attitude statements
Inorder to judge thedegreeof“Unfavorableness”to “Favorableness” of each statement on the five pointequal appearing interval continuum a panel of 50 judges was selected. The judges selected for the study comprised extension educationist, horticulturist, and statisticians with considerable practical experience in animal husbandry from

Gujarat Journal of Extension Education Vol. 24 : (December 2013)
43
theAnandAgriculturalUniversityandofficialsofveterinarydepartment, Anand. The judges were visited personally along with letter of instructions to guide them for rating the statements in desired manner for each set of the statements.
Determination of scale and quartile value
The five points of the rating scale were assigned, rangingfrom 1 for most unfavorable and 5 for most favorable. On the base of judgment, the median value of the distribution, and the Q value for the statement concerned was calculated, the inter-quartile range for each statement was also worked out for determination of ambiguity involved in the statement from the following formula.
Where,
S = Median or Scale value of statement
L = Lower limit of the interval in which the 50th centile falls
= Sum of the proportion below the interval in which the 50th centile falls
Pw = Proportion within the interval in which the 50th centile falls
i = Width of the interval, which was assumed as equal to 1.0
Thurstone and Chave (Edwards, 1957) used the inter-quartile range Q as a means of the variation of the distribution of the judgments for a given statement. To determine value of Q, two other point were measured, the 75th centile and 25th centile. The 25th centile was obtained by the following formula:
C25
Where,
S = Median or Scale value of statement
L = Lower limit of the interval in which the 25th centile falls
= Sum of the proportion below the interval in which the 25th centile falls
Pw = Proportion within the interval in which the 25th centile falls
i = Width of the interval, which was assumed as equal to 1.0
C75
Where,
S = Median or Scale value of statement
L = Lower limit of the interval in which the 75th centile falls
= Sum of the proportion below the interval in which the 75th centile falls
Pw = Proportion within the interval in which the 75th centile falls
i = Width of the interval, which was assumed as equal to 1.0
Then the interquartile range or Q value was obtained by taking the difference between C75 and C25 thus,
Q = C75 - C25
Final statements for attitude scale
When there was a good agreement among the judges, in judging the degree of agreement or disagreement of a statement, Q was smaller compared to the value obtained, when there was relatively little agreement among the judges it was reverse. Only those items were selected whose median (scale) values were greater than Q values. However, when a few items had the same scale values, items having lowest Q value were selected. Based on the median and Q values 7 statementswerefinallyselected toconstituteattitudescale.The scale values were ranging from 1.60 to 3.85 with 0.5 class intervals.
Reliability of the scale
A scale is reliable when it consistently produces the same result when applied to the same sample. In the present study, split-half method of testing reliability was used. The 7 statements were divided into two halves with four odd numbered in one half and other three even numbered statements in the other. These were administered to 20 respondents. Each of the two sets of the statements was treated as a separate scale and then these two sub-scales were correlated.The co-efficient of reliabilitywas calculated bythe Rulon’s formula (Guilford, 1954), which came to 0.78.
Content validity of the scale
Validity of the scale examined for content validity by determining how well content were selected by discussion with specialist, extension academicians, etc. thus, the present scalesatisfiedthecontentvalidity.

Gujarat Journal of Extension Education Vol. 24 : (December 2013)
44
Scoring system
Theselected7statementsforthefinalformatoftheattitude scale are randomly arranged to avoid response biases, which might contribute to low reliability and detraction from validityofthescale.Theresponsescanbecollectedonfive
point continuums viz., strongly agree, agree, undecided, disagree and strongly disagree with respective weights of 5, 4, 3, 2, and 1 for the favorable statements and with the respective weights of 1, 2, 3, 4, and 5 for the unfavorable statements.
No Statements SA A UD DA SDA1 I believe that Murrah Buffalo is good quality milch animal. (+)2 I think that Murrah Buffalo is not viable for small farmers. (-)3 There is more propaganda about Murrah buffalo but in reality it is not so. (-)4 I think that Murrah buffalo is most suitable for all types of the farmers. (+)5 I like Murrah Buffalo because this breed gives high milk at the cost of less fodder. (+)6 The most successful animal keeper is one, who keeps Murrah Buffalo. (+)7 I believe that Murrah buffalo is most potential breed in term of productivity of milk. (+)
SA=Strongly Agree A=Agree UD=Undecided DA=Disagree SDA=Strongly Disagree
REFERENCES
Edward, A. L. (1957). Techniques of attitude scale construction. Vakils, Feffer and Simons Pvt. Ltd. Bombay -1.
Guilford, J. P. (1954). Psychometric methods. Tata McGraw hill publishing Co., Bombay, 597.
Likert, R. A. (1932). A technique for the measurement of attitude scales. Arch. Psychol. New York, No.140.
Thurstone, L. L. (1946). The measurement of attitude, American J. Soci., Chicago Univ. Chicago Press, 39-50.
Received : May 2013 ; Accepted : October 2013

Gujarat Journal of Extension Education Vol. 24 : (December 2013)
45
Correlets of Attitude towoards Poultry Farmers about Poultry Technology
T. R. Patel1, J. K. Patel2, Kalpesh Chaudhary3 and J B Patel4
1 Ph.D. Scholar, Department of Extension EducationB. A. College of Agriculture, Anand Agricultural University, Anand
2 Associate Professor, Dairy Vigyan KendraSheth M. C. College of Dairy Science, Anand Agricultural University, Anand
3 Ph.D. Scholar, Department of Extension Education, SDAU, Sardarkrushinagar 4 Associate Professor, Department of Extension Education
B. A. College of Agriculture, AAU, AnandEmail : [email protected]
ABSTRACT
This present study was carried out in Anand district of Gujarat state. Anand district comprises of eight talukas. Out of these, two talukas viz, Anand (97 poultry unit) and Petlad (23 poultry unit) having maximum poultry unit were selected. Two third poultry farmers having at least three years of experience in operating poultry enterprise from each selected taluka were selected randomly. Thus, 65 poultry farmers from Anand and 15 from Peltad talukas were selected in this study. Thus total 80 poultry farmers were selected and considered as respondents with specific objectives to study the correlates of attitude towards poultry farmers, revealed that slightly more than two-third (66.25 per cent) of the poultry farmers had favourable attitude towards poultry farming, followed by 27.50 per cent, 3.75 per cent and 2.50 per cent of them had neutral, unfavourable and most favourable attitude towards poultry farming. The study also shows that variables like, age, education, caste, competition orientation, market orientation, extension contact, risk orientation, innovation proneness, scientific orientation, achievement motivation, Ability to co-ordinate activities, economics motivation, self confidence, decision making ability and planning orientation pattern having close association with correlates of attitude towards poultry farmers in study area.services worldwide. If women had better access to farm land, fertilizer and agricultural training, technology, financial services, education and markets women could increase agricultural production and reduce the number of hungry people worldwide. This study discusses the empowerment of women through agriculture. It stresses on various techniques of motivating women to take farming as profession. It also comes up with future strategies to make women a more active part of important farm decisions both at the household and legislature level.
Keywords: Attitude, Poultry farmers
INTRODUCTION
India is predominantly an agricultural country, as more than 72.2 per cent of its population is living in villages and majority of them are engaged in agricultural enterprise. In 2004, around 55.96 crores population was found engaged in agriculture which accounts for 51.76 per cent of country’s total population. Agriculture is the backbone of India and during the past four decades; spectacular progress has been
achieved in agricultural production and productivity, which has been well chronicled and universally recognized. On other hand India’s population has largely crossed one billion and by 2035 India will overtake China as the world’s most populous country in the world. While India claims self-sufficiency inproductionof grains, two-thirdof the Indianchildren under the age of 5 is malnourished. The eggs, chicken and meat are rich sources of animal protein, vitamins

Gujarat Journal of Extension Education Vol. 24 : (December 2013)
46
and minerals. Chicken is the most widely accepted meat in India. Unlike beef or pork, it does not have a much religious taboo. The prices of chicken meat are lower than those of mutton or goat meat. Many Indian families, especially, the educated people in urban areas have begun to accept eggs as a regular supplemental part of their vegetarian diet. The forecast surveys indicate that the present younger generation goes to the adulthood, the acceptability and demand for eggs and chicken meat in next two to three decades is likely to increase many-folds. In the last three decades, poultry has made tremendous strides particularly in the private sector, withtheresultthatIndiaisnowself-sufficientwithregardtorequirements of high quality breeding stocks, modern poultry equipment and availability of medicines, vaccines and technicallyqualifiedskilledmanpower.Thus,Poultryfarminginruralareasmayplayasignificantroleinthefightagainstmalnutrition, income generation and livelihood improvement among the rural masses of our country. The importance of poultry sector in solving the problems of unemployment and underemployment is well conceived by policy makers and administrators involved in the developmental programs. Among the livestock enterprise, poultry farming requires smaller capital investment and quick and better returns. Keeping in view present study was conducted with following objectives:
1 To study the attitude of the poultry farmers.
2 Tostudytherelationshipbetweenprofileofthepoultryfarmers and their attitude.
METHODOLOGY
Present study was carried out in Anand district of Gujarat state. Anand district comprises of eight talukas. Out of these, two talukas viz, Anand (97 poultry unit) and Petlad (23 poultry unit) having maximum poultry unit were selected. Two third poultry farmers having at least three years of experience in operating poultry enterprise from each selected taluka were selected randomly. Thus, 65 poultry farmers from Anand and 15 from Peltad talukas were selected in this study. Thus total 80 poultry farmers were selected and considered as respondents. Their responses were collected through pre-tested well structured Gujarati version interview schedule. The respondents were contacted at their home or at their poultry farm. The data of this study were collected through personal interview. The collected data wereclassified,tabulated,analyzedandinterpretedinordertomakethefindingsmeaningful.Theattitudewasmeasuredbase on assumption, null hypotheses were also formulated.
Ex-post-facto research design was applied for the study. The statisticaltoolssuchaspercentage,meanandco-efficientofcorrelation, were used.
RESULTS AND DISCUSSION
Attitude is defined as the degree of encouragingor depressing feeling of poultry farmers in the acceptance of poultry farming as an occupation. Attitude is a way of thinking, acting or feeling of a person towards a situation or cause. It is accepted fact that an attitude of an individual plays an important role in determining ones attitude.
The data regarding distribution of poultry farmers according to their attitude towards poultry farming is presented in Table 1.Table 1: Distribution of the respondents according to
their attitude towards poultry farming n=80
Sr. No. Category of attitude Frequency Per cent
1 Most unfavourable (Up to 25.20)
00.00 00.00
2 Unfavourable (25.21 to 36.20 score)
03.00 03.75
3 Neutral (36.21 to 47.20 score)
22.00 27.50
4 Favourable (47.21 to 58.20 score)
53.00 66.25
5 Most favourable (Above 58.21 score)
02.00 02.50
The data presented in Table 1 revealed that slightly more than two-third (66.25 per cent) of the poultry farmers had favourable attitude towards poultry farming, followed by 27.50 per cent, 3.75 per cent and 2.50 per cent of them had neutral, unfavourable and most favourable attitude towards poultry farming, respectively.
Hence, it can be concluded that majority (68.75 per cent) of the poultry farmers had favorable to most favorable attitude towards poultry farming as one of the major occupations.Profitismoreinthepoultryfarmingirrespectiveof different sizes of poultry farm as compared to crop farming andprofitmotivesisalwaysdeterminantfactors inshapingpositivism leads to develop favorable attitude towards poultry farming might be the possible explanation of this type of result.
This finding is in linewith the findings of Sharnappa andVeeranna (1999).

Gujarat Journal of Extension Education Vol. 24 : (December 2013)
47
Table 2 : Correlates of attitude towards of poultry farmers about Poultry technology n=80
Sr. No. Characteristics Correlation of knowledge
1 Age -0 -.202 NS2 Education 0.102 NS3 Caste 0.018 NS4 Competition
orientation0.041 NS
5 Market orientation 0.229*6 Extension contact 0.086 NS7 Risk orientation 0.347**8 Innovation
proneness0.302**
9 Scientificorientation
0.602**
10 Achievement motivation
0.111 NS
11 Ability to co-ordinate activities
0.275**
12 Economic motivation
0.012 NS
13 Selfconfidence -0 -.15614 Decision making
ability0.423**
15 Planning orientation 0.118 NS
*Significantat0.05percentlevelofprobability**Significantat0.01percentlevelofprobabilityNS=NonSignificant
It could be seen from table 2 that amongst the 15 selected variables of the poultry farmers of the study, six variables had establishedpositiveand twohadnegativeand significantlycorrelation with their attitude. Those variables that had
positiveandsignificantrelationshipweremarketorientation,riskorientation,innovationproneness,scientificorientation,Ability to co-ordinate activities and decision making ability andageandselfconfidenceofthepoultryfarmerwasfoundtobenegativelyandsignificantlycorrelated.Restvariablesviz., education, caste, competition orientation, extension contact, achievement motivation, economics motivation and planning orientation of poultry farmers failed to show any significantrelationshipwiththeirattitude.
CONCLUSION
To epitomize the results it can be said that majority (68.75 per cent) of the poultry farmers had favorable to most favorable attitude towards poultry farming. Out of fifteen variables selected for the study, six variables werefoundtohavepositiveandtwohadnegativeandsignificantcorrelation with attitude of the poultry farmers. The variables which exerted significant and positive relationship withtheir attitude were viz., market orientation, risk orientation, innovation proneness, scientific orientation, Ability to co-ordinate activities and decision making ability. Age and self confidencehadexertednegativeandsignificantcorrelation.Rest variables failed to show any significant influence onattitude.
REFERENCE
Sharnappa, G. S. and Veeranna, K. C. (1999). Attitude and adoption of the poultry management practices by the farmers of Kolar district in Karnataka. Indian J. of Poultry Sci., 34(2): 270 -273.
Received : May 2013 ; Accepted : November 2013

Gujarat Journal of Extension Education Vol. 24 : (December 2013)
48
Scale to measure Attitude of Extension Educationists towards Agricultural FM Radio
A.P. Shukla1 and N.B. Chauhan 2
1 Postgraduate Student, Extension Education, Department of Extension Edu. BACA, AAU, Anand2 Professor and Head, Department of Extension Education, BACA, AAU, Anand
Email : [email protected]
ABSTRACT
Realizing modern need of research on current topics, researchers have developed a scale to measure attitude of the extension educationists towards agricultural FM Radio. Among the techniques available for construction of scale, the methodology suggested by Likert (1932) and Edward (1957) was used in for the construction of scale and for ascertaining the response of the scale. The technique chosen to construct the attitude scale was “Scale Product Method” which combines the technique of Equal Appearing Interval Scale of Thurston (1946) for selection of the items and Likert’s techniques of summated rating for ascertaining the response on the scale. The scale contains total 10 statements viz. 1. I think AFMR (Agricultural FM Radio) has potentiality to be credible source information, 2. Addiction to AFMR can lead to wastage of productive time, 3. AFMR has potential to reach to the remote village, 4. AFMR could be misused to mislead farmers by the people with malevolent intension, 5. AFMR could be the best way to address area specific agriculture, 6. Establishment of AFMR is nothing but wastage of resources, 7. I think AFMR has potentiality to be credible source information, 8. AFMR is an individually affordable source to reach even the poorest workers in farm, 9. AFMR could be the best means to have interactive communication between developmental agencies and farmers, 10. AFMR is innovative avenue to make best use of local traditional artists in the process of agricultural development. Out of these, statements no. 2, 4 and 6 are negative and remaining are positive statements. The co-efficient of reliability was calculated by the Rulon’s formula (Guilford, 1954), which came to 0.83. The responses can be collected on five points continuum viz. strongly agree, agree, undecided, disagree and strongly disagree with respective weights of 1, 2, 3, 4 and 5 for the unfavourable statements no 2,4 and 6 and with the respective weights of 5, 4, 3, 2, and 1 for the favourable statements no 1,3,5,7,8,9 and 10.
Keywords : Attitude, FM Radio
INTRODUCTION
Currently FM radio channels provide a great opportunity for the advertisers to advertise their products and services. The FM broadcasts have already become very popular in both urban and rural markets. Nowadays, this system is more popular in entertainment and commercial industries. FM radio can be an excellent tool for agricultural communication to transfer agricultural information to the farmers. It can be used effectively to address area specificagricultural information and developmental needs of the rural India. To achieve desirable success in the implementation of FM Radio technology to strengthen agricultural communication, there was no any well developed scale available to measure such feeling. Realizing this, researchers have developed a scale to measure attitude of the extension educationists towards agricultural FM radio.
Among the techniques available for construction of scale, the methodology suggested by Likert (1932) and Edward (1957) was used in this study for scale construction and for ascertaining the response of the scale. The technique chosen to construct the attitude scale was “Scale ProductMethod” which combines the technique of Equal Appearing Interval Scale of Thurston (1946) for selection of the items and Likert’s techniques of summated rating for ascertaining the response on the scale.
Item collection
The items making up an attitude scale are known as statements. A statement may be defined as anythingthat is said about a psychological object.As afirst step inthe developing the scale, 31 statements about Agricultural FM Radio collected from the relevant literature, articles

Gujarat Journal of Extension Education Vol. 24 : (December 2013)
49
published on significance media and extension personals.The statements, thus selected were edited on the basis of the suggested criteria.
Judge’s rating of attitude statements
Inorder to judge thedegreeof“Unfavorableness”to Favorableness” of each statement on the five pointequal appearing interval continuum a panel of 50 judges
was selected. The judges selected for the study comprised extension educationists, extension personals and statisticians with considerable practical experience either as trainer, extension educationists or working experience related to extension work of the Anand Agricultural University. The judges were visited personally along with letter of instructions to guide them for rating the statements in desired manner for each set of the statements.
No. Statements SA A UD DA SDA
1 I think AFMR (Agricultural FM Radio) has potentiality to be credible source in-formation.
2 Addiction to AFMR can lead to wastage of productive time.
3 AFMR has potential to reach to the remote village.
4 AFMR could be misused to mislead farmers by the people with malevolent inten-sion.
5 AFMRcouldbethebestwaytoaddressareaspecificagriculture.
6 Establishment of AFMR is nothing but wastage of resources.
7 I think AFMR has potentiality to be credible source information.
8 AFMR is an individually affordable source to reach even the poorest workers in farm.
9 AFMR could be the best means to have interactive communication between devel-opmental agencies and farmers.
10 AFMR is innovative avenue to make best use of local traditional artists in the pro-cess of agricultural development.
Determination of scale and quartile value
The five points of the rating scale were assigned,ranging from 1 for most unfavourable and 5 for most favourable. On the base of judgment, the median value of the distribution, and the Q value for the statement concerned was calculated, the inter-quartile range (Q = Q3 – Q1) for each statement was also worked out for determination of ambiguity involved in the statement.
Final statements for attitude scale
When there was a good agreement among the judges, in judging the degree of agreement or disagreement of a statement, Q was smaller compared to the value obtained, when there was relatively little agreement among the judges it was reserved. Only those items were selected whose median (scale) values were greater than Q values. However, when a few items had the same scale values, items having lowest Q value were selected. Based on the median and Q values 10 statementswerefinally selected toconstituteattitude scale.The scale values were ranging from 1.42 to 3.35.
Reliability of the scale
A scale is reliable when it consistently produces the same results when applied to the same sample. In the present study, split-half method of testing reliability was used. The 10 statements were divided into two halves with five oddnumberedinonehalfandotherfiveeven-numberedstatementsin the other. These were administered to 25 respondents. Each of the two sets of statements was treated as a separate scale and then these two sub-scales were correlated. The co-efficientofreliabilitywascalculatedbytheRulon’sformula(Guilford, 1954), which came to 0.83.
Content validity of the scale
The validity of the scale examined for content validity by determining how well content were selected by discussion with specialists, extension academicians, etc. thus, thepresentscalesatisfiedthecontentvalidity.

Gujarat Journal of Extension Education Vol. 24 : (December 2013)
50
Scoring system
Theselected10statementsforthefinalformatoftheattitude scale are randomly arranged to avoid response biases, which might contribute to low reliability and detraction from validityofthescale.Theresponsescanbecollectedonfivepoints continuum viz. strongly agree, agree, undecided, disagree and strongly disagree with respective weights of 5, 4, 3, 2, and 1 for the favourable statements and with the respective weights of 1, 2, 3, 4 and 5 for the unfavuorable statements.
REFERENCES
Edward, A.L., 1957, Techniques of Attitude Scale Construction. Appleton Century Crofts, Inc., New York. 22-41.
Guilford, J.P., 1954, Psychometric Methods, Tata McGraw-Hill Publication Co. Ltd., Bombay, 55-60.
Likert, R.A., 1932, A Technique for the measurement of Attitude Scales, Psychology, New York, p. 140.
Thurston, L.L., 1946, The measurement of Attitude. American Journal of Sociology, Chicago University, Chicago Press
Received : November 2012 ; Accepted : September 2013

Gujarat Journal of Extension Education Vol. 24 : (December 2013)
51
ABSTRACT
Pomegranate is one of the important fruit crop of Gujarat state. Now-a-days in Gujarat, pomegranate crop is cultivated on the commercial basis and exported to various countries. In Gujarat, area under pome-granate cultivation is 4638 hectare and production is about 50255 mts. In Banaskantha district area under pomegranate cultivation was 400 hectares and production was 2600 metric tones in the year 2012. The present study was conducted in Banaskantha district of Gujarat state. Among all the talukas of Banaskantha district Palanpur and Vadagam talukas were selected purposively as they occupy higher area under pomegranate cul-tivation. Five villages having highest area under pomegranate cultivation were selected purposively from each taluka. Using proportionate random sampling technique, 120 respondents were selected. Ex-post facto research design was adopted for the measurement of psychological characteristics. The results revealed that about two-third respondents (67.50 per cent) were found having medium level of adoption of recommended pomegranate cultivation practices. Whereas age, education, knowledge, risk preference, economic motivation, scientific ori-entation, attitude and source of information were positively and significantly related with extent of adoption of pomegranate cultivation practices.
Keywords : Adoption, Adoption Quotient, Cultivation
INTRODUCTION
Agriculture is a way of life for India, as more than 70.00 per cent resides in villages and its occupation continues to be predominantly agriculture. The agricultural production of arid and semi-arid region is uncertain and unsuitable due to low and erratic rains coupled with adverse climate. Now a day in Gujarat, pomegranate crop is cultivated on the commercial basis. The pomegranate fruits are exported to various countries. The fruit processing industries, marketing facilities and post-harvest technologies are available in the state. In India production of pomegranate is nearly about 4 to 5 lakh tonnes. In Gujarat, area under pomegranate cultivation is 4638 hectare and production is about 50255 metric tonnes. In Banaskantha, area under pomegranate cultivation is 400 hectares and production is 2800 metric tonnes. The farmers in Banaskantha district face some problems and constraints in the adoption of improved package of practices of pomegranate cultivation. Hence, it is necessary to develop a suitable
strategy to overcome the constraints faced by the farmers in adoption of pomegranate technology. For this purpose, it is necessary to have a detail analysis of the constraints. If the extent of the constraints can be identified and appropriatesolutions to overcome these constraints are formulated, the area and production of the pomegranate can be increased.
OBJECTIVES
1 To find out extent of adoption of pomegranatecultivation practices by the pomegranate growers.
2 To study the relationship between selected characteristics of pomegranate growers and their extent of adoption of pomegranate cultivation practices.
METHODOLGY
The present investigation was carried out in Banaskantha district of Gujarat state. Banaskantha district is surrounded by Mehsana district in the South, Sabarkantha
Encouraging Attributes in Adoption of Pomegranate Cultivation Practices by the Pomegranate Growers
R. D. Dhandhukia1, M. M. Parjapati2, R. N. Patel3 and M. R. Prajapati4
1 & 2 Ph.D. Student, Dept. of Extn. Edu., CPCA, SDAU, Sardarkrushinagar3 Senior Research Assistant, KVK, SDAU, Sardarkrushinagar
4 Professior & Head, Dept. of Extn. Edu., CPCA, SDAU, SardarkrushinagarEmail : [email protected]

Gujarat Journal of Extension Education Vol. 24 : (December 2013)
52
district in the East, Patan district in the West and Marwar and Sirohi area of the Rajasthan state in the North, respectively. The present study was confined to ex-post-facto researchdesign as the independent variables had already operated in the study area. Kerlinger (1976) stated that ex-post-facto research design is worthy to apply when the independent variables have already acted upon. Among the twelve talukas of Banaskantha district, Palanpur and Vadagam talukas were selected for the study because the area and production of these two taluka is higher than other talukas of the districts. Five villages having highest area under pomegranate cultivation were selected purposively from each taluka. Thus, ten villages were selected for the purpose of study. A list of the farmers having at least three years old pomegranate orchards was prepared for each village. Using proportionate random sampling technique, 120 respondents were selected.
The extent of adoption is the degree to which a person actually adopts a practice on full scale. For the purpose of measurement of extent of adoption of various recommended practices of pomegranate crop, a structured schedule was developed. A list of recommended practices to be followed in case of pomegranate crop cultivation was prepared in consultation with the literature and agricultural scientists. Respondents were asked questions to know whether they were following them or not. Each question pertaining to recommended practice was given a score of 0 and 1 for no adoption and complete adoption, respectively. A respondent’s general adoption level was determined by using adoption quotient (AQ) developed by Sengupta (1967).
Adoption Quotient =
Number of practices used
X 100Number of
Recommended practices
RESULTS AND DISCUSSION
Extent of adoption of pomegranate cultivation practices by the pomegranate growers
The “Adoption process” is the mental processthrough which an individual passes from first hearingabout innovation to its final adoption.While “adoption” isa decision to continue full use of innovation. With a view to find out extent of adoption of scientific pomegranatecultivation practices, the pomegranate growers were asked to give the information about the package of practices adopted by them. On the basis of score obtained by the respondents,
the“AdoptionQuotient”wascalculatedforeachrespondent.BasedonAdoptionQuotient,respondentswereclassifiedintothree categories.
Table 1: Distribution of the respondents according to their level of adoption quotient n=120
Sr.No. Category Number Per cent
1 Low (0 to 33.00 per cent) 11 9.17
2Medium (33.01 to 66.00 per cent)
81 67.50
3High (66.01 to 100.00 per cent)
28 23.33
The result presented in Table 1 indicate that majority (67.50 per cent) of the respondents were having medium level of adoption. On the other hand 23.33 per cent of respondents fall under the category of high level of adoption whereas only 9.17 per cent of respondents were having low level of adoption.
(A) Practice wise adoption of pomegranate cultivation practices by the pomegranate growers
Table 2: Practice wise adoption of pomegranate cultivation practices by the pomegranate growers n=120
Sr.No. Suggestions Frequency Per cent
1 Improved variety 108 90.00
2 Bahar treatment 104 86.67
3 Harvesting 98 81.67
4 Planting 97 80.83
5 Propagation 94 78.33
6 Fertilizer 87 72.50
7 Plant protection 73 60.83
8 Irrigation 68 56.67
9 Intercropping 54 45.00
The data presented in Table 2 indicated that all nine practices of pomegranate cultivation have been adopted by the pomegranate growers. Among the nine practices of pomegranate cultivation, improved variety of the pomegranate was adopted by majority of the (90.00 per cent) pomegranate growers, while bahar treatment, it was adopted by the 86.67 per cent of the respondents followed by harvesting and

Gujarat Journal of Extension Education Vol. 24 : (December 2013)
53
planting 81.67 and 80.83 per cent, respectively.
Relationship between selected characteristics of pomegranate growers and their extent of adoption of pomegranate cultivation practices
Since adoption is a mental process, the role of situation or an environment is very crucial. Behaviour takes place in situation, which has profound influence onthe individual’s action. It was therefore assumed that the adoption of pomegranate cultivation practices is governed by personal, socio-economic, psychological and communication characteristics. An attempt was therefore made to ascertain the relationship if any, between selected personal, social, psychological and communication characteristics of the respondents and their extent of adoption of scientificpomegranate cultivation practices. This was ascertained by computingco-efficientofcorrelation(‘r’value).
Table 3: Relationship between selected characteristics of the farmers and their extent of adoption of pomegranate cultivation practices n=100
Sr.No. Variables
Coefficient of correlation (‘r’ value)
I Personal1 Age -0.1052 NS2 Education 0.2915**
II Socio – Economic3 Occupation 0.0557 NS4 Size of land holding 0.0493 NS5 Social Participation 0.1107 NS
III Psychological6 Knowledge 0.2467**7 Risk preference 0.1837*8 Economic motivation 0.1880*9 Scientificorientation 0.2531**10 Attitude 0.1982*
IV Communication11 Sources of information 0.2184*
*Signficantat0.05levelofprobability *Signficantat0.01levelofprobability NS=NonSignificant
The data presented in Table 3 reveal that the value of calculated correlation coefficient was -0.1052 whichwas non-significant indicating no relationship between ageof pomegranate growers and their adoption of scientificpomegranate cultivation practices. Education of the farmers had significant relationship with extent of adoption of
pomegranate cultivation practices. The ‘r’ value being 0.2915 wasfoundpositivelysignificantat0.01levelofsignificance.It can be seen from Table 3 that occupation of the farmers hadnon-significantrelationship(‘r’=0.0557)withextentofadoption of pomegranate cultivation. It is apparent from Table 3 that calculated correlation coefficient value ‘r’ = 0.0493wasnon-significant indicating that therewasno significantrelationship between land holding of pomegranate growers and their extent of adoption of pomegranate cultivation practices. It is apparent from Table 3 that calculated correlationcoefficientvalue‘r’=0.1107wasnon-significantindicatingthattherewasnosignificantrelationshipbetweensocial participation of pomegranate growers and their extent of adoption of pomegranate cultivation practices. The data inTable3indicatethatthecalculatedcorrelationcoefficient(‘r’ = 0.2467) was positively significant at 0.01 level ofsignificance. It can be observed from Table 3 that riskpreferenceofpomegranategrowershadpositivelysignificantrelationship (‘r’ = 0.1837) with extent of adoption of pomegranate cultivation practices. It is apparent from Table 3 that calculated correlation coefficient 0.1880 was foundsignificant at 0.05 level of significance indicating positiveand significant relationship between economic motivationof pomegranate growers and their extent of adoption. It can be observed fromTable 3 that scientific orientation ofpomegranategrowershadpositiveandsignificantrelationship(‘r’=0.2531)withextentofadoptionofscientificpomegranatecultivationpracticesat0.01 levelof significance. It canbeobserved from Table 3 that attitude of pomegranate growers hadpositiveandsignificantrelationship(‘r’=0.1982)whichextent of adoption of scientific pomegranate cultivationpracticesat0.05levelofsignificance.ThedatapresentedinTable3indicatethatthecalculatedcorrelationcoefficient(r=0.2184)wassignificantat0.05levelofsignificance.
CONCULSION
It can be concluded that majority (67.50 per cent) of the respondents were having medium level of adoption and all nine practices of pomegranate cultivation have been adopted by the pomegranate growers. Among the nine practices of pomegranate cultivation, improved variety of the pomegranate was adopted by majority of the (90.00 per cent) pomegranate growers, while bahar treatment was adopted by the 86.67 per cent of the respondents followed by harvesting and planting 81.67 and 80.83 per cent, respectively.
It was also concluded that education (0.2915**), knowledge (0.2467**), risk preference (0.1837*), economic

Gujarat Journal of Extension Education Vol. 24 : (December 2013)
54
motivation (0.1837*), scientific orientation (0.1880*),attitude (0.1982*) and sources of information (0.2184*) of the farmers had significant relationship with extent ofadoption of pomegranate cultivation practices. Similarly age, occupation,landholdinghadnon-significantrelationshipwithextentofadoptionofpomegranatecultivation.Nosignificantrelationship between social participation of pomegranate growers and their extent of adoption of pomegranate cultivation practices.
REFERENCES
Pandya, S.P. (2004). Extent of adoption of datepalm cultivation technology by the farmers of Kachchh district of Gujarat State. M.Sc. (Agri.) Thesis (Unpublished).
Sardarkrushinagar Dantiwada Agricultural University, Sardarkrushinagar.
Patel, D.B. (2004). Adoption of kagzi lime production technology by the farmers of the Mehsana district of Gujarat state. M.Sc. (Agri.) Thesis (Unpublished). Sardarkrushinagar Dantiwada Agricultural University, Sardarkrushinagar.
Vihol, D.P. (2002). Agricultural progressiveness of the farmers with respect to kagzi lime cultivation. M.Sc. (Agri.) Thesis (Unpublished). Gujarat Agricultural University, Sardarkrushinagar.
Received : January 2013 ; Accepted : August 2013

Gujarat Journal of Extension Education Vol. 24 : (December 2013)
55
Tool to Measure Attitude towards Computer Application
P. J. Joshi1 and N. B. Chauhan2
1Planningofficer,OfficeoftheDirectorofResearch,AAU,Anand2 Professor and Head, Dept of Extn. Edu., BACA, AAU, Anand
Email. : [email protected]
ABSTRACT
Realizing modern need of research on current topics, researchers have developed a scale to measure attitude of the extension educationists towards computer applications. Among the techniques available for construction of scale, the methodology suggested by Likert (1932) and Edward (1957) was used in for the construction of scale and for ascertaining the response of the scale. The technique chosen to construct the attitude scale was “Scale Product Method” which combines the technique of Equal Appearing Interval Scale of Thurston (1946) for selection of the items and Likert’s techniques of summated rating for ascertaining the response on the scale. The scale contains total 14 statements viz. 1. Computer helps in creating desire among agricultural learners to learn new subjects, 2. Use of Computer in agricultural extension education is wastage of money, 3. Anyone can learn to use a computer if they are patience and motivated, 4. I get a declining feeling when I think of trying to use a computer for extension education, 5. Computer application is useful to show demonstrated way of doing thing, 6. I avoid computers because they are unapproachable to extension education, 7. Computer presentation helps in explaining complicated topics in agricultural education, 8. I prefer getting information from a printed page instead of a computer screen, 9. The challenge of learning about computers for extension is exciting, 10. I like to do as little work with computers as possible related to extension education, 11. Gathering useful data for extension work can be simplified by using computers, 12. Computer application is not possible in agricultural extension education, 13. I am sure that with time and practice I will be as comfortable as I am in working by hand for extension education and 14. The frustration created by computer application in extension education is more troublesome than its significance. Out of these, statements no. 2, 4,6,8,10,12 and 14 are negative or unfavourable and remaining are positive or favourable statements. The co-efficient of reliability was calculated by the Rulon’s formula (Guilford, 1954), which came to 0.8721. The responses can be collected on five points continuum viz. strongly agree, agree, undecided, disagree and strongly disagree with respective weights of 1, 2, 3, 4 and 5 for the unfavourable statements no 2,4 and 6 and with the respective weights of 5, 4, 3, 2, and 1 for the favourable statements no 1,3,5,7,8,9,11 and 13.
Keywords: Computer application, Attitude scale
INTRODUCTION
Attitude refers to the degree of positive or negative feelings of an individual associated with any object (Thurstone, 1946). The introduction of computer application in the field of education, extension education and researchhas completely changed the conventional way of teaching and learning by modifying and making the enormous use of computer. In order to make the best use of our resources, it is essential that all persons engaged in such enterprise and especially the extension educationists should understand
adequately the dynamics and mechanism of computer application and provide the best possible services to the clients. Thus measuring their attitude towards computer application is very much needed. As there is no suitable tool available to measure this, the investigators decided to construct and standardize a scale to measure the extension educationists’ attitude towards computer application. In the present study, attitude has been conceptualized as positive or negative feelings of extension educationists towards computer and value of its applications.

Gujarat Journal of Extension Education Vol. 24 : (December 2013)
56
METHODOLOGY
To measure attitude scale towards computer application, researcher had developed and standardized attitude scale adopting appropriate statistical procedure. Among the techniques available, researcher used ‘Scale product method’ which combines the Turnstone’s Technique of equal appearing interval scale for selection of items and Likert’s Technique of summated rating for ascertaining the response on the scale as proposed by Eysenck and Crown (1949). To develop the attitude scale following procedure was used.
Item collection
The items of attitude scale are called statements. At the initial stage of developing the scale, 56 statements reflecting feelings of the extension educationists towardscomputer application were collected from relevant literature and discussion with experts of extension personnel. To decide relevancy a list of the statements was sent to 50 judges. They were requested to give response in terms of ‘relevant’ or ‘non-relevant’ for each statement included in the list. The responses for all the statements were collected personally and their relevancy in percentage was calculated. Primarily 50 statements which were found relevant to include in the attitude scale by more than 90 per cent of the experts were selected for the further procedure. Thereafter these statements were edited according to the criteria suggested by Edward (1957). From the 50 primarily selected statements, 41 unambiguous and non-factual statements were selected.
Item analysis
In order to judge the degree of importance of each statement more critically a panel of other judges was selected and their opinion was collected in terms of relevance ofeachstatementonthefivepointsequalappearingintervalcontinuum from ‘Fully Agree’ to ‘Fully Disagree’. 75 slips of the selected statements were handed over to the experts working in Department of Extension Education, Extension Education Institute, Directorate of Extension Education, Department of Statistics, Department of Economics, IT centre and other centers of Anand Agricultural University. Out of 75 experts, 50 experts returned list of the statements with their judgment, which was considered for the next step of analysis.
Determination of scale values
The five points of the rating scale wereassigned score ranging from 1 for fully disagreement and 5 for fully agreement. Based on judgment, the median value of the distribution and the Q value for the statement concerned were calculated with the help of following formula.
Where,
S = The median or scale value of the statement
L = Lower limit of the interval in which the median falls
= The sum of proportion below interval in which median falls
Pw = The proportion within the interval in which median falls
i = The width of the interval and is assumed to be equal to 1.0.
The inter-quartile range (Q = Q3 - Q1) for each statement was worked out for determination of ambiguity involved in the statements. Only those statements were selected, which median values were greater than Q value. Thurstone and Chave (Edwards, 1957) described criteria in addition to Q as a basis for rejecting statement in scales constructed by the method of the equal appearing interval. Accordingly when a few items had the same scale values, the item having lowest Q values were selected. Based on the scale values or say median and Q values, following 14 statementswere finally selected to constitute attitudescale.
The selected 14 statements for final format of theattitude scale were randomly arranged to avoid response bias. Against each of 14 statements, there were fivecolumns, representingafivepointcontinuumofagreementor disagreement to the statements as adopted by Likert (1932). The five points continuum were strongly agree,agree, undecided, disagree and strongly disagree with weight of 5, 4, 3, 2 and 1, respectively for favourable or positive statements and with weight of 1, 2, 3, 4 and 5, respectively forunfavourableornegativestatements.Thefinalformatofthe scale is presented above.

Gujarat Journal of Extension Education Vol. 24 : (December 2013)
57
Final statements for the development of Attitude scale towards computer application
No Statement SA A UD DA SDA1 Computer helps in creating desire among agricultural learners to learn new subjects.
(+)2 Use of Computer in agricultural extension education is wastage of money. (-)3 Anyone can learn to use a computer if they are patience and motivated. (+)4 I get a declining feeling when I think of trying to use a computer for extension
education. (-)5 Computer application is useful to show demonstrated way of doing thing. (+)6 I avoid computers because they are unapproachable to extension education. (-)7 Computer presentation helps in explaining complicated topics in agricultural
education. (+)8 I prefer getting information from a printed page instead of a computer screen. (-)9 The challenge of learning about computers for extension is exciting. (+)10 I like to do as little work with computers as possible related to extension education. (-)11 Gatheringusefuldataforextensionworkcanbesimplifiedbyusingcomputers.(+)12 Computer application is not possible in agricultural extension education. (-)13 I am sure that with time and practice I will be as comfortable as I am in working by
hand for extension education. (+)14 The frustration created by computer application in extension education is more
troublesomethanitssignificance.(-)SA=Strongly Agree A=Agree UD=Undecided DA= Disagree SDA=Strongly Disagree
Reliability of the scale
The split-half technique was used to measure the reliability of the scale. The 14 statements were divided into two equal halves as two separate sets with 7 odd numbered and 7 even numbered statements in order. These were administered to 25 respondents. Each of the two sets was treated as separate scale and obtained two scores for both the sets from the25 respondents.Co-efficientof reliabilitybetween these two sets of score was calculated by Rulon’s Formula (Guilford 1954), which was 0.8721. This value indicates that scale is reliable.
s2 d rtt = 1 - --------- s2 t
Where,
rtt = co-efficientofreliabilitys2d = variance of those two differencess2t = variance of total score
Validity of the scale
The validity of the scale was examined for content validity determining how well content were selected by discussing it with specialists, of extension and academicians. Thus,thepresentscalesatisfiedthecontentvalidity.
Administering the scale
The final attitude scale was administered on the
selected sample of extension educationists working in SAUs of Gujarat. They were asked to express their reaction in terms of their agreement or disagreement for each item by selecting oneoffiveresponsecategories.The totalattitudescore foreach extension educationist was obtained by adding scores of all the statements based on their responses and based on mean and S.D., the respondents were grouped into three categories viz., unfavourable attitude (below mean – 0.5 S.D.), neutral attitude (between mean + 0.5 S.D.) and favourable attitude (above mean + 0.5 S.D.). Maximum score one could receive was 70 and minimum 14.
REFERENCES
Edward, A.L. (1957). Techniques of scale construction. Appeton Century Crafts Inc., New York.
Eysenck, H.J. and S. Crown.[1949]. An experimental study in pinion attitude methodology. International J. of Attitude Research. 3: 47-86.
Guliford, J. P. (1954). Psychometric Methods. Tata McGraw-Hill Publication Co. Ltd., Bombay: 378-382.
Likert, R.A. (1932). A technique for the measurement of attitude scale. Psychology, New York, PP;140.
Thurston, L. L. (1946). The Measurement of Attitude American J. of Sociology. Chicago University Press, 39-50.
Received : June 2012 ; Accepted : July 2013

Gujarat Journal of Extension Education Vol. 24 : (December 2013)
58
Evaluation of Knowledge on Nutritional Facts of Tribal Women
Dipal N. Soni1, Keshav B. Kamaliya2, J. J. Pastagia3 and P. D. Verma4
1 Subject Matter Specialist (Home Science), Krishi Vigyan Kendra, Navsari Agricultural University, Athwa Farm, Surat2 Principal, Polytechnic in Food Science and Home Economics, Anand Agricultural University, Anand - 388 110
3 Programme Coordinator, Krishi Vigyan Kendra, Navsari Agricultural University, Athwa Farm, Surat4 Subject Matter Specialist (Extension Education), Krishi Vigyan Kendra, NAU, Athwa Farm, Surat
Email : [email protected]
ABSTRACT
Rural women share abundant responsibilities in family, predominantly in food preparation. Nutritional knowledge has great importance in balance diet and fulfills specific requirements. Under nutrition is widely prevalent in the tribal areas of the country. Thus the study was conducted to assess the extent of present knowledge of tribal women about selected areas of nutritional facts. Data were collected by personal interview method. The age of the respondents were 30 to 56 years, monthly family income Rs. 1000 to 7000, belonged to nuclear and joint families equally, about quarter of women were illiterate, schooling up to primary level and secondary level each and majority were engaged in agriculture work. More than half of tribal women had medium level of knowledge about selected nutritional facts. The respondent were found the most knowledgeable about ‘Fruits and vegetables are to be consumed daily’ while the least knowledgeable about ‘Fermented foods like Khaman, Dhokala provides predominantly Vitamin-B’ and ‘Cereals provides predominantly carbohydrate’ nutritional facts. The study implies that the information on certain nutritional facts could be spread to increase the awareness about human nutrition among the tribal women for their wellbeing.
Keywords: Nutritional facts, knowledge, tribal women
INTRODUCTION
Rural women in our country share abundant responsibilities and perform a wide spectrum of duties in running the family. Prepare food for all the family member is one of the important jobs they perform (Dipal & Keshav, 2009). Thus, women play an important role in the selection, preparation and serving of food of the member of the family. Nutritional knowledge has great importance in proper managementoffood,applicationofbalancedietandspecificrequirements of people of different age groups.
Under nutrition is widely prevalent in the tribal, urban, rural and slum areas of the country, especially among vulnerable sections of the population namely pre-school, school going children, expectant and nursing women (Maya Kumari et.al. 2010).
Government has introduced many programmes like Integrated Child Development Services (ICDS), Mid-
Day School Meal (MDM) to overcome malnutrition since long. But the result is still not up to the mark. Observation clearly indicates that there is enough food available, thus malnutrition can be improved through proper education and awareness (Agha et. al., 2005).
Thus, this is high time to evaluate the present knowledge of women about human nutrition. On the basis, the result of the same some areas could be identified onwhich knowledge is to be spread among rural women that act as precautionary measures to prevent malnutrition. The resultofthestudywouldbeusefultofindouttheareasandlaid down the policies for nutrition education program to be introduced by government, non-government organizations or an institution working in this area. The present study was thus undertaken for the same purpose.
METHODOLOGY
The study was conducted in Gujarat State during

Gujarat Journal of Extension Education Vol. 24 : (December 2013)
59
January-February 2013. The selected villages come under Umarpada and Mandvi talukas of Surat District. The villages were selected using purposive sampling based on accessibility.The studywas confined to thewomenof agegroup 30 to 60 years only. Randomly 100 subjects willing to participate in the study were chosen.
A survey schedule was prepared to collect various information regarding subjects. Nutrition awareness of selected group of respondent was measured using self-developed questionnaire. The questionnaire divided into three parts, Part-A consisted of General Information, Part-B covered basic aspects of day to day food habits while knowledge on nutritional facts of food was measured using Part-C. To test the knowledge of women, a set of 15 questions of multiple choice nature related to nutritional facts of food were used. Questions emphasized on sources of nutrients. The questions were approved by the panel of experts and pre-tested on a non-sample population having similar socio-economic background.
Personal interview method was used for data collection. The variable in the study were age, education, family type, type of work, income. The data was analyzed for the percentage, mean, SD using MS-excel.
RESULTS AND DISCUSSION
The present study was conducted on hundred tribal women of different villages of two talukas of Surat district to evaluate their extent of knowledge about nutritional facts.
Socio-demographical characteristics
The entire respondents were personally contacted and asked the set of questionnaire. The responses were noted. Data generated after statistical analysis are depicted in Table 1.
The range of age of tribal women was 30 to 56 years, with an average age of 36.86±11.03 years. About half (47%) women were of young age where as nearly the same (42%) women were of middle age group. The old women were just 11%. Nuclear and joint families were almost same in number as similar to Shweta et. al. (2011). Assessment of educational status of tribal women showed that, percentage of illiterate, schooling up to primary level and secondary level were almost same and in ordinance with Aziz et. al. (2007). The family income was ranged from Rs. 1000 to 7000 per month. Half of the family had annual income up to Rs. 25,000. More than half of the subjects surveyed were engaged in agriculture work since they are having their own land. Rests
were engaged either in labor in agriculture, agriculture along with animal husbandry. Eight per cent tribal women were doingserviceandfivepercentwerestudying.
Table: 1 The Socio-demographic characteristics of the tribal women n = 100
Sr. No.
Particulars Per cent
1 Age group (years)
Young (up to 35) 47.00
Middle (36 to 50) 42 .00
Old (above 50) 11 .00
2 Education status
Illiterate 27 .00
Primary 27 .00
Secondary 22 .00
Higher Secondary 10 .00
Graduate 14 .00
3 Family Type
Joint 47 .00
Nuclear 53 .00
4 Family Income
Up to 25,000 50 .00
25,001 to 50,000 30 .00
50,001 to 75,000 11 .00
Above 75,000 01 .00
5 Occupation
Labour 07 .00
Agriculture and Animal Husbandry
12 .00
Agriculture 52 .00
Service 08 .00
Study 05 .00
Household work 16 .00
Knowledge about nutritional facts
To assess the knowledge on nutritional facts of tribal women a standardized set of questions were asked to individual during survey. A score of one was given for each correct answer. The respond given by the farm women on the questions asked to them are presented in decreasing order in

Gujarat Journal of Extension Education Vol. 24 : (December 2013)
60
Table 2.
Table 2: Knowledge score of tribal women on selected nutritional facts n = 100
Sr. No.
Nutritional facts Per cent
1 Fruits and vegetables are to be con-sumed daily.
61*
2 Fruits provide predominantly vitamins and minerals.
48#
3 Ghee and oil provides predominantly fat in the diet.
48#
4 Milk is a complete food 46#
5 Amla and citrus fruits provides predom-inantly vitamin-C
46#
6 Daily 7 to 10 glasses of water needs to be drink.
45#
7 Vegetables provide predominantly vita-mins,mineralsandfiber.
43#
8 Soyabean provides the best protein in the diet.
36#
9 Pulses provide predominantly protein. 34#
10 Sunlight, particularly in early morning, provides vitamin-D.
33#
11 Sprouted pulses provide predominantly protein and vitamin-C.
30#
12 Raw fruits and vegetables with peel providespredominantlyfibers.
29#
13 Carrot provides predominantly vitamin-A.
23#
14 Fermented foods like Khaman, Dhokala provides predominantly Vitamin-B.
10@
15 Cereals provide predominantly carbo-hydrate.
09@
Mean 36.07 SD 13.94* = Most knowledge # =More knowledge @= Least knowledge
Table 2 indicates that the tribal women had the most knowledge about only one selected nutritional fact i.e. ‘Fruits and vegetables are to be consumed daily’ (61%). Only two numbers of selected nutritional facts were least knowledge by the tribal women viz. ‘Fermented foods like Khaman, Dhokala provides predominantly ‘Vitamin-B’ (10%) and ‘Cereals provides predominantly carbohydrate’ (9%). Tribal women were using cereals, preparing Khaman, Dhokala but don’t know the importance of that, might be the reason for
the same. Tribal women more aware about remaining facts in the middle range i.e. 50 to 22 %. These facts were found to be communicated by Anganwadi and health workers or even through various mass media. Tribal women thus had the knowledge about this facts might be the reason for the same.
Extent of knowledge about nutritional facts
The extent of above mentioned nutritional facts were analyzed on the bases of score. Accordingly, respondents were classified as having high (above 8), low (below 2)medium (in-between 2 to 8) level of knowledge as presented in Table 3.
Table 3: Knowledge level of tribal women on selected nutritional facts n = 100
Sr. No. Knowledge Level Per cent1 High 25.002 Medium 54.003 Low 21.00
Mean 5.42 SD 3.28
Above table reveals that, the majority (54%) tribal farm women had medium level of knowledge regarding selected nutritional facts which is slightly lower (64%) and higher (29.02%) as compared to the results obtained by Dipal and Keshav (2009) and Shweta et. al. (2011), when they conducted surveyed on farm women of Gujarat state and Hill women of Utarakhand state, respectively. Twenty five percent tribal women had high level of knowledge and almost equivalent respondent had low level (21%) of knowledge on the selected nutritional facts. The percentage of high level of knowledge obtained during this study is exactly similar to results obtained by Dipal and Keshav (2009). The demographic area for both the studies was similar i.e. Gujarat state might be the reason for similarity. The fact again supported through the studies carried out in Uttarakhand state (Shweta et. al., 2011) and Bihar state (Maya Kumari et. al., 2010) where they found 4.56% and 0% high level of knowledge, respectively. The low level of knowledge for both studies were very high 66.32% and 77.33%, respectively and found quite high as compared to present study. This type of information might be communicated by Anganwadi and health workers or even through various mass media in more effective way could be one of the reasons for the same.
CONCLUSION
The range of age of tribal women was 30 to 56 years. They were belonging to Nuclear and joint families almost same in number. About quarter of women was illiterate,

Gujarat Journal of Extension Education Vol. 24 : (December 2013)
61
schooling up to primary level and secondary level each. The family income was ranged from ` 1000 to 7000 per month. More than half of the subjects surveyed were engaged in agriculture work since they are having their own land. More than half of tribal women had medium level of knowledge about selected nutritional facts. The tribal women were found the most knowledgeable about ‘Fruits and vegetables are to be consumed daily’ nutritional fact. That might be due to its communication through various mass media. They were the least knowledgeable about ‘Fermented foods like Khaman, Dhokala provides predominantly Vitamin-B’ and ‘Cereals provides predominantly carbohydrate’ nutritional facts. Though they were using such food in their diet but don’t know the importance of the same. Comparison of the data on level of knowledge of selected tribal women in the present study revealed that information on some areas of nutritional facts might be communicated more effectively and there is need similar type of efforts in other areas.
IMPLICATION
Knowledge on the nutritional facts least aware by tribal women could be spread through various mass media like television, radio, exhibition, personal communication using Anganwadi, Primary Health Centers etc.
REFERENCES
Agha D. A., Maqbool S. and Anwar S. (2005) Is poverty or lack of nutrition awareness the main cause of malnutrition in children? Pak Paed J 29: 63-67.
Aziz Marjan Khattak, Shehla Gul, Sidra Taul Muntaha and Jamaluddin (2007) Evaluation of nutritional knowledge of mothers about their children. Gomal Journal of Medical Science 5 (1) : 17-21
Dipal N. Soni and Keshav B. Kamaliya (2009) Awareness of Farm Women about Human Nutrition. Guj J Ext Edu 20-21: 79-81.
Maya Kumari, Adrash K. Shrivastava and Nidhi Sinha (2010) Extent of Knowledge of farm women on nutrition. Indian Res J Ext Edu 10(1):65-68.
Shweta Upadhyaya, A. R. Kumar, Rita Singh Raghuvanshi and B. B. Sing (2011) Nutritional status and knowledge of hill women on anemia: effect of various socio-demographic factors. J Hum Ecol 33(1): 29-34.
Received : July 2013 ; Accepted : November 2013

Gujarat Journal of Extension Education Vol. 24 : (December 2013)
62
Attitude of Extension Educationists towards Agricultural FM Radio
A.P. Shukla1 and N.B. Chauhan2
1 Postgraduate Student, Extension Education, Department of Extension Edu. BACA, AAU, Anand2 Professor and Head, Department of Extension Education, BACA, AAU, Anand
Email : [email protected]
ABSTRACT
FM radio can be an excellent tool for agrarian communication to transfer information to the cultivators. To achieve desirable success in the implementation of FM Radio technology to strengthen agricultural communication, there was a need to understand feelings of agricultural extension educationists towards the potentiality of this system. Realizing this, a study on attitude of the extension educationists towards agricultural FM radio was conducted with objectives viz. to measure the attitude of extension educationists towards Agricultural FM radio and to find out relationship between attitude of the extension educationists towards AFM radio and their profile.The study was conducted on a random sample of 60 extension educationists working at Anand Agricultural University, Anand of Gujarat state. The data were collected by personal contacts. The data were classified, tabulated and analyzed in order to make the finding meaningful. The statistical measures, such as percentage, mean score, standard deviation and correlation coefficient. It was observed from the result that majority (71.67 per cent) of the extension educationists working at Anand Agricultural University, Anand had favourable to strongly favourable attitude towards Agricultural FM Radio system. The attitude was observed positively significant with their level of mass media liveliness and degree of job satisfaction, while it was observed insignificant with their age, academic performance, native place, job experience, training received, perception of professional development, basic knowledge of computer, basic knowledge of internet, materialistic aspiration and professional aspiration. Understanding positive feeling of extension educationists towards Agricultural FM Radio system, it is advocated that FM radio can be used as an effective tool for agrarian communication to transfer area specific agricultural information from research stations to the cultivators using local resources.
Keywords : Attitude, FM Radio
INTRODUCTION
Currently FM radio system offers a great possibility for the commercial advertisers to advertise their products and services. The FM Radio has become very accepted in both urban and rural areas. FM radio system is more admired in satisfying area specific information needs. Realisingits great scopes, it can be used for the advancement of agriculture and rural areas of India. The ‘community’ aspect of FM or local radio initiatives combines a number of approaches. The most obvious is that a FM or local radio station gives the community a voice, and by encouraging the active participation of the audience in the making and scheduling of programmes this voice can play empowering and potentially uniting functions. Hence, FM radio can be
an excellent tool for agrarian communication to transfer information to the cultivators. To achieve desirable success in the implementation of FM Radio technology to strengthen agricultural communication, there was a need to understand feelings of agricultural extension educationists towards the potentiality of this system. Realizing this, a study on attitude of the extension educationists towards agricultural FM radio was conducted with following objectives
1 To measure the attitude of extension educationists towards Agricultural FM radio.
2 TofindoutrelationshipbetweenattitudeoftheextensioneducationiststowardsAFMradioandtheirprofile.

Gujarat Journal of Extension Education Vol. 24 : (December 2013)
63
METHODOLOGY
The study was conducted on a random sample of 60 extension educationists working at Anand Agricultural University, Anand of Gujarat state. The data were collected by personal contacts. The data thus, collected were classified, tabulated and analyzed in order tomakethefindingmeaningful.The statisticalmeasures, suchaspercentage, mean score, standard deviation and correlation coefficientwereusedtoanalysisdata.
RESULT AND DISCUSSION
The attitude of extension educationists towards AFM radio
Table 1 : The extension Educationists according to their overall attitude towards AFM Radio n=60
Sr. No.
Types of Attitude Number Per cent
1 Strongly Favourable (Above mean + SD)
16 26.67
2 Favourable (Between mean +0.5 SD and mean + SD)
27 45.00
3 Neutral ( Mean Value ) 07 11.674 Unfavourable (Between mean
– SD and mean -0.5 SD)02 3.33
5 Strongly Unfavourable (Below mean – SD)
08 13.33
TheTable1showsthefactthatmorethantwo-fifth(45.00 per cent) of the extension educationists possessed favourable attitude towards AFM Radio, while slightly more than one-forth (26.67 per cent) of them were found with strongly favourable attitude towards AFM Radio, about 11.67 per cent of the extension educationists were found with the neutral attitude and 13.33 per cent of the extension educationists were found in the strongly unfavourable category, while very less (3.33 per cent) of the extension educationists were having a unfavourable attitude towards the AFM Radio. It can be concluded from the result of the Table 1 that majority (71.67 per cent) of the extension educationists had favourable to strongly favourable attitude towards AFM Radio. It can be said that majority of the extension educationists had realized significantof AFM Radio for transfer of agricultural technology, rural development and effective tool to develop farmers and farming. This might be due to the recognition and understanding amongst the extension educationists about
tremendous usefulness of AFM Radio and its application to make agricultural extension, research and rural development work more smooth and successful. This result is in line with the result of Patel (2007) and Joshi (2009).
Relationship between profile of the extension educationists and their attitude towards agricultural AFM Radio
The data presented in Table 2 show the relationship of personal, social, situational and psychological characteristics of extension educationists with their attitude towards AFM Radio. The result indicates that the attitude of the extension educationistswasobservedpositively significantwith theirlevel of mass media liveliness and degree of job satisfaction, whileitwasobservedinsignificantwiththeirage,academicperformance, native place, job experience, training received, perception of professional development, basic knowledge of computer, basic knowledge of internet, materialistic aspiration and professional aspiration.
Table: 2 Relationship between profile of the extension educationists and their attitude towards agri-cultural FM Radio n=60
Sr. No.
Independent variable Correlation Coefficient (‘r’ value)
A Personal Variable1 Age 0.1142 Academic performance -0.097B Social Variable3 Native Place -0.053C Situational Communication4 Job Experience 0.0915 Training Received 0.1256 Mass Media Liveliness 0.339**D Psychological Variable7 Perception of professional Develop-
ment0.0949
8 Basic Knowledge of Computer -0.1079 Basic Knowledge of Internet 0.07510 Materialistic Aspiration 0.04011 Professional Aspiration 0.08812 Job Satisfaction 0.467**Note:*Significantat5%and**Significantat1%
It means that positivity towards application of FM Radio system especially for agricultural information was better significantly among those extension educationistswho were with high level of job satisfaction and prominent experience to work as communicators in different mass media.
The result indicates that more or high level of

Gujarat Journal of Extension Education Vol. 24 : (December 2013)
64
working experience of extension educationists with mass media as communicator have made them more positive towards application of FM Radio for rural and agricultural development. During their course of working with mass media like TV and Radio, they must have seen tremendous opportunity of FM Radio system for rural and agricultural development; this might have made them more positive towards application of FM Radio for rural and agricultural development. The result is same with the result of Joshi (2009) and differed with result of Shah (2006).
It is also natural that the person with high degree of satisfaction with his job will always try to engage more and more in his job, this makes him more positive in collecting and using useful information through modern media about the development of his job. This might be the reason to have high level of attitude towards AFM Radio amongst those extension educationists, who had high level of job satisfaction.
CONCLUSION
It can be concluded from the result that majority (71.67 per cent) of the extension educationists working at Anand Agricultural University, Anand had favourable to strongly favourable attitude towards Agricultural FM Radio system. The attitude of the extension educationists was observedpositivelysignificantwiththeirlevelofmassmedia
liveliness and degree of job satisfaction.
IMPLICATION
Understanding positive feeling of extension educationists towards Agricultural FM Radio system, it is advocated that FM radio can be used as an effective tool for agrariancommunicationtotransferareaspecificagriculturalinformation from research stations to the cultivators using local resources.
REFERENCES
Joshi, P. J. (2009) Computer inclination of agricultural extension educationists working in state agricultural universities of Gujarat, unpublished Ph.D. thesis, AAU, Anand.
Patel, M. C. (2007) Factors affecting level of internet exposure of research scholar of Anand Agricultural University, Anand, unpublished Ph.D. thesis, YMCOU, Nasik, Maharashtra.
Shah, U. B. (2006), A study on level on internet exposure of teachers of Anand Agriculture University, Anand, unpublished Ph.D. thesis, AAU, Anand.
Received : November 2012 ; Accepted : July 2013

Gujarat Journal of Extension Education Vol. 24 : (December 2013)
65
Scale to Measure Attitude of Woman Research Scholars towards the Use of Computer for Their Empowerment
B.M.Christian1 and N.B.Chauhan2
1Agriculturalofficer,ShethM.C.PolytechnicinAgriculture,AAU,Anand.Gujarat2 Professor and Head, department of Extension Education, BACA, AAU, Anand
Email : [email protected]
ABSTRACT
In Gujarat, four SAUS working at Anand, Junagadh, Navsari and Sardarkrushinagar are contributing in developing and training personnel for agricultural research, education and extension education. To perform such works more efficiently as per the demand of present time, it is projected that students, scientists and educationists of SAUs need to be updated with latest research, communication and transfer of technology related technologies like computer and information technology. In the development of Indian agriculture, contribution of women is well accepted by policy makers, planners and academicians. It is noticed that as compared to male, participation and enrolment of women in agricultural education, research and extension activities is less. However, from last two decades, considerable woman students have shown their interest to be a part of agricultural education, research and extension activities. So, considering this immense potentiality of computer, researchers felt need to developed a scale to measure attitude of woman research scholars towards the use of computer for their empowerment. Among the techniques available, researchers were used ‘Scale product method’ which combines the Thurnstone’s Technique (1928) of equal appearing interval scale for selection of items and Likert’s Technique (1932) of summated rating for ascertaining the response on the scale as proposed by Eysenck and Crown (1949).The scale contains 10 statements viz.1. I am sure that computer affinity accelerates Woman Research Scholars (WRS) to know various job opportunities, 2. I accept that computer affinity helps WRS to develop overall personality, 3. I am sure that computer affinity gives confidence to WRS to be a good research manager, 4. I consider that computer affinity is a need of hours for WRS to be a good value addition processor of agricultural product, 5. I believe that each WRS should learn computer, 6. I think that proximity with computer is bad activity for WRS, 7. The computer motivates me in self-learning, 8. I don’t think any WRS can reach on the top with the help of compute, 9. The computer improves the quality of work, 10. I feel that computer is demoralizing WRS at work. Out of these 10 statements, statement no.6, 8, and 10 are negative and remaining are positive. Co-efficient of reliability between these two sets of score was calculated by Rulon’s Formula (Guilford 1954), which was 0.94. The responses can be collected on five point continuum viz. strongly agree, agree, undecided, disagree and strongly disagree with weight of 5, 4, 3, 2 and 1, respectively for favourable or positive statements and with weight of 1, 2, 3, 4 and 5, respectively for unfavourable or negative statements.
Keywords : Attitude, Computer, Empowerment
In present age of information and technology, computer has been considered as an important tool to carry out almost any possible tasks. Starting from very small work to amazing task, the computer has become a part and parcel ofthelife.Inthefieldofeducation,researchanddevelopmentalsoithassignificantpotentialtostraighteneffectivenessof
academicians, researcher scholars and officeholder. Manyexperts have suggested that to develop agriculture as whole, there is need to encourage women to work as agricultural educationists, researchers and extension educationists to motivate, empower and accelerate effectiveness of farmwomen in agricultural development. The association of
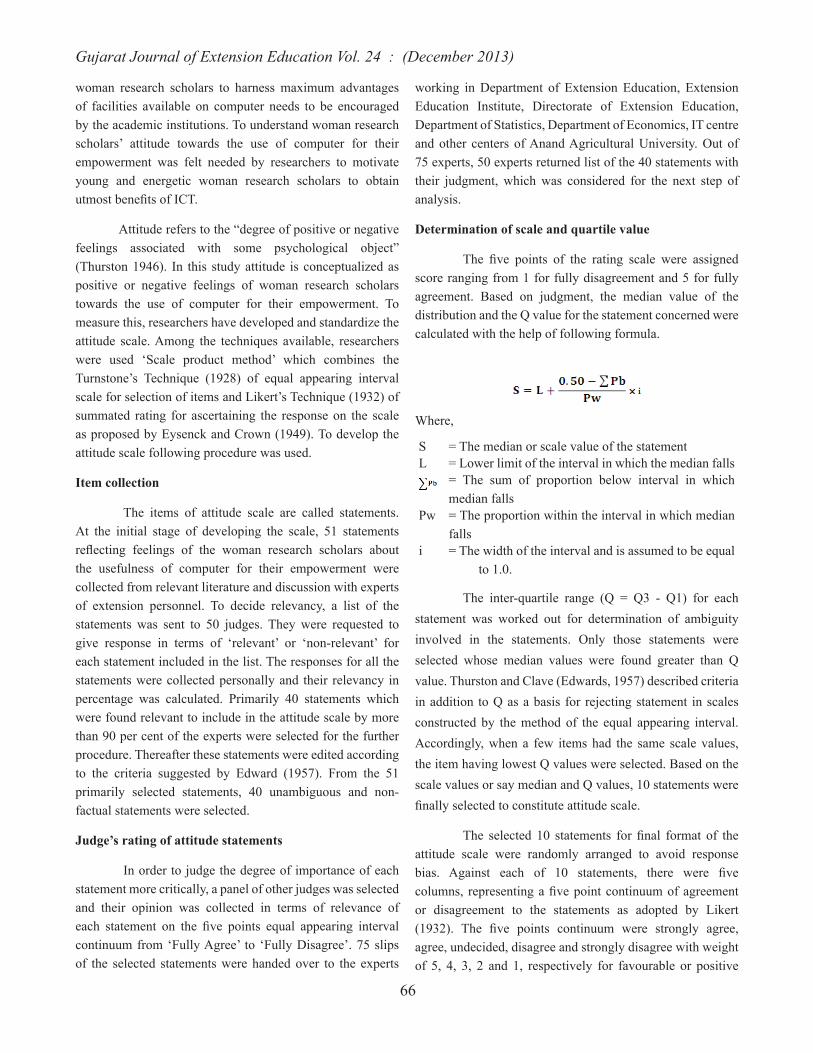
Gujarat Journal of Extension Education Vol. 24 : (December 2013)
66
woman research scholars to harness maximum advantages of facilities available on computer needs to be encouraged by the academic institutions. To understand woman research scholars’ attitude towards the use of computer for their empowerment was felt needed by researchers to motivate young and energetic woman research scholars to obtain utmostbenefitsofICT.
Attitudereferstothe“degreeofpositiveornegativefeelings associated with some psychological object” (Thurston 1946). In this study attitude is conceptualized as positive or negative feelings of woman research scholars towards the use of computer for their empowerment. To measure this, researchers have developed and standardize the attitude scale. Among the techniques available, researchers were used ‘Scale product method’ which combines the Turnstone’s Technique (1928) of equal appearing interval scale for selection of items and Likert’s Technique (1932) of summated rating for ascertaining the response on the scale as proposed by Eysenck and Crown (1949). To develop the attitude scale following procedure was used.
Item collection
The items of attitude scale are called statements. At the initial stage of developing the scale, 51 statements reflecting feelings of the woman research scholars aboutthe usefulness of computer for their empowerment were collected from relevant literature and discussion with experts of extension personnel. To decide relevancy, a list of the statements was sent to 50 judges. They were requested to give response in terms of ‘relevant’ or ‘non-relevant’ for each statement included in the list. The responses for all the statements were collected personally and their relevancy in percentage was calculated. Primarily 40 statements which were found relevant to include in the attitude scale by more than 90 per cent of the experts were selected for the further procedure. Thereafter these statements were edited according to the criteria suggested by Edward (1957). From the 51 primarily selected statements, 40 unambiguous and non-factual statements were selected.
Judge’s rating of attitude statements
In order to judge the degree of importance of each statement more critically, a panel of other judges was selected and their opinion was collected in terms of relevance of each statement on the five points equal appearing intervalcontinuum from ‘Fully Agree’ to ‘Fully Disagree’. 75 slips of the selected statements were handed over to the experts
working in Department of Extension Education, Extension Education Institute, Directorate of Extension Education, Department of Statistics, Department of Economics, IT centre and other centers of Anand Agricultural University. Out of 75 experts, 50 experts returned list of the 40 statements with their judgment, which was considered for the next step of analysis.
Determination of scale and quartile value
The five points of the rating scale were assignedscore ranging from 1 for fully disagreement and 5 for fully agreement. Based on judgment, the median value of the distribution and the Q value for the statement concerned were calculated with the help of following formula.
Where,
S = The median or scale value of the statementL = Lower limit of the interval in which the median falls
= The sum of proportion below interval in which median falls
Pw = The proportion within the interval in which median falls
i = The width of the interval and is assumed to be equal to 1.0.
The inter-quartile range (Q = Q3 - Q1) for each statement was worked out for determination of ambiguity involved in the statements. Only those statements were selected whose median values were found greater than Q value. Thurston and Clave (Edwards, 1957) described criteria in addition to Q as a basis for rejecting statement in scales constructed by the method of the equal appearing interval. Accordingly, when a few items had the same scale values, the item having lowest Q values were selected. Based on the scale values or say median and Q values, 10 statements were finallyselectedtoconstituteattitudescale.
The selected 10 statements for final format of theattitude scale were randomly arranged to avoid response bias. Against each of 10 statements, there were fivecolumns, representingafivepointcontinuumofagreementor disagreement to the statements as adopted by Likert (1932). The five points continuum were strongly agree,agree, undecided, disagree and strongly disagree with weight of 5, 4, 3, 2 and 1, respectively for favourable or positive

Gujarat Journal of Extension Education Vol. 24 : (December 2013)
67
statements and with weight of 1, 2, 3, 4 and 5, respectively forunfavourableornegativestatements.Thefinalformatof
the scale is presented in below table.
Table1: Statements finally selected to constitute attitude of woman research scholars towards the use of computer for their empowerment
Sr. No.
Statement Strongly Agree
Agree Un-decided
Dis-agree
Strongly disagree
1. IamsurethatComputeraffinityacceleratesgirlscholarstoknow various job opportunities.(+)
2 IacceptthatComputeraffinityhelpsgirlscholarstodevelopoverall personality. (+)
3 I am sure that Computer affinity gives confidence to girlscholars to be a good research manager.(+)
4 IconsiderthatComputeraffinityisaneedofhoursforgirlscholars to be a good value addition processor of agricultural product.(+)
5 I believe that each girl student should learn computer (+)6 I think that inclination with computer is bad activity for girl
students (-)7 The computer motivates me in self-learning (+)8 I don’t think any girl can reach on the top with the help of
computer (-)9 The computer improves the quality of work. (+)10 I feel that Computer is demoralizing girl students at work.(-)
Reliability of the scale
The split-half technique was used to measure the reliability of the scale. The 10 statements were divided into two equal halves as two separate sets with 5 odd numbered and 5 even numbered statements in order. These were administered to 25 respondents. Each of the two sets was treated as separate scale and obtained two scores for both the sets from the 25 respondents.Co-efficientofreliabilitybetweenthesetwosetsof score was calculated by Rulon’s Formula (Guilford 1954), which was 0.94. This value indicates that scale is reliable. s2 d rtt = 1 - ---------- s2 tWhere,
rtt = co-efficientofreliabilitys2d = variance of those two differencess2t = variance of total score
Validity of the scale
The validity of the scale was examined for content validity determining how well content were selected by discussing it with specialists of extension and academicians. Thus, the presentscalesatisfiedthecontentvalidity.
Scoring system
Theselected10statementsforthefinalformatoftheattitudescale are randomly arranged to avoid response biases, which might contribute to low reliability and detraction from validity of the scale.The responses can be collected onfive pointscontinuum viz. strongly agree, agree, undecided, disagree and strongly disagree with respective weights of 5, 4, 3, 2, and 1 for the favourable statements and with the respective weights of 1, 2, 3, 4 and 5 for the unfavourable statements.
REFERENCES
Edward, A.L. (1957). Techniques of scale construction. Appeton Century Crafts Inc., New York.
Eysenck, H.J. and S. Crown.[1949]. An Experimental study in pinion attitude methodology. International J. of Attitude Research. 3: 47-86.
Guliford, J. P. (1954). Psychometric Methods. Tata McGraw-Hill Publication Co. Ltd., Bombay: 378-382.
Likert, R.A. (1932). A Technique for the measurement of attitude scale. Psychology, New York, PP; 140.
Thurston, L. L. (1946). The Measurement of attitude American J. of Sociology. Chicago University Press, 39-50.
Received : March 2012 ; Accepted : November 2013

Gujarat Journal of Extension Education Vol. 24 : (December 2013)
68
ABSTRACT
The present investigation was undertaken with a view to study constraints faced by tomato and brinjal vegetable growers of North Gujarat. The major production constraints faced by the vegetable growers were higher production cost, plant protection and higher prices of insecticides/ pesticides. In marketing of vegetables, growers opined the problems of higher price fluctuations and lack of transportation facilities. Small farmers had the problems of credit facility and lack of information about high yielding variety for the production of vegetables. Further, they faced the problem of lack of marketing information and lack of co-operative marketing societies as the major marketing constraints.
Key words: Tomato, Brinjal, Marketing, Constaints,
INTRODUCTION
India is a country with varied agro-climatic conditions having total geographical area of 328.27 million hectares. The reported area of land utilization is 304.83 million hectares and the total cropped area is 180.11 million hectares (59.00 % of reported area). The vegetables have vital place in vegetarian diet. In terms of income, the vegetables give four times more returns as compared to food crops (Shrivastava, 1997). Moreover, they can be grown round the year and provide regular flow of income and employment. In India, the per capita availability of vegetables is only 135 g day-
1 against the ICMR recommended quantity of 285 g per capita day-1 (Wadhwani and Bhogal, 2003).
Scenario Of Area And Production
India is the second largest producer of vegetables in the world after China contributing about 8.00 per cent (9.60 Million Tonnes) of the world production from an area of about 6 million hectares. The major vegetables producing countries in the world are China, India, Nigeria, United States, Turkey and Russian Federal. India occupies firstposition in production of cauliflower, second in onion andthird in cabbage and brinjal production in the world. Like
potato, onion and brinjal are the major vegetables available around the year. West Bengal, Uttar Pradesh, Bihar, Orissa, Maharashtra, Karnataka and Gujarat are the important vegetables producing states in the country. Among all the vegetables producing states, Gujarat occupies 3rd position in respect to area and stands 4th in production.
The state of Gujarat contributes about 10.00 per cent area as well as total production of vegetables in India. Among various districts of North Gujarat, the highest vegetable production is recorded by Banaskantha (17.67 %), followed by Sabarkantha, Gandhinagar, Mehsana, Kachchh and Patan. The share of North Gujarat Districts viz., Banaskantha, Sabarkantha, Gandhinagar, Mehsana, Kachchh and Patan in vegetable area and production of state was about 28.00 and 33.00 per cent, respectively. The cultivation of vegetables is largelyconfinedtothedistrictsofSabarkanthaandMehsana,which together account for about 9.00 per cent of the total vegetable area of the state.
Considering the share of vegetables area in the state as well as in the North Gujarat, the present study was restricted to Mehsana and Sabarkantha districts of North Gujarat only. The major vegetables grown in the area are potato, brinjal, cauliflower,tomato,cabbage,chiliesandclusterbean.Among
Constraints of Vegetable Growers in North Gujarat
R.R. Patel1, K. A. Thakkar2, A. B. Bindage3 and V. M. Patel4
1 Assistant Reserach Scientist (Agril. Econ.), AICRP on OFR, S.D. Agricultural University, Jagudan-382 710 (North Gujarat)
2 Director of Extension Education, SDAU., Sardarkrushinagar-3855063 Ph.D Scholar, Department of Agril. Econ, JAU., Junagadh
4 Professor& Head, Director of Agril. Economics, CPCA., SDAU., Sardarkrushinagar-385506Email. [email protected]

Gujarat Journal of Extension Education Vol. 24 : (December 2013)
69
these, tomato contributes 10.10 per cent and brinjal 10.29 per cent to total vegetable area of North Gujarat and thus occupy important place in vegetable production.
Tomato is used to produce most popular value added products viz., tomato ketchup, tomato puree, tomato chutney and tomato sauce. While, brinjal is considered as the poor man’s crop, used as a cooked vegetable, pickle making, dehydration industry and also used as medicinal purposes.
Rational of the problem
Horticultural crops have been identified as mostremunerative crops for replacing subsistence farming in varied agro-eco-systems in our country. Its importance can very well be appreciated in terms of their rising domestic demand, export potential, large employment needs in rural areas particularly for the marginal and small farmers growing trustoncommercializationanddiversificationoffarmsectorbecause of their high profitability (Wadhwani and Bhogal,2001).
Efforts have been made by various researchers to focus on cost of production and marketing of vegetables in the state of Gujarat. Notably of them are by Shiyani et al. (1998), Singh et al. (1993) and Parmar et al. (1994). However, the comprehensive studies on constraints for prominent vegetable growing North Gujarat Agro-climatic Zone are very scanty. Hence,thepresentstudyentitled“ConstraintsofVegetablesGrowers in North Gujarat” was planned.
OBJECTIVES
1 To identify production constraints for selected vegetables in North Gujarat
2 To identify marketing constraints for selected vegetables in North Gujarat
METHODOLOGY
The state of Gujarat comprises of 25 districts. Among these, Banaskantha, Gandhinagar, Kachchh, Mehsana, Patan and Sabarkantha are covered under North Gujarat Agro-climatic Zone. Among the six districts of North Gujarat, Mehsana and Sabarkantha districts have been selected purposivelyn of t is presented in the
Identification of major vegetables
Three Taluka Vijapur and Kadi talukas from
Mehsana district and Idar taluka from Sabarkantha district were chosen for tomato.
For brinjal, Mehsana taluka (15.28 %) and Vijapur taluka (17.11 %) of Mehsana district and Idar (7.64 %) talukas of Sabarkantha district were considered for the present study. Consideringthefinancialandtimeconstraintsofresearchers,16 villages were selected for the detailed study. Total eight villages selected for tomato, three villages were from Kadi taluka and three villages from Vijapur of Mehsana district, two from Idar taluka of Sabarkantha district. In case of brinjal eight villages were chosen for the study. Among these, three villages from Mehsana taluka, three from Vijapur taluka of Mehsana district and two from Idar taluka of Sabarkantha district. Thus total
A list of all vegetable growing villages of the each of the selected taluka for each of the selected vegetable was prepared. Again from the list, the villages having the highest area under selected vegetables were considered for the study. In all 16 villages chosen from six talukas of North Gujarat.
Selection of respondents
A list of cultivators growing vegetables for each selected village was prepared and arranged in ascending order according to size of their operational holdings. They wereclassified into threegroups,more thanonehectare totwo hectares (small), more than two hectares to four hectares (medium), and above four hectares (large). Considering the size of population and resources, 12 cultivators were chosen from each selected village at random in proportion to number of farms in each size group. Thus, in all 96 tomato growers comprising of 32 small, 32 medium and 32 large farms were selected for the study.
Sources of data
The data regarding constraints faced by cultivators during production and marketing were collected by interviewing vegetable growers. Further, the data on disposal pattern of total output, marketable and marketed surplus, farm harvest prices and marketing expenditure were also collected from the respective respondents. For this purpose a specially designed schedule was used.
RESULTS AND DISCUSSION
The results derived from the analysis of the data related to the various aspects of the present study are critically discussed here. The results and interpretation are depicted

Gujarat Journal of Extension Education Vol. 24 : (December 2013)
70
under the following segments.
Production and marketing constraints in tomato and brinjal crops
Tomato
Due to perishable and bulky nature of selected vegetables, there might be number of constraints opined by the sample tomato growers in adoption of tomato production technology and marketing.
The tomato growers were asked to state the production and marketing related constraints faced by them. Their responses were collected and intensity of particular constraint was computed by calculating percentage according to their frequency and they were assigned rank on the basis of percentage as presented in Table 1.
It is observed from table that the higher production
expenditure (84.00 %), higher prices of plant protection materials (63.10 %), lack of information about high yielding varieties (60.40 %), lack of credit to meet the need higher variable cost (58.00 %) and unavailability of labour as and when needed (58.37 %) were the major constraints encountered by the sampled farmers.
Higher production expenditure (88.00 %), high price of plant protection materials (58.10 %), lack of credit (63.00 %) and lack of information about high yielding varieties (68.10 %) were the major production constraints experienced by the small farmers. In case of medium and large category of farmers, the major constraints of production of tomato as explained by them were higher production expenditure (88.00 and 85.00 %), unavailability of labour as and when needed (50.00 and 80.11 %), higher prices of plant protection materials (60.50 and 70.70 %) and lack of information about high yielding variety (64.00 and 49.10 %).
Table 1: Production and Marketing Constrains in Tomato (per cent) n=96Sr.No. Problem/Constraints Small Medium Large AverageRelated to Production
1 Lack of information about high yielding varieties 68.10 64.00 49.10 60.402 plant protection problems 42.00 40.10 32.65 38.253 Higher prices of insecticide/ pesticide 58.10 60.50 70.70 63.104 Lack of credit 63.00 60.00 51.00 58.005 Lack of irrigation facility 51.00 48.50 38.95 46.156 Un availability of labour when needed 45.00 50.00 80.11 58.377 Higher labour charges 15.00 17.00 26.05 19.358 Higher production expenditure 88.00 85.00 79.00 84.009 Lack of timely availability of fertilizer 6.00 5.50 4.49 5.3310 In adequate and irregular electric supply 4.60 7.00 12.76 8.1211 Problems of pigs and blue bull 18.00 22.00 29.99 23.33
Related to Marketing1 Lack of marketing information 64.00 60.00 44.66 56.222 Lack of transportation 28.00 33.00 36.50 32.503 Higher margin of middlemen 32.00 26.10 26.65 28.254 Lack of labour for transportation 54.10 53.00 49.19 52.105 Malpractices in weigh 18.00 20.10 19.95 19.356 Spoilage 58.00 54.50 52.95 55.157 Higherpricefluctuations 87.80 90.00 96.10 91.30
Thus, it can be inferred from the above discussion that tomato farmers faced the problems of higher production expenditure due to higher expenses of mandap and high labour wages.
So far marketing constraints were concerned more than 90.00 per cent tomato cultivators felt the problem of
higherpricefluctuations.Itmightbeduetoperishablenatureand seasonal production of tomato. Other major marketing problems faced by the tomato growers on overall basis were lack of marketing information (56.22 %) and non-availability of labour for transportation (52.10 %). In addition to these, they also faced the problems of lack of transportation facilities, malpractices in weigh and spoilage.

Gujarat Journal of Extension Education Vol. 24 : (December 2013)
71
Further, the results indicated that higher price fluctuation(87.80and90.00%),spoilage(58.00and54.50%) and lack of marketing information (64.00 and 60.00 %) were the major marketing constraints realized by small and medium farmers, respectively.
Problemofhigherpricefluctuations(96.10%)lackof labour for transportation (49.19 %) and low prices due to spoilage (52.95 %) were the major marketing constraints faced by large sized farmers.
Thus, it can be concluded that majority of small and medium farmers faced the problem of high fluctuations inprices of tomato. It was due to lack of market intelligence by marketing agencies for tomato. Lack of labour for transportationandhigherpricefluctuationswerefoundmajor
constrains on large farms.
The results of this study are in corroboration with the findings of Parmar et al. (1994) and Bilonikar et al. (1998).
Brinjal
The production and marketing constrains faced by the brinjal growers are given in Table 2. It is apparent from the table that constraints regarding plant protection (68.00 %) lack of information about high yielding variety (63.00 %), higher prices of insecticides and pesticides (59.50 %), lack of credit (64.00 %) and higher production expenditure (79.00 %) were the major production constraints as reported by the small farmers.
Table 2: Production and Marketing Constraints in brinjal (per cent) n=96
Sr. No. Constraints
Small Medium Large Average
Related to Production
1 Lack of information about high yielding variety 63.00 62.00 49.00 58.00
2 plant protection problems 68.00 66.50 60.50 65.00
3 Higher prices of insecticide/ pesticide 59.50 63.70 87.10 70.10
4 Lack of credit 66.00 60.15 33.60 53.25
5 Lack of irrigation facility 53.00 49.00 28.50 43.50
6 Un availability of labour when needed 38.00 42.00 56.80 45.60
7 Higher labour charges 40.00 42.00 56.75 46.25
8 Higher production expenditure 79.00 72.50 53.70 68.40
9 Lack of timely availability of fertilizer 4.00 3.00 0.50 2.50
10 In adequate and irregular electric supply 2.00 2.50 13.89 6.13
11 Problems of pigs and blue bull 14.50 16.70 29.10 20.10
Related to Marketing
1 Lack of marketing information 68.50 62.30 58.65 63.15
2 Lack of transportation 85.15 63.50 80.10 76.25
3 Lack co-operative marketing 72.00 66.50 53.80 64.10
4 Higher margin of middlemen 33.10 25.50 15.00 24.53
5 Lack of labour for transportation 28.00 32.00 54.30 38.10
6 Malpractices in weigh 72.00 68.00 58.50 66.17
7 Spoilage 13.00 15.00 17.00 15.00
8 Higherpricefluctuations 53.00 49.00 47.00 49.67

Gujarat Journal of Extension Education Vol. 24 : (December 2013)
72
So far as medium farmers is concerned, they opined about high production expenditure (72.50 %) followed by plant protection problem (66.50 %). In case of large farmers, about 87.10 per cent encountered the problem of high prices of pesticides followed by plant protection problems (60.50 %).
As far as pooled analysis of production constraints is concerned, majority of the brinjal growing farmers faced the higher prices of pesticides (70.10 %). The second major problem was higher production expenditure (68.40 %). In addition to these, growers also faced the problems like lack of plant protection problems (65.00 %).
Thus, it can be inferred that irrespective farm size, higher price of pesticides constraint ranked first becausemore pesticides are used in brinjal due to the infestation of diseases and pests.
The whole the most important constraints in brinjal marketing were, lack of transportation facilities (76.25 %), mal practices in weigh (66.17 %) and lack of co-operative marketing societies (64.10 %) constraints faced by growers in marketing of brinjal.
Further, the results revealed that, majority of the small (85.00 %) and large (80.10 %) farmers faced the problem of transportation facilities in the marketing of brinjal. The major constraint faced by medium farmers was malpractices in weigh (68.00 %).
Thus, it can be concluded from the preceding discussion that irrespective of size of land holdings of brinjal growers, most of them faced the problems of lack of marketing information, lack of transportation and higher pricefluctuationsinmarketingofbrinjal.Thismightbedueto lack of market intelligence particularly for vegetables like brinjal by marketing agencies, lack of co-operatives and highly perishable nature of the produce.
CONCLUSION
India is the largest producers of vegetables in the world, contributing 8.00 per cent of the word production from 6 million hectares of area. The vegetables have vital role in balanced diet, provide regular income and employment throughout the year. They also provide a better opportunity for diversification and help in improving productivity offragmented land, improving socio-economic status of farmers in general and small farmers in particular.
The state of Gujarat contributes about 10.00 per cent of area as well as production of vegetables and occupies 3rd position in respect to area and stands 4th in production in the country. Among the various districts of Gujarat, the share of area and production of vegetables of North Gujarat districts was about 28.00 and 33.00 per cent, respectively. Hence, the present study concluded that :
1 Higher production cost, plant protection and higher prices of insecticide/pesticides were the major problem faced by the vegetable growers.
2 So far marketing of vegetable is concerned, vegetable growersfacedtheproblemsofhigherpricefluctuationsand lack of transportation facilities. Low prices due to small quantity, lack of marketing information and lack of co-operative marketing were the major marketing constraints faced by marginal and small farmers in North Gujarat.
REFERENCES
Acharya, S.S. and Agrawal, N.L. (2003). Agricultural Marketing in India. Oxford and IBH Publishing Co., New Delhi. Third Edition: 299-336.
Anonymous (2008). Area and production of India Horticulture [Online]: http://www.nhb.gov.in/staticfiles/DB.htm.,Vegetable, 2008-09.
Bilonikar, K.V.; Tilekar S.N.; Nawadkar, D.S. and Kamble, S.S. (1998). Marketing Efficiency and OperationalProblems of Vegetables Co-operative Marketing Societies in Maharashtra State. The Bihar J. Agril. Mktg., 6 (2) : 220-226.
Director of Horticulture (2006-07). Department of Horticulture, Annual Report. Gujarat State, Gandhinagar.
Director of Horticulture (2007-08). Department of Horticulture, Annual Report. Gujarat State, Gandhinagar.
Jadav, K.S. (2007). An economic analysis of production and marketing of vegetables in middle Gujarat. Ph.D. Thesis (Unpublished), Submitted to Anand Agricultural University, Anand.
Parmar, G.D.; Khunt, K.A. and Desai, D.B. (1994). Marketing of Vegetables in South Gujarat. Indian J. Agril. Mktg., 8 (2) : 258-263.

Gujarat Journal of Extension Education Vol. 24 : (December 2013)
73
Patel, V.M. (1995). Emerging Problems of Agricultural Marketing, A case study of tomato in Gujarat. 115.
Shiyani, R.L.; Kuchhadiya, D.B. and Patat, M.V. (1998). Marketing of Vegetables in South Saurashtra Zone of Gujarat. Indian J. Agril. Econ., 12 (1&2) : 156-160.
Shrivastava, G.S. (1997). Production, Marketing and Export Potential of Fruits and Vegetables. The Bihar J. Agril. Mktg., 5 (1) : 29-47.
Singh, A.J. (1994). Role of Wholesale Markets in Agricultural Development in India. Indian J. Agril. Econ., Conference Special. : 81-89.
Singh, P.K.; Kakadia, B.H. and Patel, V.M. (1993). Marketing of Potato in a major potato producing area of Gujarat. Indian J. Agril. Mktg. 7 (2) : 175-185.
Wadhwani, M.K. and Bhogal, T.S. (2003). Price Behaviour of Seasonal Vegetables in Uttar Pradesh - A Comparative Study of Western (Plain) and Hill Regions. SAARC J. Agril., 1: 141-155.
Wadhwani, H.; Mukesh K. and Bhogal, T.S. (2001). Economic Analysis of Production, Post-harvest Management and Price Behaviour of Potato in Western Region of Utter Pradesh. The Bihar J. Agril. Mktg., 9 (4) : 433-47
Received : July 2013 ; Accepted : November 2013

Gujarat Journal of Extension Education Vol. 24 : (December 2013)
74
Computer Inclination of Agricultural Extension Educationists
P. J. Joshi1, N. B. Chauhan2 and D.D.Patel3
1PlanningOfficer,OfficeoftheDirectorofResearch,AAU,Anand2 Professor and Head, Department of Extension Education, BACA, AAU, Anand
3Asstt.Professor,DoEEoffice,AAU,AnandEmail : [email protected]
ABSTRACT
The present study was carried out in the four State Agricultural Universities located at Anand, Junagadh, Navsari, and Sardarkrushinagar of Gujarat state on a random sample of 150 extension educationists. Ex-post facto research design was applied for the study. The methodological procedure consisted of dependent and independent variables. The data so collected were coded classified, tabulated and analyzed in order to make the findings meaningful. The study concludes that there was a medium to high level of overall computer inclination among the majority of the extension educationists of SAUs. The level of computer inclination was observed better amongst the younger aged extension educationists with less working experience, while it was found positively significant with variables like native place, father’s education, mother’s education, facilities available in the department, professional zeal, mass media liveliness, habit of information collection, library exposure, training received, attitude towards extension work, job satisfaction and innovativeness. It means that extension personnel who were from urban background, son/daughter of educated parents, having availability of supplementary IT tools in the department, encouraging professional passion, familiar to work as mass communicator, curious to collect information, frequent visitors of library, positive in their feelings towards extension work, devotee of work and inventive in nature were more connected and attached with computers.
Keywords: Computer inclination, Agril. Extn. Educationists
INTRODUCTION
The economy of our nation is based on agriculture and allied agro-based industries, animal husbandry and all other agriculture based businesses. Thus overall development of our country is not possible by ignoring the agriculture and farmers. The present time is an age of science and information communication technology, the perfect, quick, timely, required and understandable information in thefieldofagriculturalscienceshasbeenconsideredasanindispensable input for the development of agriculture, rural people and farmers.
Looking to the importance of the agriculture in national economy, high level efforts are expected to stand in the era of open global markets. The dissemination of all recent innovative technologies is required to be deliberated. It can be possible effectively through the intervention of information and communication technology. Emerging electronic technologies are continually advancing computer’s capacity and usefulness. In the wider sense computer is well-known
as an information-processing machine. In the present time, it is hard to imagine conducting any research, educational, extension or business activity without computers. The challenge in adopting computerization in everyday work in agricultural extension system is a prominent need of the time. Today it is possible to fulfill this need and gear upnew working situation by developing and training active information technology oriented human resources for the agricultural extension system.
Nowadays, there is a large gap in terms of the availability of information systems and application of these technologies in developing countries. An integrated approach of information technology provides opportunity to develop various developmental activities; it is expected to speed up transfer of agricultural technology to the rural communities. Integrated approaches can fasten communication among the many intermediary organizations that work for rural and agricultural development. A study was felt necessary to collect reliable information on their feelings and inclination

Gujarat Journal of Extension Education Vol. 24 : (December 2013)
75
towards computer.
OBJECTIVES
1 To study the level of computer inclination of the extension educationists working in SAUs of Gujarat.
2 To ascertain relationship between profile of extensioneducationists and their level of computer inclination.
METHODOLOGY
The present study was carried out in all the four State Agricultural Universities located at Anand, Junagadh, Navsari, and Sardarkrushinagar of Gujarat state. Ex-post facto research design was applied for the study. Based on number of available agricultural extension educationists, 55 agricultural extension educationists from Anand, 38 from Junagadh, 29 from Navsari and 28 from Dantiwada Sardarkrushinagar Agricultural University were selected, thus study was conducted on a random sample of 150 respondents. The methodological procedure consisted of dependent and independent variables. The data so collected were coded classified, tabulated and analyzed in order tomakethefindingsmeaningful.
RESULTS AND DISCUSSION
Level of Computer inclination
The level of computer inclination of the extension educationists: The data presented in Table: 1 indicate that majority (73.34 per cent) of the extension educationists of SAUs had medium to high level of overall computer inclination. The result indicates that the extension educationists of SAUs had taken much interest to collect useful information and communicate messages through computer.
Table 1 : Respondents as per overall computer inclination n=150
Sr. No.
Overall computer inclination
Number per cent
1 High ( > 59.57) 49 32.672 Medium (46.50 to 59.57) 61 40.673 Low ( < 46.49) 40 26.66
The extension educationists of SAUs have to play triple roles of educationist, researcher and extension educationist, to play such roles effectively, they need to collect latest information and maintain live contacts with otherofficers,extensioneducationists,teachersandscientistsof the country and world. In addition to this, they have to publish and present their research work in state, national and
international level journals. To do all such jobs timely, they might have realized the importance of computer application, this might be the reason to have medium to high level of overall computer inclination among the majority of the extension educationists of SAUs.
Relationship between profile of extensioneducationists and their computer inclination: With a view to studying role of independent variables on the level of overall computer inclination of the extension educationists of SAUs, coefficient of correlationwasworkedout andoutcomearepresented in Table 2.
Table 2 : Relationship between profile of extension educationists of SAUs of Gujarat and their computer inclination n=150
Sr No Variables correlation coefficient (‘r’)
I Personal variables 1 Age -0.319*2 Academicqualification 0.119 NS3 Medium of education -0.146NS4 Total experience -0.297*5 Knowledge of different languages 0.073 NS6 Native place 0.230*II Economic variable 7 Annual income -0.086 NS8 Father’s occupation 0.079 NS
III Situational and communication variables 9 Father’s education 0.238*10 Mother’s education 0.208*11 Facilities available in the
Department 0.586*
12 Professional zeal 0.482*13 Mass media liveliness 0.257*14 Habit of information collection 0.218*15 Library exposure 0.791*16 Training received 0.222*IV Psychological variables 17 Attitude towards extension work 0.573*18 Perception of workload 0.071 NS19 Professional development 0.069 NS20 Job satisfaction 0.523*21 Materialistic aspiration -0.081 NS22 Professional aspiration 0.140 NS23 Selfconfidence 0.019 NS24 Perception of span of control 0.051 NS25 Inter-personal communication 0.006 NS26 Innovativeness 0.562*
*Significantat0.05level NS=NonSignification

Gujarat Journal of Extension Education Vol. 24 : (December 2013)
76
Computer inclination and personal variables:
The data presented in Table 2 indicate that the computer inclination of extension educationists was observed negativelysignificantwiththeirageandtotalexperienceinwork,whileitwasseenpositivelysignificantwiththeirnativeplace; it indicates that level of overall computer inclination was better among younger extension educationists with low level of experience than the older ones. The result also indicates that extension educationists from urban native had higher computer inclination than those who were from rural backgrounds. The other personal variables like academic qualification, medium of education and knowledge ofdifferent languages of extension educationists had non-significant relationship with their computer inclination.The result indicates that computer inclination of the extension educationists was observed indistinguishable with irrespectivelevelsoftheiracademicqualification,mediumofeducation and knowledge of different languages known by them.
Computer inclination and economic variable
The level of annual income as well as fathers’ occupation of the extension educationists and their degree of overallcomputerinclinationhadnegativeandnon-significantrelationship. The result indicates that annual income as well as fathers’ occupation of the extension educationists did not play any positive role in improving their level of computer inclination.ThefindingisinlinewithresultofShah(2006)and Patel (2007).
Computer inclination with situational and communication variables
The data seen in Table 2 clearly indicate that level of overall computer inclination of the extension educationists was observed positively significant with situational andcommunication variables like father’s education, mother’s education, facilities available in the department, professional zeal, mass media liveliness, habit of information collection, library exposure and training received. The result indicates that level of overall computer inclination was observed better amongst those extension educationists whose parents were highly educated, who had better facility of computers and other ICT tools in their departments, who were elevated level of professional zeal, mass media liveliness, tendency of information collection, library exposure and tendency to take various types of training. The level of computer inclination was observed better amongst those extension educationists, who had more liveliness and input in publication, seminar,
symposia, conference and association in professional journals. It is accepted fact that person with positivism to develop his professional career will have need of information and innovative ideas. The results are in line with the results reported by Patel (2007) and Shah (2006).
Computer inclination and psychological variables
The information seen in Table 2 indicates that level of computer inclination of the extension educationists was positively significant with their types of attitude towardsextension work, level of job satisfaction and degree of Innovativeness,while itwas observed non-significantwiththeir perception of workload, professional development, materialistic aspiration, professional aspiration, self confidence,perceptionofspanofcontrolandinter-personalcommunication. It indicates that computer inclination of those extension educationists was observed superior who had positive attitude towards extension work. Based on the result, it can be said that level of computer inclination of the extension educationists of SAUs of Gujarat was increased with increase in the level of their job satisfaction. It is natural that the person with high degree of satisfaction with his job will always try to engage more and more in his job, this makes him more positive in collecting useful information through modern media like internet via computer about the development of his job. It was found that the extension educationists with the skill and imagination to create new things were very active in making use of computer than those whowerelowinactive.Theresultisinlinewiththefindingsreported by Patel (2007).
CONCLUSION
From the above study, it can be concluded that there was a medium to high level of overall computer inclination among the majority of the extension educationists of SAUs. The level of computer inclination was observed better amongst the younger aged extension educationists with less workingexperience,whileitwasfoundpositivelysignificantwith variables like native place, father’s education, mother’s education, facilities available in the department, professional zeal, mass media liveliness, habit of information collection, library exposure, training received, attitude towards extension work, job satisfaction and innovativeness. It means that extension personnel who were from urban background, son/daughter of educated parents, having availability of supplementary IT tools in the department, encouraging professional passion, familiar to work as mass communicator, curious to collect information, frequent visitors of library,

Gujarat Journal of Extension Education Vol. 24 : (December 2013)
77
positive in their feelings towards extension work, devotee of work and inventive in nature were more connected and attached with computers.
IMPLICATION
The outcome of this study articulates that, for increasing the level of computer inclination of the extension educationists of SAUs, the variables such as facilities available in the department, professional zeal, mass media liveliness, habit of information collection, library exposure and training received. Thus, it can be suggested that to give best results of computer, ICT facilities available in the department, professional zeal, mass media liveliness, habit of information collection, library exposure and training should be improved. It can be said that computer along with internet facility helped the extension educationists of SAUs to satisfy their hunger of information and innovative ideas. It is, therefore, suggested that computer along with internet facility should be provided in other organizations also to satisfy information need of the academicians, researchers,
administrators and extension educationists. This result gives us enough support to recommend creating this facility to satisfy needs and interests of the extension educationists with said irrespective level of independent variables: perception of workload, professional development, materialistic aspiration, professional aspiration, self confidence, perception span ofcontrol and inter-personal communication. To motivate such extension educationists to make effective use of computer along with internet, efforts should be made to make them confidentwithcomputerbyreducingtheircomputeranxietyor nervousness.
REFERENCES
Patel, M.C (2007). A study on factors affecting the level of Internet exposure of research scholars of Anand Agricultural University, Unpublished Ph. D. thesis submitted to the YCMOU, Nasik, Maharashtra.
Shah, U. B. (2006). A study on level of internet exposure of teachers of Anand Agricultural University, Anand. Unpublished Ph. D. Thesis, A.A.U., Anand, Gujarat.
Received : November 2012 ; Accepted : August 2013

Gujarat Journal of Extension Education Vol. 24 : (December 2013)
78
ABSTRACT
The study was conducted among the comparative study on Bt and non Bt cotton growers of Bharuch district of Gujarat state. Ex-post Facto research design was used and by using the proportionate random sam-pling technique used. The study was consisted of 75 Bt and 75 non – Bt cotton growers as respondents were obtained for the present study. The Bt cotton growers, social participation and extension contact were found positively and significantly correlated with knowledge level, where age, education, occupation, family size, fam-ily income and land holding were non significant and other hand In case of non Bt cotton growers, land holding and extension contact were found to be positively and significantly correlated with knowledge level, whereas, age, education, occupation, family size, family income and social participation were non significant.
Keywords: Relationship, knowledge, cotton, Bt Cotton & Non Bt Cotton
INTRODUCTION
Cotton, the ‘White gold’ occupies an enviable place amongst commercial crops of our country. Cotton plays a dominant role in agriculture as well as in industrial economy. Itisoneoftheprimesourcesofnaturalfibers.Itgivessupportto prestigious textile industry and produces employment to millions of people. The pattern of cotton production and con-sumption shows that the India has major strides since inde-pendencefromnetimportertoselfsufficiencyandamarginalexporter of raw cotton. Cotton cultivation area 9.3 million hectares (25 per cent) is in India. However, India ranks sec-ond (18 per cent) in total cotton production in the world. Gu-jarat state is India’s number one cotton producing state and it produced cotton worth Rs 8,000 crore in 2006-07. Cotton is the most important commodity throughout the world, which shares considerably in the Indian economy. Cotton is one of the major cash crops of India. Cotton seed and seed cakes are important sources of concentrate and feed to animals. It is also being used in manufacturing synthetic rubber, soaps, cosmetics, plastics, explosive etc. Considering its impor-tance, cotton is grown on a large scale throughout the world. Cotton being cultivated in 93 m. hectares, which covers about 25 per cent of total area of the country however, in which context to production, India securing second rank with 18 per
cent of production of the world. ( Khadi, 2005).Hybrid cotton cultivationabout70percentoftotalcottonareaisasignifi-cant milestone achievement in Indian Agricultural scenario. Basically, it is cultivated in three distinct agro-ecological regions viz., North, Central and South, of which, 21 per cent area is under cultivation in North zone which is 100 percent irrigated and contributes 25 per cent of the total production. The Central zone is predominantly rainfed and occupies more than 56 per cent of the total area, but contributing less than 50 per cent of the total production and hybrid cultivation is dominant in this zone. In South zone is representing all types of cotton, viz., irrigated and rainfed, hybrids (inter and intra-specific,diploids,andtetraploids)andvarieties(diploidsandtetraploids).
Keeping in view of this importance, the present studywasundertakenwithfollowingspecificobjectives:
Relationship between the personal, socio-economic and psychological characteristics and level of knowledge
METHODOLOGY
Bharuch is one of the major cotton growing dis-trict in south Gujarat. This district has eight talukas. Out these eight talukas, Ankaleshwar, Amod, Bharuch, Wagara andWaliahavehighestareaunderBtcotton.All thesefive
Relationship Between the Personal Characteristics of BT and non BT Cotton Growers and their Level of Knowledge
Sameer Dalvi1 , Sumit Salunkhe2 and Surendra Kumar Rai3
1.Ex. M.Sc. Student, 2 and 3 Ph.D. Scholars Dept. of Extension. Education, N. M. College of Agriculture, NAU
Email : siremdra_86@yahoo. in

Gujarat Journal of Extension Education Vol. 24 : (December 2013)
79
talukas were purposively selected. A list of cotton growing villageswasobtainedfromtheDistrictAgriculturalOfficer,Department ofAgriculture, Bharuch. Out of these, fifteenvillages were selected purposely. The lists of Bt and non Bt cotton growers of selected villages were obtained from Talati-cum-mantri.Outoftotal,fiveBtcottongrowerswereselectedrandomlywhile,fivenonBtcottongrowersofsamevillage were selected by considering actual cultivated area of Bt cotton growers. This way, the study was consist of 75 Bt and 75 non Bt cotton growers as respondents. In all one hundredfiftyrespondentswereconsideredassamplesizeforthe present study. The basic method was used for the col-lection of data by personal interview from 150 respondents of 15 villages’ of selected Bharuch talukas by the investiga-tor.Ex-post-facto research design was used. This design was considered appropriate because the phenomenon has already occurred. Keeping in the view, the objectives of study, the interview schedule was prepared and respondents were inter-view at their home.
RESULTS AND DISCUSSION
Table 1: Relationship Between Selected Characteristics and Level of Knowledge
Sr.No. Characteristics
Coefficient of correlation (r)
Bt cotton growers
Non Bt cotton rowers
1 Age 0.12053 0.178212 Education -0.06272 -0.081193 Occupation -0.21073 -0.053064 Family Size -0.07610 0.034665 Family Income -0.08123 -0.147806 Land Holding 0.06206 0.27346*7 Social Participation 0.23451* 0.012718 Extension Contact 0.42224* 0.40161*
*Significant at 5 per cent probability level (Critical value +/- 0.22701)
The association between the selected characteris-tics of cotton growers viz, age, education, occupation, fam-ily size, family income, land holding, social participation and extension contact and knowledge level were worked out with thehelpofcoefficientofcorrelation.Thefindingswerepre-sented in table 15.
The data manifested in table 1 revealed that in case of Bt cotton growers, social participation (0.23451*) and extension contact (0.42224*)were found positively and significantly
correlated with knowledge level, where age, education, oc-cupation, family size, family income and land holding were nonsignificant.
In case of non Bt cotton growers, land holding (0.27346*) and extension contact (0.40161*) were found to be positively and significantly correlated with knowledgelevel, whereas, age, education, occupation, family size, fam-ilyincomeandsocialparticipationwerenonsignificant.
Assuchhypothesissetforthisstudythat“thereisanorelationship between the personal, socio-economic and psy-chological characteristics of Bt and non Bt cotton growers and their level of knowledge” is rejected.
ThisfindingisintheagreementwiththefindingsofMadiajaan and Somasundaram (2002), Katole et al. (1996), Nimje et al. (1990) and Murthy (1990).
CONCLUSION
Fromthefindingsofthestudy,itcanbeconcludedthat, The Bt cotton growers, social participation and exten-sioncontactwerefoundpositivelyandsignificantlycorrelat-ed with knowledge level, where age, education, occupation, family size, family income and land holding were non sig-nificantandotherhandIncaseofnonBtcottongrowers,landholding and extension contact were found to be positively andsignificantlycorrelatedwithknowledgelevel,whereas,age, education, occupation, family size, family income and socialparticipationwerenonsignificant.
REFERENCES
Katole, R. T., Nikhade, D. M. and Kubde, V. R. (1996). Awareness about plant protection measures in hybrid cotton AHH-468.Maha.J.Extn.Edu.,IV:181-84.
Khadi,B. M. (2005). Cotton scenario and future strategies for increasing cotton Productivity. Paper presented in workshopon“Enhancementofcottonproductionandquality”. 12 November, 2005. Navsari agricultural University,Surat, Gujarat (India)., 1-4.
Madiajagan, M. and Somasundaram, S. (2002). Cotton farmersfieldschool–Anempiricalanalysis.J. Extn. Edu., 13 (2) : 3314-3317.
Murthy, Ch. R. (1990). Factors associated with the knowledge of cotton growers of Guntur district (A.P.). Maha. J. Extn. Edu., IX :181-184.
Nimje, N. R., Sinha, R. R. and Choudhari, D. P. (1990). Knowledge of farmers about dryland technology of cotton crop. . Maha. J. Extn. Edu., IX:165-169.
Received : January 2013 ; Accepted : October 2013
Gujarat Journal of Extension Education Vol. 24 : (December 2013)
80
INTRODUCTION
Agriculture is largely depending on natural resources like soil, water and vegetation. Agricultural productivity dependsonhowefficientlytheseresourcesareconservedandmanaged. On agricultural land, our main interest should be protect the soil and maintain its fertility, conserve the water and to ensure sustained crop yield by adopting appropriate agronomical practices. Realizing the importance of dry land agriculture, the planners at the national level have given top priority to dry land agricultural development programmes. Considering the importance of conservation of soil and water as a basic need for agricultural development the government of India has launched the centrally sponsored scheme “NationalWatershedDevelopmentProjectinRainfedArea”(NWDPRA) in the year of 1987-88. The overall objective of
the project is to achieve sustainable production of biomass and restoration of ecological balance in rainfed area.
During the tenth year plan, the project was implemented in all the district of Gujarat state covering 2.25 lakhs ha of land under 191 watersheds. During this plan period emphasis was given to people participation in conducting village level activities. In this project, the economic development of the farmers has to be centered around, increase agricultural production through introduction of improved watershed management technology coupled with generating the employment with a view to stopping deterioration of environment which effects production of food, fuel, fodder and ultimately living organism including animals and human being. Gujarat State Land Development Corporation (GLDC) is the implementing agency of NWDPRA in the state. The
Impact of Watershed Crop Production Technology on the Adoption Level of Beneficiary and Non Beneficiary Farmers
V.M.Patel1, A.J.Patel2 and J.K.Patel3
1 PG Student, Dept. of Extn. Edu. CPCA, SDAU, Sardarkrushinagar2 & 3 Asso. Prof. Dept. of Extn. Edu. CPDA, SDAU, Sardarkrushinagar
Email : [email protected]
ABSTRACT
The Malpur, Meghraj, Idar, Bhiloda and Dhansura talukas of Sabarkantha District of Gujarat state had covered under National Watershed Development Project in Rainfed Area was purposively selected for the study. Four villages from each talukas were selected purposively. As these villages have maximum number of beneficiaries and maximum area under watershed were taken in to account. Out of twenty selected villages, five beneficiary and five non-beneficiary farmers were selected randomly from each village for making a total sample of 200 farmers. The data were collected by personal interview. Based on the finding of the study, majority of the beneficiary and non-beneficiary farmers fall under the category of medium level of adoption, followed by low level of adoption and high level of adoption. Among the various soil and water conservation technology viz., summer ploughing, tillage across the slope, sowing across the slope and land leveling were adopted by the beneficiary and non-beneficiary farmers, where as in case of crop production technologies use of improved/hybrid/short duration varieties, use of organic manure, hand weeding, use of chemical fertilizers, timely sowing and inter cropping were adopted by the beneficiary and non-beneficiary farmers. Among various personal, socio-economic, psychological and communication characteristics of beneficiary farmers of watershed crop production technology, education, occupation, herd size, irrigation potentiality, extension participation, scientific orientation and risk preference had significant relationship with their extent of adoption of watershed crop production technology. While in case of non-beneficiary farmers, education, occupation and irrigation potentiality had significant relationship with their extent of adoption of watershed crop production technology.
Keywords: Watershed crop production, Adoption
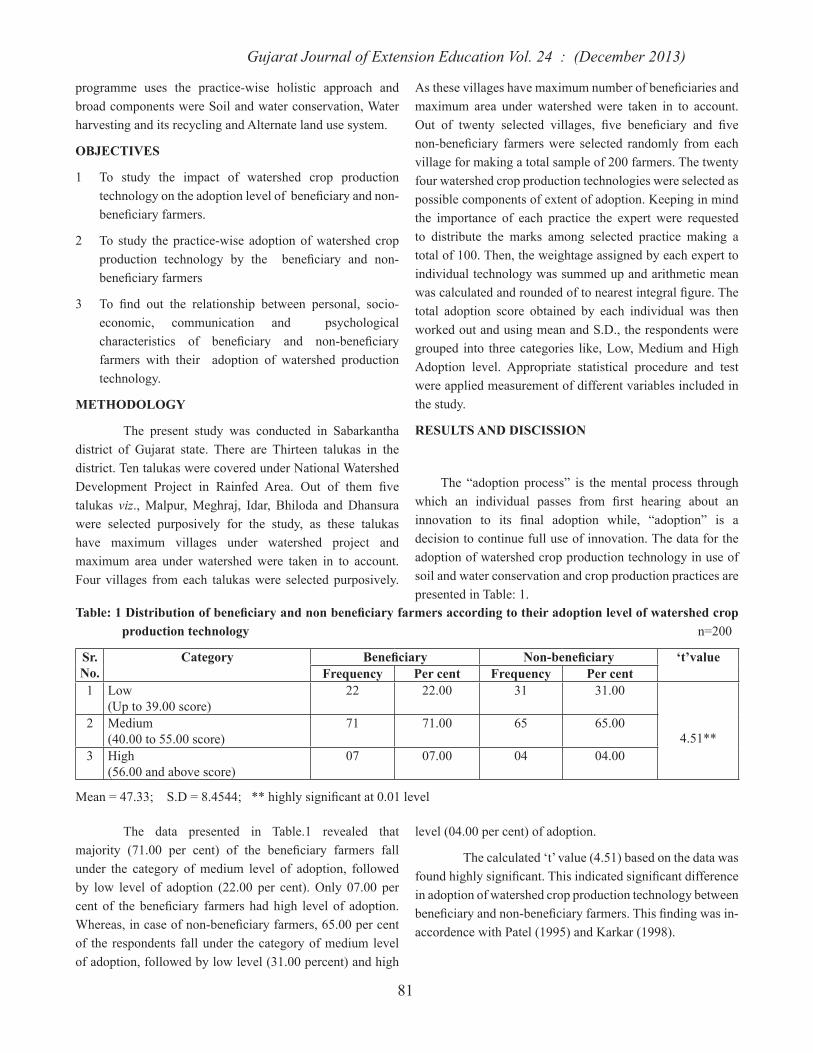
Gujarat Journal of Extension Education Vol. 24 : (December 2013)
81
programme uses the practice-wise holistic approach and broad components were Soil and water conservation, Water harvesting and its recycling and Alternate land use system.
OBJECTIVES
1 To study the impact of watershed crop production technologyontheadoptionlevelofbeneficiaryandnon-beneficiaryfarmers.
2 To study the practice-wise adoption of watershed crop production technology by the beneficiary and non-beneficiaryfarmers
3 To find out the relationship between personal, socio-economic, communication and psychological characteristics of beneficiary and non-beneficiaryfarmers with their adoption of watershed production technology.
METHODOLOGY
The present study was conducted in Sabarkantha district of Gujarat state. There are Thirteen talukas in the district. Ten talukas were covered under National Watershed Development Project in Rainfed Area. Out of them fivetalukas viz., Malpur, Meghraj, Idar, Bhiloda and Dhansura were selected purposively for the study, as these talukas have maximum villages under watershed project and maximum area under watershed were taken in to account. Four villages from each talukas were selected purposively.
Asthesevillageshavemaximumnumberofbeneficiariesandmaximum area under watershed were taken in to account. Out of twenty selected villages, five beneficiary and fivenon-beneficiary farmerswere selected randomly fromeachvillage for making a total sample of 200 farmers. The twenty four watershed crop production technologies were selected as possible components of extent of adoption. Keeping in mind the importance of each practice the expert were requested to distribute the marks among selected practice making a total of 100. Then, the weightage assigned by each expert to individual technology was summed up and arithmetic mean wascalculatedandroundedoftonearestintegralfigure.Thetotal adoption score obtained by each individual was then worked out and using mean and S.D., the respondents were grouped into three categories like, Low, Medium and High Adoption level. Appropriate statistical procedure and test were applied measurement of different variables included in the study.
RESULTS AND DISCISSION
The “adoption process” is themental process throughwhich an individual passes from first hearing about aninnovation to its final adoption while, “adoption” is adecision to continue full use of innovation. The data for the adoption of watershed crop production technology in use of soil and water conservation and crop production practices are presented in Table: 1.
Table: 1 Distribution of beneficiary and non beneficiary farmers according to their adoption level of watershed crop production technology n=200
Sr. No.
Category Beneficiary Non-beneficiary ‘t’valueFrequency Per cent Frequency Per cent
1 Low (Up to 39.00 score)
22 22.00 31 31.00
4.51**2 Medium
(40.00 to 55.00 score)71 71.00 65 65.00
3 High(56.00 and above score)
07 07.00 04 04.00
Mean=47.33;S.D=8.4544;**highlysignificantat0.01level
The data presented in Table.1 revealed that majority (71.00 per cent) of the beneficiary farmers fallunder the category of medium level of adoption, followed by low level of adoption (22.00 per cent). Only 07.00 per cent of thebeneficiary farmershadhigh level of adoption.Whereas,incaseofnon-beneficiaryfarmers,65.00percentof the respondents fall under the category of medium level of adoption, followed by low level (31.00 percent) and high
level (04.00 per cent) of adoption.
The calculated ‘t’ value (4.51) based on the data was foundhighlysignificant.Thisindicatedsignificantdifferencein adoption of watershed crop production technology between beneficiaryandnon-beneficiaryfarmers.Thisfindingwasin-accordence with Patel (1995) and Karkar (1998).

Gujarat Journal of Extension Education Vol. 24 : (December 2013)
82
Table 2 : Practicewise adoption of watershed crop production technology n=200
Sr.No.
Technology Beneficiary Non-beneficiaryFrequency Per cent Rank Frequency Per cent Rank
I Soil and water conservation technology1 Land leveling 40 40.00 IV 44 44.00 III2 Summer ploughing 83 83.00 I 80 80.00 I3 Tillage across the slope 57 57.00 II 46 46.00 II4 Sowing across the slope 56 56.00 III 41 41.00 IV5 Contour budding 24 24.00 V 22 22.00 V6 Tracing 03 03.00 XI 02 02.00 XII7 Nala plugging 12 12.00 VIII 19 19.00 VI8 Plantation on building to check soil
erosion12 12.00 VIII 13 13.00 VIII
9 Construction of farm pond 15 15.00 VII 12 12.00 IX10 Recharging of well 16 16.00 VI 18 18.00 VII11 Drip/Sprinkler irrigation system 04 04.00 X 06 06.00 XI12 Small check dam 10 10.00 IX 08 08.00 X13 Mulching 00 00.00 XII 00 00.00 XIIII Crop production technology1 Use of improved/hybrid/
short duration varieties96 96.00 I 85 85.00 III
2 Timely sowing 67 67.00 VI 50 50.00 VI3 Inter cropping 65 65.00 VII 60 60.00 V4 Mid season correction 30 30.00 X 23 23.00 VIII5 Use of organic manure 94 94.00 II 96 96.00 I6 Use of chemical fertilizer 86 86.00 V 82 82.00 IV7 Inter culturing 91 91.00 IV 60 60.00 V8 Weed management
1. Hand weeding 92 92.00 III 87 87.00 II2. Use of herbicides 03 03.00 XIV 02 02.00 XIII
9 Plant protection measures1. seed treatment 06 06.00 XIII 08 08.00 XII2. pest control 49 49.00 VIII 26 26.00 VII3. Disease control 13 13.00 XII 15 15.00 X
10 Supplementary irrigation 34 34.00 IX 22 22.00 IX11 Planting of trees
(fellowlandfield/boundary)16 16.00 XI 14 14.00 XI
The data presented in Table.2 indicates that among the various soil and water conservation technology viz., summer ploughingwasadoptedby83.00percentofthebeneficiaryfarmersandwasrankedfirst,followedbytillageacrosstheslope (57.00 per cent) and sowing across the slope (56.00 per cent) and were ranked second and third respectively. While in caseofnon-beneficiary farmers, summerploughingwasadopted by 80.00 per cernt of the respondents and was ranked firstfollowedbytillageacrosstheslope(46.00percent)andland leveling (44.00 per cent) and were ranked second and third respectively.
So far as the crop production technology were concerned, the technologies viz., use of improved/hybrid/
short duration varieties was adopted by 96.00 per cent beneficiaryfarmersandwasrankedfirst,followedbyuseoforganic manure (94.00 per cent) and hand weeding (92.00 per cent) and were ranked second and third respectively. Where as, use of chemical fertilizers (86.00 per cent), timely sowing (67.00 per cent) and inter cropping (65.00 per cent) were ranked fourth, fifth and sixth respectively.While, incaseofnon-beneficiaryfarmers,useoforganicmanurewasadopted by 96.00 per cent of the respondents and was ranked first,followedbyhandweeding(87.00percent)anduseofimproved/hybrid/short duration varieties (85.00 per cent ) and were ranked second and third respectively. Where as, use of chemical fertilizers (82.00 per cent) and inter cropping (60.00 per cent)/ inter cropping (60.00 per cent) were ranked fourthandfifthrespectively.

Gujarat Journal of Extension Education Vol. 24 : (December 2013)
83
Incase of soil and water conservation technologies, mulching was not adopted by any respondents. The probable reason might be that lack of information, less availability of mulches materials and lack of skill oriented mulch labour. ThisfindingwassupportedbyPatel(2000).
Table 3 : Relationships between selected charecteristics of beneficiary and non-beneficiary farmers with their extent of adoption watershed crop production technology n=200
Sr. No.
Characteristics Coefficient of correlation value with extent of
adoptionBeneficiary Non-
Beneficiary1 Age -0.1303 NS -0.0073 NS2 Education 0.4716** 0.4252**3 Social participation 0.0428 NS -0.0212 NS4 Occupation 0.2146** 0.1875*5 Land holding 0.1275 NS 0.1107 NS6 Herd size 0.1801* 0.0121 NS7 Irrigation potentiality 0.2314** 0.6891**8 Extension participation 0.2798** 0.0038 NS9 Scientificorientation 0.1965** 0.1076 NS10 Risk preference 0.2377** 0.0421 NS
*Significantat0.05levelprobability;
**Highlysignificantat0.01levelprobability;
NS=Non-significant.
The data presented in Table.3 revealed that, among various personal, socio-economic, psychological and communication characteristics of beneficiary farmersof watershed crop production technology, education (0.4716), occupation (0.2146), herd size (0.1801), irrigation potentiality (0.2314), extension participation (0.2798), scientific orientation (0.1965) and risk preference (0.2377)hadsignificant relationshipwith theirextentofadoptionofwatershed crop production technology, While age (-0.1303), social participation (0.0428) and land holding (0.1275) of beneficiary farmers were found to be non-significantrelationship with their extent of adoption of watershed crop production technology.
For non-beneficiary farmers, education (0.4252),occupation (0.1875) and irrigation potentiality (0.6891) hadsignificant relationshipwith theirextentofadoptionofwatershed crop production technology. While age ((-0.0073), social participation (-0.0212), land holding (0.1107), herd size (0.0121), extension participation (0.0038), scientificorientation (0.1076) and risk preference (0.0421) were found tobenon-significantrelationshipwiththeirextentofadoptionofwatershedcropproductiontechnology.Thisfindingwasin
linewiththefindingofKarkar(1998)andPatel(2000).
CONCLUSION
Majority of the beneficiary farmers fall under thecategory of medium level of adoption, followed by low level of adoption and high level of adoption. While in case of non-beneficiary farmers,majority of the respondents fall underthe category of medium level of adoption, followed by low level and high level of adoption.
Among the various soil and water conservation technology viz., summer ploughing, tillage across the slope andsowingacrosstheslopewereadoptedbythebeneficiaryfarmers,Whileincaseofnon-beneficiaryfarmers,summerploughing, by tillage across the slope and land leveling were adopted by the respondents.
So far as the crop production technology were concerned, the technologies viz., use of improved/hybrid/short duration varieties, use of organic manure, hand weeding, use of chemical fertilizers, timely sowing and inter cropping(65.00percent)wereadoptedby the beneficiaryfarmers.While in case of non-beneficiary farmers, use oforganic manure, hand weeding, use of improved/hybrid/short duration varieties, use of chemical fertilizers, inter cropping and inter cropping were adopted by the respondents. .
Among various personal, socio-economic, psychological and communication characteristics of beneficiaryfarmersofwatershedcropproductiontechnology,education, occupation, herd size, irrigation potentiality, extension participation, scientific orientation and riskpreference had significant relationship with their extent ofadoption of watershed crop production technology. While in caseof non-beneficiary farmers, education, occupation andirrigationpotentialityhadsignificant relationshipwith theirextent of adoption of watershed crop production technology.
REFERENCES
Karkar, B.R. (1998) Impact of National Watershed Development Project for rainfed areas on farmers knowledge and adoption of rainfed agro technology. Ph.D Thesis (Unpublished), Submitted to Gujarat Agricultural University, Junagadh.
Patel.J.B. (1995). Impact of management technology in Panchmahal District of Gujarat State.
M.Sc.(Agri.) Thesis(Unpublished), Submitted to Gujarat Agricultural University, Navsari.
Patel.R.C. (2000). A study on the consequences of adoption ofwatershedmanagementtechnologybybeneficiaryfarmers in watershed area of Kheda District Gujarat
State. Ph.D Thesis(Unpublished), Submitted to Gujarat Agricultural University, Anand.
Received : January 2013 ; Accepted : August 2013

Gujarat Journal of Extension Education Vol. 24 : (December 2013)
84
ABSTRACT
The study was conducted in Saurashtra region of Gujarat State with 100 veterinary officers (VOs) working under panchayat to know their managerial ability and its impact on Job satisfaction. The study revealed that majority (70.00 per cent) of the respondents expressed medium level of job satisfaction whereas, 20.00 per cent of the respondents expressed low level of job satisfaction and only 10.00 per cent of them expressed high level of satisfaction with their jobs. Item- wise satisfaction level of the respondents were observed highly satis-fied with job security (4.46 mean score) followed by Freedom of work 4.26 (mean score), Nature of work (4.22), Cooperation from colleagues/ senior (4.10), Work atmosphere (3.94) and Recognition for good work (3.80). As far as the Leave, Status in the organization, Office accommodation and Scope to prove merit & excellence are concerned they were neither satisfied nor dissatisfied as the mean score were very close to the mid value on the score. The Study further revealed that experience on VD centre, management training received, personality and job involvement had positive and significant correlation with job satisfaction of the veterinary officers, while, academic qualification had negative and significant correlation with job satisfaction of the veterinary officers. These indicated that higher educated persons were not satisfied with the present job.
Keywords: Job Satisfaction, Veterinary officers
INTRODUCTION
The term job satisfaction refers to the feelings and the emotional aspect rather than the rational aspect of indi-vidual experience towards his job. The experience of satis-faction or dissatisfaction with ones work of aspects of it is in large part, the consequence of his positive or negative job attitudes (Smith, 1955). He further stared that job satisfac-tion was employee’s judgment on how well his job on the whole was satisfying his various needs. According to Blum (1956) job satisfaction is the generalized attitude resulting frommanyspecificattitudes in threeareasviz,specificjobfactors, individual adjustment and group relationship.
In any organization, the attitude of an employee to-wards his work had a great bearing on its success. Job sat-isfaction and other satisfactions derived by members of an organization serve as one of the criteria for evaluating the
effectiveness of the organization. Earlier studies on job sat-isfaction of the employee have revealed that this has positive effect on their job performance, which serves the ultimate goalofanorganization.Theveterinaryofficers(VOs)arethecrucial employees in the organizational structure of animal husbandry department. Therefore, it was felt necessary to study the existing levels of job satisfaction of VOs in order to enhance their job performance, which may lead to achieve-ment of development goals.
OBJECTIVES
1 To study the existing level of job satisfaction of the VOs.
2 To study the Item-Wise job satisfaction of the VOs.
3 To study the relationship between selected characteris-tics of the VOs with their job satisfaction.
Job Satisfaction of Veterinary Officers
H.B. Gardharia1, M.N. Popat2 and M.K. Jadeja3
1 Training Associate, Directorate of Extension Education, Junagadh Agricultural University, Junagadh
2 Retd. Associate Director of Extension Education, Junagadh Agricultural University, Junagadh
3Agri.Officer,DirectorateofExtensionEducation,Junagadh Agricultural University, Junagadh
E-mail: [email protected]
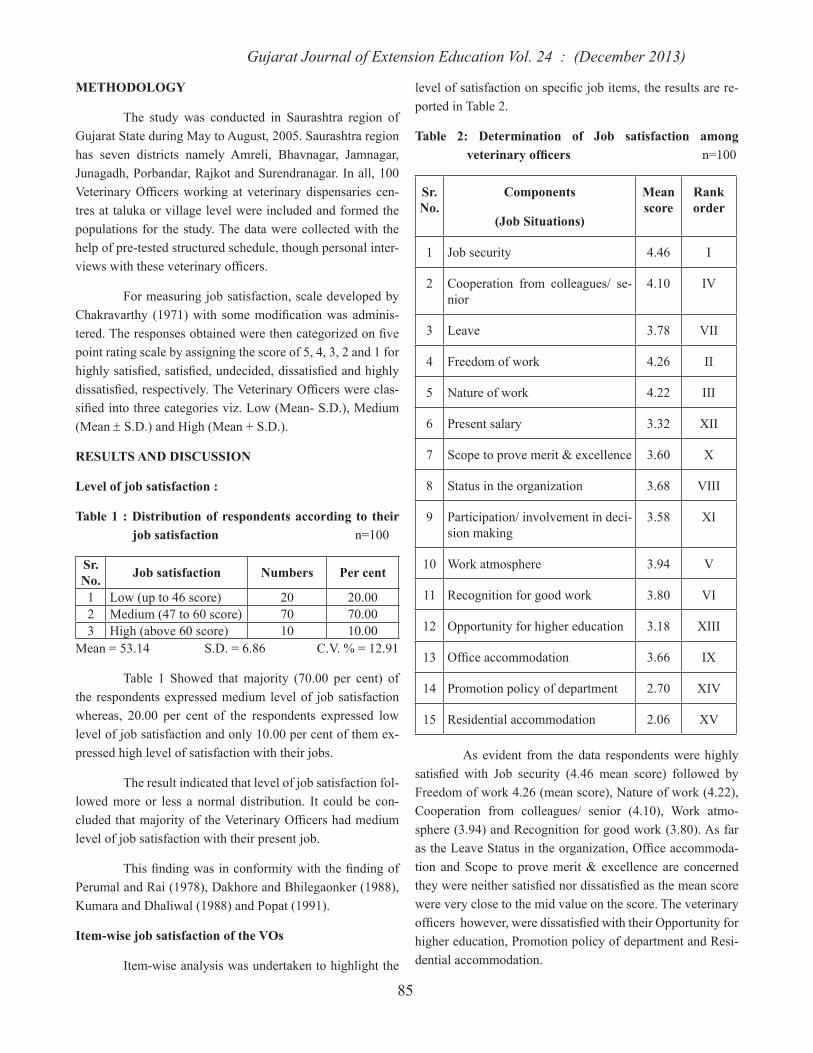
Gujarat Journal of Extension Education Vol. 24 : (December 2013)
85
METHODOLOGY
The study was conducted in Saurashtra region of Gujarat State during May to August, 2005. Saurashtra region has seven districts namely Amreli, Bhavnagar, Jamnagar, Junagadh, Porbandar, Rajkot and Surendranagar. In all, 100 VeterinaryOfficersworking at veterinarydispensaries cen-tres at taluka or village level were included and formed the populations for the study. The data were collected with the help of pre-tested structured schedule, though personal inter-viewswiththeseveterinaryofficers.
For measuring job satisfaction, scale developed by Chakravarthy (1971)with somemodificationwas adminis-tered.Theresponsesobtainedwerethencategorizedonfivepoint rating scale by assigning the score of 5, 4, 3, 2 and 1 for highlysatisfied,satisfied,undecided,dissatisfiedandhighlydissatisfied,respectively.TheVeterinaryOfficerswereclas-sifiedintothreecategoriesviz.Low(Mean-S.D.),Medium(Mean ± S.D.) and High (Mean + S.D.).
RESULTS AND DISCUSSION
Level of job satisfaction :
Table 1 : Distribution of respondents according to their job satisfaction n=100
Sr. No. Job satisfaction Numbers Per cent
1 Low (up to 46 score) 20 20.002 Medium (47 to 60 score) 70 70.003 High (above 60 score) 10 10.00
Mean = 53.14 S.D. = 6.86 C.V. % = 12.91
Table 1 Showed that majority (70.00 per cent) of the respondents expressed medium level of job satisfaction whereas, 20.00 per cent of the respondents expressed low level of job satisfaction and only 10.00 per cent of them ex-pressed high level of satisfaction with their jobs.
The result indicated that level of job satisfaction fol-lowed more or less a normal distribution. It could be con-cludedthatmajorityoftheVeterinaryOfficershadmediumlevel of job satisfaction with their present job.
ThisfindingwasinconformitywiththefindingofPerumal and Rai (1978), Dakhore and Bhilegaonker (1988), Kumara and Dhaliwal (1988) and Popat (1991).
Item-wise job satisfaction of the VOs
Item-wise analysis was undertaken to highlight the
levelofsatisfactiononspecificjobitems,theresultsarere-ported in Table 2.
Table 2: Determination of Job satisfaction among veterinary officers n=100
Sr. No.
Components
(Job Situations)
Mean score
Rank order
1 Job security 4.46 I
2 Cooperation from colleagues/ se-nior
4.10 IV
3 Leave 3.78 VII
4 Freedom of work 4.26 II
5 Nature of work 4.22 III
6 Present salary 3.32 XII
7 Scope to prove merit & excellence 3.60 X
8 Status in the organization 3.68 VIII
9 Participation/ involvement in deci-sion making
3.58 XI
10 Work atmosphere 3.94 V
11 Recognition for good work 3.80 VI
12 Opportunity for higher education 3.18 XIII
13 Officeaccommodation 3.66 IX
14 Promotion policy of department 2.70 XIV
15 Residential accommodation 2.06 XV
As evident from the data respondents were highly satisfied with Job security (4.46 mean score) followed byFreedom of work 4.26 (mean score), Nature of work (4.22), Cooperation from colleagues/ senior (4.10), Work atmo-sphere (3.94) and Recognition for good work (3.80). As far astheLeaveStatusintheorganization,Officeaccommoda-tion and Scope to prove merit & excellence are concerned theywereneithersatisfiednordissatisfiedasthemeanscorewere very close to the mid value on the score. The veterinary officershowever,weredissatisfiedwiththeirOpportunityforhigher education, Promotion policy of department and Resi-dential accommodation.

Gujarat Journal of Extension Education Vol. 24 : (December 2013)
86
Correlation of job satisfaction
Table 3: Relationship between selected characteristics and job satisfaction n=100
Sr. No.
Characteristics ‘r’ value
1 Academicqualification -0.2468*2 Experience on VD centre 0.4334**3 Management training received 0.5532**4 Interpersonal communication 0.11215 Departmental climate 0.11946 Personality 0.2555*7 Area of jurisdiction 0.02228 Job stress -0.04379 Achievement motivation 0.160410 Job involvement 0.4754**
*Significantat0.05levelofprobability **Significantat0.01levelorprobability
A perusal data in Table 3 reveals that experience on VD centre, management training received, personality and jobinvolvementhadpositiveandsignificantcorrelationwithjob satisfaction of the veterinary officers, while, academicqualification had negative and significant correlation withjobsatisfactionoftheveterinaryofficers.Thisindicatedthathighereducatedpersonswerenotsatisfiedwith thepresentjob. It could therefore be stated in other words the veterinary officersmoreworking experience on the same job, highermanagement training received, good personality and more job involvement could express satisfaction towards their as veterinaryofficerandcontentedwiththejobtheyperformed.Other characteristics had not significant relationship withjobsatisfaction.Thesefindingswere in supportoffindingsreported by Dakhore and Bhilegaonkar (1988) and Chinch-malatpure et al (2000).
CONCLUSION
Earlier researches in thefieldofassessment levelsof job satisfaction of extension workers have conclusively
established that the performance of an employee depended on the satisfaction of the employee on his job. The result of this study have shown that the job satisfaction is very much related with the facilities the organization provided to the em-ployees, particularly in the form of Job security, Freedom of work, Nature of work, Cooperation from colleagues/ senior, Work atmosphere and Recognition for good work. It is also necessary for the organization to create a favourable attitude ofitsemployeestowardstheirjob.Thefindingsofthestudywillnotonlybe applicable forveterinaryofficers, but alsofor extension personnel of organizations belonging to other disciplines.
REFERENCES
Chakravarthy, T.K. (1971) A study of factors associated with job satisfaction of Block Level Extension Personnel in two I.A.D.P. Districts of Northern India. Ph.D. Thesis (unpublished), I.A.R.I., New Delhi.
Chinchmalatpure, U.R. Shinde, P.S. and Chikhale, N.J. (2000) Job Satisfaction of Graders in Monopoly Cot-ton Procurement Scheme. Maha. J. of Extn. Edn. XIX, : 239-242.
Dekhore, K.M. and Bhilegaonkar, M.G. (1988) Job satisfac-tion of Veterinary Extension Personnel. Maha. J. Extn. Edn. 7:75-80.
Kumar, K. and Dhaliwal, A.S. (1988) Job satisfaction, job attraction and life satisfaction among the trainers of farmers training centers in India. Indian J. of Extn. Edn., 24 (3 & 4) : 16-22.
Perumal, G. and Rai, G.C. (1978) Job satisfaction and Job performance of Agricultural Extension Officers ofTamil Nadu. Indian J. of Extn. Edn., 14 (1 & 2) : 73-75.
Sharma, N. and S.P. Singh (2001) Job satisfaction among the Extension Personnel of Rajasthan. Indian J. of Extn. Edn. Vol XXXVII No. 3 & 4 : 206-209.
Received : December 2012 ; Accepted : October 2013

Gujarat Journal of Extension Education Vol. 24 : (December 2013)
87
Adoption of Recommanded Hybrid Castor Production Technologies by the Farmers of Gujarat
Harpreet Sodhi1 and K.P.Thakkar 2
1 Assistant Professor, Karnavati Education Institute of IT and Management2 Assistant Professor, C.P.College of Agriculture, SADU, Sardarkrushinagar
College of Agribussiness ManagementSardarkrushinagar Dantiwada Agriculture University, Sardarkrushinagar
Email : [email protected]
ABSTRACT
Association analysis of personal (Age and Education), Socio economic (landholding, Annual income and social participation), communication (extension contact and source if information) and psychological charac-teristics (economic motivation, scientific orientation, risk preference, innovation and knowledge level) of hybrid castor growing farmers of Gujarat with extent of adoption was studied amongst 225 castor growing farmers of North Gujarat. The study revealed that Knowledge level, education, source of information, social participation, scientific orientation, innovativeness and extension contact characteristics of the hybrid castor growing farmers had a direct bearing in the extent of adoption of recommended castor production technologies by the farmers of Gujarat.
Keywords: Adoption, Hybrid castor, Production Technologies
INTRODUCTION
Castor [Ricinus communis (L.)] is a non-edible oil seed crop of utmost industrial importance. It is indigenous to East Africa and grown in tropical and sub-tropical regions of the world. The centre of origin of castor is believed to be in Ethiopia. The seed of castor bean contains 35 to 58 per cent oil. There is evidence that castor oil was used in Egypt as lamp oilabout6000yearsago.Castoroilfindsitsapplicationinthemanufacture of a wide range of industrial products such as nylonfibers,hydraulicfluidsandmostlyusedaslubricantoilin high speed engines. Castor oil is also used in manufacture of dyes, paints, varnishes, detergents, pharmaceutical, plasticizers, polishes, grease, rubber, wetting agents etc. Castor cake is a good source of Nitrogen and widely used as manure.However,itisunfitforhumanconsumptionandascattle feed due to presence of toxin substance, ricin.
Major castor growing countries are Brazil, India, China, Thailand and Russia. Among these, India is a principal producer which contributed 8042 lakh tones of production from an area of 609 lakh hectares during year 1998-99 (Acharya et.al 2010).
In India, castor is mainly grown in the states of Gujarat, Andhra Pradesh, Tamil Nadu, Rajasthan, Orissa, KarnatakaandMaharashtra.Gujaratranksfirstbothinarea
and production with productivity of 1994 kg/ha which is the highest in the country. Gujarat shares about 54 per cent of area and 82 per cent of castor seed production of the country. The productivity is highest in Gujarat because more than 90 per cent cultivated areas are under castor hybrids grown under irrigated condition. The hybrids are well adopted by the farmers because of their high production potentiality over local varieties and the crop becoming very remunerative to the farmers.
Gujarat is pioneer in development and release of first ever commercial hybrid not only in the country butalsointhewholeworld,waybackin1969,whenfirstcastorhybrid, GCH-3 was released. This has been followed by fivemore hybrids viz., GAUCH-1, GCH-2, GCH-4, GCH-5, GCH-6 and recently GCH-7. Adoption of high yielding castor hybrids by the farmers helped in boosting the yield from 470 kg/ha (before release of hybrid in 1967-68) to 1994 kg/ha (1998-99) in Gujarat.(Pathak et.al 2005)
METHODOLOGY
The personal, Socio economic, communication and psychological characteristics of hybrid castor growing farmers of Gujarat were studied by Sodhi and Thakar (2013). Different variables of the study which include personal (age and education), socio-economic (land holding, annual income, irrigation facility and social participation)

Gujarat Journal of Extension Education Vol. 24 : (December 2013)
88
communication (extension contact) and psychological characteristics (economicmotivation, scientific orientation,risk preference, innovativeness and knowledge level) have been studied. The study was further extended to measure the extent of adoption of recommended castor cultivation technologies by these farmers in relation to the personal, Socio economic, communication and psychological characteristics.Coefficientofcorrelationisthemeasurementofassociationbetweenvariable.Thecoefficientofcorrelationwas computed between each of the independent variable and dependent variable as per standard statistical procedure given by Panse and Sukhame (1962).
With a view to find out the extent if adoption ofrecommended hybrid castor production technologies, the castor grower were asked to provide information about the package of practices adopted by them as recommended by S. D. Agricultural University (Patel et.al 2000). The adoption level of the farmers was judged by providing them a pre-structural questionnaire and score were assigned (Table 1).
RESULTS AND DISCUSSION
Adoption of any recommended technology largely depends on personnel, socio-economic, communication and psychological characteristics of the farmers which play an important role in decision making process. Since, adoption is an action, the role of situation or an environment is very crucial in understanding human behavior. Behavior takes place in a situation which has profound influences onindividual’s action.
Acceptance of recommended hybrid technology is not a unit act but a complex process involving sequence and thorough series of actions. The action of an individual farmer is governed by personnel, socio-economic, communication and psychological factor. Some farmers adopt new agricultural technologies more quickly than others because of the difference in various factors. The process of action is changed, resulting in the changed pattern of adoption process. Hence, the adoption of recommended hybrid castor technologies differs when the castor growers vary in their personnel, socio -economic, communication and psychological characteristics
Therefore, an attempt has been made in the present study to ascertain the correlations if any between personnel, socio economic, communication and psychological characteristics of the castor growers and their extent of adoption of hybrid castor cultivation technologies. This was examined and testedbycalculatingPearson’scorrelationco-efficient(“r”).The results in this regard are presented in Table 1 and Fig 1.
Table 1: Correlations between selected characteristics of castor growers and their extent of adoption n=225
Sr. No.
Characteristics Coefficient correlation
I Personal Characteristics1 Age -0.224 **2 Education 0.546 **
II. Socio -economic characteristics3 Landholding 0.0654 Annual income 0.0845 Social participation 0.357 **
Ill Communication characteristics6 Extension contact 0.163*7 Source of information 0.371 **
IV Psychological characteristics8 Economic motivation 0.195 **9 Scientificorientation 0.348 **10 Risk preference 0.01911 Innovativeness 0.283 **12 Knowledge level 0.937**
Fig. 1 : correlation ship betwen selected characteristic of castor growers and their extent of adoption

Gujarat Journal of Extension Education Vol. 24 : (December 2013)
89
Amongst the personnel characteristics it was observedthatagewasfoundtobesignificantlyandnegativelycorrelated with extent of adoption by the castor growers. The education levelof thecastorgrowerswas significantlyandpositively (0.546) correlated with the extent of adoption of recommended hybrid castor technology. Thus it can be inferred that education brings the changes in adoption behaviour. The educated farmers have greater reception power than less educated and illiterate farmers. This finding is supportedby Dhorajia (1996) and Prajapati (2005). Amongst the socio-economic characteristics, the size of the land holding possessed by the farmer was not correlated with adoption level. Similarly the annual income of the farmer didn’t show significant level of correlationwith the adoption of hybridcastor technology. The calculated correlated coefficient(0.357)wassignificantat0.01levelofsignificanceindicatingthat social participation of the castor grower and their extent ofadoptionwassignificantlyandpositivelycorrelated.Thusitcanbesaidthatsocialparticipationinfluencestheadoptionbehavior, helping in increasing adoption. The probable reason might be that social participation develops wider outlook of the farmers leading towards higher contact in the outside world. Therefore, farmers might have been convinced about the hybrid castor cultivation technologies leading to higher adoption.Thepresentfindingsaresupportedbyearlierresultsof Dhorajia (1996) and Jaloriya (2006).
Amongst the communication characteristics both the characteristics viz., extension contact (0.163) and source of information (0.371) were significantly and positivelycorrelatedat0.05and0.01levelofsignificancerespectively.Thus it may be inferred that extension contact influencesthe respondents under study towards scientific orientation,thereby widening their knowledge which leads to their higher adoption level. Similarly, the source of information acts as a link between the agricultural universities, research stations and extension personnel on one hand and farmers on another hand in communicating latest information in convincing manner to the farmers. This may have resulted in higher adoption of hybrid castor production technology by the farmers.TheresultsaresupportedbythefindingofDhorajia(1996) and Desai (2005).
Amongst the psychological characteristics economicmotivation (0.195), scientific orientation (0.348)innovativeness (0.283) and knowledge level (0.937) exhibited significantpositivecorrelationwiththelevelofadoptionofhybrid castor cultivation technologies by the castor growers. High economic motivation generally tends to achieve high
crop yield and economic returns from farming for which they have to adopt the recommended technology. Similarly the scientific orientation influences the adoption behaviourwhich helps in increasing adoption. The castor growers with more scientific orientation were motivated to seek moreinformation about recommended hybrid castor cultivation technology. The innovativeness positively affects the adoption rate as it persuades the farmer to have direct close contact with researchers and extension personnel. Moreover they are cosmopolite, eager to know advance technology and have positive attitude towards new innovations. The farmers with higher knowledge level are efficient in selecting economicand feasible technology as well as adopting the same quickly. Other possible reasons might be that the knowledge about the innovations makes an individual more receptive of innovation because of his broad vision of thinking. Further the farmers having more knowledge in production technology may be competent in solving the problems in adoption of recommended hybrid castor cultivation technology also. The presentfindingsareinaccordancewiththeearlierreportsofDhorajia (1996), Deshmukh et al., (1995), Patel et al., (2000), Jadhao (2001), Prajapati (2005), Jaloriya (2006) and Patel (2008).
CONCLUSION
The study, that knowledge level, education, source of information, social participation, scientific orientation,innovativeness and extension contact characteristics of the hybrid castor growing farmers had a direct bearing in the extent of adoption of recommended castor production technologies by the farmers of Gujarat.
REFERENCES
Acharya, S., Patel, P.S., Patel J.B. and Vaghela, K.O. (2010). Maintainance of genetic purity in castor. Technical Bulletin 3 :1-19. DOR, Sardarkrushinagar Dantiwada Krushi University, Saradarkrushinagar.
Desai, M.F. (2005). Adoption of summer bajra cultivation technology by the bajra growers in Banaskantha district in Gujarat. M.Sc.(Ag). Thesis. SDAU, Sardarkrushinagar
Deshmukh, N.D., Mahajan, B.S. and Diklk, R.N. (1995) Adoption of groundnut technology by the farmers. Gujarat J. Extn.Edn., (3 & 4) : 111 -16.
Dhorajia, M.B. (1996). A study of knowledge and adoption of Integarted Pest Management in castor cultivation. M.Sc.(Ag). Thesis. SDAU, Sardarkrushinagar.
Gujarat Journal of Extension Education Vol. 24 : (December 2013)
90
Jaloriya, J.P (2006). Adoption of recommended green gram production technology by the farmers of Banaskantha district of Gujarat state. M.Sc.(Ag). Thesis. SDAU, Sardarkrushinagar
Jadhao, D.L.(2001). A study of modernization of agriculture among the farmers of Mehsana District of Gujarat State. M.Sc. (Ag). Thesis. SDAU, Sardarkrushinagar.
Panse V. G and Sukhmane P.V (1962). Statistical Methods for Agricultural Research Workers. Indian Council of Agricultural Research . New Delhi
Patel, B.K. (2008). Adoption of recommended hybrid castor cultivation technology by the castor growers. M.Sc (Ag) Thesis. Gujarat Agricultural University, Sardarkrushinagar (Gujarat).
Patel, V.T., Prajapati, M.R., Joshi, K. M., Chaudhary, N.V. and Soni, M.C. (2000) Adoption of recommended dry farming technology of cotton in North Gujarat. Gujarat J. Extn. Ed., 10-11 : 32-36.
Pathak H.C., Chaudhary. F.P, Patel. M.S. and Patel. D.K. (2005). Gujarat Castor Hybrid 7. SDAU News 2 (2):1
Prajapati, R.C (2005). Adoption of hybrid castor cultivation technology by the castor growers in Banaskantha district in Gujarat state. M.Sc (Ag) thesis. Sardarkrushinagar Dantiwada Agricultural University, Sardarkrushinagar (Gujarat).
Sodhi.Harpreet., and Thakar K.P (2013). Personal, socio- economic, communication and psychological characteristics of hybrid castor growing farmers of Gujarat. GAU Research Journal 38 (2) : 98-102.
Received : July 2013 ; Accepted : November 2013
Gujarat Journal of Extension Education Vol. 24 : (December 2013)
91
INTRODUCTION
In the development of Indian agriculture, contribu-tion of women is well accepted by policy makers, planners and academicians. Many experts have suggested that to de-velop agriculture as whole, there is need to encourage women educationists, researchers and extension educationists to mo-tivateandcontributesignificantlytothehalfofwomanforceinvolved in the agriculture. It is noticed that as compared to male, women’s participation in agricultural education, re-search and extension activities is quite less. However, from last two decades, considerable women students have shown
their interest to be a part of agricultural education, research andextensionactivities.Itishightimetogiveconfidenceandbuild up capabilities of women agricultural students through the use of computer and information technology.
In present age of information and technology, innu-merable types of software are accessible to carry out almost any possible task using built-in rules and procedures. These programmes offer fast and efficient ways to conduct anykinds of work, business, teaching, research, learning and edu-cation. It is observed that due to many reasons as explained earlier, many agricultural woman students do not take real
Impact of Characteristics of Woman Research scholars of SAUs of Gujarat to form their Attitude towards the Use of Computer
B.M.Christian1 and N.B.Chauhan2
1 Asst. Professor, Agril Polytechnic, AAU, Vaso2 Professor and Head, department of Extension Education, BACA, AAU, Anand
Email : [email protected]
ABSTRACT
Impact of Characteristics of Woman Research of SAUs of Gujarat to form their Attitude towards the Use of Computer was studied using Ex-post facto research design and presented in this article. The data were collected through the personal interview from the randomly selected 100 woman research scholars of all the State Agricultural University of Gujarat state. The result indicates that majority (83.00 per cent) of the woman research scholars of SAUs of Gujarat had neutral to favorable attitude towards the use of computer for their empowerment. There was positive and significant impact of academic performance, father’s and mother’s education, knowledge of different languages, job preference, scientific orientation, achievement motivation, self confidence and innovation proneness of the research scholars in forming their positive attitude towards the use of computer. It was also observed that the attitude towards application of computer of the woman research scholars or their empowerment was not affected by their other characteristics viz. age, education, habit of information collection, native place, type of family, wish to migrate abroad, wish to get higher academic degree, library exposure, exposure in student’s curricular activity, competition orientation and computer anxiety. The result indicates that woman research scholars with better academic performance, highly educated parents, knowledge of more than one languages and superior job preference, achievement motivation, self confidence and innovation proneness had more positive feelings towards application the computer for their empowerment, while, feelings towards computer application for their empowerment was observed identical among those woman research scholars who had low to high level of information collection behaviour, willingness or unwillingness to get higher academic degree, wish to migrate abroad or settle in India, low to high level of orientation of competition and, low to high level of anxiety to make use of computer in their daily life.
Keywords : Attitude, Computer, Woman research scholars

Gujarat Journal of Extension Education Vol. 24 : (December 2013)
92
advantages of computer application for the development. It is therefore, there is a need to examine the major problems and issues associated with it.
Understanding this, to know existing feeling of the woman students involved in agricultural higher education and research of SAUs of Gujarat towards computer in using this classic equipment for the development of their personal-ity, a study was conducted on their feelings towards computer with following two objectives
1 To study attitude of the woman research scholars towards the use of computer for their empowerment
2 Impact of characteristics of woman research scholars of SAUs of Gujarat to form their attitude towards the use of computer
METHODOLOGY
For this study, 45 women research scholars from Anand Agricultural University, 18 from Junagadh Agricul-tural University, 20 from Navsari Agricultural University and 17 from Dantiwada Sardarkrushinagar Agricultural Univer-sity,finallyarandomsampleof100womanresearchscholarswere randomly and proportionately selected for the study. Ex-post facto research design was applied for this study. The interview schedule was used as a tool for collection of req-uisite information. The statistical tools like mean, standard deviationandPearson’scoefficientofcorrelationtechniquewere used to analyze data.
RESULTS AND DISCUSSION
Level of attitude of the woman research scholars towards the use of computer for their empowerment
The attitude of the woman research scholars towards the use of computer for their empowerment is one of the important factors to expect their high quality proximity with computer. Attitude is encouraging or depressing sensitivity of human being connected with any thing, person or technology. In the current investigation, attitude has been conceptualized as positive or negative feelings of woman research scholars towards computer and worth of its functions for their empowerment. To measure this, researchers had developed and standardized attitude scale adopting appropriate statistical procedure. The attitude towards the use of computer of woman research scholars for their empowerment was measured and result is presented in the Table 1.
Table 1: The women research scholars as per their attitude towards the use of computer for their empowerment n=100
Sr. No.
Attitude towards the use of computer
Number Per cent
1 Unfavorable (below 38 score)
17 17.00
2 Neutral (38 to 47 score) 65 65.003 Favorable (above 47 score) 18 18.00
Table 1 indicates that majority (65.00 per cent) of the woman research scholars possessed neutral attitude towards computer application, while slightly less than one-fifth (18.00 per cent) of themwere foundwith favourableattitude towards the use of computer and almost similar per cent (17.00 per cent) of woman research scholars were with unfavourable attitude towards the use of computer for their empowerment. It can be said that majority (83.00 per cent) of the woman research scholars were having neutral to favorable attitude towards the use of computer for their empowerment. It means majority of the woman research scholars were very positive to recognize application of computer in their everyday life for their personal development. This might be due to the recognition and understanding amongst the woman research scholars about tremendous usefulness of computer and its application to make them empower for future work inthefieldofagriculturalextension,researchandacademicwork more smooth and successful. This result was in line with the results of Patel (2007), Joshi (2009) and partially in the line with the result reported by Shah (2006).
Impact of characteristics of woman research scholars of SAUs of Gujarat to form their attitude towards the use of computer
The result indicates that attitude towards the use of computer of those scholars was better; whose fathers’ and mother’s education level was advanced. Understanding usefulness of internet for the personality development and collection of useful information for the study, the educated fathers and mothers might have motivated their children to think positively towards the use of computer. The result indicates that attitude towards the use of computer for their empowerment of those research scholars was favorable, who had knowledge of more number of languages and increased level of their job preference. In this study it was observed logicalthatresearchscholarswithbetterscientificorientationhad more progressive and favorable sensitivity towards innovative approaches. As a result of this, more positive

Gujarat Journal of Extension Education Vol. 24 : (December 2013)
93
Table 2 : Impact of characteristics of woman research scholars of SAUs of Gujarat to form their attitude towards the use of computer n=100
Sr. No.
Independent variable “r” Value
I Personal variable1 Age -0.121 NS2 Education -0.064 NS3 Academic performance 0.209 *4 Father’s Education 0.257 *5 Mother’s Education. 0.222 *6 Knowledge of different lan-
guages0.251 *
7 Habit of information collection 0.135 NSII Social variable8 Native place -0.030 NS9 Type of family 0.015 NS
III Situational variables10 Wish to migrate abroad -0.008 NS11 Wish to get higher academic
degree0.071 NS
12 Library exposure -0.057 NS15 Exposure in student’s curricular
activity-0.049 NS
IV Psychological variables11 Job preference 0.220 *14 Scientificorientation 0.212 *16 Competition orientation 0.069 NS17 Achievement motivation 0.236 *18 Computer anxiety -0.058 NS19 Selfconfidence 0.294 *20 Innovation proneness 0.243 *
*Significantat0.05level,NS=Non-significant
attitude towards the use of computer was observed who had elevatedscientificorientation.
It was found interesting that there was more positive attitude towards computer application that had higher realistic estimate to reach and acquire pre-decided goal in the life. As a result of this, more positive attitude towards the use of computer was observed among those woman research scholars, who had high level of achievement motivation. The result indicates that self confidenceof thewoman researchscholarsplayedroleuptosignificantextenttoimprovetheirattitude towards the use of computer. The woman research scholars with positive or negative state of interest and desire to seek changes in their research, study and learning were equally positive towards the applications of computer. The resultreportedwasinlinewiththefindingreportedbyLeeand Liu (2009), Chauhan (2004) and Patel (2007).
The additional part of the results indicate the attitude towards application of computer of the woman research scholars was not affected by their other characteristics viz. age, Education, habit of information collection, native place, type of family, wish to migrate abroad, wish to get higher academic degree, library exposure, exposure in student’s curricular activity, competition orientation and computer anxiety. It means that positivism towards computer of woman research scholars was seen identical amongst there irrespective level of their age, Education, habit of information collection, native place, type of family, wish to migrate abroad, wish to get higher academic degree, library exposure, exposure in student’s curricular activity, competition orientation and computer anxiety
CONCLUSION
The result indicates that majority (83.00 per cent) of the woman research scholars of SAUs of Gujarat had neutral to favorable attitude towards the use of computer for their empowerment. There was positive and significant impactof academic performance, father’s and mother’s education, knowledgeofdifferent languages, jobpreference,scientificorientation,achievementmotivation,selfconfidenceandin-novation proneness of the research scholars in forming their positive attitude towards the use of computer. It was also observed that the attitude towards application of computer of the woman research scholars or their empowerment was not affected by their other characteristics viz. age, education, habit of information collection, native place, type of family, wish to migrate abroad, wish to get higher academic degree, library exposure, exposure in student’s curricular activity, competition orientation and computer anxiety.
IMPLICATION
This result gives us adequate support to advice creat-ing computer facility in all research, academic and extension related institutions of India to satisfy information, research related and academic needs and interests of research schol-ars with irrespective level of their . age, education, habit of information collection, native place, type of family, wish to migrate abroad, wish to get higher academic degree, library exposure, exposure in student’s curricular activity, competi-tion orientation and computer anxiety as well as women re-search scholars with knowledge of many languages and high levelsofscientificorientation,achievementmotivation,selfconfidenceandinnovationproneness.

Gujarat Journal of Extension Education Vol. 24 : (December 2013)
94
REFERENCES
Bhatnagar, D. (1994).Factors Influencing Attitude towardComputers: A Study of Bank Employees in India Dec 1994, http://www.iimahd. Ernet.in/publications.
Chauhan, N.B. (2004).Use of internet by research scholars of Agriculture college, Anand, Times of India, Anand plus: 2.
Joshi, P.J. (2009).Computer inclination of agricultural ex-tension educationists working in state agricultural universities of Gujarat. Unpublished Ph.D. Thesis, A.A.U., Anand, Gujarat.
Lee Hung-Wen and Liu Ching-Hsiang (2009) .The relationship among achievement motivation, psychological contract and work attitude Social, April 2009, http://googleads.g.doubleclick.net
Patel, M.C. (2007) A study on Factors affecting level of inter-net exposure of research scholars of Anand Agricul-tural University ,Unpublished Ph.D.Thesis submit-ted to the YCMOU,Nasik,Maharastra.
Shah, U.B. (2006).A study on level of internet exposure of teachers of Anand Agricultural University, Anand.Unpublished Ph.D. Thesis, A.A.U., Anand, Gujarat.
Received : November 2012 ; Accepted : July 2013

Gujarat Journal of Extension Education Vol. 24 : (December 2013)
95
Exploring Suggestions offered by the Krushijivan farm Magazine Subscribers for Making Farm Magazine more Effective
J.R.Patel1, N.V.Soni2, Mahesh R. Patel3 and H. B. Patel4
1 Ex. PG Student, Extension Education, BACA, Anand2 & 4 Asso. Ext. Educationnisst, DOEE, AAU, Anand
3 Assoc. Ext. Edu., Extension Education Institute, AAU, AnandEmail : [email protected]
ABSTRACT
The farm magazine is one of the important media to disseminate agricultural information to the farming community. Among various farm magazine published in Gujarat, KRUSHIJIVAN farm magazine (KFM) is the oldest farm magazine. It is publishing regularly since May 1969 with the main aim to ‘disseminate and to popularize the scientific methods of agriculture in farming community’. The most important suggestions were offered by the KFM subscriber farmers to make the KRUSHIJIVAN farm magazine. Articles based on interview of progressive farmer by scientist, farmers’ own experience as well as more articles on animal husbandry discipline should be given. Information on use of byproducts, marketing, economic aspect and government subsidies/services as well as more photographs /figures should be given in an article. The page number of article should be given with photograph on cover page. KRUSHIJIVAN farm magazine should be available everywhere for farming community as well as the information of farm magazine should be given on radio and television to aware the farming community.
Keywords: Krushijivan, Subscribers, Suggestion
INTRODUCTION
Among various print media, farm magazine being published at a regular interval pertained latest agriculture technology and recommendations which is the best one most reliable source to the farming community. Whatever the technologyandrecommendationsareconvertedandsimplifiedonly through farm magazines in such a local language which makes them more popular for the practical utilization on the fieldof the farmers.The farmpublications aredesigned toprovidepreciseandreliablescientificinformationinsimplelanguage and interesting style of presentation. To meet the information need of the farming people, newspapers and magazines are the important print materials being used by extension workers to promote adoption of innovations among farmers. Increase in theproduction is thefinalgoalof anytechnology which could be only possible through print media. Thus, in rural development, there is nothing more important than the transfer of technology to the farmers who are real consumer of the information.
The farm magazines provide technological know-how to the farmers at regular intervals and also increase the knowledge of farmers regarding improved package of practices of different cropsandotheralliedfields. It isassumedthatindividualswho read farm magazine are likely to gain more knowledge about agricultural technology. Moreover the readers may supplement some more information by asking related questions to authors, scientists, editors, etc. But the question is that how far such farm magazines are actually helpful to adopt the improved agriculture technology on thefields ofthe farmers as well as techno-economic changes occur in the farming community. This study tried to understand the suggestion offered by the KFM subscriber farmers to make farm magazine more affective with the following objective:
To seek suggestions from the subscriber farmers of Krushijivan farm magazine to make the farm magazine more effective.
METHODOLOGY
An attempt was also made to know the suggestions from 60 KFM subscriber farmers to make the KRUSHIJIVAN

Gujarat Journal of Extension Education Vol. 24 : (December 2013)
96
farm magazine more effective. The suggestions offered by the respondents were marked in interview schedule. Number of respondents making the same suggestion(s) were counted in frequency and percentage.
Thesuggestionwereclassifiedintotwogroupsviz., most important suggestion and less important suggestion on the basis above 50 per cent and below 50 per cent frequency of the respondents, respectively.
RESULTS AND DISCUSSION
Suggestion from the KFM subscribers
The information was also collected regarding the suggestions from the KFM subscriber farmers to make the KRUSHIJIVAN farm magazine more effective as well as popular among the farmer readers. The suggestions were invited and grouped into four heads viz., subjects of article, nature of article, cover page and other suggestions which are presented in table 1 to 4.
Subject of article
Table 1: Suggestion given by the Krushijivan farm magazine subscriber farmers on subjects of article n=60
Sr. No. Suggestions Number Percent
1Article based on interview of progressive farmer by scien-tist should be given
45 75.00**
2Article based on farmers’ own experience should be given in a issue
34 56.66**
3More than one article should be included on animal hus-bandry
33 55.00**
4 Article based on bio-technol-ogy should be given 22 36.66*
5Article based on farm machin-ery and implements should be given
8 13.33*
6Article based on effect of natural calamities on farming should be given
5 8.33*
** Most important (> 50.00 per cent) *Less important (< 50.00 per cent)
ItisapparentfromtheTable1that“Articlebasedoninterview of progressive farmer by scientist should be given (75.00percent)”,“Articlebasedonfarmers’ownexperienceshouldbegiveninaissue(56.66percent)”,and“Morethan
one article should be included on animal husbandry (55.00 per cent)” were the most important suggestions offered by the KFM subscriber farmers for the subjects of article. The less important suggestions were offered by the KFM subscriber farmerswere: “Article based on bio-technologyshould be given (36.66 per cent)”, “Article based on farmmachinery and implements should be given (13.33 per cent)” and“Articlebasedoneffectofnaturalcalamitiesonfarmingshould be given (8.33 per cent)”
Nature of article
Table 2: Suggestion given by the Krushijivan farm magazine subscriber farmers on nature of article n=60
Sr. No.
Suggestions Number Percent
1
Information based on use of byproducts of farming for income generation should be given in article
39 65.00**
2Marketing and their related information should be given in article
37 61.66**
3 The economic aspect should be given in article 32 53.33**
4Information on government subsidies / services for the farmers should be given
26 43.33*
5 More photographs/figuresshould be given in article 19 31.66*
** Most important (> 50.00 per cent)
*Less important (< 50.00 per cent)
ItwasfoundfromtheTable2that“Informationonbased on use of byproducts of farming for income generation shouldbegiveninarticle(65.00percent)”,“Marketingandtheir related information should be given in article (61.66 per cent)”,“Theeconomicaspectofthesubjectshouldbegivenin each article (53.33 per cent)”, were the most important suggestion offered by the KFM subscriber farmers for nature of article followed by two less important suggestion viz., “Information on government subsidies/services forthe farmers should be given (43.33 per cent)” and “Morephotographs/figures should be given in article(31.66 percent)”

Gujarat Journal of Extension Education Vol. 24 : (December 2013)
97
Cover page
Table 3: Suggestion given by the Krushijivan farm magazine subscriber farmers on cover page
n=60
Sr. No.
Suggestions Number Percent
1 Page number of related pho-tographs should be printed on cover page
34 60.00**
2 All cover pages should be multicoloured and attractive
26 43.33*
** Most important (> 50.00 per cent)
* Less important (< 50.00 per cent)
ThedatainTable3indicatedthat“Pagenumberofrelated photographs should be printed on cover page (60.66 percent)”wasthemost importantsuggestionwhereas“Allcover pages should be multicoloured and attractive (43.33 per cent)” was the less important suggestion offered by the KFM subscriber farmers for cover page.
Other suggestion
Table 4: Other suggestion given by the Krushijivan farm magazine subscriber farmers n=60
Sr. No. Suggestions Number Percent
1 Magazine should be avail-able everywhere 36 60.00**
2
Advertising for magazine needed through radio and television during agricultur-al programme
32 53.33**
3
Camps should be organized in villages for creating awareness about farm maga-zine
28 46.66*
4
Magazine should be modern by using new technology like colour printing / photo-graphs, lamination etc.
24 40.00*
5
The information about ad-mission on agriculture and relatedfieldsshouldbegiv-en in magazine
17 28.33*
6 Magazine should be display on internet 13 21.66*
** Most important (> 50.00 per cent)
* Less important (< 50.00 per cent)
Thedata inTable4 shows that “Magazine should
beavailableeverywhere(60.00percent)”,and“Advertisingfor magazine needed through radio and television during agricultural programme (53.33 per cent)” were the offered by KFM subscriber farmers for making the KRUSHIJIVAN farm magazine more effective. The less important other suggestionswere:“Campsshouldbeorganizedinvillagesforcreating awareness about farm magazine (46.66 per cent)”, “Magazine should be modern by using new technologylike colour printing/photographs, lamination etc. (40.00 per cent)”,“Theinformationaboutadmissiononagricultureandrelatedfieldsshouldbegiveninmagazine(28.33percent)”and “Magazine should be display on internet (21.66 percent)”.
CONCLUSION
The most important suggestions were offered by the KFM subscriber farmers to make the KRUSHIJIVAN farm magazinemoreeffectivewere:“Articlebasedon interviewof progressive farmer by scientist should be given”, “Article based on farmers’ own experience should be given ina issue”, and“More thanonearticle shouldbe includedon animal husbandry” were the most important suggestions offered by the KFM subscriber farmers for the subjects of article. “Information on based on use of byproducts offarming for income generation should be given in article”, and“Marketingandtheirrelatedinformationshouldbegivenin article”, were the most important suggestion offered by the KFM subscriber farmers for nature of article,while “Pagenumber of related photographs should be printed on cover page (60.66 per cent)” was the most important suggestion offeredbytheforcoverpage.“Magazineshouldbeavailableeverywhere(60.00percent)”,and“Advertisingformagazineneeded through radio and television during agricultural programme were the most important suggestions for making the KRUSHIJIVAN farm magazine more effective.
REFERENCES
Soni, N.V. (2005) Impact of Krushigovidhya Farm Magazine on Subscriber Farmers.(Unpubished) Ph.D.(Agri) thesis, GAU, Anand.
Sadaqath, S.; Chandargi, D.M. and Sundaraswamy, B. (1998). Awareness and utility of agricultural publications among farmers. Maha. J. Ext. Edn., 17: 78-81.
Hingu, N.J. (1995). Study on Farm Magazine (Krushi-Go-Vidya) with reference to its Effectiveness, Reading behaviour and Knowledge gain by the Life members. (Unpublished) M.Sc.(Agri.) Thesis, GAU, Anand.
Received : November 2012 ; Accepted : July 2013

Gujarat Journal of Extension Education Vol. 24 : (December 2013)
98
Awareness about Climate Change and its Effect on Agriculture as Perceived by Extension Functionaries
J. B. Patel1, Onima V. T.2, Krunal Gulkari3 and B. D. Patel4
1 Associate Professor and 2 & 3 PG StudentsDepartment of Extension Education, BACA, AAU, Anand
4 Assistant Extension Educationist, EEI, AAU, Anand E-mail: [email protected]
ABSTRACT
Awareness is the perception of an individual, conscious about climate changes. The awareness taken more, as a cognitive behaviour has been operational as the respondent’s consciousness, i.e. being aware or not aware about climate change and its effect on agriculture. A study was undertaken to know awareness about climate change and its effect on agriculture as perceived by extension functionaries. The required data and information were collected through direct interview study. The results indicated that 38.37 per cent of the respondent had high level of general information about climate change and 55.00 per cent had medium level of awareness regarding the climate change and its effect on agriculture.
Keywords: Awarness, Climate change, Extension functionaries.
INTRODUCTION
Climate change inevitably affects the economy and livelihood of people. It is expected to have a serious environmental, economic, and social impact on the farming systems. In particular, rural farmers in India, whose livelihoods depend on the use of natural resources, are likely to bear the brunt of adverse impacts (Janssen, 2010). Climate change is generally detrimental to the agriculture sector; but with adaptation, vulnerability can largely be reduced (Smit and Skinner, 2002). Developing countries like India are more vulnerable due to lower adaptation capacity. Adaptation to climate variability and climate change requires long term strategic research in the area of natural resource management, crops, pests and disease dynamics, livestock, fisheries&energyefficiency.Focusedprogrammesaretakenup on different commodities on adaptation and mitigation. A detailed assessment on vulnerability of different agro-climatic zones of the country is also planned. Extension functionaries were recognized as a vital component to respond towards climate change therefore the present study was planned with followingspecificobjectives:
1 Tostudytheprofileoftheparticipants
2 To study the awareness about climate change and its effect on agriculture as perceived by extension functionary.
3 To ascertain the relationship between general information about climate change and their selected independent variable.
METHODOLOGY
The present study was conducted to assess the awareness about climate change and its effect on agriculture as perceived by extension functionaries. Participants who had attended the training programmes conducted at Extension Education Institute (EEI), Anand and outside the EEI during 2012-13 were randomly selected for the study. For the purpose, a total of 120 respondents were selected from 12 different training programmes conducted by EEI .The data were collected with the help of pretested structured interview schedule through personal interview method. The collected data were processed into some descriptive statistics and correlation analysis to draw a conclusion.

Gujarat Journal of Extension Education Vol. 24 : (December 2013)
99
RESULTS AND DISCUSSION
Profile of participants
Table: 1 Distribution of the respondents according to their profile n =120
Sr. No.
Profile of participants
Frequency Per cent
Age1 21 to 30 31 25.842 31 to 40 27 22.503 41 to 50 24 20.004 Above 50 years 38 31.66
Gender1 Male 107 89.132 Female 13 10.83
Category1 SC 19 15.832 ST 18 15.003 OBC 30 25.004 GEN 53 44.17
Designation1 Class-I 04 03.332 Class-II 86 71.673 Class-III 30 25.00
Department1 Agriculture 107 89.162 A.H. 10 08.343 Fisheries 03 02.50
Education qualification1 Graduate 55 45.832 PG 48 40.003 Doctorate 17 14.17
Experience1 0 to 10 years 62 51.672 11 to 20 years 18 15.003 20 years above 40 33.33
Out of total 120 respondents’ 38.00 per cent belonged to above 50 years of age group followed by 21 to 30 years of age group (25.84 per cent), 22.50 per cent and 20.00 per cent of respondents were observed in 31 to 40 years of age group and 41 to 50 years of age group respectively. The data presented in above table indicated that great majority (89.13 per cent) of the respondents were male and only 10.83 per cent of them was female respondents, respectively. Out of total, 44.17 per cent were belonged to general category followed 25.00 per cent, 15.83 per cent and 15.00 per cent
of them belonged to OBC, SC and ST category, respectively. The great majority of the extension functionaries 71.67 per cent had Class-II level of position followed by 25.00 per cent and only 3.33 per cent of the respondents had Class-III and Class-I level of position, respectively. The data revealed that out of total respondents’ vast majority (89.16 per cent) were from agriculture department followed by 8.34 per cent was belonged to animal husbandry department and only 2.50 per cent of them belonged to fishery department, respectively.Regarding experience of respondents, 51.67 per cent of them had upto 10 years of experience whereas 33.33 per cent and 15.00 per cent of them had above 20 years of experience and 10 to 20 years of experience of working in various departments. The presented data indicate the distribution of extension functionaries in different education level. 45.83 per cent were having education up to graduate level followed by 40.00 per cent and 14.17 per cent of them had post graduate and doctorate level of education, respectively.
Table 2: Distribution of the respondents according to general information about climate change
n=120
Sr. No. Category Frequency Per cent
1 Low (less than 16.29 score)
38 31.66
2 Medium (between 16.29 to 19.27 score)
36 30.00
3 High (more than 19.27 score)
46 38.37
From the Table-2 it was pointed out that slightly more than one third (38.37 per cent) of the respondent had high level of general information about climate change whereas, 31.66 per cent and 30 per cent of them had low and medium range of general information about climate change for agriculture, respectively.
Table 3: Distribution of the respondents according to awareness about climate change and its effect on agriculture n=120
Sr. No. Category Frequency Per cent
1 Low (less than 16.20 score)
25 20.83
2 Medium (between 16.20 to 19.30 score)
66 55.00
3 High (more than 19.30 score)
29 24.17
The data presented in Table-3 portrayed that nearly

Gujarat Journal of Extension Education Vol. 24 : (December 2013)
100
half of the respondents (55.00 per cent) had medium level of awareness regarding the climate change for agriculture, followed by 24.17 percent and 20.83 percent had high and low level of awareness regarding the climate change for agriculture.
Table 4: Relationship between profile of participants and their general information about climate change n=120
Sr. No. Characteristics r - value
1 Age -0.01946 NS2 Gender 0. 01630 NS3 Category 0.07860 NS4 Designation -0.00458 NS5 Department 0.00658 NS6 EducationQualification -0.00781 NS7 Experience 0.08480 NS
The data presented in Table 4 reveal that independent variables like, gender, category, department and experience showspositiveandnon-significantrelationshipwithgeneralinformation about climate change possessed by participants. While variables like, age, designation and education had negative and non-significant relationship with generalinformation about climate change possessed by participants. The above result reflected that, general information onclimatechangewasnotinfluencedbytheircharacteristics.
Table 5: Relationship between the profile of participants and their awareness about climate change and its effect on agriculture n=120
Sr. No. Characteristics r - value
1 Age -0.12828 NS2 Gender 0. 01023 NS3 Category 0.13768 NS4 Designation -0.00458 NS5 Department 0.01676 NS6 EducationQualification -0.02386 NS7 Experience -0.19114 NS
The data mentioned in Table 5 reveal that independent variables like, gender, category and department shows positive and non-significant relationshipwith awareness ofparticipants about climate change. While variables like, age, designation, education and experience had negative and non-significantrelationshipwithawarenessofparticipantsaboutclimatechange.Theaboveresultreflectedthat,awarenessof
participantsaboutclimatechangewasnotinfluencedbytheircharacteristics.
Table 6: Suggestions to create awareness among the extension functionaries on climate change and its effect on agriculture n=20
Sr. No. Suggestions Mean
score Rank
1 Use of plastic package mate-rial should be restricted 2.79 I
2
Awareness on long term ef-fect of climate change prob-lem should be created en-vironmental information at block level
2.66 II
3Technology solving climate change problem should be demonstrated
2.63 III
4
Regular educational visit / tours of extension function-aries should be organized at the centers / location where eco friendly efforts are dem-onstrated
2.61 IV
5
Live demonstration on the use of renewable energy should be organized in the field
2.56 V
6Regular planting of tree/plants should be organized onfarmer’sfield
2.51 VI
7 Energy saving day should be organized 2.49 VII
8Rally to protest climate change problem should be organized
2.45 VIII
9
Each extension center should established nature club to create awareness and work to minimize climate change problem
2.43 IX
10
Award should be given for best extension work done by extension functionary on cli-mate change issues
2.41 X
TheresultofTable-6 indicated that topfivemajorsuggestions offered by the extension functionaries were restriction of use of plastic package material, followed by awareness on long term effect of climate change problems, creation of environmental information centre at block level, demonstration of technology solving climate change problems, organization of regular educational visit/tour of the extension functionaries to the centers or location where eco-

Gujarat Journal of Extension Education Vol. 24 : (December 2013)
101
friendly efforts are demonstrated and also live demonstration on the use of renewable energy into field. Some minorsuggestions offered by extension functionaries to create better awareness about climate changes where regular planting of trees/plantson farmersfield,organizationof energy savingday, rally to protect climate change problems, establishment of nature club and award for the best extension work done by extension functionaries on climate change issues.
CONCLUSION
It can be concluded that, slightly more than one third (31.66 per cent) of the respondents belonged to the age group of 50 and above years. Majority of the respondents (89.13 per cent) were the male and the remaining 10.83 per cent respondent’s female. Nearly half of the respondents (44.17 per cent) belonged to general category. Slightly three fourth (71.67 per cent) of the respondents had class-II designation. Over whelming (89.16 per cent) of the respondents belonged to Agriculture department. Less than (45.83 per cent) of the respondents had Graduation as education level and slightly more than half (51.67 per cent) had 0 to 10 years of experience. Slightly more than one third (38.37 per cent) of the respondent had high level of general information about climate change, whereas, 31.66 per cent and 30.00 per cent of them had low and medium general information about climate change for agriculture, respectively. Nearly half of the
respondents (55.00per cent) had medium level of awareness regarding the climate change for agriculture followed by 24.17 percent and 20.83 percent had high and low level of awareness regarding the climate change for agriculture. The independent variables like gender, category, department and experience shows positive and non-significant relationshipwith general information about climate change possessed by participants. While variables like, gender, category and department shows positive and non-significant relationshipwith awareness of participants about climate change.
REFERENCES
Janssen, Sander, Louhichi, Kamel, Kanellopoulos, Argyris, Zander, Peter, Flichman, Hengsdijk, Huib, Meuter, Eelco, Andersen, Erling, Belhouchette, Hatem, Blanco, Maria, Borkowski, Nina, Heckelei, Thomas, Hecker, Martin, Li, Hongtao, Lansink, Alfons Oude, Stokstd, Grete, Thorne, Peter, Van Keulen, Herman and Van Ittersum, Martin K. (2010). A generic bio-economic farm models for environmental and economic assessment of agricultural systems. Environ. Manage., 46 (6): 862-877.
Smit, B. and Skinner, M. W. (2002). Adaptations options in agriculture to climate change: A typology. Mitigation & Adaptation Strategies Global Change, 7: 85-114.
Received : May 2013 ; Accepted : November 2013

Gujarat Journal of Extension Education Vol. 24 : (December 2013)
102
INTRODUCTION
In Tapi district, Okra is the main cash crop in Rabi season. This district is famous for growing okra in Rabi season. From this region, okra is exported in foreign countries. In Tapi district approximately 2000 ha. area under okra cultivation in Rabi season. Majority of the farmers are growing okra by trial and error method.
Our research scientists, extension workers and farmers have great responsibility to maximize the production of okra in Tapi district particularly in Dolvan and Bandharpada region, as okra is exported which is possible if farmers were getting very low yield in Okra. Low productivity in okra was due to lack of knowledge about scientific cultivation,poor nutrient management and lack of knowledge regarding IPDM.
Keeping all these views in mind, the research study “Knowledge levelof farmersabout scientificcultivationofOkra in Tapi district” was taken with following objectives.
OBJECTIVES
1 Tostudythepersonalprofileoftherespondentsviz. Age,
Education, Social participation, Extension participation, Annual Income, occupation, Land Holding and economic motivation .
2 To study the knowledge and adoption level of farmers aboutscientificcultivationofokra.i.eLandpreparation,Use of organic manure, Season of cultivation, Selection of varieties / Hybrid, Seed treatment, Spacing, Inorganic fertilizer application, Integrated water management, Weed management, IPDM, Harvesting, Value addition, Use of PGR
METHODOLOGY
Tapidistrictconsistsoffivetalukasviz. Vyara, Valod, Songadh, Uchchhal and Nizar. Vyara, Valod, Songadh and Uchchhal taluka were selected purposively as the majority of the farmers in these talukas are growing Okra as main cash crop in Rabi season. Ten villages were selected from these four talukas by simple random sampling techniques.
A list of Okra growers was prepared from the selected villages. 20 respondents were selected from each village by proportionate random sampling technique.
Knowledge and Adoption Level of Farmers about Scientific Cultivation of Okra in Tapi District
C. D. Pandya1, S. T. Bhatt2 and N. M. Chauhan3
1 Subject Matter Specialist (Extension), 2 Subject Matter Specialist (Horticulture) and3 Programme Coordinator, Krushi Vigyan Kendra, NAU, Vyara
Email : [email protected]
ABSTRACT
The study was conducted in Tapi district of South Gujarat. Vyara, Valod, Songadh and Uchchhal taluka were selected purposively as the majority of the farmers in these talukas are growing Okra as main cash crop in Rabi season. Ten villages were selected from these four talukas by simple random sampling techniques. A list of Okra growers was prepared from the selected villages. 20 respondents were selected from each village by proportionate random sampling technique. Thus, total number of respondents was 200. The structural interview schedule was used for the data collection. The data were tabulated, analyzed and interpreted in the light of the objectives. The statistical measures like frequency, percentage, Mean and S.D. were used. Majority of the respondents was in young age group, were illiterate, were participated in social activities, were participated in more than one extension activity, had annual income up to Rs. 50,000/-, were engaged in farming + Animal Husbandry as main occupation, possessed 0.01 – 1.00 ha of land, were found to have medium level of economic motivation, were found to have medium level of knowledge about okra production technology and were medium adopters of okra production technology.
Keywords: Knowledge, Adoption, Okra

Gujarat Journal of Extension Education Vol. 24 : (December 2013)
103
Thus, total number of respondents was 200. The structural interview schedule was used for the data collection. The data were tabulated, analyzed and interpreted in the light of the objectives. The statistical measures like frequency, percentage, Mean and S.D. were used.
RESULTS AND DISCUSSION
Personal profile of the respondents
Thefindingsof these selected characteristicshavebeen presented in the following section:
Table 1: Distribution Of Respondents According To Their Personal Characteristics n=200
Sr. No.
Personal Characteristics
Number of respondents
Per cent
1 Age group1 Young (up to 35 years) 125 62.52 Middle (36 to 50 years) 60 30.03 Old (50 years and above) 15 7.52 Level of Education1 Illiterate 68 34.02 Up to primary school
level39 19.5
3 Up to middle school level 56 28.04 Up to high school level 25 12.55 Up to college and above
college12 6.0
3 Social Participation1 Participated 153 76.52 Not participated 47 23.54 Extension Participation1 Not participated 55 27.52 Participated in one
activity38 19.0
3 Participated in more than one activity
107 53.5
5 Annual Income1 Above Rs. 2,00,000/- 0 0.02 Rs. 1,50,001 to 2,00,000 1 0.53 Rs. 1,00,001 to 1,50,000 4 2.04 Rs. 50,001 to 1,00,000 45 22.55 Up to Rs. 50,000 150 75.06 Occupation1 Farming 34 17.02 Animal Husbandary 0 03 Farming + Animal
Husbandary165 82.5
4 Service + Farming 00 005 Farming + Business 01 0.57 Land Holding1 > 10 ha 01 0.5
Sr. No.
Personal Characteristics
Number of respondents
Per cent
2 4.01 – 10.00 ha 01 0.53 2.01 – 4.00 ha 28 14.04 1.01 – 2.00 ha 56 28.05 0.01 – 1.00 ha 114 57.08 Economic motivation1 Low economic
motivation (< 6 score)30 15.0
2 Medium economic motivation (6-10 score)
133 66.5
3 High economic motivation (> 10 score)
37 18.5
Mean = 14.08 S.D. = 2.71
Age
From the data presented in Table 1(1) show that majority (62.50 per cent) of the respondents was in young age group followed by 30.00 per cent of the respondents belonging middle age group and only 7.50 per cent were under old age group.
Education
A perusal of data presented in Table 1(2) reveal that majority (34.00 per cent) of the respondents were illiterate followed by 28.00, 19.50, 12.50 and 6.00 had an education up to middle school level, primary school level, high school level and college and above college level education. This information gives indication that the literacy rate in tribal area is still very low.
Social participation
The data in Table 1(3) revealed that majority (76.50 per cent) of the respondents were participated in social activities whereas, 23.50 per cent of the respondents were not participated in social activities.
Extension participation
From the data presented in Table 1(4) it was observed that majority (53.50 per cent) of the respondents were participated in more than one activity followed by 27.50 per cent and 19.00 per cent of the respondents were not participated in any activity and participated in one activity respectively.
Annual Income
It is apparent from Table 1(5) that majority (75.00 per cent) of the respondents had annual income up to Rs. 50,000/- followed by 22.50 per cent, 2.00 per cent and 0.50

Gujarat Journal of Extension Education Vol. 24 : (December 2013)
104
per cent of the respondents had annual income between Rs. 50,001 to 1,00,000, Rs. 1,00,001 to 1,50,000 and Rs. 1,50,001 to 2,00,000 respectively. While none of them had annual income above Rs. 2,00,000/- .
Occupation
The data presented in Table 1(6) reveal that majority (82.50 per cent) of the respondents were engaged in farming + Animal Husbandry as main occupation followed by 17.00 per cent and 0.5 per cent of the respondents were engaged in farming and Farming + Business. While none of the respondents had Animal Husbandry and Farming + Business as main occupation.
Land holding
It is evident from the data in Table 1(7) that more than one-half (57.00 per cent) of the respondents possessed 0.01 – 1.00 ha of land followed by 28.00 per cent and 14.00 per cent of the respondents possessed 1.01 – 2.00 ha and 2.01 – 4.00 ha land respectively. An equal proportion (0.50 per cent) of the respondents had 4.01 – 10.00 ha and > 10 ha of land.
Economic motivation
The date presented in Table 1(8) portray that majority (66.50 per cent) of the respondents were found to have medium level of economic motivation whereas, 18.50 per cent and 15.00 per cent of the respondents had high and low level of economic motivation.
Knowledge and adoption level of farmers about scientific cultivation of okra:
Thefindingsof these selected characteristicshavebeen presented in the following section:
Knowledge about okra production technology
A perusal of data presented in Table 2(1) indicate that majority (71.00 per cent) of the respondents were found to have medium level of knowledge about okra production technology. An equal (14.50 per cent) number of respondents had low and high level of knowledge about okra production technology.
Adoption about okra production technology
The data in Table 2(1) revealed that majority (74.50 per cent) of the respondents were medium adopters of okra production technology whereas, 14.00 per cent and 11.50 per cent of the respondents were under low and high adoption level of okra production technology.
Table 2: Distribution of Respondents According to Their Knowledge and Adoption Level of Farmers About Scientific Cultivation of Okra n=200
I Level of knowledge No. Per cent1 Low level of knowledge
(< 28 score)29 14.5
2 Medium level of knowledge (28-37 score)
142 71.0
3 High level of knowledge (> 37 score)
29 14.5
Mean = 47.38 S.D. = 4.66II Level of adoption1 Low level of adoption
(< 24 score)28 14.0
2 Medium level of adoption (24-29 score)
149 74.5
3 High level of adoption (> 29 score)
23 11.5
Mean = 45.25 S.D. = 4.07
CONCLUSION
From the above discussion it could be concluded that majority of the respondents was in young age group, were illiterate, were participated in social activities, were participated in more than one extension activity, had annual income up to Rs. 50,000/-, were engaged in farming + Animal Husbandry as main occupation, possessed 0.01 – 1.00 ha of land, were found to have medium level of economic motivation, were found to have medium level of knowledge about okra production technology and were medium adopters of okra production technology.
REFERENCES
Butani Ketankumar and Dhillon, D.S.(2011).Knowledge and use of Information communication technology by the scientists. Agriculture Update, 6(3&4): 195-200.
Dubey, Swapnil. (2011). Impact of Front Line Deminstration of Pigeon pea in transfer of improved technology. Agriculture Update, 6(3&4): 61-163.
Gaikwad, A.B.,Shinde, S.B. and Kolgane, B.T.(2011). Knowledge of extension personnel about horticultural recommendations on selected fruit crops. Agriculture Update, 6(3&4): 155-160.
Pandya, C.D. and Pandya, R.D. (2010). A critical analysis of Socio-Economic Status of organic farming followers of South Gujarat. Ph.D. (Agri.) Thesis (Unpublished), Navsari Agricultural University, Navsari.
Received : February 2013 ; Accepted : November 2013
Gujarat Journal of Extension Education Vol. 24 : (December 2013)
105
Factors affecting Adoption of No-cost and Low-cost Technologies of Animal Husbandry Practices by Tribal Dairy Farmwomen in Gujarat
J. V. Prajapati1, P. M. Bhatt2 and J. B. Patel3
1 P.G.Student, Veterinary Science College, Anand Agril. University, Anand2 Director, Institute of Distance Education, Anand Agril. University, Anand
3 Asstt. Extension Educationist, Extension Education Institute (Govt. of India),AAUEmail : [email protected]
ABSTRACT
The present study was conducted in five tribal talukas of Vadodara district in Gujarat State. Important and relevant no-cost and low-cost animal husbandry technologies in six major areas i.e housing and general management, feeding and watering, calf rearing, breeding, clean milk production and health care were selected for the study . With the help of random sampling method three villages were selected from each selected tribal taluka. From each selected village, ten tribal dairy women members were randomly selected which constituted a total sample size of 150.The independent variables viz; Size of family, land holding, herd size, annual income, extension contact, mass media exposure, innovation proneness, scientific orientation, economic motivation, and knowledge had positive and highly significant correlation with adoption of tribal dairy farmwomen, whereas, experience in dairy farming had negative but significant correlation with adoption. Age of dairy farmwomen had negative and non-significant correlation with adoption, whereas, education of dairy farmwomen had positive and non-significant correlation with adoption of no-cost and low-cost technology of animal husbandry .
Keywords: Adoption, low-cost, no-cost technologies, andimal husbandry
INTRODUCTION
Animal husbandry plays an important role in na-tional economy, socio-economic development and employ-ment generation for rural people especially, to small and marginal farmers and landless laboures by providing round the year steady income from animal produce.
India has largest milch animal population in the world but productivity of Indian dairy animal remains substantially low compared to potential and world average. Besides the poor genetic potential and poor economic status, this low productivity could largely be attributed to low level of knowledge and adoption of scientific technologiesregarding four important pillars of dairy farming- i.e. breeding, feeding, health care & excellent management. Many of these technologies are mostly cost effective, either no-cost technologies or low-cost technologies. About 75 per cent of rural women are engaged in animal husbandry occupation and plays a key role in this occupation by
doing more than 60 per cent of different activities of animal husbandry occupation like, feeding, watering, milking, cleaning and sale of milk, etc. The knowledge and adoption of such no-cost and low-cost animal husbandry technologies by dairy farmwomen has great scope for improving productivity, profitability and sustainability ofdairy farming enterprise, especially for resource poor and socio-economically deprived tribal dairy farmwomen.
The adoption of no-cost and low-cost technologies of animal husbandry has some association with socio-personal, economic, communicational and psychological characteristics. If this association is ascertained and the actual situation at grass-root level is understood, it may be possible to draw out certain inferences about adoption of no-cost and low-cost technologies of animal husbandry by tribal dairy farmwomen.
So far, very limited efforts have been made to de-terminetherelationshipbetweenprofileofdairyfarmwom-

Gujarat Journal of Extension Education Vol. 24 : (December 2013)
106
en and adoption of no-cost and low-cost technologies of ani-mal husbandry by dairy farmwomen in tribal area of Gujarat state.Therefore,astudyon“FactorsinfluencingtheAdoptionof no-cost and low-cost technologies of animal husbandry by tribal dairy farmwomen in Gujarat” was undertaken with the objective to ascertain relationship between profile oftribal dairy farmwomen and extent of adoption of no-cost and low-cost technologies of animal husbandry by tribal dairy farmwomen
METHODOLOGY
Thepresentstudywasconductedinfivetribalta-lukas of Vadodara district in Gujarat. Important and relevant no-cost and low-cost animal husbandry technologies in six major groups of practices i.e. housing and general manage-ment, feeding and watering, calf rearing, breeding, clean milk production and health care were selected under study through expert opinion. Multistage sampling technique was used to select therespondents.Infirststage,outof total12talukasofVadodara district, the five talukas namely Chotaudepur,Pavi-jetpur, Kavant, Nasvadi and Shankheda which comes under tribal areas were selected purposively.Three villages were selected randomly from each selected tribal taluka and from each selected village, ten dairy women members were randomly selected which constituted a total sample size of 150womenrespondents.Thefactorsinfluencingtheadoptionof no-cost and low-cost technologies were measured with the help of a well developed structural schedule. The collected data were compiled, tabulated and analyzed with the help of statistical tools such as co-efficient of correlation,multipleregressionandpathco-efficientanalysiswereused.
RESULTS AND DISCUSSION
Relationship between profile of tribal dairy farm-women and their extent of adoption of no-cost and low-cost technologies of animal husbandry
The adoption or acceptance of recommended ani-mal husbandry technology is a complex process involving sequence and thought of action. The action of an individual dairy farmwoman is governed by personal, social, econom-ic, psychological and cultural factors involved in situation. Some dairy farmwomen adopt new animal husbandry tech-nology more quickly than others because of the difference in personal characteristics. This was determined and tested with helpofKarlPearson’scoefficientcorrelationtestandresultobtained is presented in Table 1
Table 1: Relationship between profile of tribal dairy farmwomen and their extent of adoption of no-cost and low-cost technologies of animal husbandry n=150
Sr. No. Independent Variables
Correlation Coefficient (‘r’
value)1 Age - 0.151 NS2 Education 0.160 NS3 Experience - 0.176*4 Size of family 0.236**5 Land holding 0.229**
6 Herd size 0.397**
7 Annual income 0.487**
8 Extension contact 0.650**
9 Mass media exposure 0.527**10 Innovation proneness 0.626**
11 Scientificorientation 0.617**
12 Economic motivation 0.572**13 Knowledge 0.956**
*=significantat5%levelofprobability, **=significantat1%levelofprobability, NS=non-significant
Age and adoption
It is apparent from the data presented in the Table 1agehadnegativeandnon-significantcorrelationwith theadoption of no-cost and low-cost technologies of animal hus-bandry among the tribal dairy farmwomen. Negative correla-tion was found in case of age and adoption and it might be due to the old age of dairy farmwomen and their traditional way of thinking, them to change and were taking any risk. ThisfindingisinthelinewiththeresultsofKhokhar (2007) and Durga (2009).
Education and adoption
The data presented in Table 1 make it clear that, education had positive and non-significant correlationwiththe adoption of no-cost and low-cost technologies of animal husbandry by the tribal dairy farmwomen. Adopting parental occupation since young age and medium level of extension contact and mass media exposure might be the probable reason for this non-significant relationship. This findinghasbeen supportedby thefindingsofKhokhar (2007)andRathore et al. (2009).

Gujarat Journal of Extension Education Vol. 24 : (December 2013)
107
Experience in dairy farming and adoption
It is evident from Table 1 that there was negative and significantrelationshipbetweenexperienceindairyfarmingand level of adoption of no-cost and low-cost technologies of animal husbandry by the tribal dairy farmwomen. It could beinferredthattherewasanegativeinfluenceofexperienceof animal husbandry occupation on adoption of no-cost and low-cost technologies of animal husbandry by the tribal dairy farmwomen. This might be due to the fact that dairy farm-women with more experience followed traditional animal husbandry practices, while dairy farmwomen who were rela-tively new in dairy farming, were more favorably inclined to adopt recommended improved practices for more income and minimization of risks. Mishra et al. (2009) have also reported similarfinding.
Size of family and adoption
The data presented in table 1 makes it clear that size offamilyof thedairyfarmwomenhadpositiveandsignifi-cant correlation with the extent of adoption of no-cost and low-cost animal husbandry technologies. It can be concluded that as size of family of dairy farmwomen increased, their ex-tent of adoption regarding no-cost and low-cost animal hus-bandry technologies increased/improved which might be due to easy and regular availability of family members as labor to perform various activities related to dairy farming. These findingsarewellsupportedbythefindingofRathore et al. (2009).
Land holdings and adoption
From Table 1 it can be evident that land holding had positive and highly significant relationshipwith the extentof adoption of no-cost and low-cost technologies of animal husbandry. This result indicates that adoption increase with increase in the size of land holding. It could be concluded fromthisfindingthatlargelandholdingfacilitatedtomanagefodder and housing requirement in a better way. Moreover they could maintain larger herd and get high returns. This findingisinthelinewithresultofDurga(2009)andRathoreet al. (2009).
Herd size and adoption
The data presented in the Table 1 illustrated that herd
sizeof tribaldairyfarmwomenhadpositiveandsignificantcorrelation with their extent of adoption of no-cost and low-cost technologies of animal husbandry.
It can be concluded that the dairy farmwomen who owned more number of milch animals may had more investment and return to ensure better from dairy farming, hence they might be more economically sound which led them torealizeandadoptthescientificallyproventechnologiesofanimalhusbandry.SimilarfindingswerereportedbyAroraetal. (2006), and Rathore et al. (2009).
Annual income and adoption
It is apparent from the data presented in the Table 1 that annual income of the tribal dairy farmwomen had positive and highly significant correlation with their levelof adoption of no-cost and low-cost technologies of animal husbandry. It canbeconcluded that,betterfinancial condi-tion of tribal dairy farmwomen might have helped them to be capable in purchasing the essential inputs for successful dairy farming.ThisfindingissupportedbythefindingofMaviet al. (2006) and Durga (2009).
Extension contact and adoption
Relationship between extension contact of dairy farmwomen and their extent of adoption of no-cost and low-cost technologies of animal husbandry was positive and highlysignificant.Theprobablereasonmightbetheinterac-tion between extension personnel and tribal dairy farmwom-enthathasleadtogaininknowledgeandskill.Thisfindingis similar to thefindingsof by Khokhar (2007) and Durga (2009).
Mass media exposure and adoption
The data presented in Table 1 clearly indicated that, mass media exposure of the tribal dairy farmwomen had posi-tiveandhighlysignificantcorrelationwiththeirlevelofadop-tion of no-cost and low-cost technologies of animal husband-ry. It could be concluded that better exposure of tribal dairy farmwomen to mass media helped in acquiring knowledge of various no-cost and low-cost animal husbandry technologies for sustainable dairy farming occupation. This indicated the potential of mass media in disseminating knowledge among the farmwomen in tribal area related to dairy husbandry. This

Gujarat Journal of Extension Education Vol. 24 : (December 2013)
108
findingisinthelinewiththeresultsofKhokhar(2007)andMishra et al. (2009).
Innovation proneness and adoption
Innovation proneness of the tribal dairy farmwomen had positive and highly significant relation with adoptionof no-cost and low-cost technologies of animal husbandry. This shows that level of adoption of no-cost and low-cost technologies of animal husbandry increased with increase in level of innovation proneness of tribal dairy farmwomen. Similar result was observed by Siddhartha (2001) and Durga (2009).
Scientific orientation and adoption
ItisapparentfromTable1thatscientificorientationof the tribal dairy farmwomenhad positive and significantcorrelation with level of adoption of no-cost and low-cost technologies of animal husbandry which indicates that scien-tificorientationhadpositiveinfluenceonadoptionofno-costandlow-costtechnologiesofanimalhusbandry.ThisfindingisinconformitywiththefindingsofGour(2002)andDurga(2009).
Economic motivation and adoption
It is obvious from in Table 1 that level of adoption of no-cost and low-cost technologies of animal husbandry hadpositiveandhighlysignificantcorrelationwitheconomicmotivation. This indicates that higher level of economic mo-tivation of tribal dairy farmwomen had played a vital role in adopting more number of no-cost and low-cost technologies ofanimalhusbandry. From thisfinding it economicmotivation plays vital role in adoption of technologies related toanimalhusbandry.Thefindingisinlinewiththefindingsof Gour (2002) and Durga (2009).
Knowledge and adoption
It is obvious from the data presented in Table 1 that, the adoption level of tribal dairy farmwomen regarding no-cost and low-cost technologies of animal husbandry had posi-tiveandhighlysignificantcorrelation(r=0.956**)withtheirknowledge level. It means that as knowledge level of tribal dairy farmwomen regarding no-cost and low-cost technolo-
gies of animal husbandry increases adoption level of those technologies also increases.
Knowledge of various no-cost and low-cost tech-nologies of animal husbandry helped dairy farmwomen to understand its main features very well and act as an impor-tant precursor to its adoption.Thisfinding is in agreementwiththefindingsofKhokhar(2007)and Kumar et al. (2009). Hence to increase the adoption of no cost and low cost tech-nologies of animal husbandry knowledge level of dairy farm women in tribal areas should be increased through education-al training programme.
Extent of variation caused by independent variables on dependent variable
The correlation coefficient value gives only thestrengthanddirectionofassociationbutdoesnotreflectonpredictive ability of independent variables on dependent vari-able. Hence, in order to access the amount of contribution of each independent variable, the step wise regression analysis was carried out.
Themultiple regressionco-efficient (R) representsthe correlation between the dependent variables’ actual score obtainedfromthefittedmultipleregressionequation.Theco-efficientofmultipleregressiondetermination(R2) gives the average amount of change in dependent variable when all in-dependent variables were taken together and was tested with ‘F’testforitssignificance.
Thepartialregressioncoefficient“b”representsthechange in dependent variable (y) for a unit change in inde-pendent variable (x1) keeping other variables constant and it wastestedwithstudent‘t’testforitssignificance.Thevariousindependent variables had their own units of measurement, whichdidnotpermitacomparisonofthepartial“b”values.Tofacilitatethecomparison,thepartial“b”valueswerecon-vertedintostandardpartial“b”values,whichwerefreefromthe unit of measurements.
The independent variables were then ranked on the basisofstandardpartial“b”values(ignoringsign)tofindouttheir relative importance in predicting the dependent vari-able. Stepwise regression analysis of adoption of no-cost and low-cost technologies of animal husbandry as a dependent variable with thirteen independent variables was carried out.

Gujarat Journal of Extension Education Vol. 24 : (December 2013)
109
It is obvious from Table 2 that out of total 13 inde-pendent variables, only three variables viz, knowledge level, annual income and economic motivation had accounted their significant effect on adoption.All these three variables ac-counted for 92.40 per cent of total variation in adoption of no-cost and low-cost technologies of animal husbandry by tribal dairy farmwomen
Thepartialregressioncoefficient“b”valueof
these three variables converted into standard partial regres-sionco-efficient“b”values.The‘t’valuesofpartial regres-sion coefficient were highly significant (0.01 level) forknowledgeandannualincomewhilesignificant(0.05level)for economic motivation. Based on the absolute values of standard partial regression co-efficient, they were rankedKnowledge was ranked Ist followed by annual income and economic motivation IInd and IIIrd , respectively.
Table 2 Stepwise multiple regression analysis of adoption of no-cost and low cost technologies of animal husbandry practises by tribal dairy farm women
Variables Partial regression coefficient
R2 ‘t’
value
‘F’
value
Standard partial re-gression co-efficient
Rank
Knowledge
(X13)
1.080 0.914
(91.40)
31.508** 1581.454** 0.888 I
Annual income
(X7)
0.1436 0.921
(92.10)
2.732** 851.092** 0.071 II
Economic motivation
(X12)
0.305 0.924
(92.40)
2.523* 590.233** 0.070 III
Constant = -21.594, Adjusted R2 = 0.922, R2 =0.924, Multiple R= 0.961
**=Significantat0.01levelofprobability,*=Significantat0.05levelofprobability
N.B: Figures in parentheses indicate the percentage
Table 3 : Extent of variation accounted by different independent variables on adoption of no-cost and low- cost technologies of animal husbandry
Steps Variable included Multiple correlation coefficient (R)
Total variation accounted
(% R2 )
Step I X13 (Knowledge) 0.956 0.914(91.40)
Step II X7(Annual income) + X13 0.959 0.921(92.10)
Step III X12(Economic motivation) + X13+ X7 0.961 0.924(92.40)
N.B: Figures in parentheses indicate the percentage The extent of variation accounted by different in-dependent variables on adoption of no-cost and low-cost technologies of animal husbandry are presented in Table 3 clearly indicates that knowledge alone contributed 91.40 per cent of total variation in adoption followed by annual in-come and knowledge which had jointly contributed 92.10 per cent of variation, while all three variables- knowledge, an-
nual income and economic motivation together contributed total 92.40 per cent of variation in adoption of no-cost and low-cost technologies of animal husbandry by tribal dairy farmwomen.The above findings are suggestive of the factthat, for increasing the extent of adoption of no-cost and low-cost technologies of animal husbandry by tribal dairy farm-women, such variables should be reckon and efforts should

Gujarat Journal of Extension Education Vol. 24 : (December 2013)
110
be made to increase knowledge level of improve annual in-come and increase economic motivation of tribal dairy farm-women. The R2 value was high and therefore, the selections of independent variables was done carefully and were more relevant to explain the variation.
CONCLUSION
Knowledge level annual income and motivation were the key factors affecting the adoption of no cost and low cost technologies of animal husbandry. So, efforts should be made through various extension methods and communica-tion.
REFERENCES
Arora, A.S., Avadesh Kumar, Bardhan, D. and Dabas, Y.P.S. 2006, Socio-economic and communication variables associated with level of knowledge and degree of adoption of improved dairy husbandry practices in U.S.Nagar district of Uttaranchal. Indian Journal of Dairy science.59 (5): 337-343
Durgga, R.V. 2004, Training needs of farm women of Thrissur taluka in dairy and poultry farming. M.V.Sc. thesis (Unpublished), Kerala Agricultural University, Thrissur,India.
Gour,A.K.2002, Factors influencingadoptionof someimproved animal husbandry practiced of dairying in Anand and Vadodara districts of Gujarat state. Ph.D. thesis (Unpublished), GAU, Sardar Krushinagar,Gujarat.
Khokhar, S.R. 2007, A study on adoption of dairy innovations by dairy farm women in Anand district, M.Sc. (Agri.) thesis (Unpublished), AAU, Anand,Gujarat.
Kumar, Rupendra, Singh, S.P. and Chauhan, S.V.S. 2009, Comparative analysis of dairy farmers in assured and less irrigated area regarding improved dairy husbandry practices. Indian Research Journal of Extension Education 9(2):85-88.
Mavi, K.S., Chauhan, J.P.S. and Das, B.C. 2006, Role of self employment on programme on dairying in adoption of improved dairy farming practices. Indian Journal of Dairy Science 59(3):185-190.
Mishra, Prakash., Bardhan, D., Dabas Y. P. S. and Kumar, A. 2009, Factors influencing and impact ofpackage of selected dairy husbandry technologies. Indian Journal of Dairy Science 62(4): 316-326
Rathore, R. S., Singh, R. and Kanchawala, R. N. 2009, Adoption of recommended management practices and relationship between selected traits of the respon-dents. Indian Journal of Dairy Science 62(4): 327-334.
Siddhartha, D.S.D. 2001, A study on personality traits of poultry entrepreneurs in Anand District of Gujarat state. M.Sc.thesis (unpublished), GAU, Sardar Krushinagar,India.
Received : August 2013 ; Accepted : September 2013

Gujarat Journal of Extension Education Vol. 24 : (December 2013)
111
Inspiring Personality of Farmers to have Positive Attitude towards Green Manuring for Sustainable Agriculture
Krunal P. Patel1 and Meena C. Patel2
1 Ex. PG Scholar (Extn. Edu.), B.A. College of Agriculture, AAU, Anand2 Assistant Professor, Institute of Distance Education, AAU, Anand
Email : [email protected]
ABSTRACT
Sustainable agriculture encompasses the elements of productivity, profitability, conservation, health safety and the environment. In the absence of optimum levels of soil organic matter, inorganic fertilizers and chemicals, on the long run will damage the physical-chemical structure of the soil and fail to maintain consistency in crop production. Thus, it is very essential that each farmer should be made aware of these aspects and encouraged to adopt natural farming systems. It is because the practice of green manuring is one of these avenues and an important one. Hence the study was conducted to measure the level of attitude of farmers towards green manuring and the stimulating personality of farmers to have positivism towards green manuring. A random sample of total 120 farmers having at least one year of experience in green manuring at their own land from 10 villages of two taluka of Anand district of middle Gujarat was selected. The data were collected through the personal interview. To measure the level of attitude of farmers towards green manuring the reliable and valid attitude scale developed by the researcher was used. About two third (66.67 per cent) of the respondents had positive attitude towards green manuring. The level of attitude of farmers towards green manuring was observed positively significant with their farming experience, experience in green manuring, mass media exposure, extension contact, training received, scientific orientation and knowledge level of farmers regarding green manuring,
Keywords: Attitude, Green Manuring, Sustainable Agriculture
INTRODUCTION
Sustainable agriculture is the only possible way to meet the demands of the present generation, at the same time, preserving the natural capacity of the soil without any contamination for future generations. In other words, it is a system of production and cultivation practices, which can fulfill the food and nutrition needs of a particularsociety without depleting the essential natural resources of agriculture like water, soil fertility and diverse biological resources, making it economically, socially and ecologically sustainable. Natural and organic farming systems are linked with sustainable agriculturewhich considers the beneficialinfluence of organics on soil health and the environmentalproblems associated with the excessive and continuous use of chemicals. In the absence of optimum levels of soil organic matter, inorganic fertilizers and chemicals, on the long run will damage the physical-chemical structure of the soil and
fail to maintain consistency in crop production. Thus, it is very essential that each farmer should be made aware of these aspects and encouraged their feeling to adopt natural farming systems. It is because the practice of green manuring is one of these avenues and an important one (Chandy, 2012).
Green manuring is a low cost but effective technology in minimizing the investment cost of fertilizers and in safeguarding the productive capacity of the soil. Green manuring is an inexpensive; eco-friendly alternative to mounting prices of fertilizer nitrogen and has become an effective technology in economizing the agricultural production system ensuring productive capacity of soil without causing environmental problem. (Selvi and Kalpana 2009).
Attitude are frequency described in terms of personalconsistency,asa“latentconcept”thatisindividual-

Gujarat Journal of Extension Education Vol. 24 : (December 2013)
112
dependent”. Attitude strength is an important determinant of attitude behaviour relationship. Attitudes are formed through direct and indirect life experiences and observations. These experiences are “behavioral beliefs”. They have gatheredover time and form the basis of attitudes. Therefore, attitudes are learned and can be changed. They can be viewed as an overall evaluation of behavior and can be measured on a bipolardimension.“Themore favorableaperson’sattitudetoward a behavior, the more they intend to perform that behavior” (Golam and Hivoyuki, 2007).
The action of individual farmers is governed by personal, social, psychological and cultural factors involved in situation. Some farmers manage new cultivation technology more quickly than others because of the difference in personal characteristics. Similarly if there is difference in economic factors, process of action is changed, there by changing the pattern of management. Thus, it may be stated that the degree of attitude of the respondents towards green manuring differs with their personal, social-communicational, economic and psychological characteristics. Hence considering the importance of these inspiring characteristics and review of past research studies, an attempt has been made in this investigation to measure attitude of farmers towards green manuringandtofindouttheirinspiringpersonalitytohavepositive attitude towards green manuring for sustainable agriculture.
METHODOLOGY
To measure attitude of farmers towards green manuring scale developed by researcher was administered on a randomly selected sample of total 120 farmers having at least one year of experience in green manuring at their own land from 10 villages of two taluka, namely Anand and Petlad from Anand district of middle Gujarat. The data were collected through the personal interview. Ex-Post-Facto research design was used. The responses were collected in five continuum viz. strongly agree, agree, undecided,disagree and strongly disagree. The total attitude score for each respondent was obtained by adding all the scores of their responses of all the statements. On the basis of arbitrary classificationmethod,therespondentsweregroupedintofivecategories viz; Highly negative attitude, negative attitude, neutral, positive attitude and Highly positive attitude. To findouttheinspiringpersonalityoffarmerstohavepositiveattitude towards green manuring for sustainable agriculture,
Correlationcoefficientwasused.
RESULTS AND DISCUSSION
Attitude of farmers towards green manuring for sustainable agriculture
Table 1: Distribution of the farmers according to their attitude towards green manuring for sustainable agriculture n=120
Sr. No.
Category FrequencyPer cent
1Highly negative ( up to 25.2 score )
00 00
2Negative (25.21– 36.4 score )
00 00
3Neutral (36.41 – 47.6 score )
32 26.67
4Positive ( 47.61 – 58.8 score )
80 66.67
5Highly positive ( above 58.8 score )
08 06.66
The data given in Table -1 illustrated that about two
third (66.67 per cent) of the respondents had positive attitude
towards green manuring, While 26.67 and 6.66 per cent
of the respondents had neutral and highly positive attitude
towards green manuring respectively. Negative to highly
negative attitude towards green manuring was not observed
among the respondents. Patel et al. (2007) revealed that more
than half (55.00 per cent) of the farmers had neutral level
of attitude towards IPM strategy, followed by 30.00 per cent
with negative attitude towards IPM strategy and 15.00 per
cent with positive attitude towards IPM strategy.
From the above discussion it was concluded that
majority of the farmers had positive feeling towards green
manuring. The practicability of taking up green manuring
techniquesinthefieldcontrolthesustainabilityoftheland,
which is long turned into improved agricultural productivity
and ultimately furnished higher income was well recognized
and realized by majority of farmers. This might be the reason
that the majority of the farmers had positive attitude towards
green manuring for sustainable agriculture.

Gujarat Journal of Extension Education Vol. 24 : (December 2013)
113
Table 2: Relationship between the personalities of the farmers and their attitude towards green manuring. n=120
Sr. No.
Independent Variables
Correlation Coef-ficient
(‘r’ value)1 Age 0.026 NS
2 Education 0.034 NS3 Farming experience 0.185*
4 Experience of green manuring 0.248**5 Mass media exposure 0.236 **6 Extension contact 0.183*
7 Training received 0.207*
8 Land holding 0.094 NS9 Annual income 0.105 NS10 Occupation 0.069 NS11 Scientificorientation 0.201*
12 Knowledge of green manuring 0.222*
* = significant at 5% level of probability
**= significant at 1% level of probability
The figure resulted in table-2 revealed that thelevel of attitude of respondents towards green manuring was observed positive and significant with their experience offarming, experience of green manuring, extension contact, massmediaexposure,trainingreceived,scientificorientationand knowledge level of farmers regarding green manuring, while rest of variables age, education, occupation, land holdingandannualincomehadpositiveandnon-significantrelationship with their attitude towards green manuring for sustainable agriculture. Thus it can be concluded that those farmers who had elevated level of experiences, regular habit to contact extension agents, inclination towards mass media, scientificapproachesoffarming,interesttoattaindifferenttypes of training and self equipped knowledge favoured to rely on green manuring practices, as uses and benefits oftechnology might have raised their concern with regards to feel the positivism about green manuring practices to sustain their farming occupation economically and environmentally
protected. It was seen that attitude of farmers towards greenmanuringwasnotinfluencedbytheirage,education,occupation, landholding and annual income up to the mark. Rajesh (2011) found that inspiring personalities like; education, extension contact training received, land holding knowledgeandscientificorientationoftherespondentshadplayedasignificantroletohavepositiveattitudetowardsbio-control measures of plant protection.
CONCLUSION
The outcome of the investigation concluded that about two third of the respondents had positive attitude towards green manuring. The level of attitude of farmers towardsgreenmanuringwasobservedpositivelysignificantwith their farming experience, experience in green manuring, mass media exposure, extension contact, training received, scientific orientation and knowledge level of farmersregarding green manuring,
REFERENCES
Chandy, K. T. (2012). Agricultural and Environmental Education, Sustainable Organic Farming, www.inseda.org., Booklet no.411.
Golam, F. and Hivoyuki, T. (2007). Farmer’s perception of integrated soil fertility and nutrient management for sustainable crop production, J. of agricultural Education, Vol. 48: 111-122.
Patel, M.C., Chauhan, N.B. and Korat, D.M. (2007). Consequences of farmers attributes on their attitude towards IPM strategy. Karnataka .J. Agric. Sci., Vol. 20: 797-799.
Rajesh (2011). A Scale to Measure Attitude of the farmers towards Bio-Control Measures of Plant Protection. (Unpublished) M.Sc (Agri.) Thesis, AAU, Anand.
Selvi, R.V. and Kalpana, R. (2009). Potentials of green manure in integrated nutrient management for rice, Agric. Rev., Tamil Nadu Agricultural University, Coimbatore, Vol. 30 (1) : 40 – 47.
Received : August 2013 ; Accepted : November 2013

Gujarat Journal of Extension Education Vol. 24 : (December 2013)
114
Awareness among Farmers about Krishi Vigyan Kendra - Knowledge Resource Centre in Tapi district
C. D. Pandya1, Arti N. Soni2 and N. M. Chauhan3
1 Subject Matter Specialist (Extension), 2 Subject Matter Specialist (Home Science), 3 Programme Coordinator
KVK, NAU, Vyara, Gujarat, IndiaEmail : [email protected]
ABSTRACT
The study was conducted in jurisdiction of KVK – Vyara, Tapi district of South Gujarat. Total 160 respondents from adopted and non-adopted villages of KVK, Vyara were taken. The teacher’s made interview schedule was used for the data collection. The data were tabulated, analyzed and interpreted in the light of the objectives. The statistical measures like frequency, percentage, Mean and S.D. were used. The result showed that majority of the respondent found to have medium level of awareness about Knowledge Resource Centre established by KVK in Adopted villages and Non- Adopted villages.
Keywords: Awarness, KVK
INTRODUCTION
The first KVK, on a pilot basis, was establishedin1974 at Pondicherry under the administrative control of Tamil Nadu Agricultural University, Coimbatore. The mandatesofKVKsareas follows–Conducting“On-FarmTesting” for identifying technologies in terms of location specificsustainablelandusesystems,Organisingtrainingtoupdate the extension personnel with emerging advances in agricultural research on regular basis, Organising short and long term training courses in agriculture and allied vocations forthefarmersandruralyouthswithemphasison“Learningby doing” for higher production on farms and generating self-employment, Organising Front Line Demonstrations (FLDs) on various crops to generate production data and feed back information.
In order to achieve the above mandates, the following broad objectives would help the KVKs to develop their specific objectives – To promptly demonstrate thelatest agricultural technologies to the farmers as well as extension workers of State Departments of Agriculture/Horticulture/ Fishery/ Animal Science/ NGOs with a view to reduce the time lag between the technology generation and its adoption, To test and verify the technologies in the socio-
economic conditions of the farmers with a view to study the production constraints and to modify the technologies to make them appropriate, To impart trainings to the practising farmers/ farmwomen,ruralyouthandfield levelextensionfunctionaries by following the methods of “Teaching bydoing” and “Learning by doing’,To back-upwith trainingand communication supports to the district level development departments viz; Agriculture/ Horticulture/ Fisheries/ Animal science and NGOs in their extension programmes.
The KVKs, thus are the down-to-earth institutions
committed to vocational training, transfer of latest
technologies, on farm research and thus, serving as the
light house for overall rural development in the district.
The activities of the KVK include technology assessment,
refinement and transfer, aiming to bridge the gap between
the technology developed at the research institutions
and its adoption at the field level by the farmers through
demonstration of technology/ products etc. and training of
farmers, rural youths and extension personnel. On the basis
of“India-2002”,therewere578ruraldistrictsspreadoverthe
countryandthisfigurehasfurtherbeenraisedto602districts
as per the latest data available on the internet report of NIC.

Gujarat Journal of Extension Education Vol. 24 : (December 2013)
115
In view of continuous increase in the number of districts, it
is agreed to have one KVK in each district by the end of Xth
plan. Realising the importance of technology assessment,
refinement and transfer, the Planning Commission has
allocatedRs.500croresspecificallyfortheestablishmentof
new KVKs during Xth plan period. The DDG(AE) during
the 11th EFC meeting of Xth plan, held in New Delhi on
30th Sept. 2003 out lined the importance of two issues in
the context of the present scenario of agriculture in India- (i)
thetechnologieshavetobeassessedandrefinedbeforetheir
transfer and (ii) a programme approach involving various
technology components relevant to the farmers in varying
farming situations will be required for a perceptible change.
Theconceptoftechnologyassessmentandrefinementisbased
on participatory mode ensuring greater scientists-farmer
linkage and access to agricultural technologies generated by
research systems to the farming community. For this, the role
of KVKs are of immense importance for overall agricultural
and rural development through its various research and
technology transfer mechanisms. The new mandate i.e. KVK
as Knowledge resource centre was added in 2009.
Keeping all these views in mind, the research study
“Awareness among farmers about Knowledge Resource
Centre established by Krishi vigyan” was taken with
following objectives. :
(1) Tostudythepersonalprofileoftherespondentsviz. Age,
Education, Social participation, Extension participation,
Annual Income, occupation, Land Holding and economic
motivation .
(2) To study the awareness among farmers of adopted and
non-adopted villages of KVK-Tapi about Knowledge
Resource Centre established by KVK.
(3) To ascertain the relationship between dependent and
independent variables.
METHODOLOGY
Vyara and Songadh taluka were selected
purposively. Eight villages from Vyara taluka and two
villages from Songadh taluka were selected purposively as
these villages were adopted by KVK. While ten villages
from Vyara and Songadh taluka were selected as they are
neighboring villages of the adopted villages(Non-adopted).
8 respondents were selected from each village of ten adopted
villages and 8 respondents were selected from each village
of ten non-adopted villages by random sampling technique.
Thus, total number of respondents was 160. The teacher’s
made interview schedule was used for the data collection.
The data were tabulated, analyzed and interpreted in the light
of the objectives. The statistical measures like frequency,
percentage, Mean and S.D. were used.
RESULTS AND DISCUSSION
Profile of the respondents:
Thefindingsof these selected characteristicshave
been presented in the following section:
Age
From the data presented in Table 1(1) show that
nearly one-half (49.00 per cent) of the respondents was
in middle age group followed by 23.00 per cent of the
respondents belonging young age group and 18.00 per cent
were under old age group in Adopted villages, while majority
(46.00 per cent) of the respondents was in old age group
followed by 36.00 per cent of the respondents belonging
middle age group and 18.00 per cent were under young age
group in Non-Adopted villages.
Education
A perusal of data presented in Table 1(2) reveal
that major segment (46.00 per cent) of the respondents were
educated up to primary school level followed by 19.00,
10.00, 8.00 and 6.00 had an education up to middle school
level, up to college and above college, up to high school
level education and illiterate respectively in Adopted villages
while, majority (39.00 per cent) of the respondents were
educated up to primary school level followed by 25.00,
20.00, 9.00 and 7.00 were illiterate, up to middle school
level, up to college and above college and up to high school
level education respectively in Non-Adopted villages . This
information gives indication that the literacy rate in tribal
area is still very low.

Gujarat Journal of Extension Education Vol. 24 : (December 2013)
116
Table 1: Distribution of respondents according to their personal characteristics n=160
Sr. No.
Personal Characteristics Adopted Villages (80) Non-Adopted Villages (80)Number of
respondentsPer cent Number of
respondentsPer cent
1 Age group1 Young (up to 35 years) 23 29 14 182 Middle (36 to 50 years) 39 49 29 363 Old (50 years and above) 18 22 37 462 Level of Education1 Illiterate 06 07 20 252 Up to primary school level 37 46 31 393 Up to middle school level 19 24 16 204 Up to high school level 08 10 06 075 Up to college and above college 10 13 07 093 Social Participation1 Participated 72 90 63 792 Not participated 08 10 17 214 Extension Participation1 Not participated 02 03 30 382 Participated in one activity 09 11 50 623 Participated in more than one activity 69 86 00 005 Annual Income1 Above Rs. 2,00,000/- 03 04 05 062 Rs. 1,50,001 to 2,00,000 01 01 0 03 Rs. 1,00,001 to 1,50,000 09 11 03 044 Rs. 50,001 to 1,00,000 25 31 26 325 Up to Rs. 50,000 42 53 46 586 Occupation1 Farming 08 10 13 172 Animal Husbandary 01 01 02 033 Farming + Animal Husbandary 66 82 63 794 Service + Farming 02 03 01 015 Farming + Business 03 04 0 07 Land Holding1 > 10 ha 01 01 0 02 4.01 – 10.00 ha 03 04 06 073 2.01 – 4.00 ha 06 07 16 204 1.01 – 2.00 ha 35 44 26 335 0.01 – 1.00 ha 35 44 32 408. Economic motivation for Adopted villages1 Low economic motivation (< 16 score) 15 19 -- --2 Medium economic motivation (16-18 score) 60 75 -- --3 High economic motivation (> 18 score) 05 06 -- --
Mean-17 S.D. -1 9 Economic motivation for Non-Adopted villages1 Low economic motivation (< 14 score) -- -- 11 142 Medium economic motivation (14-18 score) -- -- 69 863 High economic motivation (> 18 score) -- -- 0 0
Mean-16 S.D. -2

Gujarat Journal of Extension Education Vol. 24 : (December 2013)
117
Social participation
The data in Table 1(3) revealed that majority (90.00 per cent and) of the respondents were participated in social activities and 10.00 per cent of the respondents were not participated in social activities in Adopted villages while, majority (79.00 per cent) of the respondents were participated in social activities and 21.00 per cent of the respondents were not participated in social activities in Non-Adopted villages.
Extension participation
From the data presented in Table 1(4) it was observed that majority (86.00 per cent) of the respondents were participated in more than one activity followed by 11.00 per cent and 3.00 per cent of the respondents were participated in one activity and not participated in any activity respectively in Adopted villages while, majority (62.00 per cent) of the respondents were participated in one activity followed by 38.00 per cent were not participated in any activity in Non-Adopted villages.
Annual Income
It is apparent from Table 1(5) that more than one-half (53.00 per cent) of the respondents had annual income up to ` 50,000/- followed by 31.00 per cent, 11.00 per cent and 4.00 per cent and 1.00 per cent of the respondents had annual income between ` 50,001 to 1,00,000, ` 1,00,001 to 1,50,000, above ` 2,00,000 and ` 1,50,001 to 2,00,000 respectively in Adopted villages while, majority (58.00 per cent) of the respondents had annual income up to ` 50,000/- followed by 32.00 per cent, 6.00 per cent and 4.00 per cent of the respondents had annual income between ` 50,001 to 1,00,000, above ` 2,00,000 and ` 1,00,001 to 1,50,000 respectively whereas, none of them had an annual income between ` 1,50,001 to 2,00,000 in Non-Adopted villages.
Occupation
The data presented in Table 1(6) reveal that majority (82.00 per cent) of the respondents were engaged in farming + Animal Husbandry as main occupation followed by 10.00 per cent, 4.00 per cent and 3.00 per cent of the respondents were engaged in farming, Farming + Business and Service + Farming respectively whereas, only 1.00 per cent of the respondents had Animal Husbandry as main occupation in Adopted villages while, majority (79.00 per cent) of the respondents were engaged in farming + Animal Husbandry as main occupation followed by 17.00 per cent, 3.00 per cent and 1.00 per cent of the respondents were engaged in farming, Animal Husbandry and Service + Farming respectively
whereas, none of them had Farming + Business as main occupation in Non-Adopted villages.
Land holding
It is evident from the data in Table 1(7) that equal proportion (44.00 per cent) of the respondents possessed 0.01 – 1.00 ha and 1.01 – 2.00 ha of land followed by 7.00 per cent, 4.00 per cent and 1.00 per cent of the respondents possessed 2.01 – 4.00 ha, 4.01 – 10.00 ha and > 10 ha of land respectively in Adopted villages while, majority (40.00 percent) of the respondents possessed 0.01 – 1.00 ha of land followed by 33.00 per cent, 20.00 per cent and 7.00 per cent of the respondents possessed 1.01 – 2.00 ha, 2.01 – 4.00 ha and 4.01 – 10.00 respectively whereas, none of them possessed > 10 ha of land in Non-Adopted villages.
Economic motivation for Adopted villages
The date presented in Table 1(8) portray that three-fourth (75.00 per cent) of the respondents were found to have middle level of economic motivation and 19.00 per cent and 6.00 per cent of the respondents had low and high level of economic motivation respectively in Adopted villages.
Economic motivation for Non-Adopted villages
The data presented in Table 1(9) reveal that majority (86.00 per cent) of the respondents were found to have middle level of economic motivation and 14.00 per cent of the respondents had low level of economic motivation and none of them had high level of economic motivation in Non-Adopted villages.
Awareness among farmers about knowledge resource centre established by KVK:
Thefindingsof these selected characteristicshavebeen presented in the following section:
Awareness about Knowledge Resource Centre
A perusal of data presented in Table 2 indicate that nearly three-fourth (74.00 per cent) of the respondents were found to have medium level of awareness about Knowledge Resource Centre established by KVK and an equal (13.00 per cent) number of respondents had low and high level of awareness about Knowledge Resource Centre established by KVK in Adopted villages while, more than one-half (57.00 per cent) of the respondents were found to have medium level of awareness about Knowledge Resource Centre established by KVK whereas, 40.00 per cent and 3.00 per cent of respondents had low and high level of awareness about Knowledge Resource Centre established by KVK in Non- Adopted villages.

Gujarat Journal of Extension Education Vol. 24 : (December 2013)
118
Table 2: Distribution of respondents According to their awareness n=160
S.N. Level of awareness Number of respondents Per cent
1 Low level of awareness (< 65 score)
10 13
2 Medium level of awareness (65-85 score)
60 74
3 High level of awareness (> 85 score)
10 13
Mean-75 S.D. -10 1 Low level of awareness
(< 30 score)32 40
2 Medium level of awareness (30-54 score)
46 57
3 High level of awareness (> 54 score)
02 03
Mean-42 S.D. -12
Association between personal profile of the respondents of the Adopted and Non-Adopted villages and their extent of awareness about Knowledge Resource Centre established by KVK
The correlation coefficient of nine variables ofrespondents of the Adopted and Non-Adopted villages with their extent of awareness about Knowledge Resource Centre established by KVK is furnished in Table 3.Table 3: Association between personal profile of the
respondents of the Adopted and Non-Adopted villages and their extent of awareness about Knowledge Resource Centre established by KVK
n=160Sr. Variables Adopted
villagesNon-Adopted
villages‘r’ value ‘r’ value
1 Age 0.04234 -0.095862 Education -0.03918 0.32165 **3 Caste -0.05218 0.028954 Social participation 0.08375 0.175915 E x t e n s i o n
participation0.26801 * 0.52391 **
6 Annual income 0.04050 0.28623 *7 Occupation -0.09794 0.104768 Land holding -0.14979 0.061749 E c o n o m i c
motivation0.07695 -0.08845
*Significantat5percentlevel**Highlysignificantat1percentlevel
Age and extent of awareness
The data presented in table 3 shows that the calculatedvalueofcorrelationcoefficient(r =0.04234) was found non-significant. It means there was no associationbetween age and extent of awareness about Knowledge Resource Centre established by KVK in Adopted villages.
The data presented in table 3 shows that the calculated value of correlation coefficient (r = -0.09586) wasfoundnegativeandnon-significant.Itmeanstherewasno association between age and extent of awareness about Knowledge Resource Centre established by KVK in Non-Adopted villages.
Education and extent of awareness
The data in table 3 indicates that the calculated value ofcorrelationcoefficient (r =-0.03918) was found negative andnon-significant.Itreflectsthattherewasnoassociationbetween education and extent of awareness about Knowledge Resource Centre established by KVK in Adopted villages.
The data in table 3 indicates that the calculated value of correlation coefficient (r =0.32165**) was found highly significant. It reflects that there was associationbetween education and extent of awareness about Knowledge Resource Centre established by KVK in Non-Adopted villages.
Caste and extent of awareness
On the basis of the data presented in table 3 specify that the calculatedvalueofcorrelationcoefficient(r = -0.05218) was foundnegativeandnon-significant.Itindicatesthattherewasno association between caste and extent of awareness about Knowledge Resource Centre established by KVK in Adopted villages.
On the basis of the data presented in table 3 specify that thecalculatedvalueofcorrelationcoefficient(r = 0.02895) was found non-significant. It indicates that there was noassociation between caste and extent of awareness about Knowledge Resource Centre established by KVK in Adopted villages.
Social participation and extent of awareness
On the basis of the data presented in table 3 specify that the calculated value of correlation coefficient (r = 0.08375) was found non-significant. It indicates that therewas no association between social participation and extent of awareness about Knowledge Resource Centre established by KVK in Adopted villages.

Gujarat Journal of Extension Education Vol. 24 : (December 2013)
119
On the basis of the data presented in table 3 specify that the calculated value of correlation coefficient (r = 0.17591) was found non-significant. It indicates that therewas no association between social participation and extent of awareness about Knowledge Resource Centre established by KVK in Non-Adopted villages.
Extension participation and extent of awareness
On the basis of the data presented in table 3 specify that the calculated value of correlation coefficient(r = 0.26801)was found significant. It indicates that therewassignificantassociationbetweenExtensionparticipationand extent of awareness about Knowledge Resource Centre established by KVK in Adopted villages.
On the basis of the data presented in table 3 specify that the calculated value of correlation coefficient (r = 0.52391**)wasfoundhighlysignificant.ItindicatesthattherewassignificantassociationbetweenExtensionparticipationand extent of awareness about Knowledge Resource Centre established by KVK in Non-Adopted villages.
CONCLUSION
From the above discussion it could be concluded that majority of the respondents were in middle age group, educated up to primary school level, participated in social activities, participated in more than one extension activity, annual income up to Rs.50,000/-, engaged in farming + Animal Husbandry as main occupation, equal proportion of the respondents possessed 0.01 – 2.00 ha, found to have middle level of economic motivation and found to have medium level of awareness about Knowledge Resource Centre established by KVK in Adopted villages whereas, majority of the respondents was in old age group, educated up to primary school level, participated in social activities, participated in one extension activity, annual income up to Rs. 50,000/-, engaged in farming + Animal Husbandry as main occupation, possessed 0.01 – 1.00 ha of land and found to have middle level of economic in Non-Adopted villages and more than one-half of the respondents were found to have medium level of awareness about Knowledge Resource Centre established by KVK in Non- Adopted
villages. There was no association between age, education, cast, social participation, annual income, occupation, land holding, economic participation and extent of awareness about Knowledge Resource Centre established by KVK but there was significant association found between extensionparticipation and extent of awareness about Knowledge Resource Centre established by KVK in Adopted villages whereas, there was no association between age, cast, social participation, extension participation, occupation, land holding, economic participation and extent of awareness about Knowledge Resource Centre established by KVK but there was association between education, extension participation, annual income and extent of awareness about Knowledge Resource Centre established by KVK in Non-Adopted villages.
REFERENCES
Chauhan, N.M.(2012).Impact of Group cohesiveness on professionalism in management of co-operative sectors. Advance Research Journal of Social science Vol. 3 (2) : 213-215.
Chauhan, N.M. (2012).Impact of Linkages with tribal cooperatives for effectual TOT inTribal belt. Advance Research Journal of Social science Vol. 3 (2) : 227-230.
Chauhan, N.M. (2012).Impact and Yield crack analysis of trainingsandFLDsregardingscientificpracticesofgram. Agriculture Update, Vol. 7 (3 and 4) :199-202.
Chauhan, N.M. (2012).Impact and constraints analysis of tribal farm women in adoption of kitchen gardening. Agriculture Update, Vol. 7 (3 and 4) : 218-221.
Pandya, C.D. and Pandya, R.D. (2010). A critical analysis of Socio-Economic Status of organic farming followers of South Gujarat. Ph.D. (Agri.) Thesis (Unpublished), Navsari Agricultural University, Navsari.
Received : August 2013 ; Accepted : November 2013

Gujarat Journal of Extension Education Vol. 24 : (December 2013)
120
ABSTRACT
The study was conducted among the comparative study on Bt and non Bt cotton growers of Bharuch district of Gujarat state. Ex-post Facto research design was used and by using the proportionate random sam-pling technique used. The study was consisted of 75 Bt and 75 non – Bt cotton growers as respondents were obtained for the present study. The study concluded that the majority of the Bt cotton growers had favourable attitude towards Bt cotton, followed by of Bt cotton growers with highly favourable attitude towards Bt cotton growers had less favourable attitude towards Bt cotton and non Bt cotton growers, half of them had favourable attitude and nearly half of non Bt cotton growers had less favourable attitude towards Bt cotton and non Bt cot-ton growers had highly favourable attitude towards Bt cotton growers.
Keywords: attitude, cotton, favourable, Bt. Cotton, Non Bt. Cotton
INTRODUCTION
Cotton is the most important commodity throughout the world, which shares considerably in the Indian economy. Cotton is one of the major cash crops of India. Cotton seed and seed cakes are important sources of concentrate and feed to animals. It is also being used in manufacturing synthetic rubber, soaps, cosmetics, plastics, explosive etc. Considering its importance, cotton is grown on a large scale throughout the world. Cotton being cultivated in 93 m. hectares, which covers about 25 per cent of total area of the country however, in which context to production, India securing second rank with 18 per cent of production of the world. ( Khadi, 2005).Hybrid cotton cultivation about 70 per cent of total cotton area isasignificantmilestoneachievementinIndianAgriculturalscenario. Basically, it is cultivated in three distinct agro-ecological regions viz., North, Central and South, of which, 21 per cent area is under cultivation in North zone which is 100 percent irrigated and contributes 25 per cent of the total production. The Central zone is predominantly rainfed and occupies more than 56 per cent of the total area, but contributing less than 50 per cent of the total production and hybrid cultivation is dominant in this zone. In South zone is representing all types of cotton, viz., irrigated and rainfed, hybrids (inter and intra-specific, diploids, and tetraploids)
and varieties (diploids and tetraploids). Bt cotton technology provides new avenues for the Indian textile industry by ensuring availability of good quality raw cotton on regular basis which was a major concern a few years back. In India about 30 per cent of the cotton crop losses were due to pests, diseases and weeds. Of which 10 per cent is due to one major pest i.e. American bollworm (Helicoverpa armigera). For the control of this particular major pest alone about US $ 264 million worth pesticides were used in India. Cotton occupies 5 per cent of the total cultivable area consumed 55 percent of the totally used pesticides in all crop cultivation (Barwale et al.,2004).
Keeping in view of this importance, the present studywasundertakenwithfollowingspecificobjectives:
Study the Attitude of cotton growers towards Bt and non Bt cotton
METHODOLOGY
Bharuch is one of the major cotton growing district in south Gujarat. This district has eight talukas. Out these eight talukas, Ankaleshwar, Amod, Bharuch, Wagara and Walia havehighestareaunderBtcotton.Allthesefivetalukaswerepurposively selected. A list of cotton growing villages was obtained fromtheDistrictAgriculturalOfficer,Department
Attitude of Cotton Growers towards Bt and Non Bt cotton
Sameer Dalvi1 , Sumit Salunkhe2 and Surendra Kumar Rai3
1 Ex. M.Sc. Student, 2 and 3 Ph.D. Scholars Dept. of Extension. Education, N. M. College of Agriculture, NAU
Eru char rasta, Navsari, GujaratEmail : [email protected]

Gujarat Journal of Extension Education Vol. 24 : (December 2013)
121
ofAgriculture,Bharuch.Outof these,fifteenvillageswereselected purposely. The lists of Bt and non Bt cotton growers of selected villages were obtained from Talati-cum-mantri. Outoftotal,fiveBtcottongrowerswereselectedrandomlywhile, five non Bt cotton growers of same village wereselected by considering actual cultivated area of Bt cotton growers. This way, the study was consist of 75 Bt and 75 non Bt cotton growers as respondents. In all one hundred fiftyrespondents were considered as sample size for the present study. The basic method was used for the collection of data by personal interview from 150 respondents of 15 villages’ of selected Bharuch talukas by the investigator.Ex-post-facto research design was used. This design was considered appropriate because the phenomenon has already occurred. Keeping in the view, the objectives of study, the interview schedule was prepared and respondents were interview at
their home.
RESULTS AND DISCUSSION
Attitude of cotton growers towards Bt and non Bt cotton
All Port (1935) define attitude as amental andorneutral status of readiness, organized through experience, exerting a direct and dynamic influence on individualresponse to all objects and situations with which he is related. As we know that the success or failure of any reform would mainly depends on up the people’s attitude towards it. By and large, attitude of farmers forms an essential component for the adoption of Bt cotton to get higher yield. Against this background, an attempt was made to measure the attitude of cotton growers towards Bt cotton. The data regarding attitude of cotton growers towards Bt cotton was collected and presented in table 1.
Table 1: Distribution of respondents according to their level of attitude towards bt cotton and non bt cotton n=150
Sr.No.
Level of attitudeRespondents
Bt cotton growers Per cent Non Bt cotton
growersPer cent
1 Less favourable attitude(Up to 21 score) 04 5.33 34 45.33
2 Favourable attitude(Between 22 to 41 score) 52 69.33 38 50.67
3 Highly favourable(42 score and above) 19 25.34 03 4.00
Mean =31.43 S.D=9.89
It is apparent from Table 1 that majority of the Bt cotton growers (69.33 percent) had favourable attitude towards Bt cotton, followed by 25.34 per cent of Bt cotton growers with highly favourable attitude towards Bt cotton and only 5.33 per cent of Bt cotton growers had less favourable attitude towards Bt cotton.
Among the non Bt cotton growers, half of them (50.67 per cent) had favourable attitude and nearly half of non Bt cotton growers (45.33 per cent) had less favourable attitude towards Bt cotton and only 4.00 per cent of non Bt cotton growers had highly favourable attitude towards Bt cotton growers.
From the above table, it could be concluded that more than half percent of Bt and non Bt cotton growers had favourable attitude towards Bt cotton due to resistance against bollworm complex.
Assuchthehypothesissetforthisstudythat“thereis a less favourable attitude towards Bt cotton of Bt and no Bt cotton growers” is rejected.
ThisfindingisintheagreementwiththefindingsofPatel et al. (1990), Sriram and Palaniswamy (1999), Meti and Sambrani (2005) and Naik et al. (2008).
CONCLUSION
The finding of the study suggest that themajorityof the Bt cotton growers had favourable attitude towards Bt cotton, followed by of Bt cotton growers with highly favourable attitude towards Bt cotton growers had less favourable attitude towards Bt cotton and non Bt cotton growers, half of them had favourable attitude and nearly half of non Bt cotton growers had less favourable attitude towards Bt cotton and non Bt cotton growers had highly favourable attitude towards Bt cotton growers.

Gujarat Journal of Extension Education Vol. 24 : (December 2013)
122
REFERENCES
Barwale R.B.,Gadwal V.R.,Zehr,U.and Zehr, B. (2004). Prospects for Bt cotton technology in India. AgrBioForum 7 (1&2): 23-26.
Khadi,B. M. (2005). Cotton scenario and future strategies for increasing cotton Productivity. Paper presented in workshopon“Enhancementofcottonproductionandquality”. 12 November, 2005. Navsari agricultural University,Surat, Gujarat (India). 1-4.
Meti, S. K. and Sambrani R. M. (2005). A technique of attitude scale construction of small and marginal farmers towards improved agricultural technologies. Rural India., 95-96.
Naik, R. G., Lakshminarayan, M. K., Anand, M. G. and Reddy, R. N. (2008). Attitude of mango growers towards sustainable farming practices. Crop Res. 35(1&2) : 155-156.
Patel, P. P., Thakkar, K. A. and Patel, B. P. (1990). A scale to measure the attitude of farmers towards cotton research station. Maha. J. Extn. Edu., 207-210.
Sriram, N. and Palaniswamy, A. (1999). Attitude of cotton growers towards eco – friendly agricultural practices. J. Extn. Edu., (3) :2540-2542.
Received : November 2012 ; Accepted : June 2013
Gujarat Journal of Extension Education Vol. 24 : (December 2013)
123
Constraints Faced by the Mango Growers Towards Scientific Cultivation in Mango Orchards
Pradip A. Baria 1, N. V. Soni2 and D. D. Patel 3
1 Post Graduate student (Extension Education), BACA, AAU, Anand2 Associate Extension Educationist, DoEE, AAU,Anand3 Assistant Extension Educationist , DoEE, AAU,Anand
Email : [email protected]
ABSTRACT
The probable reasons for low productivity of mango in Panchamahal district area are many, but the adverse effect of climate as well as less scientific management of mango orchard is major one. As a result, the quality of mango is not up to the standard. Today farming enterprise is becoming more complex and complicated and therefore, management is a key to face these problems. The data were collected with the help of personal interview schedule using proportionate random sampling method. The ex-post-facto research design was used for the study. Major constraints faced by mango growers are irregular irrigation supply, lack of awareness about recommendations, lack of modern spraying equipment, high price of fertilizers, natural hazards, lack of grafts, lack of improved agricultural implement, lack of labours, lack of effective pesticides, lack of electricity supply, high price of pesticides and lack of technical suggestions.
Keywords: Mango orchards, Scientific cultivation
INTRODUCTION
Mango (Mangifera indica L.) undoubtedly deserves to be national fruit of India. In area, production, nutritive value and popularity of apple, no other fruit can compete with it. It occupies the same position in India as is occupied by the apple in temperate climates and grape in sub tropical. Among all the fruit crops, mango is being cultivated commercially in a number of countries of the world, but no where does it achieve the same premier position as in the subcontinent of India, where it is actually the king of all fruits.
Gujarat is one of the mango producing states in India. Mango has an important place among all the fruit crops growing in the state. The leading mango producing states are Andhra Pradesh, Maharashtra, Uttar Pradesh, Karnataka and Gujarat. The yield of mango in U.P and Karnataka is 12.2 and 10.1 metric tonnes/ha, respectively. While in Gujarat state, yield of mango is only 8.5 metric tonnes/ha which is quite low as compared to other states of the country. The area under mango in Panchamahal district was 3552 ha. and the yield was 592 metric tonnes/ha(NHB database, 2008).
Cultivation of fruit is a specialized field whereefficientmanagementwillhelpalottoyieldresults,whichare
anticipated. Therefore, management is a pivotal component inascientificcultivationofmango.Themangogrowershavealso to perform a role of manager to get maximum production from minimum available resources. The managerial ability of the mango growers was directly affecting the mango production and therefore an attempt was made to know the constraints faced by the mango growers about scientificcultivation in mango orchards.
METHODOLOGY
The study was conducted in Panchamahal district of Gujarat state. Halol, Lunavada, Santrampur and Ghogamba talukas of Panchamahal district were purposively selected for the study as they have the maximum area under mango crop. Twelve mango growing villages were randomly selected from those four talukas. For this study 120 mango growers were selected by proportionate random sampling. The data were collected with the help of well-structured, pre-tested, Gujarati version interview scheduled. For measuring constraints in adoption of recommended production technology of mango crop the respondents were asked to give the information about the constraints countered by them was ascertained. The frequencies obtained were from highest to lowest.

Gujarat Journal of Extension Education Vol. 24 : (December 2013)
124
RESULTS AND DISCUSSION
Constraints in adoption of new technology never end. However they can be minimized. The respondents were requestedtoexpresstheconstraintsfacedbytheminscientificcultivation of mango orchard. Frequency and percentage for each constraint were calculated and on that basis of that, the constraints were ranked and presented in Table 1.
Table:1 Constraints faced by mango growers in scientific cultivation of mango orchards
n = 120
SR. No.
Constraints Number Per cent Rank
1 Irregular irrigation supply 72 60.00 I2 Lack of awareness about
recommendations. 70 58.34 II
3 Lack of modern spraying equipment 65 54.16 III
4 High price of fertilizers 62 51.66 IV5 Natural hazards 61 50.84 V6 Lack of grafts. 58 48.34 VI7 Lack of improved agricul-
tural implement. 56 46.66 VII
8 Lack of labours. 54 45.00 VIII9 Lack of pesticides. 50 41.66 IX10 Lack of electricity supply. 48 40.00 X11 High price of pesticides. 35 29.16 XI12 Lack of technical sugges-
tions 21 17.50 XII
As seen from the table major constraints faced by mango growers are irregular irrigation supply (60.00 per cent), lack of awareness about recommendations (58.34 per cent), lack of modern spraying equipment (54.16 per cent), high price of fertilizers (51.66 per cent), natural hazards (50.84 per cent), lack of grafts (48.34 per cent), lack of improved agricultural implement (46.66 per cent), lack of labours (45.00 per cent), lack of effective pesticides (41.66 per cent), lack of electricity supply (40.00 per cent), high price of pesticides (29.16 per cent) and lack of technical suggestions (17.50 per cent).
CONCLUSION
Major constraints faced by mango growers are irregular irrigation supply, lack of awareness about recommendations, lack of modern spraying equipment, high price of fertilizers, natural hazards, lack of grafts, lack of improved agricultural implement, lack of labours, lack of effective pesticides, lack of electricity supply, high price of pesticides and lack of technical suggestions.
REFERENCES
Anonymous (2008) National Horticulture Board – 2008
Jadav, N.B. (2005) Managerial ability of mango growers about scientific cultivation of mango orchard.Ph.D Thesis (Unpublished), Junagadh Agricultural University Junagadh.
NHB -database, 2008
Received : November 2012 ; Accepted : August 2013

Gujarat Journal of Extension Education Vol. 24 : (December 2013)
125
Attitude Towards Application of Distance Education in Agriculture Field
Kaushik. G. Khadayta1, P.M.Bhatt2 and H. B. Patel3
1 P.G.Student, B.A.C.A.,Dept. of Ext.Edu., AAU, Anand2 Institute of Distance Education Anand (IDEA), AAU,Anand
3 Asso. Ext. Edu., DOEE, AAU, AnanadEmial : [email protected]
ABSTRACT
The study was conducted for random sample of total 120 agriculture students studying in the final year of graduation in agriculture faculty of State Agricultural Universities of Gujarat during 2013. Agriculture students were interviewed with a structural pre-tested English version. More than one third (35.00 per cent) of the agriculture students had high level of attitude towards application of distance education in agriculture field. Further, 34.16 per cent and 29.17 per cent agriculture students had very high and neutral level of attitude. The attitude of agriculture students was observed positive and non-significant with their knowledge of different languages while, variables like library exposure mass media exposure, self confidence and achievement motivation were observed highly significant with their attitude towards application of distance education in agriculture field.
Keywords: Distance education, attitude, agriculture students, and correlation
INTRODUCTION
Education in India is seen as one of the ways to upward social mobility. Good education is seen as a stepping stone to a high flying career. Education System in Indiacurrently represents a great paradox. Indian professionals are considered among the best in the world are in great demand. This signifies the inherent strength of Indian educationsystem.
The distance education mode was adopted by many universities to meet the ever-growing demand of those students who lacked means to pursue higher education through the regular stream. Distance Education is a system of education suitable for the persons who wanted to enhance theirqualificationsbutwerenotinapositiontoattendclasseson a regular basis. Such distance courses proved a boon for the service persons as well as others desirous of pursuing higher education. New concept of distance education include supplementary material being used through non-print media, also such as radio, television, computers, laptops, Cd’s, through projectors, contact sessions, video lessons and video conferences through satellites. As a result, a large number of in-service persons, professionals, entrepreneurs, job-less youth, school teachers, housewives and old aged free persons made a beeline for admission to distance education study programmes. Although, the students are facing so many problems with regard to Limited subject offered for post
graduate programmes in agricultural studies, less practical exposure and distance educational institution and its facilities especially for application of distance education in agriculture field. So, the study was conducted during 2012-13 atAAU.,Anand with two objectives: (1) to measure attitude of agriculture students towards application of distance education andinagriculturefieldand(2)knowtherelationshipbetweenprofileoftheagriculturestudentsandtheirattitudetowardsapplicationofdistanceeducationandinagriculturefield.
METHODOLOGY
The study was conducted for random sample of total 120 agriculture students studying in the final yearof graduation in agriculture faculty of State Agricultural Universities of Gujarat during 2013. Agriculture students were interviewed with a structural pre-tested English version interview schedule. The dependent variable like attitude towards application of distance education in agriculture field was measured with the help of scale developed byPatel (2009). Coefficient of correlation was calculated tofind out the relationship between each of the independentvariable and dependent variable. The results about attitude towards application of distance education and relationship between communicational as well as psychological factors of the agriculure college students and their attitude towards application of distance education in agriculture field arepresented here.

Gujarat Journal of Extension Education Vol. 24 : (December 2013)
126
RESULTS AND DISCUSSION
Attitude refers to the feelings of like, dislike, attraction, repulsion, interest or apathy of students towards applicationofdistanceeducationinagriculturalfield.
Table 1: Distribution of The Agriculture Students According to Their Attitude Towards Application of Distance Education in Agriculture Field. n = 120
Sr. No.
Categories Frequency Per cent
1 Most unfavorable (8.0 to14.4 score)
00 00.00
2 Unfavorable (14.5 to 20.8 score)
02 01.67
3 Neutral (20.9 to 27.2 score)
35 29.17
4 Favorable (27.3 to 33.6 score)
42 35.00
5 Highly favorable (33.7 to 40.0 score)
41 34.16
Asperfindings,resultindicateintable1andfig.1that nearly three fourth (69.16 per cent) of the agriculture students had favorable to highly favorable attitude towards applicationofdistanceeducationinagriculturefield.Further,slightly more than one forth (29.17 per cent) of the agriculture students had neutral attitude. Only a meager (01.67 per cent) of the agriculture students had unfavorable attitude towards applicationofdistanceeducationinagriculturefield.
Probable reason for above findings might be thatearn higher degree while working, scope for getting a good job, and distance learning mode provide an opportunities for those students who are uncompleted their study due to some difficulties.Highlevelofselfconfidenceandveryhighlevelofachievementmotivationtheytendtomoreselfconfidentmightbeinfluencedthemwouldmakeconscioustoachievetheir ambition.
The data depicted in Table 2 make it clear that the major constraints faced by the agriculture students had, Possibility to give less practical exposure (20.00 per cent), Unavailabilityofscientificinstrumentsandinternetfacilitiesfor students at their home
Table 2 : Relationship between profile of agriculture students and their level of attitude towards application of distance education in agriculture field n = 120
Sr. No.
Independent variables Correlation coef-ficients
(‘r’ value)I Communicational characteristics
1 Knowledge of Different languages
0.1403 NS
2 Mass media exposure 0.2351**
3 Library exposure 0.2072*
II Psychological characteristics
4 Selfconfidence 0.2413**5 Achievement motivation 0.2422**
NS=Non-significant*=Significantat0.05levl**=Significantat0.01level
Thedatafromthefig.1andtable2showsthattheknowledge of different languages of agriculture students had positive and non- significant (r = 0.1403 NS) relationshipwhereas,massmediaexposurehadpositiveandsignificant(r = 0.2351**) as well as library exposure had positive and significantcorrelation(r=0.2072*)withtheirattitudetowardsapplication of distance education in agriculture. With regard to psychological charecteristics, the in table 2 revealed that, selfconfidenceof theagriculturestudentshadpositiveandhighlysignificantrelationship(r=0.3234**)andachievementmotivationhadpositiveandhighlysignificantcorrelation(r=0.2422**) with their attitude towards application of distance educationinagriculturefield.
It might be due to better exposure, favorable situation created by organization, possessing of high level of confidence,involvementindifferentstudent’sdevelopmentalactivities and they ready to face new challenges with a strongfavorableattitude.Thefindingsalsostated thathighdegree of attitude might have due to high degree of self confidenceaswellasachievementmotivationpossessedbyagriculture students. Highly achievement motivated people are psychologically prepared to be an important part of any activity by which they can achieve something in life. Hence, better level of achievement motivation makes them more knowledgeable and prompt to plan in achieving of their future goals.Thismightbetheprobablereasonforabovefindings.

Gujarat Journal of Extension Education Vol. 24 : (December 2013)
127
CONCLUSION
As per findings, result indicate that nearly threefourth (69.16 per cent) of the agriculture students had favorable to highly favorable attitude towards application ofdistanceeducationinagriculturefield.Communicationalas well as psychological factors of the agriculure college students played a greater role with their attitude towards applicationofdistanceeducationinagriculturefield.Further,The attitude of agriculture students was observed positive and non-significantwith theirknowledgeofdifferent languageswhile variables like library exposure mass media exposure, self confidenceandachievementmotivationwereobservedhighly significantwith their attitude towardsapplicationofdistanceeducationinagriculturefield.
REFERENCES
Belfield,O.R.andLevin,H.M.(2003).EconomicsofHigherEducation, U.K. EE Publishers.
Kerlinger, F.N. (1976). Foundation of behavioural research, surjeet publication, Delhi-7, pp.129.
Patel, M.C. and Chauhan, N, B (2012). Attitude towards application of distance education in agriculture and allied field- scale development. Indian research Journal of ext. Edu., 12(1): 71-72.
Pattar, Sanjeevkumar (2010). Development of scale to measure the attitude of agricultural graduates towards agro-tourism as an enterprise. Unpublished M.Sc. thesis, AAU, Anand.
Sasane, V. R. (2009). Information technology used by the post graduate students of Agriculture. M.Sc. Theses. M.A.U., Parbhani (Maharashtra).
A N T E C E D E N T
V A R I A B L E
0
Level of attitude
towards application of
distance education in
agriculture field
I. Communicational characteristics
Knowledge of Different languages
Mass media exposure
Library exposure
INTERVENING VARIABLE
I I . Psychological
Self confidence
Achievement mo tivation
Legend
Cause Effect (Significant relationship)
Cause Effect (Non-significant relationship)
Fig. 1 : Relationship between profile of agriculture students and their level of attitude towards application of distance education in agriculture field.
Received : June 2013 ; Accepted : November 2013

Gujarat Journal of Extension Education Vol. 24 : (December 2013)
128
Agribusiness Anxiety and Constraints Perceived in Acceptance of Agribusiness by Postgraduate Students of SAUs of Gujarat
B. G. Gadhvi 1 and Meena C. Patel 2
1 PG Scholar, B.A. College of Agriculture, AAU, Anand2 Assistant Professor, Institute of Distance Education, AAU, Anand
Email : [email protected]
ABSTRACT
As a result of remarkable scope of agribusiness, agripreneurship has become an important ingredient of professionally qualified agricultural graduates and post graduates, Due to business anxiety, many postgraduate students are not in position to take advantages of agribusiness for their self employment. The important dimensions for agro-enterprise promotion are the technological backstopping, required support system, marketing, finance, credit systems, quality control etc. Lack of self confidence and knowledge regarding these aspects make graduates less conscious towards agribusiness. Hence present research work was conducted to study the existing agribusiness anxiety level of agricultural postgraduate students of SAUs of Gujarat state with the help of reliable and systematically developed scale and constraints perceived by them in acceptance of agribusiness. It was observed that fifty five per cent of the agricultural postgraduates had medium level of agribusiness anxiety, Major constraints perceived by agricultural postgraduates were; bank loan procedure is extensive, lack of consciousness to have agribusiness, inadequate technical knowledge regarding agribusiness, the dominant logic that only experienced person can run the agribusiness and lack of support from the family
Key words: Agribusiness anxiety , constraints
INTRODUCTION
Agribusiness includes not only those who farm the landbutalsothepeopleandfirmsthatprovideinputs,processthe outputs, manufacture the food products and transport and sell the food products to consumers. Sharma and Tiwari (2011) expressed that in the present era of shrinking land holding and increasing unemployment of youth, agri-business and micro enterprise promotion has evolved as an answer the employment crisis facing the world. As a result, the emphasis on job creation has shifted to the informal sector. Generation of self employment opportunities, especially for the rural youths, is a must for ensuring true development of the rural masses. As a result of remarkable scope of agribusiness, agripreneurship has become an important ingredient of professionally qualified agricultural graduates and postgraduates, at the same time it is also seen that due to some fear andlackofconfidence,consciousnessandawarenessmanyqualifiedagriculturalstudents retard tocraftprolificusagesof agricultural resources to create self employment. Such behavior in a broad sense is known as agribusiness anxiety or nervousness. During the past two decades, the agribusiness
sector has undergone overwhelming changes that have affected every phase of industry. Some of these changes are: the liberalization of global market, changing technological and regular settings, international competition, organized marketing, modern processing and pickier consumer. Agricultural production also is changing from family based, small scaleand relatively independentfirms to largerfirmsthat are more tightly designed across the production and distribution value chain. In addition to this, there has been a marked change in make-up of inputs used in agriculture, concentration and vertical integration and effective utilization of new production processing, distribution and information technologies. Agriculture has evolved into agribusiness and has become a vast and complex system that reaches far beyond the farm gate to include those who are involved in bringing food and fiber to consumers. Of all kinds of resources;physical, natural and economic resources are important for facilitating development of any nation but the most important are the human resources. Human resources are the most significantofalltheresourcestoconvertallotherresourcesintoproductionandeconomicentities.Capable,efficientandmotivated human resources can bring about the tremendous

Gujarat Journal of Extension Education Vol. 24 : (December 2013)
129
positive change towards progress (Singh, 2011).The higher educational programme in a variety of disciplines has been running under different universities. Till date most of the educated graduates are seeking services in their related field. In this context agribusiness is evolving to address the needs of youth, thereby providing avenues for revitalizing agriculture. To identify genuine level of agribusiness anxiety of post graduates, it was important to know their feelings and concern towards this self employment oriented, and agricultural growth oriented agribusiness system. Therefore this research work aims to identify level of agribusiness anxiety among postgraduates of SAUs of Gujarat State and the constraints perceived by them in acceptance of agribusiness..
METHODOLOGY
The present study was carried out on proportional random sample of total 120 postgraduate students studying eitherinthefinalyearofMastersorinanyyearofPhDinAgriculture faculty of State Agricultural Universities of Gujarat. The data were collected through interview schedule contacting postgraduates personally and analyzed with the help of statistical tools mean, frequency and standard deviation. Ex-Post-Facto research design was applied for the study. The level of agribusiness anxiety of postgraduate students of SAUs of Gujarat was measured with the help of reliable and valid scale by developed Patel (2008). Tofindoutthe priority of each constraint frequencies of the respondents under three categories of response viz; most important, important and least important were calculated and ranked accordingly, on the basis of mean value.
RESULTS AND DISCUSSION
Level of Agribusiness Anxiety of Postgraduate Students
Table 1: Distribution of postgraduates according to their level of agribusiness anxiety n = 120
Sr. No.
Categories Frequency Per cent
1 Low (Up to 60.09 score) 22 18.332 Medium
(60.08 to 73.97 score)66 55.00
3 High (Above 73.97 score) 32 26.67
AfleetinglookintoTable–1showsthatslightlymorethan half (55.00 per cent) of the agricultural postgraduates had medium level of agribusiness anxiety, while 26.67 and 18.33 per cent of the agricultural postgraduates had high and low level of agribusiness anxiety, respectively. The probable reason for this might be that agribusiness is emerging entrepreneurial customs among youths. It is affected by many personalities of the postgraduate students and their perceived constraints. Further it is fact and widely regarded that India is rural agricultural based economic developing country, but there is lacuna of agribusiness experience and exposure among Indian youth. Also busy research based schedule in higher agricultural studies make postgraduates less conscious and decisive to have positivism towards agribusiness. Patel and Chauhan (2009) concluded that 40.00 per cent of the respondents had low level of business anxiety, followed by 32.50 and 27.50 per cent of the respondents who had medium and high level of business anxiety, respectively.
Fig: 1 Level of agribusiness anxiety of Post graduate students of SAUs of Gujarat

Gujarat Journal of Extension Education Vol. 24 : (December 2013)
130
Table 2 : Constraints perceived by postgraduates in acceptance of agribusiness.
Sr. No.
Constraints perceived by postgraduates
Mean score
Rank
1 Bank loan procedure is extensive. 1.66 I2 Lack of consciousness to have
agribusiness.1.65 II
3 Inadequate technical knowledge regarding agribusiness.
1.56 III
4 The dominant logic that only experienced person can run the agribusiness.
1.49 IV
5 Lack of support from family. 1.39 V6 Huge risk involved in establishment
of Agribusiness.1.34 VI
7 Lack of confidence to succeed inagribusiness.
1.34 VII
8 Lack of decisiveness to start agribusiness.
1.20 VIII
9 Lack of positive mindset regarding agribusiness.
0.98 IX
10 Lack of awareness regarding various key agricultural business supporting services.
0.92 X
11 Not having any specific trainingregarding agribusiness.
0.90 XI
12 Difficulttogetexpectednumberofconsumers.
0.90 XII
From the Table 2 it can be seen that major constraints faced by agricultural postgraduates were; bank loan procedure is extensive (rank I), lack of consciousness to have agribusiness (rank II), inadequate technical knowledge regarding agribusiness (rank III), the dominant logic that only experienced person can run the agribusiness (rank IV ) and lack of support from the family (rank V ), Constraints like huge risk involved in establishment of agribusiness (rank VI)andlackofconfidencetosucceedinagribusiness(rankVII ), lack of decisiveness to start agribusiness (rank VIII), lack of positive mindset regarding agribusiness (rank IX), lack of awareness regarding various key agricultural business supportingservices(rankX)nothavinganyspecifictrainingregardingagribusiness(rankXI)anddifficulttogetexpectednumber of consumers (rank XII).Similarly Karjagi et al.
(2009) also reported that major constraints faced by students of agriclinics and agribusiness centers in starting their agri ventures were the high rate of interest, lack of hand holding support from training institutes, banker’s resistance to finance,NABARDandothercommercialbankswillnotgivecorrect pictures about rate of interest, subsidy and collateral security.
IMPLICATION
The study facilitates in knowing anxiety of postgraduate research scholars towards agribusiness. The level of anxiety of postgraduate research scholars towards agribusiness could be brought through change in their psychology. It is, therefore, recommended that more efforts should be made by the government, universities and other organizations so as to enable the research scholars to change their psychology in positive direction. Consciousness towards agribusiness, training, personal visits, effective communication through mass media, awareness regarding support based services and demonstrations should be made to overcome the major constraints related in acceptance of agribusiness by government or universities.
REFERENCES
Patel, Meena. C. (2008). Construction of scale to measure level of agribusiness anxiety, recommended in 4th joint Agresco, AAU, Anand.
Patel,Meena.C.andChauhan,N.B.(2009).“Entrepreneurialattitude of youth”. Agric. Sci. Digest, 29(3) : 212-214.
Sharma,M.C.andTiwari,R.(2011).Atextbookof“Agro-enterprises for Rural Development and Livelihood Security”. New India Publishing Agency, New Delhi, Chapter-19, pp: 223.
Karjagi, R. Khan, H.S.S. Vijaykumar, H. S. and Kunnal L. B. (2009).”Problems of trained Agripreneurs under the scheme of agriclinics and agribusiness centres in starting and running their agriventures” Karnataka J.Agic.Sci., 22 (1): 223-234.
Singh, S. D. (2011).A text book of “Agro-enterprises forRural Development and Livelihood Security”. New India Publishing Agency, New Delhi, Ch-12, pp: 137.
Received : September 2013 ; March : November 2013
Gujarat Journal of Extension Education Vol. 24 : (December 2013)
131
Development of Scale to Measure Attitude of the Farmers towards Agro-Processing
Priyanka M. Parmar1 and Meena C. Patel
1 Ex. PG Scholar Extn. Edu., B.A. College of Agriculture, AAU, Anand2 Assistant professor, Institute of Distance Education, AAU. Anand
ABSTRACT
The study was conducted to develop and standardize the reliable and valid scale, to measure attitude of farmer’s towards agro processing. ‘Scale product method’ which combines Thurston and Likert techniques was used, 25 statements were selected for judgment; a panel of 40 judges was requested to assign the score for each statement in five continuums. Based on the scale (median) and Q values, 16 statements were finally selected to constitute the scale to measure attitude of farmer’s towards agro processing. Reliability of the scale was found 0.83.
Keywords: Attitude, Agro processing
INTRODUCTION
Agro processing in India derives its strength from its high potential for entrepreneurship develop-ment at low capital cost, the high supply elasticity of local resources, the tremendous scope for forward and backward linkages and the potential to meet the growing domestic and export demand for the finished products.The capital-labour ratio is also remarkable low in agro processing industry as compared to non–agro industry. Agro-processed products derive its demand both in do-mestic markets as well as in international markets. It has been proved that the per capita consumption of processed products has been rising fast in India even in traditional form. The new class of products associated with income and life style of the people are the need of the time. To convince and motivate farmers to accomplish agro pro-cessing as an endeavor, positivism towards agro process-ing in terms of their skill, knowledge and attitude is very much essential. To understand real gap among all these motivational factors like skill, knowledge and attitude systematically well developed scale or tests are needed. Keeping in view the above facts, present study entitled “Development of scale to measure attitude of the farmers towards agro-processing”was undertakenwith specificobjective ‘to develop and standardize a scale to measure attitude of the farmers towards agro-processing”.
METHODOLOGY
In the present study attitude is conceptualized as positive or negative feelings towards agro-processing. Scale product method’ which combines the Thrustone’s technique of equal appearing interval scale( 1928 ), for selection of items and Likert’s technique of summated rating ( 1932 ) and for ascertaining the response on the scale as proposed by Eysenck and Crown (1949 ) was selected to develop the scale.
In initial stage of developing the scale, 37 numbers of statements about reflecting feelings of the farmers to-wards agro-processing were collected. The collected state-ments were edited according to the criteria laid down by Edward (1957). From the 37 statements, 25 statements were selectedforjudgment.Inordertojudgethedegreeof“Un-favorableness”to“Favorableness”ofeachstatementonthefivepointequalappearingintervalcontinuumi.e.stronglyagree, agree, undecided, disagree, strongly disagree, a panel of 50 judges was selected.
Determination of scale values
Based on judgment, the median value of the dis-tribution and the Q value for the statement concerned were calculated with the help of

Gujarat Journal of Extension Education Vol. 24 : (December 2013)
132
0.50-∑PbS = L +–––––––––– × i Pw
The inter-quartile range (Q = Q3 - Q1) for each statement was also worked out. Only those statements were selected whose median values were greater than Q value. When a few statements had the same scale values, the state-ments having lowest Q Values were selected (Thurstone, L.
L. 1946). Similarly as Patel and Chauhan (2012) reported the technique to develop and standardize the scale to measure attitude towards application of distance education in agricul-tureandalliedfield.
RESULTS AND DISCUSSION
Based on the scale and Q values out of 25 statements 16statementswerefinallyselectedtoconstituteattitudescale.
Table: -1 Final Statement to Measure Attitude of farmers towards Agro Processing
Sr. No.
Statement ResponseSA A UD DA SDA
1 Ithinkthatthehandlingofagro-processingunitisdifficult.
2 It is worthwhile to spend money on agro-processing. 3 The adoption of agro-processing is very risky for farming community.
4 In my opinion, agro- processing is not advisable in rural area.
5 I think that it is simple to implement agro processing techniques.
6 I believe only progressive farmer can go for agro-processing.
7 In my sense, the adoption of agro-processing helps in improving living standard of farmers.
8 I retard agro-processing, as it is an expensive technology.
9 Inmy estimation agro-processing is a profitable business, even though it needsmore investment.
10 Iamnotconfidenttostartagroprocessingunit.11 In my opinion, establishment of agro-processing unit damages rural ecology.
12 Agro-processing helps in yielding higher returns. 13 I think that it is not easy to follow legal procedure for agro-processing unit.
14 Agro-processing unit is a best source of employment for irrespective level of educated rural youth.
15 Ithinkthatagro-processingoptimizesprofitsoverthelongterm.
16 I think establishing agro-processing is not within my reach.
SA = Strongly Agree; A = Agree; UD = Undecided; D = Disagree; SD = Strongly Disagree
Reliability of the scale
The split-half technique was used to measure the reliability of the scale. The 16 statements were divided into two equal halves with 8 odd numbered and 8 even numbered. These were administered to 25 farmers. Each of the two sets
was treated as separate scales having obtained two score, for eachofthe25farmers.Co-efficientofreliabilitybetweenthetwo sets of score was calculated by Rulon’s formula (Guil-ford 1954). This was found 0.83. Thus, the developed scale was found highly reliable.

Gujarat Journal of Extension Education Vol. 24 : (December 2013)
133
Validity of the scale
The validity of the scale was examined for content validity by determining how well content were selected by discussing it with specialists, of extension and statisticians. Thus, the presentscalesatisfiedthecontentvalidity.
Scoring technique
Againsteachof16statementstherewerefivecolumns,rep-resentingafivepointcontinuumofagreementordisagree-ment to the statements as followed by Likert (1932). The points on continuum were strongly agree, agree and disagree with weight of 5, 4, 3, 2 and 1, respectively for positive state-ments and reverse scoring for negative statement. To know level of attitude towards agro processing, Score of each state-ment will be summed up.
REFERENCES
Edward, A.L.1957.Techniques of attitude scale construction, Appleton Century Crofts, Inc., New York.
Eysenck, H.J. and S. Crown.1949. An Experimental study in opinion Attitude Methodology. International J. of Attitude Research. 3: 47-86.
Guilford, J. P. 1954. Psychometric Methods. Tata McGraw-Hill Publication Co. Ltd., Bombay: 378-382.
Likert, R.A.1932. A Technique for the measurement of At-titude Scales, Psychol, New York, No 140.
Patel, Meena.C. and Chauhan N.B (2012), Attitude towards Application of Distance Education in Agriculture and Allied Field – A Scale Development. Indian res. J. Ext. Edu.12(1):71-72
Thurston. L.L. and E.G. Chave1928. The measurement of opinion. J. of Abnormal social psychology., 22:415-430.
Thurstone, L. L. (1946). The measurement of attitude, American J. Soci., Chicago pp. 39-50.
Received : December 2012 ; Accepted : August 2013

Gujarat Journal of Extension Education Vol. 24 : (December 2013)
134
Market-Led-Extension activities of APMCs
S. D. Kavad 1 and R. D. Pandya 2
1 Subject Matter Specialist (Extension Education), KVK, NAU, Waghai, Dang2 Professor & Head, Department of Extension Education, NMCA, NAU, Navsari
ABSTRACT
Agriculture is nobler and better profession in the world as its outputs are used for food, fibre and shelter which are basic necessities of life and for human survival. Inspite of all these nobilities, most of the farmers of India are not getting the remunerative price for their produces and, therefore, farmers remain scares regarding better living of their family. One of the best ways of increasing the agricultural productivity, profitability and sus-tainability of small farm holdings is an assured and remunerative marketing. Market led Extension is the market ward orientation of agriculture through extension includes agriculture & economics is the perfect blend for reach-ing at the door steps of farming community with the help of appropriate technology. The functions of the MLE is to provide market information, financing, facilitating functions like; Grading, Standardization, Processing, Storage of farm produce The APMCs have been established with a view to protect the interests of the farmers in general and small and marginal farmers, in particular. Hence, they can be considered as the prospective institutions for performing the roles relating to agricultural market-led-extension. As per the reforms in the APMC act, the APMC has to perform the market led extension activities to facilitate the farmers visiting the market. But with review of research on the facilities and services available at APMC it was found that only few facilities were available in the markets under study or it was not satisfactory. In the age of liberalization and globalization of markets, the agriculture has to be market driven, more cost effective, competitive, innovative and responsive to high tech with IT applications. There is need to build capacity of each of the beneficiary group in ‘Good Marketing Practices’ and providing information in simple and practically useful manner. Further, in several areas the farmers are to be fully familiarized with APMC through the activities of Market Led Extension. Awareness will enable the farmers to plan their production and sale more economically.
Keywords: Attitude, Agro processing
INTRODUCTION
Agriculture is nobler and better profession in the world as its outputs are used for food, fibre and shelterwhich are basic necessities of life and for human survival. Inspite of all these nobilities, most of the farmers of India are not getting the remunerative price for their produces and, therefore, farmers remain scares regarding better living of their family.
Thepricesareincreasingbutthebenefitdoesnotreach to farmers. For example, in 1951-52, about 90% of what the consumer paid for food reached to the farmers and in the mid 1980s, it was about 50% but now in 2011, only 35% or so reaches to the farmers and the remaining 65%
goes to the middlemen. (Ali, 2011).
One of the best ways of increasing the agricultural productivity, profitability and sustainability of small farmholdings is an assured and remunerative marketing.
The APMC Act was designed to ensure that the farmer brought his produce to the Mandi so that he can get greater choice.
Market-led Extension
Market led Extension is the market ward orientation of agriculture through extension includes agriculture & economics is the perfect blend for reaching at the door steps of farming community with the help of appropriate

Gujarat Journal of Extension Education Vol. 24 : (December 2013)
135
technology. (Kaleel, 2007)
Function of MLE for converting agriculture sector into profit oriented business
• Market intelligence/ information
• Financing
• Facilitating Functions
• Grading
• Standardization
• Processing
• Storage of farm produce
Information technology
Information technology should be able to provide answers to questions like what and how much to produce, when to produce, in what form to sell, at what price to sell, when to sell and where to sell. This kind of information to the farmers with ‘press a button’ on the computer on a continuous updated basis.
Essentials of Marketing Information
Accuracy, availability, applicability and analysis are the four “A’s” of market information. If MIS areto have any meaning for farmers the information they provide must be accurate and farmers must understand to which product, quality, etc. the prices refer. Further, even if prices are completely accurate, they are of much use if they are only available to farmers in time for them to use effectively. Thirdly, farmers need to be able to apply the accurate information made available to them. This requires knowledge of how to convert prices they receive from the MIS into a realistic price at their local market or farm gate. Finally, farmers need long-term data, which has been analyzed in such a way that they can make decisions about when to plant and harvest and what new crops to diversify into.
Market intelligence
The process of collecting, interpreting, and disseminating information relevant to marketing decisions is known as market intelligence.
No organization can sit still and expect things to be the same month after month, year after year. At some point, something will happen to change your assumptions. And almost every decision (especially a strategic decision) is based on certain assumptions. Over time, these assumptions fall apart and if
youfailtoadjustwithacontinuousflowofnewintelligence,thenyouwillbeforcedtoreactinawaythatmakesitdifficultto compete. Therefore, Market Intelligence can help test and validateyourassumptions.Competitiveintelligencealsofillsin gaps, covering areas that you failed to consider in your assumptions. And of course, competitive intelligence can yieldsomebasicbenefits.
Financing
In almost any production system there are inevitable lags between investing in the necessary raw materials (e.g. machinery, seeds, fertilizers, packaging, flavorings, stocksetc.) and receiving payment for the sale of produce. During theselagperiodssomeindividualorinstitutionmustfinancethe investment. The question of where the funding of the investment is to come from, at all points between production and consumption, is one that marketing must address.
Facilitating Functions
(a) Grading
It is important to have a grading system, which accurately describes products in a uniform and meaningful manner. Grades and standards contribute to operational andpricingefficiencybyprovidingbuyersandsellerswitha system of communicating price and product information. By definition, commodities are indistinguishable from oneanother. Prices vary among the grades depending upon the relative supply of and demand for each grade.
(b) Standardization
It is concerned with the establishment and maintenance of uniform measurements of produce quality and /or quantity. This function simplifies buying andselling as well as reducing marketing costs by enabling buyers to specify precisely what they want and suppliers to communicate what they are able and willing to supply with respect to both quantity and quality of product.
(c) Processing
Most agriculture produce is not in a form suitable fordirectdeliverytotheconsumerwhenitisfirstharvested.Rather it needs to be changed in some way before it can be used.
(d) Storage
Of course, processing is not the only way of adding value to a product. Storing products until such time as they are needed adds utility and therefore adds value. Similarly, transporting commodities to purchasing points convenient to

Gujarat Journal of Extension Education Vol. 24 : (December 2013)
136
the consumer adds value. In short, any action, which increases the utility of the good or service to prospective buyers, also adds value to that product or service.
Agricultural Produce Marketing Committee (APMC) consisting of the representatives of growers, traders, merchants, local bodies and government nominees as administers at each market. The APMCs have been established with a view to protect the interests of the farmers in general and small and marginal farmers, in particular. Hence, they can be considered as the prospective institutions for performing the roles relating to agricultural market-led-extension.
Market-Led-Extension activities of APMC
As per the reforms in the APMC act, the APMC has to perform the market led extension activities as under in order to facilitate the farmers visiting the market.
• Advice on production planning: Careful selection of the crop from marketability viewpoint-internal or for export
• Marketing information: Price and arrivals, forecasting of market trends, demand of other markets, facilities available in the target markets, quality requirements, market fees etc.
• Securing markets for the farmers: Awareness about regulated market laws and reforms, Information regarding procurement by Govt. agencies, contract farming arrangement for cash crops with wholesalers, processors etc.
• Advice on improved marketing practices: Packaging, appropriate storing methods, standardization and grading and other post harvest management practices such as maintenance of quality, awareness about post-harvest losses etc.
• Advice on establishing and operating markets: Farmers groups to set up and run their own markets within framework of rules
• Processing and value addition: Farmers to be educated about value addition through primary processing
• Group action: Promotion of informal groups and Self Help Groups(SHGs)
• Marketing Credit: Educating farmers about different schemes of marketing credits, Advice on warehousing withpledgefinancescheme
• Marketing extension for export market: WTO implications, Codex, Euro gap standards, Awareness on ill effects of pesticide/insecticides residue etc
Review of Facilities and Services of APMCs
The review of work done on the facilities and services of APMCs in the different part of the country is as under:
Table 1 : Infrastructure Needed in an Ideal Market
Core Facilities Support Infrastructure
Platforms for Automatic weighing
Water Supply
Auction Platforms Power Packaging & Labeling Equipments
Veterinary Services
Drying Yards Sanitary Facilities
Loading, Unloading & Dispatch Facilities
Posts & Telephones
Grading Facilities Banking
Standardization Facilities Input supply and Daily Necessity Outlets
Price Display Mechanism POL
Information Centres Repair/Maintenance Service
Storage/Cold Rooms Office
Ripening Chambers Computerized Systems
Public Address System RainProofing
Extension and Training to Farmers
Service Infrastructure Maintenance Infrastructure
Rest Rooms Cleaning and Sanitation
Parking Garbage Collection & Disposal
Sheds for Animals Waste Utilization
Market Education Vermi-Composting
Soil Testing Facilities Bio-gas Production/Power
Drainage
Chauhan (2007) reported that the infrastructure needed in an ideal market for effective and efficientworking of any market is core facilities, service, support and maintenance infrastructure (table 1).

Gujarat Journal of Extension Education Vol. 24 : (December 2013)
137
Table 2 : Farmer’s response regarding different facilities available in the selected markets for the marketing of paddy, wheat and cotton in Punjab, 1998-99. (per cent) n=60
Sr. No.
Facilities Adequate Partially ad-equate
Not adequate
1 Knowledge about the rate of incidental charges 18.89 10.00 71.112 Space for unloading 47.78 16.67 35.553 Labour availability 87.78 10.00 2.224 Parking space at the time of unloading 50.00 15.56 34.445 Parking space after unloading 45.56 11.11 43.336 Overnight parking 10.00 6.67 83.337 Proper sheds 6.67 20.00 73.338 Electricity 41.11 37.78 21.119 Drinking water 24.45 36.66 38.8910 Arrangement for food & tea 5.55 7.78 86.6711 Sitting arrangement 4.45 11.11 84.44
Sukhsanjam et al. (2000) studied the farmer’s response regarding different facilities available in the selected markets (table 2), they found that labour availability and parking space at the time of unloading were adequate, while other facilities were not adequate up to the mark.
Table 3 : Status of Essential, Market and Non-market Services n=60
APMC Market services (24) Non-market services (22) Essential services (14) OverallPres-ent
Ab-sent
% pres-ent
Present Ab-sent
% pres-ent
Pres-ent
Ab-sent
% pres-ent
% of total fa-cilities present
Azadpur 9 15 37.50 8 14 36.36 9 5 64.29 43.33Nashik 7 17 29.17 5 17 22.73 7 7 50.00 31.67Kolar 5 19 20.83 4 18 18.18 7 7 50.00 26.67Hassan 5 19 20.83 5 17 22.73 6 8 42.86 26.67Belgaum 9 15 37.50 6 16 27.27 8 6 57.14 38.33Average 29.17 25.45 52.86 33.33
Yadav and Randhawa (2008) studied the status of essential, market and non-market services (table 3) and they found that very few(33%)facilitieswerepresentinthefivemarketstheyhavestudied.
Table 4 : Farmers’ Perception on Facilities availability in Farmers Market n=60
Sl. No.
Facilities Nil /not usable Poor Average Good
1 Stall size 0 6 26 282 Store room 0 12 24 243 Standardisation 8 8 14 304 Cold storage 60 0 0 05 Transport 10 4 16 306 Garbage disposal 12 4 10 347 Pricenotification 0 2 30 288 Weighing devices 2 0 10 489 Parking place 1 28 15 1610 Canteen 42 9 8 111 Drinking water 10 9 19 2212 Rest room 11 27 22 013 Toilet 60 0 0 0

Gujarat Journal of Extension Education Vol. 24 : (December 2013)
138
Rajendran and Thamilmani (2009) studied the farmers perception on facilities availability in farmers markets, they found that only weighing devices, garbage disposal, transport
and standardization in somewhat good availability, while others were average to not usable (table 4).
Table 5 : Status of Services provided in APMCs
Services provided to farmers
No. of APMCs Providing the Respective Service / Facility (figures in nos.) (N=61)
MH AP TN RJ GJ PB HP KAR Total a) Grading nil nil 4 1 1 1 3 2 12 b) Sorting nil nil nil 1 1 1 3 2 8 c)QualityCertification nil nil 5 nil nil 5 nil nil 10 d) Standardization nil nil nil nil nil nil nil nil nil e) Information brochure nil 8 3 nil nil 2 nil nil 13 f) Market rates of com-modity on notice board of market
8 8 8 8 8 8 5 8 61
Total 8 16 20 10 10 17 11 12 It was fond in a study on status of services provided in APMCs (table 5) that only market rate on notice board is found in all the markets while other services found in very few markets (Anonymous, 2010).
CONCLUSION
Agricultural Marketing in the country is witnessing major changes owing to liberalization and globalization of markets. The agriculture has to be market driven, more cost effective, competitive, innovative and responsive to high tech with IT applications. There is need to build capacity of each of the beneficiary group in ‘Good Marketing Practices’ andproviding information in simple and practically useful manner. Further, in several areas the farmers are to be fully familiarized with APMC through the activities of Market Led Extension. Awareness will enable the farmers to plan their production and sale more economically.
REFERENCES
Ali, Nawab (2011). Indian Farming. 61(7): 28-31.
Anonymous (2010). Summary Report of Study on Impact Assessment of Agricultural Marketing Reforms in Various States, pp., 1-35, NCSAMB, Delhi.
Chauhan, U.K.S. (2007). http://www.docstoc.com/docs/10234022/Government-Ini t ia t ives- in-Revamping-the-Regulated-Markets
Kaleel, F.M.H. (2007). Market-Led Extension Dimensions and Tools. Agrotech Publishing Academy, Udaipur-313 002. Pp., 42-43.
Rajendran, R. and Thamilmani, R. (2009). Ind. Jour. Agril. Mktg., Conf. Spl., 23(1): 28-39.
Sukhsanjam, Chahal, S.S. and Toor, M.S. (2000). Ind. Jour. Agril. Mktg., Conf. Spl., 14(3): 18-24.
Yadav, J.S. and Randhawa, S.S. (2008). http://www.cosamb.org/downloads/Dr.J.S.Yadav%20&%20S.S.Randhawa.ppt
Received : April 2013 ; Accepted : November 2013

Gujarat Journal of Extension Education Vol. 24 : (December 2013)
139
SOCIETY OF EXTENSION EDUCATION, ANANDANAND
Profit & Loss A/c1-Apr-2012 to 31-Mar-2013
P a r t i c u l a r s 1-Apr-2012 to 31-Mar-2013 P a r t i c u l a r s 1-Apr-2012 to 31-Mar-2013
Indirect Expenses 1,54,730.00Accounting Fee Exp 1,000.00Audit Fee 2,000.00OTHER EXP. 280.00
3,802.00PRINTING EXP. 48,308.00SEMINAR EXP. 97,292.00STATIONERY EXP. 2,048.00
Nett Profit 8,046.00
T o t a l 1,62,776.00
Indirect Incomes 1,62,776.00Abstract Printing Income 51,000.00
64,000.00BANK INTEREST 4,176.00
43,600.00
T o t a l 1,62,776.00
SOCIETY OF EXTENSION EDUCATION, ANANDANAND
Balance Sheet1-Apr-2012 to 31-Mar-2013
L i a b i l i t i e s as at 31-Mar-2013
Capital Account 2,01,865.00TRUST FUND 2,01,865.00
Loans (Liability)
Current Liabilities 3,18,987.00Sundry Creditors 58,850.00
2,50,137.00RESERVE FUND 10,000.00
Profit & Loss A/c 67,922.36Opening Balance 59,876.36Current Period 8,046.00
T o t a l 5,88,774.36
A s s e t s as at 31-Mar-2013
Investments 3,90,913.003,90,913.00
Current Assets 1,97,861.36Cash-in-hand 1,02,552.36Bank Accounts 95,309.00
T o t a l 5,88,774.36
N. V. DeshpandyChartered Accountant
Anand

Gujarat Journal of Extension Education Vol. 24 : (December 2013)
140
Preamble
“Only who produces grains & food from soil has right to walk with upright head and confidence on this land”
- Sardar Patel- Iron Man of India
Indian Agricultural dominated by the small scale farming offers limited scope for horizontal expansion; therefore, productivity enhancement from the limited land is the only option to increase income level and eventually sustainable rural livelihood.RuralDevelopmentisthemostimportantmeanstopovertyalleviation,fiscalgrowth,safeandsecuredfoodandenvironment. Holistic Development of farmers is possible through the integration of various enterprises considering location specificneedanddemand.Successofagriculturedevelopmentprogramdependsonhoweffectivelythelatestagriculturetechnologiesreaches thefarmer’sfield toachievethedesiredresultcommunicationmethodsneedtobestrengthenedandtheproper avenuesare tobe identified through ICT.Development andempowermentof ruralpeopleare imperative forsustainable growth of agriculture. Today unprecedented technology explosion, production demand, societal expectation and other factors made the production system more competitive and complicated. The whole system is going through a transition and coping up with the increasing pressure of industrialization, global market, change of environment and demand of quality food. Keeping these issues in view, the National Seminar on Dimensions of Extension Education in Holistic Development of Farmers is designed to provide a right forum for scientists, development agents, policy makers, administrators, NGOs and farmers to share their experience and expertise to support holistic sustainable development in agriculture.
Thematic Areas
(1) Extension system : Status, policies, linkages, coordination, market led extension, contract and corporate extension, microfinancingextension,extensionintribalareaetc.
(2) Convergence of agricultural programs for rural transformation : Public Private Partnership (PPP), NGOs, farmers organizations, SHGs, rural institutions, Govt. Programs for agriculture etc.
(3) Role of ICT for enhancing agriculture : Need, Resource-matched and area based information, IT based initiatives, role of print media, mass media and ICT in information delivery system, role of information in climate change etc.
(4) Technology practices in sustainable agriculture : Role of ITKs, value addition, marketing etc.(5) Human resources management : Capacity building, training role in agri-business management, empowerment,
entrepreneurship development, gender issues, success stories etc.(6) Social and economic dimension in rural livelihood development : Woman empowerment, Gender role, role of rural
youths, food security issues etc.: Contact :
Dr. N.V. Soni Organizing Secretary &
Associate Extension EducationistOfficeofDirectorateofExtensionEducation
University Bhavan, Anand Agricultural University, Anand – 388 110Ph.:02692-261921,225984Mob:09427856045•E-mail:[email protected]
Note : Seminar update & other details Visit SEEG website : www.gjoee.org
National Seminar Jointly Organized by Society of Extension Education Gujarat & Anand Agricultural University
on April 5, 2014
“Dimensions of Extension Education in Holistic Development of Farmers”
ANNOUNCEMENT