Gujarat Gas Ltd
34
Please refer to the disclaimer towards the end of the document. Institutional Equities Initiating Coverage Reuters: GGASau.NS; Bloomberg: GUJGA IN Gujarat Gas Ltd Growing CGD leader looks rich on valuation We initiate coverage on Indian CGD giant GGL Ltd (GGL) with Accumulate rating using our DCF based target price (TP) of Rs710 (implies 6.8% upside from CMP). GGL, the 54.17% CGD subsidiary of Gujarat state PSU gas transporter GSPL, dominates India’s CGD space with gas volume of 9.4mmscmd and assets worth Rs84.8bn. The company is licensed by gas regulator PNGRB to operate in 27 areas (GAs), including 17 areas in Gujarat and 7 new areas it has won in the 9 th /10 th CGD bidding rounds held by PNGRB. GGL’s CGD business is dominated by PNG, ~86.1% of its volume, and the rest is CNG. As a result, the company’s financials are driven by the volume growth in PNG – particularly the industrial segment that faces competition from fossil fuel substitutes. Key catalysts: (i) FY21-23E revenue CAGR at 28.8%, EBITDA CAGR at 10.9% and EPS CAGR at 13.6%, supported by 16.5% FY21-23E CAGR in gas volume (ii) Growth capex of Rs7-7.5bn/year ~ 60% on new CGD networks in 7 new GAs (iii) sustained FCFF of ~Rs8.7-10.1bn, and ROIC of ~22.5%/23.7% in FY22E/23E and (iv) policy advocacy/other enablers for CGD. Concerns: (a) Potential increase in gas cost that implies pressure on PNG under soft oil prices (b) risk to scale in new GAs and (c) rich valuation of FY23E P/E of 26.8x/P/BV of 6.3x post the 90.2% rally ~ average RoE of 22.2% over the next 4 years vs sustainable RoE of 32% implied at above P/BV. We suggest entry below Rs615. Healthy outlook for PNG/CNG based on secular growth, infra build-up and new GAs: We expect GGL to see volume grow from 9.39mmscmd in FY21 to 17.93mmscmd/29.83mmscmd by FY25E/FY30E, implying CAGR of 17.6%/13.7% over FY21-25E/FY21-FY30E. This is driven by (i) growth from the Morbi ceramic tiles cluster – based on potential increase in production by existing tile units and addition of new units in the area. Morbi hosts the world’s second largest ceramic tiles cluster with a capacity of 4mn sq mtrs/day spread across 950+ tile factories, which export at least 27% of their output to Asia, Europe, Africa and North America. Also, GGL sells 5mmscmd out of its PNG sales volume of 8.09mmscmd to industries in Morbi; 90% of which are in the Morbi ceramic tiles cluster. (ii) growth in CNG based on expansion in CNG stations from 546 nos. to 700/900 nos. by FY23E and FY25E. CNG’s share in volume will rise from 13.9% in FY21 to 14.9%/14.8%by FY23E/FY25E (iii) CGD network expansion in the 7 GAs to add 1.15mmscmd/2.29mmscmd to volume by FY23E/FY25E. Earnings CAGR of 13.6% over FY21-23E: We estimate revenue CAGR of 28.8% over FY21-23E vs. 26.5% CAGR over FY17-20. This will likely be driven by (i) 20.9%/26.1% growth in PNG/CNG volumes vs. CAGR of 22.8%/7.4% over FY17-20 (ii) EBITDA margin of 16.5%/15.7% in FY22E/FY23 and (iii) Unit EBITDA of Rs4.98/scm/Rs5.07/scm vs. FY17-20 average of Rs4.13/scm. Robust FCFF and net cash balance sheet augur well for growth capex: We see FCFF at Rs8.72bn/ Rs10.1bn in FY22E/FY23E and net debt to decline from Rs6.13bn in FY21 to net cash of Rs8.4bn over FY21-FY23E after aggregate capex of Rs14bn. And, long-term FCFF should keep rising to Rs18.3bn/Rs45.4bn by FY25E/FY30E. This puts GGL in a sweet spot to use this cash for growth capex, including PNGRB’s proposed 11 th round of auctions of CGD licenses and inorganic growth through buyouts of CGD licenses. Healthy return ratios: We expect attractive return ratios - ROIC of 22.5%/23.7% and RoE of 23.6%/22.9% in FY22E/23E. This compares with average ROE of 28.5% over FY18-FY21. ROIC over FY24E-25E is estimated at 25.1%/26.8% Key risks: Slowdown in the Morbi cluster, open access impact, potential increase in gas input cost and slower growth in new GAs. NBIE Values your patronage- Vote for The Team in the Asia Money poll 2021. Click here ACCUMULATE Sector: Oil & Gas CMP: Rs665 Target Price: Rs710 Upside: 6.8% Ramesh Sankaranarayanan Research Analyst [email protected] +91-22-6273 8145 Key Data Current Shares O/S (mn) 688.4 Mkt Cap (Rsbn/US$bn) 421.7/5.6 52 Wk H / L (Rs) 705/281 Daily Vol. (3M NSE Avg.) 2,157,544 Shareholding (%) 4QFY21 3QFY21 2QFY21 Promoter* 60.89 60.89 60.89 Public# 39.11 39.11 39.11 Others - - - *includes GSPL stake of 54.17%;# includes FII/DII/PSUs One Year Indexed Stock Performance Price Performance (%) 1M 6M 1Yr GGL 3.9 57.3 90.2 Nifty Index 0.3 10.7 48.2 Source: Bloomberg Consensus FY22E FY23E EPS (Rs) 22.1 26.2 P/E 30.2 25.4 Y/E March (Rsmn) FY20 FY21 FY22E FY23E FY24E Gas Volume (mmscmd) 9.44 9.39 11.45 12.75 14.12 Revenues 1,03,003 98,543 1,31,799 1,63,497 1,79,696 EBITDA 16,343 20,878 21,710 25,699 29,657 Net Profit Adj 11,988 12,777 13,503 16,478 19,613 EPS (Rs) 17.41 18.56 19.61 23.94 28.49 EPS gr (%) 174.8 6.6 5.7 22.0 19.0 EBITDA Margin (%) 15.9 21.2 16.5 15.7 16.5 P/E 38.2 35.8 33.9 27.8 23.3 EV/EBITDA 28.4 22.2 21.4 18.1 15.6 P/BV 13.80 10.15 8.02 6.38 5.12 FCF yield % 2.1 2.3 1.9 2.2 3.2 Post-tax RoCE (%) 22.0 20.6 19.3 19.9 19.6 RoIC (%) 26.6 25.1 22.5 23.7 25.1 RoE (%) 43.4 32.6 23.6 22.9 21.9 Source: Company,Nirmal Bang Institutional Equities Research 60 80 100 120 140 160 180 200 220 Jul-20 Sep-20 Nov-20 Jan-21 Mar-21 May-21 Jul-21 GUJARAT GAS LTD Nifty 50 5 July 2021
-
Upload
khangminh22 -
Category
Documents
-
view
0 -
download
0
Transcript of Gujarat Gas Ltd

Please refer to the disclaimer towards the end of the document.
Institutional Equities
Initi
atin
g C
over
age
Reuters: GGASau.NS; Bloomberg: GUJGA IN
Gujarat Gas Ltd
Growing CGD leader looks rich on valuation We initiate coverage on Indian CGD giant GGL Ltd (GGL) with Accumulate rating using our DCF based target price (TP) of Rs710 (implies 6.8% upside from CMP). GGL, the 54.17% CGD subsidiary of Gujarat state PSU gas transporter GSPL, dominates India’s CGD space with gas volume of 9.4mmscmd and assets worth Rs84.8bn. The company is licensed by gas regulator PNGRB to operate in 27 areas (GAs), including 17 areas in Gujarat and 7 new areas it has won in the 9th/10th CGD bidding rounds held by PNGRB. GGL’s CGD business is dominated by PNG, ~86.1% of its volume, and the rest is CNG. As a result, the company’s financials are driven by the volume growth in PNG – particularly the industrial segment that faces competition from fossil fuel substitutes. Key catalysts: (i) FY21-23E revenue CAGR at 28.8%, EBITDA CAGR at 10.9% and EPS CAGR at 13.6%, supported by 16.5% FY21-23E CAGR in gas volume (ii) Growth capex of Rs7-7.5bn/year ~ 60% on new CGD networks in 7 new GAs (iii) sustained FCFF of ~Rs8.7-10.1bn, and ROIC of ~22.5%/23.7% in FY22E/23E and (iv) policy advocacy/other enablers for CGD. Concerns: (a) Potential increase in gas cost that implies pressure on PNG under soft oil prices (b) risk to scale in new GAs and (c) rich valuation of FY23E P/E of 26.8x/P/BV of 6.3x post the 90.2% rally ~ average RoE of 22.2% over the next 4 years vs sustainable RoE of 32% implied at above P/BV. We suggest entry below Rs615.
Healthy outlook for PNG/CNG based on secular growth, infra build-up and new GAs: We expect GGL to see volume grow from 9.39mmscmd in FY21 to 17.93mmscmd/29.83mmscmd by FY25E/FY30E, implying CAGR of 17.6%/13.7% over FY21-25E/FY21-FY30E. This is driven by (i) growth from the Morbi ceramic tiles cluster – based on potential increase in production by existing tile units and addition of new units in the area. Morbi hosts the world’s second largest ceramic tiles cluster with a capacity of 4mn sq mtrs/day spread across 950+ tile factories, which export at least 27% of their output to Asia, Europe, Africa and North America. Also, GGL sells 5mmscmd out of its PNG sales volume of 8.09mmscmd to industries in Morbi; 90% of which are in the Morbi ceramic tiles cluster. (ii) growth in CNG based on expansion in CNG stations from 546 nos. to 700/900 nos. by FY23E and FY25E. CNG’s share in volume will rise from 13.9% in FY21 to 14.9%/14.8%by FY23E/FY25E (iii) CGD network expansion in the 7 GAs to add 1.15mmscmd/2.29mmscmd to volume by FY23E/FY25E.
Earnings CAGR of 13.6% over FY21-23E: We estimate revenue CAGR of 28.8% over FY21-23E vs. 26.5% CAGR over FY17-20. This will likely be driven by (i) 20.9%/26.1% growth in PNG/CNG volumes vs. CAGR of 22.8%/7.4% over FY17-20 (ii) EBITDA margin of 16.5%/15.7% in FY22E/FY23 and (iii) Unit EBITDA of Rs4.98/scm/Rs5.07/scm vs. FY17-20 average of Rs4.13/scm.
Robust FCFF and net cash balance sheet augur well for growth capex: We see FCFF at Rs8.72bn/ Rs10.1bn in FY22E/FY23E and net debt to decline from Rs6.13bn in FY21 to net cash of Rs8.4bn over FY21-FY23E after aggregate capex of Rs14bn. And, long-term FCFF should keep rising to Rs18.3bn/Rs45.4bn by FY25E/FY30E. This puts GGL in a sweet spot to use this cash for growth capex, including PNGRB’s proposed 11th round of auctions of CGD licenses and inorganic growth through buyouts of CGD licenses.
Healthy return ratios: We expect attractive return ratios - ROIC of 22.5%/23.7% and RoE of 23.6%/22.9% in FY22E/23E. This compares with average ROE of 28.5% over FY18-FY21. ROIC over FY24E-25E is estimated at 25.1%/26.8%
Key risks: Slowdown in the Morbi cluster, open access impact, potential increase in gas input cost and slower growth in new GAs.
NBIE Values your patronage- Vote for The
Team in the Asia Money poll 2021. Click here
ACCUMULATE
Sector: Oil & Gas
CMP: Rs665
Target Price: Rs710
Upside: 6.8%
Ramesh Sankaranarayanan Research Analyst [email protected] +91-22-6273 8145
Key Data
Current Shares O/S (mn) 688.4
Mkt Cap (Rsbn/US$bn) 421.7/5.6
52 Wk H / L (Rs) 705/281
Daily Vol. (3M NSE Avg.) 2,157,544
Shareholding (%) 4QFY21 3QFY21 2QFY21
Promoter* 60.89 60.89 60.89
Public# 39.11 39.11 39.11
Others - - -
*includes GSPL stake of 54.17%;# includes FII/DII/PSUs
One Year Indexed Stock Performance
Price Performance (%)
1M 6M 1Yr
GGL 3.9 57.3 90.2
Nifty Index 0.3 10.7 48.2
Source: Bloomberg
Consensus FY22E FY23E
EPS (Rs) 22.1 26.2
P/E 30.2 25.4
Y/E March (Rsmn) FY20 FY21 FY22E FY23E FY24E
Gas Volume (mmscmd) 9.44 9.39 11.45 12.75 14.12
Revenues 1,03,003 98,543 1,31,799 1,63,497 1,79,696 EBITDA 16,343 20,878 21,710 25,699 29,657 Net Profit Adj 11,988 12,777 13,503 16,478 19,613 EPS (Rs) 17.41 18.56 19.61 23.94 28.49 EPS gr (%) 174.8 6.6 5.7 22.0 19.0 EBITDA Margin (%) 15.9 21.2 16.5 15.7 16.5 P/E 38.2 35.8 33.9 27.8 23.3 EV/EBITDA 28.4 22.2 21.4 18.1 15.6 P/BV 13.80 10.15 8.02 6.38 5.12 FCF yield % 2.1 2.3 1.9 2.2 3.2 Post-tax RoCE (%) 22.0 20.6 19.3 19.9 19.6 RoIC (%) 26.6 25.1 22.5 23.7 25.1 RoE (%) 43.4 32.6 23.6 22.9 21.9
Source: Company,Nirmal Bang Institutional Equities Research
60
80
100
120
140
160
180
200
220
Jul-20 Sep-20 Nov-20 Jan-21 Mar-21 May-21 Jul-21
GUJARAT GAS LTD Nifty 50
5 July 2021 28June2021

Institutional Equities
Gujarat Gas 2
Rating rationale
We initiate coverage on GGL with an Accumulate rating using our DCF-based TP of Rs710 (implies 6.8% upside from CMP).
CGD subsidiary of Gujarat state PSU gas transporter GSPL (holds 54.17% stake), GGL is India’s leader in CGD, operating in 27 geographical areas (GAs), including 17 areas in Gujarat. This also includes 7 new GAs, and covers 43 districts across 6 states - Gujarat, Maharashtra, Rajasthan, Madhya Pradesh, Punjab, Haryana and UT of Dadra & Nagar Haveli. As per PNGRB’s CGD licensing policy, GGL enjoys a CGD infrastructure monopoly in all its existing areas and will enjoy this in new GAs as well. Marketing exclusivity has ended in all its existing areas, except two, which expired by May 21, 2021. All existing GAs and new GAs will enjoy infrastructure exclusivity for 25 years from the date of authorization.
Once PNGRB notifies open access and fixed regulated tariff for network access in GGL’s existing GAs to third parties, GGL may see 10%/20% of existing and future PNG volumes shift to third parties starting FY24E/FY25E. Even after considering this impact in our earnings and DCF model, we remain positive on GGL’s future growth prospects.
Exhibit 1: GGL CGD infrastructure – existing and new GAs:
Existing GAs Existing plus New GAs
Nos. FY17 FY18 FY19 FY20 FY21 FY22E FY23E FY24E FY25E
CNG STATIONS No 252 291 344 396 546 600 700 800 900
PNG – Household 11,64,461 12,50,000 13,50,000 14,40,000 15,84,000 17,19,000 18,54,000 19,91,000 20,13,000
PNG -Commercial 12,341 13,440 12,300 12,600 13,356 13,906 14,456 15,006 15,556
PNG – Industrial 3,067 3,300 3,500 3,700 3,996 4,346 4,696 5,046 5,396
Total PNG customers 11,79,869 12,66,740 13,65,800 14,56,300 16,01,352 17,37,852 18,73,852 20,11,852 20,34,852
Pipeline Km 19,974 21,640 23,200 24,300 25,050 27,050 29,050 31,550 34,050
CNG Vol mmscmd 1.20 1.30 1.40 1.49 1.30 1.65 2.07 2.36 2.65
PNG Vol mmscmd 4.30 4.90 5.10 7.98 8.09 10.30 11.83 13.48 15.28
Total volume mmscmd 5.50 6.20 6.50 9.46 9.39 11.95 13.90 15.84 17.93
Source: Company,Nirmal Bang Institutional Equities Research Our Accumulate call is based on subdued risk-reward based on the following positives and concerns: Positives: GGL’s attractive fundamentals and the healthy gas industry outlook supported by policy/enablers Concerns: Potential risk to PNG margins - from fall in competing fuel prices and any increase in gas cost in future, risk to new GA scale up and rich valuations. Hence, we suggest entry below Rs615.
Exhibit 2: Past and future trend in earnings and return ratios
GGL financial performance parameter Historical avg
growth/returns % Forecast
growth/returns %
FY18-21 FY21-24E
Gas volume 14.8 19.0
Gross block 8.4 10.9
Revenue 16.9 22.2
EBIDTA 32.6 12.4
PAT 63.4 15.4
EPS ( adjust for split) 63.4 15.4
RoAE 32.5 22.8
Post tax ROCE 17.3 19.6
ROIC 20.8 23.8
Source: Company, Nirmal Bang Institutional Equities Research

Institutional Equities
Gujarat Gas 3
Positive catalysts for GGL
13.7% FY20-23E CAGR in gas volume, supported by 11.4%/10.6% CAGR in gross block over FY21-23E/FY20-23E supporting CGD infrastructure expansion.
FY20-23E revenue CAGR at 16.6%, EBITDA CAGR at 16.3% and EPS CAGR at 11.2%.
Capex of Rs7-7.5bn/year ~ 60% of this – Rs26.6bn for new CGD network in 17 cities across the 7 new GAs over the next 10 years.
Sustained FCFF, and ROIC in excess of 22.5%/23% over FY22E-23E vs FY20/21 range of 26.6%/25.1%. GGL’s ROIC will likely catch up with FY21 value by FY24E/25E, as per long term estimates.
India policy advocacy favoring gas/CGD business, improving availability of gas and other enablers, including transportation infrastructure, gas trading exchange, unified tariff and gas transportation system operator (TSO) to support equitable access to cross-country gas pipelines.
Experts expect the national gas grid and CGD expansion, supported by these enablers, to create a green CNG corridor straddling many GAs. This could enhance growth in CNG volumes beyond what we have experienced so far based on local network demand within a GA.
Risks/concerns:
Potential increase in input gas cost that implies pressure on PNG under soft oil prices, which could cap the price of substitutes in industrial/commercial PNG – a 1% increase in gas cost, which GGL is unable to pass due to pressure from competing fuels, implies 5.6-5.8% hit on EPS in FY22E/FY23E.
Risk of scale in new license GAs – the scalable volumes in CNG and PNG in the new areas where GGL is developing the new CGD network depends on the number of 3 and 4 wheelers that can be converted to CNG and the industrial/commercial units, which offer potential for switching from petroleum fuels or coal to gas for energy/feedstock. We estimate new GA volumes to be 7.9% of GGL volumes on average between FY22E and FY24E and 12.8% of GGL volumes from FY25E.
Rich valuation of FY23E P/E at 27.8x and P/BV at 6.4x post the 90.2% rally YoY. Please note that the average RoE of 22.4% over the next 4 years is less than the sustainable RoE of 32.5% implied at FY23E P/BV at CMP.
Exhibit 3: Open access impact on GGL’s unit EBITDA for existing GAs
EBITDA Rs/scm FY22E FY23E FY24E FY25E FY26E FY27E FY28E FY29E FY30E
EBITDA open access Not applicable Not applicable 3.4 3.2 2.8 2.3 2.3 2.1 1.8
EBITDA free volumes 5.1 5.3 5.5 5.8 6.1 6.4 6.6 6.9 7.2
Blended EBITDA 5.1 5.3 5.3 5.2 5.4 5.5 5.8 6.0 6.1
Source: Nirmal Bang Institutional Equities Research Exhibit 4: New GA Share in GGL gas volume %
FY22E FY23E FY24E FY25E FY26E FY27E FY28E FY29E FY30E
CNG share 4.3 13.9 18.3 21.6 21.9 22.3 22.6 22.9 23.2
PNG share 4.2 7.3 9.6 11.2 11.2 11.1 11.0 10.8 10.7
Total gas volume 4.2 8.2 10.8 12.8 12.7 12.6 12.6 12.5 12.4
Source: Nirmal Bang Institutional Equities Research GGL’s CGD business is dominated by PNG, which makes up 86.1% of its volumes, and the rest is CNG. As a result, the company’s financials are driven by volume growth in PNG, with the selling price benchmarked against fossil fuel alternatives. In the Morbi ceramic tiles industry cluster, the PNG price is comparable to propane/LPG - the only alternative permitted in that area.

Institutional Equities
Gujarat Gas 4
Exhibit 5: GGL’s CNG PNG mix and trend in volume
Source: Company, Nirmal Bang Institutional Equities Research Exhibit 6: Morbi impact on GGL gas volume
Source:Company,Nirmal Bang Institutional Equities Research
84.3%
15.7%
GGL PNG CNG MIX % FY20
PNG CNG
0.00
5.00
10.00
15.00
20.00
FY20 FY21 FY22 FY23 FY24 FY25 FY26
7.95 7.85 9.65 10.73 11.93 13.26 14.75
1.48 1.28 1.54
1.78 1.93
2.08 2.25
Trend in GGL PNG CNG mix mmscmd
PNG CNG
5.00 5.00 5.70 6.38 7.14 8.00 8.96
1.484 1.28
1.54 1.78
1.93 2.08
2.25
0
2
4
6
8
10
12
14
16
18
FY20 FY21 FY22 FY23 FY24 FY25 FY26
PNG- Morbi Indl PNG-other Industrial
PNG- homes PNG- commercial
CNG Sales volume
0%
20%
40%
60%
80%
100%
FY20 FY21 FY22 FY23 FY24 FY25 FY26
53% 55% 51% 51% 52% 52% 53%
24% 24% 28% 28% 28% 28% 27%
16% 14% 14% 14% 14% 14% 13% 7% 8% 7% 7% 7% 7% 7%
GGL Gas volume pie
Morbi other Industrial vol CNG Commercial/household

Institutional Equities
Gujarat Gas 5
GGL’s business model is driven by
A. Growth in existing areas based on:
1. Further growth potential in Morbi industrial/Ceramic cluster – based on increase in utilisation in existing
tile units and new capacities expected in tiles in Morbi
a. Ceramic tile units consume 90% of the gas sold in Morbi
b. The NGT order allows only gas and LPG for gasifiers in Morbi tile units
c. This implies growth based on additional production or new capacity
2. Higher penetration potential in PNG/CNG ~ currently estimated at less than 20%/30%
3. Capex on
a. Upgradation/renewal of existing CNG and PNG distribution network ~ may not give volume
upside commensurate with capex
b. Growth in infrastructure, including new CNG stations and pipelines ~ adds to volume
4. Growth in customer numbers in PNG ~ no of industrial customers, commercial entities and households
(domestic as per company release)
5. Growth in CNG vehicles through conversion of cars, autos, taxis, buses and new CNG models of cars;
and
B. Capex on expansion of PNG and CNG network in the 7 new GAs won by GGL in recent years
As we can see, the business is not asset light either in existing and new areas. The positive aspect is that pricing freedom and operating leverage along with volume growth support visibility and earnings/cash flows. This would enable GGL’s business to consistently deliver healthy ROIC and RoE over the next few years.
Exhibit 7: Volume Trend
MMSCMD FY17 FY18 FY19 FY20 FY21 FY22E FY23E FY24E FY25E FY26E
CNG 1.20 1.30 1.40 1.49 1.30 1.65 2.07 2.36 2.65 2.88
PNG 4.30 4.90 5.10 7.98 8.09 10.30 11.83 13.48 15.28 16.97
TOTAL VOLUME 5.50 6.20 6.50 9.46 9.39 11.95 13.90 15.84 17.93 19.85
Source:Company,Nirmal Bang Institutional Equities Research
Exhibit 8: Volume growth trend
Gr % FY17 FY18 FY19 FY20 FY21 FY22E FY23E FY24E FY25E FY26E
Gross block Rsmn 59,162 63,622 68,798 74,397 79,554 90,405 99,030 1,08,934 1,16,335 1,20,074
Vol gr % - CNG - 8.45 7.58 6.29 -12.55 26.83 25.41 14.13 12.32 8.43
Vol gr % - PNG - 13.95 4.08 56.34 1.41 27.30 14.88 14.32 13.00 11.09
GGL Volume gr % - 12.75 4.81 45.56 -0.79 27.24 16.33 14.29 12.90 10.69
Source:Company,Nirmal Bang Institutional Equities Research
Exhibit 9: Revenue, EBITDA and PAT growth trend
Financial growth % FY18 FY19 FY20 FY21 FY22 FY23E FY24E FY25E FY26E
Revenue 21.2 25.6 32.8 (4.3) 33.7 24.1 9.9 7.9 11.30
EBITDA 20.4 10.0 66.0 27.8 4.0 18.4 15.4 12.7 14.60
PAT 32.3 43.1 187.5 6.4 5.7 22.1 19.0 16.2 18.74
Source:Company,Nirmal Bang Institutional Equities Research

Institutional Equities
Gujarat Gas 6
Growth drivers for CGD business and GGL
Morbi growth
CGD monopoly in Morbi cluster offers further growth potential based on the prospects linked to the
ceramic tiles industry that has 90% share of GGL’s gas sales volume in Morbi.
Increase in capacity utilisation in existing units (~950 nos)
Expansion in existing units and new units based on growth outlook in domestic and export
volume
Morbi cluster represents 69% of GGL’s PNG volumes and 53% of overall volume
And industry/channel checks reveal that Morbi tiles cluster can sustain double digit growth in the coming years based on domestic and export potential (~35% of Morbi tile sales as per recent trends).
Exhibit 10: Morbi impact on industrial PNG volume FY20 Exhibit 11: Morbi impact on GGL gas volume FY20
Source: Company, Nirmal Bang Institutional Equities Research
Morbi ceramic cluster:
Morbi hosts the second largest ceramic tiles cluster in the world with capacity of 955mn Sq Mtrs (2.8mn Sq Mtrs/day) as of CY18/19, spread over 610-850 units, as per media/third party reports. The number of units is reported at 950 as on date, of which 880-890 are in operation. Capacity utilisation is reported at 80-85%.
The NGT order on March 6, 2019 forced the gasifiers in 450-500 ceramic units in Morbi to switch from coal to natural gas – impacted the units making wall and soluble salt tiles, which were still using coal. Other types of tiles had already switched from coal some years ago.
The Morbi ceramic tiles cluster accounts for
90% of GGL’s gas demand from Morbi (under steady state basis)
Prior to NGT’s ban, the gas consumption in Morbi was 2.5mmscmd or 22% of GGL’s overall
volume in FY19.
Post the ban, Morbi demand doubled to 5mmscmd in FY20 ~ 53% of GGL’s gas volume.
FY20 revenue of Rs450bn ~ US$6.5bn/ exports of Rs120bn ~ US$1.7bn from Morbi, as per the
local Morbi Ceramic Industry Association.
However, according to FY21 Indian industry data gathered by NB ceramic tiles research team:
Overall exports stood at ~Rs75bn and overall industry sales at ~Rs285bn (US$3.85bn)
If we assume 80% - 90% share, Morbi ceramic cluster’s FY21 sales were ~Rs228-256bn, of which
30-35% are exports.
Exports are growing at 7% and cater to 170 countries, 40% of exports are to the Gulf markets.
Saudi Arabia has levied anti-dumping duty on Indian tiles ~ overhang for exports growth.
69%
31%
Morbi impact on industrial PNG Vol FY20
Morbi vol other Indutrial vol
53%
24%
16%
7%
Morbi impact on GGL Gas Vol FY20
Morbi other Industrial vol CNG Commercial/household

Institutional Equities
Gujarat Gas 7
Global ceramic tiles industry capacity at 13.1mn Sq Mtrs
No. 1 China – 5.7bn Sq Mtrs has 40% of global capacity
No. 2. India – 1.15mn Sq Mtrs with 8.8% share
Many units were reported to have closed down or reduced operations due to shortage of
abrasive used in polishing vitrified tiles, as per media reports.
According to the company, the Morbi cluster suffered a 30% cut in volumes in May-June due to transport and shipping bottlenecks due to the second wave of the pandemic. The situation is expected to improve in July.
Policy advocacy support for CGD business
This is based on CNG/PNG offering a green alternative to reduce pollution from other fossil fuel substitutes
Infrastructure investments on gas imports (LNG terminals), gas transportation pipeline and domestic gas production to enhance availability of gas at a reasonable price to encourage fuel switching to gas
Gas industry reforms and other enablers to boost CGD business
The reforms initiated by the Indian government are likely to accelerate increase in the share of gas in
the Indian energy pie from the current level of 6-6.5% to government’s target of 15%
Unified tariff system for notified trunk gas transmission pipelines ~ to normalize transmission tariff across locations, irrespective of their proximity to landfall point of imported LNG/domestic gas. The PNRGB has to implement the system by notifying the unified tariff and operating guidelines as well as settlement & grievance redressal mechanism
Gas trading exchange ~ Indian Energy Exchange has set up the Indian gas exchange to promote buying and selling of gas through an exchange mechanism to achieve gas price discovery and encourage gas to gas competition
Gas grid management system under an nodal officer (TSO) to ensure smooth operation/ availability of gas grid for gas transportation and trading entities ~ the TSO and the management system are pending PNGRB/government action in this regard
Exhibit 12: India CGD demand CAGR
Last 3 yrs. Las 5 yrs Last 10yrs FY21E FY22E FY22E-25E
Growth rate % 12 14 15 13 30 12
Source: Crisil, Nirmal Bang Institutional Equities Research, note: FY21E and FY22E could get revised based on 4QFY21 and the impact of the new wave of COVID/lockdowns on 1Q/1HFY22E volumes
US$16.4bn industry capex on CGD infrastructure expansion to aid seamless CNG corridor
The CGD business is likely to lead future growth in India’s gas demand based on the massive nationwide investment in new CGD networks awarded to sponsors in the 9th and 10 rounds. This covers 132 GAs and entails an aggregate capex of Rs1.2trn (US$16.4bn) by various successful CGD entities who have won these licenses.
Industry experts are betting on the CGD network expansion to create a seamless green CNG corridor. This will likely boost CNG demand for long haul transportation based on CNG passenger vehicles and buses in the long run.
We see growth in inter-city long haul road transport getting a fillip once the CGD network expansion gathers critical mass in the 132 new GAs and access to CNG filling stations along state as well as national highways ceases to be a constraint.
The optics of this capex is also likely to have a rub-off on gas demand in GGL’s exiting GAs. Potential CNG and PNG users will be encouraged to switch to gas due to cost savings and convenience and in the institutional context, the advantage offered by gas as a clean fuel.
Rating agency CRISIL estimates CGD growth of 12% between FY22E and FY25E, based on the nationwide CGD network expansion.

Institutional Equities
Gujarat Gas 8
Preferential allocation of natural gas at low price for CNG and PNG as cooking fuel
CNG and household PNG gets preferential allocation of natural gas at government notified price (announced every six months based on 4 global gas price benchmarks)
GGL gets 22% of its gas volume from CNG and household PNG taken together, which is eligible for the above preferential allocation
The price for this gas – ‘APM gas’ – is fixed at US$1.79/mmbtu on GCV (Gross Calorific Value) basis. This is positive for 1HFY22 margins on this segment.
The caveat is that the price of APM gas and the ceiling for high temp/high pressure gas fields will likely see an increase of 50-60% in 2HFY22. This and the firm trend in imported gas (currently at US$10.5/mmbtu) pose the risk of an increase in gas cost for CGD players, including GGL.
Increased penetration in existing GAs outside Morbi
We expect increased penetration in existing industrial and commercial clusters in other GAs outside Morbi to support GGL’s PNG growth
New users getting added based on fuel switching and investments on new capacity is also likely to aid growth in PNG in other GAs
Conversion of petrol fleet, new CNG models and capex on new CNG stations
The higher margin CNG segment in its existing GAs will likely see growth from higher penetration in terms of increased personal mobility in 4 wheelers and aggregators.
This will encourage conversion of exiting petrol vehicles to CNG given the steep increase in retail prices in the last few months ~ conversion of 100 cars can add ~500-1000kg/day of incremental sales of CNG (assuming 5-10kg/day of filling per car)
This will also boost sales of CNG car models by OEMs, which will in turn aid CNG demand growth ~ every 100 CNG vehicles sold implies potential growth in CNG demand of 500-1000kg/day
The company is adding new CNG stations, which will increase access to CNG filling and encourage conversion and new CNG model sales, apart from increase in the use of personal transport. The latter will be driven by cost savings vs petrol and safety from crowded public transport, which poses the risk of Covid-19 and other infections, apart from the convenience factor
Assuming sales of ~1,000-2,000kg/CNG pump per day, every 10 CNG stations can add 10,000-20,000kg/day of CNG volume
Exhibit 13: Typical gas volume for new GA – indicative estimate
Segment Customers No. SCMD/user Demand
SCMD Demand
mmscmd
CNG CARS 10,000 4.2 42,000 0.042
HOMES 1,00,000 0.4 40,000 0.04
INDL 10 5,000 50,000 0.05
Commercial 100 150 15,000 0.015
Total for new GA 1,10,110 1.34 1,47,000 0.147
Source:Nirmal Bang Institutional Equities Research

Institutional Equities
Gujarat Gas 9
New GAs to bring in 10.6% of GGL’s EBITDA by FY25
GGL has a capex plan of Rs7bn - 8bn each year over the next few years. This includes 60% on the 7 new GAs, which we estimate at Rs26.6bn over FY22-FY30 to develop the CNG and PNG network in the 17 towns and cities spread over 7 districts.
This is likely to add to GGL’s CNG and PNG volumes as the local public and institutional customers switch to CNG and PNG based on the advantages discussed above.
GGL is planning to mitigate the risk of front-end loading capex and is waiting for scale-up in volumes and cashflows by adapting virtual pipeline to seed and develop CNG and PNG demand.
This will help the company see early visibility on volumes and EBITDA and achieve scale in volumes over 5-6 years. We see new GA CGD volumes at 2.3/3.7 mmscmd by FY25E-FY30E
New GA share in GGL volume by FY25:
CNG – 21.6%, PNG 11.2% (due to GGL’s mix being skewed towards PNG)
New GA CNG/PNG mix – 25%/75% ~ we believe CNG potential could be restricted based on
small size of these towns and the relatively smaller 3 and 4 wheeler fleet population that could
be targeted for conversion to CNG.
Discussion on volumes and margins in context:
FY20 growth boosted by Morbi cluster switching to gas under the NGT order
GGL’s business was bolstered in FY20 by ~45.6% growth in CGD volumes as a result of the 56.3% spurt in its PNG sales in Morbi/Wankaner area, driven by the March’2019 NGT order forcing the ceramic units in these clusters to switch from coal to PNG. The Morbi belt is the world’s second largest ceramic tiles cluster with close to 550-600 units.
This upswing in volumes supported 32.8%/66%/188% growth in overall Revenue/EBITDA/PAT in FY20, even as EBITDA/scm inched up by 14% to Rs4.73/scm.
The blended EBITDA for GGL will depend on the share of PNG in its volumes, the cost of gas purchased and the price of petroleum substitutes, which is driven by global oil prices
The ramp up in CNG stations from 546 to 700 is likely to support 26.1% annual growth in CNG over the next two years and 19.7% annual growth over the next 3-4 years
CNG’s share in the company’s volume mix will likely be 13.8%-14.9% over FY22E-23E vs. 13.9% in FY21. We expect blended unit EBITDA margins of Rs4.98/scm to Rs5.07/scm over FY22E-23E
However, the expansion in PNG volumes and the growth in the 7 new GAs won in 9/10 bidding rounds could see the PNG share still dominate the company’s volume mix at 85.2%/86.7% in FY25E/FY30E
This is likely to result in FY25E/FY30E unit EBITDA coming in at Rs5.1/scm/Rs6.1/scm
Exhibit 14: Trend in gas volume mix and EBITDA/scm - FY17 to FY23E
Source: Company, Nirmal Bang Institutional Equities Research
21.8 21.0 21.5 15.7 13.9 13.8 14.9
78.2 79.0 78.5 84.3 86.1 86.2 85.1
3.70
3.95 4.15
4.73 6.09 4.98 5.07
0.0 0.5 1.0 1.5 2.0 2.5 3.0 3.5 4.0 4.5 5.0 5.5 6.0 6.5
0%
20%
40%
60%
80%
100%
FY17 FY18 FY19 FY20 FY21 FY22E FY23E
CNG PNG EBITDA Rs/scm - RHS
Institutional Equities
Gujarat Gas 10
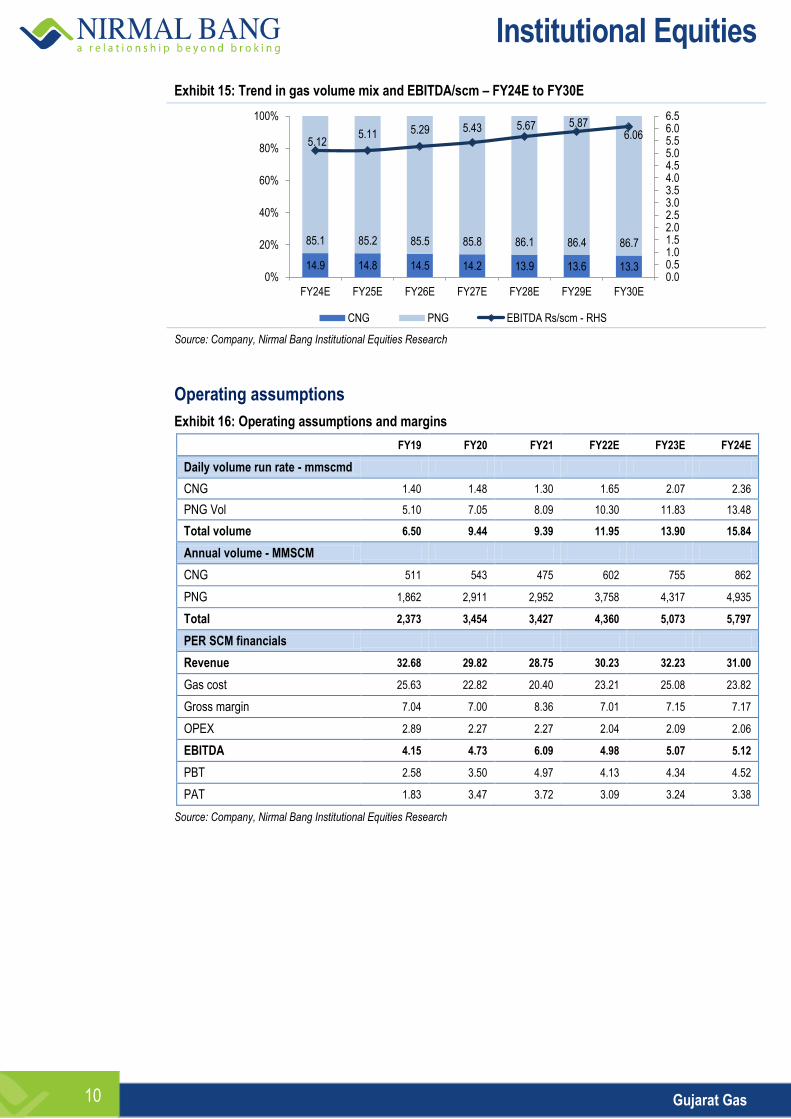
Exhibit 15: Trend in gas volume mix and EBITDA/scm – FY24E to FY30E
Source: Company, Nirmal Bang Institutional Equities Research
Operating assumptions
Exhibit 16: Operating assumptions and margins
FY19 FY20 FY21 FY22E FY23E FY24E
Daily volume run rate - mmscmd
CNG 1.40 1.48 1.30 1.65 2.07 2.36
PNG Vol 5.10 7.05 8.09 10.30 11.83 13.48
Total volume 6.50 9.44 9.39 11.95 13.90 15.84
Annual volume - MMSCM
CNG 511 543 475 602 755 862
PNG 1,862 2,911 2,952 3,758 4,317 4,935
Total 2,373 3,454 3,427 4,360 5,073 5,797
PER SCM financials
Revenue 32.68 29.82 28.75 30.23 32.23 31.00
Gas cost 25.63 22.82 20.40 23.21 25.08 23.82
Gross margin 7.04 7.00 8.36 7.01 7.15 7.17
OPEX 2.89 2.27 2.27 2.04 2.09 2.06
EBITDA 4.15 4.73 6.09 4.98 5.07 5.12
PBT 2.58 3.50 4.97 4.13 4.34 4.52
PAT 1.83 3.47 3.72 3.09 3.24 3.38
Source: Company, Nirmal Bang Institutional Equities Research
14.9 14.8 14.5 14.2 13.9 13.6 13.3
85.1 85.2 85.5 85.8 86.1 86.4 86.7
5.12 5.11 5.29 5.43 5.67 5.87
6.06
0.0 0.5 1.0 1.5 2.0 2.5 3.0 3.5 4.0 4.5 5.0 5.5 6.0 6.5
0%
20%
40%
60%
80%
100%
FY24E FY25E FY26E FY27E FY28E FY29E FY30E
CNG PNG EBITDA Rs/scm - RHS

Institutional Equities
Gujarat Gas 11
Exhibit 17: Key Financials and Margins
Rs mn FY19 FY20 FY21 FY22E FY23E FY24E
Revenue 77,544 1,03,003 98,543 1,31,799 1,63,497 1,79,696
Gross Margin 16,715 24,186 28,645 30,587 36,283 41,592
EBITDA 9,846 16,343 20,878 21,710 25,699 29,657
PAT 4,363 11,988 12,777 13,503 16,478 19,613
OCF 9,561 14,200 16,552 13,871 17,090 22,049
Capex 5,304 5,955 7,512 6,688 8,068 8,848
FCF 3,522 9,534 10,449 8,720 10,113 14,793
Margins/ Tax rate %
Gross margin 21.6 23.5 29.1 23.2 22.2 23.1
EBITDA Margin 12.7 15.9 21.2 16.5 15.7 16.5
PAT margin 5.6 11.6 12.9 10.2 10.1 10.9
Tax rate 28.9 0.8 25.2 25.2 25.2 25.2
Source: Company, Nirmal Bang Institutional Equities Research
Exhibit 18: Growth rate – Volume and Financials %
FY19 FY20 FY21 FY22E FY23E FY24E FY25E
CNG 7.58 6.26 -12,52 26.83 25.41 14.13 12.32
PNG 4.08 56.34 1.41 27.30 14.88 14.32 13.00
Total volume 4.81 45.55 -0.78 27.24 16.33 14.29 12.90
Revenue 25.6 32.8 (4.3) 33.7 24.1 9.9 7.9
EBITDA 10.0 66.0 27.8 4.0 18.4 15.4 12.7
EPS 49.1 174.8 6.6 5.7 22.0 19.0 16.2
Source: Company, Nirmal Bang Institutional Equities Research

Institutional Equities
Gujarat Gas 12
Valuation: TP of Rs710 per share/equity value of Rs489bn
The combined cashflows from existing and 7 new GAs valued at Rs710 per share/equity value of Rs489bn. We are assuming 12% volume CAGR and blended EBITDA/scm of Rs5.2-5.3 in our open access based DCF model over FY23-30E. This is based on open access kicking in for all the existing GAs at 10%/20% on a blended basis over FY24E-25E.
Exhibit 19: Valuation summary
WACC assumptions % Valuation Rs mn
Risk free rate 6.0 Terminal value 6,80,750
Risk premium 5.0 PV of terminal value 3,51,390
Cost of equity 9.4 PV of FCFF 1,37,027
Beta of the Stock (x) 0.67 Enterprise Value 4,88,417
Cost of debt 6.4 FY22 Net Debt (446)
Gearing (x) 0.25 Equity Value 4,88,863
Stable growth rate 5.0 Shares outstanding (mn) 688.4
Discounting period 9.0 Equity value Rs/share 710
WACC 8.6 CMP (Rs) 665
Upside/(Downside) % 6.8
Source: Nirmal Bang Institutional Equities Research
New GAs: We estimate potential volumes from new GAs under development based on an aggregate capex of
Rs26.6bn in the new CGD networks. We use our thumb rule estimates for the physical network expected to be
in place over FY21E-29E, as per PNGRB.
The TP implies FY23E EV/EBITDA of 19.3x, PE of 29.7x and P/BV of 6.8x. This compares with 5-year median
PE of 20.4x and 5-year median P/BV of 4.4x.
Upside case in volumes from ban on coal and liquid petroleum fuels favoring gas: NGT/state agency extending ban on fossil fuels in favour of gas: The management expects ban similar to that imposed in the Morbi cluster to be announced in other areas too. Such a ban could see GGL’s PNG sales increasing by another 5-10% on our ballpark estimates. The actual impact would depend on current volumes and the industry concentration where the ban will force a switch to gas in the GAs impacted by any such order in future. We believe that timing this and building this into base case is difficult.
Exhibit 20: Impact of deferred Volume upside from base case
10% upside in volume EPS estimate (Rs) DCF value change in TP
year of impact FY22E FY23E FY24E FY25E Rs %
Base case 19.61 23.94 28.49 33.11 710 0
FY23E 21.97 26.73 31.71 36.74 790 11.2
FY24E 19.61 23.94 31.71 36.74 788 10.9
FY25E 19.61 23.94 28.49 36.74 785 10.5
Source: Nirmal Bang Institutional Equities Research
Our bull case analysis under nil open access post exclusivity values GGL as Rs814
Higher growth and margins can add to our valuation
Every Rs1/scm increase in EBITDA/scm implies 22% upside in FY23E EPS and 19.3% upside in GGL’s valuation to Rs847/share.
Every 10% increase in additional volumes implies 10.9% upside in FY23 EPS and 11.3% upside to GGL valuation from our base case TP.

Institutional Equities
Gujarat Gas 13
Exhibit 21: Impact of open access volume and margins - Base case vs Bull case
Case Scenario FY23E EPS FY24E EPS FY25E EPS DCF value
Base case 20% open access by FY25E 23.94 28.49 33.11 710
Bull case 1 Unregulated 23.78 29.48 36.04 814
Bull case 2 Ebitda/scm up Re.1 29.20 33.73 38.31 847
Bull case 3 volume Upside 10% 26.56 31.52 36.51 790
Source: Nirmal Bang Institutional Equities Research
Note: Base open access on volumes - 10% - FY24; 20% - from FY25E; this also applies to case 2 and case3.
Exhibit 22: Impact analysis on PAT and DCF value- Change in gas volume and EBITDA/scm
Change in PAT%
Upside case change FY22E FY23E FY24E FY25E DCF value
Rs Chg in GGL
valuation (%)
Base case EPS Rs 19.6 23.9 28.5 33.1 710 0.00
Volume - V up A +10% 12.0 11.7 11.3 11.0 790 11.25
EBITDA E Rs/scm B 0.1 2.4 2.3 2.2 2.1 724.0 1.95
Downside case change FY22E FY23E FY24E FY25E DCF value Chg in GGL
valuation (%)
Volume down C -10% -12.0 -11.7 -11.3 -11.0 630 -11.28
E Down Rs/scm D 0.1 -2.4 -2.3 -2.2 -2.1 696 -1.99
E Down Rs/scm E 0.5 -12.1 -11.5 -11.1 -10.7 642 -9.59
E Down Rs/scm F 1 -24.2 -23.0 -22.1 -21.5 573 -19.31
Source: Nirmal Bang Institutional Equities Research
Sensitivity Analysis Exhibit 23: Impact of Gas Cost/Margins Per SCM and Volumes on Earnings/Valuations
Case A FY22E FY23E FY24E FY25E
CNG Volumes down -10% -10% -10% -10%
Base case Volumes 4,360 5,073 5,797 6,545
Impact of 10% cut on volume -436 -507 -580 -655
Change in Revenue -13,180 -16,350 -17,970 -19,392
Change in EBITDA -2,171 -2,564 -2,966 -3,341
Change in EBITDA -2,171 -2,570 -2,966 -3,341
Change in PAT -1,624 -1,923 -2219 -2,500
Change in PAT% -12.0 -11.7 -11.3 -11.0
Case B FY22E FY23E FY24E FY25E
Cost of gas up 5% 5% 5% 5%
Per scm impact -1.16 -1.25 -1.19 -1.12
Change in EBITDA -5,061 -6,361 -6,905 -7,356
Change in PAT -3,786 -4,759 -5,167 -5,504
Change in PAT% -28.0 -28.9 -26.3 -24.1
Case B - Impact on margin
EBITDA Margin hit % -3.8 -3.9 -3.8 -3.8
New EBITDA margin % 12.6 11.8 12.7 13.4
Base case EBITDA Margin % 16.5 15.7 16.5 17.2
Source: Nirmal Bang Institutional Equities Research

Institutional Equities
Gujarat Gas 14
Regulations/policy impacting CGD/GGL
1. Open access:
The licenses for existing areas under GGL have outlived their marketing exclusivity and could see PNGRB initiate the process to open these up to third party access as per the “open access code for CGD networks” notified by PNGRB in end Nov’20.
We have already modelled the potential impact of open access kicking in all the existing GAs of GGL at 10% in FY24E and max at 20% by FY25E. This is based on blended EBITDA/scm of Rs5.12 /Rs5.1.
As compared to its smaller but higher margin peers IGL and MGL, open access poses a higher risk to GGL as its 86% dependence on industrial/commercial PNG makes it vulnerable to losing market share to new entrants.
In CNG, there are two key physical entry and cost barriers
i. Capex and access to land to set up new CNG stations
ii. Existing petrol pumps in these GAs cannot be used by third parties
These two factors will likely pose roadblocks, which is likely to delay third party competition building up the volumes as per open access rule.
In PNG, the existing CGD network is readily available to the extent of 20% of its capacity under open access and new entrants can source their gas and use this open access capacity to sell PNG to existing and new industrial as well as commercial customers.
Every 10% loss of volume implies12.1% hit on FY23E EPS.
Impact of competition under open access in existing GAs:
Price competition is unlikely given that PNG prices in all markets are set based on prices of competing
alternatives~ in Morbi, we learn that its set based on Propane/LPG prices as this is the other fuel option
allowed in that region apart from PNG/LNG.
Price cutting is possible if the competitors are able to enjoy a lower delivered cost of gas sourced by
them, which might be sporadic based on spot volumes and not sustainable. The company’s ultimate
promoter GSPC has a presence in LNG import and sourcing through the Mundra LNG import terminal
operated by GSPL LNG LTD. This should help GGL by and larger match gas procurement costs in GAs
in Gujarat vs. that of competition, barring short periods of time.
Existing relationships could help GGL retain some of the larger customers who may not switch
material volumes unless there is a lasting cost benefit without sacrificing stability of gas supplies.
It is however possible that a third party may offer lower prices and settle for lower margins as the
competitor does not have to invest in fixed assets. This could hurt GGL’s PNG margins in the short term;
eventually, the operator’s margins and third party margins will likely move in tandem.
However, the key to this whole discussion is the volume impacted, which is currently
~1.5mmscmd, if we assume that competition eats into 20% of the entire industrial and
commercial PNG volume in existing GAs (7.44mmscmd).
On this volume, if there is a price cut of Rs0.1/scm, it implies a hit on margins of Rs54mn hit/year
And at the worst assuming Rs0.5-1/scm price cut, it implies a hit on margins of Rs270mn to
Rs540mn/year.
Hence, this is not a cause for concern; unless the extent of price cuts widen to Rs2/scm ~ this
would imply a hit on margins of Rs1.08bn and post-tax hit of Rs810mn or a downside in EPS of
Rs1.2/share. This impact could marginally increase to the extent that the entire industrial and
commercial PNG volume in existing GAs will see growth in future.

Institutional Equities
Gujarat Gas 15
Another dimension to competition is the potential impact of third-party gas marketing companies entering
GGL’s GAs in PNG post open access notification. This could imply some pressure on GGL’s pricing for the
free volumes in these GAs, although technically PNG pricing can be different as final consumer price of
CNG/PNG is deregulated. One outcome is that in GAs under open access, the PNG price for the 80% free
volume may have to be cut in line with that charged by the new third party shippers. This may be required for
at least some large customers who may have some buying power and may seek parity in pricing as in open
access volumes. And, GGL may cut prices across the board or announce a marginal cut compared to third
party prices and offer discount to large customers on a tactical basis.
We estimate a 5.8% to 11.6% potential downside to our TP assuming a price cut of Rs0.5-1/scm in the
price for 80% of PNG volumes that is not under open access, in all of GGL’s GAs. This is based on third
party shippers offering similar cuts on open access volumes compared to the previous price.
Exhibit 24: Impact of third party price cutting on free PNG volumes
Price cut Rs/scm Hit on EPS % DCF value ch in TP
FY24 FY25 FY26 FY27 FY28 FY29 FY30 Rs %
-0.5 -7.6 -6.5 -6.1 -5.5 -5.4 -5.1 -4.8 669 -5.8
-1 -15.3 -13.0 -12.2 -11.0 -10.7 -10.2 -9.6 628 -11.6
Price inc Rs/sm
0.5 7.5 6.4 6.0 5.4 5.3 5.0 4.8 751 5.8
Source: Nirmal Bang Institutional Equities Research
2. Gas pricing – CNG is based on domestic gas allocation at government notified price – “APM price” - which has boosted
CNG margins. Once the formula for this is changed and linked to JKM benchmark, the cost of gas may rise. The extent to
which this can be passed on will depend on (a) excise duty/VAT on MS /HSD the oil substitutes for CNG (b) future
changes in the PNGRB Act, which currently leaves CNG/PNG prices unregulated. It is possible that the PNGRB Act is
amended to put a cap on selling price of CNG, while allowing full pass-through of gas cost increase and opex/ capex
recovery, as per norms.
Exhibit 25: Preferential gas allocation segment share in GGL volume
Source: Company, Nirmal Bang Institutional Equities Research
Change in gas pricing formula could impact gas cost for CNG and household PNG
If the benchmark gets changed and the gas price for CNG and household PNG goes up, this would impact GGL to the extent of gas sales in these two segments, which get the first preference for gas allocation at the ‘APM gas’ price. The volume sold in these two segments was 22%/21% of GGL gas volumes in FY20/21. This will remain at least 20% in FY22E-FY24E and 19% in FY25E-26E.
21.7%
20.9%
19.8%
20.2%
19.8%
19.5%
19.1%
0.00
0.50
1.00
1.50
2.00
2.50
3.00
3.50
17.5%
18.0%
18.5%
19.0%
19.5%
20.0%
20.5%
21.0%
21.5%
22.0%
FY20 FY21 FY22 FY23 FY24 FY25 FY26
mmscmd
CNG& Household PNG Vol mmscmd SHARE IN GGL VOL % LHS

Institutional Equities
Gujarat Gas 16
The risk to GGL from APM gas price increase is less than that for IGL (ACCUMULATE) and MGL (ACCUMULATE), both of which have a higher proportion of sales volume coming in from CNG and household PNG segments.
Market based gas/LNG price: The cost of market based gas – domestic/LNG is under free pricing and can put margins on PNG at risk if price of oil based substitutes don’t increase as much as the cost of gas or worse declines.
Every 5% increase in gas cost implies material downside to EPS and TP
Potential hit on FY23E EPS: 28.9% cut in FY23E implied EPS to Rs17.02
Potential hit on DCF based TP: 21.8% cut to implied TP of Rs555
3. GST on gas
a) The bull case: This is the elephant in the room, which is difficult to predict as to the shape and size. Prima facie,
gas under GST is positive as users get input credit on the GST paid on gas, which then is at par with fuel oil that
already enjoys this benefit. This is likely to encourage substitution of fuel oil with gas and hence a potential upside
catalyst for gas demand in future. If GST input credit is also made available to CGD Cos on GST paid on operating
expenses and capex, it could reduce Opex and Capex.
Every 10% gain of volume implies 11.7% upside in FY23E EPS and 11.2% upside in TP
b) The bear case: However, it is unrealistic in our view to assume that this benefit of input tax credit can be retained by
the CGD industry in full to perpetuity given the government’s intent to promote gas as a cheap green alternative to
the polluting oil based fuels and coal.
4. Operating leverage and pricing power for Indian CGD stocks could be at risk over time:
In fact, the market’s comfort on sustained pricing power supporting above average EPS growth and return
ratios/FCF for CGD stocks could get shaken if the government puts in policy levers to force the industry to pass on
all or part of the savings on input costs and Opex, including those from GST input tax credit.
Also, the room for operating leverage benefits may dwindle as the regulations mature with policy makers’ view on
“attractive returns”, for what is after all a public utility, could be at a level below what the market is currently building
in assuming volume growth, operating leverage and unregulated pricing power.
Regulatory issues and climate change goals:
Potential impact of Indian gas price reform on CGD companies:
The other risk from a policy angle is the change in pricing for preferential allocation to CNG/household PNG at the domestic gas price linked to US, UK, Canada and Russia benchmarks.
Low domestic gas price (APM gas) hurting Indian E&P companies:
The sustained fall in the domestic gas price to US$1.79/mmbtu in 2HFY21 and 1HFY22 (on GCV basis) has put pressure on upstream gas producers like ONGC and Oil India (both are Not Rated at NBIE) for the gas they produce in the PRE-NELP fields (which has a lion’s share of their gas sales volume). The government is reported to be considering change in the gas pricing formula by adding or shifting it to JKM benchmark, which industry believes is more representative of gas demand and hence is a better indication of a “market price” for gas.
Under normal circumstances and based on past experience, the CGD industry has the pricing power to pass on any gas cost increase. This is based on the prevailing discount that CNG enjoys in Gujarat vs petrol/diesel at 46.5%-48.5% in terms of cost/km.
The discount may increase or decrease based on the rise or fall in global price for these fuels (linked to oil price) and the tax differential, which is currently very high – excise duty on CNG is 14% or ~5/kg at Rs50/kg pump price. This is very low vs Rs38-43/kg of excise duty on HSD/MS.
However, a sharp increase in gas price of more than Rs1-2/scm (US$0.4-0.8/MMBTU) may not be possible to pass on at one go. And, this could get accentuated if (a) the global price of MS and HSD fall, which is possible if oil prices were to see a downward correction in future and (b) the steep increase in excise duty effected on MS/HSD in MAY‘20, is rolled back by Rs5-10/litre, to reduce the impact of high fuel prices on retail consumers and the transportation cost on daily necessities and industrial goods.

Institutional Equities
Gujarat Gas 17
Gas pricing may entail strategy on long term tariff differentials as per climate change/green fuel goals
This move may depend on how the government views the issue of balancing need for revenue and rationalizing taxes. Key elements that may determine the tactical approach in the near term and the longer term would be as follows:
a) The need for a green tax on MS and HSD to discourage polluting petroleum fuels
b) The thinking on tax on gas, including moving it to GST – this would enable the government to have a
stable source of revenue for central and state budgets and at the same time arrive at a well-defined and
stable tariff differential in favor of gas to encourage shift towards a less polluting fuel
c) In turn, this would support India’s journey towards reducing the carbon footprint and
d) Make progress towards its commitments on sustainable development and the fight against climate
change
India appears less worried about emission risk posed by gas compared to OECD
The rider in this framework is the recent disconcerting questions being raised on methane emissions and carbon footprint left by natural gas in the OECD and climate change policy deliberations at various official forums.
The Indian government has so far not acknowledged this risk in natural gas and is yet to assess the emission from CGD and the other segments that consume gas. As things stand, the CGD industry and PNG importers like PLNG have maintained that gas is pollution free and does not leave a carbon emission footprint that would thwart India’s goals towards zero carbon economy. And, the boards of the OMCs and ONGC also have endorsed the increasing role of gas in our energy basket and have not yet articulated any visible concerns on the risk posed by natural gas on India’s emission goals.
For long-term investors and those who have an ESG framework, may eventually desire clarity on Indian gas industry’s emission norms and the sustainability of the current thumbs-up given to gas on its status as a green fuel that can be consistent with reducing India’s carbon footprint over time.

Institutional Equities
Gujarat Gas 18
Gujarat Gas in pictures
Exhibit 26: Trend in revenue and earnings per scm of gas of gas sold
Source: Company, Nirmal Bang Institutional Equities Research
Exhibit 27: Trend in GGL gas volume
Source: Company, Nirmal Bang Institutional Equities Research
Exhibit 28: Trend in PNG&CNG mix
Source: Company, Nirmal Bang Institutional Equities Research
3.70 3.95 4.15
4.73
6.09
4.98 5.07 5.12 5.11
1.10 1.29 1.83 3.47 3.72 3.09 3.24 3.38 3.48
25.36
27.27
32.68
29.82 28.75
30.23 32.23
31.00 29.63
0
5
10
15
20
25
30
35
0
1
2
3
4
5
6
7
FY17 FY18 FY19 FY20 FY21 FY22E FY23E FY24E FY25E
(Rs/scm)
EBITDA Rs/scm PAT Rs/scm Revenue Rs/scm - RHS
1.20 1.30 1.40 1.49 1.30 1.65 2.07 2.36 2.65 2.88
4.30 4.90 5.10 7.98 8.09
10.30 11.83
13.48 15.28
16.97
5.50 6.20 6.50
9.46 9.39
11.95
13.90
15.84
17.93
19.85
FY17 FY18 FY19 FY20 FY21 FY22E FY23E FY24E FY25E FY26E
CNG (mmscmd) PNG (mmscmd) Total gas sales (mmscmd)
(mmscmd)
21.8 21.0 21.5 15.7 13.9 13.8 14.9 14.9 14.8
78.2 79.0 78.5 84.3 86.1 86.2 85.1 85.1 85.2
0%
10%
20%
30%
40%
50%
60%
70%
80%
90%
100%
FY17 FY18 FY19 FY20 FY21 FY22E FY23E FY24E FY25E
CNG PNG

Institutional Equities
Gujarat Gas 19
Exhibit 29: Revenue and earnings trend
Source: Company, Nirmal Bang Institutional Equities Research
Exhibit 30: Trend in Revenue & PAT growth and Assets
Source: Company, Nirmal Bang Institutional Equities Research
Exhibit 31: Revenue, EBITDA & PAT growth YoY
Source: Company, Nirmal Bang Institutional Equities Research
FY17 FY18 FY19 FY20 FY21 FY22E FY23E FY24E FY25E
Revenue - LHS 50,926 61,743 77,544 1,03,00 98,543 1,31,79 1,63,49 1,79,69 1,93,91
EBITDA 7,433 8,953 9,846 16,343 20,878 21,710 25,699 29,657 33,414
PAT 2,216 2,926 4,363 11,988 12,777 13,503 16,478 19,613 22,795
-
5,000
10,000
15,000
20,000
25,000
30,000
35,000
40,000
-
25,000
50,000
75,000
1,00,000
1,25,000
1,50,000
1,75,000
2,00,000
2,25,000
(Rs mn) (Rs mn)
66,618 71,575
79,254 84,797
95,277
1,09,685
1,25,930
1,45,274
21.2 25.6 32.8
-4.3
33.7 24.1
9.9 7.9
32.0
49.1
174.8
6.6
5.7 22.0
19.0 16.2
-20
0
20
40
60
80
100
120
140
160
180
200
-
20,000
40,000
60,000
80,000
1,00,000
1,20,000
1,40,000
1,60,000
FY18 FY19 FY20 FY21 FY22E FY23E FY24E FY25E
Total Assets Rs mn ( LHS) Revenue growth YoY (%) PAT growth YoY %
(Rs mn) (%)
21.2
25.6
32.8
-4.3
33.7
24.1
9.9
7.9
11.3
11.2
20.4
10.0
66.0
27.8
4 18.4
15.4
12.7
14.6
13.8
32.0 49.1
174.8
6.6 5.7
22.0 19.0 16.2 18.7 22.9
-40
-20
0
20
40
60
80
100
120
140
160
180
-10
0
10
20
30
40
50
60
70
FY18 FY19 FY20 FY21 FY22E FY23E FY24E FY25E FY26E FY27E
Revenue EBITDA PAT - RHS
(%) (%)

Institutional Equities
Gujarat Gas 20
Exhibit 32: EBITDA, RoCE and RoIC trend
Source: Company, Nirmal Bang Institutional Equities Research
Exhibit 33: PAT & RoE trend
Source: Company, Nirmal Bang Institutional Equities Research
Exhibit 34: PAT, OCF & FCF Trend
Source: Company, Nirmal Bang Institutional Equities Research
7,4
33
8,9
53
9,8
46
16,
343
20,
878
21,
710
25,
699
29,
657
33,
414
9.8
7.7 9.2
22.0 20.6
19.3 19.9 19.6 18.9
8.0
8.8 10.6
26.6 25.1
22.5 23.7
25.1 26.8
0.0
2.5
5.0
7.5
10.0
12.5
15.0
17.5
20.0
22.5
25.0
27.5
30.0
-
5,000
10,000
15,000
20,000
25,000
30,000
35,000
40,000
FY17 FY18 FY19 FY20 FY21 FY22E FY23E FY24E FY25E
EBITDA (Rs mn) - LHS Post-Tax RoCE (%) ROIC (%)
(Rs mn) (%)
2,2
16
2,9
26
4,3
63
11,
988
12,
777
13,
503
16,
478
19,
613
22,
795
13.2 16.5
21.4
43.4
32.6
23.6
22.9 21.9 20.7
0.0
5.0
10.0
15.0
20.0
25.0
30.0
35.0
40.0
45.0
50.0
-
2,500
5,000
7,500
10,000
12,500
15,000
17,500
20,000
22,500
25,000
FY17 FY18 FY19 FY20 FY21 FY22E FY23E FY24E FY25E
PAT (Rs mn) - LHS RoE (%)
(Rs mn) (%)
FY18 FY19 FY20 FY21 FY22E FY23E FY24E FY25E
PAT 2,926 4,363 11,988 12,777 13,503 16,478 19,613 22,795
Opg Cashflow 7,847 9,561 14,200 16,552 13,871 17,090 22,049 24,860
Free Cashflow 3,551 3,522 9,534 10,449 8,720 10,113 14,793 20,078
-
2,500
5,000
7,500
10,000
12,500
15,000
17,500
20,000
22,500
25,000
27,500
(Rs mn)

Institutional Equities
Gujarat Gas 21
Exhibit 35: Trend in margins
Source: Company, Nirmal Bang Institutional Equities Research
Exhibit 36: CNG - Net revenue trend
Source: Company, Nirmal Bang Institutional Equities Research
Exhibit 37: PNG - Revenue trend
Source: Company, Nirmal Bang Institutional Equities Research
24.6 24.2 21.6
23.5
29.1
23.2 22.2
23.1 24.1
14.6 14.5 12.7
15.9
21.2
16.5 15.7 16.5 17.2
4.3 4.7 5.4
11.6 12.9
10.2 10.1 10.9 11.7
0.0
2.5
5.0
7.5
10.0
12.5
15.0
17.5
20.0
22.5
25.0
27.5
30.0
32.5
FY17 FY18 FY19 FY20 FY21 FY22E FY23E FY24E FY25E
Gross margin % EBITDA margin % PAT margin %
(%)
10,
158
11,
540
14,
550
15,
815
13,
149
17,
389
18,
131
21,
764
25,
648
13.6
26.1
8.7
-16.9
32.2
4.3
20.0 17.8
-60
-50
-40
-30
-20
-10
0
10
20
30
40
50
60
-
2,500
5,000
7,500
10,000
12,500
15,000
17,500
20,000
22,500
25,000
27,500
FY17 FY18 FY19 FY20 FY21 FY22E FY23E FY24E FY25E
Net Revenue - CNG YoY growth
(Rs mn) (%)
40,
768
50,
203
62,
994
87,
189
85,
394
1,1
4,41
0
1,4
5,36
8
1,7
2,54
9
2,0
2,31
5
23.1 25.5
38.4
-2.1
34.0 27.1
18.7 17.3
-60
-50
-40
-30
-20
-10
0
10
20
30
40
50
60
- 12,500 25,000 37,500 50,000 62,500 75,000 87,500
1,00,000 1,12,500 1,25,000 1,37,500 1,50,000 1,62,500 1,75,000 1,87,500 2,00,000
FY17 FY18 FY19 FY20 FY21 FY22E FY23E FY24E FY25E
Revenue - PNG YoY growth
(Rs mn) (%)

Institutional Equities
Gujarat Gas 22
Exhibit 38: Quarterly aggregate volume trend (mmscm)
Source: Company, Nirmal Bang Institutional Equities Research
Exhibit 39: Quarterly trend – Revenue, EBITDA and PAT
Source: Company, Nirmal Bang Institutional Equities Research
Exhibit 40: Quarterly trend in revenue and earnings per scm
Source: Company, Nirmal Bang Institutional Equities Research
115
115
119
122
128
128
131
133
135
136
139
134
62
118
142
154
123
142
149
162
442
412
460
486
457
485
472
452
698
723
718
771
315
788 91
1
938
797 84
6 985
974 557 527
579 608 585
613 603 585
833 859 857
905
377
906
1053 1092
921 988
1,134 1,135
Q1F
Y18
Q2F
Y18
Q3F
Y18
Q4F
Y18
Q1F
Y19
Q2F
Y19
Q3F
Y19
Q4F
Y19
Q1F
Y20
Q2F
Y20
Q3F
Y20
Q4F
Y20
Q1F
Y21
Q2F
Y21
Q3F
Y21
Q4F
Y21
Q1F
Y22
E
Q2F
Y22
E
Q3F
Y22
E
Q4F
Y22
E
CNG PNG Total
(mmscm)
Q1FY19 Q2FY19 Q3FY19 Q4FY19 Q1FY20 Q2FY20 Q3FY20 Q4FY20 Q1FY21 Q2FY21 Q3FY21 Q4FY21 Q1FY22
E Q2FY22
E Q3FY22
E Q4FY22
E
Revenue - LHS 17,651 19,643 21,174 19,076 26,146 25,129 25,062 26,666 10,829 25,130 28,294 34,289 27,378 29,367 34,295 35,301
EBITDA 2,486 1,607 3,212 2,541 4,665 3,706 3,705 4,267 1,857 7,330 6,148 5,543 5,367 5,921 4,483 5,440
PAT 1,221 410 1,380 1,166 2,340 5,170 1,973 2,504 591 4,755 3,923 3,509 3,312 3,741 2,640 3,345
-
1,000
2,000
3,000
4,000
5,000
6,000
7,000
8,000
-
5,000
10,000
15,000
20,000
25,000
30,000
35,000
40,000
(Rs mn)
26.5 26.4 27.1 28.5 30.2 32.0 35.1 32.6 31.4 29.3 29.2 29.5 28.7 27.7 26.9
31.4 29.7 29.7 30.2 31.1
4.9 3.8 3.5 3.7
4.2 2.6
5.3 4.3 5.6
4.3 4.3 4.7 4.9 8.1 5.8
5.1 5.8 6.0 4.0 4.8 1.9 1.2 1.0
1.1 2.1 0.7
2.3
2.0 2.8
6.0 2.3 2.8 1.6
5.2
3.7
3.2 3.6 3.8 2.3
2.9
0
5
10
15
20
25
30
35
40
45
Q1F
Y18
Q2F
Y18
Q3F
Y18
Q4F
Y18
Q1F
Y19
Q2F
Y19
Q3F
Y19
Q4F
Y19
Q1F
Y20
Q2F
Y20
Q3F
Y20
Q4F
Y20
Q1F
Y21
Q2F
Y21
Q3F
Y21
Q4F
Y21
Q1F
Y22
E
Q2F
Y22
E
Q3F
Y22
E
Q4F
Y22
E
Revenue (Rs/scm) EBITDA (Rs/scm) PAT (Rs/scm)

Institutional Equities
Gujarat Gas 23
Exhibit 41: Quarterly Margin Trend
Source: Company, Nirmal Bang Institutional Equities Research
Exhibit 42: GGL stock price chart
Source: Company, Nirmal Bang Institutional Equities Research
Exhibit 43: Price performance trend (%)
Source: Company, Nirmal Bang Institutional Equities Research
28.2
25.3
22.3 21.8 23.5
16.4
23.2 23.3 25.3
22.2 22.3 24.0
32.6 36.8
28.9
22.4
26.2 27.2
19.4 21.9
18.3
14.6 12.7 12.8
14.1
8.2
15.2 13.3
17.8
14.7
14.8 16.0 17.2
29.2
21.7 16.2
19.6 20.2
13.1 15.4
7.1 4.4 3.8 3.8
6.9
2.1
6.5 6.1
8.9
20.6
7.8 9.4
5.4
18.9
13.9
10.2 12.1 12.7
7.7 9.5
Q1F
Y18
Q2F
Y18
Q3F
Y18
Q4F
Y18
Q1F
Y19
Q2F
Y19
Q3F
Y19
Q4F
Y19
Q1F
Y20
Q2F
Y20
Q3F
Y20
Q4F
Y20
Q1F
Y21
Q2F
Y21
Q3F
Y21
Q4F
Y21
Q1F
Y22
E
Q2F
Y22
E
Q3F
Y22
E
Q4F
Y22
E
Gross Margin EBITDA margin PAT margin
(%)
0 50
100 150 200 250 300 350 400 450 500 550 600 650 700 750
9-15
-201
5
12-1
5-20
15
3-15
-201
6
6-15
-201
6
9-15
-201
6
12-1
5-20
16
3-15
-201
7
6-15
-201
7
9-15
-201
7
12-1
5-20
17
3-15
-201
8
6-15
-201
8
9-15
-201
8
12-1
5-20
18
3-15
-201
9
6-15
-201
9
9-15
-201
9
12-1
5-20
19
3-15
-202
0
6-15
-202
0
9-15
-202
0
12-1
5-20
20
3-15
-202
1
6-15
-202
1 Price (Rs)
3.9
23.3
90.2
0.0 20.0 40.0 60.0 80.0 100.0
1M
3M
1Y
(%)
90.2
360.2
506.8
0 50 100 150 200 250 300 350 400 450 500 550
1Y
3Y
5Y
(%)

Institutional Equities
Gujarat Gas 24
ANNEXURE 1–Valuation charts and peer group comps
Exhibit 44: 5-year P/E Chart
Source: Company, Nirmal Bang Institutional Equities Research
Exhibit 45: 5-year P/B Chart
Source: Company, Nirmal Bang Institutional Equities Research
Exhibit 46: Historic P/E vs EPS trend
Source: Company, Nirmal Bang Institutional Equities Research
0
5
10
15
20
25
30
35
40
45
4-1-
2016
7-1-
2016
10-1
-201
6
1-1-
2017
4-1-
2017
7-1-
2017
10-1
-201
7
1-1-
2018
4-1-
2018
7-1-
2018
10-1
-201
8
1-1-
2019
4-1-
2019
7-1-
2019
10-1
-201
9
1-1-
2020
4-1-
2020
7-1-
2020
10-1
-202
0
1-1-
2021
4-1-
2021
7-1-
2021
Forward P/E median PE SD +1 SD -1
P/E: 20.4
0
1
2
3
4
5
6
7
8
4-1-
2016
7-1-
2016
10-1
-201
6
1-1-
2017
4-1-
2017
7-1-
2017
10-1
-201
7
1-1-
2018
4-1-
2018
7-1-
2018
10-1
-201
8
1-1-
2019
4-1-
2019
7-1-
2019
10-1
-201
9
1-1-
2020
4-1-
2020
7-1-
2020
10-1
-202
0
1-1-
2021
4-1-
2021
7-1-
2021
Forward P/E median PE SD +1 SD -1
P/B: 4.4
6.4 2.8 3.2 4.2 6.1 17.4 18.5
46.8
33.7
35.8 27.7
8.4
12.2
20.1
39.1
47.3
39.6
24.0
13.0
29.6
0
5
10
15
20
25
30
35
40
45
50
0
5
10
15
20
25
30
FY15 FY16 FY17 FY18 FY19 FY20 FY21
EPS 1-Y forward P/E 1-Y Trailing P/E
(Rs) (%)

Institutional Equities
Gujarat Gas 25
Exhibit 47: P/BV and RoE (%)
Source: Company, Nirmal Bang Institutional Equities Research
Exhibit 48: Peer comparison
Code CMP Mkt cap EPS EPS P/E (x) P/E (x) EV/EBITDA (x) EV/EBITDA (x)
$bn FY22E FY23E FY22E FY23E FY22E FY23E
India (INR)
Petronet LNG PLNG IN Equity 223 4.5 18.16 20.65 12.28 10.80 5.71 5.06
GSPL GUJS IN Equity 331 2.5 19.17 20.93 17.26 15.82 11.59 10.70
GAIL GAIL IN Equity 151 9.0 13.93 15.85 10.84 9.53 8.09 6.71
IGL IGL IN Equity 564 5.3 21.23 24.41 26.57 23.11 18.71 15.97
MGL MAHGL IN Equity 1142 1.5 88.16 108.00 12.95 10.57 7.98 6.03
Average 15.98 13.96 10.42 8.90
Unrated
Gujarat Gas GUJGA IN Equity 665 6.2 19.61 23.94 33.9 27.78 21.37 18.05
Global
Shenzhen Gas Corp Ltd 601139 ch Equity 6.5 2.8 0.62 0.68 10.53 9.60 5.74 5.48
SNAM SPA SRG IM Equity 4.9 19.8 0.34 0.34 14.37 14.37 13.37 12.89
ITALGAS SPA IG IM Equity 5.6 5.4 0.43 0.46 13.02 12.03 9.19 8.68
ENAGAS SA ENG SM EQUITY 19.9 6.2 1.46 1.45 13.59 13.70 10.84 11.14
Global Average
12.88 12.43 9.79 9.55
Overall Average 14.60 13.28 10.14 9.19
Source: Company, Nirmal Bang Institutional Equities Research; Global peers’ CMP in local currency; Average excludes Gujarat Gas
12.5 13.8 16.5
21.4
43.4
32.6 5.8
4.5
5.6 5.2
3.0 3.5
0.0
1.0
2.0
3.0
4.0
5.0
6.0
7.0
0.0
5.0
10.0
15.0
20.0
25.0
30.0
35.0
40.0
45.0
50.0
FY16 FY17 FY18 FY19 FY20 FY21
RoE (%) - LHS 1-Y forward P/B (x)
(%) (x)

Institutional Equities
Gujarat Gas 26
ANNEXURE 2: INDIA CGD BUSINESS AND GLOBAL COMPS Exhibit 49: China Gas market trend (bcm) Exhibit 50 India gas market trend (bcm)
Source: BP statistical review Exhibit 51: Gas consumption trend MMSCMD Exhibit 52: Gas consumption CAGR %
Source: BP statistical review
0.0
50.0
100.0
150.0
200.0
250.0
300.0
350.0
CY
05
CY
06
CY
07
CY
08
CY
09
CY
10
CY
11
CY
12
CY
13
CY
14
CY
15
CY
16
CY
17
CY
18
CY
19
Consumption BCM Production BCM
Net imports BCM
0.0
20.0
40.0
60.0
80.0
100.0
CY
05
CY
06
CY
07
CY
08
CY
09
CY
10
CY
11
CY
12
CY
13
CY
14
CY
15
CY
16
CY
17
CY
18
CY
19
Consumption BCM Production BCM Net imports BCM
0.0
100.0
200.0
300.0
400.0
500.0
600.0
700.0
800.0
900.0
CY
05
CY
06
CY
07
CY
08
CY
09
CY
10
CY
11
CY
12
CY
13
CY
14
CY
15
CY
16
CY
17
CY
18
CY
19
MMSCMD
China India
0.0% 5.0% 10.0% 15.0%
CY05-CY19
CY14-CY19
CAGR %
India China

Institutional Equities
Gujarat Gas 27
Exhibit 53: India compared to China in Natural Gas industry
India China
CNG Vehicles (Mn) 3 6.64
CNG Stations Nos. #2,290 5,600
Gas production mmscmd 73.70 486.6
Overall gas consumption mmscmd 155-160 820 – 890
CGD volumes mmscmd 30 309
CGD share in gas demand % 17-18 36.3
Share of LNG Imports in gas basket %
54.9 27.3
Share of LNG+ Pipeline imports % 54.9 42.8
Segments Indian companies Chinese companies
CGD IGL, MGL & GGL Kunlun Energy, China Gas, China Resources Gas, Enn Energy And Town Gas
Gas Pipeline operators GAIL, Gujarat State
Petronet, IOC China National Petroleum Corporation, Posco, PJSC Gazprom, PJSC Transneft, And China
Petroleum & Chemical Corporation, Pipechina
LNG Imports PLNG Tianjin (Cnooc), Tianjin (Sinopec), Shangdong (Qingdao), Liaoning Dalian, Fujian Putian
Gas E&P ONGC, Oil India &
Reliance ( all unrated) Sinopec Shanghai Petrochemical Co, China National Petroleum Corporation, China National
Offshore Oil Corporation, Beijing Enterprises Holdings Limited, Shenergy Group Company Limited
Source: PPAC; BP statistical review CY19, # As of Mar 21, CNG stations in India >2837 Nos; NRDC: National Development and Reform Commission of the People's Republic of China
Exhibit 54: India ranks third in NGV nos - CY18 Exhibit 55: Share in total vehicles % - CY18
Source: https://www.oxfordenergy.org/wpcms/wp-content/uploads/2019/04/A-review-of-prospects-for-natural-gas-as-a-fuel-in-road-transport-Insight-50.pdf; NBIE
0.0 1.0 2.0 3.0 4.0 5.0 6.0 7.0
China
Iran
India
Pakistan
Argentina
Brazil
Italy
Uzbekistan
Colombia
Thailand
Others
NGV nos- mn
23.2
17.2
11.8 11.5
8.4
7.1
3.8 3.1
2.2 1.8
9.9
Global split of natural gas vehicles %
China Iran India Pakistan
Argentina Brazil Italy Uzbekistan
Colombia Thailand Others
Institutional Equities
Gujarat Gas 28
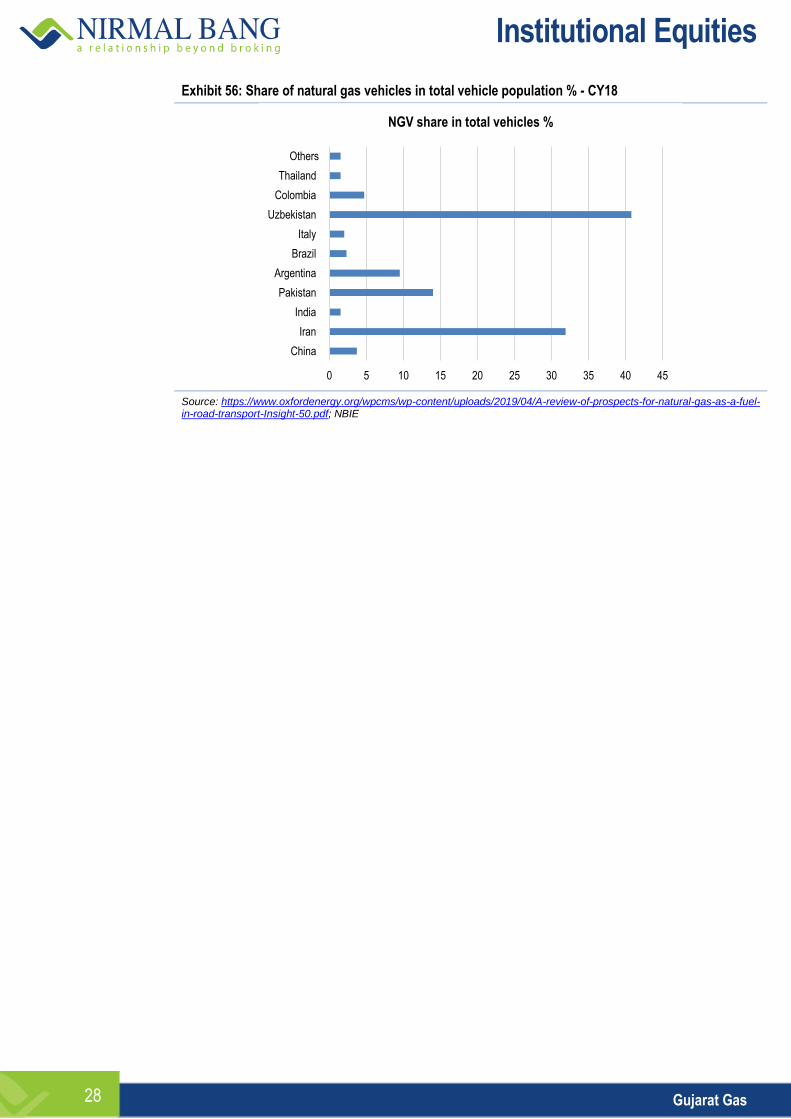
Exhibit 56: Share of natural gas vehicles in total vehicle population % - CY18
Source: https://www.oxfordenergy.org/wpcms/wp-content/uploads/2019/04/A-review-of-prospects-for-natural-gas-as-a-fuel-in-road-transport-Insight-50.pdf; NBIE
0 5 10 15 20 25 30 35 40 45
China
Iran
India
Pakistan
Argentina
Brazil
Italy
Uzbekistan
Colombia
Thailand
Others
NGV share in total vehicles %

Institutional Equities
Gujarat Gas 29
ANNEXURE 3: GGL Background
GGL holds 27 CGD licenses spread across 43 districts and six states and one Union Territory - around 11% of total CGD licenses and ~10% of total authorized areas issued by PNGRB in India, according to the company. GGL also holds one transportation pipeline license.
The company’s 30,000 kilometers of natural gas pipeline network covers 1,69,700 square kilometers of licensed area that serves more than 1.55mn residential consumers, 4,000 industrial units and over 13,000 commercial customers. GGL also sells CNG from 546 CNG stations as of March 2021.
The company had an overall sales volume of 9.39mmscmd in FY21, including 8.09/1.3 mmscmd of PNG/CNG in FY21.
In the most recent 4QFY21 results, GGL reported CGD volume in excess of 12mmscmd, including close to 10.4mmscmd of PNG – mainly industrial and another 1.7mmscmd of CNG (FY21). The CGD run-rate in 1QFY22 was reported at 10 mmscmd.
Exhibit 57: GGL - GAs/licensed areas
1. Surat- Bharuch- Ankleshwar
11. Union Territory of Dadra & Nagar Haveli
19. Narmada (Rajpipla) District
2. Nadiad 12. Palghar District and Thane Rural 20. Sirsa, Fatehabad and Mansa (Punjab) Districts
3. Navsari 13. Amreli District 21. *Ujjain District, *Dewas District and *Indore District
4. Rajkot 14. Dahej- Vagra Taluka 22. Jhabua, Banswara, Ratlam and Dungarpur Districts
5. Surendranagar 15. *Ahmedabad District 23. Ferozepur, Faridkot and Sri Muktsar Sahib Districts
6. Jamnagar 17. *Anand District 24. Hoshiarpur and Gurdaspur Districts
7. Bhavnagar 18. Panchmahal District 25. Jalore and Sirohi Districts
8. Hazira
26. Amritsar District
9. Kutch (West)
27. Bhatinda District
10. Valsad
Source: Company, Nirmal Bang Institutional Equities Research; note: * (Except area already authorized)
Exhibit 58: shareholding pattern
%
Promoter group 60.89
FII/FPI 8.64
DII 7.38
Others 23.09
Source: Bloomberg, Nirmal Bang Institutional Equities Research

Institutional Equities
Gujarat Gas 30
Exhibit 59: Key management personnel
Name Designation
Shri Anil Mukim Chairman of the Board of Directors
Shri Sanjeev Kumar Managing Director
Smt. Sunaina Tomar Director
Shri Milind Torawane Director
Dr. Manjula Subramaniam Independent Woman Director
Shri Jal Patel Independent Director
Shri K.D. Chatterjee Independent Director
Prof. Piyush Kumar Sinha Independent Director
Prof. Vishal Gupta Independent Director
Source: Company, Nirmal Bang Institutional Equities Research
Exhibit 60: Top shareholders
Shareholder Holding %
DSP Investment Managers 1.45
UTI Asset Management 0.99
Standard Life Aberdeen PLC 0.95
Canara Robeco Asset Management 0.94
Vanguard Group 0.93
Kotak Mahindra Asset Management 0.85
Axis Asset Management 0.71
Aditya Birla Sun Life Asset Management 0.48
Source: Bloomberg, Nirmal Bang Institutional Equities Research

Institutional Equities
Gujarat Gas 31
Annexure 4: QUARTERLY RESULTS
Exhibit 61: Consolidated 4QFY21 results
Y/E March (Rsmn) 4QFY20 4QFY21 Ch YoY% 3QFY21 Ch QoQ%
Net sales 26,666.3 34,289.2 28.6 28,294.0 21.19
Cost of goods 20,264.3 26,600.5 31.3 20,124.2 32.18
Contribution 6,402.0 7,688.7 20.1 8,169.8 -5.89
Employee benefits expenses 405.7 438.5 8.1 442.1 -0.81
Other expenses 1,729.7 1,707.7 (1.3) 1,579.6 8.11
EBITDA 4,266.6 5,542.5 29.9 6,148.1 -9.85
EBITDAM (%) 16.00 16.16 16.4 21.73 (556.5)
Depreciation 804.9 868.2 7.9 861.5 0.78
Other income 188.8 188.3 (0.3) 195.9 -3.88
Interest expenses 420.0 180.2 (57.1) 243.2 -25.90
PBT 3,230.5 4,682.4 44.9 5,239.3 -10.63
Tax 716.6 1,182.9 65.1 1,317.8 -10.24
PAT 2,513.9 3,499.5 39.2 3,921.5 -10.76
Share of Profits from Associates (9.6) 9.1 (194.8) 1.2 658.33
Consol Adj PAT 2,504.3 3,508.6 40.1 3,922.7 -10.56
Margins (%)
Gross 24.0 22.4 (158) 28.9 (645.2)
EBITDA 16.0 16.2 16 21.7 (556.5)
PAT 9.4 10.2 78 13.9 (365.4)
Effective Tax rate 22.2 25.3 308.0 25.2 11.0
Current tax rate 23.3 23.9 59 26.4 (254.3)
Per scm (Rs)
Net Revenues 29.5 31.4 6.6 26.9 16.9
Gross 7.1 7.0 (0.5) 7.8 (9.2)
EBITDA 4.7 5.1 7.7 5.8 (13.1)
PAT 2.8 3.2 16.1 3.7 (13.8)
Volumes (MMSCM)
Industrial 700.0 862.0 23.1 843.0 2.3
CNG 134.0 154.0 14.9 142.0 8.5
Domestic PNG 60.0 66.0 10.0 59.0 11.9
Commercial PNG 11.0 10.0 (9.1) 9.0 11.1
Total mmscm 905.0 1092.0 20.7 1053.0 3.7
Total Volumes (mmscmd) 9.9 12.1 22.0 11.4 6.0
Source: Company, Nirmal Bang Institutional Equities Research

Institutional Equities
Gujarat Gas 32
Financials- Consolidated
Exhibit 62: Income statement
Y/E March (Rs mn) FY20 FY21 FY22E FY23E FY24E
Net Revenue 1,03,003 98,543 1,31,799 1,63,497 1,79,696
y/y 32.83 -4.33 33.75 24.05 9.91
Raw Material Expenses 78,818 69,898 1,01,211 1,27,214 1,38,104
RM/Sales % 76.5 70.9 76.8 77.8 76.9
Employee cost 1,754 1,775 2,114 2,473 2,743
Other expenses 6,089 5,992 6,764 8,111 9,192
EBITDA 16,343 20,878 21,710 25,699 29,657
y/y 65.98 27.75 3.98 18.37 15.40
Depreciation 3,180 3,408 3,939 4,377 4,794
EBIT 13,163 17,470 17,771 21,322 24,863
Interest Expense 1,922 1,163 595 419 272
Other Income 839 742 842 1,092 1,592
PBT (adjusted) 12,080 17,048 18,018 21,995 26,184
Income Tax Expense 92 4,292 4,536 5,537 6,592
Associates inc/loss(+/-) (0) 21 21 21 21
PAT 11,988 12,777 13,503 16,478 19,613
EPS (Rs) 17.41 18.56 19.61 23.94 28.49
y/y 174.76 6.58 5.68 22.04 19.02
Source: Company, Nirmal Bang Institutional Equities Research
Exhibit 64: Balance sheet
Y/E March (Rs mn) FY20 FY21 FY22E FY23E FY24E
Equity Share Capital 1,377 1,377 1,377 1,377 1,377
Reserves and Surplus 31,797 43,739 55,671 70,407 88,106
Networth 33,174 45,116 57,048 71,784 89,483
Long Term Borrowings 18,344 7,700 5,264 3,624 1,984
Deferred Tax Liabilities [Net] 8,005 8,063 8,063 8,063 8,063
Other Long term liab. 636 649 649 649 649
Provisions 453 518 518 518 518
Lease Liabilities 450 630 630 630 630
Current Maturities 1,640 1,640 1,640 1,640 1,156
Trade Payable 3,684 4,472 5,454 6,766 7,437
Security Deposits 9,076 9,076 9,076 9,076 9,076
Short term provisions 130 245 245 245 245
Other current liabilities 3,663 6,689 6,689 6,689 6,689
Total Capital And Liabilities
79,254 84,797 95,277 1,09,685 1,25,930
Net Block 55,838 59,644 65,854 70,102 75,212
Capital Work-In-Progress 5,686 6,876 2,713 2,156 1,100
Intangibles under Development
9 2 9 9 9
Investments in JVs and Associates
281 281 281 281 281
Non-Current Investments 172 197 197 197 197
Long term loans and advances
610 712 712 712 712
Other Non-Current Assets 2,276 2,966 2,965 2,965 2,965
Inventories 463 522 1,805 2,240 2,462
Trade Receivables 5,101 7,831 10,833 14,782 16,246
Cash And Cash Equivalents 5,494 2,766 6,907 13,240 23,745
Bank balances other than cash
1,447 444 444 444 444
Other Current Assets 1,879 2,557 2,557 2,557 2,557
Total Assets 79,254 84,797 95,277 1,09,685 1,25,930
Source: Company, Nirmal Bang Institutional Equities Research
Exhibit 63: Cash flow
Y/E March (Rs mn) FY20 FY21 FY22E FY23E FY24E
PBT 12,080 17,048 18,018 21,995 26,184
Add depreciation 3,180 3,408 3,939 4,377 4,794
Other expenses/(Income) 1,348 798 (246) (672) (1,320)
Change in W/C (393) 537 3,303 3,072 1,016
Income tax 2,802 4,166 4,536 5,537 6,592
Cashflow from Operations (A) 14,200 16,552 13,871 17,090 22,049
Capex (5,955) (7,512) (5,993) (8,068) (8,848)
Purchase/(Sale) of Investments 704 974 - - -
Income on Investments 578 432 842 1,092 1,592
Other Income 7 3 - - -
Total Investments (4,666) (6,103) (5,151) (6,977) (7,257)
Free cash flow 9,534 10,449 8,720 10,113 14,793
Cashflow from Investing (B) (4,666) (6,103) (5,151) (6,977) (7,257)
Increase/(Decrease) in borrowings
(2,149) (11,016) (2,436) (1,640) (2,123)
Lease liability payments (131) (134) - - -
Dividends (including tax) paid -837.4 -863.3 -1548.9 -1721 -1893.1
Interest expense -1,906 -1,163 -595 -419 -272
Cashflow from Financing (C) -5,024 -13,177 -4,580 -3,780 -4,288
Ch in Cash and Cash equity 4,510 -2,728 4,140 6,333 10,505
Opening cash 984 5,494 2,766 6,907 13,240
Closing cash 5,494 2,766 6,907 13,240 23,745
Source: Company, Nirmal Bang Institutional Equities Research
Exhibit 65: Key ratios
Y/E March FY20 FY21 FY22E FY23E FY24E
Profitability & return ratios
EBITDA margin (%) 15.9 21.2 16.5 15.7 16.5
EBIT margin (%) 12.8 17.7 13.5 13.0 13.8
Adj Net profit margin (%) 11.6 12.9 10.2 10.1 10.9
RoE (%) 43.4 32.6 23.6 22.9 21.9
Pre-tax RoCE (%) 22.0 20.6 19.3 19.9 19.6
RoIC (%) 26.6 25.1 22.5 23.7 25.1
Working capital ratios
Receivables (days) 18.1 24.0 30.0 33.0 33.0
Inventory (days) 2.0 1.8 5.0 5.0 5.0
Payables (days) 12.8 15.1 15.1 15.1 15.1
Cash conversion cycle 7.3 10.7 19.9 22.9 22.9
Leverage ratios
Net debt/(Cash) (Rsmn) 13,043 6,130 -446 -8,420 -21,048
Net Debt (cash)/Equity (X) 0.39 0.14 -0.01 -0.12 -0.24
Net Debt/EBITDA 0.80 0.29 -0.02 -0.33 -0.71
Valuation ratios
EV/sales (x) 4.5 4.7 3.5 2.8 2.6
EV/EBITDA (x) 28.4 22.2 21.4 18.1 15.6
EV/FCF 48.7 44.4 53.2 45.9 31.4
P/E (x) 38.2 35.8 33.9 27.8 23.3
P/BV (x) 13.80 10.15 8.02 6.38 5.12
FCF Yield (%) 2.08 2.28 1.90 2.21 3.23
Dividend Yield (%) 0.19 0.30 0.34 0.38 0.41
Per share ratios
EPS 17.41 18.56 19.61 23.94 28.49
Cash EPS 22.03 23.51 25.34 30.30 35.45
BVPS 48.19 65.54 82.87 104.28 129.99
DPS 1.25 2.00 2.25 2.50 2.75
Source: Company, Nirmal Bang Institutional Equities Research

Institutional Equities
Gujarat Gas 33
DISCLOSURES
This Report is published by Nirmal Bang Equities Private Limited (hereinafter referred to as “NBEPL”) for private circulation. NBEPL is a registered Research Analyst under SEBI (Research Analyst) Regulations, 2014 having Registration no. INH000001436. NBEPL is also a registered Stock Broker with National Stock Exchange of India Limited and BSE Limited in cash and derivatives segments. NBEPL has other business divisions with independent research teams separated by Chinese walls, and therefore may, at times, have different or contrary views on stocks and markets. NBEPL or its associates have not been debarred / suspended by SEBI or any other regulatory authority for accessing / dealing in securities Market. NBEPL, its associates or analyst or his relatives do not hold any financial interest in the subject company. NBEPL or its associates or Analyst do not have any conflict or material conflict of interest at the time of publication of the research report with the subject company. NBEPL or its associates or Analyst or his relatives do not hold beneficial ownership of 1% or more in the subject company at the end of the month immediately preceding the date of publication of this research report. NBEPL or its associates / analyst has not received any compensation / managed or co-managed public offering of securities of the company covered by Analyst during the past twelve months. NBEPL or its associates have not received any compensation or other benefits from the company covered by Analyst or third party in connection with the research report. Analyst has not served as an officer, director or employee of Subject Company and NBEPL / analyst has not been engaged in market making activity of the subject company. Analyst Certification: I, Ramesh Sankaranarayanan, research analyst the author of this report, hereby certify that the views expressed in this research report accurately reflects my personal views about the subject securities, issuers, products, sectors or industries. It is also certified that no part of the compensation of the analyst was, is, or will be directly or indirectly related to the inclusion of specific recommendations or views in this research. The analyst is principally responsible for the preparation of this research report and has taken reasonable care to achieve and maintain independence and objectivity in making any recommendations.

Institutional Equities
Gujarat Gas 34
Disclaimer
Stock Ratings Absolute Returns
BUY > 15%
ACCUMULATE -5% to15%
SELL < -5%
This report is for the personal information of the authorized recipient and does not construe to be any investment, legal or taxation advice to you. NBEPL is not soliciting any action based upon it. Nothing in this research shall be construed as a solicitation to buy or sell any security or product, or to engage in or refrain from engaging in any such transaction. In preparing this research, we did not take into account the investment objectives, financial situation and particular needs of the reader.
This research has been prepared for the general use of the clients of NBEPL and must not be copied, either in whole or in part, or distributed or redistributed to any other person in any form. If you are not the intended recipient you must not use or disclose the information in this research in any way. Though disseminated to all the customers simultaneously, not all customers may receive this report at the same time. NBEPL will not treat recipients as customers by virtue of their receiving this report. This report is not directed or intended for distribution to or use by any person or entity resident in a state, country or any jurisdiction, where such distribution, publication, availability or use would be contrary to law, regulation or which would subject NBEPL & its group companies to registration or licensing requirements within such jurisdictions.
The report is based on the information obtained from sources believed to be reliable, but we do not make any representation or warranty that it is accurate, complete or up-to-date and it should not be relied upon as such. We accept no obligation to correct or update the information or opinions in it. NBEPL or any of its affiliates or employees shall not be in any way responsible for any loss or damage that may arise to any person from any inadvertent error in the information contained in this report. NBEPL or any of its affiliates or employees do not provide, at any time, any express or implied warranty of any kind, regarding any matter pertaining to this report, including without limitation the implied warranties of merchantability, fitness for a particular purpose, and non-infringement. The recipients of this report should rely on their own investigations.
This information is subject to change without any prior notice. NBEPL reserves its absolute discretion and right to make or refrain from making modifications and alterations to this statement from time to time. Nevertheless, NBEPL is committed to providing independent and transparent recommendations to its clients, and would be happy to provide information in response to specific client queries.
Before making an investment decision on the basis of this research, the reader needs to consider, with or without the assistance of an adviser, whether the advice is appropriate in light of their particular investment needs, objectives and financial circumstances. There are risks involved in securities trading. The price of securities can and does fluctuate, and an individual security may even become valueless. International investors are reminded of the additional risks inherent in international investments, such as currency fluctuations and international stock market or economic conditions, which may adversely affect the value of the investment. Opinions expressed are subject to change without any notice. Neither the company nor the director or the employees of NBEPL accept any liability whatsoever for any direct, indirect, consequential or other loss arising from any use of this research and/or further communication in relation to this research. Here it may be noted that neither NBEPL, nor its directors, employees, agents or representatives shall be liable for any damages whether direct or indirect, incidental, special or consequential including lost revenue or lost profit that may arise from or in connection with the use of the information contained in this report.
Copyright of this document vests exclusively with NBEPL.
Our reports are also available on our website www.nirmalbang.com
Access all our reports on Bloomberg, Thomson Reuters and Fact set.
Team Details:
Name Email Id Direct Line
Rahul Arora CEO [email protected] -
Girish Pai Head of Research [email protected] +91 22 6273 8017 / 18
Dealing
Ravi Jagtiani Dealing Desk [email protected] +91 22 6273 8230, +91 22 6636 8833
Michael Pillai Dealing Desk [email protected] +91 22 6273 8102/8103, +91 22 6636 8830
Nirmal Bang Equities Pvt. Ltd.
Correspondence Address
B-2, 301/302, Marathon Innova,
Nr. Peninsula Corporate Park,
Lower Parel (W), Mumbai-400013.
Board No. : 91 22 6273 8000/1; Fax. : 022 6273 8010