guam education board (geb) - ERIC
86
-
Upload
khangminh22 -
Category
Documents
-
view
1 -
download
0
Transcript of guam education board (geb) - ERIC


This page is left intentionally blank.


GUAM EDUCATION BOARD (GEB) SY 2015-2016
VOTING MEMBERS
Lourdes B. San Nicolas, Chairperson
Rosie R. Tainatongo, Vice-Chairperson
MembersPeter Alecxis D. Ada
Lourdes M. BenaventeKenneth P. Chargualaf
Charlene D. ConcepcionJose Q. Cruz, Ed. D.Maria A. Gutierrez
Ryan F. Torres
EX-OFFICIO MEMBERS
Ermin Samelo (SHS)IBOGS Representative
Audrey Perez (SSHS)GFT Representative
Mayor, Rudy M. MatananeMCOG Representative
EXECUTIVE SECRETARYJon J. P. Fernandez
DOE Superintendent


This page is left intentionally blank.

Introduction
District Profile Student Demographic Information
Assessment and Outcomesi. ACT Aspire Participantsii. ACT Aspire Assessment Results (Elementary, Middle and High School) iii. ACT Aspire TEst REsult COhort SY 14-15 & SY 15-16 iv. DIstrict-wide Assessment Results for Students with Disabilitiesv. Special Education Alternate Assessment vi. Assessment Accomodations and Alternate Assessmentsvii. Graduation Ratesvii. Drop Out Rates
Personnel Quality and Accountability i. Employee Demographics ii. School Administration and Staff Certification Budget and Expenditures School Exemplary Programs And AchievementsElementary, Middle and High School
Appendices
Acknowledgments
01
02
05
24
29
32
55
77
For More Information:Office of the Superintendent
Guam Department of Education500 Mariner Avenue,
Barrigada, Guam 96913Tel: (671) 300-1547
Email: [email protected]
page Table Of Contents
Annual State of Public Education Report SY15-16

he mission statement of the Guam Department of Education holds firm to its goal, that is, to prepare ALL students for life, promote excellence, and provide support. The vision statement is to educate ALL students to be responsible, respectful, and ready for life.
T

| 1SY 15-16 Annual State of Public Education Report
The Guam Department of Education (“GDOE”) presents this report in compliance with Guam Public Law 26-26 that specifically requires the Department to report on the following information in the Annual State of Public Education Report (“ASPER”):
A. Demographic information on public school children in the community;
B. Information pertaining to student achievement, including Guam-wide assessment data, graduation rates and dropout rates, including progress toward achieving the education benchmarks established by the Board;
C. Information pertaining to special program offerings;
D. Information pertaining to the characteristics of the schools and schools’ staff, including certification and assignment of teachers and staff experience;
E. Budget information, including source and disposition of school operating funds and salary data;
F. Examples of exemplary programs, proven practices, programs designed to reduce costs or other innovations in education being developed by the schools that show improved student learning
Additionally, 17 GCA Section 3106 that states that “No later than thirty (30) days following the end of each fiscal year, the Superintendent shall issue a School Performance Report Card (SPRC) on the state of the public schools and the progress towards achieving their goals and mission.”
GDOE first initiated the collection and reporting of student, staff, and administrative data in 1996 when the first Annual District and School Report Cards were developed and disseminated. In providing information on the characteristics of schools and performance of students, reports of this nature have served as a means for identifying strengths and challenges of the district, while highlighting the collaborative efforts to bring the vision that all GDOE students will be respectful, responsible and ready for life. Toward this end, the Department stands firm to its mission to prepare ALL students for life, promote excellence, and provide support!
Introduction

2 |
SY 14-15 SY 15-16 COMPARATIVEDIFFERENCE
Head Start 524 514 -10Pre-School 0 0 0Kindergarten 2,082 2,055 -27Grade 1 2,424 2,272 -152Grade 2 2,370 2,378 8Grade 3 2,326 2,350 24Grade 4 2,282 2,261 -21Grade 5 2,348 2,260 -88Grade 6 2,215 2,252 37Grade 7 2,215 2,185 -30Grade 8 2,292 2,238 -54
Grade 9 3,058 3,309 251Grade 10 2,984 2,690 -294Grade 11 2,369 2,350 -19Grade 12 1,572 1,668 96Alternative 83 39 -44
TOTAL ENROLLMENT with Headstart + Pre-school
31,144 30,821 -323
TOTAL ENROLLMENT w/o HeadStart & Pre-School
30,620 30,307 -313
(Note: Students enrolled in the federally funded Head Start program are included in the total student population. However, participation in this program is limited to income- eligible families.)
Student Demographic InformationDuring School Year (“SY”) 2015-2016, there were forty-one (41) public schools that provided educational services for 30,307 students. Further breakdown by levels showed twenty-six (26) elementary schools totaling 13,576 students in Grades K-5 and 514 students in Head Start, eight (8) middle schools totaling 6,675 students in Grades 6-8 and six (6) high schools totaling 10,017 students in Grades 9-12 and one Alternative School .
ENROLLMENTTable 1.
DOE Comparative Student Enrollment Distribution by Grade for SY 14-15 & SY15-16
Table 1. represents the student enrollment comparison between School Years (“SY”) 2014-2015 and 2015-2016. Over the last two school years, the student population decreased by 323. Within grade levels, there were noticeable variances in enrollment, with increases in Grades 2, 3, 6, 9 and 12 while all the other grades showed decreases in enrollment.
District Profile

| 3SY 15-16 Annual State of Public Education Report
Table 2. The slight decrease in the enrollment of students with disabilities eligible for services (-56 students) may be attributed to several factors: students and families relocating off-island and/or eligibility meetings that have not been conducted for students who have the potential to receive special education and related services. Additionally, the official Child Count reported to the Office of Special Education Programs (OSEP) and to USDOE through the EDFacts Reporting System is on December 1 of each school year, which may differ from the number reflected in the above table which takes into account the number of children with disabilities eligible for special education and related services on October 1st for SY2015-2016.
The enrollment for Eskuelan Puengi increased because in SY 15-16 the program was opened to all students. Prior to that, the program focused on Juniors and Seniors needing credit to graduate or be seniors the following school year.
Figure 1. represents the student population distribution of all forty-one (41) schools by grade level. Elementary level students comprised the highest percentage 45% of all students enrolled. Middle school students represented 22% of the total student enrollment and high school students made up 33%.
Figure 2. represents the student enrollment by gender, K-12 enrollment, exclusive of the Head Start enrollment. Male students comprise 53% of the total student population with an enrollment of 16,001 while female students comprise 47% of the population with an enrollment of 14,306.
SPECIAL PROGRAMS
SY 14-15
SY 15-16
GATE 1,675 1,379
SPED 1,997 1,941
ELL 14,840 14,549
HeadStart 524 514
Eskuelan Puengi 631 915
TOTAL 19,667 19,298
Table 2.Student Enrollment in Special Programs
Figure 1.
*Source: Special Ed Division, GATE Program; 2015-2016 ESL Program; Official SpEd Enrollment as of Oct. 1, 2015; ASPIRE Report from Project Director; Official Student Enrollment SY2015-2016; Eskuelan Puengi Report from Project Director (Note: Numbers reflect students enrolled in more than one special program.)
Figure 2.

4 |
Table 4 SY 15-16 Student Average Daily Membership/Attendance/Rate
SCHOOL LEVEL
AVERAGE DAILYMEMBERSHIP
AVERAGE DAILY ATTENDANCE
ATTENDANCE RATE
Elementary Schools 13,495 12,619 93.5%
Middle Schools 6,608 5,953 90.1%High Schools 9,795 8,023 81.9%
TOTAL 29,922 26,102 87.2%
Table 3 SY 15-16 Distribution of Students by Ethnicity (Aligned with EDFacts Categories)
Ethnicity Female Male Total %American Indian Alaskan Native 3 12 15 0.0%
Asian - Chinese 57 63 120 0.4%
Asian - Filipino 3,098 3,525 6,623 21.9%Asian - Indonesian 1 7 8 0.0%
Asian - Japanese 60 68 128 0.4%Asian - Korean 53 89 142 0.5%
Asian - Vietnamese 12 15 27 0.1%African American 25 20 45 0.1%
Hispanic 18 29 47 0.2%White, Non-Hispanic 89 95 184 0.6%
NHPI - Chamorro 6,777 7,704 14,481 47.8%NHPI- Chuukese 2,603 2,785 5,388 17.8%NHPI- Hawaiian 23 17 40 0.1%
NHPI - Kosraean 99 96 195 0.6%NHPI - Marshallese 58 59 117 0.4%
NHPI - Palauan 303 319 622 2.1%NHPI- Pohnpeian 507 505 1012 3.3%
NHPI - Samoan 11 12 23 0.1%NHPI - Yapese 206 252 458 1.5%
Other Ethnicity, Mixed 303 329 632 2.1%TOTAL 14,306 16,001 30,307 100%
Table 3. represents the distribution of students by ethnicity. In SY15-16, there were 30,307 locally funded students enrolled in GDOE, representing at least 21 ethnic groups. The Native Hawaiian or Other Pacific Islander include the Hawaiian, Chamorro, Filipino, Freely Associated States (FAS) and Other Pacific students. Asians include the Japanese, Chinese, Korean, Indonesian and Vietnamese ethnic groups. Pacific Islander includes Samoan, Kosraean, Pohnpeian, Chuukese, Yapese, Marshallese, Palauan, and Fijian. “Other” is comprised of Unknown and Unclassified categories.
Table 4. represents the attendance rate for the district which is determined by dividing the average daily attendance by the average daily membership. Further examination shows that the elementary schools had the highest average daily attendance rate at 93.5% when compared to the middle schools, at 90.1%, and high schools, at 81.9%.
*Native Hawaiian/Pacific Islander (NHPI)

| 5SY 15-16 Annual State of Public Education Report
In February 2012, the Guam Education Board (“GEB”) adopted the Common Core State Standards (CCSS). The CCSS is a set of high quality academic standards that ensure all students are ready for success after high school through clear, consistent guidelines for what every student should know and be able to do in math and English language arts from kindergarten through 12th grade. With the district-wide implementation of the Common Core in August 2014, the need to adopt an assessment system that measures progress against these goals and help teachers and parents track how students are doing and where they need additional support became very apparent.
In September 2014, the Board adopted the State Strategic Plan (SSP) and the Comprehensive Student Assessment System (CSAS). The Strategic Plan outlines the Department’s vision, mission, goals and objectives through 2020. The Plan focuses on helping all students to be ready for college or career by ensuring that all GDOE staff adheres to high standards of service delivery, that the learning environment for all students is safe, positive and supportive, and that resources are utilized to the maximum while meeting high standards of accountability.
The adoption of the Common Core, the State Strategic Plan, and the Comprehensive Assessment System comprise the district’s attempt at aligning curriculum, instruction, intervention, and student assessment. These curricular changes required the adoption of standards-based assessment that aligns with the Common Core and the Plan. The CSAS is a combination of standards-based formative assessments administered throughout the school year and district wide summative assessments administered toward the end of the school year. This section comprises the results of the two summative assessments administered for the first time in spring 2015: the ACT Aspire and the locally developed Standards-Based Assessment tests. The ACT Aspire is vertically-scaled and benchmarked system of standards-based assessment that can be used to track progress towards the Common Core State Standards and the ACT College Readiness Standards. It is vertically scaled and designed to measure students’ progress in English, reading math, science, and writing from grades 3 through 10 toward readiness for college and career, allowing comparisons of one grade level to another and of one cohort to another. The student’s raw score is transmuted into a three-digit scale score that provides a common language
Assessments and Outcomes

6 |
ACT Aspire Paricipants
for discussing student achievement over time. The ACT Aspire report shows not only the longitudinal growth of the student but also vertically linked to college and career data with a predicted score range on the ACT college entrance examination. Scale scores that are above, below, or significantly below the ACT readiness benchmark are respective categorized as “Ready”, “Close”, or “In need of support” following a range of scale scores for each subject and grade level that are used to determine a student’s proficiency level.
The Standards-Based Assessment (SBA) tests were developed by Guam teachers for grade levels 1, 2, 11, and 12 not tested in ACT Aspire in in subjects areas such as Science and Social Science not covered in ACT Aspire. The raw scores are also transmuted into scale scores and described according to the following performance levels: Advanced, Proficient, Basic, and Below Basic.
GDOE administered the SAT9 to students from SY 95-96 to SY 03-04, and began testing students with the SAT10 in SY 04-05 until SY 13-14. However, as noted earlier, with the adoption of the Common Core and the CSAS, GDOE administered the ACT Aspire and the SBA on SY 15-16.
GRADE LEVELS
NUMBER OFSTUDENTS
TESTED
NUMBER OFSTUDENTS ENROLLED
PERCENT OF TOTAL TESTED
Grade 3 2,264 2,350 96%
Grade 4 2,218 2,261 98%
Grade 5 2,307 2,260 102%
Grade 6 2,127 2,252 94%
Grade 7 2,193 2,185 100%
Grade 8 2,262 2,238 101%
Grade 9 2,998 2,209 91%
Grade 10 2,2351 2,690 87%
Table 5.SY 15-16 Distribution of Students Tested in ACT Aspire
(English, Reading, and Math) by Grade
Table 5. depict the number of students in SY 15-16 that took the ACT Aspire test. The percentages indicate the participation rates by grade level in comparison to the total number of students tested.
*Some percentages are more than 100% because thedenominator used as the Official Enrollment as of September 2015.

| 7SY 15-16 Annual State of Public Education Report
ACT Aspire Elementary School Level The test results in ACT Aspire transmuted into scores and categorized according to the following proficiency levels.
Proficiency Levels in ACT Aspire:Ready: Indicates student met the ACT Readiness Benchmark and on target for 50% or higher likelihood of college course success by Grade 11
Close: Indicates student scored below but near the ACT Readiness Benchmark
In need of support: Scored substantially below the ACT Readiness Benchmark
Figure 5. ACT Aspire Assessment Results 3rd Grade MATH
Figure 4. ACT Aspire Assessment Results 3rd Grade READING
Figure 3. ACT Aspire Assessment Results 3rd Grade ENGLISH
School Year In need Close Ready TOTAL
SY14-15 12% 47% 41% 100%
SY15-16 17% 36% 47% 100%
School Year In need Close Ready TOTAL
SY14-15 77% 12% 10% 100%
SY15-16 77% 15% 8% 100%
School Year In need Close Ready TOTAL
SY14-15 45% 38% 17% 100%
SY15-16 48% 33% 20% 100%
SY 14-15 SY 15-16 SY 14-15 SY 15-16 SY 14-15 SY 15-16
Figure 3. shows that in SY 15-16, Forty seven percent (47%) of 3rd graders are at a READY level of proficiency in ENGLISH, six percent (6%) higher than the previous year. However, IN NEED OF SUPPORT level was up five percent (5%) from tweleve percent (12%) SY 14-15 to seventeen percent (17 %) SY 15-16.
Figure 4. for SY 15-16, Seventy -seven percent (77%) of 3rd grade students are IN NEED OF SUPPORT based on the ACT Aspire Assessment Results in READING, and only eight percent (8%) are at a READY level.
The ACT Aspire assessment result for MATH, as shown in Figure 5. shows twenty percent (20%) of 3rd graders are at a READY level, while forty-eight (48%) percent are still IN NEED OF SUPPORT.

8 |
Figure 9. Forty - five percent (45%) of fifth (5th) graders are at a READY Level for ENGLISH. Only fifteen percent (15%) are IN NEED of SUPPORT. Four (4) out of ten (10) students, (40%) are CLOSE to the readiness level benchmark.
As shown on Figure 7. SY 15-16, only 11% are assessed as READY in the READING. 27% are CLOSE to the readiness benchmark, and sixty -two percent (62%), which means nearly 6 out of 10 students of 4th grade students, are IN NEED OF SUPPORT.
Figure 10. shows that 5th grade READING ACT Aspire results from SY 14-15 and SY 15-16 are the same. There is only a one percent (1%) decrease in the CLOSE to readiness benchmark from SY 14-15 ( 23%) and SY 15-16 (22%).
Figure 8. shows more than half (55%) of 4th grade students are CLOSE to the readiness benchmark in MATH. However, there was a five percent (5%) increase for SY 16-15 (33%) on the IN NEED of SUPPORT level compared to SY 14-15 (28%).
In Figure 11. 5th grade MATH results shows that 1 out of 10 (11%) students in SY 15-16 demonstrated READY level in ACT Aspire. While more than half at fifty-four (54%) of 5th grade students were CLOSE to being ready.
Figure 6. represents the 4th grade ACT Aspire Assessment Result for ENGLISH. It shows that forty-four percent (44%) are at READY level, and only nineteen percent (19%) are IN NEED OF SUPPORT.
ACT Aspire Elementary School Level Figure 6. ACT Aspire Assessment Results
4th Grade ENGLISHFigure 7. ACT Aspire Assessment Results
4th Grade READING Figure 8. ACT Aspire Assessment Results
4th Grade MATH
Figure 9. ACT Aspire Assessment Results 5th Grade ENGLISH
Figure 10. ACT Aspire Assessment Results 5th Grade READING
Figure 11. ACT Aspire Assessment Results 5th Grade MATH
School District In need Close Ready TOTAL
SY14-15 16% 40% 44% 100%
SY15-16 19% 37% 44% 100%
School District In need Close Ready TOTAL
SY14-15 64% 24% 11% 100%
SY15-16 62% 27% 11% 100%
School District In need Close Ready TOTAL
SY14-15 28% 58% 14% 100%
SY15-16 33% 55% 12% 100%
School Year In need Close Ready TOTAL
SY14-15 14% 41% 45% 100%
SY15-16 15% 40% 45% 100%
School Year In need Close Ready TOTAL
SY14-15 66% 23% 12% 100%
SY15-16 66% 22% 12% 100%
School Year In need Close Ready TOTAL
SY14-15 31% 59% 10% 100%
SY15-16 35% 54% 11% 100%
SY 14-15 SY 15-16 SY 14-15 SY 15-16 SY 14-15 SY 15-16
SY 14-15 SY 15-16 SY 14-15 SY 15-16 SY 14-15 SY 15-16

| 9SY 15-16 Annual State of Public Education Report
Figure 12. shows forty-eight percent (48%) of 6th grade students are in the READY level in ACT Aspire ENGLISH. A comparison between SY 14-15 and SY 15-16 shows a three percent (3%) decrease the IN NEED of SUPPORT level.
In Figure 15., more than half (53%) of the 7th Grade students are at READY Level in ACT Aspire ENGLISH. A comparison between SY 14-15 and SY 15-16 shows a two percent (2%) decrease the IN NEED of SUPPORT level.
For the 6th grade READING, as shown on Figure 13., sixty-three percent (63%) of students are at IN NEED of SUPPORT levels. Only tweleve percent (12%) are at READY Level.
As shown in Figure 16., fifty -six percent (56%) of 7th grade students scored substantially below the ACT Readiness benchmark. Only seventeen percent (17%) are in READY level for 7th Grade READING.
Figure 14. shows that fifteen percent 15% of 6th graders demonstrated READY level in ACT Aspire MATH, and forty-four percent (44%) are CLOSE to readiness.
For Figure 17., the 7th grade, only 5% are at READY level in ACT Aspire MATH. Meanwhile, there was a nine percent (9%) increase as reflected on the results that are below the ACT Readiness benchmark (SY14-15, 62% to SY 15-16, 71%).
ACT Aspire Middle School LevelFigure 12. ACT Aspire Assessment Results
6th Grade ENGLISHFigure 13. ACT Aspire Assessment Results
6th Grade READING Figure 14. ACT Aspire Assessment Results
6th Grade MATH
Figure 15. ACT Aspire Assessment Results 7th Grade ENGLISH
Figure 16. ACT Aspire Assessment Results 7th Grade READING
Figure 17. ACT Aspire Assessment Results 7th Grade MATH
School District In need Close Ready TOTAL
SY14-15 19% 33% 48% 100%
SY15-16 16% 36% 48% 100%
School District In need Close Ready TOTAL
SY14-15 58% 28% 13% 100%
SY15-16 63% 26% 12% 100%
School District In need Close Ready TOTAL
SY14-15 44% 42% 14% 100%
SY15-16 41% 44% 15% 100%
School District In need Close Ready TOTAL
SY14-15 16% 32% 52% 100%
SY15-16 14% 33% 53% 100%
School District In need Close Ready TOTAL
SY14-15 53% 30% 17% 100%
SY15-16 56% 28% 17% 100%
School District In need Close Ready TOTAL
SY14-15 62% 33% 6% 100%
SY15-16 71% 24% 5% 100%
SY 14-15 SY 15-16 SY 14-15 SY 15-16 SY 14-15 SY 15-16
SY 14-15 SY 15-16 SY 14-15 SY 15-16 SY 14-15 SY 15-16

10 |
Figure 18. Fifty -four percent (54%) of 8th graders are at a READY Level for ACT Aspire ENGLISH amd only twelve percent (12%) are IN NEED of SUPPORT. Three (3) out of ten (10) students, (30%) are CLOSE to the readiness level benchmark.
As shown in Figure 19. about 5 out of 10 (51%) GDOE 8th graders in SY 15-16 performed below average- IN NEED OF SUPPORT- level in ACT Aspire READING. Twenty-four percent (28%) of GDOE 8th graders are at READY Level.
Figure 20. shows that three percent (3%) of GDOE 8th graders in SY 15-16 performed at the Ready level in MATH. Eight (8) out of ten (10) students (83%) are below average or IN NEED OF SUPPORT Level.
ACT Aspire Middle School LevelFigure 18. ACT Aspire Assessment Results
8th Grade ENGLISHFigure 19. ACT Aspire Assessment Results
8th Grade READING Figure 20. ACT Aspire Assessment Results
8th Grade MATH
SY 14-15 SY 15-16 SY 14-15 SY 15-16 SY 14-15 SY 15-16School Year In need Close Ready TOTAL
SY14-15 13% 32% 54% 100%
SY15-16 12% 30% 58% 100%
School Year In need Close Ready TOTAL
SY14-15 50% 24% 25% 100%
SY15-16 51% 25% 24% 100%
School Year In need Close Ready TOTAL
SY14-15 84% 12% 3% 100%
SY15-16 83% 13% 4% 100%

| 11SY 15-16 Annual State of Public Education Report
ACT Aspire High School LevelFigure 21. ACT Aspire Assessment Results
9th Grade ENGLISH
Figure 24. ACT Aspire Assessment Results 10th Grade ENGLISH
Figure 22. ACT Aspire Assessment Results 9th Grade READING
Figure 25. ACT Aspire Assessment Results 10th Grade READING
Figure23. ACT Aspire Assessment Results 9th Grade MATH
Figure 26. ACT Aspire Assessment Results 10th Grade MATH
Figure 21., represents the assessment results for SY 15-16 9th Grade ENGLISH. It indicates 34% of student in the 9th graders are at READY Level.
Figure 24. The 10th Grade ACT Aspire ENGLISH indicates forty-three percent (43%) are at READY Level. twenty-three percent 23% of student are at CLOSE Level.
Figure 22. Assessment results for 9th Grade READING indicates six out of ten students (60%) are IN NEED OF SUPPORT. Sixteen percent (16%) are at READY level.
Figure 25. Assessment results for 10th Grade READING indicates six out of ten students (62%) are IN NEED OF SUPPORT. Sixteen percent (18%) are at READY level.
Figure 23. Assessment results for 9th Grade MATH indicates eighty-six percent 86% are IN NEED OF SUPPORT, while only four percent (4%) are at READY level.
Figure 26. Assessment results for SY15-16 10th Grade ACT Aspire MATH as indicated on Figure 26., shows only 3% are at READY Level and 89% are IN NEED OF SUPPORT.
School District In need Close Ready TOTAL
SY14-15 40% 28% 31% 100%
SY15-16 39% 28% 34% 100%
School District In need Close Ready TOTAL
SY14-15 35% 28% 37% 100%
SY15-16 34% 23% 43% 100%
School District In need Close Ready TOTAL
SY14-15 61% 22% 16% 100%
SY15-16 60% 24% 16% 100%
School District In need Close Ready TOTAL
SY14-15 65% 19% 16% 100%
SY15-16 62% 20% 18% 100%
School District In need Close Ready TOTAL
SY14-15 85% 11% 4% 100%
SY15-16 86% 10% 4% 100%
School District In need Close Ready TOTAL
SY14-15 93% 5% 3% 100%
SY15-16 89% 7% 4% 100%
SY 14-15 SY 15-16
SY 14-15 SY 15-16
SY 14-15 SY 15-16
SY 14-15 SY 15-16
SY 14-15 SY 15-16
SY 14-15 SY 15-16
12 |
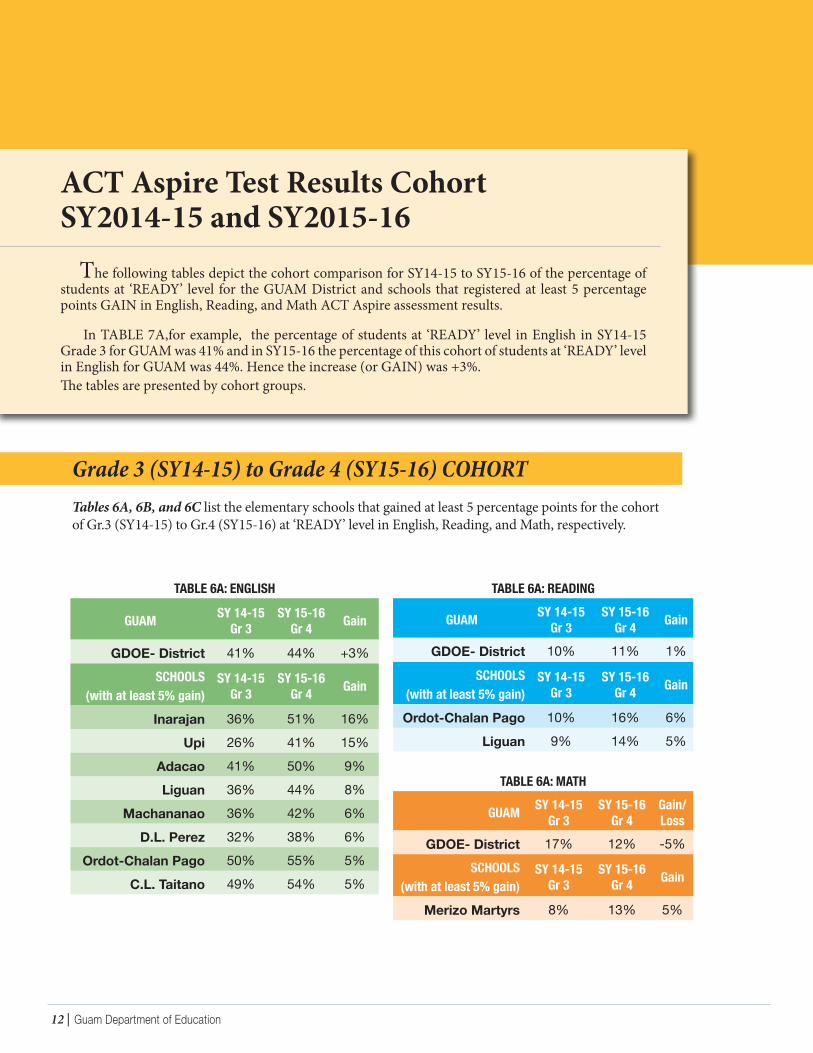
TABLE 6A: ENGLISH
GUAM SY 14-15 Gr 3
SY 15-16Gr 4 Gain
GDOE- District 41% 44% +3%SCHOOLS
(with at least 5% gain)SY 14-15
Gr 3SY 15-16
Gr 4 Gain
Inarajan 36% 51% 16%
Upi 26% 41% 15%
Adacao 41% 50% 9%
Liguan 36% 44% 8%
Machananao 36% 42% 6%
D.L. Perez 32% 38% 6%
Ordot-Chalan Pago 50% 55% 5%
C.L. Taitano 49% 54% 5%
ACT Aspire Test Results Cohort SY2014-15 and SY2015-16 The following tables depict the cohort comparison for SY14-15 to SY15-16 of the percentage of students at ‘READY’ level for the GUAM District and schools that registered at least 5 percentage points GAIN in English, Reading, and Math ACT Aspire assessment results.
In TABLE 7A,for example, the percentage of students at ‘READY’ level in English in SY14-15 Grade 3 for GUAM was 41% and in SY15-16 the percentage of this cohort of students at ‘READY’ level in English for GUAM was 44%. Hence the increase (or GAIN) was +3%. The tables are presented by cohort groups.
TABLE 6A: READING
GUAM SY 14-15 Gr 3
SY 15-16 Gr 4 Gain
GDOE- District 10% 11% 1%
SCHOOLS (with at least 5% gain)
SY 14-15 Gr 3
SY 15-16 Gr 4 Gain
Ordot-Chalan Pago 10% 16% 6%
Liguan 9% 14% 5%
TABLE 6A: MATH
GUAM SY 14-15 Gr 3
SY 15-16 Gr 4
Gain/Loss
GDOE- District 17% 12% -5%SCHOOLS
(with at least 5% gain)SY 14-15
Gr 3SY 15-16
Gr 4 Gain
Merizo Martyrs 8% 13% 5%
Grade 3 (SY14-15) to Grade 4 (SY15-16) COHORTTables 6A, 6B, and 6C list the elementary schools that gained at least 5 percentage points for the cohort of Gr.3 (SY14-15) to Gr.4 (SY15-16) at ‘READY’ level in English, Reading, and Math, respectively.

| 13SY 15-16 Annual State of Public Education Report
TABLE 7B: READING
GUAM SY 14-15 Gr 4
SY 15-16 Gr 5 Gain
GDOE District 11% 12% 1%
SCHOOLS (with at least 5% gain)
SY 14-15 Gr 4
SY 15-16 Gr 5 Gain
D.L.Perez 12% 19% 7%
Ma. Ulloa 7% 14% 7%TABLE 7C: MATH
GUAM SY 14-15 Gr 4
SY 15-16 Gr 5
Gain/Loss
GDOE District 14% 11% -3%
SCHOOLS (with at least 5% gain)
SY 14-15 Gr 4
SY 15-16 Gr 5 Gain
Ordot Chalan Pago 15% 23% 8%
Adacao 13% 18% 5%
Grade 4 (SY14-15) to Grade 5 (SY15-16) COHORTTables 7A, 7B, and 7C list the elementary schools that gained at least 5 percentage points among students at READY level for the Gr.4 (SY14-15) to Gr.5 (SY15-16) cohort, in English, Reading, and Math, respectively.
Grade 6 (SY14-15) to Grade 7 (SY15-16) COHORTTables 8A and 8B show middle schools that gained at least 5 percentage points in ENGLISH and
READING for the Gr.6 (SY14-15) to Gr.7 (SY15-16) cohort.
TABLE 7A: ENGLISH
GUAM SY 14-15 Gr 4
SY 15-16 Gr 5 Gain
GDOE District 44% 45% 1%
SCHOOLS (with at least 5% gain)
SY 14-15 Gr 4
SY 15-16 Gr 5 Gain
Tamuning 40% 51% 11%
Marcial A. Sablan 35% 43% 7%
Chief Brodie 45% 51% 6%
D.L. Perez 47% 52% 5%
TABLE 8A: ENGLISH
GUAM SY 14-15 Gr 6
SY 15-16 Gr7 Gain
GDOE- District 48% 53% +5%
SCHOOLS(with at least 5% gain)
SY 14-15 Gr 6
SY 15-16 Gr 7 Gain
Astumbo Middle 45% 53% 8%V. Benavente 52% 60% 8%
Agueda Johnston 45% 51% 6%FB Leon Guerrero 42% 47% 5%
TABLE 8B: READING
GUAM SY 14-15 Gr 6
SY 15-16 Gr7 Gain
GDOE- District 13% 17% +4%
SCHOOLS (with at least 5% gain)
SY 14-15 Gr 6
SY 15-16 Gr 7 Gain
Astumbo Middle 9% 20% 11%
V. Benavente 13% 21% 8%
Oceanview Middle 12% 17% 5%
TABLE 8C: MATH
GUAM SY 14-15 Gr 6
SY 15-16 Gr 7
Gain/Loss
GDOE-District 14% 5% -9%
SCHOOLS (with at least 5% gain)
SY 14-15 Gr 3
SY 15-16 Gr 4 Gain
None - - -

14 |
Grade 7 (SY14-15) to Grade 8 (SY15-16) COHORT Tables 9A and 9B show middle schools that gained at least 5 percentage points in ENGLISH and READING for the Gr.7 (SY14-15) to Gr.8 (SY15-16) cohort. TABLE 9A: ENGLISH
GUAM SY 14-15 Gr 7
SY 15-16 Gr8 Gain
GDOE- District 52% 58% +6%
SCHOOLS (with at least 5% gain)
SY 14-15 Gr 7
SY 15-16 Gr 8 Gain
Oceanview Middle 49% 66% +17%
FB Leon Guerrero 43% 52% +9%
Agueda Johnston 48% 56% +8%
LP Untalan 58% 65% +7%
Jose Rios Middle 49% 54% +5%
Astumbo Middle 46% 51% +5%
TABLE 10A: ENGLISH
GUAM SY 14-15 Gr 7
SY 15-16 Gr8 Gain
GDOE- District 52% 58% +6%
SCHOOLS (with at least 5% gain)
SY 14-15 Gr 7
SY 15-16 Gr 8 Gain
JF Kennedy 49% 66% +17%
Simon Sanchez 43% 52% +9%
G. Washington 48% 56% +8%
Okkodo 58% 65% +7%
Tiyan High 49% 54% +5%
TABLE 9B: READING
GUAM SY 14-15 Gr 7
SY 15-16 Gr8 Gain
GDOE- District 17% 24% +7%
SCHOOLS (with at least 5% gain)
SY 14-15 Gr 7
SY 15-16 Gr8 Gain
Oceanview Middle 20% 32% +12%
V. Benavente 20% 31% +11%
Astumbo Middle 11% 22% +11%
Agueda Johnston 14% 23% +9%
LP Untalan 18% 26% +8%
Jose Rios Middle 15% 20% +5%
TABLE 9C: MATH
GUAM SY 14-15 Gr 7
SY 15-16 Gr 8
Gain/Loss
GDOE-District 6% 4% -2%
SCHOOLS (with at least 5% gain)
SY 14-15 Gr 7
SY 15-16 Gr8 Gain
None - - -
Grade 9 (SY14-15) to Grade 10 (SY15-16) COHORTTables 10A, 10B, and 10C depict the high schools that gained at least 5 percentage points, Grade 9 (SY14-15) to Gr.10 (SY15-16, in English, Reading, and Math, respectively).
TABLE 10B: READING
GUAM SY 14-15 Gr 9
SY 15-16 Gr10 Gain
GDOE- District 16% 18% + 2%
SCHOOLS (with at least 5% gain)
SY 14-15 Gr 9
SY 15-16 Gr 10 Gain
JF Kennedy 14% 24% +10%
Simon Sanchez 16% 23% +7%
TABLE 10C: MATH
GUAM SY 14-15 Gr 9
SY 15-16 Gr 10 Gain
GDOE-District 4% 4% 0%
SCHOOLS (with at least 5% gain)
SY 14-15 Gr 9
SY 15-16 Gr 10 Gain
JF Kennedy 5% 10% +5%

| 15SY 15-16 Annual State of Public Education Report
The ASPER 2016 will be updated when the SBA 2016 test scores become available.
Performance Levels in Standards-Based Assessment (SBA):Advanced: Signifies superior performance, beyond grade-level mastery.
Proficient: Represents solid academic performance, indicating that students are prepared for the next grade.
Basic: Indicates partial mastery of the knowledge and skills that are fundamen-tal for satisfactory work.
Below Basic: Indicates little or no mastery of fundamental knowledge and skills.

16 |
GRADE
Number of Eligible Students whose IEPs state Participation in
ACT Aspire
Number of Students with IEPs
participating inACT Aspire WITHaccommodations
Number of Students with IEPs
participating inACT Aspire WITHOUT
accommodations
TOTAL Number ofStudents with IEPs perGrade that Participated
in the ACT Aspire
3 73 63 9 72
4 114 104 9 113
5 110 105 5 110
6 125 109 12 121
7 160 138 16 154
8 122 113 7 120
9 221 172 32 204
10 109 85 18 103
TOTAL 1034 889 108 997
Table 11. SY 2015-2016 ACT Aspire Participation Results for Students with Disabilities in ENGLISH
WITH AND WITHOUT ACCOMMODATIONS
District Wide Assessment Results for Students with Disabilities
Federal and local law requires that all students with disabilities be included in the general state wide and/or district-wide assessment with appropriate accommodations. If students with disabilities are unable to participate in the district-wide assessment, even with appropriate accommodations, these students will participate in the district-wide assessment through an alternate assessment. GDOE public school students in Grades 3 through 10 are assessed using the ACT Aspire; thus students with disabilities enrolled in the GDOE public schools whose Individualized Education Program (“IEP”) teams determined they should participate in the same district-wide assessment with or without accommodations are assessed using the ACT Aspire. Tables 11 through 13 describe the participation results of GDOE’s population of students with disabilities with and without accommodations in grades 3 through 10 in the ACT Aspire for the subject areas of English, Reading, and Math.

| 17SY 15-16 Annual State of Public Education Report
Table 13.SY 2015-2016 ACT Aspire Participation Results for Students with Disabilities in MATH
WITH AND WITHOUT ACCOMMODATIONS
Table 12.SY 2015-2016 ACT Aspire Participation Results for Students with Disabilities in READING
WITH AND WITHOUT ACCOMMODATIONS
GRADENumber of Eligible
Students whose IEPs state Participation in
ACT Aspire
Number of Students with IEPs
participating inACT Aspire WITHaccommodations
Number of Students with IEPs
participating inACT Aspire
WITHOUTaccommodations
TOTAL Number ofStudents with IEPs perGrade that Participated
in the ACT Aspire
3 73 61 8 69
4 114 104 9 113
5 110 104 5 109
6 125 112 11 123
7 160 139 15 154
8 122 109 7 116
9 221 177 30 207
10 109 80 18 98
TOTAL 1034 886 103 989
GRADENumber of Eligible
Students whose IEPs state Participation in
ACT Aspire
Number of Students with IEPs
participating inACT Aspire WITHaccommodations
Number of Students with IEPs
participating inACT Aspire
WITHOUTaccommodations
TOTAL Number ofStudents with IEPs perGrade that Participated
in the ACT Aspire
3 73 64 8 72
4 114 105 9 114
5 110 105 4 109
6 125 110 11 121
7 160 141 16 157
8 122 107 7 114
9 221 174 31 205
10 109 79 19 98
TOTAL 1034 885 105 990
On the next page, Tables 14 through 19 describe the performance levels of students with disabilities as they participated in the ACT Aspire, with or without accommodations, as determined by their IEPs in the subject areas of English, Reading, and Math. The data displayed is for eligible students with disabilities in grades 3rd through 10th grade. The table also describes the number of eligible students with IEPs who performed at ACT Proficiency Levels: Ready, Close, In Need of Support.

18 |
Table 14. SY 2015-2016 ACT Aspire Proficiency Levels of Students with Disabilities In ENGLISH WITH ACCOMMODATIONS
Table 15. SY 2015-2016 ACT Aspire Proficiency Levels of Students with Disabilities In READING WITH ACCOMMODATIONS
Table 16. SY 2015-2016 ACT Aspire Proficiency Levels of Students with Disabilities In MATH WITH ACCOMMODATIONS
GRADENumber of Eligible Students whose
IEPs state Participation in ACT Aspire WITH ACCOMMODATIONS
Number of Students with IEPs tested with Measurable Results
Performance Level for Number of Students with IEPs who Participated in ACT Aspire
Ready Close In Need of Support
3 105 105 0 1 634 105 105 1 6 985 110 110 1 4 1006 141 141 0 2 1087 107 107 0 5 1368 174 174 3 1 1039 79 79 2 9 16310 885 885 1 0 78
TOTAL 968 912 8 28 849
GRADENumber of Eligible Students whose
IEPs state Participation in ACT Aspire WITH ACCOMMODATIONS
Number of Students with IEPs tested with Measurable Results
Performance Level for Number of Students with IEPs who Participated in ACT Aspire
Ready Close In Need of Support
3 61 61 2 8 51
4 104 104 1 22 81
5 104 104 1 33 70
6 112 112 0 21 91
7 139 139 0 11 128
8 109 109 0 0 109
9 177 177 0 1 176
10 80 80 0 0 80
TOTAL 886 886 4 96 786
GRADENumber of Eligible Students whose
IEPs state Participation in ACT Aspire WITH ACCOMMODATIONS
Number of Students with IEPs tested with Measurable Results
Performance Level for Number of Students with IEPs who Participated in ACT Aspire
Ready Close In Need of Support 3 63 102 3 27 334 104 105 3 40 595 105 109 9 37 596 109 138 2 45 627 138 112 9 70 598 113 172 5 49 589 172 84 3 22 14710 85 885 0 3 81
TOTAL 889 904 34 293 558

| 19SY 15-16 Annual State of Public Education Report
GRADENumber of Eligible Students whose
IEPs state Participation in ACT Aspire WITHOUT ACCOMMODATIONS
Number of Students with IEPs tested with Measurable Results
Performance Level for Number of Students with IEPs who Participated in ACT AspireReady Close In Need of Support
3 9 7 2 3 24 5 8 3 5 0
5 12 4 2 1 1
6 16 11 2 4 57 7 15 4 7 48 32 7 1 5 19 18 32 4 7 2110 108 17 0 2 15
TOTAL 116 101 18 34 49
GRADENumber of Eligible Students whose
IEPs state Participation in ACT Aspire WITHOUT ACCOMMODATIONS
Number of Students with IEPs tested with Measurable Results
Performance Level for Number of Students with IEPs who Participated in ACT AspireReady Close In Need of Support
3 8 8 1 0 74 9 9 0 2 7
5 4 4 0 0 4
6 11 11 0 1 107 16 16 2 1 138 7 7 0 1 69 31 31 1 6 2410 19 18 0 1 17
TOTAL 105 104 4 12 88
GRADENumber of Eligible Students whose
IEPs state Participation in ACT Aspire WITHOUT ACCOMMODATIONS
Number of Students with IEPs tested with Measurable Results
Performance Level for Number of Students with IEPs who Participated in ACT AspireReady Close In Need of Support
3 8 7 0 2 54 9 9 3 4 2
5 5 5 0 1 4
6 11 11 3 2 77 15 15 0 3 128 7 7 0 0 79 30 30 0 2 2810 18 18 0 1 17
TOTAL 103 102 5 15 82
Table 17. SY 2015-2016 ACT Aspire Proficiency Levels of Students with Disabilities In ENGLISH WITHOUT ACCOMMODATIONS
Table 18. SY 2015-2016 ACT Aspire Proficiency Levels of Students with Disabilities In READING WITHOUT ACCOMMODATIONS
Table 19. SY 2015-2016 ACT Aspire Proficiency Levels of Students with Disabilities In MATH WITHOUT ACCOMMODATIONS

20 |
Special Education Alternate Assessment
Federal and local law requires that all students with disabilities be included in general statewide and district-wide assessment programs with appropriate accommodations, if necessary. Students with more significant cognitive disabilities who cannot participate in general large-scale assessment programs, even with accommodations, participate in the district-wide assessment through an alternate assessment based on alternate achievement standards.
Section 612(a)(17) of IDEA ’97 states:“As appropriate, the State or local educational agency – (i) develops guidelines for the participation of children with disabilities in alternate assessments for those children who cannot participate in State and district-wide assessment programs; and (ii) develops and, beginning not later than July 1, 2000, conducts those alternate assessments.”
§200.6 Inclusion of all Students of the No Child Left Behind Act (NCLB Title I) further states that:
“A state’s academic assessment system required under §200.2 must provide for the participation of all students in the grades assessed.
Students Eligible under IDEA and Section 504.A State’s academic system must provide – (i) For each student with disabilities, as defined under section 602(3) of the IDEA, appropriate accommodations that each student’s IEP team determines are necessary to measure the academic achievement of the student relative to the State’s academic content and achievement standards for the grade in which the student is enrolled, consistent with §200.1(b)(2), (b)(3), and (c);
and …
(2) Alternate Assessment. (i) The State’s academic assessment system must provide for one or more alternate assessments for a child with a disability as defined under section 602(3) of the IDEA whom the child’s IEP (Individualized Education Program) team determines cannot participate in all or part of the State assessments under paragraph (a)(1) of this section, even with appropriate accommodations. (ii) Alternate assessments must yield results for the grade in which the student is enrolled in at least reading/language arts, mathematics, and, beginning in the 2007-2008 school year, science.
Additionally, states and districts must:
• Report the number of children participating in alternate assessments;• Report the performance of children on alternate assessments after July 1, 2000, if doing
so would be statistically sound and not disclose the results of individual children;• Ensure that IEP teams determine how each student will participate in large-scale
assessments, and if not participating, describe how the child will be assessed; and• Reflect the performance of all students with disabilities in performance goals and
indicators that are used to guide State Improvement Plans.
While all state and district-wide assessment programs are expected to be as inclusive as possible of students with disabilities, the alternate assessment requirement of IDEA ’97 applies particularly to Guam’s SAT10, because the SAT10 is Guam’s primary accountability mechanism.

| 21SY 15-16 Annual State of Public Education Report
Assessment Accommodations and Alternate Assessments
Some students with disabilities need accommodations to take part in large-scale assessments. The purpose of accommodations is to minimize the
influence of disabilities that are not relevant to the purpose of testing. According to the 1999 Standards for Education and Psychological Testing, “accommodation” is a general term that can refer to any departure from standard testing content, format or administration procedures.
Guam allows for accommodations that are justified and described in the IEP of a student with a disability. The test publisher has categorized accommodations as either “standard” or “non-standard,” and the type of accommodations used may affect how the results are included in the reporting of school, district, and state assessment results.
A small number of students with disabilities, particularly those with more significant cognitive disabilities (estimated at 1% - 2% of the entire student population) cannot meaningfully participate in general large-scale assessments even with accommodations. Rather than being excluded from the district-wide assessment program altogether, IDEA requires the performance of these students to be tested via an alternate assessment aligned to the content standards. Including all students in the district’s assessment program will create a more accurate picture of the education system’s performance. It will also lead to greater accountability for the educational outcomes of all students.
Alternate assessment is best understood as a means of including all students in Guam’s district-wide assessment and accountability program. The National Center for Educational Outcomes (Thurlow, Elliot, and Ysseldyke, 1998) refers to alternate assessment as the “ultimate accommodation” because it allows for all students to be counted in the accountability system.
Guam fully implemented its newly developed “Guide for the Participation of Students with Disabilities in Guam’s District-Wide Assessment” in SY2004-2005, which resulted in a substantial increase in the “documented” participation
of students with disabilities through an alternate assessment. By grades, students with disabilities who participated through an alternate assessment based on alternate achievement standards (AA-AAS) during SY 2014-2015 are described in Table 58. It should be noted that for SY 2014-2015, students with disabilities participating in the alternate assessment based on alternate achievement standards in grades 3-8 and 11 were administered the online assessment through the NCSC Assessment System. Students in grades 1, 2, 9 and 10 were administered the Guam DOE Alternate Assessment based on Alternate Achievement Standards.
GRADE
# STUDENTS WHOSE IEPS DETERMINE
PARTICIPATION THROUGH AA-AAS
# TESTED
INMATH
# TESTED INVALID OR DID
NOT TEST IN
MATH
# TESTED IN
ENGLISH LANGUAGE
ARTS
# TESTED INVALID OR
DID NOT TEST
IN ENGLISH LANGUAGE
ARTS
1 11 7 4 7 4
2 22 18 4 18 4
3 22 20 2 20 2
4 12 11 1 10 2
5 18 17 1 17 1
6 22 22 0 22 0
7 25 24 1 25 0
8 18 18 0 18 0
9 14 9 5 9 5
10 24 20 4 20 4
11 7 6 1 6 1
12 15 10 5 10 5
Table 20.Participation Rate of Students with Disabilities Who Were Tested in the District-Wide Assessment through AA-AAS
NOTE: Reasons for students not participating include the following: Absent during testing period or repeating seniors. Repeating seniors do not participate as they have been previously assessed. The focus for these seniors would be the activities described in their IEP Transition Plans. These repeating seniors have not been included in the total count of students participating in the AA-AAS.
Table 20. depicts the number of students with disabilities who were tested in the district-wide assessment through an alternate assessment based on alternate achievement standards (“AA-AAS”) in Math and English Language Arts during SY2015-2016.

22 |
Table 21SY 2015-2016 ENGLISH LANGUAGE ARTS Summary Report for
Alternate Assessment based on Alternate Achievement Standards
Table 22.SY 2015-2016 MATH Summary Report for
Alternate Assessment based on Alternate Achievement Standards
Grade # Eligible Students
# Tested Invalid # Not
TestedPerformance Level
Level 1 Level 2 Level 3 Level 41 11 7 0 4 1 2 4 0
2 22 18 0 4 0 9 9 0
3 22 20 0 2 7 8 5 0
4 12 10 0 2 5 2 3 0
5 18 17 1 1 4 9 3 1
6 22 22 0 0 17 5 0 0
7 25 25 0 0 17 5 1 2
8 18 18 0 0 7 5 0 6
9 14 9 0 5 4 3 2 0
10 24 20 0 4 10 10 0 0
11 7 6 0 1 2 1 3 0
12 15 10 0 5 6 2 2 0
Grade # Eligible Students
# Tested Invalid # Not
TestedPerformance Level
Level 1 Level 2 Level 3 Level 41 11 7 0 4 1 0 6 0
2 22 18 0 4 0 8 10 0
3 22 20 0 2 10 3 5 2
4 12 10 0 1 5 6 0 0
5 18 17 0 1 4 8 5 0
6 22 22 0 0 7 9 6 0
7 25 25 0 1 3 16 5 0
8 18 18 0 0 6 7 3 2
9 14 9 0 5 6 1 2 0
10 24 20 0 4 3 10 7 0
11 7 6 0 1 0 2 2 2
12 15 10 0 5 6 1 3 0
Tables 21 and 22. reflect the performance of students with disabilities participating in the island-wide assessment through an alternate assessment based on alternate achievement standards in English Language Arts and Math, respectively, for SY2015-2016.

| 23SY 15-16 Annual State of Public Education Report
Table 23. DOE High School Number of High School Completers by School and Total District
HIGH SCHOOL
SY11-12 SY12-13 SY13-14 SY14-15 SY15-16Number of Graduates
Number of Graduates
Number of Graduates
Number of Graduates
Number of Graduates
GWHS 497 482 451 377 355JFKHS 372 396 481 484 365SSHS 356 338 376 353 352OHS 269 308 300 304 346SHS 274 246 257 302 346
TIYAN n/a n/a n/a 144 181TOTAL 1768 1770 1873 1964 1945
DROPOUT RATES A “dropout” as defined by Board Policy 375 is a student who was enrolled in a DOE high school
sometime during a given school year; and after enrollment, stopped attending school without having been:
• transferred to another school or to a high school equivalency educational program recognized by the Department; or
• incapacitated to the extent that enrollment in school or participation in an alternative high school program was not possible; or
• graduated from high school, or completed an alternative high school program recognized by the Department, within six (6) years of the first day of enrollment in ninth grade;
• expelled; or removed by law enforcement authorities and confined, thereby prohibiting the continuation of schooling.
Table 25. represents the dropout rates by school from SY 11-12 to SY 15-16. The dropout number and rate includes students in grades 9 to 12. The table shows that JFK High School had the greatest decrease in the dropout rate from SY 14-15 to SY 15-16 (6.0% to 1.5%).
Table 25 . SY11-12 to SY15-16 DOE Comparative High School Dropout Numbers (DN)/Dropout Rate (DR)
HIGH SCHOOL
SY 11-12 SY 12-13 SY 13-14 SY 14-15 SY 15-16DN DR DN DR DN DR DN DR DN DR
GWHS 80 3.1% 128 4.8% 149 5.6% 79 4.1% 56 3.1%JFKHS 105 4.5% 93 3.5% 122 4.6% 124 6.0% 29 1.5%SSHS 102 5.4% 53 2.7% 89 4.6% 83 4.2% 59 3.3%OHS 105 7.7% 45 3.0% 67 4.4% 61 3.4% 33 1.7%SHS 130 8.4% 51 3.3% 93 6.0% 81 5.2% 45 2.9%
TIYAN n/a n/a n/a n/a n/a n/a 53 4.1% 61 4.7%Total 522 5.3% 370 3.8% 520 5.3% 481 4.7% 283 2.8%
SY 11-12 SY 12-13 SY 13-14 SY 14-15 SY 15-1669% 68% 73% 76% 79%
Table 24. DOE Comparative High School Completion Rates SY10-12 to SY14-15
Table 24. represents the high school completion rates from SY11-12 to SY15-16. The table shows that SY15-16 completion rate increased from last school year (SY14-15) by 3 percentage points.
GRADUATION RATES Of specific interest to educators are the cohort rates because it gives an indication of the proportion of ninth grade students that leave school as graduates. The National Center for Education Statistics (“NCES”) graduation cohort rate answers the question: What proportion of those who leave school leave as graduates? The formula uses data pertaining to graduates and dropouts over four years.

24 |
POSITIONS NUMBER OF EMPLOYEES
PERCENT OF TOTAL
POPULATIONSchool Administrators 96 2.4%
Teachers 2366 59%
Health Counselors 46 1.1%Guidance Counselors 85 2.1%
Library Staff 47 1.1%Professional/Ancillary* 219 5.4%
Instructional Aides 624 15.5% Other Student Support** 81 2%
School Admin Support 169 4.2%Custodial/Maintenance/ Cafeteria 174 4.3%
LEA Administrators*** 49 1.2%LEA Support 93 2.3%
TOTAL DOE EMPLOYEES 4,019 100%
TABLE 26.SY 15-16 Employee Distribution by Position (Aligned with EDFacts)Table 26. represents the distribution of
employees by position category from the various schools and central office/support division sites. Analysis of Table 27 reveals that the largest category of employees within the Department of Education are teachers who comprise 59% of the total employee population. Instructional Aides comprise the second highest population totaling 644 or 15.5%. Principals and Assitant Principals at the Department of Education account for 2.4% of the employee population, while the remaining population who provide various support and programmatic services make up the rest of the population.
The employee categorization beginning this year follows the EDFacts categories as defined in NCES N501 File Specification. This is to ensure that local and federal reports align.
EMPLOYEE DEMOGRAPHICS As of SY 15-16, there were four thousand and twenty (4, 020) full and part-time employees who provided instructional and support services during the aforementioned schoolyear.
Personnel Quality and Accountability
Guam Department of Education Action Plan addresses the following objectives relative to Personnel Quality and Accountability:
1) To increase the number of fully certified teachers2) To implement recruitment and retention initiatives 3) To provide continuing high quality professional development to teachers and administrators.
The following section reports statistics regarding employee demographic characteristics, and statistics that describe teacher qualifications based on certification levels and degrees completed.
*Includes Instructional Coordinators and Supervisors, School Program Consultants, and Program Coordinators**Includes Attendance Officers, Social Workers, Speech Language Pathologists/Clinicians, Therapists, Community Program Aides, etc.
***Includes GDOE Board Members

| 25SY 15-16 Annual State of Public Education Report
Figure 27. shows that employees under the Chamorro ethnic category total 2,601 of the total employee population (N= 4,020). Filipinos ranked second highest totaling 914 employees. Employees identified as African American, American Indian/Alaskan Native, Hispanic/Latino, Pacific Islander, and other Asian had the lowest number of employees in those ethnic categories.
Figure 28. shows that female employees, who comprise 70% (2,828) of the total population, far outnumber the male employees at 30% (1,192).
Figure 27. SY 15-16 DOE Ethnic Distribution of Employees
Figure 28. SY 15-16 DOE Gender Distribution of Employees
ENTHIC CATEGORIES # of EES1 M - Marshallese 2
2 C - Chamorro 26013 F- Filipino 9144 K - Korean 95 P -Pohnpeian 86 I - American Indian/Alaskan Native 77 D - Chinese 78 H - Hispanic 129 O - Other 4710 V - Vietnamese 511 W - Caucasian 15412 T - Chuukese 3213 J - Japanese 2314 G - Palauan 2315 A - Asian/Pacific Islander Not List 17416 S - Carolinian 2
GRAND TOTAL: 4020

26 |
TABLE 29.SY15-16 Employee Distribution By Age Group
AGE GROUP
NUMBER OF EMPLOYEES
SY 15-16PERCENT OF
TOTAL N = 4,020
SY 14-15PERCENT OF
TOTAL N = 3,938
18-24 235 6.0% 6.0%25-34 884 22.0% 21.0%35-44 1,053 26.0% 28.0%45-54 1,037 26.0% 25.0%55-64 611 15.0% 15.0%65-70 144 4.0% 4.0%71+ 56 1.0% 1.0%Total
Employees 4,020 100% 100%
Table 29. represents the employee distribution by age group. In SY 15-16, the highest number of the employee population (1,053) are between the ages of 35-44 years old. Employees who are aged 55 or over comprise 15.0% of the population, while 6.0% of employees are below the age of 25.
SCHOOL ADMINISTRATION AND STAFF CERTIFICATION
In compliance with P.L.30-08 , otherwise known as the Adequate Education Act, the Department strives every year to recruit and maintain the number of fully certified school staff by implementing recruitment and retention initiatives and providing high quality professional development to teachers and administrators. This report monitors data pertaining to certification obtained by teachers, administrators, and other school professional staff.

| 27SY 15-16 Annual State of Public Education Report
Table 30. represents the distribution of professional school administrator certification for SY15-16.
Table 30 indicates 100% of DOE school administrators possessed full Professional Certification.
Table 31. below depicts the distribution of instructional teachers by types of certification for SY 2015-2016.
Category of Positions not included in Table 28 below are JROTC positions (total 12) who maintain certification by the Department of Defense, and Teacher’s Assistants and On-Call Substitutes whose positions do not require certification (total 441) as well as a total of (83) are On-Call Substitute Selective Factor Teachers (degree holder). Teachers who are categorized as Guidance Counselors or School Librarians are reported separately.
Teachers that possessed master or professional certification comprised about 1,482 while those that had either Standard or Temporary certification comprised about 128 teachers. There were 321 teachers who had Basic or Initial Certification
**Temporary Certification indicates new class of certification as per change in policy (GEC Rule 29-73.10000.21, Adopted 02/17/09) inclusive of Emergency, Provisional, & Conditional Certification.***Expired represents teachers who once held valid Teacher Certification and whose certificates are expired.
TYPE OF CERTIFICATION Elementary Secondary Divisions Expired***
SY 15-16 TOTAL
SY 14-15 TOTAL
Basic Educator 46 19 24 1 90 97Initial Educator 89 139 3 0 231 227
Master Educator 299 276 45 0 620 618Master Equivalency 69 70 3 0 142 156Reading Specialist 0 0 0 0 0 1
Professional I 0 0 0 0 0 0Professional II 1 0 0 1 2 2
Professional Educator 316 379 23 0 718 741
Level 1A,1B, 1C, 2 & 3 0 0 0 0 0 0Standard 0 3 0 0 3 0
Temporary** 45 80 0 0 125 92TOTAL 865 966 98 2 1,931 1,934
TABLE 31. SY 15-16 CLASSROOM TEACHER CERTIFICATION
TYPE OF CERTIFICATIONSY 15-16 Certification SY 14-15
Elementary Secondary Expired* TOTAL TOTAL
Professional I 0 2 0 2 7Professional II 6 5 0 11 14Professional III 0 1 0 1 0
Initial Administrator 5 4 0 9 9Master Educator 0 0 0 0 1
Master Administrator 22 22 0 44 41Professional Administrator 9 20 0 29 24
TOTAL 42 54 0 96 96
TABLE 30 SY 15-16 PROFESSIONAL SCHOOL ADMINISTRATORS CERTIFICATION
*Expired, represents employees who once held valid Certificates and whose certificates expired in SY 2014-2015

28 |
TABLE 32. SY 15-16 School Librarians Certification
TYPE OF CERTIFICATION Elementary Secondary SY 15-16 TOTAL
SY 14-15 TOTAL
Master Educator 8 9 17 14Master Equivalency 5 1 6 7
Professional Educator 11 3 14 11Professional I 0 0 0 0Professional II 1 0 1 2
Temporary 0 0 0 2TOTAL 25 13 38 36
Table 32. represents the distribution of School Librarian certification in SY 2015-2016. A total of 38 School Librarians held full Professional School Librarian certification.
Table 33. SY 15-16 School Health Counselor Certification
TYPE OF CERTIFICATION Elementary Secondary Division SY 15-16
TOTALSY 14-15
TOTALRegisteredNurses 26 15 3 44 43Licensed Practical 2 1 0 3 4
TOTAL 28 16 3 47 47
Table 33. Represents the distribution of school health counselor certification in SY 2015-2016. A total of 47 (100%) of the School Health Counselors in the Department of Education held License to Practice on Guam as Registered (43), Practical Nurses (3), and Community Health and Nursing Services Administrator – DOE Chief Nurse (1).
Table 34. depicts the distribution of School Guidance Counselor certification in SY 2015-2016. A total 81 School Guidance Counselors held full Professional Certification, while the 2 (LTFT) holds a Temporary School Counselor Certification.
Table 35. represents the distribution of school allied professional certification in SY 2015-2016. The majority of allied health professionals require professional licenses issued by the Allied Health Board.
TABLE 34. SY 15-16 Guidance Counselor Certification
TYPE OF CERTIFICATION Elementary Secondary SY 15-16
TOTALSY 14-15
TOTAL
Initial Counselor 6 8 14 13Master Counselor 9 17 26 15
Professional Counselor 12 29 41 50Professional I 0 0 0 0Professional II 0 0 0 0
Temporary 0 2 2 17TOTAL 27 56 83 95
TABLE 35. SY 14-15 ALLIED HEALTH PROFESSIONALS
ALLIED HEALTH PROFESSION TYPE OF CERTIFICATION/ LICENSURE
SY 15-16 TOTAL
SY 14-15 TOTAL
Audiologist Allied Health License 1 1Hospital Occupational
Therapist Assistant Allied Health License 1 1
Occupational Therapist Allied Health License 2 2Physical Therapist Allied Health License 0 0
Psychologist Allied Health License 3 3Speech/Language Clinician Allied Health License 8 8
Speech/Language Pathologist Allied Health License 6 5TOTAL 21 20

| 29SY 15-16 Annual State of Public Education Report
Budget and Expenditures
Effective October 1, 2014, GDOE implemented GASB Statement N. 68, Accounting and Financial Reporting for Pensionsand GASB Statement No. 71, Pension Transition for Contributions Made Subsequent to the Measurement Date –and amendment of GASB Statement No. 68.The implementation of these statements has no impact of GDOE’s governmental fund financial statements, which continue to report expenditures in the amount statutorily required. However, implementation has resulted in the restatement of GDOE’s fiscal year 2014 government-wide financial statements to reflect the reporting of net pension liability for its qualified pension plan and the recognition of pension expense in accordance with the provisions of GASB Statement No. 68. Refer Note 5 for moreinformation regarding GDOE’s pensions.
Pursuant to Public Law (PL)32-181, 32-219, and 33-029, GDOE appropriations in FY15 totaled $236,693,667, an overall increase of $7Min comparison to FY14appropriation levels.
The $7M increase in authorized spending included the following:
1.$2,436,500 in appropriations for the Guahan Academy ($467.5K) and I’Learn ($1.969M) charter schools, from $2,832,500 in FY14 to $5,269,000 in FY15;
2.$982,592 in new start-up funding for GDOE’s Early Childhood Education (ECE) pilot program in four GDOE elementary schools;
3.an additional $43,106 in funding for school libraries under the Public Library SystemFund, from $796,323 in FY14 to $839,429 in FY15; and4.$3.5M to cover organic growth in the cost of GDOE personnel and operations expenditures.
Deloitte and Touche .2016.Guam Department Of Education Basic Financial Statements,Additional Information Andindependent Auditors’ Report Year Ended september 30, 2015, Management’s Discussion and AnalysisYear Ended September 30, 2015, p.5

30 |
Appropriations and Expenditures data extracted from the Audited Financials by Deloitte and Touche. Please note the appropriation in the table does not include the CNP reimbursement and the Additional Rent, Maintenance & Insurance for JFK & Okkodo High Schools.. JFK, Okkodo and GACS are payments made through the Department of Administration. (TEFF: Territorial Education Facilities Fund)
Table 36. below depicts DOE appropriations by source category for FY12 thru FY15. Appropriations consist of General Fund, Special Funds and Other financing sources; such as cafeteria sales, fees and other program receipts. The federal contribution is a special fund to support the schools directly for JROTC program. *This amount is only for the JROTC program and does include Consolidated Grants & Special
Education grants
CATEGORIES FY2012 FY2013 FY2014 FY2015
Local Appropriations 230,458,401 226,373,210 239,776,988 257,260,165
Federal Contribution * 564,041 62,100,353 54,629,762 58,052,789
Cafeteria Sales 676,874 553,763 396,398 231,703Fees and Other Program
Receipts 1,041,474 1,380,266 835,928 1,040,777
Total Revenues 232,740,790 290,407,592 295,639,076 316,585,434
Table 36. Appropriations from Various Categories for FY11 to FY15
Figure 29. shows the department’s comparative appropriations and expenditures from FY 20011 to FY 2015.
SY13-14 SY14-15 SY15-16
General Fund $253,334,609 $ 257,213,485 $ 257,260,165
Federal Grants $69,191,975 $ 61,508,817 $ 64,901,461
TOTAL Expenditure $322,526,584 $ 318,722,302 $ 322,161,626
Student ADM 30,507 29,022 29,922
PPC (General Fund only) $8,304 $ 8,863 $ 8,598
PPC (TOTAL Expenditure) $10,572 $ 10,982 $ 10,767
Table 37. Comparative Expenditures and Per Pupil Cost from SY13-14 to SY15-16
Table 37. depicts comparative expenditures by budget categories for FY13, FY 14 and FY15 from the Audited Financials (Deloitte and Touche)
Figure 29. Department Comparative Appropriations and Expeditures form 2011 -2016

| 31SY 15-16 Annual State of Public Education Report
On this report and onward, the Department will not report an official per pupil cost until the audited financial reports are available. The department has been historically reporting an official per pupil cost based on the immediately preceding fiscal year data which are not yet complete as of data download and certainly not yet audited. The result was that the per pupil cost has been significantly lower than if official complete audited financial data were utilized.
Figure 30.Combined Statements of Revenue, Expenditures by Account and Changes in Fund Balances
Figure 30. represents per pupil cost based on audited expenditures of local funds. Per pupil cost is calculated by dividing the total amount of expenditures for the Fiscal Year by the official student enrollment. The figures above do not include costs for transportation provided by Department of Public Works.

32 |
School Exemplary Programs and Achievements
Adacao Elementary SchoolSpecial/Exemplary Programs: K-5th Grade Writer’s Window, 5th grade students utilized the Full Option Science System (FOSS) Program, National Elementary Honor Society (NEHS), Adacao’s Unified Courts of Guam: Mock Trial Program.
Accomplishments: • We conducted our Student Body Association (SBA) elections to officiate our SBA for
SY2015-2016 in which our intermediate students develop citizenship, leadership, and character. Our student organization provides a democratic forum to address school- related issues that affect their lives; leadership training for students in the duties and responsibilities of good citizenship, using the school environment as the primary training ground; offers a year-long program of social functions and community involvement projects for students.
• We completed K-5 th AIMS testing that provides student, parents and teachers a universal academic screening for reading and math three times a year. These assessments measures overall performance of key foundational skills at each gradelevel and the information is utilized to assists teachers in identifying the strengths and the needs of each student and the entire class.
• The K Brigance Early Childhood Screen for kindergarten students was conducted to assists teachers initiate referrals for further evaluation or special services; monitor and report progress over time by administering the age-appropriate screen mid-year or end- of-year as a post-test; guide individualized, group instruction, track, report individual and group progress.
• We piloted Common Formative Assessments (CFA) for language, reading and math. Our CFAs were administered to all students several times during a quarter. The assessed items were collaboratively designed by teachers and the results analyzed to change or continue instructional practices.
ELEMENTARY

| 33SY 15-16 Annual State of Public Education Report
Agana Heights Elementary SchoolSpecial/Exemplary Programs: Star Student Award, Positive Behavioral Interventions and Supports (PBIS), Mimasaka University Cultural and Learning Exchange, Jump Rope for Heart / Sports Week, Success in Reading
Accomplishments: • Teachers and staff trained in the SPARK Program in order to increase physical
activities in students and reduce child obesity.• AHES PTO continues their strong support of the environment through the
i-Recycle Program.• In SY15-16, AHES was the first elementary school to train Fifth grade students
and teachers how to perform Hands-Only Adult CPR through the American Heart Association (AHA) video-based training program.
• AHES supports Box Top for Education which allows for the purchase of school resources for our students and teachers.
• PBIS Spirit Week and PBIS Student of the Month to celebrate positive behavior at AHES.
• AHES participated in Red Ribbon Week which is a nationwide campaign that promotes drug awareness and prevention by encouraging the school community to participate in various drug-free activities and discussions.
• Chamoru Month activities of guest speakers, cultural dancers, and fieldtrips to historical sites foster knowledge and respect for the island and our culture.
• GATE Students participated in the AHES and Island-wide Science Fair to promote STEM.
• Fifth grade students participated in the Judiciary of Guam Annual Mock Trial where they learn about court proceedings and their Miranda Rights.
• Career Week held for 5th graders who were exposed to various careers in the community and visited by such companies and organizations as Guam Power Authority, Jamaican Grill, Pacific Islands, and Department of Youth Affairs.
Astumbo Elementary SchoolSpecial/Exemplary Programs: After School Program for Instructional Remediation & Enrichment (ASPIRE), International Math Kangaroo, National Association for Women in Construction (NAWIC) Block Kids Competition, Scripps National Spelling Bee Competition, Science Fair, Island-wide Math Olympiad Accomplishments: • Canned Food Drive Donated to Salvation Army• Coin Drive donated to Guam Cancer• Reading is Fundamental Program (RIF) Sponsored By: Macy’s• Placed 1st in the Gerran Kaddon Pika Competition• Placed 1st in all grades in the Island-wide Weaving completion for elementary• Placed 1st in the Inacha’ikak Yininga’ (Theme Poster) Contest• Placed 2nd and 3rd in local Math Kangaroo Competition in grades 1st and 2nd. • Placed 1st in 3rd grade division in the NAWIC Block Kids Competition• Maintenance of School Website and Monthly Newsletter• First Grade Scoring highest scores in the district all subtests of the SBA.

34 |
B.P. Carbullido Elementary SchoolSpecial/Exemplary Programs: Guarantee & Viable Curriculum, Home-School Connection Program, After-School Tutorial Program/Aspire, Curriculum Binder For Common Core State Standards (Ccss) Alignment In Social Studies, Health, & Science, Positive Behavior Intervention Support (Pbis) Program
Accomplishments: • Implemented school programs such as; Special Education, English As a
Second Language, Chamoru Language Program, Gifted & Talented Education (GATE) K-5, Gifted & Talented Education (GATE) Preschool, Chamoru Language, After School Program for Instructional Remedio & Enrichment (ASPIRE), Academic Tutoring, School Summer Program, STAR Reading & Math Program, & BPCES Promotes Literacy Program.
• Implemented student clubs such as: The Ko’Ko’ Choir, The Ko’Ko’ Art Club, Student Council, Service Learning, PBIS Sing & Dance Club, and Library Aides.
• School activities: Monthly Spirit Week, Sports Day, Christmas Program, PBS Read-a-thon, IRA Read-a-thon, ISLA art-a-thon, Science Fair, I-Recycle, Chamoru Program, Easter Basket Contest, Ko’Ko’ Gazette Contest, Math Olympiad, & Spelling Bee.
• Provided parent workshops & information avenues; Parent Portal Training, SBA, ACT Aspire, school website, Education Update, & Ko’Ko’ Gazette.
• Provided professional development days for faculty and staff.• Implemented Professional Learning Communities.
C.L. Taitano Elementary SchoolSpecial/Exemplary Programs: Success For All Program (SFA) - Reading Program, Student Behavior – The CLTES “Deer Awards” (Doing Everything Expected Right), G.A.T.E. Program, SPARK – Sports Physical Activity Recreation (DPHSS) Accomplishments:• School Accreditation Process – This school year 2015-2016, ALL faculty, staff,
parents & student representative are members of one of the Focus Teams and meet at least once a month. The Chairperson and Co-Chairpersons of each Focus group meet as needed. SUCCESSFULLY RECEIVING ACCREDITATION FOR THE NEXT 3 YEARS.
• Spelling Bee - The top two spellers from each 3rd-5th grade classroom are selected to participate in the school-wide spelling competition. The champion speller and alternate will compete in the island-wide Spelling Competition and possibly the regional competition.
• Math Olympiad - Students participate in a series of five monthly contests of five problems each, from November to March, and weekly practice sessions under the supervision of the coach. The top four students are selected by the coach to compete in the island- wide competition.

| 35SY 15-16 Annual State of Public Education Report
• Science Fair - The science fair promotes reading comprehension skills, self-directed learning and problem solving skills. It also allows students to present their findings to others and constructively critique each other using scientific communication skills. The top two students from kindergarten through 5th grade are chosen to participate in the school-wide competition. The first, second, and third place winners receive trophies. Every participant receives a certificate of participation.
• Drill Team - Students participate in marching drills of various patterns and formations. This team allows for students to learn cooperation, expectations, rhythm, and following directions in a synchronized fashion. The students are recommended by their teachers and must maintain a B average and have no behavior referrals.
• Mes Chamorro - Students participate in this annual event held in March that is hosted by the Chamorro Language and Studies Programs and the Chamorro Language and Culture Teachers, to promote the indigenous language and culture of Guam. Mes Chamorro is an island-wide event that is hosted by various agencies and businesses to showcase performances, displays, and competitions. These events provide opportunities for students to compete and practice the use of Chamorro Language to enhance their knowledge of the Chamorro culture and promote school pride.
• Special Olympics - The Special Olympics is an island-wide event in which Special Education athletes compete in numerous sporting competitions. The rationale for Special Olympics is to improve the quality of life for Special Olympic athletes through healthy behaviors and lifestyles, to foster teamwork and healthy competition, to promote friendships, to build community awareness and involvement, and to have fun.
• Kids For The Cure - Students in grades 3-5 participate in a special program in partnership with Guam Cancer Care to educate the students on healthy living and cancer awareness and prevention.
• Holiday Program - Students in grades Kindergarten-5th participate in an annual holiday program to showcase their musical talents. This event promotes family, community school relations, and fosters school spirit.
• Public Broadcasting System (PBS) Family Read-A-Thon - Students participate in an annual event that encourages students to read daily. Elementary school students raise funds for public television by gathering pledges. The pledges are submitted to PBS Guam to be eligible for prizes.
• Pacific Daily News (PDN) - The Newspapers in Education Program is a partnership between the PDN, local businesses and schools. A sponsor’s donation provides teachers and students the PDN, curriculum guidelines and lesson plans. The PDN helps teachers introduce students to lifelong reading habits while encouraging more meaningful, hands on learning about issues that affect them locally and globally.
• Water Safety – The water safety presentation is conducted by volunteer certified lifeguards to prepare 5th grade students in lifelong learning skills pertaining to swimming.

36 |
Chief Brodie Elementary SchoolSpecial/Exemplary Programs: Buddy Bench; Make a Difference Campaign (anti-Special/Exemplary Programs: State Systemic Improvement Plan (SSIP), Response to Intervention (RTI) Math, Buddy Bench, ASPIRE, Standards Based Grading,
Accomplishments: • Achieve 3000 (Reading)/Moby Max (Math) computer programs set up and implemented.• GATE students painted and created five Habitat Murals with GATE Visual Art Specialist,
Gisela Guile. • Special Olympics• Students wrote and published hardcover books with Studentreasures Book Publishing.• End of the Year Awards ($3000 raised and spent on awards)• Student of the Quarter• Mock Trial• ESL Book Fair• Spring Carnival• Read from the Heart
D.L. Perez Elementary SchoolSpecial/Exemplary Programs: Positive Behavioral Interventions And Supports, Student Council (Stuco), Gifted And Talented Education (G.A.T.E.) Program, Famagu’on I Lalai (Children Of The Chant), Math Olympiad
Accomplishments:• Western Association of Schools and Colleges Accreditation• FestPac Activities: United Pacific Nations Parade, Christmas Ornament Decoration
Contest• Community Projects: Sugar Plum Tree, Saipan Coin Drive, Canned Food Drive, and
community presentations • Career Day• Read for the Record• Christmas Program• Newsletters• Famagu’on I Lalai (Children of Chant) - won first place in every category of the elementary
school division at the “Bailan Taotao Tano” event held at Gef Pago in Inarajan on April 9, 2016
• MES Chamorro: Lunar Calendar Activities, Chamorro Spelling Bee, First Annual Maga’haga and Maga’lahi
• School-wide and Island-wide Science Fair

| 37SY 15-16 Annual State of Public Education Report
Finegayan Elementary SchoolSpecial/Exemplary Programs: PBIS (Positive Behavior Intervention & Support), ASPIRE (After-School Program for Instructional Remediation and Enrichment), Families and Schools Together (FAST), Prekindergarten Program Initiative
Accomplishments:• ASPIRE-After School Program for Instructional Remediation and Support;
provided tutoring opportunities to students in need of additional instructional support.
• NEHS-National Elementary Honor Society; provides an outstanding means to prepare and shape students for their middle level and high school experiences. The four pillars of membership are Scholarship, Responsibility, Leadership and Service.
• PBIS-Positive Behavior Intervention and Support; provided the guidance to improve overall school climate, specifically; 1. to reduce and eliminate disruptive behaviors.
• Maintain a safe and positive learning environment for all students. 3. Promote communication.
• SOM-Student of the Month (student recognition for outstanding character development)
• Scripps Spelling Bee; not only to encourage children to perfect the art of spelling, but also to help enlarge their vocabularies and widen their knowledge of the English language.
• Math Olympiad; goals were focused To stimulate enthusiasm and a love for Mathematics
• To introduce important Mathematical concepts• To teach major strategies for problem solving• To develop Mathematical flexibility in solving problems• To strengthen Mathematical intuition• To foster Mathematical creativity and ingenuity• To provide for the satisfaction, joy, and thrill of meeting challenges
H.S. Truman Elementary SchoolSpecial/Exemplary Programs: Kids For The Cure – K4C!, Mock Trial, Fitness Fridays & Mile Run Activity,
Accomplishments:• GATE Robotics program for grades Third, Fourth, and Fifth.• GATE STEM Projects• Island Wide Spelling Bee Participation• Island Wide Math Olympiad Competition Participation• IRA Read-A-Thon Participation• Implemented the Aims Webb Assessments• School-Wide Exercise and Healthy Program throughout the year on a weekly basis
Participated in the Special Olympics.

38 |
Inarajan Elementary SchoolSpecial/Exemplary Programs: Accreditation by the Western Association of Schools Colleges (WASC); iRecycle Program; Chief Patrol, Stock Market Game, International Reading Association
Accomplishments:• WASC Accreditation 2005-2017• PBIS • International Reading Association • IES Special Education Program• IRecycle Program• Career Day• IES Science Fair• Chamorro Program Activities• IES GATE Program• IES ESL Program
J.M. Guerrero Elementary SchoolSpecial/Exemplary Programs: Striving Readers; State Systemic Improvement Plan (SSIP), High School Partnership – Simon Sanchez Biology Students (Guardian of the Reef), G.A.T.E. Program, I-Code, W.A.V.E. Club
Accomplishments:• 3rd place Island-wind Song Festival Competition (Elementary Division) on
November 28, 2015 held at Agana Shopping Center. 4th grade honor choir• Juan M. Gue Honor Choir, won Silver (Elementary Division) in the Tumon Bay
Music Festival Island-wide Competition held on March 4, 2016 at Kahida Ballroom, Guam Plaza Hotel.
• 1st place islandwide competition “Top Performing School”- International Reading Art- a-thon.
• Juan M. Guerrero Elementary School placed 2nd as one of the top schools that were entered in Sylvan’s 2015 My Favorite Teacher contest during the November A-Club event. The following teachers, Rose Blas, Leesue Kalgren, Sheila Morales-Meno, Tiaralene Pocaigue, Sirena Cruz, Heide Cameron, Kasaundra Penaflor, Franchesca Sison, and Jan Rudolph received Sylvan’s 2015 My Favorite Teacher Recognition Awards.
J. Q. San Miguel Elementary SchoolSpecial/Exemplary Programs: Reading Is Fundamental Program (Rif), Positive Behavior Intervention And Support (Pbis), Parent Outreach Program, Easy Tech Computer Curriculum
Accomplishments: • Bullying Prevention Program• Reading is Fundamental (RIF), a Free Book Program

| 39SY 15-16 Annual State of Public Education Report
• Manaotao Agila, Cultural Performing Group• Girl’s Scouts Troop• WAVE Club• Parent Workshops/Family Engagement Leadership Team• Career Day• On-going Professional Development in Curriculum and Behavior Management• PBIS
L.B. Johnson Elementary SchoolSpecial/Exemplary Programs: LBJ & Tamuning Elementary Schools’ Balanced Leadership Approach, LBJ Elementary School’s “Angel Raffle” Student Recognition Program, LBJ & Tamuning Elementary School Vertical Teams,
Accomplishments: • LBJ and Tamuning Elementary Schools’ Unified Leadership Team: SY15-16 was the
onset of merging the leadership teams from both LBJ and Tamuning Elementary Schools. Rather than functioning from two separate leadership teams, there was only one leadership team which comprised of teacher leaders from both schools. This strengthened the schools’ efforts towards operating as one elementary school to better serve all students as they progress from grade to grade.
• Continued implementation of the Balanced Leadership Approach and Restructuring of Committees: SY15-16 was the onset of merging committees from both LBJ and Tamuning Elementary Schools. Rather than planning and coordinating activities or events as two separate schools, members from both schools and from each grade level or support program participated in one of five committees. The five committees were Student Awareness Committee, Student Achievement Committee, Student Activities Committee, Student Recognition Committee, and the Positive Behavior Interventions and Supports (PBIS) Committee. Currently, the schools are reviewing respective data and summative reports to determine if any revisions regarding committees, committee frameworks or structures, and/or coordinated activities are needed.
• Publication of a Unified Monthly Newsletter: SY15-16 was the initial school year for LBJ and Tamuning Elementary Schools to collaboratively coordinate and publish a unified newsletter ensuring pertinent information was relayed to parents on a monthly basis. The Student Awareness Committee coordinated this important task of building the connection between home and school. In addition to articles written by the administration, support programs, and grade levels, committees also shared information regarding events, accomplishments, or recognition of students.
• Quarterly Honor Wall Student Recognition: This was the first year both LBJ and Tamuning Elementary Schools recognized students for meeting “A Honor Roll” or “B Honor Roll” criteria by publicizing names on identified bulletin boards in both schools. The Student Recognition Committee focused the year on streamlining how students’ academic achievements were acknowledged.
• Reading is the Key to Success: SY15-16 was the first both LBJ and Tamuning Elementary Schools implemented this recognition program for students to read. The Librarians from both LBJ & Tamuning Elementary Schools coordinated this project with the Student Achievement Committee. Students’ reading logs were collected each semester and those who met identified criteria were recognized for their accomplishment during PBIS assemblies.

40 |
• PBIS Student Store: SY15-16 was LBJ and Tamuning Elementary Schools’ first time to implement a student store. Students were able to purchase various prizes and supplies using Whale Tickets they have earned during the school year.
• Monthly Grade Level Productions: During this school year, in lieu of a Chamorro Program, each grade level was featured during a specific month to showcase a production for students to exhibit what they have learned in regards to character development or from PBIS lessons through songs, dances, and/or skits. The following were the themes of LBJ’s grade level production:
• Kindergarten, GATE Pre-School, and Pilot Pre-School’s Disney Production, “Courage to Dream”, April 28, 2016. The youngest students in the school performed songs and dances showcasing the possibilities of setting goals and dreaming big, as these can become a reality if they set their mind(s) to doing it; and not just to do it – but to do their best at it! Be an achiever.
• 1st Grade Production, “Fest-Pac/Cultural Festivities”, March 31, 2016. The 1st grade students performed Chamorro songs and dances showcasing the values of our culture, language, pride and richness of our island and its peoples. Our students gave their expressions of respect for all things through art, song and dance. It also taught the meaning of family and cohesiveness.
• 8 Grade Levels’ Season of Giving Service Learning Projects: During this school year, in lieu of a Christmas Program, students learned about being generous and other service learning components by engaging in a Season of Giving Service Learning Project with culminating activities occurring in December and January.
Liguan Elementary SchoolSpecial/Exemplary Programs: Improving Student Learning & Achievement (ISLA) AYUDANTE Summer School Program, Positive Behavior Intervention Supports (PBIS), Super Sihek Reader Program, Science Fair, After School Program for Instructional Remediation and Enrichment (ASPIRE)
Accomplishments:• Ms. Camela Mendiola GATE Instructor Coordinator for the Isla Art-a-Thon won
a computer for being one of the top schools to raise most funds for being the Isla Art-a-Thon Advisor
• Participated in the GDOE Mes Chamorro Kadon Pika Competition• Students participated in the Healing Hearts Presentation – Good Touch vs. Bad
Touch• Participated in the annual PBS and IRA Read a Thon• Participated and won categories in the Annual Japan Airlines JAL Haiku poetry
contest• Participation and won categories in the Annual ISLA Art a Thon• Participated in the annual Kids Athletics 2016• Participated in the School Wide Science Fair• Teachers participated in the Lani-Kate Task Force Presentation• Participated in the Guam Energy Office Alternative Energy Consumption and
Development

| 41SY 15-16 Annual State of Public Education Report
M.A. Ulloa Elementary SchoolSpecial/Exemplary Programs: ASPIRE (After School Program for Instructional Remediation and Enrichment), Health Fair, PBIS (Positive Behavior Intervention Supports Program) Spotlights & Shout-Outs, “Principal’s Café & Luncheon” , Carabuck Program,
Accomplishments:• PBIS (Positive Behavioral Intervention Supports) MAUES Major Office Discipline
referrals decreased from 193 referrals in SY 14-15 to 4 referrals in SY 15-16 due to the practice of proactive discipline.
• Health and Wellness Fair and Flu shot clinic for MAUES families and students to promote health and wellness to our families and students
• Thanksgiving Food drive – MAUES faculty, staff and students collected canned goods for our local community
• Thanksgiving Feast for Guma San Jose that was provided by our faculty /staff to promote unity in education
• Rigaluyi I Famagu’on-ta (Gift Giving of our children) MAUES students randomly selected to receive Christmas gifts from faculty and staff to promote service and leadership to our students
• Continue the use of Live binder as Evidence Portfolios• Science Fair to stimulate interest for MAUES students in science, to provide students
with opportunities for research and active inquiry• Renovation of the school outdoor stage by PTO officers SY 2015-2016• Kids Athletics to promote MAUES students the opportunity to explore and express
themselves through athletic competition and to contribute the development of school spirit.
• Read Across America Day to promote reading and continue to motivate students to read.
• Career Week to support MAUES goals to promote students for college career readiness
• Teach Children to Save day shines the sportlight on students learning elementary level financial education on how to earn, save, spend their money wisely.
• Grade level monthly exhibit – to promote school pride and class spirit and to showcase the learning in the classrooms
• Computer Café – A program held every month offering basic computer training for MAUES parents/Guardians on how to use a computer and to increase our parental involvement.

42 |
M.U. Lujan Elementary SchoolSpecial/Exemplary Programs: College and Career Awareness Presentations, Parent Education Workshop, Professional Learning Activities (Haya Moving Forward, Professional Development Days, Weekly PLCs & CLTs, Vertical Team Meetings), Healthy Hearts Fair, PBIS
Accomplishments:• Full implementation of CCSS - Consensus maps were regularly reviewed and
updated as learning progression of students were closely monitored.• HAYA Moving Forward – Planned and hosted professional development with
Haya schools• Weekly CLTs & PLCs – Faculty and staff were committed to ongoing professional
learning on identified topics.• Collaborated with SPED Division on SSIP – focusing on reading proficiency by
3rd grade. • 100% of our faculty participated in the new PTEP.• Peer Mediation – Students participated in training activities on how to support
their peers in various situations.• Junior Police Cadets – students act as safety monitors to ensure order and are
advocates of our school expectations.• Purplicious – To promote cancer awareness, month long activities and
presentations were held.• CFA Pilot School – Teachers worked hard to develop proficiency scales in the
areas of Reading, Math and Language Arts in order to better gauge student proficiency of standards.
Machananao Elementary SchoolSpecial/Exemplary Programs: Response to Intervention (RtI), Professional Learning Communities (PLC), Professional Developments, After School Program for Instructional Remediation & Enrichment (ASPIRE),
Accomplishments:• School Improvement Plan - Action Steps were completed and accomplished• ACT Aspire & Standards-Based Assessment (Reading, Language, Math) – School• ranked satisfactorily in comparison with the other schools district-wide.• Positive Behavioral Interventions & Supports (PBIS) – Decrease in major
discipline incidents• Monthly Virtues “Marvelous Marlins” – Students were awarded for practicing
and displaying Character Education.• Structured Learning Computer Education – Computer Education K-5th
Curriculum were provided as a resource to implement GDOE Computer Education Standards.
• National Elementary Honor Society (NEHS) – A total of 6 students were inducted to NEHS
• Professional Development – Teachers attended/received trainings on Accreditation, CITW, Guaranteed Viable & Curriculum, Balanced Leadership, STEM, Marzano Formative Assessment, Standard Based Grading/Proficiency Scales, SIOP, etc..
• After School Program for Instructional Remediation & Enrichment (ASPIRE)

| 43SY 15-16 Annual State of Public Education Report
- As a school, in Reading, there was an increase of 12% of students performing at grade level or above. In Math, there was an increase of 28% of students performing at grade level or above.
• Science Fair – The school had over 20 participants and 4th grade student Angelique Garcia took 1st place in the Island-wide Science Fair.
• Response to Intervention - As a school, in Reading, there was an increase of 12% of students performing at grade level or above. In Math, there was an increase of 28% of students performing at grade level or above.
M. A. Sablan Elementary SchoolSpecial/Exemplary Programs: Get Fit Tuesdays, PBIS, Educational Outdoor Activities, Star of the Month,
Accomplishments: • Marcial A. Sablan Elementary School focused on healthy activities and lifestyles by
developing Get Fit Tuesdays, participating in the Relay Recess, Kids for the Cure, International Kids Yoga Day, supporting the Mighty Moves initiative, promoting after school physical activities such as afterschool basketball and working with the mayor in supporting the Agat Stars Baseball community leagues, and increasing Physical Education/Health minutes. Through these efforts students increase their physical activities and increase knowledge of the effects of healthy lifestyles.
• Marcial A. Sablan Elementary School focused on improving the availability of technology school wide. The library was able to obtain at the end of the school year 6 N-Computers, Promethean Activ Panel Touch, Promethean Board and Projector, etc. This created the library as a media center for teachers and students.
• Marcial A. Sablan Elementary School focused on improving the reporting and data collection for students with behavior and attendance challenge to better improve the interventions the students need at all Tier levels.
Merizo Elementary SchoolSpecial/Exemplary Programs: Fun Fit Fridays, I Recycle/Youth Crime Watch Student Clubs, PBIS Dynamic Dolphin/ Dolphin Dollar Store and Fun Room, HAYA Moving Forward PD, Relay Recess
Accomplishments: • Special Olympics• Island-wide Science Fair • Box Tops for Education • 2016 Career Week• 3rd place Foundation for Public Education 5K• Law Day Art Contest • Literacy Harvest Festival• 9/11 Tribute to Everyday Heros• Scripts Spelling Bee

44 |
Ordot Chalan Pago Elementary SchoolSpecial/Exemplary Programs: PBIS (Positive Behavior Intervention System) , Success For All,
Accomplishments:• Development of quarterly Common Formative Assessments for Math• Development of Math groups• Development of Admin Intervention Team• Monthly Parent Workshops• Peer Mentorship• GATE Art Show• CPR/First Aid and Seizure Training for Employees
P.C. Lujan Elementary SchoolSpecial/Exemplary Programs: Junior Achievement Program, Tutorial /After School Program for Instructional Remediation & Enrichment, Multicultural Week Project (Outer Island Students), Striving Readers Comprehensive Literacy Program (SRCLP), GATE Buddy Benches Project
Accomplishments:• PC Lujan Elementary created a plan of action to address the Critical Area #2 as listed
in the WASC six-year accreditation report. The need was to investigate and utilize additional strategies to address the unique cultural and academic needs of students from outer islands. The school has successfully started to address implementing a multicultural week project to celebrate and further study our outer island population. This was accomplished through lessons, presentations, and contests.
• The completion of the pilot phase of Standards Based Grading with the identification of priority standards and creation of matching proficiency scales. Teachers will provide students with a detailed description of their academic standing and road map to academic gains.
• As a result of PBIS strategies, P.C. Lujan experienced a less than 2% suspension rate, and a decrease of 4% in student referrals from SY 2014-2015 to 2015-2016, majority of which was recorded in the physical aggression category.
• PCLES faculty and staff completed training for Special Education IEP stipulated programs, Great Customer Service and Behavior Management. The outcome that was attained is that the faculty and staff are in compliance with the federal and local mandates as well as being better prepared to meet the needs of our students.
• Primary Common Formative Assessment Quarterly Benchmark Gains of 80% or MoreGrade Level • 80% or More on Benchmark for ELA/ Science and MathKinder • 3rd Quarter – 88% 4th Quarter – 89% First • 4th Quarter – 80%Second • 1st Quarter- 80% 4th Quarter – 80%
• Christmas and Chamorro Choir – 1st place in the Koran Famagu’on and 2nd place in the ASC Music Festival, 2nd place in the Galai’de model competition.
• 100% I.E.P. Compliance for Special Education Program Implementation.• GATE Math Olympiad and Math Kangaroo Competition Participation. Students were
exposed to math problem solving and cooperative learning settings that challenged their thinking.

| 45SY 15-16 Annual State of Public Education Report
H.B. Price Elementary SchoolSpecial/Exemplary Programs: STAR Program, STEM Program, Big Brothers Big Sisters, Positive Behavior Intervention & Supports, Girl Scouts,
Accomplishments: • Received initial accreditation status from WASC• Students participated in Math Olympiad• Students participated in Howard Scripps Spelling Bee• Students participated in National Geographic Society’s Geography Bee• Students participated in Math Kangaroo• Students participated in the GATE Honor Choir• Students participated in the Mock Trial at Guam Superior Court• Hosted GCC Math Carnival
Talofofo Elementary SchoolSpecial/Exemplary Programs: MOCK TRIAL, MATH OLYMPIAD, Good Morning Fitness Program, GATE ART PROGRAM, GATE ART PROGRAM
Accomplishments:• Imagine Guam Participants: The principal and participated in the Imagine Guam
convention.• Kid’s Athletics 2nd Place: Talofofo’s athletic team placed second in the island-wide
competition at GWHW field.• FestPac Delegates and Participants: Three students were selected as 2016 Festival
of the Pacific delegates, and third – fifth grade students participated in the opening and closing ceremonies.
• Special Olympics Participants: Twelve students practiced and participated in the Guam Special Olympics games.
• Math Olympiad Team 7th Place: Math team competed at the island-wide competition finishing in 7th place.
Tamuning Elementary SchoolSpecial/Exemplary Programs: Tamuning & LBJ Elementary Schools’ Balanced Leadership Approach, Tamuning Elementary School’s “Making A Splash” Student Recognition Program, Tamuning & LBJ Elementary School Vertical Teams
Accomplishments:• Tamuning and LBJ Elementary Schools’ Unified Leadership Team: SY15-16 was the
onset of merging the leadership teams from both Tamuning and LBJ Elementary Schools. Rather than functioning from two separate leadership teams, there was only one leadership team which comprised of teacher leaders from both schools. This strengthened the schools’ efforts towards operating as one elementary school to better serve all students as they progress from grade to grade.

46 |
• Continued implementation of the Balanced Leadership Approach and Restructuring of Committees: SY15-16 was the onset of merging committees from both Tamuning and LBJ Elementary Schools. Rather than planning and coordinating activities or events as two separate schools, members from both schools and from each grade level or support program participated in one of five committees. The five committees were Student Awareness Committee, Student Achievement Committee, Student Activities Committee, Student Recognition Committee, and the Positive Behavior Interventions and Supports (PBIS) Committee. Currently, the schools are reviewing respective data and summative reports to determine if any revisions regarding committees, committee frameworks or structures, and/or coordinated activities are needed.
• Publication of a Unified Monthly Newsletter: SY15-16 was the initial school year for Tamuning and LBJ Elementary Schools to collaboratively coordinate and publish a unified newsletter ensuring pertinent information was relayed to parents on a monthly basis. The Student Awareness Committee coordinated this important task of building the connection between home and school. In addition to articles written by the administration, support programs, and grade levels, committees also shared information regarding events, accomplishments, or recognition of students.
• Quarterly Honor Wall Student Recognition: This was the first year both Tamuning and LBJ Elementary Schools recognized students for meeting “A Honor Roll” or “B Honor Roll” by publicizing names on identified bulletin boards in both schools. The Student Recognition Committee focused the year on streamlining how students’ academic achievements were acknowledged.
• Reading is the Key to Success: SY15-16 was the first year Tamuning Elementary School implemented a recognition program for students to read. The Librarians from both Tamuning & LBJ Elementary Schools coordinated this project with the Student Achievement Committee. Students’ reading logs were collected each semester and those who met identified criteria were recognized for their accomplishment during PBIS assemblies.
• PBIS Student Store: SY15-16 was Tamuning & LBJ Elementary Schools’ first time to implement a student store. Students were able to purchase various prizes and supplies using Whale Tickets they have earned during the school year.
• Monthly Grade Level Productions: During this school year, in lieu of a Chamorro Program, each grade level was featured during a specific month to showcase a production for students to exhibit what they have learned in regards to character development or from PBIS lessons through songs, dances, and/or skits. The following were the themes of each grade level’s production:• Fifth Grade Production, “Making a Difference”, October 29, 2015. Students in
5th grade showcasing the value of having good character and gives awareness of life’s daily struggles; also in that, they have people to support and encourage them throughout their journey. They have friends to lean on, parents who will hold their hand, and their personal perseverance to fight for what they believe.
• Fourth Grade Production, “We are the Dream”, November 25, 2015. Students in 4th grade showcasing their efforts to make a difference in school or in their community. They’ve learned to appreciate their freedoms and now are able to see that no matter how bad life gets for them, they can make a difference in the lives of others just as Dr. Martin Luther King, Jr. has done for America.
• Third Grade Production, “Peseverance”, February 17, 2016. Students in 3rd grade showcasing persistence and perseverance leading to limitless possibilities thus encouraging our students to keep striving for success no matter what obstacles they may face in their lives. To “never” give up on gtheir goals and dreams to becoming the best “person” that “they” can be.

| 47SY 15-16 Annual State of Public Education Report
• Second Grade Production, “Peace, Love, and Harmony”, February 29, 2016. This showcases unity then and now, past and present. How we’ve changed in the way we live, in how we treat others and the wars that have yielded negativity in the world. This showed the way we’re viewing our world now and how we can change these views to make it a better world. This showed the way we’re viewing our world now and how we can change these views to make it a better world, and to make a difference in others thus prompting Peace, Love, and Harmony.
• Grade Levels’ Season of Giving Service Learning Projects: During this school year, in lieu of a Christmas Program, students learned about being generous and other service learning components by engaging in a Season of Giving Service Learning Project with culminating activities occurring in December and January.
Upi Elementary SchoolSpecial/Exemplary Programs: Positive Behavior Incentive Support (PBIS) , Direct Instruction Reading Program, Parent Teacher Organization
Accomplishments:• Upi Elementary School 3rd grade teacher, Mrs. Gracelle Canar was declared as the
2016 Guam Department of Education Teacher of the Year on April 28, 2016.• Completion of the new car riders’ area and a newly built awning donated by PTO• Upi Elementary School Kinder teacher Mr. Billy Navarette participated in the Ninja
Warrior Season 8.• Upi Elementary students participated in the Kids Athletics at the GWHS Track and
Field on May 7, 2016. • Christmas Gift giving for every student in partnership with Upi PTO.• FestPac parade of nations by each grade level.• Author visit: Dr. Sylvia Vardell sponsored by IRA.• First Lady’s Purplicious Challenge, to unify, support and build awareness of cancer.
Wettengel Elementary SchoolSpecial/Exemplary Programs: WETTENGEL ELEMENTARY HONOR SOCIETY, RAINBOWS FOR CHILDREN PROGRAM, ASPIRE PROGRAM, CARANADU SUMMER SCHOOL PROGRAM – MAUES & WES, SCHOOL CLIMATE CADRE
Accomplishments:• National Elementary Honor Society – WES was accepted into the National Elementary
Honor Society for the first time this school year. Thirty-one students were inducted into the program who exemplified academic and social excellence as well as being involved in civic and community programs or activities.
• Chamorro Spelling Bee Competition – Promoted the Chamorro language through an island wide competition held at UOG. WES student Dylan Babauta won 2nd place in the Intermediate Competition.
• WES Career Day provided an opportunity for the island community to be partners in education. Presenters from various federal, military, government, business and local leaders shared their roles in the island community.
• On-Going Professional Development - Teachers & staff participated in on-going training by the Curriculum Leadership Team on proficiency scales & standards-based grading.

48 |
• WES Annual Family Health Fair was coordinated by the School Health Counselor, Alma Rabena. The goal of the fair was to provide community awareness on services that are available to families. Guest speakers presented on topics such as food safety, nutrition, Whole Child, and child services. Several government and private groups participated and created table top displays and demonstrations to participants. Participants were able to taste a variety of healthy drinks during the fair.
• Jump Rope for Heart Event was held for the fifth year. Students learned how to take care of their hearts by staying healthy through exercise, eating healthy, and living tobacco free.
• During the event, students used jump ropes to exercise for 30-45 minutes and raised funds from pledges for the American Heart Association.
• Kids for Cure – WES intermediate grades (3rd, 4th & 5th) were trained in weekly fitness activities in preparation for a grade level competitions. Students endured fitness exercises to build stamina, endurance and body strength to compete in a culminating event where they won medals and certificates. The program was sponsored by the American Cancer Society to promote fitness and healthy living.
• Festival of Pacific Participation – Selected students in the intermediate grades participated in the opening ceremony for FESTPAC on May 22nd. Students practiced weekly during school hours then as a whole group with other island-wide FESTPAC participants. Sinora Jowinalyn Mendiola led the group in the months leading to the opening ceremony held at the Paseo. Sinora Mendiola was also a performer during the opening ceremony.
• CPR Training – Seventy-five 5th grade students participate in a hands-on CPR Course held by the school nurse.
• Annual Science Fair – WES Science Fair had over 30 student participants to promote exploration of the world of science in a variety projects they created and were judged on. Winners go on to compete in the Island-wide competition.
Agueda I. Johnston Middle SchoolSpecial/Exemplary Programs: Tutorial Programs to Support Academic Achievement, School Climate Cadre (SCC) to support Social Success, Sustain Silent Reading (SSR) every Friday, Mock Trail/Journalism Class, Interscholastic Program Participation, Kulu Natibu
Accomplishments:• Awarded Six Year Accreditation from WASC• Celebrated and Recognized FestPac as a culmination to the school’s Chamorro
Month Activities• Completed annual Parent/Youth Town Hall meeting for our ESL students and
families.• 4th Annual School Readiness Partnership with Guam Fire Department (GFD) and
Ordot-Chalan Pago Mayor’s Office. School was ready to open on time with the support of their volunteer’s assistance.
• Completed the Annual Script Howard Spelling Bee and placed in the top 15 schools• Participated in various community outreach programs through the collection of
monetary, canned goods, household and clothing goods.
MIDDLE SCHOOL

| 49SY 15-16 Annual State of Public Education Report
• Completed a successful Health Fair for students and their families• PTO Monthly Meetings and Activities –SWAP MEET, Movie Night, School Clean-
up• Completed the Project Isa-ta program for both female and males • Completed 2 successful Cultural Exchange programs with two tour companies.
Host approximately 700 students from different areas of Japan.
Astumbo Middle SchoolSpecial/Exemplary Programs: Positive Behavioral Interventions and Support (PBIS), Academic Interventions, Student Body Association (SBA), National Junior Honor Society (NJHS)
Accomplishments:• Six-Year Accreditation Status achieved• College, Career, and Service Learning Awareness Event• Sports: Boys’ Volleyball A-Team awarded 2nd place; Boys’ Volleyball B-Team
awarded 1st place (undefeated) Champions; Girls’ Volleyball A-Team awarded 3rd place; Boys’ Volleyball B-team awarded 2nd place; Boys’ Soccer awarded 1st place Champions; Boys’ Basketball B-Team awarded 1st place Champions; Girls’ Basketball A-Team awarded 1st place Co-Champions with BMS; and Girls’ B-Team awarded 2nd place.
• 100% Compliance in Special Education• Student participation at Special Olympics, Spelling Bee, and Academic Challenge
Bowl• Cultural Student Exchange with students from JRMS and OMS
F.B. Leon Guerrero Middle SchoolSpecial/Exemplary Programs: Positive Behavior Interventions And Supports Cadre, Robotics Class, 4H Club, .B. Leon Guerrero Fine Arts Program, F.B. Leon Guerrero Fine Arts Program
Accomplishments:• School-wide Science Fair; Our annual School-wide Science fair challenges our
students to deliver science projects from categories such as Chemistry, Biology, Physical Science, & Earth Science. Additionally, FBLG’s Science teachers work collaboratively with community partners to take part of the Science Fair as Judges.
• eCyber Mission; Our Robotics students lead by Aileen Canos, have competed nationally and garnered 1st & 2nd place in the Middle School Division.
• Band; Our Honor Band & Jazz band lead by Mrs. Carroll Flores, throughout the SY have been invited to perform in numerous community events. Additionally, took 1st place in the Island Music Festival.
• Choir; Our Honor Choir lead by Mrs. Irene Cabral, throughout the SY have been invited to perform in numerous community events. Additionally, took 2nd place in the Island Music Festival.
• Collaborative Learning Team; Piloted School for Standards Based Grading (Marzano).

50 |
Inarajan Middle SchoolSpecial/Exemplary Programs: GATE Robotics, Hurao Agricultural Project, Peer Mediation, Warriors In Need, (WIN)
Accomplishments:• Condensing WrAP;• Building in regularly occurring Collaborative Learning Teams (CLTs) with
systemic practices to drive Professional Learning and improve student learning;• Nurturing regularly occurring Professional Learning Teams (PLCs) to focus
energies on actual and current student needs and affect improvement on learning outcomes;
• Reinforcing school wide levels-of-implementation of CCSS;• Integrating Literacy across the curriculum through Consensus Maps, Snapshots,
CFAs, PLCs, PDs, and CLTs;• Develop Tiered Intervention systems and strategies.
Jose Rios Middle SchoolSpecial/Exemplary Programs: S.O.A.R.- Behavior Intervention Program, Response to Intervention- Reading,
Accomplishments:• Response to Intervention- Reading• Student-led Conferences/Portfolios• Career Awareness Fieldtrips in partnership with U.S. Military, Government
Agencies, and Private Businesses• Chamorro Month Spring Concert• War in the Pacific National Park- Fully Funded Field Trip in partnership with
the Ticket to Ride grant, which funded transportation.• Island-wide Basketball Champions (Boys)
L.P. Untalan Middle SchoolSpecial/Exemplary Programs: Science, Technology, Engineering, & Mathematics (Stem) Program, Striving Readers Comprehensive Literacy Program, 10 Steps To The Head Of The Class
Accomplishments:• WASC recognition of the school’s progress in addressing goals• School-wide implementation of the Winning Formula-10 Steps to the Head of
the Class• Foundation Grant Approval• Special Education Compliance Requirement of Offsite Data Review• Professional Development Training for administrators and teachers in the
following areas; STEM, Standard Based Grading, Aquaponics, Striving Readers, Lani Kate Curriculum, Effective Teacher Observation, Balanced Leadership, PRE AP

| 51SY 15-16 Annual State of Public Education Report
• Professional Development Training for Support Staff in the following areas; Search and Seizure, Fire Watch, Aid Certification, EEO Rights,
• Partnership with Americorps to providing tutoring services • Partnership with Junior Achievement and Docomo in offering a financial literacy
curriculum • Annual STEM EXPO Striving Readers Training
Oceanview Middle SchoolSpecial/Exemplary Programs: Pre-Advanced Placement Program , Positive Behavior Interventions and Supports (PBIS), Oceanview Middle School Performing Arts,
Accomplishments:• The Consolidated Grant FY 2015 application has been approved by the United States
Education Department allowing for the John Hopkins Talent Development Program to continue until SY 2016-2017.
• A Special Commendation from the 33rd Guam Legislature was given to Mrs. Silvina Taumoma for her 54 years of service as an educator. Mrs. Taumomoa taught 7th grade Language Arts at OMS for 19 years in addition to her many years of teaching public and private school.
• The 2016 Pacific Islands Bilingual Bicultural Association Teacher for Guam is Siñot Joseph Leon Guerrero. Siñot Leon Guerrero teaches Chamorro language to 6th grade students.
• Oceanview Middle School Chamorro Language students participated and won third place for the Lålai/Chant Competition during the annual UOG Chamorro Studies Program Inacha’igen
• Fino’ Chamorro or Chamorro Language Competition held on March 8 and 9, 2016.• Participation in the Community Eligibility Program (CEP) provides 100% Free Meal
Program to all students.• OMS Cultural Dancers participated in and won first place in the Bailan Taotao Tåno’ • Chamorro Dance Competition held at Gef På’go Inaråjan, held on April 10, 2016.• Louise Genovana, 7th grade, place 4th in the 2016 Scripps Island-wide Spelling Bee.• Jeffrey Edubalad, 7th grade, broke the island wide middle school record in the 100
meter dash in the 2016 Track & Field Events.
V.B. Benavente Middle SchoolSpecial/Exemplary Programs: Learning School Alliance Alumni member, Positive Behavior Intervention Supports, Personalization and Inter-disciplinary teams,
Accomplishments:• BMS can ensure there is a guaranteed and viable curriculum.• All grade level content teams develop Common Formative Assessments with great
success.• Several teams have piloted Pyramid of Interventions with mixed success.• The majority of walkthroughs (over 80%) indicate higher levels of Blooms taxonomy
targeted in the classroom.• Most interdisciplinary teams had a decline in their referrals, some by over 50%.

52 |
• School culture, as measured in the Standards Assessment Inventory, showed an increase in the following standards: Leadership, Resources, Data, Learning Design, Outcomes, and Implementation.
• Over 85% of teachers are proficient in setting objectives & providing feedback as measured in the walkthroughs.
• WASC reaffirmed 3 years of Accreditation during mid term visit.
George Washington High SchoolSpecial/Exemplary Programs: Achieve3000, S.T.E.M., Freshman Academy, Guam Trades Academy, Positive Behavioral Interventions & Supports (P.B.I.S.)
Accomplishments: • 121 National Career Readiness Certificates (13 Gold, 62 Silver, 46 Bronze)• 39 Certificates of Mastery for the GCC-Articulated Programs• JROTC Golden Bear National West Coast Competition: 1st Place Overall• Foundation for Public Education Grant Recipient of $3,333.33 for eScience 3000• “Make the Break Winter” Holiday Contest Achieve 3000 Winner for Guam (Arianna
Balagtas, 12th Grade)• 1st Place in the 2016 Fishbowl Competition• Chamorro Contest winners in Poetry, etc.• Six students were selected to participate in the Close Up Trip to Washington, D.C.• GW JROTC hosted the 100th Year Anniversary 5K in Tiyan baseball field.• Most Spirited & Energetic School 2016 Sorensen Media Group LipDub Competition
John F. Kennedy High SchoolSpecial/Exemplary Programs: Literacy Project; Science, Technology, Engineering and Mathematics (STEM) Program, Air Force Junior Reserves Officer Training Corps (AFJROTC), WorkKeys Assessment and National Career Readiness Certificates, Career and Technical Education (CTE) Programs,
Accomplishments:• GDOE 2015 Fixed Asset Inventory Report - JFK recognized as top performing high
school.• JFK Counselors update our College & Career Planning Guide that serves as a tool
in the classroom to keep our students on track with their goals upon completion of high school.
• Students Under Care Can Experience Successful Schooling (SUCCESS) intervention program allows for the counselors to meet with students based on PULSE data that reflects top infractions and the consistency thereof for our students. Counselors pull out students during non-instructional time to present information that helps student academically, socially, and emotionally.
• The 4th Annual Islander Pride Day was held on March 19, 2016 at the Guam Premier Outlets (GPO).
• JFK Class of 2016 produces 349 graduates!
HIGH SCHOOL

| 53SY 15-16 Annual State of Public Education Report
• Twenty-one graduates receive their GCC Certificates of Mastery in their respective programs.
• Two hundred thirty-four graduates receive National Career Readiness Certificates (NCRC) with the breakdown as follows: 85 bronze, 121 silver, and 28 gold.
• Class of 2016 Valedictorian is Sandra Nicole Lavina with a GPA of 105.5. She will attend the University of Guam in Fall 2016 and is a recipient of the Merit Scholarship.
• Class of Salutatorian is Chadler Jarred Iriarte with a GPA of 104.9375. He will attend the University of Portland in Fall 2016 and is a recipient of the Univ. of Portland’s Presidential Scholarship.
• Seven graduates of the Class of 2016 receive the UOG Merit Scholarship.
Okkodo High SchoolSpecial/Exemplary Programs: Okkodo High GCC Marketing Career Technical Education Program, GCC Work Experience Program, Pro Start Program, Lodging Management Program (LMP), Freshman Academy
Accomplishments:• Freshman Academy• OHS Electives Fair• Special Olympics• Work Keys- Key Train• Science Fair• Upward Bound• School To Work Program• Career Day• College Fair/Military Fair• Pre-Engineering Class (Pilot)
Simon Sanchez High SchoolSpecial/Exemplary Programs: SSHS JROTC Program “Shark Battalion”, SHS Fine Arts Program, GCC Vocational-Technical Education Programs,
Accomplishments:• Pre-Calculus students and Mr. Ryan Flores for competing in the UOG Math Quiz
Day on April 30. 2 teams made it to the final round and the team with Giordan Kho, Gabriel Reyes, and Jemuel Carlos won 2nd place for Category 2 Advanced Math.
• Japanese Exchange Programs (spearheaded by Japanese language teachers Mrs. M. Delfin and Mrs. T. Shibasaki) allowed SSHS students the opportunity to interact with students from another country through language activities, song, dance, and overall goodwill.
• GCC Certificates of Mastery: 73 2016 graduates received GCC Certificates of Mastery in their respective disciplines of ProStart, Lodging Management, Marketing, Automotive, Carpentry, and Health Careers & Secondary Science.
• National Career Readiness Certificate: 137 out of 313 2016 graduates obtained a gold, silver, or bronze NCRC level upon taking the WorkKeys/KeyTrain Assessments.

54 |
Southern High School
Special/Exemplary Programs: John Hopkins Talented Development 9th Grade Academy, Interscholastic Program, Safe School Ambassadors Program, GCC Programs, JROTC Program,
Accomplishments:• Physical Science, Human Anatomy and Physiology, and Guam History in the
SBA Proficient/Advanced category we are the highest amongst the island’s schools.
• Overall 9th grade academy ranked top place in the ACT Aspire District Wide Assessment.
• The Gates Millennium Merit scholarship is awarded to Michael Topasna. • Alyssandra T. Cruz and Sabrina Zamora received the GCC/UOG MODA
GINO’s scholarship.• Southern High Graduated 327 seniors and received 7 Merit Scholarships.• 119 seniors received the National Career Readiness Certificate: 69 Bronze, 47
Silver and 3 Gold.• Southern High School received 22 GCC Certificate of Mastery: Automotive
Service Technology (1), Automotive-Collision Repair and Refinishing Technology (1), Electronics/Computer Networking (1), Marketing (12), and Health Careers & Science (7).
• Students winning Art Work Competitions.• Cultural Performing Arts students winning 3rd Place World Wide and Band
students winning 1st place in the CNMI Islands band competition winning $3000.00.
• The Academy Challenge Bowl and Mock Trial Teams started this School Year.
Tiyan High SchoolSpecial/Exemplary Programs: THS Career Academies, PBIS, School to Work
Accomplishments:• THS Career Academies• THS School Marquee Ribbon Cutting• THS T-Factor• THS FestPac• THS Mes Chamorro• THS Throne Ribbon Cutting• THS Interscholastic Sports• Power 98 Senior Lip Dub Challenge Small Schools 1st Place Winner • PBIS Implementation• Japanese Student Exchange

| 55SY 15-16 Annual State of Public Education Report
Appendices
• District Summative Assessment SY14-15 & SY15-16 ACT Aspire “Ready” Level Cohort Comparison
• ACT Aspire Results: Percent at ‘READY’ Level
• ACT Aspire Results: Scale Scores and Benchmarks

56 |

| 57SY 15-16 Annual State of Public Education Report

58 |

| 59SY 15-16 Annual State of Public Education Report

60 |

| 61SY 15-16 Annual State of Public Education Report

62 |

| 63SY 15-16 Annual State of Public Education Report

64 |

| 65SY 15-16 Annual State of Public Education Report

66 |

| 67SY 15-16 Annual State of Public Education Report

68 |

| 69SY 15-16 Annual State of Public Education Report

70 |

| 71SY 15-16 Annual State of Public Education Report

72 |

| 73SY 15-16 Annual State of Public Education Report

74 |

| 75SY 15-16 Annual State of Public Education Report

76 |

| 77SY 15-16 Annual State of Public Education Report
ACKNOWLEDGMENTS:
ASPER Project Lead: Zenaida Napa Natividad, Ph.D. Administrator, Research, Planning & Evaluation State Liaison, National Forum on Education Statistics (NCES, U.S. Department of Education)
ASPER Design and Layout: Mariam Kristina Alam Graphic Artist Tech III, Chamorro Studies and Special Projects Division
Special acknowledgment to: Christopher Anderson Deputy Superintendent, Assessment and Accountability (Acting) Jospeh L.M. Sanchez Deputy Superintendent, Curriculum and Instructional Improvement
Erika F. Cruz Deputy Superintendent, Education Support and Community Learning
Taling Taitano Deputy Superintendent, Financial and Administrative Services
Rufina Mendiola Administrator, Chamorro Studies and Special Projects Division
All SY 15-16 School PrincipalsAll Members of the District Data TeamAna O. Aguon, PCIV, RPE Division,Alice F. Bonto, FSAIS DivisionTish Sahagon, FSAIS DivisionMargaret Artero, Financial Affairs DivisionAntonette M. Santos, Personnel Services Division Dolores Faisao, Personnel Services DivisionFranklin Cooper-Nurse, Internal Audit OfficeTerese Crisostomo, Special Education Division
Dennis Bakker, Special Education DivisionJohn Quinata, Education Support and LearningJoshua C. Blas, C&I DivisionMichelle Camacho, C&I DivisionAnthony Sean Monforte, SSS DivisionEmily Salas, SSS DivisionAnn Manibusan, SSSD DivisionMaria Roberto, Office of the Superintendent Christie Chargualaf, Office of the Deputy Superintendent, A&A
ASPER & SPRC Data:
FRONT Left to Right:Antonette Muna Santos, Dr. Zenaida Napa Natividad, Josephine Nededog, Tita Mafnas, Ana Aguon, Michelle Camacho, Ann Manibusan, Joshua Blas, Mariam Kristina Alam
BACK Left to Right: Dennis Bakker, Christie Chargualaf, John Quinata, Sean Anthony Manforte
Other staff members that helped significantly in the ASPER 2016 production were not available when this photo was taken.
Beginning in SY14-16 ASPER, the Department aligned student count by ethnicity, employee categories, and other reports with the U.S. Department of Education National Center for Education Statistics (NCES) EDFacts categorization. EDFacts is part of the Education Data Exchange Network that contains the uniform reporting system of education data for the US Department of Education. The RP&E Administrator oversees the EDFacts data collection, quality control, and timely reporting.

Guam Department of Education 2016