Student And Course Enrollment Reports - University of Guam
48
February 2016 University of Guam Academic and Student Affairs Office of Academic Assessment and Institutional Research TAB TITLE DESCRIPTION 1 Res_NonRes Overall HeadCount, Credits, FTE by Resident, Non-Resident Student Type 2 Headcount & CR Overall HeadCount, Credits, FTE by Undergraduate, Graduate and Non-Degree Type 3 Majors Student Enrollment by College/Major/Program Level/Course Load/Class Level/Gender 4 Majors by Ethnicity Student Enrollment by College/Major/Program Level/Ethnicity 5 Ethnic_Gender Student Enrollment by Ethnicity and Gender 6 FTPT Student Enrollment by Load and Program Level 7 Prev_HS New Freshman Enrollment by High School or Previous Institution 8 New Students New Student Enrollment by Program Level/Admission Status 9 CR Hr Prod Summary Credit Hour Production by College/Subject 10 CR Hr Prod Credit Hour Production by College/Academic Level/Subject/Course Student And Course Enrollment Reports - 2016 Spring Semester CONTENTS Page 1 of 48 16SP_enrollment_reports
-
Upload
khangminh22 -
Category
Documents
-
view
2 -
download
0
Transcript of Student And Course Enrollment Reports - University of Guam

February 2016
University of GuamAcademic and Student AffairsOffice of Academic Assessment and Institutional Research
TAB TITLE DESCRIPTION
1 Res_NonRes Overall HeadCount, Credits, FTE by Resident, Non-Resident Student Type
2 Headcount & CR Overall HeadCount, Credits, FTE by Undergraduate, Graduate and Non-Degree Type
3 Majors Student Enrollment by College/Major/Program Level/Course Load/Class Level/Gender
4 Majors by Ethnicity Student Enrollment by College/Major/Program Level/Ethnicity
5 Ethnic_Gender Student Enrollment by Ethnicity and Gender
6 FTPT Student Enrollment by Load and Program Level
7 Prev_HS New Freshman Enrollment by High School or Previous Institution
8 New Students New Student Enrollment by Program Level/Admission Status
9 CR Hr Prod Summary Credit Hour Production by College/Subject
10 CR Hr Prod Credit Hour Production by College/Academic Level/Subject/Course
Student And Course Enrollment Reports - 2016 Spring Semester
CONTENTS
Page 1 of 48 16SP_enrollment_reports
UOG IR
Cross-Out
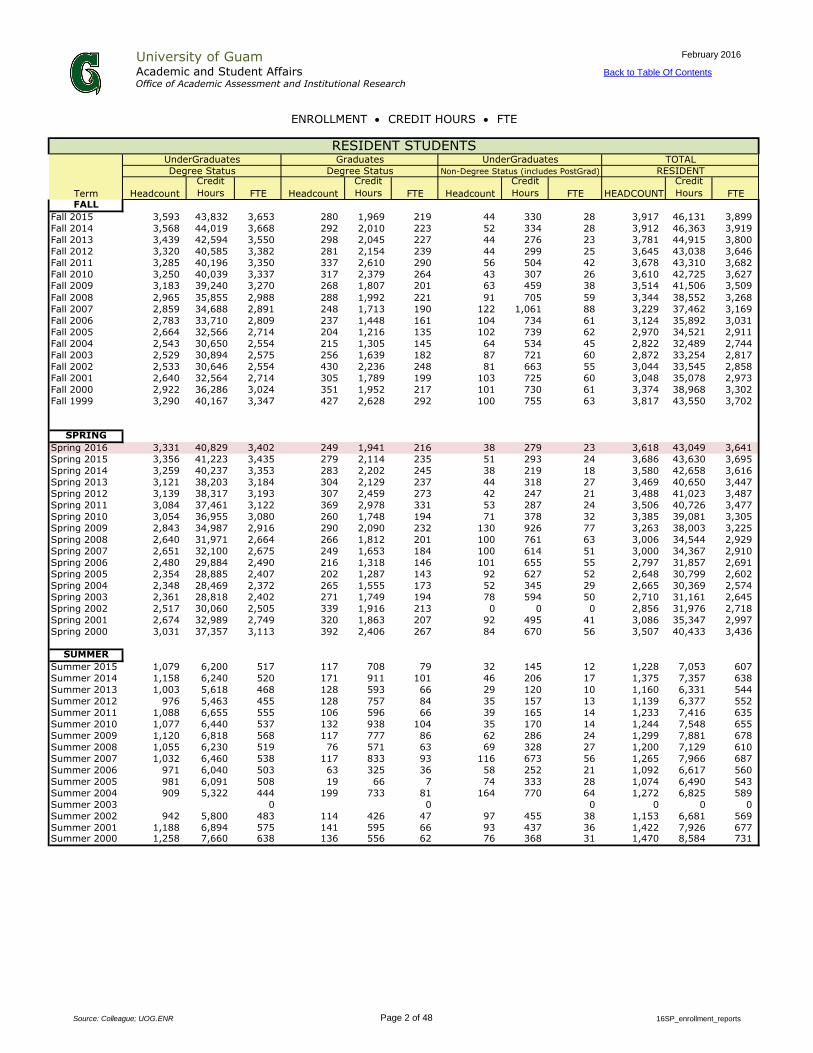
February 2016University of GuamAcademic and Student Affairs Back to Table Of Contents
Office of Academic Assessment and Institutional Research
Term Headcount
Credit
Hours FTE Headcount
Credit
Hours FTE Headcount
Credit
Hours FTE HEADCOUNT
Credit
Hours FTEFALL
Fall 2015 3,593 43,832 3,653 280 1,969 219 44 330 28 3,917 46,131 3,899
Fall 2014 3,568 44,019 3,668 292 2,010 223 52 334 28 3,912 46,363 3,919
Fall 2013 3,439 42,594 3,550 298 2,045 227 44 276 23 3,781 44,915 3,800
Fall 2012 3,320 40,585 3,382 281 2,154 239 44 299 25 3,645 43,038 3,646
Fall 2011 3,285 40,196 3,350 337 2,610 290 56 504 42 3,678 43,310 3,682
Fall 2010 3,250 40,039 3,337 317 2,379 264 43 307 26 3,610 42,725 3,627
Fall 2009 3,183 39,240 3,270 268 1,807 201 63 459 38 3,514 41,506 3,509
Fall 2008 2,965 35,855 2,988 288 1,992 221 91 705 59 3,344 38,552 3,268
Fall 2007 2,859 34,688 2,891 248 1,713 190 122 1,061 88 3,229 37,462 3,169
Fall 2006 2,783 33,710 2,809 237 1,448 161 104 734 61 3,124 35,892 3,031
Fall 2005 2,664 32,566 2,714 204 1,216 135 102 739 62 2,970 34,521 2,911
Fall 2004 2,543 30,650 2,554 215 1,305 145 64 534 45 2,822 32,489 2,744
Fall 2003 2,529 30,894 2,575 256 1,639 182 87 721 60 2,872 33,254 2,817
Fall 2002 2,533 30,646 2,554 430 2,236 248 81 663 55 3,044 33,545 2,858
Fall 2001 2,640 32,564 2,714 305 1,789 199 103 725 60 3,048 35,078 2,973
Fall 2000 2,922 36,286 3,024 351 1,952 217 101 730 61 3,374 38,968 3,302
Fall 1999 3,290 40,167 3,347 427 2,628 292 100 755 63 3,817 43,550 3,702
SPRING
Spring 2016 3,331 40,829 3,402 249 1,941 216 38 279 23 3,618 43,049 3,641
Spring 2015 3,356 41,223 3,435 279 2,114 235 51 293 24 3,686 43,630 3,695
Spring 2014 3,259 40,237 3,353 283 2,202 245 38 219 18 3,580 42,658 3,616
Spring 2013 3,121 38,203 3,184 304 2,129 237 44 318 27 3,469 40,650 3,447
Spring 2012 3,139 38,317 3,193 307 2,459 273 42 247 21 3,488 41,023 3,487
Spring 2011 3,084 37,461 3,122 369 2,978 331 53 287 24 3,506 40,726 3,477
Spring 2010 3,054 36,955 3,080 260 1,748 194 71 378 32 3,385 39,081 3,305
Spring 2009 2,843 34,987 2,916 290 2,090 232 130 926 77 3,263 38,003 3,225
Spring 2008 2,640 31,971 2,664 266 1,812 201 100 761 63 3,006 34,544 2,929
Spring 2007 2,651 32,100 2,675 249 1,653 184 100 614 51 3,000 34,367 2,910
Spring 2006 2,480 29,884 2,490 216 1,318 146 101 655 55 2,797 31,857 2,691
Spring 2005 2,354 28,885 2,407 202 1,287 143 92 627 52 2,648 30,799 2,602
Spring 2004 2,348 28,469 2,372 265 1,555 173 52 345 29 2,665 30,369 2,574
Spring 2003 2,361 28,818 2,402 271 1,749 194 78 594 50 2,710 31,161 2,645
Spring 2002 2,517 30,060 2,505 339 1,916 213 0 0 0 2,856 31,976 2,718
Spring 2001 2,674 32,989 2,749 320 1,863 207 92 495 41 3,086 35,347 2,997
Spring 2000 3,031 37,357 3,113 392 2,406 267 84 670 56 3,507 40,433 3,436
SUMMER
Summer 2015 1,079 6,200 517 117 708 79 32 145 12 1,228 7,053 607
Summer 2014 1,158 6,240 520 171 911 101 46 206 17 1,375 7,357 638
Summer 2013 1,003 5,618 468 128 593 66 29 120 10 1,160 6,331 544
Summer 2012 976 5,463 455 128 757 84 35 157 13 1,139 6,377 552
Summer 2011 1,088 6,655 555 106 596 66 39 165 14 1,233 7,416 635
Summer 2010 1,077 6,440 537 132 938 104 35 170 14 1,244 7,548 655
Summer 2009 1,120 6,818 568 117 777 86 62 286 24 1,299 7,881 678
Summer 2008 1,055 6,230 519 76 571 63 69 328 27 1,200 7,129 610
Summer 2007 1,032 6,460 538 117 833 93 116 673 56 1,265 7,966 687
Summer 2006 971 6,040 503 63 325 36 58 252 21 1,092 6,617 560
Summer 2005 981 6,091 508 19 66 7 74 333 28 1,074 6,490 543
Summer 2004 909 5,322 444 199 733 81 164 770 64 1,272 6,825 589
Summer 2003 0 0 0 0 0 0
Summer 2002 942 5,800 483 114 426 47 97 455 38 1,153 6,681 569
Summer 2001 1,188 6,894 575 141 595 66 93 437 36 1,422 7,926 677Summer 2000 1,258 7,660 638 136 556 62 76 368 31 1,470 8,584 731
ENROLLMENT CREDIT HOURS FTE
RESIDENTNon-Degree Status (includes PostGrad)
RESIDENT STUDENTSGraduatesUnderGraduates UnderGraduates TOTAL
Degree StatusDegree Status
Source: Colleague; UOG.ENR Page 2 of 48 16SP_enrollment_reports
February 2016
HEADCOUNT
Credit
Hours FTE HEADCOUNT
Credit
Hours FTE HEADCOUNT
Credit
Hours FTE HEADCOUNT
Credit
Hours FTE
FALL
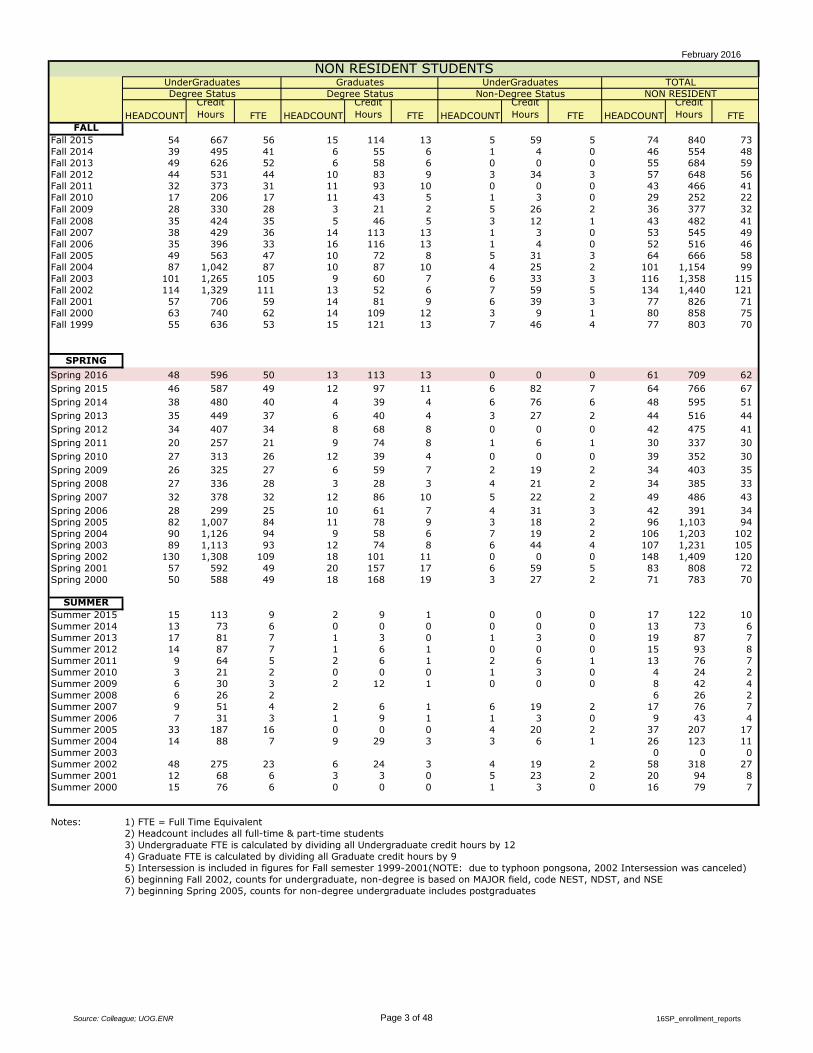
Fall 2015 54 667 56 15 114 13 5 59 5 74 840 73
Fall 2014 39 495 41 6 55 6 1 4 0 46 554 48
Fall 2013 49 626 52 6 58 6 0 0 0 55 684 59
Fall 2012 44 531 44 10 83 9 3 34 3 57 648 56
Fall 2011 32 373 31 11 93 10 0 0 0 43 466 41
Fall 2010 17 206 17 11 43 5 1 3 0 29 252 22
Fall 2009 28 330 28 3 21 2 5 26 2 36 377 32
Fall 2008 35 424 35 5 46 5 3 12 1 43 482 41
Fall 2007 38 429 36 14 113 13 1 3 0 53 545 49
Fall 2006 35 396 33 16 116 13 1 4 0 52 516 46
Fall 2005 49 563 47 10 72 8 5 31 3 64 666 58
Fall 2004 87 1,042 87 10 87 10 4 25 2 101 1,154 99
Fall 2003 101 1,265 105 9 60 7 6 33 3 116 1,358 115
Fall 2002 114 1,329 111 13 52 6 7 59 5 134 1,440 121
Fall 2001 57 706 59 14 81 9 6 39 3 77 826 71
Fall 2000 63 740 62 14 109 12 3 9 1 80 858 75
Fall 1999 55 636 53 15 121 13 7 46 4 77 803 70
SPRING
Spring 2016 48 596 50 13 113 13 0 0 0 61 709 62
Spring 2015 46 587 49 12 97 11 6 82 7 64 766 67
Spring 2014 38 480 40 4 39 4 6 76 6 48 595 51
Spring 2013 35 449 37 6 40 4 3 27 2 44 516 44
Spring 2012 34 407 34 8 68 8 0 0 0 42 475 41
Spring 2011 20 257 21 9 74 8 1 6 1 30 337 30
Spring 2010 27 313 26 12 39 4 0 0 0 39 352 30
Spring 2009 26 325 27 6 59 7 2 19 2 34 403 35
Spring 2008 27 336 28 3 28 3 4 21 2 34 385 33
Spring 2007 32 378 32 12 86 10 5 22 2 49 486 43
Spring 2006 28 299 25 10 61 7 4 31 3 42 391 34
Spring 2005 82 1,007 84 11 78 9 3 18 2 96 1,103 94
Spring 2004 90 1,126 94 9 58 6 7 19 2 106 1,203 102
Spring 2003 89 1,113 93 12 74 8 6 44 4 107 1,231 105
Spring 2002 130 1,308 109 18 101 11 0 0 0 148 1,409 120
Spring 2001 57 592 49 20 157 17 6 59 5 83 808 72
Spring 2000 50 588 49 18 168 19 3 27 2 71 783 70
SUMMER
Summer 2015 15 113 9 2 9 1 0 0 0 17 122 10
Summer 2014 13 73 6 0 0 0 0 0 0 13 73 6
Summer 2013 17 81 7 1 3 0 1 3 0 19 87 7
Summer 2012 14 87 7 1 6 1 0 0 0 15 93 8
Summer 2011 9 64 5 2 6 1 2 6 1 13 76 7
Summer 2010 3 21 2 0 0 0 1 3 0 4 24 2
Summer 2009 6 30 3 2 12 1 0 0 0 8 42 4
Summer 2008 6 26 2 6 26 2
Summer 2007 9 51 4 2 6 1 6 19 2 17 76 7
Summer 2006 7 31 3 1 9 1 1 3 0 9 43 4
Summer 2005 33 187 16 0 0 0 4 20 2 37 207 17
Summer 2004 14 88 7 9 29 3 3 6 1 26 123 11
Summer 2003 0 0 0
Summer 2002 48 275 23 6 24 3 4 19 2 58 318 27
Summer 2001 12 68 6 3 3 0 5 23 2 20 94 8
Summer 2000 15 76 6 0 0 0 1 3 0 16 79 7
Notes: 1) FTE = Full Time Equivalent
2) Headcount includes all full-time & part-time students
3) Undergraduate FTE is calculated by dividing all Undergraduate credit hours by 12
4) Graduate FTE is calculated by dividing all Graduate credit hours by 9
5) Intersession is included in figures for Fall semester 1999-2001(NOTE: due to typhoon pongsona, 2002 Intersession was canceled)
6) beginning Fall 2002, counts for undergraduate, non-degree is based on MAJOR field, code NEST, NDST, and NSE
7) beginning Spring 2005, counts for non-degree undergraduate includes postgraduates
TOTAL
NON RESIDENT
NON RESIDENT STUDENTSUnderGraduates Graduates
Degree Status Degree Status
UnderGraduates
Non-Degree Status
Source: Colleague; UOG.ENR Page 3 of 48 16SP_enrollment_reports
February 2016
University of Guam Back to Table Of Contents
Academic and Student AffairsOffice of Academic Assessment and Institutional Research
Term Headcount Credit Hours FTE
Head
count
Credit
Hours FTE
Head
count
Credit
Hours FTE
Head
count
Prior
Year
Var.
Credit
Hours
Prior
Year
Var. FTE
Prior
Year
Var.
FALL
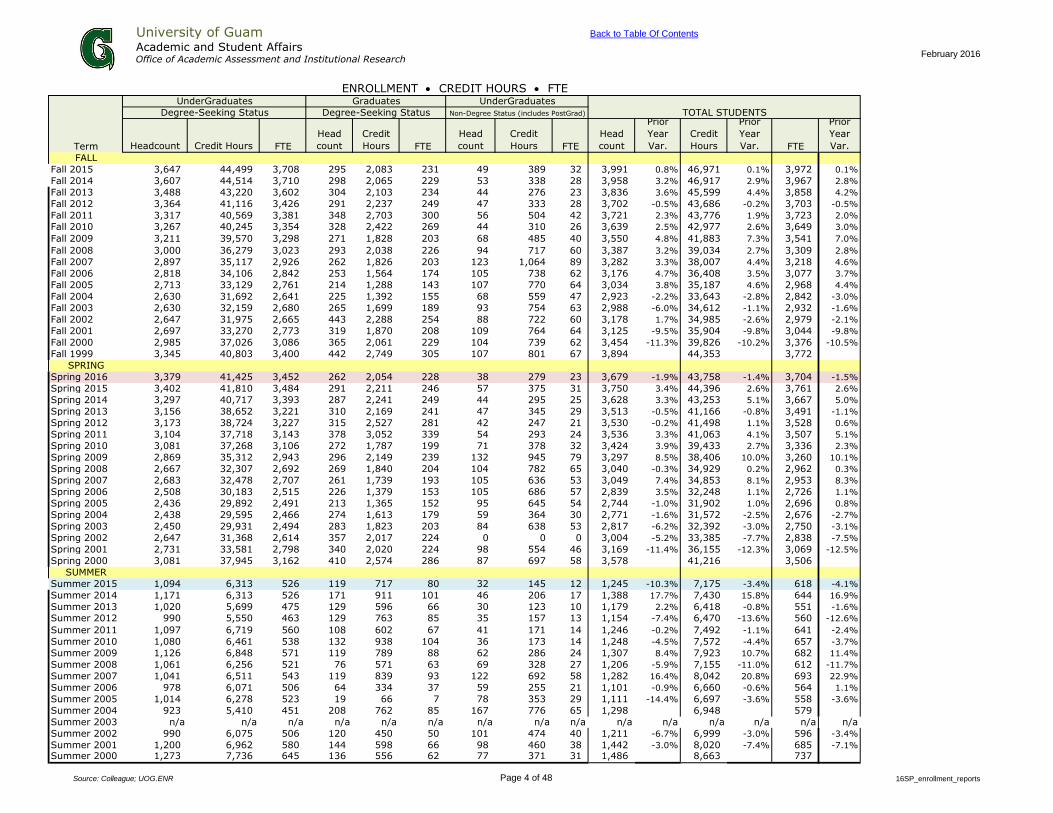
Fall 2015 3,647 44,499 3,708 295 2,083 231 49 389 32 3,991 0.8% 46,971 0.1% 3,972 0.1%
Fall 2014 3,607 44,514 3,710 298 2,065 229 53 338 28 3,958 3.2% 46,917 2.9% 3,967 2.8%
Fall 2013 3,488 43,220 3,602 304 2,103 234 44 276 23 3,836 3.6% 45,599 4.4% 3,858 4.2%
Fall 2012 3,364 41,116 3,426 291 2,237 249 47 333 28 3,702 -0.5% 43,686 -0.2% 3,703 -0.5%
Fall 2011 3,317 40,569 3,381 348 2,703 300 56 504 42 3,721 2.3% 43,776 1.9% 3,723 2.0%
Fall 2010 3,267 40,245 3,354 328 2,422 269 44 310 26 3,639 2.5% 42,977 2.6% 3,649 3.0%
Fall 2009 3,211 39,570 3,298 271 1,828 203 68 485 40 3,550 4.8% 41,883 7.3% 3,541 7.0%
Fall 2008 3,000 36,279 3,023 293 2,038 226 94 717 60 3,387 3.2% 39,034 2.7% 3,309 2.8%
Fall 2007 2,897 35,117 2,926 262 1,826 203 123 1,064 89 3,282 3.3% 38,007 4.4% 3,218 4.6%
Fall 2006 2,818 34,106 2,842 253 1,564 174 105 738 62 3,176 4.7% 36,408 3.5% 3,077 3.7%
Fall 2005 2,713 33,129 2,761 214 1,288 143 107 770 64 3,034 3.8% 35,187 4.6% 2,968 4.4%
Fall 2004 2,630 31,692 2,641 225 1,392 155 68 559 47 2,923 -2.2% 33,643 -2.8% 2,842 -3.0%
Fall 2003 2,630 32,159 2,680 265 1,699 189 93 754 63 2,988 -6.0% 34,612 -1.1% 2,932 -1.6%
Fall 2002 2,647 31,975 2,665 443 2,288 254 88 722 60 3,178 1.7% 34,985 -2.6% 2,979 -2.1%
Fall 2001 2,697 33,270 2,773 319 1,870 208 109 764 64 3,125 -9.5% 35,904 -9.8% 3,044 -9.8%
Fall 2000 2,985 37,026 3,086 365 2,061 229 104 739 62 3,454 -11.3% 39,826 -10.2% 3,376 -10.5%
Fall 1999 3,345 40,803 3,400 442 2,749 305 107 801 67 3,894 44,353 3,772
SPRING
Spring 2016 3,379 41,425 3,452 262 2,054 228 38 279 23 3,679 -1.9% 43,758 -1.4% 3,704 -1.5%
Spring 2015 3,402 41,810 3,484 291 2,211 246 57 375 31 3,750 3.4% 44,396 2.6% 3,761 2.6%
Spring 2014 3,297 40,717 3,393 287 2,241 249 44 295 25 3,628 3.3% 43,253 5.1% 3,667 5.0%
Spring 2013 3,156 38,652 3,221 310 2,169 241 47 345 29 3,513 -0.5% 41,166 -0.8% 3,491 -1.1%
Spring 2012 3,173 38,724 3,227 315 2,527 281 42 247 21 3,530 -0.2% 41,498 1.1% 3,528 0.6%
Spring 2011 3,104 37,718 3,143 378 3,052 339 54 293 24 3,536 3.3% 41,063 4.1% 3,507 5.1%
Spring 2010 3,081 37,268 3,106 272 1,787 199 71 378 32 3,424 3.9% 39,433 2.7% 3,336 2.3%
Spring 2009 2,869 35,312 2,943 296 2,149 239 132 945 79 3,297 8.5% 38,406 10.0% 3,260 10.1%
Spring 2008 2,667 32,307 2,692 269 1,840 204 104 782 65 3,040 -0.3% 34,929 0.2% 2,962 0.3%
Spring 2007 2,683 32,478 2,707 261 1,739 193 105 636 53 3,049 7.4% 34,853 8.1% 2,953 8.3%
Spring 2006 2,508 30,183 2,515 226 1,379 153 105 686 57 2,839 3.5% 32,248 1.1% 2,726 1.1%
Spring 2005 2,436 29,892 2,491 213 1,365 152 95 645 54 2,744 -1.0% 31,902 1.0% 2,696 0.8%
Spring 2004 2,438 29,595 2,466 274 1,613 179 59 364 30 2,771 -1.6% 31,572 -2.5% 2,676 -2.7%
Spring 2003 2,450 29,931 2,494 283 1,823 203 84 638 53 2,817 -6.2% 32,392 -3.0% 2,750 -3.1%
Spring 2002 2,647 31,368 2,614 357 2,017 224 0 0 0 3,004 -5.2% 33,385 -7.7% 2,838 -7.5%
Spring 2001 2,731 33,581 2,798 340 2,020 224 98 554 46 3,169 -11.4% 36,155 -12.3% 3,069 -12.5%
Spring 2000 3,081 37,945 3,162 410 2,574 286 87 697 58 3,578 41,216 3,506
SUMMER
Summer 2015 1,094 6,313 526 119 717 80 32 145 12 1,245 -10.3% 7,175 -3.4% 618 -4.1%
Summer 2014 1,171 6,313 526 171 911 101 46 206 17 1,388 17.7% 7,430 15.8% 644 16.9%
Summer 2013 1,020 5,699 475 129 596 66 30 123 10 1,179 2.2% 6,418 -0.8% 551 -1.6%
Summer 2012 990 5,550 463 129 763 85 35 157 13 1,154 -7.4% 6,470 -13.6% 560 -12.6%
Summer 2011 1,097 6,719 560 108 602 67 41 171 14 1,246 -0.2% 7,492 -1.1% 641 -2.4%
Summer 2010 1,080 6,461 538 132 938 104 36 173 14 1,248 -4.5% 7,572 -4.4% 657 -3.7%
Summer 2009 1,126 6,848 571 119 789 88 62 286 24 1,307 8.4% 7,923 10.7% 682 11.4%
Summer 2008 1,061 6,256 521 76 571 63 69 328 27 1,206 -5.9% 7,155 -11.0% 612 -11.7%
Summer 2007 1,041 6,511 543 119 839 93 122 692 58 1,282 16.4% 8,042 20.8% 693 22.9%
Summer 2006 978 6,071 506 64 334 37 59 255 21 1,101 -0.9% 6,660 -0.6% 564 1.1%
Summer 2005 1,014 6,278 523 19 66 7 78 353 29 1,111 -14.4% 6,697 -3.6% 558 -3.6%
Summer 2004 923 5,410 451 208 762 85 167 776 65 1,298 6,948 579
Summer 2003 n/a n/a n/a n/a n/a n/a n/a n/a n/a n/a n/a n/a n/a n/a n/a
Summer 2002 990 6,075 506 120 450 50 101 474 40 1,211 -6.7% 6,999 -3.0% 596 -3.4%
Summer 2001 1,200 6,962 580 144 598 66 98 460 38 1,442 -3.0% 8,020 -7.4% 685 -7.1%
Summer 2000 1,273 7,736 645 136 556 62 77 371 31 1,486 8,663 737
ENROLLMENT CREDIT HOURS FTEUnderGraduates
Non-Degree Status (includes PostGrad)
UnderGraduates
Degree-Seeking Status
Graduates
Degree-Seeking Status TOTAL STUDENTS
Source: Colleague; UOG.ENR Page 4 of 48 16SP_enrollment_reports

February 2016
University of Guam Back to Table Of Contents
Academic and Student AffairsOffice of Academic Assessment and Institutional Research
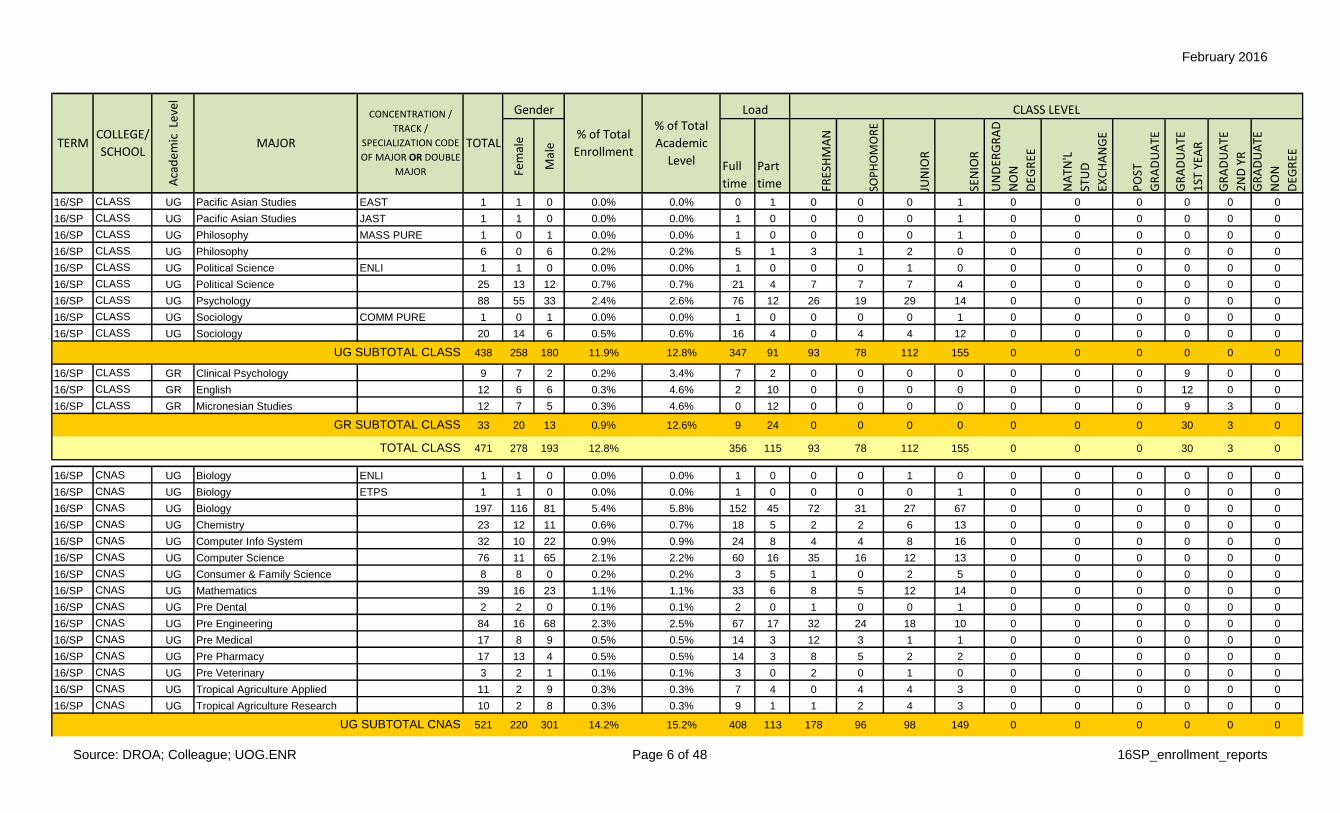
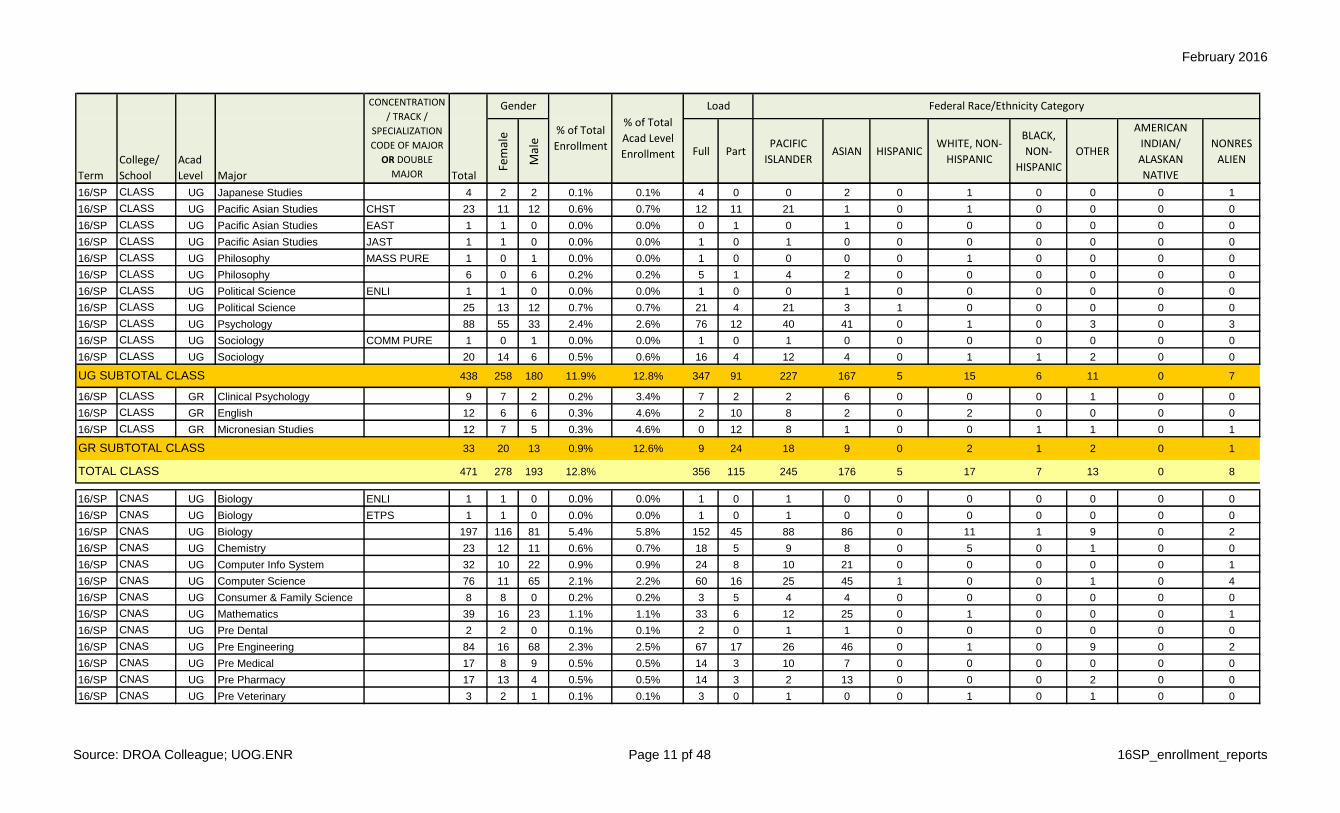
Student Enrollment by College/Academic Level/Major/Gender/Load/Class Level
Fem
ale
Mal
e
Full
time
Part
time FRES
HM
AN
SOP
HO
MO
RE
JUN
IOR
SEN
IOR
UN
DER
GR
AD
NO
N
DEG
REE
NA
TN'L
STU
D
EXC
HA
NG
E
PO
ST
GR
AD
UA
TE
GR
AD
UA
TE
1ST
YEA
R
GR
AD
UA
TE
2N
D Y
RG
RA
DU
ATE
NO
N
DEG
REE
16/SP CLASS UG Anthropology FIEC 1 0 1 0.0% 0.0% 0 1 0 0 1 0 0 0 0 0 0 0
16/SP CLASS UG Anthropology 15 10 5 0.4% 0.4% 11 4 1 1 3 10 0 0 0 0 0 0
16/SP CLASS UG Communication COMM 17 12 5 0.5% 0.5% 15 2 6 2 4 5 0 0 0 0 0 0
16/SP CLASS UG Communication COMM PURE 2 1 1 0.1% 0.1% 1 1 0 0 0 2 0 0 0 0 0 0
16/SP CLASS UG Communication JOUR 8 5 3 0.2% 0.2% 8 0 4 1 1 2 0 0 0 0 0 0
16/SP CLASS UG Communication JOUR MASS 1 0 1 0.0% 0.0% 0 1 0 0 0 1 0 0 0 0 0 0
16/SP CLASS UG Communication MASS 23 6 17 0.6% 0.7% 18 5 4 8 4 7 0 0 0 0 0 0
16/SP CLASS UG Communication MASS JOUR 1 0 1 0.0% 0.0% 0 1 0 0 0 1 0 0 0 0 0 0
16/SP CLASS UG Communication MASS PURE 5 4 1 0.1% 0.1% 5 0 0 0 0 5 0 0 0 0 0 0
16/SP CLASS UG Communication PURE 7 2 5 0.2% 0.2% 4 3 0 1 5 1 0 0 0 0 0 0
16/SP CLASS UG Communication PURE COMM 1 0 1 0.0% 0.0% 1 0 0 0 0 1 0 0 0 0 0 0
16/SP CLASS UG Communication PURE MASS 2 2 0 0.1% 0.1% 2 0 0 0 1 1 0 0 0 0 0 0
16/SP CLASS UG East Asian Studies 1 0 1 0.0% 0.0% 0 1 0 0 0 1 0 0 0 0 0 0
16/SP CLASS UG Engl & Engl As A Second Lang ESL 1 1 0 0.0% 0.0% 0 1 0 0 1 0 0 0 0 0 0 0
16/SP CLASS UG English EDUC 31 20 11 0.8% 0.9% 28 3 10 3 5 13 0 0 0 0 0 0
16/SP CLASS UG English ENLI 1 1 0 0.0% 0.0% 1 0 0 0 1 0 0 0 0 0 0 0
16/SP CLASS UG English JOUR 1 1 0 0.0% 0.0% 1 0 0 0 1 0 0 0 0 0 0 0
16/SP CLASS UG English LANG 7 5 2 0.2% 0.2% 6 1 1 2 1 3 0 0 0 0 0 0
16/SP CLASS UG English LING 22 19 3 0.6% 0.6% 20 2 1 4 7 10 0 0 0 0 0 0
16/SP CLASS UG English LITE 31 18 13 0.8% 0.9% 21 10 7 3 9 12 0 0 0 0 0 0
16/SP CLASS UG English 1 0 1 0.0% 0.0% 0 1 0 1 0 0 0 0 0 0 0 0
16/SP CLASS UG Fine Arts/Art ARTS 47 35 12 1.3% 1.4% 40 7 8 10 11 18 0 0 0 0 0 0
16/SP CLASS UG Fine Arts/Music MUSI 14 4 10 0.4% 0.4% 9 5 5 3 3 3 0 0 0 0 0 0
16/SP CLASS UG Fine Arts/Theater THEA 17 9 8 0.5% 0.5% 10 7 4 3 4 6 0 0 0 0 0 0
16/SP CLASS UG History 10 5 5 0.3% 0.3% 8 2 3 0 3 4 0 0 0 0 0 0
16/SP CLASS UG Japanese Studies 4 2 2 0.1% 0.1% 4 0 0 1 1 2 0 0 0 0 0 0
16/SP CLASS UG Pacific Asian Studies CHST 23 11 12 0.6% 0.7% 12 11 3 4 3 13 0 0 0 0 0 0
TERMCOLLEGE/
SCHOOL
Aca
dem
ic L
evel
MAJOR
CONCENTRATION /
TRACK /
SPECIALIZATION CODE
OF MAJOR OR DOUBLE
MAJOR
TOTAL
Gender
% of Total
Enrollment
% of Total
Academic
Level
Load CLASS LEVEL
Source: DROA; Colleague; UOG.ENR Page 5 of 48 16SP_enrollment_reports
February 2016
Fem
ale
Mal
e
Full
time
Part
time FRES
HM
AN
SOP
HO
MO
RE
JUN
IOR
SEN
IOR
UN
DER
GR
AD
NO
N
DEG
REE
NA
TN'L
STU
D
EXC
HA
NG
E
PO
ST
GR
AD
UA
TE
GR
AD
UA
TE
1ST
YEA
R
GR
AD
UA
TE
2N
D Y
RG
RA
DU
ATE
NO
N
DEG
REE
TERMCOLLEGE/
SCHOOL
Aca
dem
ic L
evel
MAJOR
CONCENTRATION /
TRACK /
SPECIALIZATION CODE
OF MAJOR OR DOUBLE
MAJOR
TOTAL
Gender
% of Total
Enrollment
% of Total
Academic
Level
Load CLASS LEVEL
16/SP CLASS UG Pacific Asian Studies EAST 1 1 0 0.0% 0.0% 0 1 0 0 0 1 0 0 0 0 0 0
16/SP CLASS UG Pacific Asian Studies JAST 1 1 0 0.0% 0.0% 1 0 0 0 0 1 0 0 0 0 0 0
16/SP CLASS UG Philosophy MASS PURE 1 0 1 0.0% 0.0% 1 0 0 0 0 1 0 0 0 0 0 0
16/SP CLASS UG Philosophy 6 0 6 0.2% 0.2% 5 1 3 1 2 0 0 0 0 0 0 0
16/SP CLASS UG Political Science ENLI 1 1 0 0.0% 0.0% 1 0 0 0 1 0 0 0 0 0 0 0
16/SP CLASS UG Political Science 25 13 12 0.7% 0.7% 21 4 7 7 7 4 0 0 0 0 0 0
16/SP CLASS UG Psychology 88 55 33 2.4% 2.6% 76 12 26 19 29 14 0 0 0 0 0 0
16/SP CLASS UG Sociology COMM PURE 1 0 1 0.0% 0.0% 1 0 0 0 0 1 0 0 0 0 0 0
16/SP CLASS UG Sociology 20 14 6 0.5% 0.6% 16 4 0 4 4 12 0 0 0 0 0 0
438 258 180 11.9% 12.8% 347 91 93 78 112 155 0 0 0 0 0 0
16/SP CLASS GR Clinical Psychology 9 7 2 0.2% 3.4% 7 2 0 0 0 0 0 0 0 9 0 0
16/SP CLASS GR English 12 6 6 0.3% 4.6% 2 10 0 0 0 0 0 0 0 12 0 0
16/SP CLASS GR Micronesian Studies 12 7 5 0.3% 4.6% 0 12 0 0 0 0 0 0 0 9 3 0
33 20 13 0.9% 12.6% 9 24 0 0 0 0 0 0 0 30 3 0
471 278 193 12.8% 356 115 93 78 112 155 0 0 0 30 3 0
16/SP CNAS UG Biology ENLI 1 1 0 0.0% 0.0% 1 0 0 0 1 0 0 0 0 0 0 0
16/SP CNAS UG Biology ETPS 1 1 0 0.0% 0.0% 1 0 0 0 0 1 0 0 0 0 0 0
16/SP CNAS UG Biology 197 116 81 5.4% 5.8% 152 45 72 31 27 67 0 0 0 0 0 0
16/SP CNAS UG Chemistry 23 12 11 0.6% 0.7% 18 5 2 2 6 13 0 0 0 0 0 0
16/SP CNAS UG Computer Info System 32 10 22 0.9% 0.9% 24 8 4 4 8 16 0 0 0 0 0 0
16/SP CNAS UG Computer Science 76 11 65 2.1% 2.2% 60 16 35 16 12 13 0 0 0 0 0 0
16/SP CNAS UG Consumer & Family Science 8 8 0 0.2% 0.2% 3 5 1 0 2 5 0 0 0 0 0 0
16/SP CNAS UG Mathematics 39 16 23 1.1% 1.1% 33 6 8 5 12 14 0 0 0 0 0 0
16/SP CNAS UG Pre Dental 2 2 0 0.1% 0.1% 2 0 1 0 0 1 0 0 0 0 0 0
16/SP CNAS UG Pre Engineering 84 16 68 2.3% 2.5% 67 17 32 24 18 10 0 0 0 0 0 0
16/SP CNAS UG Pre Medical 17 8 9 0.5% 0.5% 14 3 12 3 1 1 0 0 0 0 0 0
16/SP CNAS UG Pre Pharmacy 17 13 4 0.5% 0.5% 14 3 8 5 2 2 0 0 0 0 0 0
16/SP CNAS UG Pre Veterinary 3 2 1 0.1% 0.1% 3 0 2 0 1 0 0 0 0 0 0 0
16/SP CNAS UG Tropical Agriculture Applied 11 2 9 0.3% 0.3% 7 4 0 4 4 3 0 0 0 0 0 0
16/SP CNAS UG Tropical Agriculture Research 10 2 8 0.3% 0.3% 9 1 1 2 4 3 0 0 0 0 0 0
521 220 301 14.2% 15.2% 408 113 178 96 98 149 0 0 0 0 0 0
GR SUBTOTAL CLASS
TOTAL CLASS
UG SUBTOTAL CNAS
UG SUBTOTAL CLASS
Source: DROA; Colleague; UOG.ENR Page 6 of 48 16SP_enrollment_reports

February 2016
Fem
ale
Mal
e
Full
time
Part
time FRES
HM
AN
SOP
HO
MO
RE
JUN
IOR
SEN
IOR
UN
DER
GR
AD
NO
N
DEG
REE
NA
TN'L
STU
D
EXC
HA
NG
E
PO
ST
GR
AD
UA
TE
GR
AD
UA
TE
1ST
YEA
R
GR
AD
UA
TE
2N
D Y
RG
RA
DU
ATE
NO
N
DEG
REE
TERMCOLLEGE/
SCHOOL
Aca
dem
ic L
evel
MAJOR
CONCENTRATION /
TRACK /
SPECIALIZATION CODE
OF MAJOR OR DOUBLE
MAJOR
TOTAL
Gender
% of Total
Enrollment
% of Total
Academic
Level
Load CLASS LEVEL
16/SP CNAS GR Biology 20 8 12 0.5% 7.6% 8 12 0 0 0 0 0 0 0 19 1 0
16/SP CNAS GR Environmental Science 14 8 6 0.4% 5.3% 6 8 0 0 0 0 0 0 0 14 0 0
34 16 18 0.9% 13.0% 14 20 0 0 0 0 0 0 0 33 1 0
555 236 319 15.1% 422 133 178 96 98 149 0 0 0 33 1 0
16/SP EMSS UG National Student Exchange 9 7 2 0.2% 0.3% 9 0 0 0 0 0 0 9 0 0 0 0
16/SP EMSS UG Non Degree 28 15 13 0.8% 0.8% 0 28 0 0 0 0 28 0 0 0 0 0
16/SP EMSS UG Postgraduate 1 1 0 0.0% 0.0% 0 1 0 0 0 0 0 0 1 0 0 0
16/SP EMSS UG Undeclared 724 347 377 19.7% 21.2% 537 187 427 190 78 29 0 0 0 0 0 0
762 370 392 20.7% 22.3% 546 216 427 190 78 29 28 9 1 0 0 0
16/SP EMSS GR Nondegree Grad Student 1 1 0 0.0% 0.4% 0 1 0 0 0 0 0 0 0 0 0 1
1 1 0 0.0% 0.4% 0 1 0 0 0 0 0 0 0 0 0 1
763 371 392 20.7% 546 217 427 190 78 29 28 9 1 0 0 1
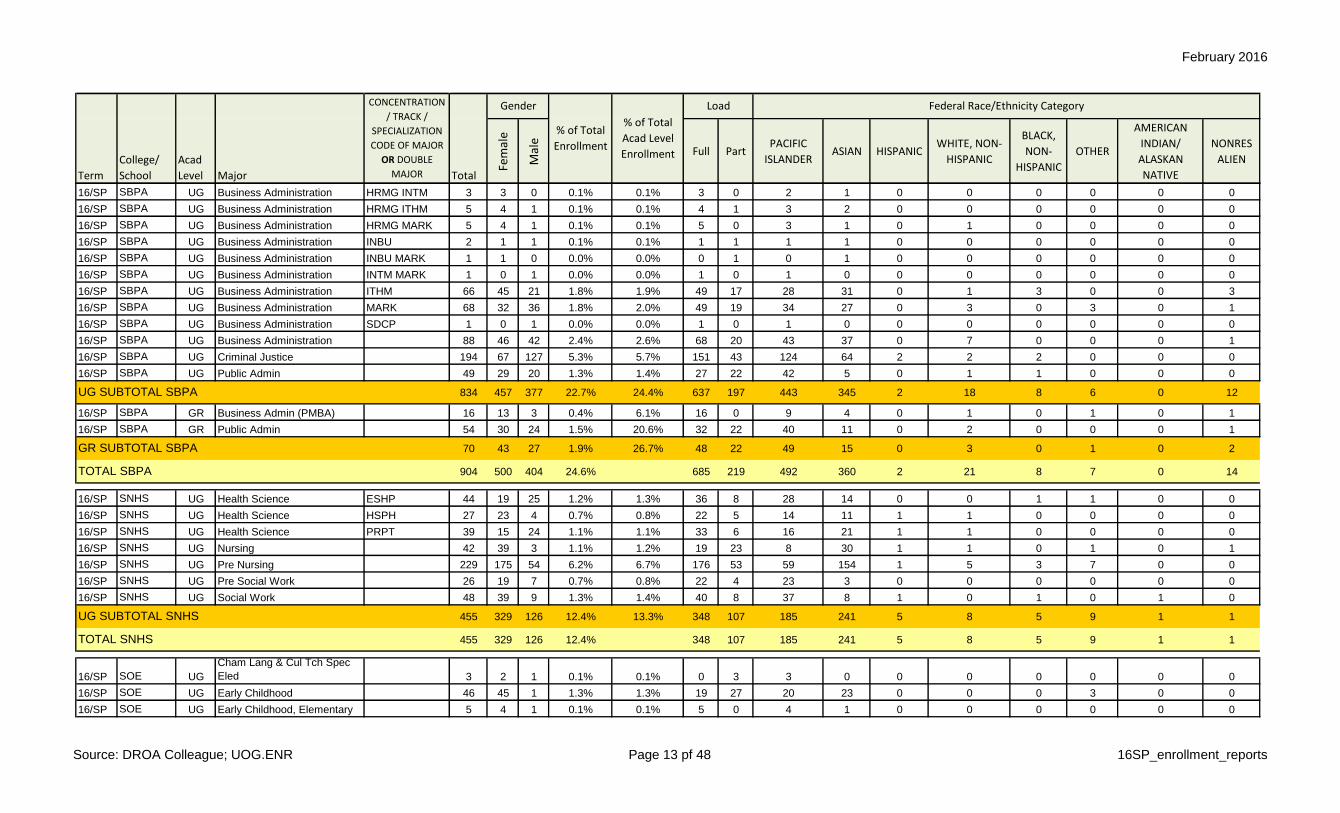
16/SP SBPA UG Accounting FIEC 5 3 2 0.1% 0.1% 5 0 0 1 0 4 0 0 0 0 0 0
16/SP SBPA UG Accounting HRMG 1 1 0 0.0% 0.0% 1 0 0 0 0 1 0 0 0 0 0 0
16/SP SBPA UG Accounting ITHM 1 1 0 0.0% 0.0% 0 1 0 0 0 1 0 0 0 0 0 0
16/SP SBPA UG Accounting 161 115 46 4.4% 4.7% 134 27 36 24 33 68 0 0 0 0 0 0
16/SP SBPA UG Business Administration ETPS 37 16 21 1.0% 1.1% 34 3 5 3 13 16 0 0 0 0 0 0
16/SP SBPA UG Business Administration ETPS FIEC 1 0 1 0.0% 0.0% 1 0 0 0 1 0 0 0 0 0 0 0
16/SP SBPA UG Business Administration ETPS MARK 2 1 1 0.1% 0.1% 2 0 0 1 1 0 0 0 0 0 0 0
16/SP SBPA UG Business Administration FIEC 59 30 29 1.6% 1.7% 40 19 5 12 11 31 0 0 0 0 0 0
16/SP SBPA UG Business Administration FIEC HRMG 3 2 1 0.1% 0.1% 1 2 0 1 0 2 0 0 0 0 0 0
16/SP SBPA UG Business Administration FIEC HRMG INBU 1 1 0 0.0% 0.0% 1 0 0 0 0 1 0 0 0 0 0 0
16/SP SBPA UG Business Administration FIEC MARK 4 2 2 0.1% 0.1% 3 1 0 1 0 3 0 0 0 0 0 0
16/SP SBPA UG Business Administration FIEC ORGB 1 0 1 0.0% 0.0% 1 0 0 1 0 0 0 0 0 0 0 0
16/SP SBPA UG Business Administration HRMG 72 52 20 2.0% 2.1% 52 20 7 11 15 39 0 0 0 0 0 0
16/SP SBPA UG Business Administration HRMG ETPS 1 0 1 0.0% 0.0% 1 0 0 0 0 1 0 0 0 0 0 0
16/SP SBPA UG Business Administration HRMG INTM 3 3 0 0.1% 0.1% 3 0 0 0 1 2 0 0 0 0 0 0
16/SP SBPA UG Business Administration HRMG ITHM 5 4 1 0.1% 0.1% 4 1 0 0 0 5 0 0 0 0 0 0
16/SP SBPA UG Business Administration HRMG MARK 4 4 0 0.1% 0.1% 4 0 0 1 1 2 0 0 0 0 0 0
16/SP SBPA UG Business Administration INBU 2 1 1 0.1% 0.1% 1 1 0 0 0 2 0 0 0 0 0 0
UG SUBTOTAL EMSS
GR SUBTOTAL EMSS
TOTAL EMSS
GR SUBTOTAL CNAS
TOTAL CNAS
Source: DROA; Colleague; UOG.ENR Page 7 of 48 16SP_enrollment_reports

February 2016
Fem
ale
Mal
e
Full
time
Part
time FRES
HM
AN
SOP
HO
MO
RE
JUN
IOR
SEN
IOR
UN
DER
GR
AD
NO
N
DEG
REE
NA
TN'L
STU
D
EXC
HA
NG
E
PO
ST
GR
AD
UA
TE
GR
AD
UA
TE
1ST
YEA
R
GR
AD
UA
TE
2N
D Y
RG
RA
DU
ATE
NO
N
DEG
REE
TERMCOLLEGE/
SCHOOL
Aca
dem
ic L
evel
MAJOR
CONCENTRATION /
TRACK /
SPECIALIZATION CODE
OF MAJOR OR DOUBLE
MAJOR
TOTAL
Gender
% of Total
Enrollment
% of Total
Academic
Level
Load CLASS LEVEL
16/SP SBPA UG Business Administration INBU MARK 1 1 0 0.0% 0.0% 0 1 0 0 0 1 0 0 0 0 0 0
16/SP SBPA UG Business Administration INTM MARK 1 0 1 0.0% 0.0% 1 0 0 0 0 1 0 0 0 0 0 0
16/SP SBPA UG Business Administration ITHM 66 45 21 1.8% 1.9% 49 17 13 9 18 26 0 0 0 0 0 0
16/SP SBPA UG Business Administration MARK 68 32 36 1.8% 2.0% 49 19 14 19 15 20 0 0 0 0 0 0
16/SP SBPA UG Business Administration MARK FIEC 2 1 1 0.1% 0.1% 2 0 0 0 1 1 0 0 0 0 0 0
16/SP SBPA UG Business Administration MARK HRMG 1 0 1 0.0% 0.0% 1 0 0 0 0 1 0 0 0 0 0 0
16/SP SBPA UG Business Administration SDCP 1 0 1 0.0% 0.0% 1 0 0 0 0 1 0 0 0 0 0 0
16/SP SBPA UG Business Administration 88 46 42 2.4% 2.6% 68 20 37 29 12 10 0 0 0 0 0 0
16/SP SBPA UG Criminal Justice 194 67 127 5.3% 5.7% 151 43 48 35 55 56 0 0 0 0 0 0
16/SP SBPA UG Public Admin 49 29 20 1.3% 1.4% 27 22 5 11 11 22 0 0 0 0 0 0
834 457 377 22.7% 24.4% 637 197 170 159 188 317 0 0 0 0 0 0
16/SP SBPA GR Business Admin (PMBA) 16 13 3 0.4% 6.1% 16 0 0 0 0 0 0 0 0 16 0 0
16/SP SBPA GR Public Admin 54 30 24 1.5% 20.6% 32 22 0 0 0 0 0 0 0 53 1 0
70 43 27 1.9% 26.7% 48 22 0 0 0 0 0 0 0 69 1 0
904 500 404 24.6% 685 219 170 159 188 317 0 0 0 69 1 0
16/SP SNHS UG Health Science ESHP 44 19 25 1.2% 1.3% 36 8 8 6 9 21 0 0 0 0 0 0
16/SP SNHS UG Health Science HSPH 27 23 4 0.7% 0.8% 22 5 2 2 5 18 0 0 0 0 0 0
16/SP SNHS UG Health Science PRPT 39 15 24 1.1% 1.1% 33 6 6 8 6 19 0 0 0 0 0 0
16/SP SNHS UG Nursing 42 39 3 1.1% 1.2% 19 23 0 1 1 40 0 0 0 0 0 0
16/SP SNHS UG Pre Nursing 229 175 54 6.2% 6.7% 176 53 96 50 41 42 0 0 0 0 0 0
16/SP SNHS UG Pre Social Work 26 19 7 0.7% 0.8% 22 4 8 4 6 8 0 0 0 0 0 0
16/SP SNHS UG Social Work 48 39 9 1.3% 1.4% 40 8 2 8 5 33 0 0 0 0 0 0
455 329 126 12.4% 13.3% 348 107 122 79 73 181 0 0 0 0 0 0
455 329 126 12.4% 348 107 122 79 73 181 0 0 0 0 0 0
16/SP SOE UG Cham Lang & Cul Tch Spec Eled 3 2 1 0.1% 0.1% 0 3 0 0 1 2 0 0 0 0 0 0
16/SP SOE UG Early Childhood 46 45 1 1.3% 1.3% 19 27 19 11 8 8 0 0 0 0 0 0
16/SP SOE UG Early Childhood, Elementry 5 4 1 0.1% 0.1% 5 0 2 3 0 0 0 0 0 0 0 0
16/SP SOE UG Elementary Education 118 102 16 3.2% 3.5% 83 35 29 31 30 28 0 0 0 0 0 0
16/SP SOE UG Physical Educ/ School Health PK 28 8 20 0.8% 0.8% 16 12 6 4 6 12 0 0 0 0 0 0
16/SP SOE UG Secondary Education ARTS 1 1 0 0.0% 0.0% 0 1 0 0 0 1 0 0 0 0 0 0
TOTAL SBPA
UG SUBTOTAL SNHS
TOTAL SNHS
UG SUBTOTAL SBPA
GR SUBTOTAL SBPA
Source: DROA; Colleague; UOG.ENR Page 8 of 48 16SP_enrollment_reports

February 2016
Fem
ale
Mal
e
Full
time
Part
time FRES
HM
AN
SOP
HO
MO
RE
JUN
IOR
SEN
IOR
UN
DER
GR
AD
NO
N
DEG
REE
NA
TN'L
STU
D
EXC
HA
NG
E
PO
ST
GR
AD
UA
TE
GR
AD
UA
TE
1ST
YEA
R
GR
AD
UA
TE
2N
D Y
RG
RA
DU
ATE
NO
N
DEG
REE
TERMCOLLEGE/
SCHOOL
Aca
dem
ic L
evel
MAJOR
CONCENTRATION /
TRACK /
SPECIALIZATION CODE
OF MAJOR OR DOUBLE
MAJOR
TOTAL
Gender
% of Total
Enrollment
% of Total
Academic
Level
Load CLASS LEVEL
16/SP SOE UG Secondary Education ENGU 4 3 1 0.1% 0.1% 3 1 0 0 3 1 0 0 0 0 0 0
16/SP SOE UG Secondary Education ENLI 2 2 0 0.1% 0.1% 2 0 0 0 1 1 0 0 0 0 0 0
16/SP SOE UG Secondary Education GESC 20 12 8 0.5% 0.6% 13 7 3 4 6 7 0 0 0 0 0 0
16/SP SOE UG Secondary Education MATH 5 2 3 0.1% 0.1% 5 0 1 2 0 2 0 0 0 0 0 0
16/SP SOE UG Secondary Education MUSI 1 1 0 0.0% 0.0% 1 0 0 0 0 1 0 0 0 0 0 0
16/SP SOE UG Secondary Education PHED 2 1 1 0.1% 0.1% 1 1 0 0 2 0 0 0 0 0 0 0
16/SP SOE UG Secondary Education SOST 18 8 10 0.5% 0.5% 12 6 1 4 4 9 0 0 0 0 0 0
16/SP SOE UG Secondary Education 67 42 25 1.8% 2.0% 52 15 23 17 11 16 0 0 0 0 0 0
16/SP SOE UG Special Education 28 22 6 0.8% 0.8% 20 8 4 3 8 13 0 0 0 0 0 0
16/SP SOE UG Undeclared Education 59 40 19 1.6% 1.7% 32 27 28 13 15 3 0 0 0 0 0 0
407 295 112 11.1% 11.9% 264 143 116 92 95 104 0 0 0 0 0 0
16/SP SOE GR Admin & Supervision 21 13 8 0.6% 8.0% 2 19 0 0 0 0 0 0 0 19 2 0
16/SP SOE GR Counseling 31 24 7 0.8% 11.8% 17 14 0 0 0 0 0 0 0 29 2 0
16/SP SOE GR Reading 15 13 2 0.4% 5.7% 0 15 0 0 0 0 0 0 0 15 0 0
16/SP SOE GR Secondary Ed 16 9 7 0.4% 6.1% 12 4 0 0 0 0 0 0 0 15 1 0
16/SP SOE GR Sec Teaching: Practitioner 26 16 10 0.7% 9.9% 16 10 0 0 0 0 0 0 0 26 0 0
16/SP SOE GR Special Ed 9 7 2 0.2% 3.4% 6 3 0 0 0 0 0 0 0 9 0 0
16/SP SOE GR
Tchng Eng Speaker Other Lang
(TESOL) 6 6 0 0.2% 2.3% 3 3 0 0 0 0 0 0 0 6 0 0
124 88 36 3.4% 47.3% 56 68 0 0 0 0 0 0 0 119 5 0
531 383 148 14.4% 320 211 116 92 95 104 0 0 0 119 5 0
3417 1929 1488 92.9% 2550 867 1106 694 644 935 28 9 1 0 0 0
262 168 94 7.1% 127 135 0 0 0 0 0 0 0 251 10 1
3679 2097 1582 100.0% 2677 1002 1106 694 644 935 28 9 1 251 10 1GRAND TOTAL
UG SUBTOTAL SOE
GR SUBTOTAL SOE
TOTAL SOE
UNDERGRADUATE TOTAL
GRADUATE TOTAL
Source: DROA; Colleague; UOG.ENR Page 9 of 48 16SP_enrollment_reports

February 2016
University of Guam Back to Table Of Contents
Academic and Student AffairsOffice of Academic Assessment and Institutional Research
Fem
ale
Mal
e
Full PartPACIFIC
ISLANDERASIAN HISPANIC
WHITE, NON-
HISPANIC
BLACK,
NON-
HISPANIC
OTHER
AMERICAN
INDIAN/
ALASKAN
NATIVE
NONRES
ALIEN
16/SP CLASS UG Anthropology ECON 1 0 1 0.0% 0.0% 0 1 1 0 0 0 0 0 0 0
16/SP CLASS UG Anthropology 15 10 5 0.4% 0.4% 11 4 10 2 2 0 1 0 0 0
16/SP CLASS UG Communication COMM 17 12 5 0.5% 0.5% 15 2 8 9 0 0 0 0 0 0
16/SP CLASS UG Communication COMM PURE 2 1 1 0.1% 0.1% 1 1 1 1 0 0 0 0 0 0
16/SP CLASS UG Communication JOUR 8 5 3 0.2% 0.2% 8 0 5 2 0 0 0 0 0 1
16/SP CLASS UG Communication JOUR MASS 1 0 1 0.0% 0.0% 0 1 1 0 0 0 0 0 0 0
16/SP CLASS UG Communication MASS 23 6 17 0.6% 0.7% 18 5 13 4 1 3 2 0 0 0
16/SP CLASS UG Communication MASS JOUR 1 0 1 0.0% 0.0% 0 1 0 1 0 0 0 0 0 0
16/SP CLASS UG Communication MASS PURE 5 4 1 0.1% 0.1% 5 0 3 2 0 0 0 0 0 0
16/SP CLASS UG Communication PURE 7 2 5 0.2% 0.2% 4 3 6 0 0 1 0 0 0 0
16/SP CLASS UG Communication PURE COMM 1 0 1 0.0% 0.0% 1 0 0 1 0 0 0 0 0 0
16/SP CLASS UG Communication PURE MASS 2 2 0 0.1% 0.1% 2 0 1 1 0 0 0 0 0 0
16/SP CLASS UG East Asian Studies 1 0 1 0.0% 0.0% 0 1 0 0 0 0 0 1 0 0
16/SP CLASS UG
Engl & Engl As A Second
Language ESL 1 1 0 0.0% 0.0% 0 1 1 0 0 0 0 0 0 0
16/SP CLASS UG English EDUC 31 20 11 0.8% 0.9% 28 3 17 13 0 0 0 1 0 0
16/SP CLASS UG English ENLI 1 1 0 0.0% 0.0% 1 0 0 1 0 0 0 0 0 0
16/SP CLASS UG English JOUR 1 1 0 0.0% 0.0% 1 0 0 1 0 0 0 0 0 0
16/SP CLASS UG English LANG 7 5 2 0.2% 0.2% 6 1 4 3 0 0 0 0 0 0
16/SP CLASS UG English LING 22 19 3 0.6% 0.6% 20 2 6 16 0 0 0 0 0 0
16/SP CLASS UG English LITE 31 18 13 0.8% 0.9% 21 10 21 9 0 1 0 0 0 0
16/SP CLASS UG English 1 0 1 0.0% 0.0% 0 1 1 0 0 0 0 0 0 0
16/SP CLASS UG Fine Arts/Art ARTS 47 35 12 1.3% 1.4% 40 7 11 27 1 3 1 2 0 2
16/SP CLASS UG Fine Arts/Music MUSI 14 4 10 0.4% 0.4% 9 5 4 7 0 2 1 0 0 0
16/SP CLASS UG Fine Arts/Theater THEA 17 9 8 0.5% 0.5% 10 7 7 9 0 0 0 1 0 0
16/SP CLASS UG History 10 5 5 0.3% 0.3% 8 2 6 3 0 0 0 1 0 0
Student Enrollment by College/Academic Level/Major/Ethnicity
Term
College/
School
Acad
Level Major
CONCENTRATION
/ TRACK /
SPECIALIZATION
CODE OF MAJOR
OR DOUBLE
MAJOR Total
Gender
% of Total
Enrollment
% of Total
Acad Level
Enrollment
Load Federal Race/Ethnicity Category
Source: DROA Colleague; UOG.ENR Page 10 pf 48 16SP_enrollment_reports
February 2016
Fem
ale
Mal
e
Full PartPACIFIC
ISLANDERASIAN HISPANIC
WHITE, NON-
HISPANIC
BLACK,
NON-
HISPANIC
OTHER
AMERICAN
INDIAN/
ALASKAN
NATIVE
NONRES
ALIEN
Term
College/
School
Acad
Level Major
CONCENTRATION
/ TRACK /
SPECIALIZATION
CODE OF MAJOR
OR DOUBLE
MAJOR Total
Gender
% of Total
Enrollment
% of Total
Acad Level
Enrollment
Load Federal Race/Ethnicity Category
16/SP CLASS UG Japanese Studies 4 2 2 0.1% 0.1% 4 0 0 2 0 1 0 0 0 1
16/SP CLASS UG Pacific Asian Studies CHST 23 11 12 0.6% 0.7% 12 11 21 1 0 1 0 0 0 0
16/SP CLASS UG Pacific Asian Studies EAST 1 1 0 0.0% 0.0% 0 1 0 1 0 0 0 0 0 0
16/SP CLASS UG Pacific Asian Studies JAST 1 1 0 0.0% 0.0% 1 0 1 0 0 0 0 0 0 0
16/SP CLASS UG Philosophy MASS PURE 1 0 1 0.0% 0.0% 1 0 0 0 0 1 0 0 0 0
16/SP CLASS UG Philosophy 6 0 6 0.2% 0.2% 5 1 4 2 0 0 0 0 0 0
16/SP CLASS UG Political Science ENLI 1 1 0 0.0% 0.0% 1 0 0 1 0 0 0 0 0 0
16/SP CLASS UG Political Science 25 13 12 0.7% 0.7% 21 4 21 3 1 0 0 0 0 0
16/SP CLASS UG Psychology 88 55 33 2.4% 2.6% 76 12 40 41 0 1 0 3 0 3
16/SP CLASS UG Sociology COMM PURE 1 0 1 0.0% 0.0% 1 0 1 0 0 0 0 0 0 0
16/SP CLASS UG Sociology 20 14 6 0.5% 0.6% 16 4 12 4 0 1 1 2 0 0
438 258 180 11.9% 12.8% 347 91 227 167 5 15 6 11 0 7
16/SP CLASS GR Clinical Psychology 9 7 2 0.2% 3.4% 7 2 2 6 0 0 0 1 0 0
16/SP CLASS GR English 12 6 6 0.3% 4.6% 2 10 8 2 0 2 0 0 0 0
16/SP CLASS GR Micronesian Studies 12 7 5 0.3% 4.6% 0 12 8 1 0 0 1 1 0 1
33 20 13 0.9% 12.6% 9 24 18 9 0 2 1 2 0 1
471 278 193 12.8% 356 115 245 176 5 17 7 13 0 8
16/SP CNAS UG Biology ENLI 1 1 0 0.0% 0.0% 1 0 1 0 0 0 0 0 0 0
16/SP CNAS UG Biology ETPS 1 1 0 0.0% 0.0% 1 0 1 0 0 0 0 0 0 0
16/SP CNAS UG Biology 197 116 81 5.4% 5.8% 152 45 88 86 0 11 1 9 0 2
16/SP CNAS UG Chemistry 23 12 11 0.6% 0.7% 18 5 9 8 0 5 0 1 0 0
16/SP CNAS UG Computer Info System 32 10 22 0.9% 0.9% 24 8 10 21 0 0 0 0 0 1
16/SP CNAS UG Computer Science 76 11 65 2.1% 2.2% 60 16 25 45 1 0 0 1 0 4
16/SP CNAS UG Consumer & Family Science 8 8 0 0.2% 0.2% 3 5 4 4 0 0 0 0 0 0
16/SP CNAS UG Mathematics 39 16 23 1.1% 1.1% 33 6 12 25 0 1 0 0 0 1
16/SP CNAS UG Pre Dental 2 2 0 0.1% 0.1% 2 0 1 1 0 0 0 0 0 0
16/SP CNAS UG Pre Engineering 84 16 68 2.3% 2.5% 67 17 26 46 0 1 0 9 0 2
16/SP CNAS UG Pre Medical 17 8 9 0.5% 0.5% 14 3 10 7 0 0 0 0 0 0
16/SP CNAS UG Pre Pharmacy 17 13 4 0.5% 0.5% 14 3 2 13 0 0 0 2 0 0
16/SP CNAS UG Pre Veterinary 3 2 1 0.1% 0.1% 3 0 1 0 0 1 0 1 0 0
GR SUBTOTAL CLASS
TOTAL CLASS
UG SUBTOTAL CLASS
Source: DROA Colleague; UOG.ENR Page 11 pf 48 16SP_enrollment_reports

February 2016
Fem
ale
Mal
e
Full PartPACIFIC
ISLANDERASIAN HISPANIC
WHITE, NON-
HISPANIC
BLACK,
NON-
HISPANIC
OTHER
AMERICAN
INDIAN/
ALASKAN
NATIVE
NONRES
ALIEN
Term
College/
School
Acad
Level Major
CONCENTRATION
/ TRACK /
SPECIALIZATION
CODE OF MAJOR
OR DOUBLE
MAJOR Total
Gender
% of Total
Enrollment
% of Total
Acad Level
Enrollment
Load Federal Race/Ethnicity Category
16/SP CNAS UG Tropical Agriculture Applied 11 2 9 0.3% 0.3% 7 4 9 1 0 1 0 0 0 0
16/SP CNAS UG Tropical Agriculture Research 10 2 8 0.3% 0.3% 9 1 9 0 0 1 0 0 0 0
521 220 301 14.2% 15.2% 408 113 208 257 1 21 1 23 0 10
16/SP CNAS GR Biology 20 8 12 0.5% 7.6% 8 12 5 3 1 9 1 1 0 0
16/SP CNAS GR Environmental Science 14 8 6 0.4% 5.3% 6 8 4 6 0 3 0 1 0 0
34 16 18 0.9% 13.0% 14 20 9 9 1 12 1 2 0 0
555 236 319 15.1% 438 145 227 283 2 33 3 25 0 10
16/SP EMSS UG National Student Exchange 9 7 2 0.2% 0.3% 9 0 1 1 3 4 0 0 0 0
16/SP EMSS UG Non Degree 28 15 13 0.8% 0.8% 0 28 8 13 0 6 1 0 0 0
16/SP EMSS UG Postgraduate 1 1 0 0.0% 0.0% 0 1 1 0 0 0 0 0 0 0
16/SP EMSS UG Undeclared 724 347 377 19.7% 21.2% 537 187 373 311 2 11 4 21 2 0
762 370 392 20.7% 22.3% 546 216 383 325 5 21 5 21 2 0
16/SP EMSS GR Nondegree Graduate Student 1 1 0 0.0% 0.4% 0 1 1 0 0 0 0 0 0 0
1 1 0 0.0% 0.4% 0 1 1 0 0 0 0 0 0 0
763 371 392 20.7% 546 217 384 325 5 21 5 21 2 0
16/SP SBPA UG Accounting FIEC 5 3 2 0.1% 0.1% 5 0 1 4 0 0 0 0 0 0
16/SP SBPA UG Accounting HRMG 1 1 0 0.0% 0.0% 1 0 0 1 0 0 0 0 0 0
16/SP SBPA UG Accounting ITHM 1 1 0 0.0% 0.0% 0 1 0 1 0 0 0 0 0 0
16/SP SBPA UG Accounting 161 115 46 4.4% 4.7% 134 27 51 104 0 0 0 1 0 5
16/SP SBPA UG Business Administration ETPS 37 16 21 1.0% 1.1% 34 3 25 12 0 0 0 0 0 0
16/SP SBPA UG Business Administration ETPS FIEC 1 0 1 0.0% 0.0% 1 0 0 0 0 0 0 0 0 1
16/SP SBPA UG Business Administration ETPS MARK 2 1 1 0.1% 0.1% 2 0 1 1 0 0 0 0 0 0
16/SP SBPA UG Business Administration FIEC 59 30 29 1.6% 1.7% 40 19 37 19 0 1 1 0 0 1
16/SP SBPA UG Business Administration FIEC HRMG 3 2 1 0.1% 0.1% 1 2 1 2 0 0 0 0 0 0
16/SP SBPA UG Business Administration
FIEC HRMG
INBU 1 1 0 0.0% 0.0% 1 0 1 0 0 0 0 0 0 0
16/SP SBPA UG Business Administration FIEC MARK 6 3 3 0.1% 0.1% 5 1 3 2 0 0 0 1 0 0
16/SP SBPA UG Business Administration FIEC ORGB 1 0 1 0.0% 0.0% 1 0 1 0 0 0 0 0 0 0
16/SP SBPA UG Business Administration HRMG 72 52 20 2.0% 2.1% 52 20 40 28 0 2 1 1 0 0
16/SP SBPA UG Business Administration HRMG ETPS 1 0 1 0.0% 0.0% 1 0 0 1 0 0 0 0 0 0
UG SUBTOTAL EMSS
GR SUBTOTAL EMSS
TOTAL EMSS
UG SUBTOTAL CNAS
GR SUBTOTAL CNAS
TOTAL CNAS
Source: DROA Colleague; UOG.ENR Page 12 pf 48 16SP_enrollment_reports
February 2016
Fem
ale
Mal
e
Full PartPACIFIC
ISLANDERASIAN HISPANIC
WHITE, NON-
HISPANIC
BLACK,
NON-
HISPANIC
OTHER
AMERICAN
INDIAN/
ALASKAN
NATIVE
NONRES
ALIEN
Term
College/
School
Acad
Level Major
CONCENTRATION
/ TRACK /
SPECIALIZATION
CODE OF MAJOR
OR DOUBLE
MAJOR Total
Gender
% of Total
Enrollment
% of Total
Acad Level
Enrollment
Load Federal Race/Ethnicity Category
16/SP SBPA UG Business Administration HRMG INTM 3 3 0 0.1% 0.1% 3 0 2 1 0 0 0 0 0 0
16/SP SBPA UG Business Administration HRMG ITHM 5 4 1 0.1% 0.1% 4 1 3 2 0 0 0 0 0 0
16/SP SBPA UG Business Administration HRMG MARK 5 4 1 0.1% 0.1% 5 0 3 1 0 1 0 0 0 0
16/SP SBPA UG Business Administration INBU 2 1 1 0.1% 0.1% 1 1 1 1 0 0 0 0 0 0
16/SP SBPA UG Business Administration INBU MARK 1 1 0 0.0% 0.0% 0 1 0 1 0 0 0 0 0 0
16/SP SBPA UG Business Administration INTM MARK 1 0 1 0.0% 0.0% 1 0 1 0 0 0 0 0 0 0
16/SP SBPA UG Business Administration ITHM 66 45 21 1.8% 1.9% 49 17 28 31 0 1 3 0 0 3
16/SP SBPA UG Business Administration MARK 68 32 36 1.8% 2.0% 49 19 34 27 0 3 0 3 0 1
16/SP SBPA UG Business Administration SDCP 1 0 1 0.0% 0.0% 1 0 1 0 0 0 0 0 0 0
16/SP SBPA UG Business Administration 88 46 42 2.4% 2.6% 68 20 43 37 0 7 0 0 0 1
16/SP SBPA UG Criminal Justice 194 67 127 5.3% 5.7% 151 43 124 64 2 2 2 0 0 0
16/SP SBPA UG Public Admin 49 29 20 1.3% 1.4% 27 22 42 5 0 1 1 0 0 0
834 457 377 22.7% 24.4% 637 197 443 345 2 18 8 6 0 12
16/SP SBPA GR Business Admin (PMBA) 16 13 3 0.4% 6.1% 16 0 9 4 0 1 0 1 0 1
16/SP SBPA GR Public Admin 54 30 24 1.5% 20.6% 32 22 40 11 0 2 0 0 0 1
70 43 27 1.9% 26.7% 48 22 49 15 0 3 0 1 0 2
904 500 404 24.6% 685 219 492 360 2 21 8 7 0 14
16/SP SNHS UG Health Science ESHP 44 19 25 1.2% 1.3% 36 8 28 14 0 0 1 1 0 0
16/SP SNHS UG Health Science HSPH 27 23 4 0.7% 0.8% 22 5 14 11 1 1 0 0 0 0
16/SP SNHS UG Health Science PRPT 39 15 24 1.1% 1.1% 33 6 16 21 1 1 0 0 0 0
16/SP SNHS UG Nursing 42 39 3 1.1% 1.2% 19 23 8 30 1 1 0 1 0 1
16/SP SNHS UG Pre Nursing 229 175 54 6.2% 6.7% 176 53 59 154 1 5 3 7 0 0
16/SP SNHS UG Pre Social Work 26 19 7 0.7% 0.8% 22 4 23 3 0 0 0 0 0 0
16/SP SNHS UG Social Work 48 39 9 1.3% 1.4% 40 8 37 8 1 0 1 0 1 0
455 329 126 12.4% 13.3% 348 107 185 241 5 8 5 9 1 1
455 329 126 12.4% 348 107 185 241 5 8 5 9 1 1
16/SP SOE UG
Cham Lang & Cul Tch Spec
Eled 3 2 1 0.1% 0.1% 0 3 3 0 0 0 0 0 0 0
16/SP SOE UG Early Childhood 46 45 1 1.3% 1.3% 19 27 20 23 0 0 0 3 0 0
16/SP SOE UG Early Childhood, Elementary 5 4 1 0.1% 0.1% 5 0 4 1 0 0 0 0 0 0
TOTAL SBPA
UG SUBTOTAL SNHS
TOTAL SNHS
UG SUBTOTAL SBPA
GR SUBTOTAL SBPA
Source: DROA Colleague; UOG.ENR Page 13 pf 48 16SP_enrollment_reports

February 2016
Fem
ale
Mal
e
Full PartPACIFIC
ISLANDERASIAN HISPANIC
WHITE, NON-
HISPANIC
BLACK,
NON-
HISPANIC
OTHER
AMERICAN
INDIAN/
ALASKAN
NATIVE
NONRES
ALIEN
Term
College/
School
Acad
Level Major
CONCENTRATION
/ TRACK /
SPECIALIZATION
CODE OF MAJOR
OR DOUBLE
MAJOR Total
Gender
% of Total
Enrollment
% of Total
Acad Level
Enrollment
Load Federal Race/Ethnicity Category
16/SP SOE UG Elementary Education 118 102 16 3.2% 3.5% 83 35 49 64 0 1 1 2 0 1
16/SP SOE UG Physical Educ/ School Health PK 28 8 20 0.8% 0.8% 16 12 10 17 0 0 1 0 0 0
16/SP SOE UG Secondary Education ARTS 1 1 0 0.0% 0.0% 0 1 0 0 0 0 0 1 0 0
16/SP SOE UG Secondary Education ENGU 4 3 1 0.1% 0.1% 3 1 3 1 0 0 0 0 0 0
16/SP SOE UG Secondary Education ENLI 2 2 0 0.1% 0.1% 2 0 1 1 0 0 0 0 0 0
16/SP SOE UG Secondary Education GESC 20 12 8 0.5% 0.6% 13 7 10 10 0 0 0 0 0 0
16/SP SOE UG Secondary Education MATH 5 2 3 0.1% 0.1% 5 0 0 5 0 0 0 0 0 0
16/SP SOE UG Secondary Education MUSI 1 1 0 0.0% 0.0% 1 0 1 0 0 0 0 0 0 0
16/SP SOE UG Secondary Education PHED 2 1 1 0.1% 0.1% 1 1 1 1 0 0 0 0 0 0
16/SP SOE UG Secondary Education SOST 18 8 10 0.5% 0.5% 12 6 8 9 0 1 0 0 0 0
16/SP SOE UG Secondary Education 67 42 25 1.8% 2.0% 52 15 28 36 0 1 1 1 0 0
16/SP SOE UG Special Education 28 22 6 0.8% 0.8% 20 8 20 7 1 0 0 0 0 0
16/SP SOE UG Undeclared Education 59 40 19 1.6% 1.7% 32 27 28 28 1 1 0 1 0 0
407 295 112 11.1% 11.9% 264 143 186 203 2 4 3 8 0 1
16/SP SOE GR Admin & Supervision 21 13 8 0.6% 8.0% 2 19 16 5 0 0 0 0 0 0
16/SP SOE GR Counseling 31 24 7 0.8% 11.8% 17 14 14 14 0 2 0 1 0 0
16/SP SOE GR Reading 15 13 2 0.4% 5.7% 0 15 9 6 0 0 0 0 0 0
16/SP SOE GR Secondary Ed 16 9 7 0.4% 6.1% 12 4 6 8 0 2 0 0 0 0
16/SP SOE GR Sec Teaching: Practitioner 26 16 10 0.7% 9.9% 16 10 10 14 0 2 0 0 0 0
16/SP SOE GR Special Ed 9 7 2 0.2% 3.4% 6 3 7 2 0 0 0 0 0 0
16/SP SOE GR
Tchng Eng Speaker Other
Lang (TESOL) 6 6 0 0.2% 2.3% 3 3 4 1 0 0 0 1 0 0
124 88 36 3.4% 47.3% 56 68 66 50 0 6 0 2 0 0
531 383 148 14.4% 320 211 252 253 2 10 3 10 0 1
3417 1929 1488 92.9% 2550 867 1632 1538 20 87 28 78 3 31
262 168 94 7.1% 127 135 143 83 1 23 2 7 0 3
3679 2097 1582 100.0% 2677 1002 1775 1621 21 110 30 85 3 34GRAND TOTAL
UG SUBTOTAL SOE
GR SUBTOTAL SOE
TOTAL SOE
UNDERGRADUATE TOTAL
GRADUATE TOTAL
Source: DROA Colleague; UOG.ENR Page 14 pf 48 16SP_enrollment_reports

February 2016
University of Guam Back to Table Of Contents
Academic and Student Affairs
Office of Academic Assessment and Institutional Research
TERM Ethnicity Headcount
% of Total
Enrollmen Male Female
Full
Time
Part
Time Undergraduate Graduate
16/SP NonResident Alien 34 0.9% 18 16 31 3 31 3
16/SP AM. INDIAN/ALASKAN 3 0.1% 1 2 2 1 3
16/SP ASIAN-CHINESE 65 1.8% 29 36 42 23 60 5
16/SP ASIAN-FILIPINO 1404 38.2% 611 793 1049 355 1339 65
16/SP ASIAN-INDIAN 8 0.2% 5 3 4 4 6 2
16/SP ASIAN-JAPANESE 36 1.0% 16 20 23 13 32 4
16/SP ASIAN-KOREAN 68 1.8% 32 36 52 16 66 2
16/SP ASIAN-OTHER 23 0.6% 12 11 18 5 20 3
16/SP ASIAN-VIETNAMESE 11 0.3% 3 8 8 3 9 2
16/SP BLACK NONHISPANIC 30 0.8% 24 6 24 6 28 2
16/SP
CHAMORRO-CNMI-
ROTA,TINIAN,SAIPAN 119 3.2% 52 67 88 31 107 12
16/SP CHAMORRO-GUAM 1260 34.2% 524 736 887 373 1160 100
16/SP HISPANIC 21 0.6% 6 15 16 5 20 1
16/SP MALAY 6 0.2% 5 1 4 2 6
16/SP MICRONESIAN-CHUUKESE 72 2.0% 18 54 51 21 71 1
16/SP MICRONESIAN-KOSRAEAN 10 0.3% 2 8 9 1 10
16/SP MICRONESIAN-MARSHALLESE 4 0.1% 2 2 2 2 4
16/SP MICRONESIAN-OTHER 2 0.1% 1 1 1 1 2
16/SP MICRONESIAN-PALAUAN 124 3.4% 52 72 101 23 114 10
16/SP MICRONESIAN-PONAPEAN 65 1.8% 29 36 47 18 57 8
16/SP MICRONESIAN-YAPESE 56 1.5% 17 39 41 15 50 6
16/SP OTHER 85 2.3% 42 43 55 30 78 7
16/SP PACIFIC -OTHER 63 1.7% 26 37 48 15 57 6
16/SP WHITE NON HISPANIC 110 3.0% 55 55 74 36 87 23Total 3679 100% 1582 2097 2677 1002 3417 262
43% 57% 73% 27% 93% 7%
TERM Ethnicity Headcount Male Female Full TimePart Time Undergraduate Graduate
16/SP NonResident Alien 0.9% 34 18 16 31 3 31 3
16/SP
AMERICAN INDIAN/ALASKAN
NATIVE 0.1% 3 1 2 2 1 3
16/SP ASIAN 44.1% 1621 713 908 1200 421 1538 83
16/SP BLACK, NON-HISPANIC 0.8% 30 24 6 24 6 28 216/SP HISPANIC 0.6% 21 6 15 16 5 20 116/SP OTHER 2.3% 85 42 43 55 30 78 7
16/SP PACIFIC ISLANDER 48.2% 1775 723 1052 1275 500 1632 143
16/SP WHITE, NON-HISPANIC 3.0% 110 55 55 74 36 87 23TOTAL 100% 3679 1582 2097 2677 1002 3417 262
43% 57% 73% 27% 93% 7%
Student Enrollment by Ethnicity, Gender, and Load
Academic LevelGender Load
Academic LevelGender
By Federal Reporting Ethnic Code
Load
% of
Enrollment
SOURCE: Colleague; UOG.ENR Page 15 of 48 16SP_enrollment_reports
February 2016
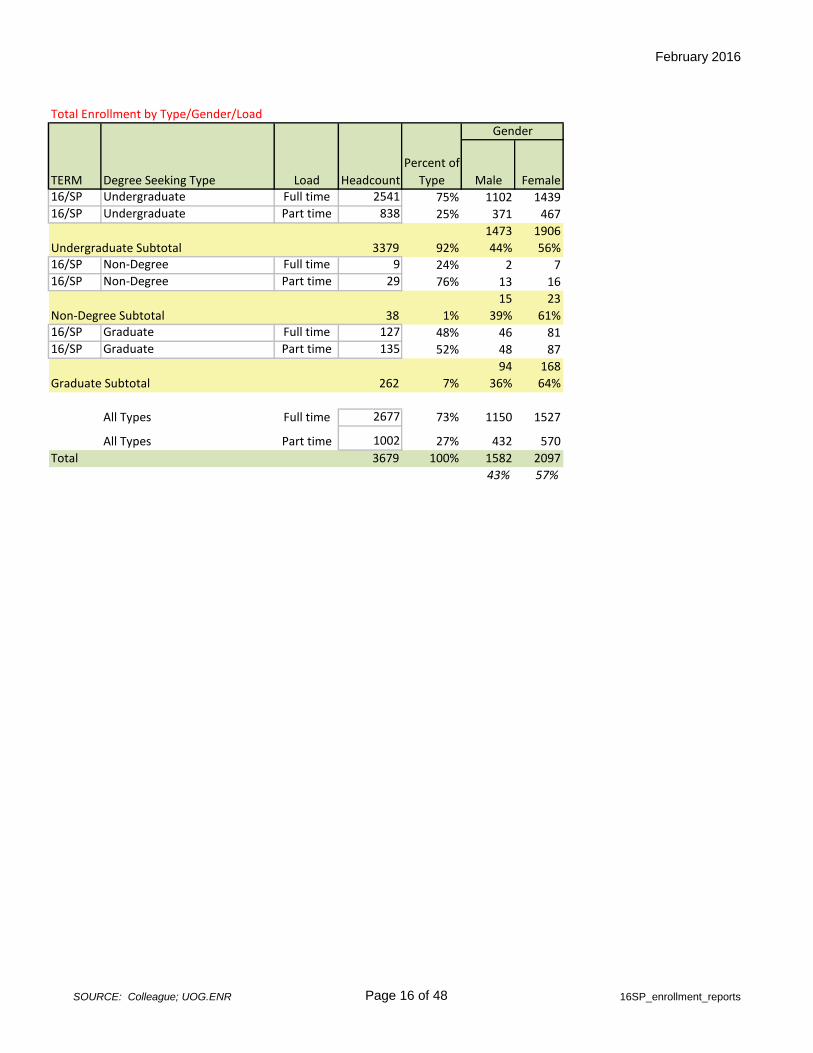
Total Enrollment by Type/Gender/Load
TERM Degree Seeking Type Load Headcount Male Female16/SP Undergraduate Full time 2541 75% 1102 143916/SP Undergraduate Part time 838 25% 371 467
1473 1906
Undergraduate Subtotal 3379 92% 44% 56%16/SP Non-Degree Full time 9 24% 2 716/SP Non-Degree Part time 29 76% 13 16
15 23
Non-Degree Subtotal 38 1% 39% 61%16/SP Graduate Full time 127 48% 46 8116/SP Graduate Part time 135 52% 48 87
94 168
Graduate Subtotal 262 7% 36% 64%
All Types Full time 2677 73% 1150 1527
All Types Part time 1002 27% 432 570
Total 3679 100% 1582 2097
43% 57%
Gender
Percent of
Type
SOURCE: Colleague; UOG.ENR Page 16 of 48 16SP_enrollment_reports
February 2016
University of Guam Back to Table Of Contents
Academic and Student Affairs
Office of Academic Assessment and Institutional Research
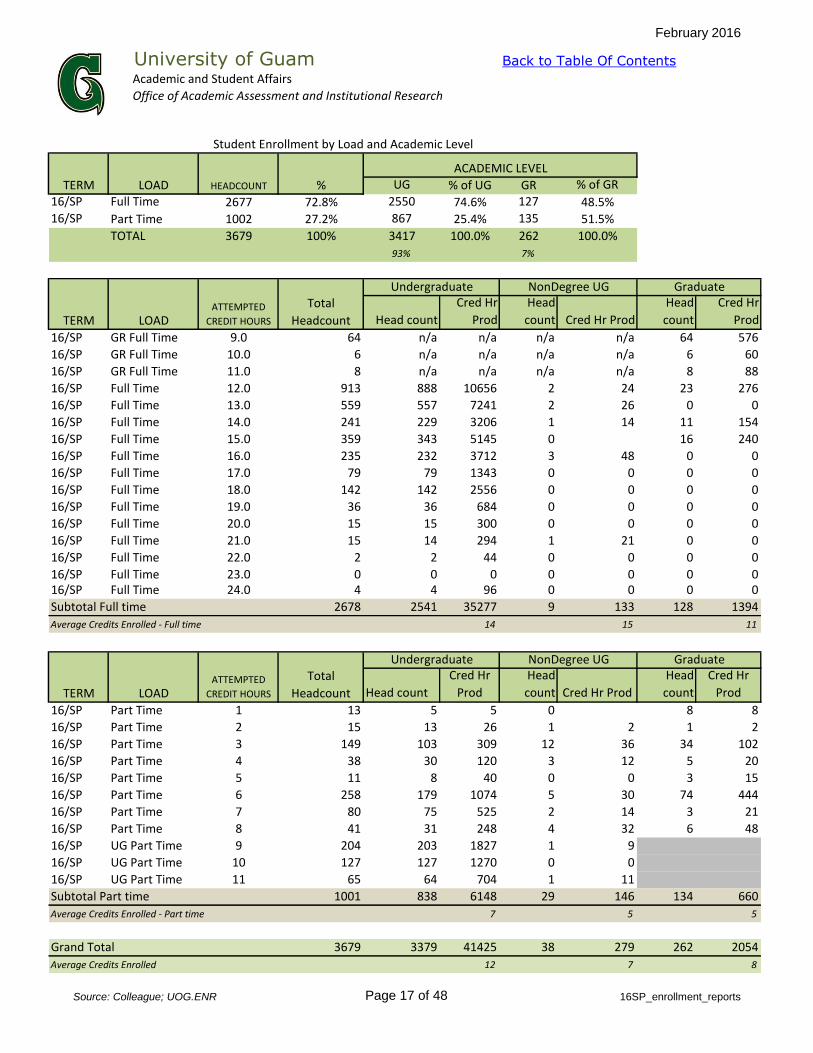
UG % of UG GR % of GR
16/SP Full Time 2677 72.8% 2550 74.6% 127 48.5%16/SP Part Time 1002 27.2% 867 25.4% 135 51.5%
TOTAL 3679 100% 3417 100.0% 262 100.0%
93% 7%
Head count
Cred Hr
Prod
Head
count Cred Hr Prod
Head
count
Cred Hr
Prod
16/SP GR Full Time 9.0 64 n/a n/a n/a n/a 64 576
16/SP GR Full Time 10.0 6 n/a n/a n/a n/a 6 60
16/SP GR Full Time 11.0 8 n/a n/a n/a n/a 8 88
16/SP Full Time 12.0 913 888 10656 2 24 23 276
16/SP Full Time 13.0 559 557 7241 2 26 0 0
16/SP Full Time 14.0 241 229 3206 1 14 11 154
16/SP Full Time 15.0 359 343 5145 0 16 240
16/SP Full Time 16.0 235 232 3712 3 48 0 0
16/SP Full Time 17.0 79 79 1343 0 0 0 0
16/SP Full Time 18.0 142 142 2556 0 0 0 0
16/SP Full Time 19.0 36 36 684 0 0 0 0
16/SP Full Time 20.0 15 15 300 0 0 0 0
16/SP Full Time 21.0 15 14 294 1 21 0 0
16/SP Full Time 22.0 2 2 44 0 0 0 0
16/SP Full Time 23.0 0 0 0 0 0 0 016/SP Full Time 24.0 4 4 96 0 0 0 0
Subtotal Full time 2678 2541 35277 9 133 128 1394
Average Credits Enrolled - Full time 14 15 11
Head count
Cred Hr
Prod
Head
count Cred Hr Prod
Head
count
Cred Hr
Prod
16/SP Part Time 1 13 5 5 0 8 8
16/SP Part Time 2 15 13 26 1 2 1 2
16/SP Part Time 3 149 103 309 12 36 34 102
16/SP Part Time 4 38 30 120 3 12 5 20
16/SP Part Time 5 11 8 40 0 0 3 15
16/SP Part Time 6 258 179 1074 5 30 74 444
16/SP Part Time 7 80 75 525 2 14 3 21
16/SP Part Time 8 41 31 248 4 32 6 48
16/SP UG Part Time 9 204 203 1827 1 9
16/SP UG Part Time 10 127 127 1270 0 0
16/SP UG Part Time 11 65 64 704 1 11
Subtotal Part time 1001 838 6148 29 146 134 660
Average Credits Enrolled - Part time 7 5 5
Grand Total 3679 3379 41425 38 279 262 2054
Average Credits Enrolled 12 7 8
HEADCOUNTTERM LOAD
ACADEMIC LEVEL
Student Enrollment by Load and Academic Level
%
Graduate
Graduate
TERM LOADATTEMPTED
CREDIT HOURS
Total
Headcount
TERM LOADATTEMPTED
CREDIT HOURS
Total
Headcount
Undergraduate
Undergraduate NonDegree UG
NonDegree UG
Source: Colleague; UOG.ENR Page 17 of 48 16SP_enrollment_reports

February 2016University of GuamAcademic and Student Affairs Back to Table Of Contents
Office of Academic Assessment and Institutional Research
Male Female
16/SP 16/SP Academy Our Lady Guam 1 1% 0 1
16/SP 16/SP Asmuyao Community School 3 3% 2 1
16/SP 16/SP Father Duenas Memorial High School 3 3% 3 0
16/SP 16/SP GCC High School 4 4% 3 1
16/SP 16/SP Ged Equivalent 4 4% 2 2
16/SP 16/SP George Washington High School 14 13% 5 9
16/SP 16/SP Guam High School 1 1% 1
16/SP 16/SP John F Kennedy High School 16 15% 8 8
16/SP 16/SP Kagman High School 4 4% 3 1
16/SP 16/SP Mainland USA High School 5 5% 3 2
16/SP 16/SP Marianas High School 5 5% 2 3
16/SP 16/SP Notre Dame High School 2 2% 1 1
16/SP 16/SP Okkodo High School 4 4% 3 1
16/SP 16/SP Palau Mission Academy 3 3% 2 1
16/SP 16/SP Penn Foster High School 1 1% 1
16/SP 16/SP Outer Island High School 1 1% 1
16/SP 16/SP Simon Sanchez High School 11 11% 4 7
16/SP 16/SP Southern High School 19 18% 8 11
16/SP 16/SP Tiyan High School 2 2% 2
16/SP 16/SP Yap High School 1 1% 1
TOTAL New Freshmen 104 99% 50 54
48% 52%
Note: New Freshman with admit status code equal to "01"
New Freshmen Enrollment by High School or Previous Institution
*NOTE: Previous institutions specified as "University or College" represent new freshman who attended another postsecondary institution while in high
school or earned less than 15 college credits.
START
TERMTERM Previous School
NEW
FRESHMAN
Gender
%
Source: Colleague; UOG.ENR Page 18 of 48 16SP_enrollment_reports

February 2016
University of Guam Back to Table Of Contents
Academic and Student AffairsOffice of Academic Assessment and Institutional Research
Academic
Level Admission Status
2016
Spring
2015
Spring
Prior Year
Variance
2016 Spring
Males
2016 Spring
Females
UG New Freshman 104 126 -17.5% 50 54
UG Transfer 120 126 -4.8% 50 70
UG High School 3 9 -66.7% 3UG Special 0 0 0.0%UG Non Degree 5 16 -68.8% 1 4UG 2nd Baccalaureate 1 1 0.0% 1
UG Nat'L Student Exchange 5 3 66.7% 1 4
Subtotal New Undergraduate Students 238 281 -15.3% 102 136
Percentage by Gender 43% 57%
Academic
Level ADMISSION STATUS
2016
Spring
2015
Spring
Prior Year
Variance
2016 Spring
Males
2016 Spring
Females
GR Graduate from UOG 31 33 -6.1% 10 21GR Graduate 9 11 -18.2% 4 5
Subtotal New Graduate Students 40 44 -9.1% 14 26
Percentage by Gender 35% 65%
Total New Students 278 325 -14.5% 116 162
Percentage by Gender 42% 58%
New Student Enrollment by Academic Level, Admission Status, and Gender
Source: Colleague; UOG.ENR Page 19 of 48 16SP_enrollment_reports

February 2016
University of Guam Back to Table Of Contents
Academic and Student AffairsOffice of Academic Assessment and Institutional Research
Overall
Within
Overall
Acad Level
Within
College/
School
16/SP CLASS UG AN Anthropology 108 327 0.75% 0.78% 1.83%
16/SP CLASS UG AR Art 367 1,098 2.51% 2.63% 6.14%
16/SP CLASS UG CO Communication 612 1,836 4.20% 4.40% 10.26%
16/SP CLASS UG EN English/Literature 1,515 4,439 10.14% 10.63% 24.82%
16/SP CLASS UG FA Fine Arts 42 126 0.29% 0.30% 0.70%
16/SP CLASS UG GE Geography 142 462 1.06% 1.11% 2.58%
16/SP CLASS UG HI History 480 1,440 3.29% 3.45% 8.05%
16/SP CLASS UG CM Language:Chamorro 217 831 1.90% 1.99% 4.65%
16/SP CLASS UG CI Language:Chinese 17 68 0.16% 0.16% 0.38%
16/SP CLASS UG FR Language:French 27 108 0.25% 0.26% 0.60%
16/SP CLASS UG JA Language:Japanese 162 648 1.48% 1.55% 3.62%
16/SP CLASS UG SN Language:Spanish 82 328 0.75% 0.79% 1.83%
16/SP CLASS UG TA Language:Tagalog 130 520 1.19% 1.25% 2.91%
16/SP CLASS UG LN Linguistics 101 303 0.69% 0.73% 1.69%
16/SP CLASS UG MU Music 162 382 0.87% 0.91% 2.14%
16/SP CLASS UG PI Philosophy 196 588 1.34% 1.41% 3.29%
16/SP CLASS UG PS Political Science 146 438 1.00% 1.05% 2.45%
16/SP CLASS UG PY Psychology 679 2,037 4.66% 4.88% 11.39%
16/SP CLASS UG SO Sociology 296 888 2.03% 2.13% 4.96%
16/SP CLASS UG TH Theatre 115 329 0.75% 0.79% 1.84%
16/SP CLASS UG WG
Women & Gender
Studies 174 522 1.19% 1.25% 2.92%
5770 17718 40.49% 42.44% 99.06%
16/SP CLASS GR AR Art 1 3 0.01% 0.15% 0.02%
16/SP CLASS GR EN English/Literature 14 40 0.09% 1.99% 0.22%
16/SP CLASS GR HI History 2 6 0.01% 0.30% 0.03%
16/SP CLASS GR LN Linguistics 2 6 0.01% 0.30% 0.03%
16/SP CLASS GR MI Micronesian Studies 19 46 0.11% 2.29% 0.26%
16/SP CLASS GR PY Psychology 29 68 0.16% 3.39% 0.38%
CLASS UNDERGRADUATE Total
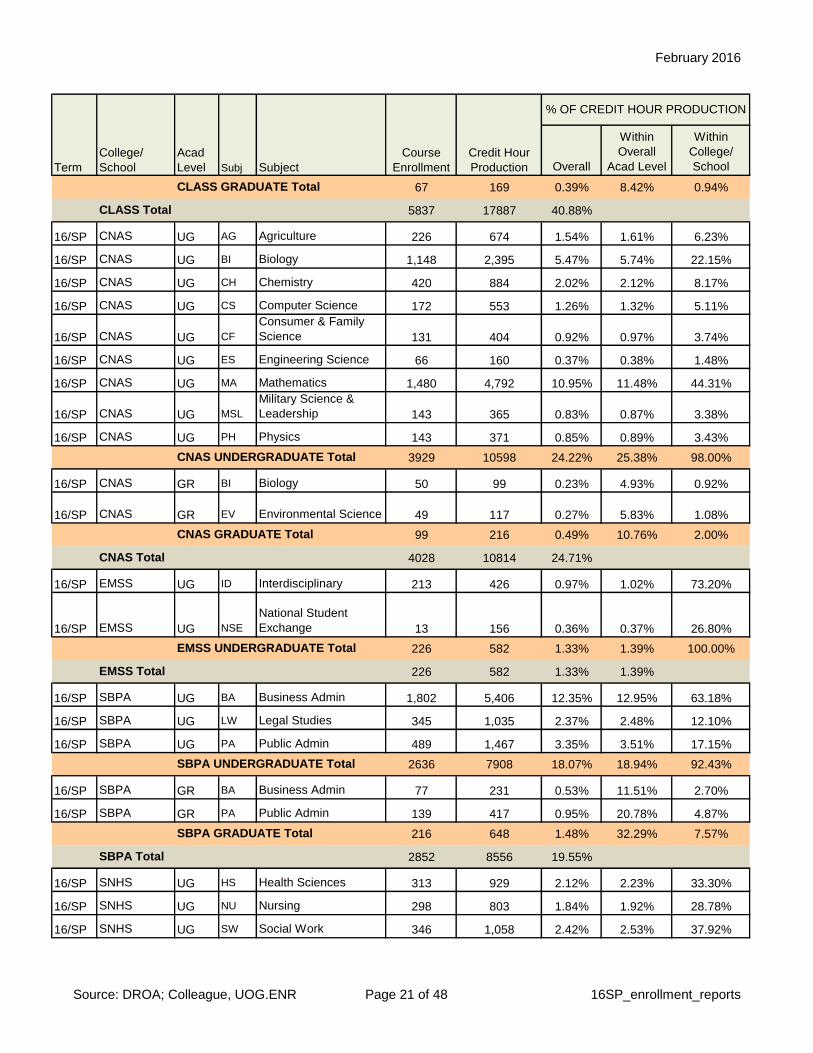
Credit Hour Production by College/Academic Level/Subject
Term
College/
School
Acad
Level Subj Subject
Course
Enrollment
Credit Hour
Production
% OF CREDIT HOUR PRODUCTION
Source: DROA; Colleague, UOG.ENR Page 20 of 48 16SP_enrollment_reports
February 2016
Overall
Within
Overall
Acad Level
Within
College/
SchoolTerm
College/
School
Acad
Level Subj Subject
Course
Enrollment
Credit Hour
Production
% OF CREDIT HOUR PRODUCTION
67 169 0.39% 8.42% 0.94%
5837 17887 40.88%
16/SP CNAS UG AG Agriculture 226 674 1.54% 1.61% 6.23%
16/SP CNAS UG BI Biology 1,148 2,395 5.47% 5.74% 22.15%
16/SP CNAS UG CH Chemistry 420 884 2.02% 2.12% 8.17%
16/SP CNAS UG CS Computer Science 172 553 1.26% 1.32% 5.11%
16/SP CNAS UG CF
Consumer & Family
Science 131 404 0.92% 0.97% 3.74%
16/SP CNAS UG ES Engineering Science 66 160 0.37% 0.38% 1.48%
16/SP CNAS UG MA Mathematics 1,480 4,792 10.95% 11.48% 44.31%
16/SP CNAS UG MSL
Military Science &
Leadership 143 365 0.83% 0.87% 3.38%
16/SP CNAS UG PH Physics 143 371 0.85% 0.89% 3.43%
3929 10598 24.22% 25.38% 98.00%
16/SP CNAS GR BI Biology 50 99 0.23% 4.93% 0.92%
16/SP CNAS GR EV Environmental Science 49 117 0.27% 5.83% 1.08%
99 216 0.49% 10.76% 2.00%
4028 10814 24.71%
16/SP EMSS UG ID Interdisciplinary 213 426 0.97% 1.02% 73.20%
16/SP EMSS UG NSE
National Student
Exchange 13 156 0.36% 0.37% 26.80%
226 582 1.33% 1.39% 100.00%
226 582 1.33% 1.39%
16/SP SBPA UG BA Business Admin 1,802 5,406 12.35% 12.95% 63.18%
16/SP SBPA UG LW Legal Studies 345 1,035 2.37% 2.48% 12.10%
16/SP SBPA UG PA Public Admin 489 1,467 3.35% 3.51% 17.15%
2636 7908 18.07% 18.94% 92.43%
16/SP SBPA GR BA Business Admin 77 231 0.53% 11.51% 2.70%
16/SP SBPA GR PA Public Admin 139 417 0.95% 20.78% 4.87%
216 648 1.48% 32.29% 7.57%
2852 8556 19.55%
16/SP SNHS UG HS Health Sciences 313 929 2.12% 2.23% 33.30%
16/SP SNHS UG NU Nursing 298 803 1.84% 1.92% 28.78%
16/SP SNHS UG SW Social Work 346 1,058 2.42% 2.53% 37.92%
EMSS UNDERGRADUATE Total
CLASS GRADUATE Total
CLASS Total
CNAS UNDERGRADUATE Total
CNAS GRADUATE Total
CNAS Total
EMSS Total
SBPA UNDERGRADUATE Total
SBPA GRADUATE Total
SBPA Total
Source: DROA; Colleague, UOG.ENR Page 21 of 48 16SP_enrollment_reports

February 2016
Overall
Within
Overall
Acad Level
Within
College/
SchoolTerm
College/
School
Acad
Level Subj Subject
Course
Enrollment
Credit Hour
Production
% OF CREDIT HOUR PRODUCTION
957 2790 6.38% 6.68% 100.00%
957 2790 6.38%
16/SP SOE UG ED Education 605 1,903 4.35% 4.56% 60.82%
16/SP SOE UG PE Physical Education 90 252 0.58% 0.60% 8.05%
695 2155 4.92% 5.16% 68.87%
16/SP SOE GR ED Education 334 974 2.23% 48.53% 31.13%
334 974 2.23% 48.53% 31.13%
1029 3129 7.15%
14929 43758
14213 41751 95.41%
716 2007 4.59%
SOE GRADUATE Total
SOE Total
Grand Total
Undergraduate Level
Graduate Level
SOE UNDERGRADUATE Total
SNHS UNDERGRADUATE Total
SNHS/CNHS Total
Source: DROA; Colleague, UOG.ENR Page 22 of 48 16SP_enrollment_reports
February 2016
University of Guam Back to Table Of Contents
Academic and Student AffairsOffice of Academic Assessment and Institutional Research
Overall
Within Overall
Acad Level
Within
College
/School
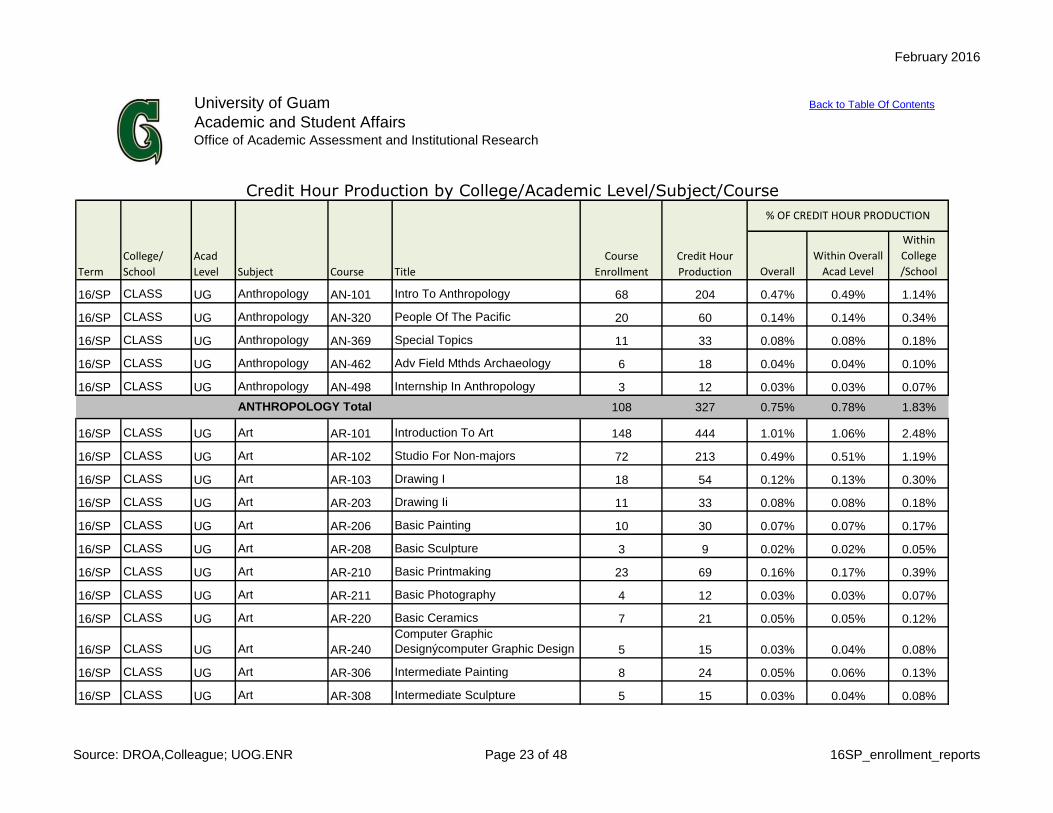
16/SP CLASS UG Anthropology AN-101 Intro To Anthropology 68 204 0.47% 0.49% 1.14%
16/SP CLASS UG Anthropology AN-320 People Of The Pacific 20 60 0.14% 0.14% 0.34%
16/SP CLASS UG Anthropology AN-369 Special Topics 11 33 0.08% 0.08% 0.18%
16/SP CLASS UG Anthropology AN-462 Adv Field Mthds Archaeology 6 18 0.04% 0.04% 0.10%
16/SP CLASS UG Anthropology AN-498 Internship In Anthropology 3 12 0.03% 0.03% 0.07%
108 327 0.75% 0.78% 1.83%
16/SP CLASS UG Art AR-101 Introduction To Art 148 444 1.01% 1.06% 2.48%
16/SP CLASS UG Art AR-102 Studio For Non-majors 72 213 0.49% 0.51% 1.19%
16/SP CLASS UG Art AR-103 Drawing I 18 54 0.12% 0.13% 0.30%
16/SP CLASS UG Art AR-203 Drawing Ii 11 33 0.08% 0.08% 0.18%
16/SP CLASS UG Art AR-206 Basic Painting 10 30 0.07% 0.07% 0.17%
16/SP CLASS UG Art AR-208 Basic Sculpture 3 9 0.02% 0.02% 0.05%
16/SP CLASS UG Art AR-210 Basic Printmaking 23 69 0.16% 0.17% 0.39%
16/SP CLASS UG Art AR-211 Basic Photography 4 12 0.03% 0.03% 0.07%
16/SP CLASS UG Art AR-220 Basic Ceramics 7 21 0.05% 0.05% 0.12%
16/SP CLASS UG Art AR-240
Computer Graphic
Designýcomputer Graphic Design 5 15 0.03% 0.04% 0.08%
16/SP CLASS UG Art AR-306 Intermediate Painting 8 24 0.05% 0.06% 0.13%
16/SP CLASS UG Art AR-308 Intermediate Sculpture 5 15 0.03% 0.04% 0.08%
ANTHROPOLOGY Total
Title
Course
Enrollment
Credit Hour
Production
% OF CREDIT HOUR PRODUCTION
Credit Hour Production by College/Academic Level/Subject/Course
Term
College/
School
Acad
Level Subject Course
Source: DROA,Colleague; UOG.ENR Page 23 of 48 16SP_enrollment_reports
February 2016
Overall
Within Overall
Acad Level
Within
College
/SchoolTitle
Course
Enrollment
Credit Hour
Production
% OF CREDIT HOUR PRODUCTION
Term
College/
School
Acad
Level Subject Course
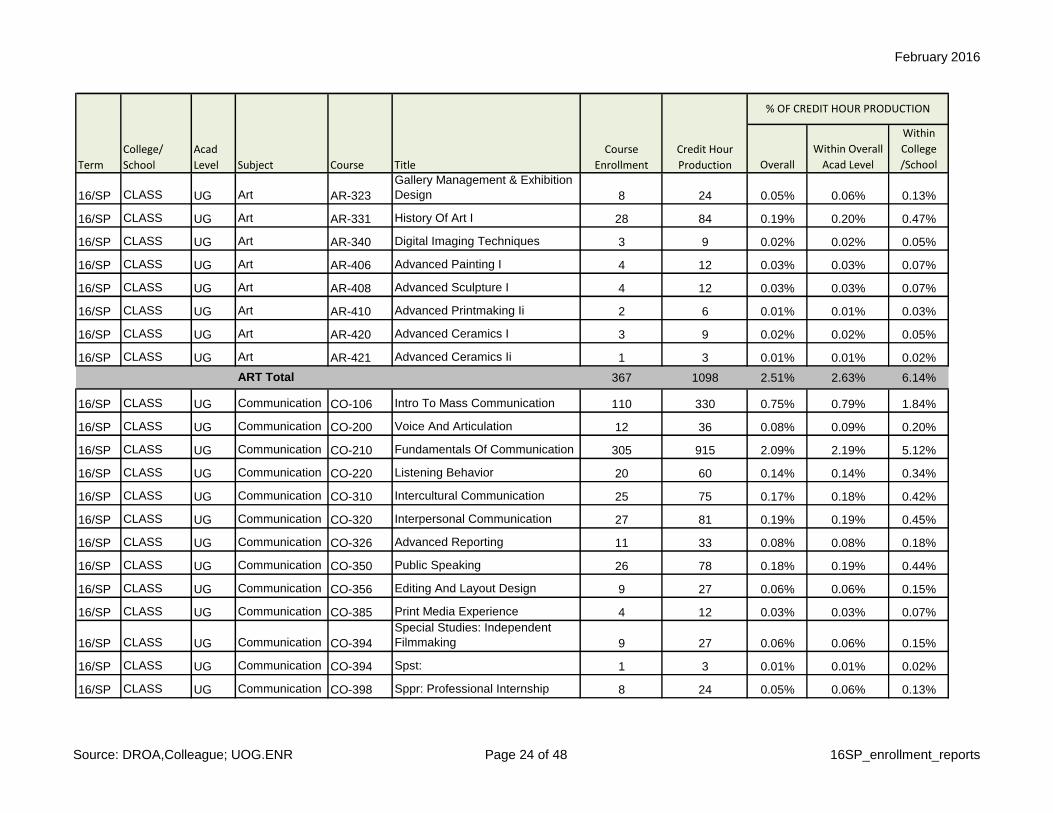
16/SP CLASS UG Art AR-323
Gallery Management & Exhibition
Design 8 24 0.05% 0.06% 0.13%
16/SP CLASS UG Art AR-331 History Of Art I 28 84 0.19% 0.20% 0.47%
16/SP CLASS UG Art AR-340 Digital Imaging Techniques 3 9 0.02% 0.02% 0.05%
16/SP CLASS UG Art AR-406 Advanced Painting I 4 12 0.03% 0.03% 0.07%
16/SP CLASS UG Art AR-408 Advanced Sculpture I 4 12 0.03% 0.03% 0.07%
16/SP CLASS UG Art AR-410 Advanced Printmaking Ii 2 6 0.01% 0.01% 0.03%
16/SP CLASS UG Art AR-420 Advanced Ceramics I 3 9 0.02% 0.02% 0.05%
16/SP CLASS UG Art AR-421 Advanced Ceramics Ii 1 3 0.01% 0.01% 0.02%
367 1098 2.51% 2.63% 6.14%
16/SP CLASS UG Communication CO-106 Intro To Mass Communication 110 330 0.75% 0.79% 1.84%
16/SP CLASS UG Communication CO-200 Voice And Articulation 12 36 0.08% 0.09% 0.20%
16/SP CLASS UG Communication CO-210 Fundamentals Of Communication 305 915 2.09% 2.19% 5.12%
16/SP CLASS UG Communication CO-220 Listening Behavior 20 60 0.14% 0.14% 0.34%
16/SP CLASS UG Communication CO-310 Intercultural Communication 25 75 0.17% 0.18% 0.42%
16/SP CLASS UG Communication CO-320 Interpersonal Communication 27 81 0.19% 0.19% 0.45%
16/SP CLASS UG Communication CO-326 Advanced Reporting 11 33 0.08% 0.08% 0.18%
16/SP CLASS UG Communication CO-350 Public Speaking 26 78 0.18% 0.19% 0.44%
16/SP CLASS UG Communication CO-356 Editing And Layout Design 9 27 0.06% 0.06% 0.15%
16/SP CLASS UG Communication CO-385 Print Media Experience 4 12 0.03% 0.03% 0.07%
16/SP CLASS UG Communication CO-394
Special Studies: Independent
Filmmaking 9 27 0.06% 0.06% 0.15%
16/SP CLASS UG Communication CO-394 Spst: 1 3 0.01% 0.01% 0.02%
16/SP CLASS UG Communication CO-398 Sppr: Professional Internship 8 24 0.05% 0.06% 0.13%
ART Total
Source: DROA,Colleague; UOG.ENR Page 24 of 48 16SP_enrollment_reports

February 2016
Overall
Within Overall
Acad Level
Within
College
/SchoolTitle
Course
Enrollment
Credit Hour
Production
% OF CREDIT HOUR PRODUCTION
Term
College/
School
Acad
Level Subject Course
16/SP CLASS UG Communication CO-426 Documentary Process 25 75 0.17% 0.18% 0.42%
16/SP CLASS UG Communication CO-491
Current Issues In Comm &
Society 13 39 0.09% 0.09% 0.22%
16/SP CLASS UG Communication CO-498 Communication Internship 7 21 0.05% 0.05% 0.12%
612 1836 4.20% 4.40% 10.26%
16/SP CLASS UG
English/Literatur
e EN-085 Fund Of English 53 159 0.36% 0.38% 0.89%
16/SP CLASS UG
English/Literatur
e EN-085L Fundamentals Of English Lab 53 53 0.12% 0.13% 0.30%
16/SP CLASS UG
English/Literatur
e EN-100 Fundamentls Of College English 259 777 1.78% 1.86% 4.34%
16/SP CLASS UG
English/Literatur
e EN-110 Freshman Composition 336 1,008 2.30% 2.41% 5.64%
16/SP CLASS UG
English/Literatur
e EN-111 Writing For Research 357 1,071 2.45% 2.57% 5.99%
16/SP CLASS UG
English/Literatur
e EN-210 Intro To Literature 250 750 1.71% 1.80% 4.19%
16/SP CLASS UG
English/Literatur
e EN-213 Literature, Myth And Culture 51 153 0.35% 0.37% 0.86%
16/SP CLASS UG
English/Literatur
e EN-225 Interduction To Literary Criticism 21 63 0.14% 0.15% 0.35%
16/SP CLASS UG
English/Literatur
e EN-311 Creative Writing: Fiction 20 60 0.14% 0.14% 0.34%
16/SP CLASS UG
English/Literatur
e EN-314 British Literature: 1800 To Present 20 60 0.14% 0.14% 0.34%
16/SP CLASS UG
English/Literatur
e EN-316 Professional Writing 22 66 0.15% 0.16% 0.37%
16/SP CLASS UG
English/Literatur
e EN-320 Ethnic American Literature 19 57 0.13% 0.14% 0.32%
16/SP CLASS UG
English/Literatur
e EN-340 Major British & American Authors 14 42 0.10% 0.10% 0.23%
16/SP CLASS UG
English/Literatur
e EN-400 Rhetoric And Composition 19 57 0.13% 0.14% 0.32%
16/SP CLASS UG
English/Literatur
e EN-411
Advanced Creative Writing
Workshop 6 18 0.04% 0.04% 0.10%
16/SP CLASS UG
English/Literatur
e EN-460 Literatures In English 15 45 0.10% 0.11% 0.25%
1515 4439 10.14% 10.63% 24.82%
16/SP CLASS UG Fine Arts FA-331 Philosophy Of Art 42 126 0.29% 0.30% 0.70%
COMMUNICATION Total
ENGLISH/LITERATURE Total
Source: DROA,Colleague; UOG.ENR Page 25 of 48 16SP_enrollment_reports

February 2016
Overall
Within Overall
Acad Level
Within
College
/SchoolTitle
Course
Enrollment
Credit Hour
Production
% OF CREDIT HOUR PRODUCTION
Term
College/
School
Acad
Level Subject Course
42 126 0.29% 0.30% 0.70%
16/SP CLASS UG Geography GE-101 Introduction To Geography 70 210 0.48% 0.50% 1.17%
16/SP CLASS UG Geography GE-201 World Regional Geography 36 108 0.25% 0.26% 0.60%
16/SP CLASS UG Geography GE-203 Princ Of Physical Geography 36 144 0.33% 0.34% 0.81%
142 462 1.06% 1.11% 2.58%
16/SP CLASS UG History HI-121 World History I 80 240 0.55% 0.57% 1.34%
16/SP CLASS UG History HI-122 World History Ii 93 279 0.64% 0.67% 1.56%
16/SP CLASS UG History HI-201 Early America 14 42 0.10% 0.10% 0.23%
16/SP CLASS UG History HI-202 Modern America 4 12 0.03% 0.03% 0.07%
16/SP CLASS UG History HI-211 The History Of Guam 219 657 1.50% 1.57% 3.67%
16/SP CLASS UG History HI-243 History Of Micronesia 2 6 0.01% 0.01% 0.03%
16/SP CLASS UG History HI-306 Modern American Military History 24 72 0.16% 0.17% 0.40%
16/SP CLASS UG History HI-444 Modern Pac Hist 1850-pres 22 66 0.15% 0.16% 0.37%
16/SP CLASS UG History HI-450 Topics In Pacific History 22 66 0.15% 0.16% 0.37%
480 1440 3.29% 3.45% 8.05%
16/SP CLASS UG
Language:Cha
morro CM-101 Elementary Chamorro I 81 320 0.73% 0.77% 1.79%
16/SP CLASS UG
Language:Cha
morro CM-102 Elementary Chamorro Ii 74 296 0.68% 0.71% 1.65%
16/SP CLASS UG
Language:Cha
morro CM-202 Intermediate Chamorro Ii 15 60 0.14% 0.14% 0.34%
16/SP CLASS UG
Language:Cha
morro CM-302 Advanced Chamorro Ii -writing 14 56 0.13% 0.13% 0.31%
16/SP CLASS UG
Language:Cha
morro CM-340 Chamoro Culture 10 30 0.07% 0.07% 0.17%
16/SP CLASS UG
Language:Cha
morro CM-394
Special Studies: Chamorro
Culture 2 6 0.01% 0.01% 0.03%
16/SP CLASS UG
Language:Cha
morro CM-412 Topics In Chamorro Studies 19 57 0.13% 0.14% 0.32%
16/SP CLASS UG
Language:Cha
morro CM-498 Intrnshp:cham Studies 2 6 0.01% 0.01% 0.03%
FINE ARTS Total
GEOGRAPHY Total
HISTORY Total
Source: DROA,Colleague; UOG.ENR Page 26 of 48 16SP_enrollment_reports
February 2016
Overall
Within Overall
Acad Level
Within
College
/SchoolTitle
Course
Enrollment
Credit Hour
Production
% OF CREDIT HOUR PRODUCTION
Term
College/
School
Acad
Level Subject Course
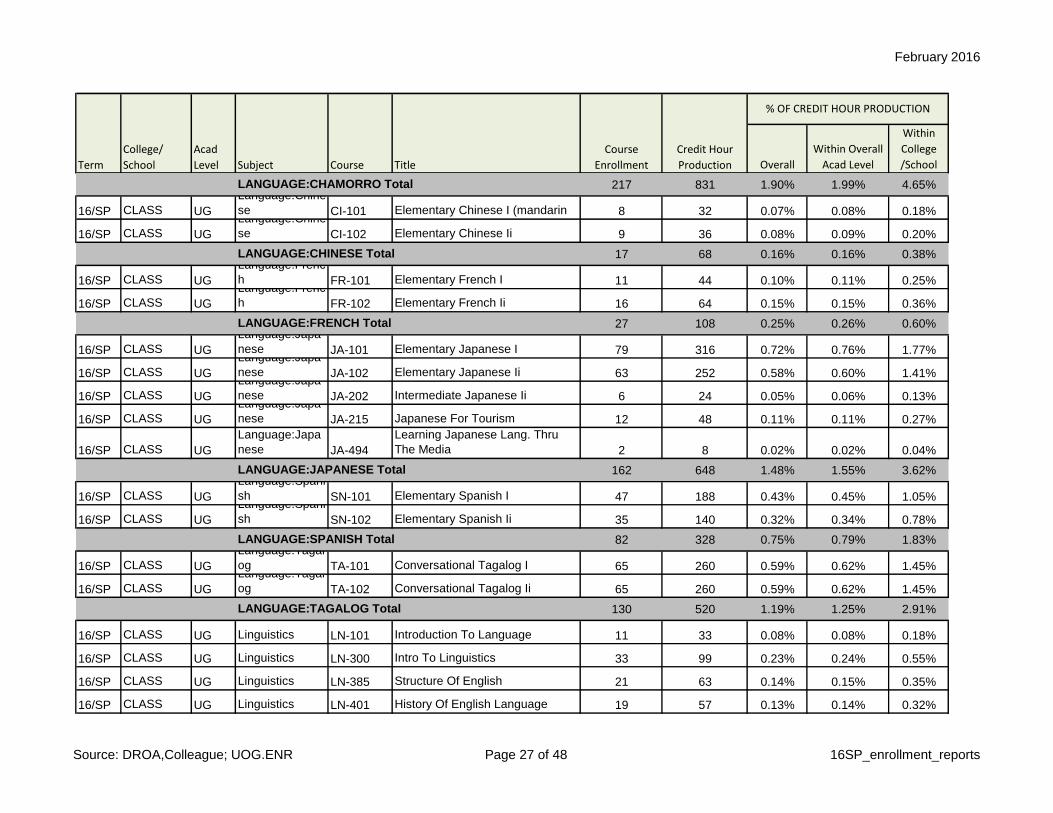
217 831 1.90% 1.99% 4.65%
16/SP CLASS UG
Language:Chine
se CI-101 Elementary Chinese I (mandarin 8 32 0.07% 0.08% 0.18%
16/SP CLASS UG
Language:Chine
se CI-102 Elementary Chinese Ii 9 36 0.08% 0.09% 0.20%
17 68 0.16% 0.16% 0.38%
16/SP CLASS UG
Language:Frenc
h FR-101 Elementary French I 11 44 0.10% 0.11% 0.25%
16/SP CLASS UG
Language:Frenc
h FR-102 Elementary French Ii 16 64 0.15% 0.15% 0.36%
27 108 0.25% 0.26% 0.60%
16/SP CLASS UG
Language:Japa
nese JA-101 Elementary Japanese I 79 316 0.72% 0.76% 1.77%
16/SP CLASS UG
Language:Japa
nese JA-102 Elementary Japanese Ii 63 252 0.58% 0.60% 1.41%
16/SP CLASS UG
Language:Japa
nese JA-202 Intermediate Japanese Ii 6 24 0.05% 0.06% 0.13%
16/SP CLASS UG
Language:Japa
nese JA-215 Japanese For Tourism 12 48 0.11% 0.11% 0.27%
16/SP CLASS UG
Language:Japa
nese JA-494
Learning Japanese Lang. Thru
The Media 2 8 0.02% 0.02% 0.04%
162 648 1.48% 1.55% 3.62%
16/SP CLASS UG
Language:Spani
sh SN-101 Elementary Spanish I 47 188 0.43% 0.45% 1.05%
16/SP CLASS UG
Language:Spani
sh SN-102 Elementary Spanish Ii 35 140 0.32% 0.34% 0.78%
82 328 0.75% 0.79% 1.83%
16/SP CLASS UG
Language:Tagal
og TA-101 Conversational Tagalog I 65 260 0.59% 0.62% 1.45%
16/SP CLASS UG
Language:Tagal
og TA-102 Conversational Tagalog Ii 65 260 0.59% 0.62% 1.45%
130 520 1.19% 1.25% 2.91%
16/SP CLASS UG Linguistics LN-101 Introduction To Language 11 33 0.08% 0.08% 0.18%
16/SP CLASS UG Linguistics LN-300 Intro To Linguistics 33 99 0.23% 0.24% 0.55%
16/SP CLASS UG Linguistics LN-385 Structure Of English 21 63 0.14% 0.15% 0.35%
16/SP CLASS UG Linguistics LN-401 History Of English Language 19 57 0.13% 0.14% 0.32%
LANGUAGE:CHAMORRO Total
LANGUAGE:CHINESE Total
LANGUAGE:FRENCH Total
LANGUAGE:JAPANESE Total
LANGUAGE:SPANISH Total
LANGUAGE:TAGALOG Total
Source: DROA,Colleague; UOG.ENR Page 27 of 48 16SP_enrollment_reports
February 2016
Overall
Within Overall
Acad Level
Within
College
/SchoolTitle
Course
Enrollment
Credit Hour
Production
% OF CREDIT HOUR PRODUCTION
Term
College/
School
Acad
Level Subject Course
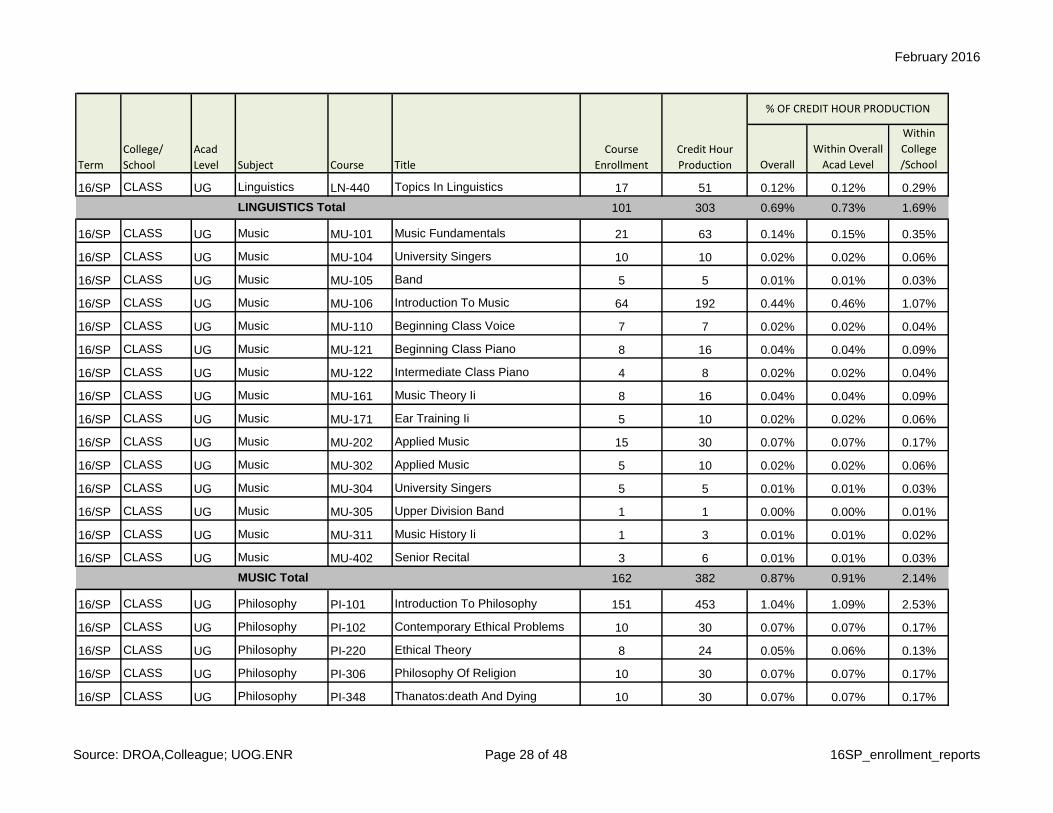
16/SP CLASS UG Linguistics LN-440 Topics In Linguistics 17 51 0.12% 0.12% 0.29%
101 303 0.69% 0.73% 1.69%
16/SP CLASS UG Music MU-101 Music Fundamentals 21 63 0.14% 0.15% 0.35%
16/SP CLASS UG Music MU-104 University Singers 10 10 0.02% 0.02% 0.06%
16/SP CLASS UG Music MU-105 Band 5 5 0.01% 0.01% 0.03%
16/SP CLASS UG Music MU-106 Introduction To Music 64 192 0.44% 0.46% 1.07%
16/SP CLASS UG Music MU-110 Beginning Class Voice 7 7 0.02% 0.02% 0.04%
16/SP CLASS UG Music MU-121 Beginning Class Piano 8 16 0.04% 0.04% 0.09%
16/SP CLASS UG Music MU-122 Intermediate Class Piano 4 8 0.02% 0.02% 0.04%
16/SP CLASS UG Music MU-161 Music Theory Ii 8 16 0.04% 0.04% 0.09%
16/SP CLASS UG Music MU-171 Ear Training Ii 5 10 0.02% 0.02% 0.06%
16/SP CLASS UG Music MU-202 Applied Music 15 30 0.07% 0.07% 0.17%
16/SP CLASS UG Music MU-302 Applied Music 5 10 0.02% 0.02% 0.06%
16/SP CLASS UG Music MU-304 University Singers 5 5 0.01% 0.01% 0.03%
16/SP CLASS UG Music MU-305 Upper Division Band 1 1 0.00% 0.00% 0.01%
16/SP CLASS UG Music MU-311 Music History Ii 1 3 0.01% 0.01% 0.02%
16/SP CLASS UG Music MU-402 Senior Recital 3 6 0.01% 0.01% 0.03%
162 382 0.87% 0.91% 2.14%
16/SP CLASS UG Philosophy PI-101 Introduction To Philosophy 151 453 1.04% 1.09% 2.53%
16/SP CLASS UG Philosophy PI-102 Contemporary Ethical Problems 10 30 0.07% 0.07% 0.17%
16/SP CLASS UG Philosophy PI-220 Ethical Theory 8 24 0.05% 0.06% 0.13%
16/SP CLASS UG Philosophy PI-306 Philosophy Of Religion 10 30 0.07% 0.07% 0.17%
16/SP CLASS UG Philosophy PI-348 Thanatos:death And Dying 10 30 0.07% 0.07% 0.17%
LINGUISTICS Total
MUSIC Total
Source: DROA,Colleague; UOG.ENR Page 28 of 48 16SP_enrollment_reports

February 2016
Overall
Within Overall
Acad Level
Within
College
/SchoolTitle
Course
Enrollment
Credit Hour
Production
% OF CREDIT HOUR PRODUCTION
Term
College/
School
Acad
Level Subject Course
16/SP CLASS UG Philosophy PI-480 Selected Studies In Asian Phil 7 21 0.05% 0.05% 0.12%
196 588 1.34% 1.41% 3.29%
16/SP CLASS UG Political Science PS-100 Intro To Citizenship 39 117 0.27% 0.28% 0.65%
16/SP CLASS UG Political Science PS-101 Intro To Govt And Politics 37 111 0.25% 0.27% 0.62%
16/SP CLASS UG Political Science PS-215 International Relations 16 48 0.11% 0.11% 0.27%
16/SP CLASS UG Political Science PS-225 State & Territorial Governmt 10 30 0.07% 0.07% 0.17%
16/SP CLASS UG Political Science PS-300
Research Methodology In Political
Scien 12 36 0.08% 0.09% 0.20%
16/SP CLASS UG Political Science PS-307
Comparative Politics Of Economic
Devývelopment 5 15 0.03% 0.04% 0.08%
16/SP CLASS UG Political Science PS-402 American Const.. Dev/law 10 30 0.07% 0.07% 0.17%
16/SP CLASS UG Political Science PS-412 Politics Of Micronesia 8 24 0.05% 0.06% 0.13%
16/SP CLASS UG Political Science PS-426 American Political Thought 9 27 0.06% 0.06% 0.15%
146 438 1.00% 1.05% 2.45%
16/SP CLASS UG Psychology PY-100 Personal Adjustment 201 603 1.38% 1.44% 3.37%
16/SP CLASS UG Psychology PY-101 General Psychology 225 675 1.54% 1.62% 3.77%
16/SP CLASS UG Psychology PY-202 Adolescent Psychology 79 237 0.54% 0.57% 1.32%
16/SP CLASS UG Psychology PY-342
The Psychology Of Close
Relationships 30 90 0.21% 0.22% 0.50%
16/SP CLASS UG Psychology PY-404 Cognitive Psychology 34 102 0.23% 0.24% 0.57%
16/SP CLASS UG Psychology PY-420 Abnormal Psychology 31 93 0.21% 0.22% 0.52%
16/SP CLASS UG Psychology PY-426 Personality Theory 27 81 0.19% 0.19% 0.45%
16/SP CLASS UG Psychology PY-455 Psychology Of Women 26 78 0.18% 0.19% 0.44%
16/SP CLASS UG Psychology PY-491 Psychological Research Seminar 12 36 0.08% 0.09% 0.20%
16/SP CLASS UG Psychology PY-492B Psychology Practicum 14 42 0.10% 0.10% 0.23%
PHILOSOPHY Total
POLITICAL SCIENCE Total
Source: DROA,Colleague; UOG.ENR Page 29 of 48 16SP_enrollment_reports

February 2016
Overall
Within Overall
Acad Level
Within
College
/SchoolTitle
Course
Enrollment
Credit Hour
Production
% OF CREDIT HOUR PRODUCTION
Term
College/
School
Acad
Level Subject Course
679 2037 4.66% 4.88% 11.39%
16/SP CLASS UG Sociology SO-101 Intro To Sociology 173 519 1.19% 1.24% 2.90%
16/SP CLASS UG Sociology SO-202 Contemporary Social Problems 15 45 0.10% 0.11% 0.25%
16/SP CLASS UG Sociology SO-230 Marriage And The Family 10 30 0.07% 0.07% 0.17%
16/SP CLASS UG Sociology SO-302 Deviance And Social Control 11 33 0.08% 0.08% 0.18%
16/SP CLASS UG Sociology SO-332 Globalization & Human Dynamics 24 72 0.16% 0.17% 0.40%
16/SP CLASS UG Sociology SO-360 Social Movements And Change 28 84 0.19% 0.20% 0.47%
16/SP CLASS UG Sociology SO-386
Juvenile Delinquency &
Criminology 20 60 0.14% 0.14% 0.34%
16/SP CLASS UG Sociology SO-414
Research Methodology In
Sociology 12 36 0.08% 0.09% 0.20%
16/SP CLASS UG Sociology SO-498 Internship 3 9 0.02% 0.02% 0.05%
296 888 2.03% 2.13% 4.96%
16/SP CLASS UG Theatre TH-101 Intro To Theatre 62 186 0.43% 0.45% 1.04%
16/SP CLASS UG Theatre TH-102 Acting I 8 24 0.05% 0.06% 0.13%
16/SP CLASS UG Theatre TH-202 Acting Ii 16 48 0.11% 0.11% 0.27%
16/SP CLASS UG Theatre TH-292 Theater Practicum 8 8 0.02% 0.02% 0.04%
16/SP CLASS UG Theatre TH-294 Theatre Movement And Dance 10 30 0.07% 0.07% 0.17%
16/SP CLASS UG Theatre TH-315 Scenic Design 11 33 0.08% 0.08% 0.18%
115 329 0.75% 0.79% 1.84%
16/SP CLASS UG
Women &
Gender Studies WG-101 Intro To Women & Gender Stud 170 510 1.17% 1.22% 2.85%
16/SP CLASS UG
Women &
Gender Studies WG-230 Marriage And The Family 1 3 0.01% 0.01% 0.02%
16/SP CLASS UG
Women &
Gender Studies WG-455 Psychology Of Women 3 9 0.02% 0.02% 0.05%
174 522 1.19% 1.25% 2.92%WOMEN & GENDER STUDIES Total
PSYCHOLOGY Total
SOCIOLOGY Total
THEATRE Total
Source: DROA,Colleague; UOG.ENR Page 30 of 48 16SP_enrollment_reports
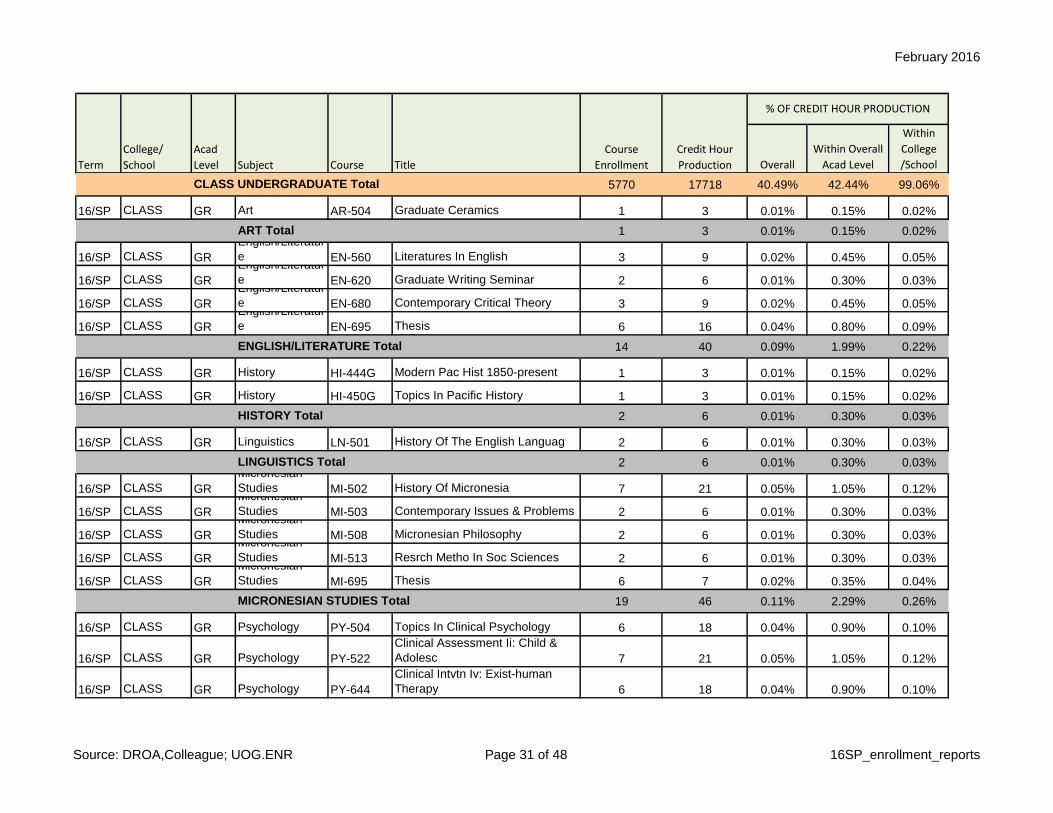
February 2016
Overall
Within Overall
Acad Level
Within
College
/SchoolTitle
Course
Enrollment
Credit Hour
Production
% OF CREDIT HOUR PRODUCTION
Term
College/
School
Acad
Level Subject Course
5770 17718 40.49% 42.44% 99.06%
16/SP CLASS GR Art AR-504 Graduate Ceramics 1 3 0.01% 0.15% 0.02%
1 3 0.01% 0.15% 0.02%
16/SP CLASS GR
English/Literatur
e EN-560 Literatures In English 3 9 0.02% 0.45% 0.05%
16/SP CLASS GR
English/Literatur
e EN-620 Graduate Writing Seminar 2 6 0.01% 0.30% 0.03%
16/SP CLASS GR
English/Literatur
e EN-680 Contemporary Critical Theory 3 9 0.02% 0.45% 0.05%
16/SP CLASS GR
English/Literatur
e EN-695 Thesis 6 16 0.04% 0.80% 0.09%
14 40 0.09% 1.99% 0.22%
16/SP CLASS GR History HI-444G Modern Pac Hist 1850-present 1 3 0.01% 0.15% 0.02%
16/SP CLASS GR History HI-450G Topics In Pacific History 1 3 0.01% 0.15% 0.02%
2 6 0.01% 0.30% 0.03%
16/SP CLASS GR Linguistics LN-501 History Of The English Languag 2 6 0.01% 0.30% 0.03%
2 6 0.01% 0.30% 0.03%
16/SP CLASS GR
Micronesian
Studies MI-502 History Of Micronesia 7 21 0.05% 1.05% 0.12%
16/SP CLASS GR
Micronesian
Studies MI-503 Contemporary Issues & Problems 2 6 0.01% 0.30% 0.03%
16/SP CLASS GR
Micronesian
Studies MI-508 Micronesian Philosophy 2 6 0.01% 0.30% 0.03%
16/SP CLASS GR
Micronesian
Studies MI-513 Resrch Metho In Soc Sciences 2 6 0.01% 0.30% 0.03%
16/SP CLASS GR
Micronesian
Studies MI-695 Thesis 6 7 0.02% 0.35% 0.04%
19 46 0.11% 2.29% 0.26%
16/SP CLASS GR Psychology PY-504 Topics In Clinical Psychology 6 18 0.04% 0.90% 0.10%
16/SP CLASS GR Psychology PY-522
Clinical Assessment Ii: Child &
Adolesc 7 21 0.05% 1.05% 0.12%
16/SP CLASS GR Psychology PY-644
Clinical Intvtn Iv: Exist-human
Therapy 6 18 0.04% 0.90% 0.10%
LINGUISTICS Total
MICRONESIAN STUDIES Total
CLASS UNDERGRADUATE Total
ART Total
ENGLISH/LITERATURE Total
HISTORY Total
Source: DROA,Colleague; UOG.ENR Page 31 of 48 16SP_enrollment_reports

February 2016
Overall
Within Overall
Acad Level
Within
College
/SchoolTitle
Course
Enrollment
Credit Hour
Production
% OF CREDIT HOUR PRODUCTION
Term
College/
School
Acad
Level Subject Course
16/SP CLASS GR Psychology PY-692D Graduate Pract In Clinical Psy Iv 6 6 0.01% 0.30% 0.03%
16/SP CLASS GR Psychology PY-695A Thesis I 2 2 0.00% 0.10% 0.01%
16/SP CLASS GR Psychology PY-695B Thesis Ii 2 3 0.01% 0.15% 0.02%
29 68 0.16% 3.39% 0.38%
67 169 0.39% 8.42% 0.94%
5837 17887 40.88%
16/SP CNAS UG Agriculture AG-101 Intro To Agriculture 80 320 0.73% 0.77% 2.96%
16/SP CNAS UG Agriculture AG-102 Introduction To Plant Science 40 120 0.27% 0.29% 1.11%
16/SP CNAS UG Agriculture AG-102L Intro To Plant Science Lab 40 40 0.09% 0.10% 0.37%
16/SP CNAS UG Agriculture AG-136 Science Of Aquaculture 21 84 0.19% 0.20% 0.78%
16/SP CNAS UG Agriculture AG-194
Intro To Science Educationýintro
To Science Education 11 33 0.08% 0.08% 0.31%
16/SP CNAS UG Agriculture AG-194L Intro To Science Education Lab 11 11 0.03% 0.03% 0.10%
16/SP CNAS UG Agriculture AG-281 Prin Of Horticultural Science 7 28 0.06% 0.07% 0.26%
16/SP CNAS UG Agriculture AG-340 Pest Management 2 8 0.02% 0.02% 0.07%
16/SP CNAS UG Agriculture AG-430 Scientific Photography 3 9 0.02% 0.02% 0.08%
16/SP CNAS UG Agriculture AG-430L Scientific Photography Lab 3 3 0.01% 0.01% 0.03%
16/SP CNAS UG Agriculture AG-480 Tropical Soil Mgmt & Fertility 2 6 0.01% 0.01% 0.06%
16/SP CNAS UG Agriculture AG-491 Seminar 3 3 0.01% 0.01% 0.03%
16/SP CNAS UG Agriculture AG-494 Special Studies 3 9 0.02% 0.02% 0.08%
226 674 1.54% 1.61% 6.23%
16/SP CNAS UG Biology BI-100 Environmental Biology 159 477 1.09% 1.14% 4.41%
16/SP CNAS UG Biology BI-100L Environmental Biol Lab 158 158 0.36% 0.38% 1.46%
16/SP CNAS UG Biology BI-103 Marine Biology 22 66 0.15% 0.16% 0.61%
AGRICULTURE Total
PSYCHOLOGY Total
CLASS GRADUATE Total
CLASS Total
Source: DROA,Colleague; UOG.ENR Page 32 of 48 16SP_enrollment_reports
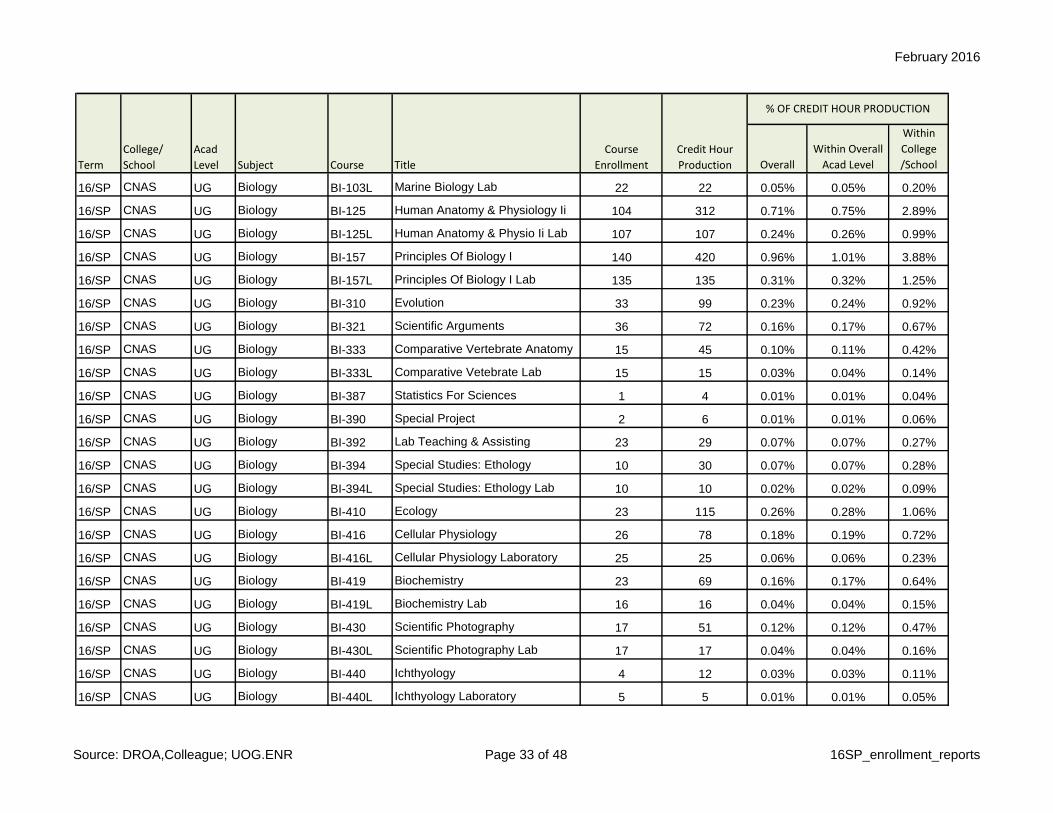
February 2016
Overall
Within Overall
Acad Level
Within
College
/SchoolTitle
Course
Enrollment
Credit Hour
Production
% OF CREDIT HOUR PRODUCTION
Term
College/
School
Acad
Level Subject Course
16/SP CNAS UG Biology BI-103L Marine Biology Lab 22 22 0.05% 0.05% 0.20%
16/SP CNAS UG Biology BI-125 Human Anatomy & Physiology Ii 104 312 0.71% 0.75% 2.89%
16/SP CNAS UG Biology BI-125L Human Anatomy & Physio Ii Lab 107 107 0.24% 0.26% 0.99%
16/SP CNAS UG Biology BI-157 Principles Of Biology I 140 420 0.96% 1.01% 3.88%
16/SP CNAS UG Biology BI-157L Principles Of Biology I Lab 135 135 0.31% 0.32% 1.25%
16/SP CNAS UG Biology BI-310 Evolution 33 99 0.23% 0.24% 0.92%
16/SP CNAS UG Biology BI-321 Scientific Arguments 36 72 0.16% 0.17% 0.67%
16/SP CNAS UG Biology BI-333 Comparative Vertebrate Anatomy 15 45 0.10% 0.11% 0.42%
16/SP CNAS UG Biology BI-333L Comparative Vetebrate Lab 15 15 0.03% 0.04% 0.14%
16/SP CNAS UG Biology BI-387 Statistics For Sciences 1 4 0.01% 0.01% 0.04%
16/SP CNAS UG Biology BI-390 Special Project 2 6 0.01% 0.01% 0.06%
16/SP CNAS UG Biology BI-392 Lab Teaching & Assisting 23 29 0.07% 0.07% 0.27%
16/SP CNAS UG Biology BI-394 Special Studies: Ethology 10 30 0.07% 0.07% 0.28%
16/SP CNAS UG Biology BI-394L Special Studies: Ethology Lab 10 10 0.02% 0.02% 0.09%
16/SP CNAS UG Biology BI-410 Ecology 23 115 0.26% 0.28% 1.06%
16/SP CNAS UG Biology BI-416 Cellular Physiology 26 78 0.18% 0.19% 0.72%
16/SP CNAS UG Biology BI-416L Cellular Physiology Laboratory 25 25 0.06% 0.06% 0.23%
16/SP CNAS UG Biology BI-419 Biochemistry 23 69 0.16% 0.17% 0.64%
16/SP CNAS UG Biology BI-419L Biochemistry Lab 16 16 0.04% 0.04% 0.15%
16/SP CNAS UG Biology BI-430 Scientific Photography 17 51 0.12% 0.12% 0.47%
16/SP CNAS UG Biology BI-430L Scientific Photography Lab 17 17 0.04% 0.04% 0.16%
16/SP CNAS UG Biology BI-440 Ichthyology 4 12 0.03% 0.03% 0.11%
16/SP CNAS UG Biology BI-440L Ichthyology Laboratory 5 5 0.01% 0.01% 0.05%
Source: DROA,Colleague; UOG.ENR Page 33 of 48 16SP_enrollment_reports

February 2016
Overall
Within Overall
Acad Level
Within
College
/SchoolTitle
Course
Enrollment
Credit Hour
Production
% OF CREDIT HOUR PRODUCTION
Term
College/
School
Acad
Level Subject Course
1148 2395 5.47% 5.74% 22.15%
16/SP CNAS UG Chemistry CH-100 Intro To Inorganic Chemistry 45 135 0.31% 0.32% 1.25%
16/SP CNAS UG Chemistry CH-100L Intro Chemistry Lab 44 44 0.10% 0.11% 0.41%
16/SP CNAS UG Chemistry CH-101 Intro To Organic Chemistry 25 75 0.17% 0.18% 0.69%
16/SP CNAS UG Chemistry CH-101L Intro To Organic Chemistry Lab 25 25 0.06% 0.06% 0.23%
16/SP CNAS UG Chemistry CH-103 General Chemistry 88 264 0.60% 0.63% 2.44%
16/SP CNAS UG Chemistry CH-103L Gen Chemistry Ii Lab 90 90 0.21% 0.22% 0.83%
16/SP CNAS UG Chemistry CH-310B Organic Chemistry 41 123 0.28% 0.29% 1.14%
16/SP CNAS UG Chemistry CH-312 Laboratory Tech In Organic Ch 36 72 0.16% 0.17% 0.67%
16/SP CNAS UG Chemistry CH-392 Lab Teaching & Assisting 1 1 0.00% 0.00% 0.01%
16/SP CNAS UG Chemistry CH-410 Instrument Methods Of Analysis 10 30 0.07% 0.07% 0.28%
16/SP CNAS UG Chemistry CH-410L Instrument Mthds Of Analys Lab 10 20 0.05% 0.05% 0.18%
16/SP CNAS UG Chemistry CH-491 Seminar 5 5 0.01% 0.01% 0.05%
420 884 2.02% 2.12% 8.17%
16/SP CNAS UG
Computer
Science CS-200 Computer Applications 57 171 0.39% 0.41% 1.58%
16/SP CNAS UG
Computer
Science CS-201 Introduction To Programming 28 108 0.25% 0.26% 1.00%
16/SP CNAS UG
Computer
Science CS-202 Programming Ii 18 72 0.16% 0.17% 0.67%
16/SP CNAS UG
Computer
Science CS-303 Data Str & Algorithm Analysis 17 51 0.12% 0.12% 0.47%
16/SP CNAS UG
Computer
Science CS-315 Intro File Proc & Database Ma 25 75 0.17% 0.18% 0.69%
16/SP CNAS UG
Computer
Science CS-360 Intro To Operating Systems 1 4 0.01% 0.01% 0.04%
16/SP CNAS UG
Computer
Science CS-365 Computer Architecture 10 30 0.07% 0.07% 0.28%
16/SP CNAS UG
Computer
Science CS-403 Data Co And Networking 6 18 0.04% 0.04% 0.17%
16/SP CNAS UG
Computer
Science CS-425
Systems Analysis &
Design(capstone Crse) 7 21 0.05% 0.05% 0.19%
BIOLOGY Total
CHEMISTRY Total
Source: DROA,Colleague; UOG.ENR Page 34 of 48 16SP_enrollment_reports
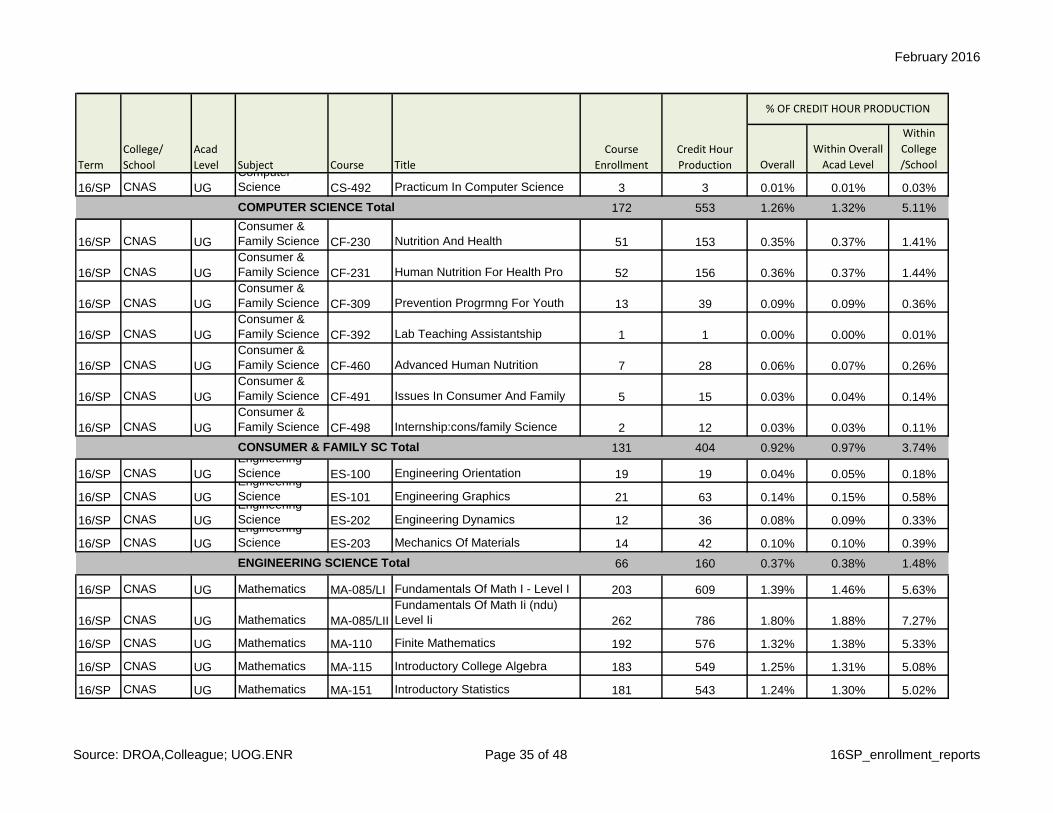
February 2016
Overall
Within Overall
Acad Level
Within
College
/SchoolTitle
Course
Enrollment
Credit Hour
Production
% OF CREDIT HOUR PRODUCTION
Term
College/
School
Acad
Level Subject Course
16/SP CNAS UG
Computer
Science CS-492 Practicum In Computer Science 3 3 0.01% 0.01% 0.03%
172 553 1.26% 1.32% 5.11%
16/SP CNAS UG
Consumer &
Family Science CF-230 Nutrition And Health 51 153 0.35% 0.37% 1.41%
16/SP CNAS UG
Consumer &
Family Science CF-231 Human Nutrition For Health Pro 52 156 0.36% 0.37% 1.44%
16/SP CNAS UG
Consumer &
Family Science CF-309 Prevention Progrmng For Youth 13 39 0.09% 0.09% 0.36%
16/SP CNAS UG
Consumer &
Family Science CF-392 Lab Teaching Assistantship 1 1 0.00% 0.00% 0.01%
16/SP CNAS UG
Consumer &
Family Science CF-460 Advanced Human Nutrition 7 28 0.06% 0.07% 0.26%
16/SP CNAS UG
Consumer &
Family Science CF-491 Issues In Consumer And Family 5 15 0.03% 0.04% 0.14%
16/SP CNAS UG
Consumer &
Family Science CF-498 Internship:cons/family Science 2 12 0.03% 0.03% 0.11%
131 404 0.92% 0.97% 3.74%
16/SP CNAS UG
Engineering
Science ES-100 Engineering Orientation 19 19 0.04% 0.05% 0.18%
16/SP CNAS UG
Engineering
Science ES-101 Engineering Graphics 21 63 0.14% 0.15% 0.58%
16/SP CNAS UG
Engineering
Science ES-202 Engineering Dynamics 12 36 0.08% 0.09% 0.33%
16/SP CNAS UG
Engineering
Science ES-203 Mechanics Of Materials 14 42 0.10% 0.10% 0.39%
66 160 0.37% 0.38% 1.48%
16/SP CNAS UG Mathematics MA-085/LI Fundamentals Of Math I - Level I 203 609 1.39% 1.46% 5.63%
16/SP CNAS UG Mathematics MA-085/LII
Fundamentals Of Math Ii (ndu)
Level Ii 262 786 1.80% 1.88% 7.27%
16/SP CNAS UG Mathematics MA-110 Finite Mathematics 192 576 1.32% 1.38% 5.33%
16/SP CNAS UG Mathematics MA-115 Introductory College Algebra 183 549 1.25% 1.31% 5.08%
16/SP CNAS UG Mathematics MA-151 Introductory Statistics 181 543 1.24% 1.30% 5.02%
ENGINEERING SCIENCE Total
COMPUTER SCIENCE Total
CONSUMER & FAMILY SC Total
Source: DROA,Colleague; UOG.ENR Page 35 of 48 16SP_enrollment_reports
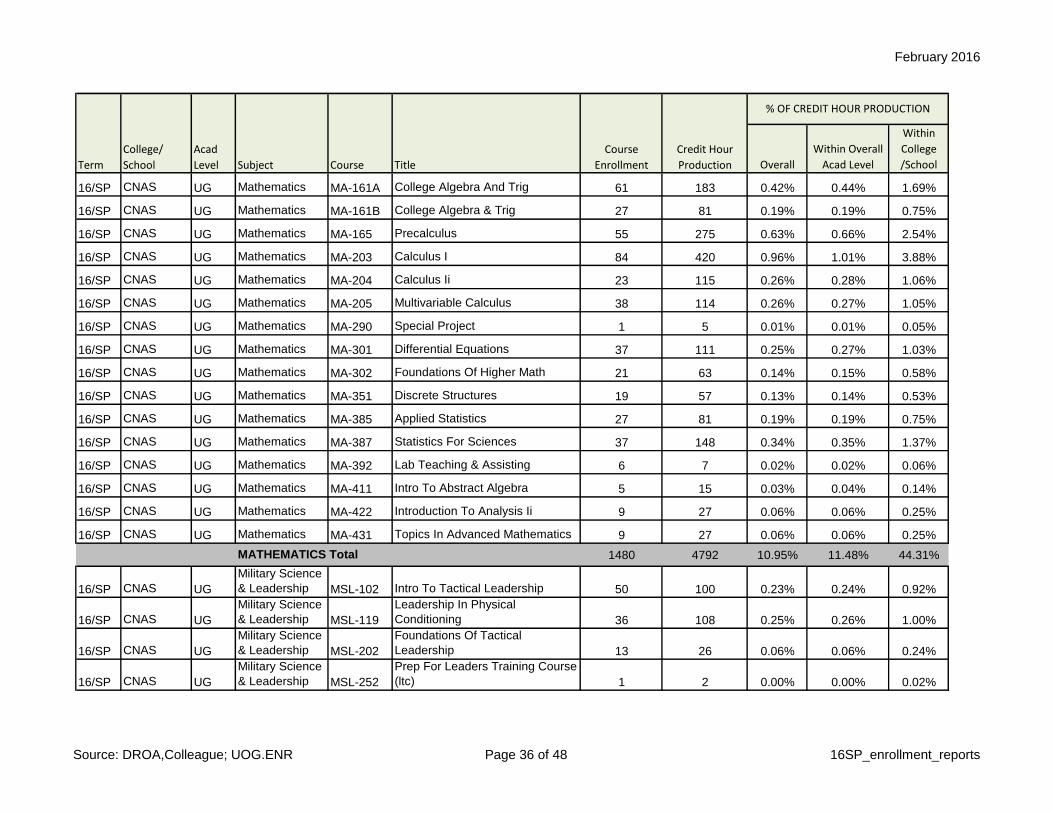
February 2016
Overall
Within Overall
Acad Level
Within
College
/SchoolTitle
Course
Enrollment
Credit Hour
Production
% OF CREDIT HOUR PRODUCTION
Term
College/
School
Acad
Level Subject Course
16/SP CNAS UG Mathematics MA-161A College Algebra And Trig 61 183 0.42% 0.44% 1.69%
16/SP CNAS UG Mathematics MA-161B College Algebra & Trig 27 81 0.19% 0.19% 0.75%
16/SP CNAS UG Mathematics MA-165 Precalculus 55 275 0.63% 0.66% 2.54%
16/SP CNAS UG Mathematics MA-203 Calculus I 84 420 0.96% 1.01% 3.88%
16/SP CNAS UG Mathematics MA-204 Calculus Ii 23 115 0.26% 0.28% 1.06%
16/SP CNAS UG Mathematics MA-205 Multivariable Calculus 38 114 0.26% 0.27% 1.05%
16/SP CNAS UG Mathematics MA-290 Special Project 1 5 0.01% 0.01% 0.05%
16/SP CNAS UG Mathematics MA-301 Differential Equations 37 111 0.25% 0.27% 1.03%
16/SP CNAS UG Mathematics MA-302 Foundations Of Higher Math 21 63 0.14% 0.15% 0.58%
16/SP CNAS UG Mathematics MA-351 Discrete Structures 19 57 0.13% 0.14% 0.53%
16/SP CNAS UG Mathematics MA-385 Applied Statistics 27 81 0.19% 0.19% 0.75%
16/SP CNAS UG Mathematics MA-387 Statistics For Sciences 37 148 0.34% 0.35% 1.37%
16/SP CNAS UG Mathematics MA-392 Lab Teaching & Assisting 6 7 0.02% 0.02% 0.06%
16/SP CNAS UG Mathematics MA-411 Intro To Abstract Algebra 5 15 0.03% 0.04% 0.14%
16/SP CNAS UG Mathematics MA-422 Introduction To Analysis Ii 9 27 0.06% 0.06% 0.25%
16/SP CNAS UG Mathematics MA-431 Topics In Advanced Mathematics 9 27 0.06% 0.06% 0.25%
1480 4792 10.95% 11.48% 44.31%
16/SP CNAS UG
Military Science
& Leadership MSL-102 Intro To Tactical Leadership 50 100 0.23% 0.24% 0.92%
16/SP CNAS UG
Military Science
& Leadership MSL-119
Leadership In Physical
Conditioning 36 108 0.25% 0.26% 1.00%
16/SP CNAS UG
Military Science
& Leadership MSL-202
Foundations Of Tactical
Leadership 13 26 0.06% 0.06% 0.24%
16/SP CNAS UG
Military Science
& Leadership MSL-252
Prep For Leaders Training Course
(ltc) 1 2 0.00% 0.00% 0.02%
MATHEMATICS Total
Source: DROA,Colleague; UOG.ENR Page 36 of 48 16SP_enrollment_reports

February 2016
Overall
Within Overall
Acad Level
Within
College
/SchoolTitle
Course
Enrollment
Credit Hour
Production
% OF CREDIT HOUR PRODUCTION
Term
College/
School
Acad
Level Subject Course
16/SP CNAS UG
Military Science
& Leadership MSL-299 Individual Leadership Studies 5 15 0.03% 0.04% 0.14%
16/SP CNAS UG
Military Science
& Leadership MSL-302
Leadership In Changing
Environments 20 60 0.14% 0.14% 0.55%
16/SP CNAS UG
Military Science
& Leadership MSL-402 Leadership In A Complex World 18 54 0.12% 0.13% 0.50%
143 365 0.83% 0.87% 3.38%
16/SP CNAS UG Physics PH-211 Introductory Physics Lab 67 67 0.15% 0.16% 0.62%
16/SP CNAS UG Physics PH-252 University Physics 76 304 0.69% 0.73% 2.81%
143 371 0.85% 0.89% 3.43%
3929 10598 24.22% 25.38% 98.00%
16/SP CNAS GR Biology BI-440G Ichthyology 7 21 0.05% 1.05% 0.19%
16/SP CNAS GR Biology BI-440G/L Ichthyology Laboratory 6 6 0.01% 0.30% 0.06%
16/SP CNAS GR Biology BI-503 Biologicallit & Scientific Wr 14 28 0.06% 1.40% 0.26%
16/SP CNAS GR Biology BI-529A
Env Cont & Tox I Fund Prin & Bas
Concep 4 12 0.03% 0.60% 0.11%
16/SP CNAS GR Biology BI-691 Seminar 8 8 0.02% 0.40% 0.07%
16/SP CNAS GR Biology BI-695 Thesis 11 24 0.05% 1.20% 0.22%
50 99 0.23% 4.93% 0.92%
16/SP CNAS GR
Environmental
Science EV-504
Environmental Literature & Scien
Pres 15 15 0.03% 0.75% 0.14%
16/SP CNAS GR
Environmental
Science EV-511 Env Sci: Geosciences/engineering 6 18 0.04% 0.90% 0.17%
16/SP CNAS GR
Environmental
Science EV-512
Env Sci: Economics-management-
law 13 39 0.09% 1.94% 0.36%
16/SP CNAS GR
Environmental
Science EV-529A
Env Cont & Tox I Fund Prin & Bas
Concep 3 9 0.02% 0.45% 0.08%
16/SP CNAS GR
Environmental
Science EV-547
Pacific Island Geologic & Climatic
Hist 6 18 0.04% 0.90% 0.17%
BIOLOGY Total
MILITARY SCIENCE & LEADERSHIP Total
PHYSICS Total
CNAS UNDERGRADUATE Total
Source: DROA,Colleague; UOG.ENR Page 37 of 48 16SP_enrollment_reports
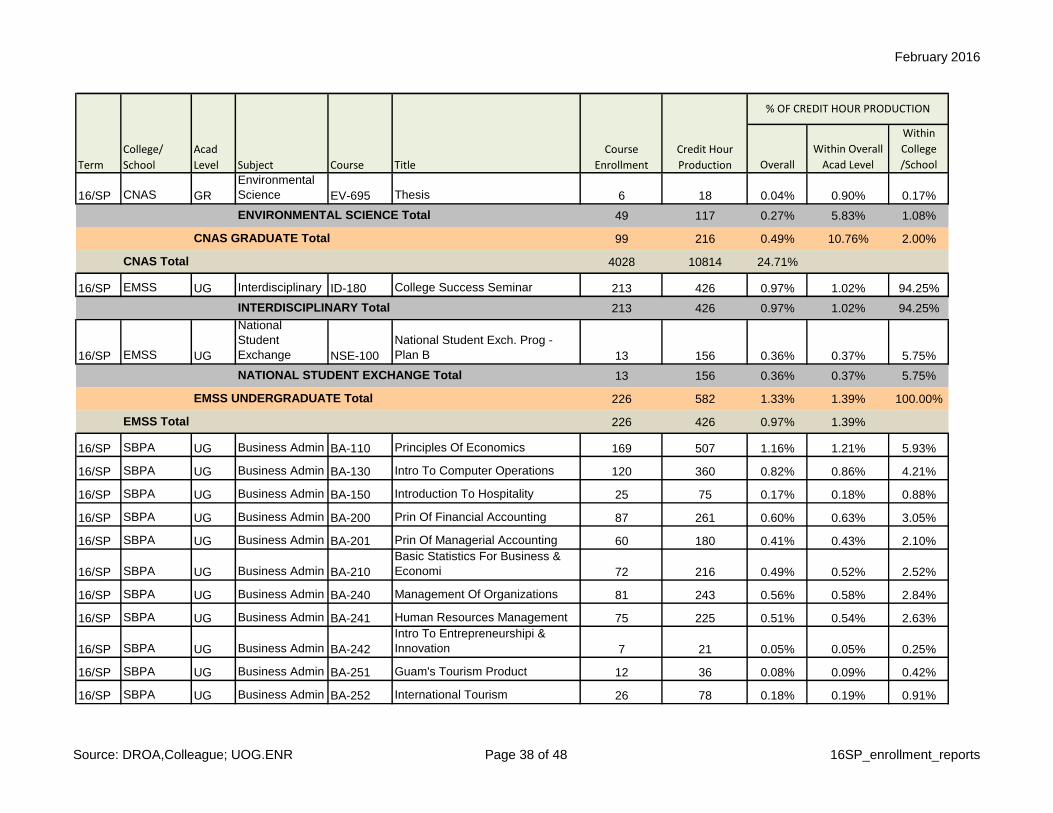
February 2016
Overall
Within Overall
Acad Level
Within
College
/SchoolTitle
Course
Enrollment
Credit Hour
Production
% OF CREDIT HOUR PRODUCTION
Term
College/
School
Acad
Level Subject Course
16/SP CNAS GR
Environmental
Science EV-695 Thesis 6 18 0.04% 0.90% 0.17%
49 117 0.27% 5.83% 1.08%
99 216 0.49% 10.76% 2.00%
4028 10814 24.71%
16/SP EMSS UG Interdisciplinary ID-180 College Success Seminar 213 426 0.97% 1.02% 94.25%
213 426 0.97% 1.02% 94.25%
16/SP EMSS UG
National
Student
Exchange NSE-100
National Student Exch. Prog -
Plan B 13 156 0.36% 0.37% 5.75%
13 156 0.36% 0.37% 5.75%
226 582 1.33% 1.39% 100.00%
226 426 0.97% 1.39%
16/SP SBPA UG Business Admin BA-110 Principles Of Economics 169 507 1.16% 1.21% 5.93%
16/SP SBPA UG Business Admin BA-130 Intro To Computer Operations 120 360 0.82% 0.86% 4.21%
16/SP SBPA UG Business Admin BA-150 Introduction To Hospitality 25 75 0.17% 0.18% 0.88%
16/SP SBPA UG Business Admin BA-200 Prin Of Financial Accounting 87 261 0.60% 0.63% 3.05%
16/SP SBPA UG Business Admin BA-201 Prin Of Managerial Accounting 60 180 0.41% 0.43% 2.10%
16/SP SBPA UG Business Admin BA-210
Basic Statistics For Business &
Economi 72 216 0.49% 0.52% 2.52%
16/SP SBPA UG Business Admin BA-240 Management Of Organizations 81 243 0.56% 0.58% 2.84%
16/SP SBPA UG Business Admin BA-241 Human Resources Management 75 225 0.51% 0.54% 2.63%
16/SP SBPA UG Business Admin BA-242
Intro To Entrepreneurshipi &
Innovation 7 21 0.05% 0.05% 0.25%
16/SP SBPA UG Business Admin BA-251 Guam's Tourism Product 12 36 0.08% 0.09% 0.42%
16/SP SBPA UG Business Admin BA-252 International Tourism 26 78 0.18% 0.19% 0.91%
EMSS UNDERGRADUATE Total
EMSS Total
ENVIRONMENTAL SCIENCE Total
CNAS GRADUATE Total
CNAS Total
INTERDISCIPLINARY Total
NATIONAL STUDENT EXCHANGE Total
Source: DROA,Colleague; UOG.ENR Page 38 of 48 16SP_enrollment_reports
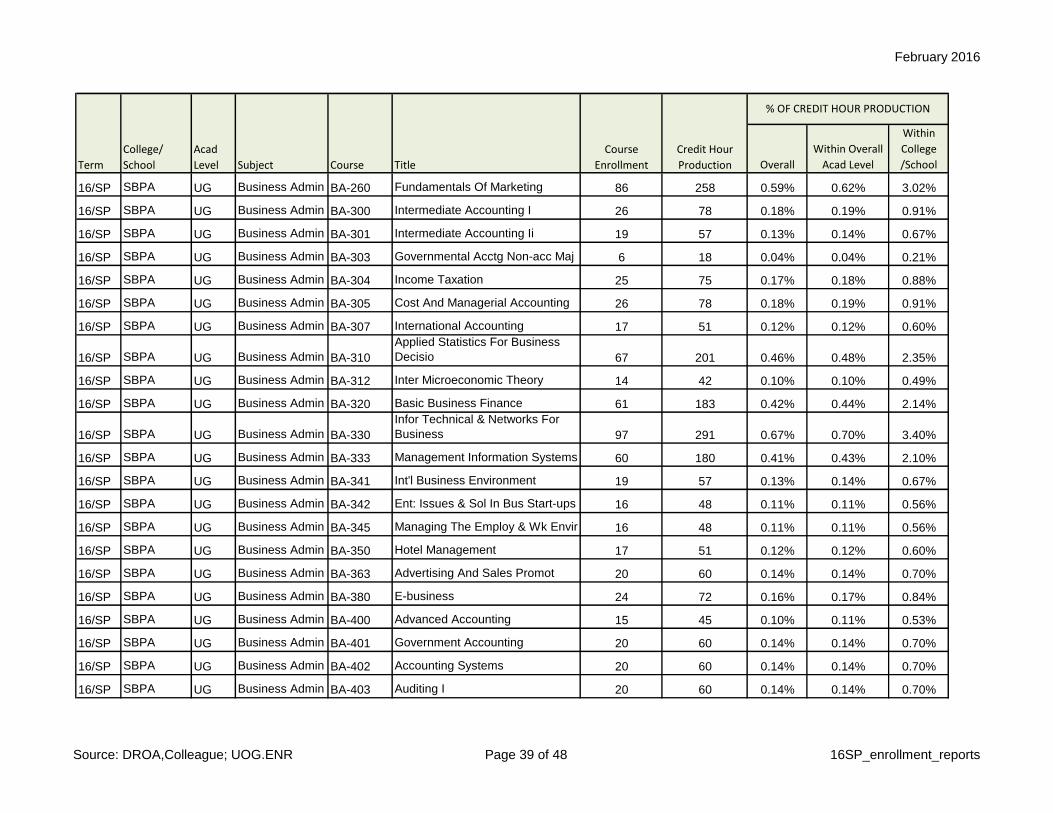
February 2016
Overall
Within Overall
Acad Level
Within
College
/SchoolTitle
Course
Enrollment
Credit Hour
Production
% OF CREDIT HOUR PRODUCTION
Term
College/
School
Acad
Level Subject Course
16/SP SBPA UG Business Admin BA-260 Fundamentals Of Marketing 86 258 0.59% 0.62% 3.02%
16/SP SBPA UG Business Admin BA-300 Intermediate Accounting I 26 78 0.18% 0.19% 0.91%
16/SP SBPA UG Business Admin BA-301 Intermediate Accounting Ii 19 57 0.13% 0.14% 0.67%
16/SP SBPA UG Business Admin BA-303 Governmental Acctg Non-acc Maj 6 18 0.04% 0.04% 0.21%
16/SP SBPA UG Business Admin BA-304 Income Taxation 25 75 0.17% 0.18% 0.88%
16/SP SBPA UG Business Admin BA-305 Cost And Managerial Accounting 26 78 0.18% 0.19% 0.91%
16/SP SBPA UG Business Admin BA-307 International Accounting 17 51 0.12% 0.12% 0.60%
16/SP SBPA UG Business Admin BA-310
Applied Statistics For Business
Decisio 67 201 0.46% 0.48% 2.35%
16/SP SBPA UG Business Admin BA-312 Inter Microeconomic Theory 14 42 0.10% 0.10% 0.49%
16/SP SBPA UG Business Admin BA-320 Basic Business Finance 61 183 0.42% 0.44% 2.14%
16/SP SBPA UG Business Admin BA-330
Infor Technical & Networks For
Business 97 291 0.67% 0.70% 3.40%
16/SP SBPA UG Business Admin BA-333 Management Information Systems 60 180 0.41% 0.43% 2.10%
16/SP SBPA UG Business Admin BA-341 Int'l Business Environment 19 57 0.13% 0.14% 0.67%
16/SP SBPA UG Business Admin BA-342 Ent: Issues & Sol In Bus Start-ups 16 48 0.11% 0.11% 0.56%
16/SP SBPA UG Business Admin BA-345 Managing The Employ & Wk Envir 16 48 0.11% 0.11% 0.56%
16/SP SBPA UG Business Admin BA-350 Hotel Management 17 51 0.12% 0.12% 0.60%
16/SP SBPA UG Business Admin BA-363 Advertising And Sales Promot 20 60 0.14% 0.14% 0.70%
16/SP SBPA UG Business Admin BA-380 E-business 24 72 0.16% 0.17% 0.84%
16/SP SBPA UG Business Admin BA-400 Advanced Accounting 15 45 0.10% 0.11% 0.53%
16/SP SBPA UG Business Admin BA-401 Government Accounting 20 60 0.14% 0.14% 0.70%
16/SP SBPA UG Business Admin BA-402 Accounting Systems 20 60 0.14% 0.14% 0.70%
16/SP SBPA UG Business Admin BA-403 Auditing I 20 60 0.14% 0.14% 0.70%
Source: DROA,Colleague; UOG.ENR Page 39 of 48 16SP_enrollment_reports

February 2016
Overall
Within Overall
Acad Level
Within
College
/SchoolTitle
Course
Enrollment
Credit Hour
Production
% OF CREDIT HOUR PRODUCTION
Term
College/
School
Acad
Level Subject Course
16/SP SBPA UG Business Admin BA-405 Internship (accounting) 13 39 0.09% 0.09% 0.46%
16/SP SBPA UG Business Admin BA-406 Ethics For The Accountant 17 51 0.12% 0.12% 0.60%
16/SP SBPA UG Business Admin BA-420 Internat'l. Corporate Finance 31 93 0.21% 0.22% 1.09%
16/SP SBPA UG Business Admin BA-421 Investments And Real Estates 15 45 0.10% 0.11% 0.53%
16/SP SBPA UG Business Admin BA-440 Organizational Behavior 70 210 0.48% 0.50% 2.45%
16/SP SBPA UG Business Admin BA-441
Operations And Project
Management 48 144 0.33% 0.34% 1.68%
16/SP SBPA UG Business Admin BA-443 Comp, Benefits & Perform Evalu 50 150 0.34% 0.36% 1.75%
16/SP SBPA UG Business Admin BA-446
Entrepreneurship: New Venture
Creation 12 36 0.08% 0.09% 0.42%
16/SP SBPA UG Business Admin BA-451 Tourism/hotel Internship 10 30 0.07% 0.07% 0.35%
16/SP SBPA UG Business Admin BA-463 Marketing Management 16 48 0.11% 0.11% 0.56%
16/SP SBPA UG Business Admin BA-480 Business Strategy And Policy 72 216 0.49% 0.52% 2.52%
16/SP SBPA UG Business Admin BA-481
Practical Applications In
Smallýbusiness/entrepreneurship 19 57 0.13% 0.14% 0.67%
16/SP SBPA UG Business Admin BA-482 Business/research Internship 4 12 0.03% 0.03% 0.14%
1802 5406 12.35% 12.95% 63.18%
16/SP SBPA UG Legal Studies LW-101 Intro To Criminal Justice 30 90 0.21% 0.22% 1.05%
16/SP SBPA UG Legal Studies LW-106 Personal Law 15 45 0.10% 0.11% 0.53%
16/SP SBPA UG Legal Studies LW-202 Trial And Evidence 30 90 0.21% 0.22% 1.05%
16/SP SBPA UG Legal Studies LW-220 Security Mgt Business & Govt 18 54 0.12% 0.13% 0.63%
16/SP SBPA UG Legal Studies LW-285 Legal Reasoning, Res. & Writin 4 12 0.03% 0.03% 0.14%
16/SP SBPA UG Legal Studies LW-306 Criminal Law 28 84 0.19% 0.20% 0.98%
16/SP SBPA UG Legal Studies LW-311 Correctional Security & Admin 11 33 0.08% 0.08% 0.39%
16/SP SBPA UG Legal Studies LW-360 Administrative Procedure 29 87 0.20% 0.21% 1.02%
BUSINESS ADMIN Total
Source: DROA,Colleague; UOG.ENR Page 40 of 48 16SP_enrollment_reports

February 2016
Overall
Within Overall
Acad Level
Within
College
/SchoolTitle
Course
Enrollment
Credit Hour
Production
% OF CREDIT HOUR PRODUCTION
Term
College/
School
Acad
Level Subject Course
16/SP SBPA UG Legal Studies LW-402 Constitutional Law 19 57 0.13% 0.14% 0.67%
16/SP SBPA UG Legal Studies LW-404 Admin & Mgmt Crim Justice Org 27 81 0.19% 0.19% 0.95%
16/SP SBPA UG Legal Studies LW-409
Problems In Crim Justice - Sr
Standing 12 36 0.08% 0.09% 0.42%
16/SP SBPA UG Legal Studies LW-442 Business Law I 86 258 0.59% 0.62% 3.02%
16/SP SBPA UG Legal Studies LW-443 Business Law Ii 21 63 0.14% 0.15% 0.74%
16/SP SBPA UG Legal Studies LW-490 Special Project 13 39 0.09% 0.09% 0.46%
16/SP SBPA UG Legal Studies LW-498 Internship (legal Studies) 2 6 0.01% 0.01% 0.07%
345 1035 2.37% 2.48% 12.10%
16/SP SBPA UG Public Admin PA-201 Pa In Guam And The West. Pac. 48 144 0.33% 0.34% 1.68%
16/SP SBPA UG Public Admin PA-210 Public Admin & Management 32 96 0.22% 0.23% 1.12%
16/SP SBPA UG Public Admin PA-215 Supervision In Gov't Organi 13 39 0.09% 0.09% 0.46%
16/SP SBPA UG Public Admin PA-233 Impact Of Govt Regula Adm Bus 111 333 0.76% 0.80% 3.89%
16/SP SBPA UG Public Admin PA-304 Government Public Information 29 87 0.20% 0.21% 1.02%
16/SP SBPA UG Public Admin PA-305
Data Analysis In Public
Administration 36 108 0.25% 0.26% 1.26%
16/SP SBPA UG Public Admin PA-306 Health Care Planning And Evalu 23 69 0.16% 0.17% 0.81%
16/SP SBPA UG Public Admin PA-307 The Economics Of Health Care 27 81 0.19% 0.19% 0.95%
16/SP SBPA UG Public Admin PA-401 Community Planning 1 3 0.01% 0.01% 0.04%
16/SP SBPA UG Public Admin PA-402 Public Admin & Public Policy 18 54 0.12% 0.13% 0.63%
16/SP SBPA UG Public Admin PA-403 Public Personnel Admin 15 45 0.10% 0.11% 0.53%
16/SP SBPA UG Public Admin PA-405
Leadership Ethics In The
Professions 105 315 0.72% 0.75% 3.68%
16/SP SBPA UG Public Admin PA-420 Public Finance & Fiscal Policy 31 93 0.21% 0.22% 1.09%
489 1467 3.35% 3.51% 17.15%
LEGAL STUDIES Total
PUBLIC ADMIN Total
Source: DROA,Colleague; UOG.ENR Page 41 of 48 16SP_enrollment_reports

February 2016
Overall
Within Overall
Acad Level
Within
College
/SchoolTitle
Course
Enrollment
Credit Hour
Production
% OF CREDIT HOUR PRODUCTION
Term
College/
School
Acad
Level Subject Course
2636 7908 18.07% 18.94% 92.43%
16/SP SBPA GR Business Admin BA-601 Case Studies In Management 16 48 0.11% 2.39% 0.56%
16/SP SBPA GR Business Admin BA-610 Managerial Economics 16 48 0.11% 2.39% 0.56%
16/SP SBPA GR Business Admin BA-613 Strategic Leadership And Ethics 16 48 0.11% 2.39% 0.56%
16/SP SBPA GR Business Admin BA-621 Managerial Accounting 15 45 0.10% 2.24% 0.53%
16/SP SBPA GR Business Admin BA-630 Human Resources Management 14 42 0.10% 2.09% 0.49%
77 231 0.53% 11.51% 2.70%
16/SP SBPA GR Public Admin PA-501 Introduction To Research 12 36 0.08% 1.79% 0.42%
16/SP SBPA GR Public Admin PA-535 Intergovernmental Relations 22 66 0.15% 3.29% 0.77%
16/SP SBPA GR Public Admin PA-540 Administrative Law 27 81 0.19% 4.04% 0.95%
16/SP SBPA GR Public Admin PA-560
Moral & Social Responsi Of
Organization 15 45 0.10% 2.24% 0.53%
16/SP SBPA GR Public Admin PA-561 Public Planning 23 69 0.16% 3.44% 0.81%
16/SP SBPA GR Public Admin PA-570C Sp.top.in.pub.prsl-emplymt.law 19 57 0.13% 2.84% 0.67%
16/SP SBPA GR Public Admin PA-598 Internship 2 6 0.01% 0.30% 0.07%
16/SP SBPA GR Public Admin PA-690 Special Project 1 3 0.01% 0.15% 0.04%
16/SP SBPA GR Public Admin PA-692 Practicum 18 54 0.12% 2.69% 0.63%
139 417 0.95% 20.78% 4.87%
216 648 1.48% 32.29% 7.57%
2852 8556 19.55%
16/SP SNHS UG Health Sciences HS-104 Conditioning And Fitness 11 11 0.03% 0.03% 0.39%
16/SP SNHS UG Health Sciences HS-105 Strength Training 15 15 0.03% 0.04% 0.54%
16/SP SNHS UG Health Sciences HS-200 Health And Wellness 121 363 0.83% 0.87% 13.01%
16/SP SNHS UG Health Sciences HS-324 Exercise Physiology 25 75 0.17% 0.18% 2.69%
SBPA UNDERGRADUATE Total
BUSINESS ADMIN Total
PUBLIC ADMIN Total
SBPA GRADUATE Total
SBPA Total
Source: DROA,Colleague; UOG.ENR Page 42 of 48 16SP_enrollment_reports
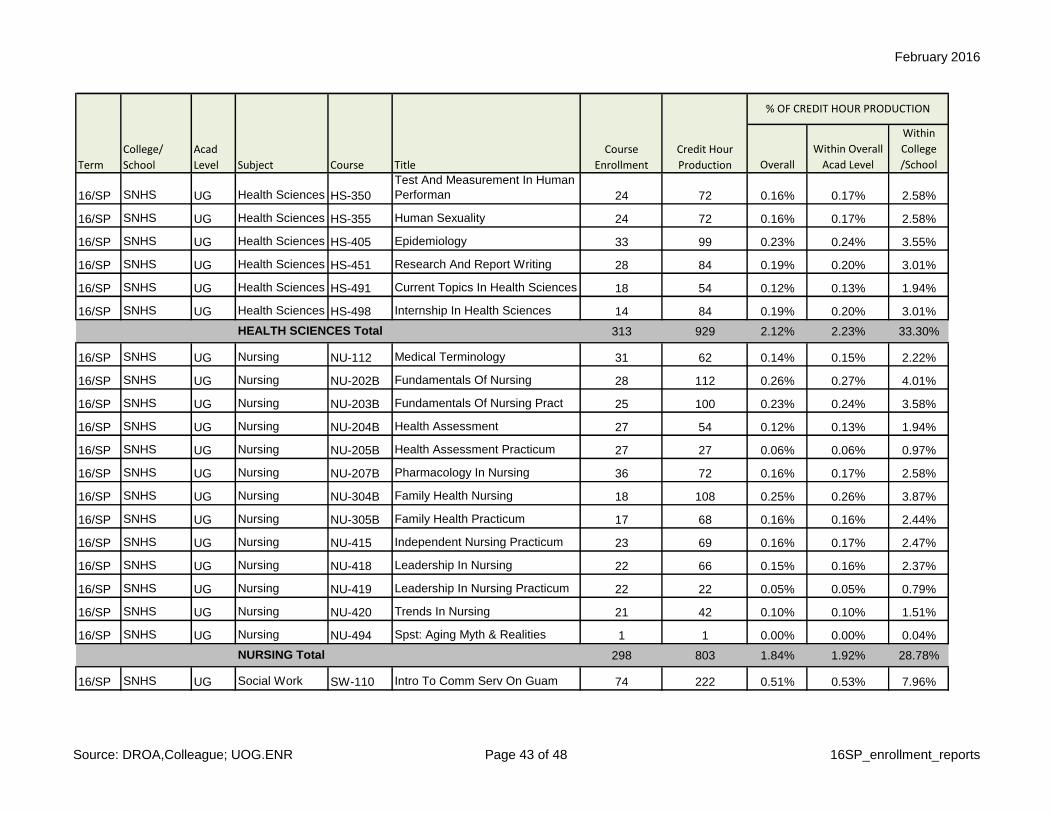
February 2016
Overall
Within Overall
Acad Level
Within
College
/SchoolTitle
Course
Enrollment
Credit Hour
Production
% OF CREDIT HOUR PRODUCTION
Term
College/
School
Acad
Level Subject Course
16/SP SNHS UG Health Sciences HS-350
Test And Measurement In Human
Performan 24 72 0.16% 0.17% 2.58%
16/SP SNHS UG Health Sciences HS-355 Human Sexuality 24 72 0.16% 0.17% 2.58%
16/SP SNHS UG Health Sciences HS-405 Epidemiology 33 99 0.23% 0.24% 3.55%
16/SP SNHS UG Health Sciences HS-451 Research And Report Writing 28 84 0.19% 0.20% 3.01%
16/SP SNHS UG Health Sciences HS-491 Current Topics In Health Sciences 18 54 0.12% 0.13% 1.94%
16/SP SNHS UG Health Sciences HS-498 Internship In Health Sciences 14 84 0.19% 0.20% 3.01%
313 929 2.12% 2.23% 33.30%
16/SP SNHS UG Nursing NU-112 Medical Terminology 31 62 0.14% 0.15% 2.22%
16/SP SNHS UG Nursing NU-202B Fundamentals Of Nursing 28 112 0.26% 0.27% 4.01%
16/SP SNHS UG Nursing NU-203B Fundamentals Of Nursing Pract 25 100 0.23% 0.24% 3.58%
16/SP SNHS UG Nursing NU-204B Health Assessment 27 54 0.12% 0.13% 1.94%
16/SP SNHS UG Nursing NU-205B Health Assessment Practicum 27 27 0.06% 0.06% 0.97%
16/SP SNHS UG Nursing NU-207B Pharmacology In Nursing 36 72 0.16% 0.17% 2.58%
16/SP SNHS UG Nursing NU-304B Family Health Nursing 18 108 0.25% 0.26% 3.87%
16/SP SNHS UG Nursing NU-305B Family Health Practicum 17 68 0.16% 0.16% 2.44%
16/SP SNHS UG Nursing NU-415 Independent Nursing Practicum 23 69 0.16% 0.17% 2.47%
16/SP SNHS UG Nursing NU-418 Leadership In Nursing 22 66 0.15% 0.16% 2.37%
16/SP SNHS UG Nursing NU-419 Leadership In Nursing Practicum 22 22 0.05% 0.05% 0.79%
16/SP SNHS UG Nursing NU-420 Trends In Nursing 21 42 0.10% 0.10% 1.51%
16/SP SNHS UG Nursing NU-494 Spst: Aging Myth & Realities 1 1 0.00% 0.00% 0.04%
298 803 1.84% 1.92% 28.78%
16/SP SNHS UG Social Work SW-110 Intro To Comm Serv On Guam 74 222 0.51% 0.53% 7.96%
HEALTH SCIENCES Total
NURSING Total
Source: DROA,Colleague; UOG.ENR Page 43 of 48 16SP_enrollment_reports

February 2016
Overall
Within Overall
Acad Level
Within
College
/SchoolTitle
Course
Enrollment
Credit Hour
Production
% OF CREDIT HOUR PRODUCTION
Term
College/
School
Acad
Level Subject Course
16/SP SNHS UG Social Work SW-201
Socialwelfare &
Development:global Chall 91 273 0.62% 0.65% 9.78%
16/SP SNHS UG Social Work SW-313 Rsch Meth For Hlth & Soc Svcs 26 78 0.18% 0.19% 2.80%
16/SP SNHS UG Social Work SW-332 Generalist Sw Prac Methods Iii 21 63 0.14% 0.15% 2.26%
16/SP SNHS UG Social Work SW-333 Generalist Sw Prac Methods Iv 21 63 0.14% 0.15% 2.26%
16/SP SNHS UG Social Work SW-351
Human Behavior&the Soicial
Envmt Ii 20 60 0.14% 0.14% 2.15%
16/SP SNHS UG Social Work SW-355 Human Sexuality 28 84 0.19% 0.20% 3.01%
16/SP SNHS UG Social Work SW-408 Advocacy For Social Justice 25 75 0.17% 0.18% 2.69%
16/SP SNHS UG Social Work SW-480 Family Violence 20 60 0.14% 0.14% 2.15%
16/SP SNHS UG Social Work SW-485B Field Instruction Ii 20 80 0.18% 0.19% 2.87%
346 1058 2.42% 2.53% 37.92%
957 2790 6.38% 6.68% 100.00%
957 2790 6.38%
16/SP SOE UG Education ED-110 Intro To Teaching 75 225 0.51% 0.54% 7.19%
16/SP SOE UG Education ED-192 Pract:observ & Participation 73 73 0.17% 0.17% 2.33%
16/SP SOE UG Education ED-201 Human Growth & Development 85 255 0.58% 0.61% 8.15%
16/SP SOE UG Education ED-215 Intro To Exceptional Individ 30 90 0.21% 0.22% 2.88%
16/SP SOE UG Education ED-265 Culture & Education In Guam 39 117 0.27% 0.28% 3.74%
16/SP SOE UG Education ED-271
Technology Applications For
Educators 59 177 0.40% 0.42% 5.66%
16/SP SOE UG Education ED-280 Intro To Bil/biculturalism 9 27 0.06% 0.06% 0.86%
16/SP SOE UG Education ED-292 Practicum In Special Education 10 30 0.07% 0.07% 0.96%
16/SP SOE UG Education ED-300 Educational Psychology 25 75 0.17% 0.18% 2.40%
16/SP SOE UG Education ED-315 Meth Of Tchng Chdn & Yth W Spc 7 21 0.05% 0.05% 0.67%
SOCIAL WORK Total
SNHS UNDERGRADUATE Total
SNHS Total
Source: DROA,Colleague; UOG.ENR Page 44 of 48 16SP_enrollment_reports

February 2016
Overall
Within Overall
Acad Level
Within
College
/SchoolTitle
Course
Enrollment
Credit Hour
Production
% OF CREDIT HOUR PRODUCTION
Term
College/
School
Acad
Level Subject Course
16/SP SOE UG Education ED-319 Children's Literature 16 48 0.11% 0.11% 1.53%
16/SP SOE UG Education ED-321 Language Arts Meth:secondary 4 12 0.03% 0.03% 0.38%
16/SP SOE UG Education ED-322 Social Sciences Meth: Secondar 1 3 0.01% 0.01% 0.10%
16/SP SOE UG Education ED-324 Science Meth:secondary 2 6 0.01% 0.01% 0.19%
16/SP SOE UG Education ED-334 Solving Discipline Problems 7 21 0.05% 0.05% 0.67%
16/SP SOE UG Education ED-343 Transition In Special Education 8 24 0.05% 0.06% 0.77%
16/SP SOE UG Education ED-350
Eff Tchg Strategies For Elem/mul
Class 18 54 0.12% 0.13% 1.73%
16/SP SOE UG Education ED-351 Fine Arts Meth Elem 6 18 0.04% 0.04% 0.58%
16/SP SOE UG Education ED-353 Social Studies Meth:elementary 9 27 0.06% 0.06% 0.86%
16/SP SOE UG Education ED-354 Science Methods: Elementary 8 24 0.05% 0.06% 0.77%
16/SP SOE UG Education ED-356 Mathematics Methods: Elementar 12 36 0.08% 0.09% 1.15%
16/SP SOE UG Education ED-357 Reading Meth:elementary 9 27 0.06% 0.06% 0.86%
16/SP SOE UG Education ED-385B Structure Of The Language 6 18 0.04% 0.04% 0.58%
16/SP SOE UG Education ED-385C Chamorro Orthography 1 3 0.01% 0.01% 0.10%
16/SP SOE UG Education ED-392 Methods Practicum 8 24 0.05% 0.06% 0.77%
16/SP SOE UG Education ED-446 Incl Chldrn W/disabili Reg Clr 11 33 0.08% 0.08% 1.05%
16/SP SOE UG Education ED-451 Audio Visual Education 1 3 0.01% 0.01% 0.10%
16/SP SOE UG Education ED-457
Behavior Management In Spec
Educ 8 24 0.05% 0.06% 0.77%
16/SP SOE UG Education ED-481 Sec Lang Teaching Methodology 13 39 0.09% 0.09% 1.25%
16/SP SOE UG Education ED-486
Best(bldg Effective Strategies For
Tch) 8 24 0.05% 0.06% 0.77%
16/SP SOE UG Education ED-489 Evaluation 11 33 0.08% 0.08% 1.05%
16/SP SOE UG Education ED-492 Practicum Student Teaching: 26 312 0.71% 0.75% 9.97%
Source: DROA,Colleague; UOG.ENR Page 45 of 48 16SP_enrollment_reports
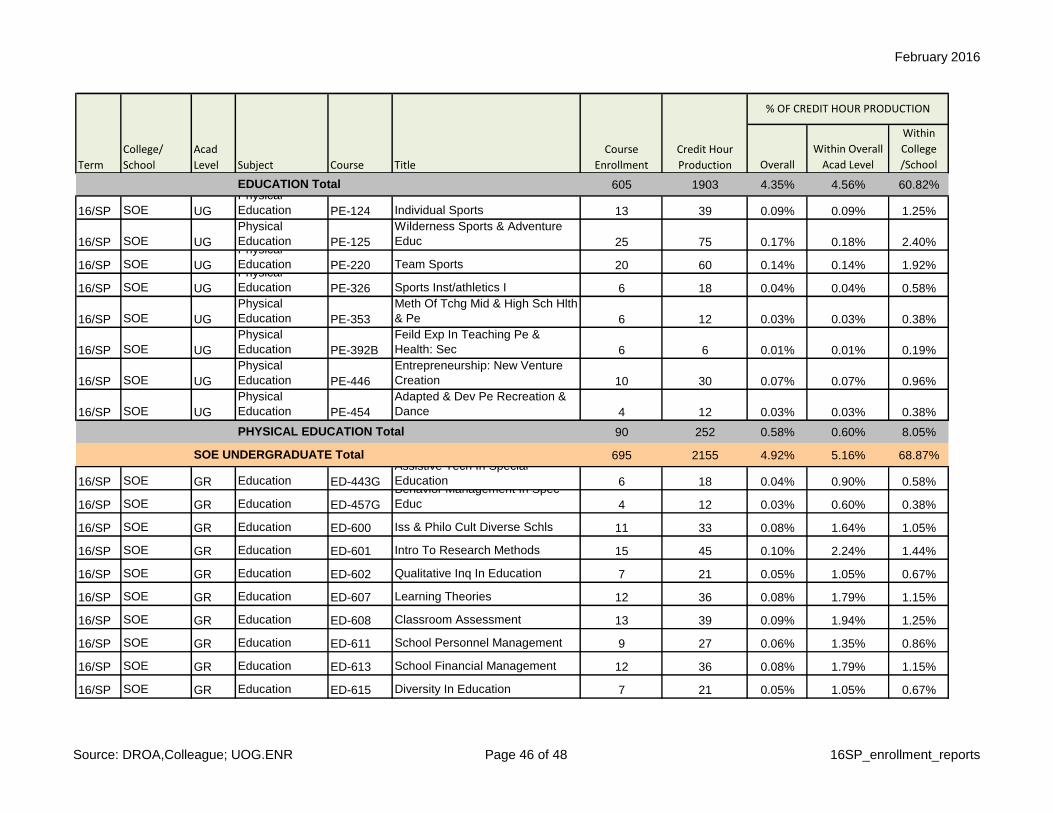
February 2016
Overall
Within Overall
Acad Level
Within
College
/SchoolTitle
Course
Enrollment
Credit Hour
Production
% OF CREDIT HOUR PRODUCTION
Term
College/
School
Acad
Level Subject Course
605 1903 4.35% 4.56% 60.82%
16/SP SOE UG
Physical
Education PE-124 Individual Sports 13 39 0.09% 0.09% 1.25%
16/SP SOE UG
Physical
Education PE-125
Wilderness Sports & Adventure
Educ 25 75 0.17% 0.18% 2.40%
16/SP SOE UG
Physical
Education PE-220 Team Sports 20 60 0.14% 0.14% 1.92%
16/SP SOE UG
Physical
Education PE-326 Sports Inst/athletics I 6 18 0.04% 0.04% 0.58%
16/SP SOE UG
Physical
Education PE-353
Meth Of Tchg Mid & High Sch Hlth
& Pe 6 12 0.03% 0.03% 0.38%
16/SP SOE UG
Physical
Education PE-392B
Feild Exp In Teaching Pe &
Health: Sec 6 6 0.01% 0.01% 0.19%
16/SP SOE UG
Physical
Education PE-446
Entrepreneurship: New Venture
Creation 10 30 0.07% 0.07% 0.96%
16/SP SOE UG
Physical
Education PE-454
Adapted & Dev Pe Recreation &
Dance 4 12 0.03% 0.03% 0.38%
90 252 0.58% 0.60% 8.05%
695 2155 4.92% 5.16% 68.87%
16/SP SOE GR Education ED-443G
Assistive Tech In Special
Education 6 18 0.04% 0.90% 0.58%
16/SP SOE GR Education ED-457G
Behavior Management In Spec
Educ 4 12 0.03% 0.60% 0.38%
16/SP SOE GR Education ED-600 Iss & Philo Cult Diverse Schls 11 33 0.08% 1.64% 1.05%
16/SP SOE GR Education ED-601 Intro To Research Methods 15 45 0.10% 2.24% 1.44%
16/SP SOE GR Education ED-602 Qualitative Inq In Education 7 21 0.05% 1.05% 0.67%
16/SP SOE GR Education ED-607 Learning Theories 12 36 0.08% 1.79% 1.15%
16/SP SOE GR Education ED-608 Classroom Assessment 13 39 0.09% 1.94% 1.25%
16/SP SOE GR Education ED-611 School Personnel Management 9 27 0.06% 1.35% 0.86%
16/SP SOE GR Education ED-613 School Financial Management 12 36 0.08% 1.79% 1.15%
16/SP SOE GR Education ED-615 Diversity In Education 7 21 0.05% 1.05% 0.67%
EDUCATION Total
PHYSICAL EDUCATION Total
SOE UNDERGRADUATE Total
Source: DROA,Colleague; UOG.ENR Page 46 of 48 16SP_enrollment_reports
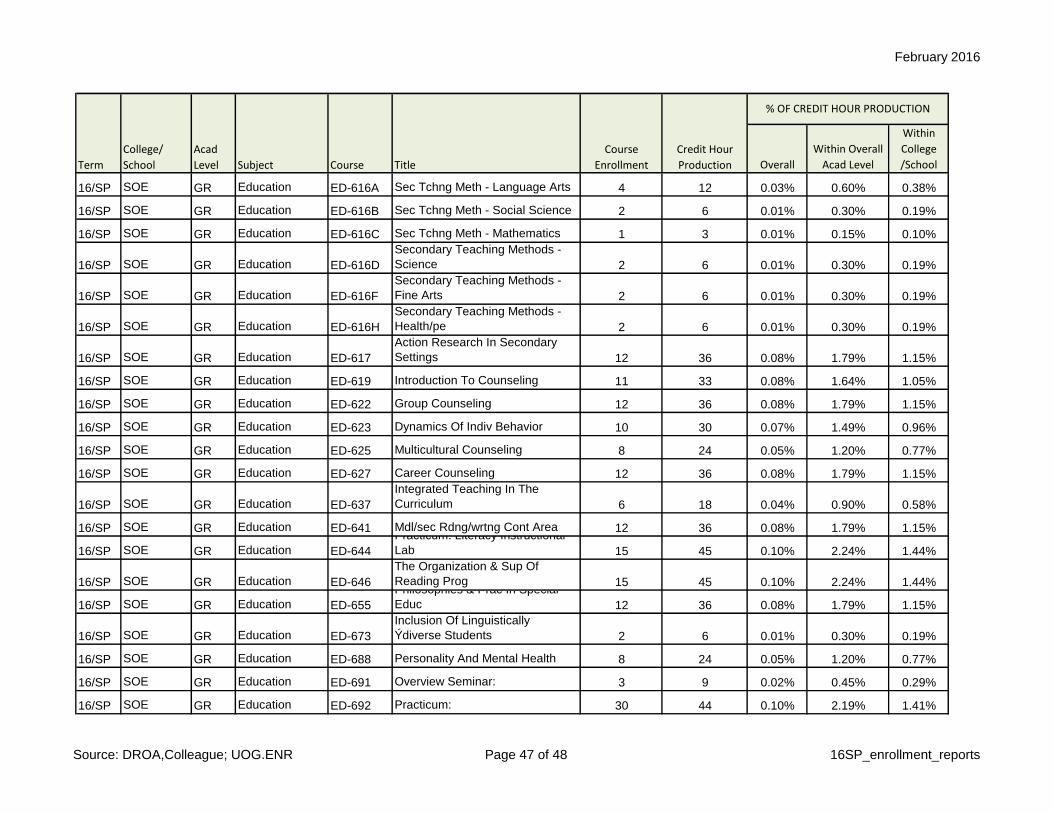
February 2016
Overall
Within Overall
Acad Level
Within
College
/SchoolTitle
Course
Enrollment
Credit Hour
Production
% OF CREDIT HOUR PRODUCTION
Term
College/
School
Acad
Level Subject Course
16/SP SOE GR Education ED-616A Sec Tchng Meth - Language Arts 4 12 0.03% 0.60% 0.38%
16/SP SOE GR Education ED-616B Sec Tchng Meth - Social Science 2 6 0.01% 0.30% 0.19%
16/SP SOE GR Education ED-616C Sec Tchng Meth - Mathematics 1 3 0.01% 0.15% 0.10%
16/SP SOE GR Education ED-616D
Secondary Teaching Methods -
Science 2 6 0.01% 0.30% 0.19%
16/SP SOE GR Education ED-616F
Secondary Teaching Methods -
Fine Arts 2 6 0.01% 0.30% 0.19%
16/SP SOE GR Education ED-616H
Secondary Teaching Methods -
Health/pe 2 6 0.01% 0.30% 0.19%
16/SP SOE GR Education ED-617
Action Research In Secondary
Settings 12 36 0.08% 1.79% 1.15%
16/SP SOE GR Education ED-619 Introduction To Counseling 11 33 0.08% 1.64% 1.05%
16/SP SOE GR Education ED-622 Group Counseling 12 36 0.08% 1.79% 1.15%
16/SP SOE GR Education ED-623 Dynamics Of Indiv Behavior 10 30 0.07% 1.49% 0.96%
16/SP SOE GR Education ED-625 Multicultural Counseling 8 24 0.05% 1.20% 0.77%
16/SP SOE GR Education ED-627 Career Counseling 12 36 0.08% 1.79% 1.15%
16/SP SOE GR Education ED-637
Integrated Teaching In The
Curriculum 6 18 0.04% 0.90% 0.58%
16/SP SOE GR Education ED-641 Mdl/sec Rdng/wrtng Cont Area 12 36 0.08% 1.79% 1.15%
16/SP SOE GR Education ED-644
Practicum: Literacy Instructional
Lab 15 45 0.10% 2.24% 1.44%
16/SP SOE GR Education ED-646
The Organization & Sup Of
Reading Prog 15 45 0.10% 2.24% 1.44%
16/SP SOE GR Education ED-655
Philosophies & Prac In Special
Educ 12 36 0.08% 1.79% 1.15%
16/SP SOE GR Education ED-673
Inclusion Of Linguistically
Ýdiverse Students 2 6 0.01% 0.30% 0.19%
16/SP SOE GR Education ED-688 Personality And Mental Health 8 24 0.05% 1.20% 0.77%
16/SP SOE GR Education ED-691 Overview Seminar: 3 9 0.02% 0.45% 0.29%
16/SP SOE GR Education ED-692 Practicum: 30 44 0.10% 2.19% 1.41%
Source: DROA,Colleague; UOG.ENR Page 47 of 48 16SP_enrollment_reports
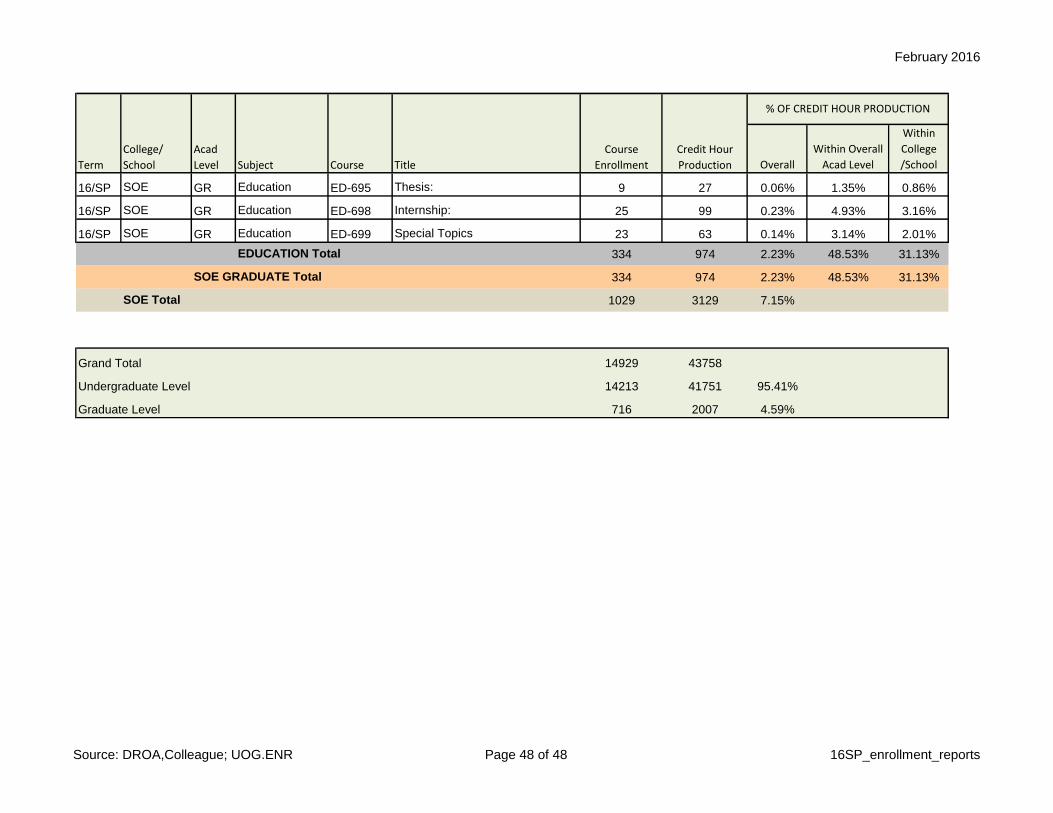
February 2016
Overall
Within Overall
Acad Level
Within
College
/SchoolTitle
Course
Enrollment
Credit Hour
Production
% OF CREDIT HOUR PRODUCTION
Term
College/
School
Acad
Level Subject Course
16/SP SOE GR Education ED-695 Thesis: 9 27 0.06% 1.35% 0.86%
16/SP SOE GR Education ED-698 Internship: 25 99 0.23% 4.93% 3.16%
16/SP SOE GR Education ED-699 Special Topics 23 63 0.14% 3.14% 2.01%
334 974 2.23% 48.53% 31.13%
334 974 2.23% 48.53% 31.13%
1029 3129 7.15%
14929 43758
14213 41751 95.41%
716 2007 4.59%
Grand Total
Undergraduate Level
Graduate Level
EDUCATION Total
SOE GRADUATE Total
SOE Total
Source: DROA,Colleague; UOG.ENR Page 48 of 48 16SP_enrollment_reports