GU JOURNAL OF PHYTOSCIENCES - Ghazi University
83
GU JOURNAL OF PHYTOSCIENCES GU J. Phytosci. E-ISSN No: 2789-3545 PRINT-ISSN No: 2789-3537 Volume: 2 | Issue : 1 | January 2022 A Quarterly Peer-Reviewed Journal Department of Botany Ghazi University, City Campus Dera Ghazi Khan- 32200 Punjab, Pakistan https://gudgk.edu.pk/phy-to-science-journal
-
Upload
khangminh22 -
Category
Documents
-
view
0 -
download
0
Transcript of GU JOURNAL OF PHYTOSCIENCES - Ghazi University
GU JOURNAL OF
PHYTOSCIENCES
GU J. Phytosci.
E-ISSN No: 2789-3545 PRINT-ISSN No: 2789-3537
Volume: 2 | Issue : 1 | January 2022
A Quarterly Peer-Reviewed Journal
Department of Botany Ghazi University, City Campus
Dera Ghazi Khan- 32200 Punjab, Pakistan
https://gudgk.edu.pk/phy-to-science-journal

GU J. Phytosci.
E-ISSN No: 2789-3545 PRINT-ISSN No: 2789-3537
Volume: 2 | Issue : 1 | January 2022
GU JOURNAL OF
PHYTOSCIENCES
A Quarterly Peer-Reviewed Journal
Department of Botany Ghazi University, City Campus
Dera Ghazi Khan- 32200 Punjab, Pakistan
https://gudgk.edu.pk/phy-to-science-journal
Patron-in-Chief
Prof. Dr. Muhammad Tufail (TI) Vice Chancellor, Ghazi University
Patron
Prof. Dr. Saadullah Khan Laghari Dr. Allah Bakhsh Gulshan
Editor-in-Chief
Dr. Faisal Hussain
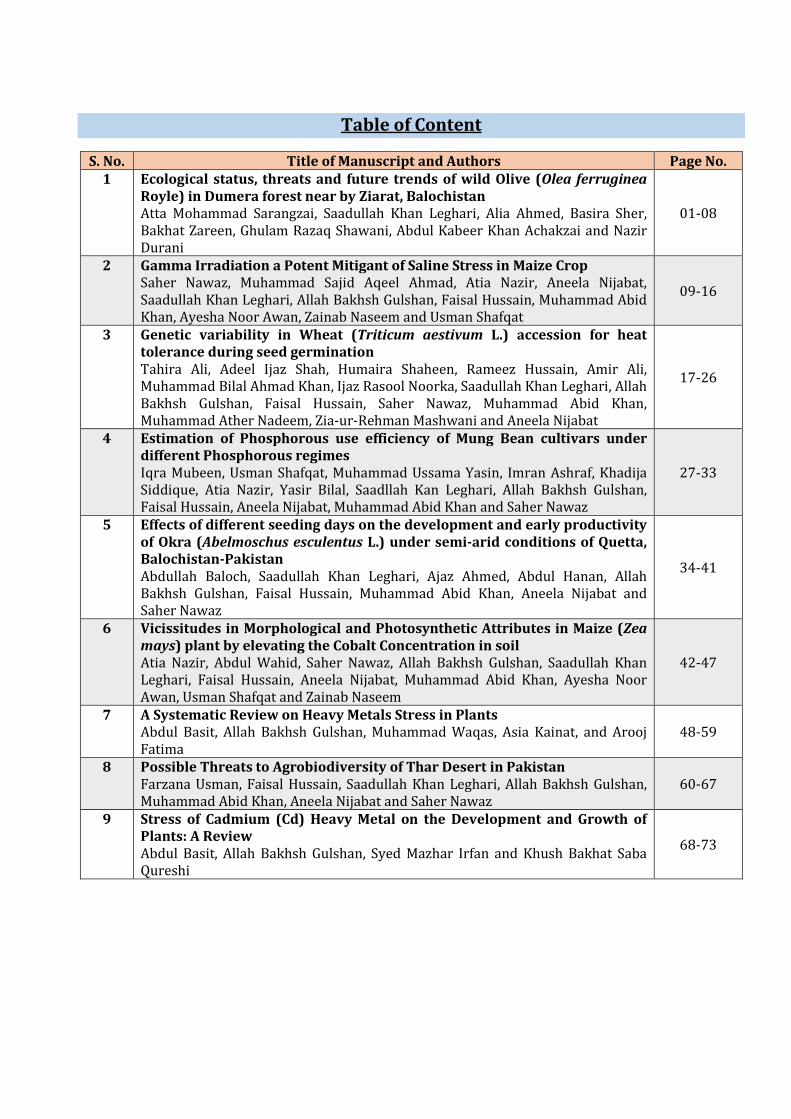
Table of Content
S. No. Title of Manuscript and Authors Page No. 1 Ecological status, threats and future trends of wild Olive (Olea ferruginea
Royle) in Dumera forest near by Ziarat, Balochistan Atta Mohammad Sarangzai, Saadullah Khan Leghari, Alia Ahmed, Basira Sher, Bakhat Zareen, Ghulam Razaq Shawani, Abdul Kabeer Khan Achakzai and Nazir Durani
01-08
2 Gamma Irradiation a Potent Mitigant of Saline Stress in Maize Crop Saher Nawaz, Muhammad Sajid Aqeel Ahmad, Atia Nazir, Aneela Nijabat, Saadullah Khan Leghari, Allah Bakhsh Gulshan, Faisal Hussain, Muhammad Abid Khan, Ayesha Noor Awan, Zainab Naseem and Usman Shafqat
09-16
3 Genetic variability in Wheat (Triticum aestivum L.) accession for heat tolerance during seed germination Tahira Ali, Adeel Ijaz Shah, Humaira Shaheen, Rameez Hussain, Amir Ali, Muhammad Bilal Ahmad Khan, Ijaz Rasool Noorka, Saadullah Khan Leghari, Allah Bakhsh Gulshan, Faisal Hussain, Saher Nawaz, Muhammad Abid Khan, Muhammad Ather Nadeem, Zia-ur-Rehman Mashwani and Aneela Nijabat
17-26
4 Estimation of Phosphorous use efficiency of Mung Bean cultivars under different Phosphorous regimes Iqra Mubeen, Usman Shafqat, Muhammad Ussama Yasin, Imran Ashraf, Khadija Siddique, Atia Nazir, Yasir Bilal, Saadllah Kan Leghari, Allah Bakhsh Gulshan, Faisal Hussain, Aneela Nijabat, Muhammad Abid Khan and Saher Nawaz
27-33
5 Effects of different seeding days on the development and early productivity of Okra (Abelmoschus esculentus L.) under semi-arid conditions of Quetta, Balochistan-Pakistan Abdullah Baloch, Saadullah Khan Leghari, Ajaz Ahmed, Abdul Hanan, Allah Bakhsh Gulshan, Faisal Hussain, Muhammad Abid Khan, Aneela Nijabat and Saher Nawaz
34-41
6 Vicissitudes in Morphological and Photosynthetic Attributes in Maize (Zea mays) plant by elevating the Cobalt Concentration in soil Atia Nazir, Abdul Wahid, Saher Nawaz, Allah Bakhsh Gulshan, Saadullah Khan Leghari, Faisal Hussain, Aneela Nijabat, Muhammad Abid Khan, Ayesha Noor Awan, Usman Shafqat and Zainab Naseem
42-47
7 A Systematic Review on Heavy Metals Stress in Plants Abdul Basit, Allah Bakhsh Gulshan, Muhammad Waqas, Asia Kainat, and Arooj Fatima
48-59
8 Possible Threats to Agrobiodiversity of Thar Desert in Pakistan Farzana Usman, Faisal Hussain, Saadullah Khan Leghari, Allah Bakhsh Gulshan, Muhammad Abid Khan, Aneela Nijabat and Saher Nawaz
60-67
9 Stress of Cadmium (Cd) Heavy Metal on the Development and Growth of Plants: A Review Abdul Basit, Allah Bakhsh Gulshan, Syed Mazhar Irfan and Khush Bakhat Saba Qureshi
68-73
Instruction to Authors
GU Journal of Phytosciences publishes original research papers and quality review papers of biological, agricultural and environmental sciences in the aspects of plant sciences. GU Journal of Phytosciences is a quarterly journal. In a year, 4 issues are published in the month of January, April, July and October. A paper would normally require at least two months from the date of receipt for its appearance in the journal.
All authors and contributors are requested to be brief and concise. The following format should be followed while preparing the research or review manuscript.
Language: Manuscript should be in English and should follow the rules of proficiency in English language.
Arrangement: The different sections of the paper must be arranged as follows.
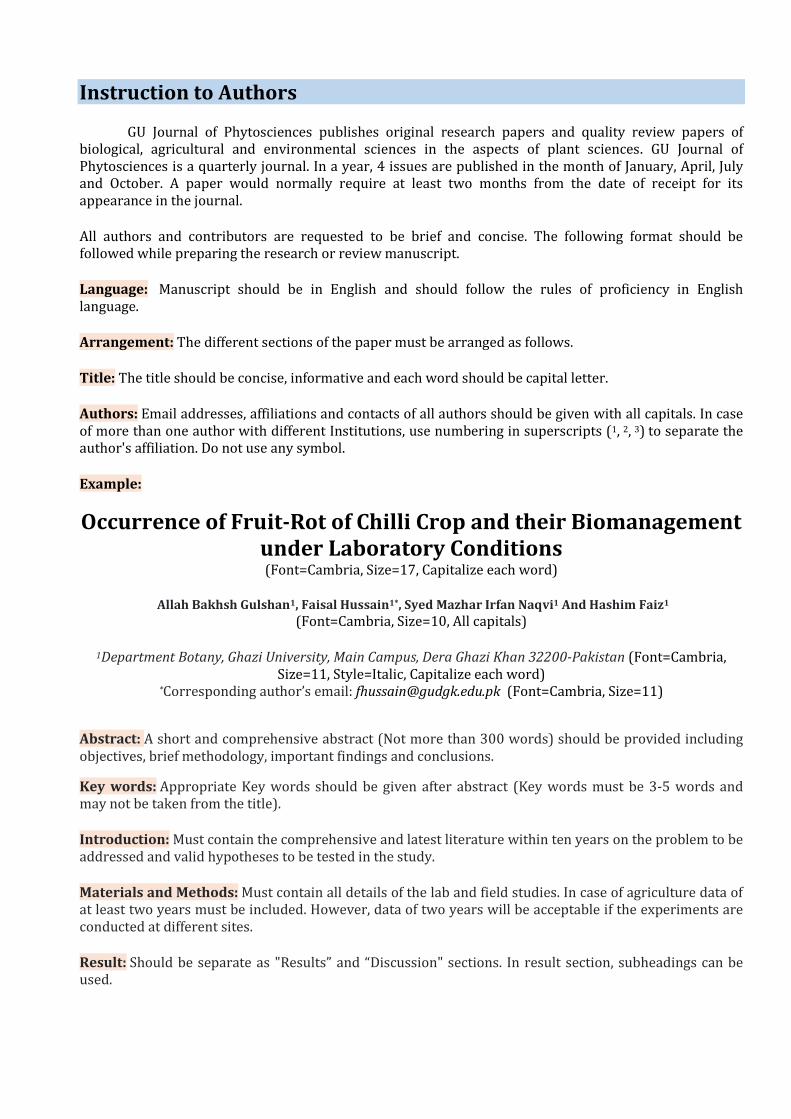
Title: The title should be concise, informative and each word should be capital letter.
Authors: Email addresses, affiliations and contacts of all authors should be given with all capitals. In case of more than one author with different Institutions, use numbering in superscripts (1, 2, 3) to separate the author's affiliation. Do not use any symbol.
Example:
Occurrence of Fruit-Rot of Chilli Crop and their Biomanagement under Laboratory Conditions
(Font=Cambria, Size=17, Capitalize each word)
Allah Bakhsh Gulshan1, Faisal Hussain1*, Syed Mazhar Irfan Naqvi1 And Hashim Faiz1
(Font=Cambria, Size=10, All capitals)
1Department Botany, Ghazi University, Main Campus, Dera Ghazi Khan 32200-Pakistan (Font=Cambria, Size=11, Style=Italic, Capitalize each word)
*Corresponding author’s email: [email protected] (Font=Cambria, Size=11)
Abstract: A short and comprehensive abstract (Not more than 300 words) should be provided including objectives, brief methodology, important findings and conclusions.
Key words: Appropriate Key words should be given after abstract (Key words must be 3-5 words and may not be taken from the title).
Introduction: Must contain the comprehensive and latest literature within ten years on the problem to be addressed and valid hypotheses to be tested in the study.
Materials and Methods: Must contain all details of the lab and field studies. In case of agriculture data of at least two years must be included. However, data of two years will be acceptable if the experiments are conducted at different sites.
Result: Should be separate as "Results” and “Discussion" sections. In result section, subheadings can be used.
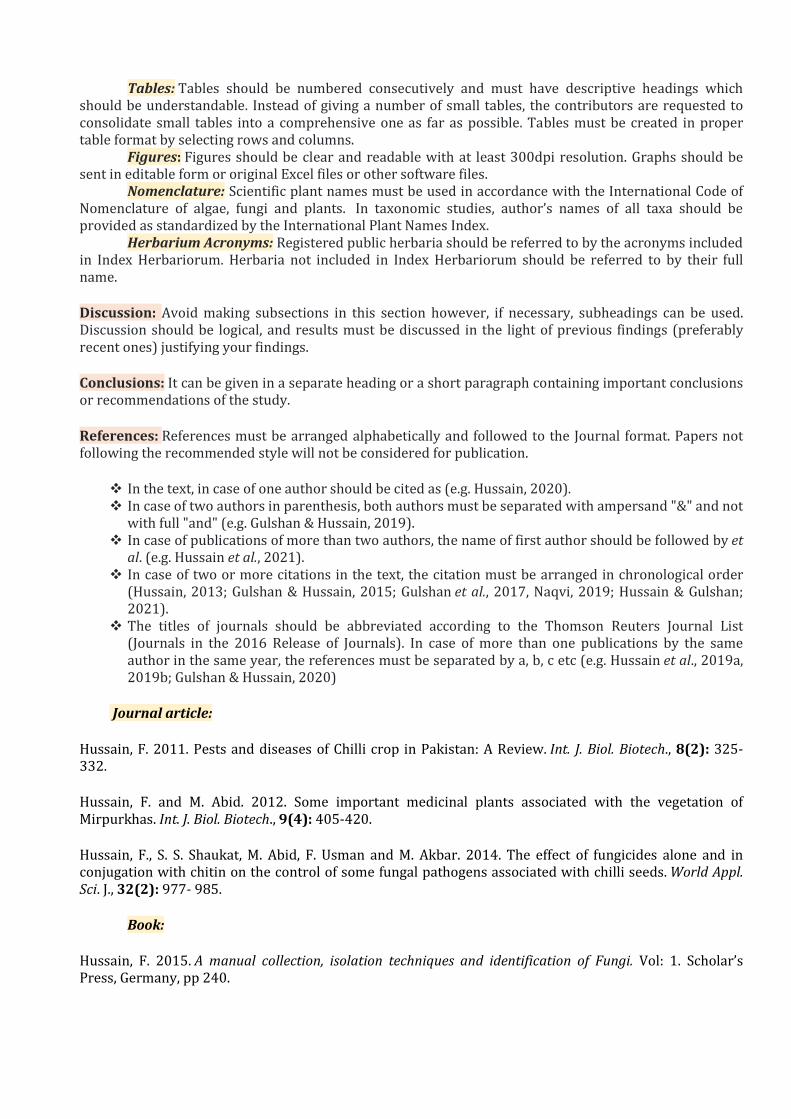
Tables: Tables should be numbered consecutively and must have descriptive headings which should be understandable. Instead of giving a number of small tables, the contributors are requested to consolidate small tables into a comprehensive one as far as possible. Tables must be created in proper table format by selecting rows and columns.
Figures: Figures should be clear and readable with at least 300dpi resolution. Graphs should be sent in editable form or original Excel files or other software files.
Nomenclature: Scientific plant names must be used in accordance with the International Code of Nomenclature of algae, fungi and plants. In taxonomic studies, author’s names of all taxa should be provided as standardized by the International Plant Names Index.
Herbarium Acronyms: Registered public herbaria should be referred to by the acronyms included in Index Herbariorum. Herbaria not included in Index Herbariorum should be referred to by their full name.
Discussion: Avoid making subsections in this section however, if necessary, subheadings can be used. Discussion should be logical, and results must be discussed in the light of previous findings (preferably recent ones) justifying your findings.
Conclusions: It can be given in a separate heading or a short paragraph containing important conclusions or recommendations of the study.
References: References must be arranged alphabetically and followed to the Journal format. Papers not following the recommended style will not be considered for publication.
❖ In the text, in case of one author should be cited as (e.g. Hussain, 2020). ❖ In case of two authors in parenthesis, both authors must be separated with ampersand "&" and not
with full "and" (e.g. Gulshan & Hussain, 2019). ❖ In case of publications of more than two authors, the name of first author should be followed by et
al. (e.g. Hussain et al., 2021). ❖ In case of two or more citations in the text, the citation must be arranged in chronological order
(Hussain, 2013; Gulshan & Hussain, 2015; Gulshan et al., 2017, Naqvi, 2019; Hussain & Gulshan; 2021).
❖ The titles of journals should be abbreviated according to the Thomson Reuters Journal List (Journals in the 2016 Release of Journals). In case of more than one publications by the same author in the same year, the references must be separated by a, b, c etc (e.g. Hussain et al., 2019a, 2019b; Gulshan & Hussain, 2020)
Journal article:
Hussain, F. 2011. Pests and diseases of Chilli crop in Pakistan: A Review. Int. J. Biol. Biotech., 8(2): 325-332.
Hussain, F. and M. Abid. 2012. Some important medicinal plants associated with the vegetation of Mirpurkhas. Int. J. Biol. Biotech., 9(4): 405-420.
Hussain, F., S. S. Shaukat, M. Abid, F. Usman and M. Akbar. 2014. The effect of fungicides alone and in conjugation with chitin on the control of some fungal pathogens associated with chilli seeds. World Appl. Sci. J., 32(2): 977- 985.
Book:
Hussain, F. 2015. A manual collection, isolation techniques and identification of Fungi. Vol: 1. Scholar’s Press, Germany, pp 240.
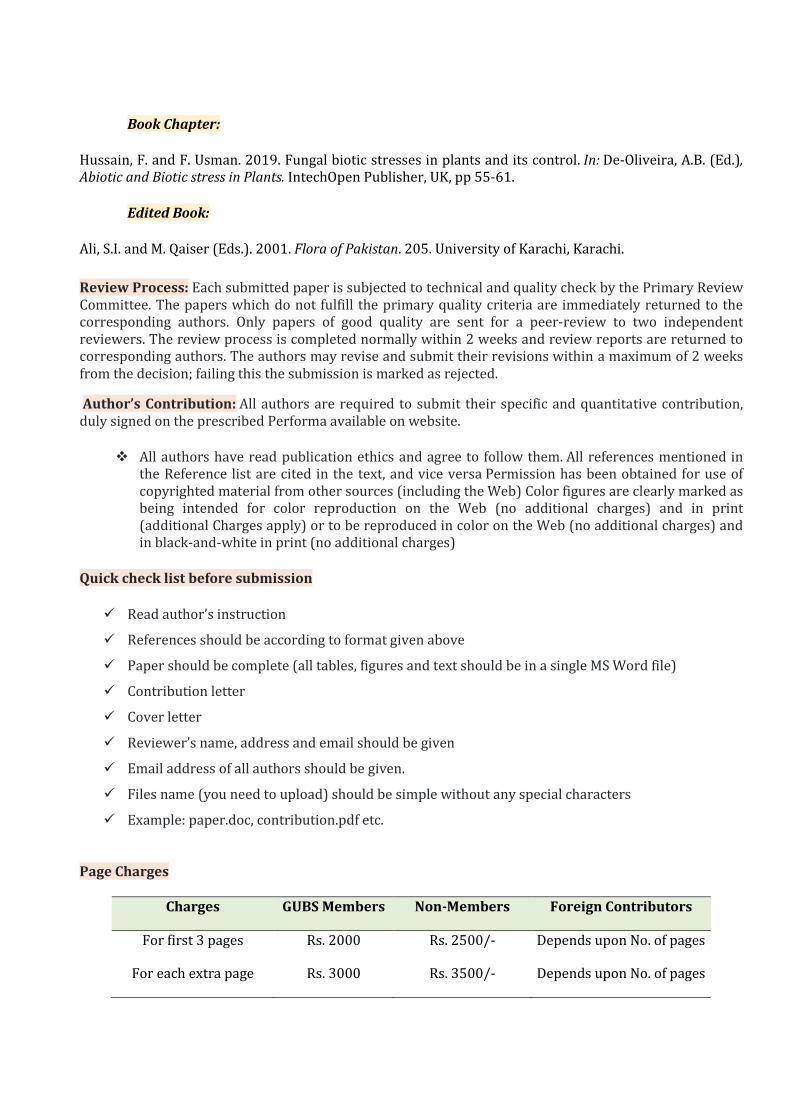
Book Chapter:
Hussain, F. and F. Usman. 2019. Fungal biotic stresses in plants and its control. In: De-Oliveira, A.B. (Ed.), Abiotic and Biotic stress in Plants. IntechOpen Publisher, UK, pp 55-61.
Edited Book:
Ali, S.I. and M. Qaiser (Eds.). 2001. Flora of Pakistan. 205. University of Karachi, Karachi.
Review Process: Each submitted paper is subjected to technical and quality check by the Primary Review Committee. The papers which do not fulfill the primary quality criteria are immediately returned to the corresponding authors. Only papers of good quality are sent for a peer-review to two independent reviewers. The review process is completed normally within 2 weeks and review reports are returned to corresponding authors. The authors may revise and submit their revisions within a maximum of 2 weeks from the decision; failing this the submission is marked as rejected.
Author’s Contribution: All authors are required to submit their specific and quantitative contribution, duly signed on the prescribed Performa available on website.
❖ All authors have read publication ethics and agree to follow them. All references mentioned in the Reference list are cited in the text, and vice versa Permission has been obtained for use of copyrighted material from other sources (including the Web) Color figures are clearly marked as being intended for color reproduction on the Web (no additional charges) and in print (additional Charges apply) or to be reproduced in color on the Web (no additional charges) and in black-and-white in print (no additional charges)
Quick check list before submission
✓ Read author’s instruction
✓ References should be according to format given above
✓ Paper should be complete (all tables, figures and text should be in a single MS Word file)
✓ Contribution letter
✓ Cover letter
✓ Reviewer’s name, address and email should be given
✓ Email address of all authors should be given.
✓ Files name (you need to upload) should be simple without any special characters
✓ Example: paper.doc, contribution.pdf etc.
Page Charges
Charges GUBS Members Non-Members Foreign Contributors
For first 3 pages Rs. 2000 Rs. 2500/- Depends upon No. of pages
For each extra page Rs. 3000 Rs. 3500/- Depends upon No. of pages
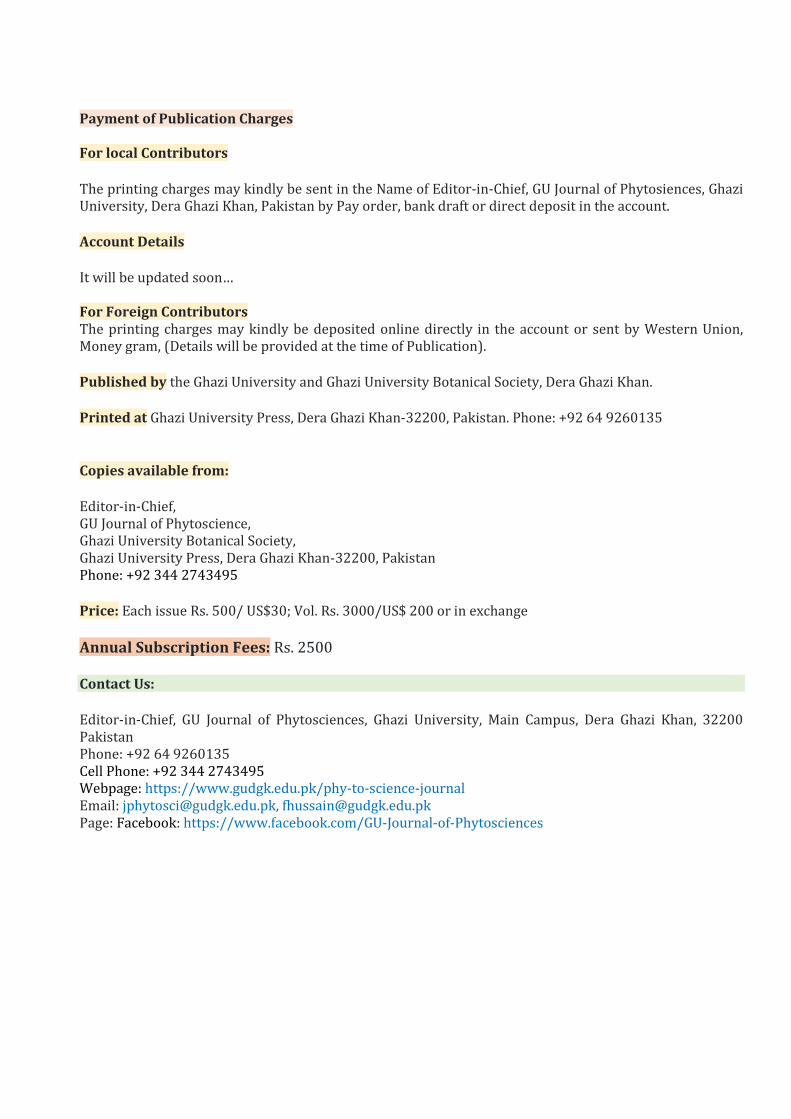
Payment of Publication Charges For local Contributors
The printing charges may kindly be sent in the Name of Editor-in-Chief, GU Journal of Phytosiences, Ghazi University, Dera Ghazi Khan, Pakistan by Pay order, bank draft or direct deposit in the account.
Account Details
It will be updated soon… For Foreign Contributors The printing charges may kindly be deposited online directly in the account or sent by Western Union, Money gram, (Details will be provided at the time of Publication).
Published by the Ghazi University and Ghazi University Botanical Society, Dera Ghazi Khan.
Printed at Ghazi University Press, Dera Ghazi Khan-32200, Pakistan. Phone: +92 64 9260135
Copies available from:
Editor-in-Chief, GU Journal of Phytoscience, Ghazi University Botanical Society, Ghazi University Press, Dera Ghazi Khan-32200, Pakistan Phone: +92 344 2743495
Price: Each issue Rs. 500/ US$30; Vol. Rs. 3000/US$ 200 or in exchange
Annual Subscription Fees: Rs. 2500
Contact Us:
Editor-in-Chief, GU Journal of Phytosciences, Ghazi University, Main Campus, Dera Ghazi Khan, 32200 Pakistan Phone: +92 64 9260135 Cell Phone: +92 344 2743495 Webpage: https://www.gudgk.edu.pk/phy-to-science-journal Email: [email protected], [email protected] Page: Facebook: https://www.facebook.com/GU-Journal-of-Phytosciences
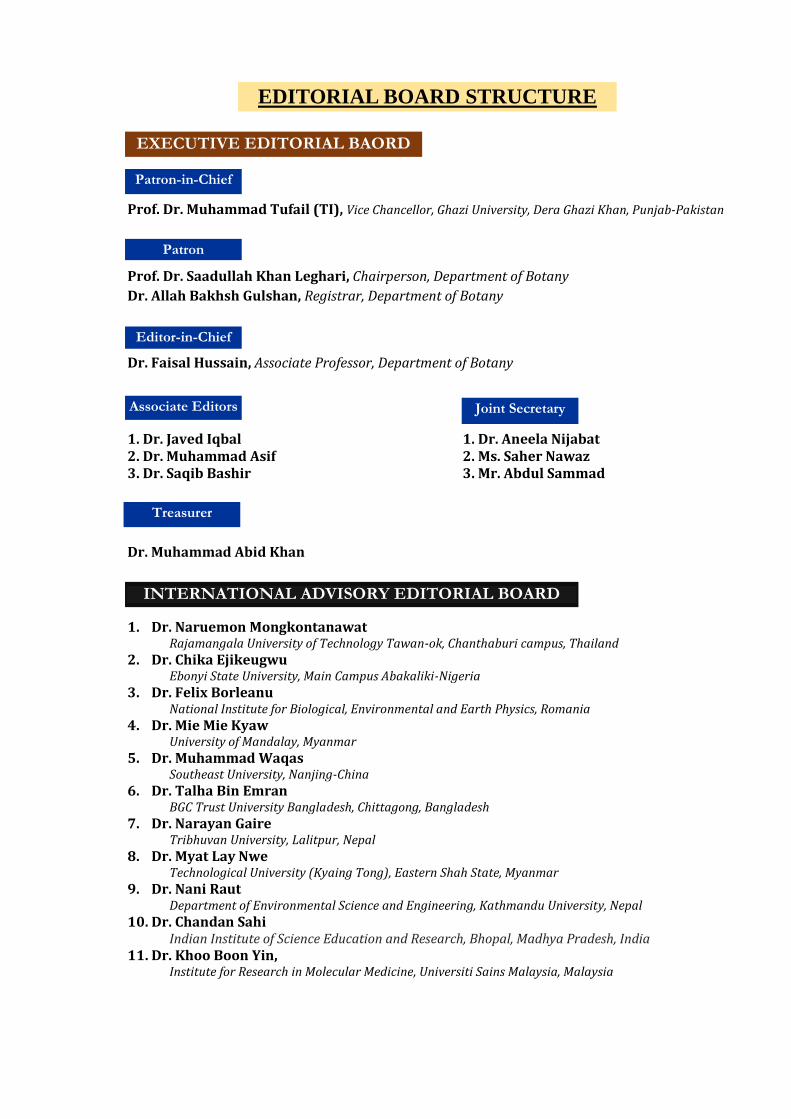
Prof. Dr. Muhammad Tufail (TI), Vice Chancellor, Ghazi University, Dera Ghazi Khan, Punjab-Pakistan
Prof. Dr. Saadullah Khan Leghari, Chairperson, Department of Botany
Dr. Allah Bakhsh Gulshan, Registrar, Department of Botany
Dr. Faisal Hussain, Associate Professor, Department of Botany
1. Dr. Javed Iqbal 1. Dr. Aneela Nijabat 2. Dr. Muhammad Asif 2. Ms. Saher Nawaz 3. Dr. Saqib Bashir 3. Mr. Abdul Sammad
Dr. Muhammad Abid Khan
1. Dr. Naruemon Mongkontanawat Rajamangala University of Technology Tawan-ok, Chanthaburi campus, Thailand
2. Dr. Chika Ejikeugwu Ebonyi State University, Main Campus Abakaliki-Nigeria
3. Dr. Felix Borleanu National Institute for Biological, Environmental and Earth Physics, Romania
4. Dr. Mie Mie Kyaw University of Mandalay, Myanmar
5. Dr. Muhammad Waqas Southeast University, Nanjing-China
6. Dr. Talha Bin Emran BGC Trust University Bangladesh, Chittagong, Bangladesh
7. Dr. Narayan Gaire Tribhuvan University, Lalitpur, Nepal
8. Dr. Myat Lay Nwe Technological University (Kyaing Tong), Eastern Shah State, Myanmar
9. Dr. Nani Raut Department of Environmental Science and Engineering, Kathmandu University, Nepal
10. Dr. Chandan Sahi Indian Institute of Science Education and Research, Bhopal, Madhya Pradesh, India
11. Dr. Khoo Boon Yin, Institute for Research in Molecular Medicine, Universiti Sains Malaysia, Malaysia
Patron-in-Chief
Patron
Editor-in-Chief
Associate Editors Joint Secretary
Treasurer
INTERNATIONAL ADVISORY EDITORIAL BOARD
EDITORIAL BOARD STRUCTURE
EXECUTIVE EDITORIAL BAORD
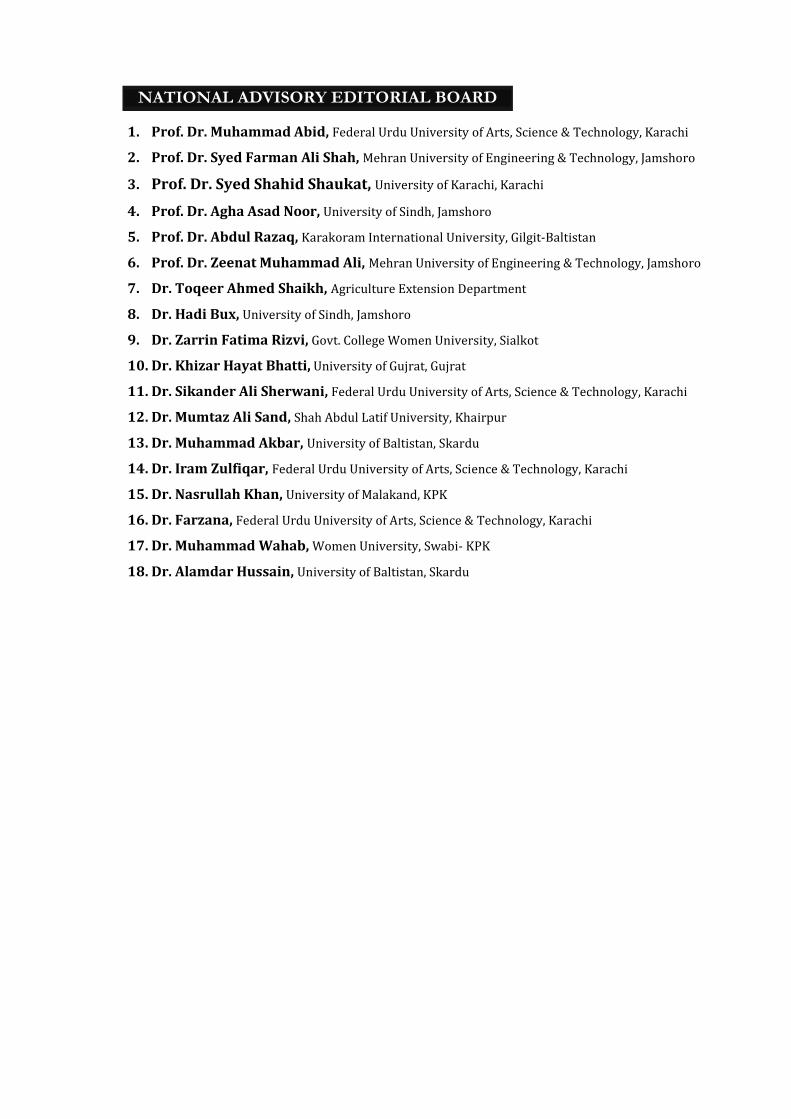
1. Prof. Dr. Muhammad Abid, Federal Urdu University of Arts, Science & Technology, Karachi
2. Prof. Dr. Syed Farman Ali Shah, Mehran University of Engineering & Technology, Jamshoro
3. Prof. Dr. Syed Shahid Shaukat, University of Karachi, Karachi
4. Prof. Dr. Agha Asad Noor, University of Sindh, Jamshoro
5. Prof. Dr. Abdul Razaq, Karakoram International University, Gilgit-Baltistan
6. Prof. Dr. Zeenat Muhammad Ali, Mehran University of Engineering & Technology, Jamshoro
7. Dr. Toqeer Ahmed Shaikh, Agriculture Extension Department
8. Dr. Hadi Bux, University of Sindh, Jamshoro
9. Dr. Zarrin Fatima Rizvi, Govt. College Women University, Sialkot
10. Dr. Khizar Hayat Bhatti, University of Gujrat, Gujrat
11. Dr. Sikander Ali Sherwani, Federal Urdu University of Arts, Science & Technology, Karachi
12. Dr. Mumtaz Ali Sand, Shah Abdul Latif University, Khairpur
13. Dr. Muhammad Akbar, University of Baltistan, Skardu
14. Dr. Iram Zulfiqar, Federal Urdu University of Arts, Science & Technology, Karachi
15. Dr. Nasrullah Khan, University of Malakand, KPK
16. Dr. Farzana, Federal Urdu University of Arts, Science & Technology, Karachi
17. Dr. Muhammad Wahab, Women University, Swabi- KPK
18. Dr. Alamdar Hussain, University of Baltistan, Skardu
NATIONAL ADVISORY EDITORIAL BOARD

Available online at https://www.gudgk.edu.pk/phy-to-science-journal
GU JOURNAL OF PHYTOSCIENCES
GU. J. Phytosci. 2(1): 01-08 (2022)
<<
Ecological Status, threats and future trends of Wild Olive in Dumer Forest nearby Ziarat, Balochistan
Ecological status, threats and future trends of wild Olive (Olea
ferruginea Royle) in Dumera forest near by Ziarat, Balochistan
Atta Mohammad Sarangzai1, Saadullah Khan Leghari1,2*, Alia Ahmed2, Basira Sher1, Bakhat Zareen1
Ghulam Razaq Shawani3, Abdul Kabeer Khan Achakzai1 and Nazir Durani4
1Department of Botany, University of Balochistan, Quetta, Pakistan 2Department of Botany, Ghazi University, Dera Ghazi Khan, Pakistan
3Faculty of Pharmacy, University of Balochistan, Quetta , Pakistan
4Balochistan University of Information, Technology and Management Sciences, Pakistan
Abstract
The wild Olive (Olea ferruginea Royle) forest is composed of patches stands and grows naturally in an isolated transitional zone
and remote valley of Dumera close to Ziarat Juniper Forest in Balochistan. Twenty forests stand dominated by Olea tree species
were sampled in 2019. Plant composition, density of ha ¹־and area m² ha¹־, health status, sex ratio, estimated number of fruits of
Olea, age, growth rate and soil analysis of forest land wild nature has been studied. Based on relative frequency values, shrubs
(Spirea boissieri) were found dominant, followed by grasses (Stipa himaliaca) while herbs (Nepeta glomerulosa) were contributed
as third dominant in the study area. Density of O. ferruginea trees (>6 cm dbh) ranged from170 to 352 trees haˉ¹ with overall
mean of 427±170 trees ha-¹; the average basal area recorded was 538 m² ha-¹. Satisfactory recruitment might be to better humid
condition of transition zone of O. ferruginea was observed. Highest seedling (< 6 cm dbh) density was recorded from the north-
east facing slope while tree density was higher on the west facing slopes. Results revealed that healthy trees were dominant
(36%), followed by unhealthy trees (21%) and over mature (07%). The sex ratio showed predominance of female as compared to
the male across all the stands. The average tree age of O. ferruginea is 222 years, with the oldest age (434 years) recorded from a
50 cm dbh tree. Growth rate ranged from 5 year/cm to 17 year/cm. Trees with thick fruits were found abundant as compared to
trees with low fruits. Sized class structure showed diverse forms in various stands. The study showed the predominance of small
individuals in the Dumera forest. Two population phenotypes have been recorded, namely the inverted J shape and the irregular
phenotype. Soil variables were not correlated with density and ground area. Increased human population, fuelwood collection,
overgrazing, illegal cutting, debarking and agriculture extension are the major threats. Present situations are threatening and
alarming. Therefore, urgent actions, management and conservation plan should be initiated to rehabilitate and save these forests
for upcoming generations.
Keywords: Olive; Status; Threats; Future trends; Ziarat, Balochistan
*Corresponding author Tel.: +92 3327811206
E-mail address: [email protected]
© 2022 (Accepted for publication in December 2021) Published by Department of Botany, Selection and/or peer-review under supervision of Executive Committee, Ghazi University, DG Khan, 32200 Pakistan
2 Sarangzai et al.,/ GU J. Phytosci. 2(1): 01-08 (2022)
Ecological Status, threats and future trends of Wild Olive in Dumer Forest nearby Ziarat, Balochistan
1. Introduction:
Olive (Olea ferruginea (or ferruginea) (Oleaceae), locally known as (Zitoon) is a native broad leaved evergreen tree species which spreads from Asia, Africa, Arabia, Europe to Australia, India, China Afghanistan and west Nepal (either write only continent or write countries, not mix).
In Pakistan, it is found as degraded tree and scattered or in small groups along waterways in the Zhob, Dir, Chitral and Salt ranges to the lower hills of the Azad Kashmir Hills, Waziristan, Swat and Murree (Baquar, 1969; Sheikh, 1993). In some cases, it has been observed along riverbanks as open and pure forests on rocky slopes and at elevations of 500 to 2000 m in dry temperate and humid temperate regions of Pakistan. These forests are drought resistant and adaptable to rainfall between 250 mm and 1000 mm per year and temperatures between 10 ºC and 40 ºC; therefore, can be easily grown over large areas of arid and semi-arid regions of Pakistan. It is a versatile evergreen fruit tree with various uses such as oil, fodder, firewood, fruit and various diseases. The leaves of the genus Olea have been used since prehistoric times to treat various ailments such as gout, diabetes and fever Olea ferruginea is a small evergreen native tree that grows in woodlands and rocky slopes and reaches heights from 15 to 18 m. in their ideal growing conditions such as broad-leaved stream banks which often grow at altitudes between 400 and 2000 m above sea level in different ecological and microclimate conditions of South Asia and Pakistan (Baquar, 1969; Sheikh, 1993).
Despite the environmental, economic, ecological and medical importance of Olea ferruginea, no detailed literature is available and little attention has been paid to the nonspecific temperate dry forests of Pakistan for evaluation, quantification and future trends of this dominant single species (Siddiqui et al., 2009; Malik et al., 2004). Ahmed et al. (2009) reported the vegetation structure of O. ferrugina Forest in Lower Dir district in Pakistan. Ahmed et al. (1991) studied the vegetation structure and dynamics of the Pinus gerardiana forest in Zhob district, Balochistan. Ahmed et al. (1991) presented phytosociological properties such as relative frequency, density, background area and absolute values such as density ha¹ and basal area m² ha of different stands. in Sheenghar Zhob district. Recently, Akbar et al. (2014) studied the current status and future trends of chilghoza forests while evaluating the Diameter Size Class (Dbh) distribution of Chalghoza forests in Goharabad district, Gilgit Baltistan, Pakistan. Abbas et al., (2007) reported biomass expansion factors of O. ferruginea in subtropical forests of Pakistan. Anwar et al. (2013) reported the properties of olive oil obtained from the wild olive tree (O. ferrugina) in Pakistan. Hussain (2013) reported the current state of Olea Spp. used multivariate approaches along the subtropical Western Himalaya, Azad Jammu and Kashmir to provide potential olive planting sites in this region. These forests have a long history of human use and are, therefore, more threatened and less protected than temperate rainforests due to high anthropogenic pressure, deforestation and overexploitation. Despite the environmental, economic, ecological and medical importance of O. ferruginea, there are no detailed documents available for a quantitative assessment of this unique forest.
Olive (O. ferruginea) at Dumera is situated at a distance of 25 km towards the south of Ziarat covering a vast area comprises of scattered patches over an area of about 10,000. Isolated and remote valleys of Dumera forest close to Ziarat juniper forest between elevations from 1906 to 2659 m of Ziarat District. The other associated potential tree species growing naturally are Pistacia khinjuk, P. atalantica, Fraxinus xanthozolides, wild almond and wild pomegranate, are among the main tree species (Sarangzai, 2012). The highest peak in the study area is Koh-Khalifa (3,475 m). When a road is built into these foothill villages making the area more accessible to Sharig and Harnai, it became essential to preserve the indigenous forest before it becomes vanished. The area is remote and isolated, has high endemism, having rich floral diversity. The climate is dry temperate forest type with three seasons in a year, i.e., spring (March–mid June), rainy (July–September) and winter (October–February). In winter maximum temperature drops in -15.2 °C. The annual rainfall varies between 250 and 300 mm, and it mostly contributed by southwest monsoon (Champion et al., 1965). There is also moderate snow fall in the winter. The highest relative humidity of 70 % recorded in May while the lowest of 46 % in October. There are a number of freshwater springs in the valley. The soil has a sandy texture and is red to dark gray in color and is extremely poor in nutrients with very little humus. Strong winds are common from north to south in September. Topography of the area is rugged comprising of steep slopes and channels. The geology includes limestone and schist from the Triassic to Jurassic period (Rafi, 1965). The plain sites were the most disturbed and the tops peak sites are least threatened at present. The best growth of the trees was found on somewhat better deep soils near the streams beds on the lower reaches of the slopes.
Sarangzai et al.,/ GU J. Phytosci. 2(1): 01-08 (2022) 3
Ecological Status, threats and future trends of Wild Olive in Dumer Forest nearby Ziarat, Balochistan
1.1. Objectives:
• To assess the ecological status, threats and future trends of the wild olive forest (O. ferruginea) in the Dumera region near the Ziarat juniper forest in Balochistan.
• To create awareness the significant importance of Olive Forest.
2. Materials and Methods:
2.1. Study Area:
The study was carried out in 2019 at different sites in the Dumera Forest adjacent to the Ziarat Juniper Forest in Balochistan. Although much of the forest area is patchy, disturbed and mature, during this study small but healthy stands were selected for quantitative sampling. Sampling sites are located on steep slopes, upper ridges and some lowlands. 20 stalls were sampled using the Point Central Quarter (P.C.Q) method. In each stand, 15 points were taken 30 m apart in a randomly stratified manner over an area of at least 2 hectares (Ahmed and Shaukat. 2012). Globe & # 40; GPS & # 41; used to record elevation, standing position and aspect while slope level is recorded using sloe meter. The ecological characteristics (storage density ha-¹ and background area m-² ha-¹) for Olea trees and seedlings were calculated using the method described by Mueller Dombois & Ellenberg (1974). Plants over 6 cm dbh (diameter at breast) were included in this sample. O. ferrugina seedling density and relative frequencies of herbs, shrubs and grasses were collected using circular plots (1.5 meters in diameter) at each PCQ site. Species identification was followed by Stewart, (1972) while statistical analysis was performed using the method described by Ahmed & Shaukat, (2012). Linear regression was calculated for the density and basal area of Olea trees (≥ 6 cm dbh) against topographic and alluvial factors (Sokal & Rohlf, 1981).
Figure 1: Showing the map of study area
Oive from each stall were visually observed for their physical condition and divided into different
categories: Hardy = dark green with dense branches and leaves; Unhealthy = dull color with open branches and leaves: Overripe = plants over 70 cm dbh with shriveled, hollow branches, weakened or dead; Disrupt = sign of a broken or cut branch; Registered = Registered strains are still available; = Dead = dry or dead tree. In each stand, the sex ratio of each Olea tree is also visible to the naked eye. Trees having fruits/berries were considered as female and trees with yellow color berries relatively small in size were recognized as male tree while trees with both male and female berries appearance were considered as bisexual tree. Five sets for yields of berries were also visually estimated in each tree of the stand. The first set was named as Thick = Olea tree with abundant berries; Moderate = Not excessive berries; Low = Less quantity of berries; Green = Green fresh berries and Dry = Dry mature berries. Sarangzai et al. (2012).
The frequency distributions of diameter size classes of O. ferruginea (≥ 6 cm dbh) and seedlings (≤ 6 cm dbh) trees were collected as follows: In the diameter size distribution of trees, 10 levels have been developed. The distance
4 Sarangzai et al.,/ GU J. Phytosci. 2(1): 01-08 (2022)
Ecological Status, threats and future trends of Wild Olive in Dumer Forest nearby Ziarat, Balochistan
between the layers is 11 cm. Thus, the first category of plants is considered among individuals whose diameter is reduced to 6.1–17 cm, and the second contains plants with equal diameters from 17.1 to 28 cm, and so on. The dbh of trees in each counter was sorted and the number of trees in each class was counted. The overall layer density (10 cm dbh) of all booths was plotted using the MS Excel bar chart command. The diameter of tree at chest height (1.3 meters or 4.3 feet above the ground). Seedlings are divided into six classes (0.5 cm to 6 cm dbh) where class 0 includes seedlings up to 0.5 cm in diameter. Type 1: sow from 0.5 to 1 cm dbh. Grades 2 to 6 have a distance of 1 cm.
Wood samples in cross-section were taken from four selected trees from each stand. The time method (Fritts, 1976) was followed to determine age and growth rate according to the method described by Stokes and Smiley (1968). Soil samples were analyzed for texture, pH, conductivity and percentage of calcium carbonate, organic matter, maximum water holding capacity, phosphorus, potassium and nitrogen using the methods described in Hussain, (1989), Jackson, (1962).
3. Results:
O. ferruginea and related vegetation grows between 1900 and 2670m on ridges and medium to steep slopes and forms pure, open and dense vegetation without any stratification any. Since O. ferruginea is a single dominant, specific forest in the sampled area, these forests are therefore described on the basis of ha¹ density and m² ha basis for trees and seedlings. Olea. The main ecological features of the study area, including slope, canopy, aspect, elevation; Latitude and longitude of each stand in the study area are given in Table 1.
Table 1: Ecological characteristics of sampling points and stocks in the study area
Stand No Sampling
sites Elevation
(m) Latitude
(N) Longitude
(E) Slope
0 Aspect Canopy
1
Dumera Forest
2663 30 º.18´ 67º.46´ 35 North Open
2 2666 30 º.18´ 67 º.46´ 36 North Open 3 1911 30 º.19´ 67 º.45´ 45 North Open 4 1911 30 º.19´ 67 º.45´ 45 North Open 5 2005 30 º.19´ 67 º.45´ 46 North Open 6 2005 30 º.19´ 67 º.45´ 51 North Open 7 2005 30 º.19´ 67 º.45´ 40 North Open 8 2204 30 º.19´ 67 º.49´ 37 North Open 9 2205 30 º.11´ 64 º.32´ 36 North Open
10 2204 30 º.19´ 67 º.49´ 33 North Open
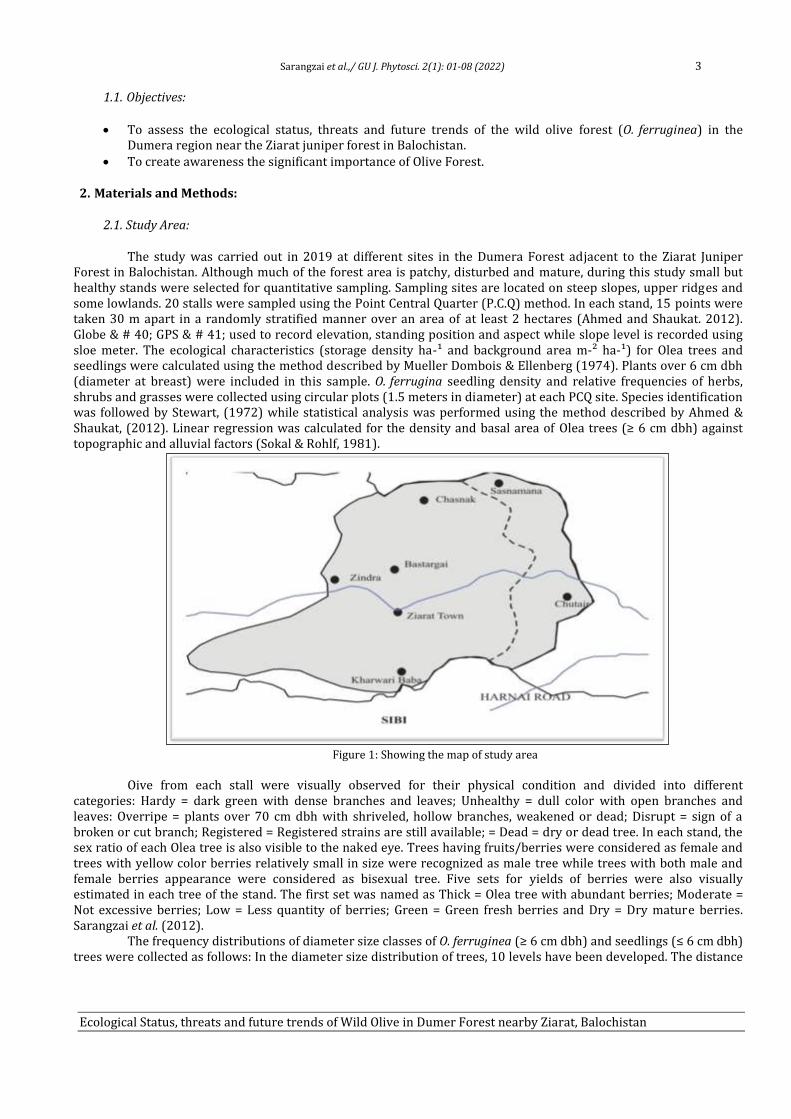
Table 2 shows the detailed quantitative estimation of O. ferruginea forest near by Ziarat Juniper Forest. Across all the stands, the overall mean density and basal area values both for Olea trees and seedlings were obtained. Highest stand density of 352 trees ha-¹ was recorded on north facing slope at elevation of 2005m while minimum density 170 trees ha-¹ recorded on north facing slope at the elevation of 7232 ft. Similarly, the basal area values were ranged from 248 to 656 m² ha-¹ with an average 427±170 m² ha-¹. Highest seedling density were 3977 individuals ha-¹ and lowest were 1136 individuals ha-¹.
S. No. Location Elevation
(m) Aspect
Tree (> 6cm dbh) Density
ha-¹
Basal area m² ha-¹
Seedling (< 6 cm dbh)
Density ha-¹
Basal area cm²
ha-¹
1
Bokrri Shaplee
2663 North 192 332 3977 555 2 2666 North 254 458 1704 375 3 1911 North 140 249 1136 253 4 1911 North 324 657 3977 454 5 2005 North 213 298 3409 386 6 2005 North 180 355 1704 329 7 2005 North 352 607 3977 471 8 2204 North 298 587 3409 416 9 2205 North 172 275 3409 689
10 2204 North 171 448 3409 314

Sarangzai et al.,/ GU J. Phytosci. 2(1): 01-08 (2022) 5
Ecological Status, threats and future trends of Wild Olive in Dumer Forest nearby Ziarat, Balochistan
Mean ± SE 427±170 424±120 3011±1073 230±73
The distribution of Olea in Dumera forest in many different forms of DBH class. The number of people decreases towards the Upper DBH classes. The results look like Ahmed et al. (2009). The propaganda of the DBH class of all people in different classes has a reverse J-shaped distribution (Fig. 2). This is a common form of regular population structure, where most trees presented the largest number of individuals in DBH classes lower with the gradual reduction of DBH classes. This shows a good prospect for Olea tree recruitment in the study area. A similar result was reported by Senbeta (2006) and Bekele (1993).
Figure 2: The population structure of trees presented in DBH size classes
Results of the present study revealed that 36% were healthy trees, followed by cut stumps 28%, unhealthy 21% Disturb 8% while over mature trees were accounted 7% across all the stands (Fig. 2).
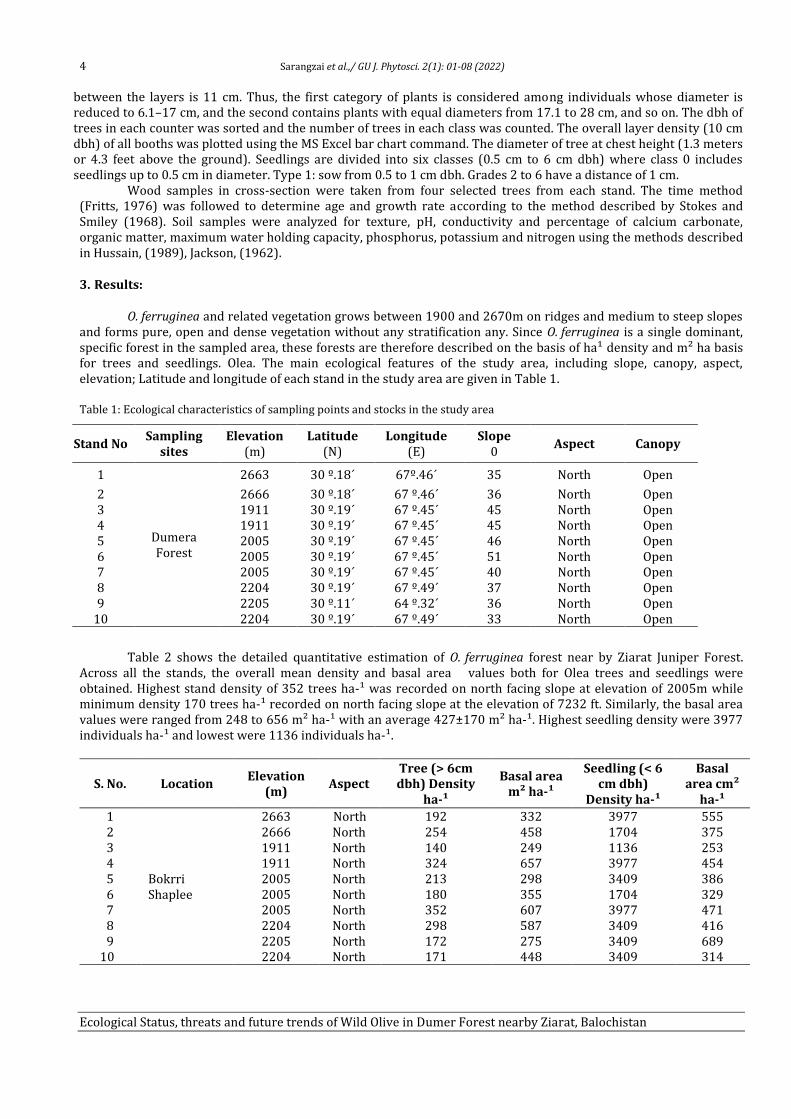
In the study, the relative abundances of male, female and hermaphrodites were very different. In general, the sex ratio shows the female predominance of the tree with the highest density of 226 ha¹ compared with that of the male tree with a density of 126 ha as compared to the male density values 126 ha-¹. Densities of bisexual trees were rare with an average of 12 ha-¹ (Fig. 3).
Figure 3: The Physical ratio and density of population structure of trees
Number of berries of trees were visually estimated in each stand and categories as thick berries, moderate berries, low berries, green mature and dry brown berries. The quantities of berries were found greatly varied not only within the trees of a stand but also between different stands of the study area. The average density of thick berries trees was 67 ha-¹. Moderate berries were ranged from78 ha-¹ while low berries were 112 ha-¹.
In total, about 14 species of plants belonging to 13 families have been identified in the Dumera forest area near Ziarat. The number of species ranges from 14 in each family. Based on the importance value index, the family Roses and the family Poceae were found to be dominant. They were followed by family Lamiaceae and the family Papilionaceae. The widely distributed shrubs (recorded over 50% of the area) are Ephedera procera, Cotoneaster
6 Sarangzai et al.,/ GU J. Phytosci. 2(1): 01-08 (2022)
Ecological Status, threats and future trends of Wild Olive in Dumer Forest nearby Ziarat, Balochistan
racemiflora, Barbaris lyium, Dehpnae oloides and Spora mollis. Grass has the lowest composition, followed by shrubs. Stipa bipannata, Cymbopgon and Malica persica are the main grasses.
Table 3: Floristic composition in study area of Dumera Forest
S. No. Name of Species Family Local Name R.F. R.D. R.C IVI
1. Nepeta glomerulosa Lamiaceae Chenjenbooti 12.96 12.33 11.71 12.33 2. Salvia bucharica. Labiatae Sarsanda 4.81 10.50 4.16 6.49 3. Stipha himalaica Poaceae Washtee 12.96 19.25 15.97 16.06 4. Spiraea boissieri Rosaceae Kashaghuni 16.66 18.69 19.35 18.23 5. Sophora mollus Papilionaceae Ghuzara 8.14 11.29 10.94 10.12 6. Saccarum griffthii Poaceae Sarghasii 5.92 3.65 6.91 5.49 7. Malica persica Graminae Levenibootii 3.33 3.65 2.73 3.24 8. Cotoneaster numularia Rosaceae Sharugii 5.55 8.19 6.28 6.67 9. Dehpnae oloides Thymelaceae) Walaghuni 4.81 1.90 2.61 3.11
10. Berberis lycium Berberidaceae Zaralug 2.96 1.19 2.88 2.34 11. Ephedera procera Ephedraceae Oman 3.33 1.11 2.81 2.42 12. Cymbopogon jwarancausa Graminae Wiza 8.88 3.02 4.99 5.63 13. Hertia intermedia Comositae Gungan 5.55 2.70 4.62 4.29 14. Periploca aphylla Asclopediaceae Berhara 4.74 2.46 3.98 3.50
Soil analysis results revealed that soil of the study area had great variability. Electrical conductivity was found varied 0.5 to 0.64 mm hos/cm. Electrical conductivity was low in all stands and soil is non-saline. Organic matters ranged from 2.75 to 3.75 % with moderate percentage across all the stands. The average pH of the soils of all stands ranged from 7.5 to 8.16. Calcium carbonate varied from 11.25 to 18.98 %. All the stands indicated low percentage of Calcium carbonate. The maximum water holding capacity ranged from 42.64 to 54.53 %. Among the soil texture classes’ sand (33%) was the predominant soil type, followed by clay percentages (27%) while silt indicted 40% throughout the sampling area (Fig. 4).
Figure 4: The soil analysis of all stands trees population with density
The mean radial growth rate and age were varied greatly from tree to tree, even among the same sized trees. The data clearly indicated differences in growth rates between the sites, ranging from 3.75 yrs/cm to7.66 yrs/cm at the high altitude to 3.75 yrs/cm in low altitude. Based on the four wood sections, the average growth rate for O. ferruginea was recorded 5±2.7 yr/cm. Based on the tree ring counting the average age of O. ferruginea was calculated as 83±38 yrs. Diameter and growth rate are found to be not significantly correlated (R= 0.17ns).
Sarangzai et al.,/ GU J. Phytosci. 2(1): 01-08 (2022) 7
Ecological Status, threats and future trends of Wild Olive in Dumer Forest nearby Ziarat, Balochistan
4. Discussion:
O. ferruginea is the main specific monophyletic species of dry temperate trees of the Zhob, Musakhail and Khuzdar highlands of Balochistan. These forests are reflected at elevations from 6587 to 8737 feet and form pure, open, unfenced stands in the sampling area. Man-made actions (illegal logging and overgrazing) have radically altered not only regeneration patterns but also the growth of trees growing in the area. No broadleaf species currently exist in these forests except Pistacia khinjuk, Juniperus outnumbers, Fraxinus xanthoxyloides, which are widely dispersed in the dry temperate regions of Pakistan; Ahmed & Qadire (1976) has now been completely wiped out from this forest. However, they are rare along the waterways of Zhob, Musakhail and Hazar Gangi National Park near Quetta. Only 14 species of herbs, shrubs and grasses have been recorded as flora associated with the Olea tree. Olea ferrugina stands in the Dumera Valley have a lower base area than the Tukht -e- Sulaiman, Malakand and Marghzar regions of Pakistan (Ahmed et al., 1990).
The average hectare density of O. ferruginea at the present study sites ranges from 171 to 352 and is relatively low compared to 200 ha; with 28 m² of base area in temperate dry forest of Tukht-e-Sulaiman range in Zhob district. Ahmed et al. (2006) also described this species in the lower elevation humid temperate regions of Malakand and the Marghzar region with densities estimated to range from 92 to 620 ha. The average tree density recorded in this study was 230 ± 73 hectares compared to the Olea dense forests found in Azad Jammu and Kashmir (Hussain, 2013). Thus, this arid temperate forest is poor in tree density as well as in seedling density. Lower densities between localities mimic the changes in habitat conditions, topography, and the effects of population growth. The total basic m² ha¹ of the Dumera Forest is 427 ± 170 m² ha. The tree with the greatest influence on the base area can be considered the most important tree in the forest (Millios, 2007). In our study, the mean background area per site ranged from 249 to 458 m² ha¹ and was higher than the range of 32,119 m² ha¹ reported for the nearby Juniperus excelsa forest by Sarangzai et al. (2010) (2015). Base area reported by other studies includes: 19-23 m² ha for some Hindukush ranges of Pakistan and 20-79 m² ha¹ for evergreen tropical dry forest in southern India (Parthasarathy & Seith 1979). In addition, the density of O. ferruginea in our stands varies greatly from area to area and within an area. The highest average density was recorded at 3977 individuals ha¹ and the lowest was 1136 individuals ha¹; with an average of 3011 ± 107 individuals ha¹. At some point, the absence of seedlings, especially in felled or eroded sites, indicates that the seedlings need shade or improved soil conditions during their early growth period. Plant density and background area of O. ferruginea showed a poor relationship with seedling density, due to greater biological stress.
The diameter-level distributions of selected Olea trees exhibit diverse patterns of population structure, indicating diverse population dynamics between different sites. The first model is an inverted J-shaped distribution showing a high number of individuals in the first and third DBH classes and with a gradual decrease for the higher DBH classes, indicating fertility and regeneration good of the healthy Olea trees in the forest. The second sample is unevenly distributed over the diameter classes. Some DBH classes have a small number of instances while other DBH classes have a large number of instances. This unequal distribution is due to selective harvesting by local people for timber and firewood. Overgrazing affecting seedlings under the parent tree may be another cause of these abnormalities. Similar results were reported by Senbeta & Denich (2006) and Bekele (1993).
Results of the present study revealed that 36% healthy trees, followed by cut stumps (28%), unhealthy (21%), Disturb (8%) while over mature trees were accounted 7% across all the stands (Fig. 2). These workers reported higher density of healthy plants (36%) and over-mature individuals (7%). Over-mature trees accounted for only 7% of the total densities, possibly due to selective logging and harvesting of large trees. In many plots, a large number of dead trees (11%) and stump felling (12%) were recorded while this was absent in the juniper region of the same province. A higher number of males (57%) than females (37%) were recorded in the study area. According to Ahmed et al. (1990b), the male/female ratio is close to 1:1 per juniper. Hermaphrodites were very rare (4%) in this study.
The usual disturbances in the whole valley of Dumera forest increased tremendously during the last few decades due to the human impact such as fuel wood collection, extension of cultivation, overgrazing and selective felling for timber, Barriers collection, branch cutting for agriculture fencing, debarking for roofing hutments and tribal controls on exploitation of natural resources are main causes of degradation of the Dumera Olea forest. These disturbances occur over a long period of time with varying intensity and duration. All these factors of the current study estimated almost the present situation, pressures and their consequences and the future trends of O. ferruginea forests in Ziarat. While no quantitative data is available for comparison from this forest in Balochistan.

8 Sarangzai et al.,/ GU J. Phytosci. 2(1): 01-08 (2022)
Ecological Status, threats and future trends of Wild Olive in Dumer Forest nearby Ziarat, Balochistan
5. Conclusion:
It is concluded that most of the stands are under threats. Therefore, prompt actions are needed to stop these assets for future generations.
• Illegal cutting should be banned, and grazing should be discouraged. • Eco-tourism potential of the Olive forests should be exploited in collaborative with the private sector. • Alternative fuel such as gas should be provided to the public on subsidized rates. • Community participation and socio-economic uplift of local communities must be ensured. • Awareness programs should be conducted by the Government and forest department.
6. References:
Abbas, G. 2007. Effect assessment of the project on community based Chilghoza pine conservation and management for income generation in Huddur Valley District Diamer NAs.
Ahmed, M.S.S., Shaukat and A.H. Buzdar. 1990b. Population structure and dynamics of Juniperus excelsa in Balochistan, Pak. J. Veg. Sci., 1: 271-276.
Ahmed, M., A. Muhammad and S. Muhammad. 1991. Vegetation structure and dynamics of Pinus geradian forest in Balochistan. Pak. J. Sci., 2: 119-124.
Ahmed, M., E.E. Naqi and E.L.M. Wang. 1990a. Present state of Juniper in Rodhmallazi forest of Balochistan, Pakistan. Pak. J. For., 40(3): 227-236.
Ahmed, M., T. Husain, A.H. Sheikh, S.S. Hussain, and M.F. Siddiqui. 2006. Phytosociology and structure of Himalayan forests from different climatic zones of Pakistan. Pak. J. Bot., 38 (2): 361–383.
Ahmed, M., N. Khan, M. Wahab, S. Hamza, M. F. Siddiqui, K. Nazim and M.U. Khan. 2009. Vegetation structure of Olea ferruginea Royle Forest of Lower Dir District of Pakistan. Pak. J. Bot., 41(6): 2683-2695.
Ahmed, M. and S.A. Qadir. 1976. Phytosociological studies along the way of Gilgit to Gopis, Yasin and Phunder. Pak. J. For., 26: 93–104.
Ahmed, M. and S.S. Shaukat. 2012. A Textbook of Vegetation Ecology. Abrar Sons new Urdu Bazar, Karachi, Pakistan Akbar, M., S.S. Shaukat, M. Ahmed, A. Hussain, S. Ali, S. Hyder and F. Hussain. 2014. Characterization of diameter distribution of
some tree species from Gilgit-Baltistan using Weibull distribution. J. Bio. & Env. Sci., 5(4): 437-444. Anwar, P., A. Bendini, M. Gulfraz, R. Qureshi, E. Valli, G. Di Lecce, S. M. S. Naqvi and T. G. Toschi. 2013. Characterization of Olive Oils
obtained from wild olive trees (Olea ferruginea Royle) in Pakistan. Food Res. Int., 54(2): 1965-1971. Bakele, T. 1993. Vegetation Ecology of Renunant Afromontane Forest on Central Plateau of Shewa Ethopia. Ph.D. Dissertation
Uppsala University, Uppssala, Sewden. Baquar, S.R. 1969. Trees of Pakistan: Their natural history, characteristics and utilization. Royal Book Company, Karachi. pp 634. Champion, G.H., S.K. Seth and G.M. Khattak. 1965. Forest types of Pakistan. Pakistan Forest Institute, Peshawar. pp 238. Fritts, H.C. 1976. Tree Rings and Climate. Academic Press Inc., New York, pp 567. Hussain, A. 2013. Phytosociology and Dendrochronological study of Cental Karakoram National Park (CKNP), Northern Areas
(Gilgit-Baltistan), Pakistan. Ph.D. Thesis, Federal Urdu University of Art, Science and Technology, Karachi. Hussain, F. 1989. Field and Laboratory Manual of Plant Ecology. UGC, Islamabad. Jackson, M.A. 1962. Soil chemical analysis. Constable & Co Ltd. London. Malik, N.Z. and Z.H. Malik. 2004. Present Status of Subtropical Chirpine Vegetation of Kotli Hills, Azad and Kashmir. J. Res. Sci.,
15(1): 85-90. Milios, E., E. Pipinis, P. Petrou, S. Akritidou, P. Smiris and M. Aslanidou. 2007. Structure and regeneration patterns of the Juniperus
excelsa M. Bieb. stands in the central part of the Nestos valley in the northeast of Greece, in the context of anthropogenic disturbances and nurse plant facilitation. Eco. Res., 22(5): 713-723.
Mueller-Dombois, D. and H. Ellenburg. 1974. Aims and Methods of Vegetation Ecology. John Wiley and Sons. New York. Parthasarathy, N. and P. Sethi. 1997. Trees and liana species diversity and population structure in a tropical dry evergreen forest
in south India. Trop. Eco., 38: 19-30 Sarangzai, A.M., M. Ahmed, A. Ahmed, L. Tareen, and S.U. Jan 2012. The Ecology and dynamics of Juniperus excelsa forest in
Balochistan. Pak. J. Bot., 44(5): 1617-1625. Senbeta, F. and M. Denich. 2006. Effects of wild coffee management on species diversity in Afromontane rainforest of Ethiopia.
For. Ecol. Manage., 232: 68-74. Sheik, M.I. 1993. Trees of Pakistan. Pictorial Printing (PVT) Ltd. Islamabad. pp 242. Siddiqui, M.F., M. Ahmed, M. Wahab, and N. Khan. 2009. Phytosociology of Pinus roxburghii Sargent (Chir Pine) in lesser
Himalayan and Hindu Kush range of Pakistan. Pak. J. Bot., 41: 2357-2369 Stewart, R.R. 1972. An annotated catalogue of the vascular plants of Pakistan. In: Nasir, E. & Ai, S. (eds) Flora of Pakistan. Karachi
University Publication, Karachi. Stockes, M.A and T.L. Smiley. 1968. An Introduction to Tree-Ring Dating. Uni. Chicago Press, Chicago. pp 68. Ward, J.H. 1963. Hierarchical grouping to optimize an objective function. J. American Stat. Assoc., 58: 236-244.
Available online at https://www.gudgk.edu.pk/phy-to-science-journal
GU JOURNAL OF PHYTOSCIENCES
GU. J. Phytosci. 2(1): 09-16 (2022)
<<
Gamma Irradiation a potent mitigant of saline stress in Maize crop
Gamma Irradiation a Potent Mitigant of Saline Stress in Maize Crop
Saher Nawaz1*, Muhammad Sajid Aqeel Ahmad2, Atia Nazir2, Aneela Nijabat1, Saadullah Khan
Leghari1, Allah Bakhsh Gulshan1, Faisal Hussain1, Muhammad Abid Khan1, Ayesha Noor Awan3,
Zainab Naseem4 and Usman Shafqat5
1Department of Botany, Ghazi University, Dera Ghazi Khan-32200, Pakistan
2Department of Botany, University of Agriculture, Faisalabad-38000, Pakistan 3Department of Botany, Government College University, Lahore-54000, Pakistan
4Institute of Soil and Environmental Sciences, University of Agriculture, Faisalabad-38000, Pakistan 5Department of Environmental Sciences, Government College University, Faisalabad-38000, Pakistan
Abstract
Salinity as main environmental factor constrains the growth and production of cereals especially maize in all over the world. Its
effects can be alleviated by various mitigants like gamma radiations. Therefore, a pot experiment was design with pre-sowing
gamma irradiated maize seeds and different concentrations of salinity i.e., control (no salts), 50mM and 100 mM. Results
indicated that salt stress negatively affect almost all morphological, biochemical characters with ionic imbalance because of
augmented uptake of Na+ and Cl- contents in irradiated plants. However, gamma irradiated plants showed improvement in all
morphological and biochemical parameters except shoot length and root fresh weight. It also increased the absorption of K+, Ca+
with reduction of Na+ ions in root and shoot.
Keywords: Abiotic stresses; Ionic imbalance; Chlorophyll degradation; Gama radiations
1. Introduction:
Abiotic stresses like salt, water, heavy metals and temperature stress results in drop in agriculturally valuable crops yield and production (He et al., 2018). In all environmental problems, salinization of soil is known as foremost substantial constraints for cultivation of crops globally particularly in regions of less rain fall (AbdElgawad et al., 2016) and alter the cultivated lands into infertile land. It has been assessed that annually 0.3 million hectare of farmland is turning into barren land (FAO & ITPS, 2015). Pakistan is also included in those areas which are severely affected by saline stress. There are various salt stresses, but NaCl stress is the most common type among them, because of deposition by natural and human processes. It causes ionic imbalance, ions toxicity and change in osmotic stress (Aslam et al., 2017), reduced photosynthesis leads to drop in leaf area, chlorophyll contents, stomatal conductance, and net photosynthetic rate (Babar et al., 2014). Salinity reduced cell division and elongation and
*Corresponding author. Tel.: +92 3316668903
E-mail address: [email protected]
© 2022 (Accepted for publication in November 2021) Published by Department of Botany, Selection and/or peer-review under supervision of Executive Committee, Ghazi University, DG Khan, 32200 Pakistan
10 Nawaz et al.,/ GU J. Phytosci. 2(1): 09-16 (2022)
Gamma Irradiation a potent mitigant of saline stress in Maize crop
retarded activities of various essential enzymes, alteration in cell metabolites (Gong et al., 2018; Shahzad et al., 2019), following reduced length and diameter of plant root and shoot of branches and overall reduction in plant growth, may leads to crop failure (Guan et al., 2011).
Gamma radiations are used successfully to improve various traits in plants such as salinity. These radiations alter the physiological processes of plants and can modify or damage important plant cells components by affecting on plant morphology, biochemistry, physiology and anatomy depending on the radiation dose (Dehpour et al., 2011). The penetration power of gamma radiations helps to mitigate and improve negative effects of stress (Moussa, 2011). Previous findings showed relatively low doses of rays accelerate the enzymatic activity, cell growth, mutation induction and stress tolerance in plants, may adapted to osmotic stress by drop in osmotic potential or closing their stomata (Kelestani et al., 2021) and ultimately improved plant produce.
Maize (Zea mays L.) being a staple food of large population around the globe is serve as an essential crop and is a chief raw material in industries (Jian et al., 2017). It is the 3rd major crop in Pakistan after wheat and rice. Maize having high nutritional values (72% starch, 10% Protein, 8.5% fiber contents, 3% sugar, and 4.8% corn oil), serves vital supplier of food products like corn flour, animal feed, corn oil and most importantly sugar (Tajamul et al., 2016). Maize can be classified as a salt intolerant crop mostly associated having high accretion of Na+ ions in plant leave which stunted growth and development, disturb ions homeostasis, compromised production (shahzad et al., 2012; Ashraf et al., 2018).
1.1. Objectives:
• To assess deleterious influence of salinization on maize • Evaluation of mitigating properties of gamma irradiation by lowering salinization effects on maize plants
while improving growth
2. Materials and Methods:
A pot study was performed in the Old Botanical Garden (wire house), at University of Agriculture, Faisalabad to assess the influence of pre-sowing gamma irradiated maize hybrid (pioneer 31R88) under saline stress conditions. The experimental design was Completely Randomized Design (CRD) having three replicates of each treatment. Maize seeds of equal sizes were sown in imperforated pots (25×32cm) each with 10kg soil (pH 7.5 and ECe 2.1 dS m-1. There were 10 seeds sown in each pot and watered at suitable intervals till the termination of experiment. After 15 days of germination thinning was made and maintained 6 plants per pots.
2.1. Treatments of Experiment:
For Gamma irradiation maize seeds were treated with 0Gy and 100 Gy on Radioactive Source (Co-57) which emits 122 Kev (85%) and 136 Kev (11.1%) gamma ray photons before sowing. After 20 days of germination three salinity levels (0 mM, 50 mM and 100 mM NaCl were applied). There were 6 combinations of treatments (0mMol NaCl+0Gy, 50mMol NaCl+0Gy, 100mM NaCl+0Gy, 0mM NaCl+100Gy, 50mM NaCl+100Gy, 100mM NaCl+100Gy). Data for growth, biochemical and ions accumulation was collected after 20 days of saline stress treatment.
2.2. Growth Parameters:
Shoot and root length of uprooted plants was measured with meter rod. For shoot and root weight plant was taken, root removed from shoot and fresh weight were taken in grams on digital electric balance. The plant samples were dried in oven for 72 hours at sixty-five Celsius and dry biomass was observed with digital electric-balance. Leaf area calculated as length×width×0.68.
2.3. Chlorophyll contents:
0.1 g plant leaves were ground to a fine paste and added 80% acetone upto the 10ml volume, filtered using Whatman filter paper. Absorbance was noted by spectrophotometer at 480, 645 and 663nm. Contents of chlorophyll a (chl. A), chlorophyll b (chl. B) and carotenoids were estimated by using below given formulas.
Nawaz et al.,/ GU J. Phytosci. 2(1): 09-16 (2022) 11
Gamma Irradiation a potent mitigant of saline stress in Maize crop
Where
E100% Cm = 2500
2.4. Ions Analysis:
0.1 g dried material (shoot/root) and 1 ml of digestion mixture was left for a night at room temperature in digestion flasks and then heated on hot plate at 200 °C till fumes were produced. On turning the material black, 0.5 ml HClO4 (35%) was poured into digestion flasks. The material in flasks heated until became colorless. The final Volume of each digested mixture was made up to 50ml with addition of distilled water. The sample filtered and analyzed to determine the K+, Ca2+ and Na+ ions on flame photometer.
2.4. Statistical Analysis:
The results obtained during present investigation were analyzed by statistix8.1 computer software. Analysis of Variance (ANOVA) was applied to all the attributes to determine significant differences between Varieties (V) their treatments (T) and interactions (V×T) followed by comparison of means using LSD test (p≤0.05).
3. Results:
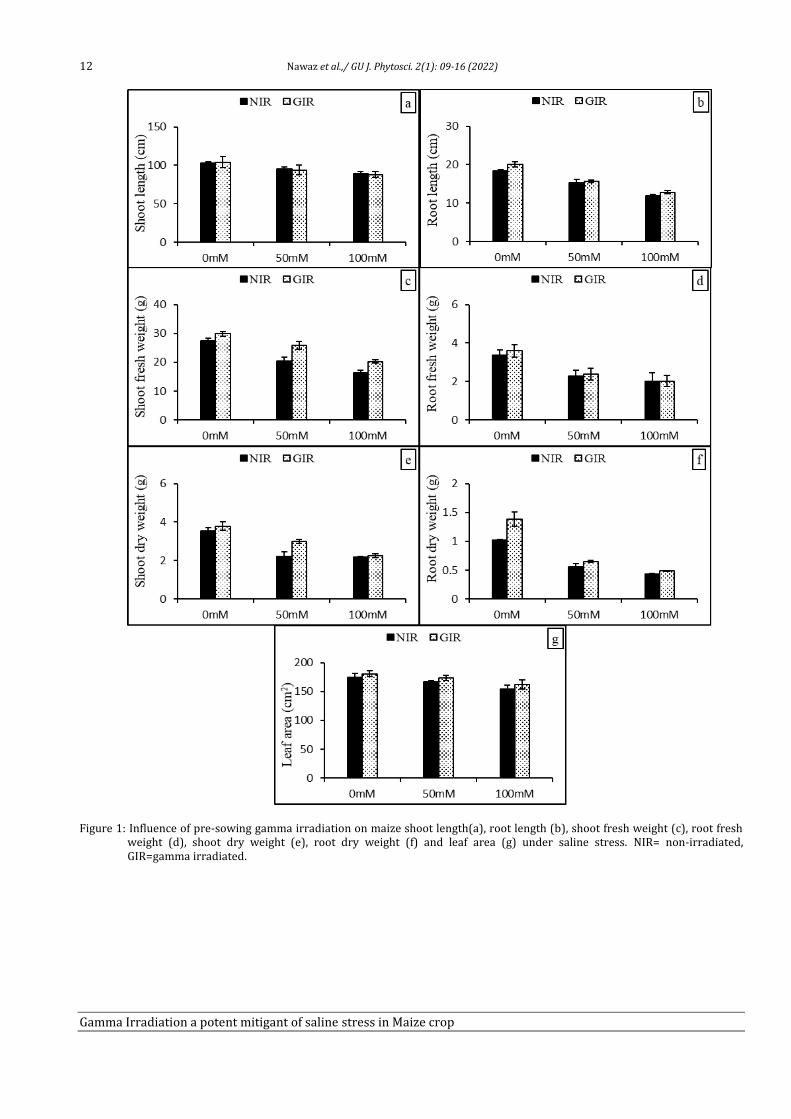
Comparison between non-irradiated and gamma irradiated seeds plants under control (0 mM) and salinization treatments (50 mM and 100 mM) for plant root, fresh, dry weight and leaf area showed in Fig. 1. It was observed that non-irradiated plants showed drop in plant shoot and root length in salt stress as compared to control. However, gamma irradiated plants helped significantly in increase of root length in control and salt stresses plants while plant shoot length showed non-significant change in length. Compared to control (0 mM), fresh and dry weight of shoot and root decreased in non-irradiated plants cultivated under salinity and more decrease in shoot, root fresh biomass and dry biomass was examined with 100 mM NaCl treated plants.
Gamma irradiated plants of control and saline stress significantly improved the shoot fresh biomass and dry biomass, root dry weight but root fresh showed non-significant increase in weight. There was no considerable difference in leaf area of those plants observed, which have given no treatment neither irradiation nor salt stress. However, non-irradiated but saline stressed plants indicated significant reduction in leaf area, but a significant increase noted in γ-irradiated plants under both control and saline stressed plants. Additionally, improvement in all above parameters of gamma rays treated plants is more in 50 mM salt stressed plants as compared to control and 100 mM.
In non-irradiated pants, saline stress reduced chl. a, chl. b, total chlorophyll contents and more reduction was observed in plants with 100 mM treatment whereas carotenoids content increase, this increase was more in plants with 50 mM salt stress comparing to 100 mM. However, gamma rays treated plants showed enhancement in chl. a, chl. b and total chlorophyll contents in both saline stressed and control conditions. Moreover, augmentation in chlorophyll a, and total chlorophyll was more in 50 mM salt treated plants, followed by control and 100 mM treated while improvement in chlorophyll b content was relatively high in 100 mM salt stress plants comparing to control and other salt stress (100 mM) treatment. Besides, no considerable change in carotenoids observed in pre-sowing gamma irradiated plants under control and salt stress (Fig. 2).
Sodium, potassium and Calcium contents in shoot and root of the plant under normal and stressed condition with both gamma radiation pre-sowing treatment and without radiation treatments are given in Fig. 3. Comparing with control in non-irradiated, salt stresses plants showed significant improvement in there shoot and root Na+ contents while there was prominent drop in K+ of shoot and K+ of root and Ca+ contents. This proliferation in Na+ content and drop in K+ and Ca+ was more with 100 mM treated plants compared to 50 mM in both shoot and root. However, gamma irradiation plants considerably enhanced the shoot and root K+, Ca+ contents whereas decrease in Na+ content was examined.
12 Nawaz et al.,/ GU J. Phytosci. 2(1): 09-16 (2022)
Gamma Irradiation a potent mitigant of saline stress in Maize crop
Figure 1: Influence of pre-sowing gamma irradiation on maize shoot length(a), root length (b), shoot fresh weight (c), root fresh weight (d), shoot dry weight (e), root dry weight (f) and leaf area (g) under saline stress. NIR= non-irradiated, GIR=gamma irradiated.

Nawaz et al.,/ GU J. Phytosci. 2(1): 09-16 (2022) 13
Gamma Irradiation a potent mitigant of saline stress in Maize crop
Figure 2: Influence of pre-sowing gamma irradiation on maize shoot chlorophyll a (a), chlorophyll b (b), Total chlorophyll, (c) carotenoids (d) contents under saline stress. NIR= non-irradiated, GIR=gamma irradiated.
Figure 3: Influence of pre-sowing gamma irradiation on maize shoot Na+ (a), root Na+ (b), shoot K+ (c) root K+ (d) shoot Ca+2 (e) root Ca+2 under saline stress. NIR= non-irradiated, GIR=gamma irradiated.

14 Nawaz et al.,/ GU J. Phytosci. 2(1): 09-16 (2022)
Gamma Irradiation a potent mitigant of saline stress in Maize crop
4. Discussion:
Globally, saline soil has deleterious effect on plant morphology, physiology and on overall development. Several studies revealed the drop in plant physical, biochemical and elemental behaviors (Hussein et al., 2017; Mariam et al., 2021) and included in major threat to food security. Therefore, research on how plants response to stresses especially abiotic and their alleviation is main interest of scientific community. The present study focused on salt (NaCl) stress and its mitigation through pre-sowing gamma irradiation (0 Gy as non-irradiated plants and 100 Gy as gamma irradiated plants) treatment on maize seeds. Both salt stress and gamma irradiation treatments significantly influence the biological activities of maize plant. Saline stressed reduced the morphological characters of root and shoot (length, fresh, dry weight, and leaf area) of Zea mays comparing to control plants and more reduction in these parameters was in plants with more salt concentration (100 mM). Several studies revealed the triggering influence of salt on morphology of plants (Tawaha & Al-Ghzawi, 2013; Alam et al., 2015; Umego et al., 2020; Dikobe et al., 2021). A significant correlation between plant growth and its salt concentration existed, reduction in these growth parameters was due to the ionic toxicity. This decline in growth means reduced shoot and root length, fresh and dry weight of plant (Sehrawat et al., 2013). Salinity result in low water potential within cells and water shortage around the root zone and root could not absorb adequate water and nutrients for normal growth (Sali et al., 2015). On the other hand, pre-sowing gamma irradiated plants under salt stress helped to reduce the negative effect of root length, shoot fresh weight, shoot, root dry weight and leaf area while no change in shoot length and root fresh weight was observed in the present study. Similarly, Toker et al., (2005) reported gamma irradiated seeds significantly increase their root length. Likewise, the root length of wheat and its biomass increased at 20 Gy dose of gamma radiations (Melki & Marouani, 2009). Gamma irradiations may stimulate plant growth and improved morphological features by changing in hormonal signalling or enhancement in reactive oxygen species under stress (Wi et al., 2007). It was recommended that energy demands increased in non-irradiated plants to increase respiration under salinity and this effect manifested the plant growth attributes including leaf area and limit biomass production (Rejili et al., 2008). Leaf area of plants depends on cell division and elongation which are salt sensitive processes and reduced due to decrease in water uptake, salt especially NaCl toxicity and reduced photosynthesis (Ali et al., 2004). Decrease in chlorophyll contents is most likely due to repressive effect of impairment and accumulation of salts on synthesis of the chlorophyll fractions results in declined photosynthesis. Salt stress caused decline in enzymatic activity of an enzyme (amino levulinic acid synthase) which catalyzed the key precursor pigment of chlorophyll (5-aminolevulinic acid). Also, there may be production of proteolytic enzyme (chlorophyllase), responsible for chlorophyll degradation and damaged photosynthetic apparatus (Heidari & Golpayegani, 2012; Vafadar et al., 2020). Mehdikhanlou et al. (2021) reported reduction in photosynthetic pigments under salinity. In another investigation by Khidr (2010) on Calotropis found that salinity reduced the chlorophyll a, b and increased carotenoid contents. Similar results were obtained in current study where non-irradiated plants abridged chlorophyll a, b total chlorophyll and carotenoids content increased due to salinization. However, gamma irradiated plants showed enhancement in these biochemical parameters under both salinity and control comparing with non-irradiated plants. So, Kim et al., (2009) found similar results of enhancement in chlorophyll content by low dose of gamma irradiation. Unlike increase in chlorophyll pigments there was decrease in wheat chlorophyll pigments at gamma radiation dose of 200 Gy (Borzouei et al., 2010). The ultrastructure of irradiated plants showed obvious structural changes in chloroplast and plant plastids were pretentious by two approaches, i.e. restriction of senescence or de-differentiation into a grana (Kim et al., 2004). Under salinity a weak root system develops in plants which leads to impairment in ions balance uptake and even insufficient uptake of nutrients which affect the young plant physiological and biochemical processes. Plants exposed to salinity are more susceptible to osmotic stress. The absorbance of nutrients like K+ and Ca+ is extremely affected in competition with other ions (Na+ and Cl+) in saline stress (Wang et al., 2012; Kausar & Gull, 2019). In the present experiments non-irradiated plants under salinity also showed decline in shoot and root K+ and Ca+ and increase in concentration of Na+ and Cl+ while plants with gamma rays showed decline in NaCl content and improvement in K+ and Ca+ uptake as equated to control and no-irradiated plants. These findings are in accordance with El-Beltagi et al. (2013) on cowpeas which showed there is increase in K+ and Ca+ ions uptake and reduction in Na+ and Cl+ ions uptake of gamma rays treated plants under salinity.
5. Conclusion:
A significant reduction in maize growth, biochemical and nutrients uptake parameters was observed as compared to control except carotenoids which increased under the stress. However, the reduction was more in 100 mM salt treated plants than 50mM in non-irradiated plants. But plants with gamma rays showed improvement in all
Nawaz et al.,/ GU J. Phytosci. 2(1): 09-16 (2022) 15
Gamma Irradiation a potent mitigant of saline stress in Maize crop
growth, biochemical attributes except shoot length and root fresh weight. Similarly, improvement in ionic uptake for K+ and Ca+ with reduction in Na+ uptake was observed. Therefore, it can be helpful in alleviating the salt stress effect on maize along with other crops.
6. References:
AbdElgawad, H., G. Zinta, M.M. Hegab, R. Pandey, H. Asard and W. Abuelsoud. 2016. High salinity induces different oxidative stress and antioxidant responses in maize seedlings organs. Front. Plant Sci., 7: 276.
Alam, M., A.S. Juraimi, M.Y. Rafii and A. Abdul Hamid. 2015. Effect of salinity on biomass yield and physiological and stem-root anatomical characteristics of purslane (Portulaca oleracea L.) accessions. BioMed. Res. Int., 2019: 1-15.
Ali, Y., Z. Aslam, M.Y. Ashraf and G.R. Tahir. 2004. Effect of salinity on chlorophyll concentration, leaf area, yield and yield components of rice genotypes grown under saline environment. International J. Environ. Sci. Technol., 1(3): 221-225.
Ashraf, M. A., A. Akbar, A.Parveen, R. Rasheed, I. Hussain and M. Iqbal. 2018. Phenological application of selenium differentially improves growth, oxidative defense and ion homeostasis in maize under salinity stress. Plant Physiol. Biochem., 123: 268-280.
Askari, K.A., S. Ramezanpour, A. Borzouei, H. Soltanloo, S. Navabpour and S. Saadati. 2021. Application of gamma rays on salinity tolerance of wheat (Triticum aestivum L.) and expression of genes related to biosynthesis of proline, glycine betaine and antioxidant enzymes. Physiol. Mol. Biol. Plants, 27(11): 2533-2547.
Aslam, M., K. Ahmad, M.A. Akhtar and M.A. Maqbool. 2017. Salinity stress in crop plants: effects of stress, tolerance mechanisms and breeding strategies for improvement. J. Agric. Basic Sci., 2(1): 70-85.
Babar, S., E.H. Siddiqi, I. Hussain, K.H. Bhatti and R. Rasheed. 2014. Mitigating the effects of salinity by foliar application of salicylic acid in fenugreek. Physiol. J., 1: 1-6.
Dehpour, A., M. Gholampour, P. Rahdary, M.R.J. Talubaghi and S.M.M. Hamdi. 2011. Effect of gamma irradiation and salt stress on germination, callus, protein and proline in rice (Oryza sativa L.). Iran. J. Plant Physiol., 1(4): 251 ‐256.
Dikobe, T.B., B. Mashile, R.R. Sinthumule and O. Ruzvidzo. 2021. Distinct Morpho-Physiological Responses of Maize to Salinity Stress. Am. J. Plant Sci., 12(6): 946-959.
El-Beltagi, H.S., H.I. Mohamed, A.H.M. Mohammad and A.M. Mogazy. 2013. Physiological and Biochemical Effects of γ-Irradiation on Cowpea Plants (Vigna sinensis) under Salt Stress. Not. Bot. Horti. Agrobot. Cluj Napoca., 41(1): 104-114.
FAO and ITPS. 2015. Status of the World’s Soil Resources (SWSR) – Main Report. Food and Agricultural Organization of the United Nations and Intergovernmental Technical Panel on Soils, Rome, Italy.
Gong, D.H, G.Z. Wang, W.T. Si, Y. Zhou, Z. Liu and J. Jia. Effects of Salt Stress on Photosynthetic Pigments and Activity of Ribulose-1,5-bisphosphate Carboxylase/Oxygenase in Kalidium foliatum. Russ. J. Plant Physiol., 65: 98–103.
Heidari, M. and A. Golpayegani. 2012. Effects of water stress and inoculation with plant growth promoting rhizobacteria (PGPR) on antioxidant status and photosynthetic pigments in basil (Ocimum basilicum L.). J. Saudi Soc. Agric. Sci., 11(1): 57-61.
Hussein, M., A. Embiale, A. Husen., I.M. Aref and M. Iqbal. 2017. Salinity-induced modulation of plant growth and photosynthetic parameters in faba bean (Vicia faba) cultivars. Pak. J. Bot., 49: 867-877.
Kausar, A. and M. Gull. 2019. Influence of salinity stress on the uptake of magnesium, phosphorus, and yield of salt susceptible and tolerant sorghum cultivars (Sorghum bicolor L.). J. Appl. Biol. Biotechnol., 7: 53-58.
Khidr, Z.A., E.D.M. Essam, S.K.E. Tahoon and A.E.S. Sabal. 2010. Stress evokes changes in response to sakha-69 wheat according to sodium and calcium anions. Aust. J. Basic Appl. Sci., 4(12): 6140-6153.
Kim, J. H., M.H. Lee, Y.R. Moon, J.S. Kim, S.G. Wi, T.H. Kim and B.Y. Chung. 2009. Characterization of metabolic disturbances closely linked to the delayed senescence of Arabidopsis leaves after gamma-irradiation. Environ. Exp. Bot., 67(2): 363–371.
Marium, A., A. Kausar, M.Y. Ashraf, H. Kanwal and Z.I.H. Nazli. 2021. Enhancement in biomass and nutrients uptake in cucumber through methionine and phenylalanine under saline soils. Pak. J. Agric. Sci., 58 (1): 125-134.
Melki, M. and A. Marouani. 2009. Effects of gamma rays irradiation on seed germination and growth of hard wheat. Environ. Chem. Lett., 8(4): 307-310.
Moussa, H.R. 2011. Low dose of gamma irradiation enhanced drought tolerance in soybean. Acta Agron. Hung., 59(1): 1-12. Rejili, M., D. Telahigue, B. Lachiheb, A. Mrabet and A. Ferchichi. 2008. Impact of gamma radiation and salinity on growth and
K+/Na+ balance in two populations of Medicago sativa (L.) cultivar Prog. Nat. Sci., 18(9): 1095-1105. Rouf, S.T., K. Prasad and P. Kumar. 2016. Maize—A potential source of human nutrition and health: A review. Cogent Food
Agric., 2(1): 1166995. Sali, A.L.I.U., I. Rusinovci, S. Fetahu, B. Gashi, E. Simeonovska and L. Rozman. 2015. The effect of salt stress on the germination of
maize (Zea mays L.) seeds and photosynthetic pigments. Acta Agric. Slov., 105(1): 85-94. Sehrawat, N., K.V. Bhat, R.K. Sairam, P.K. Jaiwal. 2013. Screening of mungbean (Vigna radiata L. Wilczek) genotypes for salt
tolerance. Int. J. Plant An. Env. Sci., 4: 36-43. Shahzad, H., S. Ullah, M. Iqbal, H.M. Bilal, G.M. Shah, S. Ahmad, A. Zakir, A. Ditta, M.A. Farooqi and I. Ahmad. 2019. Salinity types and
level-based effects on the growth, physiology and nutrient contents of maize (Zea mays). Ital. J. Agron., 14: 199–207. Shahzad, M., K. Witzel, C. Zörb and K.H. Mühling. 2012. Growth‐related changes in subcellular ion patterns in maize leaves (Zea
mays L.) under salt stress. J. Agron. Crop Sci., 198(1): 46-56. Tawaha, A.M. and A.A. Al-Ghzawi. 2013. Effect of Chitosan coating on seed germination and salt-tolerance of lentil. Res. Crops, 14
(2): 489-491. Toker, C., B. Uzun, H. Canci and F.O. Ceylan. 2005. Effects of gamma irradiation on the shoot length of Cicer seeds. Radiat. Phys.

16 Nawaz et al.,/ GU J. Phytosci. 2(1): 09-16 (2022)
Gamma Irradiation a potent mitigant of saline stress in Maize crop
Chem., 73: 365 ‐367. Umego, C., V.O. Ntui, E.E. Ita, C. Opara and E.A. Uyoh. 2020. Screening of Rice Accessions for Tolerance to Drought and Salt Stress
Using Morphological and Physiological Parameters. Am. J. Plant Sci., 11: 2080-2102. Vafadar, F., R. Amooaghaie, P. Ehsanzadeh and M. Ghanadian. 2020. Salinity stress alters ion homeostasis, antioxidant activities
and the production of rosmarinic acid, luteolin and apigenin in Dracocephalum kotschyi Boiss. Biologia, 75(12): 2147-2158.
Wang, Y., L. Li, W. Cui., W., S. Xu., W. Shen and R. Wang. 2012. Hydrogen sulfide enhances alfalfa (Medicago sativa) tolerance against salinity during seed germination by nitric oxide pathway. Plant Soil., 351: 107-119.
Wi, S.G., B.Y. Chung and J.S. Kim .2007. Effects of gamma irradiation on morphological changes and biological responses in plants. Micron, 38: 553 ‐564.
Younessi-Hamzekhanlu, M.Y., Z. Dibazarnia, S. Oustan, V. Teniyah, R. Katam and N. Mahna. 2021. Effect of Salinity on Morphological Characteristics, Biochemical Accumulation, and Essential Oil Yield and Composition in Black Horehound (Ballota nigra L.). Agron., 11(12): 1-15.
Available online at https://www.gudgk.edu.pk/phy-to-science-journal
GU JOURNAL OF PHYTOSCIENCES
GU. J. Phytosci. 2(1): 17-26 (2022)
Genetic Variability in Wheat accession for heat tolerance during seed germination
Genetic variability in Wheat (Triticum aestivum L.) accession for
heat tolerance during seed germination
Tahira Ali1, Adeel Ijaz Shah1, Humaira Shaheen1, Rameez Hussain1, Amir Ali2, Muhammad Bilal
Ahmad Khan3, Ijaz Rasool Noorka4, Saadullah Khan Leghari5, Allah Bakhsh Gulshan5, Faisal
Hussain5, Saher Nawaz5, Muhammad Abid Khan5, Muhammad Ather Nadeem3, Zia-ur-Rehman
Mashwani2 and Aneela Nijabat5*
1Department of Botany, University of Sargodha, 40100-Pakistan 2Department of Botany, PMAS-Arid Agriculture University, Rawalpindi, Punjab, Pakistan 3Department of Agronomy, University of College Agriculture, Sargodha, 40100-Pakistan
4Department of Plant Breeding & Genetics, Ghazi University, Dera Ghazi Khan, 32200-Pakistan
5Department of Botany, Ghazi University, Dera Ghazi Khan, 32200-Pakistan
Abstract
Heat stress drastically reduces the production of cool season crops including wheat (Triticum aestivum L.). Seed germination of
cool season crops is most sensitive to high temperature and reduced germination led to decrease in plant density and yield.
Therefore, present study was aimed to identify the heat tolerant and heat sensitive wheat accessions to improve the yield under
heat stress by wheat breeders. Four wheat cultivars (Anmol_90, Chkwal_50, Moomal_2002 and Sindh_8) were evaluated at six
temperature (25ºC, 30ºC, 35ºC, 37ºC, 40ºC, and 45ºC) regimes and 37ºC was defined as an appropriate screening temperature for
seed germination. Diverse wheat germplasm (n = 50) from National Agriculture Research Center (NARC) Pakistan were
evaluated under control (25ºC) and heat stress (37ºC) treatments. Heat tolerance potential of wheat accessions during seed
germination was measured by using absolute decrease in seed germination (AD), inhibition index of seed germination (II),
relative heat tolerance (RHT), and heat tolerance index (HTI). WB_4721 (winter, 1.21), WB_4515 (winter, 1.09), and WB_6341
(spring, 1.05) are most heat tolerant whereas, WB_4792 (winter, 0.04), WB_6121 (spring, 0.006), and WB_1376CLP (winter,
0.008) are most heat sensitive accessions during seed germination stage.
Keywords: Abiotic stress; Heat Stress; Seed Germination; Wheat Germplasm
1. Introduction:
Rapidly growing world population and global climate changes are the major challenges for farmers and plant breeders to increase the crop production up to a desirable level to meet the future demands (Alipour et al.,
*Corresponding author Tel.: +92 3217558449
E-mail address: [email protected]
© 2022 (Accepted for publication in November 2021) Published by Department of Botany, Selection and/or peer-review under supervision of Executive Committee, Ghazi University, DG Khan, 32200 Pakistan
18 Ali et al.,/ GU J. Phytosci. 2(1): 17-26 (2022)
Genetic Variability in Wheat accession for heat tolerance during seed germination
2017). A remarkable increase of 0.85ºC in the temperature of glob has been recorded over the last fifty years (Rohde et al., 2013) and it is predicted that annual global temperature will rise by 1-3ºC with intense and frequent heat waves by the mid of 21st century and 2-5 ºC by the end of this century (IPCC, 2014). This increase in ambient temperature is a major threat to ensure the sustainable production of fruits, vegetables and cereals, especially in temperate zones (Bolton et al., 2019; Farooq et al., 2011).
Cereals are a rich source of essential dietary nutrients and fibers with minimal fat contents (Laskowski et al., 2019) and wheat (2n = 6x = 42) is second most cultivated cereal crop after rice that feeds around 36% of total population of the world (Kim et al., 2011; Ahmad et al., 2012; Almeselmani et al., 2013). It is a main source of carbohydrates, dietary fibers, vitamin B-complex with considerable amount of proteins and energy as it provides 20% of total calories of daily human diet (Shewry & Hey, 2015). Wheat is globally grown on 30% of agricultural land area with production of 680 million ton annually which is not sufficient to meet the future demands of growing population (FAO, 2017). The forecast demands 840 million ton to 1040 million ton of wheat to fulfill the need of current population of the world in 2020 and about 2.4% increase in current wheat production per annum by 2050 (Willcock & Magan, 2000; Alipour et al., 2017).
Global warming and heat stress has slowed the wheat production since 1990 as it adversely affects the seed germination, seedling emergence, vegetative and reproductive growth (Evenson & Gollin, 2003; Rosegrant & Cline, 2003; Pipolo et al., 2004). Seed germination is most important yield contributing factor and highly influenced by temperature (Hubbard et al., 2012). Optimum temperature favors maximum seed germination, but low and high temperature delay the germination and reduce germination rate (Buriro et al., 2011). Wheat is traditionally grown as cool season crop and optimal seed germination of wheat occurs at temperature of 15ºC, but average temperature of coolest months is greater than 17.5ºC in arid and semi-arid areas of tropical and temperate regions of the world (Tewolde et al., 2006; Gupta et al., 2015). So, early heat stress during seed germination of wheat is most critical because high temperature influence the water imbibition and alters the endogenous production of enzymes including abscisic acid, gibberellins and ethylene (Argyris et al., 2008). Available literature demonstrated the adverse effects of high temperature on seed germination of various crops including spinach, maize, rice, chickpea, carrot and wheat (Riley, 1981; Hum-Musser et al., 1999; Nyachiro et al., 2002; Nascimento et al., 2008; Sikder & Paul, 2010; Buriro et al., 2011; Shah et al., 2011; Noomene et al., 2013; Iloh et al., 2014; Balla et al., 2019; Bolton et al., 2019).
In previous studies, only six wheat cultivars were evaluated under temperature of 30ºC and relatively little has been reported about the adverse impacts of high temperature of 36 ºC on seed germination of five wheat cultivars only (Sikder & Paul, 2010). Therefore, the present study was designed to evaluate the heat tolerance potential of wheat crop.
1.1. Objectives:
• To identify the threshold temperature value for heat tolerance evaluation of wheat crop. • To evaluate the heat tolerance potential of wheat (25 winter and 25 spring) accessions under high
temperature regimes. • To evaluate the relationship between domestication season, seed texture, seed color and heat tolerance of
wheat.
2. Materials and Methods:
2.1. Wheat Germplasm:
A total of fifty wheat accessions collected from National Plant Germplasm System (NPGS), United States, and four commercial fresh cultivars widely grown in the Pakistan from local market District Sargodha, were evaluated for heat tolerance during seed germination. The 50 wheat accessions were classified into two types based on sowing season (winter and spring), seed color (white and red), and seed texture (hard and soft).
2.2. Determination of Optimal Temperature for Heat Tolerance Evaluation:
A preliminary study was conducted for optimal temperature determination for evaluation of heat tolerance in wheat seed germination. Four widely grown commercial cultivars (Anmol_90, Chkwal_50, Moomal_2002 and Sindh_8) were chosen to evaluate seed germination potential under six temperatures (25ºC, 30ºC, 35ºC, 37ºC, 40ºC, and 45ºC). The temperature shown statistically most significant differences between the tested cultivars was chosen as the
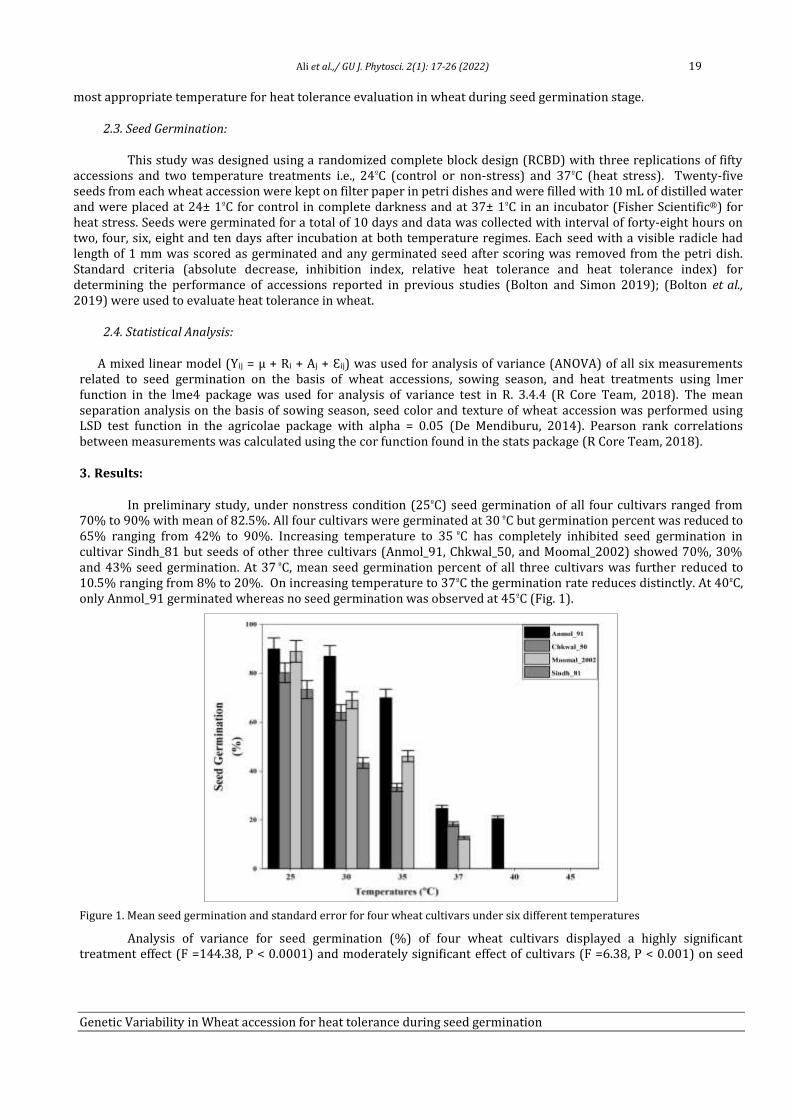
Ali et al.,/ GU J. Phytosci. 2(1): 17-26 (2022) 19
Genetic Variability in Wheat accession for heat tolerance during seed germination
most appropriate temperature for heat tolerance evaluation in wheat during seed germination stage.
2.3. Seed Germination:
This study was designed using a randomized complete block design (RCBD) with three replications of fifty accessions and two temperature treatments i.e., 24ºC (control or non-stress) and 37ºC (heat stress). Twenty-five seeds from each wheat accession were kept on filter paper in petri dishes and were filled with 10 mL of distilled water and were placed at 24± 1ºC for control in complete darkness and at 37± 1ºC in an incubator (Fisher Scientific®) for heat stress. Seeds were germinated for a total of 10 days and data was collected with interval of forty-eight hours on two, four, six, eight and ten days after incubation at both temperature regimes. Each seed with a visible radicle had length of 1 mm was scored as germinated and any germinated seed after scoring was removed from the petri dish. Standard criteria (absolute decrease, inhibition index, relative heat tolerance and heat tolerance index) for determining the performance of accessions reported in previous studies (Bolton and Simon 2019); (Bolton et al., 2019) were used to evaluate heat tolerance in wheat.
2.4. Statistical Analysis:
A mixed linear model (Yij = µ + Ri + Aj + Ɛij) was used for analysis of variance (ANOVA) of all six measurements related to seed germination on the basis of wheat accessions, sowing season, and heat treatments using lmer function in the lme4 package was used for analysis of variance test in R. 3.4.4 (R Core Team, 2018). The mean separation analysis on the basis of sowing season, seed color and texture of wheat accession was performed using LSD test function in the agricolae package with alpha = 0.05 (De Mendiburu, 2014). Pearson rank correlations between measurements was calculated using the cor function found in the stats package (R Core Team, 2018).
3. Results:
In preliminary study, under nonstress condition (25ºC) seed germination of all four cultivars ranged from 70% to 90% with mean of 82.5%. All four cultivars were germinated at 30 ºC but germination percent was reduced to 65% ranging from 42% to 90%. Increasing temperature to 35 ºC has completely inhibited seed germination in cultivar Sindh_81 but seeds of other three cultivars (Anmol_91, Chkwal_50, and Moomal_2002) showed 70%, 30% and 43% seed germination. At 37 ºC, mean seed germination percent of all three cultivars was further reduced to 10.5% ranging from 8% to 20%. On increasing temperature to 37ºC the germination rate reduces distinctly. At 40ºC, only Anmol_91 germinated whereas no seed germination was observed at 45ºC (Fig. 1).
Figure 1. Mean seed germination and standard error for four wheat cultivars under six different temperatures
Analysis of variance for seed germination (%) of four wheat cultivars displayed a highly significant treatment effect (F =144.38, P < 0.0001) and moderately significant effect of cultivars (F =6.38, P < 0.001) on seed
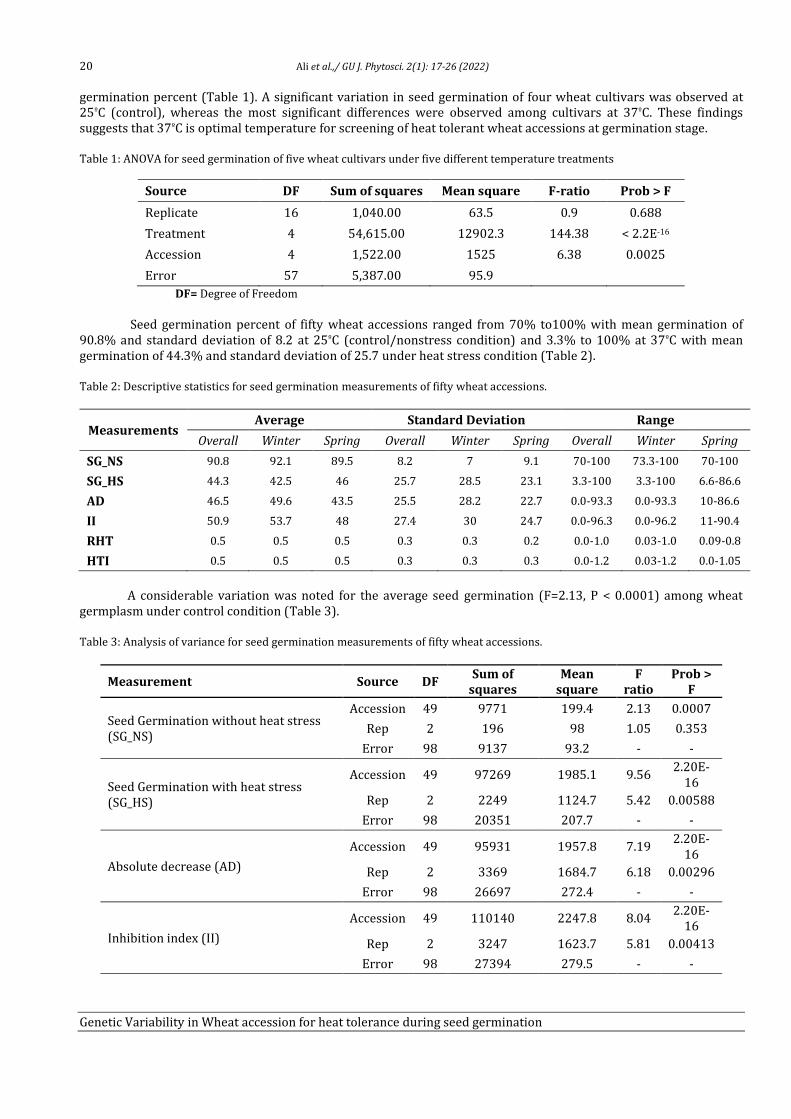
20 Ali et al.,/ GU J. Phytosci. 2(1): 17-26 (2022)
Genetic Variability in Wheat accession for heat tolerance during seed germination
germination percent (Table 1). A significant variation in seed germination of four wheat cultivars was observed at 25ºC (control), whereas the most significant differences were observed among cultivars at 37ºC. These findings suggests that 37ºC is optimal temperature for screening of heat tolerant wheat accessions at germination stage.
Table 1: ANOVA for seed germination of five wheat cultivars under five different temperature treatments
Source DF Sum of squares Mean square F-ratio Prob > F
Replicate 16 1,040.00 63.5 0.9 0.688
Treatment 4 54,615.00 12902.3 144.38 < 2.2E-16
Accession 4 1,522.00 1525 6.38 0.0025
Error 57 5,387.00 95.9
DF= Degree of Freedom
Seed germination percent of fifty wheat accessions ranged from 70% to100% with mean germination of 90.8% and standard deviation of 8.2 at 25ºC (control/nonstress condition) and 3.3% to 100% at 37ºC with mean germination of 44.3% and standard deviation of 25.7 under heat stress condition (Table 2).
Table 2: Descriptive statistics for seed germination measurements of fifty wheat accessions.
Measurements Average Standard Deviation Range
Overall Winter Spring Overall Winter Spring Overall Winter Spring
SG_NS 90.8 92.1 89.5 8.2 7 9.1 70-100 73.3-100 70-100
SG_HS 44.3 42.5 46 25.7 28.5 23.1 3.3-100 3.3-100 6.6-86.6
AD 46.5 49.6 43.5 25.5 28.2 22.7 0.0-93.3 0.0-93.3 10-86.6
II 50.9 53.7 48 27.4 30 24.7 0.0-96.3 0.0-96.2 11-90.4
RHT 0.5 0.5 0.5 0.3 0.3 0.2 0.0-1.0 0.03-1.0 0.09-0.8
HTI 0.5 0.5 0.5 0.3 0.3 0.3 0.0-1.2 0.03-1.2 0.0-1.05
A considerable variation was noted for the average seed germination (F=2.13, P < 0.0001) among wheat germplasm under control condition (Table 3).
Table 3: Analysis of variance for seed germination measurements of fifty wheat accessions.
Measurement Source DF Sum of
squares Mean
square F
ratio Prob >
F
Seed Germination without heat stress (SG_NS)
Accession 49 9771 199.4 2.13 0.0007
Rep 2 196 98 1.05 0.353
Error 98 9137 93.2 - -
Seed Germination with heat stress (SG_HS)
Accession 49 97269 1985.1 9.56 2.20E-
16
Rep 2 2249 1124.7 5.42 0.00588
Error 98 20351 207.7 - -
Absolute decrease (AD)
Accession 49 95931 1957.8 7.19 2.20E-
16
Rep 2 3369 1684.7 6.18 0.00296
Error 98 26697 272.4 - -
Inhibition index (II)
Accession 49 110140 2247.8 8.04 2.20E-
16
Rep 2 3247 1623.7 5.81 0.00413
Error 98 27394 279.5 - -
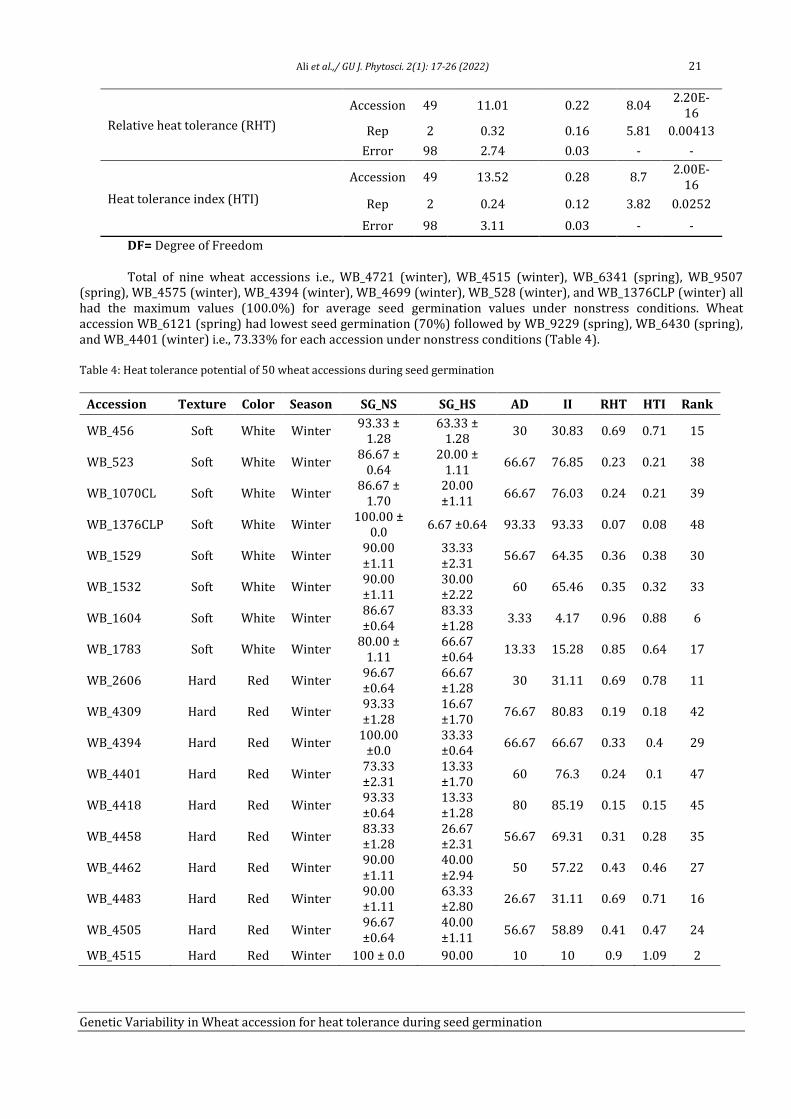
Ali et al.,/ GU J. Phytosci. 2(1): 17-26 (2022) 21
Genetic Variability in Wheat accession for heat tolerance during seed germination
Relative heat tolerance (RHT)
Accession 49 11.01 0.22 8.04 2.20E-
16
Rep 2 0.32 0.16 5.81 0.00413
Error 98 2.74 0.03 - -
Heat tolerance index (HTI)
Accession 49 13.52 0.28 8.7 2.00E-
16
Rep 2 0.24 0.12 3.82 0.0252
Error 98 3.11 0.03 - -
DF= Degree of Freedom
Total of nine wheat accessions i.e., WB_4721 (winter), WB_4515 (winter), WB_6341 (spring), WB_9507 (spring), WB_4575 (winter), WB_4394 (winter), WB_4699 (winter), WB_528 (winter), and WB_1376CLP (winter) all had the maximum values (100.0%) for average seed germination values under nonstress conditions. Wheat accession WB_6121 (spring) had lowest seed germination (70%) followed by WB_9229 (spring), WB_6430 (spring), and WB_4401 (winter) i.e., 73.33% for each accession under nonstress conditions (Table 4).
Table 4: Heat tolerance potential of 50 wheat accessions during seed germination
Accession Texture Color Season SG_NS SG_HS AD II RHT HTI Rank
WB_456 Soft White Winter 93.33 ±
1.28 63.33 ±
1.28 30 30.83 0.69 0.71 15
WB_523 Soft White Winter 86.67 ±
0.64 20.00 ±
1.11 66.67 76.85 0.23 0.21 38
WB_1070CL Soft White Winter 86.67 ±
1.70 20.00 ±1.11
66.67 76.03 0.24 0.21 39
WB_1376CLP Soft White Winter 100.00 ±
0.0 6.67 ±0.64 93.33 93.33 0.07 0.08 48
WB_1529 Soft White Winter 90.00 ±1.11
33.33 ±2.31
56.67 64.35 0.36 0.38 30
WB_1532 Soft White Winter 90.00 ±1.11
30.00 ±2.22
60 65.46 0.35 0.32 33
WB_1604 Soft White Winter 86.67 ±0.64
83.33 ±1.28
3.33 4.17 0.96 0.88 6
WB_1783 Soft White Winter 80.00 ±
1.11 66.67 ±0.64
13.33 15.28 0.85 0.64 17
WB_2606 Hard Red Winter 96.67 ±0.64
66.67 ±1.28
30 31.11 0.69 0.78 11
WB_4309 Hard Red Winter 93.33 ±1.28
16.67 ±1.70
76.67 80.83 0.19 0.18 42
WB_4394 Hard Red Winter 100.00
±0.0 33.33 ±0.64
66.67 66.67 0.33 0.4 29
WB_4401 Hard Red Winter 73.33 ±2.31
13.33 ±1.70
60 76.3 0.24 0.1 47
WB_4418 Hard Red Winter 93.33 ±0.64
13.33 ±1.28
80 85.19 0.15 0.15 45
WB_4458 Hard Red Winter 83.33 ±1.28
26.67 ±2.31
56.67 69.31 0.31 0.28 35
WB_4462 Hard Red Winter 90.00 ±1.11
40.00 ±2.94
50 57.22 0.43 0.46 27
WB_4483 Hard Red Winter 90.00 ±1.11
63.33 ±2.80
26.67 31.11 0.69 0.71 16
WB_4505 Hard Red Winter 96.67 ±0.64
40.00 ±1.11
56.67 58.89 0.41 0.47 24
WB_4515 Hard Red Winter 100 ± 0.0 90.00 10 10 0.9 1.09 2
22 Ali et al.,/ GU J. Phytosci. 2(1): 17-26 (2022)
Genetic Variability in Wheat accession for heat tolerance during seed germination
±1.11
WB_4575 Hard Red Winter 100.00
±0.0 66.67 ±2.57
33.33 33.33 0.67 0.81 9
WB_4595 Hard Red Winter 93.33 ±0.64
70.00 ±2.22
23.33 25.56 0.74 0.8 10
WB_4623CLP Hard Red Winter 90.00 ±1.11
66.67 ±1.70
23.33 24.81 0.75 0.72 14
WB_4699 Hard Red Winter 100.00
±0.0 16.67 ±1.28
83.33 83.33 0.17 0.2 40
WB_4721 Hard Red Winter 100.00
±0.0 100.00
±0.0 0 0 1 1.21 1
WB_4792 Hard Red Winter 90.00 ±0.0 3.33 ±0.64 86.67 96.3 0.04 0.04 50
WB_528 Soft White Winter 100.00
±0.0 13.33 ±1.70
86.67 86.67 0.13 0.16 43
WB_6430 Soft White Spring 73.33 ±2.31
26.67 ±1.28
46.67 57.59 0.42 0.22 37
WB_6341 Soft White Spring 100.00
±0.0 86.67 ±1.70
13.33 13.33 0.87 1.05 3
WB_6121 Soft White Spring 70.00 ±0.0 6.67 ± 0.64 63.33 90.48 0.1 0.06 49
WB_1035CL+ Soft White Spring 90.00 ±1.11
26.67 ±0.64
63.33 70.09 0.3 0.29 34
WB_Hartline Hard White Spring 96.67 ±0.64
10.00 ±1.11
86.67 89.63 0.1 0.12 46
WB_7202CLP Hard White Spring 76.67 ±1.70
46.67 ±0.64
30 38.43 0.62 0.44 28
WB_7589 Hard White Spring 90.00 ±1.92
33.33 ±2.80
56.67 58.1 0.42 0.33 32
WB_7566 Hard White Spring 93.33 ±0.64
13.33 ±0.64
80 85.56 0.14 0.15 44
WB_7417 Hard White Spring 80.00 ±1.11
50.00 ±1.11
30 35.78 0.64 0.48 23
WB_7328 Hard White Spring 96.67 ±0.64
30.00 ±1.11
66.67 68.52 0.31 0.35 31
WB_7696 Hard Red Spring 96.67 ±0.64
46.67 ±2.57
50 52.59 0.47 0.56 19
WB_9112 Hard Red Spring 96.67 ±0.64
73.33 ±0.64
23.33 24.07 0.76 0.86 7
WB_9229 Hard Red Spring 73.33 ±1.70
53.33 ±1.28
20 26.98 0.73 0.49 22
WB_9350 Hard Red Spring 86.67 ±2.57
43.33 ±0.64
43.33 47.78 0.52 0.46 26
WB_9377 Hard Red Spring 93.33 ±0.64
76.67 ±1.70
16.67 17.04 0.83 0.86 8
WB_9411 Hard Red Spring 93.33 ±0.64
63.33 ±5.25
30 33.33 0.67 0.73 13
WB_9433 Hard Red Spring 96.67 ±0.64
16.67 ±0.64
80 82.59 0.17 0.19 41
WB_9479 Hard Red Spring 93.33 ±0.64
23.33 ±0.64
70 74.81 0.25 0.26 36
WB_9483 Hard Red Spring 86.67 ±1.28
50.00 ±1.92
36.67 43.33 0.57 0.54 21
WB_9490 Hard Red Spring 96.67 ±0.64
40.00 ±1.92
56.67 58.89 0.41 0.47 25
WB_9507 Hard Red Spring 100.00
±0.0 73.33 ±1.28
26.67 26.67 0.73 0.89 5
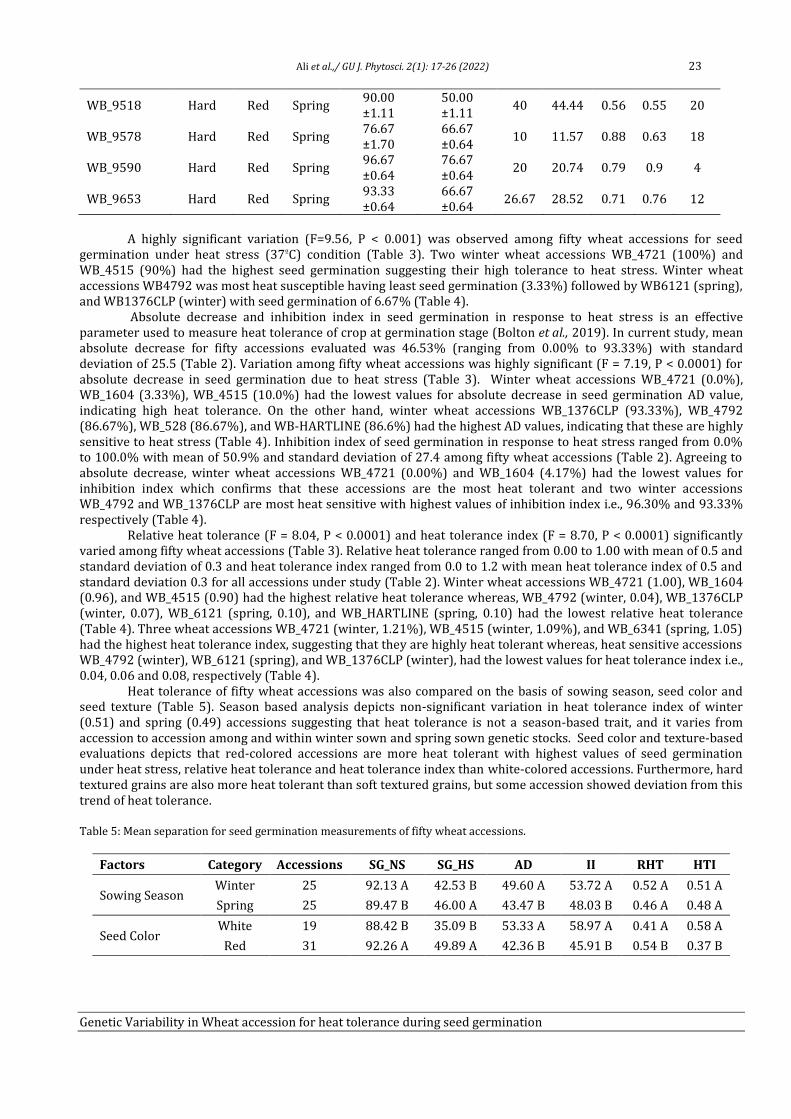
Ali et al.,/ GU J. Phytosci. 2(1): 17-26 (2022) 23
Genetic Variability in Wheat accession for heat tolerance during seed germination
WB_9518 Hard Red Spring 90.00 ±1.11
50.00 ±1.11
40 44.44 0.56 0.55 20
WB_9578 Hard Red Spring 76.67 ±1.70
66.67 ±0.64
10 11.57 0.88 0.63 18
WB_9590 Hard Red Spring 96.67 ±0.64
76.67 ±0.64
20 20.74 0.79 0.9 4
WB_9653 Hard Red Spring 93.33 ±0.64
66.67 ±0.64
26.67 28.52 0.71 0.76 12
A highly significant variation (F=9.56, P < 0.001) was observed among fifty wheat accessions for seed germination under heat stress (37ºC) condition (Table 3). Two winter wheat accessions WB_4721 (100%) and WB_4515 (90%) had the highest seed germination suggesting their high tolerance to heat stress. Winter wheat accessions WB4792 was most heat susceptible having least seed germination (3.33%) followed by WB6121 (spring), and WB1376CLP (winter) with seed germination of 6.67% (Table 4).
Absolute decrease and inhibition index in seed germination in response to heat stress is an effective parameter used to measure heat tolerance of crop at germination stage (Bolton et al., 2019). In current study, mean absolute decrease for fifty accessions evaluated was 46.53% (ranging from 0.00% to 93.33%) with standard deviation of 25.5 (Table 2). Variation among fifty wheat accessions was highly significant (F = 7.19, P < 0.0001) for absolute decrease in seed germination due to heat stress (Table 3). Winter wheat accessions WB_4721 (0.0%), WB_1604 (3.33%), WB_4515 (10.0%) had the lowest values for absolute decrease in seed germination AD value, indicating high heat tolerance. On the other hand, winter wheat accessions WB_1376CLP (93.33%), WB_4792 (86.67%), WB_528 (86.67%), and WB-HARTLINE (86.6%) had the highest AD values, indicating that these are highly sensitive to heat stress (Table 4). Inhibition index of seed germination in response to heat stress ranged from 0.0% to 100.0% with mean of 50.9% and standard deviation of 27.4 among fifty wheat accessions (Table 2). Agreeing to absolute decrease, winter wheat accessions WB_4721 (0.00%) and WB_1604 (4.17%) had the lowest values for inhibition index which confirms that these accessions are the most heat tolerant and two winter accessions WB_4792 and WB_1376CLP are most heat sensitive with highest values of inhibition index i.e., 96.30% and 93.33% respectively (Table 4).
Relative heat tolerance (F = 8.04, P < 0.0001) and heat tolerance index (F = 8.70, P < 0.0001) significantly varied among fifty wheat accessions (Table 3). Relative heat tolerance ranged from 0.00 to 1.00 with mean of 0.5 and standard deviation of 0.3 and heat tolerance index ranged from 0.0 to 1.2 with mean heat tolerance index of 0.5 and standard deviation 0.3 for all accessions under study (Table 2). Winter wheat accessions WB_4721 (1.00), WB_1604 (0.96), and WB_4515 (0.90) had the highest relative heat tolerance whereas, WB_4792 (winter, 0.04), WB_1376CLP (winter, 0.07), WB_6121 (spring, 0.10), and WB_HARTLINE (spring, 0.10) had the lowest relative heat tolerance (Table 4). Three wheat accessions WB_4721 (winter, 1.21%), WB_4515 (winter, 1.09%), and WB_6341 (spring, 1.05) had the highest heat tolerance index, suggesting that they are highly heat tolerant whereas, heat sensitive accessions WB_4792 (winter), WB_6121 (spring), and WB_1376CLP (winter), had the lowest values for heat tolerance index i.e., 0.04, 0.06 and 0.08, respectively (Table 4).
Heat tolerance of fifty wheat accessions was also compared on the basis of sowing season, seed color and seed texture (Table 5). Season based analysis depicts non-significant variation in heat tolerance index of winter (0.51) and spring (0.49) accessions suggesting that heat tolerance is not a season-based trait, and it varies from accession to accession among and within winter sown and spring sown genetic stocks. Seed color and texture-based evaluations depicts that red-colored accessions are more heat tolerant with highest values of seed germination under heat stress, relative heat tolerance and heat tolerance index than white-colored accessions. Furthermore, hard textured grains are also more heat tolerant than soft textured grains, but some accession showed deviation from this trend of heat tolerance.
Table 5: Mean separation for seed germination measurements of fifty wheat accessions.
Factors Category Accessions SG_NS SG_HS AD II RHT HTI
Sowing Season Winter 25 92.13 A 42.53 B 49.60 A 53.72 A 0.52 A 0.51 A
Spring 25 89.47 B 46.00 A 43.47 B 48.03 B 0.46 A 0.48 A
Seed Color White 19 88.42 B 35.09 B 53.33 A 58.97 A 0.41 A 0.58 A
Red 31 92.26 A 49.89 A 42.36 B 45.91 B 0.54 B 0.37 B
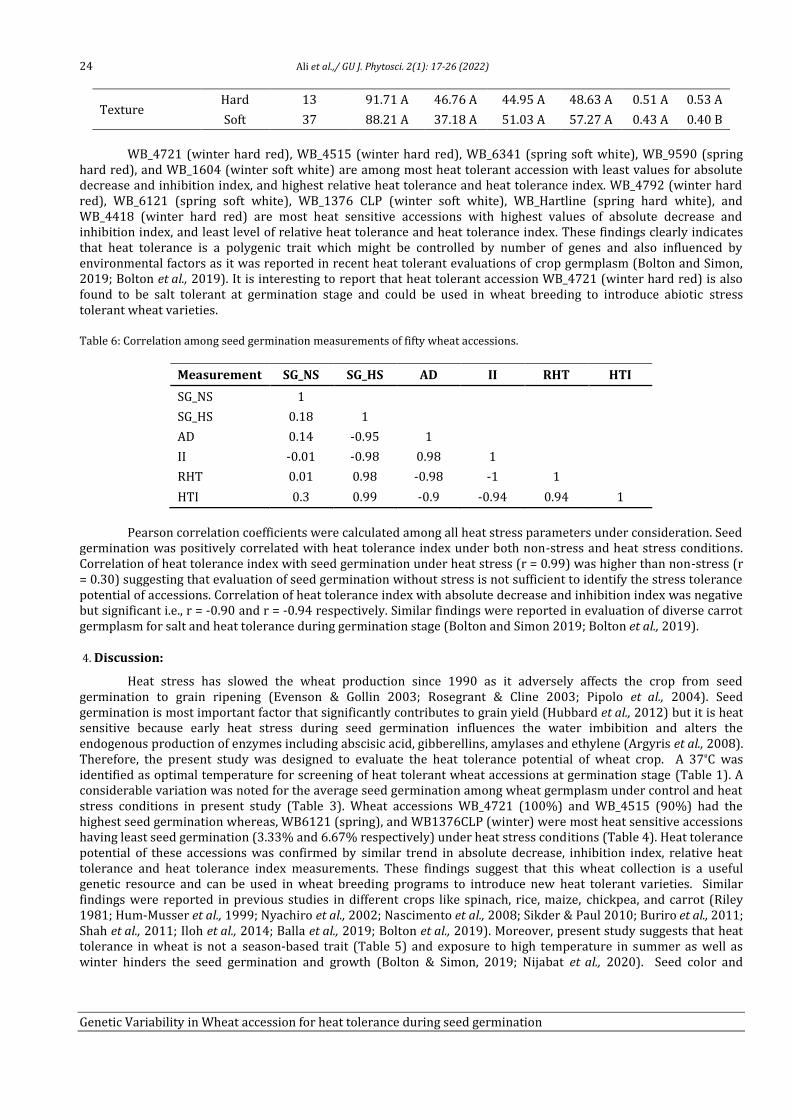
24 Ali et al.,/ GU J. Phytosci. 2(1): 17-26 (2022)
Genetic Variability in Wheat accession for heat tolerance during seed germination
Texture Hard 13 91.71 A 46.76 A 44.95 A 48.63 A 0.51 A 0.53 A
Soft 37 88.21 A 37.18 A 51.03 A 57.27 A 0.43 A 0.40 B
WB_4721 (winter hard red), WB_4515 (winter hard red), WB_6341 (spring soft white), WB_9590 (spring hard red), and WB_1604 (winter soft white) are among most heat tolerant accession with least values for absolute decrease and inhibition index, and highest relative heat tolerance and heat tolerance index. WB_4792 (winter hard red), WB_6121 (spring soft white), WB_1376 CLP (winter soft white), WB_Hartline (spring hard white), and WB_4418 (winter hard red) are most heat sensitive accessions with highest values of absolute decrease and inhibition index, and least level of relative heat tolerance and heat tolerance index. These findings clearly indicates that heat tolerance is a polygenic trait which might be controlled by number of genes and also influenced by environmental factors as it was reported in recent heat tolerant evaluations of crop germplasm (Bolton and Simon, 2019; Bolton et al., 2019). It is interesting to report that heat tolerant accession WB_4721 (winter hard red) is also found to be salt tolerant at germination stage and could be used in wheat breeding to introduce abiotic stress tolerant wheat varieties.
Table 6: Correlation among seed germination measurements of fifty wheat accessions.
Measurement SG_NS SG_HS AD II RHT HTI
SG_NS 1
SG_HS 0.18 1
AD 0.14 -0.95 1
II -0.01 -0.98 0.98 1
RHT 0.01 0.98 -0.98 -1 1
HTI 0.3 0.99 -0.9 -0.94 0.94 1
Pearson correlation coefficients were calculated among all heat stress parameters under consideration. Seed germination was positively correlated with heat tolerance index under both non-stress and heat stress conditions. Correlation of heat tolerance index with seed germination under heat stress (r = 0.99) was higher than non-stress (r = 0.30) suggesting that evaluation of seed germination without stress is not sufficient to identify the stress tolerance potential of accessions. Correlation of heat tolerance index with absolute decrease and inhibition index was negative but significant i.e., r = -0.90 and r = -0.94 respectively. Similar findings were reported in evaluation of diverse carrot germplasm for salt and heat tolerance during germination stage (Bolton and Simon 2019; Bolton et al., 2019).
4. Discussion:
Heat stress has slowed the wheat production since 1990 as it adversely affects the crop from seed germination to grain ripening (Evenson & Gollin 2003; Rosegrant & Cline 2003; Pipolo et al., 2004). Seed germination is most important factor that significantly contributes to grain yield (Hubbard et al., 2012) but it is heat sensitive because early heat stress during seed germination influences the water imbibition and alters the endogenous production of enzymes including abscisic acid, gibberellins, amylases and ethylene (Argyris et al., 2008). Therefore, the present study was designed to evaluate the heat tolerance potential of wheat crop. A 37ºC was identified as optimal temperature for screening of heat tolerant wheat accessions at germination stage (Table 1). A considerable variation was noted for the average seed germination among wheat germplasm under control and heat stress conditions in present study (Table 3). Wheat accessions WB_4721 (100%) and WB_4515 (90%) had the highest seed germination whereas, WB6121 (spring), and WB1376CLP (winter) were most heat sensitive accessions having least seed germination (3.33% and 6.67% respectively) under heat stress conditions (Table 4). Heat tolerance potential of these accessions was confirmed by similar trend in absolute decrease, inhibition index, relative heat tolerance and heat tolerance index measurements. These findings suggest that this wheat collection is a useful genetic resource and can be used in wheat breeding programs to introduce new heat tolerant varieties. Similar findings were reported in previous studies in different crops like spinach, rice, maize, chickpea, and carrot (Riley 1981; Hum-Musser et al., 1999; Nyachiro et al., 2002; Nascimento et al., 2008; Sikder & Paul 2010; Buriro et al., 2011; Shah et al., 2011; Iloh et al., 2014; Balla et al., 2019; Bolton et al., 2019). Moreover, present study suggests that heat tolerance in wheat is not a season-based trait (Table 5) and exposure to high temperature in summer as well as winter hinders the seed germination and growth (Bolton & Simon, 2019; Nijabat et al., 2020). Seed color and
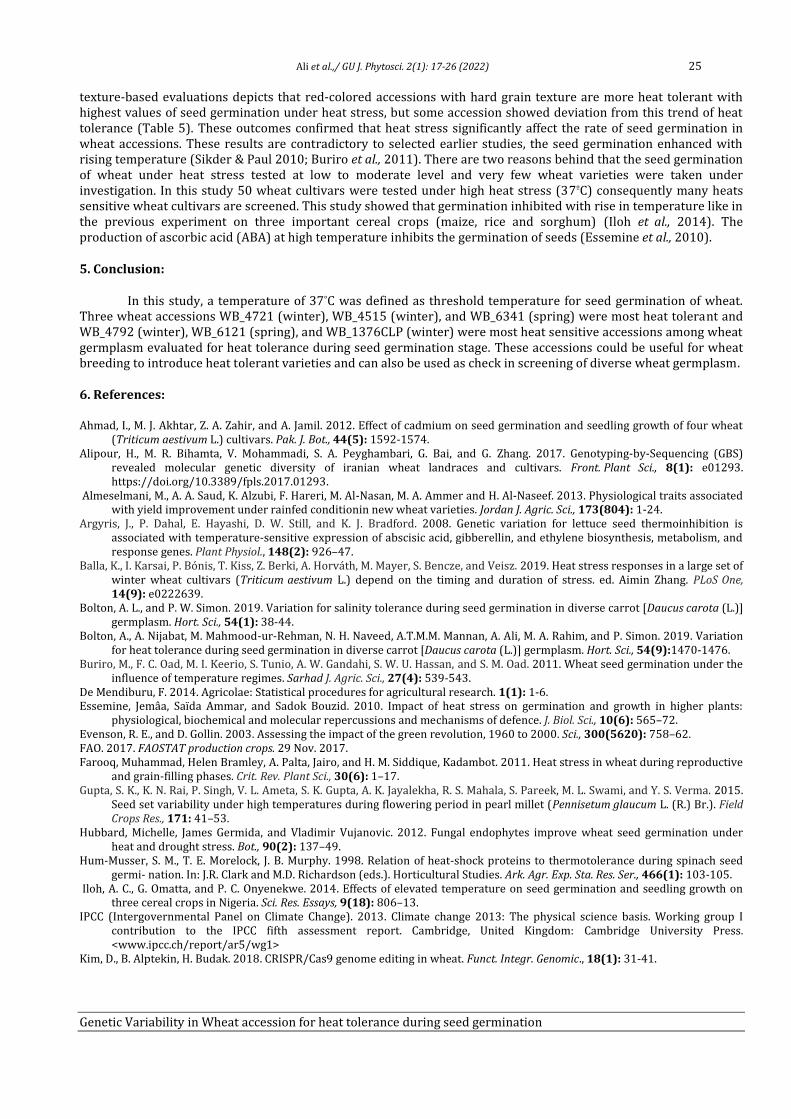
Ali et al.,/ GU J. Phytosci. 2(1): 17-26 (2022) 25
Genetic Variability in Wheat accession for heat tolerance during seed germination
texture-based evaluations depicts that red-colored accessions with hard grain texture are more heat tolerant with highest values of seed germination under heat stress, but some accession showed deviation from this trend of heat tolerance (Table 5). These outcomes confirmed that heat stress significantly affect the rate of seed germination in wheat accessions. These results are contradictory to selected earlier studies, the seed germination enhanced with rising temperature (Sikder & Paul 2010; Buriro et al., 2011). There are two reasons behind that the seed germination of wheat under heat stress tested at low to moderate level and very few wheat varieties were taken under investigation. In this study 50 wheat cultivars were tested under high heat stress (37ºC) consequently many heats sensitive wheat cultivars are screened. This study showed that germination inhibited with rise in temperature like in the previous experiment on three important cereal crops (maize, rice and sorghum) (Iloh et al., 2014). The production of ascorbic acid (ABA) at high temperature inhibits the germination of seeds (Essemine et al., 2010).
5. Conclusion:
In this study, a temperature of 37°C was defined as threshold temperature for seed germination of wheat. Three wheat accessions WB_4721 (winter), WB_4515 (winter), and WB_6341 (spring) were most heat tolerant and WB_4792 (winter), WB_6121 (spring), and WB_1376CLP (winter) were most heat sensitive accessions among wheat germplasm evaluated for heat tolerance during seed germination stage. These accessions could be useful for wheat breeding to introduce heat tolerant varieties and can also be used as check in screening of diverse wheat germplasm.
6. References:
Ahmad, I., M. J. Akhtar, Z. A. Zahir, and A. Jamil. 2012. Effect of cadmium on seed germination and seedling growth of four wheat (Triticum aestivum L.) cultivars. Pak. J. Bot., 44(5): 1592-1574.
Alipour, H., M. R. Bihamta, V. Mohammadi, S. A. Peyghambari, G. Bai, and G. Zhang. 2017. Genotyping-by-Sequencing (GBS) revealed molecular genetic diversity of iranian wheat landraces and cultivars. Front. Plant Sci., 8(1): e01293. https://doi.org/10.3389/fpls.2017.01293.
Almeselmani, M., A. A. Saud, K. Alzubi, F. Hareri, M. Al-Nasan, M. A. Ammer and H. Al-Naseef. 2013. Physiological traits associated with yield improvement under rainfed conditionin new wheat varieties. Jordan J. Agric. Sci., 173(804): 1-24.
Argyris, J., P. Dahal, E. Hayashi, D. W. Still, and K. J. Bradford. 2008. Genetic variation for lettuce seed thermoinhibition is associated with temperature-sensitive expression of abscisic acid, gibberellin, and ethylene biosynthesis, metabolism, and response genes. Plant Physiol., 148(2): 926–47.
Balla, K., I. Karsai, P. Bónis, T. Kiss, Z. Berki, A. Horváth, M. Mayer, S. Bencze, and Veisz. 2019. Heat stress responses in a large set of winter wheat cultivars (Triticum aestivum L.) depend on the timing and duration of stress. ed. Aimin Zhang. PLoS One, 14(9): e0222639.
Bolton, A. L., and P. W. Simon. 2019. Variation for salinity tolerance during seed germination in diverse carrot [Daucus carota (L.)] germplasm. Hort. Sci., 54(1): 38-44.
Bolton, A., A. Nijabat, M. Mahmood-ur-Rehman, N. H. Naveed, A.T.M.M. Mannan, A. Ali, M. A. Rahim, and P. Simon. 2019. Variation for heat tolerance during seed germination in diverse carrot [Daucus carota (L.)] germplasm. Hort. Sci., 54(9):1470-1476.
Buriro, M., F. C. Oad, M. I. Keerio, S. Tunio, A. W. Gandahi, S. W. U. Hassan, and S. M. Oad. 2011. Wheat seed germination under the influence of temperature regimes. Sarhad J. Agric. Sci., 27(4): 539-543.
De Mendiburu, F. 2014. Agricolae: Statistical procedures for agricultural research. 1(1): 1-6. Essemine, Jemâa, Saïda Ammar, and Sadok Bouzid. 2010. Impact of heat stress on germination and growth in higher plants:
physiological, biochemical and molecular repercussions and mechanisms of defence. J. Biol. Sci., 10(6): 565–72. Evenson, R. E., and D. Gollin. 2003. Assessing the impact of the green revolution, 1960 to 2000. Sci., 300(5620): 758–62. FAO. 2017. FAOSTAT production crops. 29 Nov. 2017. Farooq, Muhammad, Helen Bramley, A. Palta, Jairo, and H. M. Siddique, Kadambot. 2011. Heat stress in wheat during reproductive
and grain-filling phases. Crit. Rev. Plant Sci., 30(6): 1–17. Gupta, S. K., K. N. Rai, P. Singh, V. L. Ameta, S. K. Gupta, A. K. Jayalekha, R. S. Mahala, S. Pareek, M. L. Swami, and Y. S. Verma. 2015.
Seed set variability under high temperatures during flowering period in pearl millet (Pennisetum glaucum L. (R.) Br.). Field Crops Res., 171: 41–53.
Hubbard, Michelle, James Germida, and Vladimir Vujanovic. 2012. Fungal endophytes improve wheat seed germination under heat and drought stress. Bot., 90(2): 137–49.
Hum-Musser, S. M., T. E. Morelock, J. B. Murphy. 1998. Relation of heat‐shock proteins to thermotolerance during spinach seed germi‐ nation. In: J.R. Clark and M.D. Richardson (eds.). Horticultural Studies. Ark. Agr. Exp. Sta. Res. Ser., 466(1): 103‐105.
Iloh, A. C., G. Omatta, and P. C. Onyenekwe. 2014. Effects of elevated temperature on seed germination and seedling growth on three cereal crops in Nigeria. Sci. Res. Essays, 9(18): 806–13.
IPCC (Intergovernmental Panel on Climate Change). 2013. Climate change 2013: The physical science basis. Working group I contribution to the IPCC fifth assessment report. Cambridge, United Kingdom: Cambridge University Press. <www.ipcc.ch/report/ar5/wg1>
Kim, D., B. Alptekin, H. Budak. 2018. CRISPR/Cas9 genome editing in wheat. Funct. Integr. Genomic., 18(1): 31-41.
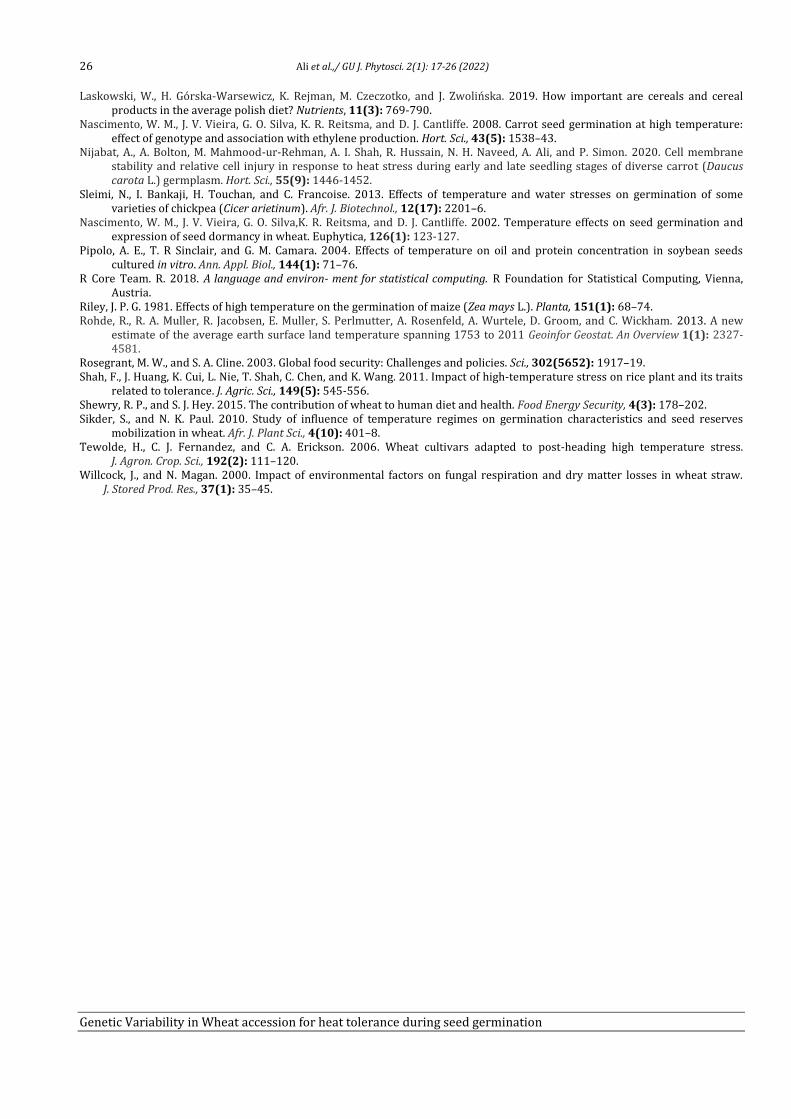
26 Ali et al.,/ GU J. Phytosci. 2(1): 17-26 (2022)
Genetic Variability in Wheat accession for heat tolerance during seed germination
Laskowski, W., H. Górska-Warsewicz, K. Rejman, M. Czeczotko, and J. Zwolińska. 2019. How important are cereals and cereal products in the average polish diet? Nutrients, 11(3): 769-790.
Nascimento, W. M., J. V. Vieira, G. O. Silva, K. R. Reitsma, and D. J. Cantliffe. 2008. Carrot seed germination at high temperature: effect of genotype and association with ethylene production. Hort. Sci., 43(5): 1538–43.
Nijabat, A., A. Bolton, M. Mahmood-ur-Rehman, A. I. Shah, R. Hussain, N. H. Naveed, A. Ali, and P. Simon. 2020. Cell membrane stability and relative cell injury in response to heat stress during early and late seedling stages of diverse carrot (Daucus carota L.) germplasm. Hort. Sci., 55(9): 1446-1452.
Sleimi, N., I. Bankaji, H. Touchan, and C. Francoise. 2013. Effects of temperature and water stresses on germination of some varieties of chickpea (Cicer arietinum). Afr. J. Biotechnol., 12(17): 2201–6.
Nascimento, W. M., J. V. Vieira, G. O. Silva,K. R. Reitsma, and D. J. Cantliffe. 2002. Temperature effects on seed germination and expression of seed dormancy in wheat. Euphytica, 126(1): 123-127.
Pipolo, A. E., T. R Sinclair, and G. M. Camara. 2004. Effects of temperature on oil and protein concentration in soybean seeds cultured in vitro. Ann. Appl. Biol., 144(1): 71–76.
R Core Team. R. 2018. A language and environ‐ ment for statistical computing. R Foundation for Statistical Computing, Vienna, Austria.
Riley, J. P. G. 1981. Effects of high temperature on the germination of maize (Zea mays L.). Planta, 151(1): 68–74. Rohde, R., R. A. Muller, R. Jacobsen, E. Muller, S. Perlmutter, A. Rosenfeld, A. Wurtele, D. Groom, and C. Wickham. 2013. A new
estimate of the average earth surface land temperature spanning 1753 to 2011 Geoinfor Geostat. An Overview 1(1): 2327-4581.
Rosegrant, M. W., and S. A. Cline. 2003. Global food security: Challenges and policies. Sci., 302(5652): 1917–19. Shah, F., J. Huang, K. Cui, L. Nie, T. Shah, C. Chen, and K. Wang. 2011. Impact of high-temperature stress on rice plant and its traits
related to tolerance. J. Agric. Sci., 149(5): 545-556. Shewry, R. P., and S. J. Hey. 2015. The contribution of wheat to human diet and health. Food Energy Security, 4(3): 178–202. Sikder, S., and N. K. Paul. 2010. Study of influence of temperature regimes on germination characteristics and seed reserves
mobilization in wheat. Afr. J. Plant Sci., 4(10): 401–8. Tewolde, H., C. J. Fernandez, and C. A. Erickson. 2006. Wheat cultivars adapted to post-heading high temperature stress.
J. Agron. Crop. Sci., 192(2): 111–120. Willcock, J., and N. Magan. 2000. Impact of environmental factors on fungal respiration and dry matter losses in wheat straw.
J. Stored Prod. Res., 37(1): 35–45.
Available online at https://www.gudgk.edu.pk/phy-to-science-journal
GU JOURNAL OF PHYTOSCIENCES
GU. J. Phytosci. 2(1): 27-33 (2022)
<<
Estimation of Phosphorous use efficiency of Mung bean cultivars under different Phosphorous regimes
Estimation of Phosphorous use efficiency of Mung Bean cultivars
under different Phosphorous regimes
Iqra Mubeen1, Usman Shafqat2*, Muhammad Ussama Yasin3, Imran Ashraf4, Khadija Siddique2, Atia
Nazir1, Yasir Bilal2, Saadllah Kan Leghari5, Allah Bakhsh Gulshan5, Faisal Hussain5, Aneela Nijabat5,
Muhammad Abid Khan5 and Saher Nawaz5
1Department of Botany, University of Agriculture, Faisalabad, 38000, Pakistan 2Department of Environmental Sciences, Government College University, Faisalabad, 38000, Pakistan
3Plant Pathology Research Institute, Ayub Agricultural Research Institute, Faisalabad-38000, Pakistan
4Department of Agronomy, University of Agriculture, Faisalabad, 38000, Pakistan
5Department of Botany, Ghazi University, Dera Ghazi Khan, 32200, Pakistan
Abstract
Phosphorus deficiency is one of the major production limiting factors in mung bean. Development of phosphorus efficient
genotypes of mung bean which perform well under phosphorus deficit conditions is key strategy to overcome this problem. A trial
was conducted following factorial completely randomized design with five mung bean genotypes i.e., NM2010, AZRI, 8009, NM-
2011 and NM-2016, three phosphorus levels i.e., P1 5 mg /kg sand (control), P2 20mg /kg sand and P3 40 mg /kg sand and four
replications in sand filled pots. Data was recorded for various morphological and physiological parameters. Significant differences
were observed for Shoot length, root length, number of lateral roots, no. of nodules, shoot and root phosphorous contents at
different phosphorus levels. Moreover, different genotypes exhibited statistically significant interaction with phosphorus levels
for various parameters. Variety NM-2010 gave the highest value for shoot length and root length at minimum phosphorus
application. Likewise, highest level of available phosphorus in growing media was observed for variety 8009 with minimum
application of phosphorus. These observations indicate that considerable genetic variation is present in available mung bean
genotypes for phosphorus use efficiency and this variation may be used to select suitable genotype for evolving phosphorus
efficient cultivars.
Keywords: Mung bean; Phosphorous; Genetic Variability; Phosphorous deficiency
1. Introduction:
Legume crops improve soil fertility by fixing atmospheric nitrogen through symbiotic association with soil bacteria (Udvardi, 2013). These crops can fix around 63-342 Kg of atmospheric nitrogen per season (Kaisher et al.,
*Corresponding author Tel.: +92 3028046916
E-mail address: [email protected]
© 2022 (Accepted for publication in December 2021) Published by Department of Botany, Selection and/or peer-review under supervision of Executive Committee, Ghazi University, DG Khan, 32200 Pakistan
28 Mubeen et al.,/ GU J. Phytosci. 2(1): 27-33 (2022)
Estimation of Phosphorous use efficiency of Mung bean cultivars under different Phosphorous regimes
2010). This phenomenon, not only help legume crops to meet their nitrogen need but also adds in soil fertility (Yakubu et al., 2008). Mung bean (Vigna radiata L.) is an important crop of Leguminosae family. Besides its use as pulse (dry seed), it is also used for green manuring to improve soil fertility (Ghulam, 2012). Mung bean is highly nutritious pulse crop and serve as main protein source for poor’s which have limited access to animal source protein. It has 24% protein, 0.6% fate, and 0.9% fibers (Monem et al., 2012). Besides this, it is also a rich source of carbohydrates, iron, calcium and β-carotene (Afzal et al., 2004). Even it is regarded as more nutritious than soybean (Mubarak, 2005).
In Pakistan, Mung bean was cultivated on an area of 178.8 thousand hectares with production of 130.1 thousand tonnes during 2019-20. In 2019-20, its estimated area is around 161.8 thousand hectares with production of 118.8 thousand tonnes which is 8.7% less than last year production (Pakistan Bureau of Statistics, 2017-18). This steep decrease in production may be attributed to declining area under mung bean. In Pakistan, it is grown in regions of Rawalpindi, Layyah, Bhakkar, and Mianwali. It fits in different cropping patterns due to its short life span. Despite of its nutritional and economic importance, as about 75% grain production is met through mung bean (Ghulam, 2012), average mung bean productivity Pakistan is 0.72 Tonnes / Hectare, which is far less than other mung bean growing countries. This low productivity is due to multifactor which include non-availability of high yielding disease tolerant varieties, poor crop production practices and unstable market situation.
As like other pulses, mung bean is treated as marginal crop and is given inadequate inputs. Being leguminous crop, mung bean doesn’t require nitrogen fertilizer, but Phosphorus fertilizer is major yield determining factor and essential element for mung bean growth. The low P fertilizer in mung bean can result in low production. Farmers avoid applying phosphate fertilizer in mung bean due to its high cost (Mansoor, 2007). Adequate Phosphorus fertilizer application ensures good mung bean yield (Akinrinde & Adigun, 2005). Phosphorus plays an important role in nodule formation, hence, Phosphorus deficiency indirectly results Nitrogen deficiency in legumes as well (Schulze et al., 2005). Moreover, Phosphorus increases the absorption of nitrogen and triggers energy process and pod formation in mung bean (Anetor & Aknirinde, 2006). Hence adequate supply of Phosphorus fertilizer is essential for having good yield of mung bean. However, being tropical region, Phosphorus deficiency is one of the restrictive features of our soils. Phosphorous deficiency is a widespread problem in plants particularly in acidic soils (Faye et al., 2006). In soil solution, Phosphorus is present in the form of primary orthophosphate (H2PO4-
1) and secondary orthophosphate (HPO4-2) which are accessible to plants. Despite of high total Phosphorus contents in soil, available Phosphorus in soil solution is low (Hinsinger, 2001) due to strong binding of phosphate ions with soil elements. That’s why, farmers have to apply phosphorus fertilizers in soil for plant growth. A major portion of this externally applied Phosphorus precipitates with other nutrient element such as Ca+2, Al+3, and Fe+3 and becomes unavailable to the plants, hence requiring furthermore need of Phosphorus fertilizers application in soil, and this cycle goes on (Khasawneh et al., 1980).
However, there exist considerable genetic variability among plants in utilizing available soil Phosphorus under Phosphorus deficient conditions. Phosphorus efficient genotypes express many adaptations as compared to Phosphorus inefficient genotypes (Richardson et al., 2007) like stimulation of root hair growth (Lynch, 2007). Plants have many mechanisms which are adopted under Phosphorus stress condition like change in root structure, exudation of organic acid, release of proton and enzymes. Formation of cluster roots is also the adaptation of plants under Phosphorus stress condition (Vance et al., 2003). Increased root growth enhances the root surface area (Lynch & Brown, 2001). Plant increases the root hairs and number of lateral roots under limited availability of Phosphorus in soil due to the expression of P starvation genes (Ward et al., 2008). Mung bean Phosphorus efficient genotypes show high shoot to root mass ratio under low P level (Nielsen et al., 2001). They can maintain growth and acquire Phosphorus from soil by increase in their lateral roots and developing shallow basal roots under P deficient conditions (Liao et al., 2001). Under Phosphorus deficient conditions, legumes develop adaptation to accumulate P in nodules and surface of nodules become involved in direct P acquisition (Sulieman & Tran, 2015).
1.1. Objectives:
• To screen, evaluate and select the Phosphorus efficient germplasm for further use in breeding program. • To find out morphological and physiological descriptors for Phosphorus uptake efficiency in mung bean.
2. Materials and Methods:
A pot experiment was conducted to evaluate Phosphorus use efficiency of various mung bean cultivars at different Phosphorus levels. The study was conducted at Agronomic Research Farm, University of Agriculture

Mubeen et al.,/ GU J. Phytosci. 2(1): 27-33 (2022) 29
Estimation of Phosphorous use efficiency of Mung bean cultivars under different Phosphorous regimes
Faisalabad during summer 2017. Five varieties of mung bean i.e., NM-2010 (V1), AZRI (V2), 08009 (V3), NM-2011 (V4) and NM-2016 (V5) were collected from Pulses Research institute, AARI, Faisalabad. Sand was used as sowing media in pots. Three different Phosphorus concentrations were applied i.e., P1= 5 mg /kg sand (control), P2= 20 mg /kg sand and P3 = 40 mg /kg sand. Trials was designed as per triplicated two factor completely randomized design. Sowing of mung bean was done in September 2017. Nine seeds of each variety were sown in one pot at 1cm depth in sand. Moisture level of each pot was maintained by applying 50 ml distilled water on daily basis. Three different nutrient solutions were prepared according to Hock land solution recipe each differencing in Phosphorus concentration and applied to the pots one-day after miniaturization of pots with water. After emergence of seedlings, pots were kept in a wire house at Agronomy Research Farm for protection from birds. Plants thinning was done, and three plants were maintained in each pot of each variety. Harvesting of plants was done after 8 weeks. Data was recorded for shoot length (cm), root length (cm), No. of lateral roots and No. of nodules. Shoot Phosphorus contents and Root Phosphorus contents were measured by the wet digestion method. Available Phosphorus in growth medium was measured by modified sodium bicarbonate method described by Olsen et al. (1954) and modified by Murphy & Riley, (1962); Olsen & Sommers (1982). Total phosphorus in growth medium was measured through procedure described by Olsen & Sommers (1982). Data collected was subjected to analysis of variance and significance of differences was detected using least significance differences (LSD) method for means comparison in all possible combinations.
3. Results:
Analysis of variance revealed significant differences among mung bean varieties for all variables under study at different Phosphorus levels. Moreover, different varieties responded significantly different through interaction with different Phosphorus levels (Table 1). However, in case of shoot length, no significant interaction among mung bean varieties and phosphorus levels was detected. Likewise, for root length, no significant differences were observed among varieties under study.
Table 1: Analysis of variance for different variables of mung bean genotypes and growth medium at different Phosphorus levels
Variables Means Sum of Squares
P levels Genotypes P×G
Shoot length 46.3** 21.3** 4.35NS
Root length 165.5** 1.5NS 23.4**
No. of lateral roots 162.2** 224.1** 83.2**
No. of nodules 245.4** 4.5** 6.9**
Shoot P content 3.2** 9.6** 1.3**
Root P content 5.2** 1.9** 2.1**
Available P in soil 0.04** 0.4** 0.09**
Total P in soil 269.5** 289.8** 155.4**
** Highly Significant at @=5%, * Significant at @=5%, NS Non- Significant at @=5%
Variety NM-2010 gave the highest fresh shoot length (23.11cm) followed by statistically at par 8009 with fresh shoot length of 21.79cm. NM-2016 gave the lowest value for fresh shoot length (19.56cm) (Table: 3). Statistically, all five varieties were classified into three significantly different groups regarding fresh shoot length. Highest fresh shoot length was recorded at P3 (40mg) phosphorus level which is statistically at par with shoot length obtained at P2 (20mg) Phosphorus level (Table: 2). However, both P2 (20mg) and P3 (40mg) gave significantly higher fresh shoot length then P1 (5mg). Hence it may be inferenced that an increase in Phosphorus level has positive effect on fresh shoot length of plant but up to a certain point.
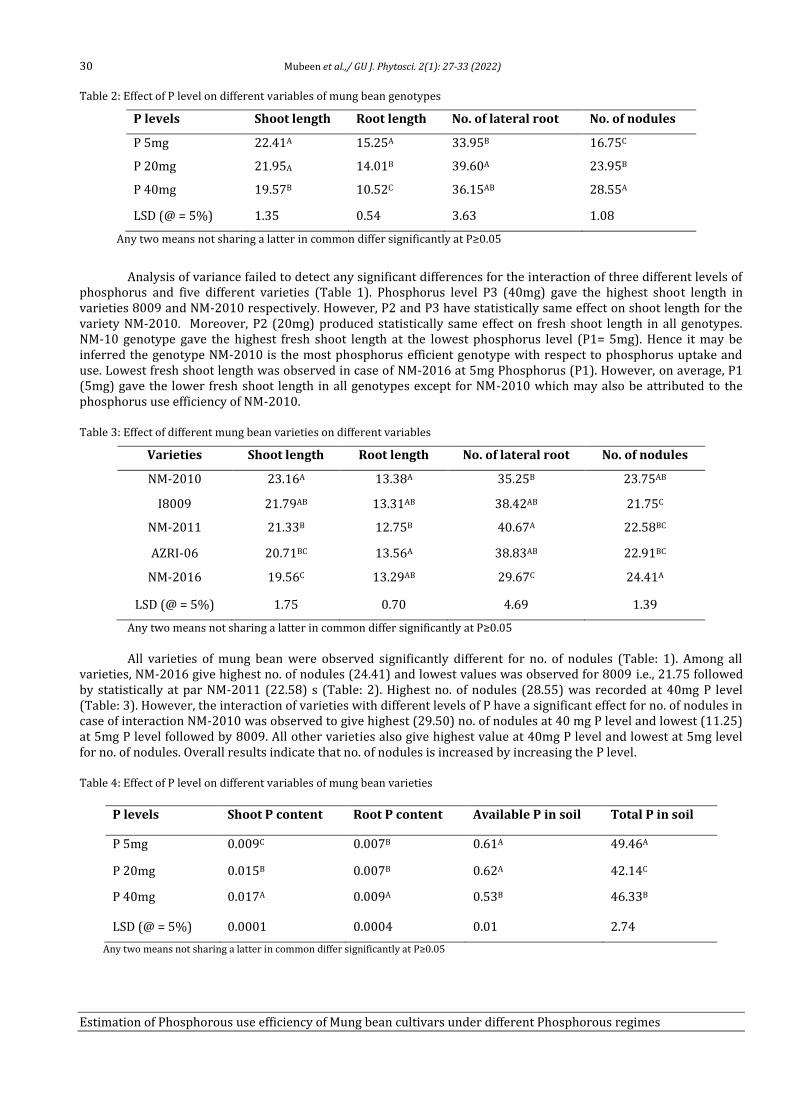
30 Mubeen et al.,/ GU J. Phytosci. 2(1): 27-33 (2022)
Estimation of Phosphorous use efficiency of Mung bean cultivars under different Phosphorous regimes
Table 2: Effect of P level on different variables of mung bean genotypes
P levels Shoot length Root length No. of lateral root No. of nodules
P 5mg 22.41A 15.25A 33.95B 16.75C
P 20mg 21.95A 14.01B 39.60A 23.95B
P 40mg 19.57B 10.52C 36.15AB 28.55A
LSD (@ = 5%) 1.35 0.54 3.63 1.08
Any two means not sharing a latter in common differ significantly at P≥0.05
Analysis of variance failed to detect any significant differences for the interaction of three different levels of phosphorus and five different varieties (Table 1). Phosphorus level P3 (40mg) gave the highest shoot length in varieties 8009 and NM-2010 respectively. However, P2 and P3 have statistically same effect on shoot length for the variety NM-2010. Moreover, P2 (20mg) produced statistically same effect on fresh shoot length in all genotypes. NM-10 genotype gave the highest fresh shoot length at the lowest phosphorus level (P1= 5mg). Hence it may be inferred the genotype NM-2010 is the most phosphorus efficient genotype with respect to phosphorus uptake and use. Lowest fresh shoot length was observed in case of NM-2016 at 5mg Phosphorus (P1). However, on average, P1 (5mg) gave the lower fresh shoot length in all genotypes except for NM-2010 which may also be attributed to the phosphorus use efficiency of NM-2010.
Table 3: Effect of different mung bean varieties on different variables
Varieties Shoot length Root length No. of lateral root No. of nodules
NM-2010 23.16A 13.38A 35.25B 23.75AB
I8009 21.79AB 13.31AB 38.42AB 21.75C
NM-2011 21.33B 12.75B 40.67A 22.58BC
AZRI-06 20.71BC 13.56A 38.83AB 22.91BC
NM-2016 19.56C 13.29AB 29.67C 24.41A
LSD (@ = 5%) 1.75 0.70 4.69 1.39
Any two means not sharing a latter in common differ significantly at P≥0.05
All varieties of mung bean were observed significantly different for no. of nodules (Table: 1). Among all varieties, NM-2016 give highest no. of nodules (24.41) and lowest values was observed for 8009 i.e., 21.75 followed by statistically at par NM-2011 (22.58) s (Table: 2). Highest no. of nodules (28.55) was recorded at 40mg P level (Table: 3). However, the interaction of varieties with different levels of P have a significant effect for no. of nodules in case of interaction NM-2010 was observed to give highest (29.50) no. of nodules at 40 mg P level and lowest (11.25) at 5mg P level followed by 8009. All other varieties also give highest value at 40mg P level and lowest at 5mg level for no. of nodules. Overall results indicate that no. of nodules is increased by increasing the P level.
Table 4: Effect of P level on different variables of mung bean varieties
P levels Shoot P content Root P content Available P in soil Total P in soil
P 5mg 0.009C 0.007B 0.61A 49.46A
P 20mg 0.015B 0.007B 0.62A 42.14C
P 40mg 0.017A 0.009A 0.53B 46.33B
LSD (@ = 5%) 0.0001 0.0004 0.01 2.74
Any two means not sharing a latter in common differ significantly at P≥0.05
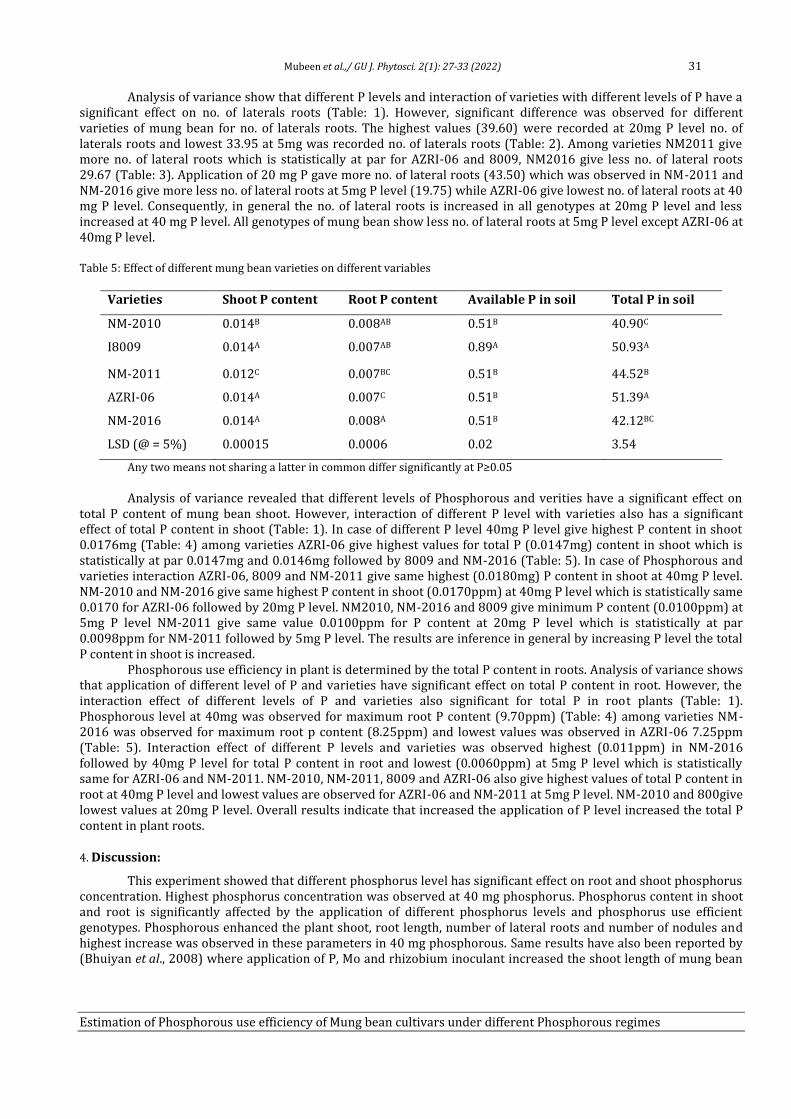
Mubeen et al.,/ GU J. Phytosci. 2(1): 27-33 (2022) 31
Estimation of Phosphorous use efficiency of Mung bean cultivars under different Phosphorous regimes
Analysis of variance show that different P levels and interaction of varieties with different levels of P have a significant effect on no. of laterals roots (Table: 1). However, significant difference was observed for different varieties of mung bean for no. of laterals roots. The highest values (39.60) were recorded at 20mg P level no. of laterals roots and lowest 33.95 at 5mg was recorded no. of laterals roots (Table: 2). Among varieties NM2011 give more no. of lateral roots which is statistically at par for AZRI-06 and 8009, NM2016 give less no. of lateral roots 29.67 (Table: 3). Application of 20 mg P gave more no. of lateral roots (43.50) which was observed in NM-2011 and NM-2016 give more less no. of lateral roots at 5mg P level (19.75) while AZRI-06 give lowest no. of lateral roots at 40 mg P level. Consequently, in general the no. of lateral roots is increased in all genotypes at 20mg P level and less increased at 40 mg P level. All genotypes of mung bean show less no. of lateral roots at 5mg P level except AZRI-06 at 40mg P level.
Table 5: Effect of different mung bean varieties on different variables
Varieties Shoot P content Root P content Available P in soil Total P in soil
NM-2010 0.014B 0.008AB 0.51B 40.90C
I8009 0.014A 0.007AB 0.89A 50.93A
NM-2011 0.012C 0.007BC 0.51B 44.52B
AZRI-06 0.014A 0.007C 0.51B 51.39A
NM-2016 0.014A 0.008A 0.51B 42.12BC
LSD (@ = 5%) 0.00015 0.0006 0.02 3.54
Any two means not sharing a latter in common differ significantly at P≥0.05
Analysis of variance revealed that different levels of Phosphorous and verities have a significant effect on total P content of mung bean shoot. However, interaction of different P level with varieties also has a significant effect of total P content in shoot (Table: 1). In case of different P level 40mg P level give highest P content in shoot 0.0176mg (Table: 4) among varieties AZRI-06 give highest values for total P (0.0147mg) content in shoot which is statistically at par 0.0147mg and 0.0146mg followed by 8009 and NM-2016 (Table: 5). In case of Phosphorous and varieties interaction AZRI-06, 8009 and NM-2011 give same highest (0.0180mg) P content in shoot at 40mg P level. NM-2010 and NM-2016 give same highest P content in shoot (0.0170ppm) at 40mg P level which is statistically same 0.0170 for AZRI-06 followed by 20mg P level. NM2010, NM-2016 and 8009 give minimum P content (0.0100ppm) at 5mg P level NM-2011 give same value 0.0100ppm for P content at 20mg P level which is statistically at par 0.0098ppm for NM-2011 followed by 5mg P level. The results are inference in general by increasing P level the total P content in shoot is increased.
Phosphorous use efficiency in plant is determined by the total P content in roots. Analysis of variance shows that application of different level of P and varieties have significant effect on total P content in root. However, the interaction effect of different levels of P and varieties also significant for total P in root plants (Table: 1). Phosphorous level at 40mg was observed for maximum root P content (9.70ppm) (Table: 4) among varieties NM-2016 was observed for maximum root p content (8.25ppm) and lowest values was observed in AZRI-06 7.25ppm (Table: 5). Interaction effect of different P levels and varieties was observed highest (0.011ppm) in NM-2016 followed by 40mg P level for total P content in root and lowest (0.0060ppm) at 5mg P level which is statistically same for AZRI-06 and NM-2011. NM-2010, NM-2011, 8009 and AZRI-06 also give highest values of total P content in root at 40mg P level and lowest values are observed for AZRI-06 and NM-2011 at 5mg P level. NM-2010 and 800give lowest values at 20mg P level. Overall results indicate that increased the application of P level increased the total P content in plant roots.
4. Discussion:
This experiment showed that different phosphorus level has significant effect on root and shoot phosphorus concentration. Highest phosphorus concentration was observed at 40 mg phosphorus. Phosphorus content in shoot and root is significantly affected by the application of different phosphorus levels and phosphorus use efficient genotypes. Phosphorous enhanced the plant shoot, root length, number of lateral roots and number of nodules and highest increase was observed in these parameters in 40 mg phosphorous. Same results have also been reported by (Bhuiyan et al., 2008) where application of P, Mo and rhizobium inoculant increased the shoot length of mung bean

32 Mubeen et al.,/ GU J. Phytosci. 2(1): 27-33 (2022)
Estimation of Phosphorous use efficiency of Mung bean cultivars under different Phosphorous regimes
plant. Reagar et al., (2003) reported that by increasing the Phosphorus level, plant height increases significantly. Riaz et al. (2003) reported that application of Phosphorus influence plant height. Khan et al. (2012) described that Mung bean plant height significantly increased with increased Phosphorus level. Similarly, Phosphorus from organic and inorganic sources significantly increased the height of Mung bean (Aslam et al., 2010). The root length, root hairs and root diameter increased by increasing the P application (Krasilnikoff et al., 2003).
In the current study, maximum number of nodules was observed at 20 and 40 mg Phosphorus. By increasing the Phosphorus level up to 40 mg Phosphorus level have not significant effect on number of nodules. Same results are reported by (Lynch, 2018). Tsvetkova & Georgiev, (2003) describes that the oversupply of Phosphorus causes decreases in no. of nodules. Schulze et al. (2006) observed that growth of nodules and development promoted by the application of Phosphorus. Chowdhury & Fujita, (1998) reported that Phosphorus application at the rate of 60 kg/ ha significantly increased the no. of nodules. No. of lateral roots were significantly increased by the application of 20 and 40 mg Phosphorus level. So, the no. of lateral roots was increased by increasing Phosphorus level. Lateral roots are rich in P patches and these lateral roots play important role in P uptake. So, the application of P increased the no. of lateral roots (Robinson, 1994). Under P deficiency the roots hairs and no. of lateral roots of plants are decreased (Jain et al., 2009). Plant increases the root hairs and no. of lateral roots without the availability of P in soil due to the expression of P starvation gens (Ward et al., 2008).
Total P in growth medium is very important parameter for plant growth and yield of crops. Analysis of variance revealed that varieties and different level of P have a significant effect on total P in soil. However, varieties and different level of P also have a significant effect on total P in soil (Table: 1). NM-2016, NM-2011, NM-2010 and AZRI-06 are P use efficient genotypes at 5mg P level in case of 20mg P level NM-2010, NM-2011 and AZRI-06 are P use efficient genotypes which is statistically at par for NM-2016 at 40mg P level only NM-2016 is more P use efficient genotypes (Table: 4 and 5). Hence it may be inferred the genotype NM-2016 is the most phosphorus efficient genotype with respect to phosphorus uptake and use at three different level of P for total P in soil and 8009 is not a better genotype for P use efficiency.
Available P in soil is an important parameter which determined the P use efficient genotypes under different level pf P. Results indicated that different P level have a significant effect on Available P in soil also different genotypes have a significant effect for available P in soil. Analysis of variance to detect significant differences for the interaction of three different levels of phosphorus and five different varieties (Table: 1). Phosphorus level P3 (40mg) gave the highest (57.39ppm) total P in soil under varieties 8009 and AZRI-06 respectively. Minimum (36.25ppm) available P was observed under NM-2010 at 40mg P level. Moreover, P2 (20mg) produced statistically same effect on available P in soil under NM-2011 and NM-2016 genotypes (Table 4 and 5). Hence it may be inferred the genotype NM-2010 is the most phosphorus efficient genotype with respect to phosphorus uptake and use and 8009 is not efficient genotypes for P use efficiency.
5. Conclusion:
Results of present study indicated that considerable genetic variation is present among available mung bean varieties regarding response to varying level of Phosphorus in soil. Also, it may be concluded that, these varieties modified their growth in response to different Phosphorus levels exhibiting varying degree of Phosphorus use efficiency. This research provides a base line for mung bean breeders to evolve phosphorus efficient mung bean varieties by increasing selection pressure for traits like increased number of lateral roots, number of nodules.
6. References:
Afzal, M.A., M.A. Bakar, A. Hamid, M.M. Haque and M.S. Akhtar. 2004. Mung bean in Bangladesh. Lentil Black gram and mung bean development Pilot Project. Pulses Res. Centre BARI Gazipur., 1701: 23-60.
Akinrinde, E.A. and I.O. Adigu. 2005. Phosphorus use efficiency by pepper (Capsicum frutescens L.) and okra (Abelmoschus esculentum L.) at different phosphorus fertilizer application levels on two tropical soils. J. Appl. Sci., 5: 1785-1791.
Anetor, M.O. and E.A. Aknirinde. 2006. Difference in liming potential of some fertilizer material in a tropical acid alfisol. J. Appl. Sci., 6: 1686-1691.
Bhuiyan, M.M.H., M.M. Rahman, F. Afroze, G.N.C. Sutradhar and M.S.I. Bhuiyan. 2008. Effect of phosphorus, molybdenum and Rhizobium inoculation on growth and nodulation of mungbean. J. Soil. Nat., 2(2):25-30.
Faye, I., O. Diouf, A. Guisse, M. Sene and N. Diallo. 2006. Characterizing root responses to low phosphorus in pearl millet (Pennisetum glaucum L.). Agron. J., 98: 1187-1194.
Ghulam, N.A. 2012. Mung bean cultivation in Pakistan. Crop Manger Agronomy Center Pivot Irrigation System Valley Irrigation Pakistan Private, Limited. pp: 1-7.
Hinsinger, P. 2001. Bioavailability of soil inorganic P in the rhizosphere as affected by root induced chemical changes. A review. Plant Soil., 237: 173-195.
Mubeen et al.,/ GU J. Phytosci. 2(1): 27-33 (2022) 33
Estimation of Phosphorous use efficiency of Mung bean cultivars under different Phosphorous regimes
Jain, A., M.D. Poling, A.P. Smith, V.K. Nagarajan, B. Lahner, R.B. Meagher and K.G. Raghothama. 2009. Variations in the composition of gelling agents affect morphophysiological and molecular responses to deficiencies of phosphate and other nutrients. Plant Physiol., 150(2): 1033-1049.
Kaisher, M.S., M.T. Rehman, M.H.A. Amin, A.S.M. Amanullah and A.S.M. Ahsanullah. 2010. Effect of sulphur and boron on the seed yield and protein content of mung bean. Bangla. Res. Pub. J., 3: 1181-1186.
Khan, S., S.S. Sen and H.W. Roesky. 2012. Activation of phosphorus by group 14 elements in low oxidation states. Chem. Comm., 48(16): 2169-2179.
Khasawneh, F. E., E. C. Sample and E. J. Kamprath. 1980. The role of phosphorus in agriculture. Amer. Soc. Agro., Madison Wisconsin, USA, p: 910.
Krasilnikoff, G., T. Gahoonia and N.E. Nielsen. 2003. Variation in phosphorus uptake efficiency by genotypes of cowpea (Vigna unguiculata) due to differences in root and root hair length and induced rhizosphere processes. Plant Soil., 251(1): 83-91.
Liao, H., G. Rubio, X. Yan, A. Cao, K.M. Brown and J.P. Lynch. 2001. Effect of phosphorus availability on basal root shallowness in common bean. Plant Soil., 232: 69-79.
Lynch, J.P. and K.M. Brown. 2001. Topsoil foraging–an architectural adaptation of plants to low phosphorus availability. Plant Soil., 237(2): 225-237.
Lynch, J.P. and K.M. Brown. 2018. Topsoil foraging–an architectural adaptation of plants to low phosphorus availability. Plant Soil., 237(2): 225-237.
Lynch, J.P. 2007. Roots of the second green revolution. Aust. J. Bot., 55: 493-512. Mansoor, M. 2007. Evaluation of various agronomic management practices for increased productivity of mungbean (Vigna radiata
L.) Ph.D. thesis, Department of Agronomy, Faculty of Agriculture, Gomal University, D.I Khan., pp 1-163. Monem, R., S.M. Mirtaheri and A. Ahmadi. 2012. Investigation of row orientation and planting date on yield and yield components
of mung bean. Ann. Biol. Res., 3: 1764-1767. Mubarak, A.E. 2005. Nutritional composition and antinutritional factors of mung bean seeds (Phaseolus aureus) as affected by
some home traditional processes. Food Chem., 89: 489-495. Muhammad, D., A.H. Gurmani and K. Matiullah. 2004. Effect of Phosphorous and Rhizobium inoculation on yield and yield
components of mung bean under rainfed condition of D. I. Khan. Sarhad J. Agric., 20: 575-582. Murphy, J. and J.P. Riley. 1962. A modified single solution method for determination of phosphate in natural waters. Anal. Chim.
Acta, 27:31-36. Nielsen, K.I., A. Eshel, and J.P. Lynch. 2001. The effect of phosphorus availability on the carbon economy of contrasting common
bean genotypes. J. Exp. Bot., 52: 329-339. Olsen, S.R., and L.E. Sommers. 1982. Phosphorus. P. 403-430 In A.L. Page et al. (ed.) Methods of soil analysis. Part 2. 2nd ed.
Agronomy Monogr. 9. ASA and SSSA, Madison, WI. Olsen, S.R., C.V. Cole, F.S. Watanabe, and L.A. Dean. 1954. Estimation of available phosphorus in soils by extraction with sodium
bicarbonate. USDA Circular 939. U.S. Government Printing Office, Washington D.C. Reagar, M.L., G.R. Choudary and A.K. Dahama. 2003. Effect of weed control and Phosphorous on growth and quality of cluster
bean. Ann. Agric. Res., 24: 563-566. Riaz, A., M. Ikram, E. Ullah and A. Mahmood. 2003. Influence of different fertilizer level on growth and productivity of three mung
bean (vigna radiata L.) cultivars. Intl. J. Agric. Biol., 5: 335-338. Richardson, A.E., T.S. George, I. Jakobsen and R.J. Simpson. 2007. Plant utilization of inositol phosphates. Plant Soil., 269: 45-56. Robinson, D. 1994. The responses of plants to non‐uniform supplies of nutrients. New Phytol., 127(4): 635-674. Schulze, J., G. Temple, S.J. Temple, H. Beschow and C.P. Vance. 2006. Nitrogen fixation by white lupin under phosphorus
deficiency. Ann. Bot., 98(4): 731-740. Sivakumaran, K., J. Wansapala and T. Herath. 2018. Total phosphorus, phytate phosphorus contents and the correlation of
phytates with amylose in selected edible beans in Sri Lanka. Potravinarstvo Slovak J. Food Sci., 12(1): 57-62. Sulieman, S. and L.S.P. Tran. 2015. Phosphorus homeostasis in legume nodules as an adaptive strategy to phosphorus
deficiency. Plant Sci., 239, 36-43. Tsvetkova, G.E. and G.I. Georgiev. 2003. Effect of phosphorus nutrition on the nodulation, nitrogen fixation and nutrient use
efficiency of Bradyrhizobium japonicum-soybean (Glycine max L. Merr.) symbiosis. Bulgarian J. Plant Physiol., 331-335. Udvardi, M. and P. S. Poole. 2013. Transport and metabolism in legume–rhizobia symbioses, Annu. Rev. Plant Biol., 64: 781-805. Vance, C.P., C. Uhde‐Stone and D.L. Allan. 2003. Phosphorus acquisition and use: critical adaptations by plants for securing a
nonrenewable resource. New Phytol., 157(3): 423-447. Ward, J.T., B. Lahner, E. Yakubova, D.E. Salt and K.G. Raghothama. 2008. The effect of iron on the primary root elongation of
Arabidopsis during phosphate deficiency. Plant Physiol., 147(3): 1181-1191. Yakubu, H., J.D. Kawari and A.L. Ngala. 2010. Screening of grain legumes varieties for nitrogen fixation in the Sudan-Sahelian zone
of North-Eastern Nigeria. J. Exp. Biol., 9: 165-171. Zhou, T., Y. Du, S. Ahmed, T. Liu, M. Ren, W. Liu and W. Yang, W. 2016. Genotypic Differences in Phosphorus Efficiency and the
Performance of Physiological Characteristics in Response to Low Phosphorus Stress of Soybean in Southwest of China. Front. Plant Sci., 7: 17-76.
Available online at https://www.gudgk.edu.pk/phy-to-science-journal
GU JOURNAL OF PHYTOSCIENCES
GU. J. Phytosci. 2(1): 34-41 (2022)
<<
Effect of Different seeding days on the development and early productivity of Okra under semi-arid conditions
Effects of different seeding days on the development and early productivity of Okra (Abelmoschus esculentus L.) under semi-arid
conditions of Quetta, Balochistan-Pakistan
Abdullah Baloch1, Saadullah Khan Leghari2,3*, Ajaz Ahmed2, Abdul Hanan1, Allah Bakhsh Gulshan3,
Faisal Hussain3, Muhammad Abid Khan3, Aneela Nijabat3 and Saher Nawaz3
1Balochistan Agricultural Research and Development Center, Quetta-Pakistan 2Department of Botany, University of Balochistan, Quetta, Pakistan
3Department of Botany, Ghazi University, Dera Ghazi Khan, Pakistan
Abstract
Existing research work was imagined determining the effects of different times of sowing on the development and early
productivity of Okra plant. Investigation was done at Balochistan agricultural research and development center, Quetta, in the
year 2016 by using the Randomized Complete Block Design (RCBD). Sowing done with the interval of ten days (10th, 20th, 30th
April). The ANOVA data on germination percentage, total survival percentage, average height of plant, and number of leaves at the
time of flower appearance, days for flowering, average yield/plant, average yield/plot, and yield/acre revealed significant
differences in different sowing times. The maximum germination percentage (64.85), total survival percentage (65.46 a), average
height of plant (92.74), number of leaves at the time of first flowering appearance (9.70), average yield/plant (341.00), average
yield/plot (13958.25) and yield/acre (4222) were noted for T3 treatment (10th April) and lowest (25.51 c, 52.08 c, 76.31, 5.60,
286.25, 3656.75 and 1106) for T1 treatment (30th April) respectively. Similarly, days taken for flowering exhibited maximum for
T3 treatment but minimum for T2 treatment (20th April).
Keywords: Okra; Sowing time; Growth; Yield; Climatic connnnditions
1. Introduction:
In Pakistan, Okra (Abelmoschus esculentus L. Moench) is one of the greatest significant temporary vegetal crops in Pakistan and commonly known as lady finger and bhindi. It is belonged to the family Malvaceae and is native of Ethiopia in Africa (Khalid et al., 2005). It is now widely cultivated all over the humid and sub-humid areas of the world (Farinde et al., 2007). In Pakistan it is cultivated over area of 14465/hac and total production of about 109239 tons of green pods is obtained (Government of Pakistan, 2005) while in Balochistan cultivated area is 2737 hectares and production 6822 tons in 2007-08 (Government of Balochistan, 2008). The genus Abelmoschus comprises of
*Corresponding author Tel.: +92 3327811206
E-mail address: [email protected]
© 2022 (Accepted for publication in November 2021) Published by Department of Botany, Selection and/or peer-review under supervision of Executive Committee, Ghazi University, DG Khan, 32200 Pakistan
Baloch et al.,/ GU J. Phytosci. 2(1): 34-41 (2022) 35
Effect of Different seeding days on the development and early productivity of Okra under semi-arid conditions
around 150 recognized species by esculentus as the species of cultivated Okra. This vegetable crop is relatively prevalent owing to its informal farming, reliable harvest flexibility to variable humidity circumstances (resilient to scarcity and waterlogging) and soil kinds and is also tolerant to wide variation in rainfall. Due to its wide adaptability and nutritional importance okra is successfully cultivated in other countries such as Egypt, China, Thailand, Nigeria, Sudan, South Africa, Ghana, India, Brazil, Cyprus and Caribbean. The financial standing of Okra cannot be exaggerated; wholly plant portions are fully used (Farinde et al., 2007). Okra fruits are very popular as a vegetable among all classes of people around the world (Talukder et al., 2003). Okra is a healthful vegetal which is a significant basis of carbohydrate, vitamins (A, B & C), protein, potassium, calcium, dietary fibers and minerals and later, have a dynamic role in humanoid food (Rashwan, 2011). Dry seeds of okra contain about 20 to 30 per cent crude protein and its seeds may be roasted and ground to form a non-caffeinated substitute for coffee (Onyishi, 2011). Okra has medicinal importance also as it is used for curing ulcers, relief from hemorrhoids and is useful against spermatorrhoea, chronic dysentery and genitor-urinary disorders (Adams, 1975).
The growth, yield and quality of okra are hampered severely by inefficient production methods or lack of knowledge about the best cultivation and management practices, low awareness on the nutritional and health benefits, low quality seed standards and limited market access. Its production and productivity are also seriously affected due to the use of local varieties (low yielding), sub or supra-optimal plant density (improper inter and intra-row spacing), inappropriate planting dates, soil nutrients, and severe attack of various insect pests, diseases and weeds (Saha et al., 1989). The importance of sowing dates and spacing in okra cannot be overlooked as it affects different plant characters. Sowing dates have great impact on the seed production, growth and quality of okra. The different cultivars require different sowing times, as good cultivars sown at improper time give poor yield. Therefore, proper and suitable date of sowing is critical to increase the production of okra. Plant sown at proper time gets advantage of climatic factors, has high growth duration, receives proper rainfall, and experience optimal temperature during establishment and the early vegetative stage. As a result, fresh fruit yield and economic returns can be obtained. Improper sowing dates lead to shorter duration, inadequate utilization of rainfall, experiences cool temperature during establishment and the early vegetative stage, and fruit takes longer time to reach marketable size. The delayed sowing causes decreased fruit yield of okra (Ghannad et al., 2014). Proper sowing time gives high fresh weight of fruit, a greater number of fruits per plant and ultimately increases fruit yield per plant. Balochistan, Pakistan, which is classified through variable climatic features (temperature, relative humidity and rainfall) Okra reply to seeding time can differ. Dates of planting might play a significant role on the production of okra plants. Ordinarily, 30 degrees Celsius is considered as an optimum temperature for germination of okra seed. Absence of the okra vegetable for winter months from the market creates a great demand for the vegetable consumers. It must be ascertained that sowing of seeds in April could have materialized early production of the crop and thus compensate the higher germination percentage in April in terms of economic return.
1.1. Objectives:
• To regulate the optimum seeding time for the diversity • To deliver a foundation for regulating seeding times • To enhance harvest in semi-arid climatic condition of Quetta.
2. Materials and Methods:
2.1. Climate and Metrological Data of study area:
Quetta is the capital of Balochistan province. It is located at an elevation of 1676 - 1900m above sea level. The type of weather of the study area is usually cold and dry. Extreme rainfall and snowfall arise in January and February. Summer periods remain modest, although June and July are the warmest month. January is the coolest month (Leghari & Zaidi, 2013). The difference in weather is the chief environmental feature, because of that flora of southern region varies from that of Northern. Due to distinction in these features, there is a dissimilarity in the penology of the crops from period to period (Leghari et al., 2013b).
2.2. Experimental Details and Layout:
The present investigation was planned and perform in Balochistan Agricultural research and development Centre, Quetta, Pakistan in the year 2016. The plot was thoroughly ploughed and brought to the fine tilth. Planking
36 Baloch et al.,/ GU J. Phytosci. 2(1): 34-41 (2022)
Effect of Different seeding days on the development and early productivity of Okra under semi-arid conditions
and harrowing were completed earlier the implementation of layout of the investigational field. The required area was marked, and 27 plots were prepared according to the layout plan. Seeds were lodged on elevated edges through diverse seeding times and planting spacing’s. Around 2-3 seeds were seeded on one place then thinning of plantlets was done keeping one plant/stand after sprouting. Manures were practical by the rate of 100kg/ha nitrogen, 60 kg/ha phosphorus, 50 kg/ha potassium to the soil. The experimental plot was irrigated during the cropping period on need-based conditions. In order to maintain the uninterrupted growth of crop, four weeding were carried out as per the requirement. For recording of the observations 5 plants from the entire inhabitants were arbitrarily designated since, all the plants get identical environmental conditions and different characters occupied in investigation are Germination percentage, Total survival percentage, Average height of plant, number of leaves at the time of first flowering, Days taken for flowering, Average yield / plant, Average yield/plot and Yield per acre. Trial was arranged by RCBD method by 3 replications. Three seeding days at ten days interval i.e., 10th (T1), 20th (T2), and 30th April (T3), and three planting distances i.e., 60 × 45cm (S1), 60 × 60cm (S2) and 60 × 75cm (S3). Data collected was statistically analysis as defined by Steel & Torrie, (1980).
2.3. Plant Protection:
To control insect-pests and diseases the plant protection measures were adopted as per recommendations given in the package of practices for okra in semi-arid climatic conditions of Quetta.
2.4. Observations Recording and Analysis:
During the course of investigation following parameters were measured as; Germination percentage of okra seed and Total number of survival plants was determined by counting the total number of germinated seeds and Total number of survival plants in each treatment and then intended in percentage. Five plants were selected randomly in individually action and then the final height of 5 arbitrarily designated plants was noted in centimeters by measuring tape (Leghari et al., 2013a). Number of leaves of each plant was determined by counting the leaves and days taken for first flowering were counted from germination dates to flowering dates. The average of these observation was used for statistical analysis and interpretation of results. For average yield/plant (gm) single plant was selected in each treatment and edible green pods from each picking was weighed, then the average of total picking was made. Average yield of green pods/plot (gm) was recorded by multiplying the yield per plant with the total number of plants in the entire plot and then it was converted in grams. Green pods of okra produced by a plot in each treatment were weighed and then converted to per acre. Yield per acre was shown in kilograms.
2.5. Statistical Analysis:
Collected data were subjected to analysis of variance technique (ANOVA). Duncan’s multiple range test at 5% probability was used to compare the alterations among treatment (Steel & Torrie, 1980).
3. Results:
Research studies embodied in this investigation was aimed to determining the effects of different dates of sowing on various parameters of growth in relation to okra plant. There were three dates of planting by ten days interval. Data were collected on different parameters, which were included as; Germination percentage, Total survival percentage, Average height of plant, Number of leaves at the time of first flowering, Days taken for flowering, Average yield / plant, Average yield / plot and Yield per acre. The research was designed statistically by RCBD method. Statistical analysis was carried out and significant differences were shown in analysis of variance. Mean values for significant treatments were then subjected to statistical analysis and the results obtained were compared for performance of individual treatments. These studies were carried out in the Balochistan Agricultural Research and Development Centre, Quetta. The results pertaining to each parameter are discussed separately below.
3.1. Germination Percentage
Statistical data obtained on germination percentage of okra plants highly reflected upon significant differences for three treatments. Germination percentage of okra plants indicated significant superiority for T3

Baloch et al.,/ GU J. Phytosci. 2(1): 34-41 (2022) 37
Effect of Different seeding days on the development and early productivity of Okra under semi-arid conditions
(64.85%) over T2 (44.53%) that, in turn, occupies the next best position and T1 (25.51%) showed lowest germination percentage (Table 1 & 3).
Table 1: Effects of different sowing days on developmental parameters of Okra plant
Parameters Days of seeding Significant
level T1 (10th April) T2 (20th April) T3 (30th April) Germination percentage 25.51c 44.53b 64.85a *** Total survival percentage 52.08c 56.65b 65.46a ** Average height of plant (cm) 76.31c 84.43b 92.74a *** Number of leaves at the time of first flowering appearance
05.60c 07.90b 09.70a **
Days taken for flowering 31.75ab 29.75b 34.00a *
Table 2: Effects of different planting Times on developments of Okra crop
Parameters Sowing Dates Significant
level T1 (10th April) T2 (20th April) T3 (30th April) Average yield/plant 286.25b 324.25a 341.00a ** Average yield/plot 3656.75c 7824.75b 13958.25a *** Yield/acre 1106c 2366b 4222a *** ** = Significant and *** = highly significant at 5% significant level
Table 3: Summary of statistical analysis (ANOVA) for Propagation (%).
S.O.V. df S.S. M.S. F.R. Replicate 3 24.93 8.310 Treatment 2 3097.19 1548.597 1134.82** Error 6 8.19 1.365 Total 15 3130.31 ** = highly significant
3.2. Total Survival Percentage
Information obtained on total survival percentage of okra plants reflected highly significant variation for different times of sowing treatments. Significantly highest survival percentage was noted for T3 (65.46%), which followed by T2 (56.65%) and lowest was noted in T1 (52.08%) treatment (Table 1 & 4).
Table 4: Summary of statistical analysis (ANOVA) for Total Survival (%).
S.O.V. df S.S. M.S. F.R. Replicates 3 2.43 0.810 Treatment 2 369.79 184.897 83.57** Error 6 13.27 2.212 Total 11 385.49 **= highly significant
3.3. Plant Height
Average plant height exhibited highly significantly differences amongst treatments when analysis of variance performs. Mean values for various treatments presented in Table 1 & 5 showed highest plant height in T3 (92.74 cm) over T2 (84.43 cm) that, in turn, occupies the next best position significantly and T1 (76.31 cm) showed least plant height.
Table 5: Summary of ANOVA for Height of Plant (cm)
S.O.V. df S.S. M.S. F.R. Replication 3 0.11 0.036 Treatment 2 539.74 269.87 20759.23**
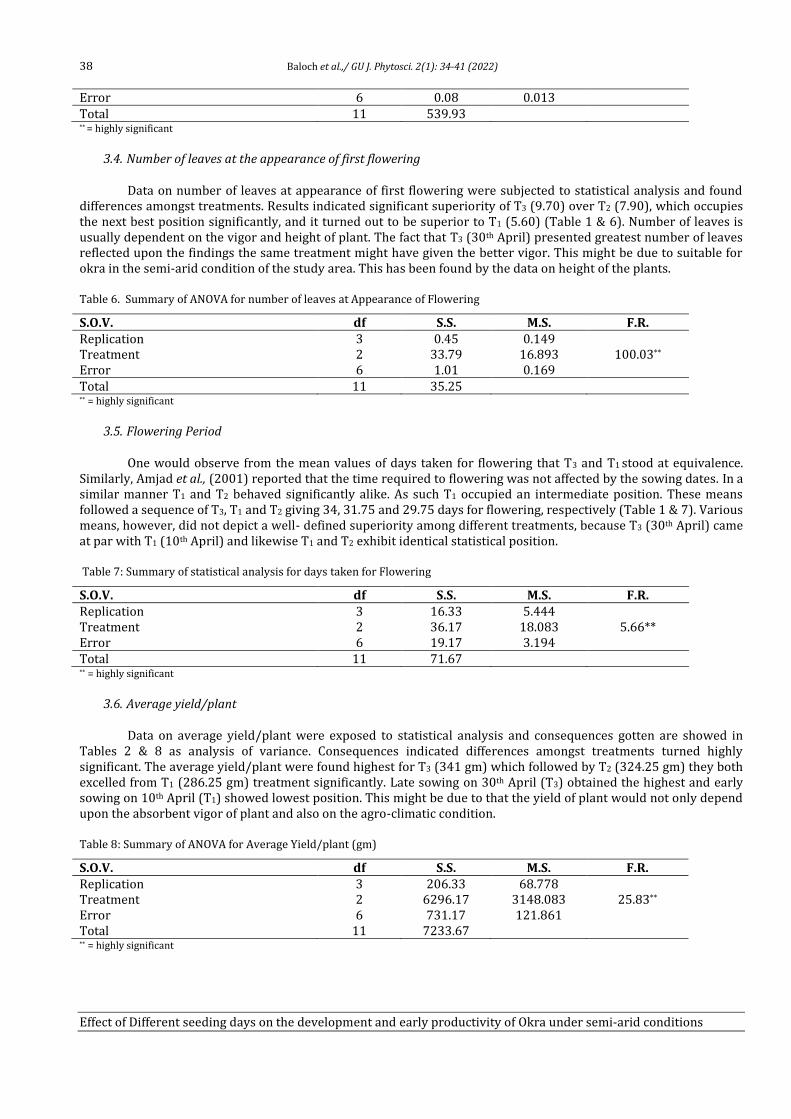
38 Baloch et al.,/ GU J. Phytosci. 2(1): 34-41 (2022)
Effect of Different seeding days on the development and early productivity of Okra under semi-arid conditions
Error 6 0.08 0.013 Total 11 539.93 ** = highly significant
3.4. Number of leaves at the appearance of first flowering
Data on number of leaves at appearance of first flowering were subjected to statistical analysis and found differences amongst treatments. Results indicated significant superiority of T3 (9.70) over T2 (7.90), which occupies the next best position significantly, and it turned out to be superior to T1 (5.60) (Table 1 & 6). Number of leaves is usually dependent on the vigor and height of plant. The fact that T3 (30th April) presented greatest number of leaves reflected upon the findings the same treatment might have given the better vigor. This might be due to suitable for okra in the semi-arid condition of the study area. This has been found by the data on height of the plants.
Table 6. Summary of ANOVA for number of leaves at Appearance of Flowering
S.O.V. df S.S. M.S. F.R. Replication 3 0.45 0.149 Treatment 2 33.79 16.893 100.03** Error 6 1.01 0.169 Total 11 35.25 ** = highly significant
3.5. Flowering Period
One would observe from the mean values of days taken for flowering that T3 and T1 stood at equivalence. Similarly, Amjad et al., (2001) reported that the time required to flowering was not affected by the sowing dates. In a similar manner T1 and T2 behaved significantly alike. As such T1 occupied an intermediate position. These means followed a sequence of T3, T1 and T2 giving 34, 31.75 and 29.75 days for flowering, respectively (Table 1 & 7). Various means, however, did not depict a well- defined superiority among different treatments, because T3 (30th April) came at par with T1 (10th April) and likewise T1 and T2 exhibit identical statistical position.
Table 7: Summary of statistical analysis for days taken for Flowering
S.O.V. df S.S. M.S. F.R. Replication 3 16.33 5.444 Treatment 2 36.17 18.083 5.66** Error 6 19.17 3.194 Total 11 71.67 ** = highly significant
3.6. Average yield/plant
Data on average yield/plant were exposed to statistical analysis and consequences gotten are showed in Tables 2 & 8 as analysis of variance. Consequences indicated differences amongst treatments turned highly significant. The average yield/plant were found highest for T3 (341 gm) which followed by T2 (324.25 gm) they both excelled from T1 (286.25 gm) treatment significantly. Late sowing on 30th April (T3) obtained the highest and early sowing on 10th April (T1) showed lowest position. This might be due to that the yield of plant would not only depend upon the absorbent vigor of plant and also on the agro-climatic condition.
Table 8: Summary of ANOVA for Average Yield/plant (gm)
S.O.V. df S.S. M.S. F.R. Replication 3 206.33 68.778 Treatment 2 6296.17 3148.083 25.83** Error 6 731.17 121.861 Total 11 7233.67 ** = highly significant
Baloch et al.,/ GU J. Phytosci. 2(1): 34-41 (2022) 39
Effect of Different seeding days on the development and early productivity of Okra under semi-arid conditions
3.7. Total yield/plot and Total yield/acre:
Obtained mean values of total yield/plot and average total yield/acre showed highly significant variation amongst different sowing dates. Consequences displayed significant superiority of T3 (13958.25gm/plot and 4222kg/acre) over T2 (7824.75gm/plot and 2366kg/acre) that occupies the next best position significantly and turned out to be superior to T1 (3656.75 gm/plot and 1106kg/acre) treatment, respectively (Table 2, 9 & 10).
Table 9: Summary of ANOVA average yield/plot (gm)
S.O.V. df S.S. M.S. F.R. Replicate 3 2046568.25 682189.417 Treatment 2 214817264.67 107408632.33 319.60** Error 6 2008422.333 236070.333 Total 11 218880254.92 ** = highly significant
Table 10. Summary of ANOVA for yield/Acre (kg).
S.O.V. df S.S. M.S. F.R. Replication 3 188042 62680 Treatment 2 19654532 9827266 319** Error 6 184763 30793 Total 11 20027337 ** = highly significant
4. Discussion:
The variation in germination percentage on different dates were also reported by Amjad et al. (2001). They found maximum germination percentage when crop was sown on 25 April or 5 May, while significantly minimum germination was recorded when crop was sown on 15 April. This might be because of the result of usual ecological circumstances particularly temperature and humidity on seed propagation. Okra is a summer or midsummer crop therefore it prefers warmer temperatures. Superiority of T3 these results could be attributed to favorable study area (Quetta city) temperature for germination. It is facts that Okra is primarily a midsummer crop and would prefer warmer temperature for germination. Our data have confirmed these findings. The month of April provides sufficiently appropriate temperature for the germination of seed; it appears from the data that earlier plants presented low germination percentage. Similar observations were also reported by Hussain et al. (2006). The difference in seeding days is the key reason of alteration in sapling appearance and their existence and potency of seedlings, as reported by Gadakh et al. (1991). Relative humidity and monthly average temperature were noted over the trial period for two years and were well-thought-out best for development and growth of Okra (Katung, 2007). Iremiren & Okiy, (1986) observed poor germination in early sowing date.
Contrary to our results, Amjad et al. (2001) reported that the vegetable height was not pretentious knowingly through the time of sowing and it was almost the same at each of the sowing date. However, they found plant height was significantly affected by various fertilizer doses. Present consequences indicated highest plant height in T3 and lowest in T1 treatment which might be due to variation in local (Quetta) climatic condition (temperature) as compared to Faisalabad because okra prefers warmer temperatures for better growth. At current study site temperature remain low comparatively on early days of April then that of late April this could be attributed to the genetic constitution of the plant, which could grow in higher temperature coupled with lack of humidity. The fact that other treatments lacked behind could not be attributed the early transplanting because in the month of April, regardless of their date of planting, the plants are subjected to higher temperature. This could be attributed to the initial advantage, which the April planting affected for better germination and development of growth, due of favorable temperature condition. Likewise, Mondal et al. (1989) perceived that Okra seeded in April made the maximum plants height, that harvest great yield with respect to the seed seeded during June. According to Singh et al. (1986) under Hisar (Haryana) conditions the okra crop sown on 15th June recorded supreme plant height, number of branches and number of pods/plants, length of pods, weight of 1000 seeds and seed yield/hectare.
The variation in number of leaves per plant due to different sowing time was also noted by other investigators (Amjad et al., 2001; Elhag & Ahmed, 2014) depending on environmental condition of the experimental sites. Amjad et al. (2001) reported maximum number of leaves once plant was seeded on 15th April or 5th May and minimum leaves numbers was recorded when crop was sown on April 25 this might be due to variation in
40 Baloch et al.,/ GU J. Phytosci. 2(1): 34-41 (2022)
Effect of Different seeding days on the development and early productivity of Okra under semi-arid conditions
environmental and weather conditions. Similarly, Elhag & Ahmed, (2014) found highest plant height and number of leaves at early sowing on 1st of July instead of late seeding on July 20th and August 10th. Good start of plants would reflect upon the better vigor situation. It is parallel to the common statement that well began is half done, for the future development of plant. Hence, greater number of leaves by virtue of better vigor could be consequent upon good short in germination. Highest height of plant, greatest number of fruits/plant and maximum fruit yield from Okra crop was recorded by Mondal et al. (1989) when seedling was done on 20th April during spring summer season.
This information indicated that later planting developed early flowering period. The cause may be because of the adaptation of diverse Okra cultivars to native situations as well as getting the best temperature and promising ecological circumstances. Similar statement was also reported by Hussain et al. (2006). Further that it has generally been seen that the more vigorous the plant in growth, the delayed flowering could occur. This could be attributed to a tendency of plant to its vegetative growth. Prompt picking on May 28th and June 8th, 2005, seeding times were because of rapid appearance and quick flowering, getting an optimal temperature and length of day that produced timely flowering and acquired fewer number of days to first picking. The aim strengthens due to the adaptation of various Okra varieties to local circumstance and receipting the best temperature and environmental situations. Similar statement was also reported by Hussain et al. (2006). It was observed for germination, height and number of leaves of plant that T3 occupied the highest place. It had out yielded plants of the other treatments. Similar observations were also reported by Bake et al. (2017). They found maximum fruit yield per plant on late sowing date D3 (30th June) as compared to the 10th (D1) and 20th (D2) treatments. Present consequences are in agreement by the conclusions of Talukder et al. (2003); Firoz et al. (2007) and Bake et al. (2017). The variation in in total yield/plot and total yield/acre were also noted by other researchers (Yogesh et al., 2001; Talukder et al., 2003; Firoz et al., 2007; Bake et al., 2017). Bake et al. (2017) reported that in case of sowing dates, D1 (June 10th) seeding listed greatest fruit yield (q/ha).
5. Conclusion:
After investigation, it can be resolved that in Quetta Balochistan, Pakistan which had semi-arid condition, the best seeding time for Okra would be the early April. This linked by a different parameter, which were included as; Germination percentage, Total survival percentage, Average height of plant, Number of leaves at the time of first flowering, Days taken for flowering, Average yield / plant, Average yield / plot and Yield per acre. It is though suggested that additional study be completed to assess a broader range of Okra variations and crosswise diverse places inside changed climatic conditions of Balochistan, Pakistan and to meet the great demand of market created by the vegetable consumers.
6. References:
Adams, C.F. 1975. Nutritive value of American foods in common units. U.S. Department of Agriculture, Agric. Handbook. USA. pp 29. Amjad, M., M.A. Anjum, and A. Ali. 2001. Effect of phosphorus and planting density on seed production in okra (Abelmoschus
esculentus L. Moench). J. Agri and Biol., 3(4): 380-383. Bake, I.D., B.K. Singh, A.K. Singh, D.P. Moharana, and A.K. Maurya. 2017. Impact of planting distances and sowing dates on yield
attributing traits of okra [Abelmoschus esculentus (L.) Moench] cv. Kashi Pragati. Int. J. Cur. Micro. App. Sci., 6(7): 4112-4125. Elhag, A.Z., and A.A. Ahmad. 2014. Effect of cultivar and sowing date on okra [Abelmoschus esculentus (L.) Moench] seed yield. Uni.
J. Appl. Sci., 2(3): 64-67. Farinde, A.J., O.K. Owolarafe, and O.I. Qgungbeni. 2007. An overview of production, processing, marketing and utilisation of okra in
Egbedore Local Government area of Osun state, Nigeria. Agri. Eng. Int. CIGR eJournal, IX: 1-17. Firoz, Z.A., M.A. Islam, M. Mohiuddin, and M.M. Rahman. 2007. Yield and yield attributes of okra as influenced by planting time and
plant spacing in hill slope condition. Prog. Agri., 18(2): 67-73. Gadakh, S.R., K.E. Lawande, and P.N. Kale. 1991. Effect of different seasons and spacing yield quality of bhindi. Haryana J. of Hort.
Sci., 19(3-4): 329-332. Ghannad, M., H. Madani, and H.H. Darvishi. 2014. Responses of Okra crop to sowing time, irrigation interval and sowing methods
in Shahrood region. Int. J. of Agri. Crop Sci., 7(10): 676-682. Government of Pakistan. 2005. Fruit, Vegetable and Condiment Statistics of Pakistan. Government of Pakistan Ministry of Food,
Agriculture and Livestock (Economic wing), Islamabad. pp 11-12. Hussain, S., M. Sajid, N. Amin, S. Alam, Z. Iqbal. 2006. Response of okra (Abelmoschus esculentus) cultivars to different sowing
times. J. Agri. Biol. Sci., 1(1): 55-59. Iremiren, G.O., and Okiy. 1986. Effect of sowing date on the growth, yield and quality of okra [Abelmoschus esculentus (L.) Moench]
in Southern Nijeria. J. Agri. Sci. U.K., 106(1): 21- 26. Katung, M.D. 2007. Productivity of okra varieties as influenced by seasonal changes in Northern Nigeria. Notulae Botanicae Horti
Agrobotanici Cluj-Napoca, 35(1): 65.
Baloch et al.,/ GU J. Phytosci. 2(1): 34-41 (2022) 41
Effect of Different seeding days on the development and early productivity of Okra under semi-arid conditions
Khalid, U., E. Ahmed, and U.K. Muhammad. 2005. Integrated weed management in okra. Pak. Weed Sci. J., 11(1/2): 55-60. Leghari, S.K., M.A. Zaid, A.M. Sarangzai, M. Faheem, G.R. Shawani and W. Ali. 2013a. Effect of roadside dust pollution on the growth
and total chlorophyll contents in Vitis vinifera L. (grape). Afr. J. of Biotech., 13(11): 1237-1242. Leghari, S.K., M.A. Zaidi, and A.M. Sarangzai. 2013b. Seasonal variation in leaf relative water, dry matter and live fine fuel moisture
contents in some common plant species of quetta, Balochistan. FUUAST J. Biol., 3(2): 73. Leghari, S.K., and M.A. Zaidi. 2013. Effect of air pollution on the leaf morphology of common plant species of Quetta city. Pak. J. Bot.,
45(S1): 447-454. Mondal, M., S. Banik, and K.P. Ghatak. 1989. Theoretical analysis of the photoemission from quantum well wires of ternary
chalcopyrite semiconductors. J. Low Temp. Phy., 74(5-6): 423-433. Onyishi, G.C. 2011. Growth and yield of okra [Abelmoschus esculentus (L.) Moench] to different nutrient sources in ultisols of
South-Eastern Nigeria. Nigeria Agri. J., 42: 330-333. Rashwan, A.M.A. 2011. Study of genotypic and phenotypic correlation for some agro economic traits in okra [Abelmoschus
esculentus (L) Moench]. Asian J. of Crop Sci., 3(2): 85-91. Saha, P.K., D.K. Aditya, and A.F.M. Sharfuddin. 1989. Effects of plant spacing and picking interval on the growth and yield of okra
cv. Pusa Sawani. Bangladesh J. Horti., 17(2):10-14. Singh, K.P., Y.S. Malik, S. Lal, and M.L. Pandita. 1986. Effect of planting dates and spacing on seed production of Okra. Haryana J. of
Hort. Sci., 15(3-4): 267-271. Steel, R.G.D, and J.H. Torrie. 1980. Multiple comparisons, Principles and Procedures of Statistics. Mc Graw Hill Book Co. New York.
pp 173-191. Talukder, M.A.H, M.A. Mannaf, M.K. Alam, M.A. Salam, and M.M.U. Amin. 2003. Influence of sowing time, plant spacing and picking
interval on the growth and yield of okra. Pak. J. Bio. Sci., 6(18):1626-1630. Yogesh, P., S. Gopal, Y. Prasad, and G.A. Singh. 2001. Effect of nutrition and time of sowing on growth and seed production of okra
(Abelmoschus esculentus). Vege. Sci., 28(2): 186-187.
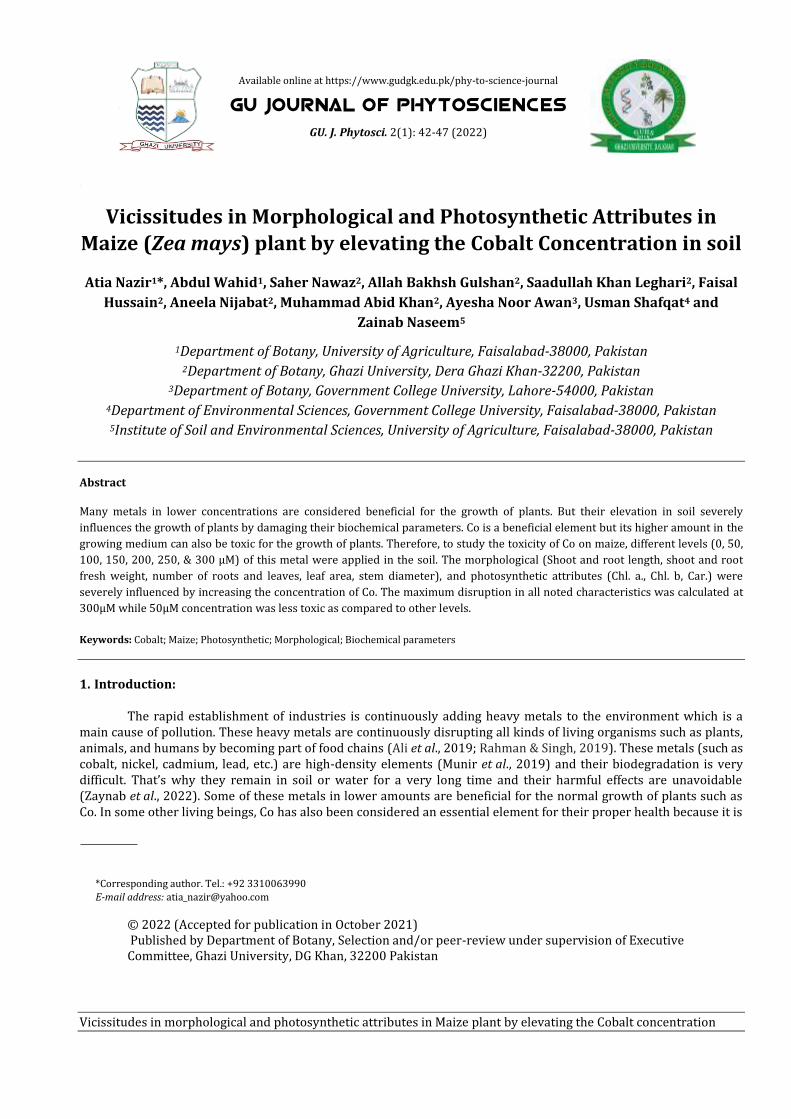
Available online at https://www.gudgk.edu.pk/phy-to-science-journal
GU JOURNAL OF PHYTOSCIENCES
GU. J. Phytosci. 2(1): 42-47 (2022)
<<
Vicissitudes in morphological and photosynthetic attributes in Maize plant by elevating the Cobalt concentration
Vicissitudes in Morphological and Photosynthetic Attributes in
Maize (Zea mays) plant by elevating the Cobalt Concentration in soil
Atia Nazir1*, Abdul Wahid1, Saher Nawaz2, Allah Bakhsh Gulshan2, Saadullah Khan Leghari2, Faisal
Hussain2, Aneela Nijabat2, Muhammad Abid Khan2, Ayesha Noor Awan3, Usman Shafqat4 and
Zainab Naseem5
1Department of Botany, University of Agriculture, Faisalabad-38000, Pakistan 2Department of Botany, Ghazi University, Dera Ghazi Khan-32200, Pakistan
3Department of Botany, Government College University, Lahore-54000, Pakistan 4Department of Environmental Sciences, Government College University, Faisalabad-38000, Pakistan 5Institute of Soil and Environmental Sciences, University of Agriculture, Faisalabad-38000, Pakistan
Abstract
Many metals in lower concentrations are considered beneficial for the growth of plants. But their elevation in soil severely
influences the growth of plants by damaging their biochemical parameters. Co is a beneficial element but its higher amount in the
growing medium can also be toxic for the growth of plants. Therefore, to study the toxicity of Co on maize, different levels (0, 50,
100, 150, 200, 250, & 300 µM) of this metal were applied in the soil. The morphological (Shoot and root length, shoot and root
fresh weight, number of roots and leaves, leaf area, stem diameter), and photosynthetic attributes (Chl. a., Chl. b, Car.) were
severely influenced by increasing the concentration of Co. The maximum disruption in all noted characteristics was calculated at
300µM while 50µM concentration was less toxic as compared to other levels.
Keywords: Cobalt; Maize; Photosynthetic; Morphological; Biochemical parameters
1. Introduction:
The rapid establishment of industries is continuously adding heavy metals to the environment which is a main cause of pollution. These heavy metals are continuously disrupting all kinds of living organisms such as plants, animals, and humans by becoming part of food chains (Ali et al., 2019; Rahman & Singh, 2019). These metals (such as cobalt, nickel, cadmium, lead, etc.) are high-density elements (Munir et al., 2019) and their biodegradation is very difficult. That’s why they remain in soil or water for a very long time and their harmful effects are unavoidable (Zaynab et al., 2022). Some of these metals in lower amounts are beneficial for the normal growth of plants such as Co. In some other living beings, Co has also been considered an essential element for their proper health because it is
*Corresponding author. Tel.: +92 3310063990
E-mail address: [email protected]
© 2022 (Accepted for publication in October 2021) Published by Department of Botany, Selection and/or peer-review under supervision of Executive Committee, Ghazi University, DG Khan, 32200 Pakistan
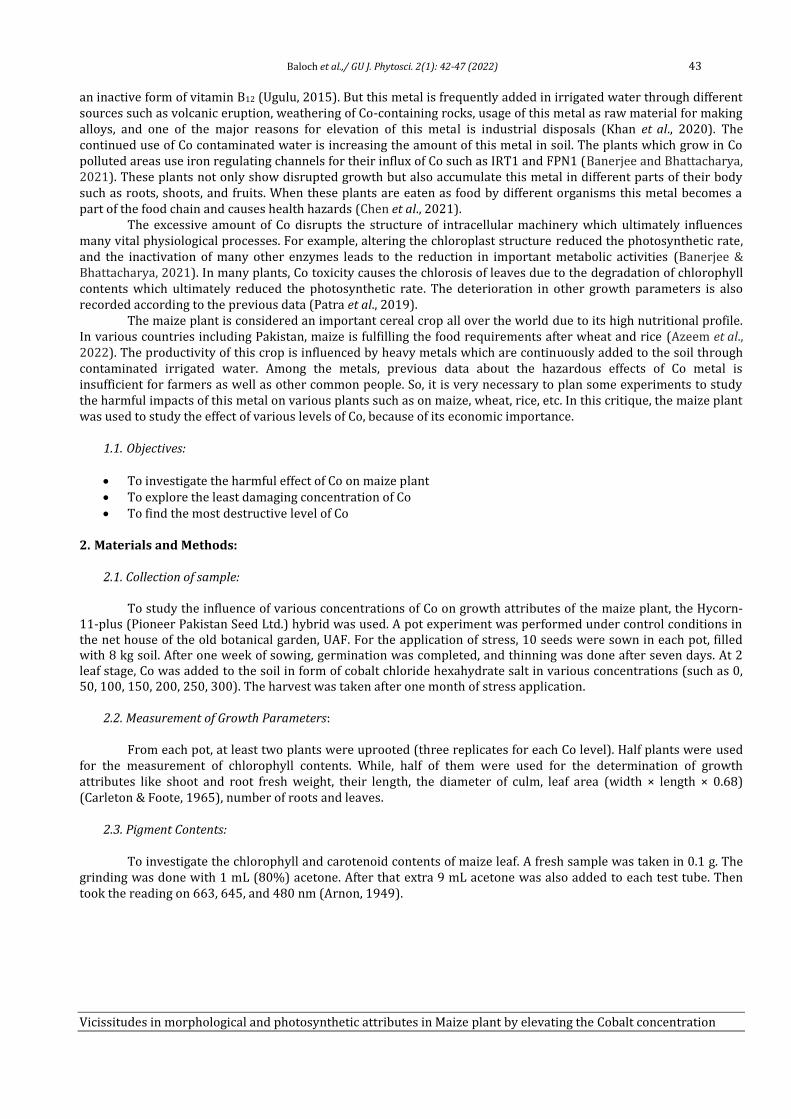
Baloch et al.,/ GU J. Phytosci. 2(1): 42-47 (2022) 43
Vicissitudes in morphological and photosynthetic attributes in Maize plant by elevating the Cobalt concentration
an inactive form of vitamin B12 (Ugulu, 2015). But this metal is frequently added in irrigated water through different sources such as volcanic eruption, weathering of Co-containing rocks, usage of this metal as raw material for making alloys, and one of the major reasons for elevation of this metal is industrial disposals (Khan et al., 2020). The continued use of Co contaminated water is increasing the amount of this metal in soil. The plants which grow in Co polluted areas use iron regulating channels for their influx of Co such as IRT1 and FPN1 (Banerjee and Bhattacharya, 2021). These plants not only show disrupted growth but also accumulate this metal in different parts of their body such as roots, shoots, and fruits. When these plants are eaten as food by different organisms this metal becomes a part of the food chain and causes health hazards (Chen et al., 2021).
The excessive amount of Co disrupts the structure of intracellular machinery which ultimately influences many vital physiological processes. For example, altering the chloroplast structure reduced the photosynthetic rate, and the inactivation of many other enzymes leads to the reduction in important metabolic activities (Banerjee & Bhattacharya, 2021). In many plants, Co toxicity causes the chlorosis of leaves due to the degradation of chlorophyll contents which ultimately reduced the photosynthetic rate. The deterioration in other growth parameters is also recorded according to the previous data (Patra et al., 2019).
The maize plant is considered an important cereal crop all over the world due to its high nutritional profile. In various countries including Pakistan, maize is fulfilling the food requirements after wheat and rice (Azeem et al., 2022). The productivity of this crop is influenced by heavy metals which are continuously added to the soil through contaminated irrigated water. Among the metals, previous data about the hazardous effects of Co metal is insufficient for farmers as well as other common people. So, it is very necessary to plan some experiments to study the harmful impacts of this metal on various plants such as on maize, wheat, rice, etc. In this critique, the maize plant was used to study the effect of various levels of Co, because of its economic importance.
1.1. Objectives:
• To investigate the harmful effect of Co on maize plant • To explore the least damaging concentration of Co • To find the most destructive level of Co
2. Materials and Methods:
2.1. Collection of sample:
To study the influence of various concentrations of Co on growth attributes of the maize plant, the Hycorn-11-plus (Pioneer Pakistan Seed Ltd.) hybrid was used. A pot experiment was performed under control conditions in the net house of the old botanical garden, UAF. For the application of stress, 10 seeds were sown in each pot, filled with 8 kg soil. After one week of sowing, germination was completed, and thinning was done after seven days. At 2 leaf stage, Co was added to the soil in form of cobalt chloride hexahydrate salt in various concentrations (such as 0, 50, 100, 150, 200, 250, 300). The harvest was taken after one month of stress application.
2.2. Measurement of Growth Parameters:
From each pot, at least two plants were uprooted (three replicates for each Co level). Half plants were used for the measurement of chlorophyll contents. While, half of them were used for the determination of growth attributes like shoot and root fresh weight, their length, the diameter of culm, leaf area (width × length × 0.68) (Carleton & Foote, 1965), number of roots and leaves.
2.3. Pigment Contents:
To investigate the chlorophyll and carotenoid contents of maize leaf. A fresh sample was taken in 0.1 g. The grinding was done with 1 mL (80%) acetone. After that extra 9 mL acetone was also added to each test tube. Then took the reading on 663, 645, and 480 nm (Arnon, 1949).
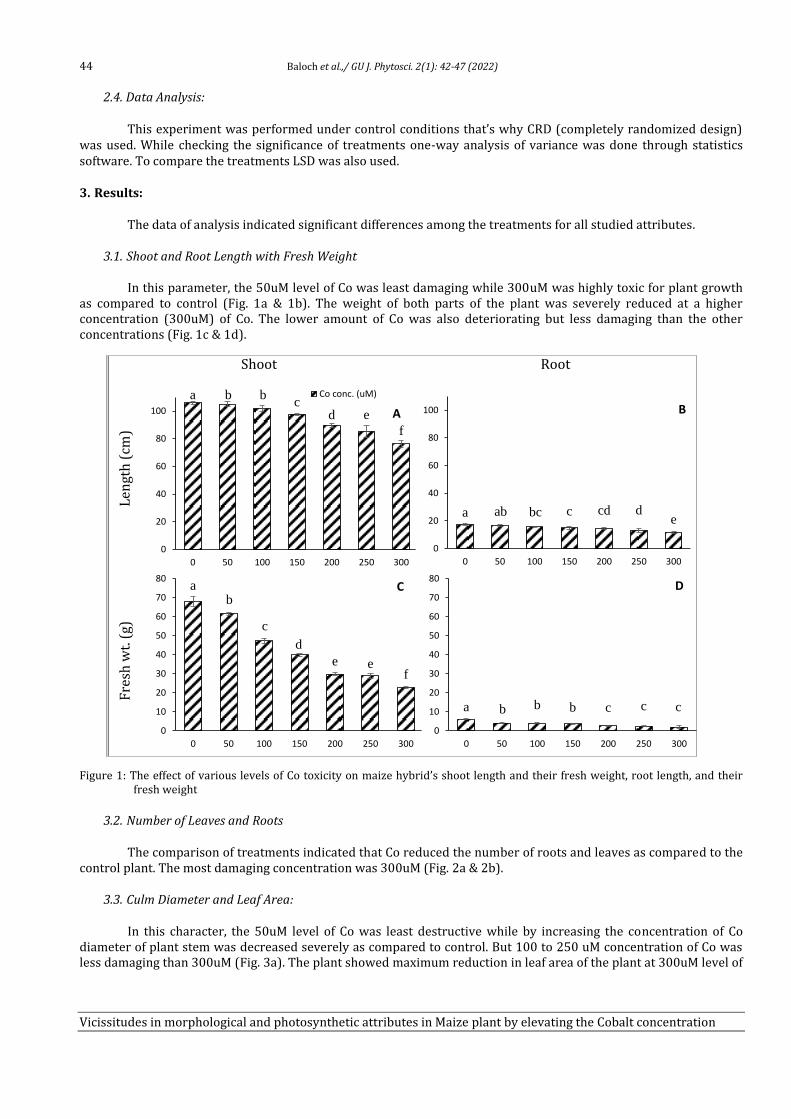
44 Baloch et al.,/ GU J. Phytosci. 2(1): 42-47 (2022)
Vicissitudes in morphological and photosynthetic attributes in Maize plant by elevating the Cobalt concentration
2.4. Data Analysis:
This experiment was performed under control conditions that’s why CRD (completely randomized design) was used. While checking the significance of treatments one-way analysis of variance was done through statistics software. To compare the treatments LSD was also used.
3. Results:
The data of analysis indicated significant differences among the treatments for all studied attributes.
3.1. Shoot and Root Length with Fresh Weight
In this parameter, the 50uM level of Co was least damaging while 300uM was highly toxic for plant growth as compared to control (Fig. 1a & 1b). The weight of both parts of the plant was severely reduced at a higher concentration (300uM) of Co. The lower amount of Co was also deteriorating but less damaging than the other concentrations (Fig. 1c & 1d).
Figure 1: The effect of various levels of Co toxicity on maize hybrid’s shoot length and their fresh weight, root length, and their fresh weight
3.2. Number of Leaves and Roots
The comparison of treatments indicated that Co reduced the number of roots and leaves as compared to the control plant. The most damaging concentration was 300uM (Fig. 2a & 2b).
3.3. Culm Diameter and Leaf Area:
In this character, the 50uM level of Co was least destructive while by increasing the concentration of Co diameter of plant stem was decreased severely as compared to control. But 100 to 250 uM concentration of Co was less damaging than 300uM (Fig. 3a). The plant showed maximum reduction in leaf area of the plant at 300uM level of
Shoot Root
Len
gth
(cm
)
Fre
sh w
t. (
g)
a b bc
d e
f
0
20
40
60
80
100
0 50 100 150 200 250 300
Co conc. (uM)
a ab bc c cd de
0
20
40
60
80
100
0 50 100 150 200 250 300
ab
c
d
e ef
0
10
20
30
40
50
60
70
80
0 50 100 150 200 250 300
a b b b c c c
0
10
20
30
40
50
60
70
80
0 50 100 150 200 250 300
A B
C D

Baloch et al.,/ GU J. Phytosci. 2(1): 42-47 (2022) 45
Vicissitudes in morphological and photosynthetic attributes in Maize plant by elevating the Cobalt concentration
Co. The lower amount of Co also decreased this character but was comparatively less damaging than the other concentrations (Fig. 3b).
Figure 2: The effect of various levels of Co toxicity on maize hybrid’s leaves number and roots number
Figure 3: The effect of various levels of Co toxicity on maize hybrid’s culm diameter and leaf area
3.4. Chlorophyll ‘a, ‘b’ and Carotenoids Content
The comparison of treatments directed that Co decline the Chl-a contents as compared to control plant. The most damaging concentration was 300uM and 50uM was the least effective (Fig. 4a). The 50uM level of Co showed a minimum reduction in Chl-b contents than control and other treatments while by increasing the concentration of Co this attribute was decreased severely (Fig. 4b).
The plant showed maximum reduction in Car. of the plant at 300uM level of Co. The lower amount of Co also declined this character but was comparatively less damaging than the other concentrations (Fig. 4c).
The results of all studied attributes (morphological as well as photosynthetic) indicated that Co was damaging even in a lower amount such as 50uM and increase in the concentration of this metal adverse effects also get enhanced like 100 to 300 uM.
Number of Leaves Number of Roots
ab abc abc
bc cd
d
0
2
4
6
8
10
12
0 50 100 150 200 250 300
Co conc. (uM)A
a abbc
c
d dee
0
2
4
6
8
10
12
14
16
18
20
0 50 100 150 200 250 300
B
Culm diameter Leaf Area
aab
bc cdd
ee
0
0.4
0.8
1.2
1.6
2
0 50 100 150 200 250 300
Co conc. (uM)A
a
bc d
ef
g
0
50
100
150
200
250
0 50 100 150 200 250 300
B
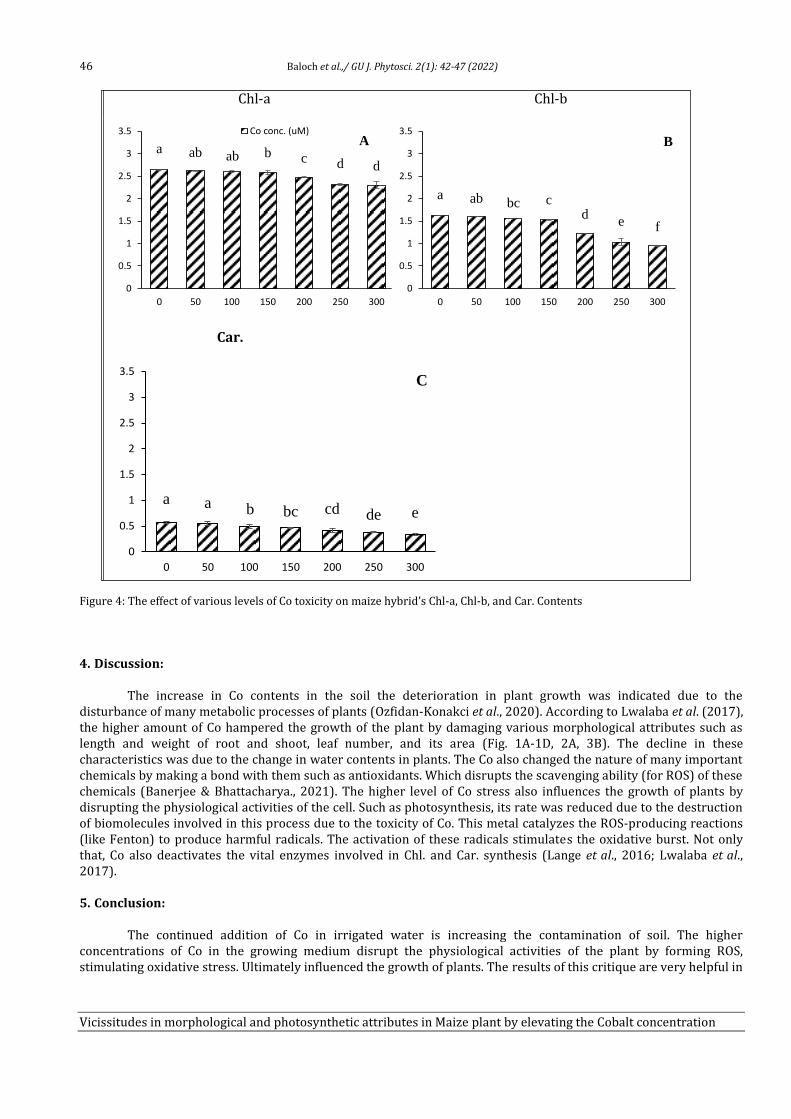
46 Baloch et al.,/ GU J. Phytosci. 2(1): 42-47 (2022)
Vicissitudes in morphological and photosynthetic attributes in Maize plant by elevating the Cobalt concentration
Figure 4: The effect of various levels of Co toxicity on maize hybrid’s Chl-a, Chl-b, and Car. Contents
4. Discussion:
The increase in Co contents in the soil the deterioration in plant growth was indicated due to the disturbance of many metabolic processes of plants (Ozfidan-Konakci et al., 2020). According to Lwalaba et al. (2017), the higher amount of Co hampered the growth of the plant by damaging various morphological attributes such as length and weight of root and shoot, leaf number, and its area (Fig. 1A-1D, 2A, 3B). The decline in these characteristics was due to the change in water contents in plants. The Co also changed the nature of many important chemicals by making a bond with them such as antioxidants. Which disrupts the scavenging ability (for ROS) of these chemicals (Banerjee & Bhattacharya., 2021). The higher level of Co stress also influences the growth of plants by disrupting the physiological activities of the cell. Such as photosynthesis, its rate was reduced due to the destruction of biomolecules involved in this process due to the toxicity of Co. This metal catalyzes the ROS-producing reactions (like Fenton) to produce harmful radicals. The activation of these radicals stimulates the oxidative burst. Not only that, Co also deactivates the vital enzymes involved in Chl. and Car. synthesis (Lange et al., 2016; Lwalaba et al., 2017).
5. Conclusion:
The continued addition of Co in irrigated water is increasing the contamination of soil. The higher concentrations of Co in the growing medium disrupt the physiological activities of the plant by forming ROS, stimulating oxidative stress. Ultimately influenced the growth of plants. The results of this critique are very helpful in
Chl-a Chl-b
Car.
a ab ab b c d d
0
0.5
1
1.5
2
2.5
3
3.5
0 50 100 150 200 250 300
Co conc. (uM)A
a ab bc cd
e f
0
0.5
1
1.5
2
2.5
3
3.5
0 50 100 150 200 250 300
B
a a b bc cd de e
0
0.5
1
1.5
2
2.5
3
3.5
0 50 100 150 200 250 300
C

Baloch et al.,/ GU J. Phytosci. 2(1): 42-47 (2022) 47
Vicissitudes in morphological and photosynthetic attributes in Maize plant by elevating the Cobalt concentration
exploring the toxicity of Co but still, this information is insufficient and further experiments are needed to conduct on this metal for better understanding.
6. References:
Ali, H., E. Khan and I. Ilahi. 2019. Environmental chemistry and ecotoxicology of hazardous heavy metals: environmental persistence, toxicity, and bioaccumulation. J. Chem., 2019: 1-14.
Arnon, D.I. 1949. Copper enzyme in isolated chloroplasts. Polyphenoloxidase in Beta vulgaris. Plant Physiol., 24: 1-15. Azeem, M., M.Z. Haider, S. Javed, M.H. Saleem and A. Alatawi. 2022. Drought stress amelioration in maize (Zea mays L.) by
inoculation of Bacillus spp. strains under sterile soil conditions. Agriculture, 12: p 50. Banerjee, P. and P. Bhattacharya. 2021. Investigating cobalt in soil-plant-animal-human system: dynamics, impact and
management. J. Soil Sci. Plant Nutr., 21: 1-16. Banerjee, P. and P. Bhattacharya. 2021. Investigating cobalt in soil-plant-animal-human system: dynamics, impact and
management. J. Soil Sci. Plant Nutr., pp 1-16. Carleton, A.E. and W.H. Foote. 1965. A comparison of methods for estimating total leaf area of barley plants 1. Crop Sci., 5: 602-
603. Chen, F., Z.I. Khan, A. Zafar, J. Ma, M. Nadeem, K. Ahmad, S. Mahpara, K. Wajid, H. Bashir, M. Munir and I.S. Malik. 2021. Evaluation
of toxicity potential of cobalt in wheat irrigated with wastewater: health risk implications for public. Environ. Sci. Pollut. Res., 28: 21119-21131.
Khan, Z.I., I. Ugulu, S. Sahira, N. Mehmood, K. Ahmad, H. Bashir and Y. Dogan. 2020. Human health risk assessment through the comparative analysis of diverse irrigation regimes for Luffa (Luffa cylindrica (L.) Roem.). J. Water Sanit. Hyg. Dev., 10: 249-261.
Lange, B., A. vanderEnt, A.J. Baker, G. Echevarria, G. Mahy, F. Malaisse, P. Meerts, O. Pourret, N. Verbruggen and M.P. Faucon. 2016. Copper and cobalt accumulation in plants: a critical assessment of the current state of knowledge. New Phytol., 213: 537-551.
Lwalaba, J. L.W, G. Zvogbo, M. Mulembo, M. Mundende and G. Zhang. 2017. The effect of cobalt stress on growth and physiological traits and its association with cobalt accumulation in barley genotypes differing in cobalt tolerance. J. Plant Nutr., 40: 2192-2199.
Munir, M., Z.I. Khan, K. Ahmad, K. Wajid, H. Bashir, I.S. Malik, M. Nadeem, A. Ashfaq and I. Ugulu. 2019. Transfer of heavy metals from different sources of fertilizers in wheat variety (Galaxy-13). Asian J. Biol. Sci., 12: 832-841.
Ozfidan-Konakci, C., E. Yildiztugay, F. Elbasan, M. Kucukoduk and I. Turkan. 2020. Hydrogen sulfide (H2S) and nitric oxide (NO) alleviate cobalt toxicity in wheat (Triticum aestivum L.) by modulating photosynthesis, chloroplastic redox and antioxidant capacity. J. Hazard. Mater., 388: 1-15.
Patra, K.K., D. Oberoi, R.K. Joshi, R. Prasad and D.D. Pandey. 2019. Changes of photosynthetic parameters in Jatropha curcas L. leaves under cobalt stress. Int. J. Plant Environ., 5: 278-283.
Rahman, Z., and V.P. Singh. 2019. The relative impact of toxic heavy metals (THMs)(arsenic (As), cadmium (Cd), chromium (Cr)(VI), mercury (Hg), and lead (Pb)) on the total environment: an overview. Environ. Monit. Assess., 191: 1-21.
Ugulu, I. 2015. Development and validation of an instrument for assessing attitudes of high school students about recycling. Environ. Educ. Res., 21: 916-942.
Zaynab, M., R. Al-Yahyai, A. Ameen, Y. Sharif, L. Ali, M. Fatima, K.A. Khan and S. Li. 2022. Health and environmental effects of heavy metals. J. King Saud Uni. Sci., 34: 1-8.

Available online at https://www.gudgk.edu.pk/phy-to-science-journal
GU JOURNAL OF PHYTOSCIENCES
GU. J. Phytosci. 2(1): 48-59 (2022)
<<
A Systematic Review on Stress of Heavy Metals in Plants
A Systematic Review on Heavy Metals Stress in Plants
Abdul Basit1*, Allah Bakhsh Gulshan1, Muhammad Waqas2, Asia Kainat1, and Arooj Fatima1
1Department of Botany, Ghazi University, Dera Ghazi Khan-32200, Pakistan 2Department of Botany, Government Graduate College for Boys, Block-17, Dera Ghazi Khan-32200, Pakistan
3Institute of Botany, University of Punjab, Lahore-54000, Pakistan
Abstract
Heavy metals like Cd, Pb, and Cr are significant environmental pollutants, especially in areas with high levels of anthropogenic
stress. Because phytotoxins from soil organisms and environmental health adversely affect the safety of foodstuffs and
economics, cultivation, and environmental health, the build-up by heavy metals in the soil has attracted much attention in
agricultural production. The plant’s importance and their metabolic movement are in and ecological redistribution of heavy
metals by air, water, and soil pollution. The consequence of heavy metals poisoning is the unnecessary increases of ROS (reactive
oxygen species) which can affects the inactivation of enzymes, damage of DNA, and other interactions of plant cells. In this review,
we describe the different heavy metals effects on plant’s growth and productivity, and their toxic effects on plant’s. Due to the
stress of heavy metals in plants the production of the crops is reduced, it also disturbs the root growth and shoots of plants. Heavy
metals stress stops the plant’s growth and height of the plants. Due to heavy metals stress on plants, the production of fruits
becomes decreases as a result stress of heavy metals the production of yield decrease.
Keywords: Phototoxins; Anthropogenic stress; Metabolic activities; Lipid peroxidation
1. Introduction:
Plants naturally face many unfavorable environmental conditions, such as organic and inorganic stresses. In the case of all other stresses, the heavy metal pressures have a negative impact on the crops yield and growth. Heavy metal stress induces unlike responses in the plants, ranging from biochemical reactions to the yield of the crops. The word "heavy metal" refers to some metallic substances which are relative with the higher substance and remain poisonous even at low concentrations. The basic term “heavy metals” applies to the metals in this group and metal which has an atomic mass greater than four g/cm3, that is, four times better than water (Rastgoo et al., 2014).
The density of metallic ions like Cd, Pb, Hg, and Zn is very high (Oves et al., 2012). Essential and non-belonging elements can cause various physiological, morphological, and genes, including growth, mutation control effects, and an increase in mortality when exceeding threshold limits (Li et al., 2013), the heavy metal, like Hg and Zn, are used by active enzymatic reactions. For example, zero enzyme activation (Seth et al., 2012) of the enzyme
*Corresponding author Tel.: +92 3496310799 E-mail address: [email protected]
© 2022 (Accepted for publication in November 2021) Published by Department of Botany, Selection and/or peer-review under supervision of Executive Committee, Ghazi University, DG Khan, 32200 Pakistan
Basit et al.,/ GU J. Phytosci. 2(1): 48-59 (2022) 49
A Systematic Review on Stress of Heavy Metals in Plants
reaction (Pintilie et al., 2016) is formed or catalyst properties such as a steel protein. These essential monitoring metal nutrients perform electronic discounts and composition purposes in oxidation-reduction reactions. Some of the heavy metals like cadmium and mercury are highly toxic for metallic enzymes, resulting the inhibition of the growth and death of plants.
Heavy metals are classified as class B metals such as non-metal, including harmful components like mercury, silver, lead, and nickel, according to the alternative classification based on their coordination chemistry (Zhang et al., 2016). The number of heavy metals is organic which means that they do not break down in the environment are difficult to digest. These metals are accumulated in the ecological food chain obligations to the absorption of major levels of producers and then accumulate by consumption. The Immobilized of plants and plant roots in the main communication sites in heavy metal ions. In aquatic classifications, the entire plants are shown by this ion. The heavy metals are directly fascinated in the plates by particles placed on the surface of the leaf. Plants become immobilized and plant roots are the main contactors of metallic ions. In aquatic classifications, all plants are shown to this ion. Due to the particles deposited on the surface of the panel, the heavy metals are also directly absorbed into the leaf.
1.1. Objectives:
• To describe the various effects of heavy metals like mercury, silver, lead, and nickel, according to the alternate classification and their chemical coordination.
• To explore the impacts of heavy metals on the environment • To summarize the information of research on the sources and effects of metallic ions in plants as well as to
conclude the heavy metal’s effects on humans and animals.
2. Review of Relevant Literature:
2.1. Pollution of Heavy Metals by Different Sources:
The potential sources of heavy metals like natural, industrial, agricultural, domestic and atmospheric; others are present in the environment. The removing and dissolving of heavy metals from industries and agriculture has polluted a huge area in the world, including China, Japan, and Indonesia, metallic ions like cadmium, copper, and zinc (Agunbiade et al., 2016). The major heavy metals sources are reported in Table 1 and also shown in Fig. 1.
Table 1: Different heavy metals sources reported in the literature.
S. No. Heavy metals Sources of Heavy Metals 1 Zinc Electroplating industry, foundry and refining, mining, biological solids
2 Cadmium Geological sources generated by human activities smelting and refining metals, burning fossil fuels, phosphate fertilizers, sewage sludge.
3 Copper Electroplating industry, foundry and refining, mining, biological solids
4 Mercury Eruptions from volcanic eruptions, wildfires, caustic soda, coal, peat and wood industry emissions.
5 Chromium Electroplating industry, solid waste, sewage sludge, leather mills
6 Lead Removing and dissolving of metal minerals, flaming of leaded oil, urban waste, lead-rich industrialized waste, paint
7 Arsenic superconductors, wood persevering, coal removing and dissolving plants, volcanoes, petroleum purifying
8 Nickel Volcanic eruptions, soil reclamation, wildfires, bubble bursts and ocean gas exchanges, soil and geological alterations
9 Iron Refining metals, engine parts
2.2. Sources of Heavy Metals by Natural Products:
The most important sources of heavy metals are primitive geological materials. The heavy metals composition and concentration depends on the rock and erosion transports. Therefore, heavy metals contamination rocks modified. The formation of soil mostly comes from sedimentary rocks; however, it has not sensitive to weathering. Igneous rocks like olivine, pyroxene, and amphibole provide the soil with large amounts of manganese, cobalt, nickel, copper, and zinc. Among sedimentary rocks are the highest content of Mn (manganese), Ni (nickel),

50 Basit et al.,/ GU J. Phytosci. 2(1): 48-59 (2022)
A Systematic Review on Stress of Heavy Metals in Plants
and Cu (copper). Volcanoes emit concentrations of aluminum, zinc, manganese, lead, nickel, copper, and mercury, as well as toxic gases (Mani & Bharagava, 2016). Wind dust originating from desert areas such as the Sahara Desert has higher Fe and lower manganese, cobalt, nickel, copper, and zinc content (Yadav et al., 2017). Marine aerosols and wildfires have also been strongly affected by the transport of some heavy metals in the environment. Totally dust transported, especially dust to the Desert of Sahara, are expected considerable care recently. Unstable heavy metals like mercury and selenium are among the carbon-based materials produced in fires. By washing, decomposing, and evaporating leaves and stems, vegetation naturally metallic ions released into the soil and in the atmosphere.
2.3. Agricultural Products:
Organic and inorganic fertilizers are materials further added in the soil for improving the growth and yield of crops, as well as heavy metals used in agricultural soils including restrictions, sewage mud, water, irrigation, pesticides, and sources among heavy metals of agricultural soil. Others, especially disinfectants, the content of manganese, cobalt, nickel, copper, and zinc in inorganic phosphate fertilizers vary from source to source. Cadmium accumulates on a very high level of leaves that can be eaten by animals or humans that we are particularly interested in plants. The enrichment of cadmium is also caused by the application of sewage sludge, manure, and lime (Tchounwou et al., 2012). The heavy metal levels of agricultural soils are very small, but a useful fertilizer and long persistence and metal time can accumulate a dangerous metal.
By adding Mn, Zn, Cu, and Co, the soil is enriched with animal manure and wastewater containing manganese, cobalt, nickel, copper, and zinc (Qiao et al., 2011). The heavy metal in forming soils depends on the application rate of substances which contributes to its element absorption and the characteristics of the soil in which it is used. Heavy metals accumulate in soil because of using organic compost and nitrogen fertilizers and other additives (Zhang et al., 2012). By way of the nitrogen fertilizers and industrial waste increases the heavy metal stress in soil. Several metallic compounds like pesticides are applied to control the disease of cereal, fruit, and crops vegetable (Zhao et al., 2014a). Orchards that regularly use these compounds which soil contaminate the higher concentrations of metallic ions like arsenic, lead, manganese, and mercury (Zhao et al., 2014b). For sixty years, Canadian orchards have used pesticides such as arsenate of lead, and these have been shown to accumulate Pb, As, and Zn, causing further contamination of food (Rachwa et al., 2015).
2.4. Industrial and Domestic Wastewater:
The extraction process of heavy metals releases depends on the different types of processes. Such as, coal mines are a source of arsenic, cadmium, iron, which directly or indirectly enrich the around soil in lignite. The use of mercury in a pot of gold and extraction in large amounts of mercury from the pot of gold has major contamination of the environmental pollution (Zhou et al., 2016). High-temperature metal processing, such as foundries, emits metallic particles and vapors. The gases metallic ions like as (Arsenic), Cd (Cadmium), Cu (Copper), and Pb (Lead) react with atmospheric and form water aerosols. It can be washed away (dry residue) or precipitation (wet residue) and contaminate soil or water. Runoff generated by tailing ore erosion, dust generated during transportation of raw materials, metal corrosion, and heavy metal leaching into soil and groundwater can also contaminate water and the soil. The soil pollution of heavy metal is caused by different treatment methods in refineries Jiang et al. (2017) power plants like coal-fired power plants, oil plants, nuclear power plants, and power transmission lines release a variety of heavy metals into the environment, including selenium, boron, cadmium, copper, zinc, cesium, and nickel (Jiang et al., 2020). Other industrial sources of heavy metals like plastics industries, textiles miles, microelectronics, preserve to wood, and paper processing. Contamination of highly concentrated copper plants growing under power lines has been reported to be toxic for the herbivores (Shao et al., 2016).
The largest source of heavy metal content wastewater is possibly rivers and lakes. The wastewater from domestic including untreated materials wastewater and materials that have passed through a biological treatment plant's filter and vehicle waste (Häyrynen et al., 2012). Projects that take water through sewers often end up in coastal residential areas. The application of detergents poses the risk of contamination as common household cleaning products will affect water quality, cause sore throats (Jain et al., 2015). Most of the enzymatic cleaners were found to contain the trace elements iron, manganese, chromium, cobalt, zinc, strontium, and boron (Ghosh et al., 2018).
2.5. Atmospheric Sources:

Basit et al.,/ GU J. Phytosci. 2(1): 48-59 (2022) 51
A Systematic Review on Stress of Heavy Metals in Plants
Both natural and man-made processes produce airborne metal-containing particles. Depending on the weather conditions at the time, these particles may be blown away, but will eventually return to the lithosphere as precipitation in the form of rain or snow. Other causes of metallic ions present in the atmosphere metal, like anthropogenic sources of higher temperatures, there is of particular importance on an international level. Geo-thermal sources, like volcanic eruptions, which caused severe pollution of air (Algreen et al., 2012).
Figure 1: Various heavy metal sources caused pollution in water and aquaculture
2.6. Other Sources:
Heavy metals are generated by waste incineration, landfilling, and transportation (cars, diesel vehicles, and airplanes). Fly ash from coal combustion and corrosion of commercial waste products are two of the most common anthropogenic sources of soil contamination, contributing chromium, copper, lead, and galvanized metals (mostly zinc) in the environment. Heavy metals like Cd (Cadmium), Hg (Mercury), Ni (Nickel), and Al (Aluminum) are released in the soils when coal is burned (Bashri et al., 2015). When oil is burned, V, Fe, Pb, and Ni are all released into the environment. Metal emissions during vehicle movement are caused by Ni (Nickel) and Zn (Zinc) from tires, Al (Aluminum) from catalysts, Cd (Cadmium), and Cu (Copper) primarily from diesel engines, Ni (Nickel) and Zn (Zinc) from aerosol pollutants. Cadmium, chromium, mercury, nickel, lead, and zinc are emitted by oils, which are anti-wear additives for automobiles. Inefficient engines release cadmium, chromium, mercury, nickel, lead, and zinc. Tetraethyl lead combustion has significant sources of lead in the environment. Community garbage incinerators produce considerable amounts of Zinc, lead, aluminum, stannum, iron, and copper
3. Heavy Metals Effects on Plants:
The levels of toxic heavy metals can cause a variety of biological and metabolic activities of the plant exposure because many heavy metals have been indifferent active portions in plants (Pintilie et al., 2016). The common evidence of heavy metal toxicity has reduced plant growth, like wilt of leaves, necrosis of leaf, loss and reduced seed germination, and damage to the photosynthetic organs, often associated with aging or death of the plant (Chen et al., 2016). All of these causes are associated with the structural, biochemical changes, and molecular changes in plants tissue and cells due to the occurrence of heavy metals (Gamalero et al., 2009). Due to its potential ecological effects, contamination of agricultural land with heavy metals has serious issues for the environment. These toxic elements are considered soil contaminants because of their widespread presence and their chronic toxic effects on plants growing in this soil.
The heavy metals absorption by plants; accumulate the food chain, endangering animals and human beings. The heavy metals uptake by plant roots is the most common mechanism by which heavy metals enter the food chain. Temperature, humidity, organic matter, and pH are factors that influence the absorption and accumulation of heavy metals by plant tissues. For perspiration, the uptake of heavy metals in summer is higher than in winter Pirzadah et
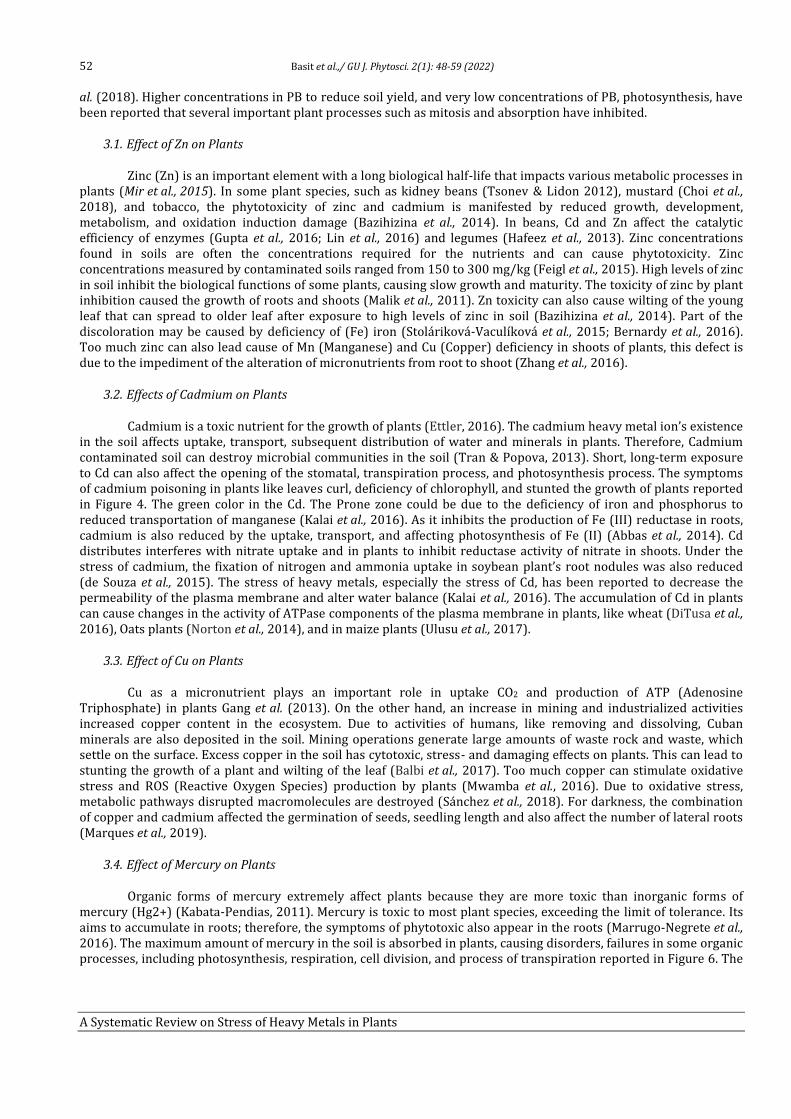
52 Basit et al.,/ GU J. Phytosci. 2(1): 48-59 (2022)
A Systematic Review on Stress of Heavy Metals in Plants
al. (2018). Higher concentrations in PB to reduce soil yield, and very low concentrations of PB, photosynthesis, have been reported that several important plant processes such as mitosis and absorption have inhibited.
3.1. Effect of Zn on Plants
Zinc (Zn) is an important element with a long biological half-life that impacts various metabolic processes in plants (Mir et al., 2015). In some plant species, such as kidney beans (Tsonev & Lidon 2012), mustard (Choi et al., 2018), and tobacco, the phytotoxicity of zinc and cadmium is manifested by reduced growth, development, metabolism, and oxidation induction damage (Bazihizina et al., 2014). In beans, Cd and Zn affect the catalytic efficiency of enzymes (Gupta et al., 2016; Lin et al., 2016) and legumes (Hafeez et al., 2013). Zinc concentrations found in soils are often the concentrations required for the nutrients and can cause phytotoxicity. Zinc concentrations measured by contaminated soils ranged from 150 to 300 mg/kg (Feigl et al., 2015). High levels of zinc in soil inhibit the biological functions of some plants, causing slow growth and maturity. The toxicity of zinc by plant inhibition caused the growth of roots and shoots (Malik et al., 2011). Zn toxicity can also cause wilting of the young leaf that can spread to older leaf after exposure to high levels of zinc in soil (Bazihizina et al., 2014). Part of the discoloration may be caused by deficiency of (Fe) iron (Stoláriková-Vaculíková et al., 2015; Bernardy et al., 2016). Too much zinc can also lead cause of Mn (Manganese) and Cu (Copper) deficiency in shoots of plants, this defect is due to the impediment of the alteration of micronutrients from root to shoot (Zhang et al., 2016).
3.2. Effects of Cadmium on Plants
Cadmium is a toxic nutrient for the growth of plants (Ettler, 2016). The cadmium heavy metal ion’s existence in the soil affects uptake, transport, subsequent distribution of water and minerals in plants. Therefore, Cadmium contaminated soil can destroy microbial communities in the soil (Tran & Popova, 2013). Short, long-term exposure to Cd can also affect the opening of the stomatal, transpiration process, and photosynthesis process. The symptoms of cadmium poisoning in plants like leaves curl, deficiency of chlorophyll, and stunted the growth of plants reported in Figure 4. The green color in the Cd. The Prone zone could be due to the deficiency of iron and phosphorus to reduced transportation of manganese (Kalai et al., 2016). As it inhibits the production of Fe (III) reductase in roots, cadmium is also reduced by the uptake, transport, and affecting photosynthesis of Fe (II) (Abbas et al., 2014). Cd distributes interferes with nitrate uptake and in plants to inhibit reductase activity of nitrate in shoots. Under the stress of cadmium, the fixation of nitrogen and ammonia uptake in soybean plant’s root nodules was also reduced (de Souza et al., 2015). The stress of heavy metals, especially the stress of Cd, has been reported to decrease the permeability of the plasma membrane and alter water balance (Kalai et al., 2016). The accumulation of Cd in plants can cause changes in the activity of ATPase components of the plasma membrane in plants, like wheat (DiTusa et al., 2016), Oats plants (Norton et al., 2014), and in maize plants (Ulusu et al., 2017).
3.3. Effect of Cu on Plants
Cu as a micronutrient plays an important role in uptake CO2 and production of ATP (Adenosine Triphosphate) in plants Gang et al. (2013). On the other hand, an increase in mining and industrialized activities increased copper content in the ecosystem. Due to activities of humans, like removing and dissolving, Cuban minerals are also deposited in the soil. Mining operations generate large amounts of waste rock and waste, which settle on the surface. Excess copper in the soil has cytotoxic, stress- and damaging effects on plants. This can lead to stunting the growth of a plant and wilting of the leaf (Balbi et al., 2017). Too much copper can stimulate oxidative stress and ROS (Reactive Oxygen Species) production by plants (Mwamba et al., 2016). Due to oxidative stress, metabolic pathways disrupted macromolecules are destroyed (Sánchez et al., 2018). For darkness, the combination of copper and cadmium affected the germination of seeds, seedling length and also affect the number of lateral roots (Marques et al., 2019).
3.4. Effect of Mercury on Plants
Organic forms of mercury extremely affect plants because they are more toxic than inorganic forms of mercury (Hg2+) (Kabata-Pendias, 2011). Mercury is toxic to most plant species, exceeding the limit of tolerance. Its aims to accumulate in roots; therefore, the symptoms of phytotoxic also appear in the roots (Marrugo-Negrete et al., 2016). The maximum amount of mercury in the soil is absorbed in plants, causing disorders, failures in some organic processes, including photosynthesis, respiration, cell division, and process of transpiration reported in Figure 6. The
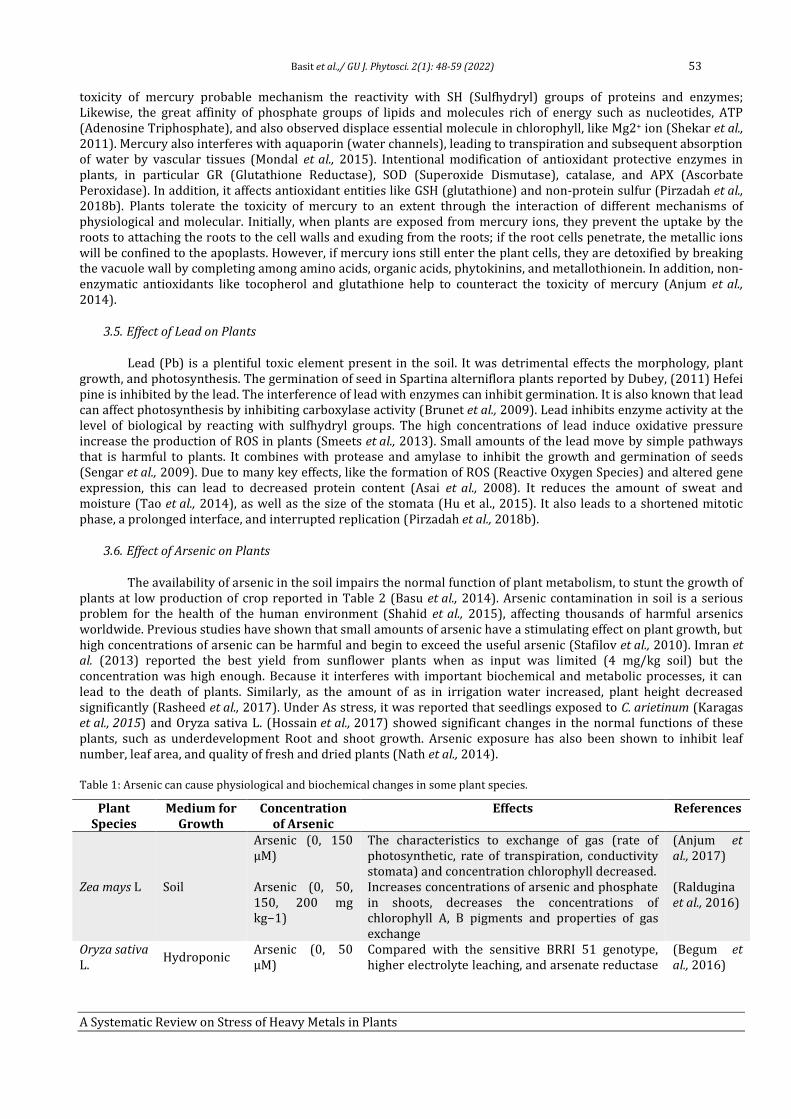
Basit et al.,/ GU J. Phytosci. 2(1): 48-59 (2022) 53
A Systematic Review on Stress of Heavy Metals in Plants
toxicity of mercury probable mechanism the reactivity with SH (Sulfhydryl) groups of proteins and enzymes; Likewise, the great affinity of phosphate groups of lipids and molecules rich of energy such as nucleotides, ATP (Adenosine Triphosphate), and also observed displace essential molecule in chlorophyll, like Mg2+ ion (Shekar et al., 2011). Mercury also interferes with aquaporin (water channels), leading to transpiration and subsequent absorption of water by vascular tissues (Mondal et al., 2015). Intentional modification of antioxidant protective enzymes in plants, in particular GR (Glutathione Reductase), SOD (Superoxide Dismutase), catalase, and APX (Ascorbate Peroxidase). In addition, it affects antioxidant entities like GSH (glutathione) and non-protein sulfur (Pirzadah et al., 2018b). Plants tolerate the toxicity of mercury to an extent through the interaction of different mechanisms of physiological and molecular. Initially, when plants are exposed from mercury ions, they prevent the uptake by the roots to attaching the roots to the cell walls and exuding from the roots; if the root cells penetrate, the metallic ions will be confined to the apoplasts. However, if mercury ions still enter the plant cells, they are detoxified by breaking the vacuole wall by completing among amino acids, organic acids, phytokinins, and metallothionein. In addition, non-enzymatic antioxidants like tocopherol and glutathione help to counteract the toxicity of mercury (Anjum et al., 2014).
3.5. Effect of Lead on Plants
Lead (Pb) is a plentiful toxic element present in the soil. It was detrimental effects the morphology, plant growth, and photosynthesis. The germination of seed in Spartina alterniflora plants reported by Dubey, (2011) Hefei pine is inhibited by the lead. The interference of lead with enzymes can inhibit germination. It is also known that lead can affect photosynthesis by inhibiting carboxylase activity (Brunet et al., 2009). Lead inhibits enzyme activity at the level of biological by reacting with sulfhydryl groups. The high concentrations of lead induce oxidative pressure increase the production of ROS in plants (Smeets et al., 2013). Small amounts of the lead move by simple pathways that is harmful to plants. It combines with protease and amylase to inhibit the growth and germination of seeds (Sengar et al., 2009). Due to many key effects, like the formation of ROS (Reactive Oxygen Species) and altered gene expression, this can lead to decreased protein content (Asai et al., 2008). It reduces the amount of sweat and moisture (Tao et al., 2014), as well as the size of the stomata (Hu et al., 2015). It also leads to a shortened mitotic phase, a prolonged interface, and interrupted replication (Pirzadah et al., 2018b).
3.6. Effect of Arsenic on Plants
The availability of arsenic in the soil impairs the normal function of plant metabolism, to stunt the growth of plants at low production of crop reported in Table 2 (Basu et al., 2014). Arsenic contamination in soil is a serious problem for the health of the human environment (Shahid et al., 2015), affecting thousands of harmful arsenics worldwide. Previous studies have shown that small amounts of arsenic have a stimulating effect on plant growth, but high concentrations of arsenic can be harmful and begin to exceed the useful arsenic (Stafilov et al., 2010). Imran et al. (2013) reported the best yield from sunflower plants when as input was limited (4 mg/kg soil) but the concentration was high enough. Because it interferes with important biochemical and metabolic processes, it can lead to the death of plants. Similarly, as the amount of as in irrigation water increased, plant height decreased significantly (Rasheed et al., 2017). Under As stress, it was reported that seedlings exposed to C. arietinum (Karagas et al., 2015) and Oryza sativa L. (Hossain et al., 2017) showed significant changes in the normal functions of these plants, such as underdevelopment Root and shoot growth. Arsenic exposure has also been shown to inhibit leaf number, leaf area, and quality of fresh and dried plants (Nath et al., 2014).
Table 1: Arsenic can cause physiological and biochemical changes in some plant species.
Plant Species
Medium for Growth
Concentration of Arsenic
Effects References
Zea mays L Soil
Arsenic (0, 150 µM) Arsenic (0, 50, 150, 200 mg kg−1)
The characteristics to exchange of gas (rate of photosynthetic, rate of transpiration, conductivity stomata) and concentration chlorophyll decreased. Increases concentrations of arsenic and phosphate in shoots, decreases the concentrations of chlorophyll A, B pigments and properties of gas exchange
(Anjum et al., 2017) (Raldugina et al., 2016)
Oryza sativa L.
Hydroponic Arsenic (0, 50 µM)
Compared with the sensitive BRRI 51 genotype, higher electrolyte leaching, and arsenate reductase
(Begum et al., 2016)
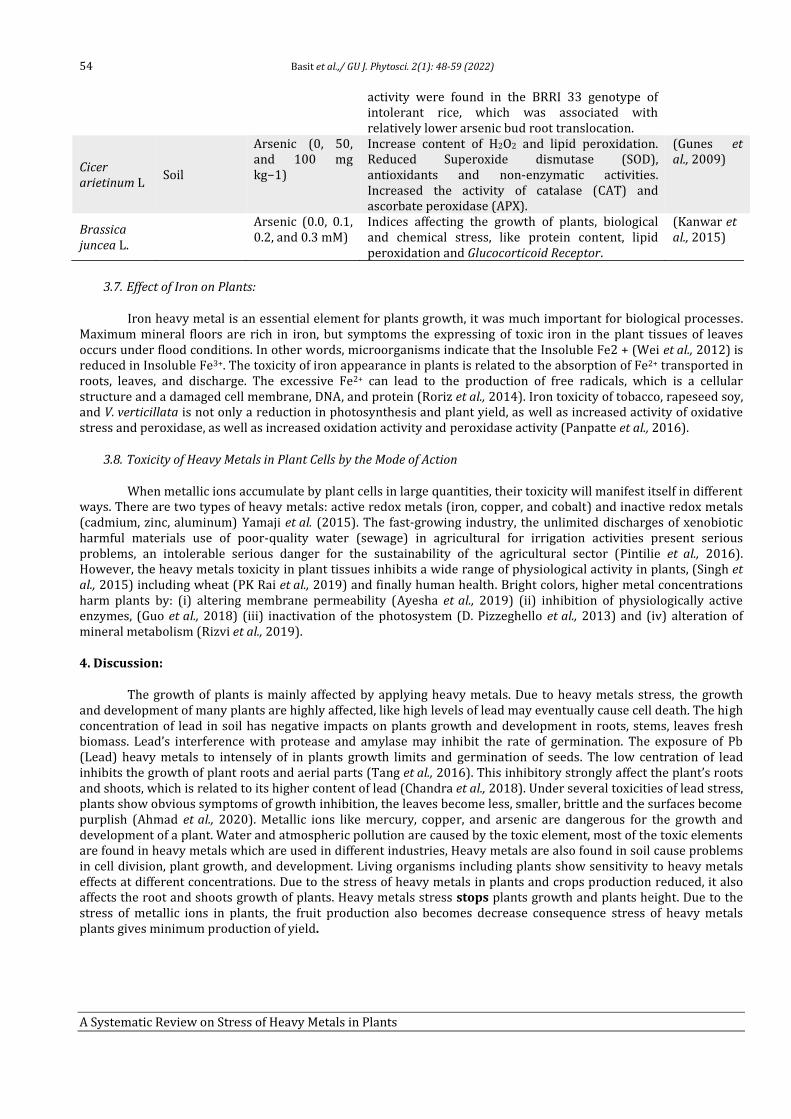
54 Basit et al.,/ GU J. Phytosci. 2(1): 48-59 (2022)
A Systematic Review on Stress of Heavy Metals in Plants
activity were found in the BRRI 33 genotype of intolerant rice, which was associated with relatively lower arsenic bud root translocation.
Cicer arietinum L
Soil
Arsenic (0, 50, and 100 mg kg−1)
Increase content of H2O2 and lipid peroxidation. Reduced Superoxide dismutase (SOD), antioxidants and non-enzymatic activities. Increased the activity of catalase (CAT) and ascorbate peroxidase (APX).
(Gunes et al., 2009)
Brassica juncea L.
Arsenic (0.0, 0.1, 0.2, and 0.3 mM)
Indices affecting the growth of plants, biological and chemical stress, like protein content, lipid peroxidation and Glucocorticoid Receptor.
(Kanwar et al., 2015)
3.7. Effect of Iron on Plants:
Iron heavy metal is an essential element for plants growth, it was much important for biological processes. Maximum mineral floors are rich in iron, but symptoms the expressing of toxic iron in the plant tissues of leaves occurs under flood conditions. In other words, microorganisms indicate that the Insoluble Fe2 + (Wei et al., 2012) is reduced in Insoluble Fe3+. The toxicity of iron appearance in plants is related to the absorption of Fe2+ transported in roots, leaves, and discharge. The excessive Fe2+ can lead to the production of free radicals, which is a cellular structure and a damaged cell membrane, DNA, and protein (Roriz et al., 2014). Iron toxicity of tobacco, rapeseed soy, and V. verticillata is not only a reduction in photosynthesis and plant yield, as well as increased activity of oxidative stress and peroxidase, as well as increased oxidation activity and peroxidase activity (Panpatte et al., 2016).
3.8. Toxicity of Heavy Metals in Plant Cells by the Mode of Action
When metallic ions accumulate by plant cells in large quantities, their toxicity will manifest itself in different ways. There are two types of heavy metals: active redox metals (iron, copper, and cobalt) and inactive redox metals (cadmium, zinc, aluminum) Yamaji et al. (2015). The fast-growing industry, the unlimited discharges of xenobiotic harmful materials use of poor-quality water (sewage) in agricultural for irrigation activities present serious problems, an intolerable serious danger for the sustainability of the agricultural sector (Pintilie et al., 2016). However, the heavy metals toxicity in plant tissues inhibits a wide range of physiological activity in plants, (Singh et al., 2015) including wheat (PK Rai et al., 2019) and finally human health. Bright colors, higher metal concentrations harm plants by: (i) altering membrane permeability (Ayesha et al., 2019) (ii) inhibition of physiologically active enzymes, (Guo et al., 2018) (iii) inactivation of the photosystem (D. Pizzeghello et al., 2013) and (iv) alteration of mineral metabolism (Rizvi et al., 2019).
4. Discussion:
The growth of plants is mainly affected by applying heavy metals. Due to heavy metals stress, the growth and development of many plants are highly affected, like high levels of lead may eventually cause cell death. The high concentration of lead in soil has negative impacts on plants growth and development in roots, stems, leaves fresh biomass. Lead’s interference with protease and amylase may inhibit the rate of germination. The exposure of Pb (Lead) heavy metals to intensely of in plants growth limits and germination of seeds. The low centration of lead inhibits the growth of plant roots and aerial parts (Tang et al., 2016). This inhibitory strongly affect the plant’s roots and shoots, which is related to its higher content of lead (Chandra et al., 2018). Under several toxicities of lead stress, plants show obvious symptoms of growth inhibition, the leaves become less, smaller, brittle and the surfaces become purplish (Ahmad et al., 2020). Metallic ions like mercury, copper, and arsenic are dangerous for the growth and development of a plant. Water and atmospheric pollution are caused by the toxic element, most of the toxic elements are found in heavy metals which are used in different industries, Heavy metals are also found in soil cause problems in cell division, plant growth, and development. Living organisms including plants show sensitivity to heavy metals effects at different concentrations. Due to the stress of heavy metals in plants and crops production reduced, it also affects the root and shoots growth of plants. Heavy metals stress stops plants growth and plants height. Due to the stress of metallic ions in plants, the fruit production also becomes decrease consequence stress of heavy metals plants gives minimum production of yield.
Basit et al.,/ GU J. Phytosci. 2(1): 48-59 (2022) 55
A Systematic Review on Stress of Heavy Metals in Plants
5. Conclusion:
The contaminate soil with heavy metals because presence of toxic components. Plants growing under heavy metals contaminated soil will grow slower due their physiological and biochemical activities. This is especially true if the participating heavy metals do not affect on growth and plants development. Heavy metals contaminated soil, water, and air on which depends on the interactions between heavy metals through plants. Further, heavy metals inhibiting the plants growth, destroy their structures and affect their activities of physiological and biochemical nature, and reduces to the functioning plants. The heavy metals effects depend on several factors like pH, environmental conditions like element, organic matter in environment, fertilizers and individual plant species. Living organisms including plants show sensitivity by heavy metals effects at different concentrations. Due to stress of heavy metals in plants crops production reduced, it also affects the growth of roots and shoots in plants. Heavy metals stress stops the plants growth and height of plants. Due to stress of heavy metals fruits production becomes decrease of plants as a result stress of heavy metals plants gives minimum production of yield. On other hand Plants have a unique mechanism for resistance due to heavy metals, negative effects binding by proteins as a result development of enzymes and nucleic acids to decode heavy metals contamination. These mechanisms help in plants to protect from heavy metals. Therefore, effects of heavy metals in plants are visible by several methods, and plants have several resistance mechanisms.
6. References:
Abbas, S.Z., M. Rafatullah, N. Ismail, and J. Lalung. 2014. Isolation, identification, and characterization of cadmium resistant Pseudomonas sp. M3 from industrial wastewater. J. Waste Manag., 2014: Article ID 160398. https://doi.org/10.1155/2014/160398.
Adrees, M., S. Ali, M. Rizwan, M. Ibrahim, F. Abbas, M. Farid, M.Z.U. Rehman, M.K. Irshad and S.A. Bharwana. 2015. The effect of excess copper on growth and physiology of important food crops: A review. Env. Sci. Poll. Res., 22(11): 8148-8162.
Agunbiade, F.O. and B. Moodley. 2016. Occurrence and distribution pattern of acidic pharmaceuticals in surface water, wastewater, and sediment of the Msunduzi River, Kwazulu‐Natal, South Africa. Envir. Toxicol. Chem., 35(1): 36-46.
Ahmad, I., M. Tahir, U. Daraz, A. Ditta, M.B. Hussain, and Z.U.H. Khan. 2020. Responses and tolerance of cereal crops to metal and metalloid toxicity. In: Agronomic Crops, ed. M. Hasanuzzaman (Singapore: Springer), 235–264.
Algreen, M., A. Rein, C.N. Legind, C.E. Amundsen, U.G. Karlson, and S. Trapp. 2012. Test of tree core sampling for screening of toxic elements in soils from a Norwegian site. Int. J. Phytoremed., 14(4): 305-319.
Anjali, C.H., S.S. Khan, K. Margulis-Goshen, S. Magdassi, A. Mukherjee, and N. Chandrasekaran. 2010.. Formulation of water-dispersible nanopermethrin for larvicidal applications. Ecotoxicol. Env. Saf., 73(8): 1932-1936.
Anjum, N.A., S.S. Gill, R. Gill, M. Hasanuzzaman, A.C. Duarte, E. Pereira, I. Ahmad, R. Tuteja and N. Tuteja. 2014. Metal/metalloid stress tolerance in plants: Role of ascorbate, its redox couple, and associated enzymes. Protoplasma, 251(6): 1265-1283.
Anjum, S.A., M. Tanveer, S. Hussain, U. Ashraf, I. Khan, and L. Wang. 2017. Alteration in growth, leaf gas exchange, and photosynthetic pigments of maize plants under combined cadmium and arsenic stress. Water Air Soil Poll., 228(1): 1-12.
Ayesha, I.C., G. Liu, B. Yousaf, Q. Abbas, and H. Zhou. 2019. A comprehensive review of biogeochemical distribution and fractionation of lead isotopes for source tracing in distinct interactive environmental compartments. Sci. Total Environ., 719: 135658. doi: 10.1016/j.scitotenv.2019. 135658.
Balbi, T., G. Camisassi, M. Montagna, R. Fabbri, S. Franzellitti, C. Carbone, K. Dawson, and L. Canesi. 2017. Impact of cationic polystyrene nanoparticles (PS-NH2) on early embryo development of Mytilus galloprovincialis: Effects on shell formation. Chemosphere, 186: 1-9.
Bashri, G. and S.M. Prasad. 2015. Indole acetic acid modulates changes in growth, chlorophyll a fluorescence and antioxidant potential of Trigonella foenum-graecum L. grown under cadmium stress. Acta Physiol. Pl., 37(3): 49.
Basu, A., D. Saha, R. Saha, T. Ghosh, and B. Saha. 2014. A review on sources, toxicity and remediation technologies for removing arsenic from drinking water. Res. Chem. Inter., 40(2): 447-485.
Bazihizina, N., C. Taiti, L. Marti, A. Rodrigo-Moreno, F. Spinelli, C. Giordano, …... and S. Mancuso. 2014. Zn2+-induced changes at the root level account for the increased tolerance of acclimated tobacco plants. J. Exp. Bot., 65(17): 4931-4942.
Begum, M.C., M.S. Islam, M. Islam, R. Amin, M.S. Parvez and A.H. Kabir. 2016. Biochemical and molecular responses underlying differential arsenic tolerance in rice (Oryza sativa L.). Pl. Physiol. Biochem., 104: 266-277.
Bernardy, K., J.G. Farias, A.O.S. Dorneles, A.S. Pereira, M.R.W. Schorr, F.R. Thewes, J.E.L. Londero, and F.T. Nicoloso. 2016. Changes in root morphology and dry matter production in Pfaffia glomerata (Spreng.) Pedersen accessions in response to excessive zinc. Revista Brasileira de Pl. Med., 18: 613-620.
Chandra, R., V. Kumar, S. Tripathi, and P. Sharma. 2018. Heavy metal phytoextraction potential of native weeds and grasses from endocrine disrupting chemicals rich complex distillery sludge and their histological observations during in-situ phytoremediation. Ecol. Eng., 111: 143–156.
Chen, Y. J., B. Groves, R.A. Muscat, and G. Seelig. 2015. DNA nanotechnology from the test tube to the cell. Nat. Nanotechnol., 10(9): 748-760.
56 Basit et al.,/ GU J. Phytosci. 2(1): 48-59 (2022)
A Systematic Review on Stress of Heavy Metals in Plants
Chen, Z., W. Yan, L. Sun, J. Tian, and H. Liao. 2016. Proteomic analysis reveals growth inhibition of soybean roots by manganese toxicity is associated with alteration of cell wall structure and lignification. J. Prot., 143: 151-160.
Choi, S., Y.M. Hu, M.E. Corkins, A.E. Palmer, and A.J. Bird. 2018. Zinc transporters belonging to the Cation Diffusion Facilitator (CDF) family have complementary roles in transporting zinc out of the cytosol. PLoS Gen., 14(3): e1007262.
DalCorso, G., S. Farinati, and A. Furini. 2010. Regulatory networks of cadmium stress in plants. Pl. Sign. Beh., 5(6): 663-667. DalCorso, G., S. Farinati, S. Maistri, and F. Furini. 2008. How plants cope with cadmium: staking all on metabolism and gene
expression. J. Integ. Pl. Biol., 50(10): 1268-1280. de-Lespinay, A., H. Lequeux, B. Lambillotte, and S. Lutts. 2010. Protein synthesis is differentially required for germination in Poa
pratensis and Trifolium repens in the absence or in the presence of cadmium. Pl. Growth Reg., 61(2): 205-214. de-Souza Guilherme, M.D.F., H.M. de Oliveira, and E. da Silva. 2015. Cadmium toxicity on seed germination and seedling growth of
Wheat Triticum aestivum. Acta Sci. Biol. Sci., 37(4): 499-504. DiTusa, S.F., E.B. Fontenot, R.W. Wallace, M.A. Silvers, T.N. Steele, A.H. Elnagar, K.M. Dearman, and A.P. Smith. 2016. A member of
the Phosphate transporter 1 (Pht1) family from the arsenic‐hyperaccumulating fern Pteris vittata is a high‐affinity arsenate transporter. New Phyto., 209(2): 762-772.
Ettler, V. 2016. Soil contamination near non-ferrous metal smelters: A Review. App. Geochem., 64: 56-74. Feigl, G., N. Lehotai, A. Molnár, A. Ördög, M. Rodríguez-Ruiz, J.M. Palma, F.J. Corpas, L. Erdei, and Z. Kolbert. 2015. Zinc induces
distinct changes in the metabolism of reactive oxygen and nitrogen species (ROS and RNS) in the roots of two Brassica species with different sensitivity to zinc stress. Ann. Bot., 116(4): 613-625.
Finnegan, P. M. and W. Chen. 2012. Arsenic toxicity: The effects on plant metabolism. Front Physiol., 3: 182. Gadd, G.M. 2007. Geomycology: Biogeochemical transformations of rocks, minerals, metals and radionuclides by fungi,
bioweathering and bioremediation. Mycol. Res., 111(1): 3-49. Gamalero, E., G. Lingua, G. Berta, and B.R. Glick. 2009. Beneficial role of plant growth promoting bacteria and arbuscular
mycorrhizal fungi on plant responses to heavy metal stress. Canadian J. Microbiol., 55(5): 501-514. Gang, A., A. Vyas, and H. Vyas. 2013. Toxic effect of heavy metals on germination and seedling growth of Wheat. J. Env. Res. Dev.,
8(2): 206-213. Ghosh, P. and U. Ghosh. 2018. Bioconversion of agrowaste to value-added product through solid-state fermentation by a potent
fungal strain Aspergillus flavus PUF5. In: Utilization and Management of Bioresources. Springer, Singapore. pp. 291-299 Glińska, S., M. Gapińska, S. Michlewska, E. Skiba, and J. Kubicki. 2016. Analysis of Triticum aestivum seedling response to the excess
of zinc. Protoplasm, 253(2): 367-377. Gunes, A., D.J. Pilbeam, and A. Inal. 2009. Effect of arsenic–phosphorus interaction on arsenic-induced oxidative stress in chickpea
plants. Pl. Soil, 314(1): 211-220. Guo, G., M. Lei, Y. Wang, B. Song, and J. Yang. 2018. Accumulation of As, Cd, and Pb in sixteen wheat cultivars grown in
contaminated soils and associated health risk assessment. Int. J. Env. Res. Pub. Health, 15(11): 2601. Guo, J., X. Dai, W. Xu, and M. Ma. 2008. Overexpressing GSH1 and AsPCS1 simultaneously increases the tolerance and accumulation
of cadmium and arsenic in Arabidopsis thaliana. Chemosph., 72(7): 1020-1026. Guo, W., H. Zhang, S. Cui, Q. Xu, Z. Tang, and F. Gao. 2014. Assessment of the distribution and risks of organochlorine pesticides in
core sediments from areas of different human activity on Lake Baiyangdian, China. Stochastic Env. Res. Risk Assess., 28(4): 1035-1044.
Gupta, N., H. Ram, and B. Kumar. 2016. Mechanism of Zinc absorption in plants: uptake, transport, translocation and accumulation. Rev. Env. Sci. Biotech., 15(1): 89-109.
Gupta, S.D. 2010. Metal toxicity, oxidative stress and antioxidative defense system in plants. In Reactive oxygen species and antioxidants in higher plants. CRC Press. pp 193-220.
Hafeez, B.M.K.Y., Y.M. Khanif, and M. Saleem. 2013. Role of zinc in plant nutrition-A Review. J. Exp. Agri. Int., 374-391. Häyrynen, P., J. Landaburu-Aguirre, E. Pongrácz, and R.L. Keiski. 2012. Study of permeate flux in micellar-enhanced ultrafiltration
on a semi-pilot scale: Simultaneous removal of heavy metals from phosphorous rich real wastewaters. Sep. Purif. Technol., 93: 59-66.
Hemambika, B., V. Balasubramanian, V.R. Kannan, and R.A. James. 2013. Screening of chromium-resistant bacteria for plant growth-promoting activities. Soil Sed. Cont. Int. J., 22(7): 717-736.
Hossain, M.A., A. Begum, and K. Akhtar, K. 2014. Study on knowledge about arsenic contamination in drinking water among the people living in selected villages of Bangladesh. J. Shaheed Suhrawardy Med. Coll., 6(2): 57-59.
Hu, W., H. Wang, L. Dong, B. Huang, O.K. Borggaard, H.C.B. Hansen, Y. He, and P.E. Holm. 2018. Source identification of heavy metals in peri-urban agricultural soils of southeast China: An integrated approach. Environ. Poll., 237: 650-661.
Imran, M.A., M.N. Ch, R.M. Khan, Z. Ali, and T. Mahmood. 2013. Toxicity of arsenic (As) on seed germination of sunflower (Helianthus annuus L.). Int. J. Phy. Sci., 8(17): 840-847.
Jain, N., T.A. Johnson, A. Kumar, S. Mishra, and N. Gupta. 2015. Biosorption of Cd (II) on jatropha fruit coat and seed coat. Env. Monit. Assess., 187(7): 1-12.
Jiang, X., Z. Xiong, H. Liu, G. Liu, and W. Liu. 2017. Distribution, source identification, and ecological risk assessment of heavy metals in wetland soils of a river–reservoir system. Env. Sci. Poll. Res., 24(1): 436-444.
Jiang, Y., Y. Sun, L. Zhang, and X. Wang. 2020. Influence factor analysis of soil heavy metal Cd based on the GeoDetector. Stochastic Env. Res. Risk Assess., 34(6):921-930.
Joutey, N.T., H. Sayel, W. Bahafid, and N. El-Ghachtouli. 2015. Mechanisms of hexavalent chromium resistance and removal by microorganisms. Rev. Env. Cont. Toxicol., 233: 45-69.
Kabata-Pendias, A. 2011. Trace Elements in Soils and Plants. CRC Press, Taylor and Francis Group.
Basit et al.,/ GU J. Phytosci. 2(1): 48-59 (2022) 57
A Systematic Review on Stress of Heavy Metals in Plants
Kalai, T., D. Bouthour, J. Manai, L.B. Ben-Kaab, and H. Gouia. 2016. Salicylic acid alleviates the toxicity of cadmium on seedling growth, amylases and phosphatases activity in germinating barley seeds. Arch. Agron. Soil Sci., 62(6): 892-904.
Kanwar, M.K., and R. Bhardwaj. 2015. Arsenic induced modulation of antioxidative defense system and brassinosteroids in Brassica juncea L. Ecotoxicol. Env. Saf., 115: 119-125.
Karaca, A. 2004. Effect of organic wastes on the extractability of cadmium, copper, nickel, and zinc in soil. Geoderma, 122(2-4): 297-303.
Karagas, M.R., A. Gossai, B. Pierce, and H. Ahsan. 2015. Drinking water arsenic contamination, skin lesions, and malignancies: a systematic review of the global evidence. Curr. Env. Health Rep., 2(1): 52-68.
Khalid, S., M. Shahid, N.K. Niazi, M. Rafiq, H.F. Bakhat, M. Imran, T. Abbas, I. Bibi and C. Dumat. 2017. Arsenic behaviour in soil-plant system: Biogeochemical reactions and chemical speciation influences. In: Enhancing cleanup of environmental pollutants. Springer, Cham. pp. 97-140.
Khan, M.J., M.T. Jan, and K. Khan. 2013. Effect of organic and inorganic amendments on the heavy metal content of soil and wheat crop irrigated with wastewater. Sarhad J. Agri., 29(1): 49-57.
Kovacik, J., P. Babula, B. Klejdus, and J. Hedbavny. 2013. Chromium uptake and consequences for metabolism and oxidative stress in Chamomile plants. J. Agri. Food Chem., 61(33): 7864-7873.
Li, J., C. Fan, H. Pei, J. Shi, and Q. Huang. 2013. Smart drug delivery nanocarriers with self‐assembled DNA nanostructures. Adv. Mat., 25(32): 4386-4396.
Liang, J., C. Feng, G. Zeng, X. Gao, M. Zhong, X. Li, X. Li, X. He, and Y. Fang. 2017. Spatial distribution and source identification of heavy metals in surface soils in a typical coal mine city, Lianyuan, China. Env. Poll., 225: 681-690.
Lin, Y.F., Z. Hassan, S. Talukdar, H. Schat, and M.G. Aarts. 2016. Expression of the ZNT1 zinc transporter from the metal hyperaccumulator Noccaea caerulescens confers enhanced zinc and cadmium tolerance and accumulation to Arabidopsis thaliana. PloS One, 11(3): e0149750. https://doi.org/10.1371/journal.pone.0149750.
Liu, J.J., Z. Wei, and J.H. Li. 2014. Effects of copper on leaf membrane structure and root activity of maize seedling. Bot. Stud., 55(1): 1-6.
Macêdo, L.D.S., and W.B.B. Morril. 2008. Origem e comportamento dos metais fitotóxicos: revisão da literatura. Tecnol. Ciência Agro., 2(2): 29-38.
Malik, N.J., A.S. Chamon, M.N. Mondol, S.F. Elahi, and S.M.A. Faiz. 2011. Effects of different levels of zinc on growth and yield of red amaranth (Amaranthus sp.) and rice (Oryza sativa, Variety-BR49). J. Bangladesh Assoc. Young Res., 1(1): 79-91.
Mani, S., and R.N. Bharagava. 2016. Exposure to crystal violet, its toxic, genotoxic and carcinogenic effects on environment and its degradation and detoxification for environmental safety. Rev. Env. Cont. Toxicol., 237: 71-104.
Marques, D.M., A.B. Da Silva, J.R. Mantovani, P.C. Magalhães, and T.C. De Souza. 2019. Root morphology and leaf gas exchange in Peltophorum dubium (Spreng.) Taub. (Caesalpinioideae) exposed to copper-induced toxicity. South African J. Bot., 121: 186-192.
Marrugo-Negrete, J., J. Durango-Hernández, J. Pinedo-Hernández, G. Enamorado-Montes, and S. Díez. 2016. Mercury uptake and effects on growth in Jatropha curcas. J. Env. Sci., 48: 120-125.
Mehmood, T., I. Bibi, M. Shahid, N.K. Niazi, B. Murtaza, H. Wang, Y.S. Ok, B. Sarkar, M.T. Javed, and G. Murtaza. 2017. Effect of compost addition on arsenic uptake, morphological and physiological attributes of maize plants grown in contrasting soils. J. Geochem. Exp., 178: 83-91.
Mir, B.A., T.A. Khan, and Q. Fariduddin. 2015. 24-epibrassinolide and spermidine modulate photosynthesis and antioxidant systems in Vigna radiata under salt and zinc stress. Int. J. Adv. Res., 3(5): 592-608.
Mondal, N.K., C. Das, and J.K. Datta. 2015. Effect of mercury on seedling growth, nodulation and ultrastructural deformation of Vigna radiata (L) Wilczek. Env. Monit. Assess., 187(5): 1-14.
Mondal, P., S. Bhowmick, D. Chatterjee, A. Figoli, and B. Van der Bruggen. 2013. Remediation of inorganic arsenic in groundwater for safe water supply: A critical assessment of technological solutions. Chemosp., 92(2): 157-170.
Mwamba, T.M., L. Li, R.A. Gill, F. Islam, A. Nawaz, B. Ali, M.A. Farooq, J.L. Lwalaba, and W. Zhou. 2016. Differential subcellular distribution and chemical forms of cadmium and copper in Brassica napus. Ecotoxicol. Env. Saf., 134: 239-249.
Naidu, R., E. Smith, G. Owens, and P. Bhattacharya. 2006. Managing arsenic in the environment from soil to human health. CSIRO publishing.
Nath, S., P. Panda, S. Mishra, M. Dey, S. Choudhury, L. Sahoo, and S.K. Panda. 2014. Arsenic stress in rice: redox consequences and regulation by iron. Pl. Physiol. Biochem., 80: 203-210.
Nematshahi, N., M. Lahouti, and A. Ganjeali. 2012.. Accumulation of chromium and its effect on growth of (Allium cepa cv. Hybrid). European J. Exp. Biol., 2(4): 969-974.
Norton, G.J., A. Douglas, B. Lahner, E. Yakubova, M.L. Guerinot, S.R. Pinson, L.Tarpley, G.C. Eizenga, S.P. McGrath, F.J. Zhao, M.R. Islam, S. Islam, G. Duan, Y. Zhu, D.E. Salt, A.A. Meharg, and A.H. Price. 2014. Genome wide association mapping of grain arsenic, copper, molybdenum and zinc in rice (Oryza sativa L.) grown at four international field sites. PLoS One, 9(2): e89685.
Oves, M., M.S. Khan, A. Zaidi, and E. Ahmad. 2012. Soil contamination, nutritive value, and human health risk assessment of heavy metals: An overview. Environ. Sci., 1-27. DOI:10.1007/978-3-7091-0730-0_1
Panpatte, D.G., Y.K. Jhala, H.N. Shelat, and R.V. Vyas. 2016. Nanoparticles: the next generation technology for sustainable agriculture. In: Microbial inoculants in sustainable agricultural productivity. Springer, New Delhi. pp. 289-300.
Pérez-Pérez, M.E., S.D. Lemaire, and J.L. Crespo. 2012. Reactive oxygen species and autophagy in plants and algae. Pl. Physiol., 160(1): 156-164.

58 Basit et al.,/ GU J. Phytosci. 2(1): 48-59 (2022)
A Systematic Review on Stress of Heavy Metals in Plants
Pintilie, O., M. Zaharia, A. Cosma, A. Butnaru, M. Murariu, G. Drochioiu, and I. Sandu. 2016. Effect of heavy metals on the germination of wheat seeds: Enzymatic Assay. The Annals of “Dunarea de Jos” University of Galati. Fascicle IX, Metallurgy Mat. Sci., 39(1): 48-53.
Pintilie, O., M. Zaharia, A. Cosma, A. Butnaru, M. Murariu, G. Drochioiu, and I. Sandu. 2016. Effect of heavy metals on the germination of wheat seeds: Enzymatic Assay. The Annals of “Dunarea de Jos” University of Galati. Fascicle IX, Metallurgy Mat. Sci., 39(1): 48-53.
Pirzadah, T.B., B. Malik, I. Tahir, Q.M. Irfan, and R.U. Rehman. 2018. Characterization of mercury-induced stress biomarkers in Fagopyrum tataricum plants. Int. J. Phytoremed., 20(3): 225-236.
Pizzeghello, D., O. Francioso, A. Ertani, A. Muscolo, and S. Nardi. 2013. Isopentenyladenosine and cytokinin-like activity of different humic substances. J. Geochem. Expl., 129: 70-75.
Qiao, M., C. Cai, Y. Huang, Y. Liu, A. Lin and Y. Zheng. 2011. Characterization of soil heavy metal contamination and potential health risk in metropolitan region of northern China. Env. Monit. Assess., 172(1): 353-365.
Rachwał, M., T. Magiera, and M. Wawer .2015. Coke industry and steel metallurgy as the source of soil contamination by technogenic magnetic particles, heavy metals and polycyclic aromatic hydrocarbons. Chemosp., 138: 863-873.
Rafiq, M., M. Shahid, G. Abbas, S. Shamshad, S. Khalid, N.K. Niazi, and C. Dumat. 2017. Comparative effect of calcium and EDTA on arsenic uptake and physiological attributes of Pisum sativum. Int. J. Phytoremed., 19(7): 662-669.
Rafiq, M., M. Shahid, S. Shamshad, S. Khalid, N.K. Niazi, G. Abbas, M.F. Saeed, M. Ali, and B. Murtaza. 2018. A comparative study to evaluate efficiency of EDTA and calcium in alleviating arsenic toxicity to germinating and young Vicia faba L. seedlings. J. Soils Sedim., 18(6): 2271-2281.
Rai, P.K., S.S. Lee, M. Zhang, Y.F. Tsang, and K.H. Kim. 2019. Heavy metals in food crops: Health risks, fate, mechanisms, and management. Env. Int., 125: 365-385.
Raldugina, G.N., M.S. Krasavina, N.F. Lunkova, and N.A. Burmistrova. 2016. Resistance of plants to Cu stress: transgenesis. In: Plant metal interaction. Elsevier. pp. 69-114.
Rasheed, H., P. Kay, R. Slack, Y.Y. Gong, and A. Carter. 2017. Human exposure assessment of different arsenic species in household water sources in a high-risk arsenic area. Sci. Total Env., 584: 631-641.
Rastgoo, L., A. Alemzadeh, A.M. Tale, S.E. Tazangi, and T. Eslamzadeh. 2014. Effects of copper, nickel and zinc on biochemical parameters and metal accumulation in gouan,'Aeluropus littoralis'. Pl. Know. J., 3(1): 42-49.
Rastgoo, L., A. Alemzadeh, A.M. Tale, S.E. Tazangi, and T. Eslamzadeh. 2014. Effects of copper, nickel and zinc on biochemical parameters and metal accumulation in gouan,'Aeluropus littoralis'. Pl. Know. J., 3(1): 42-49.
Rizvi, A., B. Ahmed, A. Zaidi, and M.S. Khan. 2019. Heavy metal mediated phytotoxic impact on winter wheat: oxidative stress and microbial management of toxicity by Bacillus subtilis BM2. RSC Adv., 9(11): 6125-6142.
Roriz, M., S.M. Carvalho, and M.W. Vasconcelos. 2014. High relative air humidity influences mineral accumulation and growth in iron deficient soybean plants. Front. Pl. Sci., 5: 726.
Rose, T.J., T. Kretzschmar, L. Liu, G. Lancaster, and M. Wissuwa. 2016. Phosphorus deficiency alters nutrient accumulation patterns and grain nutritional quality in rice. Agro., 6(4): 52.
Sánchez, M., Ò. Palacios, C. Buchensky, L. Sabio, D.F. Gomez-Casati, M.A. Pagani, M. Capdevila, S. Atrian, and J.M. Dominguez-Vera. 2018. Copper redox chemistry of plant frataxins. J. Inorg. Biochem., 180: 135-140.
Shah, S.S., F.I.D.A. Mohammad, M. Shafi, J. Bakht, and W. Zhou. 2011. Effects of cadmium and salinity on growth and photosynthesis parameters of Brassica species. Pak. J. Bot., 43(1): 333-340.
Shahid, M., S. Khalid, G. Abbas, N. Shahid, M. Nadeem, M. Sabir, M. Aslam, and C. Dumat. 2015. Heavy metal stress and crop productivity. In: Crop production and global environmental issues. Springer, Cham. pp 1-25.
Shahid, M., S. Shamshad, M. Rafiq, S. Khalid, I. Bibi, N.K. Niazi, C. Dumat, and M.I. Rashid. 2017. Chromium speciation, bioavailability, uptake, toxicity and detoxification in soil-plant system: A Review. Chemosph., 178: 513-533.
Shao, D., Y. Zhan, W. Zhou, and L. Zhu. 2016. Current status and temporal trend of heavy metals in farmland soil of the Yangtze River Delta Region: Field survey and meta-analysis. Env. Poll., 219: 329-336.
Sharma, A., D. Kapoor, J. Wang, B. Shahzad, V. Kumar, A.S. Bali, S. Jasrotia, B. Zheng, H. Yuan, and D. Yan. 2020. Chromium bioaccumulation and its impacts on plants: An overview. Pl., 9(1): 100.
Sharma, P., and R.S. Dubey. 2007. Involvement of oxidative stress and role of antioxidative defense system in growing rice seedlings exposed to toxic concentrations of aluminum. Pl. Cell Rep., 26(11): 2027-2038.
Sharma, S.S., and K.J. Dietz. 2009. The relationship between metal toxicity and cellular redox imbalance. Tren. Pl. Sci., 14(1): 43-50. Shekar, C.C., D. Sammaiah, T. Shasthree, and K.J. Reddy. 2011. Effect of mercury on tomato growth and yield attributes. Int. J. Phar.
Bio Sci., 2(2): 358-264. Singh, S., P. Parihar, R. Singh, V.P. Singh, and S.M. Prasad. 2016. Heavy metal tolerance in plants: role of transcriptomics,
proteomics, metabolomics, and ionomics. Front. Pl. Sci., 6: 1143. Stafilov, T., M. Aliu, and R. Sajn. 2010. Arsenic in surface soils affected by mining and metallurgical processing in K. Mitrovica
Region, Kosovo. Int. J. Env. Res. Pub. Health, 7(11): 4050-4061. Stoláriková-Vaculíková, M., S. Romeo, A. Minnocci, M. Luxová, M. Vaculík, A. Lux, and L. Sebastiani. 2015. Anatomical, biochemical
and morphological responses of poplar Populus deltoides clone Lux to Zn excess. Env. Exper. Bot., 109: 235-243. Tang, Z., Y. Lv, F. Chen, W. Zhang, B.P. Rosen, and F.J. Zhao. 2016. Arsenic methylation in Arabidopsis thaliana expressing an algal
arsenite methyltransferase gene increases arsenic phytotoxicity. J. Agric. Food Chem., 64: 2674–2681. Tchounwou, P.B., C.G. Yedjou, A.K. Patlolla, and D.J. Sutton. 2012. Heavy metal toxicity and the environment. Mol. Clin. Env. Toxicol.,
101: 133-164. Tsonev, T., and F.J.C. Lidon. 2012. Zinc in plants-An overview. Emirates J. Food Agri. (EJFA), 24(4): 322-333.
Basit et al.,/ GU J. Phytosci. 2(1): 48-59 (2022) 59
A Systematic Review on Stress of Heavy Metals in Plants
Ulusu, Y., L. Öztürk, and M. Elmastaş. 2017. Antioxidant capacity and cadmium accumulation in parsley seedlings exposed to cadmium stress. Russian J. Pl. Physiol., 64(6): 883-888.
Villiers, F., C. Ducruix, V. Hugouvieux, N. Jarno, E. Ezan, J. Garin, C. Junot, and J. Bourguignon. 2011. Investigating the plant response to cadmium exposure by proteomic and metabolomic approaches. Proteo., 11(9): 1650-1663.
Warne, M.S.J., D. Heemsbergen, D. Stevens, M. McLaughlin, G. Cozens, M. Whatmuff, K. Broos, G. Barry, M. Bell, D. Nash, D. Pritchard, and N. Penney. 2008. Modeling the toxicity of copper and zinc salts to wheat in 14 soils. Env. Toxicol. Chem. Int. J., 27(4): 786-792.
Wei, Y., M.J.I. Shohag, X. Yang, and Z. Yibin. 2012. Effects of foliar iron application on iron concentration in polished rice grain and its bioavailability. J. Agri. Food Chem., 60(45): 11433-11439.
Yadav, A., P. Chowdhary, G. Kaithwas, and R.N. Bharagava. 2017. Toxic Metals in the Environment: Threats on Ecosystem and Bioremediation Approaches. In: Handbook of Metal-Microbe Interactions and Bioremediation. CRC Press. pp. 128-141.
Yamaji, N., G. Sakurai, N. Mitani-Ueno, and J.F. Ma. 2015. Orchestration of three transporters and distinct vascular structures in node for intervascular transfer of silicon in rice. Proc. Natl. Acad. Sci. U.S.A. 112: 11401–11406.
Zhang, H., J. Wei, J. Dong, G. Liu, L. Shi, P. An, and J. Ye. 2016. Efficient visible‐light‐driven carbon dioxide reduction by a single‐atom implanted metal–organic framework. Angewandte Chem., 128(46): 14522-14526.
Zhang, Y., Y.H. Xu, H.Y. Yi, and J.M. Gong. 2012. Vacuolar membrane transporters OsVIT1 and OsVIT2 modulate iron translocation between flag leaves and seeds in rice. Pl. J., 72(3): 400-410.
Zhao, L., Y. Xu, H. Hou, Y. Shangguan, and F. Li. 2014. Source identification and health risk assessment of metals in urban soils around the Tanggu chemical industrial district, Tianjin, China. Sci. Total Env., 468: 654-662.
Zhao, Y., Z. Yan, J. Qin, and Z. Xiao. 2014. Effects of long-term cattle manure application on soil properties and soil heavy metals in corn seed production in Northwest China. Env. Sci. Poll. Res., 21(12): 7586-7595.
Zhou, J., K. Feng, Y. Li, and Y. Zhou. 2016. Factorial Kriging analysis and sources of heavy metals in soils of different land-use types in the Yangtze River Delta of Eastern China. Env. Sci. Poll. Res., 23(15): 14957-14967.
Available online at https://www.gudgk.edu.pk/phy-to-science-journal
GU JOURNAL OF PHYTOSCIENCES
GU. J. Phytosci. 2(1): 60-67 (2022)
<<
Possible Threats to Agrobiodiversity of Thar Desert in Pakistan
Possible Threats to Agrobiodiversity of Thar Desert in Pakistan
Farzana Usman1*, Faisal Hussain2, Saadullah Khan Leghari2, Allah Bakhsh Gulshan2, Muhammad
Abid Khan2, Aneela Nijabat2 and Saher Nawaz2
1Department of Botany, Federal Urdu University of Arts, Sciences & Technology, Gulshan-e-Iqbal Campus,
Karachi-75300, Pakistan 2Department of Botany, Ghazi University, Dera Ghazi Khan-32200, Pakistan
Abstract
The Sindh region is located on fertile land, creating conditions suitable for agriculture and irrigation. Being centrally connected to
the Indus River has created advantages for year-round farming and agriculture. Thar is considered the largest desert in Pakistan
with a rich culture, heritage, traditions, folk stories, dances and music played by people of all religions, sects and clans different
created. The main occupation of the people living here is agriculture and animal husbandry. The main occupations of the Thari
people are woodworking, wool weaving, leather making, jewelry making, snake charm-making, farming (in some regions) and
herd-grazing. Agrobiodiversity in the Thar River has a variety of uses commonly used by local residents such as food, wool
production, vegetation and herbs that provide nutritious pastures as well as medicinal plants used by locals. The vegetation in the
desert is mainly herbaceous plants or stunted shrubs; drought tolerant plants Acacia sp., Prosopis sp., Tamrix sp., Zizyphus sp.,
Capparis sp., and shrubs such as Calligonum sp., Calotropis spp., Aerva spp., Crotalaria spp. and Haloxylon sp. grows in all plains.
The sparsely populated grasslands are home to black foxes, chinkaras, caracals, and desert foxes that inhabit the plains,
grasslands, and salt flats of the central desert. Several game birds, notably francolins (penguins) and quails. Among the migratory
and resident birds, Harriers, falcons, buzzards, Peacock, kestrel, vultures, shorttoed eagles, tawny eagles, laggar falcons and
bustard are common. Agriculture is not a reliable proposition in a desert region. After the rainy season, at least 33% of the crops
fail. Animal husbandry, planting trees and grasses along with vegetables or fruit trees is the most viable model for arid and arid
regions. The area faces frequent droughts. The rapidly threatened and endangered agrobiodiversity populations in this ecoregion
have recovered in recent years due to a number of possible threats. However, the primary water element is very rare. Although
seasonal rain is collected in reservoirs, tanks, wells and canals, it is the main source for drinking and domestic purposes. Most
groundwater is unusable because it is located deep underground and is often salty. Recently almost all reservoirs have been
exhausted and the Thar River is facing starvation. It suffers from drought every two or three years, causing severe food shortages,
leading to malnutrition, disease, and death. Children and pregnant women are the most affected. Agricultural biodiversity is
rapidly disappearing in the Thar River due to the lack of water in the area; the conversion of grasslands into arable land is very
slow and the illegal hunting of animals for economic purposes. Dust storms, illiteracy of the local people, deforestation, grazing of
livestock, mainly sheep and goats are rampant, affecting soil fertility and destroying native vegetation. A large number of children,
peacocks and domestic animals have died and perished in the arid and rain-dependent areas of the Thar River due to the
development of physical infrastructure, the lack of guiding policies, and support from the government and lack of value-added
*Corresponding author Tel.: +92 3472743495
E-mail address: [email protected]
© 2022 (Accepted for publication in December 2021) Published by Department of Botany, Selection and/or peer-review under supervision of Executive Committee, Ghazi University, DG Khan, 32200 Pakistan

Usman et al.,/ GU J. Phytosci. 2(1): 60-67 (2022) 61
Possible Threats to Agrobiodiversity of Thar Desert in Pakistan
aspects are key factors related to failures in life. However, the government, there are no significant steps to improve the situation.
It is therefore imperative for our local communities and educated people to be directly involved in raising awareness about the
agro-biodiversity of the Thar Desert and its importance.
Keywords: Biodiversity; Thar Desert; Threats; Agriculture; Livestock
1. Introduction:
Conservation and management of agricultural biodiversity is a key issue in the fight to ensure food security for a growing world population in the face of global change (Thrupp 2000; Chappell & LaValle, 2011). Despite ongoing conservation efforts, in many areas, agricultural biodiversity is under serious threat (Lotti, 2010; Shen et al., 2010; Engels et al., 2011). The Thar is the 17th largest and most interesting desert in the world. Much of the desert is characterized by high sand dunes and between them are hollow valleys. The Thar Desert is located southwest of Sindh. It is derived from Thal, the general term for regions and mountain ranges. Most deserts consist of sand dunes with a flat plain between them where farming can be carried out. This part of Sindh province remains one of the country's hardest hit in terms of government priorities. Scattered and scanty rainfall, dwindling water resources, temporary and limited grazing, and reliance on exploitative middlemen for even the even for life’s mundane needs is a permanent feature of Thar. Traditionally, the economy of this population has depended on agriculture and livestock. The soil is so fertile that even a little rain can change the color of the landscape, which is mostly brown, to green with rich vegetation. And, surprisingly, with little arable land, good crops of bajra (millet), sesame and castor were grown (Hussain et al., 2014).
The way of life of the Thari people is nomadic as they continue to move to places where there is groundwater for them and their livestock. Their economy depends on grazing cattle, as cattle are their capital. The people of Thar have an amazing ability to combine colors, which is evident in their Rilly (mat) carpets and rugs. According to Hussain et al. (2014) that the Thar Desert is facing frequently droughts last several years. The rapidly threatened and endangered agriculturally diverse populations in this ecoregion have recovered in recent years due to a number of possible threats. According to Pakistan Meterological office that the main reason of drought is low rainfall over last two to three decades during the monsoon season. It is directly affected the local crop make failure; several diseases recorded among livestock as well as all type of biodiversity. The ratio of death is associated with serious lack and deficiency of food. Threats to the conservation of races include land-use intensification, structural changes in the agricultural sector (including variety regulations), invasive species, and climate change and urbanization (Biesmeijer et al., 2006; Flynn et al., 2009). According to several studeis, reports and surveys of NGOs and other institutes that varios threats to agricultural biodiversity are rapidly increasing including a) increase the need of land, food and other agrobased resources, b) impact of climate change (imbalance temperature, weather changes, events etc.), c) socio-economic growth and establishment of environment changing industries such as mining, d) resistant of pest and diseases, e) destruction of biodiversity via conversion of agricultural land to other purpose, f) lifestyle changing of local people, g) poor strategies and policies of Govt. for the conserving of agrobiodiversity, h) changing agricultural practices (use of agro-chemical including pesticides, herbicides, fertilizers etc), and i) overgrazing, deforestation, illegal hinting of animals or birds.
1.1. Objectives:
• To impart knowledge and importance of agrobiodiversity in daily life • For enabling species and ecosystems to continue to evolve and adapt, including adaptation to climate change • To promote and share knowledge among people with social, cultural, aesthetic and comfort values. • To protecting habitats for threatened agrobiodiversity • To preventing fragmentation of habitats in general conserving of vegetation and for improved the situations
of Thar
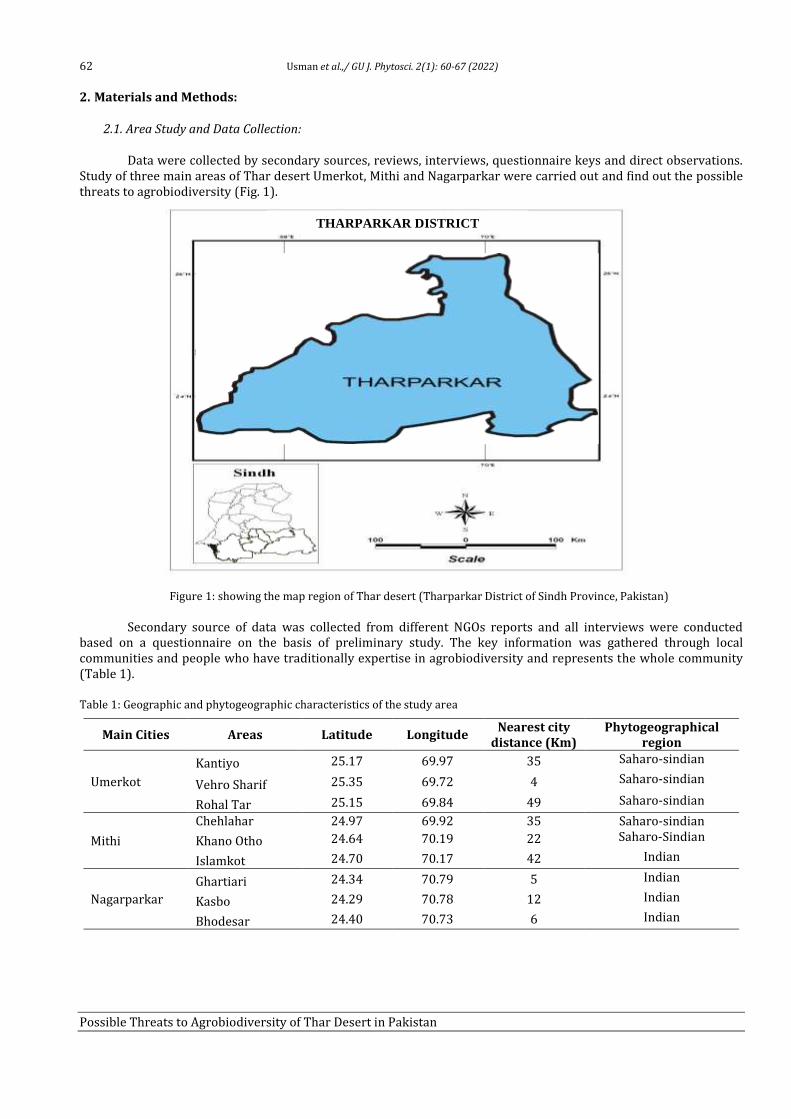
62 Usman et al.,/ GU J. Phytosci. 2(1): 60-67 (2022)
Possible Threats to Agrobiodiversity of Thar Desert in Pakistan
2. Materials and Methods:
2.1. Area Study and Data Collection:
Data were collected by secondary sources, reviews, interviews, questionnaire keys and direct observations. Study of three main areas of Thar desert Umerkot, Mithi and Nagarparkar were carried out and find out the possible threats to agrobiodiversity (Fig. 1).
Figure 1: showing the map region of Thar desert (Tharparkar District of Sindh Province, Pakistan)
Secondary source of data was collected from different NGOs reports and all interviews were conducted based on a questionnaire on the basis of preliminary study. The key information was gathered through local communities and people who have traditionally expertise in agrobiodiversity and represents the whole community (Table 1).
Table 1: Geographic and phytogeographic characteristics of the study area
Main Cities Areas Latitude Longitude Nearest city
distance (Km) Phytogeographical
region
Umerkot
Kantiyo 25.17 69.97 35 Saharo-sindian
Vehro Sharif 25.35 69.72 4 Saharo-sindian
Rohal Tar 25.15 69.84 49 Saharo-sindian
Mithi
Chehlahar 24.97 69.92 35 Saharo-sindian
Khano Otho 24.64 70.19 22 Saharo-Sindian
Islamkot 24.70 70.17 42 Indian
Nagarparkar
Ghartiari 24.34 70.79 5 Indian
Kasbo 24.29 70.78 12 Indian
Bhodesar 24.40 70.73 6 Indian
THARPARKAR DISTRICT
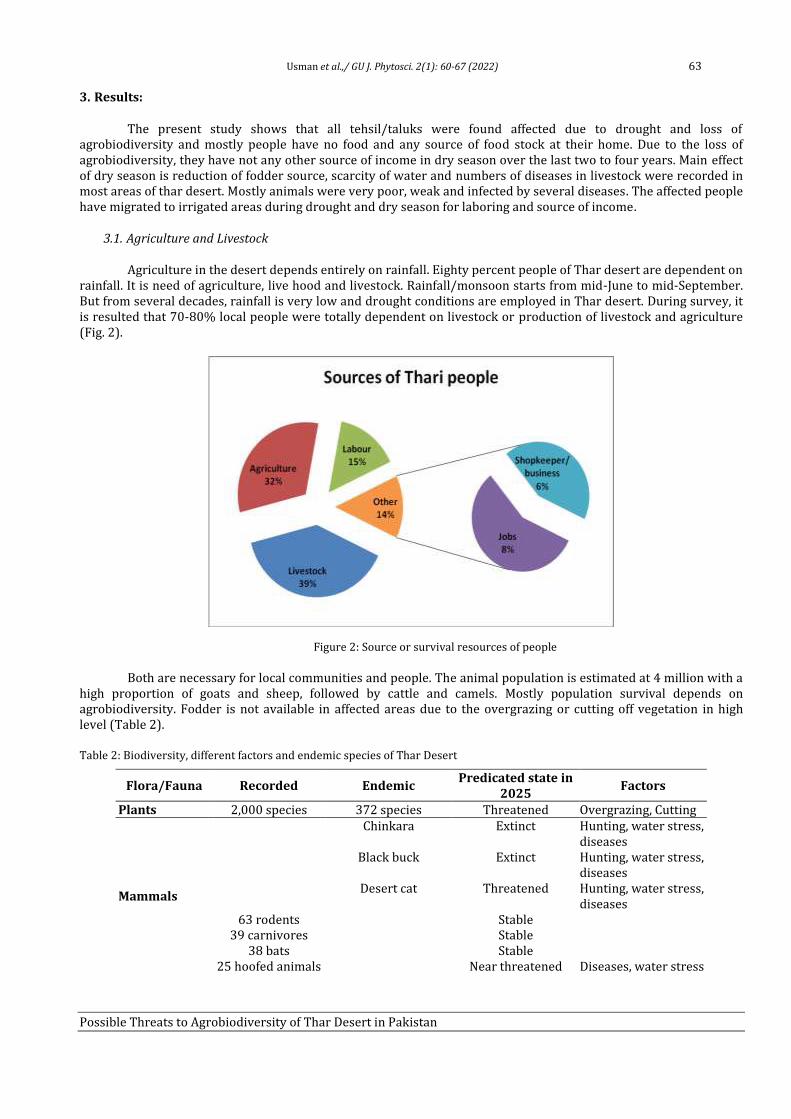
Usman et al.,/ GU J. Phytosci. 2(1): 60-67 (2022) 63
Possible Threats to Agrobiodiversity of Thar Desert in Pakistan
3. Results:
The present study shows that all tehsil/taluks were found affected due to drought and loss of agrobiodiversity and mostly people have no food and any source of food stock at their home. Due to the loss of agrobiodiversity, they have not any other source of income in dry season over the last two to four years. Main effect of dry season is reduction of fodder source, scarcity of water and numbers of diseases in livestock were recorded in most areas of thar desert. Mostly animals were very poor, weak and infected by several diseases. The affected people have migrated to irrigated areas during drought and dry season for laboring and source of income.
3.1. Agriculture and Livestock
Agriculture in the desert depends entirely on rainfall. Eighty percent people of Thar desert are dependent on rainfall. It is need of agriculture, live hood and livestock. Rainfall/monsoon starts from mid-June to mid-September. But from several decades, rainfall is very low and drought conditions are employed in Thar desert. During survey, it is resulted that 70-80% local people were totally dependent on livestock or production of livestock and agriculture (Fig. 2).
Figure 2: Source or survival resources of people
Both are necessary for local communities and people. The animal population is estimated at 4 million with a high proportion of goats and sheep, followed by cattle and camels. Mostly population survival depends on agrobiodiversity. Fodder is not available in affected areas due to the overgrazing or cutting off vegetation in high level (Table 2).
Table 2: Biodiversity, different factors and endemic species of Thar Desert
Flora/Fauna Recorded Endemic Predicated state in
2025 Factors
Plants 2,000 species 372 species Threatened Overgrazing, Cutting
Mammals
Chinkara Extinct Hunting, water stress,
diseases Black buck Extinct Hunting, water stress,
diseases Desert cat Threatened Hunting, water stress,
diseases 63 rodents
Stable
39 carnivores
Stable 38 bats
Stable
25 hoofed animals
Near threatened Diseases, water stress
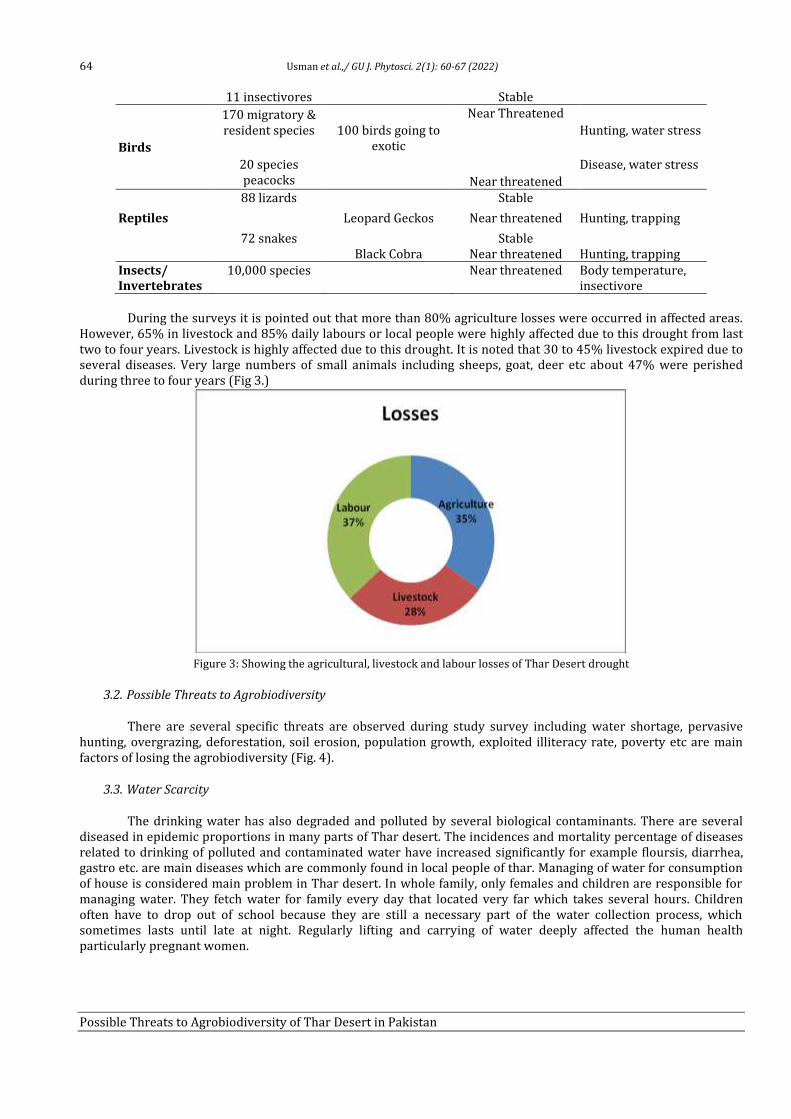
64 Usman et al.,/ GU J. Phytosci. 2(1): 60-67 (2022)
Possible Threats to Agrobiodiversity of Thar Desert in Pakistan
11 insectivores
Stable
Birds
170 migratory & resident species
20 species peacocks
100 birds going to exotic
Near Threatened
Near threatened
Hunting, water stress
Disease, water stress
Reptiles
88 lizards
Stable
Leopard Geckos Near threatened Hunting, trapping
72 snakes
Stable Black Cobra Near threatened Hunting, trapping
Insects/ Invertebrates
10,000 species Near threatened Body temperature, insectivore
During the surveys it is pointed out that more than 80% agriculture losses were occurred in affected areas. However, 65% in livestock and 85% daily labours or local people were highly affected due to this drought from last two to four years. Livestock is highly affected due to this drought. It is noted that 30 to 45% livestock expired due to several diseases. Very large numbers of small animals including sheeps, goat, deer etc about 47% were perished during three to four years (Fig 3.)
Figure 3: Showing the agricultural, livestock and labour losses of Thar Desert drought
3.2. Possible Threats to Agrobiodiversity
There are several specific threats are observed during study survey including water shortage, pervasive hunting, overgrazing, deforestation, soil erosion, population growth, exploited illiteracy rate, poverty etc are main factors of losing the agrobiodiversity (Fig. 4).
3.3. Water Scarcity
The drinking water has also degraded and polluted by several biological contaminants. There are several diseased in epidemic proportions in many parts of Thar desert. The incidences and mortality percentage of diseases related to drinking of polluted and contaminated water have increased significantly for example floursis, diarrhea, gastro etc. are main diseases which are commonly found in local people of thar. Managing of water for consumption of house is considered main problem in Thar desert. In whole family, only females and children are responsible for managing water. They fetch water for family every day that located very far which takes several hours. Children often have to drop out of school because they are still a necessary part of the water collection process, which sometimes lasts until late at night. Regularly lifting and carrying of water deeply affected the human health particularly pregnant women.
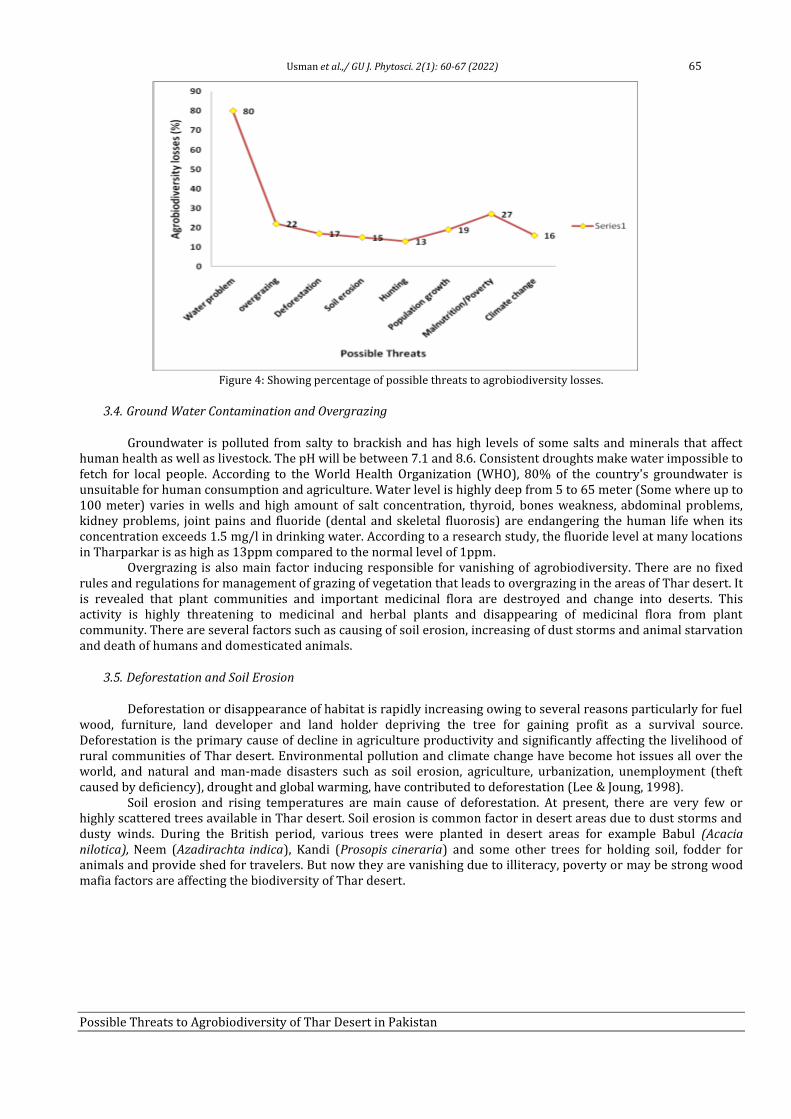
Usman et al.,/ GU J. Phytosci. 2(1): 60-67 (2022) 65
Possible Threats to Agrobiodiversity of Thar Desert in Pakistan
Figure 4: Showing percentage of possible threats to agrobiodiversity losses.
3.4. Ground Water Contamination and Overgrazing
Groundwater is polluted from salty to brackish and has high levels of some salts and minerals that affect human health as well as livestock. The pH will be between 7.1 and 8.6. Consistent droughts make water impossible to fetch for local people. According to the World Health Organization (WHO), 80% of the country's groundwater is unsuitable for human consumption and agriculture. Water level is highly deep from 5 to 65 meter (Some where up to 100 meter) varies in wells and high amount of salt concentration, thyroid, bones weakness, abdominal problems, kidney problems, joint pains and fluoride (dental and skeletal fluorosis) are endangering the human life when its concentration exceeds 1.5 mg/l in drinking water. According to a research study, the fluoride level at many locations in Tharparkar is as high as 13ppm compared to the normal level of 1ppm.
Overgrazing is also main factor inducing responsible for vanishing of agrobiodiversity. There are no fixed rules and regulations for management of grazing of vegetation that leads to overgrazing in the areas of Thar desert. It is revealed that plant communities and important medicinal flora are destroyed and change into deserts. This activity is highly threatening to medicinal and herbal plants and disappearing of medicinal flora from plant community. There are several factors such as causing of soil erosion, increasing of dust storms and animal starvation and death of humans and domesticated animals.
3.5. Deforestation and Soil Erosion
Deforestation or disappearance of habitat is rapidly increasing owing to several reasons particularly for fuel wood, furniture, land developer and land holder depriving the tree for gaining profit as a survival source. Deforestation is the primary cause of decline in agriculture productivity and significantly affecting the livelihood of rural communities of Thar desert. Environmental pollution and climate change have become hot issues all over the world, and natural and man-made disasters such as soil erosion, agriculture, urbanization, unemployment (theft caused by deficiency), drought and global warming, have contributed to deforestation (Lee & Joung, 1998).
Soil erosion and rising temperatures are main cause of deforestation. At present, there are very few or highly scattered trees available in Thar desert. Soil erosion is common factor in desert areas due to dust storms and dusty winds. During the British period, various trees were planted in desert areas for example Babul (Acacia nilotica), Neem (Azadirachta indica), Kandi (Prosopis cineraria) and some other trees for holding soil, fodder for animals and provide shed for travelers. But now they are vanishing due to illiteracy, poverty or may be strong wood mafia factors are affecting the biodiversity of Thar desert.
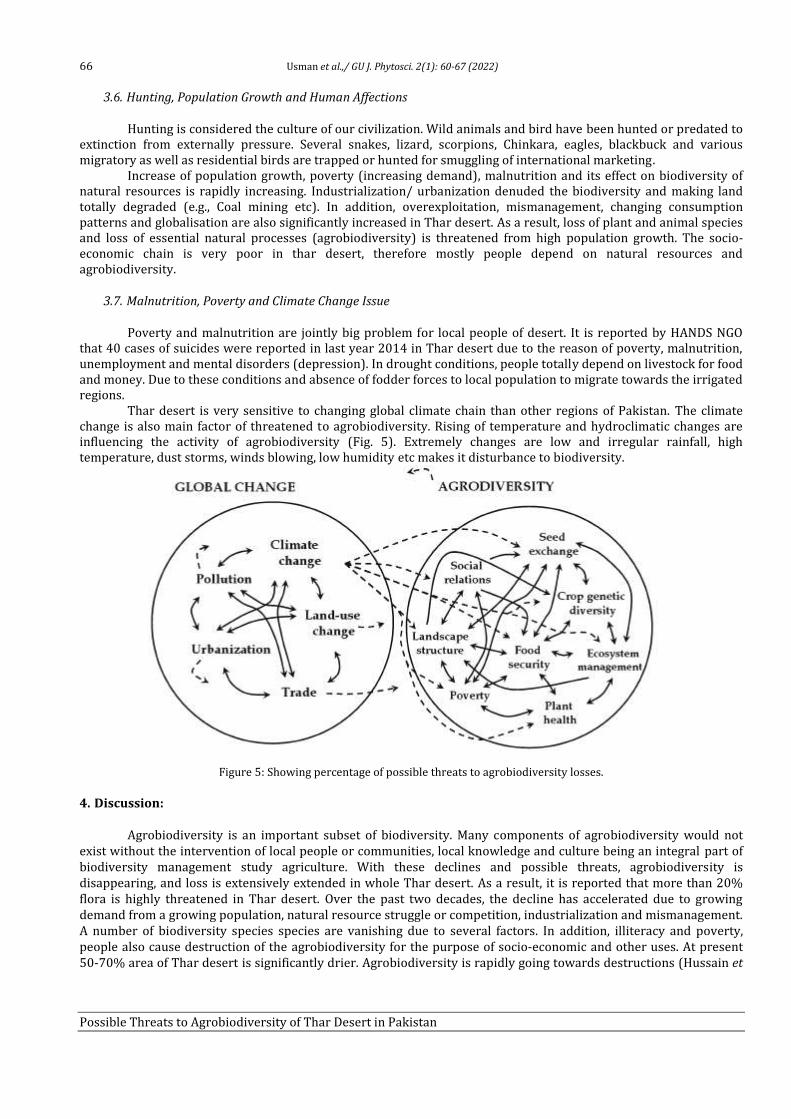
66 Usman et al.,/ GU J. Phytosci. 2(1): 60-67 (2022)
Possible Threats to Agrobiodiversity of Thar Desert in Pakistan
3.6. Hunting, Population Growth and Human Affections
Hunting is considered the culture of our civilization. Wild animals and bird have been hunted or predated to extinction from externally pressure. Several snakes, lizard, scorpions, Chinkara, eagles, blackbuck and various migratory as well as residential birds are trapped or hunted for smuggling of international marketing.
Increase of population growth, poverty (increasing demand), malnutrition and its effect on biodiversity of natural resources is rapidly increasing. Industrialization/ urbanization denuded the biodiversity and making land totally degraded (e.g., Coal mining etc). In addition, overexploitation, mismanagement, changing consumption patterns and globalisation are also significantly increased in Thar desert. As a result, loss of plant and animal species and loss of essential natural processes (agrobiodiversity) is threatened from high population growth. The socio-economic chain is very poor in thar desert, therefore mostly people depend on natural resources and agrobiodiversity.
3.7. Malnutrition, Poverty and Climate Change Issue
Poverty and malnutrition are jointly big problem for local people of desert. It is reported by HANDS NGO that 40 cases of suicides were reported in last year 2014 in Thar desert due to the reason of poverty, malnutrition, unemployment and mental disorders (depression). In drought conditions, people totally depend on livestock for food and money. Due to these conditions and absence of fodder forces to local population to migrate towards the irrigated regions.
Thar desert is very sensitive to changing global climate chain than other regions of Pakistan. The climate change is also main factor of threatened to agrobiodiversity. Rising of temperature and hydroclimatic changes are influencing the activity of agrobiodiversity (Fig. 5). Extremely changes are low and irregular rainfall, high temperature, dust storms, winds blowing, low humidity etc makes it disturbance to biodiversity.
Figure 5: Showing percentage of possible threats to agrobiodiversity losses.
4. Discussion:
Agrobiodiversity is an important subset of biodiversity. Many components of agrobiodiversity would not exist without the intervention of local people or communities, local knowledge and culture being an integral part of biodiversity management study agriculture. With these declines and possible threats, agrobiodiversity is disappearing, and loss is extensively extended in whole Thar desert. As a result, it is reported that more than 20% flora is highly threatened in Thar desert. Over the past two decades, the decline has accelerated due to growing demand from a growing population, natural resource struggle or competition, industrialization and mismanagement. A number of biodiversity species species are vanishing due to several factors. In addition, illiteracy and poverty, people also cause destruction of the agrobiodiversity for the purpose of socio-economic and other uses. At present 50-70% area of Thar desert is significantly drier. Agrobiodiversity is rapidly going towards destructions (Hussain et
Usman et al.,/ GU J. Phytosci. 2(1): 60-67 (2022) 67
Possible Threats to Agrobiodiversity of Thar Desert in Pakistan
al., 2014). Water scarcity, rapid population growth and poverty are also the principal cause of diminishing the agrobiodiversity. Certain species of flora and fauna are disappearing day by day in Thar desert.
5. Conclusion:
After investigation, it is reported that more than 20% flora is highly threatened in Thar desert. Over the past two decades, the decline has accelerated due to growing demand from a growing population, natural resource struggle or competition, industrialization and mismanagement. A number of biodiversity species are vanishing due to several factors. Water scarcity, rapid population growth and poverty are also the principal cause of diminishing the agrobiodiversity. Therefore, it is an urgent need for us to take some necessary steps for the saving of agrobiodiversity. Some recommendations for saving of agrobiodiversity are based on the analysis of this study and observations including a) the valuable knowledge about agrobiodiversity is rapidly disappearing due to poverty, illiteracy of the local people and also due to the destruction of plant and animal species, b) afforestation (establishment of plant species) particularly highly drought-tolerant plants should be planted in Thar desert, c) dripping irrigation system should be planted in desert areas for saving of vegetation, d) Moringa oleifera (Suhanjana) and Prosopis cineraria trees should be planted. They provide nutritious pods that can be used as food. Also, the leaves provide fodder for domestic animals, e) effective grazing management or limited grazing areas should be designed for people, f) therefore, it is essential for local communities and educated people to directly participate in raising awareness about agrobiodiversity and its importance, g) the situation in Thar area is alarming and requires the government to take immediate remedial measures, including better rainwater harvesting, development of fresh groundwater resources and installation of deodorization plants and desalination, h) there is an urgent need to promote local practices and technologies to advance community-managed solar, wind and free-flowing water systems to solve water problems instead of spending money, big money for overly ambitious projects, and i) for climate change, strategy formulation, adaptation of traditional knowledge and practices related to agrobiodiversity must be publicly presented through electronic and print media.
6. References:
Biesmeijer, J.C., S.P.M. Roberts, M. Reemer, R. Ohlemüller, M. Edwards, T. Peeters, A.P. Schaffers, S.G. Potts, R. Kleukers, C.D. Thomas, J. Settele and K.E. Kunin. 2006. Parallel declines in pollinators and insect-pollinated plants in Britain and the Netherlands. Sci., 313: 351–354.
Chappell, M.J. and L.A. LaValle. 2011. Food security and biodiversity: can we have both? An agroecological analysis. Agric. Human Values, 28: 3–26.
Engels, J.M.M., H. Dempewolf and V. Henson-Apollonio. 2011. Ethical considerations in agro-biodiversity research, collecting, and use. J. Agric. Enviro. Ethics, 24:107–126.
Flynn, D.F.B., M. Gogol-Prokurat, T. Nogeire, N. Molinari, B.T. Richers, B.B. Lin, N. Simpson, M.M. Mayfield and F. DeClerck. 2009. Loss of functional diversity under land use intensification across multiple taxa. Ecol. Lett., 12: 22–33.
Hussain, F., M. Abid and S.S. Shaukat. 2014. Ethnobotanical study of Mirpurkhas region in Sindh-Pakistan. Scholar’s Press, Germany. pp 224.
Lee, K.S. and M.R. Joung. 1998. Determination of land use change categories using classification of multitemporal satellite image dats. GIS Devlopment, Korea Poster Section 3, pp. 1-2.
Lotti, A. 2010. The commoditization of products and taste: slow food and the conservation of agrobiodiversity. Agric. Human Values, 27: 71–83.
Shen, S., A. Wilkes, J. Qian, L. Yin, J.A. Ren and F.D. Zhang. 2010. Agrobiodiversity and biocultural heritage in the Dulong valley, China. Mount Res. Develop, 30: 205–211.
Thrupp, L.A. 2000. Linking agricultural biodiversity and food security: the valuable role of agrobiodiversity for sustainable agriculture. Int. Affairs, 76: 265–281.
Available online at https://www.gudgk.edu.pk/phy-to-science-journal
GU JOURNAL OF PHYTOSCIENCES
GU. J. Phytosci. 2(1): 68-73 (2022)
<<
Stress of Cadmium Heavy Metal on the Development and Growth of Plants: A Review
Stress of Cadmium (Cd) Heavy Metal on the Development and
Growth of Plants: A Review
Abdul Basit1*, Allah Bakhsh Gulshan1, Syed Mazhar Irfan2 and Khush Bakhat Saba Qureshi3
1Department of Botany, Ghazi University, Dera Ghazi Khan-32200, Pakistan 2Government Associate College, Dera Ghazi Khan-32200, Pakistan
3Institute of Botany, University of the Punjab, Lahore-54000, Pakistan
Abstract
Cadmium (Cd) being heavy metal is a non-essential element that is simply engaged by plants. Cadmium heavy metal is a harmful
effect on the plant metabolism affecting the growth of the plants. Cadmium heavy metal is released into the atmosphere from
various sources, such as power plants, metalworking industries, heating systems, batteries, and urban traffic. Cadmium heavy
metal recognized as particularly hazardous pollutant due to higher toxicity and higher water solubility, and it has been listed as
one of the major poisons. Cadmium is of great importance to the health of plants and humans have been extensively studied
effects on plants at all levels, containing breakdown. The review paper aimed to examine the various properties of cadmium
heavy metals on the growth of plants and in the atmosphere.
Keywords: Cadmium; Heavy Metal; Metabolism; Industries
1. Introduction:
Heavy metals are significant environmental pollutants (Abbas et al., 2014). Its availability in soil depends on natural processes, in particular soil formation and soil development, but also on human factors such as mining, fossil fuel combustion, municipal waste treatment and soil runoff the processing industry, shipping operations, phosphate applications, wastewater from sewage treatment plants and municipal solid waste landfills. The increase in the heavy metal content of the soil can also be caused by different factors like soil nature and soil texture or various agricultural practices, such as the use of sludge on agricultural land (Abbas et al., 2018). Household, municipal and industrial wastes are also sources of heavy metals in soil nature and soil texture (Ahmad et al., 2014). Heavy metals contaminated soil allowable limit will reduce agricultural production (Ahmad et al., 2015; Abedi et al., 2020). The heavy metal accumulation in the environment has become a major issue of the environmental pollution.
Plants naturally face many unfavorable conditions in the atmosphere, like organic and inorganic stresses. In the case of all other stresses, heavy metal pressure has a significant negative impact on crop yield and growth. The stress of heavy metal induced responses in plants, ranging from biochemical reactions to the yield of the crops. The
*Corresponding author Tel.: +92 3496310799
E-mail address: [email protected]
© 2022 (Accepted for publication in November 2021) Published by Department of Botany, Selection and/or peer-review under supervision of Executive Committee, Ghazi University, DG Khan, 32200 Pakistan

Basit et al.,/ GU J. Phytosci. 2(1): 68-73 (2022) 69
Stress of Cadmium Heavy Metal on the Development and Growth of Plants: A Review
word "heavy metal" denotes some metal element that has a comparatively higher density and remains toxic even at the lower concentrations. The basic term “heavy metals” applies to the metals in this group and metals, the atomic densities of metals larger than 4 g/cm3 that are 4 times better than molecule of water (Rastgoo et al., 2014). However, for density, the heavy metals chemical nature is the major influential factor.
1.1. Objectives:
• To describe the various heavy metals effects like mercury, silver, lead, and nickel, according to the alternate classification and their chemical coordination
• To explore heavy metals impacts on the plants and humans in the environment
2. Review of Relevant Literature:
Heavy metals are classified as class B metals such as non-metal, including harmful components like mercury, silver, lead, and nickel, according to the alternative classification based on their coordination chemistry (Zhang et al., 2016). Some organic heavy metals are difficult to digest in the environment. These metals are accumulated in the ecological food chain recognitions by the absorption of major levels of producers and then accumulate by consumption. Immobilized plants and plant roots are the main interaction for heavy metal ions. In aquatic systems, the entire plant is unprotected from this ion. Heavy metals are directly absorbed into the plates by particles placed on the surface of the plates. Plants become immobilized and plant roots are the main contractors for heavy metal ions. In aquatic systems, all plants are exposed to this ion. Due to the particles deposited on the surface of the panel, heavy metals are absorbed directly into the leaves.
The cadmium heavy metal accumulation in plants has many indirect and direct effects on growth of plants, and it changes many physiological functions by compounding with O, N, and S ligands (Azzi et al., 2017). They interfere with mineral absorption (Bashir et al., 2018) breakdown of protein (Begum et al., 2019) function of the membrane (Chellaiah et al., 2018), and the relationship between water and seed germination (Chen et al., 2016). Cadmium inhibits pure photosynthesis in green algae, corn, soybeans, and pigeon peas (Chen et al., 2015a), inhibits O2 advancement in Anacystis nodules, and PS II (photosystem II) in insulated corn and spinach chloroplasts reported by Chen et al. (2015b). Furthermore, they disrupt metabolism by changing basic biochemical reactions (Chen et al., 201c).
Cadmium heavy metal is not an important component, it damages growth of plant. The cadmium heavy metal released into the environment from power plants, industries, warming systems, metallurgical, and city transportation. Cadmium heavy metal is extremely recognized as an important chemical due to its higher toxicity and higher water solubility (Chmielowska-Bąk et al., 2014). Important input sources of cadmium for the aquatic environment contain atmospheric deposition, domestic wastewater, and industrial waste (Ding et al., 2016). Wagner (Dharma-Wardana et al., 2018) is estimated uncontaminated soil solutions contained cadmium concentrations between 0.04 and 0.32 mM. Soil solutions with cadmium concentrations ranging from 0.32 to about 1 mM can be considered to be moderately contaminated (Dong et al., 2019). Therefore, cadmium is classified as an intermediate toxic element, but the mechanism of cadmium toxicity is not fully understood. Stomata opening, transpiration, and photosynthesis are affected by cadmium, and yellowing of leaves, leaf curl, and stunting are the key signs of cadmium poisoning in the plants (Ehsan et al., 2014).
2.1. Effects of Cadmium Heavy Metals in the Environments
Heavy metal cadmium can exist in atmosphere, it released from man-made and natural resources. It mainly occurs as a minerals component in the earth crust with typically concentrations of 0.01 to 1.8 mg/kg and normal concentration of 0.18 mg/kg in soil. In the natural sources freshwater, cadmium heavy metal also present at lower concentrations of 0.1^g Cd/L, but in environments affected by human activities concentrations can reach several micrograms/liter or more (USEPA 2001). Various environmental sources of cadmium are illustrated in Figure 1. The emission ratio of anthropogenic cadmium to natural cadmium can be as high as 7:1.
2.2. Effects of Cadmium (Cd) in Plants (Fresh and Dry Mass):
Cadmium is not an essential nutrient and will inhibit plant growth at high concentrations (Etim et al., 2012). Cadmium heavy metal also has been reported even at the low concentrations it will alter the breakdown of plants (Azzi et al., 2017). The occurrence of cadmium in the soil decreases the growth of soybeans (Faraz et al., 2020) and
70 Basit et al.,/ GU J. Phytosci. 2(1): 68-73 (2022)
Stress of Cadmium Heavy Metal on the Development and Growth of Plants: A Review
mung beans (Farooq et al., 2020). Higher concentrations of cadmium reduced the growth of cell and whole plant growth.
2.3. Effects on Photosynthesis:
Cadmium heavy metal is an effective inhibitor of photosynthesis (Gray et al., 2017). An undeviating relationship between photosynthesis and inhibition of transpiration was detected in soybeans, suggesting that cadmium inhibits stomatal opening (Gu et al., 2018). Cadmium can damage the photosynthetic apparatus, especially light-harvesting complex II (de Souza et al., 2015) and light systems I and II (Guo et al., 2018). The inhibition of Fe3+ reductase by cadmium leads to Fe2+ deficiency, which severely affects photosynthesis (Gutsch et al., 2019). Cadmium as well as induces stomatal closure in advanced plants (Hadi et al., 2014; Hasan et al., 2019).
2.4. Effect on Chlorophyll and Protein Content:
The presence of cadmium reduced the chlorophyll and carotenoid content in Brassica napus increased non-photochemical extinction (Hassan et al., 2019). Similarly, under the influence of cadmium, chlorophyll synthesis and levels of other plants decreased (Houben et al., 2013, Hussain et al., 2020). Growth retardation associated with cadmium treatment may be due to inhibition of protein synthesis (Abbas et al., 2018). Plant toxicity of metals in other crops has been observed in the form of reduced protein levels (Begum et al., 2019). In addition, the content of protein in cereals grown under low cadmium heavy metal stress conditions (Huybrechts et al., 2019).
2.4. Effect on Nodulation:
Cadmium heavy metal also presents in the soil like cadmium decreases the symbiotic nitrogen-fixing organisms and also increased the number of nodules per plant [Imam et al., 2016]. Occurrence of cadmium heavy metal reduces the nitrogen activity in kidney beans nodulation (Imam et al., 2016; Faraz et al., 2020), clover (Ismael et al., 2019), soybean (Jali et al., 2014), red poplar (Jali et al., 2016) and pea (Jalmi et al., 2018). Uptake of nitrogen by plants of pea is severely cadmium affected by exposure (Jalmi et al., 2018). A positive association was observed between the content of leghemoglobin and nitrogen’s activity (Jan et al., 2018). Both parameters were shown decline in parallel in the cadmium heavy metal presence (Kalai et al., 2016). Oxidative stress due to Cd2+ accelerates nodular aging in plants of soybean (Karimpour et al., 2018).
3. Effect of Cadmium on Nitrate Reductase (NR) Activity:
Nitrate reductase is a key enzyme in the pathway of nitrate uptake, it is a regulator growth of plants (Kaznina et al., 2014), and its levels are affected by environmental different factors (Khan et al., 2017). Cadmium heavy metal occurrence in soil affects NO absorption in plants of Zea maize (Hasan et al., 2009; Khandare et al., 2015), peas (Kubier et al., 2019), Silene vulgaris (Anupam et al., 2016), beans and tomatoes (Le Gall et al., 2015), and Cicer arietinum (Li et al., 2019).
3.1. Effect on antioxidant systems
Under the Cadmium heavy metal stress, the plants possess antioxidant systems of series which protect them from damage of oxidative (Li et al., 2018). SOD (Super oxidase) is the first enzyme in detoxification, which can convert O2 free radicals to H2O2 at a very swift percentage (Lopez et al., 2017). Cadmium heavy metal has been induced oxidative stress by generating free radicals (Mohamed et al., 2018), cadmium heavy metal also reduced the concentrations of enzymatic as well as non-enzymatic, antioxidants (Nazar et al., 2012, Mahajan et al., 2018). These defence systems like ascorbic acid, glutathione, tocopherol, oxygen scavengers, and these plants enzymes are peroxidase, catalase, and superoxide dismutase (Noh et al., 2016). Peroxidase induction is a common reaction after the heavy metals toxicity uptake by higher plants (Azzi et al., 2017). Cadmium heavy metal can prevent and motivate different antioxidant enzymes movement. In the Helianthus annuus plant leaves heavy metal cadmium enhances lipid peroxidation activity, and increases the activity of lipoxygenase, as well as decreases superoxidase activity (Yuriko et al., 2014), glutathione reductase activity, catalase, ascorbate and peroxidase, glutathione reductase, and dehydro ascorbate reductase activity (Webb et al., 2017). Cadmium induces peroxidase (POX) activity in the roots and leaves of soybean (Shiyu et al., 2020), bean leaves (Rady et al., 2011), and rice (Rucińska-Sobkowiak, 2016).
Basit et al.,/ GU J. Phytosci. 2(1): 68-73 (2022) 71
Stress of Cadmium Heavy Metal on the Development and Growth of Plants: A Review
4. Discussion:
Cadmium has been shown a negative effect on the germination of attached pollen by an interruption of the morphology of pollen tubes in various species of plants (Wang et al., 2018). Even in actual little the concentration of Cd (cadmium) was 0.01 μg ML1 capable of inhibiting germination of the pollen or the growth of the tube in the Angustifolia VICIA and dependent Rhaphidophora tetrasperma, indicating that this method is complex to the cadmium heavy metal (Xiao et al., 2017). Cell elongation is deficient in pollen tubes by the heavy metals of cadmium. The heavy metal cadmium is a symbol of intervention with the anion content of secretory vesicles, which may contain more pectin polysaccharides and callose, and their association with the cell wall (Yousaf et al., 2016). This cell wall inactivation, increase the diameter of cells and the abnormal growth of pollen tubes were observed in the Prunus avium (Cherry). The variety was tested in vitro at an exhibition of cadmium heavy metals (Zeng et al., 2017).
5. Conclusion:
The cadmium (Cd) heavy metal harmfully affects the fitness of the growth of plants by various methods such as pollen tube formation and germination of pollen, as a result it reduced as described in the seed germination section. Cadmium affects plant metabolism, affecting development and growth, nodulation, chlorophyll and protein content, and the rate of photosynthesis. Cadmium also inhibits the activity of nitrate reductase, nitrate absorption transported from roots to above ground, the information should be noted that, special effects of the cadmium heavy metal on reproductive stages of the growth of a plant is relatively rare and justifies more helpfulness in the future.
6. References:
Abbas, S.Z., M. Rafatullah, N. Ismail, N. and J. Lalung. 2014. Isolation, identification, and characterization of cadmium resistant Pseudomonas sp. M3 from industrial wastewater. J. Waste Manag., 2014. Article ID 160398. http://dx.doi.org/10.1155/2014/160398
Abbas, T., M. Rizwan, S. Ali, M. Adrees, M. Zia-ur-Rehman, M.F. Qayyum, and G. Murtaza. 2018. Effect of biochar on alleviation of cadmium toxicity in wheat (Triticum aestivum L.) grown on Cd-contaminated saline soil. Env. Sci. Poll. Res., 25(26): 25668-25680.
Abedi, T., and A. Mojiri. 2020. Cadmium uptake by wheat (Triticum aestivum L.): An overview. Pl., 9(4): 500. Ahmad, I., M.J. Akhtar, Z.A. Zahir, and B. Mitter. 2015. Organic amendments: effects on cereals growth and cadmium
remediation. Int. J. Env. Sci. Tech., 12(9): 2919-2928. Ahmad, I., M.J. Akhtar, Z.A. Zahir, M. Naveed, B. Mitter, and A. Sessitsch. 2014. Cadmium-tolerant bacteria induce metal stress
tolerance in cereals Environ Sci. Poll. Res., 21: 11054-11065. Anupam, R. 2016. Bhut jolokia (Capsicum chinense Jaqc): A Review. Int. J. Pharm. Scie. Res. (IJPSR), 7(3): 882-889. Azzi, V., V. Kazpard, B. Lartiges, A. Kobeissi, A. Kanso, and A.G. El-Samrani. 2017. Trace metals in phosphate fertilizers used in
Eastern Mediterranean countries. Clean-Soil, Air, Water, Wiley, 45 (1): ⟨10.1002/clen.201500988⟩. ⟨hal-02151873⟩. Bashir, S., Q. Hussain, M. Akmal, M. Riaz, H. Hu, S.S. Ijaz, M. Iqbal, S. Abro, S. Mehmood and M. Ahmad. 2018. Sugarcane bagasse-
derived biochar reduces the cadmium and chromium bioavailability to mash bean and enhances the microbial activity in contaminated soil. J. Soil Sed, 18(3): 874-886.
Begum, N., Z. Hu, Q. Cai, and L. Lou. 2019. Influence of PGPB inoculation on HSP70 and HMA3 gene expression in switchgrass under cadmium stress. Plants, 8(11): 504.
Chellaiah, E.R. 2018. Cadmium (heavy metals) bioremediation by Pseudomonas aeruginosa: A minireview. Appl. Water Sci., 8: 154. Chen, B., A.F. Stein, N. Castell, Y. Gonzalez-Castanedo, A.S. de la Campa, and J.D. De La Rosa. 2016. Modeling and evaluation of
urban pollution events of atmospheric heavy metals from a large Cu-smelter. Sci. Total Env., 539: 17-25. Chen, G., X. Liu, P.C. Brookes, and J. Xu. 2015a. Opportunities for phytoremediation and bioindication of arsenic contaminated
water using a submerged aquatic plant Vallisneria natans (Lour.) Hara. Int. J. Phytoremed., 17(3): 249-255. Chen, T., Z. Zhou, R. Han, R. Meng, H. Wang, and W. Lu. 2015b. Adsorption of cadmium by biochar derived from municipal sewage
sludge: impact factors and adsorption mechanism. Chemosph., 134: 286-293. Chen, W.H., J. Peng, and X.T. Bi. 2015c. A state-of-the-art review of biomass torrefaction, densification and applications. Ren. Sus.
Ener. Rev., 44: 847-866. Chmielowska-Bąk, J., J. Gzyl, R. Rucińska-Sobkowiak, M. Arasimowicz-Jelonek, and J. Deckert. 2014. The new insights into
cadmium sensing. Front. Plant Sci., 5: 245. Dharma-Wardana, M.W.C. 2018. Fertilizer usage and cadmium in soils, crops and food. Env. Geochem. Heal., 40(6): 2739-2759. Ding, Y., Y. Liu, S. Liu, Z. Li, X. Tan, X. Huang, G. Zeng, L. Zhou, and B. Zheng. 2016. Biochar to improve soil fertility. A review. Agron.
Sust. Dev., 36(2): 1-18. Dong, Q., J. Fang, F. Huang, and K. Cai. 2019. Silicon amendment reduces soil Cd availability and Cd uptake of two Pennisetum
species. Int. J. Env. Res. and Public Health, 16(9): 1624. Ehsan, S., S. Ali, S. Noureen, K. Mahmood, M. Farid, W. Ishaque, M.B. Shakoor, and M. Rizwan. 2014. Citric acid assisted
phytoremediation of cadmium by Brassica napus L. Ecotoxicol. Env. Saf., 106: 164-172.
72 Basit et al.,/ GU J. Phytosci. 2(1): 68-73 (2022)
Stress of Cadmium Heavy Metal on the Development and Growth of Plants: A Review
El-Beltagi, H.S., A.A. Mohamed, and M.M. Rashed. 2010. Response of antioxidative enzymes to cadmium stress in leaves and roots of radish (Raphanus sativus L.). Notulae Sci. Biol., 2(4): 76-82.
El-Naggar, A., S.S. Lee, J. Rinklebe, M. Farooq, H. Song, A.K. Sarmah, A.R. Zimmerman, M. Ahmad, S.M. Shaheen and Y.S. Ok. 2019. Biochar application to low fertility soils: A review of current status, and future prospects. Geoder., 337: 536-554.
Elouear, Z., F. Bouhamed, N. Boujelben, and J. Bouzid. 2016. Application of sheep manure and potassium fertilizer to contaminated soil and its effect on zinc, cadmium and lead accumulation by alfalfa plants. Sus. Environ. Res., 26(3): 131-135.
Etim, E.E. 2012. Phytoremediation and its mechanisms: A review. Int. J. Environ. Bioener., 2(3): 120-136. Faraz, A., M. Faizan, F. Sami, H. Siddiqui, and S. Hayat. 2020. Supplementation of salicylic acid and citric acid for alleviation of
cadmium toxicity to Brassica juncea. J. Pl. Growth Reg., 39(2): 641-655. Farooq, M., A. Ullah, M. Usman, and K.H. Siddique. 2020. Application of zinc and biochar help to mitigate cadmium stress in bread
wheat raised from seeds with high intrinsic zinc. Chemosp., 260: 127652. Gray, C.W., J.M. Chrystal, R.M. Monaghan, and J.A. Cavanagh. 2017. Subsurface cadmium loss from a stony soil—effect of cow urine
application. Environ. Sci. Poll. Res., 24(13): 12494-12500. Gu, C.S., Y.H. Yang, Y.F. Shao, K.W. Wu, and Z.L. Liu. 2018. The effects of exogenous salicylic acid on alleviating cadmium toxicity in
Nymphaea tetragona Georgi. South African J. Bot., 114: 267-271. Guo, J., M.A. Islam, H. Lin, C. Ji, Y. Duan, P. Liu, Q. Zeng, B. Day, Z. Kang and J. Guo. 2018. Genome-wide identification of cyclic
nucleotide-gated ion channel gene family in wheat and functional analyses of TaCNGC14 and TaCNGC16. Front. Pl. Sci., 9: 18. Gutsch, A., K. Sergeant, E. Keunen, E. Prinsen, G. Guerriero, J. Renaut, J.F. Hausman, and A. Cuypers. 2019. Does long-term cadmium
exposure influence the composition of pectic polysaccharides in the cell wall of Medicago sativa stems? BMC Plant Biol., 19(1): 1-17.
Hadi, F., N. Ali, and A. Ahmad. 2014. Enhanced phytoremediation of cadmium-contaminated soil by Parthenium hysterophorus plant: effect of gibberellic acid (GA3) and synthetic chelator, alone and in combinations. Bioremed. J., 18(1): 46-55.
Hasan, M.K., G.J. Ahammed, S. Sun, M. Li, H. Yin, and J. Zhou. 2019. Melatonin inhibits cadmium translocation and enhances plant tolerance by regulating sulfur uptake and assimilation in Solanum lycopersicum L. J. Agri. Food Chem., 67(38): 10563-10576.
Hasan, S.A., Q. Fariduddin, B. Ali, S. Hayat, and A. Ahmad. 2009. Cadmium: toxicity and tolerance in plants. J. Environ. Biol., 30(2): 165-174.
Hassan, M.U., M.U. Chattha, I. Khan, M.B. Chattha, M. Aamer, M. Nawaz, A. Ali, M.A.U. Khan and T.A. Khan. 2019. Nickel toxicity in plants: reasons, toxic effects, tolerance mechanisms, and remediation possibilities—A Review. Environ. Sci. Poll. Res., 26(13): 12673-12688.
Houben, D., L. Evrard, and P. Sonnet. 2013. Beneficial effects of biochar application to contaminated soils on the bioavailability of Cd, Pb and Zn and the biomass production of rapeseed (Brassica napus L.). Bio. Bioener., 57:196-204.
Hussain, B., M.N. Ashraf, A. Abbas, J. Li, and M. Farooq. 2021. Cadmium stress in paddy fields: effects of soil conditions and remediation strategies. Sci. Total Environ., 754: 142188.
Huybrechts, M., A. Cuypers, J. Deckers, V. Iven, S. Vandionant, M. Jozefczak, and S. Hendrix. 2019. Cadmium and plant development: an agony from seed to seed. Int. J. Mol. Sci., 20(16): 3971.
Imam, S.A., I.K. Rajpoot, B. Gajjar, and A. Sachdeva. 2016. Comparative study of heavy metal bioremediation in soil by Bacillus Subtilis and Saccharomyces Cerevisiae. Indian J. Sci. Technol., 9(47): 1-7.
Ismael, M.A., A.M. Elyamine, M.G. Moussa, M. Cai, X. Zhao, and C. Hu. 2019. Cadmium in plants: uptake, toxicity, and its interactions with selenium fertilizers. Metallomics, 11(2): 255-277.
Jali, P., A.B. Das, and C. Pradhan. 2014. A comparative analysis of physiological and biochemical responses to low doses of cadmium in two important varieties of Oryza sativa L. of Odisha, India. Int. J. Sci. Res., 3(12): 1920-1927.
Jali, P., C. Pradhan, and A.B. Das. 2016. Effects of cadmium toxicity in plants: A Review article. Sch. Acad. J. Biosci., 4(12): 1074-1081.
Jalmi, S.K., P.K. Bhagat, D. Verma, S. Noryang, S. Tayyeba, K. Singh, D. Sharma, and A.K. Sinha. 2018. Traversing the links between heavy metal stress and plant signaling. Front. Plant Sci., 9: 12.
Jan, S., M.N. Alyemeni, L. Wijaya, P. Alam, K.H. Siddique, and P. Ahmad. 2018. Interactive effect of 24-epibrassinolide and silicon alleviates cadmium stress via the modulation of antioxidant defense and glyoxalase systems and macronutrient content in Pisum sativum L. seedlings. BMC Plant Biol., 18(1): 1-18.
Kalai, T., D. Bouthour, J. Manai, L.B.B. Kaab, and H. Gouia. 2016. Salicylic acid alleviates the toxicity of cadmium on seedling growth, amylases and phosphatases activity in germinating barley seeds. Arch. Agro. Soil Sci., 62(6): 892-904.
Karimpour, M., S.D. Ashrafi, K. Taghavi, A. Mojtahedi, E. Roohbakhsh, and D. Naghipour. 2018. Adsorption of cadmium and lead onto live and dead cell mass of Pseudomonas aeruginosa: A dataset. Data Br., 18: 1185-1192.
Kaznina, N.M., A.F. Titov, Y.V. Batova, and G.F. Laidinen. 2014. The resistance of plants Setaria veridis (L.) Beauv. to the influence of cadmium. Biol. Bull., 41(5): 428-433.
Khan, M.A., S. Khan, A. Khan, and M. Alam. 2017. Soil contamination with cadmium, consequences and remediation using organic amendments. Sci. Total Environ., 601: 1591-1605.
Khandare, R.V., and S.P. Govindwar. 2015. Phytoremediation of textile dyes and effluents: Current scenario and future prospects. Biotechnol. Adv., 33(8): 1697-1714.
Kubier, A., R.T. Wilkin, and T. Pichler. 2019. Cadmium in soils and groundwater: A Review. App. Geochem., 108: 104388. Lange, O.L., P.S. Nobel, C.B. Osmond, and H. Ziegler. 2013. Physiological plant ecology III: Responses to the chemical and biological
environment (Vol. 12). Springer Science & Business Media. LeGall, H., F. Philippe, J.M. Domon, F. Gillet, J. Pelloux, and C. Rayon. 2015. Cell wall metabolism in response to abiotic
stress. Plants, 4(1): 112-166.

Basit et al.,/ GU J. Phytosci. 2(1): 68-73 (2022) 73
Stress of Cadmium Heavy Metal on the Development and Growth of Plants: A Review
Li, Q., G. Wang, Y. Wang, D. Yang, C. Guan, and J. Ji. 2019. Foliar application of salicylic acid alleviate the cadmium toxicity by modulation the reactive oxygen species in potato. Ecotoxicol. Environ. Saf., 172: 317-325.
Li, Z., L. Wu, Y. Luo, and P. Christie. 2018. Changes in metal mobility assessed by EDTA kinetic extraction in three polluted soils after repeated phytoremediation using a cadmium/zinc hyperaccumulator. Chemosp., 194: 432-440.
Lopez, F.B., and G.F. Barclay. 2017. Plant anatomy and physiology. In: Pharmacognosy. Academic Press. pp. 45-60. Mahajan, P. and J. Kaushal. 2018. Role of phytoremediation in reducing cadmium toxicity in soil and water. J. Toxicol., 2018:
Article ID 4864365. https://doi.org/10.1155/2018/4864365. Mohamed, R.A., A.K. Abdelbaset, and D.Y. Abd-Elkader. 2018. Salicylic acid effects on growth, yield, and fruit quality of strawberry
cultivars. J. Med. Active Pl., 6(2): 1-11. Nazar, R., N. Iqbal, A. Masood, M.I.R. Khan, S. Syeed, and N.A. Khan. 2012. Cadmium toxicity in plants and role of mineral nutrients
in its alleviation. American J. Pl. Sci., 3: 1476-1489. Noh, Y.D., H.J. Park, K.R. Kim, W.I. Kim, K.Y. Jung, S.U. Kim, V.N. Owens, J.S. Moon, S.W. Yun, S.Y. Kim, and C.O. Hong. 2017.
Contrasting effect of phosphate on phytoavailability of arsenic and cadmium in soils supporting medicinal plants. App. Biol. Chem., 60(2): 119-128.
Rady, M.M. 2011. Effect of 24-epibrassinolide on growth, yield, antioxidant system and cadmium content of bean (Phaseolus vulgaris L.) plants under salinity and cadmium stress. Sci. Hort., 129(2): 232-237.
Rucińska-Sobkowiak, R. 2016. Water relations in plants subjected to heavy metal stresses. Acta Physiol. Pl., 38(11): 1-13. Shiyu, Q.I.N., L.I.U. Hongen, N.I.E. Zhaojun, Z. Rengel, G.A.O. Wei, L.I. Chang, and Z.H.A.O. Peng. 2020. Toxicity of cadmium and its
competition with mineral nutrients for uptake by plants: A review. Pedosph., 30(2): 168-180. Souza de., G.M.D.F., H.M. de Oliveira, and E. da Silva. 2015. Cadmium toxicity on seed germination and seedling growth of wheat
Triticum aestivum. Acta Sci. Biol. Sci., 37(4): 499-504. Wang, M., Y. Yang, and W. Chen. 2018. Manganese, zinc, and pH affect cadmium accumulation in rice grain under field conditions
in southern China. J. Env. Qua., 47(2): 306-311. Webb, H.E., D.M. Brichta-Harhay, M.M. Brashears, K.K. Nightingale, T.M. Arthur, J.M. Bosilevac, and G.H. Loneragan. 2017.
Salmonella in peripheral lymph nodes of healthy cattle at slaughter. Front. Microbiol., 8: 2214. Xiao, A., Y. Ouyang, W.C. Li, and Z. Ye. 2017. Effect of organic manure on Cd and as accumulation in brown rice and grain yield in
Cd-As-contaminated paddy fields. Environ. Sci. Poll. Res., 24(10): 9111-9121. Yousaf, B., G. Liu, R. Wang, M. Zia-ur-Rehman, M.S. Rizwan, M. Imtiaz, G. Murtaza and A. Shakoor. 2016. Investigating the potential
influence of biochar and traditional organic amendments on the bioavailability and transfer of Cd in the soil–plant system. Environ. Earth Sci., 75(5): 374.
Yuriko, O., K. Osakabe, K. Shinozaki, and L.S.P. Tran. 2014. Response of plants to water stress. Front. Plant. Sci., 5: 86. Zeng, Q., Q. Ling, F. Hu, J. Wu, Z. Yang, Y. Qi, and Q. Li. 2017. Genotypic differences in growth and antioxidant enzyme activities
under cadmium stress in sugarcane. Bull. Environ. Cont. Toxicol., 99(5): 607-613.
Patron-in-Chief
Prof. Dr. Muhammad Tufail (TI) Vice Chancellor, Ghazi University
Patron
Prof. Dr. Saadullah Khan Laghari Dr. Allah Bakhsh Gulshan
Editor-in-Chief
Dr. Faisal Hussain
GU
JO
UR
NA
L O
F
PH
YT
OS
CIE
NC
ES
Executive Editorial Board
1. Dr. Javed Iqbal 2. Dr. Muhammad Asif 3. Dr. Saqib Bashir
Associate Editors
Joint Secretary
1. Dr. Aneela Nijabat 2. Ms. Saher Nawaz 3. Mr. Abdul Sammad
Treasurer
Dr. Muhammad Abid Khan