Application of composite textile at Fakhruddin Textile Mills ...
Upload
independentCategory
view
0download
0
United StatesDepartmentof Agriculture
www.ers.usda.gov
Electronic Outlook Report from the Economic Research Service
CWS-05d-01
June 2005
Growth Prospects forIndia’s Cotton and Textile IndustriesMaurice Landes, Stephen MacDonald,Santosh K. Singh, and Thomas Vollrath1
AbstractDemand for cotton and manmade fibers in India will likely strengthen inresponse to rising consumer demand in India and increased exports oftextiles and apparel following the removal of the Multifiber Arrangementquotas. The pace of growth in cotton demand will hinge on execution ofreforms to policies, including taxes that discriminate against the use ofmanmade fibers and regulations affecting the scale, technology use, andexport competitiveness of the textile and apparel industries. Imports of rawcotton have increased in concert with rising demand in recent years, but futuregrowth will depend on the extent to which India can boost chronically lowcotton yields and improve cotton quality.
Keywords: Cotton, India, textiles, clothing, apparel, Multifiber Arrange-ment, synthetic fiber, spinning, weaving, China, trade policy, policy reform,seed varieties, fiber quality.
AcknowledgmentsThe authors wish to thank the following individuals for their insightfulcomments: James Crutchfield and Rebecca Fecitt, Foreign AgriculturalService, USDA; Carol Goodloe, Office of the Chief Economist, USDA;Samarendu Mohanty, Texas Tech University; Carol Skelly, World Agricul-tural Outlook Board, USDA; Cheryl Christensen, Praveen Dixit, and JoyHarwood, Economic Research Service, USDA. Appreciation is alsoextended to Linda Hatcher for editing and production support, and to DavidNulph for graphics assistance. This research was partially funded by theIndia Emerging Markets Project.
1Landes, MacDonald, and Vollrath are senior economists at the Economic Research Service. Singh isan agricultural specialist at the Foreign Agricultural Service/New Delhi. This research was partiallyfunded by the India Emerging Markets Project.

India, the world’s third-largest producer of cotton and second-largestproducer of cotton yarns and textiles, is poised to play an increasinglyimportant role in global cotton and textile markets as a result of domesticand multilateral policy reform. Liberalization of industrial and trade policiesin the early 1990s increased the competitiveness of much of India’s industryand service sectors, sparking robust growth in output and consumerdemand. Reforms in agriculture, the economy’s major employer, and in thetextile sector, the leading industrial employer, have, however, been modest.Future reforms to these heavily regulated sectors could have significantimpacts on the structure and competitiveness of the textile sector and onIndia’s supply, demand, and trade of cotton and textile products.
On January 1, 2005, developed countries removed import quotas on textileproducts previously sanctioned by the 1974 Multifiber Arrangement (MFA).This change provides a major opportunity for India to expand productionand exports of textiles and apparel to developed country markets (see box,“The Multifiber Arrangement and Its Impacts”). The elimination of MFAquotas induced Indian policymakers to relax investment restrictions and toadopt market liberalization measures in the textile sector, although thesereforms have been slower than developments in some other key countries,most notably China. However, the opportunity created by the elimination ofMFA quotas, together with India’s rapid economic growth and demonstratedcomparative advantage in production of both raw cotton and textiles,increases the likelihood that India will continue to adopt policies aimed atexpanding its capacity to produce and export cotton and textiles.
In the post-MFA era, developments in India and other developing countriesthat export textiles will have important implications for the United States andother cotton-exporting countries. India has already emerged as a small butgrowing market for U.S. cotton in recent years, driven by the price and qualityconsciousness of export-oriented mills and garment makers. India has, histori-cally, been a competitive producer of raw cotton and mostly self-sufficient.It is not clear, however, if domestic producers will be able to meet the quan-tity and quality demands of a rapidly expanding textile sector that, according togovernment targets, aims to more than triple its exports by 2010.
2Growth Prospects for India’s Cotton and Textile Industries/CWS-05d-01
Economic Research Service/USDA
Introduction

3Growth Prospects for India’s Cotton and Textile Industries/CWS-05d-01
Economic Research Service/USDA
The Multifiber Arrangement and Its Impacts
Until recently, global trade in textiles and apparel operated outside established international rules based on a system ofquotas originally sanctioned by the 1974 Multifiber Arrangement (MFA). However, the Uruguay Round (UR) negotia-tions that concluded in 1995 included an agreement to render the sector compliant with General Agreement on Tariffs andTrade (GATT) rules, thus reversing three decades of steadily increasing protectionism. The UR’s Agreement on Textileand Clothing (ATC) mandated the phaseout of quantitative import barriers on textiles over a 10-year period, withcomplete MFA quota removal by the end of 2004. In addition, commitments were made to reduce tariffs on importedtextiles and clothing throughout the world—in both developed and developing countries.
Impacts of the MFA
In 1994, MFA quotas governed most global trade in 105 textile and garment categories. The quota restraints limited shipments from exporters, mostly developing countries, to the United States, EU, Canada, and Norway. Key impacts wereas follows:
• World textile and clothing production and trade became fragmented. The quotas supported production in developed-country markets and in countries having quotas to ship to these markets. Production did not necessarily occur wherecosts were lowest.
• Prices were higher and consumption lower in developed-country markets than they would have been without the quotas. Studies indicate that the MFA regime added 5-10 percent to U.S. consumer prices.
• Impacts on developing countries were mixed. Production and exports by low-cost producers of textiles and clothing,such as China, India, and Pakistan, were reduced by the quotas. But in other low-income countries, like Bangladeshand Mauritius, and in higher income countries, like South Korea and Taiwan, quota access supported an export industrythat otherwise would have been smaller or nonexistent.
Impacts of the End of MFA Quotas
The elimination of MFA quotas is re-orienting world production and trade of fiber, yarn, fabric, and clothing in funda-mental ways:
• Textile and clothing output will accelerate among low-cost developing-country producers, including India, Pakistan,and, especially, China due to the elimination of quotas. Production in the United States and EU will continue to decline.
• Some higher cost producers will continue to receive tariff protection; others will still profit from either geographicproximity to or preferential trade arrangements with U.S. and EU markets (for example, the Caribbean Basin Initiative,the North American Free Trade Agreement, and the Customs Union between the EU and Turkey).
• Mill use of raw cotton will continue to shift toward low-cost developing-country exporters. Unless such countries asChina, India, and Pakistan can also produce more cotton, cotton import demand will also shift toward these countries.
• Textile and clothing prices will fall in the United States and EU.
For more details, see: Stephen MacDonald and Thomas Vollrath, The Forces Shaping World Cotton Consumption After the Multifiber Arrangement, CWS-05c-01, U.S. Department of Agriculture, Economic Research Service, April2005, 30 pp.

India is one of the largest consumers of cotton in the world, ranking secondto China in production of cotton yarn and fabrics and first in installed spin-ning and weaving capacity (fig. 1). India is also an important globalproducer and consumer of synthetic fibers, ranking fifth in global produc-tion of synthetic fibers (fig. 2).
Although domestic demand accounts for most Indian cotton consumption,growth in textiles and clothing exports is outpacing domestic demand and isan increasingly important determinant of overall cotton and fiber demand inIndia. Cotton-based exports accounted for about 42 percent of mill use ofcotton in 2000 and about 80 percent of the growth in Indian consumption ofcotton fiber between 1992 and 2000.
Relatively strong recent growth in the domestic use of manmade fibers isalso shaping demand for cotton. In addition, government policy interven-tions that influence raw material and product prices, industry structure, andtechnology significantly affect both the growth in domestic demand forcotton and the competitiveness of India’s textile export sector. These poli-cies are being reformed, with potentially large impacts on growth in Indiancotton demand.
Trends in Export Demand
Exports of yarns, textiles, and clothing to the world market are an increasinglyimportant source of derived demand for Indian cotton. Since 1992, Indiantextile and clothing exports have grown 7.7 percent annually, reaching $13.4billion in 2002 and accounting for 4 percent of global trade in this sector(fig. 3). In 2002, India was the fifth-largest global exporter and the second-largest net exporter of textiles and clothing. India’s net exports of $12.1 billionin 2002 were, however, far below those of China ($54.9 billion) (fig. 4).
4Growth Prospects for India’s Cotton and Textile Industries/CWS-05d-01
Economic Research Service/USDA
Cotton Demand
Figure 1
Major world producers of cotton yarn and fabric, 2001
Source: Government of India, Ministry of Textiles, Office of the Textile Commissioner.
0
1
2
3
4
5
6
7
8Yarn
China
Mex
ico
Thaila
nd
Indo
nesia
Brazil
Turke
y
United
Sta
tes
Pakist
anIn
dia
Russia
Fabric
Million tons
Figure 2
Major world producers of synthetic fibers and yarns, 2002
Source: Government of India, Ministry of Textiles, Office of the Textile Commissioner.
Million tons
012
345
6
78
9
China
Thaila
nd
Indo
nesia
Turke
y
United
Sta
tes
Pakist
anIn
dia
Taiwan
South
Kor
ea
Japa
n

The bulk of India’s textile and clothing exports, as well as most exportgrowth, is in cotton-based yarns, fabrics, clothing, and household furnish-ings, as opposed to synthetic and blended products.
Exports of textiles and clothing now account for about 30 percent of India’sdomestic use of all natural and manmade fibers, a share that is likely tocontinue to increase. India’s exports of textiles and clothing are expandingat nearly twice the rate of domestic demand. Export growth is likely toquicken as a result of the recent elimination of the MFA quotas that servedto constrain India’s exports to the United States and the European Union(EU). The MFA quotas were most restrictive of trade in clothing, particularlycotton-based clothing, which accounts for a large share of India’s textile andapparel exports (fig. 5).
India’s success in the global textile marketplace hinges greatly on the paceof internal market reforms and its ability to achieve international competi-tiveness in its heavily regulated spinning, weaving, and apparel sectors.Current government targets call for quadrupling exports to the United Statesand increasing global exports to $50 billion by 2010.
Trends in Domestic Consumption
Domestic fiber demand has accelerated along with stronger growth in theIndian economy (fig. 6). Major reforms in domestic and trade policiesduring 1991-93 have led to faster growth in per capita incomes in India,helping boost annual growth in fiber consumption to 4.9 percent since 1990.Relatively rapid growth in consumption of manmade fibers, particularlysince 1990, has also been an important trend in Indian fiber demand. During1990-2001, per capita demand for manmade and blended fabrics grew 6.8percent annually, compared with negligible growth in demand for 100-percent cotton fabrics (table 1).
As a result of this rapid growth, manmade and blended fabrics now accountfor the bulk of household cloth purchases. Between 1991 and 2003, theshare of manmade and blended products in household cloth purchases rosefrom about 38 percent to 54 percent. The fastest growth has been in use of100 percent manmade, as opposed to blended, fabrics. However, despite
5Growth Prospects for India’s Cotton and Textile Industries/CWS-05d-01
Economic Research Service/USDA
Figure 3
India: Exports of textiles and clothing by use, 1992-2002
$ billion
Source: U.S. Department of Agriculture, Economic Research Service, Bilateral Fiber and Textile Trade Database.
0
2
4
6
8
10
12
14
1992 94 96 98 2000 02
ClothingHome furnishingsFabricYarnIndustrial products

the rapid growth in use of manmade fibers, cotton continues to account for a relatively large share of total consumption in India, compared withother developing countries, as well as with developed and transitioneconomies (fig. 7).
Demand for manmade and blended textile products in India is strong in bothurban and rural households due to their durability and ease in maintenance(washability, fewer wrinkles, etc.), compared with 100-percent cottontextiles, factors very important in the Indian tropical and subtropicalweather (fig. 8). Demand is, however, strongest in rural households, whichaccount for about 78 percent of India’s population. As of 2002, the share ofmanmade and blended products in household cloth purchases was 61percent in rural areas and 54 percent in urban areas. In rural households,where average incomes are about half those in urban areas, and in urbanlow-income households, manmade fabrics are preferred because of theirdurability, as well as their generally low cost.
6Growth Prospects for India’s Cotton and Textile Industries/CWS-05d-01
Economic Research Service/USDA
Figure 4
Net exports of textiles and clothing by global region, 1992 and 2002
-80 -60 -40 -20 0 20 40 60
United States
European Union
Japan
Other industrialized countries
North Africa and other Middle East
Canada
Former Soviet Union
Sub-Saharan Africa
Eastern Europe
Other North and South Asia
Thailand
Bangladesh
Other Southeast Asia
Latin America and Caribbean
Pakistan
Indonesia
Turkey
South Korea
Taiwan
India
China, Hong Kong, and Macau
$ billion
20021992
Source: U.S. Department of Agriculture, Economic Research Service, Bilateral Fiber and Textile Trade Database.

Overall growth in fiber consumption in India is also affected by the largeshare of household income allocated to textile purchases. According togovernment data, Indian households spent an average of 17 percent of theirincome on textiles in 1997, a share that has increased from 12 percent since1990 (fig. 9). Urban households spent about 22 percent of income ontextiles in 1997, compared with 15 percent for rural households. The higherurban share partly reflects larger purchases of higher value fabrics andreadymade goods in urban households, compared with rural households.
The sensitivity of consumer textile demand—and of textile sector output—torural incomes was demonstrated by the industry slump of 1998/99. Unchar-acteristic declines in yarn and cloth output in that year were associated withweak rural demand from sluggish growth in farm incomes and high cottonprices after a poor crop in 1997/98. A drop in yarn export demand resultingfrom the Asian financial crisis also contributed to the 1998/99 slump.
7Growth Prospects for India’s Cotton and Textile Industries/CWS-05d-01
Economic Research Service/USDA
Table 1
India: Growth in fabric consumption by type, 1972-2002
Manmade Real gross domesticPeriod Cotton and blended Total product/capita
-------------Square meters------------- 1993/94 RsAverage for:
1972-74 17.4 2.8 20.2 5,2551979-81 14.5 6.4 20.9 5,7821989-91 14.4 8.2 22.6 7,8232000-02 14.5 16.9 31.3 12,166
PercentGrowth rates:1
1973-80 -2.6 12.4 .5 1.41980-90 -.1 2.5 .8 3.11990-2001 0 6.8 3.0 3.71Growth rates between period average centered on years indicated.
Source: Computed from data from the Government of India, Ministry of Textiles, Office of theTextile Commissioner, 2004, Compendium of Textile Statistics; Government of India, Ministry ofFinance, Economic Survey, various issues.
Figure 5
India: Exports of textiles and clothing by fiber type, 1992-2002
$ billion
Source: U.S. Department of Agriculture, Economic Research Service, Bilateral Fiber and Textile Trade Database.
0
2
4
6
8
10
12
14
1992 94 96 98 2000 02
Cotton SyntheticBlended Other
Figure 6
India: Per capita cloth availability by type, 1991-2003
Source: U.S. Department of Agriculture, Economic Research Service, Bilateral Fiber and Textile Trade Database.
0
5
10
15
20
25
30
35
1991 93 95 97 99 2001 03
100% cotton Blended100% noncotton
Meters

Role of Prices in Consumer Demand
Most Indian consumers are highly price sensitive. The average Indianhousehold spends about 55 percent of its income on food and, as a result,spends discretionary income carefully. Faster economic growth beginning inthe early 1990s has led to the emergence of an expanding middle class of150-200 million consumers, with the capacity and propensity to purchasehigher priced items. But price-sensitive, lower income households continueto account for the bulk of India’s more than 1 billion consumers.
Declining real prices for yarns and textiles have likely stimulated growth indemand for textile products since the early 1990s, particularly those madeof manmade fibers (fig. 10). Real prices of cotton yarns and textiles havegenerally declined since the mid-1990s primarily due to lower prices for
8Growth Prospects for India’s Cotton and Textile Industries/CWS-05d-01
Economic Research Service/USDA
Figure 7
Cotton share of fiber use by global region, 1992 and 2002
Source: International Cotton Advisory Committee.
0
10
20
30
40
50
60
70
80
1992 2002
WorldIndustrializedDevelopingTransitionIndia
Percent
Figure 8
India: Fiber composition of textile products purchased by households, 1993 and 2002
Source: Government of India, Ministry of Textiles, Office of the Textile Commissioner.
Percent
Rural
1993 2002
Urban
1993 2002 1993
All India
2002
CottonManmade and blended
0
10
20
30
40
50
60
70
Figure 10
India: Deflated wholesale price indexes for textile products, 1990-2004
Source: ERS calculations based on data fromGovernment of India, Ministry of Finance, Economic Survey, various.
Index, 1993-94=100
Polyester fiber
Polyester yarn
Cotton yarnCotton cloth
Raw cotton
1990 92 94 96 98 2000 02 040
50
100
150
200
250
Figure 9
India: Share of household income spent on textiles, 1981-98
Source: Government of India, Ministry of Textiles, Office of the Textile Commissioner.
Percent
Rural
Urban
All India
1981 83 9391898785 97950
5
10
15
20
25

raw cotton. Prices for manmade fibers and yarns, however, have fallendramatically—about 10 percent annually in real terms—since 1990. Theprice declines for manmade fiber have been driven by increasing domesticproduction capacity and lower international prices of raw materials, as wellas reduced Indian import tariffs and excise duties on synthetic raw materialsand products.
Policies Affecting Consumer Prices
The principal government policies affecting consumer prices for textileproducts are excise taxes charged on products as they leave the factory andimport tariffs charged on raw and intermediate products used in manufac-turing. Historically, both excise taxes and tariffs have been used todiscourage domestic use of manmade fibers, which are based heavily onimported raw materials, and to promote the use of cotton, most of which isproduced domestically.
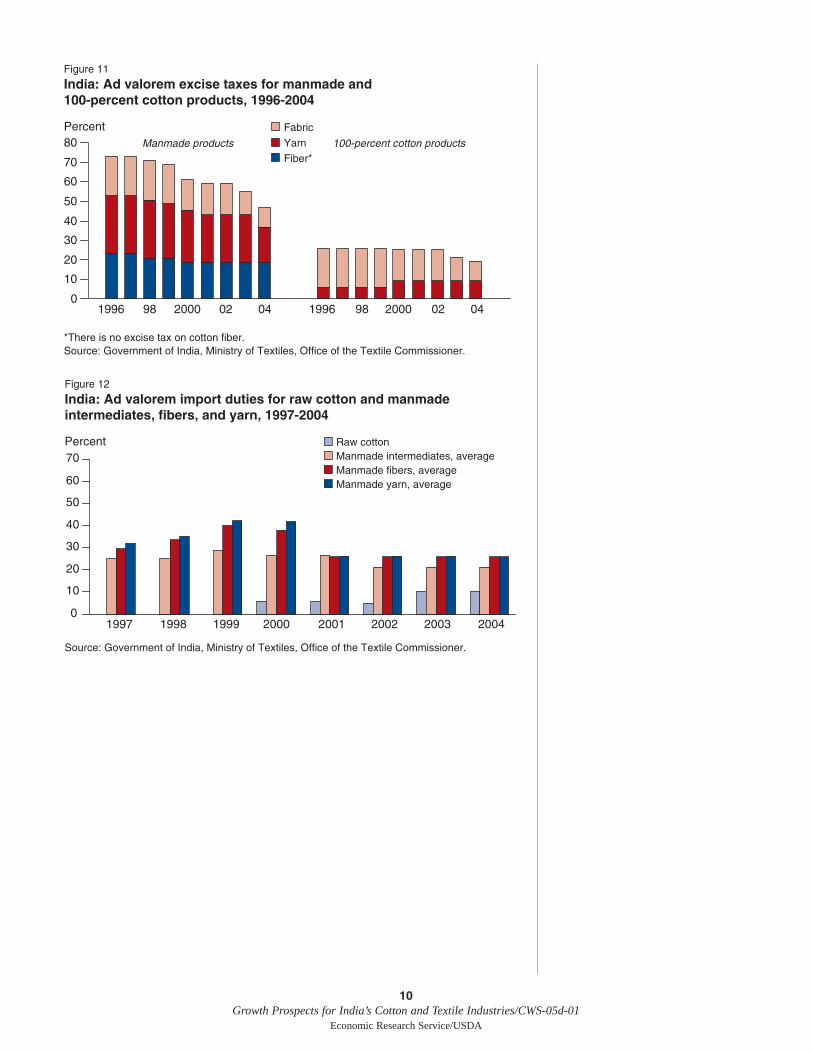
Both excise taxes and, to a lesser extent, tariffs on manmade fibers havebeen reduced during the past decade as part of policy reforms aimed atreducing protection and regulation throughout the industrial sector. Overall,excise tax rates on manmade and blended products have been reducednearly 40 percent since the mid-1990s, while taxes on cotton goods havebeen reduced about 25 percent (fig. 11). Tariff reductions on manmade rawmaterials and goods have been more recent and less significant than theexcise tax cuts (fig. 12). Despite the cuts, taxation of manmade goodsremains high relative to cotton goods.
Tariff and excise tax policies that have discriminated against manmadefibers have played a key role in shaping relative consumer prices andconsumption patterns for cotton and manmade products. Recent tariff andexcise tax adjustments have reduced discrimination against manmade fibers,but with continued high differentials in taxes on cotton and manmadegoods, there is considerable scope for future tariff and tax reductions tofurther reduce prices for manmade products.
9Growth Prospects for India’s Cotton and Textile Industries/CWS-05d-01
Economic Research Service/USDA
10Growth Prospects for India’s Cotton and Textile Industries/CWS-05d-01
Economic Research Service/USDA
Figure 12
India: Ad valorem import duties for raw cotton and manmade intermediates, fibers, and yarn, 1997-2004
Source: Government of India, Ministry of Textiles, Office of the Textile Commissioner.
Raw cottonManmade intermediates, averageManmade fibers, averageManmade yarn, average
0
10
20
30
40
50
60
70
1997 1998 1999 2000 2001 2002 2003 2004
Percent
Figure 11
India: Ad valorem excise taxes for manmade and 100-percent cotton products, 1996-2004
Percent
*There is no excise tax on cotton fiber.Source: Government of India, Ministry of Textiles, Office of the Textile Commissioner.
0
10
20
30
40
50
60
70
80
1996 98 2000 02 04
Fabric
Yarn
Fiber*
1996 98 2000 02 04
Manmade products 100-percent cotton products

India’s textile industry is one of the economy’s largest. In 2000/01, thetextile and garment industries accounted for about 4 percent of GDP, 14percent of industrial output, 18 percent of industrial employment, and 27 percent of export earnings (Hashim). India’s textile industry is alsosignificant in a global context, ranking second to China in the production of both cotton yarn and fabric and fifth in the production of synthetic fibersand yarns.
In contrast to other major textile-producing countries, India’s textile sectoris characterized by mostly small-scale, nonintegrated spinning, weaving,cloth finishing, and apparel enterprises, many of which use outdated tech-nology. Some, mostly larger, firms operate in the “organized” sector wherefirms must comply with numerous government labor and tax regulations.Most firms, however, operate in the small-scale “unorganized” sector whereregulations are less stringent and more easily evaded.
The unique structure of the Indian textile industry is due to the legacy oftax, labor, and other regulatory policies that have favored small-scale, labor-intensive enterprises, while discriminating against larger scale, more capital-intensive operations. The structure is also due to the historical orientationtowards meeting the needs of India’s predominately low-income domesticconsumers, rather than the world market. Policy reforms, which began inthe 1980s and continued into the 1990s, have led to significant gains intechnical efficiency and international competitiveness, particularly in thespinning sector. However, broad scope remains for additional reforms thatcould enhance the efficiency and competitiveness of India’s weaving, fabricfinishing, and apparel sectors.
Policies Create Fragmented Industry Structure
Unlike other major textile-producing countries, large-scale, vertically-inte-grated, composite mills that incorporate spinning, weaving, and other opera-tions account for a small and declining share of Indian textile production(see box, “Structure of India’s Textile Industry”). Composite mills, whichonce accounted for 70 percent of domestic textile production, now accountfor only 3 percent of output as a result of policies that have favored labor-intensive, small-scale, unorganized sector enterprises. Although some regu-lations that discriminate against larger scale operations have been easedsince textile reform began with the Textile Policy of 1985, the followingpast and current regulations continue to shape the structure of the industry:
• Labor Restrictions. “Organized” sector employers that use manufacturingprocesses requiring power and employ more than 10 people must adhereto wage, employment security, and other regulations. These regulationsreduce flexibility and increase wages 50-60 percent relative to the unor-ganized sector (Anubhai).
• Plant Size Regulations. Earlier restrictions on loom capacity and the useof automatic looms have recently been lifted. However, they still definethe structure and technology stock of the weaving industry.
11Growth Prospects for India’s Cotton and Textile Industries/CWS-05d-01
Economic Research Service/USDA
Textile Industry Structure and Growth

• Hank Yarn Obligation. Spinners are required to provide a share of theiroutput at fixed prices in the form of manually wound “hank yarn” for thehandloom industry, as opposed to machine-wound “cone” yarn. Theimplicit tax on spinners resulting from this policy has been reduced overtime but remains significant.
• Cloth Sales Obligations. Until recently, composite mills were required tosell a share of their output as coarse cloth at statutory prices. Compliancewith this policy significantly weakened the finances of composite mills.
• Discriminatory Excise Taxes. Until recently, composite mills had to payexcise taxes not applicable to smaller units in the organized and unorganizedsector. While all units are now subject to excise taxes, tax avoidance is a
12Growth Prospects for India’s Cotton and Textile Industries/CWS-05d-01
Economic Research Service/USDA
Structure of India’s Textile Industry
Unlike other major textile-producing countries, India’s textile industry iscomprised mostly of small-scale, nonintegrated spinning, weaving, finishing,and apparel-making enterprises. This unique industry structure is primarily alegacy of government policies that have promoted labor-intensive, small-scaleoperations and discriminated against larger scale firms:
• Composite Mills. Relatively large-scale mills that integrate spinning, weavingand, sometimes, fabric finishing are common in other major textile-producingcountries. In India, however, these types of mills now account for aboutonly 3 percent of output in the textile sector. About 276 composite mills arenow operating in India, most owned by the public sector and many deemedfinancially “sick.”
• Spinning. Spinning is the process of converting cotton or manmade fiberinto yarn to be used for weaving and knitting. Largely due to deregulationbeginning in the mid-1980s, spinning is the most consolidated and techni-cally efficient sector in India’s textile industry. Average plant size remainssmall, however, and technology outdated, relative to other major producers.In 2002/03, India’s spinning sector consisted of about 1,146 small-scaleindependent firms and 1,599 larger scale independent units.
• Weaving and Knitting. Weaving and knitting converts cotton, manmade, orblended yarns into woven or knitted fabrics. India’s weaving and knittingsector remains highly fragmented, small-scale, and labor-intensive. Thissector consists of about 3.9 million handlooms, 380,000 “powerloom” enter-prises that operate about 1.7 million looms, and just 137,000 looms in thevarious composite mills. “Powerlooms” are small firms, with an averageloom capacity of four to five owned by independent entrepreneurs orweavers. Modern shuttleless looms account for less than 1 percent of loomcapacity.
• Fabric Finishing. Fabric finishing (also referred to as processing), whichincludes dyeing, printing, and other cloth preparation prior to the manufac-ture of clothing, is also dominated by a large number of independent, small-scale enterprises. Overall, about 2,300 processors are operating in India,including about 2,100 independent units and 200 units that are integratedwith spinning, weaving, or knitting units.
• Clothing. Apparel is produced by about 77,000 small-scale units classifiedas domestic manufacturers, manufacturer exporters, and fabricators (subcontractors).

common practice for units in the unorganized sector, providing them witha significant cost advantage. Excise tax policy also continues to discriminateagainst manmade and blended products, a policy that prevents firms fromadapting to and profiting from consumer demand for manmade products.
Trends in Spinning
The spinning industry is the most modern and internationally competitivesegment of India’s textile industry. Yarn production increased 4.5 percentannually between 1990 and 2004, as rapid gains by independent spinnersmore than offset declining production from composite mills. Reflectingtrends in domestic demand, the most rapid growth has been in the produc-tion of blended and 100-percent manmade yarns (fig. 13). Between 1990and 2004, production of manmade and blended yarns grew at annual ratesof 8.6 percent and 9.1 percent, respectively, compared with 3.2 percentannually for cotton yarn. As a result of this growth, the share of manmadeand blended yarns in total production grew from 17 percent to 30 percent.
The domestic weaving sector absorbed most of the increase in yarn output,although exports became an increasingly important source of growth in yarndemand in the 1990s. Expanding from a small base, yarn exports grewrapidly and peaked at $2.5 billion in 1997 (fig. 14). Since 1997, yarnexports have declined because of falling prices and faster growth indomestic weaving, but still average about $1.9 billion annually.
Yarn output by the composite mills has declined steadily, as has their shareof spinning capacity. By 2003, independent spinning mills accounted forabout 75 percent of capacity and 92 percent of production. Capacity use inthe cotton-spinning sector averages near 80 percent, with higher ratesamong the independent spinners (fig. 15). Reflecting production anddemand trends, growth in spinning capacity and capacity use has beenhighest for manmade yarns. Between 1990 and 2004, spinning capacity formanmade yarns grew about 7 percent annually, while capacity use averagednear 90 percent (fig. 16).
The performance of the yarn-spinning industry has been less affected byrestrictive labor policies, capacity restrictions, and price controls, largelybecause it is inherently capital intensive. The modern spinning mills first
13Growth Prospects for India’s Cotton and Textile Industries/CWS-05d-01
Economic Research Service/USDA
Figure 13
India: Yarn production by type, 1990-2004
Source: Government of India, Ministry of Textiles, Office of the Textile Commissioner.
100% noncottonBlendedCotton
1,000 tons
0
500
1,000
1,500
2,000
2,500
3,000
3,500
1990 92 94 040220009896

appeared in response to the Textile Policy of 1985, which removed entry andexit barriers, encouraged the importation of modern machinery, and lowered
duties on synthetic raw materials(The World Bank). Since 1985,additional reforms, including the1991 Industrial Policy, the 1992Textile Order, and the 1996 TaxPolicy, aided the sector byremoving restrictions on domesticand foreign investment, easingindustry entry, and reducing taxdifferentials between cotton andmanmade fiber and yarn(Chakraborty et al.).
Although the spinning sectornow includes a number of tech-nologically advanced spinningmills of recent vintage able tocompete on international
14Growth Prospects for India’s Cotton and Textile Industries/CWS-05d-01
Economic Research Service/USDA
Figure 14
India: Yarn exports by fiber type, 1992-2002
Source: U.S. Department of Agriculture, Economic Research Service, Bilateral Fiber and Textile Trade Database.
OtherSyntheticCotton
$ billion
0.0
0.5
1.0
1.5
2.0
2.5
3.0
1992 94 96 98 2000 02
Figure 15
India: Capacity and use in the cotton-spinning sector, 1990-2004
Source: Government of India, Ministry of Textiles, Office of the Textile Commissioner.
Million spindles Percent
0
5
10
15
20
25
30
35
40
1990 92 94 96 98 2000 02 040
102030405060708090
100Capacity use
(right axis)
Capacity(left axis)
Figure 16
India: Capacity and use in the manmade fiber industry, 1981-2004
Source: Government of India, Ministry of Textiles, Office of the Textile Commissioner.
1,000 tons Percent
Capacity use(right axis)
Capacity (left axis)
0
200
400
600
800
1,000
1,200
1,400
1981 83 85 87 89 91 93 95 97 99 2001 030
102030405060708090
100
FiberFilament yarn

markets, average plant size and level of modernization remain low by inter-national standards. In addition to the legacy of past policies promotingsmall-scale, labor-intensive enterprises, a number of policies, including theHank Yarn Obligation and high excise taxes on manmade fibers, stillconstrain the sector’s growth and competitiveness.
Trends in Weaving
In contrast to the spinning sector, the weaving industry remains highly frag-mented and small scale and characterized by the use of outdated technology.Growth in fabric output, however, has been strong, with output expandingabout 5.5 percent per year between 1990 and 2003 (fig. 17). The small-scale,independent powerloom sector, which now accounts for about 78 percent ofcloth production, grew about 7 percent annually and the relatively smallhosiery subsector grew nearly 10 percent annually during this period. Mean-while, high growth among powerloom and hosiery units offset a 4-percentannual contraction of output from composite mills and the relatively slow 3-percent expansion of handloom fabric production. Reflecting trends in spinningand final demand, output of 100-percent manmade (9 percent) and blendedcloth (6 percent) led annual growth since 1990, while annual growth in outputof 100-percent cotton cloth was only about 0.6 percent (fig. 18).
15Growth Prospects for India’s Cotton and Textile Industries/CWS-05d-01
Economic Research Service/USDA
Figure 17
India: Cloth production by sector, 1990-2004
Billion meters
Source: Government of India, Ministry of Textiles, Office of the Textile Commissioner.
Powerloom
Handloom
Hosiery
Composite mill05
1015202530354045
1990 200098969492 0402
Figure 18
India: Cloth production by type, 1990-2004
Billion meters
Source: Government of India, Ministry of Textiles, Office of the Textile Commissioner.
100% noncottonBlendedCotton0
5
10
15
2025
30
35
40
45
1990 200098969492 0402

The unorganized powerloom sector filled the void created by the decline ofthe organized composite mills. The proliferation of powerlooms stemmedlargely from the ability of small-scale operators to avoid or evade govern-ment-imposed labor restrictions and excise taxes and, in some cases,payment for electrical power. Over time, however, government regulations,coupled with credit constraints among small-scale operators, led to a sectorcharacterized by the use of obsolete technology and the lack of backward orforward integration with spinning or finishing.
India remains internationally competitive in the production and export oflow- and medium-quality “grey” (or unfinished) fabrics in relatively smallproduction runs. Between 1990 and 2000, exports of powerloom cottoncloth and “madeups” (items such as household linens that require minimalmanufacturing) grew 27 percent annually in value and became an increas-ingly important source of final demand and foreign exchange. However, thecurrent small-scale, nonintegrated, low-technology structure is ill-equippedto compete in high-quality markets or to meet the needs of large buyers.
In recent years, progressive powerloom operators have upgraded their oper-ations through investment in modern shuttleless looms. Shuttleless looms—70 percent of which are imported into India as second-hand equipment fromthe United States, Italy, and Japan—produce superior-quality fabric andreduce labor costs by 75 percent, compared with traditional shuttle looms.However, the powerloom sector currently has about only 15,000 shuttlelesslooms, accounting for less than 1 percent of loom capacity.
Technology Upgradation Fund Scheme (TUFS)
To facilitate needed structural transformation, the Government establishedTUFS to provide subsidized, low-interest loans (6 percent versus the 12-percent market rate) to purchase imported shuttleless looms. However, useof TUFS subsidies within the unorganized sector has been limited largelybecause small-scale producers either do not qualify to receive concessionalfinancing under the scheme or perceive the benefits of participating to beless than the costs associated with increased exposure to government taxesand regulations, as well as the possibility of penalties for past evasion(www.fibre2fashion.com, 2003c). To encourage additional participation, theGovernment recently reduced interest rates to 2.5-3.0 percent for investmentsmade by larger cotton-processing units (www.fibre2fashion.com, 2004a).
Handlooms
The heavily protected handloom sector is growing much more slowly (about3 percent annually) than the powerloom and hosiery sectors but still accountsfor about 13 percent of cloth output. Handlooms, which are highly labor inten-sive and viewed as a source of employment and supplementary income for6-7 million people in over 3 million weaver households, will likely continueto receive preferential policy treatment (The World Bank; Kathuria andBhardwaj). The Government provides handloom operations with tax exemp-tions, low-interest loans, and rebates on fabrics sold through cooperatives,and also “reserves” exclusive rights for handloom operators to produce 11items, such as nonterry towels and some varieties of bed sheets (rediff.com).In addition, through the Hank Yarn Obligation, handloom operators receivea subsidy on inputs of cotton yarn from the organized spinners.
16Growth Prospects for India’s Cotton and Textile Industries/CWS-05d-01
Economic Research Service/USDA
Fabric Finishing
As in the weaving sector, most fabric finishing, or processing, is conductedby small-scale, nonintegrated firms in the unorganized sector usingoutmoded technology. Only about 200 of the roughly 2,300 processors areintegrated with weavers or apparel firms. The current structure allows Indiato be competitive in the production and export of “grey” fabrics and rela-tively small lots of medium-quality finished textiles, but not in supplyinghigh-quality product or in meeting the needs of large international buyers.
Tough environmental standards, in addition to the tax and power cost bene-fits that small-scale finishers receive, have affected modernization in thecloth-finishing sector. Fabric finishing involves use of dyes and chemicalsthat are hazardous pollutants unless properly treated. In some areas,including the intensive textile zone in Tamil Nadu, regulations that includezero or very low emission tolerances discourage the entry of modern, large-scale firms and boost incentives for finishers to remain in the unorganizedsector and outside the regulatory net.
Apparel Manufacturing
The apparel sector, like weaving and finishing, is characterized by a largenumber of independent, small-scale firms. While it is not unusual for apparelmanufacturing to be both relatively small-scale and independent from theupstream segments of the textile supply chain, India’s apparel firms tend tobe smaller and more labor intensive than other major exporters. Unlike theother segments of the textile industry, the apparel sector is relatively newbecause, traditionally, most Indian garments were made in the home or on acustom basis by local tailors. One study found that about 93 percent of theapparel firms that existed in 1990 did not exist before 1980 (Tait).
The small-scale nature of India’s apparel industry has been shaped directlyby policies that, until removed in 2001 and 2002, restricted woven andknitted apparel firms to the small-scale-industry (SSI) sector.2 In 1999, theapparel sector was made up of about 58,000 firms, of which about 48,000produced woven products and 10,000 produced knitted products (Hashim).Only 6 percent of firms operate with more than 50 machines, and more than80 percent operate with less than 20 machines. While some firms produceexclusively for either the domestic or export market, most are “fabricators,”or independent contract producers, that produce for both markets. Evenexport-oriented manufacturers are small by international standards.According to a 2002 study, the average Indian garment exporter had about119 machines, compared with 698 in Hong Kong and 605 in China (Verma).
Because of the predominance of very small-scale fabricators in the apparelsector, most apparel is produced on a contractual basis for large manufac-turers/exporters. The fabricators specialize in low-wage, labor-intensivesewing and have the flexibility to meet small custom orders but are muchless competitive with large orders and those typically involving high levelsof automation. It is not clear if the current structure of the Indian industry,with many small-scale firms that are not suited to meeting the needs of largeinternational buyers in a timely manner, will remain competitive in the post-MFA world (Kathuria and Bhardwaj).
17Growth Prospects for India’s Cotton and Textile Industries/CWS-05d-01
Economic Research Service/USDA
2SSI investment limits have rangedover time from Rs6-Rs30 million($130,000-$670,000), not includingland and building costs.

Indian apparel producers are increasingly cognizant of emerging challengesand opportunities. Some firms, including a number of the largest firms inthe textile business, are increasing investment in larger scale apparel enter-prises, as well as in integrated operations involving some combination ofspinning, weaving, finishing, and apparel making. But domestic and foreigndirect investments to build capacity and strengthen competitiveness in theapparel sector have been small, compared with investments in some othercountries, particularly China.
Competitiveness of Spinning and Weaving
Yarn and fabric cost of production data for selected major producing coun-tries indicate that India is a highly competitive producer of yarn and unfin-ished cloth, despite the small-scale, low-technology, and nonintegratedstructure of the industry. Based on 2003 data, India is particularly competi-tive in the production of yarns and fabrics based on both the “Ring” and“Open-ended (O-E)” spinning methods—two standard manufacturing tech-nologies (fig. 19). Ring spinning is an older, relatively labor intensivemethod that produces a smooth yarn, while the O-E technology produces aless smooth yarn at a faster speed with less labor intensity. India’s costadvantages stem from its comparatively low costs of labor and raw mate-rials, as well as low wastage. These advantages are partially offset by rela-tively high power costs. Compared with China, India’s most importantcompetitor, India has significantly lower raw material and wastage costs andsimilar labor costs but higher costs of power and capital.
The cost competitiveness of the Indian spinning and weaving industries, evenwith the current scale and state of technology, suggests that India will continueto be a highly competitive global player. Access to low-priced supplies ofdomestically produced cotton appears to be a significant advantage currently notmatched by other key countries with competitive labor costs, including Chinaand Brazil. Advantages in raw material and labor costs provide a foundation forIndia to maintain and even increase competitiveness, especially if comple-mented with investments to improve technology, scale, integration, and quality.
18Growth Prospects for India’s Cotton and Textile Industries/CWS-05d-01
Economic Research Service/USDA
Figure 19
International cost comparisons for production of ring yarn, fabric, and open-ended yarn and fabric, 2003
$U.S./kilogram or yard
Source: International Textile Manufacturers Federation.
Ring yarn and fabric Open-ended yarn and fabric
0.0
0.5
1.0
1.5
2.0
2.5
3.0
3.5
4.0
Yarn Wovenfabric
Knittedfabric
Italy United States Turkey China South Korea Brazil India
Yarn Wovenfabric
Knittedfabric

19Growth Prospects for India’s Cotton and Textile Industries/CWS-05d-01
Economic Research Service/USDA
Policy Developments and Private-Sector Initiatives
India has moved more slowly than other key textile exporters, most notablyChina, to restructure government policy and boost private investment tocompete more effectively in post-MFA markets. Despite the numerous post-1985 reforms in the textile sector and except for modernization in the spin-ning sector, India’s industry structure, technology use, and global exportmarket share have changed little. The policy environment, particularly highrates of excise taxation, continues to favor small-scale firms in the unorgan-ized sector that face less regulation and can avoid taxation.
A number of Indian companies have recently been investing in larger scaleoperations that use modern technology, but the pace has been slow,compared with that of China and some other countries. Data on trade intextile machinery indicate the level and pace of investment in upgradingspinning, weaving, and processing technology. During 1992-2002, China’simports of textile machinery accounted for about 25 percent of world tradein textile machinery and far outpaced those of India and other major devel-oping-country textile exporters (fig. 20). During this period, India’s importsof textile machinery averaged about one-fifth of China’s, with no upwardtrend. However, a number of policy and private investment trends, includingthe increasing interest shown by foreign textile buyers (see box, “ForeignFirms May Play Role in Developing India’s Garment Exports”), could affectthe pace of domestic investment and industry restructuring.
Export Zones and Technology Parks
Two government schemes, Apparel Parks for Exports (APE) and the TextileCenters Infrastructure Development Scheme (TCIDS), now provide firms withincentives to establish themselves in apparel export zones. Economies can beachieved in these zones with the formation of geographic clusters of textilefirms specializing in the various aspects of production. To encourage devel-opment of export parks, the Government exempts firms from some laborregulations and provides them with concessions on land purchases, credit,
and taxes. Although establishedlong before the introduction of theAPE scheme, one such geographiccluster in Tirapur, Tamil Nadu, hascaptured scale economies thathave enhanced India’s competi-tiveness in knitwear. Tirapur nowsupplies 35-40 percent of India’sknitwear exports and has helpedIndia achieve a dominant positionin this export market (www.fibre2fashion.com, 2003b).
Removal of Small-ScaleIndustry Reservation forApparel Manufacturing
The removal of the SSI reserva-tion for the woven apparel busi-ness in 2001 and for knitted
Figure 20
Textile machinery imports by major developing textile exporters, 1992-2002
Source: U.S. Department of Agriculture, Economic Research Service, Bilateral Fiber and Textile Trade Database.
$ billion
1992 94 96 98 2000 02
China andHong Kong
TurkeyIndia
Indonesia
Pakistan0.0
0.5
1.0
1.5
2.0
2.5
3.0
3.5
4.0

apparel in 2002 could significantly affect India’s clothing sector. In a relatedmove in 2002, the Government also removed a regulation that restrictedclothing exports to firms that exported at least half of their output, openingexports to all apparel firms. These reforms allow the formation of largerscale firms and permit investment in the more capital-intensive productionsystems used to produce some apparel items.
Excise Tax Reform
The Government has made limited progress in recent years in reducing thehigh level of excise taxation in the textile sector—levels that discourageformation of larger, organized-sector firms—and in reducing the tax biasagainst use of synthetic fibers. In 2003, the Government equalized excisetaxes for large- and small-scale yarn producers. The Government has alsorevived the Central Value Added Tax (CENVAT) scheme that will level theplaying field by unifying an assortment of state-level schemes and assessingtaxes—including excise taxes—on intermediate and final products based onvalue addition along the supply chain. Implementation of the CENVAT is,however, facing stiff resistance because it requires states to conform with one
20Growth Prospects for India’s Cotton and Textile Industries/CWS-05d-01
Economic Research Service/USDA
Foreign Firms May Play Role inDeveloping India’s Garment Exports
Today, the world clothing market is dominated by buyer-driven commoditychains (Gereffi, 2000).1 Large retailers and branded marketers play pivotal rolesalong global supply chains by setting up decentralized production networkslinked to countries in the developing world and by coordinating the range ofactivities involved in clothing design, production, and marketing. Many of thesefirms are interested in creating larger scale operations located in fewer countriesthan was necessary before removal of bilateral quotas. So far, China has beenthe supplier of choice as the industry has begun adjusting to the post-MFAenvironment. But, international firms are also increasingly interested in Indiaas a source of supply, both to reduce risk through diversification and becauseof the growing perception of India as a competitive clothing supplier withdomestic sources of fabric.2
Interest in India has intensified due to the removal of MFA quota constraints.Large global retailers, such as Wal-Mart, J.C Penney, The Gap, Ikea (Sweden),Cades (France), OTTO (Germany), and branded marketers, such as CalvinKlein, Lacoste, and Sara Lee, are attracted to India because of its potential toprovide one-stop shopping. Wal-Mart has expressed willingness to buy goodsworth $7-$10 billion from India over the next 2 years provided local compa-nies assure quality products, make timely delivery, and offer competitiveprices (www.fibre2fashion.com, 2004c). J.C. Penney also plans to make Indiaan important sourcing hub for apparel, recently expressing willingness to buy$2 billion worth of products annually (www.fibre2fashion.com, 2004b).
1By contrast, global auto, computer, and aircraft industries are driven by producer commoditychains in which oligopolistic, capital- and technology-intensive manufacturers exert control overraw material suppliers as well as distributors and retailers.
2A recent World Trade Organization study estimates that, with the elimination of MFA quotas,India could nearly quadruple its share of the U.S. import clothing market to 15 percent whileChina could triple its share to 50 percent (Nordas). This study estimates that the share of the EUimport clothing market captured by both India and China could increase 1.5 fold due to quotaremoval, rising to 9 and 29 percent, respectively.

21Growth Prospects for India’s Cotton and Textile Industries/CWS-05d-01
Economic Research Service/USDA
scheme, and because it will require firms operating in the unorganized sectorto shift to the organized sector and report their activities in order to receiveCENVAT refunds on the inputs they purchase. The CENVAT, along with theGovernment's 2003/04 decision to equalize excise taxes on large- and small-scale yarn producers, could significantly affect industry structure. But it isunclear how effectively either one of these reforms will be implemented.
Excise taxes have recently been reduced on some manmade products, buttaxes on products made of synthetic fiber remain considerably higher thanfor those made from cotton. In the 2004-05 budget, the Government reducedthe CENVAT rates for products made of pure cotton to 4 percent and therate for products made of blended fibers to 8 percent. However, while thetax on polyester filament yarn fell from 24 to 16 percent, taxes on all othermanmade filament fiber and yarn were raised from 12 to 16 percent.
Foreign Direct Investment Constraints
India has relaxed many restrictions on private foreign investment, botheconomywide and in the textile sector, within the last decade. The Govern-ment removed a 49-percent cap on foreign ownership of individual firms inthe weaving sector in 2001, although a 24-percent cap on foreign invest-ment in apparel-sector firms remains in effect. Total inflows of foreigndirect investment (FDI) for all sectors have increased in response to theeconomic reforms begun in the early 1990s, averaging about $4 billionannually during 2002-04, but FDI remains small relative to domestic invest-ment. Moreover, since 1991, the textile sector has accounted for only about1 percent FDI inflows in India (Government of India, 2004a). According toa World Bank survey, bureaucracy and multiplicity of regulations are seenas major impediments to FDI in both the textile sector and other areas ofIndia’s economy (Government of India, 2005).
Labor Reform
Indian labor policies are cited by Indian companies as a principal constrainton firm size, industry investment, and international competitiveness. Thesepolicies include minimum-wage requirements and rules that prevent firmslarger than 100 employees from laying off workers. Because of these policies,a number of public- and private-sector composite mills that have not oper-ated since the 1980s are still obligated to financially support the workersthey employed. As a result, it is not uncommon for larger firms to organizeinto small-scale units for the purpose of avoiding labor regulations.Although private industry has tried repeatedly to change these policies,primarily by raising the employment level at which the regulations apply,labor reforms have proven politically difficult to achieve. The currentgovernment has proposed that state governments be permitted to substan-tially ease labor regulations for firms operating in export zones, but thiscontroversial legislation is still pending.
MFA Quota Removal and Indian Textile Exports
In the world market, bilateral quotas sanctioned under the MFA restricteddeveloped-country imports from India in various product categories until thequotas were eliminated in January 2005. In India, the lowering of these tradebarriers is viewed as an opportunity as well as a threat. It is an opportunity

because markets will no longer be restricted and a threat because marketswill no longer be guaranteed by quotas and even the domestic market willbe open to competition (Kathuria and Bhardwaj). India is, however, likely tobe a net beneficiary of the elimination of MFA quotas for two reasons:
• Evidence indicates that India’s exports have been constrained by MFA quotas.
• The MFA quotas may have discriminated against export of cotton products,products in which India appears to have a strong comparative advantage.
Under the MFA regime, about three-quarters of Indian garment exports weredestined for the United States and the EU, where most quotas were levied.In 2002, the MFA quotas were binding on eight product categories exportedto the United States and five categories exported to the EU (USITC). Thedegree to which the MFA quotas restricted Indian exports can be analyzedusing export tax equivalents (ETEs), which quantify the implicit tax on India’sexports in specific product categories in specific markets.3 In 2002, the mostrecent year for which estimates are available, ETEs for Indian apparel exportsaveraged 12.5 percent, lower than for Bangladesh (21.5 percent), China (19.7),and Hong Kong (18.6), but higher than for other developing-country exporters(Andriamananjara et al.). The 2002 ETEs for India’s textile exports averaged18.4 percent, the highest among the developing-country exporters.
The ETE estimates suggest that the removal of the MFA quotas will providepotentially significant benefits to Indian exporters in a number of importantproduct categories, such as knitwear and men’s shirts. The overall signifi-cance of these potential gains are borne out in model-based economicanalysis (see box, “Model-Based Assessment of the Impacts of MFA andDomestic Reforms on India”). Success is not, however, a foregone conclu-sion partly because of nonquota constraints and emerging developments inthe international market:
• China. China is generally viewed as posing the biggest threat to theexpansion of textile and apparel exports by India and other potential sup-pliers. The Word Trade Organization (WTO) predicts that, in a free mar-ket, China could capture half of the world market for textiles and apparelby 2007, up from 16 percent in 2002 (Nordas). China’s clothing sector issignificantly more competitive than India’s. On average, Chinese factoriesare 20 times larger than those in India. China benefits from the manage-ment expertise of firms from Hong Kong now operating in China andfrom foreign direct investment inflows that are 10 times larger than inIndia (The Economist). By contrast, India’s underdeveloped infrastructure,high costs of doing business, and stringent labor laws hinder investmentand competitiveness.
• Tariffs. Even with quotas removed, steep tariffs on textiles and clothingcontinue to be widely used to protect many countries’ markets fromimports. Tariffs are as high as 12 percent in the European Union (EU), 33percent in the United States, and higher still in many developing countries(Financial Times, 2004). In the United States, the average tariff on cloth-ing made from cotton is 28 percent, while the average rate for clothingmade from manmade fibers is 17 percent (U.S. Department of State andU.S. Central Intelligence Agency).
22Growth Prospects for India’s Cotton and Textile Industries/CWS-05d-01
Economic Research Service/USDA
3ETE is defined as the ratio of thequota premium (QP) to the unit valueor price of export (UV) minus thequota premium: ETE = [QP/(UV-QP)]*100. Calculation of an ETErequires data on prices at which quotasare transferred by product, informationthat can be secured from firm records.

23Growth Prospects for India’s Cotton and Textile Industries/CWS-05d-01
Economic Research Service/USDA
• Regional Trade Agreements. Many textile-producing developing countries,such as Mexico, Mauritius, and Guatemala, have duty-free access todeveloped-country markets because they belong to regional preferential tradeagreements, like the North American Free Trade Agreement (NAFTA), theAfrican Growth and Opportunity Act (AGOA), and the Caribbean TradePartnership Basin Act (CTPB). The South Asian Association RegionalCooperation (SAARC), the regional agreement to which India belongs, isplanning a consortium on textile and apparel. However, such a consortiumis unlikely to significantly benefit India given the similar economic profiles
Model-Based Assessment of the Impacts of MFA and Domestic Reforms on India
The impacts on India of the elimination of MFA quotas and of selectedreforms to domestic textile policies have been analyzed by Elberhi et al. usinga global general equilibrium model. The impacts of MFA quota removal areanalyzed based on the terms of the Agreement on Textiles and Clothing, whichcalled for the removal of all quotas by January 2005. The package of domesticreforms analyzed included removal of restrictions on imports and exports ofcotton and cotton-based products and removal of the Hank Yarn Obligation.These reforms were assumed to lead to an increase in labor productivity inIndia’s apparel sector to levels achieved by China.
The results of the analysis indicate substantial increases in output and netexports of textiles and apparel as a result of the package of domestic reforms,resulting in total annual welfare gains of about $810 million. Gains are partic-ularly large for cotton-based products, and percentage increases in output andexports of cotton-based products exceed increases in raw cotton output. Theestimated benefits of domestic reforms are increased substantially when theimpacts of MFA quota removal are included. With MFA quota removal anddomestic reform, annual welfare gains more than double to $1.97 billion.
This model-based assessment likely results in an underestimate of the poten-tial gains from domestic reform because it excludes any impacts of increasedproductivity of factors of production other than labor. It also excludes theimpacts of potential improvements in efficiency from integration and restruc-turing in other segments of the value chain, particularly weaving.
Impacts on India of domestic and Multifiber Arrangement (MFA) quota reforms, 2003
Domestic reforms only Domestic and MFA reform
Sector Output Exports Imports Output Exports Imports
Percent change
Cotton clothing 5.9 8.3 -14.0 15.1 20.1 -7.3Noncotton clothing 5.7 8.8 -14.1 10.8 14.5 -7.7Cotton textiles 5.1 36.7 2.2 10.1 60.9 7.4Noncotton textiles .2 -.8 1.4 -.2 -6.3 4.9Cotton 3.2 77.5 3.5 4.8 66.9 8.1
Source: USDA/ERS calculations based on data from Aziz Elbehri, Thomas Hertel,and Will Martin, 2003, “Estimating the Impact of WTO and Domestic Reforms on theIndian Cotton and Textile Sectors: a General-Equilibrium Approach,” Review ofDevelopment Economics 7:343-59.

of the South Asian countries. The preferential tariffs among members ofvarious regional trade agreements will continue to pose a barrier to Indianexports even in the absence of the MFA quotas.
• Domestic Trade Remedy Laws. Trade-remedy measures, such as anti-dumping duties (ADs) and countervailing duties (CVDs), adopted byimporting countries to shield domestic firms from foreign competitionrepresent a growing problem for Indian exports. Between 1997 and 2001,the EU imposed ADs ranging from 7 to 20 percent on Indian bed linens.Following the WTO case ruling against such duties, the EU used CVDsranging from 4.4 to 10.4 percent to constrain imports of Indian bed linen(www.fibre2fashion.com, 2003a). Trade remedies were also imposed onIndian imports by South Africa (acrylic blankets) and South Korea (cottonyarn) in 2003. In the absence of the MFA quotas, trade remedy action maybecome an increasingly important barrier to Indian exports, particularly inmarkets formerly protected by the quotas.
24Growth Prospects for India’s Cotton and Textile Industries/CWS-05d-01
Economic Research Service/USDA

Although India is a major cotton producer with significant potential to expandoutput, it is not clear if domestic production will keep pace with the quantityand quality needs of an expanding textile and apparel industry. India is thethird-largest cotton producer in the world (fig. 21). Cotton area is significantlylarger than any other country in the world—accounting for about 25 percentof global cotton area—but average yields are the lowest among the top-10global cotton producers (fig. 22). Area and yield gains have boosted cottonproduction 2.4 percent annually since 1990, but progress in raising yieldstoward levels achieved by other major producers has been slow. In additionto low yields, the quality of India’s cotton is often poor because of an arrayof technical, economic, and institutional factors. The extent to which theseproductivity and quality factors can be addressed will be critical in deter-mining India’s competitiveness in global textile markets and whether risingcotton demand will be supplied by domestic producers or by global markets.
Production Trends
Cotton production has grown significantly since the mid-1980s due toimprovements in both area and yield, but growth slowed in the 1990s becauseof a sharp slowdown in yield gains (fig. 23 and table 2). Since 2000, risingyields and, more recently, a rebound in area planted have again restoredstronger growth in production, but it is uncertain if these gains will besustained. Output continues to show large annual variations due primarily toweather-induced fluctuations in average yields. About 65 percent of cottonarea is not irrigated and is dependent on erratic monsoon rainfall, a share thathas remained relatively constant since the late 1980s.
Area, yield, and production trends have varied sharply across each of India'sdistinctly different cotton-producing regions (fig. 24). The overall slowdown
25Growth Prospects for India’s Cotton and Textile Industries/CWS-05d-01
Economic Research Service/USDA
Cotton Production
Figure 22
Yields of major world cotton producers, 2001-03 average
Source: U.S. Department of Agriculture, Foreign Agricultural Service, Production, Supply, and Distribution database.
China
Greec
e
Austra
lia
Brazil
Turke
y
United
Sta
tes
Pakist
anIn
diaSyr
ia
Tons/hectare
Uzbek
istan
0.000.200.400.600.801.001.201.401.601.802.00
Figure 21
Major world cotton producers, 2001-03 average
Source: U.S. Department of Agriculture, Foreign Agricultural Service, Production, Supply, and Distribution database.
Area
China
Greec
e
Austra
lia
Brazil
Turke
y
United
Sta
tes
Pakist
anIn
diaSyr
ia
Production
1,000 tons or hectares
0
1,0002,000
3,0004,000
5,0006,000
7,0008,000
9,000
Uzbek
istan

in growth of cotton production during the 1990s was due primarily to declinesin area and yields in the North zone (Haryana, Punjab, and Rajasthan) thatbegan after 1995 (fig. 25). Most cotton in this zone is irrigated, explainingwhy the North has traditionally achieved the highest yields. But both area andyield fell in this region during the late 1990s because of adverse weather andpest infestations, as well as a lack of suitable high-yielding, short duration,and pest-resistant varieties (fig. 26). Crop competition also played a role, asincreased support prices for wheat and rice tended to shift area out of cotton,as well as reduce the harvest period. During the last several years, yields haveimproved significantly in the North zone, largely due to the availability andincreased planting of higher yielding, short-duration hybrid varieties.
26Growth Prospects for India’s Cotton and Textile Industries/CWS-05d-01
Economic Research Service/USDA
Figure 23
India: Cotton area, production, and yield, 1960-2004
Million hectares or 170-kilogram bales
1960 65 70 75 80 85 90 95 2000
Area(left axis)Production
(left axis)
Yield(right axis)
Kilograms/hectare
Source: U.S. Department of Agriculture, Foreign Agricultural Service, Production, Supply, and Distribution database.
02468
101214161820
0
50
100
150
200
250
300
350
400
Table 2
India: Trends in cotton area, yield, and production, 1969-2004
Item Area Yield Production
Million Kilograms/ Million 170-hectares hectare kilogram bales
1969-71 7.71 141 6.411979-81 8.00 171 8.071989-91 7.48 281 12.371999-01 8.70 295 15.122002-04 8.13 353 16.91
PercentGrowth rates:1
1970s .4 2.0 2.31980s -.7 5.1 4.41990s 1.5 .5 2.01990-2003 .6 1.8 2.4
Regional growth rates, 1990-2003:North -.9 -2.9 -3.9Central 1.5 3.5 5.1South -.2 .7 .51Annual growth rates between period average centered on years indicated.
Sources: USDA/ERS calculations based on U.S. Department of Agriculture, ForeignAgricultural Service, Production, Supply, and Distribution database and data from U.S.Department of Agriculture, Foreign Agricultural Service, GAIN Reports.

Cotton production showed relatively strong growth in the Central zone(Gujarat, Maharashtra, and Madhya Pradesh), India’s major cotton region,throughout much of the 1990s. The Central zone, which accounts for about63 percent of all cotton area and where only 16 percent of cotton area is irri-gated, has had the fastest growth in output (5.0 percent) and yields (3.4percent) since 1990. Yields in the Central zone, traditionally the lowest in
27Growth Prospects for India’s Cotton and Textile Industries/CWS-05d-01
Economic Research Service/USDA
Figure 25
India: Cotton production by region, 1986/87-2004
Source: U.S. Department of Agriculture, Foreign Agricultural Service, GAIN Reports.
Million 170-kilogram bales
1986/87 89 91 93 95 97 99 2001 030
5
10
15
20
Central
North
South
25
Figure 24
India: Cotton production by state
Numbers are 2003/04 cotton production in millions of 170-kilogram bales
Source: U.S. Department of Agriculture, Foreign Agricultural Service, GAIN Reports.
Jammu and Kashmir
HimachalPradesh
Chandigarh
Delhi
Uttar Pradesh
Bihar
West Bengal
Orissa
ArunachalPradesh
Assam
Meghalaya
Sikkim
Nagaland
Punjab1.10
Pondicherry
Kerala
Dadra andNagar Haveli
Goa
Manipur
MizoramTripura
Hariyana1.15
Maharashtra3.10
Andhra Pradesh2.60
Gujarat5.0
Madhya Pradesh1.95
Rajasthan0.85
Tamil Nadu0.35
Karnataka0.40
Cotton production zones
NorthernCentral
Southern

India, have now gained substantially on those in the North and South zones,but remain vulnerable to the most annual weather-induced variation. India’shighest cotton yields since the mid-1990s have generally been in the Southzone (Andhra Pradesh, Karnataka, and Tamil Nadu), where about 20 percentof cotton area is irrigated and about 60 percent of area is planted to hybridvarieties. Yields in the South zone, however, showed little growth during the1990s, partly due to significant problems with pest resistance to insecticidesin some areas, but have shown a modest upward trend since 2000.
Factors Contributing to Low Yields
The relatively rapid gains in productivity in the predominately rainfed Centralzone since 1990 are due to technological advances that, if combined with acontinuation of recent modest growth in the North and South zones, couldlead to a substantial hike in national average yields and production. Currentyields in farmers’ fields are well below not only the theoretical peak yieldsof the major varieties cultivated, but also the average yields achieved indemonstration plots under both irrigated and unirrigated conditions (table 3).While this productivity gap indicates that significant further onfarm yieldimprovements are possible, a range of technical, economic, and institutionalfactors prevent realization of the potential of the varieties cultivated (table 4):
• Delayed Sowing. Late sowing of cotton reduces yields by providing lessoptimal sunlight conditions for crop development and, in some areas, byallowing less time for picking the mature crop before clearing the field forthe following crop. Sowing delays are caused either by the late arrival ofseasonal rainfall needed for sowing or by delays in harvesting the precedingcrop. Yield losses associated with late sowing and shortened harvest timesmay be reduced by new shorter duration varieties and better management,but crop competition will likely continue to limit yields in some areas.
• Monsoon Dependence. Erratic monsoon rainfall affects 60-70 percent ofcotton area, reducing yields through moisture stress and creating risk thatreduces investment in seed, fertilizer, and pesticide inputs. Even withimproved varieties and management, average yields in the mostly rainfedCentral and South zones are likely to remain below those achieved inother countries with more reliable rainfall.
28Growth Prospects for India’s Cotton and Textile Industries/CWS-05d-01
Economic Research Service/USDA
Figure 26
India: Cotton yield by region, 1985/86-2005
Source: U.S. Department of Agriculture, Foreign Agricultural Service, GAIN Reports.
Kilograms/hectare
1985/86 20009694929088 98 02 04
North
Central
South
0
100
200
300
400
500

• Poor Seed Quality. Poor seed quality is a pervasive problem in cotton cul-tivation. Only about 35 percent of cotton area is sown with certified seedwith assured varietal purity and germination. Commercially availableseeds are often of poor quality, with sale of uncertified, substandard, andsecond generation (F2) hybrid seeds not uncommon. Although supplies of certified seed are generally available, financial constraints lead mostfarmers to use retained seeds or lower priced uncertified seeds from the market.
The proliferation of cotton varieties in markets and farmers’ fields con-founds efforts to improve seed quality, maintain varietal purity, andimprove crop management practices. Roughly 100-130 cotton varietiesdeveloped in both the public and private sectors are now cultivated inIndia. A study by the Central Institute for Cotton Research (CICR) indi-cates that the average cotton farmer in the Central and South zones plants3-4 varieties on farms averaging about 2 hectares, a practice that greatlycomplicates crop and seed management.
• Plant Protection. Insect and disease infestations, including bollworms, whitefly, jassids, and leaf curl virus, are significant problems in India’s three cot-ton production zones. Although per hectare use of pesticides is higher forcotton than for any other crop, effective plant protection is constrained bypoor farm management, pesticide subsidies that encourage indiscriminantuse, and problems with pesticide quality. Improved onfarm pest managementpractices, including appropriate crop rotations, pest surveillance, pesticideapplications, and adoption of Integrated Pest Management (IPM) practiceshave proved difficult to implement on small, resource-constrained farms.
29Growth Prospects for India’s Cotton and Textile Industries/CWS-05d-01
Economic Research Service/USDA
Table 3
India: Yield gaps for major cotton varieties
Share ofstate Potential Yield gap
Zone/state Varieties production yield range
Percent Kilograms/hectareNorth:
Punjab F414/F1054, J34/F846 91 1,200 700-800Haryana H777, J34/F846 88 1,000 600-650Rajasthan J34/RST-9 71 1,000 700-775
Central:Gujarat H6 61 1,000 150-750Madhya Pradesh H6/JKHy-1 41 600 300-500Maharashtra NHH44 35 500 225-350
LRA 5166 28 400 225-350
South:Andhra Pradesh MCU5, JKHy1/H4 24 800 400-650
MECH 1 and 11, LK861 72 600 400-650Karnataka DCH32 49 1,200 200-1,000Tamil Nadu DCH32, TCHB2 13 1,200 150-900
MCU5, LRA5166 82 1,000 150-900
Source: USDA/ERS calculations based on data from P. Ramasundaraman and H. Gajbhiye,2001, Constraints to Cotton Production in India, Nagpur, India: Central Institute for CottonResearch, January 2001, 27 pp.

• Crop Management. Large gaps between average onfarm yields and thepotential of existing varieties also stem from poor management practices,including use of inappropriate varieties, seed rates, seed spacing, and fer-tilizer dosages. As in the case of plant protection, improvement of cropmanagement practices is complicated by the need to extend recommendedpractices to large numbers of small, limited-resource farmers.
• Lack of Suitable Varieties. Cotton yields are affected by lack of vari-eties—or genotypes—suitable for some agronomic conditions. Indian sci-entists cite three priorities for plant breeding efforts: (1) higher yielding,short-duration, and pest-resistant cultivars for the irrigated North zone, (2)higher yielding varieties for the drought-prone Central zone, and (3) vari-eties suited for the soils on rice fallow common in the South zone.
Bt Cotton andImplications for Yield Improvement
The most significant recent tech-nological development affectingIndian cotton production is theapproval of insect-resistanthybrid Bacillus thuringiensis (Bt)cotton for cultivation in India.Initially, the Government’sGenetic Engineering ApprovalCommittee (GEAC) approvedthree Bt varieties developed by ajoint venture between Monsantoand Mahyco, an Indian seedcompany, in March 2002 (table 5).In April 2004, a fourth varietydeveloped by the Indian companyRasi Seeds was approved by theGEAC. During April-May 2005,
30Growth Prospects for India’s Cotton and Textile Industries/CWS-05d-01
Economic Research Service/USDA
Table 4
India: Factors constraining cotton yields
Cotton areaFactor affected
Percent
Delayed sowing 70Dependence on monsoon 60Noncertified seeds 60Improper plant protection 55Low input use 40Nonrecommended seed rate 30Improper spacing 30Multiplicity of genotypes 25Unsuitable soils 20Nonrecommended genotypes 15
Source: P. Ramasundaraman and H. Gajbhiye, 2001, Constraints to CottonProduction in India, Nagpur, India: CentralInstitute for Cotton Research, January 2001,27 pp.
Table 5
India: Approved varieties of Bt cotton by producing region
Varieties Varieties Totalapproved before approved in approved
Region/state 2005 2005 varieties
North (Punjab, Haryana, Rajasthan) None RCH 134, 138 6MRC 6301, 6304Ankur 651, 2534
Central (Gujarat, Maharashtra, MECH 12, 162, 184 RCH 138, 144, 118 10Madhya Pradesh) RCH 2 MRC 6301
Ankur 9, 681
South MECH 12, 162, 184 RCH 20, 368 Andhra Pradesh—5(Andhra Pradesh, Karnataka, RCH 2 MRC 6322, 6918 Karnataka and Tamil Nadu—7Tamil Nadu)
Source: U.S. Department of Agriculture, Foreign Agricultural Service, GAIN Reports.

the GEAC approved an additional 14 varieties from Monsanto, Rasi, andAnkur Seeds. Importantly, while all varieties approved earlier were for culti-vation only in the Central and South zones, the 2005 approvals included sixvarieties for the North zone. In May 2005, the GEAC also withdrew itsapproval for one of the original Monsanto varieties in all southern states andfor the two others in Andhra Pradesh because of reports of poor perform-ance. However, with the recent approvals, there are still five Bt varietiesavailable for Andhra Pradesh and seven for the other Southern states. Inaddition to the 19 officially approved Bt varieties, approximately 50 unap-proved Bt varieties developed and sold by farmers and private seed companies are reportedly being cultivated in the South, Central, and North zones.
With only 3 years of cultivation, including a very poor weather year in2002, and no official area or yield data that differentiate conventional andBt cotton, assessing the performance and impact of Bt cotton is difficult.Available information indicates that adoption has been rapid. Approved Btcotton varieties were planted on an estimated 525,000 hectares in 2004/05,with an additional 600,000 hectares planted to various illegal varieties. In2005/06, Bt cotton planting is projected at 1.6 million hectares, including900,000 hectares of government-approved varieties and 700,000 hectares of illegal varieties. Reports on yields, and economic benefits to farmers,have been inconsistent, owing to erratic weather and pest infestation conditions during the initial years of cultivation, the proliferation of unregulated varieties, and whether the source is an opponent or supporter of the technology.
The rapid growth in adoption of Bt varieties implies that farmers see economicbenefit from planting Bt cotton, despite the fact that the cost of Bt seed—aboutRs1,600 ($36.80) per 450-gram package—is more than three times the cost ofnon-Bt hybrids (U.S. Department of Agriculture, Foreign Agricultural Service,GAIN Report). Two recent scientific studies also provide evidence that Btcotton is effective in preventing damage caused by bollworms on Indiancotton fields and, hence, in improving yields. The studies indicate that thefinancial benefits of planting Bt cotton in India stem from higher yields ratherthan reduced costs; the savings from reduced insecticide use are roughly offsetby the higher cost of Bt seed. Qaim and Zilberman analyzed data collectedin 2001 from Bt field plots designed by Mahyco in seven states and super-vised by regulatory authorities. Subsequently, Bennett et al. evaluated datacollected from large samples of farmers growing both conventional and Btcotton under commercial field conditions in the state of Maharashtra in 2002and 2003. Both studies showed not only a substantial reduction in insecticideuse on fields planted with Bt varieties but also significantly higher yields.Qaim and Zilberman found that the average yield in controlled field trials of Btcotton exceeded those of non-Bt counterparts by 80-87 percent. Bennett et al.found that the average increase in yield on farmer’s fields for Bt cotton overnon-Bt cotton was about 45 percent in 2002 and 63 percent in 2003.
Two factors suggest that widespread adoption of Bt cotton could signifi-cantly affect cotton production in India:
• First, by affording built-in protection from bollworms, Bt cotton helps address one of the most important yield-loss factors in all three
31Growth Prospects for India’s Cotton and Textile Industries/CWS-05d-01
Economic Research Service/USDA

32Growth Prospects for India’s Cotton and Textile Industries/CWS-05d-01
Economic Research Service/USDA
cotton-producing zones. The Bt technology should permit more effectiveprotection from bollworm damage more quickly than would extensionefforts to boost use of conventional and IPM methods among the largenumber of small-scale, resource-poor farmers. In developed countries, theprimary benefits of Bt technology have been to reduce costs of both laborand pesticides. In India, by contrast, the evidence suggests that the moreeffective plant protection afforded by Bt technology will result in higheryields. Adoption of recently approved Bt varieties for the highly boll-worm-prone North zone could lead to significantly faster yield growthunder the irrigated conditions in those states.
• Second, by reducing pesticide and associated labor costs, Bt technologyshould be affordable for resource-poor farmers, freeing up resources topurchase other needed inputs, including quality seed. State-level cost ofproduction data for cotton for 1998 and 1999 (the most recent available)indicate that pesticides account for 10-27 percent of production costs. Inaddition, labor costs—a significant share of which are for pesticide appli-cation—account for 44-59 percent of costs (Government of India,Ministry of Agriculture, 2004). Although Bt seed costs more than othervarieties and some pesticide applications would still be needed, cost sav-ings may prove to be significant.
Characteristics of Cotton Produced
India is unique among major cotton-producing countries because a broadrange of agro-climatic and soil conditions permit cultivation of all varietiesand staple lengths of cotton. Indian and international standards use differentstaple length definitions for classifying cotton. By Indian standards, aboutone-half of Indian cotton is medium staple length, but, by international stan-dards, only about one-quarter of Indian cotton is considered medium staple(fig. 27). The North zone tends to produce mostly short and medium staplevarieties, the South zone mostly long and extra-long staples, and the Central
zone a range of medium and longstaple varieties.
India has the capacity to producethe full range of staple lengths ofcotton needed to meet the needsof its textile industry. And India’shand-picked cotton is consideredsuperior to mechanicallyharvested cotton in terms ofsheen of finished fabric,amenability to spinning, tensilestrength, etc. India, however, hassignificant problems in meetingother quality needs. In particular,Indian cotton is generallycontaminated with other fibersand foreign matter and oftenconsists of admixtures ofmultiple varieties with differentfiber characteristics. These prob-lems reduce efficiency (yarn
Figure 27
India: Share of cotton production by staple length
Source: ERS calculations based on data from the Government of India, Ministry of Textiles, Office of the Textile Commissioner, and Cotlook, Ltd., 2005, Cotton on the Net, Glossary of Terms.
Percent
Indiangradingstandard
Internationalgrading
standard
Extra longLongMediumShort0
102030405060708090
100

realization) in the spinning process and result in higher levels of yarn impu-rities and imperfections. A 2001 survey by the International Textile Manu-facturer’s Federation indicated that 5 of the world’s 10 most contaminatedtraded cotton types came from India.
Problems with contamination and other quality attributes of Indian cottonhave been a key factor behind the upward trend in cotton imports by India’s export-oriented textile mills since the late 1990s. The risk associated with the unreliable quality of domestic cotton leads some textileproducers to prefer imported cotton to meet export orders that demandconsistent quality.
The significant problems with admixture of varieties and contamination stemfrom practices on farms and in market yards that are not amenable to quicksolution. Improvements in quality require better onfarm seed management;improved technology of handling, transportation, and ginning; investmentsin market infrastructure; and a marketing system that provides price premiumsthat reflect the costs of supplying quality cotton. Accomplishing these changeswill likely require implementation of grades and standards for domesticcotton and improvements in marketing that provide adequate incentives toproducers, ginners, and traders to adopt quality-related practices.
Production Policy and Incentives
The principal mechanism to support domestic farm prices is the system ofMinimum Support Prices (MSPs), in which the Government sets minimumprices for cotton and other major crops. Cotton MSPs are set for all majorvarieties and revised annually by the Government in accordance with therecommendations of the Commission on Agricultural Costs and Prices(CACP). CACP recommendations are based on assessments of changes inproduction costs and trends in domestic and world prices.
Cotton MSPs, which are defended by market purchases by the CottonCorporation of India (CCI) when necessary, generally have little influenceon producer prices of cotton because market prices are typically well abovethe MSPs. By contrast, MSPs have significantly influenced market pricesfor wheat and rice in the principal surplus areas, including most of theNorth zone (wheat and rice) and Andhra Pradesh in the South zone (rice).The MSPs set for wheat and rice can directly affect area allocated to cottonby affecting relative returns to growers. Returns to wheat and rice produc-tion can also affect cotton yield by influencing the portion of the growingseason that farmers are willing to devote to cotton production and, hence,the duration of the varieties cultivated and the time available for pickingbefore planting the next crop.
Recent trends in domestic market prices for cotton and competing cropsshow that cotton prices tend to be more volatile than those for wheat andrice (fig. 28). In addition, market prices of wheat and rice increased 7-9percent annually between 1995 and 2001 because of unusually largeincreases in wheat and rice MSPs. By contrast, market prices for cottonincreased only 2 percent during the same period. More recently, however,increases in wheat and rice MSPs have slowed and relative market prices ofcotton have begun to strengthen.
33Growth Prospects for India’s Cotton and Textile Industries/CWS-05d-01
Economic Research Service/USDA

While the MSP system has generally had little direct impact on cottonproduction incentives, a number of other domestic regulatory measureshave, historically, tended to suppress domestic cotton prices. Over the last10 years, however, reforms have phased out these regulations and created anenvironment for stronger incentives to produce cotton:
• Reform of Maharashtra Monopoly Procurement Scheme. Until procure-ment was opened to private traders in 2003, all cotton in Maharashtra,India’s second-largest producing state, had to be sold at fixed prices.While protecting farmers against low prices in some years, the policy alsoled to lower returns in years of high market prices and in delayed pay-ments to farmers when the scheme ran large financial deficits. The 2003reform, in addition to reducing financial costs, has clarified and strength-ened price signals to farmers.
• Legalization of Futures Trading. Futures trading in cotton was legalizedin 1997 and in 2003 for most other farm commodities. Although illicitforward contracting in cotton was a common practice prior to legalization,expanded futures trading is likely to make price discovery more efficientand transparent while also providing a means to manage price risk. Todate, futures trading in cotton remains small, but trading volumes mayincrease, as they have for several other commodities.
• Elimination of Export Quotas. Until their elimination in 2002, India usedannual cotton export quotas to limit exports and ensure low and stable rawmaterial prices for the domestic textile industry. The quotas tended to sup-press domestic cotton prices by restricting exports, and uncertaintyregarding annual quota levels was a source of price risk for growers andtraders. Removal of the quotas will strengthen links between domestic andworld prices, likely boosting grower returns and eliminating a source ofprice risk.
• Elimination of Ginning Regulations. Regulation of variety-specific gin-ning fees ended in 1997. The fee-setting mechanism raised costs by pre-venting competition among gins, encouraged contamination by ginners,
and reduced incentives for invest-ment in the industry.
• Elimination of Credit Controls.Until lifted in 1996, governmentregulations restricted use ofcredit by cotton traders, effec-tively limiting private storage ofcotton lint and yarn and reduc-ing market prices.
• Elimination of Cotton Controland Transport Orders. Untilelimination in 1995, these con-trols gave the Governmentauthority to direct domesticmovement and storage of cotton,including confiscation of cottonunder certain market conditions.
34Growth Prospects for India’s Cotton and Textile Industries/CWS-05d-01
Economic Research Service/USDA
Figure 28
India: Wholesale price indexes for selected crops, 1990-2004
Source: ERS calculations based on data fromGovernment of India, Ministry of Finance, Economic Survey, various.
Index, 1993-94=100
Wheat
Rawcotton
Oilseeds
RiceCorn
1990 92 94 96 98 2000 02 040
20406080
100120140160180200

These regulations and their erratic use increased uncertainty and market-ing costs, thus reducing and destabilizing grower returns.
Technology Mission on Cotton
Slowed growth in cotton production during the late 1990s, together with theopportunity created by the termination of the MFA, raised the priority foraddressing factors that constrain cotton production and quality in India. In2001, the Government established the high-level Technology Mission onCotton (TMC) to direct, coordinate, and fund initiatives to raise the produc-tivity and quality of Indian cotton and strengthen returns to growers. TMCactivities focus on four program areas, including (1) research and tech-nology generation, (2) transfer of technology to farmers, (3) improvement ofmarketing infrastructure, and (4) modernization of gins. Although it is tooearly to evaluate TMC impacts on research and extension, progress inimproving market facilities and, particularly, cotton gins is evident incotton-producing areas.
35Growth Prospects for India’s Cotton and Textile Industries/CWS-05d-01
Economic Research Service/USDA

India has traditionally been a net cotton exporter, but emerged as a signifi-cant net importer in 1998 (fig. 29). Increased import demand has been asso-ciated with a combination of steady growth in domestic consumption, risingexports of cotton-based textiles, and a period of stagnating cotton produc-tion during 1997-2002 (fig. 30). Rising imports have also been supported bymore liberal import policies for cotton since the early 1990s and, in the late1990s, by increased demand for quality cotton not available in India.Although imports declined in 2003 and 2004 along with the recovery incotton production, it remains uncertain if the recent gains in production canbe sustained.
Import Policy
Cotton imports were liberalized in 1991, when the import monopoly of theCotton Corporation of India was terminated and imports were placed onOpen General License, allowing unrestricted imports by private traders. Theimport duty was originally set at zero, but little import trade occurred untilthe late 1990s, when world prices declined and India faced domestic supplyshortfalls (fig. 31). The import duty was raised to 5.5 percent in 2000 and to
36Growth Prospects for India’s Cotton and Textile Industries/CWS-05d-01
Economic Research Service/USDA
Cotton Trade
Figure 29
India: Cotton imports and exports, 1970-2004
Source: U.S. Department of Agriculture, Foreign Agricultural Service, Production, Supply, and Distribution database.
1,000 tons
0
100
200
300
400
500
600
Imports
Exports
1970 72 8280787674 888684 0220009896949290 04
Figure 30
India: Cotton production and consumption, 1970-2004
Source: U.S. Department of Agriculture, Foreign Agricultural Service, Production, Supply, and Distribution database.
Million tons
Production
Consumption
1970 72 8280787674 888684 0220009896949290 040.0
0.5
1.0
1.5
2.0
2.5
3.0
3.5

10 percent in 2002 but remains low relative to tariffs imposed on most otheragricultural products. Export-oriented textile units, which are exempt fromthe import duty, account for most, if not all, of India’s cotton imports.
Textile Exporters and the Role of Cotton Quality
Cotton importers and export-oriented textile firms indicate that both priceand quality are important factors in decisions to purchase imported versusdomestic cotton. Premiums over domestic prices are generally only paidwhen the desired quality is not available in the domestic market. Typically,large crops have yielded sufficient amounts of quality cotton to meetdomestic demand, while small crops result in shortages of quality cotton.But, with textile exports now accounting for a rising share of cotton use,quality needs may be a more consistent driver of imports unless substantialimprovements are made in the quality of domestically produced cotton.
Two quality factors of most concern to export-oriented spinners, weavers, andapparel firms are (1) consistency of fiber quality and (2) lack of contamina-tion with other fibers. Both factors pose chronic problems with a large propor-tion of domestically produced cotton. Indian cotton suffers from inconsistentquality because of the many varieties cultivated and the large numbers of smallfarmers contributing to each bale. Contamination with other fibers, prima-rily jute and synthetic fibers from the sacks used by farmers for picking andtransport, is a chronic problem that is difficult to identify and rectify once itoccurs. Contaminated cotton cannot be used to produce some exportedproducts, such as white and pastel shirting, and, as a result, imported cottonis often used to produce certain items destined for the export market.
In addition to quality, more favorable credit and contracting terms forimported cotton also provide an inducement for export-oriented mills to useimported cotton. Imported cotton typically is purchased with 3-6 months ofsupplier credit, compared with 15-30 days of credit for domestic cotton.
37Growth Prospects for India’s Cotton and Textile Industries/CWS-05d-01
Economic Research Service/USDA
Figure 31
India: Cotton imports and domestic/world price spreads, 1990/91-2003/04
1
1,000 tons Cents/pound
1990/91 92/93 94/95 96/97 98/99 2000/01 02/03
Indian minusworld price(right axis)
Imports(left axis)
0
100
200
300
400
500
600
-20
-15
-10
-5
0
5
1Domestic price is average of two Indian cotton varieties, Shankar-6 and H-4, converted to U.S.
dollars. World price is an average of the cheapest 5 quotations out of 19 of the principal upland cottons traded internationally (Cotlook Limited’s A-Index).Sources: U.S. Department of Agriculture, Foreign Agricultural Service, GAIN Reports.; Cotlook Limited.

And delivery of imported cotton can typically be arranged over a longerperiod at a fixed contracted price than can domestic cotton.
U.S. Market Share
India is a diversified and price-sensitive buyer of cotton. The United States,with an average market share of 22 percent during 1998-2002, has been the single largest supplier since large-scale cotton imports began in 1998(figs. 32 and 33). Other major suppliers during the same period have beenAustralia (11 percent), Benin (7 percent), Cote d’Ivorie (7 percent), andEgypt (5 percent). On a regional basis, African countries, known to beproducers of high-quality, long-staple cotton, have been the largest supplier,with an average share of 34 percent.
According to Indian traders and textile industry representatives, U.S cotton isfavored among many Indian buyers because of its grade uniformity, fiberstrength, and lack of contamination. However, many, if not most, Indian buyersbase their sourcing decisions primarily on landed price. U.S. cotton holds a rela-tively strong position within the highly quality-oriented segment of the market,but must be price competitive with Africa and an array of other suppliers withcloser geographic proximity to maintain the largest share of the market.
38Growth Prospects for India’s Cotton and Textile Industries/CWS-05d-01
Economic Research Service/USDA
Figure 32
India: Cotton imports by region of origin, 1989-2002
Source: U.S. Department of Agriculture, Economic Research Service, Bilateral Fiber and Textile Trade Database.
1,000 tons
1989 91 93 95 97 99 20010
50
100150
200
250
300350
400
AfricaUnited StatesMiddle EastAustraliaAsiaFormer Soviet UnionWestern EuropeLatin AmericaOther
Figure 33
India: Total cotton imports and U.S. market share, 1989-2002
1,000 tons Percent
U.S. market share(right axis) Cotton imports
(left axis)
Source: U.S. Department of Agriculture, Economic Research Service, Bilateral Fiber and Textile Trade Database.
0
50100
150
200
250300
350
400
1989 91 93 95 97 99 20010
510
15
20
2530
35
40

Demand for cotton and manmade fibers in India will likely rise as a resultof strong growth in incomes in India, as well as increased Indian exports oftextiles and apparel associated with the end of MFA quotas. The pace ofdemand growth for cotton will depend heavily on implementation ofreforms in the domestic textile industry, including taxes that discriminateagainst the use of manmade fibers and the array of past and current regula-tions that have affected the scale, technology use, and export competitive-ness of the textile and apparel industry. Imports of raw cotton haveincreased in concert with rising demand in recent years, but future growthwill depend on the extent to which India can boost chronically low cottonyields and improve cotton quality.
Low per capita use and the significant shares of income devoted to textileconsumption indicate that fiber demand will continue to respond to the nowrapid growth in rural and urban incomes. Fiber demand will, however, alsobe responsive to changing prices, so further reductions in the relatively highexcise taxes on manmade fibers, coupled with strong rural demand fordurable manmade fiber products, will likely continue to slow relativegrowth in domestic consumer demand for cotton fiber.
The end of MFA quotas is likely to result in significantly faster growth inIndia’s exports of cotton-based textiles and apparel. India’s fundamentalcost competitiveness in cotton-based textiles and its large share of exportsdestined for the historically quota-constrained U.S. and EU markets supportprospects for significant export growth even without major reforms in thedomestic textile industry. Growth in export-based cotton demand would,however, be substantially higher with implementation of measures to boostinvestment and improve technology, scale, and integration in the weaving,finishing, and apparel sectors to levels of efficiency achieved by China andother major producers. The recent trend in government policy has been toreform the sector, but the pace of reform can be expected to be slowed bypolitical concerns with the adjustment costs associated with restructuring anindustry that accounts for a large share of industrial employment.
India has the agronomic potential to meet much, if not all, of its future growthin cotton demand domestically. However, it is unclear if and when the neces-sary productivity gains will be achieved. The advent of Bt cotton, whichappears to be yield enhancing and is being adopted rapidly, should lead tosignificant gains in production in the medium term. The combination oferratic moisture conditions in rainfed producing areas and weak institutionsfor delivery of seed, technology, and other inputs seem equally likely to slowthe pace of productivity growth. In addition, meeting rising demand for qualitycotton—particularly contamination-free cotton—will require changes in thecotton supply chain that are unlikely to be implemented quickly.
To the extent that textile and apparel exporters, such as India, can meetrising export demand with domestically produced cotton, the elimination ofMFA quotas is likely to lead to diminished prospects for net cottonexporters, such as the United States. Recent yield increases in India, due inpart to Bt technology, may signal slower growth in cotton imports in the
39Growth Prospects for India’s Cotton and Textile Industries/CWS-05d-01
Economic Research Service/USDA
Implications for Cotton Demand and Trade

medium term as the technology is more widely adopted. However, thequality needs of India’s export-oriented textile firms will likely sustain amarket for quality cotton for the foreseeable future. Market shares for theIndian cotton market appear to be sensitive to both price and quality. U.S.cotton, with a reputation for consistent quality, can maintain its market shareprovided it remains price competitive.
40Growth Prospects for India’s Cotton and Textile Industries/CWS-05d-01
Economic Research Service/USDA

Abernathy, Frederick H., John T. Dunlop, Janice H. Hammond, and DavidWeil. 1999. A Stitch in Time: Lean Retailing and the Transformation ofManufacturing—Lessons from the Apparel and Textile Industries, NewYork: Oxford University Press.
Andriamananjara, Soamiely, Judith Dean, and Dean Spinanger. 2004.“Trading Textiles and Apparel: Developing Countries in 2005,” presentedat the 7th Annual Conference on Global Economic Analysis, WashingtonDC, May, 26 pp.
Anubhai, Prafull. 1988. “Sickness in Indian Textile Industry: Causes andRemedies,” Economic and Political Weekly, November 26.
Audet, Denis. 2004. Structural Adjustment in Textiles and Clothing in thePost-ATC Trading Environment, OECD Trade Policy Working Paper No. 4, TD/TC/WP(2004)23/FINAL, Organisation for Economic Co-oper-ation and Development, August 13, http://www.oecd.org/trade.
Bennett, R.M., Y. Ismael, U. Kambhampati, and S. Morse. 2004. “EconomicImpact of Genetically Modified Cotton in India,” AgBioForum 7:96-100,http://www.agbioforum.org/v7n3/v7n3a01-morse.htm
Bhavani, T.A., and Suresh D. Tendulkar. 2001. “Determinants of Firm-LevelExport Performance: A Case Study of Indian Textile Garments andApparel Industry, The Journal of International Trade and EconomicDevelopment 10(1):65-92, March.
Chakraborty, Kalyan, Darren Hudson, Don Ethridge, Sukant Misra, andGyana Kar. 1999. An Overview of the Cotton and Textile Industries inIndia, CER-99-55, U.S. Department of Agriculture, The CooperativeState Research, Education, and Extension Service, National ResearchInitiative Grant T-1-519, December.
Cline William R. 1990. The Future of World Trade in Textiles and Apparel,Washington, DC: The Institute for International Economics.
Cotlook Ltd. 2005. Cotton On the Net, Glossary of Terms, http://www.cotton-net.com/information/glossary_of_terms.php
D’Monte, Darryl. 2002. Ripping the Fabric: The Decline of Mumbai and ItsMills, Oxford University Press.
The Economist. 2000. “India’s Economy: The China Syndrome,” December 9.
Elbehri, Aziz, Thomas Hertel, and Will Martin. 2003. “Estimating theImpact of WTO and Domestic Reforms on the Indian Cotton and TextileSectors: a General-Equilibrium Approach,” Review of DevelopmentEconomics 7:343-59.
41Growth Prospects for India’s Cotton and Textile Industries/CWS-05d-01
Economic Research Service/USDA
Suggested Readings

Erzan, Refik, Junichi Goto, and Paula Holmes. 1990. “Effects of the Multi-Fibre Arrangement on Developing Countries’ Trade: An EmpiricalInvestigation,” Textiles and Trade and the Developing Countries:Eliminating the Multi-Fibre Arrangement in the 1990s, Carl B. Hamilton(ed.), Washington DC: The World Bank.
Financial Times. 2004. “Clothes on the Line: The Garment Industry Faces aGlobal Shake-up as Quotas End,” July 19.
Financial Times. 2003. “Why India is Singing in the Rain,” July 15.
Francois, Joseph F., and Dean Spinanger. 2004. “Liberalizing Quotas onTextiles and Clothing: Has the ATC Actually Worked?” presented at the7th Annual Conference on Global Economic Analysis, Washington, DC,May, 20 pp.
Gereffi, Gary. 1999. “International Trade and Industrial Upgrading in theApparel Commodity Chain,” Journal of International Economics 48:37-70.
Gereffi, Gary. 2001. “Shifting Governance Structures in Global CommodityChains, With Special Reference to the Internet,” American BehavioralScientist 44:1616-37.
Gereffi, Gary. 2000. “The Transformation of the North American ApparelIndustry: Is NAFTA a Curse or a Blessing?” Integration and Trade 4:47-95.
Government of India, Ministry of Agriculture. 2004. Report of theCommission for Agricultural Costs and Prices for the Crops SownDuring the 2003/04 Season, 467 pp.
Government of India, Ministry of Finance. 2005. Economic Survey,2004/05, 245 pp.
Government of India, Ministry of Finance. 2004a. Economic Survey,2003/04, 234 pp.
Government of India, Ministry of Textiles, Office of the TextileCommissioner. 2004b. Compendium of International Textile Statistics,Mumbai, 126 pp.
Government of India, Ministry of Textiles, Office of the TextileCommissioner. 2003. Compendium of Textile Statistics, Mumbai, 280 pp.
Hashim, Danish A. 2005. “Post-MFA: Making the Textile and GarmentIndustry Competitive,” Economic and Political Weekly XL(2):117-27,January 8-14.
Indian Cotton Mills Federation. 2004. Handbook of Statistics on the CottonTextile Industry, 29th edition, New Delhi, 164 pp.
International Cotton Advisory Committee and Food and AgriculturalOrganization of the United Nations. 2003. World Apparel FiberConsumption Survey.
42Growth Prospects for India’s Cotton and Textile Industries/CWS-05d-01
Economic Research Service/USDA

International Textile Manufacturers Federation. 2003, International ProductCost Comparison 2003: Spinning/Texturizing/Weaving/Knitting, Zurich.
Kathuria, Sanjay, and Anjali Bhardwaj. 2001. The Export Tax Equivalents ofQuota Restrictions in the India Textile and Garment Industries, WorldBank Working Paper. Washington, DC: The World Bank.
Kumar, Rajiv, and Sri Ram Khanna. 1990. “India, The Multi-FibreArrangement and the Uruguay Round,” Textiles and Trade and theDeveloping Countries: Eliminating the Multi-Fibre Arrangement in the1990s, Carl B. Hamilton (ed.), Washington DC: The World Bank.
Landes, Maurice R. 2004. “The Elephant is Jogging: New Pressures forAgricultural Reform in India,” Amber Waves 2(1):28-35, February, U.S.Department of Agriculture, Economic Research Service,http://www.ers.usda.gov/AmberWaves/February04/pdf/features_elephant.pdf
MacDonald, Stephen, and Thomas Vollrath. 2005. The Forces ShapingWorld Cotton Consumption After the Multifiber Arrangement, CWS-05c-01, U.S. Department of Agriculture, Economic ResearchService, April 2005, 30 pp,http://www.ers.usda.gov/publications/cws/apr05/cws05c01/
Nordas, Hildegunn Kyvik. 2004. The Global Textile and Clothing IndustryPost the Agreement on Textiles and Clothing, Geneva, Switzerland:World Trade Organization.
Organisation for Economic Co-operation and Development. 2003.Liberalizing Trade in Textiles and Clothing: A Survey of QuantitativeStudies, Working Party of the Trade Committee, May.
Qaim, Matin, and David Zilberman. 2003. “Yield Effects of GeneticallyModified Crops in Developing Countries,” Science 299:900-02, February.
Ramasundaraman, P., and H. Gajbhiye. 2001. Constraints to CottonProduction in India, Nagpur: Central Institute for Cotton Research,January 2001, 27 pages.
Ramaswamy, K.V,. and Gary Gereffi. 2000. “India’s Apparel Exports: The Challenge of Global Markets,” The Developing Economics38:186-210, June.
rediff.com. 2005. “Tirupur: India’s Textile Valley!” February 15,http://www.rediff.com.
Reinert, K.A. 2000. “Give us Virtue, But Not Yet: Safeguard Actions Underthe Agreement on Textiles and Clothing,” The World Economy 23:25-55.
Tait, Niki. 2001. “Gateway to India: India’s Apparel Export ManufacturingIndustry,” http://www.just-style.com, July.
43Growth Prospects for India’s Cotton and Textile Industries/CWS-05d-01
Economic Research Service/USDA

U.S. Department of Agriculture, Economic Research Service. 2004. BilateralFiber and Textile Trade Database, http://www.ers.usda.gov/Data/FiberTextileTrade/
U.S. Department of Agriculture, Foreign Agricultural Service. India Cottonand Products, GAIN Reports, various, http://www.fas.usda.gov/scriptsw/attacherep/default.asp
U.S. Department of Agriculture, Foreign Agricultural Service. 2004.Production, Supply, and Distribution Database, PSD Online,http://www.fas.usda.gov/psd/
U.S. Department of State and U.S. Central Intelligence Agency. 2004. The World After Textile/Apparel Quotas Conference, Washington DC,May 21.
U.S. International Trade Commission. 2004. Textiles and Apparel:Assessment of the Competitiveness of Certain Foreign Suppliers to theU.S. Market, Publication 3671, January,http://63.173.254.11/pub3671/main.html
Verma, S. 2002. Export Competitiveness of the Indian Textile and GarmentIndustry, Working Paper No. 94, New Delhi: Indian Center for Researchon International Economic Relations.
The World Bank. 1999. India Cotton and Textile Industries: Reforming toCompete, Report No. 18857-IN, Development Sector Unit, South AsiaRegion.
www.fibre2fashion.com. 2004a. “Big Cotton Processing Units To Get 3%Interest Relief Under TUFS,” March 1, http://www.fibre2fashion.com/
www.fibre2fashion.com. 2003a. “EU To Slap Anti-Subsidy Duty OnBedlinen,” October 17, http://www.fibre2fashion.com/
www.fibre2fashion.com. 2004b. “J.C. Penney May Source Apparel Worth$2 Bn,” February 2, http://www.fibre2fashion.com/
www.fibre2fashion.com. 2004c. “Textile Cos Poised For Their Quota OfSuccess,” January 1, http://www.fibre2fashion.com/
www.fibre2fashion.com. 2003b. “Textile Exports Likely to Touch 50 billionU.S. Dollars,” September 22, http://www.fibre2fashion.com/
www.fibre2fashion.com. 2003c. “Textile Funds Bring Little Cheer to SmallUnits,” August 21, http://www.fibre2fashion.com/
44Growth Prospects for India’s Cotton and Textile Industries/CWS-05d-01
Economic Research Service/USDA
Copyright © 2022 FDOKUMEN