Growth and Evolution in China's Agricultural Support Policies
60
Fred Gale Growth and Evolution in China’s Agricultural Support Policies Economic Research Service Economic Research Report Number 153 August 2013 United States Department of Agriculture
-
Upload
khangminh22 -
Category
Documents
-
view
1 -
download
0
Transcript of Growth and Evolution in China's Agricultural Support Policies
Fred Gale
Growth and Evolution in China’s Agricultural Support Policies
Economic Research Service
Economic Research Report Number 153
August 2013
United States Department of Agriculture
Economic Research Service www.ers.usda.gov
The U.S. Department of Agriculture (USDA) prohibits discrimination in all its programs and activities on the basis of race, color, national origin, age, disability, and, where applicable, sex, marital status, familial status, parental status, religion, sexual orientation, genetic information, political beliefs, reprisal, or because all or a part of an individual’s income is derived from any public assistance program. (Not all prohibited bases apply to all programs.) Persons with disabilities who require alternative means for communication of program information (Braille, large print, audiotape, etc.) should contact USDA’s TARGET Center at (202) 720-2600 (voice and TDD).
To file a complaint of discrimination write to USDA, Director, Office of Civil Rights, 1400 Independence Avenue, S.W., Washington, D.C. 20250-9410 or call (800) 795-3272 (voice) or (202) 720-6382 (TDD). USDA is an equal opportunity provider and employer.
United States Department of Agriculture
Visit our website for more information on this topic:
www.ers.usda.gov/topics/international-markets-trade.aspx
Access this report online:
www.ers.usda.gov/publications/err-economic-research-report/err153.aspx
Download the charts contained in this report:
• Gotothereport’sindex page www.ers.usda.gov/publications/ err-economic-research-report/err153.aspx
• Clickonthebulleteditem“Downloaderr153.zip”
• Openthechartyouwant,thensaveittoyourcomputer
Recommended citation format for this publication:
Gale,Fred,Growth and Evolution in China’s Agricultural Support Policies, ERR-153.U.S.DepartmentofAgriculture,EconomicResearchService,August2013.
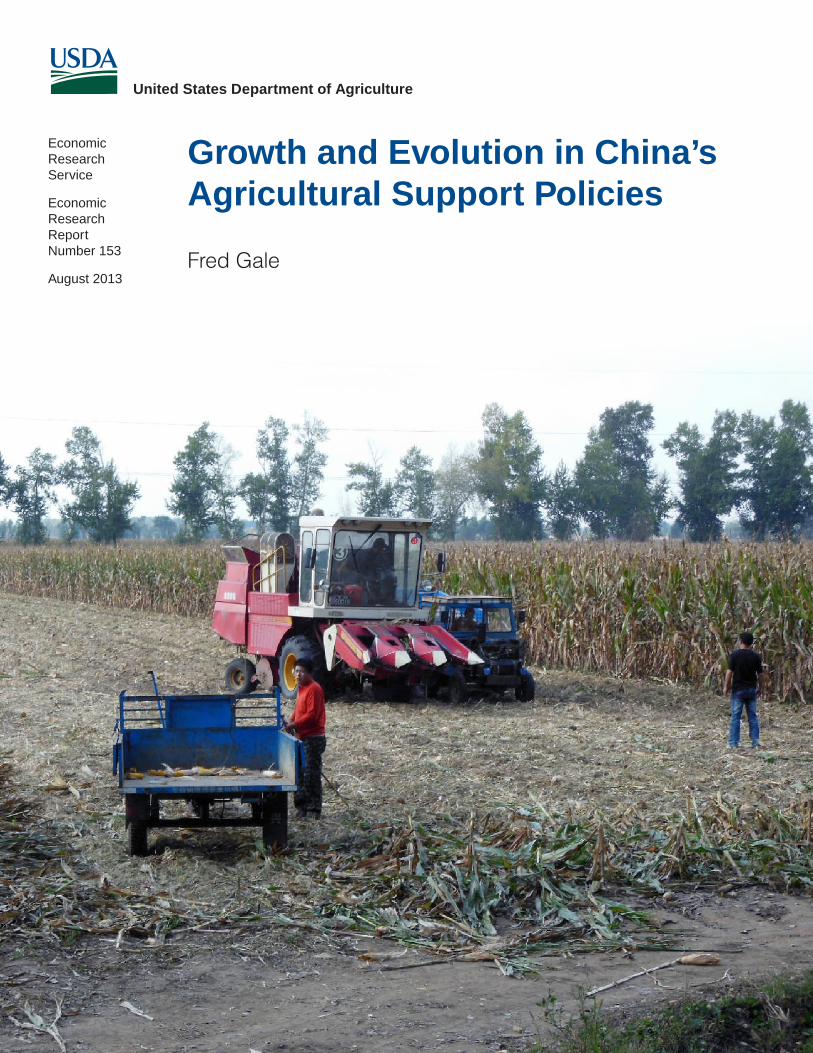
Coverphotocredit:FredGale.
United States Department of Agriculture
Economic Research Service
Economic Research Report Number 153
August 2013 Abstract
China is perhaps the most prominent example of a developing country that has transi-tioned from taxing to supporting agriculture. In recent years, Chinese price supports and subsidies have risen at an accelerating pace after they were linked to rising production costs. Per-acre subsidy payments to grain producers now equal 7 to 15 percent of those producers’ gross income, but grain payments appear to have little influence on production decisions. Chinese authorities began raising price supports annually to bolster incentives, and Chinese prices for major farm commodities are rising above world prices, helping to attract a surge of agricultural imports. U.S. agricultural exports to China tripled in value during the period when China’s agricultural support was accelerating. Overall, China’s expansion of support is loosely constrained by World Trade Organization (WTO) commit-ments, but the country’s price-support programs could exceed WTO limits in coming years. Chinese officials promise to continue increasing domestic policy support for agri-culture, but the mix of policies may evolve as the Chinese agricultural sector becomes more commercialized and faces competitive pressures.
Keywords: China, agricultural subsidies, price supports, direct payments, grain, World Trade Organization
Acknowledgments
The author received reviewer comments from Donna Roberts, U.S. Department of Agriculture, Economic Research Service; Daniel Cook, Scott Sindelar, Mark Petry, and Hui Jiang of USDA’s Foreign Agricultural Service; Carol Goodloe of USDA’s Office of the Chief Economist; Andrzej Kwiecinski of the Organisation of Economic Co-operation and Development; Jikun Huang of the Chinese Academy of Sciences; and Funing Zhong of the Nanjing Agricultural University. Chao Peng contributed to this report while he was a Fulbright Scholar at University of Maryland and an intern at ERS. Francis Tuan, Michael Jewison (now with World Agricultural Outlook Board) and Steve MacDonald of ERS also made contributions to this report. The National Grain and Oils Information Center provided data on prices of grains and oilseeds.
Fred Gale
Growth and Evolution in China’s Agricultural Support Policies
ii Growth and Evolution in China’s Agricultural Support Policies, ERR-153
Economic Research Service/USDA
Contents
Summary . . . . . . . . . . . . . . . . . . . . . . . . . . . . . . . . . . . . . . . . . . . . . . . . . . . . . . . . . . . . . . . . . . . . . iii
Introduction . . . . . . . . . . . . . . . . . . . . . . . . . . . . . . . . . . . . . . . . . . . . . . . . . . . . . . . . . . . . . . . . . . . .1
Overview of China’s Expansion of Support . . . . . . . . . . . . . . . . . . . . . . . . . . . . . . . . . . . . . . . . . .3
China’s Strategy for Increasing Agricultural Support . . . . . . . . . . . . . . . . . . . . . . . . . . . . . . . . .6
Increase in Grain Subsidy Payments . . . . . . . . . . . . . . . . . . . . . . . . . . . . . . . . . . . . . . . . . . . . . . .8
Expanded Coverage of Improved Seed Subsidy . . . . . . . . . . . . . . . . . . . . . . . . . . . . . . . . . . . . . . 11
Production Costs Outpaced Increase in Subsidies . . . . . . . . . . . . . . . . . . . . . . . . . . . . . . . . . . . .12
Raising Price Supports . . . . . . . . . . . . . . . . . . . . . . . . . . . . . . . . . . . . . . . . . . . . . . . . . . . . . . . . . 16
Continued Expansion of Support . . . . . . . . . . . . . . . . . . . . . . . . . . . . . . . . . . . . . . . . . . . . . . . . .23
WTO Limits on Domestic Support . . . . . . . . . . . . . . . . . . . . . . . . . . . . . . . . . . . . . . . . . . . . . . .23
Divergence of Chinese and World Prices . . . . . . . . . . . . . . . . . . . . . . . . . . . . . . . . . . . . . . . . . . .28
Changing Nature of Support . . . . . . . . . . . . . . . . . . . . . . . . . . . . . . . . . . . . . . . . . . . . . . . . . . . . 31
China’s Agricultural Support and U.S. Exports . . . . . . . . . . . . . . . . . . . . . . . . . . . . . . . . . . . . .33
Soybeans: Exports to China $15 Billion During 2012 . . . . . . . . . . . . . . . . . . . . . . . . . . . . . . . . .33
Cotton: Exports to China $3.6 Billion During 2012 . . . . . . . . . . . . . . . . . . . . . . . . . . . . . . . . . .34
Corn and Distillers Dried Grains: Exports to China $1.9 Billion During 2012 . . . . . . . . . . . . . .35
Wheat: Exports to China $214 Million During 2012 . . . . . . . . . . . . . . . . . . . . . . . . . . . . . . . . . .35
Meat and Poultry: Exports to China $900 Million During 2012 . . . . . . . . . . . . . . . . . . . . . . . . .36
Future Policy Directions and U.S. Exports . . . . . . . . . . . . . . . . . . . . . . . . . . . . . . . . . . . . . . . . .36
References . . . . . . . . . . . . . . . . . . . . . . . . . . . . . . . . . . . . . . . . . . . . . . . . . . . . . . . . . . . . . . . . . . . .37
Appendix 1—Glossary of Chinese Policy-Related Terms . . . . . . . . . . . . . . . . . . . . . . . . . . . . . .42
Appendix 2—Currency and Geographic Information . . . . . . . . . . . . . . . . . . . . . . . . . . . . . . . .43
Appendix 3—China’s Agricultural Support Programs . . . . . . . . . . . . . . . . . . . . . . . . . . . . . . .44
Appendix 4—How Subsidy Funds Are Distributed . . . . . . . . . . . . . . . . . . . . . . . . . . . . . . . . . . . 53
www.ers.usda.gov
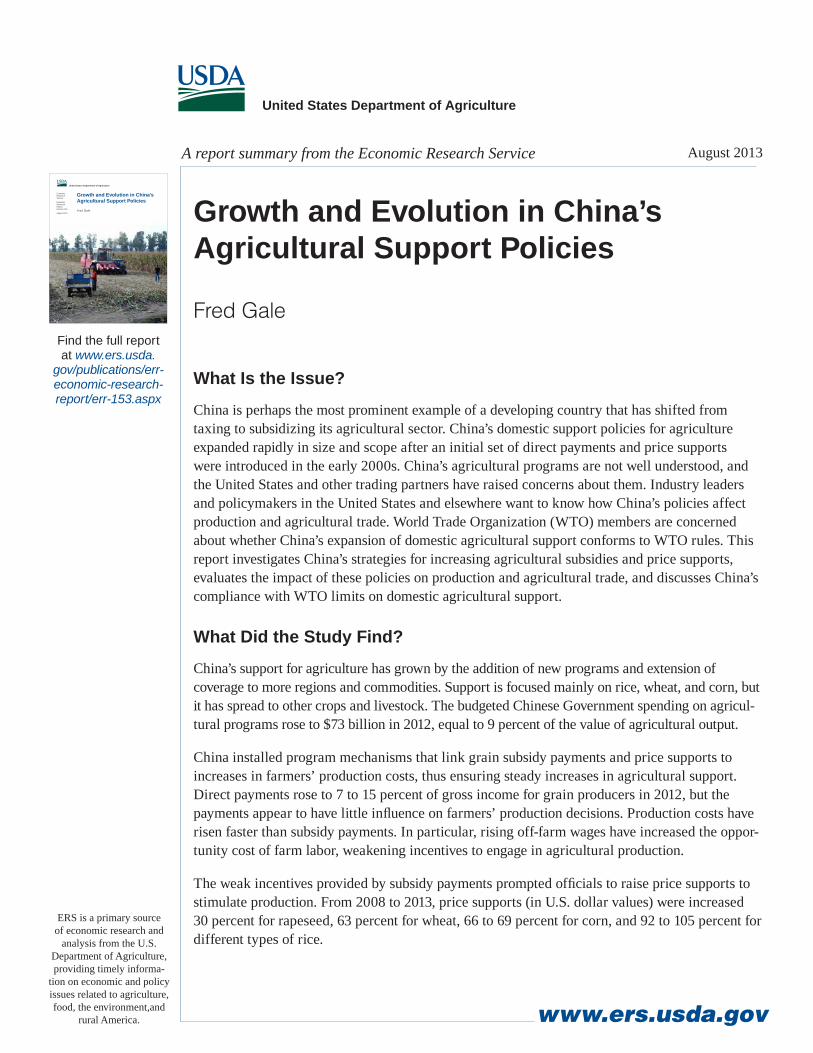
What Is the Issue?
China is perhaps the most prominent example of a developing country that has shifted from taxing to subsidizing its agricultural sector. China’s domestic support policies for agriculture expanded rapidly in size and scope after an initial set of direct payments and price supports were introduced in the early 2000s. China’s agricultural programs are not well understood, and the United States and other trading partners have raised concerns about them. Industry leaders and policymakers in the United States and elsewhere want to know how China’s policies affect production and agricultural trade. World Trade Organization (WTO) members are concerned about whether China’s expansion of domestic agricultural support conforms to WTO rules. This report investigates China’s strategies for increasing agricultural subsidies and price supports, evaluates the impact of these policies on production and agricultural trade, and discusses China’s compliance with WTO limits on domestic agricultural support.
What Did the Study Find?
China’s support for agriculture has grown by the addition of new programs and extension of coverage to more regions and commodities. Support is focused mainly on rice, wheat, and corn, but it has spread to other crops and livestock. The budgeted Chinese Government spending on agricul-tural programs rose to $73 billion in 2012, equal to 9 percent of the value of agricultural output.
China installed program mechanisms that link grain subsidy payments and price supports to increases in farmers’ production costs, thus ensuring steady increases in agricultural support. Direct payments rose to 7 to 15 percent of gross income for grain producers in 2012, but the payments appear to have little influence on farmers’ production decisions. Production costs have risen faster than subsidy payments. In particular, rising off-farm wages have increased the oppor-tunity cost of farm labor, weakening incentives to engage in agricultural production.
The weak incentives provided by subsidy payments prompted officials to raise price supports to stimulate production. From 2008 to 2013, price supports (in U.S. dollar values) were increased 30 percent for rapeseed, 63 percent for wheat, 66 to 69 percent for corn, and 92 to 105 percent for different types of rice.
United States Department of Agriculture
A report summary from the Economic Research Service August 2013
ERS is a primary source of economic research and
analysis from the U.S. Department of Agriculture, providing timely informa-
tion on economic and policy issues related to agriculture, food, the environment,and
rural America.
Find the full report at www.ers.usda.
gov/publications/err-economic-research-report/err-153.aspx
Fred Gale
Growth and Evolution in China’s Agricultural Support Policies
Economic Research Service
Economic Research Report Number 153
August 2013
United States Department of Agriculture
Fred Gale
Growth and Evolution in China’s Agricultural Support Policies
The increase in support prices—combined with appreciation of China’s currency—has eroded the price competi-tiveness of Chinese commodities. In 2011, Chinese farm prices of grains, soybeans, rapeseed, cotton, and hogs exceeded U.S. prices by margins that ranged from 20 percent for wheat to 84 percent for live hogs.
China focused expenditure on programs that are exempt from WTO limits on domestic support, provided subsi-dies not tied to specific commodities, and took advantage of high external reference prices in calculating the value of price supports reported to WTO. At least through 2008, these strategies minimized the amount of domestic support that counted towards China’s WTO commitments. However, China may exceed WTO limits if officials make large purchases at support prices or introduce product-specific subsidy payments.
Chinese officials have stated intentions to expand direct payments, raise price supports, and add new policies. Authorities are also exploring ways of encouraging commercial-scale farms and shielding producers of particular commodities from import competition.
While the increase in domestic support raises concerns among trading partners, dramatic growth in U.S. agri-cultural exports to China coincided with the expansion of Chinese agricultural support. The value of U.S. agri-cultural export sales to China tripled during 2007-12, reaching nearly $26 billion during 2012. China is now the leading destination for U.S. agricultural exports.
How Was the Study Conducted?
The study is based on an extensive review and synthesis of Chinese documents, books, research studies, and other literature. The study compiled and analyzed data on financial expenditures, survey reports, commodity prices, support prices, and cost of production survey data published by the Chinese Government. The study reviewed China’s WTO notifications of domestic support from 1996 to 2008 to discern strategies for reporting subsidies and market price support.
www.ers.usda.gov
1 Growth and Evolution in China’s Agricultural Support Policies, ERR-153
Economic Research Service/USDA
Growth and Evolution in China’s Agricultural Support Policies
Fred Gale
Introduction
China is perhaps the leading example of a developing country that has shifted from taxing to supporting its agricultural sector. During the early 2000s, Chinese officials began a broad program of agricultural support that included tax reductions, direct subsidies, price supports, policy loans, expenditure on infrastructure, and intergovernmental transfers (Gale, Lohmar, and Tuan, 2005). Since then, agricultural support programs have expanded rapidly in size and scope (Petry and Chandlee, 2009; Lohmar et al., 2009; Gale, Lohmar, and Tuan, 2009; Huang, Wang, and Rozelle, 2013). Documents outlining policies and strategies, such as the country’s 5-year plan for 2011-15 and central authorities’ 2013 “Number 1 Document,” called for continued increases in the value of subsi-dies, broader coverage of programs, and steady increases in agricultural price supports.
Many reforms were conducted during China’s lengthy negotiations to gain membership in the World Trade Organization. China’s 2001 WTO accession agreement set relatively low agricultural tariffs and placed limits on domestic agricultural support that were stricter than those for developing coun-tries, measures that were meant to minimize distortionary policies and ensure access to China’s agricultural markets. During the years leading up to its WTO accession, China had eliminated many of the price distortions that had characterized its agricultural markets in earlier decades (Huang, Liu, Martin, and Rozelle, 2009).
The rapid increase in domestic agricultural support since 2005 has prompted calls for additional scrutiny from some trade partners to ensure that China is meeting its WTO obligations to limit market-distorting measures. The significance of China’s growing support is magnified by the country’s importance as the largest producer, consumer, and trader of many agricultural products. Organisation for Economic Co-operation and Development (OECD, 2005; OECD, 2009) assess-ments reported that China’s level of agricultural support was growing rapidly, and OECD (2011) found that China’s agricultural support was approaching the average for developed countries. A U.S. International Trade Commission (2011) study commissioned by the U.S. Senate Finance Committee found that domestic support aided China’s competitiveness in some agricultural sectors. An assess-ment by the Office of the U.S. Trade Representative (2011) noted a rapid increase in domestic support, raised concerns that official Chinese information about 2005-08 support levels understated the amount of support, and promised to monitor domestic support. Concerns are compounded when Chinese officials themselves frequently attribute increases in grain production to policy support.
The emergence of agricultural support in developing countries like China poses a challenge to efforts to reduce global distortions in agricultural markets (Anderson, 2010; Orden, Josling, and Blandford, 2011). China’s scaling-up of agricultural support is the mirror image of the efforts of developed countries to discipline domestic support policies since the Uruguay Round of trade
2 Growth and Evolution in China’s Agricultural Support Policies, ERR-153
Economic Research Service/USDA
negotiations in the 1990s. Chinese officials often assert that boosting subsidies and farm prices is a necessary part of their country’s transition to an industrialized, urbanized economy, citing the 20th century history of North America, Europe, and Japan (Zhang and Zhao, 2009; Guoqiang Cheng, 2011; Xu, 2011; Niu, 2011).
This report updates earlier ERS analyses of China’s agricultural support by examining the evolu-tion of subsidy and price-support policies since their introduction. The report investigates the domestic support strategies of Chinese authorities and their effect on price competitiveness of commodities. China’s policies tend to reinforce a pattern of escalating prices and costs that erodes China’s international competitiveness in agricultural commodities. The report shows how WTO commitments shaped the mix of policies to keep China within WTO-imposed limits. China’s policies continue to evolve, and its relatively low barriers to trade constrain continued expansion of domestic support. The weak incentives provided by subsidy payments prompted a reliance on raising price supports that may cause Chinese prices to diverge from world prices, a phenom-enon that improves the prospects for exports to China. Domestic policies are evolving further to strengthen links to production, become more commodity-specific, and promote the commercial-ization of China’s agricultural sector.
3 Growth and Evolution in China’s Agricultural Support Policies, ERR-153
Economic Research Service/USDA
Overview of China’s Expansion of Support
The foundation for China’s current agricultural support program was laid during 2000-04, a period when rural poverty, underemployment, and high taxation of farmers were major concerns and WTO accession was reshaping the country’s policy landscape. In 2004—after several years of regional experiments—authorities began eliminating an agricultural tax on farmers and introduced three small subsidies targeted at grain producers: a direct payment, a subsidy for improved seed varieties, and a partial rebate for farm machinery purchases. The Government’s direct role in grain markets was reduced to an indirect one of buying and selling reserves to maintain food security and stabilize prices. Price floors for wheat and rice were introduced in 2004-06.
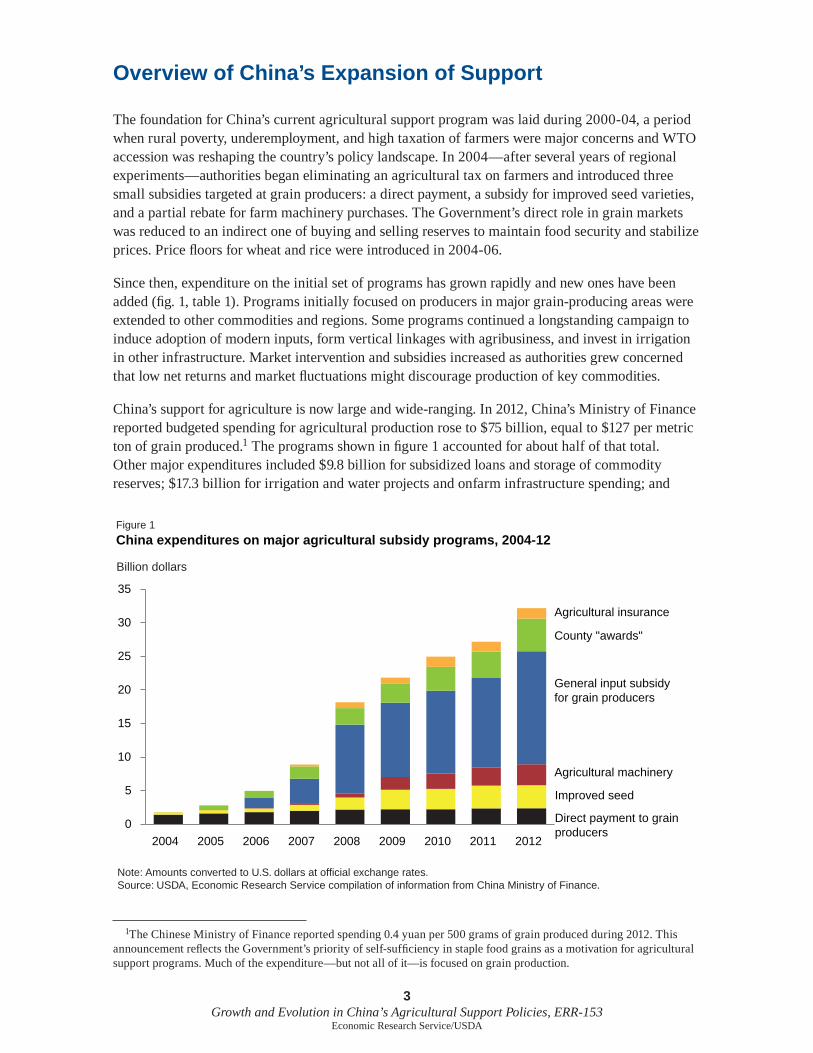
Since then, expenditure on the initial set of programs has grown rapidly and new ones have been added (fig. 1, table 1). Programs initially focused on producers in major grain-producing areas were extended to other commodities and regions. Some programs continued a longstanding campaign to induce adoption of modern inputs, form vertical linkages with agribusiness, and invest in irrigation in other infrastructure. Market intervention and subsidies increased as authorities grew concerned that low net returns and market fluctuations might discourage production of key commodities.
China’s support for agriculture is now large and wide-ranging. In 2012, China’s Ministry of Finance reported budgeted spending for agricultural production rose to $75 billion, equal to $127 per metric ton of grain produced.1 The programs shown in figure 1 accounted for about half of that total. Other major expenditures included $9.8 billion for subsidized loans and storage of commodity reserves; $17.3 billion for irrigation and water projects and onfarm infrastructure spending; and
1The Chinese Ministry of Finance reported spending 0.4 yuan per 500 grams of grain produced during 2012. This announcement reflects the Government’s priority of self-sufficiency in staple food grains as a motivation for agricultural support programs. Much of the expenditure—but not all of it—is focused on grain production.
Figure 1
China expenditures on major agricultural subsidy programs, 2004-12
Note: Amounts converted to U.S. dollars at official exchange rates.Source: USDA, Economic Research Service compilation of information from China Ministry of Finance.
Billion dollars
0
5
10
15
20
25
30
35
2004 2005 2006 2007 2008 2009 2010 2011 2012
General input subsidy for grain producers
Agricultural machinery
Improved seed
Direct payment to grain producers
Agricultural insurance
County "awards"
4 Growth and Evolution in China’s Agricultural Support Policies, ERR-153
Economic Research Service/USDA
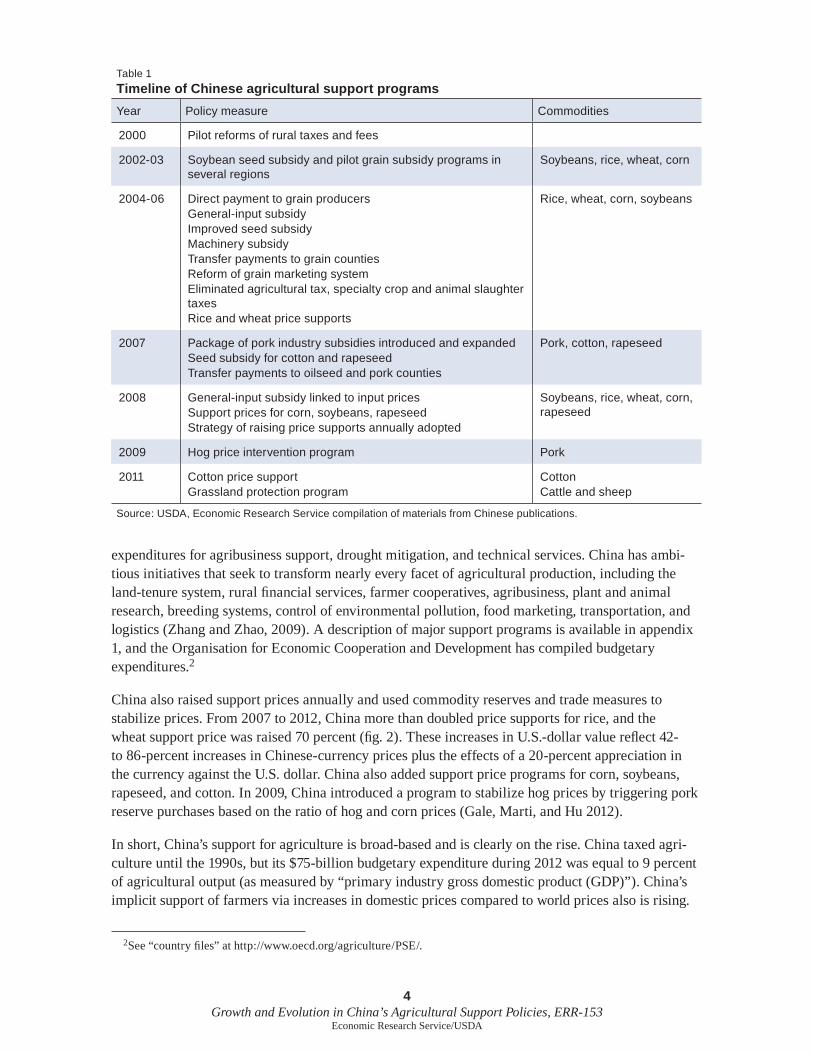
expenditures for agribusiness support, drought mitigation, and technical services. China has ambi-tious initiatives that seek to transform nearly every facet of agricultural production, including the land-tenure system, rural financial services, farmer cooperatives, agribusiness, plant and animal research, breeding systems, control of environmental pollution, food marketing, transportation, and logistics (Zhang and Zhao, 2009). A description of major support programs is available in appendix 1, and the Organisation for Economic Cooperation and Development has compiled budgetary expenditures.2
China also raised support prices annually and used commodity reserves and trade measures to stabilize prices. From 2007 to 2012, China more than doubled price supports for rice, and the wheat support price was raised 70 percent (fig. 2). These increases in U.S.-dollar value reflect 42- to 86-percent increases in Chinese-currency prices plus the effects of a 20-percent appreciation in the currency against the U.S. dollar. China also added support price programs for corn, soybeans, rapeseed, and cotton. In 2009, China introduced a program to stabilize hog prices by triggering pork reserve purchases based on the ratio of hog and corn prices (Gale, Marti, and Hu 2012).
In short, China’s support for agriculture is broad-based and is clearly on the rise. China taxed agri-culture until the 1990s, but its $75-billion budgetary expenditure during 2012 was equal to 9 percent of agricultural output (as measured by “primary industry gross domestic product (GDP)”). China’s implicit support of farmers via increases in domestic prices compared to world prices also is rising.
2See “country files” at http://www.oecd.org/agriculture/PSE/.
Table 1
Timeline of Chinese agricultural support programs
Year Policy measure Commodities
2000 Pilot reforms of rural taxes and fees
2002-03 Soybean seed subsidy and pilot grain subsidy programs in several regions
Soybeans, rice, wheat, corn
2004-06 Direct payment to grain producers General-input subsidyImproved seed subsidyMachinery subsidyTransfer payments to grain countiesReform of grain marketing systemEliminated agricultural tax, specialty crop and animal slaughter taxesRice and wheat price supports
Rice, wheat, corn, soybeans
2007 Package of pork industry subsidies introduced and expandedSeed subsidy for cotton and rapeseedTransfer payments to oilseed and pork counties
Pork, cotton, rapeseed
2008 General-input subsidy linked to input pricesSupport prices for corn, soybeans, rapeseedStrategy of raising price supports annually adopted
Soybeans, rice, wheat, corn, rapeseed
2009 Hog price intervention program Pork
2011 Cotton price supportGrassland protection program
CottonCattle and sheep
Source: USDA, Economic Research Service compilation of materials from Chinese publications.

5 Growth and Evolution in China’s Agricultural Support Policies, ERR-153
Economic Research Service/USDA
OECD’s (2011) assessment through 2010 found that China’s agricultural support was approaching the average for developed countries, and much of the increase reflected market price support.
Figure 2
Minimum prices for wheat and rice, 2004-13
Note: Converted to U.S. dollars at official exchange rates.Source: USDA, Economic Research Service analysis of information from China National Development and Reform Commission.
Dollars per metric ton
0
100
200
300
400
500
600
2004 05 06 07 08 09 10 11 12 13
Short-grain rice
Long-grain rice
Wheat
6 Growth and Evolution in China’s Agricultural Support Policies, ERR-153
Economic Research Service/USDA
China’s Strategy for Increasing Agricultural Support
China’s expansion of agricultural support is driven by a complex mix of strategic and political considerations. At least three factors are pushing support upward:
• Acampaignto“modernize”agriculturebyinducingadoptionofmoderninputs,increasinginvestment, expanding scale of farms, and promoting marketing links
• Concernsaboutrural-urbanincomeinequalityandthepotentialforruralunrest
• Concernsaboutmaintaining“foodsecurity”andself-reliance
Chinese authorities have been intervening in agriculture since the 1980s to address such concerns, but expenditure on agriculture was limited in earlier decades by lack of financial resources. Farmers were taxed—both explicitly and through low-price commodity procurement—and farmers them-selves received little of the expenditure on agriculture. In the 21st century, concerns became more acute and macroeconomic growth made more financial resources available.
Concerns about the international competitiveness of Chinese agricultural producers were an impor-tant influence on China’s agricultural support strategy. At the time of WTO accession, nearly all of China’s farms were small plots of land producing grains—often for family subsistence. The quality of products was generally low and variable, and marketing systems were not well developed. According to Ministry of Agriculture officials (Han, 2011; Niu, 2011), China’s broad strategy was to insulate grain and oilseed producers from import competition while boosting exports of China’s most internationally competitive commodities—fruits, vegetables, and aquatic products (see box, “The Broad Scope of Agricultural Support in China”).
The transition to a market economy and accession to the WTO prompted Chinese officials to adopt indirect market intervention measures—subsidies to farmers and price supports—in place of measures used under central planning. When China joined WTO, officials considered support measures used in other countries to design measures that would conform to the country’s WTO obligations (Liu, Ouyang, and Zhang, 2003; Qian, 2003).3 For example, price supports and a small direct payment to grain producers replaced “protective price” grain procurement conducted in the 1990s through state-owned grain marketing entities (Yuan and Su, 2009).
There is a degree of continuity in some of China’s “new” agricultural support measures. Subsidies for improved seed varieties, livestock breeds, and machinery purchases introduced in the past decade are a continuation of efforts to disseminate these modern inputs that began during the 1980s. Inducements to use modern inputs were central to a strategy for support and protection of agriculture formulated in the 1990s (DRC, 1997).
While Chinese officials now endorse market supply and demand as the primary forces determining prices and resource allocation, many practices reflect influences of central planning and traditional Chinese bureaucratic administration. Dozens of 5-year plans and strategic “regional layout plans” are formulated for each segment of agriculture. “Model” farming districts and Government-directed bank lending are still important policy tools. Bureaucratic structures dictate the implementation of programs,
3China’s Minister of Agriculture noted that WTO obligations also gave officials an opportunity to push forward market-based reforms of grain marketing and rural taxation (Han, 2011).
7 Growth and Evolution in China’s Agricultural Support Policies, ERR-153
Economic Research Service/USDA
and many agribusiness entities have their roots in the planned-economy era. While commodity procurement has been largely privatized, the management of buffer stocks and price-support programs by state-owned reserve management corporations continues to play an important role in markets. These operations are similar to those of Government marketing bureaus in the 1990s.
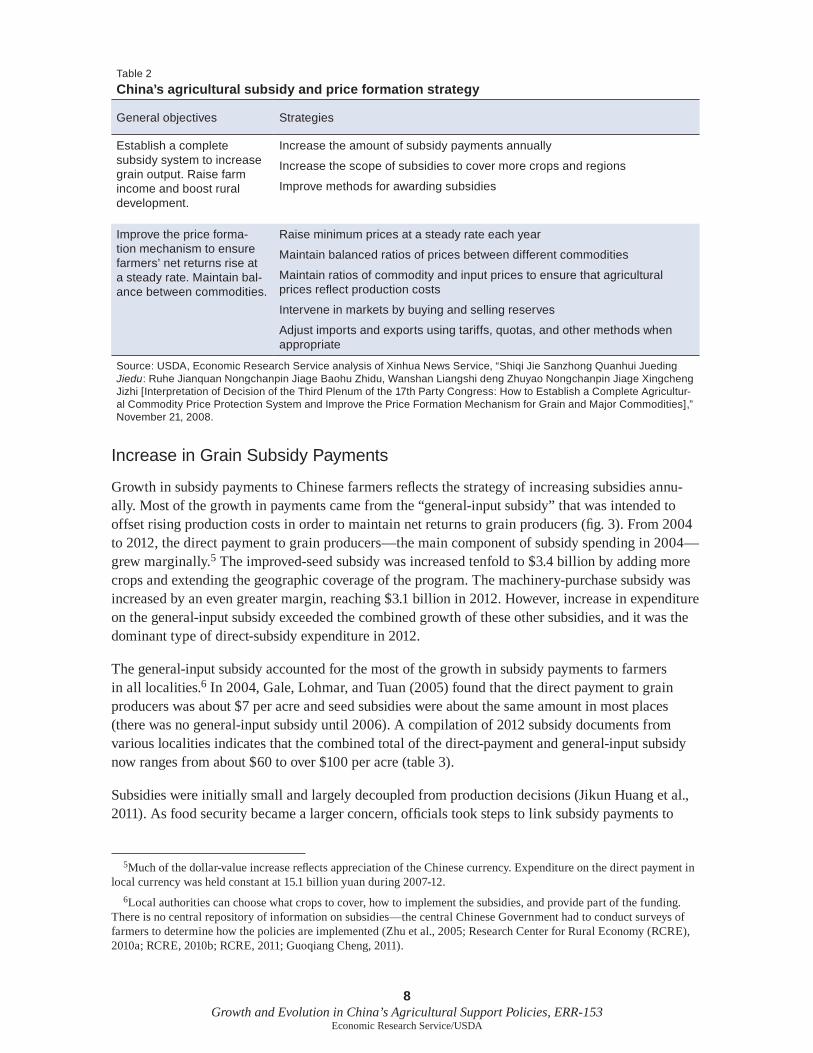
The mechanism that ensures steady increases in agricultural support was set by a strategy for protecting and supporting agriculture formulated by the Chinese Communist Party leadership in 2008, which called for continually boosting subsidy payments and price floors to ensure that net returns to farmers remain steady from year to year (table 2). Citing a variety of objectives—reducing the cost of improved seed varieties, improving the income distribution, raising efficiency, and reducing losses from natural disasters—the strategy called for continually increasing subsidy payments and spreading subsidies to more crops and regions, utilizing the maximum amount of subsidies allowed by WTO rules. The document acknowledged that prices are determined primarily by market forces, but its “price formation” component set numerous targets that seem to ensure frequent intervention in markets. The strategy called for raising agricultural prices relative to indus-trial prices (agricultural prices had been set at low levels to subsidize industry in past decades), setting minimum grain prices to ensure that farmers would earn a stable net return over production costs, and ensuring that all commodity prices and input prices are in balance.4
4China’s practice of setting price supports to guarantee farmers a reasonable profit is another example of continuity in policy. China’s WTO notification for 1996-98 described the setting of 1990s “protective prices” in the same manner.
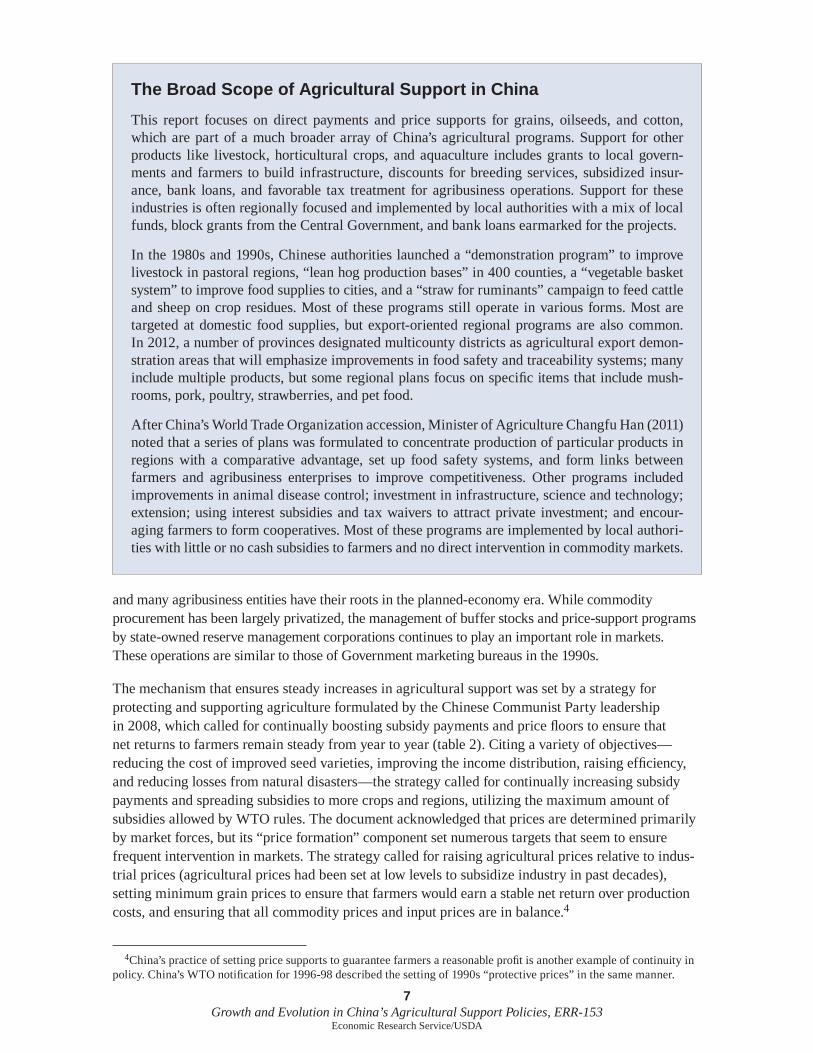
The Broad Scope of Agricultural Support in China
This report focuses on direct payments and price supports for grains, oilseeds, and cotton, which are part of a much broader array of China’s agricultural programs. Support for other products like livestock, horticultural crops, and aquaculture includes grants to local govern-ments and farmers to build infrastructure, discounts for breeding services, subsidized insur-ance, bank loans, and favorable tax treatment for agribusiness operations. Support for these industries is often regionally focused and implemented by local authorities with a mix of local funds, block grants from the Central Government, and bank loans earmarked for the projects.
In the 1980s and 1990s, Chinese authorities launched a “demonstration program” to improve livestock in pastoral regions, “lean hog production bases” in 400 counties, a “vegetable basket system” to improve food supplies to cities, and a “straw for ruminants” campaign to feed cattle and sheep on crop residues. Most of these programs still operate in various forms. Most are targeted at domestic food supplies, but export-oriented regional programs are also common. In 2012, a number of provinces designated multicounty districts as agricultural export demon-stration areas that will emphasize improvements in food safety and traceability systems; many include multiple products, but some regional plans focus on specific items that include mush-rooms, pork, poultry, strawberries, and pet food.
After China’s World Trade Organization accession, Minister of Agriculture Changfu Han (2011) noted that a series of plans was formulated to concentrate production of particular products in regions with a comparative advantage, set up food safety systems, and form links between farmers and agribusiness enterprises to improve competitiveness. Other programs included improvements in animal disease control; investment in infrastructure, science and technology; extension; using interest subsidies and tax waivers to attract private investment; and encour-aging farmers to form cooperatives. Most of these programs are implemented by local authori-ties with little or no cash subsidies to farmers and no direct intervention in commodity markets.
8 Growth and Evolution in China’s Agricultural Support Policies, ERR-153
Economic Research Service/USDA
Increase in Grain Subsidy Payments
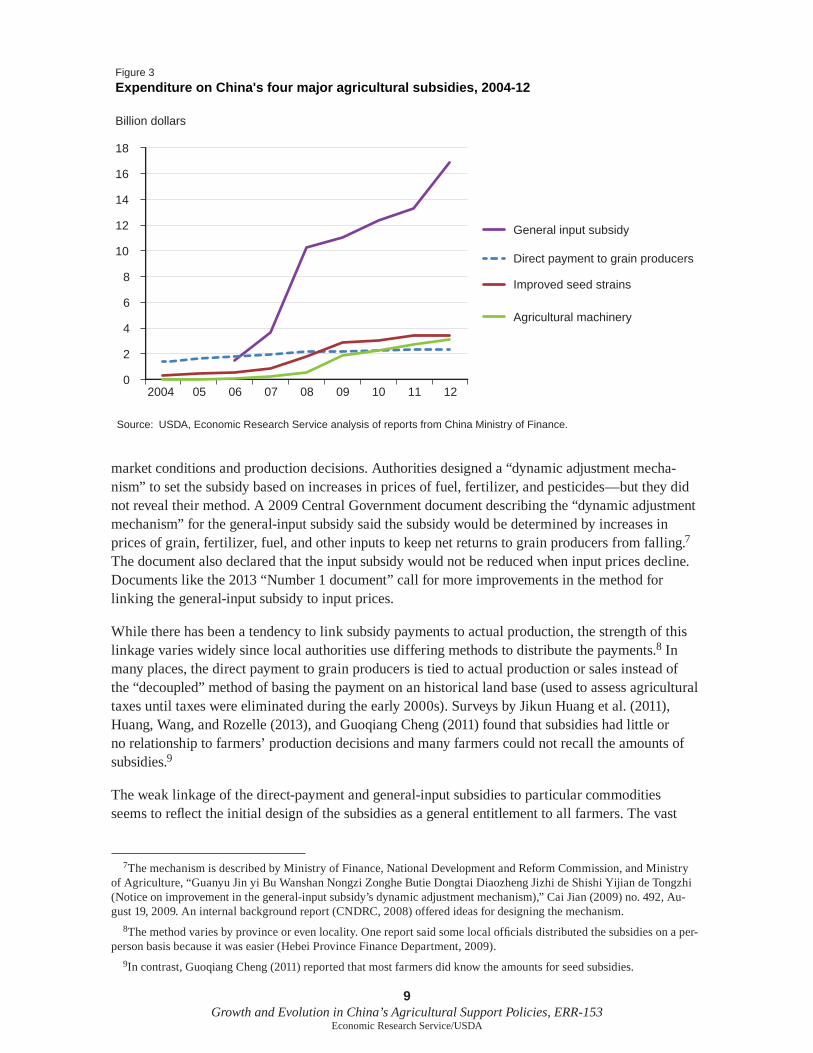
Growth in subsidy payments to Chinese farmers reflects the strategy of increasing subsidies annu-ally. Most of the growth in payments came from the “general-input subsidy” that was intended to offset rising production costs in order to maintain net returns to grain producers (fig. 3). From 2004 to 2012, the direct payment to grain producers—the main component of subsidy spending in 2004—grew marginally.5 The improved-seed subsidy was increased tenfold to $3.4 billion by adding more crops and extending the geographic coverage of the program. The machinery-purchase subsidy was increased by an even greater margin, reaching $3.1 billion in 2012. However, increase in expenditure on the general-input subsidy exceeded the combined growth of these other subsidies, and it was the dominant type of direct-subsidy expenditure in 2012.
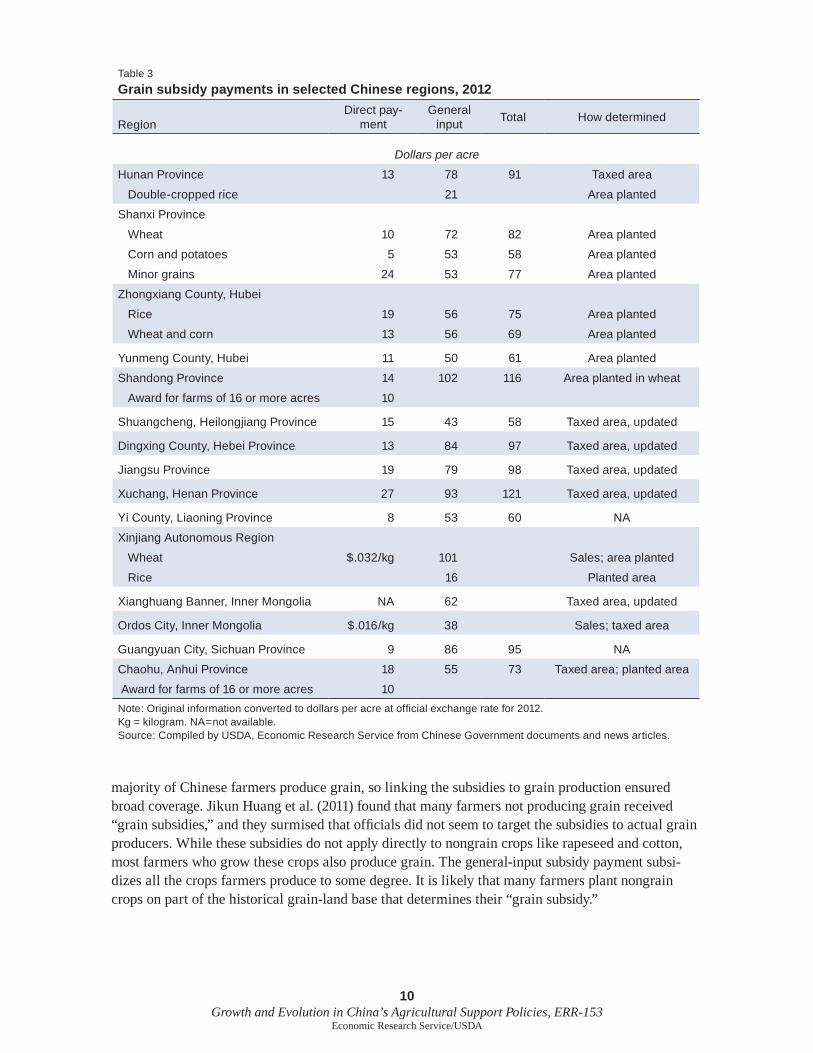
The general-input subsidy accounted for the most of the growth in subsidy payments to farmers in all localities.6 In 2004, Gale, Lohmar, and Tuan (2005) found that the direct payment to grain producers was about $7 per acre and seed subsidies were about the same amount in most places (there was no general-input subsidy until 2006). A compilation of 2012 subsidy documents from various localities indicates that the combined total of the direct-payment and general-input subsidy now ranges from about $60 to over $100 per acre (table 3).
Subsidies were initially small and largely decoupled from production decisions (Jikun Huang et al., 2011). As food security became a larger concern, officials took steps to link subsidy payments to
5Much of the dollar-value increase reflects appreciation of the Chinese currency. Expenditure on the direct payment in local currency was held constant at 15.1 billion yuan during 2007-12.
6Local authorities can choose what crops to cover, how to implement the subsidies, and provide part of the funding. There is no central repository of information on subsidies—the central Chinese Government had to conduct surveys of farmers to determine how the policies are implemented (Zhu et al., 2005; Research Center for Rural Economy (RCRE), 2010a; RCRE, 2010b; RCRE, 2011; Guoqiang Cheng, 2011).
Table 2
China’s agricultural subsidy and price formation strategy
General objectives Strategies
Establish a complete subsidy system to increase grain output. Raise farm income and boost rural development.
Increase the amount of subsidy payments annually
Increase the scope of subsidies to cover more crops and regions
Improve methods for awarding subsidies
Improve the price forma-tion mechanism to ensure farmers’ net returns rise at a steady rate. Maintain bal-ance between commodities.
Raise minimum prices at a steady rate each year
Maintain balanced ratios of prices between different commodities
Maintain ratios of commodity and input prices to ensure that agricultural prices reflect production costs
Intervene in markets by buying and selling reserves
Adjust imports and exports using tariffs, quotas, and other methods when appropriate
Source: USDA, Economic Research Service analysis of Xinhua News Service, “Shiqi Jie Sanzhong Quanhui Jueding Jiedu: Ruhe Jianquan Nongchanpin Jiage Baohu Zhidu, Wanshan Liangshi deng Zhuyao Nongchanpin Jiage Xingcheng Jizhi [Interpretation of Decision of the Third Plenum of the 17th Party Congress: How to Establish a Complete Agricultur-al Commodity Price Protection System and Improve the Price Formation Mechanism for Grain and Major Commodities],” November 21, 2008.
9 Growth and Evolution in China’s Agricultural Support Policies, ERR-153
Economic Research Service/USDA
market conditions and production decisions. Authorities designed a “dynamic adjustment mecha-nism” to set the subsidy based on increases in prices of fuel, fertilizer, and pesticides—but they did not reveal their method. A 2009 Central Government document describing the “dynamic adjustment mechanism” for the general-input subsidy said the subsidy would be determined by increases in prices of grain, fertilizer, fuel, and other inputs to keep net returns to grain producers from falling.7 The document also declared that the input subsidy would not be reduced when input prices decline. Documents like the 2013 “Number 1 document” call for more improvements in the method for linking the general-input subsidy to input prices.
While there has been a tendency to link subsidy payments to actual production, the strength of this linkage varies widely since local authorities use differing methods to distribute the payments.8 In many places, the direct payment to grain producers is tied to actual production or sales instead of the “decoupled” method of basing the payment on an historical land base (used to assess agricultural taxes until taxes were eliminated during the early 2000s). Surveys by Jikun Huang et al. (2011), Huang, Wang, and Rozelle (2013), and Guoqiang Cheng (2011) found that subsidies had little or no relationship to farmers’ production decisions and many farmers could not recall the amounts of subsidies.9
The weak linkage of the direct-payment and general-input subsidies to particular commodities seems to reflect the initial design of the subsidies as a general entitlement to all farmers. The vast
7The mechanism is described by Ministry of Finance, National Development and Reform Commission, and Ministry of Agriculture, “Guanyu Jin yi Bu Wanshan Nongzi Zonghe Butie Dongtai Diaozheng Jizhi de Shishi Yijian de Tongzhi (Notice on improvement in the general-input subsidy’s dynamic adjustment mechanism),” Cai Jian (2009) no. 492, Au-gust 19, 2009. An internal background report (CNDRC, 2008) offered ideas for designing the mechanism.
8The method varies by province or even locality. One report said some local officials distributed the subsidies on a per-person basis because it was easier (Hebei Province Finance Department, 2009).
9In contrast, Guoqiang Cheng (2011) reported that most farmers did know the amounts for seed subsidies.
Figure 3
Expenditure on China's four major agricultural subsidies, 2004-12
Source: USDA, Economic Research Service analysis of reports from China Ministry of Finance.
Billion dollars
0
2
4
6
8
10
12
14
16
18
2004 05 06 07 08 09 10 11 12
General input subsidy
Direct payment to grain producers
Improved seed strains
Agricultural machinery
10 Growth and Evolution in China’s Agricultural Support Policies, ERR-153
Economic Research Service/USDA
majority of Chinese farmers produce grain, so linking the subsidies to grain production ensured broad coverage. Jikun Huang et al. (2011) found that many farmers not producing grain received “grain subsidies,” and they surmised that officials did not seem to target the subsidies to actual grain producers. While these subsidies do not apply directly to nongrain crops like rapeseed and cotton, most farmers who grow these crops also produce grain. The general-input subsidy payment subsi-dizes all the crops farmers produce to some degree. It is likely that many farmers plant nongrain crops on part of the historical grain-land base that determines their “grain subsidy.”
Table 3
Grain subsidy payments in selected Chinese regions, 2012
RegionDirect pay-
mentGeneral
inputTotal How determined
Dollars per acre
Hunan Province 13 78 91 Taxed area
Double-cropped rice 21 Area planted
Shanxi Province
Wheat 10 72 82 Area planted
Corn and potatoes 5 53 58 Area planted
Minor grains 24 53 77 Area planted
Zhongxiang County, Hubei
Rice 19 56 75 Area planted
Wheat and corn 13 56 69 Area planted
Yunmeng County, Hubei 11 50 61 Area planted
Shandong Province 14 102 116 Area planted in wheat
Award for farms of 16 or more acres 10
Shuangcheng, Heilongjiang Province 15 43 58 Taxed area, updated
Dingxing County, Hebei Province 13 84 97 Taxed area, updated
Jiangsu Province 19 79 98 Taxed area, updated
Xuchang, Henan Province 27 93 121 Taxed area, updated
Yi County, Liaoning Province 8 53 60 NA
Xinjiang Autonomous Region
Wheat $.032/kg 101 Sales; area planted
Rice 16 Planted area
Xianghuang Banner, Inner Mongolia NA 62 Taxed area, updated
Ordos City, Inner Mongolia $.016/kg 38 Sales; taxed area
Guangyuan City, Sichuan Province 9 86 95 NA
Chaohu, Anhui Province 18 55 73 Taxed area; planted area
Award for farms of 16 or more acres 10
Note: Original information converted to dollars per acre at official exchange rate for 2012. Kg = kilogram. NA=not available.Source: Compiled by USDA, Economic Research Service from Chinese Government documents and news articles.
11 Growth and Evolution in China’s Agricultural Support Policies, ERR-153
Economic Research Service/USDA
The weak link to grain production has been criticized by many Chinese officials for failing to encourage grain production. As food security concerns have grown in importance, officials have gradually linked subsidies more closely to production. The historical land base is often updated to reflect current land use by deducting land no longer used for grain and adding newly cultivated land. The 2009 document explaining the “dynamic adjustment mechanism” urged local officials to distribute the general-input subsidy based on actual planting of crops. In most regions, the direct-payment and general-input subsidy are distributed together, but they are distributed using different methods in Xinjiang and Anhui. Many local government websites now post files listing farmers and the area planted in each eligible grain crop to calculate subsidy payments. Financial officials in Shandong Province report using remote sensing technology to verify wheat area reported by farmers to collect subsidy payments.
The “improvement” of subsidy methods also is reflected by a “large grain farm” subsidy offered by Anhui and Shandong Provinces, which gave an extra payment of 10 yuan per mu (about $10 per acre) to farms of 100 mu (16 acres) or more; 15 mu = 1 hectare; 6.07 mu = 1 acre.
This type of subsidy was implemented by various provinces after the 2008 “decision” on rural policy encouraged local officials to explore ways of consolidating farmland into larger operations. An ERS review of lists of “large” grain farm subsidy recipients from Sichuan Province and several prefectures in Zhejiang, Jiangxi, and Anhui Provinces found that the number of recipients was rela-tively small, and the size and amount of payments varied widely. Some provinces also give “award” payments to farmers who consolidate plots of land into an operation of a certain size.
“Large” farms are still a small proportion of farms in China but they are becoming more common. In a survey of 220 farms, Guoqiang Cheng (2011) found 5 “large farms” with an average of 170 acres, and each farm had nearly doubled its size in 1 year. According to the Ministry of Agriculture, China had 2.7 million “large farms” of 100 mu or larger in 2012.10
Expanded Coverage of Improved Seed Subsidy
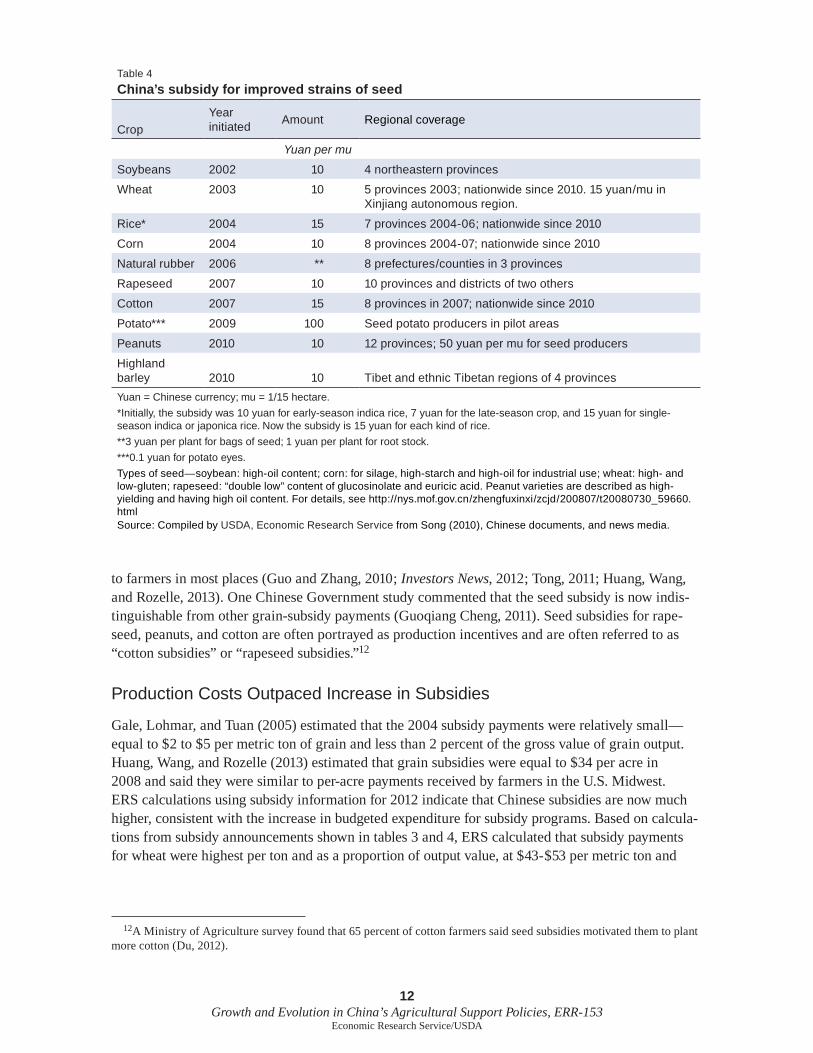
Expenditure on the subsidy for improved seeds grew by expanding the crop and regional coverage of the program. The seed subsidy began with soybeans in northeastern provinces during 2002. By 2010, seed subsidies were offered for nine major crops (table 4). In contrast to the general-input subsidy, the seed-subsidy payment level remained constant for most crops (payments were raised for certain types of rice) and is generally the same in each region. The subsidy of 10 yuan per mu planted for most crops was approximately equal to $10 per acre in 2012. Surveys by the Ministry of Agriculture found that nearly all farmers received seed subsidies (RCRE, 2010a; RCRE, 2011).11 Guoqiang Cheng (2011) estimated that seed subsidies received by farmers equaled about 20 percent of seed costs for wheat and corn, 40 percent for rapeseed and cotton and 30 to 50 percent for different types of rice.
The seed subsidy illustrates the ambiguity of program objectives and how they change over time. The subsidy for improved seed was initially aimed at inducing adoption of a “modern” input. It was paid to seed companies that were to supply seeds to farmers. However, allegations of corruption, abuse, and lack of benefit for farmers resulted in the seed subsidy being converted to a cash payment
10This is about 1.4 percent of the 200 million farming operations reported by China’s 2006 agricultural census.11There are similar subsidies for improved breeds of swine, cattle, and sheep; funds are distributed to propagation
farms and breeding stations to fund discounted artificial inseminations.
12 Growth and Evolution in China’s Agricultural Support Policies, ERR-153
Economic Research Service/USDA
to farmers in most places (Guo and Zhang, 2010; Investors News, 2012; Tong, 2011; Huang, Wang, and Rozelle, 2013). One Chinese Government study commented that the seed subsidy is now indis-tinguishable from other grain-subsidy payments (Guoqiang Cheng, 2011). Seed subsidies for rape-seed, peanuts, and cotton are often portrayed as production incentives and are often referred to as “cotton subsidies” or “rapeseed subsidies.”12
Production Costs Outpaced Increase in Subsidies
Gale, Lohmar, and Tuan (2005) estimated that the 2004 subsidy payments were relatively small—equal to $2 to $5 per metric ton of grain and less than 2 percent of the gross value of grain output. Huang, Wang, and Rozelle (2013) estimated that grain subsidies were equal to $34 per acre in 2008 and said they were similar to per-acre payments received by farmers in the U.S. Midwest. ERS calculations using subsidy information for 2012 indicate that Chinese subsidies are now much higher, consistent with the increase in budgeted expenditure for subsidy programs. Based on calcula-tions from subsidy announcements shown in tables 3 and 4, ERS calculated that subsidy payments for wheat were highest per ton and as a proportion of output value, at $43-$53 per metric ton and
12A Ministry of Agriculture survey found that 65 percent of cotton farmers said seed subsidies motivated them to plant more cotton (Du, 2012).
Table 4
China’s subsidy for improved strains of seed
CropYear initiated
Amount Regional coverage
Yuan per mu
Soybeans 2002 10 4 northeastern provinces
Wheat 2003 10 5 provinces 2003; nationwide since 2010. 15 yuan/mu in Xinjiang autonomous region.
Rice* 2004 15 7 provinces 2004-06; nationwide since 2010
Corn 2004 10 8 provinces 2004-07; nationwide since 2010
Natural rubber 2006 ** 8 prefectures/counties in 3 provinces
Rapeseed 2007 10 10 provinces and districts of two others
Cotton 2007 15 8 provinces in 2007; nationwide since 2010
Potato*** 2009 100 Seed potato producers in pilot areas
Peanuts 2010 10 12 provinces; 50 yuan per mu for seed producers
Highland barley 2010 10 Tibet and ethnic Tibetan regions of 4 provinces
Yuan = Chinese currency; mu = 1/15 hectare.
*Initially, the subsidy was 10 yuan for early-season indica rice, 7 yuan for the late-season crop, and 15 yuan for single-season indica or japonica rice. Now the subsidy is 15 yuan for each kind of rice.
**3 yuan per plant for bags of seed; 1 yuan per plant for root stock.
***0.1 yuan for potato eyes.
Types of seed—soybean: high-oil content; corn: for silage, high-starch and high-oil for industrial use; wheat: high- and low-gluten; rapeseed: “double low” content of glucosinolate and euricic acid. Peanut varieties are described as high-yielding and having high oil content. For details, see http://nys.mof.gov.cn/zhengfuxinxi/zcjd/200807/t20080730_59660.htmlSource: Compiled by USDA, Economic Research Service from Song (2010), Chinese documents, and news media.
13 Growth and Evolution in China’s Agricultural Support Policies, ERR-153
Economic Research Service/USDA
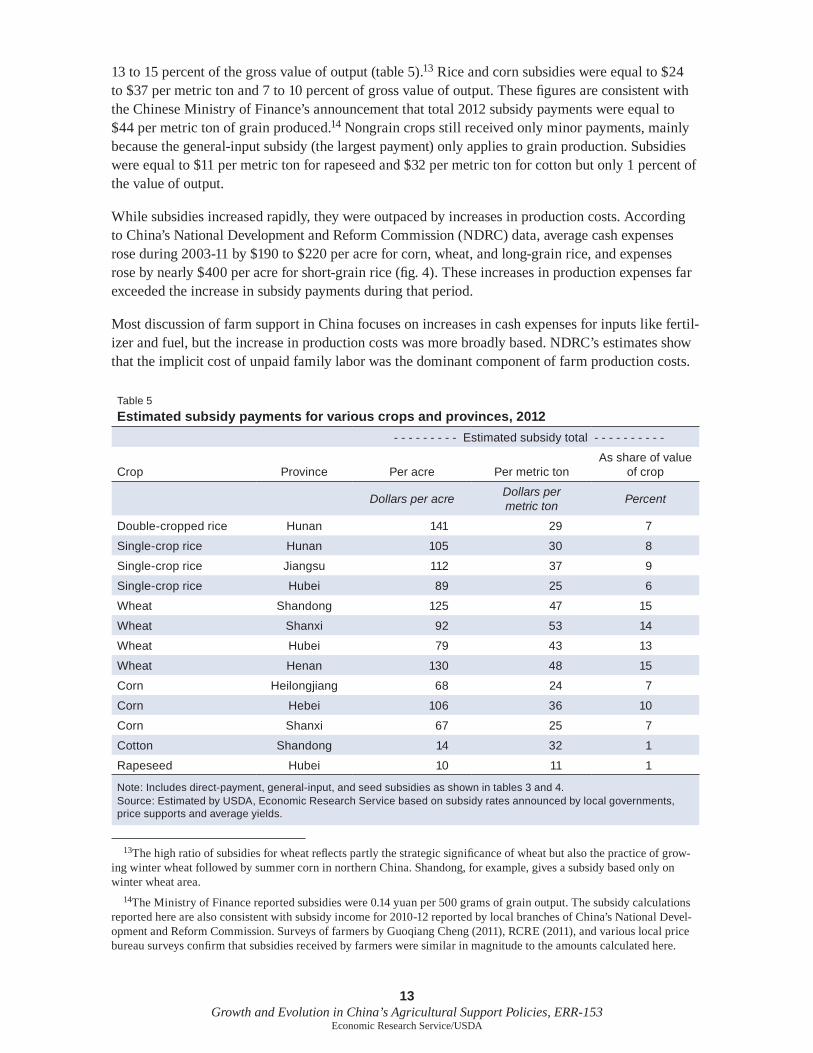
13 to 15 percent of the gross value of output (table 5).13 Rice and corn subsidies were equal to $24 to $37 per metric ton and 7 to 10 percent of gross value of output. These figures are consistent with the Chinese Ministry of Finance’s announcement that total 2012 subsidy payments were equal to $44 per metric ton of grain produced.14 Nongrain crops still received only minor payments, mainly because the general-input subsidy (the largest payment) only applies to grain production. Subsidies were equal to $11 per metric ton for rapeseed and $32 per metric ton for cotton but only 1 percent of the value of output.
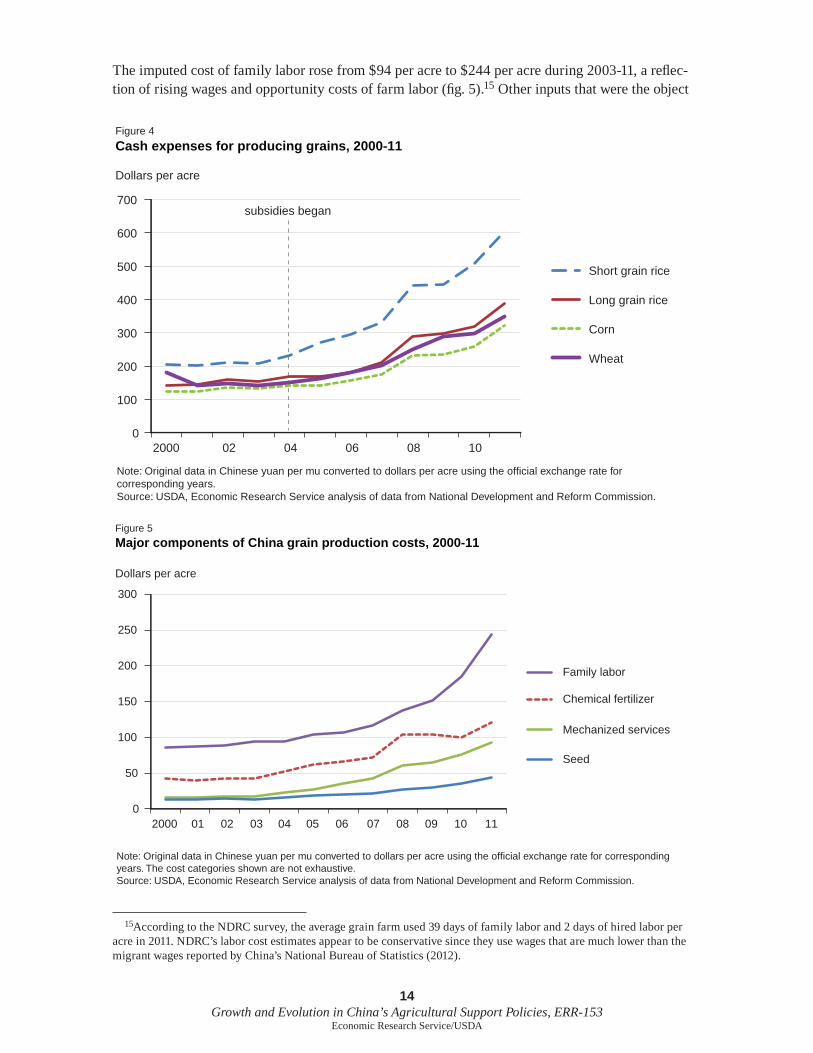
While subsidies increased rapidly, they were outpaced by increases in production costs. According to China’s National Development and Reform Commission (NDRC) data, average cash expenses rose during 2003-11 by $190 to $220 per acre for corn, wheat, and long-grain rice, and expenses rose by nearly $400 per acre for short-grain rice (fig. 4). These increases in production expenses far exceeded the increase in subsidy payments during that period.
Most discussion of farm support in China focuses on increases in cash expenses for inputs like fertil-izer and fuel, but the increase in production costs was more broadly based. NDRC’s estimates show that the implicit cost of unpaid family labor was the dominant component of farm production costs.
13The high ratio of subsidies for wheat reflects partly the strategic significance of wheat but also the practice of grow-ing winter wheat followed by summer corn in northern China. Shandong, for example, gives a subsidy based only on winter wheat area.
14The Ministry of Finance reported subsidies were 0.14 yuan per 500 grams of grain output. The subsidy calculations reported here are also consistent with subsidy income for 2010-12 reported by local branches of China’s National Devel-opment and Reform Commission. Surveys of farmers by Guoqiang Cheng (2011), RCRE (2011), and various local price bureau surveys confirm that subsidies received by farmers were similar in magnitude to the amounts calculated here.
Table 5
Estimated subsidy payments for various crops and provinces, 2012
- - - - - - - - - Estimated subsidy total - - - - - - - - - -
Crop Province Per acre Per metric tonAs share of value
of crop
Dollars per acreDollars per metric ton
Percent
Double-cropped rice Hunan 141 29 7
Single-crop rice Hunan 105 30 8
Single-crop rice Jiangsu 112 37 9
Single-crop rice Hubei 89 25 6
Wheat Shandong 125 47 15
Wheat Shanxi 92 53 14
Wheat Hubei 79 43 13
Wheat Henan 130 48 15
Corn Heilongjiang 68 24 7
Corn Hebei 106 36 10
Corn Shanxi 67 25 7
Cotton Shandong 14 32 1
Rapeseed Hubei 10 11 1
Note: Includes direct-payment, general-input, and seed subsidies as shown in tables 3 and 4. Source: Estimated by USDA, Economic Research Service based on subsidy rates announced by local governments, price supports and average yields.
14 Growth and Evolution in China’s Agricultural Support Policies, ERR-153
Economic Research Service/USDA
The imputed cost of family labor rose from $94 per acre to $244 per acre during 2003-11, a reflec-tion of rising wages and opportunity costs of farm labor (fig. 5).15 Other inputs that were the object
15According to the NDRC survey, the average grain farm used 39 days of family labor and 2 days of hired labor per acre in 2011. NDRC’s labor cost estimates appear to be conservative since they use wages that are much lower than the migrant wages reported by China’s National Bureau of Statistics (2012).
Note: Original data in Chinese yuan per mu converted to dollars per acre using the official exchange rate for corresponding years.Source: USDA, Economic Research Service analysis of data from National Development and Reform Commission.
Figure 4
Cash expenses for producing grains, 2000-11
Dollars per acre
0
100
200
300
400
500
600
700
2000 02 04 06 08 10
Short grain rice
Long grain rice
Corn
Wheat
subsidies began
Figure 5
Major components of China grain production costs, 2000-11
Note: Original data in Chinese yuan per mu converted to dollars per acre using the official exchange rate for correspondingyears. The cost categories shown are not exhaustive.Source: USDA, Economic Research Service analysis of data from National Development and Reform Commission.
Dollars per acre
0
50
100
150
200
250
300
Family labor
Chemical fertilizer
Mechanized services
Seed
2000 01 02 03 04 05 06 09 1007 08 11
15 Growth and Evolution in China’s Agricultural Support Policies, ERR-153
Economic Research Service/USDA
of subsidy programs—seeds and mechanized services—also contributed to increases in produc-tion costs. The increase in these implicit costs far exceeded the value of subsidy payments (see box, “Machinery Purchase Subsidy as a Modernization Measure”).
Growth in off-farm work opportunities poses the biggest challenge to maintaining agricultural output. As prospective off-farm wages rise, farmers require higher net returns to induce them to continue planting crops or raising livestock. China’s National Bureau of Statistics reported that 262.6 million rural people were employed off-farm for at least 6 months in 2012, up from 225 million in 2008.16
16China National Bureau of Statistics, “Progress in National Economic Development in 2012,” January 2013, http://www.stats.gov.cn/tjfx/jdfx/t20130118_402867146.htm. By comparison, China’s agricultural census estimated that 339 million people were engaged in agriculture in 2006.
Machinery Purchase Subsidy as a Modernization Measure
In contrast to grain payments and seed subsidies, the machinery subsidy in China is almost exclusively a “modernization” measure. In contrast to grain subsidies, which have been spread widely over the rural population, the machinery subsidy is received by only 2 to 3 percent of farmers annually since few make large equipment purchases (RCRE, 2010; RCRE, 2011). Purchasers receive a 30-percent discount on a national list of approved equipment. The list includes hundreds of items such as tractors, harvesting, tillage, and seeding equipment, and a wide variety of other equipment. The machinery subsidy was expanded by including more types of equipment and offering it in more regions. Increased expenditure on the machinery subsidy reflects the Chinese Government’s view that mechanization is an important means of “modernizing” agriculture and improving productivity.
Guoqiang Cheng (2011) reported that some farmers purchased machinery to facilitate large-scale operations, while others bought machines to offer custom services to other farmers. Cheng surmised that the main benefits were reductions in hired labor costs, and improved labor productivity. Mechanization potentially can raise productivity by reducing time needed for key agricultural tasks, thus facilitating earlier planting, later harvest, or double-cropping. The machinery subsidy is integrated into many specific campaigns for promoting conservation tillage; improving milk supply chains; and promoting drying of grain, irrigation programs, recovery from natural disasters, and even public health programs.
A description of the machinery purchase program’s implementation in a prefecture in Inner Mongolia reveals that local officials play an active role in inducing farmers to mechanize (Shuai Wang 2011). Farmers in this district initially showed little interest in corn harvesters and many were dissatisfied with poor-quality equipment. Only 13 percent of local corn was harvested mechanically in 2010, after a 10-year campaign to induce farmers to mechanize. In order to boost utilization of the machinery subsidy, promotion of the use of mechanical corn harvesters was included in job ratings for township officials, local funds were added to Central Government subsidy funds, farmers were instructed to space rows of corn to accommodate mechanical harvesters, and officials ordered companies to supply training and repair services. According to another report from the local mechanization bureau, the share of corn mechani-cally harvested in the prefecture doubled to 27 percent in 2012, an increase attributed to both the subsidy and rapid increases in labor costs.
16 Growth and Evolution in China’s Agricultural Support Policies, ERR-153
Economic Research Service/USDA
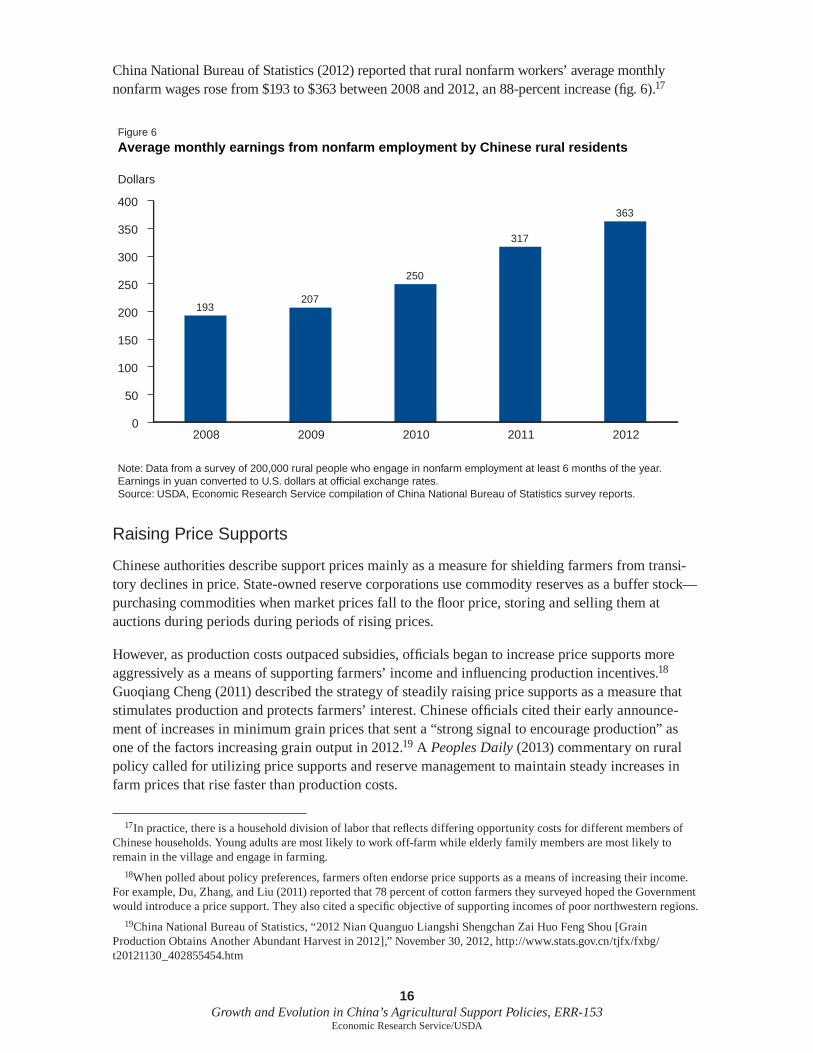
China National Bureau of Statistics (2012) reported that rural nonfarm workers’ average monthly nonfarm wages rose from $193 to $363 between 2008 and 2012, an 88-percent increase (fig. 6).17
Raising Price Supports
Chinese authorities describe support prices mainly as a measure for shielding farmers from transi-tory declines in price. State-owned reserve corporations use commodity reserves as a buffer stock—purchasing commodities when market prices fall to the floor price, storing and selling them at auctions during periods during periods of rising prices.
However, as production costs outpaced subsidies, officials began to increase price supports more aggressively as a means of supporting farmers’ income and influencing production incentives.18 Guoqiang Cheng (2011) described the strategy of steadily raising price supports as a measure that stimulates production and protects farmers’ interest. Chinese officials cited their early announce-ment of increases in minimum grain prices that sent a “strong signal to encourage production” as one of the factors increasing grain output in 2012.19 A Peoples Daily (2013) commentary on rural policy called for utilizing price supports and reserve management to maintain steady increases in farm prices that rise faster than production costs.
17In practice, there is a household division of labor that reflects differing opportunity costs for different members of Chinese households. Young adults are most likely to work off-farm while elderly family members are most likely to remain in the village and engage in farming.
18When polled about policy preferences, farmers often endorse price supports as a means of increasing their income. For example, Du, Zhang, and Liu (2011) reported that 78 percent of cotton farmers they surveyed hoped the Government would introduce a price support. They also cited a specific objective of supporting incomes of poor northwestern regions.
19China National Bureau of Statistics, “2012 Nian Quanguo Liangshi Shengchan Zai Huo Feng Shou [Grain Production Obtains Another Abundant Harvest in 2012],” November 30, 2012, http://www.stats.gov.cn/tjfx/fxbg/t20121130_402855454.htm
Note: Data from a survey of 200,000 rural people who engage in nonfarm employment at least 6 months of the year. Earnings in yuan converted to U.S. dollars at official exchange rates.Source: USDA, Economic Research Service compilation of China National Bureau of Statistics survey reports.
Figure 6
Average monthly earnings from nonfarm employment by Chinese rural residents
Dollars
193207
250
317
363
0
50
100
150
200
250
300
350
400
2008 2009 2010 2011 2012
17 Growth and Evolution in China’s Agricultural Support Policies, ERR-153
Economic Research Service/USDA
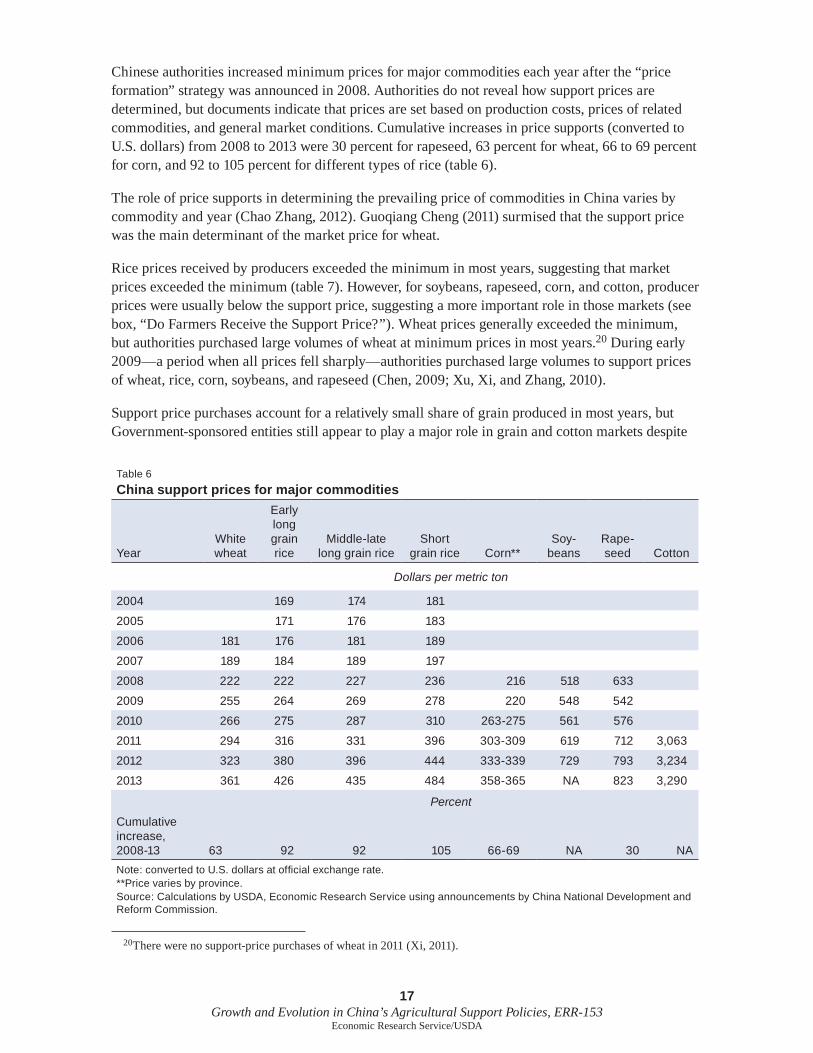
Chinese authorities increased minimum prices for major commodities each year after the “price formation” strategy was announced in 2008. Authorities do not reveal how support prices are determined, but documents indicate that prices are set based on production costs, prices of related commodities, and general market conditions. Cumulative increases in price supports (converted to U.S. dollars) from 2008 to 2013 were 30 percent for rapeseed, 63 percent for wheat, 66 to 69 percent for corn, and 92 to 105 percent for different types of rice (table 6).
The role of price supports in determining the prevailing price of commodities in China varies by commodity and year (Chao Zhang, 2012). Guoqiang Cheng (2011) surmised that the support price was the main determinant of the market price for wheat.
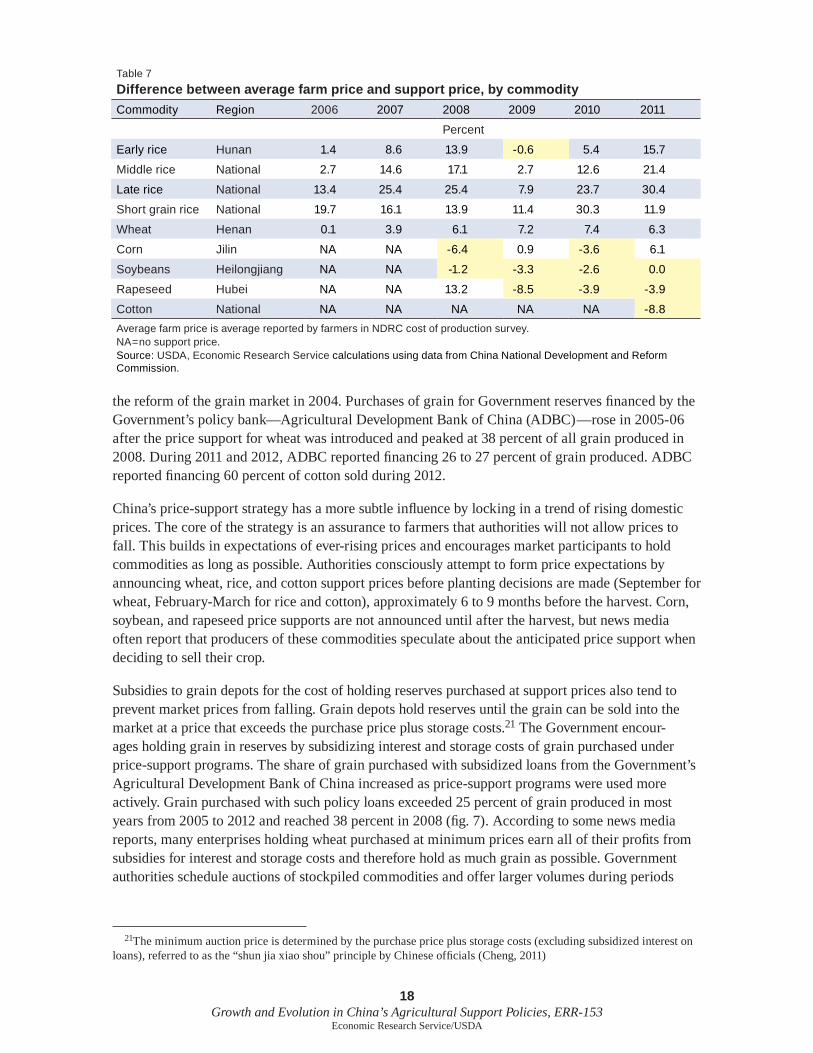
Rice prices received by producers exceeded the minimum in most years, suggesting that market prices exceeded the minimum (table 7). However, for soybeans, rapeseed, corn, and cotton, producer prices were usually below the support price, suggesting a more important role in those markets (see box, “Do Farmers Receive the Support Price?”). Wheat prices generally exceeded the minimum, but authorities purchased large volumes of wheat at minimum prices in most years.20 During early 2009—a period when all prices fell sharply—authorities purchased large volumes to support prices of wheat, rice, corn, soybeans, and rapeseed (Chen, 2009; Xu, Xi, and Zhang, 2010).
Support price purchases account for a relatively small share of grain produced in most years, but Government-sponsored entities still appear to play a major role in grain and cotton markets despite
20There were no support-price purchases of wheat in 2011 (Xi, 2011).
Table 6
China support prices for major commodities
YearWhite wheat
Early long grain rice
Middle-late long grain rice
Short grain rice Corn**
Soy-beans
Rape- seed Cotton
Dollars per metric ton
2004 169 174 181
2005 171 176 183
2006 181 176 181 189
2007 189 184 189 197
2008 222 222 227 236 216 518 633
2009 255 264 269 278 220 548 542
2010 266 275 287 310 263-275 561 576
2011 294 316 331 396 303-309 619 712 3,063
2012 323 380 396 444 333-339 729 793 3,234
2013 361 426 435 484 358-365 NA 823 3,290
Percent
Cumulative increase, 2008-13 63 92 92 105 66-69 NA 30 NA
Note: converted to U.S. dollars at official exchange rate. **Price varies by province.Source: Calculations by USDA, Economic Research Service using announcements by China National Development and Reform Commission.
18 Growth and Evolution in China’s Agricultural Support Policies, ERR-153
Economic Research Service/USDA
the reform of the grain market in 2004. Purchases of grain for Government reserves financed by the Government’s policy bank—Agricultural Development Bank of China (ADBC)—rose in 2005-06 after the price support for wheat was introduced and peaked at 38 percent of all grain produced in 2008. During 2011 and 2012, ADBC reported financing 26 to 27 percent of grain produced. ADBC reported financing 60 percent of cotton sold during 2012.
China’s price-support strategy has a more subtle influence by locking in a trend of rising domestic prices. The core of the strategy is an assurance to farmers that authorities will not allow prices to fall. This builds in expectations of ever-rising prices and encourages market participants to hold commodities as long as possible. Authorities consciously attempt to form price expectations by announcing wheat, rice, and cotton support prices before planting decisions are made (September for wheat, February-March for rice and cotton), approximately 6 to 9 months before the harvest. Corn, soybean, and rapeseed price supports are not announced until after the harvest, but news media often report that producers of these commodities speculate about the anticipated price support when deciding to sell their crop.
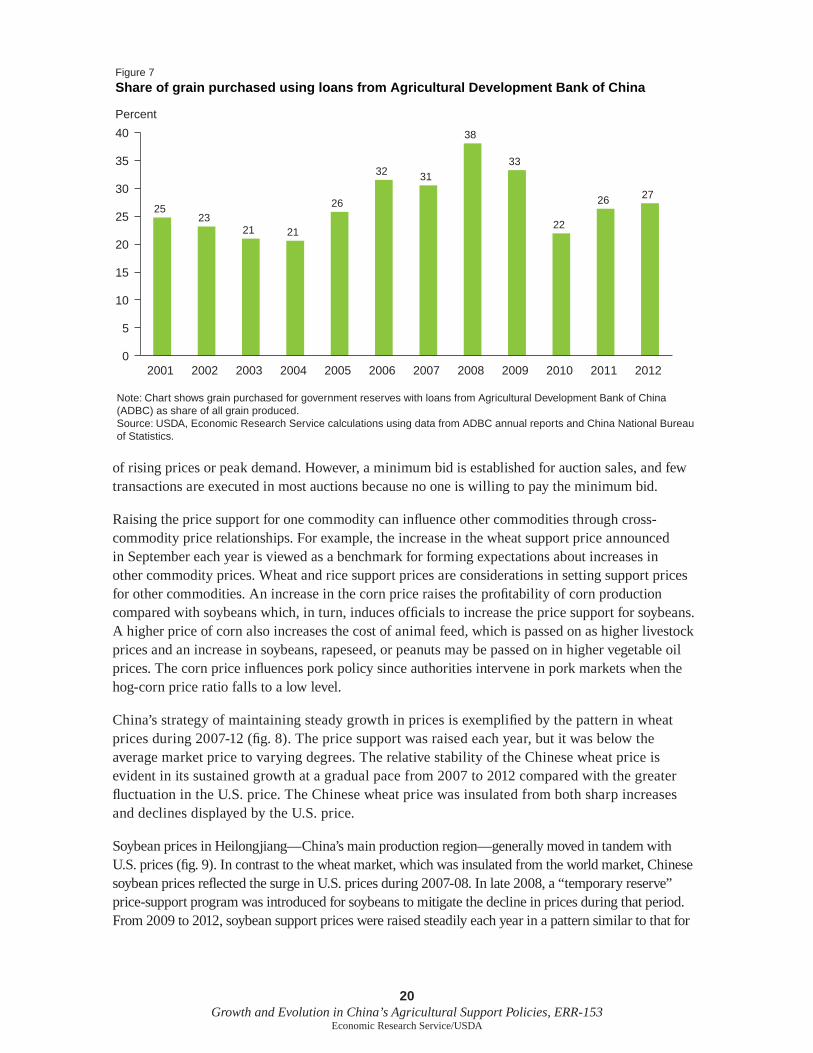
Subsidies to grain depots for the cost of holding reserves purchased at support prices also tend to prevent market prices from falling. Grain depots hold reserves until the grain can be sold into the market at a price that exceeds the purchase price plus storage costs.21 The Government encour-ages holding grain in reserves by subsidizing interest and storage costs of grain purchased under price-support programs. The share of grain purchased with subsidized loans from the Government’s Agricultural Development Bank of China increased as price-support programs were used more actively. Grain purchased with such policy loans exceeded 25 percent of grain produced in most years from 2005 to 2012 and reached 38 percent in 2008 (fig. 7). According to some news media reports, many enterprises holding wheat purchased at minimum prices earn all of their profits from subsidies for interest and storage costs and therefore hold as much grain as possible. Government authorities schedule auctions of stockpiled commodities and offer larger volumes during periods
21The minimum auction price is determined by the purchase price plus storage costs (excluding subsidized interest on loans), referred to as the “shun jia xiao shou” principle by Chinese officials (Cheng, 2011)
Table 7
Difference between average farm price and support price, by commodity
Commodity Region 2006 2007 2008 2009 2010 2011
Percent
Early rice Hunan 1.4 8.6 13.9 -0.6 5.4 15.7
Middle rice National 2.7 14.6 17.1 2.7 12.6 21.4
Late rice National 13.4 25.4 25.4 7.9 23.7 30.4
Short grain rice National 19.7 16.1 13.9 11.4 30.3 11.9
Wheat Henan 0.1 3.9 6.1 7.2 7.4 6.3
Corn Jilin NA NA -6.4 0.9 -3.6 6.1
Soybeans Heilongjiang NA NA -1.2 -3.3 -2.6 0.0
Rapeseed Hubei NA NA 13.2 -8.5 -3.9 -3.9
Cotton National NA NA NA NA NA -8.8
Average farm price is average reported by farmers in NDRC cost of production survey.NA=no support price.Source: USDA, Economic Research Service calculations using data from China National Development and Reform Commission.
19 Growth and Evolution in China’s Agricultural Support Policies, ERR-153
Economic Research Service/USDA
Do Farmers Receive the Support Price?
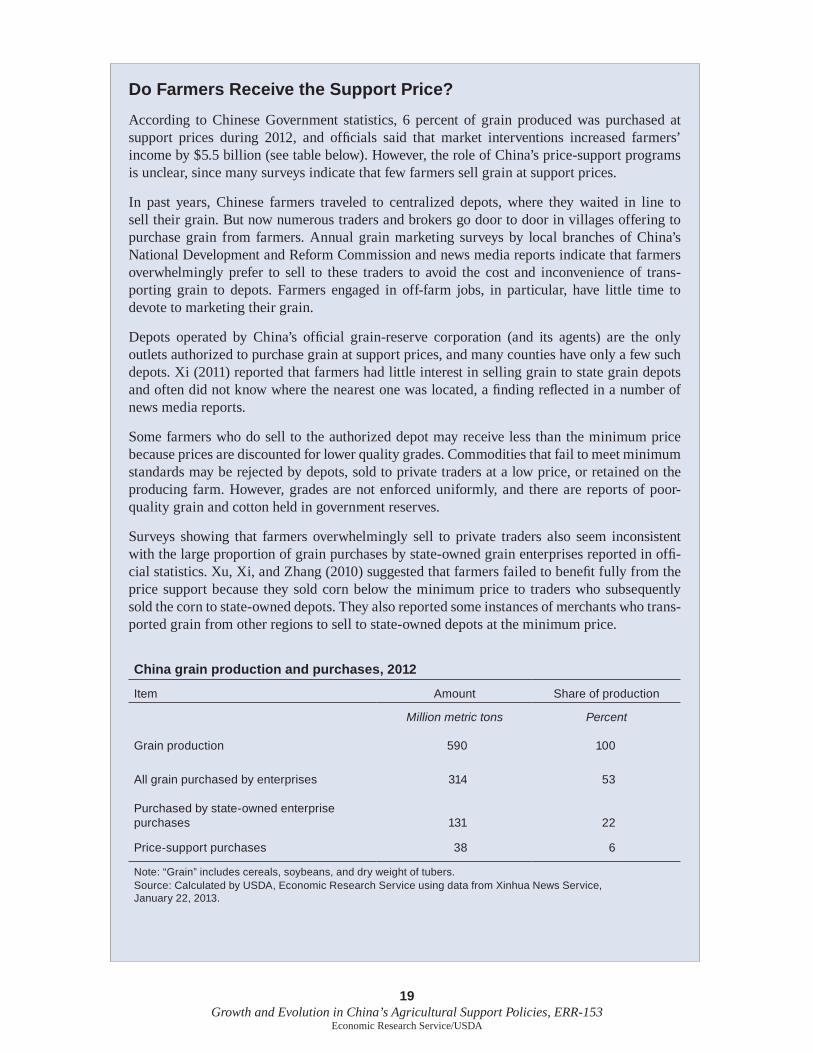
According to Chinese Government statistics, 6 percent of grain produced was purchased at support prices during 2012, and officials said that market interventions increased farmers’ income by $5.5 billion (see table below). However, the role of China’s price-support programs is unclear, since many surveys indicate that few farmers sell grain at support prices.
In past years, Chinese farmers traveled to centralized depots, where they waited in line to sell their grain. But now numerous traders and brokers go door to door in villages offering to purchase grain from farmers. Annual grain marketing surveys by local branches of China’s National Development and Reform Commission and news media reports indicate that farmers overwhelmingly prefer to sell to these traders to avoid the cost and inconvenience of trans-porting grain to depots. Farmers engaged in off-farm jobs, in particular, have little time to devote to marketing their grain.
Depots operated by China’s official grain-reserve corporation (and its agents) are the only outlets authorized to purchase grain at support prices, and many counties have only a few such depots. Xi (2011) reported that farmers had little interest in selling grain to state grain depots and often did not know where the nearest one was located, a finding reflected in a number of news media reports.
Some farmers who do sell to the authorized depot may receive less than the minimum price because prices are discounted for lower quality grades. Commodities that fail to meet minimum standards may be rejected by depots, sold to private traders at a low price, or retained on the producing farm. However, grades are not enforced uniformly, and there are reports of poor-quality grain and cotton held in government reserves.
Surveys showing that farmers overwhelmingly sell to private traders also seem inconsistent with the large proportion of grain purchases by state-owned grain enterprises reported in offi-cial statistics. Xu, Xi, and Zhang (2010) suggested that farmers failed to benefit fully from the price support because they sold corn below the minimum price to traders who subsequently sold the corn to state-owned depots. They also reported some instances of merchants who trans-ported grain from other regions to sell to state-owned depots at the minimum price.
China grain production and purchases, 2012
Item Amount Share of production
Million metric tons Percent
Grain production 590 100
All grain purchased by enterprises 314 53
Purchased by state-owned enterprise purchases 131 22
Price-support purchases 38 6
Note: “Grain” includes cereals, soybeans, and dry weight of tubers.Source: Calculated by USDA, Economic Research Service using data from Xinhua News Service, January 22, 2013.
20 Growth and Evolution in China’s Agricultural Support Policies, ERR-153
Economic Research Service/USDA
of rising prices or peak demand. However, a minimum bid is established for auction sales, and few transactions are executed in most auctions because no one is willing to pay the minimum bid.
Raising the price support for one commodity can influence other commodities through cross-commodity price relationships. For example, the increase in the wheat support price announced in September each year is viewed as a benchmark for forming expectations about increases in other commodity prices. Wheat and rice support prices are considerations in setting support prices for other commodities. An increase in the corn price raises the profitability of corn production compared with soybeans which, in turn, induces officials to increase the price support for soybeans. A higher price of corn also increases the cost of animal feed, which is passed on as higher livestock prices and an increase in soybeans, rapeseed, or peanuts may be passed on in higher vegetable oil prices. The corn price influences pork policy since authorities intervene in pork markets when the hog-corn price ratio falls to a low level.
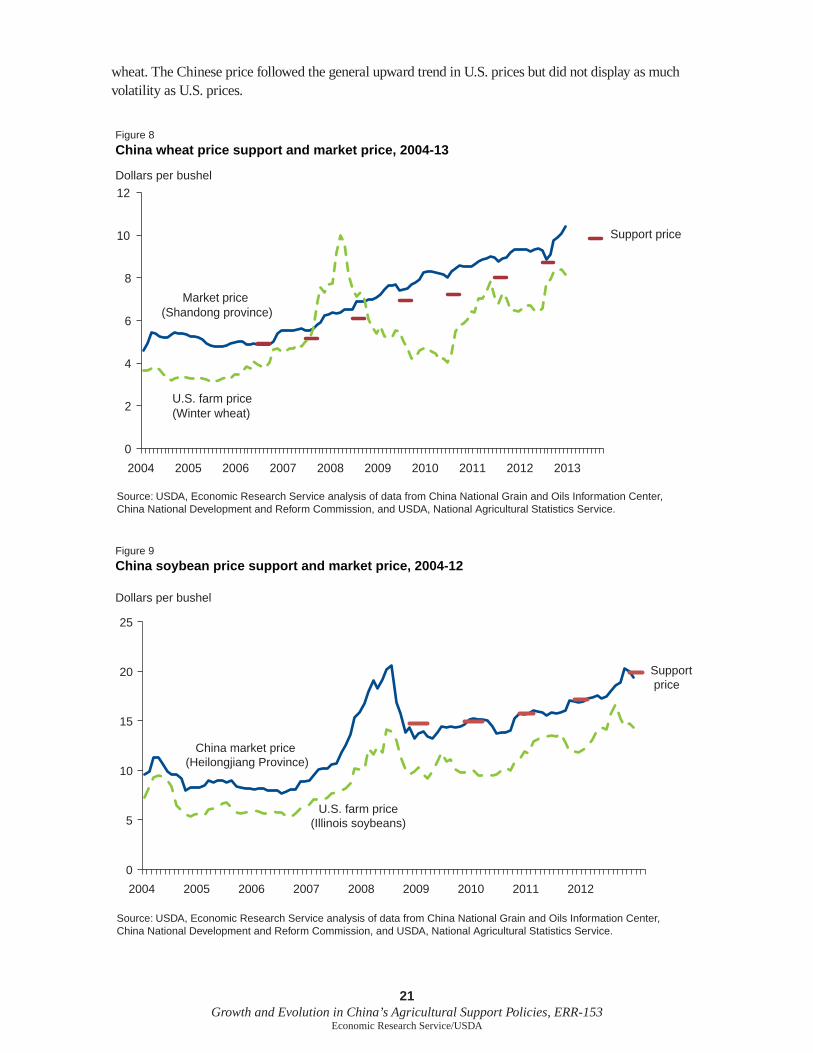
China’s strategy of maintaining steady growth in prices is exemplified by the pattern in wheat prices during 2007-12 (fig. 8). The price support was raised each year, but it was below the average market price to varying degrees. The relative stability of the Chinese wheat price is evident in its sustained growth at a gradual pace from 2007 to 2012 compared with the greater fluctuation in the U.S. price. The Chinese wheat price was insulated from both sharp increases and declines displayed by the U.S. price.
Soybean prices in Heilongjiang—China’s main production region—generally moved in tandem with U.S. prices (fig. 9). In contrast to the wheat market, which was insulated from the world market, Chinese soybean prices reflected the surge in U.S. prices during 2007-08. In late 2008, a “temporary reserve” price-support program was introduced for soybeans to mitigate the decline in prices during that period. From 2009 to 2012, soybean support prices were raised steadily each year in a pattern similar to that for
Figure 7
Share of grain purchased using loans from Agricultural Development Bank of China
Note: Chart shows grain purchased for government reserves with loans from Agricultural Development Bank of China (ADBC) as share of all grain produced. Source: USDA, Economic Research Service calculations using data from ADBC annual reports and China National Bureau of Statistics.
Percent
2523
21 21
26
32 31
38
33
22
26 27
0
5
10
15
20
25
30
35
40
2001 2002 2003 2004 2005 2006 2007 2008 2009 2010 2011 2012
21 Growth and Evolution in China’s Agricultural Support Policies, ERR-153
Economic Research Service/USDA
wheat. The Chinese price followed the general upward trend in U.S. prices but did not display as much volatility as U.S. prices.
Source: USDA, Economic Research Service analysis of data from China National Grain and Oils Information Center, China National Development and Reform Commission, and USDA, National Agricultural Statistics Service.
Figure 8
China wheat price support and market price, 2004-13
Dollars per bushel
0
2
4
6
8
10
12
2004 2005 2006 2007 2008 2009 2010 2011 2012 2013
Support price
Market price (Shandong province)
U.S. farm price(Winter wheat)
Figure 9
China soybean price support and market price, 2004-12
Source: USDA, Economic Research Service analysis of data from China National Grain and Oils Information Center, China National Development and Reform Commission, and USDA, National Agricultural Statistics Service.
Dollars per bushel
0
5
10
15
20
25
2004 2005 2006 2007 2008 2009 2010 2011 2012
China market price (Heilongjiang Province)
U.S. farm price(Illinois soybeans)
Support price
22 Growth and Evolution in China’s Agricultural Support Policies, ERR-153
Economic Research Service/USDA
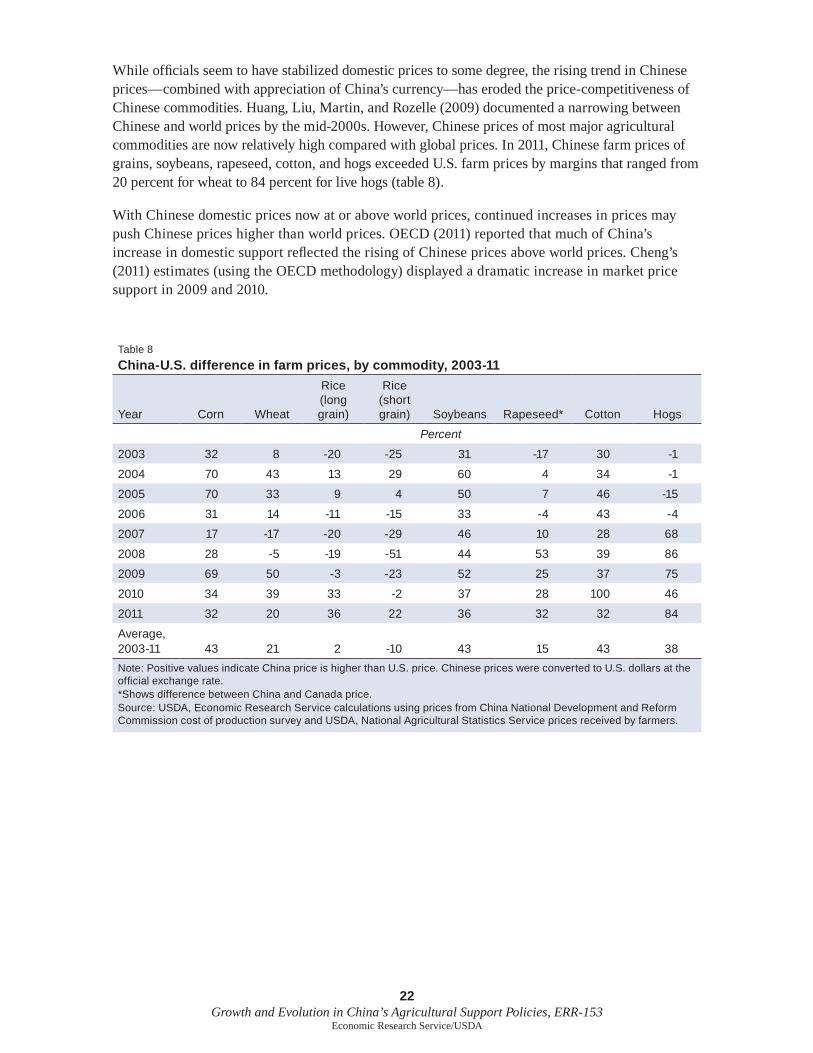
While officials seem to have stabilized domestic prices to some degree, the rising trend in Chinese prices—combined with appreciation of China’s currency—has eroded the price-competitiveness of Chinese commodities. Huang, Liu, Martin, and Rozelle (2009) documented a narrowing between Chinese and world prices by the mid-2000s. However, Chinese prices of most major agricultural commodities are now relatively high compared with global prices. In 2011, Chinese farm prices of grains, soybeans, rapeseed, cotton, and hogs exceeded U.S. farm prices by margins that ranged from 20 percent for wheat to 84 percent for live hogs (table 8).
With Chinese domestic prices now at or above world prices, continued increases in prices may push Chinese prices higher than world prices. OECD (2011) reported that much of China’s increase in domestic support reflected the rising of Chinese prices above world prices. Cheng’s (2011) estimates (using the OECD methodology) displayed a dramatic increase in market price support in 2009 and 2010.
Table 8
China-U.S. difference in farm prices, by commodity, 2003-11
Year Corn Wheat
Rice (long grain)
Rice (short grain) Soybeans Rapeseed* Cotton Hogs
Percent
2003 32 8 -20 -25 31 -17 30 -1
2004 70 43 13 29 60 4 34 -1
2005 70 33 9 4 50 7 46 -15
2006 31 14 -11 -15 33 -4 43 -4
2007 17 -17 -20 -29 46 10 28 68
2008 28 -5 -19 -51 44 53 39 86
2009 69 50 -3 -23 52 25 37 75
2010 34 39 33 -2 37 28 100 46
2011 32 20 36 22 36 32 32 84
Average,2003-11 43 21 2 -10 43 15 43 38
Note: Positive values indicate China price is higher than U.S. price. Chinese prices were converted to U.S. dollars at the official exchange rate.*Shows difference between China and Canada price.Source: USDA, Economic Research Service calculations using prices from China National Development and Reform Commission cost of production survey and USDA, National Agricultural Statistics Service prices received by farmers.
23 Growth and Evolution in China’s Agricultural Support Policies, ERR-153
Economic Research Service/USDA
Continued Expansion of Support
Chinese agricultural officials describe the current level of support as low in comparison with that of developed countries, and they promise to continue increasing support (Xu, 2011; Niu, 2011). The “Number 1 Document” issued by China’s communist party leadership in 2013 called for stronger support of agriculture in a period of “high cost, high input, and high risk,” endorsing continued increases in subsidies and price supports. The document also encouraged structural change in agri-culture to increase the scale of farms and called for measures to increase investment in fixed assets and improve the quality of inputs.
WTO Limits on Domestic Support
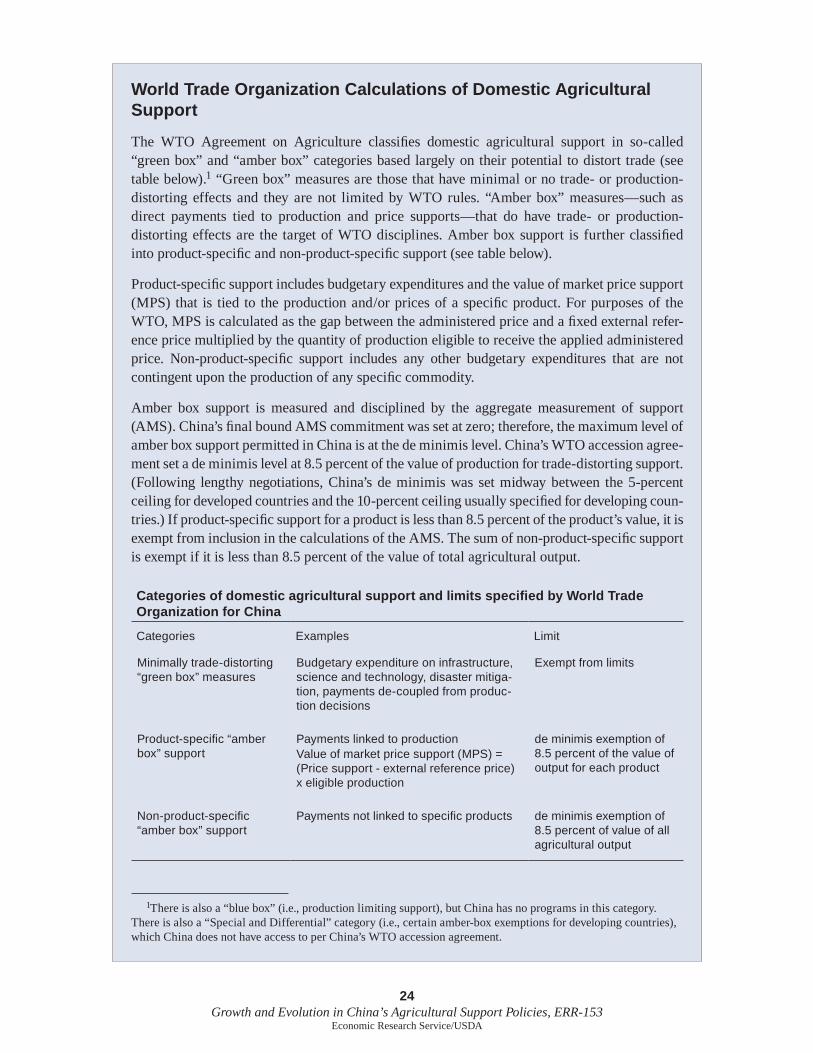
WTO limits on trade-distorting “amber box” domestic support measures have influenced the types of support programs offered by encouraging Chinese officials to focus expenditure on programs that are exempt from limits (see box, “World Trade Organization Calculations of Domestic Agricultural Support” for more information on WTO definitions of “amber box,” “green box”). In its 2004-08 WTO notifications, China’s “Aggregate Measurement of Support” (AMS) showed that both product-specific and nonproduct-specific amber box support were well below the de minimis limit. When calling for further increases in support, Chinese officials and policy advisors often note that China is well within the limits imposed by its WTO commitments. For example, a Chinese vice minister of agriculture explained that China fully utilized WTO rules to support agriculture by increasing “green box” support and adjusting methods of support to remain within limits on amber box support (Niu, 2011). A speech by another Ministry of Agriculture official in 2013 called for increasing support each year until it reaches the de minimis limit.22
An analysis of China’s 2005-08 WTO notification indicated that China used several key strategies to remain within its 8.5-percent ceiling on support:23
• Mostsupportwasreportedas“greenboxprograms,”includinginfrastructureexpenditures,disaster mitigation and recovery, extension, aid to low-income regions, decoupled direct payments to grain producers, and classified expenses for public stockholding reserves for food security as green box. The green-box total of $85 billion reported for 2008 was equal to 11.2 percent of the value of agricultural output.
• Thegeneral-inputsubsidypaymentappearstohavebeenreportedasnonproduct-specificsupportin the 2006-08 support calculations.24 In 2008, China’s total nonproduct-specific support was less than 1.5 percent of the value of all agricultural production.
22Keming Qian, “Jin yi bu wanshan Zhongguo tese Xiandaihua Nongye Zhengce Zhichi Tixi [Further Improve China’s System for Modern Agriculture Policy Support],” speech to National Committee of the Chinese People’s Political Con-sultative Conference, March 7, 2013.
23China’s 2005-08 notification was submitted in 2011 and is available at http://www.wtocenter.org.tw/SmartKMS/do/www/readDoc?document_id=117481
24China’s 2005-08 notifications of nonproduct-specific AMS (table DS:9) consists mainly of “input subsidies” which seem to correspond to the value of the “general-input subsidy.”
24 Growth and Evolution in China’s Agricultural Support Policies, ERR-153
Economic Research Service/USDA
World Trade Organization Calculations of Domestic Agricultural Support
The WTO Agreement on Agriculture classifies domestic agricultural support in so-called “green box” and “amber box” categories based largely on their potential to distort trade (see table below).1 “Green box” measures are those that have minimal or no trade- or production-distorting effects and they are not limited by WTO rules. “Amber box” measures—such as direct payments tied to production and price supports—that do have trade- or production-distorting effects are the target of WTO disciplines. Amber box support is further classified into product-specific and non-product-specific support (see table below).
Product-specific support includes budgetary expenditures and the value of market price support (MPS) that is tied to the production and/or prices of a specific product. For purposes of the WTO, MPS is calculated as the gap between the administered price and a fixed external refer-ence price multiplied by the quantity of production eligible to receive the applied administered price. Non-product-specific support includes any other budgetary expenditures that are not contingent upon the production of any specific commodity.
Amber box support is measured and disciplined by the aggregate measurement of support (AMS). China’s final bound AMS commitment was set at zero; therefore, the maximum level of amber box support permitted in China is at the de minimis level. China’s WTO accession agree-ment set a de minimis level at 8.5 percent of the value of production for trade-distorting support. (Following lengthy negotiations, China’s de minimis was set midway between the 5-percent ceiling for developed countries and the 10-percent ceiling usually specified for developing coun-tries.) If product-specific support for a product is less than 8.5 percent of the product’s value, it is exempt from inclusion in the calculations of the AMS. The sum of non-product-specific support is exempt if it is less than 8.5 percent of the value of total agricultural output.
Categories of domestic agricultural support and limits specified by World Trade Organization for China
Categories Examples Limit
Minimally trade-distorting “green box” measures
Budgetary expenditure on infrastructure, science and technology, disaster mitiga-tion, payments de-coupled from produc-tion decisions
Exempt from limits
Product-specific “amber box” support
Payments linked to productionValue of market price support (MPS) = (Price support - external reference price) x eligible production
de minimis exemption of 8.5 percent of the value of output for each product
Non-product-specific “amber box” support
Payments not linked to specific products de minimis exemption of 8.5 percent of value of all agricultural output
1There is also a “blue box” (i.e., production limiting support), but China has no programs in this category. There is also a “Special and Differential” category (i.e., certain amber-box exemptions for developing countries), which China does not have access to per China’s WTO accession agreement.
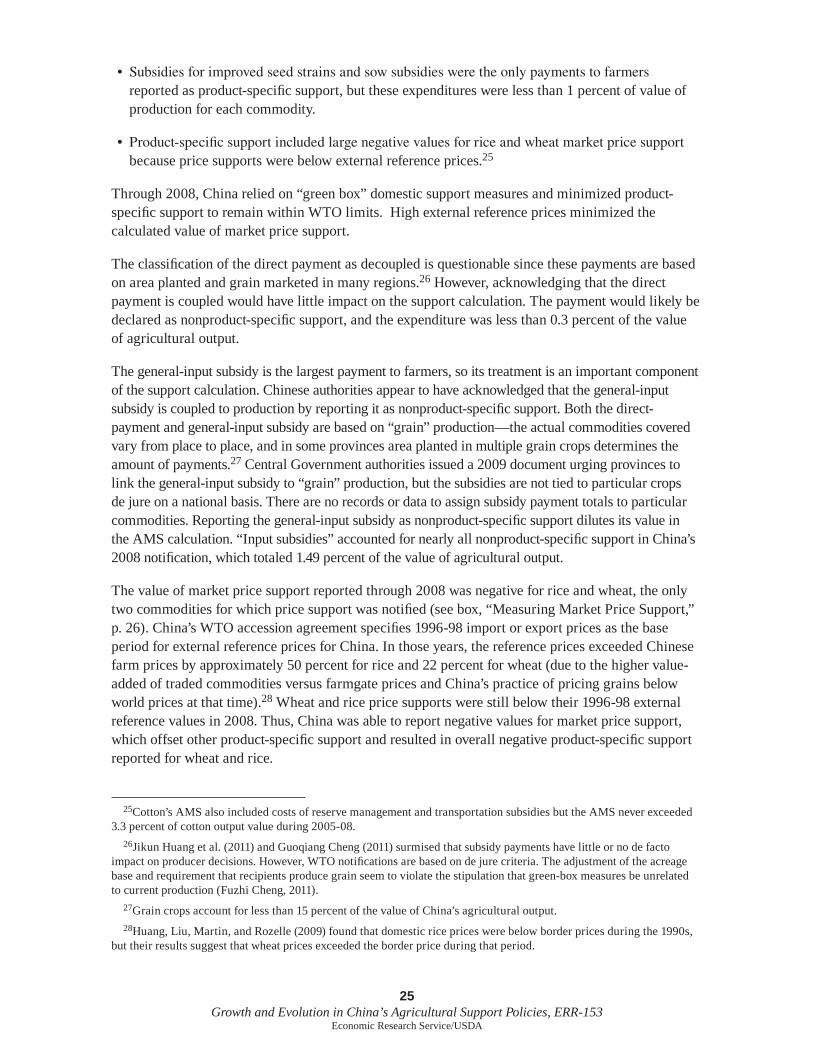
25 Growth and Evolution in China’s Agricultural Support Policies, ERR-153
Economic Research Service/USDA
• Subsidiesforimprovedseedstrainsandsowsubsidiesweretheonlypaymentstofarmersreported as product-specific support, but these expenditures were less than 1 percent of value of production for each commodity.
• Product-specificsupportincludedlargenegativevaluesforriceandwheatmarketpricesupportbecause price supports were below external reference prices.25
Through 2008, China relied on “green box” domestic support measures and minimized product-specific support to remain within WTO limits. High external reference prices minimized the calculated value of market price support.
The classification of the direct payment as decoupled is questionable since these payments are based on area planted and grain marketed in many regions.26 However, acknowledging that the direct payment is coupled would have little impact on the support calculation. The payment would likely be declared as nonproduct-specific support, and the expenditure was less than 0.3 percent of the value of agricultural output.
The general-input subsidy is the largest payment to farmers, so its treatment is an important component of the support calculation. Chinese authorities appear to have acknowledged that the general-input subsidy is coupled to production by reporting it as nonproduct-specific support. Both the direct-payment and general-input subsidy are based on “grain” production—the actual commodities covered vary from place to place, and in some provinces area planted in multiple grain crops determines the amount of payments.27 Central Government authorities issued a 2009 document urging provinces to link the general-input subsidy to “grain” production, but the subsidies are not tied to particular crops de jure on a national basis. There are no records or data to assign subsidy payment totals to particular commodities. Reporting the general-input subsidy as nonproduct-specific support dilutes its value in the AMS calculation. “Input subsidies” accounted for nearly all nonproduct-specific support in China’s 2008 notification, which totaled 1.49 percent of the value of agricultural output.
The value of market price support reported through 2008 was negative for rice and wheat, the only two commodities for which price support was notified (see box, “Measuring Market Price Support,” p. 26). China’s WTO accession agreement specifies 1996-98 import or export prices as the base period for external reference prices for China. In those years, the reference prices exceeded Chinese farm prices by approximately 50 percent for rice and 22 percent for wheat (due to the higher value-added of traded commodities versus farmgate prices and China’s practice of pricing grains below world prices at that time).28 Wheat and rice price supports were still below their 1996-98 external reference values in 2008. Thus, China was able to report negative values for market price support, which offset other product-specific support and resulted in overall negative product-specific support reported for wheat and rice.
25Cotton’s AMS also included costs of reserve management and transportation subsidies but the AMS never exceeded 3.3 percent of cotton output value during 2005-08.
26Jikun Huang et al. (2011) and Guoqiang Cheng (2011) surmised that subsidy payments have little or no de facto impact on producer decisions. However, WTO notifications are based on de jure criteria. The adjustment of the acreage base and requirement that recipients produce grain seem to violate the stipulation that green-box measures be unrelated to current production (Fuzhi Cheng, 2011).
27Grain crops account for less than 15 percent of the value of China’s agricultural output.28Huang, Liu, Martin, and Rozelle (2009) found that domestic rice prices were below border prices during the 1990s,
but their results suggest that wheat prices exceeded the border price during that period.
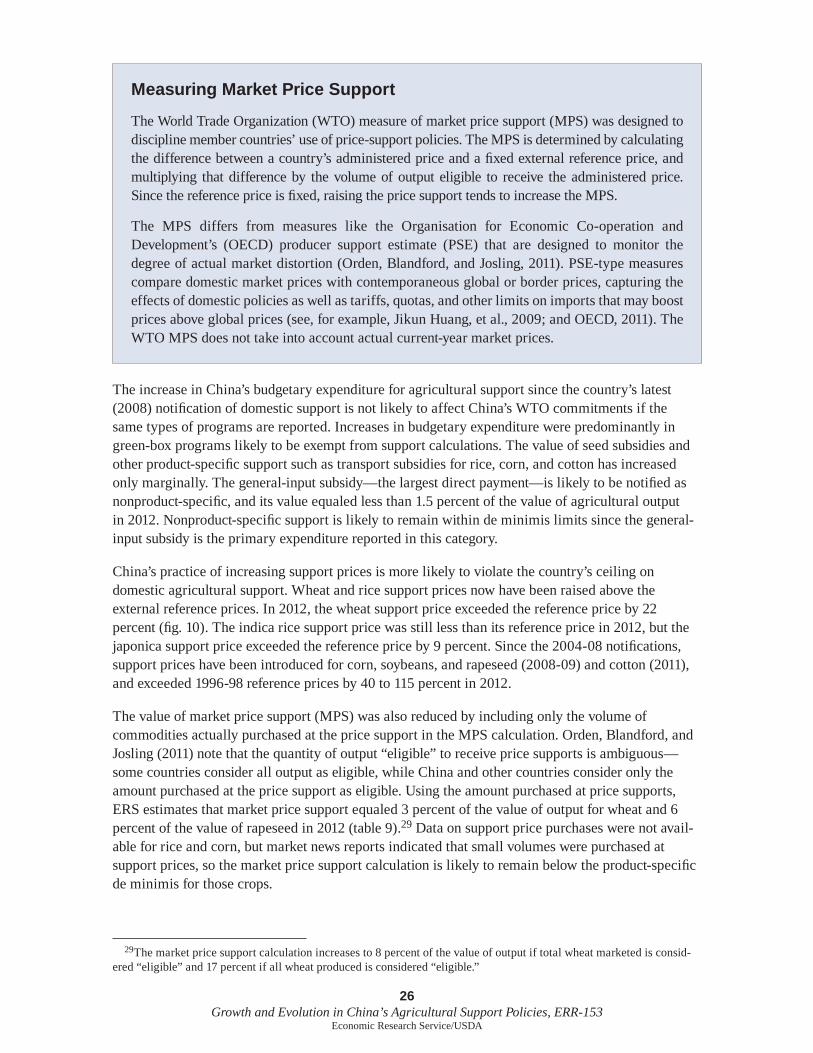
26 Growth and Evolution in China’s Agricultural Support Policies, ERR-153
Economic Research Service/USDA
The increase in China’s budgetary expenditure for agricultural support since the country’s latest (2008) notification of domestic support is not likely to affect China’s WTO commitments if the same types of programs are reported. Increases in budgetary expenditure were predominantly in green-box programs likely to be exempt from support calculations. The value of seed subsidies and other product-specific support such as transport subsidies for rice, corn, and cotton has increased only marginally. The general-input subsidy—the largest direct payment—is likely to be notified as nonproduct-specific, and its value equaled less than 1.5 percent of the value of agricultural output in 2012. Nonproduct-specific support is likely to remain within de minimis limits since the general-input subsidy is the primary expenditure reported in this category.
China’s practice of increasing support prices is more likely to violate the country’s ceiling on domestic agricultural support. Wheat and rice support prices now have been raised above the external reference prices. In 2012, the wheat support price exceeded the reference price by 22 percent (fig. 10). The indica rice support price was still less than its reference price in 2012, but the japonica support price exceeded the reference price by 9 percent. Since the 2004-08 notifications, support prices have been introduced for corn, soybeans, and rapeseed (2008-09) and cotton (2011), and exceeded 1996-98 reference prices by 40 to 115 percent in 2012.
The value of market price support (MPS) was also reduced by including only the volume of commodities actually purchased at the price support in the MPS calculation. Orden, Blandford, and Josling (2011) note that the quantity of output “eligible” to receive price supports is ambiguous—some countries consider all output as eligible, while China and other countries consider only the amount purchased at the price support as eligible. Using the amount purchased at price supports, ERS estimates that market price support equaled 3 percent of the value of output for wheat and 6 percent of the value of rapeseed in 2012 (table 9).29 Data on support price purchases were not avail-able for rice and corn, but market news reports indicated that small volumes were purchased at support prices, so the market price support calculation is likely to remain below the product-specific de minimis for those crops.
29The market price support calculation increases to 8 percent of the value of output if total wheat marketed is consid-ered “eligible” and 17 percent if all wheat produced is considered “eligible.”
Measuring Market Price Support
The World Trade Organization (WTO) measure of market price support (MPS) was designed to discipline member countries’ use of price-support policies. The MPS is determined by calculating the difference between a country’s administered price and a fixed external reference price, and multiplying that difference by the volume of output eligible to receive the administered price. Since the reference price is fixed, raising the price support tends to increase the MPS.
The MPS differs from measures like the Organisation for Economic Co-operation and Development’s (OECD) producer support estimate (PSE) that are designed to monitor the degree of actual market distortion (Orden, Blandford, and Josling, 2011). PSE-type measures compare domestic market prices with contemporaneous global or border prices, capturing the effects of domestic policies as well as tariffs, quotas, and other limits on imports that may boost prices above global prices (see, for example, Jikun Huang, et al., 2009; and OECD, 2011). The WTO MPS does not take into account actual current-year market prices.
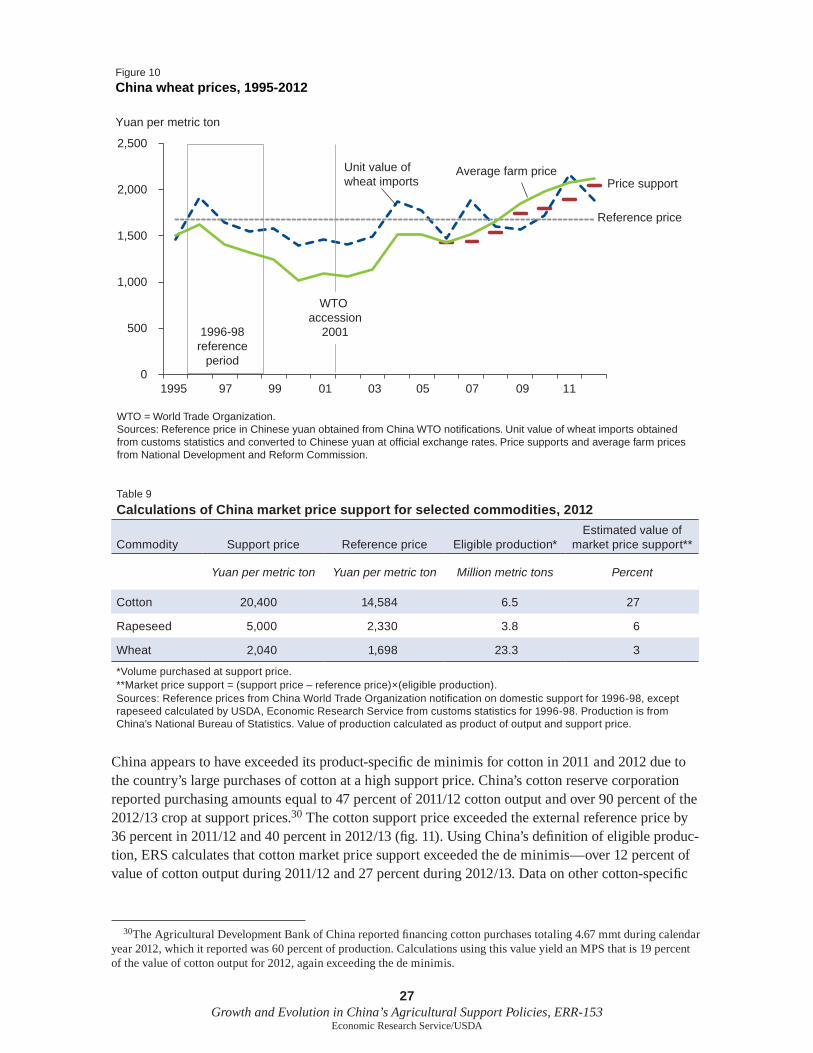
27 Growth and Evolution in China’s Agricultural Support Policies, ERR-153
Economic Research Service/USDA
China appears to have exceeded its product-specific de minimis for cotton in 2011 and 2012 due to the country’s large purchases of cotton at a high support price. China’s cotton reserve corporation reported purchasing amounts equal to 47 percent of 2011/12 cotton output and over 90 percent of the 2012/13 crop at support prices.30 The cotton support price exceeded the external reference price by 36 percent in 2011/12 and 40 percent in 2012/13 (fig. 11). Using China’s definition of eligible produc-tion, ERS calculates that cotton market price support exceeded the de minimis—over 12 percent of value of cotton output during 2011/12 and 27 percent during 2012/13. Data on other cotton-specific
30The Agricultural Development Bank of China reported financing cotton purchases totaling 4.67 mmt during calendar year 2012, which it reported was 60 percent of production. Calculations using this value yield an MPS that is 19 percent of the value of cotton output for 2012, again exceeding the de minimis.
WTO = World Trade Organization.Sources: Reference price in Chinese yuan obtained from China WTO notifications. Unit value of wheat imports obtained from customs statistics and converted to Chinese yuan at official exchange rates. Price supports and average farm prices from National Development and Reform Commission.
Figure 10
China wheat prices, 1995-2012 Yuan per metric ton
0
500
1,000
1,500
2,000
2,500
Reference price
Average farm price Unit value of wheat imports Price support
1996-98reference
period
WTO accession
2001
1995 97 99 01 03 05 07 09 11
Table 9
Calculations of China market price support for selected commodities, 2012
Commodity Support price Reference price Eligible production* Estimated value of
market price support**
Yuan per metric ton Yuan per metric ton Million metric tons Percent
Cotton 20,400 14,584 6.5 27
Rapeseed 5,000 2,330 3.8 6
Wheat 2,040 1,698 23.3 3
*Volume purchased at support price.**Market price support = (support price – reference price)×(eligible production). Sources: Reference prices from China World Trade Organization notification on domestic support for 1996-98, except rapeseed calculated by USDA, Economic Research Service from customs statistics for 1996-98. Production is from China’s National Bureau of Statistics. Value of production calculated as product of output and support price.
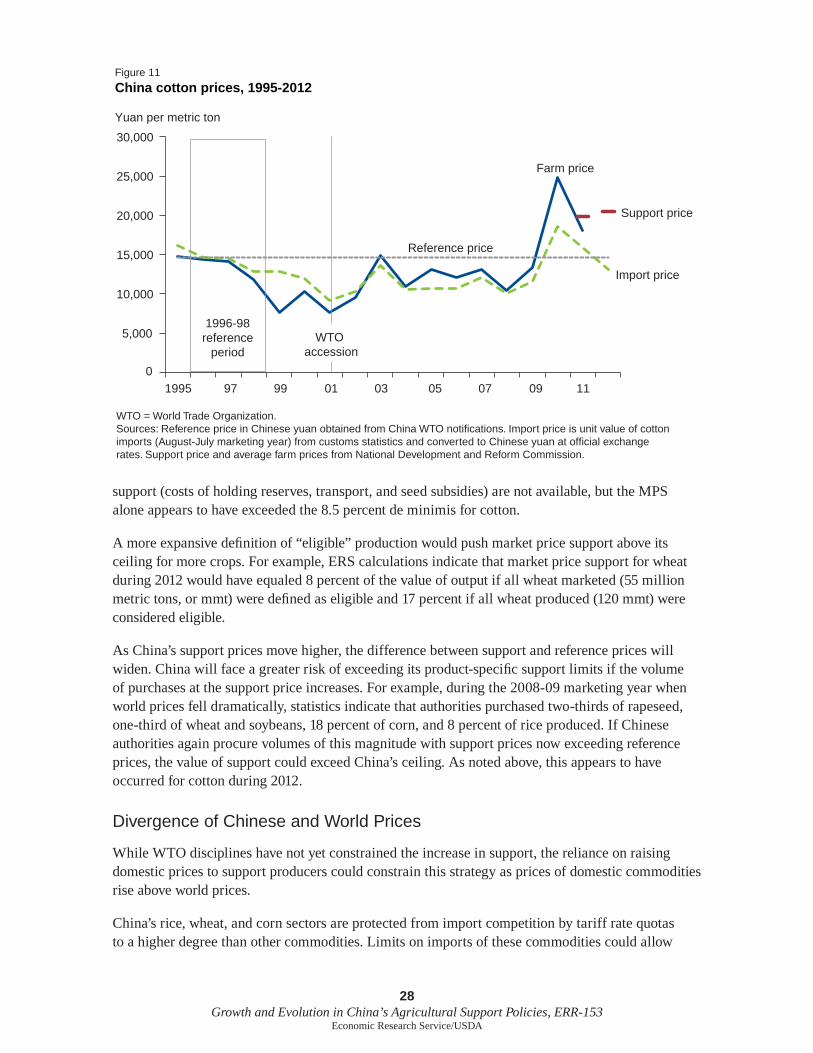
28 Growth and Evolution in China’s Agricultural Support Policies, ERR-153
Economic Research Service/USDA
support (costs of holding reserves, transport, and seed subsidies) are not available, but the MPS alone appears to have exceeded the 8.5 percent de minimis for cotton.
A more expansive definition of “eligible” production would push market price support above its ceiling for more crops. For example, ERS calculations indicate that market price support for wheat during 2012 would have equaled 8 percent of the value of output if all wheat marketed (55 million metric tons, or mmt) were defined as eligible and 17 percent if all wheat produced (120 mmt) were considered eligible.
As China’s support prices move higher, the difference between support and reference prices will widen. China will face a greater risk of exceeding its product-specific support limits if the volume of purchases at the support price increases. For example, during the 2008-09 marketing year when world prices fell dramatically, statistics indicate that authorities purchased two-thirds of rapeseed, one-third of wheat and soybeans, 18 percent of corn, and 8 percent of rice produced. If Chinese authorities again procure volumes of this magnitude with support prices now exceeding reference prices, the value of support could exceed China’s ceiling. As noted above, this appears to have occurred for cotton during 2012.
Divergence of Chinese and World Prices
While WTO disciplines have not yet constrained the increase in support, the reliance on raising domestic prices to support producers could constrain this strategy as prices of domestic commodities rise above world prices.
China’s rice, wheat, and corn sectors are protected from import competition by tariff rate quotas to a higher degree than other commodities. Limits on imports of these commodities could allow
Figure 11
China cotton prices, 1995-2012
WTO = World Trade Organization.Sources: Reference price in Chinese yuan obtained from China WTO notifications. Import price is unit value of cotton imports (August-July marketing year) from customs statistics and converted to Chinese yuan at official exchange rates. Support price and average farm prices from National Development and Reform Commission.
Yuan per metric ton
0
5,000
10,000
15,000
20,000
25,000
30,000
Reference price
Farm price
Support price
Import price
WTO accession
1995 97 99 01 03 05 07 09 11
1996-98reference
period
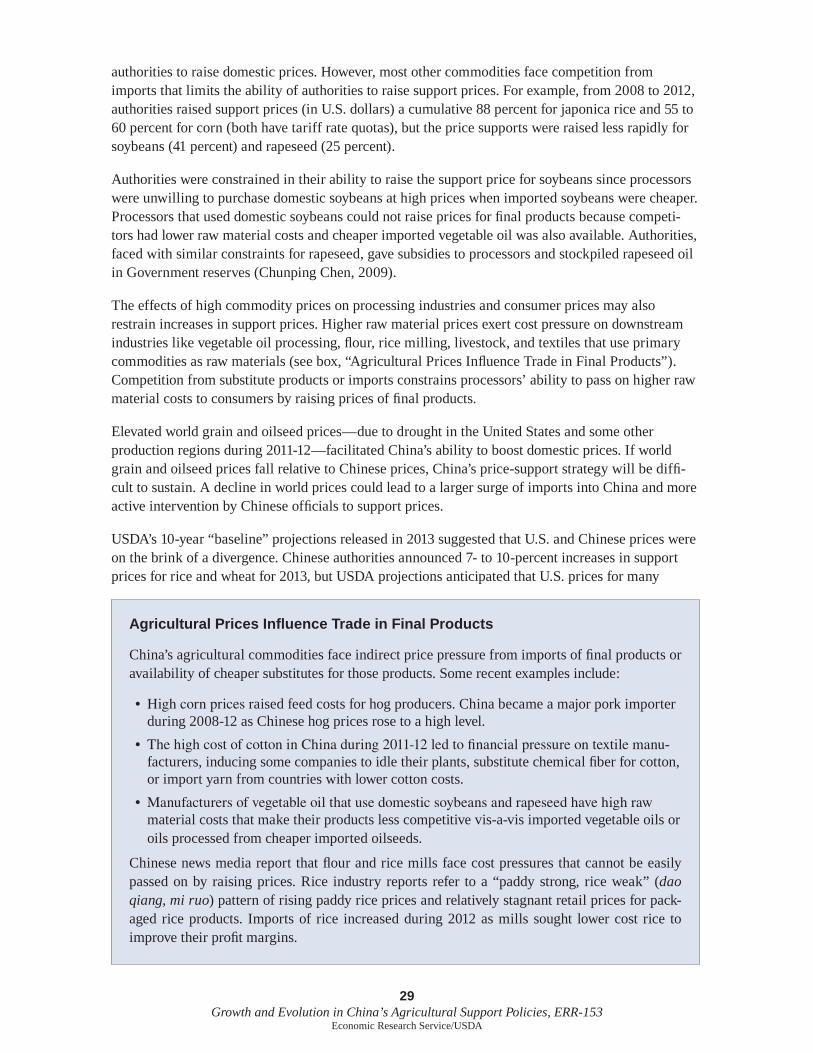
29 Growth and Evolution in China’s Agricultural Support Policies, ERR-153
Economic Research Service/USDA
authorities to raise domestic prices. However, most other commodities face competition from imports that limits the ability of authorities to raise support prices. For example, from 2008 to 2012, authorities raised support prices (in U.S. dollars) a cumulative 88 percent for japonica rice and 55 to 60 percent for corn (both have tariff rate quotas), but the price supports were raised less rapidly for soybeans (41 percent) and rapeseed (25 percent).
Authorities were constrained in their ability to raise the support price for soybeans since processors were unwilling to purchase domestic soybeans at high prices when imported soybeans were cheaper. Processors that used domestic soybeans could not raise prices for final products because competi-tors had lower raw material costs and cheaper imported vegetable oil was also available. Authorities, faced with similar constraints for rapeseed, gave subsidies to processors and stockpiled rapeseed oil in Government reserves (Chunping Chen, 2009).
The effects of high commodity prices on processing industries and consumer prices may also restrain increases in support prices. Higher raw material prices exert cost pressure on downstream industries like vegetable oil processing, flour, rice milling, livestock, and textiles that use primary commodities as raw materials (see box, “Agricultural Prices Influence Trade in Final Products”). Competition from substitute products or imports constrains processors’ ability to pass on higher raw material costs to consumers by raising prices of final products.
Elevated world grain and oilseed prices—due to drought in the United States and some other production regions during 2011-12—facilitated China’s ability to boost domestic prices. If world grain and oilseed prices fall relative to Chinese prices, China’s price-support strategy will be diffi-cult to sustain. A decline in world prices could lead to a larger surge of imports into China and more active intervention by Chinese officials to support prices.
USDA’s 10-year “baseline” projections released in 2013 suggested that U.S. and Chinese prices were on the brink of a divergence. Chinese authorities announced 7- to 10-percent increases in support prices for rice and wheat for 2013, but USDA projections anticipated that U.S. prices for many
Agricultural Prices Influence Trade in Final Products
China’s agricultural commodities face indirect price pressure from imports of final products or availability of cheaper substitutes for those products. Some recent examples include:
• Highcornpricesraised feed costs for hog producers. China became a major pork importer during 2008-12 as Chinese hog prices rose to a high level.
• ThehighcostofcottoninChinaduring2011-12ledtofinancialpressureontextilemanu-facturers, inducing some companies to idle their plants, substitute chemical fiber for cotton, or import yarn from countries with lower cotton costs.
• Manufacturersofvegetableoilthatusedomesticsoybeansandrapeseedhavehighrawmaterial costs that make their products less competitive vis-a-vis imported vegetable oils or oils processed from cheaper imported oilseeds.
Chinese news media report that flour and rice mills face cost pressures that cannot be easily passed on by raising prices. Rice industry reports refer to a “paddy strong, rice weak” (dao qiang, mi ruo) pattern of rising paddy rice prices and relatively stagnant retail prices for pack-aged rice products. Imports of rice increased during 2012 as mills sought lower cost rice to improve their profit margins.
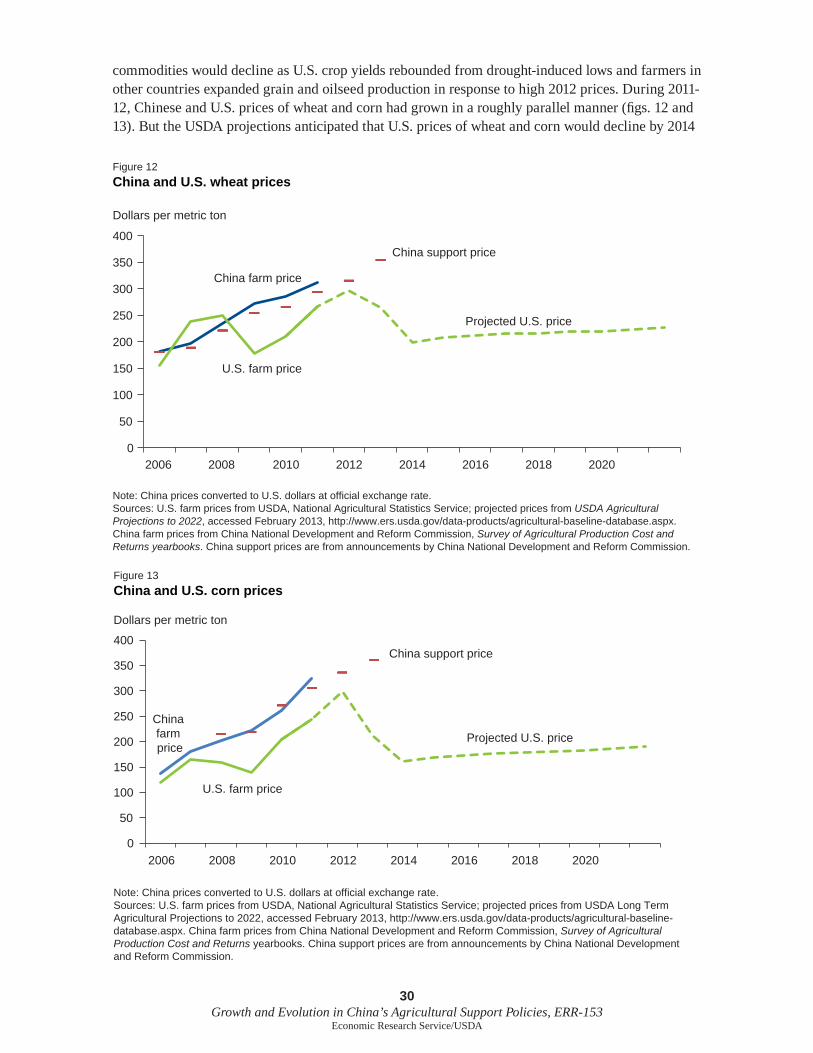
30 Growth and Evolution in China’s Agricultural Support Policies, ERR-153
Economic Research Service/USDA
commodities would decline as U.S. crop yields rebounded from drought-induced lows and farmers in other countries expanded grain and oilseed production in response to high 2012 prices. During 2011-12, Chinese and U.S. prices of wheat and corn had grown in a roughly parallel manner (figs. 12 and 13). But the USDA projections anticipated that U.S. prices of wheat and corn would decline by 2014
Figure 12
China and U.S. wheat prices Dollars per metric ton
0
50
100
150
200
250
300
350
400
2006 2008 2010 2012 2014 2016 2018 2020
China support price
China farm price
Projected U.S. price
U.S. farm price
Note: China prices converted to U.S. dollars at official exchange rate.Sources: U.S. farm prices from USDA, National Agricultural Statistics Service; projected prices from USDA Agricultural Projections to 2022, accessed February 2013, http://www.ers.usda.gov/data-products/agricultural-baseline-database.aspx. China farm prices from China National Development and Reform Commission, Survey of Agricultural Production Cost and Returns yearbooks. China support prices are from announcements by China National Development and Reform Commission.
Figure 13
China and U.S. corn prices
Dollars per metric ton
Note: China prices converted to U.S. dollars at official exchange rate.Sources: U.S. farm prices from USDA, National Agricultural Statistics Service; projected prices from USDA Long Term Agricultural Projections to 2022, accessed February 2013, http://www.ers.usda.gov/data-products/agricultural-baseline- database.aspx. China farm prices from China National Development and Reform Commission, Survey of Agricultural Production Cost and Returns yearbooks. China support prices are from announcements by China National Development and Reform Commission.
0
50
100
150
200
250
300
350
400
2006 2008 2010 2012 2014 2016 2018 2020
Projected U.S. price
China farm price
China support price
U.S. farm price
31 Growth and Evolution in China’s Agricultural Support Policies, ERR-153
Economic Research Service/USDA
before resuming a trend of modest growth, implying a divergence in U.S. and Chinese prices during 2013-14 if Chinese prices continued on their previous trajectory.
A divergence between Chinese and world prices occurred in the cotton market during 2011-12. China introduced its cotton price-support program in 2011 when world cotton prices were at a high level. However, world prices plunged during 2011, and China’s cotton price exceeded the cost of imported cotton throughout 2011 and 2012. China’s imports of cotton and yarn rose to record levels, while most of the 2011 and 2012 cotton harvests were stockpiled to support a domestic price that exceeded the price of imported cotton. Officials were reluctant to allow a reduction in cotton price since it would likely reduce farmers’ income and induce farmers to reduce cotton production. Officials were unable to sell their cotton reserves into the domestic market without reducing prices.
Changing Nature of Support
Chinese Government policymakers often describe their economy as passing through historical stages where different policy measures are appropriate. In the early 2000s, small decoupled grain subsidy payments functioned largely as a small rural entitlement, reflecting the traditional role of agriculture as a means of subsistence for the rural population. As China becomes a more urbanized and industrialized society, the character of agricultural support is shifting to emphasize the modern-ization and commercialization of agriculture.
The 2013 “Number 1 document” on rural policy raised concerns about rising farm production costs, encroachment of urban uses on farmland, a shrinking and aging agricultural labor force, and an increasing prevalence of part-time farming. A 2013 speech by a Ministry of Agriculture offi-cial recommended a strategy of shifting expenditure from broad income support for small-scale traditional farms to measures that encourage increases in production by larger scale farms and cooperatives and increasing transfer payments to agricultural counties based on their performance in supplying commodities to other regions.31 A Peoples Daily (2013) “interpretation” of the 2013 “Number 1 document” explained that grain subsidy payments will be coupled to area planted in grain instead of being “sprinkled like salt.” This was followed up by an announcement that Sichuan Province would begin distributing subsidies to producers based on the area of land they plant in grain (Xinhua News Service, 2013).32
Authorities are encountering pressure to shift support from general subsidies to measures focused on particular commodities like soybeans, cotton, and rapeseed. Some industry representatives and scholars have called for general-input subsidy payments to be introduced for cotton (Huang and Huang, 2011). Concerns about stagnant oilseed output have prompted proposals for increasing subsi-dies to oilseed producers or subsidizing sale of rapeseed and peanuts to state-owned companies.33
31Keming Qian, “Jin yi bu wanshan Zhongguo tese Xiandaihua Nongye Zhengce Zhichi Tixi [Further Improve China’s System for Modern Agriculture Policy Support],” speech to National Committee of the Chinese Peoples Political Consultative Conference, March 7, 2013.
32The method was to be introduced in 12 counties on a trial basis. As noted earlier in this report, many provinces already distribute subsidies in this manner. The announcement of Sichuan’s new subsidy method appeared to constitute an official endorsement of this practice that all provinces should consider.
33“Caizheng Bu Yunniang Tigao Huasheng Youcai Deng Youliao Zuowu Butie E’du [Ministry of Finance Mulls Rais-ing Subsidies for Peanuts and Rapeseed],” China Business News, November 12, 2012.
32 Growth and Evolution in China’s Agricultural Support Policies, ERR-153
Economic Research Service/USDA
Officials are exploring other new subsidies. The negative impact of price supports on processors seems to have increased authorities’ interest in implementing a deficiency payment subsidy equal to the difference between a target price and the market price. China’s medium- to long-term food security plan called for a deficiency payment subsidy, and Government analysts devised methods for setting target prices based on grain production costs (Guangdong Province Price Association Task Force, 2010; Li and Xu, 2011). News media reported that authorities were designing a pilot defi-ciency-payment program for soybeans in northeast provinces to reverse the steep decline in soybean production in the region.34 There are proposals to extend this type of subsidy to other commodities after testing it with soybeans.
By not linking the subsidies to specific products, the general-input subsidy was able to be classified as nonproduct-specific. If authorities adopt crop-specific subsidy payments—such as a general-input subsidy for cotton or a deficiency payment for soybeans—China will be more likely to exceed WTO limits. Authorities might limit such subsidies to selected regions (for example, cotton in Xinjiang Autonomous Region or soybeans in northeastern provinces) in order to reduce the likelihood of exceeding the WTO AMS commitments.
Chinese officials continue to devote most of their expenditure to a decades-old campaign to modernize agriculture.35 With demand for commodities growing and production limited by scarce resources, China’s 5-year plan for 2011-15 calls for creating a new mode of “modern agriculture.” A Ministry of Agriculture “blueprint” for modern agriculture calls for creating high-standard agricul-tural fields, nurturing a new generation of farm operators and agricultural technicians, investing in hundreds of model districts for agricultural modernization, and improving protection of agricultural resources and the environment. The plan features new strategies for consolidating farms as well as a revival of general agricultural development and model farm district schemes that were the main support measures during the 1980s and 1990s.
Policies for promoting larger scale commercial-oriented farms received increased emphasis during 2012-13. Five provinces were selected to experiment with a new large farm subsidy in 2013. The program gives interest subsidies or cash awards to operators of “large” grain farms above a minimum size (the threshold varied from 50 to 165 acres in different provinces) to subsidize the cost of investments in equipment and facilities for irrigation, grain storage, or grain drying. While they affirmed collective land ownership and the role of rural households as the primary operators of farms, authorities encouraged local officials to facilitate the consolidation of farmland through renting, leasing, and swapping the rights to use plots of land or forming village cooperatives.
34“Guowuyuan Diaoyanzu Modi Dadou Chanye, Yunniang Cha Jia Butie [State Council Research Team Investigates Soybean Industry, Prepares Deficiency Payment Subsidy],” Huaxia Shibao, January 17, 2013.
35Hui Liangyu, “Jianding Buji Zou Zhongguo Tese Nongye Xiandaihua Daolu [Unswervingly Follow the Road of Modernizing Agriculture with Chinese Characteristics],” National Conference on Agricultural Modernization, speech given in Heilongjiang Province, July 20, 2012. http://www.moa.gov.cn/zwllm/zwdt/201207/t20120720_2799007.htm
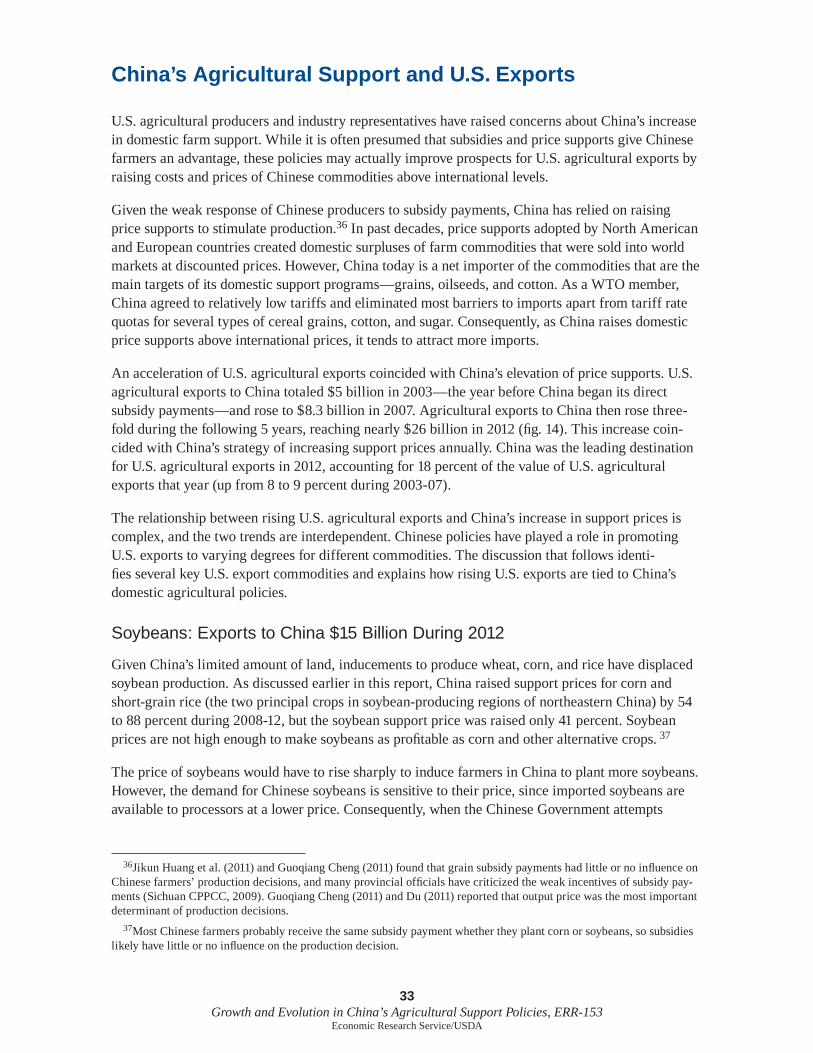
33 Growth and Evolution in China’s Agricultural Support Policies, ERR-153
Economic Research Service/USDA
China’s Agricultural Support and U.S. Exports
U.S. agricultural producers and industry representatives have raised concerns about China’s increase in domestic farm support. While it is often presumed that subsidies and price supports give Chinese farmers an advantage, these policies may actually improve prospects for U.S. agricultural exports by raising costs and prices of Chinese commodities above international levels.
Given the weak response of Chinese producers to subsidy payments, China has relied on raising price supports to stimulate production.36 In past decades, price supports adopted by North American and European countries created domestic surpluses of farm commodities that were sold into world markets at discounted prices. However, China today is a net importer of the commodities that are the main targets of its domestic support programs—grains, oilseeds, and cotton. As a WTO member, China agreed to relatively low tariffs and eliminated most barriers to imports apart from tariff rate quotas for several types of cereal grains, cotton, and sugar. Consequently, as China raises domestic price supports above international prices, it tends to attract more imports.
An acceleration of U.S. agricultural exports coincided with China’s elevation of price supports. U.S. agricultural exports to China totaled $5 billion in 2003—the year before China began its direct subsidy payments—and rose to $8.3 billion in 2007. Agricultural exports to China then rose three-fold during the following 5 years, reaching nearly $26 billion in 2012 (fig. 14). This increase coin-cided with China’s strategy of increasing support prices annually. China was the leading destination for U.S. agricultural exports in 2012, accounting for 18 percent of the value of U.S. agricultural exports that year (up from 8 to 9 percent during 2003-07).
The relationship between rising U.S. agricultural exports and China’s increase in support prices is complex, and the two trends are interdependent. Chinese policies have played a role in promoting U.S. exports to varying degrees for different commodities. The discussion that follows identi-fies several key U.S. export commodities and explains how rising U.S. exports are tied to China’s domestic agricultural policies.
Soybeans: Exports to China $15 Billion During 2012
Given China’s limited amount of land, inducements to produce wheat, corn, and rice have displaced soybean production. As discussed earlier in this report, China raised support prices for corn and short-grain rice (the two principal crops in soybean-producing regions of northeastern China) by 54 to 88 percent during 2008-12, but the soybean support price was raised only 41 percent. Soybean prices are not high enough to make soybeans as profitable as corn and other alternative crops. 37
The price of soybeans would have to rise sharply to induce farmers in China to plant more soybeans. However, the demand for Chinese soybeans is sensitive to their price, since imported soybeans are available to processors at a lower price. Consequently, when the Chinese Government attempts
36Jikun Huang et al. (2011) and Guoqiang Cheng (2011) found that grain subsidy payments had little or no influence on Chinese farmers’ production decisions, and many provincial officials have criticized the weak incentives of subsidy pay-ments (Sichuan CPPCC, 2009). Guoqiang Cheng (2011) and Du (2011) reported that output price was the most important determinant of production decisions.
37Most Chinese farmers probably receive the same subsidy payment whether they plant corn or soybeans, so subsidies likely have little or no influence on the production decision.
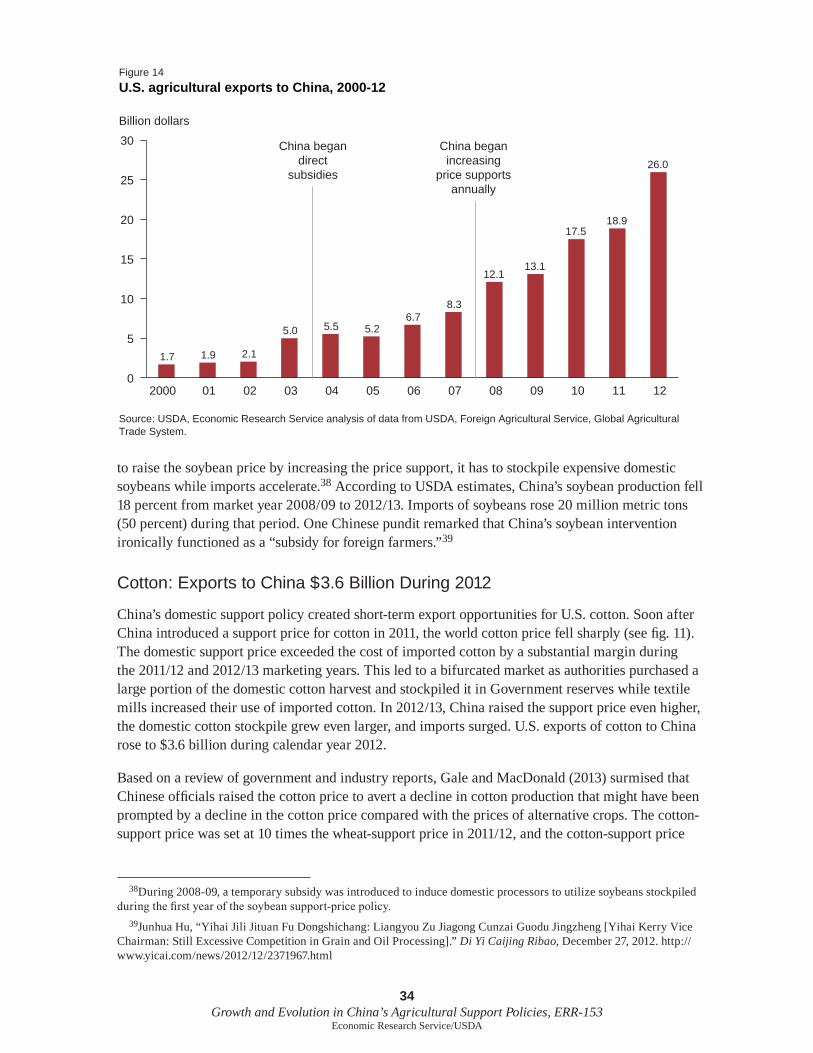
34 Growth and Evolution in China’s Agricultural Support Policies, ERR-153
Economic Research Service/USDA
to raise the soybean price by increasing the price support, it has to stockpile expensive domestic soybeans while imports accelerate.38 According to USDA estimates, China’s soybean production fell 18 percent from market year 2008/09 to 2012/13. Imports of soybeans rose 20 million metric tons (50 percent) during that period. One Chinese pundit remarked that China’s soybean intervention ironically functioned as a “subsidy for foreign farmers.”39
Cotton: Exports to China $3.6 Billion During 2012
China’s domestic support policy created short-term export opportunities for U.S. cotton. Soon after China introduced a support price for cotton in 2011, the world cotton price fell sharply (see fig. 11). The domestic support price exceeded the cost of imported cotton by a substantial margin during the 2011/12 and 2012/13 marketing years. This led to a bifurcated market as authorities purchased a large portion of the domestic cotton harvest and stockpiled it in Government reserves while textile mills increased their use of imported cotton. In 2012/13, China raised the support price even higher, the domestic cotton stockpile grew even larger, and imports surged. U.S. exports of cotton to China rose to $3.6 billion during calendar year 2012.
Based on a review of government and industry reports, Gale and MacDonald (2013) surmised that Chinese officials raised the cotton price to avert a decline in cotton production that might have been prompted by a decline in the cotton price compared with the prices of alternative crops. The cotton-support price was set at 10 times the wheat-support price in 2011/12, and the cotton-support price
38During 2008-09, a temporary subsidy was introduced to induce domestic processors to utilize soybeans stockpiled during the first year of the soybean support-price policy.
39Junhua Hu, “Yihai Jili Jituan Fu Dongshichang: Liangyou Zu Jiagong Cunzai Guodu Jingzheng [Yihai Kerry Vice Chairman: Still Excessive Competition in Grain and Oil Processing].” Di Yi Caijing Ribao, December 27, 2012. http://www.yicai.com/news/2012/12/2371967.html
Figure 14
U.S. agricultural exports to China, 2000-12
Source: USDA, Economic Research Service analysis of data from USDA, Foreign Agricultural Service, Global Agricultural Trade System.
Billion dollars
1.7 1.9 2.1
5.0 5.5 5.26.7
8.3
12.113.1
17.518.9
26.0
0
5
10
15
20
25
30
2000 01 02 03 04 05 06 07 08 09 10 11 12
China begandirect
subsidies
China began increasing
price supportsannually
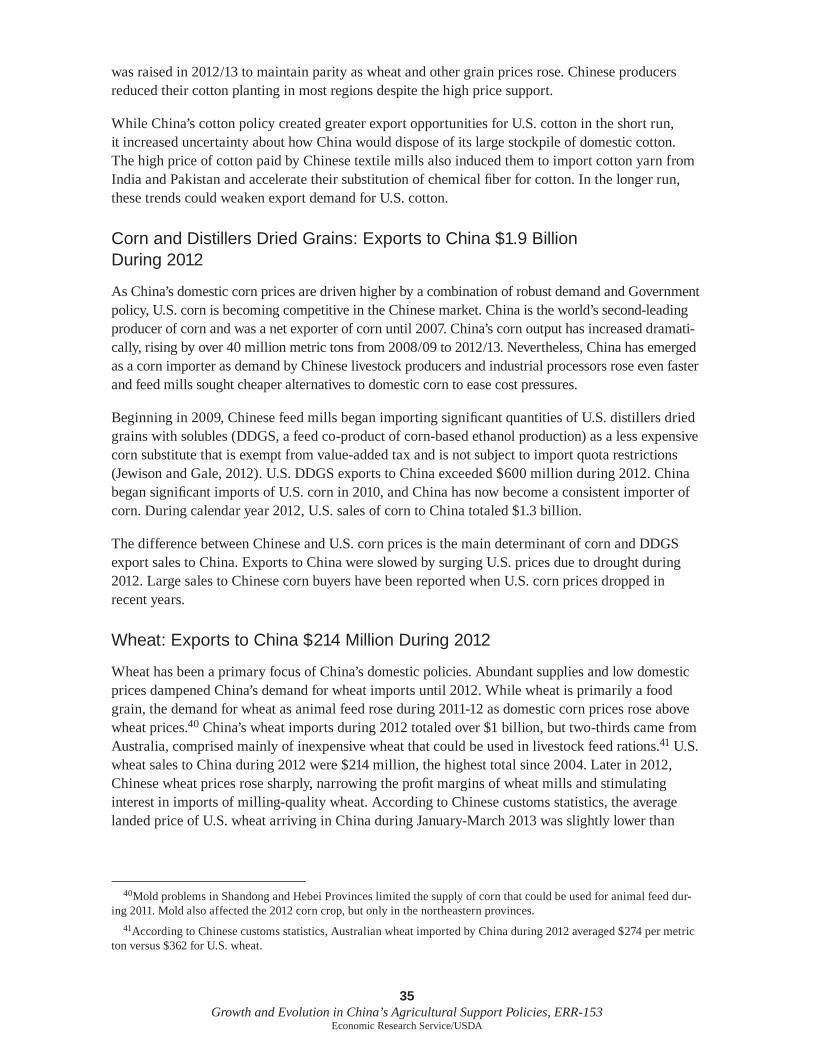
35 Growth and Evolution in China’s Agricultural Support Policies, ERR-153
Economic Research Service/USDA
was raised in 2012/13 to maintain parity as wheat and other grain prices rose. Chinese producers reduced their cotton planting in most regions despite the high price support.
While China’s cotton policy created greater export opportunities for U.S. cotton in the short run, it increased uncertainty about how China would dispose of its large stockpile of domestic cotton. The high price of cotton paid by Chinese textile mills also induced them to import cotton yarn from India and Pakistan and accelerate their substitution of chemical fiber for cotton. In the longer run, these trends could weaken export demand for U.S. cotton.
Corn and Distillers Dried Grains: Exports to China $1.9 Billion During 2012
As China’s domestic corn prices are driven higher by a combination of robust demand and Government policy, U.S. corn is becoming competitive in the Chinese market. China is the world’s second-leading producer of corn and was a net exporter of corn until 2007. China’s corn output has increased dramati-cally, rising by over 40 million metric tons from 2008/09 to 2012/13. Nevertheless, China has emerged as a corn importer as demand by Chinese livestock producers and industrial processors rose even faster and feed mills sought cheaper alternatives to domestic corn to ease cost pressures.
Beginning in 2009, Chinese feed mills began importing significant quantities of U.S. distillers dried grains with solubles (DDGS, a feed co-product of corn-based ethanol production) as a less expensive corn substitute that is exempt from value-added tax and is not subject to import quota restrictions (Jewison and Gale, 2012). U.S. DDGS exports to China exceeded $600 million during 2012. China began significant imports of U.S. corn in 2010, and China has now become a consistent importer of corn. During calendar year 2012, U.S. sales of corn to China totaled $1.3 billion.
The difference between Chinese and U.S. corn prices is the main determinant of corn and DDGS export sales to China. Exports to China were slowed by surging U.S. prices due to drought during 2012. Large sales to Chinese corn buyers have been reported when U.S. corn prices dropped in recent years.
Wheat: Exports to China $214 Million During 2012
Wheat has been a primary focus of China’s domestic policies. Abundant supplies and low domestic prices dampened China’s demand for wheat imports until 2012. While wheat is primarily a food grain, the demand for wheat as animal feed rose during 2011-12 as domestic corn prices rose above wheat prices.40 China’s wheat imports during 2012 totaled over $1 billion, but two-thirds came from Australia, comprised mainly of inexpensive wheat that could be used in livestock feed rations.41 U.S. wheat sales to China during 2012 were $214 million, the highest total since 2004. Later in 2012, Chinese wheat prices rose sharply, narrowing the profit margins of wheat mills and stimulating interest in imports of milling-quality wheat. According to Chinese customs statistics, the average landed price of U.S. wheat arriving in China during January-March 2013 was slightly lower than
40Mold problems in Shandong and Hebei Provinces limited the supply of corn that could be used for animal feed dur-ing 2011. Mold also affected the 2012 corn crop, but only in the northeastern provinces.
41According to Chinese customs statistics, Australian wheat imported by China during 2012 averaged $274 per metric ton versus $362 for U.S. wheat.
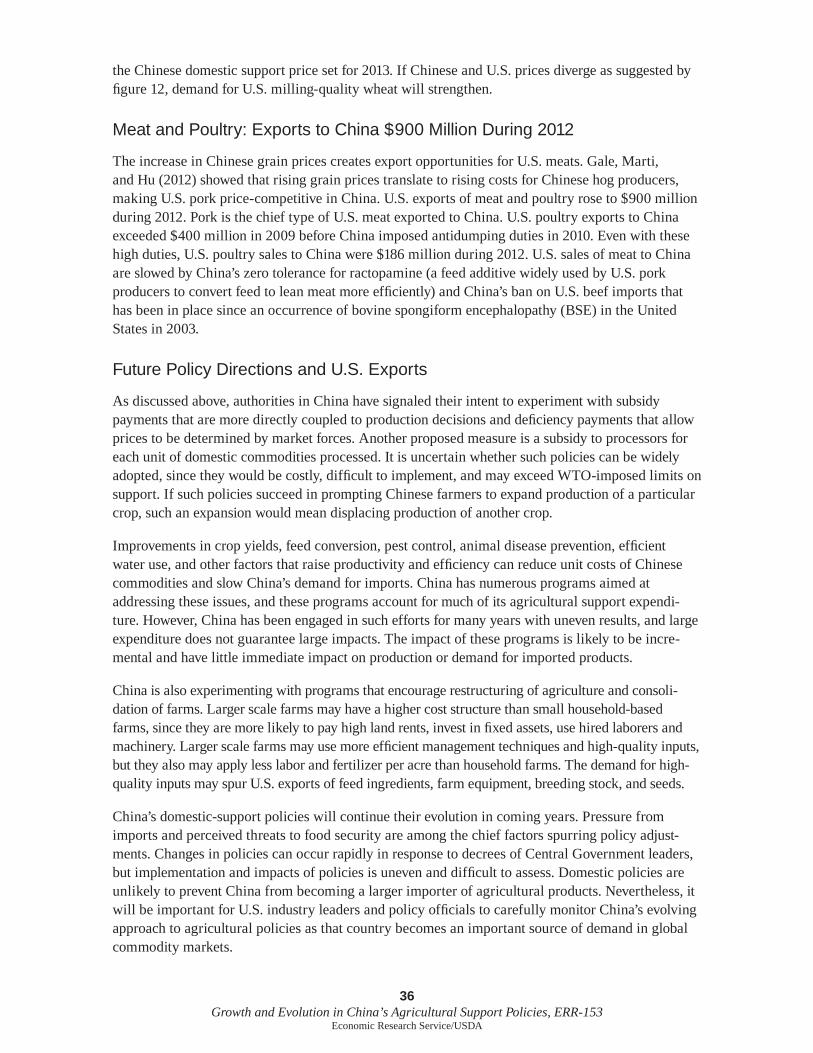
36 Growth and Evolution in China’s Agricultural Support Policies, ERR-153
Economic Research Service/USDA
the Chinese domestic support price set for 2013. If Chinese and U.S. prices diverge as suggested by figure 12, demand for U.S. milling-quality wheat will strengthen.
Meat and Poultry: Exports to China $900 Million During 2012
The increase in Chinese grain prices creates export opportunities for U.S. meats. Gale, Marti, and Hu (2012) showed that rising grain prices translate to rising costs for Chinese hog producers, making U.S. pork price-competitive in China. U.S. exports of meat and poultry rose to $900 million during 2012. Pork is the chief type of U.S. meat exported to China. U.S. poultry exports to China exceeded $400 million in 2009 before China imposed antidumping duties in 2010. Even with these high duties, U.S. poultry sales to China were $186 million during 2012. U.S. sales of meat to China are slowed by China’s zero tolerance for ractopamine (a feed additive widely used by U.S. pork producers to convert feed to lean meat more efficiently) and China’s ban on U.S. beef imports that has been in place since an occurrence of bovine spongiform encephalopathy (BSE) in the United States in 2003.
Future Policy Directions and U.S. Exports
As discussed above, authorities in China have signaled their intent to experiment with subsidy payments that are more directly coupled to production decisions and deficiency payments that allow prices to be determined by market forces. Another proposed measure is a subsidy to processors for each unit of domestic commodities processed. It is uncertain whether such policies can be widely adopted, since they would be costly, difficult to implement, and may exceed WTO-imposed limits on support. If such policies succeed in prompting Chinese farmers to expand production of a particular crop, such an expansion would mean displacing production of another crop.
Improvements in crop yields, feed conversion, pest control, animal disease prevention, efficient water use, and other factors that raise productivity and efficiency can reduce unit costs of Chinese commodities and slow China’s demand for imports. China has numerous programs aimed at addressing these issues, and these programs account for much of its agricultural support expendi-ture. However, China has been engaged in such efforts for many years with uneven results, and large expenditure does not guarantee large impacts. The impact of these programs is likely to be incre-mental and have little immediate impact on production or demand for imported products.
China is also experimenting with programs that encourage restructuring of agriculture and consoli-dation of farms. Larger scale farms may have a higher cost structure than small household-based farms, since they are more likely to pay high land rents, invest in fixed assets, use hired laborers and machinery. Larger scale farms may use more efficient management techniques and high-quality inputs, but they also may apply less labor and fertilizer per acre than household farms. The demand for high-quality inputs may spur U.S. exports of feed ingredients, farm equipment, breeding stock, and seeds.
China’s domestic-support policies will continue their evolution in coming years. Pressure from imports and perceived threats to food security are among the chief factors spurring policy adjust-ments. Changes in policies can occur rapidly in response to decrees of Central Government leaders, but implementation and impacts of policies is uneven and difficult to assess. Domestic policies are unlikely to prevent China from becoming a larger importer of agricultural products. Nevertheless, it will be important for U.S. industry leaders and policy officials to carefully monitor China’s evolving approach to agricultural policies as that country becomes an important source of demand in global commodity markets.
37 Growth and Evolution in China’s Agricultural Support Policies, ERR-153
Economic Research Service/USDA
References
Anderson, Kym. “Policy Reforms Affecting Agricultural Incentives: Much Achieved, Much Still Needed,” The World Bank Research Observer, Vol. 25, No. 1, February, pp. 21-55. 2010.
Chen Chunping. 2009 Nian Woguo Liangshi Hongguan Diaokong Zhengce Huigu yu Zhanwang (Review of 2009 National Grain Macro Adjustment Policies and Outlook), Ministry of Finance, Unpublished report, July 2010. http://www.cngrain.com/Publish/news/201007/454550.shtml
Cheng, Guoqiang (editor). China’s Agricultural Subsidies. Beijing: China Development Press, 2011.
Cheng, Fuzhi. “China,” pp. 310-352, In D. Orden, T. Josling, and D. Blandford, International Disciplines on Domestic Agricultural Support. Cambridge: Cambridge University Press, 2011.
China National Development and Reform Commission (CNDRC). Chengben Kuaisu Shangsheng Bei Jing Xia de Nongye Butie Zhengce Yanjiu [Research on Agricultural Subsidy Policy Against a Background of Rapidly Rising Cost], internal report, National Macroeconomic Research Institute, December 2008.
China National Bureau of Statistics. 2011 Nian Nongmin Gong Diaocha Jiance Baogao [2011 Rural Migrant Worker Monitoring Survey Report], online report. April 27, 2012. http://www.stats.gov.cn/tjfx/fxbg/t20120427_402801903.htm .
DRC (Development Research Center of the State Council). Zhongguo Nongye de Zhichi yu Baohu [Support and Protection for Chinese Agriculture]. Beijing: China Agriculture Press, 1997.
Du, Min. “Investigation and Analysis of Farmers’ Product and Market Behavior,” Ministry of Agriculture Research Center for Rural Economy, China Rural Research Report 2011, pp. 505-516. 2012.
Du, Min, Wenli Zhang, Rui Liu. “Research and Consideration on Cotton Minimum Purchase Price Policy in China,” Ministry of Agriculture Research Center for Rural Economy, China Rural Research Report 2011, pp. 517-528. 2012.
Farmers Daily. “Nongye Bu Fabu 2010 Nian Qiang Nong Hui Nong Zhengce Huilan (Ministry of Agriculture Announces 2010 Policies Strengthening Agriculture and Benefiting Farmers),” March 11, 2010. http://www.farmer.com.cn/zt/qnhn/
Farmers Daily. “2011 Nian Guojia Zhichi Liangshi Zeng Chan Nongmin zeng Shou de Zhengce Cuoshi (Policy Measures for National Support of Increased Grain Production and Increased Farmer Income in 2011),” March 29, 2011.
Farmers Daily. “2012 Nian Guojia Zhichi Liangshi Zengchan Nongmin Zengshou de Zhengce Cuoshi [2012 National Policy Measures Supporting Increased Grain Production and Farmers Income],” March 2012. http://www.farmer.com.cn/bbz/20123lszc/
Gale, Fred. “Financial Reforms Push Capital to the Countryside,” The Chinese Economy, Vol. 42, No. 5, September-October, pp. 58-78. 2009.
38 Growth and Evolution in China’s Agricultural Support Policies, ERR-153
Economic Research Service/USDA
Gale, Fred, and Jean C. Buzby. Imports From China and Food Safety Issues. EIB-52, USDA, Economic Research Service, 2009. http://www.ers.usda.gov/media/156008/eib52_1_.pdf
Gale, Fred and Robert Collender. New Directions in China’s Agricultural Lending, WRS-0601, USDA, Economic Research Service, January 2006.
Gale, Fred, Sophia Huang, and Yingying Gu. Investment in Processing Industry Turns Chinese Apples Into Juice Exports, FTS-344-01, USDA, Economic Research Service, 2010. http://www.ers.usda.gov/media/141094/fts34401_1_.pdf
Gale, Fred, Bryan Lohmar, and Francis Tuan. China’s New Farm Subsidies, WRS-0501, USDA, Economic Research Service, 2005. http://www.ers.usda.gov/publications/wrs0501/
Gale, Fred, Bryan Lohmar, and Francis Tuan. “How Tightly Has China Embraced Market Reforms in Agriculture?” Amber Waves, Vol. 7, Issue 2, June, pp. 30-35. 2009.
Gale, H.F., and Stephen MacDonald. Untangling China’s Cotton Policy, presentation at USDA Agricultural Outlook Forum, February 2013. http://www.usda.gov/oce/forum/presentations/Gale.pdf
Gale, Fred, Daniel Marti, and Dinghuan Hu. China’s Volatile Pork Industry, LDPM-211-01, USDA, Economic Research Service, 2012.
Gale, Fred and Francis Tuan. China Currency Appreciation Could Boost U.S. Agricultural Exports, WRS-0703. USDA, Economic Research Service, 2007. http://www.ers.usda.gov/publications/wrs-international-agriculture-and-trade-outlook/wrs-0703.aspx
Gale, Fred, Zhengzhou Yang, and Jonathan Cook. “China’s Vegetable Exports Peak as Attention Shifts to Domestic Market,” Vegetables and Pulses Outlook, VGS-353-SA3, 2013. http://www.ers.usda.gov/media/1068076/vgs-353-sa3.pdf
Gale, H. F., and Dinghuan Hu. “Food Safety Pressures Push Integration in China’s Agricultural Sector,” American Journal of Agricultural Economics, January, 94(2): 483-488. 2012.
Guangdong Province Price Association Task Force. “Jianli Guangdong Daogu Mubiao Jiage Zhengce Yanjiu [Research on setting up a target price for rice in Guangdong],” Price Management, No. 1, pp. 10-16. 2010.
Guo, Jun, and Yongchao Zhang. “Weifang Shi Xiaomai Liangzhong Butie Cunzai de Wenti ji Duice [Problems With Improved Seed Subsidy for Wheat in Weifang City].” Shandong Agricultural Sciences 11: 118-121. 2010.
Han, Changfu. “Ru Shi Shinian yu Zhongguo Nongye Fazhan [10 Years of WTO and China’s Agricultural Development],” Farmers Daily, December 26, 2011.
Hebei Province Finance Department. “Dui Hebei Sheng Liangshi Zhibu Gongzuode Diaocha (Investigation of Hebei Province Direct Grain Subsidy Work),” unpublished article, April 2009.
Huang, Haiping, and Baolian Huang. “Wo Guo Nongye Youshi Chanye Jiqun Fazhan de Kunjing Fenxi—Yi Xinjiang Mianhua Chanye Jiqun Wei Li (Analysis of Difficulties With Our Country’s
39 Growth and Evolution in China’s Agricultural Support Policies, ERR-153
Economic Research Service/USDA
Agricultural Advantaged Industry Clusters—The Example of Xinjiang’s Cotton Industry),” Rural Economy, No. 8, pp. 32-35. 2011.
Huang, Jikun, Yu Liu, Will Martin, and Scott Rozelle. “Changes in Trade and Domestic Distortions Affecting China’s Agriculture,” Food Policy, Vol. 34, pp. 407-416. 2009.
Huang, Jikun, Xiaobing Wang, Huayong Zhi, Zhurong Huang, and Scott Rozelle. “Subsidies and Distortions in China’s Agriculture: Evidence from Producer-Level Data,” The Australian Journal of Agricultural and Resource Economics, Vol. 55, pp. 53-71. 2011.
Huang, Jikun, Xiaobing Wang, and Scott Rozelle. “The Subsidization of Farming Households in China’s Agriculture.” Food Policy, Vol. 41, pp. 124-132. 2013.
Huang, Weijian, Huiping Wang, and Wu Liang. “Xin Shiqi Nongmin Fudan Yanjiu [Research on Farmer Burdens in a New Era],” Issues in Agricultural Economy No. 5, 2010, pp. 4-9.
Investors News (Touzizhe bao). “Liangzhong Butie Xianru Liyi Zhengduo de Nitan [Fine Seed Subsidy Pulled into the Quagmire of Competing Interests],” February 10, 2012.
Jewison, Michael, and Fred Gale. China’s Market for Distillers Dried Grains and the Key Influences on Its Longer Run Potential, FDS-12g-01, USDA, Economic Research Service. 2012.
Li, Linmao and Yaoming Xu. “Guanyu Liangshi Mubiao Jiage de Sikao [Thoughts on Grain Target Price].” Price Monthly, No. 4, 2011, pp. 1-3.
Liu, Zhenwei, Haihong Ouyang, and Zhaoxin Zhang, “Liangshi Butie Fangshi Gaige Tan Lun” [Explorations in Reform of Grain Subsidy Methods],” Issues in Agricultural Economy, No. 5, May 2003.
Lohmar, Bryan, Jinxia Wang, Scott Rozelle, Jikun Huang, and David Dawe. China’s Agricultural Water Policy Reforms, AIB-782. USDA, Economic Research Service, 2003.
Lohmar, Bryan, Fred Gale, Francis Tuan, and Jim Hansen. China’s Ongoing Agricultural Modernization: Challenges Remain After 30 Years of Reform. EIB-51, USDA, Economic Research Service, 2009. http://www.ers.usda.gov/publications/eib51/
Niu, Dun. “Zhongguo Nongye Ru Shi Shinian Huigu yu Zhanwang [Retrospect and Prospect for China’s Agriculture Since Entering WTO],” Issues in Agricultural Economy, No. 12, 2011.
Organisation of Economic Co-operation and Development. OECD Review of Agricultural Policies: China. Paris: OECD, 2005.
Organisation of Economic Co-operation and Development. “China,” in Agricultural Policies in Emerging Economies 2009: Monitoring and Evaluation. Paris: OECD, 2009.
Organisation of Economic Co-operation and Development. Working Party on Agricultural Policies and Markets. Agricultural Policies in OECD Countries and Emerging Economies, 2011. Paris: OECD, 2011.
Orden, D., T. Josling, and D. Blandford. International Disciplines on Domestic Agricultural Support. Cambridge: Cambridge University Press, 2011.
40 Growth and Evolution in China’s Agricultural Support Policies, ERR-153
Economic Research Service/USDA
Peoples Daily. “Nongye Butie Bu Zai ‘Sa Zhima Yan’ [Agricultural Subsidies Will No Longer be ‘Sprinkled Like Salt’],” February 4, 2013. http://theory.people.com.cn/n/2013/0204/c40531-20420126.html
Petry, Mark, and Darren Chandlee. China’s Agriculture Subsidies on the Rise, GAIN Report CH9028, USDA, Foreign Agricultural Service, July 14, 2009.
Qian, Keming. “Effectiveness of China’s ‘Green Box Policy’ Support Structure,” Issues in Agricultural Economics, No. 1. 2003.
Research Center for Rural Economy (RCRE). 2011 Nian Zhongguo Nongcun Zhengce Zhixing Baogao (2011 China Rural Policy Implementation Report). November 7, 2011.
Research Center for Rural Economy. 2010 Nian Zhongguo Nongcun Zhengce Zhixing Baogao No. 2: Jingji Fusu Guocheng Zhong de Nongcun Jingji Fazhan [2010 China Rural Policy Implementation Report No. 2: Rural Economic Development in the Process of Economic Recovery], unpublished report, November 10, 2010a.
Research Center for Rural Economy. “2010 Nian Zhongguo Nongcun Zhengce Zhixing Baogao (2010 China Rural Policy Implementation Report),” Farmers Daily San Nong Online, November 2010b. http://www.farmer.com.cn/news/tjyd/201011/t20101126_597448.htm
Sichuan CPPCC (Committee of the Peoples Political Consultative Congress). “Wo Sheng Liangshi Shengchan Cunzai de Wenti he Duice Jianyi (Problems and Countermeasures for Our Province’s Grain Production),” CPPCC net, January 4, 2009. http://www.sczx.gov.cn/system/2009/01/14/010084326.shtml
Song, Hongyuan (editor). “Shiyi Wu” Shiqi Nongye he Nongcun Zhengce Huigu yu Pingjia [Review and assessment of agricultural and rural policy during the 11th 5-year plan period]. Beijing: China Agriculture Press, 2010.
Tong, Pingya. “Liangzhong Butie, Zenme Ba Hao Shi Ban Cheng Hao [Fine Seed Subsidy, How to Do a Good Thing Better],” Seed World, No. 9. 2011.
U.S. International Trade Commission. China’s Agricultural Trade: Competitive Conditions and Effects on U.S. Exports, Publication 4219, March 2011.
U.S. Trade Representative. 2011 Report to Congress on China’s WTO Compliance. December 2011.
World Trade Organization. Trade Policy Review: China. WT/TPR/S/264, 8 May 2012.
Wang, Shuai. “Tongliao Shi Qie’er Bu She Tui Guang Yumi Jixiehua Shouhua [Tongliao Prefecture Perseveres in Expanding Mechanization of Corn Harvest],” Contemporary Farm Machinery, No. 10, pp. 12-13. 2011.
Wang, Yixuan, and Yueying Mu. “The Practise and Adjustment of China’s Agricultural Subsidies Since Entered WTO.” Chinese Agricultural Science Bulletin, Vol. 25, No.6, pp. 278-84. 2009.
Xi, Yinsheng. “Changes of Farmer’s Grain Sale Behavior and Production Mood and Policy Suggestion.” China Rural Research Report 2011, Beijing: China Financial and Economic Press, pp. 202-08. 2011.
41 Growth and Evolution in China’s Agricultural Support Policies, ERR-153
Economic Research Service/USDA
Xinhua News Service. ‘You Zhong You Bu’ Sichuan Zhong Liang Butie Xin Zheng Zhen Zheng ‘Miaozhun’ Zhong Di Nongmin [Sichuan’s Genuinely New ‘If You Plant, You Get a Subsidy’ Policy is ‘Aimed’ at Farmers Who Plant Crops], April 16, 2013. http://news.xinhuanet.com/local/2013-04/16/c_115412311.htm
Xu, Hengjie. “Zai Kaifang Zhong Tuijin Nongye You Hao You Kuai Fazhan—Jiu Ru Shi Shinian Zhongguo Nongye Fazhan Fang Nongyebu Fubuzhang Niu Zhi (Pushing Better and Faster Agricultural Development With an Open Economy—Interview With Vice Minister Niu Dun on Agricultural Development on the Tenth Anniversary of China’s WTO Accession).” Farmers Daily, December 7, 2011.
Xu, Zhigang, Yinsheng Xi, Shihuang Zhang. “Analysis on the Implementation, Mechanisms and Effects of 2008 /2009 National Corn Provisional Purchase Policy,” Issues in Agricultural Economy, No. 3, pp. 16-23. 2010.
Yan, Xinggang. Nongchanpin Fengle? [Are Agricultural Products Crazy?]. Beijing: Beijing Publishing Group, 2011.
Yuan, Yansheng, and Qun Su. “Guanyu Liangshi Zhijie Butie Zhengce de Zongshu (Overview of Grain Direct Subsidy Policy),” Issues in Agricultural Economy, 2009.
Zhang, Chao. “Dui Tuo Shi Shougou Zhengce de Tantao [Investigation of Market Intervention Policy],” Grain Decision Reference, No. 6, 2012.
Zhang, Hongyu, and Changbao Zhao (editors). Zhongguo Nongye Zhengce de Jiben Kuangjia [Basic Framework of China’s Agricultural Policy]. Beijing: China Financial and Economic Publishing House, 2009.
Zhu, Zhigang, Jinglin Hu, Xuewen Zhang, Ying Ren, Min Ma, Xiaoliang Han. Guanyu 13 ge Liangshi Zhu Chan Sheng Liangshi Zhibude Diaoyan Baogao [Report on survey of grain direct subsidies in 13 grain-producing provinces], unpublished report, Ministry of Finance Economic Construction Office, 2005. http://jjs.mof.gov.cn/zhengwuxinxi/diaochayanjiu/200806/t20080619_47083.html
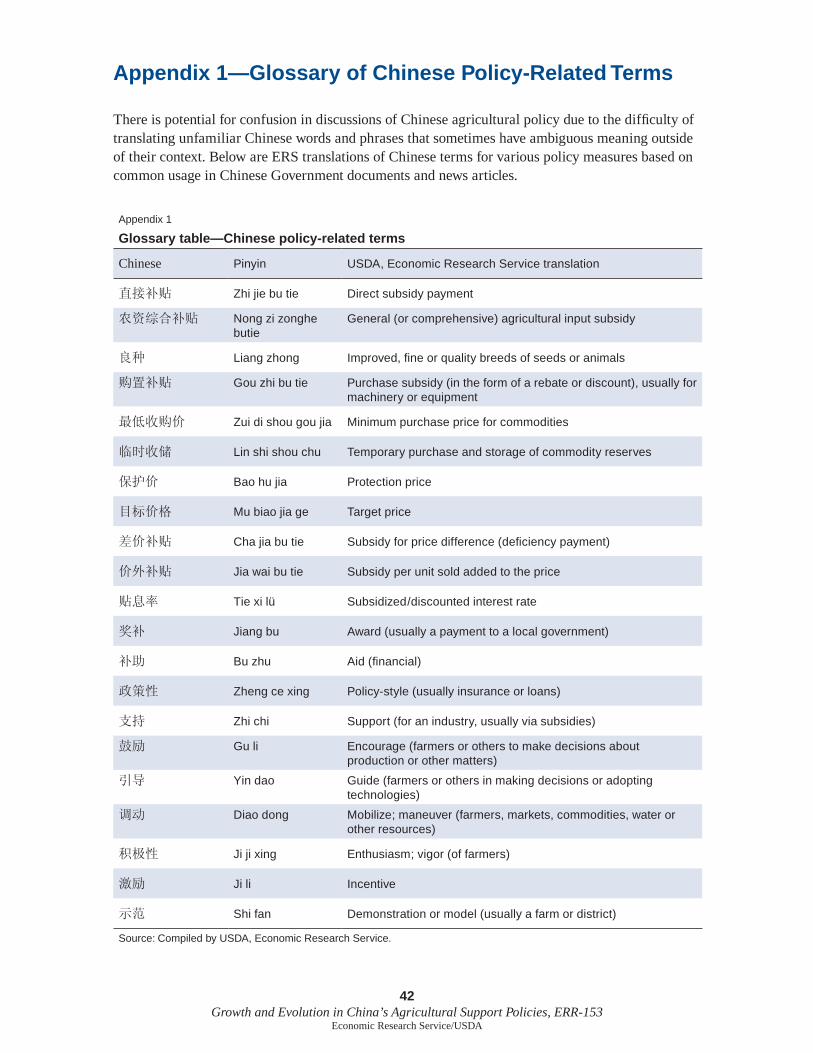
42 Growth and Evolution in China’s Agricultural Support Policies, ERR-153
Economic Research Service/USDA
Appendix 1—Glossary of Chinese Policy-Related Terms
There is potential for confusion in discussions of Chinese agricultural policy due to the difficulty of translating unfamiliar Chinese words and phrases that sometimes have ambiguous meaning outside of their context. Below are ERS translations of Chinese terms for various policy measures based on common usage in Chinese Government documents and news articles.
Appendix 1
Glossary table—Chinese policy-related terms
Chinese Pinyin USDA, Economic Research Service translation
直接补贴 Zhi jie bu tie Direct subsidy payment
农资综合补贴 Nong zi zonghe butie
General (or comprehensive) agricultural input subsidy
良种 Liang zhong Improved, fine or quality breeds of seeds or animals
购置补贴 Gou zhi bu tie Purchase subsidy (in the form of a rebate or discount), usually for machinery or equipment
最低收购价 Zui di shou gou jia Minimum purchase price for commodities
临时收储 Lin shi shou chu Temporary purchase and storage of commodity reserves
保护价 Bao hu jia Protection price
目标价格 Mu biao jia ge Target price
差价补贴 Cha jia bu tie Subsidy for price difference (deficiency payment)
价外补贴 Jia wai bu tie Subsidy per unit sold added to the price
贴息率 Tie xi lü Subsidized/discounted interest rate
奖补 Jiang bu Award (usually a payment to a local government)
补助 Bu zhu Aid (financial)
政策性 Zheng ce xing Policy-style (usually insurance or loans)
支持 Zhi chi Support (for an industry, usually via subsidies)
鼓励 Gu li Encourage (farmers or others to make decisions about production or other matters)
引导 Yin dao Guide (farmers or others in making decisions or adopting technologies)
调动 Diao dong Mobilize; maneuver (farmers, markets, commodities, water or other resources)
积极性 Ji ji xing Enthusiasm; vigor (of farmers)
激励 Ji li Incentive
示范 Shi fan Demonstration or model (usually a farm or district)
Source: Compiled by USDA, Economic Research Service.
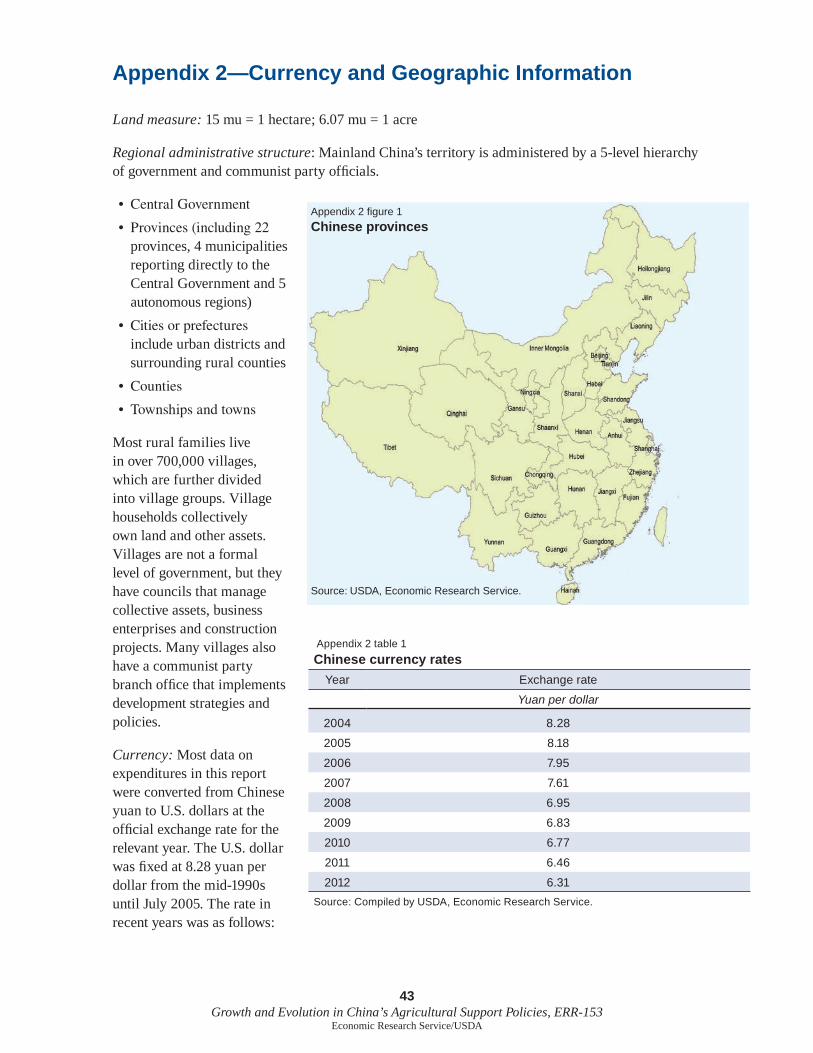
43 Growth and Evolution in China’s Agricultural Support Policies, ERR-153
Economic Research Service/USDA
Appendix 2—Currency and Geographic Information
Land measure: 15 mu = 1 hectare; 6.07 mu = 1 acre
Regional administrative structure: Mainland China’s territory is administered by a 5-level hierarchy of government and communist party officials.
• CentralGovernment
• Provinces(including22provinces, 4 municipalities reporting directly to the Central Government and 5 autonomous regions)
• Citiesorprefecturesinclude urban districts and surrounding rural counties
• Counties
• Townshipsandtowns
Most rural families live in over 700,000 villages, which are further divided into village groups. Village households collectively own land and other assets. Villages are not a formal level of government, but they have councils that manage collective assets, business enterprises and construction projects. Many villages also have a communist party branch office that implements development strategies and policies.
Currency: Most data on expenditures in this report were converted from Chinese yuan to U.S. dollars at the official exchange rate for the relevant year. The U.S. dollar was fixed at 8.28 yuan per dollar from the mid-1990s until July 2005. The rate in recent years was as follows:
Appendix 2 figure 1
Chinese provinces
Source: USDA, Economic Research Service.
Appendix 2 table 1
Chinese currency rates
Year Exchange rate
Yuan per dollar
2004 8.28
2005 8.18
2006 7.95
2007 7.61
2008 6.95
2009 6.83
2010 6.77
2011 6.46
2012 6.31
Source: Compiled by USDA, Economic Research Service.
44 Growth and Evolution in China’s Agricultural Support Policies, ERR-153
Economic Research Service/USDA
Appendix 3—China’s Agricultural Support Programs
Below is a detailed (but not exhaustive) list of China’s agricultural support programs compiled by ERS from descriptions in Farmers Daily articles that appeared in March 2011 and March 2012, supplemented by other materials. Approximate Chinese Government expenditures (converted to U.S. dollars) for calendar year 2011 are included in parentheses when available.
Elimination of the agricultural tax
Historically, the “agricultural tax” was paid by delivering grain to authorities. By the 1990s, the tax was often paid in cash based on a farm household’s capacity to produce grain. This, in turn, was determined by the farmer’s land holding; thus it was in effect a tax on agricultural land. In 2004, the Government announced a national program to phase out the agricultural tax. The tax was eliminated nationwide in 2006.42 Chinese officials have estimated the value of agricultural tax reductions to farmers at $21 billion per year.
Direct payment to grain producers ($2.4 billion)
The direct payment to grain producers is a fixed payment based (in most provinces) on the same historical land base that was used to assess the agricultural tax. In some localities, the payment is based on planted area or volume of grain sold. The particulars of the payment’s implementa-tion are determined by each provincial government. The total of these payments has risen as they were extended to more farmers and regions; coverage became nationwide in 2007. The central and provincial governments jointly contribute funds to provincial “grain risk funds” that fund subsidies and costs of grain market intervention. At least half of each province’s grain risk fund is to be used for the direct payment subsidy. The amount of the payment was initially determined by dividing the grain risk fund allocation by the amount of eligible land or volume of marketed grain. The payment is typically 10 yuan per mu ($9.50 per acre), but can vary from 5 to 20 or more yuan per mu in various provinces and municipalities.
General-input subsidy for grain producers ($13.4 billion)
The general-input subsidy was introduced in 2006 to shield grain producers from rising production costs due to increases in petroleum and fertilizer prices. This payment is made directly to farmers, usually in conjunction with the direct grain payment. The payment level is raised based on changes in grain and input prices in each year. The amount of the subsidy paid to farmers is determined by local authorities. The payment remains constant if input prices fall.
Improved strains of seed subsidy ($3.4 billion)
The quality seed subsidy is intended to reduce the cost of purchasing varieties of seed that are determined to be high quality or with special characteristics valued by processors, such as high-oil-content soybeans, corn with high starch content or for silage use, wheat with high or low gluten, and “double low” rapeseed. The subsidy is a set payment based on the area of crop planted (10 yuan
42Many local officials have imposed various fees that partially replace reduced tax revenue (Huang, Wang, and Liang, 2010). A story posted on an online forum alleged that officials in one area reclassified land and converted the agricultural tax to a forest user fee.
45 Growth and Evolution in China’s Agricultural Support Policies, ERR-153
Economic Research Service/USDA
per mu for wheat, corn, soybeans, rapeseed and early-season rice; 15 yuan per mu for single-season and late-season rice, cotton, and wheat in Xinjiang Autonomous Region). Subsidies are only given in designated counties for most crops. The seed subsidy can be distributed either by giving a cash payment to farmers to buy seeds or by transferring funds to a company which sells seeds to farmers at a discounted price. Initially, this program covered rice, wheat, corn, and soybeans, but it has been extended to cotton, rapeseed, peanuts (on a trial basis in selected counties), seed potato propagation farms, highland barley grown in Tibetan areas, and natural rubber. The composition of expenditure during 2009 was: rice $1 billion, wheat $653 million, corn $920 million, soybeans $153 million, cotton $198 million, rapeseed $116 million, and seed potatoes $31 million. Seed subsidy funds are allocated to each county based on the area of crops planted (in a separate calculation from the direct payment subsidy calculation).
Machinery-purchase subsidy ($2.7 billion)
The machinery-purchase subsidy pays up to 30 percent of the purchase price of eligible agricultural machinery and equipment. The subsidy is 50 percent in regions of Sichuan Province affected by the 2008 earthquake and in regions of central China where the program is linked to elimination of schistosomiasis (a parasitic disease spread by water buffalo). The subsidy cannot exceed $7,800 for most types of machinery. The maximum subsidy is $18,750 for tractors of 100 horsepower (hp) or more, high-capacity hay harvesters, large no-till seeding machines, milking machines, large combine harvesters, large rice transplanters, and grain drying machinery. The maximum is $31,250 for large cotton harvesters, sugar cane harvesters, and 200-hp or more tractors.
The subsidy covers a wide range of equipment, including tractors, harvesters, machinery for conser-vation tillage, fishing and forestry equipment, milking machinery, and grain-drying equipment. A national list of 180 kinds of eligible equipment is compiled, which each province can supple-ment with up to 20 additional types. Purchasers can be farmers, cooperatives, machinery service-providers, model farms, or milk collection stations. Machinery can be purchased from any county within the province, and the purchaser applies to the provincial government for the subsidy payment. In 2009, the Ministry of Agriculture added pilot subsidy programs in some regions for equipment used for conservation tillage, rice transplanting, and plant protection.
Agricultural insurance ($1.47 billion)
China launched subsidy programs for crop and livestock insurance in 2007 and expanded them in 2008. Corn, rice, wheat, soybean, cotton, rapeseed, and peanuts are insured against weather-related natural disasters and pest and rodent damage in 12 provinces and 3 regions administered by state farms. Livestock insurance covers 19 kinds of diseases for breeding sows and fattening hogs and 10 diseases for dairy cattle, as well as losses from natural disasters in central and western prov-inces. Some local governments subsidize insurance for other agricultural activities. Insurance is provided by designated insurance companies, with most of the premiums paid by subsidies from central, provincial, prefecture, and county governments. Farmers pay only 20 percent of sow insur-ance premiums and 40 percent of dairy cattle insurance premiums. The central-provincial-local split varies by region—the central share is lower in eastern provinces and higher in central and western provinces. In 2013, the Central Government raised its share of fattening-hog insurance premiums from 10 percent to 50 percent in central and western regions and 40 percent in eastern regions.
46 Growth and Evolution in China’s Agricultural Support Policies, ERR-153
Economic Research Service/USDA
Improved animal breed subsidy ($186 million)
Similar to the seed subsidy, a program to improve animal breeds was launched with a subsidy for dairy cattle in selected trial counties during 2005. The program was later extended to more dairy counties and offered for swine, beef cattle, and sheep. It includes yaks in parts of western China. The program subsidizes artificial inseminations using semen from improved breeds. The subsidy for swine is $1.56 for each insemination (two attempts each for two breedings per year for each sow) paid to a breeding station; for dairy cattle, $4.69 per Holstein and Jersey dairy heifer and water buffalos for milking, $3.12 for other breeds; beef cattle $1.56 per heifer; for sheep, $125 per ram purchased; for yaks, $312 per bull purchased. According to a Ministry of Agriculture report, the program expanded the number of county-level hog-breeding stations from 2,800 to 3,500 and it added 761 Holstein bulls.
Sow subsidy
A subsidy for each reproductive sow of 50 yuan was introduced in 2006 and raised to 100 yuan in 2007. The subsidy is only given in major pork-supply counties and its implementation is uneven. According to regulations describing a hog price stabilization program issued in 2012, the subsidy is only given during periods when the ratio of hog price to corn price is below 5.5:1.
General Agricultural Development
General agricultural development projects are implemented in a contiguous area covering one or more villages using a variety of integrated measures: upgrading or repairing infrastructure (including irrigation facilities and roads to access fields); leveling fields; raising soil fertility; building storage or processing facilities, greenhouses or other structures; supporting agribusi-ness companies and farmer cooperatives; supporting training; subsidizing new seeds; machinery purchases; extension services; and pest control (Zhang and Zhao, 2009, p. 176). The strategy often emphasizes a “demonstration” (shi fan) strategy of focusing support on selected regions or farms as models that will inspire wider dissemination of new modes of production and technologies. It incorporates other subsidy programs and loans with interest subsidies from 3.5 percentage points for small projects to 0.5 percentage points for large projects over $1.56 million.43 Funding comes from multiple levels of government, farmers, and companies. China Ministry of Agriculture (2011, p. 43) reported that general agricultural development investment included $3 billion from the Central Government, $1.65 billion from local governments, and $3 billion from investments by farmers and companies and bank loans.
“Grain for green” ($61 million)
Known in Chinese as “tui geng huan lin (return cultivated land to forests),” this environmental program compensates farmers for converting erodible or otherwise environmentally fragile land from grain production to trees or grass. Compensation can be as an in-kind payment of food grains or in cash. Recipients also may receive aid for planting trees or grass.
43Ministry of Finance, National Comprehensive Development Funds and Project Management,” Document No. 29, revised September 2010.
47 Growth and Evolution in China’s Agricultural Support Policies, ERR-153
Economic Research Service/USDA
Awards to large grain-producing counties ($3.5 billion)
Over 1,000 major grain-producing counties receive financial awards (transfer payments) from the Central Government. Counties are selected by a ranking based on a weighted formula that includes the volume of grain sold outside the county (50 percent), grain production, and area (25 percent each). The proportion of improved commercial varieties planted in the county is one of the criteria for distributing oilseed awards. The top 100 counties receive larger awards. In 2008, oilseed-producing counties were included in the program. Initially, the funds could be used as needed to relieve financial stress. Beginning in 2008, the program encouraged counties to use the funds for supporting production of grain and oilseeds. Funds cannot be used for purchases of automobiles, new office buildings or training centers, salary increases, or “image projects.” In 2011, over 1,000 major grain- and oilseed-producing counties received financial awards (transfers) from the Central Government totaling $3.7 billion.44 RCRE’s (2011) survey of counties reported that the average county’s award was $3.8 million for grain counties and $610,000 for oilseed counties.
Contribution to “grain risk funds” ($3.9 billion)
Each province has a “grain risk fund” established in the 1990s initially to finance grain procure-ment. The fund was jointly financed by central and provincial government contributions. At least half of the fund is now used to finance grain subsidies. From 2009 to 2011, the Central Government took over the entire contribution to grain risk funds. According to Farmers Daily (2009), this reduced the local contribution by $1.5 billion.
Award to major pork-supply counties ($511 million)
Major pork-supply counties can receive a financial award. Counties are ranked using a formula based on volume of pork sold outside the county (50 percent), as well as inventory and slaughter (25 percent each). The top counties receive awards. Funds are earmarked for construction or refurbish-ment of hog farms; purchase of breeding stock; vaccination programs; manure management; subsi-dized interest on loans; support for companies engaged in purchase, sale, storage, distribution and processing; and food safety measures. In 2011, 500 counties received awards totaling $512 million. According to RCRE (2011), the average award was $900,000 per county.
Large grain-farm subsidy
This subsidy is a fixed payment per mu to farms that plant grain crops on a large amount of land. The threshold and the amount of the subsidy vary widely. Farms can operate their own land contracted from their collective or land rented from others with a signed agreement. The amount of the subsidy varies from $9.50 per acre to as much as $190 per acre. The subsidy may be set at a higher per-acre amount for the largest farm sizes. It is not clear how many provinces have imple-mented the large farm subsidy.
In 2013, five provinces were chosen to experiment with a new type of large grain-farm subsidy that gives interest subsidies or partial grants for the cost of investments in irrigation, grain storage, or grain-drying equipment not covered by the machinery subsidy. The minimum size thresholds varied from 49 acres in Shandong to 165 acres in Liaoning Province. The program in Shandong also
44Farmers Daily-Ministry of Agriculture, “Grain County, Pork County Awards Steadily Improved,” September 2011, http://www.zzny.gov.cn/art/2011/9/6/art_4755_268827.html.
48 Growth and Evolution in China’s Agricultural Support Policies, ERR-153
Economic Research Service/USDA
targeted improved financial services and included a land-swap scheme to facilitate consolidation of fragmented plots.
Land transfer awards
Some provinces give one-time grants to farms that rent large contiguous plots of land. In 2008, Jiangsu Province established a fund to support $94-per-acre grants to farms that rented 1,000 mu (165 acres) of land for at least a 3-year lease or shareholding farmer cooperatives that pooled at least 49 acres. The rent had to equal or exceed the net income typically generated by farmers cultivating the land. In 2009, Anhui Province’s Hefei Municipality enacted a similar one-time award for compa-nies or other organizations that rent 165 acres of land at a rent of $475 per acre for a period of at least 3 years. Hefei’s per-mu award is larger for larger land rentals, reaching a maximum of $190 per acre if at least 494 acres are rented. The stated objective of the Hefei program is to expand vegetable and livestock production to supply the city.
Fishing diesel fuel subsidy ($2.68 billion)
Fishermen can receive a subsidy for fuel costs for self-propelled vessels used in ocean or fresh water fishing and aquaculture.
Aid for technologies and methods to prevent or alleviate natural disas-ters ($515 million in 2012)
An emergency aid program during 2011 and 2012 supported drought-mitigation measures including use of plastic tunnels and irrigation for rice seedlings; plastic mulch in southwestern corn fields; pumps, irrigation and spraying in wheat fields; aid for farms producing early-rice seedlings in southern provinces; a program promoting rice-rapeseed crop rotations; and special teams for pest and disease control in areas affected by droughts and floods.
Animal disease prevention ($122 million)
Free mandatory vaccines for major animal diseases, including highly pathogenic avian influenza, foot and mouth disease, highly pathogenic blue ear disease, and classical swine fever, are jointly funded by central and provincial governments and distributed by veterinary stations. Government funds cover costs of personnel and other expenses for providing veterinary services to farms. Producers are to receive compensation for disposal of diseased animals.
Soil fertility testing ($26 million)
Free soil fertility testing and advisory services are offered to farmers in 10,000 pilot villages. The program plans to eventually cover 180 million farm households.
Raising organic matter in soil ($86 million)
A subsidy of 20 yuan per mu has been set to encourage farmers to plough straw and stalks into soil or purchase seed for green manure crops. The program also encourages commercialization of organic fertilizer with a subsidy of 200 yuan per metric ton based on use of 100 kg per mu. Soil fertility testing results are utilized to promote use of organic fertilizer.
49 Growth and Evolution in China’s Agricultural Support Policies, ERR-153
Economic Research Service/USDA
Professionalized pest control organizations ($78 million)
This program would subsidize 2,000 pest-control organizations in 800 counties nationwide with aid of $39,000 for each organization. The subsidy can be used for purchasing pesticides, materials and equipment for field operations, and pest survey equipment. Organizations must be registered with a commercial or civil affairs bureau; have accreditation from the county agriculture bureau; have equipment and technical personnel adequate to provide services to 165 acres or more per day; and be able to contract for services with an area covering 1,650 acres in southern single-season rice-growing areas, 3,295 acres in southern early-season rice, northern single-season rice and wheat areas, and 4,940 acres in corn areas.
Modern agriculture model districts
Central and provincial governments contribute unspecified funds for agricultural projects in designated model (shi fan) districts. The district should emphasize construction of high-standard fields with packages of water, soil, road, and electricity investments; drought and flood prevention measures; improved financial services; new forms of management characterized by large farms, farmer cooperatives and agribusiness links; land rental; improvements in food safety; and environ-mental protection.
High-standard field construction ($31 billion over 2011-15)
This is intended to raise productive capacity by improving irrigation equipment and facilities in fields, raising soil quality, and improving technical guidance. All local governments are ordered to formulate plans and targets for developing high-standard fields. The program emphasizes improve-ments in major grain-producing areas.
High-yield grain, cotton, oilseed, sugar districts ($234 million)
This subsidy is intended to create 5,000 high-yielding 1,650-acre demonstration districts in 500 inte-grated townships in 50 counties nationwide (4,380 grain, 370 oilseed, and 50 sugar districts). The program aims to integrate improved fields, seeds, methods, and machinery in contiguous areas to raise production capacity. Presumably this program utilizes subsidy programs for seeds, machinery, infrastructure, training, extension programs and subsidized bank loans.
“Vegetable basket” product standardized production bases ($97 million)
Chinese authorities classify meats, milk, fish, vegetables, and fruit as “nonstaple” foods whose supply and consumption historically has been local in nature. A “vegetable basket mayors’ respon-sibility system” initiated in 1989 requires prefecture (city) leaders to ensure that their local popula-tion is supplied with nonstaple foods. Support is often in the form of tax exemptions; subsidized loans; access to land; provision of auxiliary services; and grants or earmarked loans for building greenhouses, irrigation facilities, livestock housing, or wholesale market facilities. Horticultural crop programs include a network of demonstration farms and an emphasis on marketing.
The 2010 “Number 1 Document” called for a renewed emphasis on “vegetable basket” support to address problems with food safety and price fluctuations. That year, the Ministry of Agriculture launched a campaign to set up a network of standardized horticultural demonstration projects, each
50 Growth and Evolution in China’s Agricultural Support Policies, ERR-153
Economic Research Service/USDA
supported with $78,000 in aid from the Central Government ($55,000 for “ecological cultivation,” $15,625 for technical services, and $7,812 for quality management). According to the plan, $360 million for the program’s support would come from provincial, county, and municipal budgets, and only $15 million in Central Government funds would be given. The Ministry also launched a national standardized demonstration farm project for livestock and poultry during 2010 with $547 million in government support.
Standardized livestock and poultry farms ($78 million)
The program provides aid for construction and refurbishing of livestock and poultry production facilities, either a single farm or “livestock-raising communities” (yang zhi xiaoqu, standardized barns, or sheds in villages engaged in livestock production). Subsidy levels are set for farms of various scales.
“Green channel” toll reduction
Highway and bridge tolls are waived for trucks carrying fresh produce, livestock, or aquaculture products. Fees assessed by wholesale markets are reduced or waived. Inspection procedures are streamlined.
Direct purchase of fresh and live agricultural products
In 2009, the Ministries of Commerce and Agriculture launched a direct purchase (nong chao dui jie) program that encourages supermarket chains, cafeterias, and hotels to purchase fresh produce directly from farmer cooperatives. These sales are exempt from the 13-percent value-added tax. Supermarkets are ordered not to charge farmer-suppliers slotting or shelf fees and are required to remit payments for merchandise sales to farmers on a daily basis.
Grassland protection system ($2.1 billion)
A new “grassland protection mechanism” for eight western provinces was announced in 2011. The program aimed to restore degraded grasslands by compensating herders for reducing the number of animals grazed, but official announcements also described it as a program for raising incomes of an estimated 1 million animal herders. The grassland protection mechanism includes a package of subsidies similar to those given to grain producers:
• Compensationtoherdingfamiliesof$6peracreofdegradedpasturewheregrazinganimalsisforbidden.
• Apaymentof$1.42peracreforpasturewheregrazingisallowedtocompensateherdersforkeeping the number of animals within prescribed limits.
• Subsidiesforimprovedbreedsofanimals,improvedvarietiesofpasturegrass,anda$78perhousehold subsidy for cost of fuel.
• Afinancialawardtocountygovernmentsbasedontheirimplementationofgrasslandprotectionmeasures.
51 Growth and Evolution in China’s Agricultural Support Policies, ERR-153
Economic Research Service/USDA
Small agricultural water infrastructure
This would provide aid for small irrigation projects covering 1,650 acres in 850 counties, including 521 major grain-producing counties. All levels of government, from central to county, are to increase spending on small-scale water projects and “guide” farmers to voluntarily donate their labor. Funds for village public works projects can be used.
Rural gasification
Subsidies would be provided for construction of village gas-generation facilities using animal manure and crop residues with the residual spread on fields as fertilizer. Subsidies per household are $156 in eastern provinces, $188 in central, and $234 in western provinces. The maximum subsidy per project ranges from $234,000 in western provinces to $390,000 in eastern provinces.
Minimum price policies
Authorities in China set minimum prices for rice and wheat to ensure that prices are high enough to cover production costs and earn a profit. A minimum price is set each year for rice (short-grain rice in northeastern provinces and early-, middle-, and late-season long-grain rice in southern provinces) and wheat (red, white, and mixed wheat until 2012, when a single wheat price was announced). The price is set by authorities based on production cost surveys and market conditions. Prices are announced before crops are planted (in September for wheat and January for rice). Minimum prices are in effect only during the peak months for the crop’s procurement and only in designated major production areas. Purchases are made only when the market price is below the minimum. Purchased commodities are kept in storage until they can be auctioned at a grain exchange at a higher price. The Central Government subsidizes storage and operation costs. Purchases are made by Sinograin, the Government’s reserve-management company, or by local grain depots commissioned by Sinograin. In 2010, two other state-owned companies were also permitted to make minimum-price purchases but this decision was reversed in 2012.
Temporary or provisional reserve support prices
Price supports for corn, soybeans, rapeseed, and cotton (and for wheat and rice outside the regions designated for minimum-price procurement) are called temporary reserve programs. Provisional support prices are usually set after harvest in designated regions, and authorities sometimes set targets for the volume of commodities to be purchased at the support price in each province.
Pork market intervention
Under a “price alert” program for hogs introduced in 2009, authorities intervene in pork markets by purchasing frozen pork when the ratio of hog-to-grain prices falls below a break-even point set by authorities. Reserves are sold into the market during periods of rising prices or peak demand. The reserves are held by meat companies in major cities with costs subsidized by the Government.
Income and business taxes
Most Chinese farmers do not pay income or business taxes. Farmer cooperatives and rural coopera-tive banks pay business taxes at a discounted rate. Processing and trading companies designated as a “leading enterprise” may receive tax concessions.
52 Growth and Evolution in China’s Agricultural Support Policies, ERR-153
Economic Research Service/USDA
Value-added tax (VAT) waivers
China assesses a VAT of 17 percent for most manufactured products and 13 percent for unprocessed agricultural products. Most imported agricultural commodities are assessed a 13-percent VAT on the gross value of the landed cost (including tariff). Some imported products, like animal feeds, are exempt from VAT.
Farmers and most purchasers of domestic farm products are exempt from VAT. Farmer cooperatives and agribusiness companies certified by the Government as “leading enterprises” do not have to pay VAT on agricultural commodities purchased from farmers. Fresh produce purchased by supermar-kets directly from farmer cooperatives is exempt from VAT.
In 2012, China’s Ministry of Finance declared domestic vegetable marketing sectors exempt from VAT.45 The exemption was focused on lowering domestic food costs and covered grading, cutting, washing, dehydration, cold-storage, freezing, and packaging of vegetables, mushrooms, and edible fungus and tree products. The exemption excluded canned vegetables.
45China Ministry of Finance, Notice on Waiver of Value Added Tax for Vegetable Distribution, Document 137(2011), December 21, 2011. http://finance.sina.com.cn/nongye/nyhgjj/20120109/091011155657.shtml
53 Growth and Evolution in China’s Agricultural Support Policies, ERR-153
Economic Research Service/USDA
Appendix 4—How Subsidy Funds Are Distributed
China’s agricultural subsidy funds are distributed through a bureaucratic chain that involves multiple levels and departments of government. Village officials compile lists of all households and their landholding or area planted in various crops (depending on the local method) and multiply the land area by the subsidy rates for the direct payment and the general-input subsidy to calculate the subsidy payments due each household. A separate list showing area planted in each crop is compiled for distribution of the seed subsidy. ERS reviewed dozens of these lists downloaded from local government websites, where they are publicly posted.
The lists are compiled by township and then passed up to county and provincial officials, and the funds due each locality are determined. Funds are allocated from provincial “grain risk funds” and transmitted to the county financial bureau, which deposits funds directly in a special bank account for each farm family. Township and village officials are bypassed in the distribution of funds to prevent any deductions or withholding.
Provincial finance bureaus note the high administrative costs of collecting and verifying informa-tion for distributing subsidies and surmise that some information reported to them is erroneous or fraudulent.
In many areas, the subsidy is based on the family’s historical land holding or grain sales that were the basis for assessing the “agricultural tax” in the 1990s. In many regions, this land base is updated by deducting land removed from cultivation and adding newly cultivated land. When land is rented out to another cultivator, the subsidy often is paid to the holder of the land rights, not to the farmer who cultivates the land.
When the subsidy program started, there many disputes because the subsidy payments were based on the same land holdings that previously had been the basis for assessing taxes. In earlier decades, many individuals and village officials had underreported land holdings to higher authorities to mini-mize tax liability. Consequently, some villages were not allocated enough money to pay subsidies to farmers. This phenomenon also raises questions about how authorities have adjusted crop-production statistics to correct for past underreporting of cropland.
A number of provinces distribute grain subsidies based on actual area planted in particular grain crops. However, the subsidy distribution takes place before crops are planted in the spring to stimu-late production and ensure that farmers have funds to buy inputs. In such cases, the subsidy is based on the area of the previous year’s fall-harvested crops (corn, rice) and/or the area of winter wheat already planted.
In a few places, a subsidy is based on the volume of grain sold to government reserves. In a number of southeastern provinces, companies that manage local reserves sign contracts with farmers to purchase rice at the minimum price plus a premium for each kilogram delivered.

54 Growth and Evolution in China’s Agricultural Support Policies, ERR-153
Economic Research Service/USDA