Groups of Galaxies in the Two Micron All-Sky Redshift Survey
29
arXiv:astro-ph/0610732v2 30 Oct 2006 Accepted for publication in ApJ. Preprint 2006 Oct 30. Preprint typeset using L A T E X style emulateapj v. 08/13/06 GROUPS OF GALAXIES IN THE TWO MICRON ALL-SKY REDSHIFT SURVEY Aidan C. Crook Kavli Institute for Astrophysics and Space Research, Massachusetts Institute of Technology, Cambridge, MA 02139 John P. Huchra 1 , Nathalie Martimbeau and Karen L. Masters Harvard-Smithsonian Center for Astrophysics, Cambridge, MA 02138 Tom Jarrett Infrared Processing and Analysis Center, California Institute of Technology, Pasadena, CA 91125 Lucas M. Macri National Optical Astronomy Observatories, Tucson, AZ 85719 Accepted for publication in ApJ. Preprint 2006 Oct 30. ABSTRACT We present the results of applying a percolation algorithm to the initial release of the Two Micron All-Sky Survey Extended Source Catalog, using subsequently measured redshifts for almost all of the galaxies with K< 11.25 mag. This group catalog is based on the first near-IR all-sky flux-limited survey that is complete to |b| =5 ◦ . We explore the dependence of the clustering on the length and velocity scales involved. The paper describes a group catalog, complete to a limiting redshift of 10 4 km s −1 , created by maximizing the number of groups containing 3 or more members. A second catalog is also presented, created by requiring a minimum density contrast of δρ/ρ ≥ 80 to identify groups. We identify known nearby clusters in the catalogs and contrast the groups identified in the two catalogs. We examine and compare the properties of the determined groups and verify that the results are consistent with the UZC-SSRS2 and northern CfA redshift survey group catalogs. The all-sky nature of the catalog will allow the development of a flow-field model based on the density field inferred from the estimated cluster masses. Subject headings: galaxies: clusters: general — galaxies: distances and redshifts — large-scale struc- ture of universe 1. INTRODUCTION The Two Micron All-Sky Survey (2MASS) began in the early 90s with the purpose of mapping the Milky Way and nearby Universe. Previous all-sky surveys suf- fered from a variety of selection effects, many of them inconsistent across the sky. Observations at optical wavelengths suffer from severe extinction at low galac- tic latitudes, motivating work using surveys conducted in the infrared. Many IRAS-selected galaxy samples have been investigated as tracers of the galaxy den- sity field, e.g. Strauss et al. (1992); Fisher et al. (1995), based on the 1.9 Jy and 1.2 Jy samples, respectively, and Branchini et al. (1999) based on the PSCz catalog (Saunders et al. 2000), however these samples are based on fluxes in the far-infrared and miss many early-type galaxies, thus underestimate the total galaxy number density. Even though the IRAS-selected samples are not biased by extinction, they still suffer from confusion in high-density regions. Since galaxies’ spectra peak at ∼1.6 μm, a survey in the near-infrared is optimized for their detection at the flux limit of the survey. By sampling uniformly over the entire celestial sphere in the J (1.25 μm), H (1.65 μm) Electronic address: [email protected] 1 Visiting Astronomer, Cerro Tololo Inter-American Observa- tory. CTIO is operated by AURA, Inc. under contract to the National Science Foundation. and K (2.16 μm) bands, 2MASS has been designed to maximize the number of galaxies detected at a specified flux limit, producing the most complete all-sky survey performed to date (2MASS, Skrutskie et al. 2006). Two catalogs, complete to K ∼ 13.5 mag, were re- leased in early 2003 (see the 2MASS explanatory supple- ment Cutri et al. 2003, and Jarrett et al. 2000): a point- source catalog with 470,992,970 entries and an extended source catalog (XSC) with 1,647,559 objects classified as galaxies. Although designed for completeness down to low galactic latitudes, the 2MASS XSC still suffers from confusion near the galactic plane. The 2MASS Redshift Survey (hereafter 2MRS, Huchra et al. 2005b,a) uses the XSC as its input master list and aims to produce an all-sky, (extinction-corrected) flux-limited redshift cata- log that will eventually be complete to K = 13.0 mag above |b| =5 ◦ . The 2MRS is currently 99.9% complete to K = 11.25 mag and |b| > 5 ◦ . 2 In this paper, we create a redshift-limited catalog of groups, uniformly sampled from the entire sky. By as- suming the identified groups are virialized systems, we are able to provide estimates of the group masses, avoid- ing the necessity to assume an intrinsic mass-to-light ra- tio. The local Universe is sufficiently inhomogeneous at the scales in question that the dynamics due to our in- teractions with nearby groups are non-negligible. Due to 2 See 2MRS data release, Huchra et al. (2006), In preparation.
Transcript of Groups of Galaxies in the Two Micron All-Sky Redshift Survey

arX
iv:a
stro
-ph/
0610
732v
2 3
0 O
ct 2
006
Accepted for publication in ApJ. Preprint 2006 Oct 30.Preprint typeset using LATEX style emulateapj v. 08/13/06
GROUPS OF GALAXIES IN THE TWO MICRON ALL-SKY REDSHIFT SURVEY
Aidan C. CrookKavli Institute for Astrophysics and Space Research, Massachusetts Institute of Technology, Cambridge, MA 02139
John P. Huchra1, Nathalie Martimbeau and Karen L. MastersHarvard-Smithsonian Center for Astrophysics, Cambridge, MA 02138
Tom JarrettInfrared Processing and Analysis Center, California Institute of Technology, Pasadena, CA 91125
Lucas M. MacriNational Optical Astronomy Observatories, Tucson, AZ 85719
Accepted for publication in ApJ. Preprint 2006 Oct 30.
ABSTRACT
We present the results of applying a percolation algorithm to the initial release of the Two MicronAll-Sky Survey Extended Source Catalog, using subsequently measured redshifts for almost all of thegalaxies with K < 11.25 mag. This group catalog is based on the first near-IR all-sky flux-limitedsurvey that is complete to |b| = 5. We explore the dependence of the clustering on the lengthand velocity scales involved. The paper describes a group catalog, complete to a limiting redshift of104 km s−1, created by maximizing the number of groups containing 3 or more members. A secondcatalog is also presented, created by requiring a minimum density contrast of δρ/ρ ≥ 80 to identifygroups. We identify known nearby clusters in the catalogs and contrast the groups identified in thetwo catalogs. We examine and compare the properties of the determined groups and verify that theresults are consistent with the UZC-SSRS2 and northern CfA redshift survey group catalogs. Theall-sky nature of the catalog will allow the development of a flow-field model based on the densityfield inferred from the estimated cluster masses.Subject headings: galaxies: clusters: general — galaxies: distances and redshifts — large-scale struc-
ture of universe
1. INTRODUCTION
The Two Micron All-Sky Survey (2MASS) began inthe early 90s with the purpose of mapping the MilkyWay and nearby Universe. Previous all-sky surveys suf-fered from a variety of selection effects, many of theminconsistent across the sky. Observations at opticalwavelengths suffer from severe extinction at low galac-tic latitudes, motivating work using surveys conductedin the infrared. Many IRAS-selected galaxy sampleshave been investigated as tracers of the galaxy den-sity field, e.g. Strauss et al. (1992); Fisher et al. (1995),based on the 1.9 Jy and 1.2 Jy samples, respectively,and Branchini et al. (1999) based on the PSCz catalog(Saunders et al. 2000), however these samples are basedon fluxes in the far-infrared and miss many early-typegalaxies, thus underestimate the total galaxy numberdensity. Even though the IRAS-selected samples are notbiased by extinction, they still suffer from confusion inhigh-density regions.
Since galaxies’ spectra peak at ∼1.6 µm, a survey inthe near-infrared is optimized for their detection at theflux limit of the survey. By sampling uniformly over theentire celestial sphere in the J (1.25 µm), H (1.65 µm)
Electronic address: [email protected] Visiting Astronomer, Cerro Tololo Inter-American Observa-
tory. CTIO is operated by AURA, Inc. under contract to theNational Science Foundation.
and K (2.16 µm) bands, 2MASS has been designed tomaximize the number of galaxies detected at a specifiedflux limit, producing the most complete all-sky surveyperformed to date (2MASS, Skrutskie et al. 2006).
Two catalogs, complete to K ∼ 13.5 mag, were re-leased in early 2003 (see the 2MASS explanatory supple-ment Cutri et al. 2003, and Jarrett et al. 2000): a point-source catalog with 470,992,970 entries and an extendedsource catalog (XSC) with 1,647,559 objects classified asgalaxies. Although designed for completeness down tolow galactic latitudes, the 2MASS XSC still suffers fromconfusion near the galactic plane. The 2MASS RedshiftSurvey (hereafter 2MRS, Huchra et al. 2005b,a) uses theXSC as its input master list and aims to produce anall-sky, (extinction-corrected) flux-limited redshift cata-log that will eventually be complete to K = 13.0 magabove |b| = 5. The 2MRS is currently 99.9% completeto K = 11.25 mag and |b| > 5.2
In this paper, we create a redshift-limited catalog ofgroups, uniformly sampled from the entire sky. By as-suming the identified groups are virialized systems, weare able to provide estimates of the group masses, avoid-ing the necessity to assume an intrinsic mass-to-light ra-tio. The local Universe is sufficiently inhomogeneous atthe scales in question that the dynamics due to our in-teractions with nearby groups are non-negligible. Due to
2 See 2MRS data release, Huchra et al. (2006), In preparation.

2 A. C. Crook et al.
the nature of the all-sky group catalog presented here, wewill now be able to estimate the local density field dueto baryonic matter in the local Universe. A flow-fieldmodel produced from this catalog can be used in con-junction with observations in order to answer the ques-tion of whether baryonic matter is a genuine tracer ofdark matter.
The creation of group catalogs is not a new concept,however the methods employed in developing these cat-alogs have evolved with the enhancements in instru-mentation. Early group catalogs were based on lim-ited or subjective data (e.g de Vaucouleurs 1975), as-sociating members based on similarity in apparent mag-nitude, positional coincidence and (if available) redshift.Turner & Gott (1976) proposed a method that identifiesregions in which the surface number density on the sky isenhanced, creating group catalogs from two-dimensionaldata. This technique suffers because the typical angu-lar separation of galaxies in a group will vary with dis-tance, thus nearby groups with large angular radii willnot be identified. Furthermore, when applied to flux-limited surveys, this method will identify different groupsfor different limiting fluxes.
More recently, the use of objective algorithms toidentify groups based on both their position on thesky and in redshift space has become widely accepted(e.g. Huchra & Geller 1982; Geller & Huchra 1983;Ramella et al. 1997; Diaferio et al. 1999; Giuricin et al.2000; Ramella et al. 2002), using methods designed tofind the same groups regardless of the limiting magni-tude of the sample. The applicability of a particulargroup-finding algorithm depends on the properties of thesample in question. For example, Marinoni et al. (2002)show that the Vornoi-Delauney method successfully re-produces the distribution of groups in velocity dispersionin a mock sample based on the Deep Extragalactic Evo-lutionary Probe (DEEP2) Redshift Survey (Davis et al.2003); this method is adapted by Gerke et al. (2005)for application to the DEEP2 sample. The SDSS teamdeveloped an algorithm (C4, Miller et al. 2005) thatsearches for groups in three space-dimensions as well asfour photometric colors. Kochanek et al. (2003) used amatched filter algorithm to study clusters in 2MRS at the89% completeness level. Yang et al. (2005) have devel-oped a halo-based group-finder and successfully appliedit to the 2dFGRS sample (Merchan & Zandivarez 2002;Eke et al. 2004). The same technique has been appliedto the SDSS by Weinmann et al. (2006).
In this paper we apply a variable linking-length perco-lation (also commonly referred to as a friends-of-friends)algorithm (Huchra & Geller 1982, hereafter HG82) to de-termine the groups present in 2MRS. The velocity disper-sion within the groups will allow estimates of the virialmasses of the groups, thus providing a method to tracethe density field associated with luminous matter in thelocal Universe.
We begin with an outline of the group-identification al-gorithm in §2 below. We discuss the modifications madeto the data sample prior to the application of the al-gorithm in §3. §4 presents a discussion on the choiceof parameters used in the group-identification algorithm.The group catalogs and their properties are discussed in§5, and we summarize our conclusions and discuss thepotential applications of the catalogs in §6.
2. GROUP-IDENTIFICATION ALGORITHM
We use the algorithm described in HG82 to identifygroups of galaxies in the K < 11.25 mag version of the2MRS catalog. The procedure is outlined briefly below.
We compare each galaxy in the catalog with its neigh-boring galaxies; for each pair of galaxies a linking lengthDL(Vavg) is computed that depends on the average red-shift of the galaxies, Vavg. Given two galaxies withan angular separation, θ, we ask whether their pro-jected separation, D12 = sin(θ/2)Vavg/H0, is less thanDL(Vavg). If this is true, and the difference in redshift,V12 = |V1 − V2|, is less than some linking velocity, VL,then we identify both galaxies with the same group. DL
is defined through equation (1) below.
DL = D0
[∫ M12(Vavg)
−∞ Φ(M)dM∫ Mlim
−∞Φ(M)dM
]−1/3
(1)
where
M12(Vavg) = mlim − 25 − 5 log(Vavg/H0)
Here, Φ(M) represents the differential galaxy luminosityfunction for the sample and D0 the projected separation(in Mpc) at some chosen fiducial redshift VF . Mlim =M12(VF ) is a constant for a given VF , and mlim is theapparent-magnitude limit of the sample.
This scaling of the linking length compensates for thebias that would otherwise be introduced due to the vari-ation in sampling of the luminosity function with red-shift. There is much debate on how and whether ornot to scale VL (e.g., HG82, Nolthenius & White 1987;Frederic 1995b,a). If one assumes uniform density, sim-ple scaling arguments show that the velocity is simplyproportional to the radius, suggesting that VL should bescaled in the same manner as DL. Such a scaling wouldinclude unwanted interlopers at large values of VL andthus introduce an unwanted correlation between velocitydispersion and redshift. The density profiles of galaxyclusters, however, are usually better described by theisothermal-sphere approximation; in this case the veloc-ity dispersion is independent of the size of the cluster.It follows therefore that by setting VL to a reasonablefixed value, we will minimize the number of interlopers,but not bias the algorithm against finding distant groups.Hereafter we set
VL = V0 (2)
The choice ofD0 determines the minimum density con-trast of identified groups, which can be estimated usingequation (3) below (HG82).
δρ
ρ=
3
4πD30
[
∫ Mlim
−∞
Φ(M)dM
]−1
− 1 (3)
3. THE SAMPLE
The first available sample of the 2MRS galaxy catalogcontains positions, redshifts and magnitudes for 23090galaxies selected from the XSC. The targets were by se-lected by introducing a cut on the corrected magnitudesof objects in the XSC of K < 11.25 mag (the apparentmagnitudes had previously been corrected for extinctionusing the dust maps of Schlegel et al. 1998). This cat-alog is complete, bar 40 galaxies, for galactic latitudes
Groups of galaxies in 2MRS 3
|b| > 10 between galactic longitudes 330 and 30, and|b| > 5 for other longitudes.
Below, we discuss a simple flow-field model applied toprovide improved estimates of the distances to the galax-ies (see §3.1). In §3.2 we discuss the method used topopulate the galactic plane with random galaxies to pre-vent any artifacts arising from the significantly reducedobserved number density of galaxies behind the plane.We briefly discuss the assumed form of the luminosityfunction of the sample in §3.3 and, in §3.4, consider thecompleteness of the sample in redshift-space.
3.1. Distance estimates
Locally redshifts do not provide a reliable indicationof distance because of distortions to the local velocityfield due to infall onto concentrations of mass. Althoughthe clustering algorithm is independent of the observer’sframe of reference, it is essential to have reasonable esti-mates of the distances to the galaxies in order to computethe linking parameters,D12 andDL, as well to accuratelyestimate the luminosities of the galaxies.
We apply the basic flow-field model described inMould et al. (2000) to account for the local dis-tortions to the velocity field. This prescriptionfirst corrects the reference frame to the LG frame(Yahil, Tammann, & Sandage 1977, corroborated by themore recent work of Courteau & van den Bergh 1999),then adjusts the redshift-inferred distances of galaxiesnear Virgo, Shapley and the GA region as follows: Allgalaxies within 12 of the center of Virgo with heliocen-tric redshifts less than 2500 km s−1 are placed at the red-shift of Virgo (plus a random velocity, drawn from a gaus-sian distribution with a standard deviation of 20 km s−1,to avoid artifacts in the group properties occurring fromgalaxies with identical redshifts). All galaxies within10 and 2000 km s−1 of the GA are placed at the red-shift of the GA (plus scatter) and all galaxies within12 and 3000 km s−1 of Shapley are placed at the red-shift of Shapley (plus scatter). The corrected velocitiesare then used in place of the heliocentric velocities whencomputing distances only. To infer the distances we as-sume Hubble’s law is valid to the completeness limit ofthe 2MRS catalog,3 using a Hubble constant H0 = 100hkm s−1Mpc−1, where we assume h = 0.73 when a specificvalue is required. This value is chosen based on the three-year WMAP results (Spergel et al. 2006), h = 0.73±0.03.In the very local universe (i.e. where corrected distancesare less than 3h−1 Mpc) we give galaxies an indicativedistance of 3h−1 Mpc. The velocities used in computa-tion of V12, etc. are the heliocentric velocities reportedin the 2MRS catalog.
3.2. Filling in the galactic plane
The 2MRS catalog is currently incomplete near thegalactic plane (|b| < 10 between galactic longitudes 330
and 30, and |b| < 5 for other longitudes). With a signif-icantly reduced number density of galaxies observed be-hind the galactic plane, a structure that spans the planewill not be identified by the clustering algorithm. Sim-ilarly, structures that are visible in part above or below
3 At the limiting redshifts of the galaxies analyzed, the differencebetween distances computed using a ΛCDM cosmology and simplyassuming Hubble’s law is less than 5%.
the plane may not be identified as groups, and, even ifthey are, a bias will be introduced in the number densityof groups with centers just above or below the plane. Anyflow-field model derived from such a group catalog willsuffer from these biasing effects; we therefore attempt tominimize these effects by randomly populating the sam-ple to enhance the galaxy number density behind thegalactic plane to reflect that observed above and belowit.
We follow a method similar to that of Yahil et al.(1991); this method produces similar results to themore involved Wiener reconstruction 4 discussed inLahav et al. (1994). We first divide the catalog into binsspanning 10 in galactic longitude and 10h−1 Mpc in dis-tance. For galactic longitudes ranging from 330 to 30
(masking the bulge) we now consider bins further boundby the lines |b| = 10. Sampling from the adjacent bins(10 < |b| < 20), we populate the bulge with N galax-ies drawn at random from the galaxies in adjacent bins;these galaxies are placed at random latitudes and a nor-mal scatter of 20 km s−1 is introduced in the velocity toprevent artifacts in the group properties arising due togalaxies at identical redshifts. N is calculated by draw-ing a random normal deviate from a distribution with amean equal to the number of galaxies in the two adjacentbins (above and below the plane), then subtracting thenumber of galaxies already present within the bin. Forother galactic longitudes, the latitudes 5 < |b| < 15 areused to populate the bins with |b| < 5.5 The catalog, be-fore and after population of the galactic plane, is shownin Figure 1. The population of the plane generated anadditional 2076 galaxies.
3.3. Luminosity function
The K-band luminosity function utilized in algorithmis parameterized in terms of a function of the formSchechter (1976),
Φ(M) = 0.4 ln (10)Φ⋆100.4(α+1)(M⋆−M)
× exp [−100.4(M⋆−M)]
We use the values reported in Huchra et al. (2005b),
α=−1.02
M⋆ =−24.2 (4)
Φ⋆ =1.08 × 10⁻² h3 Mpc−3
which have been computed using the galaxies in the2MRS catalog with galactic latitudes, |b| > 10.
3.4. Completeness in redshift-space
Due to the nature of flux limited surveys, the numberdensity of galaxies observed at sufficiently high redshiftswill tend toward zero. At these highest redshifts, thelinking lengths used in the algorithm become so largethat the majority of identified groups will likely be spu-rious. For the purposes of building a flow-field model, thegroups at the highest redshifts will have the smallest af-fect on local dynamics, thus we choose to limit the group
4 See Erdogdu et al. (2006), and Rassat et al. (2006), in prepa-ration for discussions on the Wiener reconstruction of the 2MRSsample.
5 In this case, we set the mean of the normal distribution fromwhich N is drawn to half the number of galaxies in the adjacentbins.
4 A. C. Crook et al.
Fig. 1.— Galaxies in 2MRS catalog shown in a Mollweide projection in galactic coordinates. The top panel shows the catalog beforethe plane was populated. The bottom panel shows the catalog including the addition of the randomly-generated galaxies. The solid lineindicates the region that was populated. (The color in the electronic edition indicates the measured redshift of the galaxy.)
Groups of galaxies in 2MRS 5
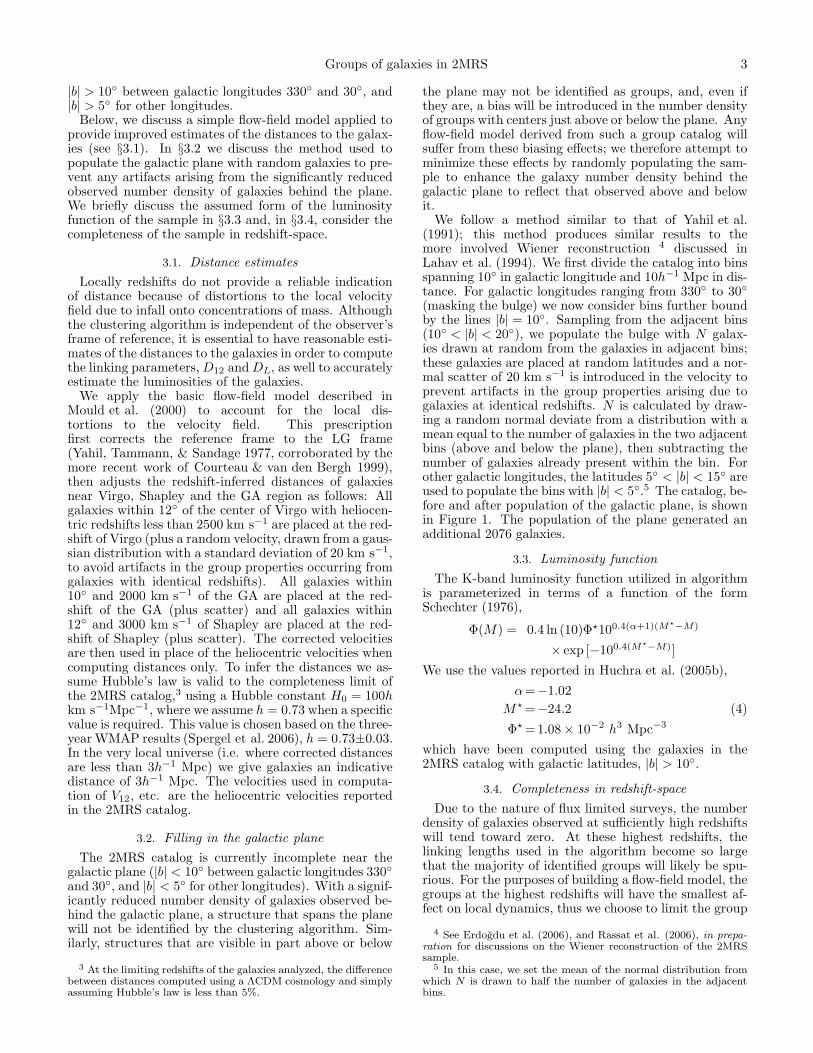
Fig. 2.— Selection function of the 2MRS survey. The data points(shown as small dots) represent the cumulative number of galaxiesas a function of (estimated) distance. The data are fit with a curveof the form of equation (5) using a least-squares fit (solid line).The dotted lines show the 5σ-errors from Poisson statistics. Thedata departs from the fit at the both smallest and largest distancesshown on the plot. The dashed line shows the derivative of thiscurve (the selection function) in arbitrary units. The histogramcontains the binned data shown in the same arbitrary units as theselection function for purposes of comparison only. The maximumand half-maximum values of the selection function are indicated.
catalog to a redshift inside which the catalog is reason-ably complete. Figure 2 shows the cumulative number ofgalaxies, N(< D), as a function of (estimated) distance,D. The points have been fitted with a curve of the form
N(< D) = N0
(
βD
[(βD)b + Sb]1/b
)a
(5)
where the best fit parameters are N0 = 2.57 × 10⁴,a = 2.10, S = 106 Mpc, β = 0.881, b = 3.94. Thederivative of equation (5) represents the selection func-tion of the survey, N(D), where the number of galaxiesobserved with estimated distances betweenD andD+dDis given by N(D)dD. We choose to cut the group catalogat the distance where the selection function falls to halfits maximum, Dcut = 140 Mpc, illustrated in Figure 2.The entire 2MRS K < 11.25 dataset plus the galaxiesgenerated in the population of the galactic plane will beused to create the group catalog, but the catalog will thenbe truncated, excluding groups with mean estimated dis-tances greater than Dcut.
4. PARAMETER CHOICES
In this section we justify the choice of linking parame-ters used in the construction of our group catalog. Anygroup catalog produced from the remaining data samplewill contain minimal biasing effects at the highest andlowest redshifts as well as minimal edge effects acrossthe galactic plane. There remains, however, a choice ofthe parameters that specify the minimum density con-trast of detected groups. These parameters, D0 and V0
from equations (1) and (2) above, must be chosen in asomewhat arbitrary fashion.
There is no perfect choice of these parameters that willallow us to identify only groups which are gravitationallybound. In any choice we make, some bound systems may
be divided and unbound galaxies will be present in somegroups. For very large values of bothD0 and V0, the algo-rithm will associate all of the galaxies into a single group.Conversely, if we choose sufficiently small D0 or V0, thealgorithm will divide substructures within real clustersinto multiple systems (Ramella, Pisani, & Geller 1997),eventually separating each galaxy into its own group. Itis clear, therefore, that a suitable parameter choice willlie between these extreme cases. The method of choos-ing the specific values of the parameters must still re-main arbitrary; in order to be able to infer properties ofthe Universe (e.g. the matter density parameter) fromthe catalog it is unwise to calibrate the algorithm us-ing simulations based on a set of defined initial assump-tions as this would bias our results towards recoveringthese initial values.6 It is obvious that there will be achoice of parameters that lie between these extreme val-ues which maximizes the number of groups produced. Itis therefore reasonable to use a method of maximizationto determine the choice of linking parameters, with noalternative method available that does not have similarshortcomings.
At this point, we must consider the size of the groupwe choose to maximize. We choose to ignore binariesin our definition of groups as previous work has shownsuch systems identified using percolation algorithms tobe unbound in the majority of cases (e.g Diaferio et al.1999). We consider the parameters obtained when max-imizing the number of groups of G or more members for3 ≤ G ≤ 20 as described below. We choose to set VF =1000 km s−1 following HG82. Figure 3 shows the numberof groups containing 3 or more members in D0–V0 space.In Figure 3(a) we explore the parameter space on theintervals D0 = [0, 10] Mpc, V0 = [0, 2000] km s−1. Wethen attempt to maximize the number of groups obtainedby the following method: we divide the region spanning0 → 10 Mpc in D0 and 0 → 2000 km s−1 in V0 into a 9×9grid and search for the combination of parameters thatproduces the largest number of groups. We then changethe range of the D0 and V0 parameters spanned to coin-cide with a 3×3 grid (as far as possible) centered on thevalues of D0 and V0 that produced the largest number ofgroups. We divide this region into a 9×9 grid and itera-tively repeat the procedure until the desired accuracy ofthe parameters is reached. This procedure is illustratedin Figure 3(b). We repeat this maximization procedurefor all values of G between 3 and 20. The obtained valueof D0 rises gently with G, while the scatter in obtainedvalues of V0 increases rapidly with G. As observed inFigure 3(a), the number of groups depends highly onD0, but is comparatively insensitive to V0. Since thevelocity dispersion of a cluster is not expected to de-pend on the size of the cluster (see the discussion in §2above) it is not sensible to consider large values of V0 (i.e.> 1000 km s−1) as this will introduce members that arenot gravitationally bound and thus propagate errors intothe mass estimates. The fraction of interlopers presentin a group will also increase with both D0 and V0, thusthe most sensible choice of parameters to minimize inter-lopers and reduce the scatter in V0 corresponds to G = 3.
The maximum number of groups of 3 or more members
6 See Crook et al. 2007a, in preparation, for further investiga-tion.

6 A. C. Crook et al.
(b)
Fig. 3.— The number of groups of 3 or more galaxies obtained as a function of the parameters D0 and V0. In (a), the clusteringalgorithm has been executed for each pair of parameters on a 25×25 grid. (b) contains a graphical representation of the execution of themaximization routine discussed in the §4 of the text.
(1538) is obtained for the values (D0, V0) = (1.63 ±0.03 Mpc, 399 ± 8 km s−1), corresponding to the densitycontrast δρ/ρ = 12.
In an analysis of the northern CfA redshift survey7
(hereafter CfAN), Ramella et al. (1997) show that thegroup properties are statistically stable for values ofdensity contrasts δρ/ρ ≥ 80, where they scale VL ina similar manner to DL and choose V0 = 350 km s−1.Diaferio et al. (1999) apply a similar choice of parametersto mock CfA surveys based on N -body simulations andconclude that 80% of groups with 4 or more members aretrue virialized systems, whereas 40% of triplets are not,confirming the hypothesis of Ramella, Geller, & Huchra(1989). As Figure 3(a) shows minimal variation in thenumber of groups produced with changing V0 comparedto changing D0, the findings of Ramella et al. (1997) areapplicable to this study. We will proceed to analyze thegroups produced at both the values of D0 and V0 thatmaximimize the number of groups of 3 or more members,as well as the values suggested by Ramella et al. (1997)(i.e. D0 = 0.89 Mpc, which corresponds to δρ/ρ = 80,8
and V0 = 350 km s−1).
5. GROUPS
We present the results of applying the group-finding al-gorithm (§2) to the 2MRS catalog subset (§3) using bothpairs of parameters discussed in §4 above. The group
7 This is a subset of the extended CfA redshift survey(de Lapparent et al. 1991; Geller & Huchra 1989; Huchra et al.1990, 1995).
8 The smallest allowed density contrast is chosen to minimizethe probability of splitting the richest systems.
catalogs are presented in Tables A1–A6 in the appendix(see the electronic edition for the complete catalogs). Weprovide an overview of the catalogs in §5.1 below, thendiscuss the identified groups and contrast the two cata-logs in §5.2. We present the properties of the obtainedgroups (§5.3) and discuss the reliability of the clusteringalgorithm (§5.4).
5.1. Overview
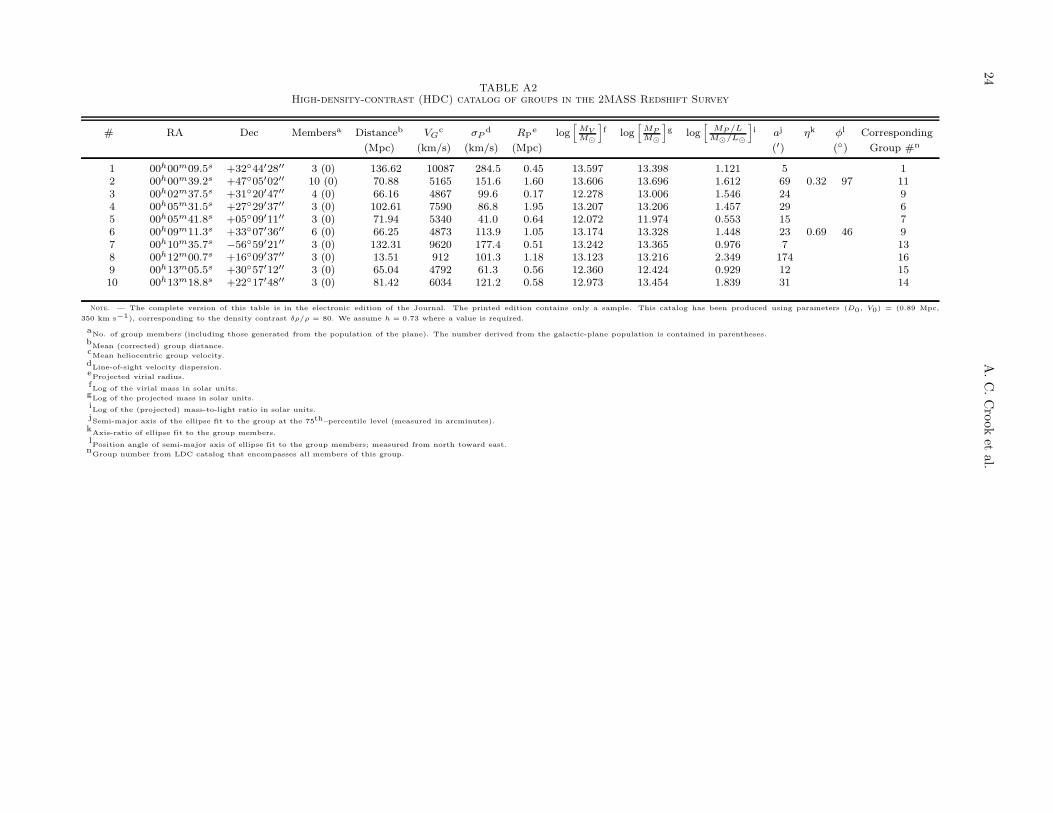
The catalog produced using the parameters (D0, V0) =(1.63 Mpc, 399 km s−1) is presented in Table A1. Theseparameters produced the maximum number of groupsof 3 or more galaxies, and correspond to a density con-trast δρ/ρ = 12; this catalog will hereafter be referred toas the low-density-contrast (LDC) catalog. The catalogproduced using the parameters (D0, V0) = (0.89 Mpc,350 km s−1) is presented in Table A2. These parame-ters correspond to the density contrast δρ/ρ = 80; thiscatalog will hereafter be referred to as the high-density-contrast (HDC) catalog.
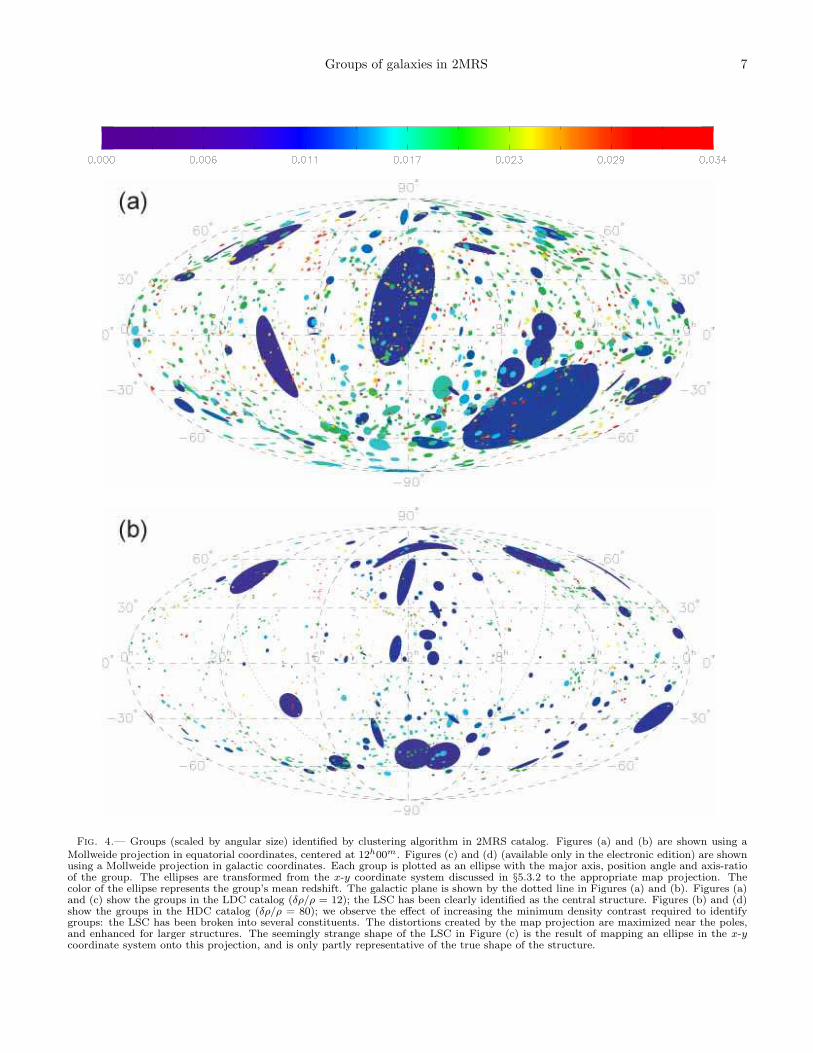
Figure 4 shows the positions and sizes of all groups inthe two catalogs. Figures 4(a) and 4(b) show the groupsin equatorial coordinates; Figures 4(c) and 4(d) show thegroups in galactic coordinates (available in the electronicedition only). The maps are shown in Mollweide pro-jection, which preserves the area of the structures on thesurface of a sphere but distorts their shape, especiallyclose to the poles. The plots show ellipses that havethe properties of the groups discussed in §5.3.2 below,and are only representative of the shape and size of thegroup. The Local SuperCluster (LSC) has been clearlyidentified in Figure 4(a) as the large structure in the
Groups of galaxies in 2MRS 7
Fig. 4.— Groups (scaled by angular size) identified by clustering algorithm in 2MRS catalog. Figures (a) and (b) are shown using aMollweide projection in equatorial coordinates, centered at 12h00m. Figures (c) and (d) (available only in the electronic edition) are shownusing a Mollweide projection in galactic coordinates. Each group is plotted as an ellipse with the major axis, position angle and axis-ratioof the group. The ellipses are transformed from the x-y coordinate system discussed in §5.3.2 to the appropriate map projection. Thecolor of the ellipse represents the group’s mean redshift. The galactic plane is shown by the dotted line in Figures (a) and (b). Figures (a)and (c) show the groups in the LDC catalog (δρ/ρ = 12); the LSC has been clearly identified as the central structure. Figures (b) and (d)show the groups in the HDC catalog (δρ/ρ = 80); we observe the effect of increasing the minimum density contrast required to identifygroups: the LSC has been broken into several constituents. The distortions created by the map projection are maximized near the poles,and enhanced for larger structures. The seemingly strange shape of the LSC in Figure (c) is the result of mapping an ellipse in the x-ycoordinate system onto this projection, and is only partly representative of the true shape of the structure.

8 A. C. Crook et al.
Fig. 4.— continued...

Groups of galaxies in 2MRS 9
center of the figure. When applying the algorithm withthe higher minimum density contrast, this structure issplit into several constituents as shown in Figure 4(b).(The same result is evident in Figures 4(c) and 4(d) inthe electronic edition, however the LSC encompasses thepole of the coordinate system in this case. The distor-tions due to the map projection are therefore enhancedin these plots, and the shape is less representative of thetrue shape of the LSC. The area occupied by the LSCin Figure 4(c) is the same as that in Figure 4(d). Theconstituents that have been merged to form the LSC areclearly visible in Figure 4(d).)
There is an apparent enhancement in the number ofgroups with large angular sizes near the galactic plane(see Figures 4(b) and 4(d), the latter is available in theelectronic edition only). There are 5 groups shown asellipses with major axes greater than 5 and with cen-ters inside |b| < 10. Of these, 2 have only 3 members (ofwhich 2 are genuine galaxies from 2MASS XSC) and only1 out of the remaining 3 groups has more than 10% of itsmembers randomly generated in the population of theplane; the remaining 2 are the only groups with morethan 5 members, thus the large apparent sizes of all 5groups in the figure is due to their proximity. We con-clude that the observed enhancement is therefore not anartifact of the population of the plane.
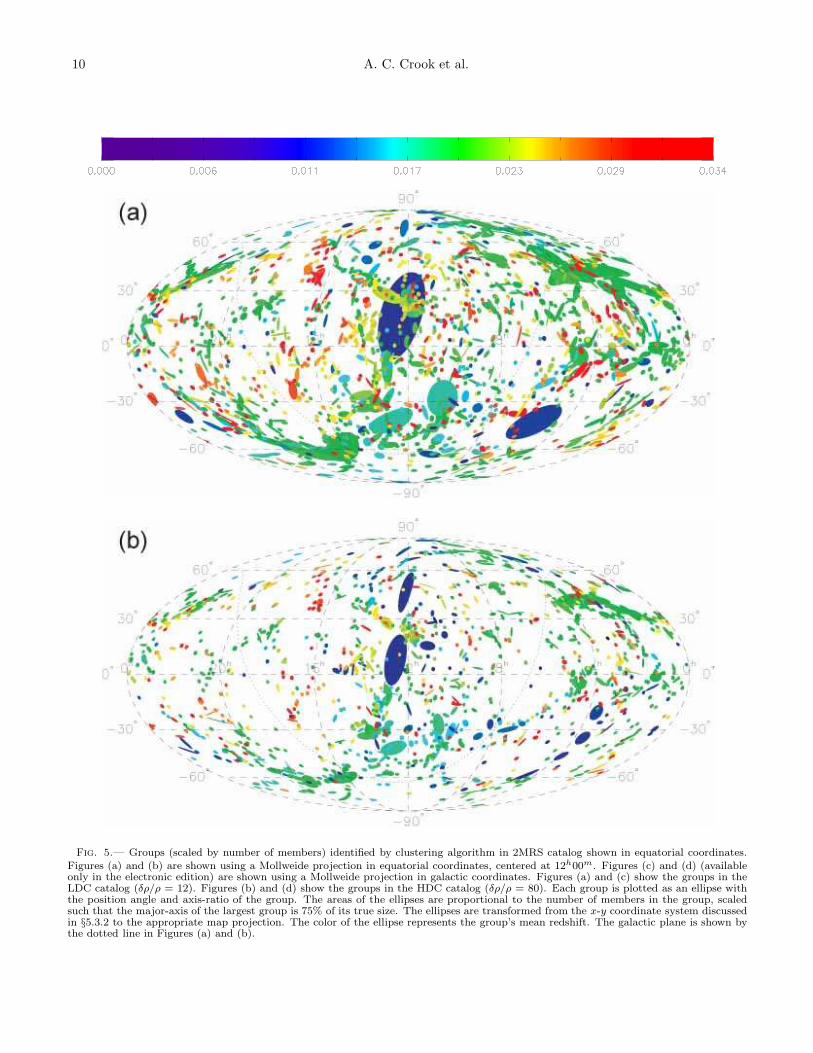
Figure 5 shows the same groups as Figure 4, howeverthe area of each ellipse is proportional to the numberof members in the group, rather than the square of thegroup’s angular size. The areas are normalized suchthat the major-axis (see §5.3.2) of the largest group ap-pears as 75% of its true angular size. These figures areno longer dominated by the foreground groups that havethe largest angular sizes, but show how the groups aredistributed across the sky out to the redshift limit of thesample.
5.2. Identification and overlap
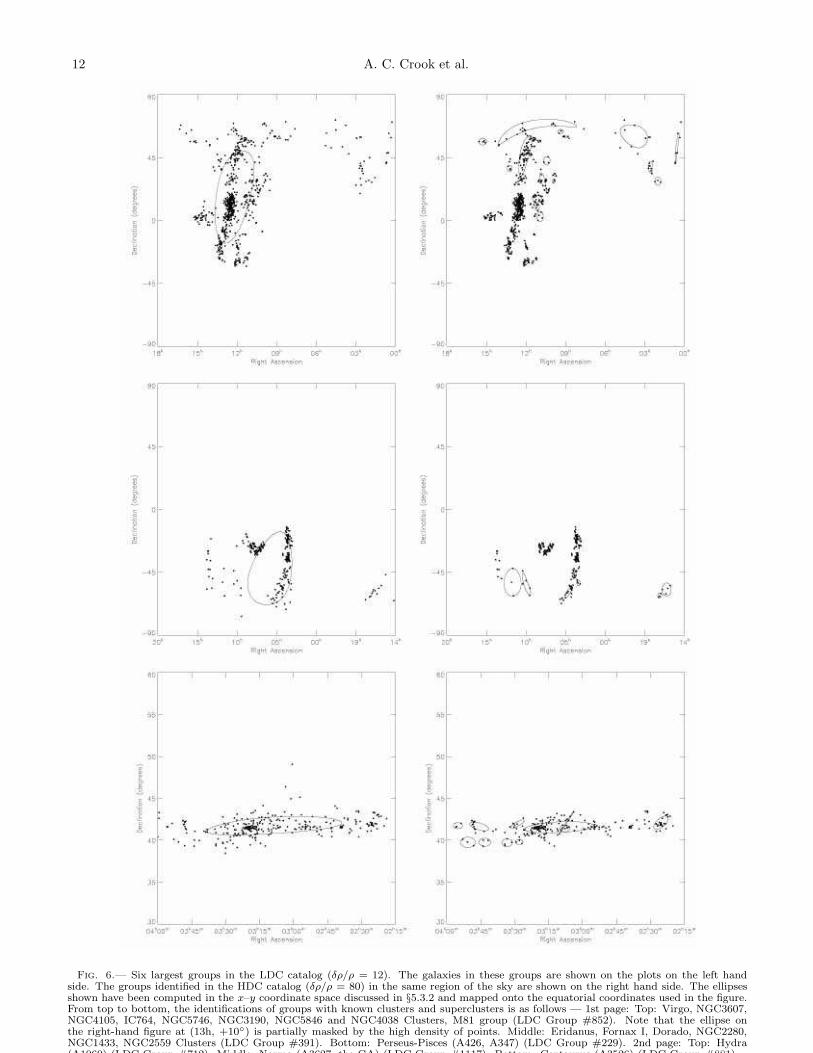
Due to the the nature of the group finding algorithm,we expect to find that all of the galaxies assigned togroups in the HDC catalog will also be assigned to groupsin the LDC catalog, however the converse is not nec-essarily true. We consider all the galaxies assigned togroups in the HDC catalog and determine the corre-spondence between groups in the two catalogs. The sixlargest groups in the LDC catalog are plotted in Fig-ure 6; the corresponding groups in the HDC catalogare also shown. The largest group in the LDC cata-log contains 810 members (of which 2 were randomlygenerated in the population of the galactic plane). Thisgroup is the result of merging several smaller groups in-cluding Virgo, NGC3607, NGC4105, IC764, NGC5746,NGC3190, NGC5846, and NGC4038 Clusters, as well asthe M81 group, and corresponds to the LSC. In the HDCcatalog, most of these groups have been identified indi-vidually; in fact Virgo has been split into two groups,containing 298 galaxies and 123 galaxies, respectively.Eridanus, Fornax I, Dorado and NGC2280, NGC1433,NGC2559 Clusters merge to form the second largestgroup in the LDC catalog (302 members, including 22simulated); again these were identified individually in theHDC catalog. A426 and A347 of the Perseus-Pisces su-percluster make up the third largest group in the LDCcatalog, containing 301 galaxies, but these were identi-
fied as two separate groups in the HDC catalog. Hydra(A1060) is identified as the fourth largest with 241 mem-bers, and Norma (A3627, the GA) is identified as thefifth with 217 members (42 of which were randomly gen-erated). Centaurus (A3526) was identified as the sixthlargest group (202 members). This exercise demonstratesthat the correct choice of parameters used in the groupalgorithm is entirely dependent on the size of the struc-tures that are desired.
The remaining identifications and correspondence be-tween the catalogs are shown in the appendix (Tables A3and A4), where we consider only groups containing 25 ormore members in the HDC catalog. Tables A5 and A6contrast the group assignments of individual galaxies be-tween the two catalogs. It may be surprising that the pa-rameters chosen to maximize the total number of groupsactually merge several of the large groups, hence appar-ently reducing the total number of groups. Although notobvious, this result is not unexpected because the largerlinking length will allow many smaller groups to be iden-tified that do not exist in the HDC catalog. The latterassociation is generating more groups than are removedby the merging of largest groups. It is likely that thegroups in the LDC catalog contain a higher fraction ofinterlopers than the groups in the HDC catalog, howeverit is evident that the LDC catalog identifies the largeststructures on the sky. This suggests that the LDC cata-log will be the better candidate for the basis of a flow-fieldmodel, as some of the largest structures are fragmentedin the HDC catalog. This is explored further in follow-upwork.9
5.3. Group properties
In this section, we discuss the properties of the LDCand HDC catalogs. Estimates of the velocity dispersion,size, mass and luminosity are discussed in §5.3.1; we ob-tain estimates of the axis-ratio and position angle of thegroups in §5.3.2 below.
5.3.1. Basic properties
The properties of the LDC and HDC catalogs are sum-marized in Table 1. In further analysis, we only considergroups with 5 or more members that are also presentin the 2MRS catalog (referred to as genuine hereafter),as opposed to those generated in the population of thegalactic plane. We do this in an attempt to excludegroups with a high fraction of interlopers in our analysis.We provide two estimates of the mass of the groups. Wefirst compute the virial mass of the group, MV ,
MV =3π
2
∑2PRP
G(6)
where G is Newton’s constant, σP is the projected veloc-ity dispersion,
σ2P =
∑
i(Vi − VG)2
N − 1(7)
and RP is the projected virial radius,
RP =N(N − 1)∑
i>j R−1ij
(8)
9 See Crook et al. (2007b), in preparation.
10 A. C. Crook et al.
Fig. 5.— Groups (scaled by number of members) identified by clustering algorithm in 2MRS catalog shown in equatorial coordinates.Figures (a) and (b) are shown using a Mollweide projection in equatorial coordinates, centered at 12h00m. Figures (c) and (d) (availableonly in the electronic edition) are shown using a Mollweide projection in galactic coordinates. Figures (a) and (c) show the groups in theLDC catalog (δρ/ρ = 12). Figures (b) and (d) show the groups in the HDC catalog (δρ/ρ = 80). Each group is plotted as an ellipse withthe position angle and axis-ratio of the group. The areas of the ellipses are proportional to the number of members in the group, scaledsuch that the major-axis of the largest group is 75% of its true size. The ellipses are transformed from the x-y coordinate system discussedin §5.3.2 to the appropriate map projection. The color of the ellipse represents the group’s mean redshift. The galactic plane is shown bythe dotted line in Figures (a) and (b).

Groups of galaxies in 2MRS 11
Fig. 5.— continued...
12 A. C. Crook et al.
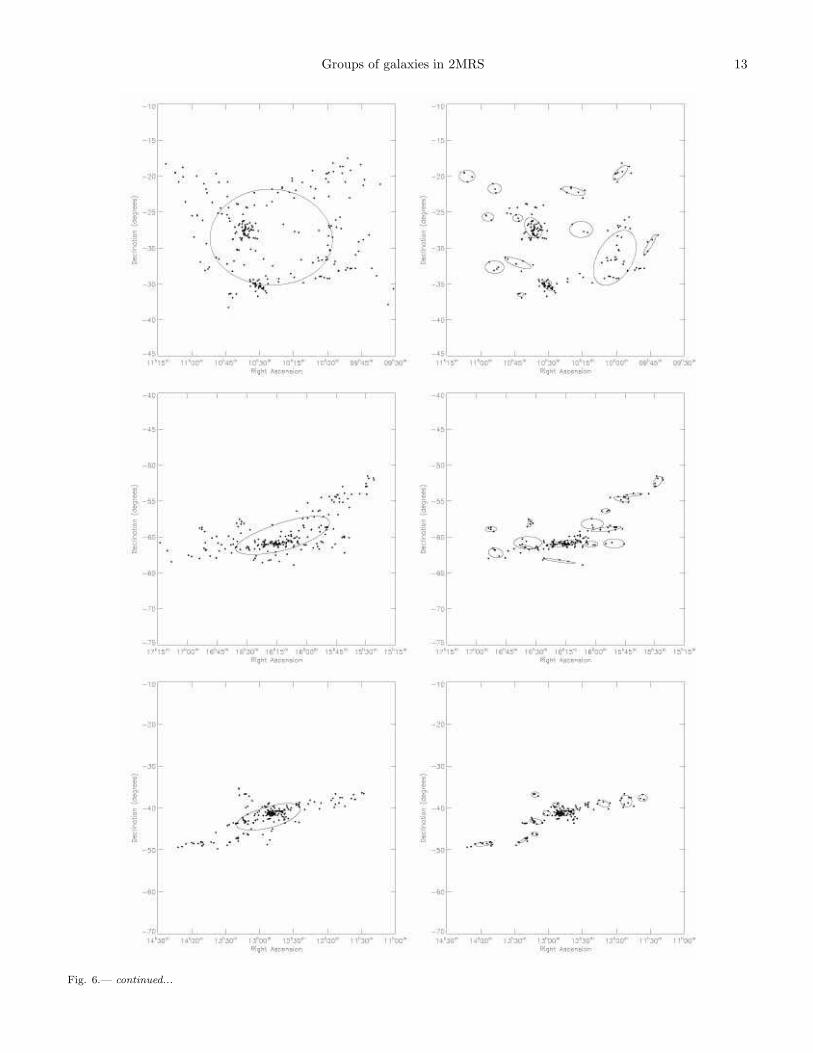
Fig. 6.— Six largest groups in the LDC catalog (δρ/ρ = 12). The galaxies in these groups are shown on the plots on the left handside. The groups identified in the HDC catalog (δρ/ρ = 80) in the same region of the sky are shown on the right hand side. The ellipsesshown have been computed in the x–y coordinate space discussed in §5.3.2 and mapped onto the equatorial coordinates used in the figure.From top to bottom, the identifications of groups with known clusters and superclusters is as follows — 1st page: Top: Virgo, NGC3607,NGC4105, IC764, NGC5746, NGC3190, NGC5846 and NGC4038 Clusters, M81 group (LDC Group #852). Note that the ellipse onthe right-hand figure at (13h, +10) is partially masked by the high density of points. Middle: Eridanus, Fornax I, Dorado, NGC2280,NGC1433, NGC2559 Clusters (LDC Group #391). Bottom: Perseus-Pisces (A426, A347) (LDC Group #229). 2nd page: Top: Hydra(A1060) (LDC Group #712). Middle: Norma (A3627, the GA) (LDC Group #1117). Bottom: Centaurus (A3526) (LDC Group #881).
Groups of galaxies in 2MRS 13
Fig. 6.— continued...
14 A. C. Crook et al.
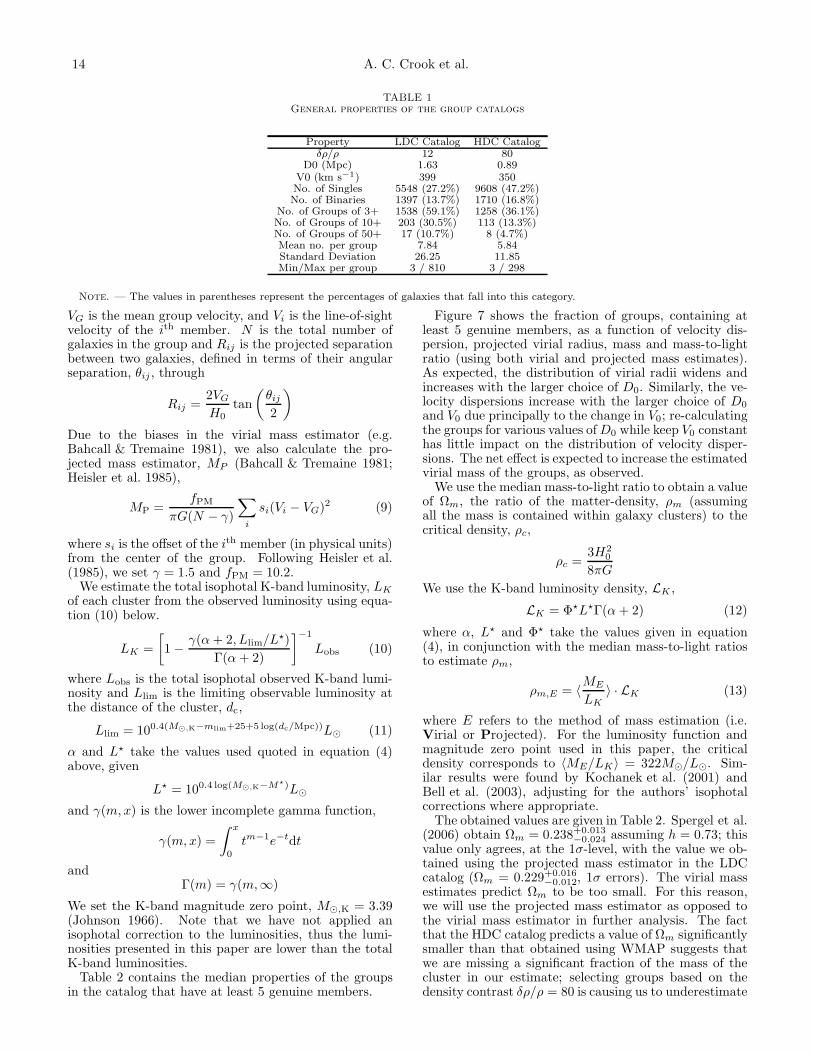
TABLE 1General properties of the group catalogs
Property LDC Catalog HDC Catalogδρ/ρ 12 80
D0 (Mpc) 1.63 0.89V0 (km s−1) 399 350No. of Singles 5548 (27.2%) 9608 (47.2%)No. of Binaries 1397 (13.7%) 1710 (16.8%)
No. of Groups of 3+ 1538 (59.1%) 1258 (36.1%)No. of Groups of 10+ 203 (30.5%) 113 (13.3%)No. of Groups of 50+ 17 (10.7%) 8 (4.7%)Mean no. per group 7.84 5.84Standard Deviation 26.25 11.85Min/Max per group 3 / 810 3 / 298
Note. — The values in parentheses represent the percentages of galaxies that fall into this category.
VG is the mean group velocity, and Vi is the line-of-sightvelocity of the ith member. N is the total number ofgalaxies in the group and Rij is the projected separationbetween two galaxies, defined in terms of their angularseparation, θij , through
Rij =2VG
H0tan
(
θij
2
)
Due to the biases in the virial mass estimator (e.g.Bahcall & Tremaine 1981), we also calculate the pro-jected mass estimator, MP (Bahcall & Tremaine 1981;Heisler et al. 1985),
MP =fPM
πG(N − γ)
∑
i
si(Vi − VG)2 (9)
where si is the offset of the ith member (in physical units)from the center of the group. Following Heisler et al.(1985), we set γ = 1.5 and fPM = 10.2.
We estimate the total isophotal K-band luminosity, LK
of each cluster from the observed luminosity using equa-tion (10) below.
LK =
[
1 −γ(α+ 2, Llim/L
⋆)
Γ(α+ 2)
]−1
Lobs (10)
where Lobs is the total isophotal observed K-band lumi-nosity and Llim is the limiting observable luminosity atthe distance of the cluster, dc,
Llim = 100.4(M⊙,K−mlim+25+5 log(dc/Mpc))L⊙ (11)
α and L⋆ take the values used quoted in equation (4)above, given
L⋆ = 100.4 log(M⊙,K−M⋆)L⊙
and γ(m,x) is the lower incomplete gamma function,
γ(m,x) =
∫ x
0
tm−1e−tdt
andΓ(m) = γ(m,∞)
We set the K-band magnitude zero point, M⊙,K = 3.39(Johnson 1966). Note that we have not applied anisophotal correction to the luminosities, thus the lumi-nosities presented in this paper are lower than the totalK-band luminosities.
Table 2 contains the median properties of the groupsin the catalog that have at least 5 genuine members.
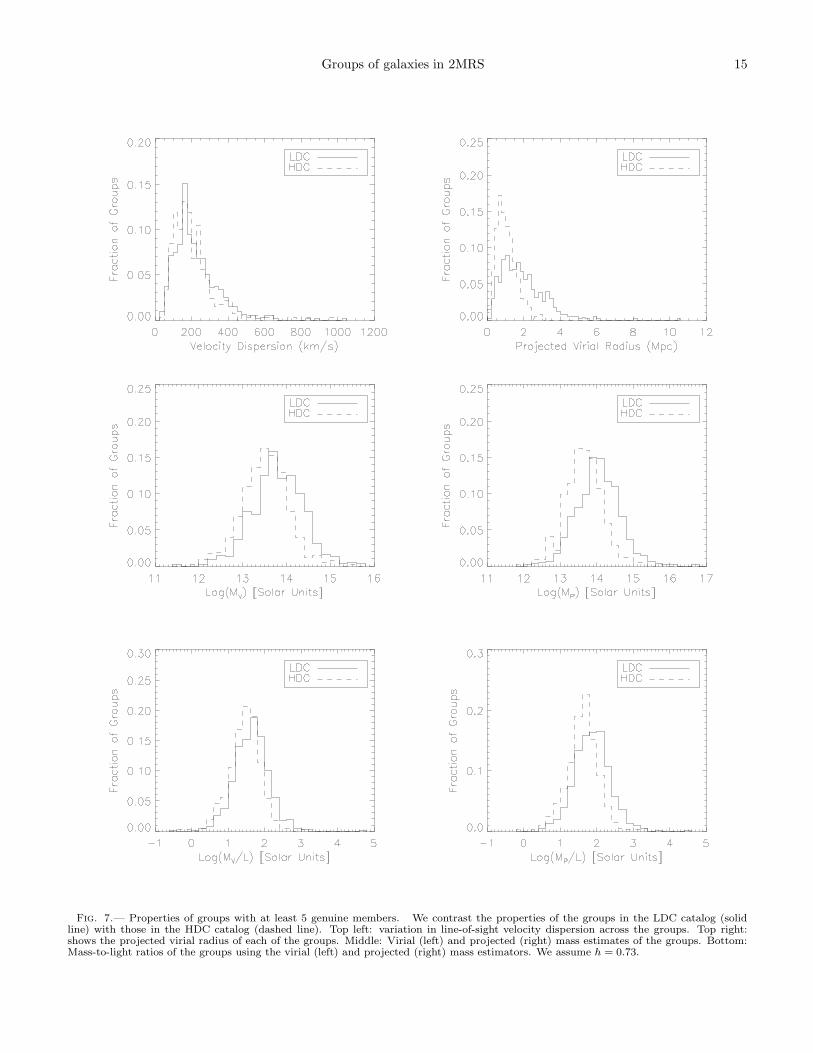
Figure 7 shows the fraction of groups, containing atleast 5 genuine members, as a function of velocity dis-persion, projected virial radius, mass and mass-to-lightratio (using both virial and projected mass estimates).As expected, the distribution of virial radii widens andincreases with the larger choice of D0. Similarly, the ve-locity dispersions increase with the larger choice of D0
and V0 due principally to the change in V0; re-calculatingthe groups for various values ofD0 while keep V0 constanthas little impact on the distribution of velocity disper-sions. The net effect is expected to increase the estimatedvirial mass of the groups, as observed.
We use the median mass-to-light ratio to obtain a valueof Ωm, the ratio of the matter-density, ρm (assumingall the mass is contained within galaxy clusters) to thecritical density, ρc,
ρc =3H2
0
8πG
We use the K-band luminosity density, LK ,
LK = Φ⋆L⋆Γ(α+ 2) (12)
where α, L⋆ and Φ⋆ take the values given in equation(4), in conjunction with the median mass-to-light ratiosto estimate ρm,
ρm,E = 〈ME
LK〉 · LK (13)
where E refers to the method of mass estimation (i.e.Virial or Projected). For the luminosity function andmagnitude zero point used in this paper, the criticaldensity corresponds to 〈ME/LK〉 = 322M⊙/L⊙. Sim-ilar results were found by Kochanek et al. (2001) andBell et al. (2003), adjusting for the authors’ isophotalcorrections where appropriate.
The obtained values are given in Table 2. Spergel et al.(2006) obtain Ωm = 0.238+0.013
−0.024 assuming h = 0.73; thisvalue only agrees, at the 1σ-level, with the value we ob-tained using the projected mass estimator in the LDCcatalog (Ωm = 0.229+0.016
−0.012, 1σ errors). The virial massestimates predict Ωm to be too small. For this reason,we will use the projected mass estimator as opposed tothe virial mass estimator in further analysis. The factthat the HDC catalog predicts a value of Ωm significantlysmaller than that obtained using WMAP suggests thatwe are missing a significant fraction of the mass of thecluster in our estimate; selecting groups based on thedensity contrast δρ/ρ = 80 is causing us to underestimate
Groups of galaxies in 2MRS 15
Fig. 7.— Properties of groups with at least 5 genuine members. We contrast the properties of the groups in the LDC catalog (solidline) with those in the HDC catalog (dashed line). Top left: variation in line-of-sight velocity dispersion across the groups. Top right:shows the projected virial radius of each of the groups. Middle: Virial (left) and projected (right) mass estimates of the groups. Bottom:Mass-to-light ratios of the groups using the virial (left) and projected (right) mass estimators. We assume h = 0.73.

16 A. C. Crook et al.
TABLE 2Median properties of groups with 5 or more genuine members
Property LDC Catalog HDC CatalogσP (km s−1) 197 (183, 206) 183 (166, 193)RPV (Mpc) 1.71 (1.58, 1.85) 0.97 (0.90, 1.04)
log[MV /M⊙] 13.79 (13.72, 13.90) 13.54 (13.46, 13.60)log[MP /M⊙] 14.05 (13.98, 14.10) 13.66 (13.57, 13.75)
log[(MV /LK)/(M⊙/L⊙)] 1.66 (1.59, 1.72) 1.49 (1.41, 1.55)log[(MP /LK)/(M⊙/L⊙)] 1.86 (1.81, 1.93) 1.63 (1.56, 1.69)
ΩM,V 0.14 (0.12, 0.16) 0.10 (0.08, 0.11)ΩM,P 0.23 (0.20, 0.27) 0.13 (0.11, 0.16)
Note. — The median values are shown, with 99% confidence levels in parentheses. We compute the confidence levels by drawing anequally-sized sample from the observed distributions and computing the median values 5,000 times.

Groups of galaxies in 2MRS 17
Fig. 8.— Position angles of groups with 5 or more genuinemembers. The figure shows the fraction of groups with positionangles in the specified intervals (binned by 10). The groups inthe LDC catalog are represented by the solid line, and the HDCcatalog by the dashed line.
the median mass-to-light ratio of groups. This suggeststhat the dark matter halos extend beyond the δρ/ρ = 80density-contrast contour that was inferred from luminousmatter.
5.3.2. Orientation and ellipticity
We include in the catalog a measure of the axis-ratio,position angle and semi-major axis of the groups con-taining 5 or more genuine members, calculated using thefollowing method: We rotate the coordinates such thatcenter of the group10 lies along the z-axis. We measurethe angle of each galaxy from the z-axis, Θ, as well as itsazimuthal angle ψ, then define
x=Θ cos(ψ) (14)
y=Θ sin(ψ) (15)
such that the positive y-axis points north and the posi-tive x-axis points east.11 This definition is chosen suchthat the shape of the group is not distorted under theprojection onto a plane.
We rotate the axes to some angle, φ, and define thecoordinates of the galaxies in the rotated frame as (xi,yi). We choose the value of φ that minimizes Σiy
2i . We
compute the 75th–percentile values of |x| and |y| (x75 andy75) and record their ratio, η, (0 < η < 1) as a measureof the axis-ratio of the group. We also record the largerof x75 and y75 as a measure of the semi-major axis of thecluster, a, as well as the angle of rotation of the semi-major axis from north toward east (the position angle ofthe group, φ). We verify that these angles are approxi-mately uniformly distributed by showing the number ofgalaxies as a function of position angle in Figure 8.
The above properties of the groups are illustratedgraphically, by using ellipses with the same semi-major
10 We define the center as the mean position of the galaxies incartesian coordinates, assuming the galaxies lie on the surface of aunit sphere.
11 Note that the mean values of x and y are not strictly zerobut, in the analyzed data, are sufficiently small that an iterativecentering procedure is not required.
TABLE 3Velocity-dispersion– and M/L–distance relations
Parameter LDC Catalog HDC Catalogα (10−3 Mpc−1) 1.0 ± 0.3 1.2 ± 0.3
β 2.21 ± 0.03 2.17 ± 0.03p (10−3 Mpc−1) −7.0 ± 0.6 −5.8 ± 0.6
q 2.43 ± 0.05 2.02 ± 0.05
Note. — Values correspond to the parameters in equations (16)and (17) that minimize their respective χ2–statistic.
axes, axis-ratios and position angles in Figure 4 and withthe same axis-ratios and position angles in Figure 5. Forgroups with 3–4 members, a circle is drawn with an an-gular radius equal to the 75th–percentile mean offset.12
In Figure 6, we show the galaxies that are associatedby the clustering algorithm to form the six largest groupsin the LDC catalog. The corresponding ellipses havebeen overlayed on this plot.13 The figure also shows thecorresponding groups identified in the HDC catalog. It isevident that the higher density contrast used in the latterchoice of parameters splits the large structures identifiedwhen choosing a lower-density contrast.
5.4. Reliability of the algorithm
In this section we discuss the verifications performedto ensure that the groups obtained are consistent withboth expectation and the literature. In 5.4.1 we exam-ine the distance-dependence of the velocity dispersionsand mass-to-light ratios of the groups. We compute themass functions of the group catalogs and compare themwith expectation in 5.4.2. Finally, we compare the 2MRSgroup catalogs directly with the UZC-SSRS2 and CfANgroup catalogs in 5.4.3.
5.4.1. Variation with distance
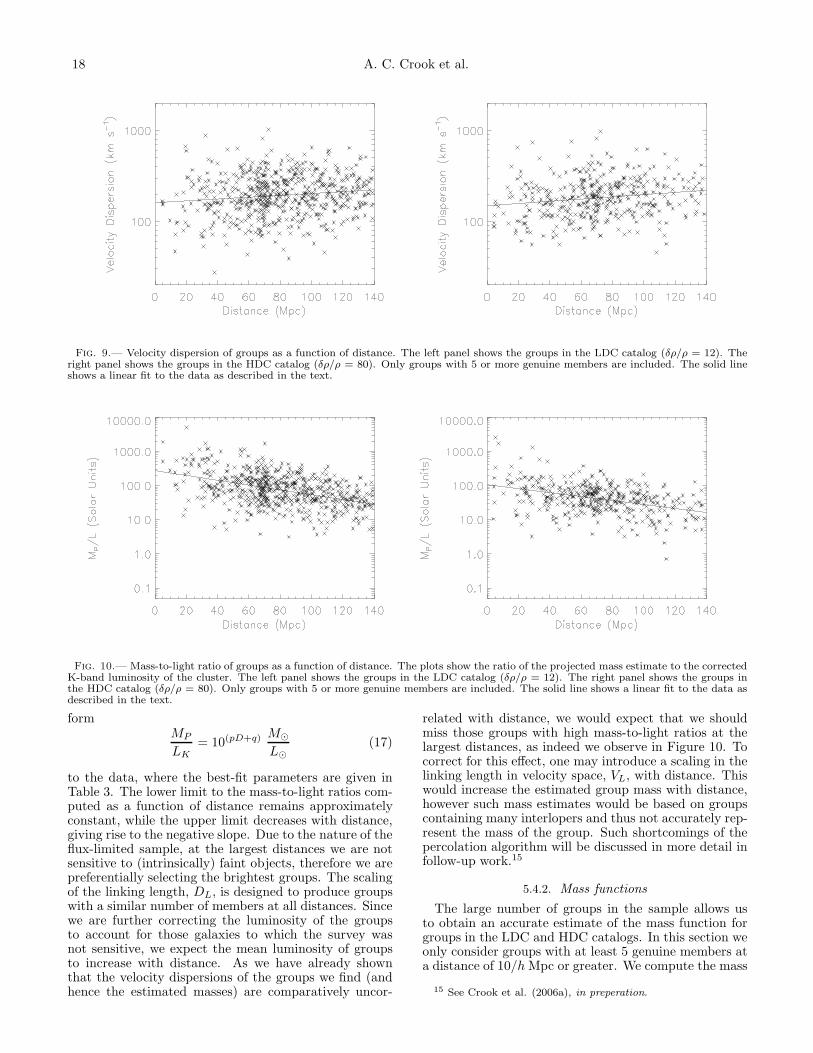
Figure 9 shows the velocity dispersion, σP , of thegroups as a function of distance. We fit a curve of theform
σP = 10(αD+β) km s−1 (16)
to the data, where the best-fit parameters are given inTable 3. The large scatter and very small correlation ob-served in Figure 9 (the mean velocity dispersion changesby a factor of 0.63σ between [20, 40] Mpc and [120, 140]Mpc in the HDC catalog, and 0.35σ in the LDC cat-alog14) demonstrates that there is minimal bias intro-duced in the velocity dispersion of groups with distance;this was desired in the construction of the algorithm (see§2). Had we chosen to scale V0 with distance, we wouldexpect the velocity dispersions of the most distant groupsto be larger than observed in this figure. Since the corre-lation is already slightly positive, scaling V0 would haveintroduced a more significant bias with distance.
Figure 10 shows the mass-to-light ratios (computed us-ing the projected mass estimators) as a function of dis-tance for both pairs of parameters. We fit a curve of the
12 This value is also reported under the column titled a in TablesA1 and A2.
13 Note that the shapes of the ellipses have been distorted dueto the choice of coordinate system.
14 σ represents the average standard deviation, weighting thestandard deviation of the velocity dispersions in each intervalequally.
18 A. C. Crook et al.
Fig. 9.— Velocity dispersion of groups as a function of distance. The left panel shows the groups in the LDC catalog (δρ/ρ = 12). Theright panel shows the groups in the HDC catalog (δρ/ρ = 80). Only groups with 5 or more genuine members are included. The solid lineshows a linear fit to the data as described in the text.
Fig. 10.— Mass-to-light ratio of groups as a function of distance. The plots show the ratio of the projected mass estimate to the correctedK-band luminosity of the cluster. The left panel shows the groups in the LDC catalog (δρ/ρ = 12). The right panel shows the groups inthe HDC catalog (δρ/ρ = 80). Only groups with 5 or more genuine members are included. The solid line shows a linear fit to the data asdescribed in the text.
formMP
LK= 10(pD+q) M⊙
L⊙(17)
to the data, where the best-fit parameters are given inTable 3. The lower limit to the mass-to-light ratios com-puted as a function of distance remains approximatelyconstant, while the upper limit decreases with distance,giving rise to the negative slope. Due to the nature of theflux-limited sample, at the largest distances we are notsensitive to (intrinsically) faint objects, therefore we arepreferentially selecting the brightest groups. The scalingof the linking length, DL, is designed to produce groupswith a similar number of members at all distances. Sincewe are further correcting the luminosity of the groupsto account for those galaxies to which the survey wasnot sensitive, we expect the mean luminosity of groupsto increase with distance. As we have already shownthat the velocity dispersions of the groups we find (andhence the estimated masses) are comparatively uncor-
related with distance, we would expect that we shouldmiss those groups with high mass-to-light ratios at thelargest distances, as indeed we observe in Figure 10. Tocorrect for this effect, one may introduce a scaling in thelinking length in velocity space, VL, with distance. Thiswould increase the estimated group mass with distance,however such mass estimates would be based on groupscontaining many interlopers and thus not accurately rep-resent the mass of the group. Such shortcomings of thepercolation algorithm will be discussed in more detail infollow-up work.15
5.4.2. Mass functions
The large number of groups in the sample allows usto obtain an accurate estimate of the mass function forgroups in the LDC and HDC catalogs. In this section weonly consider groups with at least 5 genuine members ata distance of 10/hMpc or greater. We compute the mass
15 See Crook et al. (2006a), in preperation.

Groups of galaxies in 2MRS 19
TABLE 4Best-fit values for Press-Schechter and Sheth-Tormen
mass functions
Parameter LDC Catalog HDC CatalogPS74 forma
ρ (1010 M⊙Mpc−3) 2.8 ± 1.4 0.9 ± 0.6log(M0/M⊙) 14.50 ± 0.13 13.93 ± 0.18
ST99 formb
ρ (1010 M⊙Mpc−3) 3.6 ± 1.9 1.3 ± 0.8log(M0/M⊙) 14.43 ± 0.16 13.87 ± 0.21
Note. — Values correspond to the parameters in equation (19)that minimize the χ2–statistic.aPress & Schechter (1974)bSheth & Tormen (1999)
function using the 1/Vmax procedure (e.g. Martınez et al.2002), whereby each group is weighted by the inverseof the maximum comoving volume, Vmax(Li), in whichthe group remains observable given the flux limit of thesurvey. Li is the luminosity of the fifth brightest memberof the group. The differential mass function can be thencomputing as
n(M) =∑
|Mi−M|≤∆M
[Vmax(Li)]−1 (18)
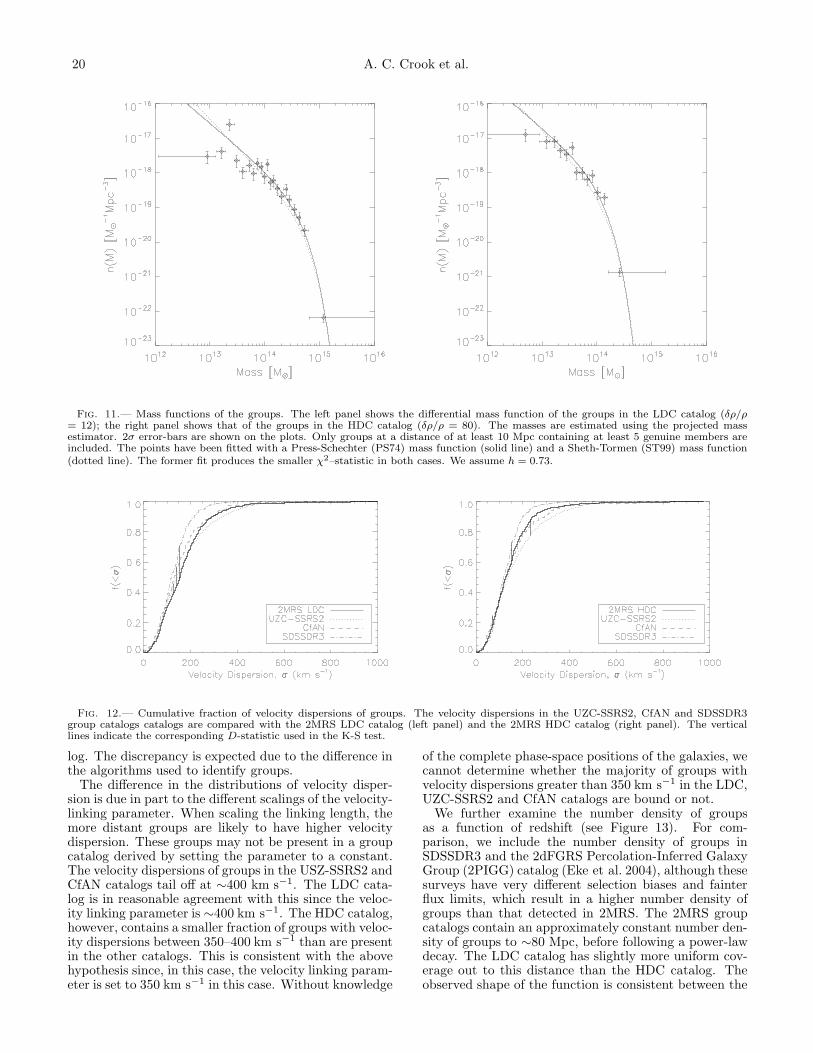
where Mi are the group masses and ∆M is the (variable)bin width. The results are shown in Figure 11.
We consider analytical differential mass functions ofthe form suggested by Sheth & Tormen (1999) (also seeJenkins et al. 2001),
n(M) = A γρM2
√
aπ
(
MM0
)γ/2[
1 + 1(2a)p
(
MM0
)−γp]
× exp[
−(
MM0
)γ]
(19)
where γ = 1 + (n/3) and we set n = 1. The choice ofparameters a = 1, p = 0, A = 0.5 corresponds to theanalytical prediction of Press & Schechter (1974) (here-after, PS74). Sheth & Tormen (1999) suggest the alter-native choice parameters A = 0.3222, a = 0.707, p = 0.3(hereafter, ST99), which provide good agreement with asubset of N -body simulations analyzed by Jenkins et al.(2001).
We fit functions of the form of equation (19) to groupsin the LDC and HDC catalogs using the parameterchoices of both PS74 and ST99 (see Figure 11 and Ta-ble 4). The analytical descriptions are both good ap-proximations to the data; similar conclusions were alsodrawn by Martınez et al. (2002), however we find the fitto the PS74 form produces a slightly smaller χ2–statisticin both cases.
We compare the ratio of the best-fit values for M0 inthe PS74 form of the mass function to the value predictedusing the simple arguments of PS74. M0 scales with theminimum density contrast according to
M0 ∝
(
δρ
ρ
)−2/γ
(20)
and thus we expect the ratio of the determined values ofM0 to be given by
logM
(LDC)0
M(HDC)0
= log[
(δρ/ρ)LDC
(δρ/ρ)HDC
]−2/γ
= − 2γ log
(
1280
)
= 1.24
The obtained values of M0 give log-ratio of 0.57 ± 0.22,providing agreement only at the 3σ-level with Press-Schechter theory. The two methods cannot be ex-pected to be within perfect agreement as the group-identification algorithm will find different groups as V0
is varied but D0 is held constant. The computed esti-mates of the group masses will therefore vary, while theratio predicted by the Press-Schechter treatment (whichis sensitive only to the change in density contrast, thusD0) does not.
5.4.3. Comparison with other group catalogs
To verify the validity of the produced group catalogs,we compare the 2MASS group catalogs with the UZC-SSRS2 group catalog (Ramella et al. 2002) and the CfANgroup catalog (Ramella et al. 1997). The former is con-structed from partial versions of the Updated ZwickyCatalog (UZC; Falco et al. 1999) and the Southern SkyRedshift Survey (SSRS2; da Costa et al. 1998) and cov-ers 37% of the sky; the latter covers 10%. The selec-tion criteria for the three catalogs result in completenesslimits at different velocities. To compute the complete-ness in redshift-space, we use the same technique as §3.4above, however in this case, we determine the velocitycorresponding to the peak in the derivative of equation(5). When comparing the 2MASS group catalog with theother two, we cut both catalogs at the smallest of the twocorresponding velocity limits (2MRS at 5697 km s−1 inthe LDC catalog and 5350 km s−1 in the HDC catalog,UZC at 7115 km s−1, CfAN at 9390 km s−1).
For each of the groups present in the UZC-SSRS2 andCfAN catalogs, we search the 2MRS group catalogs for agroup within a radius set by twice the sum of the virialradii of the group in 2MRS and the group in the compar-ison catalog, with mean velocities that differ by less than30%. We find that 86% of the groups in UZC-SSRS2 and76% of the groups in CfAN are present in the 2MRS LDCgroup catalog, whereas 78% of the groups in UZC-SSRS2and 69% of the groups in CfAN are present in the 2MRSHDC group catalog. There is reasonable agreement inboth cases given the differing selection criteria employedin the three samples.
We also compare the distributions of velocity disper-sion using the two-sided Kolmogorov-Smirnov (K-S) test(Chakravarti et al. 1967). The cumulative fractions ofthe LDC and HDC catalogs are compared with the cu-mulative fractions of the UZC-SSRS2 and CfAN cata-logs (see Figure 12). For comparison, we also show thevelocity dispersions of groups in Sloan Digital Sky Sur-vey Data Release 3 (SDSSDR3, Merchan & Zandivarez2005). The results of the test are shown in Table 5.The velocity dispersions in both the LDC and HDC cat-alogs are consistent with the CfAN sample. However onlythe LDC catalog produces groups with velocity disper-sions consistent with those in the UZC-SSRS2 catalog,although the discrepancy with the HDC catalog is small.Any discrepancy with the CfAN catalog is not apprecia-ble due to the smaller number of groups in the comparedsample of CfAN galaxies.16 Neither the LDC or HDCcatalogs are consistent with the SDSSDR3 group cata-
16 This is accounted for in the Kolmogorov-Smirnov test.
20 A. C. Crook et al.
Fig. 11.— Mass functions of the groups. The left panel shows the differential mass function of the groups in the LDC catalog (δρ/ρ= 12); the right panel shows that of the groups in the HDC catalog (δρ/ρ = 80). The masses are estimated using the projected massestimator. 2σ error-bars are shown on the plots. Only groups at a distance of at least 10 Mpc containing at least 5 genuine members areincluded. The points have been fitted with a Press-Schechter (PS74) mass function (solid line) and a Sheth-Tormen (ST99) mass function(dotted line). The former fit produces the smaller χ2–statistic in both cases. We assume h = 0.73.
Fig. 12.— Cumulative fraction of velocity dispersions of groups. The velocity dispersions in the UZC-SSRS2, CfAN and SDSSDR3group catalogs catalogs are compared with the 2MRS LDC catalog (left panel) and the 2MRS HDC catalog (right panel). The verticallines indicate the corresponding D-statistic used in the K-S test.
log. The discrepancy is expected due to the difference inthe algorithms used to identify groups.
The difference in the distributions of velocity disper-sion is due in part to the different scalings of the velocity-linking parameter. When scaling the linking length, themore distant groups are likely to have higher velocitydispersion. These groups may not be present in a groupcatalog derived by setting the parameter to a constant.The velocity dispersions of groups in the USZ-SSRS2 andCfAN catalogs tail off at ∼400 km s−1. The LDC cata-log is in reasonable agreement with this since the veloc-ity linking parameter is ∼400 km s−1. The HDC catalog,however, contains a smaller fraction of groups with veloc-ity dispersions between 350–400 km s−1 than are presentin the other catalogs. This is consistent with the abovehypothesis since, in this case, the velocity linking param-eter is set to 350 km s−1 in this case. Without knowledge
of the complete phase-space positions of the galaxies, wecannot determine whether the majority of groups withvelocity dispersions greater than 350 km s−1 in the LDC,UZC-SSRS2 and CfAN catalogs are bound or not.
We further examine the number density of groupsas a function of redshift (see Figure 13). For com-parison, we include the number density of groups inSDSSDR3 and the 2dFGRS Percolation-Inferred GalaxyGroup (2PIGG) catalog (Eke et al. 2004), although thesesurveys have very different selection biases and fainterflux limits, which result in a higher number density ofgroups than that detected in 2MRS. The 2MRS groupcatalogs contain an approximately constant number den-sity of groups to ∼80 Mpc, before following a power-lawdecay. The LDC catalog has slightly more uniform cov-erage out to this distance than the HDC catalog. Theobserved shape of the function is consistent between the

Groups of galaxies in 2MRS 21
TABLE 5Comparison between 2MRS, UZC-SSRS2, CfAN and SDSSDR3 groups
Property LDC Catalog HDC CatalogNo. of 2MRS Groups 736 630
Comparison with UZC-SSRS2No. of UZC-SSRS2 Groups 444 399
D-statistica 0.070 0.102P -valueb 0.128 0.011
Comparison with CfANNo. of CfAN Groups 119 107
D-statistica 0.128 0.062P -valueb 0.062 0.862
Comparison with SDSSDR3No. of SDSSDR3 Groups 204 177
D-statistica 0.227 0.122P -valueb 10−7 0.029
Note. — The table presents the results of two-sided Kolmogorov-Smirnov test on the comparison between the distributions of velocitydispersions of the groups in 2MRS catalog with the UZC-SSRS2, CfAN and SDSSDR3 catalogs.aD-statistic used in computation of P -value in Kolmogorov-
Smirnov test.bP -value represents the probability that such a difference would
be observed under the assumption that the two samples were drawnfrom the same parent distribution. We consider values of P < 0.05to indicate that the two samples were drawn from significantlydifferent parent distributions.
Fig. 13.— Number density of groups as a function of distance. We show the number density for the LDC (diamond) and HDC (cross)catalogs, as well as the UZC-SSRS2 (triangle), CfAN (square), SDSSDR3 (open circle) and 2PIGG (filled circle) catalogs. (The symbolsare colored black, blue, green, red, orange and yellow, respectively, in the electronic edition.) We assume h = 0.73.
LDC, HDC, UZC-SSRS2 and CfAN catalogs, and thevalues only diverge at ∼90 Mpc where the linking lengthbecomes large enough that the selection biases of the par-ent surveys will have a significant effect on the identifiedgroups. The number density of groups in the SDSSDR3and 2PIGG catalogs is approximately constant over theentire range of distances considered due to the lower fluxlimits of the surveys. We note that the HDC catalogcontains fewer groups than the LDC catalog beyond ∼30Mpc, as expected. The observed peak at ∼70 Mpc cor-responds to the location of the great attractor, and isenhanced by the distance corrections discussed in §3.1.
6. SUMMARY
We have presented two catalogs of groups in the2MASS Redshift Survey, identified using a variable-linking-length percolation algorithm (HG82). We dis-cussed the effect of the variation of the input parameters,D0 and V0, on the number of groups obtained. As demon-strated in §5.4 above, we see that the correct choice ofparameters depends on the purpose of the catalog, andfull phase-space information of each galaxy is requiredto understand the most suitable choice of parameters to
22 A. C. Crook et al.
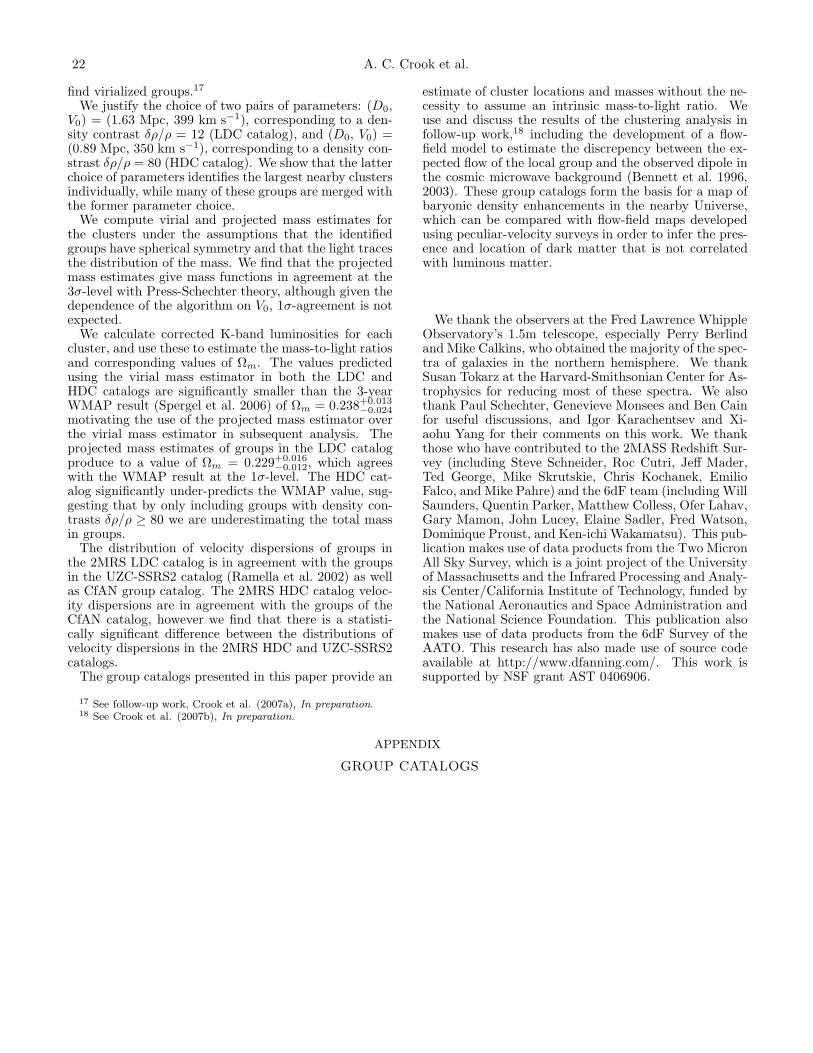
find virialized groups.17
We justify the choice of two pairs of parameters: (D0,V0) = (1.63 Mpc, 399 km s−1), corresponding to a den-sity contrast δρ/ρ = 12 (LDC catalog), and (D0, V0) =(0.89 Mpc, 350 km s−1), corresponding to a density con-strast δρ/ρ = 80 (HDC catalog). We show that the latterchoice of parameters identifies the largest nearby clustersindividually, while many of these groups are merged withthe former parameter choice.
We compute virial and projected mass estimates forthe clusters under the assumptions that the identifiedgroups have spherical symmetry and that the light tracesthe distribution of the mass. We find that the projectedmass estimates give mass functions in agreement at the3σ-level with Press-Schechter theory, although given thedependence of the algorithm on V0, 1σ-agreement is notexpected.
We calculate corrected K-band luminosities for eachcluster, and use these to estimate the mass-to-light ratiosand corresponding values of Ωm. The values predictedusing the virial mass estimator in both the LDC andHDC catalogs are significantly smaller than the 3-yearWMAP result (Spergel et al. 2006) of Ωm = 0.238+0.013
−0.024motivating the use of the projected mass estimator overthe virial mass estimator in subsequent analysis. Theprojected mass estimates of groups in the LDC catalogproduce to a value of Ωm = 0.229+0.016
−0.012, which agreeswith the WMAP result at the 1σ-level. The HDC cat-alog significantly under-predicts the WMAP value, sug-gesting that by only including groups with density con-trasts δρ/ρ ≥ 80 we are underestimating the total massin groups.
The distribution of velocity dispersions of groups inthe 2MRS LDC catalog is in agreement with the groupsin the UZC-SSRS2 catalog (Ramella et al. 2002) as wellas CfAN group catalog. The 2MRS HDC catalog veloc-ity dispersions are in agreement with the groups of theCfAN catalog, however we find that there is a statisti-cally significant difference between the distributions ofvelocity dispersions in the 2MRS HDC and UZC-SSRS2catalogs.
The group catalogs presented in this paper provide an
estimate of cluster locations and masses without the ne-cessity to assume an intrinsic mass-to-light ratio. Weuse and discuss the results of the clustering analysis infollow-up work,18 including the development of a flow-field model to estimate the discrepency between the ex-pected flow of the local group and the observed dipole inthe cosmic microwave background (Bennett et al. 1996,2003). These group catalogs form the basis for a map ofbaryonic density enhancements in the nearby Universe,which can be compared with flow-field maps developedusing peculiar-velocity surveys in order to infer the pres-ence and location of dark matter that is not correlatedwith luminous matter.
We thank the observers at the Fred Lawrence WhippleObservatory’s 1.5m telescope, especially Perry Berlindand Mike Calkins, who obtained the majority of the spec-tra of galaxies in the northern hemisphere. We thankSusan Tokarz at the Harvard-Smithsonian Center for As-trophysics for reducing most of these spectra. We alsothank Paul Schechter, Genevieve Monsees and Ben Cainfor useful discussions, and Igor Karachentsev and Xi-aohu Yang for their comments on this work. We thankthose who have contributed to the 2MASS Redshift Sur-vey (including Steve Schneider, Roc Cutri, Jeff Mader,Ted George, Mike Skrutskie, Chris Kochanek, EmilioFalco, and Mike Pahre) and the 6dF team (including WillSaunders, Quentin Parker, Matthew Colless, Ofer Lahav,Gary Mamon, John Lucey, Elaine Sadler, Fred Watson,Dominique Proust, and Ken-ichi Wakamatsu). This pub-lication makes use of data products from the Two MicronAll Sky Survey, which is a joint project of the Universityof Massachusetts and the Infrared Processing and Analy-sis Center/California Institute of Technology, funded bythe National Aeronautics and Space Administration andthe National Science Foundation. This publication alsomakes use of data products from the 6dF Survey of theAATO. This research has also made use of source codeavailable at http://www.dfanning.com/. This work issupported by NSF grant AST 0406906.
17 See follow-up work, Crook et al. (2007a), In preparation.18 See Crook et al. (2007b), In preparation.
APPENDIX
GROUP CATALOGS

Gro
ups
ofgala
xies
in2M
RS
23
TABLE A1Low-density-contrast (LDC) catalog of groups in the 2MASS Redshift Survey
# RA Dec Membersa Distanceb VGc σP
d RPe log
[
MVM⊙
]
f log[
MPM⊙
]
g log[
MP /LM⊙/L⊙
]
i aj ηk φl
(Mpc) (km/s) (km/s) (Mpc) (′) ()
1 00h00m09.5s +3244′28′′ 3 (0) 136.62 10087 284.5 0.45 13.597 13.398 1.121 52 00h00m48.3s +0405′18′′ 3 (0) 119.62 8870 272.9 3.29 14.429 14.320 2.333 393 00h00m50.1s +2817′00′′ 5 (0) 120.31 8894 199.7 0.93 13.609 13.930 1.544 33 0.22 804 00h02m07.0s +0657′55′′ 4 (0) 71.53 5306 74.7 4.66 13.455 13.505 1.775 1225 00h02m28.8s −5429′49′′ 3 (0) 132.62 9652 198.6 0.02 12.002 14.117 1.698 336 00h05m31.5s +2729′37′′ 3 (0) 102.61 7590 86.8 1.95 13.207 13.206 1.457 297 00h05m41.8s +0509′11′′ 3 (0) 71.94 5340 41.0 0.64 12.072 11.974 0.553 158 00h06m25.3s −5212′28′′ 3 (0) 138.95 10130 289.9 4.81 14.646 14.715 2.368 519 00h06m32.0s +3225′02′′ 10 (0) 66.21 4871 102.6 0.84 12.988 13.406 1.386 86 0.19 4010 00h06m51.6s −3340′17′′ 3 (0) 93.51 6872 90.5 4.07 13.562 13.523 1.580 60
Note. — The complete version of this table is in the electronic edition of the Journal. The printed edition contains only a sample. This catalog has been produced using parameters (D0, V0)
= (1.63 Mpc, 399 km s−1), corresponding to the density contrast δρ/ρ = 12. We assume h = 0.73 where a value is required.
aNo. of group members (including those generated from the population of the plane). The number derived from the galactic-plane population is contained in parentheses.
bMean (corrected) group distance.
cMean heliocentric group velocity.
dLine-of-sight velocity dispersion.
eProjected virial radius.
fLog of the virial mass in solar units.
gLog of the projected mass in solar units.
iLog of the (projected) mass-to-light ratio in solar units.
jSemi-major axis of the ellipse fit to the group at the 75th–percentile level (measured in arcminutes).
kAxis-ratio of ellipse fit to the group members.
lPosition angle of semi-major axis of ellipse fit to the group members; measured from north toward east.
24
A.C
.C
rook
etal.
TABLE A2High-density-contrast (HDC) catalog of groups in the 2MASS Redshift Survey
# RA Dec Membersa Distanceb VGc σP
d RPe log
[
MVM⊙
]
f log[
MPM⊙
]
g log[
MP /LM⊙/L⊙
]
i aj ηk φl Corresponding
(Mpc) (km/s) (km/s) (Mpc) (′) () Group #n
1 00h00m09.5s +3244′28′′ 3 (0) 136.62 10087 284.5 0.45 13.597 13.398 1.121 5 12 00h00m39.2s +4705′02′′ 10 (0) 70.88 5165 151.6 1.60 13.606 13.696 1.612 69 0.32 97 113 00h02m37.5s +3120′47′′ 4 (0) 66.16 4867 99.6 0.17 12.278 13.006 1.546 24 94 00h05m31.5s +2729′37′′ 3 (0) 102.61 7590 86.8 1.95 13.207 13.206 1.457 29 65 00h05m41.8s +0509′11′′ 3 (0) 71.94 5340 41.0 0.64 12.072 11.974 0.553 15 76 00h09m11.3s +3307′36′′ 6 (0) 66.25 4873 113.9 1.05 13.174 13.328 1.448 23 0.69 46 97 00h10m35.7s −5659′21′′ 3 (0) 132.31 9620 177.4 0.51 13.242 13.365 0.976 7 138 00h12m00.7s +1609′37′′ 3 (0) 13.51 912 101.3 1.18 13.123 13.216 2.349 174 169 00h13m05.5s +3057′12′′ 3 (0) 65.04 4792 61.3 0.56 12.360 12.424 0.929 12 1510 00h13m18.8s +2217′48′′ 3 (0) 81.42 6034 121.2 0.58 12.973 13.454 1.839 31 14
Note. — The complete version of this table is in the electronic edition of the Journal. The printed edition contains only a sample. This catalog has been produced using parameters (D0, V0) = (0.89 Mpc,
350 km s−1), corresponding to the density contrast δρ/ρ = 80. We assume h = 0.73 where a value is required.
aNo. of group members (including those generated from the population of the plane). The number derived from the galactic-plane population is contained in parentheses.
bMean (corrected) group distance.
cMean heliocentric group velocity.
dLine-of-sight velocity dispersion.
eProjected virial radius.
fLog of the virial mass in solar units.
gLog of the projected mass in solar units.
iLog of the (projected) mass-to-light ratio in solar units.
jSemi-major axis of the ellipse fit to the group at the 75th–percentile level (measured in arcminutes).
kAxis-ratio of ellipse fit to the group members.
lPosition angle of semi-major axis of ellipse fit to the group members; measured from north toward east.
nGroup number from LDC catalog that encompasses all members of this group.

Gro
ups
ofgala
xies
in2M
RS
25
TABLE A3Groups in the LDC catalog with 50 or more members
# RA Dec Membersa Distanceb VGc σP
d RPe log
[
MVM⊙
]
f log[
MPM⊙
]
g log[
MP /LM⊙/L⊙
]
i Identified
(Mpc) (km/s) (km/s) (Mpc) Withj
852 12h19m12.0s +1656′52′′ 810 (2) 19.46 1314 671.4 10.42 15.712 16.102 2.601 Virgo + NGC3607 Cluster391 05h29m43.7s −4250′28′′ 302 (22) 20.25 1493 597.8 8.07 15.500 16.728 3.704 Eridanus + Fornax I + NGC2280 Cluster + Dorado229 03h08m45.7s +4147′55′′ 301 (0) 72.39 5322 1027.5 4.95 15.758 15.982 2.394 Perseus-Pisces (A426, A347)712 10h24m57.5s −2829′04′′ 241 (0) 46.47 3283 623.4 5.96 15.405 15.681 2.422 Hydra (A1060, A1060)1117 16h10m44.6s −5950′30′′ 217 (42) 68.66 4815 825.7 4.35 15.512 15.723 2.221 Norma (A3627)881 12h51m27.6s −4211′34′′ 202 (0) 52.79 3301 631.3 4.65 15.308 15.347 1.936 Centaurus (A3526)1259 18h57m14.6s −6219′13′′ 103 (0) 62.79 4415 348.3 3.70 14.691 14.871 1.73179 01h15m17.5s +3247′01′′ 98 (0) 67.60 5006 431.7 3.35 14.836 15.071 1.933280 04h03m29.2s +5134′16′′ 86 (78) 71.02 5182 532.0 6.10 15.277 15.303 2.243956 13h39m37.8s −3105′29′′ 84 (0) 58.92 4322 481.8 3.25 14.917 15.204 2.197 Centaurus (A3574)890 12h58m53.8s +2753′23′′ 84 (0) 100.24 6842 648.0 3.31 15.183 15.271 1.876 Coma (A1656)883 12h54m53.4s −1116′36′′ 82 (0) 62.08 4258 444.7 3.37 14.863 15.186 2.215328 04h41m15.9s −0508′37′′ 77 (0) 61.24 4510 375.3 4.12 14.803 15.040 2.1361454 22h28m34.8s +3540′15′′ 76 (0) 84.62 6143 532.0 4.23 15.118 15.445 2.255127 01h57m18.5s +3419′08′′ 71 (0) 66.22 4905 388.1 3.05 14.702 14.966 2.003 Perseus-Pisces (A262)811 11h45m24.1s +2008′13′′ 56 (0) 95.74 6548 550.8 1.83 14.785 14.825 1.691 Coma (A1367)292 04h14m23.7s +3658′31′′ 51 (0) 81.93 6017 286.1 3.49 14.496 14.810 1.826
Note. — The LDC group catalog was created using (D0, V0) = (1.63 Mpc, 399 km s−1), corresponding to a density contrast δρ/ρ = 12. We assume h = 0.73 where a value is required.
aNo. of group members (including those generated from the population of the plane). The number derived from the galactic-plane population is contained in parentheses.
bMean (corrected) group distance.
cMean heliocentric group velocity.
dLine-of-sight velocity dispersion.
eProjected virial radius.
fLog of the virial mass in solar units.
gLog of the projected mass in solar units.
iLog of the (projected) mass-to-light ratio in solar units.
jComposition of group based on known galaxy clusters and superclusters (lists only those groups that appear in HDC catalog with 25 or more members).

26
A.C
.C
rook
etal.
TABLE A4Groups in the HDC catalog with 25 or more members
# RA Dec Membersa Distanceb VGc σP
d RPe log
[
MVM⊙
]
f log[
MPM⊙
]
g log[
MP /LM⊙/L⊙
]
i Corresponding Identified
(Mpc) (km/s) (km/s) (Mpc) Group #j Withk
716 12h33m06.5s +0747′52′′ 298 (0) 19.33 1353 648.7 2.95 15.134 15.257 2.171 852 Virgo214 03h10m24.3s +4134′04′′ 172 (0) 72.21 5310 974.2 2.61 15.434 15.769 2.429 229 Perseus-Pisces (A426)699 12h08m34.1s +4613′02′′ 123 (0) 15.30 966 405.0 3.39 14.785 15.109 2.548 852 Virgo722 12h44m48.4s −4105′22′′ 100 (0) 53.67 3452 752.1 1.95 15.083 15.193 2.097 881 Centaurus (A3526)928 16h15m53.1s −6054′29′′ 90 (0) 69.67 4887 827.4 1.46 15.039 14.997 1.852 1117 Norma (A3627)592 10h36m54.5s −2711′21′′ 67 (0) 51.97 3654 523.0 1.48 14.648 14.637 1.927 712 Hydra (A1060)1034 18h47m40.8s −6326′02′′ 51 (0) 63.29 4450 350.1 1.75 14.372 14.476 1.665 1259237 03h38m20.8s −2034′53′′ 51 (0) 21.77 1624 231.8 1.79 14.022 14.106 1.905 391 Eridanus235 03h35m11.8s −3504′15′′ 43 (0) 19.11 1438 293.2 1.02 13.981 14.094 1.721 391 Fornax I734 12h58m51.0s +2751′00′′ 42 (0) 102.23 6986 628.2 1.70 14.866 14.955 1.815 890 Coma (A1656)669 11h44m35.4s +1958′45′′ 42 (0) 95.31 6517 614.5 1.22 14.701 14.775 1.773 811 Coma (A1367)553 10h00m36.8s −3121′56′′ 40 (0) 37.97 2706 218.4 2.67 14.144 14.371 1.853 712 Hydra (A1060)628 11h09m31.5s +1523′42′′ 39 (0) 13.04 1035 235.2 1.16 13.845 14.082 2.164 852 NGC3607 Cluster103 01h53m36.6s +3617′59′′ 39 (0) 66.12 4891 412.0 1.55 14.461 14.466 1.770 127 Perseus-Pisces (A262)828 14h01m45.9s −3350′04′′ 36 (0) 55.71 4203 367.7 1.59 14.371 14.419 1.934 98573 01h23m18.6s +3334′59′′ 35 (0) 66.89 4953 526.0 1.01 14.486 14.429 1.766 79584 10h30m25.5s −3520′24′′ 30 (0) 40.47 2928 383.0 0.69 14.047 13.935 1.619 712727 12h52m38.0s −0857′53′′ 29 (0) 59.59 4070 350.8 1.34 14.258 14.367 1.943 883141 02h25m24.5s +4205′38′′ 29 (0) 76.52 5642 563.1 1.36 14.675 14.801 2.170 229 Perseus-Pisces (A347)78 01h26m33.5s −0134′42′′ 29 (0) 70.73 5293 442.7 0.98 14.321 14.500 1.940 95 A19456 01h09m52.6s +3243′06′′ 29 (0) 68.38 5064 368.8 1.30 14.286 14.442 1.808 79807 13h48m47.9s −3018′54′′ 28 (0) 64.59 4596 432.8 1.20 14.391 14.387 1.751 956 Centaurus (A3574)763 13h17m41.1s −1636′08′′ 28 (0) 33.44 2332 496.4 1.09 14.469 14.900 2.759 852432 07h21m47.7s −3004′19′′ 28 (4) 28.69 2054 204.9 2.19 14.004 14.221 2.247 391 NGC2280 Cluster282 04h22m27.8s +3643′26′′ 28 (0) 82.20 6032 266.6 1.79 14.145 14.255 1.520 292732 12h56m09.5s −1337′44′′ 27 (0) 65.56 4510 319.2 1.34 14.175 14.529 1.926 883295 04h35m49.4s −5857′46′′ 26 (0) 15.84 1226 188.9 1.50 13.769 14.019 2.077 391 Dorado
Note. — The HDC group catalog was created using (D0, V0) = (0.89 Mpc, 350 km s−1), corresponding to a density contrast δρ/ρ = 80. We assume h = 0.73 where a value is required.
aNo. of group members (including those generated from the population of the plane). The number derived from the galactic-plane population is contained in parentheses.
bMean (corrected) group distance.
cMean heliocentric group velocity.
dLine-of-sight velocity dispersion.
eProjected virial radius.
fLog of the virial mass in solar units.
gLog of the projected mass in solar units.
iLog of the (projected) mass-to-light ratio in solar units.
jGroup number from LDC catalog that encompasses all members of this group.
kComposition of group based on known galaxy clusters and superclusters.
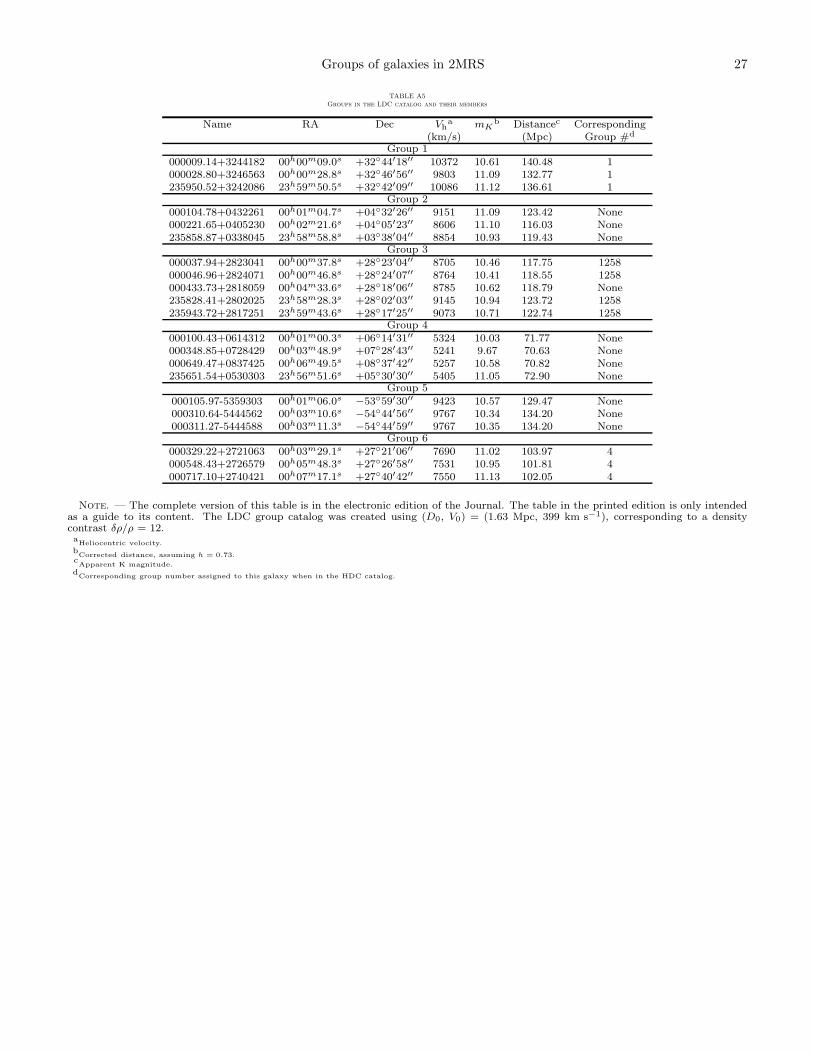
Groups of galaxies in 2MRS 27
TABLE A5Groups in the LDC catalog and their members
Name RA Dec Vha mK
b Distancec Corresponding(km/s) (Mpc) Group #d
Group 1000009.14+3244182 00h00m09.0s +3244′18′′ 10372 10.61 140.48 1000028.80+3246563 00h00m28.8s +3246′56′′ 9803 11.09 132.77 1235950.52+3242086 23h59m50.5s +3242′09′′ 10086 11.12 136.61 1
Group 2000104.78+0432261 00h01m04.7s +0432′26′′ 9151 11.09 123.42 None000221.65+0405230 00h02m21.6s +0405′23′′ 8606 11.10 116.03 None235858.87+0338045 23h58m58.8s +0338′04′′ 8854 10.93 119.43 None
Group 3000037.94+2823041 00h00m37.8s +2823′04′′ 8705 10.46 117.75 1258000046.96+2824071 00h00m46.8s +2824′07′′ 8764 10.41 118.55 1258000433.73+2818059 00h04m33.6s +2818′06′′ 8785 10.62 118.79 None235828.41+2802025 23h58m28.3s +2802′03′′ 9145 10.94 123.72 1258235943.72+2817251 23h59m43.6s +2817′25′′ 9073 10.71 122.74 1258
Group 4000100.43+0614312 00h01m00.3s +0614′31′′ 5324 10.03 71.77 None000348.85+0728429 00h03m48.9s +0728′43′′ 5241 9.67 70.63 None000649.47+0837425 00h06m49.5s +0837′42′′ 5257 10.58 70.82 None235651.54+0530303 23h56m51.6s +0530′30′′ 5405 11.05 72.90 None
Group 5000105.97-5359303 00h01m06.0s −5359′30′′ 9423 10.57 129.47 None000310.64-5444562 00h03m10.6s −5444′56′′ 9767 10.34 134.20 None000311.27-5444588 00h03m11.3s −5444′59′′ 9767 10.35 134.20 None
Group 6000329.22+2721063 00h03m29.1s +2721′06′′ 7690 11.02 103.97 4000548.43+2726579 00h05m48.3s +2726′58′′ 7531 10.95 101.81 4000717.10+2740421 00h07m17.1s +2740′42′′ 7550 11.13 102.05 4
Note. — The complete version of this table is in the electronic edition of the Journal. The table in the printed edition is only intendedas a guide to its content. The LDC group catalog was created using (D0, V0) = (1.63 Mpc, 399 km s−1), corresponding to a densitycontrast δρ/ρ = 12.aHeliocentric velocity.
bCorrected distance, assuming h = 0.73.
cApparent K magnitude.
dCorresponding group number assigned to this galaxy when in the HDC catalog.
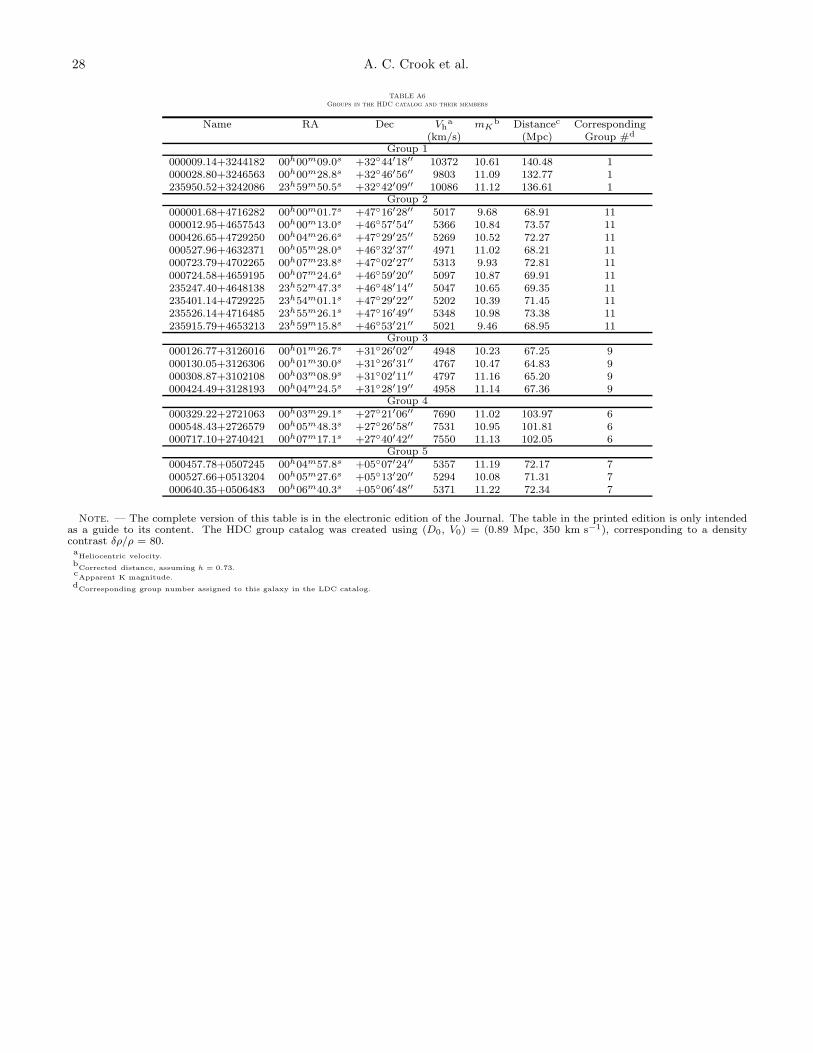
28 A. C. Crook et al.
TABLE A6Groups in the HDC catalog and their members
Name RA Dec Vha mK
b Distancec Corresponding(km/s) (Mpc) Group #d
Group 1000009.14+3244182 00h00m09.0s +3244′18′′ 10372 10.61 140.48 1000028.80+3246563 00h00m28.8s +3246′56′′ 9803 11.09 132.77 1235950.52+3242086 23h59m50.5s +3242′09′′ 10086 11.12 136.61 1
Group 2000001.68+4716282 00h00m01.7s +4716′28′′ 5017 9.68 68.91 11000012.95+4657543 00h00m13.0s +4657′54′′ 5366 10.84 73.57 11000426.65+4729250 00h04m26.6s +4729′25′′ 5269 10.52 72.27 11000527.96+4632371 00h05m28.0s +4632′37′′ 4971 11.02 68.21 11000723.79+4702265 00h07m23.8s +4702′27′′ 5313 9.93 72.81 11000724.58+4659195 00h07m24.6s +4659′20′′ 5097 10.87 69.91 11235247.40+4648138 23h52m47.3s +4648′14′′ 5047 10.65 69.35 11235401.14+4729225 23h54m01.1s +4729′22′′ 5202 10.39 71.45 11235526.14+4716485 23h55m26.1s +4716′49′′ 5348 10.98 73.38 11235915.79+4653213 23h59m15.8s +4653′21′′ 5021 9.46 68.95 11
Group 3000126.77+3126016 00h01m26.7s +3126′02′′ 4948 10.23 67.25 9000130.05+3126306 00h01m30.0s +3126′31′′ 4767 10.47 64.83 9000308.87+3102108 00h03m08.9s +3102′11′′ 4797 11.16 65.20 9000424.49+3128193 00h04m24.5s +3128′19′′ 4958 11.14 67.36 9
Group 4000329.22+2721063 00h03m29.1s +2721′06′′ 7690 11.02 103.97 6000548.43+2726579 00h05m48.3s +2726′58′′ 7531 10.95 101.81 6000717.10+2740421 00h07m17.1s +2740′42′′ 7550 11.13 102.05 6
Group 5000457.78+0507245 00h04m57.8s +0507′24′′ 5357 11.19 72.17 7000527.66+0513204 00h05m27.6s +0513′20′′ 5294 10.08 71.31 7000640.35+0506483 00h06m40.3s +0506′48′′ 5371 11.22 72.34 7
Note. — The complete version of this table is in the electronic edition of the Journal. The table in the printed edition is only intendedas a guide to its content. The HDC group catalog was created using (D0, V0) = (0.89 Mpc, 350 km s−1), corresponding to a densitycontrast δρ/ρ = 80.aHeliocentric velocity.
bCorrected distance, assuming h = 0.73.
cApparent K magnitude.
dCorresponding group number assigned to this galaxy in the LDC catalog.
Groups of galaxies in 2MRS 29
REFERENCES
Bahcall, J. N., & Tremaine, S. 1981, ApJ, 244, 805Bell, E. F., McIntosh, D. H., Katz, N., & Weinberg, M. D. 2003,
ApJS, 149, 289Bennett, C. L. et al. 1996, ApJ, 464, L1—. 2003, ApJS, 148, 1Branchini, E. et al. 1999, MNRAS, 308, 1Chakravarti, Laha, & Roy. 1967, Handbook of Methods of Applied
Statistics, Vol. I (John Wiley and Sons), 392–394Courteau, S., & van den Bergh, S. 1999, AJ, 118, 337Cutri, R., et al. 2003, IPAC, http://www.ipac.caltech.edu/2mass/da Costa, L. N. et al. 1998, AJ, 116, 1Davis, M. et al. 2003, in Discoveries and Research Prospects from
6- to 10-Meter-Class Telescopes II. Edited by Guhathakurta,Puragra. Proceedings of the SPIE, Volume 4834, pp. 161-172(2003)., ed. P. Guhathakurta, 161–172
de Lapparent, V., Geller, M. J., & Huchra, J. P. 1991, ApJ, 369,273
de Vaucouleurs, G. 1975, Stars and stellar systems, 9, 557Diaferio, A., Kauffmann, G., Colberg, J. M., & White, S. D. M.
1999, MNRAS, 307, 537Eke, V. R. et al. 2004, MNRAS, 348, 866Erdogdu, P. et al. 2006, MNRASFalco, E. E. et al. 1999, VizieR Online Data Catalog, 611, 10438Fisher, K. B., Huchra, J. P., Strauss, M. A., Davis, M., Yahil, A.,
& Schlegel, D. 1995, ApJS, 100, 69Frederic, J. J. 1995a, ApJS, 97, 275—. 1995b, ApJS, 97, 259Geller, M. J., & Huchra, J. P. 1983, ApJS, 52, 61—. 1989, Science, 246, 897Gerke, B. F. et al. 2005, ApJ, 625, 6Giuricin, G., Marinoni, C., Ceriani, L., & Pisani, A. 2000, ApJ,
543, 178Heisler, J., Tremaine, S., & Bahcall, J. N. 1985, ApJ, 298, 8Huchra, J. et al. 2005a, in ASP Conf. Ser. 329: Nearby Large-Scale
Structures and the Zone of Avoidance, ed. A. P. Fairall & P. A.Woudt, 135
Huchra, J. et al. 2005b, in IAU Symposium No. 216, 170Huchra, J. P., & Geller, M. J. 1982, ApJ, 257, 423Huchra, J. P., Geller, M. J., & Corwin, H. G. 1995, ApJS, 99, 391Huchra, J. P., Geller, M. J., de Lapparent, V., & Corwin, H. G.
1990, ApJS, 72, 433Jarrett, T. H., Chester, T., Cutri, R., Schneider, S., Skrutskie, M.,
& Huchra, J. P. 2000, AJ, 119, 2498
Jenkins, A., Frenk, C. S., White, S. D. M., Colberg, J. M., Cole,S., Evrard, A. E., Couchman, H. M. P., & Yoshida, N. 2001,MNRAS, 321, 372
Johnson, H. L. 1966, ARA&A, 4, 193Kochanek, C. S. et al. 2001, ApJ, 560, 566Kochanek, C. S., White, M., Huchra, J., Macri, L., Jarrett, T. H.,
Schneider, S. E., & Mader, J. 2003, ApJ, 585, 161Lahav, O., Fisher, K. B., Hoffman, Y., Scharf, C. A., & Zaroubi,
S. 1994, ApJ, 423, L93Marinoni, C., Davis, M., Newman, J. A., & Coil, A. L. 2002, ApJ,
580, 122Martınez, H. J., Zandivarez, A., Merchan, M. E., & Domınguez,
M. J. L. 2002, MNRAS, 337, 1441Merchan, M., & Zandivarez, A. 2002, MNRAS, 335, 216Merchan, M. E., & Zandivarez, A. 2005, ApJ, 630, 759Miller, C. J. et al. 2005, AJ, 130, 968Mould, J. R. et al. 2000, ApJ, 529, 786Nolthenius, R., & White, S. D. M. 1987, MNRAS, 225, 505Press, W. H., & Schechter, P. 1974, ApJ, 187, 425Ramella, M., Geller, M. J., & Huchra, J. P. 1989, ApJ, 344, 57Ramella, M., Geller, M. J., Pisani, A., & da Costa, L. N. 2002, AJ,
123, 2976Ramella, M., Pisani, A., & Geller, M. J. 1997, AJ, 113, 483Saunders, W. et al. 2000, MNRAS, 317, 55Schechter, P. 1976, ApJ, 203, 297Schlegel, D. J., Finkbeiner, D. P., & Davis, M. 1998, ApJ, 500, 525Sheth, R. K., & Tormen, G. 1999, MNRAS, 308, 119Skrutskie, M. F. et al. 2006, AJ, 131, 1163Spergel, D. N. et al. 2006, ApJStrauss, M. A., Davis, M., Yahil, A., & Huchra, J. P. 1992, ApJ,
385, 421
Turner, E. L., & Gott, J. R. 1976, ApJS, 32, 409Weinmann, S. M., van den Bosch, F. C., Yang, X., & Mo, H. J.
2006, MNRAS, 366, 2Yahil, A., Strauss, M. A., Davis, M., & Huchra, J. P. 1991, ApJ,
372, 380Yahil, A., Tammann, G. A., & Sandage, A. 1977, ApJ, 217, 903Yang, X., Mo, H. J., van den Bosch, F. C., & Jing, Y. P. 2005,
MNRAS, 356, 1293
Due to size limitations imposed by arxiv.org, print-quality figures appear only in the full-resolution PS and PDFversions, which are available at http://www.cfa.harvard.edu/∼acrook/preprints/.