Groundwater Pollution of the Quaternary Aquifer in Northern United Arab Emirates
19
Groundwater Pollution of the Quaternary Aquifer in Northern United Arab Emirates Eslam A. Al-Hogaraty & Zeinelabidin S. Rizk & Hassan K. Garamoon Received: 21 June 2007 / Accepted: 25 November 2007 / Published online: 30 January 2008 # Springer Science + Business Media B.V. 2007 Abstract Natural conditions and human activities have caused serious quality degradation of the Quaternary aquifer in the north of the United Arab Emirates (UAE). The aquifer within Ajman City is unconfined, receiving limited recharge (12 542 m 3 / day) from the east and large pollutants flux (4,800 m 3 / day) from land surface. Field survey and laboratory analyses revealed anomalies in groundwater salinity (TDS), total hardness (TH), dissolved oxygen (DO), cations (Ca 2+ , Mg 2+ , Na + and K + ), anions (HCO 3 , SO 2 4 , Cl - and NO 3 ) and trace elements (Fe, Pb, Cd and Cr), which can be correlated to point and non- point pollution sources. Concentrations of trace elements are more responsive to anthropogenic sources than natural ones. High Fe and Pb levels were measured close to the untreated sewage disposal site, while high Cd and Cr contents were observed near hospitals and clinics. Iso-concentration maps of salinity and major ions, in addition to hydrochemical profiles were used to define the seawater–groundwater interface in Ajman City. The potentiometric surface map of the Quaternary aquifer within the study area shows that groundwater flows from the east towards the Arabian Gulf in the west. The proposed landfill site is suitable because it lies within a topographic low, receiving groundwater flow from all directions. Keywords Groundwater pollution . Quaternary aquifer . Point-pollution source . Arid climatic . Anthropogenic factors . Hydrochemical profiles . Salt-water intrusion . Ajman City . United Arab Emirates 1 Introduction Ajman City has been experiencing rapid economic development, urbanization and dramatic change in land use. These activities impose a negative impact on groundwater quality in the Quaternary sand aquifer underlying the city. Being located down-gradient of the regional groundwater flow system in the UAE (Alsharhan et al. 2001; Rizk and El-Etr 1998), the city naturally receives poor-quality groundwater. In addi- tion, unplanned disposal of waste in unlined pits on land surface leads to downward movement of surface pollutants, causing further degradation of groundwa- ter quality. The Quaternary aquifer within Ajman City is unconfined and is vulnerable to pollution from surface sources. This vulnerability can be minimized by strict regulatory enforcement to eliminate illegal waste disposal. The objectives of this study are to identify natural and anthropogenic pollution sources, construct a potentiometric surface map for the aquifer, Water Air Soil Pollut (2008) 190:323–341 DOI 10.1007/s11270-007-9584-9 E. A. Al-Hogaraty : Z. S. Rizk (*) : H. K. Garamoon Institute of Environment, Water and Energy, Ajman University of Science and Technology, P. O. Box 346, Ajman, United Arab Emirates e-mail: [email protected]
-
Upload
algonquincollege -
Category
Documents
-
view
0 -
download
0
Transcript of Groundwater Pollution of the Quaternary Aquifer in Northern United Arab Emirates

Groundwater Pollution of the Quaternary Aquiferin Northern United Arab Emirates
Eslam A. Al-Hogaraty & Zeinelabidin S. Rizk &
Hassan K. Garamoon
Received: 21 June 2007 /Accepted: 25 November 2007 / Published online: 30 January 2008# Springer Science + Business Media B.V. 2007
Abstract Natural conditions and human activitieshave caused serious quality degradation of theQuaternary aquifer in the north of the United ArabEmirates (UAE). The aquifer within Ajman City isunconfined, receiving limited recharge (12 542 m3/day) from the east and large pollutants flux (4,800 m3/day) from land surface. Field survey and laboratoryanalyses revealed anomalies in groundwater salinity(TDS), total hardness (TH), dissolved oxygen (DO),cations (Ca2+, Mg2+, Na+ and K+), anions (HCO�
3 ,SO2�
4 , Cl− and NO�3 ) and trace elements (Fe, Pb, Cd
and Cr), which can be correlated to point and non-point pollution sources. Concentrations of traceelements are more responsive to anthropogenicsources than natural ones. High Fe and Pb levelswere measured close to the untreated sewage disposalsite, while high Cd and Cr contents were observednear hospitals and clinics. Iso-concentration maps ofsalinity and major ions, in addition to hydrochemicalprofiles were used to define the seawater–groundwaterinterface in Ajman City. The potentiometric surfacemap of the Quaternary aquifer within the study areashows that groundwater flows from the east towardsthe Arabian Gulf in the west. The proposed landfill site
is suitable because it lies within a topographic low,receiving groundwater flow from all directions.
Keywords Groundwater pollution . Quaternaryaquifer . Point-pollution source . Arid climatic .
Anthropogenic factors . Hydrochemical profiles .
Salt-water intrusion . Ajman City .
United Arab Emirates
1 Introduction
Ajman City has been experiencing rapid economicdevelopment, urbanization and dramatic change inland use. These activities impose a negative impact ongroundwater quality in the Quaternary sand aquiferunderlying the city. Being located down-gradient ofthe regional groundwater flow system in the UAE(Alsharhan et al. 2001; Rizk and El-Etr 1998), the citynaturally receives poor-quality groundwater. In addi-tion, unplanned disposal of waste in unlined pits onland surface leads to downward movement of surfacepollutants, causing further degradation of groundwa-ter quality. The Quaternary aquifer within Ajman Cityis unconfined and is vulnerable to pollution fromsurface sources. This vulnerability can be minimizedby strict regulatory enforcement to eliminate illegalwaste disposal. The objectives of this study are toidentify natural and anthropogenic pollution sources,construct a potentiometric surface map for the aquifer,
Water Air Soil Pollut (2008) 190:323–341DOI 10.1007/s11270-007-9584-9
E. A. Al-Hogaraty : Z. S. Rizk (*) :H. K. GaramoonInstitute of Environment, Water and Energy,Ajman University of Science and Technology,P. O. Box 346, Ajman, United Arab Emiratese-mail: [email protected]
evaluate the site selected by Ajman Municipality forwaste disposal, assess the impact of feed water qualityon desalination plants capacity and provide sugges-tions for pollution control.
Ajman Emirate is the smallest among sevenemirates constituting the UAE. While the total areaof the UAE is 77,700 km2 (Al Asam 1994), the areaof Ajman Emirate is only 600 km2, including460 km2 land and 140 km2 marine areas. For thisreason, the Ajman Urban Development Plan calls forefficient use of developable lands and for improve-ment of land-use management. The land area ofAjman Emirate consists of three separate regions,namely: Ajman City, Masfut and Manama (Fig. 1b).
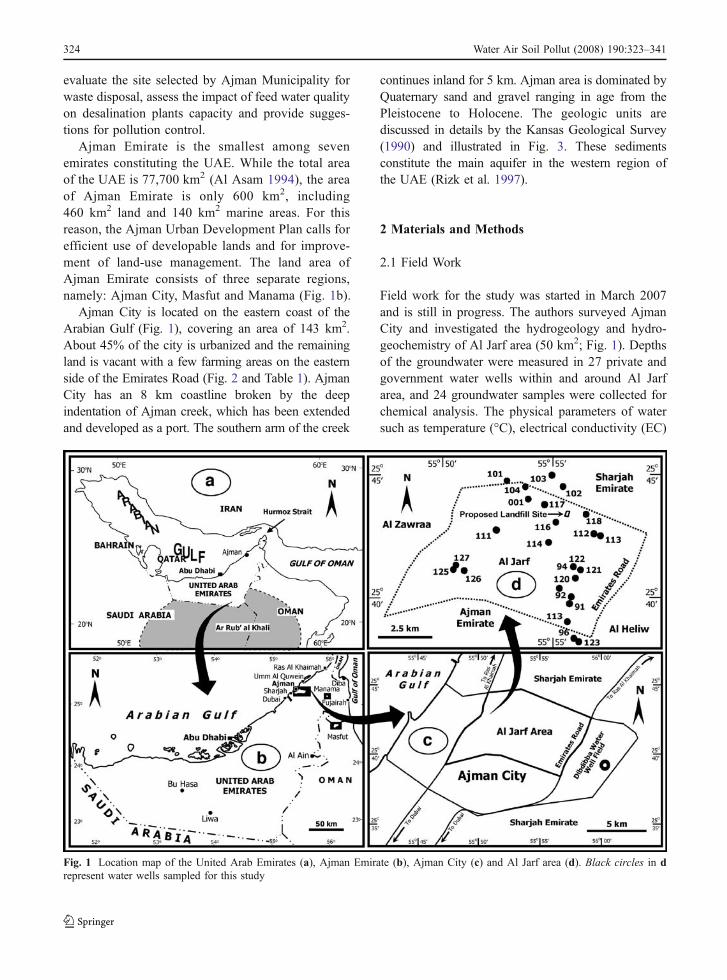
Ajman City is located on the eastern coast of theArabian Gulf (Fig. 1), covering an area of 143 km2.About 45% of the city is urbanized and the remainingland is vacant with a few farming areas on the easternside of the Emirates Road (Fig. 2 and Table 1). AjmanCity has an 8 km coastline broken by the deepindentation of Ajman creek, which has been extendedand developed as a port. The southern arm of the creek
continues inland for 5 km. Ajman area is dominated byQuaternary sand and gravel ranging in age from thePleistocene to Holocene. The geologic units arediscussed in details by the Kansas Geological Survey(1990) and illustrated in Fig. 3. These sedimentsconstitute the main aquifer in the western region ofthe UAE (Rizk et al. 1997).
2 Materials and Methods
2.1 Field Work
Field work for the study was started in March 2007and is still in progress. The authors surveyed AjmanCity and investigated the hydrogeology and hydro-geochemistry of Al Jarf area (50 km2; Fig. 1). Depthsof the groundwater were measured in 27 private andgovernment water wells within and around Al Jarfarea, and 24 groundwater samples were collected forchemical analysis. The physical parameters of watersuch as temperature (°C), electrical conductivity (EC)
Fig. 1 Location map of the United Arab Emirates (a), Ajman Emirate (b), Ajman City (c) and Al Jarf area (d). Black circles in drepresent water wells sampled for this study
324 Water Air Soil Pollut (2008) 190:323–341
in micro Siemens per centimeters (μS/cm) andhydrogen ion concentration (pH) were directly mea-sured in the field because they change after samplecollection (Hem 1985).
2.2 Laboratory Analyses
The chemical analysis of groundwater samples col-lected for this study was conducted in the Food ControlLaboratory at Ajman Municipality and PlanningDepartment. Standard analytical techniques describedin Rainwater and Thatcher (1960), FAO (1970), Wood(1976), APHA (1995) and Skoog et al. (2004) wereapplied. Chemical analysis of major, minor and tracechemical constituents was performed using titrationmethods, ion chromatography (Weiss 1986), atomicabsorption spectrophotometry (AAS; Ediger 1973)and inductively coupled plasma-atomic emissionspectrometry (ICP-AES; Wolf and Grosser 1997).
For measurement of total dissolved solids (TDS), a100 mL of well-mixed water sample was filteredthrough a standard glass fiber. The filtrate wasevaporated to dryness in a weighed dish and dried toa constant weight at 180°C. The increase in dish weightrepresented the total dissolved solid (APHA 1995).
For determination of alkalinity, soluble carbonate(CO2�
3 ) and bicarbonate (HCO�3 ) anions were mea-
sured by titration of 50 mL water sample against0.02 N HCl solution using phenolphthalein andmethyl orange indicators (Skoog et al. 2004). Totalhardness was measured by addition of 2 mL of thebuffer solution pH-10 and three to four drops ofErichrome Black T indicator to 10 mL water sample,and titration with standard 0.01 M EDTA solution.
Ion chromatograph, model Dionex-2020i, was usedfor the analysis of the anions; chloride (Cl−), nitrate(NO�
3 ) and sulphate (SO2�4 ). The Dionex-2020i ion
chromatograph is a dual-channel, high-performancechromatographic system featuring two precision ana-
Fig. 2 Land use map forAjman City, based on datafrom the Planning Depart-ment of Ajman Municipali-ty, satellite images and fieldstudy
Table 1 Land use at Ajman City, north of the UAE, traced andcalculated from satellite images
Number Land use Area (km2) Percent (%)of total
1 Government 12.90 92 Open space 25.06 183 Commercial 1.65 14 Residential 32.12 235 Industrial 20.13 146 Wet land 2.90 27 Agriculture 8.03 68 Undeveloped area 39.88 28Total area 142.67 100
Water Air Soil Pollut (2008) 190:323–341 325

lytical pumps, a dual-channel advanced chromatogra-phy module with optional column heater and twoconductivity detectors. The operating conditions were10–40°C temperature range and 1,900 psi (129 atm)maximum pressure. A calibration curve was preparedfor each anion using aliquots anion concentrationshigher than detection limits. The detection limits inmg/L of Cl−, NO�
3 and SO2�4 were 0.03, 0.13 and 0.03,
respectively.Prior to the determination of total metal concentra-
tions by AAS or ICP-AES, each water sample wasacidified with nitric acid (8 mL/L Analar grade), boiledfor 4–5 min to ensure complete solubility of metal ions(Skoog et al. 2004), and then filtered. Filtrate was usedfor both AAS and ICP-AES measurements. Atomicabsorption spectrophotometry (AAS) was used for thedetermination of calcium (Ca2+), magnesium (Mg2+),sodium (Na2+) and potassium (K+) ions by measuringtheir absorbance at the maximumwavelengths (Table 2),against reagent blank (Ediger 1973). Measurementswere carried out using the Atomic Absorption Spec-trometer (GBC 906), equipped with autosampler andbackground corrector. Inductively Coupled Plasma-
Atomic Emission Spectrometer (ICP-AES) was usedfor determination of trace elements iron (Fe), lead (Pb),cadmium (Cd), chromium (Cr), manganese (Mn),copper (Cu), nickel (Ni) and zinc (Zn). Table 2 listswavelengths and detection limits of ions determinedwith the use ICP-AES.
3 Results and Discussion
3.1 Groundwater Pollution
Groundwater pollution depends on topography,hydrogeology, the sources of groundwater rechargeand the amount of groundwater pumping. Both pointand non-point groundwater pollution sources inAjman City are summarized in Table 3 and discussedin the following:
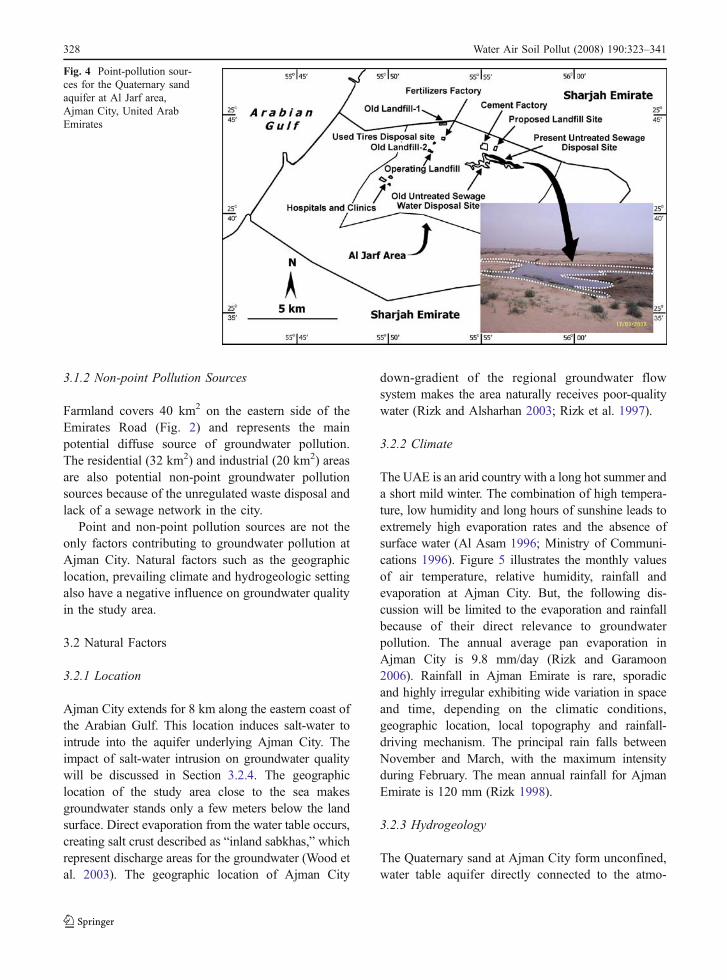
3.1.1 Point-pollution Sources
During field survey, special emphasis was given toinspection of old and operating waste disposal sites
Fig. 3 Geologic map ofAjman City, modified fromthe geologic map of theUnited Arab Emirates pre-pared by the Kansas Geo-logical Survey (1990)
326 Water Air Soil Pollut (2008) 190:323–341
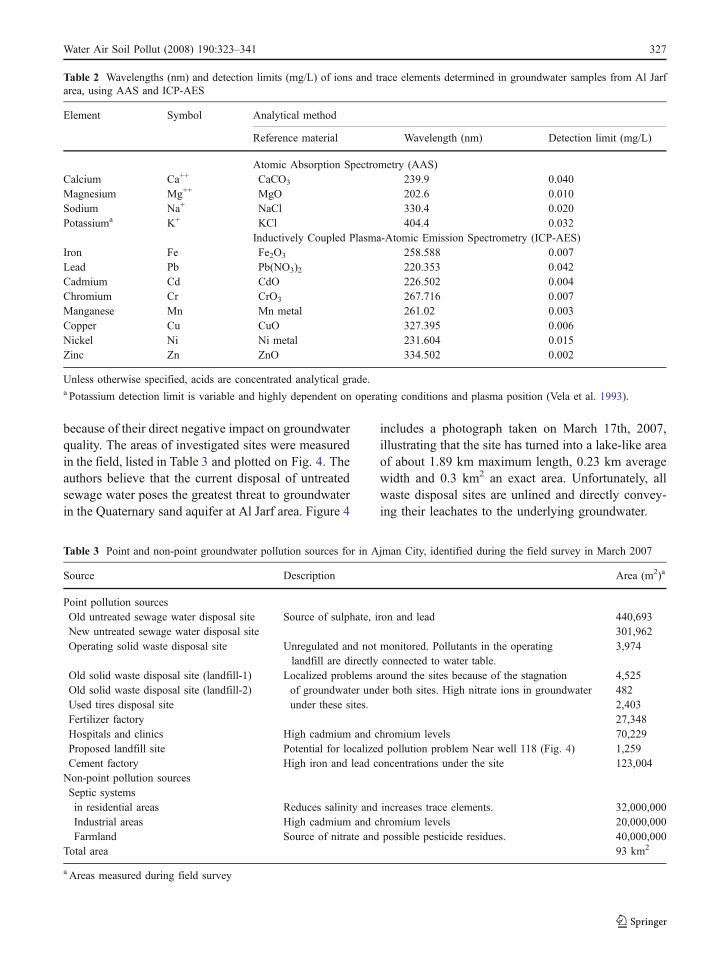
because of their direct negative impact on groundwaterquality. The areas of investigated sites were measuredin the field, listed in Table 3 and plotted on Fig. 4. Theauthors believe that the current disposal of untreatedsewage water poses the greatest threat to groundwaterin the Quaternary sand aquifer at Al Jarf area. Figure 4
includes a photograph taken on March 17th, 2007,illustrating that the site has turned into a lake-like areaof about 1.89 km maximum length, 0.23 km averagewidth and 0.3 km2 an exact area. Unfortunately, allwaste disposal sites are unlined and directly convey-ing their leachates to the underlying groundwater.
Table 2 Wavelengths (nm) and detection limits (mg/L) of ions and trace elements determined in groundwater samples from Al Jarfarea, using AAS and ICP-AES
Element Symbol Analytical method
Reference material Wavelength (nm) Detection limit (mg/L)
Atomic Absorption Spectrometry (AAS)Calcium Ca++ CaCO3 239.9 0.040Magnesium Mg++ MgO 202.6 0.010Sodium Na+ NaCl 330.4 0.020Potassiuma K+ KCl 404.4 0.032
Inductively Coupled Plasma-Atomic Emission Spectrometry (ICP-AES)Iron Fe Fe2O3 258.588 0.007Lead Pb Pb(NO3)2 220.353 0.042Cadmium Cd CdO 226.502 0.004Chromium Cr CrO3 267.716 0.007Manganese Mn Mn metal 261.02 0.003Copper Cu CuO 327.395 0.006Nickel Ni Ni metal 231.604 0.015Zinc Zn ZnO 334.502 0.002
Unless otherwise specified, acids are concentrated analytical grade.a Potassium detection limit is variable and highly dependent on operating conditions and plasma position (Vela et al. 1993).
Table 3 Point and non-point groundwater pollution sources for in Ajman City, identified during the field survey in March 2007
Source Description Area (m2)a
Point pollution sourcesOld untreated sewage water disposal site Source of sulphate, iron and lead 440,693New untreated sewage water disposal site 301,962Operating solid waste disposal site Unregulated and not monitored. Pollutants in the operating
landfill are directly connected to water table.3,974
Old solid waste disposal site (landfill-1) Localized problems around the sites because of the stagnationof groundwater under both sites. High nitrate ions in groundwaterunder these sites.
4,525Old solid waste disposal site (landfill-2) 482Used tires disposal site 2,403Fertilizer factory 27,348Hospitals and clinics High cadmium and chromium levels 70,229Proposed landfill site Potential for localized pollution problem Near well 118 (Fig. 4) 1,259Cement factory High iron and lead concentrations under the site 123,004Non-point pollution sourcesSeptic systemsin residential areas Reduces salinity and increases trace elements. 32,000,000Industrial areas High cadmium and chromium levels 20,000,000Farmland Source of nitrate and possible pesticide residues. 40,000,000
Total area 93 km2
a Areas measured during field survey
Water Air Soil Pollut (2008) 190:323–341 327
3.1.2 Non-point Pollution Sources
Farmland covers 40 km2 on the eastern side of theEmirates Road (Fig. 2) and represents the mainpotential diffuse source of groundwater pollution.The residential (32 km2) and industrial (20 km2) areasare also potential non-point groundwater pollutionsources because of the unregulated waste disposal andlack of a sewage network in the city.
Point and non-point pollution sources are not theonly factors contributing to groundwater pollution atAjman City. Natural factors such as the geographiclocation, prevailing climate and hydrogeologic settingalso have a negative influence on groundwater qualityin the study area.
3.2 Natural Factors
3.2.1 Location
Ajman City extends for 8 km along the eastern coast ofthe Arabian Gulf. This location induces salt-water tointrude into the aquifer underlying Ajman City. Theimpact of salt-water intrusion on groundwater qualitywill be discussed in Section 3.2.4. The geographiclocation of the study area close to the sea makesgroundwater stands only a few meters below the landsurface. Direct evaporation from the water table occurs,creating salt crust described as “inland sabkhas,” whichrepresent discharge areas for the groundwater (Wood etal. 2003). The geographic location of Ajman City
down-gradient of the regional groundwater flowsystem makes the area naturally receives poor-qualitywater (Rizk and Alsharhan 2003; Rizk et al. 1997).
3.2.2 Climate
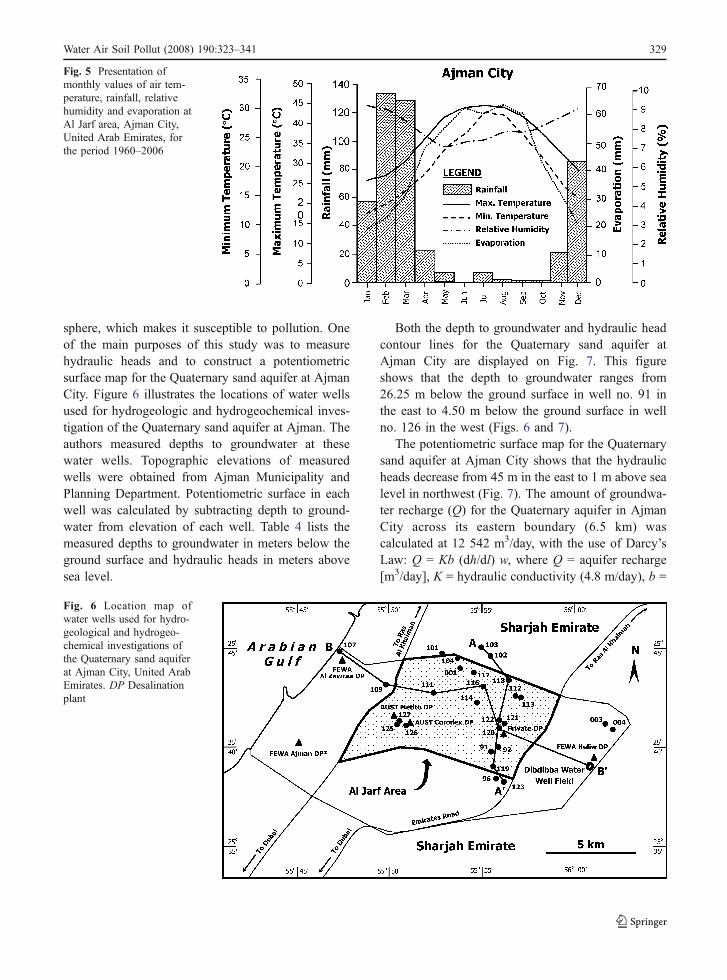
The UAE is an arid country with a long hot summer anda short mild winter. The combination of high tempera-ture, low humidity and long hours of sunshine leads toextremely high evaporation rates and the absence ofsurface water (Al Asam 1996; Ministry of Communi-cations 1996). Figure 5 illustrates the monthly valuesof air temperature, relative humidity, rainfall andevaporation at Ajman City. But, the following dis-cussion will be limited to the evaporation and rainfallbecause of their direct relevance to groundwaterpollution. The annual average pan evaporation inAjman City is 9.8 mm/day (Rizk and Garamoon2006). Rainfall in Ajman Emirate is rare, sporadicand highly irregular exhibiting wide variation in spaceand time, depending on the climatic conditions,geographic location, local topography and rainfall-driving mechanism. The principal rain falls betweenNovember and March, with the maximum intensityduring February. The mean annual rainfall for AjmanEmirate is 120 mm (Rizk 1998).
3.2.3 Hydrogeology
The Quaternary sand at Ajman City form unconfined,water table aquifer directly connected to the atmo-
Fig. 4 Point-pollution sour-ces for the Quaternary sandaquifer at Al Jarf area,Ajman City, United ArabEmirates
328 Water Air Soil Pollut (2008) 190:323–341
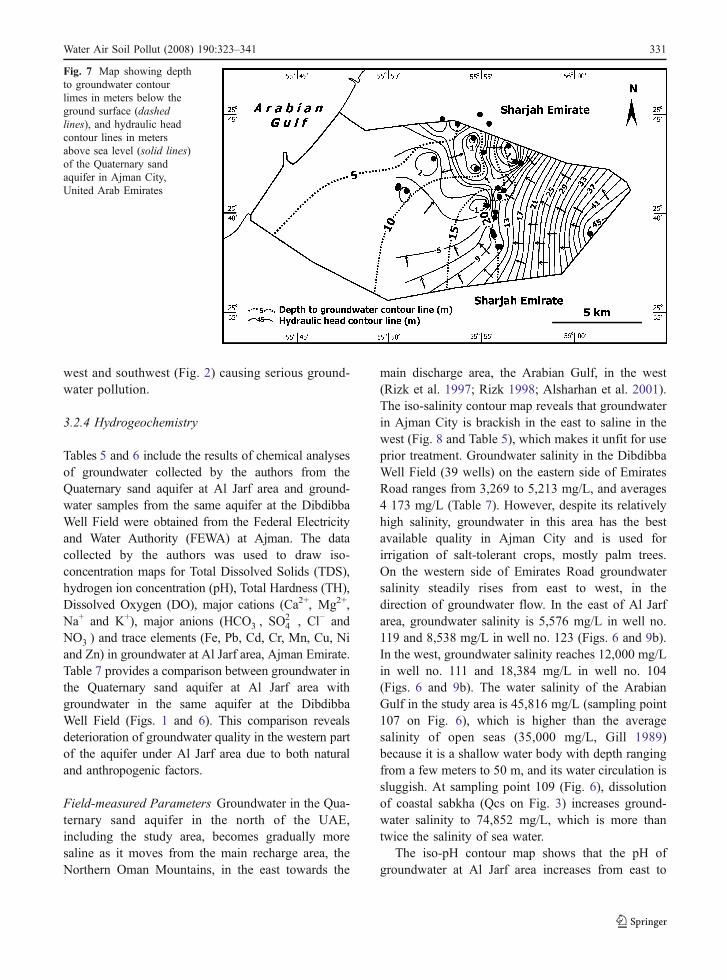
sphere, which makes it susceptible to pollution. Oneof the main purposes of this study was to measurehydraulic heads and to construct a potentiometricsurface map for the Quaternary sand aquifer at AjmanCity. Figure 6 illustrates the locations of water wellsused for hydrogeologic and hydrogeochemical inves-tigation of the Quaternary sand aquifer at Ajman. Theauthors measured depths to groundwater at thesewater wells. Topographic elevations of measuredwells were obtained from Ajman Municipality andPlanning Department. Potentiometric surface in eachwell was calculated by subtracting depth to ground-water from elevation of each well. Table 4 lists themeasured depths to groundwater in meters below theground surface and hydraulic heads in meters abovesea level.
Both the depth to groundwater and hydraulic headcontour lines for the Quaternary sand aquifer atAjman City are displayed on Fig. 7. This figureshows that the depth to groundwater ranges from26.25 m below the ground surface in well no. 91 inthe east to 4.50 m below the ground surface in wellno. 126 in the west (Figs. 6 and 7).
The potentiometric surface map for the Quaternarysand aquifer at Ajman City shows that the hydraulicheads decrease from 45 m in the east to 1 m above sealevel in northwest (Fig. 7). The amount of groundwa-ter recharge (Q) for the Quaternary aquifer in AjmanCity across its eastern boundary (6.5 km) wascalculated at 12 542 m3/day, with the use of Darcy’sLaw: Q = Kb (dh/dl) w, where Q = aquifer recharge[m3/day], K = hydraulic conductivity (4.8 m/day), b =
Fig. 5 Presentation ofmonthly values of air tem-perature, rainfall, relativehumidity and evaporation atAl Jarf area, Ajman City,United Arab Emirates, forthe period 1960–2006
Fig. 6 Location map ofwater wells used for hydro-geological and hydrogeo-chemical investigations ofthe Quaternary sand aquiferat Ajman City, United ArabEmirates. DP Desalinationplant
Water Air Soil Pollut (2008) 190:323–341 329

average aquifer thickness (60 m), (dh/dl) = averagehydraulic gradient (0.0067); and w = aquifer width(6,500 m). The volume of liquid waste disposed in1 km2 point sources (Table 3) is 13,600 m3/day(Personal Communication, Ajman Municipality).With pan evaporation of 9.8 mm/day (Rizk andGaramoon 2006), 9,800 m3/day are lost from thepoint sources to the atmosphere via evaporation,while the remaining 4,800 m3/day seep into theunderlying aquifer. The measured infiltration capacity(Ic) of 0.024 m/day, for a similar aquifer at Al Ainarea (Rizk et al. 1998), suggest that 1 km2 pointpollution sources can lose as high as 24,000 m3/dayof pollutants to the underlying aquifer.
The potentiometric surface map of the Quaternarysand aquifer at Ajman City reveals that groundwater
generally moves from the east to west in thedirection of groundwater flow in the sand and gravelaquifer in the western region of the UAE, includingthe study area (Rizk and El-Etr 1998; Rizk et al.1997; Alsharhan et al. 2001; Rizk and Garamoon2006). Groundwater pumping at wells no. 111, 114,117, 122 and 126 (Fig. 6) at Al Jarf area has causedlocal deviations, or even inversion in case of wellsno. 114 and 117, in the direction of groundwaterflow. This may induce salt water from the west tointrude into the relatively better-quality groundwaterin the east. The cones-of-depression resulting fromgroundwater pumping at wells no. 111, 114, 117,112 and 126 can also accelerates movement ofsurface pollutants from point pollution sources inthe northeast (Fig. 4) towards residential areas in the
Table 4 Groundwater elevations (in meters above sea level) calculated with the use of field measurements, topographic maps and dataobtained from the Planning Department of Ajman Municipality
Serial number Well number Latitude Longitude Groundelevation (m)
Depth togroundwater (m)
Hydraulichead (m)
1 030 25.4470 55.5287 10 0.00 102 081 25.4251 55.5720 16 26.00 11.153 089 25.3909 55.5570 17 26.25 9.254 091 25.3982 55.5579 30 20.80 9.25 092 25.4006 55.5581 30 19.95 10.056 094 25.4083 55.5605 30 19.27 10.737 096 25.3838 55.5599 30 20.82 9.188 100 25.4471 55.5286 10 0.00 10.009 101 25.4469 55.5291 10 0.00 10.0010 102 25.4447 55.5548 20 12.75 7.2511 103 25.4493 55.5499 19 12.90 6.1012 104 25.4446 55.5375 12 6.25 5.7513 105 25.4450 55.5379 12 7.75 4.2514 111 25.4271 55.5247 11 9.60 1.4015 112 25.4251 55.5720 27 26.00 1.0016 114 25.4226 55.5481 20 8.00 12.0017 116 25.4302 55.5514 20 12.25 7.7518 117 25.4375 55.5465 20 6.80 13.2019 118 25.4337 55.5654 22 22.00 0.0020 119 25.3892 55.5573 30 19.57 10.4321 120 25.4041 55.5536 23 21.90 1.1022 121 25.4083 55.5605 33 19.27 13.7323 122 25.4127 55.5597 20 12.40 7.6024 123 25.3838 55.5607 30 20.82 9.1825 125 25.4128 55.5047 10 5.80 4.2026 126 25.4114 55.5095 10 4.50 5.5027 127 25.4136 55.5052 10 5.90 4.10
See Fig. 1 for well locations.
330 Water Air Soil Pollut (2008) 190:323–341
west and southwest (Fig. 2) causing serious ground-water pollution.
3.2.4 Hydrogeochemistry
Tables 5 and 6 include the results of chemical analysesof groundwater collected by the authors from theQuaternary sand aquifer at Al Jarf area and ground-water samples from the same aquifer at the DibdibbaWell Field were obtained from the Federal Electricityand Water Authority (FEWA) at Ajman. The datacollected by the authors was used to draw iso-concentration maps for Total Dissolved Solids (TDS),hydrogen ion concentration (pH), Total Hardness (TH),Dissolved Oxygen (DO), major cations (Ca2+, Mg2+,Na+ and K+), major anions (HCO�
3 , SO2�4 , Cl− and
NO�3 ) and trace elements (Fe, Pb, Cd, Cr, Mn, Cu, Ni
and Zn) in groundwater at Al Jarf area, Ajman Emirate.Table 7 provides a comparison between groundwater inthe Quaternary sand aquifer at Al Jarf area withgroundwater in the same aquifer at the DibdibbaWell Field (Figs. 1 and 6). This comparison revealsdeterioration of groundwater quality in the western partof the aquifer under Al Jarf area due to both naturaland anthropogenic factors.
Field-measured Parameters Groundwater in the Qua-ternary sand aquifer in the north of the UAE,including the study area, becomes gradually moresaline as it moves from the main recharge area, theNorthern Oman Mountains, in the east towards the
main discharge area, the Arabian Gulf, in the west(Rizk et al. 1997; Rizk 1998; Alsharhan et al. 2001).The iso-salinity contour map reveals that groundwaterin Ajman City is brackish in the east to saline in thewest (Fig. 8 and Table 5), which makes it unfit for useprior treatment. Groundwater salinity in the DibdibbaWell Field (39 wells) on the eastern side of EmiratesRoad ranges from 3,269 to 5,213 mg/L, and averages4 173 mg/L (Table 7). However, despite its relativelyhigh salinity, groundwater in this area has the bestavailable quality in Ajman City and is used forirrigation of salt-tolerant crops, mostly palm trees.On the western side of Emirates Road groundwatersalinity steadily rises from east to west, in thedirection of groundwater flow. In the east of Al Jarfarea, groundwater salinity is 5,576 mg/L in well no.119 and 8,538 mg/L in well no. 123 (Figs. 6 and 9b).In the west, groundwater salinity reaches 12,000 mg/Lin well no. 111 and 18,384 mg/L in well no. 104(Figs. 6 and 9b). The water salinity of the ArabianGulf in the study area is 45,816 mg/L (sampling point107 on Fig. 6), which is higher than the averagesalinity of open seas (35,000 mg/L, Gill 1989)because it is a shallow water body with depth rangingfrom a few meters to 50 m, and its water circulation issluggish. At sampling point 109 (Fig. 6), dissolutionof coastal sabkha (Qcs on Fig. 3) increases ground-water salinity to 74,852 mg/L, which is more thantwice the salinity of sea water.
The iso-pH contour map shows that the pH ofgroundwater at Al Jarf area increases from east to
Fig. 7 Map showing depthto groundwater contourlimes in meters below theground surface (dashedlines), and hydraulic headcontour lines in metersabove sea level (solid lines)of the Quaternary sandaquifer in Ajman City,United Arab Emirates
Water Air Soil Pollut (2008) 190:323–341 331

west towards the Arabian Gulf (Fig. 9a). The pH alsoincreases in the southeastern corner of the area.
Results of Chemical Analyses The iso-TH contour mapindicates that groundwater in the study area is extremelyhard due to high concentrations of Ca2+ and Mg2+
(Fig. 9c). The sharp increase of groundwater hardnessin northwestern corner of Al Jarf area is due to salt-water intrusion from the Arabian Gulf. The iso-salinityand iso-TH maps show a sharp increase in TDS andTH close to the well no. 111 (Fig. 6), reflecting thepresence of the seawater–groundwater interface closeto the location of this particular well (Figs. 6 and 8).The contour map of DO in groundwater at Al Jarf areais low (7.5 mg/L) close to the sewage water disposalsite (Fig. 9d), indicating possible consumption of
dissolved oxygen in the Quaternary sand aquifer atAjman City by waste water moving from land surfacetowards groundwater.
Except for HCO�3 , major ions show steady increase
in concentration from east to west, in the direction ofgroundwater flow (Rizk and Alsharhan 2003), whilethe sharp increase in concentrations of all ions in thewestern part of the study area coincides more or lesswith the interface between groundwater within theaquifer in the east and seawater intrusion in the west(Figs. 9 and 10). Anomalies in concentrations of major,minor and trace inorganic constituents reflect theinfluence of both natural and anthropogenic factorson the deterioration of groundwater quality within thestudy area.
Table 5 Results of chemical analyses of 24 groundwater collected by the authors from the Quaternary sand aquifer at Al Jarf area and39 groundwater samples from the same aquifer at the Dibdibba well field obtained from the Federal Electricity and Water Authority(FEWA) at Ajman, UAE
332 Water Air Soil Pollut (2008) 190:323–341
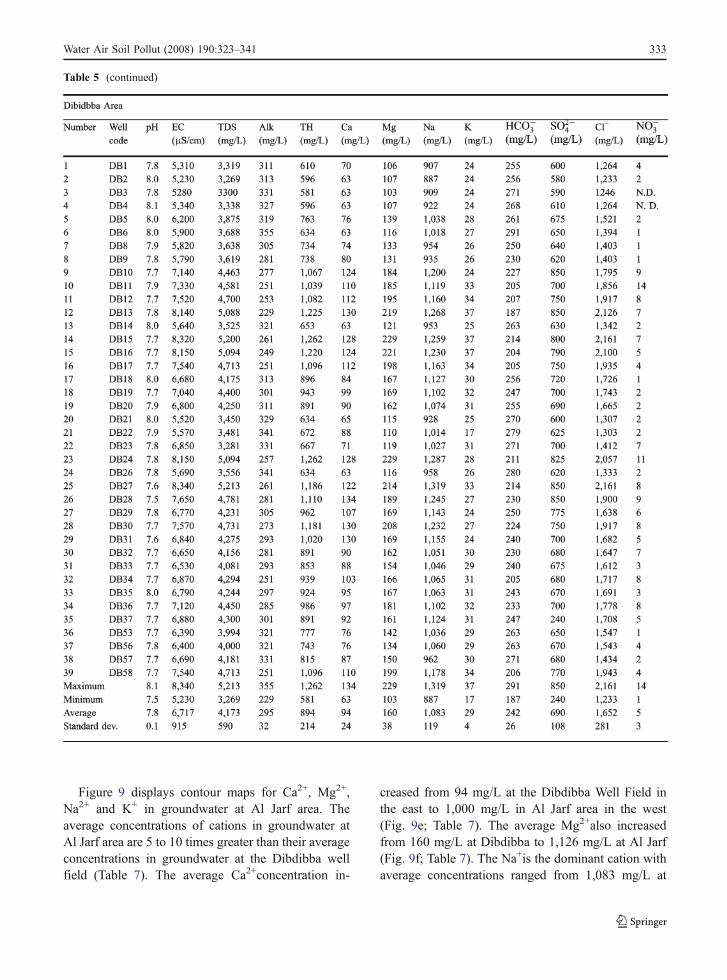
Figure 9 displays contour maps for Ca2+, Mg2+,Na2+ and K+ in groundwater at Al Jarf area. Theaverage concentrations of cations in groundwater atAl Jarf area are 5 to 10 times greater than their averageconcentrations in groundwater at the Dibdibba wellfield (Table 7). The average Ca2+concentration in-
creased from 94 mg/L at the Dibdibba Well Field inthe east to 1,000 mg/L in Al Jarf area in the west(Fig. 9e; Table 7). The average Mg2+also increasedfrom 160 mg/L at Dibdibba to 1,126 mg/L at Al Jarf(Fig. 9f; Table 7). The Na+is the dominant cation withaverage concentrations ranged from 1,083 mg/L at
Table 5 (continued)
Water Air Soil Pollut (2008) 190:323–341 333

Table 6 Concentrations of some trace elements in groundwater samples collected from the Quaternary sand aquifer at Ajman City,UAE
Serial number Well number Concentration of trace element in milligrams per liter (mg/L)
Fe Pb Cd Cr Mna Cua Nia Zn
1 100 0.42 0.36 0.09 1.03 <0.02 <0.025 <0.04 0.042 101 0.42 0.36 0.09 1.03 <0.02 <0.025 <0.04 0.043 102 0.32 0.29 N.D. 0.30 <0.02 <0.025 <0.04 0.034 103 0.29 0.21 N.D. 0.49 <0.02 <0.025 <0.04 0.065 104 0.45 0.43 0.06 0.32 <0.02 <0.025 <0.04 N.D.6 105 0.45 0.43 0.06 0.32 <0.02 <0.025 <0.04 N.D.7 106 0.29 0.32 0.06 0.83 <0.02 <0.025 <0.04 0.048 107 0.27 0.38 N.D. 0.92 <0.02 <0.025 <0.04 N.D.9 109 0.68 0.44 0.09 1.43 <0.02 <0.025 <0.04 0.1310 110 0.22 0.37 0.07 1.00 <0.02 <0.025 <0.04 0.0311 111 0.54 0.56 0.06 1.00 <0.02 <0.025 <0.04 0.4812 112 0.33 0.23 N.D. N.D. <0.02 <0.025 <0.04 0.0413 116 0.70 0.19 N.D. 0.42 <0.02 <0.025 <0.04 0.1014 117 0.29 0.40 0.06 0.38 <0.02 <0.025 <0.04 0.0715 118 0.28 0.63 N.D. 0.40 <0.02 <0.025 <0.04 0.4816 119 0.16 0.44 N.D. 0.23 <0.02 <0.025 <0.04 0.0517 120 0.49 0.44 N.D. 0.42 <0.02 <0.025 <0.04 N.D.18 121 0.10 0.13 N.D. N.D. <0.02 <0.025 <0.04 0.1019 122 0.32 0.16 N.D. N.D. <0.02 <0.01 <0.04 0.0520 123 0.62 0.37 0.06 0.53 <0.02 <0.025 <0.04 0.0421 124 0.30 0.19 N.D. N.D. <0.02 <0.025 <0.04 0.1422 125 0.25 0.49 0.08 1.02 <0.02 <0.025 <0.04 0.0223 126 0.17 0.55 0.13 1.62 <0.02 <0.025 <0.04 N.D.24 127 0.28 0.53 0.08 1.14 <0.02 <0.025 <0.04 0.03Maximum 0.70 0.63 0.13 1.62 0.00 0.00 0.00 0.48Minimum 0.10 0.13 0.06 0.23 0.00 0.00 0.00 0.02Average 0.36 0.37 0.08 0.74 0.00 0.00 0.00 0.10
aMn, Cu and Ni were below their detection limits of 0.02, 0.025 and 0.04 mg/L, respectively. Cd, Cr and were not detected in somewells.
Table 7 Comparison of the results of chemical analyses of groundwater samples collected from Al Jarf area with groundwater in theDibdibba well field in the eastern part of Ajman City (Fig. 1)
Parameter Al Jarf Dibdibba
St. Dev. Max. Min. Ave. St. Dev. Ave. Max Min. St. Dev.
pH 8.2 7.3 7.8 0.3 8.1 7.5 7.8 0.1TDS 74,852 5,576 25,311 17,302 5,213 3,269 4,173 590EC 145,000 11,000 46,333 32,811 8,340 5,230 6,717 915Total hardness 19,200 900 6,754 4,926 1,262 581 894 214Calcium 3,902 186 1,000 960 134 63 94 24Magnesium 2,582 137 1,126 858 229 103 160 38Sodium 24,040 2,069 7,688 1,319 5,606 887 1,083 119Potassium 583 25 150 142 37 17 29 4Bicarbonate 186 110 145 21 291 187 242 26Sulphate 690 240 850 506 1,410 790 2,739 108Chloride 43,400 3,900 14,508 9,817 2,161 1,233 1,652 281Nitrate 31 1 6 7.2 14 1 5 3
Concentrations are in milligrams per liter (mg/L).
334 Water Air Soil Pollut (2008) 190:323–341

Dibdibba to 7,688 mg/L at Al Jarf (Fig. 9g; Table 7).The average levels of K+ varied between 29 mg/L atDibdibba and 150 mg/L at Al Jarf (Fig. 9h; Table 7).
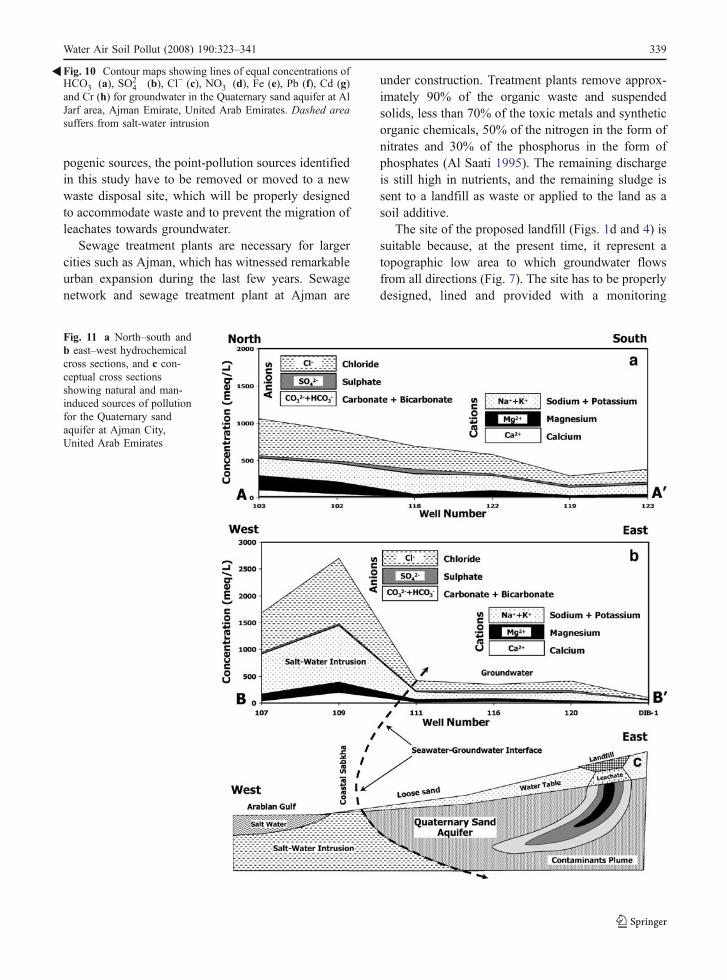
Figure 10 shows contour maps for HCO�3 , SO
2�4 ,
Cl− and NO�3 . The HCO�
3 concentration decreasedfrom an average of 242 mg/L at the Dibdibba wellfield in the east to 145 mg/L at Al Jarf area in thewest (Fig. 10a; Table 7). The average SO2�
4
increased from 690 mg/L at Dibdibba to 1,410 mg/Lat Al Jarf (Fig. 10b; Table 7). The average Cl−, thedominant anion, concentrations ranged from1,652 mg/L at Dibdibba to 14,508 mg/L at Al Jarf(Fig. 10c; Table 7). The average levels of NO�
3
varied between 5 mg/L at Dibdibba and 6 at Al Jarf(Fig. 10d; Table 7). Despite extensive farming in theeastern part of the Ajman area, low concentrations ofnitrate in groundwater may represent partial confine-ment conditions (Hounslow 1995).
Concentrations of trace elements Fe, Pb, Cd, Cr, Mn,Cu, Ni and Zn are listed in Table 6 and presented inFig. 10. Concentrations of trace elements were moreresponsive to anthropogenic pollution sources thannatural ones. High Fe (0.7 mg/L) and Pb (0.63 mg/L)levels were measured close to the untreated sewagewater disposal site (Figs. 4, 10e and f; Table 6). High Cd(0.13 mg/L) and Cr (1.62 mg/L) were measured close tohospitals and clinics (Figs. 4, 10g and h; Table 6).
To illustrate, Fig. 11a and b are prepared hydro-chemical cross sections running north–south (A–A′)and east–west (B–B′), as shown in Fig. 6. Figure 11c isa conceptual cross section illustrating both natural and
anthropogenic factors affecting groundwater quality inAjman City.
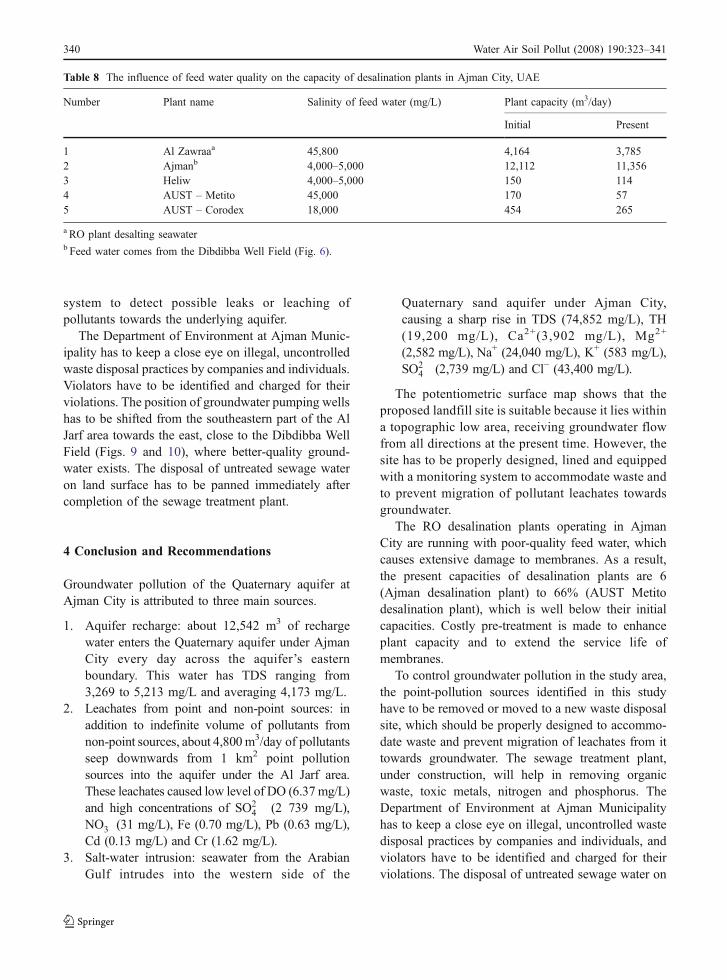
3.2.5 Groundwater Quality and Desalination
The master plan for Ajman Emirate calls for expan-sion of existing desalination plants and installation ofadditional ones in the future in order to meet theincreasing demands for domestic water. Figure 6shows the existing desalination plants at Ajman.Except for Al Zawraa plant which uses seawater asits feed water, Ajman desalination plants use reverseosmosis (RO) technology to desalt brackish and salinegroundwater. Three of these plants belong to theFEWA, one private plant and two plants of AjmanUniversity of Science and Technology (Table 8).
In the RO technology, both the performance and theservice life of membranes depend heavily upon thequality of feed water (ESCWA 2001, 2005). The ROdesalination plants operating in Ajman City are runwith poor-quality feed water, which causes buildup ofprecipitates and extensive damage to membrane integ-rity. For this reason, the present capacities of desalina-tion plants are lower than their initial designedcapacities due to water quality problems (Table 8).Costly pre-treatment is made to enhance plant capacityand extend the service life of membranes (Dolatyar andGray 2000).
The present capacity of Metito desalination plant atAl Jarf area is only 33.5% its initial design capacitybecause of the high salinity and hardness of feed water
Fig. 8 Iso-salinity contourmap in milligrams per liter(mg/L) of groundwater inthe Quaternary sand aquiferat Ajman City, United ArabEmirates
Water Air Soil Pollut (2008) 190:323–341 335

336 Water Air Soil Pollut (2008) 190:323–341

(Table 8). The plant desalts saline groundwater withTDS contents of 45 800 mg/L, which is higher than thesalinity of seawater (35,000 mg/L: Appelo and Postma1999). Also, groundwater hardness at Al Jarf(6,754 mg/L) is eight times the average groundwaterhardness at Al Heliw area (894 mg/L) in the easternpart of Ajman City (Table 7). Ajman desalination plantsare suffering from membrane fouling due to the highconcentrations of metals (Fe and Mn), salts (CaSO4,CaCO3, BaSO4 and SrSO4) and suspended solids (AlMutaz and Al Sultan 1997). Membrane fouling causesplugging of membrane pores by particulates (Dabbaghet al. 1994). Table 6 shows that the average concen-trations of Pb (0.40 mg/L) and Cd (0.08 mg/L) in feedwater are eight times higher than the recommendedconcentrations of Pb (0.05 mg/L) and Cd (0.01 mg/L).
3.3 Anthropogenic Factors
The fast pace of urban evolution in land use at AjmanCity during the last few years have directly causedgroundwater pollution. The large volumes of wastegenerated in association with municipal activities weredisposed into unlined pits on land surface (Table 3).Leachates from these holes carry large amounts ofpollutants towards groundwater in the underlyingaquifer. On the other hand, diffuse pollution sourcesare attributed to dense septic systems in residentialareas, uncontrolled waste disposal in industrial areasand the wide application of chemical fertilizers onfarmlands in the eastern part of the city (Fig. 2).
3.3.1 Municipal Activities
Two old landfill sites with a total surface area of5,007 m2 were identified in the Al Jarf area (Fig. 4;Table 3). An operating landfill site with an area of3,974 m2 is located close to well no. 111 (Fig. 6). Thedepth to groundwater in this site is less than 2 m andwater was seen at the base of the waste. A used tiredisposal site covers an area of 2,403 m2 and occursbetween the old landfills and close to the cementfactory (Fig. 4). Both the fertilizer factory (27,348 m2)and cement factory (123,004 m2) produce large
volumes of solids waste. Untreated sewage waterdisposal sites are two; an abandoned old site and anoperating one. The old site covers an area of440,693 m2 and the active site has an area of 301692 m2 (Fig. 4; Table 3). Waste from the operating sitemove downward polluting groundwater underneath.Despite the pollution caused by this site, it has beendiluted in the surrounding area. The relatively lowgroundwater salinity in well no. 118 (Fig. 11a),especially Na+, reflects the dilution effect of waterseeping from the sewage water from the site towardsgroundwater in the aquifer. Moreover, possible uncon-trolled liquid waste disposal from clinics and hospitalsin the Al Jarf area is suspected of being the mainsource of Cd and Cr in groundwater at areas close totheir locations.
3.3.2 Agricultural Activities
Non-point pollution sources refer to pollutants thatcome from a widespread area and cannot be tracked toa single point or source. Application of agrochemicalson farmland, widespread septic tanks and illegaldisposal of industrial waste are examples of non-pointpollution sources. Too many septic systems in anygiven area will overload the soil’s natural purificationsystems and allow large amounts of wastewater tocontaminate groundwater (Hamouda 1995). The highdensity of buildings and lack of a sewage network inthe study area, at the present time, will lead to awidespread of septic systems and subsequent pollutionof groundwater. The total area of point pollutionsources is only 1 km2, while the total area of non-point pollution sources is about 92 km2. The diffusesources include septic systems in residential areas(32 km2), uncontrolled disposal in industrial areas(20 km2) and application of various types of agro-chemicals on farmland (40 km2). The pollutionresulting from non-point sources is difficult to defineand hard to control.
3.4 Pollution Control
Disposal of waste in unlined pits on land surfacedirectly threatens groundwater quality in the Quater-nary sand aquifer underlying Al Jarf area, AjmanEmirate. The aquifer is unconfined and susceptible tosevere pollution from surface sources. To controlgroundwater pollution in the study area from anthro-
Fig. 9 Contour maps showing lines of equal concentrations ofpH (a), TDS (b), total TH (c), DO (d), Ca2+ (e), Mg2+ (f), Na+
(g) and K+ (h) for groundwater in the Quaternary sand aquiferat Al Jarf area, Ajman Emirate, United Arab Emirates. Dashedarea suffers from salt-water intrusion
�
Water Air Soil Pollut (2008) 190:323–341 337

338 Water Air Soil Pollut (2008) 190:323–341
pogenic sources, the point-pollution sources identifiedin this study have to be removed or moved to a newwaste disposal site, which will be properly designedto accommodate waste and to prevent the migration ofleachates towards groundwater.
Sewage treatment plants are necessary for largercities such as Ajman, which has witnessed remarkableurban expansion during the last few years. Sewagenetwork and sewage treatment plant at Ajman are
under construction. Treatment plants remove approx-imately 90% of the organic waste and suspendedsolids, less than 70% of the toxic metals and syntheticorganic chemicals, 50% of the nitrogen in the form ofnitrates and 30% of the phosphorus in the form ofphosphates (Al Saati 1995). The remaining dischargeis still high in nutrients, and the remaining sludge issent to a landfill as waste or applied to the land as asoil additive.
The site of the proposed landfill (Figs. 1d and 4) issuitable because, at the present time, it represent atopographic low area to which groundwater flowsfrom all directions (Fig. 7). The site has to be properlydesigned, lined and provided with a monitoring
Fig. 11 a North–south andb east–west hydrochemicalcross sections, and c con-ceptual cross sectionsshowing natural and man-induced sources of pollutionfor the Quaternary sandaquifer at Ajman City,United Arab Emirates
Fig. 10 Contour maps showing lines of equal concentrations ofHCO�
3 (a), SO2�4 (b), Cl− (c), NO�
3 (d), Fe (e), Pb (f), Cd (g)and Cr (h) for groundwater in the Quaternary sand aquifer at AlJarf area, Ajman Emirate, United Arab Emirates. Dashed areasuffers from salt-water intrusion
�
Water Air Soil Pollut (2008) 190:323–341 339
system to detect possible leaks or leaching ofpollutants towards the underlying aquifer.
The Department of Environment at Ajman Munic-ipality has to keep a close eye on illegal, uncontrolledwaste disposal practices by companies and individuals.Violators have to be identified and charged for theirviolations. The position of groundwater pumping wellshas to be shifted from the southeastern part of the AlJarf area towards the east, close to the Dibdibba WellField (Figs. 9 and 10), where better-quality ground-water exists. The disposal of untreated sewage wateron land surface has to be panned immediately aftercompletion of the sewage treatment plant.
4 Conclusion and Recommendations
Groundwater pollution of the Quaternary aquifer atAjman City is attributed to three main sources.
1. Aquifer recharge: about 12,542 m3 of rechargewater enters the Quaternary aquifer under AjmanCity every day across the aquifer’s easternboundary. This water has TDS ranging from3,269 to 5,213 mg/L and averaging 4,173 mg/L.
2. Leachates from point and non-point sources: inaddition to indefinite volume of pollutants fromnon-point sources, about 4,800m3/day of pollutantsseep downwards from 1 km2 point pollutionsources into the aquifer under the Al Jarf area.These leachates caused low level of DO (6.37mg/L)and high concentrations of SO2�
4 (2 739 mg/L),NO�
3 (31 mg/L), Fe (0.70 mg/L), Pb (0.63 mg/L),Cd (0.13 mg/L) and Cr (1.62 mg/L).
3. Salt-water intrusion: seawater from the ArabianGulf intrudes into the western side of the
Quaternary sand aquifer under Ajman City,causing a sharp rise in TDS (74,852 mg/L), TH(19,200 mg/L), Ca2+(3,902 mg/L), Mg2+
(2,582 mg/L), Na+ (24,040 mg/L), K+ (583 mg/L),SO2�
4 (2,739 mg/L) and Cl− (43,400 mg/L).
The potentiometric surface map shows that theproposed landfill site is suitable because it lies withina topographic low area, receiving groundwater flowfrom all directions at the present time. However, thesite has to be properly designed, lined and equippedwith a monitoring system to accommodate waste andto prevent migration of pollutant leachates towardsgroundwater.
The RO desalination plants operating in AjmanCity are running with poor-quality feed water, whichcauses extensive damage to membranes. As a result,the present capacities of desalination plants are 6(Ajman desalination plant) to 66% (AUST Metitodesalination plant), which is well below their initialcapacities. Costly pre-treatment is made to enhanceplant capacity and to extend the service life ofmembranes.
To control groundwater pollution in the study area,the point-pollution sources identified in this studyhave to be removed or moved to a new waste disposalsite, which should be properly designed to accommo-date waste and prevent migration of leachates from ittowards groundwater. The sewage treatment plant,under construction, will help in removing organicwaste, toxic metals, nitrogen and phosphorus. TheDepartment of Environment at Ajman Municipalityhas to keep a close eye on illegal, uncontrolled wastedisposal practices by companies and individuals, andviolators have to be identified and charged for theirviolations. The disposal of untreated sewage water on
Table 8 The influence of feed water quality on the capacity of desalination plants in Ajman City, UAE
Number Plant name Salinity of feed water (mg/L) Plant capacity (m3/day)
Initial Present
1 Al Zawraaa 45,800 4,164 3,7852 Ajmanb 4,000–5,000 12,112 11,3563 Heliw 4,000–5,000 150 1144 AUST – Metito 45,000 170 575 AUST – Corodex 18,000 454 265
a RO plant desalting seawaterb Feed water comes from the Dibdibba Well Field (Fig. 6).
340 Water Air Soil Pollut (2008) 190:323–341
land surface has to be banned immediately aftercompletion of the sewage treatment plant.
References
Al Asam, M. S. (1994). Dams in the United Arab Emirates andtheir role in groundwater recharge. In Proceedings of theSecond Gulf Water Conference (pp. 203–218). Manama,Bahrain: WASTA.
Al Asam, M. S. (1996). UAE water resources use in agricultureand conservation. In International Desalination Associa-tion (IDA) conference of Desalination (pp. 625–637). AbuDhabi: IDA.
Al Mutaz, I. S., & Al Sultan, B. (1997). Operation character-istics of Maufouha reserve osmosis plants. In The IDAWorld Congress on Desalination and Water Reuse.Madrid, Spain, 25 p.
Al Saati, A. J. (1995). Domestic wastewater reuse in the GCC.Attawun, 10(38), 33–46 (in Arabic).
Alsharhan, A. S., Rizk, Z. S., Nairn, A. E. M., Bakhit, D. W., &Alhajari, S. A. (2001). Hydrogeology of an arid region:The Arabian Gulf and adjoining areas. Amsterdam:Elsevier, (331 p).
APHA (1995). Standard methods for examination of water andwaste water (19th ed.). Washington, DC: APHA 2540 C.
Appelo, C. A. J., & Postma, D. (1999). Geochemistry,groundwater and pollution. Rotterdam, The Netherlands:Balkema, (636 p).
Dabbagh, T., Sadler, P., Al-Saqabi, A., & Sadeqi, M. (1994).Desalination: an emergent option. In P. Rogers, & P.Lydon (Eds.) Water in the Arab World – Perspectives andprognoses (vol. 8, (pp. 203–242)). Cambridge, MA:Harvard University, Division of Applied Sciences.
Dolatyar, M., & Gray, T. S. (2000). Water politics in the MiddleEast: A context for conflict or cooperation?. UK:Macmillan, 243 p.
Ediger, R. D. (1973). A review of water analysis by atomicabsorption. Atomic Absorption Newsletter, 12, 151.
ESCWA (2001). Water desalination technologies in the ESCWAmember countries. New York: United Nations, 177 p.
ESCWA (2005). Development of frameworks to implementnational strategies of integrated water resources managementin the ESCWA countries. New York: United Nations, 94 p.
FAO (1970). Physical and chemical methods of soil and wateranalysis. Soil Bulletin, 10, 236–238.
Gill, R. (1989). Chemical fundamentals of geology (2nd ed.).London, UK: Chapman and Hall, 290 p.
Hamouda, M. F. (1995). Reuse of sewage water and its role inwater resources development in UAE. In Proceedings ofCulture and Science Society, Meeting on Water Balance inUAE. Dubai, United Arab Emirates, 10 p.
Hem, J. D. (1985). Study and interpretation of chemicalcharacteristics of natural water. Paper no. 1473. Wash-ington: U.S. Geological Survey Water Supply, 363 p.
Hounslow, A. W. (1995). Water quality data analysis andinterpretation. New York: CRC, 397 p.
Kansas Geological Survey (1990). Geologic map of the UnitedArab Emirates (scale 1:1,000,000): U.S. GeologicalSurvey: Miscellaneous geologic investigations map I –270 A. Kansas, USA: the University of Kansas.
Ministry of Communications (1996). U.A.E. Climate. AbuDhabi: Cultural Foundation, 240 p.
Rainwater, F. A., & Thatcher, L. L. (1960). Methods forcollection and analysis of water samples. Paper no. 1454(pp. 1–301). Washington: U.S. Geological Survey WaterSupply.
Rizk, Z. S. (1998). Falajs of United Arab Emirates: Geologicalsettings and hydrogeological characteristics. The ArabianJournal for Science and Engineering, 23, 3–25.
Rizk, Z. S., & Alsharhan, A. S. (2003). Water resources in theUnited Arab Emirates. In A.S. Alsharhan, & W. W. Wood(Eds.) Water management perspectives: Evaluation, man-agement and policy (pp. 245–264). Amsterdam, TheNetherlands: Elsevier.
Rizk, Z. S., Alsharhan, A. S. & Shindo, S. S. (1997).Evaluation of groundwater resources of United ArabEmirates. In Proceedings of the 3rd Gulf Water Confer-ence (pp. 95–122). Muscat: Sultanate of Oman.
Rizk, Z. S., & El-Etr, H. A. (1998). Hydrogeology andHydrogeochemistry of some springs in the United ArabEmirates. The Arabian Journal for Science and Engineer-ing, 22, 95–111.
Rizk, Z. S., & Garamoon, H. K. (2006). The influence of majorlineaments on groundwater resources in the eastern regionof the United Arab Emirates. University of SharjahJournal of Pure and Applied Sciences, 3(3), 83–111.
Rizk, Z. S., Garamoon, H. K., & El-Etr, A. A. (1998).Hydraulic properties of dune and interdune areas aroundAl-Ain, United Arab Emirates. In A. S. Alsharhan, K. W.Glennie, G. L. Whittle, & C. G. Kendall (Eds.) Proceed-ings of the International Conference on QuaternaryDeserts and Climatic Change (pp. 455–467). Rotterdam,The Netherlands: Palkema.
Skoog, D. A., West, D. M., Holler, F. J., & Crouch, S. R.(2004). Fundamental analytical chemistry (8th ed.). USA:Thomson Brooks/Cole, 870 p.
Vela, N. P., Olson, L. K., & Caruso, J. A. (1993). Elementalspeciation with plasma mass spectrometry. AnalyticalChemistry, 65(13), 585–597.
Weiss, J. (1986). Handbook of ion chromatography. Sunnyvale,CA: Dionex (edited by E. L. Johnson).
Wolf, R. E., & Grosser, Z. A. (1997). Overview andcomparison of ICP-MS methods for environmental anal-yses. Atomic Spectroscopy, 18(5), 145–151.
Wood, W. W. (1976). Guidelines for collection and fieldanalysis of ground-water samples for selected unstableconstituents: Techniques of Water Resources Investiga-tions, U.S. Geological Survey Book 1, Chapter D2.Washington, DC: U.S. Government Printing Office, 24 p.
Wood, W. W., Rizk, Z. S., & Alsharhan, A. S. (2003). Timingof recharge, and the origin, evolution and distribution ofsolutes in a hydperarid aquifer system. In A. S. Alsharhan,& W. W. Wood (Eds.)Water management perspectives:Evaluation, management and policy (pp. 295–312).Amsterdam, The Netherlands: Elsevier.
Water Air Soil Pollut (2008) 190:323–341 341