Ground Water Year Book of Punjab State 2020-2021.pdf
190
CENTRAL GROUND WATER BOARD DEPARTMENT OF WATER RESOURCES, RIVER DEVELOPMENT AND GANGA REJUVINATION MINISTRY OF JAL SHAKTI GOVERNMENT OF INDIA GROUND WATER YEAR BOOK PUNJAB AND CHANDIGARH (UT) 2020-2021 North Western Region Chandigarh September, 2021
-
Upload
khangminh22 -
Category
Documents
-
view
1 -
download
0
Transcript of Ground Water Year Book of Punjab State 2020-2021.pdf

CENTRAL GROUND WATER BOARD
DEPARTMENT OF WATER RESOURCES,
RIVER DEVELOPMENT AND GANGA REJUVINATION
MINISTRY OF JAL SHAKTI
GOVERNMENT OF INDIA
GROUND WATER YEAR BOOK
PUNJAB AND CHANDIGARH (UT)
2020-2021
North Western Region
Chandigarh
September, 2021

CENTRAL GROUND WATER BOARD
DEPARTMENT OF WATER RESOURCES,
RIVER DEVELOPMENT AND GANGA REJUVINATION
MINISTRY OF JAL SHAKTI
GOVERNMENT OF INDIA
GROUND WATER YEAR BOOK OF PUNJAB AND CHANDIGARH (UT)
2020-2021
Principal Contributors
GROUND WATER DYNAMICS: Amandeep Kaur
Scientist- ‘B’ (Junior Hydrogeologist)
HYDROMETROLOGY Aditya Sharma
Assistant Hydrometrologist
GROUND WATER QUALITY: Rishi Raj
Assistant Chemist
REPORT EDITING & MODIFICATION
S.K. Mohiddin
Senior Hydrogeologist
North Western Region Chandigarh
September, 2021

Ground Water Year Book Punjab State and Chandigarh (UT)
2020-2021
CONTENTS
CHAPTER
PAGE No
1.0 INTRODUCTION 1
1.1 Physiography 4
1.2 Drainage 5
1.3 Soils
2.0 HYDROMETEOROLOGY 6
3.0 GENERAL GEOLOGY 31
3.1 Geological Set Up 31
3.1.1 Aeolian sands 31
3.1.2 Alluvium 32
3.1.3 Upper Siwaliks 33
3.1.4 Middle Siwaliks 34
3.1.5 Lower Siwaliks 34
3.2 Basement configuration 34
4.0 GROUND WATER REGIME MONITORING 36
4.1 Behavior of Water Level 41
4.1.1 June 2020 42
4.1.2 August 2020 45
4.1.3 October 2020 47
4.1.4 January 2021 50
4.2 Seasonal Water Level fluctuation 52
4.2.1 January 2020-June 2020 52
4.2.2 June 2020- August 2020 54
4.2.3 June 2020- October 2020 56
4.2.4 June 2020- January 2021 58
4.3 Annual water level fluctuation 60
4.3.1 June 2019-June 2020 61
4.3.2 August 2019- August 2020 63
4.3.3 October 2019- October 2020 65
4.3.4 January 2020- January 2021 67
4.4 decadal mean water level Fluctuations 69
4.4.1 June (2010- 2019) – June 2020 69
4.4.2 August (2010- 2019) – August 2020 71
4.4.3 October (2010- 2019) – October 2020 73
4.4.4 January (2010- 2019) – January 2021 75
4.5 Ground Water Table elevation and flow directions 77

5.0 GROUND WATER QUALITY IN PUNJAB AND CHANDIGARH 79
5.1 Ground water sampling and analysis 79
5.2 Composition of ground water 79
5.3 Distribution of EC 84
5.4 Distribution of Chloride 86
5.5 Distribution of Nitrates 88
5.6 Distribution of Fluorides 90
5.7 Types of ground water 92
5.8 Suitability of ground water for drinking 93
5.9 Suitability of ground water for irrigation 95
5.10 Suitability of ground water for industries 98
5.11 Temporal variation 98
5.12 Conclusions on ground water quality 99
5.13 Composition and quality of ground water quality in Chandigarh 100
Figures
Fig2.1: Seasonal Rainfall 2019 & 2020 and its departure from normal rainfall –
Punjab State
Fig 2.2: Percentage deviation in Seasonal Rainfall (2019 & 2020) – Punjab
State
Fig 2.3: Seasonal Rainfall 2019 & 2020 and its departure from normal rainfall
– Chandigarh UT
Fig 2.4: Percentage deviation in Seasonal Rainfall (2019 & 2020) –
Chandigarh UT
Fig 2.5: Deviation in actual annual rainfall 2020 v/s 2019 – Punjab &
Chandigarh (UT):
Fig 2.6: Isohyetal normal rainfall map of Punjab & Chandigarh (UT)
Fig 2.7: Actual annual rainfall map of Punjab state (year- 2020)
Fig 2.8: Actual annual rainfall map of Punjab state (year- 2019)
Fig 2.9: Deviation in SW monsoon rainfall of Punjab state
(period 2000-2020)
Fig 2.10: deviation in SW monsoon rainfall of Chandigarh UT
(period 2000-2020)
FIG 2.11: Monthly Evapotranspiration trends for Punjab & Chandigarh UT
from 01-Jan-2019 to 31-Dec-2020
Fig 4.1: District Wise Number and type of Ground Water Observation Wells
Fig 4.2: Location of ground water observation wells in Punjab State.
Fig4.3: District Wise Area Represented By Single Ground Water Observation
Well
Figure 4.4 Depth to Water level Map Punjab State & Chandigarh (UT) June
2020
Figure 4.5 Depth to Water level Map Punjab State & Chandigarh (UT) August
2020

Figure 4.6 Depth to Water level Map Punjab State & Chandigarh (UT) October
2020
Figure 4.7 Depth to Water level Map Punjab State & Chandigarh (UT) January
2020
Figure 4.8 Water level Fluctuation Map Punjab State & Chandigarh (UT)
January 2020 and June 2020
Figure 4.9 Water level Fluctuation Map Punjab State & Chandigarh (UT)
June 2020 and August 2020
Figure 4.10 Water level Fluctuation Map Punjab State & Chandigarh (UT)
June 2020 and October 2020
Figure 4.11 Water level Fluctuation Map Punjab State & Chandigarh (UT)
June 2020 and January 2021
Figure 4.12 Water level Fluctuation Map Punjab State & Chandigarh (UT)
June 2019 and June 2020
Figure 4.13 Water level Fluctuation Map Punjab State & Chandigarh (UT)
August 2019 and August 2020
Figure 4.14 Water level Fluctuation Map Punjab State & Chandigarh (UT)
October 2019 and October 2020
Figure 4.15 Water level Fluctuation Map Punjab State & Chandigarh (UT)
January 2020 and January 2021
Figure 4.16 Water level Fluctuation Map Punjab State & Chandigarh (UT)
Decadal Mean (2010-19) – June 2020
Figure 4.17 Water level Fluctuation Map Punjab State & Chandigarh (UT)
Decadal Mean (2010-19) – August 2020
Figure 4.18 Water level Fluctuation Map Punjab State & Chandigarh (UT)
Decadal Mean (2010-19) – October 2
Figure 4.19 Water level Fluctuation Map Punjab State & Chandigarh (UT)
Decadal Mean (2011-20) – January 2021
Figure 4.20 Water level Elevation Map June 2020 Punjab State and
Chandigarh (UT)
Fig-5.1: Map showing location of sampling stations in Punjab
Fig-5.2: Map of Electrical Conductance in Punjab State, 2020
Fig-5.3: Distribution of Chloride in ground water from Shallow aquifers of
Punjab
Fig-5.4: Nitrate Concentration in ground water from shallow aquifers
Fig-5.5: Fluoride Concentration in ground water from shallow aquifers
Fig-5.6, District wise Distribution of Potable Waters in Punjab
Tables:
Table2.1: District-wise and Month-wise Normal Rainfall (in mm):- Punjab &
Chandigarh (UT)
Table 2.2: Seasonal and Actual Annual Rainfall & its departure for Punjab State:
Table 2.3: Seasonal and Actual Annual Rainfall & its departure for Chandigarh
UT

Table 2.4: Month wise Normal & Actual Annual Rainfall & its departure for Punjab
State
Table 2.5: Month wise Normal & Actual Rainfall & its departure during Year 2019
& 2020 for Chandigarh UT –
Table2.6: District wise Seasonal and Annual Actual Rainfall (mm) - Year 2019
Table- 2.7: Deviation of 2020 Rainfall from 2019 Annual Rainfall and from Normal
Rainfall:
Table 2.8 : Departure in Annual Rainfall & SW Monsoon Rainfall of Punjab State
(2000-2020)
Table 2.9: Departure in Actual Annual Rainfall & SW Monsoon Rainfall of
Chandigarh UT (2000-2020)
Table 2.10: The maximum and minimum rainfall during all four seasons:
Table-2.11: Monthly evapotranspiration trends for Punjab & Chandigarh UT from
01-Jan-2019 to 31-Dec-2020
Table-2.12: District wise deviation in Evapotranspiration during 2019 – 2020 (in
mm)
Table- 4.1 District wise ground water observation wells, Punjab State and
Chandigarh
Table 4.2. Area represented by single ground water observation well.
Table4.3. The maximum and minimum water levels during all four seasons
Table-5.1 : Range of Chemical Constituents in Groundwater of Punjab State
Table 5.2- District-wise Electrical Conductivity distribution in Ground water of
Punjab State.
Table 5.3- District-wise distribution of Nitrate in Ground water of Punjab State.
Table-5.4, District-wise distribution of Fluoride in Shallow Ground water of Punjab
State
Table 5.5-Percentage wise classification of Potable Ground water in Punjab State
Table-5.6: Distribution of Well Waters of Punjab State in Different Classes of
Drinking Water Suitability
Table 5.7: Irrigation Rating of Well Waters of Punjab
Table-5.8: Periodic Variation in Suitability Classes of Well Waters of Punjab
Annexure
I.Depth to Water Level Data
II.Seasonal Water Level Fluctuation
III.Annual Water Level Fluctuation
IV.Decadal Mean Water Level Fluctuation
V.Results of Chemical Analysis Of Water Samples (June 2020)

1
GROUND WATER YEAR BOOK 2020-2021
PUNJAB STATE & CHANDIGARH (UT)
1.0 INTRODUCTION
The Punjab State is located between North latitudes 29o 32’ and 32o 28’ and East longitudes
73 o 50’ and 77 o 00’. The total geographical area of the state is 50476 sq. km. It is
surrounded by the states of Himachal Pradesh in the northeast, Jammu and Kashmir in the
north and Haryana and Rajasthan in the south and southwest respectively. The State has a
flat alluvial plain except a narrow belt along the southwestern parts where stable sand dunes
are seen dotting the landscape. The area occupied by the mountains (Himalayan foothills) in
northeast, is about 1243 sq km. Perennial Rivers Sutlej, Beas, Ravi and ephemeral river
Ghaggar drain the state. It has a vast network of canal system. With the inception of canals,
the fertile land of the State started converting into green fields and experienced spectacular
achievement in agricultural production with emphasis on cultivation of paddy and high
yielding varieties of crops, as a consequence demand for water increased manifold resulting
in over exploitation of ground water resources.
The State has been divided into four main divisions viz. Jalandhar, Patiala, Ferozpur and
Faridkot, which are further sub-divided into 22 districts, which are further divided into 77 sub-
divisions /tehsils and 146 community development blocks.
1.1 Physiography
The State forms a part of vast Indo-Genetic alluvial plain. Physiographically, the State can be
divided into seven distinct units, which run parallel to each other.
I Hilly area: Siwalik Hills on the north and northeastern part.
Ii Eroded hills with flat land (Plateau): forms top of hills.
Iii Intermountain valleys
IV Piedmont area: (Kandi zone) immediately southwest of hills.
v. Sirowal zone: lies further southwest of Kandi area which merges with the alluvium of
Ravi, Beas, Sutlej and Ghaggar rivers.
vi. Alluvial plains:
a) Active/recent flood plains include meanders and present flood plains.
b) Abandoned flood plains include terraces of rivers, abandoned during Recent age.
c) Bar upland areas: Higher elevated land which remained beyond the reach of rivers but are
composed of ancient river channels deposits (older alluvium) plains.
vii. Sand Dunes: Covering southwest part.
i) Hilly area :
The outermost low lying Siwalik Hills of the Himalayas occupy the NE part. These are the
deposits of the Indus River and comprised of alluvial, derived from the higher mountains,

2
which were swept down by their numerous rivers systems and part of Siwalik rock formations
have been involved in the latest Himalayan tectonic movements by which they have been
folded, faulted and elevated into their outermost foothills. These occupy northern and
northeastern part of Gurdaspur, Hoshiarpur, Nawanshahr and Ropar (Roop nagar) districts.
These hills traverse NW – SE direction and forms the boundary with neighboring State of
Himachal Pradesh. In Gurdaspur district, the hills extend from Ravi River on northwest to
Beas River on the southeast. In Hoshiarpur and Nawanshahr districts, the hills cover
northeast parts and extend from Beas to Satluj Rivers. These foot hills separate the main
Himalayan ranges from the vast Indo- Genetic alluvial plains. The hilly region is intersected
with numerous streams which remain dry during major part of the year except during rainy
season when these carry flood water. The highest peak in the area is 900 m above M.S.L.
The hills present uneven topography and at places are highly eroded. The gradient is varying
in the hilly areas.
ii) Eroded hills with flat land:
These areas lie within Upper Siwalik formations and locally known as `Beet’ meaning
waterless. The flat surface lands (plate or table lands) occur in Hoshiarpur district and these
are fertile land composed of sandy clay and support irrigational activities.
iii) Intermountain valleys:
Intermountain Satluj valleys extend from Nagal to Roper along the Satluj River. It is a
longitudinal valley and about 40 Km. in length having an average width of 5 Km. High land
river terraces are seem on the north east and eastern part of the area which have been
deeply eroded and furrowed to form “ bad land” topography. The thickness of valley fill is
very limited and here an average of 50 m below ground level. Another valley known as “
Soon nadir valley “ is an intermountain valley in the outer Himalayas extending from
Daulatpur in Himachal Pradesh to Hazipur (Punjab). It runs in southeast-northwest direction
and follows the general strike direction of the mountain ranges. It has a length of 20 Km and
width ranges between 1.5 km to 3 km and in Punjab State. This valley portion extend along
the left bank of Soon nadir and along its right bank, Siwalik Hills are exposed.
iv) Piedmont areas:
The transitional area between the alluvial plains and mountainous range of the Himalayan
foot hills forms the Piedmont area shown in Plate-1.2. These consist of alluvial fans which
have been dissected by hill torrents and small perennial streams; much of the detritus
material has been reworked separately by sheet flooding. The lower southeast slopes of the
piedmont forms ‘Sirowal zone’. In Punjab State, piedmont area is known as “Kandi”, and
occupies Southwest part of lower Siwalik Hills. The gradient is steeper near the hills and
gentler towards plains. The width of ‘Kandi belt’ varies from 6-10 km. having rolling type of

3
the topography. In Gurdaspur district, the spring line runs parallel to the southwestern
boundary with ‘Sirowal zone’. But in Hoshiarpur, and Ropar districts, the spring line (auto
flow) do not exist hence boundary between Kandi and Sirowal could not be precisely
demarcated.
v) Sirowal Zone:
It lies further southwest of Kandi belt. The topographic gradient is gentler as compared to
Kandi and presents very low relief. In Gurdaspur district, the Sirowal zones occupy
immediately SW of spring line and have an undulating topography.
vi) Alluvial Plains:
This forms a dominant physiographic unit and consists of alluvium of the Indus River with its
present and ancestral tributaries. The alluvium was deposited by Ravi, Satluj, Beas and
Ghaggar rivers. The plains have altitude of less than 300 m above M.S.L. The master slope
is towards southwest and matches with the course of the rivers. The alluvial plains have
been further divided into three sub-physiographic units based on the present relationship of
the surface features to the rivers. These are as follows:
- Recent Flood Plains
- Abandoned Flood Plains
- Bar Upland Areas
Recent Flood Plains: These include the meandering zone and present flood plains of the
rivers. The meanders, scars, sandbars, natural levees and back water swamps are the
conspicuous features of the flood plains. Along the major rivers, there are low flood plains
locally called ‘Bet’. The recent flood plains are often separated from the upland plains by
steep slopes. The water levels are shallow in ‘Bet’ area.
Abandoned Flood Plains: These are parallel to the rivers and are a few meters higher than
the recent flood plains. They represent flood plains that have been abandoned in recent
times by the major rivers.
Bar Uplands: These are large areas of relatively older alluvium and found in the Upper Bari
Doab area and are elevated lands above the bordering flood plains. These remain beyond
the reach of flood waters of the present river systems and are termed as “Bar Uplands”
These are the most significant physiographic features of the alluvial plain. Typically, the bar
uplands rise abruptly from the abandoned flood plains and are bordered by steep scarps. In
Gurdaspur district, bar upland areas are characterized by undulating topography, dendritic
drainage pattern and predominance of nodular “kankar”.

4
vii) Sand Dunes:
These occupy southwestern part of the state which experiences semiarid type of climate and
constitute about 28% of the area. These are spread over about 10-15 percent of the area
and cover parts of Firozpur, Mansa, Bathinda, Muktsar, Kapurthala, Sangrur, Faridkot and
Patiala districts. The area is bounded by 29o33’ and 30o36’ north latitudes and 74o18’ &
76o12’ east longitudes. These dunes are mostly isolated type and vary in size and height.
The sand dunes form a thin layer over the alluvium.
1.2 Drainage:
The Ravi, Beas, Satluj and Ghaggar rivers along with West and East Beins and the non-
perennial choes and Khads drain the Punjab State. The Ravi flows along the northwestern
boundary and forms the international boundary with the Pakistan. The Satluj forms the
international boundary with Pakistan in the south-western part of the State. Ghaggar river
flows along the southeast boundary of the State and forms the boundary with Haryana State
except at a few places where villages of Punjab lies on the left bank of Ghaggar river and
Haryana villages occupy right bank of the river. All rivers flow in the southwest direction
except the Satluj River which roughly flows from east to west up to Harike and from Harike it
assumes southwesterly trend upto Fazilka. The Satluj and Beas rivers have been damed by
construction of Bhakra dam and Pong dam respectively. After the Construction of Ropar
headworks barrage, the Satluj River has water only during the rainy season on downstream
of Ropar. At Harike Patten, it carries the flow regenerated by ground water effluent
seepages. Soan nadi originates near Daulatpur (H.P) and all the choes from the Western
slopes of Chinta Purni range (H.P.) flow into it. The Soan nadir joins the Satluj near village
Bhalan. All the rivers rise from Himalayas and after traversing long courses, they debouch
into the plains. Apart from the perennial rivers, there are other important seasonal streams,
choes and drains. The sub-montainous zone is traversed by a number of choes. Some of
them contribute to the rivers while others terminate without merging into any river. These
‘choes’ remain dry for most part of the year. Their discharge is irregular and runoff during the
monsoon period.
In Upper Bari Doab tract, Chakki Khad a perennial tributary of the Beas drains mainly the
‘Kandi’ belt. The Naumuni and Kiran are two tributaries of the Ravi and drain north western
parts of this tract. The Patti nala drains the southwestern part of the area and joins the Satluj
River. The Kiran nadir originates in north of village Isarampur in the close vicinity of
Keshopur Chhamb. It is fed by ground water seepage and the excess water of Upper Bari
Doab canal is also diverted into it. In addition to these tributaries, there are several khads
traversing ‘Kandi’ belt which remain dry except during rainy season. Some of the major

5
Khads like ‘Pungotri Khad’ traverse even beyond the spring line. Such Khads gain water
through ground water effluent seepage. The Bist Doab tract is traversed by about 85 hill
torrents known as choes, which debouch into plains. There are two main drainage patterns in
this tract and both are perennial.
I) Eastern or White Bein
ii) The Western or Black Bein.
The eastern or White Bein originates near Garhshankar village of Hoshiarpur district and
joins Satluj River near Lohian after traversing the Bist Doab tract. The Nasrala, Mehlan wali,
Rajni Devi, Mehandpur, Jaijon choes join the east Bein at different places. The Western or
Black Bein rises at Chhamb near Dasuya in Hoshiarpur district and joins the Beas river near
Durgapur which is located upstream of its confluence with Satluj at Harike. Janauri,
Mehngerwala and Kingranwala join the West Bein. In Ropar district Budki Nadi, Haripur nala,
Sugh Rao, Siswan Nadi, Jainti Devi Ki Rao and Patiali Ki Rao forms the major drainage
system. These all meets Satluj River except Patiali Ki Rao and Jainti Devi Ki Rao which
gives water to Ghaggar River. The third zone forming the southeastern part of the State is
drained by Ghaggar River which is perennial. Tangri nadir, Budha nala and Lissara nala are
the main seasonal streams in the area. In south western part, some of the important drains
are the Phidda drain, Chand Bhanja drain and Jallalabad drain etc.
1.3 Soils
The soils of Punjab have largely developed on alluvium- the material laid by the rivers, under
the dominant influence of climate followed by topography and time. The details of the soils
found in the state are as follows.
Reddish Chestnut Soils:
These soils occur on stable terraces in the north and north eastern Parts of the state and are
found in Pathankot Tehsil of Gurdaspur district, parts of Hoshiarpur, Dasuya and Garh
Shankar Tehsil of Hoshiarpur district, Balachaur Tehsil of Nawanshahr district and Ropar,
Anandpur Sahib and Kharar Tehsils of Ropar district. These soils are loamy to clay –loamy in
nature and are decalcified. Erosion of oils due to water is a very serious problem. The soils
are mildly acidic to neutral in reaction. These soils are found in areas having normal rainfall
of 800 to 1000mm.
Tropical Arid Brown Soils (Weakly Solonised):
These soils are found in remaining areas of Gurdaspur, Hoshiarpur, Nawanshahr and Ropar
districts and most parts of Jalandhar, Kapurthala, Patiala, and whole of Ludhiana, Fatehgarh
Sahib Districts and in parts of Amritsar and Sangrur districts. These soils are found in areas
having normal annual rainfall of 750 to 1000mm.

6
Arid Brown Soils, (Solonised):
These soils are found in lower parts of Amritsar, Kapurthala, Jalandhar, Patiala, Sangrur,
Ferozpur districts and entire Moga district where the normal rainfall varies from 500 to
700mm. Salinity and alkalinity are the serious problem in these soils. These soils are
calcareous in nature and in most cases Kankar layer occurs at 1.0 to 1.5m depth.
Sierozem Soils:
These soils are found in Bathinda, Faridkot, Ferozpur, Mansa and Muktsar districts, where
normal rainfall varies 300 500mm. Salinity and alkalinity are the serious problems particularly
in the canal irrigated areas. Wind erosion is also a common feature in this soil. These soils
are calcareous in nature and usually have a massive Kankar layer at a depth of 0.75 to
1.25m.
Desert Soils:
These soils are found in southern parts of Ferozpur and Muktsar districts where the normal
annual rain fall is less than 300mm. Wind erosion is a serious problem here.

7
2.0 HYDROMETEOROLOGY:
2.1 CLIMATE:
PUNJAB STATE:-
Climate of Punjab State is semi-humid to semi-arid in the North, arid in the South &
southwest and semi-arid in the remaining part of the State. The state experiences four
seasons in the year namely cold season from November to March, hot season from
April to June, southwest monsoon season from last week of June to mid of September
and post monsoon season from September to beginning of November. During cold weather
season, seasons of western disturbances affect the climate of the state and bring rainfall of
light intensity.
CHANDIGARH (UT):-
Chandigarh (UT) has a humid subtropical climate characterised by a seasonal rhythm: very
hot summers, mild winters, unreliable rainfall and great variation in temperature. The city
also receives occasional winter rains from the western disturbance originating over
the Mediterranean Sea. The western disturbances usually bring rain predominantly from mid-
December to till end of April which can be heavier sometimes with strong winds and hails if
the weather turns colder (during March–April months) which usually proves disastrous to the
crops. Cold winds usually tend to come from the north near Shimla, and from the State
of Jammu and Kashmir, both of which receive their share of snowfall during winter time.
2.2 TEMPERATURE:
PUNJAB & CHANDIGARH UT:-
Most of the year, the climate of Punjab & Chandigarh (UT) is of a pronounced continental character,
very hot in summer and markedly cold in winter. In between are the pleasant months of spring.
Punjab is extremely hot in summer at around 45 °C and mild in winter. The hottest months are May
and June and the coldest are December and January. Chandigarh (UT) has a humid subtropical
climate having very hot summers, mild winters, unreliable rainfall and great variation in temperature
(−1 °C to 46 °C).
The hot weather season commences in the month of March and continues through April to June. In
the month of May the diurnal range of temperature increases more and the day become hotter.
January is the coldest month. The normal minimum temperature ranges from 3°C to 9°C.
Temperature dips to freezing point during the month of December / January.

8
2.3 HUMIDITY:
PUNJAB & CHANDIGARH (UT):-
The air over the entire State / UT is dry during the greater part of the year. Humidity is high in the
monsoon months. April and May are the driest months with relative humidity of about 30% in the
morning and less than 20% in the afternoons.
2.4 WINDS:
PUNJAB & CHANDIGARH (UT):-
Winds are generally light during the post monsoon and winter months. They strengthen during the
summer and monsoon months. Except during the monsoon months, winds are predominantly from a
westerly or northwesterly direction and tend to be more northerly in the afternoon. Easterly and
southeasterly winds are more common in the monsoon months.
2.5 RAINFALL:
PUNJAB & CHANDIGARH (UT):-
There are two seasons of rainfall in the state. The south-west monsoon season, the principal source
of ground water sets in last week of June and withdraws towards end of September and contributes
about 80% of annual average rainfall. Another period of rainfall is winter rain from December to
March is about 20% of total rainfall which is mostly absorbed into the soil.
More than 50% of the annual rainfall received in the four rainy months for June to
September, only there by leading to large variations on temporal scale. Rainfall is highly
variable in time and space. The Normal Rainfall for the State of Punjab State is 648 mm & for
Chandigarh (UT) 1070 mm, but it has great spatial variations. Rainfall Normals computed
using rainfall records of 50 years (1951-2000) as per IMD.
The statistics is provided on 4 seasons i.e. Winter (Jan-Feb), Pre-Monsoon (Mar-May),
Southwest (SW) Monsoon (Jun-Sep) and Post-Monsoon (Oct-Dec), and on annual basis.
Percent departure of rainfall from Rainfall Normals, besides these statistics, have been
colour coded as per their categories. The list of categories, their corresponding ranges and
colour codes is given in Table (A) below.
Normal rainfall and in SW-monsoon, State received 352 mm (-30% of normal) rainfall and
during Post – Monsoon, State received 24 mm (-42% of normal) rainfall.
In 2019, during Winter – Season entire Punjab State received 101 mm (102% of normal)
rainfall and in Pre – Monsoon 56 mm (3% of normal) rainfall and in SW-monsoon 490 mm (-
2 % of normal) rainfall and during Post – Monsoon, State received 61 mm (-47% of normal)
rainfall.

9
On comparing with Normal rainfall, it may be observed that, there was (-13%) departure
seen in 2020 and (+9 %) departure in 2019 observed in Punjab State.
While observing month wise rainfall for 2020, it is observed that there is Large deficiency in
rainfall observed during October (-100%), September (-75%) & February (-65%) and Large
Excess rainfall observed during March (229%), November (137%), January (82%) & May
(65%) from normal rainfall.
Entire Punjab State gets maximum rainfall in July & August (72% of SW monsoon
rainfall).
77% of annual rainfall receives during southwest monsoon rainfall (June –
September) in Punjab State.
Maximum rainfall received during the SW monsoon season in Rupnagar districts
(624 mm) while Ferozepur & Bathinda districts received the lowest rainfall (224 mm) during
2020 SW- Mon season.
2.5.1.2 SEASONAL & ANNUAL RAINFALL STATISTICS OF CHANDIGARH (UT):
Entire Chandigarh (UT) received Actual Annual Rainfall of 867 mm in 2020 and 940 mm in
2019.
In 2019, During SW monsoon season, UT received mostly Rainfall 722 mm (77% of annual
R/f in 2019) and in 2020 during SW monsoon season UT received 628 mm rainfall (72 % of
annual R/f in 2020).
In 2020, during Winter - Season, entire UT received 61 mm (-27% of normal) rainfall and in
Pre – Monsoon 140 mm (79 % of normal) rainfall and in SW-monsoon 628 mm (-26 % of
normal) rainfall and during Post – Monsoon, 38 mm (-41% of normal) rainfall received.
In 2019, during Winter - Season, entire UT received 73 mm (-13% of normal) rainfall and in
Pre – Monsoon 81 mm (4% of normal) rainfall and in SW-monsoon 722 mm (-14% of normal)
rainfall and during Post – Monsoon 64 mm (-2% of normal) rainfall received.
On comparing with Normal rainfall, it may be seen that, there was (-19%) departure seen in
2020 and (-12%) departure in 2019 observed in Chandigarh UT.
State wise and district wise normal, seasonal and annual observed rainfall and its
percentage departure from normal rainfall are given in Table B, C, D, E, F, G, H, I, J, K & L.

10
Table2.1: District-wise and Month-wise Normal Rainfall ( in mm):- Punjab & Chandigarh (UT)
S. N DISTRICT JAN FEB MAR APR MAY JUN JUL AUG SEP OCT NOV DEC ANNU
AL
1 AMRITSAR 30.4 29 35.4 20.9 17.1 43.1 211.4 194.1 89 28.7 7.6 15 721.7
2 BARNALA 14.7 16.9 10 11.5 9.6 30.3 129.4 117.5 78.4 18.3 3.9 8.9 449.4
3 BATHINDA 11.5 17.4 13 8 9.7 33.5 109.6 115.4 62.5 19.2 2.7 5.4 407.9
4 FARIDKOT 16.1 14.3 17 8.1 13.9 36 120 103.8 65.3 9.8 3.8 7.5 415.6
5 FATEHGARH
SAHIB 24.9 21.8 22.6 10 13.7 45.6 220.6 174.6 106.3 18.9 7.1 17 683.1
6 FEROZEPUR 15.7 14.5 21.3 9.3 15.4 31.3 128.4 124.7 67.9 12.3 5.1 9.7 455.6
7 GURDASPUR 60 49.9 53.8 25.7 21.3 57.1 324.6 319.9 126.2 37.2 11 25.8 1112.5
8 HOSHIARPUR 38.4 39.8 39.8 16 20.4 74.9 275.7 241.5 125.8 31.5 9.3 20 933.1
9 JALANDHAR 28.6 28.6 30.7 13.7 20.2 48.5 203.9 188.1 111 21.9 7.3 16.6 719.1
10 KAPURTHAL
A 27.6 21 25.8 9.5 14.1 37.1 166.3 136.5 82.7 31.4 5.4 10.6 568
11 LUDHIANA 24.3 26.1 26.5 12.1 16.6 51.2 203 178.3 101.7 25.7 5.4 14.7 685.6
12 MANSA 12.3 18.4 11.3 7.2 8.9 30.3 110.9 122.8 70.8 18.2 2.4 6.3 419.8
13 MOGA 21.3 13.4 15 9.7 15.7 33.7 123 133.5 63.8 20.9 3.1 7.5 460.6
14 MUKTSAR 16.7 12.7 18.2 7 10.9 31.2 113 107.5 60.1 11.2 3.5 7.5 399.5
15 PATIALA 26.7 24.7 20.9 9.3 15.3 54.9 235.9 208.5 115.9 21.1 4.3 14.5 752
16 RUPNAGAR 41.6 38.9 51.2 14.7 25.6 65.4 291 252.9 119.2 19.7 13.2 23.1 956.5
17 SAS NAGAR 33.4 24.7 29.5 13.8 24.6 68.8 241.8 216.6 117.3 20.2 7.3 20.7 818.7
18 SANGRUR 18.3 19.3 15.9 10.4 18.7 44.8 160.5 145.8 85.7 20.4 4.7 12.9 557.4
19 NAWANSHAH
R 38.8 39.9 38.6 15.9 19.2 85.3 309.6 254.9 138.8 29.6 10.1 24.9 1005.6
20 TARN TARAN 18 18.3 21.5 10.4 12.4 23.5 133.6 111.4 68.3 17.8 4.5 9.5 449.2
21 CHANDIGARH 44.3 38.9 33.2 14.8 30.1 120 282.4 287.5 154.3 31.8 9.9 23.4 1070.6

11
Table 2.2: Seasonal and Actual Annual Rainfall & its departure for Punjab State:
SEASON
PUNJAB STATE
NORMAL
R/F (mm)
ACTUAL
R/F (mm)
- 2019
ACTUAL
R/F (mm)-
2020
%
Departure in
2019
%
Departure
in 2020
WINTER 50.45 101.74 55.86 102% 11%
PRE-
MONSOON 54.23 55.72 130.36 3% 140%
SW -
MONSOON 502.19 489.94 352.08 -2% -30%
POST-
MONSOON 41.69 61.19 24.38 47% -42%
ANNUAL
648.56 708.59 562.68 9% -13%
Fig2.1: Seasonal Rainfall 2019 & 2020 and its departure from normal rainfall – Punjab
State

12
Fig 2.2: Percentage deviation in Seasonal Rainfall (2019 & 2020) – Punjab State
Table 2.3: Seasonal and Actual Annual Rainfall & its departure for Chandigarh UT
SEASON
CHANDIGARH (UT)
NORMAL
R/F (mm)
ACTUAL
RF (mm) -
2019
ACTUAL
RF (mm) -
2020
%
Departure
in 2019
%
Departure in
2020
WINTER 83.20 72.80 60.90 -13% -27%
PRE-
MONSOON 78.10 81.20 139.80 4% 79%
SW-
MONSOON 844.20 721.90 628.40 -14% -26%
POST-
MONSOON 65.10 64.10 38.30 -2% -41%
ANNUAL
1070.60 940.00 867.40 -12% -19%

13
Fig 2.3: Seasonal Rainfall 2019 & 2020 and its departure from normal rainfall –
Chandigarh UT
Fig 2.4: Percentage deviation in Seasonal Rainfall (2019 & 2020) – Chandigarh UT
2.5.1 MONTHLY RAINFALL ANALYSIS:
While observing month wise rainfall for 2020, it is observed that there is Large deficiency in rainfall
observed during September (-88%), February (-79%) & December (-61%) and Large Excess rainfall
observed during March (145%), November (195%) & April (95%) from normal rainfall. Month wise
rainfall departure analysis shown in table (E) & (F).

14
Table 2.4: Month wise Normal & Actual Annual Rainfall & its departure for Punjab
State
Month
Normal
Rainfall
(mm)
Actual Rainfall
(mm) - 2019
Actual
Rainfall
(mm) - 2020
% Departure
in 2019
% Departure in
2020
JAN 25.97 32.72 47.21 26% 82%
FEB 24.48 69.02 8.65 182% -65%
MAR 25.90 10.67 85.31 -59% 229%
APR 12.16 24.61 18.38 102% 51%
MAY 16.17 20.44 26.67 26% 65%
JUN 46.33 27.54 58.55 -41% 26%
JUL 190.61 204.14 114.82 7% -40%
AUG 172.42 181.32 155.04 5% -10%
SEP 92.84 76.94 23.67 -17% -75%
OCT 21.70 7.75 0 -64% -100%
NOV 6.09 23.2 14.45 281% 137%
DEC 13.91 30.24 9.93 117% -29%
ANNUAL 648.55 708.59 562.68 9% -13%
Table 2.5: Month wise Normal & Actual Rainfall & its departure during Year 2019 &
2020 for Chandigarh UT –
Month
Normal
Rainfall
(mm)
Actual
Rainfall
(mm) - 2019
Actual
Rainfall (mm)
- 2020
% Departure
in 2019
% Departure
in 2020
JAN 44.3 19.7 52.6 -56% 19%
FEB 38.9 53.1 8.3 37% -79%
MAR 33.2 25.9 81.5 -22% 145%
APR 14.8 35.2 29.1 138% 97%
MAY 30.1 20.1 29.2 -33% -3%
JUN 120 22.3 98.5 -81% -18%
JUL 282.4 306.8 196.5 9% -30%
AUG 287.5 244.7 315.6 -15% 10%
SEP 154.3 148.1 17.8 -4% -88%
OCT 31.8 0.2 0 -99% -100%
NOV 9.9 31.8 29.2 221% 195%
DEC 23.4 32.1 9.1 37% -61%
ANNUAL 1070.6 940 867.4 -12% -19%

15
Table2.6: District wise Seasonal and Annual Actual Rainfall (mm) - Year 2019
S. N DISTRICT WINTER PRE-
MONSOON
SW -
MONSOON
POST-
MONSOON
ANNUAL
R/F (mm)
1 AMRITSAR 132.61 41.03 435.38 87.48 696.5
2 BARNALA 59.44 50.54 346.23 49.92 506.13
3 BATHINDA 39.59 44.54 352.24 41.8 478.17
4 FARIDKOT 34.06 62.62 327.28 42.86 466.82
5 FATEHGARH
SAHIB 64.31 52.92 676.16 51.86 845.25
6 FEROZPUR 29.06 60.2 244.81 34.89 368.96
7 GURDASPUR 273.08 52.02 597.88 112.33 1035.31
8 HOSHIARPUR 201.22 71.01 770.56 92.15 1134.94
9 JALANDHAR 140.58 54.28 621.75 63.6 880.21
10 KAPURTHALA 167.28 59.02 778.06 85.22 1089.58
11 LUDHIANA 117.55 55.24 562.71 53.89 789.39
12 MANSA 29.22 33.78 212.42 31.46 306.88
13 MOGA 79.84 48.36 394.49 57.6 580.29
14 MUKTSAR 28.03 67.23 349.05 26.49 470.8
15 PATIALA 74.63 60.38 629.04 56.48 820.53
16 ROPAR 146.39 73.44 797.5 92.82 1110.15
17 SAS NAGAR 71.79 71.24 631.16 55.23 829.42
18 SANGRUR 65.62 53.97 381.62 44.97 546.18
19 SBS NAGAR 139.65 59.98 630.84 80.41 910.88
20 TARN TARAN 112.1 53.82 513.11 82.18 761.21
21 CHANDIGARH
72.80 81.20 721.90 64.10 940
2.5.5 DEVIATION IN ACTUAL ANNUAL RAINFALL FROM NORMAL RAINFALL:
Deviation in Actual Annual Rainfall from Normal Rainfall for the States of Punjab & UT Chandigarh
w.r.t India represents that there is normal rainfall observed at Punjab & in the whole country during
2019 & 2020 and for UT Chandigarh deficient rainfall (-20%) deviation observed in 2020. Deviation
is shown in table (M) and corresponding graphs are given as fig (j) & fig (k).

16
2.5.6 DISTRICT- WISE RAINFALL ANALYSIS (2020 V/s 2019) FOR THE STATE OF
PUNJAB & CHANDIGARH (UT):
RAINFALL ANALYSIS OF PUNJAB STATE:
There are two seasons of rainfall in the state. The south-west monsoon season, the
principal source of ground water sets in last week of June and withdraws towards end of September
and contributes about 80% of annual average rainfall. Another period of rainfall is winter rain from
December to March is about 20% of total rainfall which is mostly absorbed into the soil.
In 2020, Annual highest rainfall of 982 mm was received at Rupnagar (Ropar) district and
the lowest rainfall of 353 mm was received at Ferozepur district.
In 2019, Annual highest rainfall of 1135 mm was received in Hoshiarpur District and the
lowest rainfall of 307 mm was received at Mansa district.
The lowest rainfall of (-38%) less than their corresponding normals of IMD are recorded at
Nawanshahr district and the highest rainfall of (+30% ) more than the IMD annual normal is received
at Tarn Taran district during 2020.
The annual rainfall of 2020 when analyzed and compared to the rainfall of 2019, it is
observed that out of all districts only Mansa district is showing rise of rainfall which is (+18%) more
than the rainfall of last year 2019.
It is observed that out of all districts Maximum fall in rainfall observed at Kapurthala district
which is (-33%) less than the rainfall of last year 2019 and the fall in rainfall in remaining districts
shows in Amritsar (-24%), Barnala (-6%), Bathinda (-24%), Faridkot (-4%), Fatehgarh Sahib (-16%),
Ferozepur (-4%), Gurdaspur (-29%), Hoshiarpur (-31%), Jalandhar (-30%), Kapurthala (-33%),
Ludhiana (-28%), Moga (-13%), Muktsar (-22%), Patiala (-14%), Rupnagar (-12%), SAS Nagar (-6%),
Sangrur (-6%), Nawanshahr (-31%), Tarn Taran (-23).
While comparing with normal rainfall, it is observed that 04 nos. of districts showing deficient
rainfall during 2020, i.e Nawanshahr (-38%), Gurdaspur (-34%), Amritsar (-27%), Firozpur (-22%) and
02 nos. of districts showing Excess rainfall i.e Tarn Taran (+30%) & Kapurthala (+28%) and
remaining 14 nos. of districts showing normal rainfall i.e Moga (10%), Barnala (6%), Faridkot (8%),
Fatehgarh Sahib (4%), Rupnagar (3%), Bathinda (-11%), Hoshiarpur (-16%), Jalandhar (-15%),
Ludhiana (-15%), Mansa (-14%), Muktsar (-8%), Patiala (-6%), SAS Nagar (-5%) & Sangrur (-8%).
RAINFALL ANALYSIS OF CHANDIGARH (UT):
Over 75% of the annual rainfall is received in the four rainy months for June to September in
Chandigarh UT, only there by leading to large variations on temporal scale.
In Chandigarh (UT) the annual rainfall for the year 2020 was 867 mm which is about (8%)
less than the previous year (2019) rainfall of 940 mm and (19%) less than the normal rainfall (i.e.
1070 mm).

17
Table- 2.7: Deviation of 2020 Rainfall from 2019 Annual Rainfall and from Normal Rainfall:
S.N District
Rainfall
(mm) -
2020
Rainfall
(mm) -
2019
Percentage
Deviation
from 2019
Normal
Rainfall
(%)
Deviation
in 2020
from
Normal
Remarks
1 AMRITSAR 529.17 696.5 -24% 721.7 -27% Deficient
2 BARNALA 475.54 506.1 -6% 449.4 6% Normal
3 BATHINDA 364.25 478.2 -24% 407.9 -11% Normal
4 FARIDKOT 448.58 466.8 -4% 415.6 8% Normal
5 FATEHGARH
SAHIB 708.19 845.3 -16% 683.1 4% Normal
6 FIROZPUR 353.52 369 -4% 455.6 -22% Deficient
7 GURDASPUR 734.83 1,035.30 -29% 1112.5 -34% Deficient
8 HOSHIARPUR 780.97 1,134.90 -31% 933.1 -16% Normal
9 JALANDHAR 614.04 880.2 -30% 719.1 -15% Normal
10 KAPURTHAL
A 729.85 1,089.60 -33% 568 28% Excess
11 LUDHIANA 571.82 789.4 -28% 685.6 -17% Normal
12 MANSA 361.3 306.9 18% 419.8 -14% Normal
13 MOGA 504.39 580.3 -13% 460.6 10% Normal
14 MUKTSAR 368.42 470.8 -22% 399.5 -8% Normal
15 PATIALA 706.07 820.5 -14% 752 -6% Normal
16 RUPNAGAR 982.04 1,110.20 -12% 956.5 3% Normal
17 SAS NAGAR 780.59 829.4 -6% 818.7 -5% Normal
18 SANGRUR 513.25 546.2 -6% 557.4 -8% Normal
19 NAWANSHAH
R 623.99 910.9 -31% 1005.6 -38% Deficient
20 TARN TARAN 582.66 761.2 -23% 449.2 30% Excess
21
CHANDIGAR
H
(UT)
867 940 -8% 1070.6 -19% Normal

18
Fig 2.5: DEVIATION IN ACTUAL ANNUAL RAINFALL 2020 V/S 2019 – PUNJAB &
CHANDIGARH (UT):

19
Fig 2.6: ISOHYETAL NORMAL RAINFALL MAP OF PUNJAB & CHANDIGARH (UT)

20
Fig 2.7: ACTUAL ANNUAL RAINFALL MAP OF PUNJAB STATE (YEAR- 2020)

21
Fig 2.8: ACTUAL ANNUAL RAINFALL MAP OF PUNJAB STATE (YEAR- 2019)

22
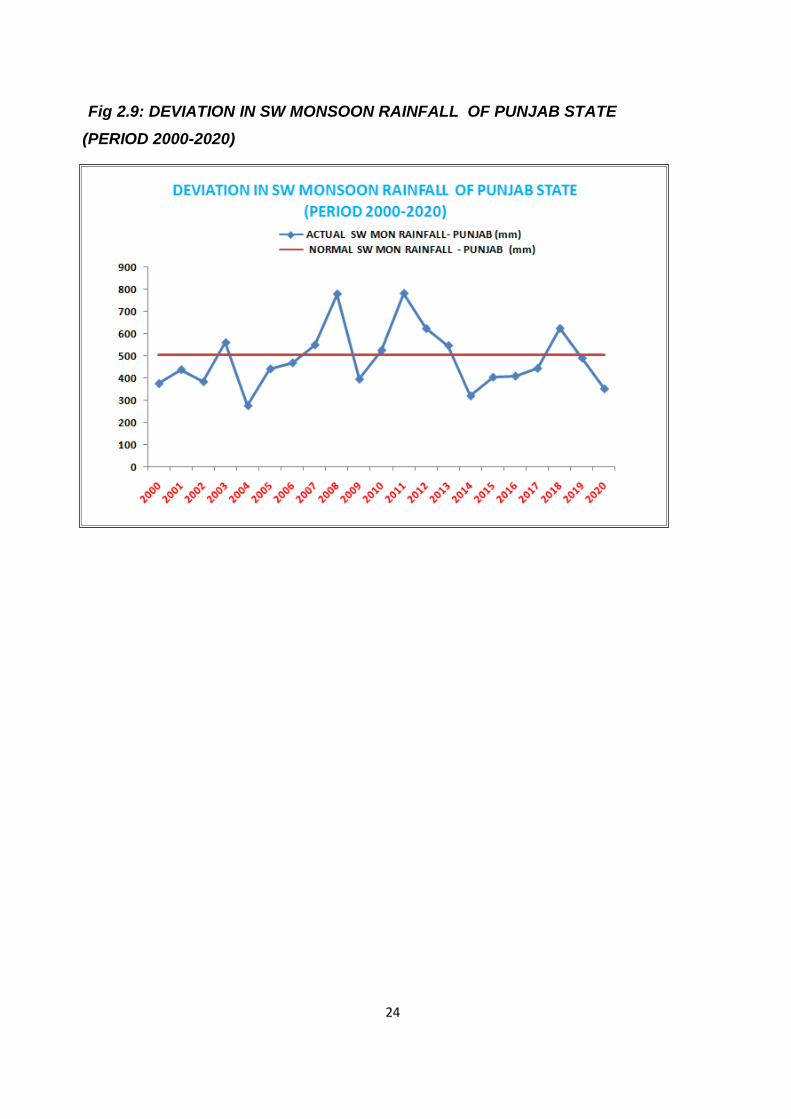
2.5.8 DECADAL FLUCTUATION IN ANNUAL AND SOUTH WEST MONSOON
RAINFALL FROM 2000 TO 2020 & ITS DEPARTURE FROM NORMAL RAINFALL:
Changes in rainfall behaviour since last one decade are determined using decadal data.
Rainfall of past two decades of Punjab & Chandigarh UT is computed and compared with the
normal rainfall of the given monitoring to determine the decadal fluctuation. Decadal
Fluctuation in Annual and South West Monsoon Rainfall from 2000 to 2020 & its departure
from normal rainfall is analyzed.
Decadal Fluctuation in Annual and South West Monsoon Rainfall for the State of Punjab:
There is Deficient rainfall observed in during the years 2000, 2002, 2004, 2009, 2014, 2016
and there is excess in rainfall observed in Punjab State in 2008, 2011, 2012 and in
remaining years normal rainfall observed. In 2008, there is highest departure (+47%)
observed and the lowest departure (-36%) observed in 2004.
Decadal Fluctuation in Annual and South West Monsoon Rainfall for Chandigarh UT:
There is Deficient rainfall observed in Punjab State during the years 2002, 2004, 2005, 2009,
2014, 2015, 2016, 2017 and excess rainfall observed in 2003, 2007, 2008, 2011 and in
remaining years normal rainfall observed. In 2008, there is highest departure (+47%)
observed and the lowest departure (-36%) observed in 2004.
The Annual and SW monsoon rainfall and their departures from normal rainfall from the
years 2000 to 2020 are shown in Table (O) & (P) and their corresponding graphs are given
below.

23
Table 2.8 : Departure in Annual Rainfall & SW Monsoon Rainfall of Punjab State (2000-2020)
YEAR
SW – MONSOON RAINFALL (MM)
ANNUAL RAINFALL (MM)
ACTUAL
RAINFALL
(INDIA)
ACTUAL
RAINFALL
(PUNJAB)
%
DEPARTURE
FROM
NORMAL
(INDIA)
% DEPARTURE
FROM NORMAL
(PUNJAB)
ANNUAL
RAINFALL
(INDIA)
ANNUAL
RAINFALL
(PUNJAB)
%
DEPARTURE
(INDIA)
REMARKS %
DEPARTURE
(PUNJAB)
REMARKS
2000 860.53 375.62 -6% -25% 1091.82 466.00 -10% Normal -28% Deficient
2001 755.89 437.98 -17% -13% 995.6 536.67 -18% Normal -17% Normal
2002 662.71 383.89 -28% -24% 895.53 483.19 -27% Deficient -25% Deficient
2003 866.16 559.64 -5% 11% 1201.14 711.96 -2% Normal 10% Normal
2004 721.77 276.33 -21% -45% 1102.69 413.52 -10% Normal -36% Deficient
2005 809.29 441.45 -12% -12% 1201.07 582.70 -2% Normal -10% Normal
2006 827.4 468.69 -10% -7% 1046.52 623.70 -14% Normal -4% Normal
2007 909.85 549.28 -1% 9% 1169.32 746.39 -4% Normal 15% Normal
2008 830.43 777.38 -9% 55% 1039.94 953.09 -15% Normal 47% Excess
2009 698.11 395.57 -24% -21% 929.97 496.14 -24% Deficient -23% Deficient
2010 862.9 525.4 -6% 5% 1211.11 581.82 -1% Normal -10% Normal
2011 926.23 780.04 1% 55% 1118.15 925.74 -8% Normal 43% Excess
2012 845 622.18 -8% 24% 1040.17 785.59 -15% Normal 21% Excess
2013 925.46 546.17 1% 9% 1209.04 684.47 -1% Normal 6% Normal
2014 784.63 320.58 -14% -36% 1074.81 494.12 -12% Normal -24% Deficient
2015 749.55 404.52 -18% -19% 1089.65 616.83 -11% Normal -5% Normal
2016 835.21 409.12 -9% -19% 1039.92 495.28 -15% Normal -24% Deficient
2017 813.21 444.02 -11% -12% 1060.85 570.36 -13% Normal -12% Normal
2018 772.75 622.96 -15% 24% 955.41 690.34 -22% Deficient 6% Normal
2019 930.36 489.94 2% -2% 1261.01 708.58 3% Normal 9% Normal
2020 828.49
352.08
-9%
-30%
1180.83
562.68
-3%
Normal -13%
Normal
24
Fig 2.9: DEVIATION IN SW MONSOON RAINFALL OF PUNJAB STATE
(PERIOD 2000-2020)

25
Table 2.9: Departure in Actual Annual Rainfall & SW Monsoon Rainfall of Chandigarh UT (2000-2020)
YEAR
SW – MONSOON RAINFALL (MM)
ANNUAL RAINFALL (MM)
ACTUAL
RAINFALL
(INDIA)
ACTUAL
RAINFALL
(CHANDIGARH
UT )
%
DEPARTURE
FROM
NORMAL
(INDIA)
%
DEPARTURE
FROM
NORMAL
(CHANDIGARH
UT )
ANNUAL
RAINFALL
(INDIA)
ANNUAL
RAINFALL
(CHANDIGARH
UT )
%
DEPARTURE
(INDIA)
REMARKS %
DEPARTURE
(CHANDIGARH
UT )
REMARKS
2000 860.53 1029.8 -6% 22% 1091.82 1243.5 -10% Normal 16% Normal
2001 755.89 1023.1 -17% 21% 995.6 1199.1 -18% Normal 12% Normal
2002 662.71 624 -28% -26% 895.53 852.8 -27% Deficient -20% Deficient
2003 866.16 1188.9 -5% 41% 1201.14 1352.1 -2% Normal 26% Excess
2004 721.77 649.3 -21% -23% 1102.69 850.6 -10% Normal -21% Deficient
2005 809.29 621.8 -12% -26% 1201.07 814.3 -2% Normal -24% Deficient
2006 827.4 637.7 -10% -24% 1046.52 878.6 -14% Normal -18% Normal
2007 909.85 991.7 -1% 17% 1169.32 1520.3 -4% Normal 42% Excess
2008 830.43 1294 -9% 53% 1039.94 1560.4 -15% Normal 46% Excess
2009 698.11 742.4 -24% -12% 929.97 859.8 -24% Deficient -20% Deficient
2010 862.9 1116.1 -6% 32% 1211.11 1239.6 -1% Normal 16% Normal
2011 926.23 1360.3 1% 61% 1118.15 1515.3 -8% Normal 42% Excess
2012 845 848.6 -8% 1% 1040.17 1004.1 -15% Normal -6% Normal
2013 925.46 782.7 1% -7% 1209.04 1026.2 -1% Normal -4% Normal
2014 784.63 413.5 -14% -51% 1074.81 819.1 -12% Normal -23% Deficient
2015 749.55 566.4 -18% -33% 1089.65 824 -11% Normal -23% Deficient
2016 835.21 423.2 -9% -50% 1039.92 575.4 -15% Normal -46% Deficient
2017 813.21 704.2 -11% -17% 1060.85 857.7 -13% Normal -20% Deficient
2018 772.75 956.9 -15% 13% 955.41 1085.9 -22% Deficient 1% Normal
2019 930.36 721.9 2% -14% 1261.01 940 3% Normal -12% Normal
2020 828.49
352.08
-9% -26%
960.3
867.4
-21% Deficient -19% Normal

26
Fig 2.10: DEVIATION IN SW MONSOON RAINFALL OF CHANDIGARH UT
(PERIOD 2000-2020)
2.5.9 BEHAVIOUR OF RAINFALL AND ITS VARIABILITY IN PUNJAB &
CHANDIGARH
The behavior of Rainfall in May 2020, August 2020, November 2020 and January 2021 is
discussed in following paragraphs. The maximum and minimum water levels recorded in
different season is given below in Table (Q).
Table 2.10: The maximum and minimum rainfall during all four seasons:
RANGE MAY, 2020
AUGUST, 2020
NOVEMBER, 2020
JANUARY, 2021
MINIMUM
370 mm
Mansa District
184 mm Ferozepur District
228 mm Mansa District
235 mm Ferozepur District
MAXIMUM
1203 mm Ropar District
602 mm Ropar District
624 mm Ropar District
669 mm Ropar District

27
It is evident from the above table (Q) that the lowest rainfall conditions prevail in South
Western & South parts Ferozepur district & Mansa district while highest rainfall conditions
exist in the eastern parts of the state covering Ropar district.
2.5.9 EVAPO-TRANSPIRATION:
Evapotranspiration (ET) is the sum of water evaporation and transpiration from a
surface area to the atmosphere. Evaporation accounts for the movement of water to
the air from sources such as the soil, canopy interception, and water bodies.
Transpiration accounts for the movement of water within a plant and the subsequent
exit of water as vapour through stomata in its leaves in vascular plants and phyllids
in non-vascular plants. A plant that contributes to evapotranspiration is called an
evapotranspirator. Evapotranspiration is an important part of the water cycle.
Potential evapotranspiration (PET) is a representation of the environmental demand
for evapotranspiration and represents the evapotranspiration rate of a short green
crop (grass), completely shading the ground, of uniform height and with adequate
water status in the soil profile. It is a reflection of the energy available to evaporate
water, and of the wind available to transport the water vapour from the ground up into
the lower atmosphere. Often a value for the potential evapotranspiration is calculated
at a nearby climatic station on a reference surface, conventionally short grass. This
value is called the reference evapotranspiration (ET0).
Actual evapotranspiration is said to equal potential evapotranspiration when there is
ample water.
As per Evapotranspiration data, Table (V) states that in 2019 & 2020, during the month of
August highest evapotranspiration observed in Punjab & Chandigarh UT.
In 2019 the lowest value of ET was observed in January i.e. (13.35mm) and in 2020 lowest
value of ET was observed in November i.e (6.08mm) in Punjab State. Similarly In 2019 the
lowest value of ET was observed in January i.e (20.25 mm) and in 2020 lowest value of ET
was observed in November i.e (9.09 mm) in Chandigarh UT.

28
Table-2.11 : MONTHLY EVAPOTRANSPIRATION TRENDS FOR PUNJAB &
CHANDIGARH UT FROM 01-JAN-2019 TO 31-DEC-2020
MONTHLY EVAPOTRANSPIRATION TRENDS FOR PUNJAB & CHANDIGARH UT
FROM 01-JAN-2019 TO 31-DEC-2020
Evapo-Transpiration (mm) –
PUNJAB
Evapo-Transpiration (mm) - CHANDIGARH UT
JANUARY -19 13.35 JANUARY-19 20.25
FEBRUARY-19 38.13 FEBRUARY-19 38.35
MARCH-19 53.36 MARCH-19 67.02
APRIL-19 58.50 APRIL-19 53.04
MAY-19 48.62 MAY-19 47.98
JUNE-19 31.19 JUNE-19 35.64
JULY-19 101.19 JULY-19 100.30
AUGUST-19 125.72 AUGUST-19 102.08
SEPTEMBER-19 72.17 SEPTEMBER-19 72.55
OCTOBER-19 51.63 OCTOBER-19 54.30
NOVEMBER-19 14.61 NOVEMBER-19 22.63
DECEMBER-19 19.06 DECEMBER-19 20.93
JANUARY-20 25.35 JANUARY-20 20.70
FEBRUARY-20 33.18 FEBRUARY-20 25.36
MARCH-20 66.36 MARCH-20 55.61
APRIL-20 66.79 APRIL-20 70.89
MAY-20 60.96 MAY-20 61.31
JUNE-20 51.08 JUNE-20 49.48
JULY-20 44.77 JULY-20 35.04
AUGUST-20 88.12 AUGUST-20 95.29
SEPTEMBER-20 62.32 SEPTEMBER-20 43.52
OCTOBER-20 9.26 OCTOBER-20 13.81
NOVEMBER-20 6.08 NOVEMBER-20 9.09
DECEMBER-20 7.82 DECEMBER-20 12.10

29
FIG 2.11: Monthly Evapotranspiration trends for Punjab & Chandigarh ut from 01-Jan-
2019 to 31-Dec-2020
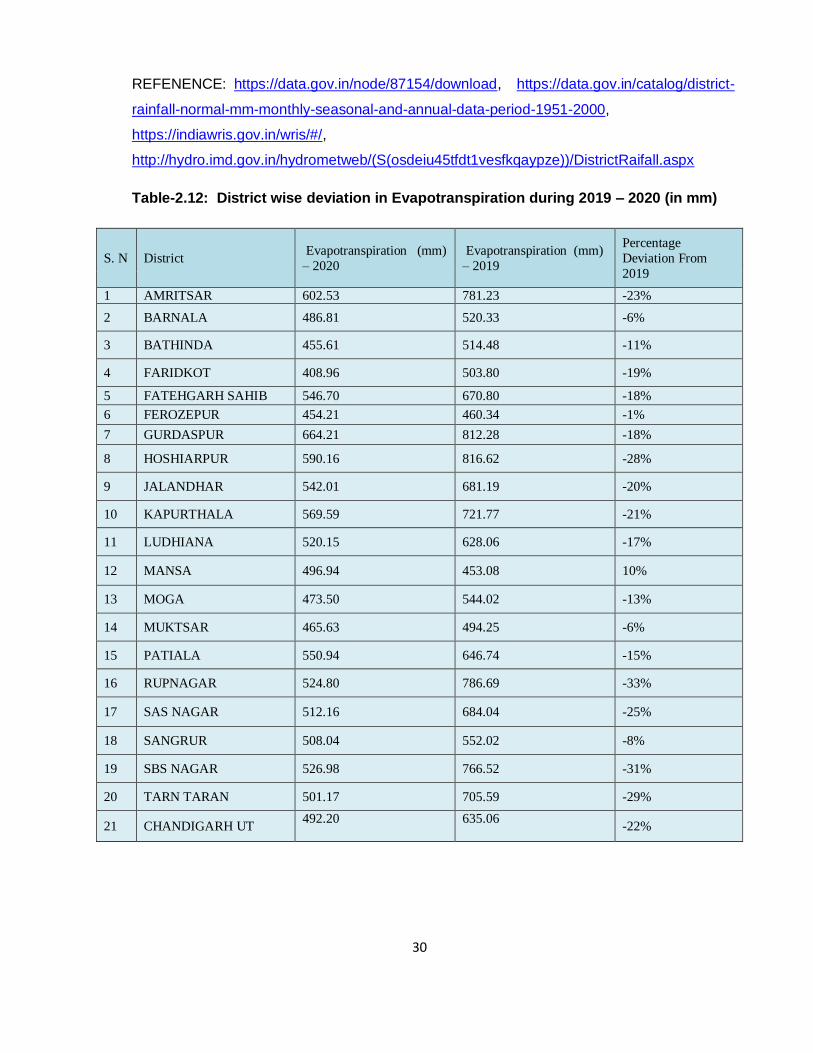
2.5.11 District wise deviation in Evapotranspiration during 2019 – 2020 (in mm):
Punjab State:
While observing district wise Evapotranspiration during 2019 – 2020, it is observed that
during 2020, Gurdaspur district showing maximum evapotranspiration i.e 664 mm and
Faridkot district showing minimum 409 mm.
In 2019, Hoshiarpur district having maximum evapotranspiration value 817 mm and Mansa
district having minimum value of 453 mm. When comparing the data of 2020 with 2019, it is
observed that out of all districts, Rupnagar district is showing maximum fall in
evapotranspiration i.e (-33) and Only Mansa district is showing (+10%) increase in
evapotranspiration.
Chandigarh (UT):
In 2019, evapotranspiration was 635 mm observed in Chandigarh (UT) and in 2020, there is
a fall of (-22%) i.e 492 mm observed in entire UT.
30
REFENENCE: https://data.gov.in/node/87154/download, https://data.gov.in/catalog/district-
rainfall-normal-mm-monthly-seasonal-and-annual-data-period-1951-2000,
https://indiawris.gov.in/wris/#/,
http://hydro.imd.gov.in/hydrometweb/(S(osdeiu45tfdt1vesfkqaypze))/DistrictRaifall.aspx
Table-2.12: District wise deviation in Evapotranspiration during 2019 – 2020 (in mm)
S. N District Evapotranspiration (mm)
– 2020
Evapotranspiration (mm)
– 2019
Percentage
Deviation From
2019
1 AMRITSAR 602.53 781.23 -23%
2 BARNALA 486.81 520.33 -6%
3 BATHINDA 455.61 514.48 -11%
4 FARIDKOT 408.96 503.80 -19%
5 FATEHGARH SAHIB 546.70 670.80 -18%
6 FEROZEPUR 454.21 460.34 -1%
7 GURDASPUR 664.21 812.28 -18%
8 HOSHIARPUR 590.16 816.62 -28%
9 JALANDHAR 542.01 681.19 -20%
10 KAPURTHALA 569.59 721.77 -21%
11 LUDHIANA 520.15 628.06 -17%
12 MANSA 496.94 453.08 10%
13 MOGA 473.50 544.02 -13%
14 MUKTSAR 465.63 494.25 -6%
15 PATIALA 550.94 646.74 -15%
16 RUPNAGAR 524.80 786.69 -33%
17 SAS NAGAR 512.16 684.04 -25%
18 SANGRUR 508.04 552.02 -8%
19 SBS NAGAR 526.98 766.52 -31%
20 TARN TARAN 501.17 705.59 -29%
21 CHANDIGARH UT 492.20
635.06
-22%

31
3.0 GENERAL GEOLOGY
The great Indo-Gangetic plain with an area of about 8,50,000 sq. km lies between the
Peninsular India and the Himalayas. On the basis of seismic and borehole data, Rao
(1973) divided the Indo-Gangetic Plain into five parts, which from west to east are (I)
The Indus Basin in Pakistan, (ii) the Indo-Gangetic Basin in Punjab and Haryana, (iii)
The Ganga Basin in Uttar Pradesh and Bihar, (iv) The Brahmaputra Basin in Assam,
and (v) The Ganga- Brahmaputra Basin in West Bengal and Bangladesh. These
basins have been delineated on the basis of subsurface ridges or highs. In the Indo-
Gangetic Basin the Quaternary alluvium has been deposited at places on semi-
consolidated Tertiary rocks (Siwalik Group) or on a basement of metamorphic and
igneous rocks of Precambrian age. The alluvial sediments were laid down by the
rivers since Pleistocene in the “fore deep” or a down warp formed in front of the rising
Himalayan ranges and thus represents the younger geological formation.
3.1 Geological Set Up
The rock formations ranging in age from middle Miocene to Recent are exposed.
They are represented by Siwaliks and Alluvium deposits. The Siwaliks (Middle
Miocene to Pleistocene) form hilly tract running in northern and northeastern part of
the State. The alluvium deposits (Pleistocene to Recent) constitute the plains of
Punjab. The Siwaliks are divided into three lower, middle and upper Siwaliks on the
basis of lithology and vertebrate fossils. The Siwalik formations have been folded and
faulted due to tectonic activities. The various stratigraphic units exposed in the state
are given in table as under:
3.1.1 Aeolian Sand (Wind Blown Sand)
These are medium to fine grained and buff colored sand. They occur in the form of
Dunes which are formed as the disintegrated product of the older rocks and found in
the southwestern part of the State. The dunes are elongated in shape and are blown
sand forming fixed dunes and sandy flats. The dunes are oriented in N-S direction
forms ridges which rise from a meter to about ten meters above the surrounding land
surface. These sands are brought from the Rajasthan desert and ultimately
deposited and shaped by the southwesterly winds which blow across the area from
April to June. Generally, the sand dunes contain loose and unconsolidated sand and

32
at places where vegetation has come up these have been fixed. The sand grains are
generally well rounded in shape and mainly consist of quartz and ferromagnesian
minerals with flakes of mica.
3.1.2 Alluvium
The greater part of Punjab is occupied by alluvial plains, which are very fertile. The
Quaternary alluvial sediments were deposited on semi-consolidated Tertiary rocks
and conceals underneath the fringes of Peninsular and extra- Peninsular rocks. Out
of the total 50362 Km2. area of State, alluvial cover about 38500 Km2 spreading over
about 76% of area. This vast expanse of plains is constituted by fluvial sediments of
Indus river system. Beneath thick alluvium cover, there are southwestern extensions
of Siwalik, which are exposed only in northeastern hilly tract of the State. The Siwalik
rocks are expected to extend Bathinda which in fact separates the northeastern
Punjab plains form Southwestern Rajasthan plains. Based on O.N.G.C. data, the
contact between the plains and the Siwalik Hills is believed to be normal in
Gurdaspur district and is faulted in Hoshiarpur and Ropar district areas. The
thickness of alluvium varies from place to places due to irregularities and
undulations. The maximum thickness of 4500 m has been reported near Dasuya in
Hoshiarpur district. The thickness of alluvium increases towards northeast. It is
comparatively less in the southwestern parts where the rocks of Pre- Cambrian age
occur as buried ridges. In the intermountain valleys in north east part, the valley fill is
estimated to be around 200 m thick underlain by rocks of Siwalik system. The
alluvium comprising sand, gravel and clay is deposited by the Indus river system. In
accordance with their mode of deposition by large constantly shifting river, the alluvial
deposits are heterogeneous in nature and individual strata have limited horizontal
and vertical continuity. The alluvial complex of Pleistocene and Recent age
represents the latest phase of sedimentation. It consists principally of fine to medium
sand, silt and clay. Beds of gravel and coarse sand are uncommon. It is also
associated with fine grained strata, concretionary zones or nodules of kankar. The
sand gravel or sand bodies embodied in the clay- silt mixture in the alluvial deposits
are usually either small or big lentoid bodies with longitudinal part either normal or
nearly normal to the Himalayan and Siwalik strike i.e. NW-SE. Sheet like bodies of

33
sand, sand and gravel had been deposited in the central part of the State and are
regionally extensive. In southwestern and southern parts of the State, ground water
is brackish to saline. The rivers have deposited their coarser material in higher
reaches, so the flood plain deposits developed in southwestern parts were richer in
finer sediments. The alluvium is normally divided in two groups viz:
I) Newer Alluvium, ii) Older Alluvium. It is not possible to clearly indicate any distinct
/demarcation line of separation between the two units
I) Newer Alluvium (Khaddar)
It occurs in the active flood plains of present day river courses and is generally
confined to the neighborhood of river channels. Along the major rivers in plain areas,
there exist low flood plain areas which are locally called khaddar of ‘bet’. These flood
plains are often separated from upland plains by a steep slope of the order of 1m to
2m per km. The Newer alluvium is light colored and poor in calcareous matter. It
consists of coarse gravel near the foot hills and ventricular beds of sand and clay
along the old river course and silt and clay in the flatter parts of the river plains. It is
of Upper Pleistocene to Recent age. The aquifers comprised of medium to coarse
sand and gravel. The clays serve as aquitards. The various aquifers are
interconnected. However, the deeper horizons show confined to semi- confined
conditions. There is wide variation of the hydraulic conductivity and Transmissivity of
the aquifers due to rapid changes in their texture and thickness.
ii) Older Alluvium (Bhangar):
It is confined to the abandoned flood plains and bar upland regions. It consists of
sandy clay, clay-silt and fine to medium sand. It consists of pale reddish brown
colored beds of clay. Kankar is found disseminated more or less throughout the beds
of sand and clays. The kankar bands are generally more in the older alluvium. At
places extensive and massive beds of kankar also exist. It is of middle to Upper
Pleistocene in age. Older alluvium forms good ground water reservoir/aquifer.
3.1.3 Upper Siwaliks
These formations are exposed throughout the hilly tract starting right from northwest
of Pathankot through Hoshiarpur, Ropar to Chandigarh. They are composed of soft
grey medium to coarse-grained sandstones, yellowish brown and brown clays. The

34
sandstones are poorly lithified, soft and friable. They are brownish grey in colour and
contain a large proportion of mica flakes and concretions of clay. They also consist of
conglomerates, boulders and pebbles of quartzite and yellowish clays. The
conglomerates consist mainly of cobbles and pebbles of quartzites. The pebbles of
granite limestone, sandstone and lumps of claystones are also present. The
conglomerate beds do not show clear stratification and occur as wedge shaped or
lenticular bands. The formations of Upper Siwaliks are prone to easy weathering and
there is considerable collection of sand as talus cones. These formations yield good
to moderate supplies of water.
3.1.4 Middle Siwaliks
These are exposed in Dhar and Dunera area of Pathankot Tehsil of Pathankot
district, north and northeast of Kiratpur in Ropar district. These are comprised of grey
micaceous, medium grained soft sandstones interbedded with red, orange and
yellowish (buff colored) clays. The sandstones occasionally contain pebbles of
calcareous clay, shale and quartzite. The Middle Siwaliks are poor in yields of ground
water due to poor permeability.
3.1.5 Lower Siwaliks
These are exposed in Dhar and Dunera area of Pathankot Tehsil of Pathankot
district, constitute massive grey to light grey, micaceous sandstones interbedded with
dark red to maroon clays grading upward in to micaceous sandstone with thick beds
of red clays. The rocks of Lower Siwaliks have poor yields of ground water. However
small springs of low discharge occur on the hill slopes they confine their position at
the bedding contacts where the argillaceous bed is underlain by arenaceous bed.
3.2 Basement Configuration
The Punjab Wedge i.e. the Achaean basement rocks either outcropping or occurring
under moderate thickness of alluvium in Lahore- Sargodha area in Pakistan
separates the Indus basin in the west, from the Punjab depression in the east. The
Punjab depression follows a NW-SE ESE and WNW direction in conformity with the
trends of the Siwalik Hills. The seismic surveys by the Oil and Natural Gas
Commission, (Data et al., 1964) have indicated that the basement rocks as well as

35
the sediments of the alluvium, dip gently towards the Himalayan foothills. The
basement, however, becomes deeper as the foothills are approached with a
corresponding increase in the thickness of the sediments. The maximum depth of
this depression, about 4500 m was at Dasuya in Punjab State. Furthermore, the
Punjab Basin which is fairly deep and wide in the northwestern portions becomes
narrower to the southwest and the basement topography rises gradually in that
direction. A basement high occurs in the subsurface corresponding to the present
water divide between the rivers of the Punjab and the Yamuna belonging to the
Ganga system. According to Rao (1973), it has been long assumed that two ridges
extending from Delhi, one to the northwest towards Lahore, and the other to north
towards Dehradun are concealed under the alluvium of the plains. These isolated
outcrops of Achaean rocks seen at Karana hills, and Sargodha extending in WNW
direction from Lahore has been taken to indicate that a subsurface ridge extends
under alluvium from Delhi in India to Lahore in Pakistan About 5km north of
Jagadhari (near Ambala in Haryana State), the basement was encountered at a
depth of 2800 m and it remains fairly flat at that level till the foothills (Nath, 1964,
Rao, 1973). This basement high, often referred to as Delhi- Lahore- Sargodha Buried
Ridge based on the inference that it represents the northwesterly extension of the
Aravalli Mountain system, trending NW - SE . As shown by the contours, the
northwestern flank of the ridge dips steeply and the depth to the bedrock increased
sharply in that direction. The contours also indicate that the slopes to the southwest
are less steep and the average depth of the bedrock over the crest of the ridge is
about 400-500 m. The basement in Punjab basin is known to slope from south to
north, and it is rather irregular and must locally contain hills and valleys. The
basement seems to have a shape of asymmetrical basin. Both longitudinal and
transverse faults are present in the basement, which forms a monocline with gentle
northeasterly dip and no major structural feature were noticed. Based on seismic
surveys carried out by O.N.G.C. indicated that the thickness of unconsolidated
sediments in the southern part of the State is 154 m and near Jalandhar it is about
3000m and increases towards north. Near Dasuya it is about 4500 m, being the
maximum. The basement rocks have been encountered in number of boreholes

36
drilled by CGWB. The basin is shallowest in the southern part, in Bathinda district
and the bed rock was encountered at a depth of 333 m below ground level at
Kumharwala. At 333 m depth hard clay top of Palana series was encountered and
416 m claystone of Nagaur series was encountered during drilling of borehole down
to 422 depth m. At Kheliwala, the bed rock comprised of Delhi quartzite was
encountered at a depth of 533 m below ground level and the borehole was drilled
down to 545 m. The thickness of unconsolidated material is maximum in the
northeastern part.
4.0 GROUND WATER REGIME MONITORING
The Central Ground Water Board, North Western Region, has established 1178
Ground water observation wells in Punjab State and Union Territory of Chandigarh
for monitoring water level. As on 31.3.2021 there were 1148 Ground Water
Observation Wells in Punjab which include 202 dug wells and 861 piezometers for
monitoring shallow aquifers and 85 deep Piezometers for monitoring the behaviour
ground water of deeper aquifers in Punjab. There are 30 observation wells in
Chandigarh (1 dug well and 21 Piezometers for monitoring phreatic aquifer) and 8
deep piezometers to monitor behaviour of water levels in deeper aquifers.
About 80% of the Ground water observation wells fall in the canal command areas of
various canal systems, the areas falling out of the major command is part of
Pathankot, Hoshiarpur, Nawanshahr, Ropar and SAS Nagar districts, parts of
Gurdaspur, Jalandhar and Ludhiana districts. The district wise details of Ground
water observation wells are given in Table 4.1 and location of these Ground water
observation wells is shown in Figure 4.2 and breakup is given in figure 4.1.

37
Table- 4.1 District wise ground water observation wells, Punjab State and
Chandigarh
S. No. Districts No. of GWOW as on 31.3.2021
DW PZ Total
1 Amritsar 11 61 72
2 Barnala 1 20 21
3 Bathinda 28 63 91
4 Faridkot 14 26 40
5 Fatehgarh 5 35 40
6 Fazilka 10 60 70
7 Ferozpur 2 31 33
8 Gurdaspur 15 59 74
9 Hoshiarpur 19 47 66
10 Jalandhar 6 79 85
11 Kapurthala 1 45 46
12 Ludhiana 10 89 99
13 Mansa 8 32 40
14 Moga 1 33 34
16 Muktsar 15 35 50
18 Pathankot 19 11 30
19 Patiala 6 67 73
20 Rupnagar 12 7 19
21 Sangrur 4 42 46
15 SAS Nagar 6 40 46
17 SBS Nagar 2 13 15
22 Tarntaran 7 51 58
Punjab State Total 202 946 1148
Chandigarh 1 29 30
Total Punjab & Chandigarh 203 975 1178

38
Fig 4.1: District Wise Number and type of Ground Water Observation Wells
0
10
20
30
40
50
60
No
. of
GW
OW
Districts
DISTRICTWISE NO. OF GWOWDug Well Piezometer

39
Fig 4.2: Location of ground water observation wells in Punjab State.

40
The area represented by single Ground water observation wells being monitored in
the state of Punjab and Chandigarh is given in Table 4.2 and depicted in figure 4.2.
Table 4.2. Area represented by single ground water observation well.
S. No. District Area
(Km2)
No. of
GWOW’s
As on
Density represented
by one GWOW’s
(area/no. of well)
31/3/2020 31/3/2021 31/3/2020 31/3/2021
Amritsar 2647 55 72 48 37
Barnala 1410 29 21 49 67
Bathinda 3385 84 91 40 37
Faridkot 1469 41 40 36 37
Fatehgarh 1180 41 40 29 30
Fazilka 3113 57 70 55 44
Ferozpur 2190 58 33 38 66
Gurdaspur 2635 72 74 37 36
Hoshiarpur 3365 64 66 53 51
Jalandhar 2632 76 85 35 31
Kapurthala 1632 46 46 35 35
Ludhiana 3767 54 99 70 38
Mansa 2171 36 40 60 54
Moga 2216 38 34 58 65
Muktsar 2615 44 50 59 52
Pathankot 929 20 30 46 31
Patiala 3218 46 73 70 44
Rupnagar 1369 38 19 36 72
Sangrur 3610 44 46 82 78
SAS Nagar 1093 30 46 36 24
SBS NAGAR 1267 26 15 49 84
Tarntaran 2449 53 58 46 42
Chandigarh 114 30 30 4 4

41
Fig4.3: District Wise Area Represented By Single Ground Water Observation Well
4.1 BEHAVIOUR OF WATER LEVEL
In order to assess the quantitative change in ground water resources, water levels
were monitored as a routine of four times in a year. The behaviour of water level in
June 2020, August 2020, October 2020 and January 2021 is discussed in following
paragraphs. The maximum and minimum water levels recorded in different season
is given below in Table 4.3.
Table4.3. The maximum and minimum water levels during all four seasons
Range June 2020 August 2020 October 2020 January 2021
Minimum
0.34 m bgl
Kundal
(Fazilka district)
0.34 m bgl
laduwala
(Fazilka District)
0.28 m bgl
Kundal
(Fazilka district)
0.24m bgl
Kundal
(Fazilka district)
Maximum
54.79 m bgl
Bassi Ballo
(Hoshiarpur
District)
54.01 m bgl
Bassi Ballo
(Hoshiarpur District)
56.73m bgl
Bassi Ballo
(Hoshiarpur
District))
56.90m bgl
Bassi Ballo
(Hoshiarpur
District))
0102030405060708090
Are
a (S
q. K
m)
Districts
Area represented by Single GWOW
2020 2021

42
It is evident from the above table-4.3 that shallowest water level conditions prevail in
southwest parts mainly in Fazilka district, Muktsar Pathankot districts. While
deepest water level conditions exist in the Hoshiarpur, Fatehgarh Sahib, SAS
Nagar, Sangrur, barnal and Patiala districts. The water level data of all four
seasons is discussed below and given in annexure-I:
4.1.1 JUNE 2020
The behavioral pattern of water level in June 2020 along with depth to water level
map (Fig. 4.4) is discussed below and data is presented in Annexure-I (Col. 4).
The depth to water level lies between 0.34 m bgl at Kundal in Fazilka district and
54.79 m bgl at Bassi Ballon in Hoshiarpur district. Very shallow water levels of 0-2
m bgl (causing water logging) occur in 3% of wells and cover nearly 1% area of the
state in isolated patches in Muktsar and Fazilka districts. Shallow water levels of 2-5
m bgl have been observed in 10% of the wells and 11% of the total area that lies in
south western parts of Muktsar, Fazilka, Faridkot, and in northern parts of
Gurdaspur and Pathankot districts and few isolated patches in north eastern parts.
These are mainly canal command areas and use canal water for their agricultural
needs. The water levels between 5-10 m bgl are observed in the northern parts
(Pathankot, Gurdaspur, Amritsar, and Hoshiarpur districts), south and south
western parts (Fazilka, Ferozpur, Faridkot, Muktsar, Bathinda and Mansa districts),
eastern parts of Ludhiana and Ropar district. About 18% of wells and 19% of the
area fall in this range. Moderately Deep water levels (10-20 m bgl) are predominant
and observed in 28% wells covering about 26% area of the State in central and
south - western parts. Deep water levels (20-40 m bgl) are also observed covering
parts of Amritsar, taran Taran, Jalandhar, Kapurthala, SBS Nagar (Nawashehar),
Bathinda, Moga, Ludhiana, Fatehgarh, Patiala, Sangrur, Barnala and SAS Nagar
districts and Chandigarh. It is observed in 42% wells covering about 38% area of
the State. Very deep water levels (>40 m bgl) are observed in 2% wells as patches
in Barnala, Sangrur, Patiala and SAS Nagar districts covering 3% area of the State.
Summarized details of depth to water level in different ranges are given in table
below.

43
Depth to water level range(m bgl)
Wells monitored Area covered
No. %age Sq. Km. %age
0-2 18 3 283 1
2-5 73 11 5026 10
5-10 134 19 8948 18
10-20 184 26 13998 28
20-40 264 38 21402 42
>40 24 3 819 2

44
Figure 4.4 Depth to Water level Map Punjab State & Chandigarh (UT) June 2020

45
4.1.2 August 2020
The behavioral pattern of water level in August 2020 along with depth to water level
map (Fig.4.5) is discussed below. The depth to water level lies between 0.34 m bgl
at Laduwala in Fazilka district and 54.01 mbgl at Bassi Ballon in Hoshiarpur District.
Very shallow water levels of 0-2 m bgl (causing water logging) occur in more than
10% of wells and cover 4% area of the state in south western parts in Mansa,
Muktsar, Faridkot, Fazilka and Pathankot, Gurdaspur, Hoshiarpur and Roopnagar
districts. Shallow water levels of 2-5 m bgl have been observed in 14% of the wells
and more than 12% of the total state area that lies in south western parts of
Muktsar, Fazilka, Faridkot districts and as isolated patches in Gurdaspur,
Pathankot, SAS Nagar, Fatehgarh Sahib and Rupnagar districts. The water levels
between 5-10 m bgl are observed in the northern parts (Pathankot, Gurdaspur and
Hoshiarpur districts), south and south western parts (Fazilka, Ferozpur, Faridkot,
Muktsar, Bathinda and Mansa districts), eastern parts of Ropar, Fatehgarh Sahib
and SAS Nagar districts. About 17% of wells and 13% of the area fall in this range.
Deep water levels (10-20 m bgl) are predominant and observed in 26% wells
covering about 28% area of the State covering almost all districts except barnala,
Pathankot, Sangru, Muktsar districts. Very deep water levels (20-40 m bgl) are also
observed covering parts of Jalandhar, Moga, SBS Nagar, Ludhiana, Kapurthala,
Amritsar, Taran taran, Ferozpur, Fatehgarh Sahib, Patiala, Sangrur, Barnala,
Chandigarh, SAS Nagar and Bathinda districts and observed in 26% wells covering
about 34% area of the State. Very deep water level (>40m bgl) is observed in 7%
wells and 9% area fallingas patches in SAS Nagar, Moga, Ludhiana, Patiala,
Sangrur, Patiala and Barnala districts. Summarized details of depth to water level in
different ranges are given in table below.
Depth to water level range
(m bgl)
Wells monitored Area covered
No. %age Sq. Km. %age
0-2 28 10 1706 4
2-5 39 14 5946 12
5-10 48 17 6740 13
10-20 74 26 14196 28
20-40 77 26 17319 34
>40 21 7 4568 9

46
Figure 4.5 Depth to Water level Map Punjab State & Chandigarh (UT) August 2020

47
4.1.3 OCTOBER 2020
The behavioral pattern of water level in October 2020 along with depth to water
level map (Fig.4.6) is discussed below. The depth to water level lies between 0.28
m bgl at Kundal in Fazilka district and 56.73 mbgl at Bassi Ballon in Hoshiarpur
District.
Very shallow water levels of 0-2 m occur in around 3% of wells and cover more than
4% area of the state in south western parts in Muktsar and Faridkot districts and as
isolated patches in Pathankot district. Shallow water levels of 2-5 m have been
observed in 10% of the wells and 12% of the total area that lies in south western
parts of Muktsar, Faridkot, and Fazilka and in northern parts of Pathankot and
Gurdaspur district; and few isolated patches in north and south eastern parts of the
state. The area in south western parts is mainly canal command and use canal
water for their agricultural needs. The water levels between 5-10 m are observed in
the northern parts (Pathankot, Gurdaspur, Amritsar, Kapurthala and Hoshiarpur
districts), south and south western parts (Fazilka, Ferozpur, Faridkot, Muktsar,
Bathinda and Mansa districts), eastern parts of Ropar, Nawashehar, Ludhiana and
SAS Nagar districts. About 15% of wells and 16% of the area fall in this range.
Deep water levels (10-20 m) are observed in 27% wells covering about 25% area of
the State dominantely in central and north-western parts. Very deep water levels
(20-40 m) are observed in parts of Amritsar, Taran taran, Jalandhar, Kapurthala,
Barnala, Moga, Ludhiana, Fatehgarh Sahib, Patiala, Sangrur, SAS Nagar,
Bathinda, Mansa, Faridkot, ferozpur and Nawanshahr districts, Chandigarh. It is
observed in 41% wells covering about 31% area of the State. Very deep water
levels (>40 m) are also observed in small patches in Sangrur Barnala, Patiala,
Mansa, Jalandhar and SAS Nagar Districts, Chandigarh in 5% wells covering about
6% area of the State. Summarized details of depth to water level in different ranges
are given in table below.

48
Depth to water level range (m bgl)
Wells monitored Area covered
No. %age Sq. Km. %age
0-2 37 4 1500 3
2-5 104 12 4798 10
5-10 135 16 7443 15
10-20 210 25 13578 27
20-40 303 37 20809 41
>40 47 6 2348 5

49
Figure 4.6 Depth to Water level Map Punjab State & Chandigarh (UT) October 2020

50
4.1.4 January 2021
The behavioral pattern of water level in January 2021 along with depth to water
level map (Fig.4.7) is discussed below and data is presented in Annexure-I (Col. 7).
The depth to water level lies between 0.24 m bgl at Kundal in Fazilka district and
56.90 mbgl at Bassi Ballon in Hoshiarpur District. Very shallow water levels of 0-2 m
(causing water logging) occur in 8% of wells and cover nearly 3% area of the state
as patches in Muktsar, Fazilka, Pathankot and Rupnagar districts. Shallow water
levels of 2-5 m have been observed in 15% of the wells and 11% of the total area
that lies in south western parts of Muktsar, Fazilka, Faridkot, and in northern parts
of Gurdaspur & Pathankot districts and few isolated patches in Rupnagar and SAS
nagar districts. The water levels between 5-10 m are observed in the northern parts
(Pathankot, Gurdaspur, Amritsar, Hoshiarpur districts), south and south western
parts (Fazilka, Ferozpur, Faridkot, Muktsar, Bathinda and Mansa districts), eastern
parts of Rupnagar, Nawashehar and SAS Nagar districts. About 24% of wells and
17% of the area fall in this range. Moderately Deep water levels (10-20 m) are
observed in 24% wells covering about 31% area of the State in parts of Gurdaspur,
Amritsar, Tarntaran, Kapurthala, Jalandhar, Hoshiarpur, Nawanshahr, Rupnagar,
Fatehgarh Sahib, Ludhiana, Moga, Ferozpur, Bathinda and Mansa Districts. Deep
water levels (20-40 m) are observed predominantly in Jalandhar, Kapurthala,
Nawanshahr, Fatehgarh Sahib, Moga, Barnala, Ludhiana, Patiala and Sangrur
districts and observed in 25% wells covering about 34% area of the State. Very
deep water levels (>40 m) are also observed as small patches in Sangrur, Patiala
and Barnala districts nd observed in 4% wells covering 4% area of the State.
Depth to water level range (m bgl)
Wells monitored Area covered
No. %age Sq. Km. %age
0-2 24 8 1621 3
2-5 44 15 5483 11
5-10 72 24 8489 17
10-20 72 24 15697 31
20-40 75 25 17128 34
>40 10 4 2058 4

51
Figure 4.7 Depth to Water level Map Punjab State & Chandigarh (UT) January 2020

52
4.2 SEASONAL FLUCTUATIONS:
On comparing Water level data of current measurement with previous measurement
data is termed as seasonal water level fluctuations. The water level data of all four
measurements are compared to previous measurement and seasonal water level
fluctuations are determined.
4.2.1 JANUARY 2020 - JUNE 2020
The behavioral pattern of this seasonal fluctuation is discussed along with
fluctuation map (Fig. 4.8) below and the data are presented in Annexure-II..
The seasonal fluctuation shows that there is a general decline of water levels in
69% of wells monitored and covering 70% area of the State. The decline has been
observed in all districts except some isolated patches scattered over the state.
Water level decline in the range of 0-2 m is observed in 48% of wells and 52% of
area. Water level decline in the range of 2-4 m is observed in 12% of wells and 14%
of area. Water level decline of >4m is observed in 10% of wells and 3% of area as
isolated patches in Pathankot, Gurdaspur, Kapurthala, SBS Nagar,Sangrur and
Patiala Districts.
The water level rise has been recorded in 31% of wells monitored and covering
30% area of the State. Water level rise in the range of 0-2 m is observed in 21% of
wells and 25% of the area. Water level rise 2-4m is observed in 5% wells and 3% of
area during the period. Water level rise of >4m is observed in 4 % wells and 3 %
area as small patches in Ferozpur, Jalandhar, Kapurthala, Bathinda,Fatehgarh
Sahib, Moga district and Chandigarh.
Water Level Fluctuation
Range (m)
Wells Monitored Area Covered
No. %age Sq. Km. %age
Decline 0-2 106 48 26259 52
2-4 26 12 7103 14
>4.0 21 10 1585 3
Rise 0-2 45 21 12563 25
2-4 11 5 1646 3
>4.0 9 4 1320 3

53
Figure 4.8 Water level Fluctuation Map Punjab State & Chandigarh (UT) January 2020 and June 2020

54
4.2.2 JUNE 2020 - AUGUST 2020
Water level data of August 2020 is compared with water level data of June 2020 to
determined seasonal water level fluctuations. The behavioral pattern of this
seasonal fluctuation is discussed along with fluctuation map (Fig. 4.9) below and
the data are presented in Annexure-II..
The seasonal fluctuation shows decline of water levels in 53% of wells monitored
and covering 63% area of the State. The decline has been observed in all districts
of the state. Water level decline in the range of 0-2 m is observed in 36% of wells
and 42% of area. Water level decline of 2-4m is observed in 9% of wells and 12%
of area. Water level decline more than 4m is observed in 8% wells and 9% of area
as patches in Moga, Taran Taran, Kapurthala, Jalandhar, Ferozpur, Fazilka,
Bathinda, Barnala, SAS Nagar, SBS Nagar and Patiala during the period.
The water level rise has been recorded in 47% of wells monitored and covering
33% area of the State. Water level rise in the range of 0-2 m is observed in 29% of
wells and 29% of the area in all districts except Taran TAran, Barnala, Moga and
Patiala District. Water level rise in the range of 2-4m is observed in 8% wells and
5% of area in parts of Pathankot, Gurdaspur, Hoshiarpur, SBS NAgar, Rupnagar,
Bathinda, Muktsar, mansa, Fazilka, SAS Nagar and Fatehgarh Sahib Districts
during the period. Water level rise more than 4m is observed in 6% wells and 3% of
area as patches in Fazilka, Bathinda, Pathankot, Hoshiarpur and Fatehgarh Sahib
Districts during the period.
Water Level Fluctuation
Range (m)
Wells Monitored Area Covered
No. %age Sq. Km. %age
Decline
0-2 95 36 21157 42
2-4 23 9 6079 12
>4.0 20 8 4611 9
Rise
0-2 88 33 14460 29
2-4 20 8 2504 5
>4.0 15 6 1665 3

55
Figure 4.9 Water level Fluctuation Map Punjab State & Chandigarh (UT) June 2020 and August 2020

56
4.2.3 June 2020 - October 2020
Water level data of October 2020 is compared with Water level data of June 2020 to
determine the seasonal water level fluctuation. The behavioral pattern of this
seasonal fluctuation is discussed along with fluctuation map (Fig. 4.10) below and
the data are presented in Annexure-II.
The seasonal fluctuation shows that there is a general decline of water levels in
59% of wells monitored and covering 60% area of the State. The fall has been
observed dominantely in southern, southeastern and central part of the state. Water
level decline in the range of 0-2 m is observed in 42% of wells and 42% of area.
Water level decline in the range of 2-4 m is observed in 12% of wells and 14% of
area. Whereas, water level decline of >4m is observed in 5% of wells and 4% of
area as isolated patches in Bathinda, Ferozpur, Mansa, Sangrur, Patiala, SAS
Nagar, SBS Nagar, Jalandhar and Barnala districts.
The water level rise has been recorded in 41% of wells monitored and covering
40% area of the State. The rise in water level has been reported in north, NE and
south western parts of the state. Water level rise in the range of 0-2 m is observed
in 31% of wells and 36% of the area. Water level rise 2-4 m is observed in 7% wells
and 3% of area during the period. Whereas, water level rise of >4m is observed in
3% of wells and 1% of area covering isolated patches in Patiala, Fazilka, Faridkot,
Bathinda, Pathankot, Hoshiarpur and SBS Nagar districts.
Water Level Fluctuation
Range (m)
Wells Monitored Area Covered
No. %age Sq. Km. %age
Decline 0-2 278 42 21284 42
2-4 78 12 6889 14
>4.0 34 5 1971 4
Rise 0-2 204 31 18412 36
2-4 44 7 1424 3
>4.0 20 3 496 1

57
Figure 4.10 Water level Fluctuation Map Punjab State & Chandigarh (UT)
June 2020 and October 2020

58
4.2.4 June 2020 - January 2021
Water level data of January 2021 is compared with Water level data of June 2020 to
determine the seasonal water level fluctuation. The behavioral pattern of this
seasonal fluctuation is discussed along with fluctuation map (Fig. 4.11) below and
the data are presented in Annexure-II.
The seasonal fluctuation between June 2020 and January 2021 shows that there is
a general decline of water levels in 44% of wells monitored and covering 50% area
of the State. The decline has been observed mostly in central, southern and south
eastern districts. Water level decline in the range of 0-2 m is observed in 35% of
wells and 42% of area. Water level decline in the range of 2-4 m is observed in 5%
of wells and 5% of area. Water level decline of >4m is observed in 4% of wells and
covering 3% of area during the period as isolated patches in Ferozpur, Jalandhar,
Rupnagar, Bathinda and Patiala districts.
The water level rise has been recorded in 59% of wells monitored and covering
50% area of the State. Water level rise in the range of 0-2 m is observed in 40% of
wells and 43% of the area. Water level rise 2-4m is observed in 10% wells and 5%
of area. Water level decline of >4m is observed in 6% of wells and covering 2% of
area during the period as isolated patches in Faridkot, Bathinda, Fatehgarh Sahib,
Patiala, Pathankot and Amritsar districts.
Water Level Fluctuation
Range (m)
Wells Monitored Area Covered
No. %age Sq. Km. %age
Decline 0-2 96 35 21763 42
2-4 14 5 2367 5
>4.0 11 4 1351 3
Rise 0-2 108 40 21643 43
2-4 26 10 2564 5
>4.0 18 6 788 2

59
Figure 4.11 Water level Fluctuation Map Punjab State & Chandigarh (UT) June 2020 and January 2021

60
4.3 ANNUAL WATER LEVEL FLUCTUATIONS
In order to know the impact of rainfall and ground water withdrawal during last one
year, annual water level data for given period in current year is compared with water
level data of corresponding period of last year and annual water level fluctuations
are determined.
4.3.1 JUNE 2019 - JUNE 2020
The behavioral pattern of annual fluctuation in Premonsoon season is discussed in
the following paragraph along with fluctuation map (Fig. 4.12) below and the data
are presented in Annexure-III.
The annual fluctuation depicts general decline of water levels in 67% of wells
monitored and covering 70% area of the State. The decline has been observed
dominantely in all the districts. Water level decline in the range of 0-2 m is observed
in 47% of wells and 56% of the area. Water level decline in the range of 2-4 m is
observed in 14% of wells and 10% of the area. Whereas, the water level decline of
>4m is observed in 6% of wells and 3% of the area during the period as isolated
patches in Fazilka, Faridkot, Amritsar, SBS Nagar, Patiala, Barnala and Bathinda
district.
The water level rise has been recorded in 33% of wells monitored and covering
30% area of the State. The water levels rise has been observed as small patches in
Pathankot, Amritsar, Gurdaspur, Hoshiarpur, Jalandhar, SBS Nagar, Kapurthala,
Ferozpur, Moga, Fazilka, Bathinda, Mansa, Muktsar, Ludhiana, fatehgarh Sahib,
SAS Nagar and Rupnagar district. Water level rise in the range of decline 0-2 m is
observed in 28% wells and 25% of area. Water level rise 2-4m is observed in 3%
wells and 4% of area. The water level rise of >4m is observed in 2% wells and 1%
of area the area during the period as isolated patches in Ferozpur, Hoshiarpur,
Bathinda, Moga, Jalandhar and Bathinda district.

61
Water Level Fluctuation Range (m)
Wells Monitored Area Covered
No. %age Sq. Km.
%age
Decline
0-2 227 47 28558 56
2-4 68 14 5443 11
>4.0 29 6 1300 3
Rise
0-2 137 28 12462 25
2-4 17 3 1994 4
>4.0 11 2 719 1

62
Figure 4.12 Water level Fluctuation Map Punjab State & Chandigarh (UT) June 2019 and June 2020

63
4.3.2 AUGUST 2019 - AUGUST 2020
The behavioral pattern of annual fluctuation in Monsoon season is discussed in the
following paragraph along with fluctuation map (Fig. 4.13) below and the data are
presented in Annexure-III.
The annual fluctuation depicts general decline of water levels in 45% of wells monitored
and covering 70% area of the State. The decline has been observed dominantely in eastern
and south eastern parts of the Punjab. Water level decline the range of 0-2 m is observed
in 37% of wells and 37% of the area. Water level decline in the range of 2-4 m is observed
in 4% of wells and 7% of the area, whereas, water level decline >4m is observed in more
than 4% of wells and 8% of the area during the period as elongated patche in Ferozpur,
Taran taran, Amritsar districts and as isolated patches in Jalandhar, Bathinda, Barnala,
Patiala and SBS Nagar districts.
The water level rise has been recorded in 55% of wells monitored and covering
47% area of the State. The water levels rise has been observed in Gurdaspur,
Amritsar, Hoshiarpur, Muktsar, Fazilka, Ferozpur, Kapurthala, Jalandhar,
Nawanshahr, Rupnagar, SAS Nagar, Sangrur, Fatehgarh Sahib, Pathankot districts
and Chandigarh. Water level rise in the range of decline 0-2 m is observed in 45%
wells and 36% of area. Water level rise of more than 2-4m is observed in 7% wells
and 9% of area, whereas, water level rise >4m is observed in more than 3% of wells
and 2% of the area during the period as isolated patch in Hoshiarpur, Pathankot
and Fatehgarh Sahib.
Water Level Fluctuation Range (m)
Wells Monitored Area Covered
No. %age Sq. Km.
%age
Decline 0-2 74 37 18883 37
2-4 9 4 3497 7
>4.0 9 4 4225 8
Rise 0-2 91 45 18147 36
2-4 14 7 4612 9
>4.0 17 3 1112 2

64
Figure 4.13 Water level Fluctuation Map Punjab State & Chandigarh (UT) August 2019 and August 2020

65
4.3.3 October 2010 - October 2020 The behavioral pattern of annual fluctuations Post-Monsoon season is discussed in the
following paragraph along with fluctuation map (Fig. 4.14) below and the data are
presented in Annexure-III.
The annual fluctuation depicts general decline of water levels in 68% of wells monitored
and covering 68% area of the State. The decline has been observed in all trhe districts of
the states dominantely in central, southern and south eastern parts of the state. Water level
decline the range of 0-2 m is observed in 54% of wells and 56% of the area. Water level
decline in the range of 2-4 m is observed in 10% of wells and 10% of the area, whereas,
water level decline >4m is observed in 4% of wells and 2% of the area during the period.
The water level rise has been recorded in 32% of wells monitored and covering
32% area of the State. The water levels rise has been observed as small isolated
patches in all the districts but occur dominately in south western Punjab. Water level
rise in the range of rise 0-2 m is observed in 27% wells and 29% of area. Water
level rise of more than 2-4m is observed in 3% wells and 2% of area, whereas,
water level rise >4m is observed in 2% of wells and 1% of the area during the
period as isolated patches in Faridkot, Barnala, Patiala, taran taran and Hoshiarpur.
Water Level Fluctuation Range (m)
Wells Monitored Area Covered
No. %age Sq. Km.
%age
Decline 0-2 331 54 28078 56
2-4 69 10 4829 10
>4.0 30 4 1243 2
Rise 0-2 180 27 14822 29
2-4 23 3 922 2
>4.0 14 2 582 1

66
Figure 4.14 Water level Fluctuation Map Punjab State & Chandigarh (UT) October 2019 and October 2020

67
4.3.4 January 2020 - January 2021
The behavioral pattern of annual fluctuations is discussed in the following paragraph along
with fluctuation map (Fig. 4.15) below and the data are presented in Annexure-III.
The annual fluctuation shows that there is a general decline of water levels in 64%
of wells monitored and covering 70% area of the State. The decline has been
observed dominantely in western, central and southern eastern parts of the state.
Water level decline the range of 0-2 m is observed in 52% of wells and 53% of the
area. Water level decline in the range of 2-4 m is observed in 6% of wells and 9% of
the area. The water level decline of >4m is observed in 6% of wells and 8% of the
area as isolated patches in Sangrur, Hoshiarpur, SBS Nagar, Rupnagar, Bathinda,
Mansa and Patiala Districts during the period.
The water level rise has been recorded in 36% of wells monitored and covering
30% area of the State. The water levels rise has been observed dominantely in
northern, south western part of the state. Water level rise in the range of 0-2 m is
observed in 30% wells and 27% of area. Water level rise 2-4m is observed in 2%
wells and 2% of area. The water level rise of >4m is observed in 4% wells covering
1% area as isolated patches in Kapurthala, Jalandhar, Fatehgarh Sahib and
chandigarh.
water level fluctuation range (m)
Wells monitored Area covered
No. %age Sq. Km.
%age
Decline 0-2 109 52 26907 53
2-4 13 6 4454 9
>4.0 13 6 4164 8
Rise 0-2 63 30 13615 27
2-4 5 2 828 2
>4.0 8 4 508 1

68
Figure 4.15 Water level Fluctuation Map Punjab State & Chandigarh (UT) January 2020 and January 2021

69
4.4 DECADAL MEAN WATER LEVEL FLUCTUATION
Changes in water level behaviour since last one decade are determined using
decadal mean data. Water level mean of past one decade for each ground water
observation well is computed and compared with the respective water level data of
the given monitoring to determine the decadal mean water level fluctuation.
4.4.1 Mean of June (2010:2019) & June 2020
The behavioral pattern of decadal mean fluctuations during of aforesaid period is
discussed in the following paragraph along with fluctuation map (Fig. 4.16). Water
level fluctuations data are given in the Annexure-IV..
The decadal mean fluctuations show that decline in 79% of observation wells
monitored covering about 84% area of the state. The decline has been observed in
all the districts of the state but predominanently in central and southern parts of the
state. The decline of 0-2 m has been observed in about 34% of wells and 38% of
area. Water level decline of 2-4 m is observed in 21% of the wells and 24% of the
area. Water level decline of >4m is observed in 24% of the wells and 22% of area.
Rise in water level has been observed in 21% of wells and 16% of area as small
isolated patches in all districts predominantely in Pathankot, Gurdaspur, Hoshiarpur,
Nawanshahr, Ludhiana, Rupnagar and SAS Nagar districts and Chandigarh. Water
level rise in the range of 0-2 m is observed in 16% of wells and 13% of the area.
Water level rise of 2-4m is observed in 3% of wells and 2% of the area. Water level
rise of >4m is observed in 2% of wells and 1% of the area.
Water Level Fluctuation
Range (m)
Wells Monitored Area Covered
No. %age Sq. Km. %age
Decline 0-2 246 34 19012 38
2-4 101 21 12243 24
>4.0 90 24 11350 22
Rise 0-2 139 16 6394 13
2-4 14 3 993 2
>4.0 4 2 484 1

70
Figure 4.16 Water level Fluctuation Map Punjab State & Chandigarh (UT) Decadal Mean (2010-19) – June 2020

71
4.4.2 Mean of August (2010:2019) & August 2020
The behavioral pattern of decadal mean fluctuations of aforesaid period is
discussed in the following paragraph along with fluctuation map (Fig. 4.17). Water
level fluctuations data are given in the Annexure-IV.
The decadal mean fluctuations show that decline in 64% of observation wells
monitored covering about 75% area of the state. The decline in the range of 2-4 and
> 4m is observed predominantely in south eastern and central parts of the state.
The decline of 0-2 m has been observed in about 29% of wells and 30% of area.
Water level decline of 2-4 m is observed in 14% of the wells and 18% of the area.
Water level decline of >4m is observed in about 21% of the wells and 28% of area
covering Moga, Bathinda, Barnala, Mansa, Sangrur, Patiala, Fazilka, Taran Taran,
Jalandhar, Chandigarh and SBS Nagar districts.
Rise in water level has also been observed in 36% of wells and 25% of area in
Pathankot, Gurdaspur, Hoshiarpur, SBS Nagar, Roopnagar, SAS Nagar, FAtehgarh
Sahib, Fazilka, Muktsar, Bathinda, Mansa and Faridkot districts. Water level rise in
the range of 0-2 m is observed in 28% of wells and 20% of the area. Water level
rise of 2-4 m is observed in 5% of wells and 3% of the area. Water level decline of
>4m is observed in 3% of the wells and 2% of the area occurring as patches in
Fatehgarh Sahib, Rupnagar, SAS Nagar, Hoshiarpur and Pathankot districts.
Summarized details of seasonal water level fluctuation in different ranges are given
in table below.
Water Level Fluctuation Range (m) Wells Monitored Area Covered
No. %age Sq. Km. %age
Decline 0-2 89 29 14893 30
2-4 52 14 9113 18
>4.0 36 21 14080 28
Rise 0-2 67 28 9882 20
2-4 13 5 1285 3
>4.0 8 3 1223 2

72
Figure 4.17 Water level Fluctuation Map Punjab State & Chandigarh (UT) Decadal Mean (2010-19) – August 2020

73
4.4.3 Decadal Mean October (2010:2019) & October 2020
The behavioral pattern of decadal mean fluctuations of aforesaid period is
discussed in the following paragraph along with fluctuation map (Fig. 4.18). Water
level fluctuations data are given in the Annexure-IV.
The decadal mean fluctuation shows decline in 68% of observation wells monitored
covering about 67% area of the state. The decline has been observed dominantely
in central, Northern and southern eastern part of the state. The decline of 0-2 m has
been observed in about 51% of wells and 52% of area. Water level decline of 2-4 m
is observed in 12% of the wells and 12% of the area. Water level decline of >4m is
observed in about 5% of the wells and 3% of area as isolated patches in Jalandhar,
Moga, Bathinda, Barnala, SBS Nagar, Taran Tran, Gurdaspur and Patiala districts.
Rise in water level has also been observed in 32% of wells and 33% of area. The
rise has been observed in small patches in whole of the state. The districts showing
rise in water level as isolated small patches in all the districts of the state. Water
level rise is dominately observed in south western part of the state in Fazilka,
Muktsar, Bathinda and Faridkot districts. Water level rise in the range of 0-2 m is
observed in 26% of wells and 29% of the area. Water level rise of 2-4 m is observed
in 4% of wells and 3% of the area, whereas, water level rise >4m is observed in 2%
of wells and 1% of the area during the period.
Water Level Fluctuation
Range (m)
Wells Monitored Area Covered
No. %age Sq. Km. %age
Decline 0-2 402 51 26885 52
2-4 92 12 5817 12
>4.0 36 5 1539 3
Rise 0-2 207 26 14489 29
2-4 31 4 1265 3
>4.0 14 2 481 1

74
Figure 4.18 Water level Fluctuation Map Punjab State & Chandigarh (UT) Decadal Mean (2010-19) – October 2

75
4.4.4 Decadal Mean of January (2011:2020) & January 2021
The behavioral pattern of decadal mean fluctuations of aforesaid period is
discussed in the following paragraph along with fluctuation map (Fig. 4.19). Water
level fluctuations data are given in the Annexure-IV.
The decadal mean fluctuations show that decline in 71% of observation wells
monitored covering about 83% area of the state. The decline has been observed in
all districts in the state. The decline of 0-2 m has been observed in about 37% of
wells and 40% of area. Water level decline of 2-4 m is observed in 20% of the wells
and 21% of the area. Water level decline of >4m is observed in about 14% of the
wells and 22% of area. It is observed mainly in Moga, Barnala, Ludhiana,
Jalandhar, Kapurthala, Sangrur, Patiala, Mansa, Rupnagar, Hoshiarpur, Bathinda,
Ferozpur and Taran Taran district.
Rise in water level has also been observed in 29% of wells and 17% of area
dominantely in Pathankot, Gurdaspur, Mansa, Fazilka, Muktsar and Bathinda
districts. Rise in water level is also observed as isolated small patches in Amritsar,
Hoshiarpur, Jalandhar, Kapurthala, Rupnagar, fatehgarh Sahib, Ludhiana, Patiala,
Faridkot and SAS Nagar districts. Water level rise in the range of 0-2 m is observed
in 21% of wells and 14% of the area. Water level rise of 2-4m is observed in 5% of
wells and 2% of the area. Water level rise >4m is observed in 3% of wells and 1%
of the area during the period as isolated patches in Pathankot, Bathinda and
Fatehgarh Sahib District.
Water Level Fluctuation Range (m)
Wells Monitored Area Covered
No. %age No. %age
Decline 0-2 97 37 20351 40
2-4 51 20 10802 21
>4.0 37 14 11112 22
Rise 0-2 55 21 6893 14
2-4 12 5 977 2
>4.0 7 3 341 1
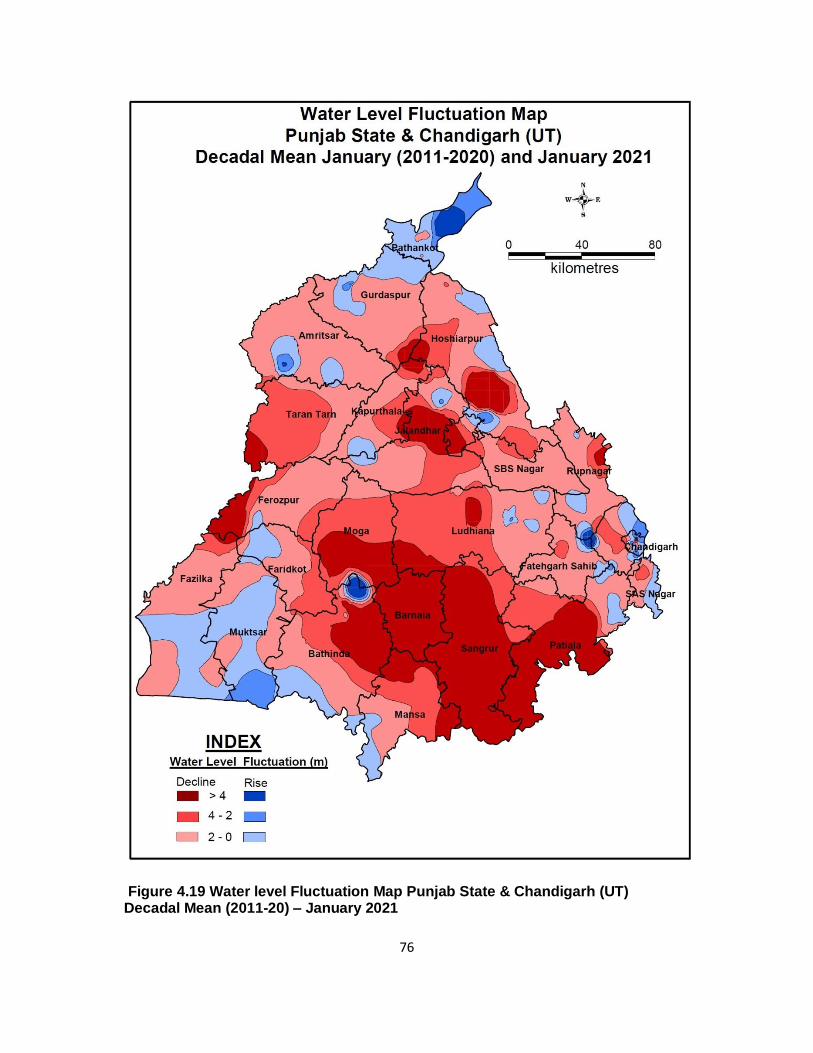
76
Figure 4.19 Water level Fluctuation Map Punjab State & Chandigarh (UT) Decadal Mean (2011-20) – January 2021

77
4.5 GROUND WATER TABLE ELEVATION AND FLOW DIRECTIONS
Ground water flows from areas of high hydraulic head (high water-level elevation) to
areas of low head (low water level elevation). Because hydraulic heads vary
laterally and vertically in a ground-water system, ground-water movements
generally have a vertical as well as a horizontal component. Contour maps of heads
in aquifers are constructed to determine the horizontal direction of flow. A contour
map of the water table represents the elevation of the top of the saturated part of
the uppermost unconfined aquifer.
The horizontal direction of ground-water flow is generally perpendicular to the
contour lines and water flows down the slope of the contours in a manner
analogous to the flow of water down the slope of the land surface. Water-table
maps are prepared from water levels measured in ground water observation wells
the elevation of the water-table surface.
4.5.1 June 2020
The water table elevation (June 2020) contours have a maximum value of 641.52 m
amsl rising in the northeastern parts in Dhar Kalan Block of Pathankot district along
the Himalayas to 141.85 m AMSL in southwestern part in the Punjab plains
(Nathana Block in Bathinda district). The map helps in determining the hydraulic
gradient and direction of ground water flow. The general ground water flow direction
follows the natural slope. There is not much change in the ground water flow
direction which still remains northeast to southwest, but the ground water gradient
between contour level 200 m and 141 m in southwestern part of the state has
become gentle indicating slowing of ground water movement resulting in spreading
of water logged areas to adjoining areas of other districts. The water table elevation
map for June 2020 is shown in Map (Fig. 4.20).

78
Figure 4.20 Water level Elevation Map June 2020 Punjab State and Chandigarh (UT)

79
5.0 GROUND WATER QUALITY IN PUNJAB
Evaluation of ground water quality through concentration of its physical, chemical
and biological parameters is essential to determine its suitability for the intended
use. It helps not only in finding its suitability; it also helps in taking effective
remedial measures for its improvement on scientific lines. In most of rural and
semi-urban areas of Punjab State, ground water is a major resource for drinking
and irrigation uses especially in areas where surface water is inadequate or
unavailable. Acknowledging the importance of this aspect of ground water,
C.G.W.B., N.W.R., Chandigarh annually monitors the ground water quality through
dedicated Ground Water Monitoring Stations consisting of dug wells and/or hand
pumps of shallow depth.
5.1 Sampling & Analysis
During June 2020, 323 nos. ground water samples were collected from GWMS
spread uniformly over 22 districts of Punjab and no specific treatment such as
acidification or filtration was given at the time of sampling. The water samples were
analyzed for major cations (Ca, Mg, Na, K) and anions (CO3, HCO3, Cl, NO3, SO4)
in addition to pH, EC, F, SiO2, PO4 and TH as CaCO3 in Regional Chemical
Laboratory by following ‘Standard analytical procedures’ as given in APHA 2017.
Results of chemical analysis of water samples are placed in Annexure-I. Fig-1
depicts the Sampling location points of Punjab state.
5.2 Composition of Water
Chemical analysis shows that the ground water is slightly to moderately alkaline in
nature. The district-wise concentration range of various chemical components in
ground water is depicted in Table 1.

80
Fig-5.1: Map showing location of sampling stations in Punjab

81
Table-5.1 : Range of Chemical Constituents in Groundwater of Punjab State
District No. of
Samples
Min/Max pH EC* in
µS/cm at 250C
CO3 HCO3 Cl SO4 NO3 F PO4 Ca Mg Na K SiO2 TH SAR RSC
in meq/l
mg/l
Amritsar 11 Min 8.32 307 12 159 6.9 7.0 0.1 0.22 <0.10 8.0 10 28 2.5 18 110 1.0 0.0
Max 8.82 1390 96 659 90 195 38 0.55 <0.10 32 56 315 13 25 260 8.5 8.8
Barnala 3 Min 8.34 1032 48 403 63 28 20 0.42 <0.10 4.0 36 178 6.4 20 200 5.0 4.6
Max 8.75 1144 84 537 76 52 30 1.45 <0.10 20 51 220 11 23 240 6.8 6.4
Bathinda 27 Min 8.10 325 0.0 61 14 38 0.9 0.25 <0.10 4.0 7.3 10 3.3 18 70 0.3 -9.8
Max 9.10 5015 276 757 625 1335 400 9.20 1.00 100 126 1160 305 28 570 32.5 11.4
Faridkot 21 Min 8.10 360 0.0 122 35 112 0.2 0.1 <0.10 4.0 17 142 3.8 19 100 3.8 -16.6
Max 9.05 6970 252 830 1091 2070 214 3.00 <0.10 120 180 1380 180 26 1041 26.9 15.6
Fatehgarh Sahib
11 Min 8.12 542 0 171 14 5.0 0.44 0.17 <0.10 12 24 50 6.1 16 130 1.4 -1.2
Max 8.85 1942 120 683 104 190 120 1.00 <0.10 36 71 210 380 22 320 6.6 11.4
Fazilka 15 Min 7.85 450 0 85 21 35 2.17 0.15 <0.10 4.0 10 30 6.7 19 50 0.9 -18
Max 8.85 8375 192 622 1417 2310 260 2.60 <0.10 265 207 1775 300 29 1061 31.2 15.6
Firozpur 7 Min 8.30 566 24 134 14 28 2.0 0.25 <0.10 4.0 4.9 42 2.6 21 30 1.1 -1
Max 9.00 1900 192 696 118 257 34 1.80 0.8 32 68 470 11 26 300 37.3 17.2
Gurdaspur 18 Min 8.12 184 0.0 85 6.9 5 0.09 0.15 <0.10 12 0.0 10 1.5 19 100 0.4 -3.4
Max 8.80 1225 168 622 160 170 110 0.70 <0.10 76 73 250 160 25 370 10.9 9.8
Hoshiarpur 26 Min 7.70 203 0.0 49 6.9 5.0 0.2 0.11 <0.10 12 4.9 11 0.93 15 80 0.4 -7
Max 8.85 1680 60 366 195 272 290 0.80 0.24 132 61 170 16 22 580 4.4 2.6
Jalandhar 15 Min 8.11 300 0.0 134 6.9 5.0 0.4 0.18 <0.10 12 12 6.7 1.6 18 90 0.2 -2.8
Max 8.84 905 132 293 125 88 140 0.90 <0.10 44 49 175 11 27 280 6.2 4.2
Kapurthala 8 Min 8.35 355 24 159 6.9 7.5 0.38 0.19 <0.10 8.0 12 45 2.0 20 70 1.7 0.6
Max 8.65 940 84 232 63 38 65 0.45 <0.10 24 36 150 6.9 24 180 6.5 4
Ludhiana 9 Min 7.64 252 0.0 49 6.9 5.0 1.15 0.14 <0.10 12 5.0 7.8 0.6 20 120 0.3 -4
Max 8.80 1296 180 525 90 186 145 0.70 <0.10 68 66 255 185 26 370 8.0 10
Mansa 10 Min 7.70 272 0.0 85 6.9 50 0.25 0.20 <0.10 16 15 5.3 1.9 18 160 0.2 -36.6
Max 8.90 6295 156 635 1153 1420 520 4.00 <0.10 317 272 730 312 26 1912 16.9 9
Moga 7 Min 8.40 470 60 122 6.9 22 0.99 0.28 <0.10 4.0 10 27 2.9 20 80 0.8 -0.6
Max 8.92 1412 156 564 90 158 54 1.78 <0.10 20 75 295 8.5 28 320 13.1 9.4
Muktsar 10 Min 7.52 266 0.00 110 14 35 1.4 0.30 <0.10 12 19 13 2.6 21 130 0.5 -19.8
Max 8.90 6895 192 757 1119 1448 1350 3.10 <0.10 212 241 1545 600 27 1221 31.3 6.4
Nawashaher 6 Min 7.92 400 0.0 122 14 0.0 0.2 0.05 <0.10 16 10 48 2.9 16 80 1.3 -10
Max 8.67 2230 48 305 250 162 650 0.50 <0.10 104 83 180 125 22 600 5.7 4.6
Pathankot 14 Min 8.00 124 0.0 73 6.9 5.0 0.1 0.15 <0.10 16 0.0 2.6 0.8 18 60 0.1 -2.2
Max 8.80 1825 108 415 104 195 120 0.52 <0.10 56 46 105 450 26 260 3.5 7
Patiala 24 Min 7.85 450 0.0 98 6.9 5.0 0.14 0.18 <0.10 4.0 2.4 32 0.9 20 30 0.9 -10.6

82
Max 8.98 3682 240 622 646 588 275 1.10 <0.10 100 141 560 305 27 761 43.7 8.4
Roop Nagar 11 Min 8.08 384 0.0 134 14 30 0.21 0.08 <0.10 12 15 13 0.4 16 150 0.4 -1.8
Max 8.7 812 72 342 56 66 95 0.70 <0.10 52 73 132 21 22 340 4.3 4.4
Sangrur 13 Min 8.05 398 0.0 183 6.9 5.0 0.8 0.30 <0.10 8.0 10 50 3.8 19 80 1.3 -0.20
Max 9.00 1745 240 769 125 205 130 4.2 <0.10 36 83 405 53 26 370 16.1 15.8
SAS Nagar 14 Min 7.45 455 0.0 159 7 5.0 0.17 0.13 <0.10 12 12 48 0.86 17 90 1.5 -78
Max 8.75 16760 120 757 4023 2340 850 3.00 <0.10 493 696 2200 364 25 4093 15.0 9.8
Tarantaran 12 Min 8.02 365 0.0 171 6.9 5.0 0.0 0.22 <0.10 8.0 15 26 4.0 20 100 0.8 -1.8
Max 8.80 1325 96 635 139 127 60 3.35 <0.10 40 54 295 47 26 320 12.2 11.4
Min 7.45 124 0.0 49 6.9 0.0 0.0 0.05 <0.10 4.0 0.0 2.6 0.4 15 30 0.1 -78
Grand Total 323 Max 9.10 16760 276 830 4023 2340 1350 9.20 1.00 493 696 2200 600 29 4093 43.7 17.2
83
The pH values range from 7.45 at Sirsini in SAS Nagar district to 9.10 at Phulla in
Bathinda district. Salinity of ground water is measured in terms of EC. The ground
water is found to have low to very high salt content as the EC of well water ranges
from 124 S/cm at Parmota in district Pathankot to 16760S/cm at Sirsini in SAS
Nagar. Hardness reported in terms of CaCO3 ranges from 30 to 1490 mg/l. The
lowest hardness value is found at Hari Majra in district Patiala and highest at Sirsini
in district SAS Nagar. The concentration of calcium ranges between 4.0 and 493mg/l.
Calcium below detection level has not been found in the State while the highest value
is observed at Sirsini in district SAS Nagar. Magnesium concentration ranges
between nil at Choranwali district Gurdaspur and 696 mg/l at Sirsini in district SAS
Nagar. In majority of ground water samples, calcium concentration is less than 100
mg/l (96%). Calcium is very low in some districts, though it is very essential element
for drinking and irrigation purposes. However, magnesium is less than the desirable
limit of 30 mg/l in 41% samples and less than the maximum permissible limit of 100
mg/l for drinking waters (BIS 1991) in 94% samples. In more than half of well waters
examined, Ca + Mg are the dominant cations. Sodium is the dominant cation in
majority of ground waters of districts Bhathinda, Faridkot, Ferozepur, Mansa, Moga,
Muktsar, Patiala, Sangrur, SAS Nagar and Tarantaran. Sodium concentration varies
widely from 2.6 mg/l at Nawapind district Pathankot to 2200 mg/l at Sirsini in SAS
Nagar. Sodium concentration is less than 100 mg/l in more than half of well waters
under consideration. Potassium is found to be present in low concentration. In
majority of the samples analyzed, the potassium content is less than 10 mg/l (41%). It
ranges from 0.4 mg/l at Brahmpur district Ropar to 600 mg/l at Sherawali district
Mukatsar. High concentration of potassium (>100mg/l) is found in 5.6% samples. Its
higher concentration indicates contamination of ground water from various point
(industry, sewage) as well as non-point sources (agriculture).
Carbonate is found in a few samples and it varies from 0 to 276 mg/l at Dialpur Mirza
in district Mukatsar. Bicarbonate is the dominant anions and it ranges from 49 mg/l
Pankhuh at Hoshiarpur district to 830 mg/l at Killi district Faridkot. The Chloride
concentration in ground water varies between 7.0 mg/l at several places and 4023
mg/l at Sirsini in district SAS Nagar. The Sulphate (SO4) content in ground waters

84
was found to be 0 at several places in the State. The highest value of 2340 mg/l of
Sulphate has been observed at Sirsini in district SAS Nagar. In majority of ground
water samples (79%), the concentration of sulphate is below 200 mg/l. Nitrate, an
indicator of domestic, irrigation and industrial contamination, is found in significant
number of samples. Its concentration in groundwater ranges from <0.20 mg/l a
several places to 1350 mg/l at Bhaliana, Mukatsar district. The fluoride (F) content
in ground water of the State is generally less than 1.0 mg/l (86%). It ranges from
<0.05 at Several places in the State to 9.2 mg/l at Nahianwala in district Bathinda.
Phosphate concentration varies from <0.10mg/l to 1.00 mg/l at Jajjal in district
Bhatinda while Silica concentration, measured as SiO2, ranged between 15 to 29
mg/l.
5.3 Distribution of EC
The EC value of ground waters in the State varies from 124 S/cm to 16760S/cm at
25°C. Grouping water samples based on EC values, it is found that 51.4 % of them
have EC less than 750, 39.6% have between 750 and 3000 and the remaining 9% of
the samples have EC above 3000µS/cm. The Plate showing aerial distribution of EC
with intervals corresponding to limits assigned for desirable, permissible and
unsuitable classes of waters indicates that desirable class of waters occur in northern
and central area of the State. Districts falling in different EC ranges are given in Table
2. The ground water occurring in the southern and southwestern parts comprising of
mainly of Mukatsar and parts of Bhatinda, Faridkot, Fazilka, and Mansa districts is
mostly saline and not suitable for drinking uses (Fig-2).
Table 5.2- District-wise Electrical Conductivity distribution in Ground water of
Punjab State.
E.C. <750
μS/cm
E.C. 751-
3000 μS/cm
E.C.>3000
μS/cm
Amritsar Amritsar Bhathinda
Barnala Barnala Faridkot
Bhathinda Bhathinda Fazilka

85
Faridkot Faridkot Mansa
Fatehgarh
Sahib
Fatehgarh
Sahib
Muktsar
Fazilka Firozepur Patiala
Firozepur Gurdaspur SAS
Nagar
Gurdaspur Hoshiarpur
Hoshiarpur Jalandhar
Jalandhar Kapurthala
Kapurthala Ludhiana
Ludhiana Mansa
Mansa Moga
Moga Muktsar
Muktsar Nawanshahr
Nawanshahr Pathankot
Pathankot Patiala
Patiala Ropar
Ropar Sangrur
Sangrur SAS Nagar
SAS Nagar Tarantaran
Tarantaran

86
Fig-5.2: Map of Electrical Conductance in Punjab State, 2020
5.4 Distribution of Chloride (Cl)
Chloride content of ground water normally follows the distribution pattern of EC and it
ranges from 7.0 mg/l to 4023 mg/l in the entire State. Chloride concentration above
400 mg/L gives salty taste to water and based on these aesthetic considerations, BIS
has recommended a desirable limit of 250 mg/L for chloride in drinking water. This
limit can be extended to 1000 mg/L in case of absence of a source with desirable

87
concentration. Grouping of samples in these categories based on chloride content, it
is found that Chloride is less than 250 mg/L in 88.9 % of the samples, between 250
and 1000 mg/L in 10.2 % samples and only 0.9% of the samples are found to have
Chloride above 1000 mg/L. Map showing spatial distribution of Cl contents in ground
water (Fig 3) indicates that Cl is below 250 mg/L in most of the districts, it is between
250 and 1000 mg/L in Patiala , SAS Nagar and in southern and southwestern
districts of the State. Cl is more than 1000 mg/L in isolated places in Mukatsar,
Faridkot, Fazilka, Mansa and SAS nagar district.
Fig-5.3: Distribution of Chloride in ground water from Shallow aquifers of Punjab

88
5.5 Distribution of Nitrate (NO3)
Occurrence of nitrate in ground water above 5.0 mg/L reflects contamination at some
stage of its percolation and circulation. The probable sources of nitrate
contamination of ground water are through excessive application of fertilizers,
bacterial nitrification of organic nitrogen, and seepage from animal and human
wastes and atmospheric inputs. In the State, nitrate in water samples varies from
<<0.20 mg/l to 1350 mg/l. BIS permits a maximum concentration of 45 mg/L nitrate
in drinking water. Considering this limit, it is found that 69 % of the samples, spread
over the entire State, have nitrate below 45 and 31% have more than 45 mg/L.
District-wise wise distribution of Nitrate in Ground water of Punjab State is depicted in
Table 3. Spatial distribution of nitrate indicates that ground water with permissible
nitrate content generally occurs in the northern and central parts with a few isolated
patches with nitrate above 45mg/L. A considerable area of the southern and
southwestern part of the state have nitrate concentration exceeding 45 mg/L (Fig-4)
Furthermore, quite a significant number water samples from, Bhatinda, Faridkot,
Fazilka, Ferozepur, , Mansa, Muktsar, Patiala and SAS Nagar districts have nitrate
above 100 mg/l.
Table 5.3- District-wise distribution of Nitrate in Ground water of Punjab State.
Nitrate <45mg/l Nitrate >45mg/l
Amritsar Bhathinda
Barnala Faridkot
Bhathinda Fatehgarh Sahib
Faridkot Fazilka
Fatehgarh Sahib Gurdaspur
Fazilka Hoshiarpur
Firozepur Jalandhar
Gurdaspur Kapurthala
Hoshiarpur Ludhiana
Jalandhar Mansa
Kapurthala Moga
Ludhiana Muktsar
Mansa Nawanshahr
Moga Pathankot

89
Muktsar Patiala
Nawanshahr Ropar
Pathankot Sangrur
Patiala SAS Nagar
Ropar Tarantaran
Sangrur
SAS Nagar
Tarantaran
Fig-5.4: Nitrate Concentration in ground water from shallow aquifers

90
5.6 Distribution of Fluoride (F)
Fluoride in small amounts in drinking water is beneficial while in large amounts it is
injurious. The fluoride content in ground water ranges from BDL to 9.2 mg/L. BIS
recommends that fluoride concentration up to 1.00 mg/L in drinking water is
desirable, up to 1.50 mg/L is permitted and above 1.50 mg/L is injurious. District
wise distribution of Fluoride in Shallow Ground water of Punjab State is given in
Table 4. Classification of samples based on this recommendation, it is found that
84.4 % samples have fluoride in desirable range, 7.4 % in the permissible and the
remaining 8.5% have fluoride above 1.50 mg/L. Map showing spatial distribution of
fluoride contents in ground water (Fig-5) indicates that ground water in most parts of
the State has desirable concentration of fluoride. Ground waters with fluoride above
1.50 mg/L are found mainly in Bathinda, Faridkot, Fazilka, Muktsar and Mansa
districts while isolated locations are also found in Firozepur, Sangrur, SAS Nagar and
Tatantaran districts. It is worth mentioning that high fluoride waters are encountered
in areas where agriculture activities are predominant. It indicates the possibility that
fluoride has come from the phosphatic fertilizers, which have fluoride as impurity.
Table-5.4, District-wise distribution of Fluoride in Shallow Ground water of
Punjab State
Fluoride
<1.00mg/l
Fluoride
1.00-
1.50mg/l
Fluoride
>1.50mg/l
Amritsar Barnala Bhathinda
Barnala Bhathinda Faridkot
Bhathinda Faridkot Fazilka
Faridkot
Fatehgarh
Sahib
Firozepur
Fatehgarh
Sahib
Firozepur Mansa
Fazilka Mansa Moga
Firozepur Moga Muktsar
Gurdaspur Muktsar Sangrur
Hoshiarpur Patiala SAS Nagar
Jalandhar Tarantaran
Kapurthala

91
Ludhiana
Mansa
Moga
Muktsar
Nawanshahr
Pathankot
Patiala
Ropar
Sangrur
SAS Nagar
Tarantaran

92
Fig-5.5: Fluoride Concentration in ground water from shallow aquifers
5.7 Type of Ground water
Considering the predominance of the cation and anion in the chemical composition of
ground water, its type is determined and its relation with its occurrence in an area as
well as with its salinity is studied. It is found that no discernible relationship between
type of water and its occurrence in any particular area could be established. Nearly

93
all types of waters are available in each district of the State. However, study of
relation of water type with salinity of the water clearly indicates that nearly 51 %
ground waters of the State are fresh, have low salinity and predominance of calcium
+ magnesium cations and bicarbonate as anion. About 45 % ground waters having
intermediate salinity and are of mixed type. In these waters, mostly HCO3 as anion
dominates but no individual cation predominates. At some places HCO3-type of
waters with sodium as dominant cation are also encountered in low to moderately
saline ground waters. This can be attributed either to precipitation of CaCO3 due to
loss of CO2 or dissolution of Na-salts from the topsoil layers or to ion exchange
reaction during the downward percolation of water. At some isolated locations,
sulphate is found to be dominant anion. In the remaining ground waters, where
salinity is high; mostly Na is the dominant cation and Cl or Cl + SO4+NO3 (Mixed
anion) are dominant. Nevertheless, a few exceptions have also been found in these
simple and well-defined types of ground waters.
5.8 Suitability of Groundwater for Drinking
Salinity, chloride, fluoride and nitrate are the important parameters that are normally
considered for evaluating the suitability of ground water for drinking uses. Based on
recommendations made for these parameters by BIS, it is found that ground water at
quite a few places is not suitable for drinking uses because of either EC/Cl/F/NO3 or
all of them. It is observed that unsuitable quality of ground water occurs in the
southern and southwestern regions, while in the northern and central areas ground
water is of suitable quality for drinking uses.
The bar diagram clearly shows that most of the groundwater occurring in the districts
Amritsar, Barnala, Fatehgarh Sahib, Firozepur, Gurdaspur, Hoshiarpur, Kapurthala,
Moga, Nawanshar, Pathankot, Patiala, Ropar and Sangrur occupy almost 75% length
of the bar and has almost all the parameters within desirable limit for drinking
purposes, thus can be considered as potable. Ground waters from the districts of
Bhatinda, Faridkot, Fazilka , and Muktsar have bar length less than 50% indicating
low potable rating. Fig-6.

94
Fig-5.6, District wise Distribution of Potable Waters in Punjab
Percentage wise classification of Potable Ground water in Punjab State is depicted in
Table 5.Table-6 shows district-wise distribution of ground waters in different classes
of suitability based upon EC, Cl, F and NO3 contents.
Table 5.5-Percentage wise classification of Potable Ground water in Punjab
State
Sr.
No.
% wise
classification
Name of the districts Remarks
1. >80 Amritsar, Barnala, Firozpur, Kapurthala,
Pathankot, Patiala & TaranTaran
Classification based
on Salinity (EC),
Cl,NO3 & F 2. 50-80 Fatehgarh Shahib, Gurdaspur , Hoshiarpur,
Jalandhar, Ludhiana, Moga, Pathankot,Ropar,
Sangrur,SAS Nagar
3. <50 Bhatinda, Faridkot, Fazilka,Mansa, Mukatsar,
Nawashaher
0102030405060708090
100
Am
rits
ar
Barn
ala
Bh
ath
ind
a
Farid
kot
Fa
teh
ga
rh S
ah
ib
Fazil
ka
Fir
ozep
ur
Gu
rdasp
ur
Hosh
iarp
ur
Jala
nd
har
Kap
urt
hala
Lu
dh
ian
a
Man
sa
Moga
Mu
kts
ar
Na
wa
nsh
ah
r
Path
an
kot
Pati
ala
Rop
ar
Sa
ng
ru
r
SA
S N
agar
Tara
nta
ran
%
%

95
Table-5.6: Distribution of Well Waters of Punjab State in Different Classes of
Drinking Water Suitability
Sr.
No
District
No. of
Sample
s
EC in 250C in
µS/cm
Cl in mg/L NO3 in
mg/L
F in mg/L
<75
0
750-
3000
>30
00
<25
0
250-
1000
>10
00
<45 >45 <1.0 1.0-
1.5
>1.
5
1 Amritsar 12 9 3 0 12 0 0 12 0 12 0 0
2 Barnala 3 3 0 0 3 0 0 3 0 2 1 0
3 Bhathinda 28 4 20 4 20 8 0 14 14 13 6 9
4 Faridkot 21 1 12 8 12 8 1 13 8 10 6 5
5 Fatehgarh
Sahib
11 7 4 0 11 0 0 8 3 10 1 0
6 Fazilka 16 0 10 6 9 6 1 6 10 14 0 2
7 Firozepur 9 2 7 0 9 0 0 9 0 7 1 1
8 Gurdaspur 22 17 5 0 22 0 0 17 5 22 0 0
9 Hoshiarpur 29 26 3 0 29 0 0 24 5 29 0 0
10 Jalandhar 20 17 3 0 20 0 0 12 8 20 0 0
11 Kapurthala 8 7 1 0 8 0 0 5 3 8 0 0
12 Ludhiana 20 15 5 0 20 0 0 14 6 20 0 0
13 Mansa 12 5 5 2 9 3 0 8 4 5 3 4
14 Moga 7 1 6 0 7 0 0 4 3 5 1 1
15 Muktsar 9 2 1 6 6 3 0 3 6 5 2 2
16 Nawanshahr 6 4 2 0 5 1 0 3 3 6 0 0
17 Pathankot 14 13 1 0 14 0 0 10 4 14 0 0
18 Patiala 24 4 19 1 22 2 0 19 5 21 3 0
19 Ropar 10 10 0 0 10 0 0 8 2 10 0 0
20 Sangrur 13 5 8 0 13 0 0 9 4 12 0 1
21 SAS Nagar 15 8 5 2 12 2 1 12 3 14 0 1
22 Tarantaran 14 6 8 0 14 0 0 10 4 13 0 1
TOTAL 323 166 128 29 287 33 3 223 100 272 24 27
5.9 Suitability of Groundwater for Irrigation
The suitability of ground water for irrigation is generally assessed considering salinity
expressed as EC, sodium in relation to calcium and magnesium in terms of SAR,
sodium in relation to carbonate in terms of RSC. EC and SAR range from 124 S/cm
to 16760S/cm at 25°C and 0.11 to 43.68 respectively. Waters having high values of

96
EC and SAR causes salinity and sodium hazards respectively when used for
customary irrigation.
USSL: Plot of USSL diagram based on EC and SAR, it is observed that ground water
occurring in the northern and central parts of the State falls under C2S1 and C3S1
classes of irrigation waters. It indicates that most of these waters are suitable for
irrigating semi-salt tolerant crops on all soils. Ground water mostly from the southern
and southwestern parts comprising of Bhatinda, Faridkot, Fazilka, Ferozepur, Mansa,
Muktsar , Patiala districts falls under C3S2,C3S3, C3S4, C4S1, C4S2, C4S3 and C4S4
classes of irrigation classification. Such waters when used continuously for irrigation,
they are likely to cause salinity hazards and lead to reduction in crop yields. They
may also cause sodium hazards and lead to hardening of soils when used for
irrigation without the addition of adequate quantity of gypsum.
RSC: Alkali hazards of irrigation ground waters are estimated through the
computation of Residual Sodium Carbonate (RSC), also known as Eaton’s Index.
Waters with RSC value <1.25 meq/L are safe for irrigational uses, RSC between 1.25
and 2.5 are marginal and waters with RSC value >2.5 meq/L are unsafe. Based on
RSC values of ground waters, it is found that 49.5% of the waters are safe, 12.1%
marginal and the remaining 38.4 % are unfit for irrigational uses. RSC of ground
waters are found to vary from below zero to 17.20 meq/l (Moharewala, Firozepur
district). The district wise distribution of ground waters in different categories of
suitability for irrigational uses based on USSL and RSC considerations is given in
Table-7.

97
Table-5.7: Irrigation Rating of Well Waters of Punjab
Sl.no. District
IRRIGATION SUITABILITY
EATON’s INDEX (RSC in meq/L) USSL Classification
Total
No. of
samples
Safe Marginal Unsafe
<1.25 1.25-2.5 >2.5
1 Amritsar 12 5 2 5 C2S1, C3S2
2 Barnala 3 0 0 3 C3S1,C3S2
3 Bhathinda 28 12 2 14 C2S1,C3S1, C3S2, C3S3, C4S2, C4S4
4 Faridkot 21 6 1 14 C2S4, C3S1, C3S2, C3S3,C4S4,
5 Fatehgarh
Sahib 11
3 3 5 C2S1, C3S1,C3S2,
6 Fazilka 16 11 0 5 C2S1, C3S1, C3S2,C3S3, C4S2, C4S4
7 Firozepur 9 3 1 5 C2S1,C3S1,C3S2,C3S3
8 Gurdaspur 22 16 3 3 C1S1,C2S1, C3S1, C3S2
9 Hoshiarpur 29 25 3 1 C1S1,C2S1, C3S1
10 Jalandhar 20 10 6 4 C2S1,C3S1
11 Kapurthala 8 2 3 3 C2S1, C3S2
12 Ludhiana 20 12 2 6 C2S1, C3S1, C3S2
13 Mansa 12 7 0 5 C2S1, C3S2, C3S3, C4S4
14 Moga 7 1 0 6 C2S1,C3S2, C3S3
15 Muktsar 9 6 0 3 C2S1, C3S1, C4S2, C4S4
16 Nawanshahr 6 3 2 1 C2S1, C3S1
17 Pathankot 14 13 0 1 C1S1, C2S1, C3S1
18 Patiala 24
7 5 12 C2S1,C2S3, C3S1, C3S2, C3S4, C4S2,
C4S4
19 Ropar 10 8 0 2 C2S1, C3S1
20 Sangrur 13 2 2 9 C2S1,C3S1, C3S2,C3S3.C3S4
21 SAS Nagar 15 3 3 9 C2S1, C3S2, C4S3
22 Tarantaran 14 5 1 8 C2S1, C3S1, C3S3, C3S2
Total 323 160 39 124
Most of ground waters from Amritsar, Fatehgarh Sahib, Gurdaspur, Hoshiarpur,
Jallandhar, Kapurthala, Ropar and Patiala are suitable for irrigation for semi-salt
tolerant crops on adequately drained soils. The waters from districts of Bhatinda,
Faridkot, Ferozepur, Mansa, Muktsar and Sangrur show wide variability in irrigation
rating.

98
5.10 Suitability of Groundwater for Industries
Industries, in general, use water for variety of works depending upon the nature and
size of the industry. As such specifications for suitability of water for industries vary
widely depending upon the process in each industry. Therefore, chemical quality of
water and its suitability could not be discussed due to diversified nature of industries.
5.11 Temporal Variation
The temporal changes in ground water quality are studied through percent of well
water falling in different categories of suitability criteria based on concentration of
important parameters such as salinity (EC), chloride, nitrate and fluoride contents.
The percent well waters falling in desirable, permissible and unsuitable classes of
BIS-2012 standards during 2020 are compared with percent well waters in same
classes during 2016 2017, 2018, 2019 & 2020. Table 8 shows both positive and
negative change in percent well waters in different suitability classes based on above
parameters and overall variation in % wells from 2016 to 2020.
On perusal of the Table-8, it is evident that there is deterioration in the quality of
ground water from 2016 to 2020. It is observed that there is decrease in salinity and
% of samples falling with EC below 750 µS/cm at 250C has increased by 8.1 %.
Whereas there is decrease by 9.5 % samples falling in 750-3000 µS/cm at 250C .
There is increase of 1.4% samples showing EC more than 3000 µS/cm at 250C. It is
inferred that there is a slight improvement in groundwater quality in the respect of
salinity. Not much variation is chloride concentration observed in 2020 when
compared with 2016 while there is deterioration in water quality in respect of Nitrate
as samples having its concentration >45mg/l has increased by 8.2%. There is a
slight decrease in % samples by 2.3 having Fluoride > 1.50 mg/l indicating a marginal
improvement in ground water quality in respect of Fluoride.
There is not much change in groundwater quality from 2019 to 2020 with exception of
Nitrate whose concentration has increased (>45mg/l) in 7.8% samples.

99
Table 5.8: Periodic Variation in Suitability Classes of Well Waters of Punjab
Parameter Class % of Samples Periodic
Variation
2016-2019
2016
(n=289)
2017
(n=281)
2018
(n=278)
2019
(n=302
)
2020
(n=323)
Salinity as
EC
<750 µS/cm 43.3 36.7 48.9 47.7 51.4 +8.1
750-3000 49.1 51.9 42.4 44.4 39.6 -9.5
>3000 7.6 11.3 8.6 7.95 9.0 +1.4
Chloride as
Cl
<250 mg/l 87.5 88.9 88.8 88.7 88.9 +1.4
250 - 1000 10.4 9.6 9.0 10.9 10.2 -0.2
>1000 mg/l 2.1 1.8 2.2 0.3 0.9 -1.2
Nitrate as
NO3
< 45 mg/l 77.2 75 82.0 76.8 69.0 -8.2
> 45 mg/l 22.8 24.9 18.0 23.2 31.0 +8.2
Fluoride as
F
<1.0 mg/l 84.4 81.8 88.1 84.4 84.2 -0.2
1.0 - 1.50 4.8 7.5 4.7 5.3 7.4 +2.6
>1.50 mg/l 10.7 10.7 7.2 10.3 8.4 -2.3
5.12: Conclusion & Recommendations on Groundwater Quality
Conclusion drawn for quality evaluations of ground water and its suitability for various
uses is based on macro level studies through monitoring stations sampled during
2019. It can be concluded that in Punjab
Ground water is generally suitable for drinking uses except at few places in
the southern and south western parts where it is not suitable due to high EC or high
fluoride or nitrate or combination of all.
Almost all waters are suitable for irrigation on well-drained soils for growing
salt tolerant crops like wheat, mustard, rice, barley and maize etc. However, at few
places where EC of ground water goes beyond 5000 µS/cm and SAR is more than
10, such waters are not suitable for customary irrigation.
It is recommended that areas identified with unsuitable or marginally suitable
water quality should be monitored on micro level to effectively delineate such areas
and use suitable management measures.

Annexure-1: Depth to Water levels
S.
No State District Location
2020/June 2020/Aug 2020/Oct 2021/Jan
(mbgl) (mbgl) (mbgl) (mbgl)
1 CHANDIGARH CHANDIGARH BURAIL - 2.92 2.74 2.52
2 CHANDIGARH CHANDIGARH Csio-combined 20.29 21.51 22.10 20.62
3 CHANDIGARH CHANDIGARH CSIO-S 22.03 22.00 21.90 18.32
4 CHANDIGARH CHANDIGARH NEW INDUST
AREA 19.94
- 20.84 17.64
5 CHANDIGARH CHANDIGARH Sec-27, Ar Well - - - -
6 CHANDIGARH CHANDIGARH Sec-27, Cgwb
Building 43.77 41.43 43.54 42.27
7 CHANDIGARH CHANDIGARH SECT 10C - 52.22 53.64 53.58
8 CHANDIGARH CHANDIGARH SECT 10C (D) 37.35 32.57 - 33.68
9 CHANDIGARH CHANDIGARH SECT 10C (S) 17.68 17.34 16.09 -
10 CHANDIGARH CHANDIGARH SECT 31D (D) 16.56 18.46 18.78 16.62
11 CHANDIGARH CHANDIGARH SECT 31D (S) 11.78 11.81 10.72 11.16
12 CHANDIGARH CHANDIGARH SECT 37D (S) 4.55 3.91 3.66 3.86
13 CHANDIGARH CHANDIGARH SECT 39D (S) 9.27 8.77 10.36 8.55
14 CHANDIGARH CHANDIGARH SECT 44D (S) 4.23 3.55 4.57 3.70
15 CHANDIGARH CHANDIGARH Sector-46
(shallow) 7.18 7.12 7.07 6.91
16 PUNJAB AMRITSAR Ajnala 12.30 - 15.00 -
17 PUNJAB AMRITSAR Amritsar 25.39 - 25.86 25.66
18 PUNJAB AMRITSAR Amritsar1 - - 26.80 -
19 PUNJAB AMRITSAR Amritsar-D 21.59 22.40 23.80 23.50
20 PUNJAB AMRITSAR Amritsar-M 23.55 24.04 22.18 21.60
21 PUNJAB AMRITSAR Amritsar-S 29.72 24.75 24.60 24.40
22 PUNJAB AMRITSAR Bajwa-Pz - - 6.20 -
23 PUNJAB AMRITSAR Bal Kalan-Pz 17.98 - 17.98 -
24 PUNJAB AMRITSAR Beas07 14.28 - 14.65 14.50
25 PUNJAB AMRITSAR Bhattaywad-Pz - - 12.85 -
26 PUNJAB AMRITSAR Bhindi Saidan 12.81 14.57 7.63 7.46
27 PUNJAB AMRITSAR Bhindi Saidan-D 10.79 10.54 7.66 7.50
28 PUNJAB AMRITSAR Bhindi Saidan-M 12.43 13.62 7.62 7.43
29 PUNJAB AMRITSAR Bholewal-Pz - - 14.40 -
30 PUNJAB AMRITSAR Boparai Khurd-Pz 21.91 - 19.29 -
31 PUNJAB AMRITSAR Chak Dogra-Pz 13.35 - 10.60 -
32 PUNJAB AMRITSAR Chogawan1 13.97 15.19 11.87 11.53
33 PUNJAB AMRITSAR ChogWan- Pz - - - -
34 PUNJAB AMRITSAR Dhulika-Pz 19.02 - 19.46 -
35 PUNJAB AMRITSAR Dohan-Pz - - - -
36 PUNJAB AMRITSAR Gago Mahal- Pz 7.01 - 7.32 7.05
37 PUNJAB AMRITSAR Gill wali-Pz 21.88 - 22.01 -
38 PUNJAB AMRITSAR Jandiala Guru-Pz 20.60 21.62 16.60 17.50

39 PUNJAB AMRITSAR Jethuwal-Pz 16.88 - 16.55 -
40 PUNJAB AMRITSAR Kandowali-Pz 14.47 - 13.46 -
41 PUNJAB AMRITSAR Karyal-Pz 10.48 - 10.32 -
42 PUNJAB AMRITSAR Mahima-Pz 21.20 - 19.64 -
43 PUNJAB AMRITSAR Majitha- Pz - - - -
44 PUNJAB AMRITSAR Majitha-Pz 13.93 - 14.11 -
45 PUNJAB AMRITSAR Mehleykey-Pz 5.46 - 4.68 -
46 PUNJAB AMRITSAR Mehta - - 17.60 -
47 PUNJAB AMRITSAR Mehta-Pz - - 9.39 -
48 PUNJAB AMRITSAR Miran Chak-Pz 18.63 - 18.09 -
49 PUNJAB AMRITSAR Nangal Sahaul-Pz 5.90 - 5.25 -
50 PUNJAB AMRITSAR Nawan Tanal- Pz 13.75 14.45 12.80 12.85
51 PUNJAB AMRITSAR Ramdas-DW 6.16 - 8.60 -
52 PUNJAB AMRITSAR Rampura-Pz - - - 7.60
53 PUNJAB AMRITSAR Rayya-Pz - - 15.80 -
54 PUNJAB AMRITSAR Rupowal Brahmana-Pz
15.01 -
14.74 -
55 PUNJAB AMRITSAR Sarangra-Pz - - 11.40 -
56 PUNJAB AMRITSAR Shabura-Pz 16.63 - 15.62 -
57 PUNJAB AMRITSAR Sham Nagar-Pz 9.80 - 8.28 -
58 PUNJAB AMRITSAR Talwandi Dogra-Pz - - - -
59 PUNJAB AMRITSAR Tarsika-Pz 16.84 - 16.60 -
60 PUNJAB AMRITSAR Ugar Aulakh-Pz 15.38 - 14.69 -
61 PUNJAB AMRITSAR Vadala Kalan-Pz 17.42 - 18.44 -
62 PUNJAB AMRITSAR Vadala Viran-Pz - - 8.50 -
63 PUNJAB AMRITSAR Verka-Pz - - 20.40 -
64 PUNJAB AMRITSAR Wandala Bittewad-Pz - -
17.41 -
65 PUNJAB BARNALA Amla Singh Wala-PZ
42.51 -
44.15 -
66 PUNJAB BARNALA Barnala (s) 40.76 41.59 - -
67 PUNJAB BARNALA Bhadaur-Pz 31.51 32.95 33.72 -
68 PUNJAB BARNALA Daula-Pz 39.38 - 39.88 -
69 PUNJAB BARNALA Dhanaula-Pz 33.02 - 35.10 -
70 PUNJAB BARNALA Kurar-Pz - - 43.53 -
71 PUNJAB BARNALA Lohgarh-Pz - - 37.54 -
72 PUNJAB BARNALA Mahal Kalan-Pz 35.95 37.50 38.75 -
73 PUNJAB BARNALA Pakho Ke-Pz 35.26 - 35.39 -
74 PUNJAB BARNALA Raisar-Pz - - 38.27 -
75 PUNJAB BARNALA Shekha 40.20 - 42.71 -
76 PUNJAB BATHINDA Ablu 14.57 15.59 14.77 -
77 PUNJAB BATHINDA Aleke Jalal-Pz 30.39 - 32.89 14.12
78 PUNJAB BATHINDA Badiala-Pz 8.15 53.61 53.60 -
79 PUNJAB BATHINDA Bagher Mohabat Singh-Pz
11.33 -
11.23 -

80 PUNJAB BATHINDA Bahman Kaur Singh-D
7.83 9.13 9.12 8.88
81 PUNJAB BATHINDA Bahman Kaur
Singh-M 10.25 10.07 10.02 9.97
82 PUNJAB BATHINDA Bahman Kaur Singh-Pz
9.91 -
9.67 -
83 PUNJAB BATHINDA Bahman Kaur Singh-S
10.00 10.17 9.67 9.64
84 PUNJAB BATHINDA Balianwali-Pz 27.25 - 28.40 -
85 PUNJAB BATHINDA Balluana1 5.41 5.55 5.53 5.47
86 PUNJAB BATHINDA Balluana-Pz - - 7.36 -
87 PUNJAB BATHINDA Bandi-Pz 6.50 - 6.57 -
88 PUNJAB BATHINDA Bhagibandar 6.33 9.53 9.33 8.35
89 PUNJAB BATHINDA Bugran-Pz - - 35.00 -
90 PUNJAB BATHINDA Burj Gill-Pz 30.47 - 32.24 -
91 PUNJAB BATHINDA Burj-Pz 11.80 - 11.93 -
92 PUNJAB BATHINDA Deratapp - 8.56 8.22 8.86
93 PUNJAB BATHINDA Dhapali1 28.17 29.95 29.95 -
94 PUNJAB BATHINDA Dhapali-Pz 29.09 31.56 31.80 30.65
95 PUNJAB BATHINDA Dialpur Mirza 28.44 30.90 31.63 29.35
96 PUNJAB BATHINDA Dialpura Bhlaike 27.75 - 33.71 31.86
97 PUNJAB BATHINDA Dialpura- Mirza - - - 30.62
98 PUNJAB BATHINDA Dulle Wala-Pz 35.49 - 37.00 -
99 PUNJAB BATHINDA Ganga-Pz 16.63 31.56 17.29 16.60
100 PUNJAB BATHINDA Ghudda-Pz 10.07 - 5.59 -
101 PUNJAB BATHINDA Gill Patti-DW - - 11.80 -
102 PUNJAB BATHINDA Gobind Pura-Pz - - 7.80 -
103 PUNJAB BATHINDA Gulabgarh 2 (s) 14.13 15.32 14.95 14.29
104 PUNJAB BATHINDA Guru Sar-Pz 8.80 10.27 9.74 9.55
105 PUNJAB BATHINDA Harraipur-Pz 21.24 - 22.01 -
106 PUNJAB BATHINDA Jajjal 8.71 8.36 8.39 7.92
107 PUNJAB BATHINDA Jajjal_DW 9.40 - 9.82 -
108 PUNJAB BATHINDA Jassi Bhagwali 7.20 7.67 6.95 6.77
109 PUNJAB BATHINDA Jhanduke 23.44 27.15 26.74 25.72
110 PUNJAB BATHINDA Jhanduke-Pz 25.85 - 27.47 -
111 PUNJAB BATHINDA Kalayan Sukha-S 27.80 29.91 29.82 28.13
112 PUNJAB BATHINDA Kalla Bandar - 50.00 50.00 -
113 PUNJAB BATHINDA Kalyan Sukha 28.00 30.15 29.60 28.85
114 PUNJAB BATHINDA Kalyan Sukha-M 28.97 31.49 29.61 28.84
115 PUNJAB BATHINDA Koir Singh Wala-Pz - -
31.46 -
116 PUNJAB BATHINDA Kot Bhaktu-Pz 6.83 - 6.57 -
117 PUNJAB BATHINDA Kot Fatta-DW 13.51 - 14.50 -
118 PUNJAB BATHINDA Kot Guru - - 6.50 -
119 PUNJAB BATHINDA Kot Shamir - 15.36 15.41 14.82
120 PUNJAB BATHINDA Kothaguru-Pz 1.70 32.83 30.07 29.05

121 PUNJAB BATHINDA Lalliana-Pz 9.16 - 8.87 -
122 PUNJAB BATHINDA Lehra Dhulkot-Pz - - - -
123 PUNJAB BATHINDA Maihma Bhagwan-PZ
11.92 -
12.18 -
124 PUNJAB BATHINDA Maisar Khana 17.07 18.42 18.59 17.84
125 PUNJAB BATHINDA Maisar Khana-Pz 17.47 - 17.82 -
126 PUNJAB BATHINDA Maluka-Pz 25.53 - 27.56 -
127 PUNJAB BATHINDA Mandi Kalan-Pz 28.68 - 29.74 -
128 PUNJAB BATHINDA Maur Kalan-Pz 14.17 - 14.19 -
129 PUNJAB BATHINDA Mehraj-Pz 25.74 - 27.65 -
130 PUNJAB BATHINDA Mehta-Pz 7.76 - 7.84 -
131 PUNJAB BATHINDA Multania-Pz - - 7.24 -
132 PUNJAB BATHINDA Nahinwala 13.40 13.87 13.95 13.65
133 PUNJAB BATHINDA Nathana-Pz 24.87 - 26.85 -
134 PUNJAB BATHINDA Nathena-Pz 7.07 - 6.93 -
135 PUNJAB BATHINDA Phulla 22.55 - 24.63 23.70
136 PUNJAB BATHINDA Phulla1 - 24.39 25.44 -
137 PUNJAB BATHINDA Phullo Mithi-D 7.65 7.80 - 6.60
138 PUNJAB BATHINDA Phullo Mithi-M 6.65 6.96 - 7.22
139 PUNJAB BATHINDA Phullo Mithi-S 7.80 8.00 - 7.05
140 PUNJAB BATHINDA Puhla-Pz - - - -
141 PUNJAB BATHINDA Raike Kalan 5.01 4.64 - 3.26
142 PUNJAB BATHINDA Rajgarh Kubey-Pz 12.18 - - -
143 PUNJAB BATHINDA Rayya-Pz 33.64 - - -
144 PUNJAB BATHINDA Salabatpur-Pz 34.96 - - -
145 PUNJAB FARIDKOT Baja Khana 20.31 22.04 22.53 21.28
146 PUNJAB FARIDKOT Bead Sikhanwala-
Pz 12.23 11.19 10.01 9.80
147 PUNJAB FARIDKOT Behabal Kalan-Pz 18.64 - 18.23 -
148 PUNJAB FARIDKOT Chahd Baja 17.73 21.00 20.62 18.60
149 PUNJAB FARIDKOT Chak Kalan-Pz 3.58 - 1.19 -
150 PUNJAB FARIDKOT Deviwala-S 14.78 - 8.85 8.50
151 PUNJAB FARIDKOT Dhilwan Kalan - 14.50 10.50 10.69
152 PUNJAB FARIDKOT Ghuiana-Pz 5.44 - - -
153 PUNJAB FARIDKOT Jand Sahib-Pz 4.87 4.44 3.45 3.55
154 PUNJAB FARIDKOT Karirwali 16.65 14.64 14.00 13.20
155 PUNJAB FARIDKOT Killi-Pz 5.63 4.02 3.68 3.97
156 PUNJAB FARIDKOT Kot Kapura 9.42 9.39 9.07 8.89
157 PUNJAB FARIDKOT Matta 7.33 10.72 10.22 9.70
158 PUNJAB FARIDKOT Mehmuana 1.40 0.58 0.45 0.62
159 PUNJAB FARIDKOT Mumra-Pz 6.23 6.92 5.43 5.27
160 PUNJAB FARIDKOT Nangal-Pz 20.02 16.53 9.98 8.85
161 PUNJAB FARIDKOT Pahluwala-Pz 5.81 - 4.52 -
162 PUNJAB FARIDKOT Rorian Kapura-Pz 13.49 - 13.62 -

163 PUNJAB FARIDKOT Sadiq-Pz 4.83 4.90 4.32 4.25
164 PUNJAB FARIDKOT Sher Singh Wala- Pz
3.70 3.14 2.54 2.65
165 PUNJAB FARIDKOT Sukhwala-Pz 3.10 1.98 2.30 2.44
166 PUNJAB FARIDKOT Tehna-Pz 10.07 9.83 9.13 9.10
167 PUNJAB FARIDKOT Wara Dwarka-Pz 5.83 3.80 3.61 3.90
168 PUNJAB FATEHGARH
SAHIB Alipur Sodhian-Pz 20.89
- 19.69
-
169 PUNJAB FATEHGARH
SAHIB Amloh1 26.05
- 26.40
-
170 PUNJAB FATEHGARH
SAHIB Badalialasingh 40.78
- 38.95 38.60
171 PUNJAB FATEHGARH
SAHIB Bagga Kalan 27.29
- 27.86
-
172 PUNJAB FATEHGARH
SAHIB Bassi Pathana 19.88
- - 20.36
173 PUNJAB FATEHGARH
SAHIB Bhaddal Tuha-Pz 28.12 26.78 26.73 25.90
174 PUNJAB FATEHGARH
SAHIB Bhagrana 3.47 1.13 2.92 2.94
175 PUNJAB FATEHGARH
SAHIB Bhateri 32.70 33.54 35.06 3.67
176 PUNJAB FATEHGARH
SAHIB Bhateri1
- 33.54
- -
177 PUNJAB FATEHGARH
SAHIB Burj 19.15
- 20.19
-
178 PUNJAB FATEHGARH
SAHIB Chandiala-Pz 17.45
- 18.32
-
179 PUNJAB FATEHGARH
SAHIB Charnarthalkalan 21.39
- 22.39
-
180 PUNJAB FATEHGARH
SAHIB Chuni Khurd-PZ 15.85
- 14.70
-
181 PUNJAB FATEHGARH
SAHIB Chunni Kalan 14.59 14.50 13.75 13.10
182 PUNJAB FATEHGARH
SAHIB Fatehgarh Sahib 21.30
- 21.85
-
183 PUNJAB FATEHGARH
SAHIB
Fatehgarh Sahib-Pz
25.33 2.34 2.34 21.55
184 PUNJAB FATEHGARH
SAHIB Inayatpur-PZ-S 20.75
- - -
185 PUNJAB FATEHGARH
SAHIB Jai Singh Wala 21.35
- 22.98
-
186 PUNJAB FATEHGARH
SAHIB Jhambela 24.82
- 26.01
-
187 PUNJAB FATEHGARH
SAHIB Kalewal 20.75
- 19.18
-
188 PUNJAB FATEHGARH
SAHIB Khamanon-pz 19.47
- 19.50
-
189 PUNJAB FATEHGARH
SAHIB Kharey_PZ 21.50
- 22.00
-
190 PUNJAB FATEHGARH
SAHIB Khera-Pz 27.96
- 29.02
-
191 PUNJAB FATEHGARH
SAHIB Ladpur 22.00
- 22.60
-
192 PUNJAB FATEHGARH
SAHIB Lohar Majra 22.22
- 23.02
-
193 PUNJAB FATEHGARH
SAHIB Mianpur-Pz 22.61
- 23.16
-

194 PUNJAB FATEHGARH
SAHIB Nalini-Pz 22.39 23.48
- 22.01
195 PUNJAB FATEHGARH
SAHIB
Nandpur Kalaur-Pz
33.24 -
34.81 -
196 PUNJAB FATEHGARH
SAHIB Pawala 14.05 7.24
- 13.20
197 PUNJAB FATEHGARH
SAHIB Sado Majra 20.33
- 21.36
-
198 PUNJAB FATEHGARH
SAHIB Salempur 35.01
- 36.65
-
199 PUNJAB FATEHGARH
SAHIB Shahpur
- - - -
200 PUNJAB FATEHGARH
SAHIB Sirhind-Pz 23.20
- 23.25
-
201 PUNJAB FATEHGARH
SAHIB Tahalpur 26.84
- 28.15
-
202 PUNJAB FATEHGARH
SAHIB Talwara 22.29
- 22.97
-
203 PUNJAB FATEHGARH
SAHIB Tarkhan Majra
- - - -
204 PUNJAB FATEHGARH
SAHIB Timber Pur-Pz 21.99
- 21.63
-
205 PUNJAB FAZILKA Abohar 3.33 2.01 1.89 1.74
206 PUNJAB FAZILKA Bannawala - 1.39 1.46 1.47
207 PUNJAB FAZILKA Bazirdpura 7.70 6.92 6.80 6.80
208 PUNJAB FAZILKA Danewal Satkosi 3.95 3.55 3.43 5.85
209 PUNJAB FAZILKA Danger Khera-Pz 3.34 - 2.39 -
210 PUNJAB FAZILKA Dhaban Kokrian-D 1.48 - 0.79 1.00
211 PUNJAB FAZILKA Dhaban Kokrian-M
2.37 0.51 1.62 1.95
212 PUNJAB FAZILKA Dhaban Kokrian-S 6.23 1.06 0.96 1.30
213 PUNJAB FAZILKA Dipulana-Pz 7.45 7.05 6.16 5.95
214 PUNJAB FAZILKA Godiwala-Pz 4.72 - - -
215 PUNJAB FAZILKA Hamed Saidoke-Pz 16.17 - - -
216 PUNJAB FAZILKA Jand Wala Johian-
Pz 5.70
- - -
217 PUNJAB FAZILKA Kaler Khera-Pz 4.51 - 4.48 -
218 PUNJAB FAZILKA Kauranwali-D 6.23 5.11 4.80 4.87
219 PUNJAB FAZILKA Kauranwali-M 6.10 5.63 4.81 4.96
220 PUNJAB FAZILKA Kauranwali-S 10.03 5.69 4.87 4.90
221 PUNJAB FAZILKA Khuiansarwar- Pz 1.80 0.62 1.25 1.35
222 PUNJAB FAZILKA Kundal1 0.34 - 0.28 0.24
223 PUNJAB FAZILKA Ladhuwala 1.65 0.34 2.21 2.45
224 PUNJAB FAZILKA Motiwala 07pz 10.42 - - -
225 PUNJAB FAZILKA Nihalkhera - - - 1.79
226 PUNJAB FAZILKA Nure-Ki-Uttar 07pz
18.43 - - -
227 PUNJAB FAZILKA Pancha Wali-Pz 11.13 - 10.10 -
228 PUNJAB FAZILKA Pattiwalla-Pz 2.86 - 2.58 -
229 PUNJAB FAZILKA Ramsara-Pz 3.71 - 3.20 -
230 PUNJAB FAZILKA Sham Singhwala- 5.67 5.35 4.53 10.84

Pz
231 PUNJAB FAZILKA Shatriwala-Pz 3.91 - 2.70 -
232 PUNJAB FAZILKA Sitoganno 7.24 0.84 1.08 3.54
233 PUNJAB FAZILKA Sohangarh Ratte 2.69 1.88 1.70 1.63
234 PUNJAB FAZILKA Sohangarh Ratte-D 2.68 1.92 1.49 2.10
235 PUNJAB FAZILKA Sohangarh Ratte-M
2.55 0.64 1.73 1.70
236 PUNJAB FAZILKA Sohangarh Ratte-S 2.45 1.34 1.68 2.05
237 PUNJAB FAZILKA Swah Wala- Pz 10.64 11.73 10.73 10.35
238 PUNJAB FIROZPUR Bara Mansur Wala-Pz
28.46 -
31.46 -
239 PUNJAB FIROZPUR Chamb-Pz 19.43 - 22.42 -
240 PUNJAB FIROZPUR Gogiani-Pz 20.26 - 21.51 -
241 PUNJAB FIROZPUR Jaimal wala-Pz 10.65 11.58 9.92 -
242 PUNJAB FIROZPUR Lauhke Kalan- Pz 18.12 21.17 20.30 19.41
243 PUNJAB FIROZPUR Lohere Khurd-Pz 20.67 - 22.35 -
244 PUNJAB FIROZPUR Machi Bugra/ Gujran-Pz - -
17.09 -
245 PUNJAB FIROZPUR Mallanwala Khas-Pz
12.80 -
14.05 -
246 PUNJAB FIROZPUR Malluwala-Pz 24.86 - 27.94 -
247 PUNJAB FIROZPUR Malsian-Pz 12.14 14.78 13.45 -
248 PUNJAB FIROZPUR Mohkam Khan Wala-Pz - -
13.86 -
249 PUNJAB FIROZPUR Mohre Wala-Pz 6.89 7.95 6.65 6.25
250 PUNJAB FIROZPUR Mudki-Pz - - 15.79 -
251 PUNJAB FIROZPUR Piyarana 5.05 5.90 4.90 5.20
252 PUNJAB FIROZPUR Rala Hazi- Pz - - 6.94 -
253 PUNJAB FIROZPUR Rukne Wala-Pz 10.50 - 9.91 -
254 PUNJAB FIROZPUR Talwandi Jalle Khan-pz
30.15 -
32.46 -
255 PUNJAB FIROZPUR Tibbi Kalan-Pz - - 8.41 -
256 PUNJAB FIROZPUR Tibbi Taiwan Laluwalla-Pz
4.30 -
3.63 -
257 PUNJAB FIROZPUR Wage Wala-Pz 11.50 - 11.38 -
258 PUNJAB GURDASPUR Bariyar 11.21 - 10.80 -
259 PUNJAB GURDASPUR Batala-Pz 8.30 - 8.40 -
260 PUNJAB GURDASPUR Bhagowal 8.60 7.84 8.80 -
261 PUNJAB GURDASPUR Bham 16.24 17.19 - -
262 PUNJAB GURDASPUR Bilasbal-Pz - - 17.63 -
263 PUNJAB GURDASPUR Chahal Kalan-Pz - - 9.98 -
264 PUNJAB GURDASPUR Chahgill-Pz 6.42 - 9.41 -
265 PUNJAB GURDASPUR Chone-Pz 13.17 - 12.33 -
266 PUNJAB GURDASPUR Choranwali-D 8.68 - 8.50 -
267 PUNJAB GURDASPUR Choranwali-M 8.40 - 6.18 -
268 PUNJAB GURDASPUR Choranwali-S 6.17 - 5.28 -
269 PUNJAB GURDASPUR Dakoha-Pz 15.75 17.15 16.40 -

270 PUNJAB GURDASPUR Dera Baba Nanak 7.10 - 6.90 -
271 PUNJAB GURDASPUR Dhianpur 10.75 10.99 10.20 -
272 PUNJAB GURDASPUR Dinanagar 4.03 3.03 2.29 -
273 PUNJAB GURDASPUR Dostpur-Pz 5.55 - 4.05 -
274 PUNJAB GURDASPUR Gajikort-Pz 5.27 - 4.66 -
275 PUNJAB GURDASPUR Galri 4.04 2.12 3.82 -
276 PUNJAB GURDASPUR Ghania Ki bangar- Pz
8.15 9.02 7.65 -
277 PUNJAB GURDASPUR Ghuman-D 15.56 16.64 15.53 -
278 PUNJAB GURDASPUR Ghumani Khurd-Pz - -
6.80 -
279 PUNJAB GURDASPUR Ghuman-M 15.31 16.34 15.34 -
280 PUNJAB GURDASPUR Ghuman-S 14.28 15.45 14.88 -
281 PUNJAB GURDASPUR Gurdaspur-Pz 9.01 - 9.23 -
282 PUNJAB GURDASPUR Harchowal-Pz 16.05 - 16.10 -
283 PUNJAB GURDASPUR Harchowal-Pz-S 14.17 13.50 13.40 -
284 PUNJAB GURDASPUR Hargobindpur1 19.20 20.35 - -
285 PUNJAB GURDASPUR Hassanpur Kalan-Pz - -
11.09 -
286 PUNJAB GURDASPUR Jhabkra 3.79 - 2.88 -
287 PUNJAB GURDASPUR Jhandalbana-Pz - - 2.67 -
288 PUNJAB GURDASPUR Kala Afgana-Pz 9.90 - 9.21 -
289 PUNJAB GURDASPUR Kalanaur-DW 12.50 12.28 12.15 -
290 PUNJAB GURDASPUR Kalanaur-Pz 7.80 5.15 4.73 -
291 PUNJAB GURDASPUR Kalerkalan-Pz 3.75 - 3.33 -
292 PUNJAB GURDASPUR Kaure-Pz 16.24 - 16.33 -
293 PUNJAB GURDASPUR Khan Fatta-Pz - - 6.04 -
294 PUNJAB GURDASPUR Khanmalik-Pz - - 13.43 -
295 PUNJAB GURDASPUR Khatgarh-Pz 6.23 - 5.18 -
296 PUNJAB GURDASPUR Lakankala-Pz 6.80 - 6.81 -
297 PUNJAB GURDASPUR Langurwal-Pz 9.48 - 8.58 -
298 PUNJAB GURDASPUR Madipur Fatehgarhchuria
10.54 11.15 10.41 -
299 PUNJAB GURDASPUR Malikpur-Pz 9.15 - 8.69 -
300 PUNJAB GURDASPUR Maman-Pz 8.08 - 7.15 -
301 PUNJAB GURDASPUR Masana-Pz - - 4.89 -
302 PUNJAB GURDASPUR Massit-Pz 2.77 - 2.82 -
303 PUNJAB GURDASPUR Mirza Jaan-Pz 9.65 - 9.90 -
304 PUNJAB GURDASPUR Mullowali 1(vs) - - 3.91 -
305 PUNJAB GURDASPUR Nangal-Pz 3.75 - 3.66 -
306 PUNJAB GURDASPUR Naushera - - 3.52 -
307 PUNJAB GURDASPUR Nishayara - - 12.00 -
308 PUNJAB GURDASPUR Pandoritalab 2.67 2.56 2.21 -
309 PUNJAB GURDASPUR Parcha-Pz 12.79 - 6.41 -
310 PUNJAB GURDASPUR Patti Atwal-Pz - - 13.40 -

311 PUNJAB GURDASPUR Quadian 07 - - - -
312 PUNJAB GURDASPUR Raipur 4.60 - 3.97 -
313 PUNJAB GURDASPUR Saidowal Kalan-DW
3.65 3.95 4.20 -
314 PUNJAB GURDASPUR Saleh Chak-S 4.47 3.62 3.50 -
315 PUNJAB GURDASPUR Salehchak(vs) 3.80 3.85 3.65 -
316 PUNJAB GURDASPUR Sathial-Pz - 14.18 13.33 -
317 PUNJAB GURDASPUR Shahpur Jattan-Pz - - - -
318 PUNJAB GURDASPUR Shahpur-Pz 5.37 - 4.87 -
319 PUNJAB GURDASPUR Shezada Kalan-Pz 5.97 - 4.86 -
320 PUNJAB GURDASPUR Sohal 11.00 - 10.60 -
321 PUNJAB GURDASPUR Tikriwala-Pz 10.94 - 11.78 -
322 PUNJAB HOSHIARPUR Aallo Batti-Pz 1.90 - 3.90 -
323 PUNJAB HOSHIARPUR Argowal-Pz 30.04 - 26.45 -
324 PUNJAB HOSHIARPUR Badla-Pz 15.48 - 15.05 -
325 PUNJAB HOSHIARPUR Baichan-Pz 24.67 - 23.49 -
326 PUNJAB HOSHIARPUR Bajwara-Pz 17.83 - 16.89 -
327 PUNJAB HOSHIARPUR Barota-PZ 3.66 - 3.13 -
328 PUNJAB HOSHIARPUR Bassi Ballo-D 54.79 54.01 56.73 56.90
329 PUNJAB HOSHIARPUR Bassi Ballo-M 43.59 46.08 48.18 38.30
330 PUNJAB HOSHIARPUR Bassi Ballo-S 27.82 27.20 27.41 25.00
331 PUNJAB HOSHIARPUR Bersa - - 17.10 -
332 PUNJAB HOSHIARPUR Bhalowal Gujjran-Pz
36.37 -
38.82 -
333 PUNJAB HOSHIARPUR Bhamnaur 11.72 2.62 12.08 14.45
334 PUNJAB HOSHIARPUR Bhangala-Chhota-DW
5.98 6.57 6.54 6.23
335 PUNJAB HOSHIARPUR Bhanowal-Pz 17.65 - 17.84 -
336 PUNJAB HOSHIARPUR Bhatolian-Pz 27.08 - 27.84 -
337 PUNJAB HOSHIARPUR Bhunga-Pz - - 17.40 -
338 PUNJAB HOSHIARPUR Bisu Chak 20.63 - 16.79 -
339 PUNJAB HOSHIARPUR Boring-PZ - - 8.83 -
340 PUNJAB HOSHIARPUR Chak Sheru-DW 3.43 3.42 4.14 3.94
341 PUNJAB HOSHIARPUR Chohal 3.02 1.70 1.70 1.75
342 PUNJAB HOSHIARPUR Dadan-Pz 39.05 - 39.55 -
343 PUNJAB HOSHIARPUR DAGAN-DW 14.28 11.87 12.39 -
344 PUNJAB HOSHIARPUR Dallewal-Pz 21.54 - 21.72 -
345 PUNJAB HOSHIARPUR Dasuya2 (s) 8.70 - 9.30 9.15
346 PUNJAB HOSHIARPUR Dharampur1 3.40 - 3.15 -
347 PUNJAB HOSHIARPUR Durimiwal 6.04 4.11 5.97 7.10
348 PUNJAB HOSHIARPUR Garh Di Wala-Pz 14.92 15.82 16.63 13.25
349 PUNJAB HOSHIARPUR Garhshankar (s) 23.18 21.07 26.15 24.94
350 PUNJAB HOSHIARPUR Haler Rampur-DW 4.59 1.25 3.08 4.52
351 PUNJAB HOSHIARPUR Hazipur 8.74 12.10 8.88 8.38
352 PUNJAB HOSHIARPUR Heer Beh-PZ - - 21.28 -

353 PUNJAB HOSHIARPUR Ittian-Pz 7.53 - 6.80 -
354 PUNJAB HOSHIARPUR Jahidpur-PZ 7.49 - 7.69 -
355 PUNJAB HOSHIARPUR Jalalpur-Pz 5.49 - 5.94 -
356 PUNJAB HOSHIARPUR Jattpur-Pz 15.38 - 12.91 -
357 PUNJAB HOSHIARPUR Khera-Pz 44.39 - 50.95 -
358 PUNJAB HOSHIARPUR Mahil Baltohian-Pz
32.38 -
39.87 -
359 PUNJAB HOSHIARPUR Mahilpur-Pz 19.95 - 20.49 20.42
360 PUNJAB HOSHIARPUR Mianipur-Pz 4.81 - 5.33 -
361 PUNJAB HOSHIARPUR Naharpur-Pz 5.45 - 3.72 -
362 PUNJAB HOSHIARPUR Nangal Bihala- DW
11.46 12.10 13.28 11.34
363 PUNJAB HOSHIARPUR Nangal Thathal-Pz 22.98 - 23.06 -
364 PUNJAB HOSHIARPUR Pan Khuh-DW 8.40 - 6.20 7.88
365 PUNJAB HOSHIARPUR Pandori Mehal-Pz 26.57 - 28.50 -
366 PUNJAB HOSHIARPUR Pandori Rai 11.10 - 5.90 -
367 PUNJAB HOSHIARPUR Parshote-Pz 24.95 - 24.50 -
368 PUNJAB HOSHIARPUR Phuglana- Pz 23.04 29.63 24.87 20.45
369 PUNJAB HOSHIARPUR Rampur Colony (HSP) pz-medium -
21.16 61.44 53.19
370 PUNJAB HOSHIARPUR Samraj Tanda-DW 0.76 3.98 5.88 4.70
371 PUNJAB HOSHIARPUR Satnoh-PZ. 40.97 - 42.52 -
372 PUNJAB HOSHIARPUR Sham Chaurasi 12.35 12.72 12.65 12.70
373 PUNJAB HOSHIARPUR Sibo Chak- DW 8.43 5.22 7.86 8.05
374 PUNJAB HOSHIARPUR Simbli- OW 16.76 15.52 20.00 18.18
375 PUNJAB HOSHIARPUR Simbli-Pz 16.68 20.18 20.36 17.09
376 PUNJAB HOSHIARPUR Talwara1 8.33 5.37 8.18 10.01
377 PUNJAB HOSHIARPUR Tanda 4.88 - 3.89 -
378 PUNJAB HOSHIARPUR Thakarwala 5.28 5.16 6.37 5.51
379 PUNJAB JALANDHAR Adampur 3(s) 8.02 8.41 8.58 8.08
380 PUNJAB JALANDHAR Adarman-Pz 24.44 - 25.72 -
381 PUNJAB JALANDHAR Akalpur-Pz 18.60 - 19.59 -
382 PUNJAB JALANDHAR Allawalpur 6.60 5.23 5.10 5.19
383 PUNJAB JALANDHAR Bilga-Pz 24.15 - 25.03 -
384 PUNJAB JALANDHAR Chania-Pz 34.58 - 36.58 -
385 PUNJAB JALANDHAR Dhanda-Pz 34.82 - 36.61 -
386 PUNJAB JALANDHAR Fateh Jalal-Pz 32.04 - 33.94 -
387 PUNJAB JALANDHAR Gehlan-pz 19.58 - 19.81 -
388 PUNJAB JALANDHAR Gillian-Pz 38.83 - 39.93 -
389 PUNJAB JALANDHAR Hardo Sheikh-Pz 33.33 - 35.74 -
390 PUNJAB JALANDHAR Jalandhar-Pz(VS) 33.41 43.56 43.84 43.32
391 PUNJAB JALANDHAR Jalbhe 11.00 10.28 10.46 -
392 PUNJAB JALANDHAR Jandiala-Pz 31.45 33.28 39.52 33.08
393 PUNJAB JALANDHAR Jandu Singha-Pz 28.52 - 33.38 -
394 PUNJAB JALANDHAR Janian-Pz 28.12 - 28.78 -

395 PUNJAB JALANDHAR Kakar Kalan-Pz 20.44 - 21.85 -
396 PUNJAB JALANDHAR Kala-Pz 29.39 - 26.58 -
397 PUNJAB JALANDHAR Kalyanpur-Pz 38.98 - 38.26 -
398 PUNJAB JALANDHAR Kang Sahib Rai-Pz 36.49 - 36.38 -
399 PUNJAB JALANDHAR Kartarpur 2(s) 20.81 21.49 21.08 20.67
400 PUNJAB JALANDHAR Kharal Kalan Pz-S 15.48 16.85 16.09 15.94
401 PUNJAB JALANDHAR Kot Wadal Khan-Pz
28.38 -
28.80 -
402 PUNJAB JALANDHAR Kurla-Pz 23.55 - 22.05 -
403 PUNJAB JALANDHAR Lallian kalan Pz-S 37.00 35.04 39.37 38.95
404 PUNJAB JALANDHAR Mahmuwal-Pz 35.18 - 36.55 -
405 PUNJAB JALANDHAR Mehsampur-Pz 23.82 - 25.14 -
406 PUNJAB JALANDHAR Nakodar 2(m) - - - -
407 PUNJAB JALANDHAR Nangal Shaman 34.70 - 34.84 -
408 PUNJAB JALANDHAR Nussi-Pz 33.16 - 36.67 -
409 PUNJAB JALANDHAR Pathial-Pz 18.78 - 16.48 -
410 PUNJAB JALANDHAR Pharwala-Pz 27.26 - 28.85 -
411 PUNJAB JALANDHAR Phillaur 2(s) 17.44 17.75 17.80 17.65
412 PUNJAB JALANDHAR Rahimpur-Pz 27.70 - 31.06 -
413 PUNJAB JALANDHAR Rurka Kalan- Pz 31.00 - 31.03 -
414 PUNJAB JALANDHAR Samarahi-Pz 23.66 - 23.94 -
415 PUNJAB JALANDHAR Shahkot(s) 34.10 - 31.57 -
416 PUNJAB JALANDHAR Shahkot-Pz-Pb 20.35 - 18.99 -
417 PUNJAB JALANDHAR Skarar Pur-Pz 32.56 - 30.49 -
418 PUNJAB JALANDHAR Sultanpur-Pz 18.64 - 19.11 -
419 PUNJAB JALANDHAR Talwan-Pz 21.35 - 24.33 -
420 PUNJAB JALANDHAR Thanda-Pz 27.11 - 29.38 -
421 PUNJAB JALANDHAR Turaan-D 18.14 22.18 22.20 21.02
422 PUNJAB JALANDHAR Turaan-M 18.18 23.06 25.45 24.30
423 PUNJAB JALANDHAR Turaan-S 17.90 24.41 24.43 22.91
424 PUNJAB KAPURTHALA Bauril Harnampur-Pz
17.24 -
18.39 -
425 PUNJAB KAPURTHALA Begowal-Pz 7.21 - 7.52 -
426 PUNJAB KAPURTHALA Bhatnura Khurd- S
17.97 16.82 16.87 14.47
427 PUNJAB KAPURTHALA Bhawanipur-Pz 15.83 - 12.53 -
428 PUNJAB KAPURTHALA Bholath M 10.17 12.02 10.80 9.27
429 PUNJAB KAPURTHALA Bholath S 10.74 10.63 12.07 9.45
430 PUNJAB KAPURTHALA Chakoke-Pz 9.08 - 7.75 -
431 PUNJAB KAPURTHALA Dhilwan 8.30 - 6.70 -
432 PUNJAB KAPURTHALA Hamira-Pz 13.19 - 13.81 -
433 PUNJAB KAPURTHALA Hazipur-Pz 8.61 - 7.97 -
434 PUNJAB KAPURTHALA Hussainpura-S Pz 22.00 24.99 26.85 24.90
435 PUNJAB KAPURTHALA Hussainpura-VS Pz
24.53 - - -

436 PUNJAB KAPURTHALA Kapurthala2 (s) 25.64 25.32 26.02 21.87
437 PUNJAB KAPURTHALA Karnail Ganju-Pz 9.11 - 9.63 -
438 PUNJAB KAPURTHALA Maheru-Pz 23.20 - 24.83 -
439 PUNJAB KAPURTHALA Miani Bola-Pz 10.96 - 10.70 -
440 PUNJAB KAPURTHALA Mithra-Pz 18.60 - 22.70 -
441 PUNJAB KAPURTHALA Nadala 8.80 - 9.20 -
442 PUNJAB KAPURTHALA Nangal Lubhana-Pz
7.70 -
7.70 -
443 PUNJAB KAPURTHALA Nathu Chahal-Pz 33.75 - 36.88 -
444 PUNJAB KAPURTHALA Nurpur Janoa-Pz 11.30 - 10.96 -
445 PUNJAB KAPURTHALA Paazian-Pz 22.20 - 24.00 -
446 PUNJAB KAPURTHALA Phagwara(shallow) 29.90 - 31.40 -
447 PUNJAB KAPURTHALA Phagwara2 (s) 27.55 30.67 30.81 30.25
448 PUNJAB KAPURTHALA Sangatpur-Pz 23.63 - 28.33 -
449 PUNJAB KAPURTHALA Shalapur Dona-Pz 30.15 - 33.70 -
450 PUNJAB KAPURTHALA Sultanpur2 (s) 14.14 16.83 15.63 14.65
451 PUNJAB KAPURTHALA Talwandi Chaudary -Pz
11.20 12.66 11.74 -
452 PUNJAB KAPURTHALA Thikriwali-Pz 9.89 - 10.16 -
453 PUNJAB LUDHIANA Alamgir-Pz 22.30 - 22.58 -
454 PUNJAB LUDHIANA Aliwal-Pz 9.30 - 10.33 -
455 PUNJAB LUDHIANA Basian Bet-D 17.98 18.52 18.40 18.02
456 PUNJAB LUDHIANA Basian Bet-M 17.45 18.40 18.60 16.91
457 PUNJAB LUDHIANA Basian Bet-S 16.76 18.21 36.40 16.46
458 PUNJAB LUDHIANA Begowal 9.65 10.17 10.59 10.32
459 PUNJAB LUDHIANA Bhagwanpur-Pz 14.60 - 15.68 -
460 PUNJAB LUDHIANA Bhahlolpur-DW 13.02 13.15 13.33 12.88
461 PUNJAB LUDHIANA Bharthala Randhawa-Pz
25.00 -
25.44 -
462 PUNJAB LUDHIANA Bhikhi Khatron-Pz 16.00 - 16.02 -
463 PUNJAB LUDHIANA Bilaspur-Pz 9.71 - 10.88 -
464 PUNJAB LUDHIANA Chankoian Khurd-Pz
8.50 -
9.16 -
465 PUNJAB LUDHIANA Chattar Singh Park-ldh
42.21 41.44 40.44 40.81
466 PUNJAB LUDHIANA Chaunta-Pz 5.15 - 6.14 -
467 PUNJAB LUDHIANA Chhapar-Pz 27.06 - 28.13 -
468 PUNJAB LUDHIANA Dinnamder-Pz 23.00 - 24.15 -
469 PUNJAB LUDHIANA Dodpur-Pz 21.50 - 22.52 -
470 PUNJAB LUDHIANA Doraha-Pz - - 6.85 7.38
471 PUNJAB LUDHIANA Galibkalan-Pz 27.10 - 30.07 -
472 PUNJAB LUDHIANA Gohaur-Pz 25.80 - 25.22 -
473 PUNJAB LUDHIANA Gopalpur 2(s) 19.47 - - 20.09
474 PUNJAB LUDHIANA Hambowal-Pz 5.90 - 5.78 -
475 PUNJAB LUDHIANA Harnampur 22.02 - 20.92 -
476 PUNJAB LUDHIANA Hedon-Pz 18.00 - 19.54 -

477 PUNJAB LUDHIANA Ikloha-Pz 23.59 24.57 24.69 24.18
478 PUNJAB LUDHIANA Jagraon 2(s) - 84.00 - -
479 PUNJAB LUDHIANA Kalsian - - 34.51 -
480 PUNJAB LUDHIANA Katanikalan-Pz 9.10 - 9.56 -
481 PUNJAB LUDHIANA Khandur 23.90 - 26.61 -
482 PUNJAB LUDHIANA Kishangarh-Pz 21.10 - 21.36 -
483 PUNJAB LUDHIANA Kishanpur-Pz 27.50 - 30.43 -
484 PUNJAB LUDHIANA Lalan1 5.72 10.70 10.30 6.17
485 PUNJAB LUDHIANA Lil- II Pz 16.06 16.12 16.20 17.68
486 PUNJAB LUDHIANA Lil-Pz III 18.06 18.04 18.34 16.10
487 PUNJAB LUDHIANA Lodhiwal-Pz 14.20 - 13.60 -
488 PUNJAB LUDHIANA Lohara-Pz 31.60 - 32.46 -
489 PUNJAB LUDHIANA Maksudra-Pz 10.84 11.61 11.70 11.32
490 PUNJAB LUDHIANA Manak Majra-Pz 22.80 - 23.76 -
491 PUNJAB LUDHIANA Mangat-Pz 12.00 - 12.16 -
492 PUNJAB LUDHIANA Mangat-Pz-S 11.67 12.01 12.20 -
493 PUNJAB LUDHIANA Manoke-Pz 32.90 - 35.10 -
494 PUNJAB LUDHIANA Mehma Singh Wala-Pz
25.90 -
26.61 -
495 PUNJAB LUDHIANA Mushkabad 12.54 12.48 13.03 12.61
496 PUNJAB LUDHIANA Nelokalan 5.10 - 4.75 -
497 PUNJAB LUDHIANA Nurpur-Pz 30.60 - 34.30 -
498 PUNJAB LUDHIANA P.A.U.Ludhiana 2(s)
33.75 33.70 33.87 34.87
499 PUNJAB LUDHIANA Pabbian-Pz 23.00 - 22.04 -
500 PUNJAB LUDHIANA Pandori-Pz 24.50 - 24.68 -
501 PUNJAB LUDHIANA Payal-Pz 17.35 - 14.53 -
502 PUNJAB LUDHIANA Punjeta 9.80 11.75 10.40 10.16
503 PUNJAB LUDHIANA Raikot-Pz 32.10 - 34.84 -
504 PUNJAB LUDHIANA Rajona Khurd 33.00 - 35.07 -
505 PUNJAB LUDHIANA Rashin 29.00 - 31.90 -
506 PUNJAB LUDHIANA Rattewal-Pz 27.10 - 29.87 -
507 PUNJAB LUDHIANA Roomi-Pz 28.00 - 32.38 -
508 PUNJAB LUDHIANA Roshiana-Pz 24.00 - 25.24 -
509 PUNJAB LUDHIANA Sajaywal-Pz 30.00 - 32.40 -
510 PUNJAB LUDHIANA Samrala 2(s) 14.18 14.19 14.87 14.34
511 PUNJAB LUDHIANA Sanewal-Pz 17.10 - 17.65 -
512 PUNJAB LUDHIANA Sangatpura-Pz 19.45 - 20.51 -
513 PUNJAB LUDHIANA Sherian 3.28 3.22 3.77 3.79
514 PUNJAB LUDHIANA Sherpur Bhet 5.55 - 8.98 -
515 PUNJAB LUDHIANA Sidhwan Bet-Pz 10.94 11.05 8.76 10.99
516 PUNJAB LUDHIANA Talwandi Kalan-Pz
20.50 -
23.34 -
517 PUNJAB LUDHIANA Udonwal-Pz 4.40 - 4.66 -
518 PUNJAB LUDHIANA Upplan 8.40 - 9.09 -

519 PUNJAB LUDHIANA Utlan 9.30 10.34 11.65 11.66
520 PUNJAB MANSA Aklia-Pz 25.94 - 26.63 -
521 PUNJAB MANSA Alampur Mandran-Pz
12.24 -
13.31 -
522 PUNJAB MANSA Alisher Khurd-Pz 17.63 - 17.83 -
523 PUNJAB MANSA Bahadur Pur-Pz 20.67 - 21.32 -
524 PUNJAB MANSA Bareh-Pz 12.54 - 12.71 -
525 PUNJAB MANSA Behniwala-Pz 7.28 - 7.09 -
526 PUNJAB MANSA Bhikhi 1 (s) 19.52 20.20 20.22 20.12
527 PUNJAB MANSA Bhikhi 2 (s) 20.98 - 21.16 -
528 PUNJAB MANSA Budhlada 16.50 17.60 - -
529 PUNJAB MANSA Budhlada-Pz 17.24 18.07 17.78 16.15
530 PUNJAB MANSA Burj Bhalaike 4.42 0.74 3.17 3.52
531 PUNJAB MANSA Burj Rathi-Pz 16.82 - 17.32 -
532 PUNJAB MANSA Fattamaluka 6.43 5.93 - 6.01
533 PUNJAB MANSA Gharangne-Pz 8.83 - 9.04 -
534 PUNJAB MANSA Hero Kalan-Pz 31.05 - 32.47 -
535 PUNJAB MANSA Hirke-Pz - - 24.72 -
536 PUNJAB MANSA Jhanda Khurd Pz - - 28.00 -
537 PUNJAB MANSA Joga -Dp-PZ 7.53 - 1.94 -
538 PUNJAB MANSA Khiala Kalan-Pz 12.68 - 12.30 -
539 PUNJAB MANSA Khokhar Kalan-Pz 10.92 - 10.71 -
540 PUNJAB MANSA Kot Dhamru 7.95 8.63 - 8.67
541 PUNJAB MANSA Kotra 14.90 15.53 15.52 15.37
542 PUNJAB MANSA Lakhiwal-Pz 21.84 - 22.91 -
543 PUNJAB MANSA Makha-[PZ 8.10 - 8.00 -
544 PUNJAB MANSA Mansa 10.65 - 10.86 -
545 PUNJAB MANSA Phaphare Bhaike-Pz
20.15 -
21.11 -
546 PUNJAB MANSA Raipur-Pz 6.95 7.23 7.15 6.93
547 PUNJAB MANSA Ralla 15.15 16.35 16.23 16.01
548 PUNJAB MANSA Tibbi Hari Singh-PZ - -
20.73 -
549 PUNJAB MOGA Baje Ke-Pz 20.14 22.25 22.45 -
550 PUNJAB MOGA Bilaspur-PZ 35.92 - 38.43 -
551 PUNJAB MOGA Budh Singh Wala-Pz
25.93 28.12 28.28 -
552 PUNJAB MOGA Chogawan-Pz 34.93 40.03 38.37 -
553 PUNJAB MOGA Dagru- Pz 35.05 37.02 37.36 -
554 PUNJAB MOGA Damru Khurd 22.71 26.43 50.00 -
555 PUNJAB MOGA Dhudi Ke-PZ 34.61 - 36.89 -
556 PUNJAB MOGA Dinna-PZ 35.11 - 37.37 -
557 PUNJAB MOGA Himatpura-Pz 36.13 - 38.79 -
558 PUNJAB MOGA Indergarh-Pz 25.38 - 23.91 -
559 PUNJAB MOGA Jhandewala-Pz 37.60 - 39.20 -

560 PUNJAB MOGA Kamalke-Pz - - 15.53 -
561 PUNJAB MOGA Khokri Kalan-Pz 31.43 - 33.22 -
562 PUNJAB MOGA Khosa Randhir-Pz 32.28 - 33.50 -
563 PUNJAB MOGA Mandar-Pz 10.47 - 9.92 -
564 PUNJAB MOGA Mangewala-Pz 23.17 - 23.50 -
565 PUNJAB MOGA Meemana-PZ 37.90 - 40.90 -
566 PUNJAB MOGA Mehron-PZ - - - -
567 PUNJAB MOGA Nathu Wala-Pz 24.48 - 25.85 -
568 PUNJAB MOGA Nihalsinghwala-Pz 36.15 - 40.00 -
569 PUNJAB MOGA Raonke Kalan-Pz 31.49 - 33.91 -
570 PUNJAB MOGA Samad Bhai-Pz 25.90 - 27.69 -
571 PUNJAB MOGA Samalsar-Pz 24.36 - 25.74 -
572 PUNJAB MOGA Tota Singh Wala-Pz - -
12.65 -
573 PUNJAB MUKTSAR Abulkharana-Pz 3.25 - 2.89 -
574 PUNJAB MUKTSAR Balocha Khera(rasoolpur)
1.45 -
0.95 0.57
575 PUNJAB MUKTSAR Bhaliana 7.53 11.35 10.99 10.33
576 PUNJAB MUKTSAR Bhiti Wala-Pz 4.07 - 3.85 -
577 PUNJAB MUKTSAR Chaktam Kot-Pz 1.87 - 1.69 -
578 PUNJAB MUKTSAR Dahak-S 1.65 - 1.04 1.05
579 PUNJAB MUKTSAR Doda 3.92 1.08 0.97 1.23
580 PUNJAB MUKTSAR Doda-Pz 3.03 1.84 1.70 1.97
581 PUNJAB MUKTSAR Gaga-Pz - - - -
582 PUNJAB MUKTSAR Giddarbaha-Pz 3.31 - 3.32 -
583 PUNJAB MUKTSAR Husnar-Pz 3.08 - 2.90 -
584 PUNJAB MUKTSAR Kabar Wala 4.59 3.72 - 3.54
585 PUNJAB MUKTSAR Kattianwali-Pz 3.84 - 2.47 -
586 PUNJAB MUKTSAR Khunde Halal-Pz 1.77 0.87 1.71 1.60
587 PUNJAB MUKTSAR Kollian Wali-pz 2.63 - 2.87 -
588 PUNJAB MUKTSAR Labanianwali 3.45 3.21 3.24 3.21
589 PUNJAB MUKTSAR Lambi 1.39 1.04 0.55 0.33
590 PUNJAB MUKTSAR Lambi-Pz 2.66 - - -
591 PUNJAB MUKTSAR Muktsar 6.73 4.08 3.90 3.58
592 PUNJAB MUKTSAR Phulu Khera-Pz 2.49 - 2.64 -
593 PUNJAB MUKTSAR Ratta Khera Chota-Pz
2.07 -
2.10 -
594 PUNJAB MUKTSAR Sehna khera-Pz 2.77 - 2.64 -
595 PUNJAB MUKTSAR Sheikh-Pz 2.96 - 1.49 -
596 PUNJAB PATHANKOT Bamyal 5.72 3.60 3.46 3.24
597 PUNJAB PATHANKOT Bhoa 4.43 2.61 4.59 4.29
598 PUNJAB PATHANKOT Dhar Khurd 3.00 - 3.10 -
599 PUNJAB PATHANKOT Gharotakalan 6.23 12.32 6.61 6.48
600 PUNJAB PATHANKOT Ghoh 8.69 6.21 5.79 5.67
601 PUNJAB PATHANKOT Jainpur-PZ - - 2.90 -

602 PUNJAB PATHANKOT Jandwala 26.11 - 24.89 -
603 PUNJAB PATHANKOT Jhakolahri 2.06 1.70 2.43 2.01
604 PUNJAB PATHANKOT Khanikhui 1.56 1.08 1.38 1.51
605 PUNJAB PATHANKOT Khogaki Chaka-PZ
3.59 -
2.23 -
606 PUNJAB PATHANKOT Kiari- DW 6.05 0.79 0.48 0.43
607 PUNJAB PATHANKOT Kirian Khurd-PZ - - 4.66 -
608 PUNJAB PATHANKOT Kui-DW - 1.89 1.14 1.03
609 PUNJAB PATHANKOT Kuther-PZ 21.30 - 18.39 -
610 PUNJAB PATHANKOT Malikpur 7.35 - 7.15 -
611 PUNJAB PATHANKOT Matti-PZ 25.03 - 16.39 -
612 PUNJAB PATHANKOT Mirthal 7.15 - 3.76 -
613 PUNJAB PATHANKOT Mirthal-DW 3.75 - 3.60 -
614 PUNJAB PATHANKOT Muthi 4.70 - 4.50 -
615 PUNJAB PATHANKOT Narot Jaimalsingh-Pz
5.81 -
5.19 -
616 PUNJAB PATHANKOT Nawan Pind 6.17 3.33 5.48 5.40
617 PUNJAB PATHANKOT Parmota-DW 6.80 1.24 5.48 1.59
618 PUNJAB PATHANKOT Pathankot1 4.51 2.67 0.83 0.71
619 PUNJAB PATHANKOT Philora-PZ 1.51 - 2.47 -
620 PUNJAB PATHANKOT Phulpiara 5.10 - 5.20 -
621 PUNJAB PATHANKOT Rakawal-PZ 4.48 - 4.25 -
622 PUNJAB PATHANKOT Rani Pur-PZ 10.04 - 6.81 -
623 PUNJAB PATHANKOT Sarna 9.37 6.74 9.62 9.36
624 PUNJAB PATHANKOT Sujanpur-PZ 3.67 - 3.41 -
625 PUNJAB PATIALA Bassma Pipla 6.30 5.50 - 5.05
626 PUNJAB PATIALA Bhankhar-Pz 37.55 - 38.10 -
627 PUNJAB PATIALA Bhojo majri 07pz - 26.44 26.76 25.86
628 PUNJAB PATIALA Bhora-Pz - - 25.50 -
629 PUNJAB PATIALA Birkauli 29.03 - 51.00 29.06
630 PUNJAB PATIALA Challeta-PZ 28.90 - 26.25 -
631 PUNJAB PATIALA Chehal 25.44 25.98 - -
632 PUNJAB PATIALA Devigarh - - - -
633 PUNJAB PATIALA Devigarh 1Pz 36.11 42.84 40.63 37.65
634 PUNJAB PATIALA Devigarh IIPz 35.80 42.61 40.83 38.09
635 PUNJAB PATIALA Devigarh-III Pz 35.95 43.06 41.35 38.19
636 PUNJAB PATIALA Dhaneta-PZ 38.25 - 39.50 -
637 PUNJAB PATIALA Duggal Kalan 41.42 - 42.73 -
638 PUNJAB PATIALA Gharam-PZ 40.43 - 41.48 -
639 PUNJAB PATIALA Gulwatti-PZ 34.03 - 35.23 -
640 PUNJAB PATIALA Haluka 9.16 9.03 9.40 8.14
641 PUNJAB PATIALA Hari Majra 6.13 5.26 6.47 7.55
642 PUNJAB PATIALA Jainagar-PZ 32.39 - 30.22 -
643 PUNJAB PATIALA Jogewal-PZ 37.47 - 38.88 -

644 PUNJAB PATIALA Kalyan 07pz - 28.07 28.13 27.46
645 PUNJAB PATIALA Kami Kalan 12.10 9.57 11.44 11.74
646 PUNJAB PATIALA Kami Khurd-PZ 19.97 - 22.11 -
647 PUNJAB PATIALA Karan Pur 32.13 - 28.57 -
648 PUNJAB PATIALA Kauli state - - 29.21 -
649 PUNJAB PATIALA Kheri Pandte-PZ 27.48 - 32.63 -
650 PUNJAB PATIALA Kulburcha-Pz 42.02 - 43.46 -
651 PUNJAB PATIALA Kutha Kheri-Pz 38.40 - 41.04 -
652 PUNJAB PATIALA Lacharu Kalan 4.13 3.23 3.54 4.16
653 PUNJAB PATIALA Lachkani-Pz 23.90 25.20 25.06 24.31
654 PUNJAB PATIALA Mehmood Pur-PZ - - 33.35 -
655 PUNJAB PATIALA Mongowal-PZ - - 28.29 -
656 PUNJAB PATIALA Nanhera-Pz - - 25.33 -
657 PUNJAB PATIALA Nariana 10.43 9.93 9.05 8.65
658 PUNJAB PATIALA Passiana-PZ 26.82 - 26.06 -
659 PUNJAB PATIALA Patran-Pz 44.39 45.05 45.35 45.69
660 PUNJAB PATIALA Rajgarh - 28.42 27.93 26.88
661 PUNJAB PATIALA Rajpura Pz M 43.48 - 30.26 37.28
662 PUNJAB PATIALA Rajpura-PzSt - 70.00 70.00 -
663 PUNJAB PATIALA Rakhra-Pz - - 28.00 -
664 PUNJAB PATIALA Ramgarh 33.83 35.53 35.67 -
665 PUNJAB PATIALA Randhawa-Pz - 39.47 38.50 -
666 PUNJAB PATIALA Rasoolpur Jaura-PZ
29.82 -
31.22 -
667 PUNJAB PATIALA Saghraur-PZ 42.92 - 44.77 -
668 PUNJAB PATIALA Samana-Pz 38.72 - 40.22 -
669 PUNJAB PATIALA Samaspur-Pz 29.21 - 29.62 39.47
670 PUNJAB PATIALA Sanaur 40.12 - 38.11 -
671 PUNJAB PATIALA Sangatpura-Pz - 31.32 - 30.47
672 PUNJAB PATIALA Sauja-PZ 33.94 - 33.17 -
673 PUNJAB PATIALA Surala Kalan-PZ - - 1.40 -
674 PUNJAB PATIALA Thua - - 34.77 -
675 PUNJAB RUPNAGAR Ahmedpur 7.83 3.71 6.70 6.29
676 PUNJAB RUPNAGAR Amrali-PZ 18.42 - 19.06 -
677 PUNJAB RUPNAGAR Attari-PZ 5.71 - 5.44 -
678 PUNJAB RUPNAGAR Bains 14.85 - 14.95 -
679 PUNJAB RUPNAGAR Bera Chauta 2.99 2.51 2.78 3.32
680 PUNJAB RUPNAGAR Bhatto-PZ 5.22 - 3.86 -
681 PUNJAB RUPNAGAR Braham Pur 4.38 3.01 4.57 4.75
682 PUNJAB RUPNAGAR Chakdera 4.55 3.66 4.15 4.40
683 PUNJAB RUPNAGAR Chatamli- Pz 31.13 39.43 42.45 38.55
684 PUNJAB RUPNAGAR Dhair 8.53 6.71 8.29 8.04
685 PUNJAB RUPNAGAR Dumewal 12.96 9.61 10.36 -

686 PUNJAB RUPNAGAR Hardinamoh 2.54 0.94 2.80 6.64
687 PUNJAB RUPNAGAR Kakrali - - 20.34 18.66
688 PUNJAB RUPNAGAR Klwan-PZ 10.47 - 9.05 -
689 PUNJAB RUPNAGAR Kotla 1.74 - 1.18 -
690 PUNJAB RUPNAGAR Morinda-PZ 24.88 - 25.71 -
691 PUNJAB RUPNAGAR Rajgiri-PZ - - 16.89 -
692 PUNJAB RUPNAGAR Rurki Heeran-Pz - - - -
693 PUNJAB RUPNAGAR Salempur 22.00 - 23.15 -
694 PUNJAB RUPNAGAR Singh Bhagwant Pur
32.20 -
32.60 -
695 PUNJAB SANGRUR Bagarian-Pz 32.27 36.00 36.84 32.45
696 PUNJAB SANGRUR Bakshiwala-PZ 37.50 - 38.68 -
697 PUNJAB SANGRUR Banbhaura-PZ 31.15 - 32.50 -
698 PUNJAB SANGRUR Benra-PZ-S 37.56 38.67 - 39.30
699 PUNJAB SANGRUR Bhojowali-Pz 39.77 41.84 41.16 40.22
700 PUNJAB SANGRUR Bhunerheri-PZ 40.30 - 42.15 -
701 PUNJAB SANGRUR Bugra 1 34.32 35.39 - 35.74
702 PUNJAB SANGRUR Chatha Nanhera-PZ
32.00 -
33.78 -
703 PUNJAB SANGRUR Chural Kalan M 33.06 33.91 33.81 33.22
704 PUNJAB SANGRUR Dharamgarh-Pz 34.70 - 36.06 -
705 PUNJAB SANGRUR Ghanauri Kalan 42.58 43.50 - -
706 PUNJAB SANGRUR Ghanauri Kalan-Pz - - 44.51 43.90
707 PUNJAB SANGRUR Kala Jhar-Pz 35.50 - 37.62 -
708 PUNJAB SANGRUR Khanpur Fakiran-PZ - - - -
709 PUNJAB SANGRUR Kheri Naran-PZ 37.00 - 37.98 -
710 PUNJAB SANGRUR Khurni-PZ 38.00 - 40.41 -
711 PUNJAB SANGRUR Kila Hakima 31.90 - 34.65 -
712 PUNJAB SANGRUR Kokahar-PZ 28.00 - 30.24 -
713 PUNJAB SANGRUR Kuler Khurd-Pz 38.00 - 40.15 -
714 PUNJAB SANGRUR Ladda-Pz 39.95 - 41.80 -
715 PUNJAB SANGRUR Longowal-Pz 34.13 33.75 33.91 34.25
716 PUNJAB SANGRUR Majji-PZ 35.10 36.48 37.46 36.27
717 PUNJAB SANGRUR Malerkotla-DW 39.03 39.41 - 39.09
718 PUNJAB SANGRUR Manvi-Pz 29.00 24.99 25.10 24.30
719 PUNJAB SANGRUR Minsa-Pz - - 41.20 -
720 PUNJAB SANGRUR Panjgaraian- Pz 42.00 - 44.33 -
721 PUNJAB SANGRUR Rajo Majra-PZ 34.00 - 37.50 -
722 PUNJAB SANGRUR Rampur Channa-
Pz 29.50
- 29.30
-
723 PUNJAB SANGRUR Rurgarh-PZ 44.50 - 46.39 -
724 PUNJAB SANGRUR Rurki Kalan-Pz 24.90 - 26.39 -
725 PUNJAB SANGRUR Sekhpur Khurd-PZ 38.00 - 39.85 -
726 PUNJAB SANGRUR Sekhwas-PZ 30.90 - 33.70 -

727 PUNJAB SANGRUR Sikandarpur-PZ 41.10 - 43.66 -
728 PUNJAB SANGRUR Sunam-Pz 38.35 39.27 37.81 38.93
729 PUNJAB SAS NAGAR Antala 3.79 2.70 3.94 2.78
730 PUNJAB SAS NAGAR Balongi-PZ 43.00 - 44.61 -
731 PUNJAB SAS NAGAR Barauli-PZ 30.50 - 36.61 -
732 PUNJAB SAS NAGAR Chandiala-Pz - - - -
733 PUNJAB SAS NAGAR Dera Bassi 07pz 13.09 12.17 12.35 12.01
734 PUNJAB SAS NAGAR Dheri 6.25 4.52 5.09 6.12
735 PUNJAB SAS NAGAR Gharoon 14.10 - 11.06 -
736 PUNJAB SAS NAGAR Ghoga 5.91 1.20 2.43 3.68
737 PUNJAB SAS NAGAR Gholu majra 07pz - - - -
738 PUNJAB SAS NAGAR Issapur- DW - 4.78 - -
739 PUNJAB SAS NAGAR Joli 6.52 5.51 3.06 5.80
740 PUNJAB SAS NAGAR Kurrha-Pz 27.00 - 26.85 -
741 PUNJAB SAS NAGAR Landran Pz 15.12 16.45 16.13 14.65
742 PUNJAB SAS NAGAR Landran-Pz - - - -
743 PUNJAB SAS NAGAR Malkpur-Pz 16.10 - 13.07 -
744 PUNJAB SAS NAGAR Manoli-PZ 19.40 - 20.77 -
745 PUNJAB SAS NAGAR Mirpur-Pz 30.20 - 30.85 -
746 PUNJAB SAS NAGAR Palheri-PZ 28.00 - 31.05 -
747 PUNJAB SAS NAGAR Pedol-PZ 52.40 - 51.00 -
748 PUNJAB SAS NAGAR Raipur Kalan 16.20 - 16.86 -
749 PUNJAB SAS NAGAR Singhpura-Pz 29.10 - 33.87 -
750 PUNJAB SAS NAGAR Sirsini 1.59 0.63 1.32 0.88
751 PUNJAB SAS NAGAR Siswan 21.10 - 20.12 -
752 PUNJAB SAS NAGAR Sohana-PZ 3.10 - 2.75 -
753 PUNJAB SBS NAGAR Alowal-Pz 15.61 - 6.77 -
754 PUNJAB SBS NAGAR Aur-PZ 11.16 - 11.83 -
755 PUNJAB SBS NAGAR Baharam-Pz 20.75 - - -
756 PUNJAB SBS NAGAR Bahara-Pz 17.29 - 18.54 -
757 PUNJAB SBS NAGAR Bahlora Kallan- Pz 10.81 5.74 5.79 4.43
758 PUNJAB SBS NAGAR Bahua-Pz 22.29 - 27.90 -
759 PUNJAB SBS NAGAR Balaipur-PZ 22.88 - 24.58 -
760 PUNJAB SBS NAGAR Bhadi-PZ 20.11 - 19.57 -
761 PUNJAB SBS NAGAR Dugri Garol-PZ 5.60 - 8.43 -
762 PUNJAB SBS NAGAR Jethu Majra-PZ 17.48 - 17.81 -
763 PUNJAB SBS NAGAR Kariam-Pz 16.43 - 17.90 -
764 PUNJAB SBS NAGAR Langoya-PZ 15.85 - 17.91 -
765 PUNJAB SBS NAGAR Mauhra-Pz 38.21 43.42 41.86 30.39
766 PUNJAB SBS NAGAR Padmaiwal-PZ 20.96 - 21.70 -
767 PUNJAB SBS NAGAR Rahon 9.41 9.58 11.57 9.45
768 PUNJAB SBS NAGAR Raipur Dhaba-Pz 17.73 20.75 22.43 16.41

769 PUNJAB SBS NAGAR Ramgarh-Pz 13.60 - 12.40 -
770 PUNJAB TARAN TARAN Aima Khurd-Pz 16.50 - 15.49 -
771 PUNJAB TARAN TARAN Attari-Pz - - 17.87 -
772 PUNJAB TARAN TARAN Bahla-Pz - - 22.20 -
773 PUNJAB TARAN TARAN Bakipur-Pz 27.04 - 27.26 -
774 PUNJAB TARAN TARAN Bath-Pz 23.53 - 24.39 -
775 PUNJAB TARAN TARAN Bhagala-Pz - - 13.31 -
776 PUNJAB TARAN TARAN Bhagwanpur-Pz 18.40 - 18.96 -
777 PUNJAB TARAN TARAN Bhalaipur-Pz - - 21.85 -
778 PUNJAB TARAN TARAN Bhankar Kalan-Pz - - 18.88 -
779 PUNJAB TARAN TARAN Bhikiwind- Pz - - 18.50 18.25
780 PUNJAB TARAN TARAN Bhura-Pz - - 16.45 -
781 PUNJAB TARAN TARAN Bhure-Pz 27.07 - 22.39 -
782 PUNJAB TARAN TARAN Bhusse-Pz 17.28 - 18.29 -
783 PUNJAB TARAN TARAN Brahmpur-Pz 21.95 - 20.11 -
784 PUNJAB TARAN TARAN Chakkare Khan-Pz 21.93 - 21.06 -
785 PUNJAB TARAN TARAN Chola Sahib-Pz 21.38 26.02 20.62 20.65
786 PUNJAB TARAN TARAN Choudhary Wala-Pz - - - -
787 PUNJAB TARAN TARAN Chuselawad-Pz 23.58 - 23.97 -
788 PUNJAB TARAN TARAN Ekalgoda-Pz - - 25.08 -
789 PUNJAB TARAN TARAN Fatehabad- PZ 20.16 - 20.69 -
790 PUNJAB TARAN TARAN Gandi Wind-Pz 14.80 15.52 14.41 13.91
791 PUNJAB TARAN TARAN Goindwal 20.04 20.19 - 20.17
792 PUNJAB TARAN TARAN Goindwal 07 - - - -
793 PUNJAB TARAN TARAN Jalalabad-PZ - - 20.10 -
794 PUNJAB TARAN TARAN Jandoke-Pz 22.42 - 24.08 -
795 PUNJAB TARAN TARAN Kairon-PZ 19.58 - 20.57 -
796 PUNJAB TARAN TARAN Kalsia Kalan 17.95 19.80 - 18.76
797 PUNJAB TARAN TARAN Kalsia Kalan07 - - - -
798 PUNJAB TARAN TARAN Khadur Sahib-Pz 19.52 20.95 20.66 20.15
799 PUNJAB TARAN TARAN Khalra-Pz 14.95 - 16.19 -
800 PUNJAB TARAN TARAN Kirtowal-Pz - - 20.60 -
801 PUNJAB TARAN TARAN Kotbudda-Pz - - 11.69 -
802 PUNJAB TARAN TARAN Kotli Sur Singh-Pz 18.78 - 19.10 -
803 PUNJAB TARAN TARAN Mahendipur-Pz - - 19.21 -
804 PUNJAB TARAN TARAN Marhona-Pz 19.77 - 19.54 -
805 PUNJAB TARAN TARAN Mari Kamboke-Pz 12.23 - 12.40 -
806 PUNJAB TARAN TARAN Nandpur-Pz - - 20.40 -
807 PUNJAB TARAN TARAN Patti 24.53 - 26.55 -
808 PUNJAB TARAN TARAN Pindan-Pz 18.30 - 17.44 -
809 PUNJAB TARAN TARAN Rajoke-Pz 7.59 - 7.72 -
810 PUNJAB TARAN TARAN Ratoke-Pz 23.27 24.82 22.80 22.40

811 PUNJAB TARAN TARAN Sabran-Pz - - 24.92 -
812 PUNJAB TARAN TARAN Sahab Pura- Pz 22.14 24.09 23.05 22.51
813 PUNJAB TARAN TARAN Sugga-Pz 20.70 - 22.49 -
814 PUNJAB TARAN TARAN Varing-Pz - - 23.00 -

Annexure-2: Seasonal Water Level Fluctuation in meters (+ decline in water levels, - rise in water levels)
S.
No State District Location
2020
January
2020
June
2020
June
2020
June
2020
June
2020
August
2020
October
2021
January
1 CHANDIGARH CHANDIGARH BURAIL - - - -
2 CHANDIGARH CHANDIGARH Csio-combined 1.22 -1.22 -1.81 -0.33
3 CHANDIGARH CHANDIGARH CSIO-S 0.35 0.03 0.13 3.71
4 CHANDIGARH CHANDIGARH NEW INDUST AREA 4.60 -
-0.90 2.30
5 CHANDIGARH CHANDIGARH Sec-27, Ar Well - - - -
6 CHANDIGARH CHANDIGARH Sec-27, Cgwb Building 2.04
2.34 0.23 1.50
7 CHANDIGARH CHANDIGARH SECT 10C - - - -
8 CHANDIGARH CHANDIGARH SECT 10C (D) -3.00 4.78 - 3.67
9 CHANDIGARH CHANDIGARH SECT 10C (S) - 0.34 1.59 -
10 CHANDIGARH CHANDIGARH SECT 31D (D) 2.04 -1.90 -2.22 -0.06
11 CHANDIGARH CHANDIGARH SECT 31D (S) 0.70 -0.03 1.06 0.62
12 CHANDIGARH CHANDIGARH SECT 37D (S) -0.49 0.64 0.89 0.69
13 CHANDIGARH CHANDIGARH SECT 39D (S) -1.92 0.50 -1.09 0.72
14 CHANDIGARH CHANDIGARH SECT 44D (S) -0.66 0.68 -0.34 0.53
15 CHANDIGARH CHANDIGARH Sector-46 (shallow) 0.10
0.06 0.11 0.27
16 PUNJAB AMRITSAR Ajnala 0.10 - -2.70 -
17 PUNJAB AMRITSAR Amritsar 1.01 - -0.47 -0.27
18 PUNJAB AMRITSAR Amritsar1 - - - -
19 PUNJAB AMRITSAR Amritsar-D - -0.81 -2.21 -1.91
20 PUNJAB AMRITSAR Amritsar-M - -0.49 1.37 1.95
21 PUNJAB AMRITSAR Amritsar-S - 4.97 5.12 5.32
22 PUNJAB AMRITSAR Bajwa-Pz - - - -
23 PUNJAB AMRITSAR Bal Kalan-Pz - - 0.00 -
24 PUNJAB AMRITSAR Beas07 0.60 - -0.37 -0.22
25 PUNJAB AMRITSAR Bhattaywad-Pz - - - -
26 PUNJAB AMRITSAR Bhindi Saidan - -1.76 5.18 5.35
27 PUNJAB AMRITSAR Bhindi Saidan-D - 0.25 3.13 3.29
28 PUNJAB AMRITSAR Bhindi Saidan-M - -1.19 4.81 5.00
29 PUNJAB AMRITSAR Bholewal-Pz - - - -
30 PUNJAB AMRITSAR Boparai Khurd-Pz - - 2.62 -
31 PUNJAB AMRITSAR Chak Dogra-Pz - - 2.75 -
32 PUNJAB AMRITSAR Chogawan1 -2.62 -1.22 2.10 2.44
33 PUNJAB AMRITSAR ChogWan- Pz - - - -
34 PUNJAB AMRITSAR Dhulika-Pz - - -0.44 -
35 PUNJAB AMRITSAR Dohan-Pz - - - -
36 PUNJAB AMRITSAR Gago Mahal- Pz -0.46 - -0.31 -0.04
37 PUNJAB AMRITSAR Gill wali-Pz - - -0.13 -

38 PUNJAB AMRITSAR Jandiala Guru-Pz -4.15 -1.02 4.00 3.10
39 PUNJAB AMRITSAR Jethuwal-Pz - - 0.33 -
40 PUNJAB AMRITSAR Kandowali-Pz - - 1.01 -
41 PUNJAB AMRITSAR Karyal-Pz - - 0.16 -
42 PUNJAB AMRITSAR Mahima-Pz - - 1.56 -
43 PUNJAB AMRITSAR Majitha- Pz - - - -
44 PUNJAB AMRITSAR Majitha-Pz - - -0.18 -
45 PUNJAB AMRITSAR Makhan Windi-Pz - - - -
46 PUNJAB AMRITSAR Mehleykey-Pz - - 0.78 -
47 PUNJAB AMRITSAR Mehta - - - -
48 PUNJAB AMRITSAR Mehta-Pz - - - -
49 PUNJAB AMRITSAR Miran Chak-Pz - - 0.54 -
50 PUNJAB AMRITSAR Nangal Sahaul-Pz - - 0.65 -
51 PUNJAB AMRITSAR Nawan Tanal- Pz -1.44 -0.70 0.95 0.90
52 PUNJAB AMRITSAR Ramdas-DW 2.89 - -2.44 -
53 PUNJAB AMRITSAR Rampura-Pz - - - -
54 PUNJAB AMRITSAR Rayya-Pz - - - -
55 PUNJAB AMRITSAR Rupowal Brahmana-Pz - -
0.27 -
56 PUNJAB AMRITSAR Sarangra-Pz - - - -
57 PUNJAB AMRITSAR Shabura-Pz - - 1.01 -
58 PUNJAB AMRITSAR Sham Nagar-Pz - - 1.52 -
59 PUNJAB AMRITSAR Talwandi Dogra-Pz - - - -
60 PUNJAB AMRITSAR Tarsika-Pz - - 0.24 -
61 PUNJAB AMRITSAR Ugar Aulakh-Pz - - 0.69 -
62 PUNJAB AMRITSAR Vadala Kalan-Pz - - -1.02 -
63 PUNJAB AMRITSAR Vadala Viran-Pz - - - -
64 PUNJAB AMRITSAR Verka-Pz - - - -
65 PUNJAB AMRITSAR Wandala
Bittewad-Pz - - - -
66 PUNJAB BARNALA Amla Singh Wala-PZ - -
-1.64 -
67 PUNJAB BARNALA Barnala (s) - -0.83 - -
68 PUNJAB BARNALA Bhadaur-Pz - -1.44 -2.21 -
69 PUNJAB BARNALA Daula-Pz - - -0.50 -
70 PUNJAB BARNALA Dhanaula-Pz - - -2.08 -
71 PUNJAB BARNALA Kurar-Pz - - - -
72 PUNJAB BARNALA Lohgarh-Pz - - - -
73 PUNJAB BARNALA Mahal Kalan-Pz - -1.55 -2.80 -
74 PUNJAB BARNALA Pakho Ke-Pz - - -0.13 -
75 PUNJAB BARNALA Patti Dwarka-Pz - - - -
76 PUNJAB BARNALA Raisar-Pz - - - -
77 PUNJAB BARNALA Shekha - - -2.51 -
78 PUNJAB BATHINDA Ablu 0.30 -1.02 -0.20 -

79 PUNJAB BATHINDA Aleke Jalal-Pz - - -2.50 -
80 PUNJAB BATHINDA Badiala-Pz - - - -
81 PUNJAB BATHINDA Bagher Mohabat Singh-Pz - -
0.10 -
82 PUNJAB BATHINDA Bahman Kaur Singh-D -
-1.30 -1.29 -1.05
83 PUNJAB BATHINDA Bahman Kaur Singh-M -
0.18 0.23 0.28
84 PUNJAB BATHINDA Bahman Kaur
Singh-Pz - - 0.24
-
85 PUNJAB BATHINDA Bahman Kaur Singh-S -
-0.17 0.33 0.36
86 PUNJAB BATHINDA Balianwali-Pz - - -1.15 -
87 PUNJAB BATHINDA Balluana1 - -0.14 -0.12 -0.06
88 PUNJAB BATHINDA Balluana-Pz - - - -
89 PUNJAB BATHINDA Bandi-Pz - - -0.07 -
90 PUNJAB BATHINDA Bhagibandar 1.95 -3.20 -3.00 -2.02
91 PUNJAB BATHINDA Bugran-Pz - - - -
92 PUNJAB BATHINDA Burj Gill-Pz - - -1.77 -
93 PUNJAB BATHINDA Burj-Pz - - -0.13 -
94 PUNJAB BATHINDA Deratapp 0.78 - - -
95 PUNJAB BATHINDA Dhapali1 0.68 -1.78 -1.78 -
96 PUNJAB BATHINDA Dhapali-Pz - -2.47 -2.71 -1.56
97 PUNJAB BATHINDA Dialpur Mirza 0.22 -2.46 -3.19 -0.91
98 PUNJAB BATHINDA Dialpura Bhlaike 3.31 - -5.96 -4.11
99 PUNJAB BATHINDA Dialpura- Mirza - - - -
100 PUNJAB BATHINDA Dulle Wala-Pz - - -1.51 -
101 PUNJAB BATHINDA Ganga-Pz -0.40 - -0.66 0.03
102 PUNJAB BATHINDA Ghudda-Pz - - 4.48 -
103 PUNJAB BATHINDA Gill Patti-DW - - - -
104 PUNJAB BATHINDA Gobind Pura-Pz - - - -
105 PUNJAB BATHINDA Gulabgarh 2 (s) 0.24 -1.19 -0.82 -0.16
106 PUNJAB BATHINDA Guru Sar-Pz 0.57 -1.47 -0.94 -0.75
107 PUNJAB BATHINDA Harraipur-Pz - - -0.77 -
108 PUNJAB BATHINDA Jajjal -0.11 0.35 0.32 0.79
109 PUNJAB BATHINDA Jajjal_DW - - -0.42 -
110 PUNJAB BATHINDA Jassi Bhagwali -0.43 -0.47 0.25 0.43
111 PUNJAB BATHINDA Jhanduke 2.23 -3.71 -3.30 -2.28
112 PUNJAB BATHINDA Jhanduke-Pz - - -1.62 -
113 PUNJAB BATHINDA Kalayan Sukha-S - -2.11 -2.02 -0.33
114 PUNJAB BATHINDA Kalla Bandar - - - -
115 PUNJAB BATHINDA Kalyan Sukha -0.38 -2.15 -1.60 -0.85
116 PUNJAB BATHINDA Kalyan Sukha-M -2.60 -2.52 -0.64 0.13
117 PUNJAB BATHINDA Koir Singh Wala-Pz - - - -
118 PUNJAB BATHINDA Kot Bhaktu-Pz - - 0.26 -
119 PUNJAB BATHINDA Kot Fatta-DW - - -0.99 -

120 PUNJAB BATHINDA Kot Guru - - - -
121 PUNJAB BATHINDA Kot Shamir - 6.18 6.13 -
122 PUNJAB BATHINDA Kothaguru-Pz - - - -
123 PUNJAB BATHINDA Lalliana-Pz - - 0.29 -
124 PUNJAB BATHINDA Lehra Dhulkot-Pz - - - -
125 PUNJAB BATHINDA Maihma Bhagwan-PZ - -
-0.26 -
126 PUNJAB BATHINDA Maisar Khana - -1.35 -1.52 -0.77
127 PUNJAB BATHINDA Maisar Khana-Pz - - -0.35 -
128 PUNJAB BATHINDA Maluka-Pz - - -2.03 -
129 PUNJAB BATHINDA Mandi Kalan-Pz - - -1.06 -
130 PUNJAB BATHINDA Maur Kalan-Pz - - -0.02 -
131 PUNJAB BATHINDA Mehraj-Pz - - -1.91 -
132 PUNJAB BATHINDA Mehta-Pz - - -0.08 -
133 PUNJAB BATHINDA Multania-Pz - - - -
134 PUNJAB BATHINDA Nahinwala -0.29 -0.47 -0.55 -0.25
135 PUNJAB BATHINDA Nathana-Pz - - -1.98 -
136 PUNJAB BATHINDA Nathena-Pz - - 0.14 -
137 PUNJAB BATHINDA Phulla 0.41 - -2.08 -1.15
138 PUNJAB BATHINDA Phulla1 - - - -
139 PUNJAB BATHINDA Phullo Mithi-D - -0.15 - 1.05
140 PUNJAB BATHINDA Phullo Mithi-M - -0.31 - -0.57
141 PUNJAB BATHINDA Phullo Mithi-S - -0.20 - 0.75
142 PUNJAB BATHINDA Puhla-Pz - - - -
143 PUNJAB BATHINDA Raike Kalan -2.25 0.37 - 1.75
144 PUNJAB BATHINDA Rajgarh Kubey-Pz - - - -
145 PUNJAB BATHINDA Rampura - - - -
146 PUNJAB BATHINDA Rampura-Pz - - - -
147 PUNJAB BATHINDA Rayya-Pz - - - -
148 PUNJAB BATHINDA Salabatpur-Pz - - - -
149 PUNJAB BATHINDA Seema-DW - - - -
150 PUNJAB BATHINDA Sidhana - - - -
151 PUNJAB BATHINDA Sooch-Pz - - - -
152 PUNJAB BATHINDA Teona-Pz - - - -
153 PUNJAB BATHINDA Tungwali-Pz - - - -
154 PUNJAB FARIDKOT Baja Khana 0.22 -1.73 -2.22 -0.97
155 PUNJAB FARIDKOT Bead Sikhanwala-
Pz -2.28 1.04 2.22
2.43
156 PUNJAB FARIDKOT Behabal Kalan-Pz - - 0.41 -
157 PUNJAB FARIDKOT Chahd Baja 0.22 -3.27 -2.89 -0.87
158 PUNJAB FARIDKOT Chak Kalan-Pz - - 2.39 -
159 PUNJAB FARIDKOT Deviwala-S -6.56 - 5.93 -
160 PUNJAB FARIDKOT Dhilwan Kalan - - - -
161 PUNJAB FARIDKOT Dipsinghwala - - - -

162 PUNJAB FARIDKOT Ghuiana-Pz - - - -
163 PUNJAB FARIDKOT Jand Sahib-Pz -0.97 0.43 1.42 1.32
164 PUNJAB FARIDKOT Karirwali -3.75 2.01 2.65 3.45
165 PUNJAB FARIDKOT Killi-Pz -0.96 1.61 1.95 1.66
166 PUNJAB FARIDKOT Kot Kapura -0.50 0.03 0.35 0.53
167 PUNJAB FARIDKOT Matta 1.94 -3.39 -2.89 -2.37
168 PUNJAB FARIDKOT Mehmuana -0.20 0.82 0.95 0.78
169 PUNJAB FARIDKOT Mumra-Pz -0.28 -0.69 0.80 0.96
170 PUNJAB FARIDKOT Nangal-Pz - 3.49 - -
171 PUNJAB FARIDKOT Pahluwala-Pz - - 1.29 -
172 PUNJAB FARIDKOT Rorian Kapura-Pz - - -0.13 -
173 PUNJAB FARIDKOT Sadiq-Pz -0.03 -0.07 0.51 0.58
174 PUNJAB FARIDKOT Sher Singh Wala- Pz -0.75
0.56 1.16 1.05
175 PUNJAB FARIDKOT Sukhwala-Pz -0.25 1.12 0.80 0.66
176 PUNJAB FARIDKOT Tehna-Pz -2.02 0.24 0.94 0.97
177 PUNJAB FARIDKOT Wara Dwarka-Pz -1.56 2.03 2.22 1.93
178 PUNJAB FATEHGARH
SAHIB Alipur Sodhian-Pz
- - 1.20
-
179 PUNJAB FATEHGARH
SAHIB Amloh1
- - -0.35
-
180 PUNJAB FATEHGARH
SAHIB Badalialasingh
- - 1.83
2.18
181 PUNJAB FATEHGARH
SAHIB Bagga Kalan
- - -0.57
-
182 PUNJAB FATEHGARH
SAHIB Bassi Pathana
-0.03 - - -0.48
183 PUNJAB FATEHGARH
SAHIB Bhaddal Tuha-Pz
-2.22 1.34 1.39
2.22
184 PUNJAB FATEHGARH
SAHIB Bhagrana
-0.55 2.34 0.55
0.53
185 PUNJAB FATEHGARH
SAHIB Bhateri
-0.18 -0.84 -2.36
-
186 PUNJAB FATEHGARH
SAHIB Bhateri1
- - - -
187 PUNJAB FATEHGARH
SAHIB Burj
- - -1.04
-
188 PUNJAB FATEHGARH
SAHIB Chandiala-Pz
- - -0.87
-
189 PUNJAB FATEHGARH
SAHIB Charnarthalkalan
- - -1.00
-
190 PUNJAB FATEHGARH
SAHIB Chuni Khurd-PZ
- - 1.15
-
191 PUNJAB FATEHGARH
SAHIB Chunni Kalan
-1.61 - 0.84
1.49
192 PUNJAB FATEHGARH
SAHIB Fatehgarh Sahib
- - -0.55
-

193 PUNJAB FATEHGARH
SAHIB
Fatehgarh Sahib-
Pz -4.16 - - 3.78
194 PUNJAB FATEHGARH
SAHIB Inayatpur-PZ-S
- - - -
195 PUNJAB FATEHGARH
SAHIB Jai Singh Wala
- - -1.63
-
196 PUNJAB FATEHGARH
SAHIB Jhambela
- - -1.19
-
197 PUNJAB FATEHGARH
SAHIB Kalewal
- - 1.57
-
198 PUNJAB FATEHGARH
SAHIB Khamanon-pz
- - -0.03
-
199 PUNJAB FATEHGARH
SAHIB Kharey_PZ
- - -0.50
-
200 PUNJAB FATEHGARH
SAHIB Khera-Pz
- - -1.06
-
201 PUNJAB FATEHGARH
SAHIB Ladpur
- - -0.60
-
202 PUNJAB FATEHGARH
SAHIB Lohar Majra
- - -0.80
-
203 PUNJAB FATEHGARH
SAHIB Mianpur-Pz
- - -0.55
-
204 PUNJAB FATEHGARH
SAHIB Nalini-Pz
-0.71 -1.09
- 0.38
205 PUNJAB FATEHGARH
SAHIB Nandpur Kalaur-Pz - -
-1.57 -
206 PUNJAB FATEHGARH
SAHIB Pawala
0.17 - - 0.85
207 PUNJAB FATEHGARH
SAHIB Sado Majra
- - -1.03
-
208 PUNJAB FATEHGARH
SAHIB Salempur
- - -1.64
-
209 PUNJAB FATEHGARH
SAHIB Shahpur
- - - -
210 PUNJAB FATEHGARH
SAHIB Sirhind-Pz
- - -0.05
-
211 PUNJAB FATEHGARH
SAHIB Tahalpur
- - -1.31
-
212 PUNJAB FATEHGARH
SAHIB Talwara
- - -0.68
-
213 PUNJAB FATEHGARH
SAHIB Tarkhan Majra
- - - -
214 PUNJAB FATEHGARH
SAHIB Timber Pur-Pz
- - 0.36
-
215 PUNJAB FAZILKA Abohar -0.02 1.32 1.44 1.59
216 PUNJAB FAZILKA Alamgarh - - - -
217 PUNJAB FAZILKA Bannawala - - - -
218 PUNJAB FAZILKA Bazirdpura -0.83 0.78 0.90 0.90

219 PUNJAB FAZILKA Danewal Satkosi 0.53 0.40 0.52 -1.90
220 PUNJAB FAZILKA Danger Khera-Pz - - 0.95 -
221 PUNJAB FAZILKA Dhaban Kokrian-D - - 0.69 0.48
222 PUNJAB FAZILKA Dhaban Kokrian-M -
1.86 0.75 0.42
223 PUNJAB FAZILKA Dhaban Kokrian-S - 5.17 5.27 4.93
224 PUNJAB FAZILKA Dipulana-Pz - 0.40 1.29 1.50
225 PUNJAB FAZILKA Godiwala-Pz - - - -
226 PUNJAB FAZILKA Hamed Saidoke-Pz - - - -
227 PUNJAB FAZILKA Jand Wala Johian-Pz - - - -
228 PUNJAB FAZILKA Kaler Khera-Pz - - 0.03 -
229 PUNJAB FAZILKA Kauranwali-D - 1.12 1.43 1.36
230 PUNJAB FAZILKA Kauranwali-M - 0.47 1.29 1.14
231 PUNJAB FAZILKA Kauranwali-S - 4.34 5.16 5.13
232 PUNJAB FAZILKA Khuiansarwar- Pz - 1.18 0.55 0.45
233 PUNJAB FAZILKA Kundal1 0.93 - 0.06 0.10
234 PUNJAB FAZILKA Ladhuwala 0.56 1.31 -0.56 -0.80
235 PUNJAB FAZILKA Motiwala 07pz - - - -
236 PUNJAB FAZILKA Nihalkhera - - - -
237 PUNJAB FAZILKA Nure-Ki-Uttar 07pz - - - -
238 PUNJAB FAZILKA Pancha Wali-Pz - - 1.03 -
239 PUNJAB FAZILKA Pattiwalla-Pz - - 0.28 -
240 PUNJAB FAZILKA Ramsara-Pz - - 0.51 -
241 PUNJAB FAZILKA Sham Singhwala-Pz -
0.32 1.14 -5.17
242 PUNJAB FAZILKA Shatriwala-Pz - - 1.21 -
243 PUNJAB FAZILKA Sitoganno - - - 3.70
244 PUNJAB FAZILKA Sohangarh Ratte -0.51 0.81 0.99 1.06
245 PUNJAB FAZILKA Sohangarh Ratte-D - 0.76 1.19 0.58
246 PUNJAB FAZILKA Sohangarh Ratte-M -
1.91 0.82 0.85
247 PUNJAB FAZILKA Sohangarh Ratte-S - 1.11 0.77 0.40
248 PUNJAB FAZILKA Swah Wala- Pz 0.23 -1.09 -0.09 0.29
249 PUNJAB FIROZPUR Bara Mansur
Wala-Pz - - -3.00
-
250 PUNJAB FIROZPUR Chamb-Pz - - -2.99 -
251 PUNJAB FIROZPUR Gogiani-Pz - - -1.25 -
252 PUNJAB FIROZPUR Jaimal wala-Pz -0.85 -0.93 0.73 -
253 PUNJAB FIROZPUR Lauhke Kalan- Pz 0.02 -3.05 -2.18 -1.29
254 PUNJAB FIROZPUR Lohere Khurd-Pz - - -1.68 -
255 PUNJAB FIROZPUR Machi Bugra/ Gujran-Pz - - - -
256 PUNJAB FIROZPUR Mallanwala Khas-Pz - -
-1.25 -
257 PUNJAB FIROZPUR Malluwala-Pz - - -3.08 -
258 PUNJAB FIROZPUR Malsian-Pz 0.79 -2.64 -1.31 -

259 PUNJAB FIROZPUR Mohkam Khan Wala-Pz - - - -
260 PUNJAB FIROZPUR Mohre Wala-Pz 0.06 -1.06 0.24 0.64
261 PUNJAB FIROZPUR Mudki-Pz - - - -
262 PUNJAB FIROZPUR Piyarana -0.25 -0.85 0.15 -0.15
263 PUNJAB FIROZPUR Rala Hazi- Pz - - - -
264 PUNJAB FIROZPUR Rukne Wala-Pz - - 0.59 -
265 PUNJAB FIROZPUR Talwandi Jalle Khan-pz - -
-2.31 -
266 PUNJAB FIROZPUR Tibbi Kalan-Pz - - - -
267 PUNJAB FIROZPUR Tibbi Taiwan Laluwalla-Pz - -
0.67 -
268 PUNJAB FIROZPUR Wage Wala-Pz - - 0.12 -
269 PUNJAB GURDASPUR Bariyar - - 0.41 -
270 PUNJAB GURDASPUR Batala-Pz - - -0.10 -
271 PUNJAB GURDASPUR Behrampur - - - -
272 PUNJAB GURDASPUR Bhagowal - 0.76 -0.20 1.63
273 PUNJAB GURDASPUR Bham - -0.95 - 0.52
274 PUNJAB GURDASPUR Bilasbal-Pz - - - -
275 PUNJAB GURDASPUR Chahal Kalan-Pz - - - -
276 PUNJAB GURDASPUR Chahgill-Pz - - -2.99 -
277 PUNJAB GURDASPUR Chone-Pz - - 0.84 -
278 PUNJAB GURDASPUR Choranwali-D - - 0.18 3.18
279 PUNJAB GURDASPUR Choranwali-M - - 2.22 0.40
280 PUNJAB GURDASPUR Choranwali-S - - 0.89 0.92
281 PUNJAB GURDASPUR Dakoha-Pz -0.77 -1.40 -0.65 -0.20
282 PUNJAB GURDASPUR Dera Baba Nanak -0.48 - 0.20 0.48
283 PUNJAB GURDASPUR Dhianpur -0.82 -0.24 0.55 0.20
284 PUNJAB GURDASPUR Dinanagar -0.50 1.00 1.74 -0.20
285 PUNJAB GURDASPUR Dostpur-Pz - - 1.50 -
286 PUNJAB GURDASPUR Gajikort-Pz - - 0.61 -
287 PUNJAB GURDASPUR Galri -0.75 1.92 0.22 0.28
288 PUNJAB GURDASPUR Ghania Ki bangar-
Pz -0.70 -0.87 0.50
0.10
289 PUNJAB GURDASPUR Ghuman-D - -1.08 0.03 -0.09
290 PUNJAB GURDASPUR Ghumani Khurd-Pz - - - -
291 PUNJAB GURDASPUR Ghuman-M - -1.03 -0.03 -0.74
292 PUNJAB GURDASPUR Ghuman-S - -1.17 -0.60 -0.12
293 PUNJAB GURDASPUR Gurdaspur-Pz - - -0.22 -
294 PUNJAB GURDASPUR Harchowal-Pz - - -0.05 -
295 PUNJAB GURDASPUR Harchowal-Pz-S -1.30 0.67 0.77 0.67
296 PUNJAB GURDASPUR Hargobindpur1 - -1.15 - 0.17
297 PUNJAB GURDASPUR Hassanpur Kalan-Pz - - - -
298 PUNJAB GURDASPUR Jhabkra - - 0.91 -
299 PUNJAB GURDASPUR Jhandalbana-Pz - - - -

300 PUNJAB GURDASPUR Kala Afgana-Pz - - 0.69 -
301 PUNJAB GURDASPUR Kalanaur-DW - 0.22 0.35 0.14
302 PUNJAB GURDASPUR Kalanaur-Pz 4.64 2.65 3.07 3.25
303 PUNJAB GURDASPUR Kalerkalan-Pz - - 0.42 -
304 PUNJAB GURDASPUR Kaure-Pz - - -0.09 -
305 PUNJAB GURDASPUR Khan Fatta-Pz - - - -
306 PUNJAB GURDASPUR Khanmalik-Pz - - - -
307 PUNJAB GURDASPUR Khatgarh-Pz - - 1.05 -
308 PUNJAB GURDASPUR Lakankala-Pz - - -0.01 -
309 PUNJAB GURDASPUR Langurwal-Pz - - 0.90 -
310 PUNJAB GURDASPUR Madipur Fatehgarhchuria -0.27
-0.61 0.13 0.57
311 PUNJAB GURDASPUR Malikpur-Pz - - 0.46 -
312 PUNJAB GURDASPUR Maman-Pz - - 0.93 -
313 PUNJAB GURDASPUR Masana-Pz - - - -
314 PUNJAB GURDASPUR Massit-Pz - - -0.05 -
315 PUNJAB GURDASPUR Mirza Jaan-Pz - - -0.25 -
316 PUNJAB GURDASPUR Mullowali 1(vs) - - - -
317 PUNJAB GURDASPUR Nangal-Pz - - 0.09 -
318 PUNJAB GURDASPUR Naushera - - - -
319 PUNJAB GURDASPUR Nishayara - - - -
320 PUNJAB GURDASPUR Pandoritalab -0.50 0.11 0.46 0.62
321 PUNJAB GURDASPUR Parcha-Pz - - - -
322 PUNJAB GURDASPUR Patti Atwal-Pz - - - -
323 PUNJAB GURDASPUR Quadian 07 - - - -
324 PUNJAB GURDASPUR Raipur - - 0.63 -
325 PUNJAB GURDASPUR Saidowal Kalan-
DW -1.15 -0.30 -0.55
-0.44
326 PUNJAB GURDASPUR Saleh Chak-S -1.14 0.85 0.97 1.03
327 PUNJAB GURDASPUR Salehchak(vs) - -0.05 0.15 0.30
328 PUNJAB GURDASPUR Sathial-Pz - - - -
329 PUNJAB GURDASPUR Shahpur Jattan-Pz - - - -
330 PUNJAB GURDASPUR Shahpur-Pz - - 0.50 -
331 PUNJAB GURDASPUR Shezada Kalan-Pz - - 1.11 -
332 PUNJAB GURDASPUR Sohal - - 0.40 -
333 PUNJAB GURDASPUR Tikriwala-Pz - - -0.84 -
334 PUNJAB HOSHIARPUR Aallo Batti-Pz - 1.90 -2.00 -
335 PUNJAB HOSHIARPUR Argowal-Pz - - 3.59 -
336 PUNJAB HOSHIARPUR Badla-Pz - - 0.43 -
337 PUNJAB HOSHIARPUR Baichan-Pz - - 1.18 -
338 PUNJAB HOSHIARPUR Bajwara-Pz - - 0.94 -
339 PUNJAB HOSHIARPUR Barota-PZ - 3.66 0.53 -
340 PUNJAB HOSHIARPUR Bassi Ballo-D - 0.78 -1.94 -2.11
341 PUNJAB HOSHIARPUR Bassi Ballo-M - -2.49 -4.59 5.29

342 PUNJAB HOSHIARPUR Bassi Ballo-S - 0.62 0.41 2.82
343 PUNJAB HOSHIARPUR Bersa - - - -
344 PUNJAB HOSHIARPUR Bhalowal Gujjran-Pz - - - -
345 PUNJAB HOSHIARPUR Bhamnaur -1.54 - - -2.73
346 PUNJAB HOSHIARPUR Bhangala-Chhota-DW - - - -0.25
347 PUNJAB HOSHIARPUR Bhanowal-Pz - - - -
348 PUNJAB HOSHIARPUR Bhatolian-Pz - - - -
349 PUNJAB HOSHIARPUR Bhunga-Pz - - - -
350 PUNJAB HOSHIARPUR Bisu Chak - - 3.84 -
351 PUNJAB HOSHIARPUR Boring-PZ - - - -
352 PUNJAB HOSHIARPUR Chak Sheru-DW 0.97 0.01 -0.71 -0.51
353 PUNJAB HOSHIARPUR Chohal - 1.32 1.32 1.27
354 PUNJAB HOSHIARPUR Dadan-Pz - - -0.50 -
355 PUNJAB HOSHIARPUR DAGAN-DW -0.41 2.41 1.89 -
356 PUNJAB HOSHIARPUR Dallewal-Pz - - -0.18 -
357 PUNJAB HOSHIARPUR Dasuya2 (s) -1.00 - -0.60 -0.45
358 PUNJAB HOSHIARPUR Dharampur1 - 3.40 0.25 -
359 PUNJAB HOSHIARPUR Durimiwal -0.82 1.93 0.07 -1.06
360 PUNJAB HOSHIARPUR Garh Di Wala-Pz -1.63 -0.90 -1.71 1.67
361 PUNJAB HOSHIARPUR Garhshankar (s) -2.20 2.11 -2.97 -1.76
362 PUNJAB HOSHIARPUR Haler Rampur-DW -0.27 3.34 1.51 0.07
363 PUNJAB HOSHIARPUR Hazipur -0.74 -3.36 -0.14 0.36
364 PUNJAB HOSHIARPUR Heer Beh-PZ - - - -
365 PUNJAB HOSHIARPUR Ittian-Pz - - 0.73 -
366 PUNJAB HOSHIARPUR Jahidpur-PZ - - -0.20 -
367 PUNJAB HOSHIARPUR Jalalpur-Pz - 5.49 -0.45 -
368 PUNJAB HOSHIARPUR Jattpur-Pz - - 2.47 -
369 PUNJAB HOSHIARPUR Khera-Pz - - -6.56 -
370 PUNJAB HOSHIARPUR Mahil Baltohian-Pz - - - -
371 PUNJAB HOSHIARPUR Mahilpur-Pz -1.17 - -0.54 -0.47
372 PUNJAB HOSHIARPUR Mianipur-Pz - 4.81 -0.52 -
373 PUNJAB HOSHIARPUR Naharpur-Pz - 5.45 1.73 -
374 PUNJAB HOSHIARPUR Nangal Bihala- DW -2.16
-0.64 -1.82 0.12
375 PUNJAB HOSHIARPUR Nangal Thathal-Pz - - -0.08 -
376 PUNJAB HOSHIARPUR Pan Khuh-DW -2.30 - 2.20 0.52
377 PUNJAB HOSHIARPUR Pandori Mehal-Pz - - -1.93 -
378 PUNJAB HOSHIARPUR Pandori Rai - - 5.20 -
379 PUNJAB HOSHIARPUR Parshote-Pz - - 0.45 -
380 PUNJAB HOSHIARPUR Phuglana- Pz - - -1.83 2.59
381 PUNJAB HOSHIARPUR Rampur Colony (HSP) pz-medium - - - -
382 PUNJAB HOSHIARPUR Samraj Tanda-DW 3.18 -3.22 -5.12 -3.94

383 PUNJAB HOSHIARPUR Satnoh-PZ. - - -1.55 -
384 PUNJAB HOSHIARPUR Sham Chaurasi -0.19 -0.37 -0.30 -0.35
385 PUNJAB HOSHIARPUR Sibo Chak- DW -4.11 3.21 0.57 0.38
386 PUNJAB HOSHIARPUR Simbli- OW -3.61 1.24 -3.24 -1.42
387 PUNJAB HOSHIARPUR Simbli-Pz -5.18 -3.50 -3.68 -0.41
388 PUNJAB HOSHIARPUR Talwara1 2.44 2.96 0.15 -1.68
389 PUNJAB HOSHIARPUR Tanda - 4.88 0.99 -
390 PUNJAB HOSHIARPUR Thakarwala -0.27 0.12 -1.09 -0.23
391 PUNJAB JALANDHAR Adampur 3(s) -1.19 -0.39 -0.56 -0.06
392 PUNJAB JALANDHAR Adarman-Pz - - -1.28 -
393 PUNJAB JALANDHAR Akalpur-Pz - - -0.99 -
394 PUNJAB JALANDHAR Allawalpur -1.16 1.37 1.50 1.41
395 PUNJAB JALANDHAR Bilga-Pz - - -0.88 -
396 PUNJAB JALANDHAR Chania-Pz - - -2.00 -
397 PUNJAB JALANDHAR Dhanda-Pz - - -1.79 -
398 PUNJAB JALANDHAR Fateh Jalal-Pz - - -1.90 -
399 PUNJAB JALANDHAR Gehlan-pz - - -0.23 -
400 PUNJAB JALANDHAR Gillian-Pz - - -1.10 -
401 PUNJAB JALANDHAR Hardo Sheikh-Pz - - -2.41 -
402 PUNJAB JALANDHAR Jalandhar-Pz(VS) - - - -
403 PUNJAB JALANDHAR Jalbhe -3.17 0.72 0.54 -
404 PUNJAB JALANDHAR Jandiala-Pz 0.52 -1.83 - -1.63
405 PUNJAB JALANDHAR Jandu Singha-Pz - - -4.86 -
406 PUNJAB JALANDHAR Janian-Pz - - -0.66 -
407 PUNJAB JALANDHAR Kakar Kalan-Pz - - -1.41 -
408 PUNJAB JALANDHAR Kala-Pz - - 2.81 -
409 PUNJAB JALANDHAR Kalyanpur-Pz - - 0.72 -
410 PUNJAB JALANDHAR Kang Sahib Rai-Pz - - 0.11 -
411 PUNJAB JALANDHAR Kartarpur 2(s) -1.45 -0.68 -0.27 0.14
412 PUNJAB JALANDHAR Kharal Kalan Pz-S -1.49 -1.37 -0.61 -0.46
413 PUNJAB JALANDHAR Kot Wadal Khan-Pz - -
-0.42 -
414 PUNJAB JALANDHAR Kurla-Pz - - 1.50 -
415 PUNJAB JALANDHAR Lallian kalan Pz-S 0.30 1.96 -2.37 -1.95
416 PUNJAB JALANDHAR Mahmuwal-Pz - - -1.37 -
417 PUNJAB JALANDHAR Mehsampur-Pz - - -1.32 -
418 PUNJAB JALANDHAR Nakodar 2(m) - - - -
419 PUNJAB JALANDHAR Nangal Shaman - - -0.14 -
420 PUNJAB JALANDHAR Nussi-Pz - - -3.51 -
421 PUNJAB JALANDHAR Pathial-Pz - - 2.30 -
422 PUNJAB JALANDHAR Pharwala-Pz - - -1.59 -
423 PUNJAB JALANDHAR Phillaur 2(s) -0.44 -0.31 -0.36 -0.21
424 PUNJAB JALANDHAR Rahimpur-Pz - - -3.36 -

425 PUNJAB JALANDHAR Rurka Kalan- Pz - - -0.03 -
426 PUNJAB JALANDHAR Samarahi-Pz - - -0.28 -
427 PUNJAB JALANDHAR Shahkot(s) - - 2.53 -
428 PUNJAB JALANDHAR Shahkot-Pz-Pb - - 1.36 -
429 PUNJAB JALANDHAR Skarar Pur-Pz - - 2.07 -
430 PUNJAB JALANDHAR Sultanpur-Pz - - -0.47 -
431 PUNJAB JALANDHAR Talwan-Pz - - -2.98 -
432 PUNJAB JALANDHAR Thanda-Pz - - -2.27 -
433 PUNJAB JALANDHAR Turaan-D - -4.04 -4.06 -2.88
434 PUNJAB JALANDHAR Turaan-M - -4.88 -7.27 -
435 PUNJAB JALANDHAR Turaan-S - -6.51 -6.53 -5.01
436 PUNJAB KAPURTHALA Bauril Harnampur-Pz - -
-1.15 -
437 PUNJAB KAPURTHALA Begowal-Pz - - -0.31 -
438 PUNJAB KAPURTHALA Bhatnura Khurd- S -3.35
1.15 1.10 3.50
439 PUNJAB KAPURTHALA Bhawanipur-Pz - - 3.30 -
440 PUNJAB KAPURTHALA Bholath M -1.63 -1.85 -0.63 0.90
441 PUNJAB KAPURTHALA Bholath S -2.25 0.11 -1.33 1.29
442 PUNJAB KAPURTHALA Chakoke-Pz - - 1.33 -
443 PUNJAB KAPURTHALA Dhilwan - - 1.60 -
444 PUNJAB KAPURTHALA Hamira-Pz - - -0.62 -
445 PUNJAB KAPURTHALA Hazipur-Pz - - 0.64 -
446 PUNJAB KAPURTHALA Hussainpura-S Pz 0.42 -2.99 -4.85 -2.90
447 PUNJAB KAPURTHALA Hussainpura-VS Pz -2.16 - - -
448 PUNJAB KAPURTHALA Kapurthala2 (s) -5.34 0.32 -0.38 3.77
449 PUNJAB KAPURTHALA Karnail Ganju-Pz - - -0.52 -
450 PUNJAB KAPURTHALA Maheru-Pz - - -1.63 -
451 PUNJAB KAPURTHALA Miani Bola-Pz - - 0.26 -
452 PUNJAB KAPURTHALA Mithra-Pz - - -4.10 -
453 PUNJAB KAPURTHALA Nadala - - -0.40 -
454 PUNJAB KAPURTHALA Nangal Lubhana-
Pz - - 0.00
-
455 PUNJAB KAPURTHALA Nathu Chahal-Pz - - -3.13 -
456 PUNJAB KAPURTHALA Nurpur Janoa-Pz - - 0.34 -
457 PUNJAB KAPURTHALA Paazian-Pz - - -1.80 -
458 PUNJAB KAPURTHALA Phagwara(shallow) - - -1.50 -
459 PUNJAB KAPURTHALA Phagwara2 (s) -0.67 -3.12 -3.26 -2.70
460 PUNJAB KAPURTHALA Sangatpur-Pz - - -4.70 -
461 PUNJAB KAPURTHALA Shalapur Dona-Pz - - -3.55 -
462 PUNJAB KAPURTHALA Sultanpur2 (s) - -2.69 -1.49 -0.51
463 PUNJAB KAPURTHALA Talwandi
Chaudary -Pz - -1.46 -0.54
-
464 PUNJAB KAPURTHALA Thikriwali-Pz - - -0.27 -
465 PUNJAB LUDHIANA Alamgir-Pz - - -0.28 -

466 PUNJAB LUDHIANA Aliwal-Pz - - -1.03 -
467 PUNJAB LUDHIANA Basian Bet-D - -0.54 -0.42 -0.04
468 PUNJAB LUDHIANA Basian Bet-M - -0.95 -1.15 0.54
469 PUNJAB LUDHIANA Basian Bet-S - -1.45 - 0.30
470 PUNJAB LUDHIANA Begowal 0.47 -0.52 -0.94 -0.67
471 PUNJAB LUDHIANA Bhagwanpur-Pz - - -1.08 -
472 PUNJAB LUDHIANA Bhahlolpur-DW -0.74 -0.13 -0.31 0.14
473 PUNJAB LUDHIANA Bharthala Randhawa-Pz - -
-0.44 -
474 PUNJAB LUDHIANA Bhikhi Khatron-Pz - - -0.02 -
475 PUNJAB LUDHIANA Bilaspur-Pz - - -1.17 -
476 PUNJAB LUDHIANA Chaminala-Pz - - - -
477 PUNJAB LUDHIANA Chankoian Khurd-
Pz - - -0.66
-
478 PUNJAB LUDHIANA Chattar Singh Park-ldh -
0.77 1.77 1.40
479 PUNJAB LUDHIANA Chaunta-Pz - - -0.99 -
480 PUNJAB LUDHIANA Chhapar-Pz - - -1.07 -
481 PUNJAB LUDHIANA Dinnamder-Pz - - -1.15 -
482 PUNJAB LUDHIANA Dodpur-Pz - - -1.02 -
483 PUNJAB LUDHIANA Doraha-Pz - - - -
484 PUNJAB LUDHIANA Galibkalan-Pz - - -2.97 -
485 PUNJAB LUDHIANA Gohaur-Pz - - 0.58 -
486 PUNJAB LUDHIANA Gopalpur 2(s) -0.54 - - -0.62
487 PUNJAB LUDHIANA Hallawara-Pz-S - - - -
488 PUNJAB LUDHIANA Hambowal-Pz - - 0.12 -
489 PUNJAB LUDHIANA Harnampur - - 1.10 -
490 PUNJAB LUDHIANA Hedon-Pz - - -1.54 -
491 PUNJAB LUDHIANA Ikloha-Pz -0.34 -0.98 -1.10 -0.59
492 PUNJAB LUDHIANA Jagraon 2(s) - - - -
493 PUNJAB LUDHIANA Kalsian - - - -
494 PUNJAB LUDHIANA Katanikalan-Pz - - -0.46 -
495 PUNJAB LUDHIANA Khandur - - -2.71 -
496 PUNJAB LUDHIANA Kishangarh-Pz - - -0.26 -
497 PUNJAB LUDHIANA Kishanpur-Pz - - -2.93 -
498 PUNJAB LUDHIANA Lalan1 3.60 -4.98 -4.58 -0.45
499 PUNJAB LUDHIANA Lil- II Pz 0.06 -0.06 -0.14 -1.62
500 PUNJAB LUDHIANA Lil-Pz III 2.47 0.02 -0.28 1.96
501 PUNJAB LUDHIANA Lodhiwal-Pz - - 0.60 -
502 PUNJAB LUDHIANA Lohara-Pz - - -0.86 -
503 PUNJAB LUDHIANA Maksudra-Pz - -0.77 -0.86 -0.48
504 PUNJAB LUDHIANA Manak Majra-Pz - - -0.96 -
505 PUNJAB LUDHIANA Mangat-Pz - - -0.16 -
506 PUNJAB LUDHIANA Mangat-Pz-S -0.17 -0.34 -0.53 -
507 PUNJAB LUDHIANA Manoke-Pz - - -2.20 -

508 PUNJAB LUDHIANA Mehma Singh Wala-Pz - -
-0.71 -
509 PUNJAB LUDHIANA Mushkabad -1.44 0.06 -0.49 -0.07
510 PUNJAB LUDHIANA Nelokalan - - 0.35 -
511 PUNJAB LUDHIANA Nurpur-Pz - - -3.70 -
512 PUNJAB LUDHIANA P.A.U.Ludhiana 2(s) -0.58
0.05 -0.12 -1.12
513 PUNJAB LUDHIANA Pabbian-Pz - - 0.96 -
514 PUNJAB LUDHIANA Pandori-Pz - - -0.18 -
515 PUNJAB LUDHIANA Payal-Pz - - 2.82 -
516 PUNJAB LUDHIANA Punjeta - -1.95 -0.60 -0.36
517 PUNJAB LUDHIANA Ragba-Pz - - - -
518 PUNJAB LUDHIANA Raikot-Pz - - -2.74 -
519 PUNJAB LUDHIANA Rajona Khurd - - -2.07 -
520 PUNJAB LUDHIANA Rashin - - -2.90 -
521 PUNJAB LUDHIANA Rattewal-Pz - - -2.77 -
522 PUNJAB LUDHIANA Roomi-Pz - - -4.38 -
523 PUNJAB LUDHIANA Roshiana-Pz - - -1.24 -
524 PUNJAB LUDHIANA Sajaywal-Pz - - -2.40 -
525 PUNJAB LUDHIANA Samrala 2(s) -0.57 -0.01 -0.69 -0.16
526 PUNJAB LUDHIANA Sanewal-Pz - - -0.55 -
527 PUNJAB LUDHIANA Sangatpura-Pz - - -1.06 -
528 PUNJAB LUDHIANA Sherian 1.46 0.06 -0.49 -0.51
529 PUNJAB LUDHIANA Sherpur Bhet - - -3.43 -
530 PUNJAB LUDHIANA Sidhwan Bet-Pz -0.49 -0.11 2.18 -0.05
531 PUNJAB LUDHIANA Talwandi Kalan-Pz - -
-2.84 -
532 PUNJAB LUDHIANA Udonwal-Pz - - -0.26 -
533 PUNJAB LUDHIANA Upplan - - -0.69 -
534 PUNJAB LUDHIANA Utlan - -1.04 -2.35 -2.36
535 PUNJAB MANSA Aklia-Pz - - -0.69 -
536 PUNJAB MANSA Alampur Mandran-Pz - -
-1.07 -
537 PUNJAB MANSA Alisher Khurd-Pz - - -0.20 -
538 PUNJAB MANSA Bahadur Pur-Pz - - -0.65 -
539 PUNJAB MANSA Bareh-Pz - - -0.17 -
540 PUNJAB MANSA Behniwala-Pz - - 0.19 -
541 PUNJAB MANSA Bhikhi 1 (s) -1.97 -0.68 -0.70 -0.60
542 PUNJAB MANSA Bhikhi 2 (s) - - -0.18 -
543 PUNJAB MANSA Budhlada - -1.10 - -
544 PUNJAB MANSA Budhlada-Pz -0.29 -0.83 -0.54 1.09
545 PUNJAB MANSA Burj Bhalaike 0.03 3.68 1.25 0.90
546 PUNJAB MANSA Burj Rathi-Pz - - -0.50 -
547 PUNJAB MANSA Fattamaluka 0.33 0.50 - 0.42
548 PUNJAB MANSA Gharangne-Pz - - -0.21 -

549 PUNJAB MANSA Hero Kalan-Pz - - -1.42 -
550 PUNJAB MANSA Hirke-Pz - - - -
551 PUNJAB MANSA Jhanda Khurd Pz - - - -
552 PUNJAB MANSA Joga -Dp-PZ - - 5.59 -
553 PUNJAB MANSA Khiala Kalan-Pz - - 0.38 -
554 PUNJAB MANSA Khokhar Kalan-Pz - - 0.21 -
555 PUNJAB MANSA Kot Dhamru -4.65 -0.68 - -0.72
556 PUNJAB MANSA Kotra - -0.63 -0.62 -0.47
557 PUNJAB MANSA Lakhiwal-Pz - - -1.07 -
558 PUNJAB MANSA Makha-[PZ - - 0.10 -
559 PUNJAB MANSA Mansa - - -0.21 -
560 PUNJAB MANSA Phaphare Bhaike-Pz - -
-0.96 -
561 PUNJAB MANSA Raipur-Pz 0.27 -0.28 -0.20 0.02
562 PUNJAB MANSA Ralla -0.10 -1.20 -1.08 -0.86
563 PUNJAB MANSA Tibbi Hari Singh-PZ - - - -
564 PUNJAB MOGA Baje Ke-Pz - -2.11 -2.31 -
565 PUNJAB MOGA Bilaspur-PZ - - -2.51 -
566 PUNJAB MOGA Budh Singh Wala-Pz -
-2.19 -2.35 -
567 PUNJAB MOGA Chogawan-Pz - -5.10 -3.44 -
568 PUNJAB MOGA Dagru- Pz - -1.97 -2.31 -
569 PUNJAB MOGA Damru Khurd - -3.72 - -
570 PUNJAB MOGA Dhudi Ke-PZ - - -2.28 -
571 PUNJAB MOGA Dinna-PZ - - -2.26 -
572 PUNJAB MOGA Himatpura-Pz - - -2.66 -
573 PUNJAB MOGA Indergarh-Pz - - 1.47 -
574 PUNJAB MOGA Jhandewala-Pz - - -1.60 -
575 PUNJAB MOGA Kamalke-Pz - - - -
576 PUNJAB MOGA Khokri Kalan-Pz - - -1.79 -
577 PUNJAB MOGA Khosa Randhir-Pz - - -1.22 -
578 PUNJAB MOGA Mandar-Pz - - 0.55 -
579 PUNJAB MOGA Mangewala-Pz - - -0.33 -
580 PUNJAB MOGA Meemana-PZ - - -3.00 -
581 PUNJAB MOGA Mehron-PZ - - - -
582 PUNJAB MOGA Nathu Wala-Pz - - -1.37 -
583 PUNJAB MOGA Nihalsinghwala-Pz - - -3.85 -
584 PUNJAB MOGA Raonke Kalan-Pz - - -2.42 -
585 PUNJAB MOGA Samad Bhai-Pz - - -1.79 -
586 PUNJAB MOGA Samalsar-Pz - - -1.38 -
587 PUNJAB MOGA Tota Singh Wala-Pz - - - -
588 PUNJAB MUKTSAR Abulkharana-Pz - - 0.36 -
589 PUNJAB MUKTSAR Balocha Khera(rasoolpur) -0.60 -
0.50 0.88

590 PUNJAB MUKTSAR Bhaliana - -3.82 -3.46 -2.80
591 PUNJAB MUKTSAR Bhiti Wala-Pz - - 0.22 -
592 PUNJAB MUKTSAR Chaktam Kot-Pz - - 0.18 -
593 PUNJAB MUKTSAR Dahak-S -0.20 - 0.61 0.60
594 PUNJAB MUKTSAR Doda -2.20 2.84 2.95 2.69
595 PUNJAB MUKTSAR Doda-Pz -0.54 1.19 1.33 1.06
596 PUNJAB MUKTSAR Gaga-Pz - - - -
597 PUNJAB MUKTSAR Giddarbaha-Pz - - -0.01 -
598 PUNJAB MUKTSAR Husnar-Pz - - 0.18 -
599 PUNJAB MUKTSAR Kabar Wala -0.46 0.87 - 1.05
600 PUNJAB MUKTSAR Kattianwali-Pz - - 1.37 -
601 PUNJAB MUKTSAR Khunde Halal-Pz 0.58 0.90 0.06 0.17
602 PUNJAB MUKTSAR Kollian Wali-pz - - -0.24 -
603 PUNJAB MUKTSAR Labanianwali -0.90 0.24 0.21 0.24
604 PUNJAB MUKTSAR Lambi -0.28 0.35 0.84 1.06
605 PUNJAB MUKTSAR Lambi-Pz -1.99 - - -
606 PUNJAB MUKTSAR Muktsar -2.47 2.65 2.83 3.15
607 PUNJAB MUKTSAR Phulu Khera-Pz - - -0.15 -
608 PUNJAB MUKTSAR Ratta Khera Chota-Pz - -
-0.03 -
609 PUNJAB MUKTSAR Sehna khera-Pz - - 0.13 -
610 PUNJAB MUKTSAR Sheikh-Pz - - 1.47 -
611 PUNJAB PATHANKOT Bamyal -1.82 2.12 2.26 2.48
612 PUNJAB PATHANKOT Bhoa -0.79 1.82 -0.16 0.14
613 PUNJAB PATHANKOT Dhar Khurd - - -0.10 -
614 PUNJAB PATHANKOT Gharotakalan 2.12 - -0.38 -0.25
615 PUNJAB PATHANKOT Ghoh -3.06 2.48 2.90 3.02
616 PUNJAB PATHANKOT Ghoh DW - - - -
617 PUNJAB PATHANKOT Jainpur-PZ - - - -
618 PUNJAB PATHANKOT Jandwala - - 1.22 -
619 PUNJAB PATHANKOT Jhakolahri 0.00 0.36 -0.37 0.05
620 PUNJAB PATHANKOT Khanikhui -0.32 0.48 0.18 0.05
621 PUNJAB PATHANKOT Khogaki Chaka-PZ - -
1.36 -
622 PUNJAB PATHANKOT Kiari- DW -5.10 5.26 5.57 -
623 PUNJAB PATHANKOT Kirian Khurd-PZ - - - -
624 PUNJAB PATHANKOT Kui-DW - - - -
625 PUNJAB PATHANKOT Kuther-PZ - - 2.91 -
626 PUNJAB PATHANKOT Malikpur - - 0.20 -
627 PUNJAB PATHANKOT Matti-PZ - - - -
628 PUNJAB PATHANKOT Mirthal - - 3.39 -
629 PUNJAB PATHANKOT Mirthal-DW - - 0.15 -
630 PUNJAB PATHANKOT Muthi - - 0.20 -
631 PUNJAB PATHANKOT Narot Jaimalsingh-Pz - -
0.62 -

632 PUNJAB PATHANKOT Nawan Pind -0.73 2.84 0.69 0.77
633 PUNJAB PATHANKOT Parmota-DW - 5.56 1.32 5.21
634 PUNJAB PATHANKOT Pathankot1 -0.90 1.84 3.68 3.80
635 PUNJAB PATHANKOT Philora-PZ - - -0.96 -
636 PUNJAB PATHANKOT Phulpiara - - -0.10 -
637 PUNJAB PATHANKOT Rakawal-PZ - - 0.23 -
638 PUNJAB PATHANKOT Rani Pur-PZ - - 3.23 -
639 PUNJAB PATHANKOT Sarna -0.29 2.63 -0.25 0.01
640 PUNJAB PATHANKOT Sujanpur-PZ - - 0.26 -
641 PUNJAB PATIALA Bassma Pipla - 0.80 - 1.25
642 PUNJAB PATIALA Bhankhar-Pz - - -0.55 -
643 PUNJAB PATIALA Bhojo majri 07pz - - - -
644 PUNJAB PATIALA Bhora-Pz - - - -
645 PUNJAB PATIALA Bhunerheri-Pz - - - -
646 PUNJAB PATIALA Birkauli - - - -0.03
647 PUNJAB PATIALA Challeta-PZ - - 2.65 -
648 PUNJAB PATIALA Chehal -0.78 -0.54 - -
649 PUNJAB PATIALA Devigarh - - - -
650 PUNJAB PATIALA Devigarh 1Pz 0.30 - -4.52 -1.54
651 PUNJAB PATIALA Devigarh IIPz - - -5.03 -2.29
652 PUNJAB PATIALA Devigarh-III Pz - - -5.40 -2.24
653 PUNJAB PATIALA Dhaneta-PZ - - -1.25 -
654 PUNJAB PATIALA Duggal Kalan - - -1.31 -
655 PUNJAB PATIALA Gharam-PZ - - -1.05 -
656 PUNJAB PATIALA Gulwatti-PZ - - -1.20 -
657 PUNJAB PATIALA Haluka -0.59 0.13 -0.24 1.02
658 PUNJAB PATIALA Hari Majra - 0.87 -0.34 -1.42
659 PUNJAB PATIALA Jainagar-PZ - - 2.17 -
660 PUNJAB PATIALA Jogewal-PZ - - -1.41 -
661 PUNJAB PATIALA Kalyan 07pz - - - -
662 PUNJAB PATIALA Kami Kalan -0.30 2.53 0.66 0.36
663 PUNJAB PATIALA Kami Khurd-PZ - - -2.14 -
664 PUNJAB PATIALA Karan Pur - - 3.56 -
665 PUNJAB PATIALA Kauli state - - - -
666 PUNJAB PATIALA Kheri Pandte-PZ - - -5.15 -
667 PUNJAB PATIALA Kulburcha-Pz - - -1.44 -
668 PUNJAB PATIALA Kutha Kheri-Pz - - -2.64 -
669 PUNJAB PATIALA Lacharu Kalan 0.13 0.90 0.59 -0.03
670 PUNJAB PATIALA Lachkani-Pz -0.15 -1.30 -1.16 -0.41
671 PUNJAB PATIALA Mehmood Pur-PZ - - - -
672 PUNJAB PATIALA Mongowal-PZ - - - -
673 PUNJAB PATIALA Nanhera-Pz - - - -

674 PUNJAB PATIALA Nariana 0.48 0.50 1.38 1.78
675 PUNJAB PATIALA Passiana-PZ - - 0.76 -
676 PUNJAB PATIALA Patran-Pz -1.99 -0.66 -0.96 -1.30
677 PUNJAB PATIALA Rajgarh - - - -
678 PUNJAB PATIALA Rajpura Pz M - - - -
679 PUNJAB PATIALA Rajpura-PzSt - - - -
680 PUNJAB PATIALA Rakhra-Pz - - - -
681 PUNJAB PATIALA Ramgarh -2.15 -1.70 -1.84 -
682 PUNJAB PATIALA Randhawa-Pz - - - -
683 PUNJAB PATIALA Rasoolpur Jaura-
PZ - - -1.40
-
684 PUNJAB PATIALA Saghraur-PZ - - -1.85 -
685 PUNJAB PATIALA Samana-Pz 0.13 - -1.50 -
686 PUNJAB PATIALA Samaspur-Pz - - -0.41 -
687 PUNJAB PATIALA Sanaur - - 2.01 -
688 PUNJAB PATIALA Sangatpura-Pz - - - -
689 PUNJAB PATIALA Sauja-PZ - - 0.77 -
690 PUNJAB PATIALA Surala Kalan-PZ - - - -
691 PUNJAB PATIALA Thua - - - -
692 PUNJAB RUPNAGAR Ahmedpur -2.63 4.12 1.13 1.54
693 PUNJAB RUPNAGAR Amrali-PZ - - -0.64 -
694 PUNJAB RUPNAGAR Attari-PZ - - 0.27 -
695 PUNJAB RUPNAGAR Bains - - -0.10 -
696 PUNJAB RUPNAGAR Bera Chauta -0.27 0.48 0.21 -0.33
697 PUNJAB RUPNAGAR Bhatto-PZ - - 1.36 -
698 PUNJAB RUPNAGAR Braham Pur -0.45 1.37 -0.19 -0.37
699 PUNJAB RUPNAGAR Chakdera 0.28 0.89 0.40 0.15
700 PUNJAB RUPNAGAR Chatamli- Pz 4.32 - - -
701 PUNJAB RUPNAGAR Dhair -0.81 1.82 0.24 0.49
702 PUNJAB RUPNAGAR Dumewal -4.32 3.35 2.60 -
703 PUNJAB RUPNAGAR Hardinamoh -1.14 1.60 -0.26 -4.10
704 PUNJAB RUPNAGAR Kakrali - - - -
705 PUNJAB RUPNAGAR Klwan-PZ - - 1.42 -
706 PUNJAB RUPNAGAR Kotla - - 0.56 -
707 PUNJAB RUPNAGAR Morinda-PZ - - -0.83 -
708 PUNJAB RUPNAGAR Rajgiri-PZ - - - -
709 PUNJAB RUPNAGAR Rurki Heeran-Pz - - - -
710 PUNJAB RUPNAGAR Salempur - - -1.15 -
711 PUNJAB RUPNAGAR Singh Bhagwant Pur - -
-0.40 -
712 PUNJAB SANGRUR Bagarian-Pz -0.62 -3.73 -4.57 -0.18
713 PUNJAB SANGRUR Bakshiwala-PZ - - -1.18 -
714 PUNJAB SANGRUR Banbhaura-PZ - - -1.35 -
715 PUNJAB SANGRUR Benra-PZ-S - -1.11 - -1.74

716 PUNJAB SANGRUR Bhojowali-Pz -1.17 -2.07 -1.39 -0.45
717 PUNJAB SANGRUR Bhunerheri-PZ - - -1.85 -
718 PUNJAB SANGRUR Bugra 1 - -1.07 - -1.42
719 PUNJAB SANGRUR Chatha Nanhera-PZ - -
-1.78 -
720 PUNJAB SANGRUR Chural Kalan M 2.75 -0.85 -0.75 -0.16
721 PUNJAB SANGRUR Dharamgarh-Pz - - -1.36 -
722 PUNJAB SANGRUR Ghanauri Kalan 0.09 -0.92 - -
723 PUNJAB SANGRUR Ghanauri Kalan-Pz - - - -
724 PUNJAB SANGRUR Haryao-DW - - - -
725 PUNJAB SANGRUR Hassanpur-Pz - - - -
726 PUNJAB SANGRUR Kala Jhar-Pz - - -2.12 -
727 PUNJAB SANGRUR Khanpur Fakiran-
PZ - - - -
728 PUNJAB SANGRUR Kheri Naran-PZ - - -0.98 -
729 PUNJAB SANGRUR Khurni-PZ - - -2.41 -
730 PUNJAB SANGRUR Kila Hakima - - -2.75 -
731 PUNJAB SANGRUR Kokahar-PZ - - -2.24 -
732 PUNJAB SANGRUR Kuler Khurd-Pz - - -2.15 -
733 PUNJAB SANGRUR Ladda-Pz - - -1.85 -
734 PUNJAB SANGRUR Lehal Kalan-Pz - - - -
735 PUNJAB SANGRUR Longowal-Pz -1.28 0.38 0.22 -0.12
736 PUNJAB SANGRUR Majji-PZ - -1.38 -2.36 -1.17
737 PUNJAB SANGRUR Malerkotla-DW 0.30 -0.38 - -0.06
738 PUNJAB SANGRUR Manvi-Pz -4.98 4.01 3.90 4.70
739 PUNJAB SANGRUR Minsa-Pz - - - -
740 PUNJAB SANGRUR Panjgaraian- Pz - - -2.33 -
741 PUNJAB SANGRUR Rajo Majra-PZ - - -3.50 -
742 PUNJAB SANGRUR Rampur Channa-Pz - -
0.20 -
743 PUNJAB SANGRUR Rurgarh-PZ - - -1.89 -
744 PUNJAB SANGRUR Rurki Kalan-Pz - - -1.49 -
745 PUNJAB SANGRUR Sekhpur Khurd-PZ - - -1.85 -
746 PUNJAB SANGRUR Sekhwas-PZ - - -2.80 -
747 PUNJAB SANGRUR Sikandarpur-PZ - - -2.56 -
748 PUNJAB SANGRUR Sunam-Pz -0.20 -0.92 0.54 -0.58
749 PUNJAB SAS NAGAR Antala -1.01 1.09 -0.15 1.01
750 PUNJAB SAS NAGAR Balongi-PZ - - -1.61 -
751 PUNJAB SAS NAGAR Barauli-PZ - - -6.11 -
752 PUNJAB SAS NAGAR Chandiala-Pz - - - -
753 PUNJAB SAS NAGAR Dera Bassi 07pz -1.08 0.92 0.74 1.08
754 PUNJAB SAS NAGAR Dheri -0.13 1.73 1.16 0.13
755 PUNJAB SAS NAGAR Gharoon - - 3.04 -
756 PUNJAB SAS NAGAR Ghoga -2.23 4.71 3.48 2.23
757 PUNJAB SAS NAGAR Gholu majra 07pz - - - -

758 PUNJAB SAS NAGAR Issapur- DW - - - -
759 PUNJAB SAS NAGAR Joli -0.72 1.01 3.46 0.72
760 PUNJAB SAS NAGAR Kurrha-Pz - - 0.15 -
761 PUNJAB SAS NAGAR Landran Pz -0.47 -1.33 -1.01 0.47
762 PUNJAB SAS NAGAR Landran-Pz - - - -
763 PUNJAB SAS NAGAR Malkpur-Pz - - 3.03 -
764 PUNJAB SAS NAGAR Manoli-PZ - - -1.37 -
765 PUNJAB SAS NAGAR Mirpur-Pz - - -0.65 -
766 PUNJAB SAS NAGAR Palheri-PZ - - -3.05 -
767 PUNJAB SAS NAGAR Pedol-PZ - - 1.40 -
768 PUNJAB SAS NAGAR Raipur Kalan - - -0.66 -
769 PUNJAB SAS NAGAR Singhpura-Pz - - -4.77 -
770 PUNJAB SAS NAGAR Sirsini -0.71 0.96 0.27 0.71
771 PUNJAB SAS NAGAR Siswan - - 0.98 -
772 PUNJAB SAS NAGAR Sohana-PZ - - 0.35 -
773 PUNJAB SBS NAGAR Alowal-Pz - - - -
774 PUNJAB SBS NAGAR Aur-PZ - - -0.67 -
775 PUNJAB SBS NAGAR Baharam-Pz - - - -
776 PUNJAB SBS NAGAR Bahara-Pz - - -1.25 -
777 PUNJAB SBS NAGAR Bahlora Kallan- Pz - - - -
778 PUNJAB SBS NAGAR Bahua-Pz - - -5.61 -
779 PUNJAB SBS NAGAR Balaipur-PZ - - -1.70 -
780 PUNJAB SBS NAGAR Bhadi-PZ - - 0.54 -
781 PUNJAB SBS NAGAR Dugri Garol-PZ - - -2.83 -
782 PUNJAB SBS NAGAR Jethu Majra-PZ - - -0.33 -
783 PUNJAB SBS NAGAR Kariam-Pz - - -1.47 -
784 PUNJAB SBS NAGAR Langoya-PZ - - -2.06 -
785 PUNJAB SBS NAGAR Mauhra-Pz - -5.21 -3.65 -
786 PUNJAB SBS NAGAR Padmaiwal-PZ - - -0.74 -
787 PUNJAB SBS NAGAR Rahon 0.04 -0.17 -2.16 -0.04
788 PUNJAB SBS NAGAR Raipur Dhaba-Pz -1.32 -3.02 -4.70 1.32
789 PUNJAB SBS NAGAR Ramgarh-Pz - - 1.20 -
790 PUNJAB TARAN TARAN Aima Khurd-Pz - - 1.01 -
791 PUNJAB TARAN TARAN Attari-Pz - - - -
792 PUNJAB TARAN TARAN Bahla-Pz - - - -
793 PUNJAB TARAN TARAN Bakipur-Pz - - -0.22 -
794 PUNJAB TARAN TARAN Bath-Pz - - -0.86 -
795 PUNJAB TARAN TARAN Bhagala-Pz - - - -
796 PUNJAB TARAN TARAN Bhagwanpur-Pz - - -0.56 -
797 PUNJAB TARAN TARAN Bhalaipur-Pz - - - -
798 PUNJAB TARAN TARAN Bhankar Kalan-Pz - - - -
799 PUNJAB TARAN TARAN Bhikiwind- Pz - - - -

800 PUNJAB TARAN TARAN Bhura-Pz - - - -
801 PUNJAB TARAN TARAN Bhure-Pz - - 4.68 -
802 PUNJAB TARAN TARAN Bhusse-Pz - - -1.01 -
803 PUNJAB TARAN TARAN Brahmpur-Pz - - 1.84 -
804 PUNJAB TARAN TARAN Chakkare Khan-Pz - - 0.87 -
805 PUNJAB TARAN TARAN Chola Sahib-Pz - -4.64 0.76 0.73
806 PUNJAB TARAN TARAN Choudhary Wala-Pz - - - -
807 PUNJAB TARAN TARAN Chuselawad-Pz - - -0.39 -
808 PUNJAB TARAN TARAN Ekalgoda-Pz - - - -
809 PUNJAB TARAN TARAN Fatehabad- PZ - - -0.53 -
810 PUNJAB TARAN TARAN Gandi Wind-Pz - -0.72 0.39 0.89
811 PUNJAB TARAN TARAN Goindwal -0.14 -0.15 - -0.13
812 PUNJAB TARAN TARAN Goindwal 07 - - - -
813 PUNJAB TARAN TARAN Jalalabad-PZ - - - -
814 PUNJAB TARAN TARAN Jandoke-Pz - - -1.66 -
815 PUNJAB TARAN TARAN Kairon-PZ - - -0.99 -
816 PUNJAB TARAN TARAN Kalsia Kalan - -1.85 - -0.81
817 PUNJAB TARAN TARAN Kalsia Kalan07 - - - -
818 PUNJAB TARAN TARAN Khadur Sahib-Pz - -1.43 -1.14 -0.63
819 PUNJAB TARAN TARAN Khalra-Pz - - -1.24 -
820 PUNJAB TARAN TARAN Kirtowal-Pz - - - -
821 PUNJAB TARAN TARAN Kotbudda-Pz - - - -
822 PUNJAB TARAN TARAN Kotli Sur Singh-Pz - - -0.32 -
823 PUNJAB TARAN TARAN Mahendipur-Pz - - - -
824 PUNJAB TARAN TARAN Marhona-Pz - - 0.23 -
825 PUNJAB TARAN TARAN Mari Kamboke-Pz - - -0.17 -
826 PUNJAB TARAN TARAN Nandpur-Pz - - - -
827 PUNJAB TARAN TARAN Patti - - -2.02 -
828 PUNJAB TARAN TARAN Pindan-Pz - - 0.86 -
829 PUNJAB TARAN TARAN Rajoke-Pz - - -0.13 -
830 PUNJAB TARAN TARAN Ratoke-Pz - -1.55 0.47 0.87
831 PUNJAB TARAN TARAN Sabran-Pz - - - -
832 PUNJAB TARAN TARAN Sahab Pura- Pz - -1.95 -0.91 -0.37
833 PUNJAB TARAN TARAN Sheron-Pz - - - -
834 PUNJAB TARAN TARAN Sugga-Pz - - -1.79 -
835 PUNJAB TARAN TARAN Varing-Pz - - -

Annexure-3: Annual Water Level Fluctuation (+ decline in water levels and – rise in water levels)
S.
No State District Location
2019/June 2019/Aug 2019/ Oct 2020/Jan
2020/ June 2020/Aug 2020/Oct 2021/Jan
1 CHANDIGARH CHANDIGARH BURAIL - 0.08 0.13 0.16
2 CHANDIGARH CHANDIGARH Csio-combined 2.95 0.98 1.17 0.89
3 CHANDIGARH CHANDIGARH CSIO-S 1.21 0.16 4.08 4.06
4 CHANDIGARH CHANDIGARH NEW INDUST AREA 0.3 - 2 -
5 CHANDIGARH CHANDIGARH Sec-27, Ar Well - - - -
6 CHANDIGARH CHANDIGARH Sec-27, Cgwb Building - 0.51 -0.93 3.54
7 CHANDIGARH CHANDIGARH SECT 10C - 1.02 - -
8 CHANDIGARH CHANDIGARH SECT 10C (D) -4.19 0.06 - 0.67
9 CHANDIGARH CHANDIGARH SECT 10C (S) 1.49 0.98 0.69 -
10 CHANDIGARH CHANDIGARH SECT 31D (D) 2.41 0.85 0.19 1.98
11 CHANDIGARH CHANDIGARH SECT 31D (S) 0.08 0.15 0.64 1.32
12 CHANDIGARH CHANDIGARH SECT 37D (S) 0.28 0.55 0.73 0.2
13 CHANDIGARH CHANDIGARH SECT 39D (S) 1.78 0.45 -0.51 -1.2
14 CHANDIGARH CHANDIGARH SECT 44D (S) -0.1 -0.38 -1.12 -0.13
15 CHANDIGARH CHANDIGARH Sector-46 (shallow) 0.3 -0.42 0.32 0.37
16 PUNJAB AMRITSAR Ajnala 0.1 - -2.1 -
17 PUNJAB AMRITSAR Amritsar 1.51 - -0.41 0.74
18 PUNJAB AMRITSAR Amritsar1 - - -0.3 -
19 PUNJAB AMRITSAR Bal Kalan-Pz -0.88 - -0.18 -
20 PUNJAB AMRITSAR Beas07 -0.46 - -0.13 0.38
21 PUNJAB AMRITSAR Bhattaywad-Pz - - 2.35 -
22 PUNJAB AMRITSAR Boparai Khurd-Pz - - -1.29 -
23 PUNJAB AMRITSAR Chak Dogra-Pz -3.55 - -0.4 -
24 PUNJAB AMRITSAR Chogawan1 -2.28 - -0.14 -0.18
25 PUNJAB AMRITSAR Dhulika-Pz -1.42 - -1.66 -
26 PUNJAB AMRITSAR Gago Mahal- Pz -1.22 - -0.79 -0.5
27 PUNJAB AMRITSAR Gill wali-Pz -1.58 - -2.31 -
28 PUNJAB AMRITSAR Jandiala Guru-Pz 0.13 0.81 4.21 -1.05
29 PUNJAB AMRITSAR Jethuwal-Pz -1.38 - -0.85 -
30 PUNJAB AMRITSAR Kandowali-Pz 0.93 - 0.04 -
31 PUNJAB AMRITSAR Karyal-Pz -0.28 - -0.72 -
32 PUNJAB AMRITSAR Mahima-Pz -1.4 - 0.06 -
33 PUNJAB AMRITSAR Mehleykey-Pz 1.54 - 1.92 -
34 PUNJAB AMRITSAR Mehta - - -3.35 -
35 PUNJAB AMRITSAR Miran Chak-Pz -1.53 - -0.39 -
36 PUNJAB AMRITSAR Nangal Sahaul-Pz -0.6 - 0.25 -
37 PUNJAB AMRITSAR Nawan Tanal- Pz -1.9 -1.77 0.06 -0.54
38 PUNJAB AMRITSAR Ramdas-DW 1.94 - -2.38 -
39 PUNJAB AMRITSAR Rayya-Pz - - 0.9 -
40 PUNJAB AMRITSAR Rupowal Brahmana-Pz -1.11 - -0.54 -
41 PUNJAB AMRITSAR Shabura-Pz -3.43 - 0.38 -
42 PUNJAB AMRITSAR Sham Nagar-Pz -1.2 - -0.38 -
43 PUNJAB AMRITSAR Tarsika-Pz -2.04 - -0.3 -
44 PUNJAB AMRITSAR Ugar Aulakh-Pz 0.02 - 1.01 -
45 PUNJAB AMRITSAR Vadala Kalan-Pz -1.22 - -0.44 -
46 PUNJAB AMRITSAR Wandala Bittewad-Pz - - -0.01 -
47 PUNJAB BARNALA Amla Singh Wala-PZ -3.31 - -1.48 -
48 PUNJAB BARNALA Barnala (s) -1.14 -0.85 - -

49 PUNJAB BARNALA Bhadaur-Pz -1.23 -1.21 -1.43 -
50 PUNJAB BARNALA Daula-Pz -2.47 - - -
51 PUNJAB BARNALA Dhanaula-Pz -2.2 - 5.46 -
52 PUNJAB BARNALA Kurar-Pz - - -0.78 -
53 PUNJAB BARNALA Lohgarh-Pz - - -1.86 -
54 PUNJAB BARNALA Mahal Kalan-Pz -1.07 -0.97 -1.53 -
55 PUNJAB BARNALA Pakho Ke-Pz - - -0.79 -
56 PUNJAB BARNALA Shekha -3.17 - -1.11 -
57 PUNJAB BATHINDA Ablu -2.04 -0.32 0.2 -
58 PUNJAB BATHINDA Aleke Jalal-Pz -2.69 - -1.47 -
59 PUNJAB BATHINDA Bagher Mohabat
Singh-Pz -1.57
- -0.47
-
60 PUNJAB BATHINDA Bahman Kaur Singh-Pz 0.33 - 0.57 -
61 PUNJAB BATHINDA Balianwali-Pz -2.33 - -0.53 -
62 PUNJAB BATHINDA Balluana1 - -0.55 1.38 -
63 PUNJAB BATHINDA Balluana-Pz - - -2.81 -
64 PUNJAB BATHINDA Bandi-Pz 0.43 - - -
65 PUNJAB BATHINDA Bhagibandar 2.87 1.1 0.15 -0.07
66 PUNJAB BATHINDA Bugran-Pz - - -1.54 -
67 PUNJAB BATHINDA Burj Gill-Pz -2.71 - -1.12 -
68 PUNJAB BATHINDA Deratapp - -1.49 0.15 -0.6
69 PUNJAB BATHINDA Dhapali1 0.84 -1.2 -0.03 -
70 PUNJAB BATHINDA Dhapali-Pz -2.51 -3.31 -3.13 -
71 PUNJAB BATHINDA Dialpur Mirza -0.33 -0.7 -0.17 -0.69
72 PUNJAB BATHINDA Dialpura Bhlaike 0.75 - -1.71 -0.8
73 PUNJAB BATHINDA Dulle Wala-Pz -2.81 - -0.84 -
74 PUNJAB BATHINDA Ganga-Pz -0.43 - -0.22 -0.37
75 PUNJAB BATHINDA Ghudda-Pz 0.07 - - -
76 PUNJAB BATHINDA Gill Patti-DW - - -0.51 -
77 PUNJAB BATHINDA Gulabgarh 2 (s) 0.05 -0.46 -0.65 0.08
78 PUNJAB BATHINDA Guru Sar-Pz 0.99 -0.32 0.16 -0.18
79 PUNJAB BATHINDA Harraipur-Pz -2.56 - -0.41 -
80 PUNJAB BATHINDA Jajjal 0.19 0.64 0.61 0.68
81 PUNJAB BATHINDA Jajjal_DW -1 - -0.67 -
82 PUNJAB BATHINDA Jassi Bhagwali 1 -0.25 0.1 0
83 PUNJAB BATHINDA Jhanduke -0.6 - - -0.05
84 PUNJAB BATHINDA Jhanduke-Pz -2.35 - -1.41 -
85 PUNJAB BATHINDA Kalayan Sukha-S -2.3 - - -
86 PUNJAB BATHINDA Kalyan Sukha - -0.46 -1.1 -1.23
87 PUNJAB BATHINDA Kalyan Sukha-M -1.98 -1.92 -1.46 -2.47
88 PUNJAB BATHINDA Koir Singh Wala-Pz - - -2.29 -
89 PUNJAB BATHINDA Kot Bhaktu-Pz -0.65 - -0.08 -
90 PUNJAB BATHINDA Kot Guru - - 0.19 -
91 PUNJAB BATHINDA Kot Shamir - -0.28 -0.05 -
92 PUNJAB BATHINDA Kothaguru-Pz - -4.53 -1.28 -1.2
93 PUNJAB BATHINDA Lalliana-Pz -0.93 - -0.37 -
94 PUNJAB BATHINDA Maihma Bhagwan-PZ 0.06 - 0.57 -
95 PUNJAB BATHINDA Maisar Khana - - -1.06 -
96 PUNJAB BATHINDA Maisar Khana-Pz -1.05 - 0.27 -
97 PUNJAB BATHINDA Maluka-Pz -1.91 - -1.45 -
98 PUNJAB BATHINDA Mandi Kalan-Pz -2.15 - -1.17 -
99 PUNJAB BATHINDA Maur Kalan-Pz -0.81 - - -

100 PUNJAB BATHINDA Mehraj-Pz -2.32 - -1.85 -
101 PUNJAB BATHINDA Mehta-Pz -0.14 - 0.1 -
102 PUNJAB BATHINDA Multania-Pz - - 0.51 -
103 PUNJAB BATHINDA Nahinwala -0.27 -0.43 -0.51 -0.54
104 PUNJAB BATHINDA Nathana-Pz -2.64 - -1.32 -
105 PUNJAB BATHINDA Nathena-Pz -0.55 - 0.07 -
106 PUNJAB BATHINDA Phulla - - -1.23 -0.74
107 PUNJAB BATHINDA Phulla1 - -0.72 -0.46 -
108 PUNJAB BATHINDA Raike Kalan -2.53 -0.61 - -0.5
109 PUNJAB BATHINDA Rajgarh Kubey-Pz -1.36 - - -
110 PUNJAB BATHINDA Rayya-Pz -3.94 - - -
111 PUNJAB BATHINDA Salabatpur-Pz -2.93 - - -
112 PUNJAB FARIDKOT Baja Khana -0.59 -0.66 -1 -0.75
113 PUNJAB FARIDKOT Bead Sikhanwala- Pz -2.37 0.07 -0.12 0.15
114 PUNJAB FARIDKOT Behabal Kalan-Pz - - -0.73 -
115 PUNJAB FARIDKOT Chahd Baja -0.82 - -1.02 -0.65
116 PUNJAB FARIDKOT Chak Kalan-Pz - - 1.7 -
117 PUNJAB FARIDKOT Deviwala-S - - -0.29 -0.28
118 PUNJAB FARIDKOT Jand Sahib-Pz -0.33 0.21 1.03 0.35
119 PUNJAB FARIDKOT Karirwali -4.07 -0.03 -0.55 -0.3
120 PUNJAB FARIDKOT Killi-Pz -0.64 - 0.96 0.7
121 PUNJAB FARIDKOT Kot Kapura -0.76 1.55 0.06 0.03
122 PUNJAB FARIDKOT Matta 2.27 -0.35 -0.4 -0.43
123 PUNJAB FARIDKOT Mehmuana 0 0.39 0.85 0.58
124 PUNJAB FARIDKOT Mumra-Pz -0.38 0.16 - 0.68
125 PUNJAB FARIDKOT Nangal-Pz - 2.95 - -0.58
126 PUNJAB FARIDKOT Pahluwala-Pz - - 0.93 -
127 PUNJAB FARIDKOT Rorian Kapura-Pz - - -1.26 -
128 PUNJAB FARIDKOT Sadiq-Pz -0.04 0.14 0.7 0.55
129 PUNJAB FARIDKOT Sher Singh Wala- Pz -0.52 0.15 0.72 0.3
130 PUNJAB FARIDKOT Sukhwala-Pz 0.31 0.18 0.4 0.41
131 PUNJAB FARIDKOT Tehna-Pz -0.71 -0.93 0.27 -1.05
132 PUNJAB FARIDKOT Wara Dwarka-Pz -1.29 0.43 0.44 0.37
133 PUNJAB FATEHGARH
SAHIB Alipur Sodhian-Pz -0.64
- 0.76
-
134 PUNJAB FATEHGARH
SAHIB Badalialasingh 0.5
- 0.36
-
135 PUNJAB FATEHGARH
SAHIB Bagga Kalan -0.04
- -0.31
-
136 PUNJAB FATEHGARH
SAHIB Bassi Pathana 0.07
- - -0.51
137 PUNJAB FATEHGARH
SAHIB Bhaddal Tuha-Pz -1.94
- -2.25 0
138 PUNJAB FATEHGARH
SAHIB Bhagrana 1.4 1.57 -0.25 -0.02
139 PUNJAB FATEHGARH
SAHIB Bhateri
- 0.06 -2.46
-
140 PUNJAB FATEHGARH
SAHIB Burj 0.1
- 0.36
-
141 PUNJAB FATEHGARH
SAHIB Chandiala-Pz 0.4
- 0.98
-
142 PUNJAB FATEHGARH
SAHIB Charnarthalkalan
- - -1.39
-

143 PUNJAB FATEHGARH
SAHIB Chuni Khurd-PZ 1.55
- 0.9
-
144 PUNJAB FATEHGARH
SAHIB Chunni Kalan 0.31 -0.1 -0.79 -0.12
145 PUNJAB FATEHGARH
SAHIB Fatehgarh Sahib -0.5
- 0.8
-
146 PUNJAB FATEHGARH
SAHIB Fatehgarh Sahib-Pz -3.48
- - -0.38
147 PUNJAB FATEHGARH
SAHIB Inayatpur-PZ-S 0.25
- - -
148 PUNJAB FATEHGARH
SAHIB Jai Singh Wala -0.4
- -2.58
-
149 PUNJAB FATEHGARH
SAHIB Jhambela -0.27
- -0.86
-
150 PUNJAB FATEHGARH
SAHIB Kalewal -2
- - -
151 PUNJAB FATEHGARH
SAHIB Khamanon-pz 0.73
- 1.3
-
152 PUNJAB FATEHGARH
SAHIB Kharey_PZ -0.4
- - -
153 PUNJAB FATEHGARH
SAHIB Khera-Pz -1.56
- -0.82
-
154 PUNJAB FATEHGARH
SAHIB Ladpur 0.05
- - -
155 PUNJAB FATEHGARH
SAHIB Lohar Majra -0.07
- 0.33
-
156 PUNJAB FATEHGARH
SAHIB Mianpur-Pz -2.11
- -1.16
-
157 PUNJAB FATEHGARH
SAHIB Nalini-Pz -0.3 0.29
- -0.33
158 PUNJAB FATEHGARH
SAHIB Nandpur Kalaur-Pz -1.04
- -1.61
-
159 PUNJAB FATEHGARH
SAHIB Pawala -4.27
- - 1.02
160 PUNJAB FATEHGARH
SAHIB Sado Majra 0.12
- 0.19
-
161 PUNJAB FATEHGARH
SAHIB Salempur -4.01
- - -
162 PUNJAB FATEHGARH
SAHIB Sirhind-Pz 0.4
- -0.55
-
163 PUNJAB FATEHGARH
SAHIB Tahalpur -1.74
- -1.75
-
164 PUNJAB FATEHGARH
SAHIB Talwara -0.29
- 0.03
-
165 PUNJAB FATEHGARH
SAHIB Timber Pur-Pz 0.01
- -0.23
-
166 PUNJAB FAZILKA Abohar 0.12 1.3 1.66 1.57
167 PUNJAB FAZILKA Bannawala - 1.81 1.69 1.43
168 PUNJAB FAZILKA Bazirdpura -0.43 0.28 0.4 0.07
169 PUNJAB FAZILKA Danewal Satkosi 0.24 -0.07 1.02 -1.37
170 PUNJAB FAZILKA Danger Khera-Pz - - 0.71 -
171 PUNJAB FAZILKA Dipulana-Pz 0.03 0.78 0.93 -
172 PUNJAB FAZILKA Kaler Khera-Pz - - -0.07 -
173 PUNJAB FAZILKA Kauranwali-D - - - -
174 PUNJAB FAZILKA Kauranwali-M - - - -
175 PUNJAB FAZILKA Kauranwali-S - - - -
176 PUNJAB FAZILKA Khuiansarwar- Pz 0.22 1.41 0.96 -

177 PUNJAB FAZILKA Kundal1 0.92 - 1.58 1.03
178 PUNJAB FAZILKA Ladhuwala - 0.76 0.12 -0.24
179 PUNJAB FAZILKA Pancha Wali-Pz - - 0.05 -
180 PUNJAB FAZILKA Pattiwalla-Pz - - 0.54 -
181 PUNJAB FAZILKA Ramsara-Pz - - 0.5 -
182 PUNJAB FAZILKA Sham Singhwala-Pz - - 0.64 -
183 PUNJAB FAZILKA Shatriwala-Pz - - 1.49 -
184 PUNJAB FAZILKA Sitoganno - 1.29 - -
185 PUNJAB FAZILKA Sohangarh Ratte 0.04 0.25 0.33 0.55
186 PUNJAB FAZILKA Swah Wala- Pz 0.36 0.1 0.7 0.52
187 PUNJAB FIROZPUR Bara Mansur Wala-Pz - - -2.71 -
188 PUNJAB FIROZPUR Chamb-Pz - - -4.3 -
189 PUNJAB FIROZPUR Gogiani-Pz - - -2.71 -
190 PUNJAB FIROZPUR Jaimal wala-Pz - - 0.91 -
191 PUNJAB FIROZPUR Lauhke Kalan- Pz - 0.16 -2.95 -1.27
192 PUNJAB FIROZPUR Lohere Khurd-Pz - - -2.38 -
193 PUNJAB FIROZPUR Machi Bugra/ Gujran-
Pz - - 0.53
-
194 PUNJAB FIROZPUR Mallanwala Khas-Pz - - -0.05 -
195 PUNJAB FIROZPUR Malluwala-Pz - - -3.98 -
196 PUNJAB FIROZPUR Malsian-Pz - -0.23 - -
197 PUNJAB FIROZPUR Mohkam Khan Wala-
Pz - - 2.84
-
198 PUNJAB FIROZPUR Mohre Wala-Pz - 0.09 0.6 0.7
199 PUNJAB FIROZPUR Mudki-Pz - - -1.14 -
200 PUNJAB FIROZPUR Piyarana - -0.5 -3.65 -0.4
201 PUNJAB FIROZPUR Rala Hazi- Pz - - 0.01 -
202 PUNJAB FIROZPUR Rukne Wala-Pz - - -0.63 -
203 PUNJAB FIROZPUR Talwandi Jalle Khan-
pz - - -3.14
-
204 PUNJAB FIROZPUR Tibbi Kalan-Pz - - 2.29 -
205 PUNJAB FIROZPUR Tibbi Taiwan
Laluwalla-Pz - - 0.81
-
206 PUNJAB FIROZPUR Wage Wala-Pz - - 1.42 -
207 PUNJAB GURDASPUR Bariyar -1.51 - -0.8 -
208 PUNJAB GURDASPUR Batala-Pz 0.2 - - -
209 PUNJAB GURDASPUR Bhagowal -0.15 -0.2 -0.25 1.68
210 PUNJAB GURDASPUR Bham - -0.69 - 0.52
211 PUNJAB GURDASPUR Bilasbal-Pz - - -1.53 -
212 PUNJAB GURDASPUR Chahal Kalan-Pz - - -1.08 -
213 PUNJAB GURDASPUR Chahgill-Pz 2.43 - -0.36 -
214 PUNJAB GURDASPUR Chone-Pz -0.82 - -0.33 -
215 PUNJAB GURDASPUR Dakoha-Pz -0.13 0.31 -0.44 -0.2
216 PUNJAB GURDASPUR Dera Baba Nanak -0.25 - -0.33 0.63
217 PUNJAB GURDASPUR Dhianpur -0.03 0.58 0.3 0.2
218 PUNJAB GURDASPUR Dinanagar 3.07 2.58 1.14 -0.2
219 PUNJAB GURDASPUR Dostpur-Pz -0.85 - 0.75 -
220 PUNJAB GURDASPUR Gajikort-Pz -0.77 - -0.16 -
221 PUNJAB GURDASPUR Galri 0.53 3.65 0.31 0.28
222 PUNJAB GURDASPUR Ghania Ki bangar- Pz -1.1 -0.22 - 0.1
223 PUNJAB GURDASPUR Ghumani Khurd-Pz - - -0.2 -0.09

224 PUNJAB GURDASPUR Ghuman-M - - - -0.74
225 PUNJAB GURDASPUR Ghuman-S - - - -0.12
226 PUNJAB GURDASPUR Gurdaspur-Pz -0.01 - -0.08 -
227 PUNJAB GURDASPUR Harchowal-Pz - 1.41 - -
228 PUNJAB GURDASPUR Harchowal-Pz-S 1.13 - -0.44 0.67
229 PUNJAB GURDASPUR Hargobindpur1 0.4 - - 0.17
230 PUNJAB GURDASPUR Hassanpur Kalan-Pz - - -1.44 -
231 PUNJAB GURDASPUR Jhabkra -1.34 - -0.03 -
232 PUNJAB GURDASPUR Jhandalbana-Pz - - -0.42 -
233 PUNJAB GURDASPUR Kala Afgana-Pz -1 - -0.31 -
234 PUNJAB GURDASPUR Kalanaur-DW -0.64 1.03 1.34 0.14
235 PUNJAB GURDASPUR Kalanaur-Pz -3.4 3.6 -0.95 3.25
236 PUNJAB GURDASPUR Kalerkalan-Pz -0.7 - - -
237 PUNJAB GURDASPUR Kaure-Pz -1.74 - -1.03 -
238 PUNJAB GURDASPUR Khan Fatta-Pz - - 3.51 -
239 PUNJAB GURDASPUR Khanmalik-Pz - - -3.83 -
240 PUNJAB GURDASPUR Khatgarh-Pz -2.53 - -1.28 -
241 PUNJAB GURDASPUR Lakankala-Pz -2.2 - -2.16 -
242 PUNJAB GURDASPUR Langurwal-Pz -1.03 - 0.37 -
243 PUNJAB GURDASPUR Madipur
Fatehgarhchuria 0.47 0.53 0.71 0.57
244 PUNJAB GURDASPUR Malikpur-Pz -0.9 - -0.04 -
245 PUNJAB GURDASPUR Maman-Pz -0.93 - 0.25 -
246 PUNJAB GURDASPUR Masana-Pz - - -1.99 -
247 PUNJAB GURDASPUR Massit-Pz -0.77 - -0.77 -
248 PUNJAB GURDASPUR Mirza Jaan-Pz 0.2 - -0.45 -
249 PUNJAB GURDASPUR Nangal-Pz -0.75 - -0.66 -
250 PUNJAB GURDASPUR Naushera - - -0.72 -
251 PUNJAB GURDASPUR Pandoritalab 0.02 1.35 0.24 0.62
252 PUNJAB GURDASPUR Parcha-Pz - - -0.41 -
253 PUNJAB GURDASPUR Patti Atwal-Pz -0.34 - -0.9 -
254 PUNJAB GURDASPUR Raipur -2 - -1.07 -
255 PUNJAB GURDASPUR Saidowal Kalan-DW 0.65 1.92 -0.54 -0.44
256 PUNJAB GURDASPUR Saleh Chak-S -0.32 1.16 0.44 1.03
257 PUNJAB GURDASPUR Salehchak(vs) 0.07 1.46 - 0.3
258 PUNJAB GURDASPUR Shahpur-Pz -0.12 - 0.33 -
259 PUNJAB GURDASPUR Shezada Kalan-Pz 2.93 - 2.34 -
260 PUNJAB GURDASPUR Sohal -0.2 - 0.3 -
261 PUNJAB GURDASPUR Tikriwala-Pz -1.44 - -2.18 -
262 PUNJAB HOSHIARPUR Aallo Batti-Pz 0.05 - -3 -
263 PUNJAB HOSHIARPUR Argowal-Pz - - -2.25 -
264 PUNJAB HOSHIARPUR Badla-Pz - - 1.35 -
265 PUNJAB HOSHIARPUR Baichan-Pz - - -1.19 -
266 PUNJAB HOSHIARPUR Bajwara-Pz - - 0.31 -
267 PUNJAB HOSHIARPUR Barota-PZ -0.66 - -0.23 -
268 PUNJAB HOSHIARPUR Bersa - - -1.6 -
269 PUNJAB HOSHIARPUR Bhalowal Gujjran-Pz - - -1.22 -
270 PUNJAB HOSHIARPUR Bhamnaur - - -3.03 -4.27
271 PUNJAB HOSHIARPUR Bhangala-Chhota-DW -0.1 -1.87 - -
272 PUNJAB HOSHIARPUR Bhanowal-Pz -1.45 - 1.06 -

273 PUNJAB HOSHIARPUR Bhatolian-Pz 0.22 - -1.74 -
274 PUNJAB HOSHIARPUR Bisu Chak -0.23 - 1.81 -
275 PUNJAB HOSHIARPUR Boring-PZ - - 3.27 -
276 PUNJAB HOSHIARPUR Chak Sheru-DW 0.3 -0.49 -1.34 0.46
277 PUNJAB HOSHIARPUR Chohal -1.27 - 0.91 -
278 PUNJAB HOSHIARPUR Dadan-Pz - - -0.25 -
279 PUNJAB HOSHIARPUR DAGAN-DW -0.68 -2.09 -0.67 -
280 PUNJAB HOSHIARPUR Dallewal-Pz -2.64 - -4.22 -
281 PUNJAB HOSHIARPUR Dasuya2 (s) -0.4 - -1.07 -1.45
282 PUNJAB HOSHIARPUR Dharampur1 -0.7 - -0.05 -
283 PUNJAB HOSHIARPUR Durimiwal 0.36 1.15 -1.05 -1.88
284 PUNJAB HOSHIARPUR Garh Di Wala-Pz 1.27 0.53 1.95 0.04
285 PUNJAB HOSHIARPUR Garhshankar (s) 4.6 4.84 -1.5 -3.96
286 PUNJAB HOSHIARPUR Haler Rampur-DW -0.07 3.19 0.59 -0.2
287 PUNJAB HOSHIARPUR Hazipur 0.45 - - -0.38
288 PUNJAB HOSHIARPUR Jahidpur-PZ - - 0.41 -
289 PUNJAB HOSHIARPUR Jalalpur-Pz - - -1.04 -
290 PUNJAB HOSHIARPUR Jattpur-Pz - - 1.39 -
291 PUNJAB HOSHIARPUR Khera-Pz - - -3.75 -
292 PUNJAB HOSHIARPUR Mahil Baltohian-Pz - - -4.67 -
293 PUNJAB HOSHIARPUR Mahilpur-Pz 0.34 - -1.52 -1.64
294 PUNJAB HOSHIARPUR Naharpur-Pz -2.1 - -0.82 -
295 PUNJAB HOSHIARPUR Nangal Bihala- DW -0.28 -1.25 -3.83 -2.04
296 PUNJAB HOSHIARPUR Nangal Thathal-Pz -2.48 - - -
297 PUNJAB HOSHIARPUR Pan Khuh-DW -0.82 - -1.5 -1.78
298 PUNJAB HOSHIARPUR Pandori Mehal-Pz - - 1.2 -
299 PUNJAB HOSHIARPUR Pandori Rai - - 1.9 -
300 PUNJAB HOSHIARPUR Parshote-Pz - - -2.3 -
301 PUNJAB HOSHIARPUR Phuglana- Pz 0.91 -2.43 -2.5 -
302 PUNJAB HOSHIARPUR Samraj Tanda-DW 4.54 0.44 -1.27 -0.76
303 PUNJAB HOSHIARPUR Satnoh-PZ. - - -0.82 -
304 PUNJAB HOSHIARPUR Sham Chaurasi 0.73 0.61 -0.33 -0.54
305 PUNJAB HOSHIARPUR Sibo Chak- DW 0.12 0.43 -0.58 -3.73
306 PUNJAB HOSHIARPUR Simbli- OW 0.74 - -1.84 -
307 PUNJAB HOSHIARPUR Simbli-Pz 0.37 0.02 -3.76 -
308 PUNJAB HOSHIARPUR Talwara1 3.2 4.9 2.45 0.76
309 PUNJAB HOSHIARPUR Tanda - - -0.29 -
310 PUNJAB HOSHIARPUR Thakarwala 2.73 1.76 -0.47 -0.5
311 PUNJAB JALANDHAR Adampur 3(s) -1.04 -0.65 -1.3 -1.25
312 PUNJAB JALANDHAR Akalpur-Pz - - 0.01 -
313 PUNJAB JALANDHAR Allawalpur 0.2 0.12 0.3 0.25
314 PUNJAB JALANDHAR Bilga-Pz - - 0.47 -
315 PUNJAB JALANDHAR Chania-Pz - - -0.38 -
316 PUNJAB JALANDHAR Dhanda-Pz - - -0.01 -
317 PUNJAB JALANDHAR Fateh Jalal-Pz - - -0.44 -
318 PUNJAB JALANDHAR Gehlan-pz - - -0.01 -
319 PUNJAB JALANDHAR Gillian-Pz - - -3.13 -
320 PUNJAB JALANDHAR Hardo Sheikh-Pz - - -0.44 -
321 PUNJAB JALANDHAR Jalandhar-Pz(VS) 4.6 - -5.11 -
322 PUNJAB JALANDHAR Jalbhe -0.14 -2.11 -2.92 -

323 PUNJAB JALANDHAR Jandiala-Pz -1.28 -1.02 - -1.11
324 PUNJAB JALANDHAR Jandu Singha-Pz - - -0.48 -
325 PUNJAB JALANDHAR Janian-Pz - - -1.18 -
326 PUNJAB JALANDHAR Kakar Kalan-Pz - - 0.35 -
327 PUNJAB JALANDHAR Kala-Pz - - -0.98 -
328 PUNJAB JALANDHAR Kalyanpur-Pz - - -1.76 -
329 PUNJAB JALANDHAR Kang Sahib Rai-Pz - - -1.98 -
330 PUNJAB JALANDHAR Kartarpur 2(s) 1.24 -0.05 -0.9 -1.31
331 PUNJAB JALANDHAR Kharal Kalan Pz-S -1.21 0.85 - -1.95
332 PUNJAB JALANDHAR Kot Wadal Khan-Pz - - -1 -
333 PUNJAB JALANDHAR Kurla-Pz - - 2.35 -
334 PUNJAB JALANDHAR Lallian kalan Pz-S -0.45 - - -1.65
335 PUNJAB JALANDHAR Mahmuwal-Pz - - -0.95 -
336 PUNJAB JALANDHAR Mehsampur-Pz - - -0.64 -
337 PUNJAB JALANDHAR Nangal Shaman - - -1.04 -
338 PUNJAB JALANDHAR Nussi-Pz - - -3.87 -
339 PUNJAB JALANDHAR Pathial-Pz - - -0.38 -
340 PUNJAB JALANDHAR Pharwala-Pz - - 0.55 -
341 PUNJAB JALANDHAR Phillaur 2(s) -0.9 -0.24 - -0.65
342 PUNJAB JALANDHAR Rahimpur-Pz - - -0.96 -
343 PUNJAB JALANDHAR Rurka Kalan- Pz - - -0.33 -
344 PUNJAB JALANDHAR Samarahi-Pz - - -0.14 -
345 PUNJAB JALANDHAR Shahkot(s) 3.9 - -5.73 -
346 PUNJAB JALANDHAR Shahkot-Pz-Pb - - 1.71 -
347 PUNJAB JALANDHAR Skarar Pur-Pz - - -1.69 -
348 PUNJAB JALANDHAR Sultanpur-Pz - - 0.39 -
349 PUNJAB JALANDHAR Talwan-Pz - - -2.23 -
350 PUNJAB JALANDHAR Thanda-Pz - - -0.03 -
351 PUNJAB KAPURTHALA Bauril Harnampur-Pz - - -0.99 -
352 PUNJAB KAPURTHALA Begowal-Pz - - -0.52 -
353 PUNJAB KAPURTHALA Bhatnura Khurd- S -3.65 1.35 -1.91 0.15
354 PUNJAB KAPURTHALA Bhawanipur-Pz - - -0.93 -
355 PUNJAB KAPURTHALA Bholath M -1.68 -1.3 - -0.73
356 PUNJAB KAPURTHALA Bholath S -2.34 -0.01 -3.32 -0.96
357 PUNJAB KAPURTHALA Chakoke-Pz - - -0.75 -
358 PUNJAB KAPURTHALA Dhilwan - - 1.2 -
359 PUNJAB KAPURTHALA Hamira-Pz - - -0.91 -
360 PUNJAB KAPURTHALA Hazipur-Pz - - 0.03 -
361 PUNJAB KAPURTHALA Hussainpura-S Pz 1.57 2.11 -2.21 -2.48
362 PUNJAB KAPURTHALA Kapurthala2 (s) -4.42 1.58 - -1.57
363 PUNJAB KAPURTHALA Karnail Ganju-Pz - - -1.03 -
364 PUNJAB KAPURTHALA Maheru-Pz - - 0.17 -
365 PUNJAB KAPURTHALA Miani Bola-Pz - - 0.1 -
366 PUNJAB KAPURTHALA Nathu Chahal-Pz - - -1.08 -
367 PUNJAB KAPURTHALA Nurpur Janoa-Pz - - -1.26 -
368 PUNJAB KAPURTHALA Phagwara(shallow) -3.15 - -3.2 -
369 PUNJAB KAPURTHALA Phagwara2 (s) - - -0.81 -3.37
370 PUNJAB KAPURTHALA Sangatpur-Pz - - -5.13 -
371 PUNJAB KAPURTHALA Shalapur Dona-Pz - - -0.4 -
372 PUNJAB KAPURTHALA Sultanpur2 (s) 3.64 2.61 2.48 -

373 PUNJAB KAPURTHALA Talwandi Chaudary -Pz -0.6 0.73 -1.05 -
374 PUNJAB KAPURTHALA Thikriwali-Pz - - 0.04 -
375 PUNJAB LUDHIANA Alamgir-Pz -1.15 - -0.63 -
376 PUNJAB LUDHIANA Aliwal-Pz 0.45 - -0.18 -
377 PUNJAB LUDHIANA Begowal 0.38 -0.39 -1.07 -0.2
378 PUNJAB LUDHIANA Bhagwanpur-Pz 0.35 - -0.48 -
379 PUNJAB LUDHIANA Bhahlolpur-DW 0.18 -1.45 -1.28 -0.6
380 PUNJAB LUDHIANA Bharthala Randhawa-
Pz 0.06
- -0.54
-
381 PUNJAB LUDHIANA Bhikhi Khatron-Pz -0.57 - -0.49 -
382 PUNJAB LUDHIANA Bilaspur-Pz 0.39 - -1.23 -
383 PUNJAB LUDHIANA Chankoian Khurd-Pz 0.2 - -0.71 -
384 PUNJAB LUDHIANA Chattar Singh Park-ldh -0.82 1.87 - -
385 PUNJAB LUDHIANA Chaunta-Pz 0.95 - -1.14 -
386 PUNJAB LUDHIANA Chhapar-Pz -2.26 - -1.63 -
387 PUNJAB LUDHIANA Dinnamder-Pz -0.35 - -0.65 -
388 PUNJAB LUDHIANA Dodpur-Pz -0.25 - -1.37 -
389 PUNJAB LUDHIANA Galibkalan-Pz -0.85 - - -
390 PUNJAB LUDHIANA Gohaur-Pz -1.55 - -0.37 -
391 PUNJAB LUDHIANA Gopalpur 2(s) -0.58 - - -1.16
392 PUNJAB LUDHIANA Hambowal-Pz 0.15 - -0.43 -
393 PUNJAB LUDHIANA Harnampur -0.74 - -0.69 -
394 PUNJAB LUDHIANA Hedon-Pz 0.5 - -1.64 -
395 PUNJAB LUDHIANA Ikloha-Pz 0.33 -0.23 -0.54 -0.93
396 PUNJAB LUDHIANA Kalsian - - -1.36 -
397 PUNJAB LUDHIANA Katanikalan-Pz 0.5 - -0.61 -
398 PUNJAB LUDHIANA Khandur -0.86 - -1.42 -
399 PUNJAB LUDHIANA Kishangarh-Pz 0.3 - -0.16 -
400 PUNJAB LUDHIANA Kishanpur-Pz 0 - -0.58 -
401 PUNJAB LUDHIANA Lalan1 0.31 - -1.04 3.15
402 PUNJAB LUDHIANA Lil- II Pz 2.58 4.36 2.27 -1.56
403 PUNJAB LUDHIANA Lil-Pz III -2.77 - - -
404 PUNJAB LUDHIANA Lodhiwal-Pz -1.45 - -0.75 -
405 PUNJAB LUDHIANA Lohara-Pz -0.05 - -0.21 -
406 PUNJAB LUDHIANA Maksudra-Pz -0.23 -0.9 - -
407 PUNJAB LUDHIANA Manak Majra-Pz 0.2 - -0.16 -
408 PUNJAB LUDHIANA Mangat-Pz -0.5 - -0.61 -
409 PUNJAB LUDHIANA Mangat-Pz-S -1.64 - - -
410 PUNJAB LUDHIANA Manoke-Pz -0.6 - -1 -
411 PUNJAB LUDHIANA Mehma Singh Wala-Pz -3.25 - -2.11 -
412 PUNJAB LUDHIANA Mushkabad 0.58 -1.9 -1.98 -1.51
413 PUNJAB LUDHIANA Nelokalan 0.7 - 0.65 -
414 PUNJAB LUDHIANA Nurpur-Pz -0.6 - -0.8 -
415 PUNJAB LUDHIANA P.A.U.Ludhiana 2(s) 0.81 -3.73 -0.17 -1.7
416 PUNJAB LUDHIANA Pabbian-Pz -3.3 - -0.14 -
417 PUNJAB LUDHIANA Pandori-Pz -2.4 - -0.58 -
418 PUNJAB LUDHIANA Punjeta 0.33 -1.74 2 -
419 PUNJAB LUDHIANA Raikot-Pz -1.4 - -1.34 -
420 PUNJAB LUDHIANA Rajona Khurd - - -2.79 -
421 PUNJAB LUDHIANA Rashin -0.62 - -1.42 -
422 PUNJAB LUDHIANA Rattewal-Pz -2.25 - -1.77 -

423 PUNJAB LUDHIANA Roomi-Pz 0.45 - 0.07 -
424 PUNJAB LUDHIANA Roshiana-Pz -0.7 - -0.79 -
425 PUNJAB LUDHIANA Sajaywal-Pz -3 - -1.65 -
426 PUNJAB LUDHIANA Samrala 2(s) 0.61 0.33 -0.9 -0.73
427 PUNJAB LUDHIANA Sanewal-Pz 0.35 - -0.2 -
428 PUNJAB LUDHIANA Sangatpura-Pz -0.35 - -2.16 -
429 PUNJAB LUDHIANA Sherian 0.51 -0.74 -0.64 0.95
430 PUNJAB LUDHIANA Sherpur Bhet -0.15 - -4.48 -
431 PUNJAB LUDHIANA Sidhwan Bet-Pz -0.42 -0.75 1.38 -0.54
432 PUNJAB LUDHIANA Talwandi Kalan-Pz -0.55 - -0.84 -
433 PUNJAB LUDHIANA Udonwal-Pz 0.4 - -0.71 -
434 PUNJAB LUDHIANA Upplan 0.3 - -0.89 -
435 PUNJAB LUDHIANA Utlan -2 - - -
436 PUNJAB MANSA Aklia-Pz -1.02 - -0.86 -
437 PUNJAB MANSA Alampur Mandran-Pz - - -0.74 -
438 PUNJAB MANSA Alisher Khurd-Pz - - -1.73 -
439 PUNJAB MANSA Bahadur Pur-Pz - - -1.22 -
440 PUNJAB MANSA Bareh-Pz - - -0.58 -
441 PUNJAB MANSA Behniwala-Pz - - 0.49 -
442 PUNJAB MANSA Bhikhi 1 (s) -0.82 -0.7 -0.1 -2.57
443 PUNJAB MANSA Bhikhi 2 (s) -2.33 - - -
444 PUNJAB MANSA Budhlada -3.81 - - -
445 PUNJAB MANSA Budhlada-Pz -0.84 -0.99 - 0.8
446 PUNJAB MANSA Burj Bhalaike 0.4 0.58 1.29 0.93
447 PUNJAB MANSA Burj Rathi-Pz - - -0.76 -
448 PUNJAB MANSA Fattamaluka 0.06 0.48 - 0.75
449 PUNJAB MANSA Gharangne-Pz - - -0.4 -
450 PUNJAB MANSA Hero Kalan-Pz - - -1.47 -
451 PUNJAB MANSA Hirke-Pz - - -0.67 -
452 PUNJAB MANSA Khiala Kalan-Pz - - -0.07 -
453 PUNJAB MANSA Khokhar Kalan-Pz - - -0.26 -
454 PUNJAB MANSA Kot Dhamru 0.88 - - -
455 PUNJAB MANSA Kotra -0.66 - - -
456 PUNJAB MANSA Lakhiwal-Pz - - -0.71 -
457 PUNJAB MANSA Makha-[PZ - - -0.38 -
458 PUNJAB MANSA Phaphare Bhaike-Pz - - -1.27 -
459 PUNJAB MANSA Raipur-Pz 0.72 0.12 0.4 0.29
460 PUNJAB MANSA Ralla -1.12 -1.09 -0.95 -0.96
461 PUNJAB MANSA Tibbi Hari Singh-PZ - - 0 -
462 PUNJAB MOGA Baje Ke-Pz -3.09 -0.43 -2.14 -
463 PUNJAB MOGA Bilaspur-PZ -1.34 - -2.67 -
464 PUNJAB MOGA Budh Singh Wala-Pz -1.26 -0.85 -1.16 -
465 PUNJAB MOGA Chogawan-Pz -1.45 -1.16 -1.74 -
466 PUNJAB MOGA Dagru- Pz -0.97 -1.15 -0.89 -
467 PUNJAB MOGA Damru Khurd -0.94 - - -
468 PUNJAB MOGA Dhudi Ke-PZ -2.41 - -1.75 -
469 PUNJAB MOGA Dinna-PZ -2.19 - -4.37 -
470 PUNJAB MOGA Himatpura-Pz - - -5.6 -
471 PUNJAB MOGA Indergarh-Pz - - 2.09 -
472 PUNJAB MOGA Jhandewala-Pz -1.9 - -1.45 -
473 PUNJAB MOGA Kamalke-Pz - - 1.47 -
474 PUNJAB MOGA Khokri Kalan-Pz -2.53 - -1.62 -

475 PUNJAB MOGA Khosa Randhir-Pz -2.53 - -4.22 -
476 PUNJAB MOGA Mandar-Pz 2.73 - 3.95 -
477 PUNJAB MOGA Mangewala-Pz 0.43 - 2.07 -
478 PUNJAB MOGA Meemana-PZ - - 1.64 -
479 PUNJAB MOGA Nathu Wala-Pz -0.38 - -1.05 -
480 PUNJAB MOGA Nihalsinghwala-Pz -1.77 - -3.1 -
481 PUNJAB MOGA Raonke Kalan-Pz - - -2.09 -
482 PUNJAB MOGA Samad Bhai-Pz -2 - -2.69 -
483 PUNJAB MOGA Samalsar-Pz -5.94 - -4.51 -
484 PUNJAB MOGA Tota Singh Wala-Pz - - -1.01 -
485 PUNJAB MUKTSAR Abulkharana-Pz - - 0.11 -
486 PUNJAB MUKTSAR Balocha
Khera(rasoolpur) -0.75
- 1.1 0.28
487 PUNJAB MUKTSAR Bhaliana 3 -0.22 -0.08 -
488 PUNJAB MUKTSAR Bhiti Wala-Pz - - 0.15 -
489 PUNJAB MUKTSAR Chaktam Kot-Pz - - 0.04 -
490 PUNJAB MUKTSAR Dahak-S - - - 0.4
491 PUNJAB MUKTSAR Doda -0.49 1.64 0.55 0.49
492 PUNJAB MUKTSAR Doda-Pz 1.17 0.49 0.67 0.52
493 PUNJAB MUKTSAR Husnar-Pz - - -0.84 -
494 PUNJAB MUKTSAR Kabar Wala -0.67 1.49 - 0.59
495 PUNJAB MUKTSAR Kattianwali-Pz - - 0.53 -
496 PUNJAB MUKTSAR Khunde Halal-Pz 0.39 1.51 0.64 0.75
497 PUNJAB MUKTSAR Kollian Wali-pz - - -0.12 -
498 PUNJAB MUKTSAR Labanianwali -0.61 0.09 -0.74 -0.66
499 PUNJAB MUKTSAR Lambi - 0.06 1.6 0.78
500 PUNJAB MUKTSAR Lambi-Pz -0.33 - - -
501 PUNJAB MUKTSAR Muktsar -1.95 0.62 0.73 0.68
502 PUNJAB MUKTSAR Phulu Khera-Pz - - 0.16 -
503 PUNJAB MUKTSAR Ratta Khera Chota-Pz - - 0.08 -
504 PUNJAB MUKTSAR Sheikh-Pz - - 0.93 -
505 PUNJAB PATHANKOT Bamyal -0.89 2.07 1.13 0.66
506 PUNJAB PATHANKOT Bhoa -0.74 1.58 -0.74 -0.65
507 PUNJAB PATHANKOT Dhar Khurd -0.3 - - -
508 PUNJAB PATHANKOT Gharotakalan 3.14 -2.65 0.27 1.87
509 PUNJAB PATHANKOT Ghoh - - -0.81 -0.04
510 PUNJAB PATHANKOT Jainpur-PZ - - -0.3 -
511 PUNJAB PATHANKOT Jandwala -0.01 - -0.69 -
512 PUNJAB PATHANKOT Jhakolahri - 1.81 -0.53 0.05
513 PUNJAB PATHANKOT Khanikhui 0.28 1.45 -0.07 -0.27
514 PUNJAB PATHANKOT Khogaki Chaka-PZ -1.19 - 0.07 -
515 PUNJAB PATHANKOT Kiari- DW -1.9 3.78 1.16 0.52
516 PUNJAB PATHANKOT Kirian Khurd-PZ - - 0.94 -
517 PUNJAB PATHANKOT Kui-DW - 3.08 0.97 0.84
518 PUNJAB PATHANKOT Kuther-PZ -0.3 - -0.09 -
519 PUNJAB PATHANKOT Malikpur -0.05 - - -
520 PUNJAB PATHANKOT Matti-PZ -0.43 - 1.21 -
521 PUNJAB PATHANKOT Mirthal -3.5 - -1.56 -
522 PUNJAB PATHANKOT Narot Jaimalsingh-Pz -0.71 - -0.04 -
523 PUNJAB PATHANKOT Nawan Pind -0.41 2.94 -0.02 0.04
524 PUNJAB PATHANKOT Parmota-DW 1.2 - -2.91 -
525 PUNJAB PATHANKOT Pathankot1 -0.41 1.61 2.79 2.9

526 PUNJAB PATHANKOT Philora-PZ 1.09 - -0.62 -
527 PUNJAB PATHANKOT Phulpiara -0.2 - - -
528 PUNJAB PATHANKOT Rakawal-PZ - - -0.15 -
529 PUNJAB PATHANKOT Rani Pur-PZ -1.74 - -1.41 -
530 PUNJAB PATHANKOT Sarna -0.07 2.81 -1.53 -0.28
531 PUNJAB PATHANKOT Sujanpur-PZ 0.13 - -0.51 -
532 PUNJAB PATIALA Bassma Pipla 1.2 0.4 - -
533 PUNJAB PATIALA Bhankhar-Pz - - -1.95 -
534 PUNJAB PATIALA Bhojo majri 07pz - - -3.69 -
535 PUNJAB PATIALA Birkauli -1.97 - - -
536 PUNJAB PATIALA Devigarh 1Pz 0.4 -2.33 -3.11 -1.24
537 PUNJAB PATIALA Devigarh IIPz 0.3 - -2.81 -
538 PUNJAB PATIALA Devigarh-III Pz 0.49 - -3.07 -
539 PUNJAB PATIALA Dhaneta-PZ -2.55 - - -
540 PUNJAB PATIALA Duggal Kalan -0.82 - -0.73 -
541 PUNJAB PATIALA Gharam-PZ -2.23 - -0.38 -
542 PUNJAB PATIALA Gulwatti-PZ -0.98 - -0.93 -
543 PUNJAB PATIALA Haluka - 1.24 - 0.43
544 PUNJAB PATIALA Hari Majra -0.8 -2.49 -4.51 -
545 PUNJAB PATIALA Jainagar-PZ - - -0.57 -
546 PUNJAB PATIALA Jogewal-PZ -1.12 - -1.38 -
547 PUNJAB PATIALA Kalyan 07pz - -0.14 0.2 -0.16
548 PUNJAB PATIALA Kami Kalan 0.36 -0.09 0.44 0.06
549 PUNJAB PATIALA Kami Khurd-PZ -3.57 - -1.76 -
550 PUNJAB PATIALA Kauli state - - 0.79 -
551 PUNJAB PATIALA Kheri Pandte-PZ -2.93 - -0.28 -
552 PUNJAB PATIALA Kulburcha-Pz -2.62 - -1.66 -
553 PUNJAB PATIALA Kutha Kheri-Pz -1.75 - -0.14 -
554 PUNJAB PATIALA Lacharu Kalan 0.58 1.46 0.42 0.1
555 PUNJAB PATIALA Lachkani-Pz 0.13 0.27 -0.3 -0.56
556 PUNJAB PATIALA Mehmood Pur-PZ - - -0.85 -
557 PUNJAB PATIALA Mongowal-PZ - - -0.09 -
558 PUNJAB PATIALA Nanhera-Pz - - 0.27 -
559 PUNJAB PATIALA Nariana - - - 2.26
560 PUNJAB PATIALA Passiana-PZ -2.27 - -1.46 -
561 PUNJAB PATIALA Patran-Pz -0.96 -0.8 -0.55 -3.29
562 PUNJAB PATIALA Rajgarh - -1.15 -1.42 -1.07
563 PUNJAB PATIALA Ramgarh 0.27 - -0.59 -
564 PUNJAB PATIALA Randhawa-Pz - -0.88 - -
565 PUNJAB PATIALA Rasoolpur Jaura-PZ -0.47 - -0.42 -
566 PUNJAB PATIALA Saghraur-PZ - - -0.17 -
567 PUNJAB PATIALA Samana-Pz -0.98 - -1.07 -
568 PUNJAB PATIALA Samaspur-Pz -2.66 - -2.12 -
569 PUNJAB PATIALA Sanaur - - -0.61 -
570 PUNJAB PATIALA Sangatpura-Pz - -0.29 - -1
571 PUNJAB PATIALA Sauja-PZ -2.44 - -1.22 -
572 PUNJAB RUPNAGAR Ahmedpur -0.29 1.8 -1.79 -1.09
573 PUNJAB RUPNAGAR Amrali-PZ -0.77 - -0.16 -
574 PUNJAB RUPNAGAR Attari-PZ -0.46 - -0.64 -
575 PUNJAB RUPNAGAR Bains 1.6 - 1.15 -
576 PUNJAB RUPNAGAR Bera Chauta 0.23 - -0.22 -0.6
577 PUNJAB RUPNAGAR Bhatto-PZ -0.62 - -0.06 -

578 PUNJAB RUPNAGAR Braham Pur 0.07 -0.14 -0.77 -0.82
579 PUNJAB RUPNAGAR Chakdera 0.35 0.63 -0.33 0.43
580 PUNJAB RUPNAGAR Chatamli- Pz 5.32 1.04 -5.63 -3.1
581 PUNJAB RUPNAGAR Dhair 0.51 0.41 -0.75 -0.32
582 PUNJAB RUPNAGAR Dumewal -0.48 3.69 -0.18 -
583 PUNJAB RUPNAGAR Hardinamoh 4.53 0.2 -0.76 -
584 PUNJAB RUPNAGAR Kakrali - - -2.86 -0.8
585 PUNJAB RUPNAGAR Klwan-PZ -0.97 - 0.25 -
586 PUNJAB RUPNAGAR Kotla -0.64 - -0.48 -
587 PUNJAB RUPNAGAR Morinda-PZ -1.23 - -1.21 -
588 PUNJAB RUPNAGAR Rajgiri-PZ - - 2.81 -
589 PUNJAB SANGRUR Bagarian-Pz 1.75 - -4.39 -0.8
590 PUNJAB SANGRUR Bakshiwala-PZ -0.9 - -0.63 -
591 PUNJAB SANGRUR Banbhaura-PZ -1.55 - -0.1 -
592 PUNJAB SANGRUR Benra-PZ-S -1.34 -0.62 - -
593 PUNJAB SANGRUR Bhojowali-Pz -1.31 -0.74 -1.24 -1.62
594 PUNJAB SANGRUR Bhunerheri-PZ -1.4 - -0.3 -
595 PUNJAB SANGRUR Bugra 1 -1.62 0.98 - -
596 PUNJAB SANGRUR Chatha Nanhera-PZ -1.95 - -2.18 -
597 PUNJAB SANGRUR Chural Kalan M -1.65 -1.31 -0.98 2.59
598 PUNJAB SANGRUR Dharamgarh-Pz -0.8 - -0.46 -
599 PUNJAB SANGRUR Ghanauri Kalan-Pz - - -1.86 -
600 PUNJAB SANGRUR Kala Jhar-Pz - - -0.87 -
601 PUNJAB SANGRUR Kheri Naran-PZ -1.6 - -0.63 -
602 PUNJAB SANGRUR Khurni-PZ -2.15 - -1.51 -
603 PUNJAB SANGRUR Kila Hakima -1.45 - -0.55 -
604 PUNJAB SANGRUR Kokahar-PZ -0.6 - - -
605 PUNJAB SANGRUR Kuler Khurd-Pz -1.1 - -1.05 -
606 PUNJAB SANGRUR Ladda-Pz -4 - -2.62 -
607 PUNJAB SANGRUR Longowal-Pz -2 0.39 0.06 -1.4
608 PUNJAB SANGRUR Majji-PZ 1.73 0 -0.41 -
609 PUNJAB SANGRUR Malerkotla-DW 0.01 -0.58 - 0.24
610 PUNJAB SANGRUR Manvi-Pz - -0.81 - -0.28
611 PUNJAB SANGRUR Panjgaraian- Pz -0.85 - -1.23 -
612 PUNJAB SANGRUR Rajo Majra-PZ -0.6 - -1.2 -
613 PUNJAB SANGRUR Rampur Channa-Pz 0.65 - 1.7 -
614 PUNJAB SANGRUR Rurgarh-PZ -0.4 - -0.34 -
615 PUNJAB SANGRUR Rurki Kalan-Pz 0.1 - -1.09 -
616 PUNJAB SANGRUR Sekhpur Khurd-PZ 0.05 - -0.05 -
617 PUNJAB SANGRUR Sekhwas-PZ -2.3 - -2.65 -
618 PUNJAB SANGRUR Sikandarpur-PZ -0.15 - -0.71 -
619 PUNJAB SANGRUR Sunam-Pz -1.03 - 0.45 -0.78
620 PUNJAB SAS NAGAR Antala 0.2 0.04 -1.2 3.02
621 PUNJAB SAS NAGAR Balongi-PZ 0.7 - -4.51 -
622 PUNJAB SAS NAGAR Barauli-PZ 1.4 - 1.19 -
623 PUNJAB SAS NAGAR Dera Bassi 07pz 0.43 0.75 0.27 -
624 PUNJAB SAS NAGAR Dheri -0.35 1.28 0.01 -
625 PUNJAB SAS NAGAR Gharoon -0.7 - -0.01 -
626 PUNJAB SAS NAGAR Ghoga -0.08 -0.19 0.13 -
627 PUNJAB SAS NAGAR Joli 0.48 0.79 2.5 -
628 PUNJAB SAS NAGAR Kurrha-Pz -4.5 - -3.95 -
629 PUNJAB SAS NAGAR Landran Pz - - -0.16 -

630 PUNJAB SAS NAGAR Malkpur-Pz - - -0.97 -
631 PUNJAB SAS NAGAR Manoli-PZ -0.4 - -1.17 -
632 PUNJAB SAS NAGAR Palheri-PZ -0.9 - -1.65 -
633 PUNJAB SAS NAGAR Pedol-PZ -2 - 0.6 -
634 PUNJAB SAS NAGAR Raipur Kalan 0.3 - -0.26 -
635 PUNJAB SAS NAGAR Singhpura-Pz 3.4 - - -
636 PUNJAB SAS NAGAR Sirsini 0.23 0.07 -0.29 1.50
637 PUNJAB SAS NAGAR Siswan -0.05 - -0.12 -
638 PUNJAB SAS NAGAR Sohana-PZ 0.4 - - -
639 PUNJAB SBS NAGAR Alowal-Pz - - -0.37 -
640 PUNJAB SBS NAGAR Aur-PZ - - -0.63 -
641 PUNJAB SBS NAGAR Bahara-Pz - - -2.14 -
642 PUNJAB SBS NAGAR Bahlora Kallan- Pz - -0.51 -1.54 -
643 PUNJAB SBS NAGAR Bahua-Pz - - -2.1 -
644 PUNJAB SBS NAGAR Balaipur-PZ - - -1.38 -
645 PUNJAB SBS NAGAR Bhadi-PZ - - 3.53 -
646 PUNJAB SBS NAGAR Dugri Garol-PZ - - -2.03 -
647 PUNJAB SBS NAGAR Jethu Majra-PZ 0.41 - -0.71 -
648 PUNJAB SBS NAGAR Kariam-Pz - - -1.2 -
649 PUNJAB SBS NAGAR Langoya-PZ - - -1.11 -
650 PUNJAB SBS NAGAR Mauhra-Pz 2.22 - - -
651 PUNJAB SBS NAGAR Padmaiwal-PZ - - -2 -
652 PUNJAB SBS NAGAR Rahon 0.99 0.91 -2 -
653 PUNJAB SBS NAGAR Raipur Dhaba-Pz -0.58 -1.35 - -
654 PUNJAB TARAN
TARAN Aima Khurd-Pz -1
- 0.31
-
655 PUNJAB TARAN
TARAN Attari-Pz
- - -1.47
-
656 PUNJAB TARAN
TARAN Bath-Pz -1.03
- -2.89
-
657 PUNJAB TARAN
TARAN Bhagala-Pz
- - 2.09
-
658 PUNJAB TARAN
TARAN Bhagwanpur-Pz -1.6
- -0.96
-
659 PUNJAB TARAN
TARAN Bhalaipur-Pz
- - -0.95
-
660 PUNJAB TARAN
TARAN Bhankar Kalan-Pz
- - -2.18
-
661 PUNJAB TARAN
TARAN Bhura-Pz
- - 0.15
-
662 PUNJAB TARAN
TARAN Bhure-Pz
- - -2.39
-
663 PUNJAB TARAN
TARAN Bhusse-Pz -0.38
- -1.79
-
664 PUNJAB TARAN
TARAN Brahmpur-Pz -2.25
- -0.51
-
665 PUNJAB TARAN
TARAN Chakkare Khan-Pz -1.03
- -0.26
-
666 PUNJAB TARAN
TARAN Chola Sahib-Pz -3.6
- - -
667 PUNJAB TARAN
TARAN Chuselawad-Pz -1.08
- -0.47
-
668 PUNJAB TARAN
TARAN Ekalgoda-Pz
- - -0.38
-
669 PUNJAB TARAN
TARAN Fatehabad- PZ 1.04
- -1.29
-

670 PUNJAB TARAN
TARAN Gandi Wind-Pz -0.98
- - -
671 PUNJAB TARAN
TARAN Goindwal
- - - -0.27
672 PUNJAB TARAN
TARAN Jandoke-Pz -1.62
- -3.58
-
673 PUNJAB TARAN
TARAN Kairon-PZ -0.78
- -0.67
-
674 PUNJAB TARAN
TARAN Khadur Sahib-Pz -1.02 -0.3 -0.27
-
675 PUNJAB TARAN
TARAN Khalra-Pz -1.15
- -0.89
-
676 PUNJAB TARAN
TARAN Kotbudda-Pz
- - -0.19
-
677 PUNJAB TARAN
TARAN Kotli Sur Singh-Pz -2.38
- -3.1
-
678 PUNJAB TARAN
TARAN Mahendipur-Pz
- - 0.29
-
679 PUNJAB TARAN
TARAN Marhona-Pz 0.13
- 0.66
-
680 PUNJAB TARAN
TARAN Mari Kamboke-Pz -1.33
- 0.6
-
681 PUNJAB TARAN
TARAN Patti 0.07
- -0.55
-
682 PUNJAB TARAN
TARAN Pindan-Pz -0.8
- 0.36
-
683 PUNJAB TARAN
TARAN Rajoke-Pz -0.59
- -1.22
-
684 PUNJAB TARAN
TARAN Ratoke-Pz -3.62
- 0.45
-
685 PUNJAB TARAN
TARAN Sabran-Pz
- - -1.12
-
686 PUNJAB TARAN
TARAN Sahab Pura- Pz -2.46 -1.1 -0.7
-
687 PUNJAB TARAN
TARAN Sugga-Pz -0.6
- -2.39
-
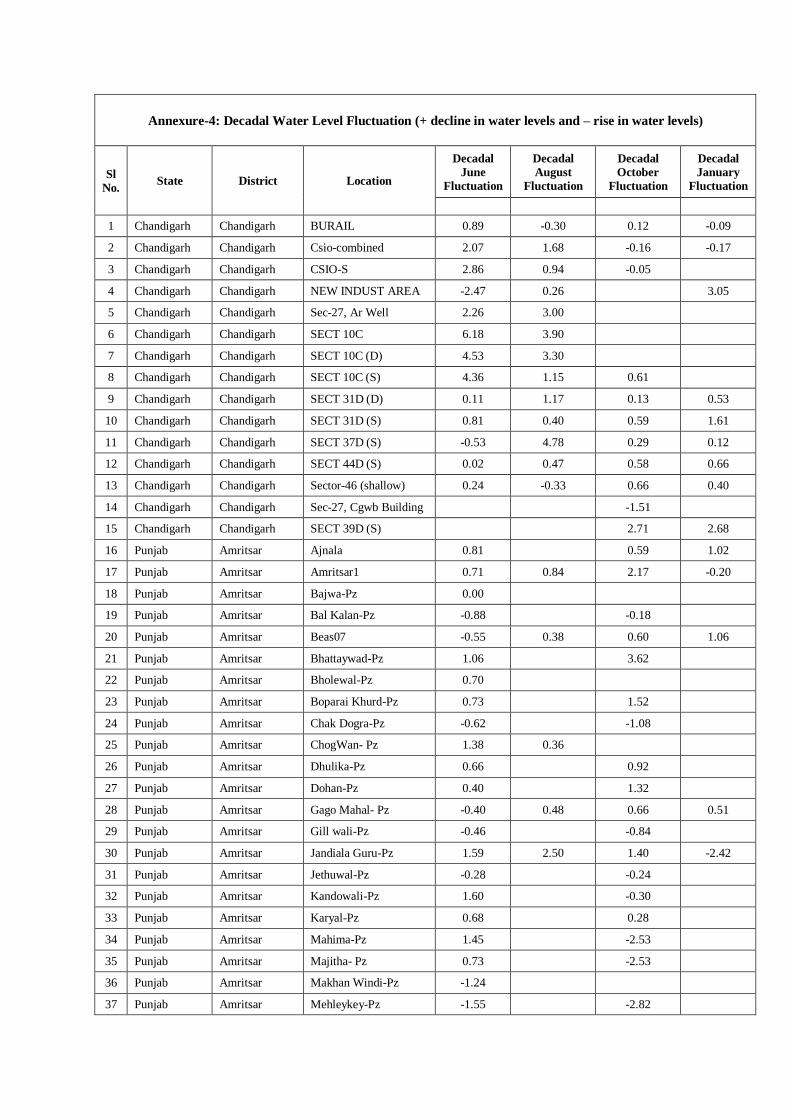
Annexure-4: Decadal Water Level Fluctuation (+ decline in water levels and – rise in water levels)
Sl
No. State District Location
Decadal
June
Fluctuation
Decadal
August
Fluctuation
Decadal
October
Fluctuation
Decadal
January
Fluctuation
1 Chandigarh Chandigarh BURAIL 0.89 -0.30 0.12 -0.09
2 Chandigarh Chandigarh Csio-combined 2.07 1.68 -0.16 -0.17
3 Chandigarh Chandigarh CSIO-S 2.86 0.94 -0.05
4 Chandigarh Chandigarh NEW INDUST AREA -2.47 0.26 3.05
5 Chandigarh Chandigarh Sec-27, Ar Well 2.26 3.00
6 Chandigarh Chandigarh SECT 10C 6.18 3.90
7 Chandigarh Chandigarh SECT 10C (D) 4.53 3.30
8 Chandigarh Chandigarh SECT 10C (S) 4.36 1.15 0.61
9 Chandigarh Chandigarh SECT 31D (D) 0.11 1.17 0.13 0.53
10 Chandigarh Chandigarh SECT 31D (S) 0.81 0.40 0.59 1.61
11 Chandigarh Chandigarh SECT 37D (S) -0.53 4.78 0.29 0.12
12 Chandigarh Chandigarh SECT 44D (S) 0.02 0.47 0.58 0.66
13 Chandigarh Chandigarh Sector-46 (shallow) 0.24 -0.33 0.66 0.40
14 Chandigarh Chandigarh Sec-27, Cgwb Building -1.51
15 Chandigarh Chandigarh SECT 39D (S) 2.71 2.68
16 Punjab Amritsar Ajnala 0.81 0.59 1.02
17 Punjab Amritsar Amritsar1 0.71 0.84 2.17 -0.20
18 Punjab Amritsar Bajwa-Pz 0.00
19 Punjab Amritsar Bal Kalan-Pz -0.88 -0.18
20 Punjab Amritsar Beas07 -0.55 0.38 0.60 1.06
21 Punjab Amritsar Bhattaywad-Pz 1.06 3.62
22 Punjab Amritsar Bholewal-Pz 0.70
23 Punjab Amritsar Boparai Khurd-Pz 0.73 1.52
24 Punjab Amritsar Chak Dogra-Pz -0.62 -1.08
25 Punjab Amritsar ChogWan- Pz 1.38 0.36
26 Punjab Amritsar Dhulika-Pz 0.66 0.92
27 Punjab Amritsar Dohan-Pz 0.40 1.32
28 Punjab Amritsar Gago Mahal- Pz -0.40 0.48 0.66 0.51
29 Punjab Amritsar Gill wali-Pz -0.46 -0.84
30 Punjab Amritsar Jandiala Guru-Pz 1.59 2.50 1.40 -2.42
31 Punjab Amritsar Jethuwal-Pz -0.28 -0.24
32 Punjab Amritsar Kandowali-Pz 1.60 -0.30
33 Punjab Amritsar Karyal-Pz 0.68 0.28
34 Punjab Amritsar Mahima-Pz 1.45 -2.53
35 Punjab Amritsar Majitha- Pz 0.73 -2.53
36 Punjab Amritsar Makhan Windi-Pz -1.24
37 Punjab Amritsar Mehleykey-Pz -1.55 -2.82

38 Punjab Amritsar Mehta-Pz -0.44 0.28 0.02 1.99
39 Punjab Amritsar Miran Chak-Pz -0.10 0.28
40 Punjab Amritsar Nangal Sahaul-Pz -0.76 -0.28
41 Punjab Amritsar Nawan Tanal- Pz 0.49 0.53 1.65 1.75
42 Punjab Amritsar Ramdas-DW 0.82 -1.49 0.98 1.59
44 Punjab Amritsar Rayya-Pz -1.50 -0.25
45 Punjab Amritsar Rupowal Brahmana-Pz 0.09 -0.02
46 Punjab Amritsar Sarangra-Pz -1.10
47 Punjab Amritsar Shabura-Pz 1.30 3.94
48 Punjab Amritsar Sham Nagar-Pz 0.04 -0.24
49 Punjab Amritsar Talwandi Dogra-Pz 1.32 0.24
50 Punjab Amritsar Tarsika-Pz -1.92 -0.20
51 Punjab Amritsar Ugar Aulakh-Pz 0.66 1.30
52 Punjab Amritsar Vadala Kalan-Pz 0.50 2.40
53 Punjab Amritsar Vadala Viran-Pz -0.55
54 Punjab Amritsar Verka-Pz -0.90
55 Punjab Amritsar Wandala Bittewad-Pz 0.50 1.44
56 Punjab Barnala Amla Singh Wala-PZ 2.19 4.82
57 Punjab Barnala Barnala (s) 7.10 7.06 7.02 7.46
58 Punjab Barnala Bhadaur-Pz 5.66 4.44 5.09 6.78
59 Punjab Barnala Daula-Pz 6.35
61 Punjab Barnala Kurar-Pz 6.66 7.38
62 Punjab Barnala Lohgarh-Pz 4.78 7.91
63 Punjab Barnala Mahal Kalan-Pz 5.76 3.88 5.45 6.67
64 Punjab Barnala Pakho Ke-Pz -0.91
67 Punjab Barnala Shekha 4.86
68 Punjab Bathinda Ablu 0.02 2.22 2.03 2.62
69 Punjab Bathinda Aleke Jalal-Pz 3.11 3.97
70 Punjab Bathinda Badiala-Pz 4.00 4.04 7.07
71 Punjab Bathinda Bagher Mohabat Singh-Pz
1.17
1.42
72 Punjab Bathinda Bahman Kaur Singh-Pz 0.78 0.54
73 Punjab Bathinda Balianwali-Pz 2.69 2.55
74 Punjab Bathinda Balluana-Pz -0.88 0.20 -2.52
75 Punjab Bathinda Bandi-Pz 0.07
76 Punjab Bathinda Bhagibandar 0.56 2.03 0.92 0.27
77 Punjab Bathinda Bugran-Pz 3.84 3.64
78 Punjab Bathinda Burj Gill-Pz 4.01 5.12
79 Punjab Bathinda Deratapp 2.00 1.52 2.62 2.83
80 Punjab Bathinda Dhapali1 9.94 8.49 9.65
81 Punjab Bathinda Dhapali-Pz 5.31 4.23 5.34 0.91
82 Punjab Bathinda Dialpur Mirza 6.74 7.65 8.35 7.37
83 Punjab Bathinda Dialpura Bhlaike 5.91 8.54 7.51 8.51

84 Punjab Bathinda Dialpura- Mirza 1.25 0.59
85 Punjab Bathinda Dulle Wala-Pz 3.77 4.82
86 Punjab Bathinda Ganga-Pz 1.78 1.27 1.86
87 Punjab Bathinda Gill Patti-DW 2.65 2.88
88 Punjab Bathinda Gobind Pura-Pz 0.84
89 Punjab Bathinda Gulabgarh 2 (s) 2.00 1.74 1.43 2.54
90 Punjab Bathinda Guru Sar-Pz 0.69 0.01 0.48 0.49
91 Punjab Bathinda Harraipur-Pz 1.80 3.46
92 Punjab Bathinda Jajjal 0.87 0.93 0.75 0.84
93 Punjab Bathinda Jajjal_DW 1.30 1.18
94 Punjab Bathinda Jassi Bhagwali 0.24 -0.99 -0.92 -1.04
95 Punjab Bathinda Jhanduke 2.57 5.94
96 Punjab Bathinda Jhanduke-Pz 2.38 4.62 2.53
97 Punjab Bathinda Kalla Bandar 4.79
98 Punjab Bathinda Kalyan Sukha-M 1.47 0.75 0.68
99 Punjab Bathinda Koir Singh Wala-Pz 2.83 4.47
100 Punjab Bathinda Kot Bhaktu-Pz 0.82 0.47
101 Punjab Bathinda Kot Guru 0.34 0.40
102 Punjab Bathinda Kot Shamir 0.82 0.03 1.27
103 Punjab Bathinda Kothaguru-Pz 4.92 5.21 5.69
104 Punjab Bathinda Lalliana-Pz 1.73 1.33
105 Punjab Bathinda Lehra Dhulkot-Pz 3.02 1.33
106 Punjab Bathinda Maihma Bhagwan-PZ 1.03 1.10
107 Punjab Bathinda Maisar Khana-Pz 2.11 3.19 3.47
108 Punjab Bathinda Maluka-Pz 3.20 4.00
109 Punjab Bathinda Mandi Kalan-Pz 2.62 2.52
110 Punjab Bathinda Mehraj-Pz 3.36 4.27
111 Punjab Bathinda Multania-Pz 0.84 0.39
112 Punjab Bathinda Nahinwala 2.78 2.80 2.84 3.52
113 Punjab Bathinda Nathana-Pz 3.35 2.86
114 Punjab Bathinda Phulla1 5.32 7.00 8.11 8.71
115 Punjab Bathinda Puhla-Pz 5.19
116 Punjab Bathinda Raike Kalan 0.02 0.50 0.97 0.46
117 Punjab Bathinda Rajgarh Kubey-Pz 2.19 2.62
118 Punjab Bathinda Rampura 6.59
119 Punjab Bathinda Rampura-Pz 0.59
120 Punjab Bathinda Rayya-Pz 4.66 5.52
121 Punjab Bathinda Salabatpur-Pz 3.15 2.41
122 Punjab Bathinda Seema-DW 3.15
123 Punjab Bathinda Sidhana 3.97
124 Punjab Bathinda Sooch-Pz 2.02 3.11
125 Punjab Bathinda Teona-Pz 0.13 0.44

126 Punjab Bathinda Tungwali-Pz 1.66 3.26
127 Punjab Faridkot Baja Khana 5.14 1.98 0.45 2.80
128 Punjab Faridkot Bead Sikhanwala- Pz 0.62 1.63 0.78 0.89
129 Punjab Faridkot Chahd Baja 1.46 2.97 2.32
130 Punjab Faridkot Deviwala-S 1.10 1.76 2.12
131 Punjab Faridkot Dhilwan Kalan 2.22
132 Punjab Faridkot Dipsinghwala 0.99 1.21
133 Punjab Faridkot Jand Sahib-Pz -0.39 -0.20 0.19 -0.38
134 Punjab Faridkot Karirwali 2.71 3.90 3.54 3.24
135 Punjab Faridkot Killi-Pz -0.25 0.19 0.29
136 Punjab Faridkot Kot Kapura 1.35 3.39 1.55 1.99
137 Punjab Faridkot Matta 2.17 2.04 2.01 2.05
138 Punjab Faridkot Mehmuana -0.91 -0.81 -0.43 -0.69
139 Punjab Faridkot Mumra-Pz -0.36 0.17 -0.10
140 Punjab Faridkot Nangal-Pz 0.47 0.35
141 Punjab Faridkot Sadiq-Pz -0.40 -0.33 0.04 -0.46
142 Punjab Faridkot Sher Singh Wala- Pz -0.19 -0.34 0.11 -0.33
143 Punjab Faridkot Sukhwala-Pz 0.48 -0.48 0.46 0.31
144 Punjab Faridkot Tehna-Pz 0.00 -1.39 0.41 -1.05
145 Punjab Faridkot Wara Dwarka-Pz 0.53 0.49 0.49 0.76
146 Punjab F. Sahib Alipur Sodhian-Pz 2.52 1.73
147 Punjab F. Sahib Amloh1 3.65
148 Punjab F. Sahib Badalialasingh 7.52 2.63 3.89
149 Punjab F. Sahib Bagga Kalan 4.48 4.66
150 Punjab F. Sahib Bassi Pathana 2.49 6.26 2.82
152 Punjab F. Sahib Bhagrana -0.80 -2.59 -1.21 -1.82
153 Punjab F. Sahib Bhateri1 2.24 2.29
154 Punjab F. Sahib Burj 2.21 3.19
155 Punjab F. Sahib Chandiala-Pz -0.45 0.25
156 Punjab F. Sahib Chuni Khurd-PZ 1.55 -1.65
157 Punjab F. Sahib Chunni Kalan -1.35 -1.21 -2.48 -2.57
158 Punjab F. Sahib Fatehgarh Sahib 1.59 3.85
159 Punjab F. Sahib Fatehgarh Sahib-Pz 2.80 2.30 2.00 2.55
160 Punjab F. Sahib Inayatpur-PZ-S -0.83
161 Punjab F. Sahib Jai Singh Wala 4.86 3.74
162 Punjab F. Sahib Jhambela 3.81 3.91
163 Punjab F. Sahib Kalewal 1.38
164 Punjab F. Sahib Khamanon-pz 0.25 0.77
165 Punjab F. Sahib Kharey_PZ 0.05
166 Punjab F. Sahib Khera-Pz -0.20 1.00
167 Punjab F. Sahib Ladpur 2.13
168 Punjab F. Sahib Lohar Majra 2.55 3.23

169 Punjab F. Sahib Mianpur-Pz 0.51 1.28
170 Punjab F. Sahib Nalini-Pz 1.97 2.99 1.22 1.11
171 Punjab F. Sahib Nandpur Kalaur-Pz 1.84 1.71
172 Punjab F. Sahib Pawala -2.06 2.87 2.17 1.86
173 Punjab F. Sahib Sado Majra 3.08 3.68
174 Punjab F. Sahib Salempur 0.33
175 Punjab F. Sahib Shahpur 2.83 3.03
176 Punjab F. Sahib Sirhind-Pz 1.76 0.66
177 Punjab F. Sahib Tahalpur 3.43 4.13
178 Punjab F. Sahib Talwara 2.46 2.98
179 Punjab F. Sahib Timber Pur-Pz -1.48 -1.69
180 Punjab Fazilka Abohar 1.30 1.05 1.34 1.39
181 Punjab Fazilka Alamgarh 0.73
182 Punjab Fazilka Bannawala 0.07 0.88 0.60 0.81
183 Punjab Fazilka Bazirdpura -1.54 -1.92 -1.47 -2.49
184 Punjab Fazilka Danewal Satkosi 0.22 -1.08 0.04 0.11
185 Punjab Fazilka Dipulana-Pz 1.56 1.55 1.64
186 Punjab Fazilka Jaimal Singhwala Pz 2.11
187 Punjab Fazilka Khuiansarwar- Pz 0.63 0.90 1.04
188 Punjab Fazilka Kundal1 0.45 0.79 1.01 0.60
189 Punjab Fazilka Ladhuwala 0.69
190 Punjab Fazilka Nihalkhera 1.68 1.68
191 Punjab Fazilka Sitoganno -1.46 -1.15
192 Punjab Fazilka Sohangarh Ratte 0.39 0.32 0.57
193 Punjab Fazilka Swah Wala- Pz 1.71 2.00 1.70
194 Punjab Firozpur Bara Mansur Wala-Pz 2.02 0.71
195 Punjab Firozpur Chamb-Pz 2.16 -0.38
196 Punjab Firozpur Gogiani-Pz 2.79 0.26
197 Punjab Firozpur Jaimal wala-Pz 1.45 0.80 0.46
198 Punjab Firozpur Lauhke Kalan- Pz 1.14 0.02 -1.73 -0.34
199 Punjab Firozpur Lohere Khurd-Pz 1.67 -0.21
200 Punjab Firozpur Mallanwala Khas-Pz 0.93 -1.47
201 Punjab Firozpur Malluwala-Pz 3.37 0.95
202 Punjab Firozpur Malsian-Pz 1.63 2.35
203 Punjab Firozpur Mohre Wala-Pz -0.04 -0.16 0.17 2.44
204 Punjab Firozpur Piyarana 0.23 0.38 0.85 -0.07
205 Punjab Firozpur Rukne Wala-Pz 2.27 0.43 0.47
206 Punjab Firozpur Talwandi Jalle Khan-pz 3.29 0.40
207 Punjab Firozpur Wage Wala-Pz 1.75 2.47
208 Punjab Gurdaspur Bariyar -0.40 0.43
209 Punjab Gurdaspur Batala-Pz -0.10
210 Punjab Gurdaspur Bhagowal 1.20 0.82 1.80

211 Punjab Gurdaspur Bham 2.41
212 Punjab Gurdaspur Bilasbal-Pz -0.66 -0.50
213 Punjab Gurdaspur Chahal Kalan-Pz 0.89 0.71
214 Punjab Gurdaspur Chahgill-Pz -0.25 0.02
215 Punjab Gurdaspur Chone-Pz 1.90 1.60
216 Punjab Gurdaspur Dakoha-Pz 1.67 2.27 1.92 1.57
217 Punjab Gurdaspur Dera Baba Nanak 0.52 0.76 0.21 0.37
218 Punjab Gurdaspur Dhianpur -1.09 0.69 -2.05 -1.57
219 Punjab Gurdaspur Dinanagar 2.07 2.74 -0.42 -1.03
220 Punjab Gurdaspur Dostpur-Pz -0.16
221 Punjab Gurdaspur Galri -0.74 2.15 -0.09 -1.12
222 Punjab Gurdaspur Ghania Ki bangar- Pz -0.81 0.24 -0.07
223 Punjab Gurdaspur Ghumani Khurd-Pz -0.56 0.07
224 Punjab Gurdaspur Gurdaspur-Pz 0.43 0.17
225 Punjab Gurdaspur Harchowal-Pz-S 1.30 0.81 0.17
226 Punjab Gurdaspur Hargobindpur1 8.28 2.54 1.68
227 Punjab Gurdaspur Hassanpur Kalan-Pz 0.01 -0.03
228 Punjab Gurdaspur Jhabkra -1.72 -0.15
229 Punjab Gurdaspur Jhandalbana-Pz -0.85 -0.59
230 Punjab Gurdaspur Kala Afgana-Pz 0.23 0.20
231 Punjab Gurdaspur Kalanaur-DW 0.05 1.79 1.65
232 Punjab Gurdaspur Kalanaur-Pz -0.82 2.25 -1.28 3.79
233 Punjab Gurdaspur Kalerkalan-Pz -0.28
234 Punjab Gurdaspur Kaure-Pz -0.16 0.04
235 Punjab Gurdaspur Khan Fatta-Pz -0.65 3.86
236 Punjab Gurdaspur Khanmalik-Pz -0.78 -0.05
237 Punjab Gurdaspur Khatgarh-Pz -0.53 0.04
238 Punjab Gurdaspur Lakankala-Pz 0.44 0.60
239 Punjab Gurdaspur Langurwal-Pz 0.25 0.98
240 Punjab Gurdaspur Madipur Fatehgarhchuria
1.46 1.20 1.47 1.03
241 Punjab Gurdaspur Malikpur-Pz -0.62 -0.00
242 Punjab Gurdaspur Maman-Pz 0.06 0.58
243 Punjab Gurdaspur Masana-Pz -1.17 -1.07
244 Punjab Gurdaspur Massit-Pz -0.63 -0.28
245 Punjab Gurdaspur Mirza Jaan-Pz 1.20
246 Punjab Gurdaspur Mullowali 1(vs) 0.33 0.45
248 Punjab Gurdaspur Nangal-Pz -0.62 0.67 -0.39
249 Punjab Gurdaspur Nishayara 1.76 3.14 1.33 0.98
250 Punjab Gurdaspur Pandoritalab -0.29 1.74 -0.29 -0.48
251 Punjab Gurdaspur Parcha-Pz -0.23 -0.19
252 Punjab Gurdaspur Patti Atwal-Pz 0.62 0.54
253 Punjab Gurdaspur Quadian 07 1.45

254 Punjab Gurdaspur Raipur -1.58 -0.33
255 Punjab Gurdaspur Saidowal Kalan-DW -0.36 1.99 -0.20 -1.34
256 Punjab Gurdaspur Saleh Chak-S 0.66 1.42 0.64 0.13
257 Punjab Gurdaspur Salehchak(vs) 0.20 1.91 0.64
258 Punjab Gurdaspur Sathial-Pz -0.48
259 Punjab Gurdaspur Shahpur Jattan-Pz -0.22
260 Punjab Gurdaspur Shahpur-Pz 0.44 0.56
261 Punjab Gurdaspur Shezada Kalan-Pz 3.57 1.73
262 Punjab Gurdaspur Sohal -0.80 -0.20
263 Punjab Gurdaspur Tikriwala-Pz 0.88 1.06
264 Punjab Hoshiarpur Aallo Batti-Pz -1.75
265 Punjab Hoshiarpur Adowal Garhi-Pz -0.75
266 Punjab Hoshiarpur Argowal-Pz 3.20
267 Punjab Hoshiarpur Barota-PZ -1.90
268 Punjab Hoshiarpur Bersa 0.10
269 Punjab Hoshiarpur Bhamnaur -4.95 -3.52
270 Punjab Hoshiarpur Bhangala-Chhota-DW -0.26 0.98
271 Punjab Hoshiarpur Bhanowal-Pz 3.12
272 Punjab Hoshiarpur Bhatolian-Pz 6.67
273 Punjab Hoshiarpur Boring-PZ 1.00
274 Punjab Hoshiarpur Chak Sheru-DW -0.12 -0.07 -0.39 1.06
275 Punjab Hoshiarpur Chohal -1.96 -0.70
276 Punjab Hoshiarpur DAGAN-DW 1.03 -0.07 -0.15 3.10
277 Punjab Hoshiarpur Dallewal-Pz 3.47 -0.85
278 Punjab Hoshiarpur Dasuya2 (s) 0.52 2.45 0.83 0.48
279 Punjab Hoshiarpur Dharampur1 0.71 0.23
280 Punjab Hoshiarpur Durimiwal 1.63 1.23 0.69 1.04
281 Punjab Hoshiarpur Garh Di Wala-Pz 2.58 3.67 5.67 2.76
282 Punjab Hoshiarpur Garhshankar (s) 5.40 3.19 2.07
283 Punjab Hoshiarpur Haler Rampur-DW 0.45 0.09 -0.43 0.40
284 Punjab Hoshiarpur Hazipur 0.08 -0.73
285 Punjab Hoshiarpur Heer Beh-PZ -0.80
286 Punjab Hoshiarpur Mahilpur-Pz -0.08 -0.85 -0.79 -0.34
287 Punjab Hoshiarpur Mukerian Dw -0.66 1.20 -1.90
288 Punjab Hoshiarpur Naharpur-Pz -0.32
289 Punjab Hoshiarpur Nangal Bihala- DW -0.23 -0.64 -1.46 -1.31
290 Punjab Hoshiarpur Nangal Thathal-Pz 2.77
291 Punjab Hoshiarpur Pan Khuh-DW 0.02 -0.09 0.39 0.82
292 Punjab Hoshiarpur Phuglana- Pz -3.29 -0.70 -2.97
293 Punjab Hoshiarpur Rampur Colony (HSP) pz-medium
2.57
-0.40
294 Punjab Hoshiarpur Samraj Tanda-DW -0.23 -0.09 -0.01
295 Punjab Hoshiarpur Sham Chaurasi 0.92 2.23 -0.03 0.02

296 Punjab Hoshiarpur Sibo Chak- DW 0.00 -1.37 -0.27 -3.55
297 Punjab Hoshiarpur Simbli- OW 0.22 0.03 -3.00
298 Punjab Hoshiarpur Simbli-Pz -0.20 -0.14 -0.70 -4.84
299 Punjab Hoshiarpur Talwara1 -0.49 -0.53 -0.62 -0.71
300 Punjab Hoshiarpur Thakarwala -3.02 -3.81 -4.07 -4.79
301 Punjab Jalandhar Adampur 3(s) -0.76 -0.22 0.17 0.22
302 Punjab Jalandhar Allawalpur -0.28 -1.26 -1.37 -1.86
303 Punjab Jalandhar Gohiran 5.67
304 Punjab Jalandhar Jalandhar-Pz(VS) 5.05 0.15 4.90
305 Punjab Jalandhar Jalbhe -0.95 -3.43 -2.97 -3.23
306 Punjab Jalandhar Jandiala-Pz 2.00 3.34 3.43 3.53
307 Punjab Jalandhar Kartarpur 2(s) 4.47 2.96 2.55 2.99
308 Punjab Jalandhar Kharal Kalan Pz-S 0.72 4.16 -4.40 1.12
309 Punjab Jalandhar Lallian kalan Pz-S 4.76 5.29
310 Punjab Jalandhar Nakodar 2(m) 4.04
311 Punjab Jalandhar Phillaur 2(s) 0.50 1.46 0.96
312 Punjab Jalandhar Shahkot(s) -1.33
313 Punjab Kapurthala Bhatnura Khurd- S 0.24 1.89 1.50 1.64
314 Punjab Kapurthala Bholath M 0.30 1.75 0.62
315 Punjab Kapurthala Bholath S -0.12 1.93 0.55 1.33
316 Punjab Kapurthala Dalla 5.87
317 Punjab Kapurthala Hussainpura-S Pz -0.14 1.62 1.97 1.50
318 Punjab Kapurthala Hussainpura-VS Pz 2.35 3.44
319 Punjab Kapurthala Kapurthala2 (s) 1.03 1.85
320 Punjab Kapurthala Phagwara(shallow) 1.90 0.84 2.53 2.59
321 Punjab Kapurthala Sultanpur2 (s) 4.16 4.14 1.78
322 Punjab Kapurthala Talwandi Chaudary -Pz 0.84 2.03 0.91 0.53
323 Punjab Ludhiana Alamgir-Pz 1.59 1.87
324 Punjab Ludhiana Aliwal-Pz 1.29 0.93
325 Punjab Ludhiana Begowal 0.47 0.02 -0.01 0.76
326 Punjab Ludhiana Bhagwanpur-Pz 0.02 -0.28
327 Punjab Ludhiana Bhahlolpur-DW 0.46 -0.87 0.01 0.02
328 Punjab Ludhiana Bharthala Randhawa-Pz 2.06
329 Punjab Ludhiana Bhikhi Khatron-Pz 1.44
330 Punjab Ludhiana Bilaspur-Pz 0.63
331 Punjab Ludhiana Chaminala-Pz 2.28
332 Punjab Ludhiana Chankian Khurd-Pz 0.17
333 Punjab Ludhiana Chaunta-Pz -0.21
334 Punjab Ludhiana Chhapar-Pz 1.63
335 Punjab Ludhiana Chattar Singh Park-ldh 5.33
336 Punjab Ludhiana Dodpur-Pz 1.50 0.68
337 Punjab Ludhiana Doraha-Pz 0.44 -0.06

338 Punjab Ludhiana Galibkalan-Pz 3.72 -5.39
339 Punjab Ludhiana Gohaur-Pz 1.96
340 Punjab Ludhiana Gopalpur 2(s) 3.23 4.43 3.41 3.25
341 Punjab Ludhiana Hallawara-Pz-S -0.76 0.02
342 Punjab Ludhiana Hambowal-Pz -0.08 -1.17
343 Punjab Ludhiana Harnampur 3.06 1.25
344 Punjab Ludhiana Hedon-Pz 0.28 -0.99
345 Punjab Ludhiana Ikloha-Pz 2.71 2.08 2.64 2.24
347 Punjab Ludhiana Kalsian 5.48 7.00
348 Punjab Ludhiana Katanikalan-Pz 0.12 -0.23
349 Punjab Ludhiana Khandur 3.01 4.23
350 Punjab Ludhiana Kishangarh-Pz 1.32 0.35
351 Punjab Ludhiana Kishanpur-Pz 1.89 1.72
352 Punjab Ludhiana Lalan1 -0.16 0.49
353 Punjab Ludhiana Lil- II Pz 4.23 5.72 3.88 1.87
354 Punjab Ludhiana Lil-Pz III 0.93
355 Punjab Ludhiana Lodhiwal-Pz 1.70 1.49
356 Punjab Ludhiana Lohara-Pz 2.43 2.42
357 Punjab Ludhiana Maksudra-Pz 0.18 -0.13
358 Punjab Ludhiana Manak Majra-Pz 1.46 0.88
359 Punjab Ludhiana Mangat-Pz 0.07 -1.14
360 Punjab Ludhiana Mangat-Pz-S -1.11
361 Punjab Ludhiana Mehma Singh Wala-Pz 1.92 1.95
362 Punjab Ludhiana Mushkabad 0.73 -1.77 -0.63 -0.48
363 Punjab Ludhiana Nurpur-Pz 2.65 4.10
364 Punjab Ludhiana P.A.U.Ludhiana 2(s) 6.02 1.84 5.89 5.91
365 Punjab Ludhiana Pabbian-Pz 2.10 3.29
366 Punjab Ludhiana Pandori-Pz 1.50 2.23
367 Punjab Ludhiana Payal-Pz -7.06 0.05
368 Punjab Ludhiana Punjeta -0.15 2.45
369 Punjab Ludhiana Ragba-Pz 1.49 1.88
370 Punjab Ludhiana Raikot-Pz 3.39 4.00
371 Punjab Ludhiana Rajona Khurd 4.22 6.33
372 Punjab Ludhiana Rashin 4.75 5.08
373 Punjab Ludhiana Rattewal-Pz 2.21 3.37
374 Punjab Ludhiana Sajaywal-Pz 3.39 3.39
375 Punjab Ludhiana Samrala 2(s) 1.58 1.51 0.55 0.36
376 Punjab Ludhiana Sanewal-Pz 1.18 0.89
377 Punjab Ludhiana Sangatpura-Pz -0.18 -1.48
378 Punjab Ludhiana Sherian -0.37 -1.97 -0.61 0.83
379 Punjab Ludhiana Sidhwan Bet-Pz 1.53 2.11 2.06 2.80
380 Punjab Ludhiana Talwandi Kalan-Pz 1.51 2.81

381 Punjab Ludhiana Udonwal-Pz 0.30 -0.60
382 Punjab Ludhiana Upplan -0.21 -0.72
383 Punjab Mansa Bhikhi 1 (s) 0.14 2.22 2.32 0.52
384 Punjab Mansa Budhlada 1.05 5.67 4.41
385 Punjab Mansa Budhlada-Pz 2.98 3.84
386 Punjab Mansa Burj Bhalaike 0.23 -2.28 1.03 0.43
387 Punjab Mansa Fattamaluka 0.53 0.99 1.18 1.24
388 Punjab Mansa Jhanda Khurd Pz 2.05
389 Punjab Mansa Kot Dhamru 1.57 4.76 -3.79
390 Punjab Mansa Kotra 3.59
391 Punjab Mansa Raipur-Pz 0.26 -0.53 -0.05 -0.15
392 Punjab Mansa Ralla 4.12 4.81 4.91 5.95
393 Punjab Moga Baje Ke-Pz 1.46 3.18 4.21 1.36
394 Punjab Moga Budh Singh Wala-Pz 4.06 4.42 4.88 5.44
395 Punjab Moga Chogawan-Pz 3.51 5.77 2.90 3.21
396 Punjab Moga Dagru- Pz 3.44 3.39 2.63 3.92
397 Punjab Moga Damru Khurd 5.85
398 Punjab Moga Dhudi Ke-PZ 3.22
399 Punjab Moga Jhandewala-Pz 6.37 7.05
400 Punjab Moga Kamalke-Pz 3.15 3.15
401 Punjab Moga Khokri Kalan-Pz 4.06 4.85
402 Punjab Moga Khosa Randhir-Pz 2.00 1.90
403 Punjab Moga Mandar-Pz 4.33 3.55
404 Punjab Moga Mangewala-Pz 2.78 3.24
405 Punjab Moga Mehron-PZ 3.21 4.60
406 Punjab Moga Nihalsinghwala-Pz 4.39 6.14 4.70 2.63
407 Punjab Moga Tota Singh Wala-Pz 1.60 0.83
408 Punjab Muktsar Balocha Khera(rasoolpur)
-0.19 -0.09 1.13 0.06
409 Punjab Muktsar Bhaliana 2.20 2.24 2.61
410 Punjab Muktsar Dahak-S 0.70
411 Punjab Muktsar Doda 0.90 0.71 -0.13 -0.54
412 Punjab Muktsar Doda-Pz 1.18 -0.30 0.08 -0.21
413 Punjab Muktsar Kabar Wala 0.82 1.85 1.21 1.05
414 Punjab Muktsar Khunde Halal-Pz -0.09 -0.54 0.50 0.43
415 Punjab Muktsar Labanianwali 0.41 0.32 0.03 -0.14
416 Punjab Muktsar Lambi -1.10 0.47 -0.66
417 Punjab Muktsar Lambi-Pz -0.04 -0.40 -1.69 -1.66
418 Punjab Muktsar Muktsar 0.56 0.65 0.72 0.62
419 Punjab Pathankot Bamyal -0.60 1.81 -0.05 -0.91
420 Punjab Pathankot Bhoa -1.02 1.00 -0.38 -0.42
421 Punjab Pathankot Dhar Khurd -0.50
422 Punjab Pathankot Gharotakalan 0.77 2.35 -0.38 1.16

423 Punjab Pathankot Ghoh DW -6.96 -4.68
424 Punjab Pathankot Jainpur-PZ -0.70 -0.37
425 Punjab Pathankot Jandwala 0.25 -1.64
426 Punjab Pathankot Jhakolahri 1.31 -0.59 -0.54
427 Punjab Pathankot Khanikhui -0.34 1.23 -0.41 -0.27
428 Punjab Pathankot Khogaki Chaka-PZ -1.07 -0.08
429 Punjab Pathankot Kiari- DW -0.51 2.29 -0.58 -3.34
430 Punjab Pathankot Kirian Khurd-PZ -1.07 0.12
431 Punjab Pathankot Kui-DW -0.17 1.39 -0.54 -1.99
432 Punjab Pathankot Kuther-PZ -3.93 -5.42
433 Punjab Pathankot Malikpur 0.00
434 Punjab Pathankot Matti-PZ -0.80 -1.13
435 Punjab Pathankot Mirthal -0.54 -1.57
436 Punjab Pathankot Narot Jaimalsingh-Pz -0.03 0.51
437 Punjab Pathankot Nawan Pind -0.23 3.02 0.44 -0.43
438 Punjab Pathankot Parmota-DW -2.34 3.81 -2.51
439 Punjab Pathankot Pathankot1 -0.71 0.97 -0.53 -1.54
440 Punjab Pathankot Philora-PZ -0.73 -0.73
441 Punjab Pathankot Phulpiara 0.37
442 Punjab Pathankot Rani Pur-PZ -3.43 -3.03
443 Punjab Pathankot Sarna -1.00 0.32 0.06
444 Punjab Pathankot Sujanpur-PZ -0.95 -0.53
445 Punjab Patiala Bassma Pipla 1.25 0.08
446 Punjab Patiala Bhankhar-Pz 3.39 6.16
447 Punjab Patiala Bhojo majri 07pz 1.01
448 Punjab Patiala Bhora-Pz 5.06
449 Punjab Patiala Bhunerheri-Pz 5.79
450 Punjab Patiala Birkauli 1.57
451 Punjab Patiala Challeta-PZ 0.05
452 Punjab Patiala Devigarh 6.48 -0.34
453 Punjab Patiala Devigarh 1Pz 7.08 6.60 6.10
454 Punjab Patiala Devigarh IIPz 7.26 6.66 -2.56
455 Punjab Patiala Devigarh-III Pz 7.46 6.46
456 Punjab Patiala Dhaneta-PZ 1.62
457 Punjab Patiala Gharam-PZ 3.87 5.72
458 Punjab Patiala Gulwatti-PZ 1.90 2.57
459 Punjab Patiala Haluka 2.03 1.09
461 Punjab Patiala Hari Majra -1.83 -3.77 -4.83
462 Punjab Patiala Jainagar-PZ -1.38 0.53
463 Punjab Patiala Kalyan 07pz 4.21 3.74 4.30 -0.34
464 Punjab Patiala Kami Kalan -2.08 -3.15 -2.61 -1.66
465 Punjab Patiala Kami Khurd-PZ -3.73 -0.53

466 Punjab Patiala Kheri Pandte-PZ -2.27 4.55
467 Punjab Patiala Kulburcha-Pz 6.17 7.48
468 Punjab Patiala Kutha Kheri-Pz 2.32 5.44
469 Punjab Patiala Lacharu Kalan -1.22 -0.53 -0.77 -0.93
470 Punjab Patiala Lachkani-Pz 2.80 3.75 3.24 2.94
471 Punjab Patiala Mehmood Pur-PZ 1.55 2.63
472 Punjab Patiala Mongowal-PZ 0.80 1.45
473 Punjab Patiala Nanhera-Pz 9.69 1.10
474 Punjab Patiala Nariana -0.74
475 Punjab Patiala Passiana-PZ 1.67 1.27
476 Punjab Patiala Patran-Pz 5.23 5.89 6.09 4.93
477 Punjab Patiala Rajgarh 0.15
479 Punjab Patiala Ramgarh 2.55
480 Punjab Patiala Rajpura-PzSt 2.55 -2.56 -0.75
481 Punjab Patiala Rakhra-Pz 5.07
482 Punjab Patiala Randhawa-Pz 9.21
483 Punjab Patiala Rasoolpur Jaura-PZ 0.33 1.07
484 Punjab Patiala Samana-Pz 5.15 4.82 5.34 6.37
485 Punjab Patiala Samaspur-Pz 2.55 2.81
486 Punjab Patiala Sangatpura-Pz 3.41 2.05 1.42 3.84
487 Punjab Patiala Sauja-PZ 1.23 0.77
488 Punjab Patiala Surala Kalan-PZ -0.58
489 Punjab Patiala Thua 1.52
490 Punjab Rupnagar Ahmedpur 1.28 -0.83 -0.65 0.01
491 Punjab Rupnagar Amrali-PZ 0.53 1.13
492 Punjab Rupnagar Attari-PZ -1.42 -1.40
493 Punjab Rupnagar Bera Chauta -0.70 -0.87 -0.95
494 Punjab Rupnagar Bhalan -1.64 0.89 1.08
495 Punjab Rupnagar Bhatto-PZ -1.08 -1.03
496 Punjab Rupnagar Braham Pur -0.41 -0.10 -0.45 -0.25
497 Punjab Rupnagar Chakdera 0.44 0.64 -0.33 0.96
498 Punjab Rupnagar Chatamli- Pz 1.49 3.19 -0.93 1.24
499 Punjab Rupnagar Dhair -0.85 -1.20 0.04 0.07
500 Punjab Rupnagar Dumewal 1.02 2.37 -0.25 -1.68
501 Punjab Rupnagar Hardinamoh 4.15 -0.19 -0.13 -0.56
502 Punjab Rupnagar Kakrali -0.65 -1.04 0.77 -0.98
503 Punjab Rupnagar Klwan-PZ -0.70 -0.33
504 Punjab Rupnagar Kotla -0.21 -0.33
505 Punjab Rupnagar Morinda-PZ -0.32 -0.02
506 Punjab Rupnagar Rajgiri-PZ 0.40 -0.70
507 Punjab Rupnagar Rurki Heeran-Pz 0.76
508 Punjab Sangrur Bagarian-Pz 4.41 2.82 2.92

509 Punjab Sangrur Bakshiwala-PZ 2.15 3.25
510 Punjab Sangrur Banbhaura-PZ 2.42 2.80
511 Punjab Sangrur Benra-PZ-S -1.82 2.20
512 Punjab Sangrur Bhojowali-Pz 5.12 4.36 4.34 4.85
513 Punjab Sangrur Bugra 1 5.92 7.44 -2.47
514 Punjab Sangrur Chatha Nanhera-PZ 1.35 2.40
515 Punjab Sangrur Chural Kalan M 7.41 7.38 7.58
516 Punjab Sangrur Dharamgarh-Pz 8.05 8.79
517 Punjab Sangrur Ghanauri Kalan-Pz 3.09 3.51
518 Punjab Sangrur Haryao-DW 9.77 9.37
519 Punjab Sangrur Hassanpur-Pz 6.44
520 Punjab Sangrur Khanpur Fakiran-PZ 4.03 4.13
521 Punjab Sangrur Kheri Naran-PZ 2.20 3.22
522 Punjab Sangrur Khurni-PZ 1.77 3.28
523 Punjab Sangrur Kila Hakima 3.23 4.93
524 Punjab Sangrur Kokahar-PZ 1.57
525 Punjab Sangrur Kuler Khurd-Pz 5.87 7.32
526 Punjab Sangrur Ladda-Pz 6.42 6.26 6.74
528 Punjab Sangrur Longowal-Pz 5.99 6.85 6.27 6.96
529 Punjab Sangrur Majji-PZ 7.44 0.88 1.43
530 Punjab Sangrur Malerkotla-DW 6.47 6.98 5.22
531 Punjab Sangrur Manvi-Pz 2.01 1.30 3.82
532 Punjab Sangrur Minsa-Pz 6.29
533 Punjab Sangrur Panjgaraian- Pz 6.56 6.97
534 Punjab Sangrur Rajo Majra-PZ 2.32 2.77
535 Punjab Sangrur Rampur Channa-Pz 5.25 4.98
536 Punjab Sangrur Rurgarh-PZ 2.17 2.53
537 Punjab Sangrur Rurki Kalan-Pz 4.78 3.86
538 Punjab Sangrur Sekhpur Khurd-PZ 1.13 1.47
539 Punjab Sangrur Sekhwas-PZ 2.55 3.58
540 Punjab Sangrur Sikandarpur-PZ 1.57 2.00
541 Punjab Sangrur Sunam-Pz 4.23 4.94 5.98
542 Punjab SAS Nagar Antala 0.12 0.70 -0.29 -0.98
543 Punjab SAS Nagar Balongi-PZ 1.88 -1.92
544 Punjab SAS Nagar Barauli-PZ -1.12
545 Punjab SAS Nagar Chandiala-Pz -0.62 4.40
546 Punjab SAS Nagar Dera Bassi 07pz -0.06 -0.41 -0.33 -0.46
547 Punjab SAS Nagar Dheri 0.18 1.11 0.56 0.99
548 Punjab SAS Nagar Gharoon -3.25 -4.74
549 Punjab SAS Nagar Ghoga -0.44 -2.85 -0.69 -0.69
550 Punjab SAS Nagar Gholu majra 07pz 0.43
551 Punjab SAS Nagar Issapur- DW -1.03

552 Punjab SAS Nagar Joli -1.08 -0.85 -0.44 -1.14
553 Punjab SAS Nagar Kurrha-Pz 3.16 2.65
554 Punjab SAS Nagar Landran-Pz -0.54 0.34 1.87
555 Punjab SAS Nagar Malkpur-Pz 1.44 5.67
556 Punjab SAS Nagar Manoli-PZ 0.98 0.65
557 Punjab SAS Nagar Palheri-PZ -2.05 0.23
558 Punjab SAS Nagar Pedol-PZ 0.97 0.60
559 Punjab SAS Nagar Raipur Kalan -0.34 0.01
560 Punjab SAS Nagar Singhpura-Pz 8.15
561 Punjab SAS Nagar Sirsini 0.22 -0.33 -0.03 -0.60
562 Punjab SAS Nagar Sohana-PZ 0.20
563 Punjab SBS Nagar Bahlora Kallan- Pz -0.17 -0.56 -0.96 -0.66
564 Punjab SBS Nagar Balachore 1.10
565 Punjab SBS Nagar Mauhra-Pz 6.94 0.92 -0.02 -0.94
566 Punjab SBS Nagar Rahon 1.09 1.03 -0.24 0.28
567 Punjab SBS Nagar Raipur Dhaba-Pz 1.82 3.42 1.40 1.57
568 Punjab Taran Taran Aima Khurd-Pz 1.47 1.60
569 Punjab Taran Taran Aminshah Khalra 0.12
570 Punjab Taran Taran Attari-Pz -1.84 -0.06
571 Punjab Taran Taran Bahla-Pz 7.31
572 Punjab Taran Taran Bakipur-Pz 0.53 0.55
573 Punjab Taran Taran Bath-Pz 1.76 0.29
574 Punjab Taran Taran Bhagala-Pz 4.39 3.23
575 Punjab Taran Taran Bhagwanpur-Pz 0.63 1.99
576 Punjab Taran Taran Bhalaipur-Pz -0.09 0.11
577 Punjab Taran Taran Bhankar Kalan-Pz 0.99 0.33
578 Punjab Taran Taran Bhikiwind- Pz 0.96 0.73
579 Punjab Taran Taran Bhura-Pz 1.91 1.89
580 Punjab Taran Taran Bhure-Pz 2.19 1.05
581 Punjab Taran Taran Bhusse-Pz 0.72 0.78
582 Punjab Taran Taran Brahmpur-Pz 0.79 0.16
583 Punjab Taran Taran Chakkare Khan-Pz 1.22 0.92
584 Punjab Taran Taran Chola Sahib-Pz 0.03 0.56
585 Punjab Taran Taran Choudhary Wala-Pz 0.66 1.01
586 Punjab Taran Taran Chuselawad-Pz 2.83 2.57
587 Punjab Taran Taran Ekalgoda-Pz 1.42 1.54
588 Punjab Taran Taran Fatehabad- PZ 1.03 -1.37
589 Punjab Taran Taran Gandi Wind-Pz 2.32
590 Punjab Taran Taran Goindwal 07 -1.37 1.38 0.58 0.32
591 Punjab Taran Taran Jalalabad-PZ -0.90
592 Punjab Taran Taran Jandoke-Pz 0.94 0.28
593 Punjab Taran Taran Kairon-PZ 0.77 1.67
594 Punjab Taran Taran Kalsia Kalan07 1.27 1.88 3.82 -1.41

595 Punjab Taran Taran Khadur Sahib-Pz -0.11 0.76 1.11
596 Punjab Taran Taran Khalra-Pz -0.08 1.38
597 Punjab Taran Taran Kirtowal-Pz -2.70
598 Punjab Taran Taran Kotbudda-Pz -2.62 -1.71
599 Punjab Taran Taran Kotli Sur Singh-Pz -0.07 -0.84
600 Punjab Taran Taran Mahendipur-Pz 1.80 0.30
601 Punjab Taran Taran Marhona-Pz 1.00 0.88
602 Punjab Taran Taran Mari Kamboke-Pz 0.75 3.01
603 Punjab Taran Taran Nandpur-Pz 0.80
604 Punjab Taran Taran Pindan-Pz 0.04 0.24
605 Punjab Taran Taran Rajoke-Pz -0.73 -1.68
606 Punjab Taran Taran Ratoke-Pz 1.06 3.47
607 Punjab Taran Taran Sabran-Pz -0.40 0.78
608 Punjab Taran Taran Sahab Pura- Pz 0.09 2.43 2.39
609 Punjab Taran Taran Sheron-Pz 1.82 0.36
610 Punjab Taran Taran Sugga-Pz 0.69 1.02
611 Punjab Taran Taran Varing-Pz -0.30

Annexure-5: Chemical quality of ground water from shallow aquifers in Punjab and Haryana in June 2020
S.No. District Block Location Source Latitu
de
(DMS)
Longitud
e (DMS)
pH* EC* in
µS/cm
at 250
C
CO3 HC
O3
Cl* SO4 NO3* F* PO4 Ca* Mg* Na K SiO2 TH *as
CaCO3
mg/l
1 Amritsar chogawan Beas DW 31.515 75.3 8.47 523 48 159 35 42 7.6 0.45 <0.10 16 41 45 6.7 20 210
2 Amritsar Jandiala Jandiala Guru HP 31.567 75.033 8.65 652 48 281 28 60 13 0.55 <0.10 12 44 96 8.6 22 210
3 Amritsar Chogawan Mohawa HP 31.567 74.938 8.45 680 24 281 56 10 BDL 0.32 <0.10 16 24 97 11 18 140
4 Amritsar Chogawan Chogawan TW 31.717 74.667 8.70 1215 96 415 90 38 1.0 0.44 <0.10 12 36 220 13 20 180
5 Amritsar Chogawan Bhindi Saidan TW 31.811 74.641 8.82 1390 96 659 28 195 0.1 0.45 <0.10 12 56 315 4.6 22 260
6 Amritsar Ajnlala Ajnala TW 31.846 74.758 8.50 382 36 183 14 58 BDL 0.24 <0.10 16 39 41 5.7 25 200
7 Amritsar Ajnlala Urdhan TW 31.879 74.866 8.45 307 36 159 6.9 32 BDL 0.24 <0.10 16 32 30 4.7 18 170
8 Amritsar Ajnlala Gaggo Mahal TW 31.9 74.667 8.70 957 72 317 49 62 BDL 0.22 <0.10 12 22 180 6.4 22 120
9 Amritsar Ajnlala Ramdas DW 31.967 74.917 8.68 675 60 330 14 BDL BDL 0.55 <0.10 8.0 22 130 2.5 21 110
10 Amritsar Verka Amritsar TW 31.633 74.875 8.38 685 36 195 56 BDL 38 0.28 <0.10 20 27 72 12 25 160
11 Amritsar Tarike Nawan tanel HP 31.667 75.164 8.32 368 12 159 21 7.0 0.3 0.28 <0.10 32 10 28 8.1 21 120
12 Amritsar Raiya Mehta HP 31.667 75.25 8.60 435 72 171 6.9 7.0 BDL 0.55 <0.10 20 27 52 7.0 24 160
13 Barnala Sehna Bahadaur TW 30.475 75.324 8.34 1144 48 537 63 52 20 0.55 <0.10 20 36 220 6.4 22 200
14 Barnala Barnala Barnala TW 30.363 75.525 8.60 1050 84 403 69 30 22 0.42 <0.10 4.0 46 192 6.8 23 200
15 Barnala Mahal Kalan Mahal kalan TW 30.523 75.559 8.75 1032 84 403 76 28 30 1.45 <0.10 12 51 178 11 20 240
16 Bhatinda Talwandi Saboo
Bahman Kor Sing TW 29.909 75.127 9.05 2340 204 439 174 255 60 5.20 <0.10 24 39 480 10 21 220
17 Bhatinda Talwandi Saboo
Gurusar TW 29.993 75.092 8.10 2445 0 98 327 482 400 0.25 <0.10 100 78 335 56 28 570
18 Bhatinda Talwandi Saboo
Jajal TW 29.964 75.033 8.22 2690 0 757 327 242 30 0.76 1.00 92 46 345 150 23 420
19 Bhatinda Talwandi Saboo
Bhagi Bandar TW 30.031 75.067 8.70 1445 84 317 104 360 2.5 1.20 <0.10 40 12 355 6.4 25 150
20 Bhatinda Talwandi Saboo
Kala Bandar TW 30.069 75 8.75 3082 132 513 340 278 280 2.50 0.10 16 73 574 48 21 340
21 Bhatinda Bhatinda Kot Shamir TW 30.113 75.008 8.48 3187 48 195 334 935 2.3 0.80 <0.10 52 61 600 7.6 18 380

22 Bhatinda Bhatinda Dera Dappa HP 30.258 74.936 8.47 369 24 134 14 90 1.8 0.60 <0.10 44 32 10 4.8 23 240
23 Bhatinda Bhatinda Nahianwala TW 30.306 74.91 8.70 965 72 342 63 70 14 9.20 <0.10 24 7.3 230 7.8 25 90
24 Bhatinda Bhatinda Khialiwala TW 30.226 74.982 8.60 2440 60 659 181 468 45 5.60 <0.10 12 10 625 5.7 22 70
25 Bhatinda Nathana Phulla TW 30.28 75.1 9.10 964 156 159 42 125 52 4.10 <0.10 8.0 15 218 61 21 80
26 Bhatinda Nathana Kalyan sukha TW 30.373 75.116 8.54 2110 60 268 195 350 255 1.90 <0.10 12 63 405 6.6 25 290
27 Bhatinda Rampura Phul
Dialpur Mirja TW 30.404 75.134 9.00 2210 276 293 125 340 48 2.20 <0.10 4 36 510 6.0 24 160
28 Bhatinda Bhagta Bhaika
Kothaguru TW 30.434 75.1 8.60 1360 60 183 90 298 22 0.69 <0.10 16 34 240 5.3 28 180
29 Bhatinda Bhagta Bhaika
Dialpur Bhilaika TW 30.396 75.133 8.90 1030 156 366 28 55 18 1.30 <0.10 12 27 215 54 19 140
30 Bhatinda Rampur phul Dhapali TW 30.363 75.242 8.48 325 24 98 21 38 11 0.42 <0.10 8.0 41 40 3.3 18 110
31 Bhatinda Phul Phul TW 30.32 75.07 8.78 1675 108 366 188 150 50 0.55 <0.10 8.0 83 270 5.9 22 360
32 Bhatinda Rampura Badiala TW 30.235 75.348 8.30 1835 24 293 167 462 0.9 0.60 <0.10 32 39 345 10 26 240
33 Bhatinda Rampur phul Rampuraphul TW 30.252 75.235 8.78 2085 144 488 174 235 105 1.10 <0.10 8.0 56 420 44 23 250
34 Bhatinda Maur Maiser Khanna TW 30.106 75.181 8.68 1610 72 366 139 200 95 2.20 <0.10 32 51 255 51 21 290
35 Bhatinda Sangat Sangat Kalan HP 30.091 74.829 8.74 5015 204 476 625 1335 100 1.00 <0.10 8.0 126 1160 21 24 540
36 Bhatinda Sangat Jassi Bhagwali HP 30.068 74.801 8.54 1670 60 220 167 210 208 0.28 <0.10 16 71 260 10 23 330
37 Bhatinda Sangat Ghudda TW 30.128 74.789 8.39 1430 36 171 139 310 177 0.34 <0.10 20 85 170 78 24 400
38 Bhatinda Bhatinda Balluana TW 30.224 74.784 8.90 1960 156 476 250 95 21 0.80 <0.10 8.0 41 250 305 21 190
39 Bhatinda Sangat Raike Kalan 30.131 74.668 8.59 2618 96 122 347 589 136 1.00 <0.10 48 105 380 80 22 550
40 Bhatinda Sangat Phullo Mithi TW 30.098 74.845 8.40 377 36 146 14 BDL 2.6 1.00 <0.10 24 24 20 6.5 19 160
41 Bhatinda Rampura Jhanduke TW 30.164 75.15 8.60 4730 108 635 542 958 183 4.20 <0.10 32 90 895 180 22 450
42 Bhatinda Bhatinda Ablu HP 30.339 74.79 8.19 800 48 61 76 170 19 0.35 <0.10 24 34 90 32 21 200
43 Bhatinda Bhatinda Ganga TW 30.362 74.835 8.38 577 36 85 49 110 6.78 0.30 <0.10 28 34 48 6.7 26 210
44 Faridkot Ferozepur Mumaru TW 30.793 74.59 8.85 2233 120 439 153 370 24 0.50 <0.10 16 34 460 4.8 24 180
45 Faridkot Faridkot Killi TW 30.786 74.546 8.90 4155 216 830 299 680 184 2.00 <0.10 20 51 843 180 25 260
46 Faridkot Kotkapura Deepsingwala HP 30.739 74.479 8.72 1040 72 317 35 112 15 0.90 <0.10 12 17 210 3.8 22 100
47 Faridkot Faridkot Jand Sahib TW 30.69 74.527 8.74 2735 108 391 257 558 33 0.85 <0.10 16 36 580 18 21 190
48 Faridkot Faridkot Sadiq HP 30.708 74.656 8.67 3410 84 342 417 818 0.2 0.50 <0.10 16 29 780 7.1 26 160
49 Faridkot Faridkot Mehmunna Sadiq HP 30.707 74.59 8.40 1025 36 122 111 230 21 0.45 <0.10 36 41 142 7.3 24 260
50 Faridkot Faridkot Sher Singhwala HP 30.671 74.623 8.15 4915 0 122 820 1402 16 0.10 <0.10 112 148 845 14 22 891

51 Faridkot Faridkot Sukhanwala TW 30.646 74.639 8.10 4820 0 183 827 1220 70 0.21 <0.10 108 143 813 18 26 861
52 Faridkot Faridkot NawanKilia HP 30.648 74.695 8.15 6970 0 256 1091 2070 214 1.10 <0.10 120 180 1380 35 24 1041
53 Faridkot Faridkot Tehna TW 30.69 74.791 8.80 1880 144 207 146 325 13 1.20 <0.10 16 32 365 8.2 22 170
54 Faridkot Faridkot Chand Baja TW 30.739 74.862 8.90 1850 132 403 118 190 95 3.00 <0.10 8.0 56 340 8.9 25 250
55 Faridkot Kotkapura Beed Sikhanwala HP 30.608 74.866 8.55 1790 60 281 125 345 90 1.40 <0.10 28 63 275 13 21 330
56 Faridkot Kotkapura Nagal TW 30.666 74.859 8.75 1305 96 281 69 170 34 0.48 <0.10 12 49 210 8 23 230
57 Faridkot Kotkapura Daviwala HP 30.612 74.871 8.80 2700 204 561 195 340 21 1.90 <0.10 8.0 68 522 15 22 300
58 Faridkot Kotkapura Dhilwan Kalan TW 30.571 74.867 8.85 2025 60 378 153 420 19 1.50 <0.10 24 36 365 68 24 210
59 Faridkot Kotkapura Baja Khana DW 30.455 74.977 9.05 3320 252 549 208 618 30 1.40 <0.10 4.0 46 745 19 22 200
60 Faridkot Kotkapura Matta TW 30.481 74.838 8.80 1712 120 354 215 120 48 1.40 <0.10 20 85 215 73 21 400
61 Faridkot Kotkapura Kot Kapura HP 30.583 74.833 8.70 4395 108 647 320 942 125 1.70 <0.10 16 61 890 17 24 290
62 Faridkot Kotkapura Wara Daraka TW 30.552 74.754 8.78 360 120 439 382 832 26 0.80 <0.10 12 36 830 7.3 19 180
63 Faridkot Kotkapura Karir Wali TW 30.406 74.828 8.75 4750 132 549 466 1292 75 2.80 <0.10 20 66 1080 56 22 320
64 Faridkot Kotkapura Dal Singhwala TW 30.466 74.932 8.32 1555 48 207 139 320 17 0.50 <0.10 20 39 285 6.6 25 210
65 Fatehgarh Sahib
Chunni Kalan Chunni Kalan TW 30.715 76.494 8.12 542 0 391 14 20 BDL 1.00 <0.10 28 44 50 6.1 20 250
66 Fatehgarh
Sahib Khera Pawala TW 30.634 76.61 8.85 1942 120 683 104 190 26 0.65 <0.10 12 39 210 380 22 190
67 Fatehgarh
Sahib Khera Bhangrana HP 30.611 76.578 8.65 910 84 330 83 35 0.5 0.30 <0.10 12 71 110 6.3 18 320
68 Fatehgarh
Sahib Khera Badli Ala singh HP 30.642 76.517 8.65 632 60 305 14 BDL 8.0 0.35 <0.10 12 29 100 9.8 21 150
69 Fatehgarh
Sahib Bassi pathana
Bhateri 30.7 76.538 8.45 680 36 256 76 10 0.4 0.25 <0.10 28 44 60 9.5 20 250
70 Fatehgarh
Sahib Bassi Pathana
Bassi Pathana HP 30.713 76.378 8.50 830 60 171 90 5.0 60 0.30 <0.10 20 39 93 9.8 19 210
71 Fatehgarh
Sahib Bassi pathana
Fatehgarh Sahib 30.65 76.4 8.60 1020 48 342 56 82 65 0.35 <0.10 12 34 83 181 18 170
72 Fatehgarh
Sahib Sarhind Innayatpur HP 30.648 76.39 8.75 680 60 342 28 BDL 2.6 0.28 <0.10 12 24 127 14 16 130
73 Fatehgarh
Sahib Sirhind Nalini HP 30.5 76.425 8.50 617 24 256 28 20 28 0.17 <0.10 16 24 85 9.4 18 140
74 Fatehgarh
Sahib Sirhind Bhaddal Thuha HP 30.591 76.233 8.45 575 36 268 28 5.0 28 0.23 <0.10 20 24 86 8.8 20 150
75 Fatehgarh
Sahib Amloh Amloh TW 30.605 76.263 8.25 740 0 207 49 82 120 0.25 <0.10 36 34 84 9.2 16 230
76 Fazilka Jalalabad Sohangarh DW 30.601 74.389 8.60 6970 96 464 813 2059 120 2.20 <0.10 32 97 1550 64 29 480
77 Fazilka Abohar Kundal HP 30.215 74.269 7.95 3870 0 85 778 752 187 0.15 <0.10 265 75 480 72 19 971

78 Fazilka Abohar Abohar HP 30.148 74.192 8.05 8375 0 244 1417 2310 260 0.44 <0.10 100 163 1775 36 25 921
79 Fazilka Khuiyan Serovar
Almgarh HP 30.127 74.158 8.49 3030 72 317 507 350 180 0.34 <0.10 12 117 330 300 21 510
80 Fazilka Khuiyan Serovar
Khuyansarwar HP 30.113 74.078 8.20 5220 0 330 771 1500 45 0.58 <0.10 60 175 950 25 26 871
81 Fazilka Khuiyan Serovar
Danewal Satkosi TW 30.199 74.038 8.05 2804 0 232 375 585 214 0.52 <0.10 68 109 375 59 29 620
82 Fazilka Abohar Sitogano TW 30.038 74.346 8.54 1050 36 244 83 235 50 0.72 <0.10 28 88 96 21 20 430
83 Fazilka Abohar Bazipur Bhoma TW 29.958 74.383 8.37 450 36 122 42 35 7.6 0.57 <0.10 24 32 30 7.3 22 190
84 Fazilka Khuiyan Serovar
Nihal Khera HP 30.238 74.138 7.85 1175 0 415 90 178 21 0.98 <0.10 4.0 92 104 44 24 390
85 Fazilka Fazilka Kauranwali TW 30.383 74.056 7.85 3175 0 354 257 1220 31 0.60 <0.10 84 207 400 16 21 1061
86 Fazilka Abohar Dhaban Kokaryan TW 30.122 74.327 8.25 1952 0 268 208 470 115 0.32 <0.10 52 97 175 150 25 530
87 Fazilka Fazilka Theh Kalandar HP 30.471 74.093 8.80 1580 84 586 63 200 20 0.55 <0.10 8.0 41 340 6.7 24 190
88 Fazilka Fazilka Deepulana TW 30.453 74.099 8.75 1482 108 354 69 189 90 0.60 <0.10 16 34 275 51 21 180
89 Fazilka Jalalabad Swahwala TW 30.628 74.31 8.85 2212 192 622 83 158 60 2.60 <0.10 4.0 10 508 13 23 50
90 Fazilka Jalalabad Mottiwala TW 30.706 74.36 8.72 870 96 268 35 64 14 0.32 <0.10 8.0 44 136 11 22 200
91 Fazilka Jalalabad Noore ke Uttar TW 30.683 74.283 8.80 875 84 330 21 44 2.2 0.36 <0.10 8.0 56 105 9.3 24 250
92 Firozpur Jalalabad Ladhewala HP 30.532 74.386 8.30 1162 24 220 90 207 26 0.46 <0.10 32 46 140 11 25 270
93 Firozpur Ferozepur Moharewala TW 30.857 74.578 9.00 1900 192 696 56 70 11 1.80 0.80 4.0 4.9 470 2.6 23 30
94 Firozpur Mamdot Malsian HP 30.817 74.381 8.60 582 60 146 14 120 2.0 0.45 <0.10 16 56 42 5.8 24 270
95 Firozpur Mamdot Sham Singhwala HP 30.808 74.483 8.80 912 84 281 35 28 22 1.00 <0.10 16 36 125 5.3 21 190
96 Firozpur Makhu Lauke Kalan TW 31.063 74.846 8.70 782 96 207 28 90 15 0.30 <0.10 8.0 68 80 7.8 21 300
97 Firozpur Firozpur Jhokharihar TW 30.862 74.611 8.68 912 60 305 35 128 34 0.95 <0.10 24 17 197 6.1 26 130
98 Firozpur Gahll Khurd Piyarana TW 30.856 74.667 8.90 1195 120 488 35 50 23 0.65 <0.10 12 29 260 5.5 24 150
99 Firozpur Ferozepur Jaimal Singh Wala TW 30.058 74.342 8.60 566 84 134 14 50 BDL 0.25 <0.10 24 29 65 4.6 23 180
100 Firozpur Makhu Gattah Badsha TW 31.122 74.901 8.80 1775 120 378 118 257 26 0.55 0.10 12 44 345 7.0 22 210
101 Gurdaspur Dera Baba Nanak
Dera Baba Nanak TW 32.013 75.033 8.35 288 36 159 6.9 48 BDL 0.23 <0.10 16 34 34 2.9 20 180
102 Gurdaspur Dera Baba Nanak
Mullanwali TW 31.992 75.008 8.42 338 48 146 6.9 8.0 6.2 0.70 <0.10 20 12 58 3.3 23 100
103 Gurdaspur Dera Baba Nanak
Haruwal TW 31.916 74.908 8.65 1082 60 293 42 170 0.9 0.15 <0.10 12 29 190 16 20 150
104 Gurdaspur Gurdaspur Saleh Chak TW 32.05 75.183 8.80 1125 48 622 21 22 0.4 0.35 <0.10 12 17 250 3.8 22 100

105 Gurdaspur Gurdaspur Kalanaur TW 32.017 75.133 8.40 239 24 146 6.9 5 BDL 0.18 <0.10 16 15 34 3.1 21 100
106 Gurdaspur Dera Baba Nanak
Dhianpur HP 31.925 75.081 8.28 740 0 195 69 42 85 0.22 <0.10 24 36 76 2.8 20 210
107 Gurdaspur Batala (FG Churian)
Choranwali HP 31.858 75.148 8.28 320 0 195 6.9 125 8.2 0.22 <0.10 56 0.0 78 2.8 24 140
108 Gurdaspur Batala Bhagowal HP 31.896 75.163 8.28 647 0 220 42 70 55 0.50 <0.10 32 44 45 4.3 23 260
109 Gurdaspur Fatehgarh Churian
Ghaniya ke Bangar HP 31.867 75.05 8.40 1225 48 122 160 142 85 0.60 <0.10 52 54 125 7.7 21 350
110 Gurdaspur Fatehgarh Churian
Madipur (Fatehgarh
Churian) TW 31.864 74.958 8.42 578 24 220 28 20 1.7 0.32 <0.10 12 17 83 7.3 20 100
111 Gurdaspur Har Govindpur
Dokoha HP 31.658 75.383 8.25 495 0 171 42 12 50 0.16 <0.10 24 32 28 5.9 22 190
112 Gurdaspur Har Govindpur
Ghoman TW 31.691 75.386 8.32 312 12 159 6.9 22 20 0.42 <0.10 24 24 18 5.8 21 160
113 Gurdaspur Har Govindpur
Sri Hargobindpur TW 31.692 75.475 8.35 358 12 159 14 12 29 0.28 <0.10 28 24 17 4.9 22 170
114 Gurdaspur Quadian Aulakh Kalan TW 31.796 75.506 8.12 292 0 159 42 BDL 0.8 0.20 <0.10 36 12 20 6.6 19 140
115 Gurdaspur Quadian Harchowal HP 31.792 75.45 8.15 184 0 110 35 BDL BDL 0.18 <0.10 20 12 18 2.5 22 100
116 Gurdaspur Kahnuwan Sathiali Naulkot HP 31.9 75.433 8.18 195 0 110 28 BDL BDL 0.32 <0.10 32 7.3 10 2.4 19 110
117 Gurdaspur Dinanagar Saidowal HP 31.98 75.519 8.70 1020 60 305 111 BDL 26 0.25 <0.10 16 34 68 160 23 180
118 Gurdaspur Gurdaspur Pandori Dham HP 32.053 75.513 8.55 855 60 195 49 60 110 0.20 <0.10 76 44 36 31 25 370
119 Gurdaspur Kahnuwan Gahlri HP 31.837 75.474 8.60 416 36 183 21 20 0.6 0.18 <0.10 12 46 21 1.8 21 220
120 Gurdaspur Dhariwal Nishiyana majja
singh TW 31.929 75.308 8.31 302 24 195 6.9 BDL BDL 0.16 <0.10 40 12 28 2.5 20 150
121 Gurdaspur Dorangla Ganja (Ganji) TW 32.114 75.353 8.55 595 36 220 49 7.0 0.1 0.25 <0.10 20 19 85 3.9 24 130
122 Gurdaspur Dinanagar Dinanagar HP 32.142 75.475 8.50 605 168 85 35 27 14 0.48 <0.10 24 73 38 1.5 20 360
123 Hoshiarpur Moga Garhshankar TW 31.25 76.05 8.48 445 48 195 14 10 14 0.35 <0.10 24 34 36 4.2 15 200
124 Hoshiarpur Mahalpur Mahalpur TW 31.358 76.042 8.34 383 36 171 10 BDL 23 0.25 <0.10 28 19 38 3.3 18 150
125 Hoshiarpur Mahalpur Thakarwala HP 31.369 75.917 8.65 445 36 268 6.9 BDL 0.2 0.23 <0.10 16 27 65 3.8 21 150
126 Hoshiarpur Hoshiarpur II Phuglana HP 31.384 75.834 7.70 1680 0 281 125 272 290 0.30 <0.10 132 61 160 1.2 18 580
127 Hoshiarpur Hoshiarpur II Chohal TW 31.611 75.972 8.20 311 0 122 21 18 35 0.15 <0.10 24 12 29 4.2 20 110
128 Hoshiarpur Hoshiarpur Nari TW 31.641 75.998 8.18 298 0 159 6.9 15 21 0.15 <0.10 28 7 33 3.0 15 100
129 Hoshiarpur Talwara Bhamnaur TW 31.831 75.965 8.32 262 12 134 6.9 BDL 13 0.20 <0.10 28 10 20 0.9 19 110
130 Hoshiarpur Talwara Talwara TW 31.942 75.9 8.34 330 24 159 14 BDL 23 0.15 <0.10 48 10 22 1.8 17 160

131 Hoshiarpur Talwara Jhir Di Khui HP 31.963 75.813 8.10 330 0 98 14 98 6.1 0.15 <0.10 24 7.3 20 1.6 16 90
132 Hoshiarpur Hajipur Hajipur TW 31.975 75.758 8.30 408 24 232 14 BDL 9.6 0.18 <0.10 28 22 44 2.1 22 160
133 Hoshiarpur Hajipur Sibochak HP 31.987 75.736 8.10 1262 0 232 195 135 55 0.12 <0.10 76 22 170 3.5 18 280
134 Hoshiarpur Mukerian Pankhuh HP 32.021 75.688 8.85 203 24 49 6.9 10 14 0.12 <0.10 24 5 12 6.2 22 80
135 Hoshiarpur Mukerian Chak Sheru HP 32.051 75.624 8.32 540 24 183 35 40 1.1 0.14 <0.10 28 29 34 16 21 190
136 Hoshiarpur Mukerian Bhangala HP 32.025 75.609 8.11 815 0 366 42 BDL 65 0.16 0.24 16 56 60 11 19 270
137 Hoshiarpur Mukerian Samraj Tanda HP 31.915 75.589 8.21 440 0 159 42 121 26 0.13 <0.10 44 44 21 3.0 22 290
138 Hoshiarpur Hajipur Dagan HP 31.951 75.715 8.13 295 0 171 14 5.0 9.4 0.14 <0.10 40 12 11 1.0 19 150
139 Hoshiarpur Hajipur Nangal Bhaiala TW 31.908 75.708 8.22 620 0 146 14 90 112 0.14 <0.10 48 36 25 1.3 16 270
140 Hoshiarpur Dasuya Dulmiwal DW 31.832 75.751 8.32 460 24 281 6.9 BDL 15 0.15 <0.10 56 32 25 5.5 19 270
141 Hoshiarpur Dasuya Dasuya HP 31.8 75.667 8.15 492 0 195 21 20 55 0.80 <0.10 40 24 26 2.6 20 200
142 Hoshiarpur Bhunga Garhdiwala TW 31.75 75.742 8.32 418 24 159 28 5.0 24 0.11 <0.10 24 27 30 1.1 22 170
143 Hoshiarpur Hoshiarpur I Sham Chaurassi TW 31.501 75.749 8.45 372 24 220 6.9 BDL 0.6 0.23 <0.10 24 19 42 2.4 19 140
144 Hoshiarpur Hoshiarpur II Rampur Camp
colony
HP 31.503 75.947 8.45 420 24 195 28 BDL 0.7 0.45 <0.10 28 15 50 2.3 21 130
145 Hoshiarpur Mahilpur Simbli TW 31.143 76.178 8.59 530 60 244 14 BDL 8.8 0.42 <0.10 24 44 39 4.2 18 240
146 Hoshiarpur Mukerian Mukeriya TW 31.942 75.617 8.18 405 0 171 28 25 26 0.20 <0.10 36 19 25 4.4 20 170
147 Hoshiarpur Dasuya Haler Rampur HP 31.863 75.789 8.45 375 36 195 14 BDL 2.9 0.18 <0.10 12 34 32 3.4 22 170
148 Hoshiarpur Bhunga Adowal Garhi TW 31.963 75.619 8.25 275 0 183 6.9 5 0.2 0.30 <0.10 36 12 12 1.1 21 140
149 Hoshiarpur Roonagar Hardo Namoh TW 31.15 76.575 8.35 537 24 195 28 42 0.7 0.26 <0.10 28 32 33 12 18 200
150 Hoshiarpur Bhunga Bassi Ballo DW 31.655 75.869 8.09 288 0 207 6.9 BDL 7.7 0.23 <0.10 28 17 22 1.3 20 140
151 Hoshiarpur Dasuya Jandaur TW 31.848 75.634 8.27 255 0 183 6.9 BDL 7.8 0.25 <0.10 28 15 18 1.4 18 130
152 Jalandhar Phillaur Turan TW 31.12 75.901 8.36 442 36 183 14 12 7.4 0.6 <0.10 20 29 37 5.2 20 170
153 Jalandhar Phillaur Phillaur HP 31.029 75.793 8.32 525 24 268 14 BDL 12 0.42 <0.10 16 27 63 6.3 24 150
154 Jalandhar Rurka Kalan Goraya TW 31.233 75.533 8.60 905 132 244 97 8.0 35 0.40 <0.10 12 44 175 7.4 20 210
155 Jalandhar Rurka Kalan Jandiala TW 31.158 75.617 8.30 500 48 232 6.9 BDL 10 0.70 <0.10 20 27 58 5.1 18 160
156 Jalandhar Nur Mahal Sarih HP 31.117 75.6 8.15 300 0 183 6.9 10 0.8 0.45 <0.10 24 24 6.7 2.4 22 160
157 Jalandhar Nakodar Nakodar TW 31.133 75.485 8.55 554 60 293 6.9 5.0 6.9 0.90 <0.10 12 24 105 4.9 24 130
158 Jalandhar Shahkot Billi Charmi TW 31.112 75.394 8.34 585 48 207 42 5.0 60 0.54 <0.10 20 44 60 4.8 23 230
159 Jalandhar Shahkot Shahkot TW 31.079 75.33 8.15 828 0 171 118 20 140 0.18 <0.10 40 44 73 6.8 18 280
160 Jalandhar Shahkot Malsian TW 31.125 75.361 8.55 595 48 281 35 BDL 34 0.45 <0.10 12 34 98 5.5 22 170

161 Jalandhar Lohian Talwandi Madho TW 31.2 75.311 8.32 575 24 268 28 BDL 60 0.30 <0.10 24 34 65 6.3 21 200
162 Jalandhar Jalandhar East
Lallian Kalan TW 31.263 75.492 8.84 330 36 183 14 5.0 0.4 0.50 <0.10 28 12 52 4.1 27 120
163 Jalandhar Nakodar Udhopur TW 31.194 75.533 8.44 503 24 281 14 BDL 27 0.45 <0.10 12 36 58 5.5 22 180
164 Jalandhar Rurka Kalan Gohiran TW 31.179 75.5 8.70 605 60 281 42 20 33 0.45 <0.10 16 49 89 6.2 18 240
165 Jalandhar Jalandhar west
Kartarpur TW 31.436 75.499 8.16 765 0 159 125 20 85 0.29 <0.10 28 41 70 6.5 20 240
166 Jalandhar Jalandhar city
Jalandhar TW 31.325 75.589 8.11 475 0 207 35 58 0.66 0.40 <0.10 24 36 33 4.3 22 210
167 Jalandhar Adampur Jandu Singha TW 31.373 75.646 8.35 635 24 159 69 88 BDL 0.22 <0.10 24 34 72 9.2 19 200
168 Jalandhar Jalandhar city
Adampur HP 31.422 75.708 8.60 662 36 268 35 BDL 65 0.60 <0.10 12 15 135 3.3 24 90
169 Jalandhar Adampur Allowalpur HP 31.429 75.664 8.20 575 0 159 42 60 80 0.22 <0.10 28 29 55 11 19 190
170 Jalandhar Lohian Khera kalan TW 31.082 75.379 8.58 472 48 220 21 22 0.9 0.32 <0.10 16 34 62 6.0 20 180
171 Jalandhar Adampur Jalbhe TW 31.47 75.786 8.25 405 0 134 28 10 90 0.18 <0.10 44 19 21 1.6 21 190
172 Kapurthala Phagwara Phagwara TW 31.229 75.779 8.65 635 60 183 42 BDL 65 0.19 <0.10 16 27 95 6.9 22 150
173 Kapurthala Kapurthala Kapurthala TW 31.369 75.381 8.40 385 24 159 35 BDL 25 0.40 <0.10 20 22 45 4.7 24 140
174 Kapurthala Kapurthala Hussainpur TW 31.571 75.571 8.35 392 36 171 6.9 7.5 30 0.38 <0.10 24 19 45 5.6 21 140
175 Kapurthala Sultanpur Lodhi
Sultanpur Lodhi TW 31.219 75.2 8.65 940 84 195 63 38 0.4 0.20 <0.10 8 19 150 5.2 23 100
176 Kapurthala Sultanpur Lodhi
Dalla TW 31.174 75.242 8.50 520 36 232 35 BDL 11 0.25 <0.10 12 36 58 5.5 20 180
177 Kapurthala Sultanpur Lodhi
Talwandi
Choudhrian HP 31.296 75.2 8.62 525 48 207 42 8.0 BDL 0.24 <0.10 12 15 105 2.0 20 90
178 Kapurthala Dhilwan Bhatura Khurd HP 31.604 75.588 8.52 500 60 207 21 BDL 1.2 0.35 <0.10 16 27 68 4.9 21 150
179 Kapurthala Dhilwan Bholath TW 31.535 75.506 8.60 355 36 195 14 BDL BDL 0.45 <0.10 8.0 12 78 3.6 23 70
180 Ludhiana Samrala Otalan HP 30.819 76.197 8.60 492 60 183 21 BDL 24 0.30 <0.10 20 41 35 7.1 23 220
181 Ludhiana Macchiwara Samrala TW 30.883 76.2 8.01 460 0 256 21 BDL 17 0.45 <0.10 68 5.0 20 21 25 190
182 Ludhiana Macchiwara Muskabad HP 30.866 76.231 7.64 957 0 281 83 32 145 0.18 <0.10 60 54 56 9.5 20 370
183 Ludhiana Macchiwara Behlolpur HP 30.904 76.289 8.25 443 0 159 14 40 55 0.14 <0.10 20 39 12 5.4 20 210
184 Ludhiana Macchiwara Manewal HP 30.938 76.162 8.55 1240 84 281 90 158 1.2 0.20 <0.10 12 49 93 185 24 230
185 Ludhiana Samrala Punjeta HP 30.873 76.088 8.32 362 24 146 14 BDL 34 0.22 <0.10 20 32 12 5.8 21 180
186 Ludhiana Ludhiana II Mangat TW 30.981 75.913 8.48 498 48 171 14 48 BDL 0.32 <0.10 20 17 78 4.4 22 120
187 Ludhiana Macchiwara Lallian Kalan HP 30.938 76.624 8.22 252 0 146 14 10 1.7 0.29 <0.10 28 17 7.87 0.6 20 140

188 Ludhiana Samrala Begowal HP 30.817 76.056 8.70 712 84 293 28 5.0 24 0.60 <0.10 28 34 105 7.3 24 210
189 Ludhiana Dehlon Doraha HP 30.8 76.021 8.35 483 12 146 21 48 36 0.62 <0.10 28 24 20 32 26 170
190 Ludhiana Khanna Ikloha TW 30.702 76.219 8.40 709 36 49 69 186 55 0.46 <0.10 24 58 44 38 23 300
191 Ludhiana Khanna Maksudra HP 30.73 76.01 8.75 782 180 159 14 5.0 25 0.50 <0.10 12 66 78 7.7 22 300
192 Ludhiana Dehlon Gopalpur HP 30.738 75.842 8.25 1296 156 525 28 BDL 23 0.70 <0.10 12 39 255 8.3 20 190
193 Ludhiana Pakhowal Lil TW 30.726 75.7 8.57 578 60 293 6.9 18 10 0.32 <0.10 12 49 66 7.4 20 230
194 Ludhiana Sudhar Halwara HP 30.725 75.638 8.38 712 48 207 56 12 50 0.34 <0.10 28 34 45 62 25 210
195 Ludhiana Ludhiana I Chattar Singh Park TW 30.9 75.792 8.28 717 0 232 63 38 90 0.26 <0.10 32 49 48 8.2 22 280
196 Ludhiana Ludhiana I Bassian Bet 30.902 75.624 8.28 325 0 207 6.9 BDL 14 0.42 <0.10 24 24 14 4.9 23 160
197 Ludhiana Sidhwan Bet Sidhwan Bet TW 30.923 75.44 8.37 345 24 146 6.9 18 12 0.37 <0.10 20 32 7.8 5.3 25 180
198 Ludhiana Jagraon Jagraon HP 30.775 75.471 8.45 544 48 256 21 BDL 26 0.55 <0.10 16 22 95 5.3 24 130
199 Ludhiana Jagraon Rasulpur TW 30.699 75.394 8.80 980 96 403 63 5.0 11 0.50 0.10 12 24 210 7.5 23 130
200 Mansa Bhikhi Bhikhi TW 30.067 75.538 8.40 341 12 146 6.9 122 0.3 0.56 <0.10 36 24 40 3.3 24 190
201 Mansa Bhikhi Kotra Kalan TW 30.055 75.493 8.10 1750 0 635 201 142 40 1.30 <0.10 48 41 305 32 22 290
202 Mansa Bhikhi Ralla DW 30.124 75.44 8.45 530 36 171 28 70 20 0.70 <0.10 36 46 15 15 18 280
203 Mansa Budhwala Budhlanda TW 29.929 75.542 8.22 3830 0 268 452 1168 210 0.72 <0.10 76 112 730 8.8 25 651
204 Mansa Budhwala Budhlanda TW 29.929 75.542 8.90 2230 156 561 97 418 60 3.00 <0.10 20 54 495 10 26 270
205 Mansa Budhwala Mofar TW 29.779 75.419 8.35 272 24 85 14 50 0.7 0.38 <0.10 32 22 5.3 1.9 22 170
206 Mansa Sardulgarh Fatta Maluka HP 29.8 75.283 8.60 732 84 232 35 72 0.3 1.60 <0.10 24 27 132 4.2 21 170
207 Mansa Sardulgarh Jhanda Khurd TW 29.654 75.186 8.55 692 48 293 21 84 5.5 1.30 <0.10 16 56 79 6.9 19 270
208 Mansa Budhwala Dialpura TW 29.893 75.665 8.85 2600 120 220 215 748 13 2.00 <0.10 64 15 575 7.4 25 220
209 Mansa Budhwala Kot Dharmu HP 29.908 75.461 8.70 1570 84 305 125 BDL 19 4.00 <0.10 24 24 305 49 21 160
210 Mansa Jhunir Burj Bhalaika TW 29.842 75.279 7.90 2150 0 452 347 200 67 1.10 <0.10 52 80 270 64 19 460
211 Mansa Jhunir Raipur HP 29.694 75.229 7.70 6295 0 98 1153 1420 520 0.20 <0.10 317 272 600 312 22 1912
212 Moga Moga-I Chougawan HP 30.836 75.269 8.90 1152 108 513 35 45 10 1.14 <0.10 4.0 29 265 5.9 24 130
213 Moga Kote Ishe Khan
Bajeke TW 31 75.151 8.40 470 60 122 6.9 76 BDL 0.28 <0.10 20 44 27 5.6 23 230
214 Moga Moga-II Dagru TW 30.824 75.026 8.70 770 60 305 28 85 8.4 0.50 <0.10 12 19 174 2.9 22 110
215 Moga Moga-I Darapur TW 30.84 74.963 8.70 1155 108 317 42 158 1.0 0.62 <0.10 16 10 270 3.3 20 80
216 Moga Bagha Purana
Budh singh wala TW 30.618 75.077 8.80 1052 108 207 69 118 22 0.38 <0.10 12 36 190 6.9 25 180

217 Moga Moga-II Jai singh wala TW 30.728 75.072 8.92 1345 156 391 49 70 54 1.78 <0.10 8.0 27 295 4.5 24 130
218 Moga Nihal singh wala
Nihal singh wala TW 30.611 75.183 8.82 1412 129.6
564 90 22 48 0.55 0.10 4.0 75 250 8.5 28 320
219 Muktsar Lambi Lambi HP 30.058 74.614 8.60 6895 84 452 1028 985 1180 1.70 <0.10 28 156 1450 69 24 711
220 Muktsar Lambi Sheranwali HP 30.032 74.464 8.80 6040 192 757 1091 730 340 1.10 <0.10 16 141 980 600 23 620
221 Muktsar Muktsar Balochkhera HP 30.368 74.522 7.52 4012 0 281 486 568 900 0.42 <0.10 212 168 280 320 24 1221
222 Muktsar Malout Kabarwala TW 30.193 74.41 8.90 3300 108 378 417 775 154 3.10 <0.10 24 44 805 28 22 240
223 Muktsar Muktsar Bhalaiana TW 30.33 74.714 8.45 5835 72 195 716 892 1350 0.30 <0.10 28 241 780 437 21 1061
224 Muktsar Muktsar Doda HP 30.389 74.633 8.30 570 24 110 35 115 11 0.35 <0.10 20 19 82 3.2 25 130
225 Muktsar Malout Khandehalal HP 30.364 74.403 8.52 6740 108 549 1119 1448 240 1.10 <0.10 12 105 1545 72 27 460
226 Muktsar Muktsar Muktsar HP 30.458 74.517 8.37 266 12 110 14 35 1.4 0.40 <0.10 20 22 13 2.6 25 140
227 Muktsar Muktsar Labanianwali HP 30.586 74.546 8.40 1280 60 244 111 295 34 0.50 <0.10 12 83 190 12 21 370
228 Nawanshahar Talwara Balachor HP 31.862 75.847 8.67 562 36 305 14 0 9.9 0.30 <0.10 16 10 118 3.9 21 80
229 Nawanshahar Balachor Mauhra HP 31.103 76.316 8.45 651 48 207 35 5.0 70 0.14 <0.10 16 51 48 5.8 18 250
230 Nawanshahar Hosiarpur Mehandpur HP 31.708 75.567 8.28 796 0 305 63 BDL 115 0.30 <0.10 36 51 60 2.9 16 300
231 Nawanshahar Nawanshahar Rahon DW 31.057 76.136 7.92 2230 0 122 250 162 650 0.05 <0.10 104 83 180 125 20 600
232 Nawanshahar Nawanshahar Behloor Kalan HP 31.018 76.156 8.55 462 48 195 14 8.0 6.3 0.30 <0.10 20 24 51 12 22 150
233 Nawanshahar Aur Raipur Daba TW 31.134 76.003 8.60 400 48 207 14 BDL 0.2 0.50 <0.10 20 24 50 11 18 150
234 Pathankot Shri Govindpur
Bham TW 31.717 75.458 8.37 304 12 134 6.9 50 14 0.27 <0.10 16 34 13 3.7 21 180
235 Pathankot Bamyal Bamyal HP 32.288 75.458 8.80 1825 108 415 104 195 120 0.40 <0.10 16 32 105 450 23 170
236 Pathankot Pathankot Jhakho Lahri HP 32.217 75.533 8.12 312 0 183 14 88 10 0.18 <0.10 28 46 5.6 2.1 18 260
237 Pathankot Pathankot Bhoa DW 32.25 75.522 8.10 442 0 159 21 48 38 0.15 <0.10 44 19 21 10 24 190
238 Pathankot Pathankot Dhalorian HP 32.209 75.543 8.20 250 0 146 14 8 8.5 0.16 <0.10 24 22 4.5 1.1 21 150
239 Pathankot Pathankot Gharota Kalan HP 32.15 75.572 8.55 324 36 183 6.9 18 0.1 0.21 <0.10 16 36 24 1.9 26 190
240 Pathankot Pathankot Pathankot TW 32.267 75.625 8.05 245 0 159 6.9 22 15 0.21 <0.10 24 24 9.4 1.3 22 160
241 Pathankot Pathankot Sarna DW 32.263 75.592 8.15 484 0 122 49 35 60 0.20 <0.10 40 22 32 1.3 24 190
242 Pathankot Dhar kalan Nawanpind HP 32.342 75.583 8.20 175 0 98 6.9 20 2.1 0.20 <0.10 28 10 2.6 1.1 20 110
243 Pathankot Pathankot Ghoh DW 32.329 75.663 8.20 547 0 232 49 5.0 50 0.32 <0.10 56 19 40 0.9 22 220
244 Pathankot Dhar kalan Parmota HP 32.348 75.753 8.05 124 0 73 14 BDL 1.1 0.18 <0.10 16 4.9 10 0.8 21 60

245 Pathankot Narota Jaimal singh
Keari DW 32.279 75.497 8.00 332 0 207 6.9 7.0 8.9 0.28 <0.10 52 0.0 30 2.0 20 130
246 Pathankot Dhar kalan Kui DW 32.433 75.871 8.18 268 0 134 6.9 34 9.0 0.28 <0.10 36 15 8.1 2.0 18 150
247 Pathankot Khani Khui Khani Khui HP 32.16 75.55 8.50 458 60 183 21 25 BDL 0.52 <0.10 20 46 32 1.6 23 240
248 Patiala Rajpura Thuha TW 30.5 76.554 8.32 1590 12 256 167 381 4.54 0.24 <0.10 32 56 260 2.6 26 310
249 Patiala Rajpura Basma Pepla HP 30.46 76.728 7.85 3682 0 281 646 522 275 0.18 <0.10 72 141 350 305 22 761
250 Patiala Ghanaur Kami Kalan HP 30.378 76.679 8.40 1010 36 293 76 128 2.5 0.38 <0.10 20 41 148 7.5 20 220
251 Patiala Ghanaur Lacharu HP 30.345 76.642 8.75 2828 240 305 438 270 0.6 0.65 <0.10 100 19 560 7.6 25 330
252 Patiala Ghanaur Hari Majra HP 30.319 76.607 8.60 2205 96 354 104 588 6.5 0.8 <0.10 8.0 2.4 550 2.1 23 30
253 Patiala Bhuner Heri Devi Garh TW 30.185 76.513 8.74 665 108 207 35 20 1.8 0.45 <0.10 8.0 2.4 180 7.3 24 30
254 Patiala Bhuner Heri Miranpur TW 30.208 76.494 8.33 1230 24 317 139 145 BDL 1.10 <0.10 48 17 210 7.0 22 190
255 Patiala Patiala Lachkani TW 30.408 76.338 8.42 945 48 415 35 20 42 0.45 <0.10 8 41 140 29 21 190
256 Patiala Nabha Allowal TW 30.438 76.29 8.70 825 72 293 35 80 0.1 0.40 <0.10 12 49 120 7.1 26 230
257 Patiala Patiala Bir Kauli TW 30.414 76.514 8.73 1518 72 317 132 265 6.7 0.65 <0.10 12 56 270 7.3 25 260
258 Patiala Ghanaur Lohakheri TW 30.409 76.586 8.13 1630 0 305 97 500 11 1.0 <0.10 68 80 190 10 21 500
259 Patiala Rajpura Chhat HP 30.614 76.796 8.15 1335 0 622 90 102 25 0.37 <0.10 16 61 220 4.3 27 290
260 Patiala Rajpura Naraina TW 30.612 76.579 8.72 1045 108 427 42 15 27 1.10 <0.10 32 41 174 4.8 22 250
261 Patiala Nabha Chahal TW 30.546 76.238 8.70 522 36 305 14 BDL BDL 0.50 <0.10 20 36 57 8.1 20 200
262 Patiala Nabha Rajgarh TW 30.416 76.732 8.72 815 108 244 14 80 15 0.42 <0.10 8.0 44 136 6.8 21 200
263 Patiala Nabha Dulladi TW 30.383 76.138 8.10 862 0 366 83 7.0 65 0.28 <0.10 36 44 92 9.0 23 270
264 Patiala Nabha Ramgarh TW 30.555 76.715 8.44 543 48 232 6.9 38 26 0.30 <0.10 24 49 35 6.9 22 260
265 Patiala Nabha Kalyan TW 30.353 76.308 8.70 875 96 171 83 20 20 0.41 <0.10 52 2 130 31 25 140
266 Patiala Patran Kangthala TW 29.841 76.133 8.98 1347 96 439 104 90 16 0.40 0.10 12 58 230 9.2 22 270
267 Patiala Sanour Mardan Heri TW 30.056 76.205 8.17 1150 0 549 111 BDL 14 0.35 <0.10 24 71 120 11 20 350
268 Patiala Patrah Patran TW 29.95 76.056 8.62 820 48 391 56 5.0 44 0.60 <0.10 16 54 116 9.1 22 260
269 Patiala Samana Samana TW 30.146 76.19 8.50 1070 48 98 125 127 110 0.28 <0.10 24 41 128 43 24 230
270 Patiala Samana Behmana TW 30.178 76.134 8.82 933 84 293 35 90 0.6 0.80 0.10 4.0 4.9 230 0.9 20 30
271 Patiala Samana Dakarba TW 30.255 76.278 7.98 450 0 293 14 BDL 20 0.30 <0.10 36 27 32 6.3 20 200
272 Roper Nurpur Bedi Dumewal TW 31.208 76.417 8.08 535 0 134 28 50 95 0.08 <0.10 48 19 35 4.3 16 200
273 Roper Anandpur
Sahib
Bhalan HP 31.275 76.375 8.45 812 36 244 49 50 85 0.35 <0.10 20 56 67 21 22 280

274 Roper Anandpur
Sahib
Brahampur HP 31.331 76.4 8.10 384 0 146 21 40 28 0.28 <0.10 52 15 13 0.4 20 190
275 Roper Anandpur
Sahib
Dher DW 31.271 76.446 8.32 488 36 146 35 42 0.4 0.26 <0.10 32 29 34 3.3 19 200
276 Roper Rup Nagar Chak Dehra TW 31.042 76.533 8.40 454 48 134 21 66 1.17 0.25 <0.10 28 29 35 21 17 190
277 Roper Rup Nagar Ahemadpur HP 31 76.575 8.23 679 0 293 56 52 15 0.32 <0.10 36 22 95 2.7 20 180
278 Roper Rup Nagar Bara Chauta HP 30.928 76.463 8.55 482 36 281 14 BDL 11 0.34 0.05 16 27 75 6.3 22 150
279 Roper Chamkaur
sahib
Rurkee Heeran HP 30.85 76.428 8.35 478 24 159 35 62 22 0.16 <0.10 20 44 31 7.5 19 230
280 Roper Morinda Kakrali TW 30.834 76.524 8.65 692 60 330 56 BDL 0.2 0.40 <0.10 16 73 47 7.1 21 340
281 Roper Morinda Chitamli TW 30.812 76.538 8.70 728 72 342 14 30 21 0.70 <0.10 12 36 132 3.6 19 180
282 Sangrur Malerkotla-II Baurhi Khurd TW 30.626 75.84 8.52 625 36 232 42 30 38 0.30 <0.10 20 51 50 7.9 25 260
283 Sangrur Amargarh Maler Kotla DW 30.525 75.9 8.05 935 0 488 49 BDL 75 0.45 <0.10 36 44 115 11 22 270
284 Sangrur Maler Kotla
II
Bagarian TW 30.459 76.021 8.52 398 60 183 14 8.0 0.8 0.41 <0.10 24 27 50 5.0 20 170
285 Sangrur Dhuri Bhojowal TW 30.338 75.925 8.70 1680 132 647 118 62 29 0.65 <0.10 16 34 380 6.5 19 180
286 Sangrur Dhuri Behra TW 30.334 75.849 8.58 726 72 317 21 5.0 14 0.45 <0.10 12 34 115 7.1 20 170
287 Sangrur Dhuri Ghanauri Kalan HP 30.41 75.77 8.10 738 0 452 42 BDL 22 0.35 <0.10 28 44 88 7.8 24 250
288 Sangrur Dhuri Bugra TW 30.286 75.761 8.75 1252 132 452 97 BDL 65 0.38 <0.10 16 75 195 9.2 22 350
289 Sangrur Sangrur Lohgowal TW 30.192 75.675 8.40 1280 60 732 69 12 12 0.53 <0.10 16 36 290 6.5 23 190
290 Sangrur Sangrur Manjhi TW 30.29 76.098 8.70 495 36 293 6.9 BDL BDL 0.45 <0.10 16 10 105 3.8 22 80
291 Sangrur Sangrur Badrukhan TW 30.251 75.797 9.00 1745 240 622 49 7.0 20 0.75 <0.10 8 24 405 5.2 22 120
292 Sangrur Sunam Sunam TW 30.123 75.815 8.50 887 36 195 76 60 130 0.32 <0.10 20 39 130 7.7 24 210
293 Sangrur Lehra Gaga Chural Kalan TW 29.819 75.8 8.78 1632 120 769 28 30 14 4.20 <0.10 16 22 365 5.7 26 130
294 Sangrur Andana Bhulan TW 29.763 76.01 8.80 1497 96 439 125 205 16 0.70 <0.10 12 83 228 53 25 370
295 SAS Nagar Kharar Landran TW 30.694 76.661 8.55 970 36 317 69 110 60 0.29 <0.10 20 29 175 28 18 170
296 SAS Nagar Kharar Goga HP 30.708 76.554 8.48 455 48 220 21 BDL 0.2 0.38 <0.10 20 34 48 0.9 20 190
297 SAS Nagar Rajpura Hulka DW 30.56 76.66 8.75 915 120 464 14 BDL 0.2 0.65 <0.10 16 36 190 2.8 22 190
298 SAS Nagar Kharar Dheri HP 30.625 76.696 8.18 667 0 342 42 20 8.1 0.66 <0.10 28 27 86 2.3 18 180
299 SAS Nagar Dera Bassi Sawara HP 30.684 76.641 8.75 2155 120 757 257 84 26 0.60 0.10 24 73 384 79 19 360
300 SAS Nagar Kharar Issapur HP 30.592 76.846 7.60 6145 0 598 938 1020 850 0.32 <0.10 176 224 800 364 22 1361
301 SAS Nagar Dera Bassi Dera Bassi DW 30.586 76.838 8.55 546 24 281 21 BDL 14 0.38 <0.10 16 12 102 2.3 18 90

302 SAS Nagar Dera Bassi Joli TW 30.55 76.9 8.40 1330 48 342 153 100 39 0.35 <0.10 20 36 235 4.3 23 200
303 SAS Nagar Dera Bassi Handesra HP 30.417 76.892 8.65 705 84 305 21 5.0 1.9 0.60 <0.10 12 22 140 3.7 20 120
304 SAS Nagar Dera Bassi Sirsini TW 30.454 76.771 7.45 16760 0 232 4023 2340 725 0.13 <0.10 493 696 2200 18 25 4093
305 SAS Nagar Dera Bassi Antala HP 30.383 76.917 8.42 653 48 159 42 45 18 0.50 <0.10 24 36 56 1.8 22 210
306 SAS Nagar Dera Bassi Gholu Majra HP 30.533 76.824 8.70 1012 96 549 14 5.0 0.5 3.00 <0.10 20 17 240 3.2 19 120
307 SAS Nagar Majri Akalgarh TW 30.857 76.612 8.02 533 0 391 14 BDL BDL 0.60 <0.10 24 15 102 2.1 17 120
308 SAS Nagar Dera Bassi Sundran TW 30.615 76.893 8.22 455 0 330 6.9 BDL 3.8 0.33 <0.10 28 15 70 2.0 21 130
309 SAS Nagar SAS Nagar Banaur TW 30.493 76.586 8.40 615 48 195 42 8.0 25 0.30 <0.10 16 19 96 3.0 24 120
310 Taran Taran Tarn Taran Daburji TW 31.495 74.9 8.20 365 0 232 14 BDL 1.7 0.45 <0.10 32 17 27 7.9 23 150
311 Taran Taran Tarn Taran Sahabpura TW 31.392 74.931 8.58 825 72 220 63 28 22 0.57 <0.10 16 39 83 47 26 200
312 Taran Taran Khadur sahib Khadur Sahib TW 31.433 75.131 8.02 1100 0 281 139 127 60 0.25 <0.10 40 54 130 7.5 21 320
313 Taran Taran Chola Sahib Chola Sahib TW 31.25 74.842 8.22 498 0 281 28 BDL 15 0.60 <0.10 32 34 26 7.4 22 220
314 Taran Taran Khadur sahib Goindwal Sahib DW 31.365 75.144 8.62 422 48 220 6.9 BDL 0.0 0.34 <0.10 12 24 64 4.0 21 130
315 Taran Taran Khadur sahib Khawaspur HP 31.392 75.1 8.50 435 36 171 14 10 1.3 0.28 <0.10 12 34 29 4.9 25 170
316 Taran Taran Patti Barwala HP 31.224 74.803 8.80 1325 96 635 42 5.0 9.3 3.35 <0.10 12 19 295 11 21 110
317 Taran Taran Valtoha Rattoke TW 31.15 74.633 8.62 1120 60 391 97 18 2.4 0.45 0.10 12 17 220 4.4 23 100
318 Taran Taran Bhikhiwind Kalsian Kalan TW 31.278 74.7 8.32 825 48 232 49 88 26 0.50 <0.10 24 54 77 10 20 280
319 Taran Taran Bhikhiwind Bhikhiwind TW 31.35 74.7 8.55 940 36 464 28 42 13 0.57 <0.10 12 27 180 6.6 20 140
320 Taran Taran Gandi wind Gandiwind HP 31.517 74.7 8.40 885 48 317 83 10 0.1 0.32 <0.10 8.0 34 140 6.7 23 160
321 Taran Taran Bhikiwind Maarihinavaabad TW 31.332 74.666 8.80 1280 84 415 83 88 BDL 0.3 <0.10 8.0 22 265 7.8 21 110
322 Taran Taran Bhikhiwind Aminsha Khatra TW 31.396 74.625 8.70 590 60 268 28 BDL BDL 0.25 <0.10 8.0 34 90 4.8 22 160
323 Taran Taran Tarn Taran Chabal TW 31.481 74.8 8.55 452 36 244 6.9 10 BDL 0.22 <0.10 20 15 78 4.8 20 110