Ground Water Scenario in Major Cities of India Central ...
239
-
Upload
khangminh22 -
Category
Documents
-
view
0 -
download
0
Transcript of Ground Water Scenario in Major Cities of India Central ...


Background
Rapid growth of urban population has been the character of Indian urbanisation. The urban population in the country has increased more than 8 times, since the turn of the century, and around 3 fold since Independence. The level of urbanisation was 11-12% during the first three decades of this century. 17.3% of Indian population was living in urban areas in 1951 and that has risen to 25.7% in 1991. The urban population growth rate is significantly higher (3.1%) than the overall population growth rate (2%) the urban population is projected to be about 658 million by the year 2025. The reasons for rapid urban growth rate have been largely attributed to rural-urban migration in search of livelihood and extension of urban zone under master plan programme.
The rivers are the lifelin e of the many cities and towns since time immemorial. One of the factors that determined the location of urban centres in earlier times was easy access to water sources, to meet the need for domestic and other purpose. However, in recent decades increasing population, neglect of the existing water harvesting and storage structures, obstructing the water supply channels by people and also by urban planners, due to ill planned urbanisation, have resulted in encroachment and dysfunction of natural drainage. Half a century ago, most of the rivers in India were biologically in good condition, amply met the water needs of the populations and also supported diverse fish and flora species (World Bank 1998: 8). Today, it would be difficult to find a single river in the plains of the country that would have potable water.
Ground water plays a very important role in meeting the water demand of Indian cities. There are three types of situations (i) where the entire water supply is met from surface water (ii) where the entire water supply is met from ground water (iii) where there is a mixed supply, a combination of both. The first option is no longer existent in absence of adequate and consistent supplies. The option of own source is gaining ground and this own source invariably taps ground water. Industries invariably have network of their own wells. Thus the ground water regime beneath cities is being adversely affected. Where there is a mixed supply, generally the core part of the city may have surface water supply and the extensions areas which came in later on depend on the ground water supply. This results in a ground water mound in the central part and a declining trend in the peripheries. In case of the third situation, extraction creates a ground water trough below the city. Besides this, the ever increasing sewerage and industrial waste are polluting the fresh ground water. Various options for sustainable water supply in urban India are augmentation of water supply through rainwater harvesting, conservation and groundwater recharge. This supported by ground water regulation would enable overall improvement of water resources in the cities. In addition there is need for demand management, which the urban policy makers have to emphasise. Though there are novel efforts of the government agencies, what is equally important is innovative measures promoted by private and individuals in cities to augment water supply. The urban centres have to learn from the successful experiences demonstrated by government and NGOs to augment water supply. A decentralised approach, where co-ordination among the state, private sector and civil society, is needed for evolving better water supply options in urban India.
There is also substantial potential for demand side management options. Unaccounted water in urban areas exceeds 50% which if saved can substantially meet the justified water demand. Conservation, which is less expensive and more environmentally sound than new investment, would minimise the future capital requirements. Water conservation can be achieved through more effective maintenance mechanisms, which can help to overcome the problems of pilferage and leakage. Demand management can be achieved through financial incentives and technological interventions.
As per the National Water Policy, drinking water was given the first priority. Accordingly, Central Ground Water Board also started giving greater emphasis to drinking water and in course of time realising the growing demand of the urban sector, studies have been initiated in some of the major cities of the country. This report is a consolidation of the urban studies carried out by the Central Ground Water Board and the contents are very pertinent to the theme “Water for Cities- Responding to the Urban Challenge” of World Water Day 2011. The cities are alphabetically arranged in the report. They cover varying ground water scenarios in the country including the highly developed Metros, the hilly region, the coastal cities, the cities taping unconsolidated and hard rock aquifers etc. The report briefly describes administrative setup, status of water supply and demand, ground water scenario, feasibility of rain water harvesting, ground water development strategy etc. along with maps.

1
AGARTALA CITY, TRIPURA
G.R.C. Reddy, B.U. Rao, CGWB, Agartala
INTRODUCTION
Agartala is the capital city of Tripura state. The ancient capital of the princely state “Swadhin Tripura” was
shifted from Udaipur to Agartala in 1760 by Maharaja Krishna Kishore Manikya of Manikya dynasty. During the
British rule Agartala was the capital of Hill Tippera. It became a municipality in 1871 with an area of 7.20 sq km
with 875 persons and the city became a planned city during the reign of Maharaja Bir Bikram Manikya Bahadur
in 1940’s. This erstwhile princely State Capital of Tripura merged with India on 15th
October 1949. It is
connected by road, rail and air with the other parts of
the state and with the rest of the country. The city has
been an important border trading town with trading
linkages with Bangladesh.
GENERAL FEATURES
Area/ Administrative Divisions
The area of the city increased from 7.20 sq km to
presently 62.60 sq.km (2004). The city lies between
north latitude 23049’15”& 23
053’30” and east longitude
91014’30” & 91
019’15” and falls in the Survey of India
toposheet no. 79 M/1 and M/5. It lies on the banks of
the Haora River. The city has international boundary
with Bangladesh in the west of 6.5 km. The city is
divided in to 35 words and the administration is looked
after by Agartala Municipal Council (AMC) headed by
Chairman. The location map of Agartala city is shown in
Fig.1.
Demography
The population of Agartala Municipality increased 29.6
times from 1901 to 2001 i.e. from 6415 persons to
189998 persons (2001, Census of India). The population
increased from 6415 (1901), to 6831(1911), 7743
(1921), 9580 (1931), 17693 (1941), 42595 (1951), 54878
(1961), 100264 (1971) 132186 (1981), 157636 (1991)
and to 189998 (2001). As per 2001 census, there are 44,167 households literates constitute 92% of the total
population, the SC’s and ST’s constitute 11.67% and 8.2% respectively. The density of population of Agartala
city was 802 per sq.km in 1901 which increased to 11,866 per sq.km in 2001. The projected population has
been worked out as 3,88,335 by 2011. The increase in population and its area over time is given in Fig.2.
Hydrometeorology
The Climate of Agartala city is characterized by humid to sub-tropical climate i.e., moderate temperature and
high humidity. The highest mean maximum temperature recorded is 35oC (April) and lowest mean minimum
temperature recorded is 10.4oC (January).
The average annual rainfall is around 2200 mm and the average number of rainy days is 100. The area receives
rain fall mainly from SW monsoon, which commences in the month of May and lasts till September. The
rainfall pattern during the last 40 years indicates falling long term trend at the rate of 19.4 mm per year.

2
Fig.2. Population and area of Agartala city from1901 to 2011
Physiography and Drainage
Agartala city shows undulating plains with low lying flat topped mounds with narrow to wide valleys. Central
portion of Agartala municipal area is more or less flat. The main city part is at a lower level than its peripheral
parts which gives saucer shaped appearance. The average topographic elevation of Agartala is 12 m amsl.
The city is drained by two rivers viz. Haora and Katakhal. The Haora River lies on south of Agartala and Katakhal
River is on the north. A few streamlets/ cherras are distributed all over the greater Agartala e.g. Bangeswar
cherra, Nagi cherra, Kalapania cherra etc. The streams are of 1st
and 2nd
order and shows sub parallel to
parallel drainage pattern. The drainage system of the area is controlled by topography, local and regional
structures.
Soil types
Broadly two types of soils are present in Agartala. They are Alluvial soils and Red sandy lateritic soils. The
alluvial soi is found in the entire municipal area and along the river courses. The Red sandy Lateritic soil is
found in the northern and southern parts of the city.
STATUS OF WATER SUPPLY AND DEMAND
At present the total population within AMC area is 3,88,355 persons and considering 135 lpcd the water
demand works out to be 52.42 MLD. With addition of wastage of 10% (5242522 litres) the total demand works
out to 57.67 MLD.
To meet this demand there are two surface water treatment plants one at college tilla and the other at
Milansangha with a total production capacity of 31.78 MLD. There are 60 no’s deep tube wells supplying 28.18
MLD and the total supply is 59.96 MLD. There are 16 no’s of elevated storage reservoirs, 4 no’s ground storage
reservoirs and 477 km length of pipe lines to supply water to residents. In all there are 26,368 water
connections in the city to supply water.
The Asian development Bank has sanctioned project of Rs. 292 crores for drinking water supply in Central and
North Zone of Agartala Municipal Council, which shall include construction of infiltration galleries at college
tilla, augmentation of treatment capacity, rehabilitation of 25 deep tube wells and drilling of 9 new ones,
rehabilitation of 17 iron removal plants and creation of 8 new ones, 7 ground water treatment plants, 17.5 ML
capacity water reservoirs, 67 km primary pump mains, 140 km secondary pipeline and metered connections to
70,000 houses.
WATER PROFILE
Both surface and ground water play key role in meeting the water demand of the city almost equally. The two
surface water treatment plants located on the perennial Haora river suppling 31.78 MLD. There are 60 no’s of
Population and Area, Agartala City
0
50000
100000
150000
200000
250000
300000
350000
400000
450000
1901 1911 1921 1931 1941 1951 1961 1971 1981 1991 2001 2004 2011
Years
Po
pu
lati
on
0
10
20
30
40
50
60
70
Are
a i
n S
q.
Km
s
Population Area in Sq.Km

3
deep tube wells located throughout the city supplies 28.18 MLD. Hence, both surface and ground water
equally meets the water demand of the city. However, ground water is rich in iron concentration up to 12
ppm, which were passed through 26 no’s of iron removal plants to bring to make it potable before suppling.
GROUND WATER SCENARIO
Agartala city is underlain by a succession of argillaceous and arenaceous sedimentary rocks, ranging in age
from Mid-Tertiary to Recent. The geological succession of the city is given in Table.1.
Table 1 Geological succession of Agartala city
Era Epoch Lithology
Quaternary Recent Unconsolidated silt, sand and clay found along the river course.
Unconformity
Tertiary
Dupitila
Unconsolidated to semi-consolidated sediments. (Clayey sandstone with few
bands of ferruginous concretions and purple to dirty white silty clay). Thickness
of this group is 10-30m and occurs in synclinal troughs.
Unconformity
Tipam
Sandstone of various grades and intercalated with clays, brown to grey with
ferruginous concretions Occur in the hill slopes and foothills. Thickness over
2000m.
Unconformity
Surma Mainly argillaceous material with fine sandstone, grey in colour & occur in the
core of anticlines.
Alluvium of recent age made up of faint yellow, fine grained sand, light yellow silt and grey to dark grey clay is
found in the valleys and
river courses.
Dupitila formation
composed mainly of clay
and silt, with some thin
layers of coarse grained to
gritty ferruginous
sandstone. These
sandstone form the near-
surface aquifer, within 10-
30 m bgl, and are generally
tapped by dug wells. Due
to predominance of clay,
the permeability and the
storage capacity of the
formation are very low.
Ground water in this
formation occurs in
unconfined condition.
Dupitila group is well
developed in synclinal
valleys and exposed in
disconnected mounds.
Fig.3 Hydrogeology of Agartala City
The semi-consolidated Tipam group of Upper Tertiary age form the main hydrogeological unit. However, small
depositions of alluvial formation also constitute local hydrogeological units along river courses but not very
important from the viewpoint of ground water development.
4
Potential Aquifers
Under Ground water
exploration, the CGWB has
constructed 4 exploratory wells
at G.P.A., Salbagan (2 wells) and
A.D Nagar. The Board also
constructed 12 peizometers
(Deep and Shallow) at six places.
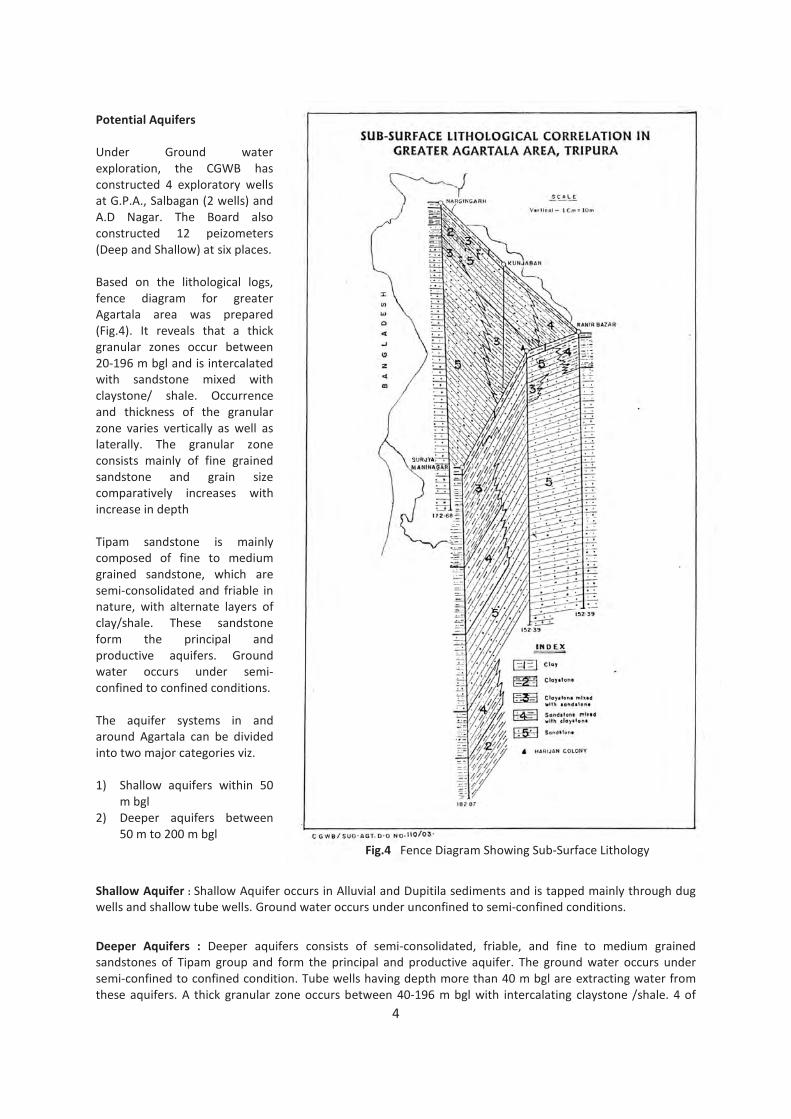
Based on the lithological logs,
fence diagram for greater
Agartala area was prepared
(Fig.4). It reveals that a thick
granular zones occur between
20-196 m bgl and is intercalated
with sandstone mixed with
claystone/ shale. Occurrence
and thickness of the granular
zone varies vertically as well as
laterally. The granular zone
consists mainly of fine grained
sandstone and grain size
comparatively increases with
increase in depth
Tipam sandstone is mainly
composed of fine to medium
grained sandstone, which are
semi-consolidated and friable in
nature, with alternate layers of
clay/shale. These sandstone
form the principal and
productive aquifers. Ground
water occurs under semi-
confined to confined conditions.
The aquifer systems in and
around Agartala can be divided
into two major categories viz.
1) Shallow aquifers within 50
m bgl
2) Deeper aquifers between
50 m to 200 m bgl
Fig.4 Fence Diagram Showing Sub-Surface Lithology
Shallow Aquifer : Shallow Aquifer occurs in Alluvial and Dupitila sediments and is tapped mainly through dug
wells and shallow tube wells. Ground water occurs under unconfined to semi-confined conditions.
Deeper Aquifers : Deeper aquifers consists of semi-consolidated, friable, and fine to medium grained
sandstones of Tipam group and form the principal and productive aquifer. The ground water occurs under
semi-confined to confined condition. Tube wells having depth more than 40 m bgl are extracting water from
these aquifers. A thick granular zone occurs between 40-196 m bgl with intercalating claystone /shale. 4 of

5
EW’s and 12 Pz’s drilled upto the depth of 226 m bgl have shown that the cumulative thickness of aquifers
ranges from 24 to 54 m. In general the aquifers are capable of yielding 29 to 165 m3/hr, for a maximum
drawdown of 17.5 m. However, the yields at Nagicherra and Bodhjungnagar are low. The transmissivity of the
aquifer varies from 933 to 6859 m2/day, and the permeability as 22.76 to 135 m/day.
Ground Water Levels
The depth to water levels in the phreatic aquifers ranges from < 1 m bgl to > 5 m bgl. The pieziometric heads
in the deeper zones varied from 3.73 to 23.45 m bgl during March 2010, and from 2.06 to 22.10 m bgl during
November 2010. In general ground water movement is in west - north westerly direction.
Ground Water Resource & Status of Development
The ground water resource as per GEC 97 worked out to be 781.75 ham and ground water draft as 443.7 ham.
Ground water resources available for future development worked out to be 338.05 ham. The stage of ground
water development is 56.7% and the area falls under safe category.
Hydrochemistry
Ground water is neutral to alkaline with pH ranging from 6.9 to 8. Electrical conductivity (EC) ranges from 70 to
230 µs/cm. Total Hardness varies from 50 to 100 mg/l. Calcium (Ca) is the most abundant cation with
concentrations ranging from 31 to 84 mg/l, Sodium (Na) concentration is varying from 5 to 18 mg/l, and
Magnesium (Mg) concentration varying from 0.8 to 7.3 mg/. Among anions Bicarbonate is the most abundant.
Its’ concentration ranges from 20 to 150 mg/l. Concentration of Chloride (Cl) ranges from 10 to 25 mg/l. The
relative abundance of cations is Ca2+
> Na+ > Mg
2+ > K
+, while that of anions is
HCO3
-> Cl
– > SO4
2–> NO3
- . Most of
the constituents are within desirable/ permissible limit.
High Concentration of Iron in Ground Water : The concentration of iron is beyond permissible limit (1 mg/l) in
major part of the area. The Iron concentration in groundwater ranges from 0.1 to 12.38 mg/l. Ground water is
potable only after treating for iron. Higher concentration of iron > 5 mg/l are observed in the northern and
southern parts. Whereas, in the central part the concentration of iron is <5 mg/l. The iron concentration along
the Haora River is less than 3 mg/l. The concentration of iron in shallow aquifer is lesser than that of deeper
aquifers.
Major Ground Water Related Problems
The major ground water related problems in the city are high concentration of iron in the ground water,
deterioration of ground water quality due to mixing of sewerage water through unlined open drains, increase
in ground water dependency due to non-supply of surface water throughout the city, and reduction in ground
water recharge in the core areas due to roads and building.
Feasibility of Rainwater Harvesting and Artificial Recharge
A large number of water bodies covering 266.25 ha area already exists in the city and are recharging the
aquifer system. The depth to water levels in the central part of the city is less than 2 m bgl. This is due to the
fact that the central part is low lying area and the urban demand is mostly met through surface water supply
schemes. In surrounding areas the depth to water levels ranges from 2-5 m bgl. This is due to the utilization of
both surface and ground water for the domestic needs. The northern and southern part of the greater Agartala
Urban Area, which is recently included in the AMC is wholly depended on the ground water source, and the
depth to water levels are more than 5 m bgl. Since the water levels are more than 5 m bgl and area is fully
depended on ground water resources the rain water harvesting and artificial recharge of ground water
schemes may be taken up as pilot projects.
GROUND WATER DEVELOPMENT STRATEGY
The Agartala city is located on the banks of perennial river Haora. At present the river water is not fully
utilized. During rainy season much of the water flows to the Bangladesh. If a surface water reservoir is
constructed on the upstream side of the Agartala city it will not only enhance the water supply to the city
including summer requirements but also improves the ground water levels in the area.
6
A. In the central part of the city the water levels are less than 2 m bgl. Deep tube wells can be constructed in
the central part of the city tapping the deeper aquifer and utilised along with the surface water. To utilise
the available ground water resources, additional deep tube wells tapping the deeper aquifers with a
spacing of about 500m can be constructed after inventorying the existing wells throughout the city and
the water can be utilised after treatment for iron and other chemical parameters exceeding the
permissible limit.
B. At present the unaccounted surface water supply is around 35% of the total demand. This is due to
severely deteriorated water supply distribution system particularly in the older parts of the city. By
reducing the transmission and distribution losses through efficiency in operation and maintenance,
replacement of old machinery and network systems etc, water service delivery can be improved. This will
also help in reducing recharge of phreatic aquifer where depth to ground water level is shallow.
C. Huge campaigns should be made every year by Government and NGO’s for increase in awareness of
people about water conservation.
D. At present an area of 266.25 ha area exists under water bodies in the city and recharging the ground
water. The depth to water levels in most of the area is less than 5 m bgl, hence the scope of artificial
recharge to ground water is at present very limited. However, area specific pilot project of rainwater
harvesting and artificial recharge of ground water should be taken up in those areas where water level is
deep. The data generated from the pilot project will help in replicating the project in other areas in the
state in future.

7
AHMEDABAD – GANDHINAGAR TWIN CITY, GUJARAT
P.R.Gupte, CGWB, Ahmedabad
INTRODUCTION
The city of Ahmedabad was founded in 1411 AD as a walled city on the eastern bank of the river Sabarmati,
now the seventh largest metropolis in India and the largest in the state. Gandhinagar city came into existence
as new capital city of Gujarat State in year 1960. Historically Ahmedabad has been one of the most important
centres of trade and commerce in western India. The city was once famous as the ‘Manchester of India’ on
account of its textile industry. It is also a major industrial and financial city and home of several scientific and
educational institutions of national, regional and global importance. The city has a great architectural tradition
reflected in many exquisite monuments, temples and modern buildings. Gandhinagar is also emerging as
rapidly developing urban centre.
GENERAL FEATURES
Area & Administrative Divisions
Ahmedabad is situated on both sides of river Sabarmati. It lies
between 22°55' & 23°08' North latitude and 72°30' & 72°42' East
longitudes where as new capital city, Gandhinagar is at 30 km
north of Ahmedabad, on right bank of Sabarmati River, situated
between 23°05' and 23°22' North latitude and 72°31' to 72°49'
East longitude. The areas around Ahmedabad and Gandhinagar
city are rapidly developing and became one of the largest urban
agglomerate known as “Greater Ahmedabad”. Out of its nearly
4200 sq km area, Ahmedabad Municipal Corporation (AMC)
areas is 190.84 sq km, 1200 sq km is under Ahmedabad Urban
Development Authority (AUDA), 57 sq. km is under Gandhinagar
Notified Area (GNA) as Gandhinagar city and rest is of Chatral,
Bopal and 9 other Municipalities and other 150 semi urban /
urban villages as Urban Agglomerates (UA) falls in Dascroi taluka
and Gandhinagar taluka. (Location Map - Fig -1).
Demography
There is rapid growth of population in the Ahmedabad
Gandhinagar urban areas during last three decades (Fig. 2). The
population in AMC area in 1981 was
21.5 Lakh which became 35.2 lakh in
2001, Same way the population of AUDA
area also increased from 27.2 lakh in
1981 to 47.0 lakh in 2001. The
population within the AMC limits
appears to approach a stabilization
level. The areas adjoining AMC, falling
within AUDA limits have shown rapid
growth. Gandhinagar is also
experiencing relatively high rate of
growth 40 % and population of 1.95 lakh
persons as per census of 2001.
Hydrometeorology
Ahmedabad – Gandhinagar area has a tropical monsoon climate, which is hot and dry, except in the rainy
season. Summer days are very hot with mean maximum temperature of 41.30C while, nights are pleasant with
Gujarat
Gandhinagar
Gandhinagar City
Ahmedabad - Gandhinagar - Twin City with surrounding urban areas
Ahmedabad City
Location map of Ahmedabad –
Gandhinagar Twin City along
with its urban areas
Fig -1

8
mean minimum temperature of 26.30C. The mean maximum and minimum temperatures in winter are 30°C
and 15.4°C respectively. The average annual rainfall of the area is 782 mm, although there is a considerable
variation from year to year. It occurs generally during the months of June to September. The average relative
humidity is 60% with a maximum of 80% to 90% during the rainy season.
Physiography & Drainage
The area as a whole, in general monotonously flat except few mildly undulating topography owing to the
presence of stabilized dunal land forms. The elevation of land surface ranges from 40 to 60m AMSL with master
slope towards south. The average elevation of the city area is about 48m AMSL. Isolated high grounds, with
elevations more than 60m AMSL, are observed on both sides of river Sabarmati. The most important surface
water body in the Ahmedabad Gandhinagar area is the river Sabarmati. The Khari river runs almost parallel to
the Sabarmati towards east, beyond the city limits. One of the oldest irrigation schemes of Gujarat ‘Kharicut
canal scheme’ passes through eastern part of Ahmedabad City, which also serve as ‘Storm Water Drainage’
during monsoon. The Kankaria and the Chandola are two important ponds in the Ahmedabad city area. Under
ambitious ‘National Lake Conservation Plan’, AMC and AUDA have taken up project to interlink 45 surface
bodies (ponds & lakes) and recharge it with storm water and surplus surface water of Narmada Canal.
Soil Type
The area is mostly underlain by blown sand and silt deposits of aeolian character, except localized pockets
where it is fluvial. The soil is therefore either coarse sandy or fine sandy loam, with less clay content and has
good to excellent drainability. The soils in the entire area are deep to very deep, with soil depths more than
100 cm.
STATUS OF WATER SUPPLY AND DEMAND
In decades of 1970-80, water requirement of
Ahmedabad urban area was totally met through series
of deep tube wells spread in entire city areas. During
decades of 1980-90, (fig.3) to supplement groundwater
resources, surface water supply from Dharoi reservoirs
was planned with construction of riverbed intake wells.
With increasing agriculture demand in upstream reach
of Sabarmati river and also due to diminishing base
flow in Sabarmati river, project could not be succeeded
to lessen stress on groundwater resources.
As per water supply data of AMC, before
1986, out of total 400 mld water supplied,
contribution from groundwater resources
was 350 mld (88 %). With implementation
of various surface water sources projects
at present, out of total 760 mld water
supply, only 30 mld (4 %) is from ground
water resources (AUDA 2008). The water
demand is increasing with rise in
population. AMC has projected that by
year 2031 projected population of
1,01,44,000 persons would require around
1623 MLD from present 760 MLD in AMC
area. Same way, water requirement of
Gandhinagar Urban area is mainly meeting
through surface water resources as
groundwater levels are rapidly declining and deep water has high TDS, making it unsuitable for drinking uses.
Preset and projected water demand of Ahmedabad – Gandhinagar urban area is given in Table 1a & 1b.
Table -1 a - Present Water Supply & Projected Demand –
Ahmedabad Urban Area
Year 1991 2001 Projection
2011 2021 2023
Population in lakh 33.00 44.27 53.99 79.58 101.44
Water Requirements
in mld @ 160 LPCD 528 706 863 1273 1623
Table – 1 b - Present Water Supply & Projected Demand –
Gandhinagar Urban Area
Year 1999 2001 Projection
2025
Population in lakh 1.90 2.00 4.25
Water Requirements in mld @ 250
LPCD
in 1999 & @ 270 in 2001 & 2025
45 50 120

9
WATER PROFILE
State has created huge surface water potential in Narmada Canal Networks, large part of urban areas, mainly
in Urban Agglomerate (UA), outside Ahmedabad Municipal and Gandhinagar Capital city area which are
equally urbanised and have high demand of water resources, depends on local groundwater sources. At
present, most of the groundwater development is mainly through private tube wells. It is observed that UA is
rapidly developing & with rising population its demand on groundwater resources is increasing tremendously
and still there is large gap between supply and demand. Although, there is huge potential of surface water
resources, lack of piped supply network in all developing urban areas is creating tremendous pressure on
existing groundwater resources. The rapid developments during last four decades in Ahmedabad urban areas
have created tremendous stress on
its natural environs. Increasing
groundwater draft to cater the
domestic and industrial
requirements has rendered most of
the unconfined aquifer zone dry. At
places, groundwater is brackish at
shallow depth. With increasing
urbanization process, groundwater
pollution also rendered some of the
shallow aquifer unsuitable for
domestic need. All such
development resulted in
exploitation of deep confined
aquifers, which in turn has led to
sharp decline in piezometric level below 60 to 80 m at places. Projected overall water demand and availability
through ground water resources, for Ahmedabad Urban Area, (Fig - 4) indicate that there is urgent need to
conserve recharge groundwater resources for sustainable development.
GROUNDWATER SCENARIO
Geologically, the Ahmedabad -Gandhinagar urban area forms a part of the Cambay Basin. The thickness of
multilayered Quaternary alluvium system in Ahmedabad – Gandhinagar urban area is around 300 to 600m,
which is underlain by Tertiary sediments. The unconsolidated Quaternary formation consists mainly of
alternate layers of sand, silt gravels and intermixed kankars etc granular materials and yellow to gray colored
sticky clay (Table 2).
Table -2 – Geological sequence of Cambay Basin
Age Lithology Thickness
Quaternary
(Holocene –
Pleistocene)
Alluvium Maximum 700 m ;
400 - 600 m around A`bad –G`Nagar
Tertiary
(Miocene) Sandstone and Shale
Maximum 900 m.
200-300 m near margin of the basin
- - - -- - - - - - - - - - - -- - -- - -Unconformity - - - - - - -- - -- - - - - - - - - - - -
(Oligocene) Sandstones, shale and
limestone Maximum 160 m
(Eocene)
Shale and siltstone with
sandstone and limestone
intercalation
About 100 m thick in the centre and thinning
towards east and west margin
Mesozoic
(Cretaceous) Deccan Trap
-- - - - - - - - - - - -- - -- - -Unconformity - - - - - - -- - -- - - - - - - - - - - -
Bagh Beds
Geomorphologically they represent two types of landforms, i.e. fluvial and aeolian of Quaternary period. The
fluvial landforms consist terrace deposit, abandoned channels, cut-off meanders and swampy lands while
Fig -4

10
ISROLD Eng
Central School MES AP NarodaSabarmati
River
0 m
-40
-80
-120
-160
-200
60
276
296
226214 219
Subsurface section between ISRO - Naroda
Scale
0 0.5 1 2 km Sand, gravel etc - AquiferClay -silty clay etc Aquitard
Unconfined Aquifer
Confined Aquifer
aeolian landform consist dunes, inter dunes and sandy flats etc, of geological past in Quaternary period.
Accordingly, depositional variations due to sea level changes, lateral shifting of river courses, soil formation and
aeolian activities etc., were the active environmental agencies responsible for lateral and vertical variation of
the lithological characters of Quaternary sediments. The sand horizons are prevalent at different depth levels
and form aquifers. Spatial variation in groundwater quality and quantity may be attributed to intermixing /
overlapping of various facies, forming aquifer system in the area.
Potential Aquifer
The study of lithological logs and geophysical log characteristic of boreholes drilled in Ahmedabad –
Gandhinagar urban areas reveals thickness of various litho units of alternating argillaceous and arenaceous
horizons with 'kankar' and gravel beds occurring at depths, exhibits typical multilayered aquifer system. Within
250 m depth of this multilayered aquifer system, two major aquifer units are identified. The sediments at
shallow depths extending down to 40-50 m depth in general are uniform in character and composed of
medium to fine sands, silt with kankar and minor clay lenses. This sandy-silty horizon is aeolian in character and
akin to loess deposits. The sand: clay ratio in the boreholes ranges from 1:0.23 to 1:0.76. The groundwater in
the upper unit, down to average 40 m depth, occurs mainly under phreatic conditions. The lower units
comprising more than 250 m of alternating sandy and clayey horizons form multiple confined aquifer system. In
general, three distinct confined aquifers with thickness varying from 12 to 30 m can be identified. These
aquifers lie between 45 & 90 m, 100 & 170 m and 180 & 250+ m bgl separated by clays and sandy clays that
form aquitard.
The subsurface aquifer disposition in Ahmedabad urban area, down to explored depth up to 300m, is very well
established. One of such sections, showing phreatic and confined aquifer system as per nature of groundwater
occurrence condition, is reproduced (Fig. 5).
Deep boreholes have penetrated the thick sequence of post-Miocene sediments down to 300 m depth and
these sediments continue further below. The Miocene (Tertiary) sediments and/or basement have not been
touched within this depth. The marker blue/grey clays representing the Miocene formations, however, occur at
shallow depths towards east in the adjoining Dehgam taluka of Ahmedabad district & also in adjoining Kheda,
Sabarkantha districts.
Hydrogeological data analysis shows that the aquifer system in this area is regionally extensive and correlates
with the aquifer system demarcated by CGWB in Central Gujarat plains (CGWB/UNDP-1978). The Phreatic
aquifer and first confined to semi confined aquifer can be correlated with the aquifer "A", which is phreatic at
top and becomes semi-confined to confined at lower levels in the central Gujarat plains. The second and third
confined aquifers can be correlated with the aquifers "B" and "C" respectively. The sub surface geology and
aquifer properties as per earlier studies (CGWB/UNDP,1976) is given in Table 3.
Fig - 5

11
Table 3 : Regional aquifer system established as per CGWB / UNDP Work.
S.No Aquifer
Nomenclature Lithological Characteristics
Depth range (m
bgl)
Thickness
(m)
Nature of
aquifer
1 Aquifer A Coarse sand, gravel, pebbles, medium and
fine sand & Clay 0- 96.32 96.32
Phreatic &
semi
confined.
2 Aquitard I Clay interbeded with sand and sandy clay 96.32-123.14 26.82
3 Aquifer B Medium to coarse sand and gravel
interbeded with sandy clay 123.14-151.48 28.34 Confined
4 Aquitard II Clay interbeded with sand and sandy clay 151.48-181.96 30.48
5 Aquifer C Fine to medium sand interbeded with clay,
sandy clay 181.96-200.56 18.6 Confined
6 Aquitard III Clay interbeded with sand and sandy clay. 200.56-232.86 32.3
7 Aquifer D Medium sand interbeded with sandy clay 232.86-278.89 46.03 Confined
8 Aquitard IV Clay interbeded with sandy clay. 278.59-301.14 22.25
9 Aquifer E Fine to medium sand with sandy clay 301.14-317.60 16.46 Confined
10 Aquiclude V Grey clay and clay stone. 317.60-465.73 148.13
11 Aquifer F Fine to medium sand, sand stone interbeded
with silt stone 465.73-521.81 56.08 Confined
12 Aquiclude VI Clay & Clay stone 521.81-546.2 24.39
13 Aquifer G Fine to medium sand interbeded with
siltstone 546.2-572.41 26.21 Confined
Groundwater Level
The shallow phreatic aquifer is a regionally
extensive and extends down to 30 to 60 m
depth (avg. 40m) was reported dried up due to
large scale development few years backs , now
shows water levels in many parts of Ahmedabad
urban areas due to recharges activities and
stoppage of groundwater pumping after
introduction of Surface water sources based
water supply. Based on the observation wells
data and select wells monitored in and around
the Ahmedabad city, it is observed that the
depth to water level ranges between 7m and
40m bgl (Fig. 6) in phreatic aquifer. Water level
increasing in depth from northwest to southeast
direction. In Gandhinagar city phreatic aquifer is
de-saturated and water level is hardly found
between 35m and 40m bgl. It is also observed
that seasonal fluctuation of water table,
between pre-post monsoon periods, ranges
from -0.25 to 3.72m in phreatic aquifer.
The aquifers occurring below 50-80 m bgl in the
area are under semi-confined to confined
conditions and as discussed three such aquifers
lie approximately between 45 & 90m; 100 &
170m; 180 - 250+m and so on. Tube wells
however screen all these aquifers and thus
providing effective interconnection and
therefore the information is cumulative of different aquifers tapped.

12
As per earlier reports, in late sixties the water levels in
the tube wells ranged from 33.5 to 44.19 m bgl and
reported declining trends ascribed to large
concentration of tube wells & heavy draft in the
Ahmedabad City. Uninterrupted large scale
development of groundwater from deep aquifers has
resulted in progressive decline in water levels.
Presently, the water level rests more than 90 m bgl
and as per average water level data given by AMC
(White Paper, AMC, 1996), piezometric level ranged
around 90 to 100 m bgl in most part of Ahmedabad
urban area (Table 4).
Water table in user confined aquifer ranges from 20
m below MSL to 50 m below MSL in Ahmedabad city
and therefore the flow of ground water is towards
northwest direction (Fig. 7). In Gandhinagar the water
table is approximately 40 below MSL.
CGWB piezometers in Ahmedabad & Gandhinagar
area shows continuous decline of deep water level
since last two decades. Data for two piezometers,
located at Cantonment, Ahmedabad area, from 1984
to 2000, for aquifer zones between 87 & 97 m reveals
a consistent declining trend with rate of decline of
about 2.8 m/yr where as Piezometer at Bhopal – 40
m, from 2002 to 2010 shows rise of 1.9 m/yr
respectively (Fig 8a & 8b). The unconfined water level
at Gandhinagar Pz III, tapping zones between 40 and
60 m bgl, has shown a decline of about 0.40 m/year
between 1986 and 2000 (Fig 8c). The Pz II tapping
zones between 67 and 115 m bgl show a decline of
about 1.6 m/year. The water level data for deeper aquifers is available for piezometers at Sardhao. At Pz I
(#466-522 m bgl), there has been a decline of 1.9 m/year and at Pz II (#257-387m bgl), the decline was 2.1
m/year (fig 8e & 8f). Deep aquifer zones at Kalol Pz –I, for period 1996 to 2010 shows decline of 1.84m / year
(Fig –8g) while at Bopal, for period 2002 to 2010 shows rise of 0.53.m / year (Fig 8h).
Table 4: Water levels in AMC Tube Wells
Year Water level in Tube Wells(m bgl)
Central Zone Eastern Zone Western Zone
1960 24.38 17.06 23.16
1965 41.45 31.69 40.23
1970 54.86 45.11 53.64
1975 67.05 54.86 64.61
1980 78.03 65.83 73.76
1985 86.56 75.59 83.51
1990 93.87 82.90 91.44
1995 99.97 90.22 96.31
Fig – 8 b Well Hydrograph
Bppaz – Pz – III
Zones : Shallow Unconfined 10 -40 m bgl

13
Ground Water Resources & Status of Development
Groundwater formed a dependable, most important source of water in Ahmedabad –Gandhinagar area till year
1980. Groundwater withdrawal in the area is mainly through large number of tube wells constructed by AMC &
other public and private sector primarily for domestic water supply as well as for industrial use. In adjoining
rural areas, groundwater is also being used extensively for irrigation both by shallow wells and tube wells.
Earlier, groundwater recharge to shallow aquifer was taking place through infiltration from rainfall and seepage
from river bed during the monsoon period. In changed scenario development of urban areas, however, there is
now considerable reduced groundwater recharge due to paved surface area and other factors like rapid storm
runoff through water drains, export of waste water collected by sanitary sewers coupled with high drawl of
ground water. Groundwater recharge to sustain pumping from the deeper aquifer system mainly takes place
from recharge area in the north east by lateral flow, vertical leakages from shallow aquifer and also reverse
leakages from still deeper aquifers whose heads are higher than the aquifers under exploitations in the area as
revealed by studies in adjoining parts of Gandhinagar, Mehsana districts. With overall development of
groundwater resources in all over the State, mainly in Central Mainland Gujarat, groundwater draft has
outpaced natural recharge component and same is reflected in groundwater resources computation.
Fig 8 g Well Hydrograph
Kalol Pz – I I - Deep : Zones 130 -180 m
Fig 8 h Well Hydrograph
Bopal Pz – I Deep Zone : 180 – 230 m

14
Ahmedabad urban area is a part of part of Daskroi & City taluka and Gandhinagar urban area lies in
Gandhinagar taluka. Ground water resources of both unit areas for year 2004 are tabulated below (Table -.5)
For Gandhinagar taluka, the Gross Groundwater Recharge and Utilisable Groundwater recharge for irrigation
are 121.04 and 114.99 MCM/yr. respectively while the total groundwater draft is 160.98 MCM/yr. Thus, there
is a negative balance of 49.79 MCM/yr. and level of groundwater development is 139.99%. Therefore, the
groundwater in the area has been categorised as “Over Exploited”. For Dacscroi & Ahmedabad city taluka, the
utilisable groundwater resources are 142.56 MCM/yr. With a draft of 215.06 MCM/yr, there is a (negative)
balance of -95.75.20 MCM/yr. The stage of development is 150.86 % and the talukas have been classified as
"Over Exploited".
Hydrochemistry
In urban area of Ahmedabad & Gandhinagar,
groundwater at shallow depths shows wide variation
in the chemical quality. In parts of Ahmedabad urban
area, in general, groundwater quality is brackish with
EC >3000 µS/cm in most of the area (Fig. 9). It is
observed that in the area close to the Sabarmati river,
in the central and northern parts, the groundwater
quality is better with EC less than 3000 µS/cm where
as it is brackish to saline (EC more than 3000 µS/cm) in
rest of the area. High nitrate concentration (more
than 100 ppm), indicating probable pollution of this
aquifer, has been observed at a number of sampling
points. High fluoride concentration (more than 1.5
ppm) has also been observed in localized areas. The
quality of the groundwater in the deeper aquifers is
generally fresh upto 250 m depth for which data is
available. However, at places the brackish
groundwater is also observed within this depth. In
Gandhinagar area Electrical Conductivity (EC) of
groundwater varies between 250 to 1000 µS/cm at
25°C in phreatic aquifer. The chloride value in
groundwater ranges from 65 ppm to 250 ppm. Thus
the groundwater quality in major part of the area is fresh except a small area in the south-western part of the
area, around Sertha, is brackish to saline.
The range of different chemical constituents found in the deeper groundwater is given below (Table-6)
Major Groundwater Related Problem
Groundwater resources are depleting at alarming rate in major part of Ahmedabad – Gandhinagar urban
areas, although most of the domestic and industrial requirement is meeting through Narmada based surface
Table 5: Groundwater Resources ( Year 2004)
S.
No. Groundwater Resource Component
Ahmedabad City
and Daskroi Taluka
Gandhinagar
Taluka
1. Gross Groundwater Recharge (MCM/yr.) 150.06 121.04
2. Allocation for Natural Discharge (MCM / year) 7.50 6.05
3. Utilisable Groundwater Recharge (MCM/yr.) [80% of “1”] 142.56 114.99
4. Total Groundwater Draft (MCM/yr.) 215.06 160.98
5. Groundwater Balance (MCM/yr.) -95.75 -49.79
6 Allocation for domestic & industrial used for next 25 years 70.91 10.15
7. Level of Groundwater Development (%) 150.86 139.99
8. Category OE OE
Fig.9

15
water resources. The AMC operates about 300 deep tube wells to augment city water supply. Abstraction from
river bed aquifer by radial wells other 2000 no of private bore wells / tube wells owned by private housing
societies, business houses, industries, cantonment area
etc., create huge stress on already exploited deep
aquifer system. Over the years, consistent fall in water
levels (piezometric surface) and has affected the well
yields and pumping costs. Lowering of aquifer potential
heads seems to have created a regional groundwater
trough in the central part.
Presently only one third of the sewage of the city is
being partially treated. Part of the treated water is
recycled and used for irrigation and industrial purposes
and the excess quantity is discharged in the Sabarmati
river. Remaining two thirds of untreated sewage is
directly discharged in the Sabarmati which make
downstream most vulnerable to groundwater pollution.
Industrial effluent of eastern part of Ahmedabad urban
area are either discharged in to the Kharicut canal,
small nallas or spread over the topographic depressions. This has caused degradation of land in these areas
and probably also effected the shallow groundwater.
The vulnerability of deeper aquifers for pollution, in general, is very low because of thick filtration media, i.e.,
vadose zone and aquitard-aquifer sequence. However, improper construction of wells particularly in private
sector, lack of aquifer protection by cement seals and grouts and old abandoned wells can serve as conduits
for direct vertical connection and thus aquifer pollution.
Feasibility of Rainwater Harvesting and Artificial Recharge
Large scale exploitation of groundwater resources during last two decades has created major portion of
unconfined aquifer system dry, which has good scope to get recharge through suitable structures and sources..
Construction of storm water drainage system and connecting it to various ponds /lakes of the areas during last
few years has rejuvenated unconfined system at places. Earlier groundwater recharge experiment by injection
under pressure were carried out in the city in 1974 by State Govt in a deep tube well, under pressure varying
between 80 to 100 psi and its results established feasibility of injecting nearly 3888 m3/day of water. In
another artificial recharge using injection under gravity (By Siphon) technique was taken up by the State Govt.
in collaboration with PRL, in 1977 near Hansol involving shallow dug well as source well and deep tube well of
tapping aquifer below 75 m (tapping 80 m of granular zones) as target zones. In this experiment also, no
clogging in injection well was observed after 220 hrs of recharge. It was estimated that, if the efficiency of
injection well could be improved and the frictional losses minimised using PVC pipes for siphon, better
recharge rates of up to 980 lpm could be achieved. This method was found more economical and cost, at the
time of experiment was found to be 45 paisa per 1000 litres. These two pilot studies on artificial recharge
carried out in the city of Ahmedabad have clearly established the technical feasibility of artificial recharge both
by pressure injection and syphon transfer. Similarly the technical feasibility and economic viability of artificial
recharge of groundwater, in North Gujarat alluvial plains, having similar hydrogeological condition like
Ahmedabad –Gandhinagar area, has already been established by CGWB on the basis of pilot studies carried
out under UNDP –CGWB project in 1986.
A pilot project for waste water renovation for unrestricted irrigation and groundwater recharge using Soil-
Aquifer Treatment System Technique in the Sabarmati bed at Ahmedabad was conducted jointly by NEERI, PRL
and AMC(1997). The project studies concluded that the SAT renovated effluent obtained from the pilot plant
using the primary settled sewage conformed to the WHO bacteriological guidelines for unrestricted irrigation.
Based on the findings, a conceptual design of a 55 MLD SAT system using primary settled domestic water was
proposed for the city.
Table 6 : Range of different chemical constituents
in the deep aquifer
Parameters Unit Range
Ph - 7.9 to 8.2
EC µS / cm 1500 to 300
CO3 ppm Nil
HCO3 ppm 200 to 787
Cl ppm 284 to 709
NO3 ppm 40 to 217
SO4 ppm 149 to 470
Mg ppm 10 to 112
Ca ppm 12 to 86
Na ppm 80 to 675
K ppm 2.3 to 5.7
F ppm 0.65 to 5.7
TH ppm 80 to 675

16
Recently, under ‘National Lake Conservation Plan’ few lakes in AUDA and AMC area have been renovated and
connected through storm water drainage. It has shown good result and rise in ground water level and
improvement in quality recorded in few monitoring wells. It is proposed that all the existing water bodies of
urban areas of Ahmedabad – Gandhinagar would be renovated and provided with site suitable artificial
recharge structure. Moreover, they would be inter linked with each other with storm water drainage, Narmada
Canal and Sabarmati River for maximum recharge of monsoon runoff and additional surface water available in
Narmada Canal.
GROUND WATER DEVELOPMENT STRATEGY
Groundwater development in and around Ahmedabad – Gandhinagar urban area has reached a critical stage
and not much scope exists for further development. Groundwater level has gone down too much to extract
groundwater economically even for domestic use. Moreover increasing urban population and industrial
requirement create more stress, making situation more critical. There is deterioration in groundwater quality
due to geogenic condition of deep aquifer system and also due to an unregulated industrial effluent and
sewerage. In the prevailing urban scenario, for better health and hygiene of public at large, protection of
water source and natural recharge system should be a priority. The following generalized strategies are
envisaged to augment drinking water supply to the city.
Regulating the Development
The phreatic / shallow aquifer being most vulnerable to exploitation as they are easily tapped through shallow
bore wells. Development of groundwater resources should be planned such that further decline in water level
can be arrested. Construction of deep tube wells, in heavily depleted aquifer zones should be avoided. In such
areas more priority should be given to provide surface water source based water supply. With regular
monitoring of aquifer for change in water level and also for quality variation, alternate surface water resources
should be used conjunctively for optimum utilization of available water resources. For this purpose real time
water level monitoring and management systems should be developed. In stressed areas, through suitable
regulatory measures, enforcement of directives to uses ground water resources for specific purpose can be
worked out.
Multilayered aquifer system down to 300-400 m depth in Ahmedabad – Gandhinagar areas have brackish to
saline or high fluoride / nitrite zones at various depths. Unrestricted and inefficient construction of deep tube
wells through such multilayered aquifer, tapping the entire available granular horizon mixes inferior quality
groundwater with good quality at many places. Some time, through old and damaged tube wells casing,
brackish or polluted water mixes with good quality aquifer zones. All such environment degrading incidences
can be controlled by regulating tube well constructing activities and suitable remedial measures to restore old
tube wells for recharge work. There should be administrative set up to regulate, monitor and provide
technical guideline for all such groundwater development work in Ahmedabad – Gandhinagar urban area.
Conserving Available Resources
For this purpose, the surface run off water from roof top of buildings, road surfaces, parks, schools, stadiums,
etc., can be diverted to shallow recharge pits, shallow bores, abandoned dried dug wells, etc. The areas where
excess rain water accumulates, like the village ponds/talavs and other natural depressions, should be utilised
for water conservation purposes. Such measures would also help in reducing urban run off.
There is a directive to construct rainwater harvesting structures in all newly constructed houses / group
societies etc, in urban areas of Gujarat State. Suitable regulatory and monitoring system should be established
for effective enforcement of this directive. For encouraging such activities of groundwater recharge work by
people’s participation and with individual efforts, authority should work out some way to award suitable
incentive directly or indirectly by waiving or subsiding tax etc.
Similarly, for Gandhinagar area, aquifers below 200m depth are notified as protected aquifer for drinking
water use only by CGWA during year 2000. Adequate administrative and enforcement measures should be

17
taken to monitor exiting developing activities for further improvement and conservation of deep aquifer
resources.
As a groundwater conservation strategy, serious thinking is required to be given for adoption of dual system of
water supply in select urban centers, particularly newer ones. In this system, the supply of water for
potable/kitchen use, @30-50 lpcd, can be through deep protected fresh water source and domestic sanitary
water supply can be from shallow aquifer. Moreover, mass awareness through peoples active participation to
preserve water and avoid wasteful usage should be undertaken. The habit of storing water every day and
throwing away the next day should be dispensed with in this semi arid land of scarce water.
Many part of Ahmedabad urban areas is underlain by brackish unconfined aquifers whereas some local
patches are polluted by industrial effluents. The drinking water supply (potable use) from this aquifer should
be banned completely. However, this aquifer needs to be vitalised and utilised for non-drinking / non-kitchen
use and other uses. The sites selected for new tube wells should avoid areas that are polluted and care should
be taken to properly seal the supply wells as well as the aquifer to prevent any kind of pollution/
contamination. Therefore, it should be mandatory that all supply wells be sealed down to minimum 5-6 m by
providing effective cement grout. The land surface at the site be graded and sloped so that surface water is
diverted away from the well. Provision of top concrete platform (say 1 m x 1m x 0.2m) around the well should
be made.
Pollutants both industrial and sewage should be treated by appropriate methodology
(primary/secondary/tertiary) before discharging in the drains and the river etc. Toxic waste should not be
disposed of on natural surface/drains etc. In the areas, particularly outside of city limit, where sewerage is
non-existent, there is a general requirement of planned urban development. It should be mandatory to
develop infrastructure particularly the sewage disposal system and protected water supply system
beforehand. Improper planning may pose a serious threat to underground environment.
Artificial Recharge Projects
Harvesting of rain water for artificial recharge to shallow aquifer needs to be taken up in order to maintain
groundwater balance and to make shallow aquifer reliable and sustainable source for supplementing domestic
and industrial water supply needs in urban areas. In order to properly manage the over exploited aquifers, to
retard, and, if possible, reverse the declining water level trends; there is an urgent need for operational
measures for artificial recharge of groundwater. The efficacy and technology of artificial recharge has amply
been established in and around the city. Existing surface water bodies – ponds / lakes should be renovated and
restored such that they can be fully utilized for groundwater recharge. Surface runoff of monsoon rainfall
should be collected by constructing storm water canal for diverting it to artificial recharge structures and lakes
/ ponds. To start with, existing work taken up under ;National Lake Conservation Plan, should be implemented
for each of existing surface water bodies and constructing site appropriate recharge structure ; like recharge
well, percolation pits / shaft, percolation tanks, etc in all over the urban areas. There are more than 50 natural
lakes identified by the AMC / AUDA authorities which can be interlinked with storm water drainage. Adequate
provision of budget should be made in ongoing ‘Urban Area Development’ projects in phased manner. In
Gandhinagar area, under Capital Development Scheme, work is going on to collect all storm water and
construction of recharge / percolation tanks. Taking into consideration of aquifer disposition of the area, 25
shallow depth percolation well should be constructed in grid pattern, along storms water drain all over the
urban area. Gandhinagar areas have advantage of its open area with plantation and sandy soils, facilitating fact
percolation of rainwater. Extra care should be taken to preserve and maintain such area free from
encroachment and pollution.

18
BANGLORE CITY, KARNATAKA
M.A. Farooqi, CGWB, Bangalore
INTRODUCTION
Bangalore, the capital of Karnataka, is one of the fastest growing city of Asia. In the year 1120 AD, the
Hoysala King, Veera Ballalla during a hunting trip in the forest lost his way. After a long search he met an
old lady in the forest who offered him shelter for the night and served him some boiled beans for
dinner. To show his gratitude to this lady for having saved his life, the King constructed a town and
named it as Benda Kalooru which means town of boiled beans. Later in 1537, a local chieftain, Kempe
Gowda helped design this town and laid the foundation for modern Bangalore. The city was extended
by several suburbs, or layouts, at the end of the 1800s. By the 1930s the suburbs had sprawled out and
people who could afford to commute by carriage lived outside the city. After Independence, Bangalore
grew rapidly in all directions, though with particularly intensive pressure on the inner city. In 1956,
Mysore State was reorganised (Now Karnataka), with Bangalore as State capital, resulting in a major
influx of migrants and further extension of the city. The old city and the Cantonment were merged into
one entity and grew rapidly. Now, the Bangalore city or the Bruhat Bangalore Mahanagara Palike
(Greater Bangalore Municipal Corporation) is the key Urban Local Body. It was constituted by the
Government of Karnataka vide Notification No. UDD 92 MNY 2006 dated 16.01.2007 including 7
Municipal Councils, one Town Municipal Council and 111 urbanized villages in the Bangalore Mahanagar
Palike. The area that Bangalore covers has grown manifold over the past century, from 75 km2 in 1901,
to 801 km2 as of now.
GENERAL FEATURES
Area / Administrative Divisions
The Bruhat Bangalore Mahanagara Palike (12�45’ - 13�10’ and 77�25’ - 77�45’) covers an area of 801
km2
and is divided into the following zones for administrative purposes:
1. East Zone
2. West Zone
3. South Zone
4. Rajarajeshwarinagar
5. Bommanahalli
6. Yelahanka
7. Dasarahalli
8. Mahadevapura
Demography
In terms of population, Bangalore’s growth has been quite extraordinary. In 1961 the city was the sixth
largest in India, with 1.2 million inhabitants. It is now the fourth largest. Between 1971 and 1981,
Bangalore’s growth rate was 76 percent – the fastest in Asia. Between 1991 and 2001, the urban part of
Bangalore District witnessed the country’s fastest growth after New Delhi, with almost 38 percent. This
is in comparison to an average of 17 percent growth in the entire Karnataka, and 21.34 percent in India
as a whole during the decade. The 2001 census put the population of Bangalore city at 4.3 million
inhabitants and of the urban agglomeration as 5.7 million. The population is estimated to cross 7.5
millions by 2011 census.
Hydrometeorology
According to Koppen’s broad climate classification, the climate of Bangalore can be classified as the
Tropical Monsoon Plateau Type i.e., characterized by mild summer and mild winter. The pre-monsoon
period lasts from January to May. This period can be divided into winter (December – February) and

19
summer (March – May). Winter is generally characterized by very little rainfall. Erratic thunderstorms
occur during the month of May.
Table 1 Normal Climatological data of Bangalore Meteorological Station
Month
Temperature
(0C)
Relative
Humidity
(%)
Rainfall
(mm)
PET
(mm)
Wind
Speed
(kmph)
Sunshine
(Hour/
Month) Min Max 0830
Hrs
1730
Hrs
January 15.0 26.7 77 40 3.3 117.4 10.4 259.8
February 16.5 29.7 67 29 10.2 130.0 9.7 248.4
March 19.0 32.3 63 24 6.1 166.2 9.4 268.9
April 21.2 33.4 70 34 45.7 158.2 9.0 252.0
May 21.1 32.7 75 46 116.5 156.5 11.8 239.8
June 19.7 28.9 82 62 80.1 126.5 17.1 135.3
July 19.2 27.2 86 68 116.6 115.7 17.5 99.8
August 19.2 27.3 86 66 147.1 114.2 15.2 108.3
September 18.9 27.6 85 62 142.7 108.2 12.1 145.1
October 18.9 27.5 83 64 184.9 105.1 8.2 171.1
November 17.2 26.3 78 59 54.3 98.3 8.5 182.9
December 15.3 25.7 78 51 16.2 102.9 9.6 213.6
Annual 18.4 28.8 77 50 923.7 1500.5 11.5 259.8
Temperature is the lowest during December and January with mean minimum and maximum
temperatures of 150C and 26
0C respectively. Temperature increases gradually thereafter until the
beginning of May with mean temperature ranging between 220C and 34
0C. Annual normal rainfall is
over 900 mm. Normal monthly rainfall varies from a high of over 185 mm in October to a low of less
than 10 mm in January. Even during May rainfall of the order of 100 mm is not uncommon. Southwest
monsoon in the area starts during the first two weeks of June. Normal Climatological features of
Bangalore Meteorological Station are given in Table -1
Physiography and Drainage
Geomorphological landforms predominantly seen in the area are denudational plateau, pediment,
pediplain and valley flats. The occurrence of fractures is more significant in pediplain areas. Bangalore
city situated on an N-S trending highland with an average altitude of 930 m above mean sea level (amsl),
forms a divide between the rivers Arkavathi on the west and South Pennar on the east. The major part
of the Bangalore Metropolitan City is situated on a hog back of granite. Hillocks of limited areal extent
are seen in the southernmost and south-western parts. Interpretation of Landsat imagery shows that a
NNW-SSE trending deep-seated fault cuts across the Closepet Granites west of main Bangalore city.
Lineaments interpreted for the area show general directions of NE-SW, NW-SE and E-W, the NE-SW
trending lineaments being more prominent. However, NW-SE trending lineaments are seen sporadically
in the northern part of the metropolis. The drainage pattern in the area is more or less fracture
controlled. More than one third of the Greater Bangalore is drained by Arkavati, a tributary of the
Cauvery river. It flows in N-S direction and joins the Cauvery river at the Sangama. The drainage pattern
is trellis to sub-dendritic. Remaining two-third area comes under Upper Pennar Sub-basin, with a low
drainage density. High drainage density in the western part is mainly due to a higher density of first
order streams with lesser lengths.
Soil Type
The area is predominantly covered by red loamy and lateritic soils. While lateritic soils covering more
than three-fourth area occur in the upland and transitional zones, on the slopes and in the flood plains
of streams with thickness ranging from 0.3 to 1.0 m, the red loamy soils are found to occur in the upland
and plain regions having thickness ranging between 0.5 to 3.0 metres.

20
STATUS OF WATER SUPPLY AND DEMAND
Bangalore Water Supply & Sewerage Board (BWSSB) is entrusted with the task of providing water supply
to Bangalore metropolis. The water supply of BWSSB from surface water resources viz., Arkavati and
Cauvery Rivers, is presently inadequate to meet the drinking water needs of the people. It is obvious
that the citizens of Bangalore and the numerous industrial establishments are thus heavily dependent
on ground water to meet the deficiency. The demand supply gap is met by groundwater exploitation.
DEMAND
Present Demand : 1275 MLD (For a population of 75 lakhs at 170 LPCD)
Projected Demand : 1700 MLD (For a population of 100 lakhs at 170 LPCD)
PRESENT SUPPLY
1. Surface Water : 840 MLD
2. Ground Water : 475 MLD
Projected demand for a population of 10 millions is going to be 1700 MLD for Bangalore city itself.
Further, with increasing population and rising income, the lifestyle of urban residents is also changing.
Total supply from various surface water sources is going to be 1335 MLD (after the completion of
Cauvery stage IV – Phase II) leaving about 365 MLD to be pumped from ground water sources.
WATER PROFILE
Unlike many other major cities Bangalore is not blessed with a perennial river and this may be the
reason for construction of many lakes across seasonal streams. Once upon a time, about 262 lakes
existed within the Bangalore city limits. This number has come down considerably due to
encroachment. Recently, attempts have been made on selected basis to maintain some of these lakes.
At present major source of water for domestic water supply, is Cauvery River, situated at a distance of
about 100 km from Bangalore. Water is pumped from the source against a head of 510 metres in three
stages. It is estimated that almost 40 per cent of the population of Bangalore is dependent on ground
water. Various government agencies are maintaining a large number of energised bore wells and about
hand pumps in Bangalore City area for augmenting domestic water supply. Various housing colonies,
commercial and industrial establishments have come up in the extension areas. These areas are entirely
dependent on ground water to meet their domestic and industrial needs. On a rough estimate, there
are more than 1.5 lakh ground water abstraction structures in Bangalore. A flourishing ground water
market exists in the city and its outskirts, where ground water is sold by tankers to meet the
requirements of the city population during emergency. On a rough estimate, there are about 2800
tankers with 3000 litres capacity, supplying/selling ground water daily on an average about 8.4 million
litres of ground water, pumped from private bore wells. Peripheral areas, which are solely dependent on
ground water, are going to put further strain on ground water resource with sustained urbanization.
Hence, share of ground water will in drinking water supply increase manifold in days to come. Ever
increasing dependence on ground water has resulted in over-exploitation of the resource.
GROUND WATER SCENARIO
To understand the Ground Water Scenario prevailing in the metroplolis, Bangalore city can be divided
into three zones. First and the innermost zone is erstwhile Bangalore Mahanagar Palika (Bangalore City
Corporation) area, which is fully covered by piped water supply from Cauvery and Arkavathi. Second or
the intermediate zone includes the areas surrounding the Corporation area comprising of 8 C.M.Cs and
one TMC. This area/zone is having partial surface water supply limited to small pockets. The third and
outer most zone comprises of 111 surrounding villages covered under the green belt area. In other
words, wells located in Central part i.e., in old Bangalore City Corporation area have the shallowest
water levels in the range of < 2 - 5 m below ground level (bgl) in post-monsoon season and 3 – 10 m in
pre-monsoon season. In contrast the depth to water level in the outer zone is of the order of 8 – 15 m
in post-monsoon and 10 - > 20 m bgl in pre-monsoon seasons.
In the outer boundaries, the depth to water levels is found to have direct relationship with urbanization
of the area i.e. wherever private colonies/layout have come up water levels are found to be deeper like
21
south-eastern parts of the city and north east parts of green belt area. These colonies/layouts supply
water to the inmates through individual or group borewells called syndicate borewells and hence put
tremendous pressure on ground water resources. With the construction activities on the rise, draft
overcomes recharge and as a result water table depletes fast.
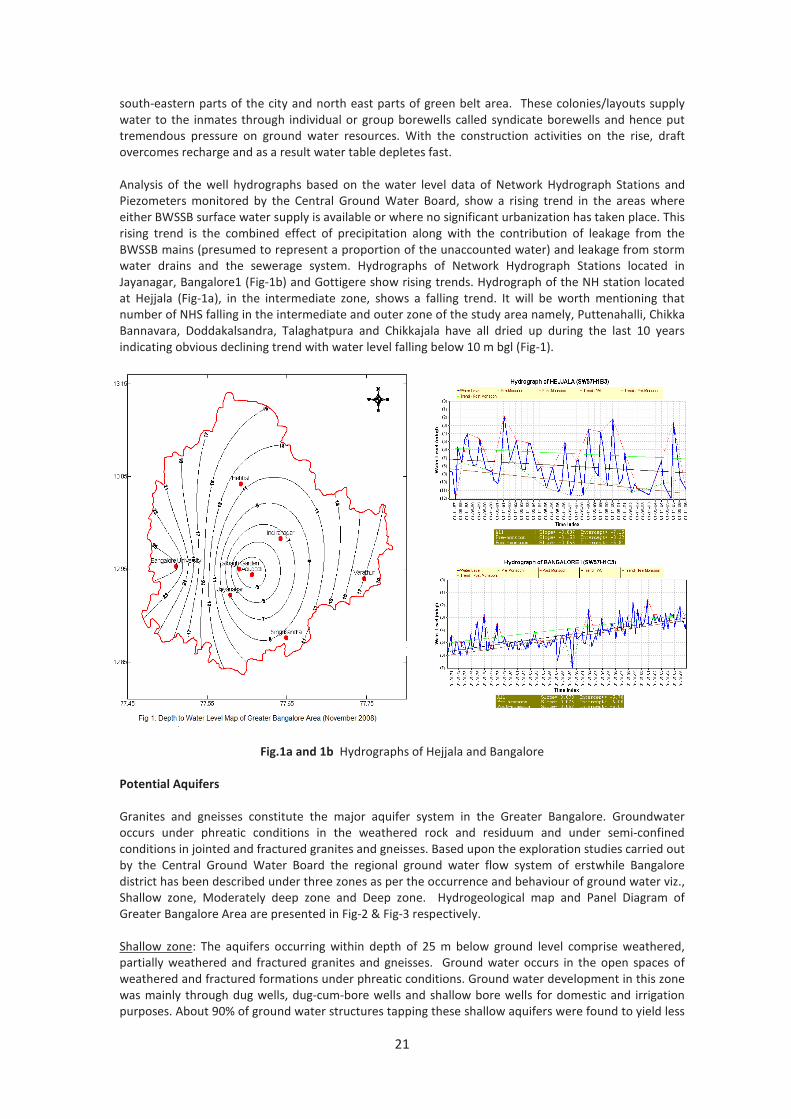
Analysis of the well hydrographs based on the water level data of Network Hydrograph Stations and
Piezometers monitored by the Central Ground Water Board, show a rising trend in the areas where
either BWSSB surface water supply is available or where no significant urbanization has taken place. This
rising trend is the combined effect of precipitation along with the contribution of leakage from the
BWSSB mains (presumed to represent a proportion of the unaccounted water) and leakage from storm
water drains and the sewerage system. Hydrographs of Network Hydrograph Stations located in
Jayanagar, Bangalore1 (Fig-1b) and Gottigere show rising trends. Hydrograph of the NH station located
at Hejjala (Fig-1a), in the intermediate zone, shows a falling trend. It will be worth mentioning that
number of NHS falling in the intermediate and outer zone of the study area namely, Puttenahalli, Chikka
Bannavara, Doddakalsandra, Talaghatpura and Chikkajala have all dried up during the last 10 years
indicating obvious declining trend with water level falling below 10 m bgl (Fig-1).
Fig.1a and 1b Hydrographs of Hejjala and Bangalore
Potential Aquifers
Granites and gneisses constitute the major aquifer system in the Greater Bangalore. Groundwater
occurs under phreatic conditions in the weathered rock and residuum and under semi-confined
conditions in jointed and fractured granites and gneisses. Based upon the exploration studies carried out
by the Central Ground Water Board the regional ground water flow system of erstwhile Bangalore
district has been described under three zones as per the occurrence and behaviour of ground water viz.,
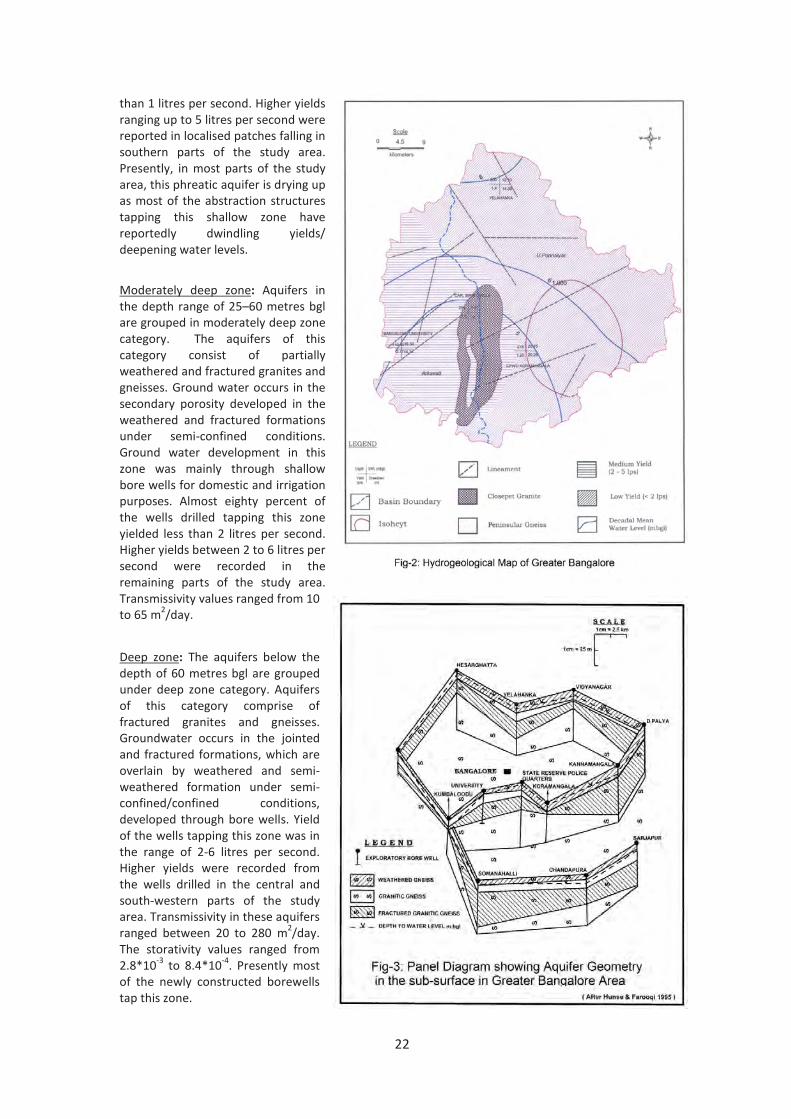
Shallow zone, Moderately deep zone and Deep zone. Hydrogeological map and Panel Diagram of
Greater Bangalore Area are presented in Fig-2 & Fig-3 respectively.
Shallow zone: The aquifers occurring within depth of 25 m below ground level comprise weathered,
partially weathered and fractured granites and gneisses. Ground water occurs in the open spaces of
weathered and fractured formations under phreatic conditions. Ground water development in this zone
was mainly through dug wells, dug-cum-bore wells and shallow bore wells for domestic and irrigation
purposes. About 90% of ground water structures tapping these shallow aquifers were found to yield less
22
than 1 litres per second. Higher yields
ranging up to 5 litres per second were
reported in localised patches falling in
southern parts of the study area.
Presently, in most parts of the study
area, this phreatic aquifer is drying up
as most of the abstraction structures
tapping this shallow zone have
reportedly dwindling yields/
deepening water levels.
Moderately deep zone: Aquifers in
the depth range of 25–60 metres bgl
are grouped in moderately deep zone
category. The aquifers of this
category consist of partially
weathered and fractured granites and
gneisses. Ground water occurs in the
secondary porosity developed in the
weathered and fractured formations
under semi-confined conditions.
Ground water development in this
zone was mainly through shallow
bore wells for domestic and irrigation
purposes. Almost eighty percent of
the wells drilled tapping this zone
yielded less than 2 litres per second.
Higher yields between 2 to 6 litres per
second were recorded in the
remaining parts of the study area.
Transmissivity values ranged from 10
to 65 m2/day.
Deep zone: The aquifers below the
depth of 60 metres bgl are grouped
under deep zone category. Aquifers
of this category comprise of
fractured granites and gneisses.
Groundwater occurs in the jointed
and fractured formations, which are
overlain by weathered and semi-
weathered formation under semi-
confined/confined conditions,
developed through bore wells. Yield
of the wells tapping this zone was in
the range of 2-6 litres per second.
Higher yields were recorded from
the wells drilled in the central and
south-western parts of the study
area. Transmissivity in these aquifers
ranged between 20 to 280 m2/day.
The storativity values ranged from
2.8*10-3
to 8.4*10-4
. Presently most
of the newly constructed borewells
tap this zone.

23
Ground Water Level
Long- term pre-monsoon water level trend shows a general rise in the range of 0-2 metres in the
southern, central and western parts covering almost 50% area of the Greater Bangalore. Fall in water
levels in the range of 0-2 meters is recorded in northern and eastern parts covering remaining parts of
the metropolis. Long term post-monsoon water level trend shows a general fall in the whole area.
While decline in almost the entire area is in the range of 0-2 meters, it is even higher (2-4 metres) in a
small patch in northern part of the study area. National Hydrographic Stations were all dug wells, which
became dry when the water table fell below the bottom of the well (average depth 10 m) as seen in the
Hydrograph of Hejjala (Fig-1a). Keeping this changing hydrogeological scenario in view, a number of
purpose built piezometers were constructed for long time monitoring of water levels and water quality
in Bangalore Urban and Bangalore Rural districts under Hydrology Project by the Central Ground Water
Board during 1999. Hydrographs of the piezometers located in the intermediate and outer zones e.g., at
Dasnapura, Hebbal, Yelahanka and Bommasandra, show declining trend.
Ground Water Resource and Status of Development
Ground water resource of Bangalore Urban district, which includes the entire Bangalore area, are
presented below in Table-2. The resource has been computed jointly by CGWB and DMG. The ground
water draft is mainly through hand pumps and heavy duty water supply borewells. Commercial trading
of water (water marketing through private tankers) based on excessive pumpage of borewell has also
added to the ground water draft. The average stage of development for the Bangalore Urban district
works out to be around 142 percent, categorizing the whole of Bangalore Urban district under Over-
exploited category, pinpointing a very alarming situation.
Table 2: Ground water resource of Bangalore Urban District, Karnataka as on 31.03.2009.
TALUK
Ne
t A
nn
ua
l G
rou
nd
Wa
ter
av
ail
ab
ilit
y
Exi
stin
g G
ross
Gro
un
d W
ate
r
Dra
ft
for
Irri
ga
tio
n
Exi
stin
g G
ross
Gro
un
d W
ate
r
Dra
ft f
or
Do
me
stic
an
d I
nd
ust
ria
l
Wa
ter
Su
pp
ly
Exi
stin
g
Gro
ss G
rou
nd
Wa
ter
Dra
ft
for
All
Use
s
Pro
vis
ion
fo
r D
om
est
ic a
nd
Ind
ust
ria
l R
eq
uir
em
en
t su
pp
ly t
o
20
25
Ne
t G
rou
nd
Wa
ter
av
ail
ab
ilit
y
for
Fu
ture
Irr
iga
tio
n
De
ve
lop
me
nt
Exi
stin
g S
tag
e o
f G
rou
nd
Wa
ter
De
ve
lop
me
nt
ha m ha m ha m ha m ha m ha m %
Anekal 3377 3787 536 4324 536 0 128
Bangalore East 2400 2813 300 3112 300 0 130
Bangalore North 2975 3661 368 4028 368 0 135
Bangalore South 2971 2649 2590 5239 2590 0 176
Total 6348 6436 3126 16703 3794 0 142
Hydrochemistry
Ground water quality has been assessed based on network of sampling stations and it is observed that
concentrations of all the chemical constituents in ground water are within the ‘desirable to permissible’
range except for nitrate. Water quality data of select observation wells is presented in Table 3. The
nitrate (NO3) content in ground water ranges from nil to 554 mg/l. About 50% of the well waters have
nitrate more than the permissible limit of 45 mg/l. The areal distribution of NO3 contents in ground
water indicates that northern part of Bangalore Metropolitan Region is more affected than the southern
part. In north, about 70% of area is having groundwater with high NO3 concentration of more than 45
mg/l as compared to the 30% in the south. It is interesting to note that shallow as well as intermediate
zone of ground water showed high NO3 concentration. The cause for high concentrations of nitrate in
ground water may be point sources i.e., sewage or anthropogenic activities, or non-point sources like

24
the use of excessive nitrate fertilizers in the rural areas. In the mega city, due to predominantly urban
environs, the contamination can only be attributed to municipal waste and sewage Open dumping
practices are commonly adopted for disposal of solid waste, which causes deterioration of
environmental and ground water quality. The prominent areas of nitrate contamination are
Banasawadi, Channasandra, Gottigere, Jalahalli, Kamakshipalya, Laggere, Nagavara and Yelahanka.
Table 3 Water quality data of select observation wells in Greater Bangalore Area
Sl
No Location pH EC*
Concentration in mg/litre
TH^ Ca M
g
N
a
K CO3 HCO3 Cl SO4 NO3 F
1. Banaswadi 8.40 605 185 30 27 46 5.5 18 60 64 50 80 0.53
2. Bannerghatta 7.83 2490 515 120 52 190 220 0 335 330 240 310 0.56
3. Begur 8.04 3260 520 120 53 275 350 0 586 440 258 280 0.32
4. Jalahalli 8.24 1100 320 62 40 84 26 0 104 202 78 120 0.37
5. Kamakshipalya 8.11 1790 620 144 63 103 6 0 134 370 120 120 0.67
6. Laggere 8.00 1840 725 106 112 80 10 0 140 372 102 185 0.47
7. Lakkasandra 8.69 905 315 86 24 52 16 60 165 67 61 56 0.65
8. Maratahalli 7.60 1775 640 148 66 90 5 0 213 376 84 98 0.46
9. Nagavara 8.26 700 235 52 25 40 12 0 85 85 36 147 0.27
10
.
Yelahanka 7.15 2250 610 190 33 210 50 0 290 500 110 85 0.56
* EC in micromhos/cm at 250C ^ TH (Total Hardness as CaCO3)
Major Ground Water Related Problem
The stage of development of 142 percent indicates that ground water is being pumping more than that
of rechargeable quantity. It leads to continuously fall in water level as the ground water is being
pumped from the static resource which accumulated over hundreds of years. If this trend continues, it
will lead to serious environmental problem by drying up of the top zone permanently, which supports
the bio-sphere. As such, major groundwater related problem is dwindling yield in intermediate and
peripheral area, where domestic water supply is wholly dependent on ground water. Nitrate pollution is
quite rampant in the city due to improper waste management practices.
Feasibility of Rainwater Harvesting and Artificial Recharge
Rainwater harvesting needs to be adopted for replenishing the over-exploited ground water resources.
Rejuvenation of existing water bodies and tanks will also affect increase in groundwater recharge, apart
from adding to the city’s available water supplies.
GROUND WATER DEVELOPMENT STRATEGY
The Strategy for ground water management should be on the following lines:
• Compulsory rain water harvesting in all the buildings irrespective of the size of the site area.
• Compulsory Artificial recharge to ground water at all feasible locations.
• Conservation and preservation of all the water bodies including wells, tanks, ponds, lakes and
streams. Recently, attempts have been made on selected basis to maintain certain lakes like
Madivala, Puttenahalli, Dorekere, Vasanthapura, Narsipura, Kundalahalli, Chikk Jalahalli,
Yediyur and Moggekere by de-weeding and fencing. Few of these lakes at Madivala, Ulsoor,
Sankey, Vasanthapura, Narsipura and Yediyur are even having parks and boating facilities.
Some of these lakes are receiving sewage throughout the year in addition to the surface runoff
generated from rain water and hence contaminate the water bodies. In many areas the tanks
have become the site for garbage disposal. This has to be stopped and spoiling a water body /
water abstraction structure including dug wells should be made a criminal offence.
• Dual Water Supply line system should be made mandatory. Water should be recycled, treated
and reused for non-domestic purposes.
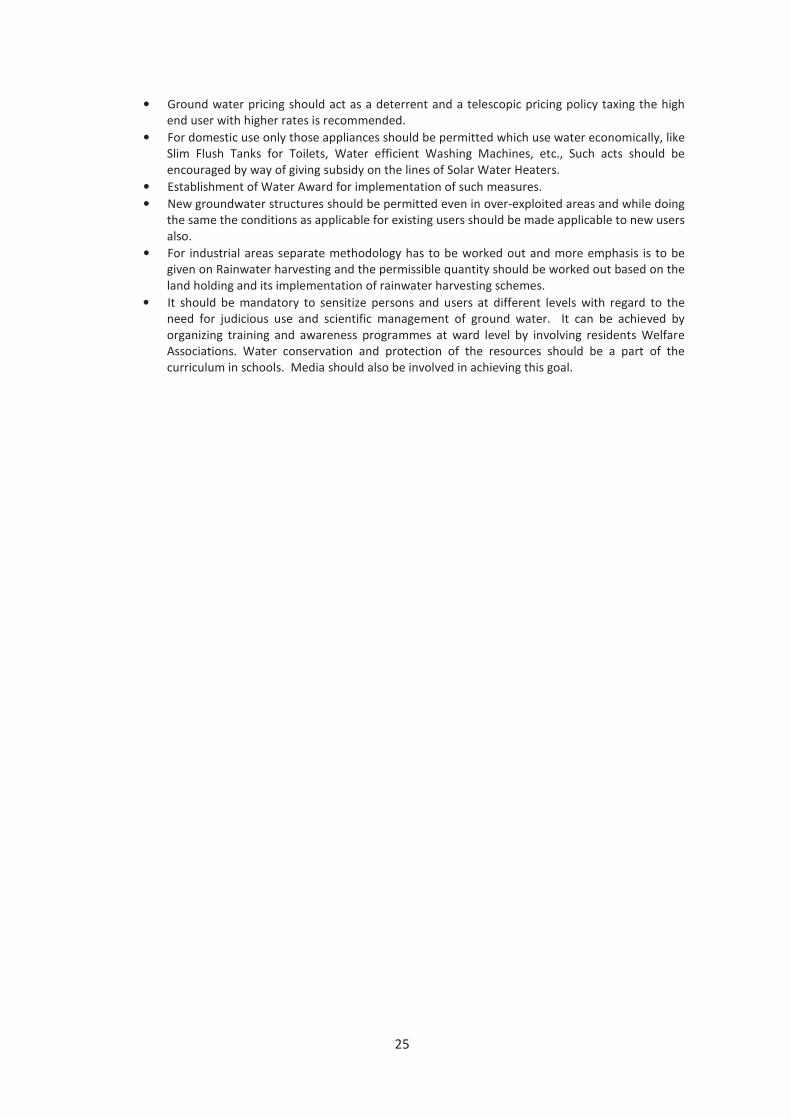
25
• Ground water pricing should act as a deterrent and a telescopic pricing policy taxing the high
end user with higher rates is recommended.
• For domestic use only those appliances should be permitted which use water economically, like
Slim Flush Tanks for Toilets, Water efficient Washing Machines, etc., Such acts should be
encouraged by way of giving subsidy on the lines of Solar Water Heaters.
• Establishment of Water Award for implementation of such measures.
• New groundwater structures should be permitted even in over-exploited areas and while doing
the same the conditions as applicable for existing users should be made applicable to new users
also.
• For industrial areas separate methodology has to be worked out and more emphasis is to be
given on Rainwater harvesting and the permissible quantity should be worked out based on the
land holding and its implementation of rainwater harvesting schemes.
• It should be mandatory to sensitize persons and users at different levels with regard to the
need for judicious use and scientific management of ground water. It can be achieved by
organizing training and awareness programmes at ward level by involving residents Welfare
Associations. Water conservation and protection of the resources should be a part of the
curriculum in schools. Media should also be involved in achieving this goal.

26
BHOPAL CITY, MADHYA PRADESH
L. K. Mathur, CGWB, Bhopal
INTRODUCTION
Bhopal is the capital of the Indian state of Madhya Pradesh and the administrative headquarters of Bhopal
District and Bhopal Division. The city was
the capital of the former Bhopal state.
Bhopal is also known as the Lake City for its
various natural as well as artificial lakes
and is one of the greenest cities in India.
The city attracted international attention
after the Bhopal disaster, when a Union
Carbide India Limited (UCIL) pesticide
manufacturing plant leaked a mixture of
deadly gases including methyl-isocyanate
on the night of 2/3 December 1984,
leading to the worst industrial disaster in
history and a loss of thousands of lives
Bhopal is said to have been founded by the
Parmar King Bhoj-2 (1000–1055), who had
his capital at Dhar. The city was originally
known as Bhopal named after Bhoj and the
dam ('pal') that is said to have been
constructed by him to form the lakes
surrounding the city. The fortunes of
Bhopal rose and fell with that of its reigning dynasty. As the Parmar’s declined in power, the city was
ransacked several times and finally faded away into obscurity. The ruler of Bhopal acceded to India only on 1
May 1949. Sindhi refugees from Pakistan were accommodated in West Bhopal Cities, Bairagarh Sub-Area (Sant
Hirdaram Nagar), a western suburb of Bhopal. According to the States Reorganization Act of 1956, Bhopal
state was integrated into the state of Madhya Pradesh, and Bhopal was declared as its capital. The population
of the city rose rapidly thereafter. In Fig no.1 Bhopal city map is shown with all the water bodies.
GENERAL FEATURES
Area / Administrative Division
Bhopal city is the capital of Madhya Pradesh and it is situated in the central part of India. It lies between N-
latitude 23007' & 23
020' and E- longitude 77
019' & 77
031'. Bhopal city encompasses an area of 296 sq. km with
having 66 municipal wards of which Kaliasot, Gandhinagar & Narela Sankari, become encompasses major area
of the city.
Demography
The urbanization and industrialization leads to growth and development of a city but in turn brings adverse
impact on precious water resources and there by posing a problem to the planners for arranging sustainable
water supply of desired quality for public health. The city particularly the capital of State grow with migration
of population from rural areas and water availability meet out various growing needs and generation of waste
water multiply every-year and such a critical stage over a period of time. The present population of Bhopal
municipal corporation as per census 2001 is 14,37,354 in comparison to the year 1951, in which the population
was 102333.
Hydrometeorology
Rainfall: There is only one rain gauge station at Bairagarh maintained by IMD. The normal annual rainfall of
Bhopal city is about 1260.2 mm. The southern part of the city receives more rainfall than northern part of the
city the rainfall as we move from south to north and towards north west about 92% of the annual rainfall takes
place during the south west monsoon i.e. from July to September. The maximum rainfall (about 39%) takes
Fig.1

27
place during the month of July. Only 6% and 2% of the annual rainfall takes place during the winter (November
to February) and summer season (March to May) respectively. Hence about 8% of the annual rainfall takes
place from November to May. The rainfall in the year 2008 is 697.4 mm only. The rainfall in the year 2010 was
817.2mm
Climate:-The climate of Bhopal city is characterized by a hot summer and well distributed rainfall during the
south west monsoon season. There are three well defined seasons. The winter commences from middle to
November and lasts till end of February and January is the coldest month. The summer season stretched from
March to first week of June and May is the hottest month. The south west monsoon sets in the middle of June
and continues to the end of September during which the maximum rainfall occurs in the city. October month is
retreat of monsoon and November constitutes the post monsoon season.
The daily mean normal temperature of Bhopal is May is about 40.70 C and minimum is 26.4
0 C. The summer
season is the driest period of the year. The humidity is lowest (about 25%) during the month of April. The
humidity is highest during the month of August about 88%.
Physiography & Drainage
The Bhopal city, as shown in
Fig.2, form a part of Malwa
plateau with generally
undulating topography. The
major part is covered by
Vindhyan hills ranges & the
valleys are occupied by Deccan
trap basalt. There are seven
hills scatteredly located
around upper lake and the
highest of them is Singarcholi
near Lalghati which has an
elevation of 625 m above
mean sea level (amsl) the
elevation of Bhopal city
generally varies from 490 to
601 m amsl and the average
elevation is 523 m amsl. In the
catchment area of upper lake
elevation is a high as 540 m amsl. There is no major river flowing through the Bhopal city. The southern part is
drained by river Kaliasot, a small drainage course. It is an outlet of upper lake and becomes a tributary of river
Betwa in the downstream. A limited area in the western side is drained by river Kolans. Patra nala, which
receives overflow of lower lake, drains the central and northern part of the city.
Soil Type
Black cotton soil covers the major part of the area where as central part of the Bhopal occupies Vindhyan sand
stone a thin veneer of red colour soil exist.
STATUS OF WATER SUPPLY AND DEMAND
Sustainable water supply of desired quality in adequate quantity catering to growing need is one of the main
sources of Bhopal city. It included 66 municipal wards spread over an area of 296 sq km. The population has
increased from 185000 in year 1961 to 1482718 in year 2001 indicating an increase of 800% over a period of
40 years. The major requirement of drinking water supply in Bhopal city is met from surface water sources,
namely upper lake and Kolar reservoir besides, more than 400 tube wells and few large diameters dug wells
and hand pumps also meet the requirement, in addition, termination development took place resulted
number of private and government colonies came up in the out skirts of the Bhopal city unaccounted privately
owned dug wells and bore wells installed in individual households, housing colonies, industries, and business
Fig.2

28
complexes also cater the requirement a quantity of approximately 239.40 – 11.71 MLD from upper lake 12.69
MLD from Kolar Dam is released from surface water sources and 11.55 MLD is available from ground water
sources. After accounting for distribution and generation loosed the net water supply 210 MLD is available
from surface water sources. The total water supply from both the sources is 232 MLD against water demand of
350 MLD. Thus the present water supplies falls short of about 120 MLD there is a proposal to release
additional water supply from Kolar reservoir as well as bring the water from Narmada River and revival of old
ground water structures existing in the old city.
WATER PROFILE (SURFACE AND GROUND WATER)
Bhopal city is also known as city of lakes (as shown in Fig.3) because it is embedded 18 water bodies of
different sizes located in and around Bhopal. These water bodies were developed over period of 900 yrs. Since
legendry of Raja Bhoj who has credit for construction of upper Lake Bhopal city is developing very fast is
moving to attend the status of mega city within a decade. Therefore it is need of a time to make a consolidate
plan for restoring vital water resources.
Out of 18 water bodies, the peoples of Bhopal town are more familiar with only 5-6 water bodies because of
their proximity of city some irrigation reservoir such as Hataikheda, Kerwa, Laharpur earlier located in the out
Skirts of the city have now become in internal part of city due to expansion of city in all the directions Salient
features of Bhopal Lakes is given in Table - 1.
UPPER LAKE Fig.3 LOWER LAKE
Table -1: Salient features of Bhopal Lakes
S.N. Name of Water body Water spread Area (in Ha) Present Use
1 Upper Lake 3100 Water supply, recreation, and fisheries
2 Lower Lake 129 Raw water supply and recreation
3 Shahpura 96 Recreation & fisheries
4 Motia tank 1.89 Washing
5 Siddique Hussain Tank 1 Abandoned
6 Munshi Hussain Khan Tank 1.2 Fisheries
7 Lendiya Talab. 1.5 Recreation & fisheries
8 Sarangpani 42 Recreation
9 Laharpur Reservoir 350 Irrigation
10 Hataikheda Reserve 113 Irrigation
11 Halali Reservoir 1625 Irrigation
12 Kerwa Reservoir 524 Irrigation
13 Kolar Reservoir 2850 potable water supply & irrigation
14 Char Imli Pond 1.2 Recreation
15 Ayodhya Nagar Abandon
stone Quarry pond (4 Nos)
6.5 Recreation
16 Damkheda village pond 2.4 potable water recreation

29
GROUND WATER SCENARIO
The area is occupied by the rocks of Vindhyan & Deccan trap and alluvial formations as shown in Fig. 4, the
general geological succession in the city is as under:
Age Group Formation
Quaternary Alluvium
~~~~~~~~~~~~~~~~~Unconformity~~~~~~~~~~~~~~~~~~
Upper cretaceous
to Eocene Deccan Trap
~~~~~~~~~~~~~~~~~Unconformity~~~~~~~~~~~~~~~~~~
Upper Vindhyan Bhander Bhander sandstone
Proterozoaic Supper group Group and shales
Potential Aquifers
In the major part of the study
area, occurrence of promising
aquifer zones is confined
within shallow depths in 70 m.
The shallow aquifer occurs in
(1) Alluvium (2) Weathered
and jointed fractured portions
of Deccan traps and (3)
Weathered and jointed of
Vindhyan sandstone. Alluvium
is deposited in patches along
the major drainage and the
yield is very limited (1 to2 lps).
The Deccan trap basalt forms
moderate to good shallow
aquifers were thickness of
weathering and vesicular
zones is adequate. The Deccan
traps on weathering generally
develop a top layer of black
cotton soil and yellow clay of
low permeability. The
underlying layer of weathered basalts forms the water bearing horizon tapped by most of the dug wells.
Sometimes a layer of jointed basalt located at suitable geographic locations show very high permeability and
supports high pumping through dug wells. In low lying areas the depth of weathering is greater and often a
thick clay layer is also developed which confined the ground water at deeper levels. In the-south-western part
of Bhopal (Misrod valley) the basalt exhibits weathering up to a thickness of 30 meters.
The dug wells are the main ground water abstraction structures for the development of ground water in
phreatic aquifer of Deccan traps. Large diameter dug wells (6 to 8 in) located in topographic depressions or
nearer lo rivers/streams yield, moderate quantity of water. The yield of dug wells in Bairagarh area was
recorded up to 600 cum/day. The shallow tube wells around Hataikheda area were found lo yield between 300
and 600 cum/day. In general the shallow aquifer in Deccan traps yield between 100 and 400 cum/day.
Vindhyan sandstones being general orthoquartzitic in nature are resistant to weathering and do not favour
development of thick weathered profile unless the area is predominantly shale. In sandstones groundwater
occurs mainly in fractures and along bedding joints. The Vindhyan sandstones in the area occupy mainly higher
Fig.4
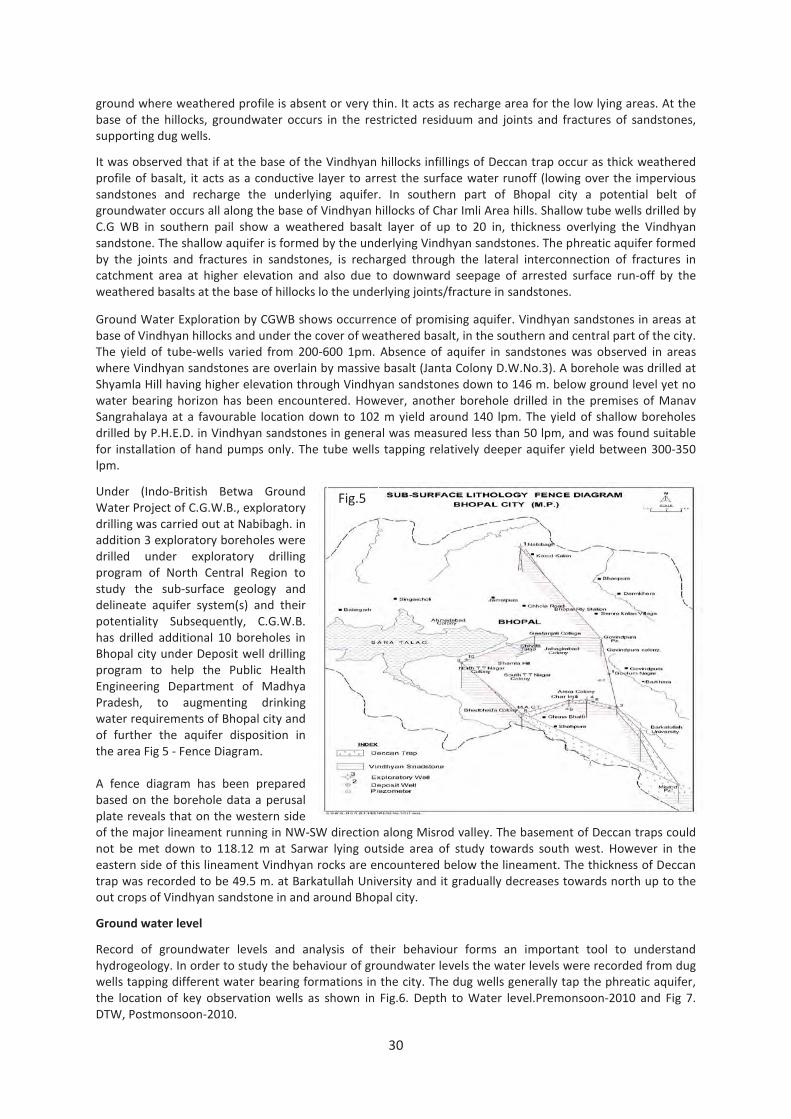
30
ground where weathered profile is absent or very thin. It acts as recharge area for the low lying areas. At the
base of the hillocks, groundwater occurs in the restricted residuum and joints and fractures of sandstones,
supporting dug wells.
It was observed that if at the base of the Vindhyan hillocks infillings of Deccan trap occur as thick weathered
profile of basalt, it acts as a conductive layer to arrest the surface water runoff (lowing over the impervious
sandstones and recharge the underlying aquifer. In southern part of Bhopal city a potential belt of
groundwater occurs all along the base of Vindhyan hillocks of Char Imli Area hills. Shallow tube wells drilled by
C.G WB in southern pail show a weathered basalt layer of up to 20 in, thickness overlying the Vindhyan
sandstone. The shallow aquifer is formed by the underlying Vindhyan sandstones. The phreatic aquifer formed
by the joints and fractures in sandstones, is recharged through the lateral interconnection of fractures in
catchment area at higher elevation and also due to downward seepage of arrested surface run-off by the
weathered basalts at the base of hillocks lo the underlying joints/fracture in sandstones.
Ground Water Exploration by CGWB shows occurrence of promising aquifer. Vindhyan sandstones in areas at
base of Vindhyan hillocks and under the cover of weathered basalt, in the southern and central part of the city.
The yield of tube-wells varied from 200-600 1pm. Absence of aquifer in sandstones was observed in areas
where Vindhyan sandstones are overlain by massive basalt (Janta Colony D.W.No.3). A borehole was drilled at
Shyamla Hill having higher elevation through Vindhyan sandstones down to 146 m. below ground level yet no
water bearing horizon has been encountered. However, another borehole drilled in the premises of Manav
Sangrahalaya at a favourable location down to 102 m yield around 140 lpm. The yield of shallow boreholes
drilled by P.H.E.D. in Vindhyan sandstones in general was measured less than 50 lpm, and was found suitable
for installation of hand pumps only. The tube wells tapping relatively deeper aquifer yield between 300-350
lpm.
Under (Indo-British Betwa Ground
Water Project of C.G.W.B., exploratory
drilling was carried out at Nabibagh. in
addition 3 exploratory boreholes were
drilled under exploratory drilling
program of North Central Region to
study the sub-surface geology and
delineate aquifer system(s) and their
potentiality Subsequently, C.G.W.B.
has drilled additional 10 boreholes in
Bhopal city under Deposit well drilling
program to help the Public Health
Engineering Department of Madhya
Pradesh, to augmenting drinking
water requirements of Bhopal city and
of further the aquifer disposition in
the area Fig 5 - Fence Diagram.
A fence diagram has been prepared
based on the borehole data a perusal
plate reveals that on the western side
of the major lineament running in NW-SW direction along Misrod valley. The basement of Deccan traps could
not be met down to 118.12 m at Sarwar lying outside area of study towards south west. However in the
eastern side of this lineament Vindhyan rocks are encountered below the lineament. The thickness of Deccan
trap was recorded to be 49.5 m. at Barkatullah University and it gradually decreases towards north up to the
out crops of Vindhyan sandstone in and around Bhopal city.
Ground water level
Record of groundwater levels and analysis of their behaviour forms an important tool to understand
hydrogeology. In order to study the behaviour of groundwater levels the water levels were recorded from dug
wells tapping different water bearing formations in the city. The dug wells generally tap the phreatic aquifer,
the location of key observation wells as shown in Fig.6. Depth to Water level.Premonsoon-2010 and Fig 7.
DTW, Postmonsoon-2010.
Fig.5

31
The higher fluctuation in water levels is recorded in Vindhyan sandstones due to low permeability except
Nabibagh area which is underlain by Deccan
Trap formation.
The water level fluctuation in the major area
lies less than 4 m. The higher fluctuation in
water levels is recorded in Vindhyan
sandstones due to low permeability except
Nabibagh area which is underlain by Deccan
Trap formation. The water level fluctuation
map is shown in Fig.8.
Ground Water Resources & Status of
Development
Ground Water Resources
The groundwater resource evaluation for
year 2004 indicates that the stage of
groundwater development in district has
reached to 71% (83% and 61% in Phanda and
Berasia block respectively).Bhopal City falls in
Phanda block. The Net annual ground water
available in the Phanda block is 155.93 MCM
and draft from all uses is 128.92 MCM, Net
ground water available for future irrigation
use is 24.22 MCM only. Thus it has become
imperative for further detailed
hydrogeological investigation in district for
water balance studies making watershed as a
unit. Phanda block falls under semi-critical
Category.
Status of Ground Water Development
Ground water is the main source for drinking
and irrigation in the Bhopal district. About
60% of irrigation in the district is from
groundwater, though the level of irrigation in
the district is only 28%. The total number of
dug wells and tube wells in the district during
2005-06 were 13,080 and 9,708 respectively.
On the drinking water front, Bhopal city have
water supply from surface water (Upper Lake
and Kolar Dam), while the outskirts of Bhopal
city is totally dependent on groundwater. 511
villages in the district have tube wells for
water supply. It is estimated that there is a
steady rise in ground water development in
the district. During the year 2004, the stage of
groundwater development in the district was
71%, which has increased considerably from
1997 estimates.
Hydrochemistry
Surface Water Bodies:-Water quality of different water bodies of Bhopal depicted wide variation in its
characteristics. The water quality of upper lake, Kaliasot, Kolar, HathaiKheda, Kerwa, Kolar etc are moderate.
The relative lower concentration of Nitrate and phosphate reveals the low productivity of the water bodies,
Fig.7
Fig.8
Fig.6

32
while lower concentration of BOD & COD depicts lower content of organic matter in the water body while
water quality of lower lake Char-Imli, Sarangpni, Motia, Munsi Hussain, and Shahpura lakes have deteriorated
due to urbanization and anthropogenic activities. The high concentration of Nitrate and Phosphate in these
water bodies reveals high rate of primary production in the water bodies, while high concentration of BOD and
COD depicts the poor water quality with reference to the organic content.
Ground Water Quality:-The water samples were collected from 16 locations in and around Bhopal city during
June 2008 and were analysed for major containments to evaluate the chemical quality in the Bhopal city. The
chemical analysis data reveals that the water is weakly alkaline in nature as the pH range from 7.16 to 8.09
regarding minerals station of ground water it is good to moderate as evidence by EC values. The highest EC
values observed at 1217 µS/cm at 250 C Barkhera Pathani followed by 1145 us/.cm at Raslakheri. In remain
other locations the values are below 1000 µS/cm at 250 C even at four locations it is less than 500 µS/ cm.
Major Ground Water Related Problems
Bhopal city is expanded in all direction and Municipal Corporation is unable to supply water in agglomeration
area i.e. Kolar road, Ayodhya by pass, Hoshangabad road etc, these areas are completely depending on
ground water and the number of bore hole has increased in many fold high rate of pumping is a main cause in
declining water level every year.
Feasibility of Rain Water Harvesting and Artificial Recharge
Ground Water development has resulted in declining ground water levels and depletion of ground water
resources in such areas. Artificial recharge efforts are basically aimed at augmentation of the natural
movement of surface water into ground water reservoir through suitable civil construction techniques.
Occurrence of rainfall in Bhopal is mostly limited to about three months in a year. The natural recharge to
ground water reservoir is restricted to this period only in a major part of the Bhopal City. Artificial recharge
techniques aim at extending the recharge period in the post-monsoon season for about three or more months,
resulting in enhanced sustainability of ground water sources during the lean season.
In Bhopal city 65-70% area is paved and not available to recharge ground water system, roof top rain water
harvesting is most suitable technique adopted in the city to recharge phreatic and semi-unconfined aquifer
and in the campus of Universities, Engineering Colleges, Government Institutes other various artificial recharge
structures i.e. Stop Dam/Recharge Shaft /Percolation Tank can be constructed at suitable site after conducting
detail study.
GROUND WATER DEVELOPMENT STRATEGIES
Ground Water Development: The Ground Development in the city is being taken up on need basis without
proper back up of scientific investigations. The failure of monsoon of 1989 led to crisis of drinking water in the
city. There was a spurt of drilling of boreholes by PHED for installation of hand pump as a measure for
augmenting water supply. The desired stress on the scientific selection of drilling sites could not be given due
to urgency. The sites for these boreholes were indiscriminately located, even in the proximity of surface
pollution sources or near sanitary channels and no sanitary protection was provided in the intake portion of
well. As a result many hand pumps have gone defunct due to poor quality of water. Subsequently also the tube
wells were constructed to solve drinking water problem at places but selection of sites is not based on
scientific approach. In year 2008 again failure of monsoon and city faced great crisis for drinking water,
Municipal Corporation at this time drilled large diameter (12”) telescopic gravel pack Bore holes sites were
selected keeping in view recharge component
Ground Water Development Possibilities & Recommendations
The share of ground water in the present municipal water supply is only 12.05%.With a view to optimally
develop the resource there is need to properly understand the ground water system which would enable to
demarcate area feasible for construction of various ground water structures. Bhopal city is mainly hard rock
area and the decision for the type of ground water structure to the sunk for ground water development is

33
based on hydrogeological conditions prevailing in different water bearing formation. The different options of
ground water development possibilities are as under:-
1. In areas underlain by alluvium, thickness of which is limited to 30m, Dug wells are feasible. The Deccan
trap basalt occurs in as lava infillings in the valleys of pre existing Vindhyan topography. The weathered
basalt forming phreatic aquifer sustains limited ground water withdrawal mainly through open wells due
to low permeability. In areas where vesicular basalt or highly jointed basalt forms the phreatic aquifer dug
wells diameter about 3 to 4m may be constructed down to average depth of 15m.The dug wells tapping
these aquifer generally yield between 1 to 3 lps and sometime yield is limited i.e. less than 1 lps. The yield
of bore holes1 to 3lps drilled in Deccan trap formation down to the depth of 90 to 200 m bgl occur only
when thickness of aquifer is more. The average depth of tube well in this formation is recommended to be
60 to 70m.
2. At favourable location Vindhyan sandstone moderate to good aquifer and shallow tube wells are feasible.
In general it is found that shallow tube well at the base of Vindhyan hillocks in a narrow belt covered by
the weathered profile of Deccan trap basalts are generally successful. Increase in yield is observed at the
Deccan trap/ Vindhyan contact and joints/ fractures mat at the depths. In general the higher areas
covered by Vindhyans are generally poor in the ground water potential
Conservation of Ground Water Resources
To obtain sustainable yield from groundwater abstraction structures it would be prudent to further recharge
ground water resources through suitable artificial recharge structures. Due to highly undulating topography in
parts of Bhopal city substantial surplus monsoon run off goes unutilised. There is need to conserve this surplus
monsoon run off through simple artificial recharge techniques. The area capable for strong surplus monsoon
run off and subsequently to yield the ground water needs to be selected.
Roof top rain water harvesting for ground water recharge is fast catching up as a effective method to conserve
water and augment the ground water storage. In the plain areas of basaltic terrain with thick cover of
weathered /vesicular basalts forming phreatic aquifer, this method can be implemented. Feasible areas are
around Barkatullah University, RGPV University, C.I.A.R, Nabibagh and Various Engineering Colleges etc. where
large roof area of Govt. Buildings can be utilised to divert the rain water run- off to dug wells/ shallow tube
wells.

34
BHUBANESHWAR CITY, ORISSA
D.Y. Sirsikar, D.P. Pati, Anirwan Choudhary, CGWB, Bhubaneshwar
INTRODUCTION
Bhubaneswar, the capital of Odisha is known as “Temple City of India”. The city has rich cultural background
and represents some of the finest manifestations of Kalingan style of temple architecture. Bhubaneswar at
present stands at the confluence of the past and the present and proudly manifests the soaring spire of Lord
Lingraj, the Raja Rani temple, the Pagoda of Dhauli, popularly known as the white dome of peace, the Jain
temples and the caves of Khandagiri and Udaigiri. Bhubaneswar, once a flourishing capital of ancient Kalinga, is
today the largest city in Odisha. The city has a long history and it dates back to the period of great Mauryan
emperor Ashoka. During the days of Mauryan Emperor, it was known as “Tosali”, the Capital City of Ancient
Kalinga. The serene land has such inherent mysterious power that it could turn the great Mauryan Emperor
Ashoka to the compassionate teachings of Lord Budha after horrendous Kalinga war in the 261 B.C. Today,
because of its magnificent culture and heritage, Bhubaneswar is an important tourist centre not only in India,
but also in the whole world. Tourism is the major industry of the city. The Lingaraj Temple, Mukteswar temple
and Raja Rani Temple(1000 AD), Ashok inscriptions at Dhauli, archaeological remains of Sisupalgada (300 B.C.)
and Jain monuments of Khandagiri and Udaygiri (between 200 B.C. to 100 A.D.) are some of the important
monuments of the city. The old city, popularly known as, Ekamrakhsetra, featured by conglomeration of
temples, monuments, mandapas, heritage ponds etc. The city was adopted as the Capital city of Odisha in
1948. Subsequently a number of offices, organizations and other infrastructural facilities developed in the city
to keep pace with time. As of now, Bhubaneswar is under tremendous pressure because of the rapid
urbanization and tourist importance. The present Bhubaneswar is transforming towards a new identity apart
from its cultural heritage, as a major centre for information technology, educational and research organization
and attracting millions of tourists both from India and abroad.
GENERAL FEATURES
Area / Administrative Divisions
The Bhubaneswar city lies in the eastern part of Orissa State. The master plan area of city includes major part
of Bhubaneswar block of Khurda district and also small part of Cuttack and Puri districts. It is situated
between latitudes of 20°12′N to 20°25′N
and longitudes between 85°44′E to
85°55′E and falls within Survey of India
toposheet nos. 73 H/15 and 73 H/16 (1:
50,000 Scale).The city master plan area
covers 233 sq.km. though the municipal
area of Bhubaneswar Municipal
Corporation covers only 135 sq. km. The
city is divided into 30 wards(converted
from its original 28 villages). It is situated
on the South Eastern Railway line joining
Howrah and Chennai at a distance of 435
Km South of Kolkata. Bhubaneswar is well
connected with the main cities are
Kolkatta, Chennai, Hyderabad and
Visakhapatnam by Highways, Railways and
Airways. The location map of
Bhubaneswar city is given in figure 1.
Figure 1 : Location Map of Bhubaneswar City, Odisha
Demography
The extent of infrastructure requirements and urban services mainly depend on size of the population residing
in the city. The city has grown from a meager population of 8170 in 1921 to 6,57,477 in the year 2001, which is

35
highest in the state.. There has been steady growth of population in Bhubaneswar city except for the first two
decades when there was a drop in the population. This was mainly due to epidemics like cholera, plague etc.
There has been sudden rise since 1941. The sudden rise in population was due to the migration of the people
from all over Odisha to Bhubaneswar. The city experienced the highest growth rate in 1961-1971. This was the
highest growth (176.07%) rate experienced by any other capital cities in the country. This was due to
expansion of the administrative, liaison, and institutional and industrial activities.Later on the city experiencing
a fall in the population growth rate. The reduced population growth during 1981 to 1991 could be the
restricted industrial development due to the declaration of the Bhubaneswar Urban Area as the ‘Air Pollution
Control Area’. The increase in population from 1991 to 2001 at the normal rate is the normal urbanization
trend as is happening in other cities of the country. The Projected Population for 2011 is likely to be around
13,14,954. The average tourist inflow to the city is around 3500 per day.
Hydrometeorology
The city experiences a humid sub-tropical climate. The rainy season is from June to September. The winter
extends from December to February. And summer season is from March to May. The average annual rainfall is
around 1380 mm (1996 to 2009) and about 80 % of annual rainfall is received from the South-West monsoon
from June to September. The analysis of long term rainfall data indicates that on an average the city
experiences mild drought in 30% cases and 8% normal drought and no severe drought. May is the hottest
month with the mean daily temperature of 38 °C while December is the coldest month with mean daily
temperature around 16 °C. The mercury occasionally rises upto 48 °C during summer and it drops to 9.4 °C
during the winter. The relative humidity varies from 48 to 85% and sometimes goes upto 95% during rainy
season. Wind speed is fairly strong during summer and monsoon months and major directions from SW and
South. The average wind speed is around 14 Km/ Hour. The mean monthly potential evapo-transpiration varies
from 57 mm during January to 248 mm during May.
Physiography & Drainage
Bhubaneswar city area is characterized by undulating upland topography in western and central part while
eastern part shows more or less flat topography with gentle slope towards east or south east. Altitude varies
from 60m in the western part to 15m in the extreme eastern part. The East Coast Railway line forms the broad
boundary between the above mentioned morphological setups. The upland areas shows lateritic cover while
gently sloping area shows mainly alluvial cover with or without thin lateritic cover on the top. The upland areas
in the western part are dotted with isolated hillocks made up of shale-sandstone sequence of Upper
Gondwana rocks belonging to the Athgarh Formation. The main drainage channel is the Kuakhai River which is
a distributary of the Mahanadi River. The Kuakhai River flows more or less along the eastern margin of the
city. The Kuakhai River has been
subdivided into Bhargavi and Daya River
in the extreme south eastern part of the
city. The Daya River flows in more or
less along the south eastern margin of
the city. Besides these, a number of
small streams originates from the
western upland areas and flows through
the city mostly in easterly and south
easterly direction and falls either in
Kuakhai or Daya River. The Kuakhai and
Daya rivers are perennial while the
other minor streams are ephemeral in
nature. The hydrogeomorphological
map of the Bhubaneswar city is shown
in figure 2.
Fig 2 : Hydrogeomorphological Map of Bhubaneswar City
Soil Type
The soils of the city can be divided into Alfisols and Ultisols

36
Alfisols :The texture of this soil is sandy loam and these occur in the eastern part of the city. The soils are
generally deficient in phosphorous and nitrogen and pH ranges from 6.5 to 7.3.
Ultisols : The laterite and lateritic soils cover rest of the city area. These soils are characterized by a compact to
vermicular mass in sub-soil horizons, composed merely of mixture of hydrated oxides of Aluminium
and Iron and are devoid of the alkali and alkaline earth metals.
STATUS OF WATER SUPPLY & DEMAND
The PHED at present (March’ 2010) supplies 206 million litres per day (MLD) of water through pipe water
supply scheme and out of which the supply from ground water source is 41.6 MLD and the rest is from the
surface water source. PHED generally withdraws 41.6 MLD i.e., 4.16 ham / Day of ground water through 103
deep bore wells for pipe water supply. Besides this, the dwelling complexes like flats and individual house
owners also use ground water where
PHED pipe water supply is not available.
It has been estimated that about 20
MLD ground water is drawn in addition
to PHED supply through shallow / deep
bore wells and open / dug wells on
private capacity which accounts for 2
ham per day. The estimated water
requirement for the city by the year
2020 is about 422 MLD at the rate of
165 litres per person per day. Apart
from this, there may be additional
requirement of water for smooth
functioning of city life. The available
ground water resource in the city
master plan area indicates that ground
water can supply 122 MLD maximum
considering 85% utilization of the
available annual replenishable ground
water resources of 5242.5 ham. The
balance requirement which amounts to
more that 300 MLD is to be met from
other resources like surface water
sources etc. However, ground water
draft of 162 MLD may be feasible
considering the fact that the draft
during rainy season does not affect the
annual replenishable resource and
available resource can be utilized for
non-rainy seasons. Under this situation
also the balance requirement of 260
MLD of water is required to be
arranged from other sources. The water
supply system of Bhubaneswar is given
below in figure 3 Fig 3 : Water Supply map of Bhubaneswar city, Odisha
(Source PHED, Govt. of Odisha)
WATER PROFILE
Surface Water
Bhubaneswar City gets its water supply from Mahanadi, Kuakhai and Daya River. River Daya and River Kuakhai
are needed for drinking water supplies for the current and the future needs of the City and for carrying storm

37
water from the City. Presently, water supplied to the City is about 164 MLD. In addition to this there are about
500 and odd temples mostly confined to the Old Town area. Each temple in this part of the city has one or
more water tanks nearby. Some are quite small while others represent huge expanse of freshwater. As regard
to their origin, temple ponds are believed to have originated initially as vast depressions created by removing
enormous amount of soil needed to built earthen ramps that were used for dragging the huge blocks of stone
to heights corresponding to the rising height of the temple under construction. After the completion of the
temples, these depressions were sized and lined with the surplus stone available and were converted into
temple ponds for use during daily rituals and festive occasions. There are around 10 heritage tanks and
another additional 13 manmade tanks covering an area of over 70.39 hectares. There are some minor cold
water springs in the western upland areas. The springs are mostly seasonal and discharges of water in these
springs are either water trickles down or oozes out or are have 0.5 to 1.5 lps discharge with variation in
different reasons.
Ground Water
Ground water development is through open / dug wells, shallow and deep bore wells as well as shallow and
Filter point tube wells. PHED, Govt of Odisha is the major organization for withdrawal of ground water for
domestic water supply. Besides this, the dwelling complexes like flats and individual house owners also use
ground water where PHED pipe water supply is not available. The top weathered zone overlying the gritty and
partially lateritized Athagarh sandstones of Gondwana are mainly tapped by dug wells & filter point tube wells.
In general it has been found that the ground water from both the shallow and deeper zones are slightly acidic
in nature. The deeper aquifer though in general contain a little higher concentration of iron than that of
permissible limit but the dug well water normally does not show any higher concentration beyond permissible
limit except in isolated cases as the dug well water remains in constant contact of atmospheric air which
facilitates oxidation and precipitation of iron.
GROUND WATER SCENARIO
Potential Aquifers
Bhubaneswar city is underlain by geological formations belonging to Upper Tertiary and Quaternary age. The
Upper Tertiary formations include shale-sandstone sequence belonging to the Athgarh Formation of Upper
Gondwana Group. The Quaternary formations include laterites and alluvial deposits.
The major part of the city i.e., western and central part are underlain by shale-sandstone sequences of Athgarh
Formation. The sandstones are fine to coarse grained, white to grey in colour and feldspathic in nature. These
sandstones are at times pebbly, conglomeratic, gritty and ferruginous and are intercalated with greyish white,
pinkish and carbonaceous shale and kaoline. The sandstones in general though fractured and friable but are
hard and compact at places. The near surface parts of the sandstones are generally partly lateritised. The
thickness of the Athgarh Formation in major part of the city is more than 200m. The Quaternary formations
comprises mainly of laterites and alluvial deposits. The laterite and lateritic gravels mainly occur in the central
and western part as capping over the country rocks. The thickness of laterites on average is around 4 to 5m
with the maximum around 12 to 13 m at local pockets. The thick laterite cover generally occurs in the western
upland part of the city. The alluvial deposits which include mostly Recent alluvium occurs as thin layers along
the extreme eastern part of the city. The maximum thickness is around 30 to 40m and composed of clay, silt
and fine to medium coarse sand. The Alluvial deposits are underlain by the Athgarh Formation. The
hydrogeological map of Bhubaneswar city is given in figure 4.
Athgarh Formation: The aquifer systems in this formation at shallow as well as at deeper depths are mainly
formed by sandstones. The shale form mainly phreatic aquifers and that also with limited potential. The
weathered zone extends down to 12 to 15m and top weathered part down to an average depth of 5 – 6m is
lateritised. The yield from the dug wells on an average is around 20 – 25 m3 / day, if sandstone predominates.
The same is around 10 – 12 m3 / day, if shale predominates. The yield factor in sandstones generally varies
from 1 – 2 lpm / m2 / m of drawdown while the same in shale is less than 1 lpm / m
2 / m of drawdown. The
yield from the deeper fractures varies widely and mostly fractured and friable sandstones form the aquifer
zones. The wells were drilled down to a maximum depth of 151 m and the yield varied from 1.5 lps to 30 lps

38
with the average around 7 – 10 lps. The fracture zones are generally restricted within 100 m depth. The depth
of static water levels vary between 8 – 12 m below ground level during summer and drawdown of water levels
during pumping is restricted within 30 m. The specific capacity values ranges from 9.47 to 252.4 lpm / m of
drawdown with the average value around 90 – 100 lpm / m of drawdown. The transmissivity values ranges
from 15 - 258 m2 / day with the average around 100 m
2 / day.
Laterites : The laterites form only phreatic / shallow unconfined (dug well zone) aquifers mostly in western
and west central part of the city but in other part the laterite aquifers are seasonal(Perched Aquifers) i.e.,
holds water upto January or February month due to len thickness 4 to 5 m. In the western part on an average
laterite forms aquifers down to 10 – 14 m depth and hold water almost throughout the year. The yield of the
existing dug wells in these aquifers upto the month of December / January on an average is around 30 – 35 m3
/ day and afterwards reduces due to depletion of water levels. In the west central part the lateritic aquifers
form seasonal aquifers as the average thickness of the laterite is only 4 – 5 m. The dug wells which tap only
laterite generally go dry after January / February. During post monsoon season these existing wells yields
water around 30 – 35 m3 / day. As such only lateritic aquifers are not dependable for meeting up water supply
throughout the year even for individual house hold unless sandstone aquifers occurring below them are
tapped. The yield factor in laterites is generally 2 lpm / m2 / m of drawdown.
Un-Consolidated Formation : This formation includes sand, clay, silt layers which occurs in the extreme
eastern part of the city. The thickness varies from negligible to a maximum of 30 – 40 m. The aquifers are
mainly formed by the sand layers and may be divided into shallow unconfined and deeper semi-confined
aquifers. The yield of the existing dug wells in shallow aquifer on average, is around 40 – 45 m3 / day and the
yield sustains throughout the year without any variation. The yield factor of the alluvial aquifers is generally
2.5 – 3 lpm / m2 / m of drawdown. The yield from deeper zones which are generally tapped by tube wells
depend upon the thickness of alluvial deposit and also on the cumulative thickness of sand zones (medium to
coarse sand). On an average 4 – 6 m thick (individual or cumulative thickness) medium to coarse sand layers
may yield upto 35 lps with the average yield of 15 to 20 lps. The drawdown of pumping water level is generally
within 6 / 7 m and tube wells may be run for 8 – 9 hours in a day and continuously for 3 – 4 hours. The water
level in these tube wells generally rests within 4 – 5 m during peak summer.
Fig 4 : Hydrogeological Map of Bhubaneswar city , Odisha

39
Ground Water Level
Ground water regime was earlier monitored by Central Ground Water Board, four times in a year through 5
permanent hydrograph stations which are dug wells and also through 2 Piezometers constructed under
Hydrology Project. Since 2009, 51 additional stations have been established in the master plan area and are
being monitored on a monthly basis. The pre-monsoon depth to water level(2009) of the phreatic aquifers
varies from 1.22 mbgl to a maximum of 11.30mbgl with an average of around 4.77 mbgl. The post-monsoon
depth to water level(2009) of the phreatic aquifers varies 1.08 mbgl to a maximum of 9.02 mbgl with an
average of around 4.38 metres below ground level. The seasonal fluctuation of pre vs. post monsoon depth to
water levels varies from a fall of 2.27 m to a rise of 3.97 with an average rise of about 0.39 m. The depth to
water level maps of phreatic aquifers in 2009 are shown in figure 5.
Fig 5 : Pre & Post Monsoon Depth to Water Level 2009 & Fluctuation(Phreatic Aquifer)
Map of Bhubaneswar City
Long Term Scenario : The average range of depth to water levels, from 2000 to 2009 is furnished in table 1
below
Table 1 : Average Water Levels (2000 – 2009) of Bhubaneswar City
Location January April August November
Metres below ground level
Saheed Nagar 4.11 4.02 2.41 3.34
Kapilprasad 5.56 5.41 0.96 2.83
Khandagiri 12.71 12.95 10.99 10.59
Patia 5.08 5.52 1.72 3.9
Raghunathpur 1.96 2.53 2.34 2.03
The above table indicates that, the average water level during pre monsoon period along central part of the
city varies from 4 – 5 m while in the western part (Khandagiri) the water level is deep. Similarly during post
monsoon period the water level along the central part varies from 2 – 3.4m and it is deep in the western part.
During pre-monsoon period depth to water level remains between 2 – 4 m depth range in the eastern,
southern and north eastern part of the city and water level is deep (> 8m) in the extreme WNW sector of the
city. The water level ranges between 4 – 6 m depth in the central part. During post monsoon period water
level is less than 2 m depth in the eastern, southern and north eastern part. The water level is more than 6 m
deep in the WNW sector. In the rest of the area, water level varies from 2 – 6 m depth range. The average
water level fluctuation with respect to pre and post-monsoon is to the tune of 2 – 3 m only.
The trend of water levels on long term basis (2000 – 2009) has been studied for pre-monsoon and post-
monsoon season periods based on the data of permanent hydrograph stations and presented in the following
table 2 below

40
Table 2 : Trend of Ground Water level ( 2000 – 2009 )
Location Pre-Monsoon Post-Monsoon
Rise(m) Fall(m) Rise(m) Fall(m)
Saheed Nagar - 0.031 0.042 -
Kapilprasad - 0.025 0.089 -
Khandagiri - 0.149 - 0.082
Patia - 0.147 0.065 -
Raghunathpur 0.144 - 0.274 -
The table above shows rise and fall during pre and post-monsoon periods and values of rise and fall are of vary
minor magnitudes. Hence the values of rise and fall are ignored and opined that the water levels remain more
or less same over the years indicating no adverse affect on the ground water regime quantitatively.
Water Table Configuration : An attempt was made to depict the water table configuration of pre-monsoon
period by using water level data of National Hydrograph Stations and other water level data collected during
different investigations. Based on the available data, water table configuration could be depicted for central,
eastern and southern part of the city and contour indicates that water table varies from 35 m amsl in the
central part to 15 m amsl in the east central part. The ground water flow is towards east and south east. i.e.,
towards the rivers, bordering eastern and south eastern boundary of the city. The water table gradient on an
average varies from 0.5 m / Km to 2 m / Km in the major part of the city, which indicates that the nature of
the water table.
Ground Water Resource & Status of Development
The Annual replenishable ground water resource for the master plan area (233 Sq.Km.) has been estimated
following the GEC norm,1997 considering the available data on water level fluctuation and specific yield of the
formation. Based on the data, average water level fluctuation was considered as 3 m and specific yield as 7.5
%. It is found that the annual replenishable ground water resources is to the tune of 5242.5 Hectare Metre
(HaM) for the city master plan area. Due to the absence of precise data the resource of deeper zones could
not be estimated, however, this resource (5242.5 HaM) can be taken as annual replenishable resource for both
shallow and deeper zones down to 100 m depth because major part of the city area is underlain by semi-
consolidated highly fractured sandstone. The shallow and deeper aquifers appears to be directly connected.
Ground water development is through open / dug wells, shallow and deep bore wells. PHED, Govt of Odisha is
the major organization for withdrawal of ground water. PHED generally withdraws 41.6 MLD i.e., 4.16 HaM /
Day. Besides this, the dwelling complexes like flats and individual house owners also use ground water where
PHED pipe water supply is not available. It has been tentatively estimated that these flats and individual
houses, small industries and PHED hand pumps together draws 20 MLD ground water through shallow / deep
bore wells and open / dug wells which accounts for 2HaM per day. The total ground water withdrawal is 6.16
ham per day and annual figure becomes 2248.4 ham (say 2250 ham). But it can be assumed here that during
rainy season, the withdrawal of ground water is immediately replenished by the rain water. Hence the draft
for rainy season which accounts for 549 ham (6.16 ham per day X 90 days) is balanced by rainfall and actual
draft may hence be assumed to be only 1701 ham, which is 32.24 % of the available ground water resource.
The balance ground water resource is 3541.5 ham.
Hydrochemistry
The ground water quality of the Bhubaneswar city has been studied by analysing water from dug wells and
bore wells. In general it has been found that the ground water from both the shallow and deeper zones are
slightly acidic in nature. The deeper aquifer though in general contain a little higher concentration of iron than
that of permissible limit but the dug well water normally does not show any higher concentration beyond
permissible limit except in isolated cases as the dug well water remains in constant contact of atmospheric air
which facilitates oxidation and precipitation of iron. The analysis data also indicated that concentration of
different chemical constituent and pH vary in pre and post monsoon period. A perusal of data revealed that pH
is low in majority of the cases and in some cases iron content is high particularly in deeper aquifer water. As

41
per BIS norms the water is fit for drinking purpose except for lower pH value in majority of the cases and high
iron content in deeper aquifer in some cases. The pollutants like nitrate and fluoride etc. are generally within
the permissible limits, though, higher concentration of nitrate is noticed in some isolated pockets. This
indicates that proper treatment is needed to raise pH values and reduce the iron content though iron content
does not create any major health problem except staining utensils, clothes etc. The seasonal areal distribution
of chemical parameters of phreatic and deeper aquifers are given in figure 6 and 7 respectively. The range of
chemical parameters for both shallow and deeper aquifer are given in table 3 below
Table 3 : Range of Chemical Parameter of Ground Water in Bhubaneswar
Parameters
(in mg / l
except pH)
Indian Standard
( BIS: 10500, 1991)
Total No. of
Samples from
shallow and
Deeper zones
No. of Samples
within Standard
Limit
% of Sample
above
Permissible
Limit Desirable
Limit
Permissible
Limit
pH 6.5 – 8.5 No Relaxation 80 10 87.5
TDS 500 2000 80 80 Nil
Total Hardness 300 600 80 80 Nil
Calcium 75 200 80 80 Nil
Magnesium 30 100 80 80 Nil
Chloride 250 1000 80 80 Nil
Nitrate 45 100 80 79 1.25
Sulphate 200 400 80 80 Nil
Fluoride 1 1.5 80 80 Nil
Iron 0.3 1.0 80 67 16.25
Fig 6 : Pre and Post Monsoon Water Quality(Phreatic Aquifer)

42
Fig 7 : Pre and Post Monsoon Water Quality(Deeper Aquifer)
Major Ground Water Related Problems
In general it has been found that the ground water from both the shallow and deeper zones are slightly acidic
in nature. The deeper aquifer though in general contain a little higher concentration of iron than that of
permissible limit but the dug well water normally does not show any higher concentration beyond permissible
limit except in isolated cases as the dug well water remains in constant contact of atmospheric air which
facilitates oxidation and precipitation of iron. The analysis data also indicated that concentration of different
chemical constituent and pH varies in pre and post monsoon period. A perusal of data revealed that pH is low
in majority of the cases and in some cases iron content is high particularly in deeper aquifer water. As per BIS
norms the water is fit for drinking purpose except for lower pH value in majority of the cases and high iron
content in deeper aquifer in some cases. The pollutants like nitrate and fluoride etc. are generally within the
permissible limits, though, higher concentration of nitrate is noticed in some isolated pockets.
Feasibility of Rainwater Harvesting and Artificial Recharge
The PHED at present utilizes 41.6 MLD of ground water for domestic supply. The expected requirement of
water by 2020 is 422 MLD. Apart from this, there may be additional requirement of water for smooth
functioning of city life. The available ground water resource in the city master plan area indicates that ground
water can supply 122 MLD maximum considering 85% utilization of the available annual replenishable ground
water resources of 5242.5 ham. Considering the huge requirement of water, steps are to be taken for
augmentation of ground water resource by artificial recharge method. Rain water may be used as a source for
artificial recharge. The entire rainwater precipitating on the roof top of any building may be collected at one or
more place on the ground surface and same may be injected underground through pits, trenches etc. This will
facilitate in augmenting ground water resources. The roof top harvesting of rain water should be made
mandatory for each building in the city area. Apart from this, surface storage facilities like tanks, lakes, ponds
etc. should also be created and / or renovated as far as possible.

43
GROUND WATER DEVELOPMENT STRATEGY
Augmentation of Drinking Water Supply from Existing Ground Water Resources
The PHED presently supplies 206 MLD of water through pipe water supply scheme out of which ground water
source supplies 41.6 MLD. The estimated water requirement for the city by the year 2020 is about 422 MLD at
the rate of 150 litres per person per day. Apart from this, there may be additional requirement of water for
smooth functioning of city life. The available ground water resource in the city master plan area indicates that
ground water can supply 122 MLD maximum considering 85% utilization of the available annual replenishable
ground water resources of 5242.5 ham. The balance requirement which amounts to more that 300 MLD is to
be met from other resources like surface water sources etc. However, ground water draft of 162 MLD may be
feasible considering the fact that the draft during rainy season does not affect the annual replenishable
resource and available resource can be utilized for non-rainy seasons. Under this situation also the balance
requirement of 260 MLD of water is required to be arranged from other sources. However, pumping schedules
should be clearly be synchronized in different part of the city specially in the high population pockets and in
areas with higher density of ground water abstraction structures to reduce the effects of cumulative
drawdown. Also people should be encouraged to use dug well water for both potable and non-potable use to
reduce the stress on the underlain deeper confined to semi-confined aquifers. The ground water development
possibility map is given in figure 8
Fig 8 : Ground Water Development Possibility Map of Bhubaneswar City, Odisha
Augmentation of Water Resources by Water Conservation etc.
As described earlier there are more than 10 heritage tanks and about 13 man made tanks in Bhubaneswar.
These have been the traditional spots for rainwater conservation since time immemorial. In addition to this
there are a number of small nallahs, drainage channels, springs. Due to the rapid stress of urbanization, most
of these natural drainage channels have now become obscured or blocked. Efforts must be made to
demarcate these areas and make them encroachment free. This will improve drainage congestion and restore
hydrological equilibrium of the city area. Apart from this, under JNNURM, Bhubaneswar Development
Authority undertook steps to study the feasibility of renovation / restoration of old tanks and other water

44
bodies. Once implemented, this will enhance the ground water recharge in the environs and improve both the
quality and quantity of the ground water.
Considering there is 70.39 hectares(≈ 7,03,900 m2) area of water bodies and 50% of it to be repaired / restored
/ renovated. Once renovated, considering 60 days monsoonal storage about 10,55,850 m3 / year of water can
be potentially recharged to the phreatic aquifer from these existing water conservation structures. The
renovation / repair / restoration cost on an average @ Rs. 50/- per square metre will amount to Rs.
1,75,97,500/-
Augmentation of Water Resources by Artificial Recharge etc.
Considering the huge requirement of water, steps are to be taken for augmentation of ground water resource
by artificial recharge method. Only rain water should be used as a source for artificial recharge. Besides above,
it is very much necessary to keep a vigil on ground water regime of Bhubaneswar city both quantitatively and
qualitatively. The ground water level monitoring periodically by construction of piezometers in the city area on
a grid pattern should be initiated to reveal the exact ground water scenario in finer detail. Indiscriminate
boring, particularly in the municipal area by multi-storeyed dwelling or other complexes should be restricted,
otherwise ground water depletion in local pockets may happen. Additionally, proper disposal of huge city
garbage should be ensured, so that ground water should not be polluted. This should be checked by Periodic
monitoring of ground water quality.
As per the latest comprehensive development plan for the city of Bhubaneswar(as per Bhubaneswar
Development Authority) a total of 96.21 sq. km. of area is earmarked for buildings which includes residential,
commercial, Industrial, Institutional and Utilities and Administrative areas. The envisaged land use pattern is
given below in table 4.
Table 4 : Envisaged land use pattern of Bhubaneswar City(CDP)
Sl Landuse Area in
Sq. Km.
% of
Total Area
1 Residential 75.40 32.7
2 Commercial 4.94 2.14
3 Industrial 5.86 2.54
4 Institutional & Utilities 7.11 3.09
5 Administrative 2.9 1.26
6 Open Space 13.77 5.98
7 Transport & Communication 18.91 8.21
8 Water Bodies 33.82 14.7
9 Drainage Channel 2.59 1.10
10 Green Belt including Protected Forest & Reserve Forest 68.15 28.3
TOTAL 233.3 100
In view of the above it is expected that a huge surge of population will live within the city municipal limits. This
would in turn trigger an accelerated water consumption which in turn will evolve to an addition dependence
ground water and add stress to the existing ground water regime.
Under such circumstances the following measures for artificial recharge is proposed for the city of
Bhubaneswar.
1. Roof top rain water harvesting to be made mandatory to all new constructions hence forth. First all the
governmental building and infrastructures(existing/ under construction / under consideration) should
adopt roof top rain water harvesting. For around 20 such buildings feasibility studies may be undertaken.
2. As per CGWA guidelines, all commercial establishments, hotels, Apartment complexes, Malls etc should
mandatory implement a Rain water harvesting scheme which should include a component of Artificial
recharge to ground water as well. Around 20 such complexes exist and feasibility studies may be carried
out for the same.

45
3. In all the green belts, in addition to renovating & restoring the existing ground water conservation and
storage structures, new cost effective structures may be constructed. On a pro-rata basis it is estimated
that an additional 100 such structures are feasible in the city.
Considering 60 days of monsoonal storage, the potential recharge from 100 proposed water conservation
structures is expected to be around 45,000m3 / year to the phreatic aquifer. Again considering at least 40
recharge bore wells is feasible in the City which are capable of taking 1 lps of water on an average, for 60
monsoon days, potential recharge to the underlain deeper aquifer is expected to be around 3,11,040 m3/year.
Thus if feasible and implemented the water conservation and rain water harvesting is expected to recharge
around 15,05,850 m3 of water per year to the phreatic aquifer & around 3,11,040 m
3 of water per year to the
deeper aquifer. The areal distribution of the proposed rainwater harvesting plan are given in figure 9
Expected Cost Component for Water Conservation and Artificial Recharge:
1. Feasibility Studies for Roof Top Rain Water Harvesting @ Rs. 5,000/-each X 40= Rs. 2,00,000/-
2. Roof Top Rain Water Harvesting @ Rs. 15,00,000/- each Govt. Buildings X 20 = Rs.3,00,00,000/-
3. Roof Top Rain Water Harvesting @ Rs. 5,00,000/- each Commercial Complex X 20= Rs.1,00,00,000/-
4. Operational & Maintenance cost per year @ Rs. 10,000/- each X 40 = Rs. 4,00,000/-
5. Impact assessment studies @ Rs. 2000/- each per year X 40 = Rs. 80,000/-
6. Construction of Water Conservation Structures @ Rs. 1,00,000/- each X 100 = Rs.1,00,00,000/-
7. Repair/ Renovation / Restoration of Existing Water Conservation Structures = Rs.1,75,97,500/-
========================================================================================
TOTAL Rs. 6,82,77,500/-
========================================================================================
Fig 9 : Proposed Rainwater Harvesting Plan for Bhubaneswar City, Odisha

46
REFERENCES
• Das, P. K., & Choudhury, A., April 2007 : Hydrogeological Framework & Groundwater Development
Prospect in Bhubaneswar City, Orissa, Unpub. Technical Report, CGWB, SER
• Das, P. K., Roy, G. K., & Choudhury, A., July 2004: Hydrogeological Framework & Groundwater
Development Prospect in Orissa, Unpub. Technical Report, CGWB, SER
• Environmental Management Plan of Bhubaneswar, Govt. of Odisha Publ.
• Comprehensive Development Plan for Bhubaneswar, Govt. of Odisha Publ.
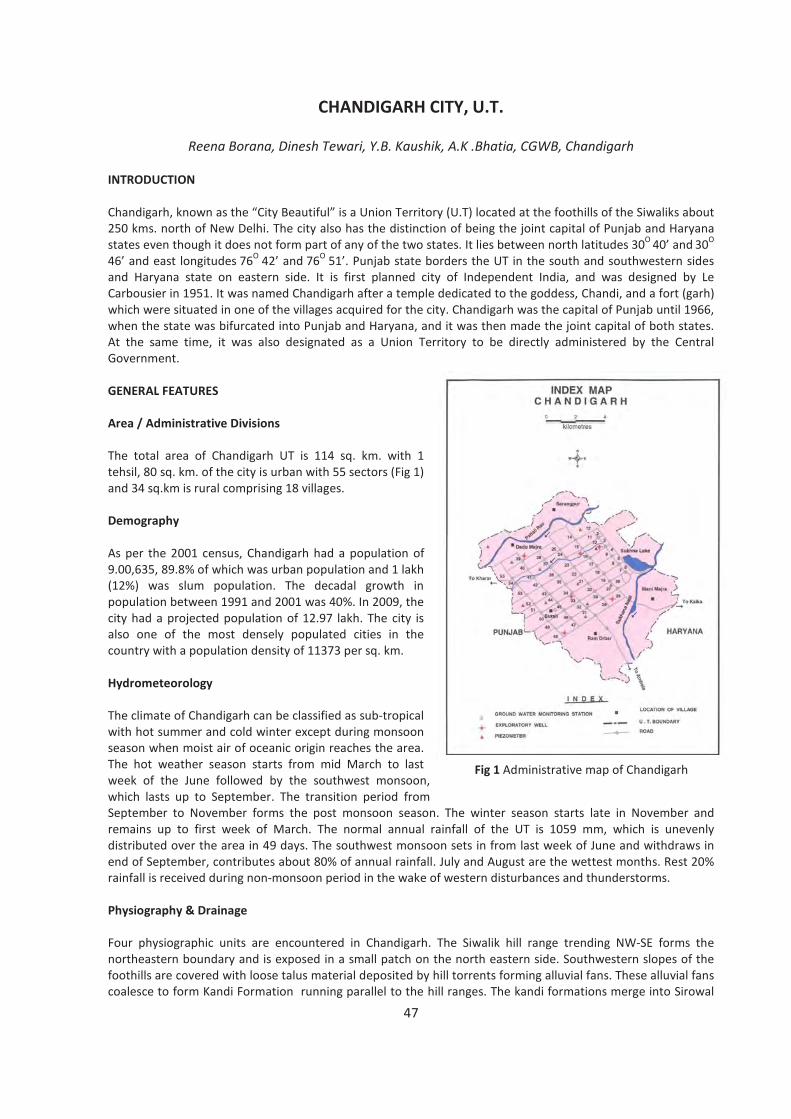
47
CHANDIGARH CITY, U.T.
Reena Borana, Dinesh Tewari, Y.B. Kaushik, A.K .Bhatia, CGWB, Chandigarh
INTRODUCTION
Chandigarh, known as the “City Beautiful” is a Union Territory (U.T) located at the foothills of the Siwaliks about
250 kms. north of New Delhi. The city also has the distinction of being the joint capital of Punjab and Haryana
states even though it does not form part of any of the two states. It lies between north latitudes 30O
40’ and 30
O
46’ and east longitudes 76
O 42’ and
76
O 51’. Punjab state borders the UT in the south and southwestern sides
and Haryana state on eastern side. It is first planned city of Independent India, and was designed by Le
Carbousier in 1951. It was named Chandigarh after a temple dedicated to the goddess, Chandi, and a fort (garh)
which were situated in one of the villages acquired for the city. Chandigarh was the capital of Punjab until 1966,
when the state was bifurcated into Punjab and Haryana, and it was then made the joint capital of both states.
At the same time, it was also designated as a Union Territory to be directly administered by the Central
Government.
GENERAL FEATURES
Area / Administrative Divisions
The total area of Chandigarh UT is 114 sq. km. with 1
tehsil, 80 sq. km. of the city is urban with 55 sectors (Fig 1)
and 34 sq.km is rural comprising 18 villages.
Demography
As per the 2001 census, Chandigarh had a population of
9.00,635, 89.8% of which was urban population and 1 lakh
(12%) was slum population. The decadal growth in
population between 1991 and 2001 was 40%. In 2009, the
city had a projected population of 12.97 lakh. The city is
also one of the most densely populated cities in the
country with a population density of 11373 per sq. km.
Hydrometeorology
The climate of Chandigarh can be classified as sub-tropical
with hot summer and cold winter except during monsoon
season when moist air of oceanic origin reaches the area.
The hot weather season starts from mid March to last
week of the June followed by the southwest monsoon,
which lasts up to September. The transition period from
September to November forms the post monsoon season. The winter season starts late in November and
remains up to first week of March. The normal annual rainfall of the UT is 1059 mm, which is unevenly
distributed over the area in 49 days. The southwest monsoon sets in from last week of June and withdraws in
end of September, contributes about 80% of annual rainfall. July and August are the wettest months. Rest 20%
rainfall is received during non-monsoon period in the wake of western disturbances and thunderstorms.
Physiography & Drainage
Four physiographic units are encountered in Chandigarh. The Siwalik hill range trending NW-SE forms the
northeastern boundary and is exposed in a small patch on the north eastern side. Southwestern slopes of the
foothills are covered with loose talus material deposited by hill torrents forming alluvial fans. These alluvial fans
coalesce to form Kandi Formation running parallel to the hill ranges. The kandi formations merge into Sirowal
Fig 1 Administrative map of Chandigarh

48
Formations in the south and southwest. The Sirowal merges with the main alluvial plain towards south and
southwest. The alluvial deposits belong to Quatenary age and comprise layers of fine sand and clay. Two major
streams Sukhna Choe and Patiali ki Rao, originating from Siwalik hill ranges forms the natural drainage of the
city. Both are ephemeral in nature and carry high flows during monsoon. The Sukhana Choe has been dammed
in the north east side of the city, which has given rise to an artificial lake known as Sukhana.
Soil Type
The soils are loamy at surface and calcareous sandy loam in subsurface layers. The soil is sandy to sandy loam in
northern part while loamy to silt loam in southern part. Almost all soils are deficient in nitrogen, phosphorous &
potash with colour varying from light yellowish brown to pale brown.
STATUS OF WATER SUPPLY AND DEMAND
As per the projected population figures compiled by the Office of the Registrar General & Census Commissioner
of India, Chandigarh’s Population was 12.97 lakh in 2009. The domestic water demand of this population is 204
MLD. Adding it with other demands, the total demand goes up to 452.77 MLD, while the total water available
for supply through canal water and ground water is 396.72 MLD leaving a Demand/Supply gap of 56.05 MLD.
The projected water demand for the city for 2025 is 800.75 MLD and estimated supply would be 469.98 MLD
thus leaving a gap of 331.07 MLD. A major part of water requirement of the city is met by canal water. There
are 200 deep tube wells in the city and 39 in rural areas for drinking purpose and 30 deep tube wells for
irrigation purpose.
WATER PROFILE
The city was being supplied with water from ground water through tubewells till 1983. The city administration
augmented the water supply through water from Bhakra Main canal in 1983. Today, Chandigarh city gets 67
MGD of water from the Bhakra main canal and 20 MGD of ground water from 239 tubewells in the city, making
the total available water at 87 MGD. The Chandigarh Administration has planned for further augmentation of
surface water supply to provide additional 32 MGD. Thus the total canal water supply available will be 103 MGD
or 469.68 MLD. In Chandigarh, the use of private tubewells has been banned. Ground water for drinking water
supply and for irrigation is being provided solely by the municipal corporation. Water is pumped from the deep
aquifers below 100 m. There are about 239 tubewells for both urban and rural areas, out of which water from
200 tubewells is used for urban water supply. The responsibility of water supply rests with Public Health
Department of the municipal corporation.
GROUND WATER SCENARIO
Potential Aquifers
Based on the exploratory drilling carried out by Central Ground Water Board down to a depth of 450 m bgl, it
can be concluded that fair to good aquifer horizons occur in most part of Chandigarh except in south-western
parts near sectors 37, 38, 39, 40 and 41. An aquifer, 20 meters thick, occurring at a depth of 160 mbgl,
comprising medium to coarse sand, occurs in almost all of Chandigarh except around sector 38. It has also been
inferred that the sediments are relatively coarse-grained down to a depth of 180 m bgl below which they
become finer. The yield of the deep aquifers is also less as compared to the shallow ones. The formations
encountered in a borehole drilled down to 465 mbgl in sector 28, close to Sukhna Choe, are well-defined coarse
sediments up to 240 mbgl. Below this depth the formations are finer grained. The shallow formations comprise
coarse sand to gravel and pebbles intercalated with clays, whereas the deeper ones are fine sand and silt. In
sector 47, the aquifer material is coarse grained down to a depth of 174 m bgl below which it becomes finer.
The aquifer material encountered at sector 33 is coarse down to 180 m bgl. This indicates that the thickness of
coarser sediments is greater in northern parts of the city as compared to the southern parts. Along Sukhna
Choe, three prominent sand beds occur (inter-bedded with clay beds) within a depth of about 100 m. The upper
sand bed is about 15 m thick and occur 8 m below ground level. Middle sand bed is about 18 m thick and occurs

49
at depths varying from 21 to 38 m bgl. The deeper sand bed occurs at depth varying from 39 to 76 m bgl and is
about 27 m thick. These beds are more persistent in the downstream direction of Sukhna Choe. Hydrogeology
of Chandigarh and indicating ground water development potential is produced in Fig. 2.
Ground water in the area occurs under
water table, confined as well as semi-
confined conditions. Good confined
aquifers occur around sector 10, 33, 38 and
47 while leaky aquifers are encountered
around sector 28. One interesting feature
is that the aquifers in the southern parts of
the city are restricted in aerial extent due
to lithological boundaries. Ground water
occurs under unconfined conditions down
to about 80 m in Manimajra area. In other
areas the semi-confined conditions prevail
up to 20-30 m below land surface. Barring
Manimajra area ground water below 20-30
m exist under confined conditions. The
depth of the shallow aquifer system is less
than 30 m below ground level whereas the
depth of the deeper aquifer system ranges
from 40 to 450 mbgl of explored depth,
while in Manimajra area confined aquifers
occur below 90 m. The transmissivity
values for the deeper aquifer system
ranged between 74 m2/day at Sector 10 to
590 m2/day at Sector 28. The storativity
values ranged between 1.5x10⁻⁴
to 7.5x10⁻⁴
indicating confined nature of aquifer
systems. The transmissivity values of
shallow aquifers up to 100 m depth range
obtained during these tests ranged
between 70 and 466 m2/day.
Ground Water Level
The depth to water level in the shallow aquifer system in pre-monsoon season varies from 2.92 m in the
southern sectors to 13.44 m bgl in the northern sectors. In the western and southwestern part of the city
covering sectors 37 to 46 the water level is shallow i.e. <5.0 m bgl. This is due to fine nature of sediments and
lithological boundaries. In the northern sectors, the water levels are more than 7.0 mbgl. During the post
monsoon, the water level varies from 2.15 in the southern part to 11.79 m bgl in the northern part of the city.
The long term (decadal) water level shows declining trend for the shallow aquifers system. The decline in water
level fluctuation ranges between 0.01 to 0.36 m/year. The water level in the deeper aquifer system ranges
between 9.64 to 27.96 m bgl during pre monsoon and 8.50 to 22.30 m bgl in post monsoon. The long term
water level of the deep aquifer system shows that in all part of city, there is significant decline trend in the
range between 0.32 to 1.55 m/year. This fall in water level is attributed to heavy pumping from the deeper
aquifer for domestic and irrigation purposes. However, the water level data and draft from the deeper aquifer
has not been considered for the estimation of the dynamic ground water resources of Chandigarh UT.
Ground Water Resource & Status of Development
It has been estimated that the annual replenishable ground water resource (Net Ground Water Availability) of
Chandigarh are 1956 hectare meter (ham) and groundwater draft from unconfined aquifer is nil, since all the
tubewells are deep and are drawing water from deeper aquifers. The details of the assessment are given below:
Fig. 2 Hydrogeology of Chandigarh urban area

50
The Ground water resource of shallow aquifer in Chandigarh UT is
Recharge from rainfall during monsoon = 1545 ham
Recharge from other source during monsoon = 53 ham
Recharge from rainfall during non- monsoon = 488 ham
Recharge from other source during non-monsoon = 87 ham
Total annual ground water recharge = 2173 ham
Natural discharge during non-monsoon = 217 ham
Ground water draft as on 31.03.2010 = nil
Net annual ground water availability = 1956 ham
Since, there is no draft from shallow aquifers, The
stage of ground water development is nil and the
Chandigarh UT falls under SAFE Category (Fig 3).
Hydrochemistry
Based on the data generated from the analysis of
ground water samples from hand pump and tube
wells, it is found that the ground water is fresh
and suitable for drinking as well as irrigation
purposes. Normally, the ground water from the
deeper aquifers is less mineralized as compared to
water from shallow aquifers. Geochemical facies
evaluation of ground water indicates that most of
the waters, both from shallow and deeper aquifer,
are of Ca-HCO3 type. Concentration of some of the
vital parameters such as F, NO3, salinity, and
hardness is within permissible limits of drinking
water standards (BIS -1991).Analysis of trace
elements in ground water indicated that
concentration of copper, iron and manganese in
some of the shallow hand pump waters is above
maximum permissible limit for drinking purpose.
As far as deeper ground water is concerned, none
of the water sample registered higher
concentration of any of the metal analyzed. It can
be safely concluded that most of ground water
samples are free from heavy metal contamination.
Fig 3 Ground water development potential of shallow
aquifer of Chandigarh Urban area
Major Ground Water Related Problems
Groundwater has been used for water supply since creation of the city and presently Chandigarh is sourcing
22% of its water supply from ground water through deep tube wells tapping below 100 m. There is considerable
decline in the ground water level of the deep aquifers. The pre monsoon data for the period 1991 to 2010 (20
years) reveals that in sector 10 in north, shows a maximum decline of 16 m and in sector 31 decline of 10m. The
remaining part of the city show on an average a decline of 5-8 m. Every year about 10% of such tubewells
become defunct.
The Water Supply Bye Laws of Chandigarh ensure that all water supply is to be met from government tubewells
and no private tubewells are allowed to be constructed. Also, only the deeper aquifers, below 100m, are to be
exploited and thus at present there is none or negligible withdrawal of ground water from shallow aquifers in
Chandigarh city. This is also evident from the fact that whereas there is heavy decline in the water levels of the
deeper aquifers due to sustained pumping, there is hardly any decline in the water levels of the shallow aquifers

51
(except in the central parts where the decline can be attributed to leaky confined conditions). Chandigarh city
has the twin problem of ground water decline as well as rise. Whereas the deeper aquifers are under great
stress and are depicting declining water levels, the shallow aquifers are not being put to any use and the water
levels are rising leading to near water logging conditions in the southern areas of the city. To balance this
problem, it is essential that pumping from the deeper aquifers is reduced and that from the shallow aquifers be
increased. Another interesting observation is that while the water levels of the deeper aquifer are in the range
of 15 to 70 mbgl, those in the shallow aquifer are in the range of 2 to 17 mbgl. The water levels are quiet
shallow in the southern sectors (where in certain areas water logged conditions exist). It is worth mentioning
that the chemical quality of ground water of all the aquifer systems in Chandigarh is good and within the
permissible limits prescribed by BIS(1991) for drinking water except at a couple of locations where water
sample drawn from hand pumps that are about 15 m deep, the iron concentration was higher than the
permissible limits. This may also be due to corrosion in the pipes of the tube well.
Feasibility of Rain Water Harvesting and Artificial Recharge
Chandigarh is a highly urbanized city and the rooftop of the buildings can be suitably used for artificial recharge
of the rainfall falling. There is a lot of green area and water bodies that can be effectively utilized for recharging
from the rainfall. In Chandigarh, there are two distinct aquifer systems – shallow and deep. Shallow aquifer
occurs under semi-confined conditions and exists down to 20 to 30 m below ground level. Deep aquifers below
40 m are under confined conditions. The piezometric head of the deep aquifers stands much below the water
table of shallow aquifers and thus it can receive water easily on being recharged artificially.
It is estimated that about 30.71 MCM (18.45 MGD) surface runoff is available in the city for recharge to ground
water during monsoon season from the roads (15.89 sq.km), from rooftops of residential areas (30.19 sq.km)
from shopping areas (3.97 sq. km) and public and institutional building (7.94 sq. km). This is almost equivalent
to the water pumped out from aquifers and therefore, harvesting and recharging rainwater will go a long way in
contributing towards sustainability of water supply. The total runoff generated during an hour of 30 mm of
rainfall would be 870000 m3. As per the prevailing hydrogeological conditions, the most suitable structure for
artificial recharge to ground water in Chandigarh UT is trench cum recharge well. The dimensions of the trench
would be site specific and will depend on the water availability. A recharge trench of 8 m X 2 m X 3 m capacity
with twin recharge wells of 40 – 80 m. depth would store and recharge ~ 100 m3
of rainfall. It is estimated that a
total of 8700 recharge structures would be required to be constructed at cost estimate of Rs. 652.50 crores @
Rs. 7.50 lakh per structure. Rain water harvesting will also address the problem of flooding due to overflowing
of the storm water drains.
GROUND WATER DEVELOPMENT STRATEGY
Chandigarh is a rapidly growing city with population growth rate of 40%. Against the background of the
envisaged economic growth and the resulting population growth, the water needs of Chandigarh will grow at an
explosive rate. It is estimated that by 2025, the water demand will be 800 MLD, an increase of 76% over the
2011 demand of 452.77 MLD. But water availability will not grow in parallel leading to water stress and
resultant conflicts. There is a need to put in place a number of measures to create awareness among the people
about the importance of water and incentivize them to use water carefully and wisely. As already mentioned,
Chandigarh city has the twin problem of ground water decline as well as rise. The deeper aquifers are under
great stress and are depicting declining water levels, the shallow aquifers are not being put to any use and the
water levels are rising and also causing near water logging conditions in the southern areas of the city. To
balance this problem, it is essential that pumping from the deeper aquifers is reduced and that from the shallow
aquifers be increased. There is also a shortage of about 56.05 MLD (12.29 MGD) of drinking water in Chandigarh
as on date. This can also be partially met through shallow dynamic ground water resources of the city. Annual
replenishable ground water to the tune of 1956 ham are available in the city. Pumping out at least 70% of this
resource i.e. 1369 ham annually is not likely to have any negative impact on the ground water regime. This can
augment drinking water to the tune of 37.5 MLD. The exploitation from the shallow aquifer should be
concentrated in the southern sectors, especially 39 to 55 because of shallow ground water levels.

52
CHENNAI CITY, TAMIL NADU
D. Dayamalar, CGWB, Chennai
INTRODUCTION
Chennai erstwhile Madras is the capital of Tamil Nadu state and is one of the oldest of the presidential cities of
India. It is one of four metropolis of the country. The corporation of Madras established in 1688. The increase
in population density coupled with industrial
development has given rise to a greater demand
far exceeding the available resources. The
efforts of the State Govt. to bridge the gap from
other sources including transport of ground
water have not completely mitigated the water
scarcity. The status of water supplies, demand
and availability vis-à-vis the hydrogeological
conditions are discussed. An attempt has been
made to compile the existing data and carryout
the analysis to bring out sustainable
development strategies.
GENERAL FEATURES
Area/Administrative Divisions
Chennai city is located in the northeastern
corner of the state. It is bounded by Bay of
Bengal in the east, Tiruvallur District in the north
and West and Kancheepuram District in the
south. The district is bounded by Latitudes
13°02’30” to 13°14’00” and Longitudes
80°12’00” to 18°18’30”. The geographical area
of Chennai city is 176 Sq.km while Chennai
Metropolitan Area (CMA) is 1189 sq.km. The
administrative set up is given on Fig-I. The
Chennai metropolitan area consists of 214
villages, 20 town panchayats and 16
municipalities situated in 6 taluks of Chennai,
Tiruvallur and Kancheepuram districts.
Demography
The population of Chennai city was reported to be 50,000 in 1674 by Sir William Langhorn (Vestiges of Old
Madras 1640-1800), which increased to 5,40,000 by 1901. The population of Chennai City as per 2001 Census
is 43,43,645.The-projected census is given in Table 1.
Table 1: Projected Population for CMA and Chennai City (In Lakhs)
Sl.
No.
Description Actual Projection Gross density
Persons /
hectare
2001 2006 2011 2016 2021 2026 2026
1 Chennai City 43.44 46.28 49.50 52.39 55.40 58.56 333
2 Municipalities 15.81 18.52 21.75 25.60 30.20 35.69 149
3 Town Panchayats 3.86 4.73 5.89 7.41 9.45 12.22 78
4 Village Panchayats 7.31 8.70 10.59 12.96 15.99 19.88 32
5 CMA [total] 70.41 78.96 88.71 99.66 111.97 125.82 105
Fig-1
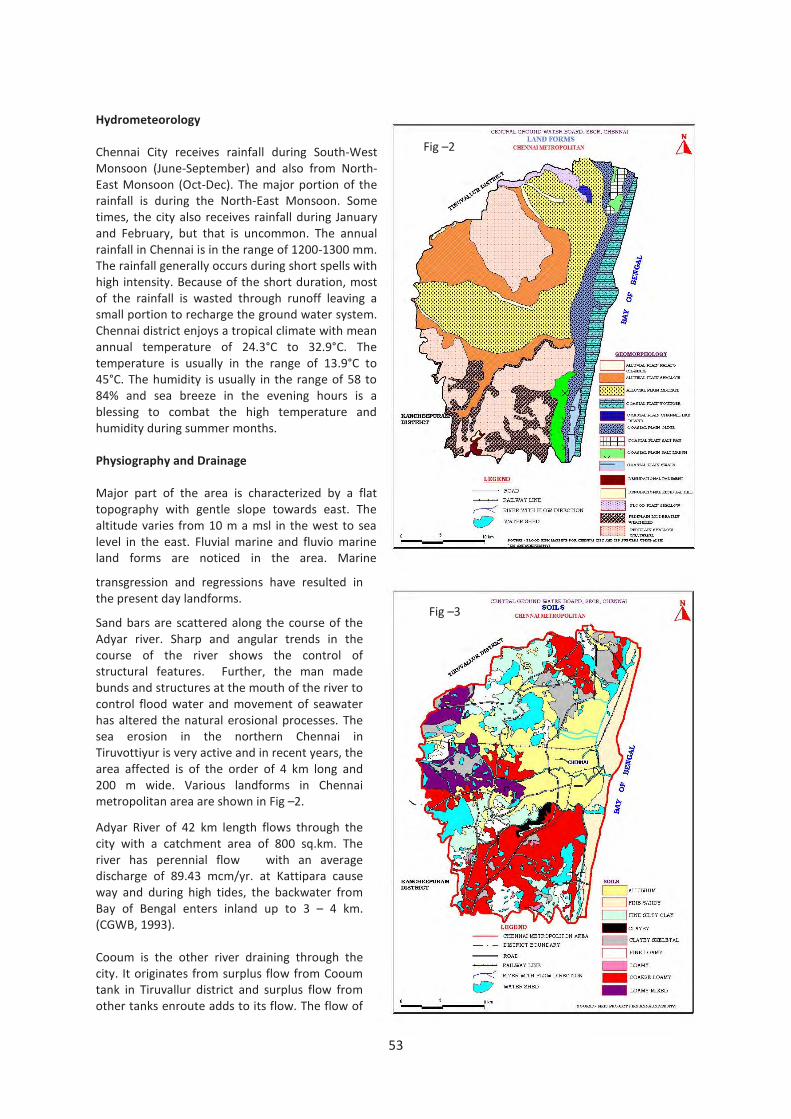
53
Hydrometeorology
Chennai City receives rainfall during South-West
Monsoon (June-September) and also from North-
East Monsoon (Oct-Dec). The major portion of the
rainfall is during the North-East Monsoon. Some
times, the city also receives rainfall during January
and February, but that is uncommon. The annual
rainfall in Chennai is in the range of 1200-1300 mm.
The rainfall generally occurs during short spells with
high intensity. Because of the short duration, most
of the rainfall is wasted through runoff leaving a
small portion to recharge the ground water system.
Chennai district enjoys a tropical climate with mean
annual temperature of 24.3°C to 32.9°C. The
temperature is usually in the range of 13.9°C to
45°C. The humidity is usually in the range of 58 to
84% and sea breeze in the evening hours is a
blessing to combat the high temperature and
humidity during summer months.
Physiography and Drainage
Major part of the area is characterized by a flat
topography with gentle slope towards east. The
altitude varies from 10 m a msl in the west to sea
level in the east. Fluvial marine and fluvio marine
land forms are noticed in the area. Marine
transgression and regressions have resulted in
the present day landforms.
Sand bars are scattered along the course of the
Adyar river. Sharp and angular trends in the
course of the river shows the control of
structural features. Further, the man made
bunds and structures at the mouth of the river to
control flood water and movement of seawater
has altered the natural erosional processes. The
sea erosion in the northern Chennai in
Tiruvottiyur is very active and in recent years, the
area affected is of the order of 4 km long and
200 m wide. Various landforms in Chennai
metropolitan area are shown in Fig –2.
Adyar River of 42 km length flows through the
city with a catchment area of 800 sq.km. The
river has perennial flow with an average
discharge of 89.43 mcm/yr. at Kattipara cause
way and during high tides, the backwater from
Bay of Bengal enters inland up to 3 – 4 km.
(CGWB, 1993).
Cooum is the other river draining through the
city. It originates from surplus flow from Cooum
tank in Tiruvallur district and surplus flow from
other tanks enroute adds to its flow. The flow of
Fig –3
Fig –2

54
the river at Korattur is 40.2 Mcm/yr for a flow for 31 days in a year. However, due to discharge of sewerage
into it after the entry into the city, the river is highly polluted. (CGWB, 1993). Buckingham canal is a manmade
navigation canal, not in use for last four decades and presently act as sewerage carrier within the city.
Soil type
The major soil-types encountered in the metropolitan area are Alluvial, Clayey and loamy soils. Alluvial soils
are commonly observed in the central part along the rivers and in coastal area and have high permeability.
Clayey and clayey skeletal soils are seen in the northern part of the metropolitan area. These soils are alkaline
in nature, have poor permeability and are highly calcareous and cracking. A generalised map showing the
distribution of major soil types in the district is shown as Fig -3.
STATUS OF WATER SUPPLY AND DEMAND
The present water supply and the projected scenario by the year 2021 are presented in Table 2. The analysis of
the water supply position gives the real magnitude of the problem even after all the possible measures taken
by the government so far. A perusal of the Table 2 shows that the demand would be around 1026 MLD (2001)
& 1980 MLD (2021), while the supply is expected to be around 1586 MLD, if full capacity of surface reservoirs
and the ground water supply projected were to be considered.
Table 2 Demand, water supply for Chennai city and urban agglomeration
S.
No.
Parameter 2010 2021
A. DEMAND
1 Chennai City 752.91 942
Municipalities 190.29 330
Town panchayats 30.90 511
Village panchayats 52.16 197
Total 1026.26 1980
B. SUPPLY
3 Existing Planned Sources (On full capacity MLD)
(a) Surface Water
i) Puzhal water treatment plant 300
ii)Kilpauk water treatment plant 270
iii)Vadakuthu water treatment plant (Veeranam source) 180
iv)Chembarambakkam water treatment plant (Krishna
water)
530
Total of (a) 1280
(b) North Chennai Well Fields (MLD)
i) Minjur 27.3
ii)Panjetty 31.8
iii)Tamaraipakkam 36.4
iv)Kannigaiper 13.6
v) Poondi 27.3
vi) Flood plains 13.6
Total of (b) 150.0
(c) South Chennai well Fields (MLD)
i) Palavakkam 1.5
ii)Porur well field 4.5
iii)Belur near Kilpakkam 45.5
iv)Palavakkam 4.5
Total of © 56
(d) Desalination (Proposed) 100
Total of a, b, c & d 1586
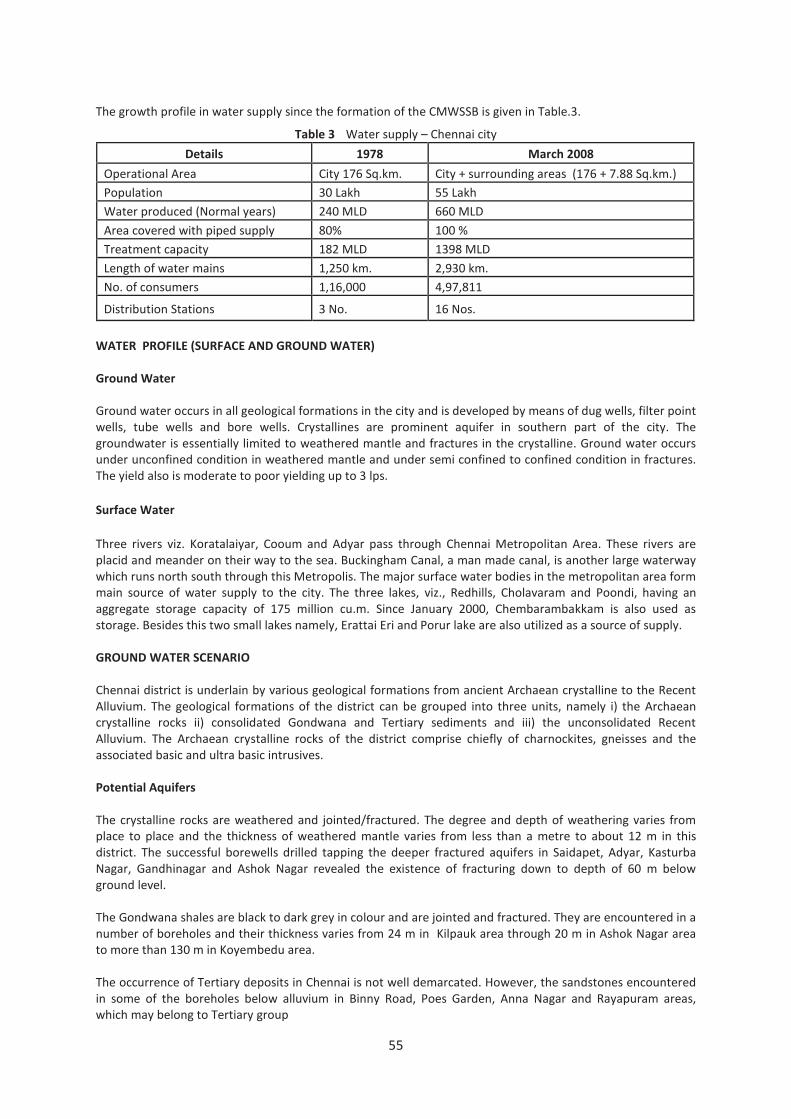
55
The growth profile in water supply since the formation of the CMWSSB is given in Table.3.
Table 3 Water supply – Chennai city
Details 1978 March 2008
Operational Area City 176 Sq.km. City + surrounding areas (176 + 7.88 Sq.km.)
Population 30 Lakh 55 Lakh
Water produced (Normal years) 240 MLD 660 MLD
Area covered with piped supply 80% 100 %
Treatment capacity 182 MLD 1398 MLD
Length of water mains 1,250 km. 2,930 km.
No. of consumers 1,16,000 4,97,811
Distribution Stations 3 No. 16 Nos.
WATER PROFILE (SURFACE AND GROUND WATER)
Ground Water
Ground water occurs in all geological formations in the city and is developed by means of dug wells, filter point
wells, tube wells and bore wells. Crystallines are prominent aquifer in southern part of the city. The
groundwater is essentially limited to weathered mantle and fractures in the crystalline. Ground water occurs
under unconfined condition in weathered mantle and under semi confined to confined condition in fractures.
The yield also is moderate to poor yielding up to 3 lps.
Surface Water
Three rivers viz. Koratalaiyar, Cooum and Adyar pass through Chennai Metropolitan Area. These rivers are
placid and meander on their way to the sea. Buckingham Canal, a man made canal, is another large waterway
which runs north south through this Metropolis. The major surface water bodies in the metropolitan area form
main source of water supply to the city. The three lakes, viz., Redhills, Cholavaram and Poondi, having an
aggregate storage capacity of 175 million cu.m. Since January 2000, Chembarambakkam is also used as
storage. Besides this two small lakes namely, Erattai Eri and Porur lake are also utilized as a source of supply.
GROUND WATER SCENARIO
Chennai district is underlain by various geological formations from ancient Archaean crystalline to the Recent
Alluvium. The geological formations of the district can be grouped into three units, namely i) the Archaean
crystalline rocks ii) consolidated Gondwana and Tertiary sediments and iii) the unconsolidated Recent
Alluvium. The Archaean crystalline rocks of the district comprise chiefly of charnockites, gneisses and the
associated basic and ultra basic intrusives.
Potential Aquifers
The crystalline rocks are weathered and jointed/fractured. The degree and depth of weathering varies from
place to place and the thickness of weathered mantle varies from less than a metre to about 12 m in this
district. The successful borewells drilled tapping the deeper fractured aquifers in Saidapet, Adyar, Kasturba
Nagar, Gandhinagar and Ashok Nagar revealed the existence of fracturing down to depth of 60 m below
ground level.
The Gondwana shales are black to dark grey in colour and are jointed and fractured. They are encountered in a
number of boreholes and their thickness varies from 24 m in Kilpauk area through 20 m in Ashok Nagar area
to more than 130 m in Koyembedu area.
The occurrence of Tertiary deposits in Chennai is not well demarcated. However, the sandstones encountered
in some of the boreholes below alluvium in Binny Road, Poes Garden, Anna Nagar and Rayapuram areas,
which may belong to Tertiary group

56
Ground water in Chennai district occurs in all the geological formations viz., the Archaean crystallines,
Gondwanas, Tertiaries and alluvium and is developed by means of ring wells, dug wells, filter point wells, bore
wells and tube wells.
The alluvium covers the major part of the district. The alluvium consists of sand, silts and clays. The thickness
of alluvium varies from place to place and a maximum of 28 m thickness has been encountered in north
Chennai near Perambur. Kilpauk water works area has 24 m thick alluvium.
The yield of the exploratory wells at Kilpauk and Tirumangalam tapping the productive granular zones met
within the alluvium is 25 lps to 6 lps for a drawdown of 7.21 to 0.22 m. The yield of four borewells tapping the
productive granular zones met within the Gondwana sediments were found to range from less than 1 to 4 lps
for drawdowns varying between 8 to 9 m. The specific capacity ranged from 8 to 32 lpm/m of drawdown.
In Velacherry area there is a sheet of black clay over crystalline rocks. The open wells located in Velacherry
area are giving low yield and the yield of wells varies from 2 to 10 m3/day depending on the diameter,
topography and thickness of weather zone tapped. Many wells are dry in summer months due to limited
thickness of productive zones or over development. There are a few fractures developed in the crystalline
rocks and bore wells encountered such fractures down to 90 m depth. The yield of these bore wells are as high
as 4 lps at certain areas. There are no indications of any prominent lineaments. There are number of bore
wells in the city piercing the top 10 to 15 m thick alluvial cover and penetrate the crystalline rocks. The failure
of many bore wells in Velacherry area may be due to absence of potential fracture down to 60 m. The map
showing the areal distribution of the lithology and aquifer thickness are given in Fig-4 and 5.
In general, yield of dug wells varies from 2000 to 50,000 lit./day depending on their dimension, lithology and
season, while that of bore well and tube well vary between 1200 to 45,000 lph. However, the yield of wells is
subject to change due to over stressed aquifer during the past decade.
Based on the UNDP studies carried out during 1966 to 1969, ground water aquifer was identified at
Tamaraipakkam, Panjetty and Minjur in the Araniar-Koratalaiyar Basin (A.K. Basin) located north of Chennai.
These three Well fields were developed for abstracting water at an estimated yield of 125 MLD. Ground water
Fig –5 Fig –4

57
abstracted through bore wells from these well fields
was supplied to Industries in Manali from 1969 by the
PWD Ground Water Wing, later on, after taking over
by CMWSSB in 1978.
GROUND WATER LEVEL
Central Ground Water Board monitors water levels in
Chennai city every month and on quarterly basis in the
metropolitan area and for water quality once in a year
(May). The pre monsoon and post monsoon water
level have been presented as Figs 7 and 8. The analysis
of water level data shows that during pre monsoon, 62
% of wells recorded shallow water levels in the range
of less than 5m bgl and water level in 38 % of wells in
the range of more than 5 m bgl observed in southern
part of the CMA. During post monsoon 91 % of wells
have recorded shallow water level in the range of 0 to
5 and nine percent of wells have recorded deeper
water levels in the range of more than 5 m bgl and
noted in Vepery, Aminjikarai and Thiruneermalai area.
GROUND WATER RESOURCES & STATUS OF DEVELOPMENT
The ground water resources have been computed jointly by Central Ground Water Board and State Ground &
Surface Water Resources and Development Centre (PWD, WRO, Government of Tamil Nadu) as on 31st
March
2009. The salient features of the computations are furnished in Table 5. The computation of ground water
resources available in the district has been done using GEC 1997 methodology.
Fig –7
Fig –6
Fig –8

58
Table 5 Ground Water Resources and Status of Development (As on March 2009)
District Net annual
ground
water
availability
Existing
gross
ground
water
draft for
irrigation
Existing Gross
ground Water
draft for
domestic and
industrial
water supply
Existing
gross
ground
water
draft for
all uses
Requirement
for domestic
and
industrial
requirement
supply to
2025
Net ground
water
availability
for future
irrigation
developme
nt
Stage of
ground
water
develop
ment
%
Category
Chennai 1020.74 0.00 4141.00 4141.00 4141.00 -3120.26 406% Over Exploited
Hydrochemistry
The quality of unconfined aquifer has been evaluated by
sampling and analysis of water sample collected from
Chennai metropolitan area. About 39 water samples were
collected for water quality analysis during May 2009
representing pre-monsoon water quality. The summarized
results given in Table-6.
In general the ground water quality in the Chennai
metropolitan area is fresh and in about 18% of the wells as
indicated by the EC value less than 750 µs/cm at 25oC. In
about 62% of the Ground Water wells the EC varies between
751 -2250µs/cm at 25o
C and 7 % of wells are reveal between
2251-3000 µs/cm at 25o
C indicating that the ground water is
slightly mineralized and about 13% of Ground Water samples
the EC is more than 3000 µs/cm at 25oC indicating that the
ground water is highly mineralized. The highest value 4860
µs/cm at 25o C was observed in Kovilpathagai. Distribution of
EC is shown in Fig 9.
Table 6 Ground water quality, May-2009
S.No Parameters Range No. of sample Percentage
(%)
1 Electrical
Conductivity (EC)
µs/cm at 25oc
< 750 7 18
75 1- 2250 24 62
2251- 3000 3 7
> 3000 5 13
2 Chloride
mg/l
< 250 21 54
251-1000 7 44
> 1000 1 2
3 Fluoride mg/l < 1.0 30 77
1.1- 1.5 6 15
>1.5 3 8
4 Nitrate
mg/l
<4 5 16 41
46- >100 23 49
In the case of Chloride 54% of wells analysed show Chloride concentration within the desirable limit (less than
250 mg/) , 44% of the sample are show within permissible limit ( between 251 – 1000 mg/l) and rest of the
samples (2%), in which it exceeds permissible limits, is found in Kovilpathagai, shows more than 1000mg/l.
Distribution of chloride is shown in Fig 10.
Fig –9

59
The Nitrate content is less than 45mg/l in about 41% of
the sample analyzed and 41% of the water sample is
within the permissible limit of 46-100 mg/l and 8% of
sample exceed the permissible limits, (more than 100
mg/l) which are from the location of Manali, Mathravoyal,
Pattabiram,Ambattur, Vepery,, Aminjakarai and
Vengaivasal. Distribution of nitrate shown in Fig. 1.
The Fluoride content is less than 1.0 mg/l in about 77% of
the sample analyzed and 15% of the sample shows within
permissible limit (1.0 to 1.5 mg/l), and 8 % of the sample
shown more than 1.5 which are from Vengaivasal,
Velacherry and Vepery. Distribution of fluoride is shown
in Fig. 12I.
Major Ground water Related Problem
Sea Water Intrusion-The quality changes due to marine
transgression in the past is evidenced from the high
mineralization in Mandaveli, Anna Nagar, Indira Nagar
and Taramani areas. The presence of thick clay bed with
fossils are indicative of lagoon and estuary environment
and or the reducing condition due to water logging
condition of low-lying ground. The landward invasion of
sea water into low-lying areas during storm and the high
tide periods also results in sea water spreading over land.
The intrusion of sea water due to over development of Araniyar-Koratalaiyur alluvial aquifer system is also
noticed in north of Chennai. The excess ground water development in Koratalaiyar alluvium has resulted in
reversal of hydraulic gradient in coastal area and already the movement of interface to a distance of 3 km
Fig – 10
Fig – 11 Fig – 12

60
westwards is established in north of Chennai. However, the discontinuous nature of granular zones in city area
do not favour such interface movement due to local ground water abstraction far inland.
Most of the fresh-water zones are floating lenses over saline water zones. Tiruvanmiyuyr-Covelong belt is one
such potential fresh water aquifer in dunes. The same is harnessed extensively resulting in local ground water
mining in Besant Nagar area and there is danger of seawater intrusion locally, which necessitates detailed
monitoring.
Buckingham canal constructed at sea level for navigation has resulted in extensive seawater percolation in to
the freshwater aquifer. The usage of canal in the part has allowed the seawater movement inland and the
unlined nature of canal has resulted in seawater seepage into the ground water system. Further, the use of the
canal for transporting sewerage in recent years has caused contamination in the ground water system
adjoining the canal. This is evident from the high dissolved solid in ground water of Indira Nagar area. In
addition, the spurt in the building activities has resulted in the reduction in net recharge area and hence the
effective freshening is lacking in recent years.
Pollution by Industries-The industrial belts also add to the groundwater contamination and special study was
taken up by CGWB in Manali (CGWB, 2003). The Manali Industrial area falls in Manali Town Panchayat, Puzhal
Panchayat Union, Ambattur taluk, Tiruvallur district. About 85 sq.km has been taken up for the study. The
study area is a coastal plain drained by Korttalaiyar river and its tributaries. Surface water flow in them is
seasonal and major part of the year backwater occupies them. Buckingham canal traverses the central part of
the study area from south to north and also functions as a carrier of various types of pollutants. All the surface
water sources are highly polluted. About 59 Red (Large, Medium, and small) category industries are located in
the study area.
Feasibility of Rainwater Harvesting and Artificial Recharge
The topography of Chennai district, in general, is suited for construction of various artificial recharge structures
such as percolation ponds, check dams and recharge shaft/well. However, detailed studies are necessary to
formulate a comprehensive scheme for artificial recharge of phreatic ground water in the district in view of the
variations in the geomorphic set-up and the complex hydrological and hydrogeological conditions. Roof top
rain water harvesting made mandatory by the State Government has improved the water level condition but
due to lack of periodical maintenance, the effect has reduced over the period of time.
GROUND WATER DEVELOPMENT STRATEGY
The budgeting of ground water resource potential attempted for Chennai district has brought to light that the
ground water balance available for further development is rather limited. The number of existing abstraction
structures, their withdrawal and reasons for failure, if any, has to be documented by a strict ground water
legislation.
The district being completely an urban area, the ground water resources available are exclusively used for
domestic and industrial requirements only. In order to have better management of the coastal aquifers,
proper design of wells is necessary.
Design of Ground Water Abstraction Structures
The dug wells, filter point wells, tube wells and bore wells are the most common abstraction structures in the
district. The dug wells are constructed in the alluvium as well as in hard rock area sin the city. The depth of the
wells generally range between 8 to 10 m and as shallow as 4 m in Marina beach and the masonry structures
are common and wells are 1 to 2.65 m in diameter and few wells are 4.5 m in diameter. Some of the wells in
coastal tract are tapping beach sands and are brick lined with cement plastering on the top 6 m. The
deepening of structures with small diameter ring well inside the open well is commonly practiced, but fails to
get desired results.
The following well design are recommended for the Chennai city area are:- (i) infiltration well with horizontal
and extrusion bones (ii) shallow tube well (Hand auger) (iii) shallow/medium tube well (Rotary rig) and (iv)

61
deep bore well. Infiltration wells of 4.5 m diameter and of 6 to 7 m depth in beach aquifers of Besant Nagar
are likely to give 10,000 to one lakh litres per day. Shallow tube wells of 100 mm /125 mm diameter and of 10
to0 20 m depth are likely to yield 1000 litres per hour and shallow medium tube wells with proper gravel
packing will give 1000-30,000 litres per hour. The deep borewells of 45-60 m depth are likely to give 1000 to
45,000 lph.
Problems in Ring Well Construction
The common problem is sand filling inside the rings during and after the lowering of rings, thereby practically
eliminating the scope of deepening of wells to tap more saturated column in summer months. The weep holes
provided in the rings allow water with fine sands and gets filled up as and when sand removal is in progress
thereby making it difficult for lowering of rings in highly saturated sands.
Problems in Tube well / Bore Well Construction
In case of filter point wells drilled with hand bores, the depth of penetration is variable and whenever the
Kankar or any other compact layers are encountered, further drilling becomes difficult. When portable rotary
rigs m (Calyx) are deployed for drilling, the drilling operations become very slow and the pore spaces in fine
grained layers are invaded by drilling fluid as a result the discharges tend to be poor. Proper well development
is seldom carried out by private drillers and as a result fine sands get deposited in the bore. Some times caving
of wells are commonly reported particularly when the top alluvium is cased and the bottom shales and
crystallines are drilled with down the hole hammer rig.
Rainwater Harvesting in Chennai City
CGWB has rendered technical guidance to local residents and a few central government organizations in
implementing RWH in the city. In addition it has also given financial assistance for construction of Percolation
ponds in CLRI under Central Sector Scheme and the impact assessment is in progress.
In view of deficit in Demand –Supply, Govt. of Tamil Nadu has taken lots of efforts in rainwater harvesting and
water conservation measures. Chennai Metropolitan Water Supply and Sewerage Board (CMWSSB) is the
nodal agency for water supply in Chennai city. It has constituted a fully dedicated “Rainwater Harvesting Cell”.
Further, Govt. of Tamil Nadu has made it mandatory that all buildings in Tamil Nadu should have provision for
RWH. It has also been informed by CWWSSB, Chennai that they have covered 99.77% of buildings by
December 2003. Further they have also identified 759 locations to study the impact of RWH on water quality
and water level.
More awareness has been created by the Central and state government agencies regarding rain water
harvesting and its benefits within a short span of time and every citizen felt it as mandatory for the present
and future generation for protecting the precious ground water resource. Though the rainwater harvesting
was implemented in large scale in the coastal area of Chennai particularly in Thiruvanmiyur and Valmiki nagar
areas of south Chennai city, no appreciable improvement in chemical quality of ground water has been
observed. This is mainly due to the seawater ingress in the fresh water aquifers and it is over riding the
rainwater harvesting at ThIruvanmiyur area. This situation can be tackled by implementing alternative large-
scale artificial recharge schemes as suggested in the following section.
Heavy rains in urban areas results water logging and submergence of low-lying areas. Encroachment on
waterways is often root cause of such problems. Various measures to solve the issue is planned and partly
implemented. This issue could be tackled on more scientific lines by minimising the adverse impacts. In this
regard the possibility of utilising the heavy runoff for improving the ground water regime and preventing the
seawater ingress in the coastal aquifers is explored.
The isolated over development of ground water from the Thiruvanmiyur aquifer due to urbanisation has
resulted seawater ingress. The area from Velachery to IIT tract, occupied by crystalline formations, has limited
scope for ground water recharge and during normal low intensity monsoon rains leads to water logging
conditions.

62
The observations from the ground water monitoring study revels the need of artificial recharge of
Tiruvanmiyur aquifer which is under great stress for augmentation of ground water resources in respect of
quality and quantity. The water logging at Velachery and Taramani areas and recharging of Thiruvanmiyur
aquifer can be combined for improving the local ground water source and prevention of sea water ingress
further. Two recharge cum pumping water line with booster pumps and recharge tube wells are
recommended. The surplus runoff channel from IIT area and partly reclaimed Buckingham canal in Adyar
Muthukadu section can be used to store fresh water and continuous supply to recharge system. The time lag
for the recharge phenomena and the fast rate of flood water collection needs proper understanding and
creation of collection chambers and drains without mixing of sewage which is important to get suitable quality
source water for recharge.
There is a possibility of desiltation and improving the storage capacity of Pallikaranai marshy land in south side
of Velachery railway line. Dewatering of water logging prone areas in and around Velachery, Taramani and IT
corridor can be made with separate storm water system and transport to new pond and pumping system
along the Buckinghum canal. Surplus weir to drain excess water to the sea along the canal and a well-planned
direct canal to sea can be implemented with this artificial recharge scheme.
The Velachery and Pallikaranai lakes can be cleaned and used for fresh water storage to augment Chennai
water supply in the long run. The uncovered locations poorly connected sewage lines in the entire catchment
area needs to be modified and disposed while the storm water can be treated and used for water supply as
well as ground water recharge and protection of coastal ecosystem.

63
DEHRADUN CITY, UTTARKHAND
D. Bagchi & R.A.Pir, CGWB, Dehradun
INTRODUCTION
Dehradun is the capital of Uttarakhand State. Dehradun is located in the foothills of the Himalaya at the
centre of an intermontane, structural valley known as the Doon Valley. The name Dehra Dun literally
comprises two words Dera (or Dehra) meaning a camp, while Dun (or Doon) is a local term used for a river
valley. Doon Valley is one of the largest and picturesque tectonic valleys having an area of ~1600 km2, which is
surrounded by Siwalik Hills to the south and Mussoorie Hills to the north. The valley is historically important
and culturally famous due to its pleasant climate and a number of reputed institutes., Dehradun is believed to
be one of the oldest cities of India and was occupied at different times by the Sikhs, Mughals and the Gurkhas
before coming under the reigns of the British. The present city was founded in the early eighteenth century by
Guru Ram Rai, the elder son of Guru Har Rai. Guru Ram Rai came to the place on exile after being banished by
the Mughal emperor, Aurangzeb. Guru Ram Rai first settled in village Dhamawala in 1675 AD. The name
“Dehra” refers to his Dera (or settlement) around which the present city of Dehradun developed gradually.
One of the first settlements was a Gurudwara known as “Guru Ram Rai Darbar”, which was built in 1699 AD
with the help of Fateh Shah, the then Raja of Garhwal. The architecture of the Gurudwara resembles the tomb
of Mughal Emperor Jehangir. In Skanda Purana, Dun is mentioned as a part of the holy region “Kedar Khand”,
meaning the abode of Lord Shiva.
CGWB has so far drilled eight Exploratory Wells in Dehradun District (as on February 2011). Apart from this,
four deposit wells were also constructed in and around Dehradun City, which were subsequently handed over
to the state government for water supply.
GENERAL FEATURES
Dehradun, the capital of Uttaranchal State is also
the headquarter of Raipur Block and has both
strategic and political importance. The
administrative map of Dehradun city is given in Fig-
1.
The average elevation of the city is 450 m (1480 ft)
above Mean Sea Level. The population of Dehradun
City (excluding the cantonment area) is 447808
(Census 2001). The male: female sex ratio is
1000:893. The density of population as per Census
2001 in Dehradun City was 329 person per km2. The
decadal growth rate of population in Dehradun
(Period: 1991 to 2001) is 39.73%.
Generally the climate of Dehradun City is temperate.
The temperature during summer ranges from 16.7 to
36.0ºC while winter temperature varies from 5.2 to
23.4ºC. The summer starts by March and lasts up to
mid of June when the monsoon sets in. The City
experiences moderate to heavy showers during late
June to mid August. The maximum temperature
recorded in Dehradun City was 43.9ºC on 4th
June
1902 while the lowest minimum daily temperature in
Dehradun was –1.1ºC recorded on 1st
February 1905
and 11th
January 1945.
Fig-1. Administrative Map of Dehradun City

64
Dehradun City is a part of Intermontane Doon Valley formed by the piedmont alluvial fan deposits and exhibits
a general fall in gradient towards south located between the Lesser and Sub-Himalayan ranges. Seasonal
streams like Bindal Rao, Rispana Rao, Baldi Nadi, Nalota Nala etc. drain the city.
Due to wide variation in topography, drainage, geomorphology, intensity of erosion, host rock etc., the soils of
Dehradun City show wide variation in texture, colour, stoniness, moisture and organic matter. However, as per
the classification of NBSSLUB, the main soils of Dehradun City are Udifluventic Ustochrepts, Udic Ustochrepts,
Udic Haplustolls and Typic Ustipsamments. The forest cover is scattered across the City and comprises parts of
Forest Research Institute, Garhi Cantonment and Chandrabani areas. Soils in the forested areas consist of
Inceptisol, Mollisol and Alfisol.
STATUS OF WATER SUPPLY AND DEMAND
The major problems of water supply in Dehradun City are unequal distribution of water, old dilapidated pipe
lines, uncontrolled zoning and unsatisfactory operation and maintenance (City Development Plan, Jawaharlal
Nehru National Urban Renewal Mission, May 2007). Urban water supply of Dehradun is operated and
maintained by Uttarakhand Jal Sansthan (UJS) whereas large capital works and overall planning is done by
Uttarakhand Pey Jal Sansadhan Vikas Evam Nirman Nigam, popularly known as Uttarakhand Pey Jal Nigam
(UPJN). Although the natural topography of the City helps in gravity drainage, pockets of water logging are
present due to local urbanization.
In Dehradun City the duration of water supply is mostly for short hours. Hand Pumps, which were installed and
maintained by the UJS, cater to the needs of a limited number of residents. Water supply of Dehradun is
based on surface water and groundwater sources. The total water supply from surface water sources is 35.33
million litres per day (MLD), the details of which is given below:
a) Bandal intake works (Gravity Main): 6.75 MLD
b) Massi Fall (Gravity Main): 8.00 MLD
c) Kaligad (Gravity Main): 0.58 MLD
d) Galogi Power House (Gravity Main): 8.00 MLD
e) Bijapur Canal (Pumping): 12.00 MLD
At present, total 92 tube wells are operational for water supply in the City, which is producing 140 MLD. The
total demand of water is 117.73 MLD, which is less than the total supply of 175.33 MLD from surface and
groundwater sources (Source: Uttarakhand Jal Sansthan). Recently, the SCADA Automatic Water Supply
System was installed in some of the tube wells by UPJN, which automatically switch on and off the pumping
stations. Similarly, the UJS has also installed automatic water supply and distribution system in many areas of
the City like Indra Nagar, Parade Ground, Maharani Bagh, Vasant Vihar, Race Course, Dilaram Bazar etc. The
water supply tube wells include many mini tube wells (with limited discharge and much lower construction
cost than a regular deep tube well) being maintained by the UJS. Monitoring of the tube wells is being done
through the Master Control Station of the UJS located in Nehru Colony.
WATER PROFILE
Surface water sources (rivers, streams etc.) were traditionally used in Dehradun City for water supply but
groundwater sources have started playing an important role in supplementing the surface water sources in
recent times. The total water supply to the City is 127.05 million litre per day (MLD) out of which surface water
sources contributes only 24.54 MLD (19.32%). Contribution of groundwater in total water supply is 102.51
MLD (80.68%), which means that groundwater plays a pivotal role in urban water supply (Source: National
Institute of Urban Affairs, 2007). The average per capita water supply in Dehradun is 124 litre per capita per
day (lpcd) while the average duration of supply is 4 hours (twice a day). The total water loss in supply is
estimated to be a staggering 30%, which demands a thorough review of the water supply position and
effective management of the water resource in the City. A socio-economic survey of 1160 households in the

65
City has revealed that 71% of the population has access to piped water supply (National Institute of Urban
Affairs, 2007).
Two water treatment plants are operational in the City with a total capacity of 34 MLD. Water supply in the
northern part of Dehradun City is through gravity, in the central part through gravity and pumping while in the
southern part, supply is through pumping only (op. cit.). One of the biggest problems of water supply in
Dehradun is the unequal intra-city distribution, due to which some localities are facing acute water shortage.
GROUND WATER SCENARIO
Potential Aquifers
The hydrogeology of Dehradun City (a part of Raipur block) is related to the geology and geomorphology of the
area. Dehradun City comes under two hydrogeological units namely Dun Gravels and Siwalik Group. These
units are briefly described below.
Doon Gravels: The intermontane valley comprises alluvial fans and sediments which descend from the Lesser
Himalaya to the north (facing slopes of the Siwalik Hills or Sub Himalaya). Geologically the formation is known
as Doon Gravels, which is characterized by very coarse boulders embedded in sandy and silty matrix. The clasts
are mainly composed of quartzite, limestone, sandstone and phyllite, which are derived mainly from the Krol
Group. Conglomerate pebbles of Siwalik Group are also present in Doon Gravels. The Doon Gravels are
subdivided into three chronological sub-units namely Older, Younger and Youngest Doon Gravels. The older
Doon Gravels are characterized by clasts eroded from the Upper Siwalik conglomerate. These conglomerates
are massive, supported by red matrix and represent debris flow deposits. The Younger Doon Gravels are
characterized by rounded clasts of quartzite, limestone, sandstone, phyllite and shale derived from the Lesser
Himalaya and Sub Himalaya (Siwalik Hills). Calcification is pronounced due to carbonate minerals, whose
provenance is Krol Group. The Youngest Doon Gravels comprises very large boulders representing both debris
flow and braided river systems. Recent and alluvial deposits formed by rivers overlie this unit.
Groundwater generally occurs in unconfined, confined and perched conditions. The perched water table
condition is generally met due to the semi permeable nature of the clay beds owing to their gritty nature, and
the limited thickness and wedge or lens shaped tapering of the beds unsuitable for creating confined pressure
heads.
Confined groundwater conditions in the area under study are largely attributed to the underground disposition
of aquifers and elevation difference between the point of intake or recharge of the aquifer at any point, in the
down gradient where the tubewell has been bored. The depth to water in the Doon Valley varies from 6.0 to
>100.0 m bgl and the terrain being proximal to Siwalik foothills, the depth of water table is largely dependent
on the slope of the country.
Siwalik Group: Groundwater occurs in confined conditions and the depth to water levels is comparatively
higher than in Doon Gravels. In spite of the boulder-conglomerate bed of Upper Siwalik Formation being highly
porous and permeable, much of the water goes as run off due to steep slopes and the sediments forming
piedmont fans dipping into the intermontane valley. About 70 gravitational springs have been reported which
have a varying discharge ranging from less than 1 liter per second (lps) to 113 lps. The fresh water bearing
zones are present in the Upper Siwalik due to the presence of pebble–gravel–conglomerate–boulder beds and
act as good groundwater reservoirs when underlain by the Bhabar or Doon Gravel. Groundwater exploration
has revealed that the pebble–boulder and gravel–sand beds of Siwalik Group are capable of yielding copious
quantities of water for irrigational purpose.
Ground Water Level
A total of five Ground Water Monitoring Wells are monitored regularly in Dehradun City four times in a year
viz. January, May, August and November. These include one Dug Well at Kanwali and four Hand Pumps at
Harbanswala, Nanurkhera, Tarla Nagal and Balliwala. Apart from these, a Piezometer constructed in the office
building of CGWB, UR, Dehradun is also being monitored weekly since 5th
February 2010.
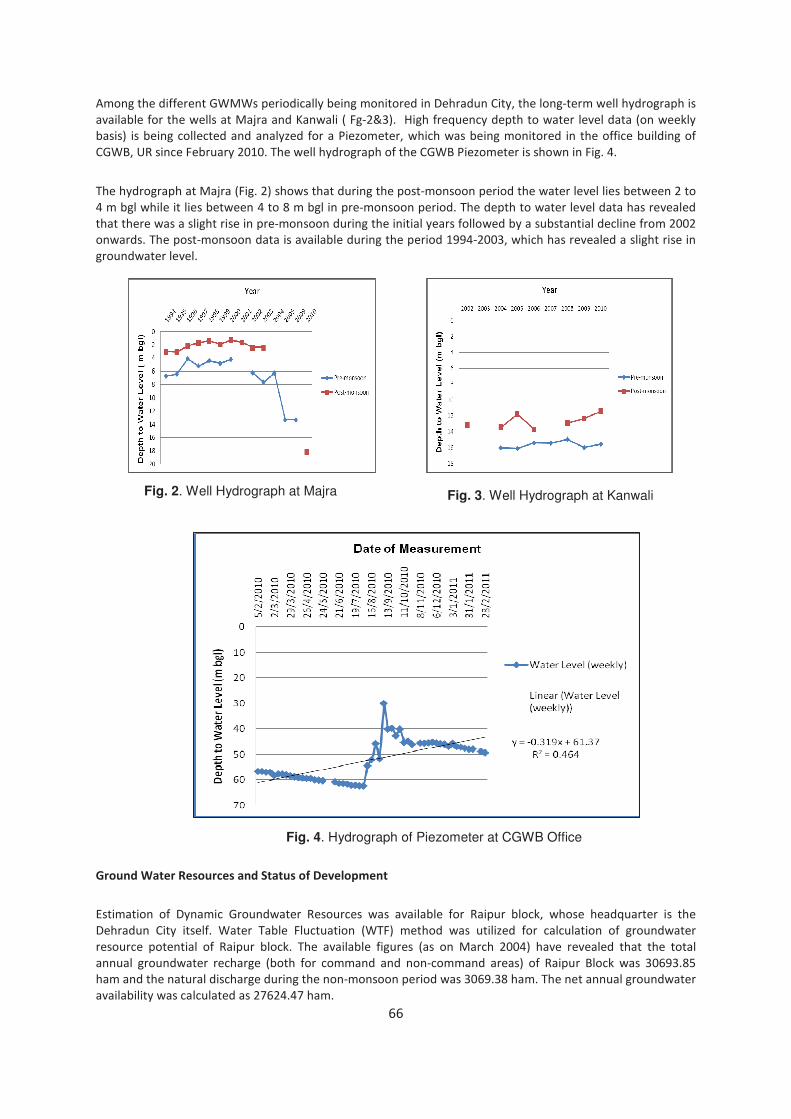
66
Among the different GWMWs periodically being monitored in Dehradun City, the long-term well hydrograph is
available for the wells at Majra and Kanwali ( Fg-2&3). High frequency depth to water level data (on weekly
basis) is being collected and analyzed for a Piezometer, which was being monitored in the office building of
CGWB, UR since February 2010. The well hydrograph of the CGWB Piezometer is shown in Fig. 4.
The hydrograph at Majra (Fig. 2) shows that during the post-monsoon period the water level lies between 2 to
4 m bgl while it lies between 4 to 8 m bgl in pre-monsoon period. The depth to water level data has revealed
that there was a slight rise in pre-monsoon during the initial years followed by a substantial decline from 2002
onwards. The post-monsoon data is available during the period 1994-2003, which has revealed a slight rise in
groundwater level.
Ground Water Resources and Status of Development
Estimation of Dynamic Groundwater Resources was available for Raipur block, whose headquarter is the
Dehradun City itself. Water Table Fluctuation (WTF) method was utilized for calculation of groundwater
resource potential of Raipur block. The available figures (as on March 2004) have revealed that the total
annual groundwater recharge (both for command and non-command areas) of Raipur Block was 30693.85
ham and the natural discharge during the non-monsoon period was 3069.38 ham. The net annual groundwater
availability was calculated as 27624.47 ham.
Fig. 2. Well Hydrograph at Majra Fig. 3. Well Hydrograph at Kanwali
Fig. 4. Hydrograph of Piezometer at CGWB Office

67
During the course of Groundwater Management Studies in Dehradun District (AAP:2007-08), an attempt was
made to evaluate the available groundwater resources in Raipur Block based on the norms laid down by the
Groundwater Estimation Committee (GEC, 1997) and the ad hoc norms followed by the ground water
department of Uttar Pradesh. Groundwater resources were calculated both for command and non-command
areas (including forest area), leaving the areas where the slope exceeds 20% (hilly area).
The gross groundwater draft (both for command and non-command area) in Raipur Block was calculated as
9139.59 ham and the allocation for domestic and industrial water supply (up to next 25 years from the period
2007-08) was found to be 2992.68 ham. The stage of groundwater development in the command area was
found to be 61.71% and for non-command area it was only 28.0%. The overall stage of groundwater
development of Raipur Block was 33.08%, which falls in “Safe” Category.
Hydrochemistry
Water samples for complete chemical analysis were collected from Ground Water Monitoring Wells located
within the municipal limits of Dehradun City viz. Majra, Kanwali, Balliwala, Harbanswala (Vasant Vihar Phase-II)
and Nanurkhera during pre-monsoon monitoring. The analysis results are available for 12 parameters viz.
Electrical Conductivity (µS/cm at 25°C), pH, bicarbonate (HCO3), chloride (Cl), nitrate (NO3), sulphate (SO4),
fluoride (F), calcium (Ca), magnesium (Mg), total hardness (TH) as CaCO3, sodium (Na) and potassium (K).
The distribution of nine hydrochemical parameters viz. HCO3, Cl, NO3, SO4, F, Ca, Mg, Na and K are
represented as bar diagrams (histograms). Due to long-term hydrochemical data availability for Kanwali
(period 2004-2009), a separate histogram is given (vide Fig. 5). The intervariability of hydrochemical
parameters for the rest of the monitoring stations is shown in Fig. 6.
A perusal of Fig. 5 and Fig. 6 has revealed that the various parameters are well within the acceptable limit as
per the Revised Guidelines on Drinking Water of the Bureau of Indian Standards (BIS, IS: 10500, 2nd
Revision,
2003). However, high nitrate was observed at Kanwali dug well in 2008 and 2009, which may be attributed due
to anthropogenic source.
Major Ground Water Related Problems
The study of hydrographs of shallow aquifers tapping perched water bodies has revealed a slightly declining
trend. After creating of Uttarakhand State, parts of the Dehradun City and nearby areas like Selakui Industrial
Area, Lal Tappar Industrial Area etc. have become a hub of industrial activities. The population of Dehradun
Fig. 5. Variation of Hydrochemical
Parameters at Kanwali
Fig. 6. Intervariability between four
Monitoring Stations during 2009

68
has increased at a very high rate over the last few years. This has created tremendous stress on groundwater
resource of Doon Valley. As a consequence, the urban water supply deep tube wells and mini tube wells are
being forced to operate for longer hours due to increase in demand for groundwater.
During the peak summer season, there has been scarcity of drinking water and some of the mini tube wells
have failed. Quality of groundwater in Dehradun City has been found acceptable. However, some slum
dwellers have reported contaminated water in the piped water supply schemes. Decline of groundwater level
in Hand Pumps was observed in fringe areas of Dehradun City (along Dharmawala-Kunja-Judli-Matak Majri and
also along Dalippur–Dakrani–Dakpatthar area) in the post monsoon periods during Groundwater Management
Studies in Dehradun District. This may be attributed to seasonal fluctuation in the Yamuna flood plain where
the aquifers are recharged by Yamuna River.
Due to rapid urbanization in the last decade (essentially after the formation of Uttarakhand State in the year
2000), the stream flow has reduced substantially except during monsoon. Moreover, encroachment on the
banks of Bindal Rao and Rispana Rao has worsened the surface water quality of the streams (Fig-7).
Fig. 7. Illegal Encroachment along Bindal Rao, Dehradun City
Feasibility of Rain Water Harvesting and Artificial Recharge
Due to urbanization and industrialization, there is an ever-increasing stress on groundwater resources. Runoff
is quite high in the City. Construction of roads and increase in paved areas during recent years has lead to
increased run off and reduced natural recharge to the aquifers. Only very limited channel bed infiltration takes
place along some of braided rivers.
Artificial recharge of the aquifer system is not in pace when compared to that of groundwater withdrawal in
Dehradun City. The water levels in some parts of the City have declined considerably over the last decade. The
Government of Uttarakhand has given instructions for compulsory installation and execution of roof top rain

69
water harvesting system in all government buildings, schools and hospitals in Uttarakhand State vide Official
Orders during May 2004 and July 2008. It has been suggested by the Central Ground Water Board, Uttaranchal
Region to implement roof top rain water harvesting system in buildings having a roof top area of ≥ 200 m2.
Central Ground Water Board, Uttaranchal Region has implemented a demonstrative artificial recharge scheme
in Thano, Raipur Block under the Central Sector Scheme. A series of four check dams were constructed in a
Nala and the success of the scheme was evidenced after a span of five years (in 2008) by increased vegetation
cover. Substantial recharge to the shallow aquifers in the area was indicated by absence of surface flow in the
downstream side of the check dams.
Roof top rain water harvesting and groundwater recharge schemes have been installed in the buildings by the
state government departments in Dehradun City. Besides this, technical assistance to various agencies, NGOs
and self help groups are being provided by CGWB, UR.
GROUNDWATER DEVELOPMENT STRATEGY
The overall utilization of groundwater resources in Dehradun City is moderate and exploration activities have
been carried out in different locations viz. Tarla Nagal in the north eastern part and Vasant Vihar in the
southern part by the Central Ground Water Board, Uttaranchal Region. The various components of a holistic
groundwater development strategy of Dehradun City are mentioned hereunder:
Utilization of Existing Groundwater Resources
• Groundwater supply in the City is principally through the deep tube wells, mini tube wells and India Mark-
II hand pumps. It has been observed through exploration activities carried out by the CGWB, that
potential aquifers exist in parts of Dehradun City where Doon Gravels constitute promising aquifers.
• It has been suggested that sites for groundwater exploration in the City be selected scientifically with an
emphasis to generate subsurface hydrogeological data. Surface resistivity surveys should be carried out in
virgin areas rather than areas which have good groundwater potential.
• Water supply tube wells can be used both for drinking and irrigation purposes (in the fringe areas of
Dehradun City). Existing data from state government departments have revealed that a total of 331 tube
wells created groundwater draft of 9139.59 ham for Raipur Block, whose headquarter is Dehradun City.
• Analysis of data of government and private tube wells has revealed that there is a potential of
constructing about 1000 tube wells in Raipur Block to fully utilize the available groundwater resources.
However, the production wells should be constructed where hydraulic troughs were formed.
• It has been suggested that the optimum spacing between two tube wells should be between 150 and 200
m in Dehradun City.
• It has been observed in the past that failure of mini tube wells in some areas has posed problem in
sustainable development of groundwater in and around the City. To overcome the problem, it is
suggested to carry out detailed hydrogeological investigation followed by surface resistivity surveys (VES
and Profiling depending on the site condition) to locate feasible sites for construction of the mini tube
wells.
• Occasional drying up of India Mark-II Hand Pumps is attributed to the shallow depth of penetration and
tapping of shallow, perched water bodies. It is suggested to extend the drilling depth by 20-30 m below
the static water level in the Hand Pumps for a sustainable supply of groundwater, especially in the slum
areas of the City.
• Instead of constructing tube wells haphazardly in different pockets of Dehradun City, battery of tube wells
should be constructed along the banks of Song River, located to the east of Dehradun City. Similarly,
battery of tube wells should be constructed along the bank of Asan River located to the west of the City.
Systematic groundwater exploration has to be carried out along the banks of Song and Asan Rivers for a
sustainable water supply through the potential multi aquifer system developed in Doon Gravel.
• River Bank Filtration technology has been proved quite successful in Uttarakhand. Uttaranchal Koops have
been installed in the past by Uttarakhand Jal Sansthan along river banks, which have proved to be quite
successful in augmenting the water supply position. Pilot studies in Song and Asan Rivers are required so
that the technology may be adopted in many areas of Raipur Block.

70
• There is a scope of augmenting the spring-based irrigation system in the peripheral parts of Dehradun City
by adopting spring rejuvenation. Also instead of the existing open channel flow scheme (Guhl system),
piped water supply should be practiced for irrigation as it involves minimum distribution loss and lesser
maintenance cost than the Guhl system.
Water Conservation Methods
• Water conservation methods like construction of contour bunds, check dams, gully plugs, gabion
structures etc. may be adopted on small streams and Nalas in the fringe areas of the City depending on
the local geological and hydrogeological conditions.
• Gully plugs having width of 1.5-2.0 m and height of 0.7-1.0 m may be constructed on first and second
order streams. Contour bunds may be constructed where land slope is <6%. The dimension of contour
bunds will depend on the slope and the type of soil.
• Bushwood Check Dams may be constructed for conservation of water and soil in small Nalas with locally
available vegetation. This is a bio engineering structure with long life span and involves very less
expenditure of only few thousand rupees.
• Similarly, Gabion Structures can also be constructed in small seasonal streams like Nalota Nala, Baldi Nadi
etc. The height of this bio engineering structure may vary from 0.5 to 1.0 m and it requires a good quality
steel wire mesh to bind the locally available stones for sustainable water conservation.
Artificial Recharge and Rain Water Harvesting
• There is immense scope for implementing roof top rain water harvesting system in the City .The rain water
may be conserved as surface storage or may be utilized for recharging the shallow aquifers.
• Surface storage of rain water may involve construction of a Syntex tank, RCC tank or Masonry tank. The
cost component is variable depending on the engineering design and may range between Rs. 10000/- to
Rs. 25000/-. The system may be adopted in Group Housing Societies being constructed in Dhoran Khas
area by infrastructural firms.
Roof top rain water harvesting and artificial recharge scheme through recharge trench has been implemented
in the various state govt offices in Dehradun city. However Artificial Recharge to the aquifers in Doon Gravel,
which is applicable for Dehradun City, requires detailed site specific studies.
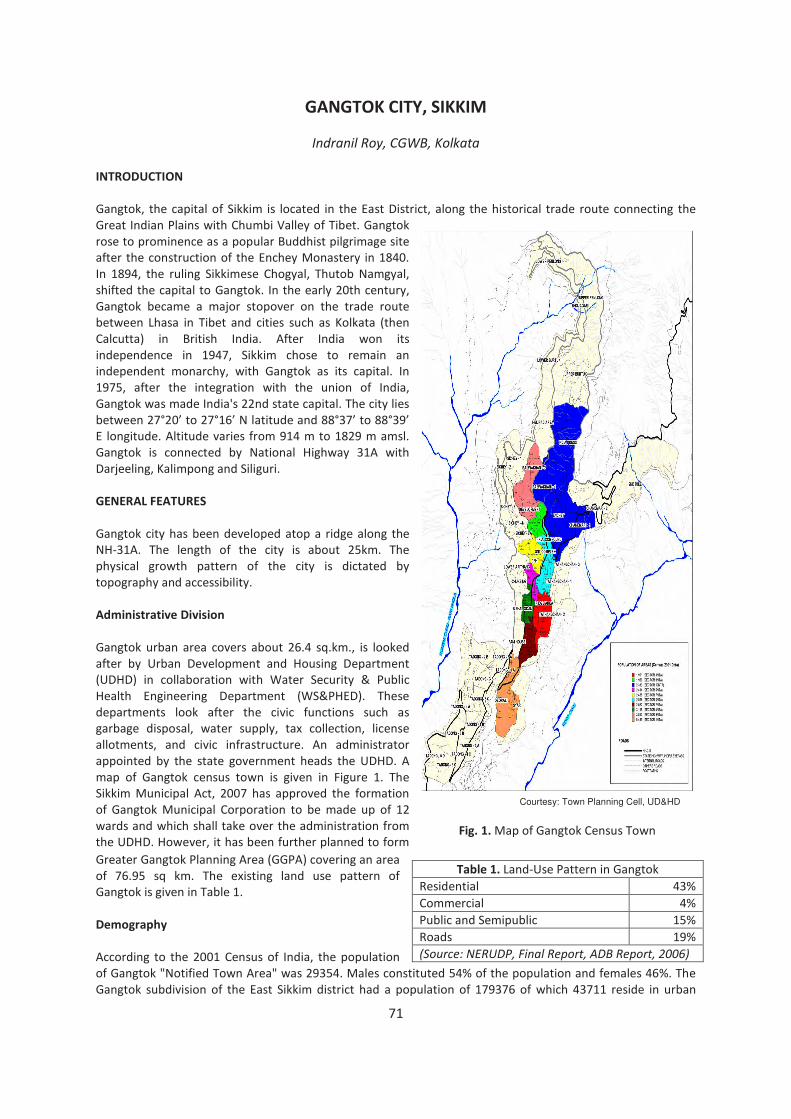
71
GANGTOK CITY, SIKKIM
Indranil Roy, CGWB, Kolkata
INTRODUCTION
Gangtok, the capital of Sikkim is located in the East District, along the historical trade route connecting the
Great Indian Plains with Chumbi Valley of Tibet. Gangtok
rose to prominence as a popular Buddhist pilgrimage site
after the construction of the Enchey Monastery in 1840.
In 1894, the ruling Sikkimese Chogyal, Thutob Namgyal,
shifted the capital to Gangtok. In the early 20th century,
Gangtok became a major stopover on the trade route
between Lhasa in Tibet and cities such as Kolkata (then
Calcutta) in British India. After India won its
independence in 1947, Sikkim chose to remain an
independent monarchy, with Gangtok as its capital. In
1975, after the integration with the union of India,
Gangtok was made India's 22nd state capital. The city lies
between 27°20’ to 27°16’ N latitude and 88°37’ to 88°39’
E longitude. Altitude varies from 914 m to 1829 m amsl.
Gangtok is connected by National Highway 31A with
Darjeeling, Kalimpong and Siliguri.
GENERAL FEATURES
Gangtok city has been developed atop a ridge along the
NH-31A. The length of the city is about 25km. The
physical growth pattern of the city is dictated by
topography and accessibility.
Administrative Division
Gangtok urban area covers about 26.4 sq.km., is looked
after by Urban Development and Housing Department
(UDHD) in collaboration with Water Security & Public
Health Engineering Department (WS&PHED). These
departments look after the civic functions such as
garbage disposal, water supply, tax collection, license
allotments, and civic infrastructure. An administrator
appointed by the state government heads the UDHD. A
map of Gangtok census town is given in Figure 1. The
Sikkim Municipal Act, 2007 has approved the formation
of Gangtok Municipal Corporation to be made up of 12
wards and which shall take over the administration from
the UDHD. However, it has been further planned to form
Greater Gangtok Planning Area (GGPA) covering an area
of 76.95 sq km. The existing land use pattern of
Gangtok is given in Table 1.
Demography
According to the 2001 Census of India, the population
of Gangtok "Notified Town Area" was 29354. Males constituted 54% of the population and females 46%. The
Gangtok subdivision of the East Sikkim district had a population of 179376 of which 43711 reside in urban
Table 1. Land-Use Pattern in Gangtok
Residential 43%
Commercial 4%
Public and Semipublic 15%
Roads 19%
(Source: NERUDP, Final Report, ADB Report, 2006)
Courtesy: Town Planning Cell, UD&HD
Fig. 1. Map of Gangtok Census Town

72
areas of Gangtok and Tadong. Of total urban population of Sikkim, Gangtok Notified Town Area has a share of
55.5%. Historical population growth of the area is given in Table 2. It is also to be noted that Government of
Sikkim reclassified the city limits of Gangtok in 1991, causing the population and the city area to shrink by 60%.
Table 2. Growth of Population in Gangtok Subdivision and Gangtok Notified Town Area
Year Population Decadal
Growth Rate Remarks
1951 2744
1961 6848 149.56
1971 13308 94.33
1981 36747 176.13
1991 25024 -31.9* The negative growth rate was due to the reduction in the size of
the urban area.
2001 29354 17.3
Source: Census of India, 2001
Hydrometeorology
Climate of Gangtok remains pleasant throughout the year with
an average summer temperature ranging from 17°C to 25°C
(from April to September) and average winter temperature
ranging from 9°C to 18°C (March to October). The weather of
Gangtok is alpine type. Humidity is fairly high throughout the
year with an annual average of about 85%. The region receives
an annual normal rainfall of 3800 mm over 165 rainy days per
year. A major portion of the rainfall is from the south-west
monsoon between June to September. Snowfall is rare, and in
recent times Gangtok has received snow only in 1990, 2004
and 2005. The annual mean wind speed ranges between 1.8
and 4.1 kmph. Normal rainfall, average rainfall and average
rainy days of the area are compiled in Table 3.
Physiography & Drainage
Gangtok ridgeline divides the city into two parts viz. eastern
and western. The general slope of the western side of the
ridge vary from 30° to 42° but in certain stretches around
Adampool below Amdo Golai and Rani Khola areas of Sichey,
slopes are gentler and varies from 10° to 15°. On eastern side the slopes varies from 20° to 40°. In the areas
with more than 60% slope (i.e., 30° from horizontal), the rocks are incompetent and structurally disturbed and
susceptible to slope failures. The city is located in Seismic Zone IV. Terrain model of the area is given in Figure
2 (a) and FCC of Gangtok area using IRS-1D LISS III data is given in Figure 2 (b).
The area occupies the central portion of the leaf shaped Rongni Chu catchment, surrounded by two streams,
namely Rani Khola in the west and the Roro Chu in the east. These two rivers divide the natural drainage into
two parts, the eastern and western parts. Both the streams meet the Ranipool and flow towards south as the
main Rani khola before it joins the Teesta at
Singtam. Numerous small and large natural
springs and rivulets locally known as
“Jhoras” dissect the entire area. There are
95 major jhoras (30 in South-Eastern region
and 65 in North Western region) draining
into Roro Chu and Rani Khola Rivers. Average spring discharge is given in Table 4.
Soil Type
Soils in the region are excessively drained, coarse to fine loamy with slight surface stoniness. The soils are
acidic in nature with pH < 5 and shows contrasting morphologies under varying topographic settings. Soils in
Table 3. Rainfall Pattern in Gangtok (in mm)
Month
Normal
Rainfall
(mm)
Average No
of Rainy Days
(1941-90)
January 43.8 3.3
February 58.6 5.1
March 132.5 8.1
April 280.9 13.8
May 578.8 22.4
June 684.1 24.7
July 700.8 27
August 616.4 26.4
September 477 21
October 205.3 8.8
November 35.6 3.2
December 20.3 2
Total 3842.1 165.8
Source: NHPC (2005)
Table 4. Average Spring Discharge
Sub Division No. of Springs
measured
Average lean period
discharge (lpm)
Gangtok 46 13.28
Source: RM&DD (2004)

73
Fig. 2. a) Topographic model of Gangtok Area (source: Google Earth) b) FCC of Gangtok area using IRS-1D
LISS III data.
a b
north and eastern part of the Gangtok planning area are thin and highly sandy when compared to the western
part. The western part of the ridge towards the River Rani Khola possesses fertile agricultural land where as
the eastern part towards the River Roro Chu possesses steep terrain and is not suitable for agriculture.
STATUS OF WATER SUPPLY AND DEMAND
Water is supplied in Gangtok by the WS&PHED, RM&DD and spring sources. While one pays for water supplied
by the WS&PHED, water supplied from RM&DD sources is free. The three major sources of water supply in
Gangtok are,
1. Treated and piped water supply by the PHED (access coverage range 70-85%)
2. Treated and piped water supply by the RM&DD (~ 21%)
3. Private piped water supply from spring sources
(Source: Community Engagement, GWSSP)
RM&DD supplies treated water mainly to Burtuk, Sixth mile, Chandmari, 2nd mile, Sichay, Lower Arithang and
Lower Syari. WS&PHED supplies treated water to various areas of Gangtok such as the Town area, Arithang,
Syari, TNHS and Tadong. Considering reliability of service, although about 83% of the population of Greater
Gangtok Planning Area (GGPA) have access to PHED’s piped water supplies, only about 50% have an individual
water tap. There are a substantial number of shared connections. About 25% of households having PHED
water taps receive water 24 hours a day, and almost all get water for a few hours every day. People also
collect water from small springs and small streams called jhoras through private connections.
The main source of drinking water for the entire area is the Ratey Chu River located 16 km from the main
water treatment plant at Selep. Mainly three treatment plants of 4.5 mld, 9.14 mld and 22.68 mld capacities
have been installed under various phases since 1973. A fourth small treatment plant of one mld capacity was
also installed some time back, to serve a locality at an elevation higher than Selep. However, the most recent
22.68 mld plant has not become fully operational till date. The river Ratey Chu is snow fed and has perennial
streams with alpine characteristics. The discharge of the stream is about 20 cusecs (48.5 mld) during the dry
season and 40 cusecs (97 mld) during the monsoon. Like other hill cities Gangtok too has the gravity flow
based ‘bunched pipelines’ system for distribution.

74
The population of GGPA as per 2001 census was 86,832. Present (2010) estimated population is about
1,10,000. Going by a demand of 140 lpcd and service coverage of 80%, the requirement for water at the
consumer end is 12.3 mld. Against this demand, production from all sources is 13.50 mld and is now adequate.
However, considering future demands based on projected population, an immediate increase in capacity is
needed and work has been planned in phased manner (Table 5). This is also to be noted that a high amount of
unaccounted water loss is present in the system, primarily due to distribution losses, pipe leakages, illegal
tapping, mechanical damages etc (UD&HD, 2001).
WATER PROFILE
The River Rani Khola flowing southerly is fed by numerous streams from the western side of the Gangtok ridge.
The River Roro Chu follows a southwesterly course with numerous easterly and westerly flowing feeder
streams. Unlike Rani Khola, Roro Chu is of younger origin and follows more or less along a straight course.
Apart from these streams, about 95 jhoras are present in the area. However the area being on the ridge top,
surface water bodies like ponds are absent in the area. Moreover, being hilly terrain with slopes commonly >
20%, scope of groundwater storage is also limited. Most of the rainwater flows out as surface run off.
Depending upon secondary porosity and structural control of the underlying aquifers, groundwater emanates
in the form of springs.
Table 5. Projected Population, Water Requirement and Designed Capacities
Sl.
No. Year Population
Water
demand at
200 lpcd at
consumer
end (mld)
Gross
Demand
required at
source
(mld)
Designed
Capacity
(mld)
Remarks
1 2011 112005 ― ― 13.50 New plant work partly completed
2 2013 116613 23.32 27.32 36.32
Phase-I design population. The
population of years 2013 has been
arrived on linear interpolation
method
3 2021 135046 ― ― ― ―
4 2026 147477 29.49 33.86 36.32 Phase-II design population
5 2031 159908 ― ― ― ―
Source: WS&PHED, Govt. of Sikkim
GROUND WATER SCENARIO
Ground water occurs in the area in the form of localised disconnected bodies and circulates under favourable
geological conditions mainly in secondary porosity i.e. through joints, fractures, fissures etc. of across various
lithological units, along contact zones and also in weathered mantle and thin veneers of soil present over
various lithological formations. Direct infiltration from rainfall through secondary porosities is the principal
mode of recharge of ground water. Due to rugged relief and steep gradient of the area, sub-surface flows are
frequently intercepted, and manifested as seepages and springs.
Potential Aquifers
Geologically the region forms part of inner belt of lesser Himalayas and consists of three main lithological
units. The regional strike of all these lithological units is NW-SE with a dip of 15° – 60° towards NE. Two sets of
planar structures are most conspicuous, Bedding plane (S1) and the Schistosity (S2) mostly occurring in sub
parallel arrangement. Due to different phases of structural disturbances, numerous fractures, small scale faults
and joints have been developed. Fracture cleavage occurs in the schistose rock. 3 sets of joints are found in all

75
the rock types. Table 6 provides a description of the geology in Gangtok area. Hydrogeological map of the city
is given in Figure 3.
Table 6. Local geology of Gangtok Area
Group Subgroup/Formation Lithology
Locations
Quaternary Alluvial deposit
Patchy valley fills
– Unconformity –
Daling
Group
Garubathan Subgroup Phyllite Ranipool-Samdur-
Linding areas
– Thrust contact –
Lingtse Granite Gneiss Granite Gneiss Upper Syari
– Thrust contact –
Sikkim
Group
Chungthang Subgroup
(Rongli Schist)
Biotite gneiss, quatrzite,
impure marble, graphitic
schist
Major portions of the
Gangtok town area
Darjeeling Gneiss Migmatitic gneiss with calc-
silicate lenses
Burtuk, Rongye
(Simplified after ADB,2009; GSI, 2000)
Lineament study by Central Ground
Water Board (CGWB) in nearby areas
(namely Rumtek and Pakyong) in East
district, indicates presence of
prominent lineaments trending along
N-S, E-W, NE-SW, ENE-WSW and NW-SE
directions with lineament intersection
density of 10 to 14 intersections per
12.5 x 12.5 km2 area. This may be
indicative of presence of deep-seated
regionally extensive fractures in the
area. The ground water exploration
done in the district through exploratory
boreholes along with geophysical
surveys indicates that fractures
generally start from a depth of about 10
m and continue down to about 70 m
bgl. While fractures, down to 45 m bgl
are not very persistent and appear to
be of local pattern, fractures occurring
below 50 m bgl are rather persistent
and probably of regional extension.
Spring Characteristics
Due to steep gradient groundwater
comes out as seepages and springs,
whenever the surface intersects ground
water table. Steeper hill slopes
dominantly form the areas of spring discharge. The movement of ground water in the area is mainly controlled
by the structural set up and physiography. Study by CGWB indicates that mainly two types gravity springs are
prevalent in the area, namely a) Depression Spring; and b) Fracture Spring. It has been observed that spring

76
discharge decreases during December to April and increases during May to September. Monsoon rainfall
results into 2 to 6 times increase in discharge of the springs. In Daling phyllites, spring discharges range from 1
to 60 lpm, while in Darjeeling granite gneiss discharge range from 3 to 30 lpm. Comparison of TDS values
indicate very-short to short flow path of springs of Gangtok area.
Ground Water Resources and Status of Development
Ground water resource
estimation has not been
carried out for Gangtok
area specially. District-
wise resource estimation
results for East District in
which Gangtok belongs is
summarised in Table 8.
However, as mentioned
earlier, 83% population
of Gangtok town has
access to piped water
supply of WS&PHED.
Hence stage of ground
water development is
much less in Gangtok area in comparison to entire district.
Hydrochemistry
Quality of spring water is very good when away from major urban area and commonly potable for drinking
purposes. It depends mainly on (i) intake or recharge area, (ii) annual rainfall percolation, and (iii) continuous
flow of the spring.
Quality of water of few springs near Gangtok is given Table 9. Spring water temperature varies from 10° C to
23° C in the area. In general water quality is potable except pH is quite low in all the samples and iron is high in
Goskan jhora. This low pH may be indicative of presence of carbonic acid at the forested recharge zone as
supported by higher DCO2 values in the sample. This situation may be treated by boiling and using lime. On the
other hand, when quality of stream water (Table 10) is considered, anthropogenic bacteriological
contamination is prominent. This is result of city sewerage release in rivers.
Table 9. Water Quality of Springs in and around Gangtok
Sl. No. Parameters
Go
ska
n J
ho
ra
Ho
spit
al
Jho
ra
Pa
ljo
r S
tad
ium
Jho
ra
Fis
he
rie
s Jh
ora
Die
sel
Po
we
r
Ho
use
Jh
ora
1 Source Type Spring Spring Spring Spring Spring
2 Temp 13.5 °C 10.5 °C 17 °C 15 °C -
3 Odor Toxic Toxic Toxic Toxic -
4 Colour Blakkish Muddy Yellowish Darkish -
5 pH 5.3 5.8 5.5 5.4 -
6 Conductivity (μ mhos/cm) 650 300 200 200 -
7 Salinity 0.50% - - - -
8 Dissolved Oxygen (mg/I) 5.33 8,53 8.13 8.47 7.87
Table 8. Summary of Ground water Resource Estimation (2008)
Assessment Unit/ District East Sikkim
Net Annual Ground Water Availability 805
Existing Gross Ground Water Draft for Irrigation 129.77
Existing Gross Ground Water Draft for Domestic and Industrial
need 307
Existing Gross Ground Water Draft for All uses 437
Provision for domestic and Industrial supply by year 2025 553
Net Ground Water Availability for future Irrigation
development 122
Stage of Ground Water Development (%) 54.3
Estimated Average Individual Spring Catchment area (ha) 30
Estimated Total Spring Catchment area (ha) 41520
Annual Replenishable Ground Water Resources (m) 0.019

77
9 Dissolved CO2 (mg/I) 89.34 20.66 27.34 7.34 11.34
10 Chlorides (mg/I) 4.50 2.60 1.66 1.42 8.91
11 Alkalinity (mg/I) 201.8 118.67 84.67 72.33 58.67
12 Acidity (mg/I) 49.67 15.17 11.33 4.33 6.83
13 Hardness (mg/I) 199.46 93.48 68.26 75.44 63.84
14 Ca (mg/I) 38.61 28.32 22.71 27.12 24.71
15 Mg (mg/I) -ND- -ND- -ND- -ND- -ND-
16 Fe (mg/I) 2.12 0.01 0.18 0.02 0.2
17 Na (mg/I) 51.16 35.48 41.75 37.05 28.98
18 K (mg/I) 92.9 57.32 33.6 37.56 37.56
19 Phosphates (mg/I) 67.1 4.11 7.92 6.54 4.19
20 Nitrates (mg/I) 0.01 0.02 0.011 0.01 0.01
21 Silicates (mg/I) 25.25 18.5 11.6 10.99 12.95
22 TS (mg/I) 428.0 455.2 240.2 104.4 230.1
23 TDS (mg/I) 332.6 384.2 202.0 83.7 226.3
24 TSS (mg/I) 95.4 71.0 38.2 20.7 3.8
Source: SPCB (2007)
Table 10. Water Quality of Streams in and around Gangtok
Sl. No. Parameters
Sampling Locations
Adampool (Rani
Khola)
Ranipool
(Rani Khola) Jalipool (Roro Chu)
1 Turbidity (NTU) 2.5 2.5 2.5
2 pH 7.2 7.5 7
3 Conductivity (μmho/cm) 280 280 270
4 Total Alkalinity (mg/l) 200 210 210
5 Total Hardness (mg/l) 132 130 138
6 Sulphate (mg/l) 28 27 28
7 Phosphates (mg/l) 0.02 NT NT
8 Nitrate as NO3 (mg/l) 2.5 2.2 2.4
9 Fluoride (mg/l) NT NT NT
10 BOD (mg/l) 12 11 10
11 DO (mg/l) 8 6 5
12 Total Coliforms 220000 170000 130000
13 Faecal Coliform 170000 110000 90000
Source: WS&PHED (2008)
Major Ground Water Related Problems
As such major problem related to ground water of the city is absent. However, springs are very much
vulnerable to surface pollution and sometimes it is contaminated due to turbidity in it and presence of organic
filths and harmful bacteria. Gangtok city generates about 45 tons of garbage per day. It is estimated that 57%
of domestic solid waste is dumped in jhoras. Study (JNNURM, 2008) has revealed that around 66% of the
households dispose their wastes into jhoras and drains polluting the jhoras and posing serious threat to the
groundwater quality. Moreover, with 83% of the drains being unlined, coupled with porous and permeable soil
formations act as groundwater pollution source.

78
Feasibility of Rainwater Harvesting and Artificial Recharge
Although the area gets more than 3800 mm of rain fall annually but most of the rainfall goes as surface run off.
In lean periods discharges of the springs become meager and people suffer a lot. As the terrain is moderate to
very steep, landslide prone and within seismic Zone IV, hence artificial recharge to groundwater is generally
not possible in the area as it may increase susceptibility to landslide. Moreover, construction of tube well
structure is also a costly affair in hilly terrain of Sikkim due to limited site suitability for placement and
transportation of drilling rig, availability of potential fractures etc.
Roof top rainwater harvesting (RWH) may be encouraged to overcome the water crisis problem. Suitable big
reservoirs (made of the RCC, fiber glass etc.), storage tanks would be highly useful to collect roof water from
the building during monsoon period. In this respect, Ministry of Water Resources, Govt. Of India has funded
various schemes on Rain water harvesting at Sikkim. Pilot project on roof-top rain water harvesting structure
at Governor’s House at Gangtok has been implemented by WS&PHED, Govt. of Sikkim under the technical
guidance of CGWB under Central Sector Scheme and 5 nos. of RWH structures for have been constructed in
Govt. Rural Schools of Sikkim for drinking and use in girl’s toilets. Salient features of pilot RWH project at
Governor’s house is given in Table 11. Structural design of the scheme is given in Figure 4. Estimated cost
break-up for construction of a RWH Unit of 50000 litres capacity in mountainous area of Sikkim is given in
Table 12. It is also to be noted that being hilly area, while on one hand most of the houses have sloping roofs
of galvanized cast iron (GCI) making rooftop water harvesting feasible, on the other hand scattered houses
make it difficult to have a collective approach which is cost effective.
Selective artificial recharge of rain water in the areas of spring recharge zone may also be taken into
consideration. With high degree of caution, considering physiography and geological conditions, some
structures like contour trenching, gabion structures etc. of small extent may be constructed along with
aforestation within spring catchment area to increase recharge.
Table 11. Salient features of Pilot Rainwater harvesting Project at Governor’s House
Structure Details One Storage Tank with Filtration chamber of 20000 lts capacity
Annual Rainfall 3800 mm with an average of 150mm in single spell
Roof Utilized Rooftop of Banquet Hall, Rajbhaban
Roof Area 600 m2
Date of completion 30th September, 2004
Implementing Agency WS&PHED, Govt. of Sikkim
Funding Agency MOWR, Govt. of India
Cost Rs. 2.30 lacs
Table 12. Estimated cost break-up of RWH Unit construction
Sl. No. Item/Head Cost
Capacity: 50000 litre
1) Material Rs. 125000
Stones -
Cement -
Iron bars -
Hand pump -
Manhole Lids -
Ventilators -
Connecting Pipes -
2) Labour Rs. 75000
3) Transport Rs. 30000
4) Designing & Documentation Rs. 10000
5) Others Rs. 10000
Total Rs. 2,50,000

79
Fig.4. Design of Rain Water Harvesting Structure

80
GROUND WATER DEVELOPMENT STRATEGY
In Sikkim, mountain springs, have been traditionally playing a vital role in providing water security to rural
households, hence they have utmost significance in water resource management. With increasing population
and developing activities, maintaining Quality and Quantity (Q & Q) of spring water is of prime importance.
Spring sources should be cleaned periodically and storage tanks of adequate capacity may be built and water
needs to undergo treatment (both chemical and bacteriological) before put into the network of distribution.
Number of spring waters can be collected in tanks (depending on the demand) in a particular altitude and can
be supplied through pipe lines by gravity drainage after necessary treatment for drinking & domestic uses.
Protection of spring recharge catchment area is another aspect to look into. Sikkim governments initiative in
this direction through “Dhara Vikas” project is worth mentioning. This resulted in increase in discharge as well
sustainability of the springs under this project.
Effort should be made for provision of roof top rain water harvesting particularly in the Govt. buildings,
Schools, Colleges etc. On the basis of its usefulness the local people should be educated to implement RWH
schemes in their own buildings. Local panchayats should take initiative to make local people to understand the
technique & significance of RWH and provide financial assistance wherever possible.
To achieve the above mentioned targets, proper scientific study is needed to understand the underlying earth
system processes and interactions between various components at wide range of nested temporal and spatial
scales. Development with the aim of sustainability should be the aim for further work where people’s
participation plays pivotal role.
REFERENCES
• ADB (2009) Draft Initial Environmental Examination (IEE): Water Supply in Gangtok (Tranche I); India:
Northeastern Region Capital Cities Development Investment Program (NERCCDIP); Asian Development
Bank; January 2009; Project Number: 35290-01
• AFC (1994) Master Plan for Irrigation Development, Sikkim; Agricultural Finance Corporation Ltd. Report;
Govt. of Sikkim; Vol. 2, pp. 35–47.
• Census of India. 2001. Provisional Population Totals: India: Census of India 2001; Paper 1 of 2001
• GSI (2001) Geology and mineral resources of Districts of Sikkim; Geol. Surv. Ind.; Eastern Region; pp. 1-44.
• Mishra, A. K. (1995) Hydrogeology and Ground Water Resources of Sikkim; Report of Central Ground
Water Board, ER; MOWR; Govt. of India.
• NHPC (2005) Carrying Capacity Study of Teesta Basin; CISMHE; Univ. of Delhi; NHPC; Vol. II; 172 P.
• RM&DD (2004) A Report on identified main water sources under East, West, South and North districts in
Sikkim; Rural Management and Development Department; Govt. of Sikkim.
• RM&DD (2004) A Report on drinking water survey : Different options and costs; Rural Management and
Development Department; Govt. of Sikkim.
• Roy, I. (2009) Understandings about Springs of Sikkim; Proc. of the workshop on Integrated Water
Resource Management held at Gangtok, Nov 27, 2009; pp. 81-88;
• Saha, D. B. (1999) Hydrogeology and Ground Water Resources of East district, Sikkim; Report of Central
Ground Water Board, ER; MOWR; Govt. of India.
• SPCB (2007) State of Environment 2007 – Sikkim; Environmental Pollution; Chapter 9; State Pollution
Control Board; Govt. of Sikkim; pp 77-82.
• Sharma, A.K, Joshi, V., Parkash, S., and Krishna, A.P. (2009): Land use pattern mapping using Remote
Sensing and GIS in Gangtok area, Sikkim Himalaya, India; GISdevelopment.net;
• Tambe, S., Arrawatia, M. L., Kumar, R., Bharti, H., Shrestha, P., (2009) Conceptualizing Strategies to
Enhance Rural Water Security in Sikkim, Eastern Himalaya, India; Proc. of the workshop on Integrated
Water Resource Management held at Gangtok, Nov 27, 2009; pp. 1-17;
• Tshering S. D. and Geleg T. (2009) Drinking Water Management System in Sikkim – A Glance; Proc. of the
workshop on Integrated Water Resource Management held at Gangtok, Nov 27, 2009; pp. 105-109;
• UDHD (2008) City Development Plan (CDP): Gangtok; JNNURM; Shristi Urban Infrastructure Development
Ltd; Urban Development And Housing Department; Government of Sikkim.
• WS&PHED (2008) DPR for Extension of Sewerage System Zone IV, Gangtok; GENESISFINTEC; Department
of Water Security & Public Health Engineering, Government of Sikkim.

81
Study Area
GUWAHATI CITY, ASSAM
P. Kalita & D.P. Reddy, CGWB, Guwahati
INTRODUCTION
Guwahati is Assam's largest commercial and industrial city. It is also known as the Gateway of North-East India.
During the Mahabharata era Guwahati was known as Pragjyotishpur meaning the City of Eastern Light. The
name Guwahati has been derived from the Assamese words, guwa meaning areca nut, and haat meaning
weekly market.
Guwahati's myths and history go back several thousands of years. Its references in the epics, puranas, and
other traditional histories, lead many people to assume that it is one of the ancient cities of Asia.
Guwahati was the capital of
many ancient kingdoms.
According to the Mahabharata
it was the capital of the
'mythological' kings Naraka
and Bhagadatta . It was also
the capital under
the Varman and
the Pala dynasties of
the Kamarupa kingdom.
With each dynasty the city had
a new name but retained its
status as a Capital, and did so
till the 11th
century. Between
the 12th
to the 15th
century, when it came
under the Mughal rule, it lost some of its
importance and glory. It is said that Assam was
attacked 17 times by the Mughals. The most
famous battle was the Battle of Saraighat, where
the Mughals were actually defeated sometime in
the late 16th
century.
The city also has an ancient tradition
of tantric worship. The ancient sakti temple of
Goddess Kamakhya located in Nilachal hill
remained the important seat
of Tantric and Vajrayana Buddhism.
GENERAL FEATURES
Area / Administrative Division
Guwahati City is headquarters of Kamrup (Metro)
district of Assam. Official capital of the state of
Assam is Dispur which is a part of Guwahati city. It
is located on the bank of the river Bramhaputra,
covering an area of 315.72 sq.km (excluding Bramhaputra river). with the municipality area of 216.79 sq.km.
The area is bounded by 910 34’ & 91
0 51’ E. longitudes. and 26
0 04’ 27’’ & 26
0 14’ 51’’ N latitudes.. Guwahati
Municipal Corporation covers an area of 216 km² under its jurisdiction and it is divided into 60 municipal
wards. Location map of the urban area is given in Fig. 1
Fig. 1 Location map of Greater Guwahati Area

82
Demography
Guwahati is one of the most rapidly growing cities in India. It witnessed major increase in population during
1950s and during 1970-90s. As per 2001 census, the population of the city is 8,14,575 with a population
density of 3757persons/sq.km. The population has been projected as 1.19 million by 2011.
Hydrometeorology
The city experiences sub-tropical humid climate with an average annual rainfall of 1715.7 mm in the average
normal 94 rainy days, with the average annual temperatures 60C minimum to 38
0C maximum. Monsoon
season receives about 70% and pre-monsoon receives about 20% of annual rainfall.
Physiography & Drainage
Physiographically the area can be broadly sub-divided into three units i.e. hills, plains and marshy lands.
Altitude varies between 50m and 600m above msl with an average elevation of 55m. The area is surrounded
by hills in eastern and southern margins. Northern and western margin is open and continues as alluvial tract.
The area drained by the river Bhramhaputra and its tributaries Bahralu and Bahini.
Soil Type
The major soil type of the city can be classified as 1) Newer alluvial soils, 2) Older alluvial soils, 3) Red loams,
and 4) Laterites.
STATUS OF WATER SUPPLY AND DEMAND
The existing water supply is supported by Guwahati Municipal Corporation (GMC), Public Health Engineering
Department (PHED) and Assam Urban Water Supply and Sewerage Board (AUWSSB), which partially meets the
demand of the city. The existing infrastructure is unable to keep pace with the present population pressure.
The present requirement of water for the city is estimated to be 243 million litres /day (MLPD). The existing
water supply by GMC, PHED, and AUWS&SB is unable to cope up with the demand and they together could
cover only 30.85% of population of GMC area @ 73.40 MLPD.
WATER PROFILE
Water supply of Guwahati city is dependent on both Surface and Ground Water. Major part of the water
supply (72000 m3
per day) by GMC within municipality area comes from the river Brahmaputra. AUWS&SB
also supplies ~ 9000 m3/day of river water daily. Apart from the above mentioned public water supply systems,
N. F. Railway and Indian Oil Corp., has its own water supply system, supplying 6000 and 11000 m3/day
respectively, from the river Brahmaputra.
However, major part of the population is dependent on ground water through individual Dug wells, Shallow
tube wells and Deep tube wells. PHED provides water supply to a considerable number of population through
deep tubewell and spring sources.
GROUND WATER SCENARIO
Potential Aquifers
Hydrogeologically the area is underlain by two distinct types of formations belonging to Quaternary and
Precambrian age. The Quaternary formations constitute the plain area adjoining to river Brahmaputra and its
tributaries comprising different grades of sand, gravel, clay and silt. This plain is widened in the western part of
the city. Fence diagram of the area is shown in Fig. 2
The Precambrian formations are exposed in the hilly terrain and comprise of granite gneiss, schist, granite,
amphibolite, pegmatite, aplite and quartz veins etc as litho units. These hard rocks from the hillocks and has

83
undergone weathering up to considerable depths. The thickness of weathered formation varies from less than
a meter to more than 30m. The hard massive formations are fractured and fissured due to tectonic activities
over the geological period.
Based on the hydrogeological properties and relative ground water potentialities, the subsurface lithology can
be broadly grouped into two major hydrogeological units i.e. a) Fractured formation and b) Granular
formation.
Fractured formations are comprised of granite gneiss, biotite gneiss, amphibolites etc. These are predominant
at shallow depth mostly in eastern and southern parts with sporadically at central and northern parts of the
study area. They are characterised by a weathered lateritic layer at top, followed by a semi-weathered layer
containing fragmented rocks of basement and massive rock with fractures. Ground water occurs in the
weathered zone under water table conditions. On the other hand, ground water occurs under semi-confined
to confined conditions in the hard fissured and fractured formations at various depths.
The Granular formations constitute
deposits comprising of several grades of
gravel, sand, clay, silt etc. The Quaternary
deposits cover the plains in the western
part of the city and valleys within the
central part. In these formations, ground
water occurs under water table to semi-
confined conditions. Average thickness of
granular zone is given in Table 1.
Hydrogeological map of Guwahati is given
in Fig. 3
Ground Water Level
In general, the water level close to the undulating inselbergs/residual hills, is deeper and in areas situated in
relatively flat alluvial plains and valley-fill areas, the water level is generally shallower. In valley-fill areas depth
to water level is variable depending on thickness of the weathered residuum. Overall depth to water level
Table 1 Average Granular zone thickness
Area Sub-area
Aquifer
thickness
range (m)
Average
thickness
(m)
Northern Bank - 10 - >200 >50
Southern Bank
Eastern part 20 - >150 40
Western part 20 – 40 20
Northern part 30 - >150 50
Southern part 5 - 15 10
Central part 50 - 60 55

84
gradually reduces from elevated eastern and south-eastern areas towards the flat lying alluvial planes in the
west.
In the dugwell zone the water level, in general, varies from less than 1.00 mbgl to 5 mbgl, except in the foot hill
area where it varies from 8 to 10.00 mbgl.
In the deeper aquifer of foot-hill area, the piezometric level varies from 14 to 36.12 mbgl. However in certain
localities in the eastern foothills area of the city water level varies from 0.07 mbgl to auto flow conditions
indicating confined to semi-confined conditions. In the valley-fill/alluvial area the piezometric level of deeper
aquifer varies from less than 1.00 mbgl to about 15.00 mbgl.
Long term water level trend analysis of the water level in monitoring wells in Greater Guwahati area shows
that there is no significant rise or fall in water level.
Ground Water Resources and Status of Development
Guwahati city is surrounded by hiils. Out of the total area the ground water recharge worthy area is about
22945 ham and remaining area is covered hill with more than 20% slope. As per GEC 1997, the Dynamic
ground water resources of Guwahati city is estimated to be 11045 ham. The stages of ground water
development in the city is 25% only. Hence there is sufficient scope of future development.
Hydrochemistry
Ground water in general is alkaline with pH value ranging from 6.7 to 8.1 with an average of 7.4. Various
chemical constituents indicate that ground water quality is generally suitable for irrigation and domestic
purposes except where iron content which is high. Total hardness (as CaCO3) of ground water in the area
varies from 30 and 390 mg/l with an average of 154, which shows moderately hard nature of ground water.
Electrical Conductivity, which is a function of amount of total dissolved solids in ground water, ranges between
115 and 1650 µ mhos/cm (laboratory values) in ground water of the area.
Major chemical constituents of ground water of the area can be broadly classified as:
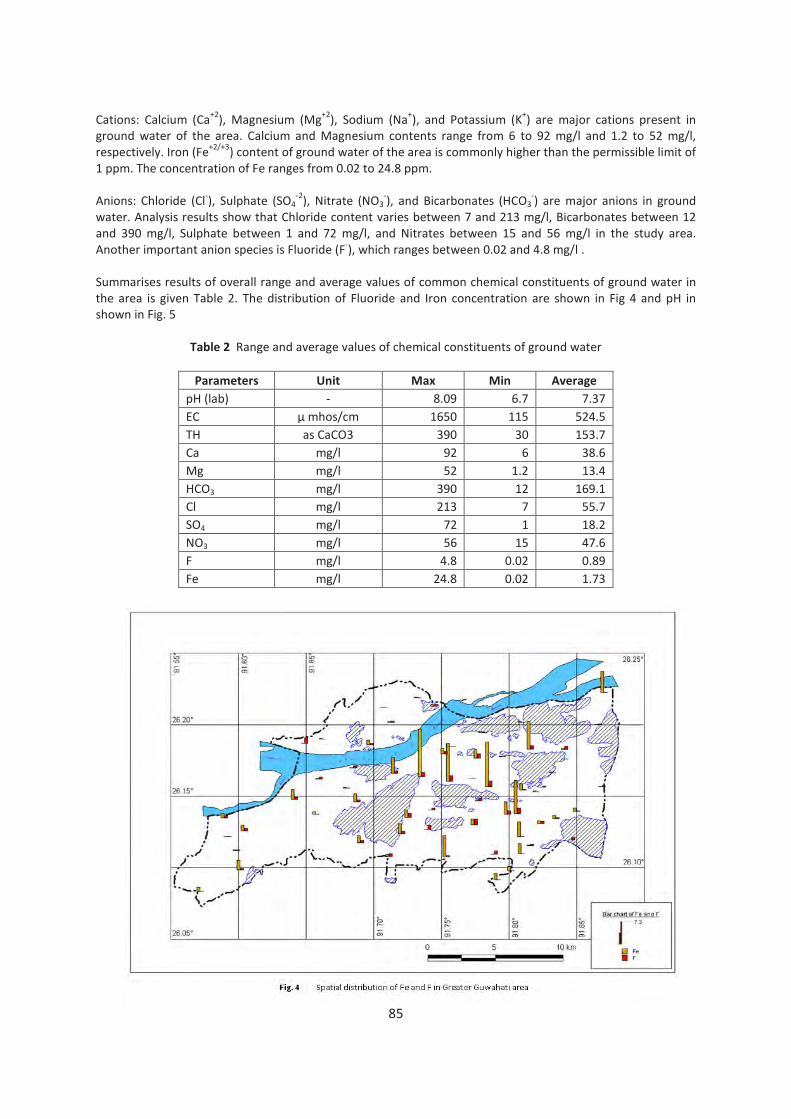
85
Cations: Calcium (Ca+2
), Magnesium (Mg+2
), Sodium (Na+), and Potassium (K
+) are major cations present in
ground water of the area. Calcium and Magnesium contents range from 6 to 92 mg/l and 1.2 to 52 mg/l,
respectively. Iron (Fe+2/+3
) content of ground water of the area is commonly higher than the permissible limit of
1 ppm. The concentration of Fe ranges from 0.02 to 24.8 ppm.
Anions: Chloride (Cl-), Sulphate (SO4
-2), Nitrate (NO3
-), and Bicarbonates (HCO3
-) are major anions in ground
water. Analysis results show that Chloride content varies between 7 and 213 mg/l, Bicarbonates between 12
and 390 mg/l, Sulphate between 1 and 72 mg/l, and Nitrates between 15 and 56 mg/l in the study area.
Another important anion species is Fluoride (F-), which ranges between 0.02 and 4.8 mg/l .
Summarises results of overall range and average values of common chemical constituents of ground water in
the area is given Table 2. The distribution of Fluoride and Iron concentration are shown in Fig 4 and pH in
shown in Fig. 5
Table 2 Range and average values of chemical constituents of ground water
Parameters Unit Max Min Average
pH (lab) - 8.09 6.7 7.37
EC µ mhos/cm 1650 115 524.5
TH as CaCO3 390 30 153.7
Ca mg/l 92 6 38.6
Mg mg/l 52 1.2 13.4
HCO3 mg/l 390 12 169.1
Cl mg/l 213 7 55.7
SO4 mg/l 72 1 18.2
NO3 mg/l 56 15 47.6
F mg/l 4.8 0.02 0.89
Fe mg/l 24.8 0.02 1.73
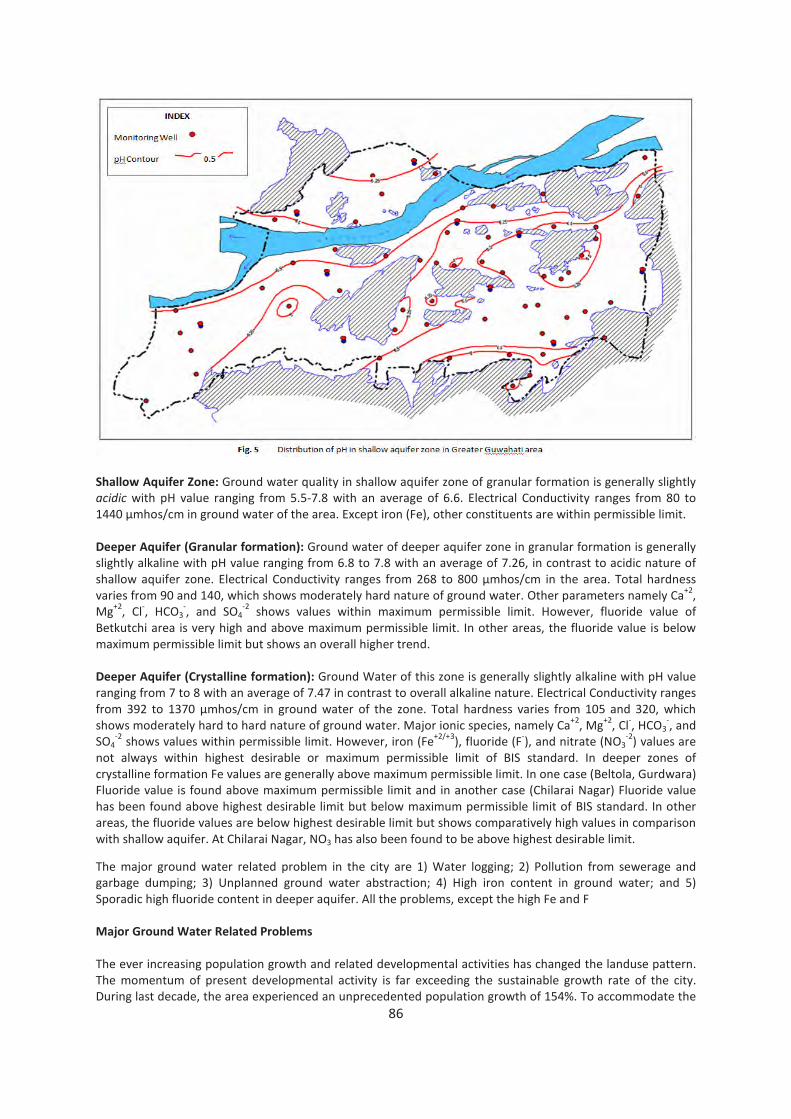
86
Shallow Aquifer Zone: Ground water quality in shallow aquifer zone of granular formation is generally slightly
acidic with pH value ranging from 5.5-7.8 with an average of 6.6. Electrical Conductivity ranges from 80 to
1440 µmhos/cm in ground water of the area. Except iron (Fe), other constituents are within permissible limit.
Deeper Aquifer (Granular formation): Ground water of deeper aquifer zone in granular formation is generally
slightly alkaline with pH value ranging from 6.8 to 7.8 with an average of 7.26, in contrast to acidic nature of
shallow aquifer zone. Electrical Conductivity ranges from 268 to 800 µmhos/cm in the area. Total hardness
varies from 90 and 140, which shows moderately hard nature of ground water. Other parameters namely Ca+2
,
Mg+2
, Cl-, HCO3
-, and SO4
-2 shows values within maximum permissible limit. However, fluoride value of
Betkutchi area is very high and above maximum permissible limit. In other areas, the fluoride value is below
maximum permissible limit but shows an overall higher trend.
Deeper Aquifer (Crystalline formation): Ground Water of this zone is generally slightly alkaline with pH value
ranging from 7 to 8 with an average of 7.47 in contrast to overall alkaline nature. Electrical Conductivity ranges
from 392 to 1370 µmhos/cm in ground water of the zone. Total hardness varies from 105 and 320, which
shows moderately hard to hard nature of ground water. Major ionic species, namely Ca+2
, Mg+2
, Cl-, HCO3
-, and
SO4-2
shows values within permissible limit. However, iron (Fe+2/+3
), fluoride (F-), and nitrate (NO3
-2) values are
not always within highest desirable or maximum permissible limit of BIS standard. In deeper zones of
crystalline formation Fe values are generally above maximum permissible limit. In one case (Beltola, Gurdwara)
Fluoride value is found above maximum permissible limit and in another case (Chilarai Nagar) Fluoride value
has been found above highest desirable limit but below maximum permissible limit of BIS standard. In other
areas, the fluoride values are below highest desirable limit but shows comparatively high values in comparison
with shallow aquifer. At Chilarai Nagar, NO3 has also been found to be above highest desirable limit.
The major ground water related problem in the city are 1) Water logging; 2) Pollution from sewerage and
garbage dumping; 3) Unplanned ground water abstraction; 4) High iron content in ground water; and 5)
Sporadic high fluoride content in deeper aquifer. All the problems, except the high Fe and F
Major Ground Water Related Problems
The ever increasing population growth and related developmental activities has changed the landuse pattern.
The momentum of present developmental activity is far exceeding the sustainable growth rate of the city.
During last decade, the area experienced an unprecedented population growth of 154%. To accommodate the

87
population growth, resulting developmental activity for residential / commercial purpose has lead to filling up
of marshy lands and conversion of agricultural low lands to residential / commercial plots as well as cutting of
hill slopes. By disturbing the natural flow pattern, reduction of recharge area, sewerage and garbage disposal
have also became burning problems posing threat to the ground water resources.
The major ground water related problem in the city are 1) Water logging; 2) Pollution from sewerage and
garbage dumping; 3) Unplanned ground water abstraction; 4) High iron content in ground water; and 5)
Sporadic high fluoride content in deeper aquifer. All the problems, except the high Fe and F content of ground
water are anthropogenic and can be related with rapid urbanization process. On the other hand, problems of
high Fe and F are geogenic.
Feasibility of Rainwater Harvesting and Artificial Recharge
The area, having mostly shallow water table and low ground water development, at present artificial recharge
to ground water may not be suitable. However, rainwater harvesting and artificial recharge in selective areas
may reduce water scarcity as well as reduce the pollution threat.
In urban areas, artificial recharge through roof-top rainwater harvesting may be carried out to reduce water
scarcity as well as reduce the pollution threat. As the incidence of rainfall is high in the area, Roof-top Rain
Water Harvesting may be considered as most viable means to augment the water supply for domestic water
needs. The design and storage of such structure are decided based on the water to be harvested from the
rainfall.
In hilly parts, artificial recharge may be done to augment the natural infiltration process. Like many cities in
India, Roof-top Rainwater Harvesting should be made mandatory for every house. At suitable locations sub-
surface dyke may be constructed to arrest the natural discharge.
GROUND WATER DEVELOPMENT STRATEGY
The development of ground water in the city is in the tune of 25% only. With the replenishable ground water
resource of 11 MCM, there is ample scope for ground water development. Both shallow and deeper ground
water abstraction structures may be constructed for development of ground water.
Design of Wells
Designing of wells should be done based on the aquifer characteristics, hydrogeological setup, and water
requirement. Three types of wells are feasible in survey area, namely a) Dug wells; b) Shallow tube wells; and
c) Deep tube wells.
A) Dug wells: In the study area, dug wells are most prevalent. It is conventional source to draw potable water.
Dug wells of the area occur both as lined and unlined condition. Ideally they should be lined and constructed
with 5-15.00 m deep, and 0.75 to 1.50 m diameter. Considering an average depth to water level of 4.00m and
depth of well as 15.00 m, the well can store 7 to 28 m3 of water.
Dug cum bore wells may be more effective in the hilly part of the area, where aquifer zone is deep seated.
Boring may be done down to 30.00 m. Site specifically, multiple directional bores may also be useful. A
statistical study by Duba (1974) showed that in granites and gneisses, inflow rate is higher for rectangular wells
than circular wells. Hence for hard rock part of the area, rectangular wells may provide better results.
B) Shallow tube wells: The northern bank of river Brahmaputra is represented by mono alluvial aquifer system
and southern bank is represented by perched – lensoid multiple alluvial aquifer system. With this background,
within the study area, in North Guwahati – Amingaon area, gravel packed shallow tube wells are feasible. The
tube well should be constructed down to a depth of 50.00 m. By tapping 10 to 15.00 m of aquifer thickness, a
discharge of 30 to 45 m3/hr may be expected from these wells for a drawdown of 1 to 5 m. Borehole diameter
of 102mm and 152mm are suggested for 30 m3/hr and 45 m
3/hr discharges respectively.

88
c) Deep tube wells: The optimum well design criteria is computed from the data generated from exploratory
tube wells drilled by Central Ground Water Board, taking into account for average hydraulic conductivity,
aquifer thickness to be tapped, optimum screen entrance velocity, and well efficiency for the area. The
alluvial/ valley-fill area the tube wells may be constructed down to a depth of 80 to 150.00 m bgl with 30 to 40
m housing and tapping 15 – 20 m aquifer materials. The expected yield of these wells are about 100 to 200
m3/hr. The design should be site specific and in tune with the local sub-surface geology to get maximum yield,
as clay lenses of various thickness is present in the area.
However, for efficient working of neighbouring wells without causing mutual interference during pumping,
some control on ground water development should be employed. The spacing between two adjacent tube
wells should be kept at two times the radius of influence, as estimated, on the basis of field pumping tests. The
recommended parameters for various abstraction structures are given in Table 3.
Table 3. Recommended parameters for various abstraction structures
Abstraction structure Yield (lpm)
Recommendations
Optimum Depth Expected
Coverage
Suggested
Spacing
Dug well < 30 5 - 15 m 1 - 3 household 10 – 20 m
Handpump (tapping
dugwell zone)
< 50 10 - 20 m 2 - 5 household 20 - 30 m
Shallow tube well
(Granular Formation)
150 – 500
Avg. 200
Running hours 6-8
hours/day
20 -40 m 20 – 30
household
150 - 200 m
Deep tube well
(Granular Formation)
100 – 3000
Avg. 1000
Running hours 8-
10 hours/day
80 - 90 m 300 - 400
household
1500 - 2000 m
Deep bore well
(Crystalline Formation)
180-300
Running hours 4-5
hours/day
75 – 85 m, 105
- 130 m
195 - 215 m
120 - 150
household
Site specific
Selection of pump: Determination of the capacity of pump is essential for optimum utilisation of discharge and
the lift from the tube well. Results of field tests indicate that pump capacity in the range of 3 to 5 H.P for the
shallow tube wells and 12.5 to 45 H.P for deep tube wells are suitable in the area, considering 75% pump
efficiency. The same for crystalline formation will be 2 HP
Selection of well screens: Well screen is a vital part of a well assembly. It controls the water intake capacity of
the well as well as prevents the formation material from coming in. As aquifers of the area are commonly
composed of fine to medium sand, The slot size should be 1.5 mm and the well should be shrouded with pea
gravel. Where ever the aquifer material is finer in nature, Johnson Screen having slot size of 1 mm should be
used to ensure the stoppage of incoming of fine sand.
The general water level in Guwahati city is shallow. In such terrain artificial recharge to ground water may not
be suitable. However, in the valley area Roof-top rainwater harvesting structures may adopted to supplement
the individual water supply and in the foot-hill area, water conservation structures and spring development
can be a suitable means for augmentation of domestic water supply system.
Spring Development: Several springs are identified in the area. Typically these springs are perennial with
average monsoon discharge of 0.84 lps. However, average daily discharge is 70 m3, which if stored properly
can serve about 150 households with 100 lpcd. Benefits of spring development for the area can be
summarized as follows:
1. Good quality, potable water available from springs sources.
2. Availability of fresh water round the year.

89
3. Low vulnerability to contamination due to human activity as it is situated at higher altitude.
4. Water directly available for consumption with minimum treatment cost.
5. Low cost structures required for harvesting the spring resources.
6. Distribution under gravity would eliminate cost of pumping.
The catchment area of the spring should be protected from interference of human being and animals by
erecting fencing. Small spring can developed by constructing concrete sump fitted with proper cover and over
flow-cum-delivery pipe. It is estimated that the cost of development of a spring is about 3 to 5 lacs..
Roof-Top Rainwater Harvesting Structure: The city is bestowed with good rainfall. The annual average rainfall
in the city is more than 1700 mm. This rainfall can be harnessed and stored in surface / sub-surface storage
tank. Individual houses, School buildings, offices may be used for Roof-top rainwater harvesting. On an
average a house with 100 sq.mtr. roof and 1.7 m rainfall it can harvest about 1,36,000 lit. of water per annum.
The average cost of a roof-top rain water harvesting structure is about 2 to 3 lacs. Including storage tank.

90
HYDERABAD CITY, ANDHRA PRADESH
Ravi Kumar Gumma, P.N.Rao, N.Varadaraj, G.Praveen Kumar, CGWB, Hyderabad
INTRODUCTION
Hyderabad, the capital of Andhra Pradesh, founded in the year 1591 by Mohammed Quli Qutub Shah, offers a
fascinating panorama of the past with richly mixed
cultural and historical tradition spanning over 400 years.
Soon after India gained independence, Hyderabad State
merged with the Union of India in the year 1948. On
November 1, 1956 the map of India was redrawn into
linguistic states and Hyderabad became the capital of
Andhra Pradesh. Hyderabad, centrally located on the top
of the Deccan Plateau, presently is one of the fastest
growing cities of India and has emerged as a strong
industrial, commercial, technology centre and occupies
prime position in India and as a regional hub in this part
of the world.
GENERAL FEATURES
Area/ Administrative Divisions
Hyderabad city is situated at 17°22' N Latitude and
78°27' E Longitude with an elevation of 525 m amsl.
The Hyderabad Urban Agglomeration (HUA) is the sixth
largest in India and is spread over an area of 778
sq.kms comprising Municipal Corporation Hyderabad
(MCH), ten peripheral municipalities, Secunderabad
Cantonment and Osmania University (Fig.1). The
details of the MCH and surrounding Municipality areas
are provided in Table-1. The Hyderabad Metropolitan
area covers an area of 1905 sq. km under the
jurisdiction of Hyderabad Urban Development
Authority (HUDA) covering toposheet nos. 56 K/6, 7,
10, 11 and 12.
Demography
Hyderabad is one of the fastest growing metropolitan
cities with a decadal growth rate of 32%. The Population of HUA increased from 4.3 million in 1991 to 5.7
million in 2001. The growth of population was more than 50% during 1981-91 and 27% during 1991-2001. The
details of the present population and future projections of HUA and other constituents of Hyderabad
Metropolitan Area are given in Table-2.
Table-2: Population Trends in Hyderabad Metropolitan Area
Component Area
(Sq.
Kms)
Population (Lakhs) Density
(2001)
Projected
Population
(Lakhs)
Projected
Density
Projected
Population
(Lakhs)
Projected
Density
1981 1991 2001 (P/Sq.kms) 2011 (P/Sq.kms) 2021 (P/Sq.kms)
MCH 172 21.0 30.5 36.3 21048 43.3 25116 51.7 29977
Surrounding
Municipalities
419 3.8 9.9 17 4102 28.9 6926 50.9 12151
Others 187 2.3 3.2 4 2147 5 2692 6.3 3391
HUA 778 27.1 43.6 57.5 7393 77.2 9923 108.9 13997
HUDA 1905 29.9 46.7 63.8 3351 90.5 4753 136.4 7162 (Source: City Development Plan: JNNURM/GHMC, Hyderabad)
Table 1: Administrative Divisions
Name of the Municipality Area (Sq.kms)
Municipal Corporation of
Hyderabad (MCH)
172.60
Kapra 43.81
Uppal 21.97
Malkajgiri 16.75
Alwal 26.32
Rajendra Nagar 50.87
Serilingampalli 96.99
Kukatapally 43.12
Qutubullapur 43.12
LB Nagar 66.73
Gaddi Annaram 19.87 (Source: City Development Plan: JNNURM/GHMC, Hyderabad)

91
Physiography
The area has undulating topography with elevation ranging from 460 to 560 m amsl. The main geomorphic
units are residual Hills, pediment inselbergs, pediplains and valley fills. The River Musi, with a gradient of 2 m
per km flows from west to east and most of the streams are ephemeral in nature.
Soil Type
The soils are mostly of red lateritic, yellow sandy-clay loams and alluvial black soils. The thickness of the soil
cover ranges from 0.5 m to 2.0 m. The land use pattern indicates the changing pattern of land use over the
years. It shows increase in residential and commercial at the expense of vacant and agricultural land (Fig.2).
Hydrometerology
Hyderabad experiences the semi arid tropical climatic conditions. The average annual rainfall is 810 mm. The
south west monsoon contributes 74% of annual rainfall and north east monsoon contributes 14%. The
temperatures touches 45º C during the summer season and with the onset of monsoons during June, the
temperature drops and varies between 26º C to 38º C.
Fig-2: Trends in Land Use pattern from 1975-2008 Fig-3: Projected Water deficit.
STATUS OF WATER SUPPLY & DEMAND
The Hyderabad Metro Water Supply and Sewerage Board (HMWS & SB) is providing 340 mgd of piped water
supply from surface water resource covering MCH, ten adjoining municipalities, Osmania University,
Secunderabad Cantonement and ten enroute villages along NH-9 upto Sanga Reddy (793 sq.kms). This includes
180 mgd from Krishna river source, located about 145 km from city. Apart from the 340 mgd piped water
supply from surface water resource, about 25 mgd is being supplied from ground water resource. The
indicators of water supply positions are as follows.
Indicators MCH Surrounding Municipalities
Total Population 36.33 lakhs 17.18 lakhs
Slum Population 14.1 lakhs 6.98 lakhs
Network Coverage 90% 65%
% Access to piped water supply 70% 43%
Average Per capita Supply 162 lpcd 91 lpcd
Duration of supply 2 hours alternate day 1 hrs alternate day
Source: HMWS & SW
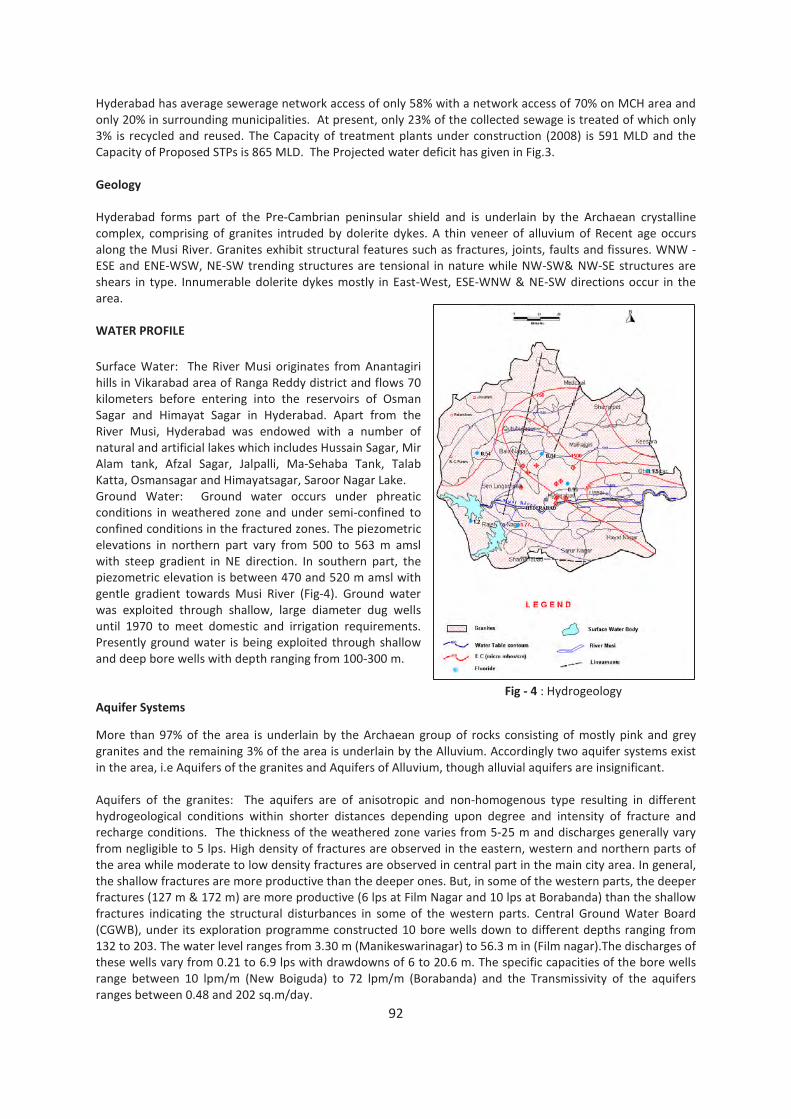
92
Hyderabad has average sewerage network access of only 58% with a network access of 70% on MCH area and
only 20% in surrounding municipalities. At present, only 23% of the collected sewage is treated of which only
3% is recycled and reused. The Capacity of treatment plants under construction (2008) is 591 MLD and the
Capacity of Proposed STPs is 865 MLD. The Projected water deficit has given in Fig.3.
Geology
Hyderabad forms part of the Pre-Cambrian peninsular shield and is underlain by the Archaean crystalline
complex, comprising of granites intruded by dolerite dykes. A thin veneer of alluvium of Recent age occurs
along the Musi River. Granites exhibit structural features such as fractures, joints, faults and fissures. WNW -
ESE and ENE-WSW, NE-SW trending structures are tensional in nature while NW-SW& NW-SE structures are
shears in type. Innumerable dolerite dykes mostly in East-West, ESE-WNW & NE-SW directions occur in the
area.
WATER PROFILE
Surface Water: The River Musi originates from Anantagiri
hills in Vikarabad area of Ranga Reddy district and flows 70
kilometers before entering into the reservoirs of Osman
Sagar and Himayat Sagar in Hyderabad. Apart from the
River Musi, Hyderabad was endowed with a number of
natural and artificial lakes which includes Hussain Sagar, Mir
Alam tank, Afzal Sagar, Jalpalli, Ma-Sehaba Tank, Talab
Katta, Osmansagar and Himayatsagar, Saroor Nagar Lake.
Ground Water: Ground water occurs under phreatic
conditions in weathered zone and under semi-confined to
confined conditions in the fractured zones. The piezometric
elevations in northern part vary from 500 to 563 m amsl
with steep gradient in NE direction. In southern part, the
piezometric elevation is between 470 and 520 m amsl with
gentle gradient towards Musi River (Fig-4). Ground water
was exploited through shallow, large diameter dug wells
until 1970 to meet domestic and irrigation requirements.
Presently ground water is being exploited through shallow
and deep bore wells with depth ranging from 100-300 m.
Fig - 4 : Hydrogeology
Aquifer Systems
More than 97% of the area is underlain by the Archaean group of rocks consisting of mostly pink and grey
granites and the remaining 3% of the area is underlain by the Alluvium. Accordingly two aquifer systems exist
in the area, i.e Aquifers of the granites and Aquifers of Alluvium, though alluvial aquifers are insignificant.
Aquifers of the granites: The aquifers are of anisotropic and non-homogenous type resulting in different
hydrogeological conditions within shorter distances depending upon degree and intensity of fracture and
recharge conditions. The thickness of the weathered zone varies from 5-25 m and discharges generally vary
from negligible to 5 lps. High density of fractures are observed in the eastern, western and northern parts of
the area while moderate to low density fractures are observed in central part in the main city area. In general,
the shallow fractures are more productive than the deeper ones. But, in some of the western parts, the deeper
fractures (127 m & 172 m) are more productive (6 lps at Film Nagar and 10 lps at Borabanda) than the shallow
fractures indicating the structural disturbances in some of the western parts. Central Ground Water Board
(CGWB), under its exploration programme constructed 10 bore wells down to different depths ranging from
132 to 203. The water level ranges from 3.30 m (Manikeswarinagar) to 56.3 m in (Film nagar).The discharges of
these wells vary from 0.21 to 6.9 lps with drawdowns of 6 to 20.6 m. The specific capacities of the bore wells
range between 10 lpm/m (New Boiguda) to 72 lpm/m (Borabanda) and the Transmissivity of the aquifers
ranges between 0.48 and 202 sq.m/day.

93
Aquifers of Alluvium: The alluvial formations, though negligible both in areal and vertical extension, occurs as
isolated patches along the Musi River. It consists of medium to fine grained sand, silt with thickness varies
from few meters to about 5 meters. Ground Water occurs under phreatic conditions. The ground water used
to be developed through large diameter dug wells, but presently not in practice due to the contamination of
the pollutants from the Musi effluents.
Ground Water Levels
It is observed that in general the depth to water levels ranged between 5 and 20 m but on an average it is
around 12 m. The general depth to water level during pre-monsoon period varies from 5 m to 20 m bgl,
whereas during post monsoon periods, it varies from 2 m to 15 m bgl. In the core area of Hyderabad, the
general pre-monsoon water level ranges from 6.10m bgl (Erra Manzil) to 17.33 m bgl (Nampalli) and the post
monsoon water level ranges from 1.40 m bgl (Alwal) to 9.42 m bgl (West Maredpalli) and from 8.65m bgl
(Tarnaka) to 18 m bgl (Kothapaet). In Secunderabad area, pre-monsoon water levels range from 7.26 m bgl
(Bolarum) to 23.40 m bgl (West Maredpalli) and post- monsoon water level ranges from 2.40 m bgl (Bolarum)
to 9.5 m bgl(West Maredpalli). In the peripheral areas of Hyderabad, the pre-monsoon water level ranges from
1.98b bgl (Ahmedguda) to 7.7 m bgl (Patancheru) and post monsoon water level ranges from 2.90m bgl
(Kokapet) to 6.7m bgl (Suraram).
A study of the hydrographs indicate that the water table is depleted over the years at many places like
Boinpalli, Aghapura, Erragadda, Bashherbagh, Langar house, Jubilee hills, Begumpet, Koti, West Maredpalli,
Gudimalkapur, Mushherabad, Sanath nagar, Picket, Madhapur etc., (Fig-5). However, there is a substantial rise
of ground water levels in most of the localities of Hyderabad due to the high precipitation received after 2008.
Fig-5: Hydrographs of select monitoring wells in City Core area
Ground Water Resources: The dynamic ground Water Resources (2004) estimates for the mandals under the
jurisdiction of Hyderabad Metropolitan Development Authority (HMDA) falling in Ranga Reddy district are
given in Table-4.

94
Table-4: Ground Water Resources in Ranga Reddy falling under HMDA
S.No Mandal Ground Water
Availability
ha.m
Ground
Water
Utilization
ha.m
Ground Water
Balance
ha.m
Stage of
Development
(%)
Category
1 BalaNagar 969 86 883 9 Safe
2 Ghatkesar 1647 862 786 52 Safe
3 Hayaat Nagar 2283 1609 674 70 SC
4 Keesara 1513 1649 -136 109 OE
5 Malkajgiri 626 291 335 47 Safe
6 Medchal 2275 3752 -1478 165 OE
7 Qutubullapur 1782 1109 673 62 Safe
8 Rajendra Nagar 1896 808 1088 43 Safe
9 Saroor Nagar 1101 856 245 78 SC
10 Serilingampalli 1463 301 1163 21 Safe
11 Shamirpet 3252 6093 -2841 187 OE
12 Shamshabad 2371 2724 -353 115 OE
13 Uppal 437 130 307 30 Safe
14 Hyderabad 1400 12099 -10699 864 OE
Ground Water Quality
The effects of urbanization and industrialization in Hyderabad led to the contamination of ground water. Due
to inadequate sewerage system and treatment capacities, the domestic sewerage and industrial effluents are
letting directly into the nalas and streams, causing severe ground water contamination. The concentration of
Nitrate far exceeded the permissible limits in many parts of the city. The excessive concentrations of sulphates,
trace elements like copper, cadmium, zinc, manganese and lead are found in and around industrial areas.
The analytical results of chemical analysis of ground water samples (1998) from shallow bore wells (40-60 m)
indicates the alkaline nature. The total hardness ranges from 95 to 711 mg/l and the ground water is
moderately soft to very hard type. The electrical conductivity (EC) range from 200-7500 µS/cm, while the
general range is 750-3000 µS/cm. (Table-5) The areas with EC values beyond permissible limits (more than
3000 µS/cm) are located mostly around industrial localities like Bollarum, Suraram, Jeedimetla, Sanath Nagar,
Kukatpalli and Saroornagar etc. Nitrate (NO3 ) is observed to be high in more than permissible limits of drinking
water standards in 72 % of samples at locations like Moosapet, Alwal, Kutubshahi tombs, Tarnaka, Amberpet,
Moosarambagh, Lalapet, Nallakunta, Secunderabad, Kavadiguda, Ranigunj, Gosha Mahal, Golconda fort,
Langar house, Tolichowki, Sanath Nagar, Tadbund, Chandrayangutta. Higher concentrations of Sulphates
(more than 400 mg/l) is noticed in areas like Uppal, Sanath Nagar, Saroor Nagar and also near Musi river,
attributed to the industrial pollution in these areas.
Table-5: Ranges of Chemical constituents in shallow aquifers
Sl.
No
Constituents Range General Range Percent of samples
exceeding permissible limits Min Max
1 PH 6.5 8.57 6.9-7.7
2 EC (µs/cm) 200 7500 700-3000 2 %
3 TH (mg/l) 70 2780 150-1000 29 %
4 NO3 (mg/l) 1.2 760 10-300 72 %
5 SO4 (mg/l) 4.8 1392 25-450 2 %
6 F (mg/l) 0.17 3.3 0.5-1.7 7 %
(Source: CGWB, SR)
The ground water in deep seated fractures is also alkaline in nature (p
H from 7.0 to 7.9) and the ground water
is hard to very hard type. The Electrical conductivity of ground water in deeper aquifers ranges from 850 to

95
2000 µS/cm. The concentration of fluoride in deeper ground water ranging from 0.50-2.57 mg/l and at certain
places, the concentration of fluoride is beyond permissible limits (New Boiguda, BJR Nagar, Borabanda areas).
There are about nine the Industrial Development Areas (IDAs) spread throughout the city intermingling with
large residential colonies. Almost all the IDAs have few industries which are potential sources of heavy metal
wastes into the environment. Chemical analysis of Ground water samples from these areas in 2003-04 has
revealed the presence of Fe and Mn with concentration in some wells exceeding the BIS maximum permissible
limit (MPL). Lead, Nickel, Zinc and Cadmium were detected in the IDAs of Balanagar, Sanatnagar & Jeedimetla.
Lead and Cadmium were beyond the MPL in some of the wells in these areas (Table-6 ).
Table - 6 Industrial Agglomerations and Metals detected in Ground Water
Sl No Industrial Area Nature of Industry Metals detected
beyond permissible
limits
Remarks
1 Kadedam Metallurgical, food
processing, plastic
food processing
Fe, Cd, Mn, Ni Notified by CPCB
2
Nacharam
Foundries, fabrication
Ni, Cd, Fe, Mn
3 Jeedimetla-
Balanagar
Metallurgical, food
processing,
pharmaceutical, paints
Fe, Zn, Cd, Pb, Cr
4 Patancheru -do-
Fe, Pb, Cd, Cu, Co, Mn
Notified by CPCB
Major Ground Water Related Problems
Extinct/Shrinkage of tanks: The existing surface water bodies are diminishing because of inconsiderate
development of the city and its surroundings. Initially, the city had 25 tanks and with the progressive
urbanization, some of the tanks within the city and surroundings were disappeared (Masab tank, Nallakunta)
or their sizes got reduced due to unabated human encroachments (Saroor Nagar tank) or the inflows into the
tanks got reduced due to inconsiderate management of Catchment areas (Osman sagar, Himayat sagar) or
affected by pollution (Kukatpalli Nala, Hussain sagar, Miralam tank etc). Many water channels that used to
carry floodwaters from one lake to the next in a catchment area, have also been encroached by private and
government agencies. This has resulted in substantial decrease in natural ground water recharge and
deterioration in its quality. As per the one study by JNTU, there is a continuous decrease in inflows in water
supply reservoirs of Himayat Sagar and Osman Sagar for the past 36 years due to urbanization though there is
no change in normal rainfall pattern in these years.
Vast open areas within the widely scattered buildings have now been converted into dwelling units due to
heavy influx of people migrating from all corners of the state and the country. During the last 4 decades there
was an increase of residential area (10-44 %) and reduction of vacant land (38 to 2 %) and open spaces, parks
and play grounds together account 6.81% only. There was, increase in area from 6.67% to 10.87 % under
transport and communication also. This drastic changes in land use pattern resulted in altercations in
hydrological cycle and had greatly reduced the scope of natural recharge to ground water body. Water
conservation is practiced in very few buildings and areas.
Discharge of untreated industrial and domestic effluents has led to the total degradation of the water quality
in surface and sub-surface water bodies. The sewerage network coverage is low and the treatment facilities
are highly inadequate. Most of the untreated sewage finds its way into water bodies resulting in poor water
quality, high pollution, loss of habitat and environmental degradation. Due to this, ground water quality is
deteriorated in not only industrial areas but also in residential areas. River Musi, the main source of water,
gets an estimated untreated sewage of 500 ML per day. Hussain Sagar Lake, once used to supply water for the
city until 1930 is getting untreated domestic sewage leading to high pollution levels. The fact that about 72%
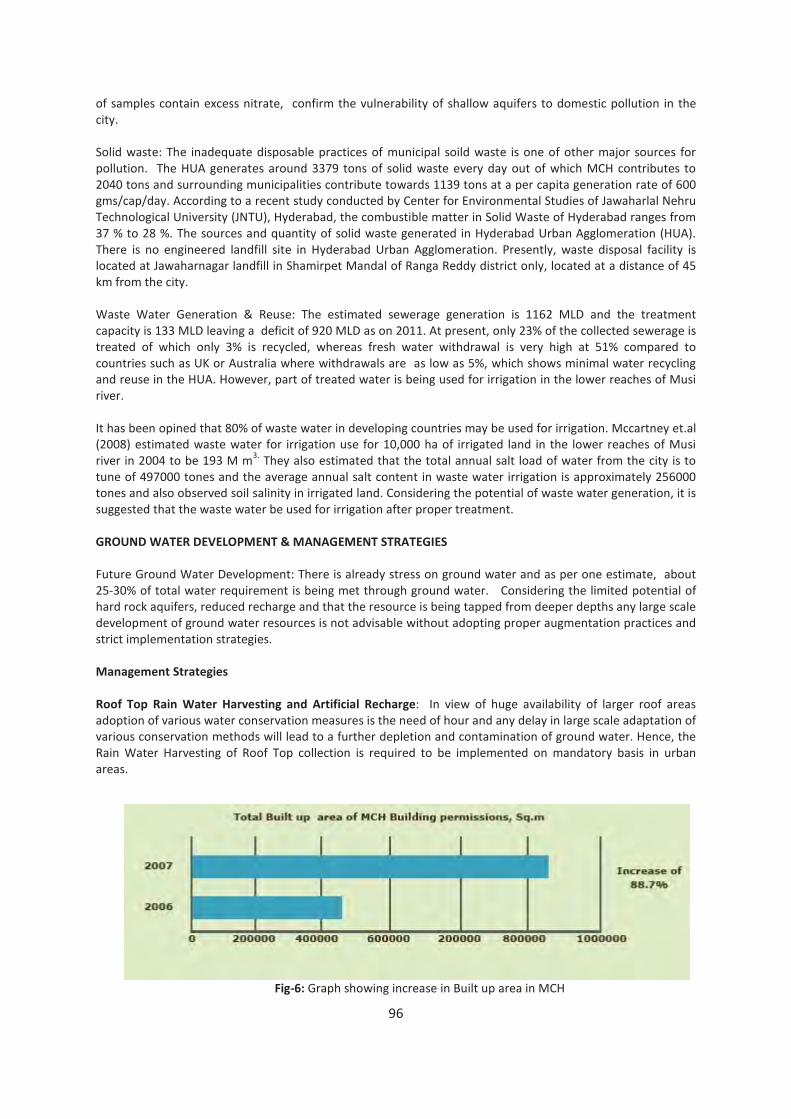
96
of samples contain excess nitrate, confirm the vulnerability of shallow aquifers to domestic pollution in the
city.
Solid waste: The inadequate disposable practices of municipal soild waste is one of other major sources for
pollution. The HUA generates around 3379 tons of solid waste every day out of which MCH contributes to
2040 tons and surrounding municipalities contribute towards 1139 tons at a per capita generation rate of 600
gms/cap/day. According to a recent study conducted by Center for Environmental Studies of Jawaharlal Nehru
Technological University (JNTU), Hyderabad, the combustible matter in Solid Waste of Hyderabad ranges from
37 % to 28 %. The sources and quantity of solid waste generated in Hyderabad Urban Agglomeration (HUA).
There is no engineered landfill site in Hyderabad Urban Agglomeration. Presently, waste disposal facility is
located at Jawaharnagar landfill in Shamirpet Mandal of Ranga Reddy district only, located at a distance of 45
km from the city.
Waste Water Generation & Reuse: The estimated sewerage generation is 1162 MLD and the treatment
capacity is 133 MLD leaving a deficit of 920 MLD as on 2011. At present, only 23% of the collected sewerage is
treated of which only 3% is recycled, whereas fresh water withdrawal is very high at 51% compared to
countries such as UK or Australia where withdrawals are as low as 5%, which shows minimal water recycling
and reuse in the HUA. However, part of treated water is being used for irrigation in the lower reaches of Musi
river.
It has been opined that 80% of waste water in developing countries may be used for irrigation. Mccartney et.al
(2008) estimated waste water for irrigation use for 10,000 ha of irrigated land in the lower reaches of Musi
river in 2004 to be 193 M m3.
They also estimated that the total annual salt load of water from the city is to
tune of 497000 tones and the average annual salt content in waste water irrigation is approximately 256000
tones and also observed soil salinity in irrigated land. Considering the potential of waste water generation, it is
suggested that the waste water be used for irrigation after proper treatment.
GROUND WATER DEVELOPMENT & MANAGEMENT STRATEGIES
Future Ground Water Development: There is already stress on ground water and as per one estimate, about
25-30% of total water requirement is being met through ground water. Considering the limited potential of
hard rock aquifers, reduced recharge and that the resource is being tapped from deeper depths any large scale
development of ground water resources is not advisable without adopting proper augmentation practices and
strict implementation strategies.
Management Strategies
Roof Top Rain Water Harvesting and Artificial Recharge: In view of huge availability of larger roof areas
adoption of various water conservation measures is the need of hour and any delay in large scale adaptation of
various conservation methods will lead to a further depletion and contamination of ground water. Hence, the
Rain Water Harvesting of Roof Top collection is required to be implemented on mandatory basis in urban
areas.
Fig-6: Graph showing increase in Built up area in MCH

97
There was about 9, 00,000 sq.mts built up area (2007) under the MCH which accounts for an increase of 88.7%
in built up area where permissions given by MCH during 2006 to 2007 (Fig-6). There is likely to be a 133%
increase in residential area in next 15 years and also Commercial area. More than 60 lakh sq.feet areas (new
apartments) were ready for occupants for the year 2010. According to the 2001 Census the city had 6.52 Lakh
households in Hyderabad. At present the approximate total households in the MCH and surrounding 12
municipalities and Secunderabad area is 13.02lakh (GHMC website).
It is observed that mainly 3 sets of fracture systems (shallow zone: 20-40, intermediate: 40-60 m and deeper
>60 m) exist in the area. Of these though shallow fractures are more prevalent, intermediate fractures, often
connected to shallow fractures are more productive, which need to be harnessed through rooftop rain water
harvesting. Considering that each apartment complex/household has one functioning/abandoned bore well, it
is recommended that each house/apartment complex should have recharge unit/ fast filtration unit, above or
below ground ( preferably above ground ) which is dug and filled with coarse gravel (bottom 2/3 portion) and
keeping the remaining part open. The rooftop water be allowed to pass through recharge unit/filtration unit
and recharge existing well/abandoned well. There should be proper maintenance of the structure and
surveillance. The cost involved for execution of this structure is about Rs 15000/- for each house. This equals
to an estimated amount of about 1000 crores for 50 % of total estimated households for implementing Roof
Top Rain water harvesting in the MCH and surrounding municipalities and Secunderabad. Besides this, in
twin cities, Defence establishments (Secunderabad area), Universities, Central and State Institutions, Public
Parks, Play grounds etc have large open areas. These areas are suitable for taking up artificial recharge
structures such as recharge shafts and recharge pits.
Storm runoff collection and recharge: Hyderabad often faces serious floods during monsoons. This water can
be recharged with proper infrastructure in place. The storm runoff generated within an area can be utilized for
groundwater recharging by diverting it into suitably designed structures near pavements, parking lots,
municipal parks, play grounds, stadiums, airports etc., and by earmarking some open spaces exclusively for the
purpose. As per the land use pattern, a total of 66% including Residential areas (44.24%), Parks and play
grounds (6.81%), Defence establishments (4.83 %), Public and semi-public (9.01%) and Vacant open lands
(1.58%) can be brought under the ambit of Artificial recharge. The design of recharge structures should involve
construction of sufficient number of recharge pits and trenches filled with gravel. Pavements can be utilized
for collecting road run off and for recharging groundwater. Permeable pavement is an alternative to
conventional paving in which water permeates through the paved structure rather than draining off it.
Waste water Recycling and Re-use : Wastewater recycling and reuse at source can save up to 45% of water
demand in individual residential buildings and can save up to 60% of water demand in apartment complexes,
residential layouts, townships, institutional buildings and other large neighbourhoods. Introduction of dual
plumbing systems to segregate wastewater (grey & black) will enable the separation of grey and black water at
the source of generation. The grey water (sullage) constitutes about 70% of the wastewater generated, which
can be treated by using simple and cost effective systems and thereby can be reused for landscaping, external
washing in all treatment options and also be used for WC flushing by using some secondary treatment options.
Once the grey water is separated, the remaining black water (sewage) can then be treated by decentralized
wastewater treatment systems. These parameters will enable the architects/ contractors/ developers and
users in assessing upon type of treatment option that should be adopted for different types of buildings.
Solid waste collection & treatment: As mentioned earlier, the HUA generates around 3379 tons of solid waste
every day at a per capita generation rate of 600 gms/cap/day. There is no engineered landfill site in Hyderabad
Urban Agglomeration. Presently, waste disposal facility is located at Jawaharnagar in Shamirpet Mandal of
Ranga Reddy district only, where contamination of ground water is observed. Efforts should be made to
identify the sites based on scientific surveys and wastes be collected and treated properly before disposal.
Water Use Auditing: Water use audits are an important initiative toward understanding a building’s water use
and how it can be reduced. It reviews water use from its point of entry into the building through its discharge
into the sewer. It identifies each point of water use within and around the building and estimates the quantity
of water used at each of these areas.

98
REFERENCES
• Mccartney, Mathews., Christoper Scott, Jersen Ensink, Bimmin Jiang & Trent Biggs (2008), Salinity
implications of waste water irrigation in the Musi river catchment in India, Cey J.Sci (Bio.Sci) 37 (I) : 49-51,
2008.
• Reddy, G.R.C (April, 1999) Hydrogeology and Ground Water Quality in Hyderabad and Environs, CGWB, SR,
Hyderabad Unpublished report, CGWB, SR, Govt.of India.
• Reddy, G.R.C (August 2006) : Hydrogeological Frame work and development prospects in Hyderabad
District, A.P. CGWB, SR, Unpublished report, CGWB, SR, Govt.of India.
• Revised Master Plan of Core area of Hyderabad, Hyderabad Metropolitan Development Authority,
January-2010.
• Reddy, G.V. (2008) Ground Water Management Studies in parts of Ranga Reddy district, A.P,Unpublished
report, CGWB, SR Govt.of India.
• Veeranna, M.,Rao. P.N.,Reddy, G.R.C (2002 ), Ground Water Regime and Management Stratagies for
Hyderabad, Pre-Volume Workshop volume on Water Resource in Hyderabad and its environs organized at
Hyderabad (29th
December 2002).
• Ground Water Exploration in Hyderabad District, A.P (2003), Unpublished report, CGWB, SR, Govt.of India.

99
JAIPUR CITY, RAJASTHAN
Manoj Srivastava & S.K. Gupta, CGWB, Jaipur
INTRODUCTION
Jaipur city was founded by Sawai Jai Singh in the year 1723. The areal extension of Jaipur Urban area is
between North latitudes 26°47’-27°02’ and East
longitudes 75°36’ – 75°55’ (Fig. 1) located almost in the
centre of the district and covers an area of about 470 sq.
km. The Jaipur agglomerate has parts of Sanganer
(45.5%), Jhotwara (42.5%) and Amer (12%) blocks.
GENERAL FEATURES
Demography
Jhotwara block which constitutes the major part of the
urban city has a population density of 2745 persons/sq.
km. With the increase in the rate of urbanization the
population of the city also increased many fold during
the last 6 decades. The decadal growth rate of
population is highest during 1941 – 51 as 65.59 %
followed by 62.77 % during 1991– 2001. The population
growth since 1931 is given below and shown in Fig. 2.
The present population as per projection is 35.60 lacs
(Table 1).
Physiography & Drainage
Physiography
Fig. 1 Administrative setup
Physiographically the city area is characterized by sandy-plains, hills, intermountain-valleys, pediments etc.
Major part of the city is covered by the alluvial sandy plains which are dissected at places. In the northern and
eastern parts, the Aravalli Hill Ranges, trending north east-south west alternating with intermountain-valleys,
constitute significant signatures of physiography. The ridges are generally made-up of resistant quartzite rocks.
Important among these are the Nahargarh, Amer, Puranaghat and Jhalana Hills. The highest peak of these hills
is about 648 meter above mean sea level (m amsl). Hills are often marked by escarpments and uplands have
slopes at 15-20%, and are characterized by sheet and gully erosion. Pediment landscapes are observed in the
south western part of the city. The latitude of the peneplained area ranges from about 350 in the southern
part to 480 m amsl in the northern part of the urban area.
Table 1 Population and decadal growth rate of Jaipur Urban Area
Year Population Decadal Growth %
1931 150000 -
1941 175810 17.21
1951 291130 65.59
1961 403444 38.58
1971 615258 52.50
1981 977165 58.82
1991 1458483 49.26
2001 2374000 62.77
Projected Population
2011 3560000 49.95
2021 5340000 50.00
Source : Public Health and Engineering Department, Govt. of Rajasthan

100
Drainage
There is no major river drainage system in the Jaipur Urban Area. One streamlet originating from Nahargarh
Hill namely Amanishah Nalla flows southerly up to Sanganer area where it takes easterly flow direction due to
structural control. The Amanishah nalla and associated streamlets are ephemeral in nature and merge with the
Dhund River, a tributary of Morel River (out of urban area). Surface runoff in extreme western part flows in
westerly direction and discharged through Bandi (locally called Mashi) river. In major part, drainage density
ranges between 0.30 and 0.50 km/sq. km whereas in extreme western and southern part it is of the order of
0.20 to 0.30 km/sq. km. Studies reveal the existence of palaeochannels in the area also.
Hydrometeorology
It enjoys semi-arid climatic condition. The mean annual rainfall at Sanganer, Amer and Jaipur raingauge
stations have been 534.3, 622.78 and 546.03 mm respectively during the period 1980-2009. The average mean
annual rainfall for these three stations works out to 567.70 mm.
The highest rainfall has been recorded as 1101.90 mm at Sanganer (1981), 1008 mm at Amer (1995) and 887
mm at Jaipur (1996), where as lowest rainfall has been recorded at Sanganer as 206 mm (1980), at Amer as
235.00 mm (2002) and at Jaipur as 222.40 mm (2002) Table 2. The standard deviation of annual rainfall from
mean annual rainfall has been worked out as 206.47.
Table 2 Analysis of rainfall data
S.
No.
Rain Gauge
Station
Mean Annual
Rainfall (mm)
Highest Annual
Rainfall (mm)
Year Lowest Annual
Rainfall (mm)
Year Standard Deviation
(mm)
1 Sanganer 534.30 1101.90 1981 206.00 1980 206.43
2 Amer 622.78 1008.00 1995 235.00 2002 223.43
3 Jaipur 546.03 887.00 1996 222.40 2002 189.54
The monsoon rainfall, which contributes about 90% of the total annual rainfall extends from June end till
September, July and August being the wettest months. Based on Chegodev’s empirical relation, probability of
exceedance of average annual rainfall is about 25% and normal drought 19.4% whereas probability of severe
and most severe drought is almost negligible. Summer season starts in the month of March and continues till
mid June. The mean daily maximum temperature is highest (40.6°C) in May, whereas mean daily minimum
temperature is highest (27.3°C) in June. The on-set of monsoon in June end/July brings down the temperature.

101
Winter season starts in November and the temperature continues to fall till January which is the coldest
month of the year. The mean daily minimum temperature is lowest in January (8.3°C). Climatological
parameters of Jhotwara Station are shown in fig 3.
The air is generally dry during the major part of the year. However, during monsoon period (July-September)
the relative humidity is generally over 60% and during summer months it is as low as 20%. As characteristic of
semi-arid climate, the rate of potential evapotranspiration is high in the city area. It is highest in the month of
May (average 257 mm) and is lowest during December (average 167 mm). The city by and large experience
light to moderate winds during major part of the year. However, winds become relatively stronger in summers
as well as during the monsoon period. The wind speed is highest (17.8 km/hr) in June and is lowest (7.6 km/hr)
in November.
Soil Type
Sandy alluvial soil is the main soil type in the city area. Agricultural activity is restricted to cash crops and
horticultural. The land is largely utilized for domestic housing, office complexes, industrial set-up, gardening
etc.
STATUS OF WATER SUPPLY AND DEMAND
At the time of foundation of Jaipur city in 1727, water supply scheme started by construction of Jhalaras (a big
public well) in each of the nine Chowkaris (squares). In the beginning of the 18th
century the citizens used to
draw water from 100 open wells and baoris located in the city. The first water supply scheme for City Palace
where water from open wells was drawn with oxen and was supplied through a small canal. In the mid of 18th
century the walled city was supplied water from Amanishah Nala through canals up to Chhoti Chopar and Bari
Chopar from where people used to take water. Piped-water supply to Jaipur for public began in 1874 with the
construction of a Reservoir of 4.5 MLD capacity across Amanisha Nala. Open wells were constructed in the
Nala to meet the drinking water demand. In 1915, water supply for the city was about 23.7 litres per capita per
day. This was followed by the development of alternative sources for water supply in the city in view of the
growing population.
The Ramgarh dam was constructed in the year 1906. Due to increased population a scheme was taken up to
augment water supply from the lake. The foundation stone of the scheme was laid on 13th
March 1931 by the
Climatological Parameters - Jhotwara Station
0
50
100
150
200
250
300
Jan Feb Mar Apr May Jun Jul Aug Sep Oct Nov Dec
Month
Ra
infa
ll (
mm
)
Normal Rainfall (mm) Pot. Evapo transpiration (mm)Max. Mean Daily Temp( ºC ) Min. Mean Daily Temp ( ºC )Relative Humidity (%) 0830 hrs Relative Humidity (%) 1730 hrsWind Speed (km/hr)
Fig. 3

102
Lord Irvin to develop capacity of supplying 9 MLD of water to a population of 1.5 lacs. In 1953, capacity of
pumpage from the Ramgarh Lake was increased from 9 MLD to 27 MLD by installation of necessary pumping
stations, carrier main filter plants, distribution mains etc. In 1963, capacity of the Lake was further increased
from 27 MLD to 54 MLD and filter plants were installed at Laxman Dungri. Because of the increasing
population the augmentation scheme was sanctioned during 1971-72 taking ground water as source with 63
MLD capacity. During 1973-74, capacity of ground water withdrawal was increased from 63 to 99 MLD by
constructing additional tubewells in the outskirt areas. This scheme was sanctioned during 1976-77 to enhance
the supplies from the ground water to the tune of 126 MLD. IDA assisted augmentation scheme was
implemented during 1980-85 to further increase the water supply capacity by 72 MLD. About 18 MLD of water
was increased from Ramgarh lake whereas 54 MLD ground water from 120 wells. Thus the total capacity of
Jaipur water supply scheme was raised to 234 MLD.
Present Status
The present status of water supply scheme to cater about 27.98 lacs population of Jaipur Urban area is as
under.
i. Water Sources : a. Ramgarh Lake
b. Tubewells : 1897
c. Hand Pumps : 1983
d. Tubewells (125mm) : 176
e. Bisalpur Dam :
ii. Water supply (352.5 MLD)
a. Ramgarh Lake : Nil
b. Tubewells : 300 MLD
c. Hand Pumps : 1 MLD
d. Tubewells (125mm) : 1.5 MLD
e. Bisalpur Dam : 50 MLD
iii Service Level : 125 lpcd
iv Water Requirement : 349.75 MLD
The present population of Jaipur Urban Area as per projection is estimated to be 35.60 lacs for which water
requirement is about 445 MLD. There are about 5000 private tube wells with average 2 hrs pumping per day.
This leads to ground water abstraction of about 30 MLD considering 15 m3/hr average discharge of a well.
WATER PROFILE (SURFACE AND GROUND WATER)
State water supplying department (PHED) has formulated Bisalpur Water Supply Project to meet a target of
950 MLD of water to JUA. The project has been commissioned in 2010, and present supply from Bisalpur is
only 50 MLD despite good rainfall during the year 2010. The present surface water supply to JUA from
Ramgarh Lake (dry) is nil, which was used to be 54 MLD since 1963. The ground water abstraction in JUA is
about 302.5 MLD from Govt tube wells and about 30 MLD from private tube wells. The ground water
contributes 92.12 % of total water utilization. The status of water supply from surface and ground water is
given in Table 3.
Table 3 Status of water supply in Jaipur urban area (in MLD)
Year Surface water Ground water Total water supply
1980 27.00 (Ramgarh lake) 108.00 135.00
1985 29.50 (Ramgarh lake) 136.35 165.60
1990 11.60 (Ramgarh lake) 152.90 174.60
1995 11.25 (Ramgarh lake) 209.25 220.50
2000 32.00 (Ramgarh lake) 300.00 332.00
2005 Nil 328.00 328.00
2010 50.00 (Bisalpur Dam) 300.00 350.00
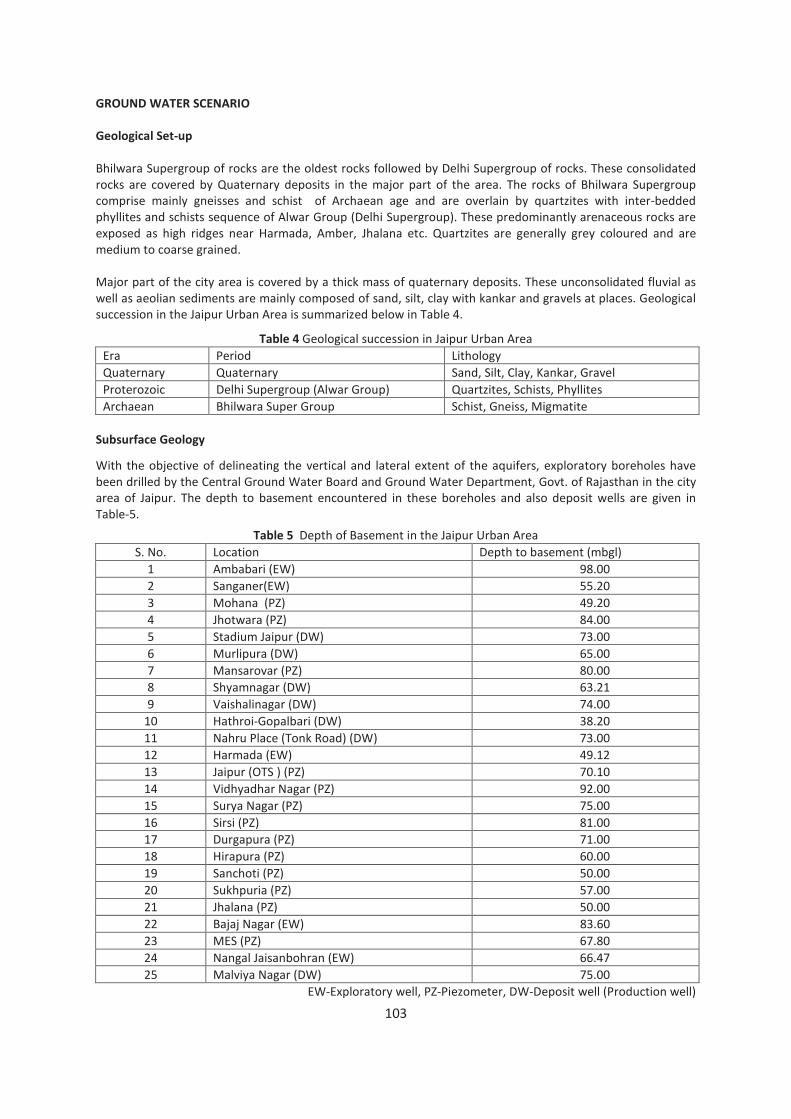
103
GROUND WATER SCENARIO
Geological Set-up
Bhilwara Supergroup of rocks are the oldest rocks followed by Delhi Supergroup of rocks. These consolidated
rocks are covered by Quaternary deposits in the major part of the area. The rocks of Bhilwara Supergroup
comprise mainly gneisses and schist of Archaean age and are overlain by quartzites with inter-bedded
phyllites and schists sequence of Alwar Group (Delhi Supergroup). These predominantly arenaceous rocks are
exposed as high ridges near Harmada, Amber, Jhalana etc. Quartzites are generally grey coloured and are
medium to coarse grained.
Major part of the city area is covered by a thick mass of quaternary deposits. These unconsolidated fluvial as
well as aeolian sediments are mainly composed of sand, silt, clay with kankar and gravels at places. Geological
succession in the Jaipur Urban Area is summarized below in Table 4.
Table 4 Geological succession in Jaipur Urban Area
Era Period Lithology
Quaternary Quaternary Sand, Silt, Clay, Kankar, Gravel
Proterozoic Delhi Supergroup (Alwar Group) Quartzites, Schists, Phyllites
Archaean Bhilwara Super Group Schist, Gneiss, Migmatite
Subsurface Geology
With the objective of delineating the vertical and lateral extent of the aquifers, exploratory boreholes have
been drilled by the Central Ground Water Board and Ground Water Department, Govt. of Rajasthan in the city
area of Jaipur. The depth to basement encountered in these boreholes and also deposit wells are given in
Table-5.
Table 5 Depth of Basement in the Jaipur Urban Area
S. No. Location Depth to basement (mbgl)
1 Ambabari (EW) 98.00
2 Sanganer(EW) 55.20
3 Mohana (PZ) 49.20
4 Jhotwara (PZ) 84.00
5 Stadium Jaipur (DW) 73.00
6 Murlipura (DW) 65.00
7 Mansarovar (PZ) 80.00
8 Shyamnagar (DW) 63.21
9 Vaishalinagar (DW) 74.00
10 Hathroi-Gopalbari (DW) 38.20
11 Nahru Place (Tonk Road) (DW) 73.00
12 Harmada (EW) 49.12
13 Jaipur (OTS ) (PZ) 70.10
14 Vidhyadhar Nagar (PZ) 92.00
15 Surya Nagar (PZ) 75.00
16 Sirsi (PZ) 81.00
17 Durgapura (PZ) 71.00
18 Hirapura (PZ) 60.00
19 Sanchoti (PZ) 50.00
20 Sukhpuria (PZ) 57.00
21 Jhalana (PZ) 50.00
22 Bajaj Nagar (EW) 83.60
23 MES (PZ) 67.80
24 Nangal Jaisanbohran (EW) 66.47
25 Malviya Nagar (DW) 75.00
EW-Exploratory well, PZ-Piezometer, DW-Deposit well (Production well)

104
The borehole data reveal that thickness of the alluvium is less than 50 m in the area around Harmada and
Hathroi, and over 80 m at Vidhyadhar Nagar, Jhotwara, Sirsi, Ambabari and Bajajnagar area of the city. In
remaining areas, the alluvium thickness is between 50 to 80 m (Fig. 4). Altitude of the bed rock is from about
325 m amsl in southern part to over 400 m amsl (Fig. 5) in the northern part of the urban agglomerate. Mostly
quartzitic rocks have been encountered, except in southern part, where granitic gneisses and schist are the
bed rocks.
Fig.4 Fig. 5
Fig.6
Potential Aquifers
Ground water conditions are mainly governed
by the geological set-up besides the influence
of geo-morphological and climatological
factors. The movement of ground water takes
place through the primary and secondary
porosity in the formation. Unconsolidated
Quaternary formation forms the principal
aquifer in the Jaipur urban area. These
sediments are fluvial, fluvio-aeolian and aeolian
in origin. Talus and scree near foothills also
serve as potential aquifers at places.
Hydrogeological set up of the area is given in
Fig. 6.
Saturated thickness of the alluvial aquifer varies
considerably. Towards southern and western
part of the city it ranges from about 15 m to 30
m, along the axis of walled city-Sanganer it is
over 20 m, reducing to less than 10 m towards
Amanishah Nalla. In the area west of
Amanishah Nalla, saturated thickness is again
more, varying from 20 m to 35 m.
Ground Water Level
To ascertain the behaviour of water table in the
city area 15 National Hydrograph Network
stations are monitored four times a year i.e.
January, May, August and November. The data
from these stations of Nov. 2010 reveals that

105
the depth to water level in the city area varies from 10.75 m to 66.95 m (Fig. 6) and is more in western part of
the urban agglomerates and in the area of Officers Training School (OTS), Jawahar Nagar et. Depth to water
level within walled city, Amer, Jal Mahal, Puranaghat area etc., is generally shallow i.e. generally less than 15 m
bgl. Depth to water table in the range of 40 m to 60 m occurs near Chandpole, C-scheme, Mansarovar,
Durgapur, Sanganer and Sukhpuria. Water levels over 65 m have been recorded around Jhotwara, Army Cant
and Sirsi.
Water Table Elevation and Slope
The elevation of water level varies from about 430 m above mean sea level (m amsl) in northern part of the
area to about 330 mamsl in the southern part. Hydraulic gradient closely follows the physiography and is in the
southern and south-westerly directions. The monitoring of National Hydrograph Network Stations in the city
area reveals declining trend in water levels. Water level fluctuation data of hydrograph stations for the period
of Nov. 1990, 1995, 2000, 2005 and 2010 are given in Table 6.
Table 6 Depth to water level and fluctuation in Jaipur Urban Area
Sl
No Location
Depth to Water Level (mbgl) Water Level Fluctuation m/year
Nov-
1990
Nov-
1995
Nov-
2000
Nov-
2005
Nov-
2010
1990-
2010
1995-
2010
2000-
2010
2005-
2010
1 Amer 11.9 5.73 11.77 9.31 10.75 0.06 -0.33 0.10 -0.29
2 Durgapura 18.98 22.8 33.54 58.4 -2.63 -3.56 -4.97
3 Goner 6.97 11.28 6.79 12.4 -0.36 -0.11 -1.12
4 Gopalpura Bye Pass 43.5
5 Jhotwara 36.28 46 54.7 66.95 -2.04 -2.10 -2.45
6 Mansarowar 24.62 35.95 51.45 -2.68 -3.10
7 Mansrowar CGWB 47.1
8 MES Jaipur 35.95 39.14 43.97 57.35 -1.43 -1.82 -2.68
9 Mohana 26.85 37.87 33.73 31.5 -0.31 0.64 0.45
10 Shivdaspura 11.6 19.96 18.2 19.5 -0.40 0.05 -0.26
11 Sirsi 35.45 42.17 55.02 65.1 -1.98 -2.29 -2.02
12 Sukhpura 22 22.09 25.32 45.7 -1.58 -2.36 -4.08
13 Suryanagar 16.82 20.59 42.4 -2.56 -4.36
Average 23.53 26.77 30.65 42.47 -0.17 -1.33 -1.52 -2.26
The decline in water level has been observed in the area and it has been estimated as 0.17 m/year during 1990
-2010, 1.33
m/year during
1995 -2010, 1.52
m/year during
2000 – 2010 and
2.26 m/year
during 2005 –
2010. This shows
that rate of
decline in water
is increasing day
by day due to
increase in
ground water
utilization and
poor aquifer at
deeper levels. The hydrograph of Mansarowar for the period 1996-2010, Durgapura for the period 1995-2010,
Jhotwara for the period 1992 – 2010 and Amer for the period 1975 - 1976 stations are plotted and shown in

106
Fig 7a, 7b, 7c, and 7d. The reason for declining trend in ground water table in the area is due to the ever-
increasing exploitation of ground water to meet the demands mainly for drinking and industrial purposes. The
decline in water level more than 3m/year has been observed in hydrograph station of Durgapura, Mansarowar
and Sukhpura during the period from 2005 -2010.
Fig. 7b
Fig. 7c
Fig. 7d
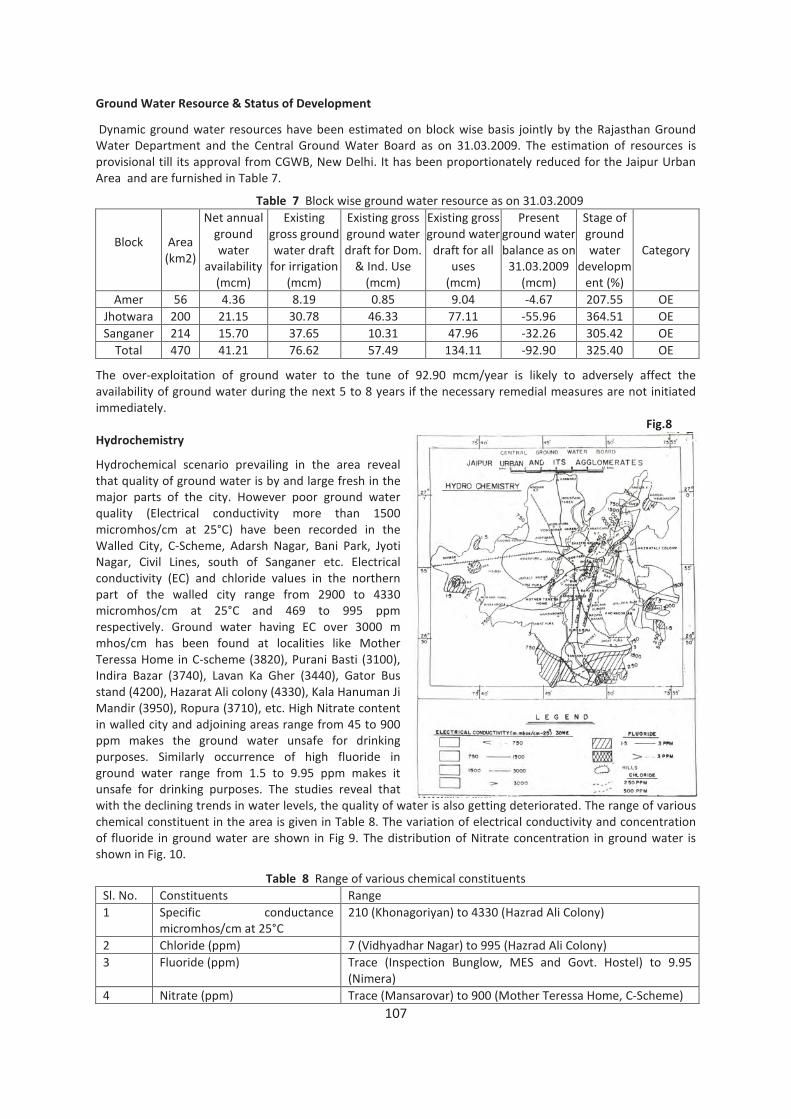
107
Ground Water Resource & Status of Development
Dynamic ground water resources have been estimated on block wise basis jointly by the Rajasthan Ground
Water Department and the Central Ground Water Board as on 31.03.2009. The estimation of resources is
provisional till its approval from CGWB, New Delhi. It has been proportionately reduced for the Jaipur Urban
Area and are furnished in Table 7.
Table 7 Block wise ground water resource as on 31.03.2009
Block
Area
(km2)
Net annual
ground
water
availability
(mcm)
Existing
gross ground
water draft
for irrigation
(mcm)
Existing gross
ground water
draft for Dom.
& Ind. Use
(mcm)
Existing gross
ground water
draft for all
uses
(mcm)
Present
ground water
balance as on
31.03.2009
(mcm)
Stage of
ground
water
developm
ent (%)
Category
Amer 56 4.36 8.19 0.85 9.04 -4.67 207.55 OE
Jhotwara 200 21.15 30.78 46.33 77.11 -55.96 364.51 OE
Sanganer 214 15.70 37.65 10.31 47.96 -32.26 305.42 OE
Total 470 41.21 76.62 57.49 134.11 -92.90 325.40 OE
The over-exploitation of ground water to the tune of 92.90 mcm/year is likely to adversely affect the
availability of ground water during the next 5 to 8 years if the necessary remedial measures are not initiated
immediately.
Fig.8
Hydrochemistry
Hydrochemical scenario prevailing in the area reveal
that quality of ground water is by and large fresh in the
major parts of the city. However poor ground water
quality (Electrical conductivity more than 1500
micromhos/cm at 25°C) have been recorded in the
Walled City, C-Scheme, Adarsh Nagar, Bani Park, Jyoti
Nagar, Civil Lines, south of Sanganer etc. Electrical
conductivity (EC) and chloride values in the northern
part of the walled city range from 2900 to 4330
micromhos/cm at 25°C and 469 to 995 ppm
respectively. Ground water having EC over 3000 m
mhos/cm has been found at localities like Mother
Teressa Home in C-scheme (3820), Purani Basti (3100),
Indira Bazar (3740), Lavan Ka Gher (3440), Gator Bus
stand (4200), Hazarat Ali colony (4330), Kala Hanuman Ji
Mandir (3950), Ropura (3710), etc. High Nitrate content
in walled city and adjoining areas range from 45 to 900
ppm makes the ground water unsafe for drinking
purposes. Similarly occurrence of high fluoride in
ground water range from 1.5 to 9.95 ppm makes it
unsafe for drinking purposes. The studies reveal that
with the declining trends in water levels, the quality of water is also getting deteriorated. The range of various
chemical constituent in the area is given in Table 8. The variation of electrical conductivity and concentration
of fluoride in ground water are shown in Fig 9. The distribution of Nitrate concentration in ground water is
shown in Fig. 10.
Table 8 Range of various chemical constituents
Sl. No. Constituents Range
1 Specific conductance
micromhos/cm at 25°C
210 (Khonagoriyan) to 4330 (Hazrad Ali Colony)
2 Chloride (ppm) 7 (Vidhyadhar Nagar) to 995 (Hazrad Ali Colony)
3 Fluoride (ppm) Trace (Inspection Bunglow, MES and Govt. Hostel) to 9.95
(Nimera)
4 Nitrate (ppm) Trace (Mansarovar) to 900 (Mother Teressa Home, C-Scheme)

108
Ground Water Pollution Fig. 9
Increasing industrialisation and urbanization have
caused not only air, sound and surface water
pollution but have also caused ground water
pollution in the Jaipur city resulting in adverse effects
on the health. Some parts of the urban agglomerate
is affected with fluoride pollution (as in Sanganer)
while the major parts lying within the walled-city is
suffering from nitrate pollution. There is an urgent
warning and calls for measures to tackle the quality
hazards of ground water.
High Fluoride in Ground Water
The concentration of fluoride in ground water in
greater part of the area is with in permissible limit of
1.5 mg/liter. Alarming levels of fluoride in ground
water has been recorded in Sanganer block area
forming part of Jaipur urban area. Alluvium is the
principal aquifer in the Sanganer area having
maximum thickness of 76 m. Depth to water level
generally ranges from 35 to 45 m.
The town Sanganer is famous for specific cloth print designs for which vegetable dyes were being used during
earlier days. However because of considerably lower cost of the organic (chemical) dyes, the same are
preferred and are now being used extensively by the dyeing and printing industry. Voluminous liquid wastes
are generated by the dyeing and printing industry and are disposed off in carrier channels (canals). In addition,
some industrial units are also pouring their effluents into the Amanishah Nala. These liquid wastes are also
being used for irrigation purposes. The unused part of effluent water is allowed to accumulate near the bunds
in the peripheral areas giving adequate time period to this effluent water to percolate and reach the saturated
zone. Thereby degrading and deteriorating ground water quality. The polluted surface water flows as per
hydraulic gradient and gets concentrated at favourable geomorphic locations where its flow is sluggish. The
organic dyes have been found to contain fluoride content from 0.2 to 1.8 ppm whereas the effluent wastes
have fluoride concentration ranging from 1.6 to 7.7 ppm. It is therefore recommended that the liquid effluents
should be treated and beneficiated to remove the hazardous constituents before their disposal and also to
encourage / motivate to use vegetable dyes. Alternatively, the dyes having higher concentration of fluoride be
replaced by alternative dyes.
High Nitrates in Ground Water
Prolonged use of water with nitrate beyond permissible limit of 45 ppm for drinking purposes causes stomach
disorder and methemoglobinemia. Presence of high nitrate in aquifer water has been recorded in the Jaipur
city, particularly within the walled-city and adjoining areas. Ground water occurs mostly under phreatic
conditions except at few locations. The significant findings of the scientific studies is that high level of nitrate
contents were found more in thickly populated walled city area where proper sewerage system do not exist
and also ground water levels are shallow. Therefore, it is recommended to develop a proper sewerage
network system in urban agglomerate areas particularly in the walled city so as to prevent mixing with ground
water.
Major Ground Water Related Problems
Depleting ground water resource
The ground water requirement is increasing day by day in the urban area for domestic and industrial purposes
due to rapid growth in population and economic developments. The water requirement met by surface water

109
in JUA is only 15 % of total requirement and remaining requirements are met by ground water. The earlier
source of surface water was Ramgarh lake, which has been dried up and now surface water is transferred
through pipe line from Bisalpur Dam on Banas river located about 110 km. from Jaipur. Large scale ground
water development due to urbanization and industrialization has rendered Jaipur urban area ground water
system as over exploited with stage of ground water development as 325.40%. Natural recharge to ground
water is also diminishing because of the shrinkage in the open areas due to construction of buildings and
increase in paved area. The ground water resource estimate reveals that there is overexploitation of 92.8966
MCM / year, resulting into declining trends in water levels there by causing decrease in yield of the wells.
Quality Deterioration
Increasing urbanization and industrialization have caused not only air, sound and surface water pollution but
have also caused ground water pollution in the Jaipur city resulting in adverse effect on the health,
environment and imbalance in the eco-system:
Urbanisation – Nitrate pollution
Intake of high nitrate water (more than 45 ppm) causes stomach disorder and the disease called
methemoglobinemia. The ever-increasing pollution density, lack of properly developed sewerage system and
shallow water levels have resulted in high nitrate pollution in ground water particularly in walled city and
adjoining areas. The situation is likely to improve if proper development / maintenance of sewerage system is
given due attention.
Textile industrialization – Fluoride pollution
High concentration of fluoride in drinking water causes the disease called fluorisis. In Sanganer area, famous
the world over for printed fabric, use of chemical dyes in place of vegetable dyes by the expanding cloth
printing industry has resulted in qualitative deterioration of ground water by high level of fluoride. The already
alarming level of fluoride in ground water in some areas is likely to further expand in time and space due to
enhanced use of such fluoride containing dyes (in printing industry) if immediate remedial measures are not
taken.
Salinity
High level of salinity in ground water has been found particularly in the walled city. The high salinity in ground
water is attributed to contamination by increased pollution, poor sewerage network and shallow water levels.
Diminishing natural recharge of ground water due to shrinking of open space and continuous over-exploitation
leading to mining of aquifer water have also resulted in the increase in salinity in ground water.
Feasibility of Rainwater Harvesting and Artificial Recharge
The area is receiving rainfall on an average of 567.7 mm/year and thus there is precipitation of 266.82
mcm/year. A part of this source water can be used for artificial recharge of ground water. The subsurface
formation in greater part of the area is alluvium. The depth to water level in the area varies from 10.75 to
66.95 m bgl with an average of 42.47 m bgl. The subsurface storage space available for artificial recharge has
been estimated as 1317.419 mcm which can be used for rain water harvesting and artificial recharge of ground
water. The rain water run off from roof top / paved area / roads and storm water can be used for artificial
recharge. The feasible rain water harvesting structures in the area are recharge shafts (with / without boring),
trench, recharge tube wells, abandoned dug wells / tube wells / hand pumps and anicuts at suitable locations.
The Central Ground Water Board has constructed roof top / paved area rain water harvesting structures in the
14 government buildings in the city as demonstrative projects of rain water harvesting and artificial recharge
of ground water. About 25% of rain water i.e. about 66.7 mcm can be planned for artificial recharge of ground
water through construction of suitable recharge structures which will result in restricting decline in water
levels and lead to increase in yield of wells.

110
GROUND WATER DEVELOPMENT STRATEGY
Ground Water Resources
The replenishable /dynamic ground water resources are overexploited to the tune of 92.8966 MCM with stage
of ground water development as 325.40%. The principal aquifer in the area is alluvium and depth to water
level ranges from 10.75 m to 66.95 m with an average of about 42.27 m. Alluvium is underlained by schist,
gneisses and quartzite with negligible yield. The depth to basement in the area varies from 49.20 to 98 metres
with an average depth of 68 m. There is need for ban on further ground water development in the area. The
Central Ground Water Board has notified Jhotwara block as “NOTIFIED” area for regulation of control and
development of ground water resources vide Public Notice dated 14.09.2006. The Sanganer block area is in
process of notification by CGWA for regulation of control and development of ground water resources.
There is need of transfer of surface water from adjoining basin. Bisalpur Project of Govt. of Rajasthan was
planned for transfer of 950 MLD water to Jaipur. But it has been restricted to 50 MLD only. The constraint in
less supply to Jaipur from Bisalpur needs to be addressed.
The flow of water leaving the Jaipur Urban Area is waste water of about 91 MCM /year and this flow will only
increase as a result of increased sewerage cover and increasing consumption. Treated waste water can be
used for watering of green areas in Jaipur city. The waste water leaving the JUA from north through Brahmpuri
STP plant and Jalmahal Lake and from south through Delawas STP plant and Amanisha nala. There is need of
pumping to bring the treated waster water in urban area as there is elevation difference of more than 100 m.
Therefore small STP can be installed and treated waste water should be utilized in nearby areas. This will save
fresh ground water.
Conservation Methods
• Ground water exploitation needs to be regulated. In the peripheral areas of the urban agglomerate,
utilization of ground water for irrigation purposes should be practiced by employing sprinklers / drip
methods only. The quantity of water thus saved may be diverted and utilized for city water supply.
• All ground water based industries must re-use 80% of the water in different operation.
• Use of recycled treated waste industrial waters for agriculture may be made mandatory, so as to
conserve ground water for drinking purposes.
• Defunct boreholes with hand pumps should be deepened and repaired immediately. Use of hand
pumps should be encouraged.
• Wastage of water from leakage through pipelines is a common and serious phenomenon. Prompt
action to check such losses may save the water to a greater extent. Organizations including Public
Health Engineering Department / Housing Society etc. should give proper attention to control such
leakages. Besides every citizen should also feel the responsibilities to inform such incidences to the
concerned organization immediately.
• Re-use of domestic waste water needs to be encouraged. Use of water disposed off from kitchen may
be encouraged for gardening which may be a step in this direction. Sale of low capacity flushing system
(7 to 10 liters) in the domestic latrines should be promoted.
• Registration of drilling agencies, existing ground water abstraction structures, must be made
mandatory. Seeking of permission for further construction of ground water abstraction structures
should be also made mandatory so as to control exploitation and protection of ground water from over
draft and quality degradation.
• Mass awareness and education to protect and conserve the precious and scarce ground water is the
need of the hour.
Artificial Recharge
About 25% of annual rain fall occurring in Jaipur Urban Area i.e. about 66.7 mcm can be planned for artificial
recharge of ground water through construction of suitable recharge structures which will result in restricting
decline in water levels and increase in yield of wells. The area is feasible for artificial recharge to ground water
as mentioned above.
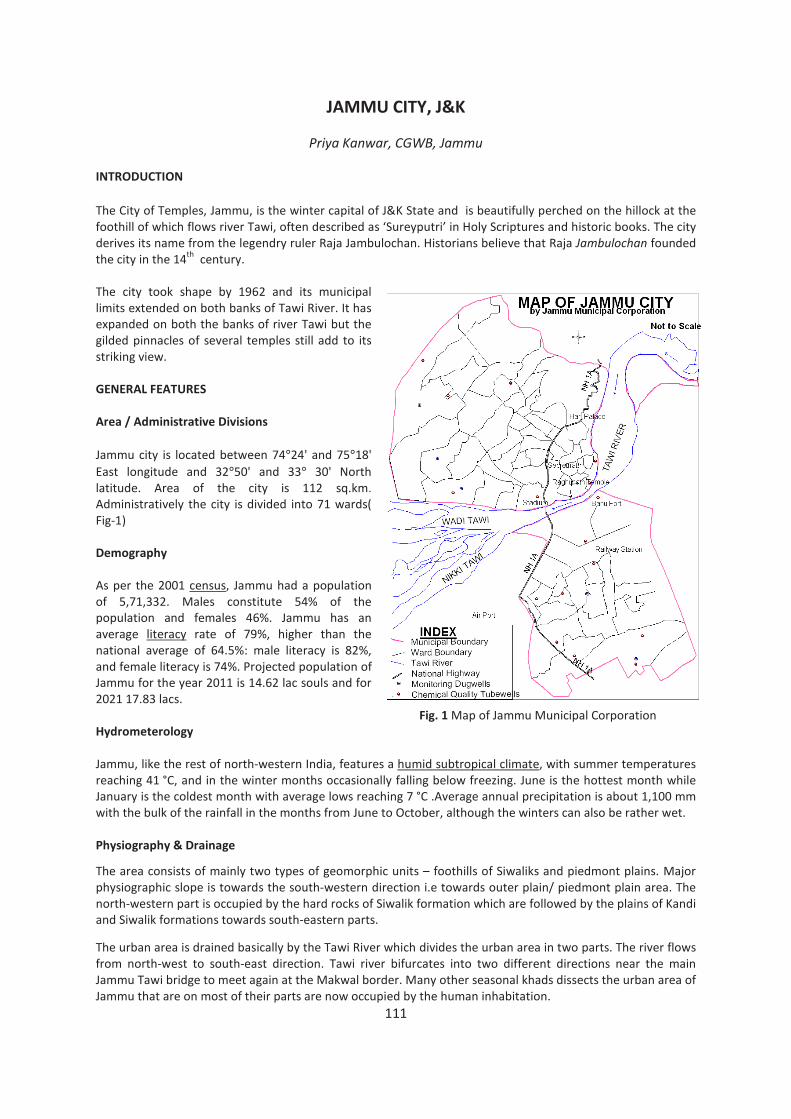
111
JAMMU CITY, J&K
Priya Kanwar, CGWB, Jammu
INTRODUCTION
The City of Temples, Jammu, is the winter capital of J&K State and is beautifully perched on the hillock at the
foothill of which flows river Tawi, often described as ‘Sureyputri’ in Holy Scriptures and historic books. The city
derives its name from the legendry ruler Raja Jambulochan. Historians believe that Raja Jambulochan founded
the city in the 14th
century.
The city took shape by 1962 and its municipal
limits extended on both banks of Tawi River. It has
expanded on both the banks of river Tawi but the
gilded pinnacles of several temples still add to its
striking view.
GENERAL FEATURES
Area / Administrative Divisions
Jammu city is located between 74°24' and 75°18'
East longitude and 32°50' and 33° 30' North
latitude. Area of the city is 112 sq.km.
Administratively the city is divided into 71 wards(
Fig-1)
Demography
As per the 2001 census, Jammu had a population
of 5,71,332. Males constitute 54% of the
population and females 46%. Jammu has an
average literacy rate of 79%, higher than the
national average of 64.5%: male literacy is 82%,
and female literacy is 74%. Projected population of
Jammu for the year 2011 is 14.62 lac souls and for
2021 17.83 lacs.
Fig. 1 Map of Jammu Municipal Corporation
Hydrometerology
Jammu, like the rest of north-western India, features a humid subtropical climate, with summer temperatures
reaching 41 °C, and in the winter months occasionally falling below freezing. June is the hottest month while
January is the coldest month with average lows reaching 7 °C .Average annual precipitation is about 1,100 mm
with the bulk of the rainfall in the months from June to October, although the winters can also be rather wet.
Physiography & Drainage
The area consists of mainly two types of geomorphic units – foothills of Siwaliks and piedmont plains. Major
physiographic slope is towards the south-western direction i.e towards outer plain/ piedmont plain area. The
north-western part is occupied by the hard rocks of Siwalik formation which are followed by the plains of Kandi
and Siwalik formations towards south-eastern parts.
The urban area is drained basically by the Tawi River which divides the urban area in two parts. The river flows
from north-west to south-east direction. Tawi river bifurcates into two different directions near the main
Jammu Tawi bridge to meet again at the Makwal border. Many other seasonal khads dissects the urban area of
Jammu that are on most of their parts are now occupied by the human inhabitation.

112
Soil Type
The soil of the city is mainly of two types a) Boulder Conglomerate mixed with hard clay; and b) alluvial soils.
STATUS OF WATER SUPPLY AND DEMAND
The present source of drinking water supply to Jammu city is partly from river Tawi and partly from ground
water. Most of the water supply schemes in the city were implemented during the period from 1950s to
1970s. The water supply in the city is intermittent with 1-2 hours of supply each in the morning and evening.
Against the demand of 45.50 MGD drinking water in Jammu
city, the present water supply to the city is 42.5 MGD and
there is a shortage of 3 MGD. The problem of water supply
has been so acute due to the depletion of surface water
resources. The city relies on groundwater more than two
thirds of its need.
WATER PROFILE
Ranbir Canal takes off from left of Chenab River, up-stream
Akhnoor Bridge and passes through the Jammu city. This
canal was completed in 1905. The main canal is 60 km in
length and its distribution system about 400 km. The drawals
in Ranbir Canal from River Chenab are restricted under Indus
Water Treaty of 1960. The canal was remodeled during 1968-
75. Due to loss and seepage, increased irrigated agriculture,
over-aging of canal and distributaries the modernization of
Ranbir Canal was proposed.
GROUND WATER SCENARIO
Potential Aquifers
Geologically, the urban area is occupied by the hard rocks of Upper Siwalik formations of Lower to Middle
Pliestocene age in the north-eastern part and unconsolidated Kandi and Sirowal plains of Quaternary to Recent
age in the south-western part.
The hard rock of Siwalik formation are not explored much deeper from the ground water point of view. But it
occurs as small isolated bodies and in weathered and fractured portions, cracks, joints and crevices in these
rocks. It manifests in the form of springs emerging out along the contacts and other structural features. The
water levels in the transition area from Siwaliks to Kandi plains are about 60 m to 75 m bgl. Discharge is
generally low and it varies from negligible to 600 lpm. The flow direction of groundwater is broadly form north
to south and corresponds roughly with the topographic slope.
In the outer plains, Kandi and Sirowal formations the ground water occur as regional bodies. It occurs under
unconfined conditions in Kandi belt and under confined conditions in Sirowal plains. The Kandi formation has
steep slopes and deeper water levels ranging between 5 m and 65 m bgl and yield varies from 235 to 2574
lpm. In Sirowal formation the topographic slopes are gentle and water levels are quite shallow in the range of
10 m to 20 m bgl and discharge range between 1050 and 3785 lpm. The Hydrogeological of Jammu city has
been depicted in Fig.2.
Depth to Water Level
The water levels in the plain areas
of for Jammu city are measured
from 5 dugwells for the month of
May 2010, which is as follows in
Table-II. The Map of Ground
Water Level has been depicted in
Fig.3.
SN Location Water Levels
in May 2010
mbgl
EC
(micromhos/cm)
Cl
mg/l
1 Muthi 2.19 755 21
2 Nagbhani 4.38 742 71
3 Hazuribag 12.00 955 39
4 Trikuta Nagar 4.05 840 32
5 Greater Kailash 15.05 730 21

113
Ground Water Resources and Status of Ground Water
Development
Ground water development in the district on moderate
scale is restricted along the major streams and rivers. In
these areas, all the major irrigation and drinking water
supplies depend on the tube well and dug wells in
addition to various water supply schemes based on
rivers / nallas. Outer plains occupy more than 75 % of
the area of the city. Ground water development on
moderate scale is seen in the areas particularly in the
outer plains.
So far the ground water resources of Jammu city have
not been calculated separately (resources have been
estimated for whole Jammu District) by CGWB. PHE
has constructed about 114 tubewells in the city which
has a total area of 132 sq.km.
Hydrochemistry
The chemical quality in Jammu city is by and large fit
for drinking and irrigation purposes as per Indian Standards (IS-10500-1991). Chemical analysis of water
samples from sources like Dug wells and Tubewells has been taken in to consideration.
Shallow Aquifers:- Ground water quality of Jammu urban area is potable and fresh (Table-II) . Electrical
conductivity ranges from 540 micro mhos /cm to 1297 micro mhos /cm. while Cl varies from 11 to 92 mg/l. pH
varies from 7.10 to 7.65, mild alkaline in nature. Bicarbonate concentration ranges from 384 mg/l to 628 mg/l.
Sulphate, Nitrate & Fluoride constituents are within the safe limit. Maximum concentration of nitrate, 28 mg/l
is reported in water sample collected from Purkhoo. Iron concentration is also well within the maximum
permissible limit (1.0mg/l). Alkaline earth metals like Ca & Mg are dominating over alkali metals. As per
classification of hardness ground water is very hard.
Deeper Aquifers:- Electrical conductivity ranges from
310 micro mhos/cm to 1220 micro mhos/cm pH varies
from 7.7 to 8.45 which shows that ground water is
quite alkaline in nature. Chloride varies from 3.6 mg/l
to 75 mg/l. Bicarbonate concentration varies from 98
mg/l to 525 mg/l. Sulphate and Nitrate concentration
ranges from traces to 100 mg/l and 1.2 mg/l to 92 mg/l
respectively. Fluoride concentration is also low. The
concentration of Fluoride and Iron are well within the
maximum permissible limit set up by BIS. Alkaline
earth metals dominate over alkali metals i.e Na & K.
Ground water is very hard. EC (Spot Value) of ground
water from tubewells has been depicted in Fig.4.
Major Ground Water Related Problems
1. Open dugwells which could have served as
monitoring wells have either been filled or
covered with RCC slabs
2. Tube wells used for water supply in Urban areas
are continuously running for more than 21 hrs in a
day, which is ultimately putting huge stress on
ground water.

114
3. Acute shortage of water in Kandi region
4. Occurrence of high Nitrate in the water samples from tubewells.
Feasibility of Rain Water Harvesting and Artificial Recharge
Roof top rainwater harvesting need to be adopted in urban and water scarce hilly areas and proper scientific
intervention for development of groundwater is required in water scarce areas. Kandi region of the district
faces acute shortage of water supply round the year because of deep water level and hard boulders in clayey
matrix. To recharge and conserve the groundwater resources, de-silting and revival of Kandi ponds appears an
effective solution
Central Ground Water Board has taken up a few pilot schemes on Artificial Recharge to groundwater in J&K
State. Such schemes are completed in which roof top water is collected and recharged through recharge wells
at Government College for Women, Gandhi Nagar, Air port building, Satwari and at Nirman Bhawan in Jammu
city.
GROUND WATER DEVELOPMENT STRATEGY
• The Piezometeres may be constructed to monitor the behavior of ground water in multi aquifer system.
• Since there are data gaps in monitoring of depth to water levels, it is recommended to install piezometers
to observe behavioral changes of water levels over a long period of time in order to know the trends.
• Rainwater harvesting in general & RTRWH in particular is an ideal solution for augmenting water resources
particularly in sloppy hilly & chronic water scarce areas. There is thus need to create awareness for water
conservation and augmentation and proper waste disposal for protecting water sources
• Kandi ponds / tanks / talavs must be utilized for conserving and augmenting water resources and for
recharging ground water body. These structures can be de-silted, rehabilitated and renovated for
harvesting water and utilized for both recharging and meeting the local needs.
• Mining of the riverbeds should be prohibited as it leads to fall in the water levels & it also damages the
natural river system.
• In addition, micro level efforts are required for proper implementation of development programme.
• Over pumping of tubewells constructed by the State Government Agencies should be minimized.
• Further development of ground water by the State Government Organizations should be regulated and
monitored.
• People should be made aware for proper utilization and conservation of available water resources.
• There is need of creation of ground water department in the State which can take up matters related to
ground water management at the micro levels.

115
KOLKATA CITY, WEST BENGAL
Tarun Mishra, CGWB, Kolkata
INTRODUCTION
Kolkata is the capital of West Bengal. It is located in eastern India on the east bank of the River Hooghly. The
city was a colonial city developed by the British East India Company and then the British Empire. The city was
the capital of the British Indian empire till 1911. It is labelled as the "Cultural Capital of India", "The City of
Processions", "The City of Palaces", and the "City of Joy". Kolkata has also been home to luminaries such as
Rabindranath Tagore, Subhash Chandra Bose, Mother Teresa and Satyajit Ray. Problems related to rapid
urbanisation started to plague the city
from 1930s and still the city is an example
of an urban hotbed of the developing
nations. The state government changed
the city’s official name from Calcutta to
Kolkata in 2001.
GENERAL FEATURES
Kolkata municipal corporation is bounded
by 22˚ 28′ 00” N to 22˚37′ 30” N latitudes
and 88˚ 17’ 30” E to 88˚25’ 00” E
longitudes with its Western boundary with
river Ganga. The city Kolkata is the capital
of the State and is well connected by rail,
road & air netwok.
Area/ Administrative Divisions
The Kolkata Municipal Corporation (KMC)
having an area of 187.33 sq.km. comprises
of 141 wards and 15 nos. of Borough
having 21 assemblies and 3 parliamentary
constituencies (Fig. 1).
Fig. 1 Administrative map of Kolkata municipal corporation area.
Demography
As per 2001 census, the KMC area has a population of 4572876 of which 54.67% are male and 45.33% are
female. The population density of KMC area is 24718 per sq km as per 2001 census. As per 1901 census its
population was 933754, and as per 1951 census 2698494 and it became 4572876 in 2001 census. The
population density is 24718 per sq km in 2001. The growth rate of Kolkata city is 17305 populations per year.
The population growth of the Kolkata city is increasing rapidly which also enhances the demand of ground
water in the city and ultimately imposes stress on ground water regime in the area.
Hydrometeorology
Kolkata has a tropical wet-and-dry climate. The annual mean temperature is 26.8 °C, monthly mean
temperatures ranges from 19 °C to 30 °C. Often during early summer, dusty squalls followed by spells of
thunderstorm or hailstorms and heavy rains with ice sleets lash the city, bringing relief from the humid heat.
These thunderstorms are convective in nature, and is locally known as Kal baisakhi. Rains brought by the Bay
of Bengal branch of South-West monsoon lash the city between June and September and supplies the city with
most of its annual rainfall of 1,582 mm. The highest rainfall occurs during the monsoon in August—306 mm
(12 in). The city receives 2,528 hours of sunshine per annum, with the maximum sunlight occurring in March.
Annual rainfall of KMC area is 1647 mm (2006). Normal monsoon rainfall is 1282 mm and normal non-
monsoon rainfall is 365 mm.

116
Physiography and drainage
Kolkata forms a part of the lower deltaic plains of the Ganga-Bhagirthi river system. The area lies due east of
the Hugli distributory, which takes off from the main Ganga channel at the head of the delta near Farakka as
Bhagirathi. This Bhagirathi in further down- stream in the tidal stretch is called Hugli. It is a typical deltaic flat
land with surface elevation ranging between 3.5 to 6.0 meter above mean sea level (amsl). Several low lying
depressions in the form of marshes, shallow lakes or jhils occur within the city and most of these represent
river scars of the post river channels of Bhagirathi. The master slope of the land is towards south. Younger
levee, deltaic plain, interdistributory marsh, paleo channels and younger levee adjacent to river Hugli and
older levee on both sides of the old Adi Ganga are the important geomorphological units present in the area.
Due to rapid urbanization of the city the major part of the original geomorphologic units has been obscured.
Most of the marshy lands have been filled up and covered with buildings. The area is drained by major Hugli
river along its Northwestern boundary and by several canals like Bagjola Khal in the north and Beleiaghata and
Circular Khal (canal) in the central part and Adi-Ganga ( a paleo channel), and Talli nala in the southern part,
which flows in the NNW-SSE direction. These khals and nalas cover a large area of the city. At present all the
khals and nalas have been silted.
Soil Types
The is covered with younger alluvial soils mainly of silty and clayey loams
STATUS OF WATER SUPPLY AND DEMAND
As per extended population (48 lakhs as on 2011) water demand is 969.00 million litre per day. To overcome
the disconsolate predicament multi various activities, in line with the recommendations of the Master Plan
(1966-2001), so far been rendered by different Organizations within the limited financial resources have
resorted this metropolis from crisis to a more or less stable condition no doubt, but there remains a huge back
log requires to be wiped out on urgent basis taking into consideration the changed scenario that have taken
place during the intervening period since 1966. KMC has got its twofold water source viz: (a) Surface water
from the only source of river Hooghly and (b) Ground water source. Out of these two sources, the water from
river Hooghly is being treated and supplied to a very limited areas of KMC through the treatment plants and
infrastructures that has so far been constructed leaving the vast majority of remaining KMC to depend on the
source (b) i.e. Ground water.
Table - 1 : Status of water supply in KMC area.
WATER PROFILE (SURFACE AND GROUND
WATER)
City water supply is dependent on both surface
water source from the river Hugli and ground
water sources.
Surface Water Sources
Initially surface water supply was made from
Palta pumping station (27mld in 1869). A
quantity of 1161mld (2006) of treated surface
water from river Hugli is being supplied in KMC
area through four pumping stations at Palta,
Garden Reach, Jorabagan and Watganj.
Ground Water Sources
As on December 2006 Kolkata Municipal Corporation owned 264 nos large dia (300mm) tube wells fitted with
20 Horse Power submersible pump with a discharge of 0.486 million litres per day and 10,000 nos small dia
(40mm) tube wells fitted with hand pump with a discharge of 0.0016 million litres per day, which are operating
in Kolkata Municipal Corporation area. Besides Kolkata Municipal Corporation owned tube wells, there are
Kolkata: Water Supply Statistics at a Glance (As on date)
Total daily potable water supply(in million litre) 1350
Per capita availability of water per day (in litre) 202
No. of Tube Wells Big daimeter
Small Diameter
455
7875
No. of connections Domestic
Industrial and Commercial
2,12,000
25,000
Public Access Standard Posts (in nos.)
Unfiltered water through street hydrants (in nos.)
17,019
2000
No. of reservoirs Present 7
Under construction
Combined capacity(in million gallon)
14
96
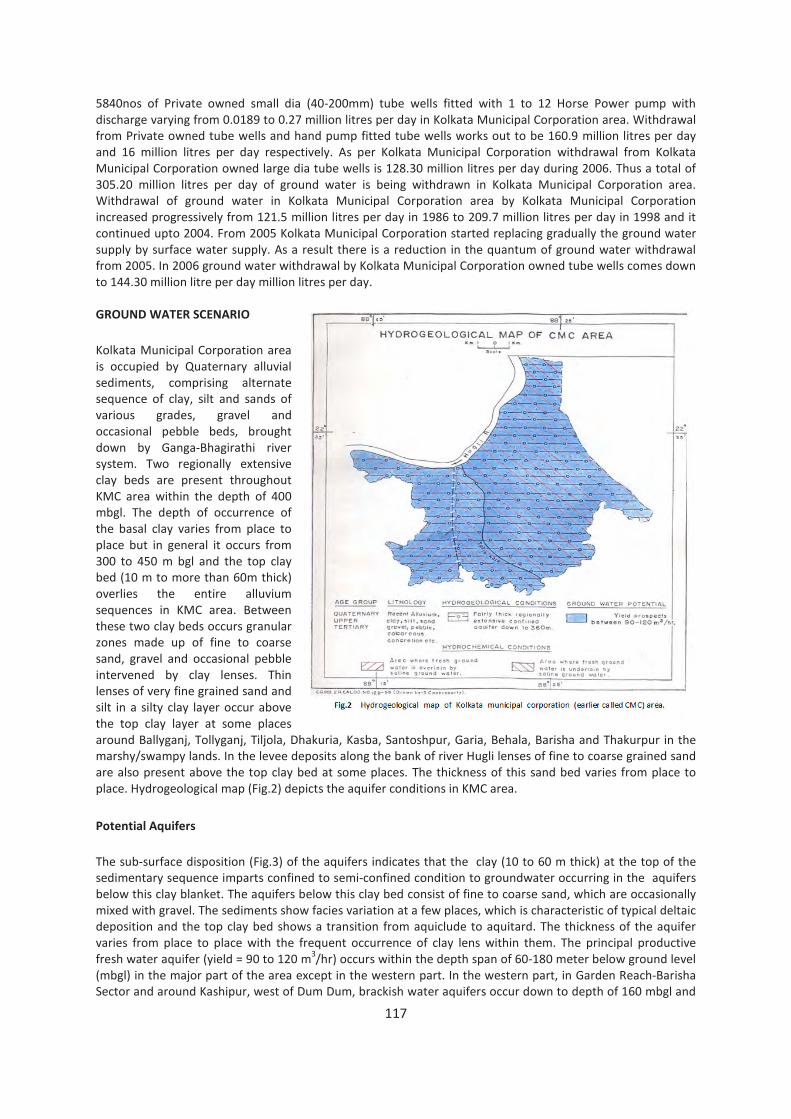
117
5840nos of Private owned small dia (40-200mm) tube wells fitted with 1 to 12 Horse Power pump with
discharge varying from 0.0189 to 0.27 million litres per day in Kolkata Municipal Corporation area. Withdrawal
from Private owned tube wells and hand pump fitted tube wells works out to be 160.9 million litres per day
and 16 million litres per day respectively. As per Kolkata Municipal Corporation withdrawal from Kolkata
Municipal Corporation owned large dia tube wells is 128.30 million litres per day during 2006. Thus a total of
305.20 million litres per day of ground water is being withdrawn in Kolkata Municipal Corporation area.
Withdrawal of ground water in Kolkata Municipal Corporation area by Kolkata Municipal Corporation
increased progressively from 121.5 million litres per day in 1986 to 209.7 million litres per day in 1998 and it
continued upto 2004. From 2005 Kolkata Municipal Corporation started replacing gradually the ground water
supply by surface water supply. As a result there is a reduction in the quantum of ground water withdrawal
from 2005. In 2006 ground water withdrawal by Kolkata Municipal Corporation owned tube wells comes down
to 144.30 million litre per day million litres per day.
GROUND WATER SCENARIO
Kolkata Municipal Corporation area
is occupied by Quaternary alluvial
sediments, comprising alternate
sequence of clay, silt and sands of
various grades, gravel and
occasional pebble beds, brought
down by Ganga-Bhagirathi river
system. Two regionally extensive
clay beds are present throughout
KMC area within the depth of 400
mbgl. The depth of occurrence of
the basal clay varies from place to
place but in general it occurs from
300 to 450 m bgl and the top clay
bed (10 m to more than 60m thick)
overlies the entire alluvium
sequences in KMC area. Between
these two clay beds occurs granular
zones made up of fine to coarse
sand, gravel and occasional pebble
intervened by clay lenses. Thin
lenses of very fine grained sand and
silt in a silty clay layer occur above
the top clay layer at some places
around Ballyganj, Tollyganj, Tiljola, Dhakuria, Kasba, Santoshpur, Garia, Behala, Barisha and Thakurpur in the
marshy/swampy lands. In the levee deposits along the bank of river Hugli lenses of fine to coarse grained sand
are also present above the top clay bed at some places. The thickness of this sand bed varies from place to
place. Hydrogeological map (Fig.2) depicts the aquifer conditions in KMC area.
Potential Aquifers
The sub-surface disposition (Fig.3) of the aquifers indicates that the clay (10 to 60 m thick) at the top of the
sedimentary sequence imparts confined to semi-confined condition to groundwater occurring in the aquifers
below this clay blanket. The aquifers below this clay bed consist of fine to coarse sand, which are occasionally
mixed with gravel. The sediments show facies variation at a few places, which is characteristic of typical deltaic
deposition and the top clay bed shows a transition from aquiclude to aquitard. The thickness of the aquifer
varies from place to place with the frequent occurrence of clay lens within them. The principal productive
fresh water aquifer (yield = 90 to 120 m3/hr) occurs within the depth span of 60-180 meter below ground level
(mbgl) in the major part of the area except in the western part. In the western part, in Garden Reach-Barisha
Sector and around Kashipur, west of Dum Dum, brackish water aquifers occur down to depth of 160 mbgl and

118
200 mbgl respectively from the surface. These
brackish water aquifers are underlain by fresh water
aquifers. In Santoshpur area in the extreme south all
the aquifers within 300 m bgl are brackish. In
general ground water in KMC area occurs under
confined to semi-confined condition. In the levee
deposit on the bank of Hugli river thin lens of
shallow aquifer occur within 12 m bgl, where
ground water occurs under water table condition.
Ground water also occurs under unconfined
condition within 17 m below ground level in the
marshy/swampy lands around Ballyganj, Tollyganj,
Tiljola, Dhakuria, Kasba, Santoshpur, Garia, Behala,
Barisah and Thakurpukur. A number of open well
are present in these areas. In general potentiality of
this unconfined aquifer is low. In most cases this
unconfined aquifer is hydraulically connected with
the surface water bodies like ponds, unlined nalas
and stagnant water in the low lying marshy lands
and the open wells get a constant supply of surface
water. As a result the open wells which are
hydraulically connected with the surface water
bodies do not dry even in the peak summer season.
The surface water in these ponds, the unlined nalas
and water in the low lying marshy lands in these
thickly habited areas is highly polluted and hence
the ground water from these open wells is not suitable for domestic uses without proper treatment.
Ground Water Level
The piezometric surface of the confined fresh ground
water in KMC area was initially flat before the large
scale development of ground water started. The flow
of ground water initially followed the slope of land
and movement of ground water was towards south
and southeast. Withdrawal of more and more ground
water in excess of replenishment has created adverse
effect on ground water regime in KMC area and it is
reflected in the pattern of piezometric surface(Fig.5).
Premonsoon piezomertic level in KMC area varies
from 13-14 mbgl (meter below ground level) to 17-18
mbgl during 2010. Postmonsoon piezometric level
varies from 7-8 mbgl to 17-18 mbgl during 2010 (Fig.
4).Study of piezometric contours for KMC area for
premonsoon 2004 indicates that the piezometric level
is deepest (>-16 m) around Park Street forming a
trough in Central Kolkata around Park Street,
Rajabazar, For William etc., due to excessive
withdrawal of ground water as well as due to
interference effect of closely spaced tube wells
running simultaneously.In post monsoon period the
piezometric level comes up to <-11.5 m in the core of
the trough around Park Street due to natural
monsoon recharge . A comparative study for pre-
monsoon piezometric level for the period from 1958

119
to 2003 in KMC area (Fig.5) indicates that trough
formed with a core of >-9 m has been expanded in
area and the core has become >-16 m. This is due to
excessive withdrawal of ground water from 1989 to
2003.
Ground Water Resources and Status of Development
Due to semi-confined to confined nature of aquifers
estimation of ground water resources by water table
fluctuation method could not be done. An attempt
was made to evaluate the quantum of sub-surface out
flow of ground water through the aquifers on the
basis of TIL. Where T is the transmissivity of the
aquifer, I is the hydraulic gradient of the ground water
flow and L is the length of the flow path along the
section. Depending upon the available data a total
quantum of 204 million litres per day (45.3 million
gallons per day) of ground water has been estimated
by CGWB, which is entering into the central
depressed zone.
Ground water in the localized water table aquifers
around Ballyganj, Tollyganj, Tiljola, Dhakuria, Kasba,
Santoshpur, Garia, Behala, Barisha and Thakurpukur
area and in the levee deposit as discussed above has got limited yield prospects but estimation of ground
water resources is not possible due to paucity of data as the aerial extension of the aquifer can not be
determined due to cover by urban agglomeration.
Hydrochemistry
Ground water in KMC area may be classified under two principal types, viz. a) Bicarbonate type and (b)
Chloride type. The anionic types may further be subdivided into two types on the basis of predominance of
cation concentration. These are (i) Calcium-magnesium bicarbonate, (ii) Sodium bicarbonate; (iii) Calcium-
Magnesium chloride; and (iv) Sodium chloride (Fig.).Ground Water in the area west of a line connecting BBD
Bag, Park Street and Jadavpur is of Bicarbonate type whereas in the area east of this line ground water is of
Chloride type.l
Bicarbonate type: Ca-Mg-HCO3: Ground water in the entire Western and South-Central part of the city, south
of Taltala-Kasba-Santoshpur tract in the NNW-SSE direction is of Ca-Mg-HCO3 type. Concentration of chloride is
low. In some places around New Alipur, Khidirpur, Elgin road and Harish Park etc., chloride concentration is as
low as 11 mg/lt to 67 mg/lt. Sodium concentration ranges from 14 to 32 mg/lt and average total dissolved
solid is 500 mg/lt.
Na-HCO3: Ground water in the southern part of the city and particularly Behala, Tallygunj, Jadavpur and Putiari
is of Na-HCO3 type and ground water is soft with total hardness less than 150 mg/lt. The softening of ground
water occurs as a result of Base Exchange of Calcium-magnesium ion with Sodium ion from Sodium
montmorillonite clay.
Chloride type: Ca-Mg-Cl: Ground water in the entire Northern and eastern part of the city, north of Taltala-
Kasba-Santoshpur tract in the NNW-SSE direction is of Ca-Mg-Cl type. Concentration of chloride is high (280-
620 mg/lt) having more than 1000 mg/lt TDS. Ground water is hard with total hardness 460-775 mg/lt. Sodium
rarely exceeds 40%. Generally high Chloride is mostly associated with sodium ions. Such unusual chemical type
(Ca-Mg-Na) is caused due to ion exchange phenomenon. The sodium chloride ground water (originally existing

120
in the aquifers in Bengal Basin) while passing through the clay complex exchanges sodium of the saline ground
water for calcium-magnesium from the clay complex resulting the water of Calcium-magnesium-chloride type.
Na-Cl: Ground water rarely contains high
chloride in combination with sodium in the
depth range of less than 125 m bgl. At a few
places in Dhakuria, Jadavpur, Garfa, Ranikuthi
groundwater contains 55-69% sodium and 50-
80% chloride. Occurrence of relatively high
sodium-chloride in ground water in some
localized pockets (Fig.6) is most likely due to
entrapped condition preventing further
dilution.
The total mineral contents and the chemical
types gradually changes from Maidan area
through Park Circus to Tangra and further
south. The sequence is HCO3- HCO3+ Cl-Cl +
HCO3- Cl. Ground water in the northern part
extending from Kashipore-Sinthi down to BD
Bag – Sealdah contains highly mineralized
ground water. Similarly, highly mineralized
ground water occurs between Picnic Garden
and Baghajatin. Ground Water in the HCO3
dominated area is neutral with pH value 7.0
Free CO2 (42-200 mg/l) has been noticed in
ground water present in south-western part.
The quality of ground water, although being
utilized for domestic, commercial and industrial uses, is considered by the users as problematic particularly in
Bidhannagar to Baghajatin in the east and in the southern part, where mineralization increases depth-wise.
Ground water in the southwestern part is fresh and is suitable for all purposes. The mineralization is due to
relict salinity of deltaic alluvium formed at the time of deposition and simultaneous dilution/flushing of the
seawater. With the process of dilution base exchange, SO4 reduction, production of CO2 and dissolution took
place. Thus mineralized ground water is low in SO4 high in HCO3, Cl and Ca + Mg.
Major Ground Water Related Problems
Pollution of Ground Water: Due to the presence of the thick clay layer at the top of the sedimentary in KMC
area, there is no direct ground water recharge from rainfall or surface water sources in KMC area. Therefore,
the chances of ground water pollution arises from external sources (anthropogenic) in major parts of KMC area
is less. However, ground water pollution has been noticed in some parts, which are as follows:
• In the eastern part of KMC area near Tangra-Topsia-Tiljala toxic trace elements like Cr, Co were found in
excess of 0.01 mg/lt in the shallow aquifers within 20 m bgl, which is under semi-confined conditions.
Leather industries were present in those areas. Industrial effluents from Tanneries cause serious
environmental hazards due to pollution in the Bheris, Wetlands and Agricultural fields. Ground water here
occurs under semi confined condition as a result of which polluted water from the surface finds its way to
reach this shallow aquifer.
• Presence of thick clay layer does not permit these pollutants to go further below. In the deeper aquifers
below 80 m bgl Cr, Co and other heavy metals are below permissible limit. Ground water tapped by open
wells in Ballyganj, tollyganj, tiljola, Dhakuria, Kasba, Santoshpur, Garia, Behala, Barisha and Thakurpukur
area in the marshy/swampy lands is hydraulically connected to the surface water bodies like ponds,
unlined drains etc.
• Kolkata Municipal Corporation has reported the sporadic occurrence of Arsenic in ground water in excess
of permissible limit (0.05 mg/lt) in some places. The concentration of arsenic varies from 0.054 mg/lt to
0.71 mg/lt .

121
Depletion of ground water level in KMC Area: In Kolkata Municipal Area the piezometric water level is deeper
both during pre and post monsoon period. The average depth to water level ranges from14.67 to 18.63 m bgl
during pre-monsoon and 12.10 to 16.08 m bgl during post monsoon period. The long-term trend analysis for
the existing hydrograph network stations have also indicated the lowering of water level at the rate of 30
cm/yr during pre-monsoon and 45 cm/yr during post-monsoon period. Consequent to the significant fall in
Piezometric level especially in central and south central part of Kolkata, ground water trough has been formed
with the piezometric surface resting at 12 m a msl spread over an area of nearly 60 sq.kms in pre-monsoon
1989, 90 sq. kms in 1998 and 100 sq kms in 2004 (Fig.5). These can be explained by the increase in ground
water draFt due to domestic use in consequence to the rapid growth of population and urbanization in the
KMC Area. As a result the ground water flow direction has been changed and original southern flow direction
has been reversal and flow of ground water became radial towards the central part of the trough. The
components of Surface and Ground water utilized for KMC area from 1986 to 2003 has been presented in
Table -5.
Table – 5: Yearwise Ground Water and Surface Water Supply in KMC Area
Year
Surface Water Supply in KLD
(approx)
No. of
DTW
No. of
STW
GW Supply in
KLD (Approx)
Total Supply of
Water in KLD
(approx.) Palta Garden Reach Total
1 2.a 2.b 2.c 3 4 5 6
1986 720000 157500 877500 232 5000 121500 999000
1991 720000 157500 877500 285 10500 184950 1062450
1993 720000 157500 877500 308 11877 202720 1080220
1998 810000 180000 990000 325 12000 209700 1199700
2000 810000 180000 990000 350 12000 210000 1200000
2001 810000 301500 1110500 380 12000 250000 1360500
2002 817000 301500 1118500 320 11000 210000 1328500
2003 817000 301500 11185000 245 10000 123100 1241600
Feasibility of Rain Water Harvesting and Artificial Recharge
Considering the hydrogeological condition in KMC area vis-à-vis the withdrawal of ground water, it is very
much necessary to reduce the stress on ground
water resources. In addition to increase the
dependence on surface water resources of the
river Hugli rainwater harvesting may be adopted,
as there is a bright scope for rainwater harvesting
in the area. This will reduce the stress on both
ground water and surface water resources and will
be able to help controlling further decline of
ground water level. In 187.33 sq. km. area of KMC
normal annual rainfall is 1647 mm and net annual
rainwater availability is 247 million cubic meter.
Therefore roof top rainwater conservation
methods and artificial recharge to ground water
may be adopted in central and southern parts of
KMC, where ground water trough is formed due to
heavy ground water withdrawal (Fig.7).
GROUND WATER DEVELOPMENT STRATEGY
From Existing Ground Water Resources
In order to control the excessive withdrawal of ground water and the interference effect caused due to
simultaneous running of closely spaced tube wells in KMC area, which are responsible for the formation of
ground water trough in KMC area the following regulatory measures need to be taken.

122
•••• Further ground water exploitation is to be restricted.
•••• Withdrawal from existing tube wells should be regulated by phasing out tube well operation time in area
where recession of piezometric level has taken place conspicuously.
•••• Emphasis is to be given to lower the stress on ground water development by covering more and more
area under pipe water supply gradually in different phases.
•••• Minimum spacing between two tube wells is to be maintained to avoid the risk of interference. In case of
already existing closely spaced tube wells, the adjacent tube wells should not be run simultaneously
instead alternate pumping for a short period of different intervals may be adopted.
•••• Close monitoring system should be developed to record the piezometric levels at regular intervals of time
vis a vis withdrawal of ground water from the deep tube wells.
•••• Presence of a thick clay layer at the surface prevents any contaminates to migrate from the surface to the
underlying aquifers but the lace of proper construction of tube wells may permit the pollutants to spoil
the ground water quality. Moreover, sporadic occurrence of arsenic above toxic limit has been reported in
some parts of the corporation area. It is, therefore, very much necessary to assess the quality of ground
water along with quantity.
•••• Regular monitoring of quality of ground water is to be done systematically. This will help to understand
the change in ground water quality and to identify the tube wells affected by arsenic or any other
chemical and/or biogenic contamination. The tube wells affected by any shot of pollution should be
discarded.
•••• Ground water from open wells, wherever present, may be used for domestic purposes after proper
treatment.
Roof Top Rainwater Conservation
Roof Top Rainwater Conservation for Individual Houses – The roof top rainwater conservation, which is
simplest, may be done everywhere by all. West Bengal Pollution Control Board has constructed two such
structures at Salt Lake using the roofs of Administrative building of Bidhan Nagar Municipality and College
building. Use of conserved rainwater even in rainy season will save same amount of ground water from
withdrawal.
Collection of Roof Top Rainwater from a Number of Buildings at a Central Place for Community Water Supply –
Rainwater collected from roofs of some buildings may be stored at a centrally located reservoir for community
water supply. This will save a substantial quantum of ground water from withdrawal. The conserved water
may be used for both drinking and non-drinking purposes. For drinking a little treatment is required before
use.
Artificial Recharge to Ground Water
Besides Central Ground Water Board, there are other State Govt. Departments and NGOs which are actively
involved in implementation of artificial recharge and rain water harvesting schemes throughout the state of
West Bengal. However, a definite and reliable monitoring system to test the practical efficacy of these
schemes is not available at present.
In Kolkata Municipal Corporation area the presence of a thick clay layer at the top of the sedimentary
sequence and the metalled and concrete pavement in the surface restrict the rainfall recharge to ground water
in the area. Considering hydrogeological set up of KMC area gravity head recharge tube well using the roof top
rainwater is the only recharge structure feasible. The roof top rainwater after being filtered through beds of
coarse sand (1-2 mm size & 50 cm thick), gravel (2-5 mm size and 50 cm thick) and boulder (6-9 mm size & 50
cm thick) placed successively from the top in the recharge trench will enter recharge well through the slot put
against the bottom filtered beds. This water will then disperse into the aquifer to be recharged through the
slots put against the aquifer. The exact depth, dimension of the tube well and position of slots will be decided
on the basis of the depth of aquifer to be recharged and the quantum of roof top rainwater available.
Areas feasible for Artificial Recharge: In Kolkata Municipal Corporation area, gravity head recharge tube well
may be used where a huge ground water trough has been formed in Central Kolkata around Park Street,

123
Camac Street, For William, Kalighat, Ballyganj etc., and has been demarcated in Fig.7. In Kolkata Municipal
Corporation area the following precautions are to be taken in artificial recharge schemes.
• The borehole needs to be electrically logged to ascertain the exact position of the fresh water zone
because of the typical hydro-chemical situation in Kolkata Municipal Corporation area.
• In KMC area the occurrence of both fresh water and brackish/saline water aquifers are not following a
particular pattern. At some places the brackish/saline aquifer overlies the fresh water aquifer and at other
places it underlies the freshwater aquifer. In addition to this brackish/saline water occurs laterally in the
same freshwater aquifer. For artificial recharge only fresh water aquifer is to be selected.
• The upper part of the recharge tube well is to be properly sealed with cement against the clay zone to
avoid any contamination from the top.
• In the area where upper zone is brackish/saline the lower fresh water zone is to be separated with proper
cement sealing.
• Proper monitoring of water level is to be carried out to study the effect of recharge.
• Combination of conservation and artificial recharge will also be very successful.
• Blending of arsenic/fluoride contaminated or saline ground water with conserved rainwater will reduce
the concentration of arsenic or salinity and makes this blended water fit for use.
REFERENCES
• Misra, A.K., 1994, Hydrogeology and Ground Water Resources of South 24 Parganas district, West Bengal,
Technical Report Series ‘D’ No. 112, CGWB, Unpublished Report.
• Misra, A.K. et al., 1999. Hydrogeology and Ground Water Resources of Calcutta Municipal Corporation
Area. (technical Report Series-D) CGWB, unpublished report.
• Central Ground Water Board, Eastern Region, Ministry of Water Resources, Govt. of India, Kolkata, 2010,
Ground Water Year Book of West Bengal & Andaman & Nicobar Islands (2008-2009).
• Bureau of Applied Economics & Statistics, Govt. of West Bengal, Kolkata, 2004, District Statistical Hand
Book, Kolkata.
• Environmental Cell, Calcutta Metropolitan Development Authority, Kolkata., 1997, Report on Status of
Ground Water Exploitation in Calcutta Municipal Corporation Area for its budgeting (First Phase).
• Guha R.K. & Datta S., 2006, Artificial Recharge to Deeper Aquifers by Roof Top Rainwater Harvesting in
Kolkata Municipal Corporation Area, A Case Study in South Kolkata. Technical Paper on All India Seminar
on Role of Ground Water in National Economy at Bangalore organized by AICGWBOA
• Guha, R.K. & Kujur, R.A., 2007, Hydrogeology and Ground Water Development and Management in
Kolkata Municipal Corporation Area, West Bengal Technical Report Series ‘D’ No. 193.
• Talukdar, T., 2008, Micro-level Survey and Ground Water Management Study in Parts of Kolkata Municipal
Corporation area, West Bengal.
• Misra A.K., 2011, Hydrogeological study in KMC area with special reference to declining of piezometric
level through ground water development (unpublished report).

124
LUCKNOW CITY, UTTAR PRADESH
Arun Kumar, S.G.Bhartariya, S.Kudesia & S.K.Srivastava, CGWB, Lucknow
INTRODUCTION
Lucknow is one of the major cities of Northern India named after Laxman devoted brother of legend Rama
who gifted territory of Lucknow to his brother after he had conquered Sri Lanka. Lucknow is the capital city of
Uttar Pradesh and it has always been a multicultural city. Courtly manners, beautiful gardens, poetry, music,
and fine cuisine patronized by the Persian-loving Shia Nawabs of the city are well known amongst Indians and
students of south Asian culture and history. Lucknow is popularly known as the “City of Nawabs”
GENERAL FEATURES
Area / Administrative Divisions
Lucknow city, the capital of Uttar Pradesh, lies
on the banks of river Gomti and occupies an
area of 340 sq km in parts of three blocks
namely Sarojini Nagar, Chinhat and Kakori. It
stretches over 10 kms along Gomti river on
either side of the banks. The population density
of 6600 persons /sq km with a high decennial growth has put on tremendous stress on ground water resources
for drinking and other purposes.The salient Features of Lucknow City is given below:
Demography
As per 2001 census the
population of city area is as
given in table.
It is evident from the above
that total population of the
city area is 22.45 lac in the
year 2001 against the
population of 17.31 lac in the 1991.The population increase of 5.14 lac has been recorded in the last 10 years
showing growth rate of 51.4% .Projected population for 2011 will be 33.90 lacs. The alarming increase in the
population of the city is putting an immense pressure on the available water resources. Thus swelling demand
of water supply is attracting water planners & Managers for its critical examination.
Hydrometeorology
The climate of the city is sub-tropical with three distinct seasons viz; monsoon, summer and the winter. The
normal maximum mean temperature is 40.5 ºC during May and minimum is 6.9 ºC during January.
The long term normal annual rainfall (1901 to 1970) recorded at Lucknow and is 1019 mm. The monsoon
normal and annual rainfall from the same observatories is 902 mm and non-monsoon normal annual rainfall is
117mm. The area falls under sub humid climate condition and hottest month is June while the coldest is
January.
Physiography and Drainage
Lucknow city occupies the interfluvial region of Gomti and Sai rivers of the Central Ganga Plain in Ganga basin.
It is almost a flat country with conspicuous natural depression in north-eastern part around Jankipuram
(Fig.1). The general slope of the city area is towards south and south-east. The elevation of city area varies
from 110 to 124 m above mean sea level.
1. Geographical Area 340.00 Sq.Km
2. Latitude 26º40’ to 27 º00’
3. Logitude 80 º 45’ to 81º 05’
4. Length of Gomati river 23.98 Km
5. Area of Gomati river 2.16 Sq.Km
6. Length of Kukrail Nala 17.07 Km
7. No of Water Bodies 37
/8. Area of Water Bodies 1.35 Sq.Km(0.39%)
9. Area of forest in Lucknow city 20.86 Sq.Km(6.13%)
Lucknow Municipal Corporation Total S/C ST
Persons 2185927 220035 2320
Males 1156151 116972 1233
Females 1029776 103063 1087
Lucknow Cantonment Board
Persons 59582 10024 91
Males 33315 517 46
Females 26267 4853 45
Total Population 2245509 230059 2411

125
The drainage system of the area is controlled mainly by river Gomti which flows to south-east and Kukrail Nala
is the only prominent tributary which
joins on the northern bank of Gomti
River. There are 23 nalas which drain
into Gomati between Gaughat and
Gomati Barrage. The drainage exhibits
dendritic to sub- dendritic pattern and
are highly sinuous in nature. Gomti river
originate from the spring line in the
Terai belt of Pilibhit district. It flows
southeasterly over a distance of 490 km
before joining the Ganga river in
Ghazipur district. The catchments area
of the river is 30500 sq km.
Soil Type
Soils of the City exhibits a wide variation
in composition, texture and
appearance. The major position of the
city is occupied by soils locally known as
"Bhur" or "Silty Sand" on the ridges. "Matiyar" or "Clay Soils" occurs along topographic lows and "Dumat or
Loamy soils" in the level lands. Clay is dominant in the areas where "Reh" (Usar) prevails. Along the river
valleys, a very fertile soil called "Dumat" is prevalent which is youngest.
STATUS OF WATER SUPPLY AND DEMAND
As per WHO norm of 250 lit/day/capita (lpcd) the total requirement of Lucknow city is 849.75 MLD (say 850
MLD) thus a deficit in water supply is 370 MLD approximately in the year 2011.Considering the water
requirement of 150 lpcd which is being taken as a norm , the total requirement is 509.85 MLD in the year
2011 leaving behind a gap of 29.85 MLD. It is worth mentionable that there is a transmission losses during
water supply which is approximately 40% and quite significant. It is suggested to control these losses to
minimize the gap of requirement and water supply. However it is equally met with surface and ground water
both. Ground water is exploited through 600 tubewells constructed in first aquifer group by state usar
agencies as well as by private builders and colonizers.In sustaing water supply of Lucknow city, ware table is
declining at the rate of 0.66m year especially in central part and in trans gomti area. As per decinal population
growth of 51.4% the projected population and demand has been calculated as follows:
Future projection of demand and supply in Lucknow City
Year Projected
Population (Lacs)
Projected Demand
@ 150 Lpcd
Supply
(ML/D)
Gap between Demand & Supply
(ML/D)
2011 33.99 509.85 480.00 29.85
2021 51.46 771.9 480.00 291.9
WATER PROFILE
Surface Water
The present supply from surface water is met through river Gomati through its water works at Aishbagh and
Balagunj. Lucknow Jal Sansthan supplies the water supply to Lucknow city. Another water works is under
construction stage at Gomti Nagar . The water works will get water from Sharda canal which will benefit the
residence of Gomti Nagar and trans –gomti area.At present 30 lacs people are benefited by Jal Santhan supply.
The present Supply through Jal Sansthan is as follows:
Fig.1

126
1. Supply through Aishbagh Water works-172 MLD
2. Supply through Balagunj water Works -70 MLD.
Total Surface Water Supply - 242 MLD
Ground Water
Ground water supply is met through deep ,shallow tubewells, Indiamark II Handpumps & Indara wells through
Jal Sansthan as follows:
1. Supply through more than 350 tubewells. 185 MLD.
2. Supply through 5000 india Mark II Handpumps. 25 MLD.
3. Supply through 55 Indara wells.- 28 MLD.
Total Ground water supply- 238 MLD.
Thus the total supply at present is 480 MLD, out of which surface contributes 242 MLD.and Ground water
contributes 238 MLD.
GROUND WATER
SCENARIO
Area of Lucknow city forms
a part of central Ganga
plains and is piled up of
alluvial sediments of
Quaternary age and can be
classified as Newer and
Older Alluvium. The Newer
alluvium occurs in the
active flood plains of river
Gomti at topographic low
areas. The sediments in the
Newer Alluvium are
generally micaceous grey
sands, silt and clay
belonging to Upper Pleistocene to Recent age group. The Older Alluviums occur at topographic high areas & do
not get flooded. The sediments in Older Alluvium are generally sand of various grades, clays, kankar, and silt.
Alternate beds of sand and clay occur with intermixing of kankar bed. These sediments belong to upper to
middle Pleistocene age. Ground water occurs in the pore spaces of unconsolidated alluvial sediments in the
zone of saturation under phreatic and semi-confined conditions. In deeper aquifers it occurs under semi-
confined to confined conditions.
Potential Aquifers
To know the aquifer geometry of the district Central Ground Water Board has carried out extensive
exploration down to depth of 750 m bgl. A total number of 31 exploratory wells, 5 Piezometres have been
constructed (Fig.2)
The hydrological properties (hydraulic
conductivity, transmissivity, storage
coefficient and specific capacity etc.) of each
and individual aquifer group and cumulative
aquifer groups has been determined by
conducting hydrological tests on these
tubewells. On the basis of lithological logs,
electrical logs and linear cross sections and fence diagram it has been established that five tier aquifer system
Aquifer group
S. No. Aquifer Group Depth range (mbgl)
1. First Aquifer Group 00.00-150.00
2. Second Aquifer Group 160.00-240.00
3. Third Aquifer Group 260.00-370.00
4. Fourth Aquifer Group 380.00-480.00
5. Fifth Aquifer Group 483.00-680.00
Fig.2

127
exist in the Lucknow City which is as follows. The aquifer material in these groups is sands of various grades,
clays, kankar and silts.
The hydrogeological details of the tube wells constructed in different aquifer groups are given in the following
tables:
The Location of Exploratory wells and
Piezometers constructed by CGWB in Lucknow
city has been depicted in Fig.3. Based on the
exploration carried out by CGWB it is inferred
that maximum discharge of 1100-1700 lpm can
be obtained from the First aquifer group at
moderate draw down and the quality formation
water is fresh and potable (Fig. 4). The formation
in the Second aquifer group is silty and discharge
of 300-600 lpm can be obtained at higher draw
down, moreover quality of this aquifer group is
inferior to other aquifer groups. The third and
fourth aquifer groups have a yield potential of
1000-1600 lpm at moderately high draw down
with potable water quality. The fifth aquifer
group below 483 m has been tapped along with
other group of aquifers and has resulted a free
flow discharge of 200 lpm at Lucknow University
with the piezometeric head of 0.70 m. above
ground level.
On perusal of the above table the occurrence of
ground water is quite encouraging in northern
and north eastern part of the city in Janakipuram,
along Kursi Road and Chinhat. Moderate yield
potential lies in the north west and western part
of the city. To augment the demand of the future
mega city, all ground water abstractions should
be done from Trans–Gomti area in the north and
north east and beyond Sarojani Nagar. Further
flood plains of Gomati river can be exploited by
constructing shallow tubewells ,radial wells,
collector wells, rainy wells. These structures may
be taken up in the up stream of Gaughat.
Ground Water Level
Depth to water in Lucknow city is being monitored monthly by CGWB through 19 piezometers since 2003. The
summarized comparative data of is given in the following tables.
Fig.3
Fig.4

128
Pre-Monsoon Water Level and Trend: The Pre-Monsoon Water level in 2003 & 2010 and trend of Water Level
is summarized below-
Cis Gomti Area
Sl.
No.
Location Pre-monsoon Depth to Water Level (mbgl) Pre-monsoon Trend
(2003 to 2010)
(m/year) May’2003 May’2010
1 River Bank Colony 19.63 23.07 Fall- 0.52
2 Sarojini Nagar 10.07 11.85 Fall-0.41
3 MahilaCollege,Aminabad 13.00 14.55(2009) Fall-0.50
4 Dilkusha 29.60 32.62 Fall-0.44
5 Narhi 27.05 33.12 Fall-0.94
6 Arya Nagar 20.13 19.73 Rise-0.09
7 Campbell Road 14.17 10.00 Rise-0.26
8 Gulistan colony 28.82 33.15 Fall-0.64
9 Rajaji Puram 25.55 29.20 Fall-0.52
10 Cantt 17.99 22.45(2009) Fall-0.84
Trans Gomti Area
Sl.
No.
Location Pre-monsoon Depth to Water Level (mbgl) Pre-monsoon Trend
(2003 to 2010)
(m/year) May’2003 May’2010
1 BhujalBhawan, Aliganj 16.06 19.20 Fall-0.47
2 New Hyderabad 19.21 24.37 Fall-0.80
3 L.U. New Campus 11.17 12.95 Fall-0.33
4 L.U. Old Campus 24.95 29.51 Fall-0.68
5 Vikas Nagar 22.06 27.75 Fall-0.86
6 Mahanagar-H Park 24.05 28.66 Fall-0.75
7 Gomti Nagar 15.47 21.55(2007) Fall-1.69*
8 Indira Nagar 21.49 26.13(2007 Fall-1.11*
9 Nirala Nagar 26.30 29.55(2007) Fall-0.79*
* Period of trend 2003 to 2007
It is found that out of 10 piezometers in
Cis-Gomti area, 8 have shown a falling
trend in pre-monsoon period for the
period 2003 to 2010. The minimum fall is
observed at Sarojininagar-0.41 m/year
and maximum at Narhi-0.94 m/year. The
rising trend is seen at Arya Nagar and
Campbell road where the extraction of
Ground water is minimum. It is found
that all piezometers in Trans-Gomti area
show a falling trend in Pre-monsoon
period. The minimum fall is observed at
Lakhnow University New Campus-0.33
m/year and maximum at Gomti nagar-
1.69 m/year. Depth to water level of pre-
monsoon season is given in Fig. 5.
Post-Monsoon Water Level and Trend
The Post-monsoon water level in 2003 and 2010 and trend of water level is summarized in Table below. It is
found that out of 10 piezometers in Cis-Gomti area 8 have shown a falling trend in Post-monsoon period. The
Fig.5

129
minimum fall is observed at Sarojininagar-0.14 m/year and maximum at Narhi-1.07 m/year. The rising trend is
seen at Arya Nagar and Campbell
road. It is found that all
piezometers in Trans-Gomti area
show a falling trend in Post-
monsoon period. The minimum fall
is observed at Bhujal Bhawan,
Aliganj- 0.44 m/year and maximum
at Gomti Nagar.
The water elevation map of
Lucknow city (Fig. 6) shows two
conspicuous ground water troughs
in the city area, one located in the
Cantonment, Charbagh and Narhi in
Cis – Gomti and the other one in
the Trans-Gomti area covering
Nirala Nagar, Vikas Nagar, Indira
Nagar and Gomti Nagar. These
troughs indicate heavy withdrawal
of ground water. Even the River
Gomti becomes influent in the
central part due to heavy withdrawal of ground water through various tubewells located in this area.
Cis Gomti Area
Sl. No. Location Post-monsoon Depth to Water Level
(mbgl)
Post-monsoon Trend
(2003 to 2010)
(m/year) Nov’2003 Nov’2010
1 River Bank Colony 18.78 22.40 Fall-0.37
2 Sarojini Nagar 8.40 10.50 Fall-0.14
3 MahilaCollege,Aminabad 11.58 12.87(2008) Fall-0.33
4 Dilkusha 28.20 29.85 Fall-0.26
5 Narhi 27.25 33.70 Fall-1.07
6 Arya Nagar 19.33 18.85 Rise-0.17
7 Campbell Road 12.05 10.40 Rise-0.08
8 Gulistan colony 28.40 33.40 Fall-0.73
9 Rajaji Puram 24.99 29.82 Fall-0.46
10 Cantt 18.19 23.95 Fall-0.78
Trans- Gomti Area
Sl.No. Location Post-monsoon Depth to Water Level
(mbgl)
Post-monsoon Trend
(2003 to 2010)
(m/year) Nov’2003 Nov’2010
1 Bhujal Bhawan, Ailganj 16.33 19.55 Fall-0.44
2 New Hyderabad 18.25 24.97 Fall-0.78
3 L.U. New Campus 8.55 13.10 Fall-0.49
4 L.U. Old Campus 23.75 28.73 Fall-0.67
5 Vikas Nagar 21.30 27.56 Fall-0.73
6 Mahanagar-H Park 23.90(2004) 29.06 Fall-0.77
7 Gomti Nagar 10.00 19.65(2006) Fall*
8 Indira Nagar 21.80 24.20(2006) Fall-0.93*
9 Nirala Nagar 26.80 29.05(2006) Fall-0.75*
** Period of trend : 2003 to 2006
Fig.6

130
Ground Water Resources and Status of Development
The dynamic ground water resources as on 31.3.2009 is as follows:
Hydrochemistry
The chemical quality of water is an
important parameter and its
suitability for public water supply
needs to be ascertained. To study
the water quality and to know the
impact of faster growth of
urbanization in Lucknow city area,
50 numbers of ground water
samples from shallow and deeper
aquifers were considered and
chemical analysis data were
compiled for their basic
parameters such as- pH, electrical
conductivity, carbonate,
bicarbonate, chloride, nitrate,
sulphate, fluoride, phosphate,
calcium, magnesium, total
hardness, sodium, potassium, and
silica. 8 numbers of samples were also collected at different sites of river Gomti.
Chemical Quality of Surface Water: It has been observed that all the constituents present in the river water
samples are within permissible limit before the river enters the Lucknow city and as it passes through the city
the quality of river water deteriorates due to the mixing of several city drains specially near Mohan Meakins
disposal drains and Haider Canal (Gomti barrage). The Dissolved Oxygen content decreases from 7.0 mg/l from
outskirt to 2.0 near Mohan Meakins disposal drains and Haider Canal. There are few Dhobi ghats and cloth
dyeing units at the bank of river Gomti, which are also polluting the river water.
Chemical Quality of Ground Water : The chemical analysis data of the ground water samples reveals that
most of the chemical parameters are well with in permissible limits of Bureau of Indian Standards ( BIS). The
various chemical characteristics of ground water samples in Lucknow city have been summarized in the table
& also given in Fig.7. In central part of the city area near IT college, Nirala nagar, Mahanagar, part of Indira
nagar, Aminabad and Arya nagar area, electrical conductivity value ranges from 1250 to 1500 µS/cm at 25 0 C
.In other areas the electrical conductivity value ranges between 750 and 1250 µS/cm at 25 0 C. In outskirts of
the city the electrical conductivity values have been observed to be below 750 µS/cm. the pH values ranges
from 7.35 to 8.4 in the city. The nitrate concentration more than permissible limit of 45 mg/l has been found in
12% of samples specially at Nirala nagar, Compell road, Aminabad, Indiranagar, Mahanagar, Chowk and Buland
bagh areas .The maximum value of 244 mg/l of nitrate has been observed at Buland bagh. High nitrate
concentration in ground water is a matter of concern and is mainly due to disposal of domestic and untreated
sewage through open and unlined drains and wrong landfill sites on permeable formations, thereby polluting
the ground water system. Chemical character of groundwater is given below:
Fig.7

131
Chemical Characteristics of Ground Water samples in Lucknow city
Sl No Parameters No. of samples
B. I.S.; IS:10500 Values Observed
Desirable
limit
Permissible
limit Min. Max.
1 pH 50 6.5 8.5 7.35 8.4
2 Alkalinity; mg/l 50 200 600 171 659
3 Chloride; mg/l 50 250 1000 7 213
4 Nitrate; mg/l 50 45 45 nil 244
5 Sulphate; mg/l 50 200 400 nil 165
6 Fluoride; mg/l 50 1 1.5 nil 1.66
7 Phosphate; mg/l 33 - - nil nil
8 Calcium; mg/l 50 75 200 8 96
9 Magnesium; mg/l 50 30 100 2.4 141
10 T.H.as CaCO3; mg/l 50 300 600 30 600
11 Sodium; mg/l 50 - - 9 276
12 Potassium; mg/l 50 - - 1 32
13 Silica; mg/l 17 - - 15 27
14 Iron; mg/l 3 0.3 1 0.25 1.9
15 E.C.µS/cm 50 835 3300 325 1507
Fluoride concentration of more than permissible limit of 1.5 mg/l has been observed in Tulsi park (1.59 mg/l),
and at Lucknow University campus (1.66 mg/l). in deeper aquifers in the tubewells below 370 m and form the
fourth aquifer system group, which further indicates that the high fluoride in this area are may be due to the
minerals assemblage in the of the geological formations belonging to Siwaliks. High iron content (up to 1.9
mg/l) has also been observed in few cases. The other constituents are mostly well with in permissible limits
and hence suitable for domestic and drinking purpose.
Major Ground Water Related Problems
Lowering of Water Level : There is heavy demand of ground water to cater the needs of domestic and
industrial sectors due to which almost all parts of the city area are facing this problem both during Pre-
monsoon and Post-monsoon periods. The fall in water level ranges from 0.33 to 1.69 m/year in Pre-monsoon
period and from 0.14 to more than 1.50 m/year in Post-monsoon period. Three is heavy withdrawal of ground
water in the Cantonment, Charbagh and Narhi in Cis – Gomti and Nirala Nagar, Vikas Nagar, Indira Nagar ,
Gomti Nagar.in the Trans-Gomti area. Even the River Gomti becomes influent in the central part due to heavy
withdrawal of ground water through various tubewells located in this area.
Stressed Aquifer : Since last two decades, the city is witnessing widespread exploitation of groundwater. The
top Aquifer Group (< 150
mbgl) of the city is
presently under high
stress. The granular zone of
this dynamic aquifer is
gradually drying up,
causing almost irreversible
damage to groundwater
domain of this capital city
of the state. The trend of
groundwater exploitation of First aquifer group in Lucknow shows continuous rise in resource withdrawals.
Private tube well construction activity in the city (Table) has almost mushroomed, causing intensive and
unregulated extractions, which is yet to be assessed.
It is evident from the above table and water level data of Lucknow city the over exploitation of first aquifer is
continued and water level is declining at different rates and pace in different localities. the average rate of
No. of groundwater structures
Jal Sansthan Tubewells More than 350
Handpumps (Public) >6000
Mini tube wells/Borings 300-400
Tube wells : Government /Private establishments >150
Tube wells : Private colonies/multi story buildings >400
Private domestic borings Innumerable (no inventory)
Tentative withdrawals 550 MLD or even more

132
decline is 0.66m /year in the city area. Since the shallow aquifer is overexploited ,search may be made for
deeper aquifers in North & North –East part of the city particularly in Trans Gomti area for future
development.
Retarding Ground Water Recharge : The
city population which was 256239 in year
1901 with a growth rate of 18.97% in the
last decade reached upto 2245509 in
year 2001.The table clearly indicates the
increase in residential area and decrease
in open space and water body areas in
Lucknow.
Increase in Surface Runoff : Less
infiltration of precipitated water causes
increase in surface run-off from the city
area. The city area which was 145.94 sq. km. in year 1981 grown to 340sq. km. in recent time and it is
increasing day by day. The Population density at present is 6600 persons per sq. km.which is directly
proportional to. building density. An increase in building density will increase the surface- runoff since paved
and cemented area will increase.
Ground Water Quality Problem : Ground water quality reveals that the central part of the city area near IT
college ,Nirala Nagar, Maha Nagar,Aminabad and part of Indira Nagar affected by higher concentration of TDS,
Cl , SO4 ,Fl .NO3 & PO4. The high concentration of NO3 & PO4 indicates pollution due to anthropogenic activity
and unlined sewerage system. However now the Government is laying down deep sewerage line in the city.
This may improve the ground water quality in near future or atleast this will stop further deterioration of
Ground water quality.
Feasibility of Rain water Harvesting & Artificial Recharge
Roof top Rain water Harvesting and Artificial Recharge to ground water in Lucknow City are feasible in the
following:
Institutional buildings : Roof top rain water harvesting and artificial recharge to ground water should be taken
up in UP State Govt. Buildings such as Pariyavaran Nideshalaya, RTO, Transport nagar, DGM building, UP
Bhoomi Sudhar Nigam building, Krishi Bhawan, Pikup Bhawan in the first phase.
Stadiums : The Lucknow city has number of play grounds having various sizes of stadiums such as K. D. Singh
Babu, Sports College Chowk Stadium, Railway Stadium and Aliganj Stadium.
Parks/ Zoo: In order to take up rain water harvesting and artificial recharge to ground water in parks- the
Aurobindo and Swarnajayanti parks should be identified and parks in the residential as well as in open areas be
taken up for recharge projects. The museum building in the zoo complex can be taken up for Roof top rain
water harvesting and artificial recharge to ground water. Possibilities have to be explored to harness rain
water runoff in the adjoining areas of the museum building in zoo complex so as to make a comprehensive
project.
Airport Complex: A scheme to harvest rain water in the Amausi Airport has been prepared by CGWB, NR office
in the recent past and can be taken up.
Artificial recharge utilizing monsoon flood water in Old Sharda Canal: Possibilities to take up Artificial
recharge to ground water utilizing monsoon flood water in Sharda Canal (Old) are suggested.
Artificial recharge utilizing monsoon flood water along Gomti river: Artificial recharge to ground water
utilizing monsoon flood water along Gomti river is also feasible. It is proposed to construct long/ multiple
Changes in Land-use Pattern in Lucknow City
Sl. No. Land use type Land use in %
per cent
1965 1987 2001
1. Residential 29.29 48.91 67.20
2. Commercial 1.85 2.43 4.10
3. Industrial 3.31 6.50 3.10
4. Industrial Public/semi-public 16.86 15.02 8.20
5. Transport 13.69 10.38 9.50
6. Recreational 4.0 3.78 7.90
7. Vacant and water body 31.0 12.98 -
Total 100 100 100
(Source-Master plan-2021)
133
lateral shaft filled with inverted filter and injection well depending upon the surplus monsoon discharge by
diverting Gomti flood water.
Artificial recharge utilizing monsoon runoff in Kukrail forest area: The field investigations have revealed that
the Kukrail forest is drained by Kukrail nala, having a length of 28 km. The catchment area upstream of Kukrail
barrage is 192 sq.km. The suitable artificial recharge/ water harvesting structures such as check dams, nala
bunds, cement plugs, gabion structures should be identified.
Artificial recharge utilizing lake water: The Lucknow city has no. of ancient surface water bodies such as Moti
jheel, Aishbagh, Tikaitrai jheel, jheel near Husain marg, jheel behind B-Block Indira Nagar that can be
considered for artificial recharge to ground water.
GROUND WATER DEVELOPMENT STRATEGY
Rapid change in demography and technological advancements together has led to unplanned and
indiscriminate growth of urban settlements which, in turn, has created escalating demand for drinking water
causing excessive stress on ground water resources. Since surface water sources are inadequate to meet the
rising demand of drinking water in Lucknow city, Groundwater has gradually become the main contributor to
water supplies and hence, there is tremendous pressure on groundwater resources to fulfill the drinking water
requirements. Following development strategies are suggested to be adopted
1. Withdrawals from Stressed Aquifers should be strictly regulated & minimized. Excessive withdrawals from
top aquifers should be effectively regulated through a suitable legislative provision.
2. The peri-urban regions of urban agglomerates of Lucknow, prolific aquifers can be systematically
exploited to supplement city’s water supply. New tube wells for water supply should be avoided in the
first aquifer system.
3. An action-oriented policy for rehabilitation and maintenance of existing ponds/ tanks is needed so that
they may continue to augment groundwater in future also.
4. Abandoned channels, Ox-bow lakes old-brick-kilns, ravines and excavations should be converted into rain
water conservation tanks instead of garbage dumping ground.
5. Domestic waste water from ever-increasing number of hotels, restaurants, commercial complexes due to
growing urbanization should be recycled and reused after making it utilizable through natural filtration
processes. The recycle and reuse of utilizable waste water should be made mandatory on part of all
commercial complexes.
6. Long term comprehensive urban ground water management plans (City Master plan) with regulatory
provisions should be prepared for effective Integrated Water Resource Management envisaging
interventions for a more harmonized conjunctive use of surface and groundwater.
7. River bed filtrate method is efficient and economical to cater the need of growing urban areas. Lucknow
city is located on the River Gomti and there is a fair possibility of harvesting large volume of water
through river bed filter techniques. There is a thick and continuous aquifer of over 150 m along the river
Gomti covering about 20 sq Km in the west and North west of the Gaughat of the old city area. Tube wells
tapping the aquifers in this area will be charged through induced recharge from the Gomti river. Individual
well is expected to yield about 200 cubic m / hour with the normal draw down of less than 6 m . Battery
of such tube wells can provide over 100 mld of water to cater the needy populace in the old city area of
Lucknow.
8. Transmission losses up to 40% during water supply should be reduced to maximum extent possible. There
should be a city-oriented regulation on excessive groundwater withdrawal/ misuse.
9. Proper surface drainage and sewerage systems should be developed to prevent leaching of pollutants and
consequent degradation of groundwater quality. Periodic monitoring of quality is essential to plan for
alternative sources of potable water considering its long term health effects. In the zero discharge toilet
system the residues generated per person is about 1/5th as compared to conventional toilet system
results in significant saving of fresh water.
10. The positive correlation between extent of water level decline and intensity of urban activity amply
demonstrates that there should be purpose-built piezometers in urban areas for proper ground water
regime monitoring so as to facilitate decision making as regard to corrective measures for sustainable
development of urban area aquifers.
134
REFERENCES
• Arun Kumar & Srivastava, N.K.2005. Hydrogeology and Development Prospects in Urban Environment of
Lucknow, U.P. C.G.W.B., N.R. Lucknow.
• Rai, J.N., Arun Kumar, Bhartariya, SG., 2011, Proceeding of Regional workshop on Management
Techniques in Ground water stressed Urban Areas , Lucknow pp 67-77.
• Rai, J.N., Arun Kumar, Bhargava, A. K., and Mehrotra, S. 2004.Management for Sustainable Development
of Ground Water in Lucknow Urban Agglomeration. Our Earth, Lucknow, Vol.1, No.1, pp.18-22.
• K. K. Singh Suresh Singh K. B. Biswas Artificial Recharge To Augment Ground Water Resources In Stressed
Part Of Lucknow City Uttar Pradesh Proceeding of Regional workshop on Management Techniques in
Ground water stressed Urban Areas ,Lucknow,pp26-32
• Venkatesh Dutta, R S Sinha, Nupoor Prasad, M Yunus Land use Change and Management of Stressed
Urban Aquifers in U.P. with Special Reference to Lucknow Proceeding of Regional workshop on
Management Techniques in Ground water stressed Urban Areas ,Lucknow,pp46-53
• Lucknow Master Plan-2021.Town and Country Planning and Lucknow Development Authrity, Lucknow,
Uttar Pradesh.
• Water Level Data ,CGWB,Lucknow.

135
MUMBAI CITY, MAHARASHTRA
Saurabh Gupta, CGWB, Pune
INTRODUCTION
Greater Mumbai is located on the western most periphery of the Maharashtra State. The city in the past
(year1885) was comprised of elongated shaped group of seven islands viz., Bombay, Mazgaon, Matunga,
Mahim, Worli, Soyster Rode and Old Woman’s Island which over the period of time, have been connected to
main land by a series of reclamation measures such as filling of narrow creeks etc.
The Mumbai city is known as financial capital of India. Due to continuous expansion of infrastructural facilities,
industries, and commercial units in the city, a wide business opportunities and massive employment were
generated. Many people from western
Maharashtra, Konkan and other states came to
Mumbai in search of employment. Therefore
continuous migration has resulted in to
overcrowding of the city. The ever increasing
water demand of growing city is being met,
mainly, by a number of water supply dams
situated in the adjacent districts and areas.
Whereas, the availability of ground water in the
city is not found sustainable because of limited
quantity as well as was of poor quality.
GENERAL FEATURES
Area and Administrative Divisions
Greater Mumbai district comprises South Salsete,
Trombay and Bombay islands having a
geographical area of 603 sq. km. (Mumbai City-
69 sq. km. and Mumbai Suburbs- 534 sq. km.).
The district is bounded by north latitude 18°53’
and 19°19’ and east longitude 72°47’ and 72°58’.
Arabian Sea lies on the southern and western
side of the district while it borders Thane district
in the north and eastern side. A map of the
district showing the district boundary and
headquarter, physical features and location of
monitoring wells is presented as Fig. 1
Demography
The population of Greater Mumbai as per 2001 census is 11,914,398 which includes population of city
3,326,837 and its suburb 8,587,561.Mumbai city is the third most populous city in the world after Tokyo and
Sao Paulo. The population of city is projected to be 20.5 million in year 2011A.D. It is observed that population
is being doubled in every 20 years.
Hydrometeorology
The climate of the district is characterized by an excessive summer, dampness in the atmosphere nearly
throughout the year and heavy south – west monsoon rainfall from June to September. The mean minimum
temperature is 16.3°C and the mean maximum temperature is 32.2°C at Santacruze.
The average annual rainfall varies from about 1800 mm to about 2400 mm, minimum being in the central part
of the district around Kurla (1805 mm) and it gradually increases towards north and reaches a maximum
around Santacruze (2382 mm).

136
Physiography and Drainage
The broad physiographic feature of the Mumbai district is broad and flat terrain flanked by north – south
trending hill ranges. The hill ranges form almost parallel ridges in the eastern and western part of the area. The
Powai – Kanheri hill ranges are the other hill extending in the eastern and central part running NNE – SSW. The
maximum elevation of the area is 450 m above mean sea level (m amsl) at some of the peaks of hill ranges.
Trombay island has north – south running hills with maximum elevation of 300 m above man sea level (m
amsl). Malbar, Colaba, Worli and Pali hills are the isolated small ridges trending north – south in the western
part of the district. The Powai – Kanheri hills form the largest hilly terrain in the central part of the Salsette
island and are the feeder zone for the three lakes viz., Powai, Vihar and Tulsi. There are a number of creeks,
dissecting the area. Among them, Thane is the longest creek. Other major creeks are Manori, Malad and
Mahim which protrudes in the main land and give rise to mud flangs and swamps.
The area is drained by Mahim, Mithi, Dahisar and Polsar rivers. These small rivers near the coast, form small
rivulets which inter mingle with each other resulting in swamps and mud flats in the low lying areas.
Soil Types
Two types of soils have been observed in the district viz., medium to deep black and reddish colored soil. The
deep black soils found in the area belong to the Soil Group of “Andosols”. These soils develop in volcanic
materials as black soils of volcanic landscapes. The parent material is mainly volcanic ash, but also tuff, pumice,
cinders and other volcanic ejecta. It is found in undulating mountains, humid, arctic to tropical regions with a
wide range of vegetation types. The reddish coloured soil is developed from the lateritic parent rock materials.
STATUS OF WATER SUPPLY AND DEMAND
The entire Greater Mumbai is an urban area. All the major surface water reservoirs located in surrounding
districts are used for water supply. The major rivers in the area and surrounding region are the Vaitarna and
the Ulhas river which originate in Konkan region. The other two rivers are the Patalganga and the Amba. Even
though these rivers does not flow in the Greater Mumbai, their basins form the major source of surface water
for Greater Mumbai as a whole for its domestic and industrial consumption. The Mumbai Hydrometric Area
(MHA) under Department of Irrigation, Government of Maharashtra, comprising these four river basins. They
have a total catchment area of 575 Sq. Km. The total surface water potential of MHA is estimated to be 10439
mcm at 75% dependability and 7869 mcm at 90% dependability by the irrigation Department. The basin-wise
available surface water is given in Table 1.
Water supply to Mumbai city is dependent on six lakes viz
Tulsi,Vihar,Tansa,Upper Vaiterna,Bhatsa and Mumbai III.
The source wise water supply through lakes is given in
Table 2.
Demand of Water: The norms of water supply
recommended for water supply as per Central Public
Health and Environmental Engineering Department,
Ministry of Urban Development for cities with population
above one lakh is 150-200 liters per capita per day (1pcd).
For Greater Mumbai at present water is being supplied @
150 lpcd which may rise to 200 lpcd by 2011 and 225 lpcd
by 2021. The total net domestic and gross requirements
(taking norm as 150 lpcd) for different purposes are given in the Table 3
Table 2 Water sources to Mumbai city
Sources Yield (MLD) Percent
Tulsi 18 0.54
Vihar 110 3.28
Tansa 417 12.45
Upper Vaitarna 1025 30.60
Bhatsa 1650 49.25
Mumbai-III 150 4.48
Sub-total 3350 100
En-route supply 120 -3.58
Total water supply 3230 96.42

137
Table 3 Net and gross water requirements for Greater Mumbai.
Sl. No. Type of use Water requirement
in mld
Water requirement
in mld
Water requirement
in mld(projected)
1991 2001 2011
1. Domestic 1489 2200 3080
2. Industrial Institutional 400 400 400
3. Other uses 38 54 69
4. En-route 90 90 90
Total (Net) requirement 2017 2823 3819
Total (Gross) requirement 2521 3529 4525
Future water supply : The projected demand of water for Greater Mumbai for the year 2021 is estimated to
be 5355 mld. To meet this additional
requirement of water, four water supply projects
are being under construction and by the
completion of these projects the total supply will
rise to 5479 mld. The source identified for
augmentation of water supply is as below in
Table 4.
WATER PROFILE
Surface Water
The very old record indicates existence of dug wells, lakes and tanks for water supply in the district. However,
the growing population led to spurt in demand of water, which necessitated the municipal corporation to
install the surface water based pipe line distribution system in the city. Water distribution system is very
complex in the city. The water transmission (650 km) and service pipes (3200 km) are covering the entire city.
The water supply system of Greater Mumbai is more than hundred years old. Mumbai city has received first
piped water supply in 1860. The present water supply to Mumbai city is depended on six lakes. Bhatsa is one
of the important sources of water to city and it alone supplies 1650 mld water to city. Tulsi is one of the old
water resources but it supplies only 18 mld water to Mumbai city. Upper Vaitarna resource supplies 1025 mld
water. The total water yield from Tulsi (18mld), Vihar (110mld), Tansa (417 mld), Upper Vaitarna (1025mld),
Bhatsa (1650mld) and Mumbai-III (150 mld) is 3350 mld. Water is also supplied to en-route villages, which is
120 mld. Therefore the total water supplied for the entire city is 3230mld.
Ground Water
Ground water is not suitable for drinking purposes. In order to reduce the illness prevalence in the city,
Brihanmumbai Corporation (BMC) and Government of Maharashtra (GoM) have been discouraged the use of
water from wells and ponds for domestic purpose. As result, the dug well based water supply was completely
neglected. However, being a financial capital of the country, the population growth in the city is very high as
compared to other part of country. The supply of water from surface water sources fluctuates depending upon
the rainfall during the year. Therefore, there is always the gap between demand and supply. In order to meet
the shortfall in water supply, ground water based supply as a supplementary source of supply has been used
for all purposes other than domestic. As per the record, 3950 dug wells and 2514 bore wells are in operation
under BMC for water supply purpose in the city. The aquifers in the district are of limited areal extent and of
limited thickness. Ground water is quite vulnerable to contamination from sewage disposal and other human
activities. The over pumping may also lead to sea water intrusion.
GROUND WATER SCENARIO
Potential Aquifers
The area is mainly underlain by Deccan Traps, Alluvium, and also having marshy swamps and mud planes.
Along the coast, trachytes and Rhyolites are also present. The Deccan Trap basalts and alluvium are the major
water bearing formation. The description of each is as below:
Table 4 Identified sources of water supply
Source of water
(future projects)
River Water supply
capacity (mld)
Middle Vaitarna Vaitarna 455
Gargai Vaitarna 455
Pinjal Vaitarna 865
Kalu Ulhas 590
Shai Ulhas 1067

138
Alluvium : The thin alluvial patches along the river and the marine unconsolidated deposits in coastal area are
highly potential aquifers but are of limited extent with
respect to time and space. The Thickness of the shallow
aquifer extends down to 5.0/ 7.0 m.bgl and is separated
by marine clay from the underlying deeper basaltic
aquifer. The ground water occurs in sandy/gritty layers
under water table condition, but very often its occurrence
and movement depends upon the ratio of sand and clay in
a particular locality. The alluvial fill of low lying areas
underlain by weathered basalt has relatively batter
ground water potential as observed from well yields.
Basaltic Lava : The ground water occurs in fractures, joints
vesicles and in weathered zones of the basalt under water
table condition at shallow depth and under semi-confined
to confined condition at deeper depths. The leaky
confined condition has also been observed in deeper
aquifer in some area. The primary porosity that is due to
the presence of vesicles along flow contacts and in lava
tubes etc, and is completely missing in the area due to
amygdular nature of basalt. However, the Secondary
porosity is developed due to jointing and weathering of
the rock formation in the area. The various flow units
have also been weathered to varying extent giving rise to
potential aquifer zones. The basalt flows dip westwards
with 80 - 25
0 while strike joint planes dip eastwards. Due
to this the westward movement of ground water is guided
by the partition plains between lava flows and eastward
movement by the major easterly dipping strike joint
systems occurs. The distribution of rock formations is
shown in Fig. 2.
Ground Water Level
The ground water level in the area has been observed
based on the water level data of National Network
hydrograph Stations established in the district. These wells
are monitored four times a year i.e. August, January, May
(Pre-monsoon), August, November (post Monsoon).
Pre-monsoon Depth to Water Level (May 2007)
The pre-monsoon depth to water levels monitored during
May 2007 ranges between 2.77 m bgl (Church Gate) and
7.10 m bgl (A.M.C. Colony). The depth to water levels
during pre-monsoon has been depicted in Fig.3.
The shallow water levels between 2 and 5 m bgl are
observed in southern part, whereas moderate deep water
levels in the range of 5 to 10m bgl are observed in
northern and central part of the district. Shallow water
levels of < 2 m bgl are observed in small area in southern
part.
Post-monsoon Depth to Water Level (Nov.–2007)
The depth to water levels during postmonsoon (Nov. 2007)
ranges between 1.80 m bgl (Church Gate) and 6.42 m bgl

139
(A.M.C. Colony). Spatial variation in postmonsoon depth to water level is shown in Fig. 4.
Water Level Trend (1998 – 2007)
Trend of water levels for pre-monsoon and post-
monsoon periods for last ten years (1998-2007) have
been computed for 4 National Hydrograph Stations
(NHS). Analysis of long term water level trend data
indicates fall in water levels in the 4 NHS and it ranges
between 0.11 (Church Gate) and 0.38 m/year (A.M.C.
Colony). During post-monsoon period rise in water level
of 0.09 m/year has been recorded at only 1 NHS located
at Mahroli (Chemur) while at 3 NHS fall in water level
have been recorded and it ranges between 0.02 (Colaba
(Dandi)) and 0.26 m/year (A.M.C. Colony). Thus in
major parts of the district, both during pre-monsoon
and post-monsoon seasons declining water level trends
have been recorded. The pre-monsoon and post-
monsoon trend maps were also prepared and the same
are presented in Fig. 4. During pre-monsoon period
entire district shows fall in water level trend of up to 20
cm/year, whereas during post-monsoon period rise in
water level trend of up to 20 cm/year is observed in
extreme northern part and central southern parts and
the rest of the district shows fall in water level trend of
up to 20 cm/year.
Fig. 5 Premonsoon (L) and Postmonsoon (R) Water Level Trend (May and Nov. 1998-2007)
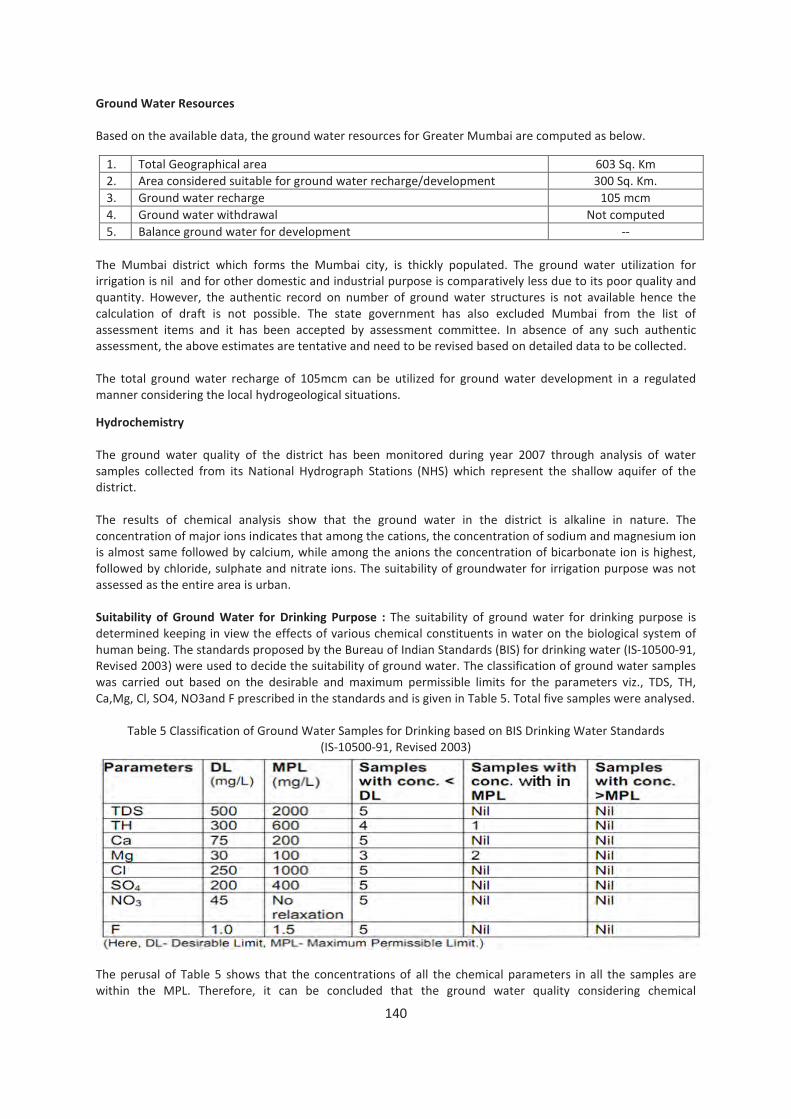
140
Ground Water Resources
Based on the available data, the ground water resources for Greater Mumbai are computed as below.
1. Total Geographical area 603 Sq. Km
2. Area considered suitable for ground water recharge/development 300 Sq. Km.
3. Ground water recharge 105 mcm
4. Ground water withdrawal Not computed
5. Balance ground water for development --
The Mumbai district which forms the Mumbai city, is thickly populated. The ground water utilization for
irrigation is nil and for other domestic and industrial purpose is comparatively less due to its poor quality and
quantity. However, the authentic record on number of ground water structures is not available hence the
calculation of draft is not possible. The state government has also excluded Mumbai from the list of
assessment items and it has been accepted by assessment committee. In absence of any such authentic
assessment, the above estimates are tentative and need to be revised based on detailed data to be collected.
The total ground water recharge of 105mcm can be utilized for ground water development in a regulated
manner considering the local hydrogeological situations.
Hydrochemistry
The ground water quality of the district has been monitored during year 2007 through analysis of water
samples collected from its National Hydrograph Stations (NHS) which represent the shallow aquifer of the
district.
The results of chemical analysis show that the ground water in the district is alkaline in nature. The
concentration of major ions indicates that among the cations, the concentration of sodium and magnesium ion
is almost same followed by calcium, while among the anions the concentration of bicarbonate ion is highest,
followed by chloride, sulphate and nitrate ions. The suitability of groundwater for irrigation purpose was not
assessed as the entire area is urban.
Suitability of Ground Water for Drinking Purpose : The suitability of ground water for drinking purpose is
determined keeping in view the effects of various chemical constituents in water on the biological system of
human being. The standards proposed by the Bureau of Indian Standards (BIS) for drinking water (IS-10500-91,
Revised 2003) were used to decide the suitability of ground water. The classification of ground water samples
was carried out based on the desirable and maximum permissible limits for the parameters viz., TDS, TH,
Ca,Mg, Cl, SO4, NO3and F prescribed in the standards and is given in Table 5. Total five samples were analysed.
Table 5 Classification of Ground Water Samples for Drinking based on BIS Drinking Water Standards
(IS-10500-91, Revised 2003)
The perusal of Table 5 shows that the concentrations of all the chemical parameters in all the samples are
within the MPL. Therefore, it can be concluded that the ground water quality considering chemical

141
constituents in majority of the area is good for drinking purpose. The ground water quality of deeper aquifer is
brackish to slightly saline in some localities such as Colaba, Dharavi and Khar as observed from BMC data. This
may be due to ingression of sea water. In view of this it is suggested that Samples with concentration >MPL
borewells drilled especially along the coastal areas should be pumped at the optimum discharge(only water
skimming is permitted), so that it does not result in sea water ingression, failing to do so, may spoil the fresh
water aquifers.
Major Ground Water Problems and Issues
Though the ground water in the city area appears to be free from pollution by chemical constituents but in the
shore area there is every possibility of pollution. The creeks in the region have become the dumping ground of
sewage and industrial effluents. In addition to this, various industrial effluents from oil refineries, reactors,
fertilizers plants at Chembur have polluted the sea water in eastern part and are hazardous to marine life.
The data of Maharashtra Pollution Control Board (MPCB) indicate high concentration of Mercury (Hg) than the
prescribed limit of 1.90 ppm. The alkali and dye industries are responsible for mercury pollution in the Thane
creek. The higher Arsenic (As) concentration of more than 2.00 ppm and slightly more is observed in fishes
from Thane and Chembur. The other heavy metals like Lead (0.60 ppm), Cadmium (12.60 ppm) and Copper
(8.84 ppm) are also reported from creek water.
Recently it has been observed that ground water exploitation for commercial purpose is being carried out in
entire district and the water is extracted from existing dugwells and borewells, even new borewells are also
being drilled for this purpose. The ground water is used for construction purposes, hotel industry and for
domestic purpose of the housing societies. Excessive ground water development in the beach and coastal
areas can lead to saline water intrusion as observed in some parts of Colaba, Dharavi and Khar as reported
from BMC data.
Even though the borewells drilled in the area, are in large number, no adequate data regarding areal extent of
the aquifer is available. The borewells in low lying area are affected by saline water whereas in upland areas
the source water is relatively fresh but the potential of the aquifer is very poor.
Water Conservation and Artificial Recharge
The artificial recharge structures feasible in the city are Recharge through roof top rain water harvesting to
existing dug/borewells may be taken up. However, the source water should be properly filtered before
recharging into the wells. These sites need to be located where the hydrogeological conditions are favorable,
i.e., where sufficient thickness of unsaturated/de-saturated aquifer exists and water levels are more than 3.0
m deep (post-monsoon). The post-monsoon depth to water level map and pre-monsoon/post-monsoon water
level trend map gives a good idea of areas suitable for artificial recharge of ground water. Such areas are
located in north central part of the district, where water levels are moderately deep and falling water level
trends is observed. In other areas where water levels is shallow, ground water development along with
augmentation is recommended. In the elevated area roof top rain water harvesting is also feasible by storing
rainwater in storage tanks, thereby supplementing the main source of water.
GROUND WATER DEVELOPMENT STRATEGY
The ground water is presently developed through dugwells and borewells. Hydrogeological set-up and
disposition of rock types show that availability of ground water resources is limited in ground water worthy
areas mostly located in Salsete island and limited areas of Bombay and Trombay islands. About 500 to 800
wells can be constructed with the yield of wells varying from 30 to 50 m3/day. In these areas the ground water
can be developed through borewells also. However the sites for borewell need to be selected only after proper
scientific investigation and they should only be used for drinking water supply and not for industrial and
commercial exploitation. The promising and productive aquifers exist in the depth range of 60 to 80 mbgl. In
the Alluvial areas shallow dugwells of 5 to 7 m depth, whereas in Deccan Trap Basalt areas dugwells of 7 to 15
m depth are the most feasible structures for ground water development. The ground water quality also needs
to be ascertained and the wells used for water supply should be first checked for nitrate and other pollutants.
Ground water exploitation for commercial purpose needs to be regulated, even as the ground water is
extracted from existing dugwells and borewells needs to be monitored. Otherwise saline water intrusion in
beach and coastal areas may happen.

142
Even though ground water is available in the area, more emphasis is given on creating surface water
reservoirs, rather than developing ground water in a planned way. The conjunctive utilization of available
surface and ground water in systematic and planned way will be the best solution for meeting present and
future demands of water.
Rain Water Harvesting
Rainwater harvesting is an old method of capturing run-off rainwater from the terrace. In Mumbai city, there
are 250000 private properties and commercial establishments. If we assume that each property has an area of
1000 sq. meters and the average rainfall is assumed as 2.0 meters in the city. Then after all the necessary
arrangements, if eighty percent rain of water is captured at all the terraces, for example, commercial
establishments and government buildings. It will yield more than 500 mld water in the city. The flushing need
per person per day is 40 liter for 270 dry days. It has been calculated that around 400000 persons flushing
need could be satisfied through rainwater harvesting in the city. The rainwater harvesting capacity of future
constructions has not been calculated. Similarly, there are many old building and government offices in the
city. Such establishments can yield considerable water through rainwater harvesting. Government has made
compulsory rain water harvesting for each plot having area of more than 1000 square meters.. Rainwater
harvesting system has number of advantages. It increases ground water level, provides ready and natural
source of water. It is also helpful to reduce the salinity of groundwater.
Roof top rain water harvesting is also feasible by storing rainwater in storage tanks in elevated areas, thereby
supplementing the main source of water.
The scope exists for constructing suitable artificial recharge structures like recharge shafts in limited areas
located in north central part of the district. The existing dugwells/borewells can also be used for artificial
recharge, however, the source water should be properly filtered before putting in the wells.
In the south central part of Mumbai the aquifer is although at a depth of 10m .below msl yet it is yielding fresh
water .But the continued ground water extraction may deteriorate the quality. The artificial recharge in this
area may not only increase the water availability but also control the water intrusion.
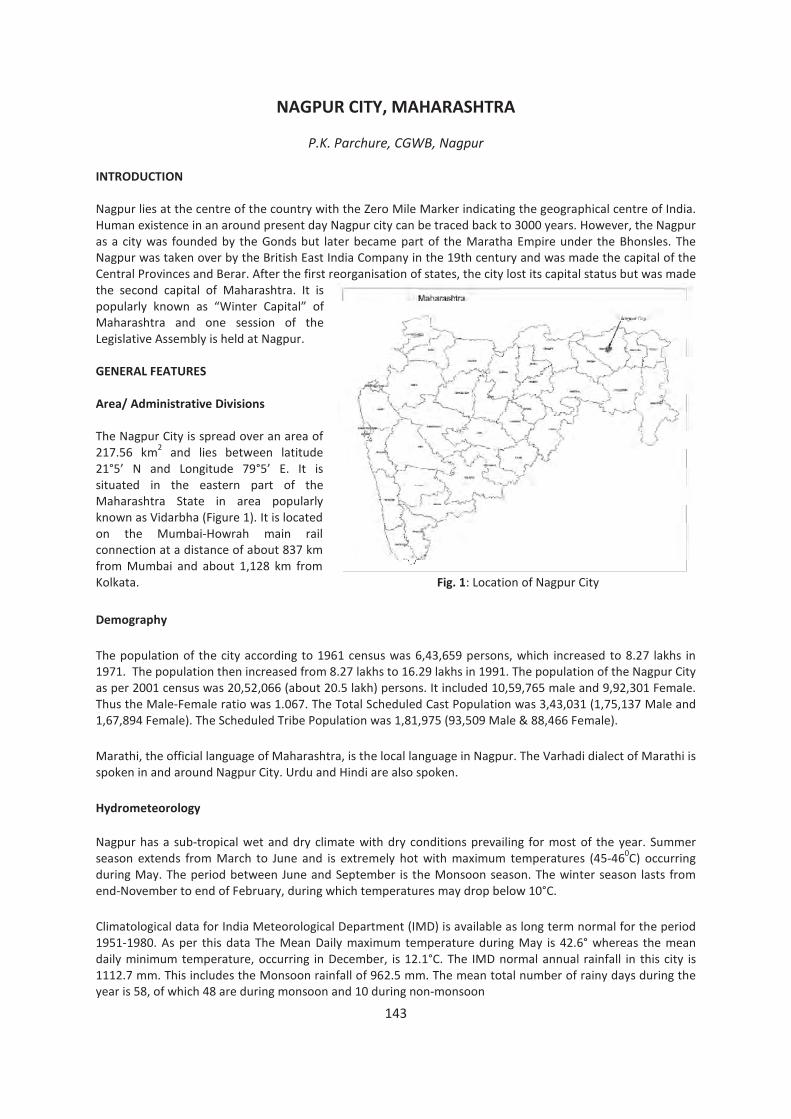
143
NAGPUR CITY, MAHARASHTRA
P.K. Parchure, CGWB, Nagpur
INTRODUCTION
Nagpur lies at the centre of the country with the Zero Mile Marker indicating the geographical centre of India.
Human existence in an around present day Nagpur city can be traced back to 3000 years. However, the Nagpur
as a city was founded by the Gonds but later became part of the Maratha Empire under the Bhonsles. The
Nagpur was taken over by the British East India Company in the 19th century and was made the capital of the
Central Provinces and Berar. After the first reorganisation of states, the city lost its capital status but was made
the second capital of Maharashtra. It is
popularly known as “Winter Capital” of
Maharashtra and one session of the
Legislative Assembly is held at Nagpur.
GENERAL FEATURES
Area/ Administrative Divisions
The Nagpur City is spread over an area of
217.56 km2 and lies between latitude
21°5’ N and Longitude 79°5’ E. It is
situated in the eastern part of the
Maharashtra State in area popularly
known as Vidarbha (Figure 1). It is located
on the Mumbai-Howrah main rail
connection at a distance of about 837 km
from Mumbai and about 1,128 km from
Kolkata. Fig. 1: Location of Nagpur City
Demography
The population of the city according to 1961 census was 6,43,659 persons, which increased to 8.27 lakhs in
1971. The population then increased from 8.27 lakhs to 16.29 lakhs in 1991. The population of the Nagpur City
as per 2001 census was 20,52,066 (about 20.5 lakh) persons. It included 10,59,765 male and 9,92,301 Female.
Thus the Male-Female ratio was 1.067. The Total Scheduled Cast Population was 3,43,031 (1,75,137 Male and
1,67,894 Female). The Scheduled Tribe Population was 1,81,975 (93,509 Male & 88,466 Female).
Marathi, the official language of Maharashtra, is the local language in Nagpur. The Varhadi dialect of Marathi is
spoken in and around Nagpur City. Urdu and Hindi are also spoken.
Hydrometeorology
Nagpur has a sub-tropical wet and dry climate with dry conditions prevailing for most of the year. Summer
season extends from March to June and is extremely hot with maximum temperatures (45-460C) occurring
during May. The period between June and September is the Monsoon season. The winter season lasts from
end-November to end of February, during which temperatures may drop below 10°C.
Climatological data for India Meteorological Department (IMD) is available as long term normal for the period
1951-1980. As per this data The Mean Daily maximum temperature during May is 42.6° whereas the mean
daily minimum temperature, occurring in December, is 12.1°C. The IMD normal annual rainfall in this city is
1112.7 mm. This includes the Monsoon rainfall of 962.5 mm. The mean total number of rainy days during the
year is 58, of which 48 are during monsoon and 10 during non-monsoon

144
Physiography & Drainage
The city stands on comparatively level country with average elevation of about 330 m amsl. However, there
are small hills, the most prominent being the “Seminary Hills” with highest elevation of about 354 m amsl.
The Nag River, from which the city has taken its name, flows through the centre of the city. Another small
stream, the “Pili Nadi” flows in east-west direction in northern part of the city.
Soil Type
The soils in any area are derived from the underlying rock formations. Thus the soils in Nagpur City area are
also reflection of the underlying geological formations. The soils in major part of the city area are brownish to
blackish in colour and medium deep. In general, they can be classified as of mixed type.
STATUS OF WATER SUPPLY AND DEMAND
The total quantity of 515 Million Litres per Day is being supplied to the city of Nagpur. About 85% of the city
area has been covered by the water supply pipeline network. Presently there are five water treatment plants
(WTP) in the city, the details are given below:
Sr. No. Water Treatment Plant Capacity (MLD)
1 Kanhan Water Treatment Plant at Kamptee 120
2. Pench Water Treatment Plant, at Gorewada, Stage I 136
3. Pench Water Treatment Plant, at Gorewada, Stage II 133
4. Pench Water Treatment Plant, at Gorewada, Stage III 120
5. Gorewada Water Treatment Plant 18
There are three Master Balancing Reservoirs (MBR) and 42 Ground Level/ Elevated Service Reservoirs.
For the present population of Nagpur City, the water demand is 361 MLD which has been worked out on the
basis of norms suggested by the Maharashtra Jeevan Pradhikaran @ 170 lpcd The projected total demand of
water for Nagpur Urban Agglomeration in the year 2021 is worked out to be in the range of 670 MLD.
The future planning for water supply to the Nagpur City includes:
• Providing piped water supply to the remaining areas
• Construction of 115 MLD Pench-V W.T.P
• Bringing the water from Pench Reservoir by close conduit (2300 mm)
• Providing continuous water supply to the city under a PPP mode project.
These future plans are being implemented under the Jawaharlal Nehru Urban Revival Mission (JNURM) under
which 50% funding is being provided by the Govt. of India and 25 by the Government of Maharashtra. The
total cost of the project under JNURM is Rs.1669.157 Crores.
WATER PROFILE (SURFACE AND GROUND WATER)
The important streams passing through the
Nagpur City area are the Nag and the Pili
Streams. There are three large Tanks/ Lakes
within the city area:
Besides these, there are few smaller tanks like
Gandhi Sagar, Lendi Talav, Naik Talav, Sonegaon Talav, Raghuji and Baradri Talav.
In the older part of the city almost every residential plot has a dugwell. However, these dugwells are seldom
used. In the newer parts of the city, Borewells have been drilled in almost every residential plot. These are
Sr. No. Tank Catchment Area
(sq. km)
Capacity
(MCM)
1. Gorewada 30.80 8.8
2. Ambajhari 14.40 8.3
3. Phutatal 0.50 -

145
often used to supplement the water demand. In the peripheral areas, where new residential colony have come
up recently, many of the households have water supply exclusively from ground water (borewell/dugwell).
GROUND WATER SCENARIO
Potential Aquifers
Crystallines (Granite Gneiss) and Deccan Trap Basalt are the main consolidated rock formation occurring within
the city limits. The crystalline formations occur mostly in the western part of the city covering about 23% of
the area. The Deccan Traps occur in the western part of the city and cover about 57% of the area. These
formations do not possess any primary porosity due to its massive and compact nature but when it is jointed,
fractured, weathered or subjected to any tectonic disturbances, secondary porosity take place and they form
potential aquifer underneath.
The sandstone of Gondwana age occurs as an elongated patch in the north eastern part of the city covering
about 12% of the area including the area overlain by alluvium. Because of granular nature of this formation, it
possesses primary porosity and the presence of fracture and
joints further increased its water bearing capacity.
The Lameta formation occurs as an elongated north-south
trending patch in the central part of the city. It occupies
about 9% of the city area. The water bearing capacity of
Lameta formations depend upon the lithological
composition. The calcareous sand stones and cherty
limestone, which occur as very thin layers have relatively
poor porosity and yield. The alluvium occurs as a small round
patch, covering about 2% of the area, in the north-eastern
part of the city. However, it does not form a potential aquifer
due to limited thickness. The geological formations of the
Nagpur City is shown in Figure 2.
Fig. 2: Distribution of geological formation
Ground Water Level in Nagpur city
There are three National Hydrograph Stations (NHS) in the city. They area located at Ramdas Peth, VNIT Pz and
Hanuman Nagar. The long term data for the well at Ramdaspeth is available since 1989. Fig. 3 shows the
groundwater hydrograph for this well. The hydrograph shows a regular seasonal fluctuation with a very
marginal rising trend of 0.004 m/year.
Ramdas Peth (Nagpur City)
y = -0.0041x + 11.979
0
1
2
3
4
5
6
7
8
9
10
1985 1990 1995 2000 2005 2010 2015
Year
DT
W (
m b
gl)
Fig. 3: Ground Water Level Hydrograph for Monitoring Station at Ramdaspeth.

146
Besides three National hydrograph
Stations, a total number of 60 wells
have been established in the city for
monthly monitoring of water levels.
These are being monitored for last
one year. The data from these wells
have been utilised for depicting the
pre- and post-monsoon water levels
and seasonal fluctuation of water
levels.
The depth to water level during pre-
monsoon (May 2010) ranges from
less than one metre to 18.5 m bgl.
Shallow water levels, less than 2 m
bgl are observed in central parts
around Civil Lines and Sadar areas
and north-western part around Hajari
Pahad area. In major part of the city,
central and western parts, the water
levels are less than 4 m bgl. Water
level in the range of 4 to 6 m bgl is
observed in south-western, south-
eastern, eastern and northern parts.
Deeper water levels, i.e., more than 6
m bgl are mainly observed in
southern parts (around Sonegaon),
eastern parts (around Pardi Naka and
Kalmana) and in few isolated areas.
In general, the deeper water levels
are observed in peripheral areas. A
map depicting the pre-monsoon
water levels is given in figure 4.
The depth to water level during post-
monsoon (November 2010) ranges
from almost ground level to 11.0 m
bgl. The water levels are less than 2
m bgl in north-western part around
Hajari Pahad area and as isolated
patches in the central part. In
majority of the central and western
parts, the water levels are between 2
and 4 m bgl. Water levels in the
range of 4 to 6 m bgl are observed in
southern, eastern an northern parts. Deeper water levels, i.e., more than 6 m bgl are mainly observed in
southern parts (around Airport and Chinchbhuvan), eastern parts (around Pardi Naka and Kalmana, Reshim
bag and Tulibag) and in few isolated areas. In general, the deeper water levels are observed in peripheral
areas. Figure 5 shows the post-monsoon water levels in the city.
The seasonal fluctuation of water levels (May – November 2010) ranges from less than 0.1 m to 11.2 m in
major part of the area. The figure 6 shows the seasonal fluctuation in the City. In major part of the city, water
level fluctuation varies from 2 to 4 m. In central part it is 0 to 2 m and is observed in elongated area stretching
between Civil Lines in the west and Reshimbag in south-east and a small area around Hajari Pahad in the west.

147
Seasonal Fluctuation of more than 4 m is observed in isolated areas around Sonegaon, Durganagar and
Jaripatka.
Ground Water Resources & Status of
Development
Recently, ground water resources of the
state have been estimated taking the base
year as 2008. The data for the Nagpur
taluka, which includes the Nagpur city and
surrounding rural areas are available As per
these estimates, the net ground water
availability for Nagpur taluka is 6498.86 ha
m. The existing ground water draft for all
uses is 2026.68 ha m, out of which irrigation
draft is of 1619.85 ha m and domestic and
industrial draft is 406.83 ha m. A provision
of 878.77 ha m has been kept for future
(2005) domestic and industrial
requirements. Thus a total of 3593.41 ha m
of net ground water is available for future
irigation. The present stage of development
is 31.19% and the taluka has been
categorised as “Safe”.
Hydrochemistry
The water samples were collected from 45
wells set-up for urban water level
monitoring during May 2010. A map
showing distribution of Electrical
Conductivity (EC) of ground water is
shown in figure 7. It is seen from water
quality data that the ground water is quite
fresh in the western and central part with
EC less than 1000 µS/cm. The EC is more
than 1000 µS/cm in majority of the
eastern part and a small area in southern
part. EC values of more than 2000 µS/cm
are observed in small areas around
Pardinaka in eastern part and Nari in
northern part.
Other quality parameters are within
permissible limits at most of the places,
however, high values of certain parameter
are noticed. Higher value of NO3 ( > 45
mg/l) are observed at 9 locations, i.e., Chinchbhavan, Tulsibag, Tajbag, Pardinaka, Sonegaon, Bhamti, Nari,
Joginagar, and Durganagar. Higher values of Fluoride (> 1 mg/l) have also been observed at several location,
these are Ajni, Telangkhedi, Gayatrinagar, Tulsibag, Nara, Khamla, Tajbag, Nari, Joginagar and Nandanvan.
Higher values of Ca, Mg and Total Hardness have also been observed to be higher at several locations. Metallic
parameters like Cu, Fe, Pb, Zn and Mn were also determined. The values of Cu and Zn were found to be within
permissible limits in all the samples. The value of Pb was below detection limits at most of the places, higher
value of 0.058 mg/l was observed only at one place, i.e., Suyog Nagar. Higher levels of Fe (>0.3 mg/l) were
noticed at 6 locations, i.e., Gandhibag, Ravinagar, Police Line Takli, Sonegaon, Tukdoji Square and Joginagar.
Higher values of Mn were observed at several locations, it was found to be more than 0.1 mg/l at Pardinaka,

148
Khova Market, Tukdoji Square, Police Line Takli, Nandanvan, Gandhibag, Joginagar, Nara, Panchpaoli and
Shantinagar
Major Ground Water Related Problems
Urbanisation is normally identified with growth and development of the country. Industrialisation is one of
the indicators of country’s overall progress, which results in development of urban centres and related issues.
The Nagpur Metro City is no exception to this problem and over the period of time multitudes of problems are
cropping up. In order to cater to the need of this ever-growing demand of drinking and domestic water
supply, the ground water based supply is the most dependable alternative. Every household prefers to
construct a dug well or bore well in its premises. However, its sustainability, especially in hard rock formation
is a problem during the summer season, and during drought years. The ground water is under stress in certain
pockets of city due to shrinkage of recharge area caused by sudden spurt in constructional activities and
asphalting of roads etc. This non-basis and unplanned development of ground water is witnessed particularly
in peripheries and unauthorised/illegal layouts causing environmental degradation and lowering of water
levels.
Ground water quality is also a major issue in the city. Though the different chemical constituents in ground
water is well within the permissible limitshigher values of EC and and some of the contaminants like NO3, F, Cu
and Mn at isolated pockets should be taken care of.
Feasibility of Rainwater Harvesting and Artificial Recharge
Sufficient scope exists for augmenting the ground water resources for its sustainability during peak demand
period. From the present study it is observed that there is around 45 sq km area where the ground water level
was observed below 4.00 m bgl, and around 14 sq. km of area was observed to have the ground water level
below 6.00 m bgl. Thus artificial recharge to ground water is feasible in around 60 sq. km of the area. Such
area is mainly located in the eastern and southern part of the city. Majority of this area is underlain by
Crystalline formations (Granite Gneiss) in eastern part and Deccan Trap in the southern part. Only a small area
in north-eastern part is underlain by Gondwana Formations. Artificial recharge to ground water through
rooftop rainwater harvesting may be practised in these areas This may not only help to augment the ground
water resource but also help in improvement in quality.
GROUND WATER DEVELOPMENT STRATEGY
Proper ground water management strategy envisages that there should be planned and systematic
management of the resources available. Therefore, the extraction of ground water need to be promoted in
areas where the ground water levels remain above 4.00 m bgl even during in summer. The areas with water
level below 4 m bgl may also be considered for ground water development with option for proper
augmentation through rain water harvesting.
In order to cater the need of growing demand of safe drinking water, the ground water based supply is the
most dependable alternative. However, its sustainability especially in hard rock formation possesses a problem
during the summer and scarcity years. In basaltic terrain of the Nagpur City, the ground water pumping is
taking place almost at every household in peripheral areas. However, the shrinkage of recharge area due to
sudden spurt in constructional activities, unplanned ground water development the ground water resources
are under stress in some parts.
The situation of ground water availability seems quite favourable in major part of the city, the peripheral
areas, particularly the areas like Somalwada, Ujjwal Nagar, Pandey Layout are facing acute shortage of ground
water. This is not only due to excessive ground water development alone but also the aquifers available in this
area are not capable of large-scale development of ground water.
In the northern part of the city, i.e, the area between Beszonbag and Kalmana where Gondwana formations
occur, are suitable for ground water development through tubewells. the eastern parts, which are underlain
by the Crystalline formations, do not offer much scope for ground water development. However, shallow
dugwells for individual household use may be constructed. The western part of the city, which is mostly

149
underlain by the Deccan traps are also not very suitable for ground water development. In these areas, shallow
dugwells for individual use are suggested. In some of the areas in central and southern parts, the Gondwana
formations reportedly occur below Deccan Traps at shallow depth. Deeper tubewells, tapping underlying
Gondwana formations may be constructed in such areas.
Considering the overall physiographic, Hydrogeological, hydrological, demographic and socio-cultural set up of
the Nagpur City, following types of the schemes are found to be feasible for ground water augmentation
1. Roof top rainwater harvesting
2. Runoff rain water Conservation.
In Nagpur City, rooftop rain water-harvesting experiment has been done to recharge the ground water
reservoir by the Central Ground Water Board. The experiment was done in Ujjwal Nagar area where the roof
top water collected from the concrete roof of 100 m2 was diverted into the existing water supply dug well of
the house hold. About 80,000 litres is being recharged during the monsoon. About 500 litres of water was
recharged at the expense of one rupee only.
The scheme is simple and easy to operate. The effect of such practices is instant and about l m rise in water
level was recorded in the recharged well. Further, the quality of ground water also improved as nitrate
concentration prevailing in the ground water got diluted considerably to the permissible limit due to mixing of
nearly pure rainwater. Suitable modifications can be made in the system depending upon the actual site-
specific conditions. Such a practice if replicated on larger scale can bring substantial relief to the scarcity prone
areas of the city.
The rainfall runoff flowing from the roads open grounds and public parks are substantial during the Monsoon
period. This water often creates the water logging and the drainage system is put under stress. This runoff
ultimately flows out of the city unutilised. This water if, conserved and utilised properly for recharging the
ground water reservoir may bring much needed relief to the water scarcity areas of the city.
In Nagpur City, rainwater Runoff harvesting experiment has also been done to recharge the ground water
reservoir by the Central Ground Water Board. The experiment was done in Ujjwal Nagar area where the public
ground (Park) of Municipal Corporation was selected for recharging the aquifer. During the experiment in year
1998 around 3790m3 of runoff had been generated in the catchment which was utilised for recharging the
aquifer through recharge shaft. To make source water free from silt and other pollutant a provision of filter pit
to tackle around 50,000 lit/hrs was made considering the all the technical aspect. The initial observation and
the end result of this study were very positive. The success of this scheme in view of land use in urban setup
and local hydrogeological setup of the area, a scope of its replication on bigger scale is immense.

150
NCT DELHI
A.D. Rao, P. Saxena, R. Purohit, M. Kanwar & S.K. Naik, CGWB, New Delhi
INTRODUCTION
Delhi, the capital of India has a strong historical background. The history of the city is as old as the epic
Mahabharata. The town was known as Indraprastha, where Pandavas used to live. In due course eight more
cities came alive adjacent to Indraprastha: Lal Kot, Siri, Dinpanah, Quila Rai Pithora, Ferozabad, Jahanpanah,
Tughlakabad and Shahjahanabad. In 1192 the legions of the Afghan warrior Muhammad of Ghori captured the
Rajput town, and the Delhi Sultanate was established (1206). The invasion of Delhi by Timur in 1398 put an end
to the sultanate; the Lodis, last of the Delhi sultans, gave way to Babur, who, after the battle of Panipat in
1526, founded the Mughal Empire. The early Mughal emperors favoured Agra as their capital, and Delhi
became their permanent seat only after Shah Jahan built (1638) the walls of Old Delhi. In the year 1803 AD,
the city came under the British rule. In 1911, British shifted their capital from Calcutta to Delhi. It again
became the center of all the governing activities. After independence in 1947, New Delhi was officially
declared as the Capital of India. The Constitution (Sixty-ninth Amendment) Act, 1991 declared the Union
Territory of Delhi to be formally known as National Capital Territory of Delhi. The Act gave Delhi its own
legislative assembly, though with limited powers.
GENERAL FEATURES
Area/Administrative Divisions
National Capital Territory of Delhi occupies an area of 1483 Sq.km. and lies between latitudes 280 24’ 15’’ and
280 53’ 00’’N and longitudes 76
0 50’24” and 77
0 20’ 30” E. Area is covered under Survey of India Toposheet
Nos. 53D and 53H. For administrative purposes, NCT Delhi is divided into 9 districts and 27 Tehsils/Sub-
divisions. NCT, Delhi has three Statutory Towns, 59 Census Towns and 165 Villages as per the census of 2001.
Demography
The Decnnial population census conducted during 2001, revealed that the population of NCT Delhi, as on
March 1, 2001, worked out to be 13.85 million as against 9.42 million as on March 1991. The decennial growth
recorded during 1991-2001, therefore, comes to 47.02%. The corresponding percentage at All-India level
worked out to 21.34%. The total population of Delhi accounts for 1.34% of All India population whereas in
area, it is only 0.05% of total area of the country. The population density is 9344 persons/Sq. km area. There is
a vide variation in density of population from 4165 persons per Sq. km. in Southwest district to 29395
persons/sq. km in North east district. The projected population of Delhi in 2011 comes out to be 18.45 million
and in 2021 to be 24.48 million.
Hydrometeorology
The normal annual rainfall in the NCT Delhi is 611.8 mm. The rainfall increases from the southwest to the
northwest. However slight increase in rainfall is observed towards Yamuna River. About 81% of the annual
rainfall is received during the monsoon months July, August and September. The rest of the annual rainfall is
received as winter rain and as thunderstorm rain in the pre and post monsoon months. January is the coldest
month with the mean daily maximum temperature at 21.3ºC. and the mean daily minimum at 7.3ºC. May and
June are the hottest months. While day temperature is higher in May the nights are warmer in June. From
April the hot wind known locally as ‘loo’ blows and the weather is unpleasant. In May and June maximum
temperature sometimes reach upto 46 - 47 ºC. Humidity is high in the monsoon months. April and May are
the driest months with relative humidity of about 30% in the morning and less than 20% in the afternoons.
Physiography and Drainage
There are seven distinct landforms in Delhi viz. Mehrauli-Fatehpur-Beri Plateau, Masudpur-Wazirabad Ridge,
Najafgarh Older Alluvial plain, Delhi Older Alluvial Plain, Sandy Upland Plain with ravenous tracts, Yamuna
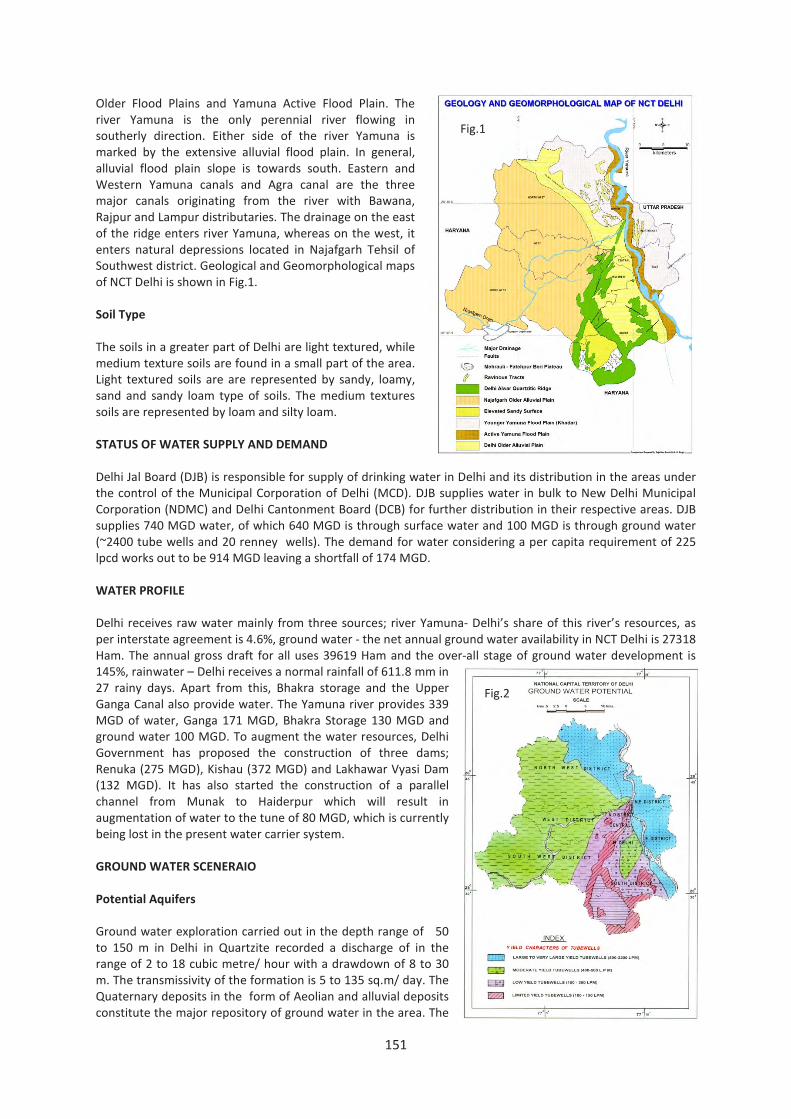
151
Older Flood Plains and Yamuna Active Flood Plain. The
river Yamuna is the only perennial river flowing in
southerly direction. Either side of the river Yamuna is
marked by the extensive alluvial flood plain. In general,
alluvial flood plain slope is towards south. Eastern and
Western Yamuna canals and Agra canal are the three
major canals originating from the river with Bawana,
Rajpur and Lampur distributaries. The drainage on the east
of the ridge enters river Yamuna, whereas on the west, it
enters natural depressions located in Najafgarh Tehsil of
Southwest district. Geological and Geomorphological maps
of NCT Delhi is shown in Fig.1.
Soil Type
The soils in a greater part of Delhi are light textured, while
medium texture soils are found in a small part of the area.
Light textured soils are are represented by sandy, loamy,
sand and sandy loam type of soils. The medium textures
soils are represented by loam and silty loam.
STATUS OF WATER SUPPLY AND DEMAND
Delhi Jal Board (DJB) is responsible for supply of drinking water in Delhi and its distribution in the areas under
the control of the Municipal Corporation of Delhi (MCD). DJB supplies water in bulk to New Delhi Municipal
Corporation (NDMC) and Delhi Cantonment Board (DCB) for further distribution in their respective areas. DJB
supplies 740 MGD water, of which 640 MGD is through surface water and 100 MGD is through ground water
(~2400 tube wells and 20 renney wells). The demand for water considering a per capita requirement of 225
lpcd works out to be 914 MGD leaving a shortfall of 174 MGD.
WATER PROFILE
Delhi receives raw water mainly from three sources; river Yamuna- Delhi’s share of this river’s resources, as
per interstate agreement is 4.6%, ground water - the net annual ground water availability in NCT Delhi is 27318
Ham. The annual gross draft for all uses 39619 Ham and the over-all stage of ground water development is
145%, rainwater – Delhi receives a normal rainfall of 611.8 mm in
27 rainy days. Apart from this, Bhakra storage and the Upper
Ganga Canal also provide water. The Yamuna river provides 339
MGD of water, Ganga 171 MGD, Bhakra Storage 130 MGD and
ground water 100 MGD. To augment the water resources, Delhi
Government has proposed the construction of three dams;
Renuka (275 MGD), Kishau (372 MGD) and Lakhawar Vyasi Dam
(132 MGD). It has also started the construction of a parallel
channel from Munak to Haiderpur which will result in
augmentation of water to the tune of 80 MGD, which is currently
being lost in the present water carrier system.
GROUND WATER SCENERAIO
Potential Aquifers
Ground water exploration carried out in the depth range of 50
to 150 m in Delhi in Quartzite recorded a discharge of in the
range of 2 to 18 cubic metre/ hour with a drawdown of 8 to 30
m. The transmissivity of the formation is 5 to 135 sq.m/ day. The
Quaternary deposits in the form of Aeolian and alluvial deposits
constitute the major repository of ground water in the area. The
Fig.1
Fig.2

152
thickness of unconsolidated sediments towards east of
the ridge gradually increase away from the ridges,
with the maximum reported thickness being 170m. In
the south-western, western and northern parts of the
area, the thickness of sediments is more than 300 m
except at Dhansa where the bedrock has been
encountered at 297 m below land surface. In
Chattarpur basin, the maximum thickness of
sediments is 116 m. The Aeolian deposits are mainly
loam, silty loam and sandy loam. The bedrock is
overlain by these deposits. Older alluvial deposits
consists mostly of interbedded, lenticular and inter
fingering deposits of clay, silt, and sand along with
kankar. Tubewells in this formation are explored upto
the depth of more than 300m. However, fresh water
zones are encountered upto the depth of 90 m only.
The yield of the wells are generally in the range of 8 to
35 cubic metre/ hour with drawdown of 6 to 24 m.
The transmissivity of the formation ranges between
130 to 400 sq.m./day. These deposits overlay the
Aeolian deposits and are in turn overlain by the newer
alluvium, which occurs mostly in the flood plains of river Yamuna. The tubewells upto the depth of 50 m
generally yield 100 to 210 cubic metre / hour with drawdown of 5 to 11 meter. The transmissivity of the
formation ranges between 1300 to 2000 sq.m/day. The tubewells drilled in the Chattarpur basin have
recorded yield of 7 to 14 cubic meter/ hour with drawdown of 12 to 20 m. The ground water potential map
and fence diagrams are shown as Fig. 2 and 3.
Ground Water Level
In the pre-monsoon, the depth to water level recorded in NCT Delhi ranges from 0.80 to 63.46 m.bgl. The
deepest water level are found in South district where 46% wells show more than 40 m.bgl water level and
28% wells have 20 to 40 m.bgl water level. In New Delhi district and South-West district, water levels range 10
to 20 m.bgl, with deeper water levels of 20-40 mbgl in parts of South west district. In Central, East, West,
North East and North West districts the water level ranges from of 5 to10 m.bgl respectively, with deeper
water levels of 10-20 mbgl in certain areas. The entire Yamuna flood plain the water levels are between 2 to
5m.
The Depth to water level recorded in NCT Delhi during post monsoon ranges from 0.16 to 66.10 m.bgl. The
deepest water levels of more than 40 m.bgl are again found in South district which also has 23% wells
showing water levels between 20 to 40 m.bgl water level. In South-West district 26% and 7% wells have water
level between 20 to 40 m. bgl and more than 40 m.bgl respectively. The depth to water level of East, North-
East and North-West districts are in the range of 5-10 m.bgl. In North district and the entire Yamuna flood
plain, the water levels are generally in the range of 2 to 5 m. bgl and at few places < 1 mbgl.
The decadal fluctuation in pre-monsoon shows a decline in water levels in majority of area, with a maximum
fall of 7.92 to 9.25 m in South and South West districts. Only 5% wells of the North-West, West and New Delhi
have been observed to show a rise in the range of 0 to 2 m. The decadal fluctuation during post-monsoon also
shows a decline in water level in the majority of area. Only 25% wells of the North, East and New Delhi districts
have a rising condition in the range of 0 to 2m.
Ground Water Resources & Status of Development
The net annual ground water availability in NCT Delhi is 27318 Ham. The annual gross draft for all uses 39619
Ham and the over-all stage of ground water development is 145%. Out of the 27 assessment units (tehsils), 2
(Daryaganj and Civil Lines) are falling in the ‘Safe’ Category, 5 (Gandhi Nagar, Connaught Place, Seelam Pur,
Narela and Punjabi Bagh) are in the ‘Semi-Critical Category while rest 20 tehsils are over-exploited.
Fig.3

153
Hydrochemistry
Chemical quality of ground water in NCT Delhi varies with time and space. The fresh ground water aquifers
mainly exist up to a depth of 25 to 35 m in Northwest, West and South-West districts and in minor patches in
North and Central districts. In Southwest district, especially in Najafgarh Jheel area the fresh water occurs up
to a depth of 30 to 45 m. A localized area located just north of Kamala Nehru Ridge (part of Delhi ridge falling
in Central District) covering area of Dhirpur, Wazirabad and Jagatpur are characterized by shallow depth of
fresh water aquifers that is in the range of 22 to 28m, regardless of proximity to River Yamuna.
In alluvial formations, the quality of ground water deteriorates with depth, which is variable in different areas.
The ground water is fresh at all depths in the areas around the ridge falling in Central, New Delhi, South and
eastern part (Ridge Area) of South-West districts and also Chattarpur basin. In the areas west of the ridge, in
general, the thickness of fresh water aquifers decreases towards North-West, the thickness of fresh water
zone is limited in most parts of west and southwest districts. In the flood plains of Yamuna, in general, fresh
water aquifers exist down to depth of 30-45m and especially in Palla and Zero RD area it reaches to the depth
of 60 to 75m below which brackish and saline water exists.
The chemical quality data indicates that South–
West and West districts are the only fluoride
affected parts of NCT Delhi. The fluoride minerals
present in soil have mostly contributed fluoride
pollution (geo-genic). High fluoride levels are mostly
found in the areas where ground water is brackish to
saline in nature. Human activities like use of fluoride
salts in steel, aluminum, bricks and tile-industries
and also agricultural discharges, are also
contributing for fluoride pollution in ground water.
The studies carried out by CGWB indicates that
nitrate concentrations in ground water of Delhi have
wide range (0.75mg/l Palla Mandir to 140 mg/l
Chatarpur Mandir).Three locations are showing
more than 100 mg/l i.e. Inderlok Temple well (116
mg/l), Chattarpur Temple (140mg/l) and Chawala
(136 mg/l). The higher nitrate concentration may be
attributed due to combined effect of contamination
from domestic sewage; livestock rearing, landfills
and run off from fertilized fields, unlined drains and
cattle sheds. The higher concentration of nitrates
are found at the places where domestic effluent is
discharged into open unlined drains. The higher
concentration is mainly due to point source of
contamination. Delhi’s ground water has more
nitrate contents at shallow levels but decrease with depth. This is mainly due to the sub-standard well
construction and location factor of wells near potential source of contamination like domestic effluent. Water
Quality map is shown in Fig.4.
Major Ground Water Related Problems
Qualitatively, NCT Delhi has three major problems – salinity, fluoride and nitrate. There is a large variation in
saline fresh water interface in the horizontal and vertical direction. In NCT Delhi, the fresh saline interface
varies from 22m (North West district, excluding the area of Yamuna Flood Plain) to > 100m (South district).
The existence of saline water at shallow depth inhibits the development of fresh ground water. Fluoride
concentrations in ground water is more than 1.5mg/l in more than 30 percent of the area. The fluoride
affected areas are spread mainly in the South-western and Western part of the city comprising Southwest,
West and Northwest districts. Nitrate concentration is significant particularly in the parts of West, Southwest
and some pockets in Northwest districts. Concentration is more at shallow levels but decreases at deeper
Fig.4

154
levels. Near Okhla – Kalindi Kunj Barrage, high nitrate in ground water is observed on the western bank of the
river Yamuna.
Feasibility of Rainwater Harvesting and Artificial Recharge
Delhi receives normal rainfall of 611.8 mm in 27 rainy days, most of which is going waste as runoff. The runoff
being generated from the rainfall is about 194 MCM. Artificial recharge worthy areas have been demarcated
based on the depth to water level and showing decline trend in water levels. These are:
• Area underlain by Newer Alluvium with water levels more than 8 m: Areas falling in this category are-
Vasundhara Enclave, Preet Vihar, Vivek Vihar areas of East Delhi, Narela-Singhola areas of North Delhi,
• Area occupied by Older Alluvium with water levels 8 to 20 m: Areas falling in this category are Connaught
place, Lodhi Road and Lodhi Colony, Parts of Lutyen Delhi, Karol Bagh, IARI Pusa, Parts of Southwest
district-Dwarka, Najafgarh.
• Area occupied by Older Alluvium with water levels 20 to 40 m: Areas falling in this zones are: Central parts
of Chattarpur Basin, Gadaipur , Ghittorni and Surrounding areas, Parts of South district-AIIMS, Green Park,
Hauzkhas, R.K. Puram, Malviya Nagar
• Area occupied by Older Alluvium with water levels 40 to 70 m: Areas along Mehrauli-Badarpur Road,
Tughlakabad-Pushp Vihar, Lado Sarai, Saket.
• Area occupied by Older Alluvium of depth 10 to 20 m followed by weathered and fractured quartzite with
water levels varying between 20 to 40 m. (Fringe areas of ridge): Parts of C.R. Park, Kalkaji, Parts of
Connaught place, Rajendra Nagar, Parts of Karol Bagh, Parts of Vasant Vihar
• Area occupied by Weathered and fractured quartzite with water levels varying between 20 to 60 m : Delhi
ridge extending from Kamala Nehru ridge to South Delhi, Vasant Kunj, Vasant Vihar, Okhla Industrial Area.
A basic design for roof top rain water harvesting is shown in Fig. 5 Fig.5
Several seasonal streams located in
Delhi Ridge which occupies about 145
Sq.km of area have substantial flows
during the monsoon. A total of 17
watersheds have been recognized in
the ridge and adjoining areas having
estimated runoff of 6.785 MCM in a
normal rainfall. Apart from this on-
channel storage of storm water in
Najafgarh, Mungeshpur, Bawana and
Kushak-Barapullah will be the tune of
about 122 MCM. Off-channel storage
of flood water along these canals can
also yield about 15 MCM of water.
GROUND WATER DEVELOPMENT
STRATEGY
The ground water resources of 20
tehsils of NCT, Delhi are over-
exploited with stage of development
reaching to even 243% in south
district. Moreover, the presence of
saline aquifers below a depth of 30 to
40 m further limits the development
of ground water resources. Thus the
complex situation of ground water
existence calls for scientific planning

155
to make the ground water resources as sustainable source for water supply in NCT, Delhi. Few of the
management strategies to develop ground water resources on sustainable basis are discussed below.
Utilizing Potential Aquifers Underlying Yamuna Flood Plains: Yamuna Active Flood Plain Aquifer System
occupies an area of 97 Sq.km and stretches for about 35 Km along river Yamuna. The potential aquifers
underlying the Newer Alluvium (Yamuna Sand), which is predominantly silty sand, mixed with clay and gravel
can be developed on sustainable basis adopting the technique of abstraction during the non-monsoon period
and recharging the same aquifers during the flood season. Total thickness of Newer Alluvium varies between
45 to 55 m (Plate-4.1). Aquifer system in Newer Alluvium is unconfined with depth to water level ranging from
of 0.5 to 3.50 m bgl and can sustain the tubewells with yields ranging from 1400 to 2800 lpm.
Four Potential areas have been identified to construct high yielding tubewells. These are Palla-Hiranki Sector,
Akshardham Mandir- Mayur Vihar Sector, DND Flyover Sector and Kalindi Kunj-Jaitpur Sector. From these four
sectors 65 MGD of fresh ground water can be exploited on sustainable basis. The dewatered aquifer zones
would be recharged during the monsoon period through flood water.
Water Supply Plan for Dwarka Township: The projected water requirement for Dwarka township is estimated
as 10 MGD. As the Dwarka township, extending in an area of about 35 Sq. km has limited prospects for fresh
ground water development. Hence it is proposed to have dual water supply scheme for the entire township
where in 5 MGD of fresh water for drinking purposes can be supplied through a battery of 70 number of
tubewells (of 30 m depth) proposed along the Najafgarh drain. Three pockets (topographical depressions) have
been identified a) Gummenhera depression b) Pochanpur depression c) Kakraula depression. The fresh water
supply can be supplemented by another 5 MGD of fresh to marginal quality of water through a battery of 70
number of tubewells proposed within the township and can be supplied through the same transmission line
for domestic uses at pre-decided hours of the day or through separate pipe line.
Water Supply to Rural areas in Northwest Delhi: Central Ground Water Board, based on the detailed ground
water exploration studies, identified the potential aquifers in the area along the Western Yamuna Canal. The
area is underlain by sand, medium to coarse grained, admixed with varying proportions of kankar horizons
predominantly at shallow depths and it acts as moderately potential aquifer zones. A thick column of fresh
ground water aquifer system exists down to a depth of 50 to 70 m in the vicinity of Western Yamuna Canal and
thickness decreases away from canal. The ground water development plan envisages the development of fresh
ground water aquifers underlying Western Yamuna Canal by constructing 40 tubewells of depth 50 to 70 m all
along the canal. The discharge of these tubewells will be about 600 to 800 LPM and can be pumped for 12 to
15 hours a day. These tubewells can yield about 5.0 MGD of water for drinking purpose to be supplied to the
villages located in North west district.
Water Supply System for East Delhi: The area is underlain by Newer alluvium consisting of predominantly
sand mixed with gravel and little amount of silt and clay upto a depth of about 30-40 meters followed by older
alluvium. Presently shallower ground water level area are found in the vicinity of river Yamuna and also in
scarcely inhabitated areas. In general the ground water in shallow aquifers in the vicinity of river Yamuna has
lower salinity and it increases towards west reaching to its maximum in the vicinity of Gazipur landfill site.
It is proposed to develop the fresh ground water resources present in the areas where ground water levels are
shallow about 3 to 5 m bgl. In these areas, it is recommended to construct tubewells of depth varying between
40 to 45 m. These tubewells will yield about 1000 to 1500 lpm of water and can be pumped for 12 to 16 hours
a day. Development of ground water resources of East Delhi shall be coupled with effective promotion of
recharging to ground water and water conservation techniques. About 35 Sq.km area has been identified in
East and North East districts where water levels are shallow to construct the tubewells. About 40 tubewells are
recommended in these two areas which can yield 10 MGD of water. These tubewells shall be developed with a
caution of promoting the rain water harvesting to recharge the ground water aquifers.
Waste Water Re-use: In Dry season approximately 2,867 Mld of sewage including industrial effluent is
discharged to the Yamuna River from the various drains and nullahs in the city. Thus there exist a great
potential for recycling treated domestic wastewater that can be used primarily for irrigation and horticultural
reuse. There is also some demand for use of wastewater as cooling water in the power stations. In addition
other options include return to the raw water source, treatment and reuse of wastewater for toilets systems

156
etc. At present about 1349 MLD of wastewater generated in the city is treated by sewage treatment plants and
rest of the waste water is being discharged into the drains without any treatment. INTACH in a study,
sponsored by DJB, has advocated the use of secondary/tertiary treated effluent as a regular recharge source.
The main features of the plan revolve around the natural drainage basins of Delhi, the Sewage Treatment
Plants (STP) located therein, the available government ownd land where detention basins could be flooded on
a regular basis using treated effluent as well as rainfall runoff. A total of 56 projects have been identified with
an estimated cost of 343.44 Crores resulting in an estimated recharge of approximately 30 MCM annually. The
proposals are slated for implementation over 5 years.
Exploration and Development of Brackish Water Aquifers: Ground water over-development not only resulted
in depletion of fresh ground water resources but also gradual invasion of brackish water into fresh water
aquifers. Thus it has become eminent to explore the brackish water areas located within shallow/water logged
areas to promote the scientific management and proper planning for exploitation of brackish water which is
the only effective controlling method of spreading brackish water front. At present about 670 Sq. Km of area
has brackish water at shallow depths which can be developed to use for domestic uses other than drinking
purpose. Moreover, it will also result into arresting spreading of brackish water. Six areas have been identified
for ground water exploration under the scheme
• Area extending from Sanoth-Bhaktawarpur-Bhalsawa-Jahangirpuri-Dhirpur-Burari-Hiranki areas.
• Bawana-Barwala-Puthkalan-Rohini- Kanjhawla-Majra dabas
• Subhey pur-Sonia vihar-Sadat pur area
• Pragati Maidan-National Zoological Park-Nizamuddin-Saraikalekhan-Okhla Village- Friends colony
• Sarita vihar-Jait pur and area along Agra canal
• Dwarka-Janakpuri area
Development of brackish water aquifers will yield about 80 MGD of water. Brackish water can be used by
providing the dual water supply system where the same pipe lines can be used to supply fresh water as well as
brackish water for domestic uses at pre-determined hours of supply. The brackish water can also be mixed
with fresh water to bring the elements under permissible limits as per drinking water standards.

157
PATNA URBAN, BIHAR
S.N. Dwivedi, R.K. Singh & Dipankar Saha, CGWB, Patna / Faridabad
INTRODUCTION
Patna- the capital of Bihar state- is amongst the few oldest surviving cities of the world with a continuous
recorded history dating back to the 5th
century BC. Along with few other Indian cities like Varanashi, Madurai
and Kanchipuram, it is symbolic of India’s long urban heritarge (Ramchandran, 1999). Its strategic location with
important rivers on three sides (Ganga, Sone and Punpun) has earned it the sobriquet of ‘Jal Durg’ in historical
accounts (NCERT, Ancient India). The original name of Patna was Pataliputra and in its journey through the
pages of history, the city has been variously named as Kusumpur, Pushpapur, and Azeemabad. Modern Patna
is the second largest city of eastern India and is vibrant with the trading, political and academic activities. The
city is also a gateway to the internationally acclaimed Buddhist and Jain pilgrimage centres of Bodhgaya,
Vaishali, Rajgir, Nalanda, and Pawapuri. The Patna Urban Area with a population of ~1.7 million and absolute
dependence on groundwater to meet its domestic and industrial water demand is a unique example.
GENERAL FEATURES
Area/Administrative Division
Patna Municipal Corporation (PMC) along
with Danapur Cantonment Area, Danapur
Nagar Palika Parishad area, Khagaul Nagar
Palika Parishad area and Phulwari Sharif
Nagar Palika Parishad together constitute the
Patna Urban Agglomeration Area (PUAA)
which is spread over an area of 135.7 Sq Kms
(Fig 1).
Demography
Patna is the only city in Bihar with a
population exceeding 1 million (Census
2001), constituting ~20 % of the total urban
population of Bihar. The population of the
Patna Urban Agglomeration area has
increased from 6.02 lakh in 1971 to 16.97 lakh in 2001. The projected population for 2011 and 2021 is 22.5
Lakh and 28 lakh respectively; however, owing to severe push factors in its hinterland the population is likely
to surpass the projected increase.
Hydrometeorology
The city enjoys a sub-tropical sub-humid climate with three distinct seasons viz, monsoon (June to September),
summer (March to May) and winter (December and January). The long-term average annual rainfall (1930-
1980) is 1051 mm. The average annual rainfall during the last decade was 1115.9 mm. The city experiences
extremes of temperature with the normal temperature going as high as 440C during summer and to as low as
40C in winter. The highest temperature recorded was 47.8
0C in June 1987. With the advent of monsoon, the
temperature starts decreasing during July and August. The temperature is the lowest during the month of
January. Relative humidity shows a sympathetic variation with the rainfall. The relative humidity in Patna
ranges between 84.8% and 56.8% in the morning, with higher humidity during the monsoon season.
Physiography & Drainage
Physiographically, the area lies in the Middle Ganga Plain representing monotonously flat topography (Fig 1).
The nucleus of the residential areas of Patliputra was the prominent natural levee along the southern bank of

158
the River Ganga. Subsequent expansion followed the levee towards east and west rendering the town an
elongated shape. Post-independence, the expansion has pushed the city southwards invading the low lying
water logged areas along Patna bypass road. The low lying area of southern Patna is actually a back swamp of
river Ganga in the north, Punpun in the East and South and Sone in the west. The topographical variation
within the Patna urban area indicates that the general slope is from west to east with minor variations. Patna
urban area within itself does not contain any major streamlets except for a few scattered drainage lines in the
south western part trending generally towards south and south-east. The natural drainage pattern in north
Patna is completely obliterated due to habitation. As a result of improper drainage a number of small water
bodies are formed in east Patna and along the railway line.
Soil Type
The light to dark brown alluvial loamy soil of Patna with low to medium nutrient status and pH between 6.3
and 8.2 is characterised by moderate permeability.
STATUS OF WATER SUPPLY AND DEMAND
Ground water based piped water supply system was first introduced in Patna in 1916 when water supply in
areas around Patna High Court was made through a large diameter dug well constructed at Digha. During
1920, three tubewells were constructed with an average depth of 122m. In the 1934 earthquake most of the
wells were destroyed. To meet the city water demand and extend the water supply network to other part of
the city “Patna Bankipur Joint Water Works Committee” was entrusted with task to supply water to Patna city
and Bankipur Municipal Area. Further, after enactment of Patna Municipal Corporation Act 1951, the
Corporation was formed in 1952 by merging Patna and Bankipur Municipal area.
The present water supply of city is done through a network of 89 deep tube wells tapping the deeper aquifer in
the range of 150- 200m below ground. As per an estimate these wells cover about 52% of the population
(JNNURUM, 2006) and the estimated annual production of water through these wells is ~140 MCM. About
40% of the households have their own tube wells, having a depth range of 40 to 100 m in different parts of the
city. The annual abstraction through these private tubewells has been assessed as ~40 MCM. The progressive
increase in the number of water supply wells in the municipal area and annual production of water from these
wells is shown in Table 1
Table 1 Progressive increase in water supply wells and annual production of water
Year No of Water supply wells Total installed capacity m3/hr Annual abstraction of water (MCM)
1972 18 0.5*104 33.44
1980 44 1.40*104
81.76
1988 59 1.83*104 107.3
2008 89 2.97*104 136.87
GROUND WATER SCENARIO
Potential Aquifers
Aquifer geometry of Patna urban area has been
delineated by combining the geological and
hydrogeological information.
Thick pile of alluvial sediments of Quaternary age
comprising various grades of clay, silt and sand,
forms the ground water reservoir of Patna. A
pervasive layer of clay with or without kankar
constitutes the top of the succession. Towards
the southern and the western part this overlying
clay layer is admixed with fine sand. The presence
of kankar and fine sand makes this clay layer semi

159
pervious rendering the underlying shallow aquifer amenable to vertical recharge through infiltration. The
aquifer system (based on exploratory drilling and geophysical logging) has been broadly divided into two
groups (Fig 2). An aquitard layer made up of clay/ clay mixed with sand or kankar is present between the depth
range of 45 and 70 m. This aquitard layer separates the overlying shallow aquifers with the underlying deeper
aquifer. The top clay layer is underlain by sandy clay and fine to medium sand and together constitutes the
shallow aquifer system. However, towards the eastern part of the urban area the shallow aquifer system is not
well defined and is replaced by a thick aquitard layer.
The deeper aquifer which commences below the intervening aquitard layer is made up of medium to coarse
grained sand often grading to gravelly sand at the bottom. In most parts of the urban area, the deeper aquifer
has been found to continue uninterrupted upto 220 m. Below 220 m another clay layer has been found at
several locations. The lateral continuity of this deeper clay layer could not be traced owing to insufficient
depth of drilling at other locations. However, this clay layer may be considered as the base of the deeper
aquifer which presently caters the entire water demand of Patna. The salient characteristic of the exploratory
wells drilled in and around the urban area is summarized in Table 2.
Ground Water Level
The water level of the shallow
aquifer and the piezometric
head of the deeper aquifers
in Patna urban area are
markedly different.
Systematic monitoring of the
piezometric level of the
deeper aquifer was initiated
from June 2008 at 7 locations
within the urban area. During
2009, 3 more piezometers
were installed tapping the
deeper aquifer. The available
records of the past along with
the present data set
exhibiting signs of stress on
the deeper aquifer are
presented in Fig 3.

160
The Piezometric level of the deeper aquifer in Gandhi
Maidan area during 1988 and that of 2009 shown in
Fig.4 reveals a decline of 2.5 m over the past 2 decades
(0.12 m/ year).
The pre and post-monsoon (2010) depth of piezometric
level of the deeper aquifer is shown in Fig. 5 and 6
respectively.
The piezometric level of the deeper aquifer exhibits
moderate seasonal fluctuation of ~ 4 m.
During long duration pumping tests conducted on wells
tapping deeper aquifer, no effect has been recorded in
nearby dugwells reflecting poor hydraulic connection
between the shallow and the deeper aquifers. The
depth to water level of the shallow aquifers has been
found varying between 0.78 and 10.78 m during pre-
monsoon and 0.68 to 7.7 m during post-monsoon. The
difference in the water level of the shallow and the
piezometric level of the deeper aquifer monitored at
same location at three different parts of the city is
shown in Table 3.
Table 3: Comparison of water level of the shallow aquifers and the piezometric level of the deeper aquifer
Location Shallow aquifer Deeper Aquifer
Pre-Monsoon
(m bgl)
Post-Monsoon
(m bgl)
Pre-Monsoon
(m bgl)
Post-Monsoon
(m bgl)
Gandhi Maidan 3.44 1.33 13.32 10.49
Kankarbagh 4.98 2.95 11.52 8.64
Khagaul 3.31 2.45 9.08 6.49
The groundwater regime of the shallow aquifers has not shown any major change over the years. Long term
water level trend of an open dugwell in the urban area ( CGWB, MER data) rather shows a slightly rising trend.
Ground Water Resources & Status of Development
As per the provisional figures of the dynamic ground water resource estimation of Bihar (GWD & CGWB 2011),
the replenishable ground water resource of Patna Sadar block is 43.21 MCM. The stage of development has
been assessed as 74.6%. It thus indicates that the shallow aquifer system supplements only a fraction of the
total drinking requirement in the urban area. As about 18% of the land use in the Patna Urban agglomeration
area is under agricultural uses, shallow aquifers are mainly being tapped through shallow tube wells for
Fig 5. Pre-monsoon (2010) depth to
piezometric level map
Fig 6. Post-monsoon (2010) depth to piezometric
level map

161
vegetable farming being practised in the urban fringe areas. To meet the drinking, domestic and industrial
water requirement in the urban area, the deeper aquifers are mainly being used.
Over the last 40 years, the ground water extraction in the urban area has increased from ~40 MCM to ~180
MCM; however, the contribution from aquifer storage is within 1% of the total ground water draft. The total
ground water availability in the deeper aquifer within the urban area has been assessed as 1,500 MCM. The
depletion in aquifer storage (15 MCM over past 40 years) attributable to the decline in piezometric level is just
1.0 % of the total resource of the deeper aquifer (Dwivedi et al., 2011). It is thus apparent that the high
potential deeper aquifers of Patna urban area can sustain the future water demand.
Hydrochemistry
Ground Water from the deeper aquifer which are tapped through deep tube wells have been found suitable
for drinking uses. The average EC of groundwater from the shallow aquifer (1100 µS/cm) is higher in
comparison to that of the deeper aquifer (440 µS/cm). Concentration of nitrate in ground water from the
shallow aquifer has been found above the permissible limit (> 45 ppm) in some parts of the urban area. The
mean chloride concentration is also higher in ground water from shallow aquifers (142 ppm) in comparison to
the deeper aquifer (41 ppm). Earlier studies by Ghose et al. (1986) and Ghose and Sharma (1986) have
indicated high bacteriological contamination in samples from dugwells with Most Probable Number (MPN)
count ranging between 1000 and 25000 per 100 ml. In areas where open channel carries sewage and waste
water, faecal tests have been found positive in samples from dugwells (Maitra & Ghose, 1992).
Major Ground Water Related Problems
Some of the major ground water related problems pertaining to the urban area are:-
• The water quality of the phreatic aquifers in the urban area exhibits signs of contamination from the
surface sources. The contamination is higher in the water logged area, along the open sewage lines and
towards the southern part along the Patna bye pass road. Unplanned disposal of solid and sewage wastes
is the main reason causing contamination to the phreatic aquifer.
• Threats of contamination of the phreatic aquifer from biomedical wastes (TOI, dated 10/2/2011)
• Decline in the piezometric head of the deeper aquifer (13 cm/year) during the previous 2 decades is
another concern.
• The distribution of the high discharge municipal supply wells is concentrated in the eastern and central
parts of the city. In this part of the city, the thickness of the deeper aquifer which is presently being
tapped is also less as compared to the western and the southern parts.
Feasibility of Rainwater Harvesting and Artificial Recharge
Rain water harvesting and artificial recharge are suitable only for the deeper aquifers of Patna urban area. The
area suitable for recharge with minimum depth of the recharge well is indicated in Fig. 7. As the shallow
aquifers are barely used and the deeper aquifers
are extensively exploited, artificial recharge
through combination well may be a feasible
option. However, recharge through combination
well is to be carefully planned before attempting
this option as quality of ground water from the
phreatic aquifer is of sub-potable quality at many
places. Such combination well is based on Siphon
principle (NPRL, 1977) as the piezometric level of
the deeper aquifer is lower than the water level of
the shallow aquifers in the Patna urban area. A
combination well consists of a dugwell section
tapping the phreatic zone and a tubewell section
screened in the deeper aquifer to be recharged Fig 7 Area suitable for recharge with minimum
depth of the recharge well

162
(Karanth, 1997). The design of the dugwell portion should be such as to sustain full, continuous flow through
the tube well section ensuring that the water is
naturally filtered. The design of the combination
well is shown in Fig 8. The recharge capacity of
a well is the maximum rate at which it can take
in and dispose of the water admitted at or near
its upper end and is approximately equal to the
product of the specific capacity and the
available pressure head (Meinzer, 1923). The
specific capacity of the wells in the Patna urban
area has been found varying between 50 and 80
m3/hr/m. The available pressure head (the
difference in the hydraulic head of the shallow
and the deeper aquifer) may be considered as 4
m. Thus, the recharge capacity has been worked
out as ~1000 m3/day.
GROUND WATER DEVELOPMENT STRATEGY
The Highly prolific aquifer system is capable of long term water supply of the Patna Urban area by adopting a
sustainable management plan which should address the following key concerns:-
• There is substantial water loss as well as threats of contamination during transmission through the old
distribution pipelines. The unaccounted flow of water (UFW) has been estimated as 40% ( JNNURUM
2006) in Patna urban area. Steps should be taken on priority to reduce the UFW to 10% through
rehabilitation of the old pipeline network and providing a mechanism for proper water monitoring (i.e
bulk metering and consumer metering system).
• The storage capacity in Patna urban area (~ 6% of the total supply) is much below the Central Public
Health and Environmental Engineering Organisation (CPHEEO) norms of 1/3rd
of the total supply. Owing to
insufficient storage capacity, direct supply in the distribution pipelines is made through continuous
pumping for long hours leading to high frictional losses (Maitra & Ghose, 1992). Continuous pumping for
long hours also causes interference of the drawdown cones in the eastern and the central part of the
urban areas which has higher concentration of the water supply wells. There is also uneven supply in
different parts of the city which is presumably due to low pressure head at the tail end of the distribution
network.
• The installed capacity of the municipal water supply wells range from 136 to 454 m3/hr. As the municipal
supply wells in general are high discharge wells, it is essential that they be located in areas with higher
transmissivity so as to have minimum drawdown, thereby indirectly saving the energy cost of pumping. As
the natural growth of the city is taking towards the western part, high discharge wells can be installed in
this part of the city to meet the projected water requirement as these areas are better suited for
groundwater development from hydrogeological standpoint.
• Artificial recharge of the deeper aquifer in Patna urban area should also be taken as a key component of
the sustainable ground water management plan. The intended benefit from artificial recharge is to
maintain the piezometric level so as to save the energy cost of pumping in the urban area. The areas
suitable for artificial recharge are in the eastern and the central parts of the city. Recharge to the deeper
aquifer can be attempted through roof top water harvesting and recharge through wells as well as
through combination wells.
• To prevent the shallow aquifer system from the threats of pollution from sewage, solid and biomedical
wastes along with other anthropogenic sources, proper arrangements for their safe disposal is essential. It
is suggested to dispose of waste as treated effluents in the sewage streams or nalas. Sites for land fills
must be selected away from habitations and should be provided by impervious lining. Sewage nalas which
are flowing in the city should have both lateral and bottom lining to prevent horizontal and vertical
seepage. Sanitary protection around tubewells and dugwells must be made.
Piezometric surfaceRecharge cone
Confined aquifer
Combination well
Ground surface
Pheratic aquifer
Ground surface
Drawdown cone
Fig. 8 Design of combination well

163
• Steps should be taken to generate a reliable data base on the quantum of ground water withdrawal in the
urban area. Co-ordination amongst the different agencies dealing with the water supply aspect is
desirable to manage the ground water resources in an effective manner.
• To ascertain the detailed configuration of the multi-aquifer system underlying the urban area and account
for the inter-aquifer interaction upto the inferred depth of ~ 700 m, deep drilling upto the basement and
installation of piezometers in each aquifer system is essential.
REFERENCES
• Bose P. K., Saikia B.C. and Mukherjee B.B. (1966) Refraction seismic survey for ground water in Patna
and Gaya districts Bihar, unpublished report, GSI, Calcutta.
• Ghose N.C. and Sharma C.B (1986) An integrated study of the pollution of Dugwell around Patna, Bihar.
In Radakrishnan, B.P. and Ramchandran K.K. (ed.), India’s Environment : Problems and Perspectives,
Geol. Soc. Ind. Mem. v 5, p. 175-182.
• Ghose N.C., Sharma C.B and Sinha, S.N. (1986) An appraisal of the quality of drinking water resources of
Bihar, a case study from eastern India. Ind. Jour. Landscape Systems ecological study, Calcutta, v. 9, p
55-63.
• GWD and CGWB (2011) Dynamic Groundwater Resource Estimation of Bihar.
• JNNURUM (2006) Patna City development plan, Appraisal report
• Karanth K.R., (1997) Ground Water Assessment Development and Management. Tata MacGraw Hills
• Maitra M.K. and Ghose N.C. (1992) Ground water management-an application, Ashish Publishing House,
New Delhi
• Meinzer, O.E. (1923) Outline of Ground water hydrology with definitions, water supply paper, USGS,
494 p 71
• National Physical Research Laboratory, Ahmedabad (1977) Artificial recharge experiments for
underground storage of water based on Siphon principle, p 62
• NCERT (2006) Ancient India.
• Ramchandran, R. (1999) Urbanization and urban systems in India. Oxford University Press, New Delhi.

164
PANAJI CITY, GOA
K.R.Sooryanarayana & J.Davithuraj, CGWB, Bangalore INTRODUCTION Goa is the smallest state of India and is located on the West Coast of India. Panaji is capital city of Goa state. The early administration of Panaji was carried out by the Kadamba Kings. Panaji was often referred to as Pahajani Khali-Pahajani from which Panaji supposedly got its name and khali probably refers to the creeks and backwaters abounding in this area. The Portuguese, soon after the conquest of Goa, refer to Panjim as Panaji or Ponji, which is said to mean ‘the land that never gets flooded’. It is also said that the word Ponji is derived from Panch Yma Afsumgary or five wonderful castle where the Muslim king-Ismail-Adil Shah and his wives used to live. Its name was later changed by the Portuguese into Panjim. In 1510, when Portuguese occupied Goa, Panaji was a small ward in Taleigao village. The only prominent construction in Panaji was the 15th century castle built by Adil Shah on the Southern bank of the Mandovi River. In 1759, when the abode of the Viceroy Count of Ega was shifted to Panaji, the old castle build by Adil Shah was completely remodeled and a palace was built. This palace, which was used as the Government Secretariat during the Portuguese period, initiated some kind of growth spurt in the city. On March 22nd 1843, Panaji was officially declared as the capital of Portuguese Goa. Portais, Fontainhas and Boca da Vaca are the oldest settlements which developed around two freshwater springs. These old residential areas are characterized by narrow streets edged by low rise houses and bungalows. Several important buildings were constructed in Panaji between 1826 and 1870. The residential areas of Altinho and Campal were opened for development in 1893 but actual growth took place between the years 1929 and 1940. Development spread along the seafront towards Cabo and Dona Paula during later period. Portuguese Viceroy, Dom Manuel De Portugal E Castro carried out extensive works of reclamation and leveling of sand dunes of the area and starting from Old GMC hospital Complex and covering the whole of Campal and Miramar till Tonca. Post 1961 after Goa became part of Indian Union, the area around Miramar beach was opened to development. The new Patto complex which is a high rise commercial complex was designed and executed after the year 1985. GENERAL FEATURES
Area / Administrative Divisions Panaji is located on the Southern bank of the Mandovi River and Northern bank of the Zuari River. It lies between the 150 27' 00'' - 150 30'00'' North latitude and 730 47' 00" - 740 50' 00" East longitude. The geographical area of the Panaji city is 8.21 sq.kms falling in Survey of India toposheet No 48E/15. (Fig.1). Panaji city has a mixed economic base, the, more significant amongst them are Trade & Commerce, Tourism, Hospitality / Hotel & Restaurants. Being a state & District Head Quarter, the role of administrative activities in the economy became important. There are small parks and gardens along a traditional street and square pattern, beaches at its western tip and large open maidans. These are well conceived public open spaces

165
strategically located to enhance the entire structure of Panaji city. Some of those are the Municipal Garden,
the Azad Maidan, the Menezes Braganza and the Campal gardens. These small parks and gardens, which were
once an integral part of the city, functioned as the city’s lungs. The municipal gardens used to play bands to
entertain visitors in the evening.
Connectivity: Panaji city is well connected with Highways (No.17 and 4A) with the rest of the nation and it has
about 77 kms. of road network within the city with arterial, collector and local level of roads The prominent
movement patterns are located towards the central areas of Panaji which houses the prominent natural and
built heritage, carnival and festival areas and commercial and accommodation areas along with the
administrative, institutional and other departmental offices. This central zone has maximum concentration of
pedestrian and vehicular movement.
The D B Road is the most frequented road as it is a scenic route that leads not only to the western tip of Dona
Paula which has viewing point, but also to Ribander and further to Old Goa. It is the widest road in Panaji and
is designed as a promenade. Several buildings in the central area of Panaji are arcaded and hence provide
shaded pathways for the movement of pedestrians. Most pedestrian movement is seen on all the main roads
in the central area,which includes Dada Vaidya Marg, A B Road, 18th June Road, M G Road and other which
lead to the Kadamba bus station via church square and foot bridge over ourem creek.
Demography
As per the 2001 census, Panaji city has a population of 59,066 (Male: 29,911 and Female: 29,155) and Panaji
(Urban Agglomeration) has a population of about one lakhs (Actual figure is 99,677). The population has
grown from 35 thousand populations in 1971 to 60 thousand in 2001 (Table.1). Panaji city contributes 4.38% of
population of Goa State. It has 13,581 households and an impressive sex ratio of 975 female per 1000 male.
The projected population figures are shown in Table.2.
Table : 1 Population of Panaji from 1971 to 2001
Year Persons Male Female Decadal growth
1971 34953 18577 16376 1.45
1981 43165 22798 20367 +23.49
1991 43349 22542 20807 +00.43
2001 59066 29911 29155 +36.26
Source: Panaji CDP (Primary Source: Census of India)
Table 2: Projected population of Panaji City
Sl.No Year Population Density (per/Sq.kms
1 2001 59066 7211
2 2006 61171 7553
3 2010 69002 8498
4 2015 76415 9411
5 2020 85181 10490
6 2025 95300 11736
7 2030 106772 13149
Source: CDP, Panaji
Hydrometeorology
Panaji city falls in the tropical zone and due in proximity to Arabian Sea has a moderate climate. For most of
the year the city experience warm and humid climate. The hottest month is May, during which the
temperatures goes as high as 350C.The summer season prevails from March to June. Panaji receives rainfall
from June to September. The annual rainfall in the year 2010 was 3862.6mm. The winter season prevails from
November to February.
Climate : Due to proximity to the Arabian Sea, the city is generally humid with further rise during the
monsoon season. During summer months the relative humidity is generally about 60%.

166
Rainfall : Panaji receives its rainfall mainly during the southwest monsoon (June to September). One rain
gauge station located in the city, is maintained by Indian
meteorological Department (IMD). The detail of annual rainfall for
the period from 2001 to 2010 is presented in the Table 3. The 30
years normal rainfall of Panaji is 2766.9 mm (1971-2000).
Physiography and drainage
Goa is located on the slope of the Western Ghats. Some peaks of
Sahyadri Ranges of Western Ghats are located in the Eastern Part
of the State. There are three main physical divisions which are the
mountainous region of the Sahyadris in the east, the middle level
plateaus in the centre and the low-lying river basins, and the
coastal plains. Panaji is located on dissected table land
characterized by thick lateritic cover followed by low lying coastal
plains. It has marine land form towards the west with the
elevation ranging from 0 to 57 m amsl. Generally elevation ranges from 0 to 10 m amsl.
Goa has an extensive network of river systems. Important rivers among them are Terekhol, Mandovi, Zuari and
Talpona. Among all the rivers Mandovi is considered the most important. Panaji city has one small drainage
which originates from Altino hills and joins in the Mandovi river near Champal area.
Soil Type
Soils of the city can be grouped into two classes namely Lateritic soils which are confined to Altiho hills and
foothill areas and also in Donapaula area. Remaining area is covered by coastal alluvial sand and clay. Beach
sand is occurring on Miramar beach area.
STATUS OF WATER SUPPLY AND DEMAND
As per data of the Public Work Department (Water supply), presently, the town is supplied with 11 MLD of
water at the rate of 180 liters per capita per day from OPA water works, Ponda. There is no shortage of water
to the city.
WATER PROFILE
As mentioned above, The city is fed by surface water source from OPA water works. Duwells and few bore
wells in the area also cater the needs of domestic water to some extent.
GROUND WATER SCENARIO
Goa state is dominantly covered by the rocks of the Goa Group belonging to Dharwar Super Group of Archaean
to Proterozoic age, except for a narrow strip along the north eastern corner which is occupied by Deccan Trap
of Upper Cretaceous to Lower Eocene age. The Goa group is consisting of green schist facies and is divided
into Barcem, Sanvordem, Bicholim and Vageri formations in the ascending order of super position.
Panaji town is underlain by metagreywacks and argillites of Savordem Formation of Goa Group. The
metagreywacks is fine to medium grained, hard compact, faintly schistose in nature and dark green to
greenish black in colour. During Sub-Recent and Recent times, the rocks have been lateritised capping the
older country rocks . The thickness of laterites varies between 18 to 40 m bgl, followed by lithomargic clays at
the bottom. The laterite on the top of Althno and Donupaule areas is very hard.
Recent marine deposits consist of sands, gravels, pebbles having intercalatuions of clays and silts. Aeolian
sand also occurs on the top of the marine deposits and Beach sand deposits occur along the coast (Miramare).
Table.3 : Annual rainfall of Panaji city
Year Actual Rain fall mm
2001 2128.1
2002 2270.4
2003 2682.9
2004 2156.0
2005 3345.1
2006 2968.3
2007 3689.0
2008 2829.8
2009 3114.5
2010 3862.6
Source:IMD, Panaji, Goa

167
Potential Aquifers
Ground water occurs under phreatic condition in beach sand. laterites and weathered crystalline rocks in
shallow zones. The occurrence and movement of groundwater in the crystalline rock is along the weathered
and fractured zones.
Laterite is the most important water-bearing formation in and around the Panaji town, which covers over 60
percent of the city area. The lower section of the pallied zone, i.e., lithomarge, serves as an effective
aquiclude. Secondary laterite of detrital origin is good groundwater repository because of its opening and
loosely cemented zones. Besides the inherent porosity, the laterites are highly jointed and fractured, which
further enhances their water-bearing capacity. Like other formations, the degrees of weathering and
topographical setting of laterites have a definite role to play in deciphering ground water potential.
The thickness of laterites in the Panaji town area varies from 18 m to 40 m bgl and most of the dug wells are
tapping laterites aquifers. Depth of the dugwells range from 6.00 m to 10.00m bgl. Depth to water table
ranges between 1.50 and 6.70 m bgl. The diameter of the dug wells ranges from 2.00 m to 5.00 m. Specific
capacities varies from 1.73 to 3205 m3/day/m.
Bore wells have been drilled in the Althino platean, Panaji by PWD(PHE), Govt of Goa to a depth of 48 mbgl at
the foot hills which indicated that the thickness of the over burden ( laterites, lithomargic clay and highly
weathered argillites) is up to 50m bgl. The moderate weathered/fractured zones constitute aquifer zone in
argillites and reported yield from the bore well is 3.6m3/hr.
Three deposit wells have been drilled by CGWB in the Panaji town area i.e in Donapaule area during 1985 for
augmentation of water supply for irrigation and other purposes. The depth of wells ranges from 22.05 m to
79.0m bgl. The static water level ranges from 1.44 m to 18.0 m bgl. Details of the bore wells are presented in
the Table.4.
Table.4. Hydrogeological details of Panaji town
The beach sands along the coast are characterised by their primary porosity. The groundwater occurs in the
inter-granular pore spaces of sands, gravels and pebbles with intercalated clays muds and silts serving as
limited aquicludes. The gravel beds occurring at different depths varying from 1 to 8 m bgl in the beach sand
deposit and these are the most important water bearing horizons of the beach area. The aquifer zone
consisting of sand gravel and pebble occur at depth range of 1.00 to 18.00 m bgl. The depth to water levels
rests around 2.00 m to 4.00m bgl. Specific capacities varies from 27.10 to 200.78 m3/day/m.
Long-Term Water Level Analysis
Karanjhalen Network Hydrograph Station is situated in Panaji town area. The data for this station shows a
rising trend in ground water levels for the period from 1994 to 2010 (Fig.2).
Springs
Panaji has two fresh water springs namely Fonte Phoenix and Boca da Vaca. On the eastern side of Altinho Hill
is the Fonte Phoenix or the Fontainhas spring and on the western side of the hill and close to Mahalakshmi
Sl
No
Location Drilled by Total depth
(mbgl)
SWL
(mbgl)
Discharge
(lps)
Aquifer
1 Caboraj-I,
Donapaulla
CGWB 40.0 1.66 1.0 Lateritic gravel
2 Caboraj-II,
Donapaulla
CGWB 79.0 18.0 1.0 Lateritic gravel
Metagraywacke 3 Caboraj-III,
Donapaulla
CGWB 22.05 1.44 1.0 Sand
4 Western part of
St.inez
PWD 3.37 1.99 - Coastal Alluvium
5 VelisBhat st.inez PWD 28.00 - - Coastal Alluvium
6 Bhatlem PWD 48.0 - - Argillite
7 PWD Office Dn.IX
Tonca
PWD 29.0 - - Coastal Alluvium

168
temple is Boca da Vaca. Initially Boca da Vaca spring served as the major source of water supply for the city.
The discharge of these springs ranges from 0.02 to 0.53 lps.
Hydrochemistry
Seven dug well water
samples collected from
Directorate of Health
services, Govt of Goa and
have been analyzed for
assessment of suitability of
water quality given in Table
5. The ground water is
used for drinking and
domestic purpose. It is
observed that concentration
of all the chemical
constituents ground water
are within desirable to
permissible limit in water sample drawn from Chaitanya Appts area in Caranzalem. However, ground water
occurring in dug wells as well as bore wells is brackish to saline in areas adjacent to the coast and tidal areas
due to seawater. Salinity is more pronounced during May when fresh water flow is minimum and maximum
seawater ingress takes place.
Bacteriological Analysis:- To know the bacteriological organism of ground water in Panaji town, 13 dug well
samples data have been collected from Directorate of Health services, Govt of Goa. The results of the
bacteriological organism are furnished in Table 6. The perusal of table 6 shows that 7 dug well samples are
having high concentration of coliform organisms and acid and gas formation in lactose groth at 37oC is positive
as per standard proposed by BIS-1991 and is indicating non potable. Rests of six samples are having
concentration of coliform organism within permissible limit.
Table 6 Bacteriological Parameters
Sl
No
Location Source Bacteriological organism Status
Coliform Acid and Gas formation in
Lactose broth at 37oC
1 Sequeira petrol pump area Dug well Nil Negative Potable
2 St.Inez area Dug well Nil Negative Potable
3 Mahalaxmi temple Dug well Nil Negative Potable
4 Cama Pinto road Dug well Nil Negative Potable
5 Chaitanya Appts, Caranzelem Dug well Nil Negative Potable
6 Fontainhas, Mala Bore well Nil Negative Potable
7 Campo Verde Agl Caranzelm Dug well 14 Positive Non-Potable
8 Campal area Dug well 14 Positive Non Potable
9 Miramare area Dug well 11 Positive Non-Potable
10 J.B.Store, Mala Dug well 14 Positive Non Potable
11 Souza Towers Dug well 14 Positive Non Potable
12 Ribander Dug well 12 Positive Non Potable
13 Dona Paula Dug well 14 Positive Non Potable

169
Stage of Ground Water Development
Stage of ground water development is 55% (as on March 2009 for Tiswadi block) and the area as a whole falls
in SAFE category. There is scope for further development of ground water resource.
GROUND WATER DEVELOPMENT STRATEGY
Deeper ground water abstraction structures should be at least 0.5 km away from creeks and 400m away from
coastline in low-lying areas to avoid quality problems. Due to complexities of formations, structure and
morphological control, ground water development through shallow dug wells is ideal for the area. Caution is to
be exercised while ground water is developed through bore wells. Deeper ground water abstraction structures
should be at least 0.5 kms away from coast line in low lying areas to avoid quality problems.
Ground water occurring in dug wells as well as bore wells is brackish to saline in areas adjacent to the coast
and tidal areas due to seawater ingress in inland aquifers. Salinity is more pronounced during May when fresh
water flow is minimum and maximum seawater ingress takes place. Investigations have revealed that ground
water adjacent to stream course in the north east of Panaji is also polluted due to domestic sewage in addition
to salinity problem. Hence, periodical ground quality monitoring is a must for the area to use the ground water
for potable purpose.

170
PORTBLAIR TOWN, ANDAMAN & NICOBAR ISLANDS
Amlanjyoti Kar, CGWB, Kolkata
INTRODUCTION
The town of Port Blair named after the British Marine Surveyor Mr.Archibald Bair. At the behest of the then
East India company, he discovered it in the year 1774 for Penal Settlement. Because of several difficulties
including availability of water, the settlement could
not properly flourish. However, from 1859,
immediately after the Sepoy Mutiny, penal settlement
started with the establishment of the office of Chief
Commissioner of British colonial govt at Ross Island
(Fig-1). The population of Port Blair also started
accruing with the settlement of the banished convicts
in the small islands( i.e in Chatham, Viper , Hopetown
etc.) and in small patches in and around Port Blair.
Fig-1 View of Ross Island
To cater the drinking water need for the population, the British rulers constructed few dug wells and number
of ponds to harvest copious rainfall in the settlement areas and observed the problem of insufficient potable
water availability right from the beginning. Many such ponds still exist in Port Blair and at Viper and Ross
Islands. At Ross Island they even used to utilize the pond water for potable Mineral water production as early
as in the eighteenth century.
Earlier water requirement was somehow managed because of less population. But after indendence severe
water scarcity felt due to exodus of people. The Mega earthquake and Tsunami on 26th
December, 2004 made
an appreciable impact on civil structures and water sources in and around Port Blair Town. The tourism
industry, the backbone of the economy was hit hard in the Post-tsunami which was also coupled with water
scarcity situation. For the full-fledged growth of tourism industry which is one of the main source of economy
for the people, judicious planning in the water sector would be vital for a sustainable development and growth
of Port Blair town .
GENERAL FEATURES
Area / Administrative
Divisions of Port Blair Town
The Port Blair town,the
capital town of the Union
Territory of Andaman
&Nicobar Islands, falls in
the south Andaman Island
(Fig-2). The A&N Islands
have 572 small, medium
and large islands of which
36 are inhabited. Port Blair
is located at a distance of
1255 Kms from
Kolkata,1190 Kms from
Chennai and 1200 Kms from Visakhapatnam in sea route and connected to Kolkata and Chennai through
regular air services.
The town of Port Blair (Fig-2b) has grown slowly since its inception. However the town area expanded
considerably with the population explosion in Post nineties. The urban centre of Port Blair is run by Port Blair

171
Municipal council which is having a current jurisdiction area of 16.64 sq.km., incorporated in 18 Municipal
wards. During 1991 census the ward numbers under the Municipal council was only 11 which was expanded to
18 before the 2001 census .
Demography
The population of Andaman till 1951 includes only the population of Port Blair, population of the penal
settlements in parts of South Andaman and Maya Bunder in North Andaman. Noticeable rise in the population
observed in sixties, early seventies, as also from nineties. This happened due to two factors: i) Rehabilitation
of displaced persons from East Pakistan now Bangla Desh ii) Exodus of people especially from South India and
West Bengal in search of Livelihood. With rapid changes in demographic pattern, the water sources have
disappeared at many places with the destruction of hills and rain water recharge areas. Many perennial
springs either vanished or ceased to flow. Random encroachment in and around the Port blair town has
caused constriction of the reservoir capacity of many ponds and pollution of the water sources. As per 2001
census, the population of Port Blair urban area was 99984,consisting of 55373 males and 44611 females.
Hydrometeorology
The relative humidity in Port Blair varies from 79% to 89% ,while the wind speed varies from 7 km/hr to
10km/hr. The maximum and minimum ambient temperature fluctuates between 27 to 330c and 21 to 25
0c.
Daily evaporation rate in Port Blair is fairly high which cumulatively ranges from 1500-1800 mm. per annum .
The effect of global warming and climate changes are also influencing the rainfall pattern in the Archipelago.
This can be quite evident from the rainfall record in the islands. In the current decade the rainfall distribution
has become highly erratic and dwindling. Prior to 1990 the rainfall used to commence from 1st
week of April
every year, while now it has been receded to the end part of May to 1st
week of June as happened in 2001,
2002 and 2003. In 2002 the situation was so worse that Dhanikhari dam got dried up and the Port Blair town
water supply was totally shattered. Barring 2004 which recorded a rainfall close to normal, in the last few
years in the Post-tsunami the same vagaries of rainfall continues. Occasionally there was excessive rainfall as
observed in 2008 (4152.6 mm) or very close to normal i.e. 2010(3016.6 mm) , otherwise in majority of the
occasions, the downpour was below normal( 2005,2006,2007&2009).
Physiography and drainage
The area in and around the town of Port Blair is highly undulating. Small to moderate high hills with
intermontane valleys are the main topographical features. Drainage system in and around the town of Port
Blair has not been developed properly rather it is almost absent. Few perennial streams can be observed i.e.
the stream flowing in the east of Nayagoan - Chakragoan Diggi and the stream flowing adjacent to the Mazhar.
Besides these, there are few perennial and many other non-perennial streams which carry lot of surface run-
off water to the sea during rainy season.
Soil type
Mostly clayey to clayey loam soils could be observed in an around Port Blair town which has been derived
from the underlying siltstone-shale-fine grained sandstone sequence of Tertiary Flysch deposits and Mithakari
Formations.
STATUS OF WATER SUPPLY AND DEMAND
The distribution of water supply system for Port Blair urban area has been designed by the CPHEEO to meet
the projected requirement of water up to 2011 considering 120 litres Per capita per day (lpcd). The present
and future water supply requirement up to 2025 for the Municipal Council area including extended areas is
given below considering 135 lpcd from 2011 onwards. Presently only 139 lakhs liters of treated water is being
supplied by PBMC from various treatment units of APWD against a demand of 288 lakhs liters Thus there is a
short fall of 149 lakhs liters i.e 51.75 % due to which water is supplied to the public on alternate day. Total
requirement of water for present and the future up to 2025 has been given in (Table-1)

172
Table-1 Total requirement of water in Port Blair town.
Years Requirement based on population
(Lakh litres)
Requirement of institution
(lakh litres)
Total Requirement
(Lakh litres)
2001 160 44 235
2011 248 60 354
2021 338 78 478
2025 385 101 559
Source: APWD, A&N and PBMC
WATER PROFILE
The water supply to the Portblair town is mainly catered from the Dhanikhari reservoir and also from few
ponds and wells. After the discovery of Rutland spring sources by CGWB(Kar,2002a), water supply through
barges is also carried to the Port Blair town for supply to the ships. In the years of water scarcity, the water
supply is drastically cut down by the APWD and only twice to thrice in a week the water supply is given to the
urban area. The old wells in Port Blair and the successful bore wells of CGWB in the rural areas of Port Blair
helps significantly in times of acute shortage. Currently a desalination plant has been installed by APWD in
G.B.Pant hospital which is under
operation.
GROUND WATER SCENARIO
The town of Port Blair i.e. the Port
Blair Municipal Council area is
underlain mostly by the Marine
Sedimentary group of rocks (Fig-3)
comprising shale and fine grained
cemented sand stones which are
seen to be exposed in small
laminations Only in parts of Ward
No. 17, in Brookshabad area and in
Austinabad area (adjacent Ward
No. 18) volcanic & intrusive rocks
are available. Porous coralline
formations which are available in
many islands, are absent in and
around the town of Port Blair
barring a small patch of coralline
sands occur nearby Corbyn’s cove
beach and Peerless Beach Resort
Hotel.
Potential Aquifers
Detailed hydrogeological studies
carried out by CGWB revealed that
the Marine sedimentary rocks
comprising shale and fine grained
sandstone do not form good
repository of ground water. (Fig4)
A dug well properly sited in low
topography and 4.5 to 5 m dia, 6 m
deep can yield 3000 to 5000 liters
per day. Where as the dug well in
Peerless Beach resort (underlain by
coralline formation)with lesser dia
(3 metres) yielding over 15,000
litre per day. In volcanic rocks
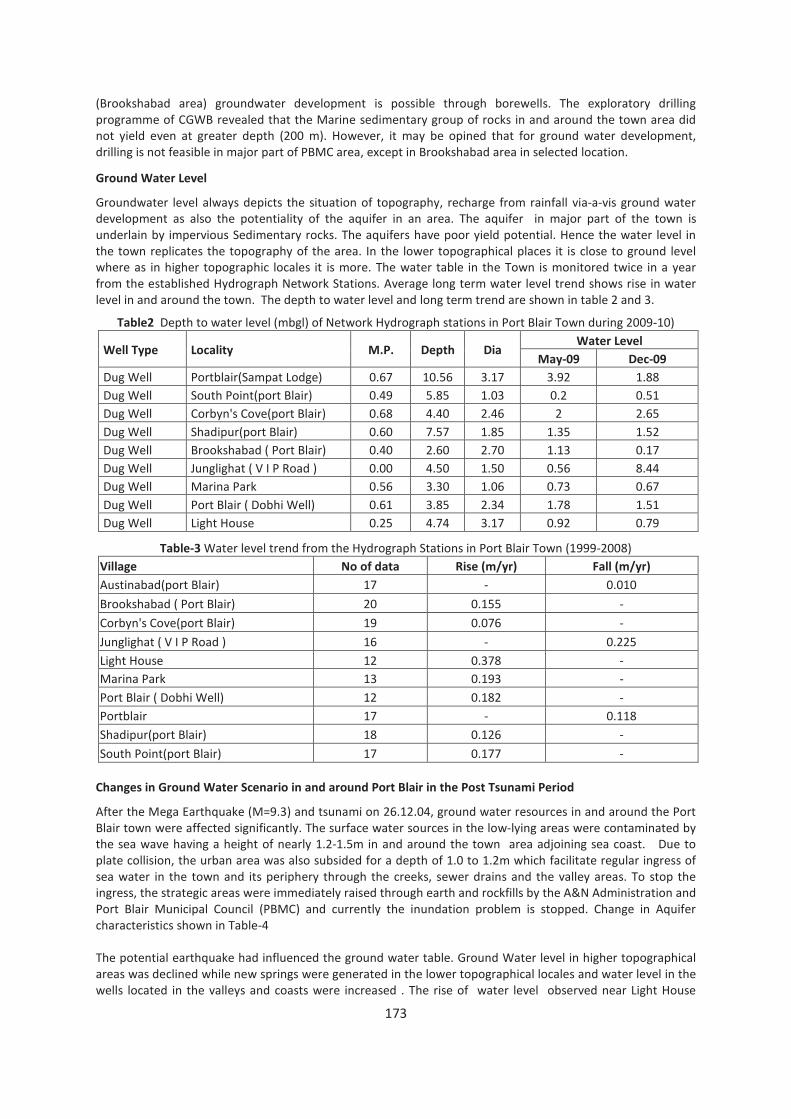
173
(Brookshabad area) groundwater development is possible through borewells. The exploratory drilling
programme of CGWB revealed that the Marine sedimentary group of rocks in and around the town area did
not yield even at greater depth (200 m). However, it may be opined that for ground water development,
drilling is not feasible in major part of PBMC area, except in Brookshabad area in selected location.
Ground Water Level
Groundwater level always depicts the situation of topography, recharge from rainfall via-a-vis ground water
development as also the potentiality of the aquifer in an area. The aquifer in major part of the town is
underlain by impervious Sedimentary rocks. The aquifers have poor yield potential. Hence the water level in
the town replicates the topography of the area. In the lower topographical places it is close to ground level
where as in higher topographic locales it is more. The water table in the Town is monitored twice in a year
from the established Hydrograph Network Stations. Average long term water level trend shows rise in water
level in and around the town. The depth to water level and long term trend are shown in table 2 and 3.
Table2 Depth to water level (mbgl) of Network Hydrograph stations in Port Blair Town during 2009-10)
Well Type Locality M.P. Depth Dia Water Level
May-09 Dec-09
Dug Well Portblair(Sampat Lodge) 0.67 10.56 3.17 3.92 1.88
Dug Well South Point(port Blair) 0.49 5.85 1.03 0.2 0.51
Dug Well Corbyn's Cove(port Blair) 0.68 4.40 2.46 2 2.65
Dug Well Shadipur(port Blair) 0.60 7.57 1.85 1.35 1.52
Dug Well Brookshabad ( Port Blair) 0.40 2.60 2.70 1.13 0.17
Dug Well Junglighat ( V I P Road ) 0.00 4.50 1.50 0.56 8.44
Dug Well Marina Park 0.56 3.30 1.06 0.73 0.67
Dug Well Port Blair ( Dobhi Well) 0.61 3.85 2.34 1.78 1.51
Dug Well Light House 0.25 4.74 3.17 0.92 0.79
Table-3 Water level trend from the Hydrograph Stations in Port Blair Town (1999-2008)
Village No of data Rise (m/yr) Fall (m/yr)
Austinabad(port Blair) 17 - 0.010
Brookshabad ( Port Blair) 20 0.155 -
Corbyn's Cove(port Blair) 19 0.076 -
Junglighat ( V I P Road ) 16 - 0.225
Light House 12 0.378 -
Marina Park 13 0.193 -
Port Blair ( Dobhi Well) 12 0.182 -
Portblair 17 - 0.118
Shadipur(port Blair) 18 0.126 -
South Point(port Blair) 17 0.177 -
Changes in Ground Water Scenario in and around Port Blair in the Post Tsunami Period
After the Mega Earthquake (M=9.3) and tsunami on 26.12.04, ground water resources in and around the Port
Blair town were affected significantly. The surface water sources in the low-lying areas were contaminated by
the sea wave having a height of nearly 1.2-1.5m in and around the town area adjoining sea coast. Due to
plate collision, the urban area was also subsided for a depth of 1.0 to 1.2m which facilitate regular ingress of
sea water in the town and its periphery through the creeks, sewer drains and the valley areas. To stop the
ingress, the strategic areas were immediately raised through earth and rockfills by the A&N Administration and
Port Blair Municipal Council (PBMC) and currently the inundation problem is stopped. Change in Aquifer
characteristics shown in Table-4
The potential earthquake had influenced the ground water table. Ground Water level in higher topographical
areas was declined while new springs were generated in the lower topographical locales and water level in the
wells located in the valleys and coasts were increased . The rise of water level observed near Light House

174
Cinema &Gandhi Bhawan, Port Blair (Table 5). Here the water level is still remaining in elevated condition.
New fractures also changed the aquifer characteristics .However, at many places the water level situation has
been bounced back to the pre-tsunami condition while at places the change is still persistent. Both the
qualitative and quantitative changes in the Post-tsunami was monitored continuously by CGWB (Kar et.
al,2005,2006).
Table- 4 Change in aquifer characteristics of a select well in low altitude of Port Blair, Post-tsunami
Table-5 Rise in water level in Select dug wells in low altitude in Andaman District
Hydrochemistry
Analysis of ground water samples collected from the dugwells and also from exploratory borewells
constructed in the area, revealed that the quality of water is fresh and fit for all purposes. However, in view of
plate collision and subsidence after the earthquake and Tsunami on 26.12.04, a qualitative change has been
noticed in the groundwater samples collected from parts of the affected areas in the town. The qualitative
change is still persisting.

175
Major Ground Water Related Problems
The geologic formations in and around Port Blair town are highly varied and major parts are occupied by
impervious sedimentary rocks where ground water development possibility is low . These rocks are not
suitable for construction of borewells/tubewells. Dugwells are feasible in such formations but yield is
restricted. A dug well of 2-3m diameter and 5m depth can only yield 2000-3000 litres per day. However in
select locations especially near the drainage it may discharge in much higher tune. In Port Blair municipal area
only in Brookshabad the igneous rocks in area of bore wells can be drilled in specific areas. In a small patch
near Corbin’s Cove adjacent to Peerless Beach Resort where moderate quantity of water could be available
from shallow and porous Coralline limestone Formations through dug wells, where the quality of groundwater
has been slightly deteriorated in the post-tsunami period.
Feasibility of Rain Water and Artificial
Recharge
While the impervious sedimentary
formations are unfit for groundwater
development, these formations are highly
suitable for construction of ponds especially
feasible in the valleys and topographic lows
where it get ground water and alsoact as a
very good rainwater harvesting structure.
Consequently the low-lying areas as opined
by CGWB(Kar,2003,2005,2006,2007) can be
developed for construction of ponds as also
reservoirs. Artificial recharge techniques also could be applied (Fig.5) only in small pockets which were
suggested by CGWB (Kar,2001,2003). Many of these recommendations are already implemented by PBMC
(Port Blair Municipal Council) and APWD (Andaman Public Works Department).
GROUNDWATER DEVELOPMENT STRATEGY
During Pre-Tsunami Period
To overcome the shortage of water supply to the Port Blair town as also in view of severe water scarcity in
2002, the following short, medium and long term options were adopted by APWD in the pre tsunami period.
The Short term options included i) Carrying water from Chain Nallah( Rutland island) through barges for supply
to the ships at Port Blair by Port Management Board and Ii) Taping the ground water sources(dug wells) and
Ponds in Port Blair town suggested by CGWB. Medium term options included Carrying water from Rutland
through pipe lines, raising of Dhanikhari dam, water from Chouldari project & Indranala project. The only long
term option which was planned in the Pre-tsunami was completion of Flat bay project. This project was
designed for augmentation of water supply to the tune of 67 MLD, keeping in view of projected demand up to
2050. In this project there was a proposal to make an earthen dam in between Minnie Bay and Mithakhari
village where Flat Bay is constricted. The project was abandoned after tsunami.
Post-Tsunami Period
It is already mentioned that the water scarcity in Port Blair town water supply was aggravated in the Post-
tsunami. To tide over the crisis, various short, medium and long term options were adopted.
The short term options included to increase the water availability of Port Blair town from the Springs of
Rutland through Barges, Urgent installation of Desalination plants in turn key basis to increase the immediate
potable water availability at Port Blair and use of Dug well Sources. Medium term options include Fresh
water lake Project near Sippi-Ghat and augmentation from Pond sources, while the Long term options include
Raising of Dhanikhari Dam, Inter-island transfer of Spring water from Rutland island and water supply from
Indranala project.
Besides the above, the following three options may also be considered for better management of water supply
in the town:-

176
Water sources for catering raw water need in Port Blair town:- In connection with the ongoing constructional
work huge quantity of fresh raw water is daily required in Port Blair town. For this purpose the use of
Dhanikhari water should be stopped if it is under utilization. For this purpose small reservoirs or sources may
be created to cater water for the said purpose. The Pond water also can be supplemented to the requirement.
Large Scale Roof top rainwater harvesting in all houses and institutions:-Rainwater harvesting in each house
and Government and Private institutions may be introduced. The rain water may be conserved in over surface
or sub-surface cisterns and should be regularly utilized for household uses, gardening, car washing etc.
From the preceding chapters it is clear that a good amount of fresh water can be generated for sustainable
water supply in Port Blair town. The options can augment a volume of 50.23 Million Litres of additional fresh
water supply per day to the town. The approximate water availability from various sources are given below
(Table-6).
Table-6 Augmentation of water supply to Port Blair town from Short, Medium and Long term
options in the Post- tsunami Period
Options Name of the sources Tentative water
availability (lakh
litres/day)
Remarks
Short term option Water carriage from Rutland
through barges.
0.5 mld
*Among the Long term
option Flat Bay project
was most important in
the Pre-tsunami having a
tentative yield of 67 mld
which was abandoned
due to land subsidence in
the post-tsunami.
From desalination Plant. 14 mld
New well sources in Port Blair. 0.39 mld
Medium term option Sippighat fresh water lake. 5.6 mld
Pond sources. 0.34 mld
Creation of new reservoirs in and
around Port Blair.
2.9 mld
Long term option (*) Raising of Dhanikhari dam. 13.5 mld
Inter Island transfer of Rutland
spring water.
12 mld
Indra Nallah Project. 1.0 mld
Total water availability Million Lakh litres(mld) 50.23 mld
Source: APWD,A&N Admn.
References
• Jain, S.K. et al, (2005): Effects of M9 Sumatra earthquake and tsunami of 26 December 2004. Curr,
Sci.Vol.88 No.3, 10th February issue, 2005,pp-357-359
• Kar,A(2001): Hydrogeology of Andaman and Nicobar Islands(Unpub Report of CGWB)
• Kar,A(2002a) : Preliminary reports on investigation of springs as a possible water supply source to Port
Blair town from Rutland island(Unpub. Report of CGWB)
• Kar,A et al .(2002b): Water supply to rural and urban areas of Andaman and Nicobar Islands with special
reference to the application of artificial recharge and conservation technique.Nat.Sem. of Ind.
Desalination Assoc., Kolkata. Abs Vol.
• Kar,A(2002c):Artificial recharge of ground water for augmentation of water supply and landscape
development in Port Blair town and A&N islands. Nat. Sem., LAWMI, Kolkata, Abs.Vol.
• Kar,A(2003) Hydrogeological studies in Port Blair Municipal area to augment the water supply situation
through construction of new structures and renovation of old dug wells and ponds. (Unpub. Report of
CGWB).
• Kar,A(2004a): Studies on Hydrogeology of South Andaman Islands with special reference to application of
artificial recharge and conservation techniques of ground water and inter island transfer of spring water
for sustainable water supply to Portblair town and environs-( Trans.M.G.M.I.,Kolkata,V-100 No-1&2,pp-
37-59).
• Kar,A et al. (2004b): Conservation and artificial recharge of Ground Water - an urgent strategic option for
water supply to Portblair and Surroundings in Andaman Islands. (Abs. Vol. International Geological
Congress,Florence,Italy,)

177
• Kar,A et al.(2005): Impact of 26thdecember,2004 tsunami and earth quake on ground water resources in
A&N islands : Post tsunami studies by Central Ground Water Board. (Unpub. Report of CGWB).
• Kar, A and C.P.Gawri (2006a) Hurdles in framing ground water management strategies in A&N islands in
the aftermath of tsunami. Proc.of 12th Nat.Symp. on Hydrology.Nov.14-15, 2006,New Delhi, pp-181-202.
• Kar,A(2007a): Brief Master Plan for Water Supply in Port Blair town.Unpub.CGWB report
• Kar, A (2007) Successful application of artificial recharge technique to mitigate acute drinking water crisis
in Rural Andaman in the Post – Tsunami: a few case studies. Proc. Int. Ground water congress.
Coimbatore (In Palanisami,K,B.R.Neupane and M.Tangarajan(Editors),Adv.Res.Series,Macmillan.
• Kar,A(2009) Management of groundwater in the mega earthquake (M=9.3) affected hard rock aquifers of
South Andaman Island, India.Joint International Conference of IAH &IAHS,Hyderabad(Abs.vol)

178
PUDUCHERRY CITY, U.T.
D. Dayamalar, CGWB, Chennai
INTRODUCTION
Historical researches go to show that trade contact existed between the Romans and the inhabitants of the
Puducherry area in the long centuries of Christian era. The French like the British, the Dutch and the
Portuguese who had established their markets at Surat on the west coast in the 17th
century were officially
invited by Sherkhan Lody, the then Bijapur commandant of Valikondapuram (near Perambalur, in erstwhile
composite Trichirapalli district) to settle down in his government. The French landed at Pondicherry
(Poudicheri) on 4th
February 1673 and began their occupation. In course of time they expanded their colonial
and trade activities and the subsequent recorded history unfolds how the French supremacy held sway over a
great part of India, south of the Deccan and underwent rises and falls in fortunes. In 1701, the French
Government at Paris recognised the importance of Puducherry town and established a sovereign counsel to
aid and advise in the administration of the colony. During 1793, there was internal disturbance in Puducherry
and the Britishers utilised this opportunity to gain Puducherry under their control upto 1815.Consequent upon
the Treaty of Paris, 1814, the French got back Puducherry, Karaikal, Mahe and Yanam regions during 1816 for
governance of the administration by them and since then ruled continuously till 1954.
The French government transferred the above said four enclaves (Viz:-Puducherry, Karaikal, Mahe and Yanam)
to the Indian Union on 1st November 1954 under a de facto treaty. Of these Puducherry and Karaikal is in
Tamil Nadu coast Whereas Mahe is in Kerala coast and Yanam in Andhra Pradesh coast. But the registration of
the treaty of Cession was delayed and ultimately the de jure transfer took place on 16th
August 1962. The
erstwhile French establishments were constituted into Union Territory of Pondicherry under the constitution
(Fourteenth Amendment) Act, 1962. For the proper administration of the territory, the parliament enacted the
Pondicherry (Administration) Act, 1962. As the people aspired for a popular government, the parliament
enacted the Government of Union Territories Act 1963 and it came into force on 1st
July 1963. The territory
was given a popular government with elected legislature and responsible government through the council of
ministers. The pattern of government prevailing in other parts of India was introduced in this territory subject
to certain limitations.
Puducherry of U.T. of Puducherry being agrarian region, special attention needs to be paid for the
development of irrigation potential. Due to rapid development of ground water in the region, problems like
over-exploitation in entire Puducherry and degradation of quality due to sea water intrusion in the coastal
areas have led to problems forcing water managers to adopt suitable strategies for proper management of
available ground water resources.
The Head quarter of U.T.of Puducherry is located in Puducherry.
GENERAL FEATURES
Area/Administrative Divisions
Puducherry is situated on the Coromandel coast as scattered isolated patches between 11o45’ and 12
o03’ N
latitudes and 79o37’ and 79
o53’ E longitudes. It is bounded on the east by the Bay of Bengal, on the north and
west by Villupuram and on south by Cuddalore districts of Tamil Nadu state. It is not a contiguous area and is
interspersed with enclaves of territory of Tamil Nadu. The region is 293 sq. km. in areal extent and is divided
into seven communes namely Puducherry, Ozhukarai (Oulgaret), Bahour, Ariyankuppam, Villianur,
Nettapakkam and Mannadipet. Location of Puducherry is presented in Fig. 1. Besides Puducherry municipal
town, there are two more towns in the region namely Kurumbapet and Ozhukarai. There are 164 inhabited
villages in this region. It represents a picture of scattered parts enclaves within Villupuram and Cuddalore
districts of Tamil Nadu. The layout of Puducherry enclaved within Tamil Nadu, presents a peculiar picture of
territorial jurisdiction perhaps the only one of its kind in the world. This region has several places of religious,
historical or archaeological importance and tourist interest.

179
Demography
The total population of the Union Territory of
Puducherry as per the Census 2001 is 974345
consisting of 486961 males and 487384 females.
Out of this the rural and urban populations
constitute 33 and 67 percent respectively. The
density of population is 2510/sq.km.
Hydrometeorology
The normal annual rainfall is 1205 mm, which is
received in four different seasons. The maximum
rainfall is during north-east monsoon (Oct to
Dec), which brings about 65% of the total annual
rainfall, which accounts for about 650 mm. The
southwest monsoon rainfall, which occurs
between June and September, brings about
350mm rainfall. The rainfall in winter period (Jan
& Feb) and hot weather period (March to May) is
collectively accounts about 200 mm. The climate
of Puducherry is tropical. Both winter and
summer are not very severe. The temperature
ranges from a minimum of 170C to a maximum of
420C. The humidity is comparatively higher,
becoming as high as 83% at times.
Physiography & Drainage
The Puducherry in general is a flat peneplain with an average elevation of 15 m above mean sea level. The
terrain becomes a little undulating with prominent high grounds varying from 30 to 100m above mean sea
level towards northwest and northeastern parts of the region. Three major physiographic units are generally
observed namely (i) Coastal plain, (ii) Alluvial plain and (iii) Uplands.
The coastal plain extends as a narrow stretch for about 22 km and of four to six hundred meters width on the
eastern part of the region along the Bay of Bengal. The major part of the coastal plain comprises gently sloping
land with a chain of sand dunes extending all along the coast. Other physiographic units which are
characteristic of the coastal plains such as spit bars, mud flats, lagoons and tidal inlets also occur.
The alluvial plain formed due to two major rivers namely Gingee and Ponnaiyar that pass through the area
occupies major portion of Puducherry covering the Bahour, Nettapakkam, Ariyankuppam, southern half of
Mannadipet and Villiyanur and part of Ozhukarai communes. The alluvial plain in this part in general is a
monotonous plain with slope ranging from 1 to 3 percent. The lands in this region are intensively cultivated
throughout the year. Besides the rivers and major canals, there are depressions acting as storage tanks, which
are spread all over the terrain, to serve as surface water reservoirs. The high grounds known as Uplands with
elevations of about 30 to 100m above mean sea level are seen in the north-western and north-eastern sectors
of Puducherry covering northern part of Mannadipet, Villiyanur and Ozhukarai communes. These uplands
which are popularly known as “Les Montagnes Rouges” or the “Red Hills of Puducherry” are intersected by a
number of gullies and deep ravines which give rise to bad land topography. A patch of gently sloping
fossiliferrous limestone terrain also exists in the north-western part.
There are two major drainage basins in this region 1) the Gingee river, which traverses the region diagonally
from north-west to south-east and 2) the Ponnaiyar (Penniyar) river, which forms the southern border of the
region. The river Gingee also known as the Varahanadi or Sankaraparani which has its source in the hills of
Malayanur of Villupuram district, Tamil Nadu has a course of 34 km in this region before it confluences with

180
the Bay of Bengal. At a distance of 7 km. from its mouth, it shoots into two branches knowns as Ariyankuppam
river in the north and Chunnambar river in the south. The affluents of Gingee river, are the Vikravandi, the
Pambaiyar and the Kuduvaiyar. The river Ponnaiyar originates from the hills of Karnataka and enters the
Puducherry after flowing through the districts of Dharmapuri, Salem, Vellore and Cuddalore of Tamil Nadu.
The Malattar is the distributary of the Ponnaiyar and drains the southern part of the region and finally
discharges into the Bay of Bengal near Aladimedu and Pannithittu. All the rivers are ephemeral in nature.
Soil Type
Various soil types found in Puducherry are red loamy, coastal alluvium, red laterite, deep black and red sandy.
STATUS OF WATER SUPPLY AND DEMAND
The water supply and the projected scenario up to 2040 are presented in Table 1. The analysis of the water
supply position gives the real magnitude of the problem even after all the possible measures taken by the
government so far. A perusal of the table-2 shows that the demand would be around 90.46 MLD (2025) &
114.25 MLD (2040). Presently 60 MLD water is supplied for Puducherry Municipality and oulgaret Municipality.
Water supply details are given in Table 2.
Table-1: Present and Projected Population and Demand Details for Water Supply Schemes.
Sewarag
e zone
Area in
Ha
Population in lakhs Demand in MLD @135 lpcd
excluding the loss
2001 2007 2020 2025 2040 2007 2020 2025 2040
I 203 0.62 0.67 0.92 1.00 1.25 9.05 12.42 13.5 16.89
II 200 0.45 0.48 0.67 0.73 0.91 6.48 9.05 9.86 12.29
III 440 0.78 0.84 1.15 1.26 1.59 11.34 15.53 17.01 21.47
IV 570 0.84 0.91 1.25 1.36 1.77 12.29 16.88 18.36 23.89
V 640 0.52 0.56 0.77 0.84 1.05 7.56 10.39 11.34 14.18
VI 350 0.39 0.42 0.58 0.63 0.79 5.67 7.83 8.51 10.67
VII 250 0.22 0.24 0.33 0.36 0.45 3.24 4.46 4.86 6.08
VIII 360 0.22 0.24 0.33 0.36 0.45 3.24 4.46 4.86 6.08
IX 236 0.10 0.11 0.15 0.16 0.2 1.49 2.03 2.16 2.7
Total 3249 4.14 4.47 6.15 6.7 8.46 60.36 83.05 90.46 114.25
Table-2: Present water supply in Puducherry urban area
Water supply Coverage
Percentage of house holds covered by protected water supply 100%
Percapita domestic water supply 120 – 135 lpcd
Average number of hours of water 10 hours per day
Quantity of water supply 60 MLD
Percentage of water loss due to leakage 15 to 20%
WATER PROFILE
Surface Water
About 140 small and two big tanks viz. Usteri and Bahour lakes, the other important lakes are Oustery lake,
Olandai and Murungapakkam lakes. Besides these, there are number of tanks and spring ponds in this region.
These tanks are interlinked and act as water storage for agricultural purposes as well as to recharge the ground
water.
Ground Water
Ground water occurs in all the geological formations ranging in age from the Achaeans to Recent which can be
broadly classified into two hydrogeological units viz., (i) Fissured and fractured crystalline formations and (ii)
Porous sedimentary formations.

181
GROUND WATER SCENARIO
The ground water occurrences can be broadly classified into two hydrogeological units viz., (i) Fissured and
fractured crystalline formations and (ii) Sedimentary formations. The yield of dug wells depends on the
topography, geology, rainfall and prevailing ground water extraction pattern. There are number of dug wells
and dug cum bore wells in the hard rock terrain while tube wells are common in sedimentary terrain. The dug
wells yield 20,000 to 50,000 liters/day in summer months and few wells remain dry. The yield of the well is
adequate for irrigation for one or two crops in the monsoon period. The yield of bore wells, in favourable
locations, varies from 0.2 to 3 lps and sustainable sources are limited to few pockets. The river valley and
intersection of lineaments are reported to have potential pockets suitable for dug wells and bore wells. The
contact between crystalline and sedimentary tract has variable yield prospects. The cretaceous formations are
very compact and yield prospects are low. In the regions, shallow unconfined aquifers are tapped by dug wells
and deeper semi confined to confined aquifers are tapped by dug-cum-borewells or tube wells. The
Hydrogeology of Puducherry is shown in Fig. 2.
Potential Aquifers
Fissured and fractured formations : The crystalline rocks of Archaean age, consisting of mainly charnockite
and gneissic rocks represents the fissured and fractured formations which are confined in the northwestern
corner of the Puducherry. These rocks are devoid of primary porosity. The secondary porosity in the
weathered, fissured and fractured zones forms the avenues for ground water occurrence and movement. The
thickness of weathered zone varies from less than a metre to more than 15 m. below ground level (m bgl) at
places. Ground water in this terrain is developed by means of dug wells and dug-cum-borewells. Ground water
occurs under water table conditions in the shallow weathered zones and under phreatic to semi-confined
conditions in the fissures occurring at depths. The depth of dug wells varies from 4 to 22 m bgl. The yield of
dug wells tapping this aquifer ranges between 250 to 400 lpm.
Sedimentary formations : The porous sedimentary formations occur in almost the entire region and are
represented by the semi consolidated formations of Cretaceous and Tertiary age and the unconsolidated
Quaternary formations of Recent age. Among the sedimentary aquifers, the Vanur-Ramanathapuram
Sandstone (Cretaceous) and the deep Cuddalore sandstone (Tertiary) aquifers and the recent alluvial
(Quaternary) aquifers constitute the three major potential aquifer systems, in the region. Ground water occurs
in these formations both under water table as well as under confined conditions and is being developed by
means of dug wells, dug-cum-borewells and tube wells.
Cretaceous Aquifers : Among the various water bearing formations of Cretaceous age, the Ramanathapuram
and Vanur formations form potential aquifers. They occur in the north-western part of Puducherry and are
encountered in the boreholes drilled in the major part of the region. The aquifers of the above formations
include sands and calcareous sandstones. They are coarse grained in the western part and grade into finer
facies towards east and northeast. The thickness of these aquifers ranges from 38 to 92 m. The yields of the
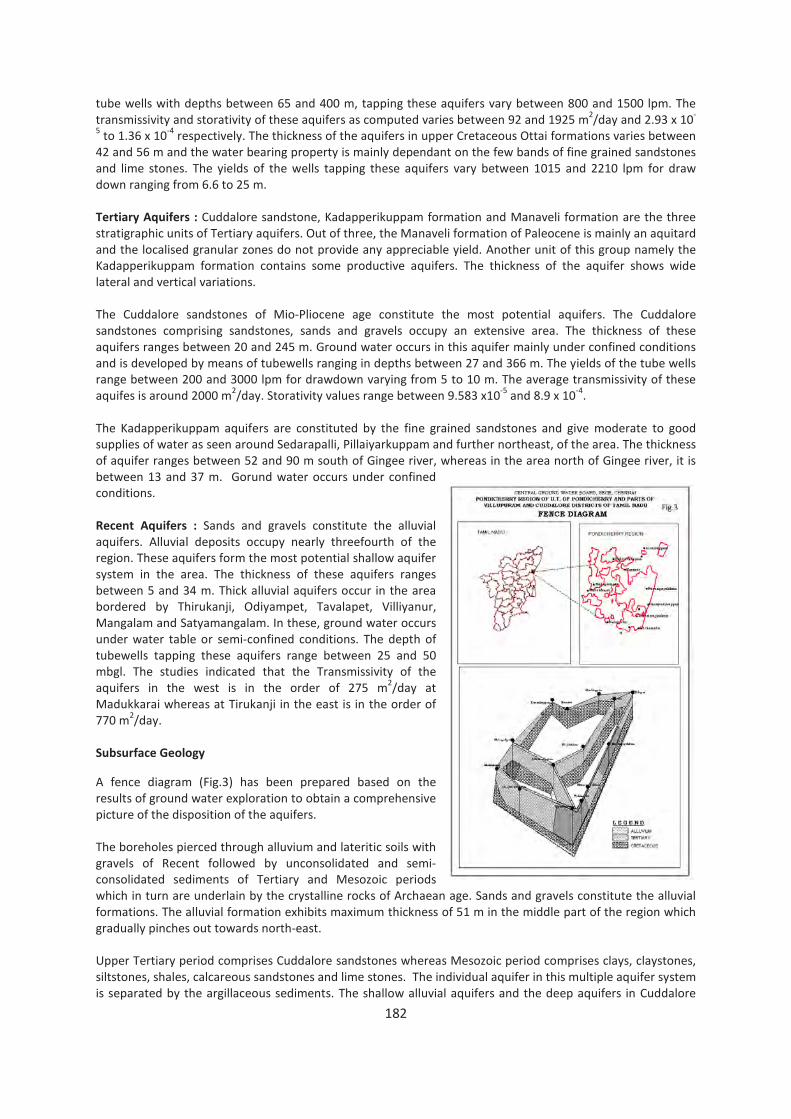
182
tube wells with depths between 65 and 400 m, tapping these aquifers vary between 800 and 1500 lpm. The
transmissivity and storativity of these aquifers as computed varies between 92 and 1925 m2/day and 2.93 x 10
-
5 to 1.36 x 10
-4 respectively. The thickness of the aquifers in upper Cretaceous Ottai formations varies between
42 and 56 m and the water bearing property is mainly dependant on the few bands of fine grained sandstones
and lime stones. The yields of the wells tapping these aquifers vary between 1015 and 2210 lpm for draw
down ranging from 6.6 to 25 m.
Tertiary Aquifers : Cuddalore sandstone, Kadapperikuppam formation and Manaveli formation are the three
stratigraphic units of Tertiary aquifers. Out of three, the Manaveli formation of Paleocene is mainly an aquitard
and the localised granular zones do not provide any appreciable yield. Another unit of this group namely the
Kadapperikuppam formation contains some productive aquifers. The thickness of the aquifer shows wide
lateral and vertical variations.
The Cuddalore sandstones of Mio-Pliocene age constitute the most potential aquifers. The Cuddalore
sandstones comprising sandstones, sands and gravels occupy an extensive area. The thickness of these
aquifers ranges between 20 and 245 m. Ground water occurs in this aquifer mainly under confined conditions
and is developed by means of tubewells ranging in depths between 27 and 366 m. The yields of the tube wells
range between 200 and 3000 lpm for drawdown varying from 5 to 10 m. The average transmissivity of these
aquifes is around 2000 m2/day. Storativity values range between 9.583 x10
-5 and 8.9 x 10
-4.
The Kadapperikuppam aquifers are constituted by the fine grained sandstones and give moderate to good
supplies of water as seen around Sedarapalli, Pillaiyarkuppam and further northeast, of the area. The thickness
of aquifer ranges between 52 and 90 m south of Gingee river, whereas in the area north of Gingee river, it is
between 13 and 37 m. Gorund water occurs under confined
conditions.
Recent Aquifers : Sands and gravels constitute the alluvial
aquifers. Alluvial deposits occupy nearly threefourth of the
region. These aquifers form the most potential shallow aquifer
system in the area. The thickness of these aquifers ranges
between 5 and 34 m. Thick alluvial aquifers occur in the area
bordered by Thirukanji, Odiyampet, Tavalapet, Villiyanur,
Mangalam and Satyamangalam. In these, ground water occurs
under water table or semi-confined conditions. The depth of
tubewells tapping these aquifers range between 25 and 50
mbgl. The studies indicated that the Transmissivity of the
aquifers in the west is in the order of 275 m2/day at
Madukkarai whereas at Tirukanji in the east is in the order of
770 m2/day.
Subsurface Geology
A fence diagram (Fig.3) has been prepared based on the
results of ground water exploration to obtain a comprehensive
picture of the disposition of the aquifers.
The boreholes pierced through alluvium and lateritic soils with
gravels of Recent followed by unconsolidated and semi-
consolidated sediments of Tertiary and Mesozoic periods
which in turn are underlain by the crystalline rocks of Archaean age. Sands and gravels constitute the alluvial
formations. The alluvial formation exhibits maximum thickness of 51 m in the middle part of the region which
gradually pinches out towards north-east.
Upper Tertiary period comprises Cuddalore sandstones whereas Mesozoic period comprises clays, claystones,
siltstones, shales, calcareous sandstones and lime stones. The individual aquifer in this multiple aquifer system
is separated by the argillaceous sediments. The shallow alluvial aquifers and the deep aquifers in Cuddalore

183
sandstones (Tertiary) and the aquifers of Vanur-Ramanathapuram sandstones (Cretaceous) constitute three
major potential aquifer systems. The sandstones of Cuddalore formations form the principal aquifer in the
region. The thickness of the sediments shows a wide variation at different places both laterally and vertically
depending upon the depositional conditions and basement topography. In the northern part of the region (i.e.)
to the north of Gingee or Varahanadhi river, the thickness of the sediments is comparatively less and it
increases towards south and south-east. The thickness of the sediments which is 193m in the northern part of
the region as observed at Katterikuppam increases to 500 m at Kalapettai falling in the northeastern part of
the region and over 1200 m in the south east near the mouth of Ponnaiyar river. Basement has been
encountered at Kalarpettai at 500 m bgl. The absence of potential aquifers within the depth of 227 m bgl at
Kalapettai is a conspicuous feature.
The Ramanathapuram and Vanur formations are both clastic and coarse grained in nature in the north-west
whereas in the down dip direction, they are finer clastic type with limestone bands. These formations have a
maximum thickness of about 500 m in the north-east, to about 700 m in the south. The thickness of alluvium is
maximum (i.e,) around 50 m at the central part of the region as observed at Sattamangalam. Sands of varying
grades constitute the aquifers. The maximum cumulative thickness of saturated granular zones met with in the
Cretaceous and Palaceocene sediments was of the order of 144 m near Madukkarai whereas in the Cuddalore
formations it is of the order of 265 m near Manapattu and about 34 m in alluvium near Sattamangalam.
Broken shell pieces and limestone have been encountered at different depth ranges in the region and the
presence of these materials suggests these might have been deposited under marine/fluvio-marine conditions
during the transgressional / regressional periods of the sea.
Ground Water
Level
State Ground
Water Unit of
Agriculture
Department,
Puducherry has
constructed
about 100
observation tube
wells, piercing
different aquifer
system and the
water level data
are periodically
collected from
these observation
tube wells. While
perusal of the
water level data,
shows that the
water level in the alluvial aquifer during premonsson (july 2009) ranges from 5.75 to 35.9 m bgl. Whereas
during post monsoon the water level ranges from 3.2 to 34.7 m bgl. In tertiary formation, the water level is in
the range of 6.1 to 34 m bgl during premosoon and 4.8 to 33.75 m bgl during post-monsoon. In cretaceous
aquifer, the water level is 12.5 to 39.85 m bgl during pre-monsoon and 12.2 to 50.75 during post-monsoon.
Depth to water level maps for alluvium aquifers are presented in fig. 4 & 5.
Ground Water Resources and Development
The ground water resources have been computed jointly by Central Ground Water Board and Ground water
division, Department of Agriculture, U.T.of Puducherry as on 31st
March 2009. The salient features of the
computations are furnished in Table-3.

184
Hydrochemistry
The groundwater of alluvial aquifer is almost neutral to alkaline in nature with pH values ranging from 7 to 8.5.
The water is generally bicarbonate chloride type, the bicarbonate is predominating over chloride. Carbonate is
generally absent or occurs in traces. Chloride content is generally below the permissible limit except in few
places along the coast. The electrical conductivity ranges from 1500 to 2000 micromhos/cm at 250C. The
quality of groundwater being tapped from Tertiary aquifer is alkaline with pH ranging from 7.4 to 8.5.
Carbonate is almost nil and the groundwater is generally calcium – Magnesium – bicarbonate type. The quality
of groundwater in the Cretaceous aquifer is slightly alkaline with pH ranging from 7.7 to 8.5. The
concentration of chloride is generally within 150ppm. The electrical conductivity values are less than 1500
micromhos/cm at 250C. Groundwater from all the aquifer system is, in general, suitable for both domestic and
irrigational purpose. However, water with high salinity and medium sodium hazard are reported from both
alluvial and Tertiary aquifers in the coastal areas of Puducherry. High salinity and high sodium are reported
from select wells along the coast due to sea water intrusion.
Major Ground Water Related Problems
Industrial pollution : Many water based industries have been established in the Puducherry during early
eighties because of availability of ground water and electricity in plenty. Some of the chemical industries
started dumping the chemicals, both used and unused, in open yards and releasing untreated effluents on
open ground/unlined channels. As a result, in Puducherry, ground water has been polluted in the industrial
estates, particularly in Mettupalayam area, leading to environmental degradation.
In order to study the industrial pollution, Central Ground Water Board, along with State Ground Water
Department and State Pollution Control Board, Government of Puducherry, carried out a study at
Mettupalayam Industrial Estate during July 2001. Ground water samples from the tube wells in and around the
PIPDIC Estate area, Mettupalayam were collected and analysed. Mettupalayam Industrial Estate is situated on
the elevated lateritic terrain with a maximum elevation of 27 m with the steep slope dipping towards
southeast. There are eight deep tube wells in the PIPDIC Estate area to cater to the need of in house
industries. A couple of industries are having their own tube wells.
The study revealed that quality of ground water in and around the Mettupalayam Industrial area is slightly
acidic in nature as pH varied from 6.13 to 7.81, except for two samples. The electrical conductivity ranged from
256 to 2040 µS/cm at 25°C, except from Saradha Castings and Guru Papers (opposite) where it recorded 9750
and 12510 µS/cm at 25°C respectively. Sulphate was found to be 1670 and 5203 mg/L and also, Fluoride
contents were 1.5 and 1.65 mg/L in those tube wells, which may be due to the effect of chemicals used in
those industries. It was also noticed that Arsenic content (20.15 µg/L) in Gurupaper Mill, which may be due to
leaching effect of dyes used in this paper industry, which is below permissible limit.
The previous records of the Government of Puducherry for Mettupalayam Industrial Estate reveals that one of
the tubewells, constructed in 1992 by PIPDIC, had pH value of 7.7, which turned into acidic nature with pH
value of 3.5 during 1993. Similarly, Fluoride value had also increased from 2.5 to 6 ppm as against permissible
limit of 1 ppm. The tubewell has since been abandoned.
Another tube well constructed in this Industrial Estate during 1983 had a fresh ground water in the beginning,
which is at present abandoned since the pH was found to be 3.8 and the sulphate content increased to 1800
185
ppm. Also, another deep tube well, constructed in 1997 near the industrial estate at Shanmugapuram, was
abandoned due to the presence of high sulphate and high electrical conductivity.
A study by the Government of Puducherry in Mettupalayam Industrial Estate revealed that ground water
extracted from the tube wells is found degraded widely in and around Mettupalayam Industrial Estate area,
with Sulphate to the limit of 2714 ppm and more acidic nature near the Electricity staff quarters.
The main cause for the total deterioration of ground water in and around Mettupalayam Industrial Estate is
the reported dumping of chemicals by some chemical industries and discharging of untreated effluents in the
open drains. It has been found that effluents of certain units are having pH in the range of 1.2, 3.2, 3.5 and
12.8 and total dissolved solids in the range of 11500, 14000 and 29300. To identify the source of ground water
pollution in the aquifer system of Mettupalayam industrial Estate and to take remedial measures, the
Government of Puducherry has taken up a detailed study in that area.
Sea water intrusion : The United Nations Development Project in Tamil Nadu had studied the effects of sea
water intrusion due to ground water development during 1968-70 in the Puducherry. A tube well was
constructed at Krishnapuram in southeast corner of Puducherry near the coast tapping the zones between 152
and 226 m bgl. The static pressure head was 4.6 m agl at that time and the studies indicated that strong
dynamic hydrostatic equilibrium existed between fresh water and salt water due to high transmissivity of the
deeper confined aquifer in this area. The recent static pressure head at this well was around 8.5 m bgl
recording a drop of about 13 m within a period of 25 years, which may be due to intensive development of
ground water in the area over the years. The large scale development of ground water in the area caused
reversal of gradient of piezometric head and increasing the salinity of water of deeper tube wells in villages like
Kirumambakkam, Manapattu, Narambi, Murungapakkam etc. on the coast indicate sea water intrusion in
recent years.
In the northeastern part of the region lying north of Puducherry near Kalapettai, a borewell constructed
tapping the deeper aquifers (Vanur and Ramanathapuram) has turned to be saline due to sea water intrusion
indicating that interface exists beyond a depth of 465 m bgl. The intensive ground water development in the
area has resulted in sea water intrusion due to the up coning of salt water.
The State Ground Water Department has constructed a battery of tube wells tapping both shallow and deep
aquifers along the coast to monitor the sea water intrusion and the salt-fresh water interface movement due
to large scale development of ground water in recent years. Water levels and water samples are collected
once in every one or two months. Effects of sea water intrusion and interface movement are noticed in some
of the above observation wells.
The Geophysical logging done by the State Ground Water Department in the tube wells drilled along the
coastal belt during 1993-97 reveals the intrusion of sea water from Kalapet to Cuddalore area at depths
ranging from 40 to 140 m bgl. It has moved inland by about a kilometre at Kalapet and 8 kms at Bahour areas.
In Puducherry, the coastal aquifers can be broadly divided into three groups, viz., Alluvial, Tertiary &
Cretaceous. The thickness of alluvial aquifers range from 5 – 34 m tapped by wells in the depth range of 25- 50
m, while it varies from 20 to 245 m in Tertiary formations and are tapped by tube wells in the range of 27-366
m depth. In Cretaceous aquifers, the thickness varies from 38 – 92 m and the depth of the wells tapping this
aquifer varies from 65 – 400 m bgl. The groundwater exploration has revealed that in general, the
groundwater encountered down to 300 m bgl was of good quality with EC less than 600 µS/cm, while the
zones beyond 300 had EC about 1500 µS/cm.
In general, the quality of the formation water in alluvial aquifers is good and has EC <750 µS/cm except at
Murungapakkam, Kirumampakkam, Kizparikelpet & Uchimedu along the coast. It has also been reported that
the deterioration in quality at these places may be due to seawater intrusion, which needs to be ascertained.
The quality of groundwater in Tertiary aquifer is good and has EC <750 µS/cm except along the coast at
Murungapakkam (8280 µS/cm), Kizparikelpet (6800 µS/cm) & Uchimedu (5100 µS/cm). Similarly, the quality of
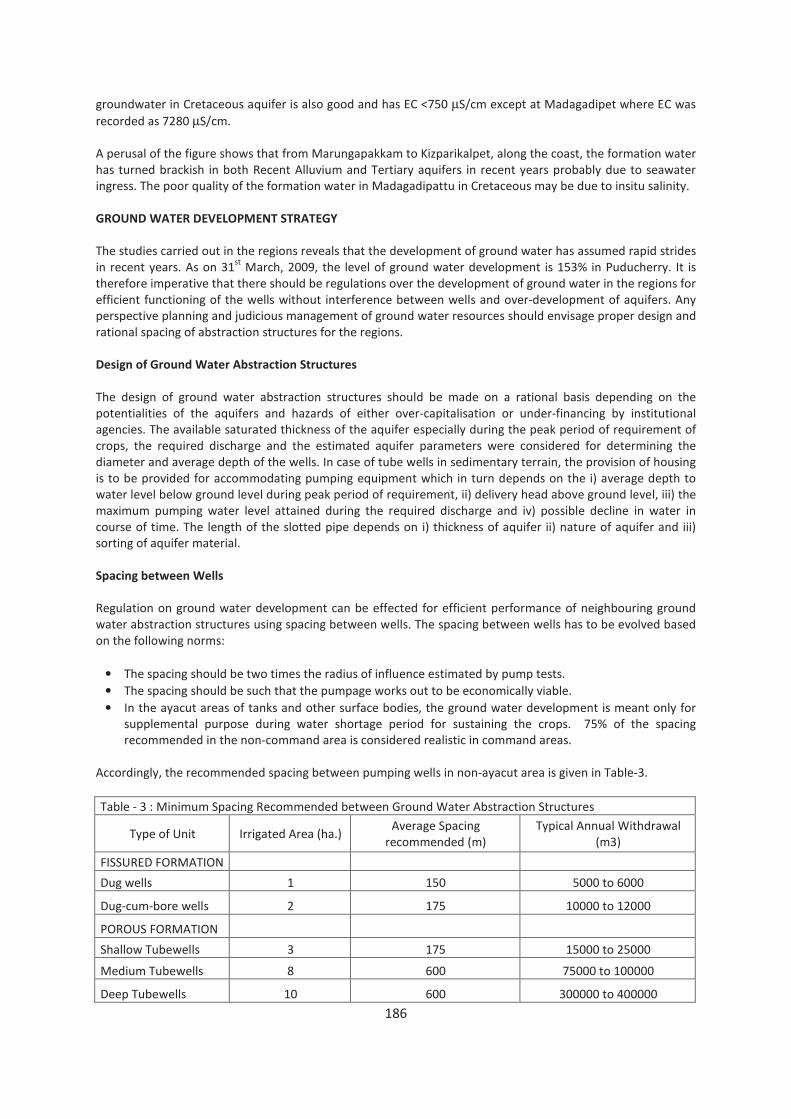
186
groundwater in Cretaceous aquifer is also good and has EC <750 µS/cm except at Madagadipet where EC was
recorded as 7280 µS/cm.
A perusal of the figure shows that from Marungapakkam to Kizparikalpet, along the coast, the formation water
has turned brackish in both Recent Alluvium and Tertiary aquifers in recent years probably due to seawater
ingress. The poor quality of the formation water in Madagadipattu in Cretaceous may be due to insitu salinity.
GROUND WATER DEVELOPMENT STRATEGY
The studies carried out in the regions reveals that the development of ground water has assumed rapid strides
in recent years. As on 31st
March, 2009, the level of ground water development is 153% in Puducherry. It is
therefore imperative that there should be regulations over the development of ground water in the regions for
efficient functioning of the wells without interference between wells and over-development of aquifers. Any
perspective planning and judicious management of ground water resources should envisage proper design and
rational spacing of abstraction structures for the regions.
Design of Ground Water Abstraction Structures
The design of ground water abstraction structures should be made on a rational basis depending on the
potentialities of the aquifers and hazards of either over-capitalisation or under-financing by institutional
agencies. The available saturated thickness of the aquifer especially during the peak period of requirement of
crops, the required discharge and the estimated aquifer parameters were considered for determining the
diameter and average depth of the wells. In case of tube wells in sedimentary terrain, the provision of housing
is to be provided for accommodating pumping equipment which in turn depends on the i) average depth to
water level below ground level during peak period of requirement, ii) delivery head above ground level, iii) the
maximum pumping water level attained during the required discharge and iv) possible decline in water in
course of time. The length of the slotted pipe depends on i) thickness of aquifer ii) nature of aquifer and iii)
sorting of aquifer material.
Spacing between Wells
Regulation on ground water development can be effected for efficient performance of neighbouring ground
water abstraction structures using spacing between wells. The spacing between wells has to be evolved based
on the following norms:
• The spacing should be two times the radius of influence estimated by pump tests.
• The spacing should be such that the pumpage works out to be economically viable.
• In the ayacut areas of tanks and other surface bodies, the ground water development is meant only for
supplemental purpose during water shortage period for sustaining the crops. 75% of the spacing
recommended in the non-command area is considered realistic in command areas.
Accordingly, the recommended spacing between pumping wells in non-ayacut area is given in Table-3.
Table - 3 : Minimum Spacing Recommended between Ground Water Abstraction Structures
Type of Unit Irrigated Area (ha.) Average Spacing
recommended (m)
Typical Annual Withdrawal
(m3)
FISSURED FORMATION
Dug wells 1 150 5000 to 6000
Dug-cum-bore wells 2 175 10000 to 12000
POROUS FORMATION
Shallow Tubewells 3 175 15000 to 25000
Medium Tubewells 8 600 75000 to 100000
Deep Tubewells 10 600 300000 to 400000
187
Artificial Recharge Structures
The topography of Puducherry, in general, is suited for construction of various artificial recharge structures
such as percolation ponds, check dams and recharge shaft/well. However, detailed studies are necessary to
formulate a comprehensive scheme for artificial recharge of phreatic ground water in the district in view of the
variations in the geomorphic set-up and the complex hydrological and hydrogeological conditions. Since there
are a large number of irrigation tanks in the regions suitable measures for increasing the quantum of storage
like desilting, raising of bunds etc have to be taken up immediately which will facilitate recharge of the shallow
water table aquifer to a considerable extent. For recharging deeper aquifers and to prevent sea water
intrusion, recharge wells in all favourable tanks and coastal areas is recommended. Sub-surface dykes,
percolation ponds and small check weirs to hold rain water can be planned in the fissured hard rock areas.
Roof top rain water harvesting made mandatory by the State Government has improved the water level
condition but due to lack of periodical maintenance, the effect has reduced over the period of time.
The ongoing large scale of development of ground water for ever increasing demands has caused considerable
impact on the ground water regime of the region. The region, which had many flowing wells in the past, has
witnessed termination of free flow over the years and continued declining trend of water levels. Artificial
Recharge Programme for augmentation of the ground water resources can be used to arrest the declining
trend.
The availability of the water source with good quality in the vicinity of favourable site for the aquifer to be
recharged is the most important factor for any artificial recharge programme. The selection of site for artificial
recharge depends on several factors like topography, nature and infiltration capacity of soils, lithology,
permeability and thickness of aquifer to be recharged etc. Specific studies together with a sound knowledge of
hydrological and hydrogeological parameters and identifying appropriate technique or the methodology to be
adopted at each site is essential for selecting site for artificial recharge programme. Recharge can be
augmented through 1) contour bunding, 2) nala bunding, 3) check dams, 4) contour trenching, 5) construction
of percolation ponds, 6) surface channels, trenches and subsurface dykes in hydrogeological favourable
locations.
Poor recharge conditions and over draft of available groundwater resources are mainly responsible for the
high-level ground water development in the regions. There is an urgent need to replenish the ground water
resources through construction of appropriate ground water conservation/artificial recharge structures.
Steps Taken for Augmentation of Ground Water Resources
Steps taken by Central Ground Water Board include a) Implementation of Pilot Schemes for Recharge
Augmentation / Ground Water Conservation in areas of over-exploitation of Ground Water Resources/ Long
Term Water Level Decline for popularising cost-effective technologies for Augmentation Of Ground Water
Resources & b) Initiatives for Creating Mass Awareness on the importance of Conservation, Protection and
sustainable management of available Ground Water Resources & for creation of trained manpower to
implement strategies for Sustainable Ground Water Management at Community Level.
Measures taken by Government of Puducherry are schemes for augmentation of ground water resources in
Puducherry since 1990. Implementation of such schemes has been geared up since 2001. Various campaigns
aimed at creating public awareness on the importance of ground water augmentation and conservation are
also being taken up regularly in the regions by the concerned Govt. agencies and NGOs.

188
INDIACHHATTISGARH STATE
RAIPUR DISTRICTRAIPUR URBAN AREA
Fig. 1: Location map of Raipur Urban Area
DHARSIWA BLOCK
RAIPUR CITY, CHATTISGARH
Rumi Mukherjee, Mausumi Sahoo, K.C. Naik, CGWB, Raipur
INTRODUCTION
Raipur, the capital city of Chhattisgarh along with its outgrowths lies between 21° 10’and 21° 21’ N latitudes
and 81° 32’ to 81° 44’E longitudes and falls under Survey of India toposheets no. 64G/11 & 64G/12 .The town
of Raipur has been in existence since the 9th
century. As per one story, King Ramachandra’s son Brahmdeo Rai
established Raipur and named it after himself in around 1402 A.D. He belonged to the Kalchuri Dynasty of
Tumman. Chhattisgarh was declared a separate commissionary in 1854 by the British Government with its
headquarters at Raipur. Raipur attained municipal status in early 1867 and was upgraded to Municipal
Corporation in 1967. After independence, Raipur district was included in the Central Provinces and Berar.
Chhattisgarh was carved out of
Madhya Pradesh and became a
separate state in the year 2000.
GENERAL FEATURES
Area/Administrative Divisions
Raipur urban area spans over
more than193 sq. km. It is an
important urban centre of
Raipur district and comes under
Dharsiwa block. For
administrative purpose, it is
divided into 67 wards. The
location map is given in Fig. 1.
Demography
As per 2001 census, the total
population of Raipur Urban Area
(Municipal corporations and
outgrowths) was 670042. The
total population of Raipur
Municipal Corporation alone is
605747. Apart from Municipal
Corporation, the outgrowths have
also been brought under urban
area. Considering an increase of
about 49% per decade (the
average growth rate in the last
three decades), the projected
population for the year 2011 for
Raipur Urban Area works out to
be 998363 i.e. approximately 10
lakhs.
Hydrometeorology
Sub-tropical climatic condition prevails in Raipur Urban Area. The area experiences a very hot long summer
from March to mid June followed by rainy season which lasts for almost four months from mid June to
September. The winter season commences from December and lasts till end of February. The mean maximum

189
temperature in May is 45.2°C, whereas the mean minimum temperature in January is 9.2°C (for the
period1951 to 2008,IMD).The average (1980-2007) potential evapo-transpiration varies from 104mm. in
December to 258mm in April.
South west monsoon contributes more than 85% of the annual rainfall. The annual normal rainfall of the area
is 1288.8 mm. On an average there are 63 rainy days in a year. Table 1 contains the monthly rainfall data of
year 2005-2009 of the area.
Physiography & Drainage
Physiographically Raipur is situated in the south central part of Chhattisgarh basin having gentle undulating
topography. The maximum elevation is 304 m. amsl whereas lowest elevation is 268m amsl. The center of area
forms an elongated ridge like structure, generating a radial pattern of drainage of lower order streams flowing
towards the north-south and west, and joining the Kharun River. The Karun River joins Seonath River (a
tributary of Mahanadi River). Kharun along with Chhokra Nallah and other small nallah systems drain the area.
Drainage density is moderate in the area due to flat terrain and underlying layers of laterite and sandstone
which have moderate permeability.
Soil Types
Mainly two soil categories are present in Raipur Urban Area-ultisol and vertisols.
Vertisols-Under this category, only one soil type is found in Raipur namely deep black soil. It is characterized by
a high content of expanding and shrinking clay known as montmorillonite having high level of plant nutrients.
Owing to the high clay content, it is not well suited to cultivation. This type of soil has developed mostly over
limestone covered areas.
Ultisols- Under this category, only one soil type is found in Raipur namely lateritic soil. This is a highly
weathered and leached acid soil with high levels of clay below top layer. This soil has variety of clay minerals
but in many cases the dominant mineral is Kaolinite. They are red to yellow in colour and are quite acidic
having pH less than 5.The red and yellow colour results from the accumulation of iron oxide which is highly
insoluble in water. It has developed mostly over the sandstone and shale covered areas.
STATUS OF WATER SUPPLY AND DEMAND
The demand of water for municipal and industrial uses has been worked out. The water demand for municipal
use has been worked out @170 lit/capita/day (lpcd). In the year 2011 the water requirement for Raipur Urban
Area worked out to be 62.05 MCM.
This requirement is met through surface and ground water resources. As per the data of Raipur Municipal
Corporation (RMC Water Works Department, 2011)), total water supply by RMC is 150 MLD, i.e. 54.75 MCM.
Out of it 127 MLD (i.e. 46.35 MCM) is supplied from surface water sources. The rest 23 MLD (i.e. 8.4 MCM) is
supplied met from ground water.
RMC supplies a total of 54.75 MCM against a demand of 62.05 MCM. Remaining 7.3 MCM is met entirely
through private borewells. Thus the total annual ground water draft is estimated as 15.7 MCM.

190
GROUND WATER SCENARIO
Major Geological Formations
Raipur is situated on Proterozoic Chandi Formation of Raipur group (Chhattisgarh Super Group) comprising of
limestone, shale and sandstone which is at places intruded by dolerite intrusives. 0 Chandi Formation
comprises of horizontal to gently dipping Niwari stromatlitic limestone and Deodongar shale and sandstone
member. The limestone is generally massive to jointed, karstic in nature showing fractures, solution cavities
and sink holes is exposed at Mahadevghat and Purena section. Deodongar Member overlies the limestone.
Deondonger Member consists of khaki to purple colored shale, inter-bedded with layers of sandstone. The
shales are thinly laminated, compact and impervious. The sandstones are orthoquartzite with siliceous
cement and ferruginous coating, compact, thinly to thickly bedded. The sandstones are generally covered with
lateritic soil and the shales are covered by soil.
The sub surface geology of the area prepared on
the basis of lithologs of boreholes data and
dugwell sections reveals that Deodongar Member
is forming an uneven capping of impervious layer
over limestone. The maximum thickness of shale
is recorded in Telibandha area and which is
thinning towards Raipura and Labhandi area
forming a prismatic cover on limestone (Fig. 2). A
subsurface dolerite dyke is running roughly E-W
to NE to SW in Kota – Samta colony area. A
borehole drilled down to 300-mbgl shows that the
thickness of Chandi Limestone is 136 m and
overlies the Gunderdehi Shale. The exploratory
data in the Daldal Seoni indicates presence of
Chandi Shale from the top to 72 m bgl after which
limestone is encountered. Water bearing zone is
encountered at the contact of shale and
limestone of Chandi Formation.
Potential Aquifers
Limestone, shale and sandstone of Chandi Formation comprise the major aquifers in the area. The major
aquifers can be grouped into three - an unconfined (shallow) aquifer, a discontinuos semiconfined (deeper)
aquifer and a perched aquifer. The perched aquifer is characterized by very shallow water table condition
throughout the year and is encountered in the central part of Raipur town covering Ashram-Amapara-
Rajatalab, Shankarnagar,Telibandha,Rawabhata areas due to the presence of impermeable shale layer above
the unconfined aquifer. Ground water in Chandi Formation occurs both under phreatic and semi-confined to
confined condition. The dug wells in the area tap the upper part of the shale or limestone. The depth of the
dug wells varies from 7 to 21 m bgl with diameter ranging from 2 to 6 meter. The deeper aquifer in the form of
fractures and solution cavities are being tapped by means of bore wells, where the ground water remains
under semiconfined to confined condition. The deeper fractured zones between 30 and 70 mbgl are the major
aquifer zones in the Chandi Limestone and Gunderdhi Shale underlying the city. In some areas, like
Shyamnagar, Telibandha, Sundernagar, cavernous limestone has been encountered in a depth range of 20 to
70 mbgl. In general the water bearing horizons are encountered in depth ranges of 13 to 45m bgl and 65 to
85m bgl. The depth of the borewells in the area ranges from 30 to 120m bgl. The yield of the bore wells
tapping these horizons ranges from 1 lps to 12.5 lps and the drawdown varies from 7 to 60m It has been
observed that low yielding wells tapping limestone aquifer show increase in discharge up to 2 lps after blasting
through explosive by crude method (RMCWD, 1998-99). At present, aquifers ranging in depth from 20.00 to
60.00m bgl are not yielding because of heavy ground water withdrawal due to rapid urbanization. This aquifer
zone was earlier capable of catering to the ground water needs of the city. The Transmissivity(T) & Storativity
(S) calculated for Chandi Formation varies from 1 to 120 m2/day and 2*10
-3 to 8.3*10
-5 respectively (Shobnath
et.al, 2000).

191
In general the ground water flow
direction is perpendicular to
ground water divide. Towards the
Kharun River in the south of
Dumartalab the ground water flow
direction is south to south-west
with gentle gradient. Ground
water plateau is formed in the
central part of the city having flow
direction towards Daldal Seoni and
Labhandi. The detailed
hydrogeological map is shown in
Fig. 3.
Water Level Conditions
The phreatic aquifer depth to
water level ranges from 4 to 15m
bgl during pre-monsoon
period(Fig. 4) and 1.3 to 9 m
bgl.during post monsoon period
(Fig 5).In many areas like Daldal
Seoni, Bhatagaon, Sadu etc. , the
phreatic aquifer dries up during
pre-monsoon period leading to
acute water shortage.
For the deeper aquifer, the depth to
water level varies from 4 to 55 m
bgl during pre-monsoon period
(Fig.6).Whereas during the post-
monsoon period, the depth to
water level varies from <3m to
35m bgl. (Fig. 7). From the map it is
seen that the depth to water level
of the deeper aquifer remains at
more than 15m bgl in the northern
areas (Rawabhatta-Gogaon-
Gudhiari) during the post-monsoon
period. This area is adjacent to the
Urla industrial belt located in the
northern western outskirts of
Raipur. So there may be excessive
ground water withdrawal from
deeper aquifer which is under
stress.
The Fig. 8 shows the water level-
rainfall relationship for shallow,
deeper and perched aquifers in
Raipur Urban Area. Water level
behaviours in most of the cases are
sympathetic with rainfall. At some

192
points in the deeper aquifer, delayed
recharge is apparent.
Ground Water Resources
Ground water resource of Raipur Urban
Area has been estimated using water table
fluctuations and specific yield of different
rock types (Table 2). The rainfall infiltration
method was not considered because it was
difficult to estimate recharge worthy areas
in an urban environment. Many parts of the
urban areas are rendered impermeable
because of roads and other constructions.
Further, there are many additional sources
of ground water recharge in an urban area
(Lerner 2002), which are difficult to identify
and quantify. Water level fluctuations reflect the resultant ground water recharge from all the possible
sources. Though the shallowest water levels are attained during the month of August, the water levels deplete
very fast and usually stabilize by the month of November. So the available ground water resource was
estimated considering water table fluctuations between from May and Nov. 2010. The estimate was based on
water level fluctuations in the phreatic aquifer multiplied with area and and the specific yield for the aquifer
(GEC’97). The total annual available resource was estimated to be 19.80 MCM.
Total annual ground water draft was estimated earlier as 15.7 MCM. The stage of ground water development
calculated as a ratio of total annual ground water draft to total annual available ground water resource
(15.7/19.8) is nearly 80% for Raipur Urban Area. With the stage of ground water development more than 70%
and pre-monsoon water levels in most of the wells showing falling trends, Hence, the Raipur Urban Area can
be categorized as semi-critical.
Table 2: Ground water resource estimation using water level fluctuation method
Geology Fluctuation (m) Area (Km2) Sp. Yield Resources (MCM)
Limestone 1.21 25.05 0.03 0.91
3.00 7.94 0.03 0.71
5.00 28.58 0.03 4.29
7.00 17.68 0.03 3.71
8.85 1.57 0.03 0.42
Shale 1.21 0.30 0.02 0.01
3.00 8.77 0.02 0.39
5.00 11.11 0.02 0.83
7.00 1.67 0.02 0.18
8.85 0.00 0.02 0.00
Sst 1.21 4.32 0.02 0.10
3.00 28.06 0.02 1.68
5.00 43.39 0.02 4.34
7.00 10.89 0.02 1.52
8.85 3.98 0.02 0.70
Total 19.8
Hydrochemistry
Water samples of wells in and around Raipur were analysed for the basic parameter. pH (laboratory
measurements) in ground water samples of Raipur varies from 7.04 to 8.7 with an average of 8.03,which
shows that water is mostly alkaline in nature. pH is within the permissible limits.
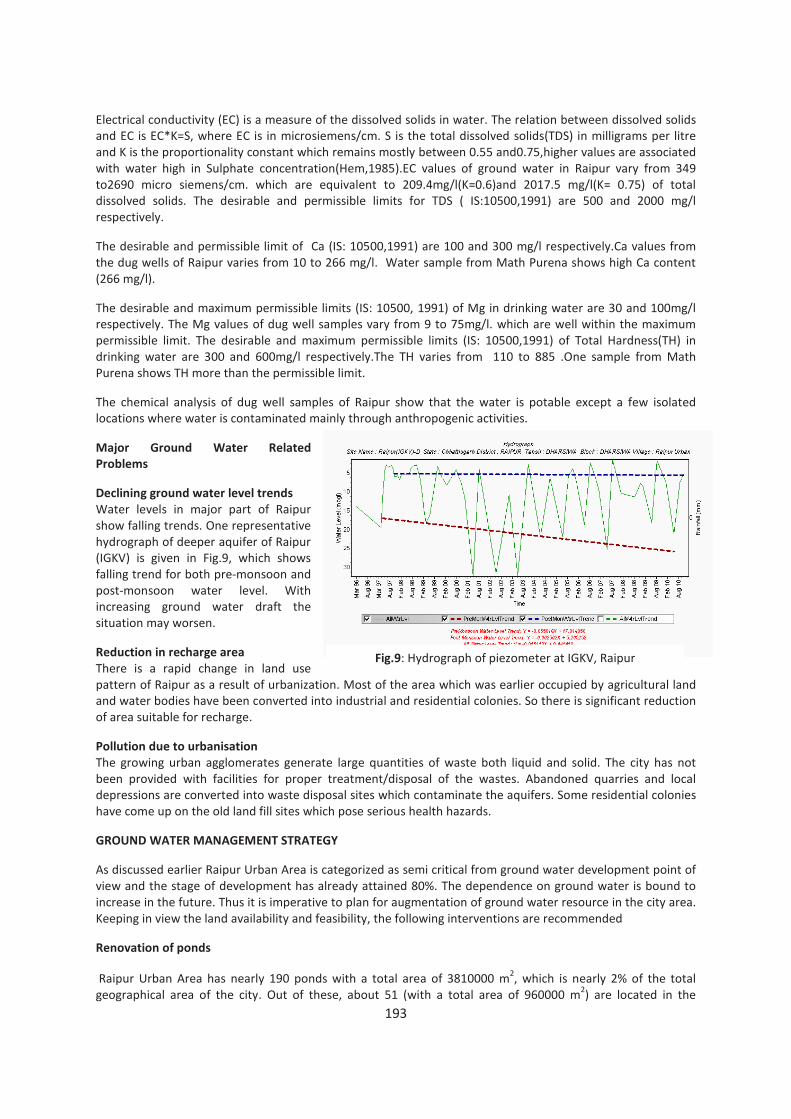
193
Electrical conductivity (EC) is a measure of the dissolved solids in water. The relation between dissolved solids
and EC is EC*K=S, where EC is in microsiemens/cm. S is the total dissolved solids(TDS) in milligrams per litre
and K is the proportionality constant which remains mostly between 0.55 and0.75,higher values are associated
with water high in Sulphate concentration(Hem,1985).EC values of ground water in Raipur vary from 349
to2690 micro siemens/cm. which are equivalent to 209.4mg/l(K=0.6)and 2017.5 mg/l(K= 0.75) of total
dissolved solids. The desirable and permissible limits for TDS ( IS:10500,1991) are 500 and 2000 mg/l
respectively.
The desirable and permissible limit of Ca (IS: 10500,1991) are 100 and 300 mg/l respectively.Ca values from
the dug wells of Raipur varies from 10 to 266 mg/l. Water sample from Math Purena shows high Ca content
(266 mg/l).
The desirable and maximum permissible limits (IS: 10500, 1991) of Mg in drinking water are 30 and 100mg/l
respectively. The Mg values of dug well samples vary from 9 to 75mg/l. which are well within the maximum
permissible limit. The desirable and maximum permissible limits (IS: 10500,1991) of Total Hardness(TH) in
drinking water are 300 and 600mg/l respectively.The TH varies from 110 to 885 .One sample from Math
Purena shows TH more than the permissible limit.
The chemical analysis of dug well samples of Raipur show that the water is potable except a few isolated
locations where water is contaminated mainly through anthropogenic activities.
Major Ground Water Related
Problems
Declining ground water level trends
Water levels in major part of Raipur
show falling trends. One representative
hydrograph of deeper aquifer of Raipur
(IGKV) is given in Fig.9, which shows
falling trend for both pre-monsoon and
post-monsoon water level. With
increasing ground water draft the
situation may worsen.
Reduction in recharge area
There is a rapid change in land use
pattern of Raipur as a result of urbanization. Most of the area which was earlier occupied by agricultural land
and water bodies have been converted into industrial and residential colonies. So there is significant reduction
of area suitable for recharge.
Pollution due to urbanisation
The growing urban agglomerates generate large quantities of waste both liquid and solid. The city has not
been provided with facilities for proper treatment/disposal of the wastes. Abandoned quarries and local
depressions are converted into waste disposal sites which contaminate the aquifers. Some residential colonies
have come up on the old land fill sites which pose serious health hazards.
GROUND WATER MANAGEMENT STRATEGY
As discussed earlier Raipur Urban Area is categorized as semi critical from ground water development point of
view and the stage of development has already attained 80%. The dependence on ground water is bound to
increase in the future. Thus it is imperative to plan for augmentation of ground water resource in the city area.
Keeping in view the land availability and feasibility, the following interventions are recommended
Renovation of ponds
Raipur Urban Area has nearly 190 ponds with a total area of 3810000 m2, which is nearly 2% of the total
geographical area of the city. Out of these, about 51 (with a total area of 960000 m2) are located in the
Fig.9: Hydrograph of piezometer at IGKV, Raipur

194
limestone areas and the rest 139 (with a total area of 2850000 m2) are located in the sandstone and shale
areas. Ponds in the limestone areas are already effective recharge structures. Water in these ponds remains
for nearly 180 days in a year. Desilting and deepening of these ponds will increase the water storage, which
may increase in ground water recharge.
On the other hand, the ponds situated on
the sandstone and shale contribute
marginally to ground water recharge.
Thickness of the upper sandstone is not
more than 2m in most parts. The bottom
of all these ponds is on shale, which does
not allow percolation at faster rate.
Thickness of this shale layer is up to 30 m,
below which stromatolitic limestone is
encountered. This stromatolitic limestone
is a potential aquifer. To increase
recharge efficiency, inverted wells or
recharge wells may be constructed in
these ponds. Ponds in the urban areas in
many places are polluted by urban
wastes, so special care should be taken
and complete hydrochemical and
biochemical assessment of water of
individual ponds should be carried out,
before constructing recharge wells. Out
of 139 such water bodies, those water
bodies which have areas more than 1000
m2 may be considered for construction of
recharge wells. The recharge wells should
be constructed in such a way that a
minimum storage is maintained in the
pond. There are 103 (say 100) such ponds
in Raipur Urban Area. Cumulative area of these ponds is 2596000 m2. Assuming an average water column of
4m and a recharge efficiency of 50%, by the construction of recharge wells, recharge from these ponds is
expected to increase by a significant 5 MCM.
Construction of Recharge Wells and Cost Estimates
It is proposed to construct two recharge wells (bore-well) in each pond of area more than 10000 m2. This
means that a total of 200 recharge wells are to be constructed. The bore wells may be constructed during the
dry season, when the water levels in the ponds are at minimum level. Recharge wells may be constructed in
such a manner that pond water enters the recharge structure only when water level in the pond rises above
water level in the summer. Each borewell may be of 70m depth and an associated insitu filter is to be
constructed. Average rate of construction of a bore well is around Rs. 1500 per m and the average cost of
construction of the filter is 20000. Thus the unit cost of each installation will be around Rs. 125000. Total cost
of construction of 200 bore wells will be Rs. 2.5 crores.
Rooftop Rainwater Harvesting
The most effective way of ground water augmentation in an urban area is rooftop rainwater harvesting.
Rooftop rainwater harvesting is effective for harvesting non-monsoon rainfall. During monsoon period, the
aquifers are already saturated in many parts and the recharge efficiency is greatly reduced. Normal
nonmonsoon rainfall in Raipur Urban Area is 1146mm. There are nearly 200000 households in the Raipur
Urban Area. Assuming a total roof area of 500.0000 m2 and a harvesting efficiency of 20%, total volume of
harvested water will be nearly 14MCM, which is a significant amount.
Fig. 10 Distribution of water bodies in Raipur Urban Area.
195
Construction of Subsurface Dykes
Central Ground Water board has constructed a subsurface dyke across Chhokra nala and it has shown
promising results. Two additional subsurface dykes may be constructed at suitable sites to restrict subsurface
flow.
Water Quality Considerations
Most important aspect of ground water development in the city is to maintain ground water quality standards.
It has been pointed out in many reports (State Report 2006) that the karstic limestone terrain in Raipur Urban
Area is highly vulnerable to pollutions especially when the urban waste dump sites are located above them. It
is recommended that all the urban waste dump sites be relocated to low lying shale covered areas.
Demand Side Management
It is also imperative to reduce groundwater demand by adopting water efficient lifestyle. The success of any
programme finally depends on people’s participation. So mass awareness campaigns regarding water
conservation in day-to-day activities can go a long way in ground water conservation in Raipur Urban Area.
Further suitable regulatory guidelines and legislations should be adopted to control ground water draft and to
promote safe ground water abstraction.
REFERENCES
• GEC’97 (1997) Report of the Ground Water Resource Estimation Committee-Ground water resource
estimation methodology 1997. Central Ground Water Board, Ministry of Water Resources, Govt. of India,
New Delhi 107p.
• Hem J D (1985) Study and interpretation of the chemical characteristics of natural waters, USGS Water
Supply Paper 2254, 263p.
• Lerner DN (2002) Identifying and quantifying urban recharge: a review. Hydrogeol J 10: DOI
10.1007/s10040-001-0177-1
• Mukherjee A and Tewari D, 2005, Brochure on Hydrogeology of Raipur Urban Area, CGWB,NCCR, Raipur.
• Shobhnath ,Mishra A K , Shrivastava Manoj, Pati G C, Tewari D and Mukherjee A , 2000, Impact of
urbanisation on ground water resource of Raipur Urban Agglomerate, Worshop on Strategies for Ground
Water Management in Madhya Pradesh,29th
March, ,Raipur
• State Report- Hydrogeology of Chhattisgarh,2006,CGWB, NCCR, Raipur

196
RANCHI CITY, JHARKHAND
G.K Roy, R.A. Kujur & S. Toppo, CGWB, Ranchi
INTRODUCTION
The Ranchi district was formed in 1899. It was named after a small village. The district was earlier known as
Lohardaga, which came into existence after the creation of the non-regulation South-West Frontier as a result
of the Kol rising. In ancient times the district of Ranchi and the neighbouring parganas were in the possession
of Munda and Oraon tribes and were known to Aryans as Jharkhand or the 'forest territory'. Ranchi urban
area is capital of the state of Jharkhand and is also district Headquarter. It is known for its rich deposits of
minerals, waterfalls, rivers, streams, lakes, dams and forests. Ranchi has witnessed a huge influx of people
after the formation of Jharkhand State on November 15, 2000, owing to the rise in employment opportunities
and opening of numerous regional and state level offices, banks, and private organisations.
Subernarekha River flows by the side of the city. Ranchi Lake is one of the major water bodies located in the
heart of the city spreading over an area of 53 acres. Water demand of the city is met from three surface
water reservoirs namely, Kanke Dam, Dhurwa Dam and Rukka Dam and by large numbers of dug wells of 10-
15m depth tapping phreatic aquifer represented by
weathered mantle and saprolite zones. These dugwells
are of late replaced by large scale deep bored wells.
GENERAL FEATURES
Area/ Administrative Division
Presently the capital city of Ranchi spreads over an area
of about 257 km2 which has increased from 173 sq.km
in 1991. It is bounded by 23015’-23
025’N latitude and
85015’-85
025’E longitude and falls in Survey of India
toposheet 73E/7. The urban area is divided into 55
wards (Fig. 1).
Demography
As per the 2001 census, the total population of the area
is 10.5 Lakh. The population of the urban area has grown
from 5.99 to 10.5 lakh during 1991-2001 recording 41%
decadal growth rate. The population density has
increased to 4086 persons/km (2001) as compared to
2330 person / Sq.Km in 1991. The present population is
estimated to be 11.93 lakhs and is likely to touch around
17 lakhs in 2021 considering the same growth rate.
Hydrometeorology
Ranchi represents a sub-tropical climate. The minimum ambient temperature has been recorded as low as 4-5o
Celcius in December/January, whereas maximum temperature of 42o
Celcius has been recorded in May/June.
The average annual rainfall of 1377mm (year 2004–year 2008) has been recorded in the urban area. The rain in
the monsoon months of July to September varies from 117.4 to as high as 640.6 mm.
Physiography & Drainage
The area was subjected to long phase of denudation and is approaching to peneplain stage except for some
residual hillocks with scattered distribution in Ranchi Urban Area. There are mainly three types of
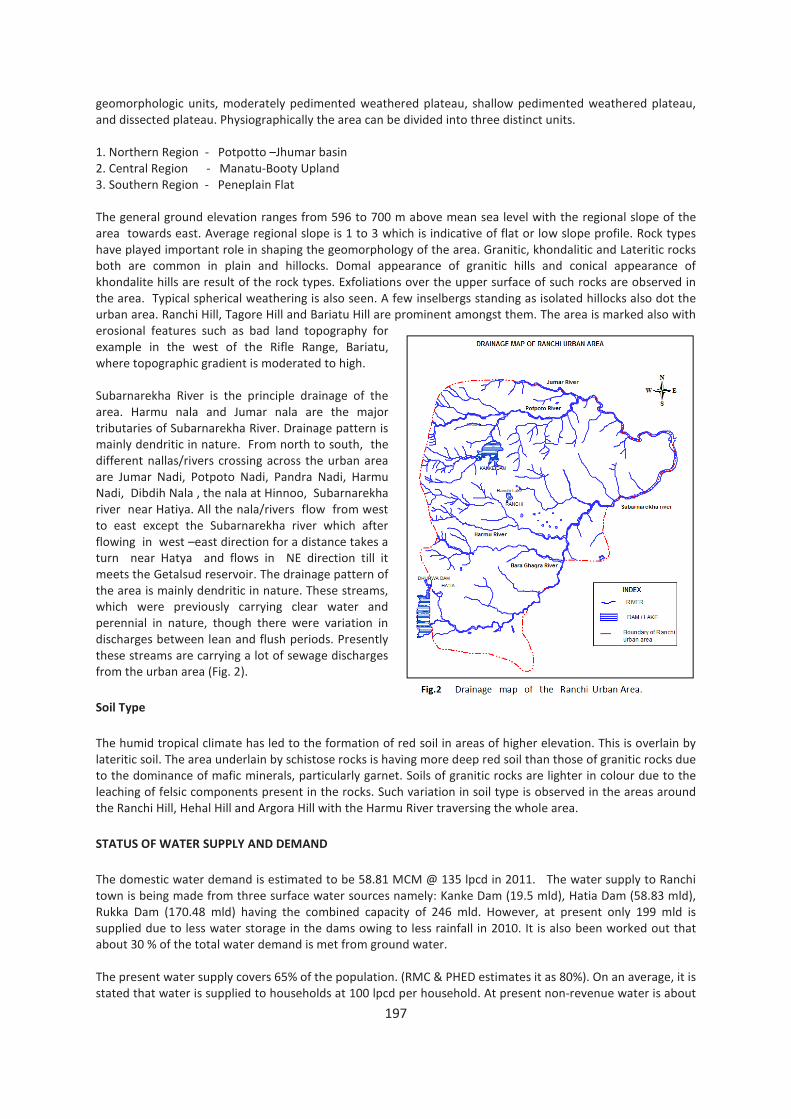
197
geomorphologic units, moderately pedimented weathered plateau, shallow pedimented weathered plateau,
and dissected plateau. Physiographically the area can be divided into three distinct units.
1. Northern Region - Potpotto –Jhumar basin
2. Central Region - Manatu-Booty Upland
3. Southern Region - Peneplain Flat
The general ground elevation ranges from 596 to 700 m above mean sea level with the regional slope of the
area towards east. Average regional slope is 1 to 3 which is indicative of flat or low slope profile. Rock types
have played important role in shaping the geomorphology of the area. Granitic, khondalitic and Lateritic rocks
both are common in plain and hillocks. Domal appearance of granitic hills and conical appearance of
khondalite hills are result of the rock types. Exfoliations over the upper surface of such rocks are observed in
the area. Typical spherical weathering is also seen. A few inselbergs standing as isolated hillocks also dot the
urban area. Ranchi Hill, Tagore Hill and Bariatu Hill are prominent amongst them. The area is marked also with
erosional features such as bad land topography for
example in the west of the Rifle Range, Bariatu,
where topographic gradient is moderated to high.
Subarnarekha River is the principle drainage of the
area. Harmu nala and Jumar nala are the major
tributaries of Subarnarekha River. Drainage pattern is
mainly dendritic in nature. From north to south, the
different nallas/rivers crossing across the urban area
are Jumar Nadi, Potpoto Nadi, Pandra Nadi, Harmu
Nadi, Dibdih Nala , the nala at Hinnoo, Subarnarekha
river near Hatiya. All the nala/rivers flow from west
to east except the Subarnarekha river which after
flowing in west –east direction for a distance takes a
turn near Hatya and flows in NE direction till it
meets the Getalsud reservoir. The drainage pattern of
the area is mainly dendritic in nature. These streams,
which were previously carrying clear water and
perennial in nature, though there were variation in
discharges between lean and flush periods. Presently
these streams are carrying a lot of sewage discharges
from the urban area (Fig. 2).
Soil Type
The humid tropical climate has led to the formation of red soil in areas of higher elevation. This is overlain by
lateritic soil. The area underlain by schistose rocks is having more deep red soil than those of granitic rocks due
to the dominance of mafic minerals, particularly garnet. Soils of granitic rocks are lighter in colour due to the
leaching of felsic components present in the rocks. Such variation in soil type is observed in the areas around
the Ranchi Hill, Hehal Hill and Argora Hill with the Harmu River traversing the whole area.
STATUS OF WATER SUPPLY AND DEMAND
The domestic water demand is estimated to be 58.81 MCM @ 135 lpcd in 2011. The water supply to Ranchi
town is being made from three surface water sources namely: Kanke Dam (19.5 mld), Hatia Dam (58.83 mld),
Rukka Dam (170.48 mld) having the combined capacity of 246 mld. However, at present only 199 mld is
supplied due to less water storage in the dams owing to less rainfall in 2010. It is also been worked out that
about 30 % of the total water demand is met from ground water.
The present water supply covers 65% of the population. (RMC & PHED estimates it as 80%). On an average, it is
stated that water is supplied to households at 100 lpcd per household. At present non-revenue water is about

198
92%. The other identified issues are; non-uniformity in supply (levels), high amount of distribution losses (over
40%), inefficient operations, high pollution in distribution network, and decline in ground water level.
The expected water demand will increase to about 83 mcm by 2020 and 232 mcm by the year 2051 and
ground water demand will increase from 17.64 mcm at present to 69.73 mcm by 2050 taking 30% dependency
on ground water in Ranchi Urban Area. The present and projected demand has been shown in Table1.
Table1 Water demand of Ranchi Urban Area
Year Population Expected water
demand(m3/day)
@ 135 lit/person /day
Expected water demand
(mcm/annum)
Ground Water Demand
(mcm / annum) (30 %
DEPENDENCY)
1991 599000 80865 29.52 8.85
2001 846454 114271 41.71 12.51
2011 1193500 161123 58.81 17.64
2021 1682835 227183 82.92 24.88
2031 2372798 320328 116.92 35.08
2041 3345644 451662 164.86 49.46
2051 4717359 636843 232.45 69.73
GROUND WATER SCENARIO
Potential Aquifers
Ranchi urban area is
underlain by Chotanagpur
Gneiss Granulite Complex of
Precambrian age and
exhibits a gently rolling to
undulating topography.
Occurrence and movement
of ground water in
consolidated formation is
controlled by rock types and
their properties related to
weathering and deformation.
In Ranchi urban area ground
water occurs under
unconfined condition in
phreatic aquifer consisting of
weathered mantle and
saprolite zones (fractured
zone in contact with
weathered mantle) in
confined to semi-confined
conditions in deep seated
fractures in the consolidated
formation. Weathered zone
thickness varies between
5.50 m to 37 m bgl. The
hydrogeological of ranchi
urban area has been given Fig.3
The fractures were detected up to a depth of 192 m bgl. However, the fractures occurring between 70 and 150
m depth constitute potential aquifers. The ground water occurs under semi-confined condition in these
fractures. Transmissivity has been found to vary between 2.46 m2/day (Rajbhawan campus) to 80 m
2/day (Golf
ground, Dipatoli). Storativity at Doranda was observed to be 6.00 X10⁻⁴
.

199
Ground Water Level
40 dug wells and 13 peizometers are being monitored monthly in Ranchi Urban area for study if spatial and
the ground water regime . The water level data of key observation wells and piezometers is given in table – 2
and 3.
In shallow aquifers during pre-monsoon period (May 2010) water levels vary between 2.04 (Dindyal Nagar) to
15.95 mbgl (Daily Market). During post-monsoon (November 2010) water levels vary between 0.25 (Tiril) to
11.81 mbgl (Church Compound). Depth to water level maps of both the period have been shown in Fig. 4.
Table 2 : Depth to water level in shallow aquifer (dug well zone)
Well No. Village / Area Depth
(mbgl)
Diameter(m.) DTW (mbgl)
May-2010
DTW (mbgl)
Nov-2010
RNC - 1 Tupudana
10.82 1.87 9.52 6.4
RNC - 2 Kachnar Toli
(Hatia)
11.10 1.90 11.03 5.55
RNC - 3 Birsa Chowk (Check post)
6.01 2.00 4.96 2.76
RNC - 5 Hinoo
(Mani Tola)
8.73 2.00
3.19 2.19
RNC - 6 Namkum
9.25 3.15 8.04 4.37
RNC - 7 Dhurwa (HEC)
New Market
7.27 2.45 3.87 2.39
RNC - 8 Tiril
13.45 4.60 8.66 5.92
RNC - 9 Pundag
8.90 3.80 8.2 5.01
RNC - 10 Ashok Nagar
6.50 2.17 5.15 3.01
RNC - 11 Lowadih
7.76 1.84 7.2 5.16
RNC - 12 Kokar
11.25 2.10 5.95 4.53
RNC - 13 Hotwar
13.60 1.50 11.51 7.11
RNC - 14 Booty(Nayak Toli)
5.41 1.22 3.98 3.41
RNC - 15 Baragai
(Chitragupt Colony
6.34 2.50 3.51 3.04
RNC - 16 Ratu Road Bus Stand 8.75 3.10 5.05 3.49
RNC - 17 Dindayal Nagar 3.98 1.83 2.04 1.66
RNC – 18 Morabadi
12.36 1.80 Dry 7.55
RNC – 20 Chauri Basti (Kanke
Road)
8.97 1.15 3.35 4.03
RNC – 21 Bajra (Itki Road) 12.95 1.80 12.95 2.3
RNC – 22 Pandra
6.80 4.00 6.16 3.93
RNC – 23 Piska More(Hehal) 10.13 2.36 7.43 1.53
RNC – 24 Jahaj Kothi (Kanke Road) 7.56 3.38 2.68 3.42
RNC – 25 Upper Bazar (Zilla
School)
6.70 1.55 5.35 0.28
RNC – 26 Chutia
5.78 2.44 3.89 3.59
RNC – 27 BaraGhaghra
8.44 2.80 7.63 5.85
RNC – 28 Kadru
12
.50
2.60 13.1 4.61
RNC – 29 Balsiring
11.81 0.92 7.13 6.36
RNC – 30 Harmu
13.20 3.36 12.7 3.93
RNC – 31 Tupudana 7.95 1.47 7.98 5.95
RNC – 32 Doranda (AG Office) 11.48 1.78 9.01 2.16
RNC – 33 Doranda (Nepal House) 11.50 3.00 2.96 4.35
RNC – 34 Lalganj 11.25 2.35 7.9 1.82
RNC – 35 Kanke 5.80 1.60 3.41 4.07
RNC – 36 Sukurhutu 7.20 2.47 7.29 4.03
RNC – 38 Sainik Market 9.20 1.9 Dry 8.14
RNC – 39 Daily Market 16.25 1.9 15.93 11.04
RNC – 40 Church Compound 14.65 1.9 11.44 7.92

200
Water Level in Deeper Aquifer
During May 2010 the depth to
water level registered wide
variation throughout Ranchi
Urban Area. The minimum
water level has been recorded
as 5.49 m bgl at Bariyatu, where
as maximum water level has
been recorded as 22.08 m bgl at
Kanke (Table 3).
During November 2010 also
depth to ground water level
registered wide variation
throughout Ranchi Urban Area.
The minimum water level has
been recorded as 3.9 m bgl at
Zilla School, where as maximum
water level has been recorded
as 19.84 m bgl at Kanke. The
depth to water level map of the
deeper aquifer has been shown
in Fig. 5.
If water level of the deeper aquifer during a month is compared with water level of the previous year is may
seen that there is decline in water level in the deeper aquifers. It may be attributed to increase in stress on
the deeper fractures for meeting the water demand of the population. Decline in water level has been depicted
in Fig.6.
The water level data of the phreatic aquifer analysed to ascertain falling or rising trends, if any. It has been
found that at some localities like Birsa Chawk , Pundag , Lowadih, Chauri basti, Chutia, BaraGhagra,Balsiring,
Table 3 Peizometric levels (m bgl) in deeper fractures
Location Pre-monsoon
(May 2010)
Post-monsoon
(Nov.10)
Zilla School, Upper Bazar 5.80 3.9
RIMS, Bariyatu 5.49 4.02
DAV School, Doranda-PZ-I 22.01 15.9
DAV School, Doranda PZ-II 22.08 16.03
DAV School, Doranda PZ-III 21.92 15.93
Dipa Toli, Booti More 8.47 6.9
Khoja Toli, Namkom 8.19 5.27
Ranchi College 5.26 3.63
NIFFT Campus, Hatia 18.74 10.87
Army Aviation Mess, Hinoo 8.42 4.61
Harmu, HHC 24.57 12.35
Kanke 19.84 17.08
Harser, Dhurwa 7.13 5.58

201
the water level shows declining trend. The rate of decline varies from 0.017m/yr at Piska More to 1.025m/yr at
Chiraundi .
The piezometers tapping different fracture zones at different depths also shows declining trend varying from
0.017 m/yr at RIMS Pz-I in and around Bariyatu area, to 0.922 m/yr DAV Shyamali PZ-I, Doranda area. This
declining trend may increase in due course of time with the increase in population and other infrastructural
facilities for the urban area. The piezometers with falling trend has been shown in figure:-7
Fig.5 Depth to Piezometric Surface map (Pre & Post-monsoon periods 2010) of the deeper fractures
Fig.-6 Decline in water levels in two consecutive years

202
Fig. 7 Hydrographs of Piezometers with falling trend
Ground Water Resources & Status of Development (2004)
As per the provisional figures of the dynamic ground water resource estimation of Jharkhand (GWD & CGWB
2011), the replenishable ground water resource of Kanke block , Namkum block and Ratu block in which the
Ranchi Urban area is situated are 36.79mcm,25.67mcm and 22.07 mcm respectively. Majority portion (70%)
of Ranchi urban Area comes under Kanke block. The stage of development has been assessed to be 112.4%,
25.67%, and 22.07% respectively for Kanke, Namkum and Ratu blocks. It thus indicates that the enormous
stress is being given on the shallow aquifer system which has become overexploited in Kanke block. However,
due to increase in urban population and more and more apartments and high rise buildings are coming up in
203
the city. The deeper fractures are mainly being exploited through bore wells to meet the drinking, domestic
and industrial water requirement.
Hydrochemistry
In general ground water from shallow as well as deeper aquifer are found suitable for drinking uses. The EC
of groundwater from the shallow aquifer(27 samples) varies from 162 µS/cm at Badghagra to 1168µS/cm at
Daily market area. Whereas, in deeper fractures (14 samples) it varies from 252 µS/cm at Dipatoli area to
1319 at Mochuatoli area( central part of Ranchi Urban Area). In common market place and highly populated
areas in central Ranchi, the EC values has been found on the higher side in both shallow and deeper aquifer.
The chloride values in groundwater from the shallow aquifer varies from 14.2ppm at Harmu and Pandra to
192 ppm at Daily market area whereas deeper fractures it varies from 14.2 ppm at Dipatoli area to 178 ppm
at Mochuatoli area (central part of Ranchi Urban Area). Concentration of iron (Fe) in ground water from the
deeper aquifer has been found above the permissible limit (> 1.5 ppm) in some parts of the urban area like
Sadar hospital area, Dipatoli area.
Major Ground Water Related Problem
• The Ranchi urban area is facing unique situation where water level in phreatic aquifer in some areas is
rising, while water levels in deep seated fractures are showing declining trend.
• The deep seated fractures having higher discharge has witnessed higher fluctuation between pre and
post-monsoon period peizometric heads.
• In the localities where population is growing fast like Doranda, Ashoknagar, Lalpur chowk, Kanke road the
water level in deeper fractures rest between 20 and 25m blg during pre-monsoon period due to heavy
draft.
• Iv After rainy season is over in some areas the water levels remain at deeper levels which shows higher
degree of ground water withdrawal.
• Some areas with ground water quality problem ( higher EC, Higher Fe than permissible limit)have been
observed in the urban area.
• vi The problem with the existing distribution system is non-uniform water supply. Many areas do not
receive any water while some areas receive water scantly. The some of affected areas are Doranda,
Hindpiri, Harmu and isolated residential colonies.
Feasibility of Rainwater Harvesting and Artificial Recharge
Most of the areas are occupied by the hard rock, which are part of the Chotanagpur Plateau. These rocks are
devoid of primary porosity and occurrence and movement of groundwater is controlled by the joints, fractures
and fissures present in them. Due to the uneven topography major part of rain water flows as surface runoff
resulting in less water available for percolation below the surface. The need of the day is to conserve every
drop of water and use rain water for recharge of the depleted fractures. The scheme can benefit thousands of
acres of barren land; if small ponds are excavated at suitable points or small check dams are build in the
different rivulets. It will conserve soil moisture. The areas where artificial recharge is necessary are described
in the following paragraphs.
D.A.V. Shyamli, Doranda
Geologically the area consists of granite gneiss. Weathered zone thickness is about 12 m. Piezometric surface
level remains between 22.08 m bgl- 16.03m bgl during pre-monsoon and post-monsoon seasons. Fractures
were encountered at different depths 36.00 - 38.00m bgl, 42.00 - 44.00m bgl, 45.00 - 46.00m bgl, and 89.00 -
91.00m bgl and 120.00 - 121.00 m bgl.
Harmu Housing Colony
Granite gneiss is the main geological formation. Weathered zone thickness is around 20 – 22 meters. Two sets
of fractures were identified one at 29.00 - 32.00 mbgl and other at 102.00 - 103.00 mbgl. Discharge in

204
different bore wells in the area varies between 2 to 7 lps. Water level observed during May was 24.57m bgl.
Artificial recharge may be taken up in the fracture zones.
NIFT Campus, Hatia area
Granitic gneiss is the mainn formation over here. The depth to piezometric surface in the area varied from
18.54 mbgl during premonsoon to 12.35 during postmonsoon period. long term trend of Hatia monitoring
well( dugwell) indicates falling trend. Deeper fracture zone was encountered at 152 m to 156 m with
discharge of 6.34 lps. In the area recharge to shallow weathered zone as well as deeper fracture zone may be
taken up.
Kanke Area
Granite gneiss is the main geological formation. The piezometer which is being monitored here is having
water level of 19.84 during premonsoon and 17.08 during postmonsoon. Fracture zone was encountered at
depth of 45 to 46 meter with discharge less than 1 lps. The area is suitable for recharge to deeper aquifers.
GROUND WATER DEVELOPMENT & MANAGEMENT STRATEGY
Keeping in view spatial and temporal variation of ground water levels in different localities in both phreatic
and deed seated fractures, suitable ground water development strategies may be evolved to arrest further
decline of the water level in the urban area and to make ground water supply sustainable.
• The localities where decline in water level of both shallow and deeper fractures has been observed
artificial recharge of ground water may be made mandatory.
• The fractures occurring between 70 and 150 m bgl constitute potential aquifers and may be tapped for
ground water withdrawal.
• High amounts of distribution losses (40%) due to old water supply distribution network, besides,
unauthorized tapings should be checked by adopting suitable measures on priority basis. This will reduce
pressure on ground water system
• The old water bodies within the urban area may be revived and renovated. This will help in recharging the
shallow aquifer.
• There are a number of nalas flowing within the urban area. Suitable sites for Nala bunds and check dams
may be identified and construction on priority basis.
• Roof top rainwater harvesting and artificial recharge may be taken up in the areas found suitable.
REFERENCES
• Custodio E (2002) Aquifer overexploitation: what does it mean? Hydrogeology Journal 10:254-277
• City development plan of Ranchi,RMC, JNNURUM (2006),Appraisal report
• GWD and CGWB (2011) Dynamic Groundwater Resource Estimation of Jharkhand.
• Karanth K.R., (1997) Ground Water Assessment Development and Management. Tata MacGraw Hills
• Sarkar,S.N., Jha, B.N ., Structure , metamorphism and granitic evolution of the Chotanagpur granite gneiss
complex around Ranchi. Records of GSI, Vol-113, 1985, Part-3.

205
SHILLONG, MEGHALAYA
Anu Radha Bhatia & Utpal Gogoi, CGWB, Shillong
INTRODUCTION
Shillong is the capital of Meghalaya, one of the smaller states in India. It is also the district headquarters of East
Khasi Hills District. Shillong was a princely state (Hima Shillong), which was bifurcated into Mylliem State and
Khyrim State in 1830. A hill town in the north eastern part of India, termed as “Scotland of the East”, Shillong is
situated at an altitude of 1,496 m (4,908 ft) above sea level in the centre of the Shillong Plateau and is
surrounded by hills, three of which are: Lum Sohpetbneng, Lum Diengiei and Lum Shillong or Shillong Peak.
During the British Rule, Shillong consisted of only a few scattered clusters of hamlets.It is said that the rolling
hills around the town with waterfalls, brooks and cool colonnades of tall pine trees reminded the European
settlers of Scotland. The city was founded by Col. Henry Hopkinson, Commissioner of Assam in 1864 as a civil
station of the Khasi and Jaintia Hills. In 1874, the State of Assam was created out of Bengal and Shillong
became a Chief Commissioner's Province and provincial capital of the new administration. Shillong has steadily
grown in size and significance since then. It remained the capital of undivided Assam until the creation of the
new state of Meghalaya on January 21, 1972, when Shillong became the capital of Meghalaya and Assam
moved its capital to Dispur in Guwahati.
GENERAL FEATURES
Administrative Setup
Shillong city is now an urban agglomerate known as
Greater Shillong comprising Shillong Muncipality and
6 suburbs, namely Shillong Cantonment,
Madanryting, Mawlai, Nongthymmai,
Pynthorumkhrah and Nongmynsong. The Greater
Shillong area falls under Mylliem block, East Khasi
Hills district, Meghalaya covers an area of
approximately 40 sq. km. The area lies between north
latitudes 25°33’15
” to 25°36
’ 02
” and east longitude
91°50’50
” to 91°56
’17
” and falls in the survey of India
toposheet No. 78 O/14. Location Map of Greater
Shillong is shown in Fig. 1. Shillong is well connected
by road with all major north eastern states. Two
major National Highways pass through Shillong -
National Highway 40 connects Shillong to Guwahati and National Highway 44 connects it to Tripura &
Mizoram. There is no rail connection and the nearest Railway Station is Guwahati at a distance of about 110
Km from Shillong. Although Umroi Airport exists but there are only limited flights and connectivity. Helicopter
service is also available between Shillong-Guwahati and Shillong-Tura.
Demography
As per 2001 Census, the total population of the urban area is 267662 as against 233280 in 1991 indicating a
decadal growth of about 15%. The projected population of the urban area from 2011 to 2041 is presented in
Table 1. As per 2001 Census there are 134497 Males and 133165 Females. The sex ratio is 101 males to 100
females. Average literacy rate is 80%, higher than the national average of 59.5%: male literacy is 83%, and
female literacy is 78%. 11% of the population is under 6 years of age.
Table 1 Population in Greater Shillong (1991, 2001 and projected population for 2011 to 2041)
Year 1991 2001 2005 2007 2010 2011 2021 2025 2031 2041
Population 233280 267662 285141 296000 313676 316000 374000 405000 439000 512000

206
The population of the suburban towns of Greater Shillong as per 2001 Census is given in Table 2.
Table 2: The population of the suburban towns of Greater Shillong
Suburban Town Area in sq.km. Population (2001 Census) Projected Population (2010 )
Shillong Muncipality 10.5 132867 133827
Shillong Cantonment 2 12396 13678
Madanryting 2.1 16318 27804
Mawlai 6.2 38303 46179
Nongthymmai 3 34292 42453
Pynthorumkhrah 2.2 22115 34015
Nongmynsong 2 11371 15720
Total 28 267662 313676
Khasi tribals make up majority of the population. All the other northeast Indian tribes are represented here as
well as significant numbers of Bengali, Nepali, Assamese, Biharis and Marwaris making it a fairly cosmopolitan
city. Christianity is the dominant religion in the city. A sizable proportion of the population follows the original
Khasi religion, Niam Khasi and Niamtre. Other religions found in India are also represented in significant
numbers in the city.
Hydrometeorology
The city features a subtropical highland climate with temperature varying from 2° to 25.0° C (Table 3). Winter
usually starts from October and continues up to March. During the months of December and January ground
frost in early morning is very common. Summer is rather of short duration followed by monsoons which
generally starts from May and continues till September and so. 90% of the total annual rainfall takes place in
this season. Rainfall is high in the area with an annual rainfall of about 2400 mm.
A major percentage of the heavy precipitation, received in Shillong area goes as direct surface runoff because
of steep hilly slopes but ground water recharge does take place in those areas that are characterized by gently
undulating terra.
Physiography and Drainage
The area under Greater Shillong forms a part of the Shillong Plateau. It is located on a gently undulating area
with steep slopes running in different directions. The master slope runs mainly in south-west to north-east
direction. The whole area is altered by construction and other related activities, habitations and office
establishments. Hence, it is difficult to decipher the original land forms of the area. The average height of the
area is about 800-1400 m above msl. The highest point of Shillong is Shillong peak, which is situated at a
height of 1960 m above mean sea level. The plateau is dissected by a number of streams into hills and
intermontane valleys. One major intermontane valley lies to the north of the city along Wah Umkhrah river in
the Polo Ground area.
The main drainage of Shillong is carried by two rivers, namely Wah Umshirpi and Wah Umkhrah, which
confluence near Beadon and Bishop Falls to form the Wah Ro Ro river, a tributary to Wah Umium river. These

207
two rivers surround the Shillong town and roughly determine the municipal limits. The numerous streams in
the western and southern parts of the city are tributaries of Wah Umshirpi, whereas streams in northern and
eastern parts of the city are tributaries of Wah Umkhrah which starts as Umpling River near Umpling. The
drainage pattern of the area is angular to sub-angular, typical of hard rock hilly terrain. The streams are not
perennial in nature. The discharge in the streams varies from season to season.
Soil Type
The soils present in and around Shillong Urban area are ultisols, colloquially known as "red clay soil". The soils
are shallow to moderately deep, loamy, skeletal, fine and excessively drained, with severe to very severe
erosion hazards. Ultisols vary in color from purplish-red, to a blindingly bright reddish-orange, to pale
yellowish-orange and even some subdued yellowish-brown tones. They are acidic, often having pH of less than
5. The red and yellow colors result from the accumulation of iron oxide (rust) which is highly insoluble in
water. Major nutrients, such as calcium and potassium, are typically deficient in ultisols, which means they
generally cannot be used for sedentary agriculture without the aid of lime and other fertilizers such as
superphosphate.
STATUS OF WATER SUPPLY AND DEMAND
The main source of water for Greater Shillong is water supply from the river Umiew originating from Shillong
Peak (RL1964 m above mean sea level). River Umiew is one of the major rivers in the state perennially flowing
throughout the year. Under the Greater Shillong Water Supply Project, a mass gravity concrete dam was
constructed across the river Umiew at Mawphlang, about 20 km. from Shillong. The dam is 135m wide and
about 50m high and provides 9.145 MCM of live storage. The catchment of river Umiew is about 115 sq km
and a large area of the catchment is in close proximately to Cherrapunjee. As a result, the catchment receives a
fairly good amount of rain in comparison to other areas. Records available indicate daily spilling of water
almost 24 hrs a day despite lifting about 51.30 MLD (Million liters per day), indicating that the river has the
potential to cater to the additional demand in future which may arise due to increase in population of the
Greater Shillong. The responsibility of P.H.E.D. in Shillong municipal area is to lift required quantity of water
from Greater Shillong Water Supply Scheme at Mawphlang Treatment Plant and release to 13 zonal overhead
tanks/reservoirs located in different parts of Shillong City for distribution of water to consumers.
At present, along with the municipal water supply from 7 springs ((Table 4)) and about 7 deep tubewells and
more than 25 shallow tubewells, the Greater Shillong Water Supply Project completely meets the water
requirement of 42.5 Mld. However, for projected future demand, with the present water availability, there will
be shortfall in water supply of 8MLD and 24MLD in the years 2026 and 2041respectively. Taking this into
consideration, infrastructure for generation and distribution of additional quantity of water to meet the
shortfall is required to be created without any loss of time.
Water is supplied in Shillong municipality area from (i) Municipal Sources and (ii) Greater Shillong Water Supply
Scheme (G.S.W.S.S.). The Shillong Municipal Board (SMB) has the capacity to supply nearly 6.0 MLD of water
every day. The springs, which are the major sources of water, are Wahrisa, Wahjalynnoh and Umjasai. Shillong
Municipal Board has provided about 8851 water connection around the Shillong Municipal Area.
Table 4: Water Supply through Springs in Shillong area
Sources of Water Amount of Water (litres)
Pre- monsoon period Monsoon period
Wahrisa 454600.0 636440.0
Wahjahlynnoh 454600.0 545520.0
Umjasai 909200.0 1136500.0
Madan Laban 227300.0 363680.0
Crinoline 363680.0 454600.0
Patta Khana 113650.0 227300.0
Wahdienglieng 227300.0 295490.0
Total 2750330.0 3659530.0

208
Outside Shillong municipal area but within Greater Shillong, 1.5 million litres water is supplied from the
following water supply schemes, which were implemented & are being maintained by PHED:(i) Mawlai
Umsohlang WSS for Mawlai, (ii) Pynthorumkhrah WSS for Pynthorumkhrah, (iii) Umkhen WSS & Lum
Demthring for Nongthymmai area, (iv) Nongmynsong WSS for Nongmynsong area. The water demand and
supply of Greater Shillong area is shown in table -5.
Table 5 Water Demand and Supply of Greater Shillong area
Suburban Town Area
in sq.km.
Projected
Population
(2011)
Drinking and
domestic Water
Demand per day
(Million Litres)
Water Supply
per day from
G.S.W.S.S
(Million Litres)
Water Supply per day
through Springs and
Tubewells
(Million Litres)
Shillong Muncipality 10.3 155737 21.1 19.97 Approximately 4.0 Ml
(Ground Water - 7
major springs, 16
small springs, 7 deep
tubewells and 25(+)
shallow tubewells
+ 4.5 Ml (other
surface water
sources)
Shillong Cantonment 2 13628 1.8 3.74
Madanryting 2.02 21118 2.8 0.75
Mawlai 6.14 42748 5.8 2.5
Nongthymmai 3 38085 5.1 3.9
Pynthorumkhrah 2.11 28627 3.8 2.7
Nongmynsong 10.3 16057 2.1 1.6
Total 35.87 316000 42.5 35.16 7.5
The contribution of ground water is only 10 % of the total water supply to Shillong urban area. However, a
number of private ground water sources (shallow dug wells and shallow tubewells) exist, for which no census is
available.
GROUND WATER SCENARIO
Geology
The area forms a part of Shillong Group of rocks consisting of quartzite & phyllites. Exposures of crystalline
rocks in the area are of quartzites belonging to Shillong Group of Pre-cambrian age are scattered all over the
area. The base of Shillong Group is marked by conglomerate bed containing cobbles and boulders of earlier
rocks, i.e. Archaean crystalline rocks, which formed the basement rocks over which the Shillong Group of rocks
were laid down as sedimentary deposits during Pre-Cambrian age and metamorphosed over time. The rocks
were intruded by epidiorite rocks known as Khasi green stone. These metabasic rocks occur mostly as sills
being concordant with the formations they intruded.
The surface area is covered by red soil to mixed soil type having thickness ranging from few centimeters to 2
m. The rocks are highly weathered at shallow depth leading to the formation of thick soil cover in the low lying
areas & thin veneer of soil layer at higher elevation. This weathered zone is underlain by jointed and fractured
quartzite. The distribution and disposition of these joints and fractures are of complex nature due to the
various tectonic and structural disturbances to which country rocks are subjected to. The depth of this zone
varies from 10-60 m below ground level. This is followed by hard massive quartzites, which are generally
devoid of prominent structural features. However fracture/jointed rocks are found to occur at greater depths
in certain exploratory wells drilled in similar formations in the area. Broadly, there are three sets of
lineaments in the area, mainly along ENE–WSW, NW–SE and E–W directions. Lineaments along NE–SW, NNW–
SSE and N–S directions are also developed.
Potential Aquifers
Groundwater resources in Shillong area are highly variable, it being mountainous terrain and are mainly
dependent on topography, zone of weathering, fracturing and interstices present in country rocks. The
availability of ground water in hilly region is manifested in the form of springs, seepages, wells and bore well of
limited/ nominal yield.

209
Ground water occurs in the area under water table condition in the top weathered and fractured zone of
quartzite. Further below, semi-confined to confined condition exist in the interconnected joints, fractures etc.
of the underlying hard quartzite. The weathered quartzite has poor to moderate yields. The depth of this
weathered zone varies up to about 30 m below ground level. The underlying second zone is fissured and
jointed which is the zone of saturation. The distribution and disposition of these joints and fractures are of
complex nature due to the various tectonic and structural disturbances to which country rocks were subjected
to. Groundwater occurs under semi-confined condition in this zone. Such zones saturated with water are
likely to extend down to 60 to 180 m below ground level.
Quartzite and recent valley fills (in
Polo area) constitute the major
aquifer system in the area. Ground
water occurs under unconfined
condition in the weathered rock
and residuum. Ground water
development in the urban
agglomeration is both by dug wells
generally confining to the
weathered zone & bore wells,
which mainly tap, fractured zone
in the hard rocks. These fractures
sometime extend very deep
beyond 60m bgl, but otherwise
generally close before 60m depth.
From the well inventory data, it
has been found that during the
dry period, in dug wells, depth to
water level varies from 0.50m bgl
(at Polo) to 5.56m bgl (at Pynther).
In post-monsoon period it varies from 0.15m bgl to 5.10 m bgl at the same locations respectively. The average
seasonal water level fluctuation is 1.19m with minimum fluctuation of 0.35 m at Polo and maximum 2.95m at
Mawlai-Mawroh. The hydrogeological map of Greater Shillong is shown in Fig.2.
As the topography is uneven and the thickness of the weathered horizon varies considerably, open wells are
restricted to the Umkhrah valley in polo ground and Pynthorumkhrah area. Inventory of these wells have
indicated the following-
(a) Depth to water level is shallow in topographic depressions than in the upland areas. It varies from
about 10 to 5.0 m bgl in the depressions while it is about 10.0 m bgl in the upland.
(b) Water level values are independent of lithology of the area.
(c) Wells in weathered metabasic rocks hold water throughout the year, whereas wells in weathered
quartzites dry up during the lean period, indicating thereby better inflow of ground water in
metabasic rocks.
(d) The seasonal water level fluctuation is about 3.0 m in topographic depressions and about 8.0 m in
higher upland areas.
Yield capacity test in the near surface aquifers in the Shillong area establishes that weathered matabasic rocks
have a moderately high yield potential. From the study of lithological and hydrological data of shallow
borewells of Shillong area it has been observed that Pynthorumkhrah area is most productive. The wells have
been drilled in quartzites and metabasic rocks to a depth ranging from 30.00 to 110.00 m below ground. The
yield of the boreholes ranged from 5.0 m3/hr to 8.0 m
3/ hr. with drawdown of about 3.5 m.
National Hydrograph Station located near Polo market fall falls in Greater Shillong. The piezometric head in dry
period varies from 2.63 (at Lapalang) to 17.2m bgl (at Raj Bhawan complex). In post-monsoon period it varies
from 1.97 to 14.32m bgl at the same locations respectively. Two tubewells, located at Nongmensong &
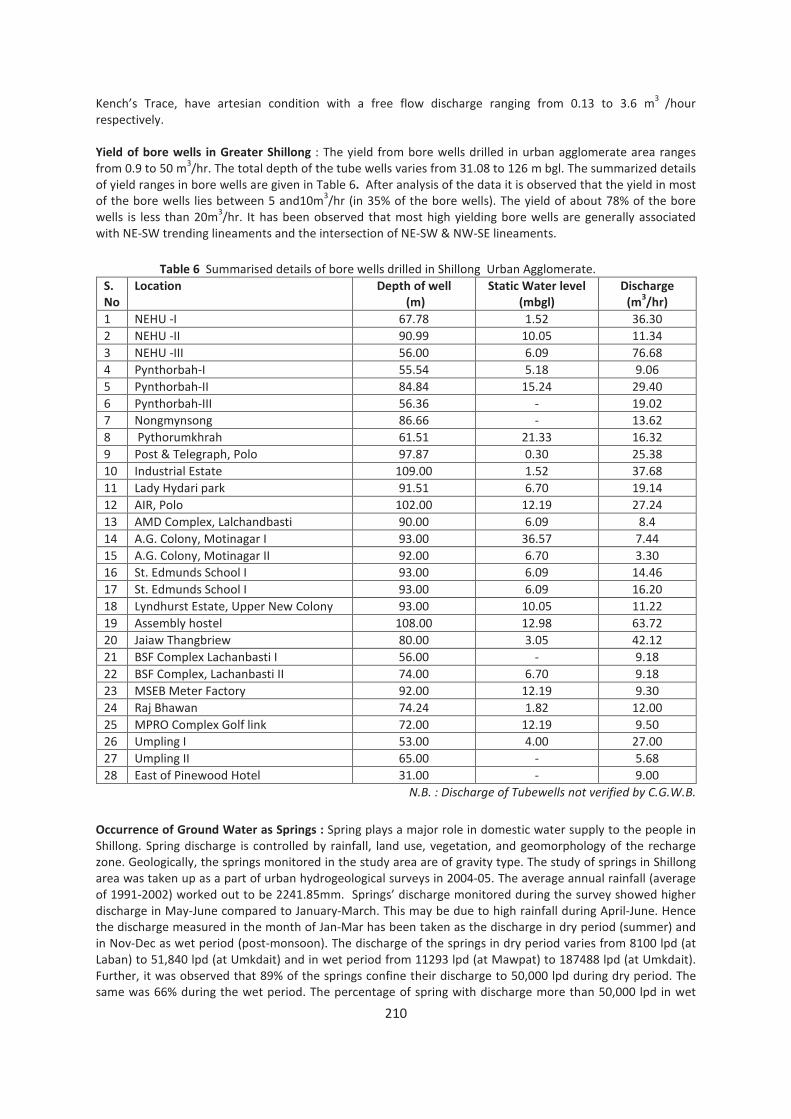
210
Kench’s Trace, have artesian condition with a free flow discharge ranging from 0.13 to 3.6 m3
/hour
respectively.
Yield of bore wells in Greater Shillong : The yield from bore wells drilled in urban agglomerate area ranges
from 0.9 to 50 m3/hr. The total depth of the tube wells varies from 31.08 to 126 m bgl. The summarized details
of yield ranges in bore wells are given in Table 6. After analysis of the data it is observed that the yield in most
of the bore wells lies between 5 and10m3/hr (in 35% of the bore wells). The yield of about 78% of the bore
wells is less than 20m3/hr. It has been observed that most high yielding bore wells are generally associated
with NE-SW trending lineaments and the intersection of NE-SW & NW-SE lineaments.
Table 6 Summarised details of bore wells drilled in Shillong Urban Agglomerate.
S.
No
Location Depth of well
(m)
Static Water level
(mbgl)
Discharge
(m3/hr)
1 NEHU -I 67.78 1.52 36.30
2 NEHU -II 90.99 10.05 11.34
3 NEHU -III 56.00 6.09 76.68
4 Pynthorbah-I 55.54 5.18 9.06
5 Pynthorbah-II 84.84 15.24 29.40
6 Pynthorbah-III 56.36 - 19.02
7 Nongmynsong 86.66 - 13.62
8 Pythorumkhrah 61.51 21.33 16.32
9 Post & Telegraph, Polo 97.87 0.30 25.38
10 Industrial Estate 109.00 1.52 37.68
11 Lady Hydari park 91.51 6.70 19.14
12 AIR, Polo 102.00 12.19 27.24
13 AMD Complex, Lalchandbasti 90.00 6.09 8.4
14 A.G. Colony, Motinagar I 93.00 36.57 7.44
15 A.G. Colony, Motinagar II 92.00 6.70 3.30
16 St. Edmunds School I 93.00 6.09 14.46
17 St. Edmunds School I 93.00 6.09 16.20
18 Lyndhurst Estate, Upper New Colony 93.00 10.05 11.22
19 Assembly hostel 108.00 12.98 63.72
20 Jaiaw Thangbriew 80.00 3.05 42.12
21 BSF Complex Lachanbasti I 56.00 - 9.18
22 BSF Complex, Lachanbasti II 74.00 6.70 9.18
23 MSEB Meter Factory 92.00 12.19 9.30
24 Raj Bhawan 74.24 1.82 12.00
25 MPRO Complex Golf link 72.00 12.19 9.50
26 Umpling I 53.00 4.00 27.00
27 Umpling II 65.00 - 5.68
28 East of Pinewood Hotel 31.00 - 9.00
N.B. : Discharge of Tubewells not verified by C.G.W.B.
Occurrence of Ground Water as Springs : Spring plays a major role in domestic water supply to the people in
Shillong. Spring discharge is controlled by rainfall, land use, vegetation, and geomorphology of the recharge
zone. Geologically, the springs monitored in the study area are of gravity type. The study of springs in Shillong
area was taken up as a part of urban hydrogeological surveys in 2004-05. The average annual rainfall (average
of 1991-2002) worked out to be 2241.85mm. Springs’ discharge monitored during the survey showed higher
discharge in May-June compared to January-March. This may be due to high rainfall during April-June. Hence
the discharge measured in the month of Jan-Mar has been taken as the discharge in dry period (summer) and
in Nov-Dec as wet period (post-monsoon). The discharge of the springs in dry period varies from 8100 lpd (at
Laban) to 51,840 lpd (at Umkdait) and in wet period from 11293 lpd (at Mawpat) to 187488 lpd (at Umkdait).
Further, it was observed that 89% of the springs confine their discharge to 50,000 lpd during dry period. The
same was 66% during the wet period. The percentage of spring with discharge more than 50,000 lpd in wet
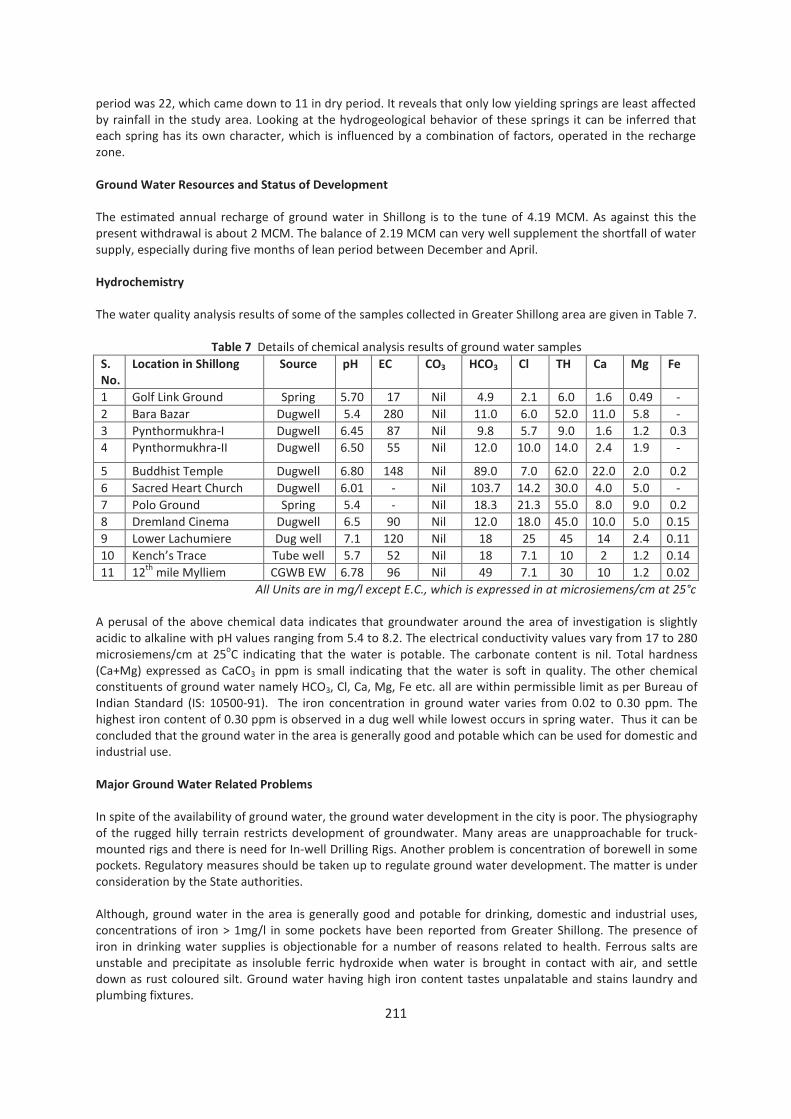
211
period was 22, which came down to 11 in dry period. It reveals that only low yielding springs are least affected
by rainfall in the study area. Looking at the hydrogeological behavior of these springs it can be inferred that
each spring has its own character, which is influenced by a combination of factors, operated in the recharge
zone.
Ground Water Resources and Status of Development
The estimated annual recharge of ground water in Shillong is to the tune of 4.19 MCM. As against this the
present withdrawal is about 2 MCM. The balance of 2.19 MCM can very well supplement the shortfall of water
supply, especially during five months of lean period between December and April.
Hydrochemistry
The water quality analysis results of some of the samples collected in Greater Shillong area are given in Table 7.
Table 7 Details of chemical analysis results of ground water samples
All Units are in mg/l except E.C., which is expressed in at microsiemens/cm at 25°c
A perusal of the above chemical data indicates that groundwater around the area of investigation is slightly
acidic to alkaline with pH values ranging from 5.4 to 8.2. The electrical conductivity values vary from 17 to 280
microsiemens/cm at 25oC indicating that the water is potable. The carbonate content is nil. Total hardness
(Ca+Mg) expressed as CaCO3 in ppm is small indicating that the water is soft in quality. The other chemical
constituents of ground water namely HCO3, Cl, Ca, Mg, Fe etc. all are within permissible limit as per Bureau of
Indian Standard (IS: 10500-91). The iron concentration in ground water varies from 0.02 to 0.30 ppm. The
highest iron content of 0.30 ppm is observed in a dug well while lowest occurs in spring water. Thus it can be
concluded that the ground water in the area is generally good and potable which can be used for domestic and
industrial use.
Major Ground Water Related Problems
In spite of the availability of ground water, the ground water development in the city is poor. The physiography
of the rugged hilly terrain restricts development of groundwater. Many areas are unapproachable for truck-
mounted rigs and there is need for In-well Drilling Rigs. Another problem is concentration of borewell in some
pockets. Regulatory measures should be taken up to regulate ground water development. The matter is under
consideration by the State authorities.
Although, ground water in the area is generally good and potable for drinking, domestic and industrial uses,
concentrations of iron > 1mg/l in some pockets have been reported from Greater Shillong. The presence of
iron in drinking water supplies is objectionable for a number of reasons related to health. Ferrous salts are
unstable and precipitate as insoluble ferric hydroxide when water is brought in contact with air, and settle
down as rust coloured silt. Ground water having high iron content tastes unpalatable and stains laundry and
plumbing fixtures.
S.
No.
Location in Shillong Source pH EC
CO3 HCO3 Cl TH Ca Mg Fe
1 Golf Link Ground Spring 5.70 17 Nil 4.9 2.1 6.0 1.6 0.49 -
2 Bara Bazar Dugwell 5.4 280 Nil 11.0 6.0 52.0 11.0 5.8 -
3 Pynthormukhra-I Dugwell 6.45 87 Nil 9.8 5.7 9.0 1.6 1.2 0.3
4 Pynthormukhra-II Dugwell 6.50 55 Nil 12.0 10.0 14.0 2.4 1.9 -
5 Buddhist Temple Dugwell 6.80 148 Nil 89.0 7.0 62.0 22.0 2.0 0.2
6 Sacred Heart Church Dugwell 6.01 - Nil 103.7 14.2 30.0 4.0 5.0 -
7 Polo Ground Spring 5.4 - Nil 18.3 21.3 55.0 8.0 9.0 0.2
8 Dremland Cinema Dugwell 6.5 90 Nil 12.0 18.0 45.0 10.0 5.0 0.15
9 Lower Lachumiere Dug well 7.1 120 Nil 18 25 45 14 2.4 0.11
10 Kench’s Trace Tube well 5.7 52 Nil 18 7.1 10 2 1.2 0.14
11 12th
mile Mylliem CGWB EW 6.78 96 Nil 49 7.1 30 10 1.2 0.02

212
Feasibility of Rainwater Harvesting
Rainwater harvesting is an important aspect of water conservation and management as it provides a cost
effective means of collection and storage of water for use during the water deficit period. Bestowed with high
rainfall, some areas of Greater Shillong face water scarcity during the lean period. It is not always feasible to
construct ponds/lakes/reservoirs in the city due to the cost of land and urban development pressures.
However, roof-top rainwater can be conserved, thus bringing much needed relief to the water scarcity areas of
the city. Central Ground Water Board implemented pilot project studies of roof-top rainwater harvesting in
Shillong under Central Sector Scheme during IX Plan. The scheme was implemented in the locations shown in
Table 8, at a total cost of 20.32 lakhs.
Table 8 Details of roof-top rainwater harvesting in Shillong
Sl.
No.
Location Roof-top
area
(sq.m)
Gutter
Length
(m)
Drop
Pipe
(m)
Conveyance
Pipe
(m)
Carrying
Pipe
(m)
Water
harvested
(cu.m)
1 State Guest House Barik 186.2 53.4 12.0 85.0 40.0 357.5
2 Circuit House Laban 137.6 42.4 10.0 60.0 60.0 264.19
3 State Central Library, IGP 1103.2 162.6 42.0 90.0 45.0 2118.4
4 Auxilium Convent
Nongthymmai
520.5 123.0 15.0 60.0 45.0 999.36
5 Pine Mount School in Barik 973.3 176.1 24.0 140.0 40.0 1868.73
6 All Saints School, IGP 613.4 106.0 15.0 120.0 48.0 1177.73
GROUND WATER DEVELOPMENT STRATEGY
Development of ground water by construction of borewells is suggested in the following locations-
(A) European Ward – Laban – Malki area
1. South of Pine Mount School, near the confluence of Umkyrud, Umshan Show and Wah Risa River.
2. Adjacent to Umkdait River, North of Cromeen’s House.
3. NE of Pine Wood Hotel and south of Bishop Cotton Road and Polo Road.
4. Malki play ground on east of Survey of India office.
(B) Police Bazar – Mawlai – Mankhar – Kench’s Trace area
1. SW of the confluence of Umkhrah river and Umsoh-sun stream.
2. East of Mawlai and north of the right angled bend of the Umkhrah River.
3. At the confluence of Umjasai and Ummawlong rivers, west of Kench’s Trace.
(C) Nongthymmai – Umpling – Happy Valley area
1. East of Nongthymmai and SW of Rynjah in the valley of Wah Demthring nalla.
2. Located between Umpling and Nongmynsong at the confluence of Wahkdent and Umpling rivers.
3. NNW of the bridge on NH-44 on Wah Nongthymmai rivers western bank.
In the above mentioned sites drilling with a DTH rig down to a depth of about 60.00 m from the surface can be
taken up. As the rocks of the shilling area are sometimes highly weathered with the deep situated water
bearing zones, it is suggested that such unstable formations may be cased and assembly lowered and annular
space gravel packed, to facilitate entry of ground water and at the same time preventing collapse of the
tubewell wall. The potential ground water zones are not uniform in characteristics as the aquifer material,
fracture density, its’ distribution and hydrogeological characteristics vary widely over short distances.
Consequently, water yielding capabilities vary considerably. In hard rock terrain, selection of site with the
highest potential on the basis of geomorphology, relative relief, gentle gradient, thick top weathered mantle
and occurrence of fractured zone for getting a productive borehole is necessary and reduces chances of
striking a dry hole.
Further, there is ample scope for the construction of large diameter open wells in a few selected intermontane
valleys of Greater Shillong area, which can considerably help in augmenting the water supply system. The
favourable areas are as follows-

213
• In the linear valley on the eastern side of the meter factory of MESB, marked in Fig. 2 as A.
• In the linear valley on the eastern side of the Sacred Church Convent in Mawlai area marked in Fig. 2 as C.
• In the small valley adjacent to and NNW of Bara Bazar, south of District Council Office, at the junction of
G.S. Road and Cantonment road, marked in Fig. 2 as F.
• A broad valley on the southern side of NH-40 near Fire brigade ground, marked in Fig. 2 as H.
• The main Polo river valley, marked in Fig. 2 as M.
• Broad flat valley of Wah Yblam river between CPRS and Government Agriculture Farm. The valley extends
for about a km and has an average width of about 100 m, marked in Fig. 2 as L.
Though ground water has the possibility to further augment the drinking water supply of the city, conjunctive
use of surface and ground water sources is highly recommended. For better utilization of the surface sources
like springs, streams, it is recommended that effort should be make to tap the springs right at the source of
emergence and water be conducted through large diameter pipes to avoid pollution and other losses.
Groundwater development may be regulated by permitting development only in needy areas and new
colonies. Further, rainwater harvesting techniques should be universally educated and brought to practice
with immediate effect.

214
SHIMLA, HIMACHAL PRADESH
Sunil Kumar & Vidya Nand, CGWB Dharamshala
INTRODUCTION
Shimla is the Capital Town of Himachal Pradesh. The name Shimla was derived from 'Shyamalaya' meaning blue house said to be the name of house built of blue slate by a faqir on Jakhu. According to another version, Shimla takes it name from 'Shamla' meaning a blue female another name for Goddess Kali. The place was on the Jakhu Hillside and there was a temple of Goddess Kali. During the British period, the image of the Goddess was shifted to a new place, now famous Kali Bari Temple. Shimla remained unnoticed during the Anglo-Gorkha War. It was only in 1819 A.D. that the then Assistant Political Agent of hill states Lt. Ross set up first British residence, a mere wood cottage. His successor Lt. Charles Patt Kennedy’ erected the first pucca house in 1822 named after Lt. Kennedy as 'Kennedy House'. The land of present Shimla town originally belonged to the Maharaja of Patiala and Rana of Keonthal and was acquired by British regime in 1930. Thereafter Shimla became summer capital of India. After independence of India, it continued to be the summer capital of Punjab Government till 1948 when Himachal Pradesh was formed by merger of erstwhile princely state on 15th April, 1948.
GENERAL FEATURES
Area and Administrative Divisions
Shimla city is located between North latitudes 31o04’and 31o07’ and East longitudes 77o06’ and 77o13’. The city falls in survey of India toposheet no. 53 E/4 and covers an area of about 28.53 sq km. The city is well connected by roads and railways. The Hindustan Tibet road i.e. National Highway No. 22 passes through the city and connects Delhi, Chandigarh and other major part of India by all season motorable road. The narrow gauge railway lines connect Shimla town with Kalka. The city consists of the Shimla Municipal Corporation and Shimla Planning Areas (SPA). The SPAs are Dhalli, Tutu and New Shimla urban agglomerations.
Demography
As per the 2001 India Census, the city has a population of 1,44,555 spread over an area of 28.53 km. A floating population of 75,000 is attributed to service industries such as tourism. 84% of the population of Shimla city is literate, compared to 80% in Shimla district and 77% in the entire state. The majority of Shimla's population consists of natives of Himachal Pradesh. Hindi and Punjabi are the main languages. The major religion is Hinduism (93.5%), followed by Sikhism (2.5%) and small minorities of Buddhists, Christians, and Muslims.
Hydrometeorology
The climate of the city is cold and tends to be temperate. There are four major seasons. The winter season commences from October to February and ends in March. Summer season extends from March to June followed by the monsoon period extending from July to September. Maximum precipitation occurs during the months from July to September. The normal annual rainfall of the Shimla city is 1340 mm. The southwest monsoon sets in last week of June, withdraws towards the middle of September, and contributes about 75% of annual rainfall. The July and August are the wettest months of the year. The rest of the annual rainfall, i. e. 25% occurs during non-monsoon period, in the form of thunderstorm and western disturbances. In the winter season precipitation as snowfall also occurs. The city remained under a cold spell from mid December to February and during the period the town experiences occasional snowfalls. Mean maximum and minimum temperature ranges between 33.3°C and –3.1°C. The relative humidity varies from 51% in December to 89% in August.
Physiography & Drainage Shimla is situated on a range of hills which forms the last traverse of the Central Himalayas to the south of river Satluj with an average elevation of 2205 m amsl. The city is situated in a seismic belt (seismic zone IV) as per IS-1983. Shimla is spread over seven hills spurs with average elevation above mean sea level from 2073 to 2454 m amsl. The phsiographic and drainage map is depited in Fig. 1. The important character of the road network

215
circumscribing these hills is that it is connected to the Mall road from Boileaugang in west to Chhota Shimla in
the east. Shimla town is situated on the rocks
of Shimla group comprising shale, slates,
greywacke, quartzite, local conglomerates
and dolomites of Jutogh group with
carbonaceous phyllite and local land of
quartzite and limestone. The rocks have
undergone three distinct generations of
deformations resulting in the variation in
altitude of formations structurally the area
forms a synform whose main axis trends
WNW-ESE. The springs and seepage points
are generally located between 1660 m and
1950 m on the southern slopes and on the
eastern elevation at 2060 and 2180 m. The
presence of subsurface water in sheared and
fractured zone is also revealed by the
existence of several springs around the
periphery of Jakhu hills. The Shimla town is
situated on water divide separating Indus
basin with Ganga basin. A number of nala
originates along the southern slopes and
meets Aswani khad, which is tributary of Giri
river of Yamuna sub basin of Ganga basin.
Similarly, various khad originating from hill
slopes forms Nayaser ki Khad which meets
Satluj river of Indus basin.
STATUS OF WATER SUPPLY AND DEMAND
The major water supply to the Shimla city is
based on surface water sources made
through trough track mains emerging from
various existing reservoir located at different
locations. The present water supply networks
system has become inadequate to cater the
water supply demand in most of the area of city due to increase in water demand and leakage. The first
systematic water supply was executed in the year 1875 for a small population of 16,000 persons. With the
increase in demand of water supply has been augmented several times i.e. during the year 1889, 1914, 1923,
1974, 1982, 1992 and 2008. At present water has been tapped from the following six sources (Table 1).
Table 1 : Status of water supply schemes, Shimla
S.
No.
Name of source Year of
installation
System design
capacity in MLD
Present average
supply in MLD
Present status
during May 2010
1 Upper gravity line in
Dhalli catchments area
1875 4.54 0.45 0
2 Cherot Nallah 1889 4.80 3.50 2.48
3 Chair Nallah 1914 2.50 1.20 0.55
4 Gumma 1923,
1982
2008
7.72
16.34 } 28.60
4.54
16.75 16.44
5 Ashwani Khad 1992 10.80 7.60 4.96
6
LWSS Shimla town
from River Giri
2008 20.00 12.00 10.69
Total 71.24 41.50 35.12

216
In addition to tapping of surface water from above six sources, raw water requirement is further supplemented
at following sources by installing tube wells.
i) Gumma 4 Nos.
ii) Ashwani khad 4 Nos.
iii) Cherot 2 Nos.
The projected population of Shimla town up to 2042 is 604,044 and the ultimate water demand @135 liter per
capita per day works out 99MLD. As such a shotfall of 41 MLD is to be met out by constructing additional water
supply schemes. Following two proposals are under consideration:
Construction of water supply scheme to Shimla from River Pabbar : This scheme has been proposed as a gravity
scheme of 41 MLD capacity. The distance of the proposed source from Shimla up to Dhalli filter is 139 km and
the total estimated cost is Rs. 1417 crores. This scheme has submitted to the Govt. of India for approval and
funding.
Construction of Lift Water Supply Scheme to Shimla from KOL Dam Reservoir on River Satluj near Sunni, district
Shimla : This scheme has been proposed as a lift water supply scheme of 11 MLD capacity. The distance of the
proposed source from Shimla up to Ridge is only 22 km and the total estimated cost is Rs.324 crores. This
scheme has submitted to the Govt. of India for approval and funding.
WATER PROFILE
Shimla city is situated on hilly terrain and area is underlain by hard rock formations, which are devoid of
primary porosity. The occurrence and movement of ground water are controlled by secondary porosity. The
aquifer of the area have low yield prospect as inferred from ground water development in the city by
construction of the various ground water structures. The large scale development of ground water resource is
limited. In the low lying areas on the banks of perennial rivers/khads, where river terrace deposits are found
are the favorable locations for ground water development. Due to non availability of ground water in the area
only perennial rivers are tapped so far for domestic as well as industrial uses.
GROUND WATER SCENARIO
Potential Aquifers
The area is situated on rocks of Shimla Group and Jutogh formation comprising of shale, slates, phyllites,
quartzite, dolomite and limestone and structurally it forms a synform with main axis trending in WNE-ESE
direction (Fig. 2). The Shimla hills mainly comprises of metamorphic rocks that are devoid of primary porosity.
However, when adequate secondary porosity is available in the form of fractures, fissures, joins and shear
planes, this may facilitate storage and transmission of ground water. The availability of satellite images has
made possible the delineation of secondary porosity zones even if they are covered by diverse land cover. The
following sets of lineament have been delineated from satellite images. The hydrogeological map of the area is
depicted in Fig. 3.
(i) NE-SW to ENE-WSW
(ii) N-S to NNE-SSW
(iii) WNW-ESE
Secondary porosity (fracture & fissure) in these rocks, topographical set up coupled with precipitation in the
form of rain and snow, mainly govern occurrence and movement of ground water. The area is underlained
mostly by hard rocks which form aquifer of low yield prospect. Ground water potential in such areas is very low
due to its hydro-geomorphic set up. Springs are the main ground water structures that provide water for
domestic use.
Springs in the area are mainly gravity, contact or fracture type and located along major thrust/faults or
structurally weak planes are high yielding. The discharge of springs, locally called Chasma, varies from
seepages to as high as 18 lpm. Bowries, a type of dug well, are another structure constructed in the hill slopes
to tap the seepages. Such Bowries are very common and observed all over the city.

217
Ground Water Level
There are no dug wells in the area because of hilly nature of the terrain as such no water level record is
available. Irrigation and Public Health (I&PH) department, Govt. of Himachal Pradesh have drilled shallow bore
wells (hand pumps) to provide water for domestic use. These hand pumps have been drilled between the
depth ranges of 50-90 m. The static watr level (SWL) of hand pump constructed in the city varies between 10 to
30 m bgl and discharge varies from 0.14 lps to 1.37 lps. To know the aquifer system of the hard rock, Central
Ground Water Board, NHR, Dharamshala has drilled a tube wells up to the depth of 302 m. The tube well was
constructed up 74 m and yielded 1173 lpm with drawdown of 26.62 m. The SWL of this tube well was 1.60 m
and transmissivity is 70.39 m2/day.
Ground Water Resources and Status of Development
The ground water resources of the city have not been computed because the entire area is hilly and having
slope more than 20%.
Hydrochemistry
In order to ascertain the variation in chemical quality of ground water, data of ground water samples collected
from spring, hand pumps and tube wells have been analyzed. The result of chemical analysis of ground water
samples is given in Table-2. The chemical analysis of ground water samples indicates ground water is generally
alkaline in nature and fresh and is within permissible limit as prescribed BIS, 1991 except at few places where
nitrate concentration have been found slightly higher. In general, ground water is suitable for drinking and
domestic. Though contamination of ground water have not been reported in the city so far, however, the fast
increase in population/tourist population in the major towns, mainly Shimla city is highly vulnerable to
pollution from Municipal effluent and small industries. There is thus need to have proper ETPs and waste
disposal system with all the industries and major towns. Proper monitoring is very much required.
Major Ground Water Related Problems
Most of the ground water issues and problems in the district are localized and need to be treated
independently by taking the micro level studies in a particular area. In hilly and mountainous parts, the most
common issues relate to scarcity of water particularly in low precipitation year during non-monsoon period
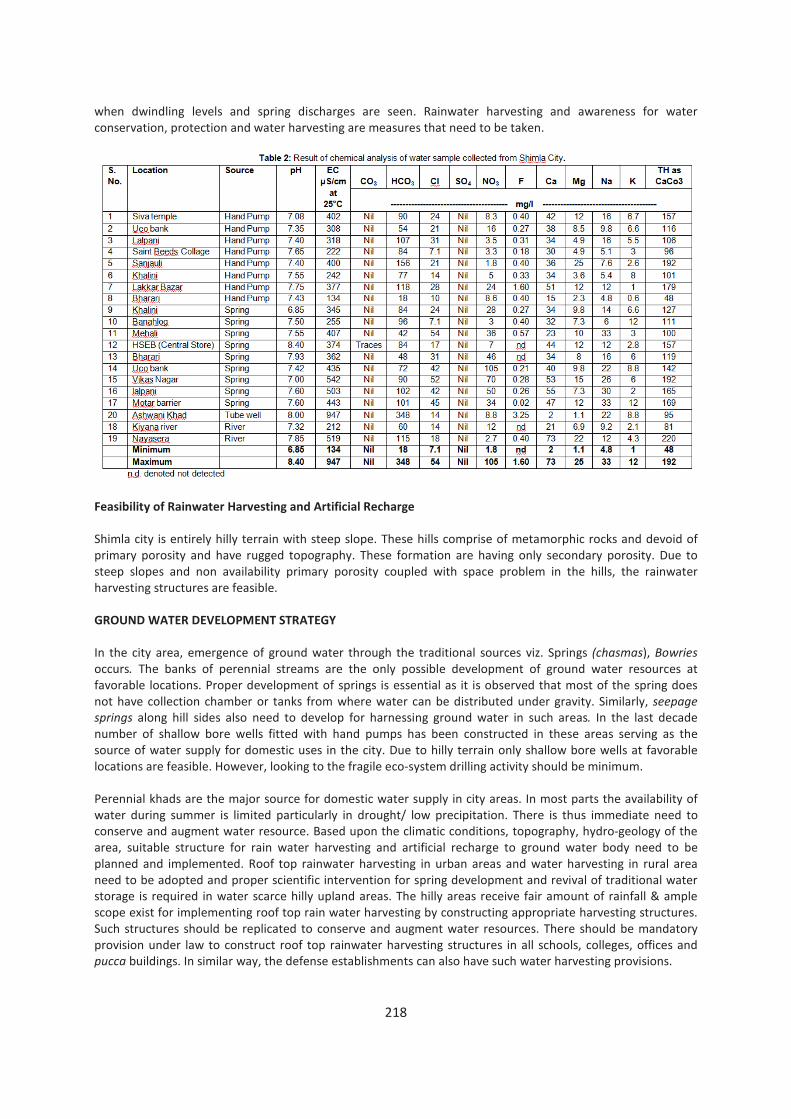
218
when dwindling levels and spring discharges are seen. Rainwater harvesting and awareness for water
conservation, protection and water harvesting are measures that need to be taken.
Feasibility of Rainwater Harvesting and Artificial Recharge
Shimla city is entirely hilly terrain with steep slope. These hills comprise of metamorphic rocks and devoid of
primary porosity and have rugged topography. These formation are having only secondary porosity. Due to
steep slopes and non availability primary porosity coupled with space problem in the hills, the rainwater
harvesting structures are feasible.
GROUND WATER DEVELOPMENT STRATEGY
In the city area, emergence of ground water through the traditional sources viz. Springs (chasmas), Bowries
occurs. The banks of perennial streams are the only possible development of ground water resources at
favorable locations. Proper development of springs is essential as it is observed that most of the spring does
not have collection chamber or tanks from where water can be distributed under gravity. Similarly, seepage
springs along hill sides also need to develop for harnessing ground water in such areas. In the last decade
number of shallow bore wells fitted with hand pumps has been constructed in these areas serving as the
source of water supply for domestic uses in the city. Due to hilly terrain only shallow bore wells at favorable
locations are feasible. However, looking to the fragile eco-system drilling activity should be minimum.
Perennial khads are the major source for domestic water supply in city areas. In most parts the availability of
water during summer is limited particularly in drought/ low precipitation. There is thus immediate need to
conserve and augment water resource. Based upon the climatic conditions, topography, hydro-geology of the
area, suitable structure for rain water harvesting and artificial recharge to ground water body need to be
planned and implemented. Roof top rainwater harvesting in urban areas and water harvesting in rural area
need to be adopted and proper scientific intervention for spring development and revival of traditional water
storage is required in water scarce hilly upland areas. The hilly areas receive fair amount of rainfall & ample
scope exist for implementing roof top rain water harvesting by constructing appropriate harvesting structures.
Such structures should be replicated to conserve and augment water resources. There should be mandatory
provision under law to construct roof top rainwater harvesting structures in all schools, colleges, offices and
pucca buildings. In similar way, the defense establishments can also have such water harvesting provisions.

219
SRINAGAR, J&K
Priya Kanwar, CGWB, Jammu
INTRODUCTION
Srinagar is the summer capital of the state of Jammu and Kashmir and is the pride of the beautiful valley of
Kashmir. Famous for its excellent landscapes- lakes, gardens and the charming rows of houseboats floating on
them and abundant natural beauty, the
city is also called Heaven on Earth.
Founded by the King Pravarasena II over
2,000 years ago, Srinagar owes its name
to two Sanskrit words, Sri (meaning
profusion and wealth) and Nagar,
(meaning a city). Dating back to the 3rd
century BC, the city was formerly a part
of the Mauryan Empire. This region
prospered quite well under the rule of
the Kushans in the 1st century AD.
During this period, it used to be an
important Buddhist pilgrimage site. In
the 6th century, however, it became a
part of the kingdom of Vikramaditya,
Local Hindu rulers ruled it until the 14th
century, when Muslims captured it. In
1814, it went to the Sikhs. However,
ultimately the British defeated Ranjit
Singh and appointed Gulab Singh as the
autonomous ruler of Kashmir. Later, Hari
Singh, the great grandson of Gulab Singh, united this huge state into India.
GENERAL FEATURES
Area / Administrative Divisions
Srinagar city is located in the heart of the oval shaped Valley of Kashmir at 74°47’24” E Longitude and
34°5’24”N Latitude. The total geographical area of Srinagar urban area is 238 km2. Srinagar urban area is
administratively divided into 2 divisions viz Left River division and Right River division, 4 zones and 34 wards.
Demography
As of 2001, Srinagar city had a population of 894,940 and population density is 556 inhabitants/sq.km. The
average decadal growth rate is 45%, and thus the projected population of 2011 is 12,97,663 and 16,81,611 in
2021.
Hydrometerology
The climate of Srinagar may be described as a humid subtropical climate with warm summers from June to
August, and winters from December–February. The city generally gets some snowfall from December to
February. The average temperatures are 24 °C in July and 4 °C in January. Precipitation is in the form of snow
and sleet in the winter months and as rain or hail during rest of the year. The average annual rainfall is around
675 mm.
Physiography & Drainage
The general topographic slope in the northern part is towards the south, in the southern part is towards north
while in the central part the master slope is towards west. The city has unique physiographic set up with steep

220
hills in the east, low lying paddy fields on flood plain of Jhelum in the south and west and raised plateau lands
in the south. The average elevation of alluvial tract is 1500 m amsl.
The natural drainage of the city is provided by three main rivers which are joined by small rivulets and canals.
River Jhelum enters Srinagar in the south-east- flows through the city, leaving it in the west after dividing the
city into two parts. In the south, drainage is provided by Doodhganga river and in the north by the River Sindh
which drains into Anchar lake and ultimately joins Jhelum River.
Soil Type
Mainly two types of soils are found in the area viz. Hapludalfs found on the Karewa tops and uplands and
Ochraqualfs found in plain to mid upland topography. The Hapludalfs are medium to fine textured soils, varies
from yellowish brown to dark brown and the Ochraqualfs are moderately fine textured, dark brown to
yellowish brown in colour.
STATUS OF WATER SUPPLY AND DEMAND
The total water supply of Srinagar city is 65.38 MGD of which the ground water meets only 13%. There was no
proper water supply scheme one and a half centuries ago in Srinagar city. People used water from Jhelum river
for drinking, bathing and washing purposes. During the rule of Maharaja Pratap Singh water works department
came into existence. Harvan Reservoir was built to provide clean water to residents of Srinagar. It was fed by
Marsar nullah. In all, five Surface Water Supply Schemes are in operation in the city, of which three are gravity
and two are lift Schemes. At present 43.54 MGD of water is released from these schemes against the designed
capacity of 57.55 MGD.
Ground water based water supply of Srinagar City was initiated in 1968. Total of 133 tubewells have been
drilled in the city for water supply. Out of these, about 81 tubewells are being used by the PHED for water
supply and providing 8.5 MGD of water.
WATER PROFILE
The surface water supply to the city is through five major schemes. These five Schemes are Nishat, Alastenag,
Rangil, Doodhganga and Pokhribal and their sources are Dachigam Nalla, Sindh Nalla and Doodhganga
respectively.
Besides, these the Dal lake which is the second largest lake in the State, occupies a major portion of the city.
The lake is located within a catchment area covering 316 square kilometres in the Zabarwan mountain valley,
in the foothills of the Himalayan range, which surrounds it on three sides. The lake, lies to the east and north
of Srinagar city covers an area of 18 square kilometres. The shore line of the lake, about 15.5 kilometres. The
average elevation of the lake is 1,583 metres.
GROUND WATER SCENARIO
Potential Aquifers
The hydrogeological condition of any area depends on the lithology, structure and geomorphic set up.
Groundwater in the city area occurs both under water table and confined conditions. In alluvial sediments,
that consists of valley fills & Karewa formation, the ground water occurs in the inter granular pore spaces of
the individual grains under water table conditions. Recharge to the alluvial aquifers is received both by in situ
filtration of rain water/ snow melt.
The bedrocks does not forms potential aquifers in the area, as they are hard, compact and lack primary
porosity. Secondary porosity developed due to weathering and fracturing facilitates storage and movement of
ground water. The near surface weathered zones forms the phreatic aquifers and is the source for circulation
of water in the hydraulically interconnected deeper fracture zones. Thus, zones of secondary porosity in them
form suitable areas, worthy for ground water development.

221
Dugwells have shallow water levels, generally less than five m bgl. Springs are also seen in the talus and scree
material/alluvium. A good number of springs are present in the area. Discharges of springs range between 480
lpm and 2250 lpm.
The yield of tubewells in the area has a vide range from 11.2 m3/hour to 121 m
3/hour (Idgah & Bus stand
Batmaloo). Majority of the tubewells are yielding 22.5 m3/hour to 67.5 m
3/hour. The Exploratory tubewells
constructed by the Central Ground Water Board have shown a maximum yield of 188 m3/hour. Yield of
tubewells tapping confined aquifers is expected to be in the range of 75 m3/hour to 150m
3/hour/. Hydraulic
conductivity of the tubewells constructed by the CGWB ranges from 0.464m/day (at Karan Nagar) to 43.34
m/day (at Badampora). The value of transmissivity ranges from 97.83 m2/day (Satsukalan) to 931.77m
2/day
(Badampora) and specific capacity has been found ranging from 2.04 m3/hour/m (Satsukalan) to 31.27
m3/hour/m (Bemina-II).
Ground Water Level
Water level behavior in the Kashmir Valley is entirely different from the other parts of the country. This is
mainly because of the fact that about 60 to 70% of the precipitation is received in the form of snow during
December to February while March to April are the months of heavy rainfall. May to September are relatively
dry months. Hence recharging to the ground water takes place in the valley in the months of April to June with
the melting of snow and onset of rainfall. Therefore water levels show rising trends from April onwards and
falling from August onwards. Thus the pre and post monsoon conditions in the Kashmir valley shows a reverse
scenario from the rest of the country.
The water levels in the Srinagar city are very shallow. The open dugwells have water levels generally less than
five mbgl. The water levels are measured from 3 dugwells for the months of May 2010.
Location Water Levels in May 2010 EC (micromhos/cm) Cl mg/l
Rainawari 9.16 690 32
Regal Chowk 2.26 685 43
Mirgund 0.95 335 14
Status of Ground Water Development
PHE has constructed about 93 tubewells and CGWB has constructed 21 exploratory tubewells in the city which
has a total area of 238 sq.km.
Hydrochemistry
The chemical quality in Greater Srinagar is by and large fit for drinking and irrigation purposes as per Indian
Standards (IS-10500-1991). Chemical analysis of water samples from various sources like Dug wells,
Handpumps, Tubewells, Springs, Jhelum river & Dal Lake has been taken in to consideration. The Iron content
is slightly high at one to places which requires proper treatment before use.
A few tubewells have been found releasing methane gas (due to occurrence of peat in the Karewas), but in
most cases it is not a problem, as it is released out and is not dissolved in water.
Electrical conductivity ranges from 335 micro mhos/cm to 850 micro mhos/cm pH varies from 7.35 to 7.56
which shows that ground water is quite alkaline in nature. Chloride varies from 14 mg/l to 46 mg/l.
Bicarbonate concentration varies from 177 mg/l to 360 mg/l. Sulphate and Nitrate concentration ranges from
16mg/l to 70 mg/l and traces to 21 mg/l respectively. Fluoride concentration is also low. The concentration of
Sulphate, Fluoride and Iron are well within the maximum permissible limit set up by BIS. Alkaline earth metals
dominate over alkali metals i.e Na & K. Ground water is very hard.
Major Ground Water Related Problems
• The presence of high Iron content in ground water especially in deeper aquifers is one of the major
problems.

222
• A few tubewells have been found releasing methane which is gas due to occurrence of lignite in Karewa
formation.
• Water logging is also a problem in some of the areas of the city especially the southern part where the
static water levels in the tubewells drilled were found from 0.32 m bgl to 4 m bgl at the time of their
construction.
Feasibility for Rain Water Harvesting and Artificial Recharge
The rain water harvesting is feasible in the city provided there is availability of space for construction of water
harvesting structures. But condition is quite different in case of feasibility for artificial recharge. The artificial
recharge to the ground water is not feasible in the southern part of the city because this part has very shallow
water levels and is prone to water logging.
GROUND WATER DEVELOPMENT STRATEGY
• Since the depth to water levels in valley portions are within 5 m bgl the ground water development is
required to be given a fillip of construction of shallow tube wells, dug wells, hand pumps etc. Harnessing
the shallow aquifers will also minimize the chances of getting comparatively higher Iron content which is a
regular problem in the Karewas.
• Since there are data gaps in monitoring of depth to water levels, it is recommended to install piezometers
to observe behavioral changes of water levels over a long period of time in order to know the trends.
• There is a need of State Ground Water Department which can take up the detailed and micro level studies
in the field of ground water in the state.
• Over pumping of tubewells constructed by the State Government Agencies should be minimized.
• Further development of ground water by the State Government Organisations should be checked.
• At suitably identified locations, along the Sindh River, Collector Wells/ Percolation Wells/ Ranney Wells
may be constructed, which can provide a large volume of filtered water to augment the drinking water
supplies of Srinagar city.
• The ground water from the proposed tubewells/Collector Wells etc. should be dis-infected, by installing
silver-Ionization plants. Silver based water purification systems offer the most reliable and cost effective
alternative to chlorine. Chlorine is a chemical that is increasingly coming under fire for the carcinogenic
impacts and ite by products generated and left in the treated water.
• People should be made aware for proper utilization and conservation of water resources available.

223
TRIVENDRUM CITY, KERALA
V.R.Rani, Anitha Shyam, P. Nandakumaran, CGWB, Trivendrum INTRODUCTION
Thiruvananthapuram, formerly known as Trivandrum, is the capital city of Kerala state and erstwhile Travancore Kingdom. Thriuvanthapuram city and several other places in the district loom large in ancient traditions, folklore and literature. The city gets its name from the word Thiru-anantha-puram, meaning the “Abode of Lord Anantha”. The ancient political as well as cultural history of the city stood entirely independent from that of the rest of the Kerala. The Ays were the leading political power till the beginning of the 10th century A.D. The disappearance of the Ays, synchronised with the emergence of the rulers of Venad. In 1684, during the regency of Umayamma Rani, the English East India Company obtained a sandy piece of land at Anchuthengu (Anjengo) on the sea coast for erecting a factory and fortifying it and from here that the English gradually extended their domain to other parts of Thiruvithamcore anglicised as Travancore. Modern history begins with Maharaja Marthanda Varma (1729 to 1758 AD) who is generally regarded as the Father of modern Travancore. During this period the city developed into a major intellectual and artistic centre. Thiruvananthapuram was made the Capital of Travancore in 1745 after shifting the capital from Padmanabhapuram in Kanyakumari district. The mid of 19th century was earmarked as golden age in the city’s history under the reign of Maharaja Swathi Thirunal (1829 to 1847 AD) and of Maharaja Ayilyam Thirunal (1860-1880). During their reign the city ushered in an epoch of cultural progress and economic prosperity. This era saw the beginning of English education, establishment of English schools, colleges, observatory, charity hospitals and oriental Research Institute and Manuscript library. A tremendous political and social change was associated with Maharaja Sree Moolam Thirunal reign. He inaugurated the Legislative Council in 1888 which was the first legislative chamber, instituted in an Indian State and Sri. Moolam Assembly came into being in 1904. During his reign, the activities of the Indian National Congress echoed in various parts of the city. The period of Maharaja Sri. Chitra Thirunal Bala Rama Varma who took the reigns of administration in 1931, witnessed many-sided progress. The Thiruvananthapuram Municipality came into existence in 1920 and was converted into corporation on 30th October 1940. With the accession of Travancore to the Indian Union after Independence, the policy of the State Government as well as the political atmosphere underwent radical changes. Consequent on the recommendations of the State Reorganisation Commission, the four southern taluks of Thovala, Agastheewaram, Kalkulam and Vilavancode were merged with Tamil Nadu and the State of Kerala came into being on 1st November, 1956.
GENERAL FEATURES Administrative Divisions Trivandrum Urban Area (TUA) which house Capital city is located between North latitude of 8°21'45'' & 8°34'49'', east longitude of 76°49'39''& 77°00'25''. The TUA comes under the jurisdiction of Thiruvananthapuram Development Authority (TRIDA) which covers a geographical ambience of 296.35 sq.km (13.5% of district area). The Urban area is bordered by Nedumangad, Vellanad and Perumkadavila block in the east, less turbulent turquoise blue waters of the Lakshadweep sea in the west, Parassala and Athiyannur block in south and Attingal and Kilimanoor blocks in the north. Administratively, the Thiruvananthapuram Urban Area (TUA) is broadly divided into municipal corporation (Trivandrum City) and the adjacent 10 panchayats namely Kazhakootam, Sreekariyam, Kudapanakunnu, Vattiyoorkavu, Kalliyoor, Valavoorkal, Vilappil, Pallichal, Venganoor and Vizhnijam. Of these 10 panchayats, 5 panchayats given the status of corporation. The City Corporation is spread over an area of 215.86 sq.km (72.84%) of TRIDA area) and the adjoining 10 panchayats cover an area of 80.49 sq.km (27.16% of TRIDA area). The map showing the various administrative divisions of TUA is given in fig.1.

224
The city is well connected with other parts of the state and to almost all major cities in India by all weather
networks of roads and railways. The National Highway (NH 47) passes through the entire length of the city
which is almost parallel to the
coastline. The Main Central Road
(MC Road) together with NH
47connects the northern parts of
the state with the city. In addition
to these transport facilities, the
city is well connected by air also.
There is an International airport
situated at Thiruvananthapuram.
Demography
TUA registered a population of
11,32,394 (35% of the district
population) as per census 2001
(Table 1). The population density
for Trivandrum Municipal
Corporation area and the total
panchayat area is 4422 and 2210
persons per sq.km respectively,
with an average value of 3026
persons per sq.km for the TUA. The
literacy rate of the TUA is 89.36 %.
The sex ratio indicates that there
are more women than men in TUA.
The City Development Plan(2006)
has attempted to project the population and is estimated that the Thiruvananthapuram Municipal Corporation
population which is 744893 in 2001 may grow to 7.70 lakhs in 2011.
Table 1. Constituent Units of TRIDA with their area and population (2001)
No. City/Panchayat Area (sq km) Population (2001) Density (p/sq km)
1 Thiruvananthapuram (M.C.) 141.74 744983 5256
2 Kazhakuttam (C) 19.47 34131 1753
3 Sreekaryam (C) 23.73 49145 2071
4 Kudappanakunnu (C) 7.69 38175 4964
5 Vattiyurkavu (C) 10.61 41890 3948
6 Kalliyur 17.23 36836 2137
7 Vilavoorkal 12.02 27495 2287
8 Vilappil 19.42 34079 1755
9 Pallichal 21.70 45118 2079
10 Venganoor 10.12 33372 3298
11 Vizhinjam (C) 12.62 47170 3738
TOTAL 296.35 1132394 3026(Av.)
Hydrometeorology
The city experiences a humid type of climate condition with an oppressive summer since the climate borders
Tropical Savanna and Tropical monsoon climate. The Trivandrum city is the first city along the path of south-
west monsoon and gets its first showers in early June which contributes 48.9% of the total rainfall. The city
also gets rain from receding north-east monsoon which hit the city by October and contributes 28.31%. Hence
the city is characterized by high precipitation which is spread over very few wet days and long dry season
(December-May). The average annual rainfall is 1623.9 mm (~1700 mm). The normal rainfall is 2001.6mm.
Generally the rainfall increases from southwest to northeast in the city. During the period 2005-07, the rainfall

225
was above the normal rainfall. The coldest months are December, January and February with a recorded
lowest temperature of 15°C while March, April and May are hottest with a record high of 37°C. The mean wind
speed during June to September varies between 9.6 to 11.2 km/hr and during October to December varies
between 4.8 to 7.3 km/hr.
Physiography and Drainage
Physiographically, the TUA can be divided into two categories- lowlands and midlands. The lowland or coastal
plain is the area with an elevation of less than 7.6 m amsl formed by a combination of fluvial and marine
processes and is represented by a gently sloping terrain whereas elevation is between 7.6m and 76 m amsl in
the case of midlands which is mainly formed by fluvial and denudational processes. The lowland is
comparatively narrow and is densely covered with coconut palms while the midland is made up of tiny hills
and valleys and is an area of intense agricultural activity.
The TUA is mainly drained by Karamana River and its main tributary, Killiyar, which debouches in to the
Lakshadweep Sea. The river runs from NE – SW skirting the city and before the confluence with the sea form
some islands, mainly Edayar. Formation of intervening bars or sand bars near the estuarine mouths are
common features particularly produced by littioral drift of sand during the period of south-west monsoons.
Karamana River is perennial in nature with dendritic drainage pattern. Two dams constructed across the river
at Aruvikara and Peppara supply the drinking water to the TUA. Vellayani lake is the only freshwater lake
available in TUA which form the main source of drinking water in Nemom block. And the only other lake of the
city is Aakulam lake which is backwater lake.
Soil Type
The main types of soil found in TUA are coastal alluvium, riverine alluvium, lateritic soil and brown
hydromorphic soil. Most predominant soil is lateritic soil and is mainly found along the midland region. Brown
hydromorphic soils are mostly confined to valley bottom in the midland and low lying area of coastal strip. The
lowland area is dominated by alluvium. Coastal alluvium is mainly found along the coastline while riverine
alluvium is found along the banks of river and their tributaries.
STATUS OF WATER SUPPLY
The traditional practice of dependence on surface water and ground water is in the form of ponds and open
dug wells and are in existence for generation is almost vanished from the society mainly in the city area. The
piped water supply for the Trivandrum district started in 1930’s by the erstwhile Travancore state. After the
formation of the Kerala State, Kerala Water Authority (KWA) is entrusted with piped water supply. The water
supply scheme in TUA comprises 183.76 sq.km with complete coverage of earlier Thiruvananthapuram
Corporation (141.74 sq.km) and partial coverage of newly included area viz. Sreekariyam (23.73 sq.km),
Kudapanakunnu (7.69 sq.km) & Vattiyoorkavu(10.61 sq.km).
The main source of water for Trivandrum Urban Water Supply Scheme is the Karamana River. There are two
reservoirs constructed at the upstream of the river for sufficient storage of water viz., Aruvikkara ( which have
a storage capacity of 2 million cubic meter) and Peppara (having 70 million cubic meter storage capacity). The
water supply is designed for 24 hrs after proper treatment at various treatment plants. Presently the average
per capita consumption is around 174 litres per day. The existing supply provides a supply of 185 mld of water
as against present demand of 246 mld. In order to augment the water supply scheme, KWA has been taken up
a project at the cost of Rs.311.91 crore with loan assistance from JBIC (Japan Bank for International
Cooperation). This project has been formulated to provide a supply of 74 mld of water. The projected water
demand for 2036, at the rate of 200 lpcd works out to be 410 mld which include domestic use along with a
provision for non-domestic and industrial requirement. The ongoing JBIC project can supplement 74 mld still
leaving the gap of 185 mld due to growth in population. This gap is proposed to be compensated by 3 tier
system (1) augment the system by 76 mld (2) bring down the unaccounted water losses to the range of 15%
from 35.5%. and (3) Cut-off some boundary areas from the city water supply system (WSS) by providing small
WSS exclusively for those areas.

226
GROUND WATER SCENARIO
Trivandrum Urban Area is underlain predominantly by Precambrian crystalline rocks. Sedimentary formations
ranging in the age from Miocene to Recent overlie these formations. The Precambrian rocks include
Khondalite suite of rocks which is exposed in eastern part of TMC and charnockite which are seen mainly in
Vizhinjam and Venganoor areas. The trend of both of these rocks is NW-SE. Based on the water bearing
properties, the entire district can be broadly classified into crystalline formation and sedimentary formation.
The crystallines include khondalites, charnockites, migmatites and intrusives occur at shallow or deep with or
without fractures. Whereas sedimentary formation comprise the (1)Recent alluvium that occur along the
coastal plain and in the valleys and are mainly composed of sand and clay (2) Tertiary formation such as
Warkallai and Quilon beds and (3) laterites which occur as a capping over crystallines. Two types of laterite are
seen in this area: the one developed over the crystallines and other formed during Tertiary. The insitu laterite
developed by the weathering of khondalite is rich in clay content due to higher amount of feldspathic minerals
in parent rock (CGWB, 1999). The hydrogeological map of TUA is given in fig.2.
Ground water occurs in all geological formations from crystallines to Recent alluvium either in unconfined or
semi-confined/confined conditions. Phreatic conditions mainly exist in coastal alluvium and in weathered
crystalline formation and are mostly developed by dug wells for domestic or irrigation purposes. Semi-
confined/confined condition exists
in deep fractures of crystalline
rocks where storage and
movement is mainly controlled by
interconnected fractures which is
developed by deep bore wells.
To understand the impact of
modernisation and urbanisation
on the ground water scenario of
TUA, CGWB has established 21
key wells in various parts of the
area and monitoring was carried
out monthly since April 2007.
Earlier TMC was only considered
as urban area. Later while
considering the population growth
and other facilities in the outskirts
of the city, adjoining panchayats
were also included. Anticipating
the impact of proposed Vizhinjam
Container Terminal Project on
ground water regime 5 more
monitoring wells have been
established recently in Vizhinjam
and Kalliyoor panchayat.
Potential Aquifers
Central Ground Water Board has drilled exploratory wells in hard rocks, particularly khondalites and in soft
rocks to delineate the aquifer geometry and quality of formation water. The wells drilled in khondalites are in
the depth range of 60 - 200 m bgl and the discharge ranges from 12 to 90 lpm. Exploratory drilling revealed
the presence of 2 - 3 aquifer groups within the depth range of 200 m (CGWB, 2006). The bore wells tapping
NNW, NE, NW lineaments in the district gives better yield. In the sedimentary formation wells of medium
yields have been encountered from the granular zones of Tertiary formations down to maximum depth of 100
m bgl. The Warkallai formation has a limited potential in the Thiruvananthapuram district. The wells drilled in
this formation are in the depth range of 32 to 100.5 m bgl have low discharge(CGWB,2008). Recent alluvial
formation is thinner and the maximum thickness of alluvium is 18 m, which is encountered at Chakkai.

227
Ground Water Level
The monthly monitoring of depth to water level of 26
key wells reveals that deepest water level is noticed
before the onset of south-west monsoon (pre-monsoon)
and the shallowest water level during the month of
October/November which in turn also depends on the
retreating period of North-East monsoon. The depth to
water level varies from 1.9 to 19.8 m bgl and 1.56 to
19.88 m bgl during pre-monsoon(Fig.3) and post-
monsoon(Fig.4) respectively. The depth to water level
ranges from 0 to 5 m bgl in wells tapping recent alluvium
while the depth to water level is more than 10 m bgl
particularly in laterite formation. Seasonal fluctuation
also indicates that in major portion of TUA, there is rise
in water level in the range of 0 to 5 m.
Ground Water Resources and Status of Development
The computation of ground water resource of urban
area is difficult due to large built-up area and other
structures, hence the Ground Water Resource of the
district has been assessed based on Ground Water
Resource Estimation Methodology–97 (GEC- ‘97) by
considering administrative block as the assessment unit
by excluding hilly regions and is computed based on the
data available as on March 2004. The net groundwater
availability of the Thiruvananthapuram (Rural) block is
14.90 MCM whereas the gross ground water draft of the
block is 11.23 MCM, hence scope for further ground
water development is possible. The stage of ground
water development in Thiruvananthapuram block is
75.37% (CGWB, 2005) and is categorised under safe
category indicating the presence of potential aquifer
which can be harnessed. In addition to
Thiruvananthapuram block, Kazhakuttam and
Sreekaryam panchayats also show lesser development.
Hence further ground water development can be taken
up safely and more wells can be constructed. The
Venganoor panchayat and Vizhinjam Corporation of
Athiyanuur block shows development more than 100% .
Analysis of trend of water table shows significant decline
during pre and post-monsoon, hence both areas are
categorised under over-exploited category which
requires a restriction in ground water development. The
4 panchayats of Nemom block shows 91.7% of ground
water development and is categorised under semi-critical
category and this area requires a control on ground
water development. The categorisation of TUA based on
block-wise GEC calculation is depicted in fig.5
The main groundwater abstraction structures for
domestic and agricultural purposes are dug wells, bore
wells and tube wells. In the crystalline and lateritic
terrain the groundwater is developed through dug wells
and bore wells while filter point wells and tube wells are in vogue in coastal alluvium. During the last few

228
years, construction of private tube wells and bore wells has increased tremendously. Majority of the
households in the panchayat area have their own dug wells or bore wells. Irrigation in TUA is mainly by means
of surface water. The potential aquifers of fractured crystalline rocks are being tapped through tube
wells/bore wells, ranging in depth from 70to 200m. The deep tube wells have depth range of 150 - 200 m and
the diameter ranges from 152 mm to 305mm. Since the degree of weathering in charnockite is low the shallow
bore wells in charnockites vary in depth from 6 to 13 m bgl. The depth of the wells in Tertiaries generally varies
from 15 to 30 m bgl. The most potential aquifer in the area is alluvial deposits, which are composed of sand
and clays. The depth of the wells ranges from 2 to 6 m bgl and is developed by shallow tube wells and filter
point wells. The average yield is about 10 to 60 m3/day.
Hydrochemistry
The ground water in the district is generally potable
except in few locations such as areas adjacent to the
seacoast and area polluted by industrial effluents. In
the coastal plain the electrical conductivity is greater
than 1000 µS/cm (Vizhinjam). Similarly the chloride
content is also high in the same location. The water is
generally alkaline in nature. All the major constituents
are within the permissible limit. The ground water is
suitable for domestic and drinking purposes. The
minimum and maximum values of various constituents
in water samples collected from TUA is given in Table .2
Major Ground Water Related Problems
The important ground water related problems in Trivandrum Urban area are:
• Over-exploitation: With the adoption of modern drilling techniques, construction of bore wells has
become a common practice to meet domestic as wells as agriculture needs. This increase in tube wells
may result in more ground water draft from potential aquifers.
• Pollution: Mainly due to municipal waste and due to waste disposal particularly around Vilapilsala where
the waste disposal facility has been established. The E.Coli content is very high in ground water of this
area whereas the other constituents are within the desirable limit.
• Water marketing: Mainly seen during summer months, particularly in Vengannur panchayat and area near
to Aakulam lake, due to heavy withdrawal resulting in decline of water table.
Feasibility of Rainwater Harvesting and Artificial Recharge
Due to lateral spread of urbanisation, ground water is vulnerable both quantitatively and qualitatively and
hence it is very necessary to take up artificial recharge schemes in urban area. The identification of feasible
areas for artificial recharge to groundwater was made on the basis of depth and declining trend of water level.
Rain water harvesting, conservation of existing water bodies in the neighbourhood and recharging of these
water bodies with filtered drain water etc. should be considered instead of allowing all run off to drain into
the sea or to cause flooding in some part of the city. Artificial recharge and rainwater harvesting are the best-
suited and most effective methods to augment ground water resources in the area (CGWB, 2009). Sub surface
dams and dykes are the main structures feasible for the artificial recharge of ground water in the upstream
portion of Karamana basin. The most feasible structure is the roof top rainwater harvesting technique. Such
schemes can arrest the decline in groundwater levels and improve groundwater quality. Recharge pits and
trenches are ideal structures for rainwater harvesting in the midland areas of Trivandrum Urban Area. Roof
water can be used for recharge the dug wells, bore wells and tube wells. In TUA, a large number of ponds,
tanks and other abstraction structures in the area are filled up with silt, clay and hence sufficient recharge is
not taking place in the aquifers. Hence restoration of these structures has to be done to induce recharge.
Similarly, many quarry ponds are present in and around Vizhinjam, Kovalam and Pothencode areas which can
be effectively used for rainwater harvesting structures.
Table. 2: Chemical Quality of Ground Water in TUA
Constituents Minimum Maximum
pH 4.15 9.9
EC 93 1294
Total Hardness mg/l 14 2582
Ca2+
4.2 89
Mg2+
1.5 7.3
Na+ 5.7 140
Cl- 11 337
No3 2.1 152
F 0 0.53

229
GROUND WATER DEVELOPMENT STRATEGY
There is scope for further ground water development for irrigation in TUA in areas where the stage of
development is low. Ground water development should be coupled with management of rainwater and
surface water. The existing water resources and dug wells, ponds and streams should be protected and
conserved. Rainwater harvesting and artificial recharge schemes should be taken up on a massive scale. An
essential part of management of the resource is the proper spacing of abstraction structures. The spacing
between shallow tube wells should be kept 225 m and for deep tube wells the spacing between the well
should be kept 800m.
Hydrologeologically, the areas have been grouped into hard rock and alluvial areas. Since the water level is
very shallow in alluvial aquifer, artificial recharge can be considred only in hard rock areas. The surface
spreading techniques such as check dams, gully plugs and nalah bunds are most appropriate for TUA. As per
the Master Plan for Artificial Recharge to Ground Water(2002), in Karamana River basin 544 nos of Check dams
of capacity 0.1 MCM, subsurface dykes of 0.03 MCM(906nos), Gully plugs(1360 nos) of 0.02 MCM and Nalah
Bunding(1360 nos) of 0.02 MCM is feasible. The impact of artificial recharge to ground water shall be created
mainly at the downstream side of the recharge structures.
RECOMMENDATIONS
The TUA is predominantly underlain by hard rocks especially Khondalite with low porosity which in turn reduce
the infiltration capacity. Moreover, the city has the highest population density in Kerala resulting in more built
up area which reduce the groundwater recharge. In order to tackle the declining water level trend in urban
area, groundwater management techniques such as roof top ran water harvesting system and artificial
recharge structures should be constructed to augment the groundwater reservoir. The area can withstand only
low to moderate capacity tube wells. Filter point wells are in vogue in coastal areas. Since the ground water is
potable, it is recommended that the ground water can be made use for domestic needs. Groundwater
resource in blocks with low stage of development is recommended for further development. It is necessary to
regulate the construction of groundwater abstraction structures. There is also need for creation of awareness
among the public on judicious use of ground water resources and for capacity building of stakeholders at the
grass root level on various aspects of ground water conservation and augmentation.
REFERENCES
• CGWB (1999). Report on Hydrogeology of Trivandrum Metro, CGWB, Kerala Region, Unpublished Report.
• CGWB (2002).Master Plan for Artificial Recharge to Ground Water in India, CGWB, p.115.
• CGWB (2004). Report on the study if Iron concentration in Ground Water in Karamana River Basin,
Trivandrum district, CGWB, Kerala Region, Unpublished Report.
• CGWB (2005).Dynamic Ground Water Resources of Kerala, Kerala Region, Unpublished Report.
• CGWB (2006).Ground Water Exploration Report of Kerala, CGWB, Kerala Region, Unpublished Report.
• CGWB (2008).Basic Data Report of Piezometers constructed in Trivandrum District, Kerala, CGWB, Kerala
Region, Unpublished Report.
• CGWB (2009).Ground Water Brochure of Trivandrum District, Kerala State, CGWB, Kerala Region,
Unpublished Report.
• CGWB. Rain Water Harvesting Techniques to augment Ground Water, CGWB, p.27.
• City Development Plan (2006). Thiruvananthapuram Municipal Corporation & Local Self Government
Department, Government of Kerala, p.340.
• Economic Review (2008), State Planning Board, Trivandrum.
• National Water Policy (2002), Ministry of Water Resources, Government of India.