Gross job flows and institutions in Europe
52
WORKING PAPER SERIES NO. 318 / MARCH 2004 GROSS JOB FLOWS AND INSTITUTIONS IN EUROPE by Ramón Gómez-Salvador, Julián Messina and Giovanna Vallanti
-
Upload
khangminh22 -
Category
Documents
-
view
1 -
download
0
Transcript of Gross job flows and institutions in Europe

WORK ING PAPER S ER I E SNO. 318 / MARCH 2004
GROSS JOB FLOWSAND INSTITUTIONS IN EUROPE
by Ramón Gómez-Salvador,Julián Messinaand Giovanna Vallanti

In 2004 all publications
will carry a motif taken
from the €100 banknote.
WORK ING PAPER S ER I E SNO. 318 / MARCH 2004
GROSS JOB FLOWSAND INSTITUTIONS
IN EUROPE1
by Ramón Gómez-Salvador 2,Julián Messina 3
and Giovanna Vallanti 4
1 We are grateful to Neale Kennedy, Giovanni Notaro, Luca Onorante, Barbara Petrongolo, Christopher Pissarides,Anna Sanz de Galdeano,Alfred Stiglbauer, Jarkko Turunen and two anonymous referees for their valuable comments and
suggestions.We also thank seminar participants at the EALE meetings, ECB, Federal Reserve Bank of Boston, LACEA meetings,LSE and WIFO.The views presented in this paper are those of the authors and do not necessarily reflect the views of the
European Central Bank.All the errors are our own.2 Ramón Gómez-Salvador. European Central Bank, Kaiserstrasse 29, D-60311 Frankfurt am Main. Fax: +496913446000.
Tel: +491613446398. Email: [email protected] Julián Messina. European Central Bank, Kaiserstrasse 29, D-60311 Frankfurt am Main.Fax: +496913446000.
Tel: +491613448826. Email: [email protected] Giovanna Vallanti. London School of Economics, Houghton Street, London WC2A 2AE. Fax: +02079557595.
Tel: +02079556958. Email: [email protected].
This paper can be downloaded without charge from http://www.ecb.int or from the Social Science Research Network
electronic library at http://ssrn.com/abstract_id=526982.

© European Central Bank, 2004
AddressKaiserstrasse 2960311 Frankfurt am Main, Germany
Postal addressPostfach 16 03 1960066 Frankfurt am Main, Germany
Telephone+49 69 1344 0
Internethttp://www.ecb.int
Fax+49 69 1344 6000
Telex411 144 ecb d
All rights reserved.
Reproduction for educational and non-commercial purposes is permitted providedthat the source is acknowledged.
The views expressed in this paper do notnecessarily reflect those of the EuropeanCentral Bank.
The statement of purpose for the ECBWorking Paper Series is available from theECB website, http://www.ecb.int.
ISSN 1561-0810 (print)ISSN 1725-2806 (online)

3ECB
Work ing Paper Ser ie s No . 318March 2004
CONTENT S
Abstract 4
Non-technical summary 5
1 Introduction 7
2 Theoretical motivations and empiricalevidence 9
2.1 Job flows: internationalcomparisons 9
2.2 Job flows and labour marketinstitutions: theory and empiricalevidence 10
3 Data and measurement issues 13
3.1 Data source 13
3.2 Measuring job flows 15
3.3 Sample description 16
4 Job turnover, firm characteristicsand the cycle 18
4.1 An overview 18
4.2 The impact of firm characteristicson job flows 22
5 Job flows and institutions 24
6 Sensitivity analysis 27
7 Conclusions 29
References 30
Tables and figures 32
Appendix 43
European Central Bankworking paper series 44

Abstract
We examine job flows in the 1990s for a sample of 13 European countries. By using adataset of continuing firms that covers all sectors, we find firm characteristics to beimportant determinants of job flows, with smaller and younger firms within servicestypically having a larger degree of job turnover. Once controlled for firm and sectoraleffects, the role of institutions in the dynamics of job creation and destruction isexamined. As expected, employment protection is found to reduce job flows. Similarly,countries with higher unemployment benefits and more coordinated wage bargainingsystems are characterised by lower job flows.
Keywords: Gross Job Flows, labour market institutions.JEL-Codes: J23, J60
4ECBWork ing Paper Ser ie s No . 318March 2004

Non-technical summary
Recent literature has stressed the importance of job flows when firms and workers areheterogeneous and the matching process between vacancies and workers is costly. When ashock hits the economy, the desired allocation of jobs among firms and sectors changes,leading to simultaneous job creation and destruction. Because of heterogeneity and otherlabour market frictions, new vacancies and unemployed workers do not matchinstantaneously, implying spells of unemployment and vacant positions in the economy.Studies estimating job creation and destruction from plant or firm level data show that a highnumber of jobs are simultaneously created and destroyed in the economy even when theemployment growth is close to zero. This provides evidence on the complexity of thedynamics underlying the adjustment process in the labour market.
An important limitation of the existing empirical studies on job flows is the lack ofinternationally comparable job flows statistics. A number of problems arise when usingestablishment/firm level data, which became of particular concern when doing internationalcomparisons. Differences in definitions, sampling intervals, sectoral coverage and samplingframe may lead to misleading interpretations of the cross-country differences in estimatedjob flows. Cross-country comparisons of job flows provide the basis for a formalinvestigation on the link between job turnover and labour market institutions and policies.The focus on the institutional determinants of gross job flows allows testing theoreticalpredictions, which otherwise have ambiguous effects on net employment changes. A typicalexample is employment protection legislation. Barriers to the layoff of workers are expectedto hinder both job creation and destruction, having ambiguous effects on the average levelof labour demand.
We examine time series and cross-sectional patterns of job flows for 13 Europeancountries in the 1990s using a unique homogeneous firm data set that covers all productivesectors. We provide comparable estimates of job flows of continuing firms, i.e. excludingstart-ups and shutdowns, and examine cross-country differences and regularities.
The multivariate analysis indicates a number of cross-country regularities in therelationship between job flows and firm characteristics. These can be summarised asfollows: i) a negative relationship between both job reallocation and job creation and the ageof the firms; ii) a higher job reallocation and job creation rates in construction and servicesectors than in industry, but a higher job destruction in the later; iii) a negative relationshipbetween the size of the firm and job reallocation; v) a positive association between jobreallocation and the net employment change. Moreover, differences across countries ingross job flows are statistically significant even after controlling for a full set of firmcharacteristics.
Focusing on cross-country differences, the role of a number of institutional factors in thedetermination of job turnover is examined. As expected, the strictness of employmentprotection legislation has a negative and statistically significant impact on job reallocation. Itresponds to a reduction of both job creation and job destruction in countries with morestringent employment protection legislation, although in general only the effects on job
5ECB
Work ing Paper Ser ie s No . 318March 2004

destruction are statistically significant. The duration of unemployment benefits and thedegree of wage-setting co-ordination have similar effects, reducing job reallocation bydampening job creation and job destruction. Regarding the tax wedge, countries with highertax burdens experience lower job creation and job reallocation. Finally, temporary contractsand employment subsidies present opposite effects on job destruction, the formerincreasing and the latter obstructing the destruction of jobs. We find that these results arerobust to a variety of specifications. Moreover, sensitivity analysis indicates that the mainresults do not hinge on a particular set of countries, but instead are quite robust to the set ofcountries included in the analysis.
6ECBWork ing Paper Ser ie s No . 318March 2004

1 Introduction
Recent theoretical and empirical literature has stressed the importance of job
reallocation in a world where agents (firms and workers) are heterogeneous and the
matching process between vacancies and workers is costly. When a shock hits the
economy, the desired allocation of jobs among firms and sectors changes, leading to job
destruction on the one hand and the creation of new vacancies on the other. Because of
heterogeneity and other labour market frictions, new vacancies and unemployed
workers do not match instantaneously, implying spells of unemployment and vacant
positions in the economy (Pissarides, 2000).
Gross job flows may be considered a proxy for labour market flexibility to the extent
that they provide a measure of the responsiveness of the labour market to changes in
economic conditions. In recent years, several studies have estimated job creation and
destruction from longitudinal data at plant or firm level. Studies on gross job flows
have shown that a high number of jobs are simultaneously created and destroyed in the
economy even when the employment growth is close to zero.1 This provides evidence on
the complexity of the dynamics underlying the adjustment process in the labour
market and the heterogeneity in the behaviour of both workers and firms.
The main limitation of the existing studies on job flows is the lack of internationally
comparable job flows statistics (OECD 1994). A number of problems arise when using
establishment/firm level data, which became of particular concern when doing
international comparisons. Differences in definitions, sampling intervals, sectoral
coverage and sampling frame may lead to misleading interpretations of the cross-
country differences in estimated job flows.
1 For a thorough discussion of the results in this literature, see the excellent survey of
Davis and Haltiwanger (1999).
7ECB
Work ing Paper Ser ie s No . 318March 2004

We examine time series and cross-sectional patterns of job flows for 13 European
countries using a unique homogeneous firm dataset that covers the whole spectrum of
productive sectors. We provide comparable estimates of job flows of continuing firms,
i.e. excluding start-ups and shutdowns, and examine cross-country differences and
regularities.
Job flow measures in relation to firm characteristics are reported in order to identify
the patterns of job reallocation among different groups of firms within and between the
countries studied. We find important regularities across countries, where smaller and
younger firms concentrated in services exhibit the larger job turnover.
After controlling for firm characteristics, we find persistent cross-country differences
in job flows that can be partially explained by institutional features. As expected, we
find a negative effect of policies aiming to protect jobs on the dynamics of job
reallocation. Similarly, generous unemployment benefits and institutions that increase
co-ordination in the wage bargaining process reduce job turnover.
The remainder of the paper is organised as follows. In section 2, we present the
theoretical motivations of our study and the most relevant empirical evidence. Section
3 describes the data used in the analysis and defines concepts and measures of gross job
flows. In section 4, we describe gross job flows for different firm characteristics and
extend the analysis to the multivariate framework in order to uncover the main driving
factors of labour dynamics. Section 5 assesses the role of institutional features in
explaining persistent cross-country differences in gross job flow patterns. In Section 6 a
number of robustness checks is carried out and Section 7 concludes.
8ECBWork ing Paper Ser ie s No . 318March 2004

2 Theoretical motivations and empirical evidence
2.1 Job flows: international comparisons
There is a large literature aiming to explain the magnitude and cyclical behaviour of
job reallocation and its components. Empirical studies on job flows include Davis and
Haltiwanger (1992), Davis et al. (1996) and Haltiwanger and Schuh (1999) for the US
manufacturing industry, Blanchflower and Burgess (1996) for the UK, Broersma and
Gautier (1997) for the Netherlands, Albaek and Sorensen (1998) for Denmark, Lagarde
et al. (1994) for France, Dolado and Gomez (1995) for Spain, Contini et al. (1991) for
Italy, Stiglbauer et al. (2002) for Austria, Faggio and Konings (2001) for 5 accession
countries and Contini et al. (1995) for countries of the European Union. In addition
OECD (1994) and OECD (1996) report results on job flows for 10 OECD countries
between the late 1980s and early 1990s.
The main findings of this literature can be summarised as follows:
1. A high number of jobs are simultaneously created and destroyed in all countries
and sectors regardless of the cycle phase;
2. Job creation and destruction are negatively correlated but not perfectly. This
implies that, although job creation is clearly pro-cyclical and job destruction is
counter-cyclical, the volatility of the two flows over the business cycle may differ.
Estimates for the US, Canada and the UK show that the increase in job
destruction during economic downturns tends to be stronger than the increase in
job creation during upturns, resulting in counter-cyclical movements in job
reallocation. The cyclical behaviour of job reallocation is less clear for countries
in Europe, where job reallocation tends to be a-cyclical or slightly pro-cyclical;
3. Job reallocation is inversely correlated with capital intensity, more jobs being
created and destroyed in services than in manufacturing;
4. The intensity of job reallocation depends on some firm-specific characteristics, in
9ECB
Work ing Paper Ser ie s No . 318March 2004

particular job creation tends to be negatively associated with firms’ age and size;
5. Job reallocation is a persistent phenomenon. This implies that the observed job
flows can not be accounted for by temporary layoff and recall policies.
2.2 Job flows and labour market institutions: theory and empirical
evidence
Cross-country comparisons of job flows provide the basis for a formal investigation of
the link between job turnover and labour market institutions and policies. The focus on
gross job flows instead of net employment changes allows testing sharper theoretical
predictions of the effects of some institutions. A typical example is employment
protection legislation (EPL). Barriers to the layoff of workers are expected to hinder
both job creation and destruction, having ambiguous effects on the average level of
labour demand (Bertola, 1990).
Pissarides (2000) the effects of unemployment benefits, employment taxes and
job subsidies in a fairly general search-equilibrium framework. Both unemployment
benefits and employment taxes decrease job creation and increase job destruction
through an increase in labour costs. Job subsidies reduce the cost of matching inducing
higher job creation. But job destruction increases as well because of the increase in
market tightness that improves the worker’s options in the labour market. In contrast,
Leonard and Audenrode (1993) argue that subsidies to declining firms must be
supported by taxes on growing firms, which overall reduce job creation and destruction
and therefore job reallocation.
The role of wage setting institutions on employment dynamics has been emphasised
in a number of studies. It has been argued that union may influence worker exit
behaviour through keeping wages above the market clearing level and through other
“non wage” aspects (Farber, 1986; Freeman, 1980). In both cases the presence of
unions contributes to improve the employee-employer relationship, making job
10ECBWork ing Paper Ser ie s No . 318March 2004
studies

separation more costly and consequently reducing job turnover. Salvanes (1997) points
out that more co-ordinated wage negotiations combined with wage drift policies might
impose an additional restriction to plants when negotiating wages, reducing job
creation and therefore gross job flows. However, more co-ordinated wage bargaining
systems will result in higher job reallocation if they compress the wage structure
(Bertola and Rogerson, 1997).2
It has been emphasised in the literature that labour market institutions can have an
impact on the employment adjustment along the business cycle. Garibaldi (1998)
focuses on the effect of dismissal costs on the cyclical behaviour of job creation and
destruction. Introducing firing restrictions in a quite standard matching framework
with endogenous job destruction, he argues that when costs associated with dismissals
are negligible, job destruction is instantaneous while job creation takes time. As a
consequence job destruction varies more than job creation and job reallocation should
move counter-cyclically. This prediction is supported by the counter-cyclical pattern of
job reallocation observed in US manufacturing (Davis and Haltiwanger, 1992).
However, when firing is costly and time consuming the asymmetry in the job flows’
cyclical behaviour disappears or might even be reversed for stringent enough dismissal
restrictions. Thus, taking into account the stringency of firing laws in Continental
Europe this could provide a rationale for the a-cyclical pattern in job reallocation found
in Austria (Stiglbauer et al., 2002) and Germany (Boeri and Cramer, 1992) and pro-
cyclical pattern found in France (Lagarde et al., 1994) and Sweden (OECD, 1994).
From an empirical point of view, a preliminary attempt to relate facts with theory
within a cross-country framework is due to Garibaldi et al. (1997). By pooling
summary job turnover measures from previous studies, they present cross-country
2 Bertola and Rogerson (1997) show how wage compression induced by either a centralised
bargaining system or by the presence of wage floors, may be conducive to higher job turnover
through an increase in job creation by the more productive firms and job destruction by the
less productive ones.
11ECB
Work ing Paper Ser ie s No . 318March 2004

bivariate relationships with some labour market institutions and policies and find a
negative correlation between job reallocation and the strictness of EPL and the
duration of unemployment benefits. On the contrary, similar correlations in OECD
(1999) show a very weak negative association between different indicators of the
strictness of EPL and job turnover rates.
Regarding wage setting institutions, Lucifora (1998) for Italy and Blanchflower and
Burgess (1996) for the UK find a lower rate of job turnover in unionised sectors, while
Heyman (2001) finds a positive association between job reallocation and the degree of
wage compression on a panel of Swedish manufacturing establishments, supporting
Bertola and Rogerson’s (1997) hypothesis.
To the best of our knowledge, Salvanes (1997) is the only study that presents
multivariate analysis on the effect of labour market institutions on cross-country labour
market dynamics. Pooling cross-sectional sectoral data from previous studies for 7
OECD countries, he assesses the role of EPL, wage bargaining centralisation and
industrial subsidies on job flows. He finds that stricter dismissal costs have a negative
impact on job creation and destruction rates. Interestingly, the degree of centralisation
also has a negative effect on labour market dynamics by reducing job creation. With
regards to industrial subsidies, the positive impact on job reallocation reported in this
paper contrasts with the negative effect found by Leonard and Van Audennrode (1993)
when comparing the US and Belgium labour markets.
Therefore, despite the growing number of studies on this area, there is still little
consensus on the effects of institutions on job flows and no clear pattern emerges by
looking at the cross-country job flow developments. The difficulties in international
comparisons partly reflect the lack of homogeneous data, which may have affected the
empirical results presented so far.
12ECBWork ing Paper Ser ie s No . 318March 2004

3 Data and measurement issues
3.1 Data source
Annual firm-level observations over the period 1992-2001 are available from
Amadeus produced by Bureau van Dijk (BvD). Amadeus contains comparable firm-
level data for European countries and covers all sectors with the exception of the
financial sector. BvD local providers collect balance sheet information, sector of
operation and number of employees from the national Chambers of Commerce, and
uniform formats are applied to the data allowing accurate cross-country comparisons
and analysis. Thus, apart from employment data, the dataset includes a wide range of
financial and descriptive information (industry and activity codes, incorporation year of
the firm to the register, etc.). There are several versions of Amadeus, depending on the
number of firms included in the dataset. The version of Amadeus used for our study is
the top 1 million companies. In order to be included in Amadeus, a firm must satisfy at
least one of the following criteria: operating revenues equal to at least 1.5 (1) million
euro, total assets equal to at least 3 (2) million euro, number of employees equal to at
least 15 (10) for the UK, Germany, France and Italy (for all the other European
countries).
The data has several advantages, which make it especially well suited for
international comparisons. First, the data collection method is reasonably homogeneous
across countries. This overcomes the problem of previous studies where available
country data differed on the sources (administrative vs. survey) and unit of study (firm
vs. establishment). Second, information is provided on narrowly defined sectors (2-digit
NACE classification) and data on both manufacturing and non-manufacturing sectors
are reasonably representative. The availability of services data is an important
advantage with respect to previous studies, where cross-country comparisons relied on
13ECB
Work ing Paper Ser ie s No . 318March 2004

information obtained from the whole economy in some countries and the manufacturing
sector in others.
There are, however, some limitations in the data. First, it is not possible to
distinguish between newly created firms and firms that simply enter the sample at a
given period t but were already operating in the period before. Similarly, it is not
possible to identify firms’ closures from firms that exit the sample for other reasons.
Therefore, we restrict our analysis to continuing firms, e.g. firms that are in the sample
for at least two consecutive periods. Although this is quite standard in the literature, it
introduces a downward bias in the estimates of job flows. Moreover, differences across
countries in job turnover rates implied by entry and exit have been found to be
quantitatively relevant (Bartelsman et al., 2003) and this may further hamper the
cross-country comparability of estimated job flows. However, the exclusion of entry and
exit should be less of a problem because it is precisely job turnover of continuing firms
the component that is more likely to be affected by some of the labour market
institutions considered in this paper (OECD, 1999).
Second, the data are available at the firm rather than the establishment level.
Measuring job flows at firm level understates the actual magnitude of total gross flows
among plants3 and may lead to longitudinal linkage problems if ownership and
organisational changes (i.e. mergers, acquisitions, etc) are not accounted for.4 This may
be less of a problem with plant-level data, plant being defined in terms of physical
location of production. However, cross-country comparisons of establishment data pose
serious difficulties since there is important heterogeneity in the definition of
3 Job creation and job destruction resulting from movement between establishments within
the same firm offset each other at the firm level. As a result, higher job reallocation rates are
expected at the establishment level. Schuh and Triest (2000) estimate for the United States
that job flows between firms represent less than 60% of the total job flows between
establishments owned by these firms.4 See Davis et al. (1996) for a detailed discussion on problems arising from the
measurement of employment changes at the establishment/firm level.
14ECBWork ing Paper Ser ie s No . 318March 2004

establishment across datasets (OECD, 1994). This is less of a problem with firm data.
Similarly, estimates of job creation and job destruction based on year-to-year
employment changes will also understate the actual flows since short term jobs (i.e.
seasonal jobs) are likely not to be accounted for. As shown by Blanchard and Portugal
(2000), the frequency of the data can be quite relevant for cross-country comparisons of
job turnover.
Finally, the inclusion criteria in Amadeus introduces a bias against very small firms.
We assess how representative the data is in Section 3.3. Although the results yield
clear positive signs, these characteristics of the data should be kept in mind when
comparing our results with previous studies.
3.2 Measuring job flows
The conventions of Davis et al. (1996) are followed in defining job flows statistics.
Denote the level of employment at firm f in period t with nft and let �nft be the change
in employment between period t and t-1. Let S+ be the set of firms in sector S with
�nft>0 and S- be the set of firms in sector S with �nft<0. We calculate job creation by
summing employment changes in S+. Correspondingly, job destruction is calculated by
summing all the (absolute) changes in S-. Rates of job creation and job destruction are
obtained by dividing by the size of sector. Firm size at time t is calculated as the
average employment between period t and t-1, i.e. xft=0.5(nft + nft-1). Accordingly, the
sector size is defined as ��
�
Sfftst xX .
Job flow rates can equivalently be expressed as the size-weighted average over firms’
growth rates as follows
st
ft
Sfftst Xx
gJCt
��
�
� Job Creation Rate
15ECB
Work ing Paper Ser ie s No . 318March 2004
st
ft
Sfftst Xx
gJDt
��
�
� Job Destruction Rate
where ft
ftft x
ng �� is the growth rate of employment in firm f and period t.5 The sum
of the job creation rate and job destruction rate is the job reallocation rate (JR). It
gives the total number of employment positions reallocated in the economy.
The difference between job creation and job destruction is the net employment growth
(NET). Finally, minimum worker reallocation (minWR) is defined as the maximum
between JC and JD and represents the lower bound of the fraction of workers who
change jobs or employment status (worker reallocation) in response to firm-level
employment changes.
3.3 Sample description
In order to judge how representative our dataset is, we present comparisons with
respect to official sources. Using information provided by Eurostat and the OECD, we
compare the employment coverage and yearly net employment changes in our sample
with labour force survey data. Similarly, we assess how representative is the coverage
in our sample as regards the distribution of employment by sector and firm size.
Figure 1 compares the evolution of employment growth from our sample with the
growth in the number of employees measured by OECD statistics.6 Although there are
some minor inconsistencies, the employment figures in our sample follow quite closely
5 The growth measure defined above is monotonically correlated with the conventional
measure defined as the change in employment divided by the lagged employment, and the
two measures are approximately the same for small growth rates. Moreover, unlike the
conventional measure, which ranges from —1 and �� , this measure of growth rate is
symmetric around zero, being bounded in the interval [-2,2], allowing employment expansions
and contractions to be treated symmetrically.6 The final sample covers the EU countries with the exception of Luxembourg and Greece.
Greece and Luxembourg are excluded from the analysis due to lack of institutional data.
16ECBWork ing Paper Ser ie s No . 318March 2004

the official statistics. The most significant exception is Italy, which consistently
overstates employment growth. This inconsistency is not related to specific outliers,
since tabulations show that Italian employment growth in Amadeus is always above
the mean values of the rest of the sample for all breakdowns of firm characteristics.7
[INSERT FIGURE 1 ABOUT HERE]
Table 1 shows the final sample composition and the sample period for each country,
after filtering the observations from outliers.8 The period of observation varies across
countries but information is available in most cases at least during 1995-2000. The
number of average valid observations per year ranges from almost 90,000 firms in
Germany to some 500 firms in Ireland. This implies an annual average employment
coverage of 25 per cent when compared to figures in the Labour Force Survey (LFS).
[INSERT TABLE 1 ABOUT HERE]
Table 2 shows the distribution of firms and employment by sector and country and
compares the distribution of sectoral employment in our sample with the distribution
calculated using information from the LFS. Although there is a bias towards
employment in manufacturing, the sample is well representative of both manufacturing
and non-manufacturing sectors. Moreover the sectoral coverage is rather homogeneous
across countries and stable over time.
[INSERT TABLE 2 ABOUT HERE]
Regarding the distribution of firms by size classes, our sample is expected to be
biased against small firms due to the eligibility criteria applied in Amadeus. Our next
table shows that the sample is still well balanced across different size classes. Table 3
compares the distribution of employment by firm size in our sample and OECD (1994)
7 In the text, we report results including Italy. We have repeated the analyses in sections 4
and 5 excluding Italy from the sample (available upon request). The main findings of the
paper are largely unaffected by the exclusion of Italy, although results are somewhat more
robust when Italy is excluded from the institutional analysis.
17ECB
Work ing Paper Ser ie s No . 318March 2004

estimates based on the report Enterprises in Europe produced by Eurostat in 1992 and
1994. It shows that, overall, although there is a bias towards larger firms in our sample,
smaller firms are well represented.
[INSERT TABLE 3 ABOUT HERE]
4 Job Turnover, Firm Characteristics and the Cycle
4.1 An Overview
In this Section, we present an overview of recent developments in the job flows in
European countries. Figure 2 presents the distribution of employment growth rates for
the whole sample of EU countries over the 1992-2000 period. It shows that the
employment change for 30% of the observations falls in the [—5%, 5%] range. This
percentage increases to about 50% when the range of growth considered is [—10%, 10%].
It is clear, however, that there is a high dispersion of growth rates. Moreover, this
figure also points to a higher concentration of observations in positive growth rates,
which reflects the fact that the period of study is overall expansionary.
[INSERT FIGURE 2 ABOUT HERE]
Table 4 reports the aggregate rates of job creation (JC), job destruction (JD), job
reallocation (JR), minimum worker reallocation (minWR) and net employment change
(NET) in each country, averaged within the sample period. First note the large flows,
both regarding job creation and destruction, observable in all countries. Although all of
the countries registered a net increase of employment within the period of study, the
coexistence of significant job creation and destruction flows is a broadly based finding.
Job creation rates range between 4.4% in Germany and 8.6% in Spain, and job
8 Discussion of the data selection and cleaning can be found in the Appendix.
18ECBWork ing Paper Ser ie s No . 318March 2004

destruction rates from 3.0% in Finland and 4.4% in the UK. These developments led to
job reallocation rates of around 10% on average in the EU, Austria and Germany being
the country with the lowest job reallocation (7.9% and 8.1% respectively) and Spain
and Italy those with the highest (12.1% and 12.3%). This means that, on average, one
tenth of jobs are either created or destroyed per year. The minimum amount of
workers that have to move to accommodate the change in job positions or employment
status (minimum worker reallocation) varied between 4.6% on average in Austria and
8.6% in Spain.
[INSERT TABLE 4 ABOUT HERE]
The rest of Table 4 presents summary statistics of flow rates by sector and firm’s
size, age and capital intensity pooling the information across countries and years.
According to the sector,9 service industries exhibit, on average, larger job flows.
Business services is the sector with larger job flows in Europe during the period of
study, a pattern mainly driven by the strong employment creation in this sector, while
manufacturing and energy present the lowest JR rates. As regards size classes, the
concept used in the analysis refers to the average size of the firm in two consecutive
periods. The average size is used instead of the current size as it is expected to give a
better indication of the intended scale of operations. We divide the sample in eight
categories: 1-19 employees; 20-49; 50-99; 100-249; 250-499; 500-999; 1,000-2,499; and
2,500 and over. The process of job reallocation is clearly stronger among smaller firms.
In fact, there is an inverse relationship between the size of the firm and the intensity of
job reallocation. Moreover, this inverted relationship is mainly due to the pattern of
job creation, which shows a higher variation among firm size than the pattern of job
destruction. Concerning the age of the firm, four groups are considered: 1 year old; 2-5
years; 6-10 years; and more than 10 years. Job flows are significant in all age groups
9 Sectors are defined according to the 1-digit NACE classification (NACE code, rev 1).
19ECB
Work ing Paper Ser ie s No . 318March 2004

but higher in the youngest firms than in the oldest. This fact is again related with a
higher variation in job creation than in destruction.
Capital intensity is defined as the capital (measured as value added minus the wage
bill) share in value added. We distinguish four categories: below 20%; 20-30%; 30-40%;
and more than 40%. According to the estimates in Table 4, there seems to be an U—
shaped relationship between capital intensity and JR, with firms with either low or
high capital intensity exhibiting larger turnover rates.
To better understand firm-level job dynamics, it is also useful to measure how
persistent are the decisions of creating or destroying jobs. Job reallocation may not be
a persistent phenomenon if it is related to temporary layoffs and recalls. On the other
hand, to the extent that job flows are persistent, they must be associated with long-
term joblessness or worker reallocation across firms. Following Davis et al. (1996), we
define the N-period persistence of job creation as the fraction of newly created jobs at
time t that survives through the period t+N. Analogously, the N-period persistence of
job destruction is defined as the fraction jobs destroyed at time t that do not reappear
through the period t+N.
Table 5 summarises the persistence rates of job creation and job destruction over a
one and two-year horizon. Between 81% and 92% of newly created jobs and 64% and
86% of recent destroyed jobs persist at least one year in our sample of European
countries. After two years the persistence rates in job creation fall up to a minimum of
71% in Belgium and a maximum of 86% in Austria, while the persistence in destruction
rate vary between 52% in Italy and 79% in Austria. These results indicate that firm-
level job decisions are highly persistent, while job creation appears as a more persistent
phenomenon than job destruction. As indicated at the bottom of the table, the
differences between persistence rates of job creation and job destruction both over one
and two year periods are statistically significant for the whole sample of countries.
However, this can be partly explained by activity developments, as our results refer to
20ECBWork ing Paper Ser ie s No . 318March 2004

a period of overall expansion and persistency rates tend to show a pro-cyclical pattern
(Davis et al. 1996).
[INSERT TABLE 5 ABOUT HERE]
Some of these results, including the negative relationship between job reallocation
and firm size and age and the fact that job creation and job destruction largely reflect
persistent changes, are similar to those reported in Davis et al. (1996) for the US. They
are not totally comparable, however, as their study refers to the manufacturing sector
only and includes, apart form continuing firms, start-ups and shutdowns.
As a final exercise, the job flows for the euro area as a whole are estimated and
confronted with those of the UK, whose labour market is considered to be more flexible
than that of the euro area on average, and those of the Nordic countries,10 which lie
under a more “corporatist” model. The average job reallocation rate in the UK is 11%,
compared with in the euro area (see Table 4). In addition, even if the net
employment growth is slightly higher in the UK than in the euro area, not only job
creation is higher in the former compared to the latter but also job destruction. Job
flows in Nordic countries lie between these two. Table 6 presents detailed comparisons
that confirm the difference in average job reallocation among the three areas. All
breakdowns by firm size, age and capital intensity reflect higher flows in the UK than
in the euro area. The same pattern emerges by sectors, only with the exception of
agriculture. These patterns are confirmed by differences in persistence rates across
these three areas, which point to more persistent decisions in the euro area than in the
UK and Nordic countries. Whether or not labour market institutions are responsible for
these differences is something that will be investigated in section 5.
[INSERT TABLE 6 ABOUT HERE]
10 Including only Denmark, Finland and Sweden.
21ECB
Work ing Paper Ser ie s No . 318March 2004
9.3%

4.2 The impact of firm characteristics on job flows
Next, we study the joint impact of the different firm characteristics considered in the
descriptive analysis on the dynamics of job flows. Some of the firm characteristics
presented above are highly correlated among each other (e.g. firm’s age and size),
suggesting the need of moving to a multivariate framework in order to disentangle the
main determinants of labour market flows. For this purpose, we calculate JC, JD and
JR rates for narrow sectors defined as the crossing of 4 age groups, 7 sectors of
activity, 4 size groups, 13 countries, 10 years (between 1992 and 2001) and 4 capital
intensity groups. Then, we regress the sectoral flows on dummy variables defined for
each of these groups and the aggregate employment growth rate in each country-year
to control for the business cycle.
We consider two different specifications, depending on whether we include or not
capital intensity in the definition of the cells. The reason is that Amadeus has very
limited information on value added for firms in Austria, Germany and the Netherlands.
Thus, considering capital intensity classes might affect significantly the estimates of
these countries. When capital intensity crossings are excluded, the potential number of
cells is 13,440, ascending to 53,760 if capital is included in the analysis. In the first
case, we have about 8,000 valid observations, and almost 21,000 when capital intensity
is considered.11 Reported standard errors are robust to heteroskedasticity and country
clustering.12
11 The main reason for missing observations is the different sample periods available for
each country. See Table 1 for a full description of the sample coverage by year and country.12 We trimmed out outlier observations following the method of detection of outliers in the
multivariate framework developed by Hadi (1992). In order to identify the outliers, we
constructed categorical variables by age, size, industrial sector, country and capital intensity
(if applicable). This implied the exclusion of 56 (147) cells in the case of JR, 65 (153) in the
case of JC and 101 (237) in the case of JD in the sample without (with) capital intensity.
The results presented in the paper refer to the regressions without outliers. Results including
outliers, available upon request, do not differ importantly with respect to those presented in
22ECBWork ing Paper Ser ie s No . 318March 2004

Table 7 summarises the results of the OLS regressions for JR, JC and JD on the
class dummies. Columns (A) to (C) do not include capital intensity groups, which are
reported in columns (D) to (F). According to the goodness of fit in the regressions, the
proposed models do a much better job in explaining the patterns of JR and JC than in
explaining the sources of JD, suggesting a more important role to idiosyncratic factors
in the determination of the latter. The results tend to be in line with the descriptive
analysis discussed in the previous section. Thus, there is a negative relationship
between JR and JC and the age of the firms, especially when firms are more than 5
years old. According to columns (A) and (B), JR and JC are 4 percentage points lower
in firms above 10 years old than in those which have been operating for less than a
year. Interestingly, there is some indication of a reversed pattern in JD, with older
firms significantly destroying more jobs than younger ones. The sectoral dummies
confirm a higher job reallocation and creation in construction and service than in
manufacturing, while the latter presents higher job destruction. For instance, job
reallocation and creation rates in Business services are more than 5 percentage points
higher than in industry, while the difference in job destruction is not significant.
[INSERT TABLE 7 ABOUT HERE]
Similarly, the negative relationship between the size of the firm and job reallocation
is confirmed by the multivariate analysis. Indeed, both job creation and destruction
rates are lower the larger the firm is, although differences are higher in job creation
than in job destruction. As a result, a firm of more than 1,000 employees presents a job
reallocation rate around 7 percentage points lower than a firm with less than 50
workers, which is explained by 6.2 percentage points less in job creation and 1.3
percentage point less in job destruction.
Differences across countries in job flow statistics are statistically significant even
after controlling for a wide range of firm characteristics. According to the estimates of
the text.
23ECB
Work ing Paper Ser ie s No . 318March 2004

JR, only Spain and Italy show a higher rate than the UK, while all the other countries
show significantly lower rates. The highest difference compared with the UK is
observed in Austria, which has a 5 percentage points lower JR rate.13
When ranges of capital intensity are taken into account, all previous results remain
broadly unchanged (see Columns D to F in Table 7). In addition, we do not find a
systematic role of capital intensity in the determination of job flows.
Finally, we focus on the effects of the business cycle on job turnover. Previous
country estimates suggest clear pro-cyclical patterns of JR in the US (Davis and
Haltiwanger, 1999) but either a-cyclical or slightly pro-cyclical movements in European
countries. Our estimates suggest a pro-cyclical character of JR in Europe, although the
effect is only statistically significant when capital intensity classes are considered.
5 Job Flows and Institutions
The aim of our next set of regressions is to uncover the determinants of country
idiosyncratic factors in the patterns of job turnover. According to our previous
discussion, we concentrate on several institutional and regulatory aspects of the labour
market:
� Tax and benefits systems: including an index of the duration of unemployment
benefits and the tax wedge between the real (monetary) labour cost faced by the
firms and the consumption wage received by the employees. The latter is
normalized by GDP, while the former ranges from 0 (if benefit provision stops
before 1 year) to 1 (for a constant benefit after 5 years).
13 Interestingly, the UK presented relatively low job flow patterns when compared to many
Continental European countries in previous international comparisons (e.g. OECD, 1994;
Garibaldi et al, 1997 and OECD, 1999). This apparently puzzling result, reversed in our
study, might be due to the lack of homogeneous data in previous analyses.
24ECBWork ing Paper Ser ie s No . 318March 2004

� Wage-setting institutions: including an index of co-ordination in the wage
bargaining process which ranges from 1 to 3 according to the increasing degree of
co-ordination.14 Within our sample, this indicator is time-invariant.
� Restrictions to hiring and firing: we consider an updated version of the time-
varying index of EPL reported in Nickell et al. (2001) and a time-invariant index as
described by OECD (1999). Both increase with the relative stringency of EPL.
� Sectoral employment subsidies: we include an indicator of the share of sectoral and
ad hoc state aid as a percentage of GDP.15
Additionally, we include in the regressions the share of workers holding temporary
contracts in the total number of employees.16
The results presented above suggest that failing to control for differences across
countries in the size, age and sectoral distribution of firms might blur cross-country
comparisons. Hence, we repeat the cell regressions presented in Columns (A) to (C) of
Table 7 including the institutional indicators.
First we present pooled OLS regressions where the country dummies are substituted
by the institutional variables. A second set of regressions includes country fixed effects.
The main advantage of this specification is that it allows controlling for unobserved
time-invariant country heterogeneity. However, together with the limitation of not
allowing for the inclusion of time-invariant covariates (one of the indicators of EPL and
wage-setting co-ordination) the fixed effect specification disregards the cross-country
information in the data. The latter might severely affect the efficiency of the estimates
of institutional variables given the slow moving nature of institutions and the short
14 Wage-setting co-ordination, unemployment benefits duration, and the tax wedge are
taken from an updated series from Nickell et al. (2001). The information is annual till 1998.
When necessary, we extrapolated the variables for the period 1999-2001.15 Source: NewCronos Database.
25ECB
Work ing Paper Ser ie s No . 318March 2004
sample period (see Table 1) of our panel. Thus, as Heckman and Pages (2000) point
out, the reduced time-series variation in the institutional data may result in imprecise
estimates (high standard errors) when country-specific fixed effects are included in the
regressions. A final set of regressions treats country unobserved heterogeneity as
random. Differently from the fixed effect methodology, the random effect methodology
allows to exploit both the cross-country and time-series variation of the data, implying
more precise estimates. The advantage of this approach in terms of efficiency comes
with the cost of imposing the assumption of orthogonality between the individual
effects and the covariates.
The effects of institutions on JR, JC and JD are reported on Table 8. As expected,
the strictness of EPL has a negative and statistically significant impact on JR. This
result is similar for both indicators of EPL and robust to the inclusion of fixed or
random effects in the regression, thought not significant at the conventional levels in
the pooled OLS specification. It responds to a reduction of both JC and JD in countries
with more stringent EPL, although only the coefficients on JC are statistically
significant.
The duration of unemployment benefits and the degree of wage-setting co-ordination
have similar effects, reducing JR by dampening JC and JD. All these effects are
statistically significant across the different specifications, with the exception of the role
of benefits on JD when fixed or random effects are present (Columns L and M).
Results for wage-setting co-ordination are in line with those of Salvanes (1997), while
the reduction of JC in countries with more generous unemployment benefits supports
the predictions of matching models discussed by Pissarides (2000).
[INSERT TABLE 8 ABOUT HERE]
Regarding the tax wedge, countries with higher tax burdens experience lower JC and
JR. According to the estimates in Columns (A) to (D), a 10 percentage points increase
16 Source: Labour Force Survey.
26ECBWork ing Paper Ser ie s No . 318March 2004

of the tax wedge reduces JR by 0.5 percentage point. However, the tax wedge becomes
non-significant although correctly signed when fixed effects are included. These results
support the predictions of matching models discussed by Pissarides (2000), although we
do not find statistically significant effects of the tax wedge on JD.
Employment subsidies have a negative and significant effect on JD, in line with the
results in Leonard and Van Audennrode (1993), suggesting that these policies are
successful in alleviating job losses. The effect on JC is positive but statistically
significant only when country unobserved heterogeneity is taken into account.
Finally, the evidence suggests a non-significant impact of the use of temporary
contracts in the determination of job flows.
The evidence presented is relatively robust to different specifications. When country-
specific fixed effects are included in the regressions, most of the effects of institutions
remain statistically significant at standard confidence levels. Moreover, the fact that
our findings are robust to the use of alternative estimators that do not rely exclusively
on the time-series variation of institutions is reassuring.
6 Sensitivity Analysis
The purpose of this section is to investigate the robustness of the regression results
presented in the previous section.
Table 9 presents the results of the institutional regressions when the sample is
restricted to those years for which we have reliable institutional data. Since some noise
might be introduced in the extrapolation of the data on institutions for the period
1999-2001, we repeat the analysis restricting the sample to the years when information
on labour market institutions is available. The results are qualitatively and
quantitatively similar to those previously presented.
[INSERT TABLE 9 ABOUT HERE]
27ECB
Work ing Paper Ser ie s No . 318March 2004

Aggregate cross-country studies are often criticised on grounds of lack of robustness
with respect to the set of countries included in the analysis. Hence, the last set of
regressions presented performs sensitivity analysis following the approach proposed by
Sala-i-Martin (1997) in the context of growth regressions, but focusing on the number
of countries included in the regression. Very briefly, we look at the distribution of the
estimates of the institutional variables across the full set of regressions that result from
dropping any combinations of three countries in the OLS, FE and RE specifications.
Taking into account that the full sample of countries is 13, the resulting number of
regressions is 1365 for each institutional variable (910 for union co-ordination, since
this variable is not included in the fixed effect specifications). For each institutional
variable, we take averages of the estimated coefficients and their standard deviations
across the different regressions. Under the assumption of normality, these two statistics
are sufficient to calculate the cumulative distributive function (cdf) of the estimates
and apply standard confidence levels. However, even if the estimates in every regression
follow a t-Student distribution, it might be the case that the distribution of the
estimates is not normal. Following Sala-i-Martin (1997), in this case we can still
compute their cdf as the average of the individual cumulative distributive functions.
Table 10 presents the results of the sensitivity analysis with respect to the number of
countries. According to the normality criterion (Column C), the results in Table 8 do
not depend on the set of countries included in the analysis in the cases of EPL, wage-
setting co-ordination, employment subsidies and the duration of unemployment
benefits. These institutions retain their significance at the 95% level in those cases in
which they were found significant with the full sample. The significance is somewhat
weaker in most cases when non-normality is assumed (Column D), but results remain
largely consistent with those of Column C. The most remarkable change with respect
to Table 8 regards the tax wedge, which becomes non-significantly correlated with JR
and JC when the set of countries in the sample varies.
[INSERT TABLE 10 ABOUT HERE]
28ECBWork ing Paper Ser ie s No . 318March 2004

7 Conclusions
This paper presents an analysis of job flows for a panel of 13 European countries in
the 1990s using a dataset of continuing firms that covers the whole spectrum of
productive sectors and, given homogeneity in the definitions and sectoral coverage,
permits cross-country comparisons.
We estimate the joint effect of different firm characteristics on job flow rates. We
find that both the size and age of the firm have a negative impact on job reallocation.
Similarly, firms located in services typically exhibit stronger patterns of job flows than
firms operating in manufacturing.
Even after controlling for a number of firm characteristics we find significant cross-
country differences in labour market dynamics. Thus, we investigate the role of
institutional aspects of labour markets in the determination of job turnover. Once
controlled for sectoral and firm characteristics, we find that the strictness of
employment protection legislation has a negative effect on job creation and therefore on
job reallocation. Similarly, the extent of wage bargaining co-ordination and the
generosity of unemployment benefits reduce both job creation and job destruction. All
these results are robust to different specifications and different sets of countries
included in the regressions. The role of other institutions such as the tax wedge, the
use of temporary contracts and employment subsidies on job dynamics are less clear-
cut, suggesting the need of further empirical and theoretical work.
29ECB
Work ing Paper Ser ie s No . 318March 2004
ReferencesAlbaek, K. and B.E. Sorensen (1998), “Worker Flows and Jobs Flows in Danish
manufacturing, 1980-91”, Brown The Economic Journal, 108:1750-1771.
Bartelsman, E., S. Scarpetta and Schivardi F. (2003), “Comparative analysis of firmdemographics and survival: Micro-level evidence for the OECD countries”, OECDEconomics Department WP No. 348.
Bertola, G. (1990), “Job Security, Employment and Wages”, European EconomicReview, 34: 851-886
Bertola, G. and R. Rogerson (1997), “Institution and labour reallocation”, EuropeanEconomic Review, 41: 1147-1171.
Blanchard, O. and P. Portugal (2001), “What Hides Behind an Unemployment Rate:Comparing Portuguese and U.S. Labor Markets”, American Economic Review, 91(1):187-207.
Blanchflower, D. and S. Burgess (1996), “Job creation and job destruction in GreatBritain in the 1980s”, CEP Discussion Papers, 287.
Boeri, T. and U. Cramer, (1992), “Employment Growth, Incumbents and Entrants:Evidence from Germany”, International Journal of Industrial Organisation, n.10.
Broersma, L. and P. A. Gautier (1997), “Job Creation and Job Destruction by SmallFirms: An Empirical Investigation for the Dutch Manufacturing Sector”, SmallBusiness Economics, 8.
Contini, B, A. Gavosto, R. Revelli, P. Sestito, (1991), “Creazione e distruzione diposti-lavoro in Italia, 1984-89”, Temi di discussione, Banca d'Italia.
Contini, B., L. Pacelli, M. Filippi, G. Lioni and R. Revelli, (1995), “A study on jobcreation and job destruction in Europe”, Study for the commission of the EuropeanCommunity.
Davis, S. J. and J. Haltiwanger, (1992), “Gross Job Creation, Gross Job Destructionand Employment Reallocation”, The Quarterly Journal of Economics, 107.
Davis, S. J., J. Haltiwanger and S. Schuh, (1996), “Job Creation and JobDestruction”, MIT press.
Davis, S. J. and J. Haltiwanger, (1999), “Gross Job Flows”, Handbook of LabourEconomics, Edited by O. Ashenfelter and D.Card, Elsevier Science B.V.
Dolado, J. J. and R. Gomez Salvador. (1995), “Creacion y destruccion de empleo enel sector privado manufacturero español: un analisis descriptivo”, InvestigacionesEconomicas, Vol. XIX (3).
Faggio, G. and J. Konings, (2001), “Job Creation, Job Destruction and EmploymentGrowth in Transition Countries in the 90’s”, Discussion Paper 242, IZA.
Farber, H. (1986), The analysis of union behaviour. In: Ashenfelter O. and R. Layard(eds), Handbook of Labour Economics, Vol. 2, North-Holland, Amsterdam.
Freeman, R.B. (1980), “The exit-voice tradeoff in the labour market: Unionism, jobtenure, quits and separations”, Quarterly Journal of Economics, 94, 643-673.
Garibaldi, P., J. Konings and C.A. Pissarides (1997), “Gross Job Reallocation andLabour Market Policy”, Unemployment Policy: Government Options for the LabourMarket, Edited by D.J. Snower and G. la Dehesa, Cambridge University Press,Cambridge.
Garibaldi, P., (1998), “Job Flows Dynamics and Firing Restrictions”, EuropeanEconomic Review, 42.
30ECBWork ing Paper Ser ie s No . 318March 2004

Hadi, A. S. (1992). “Identifying multiple outliers in multivariate data”. Journal ofthe Royal Statistical Society, B54: 761-771
Haltiwanger, J. C. and S. Schuh, (1999), “Gross Job Flows Between Plants andIndustries”, New England Economic Review.
Heckman, J. J. and C. Pages, 2000, The Cost of Job Security Regulation: Evidencefrom Latin American Labour Markets, NBER Working Paper, 7773.
Heyman, F. (2001), “Wage Dispersion and Job Turnover: Evidence form Sweden”,Working Paper 181, Trade Union Institute for Economic Research.
Lagarde, S., E. Maurin and C. Torelli (1994), “Créations et suppressions d'emploisen France: uneétude de la période 1984-1992”, Economie et Prévision, 67-88.
Leonard, J. and M. Van Audenrode (1993), “Corporatism Run Amok: Job Stabilityand Industrial Policy in Belgium and the United States" Economic Policy, No. 17, pp.355-389.
Lucifora, C. (1998), “The Impact of Unions on Labour Turnover in Italy: EvidenceFrom Establishment Level Data”, International Journal of Industrial Organization,16:353-376.
Mortensen, D. and C. Pissarides (1999), New developments in models of search inthe labour market . In: Anshenfelter O. and D. Card (eds), Handbook of LabourEconomics, Vol. 3, North-Holland, Amsterdam.
Nickell, S., L. Nunziata, W. Ochel and G. Quintini (2001), “The Beveridge curve,unemployment and wages in the OECD form the 1960s to the 1990s”, Working Paper,Centre for Economic Performance.
OECD, (1994), Employment Outlook (ch.3), Paris
OECD, (1996), Employment Outlook (ch.5), Paris
OECD, (1999), Employment Outlook (ch.2), Paris
Pissarides, C.A., (2000), Equilibrium Unemployment Theory, Cambridge MIT Press.
Sala-i-Marin, X., 1997, I just run two million regressions, American Economic
Review 87, 178-183.
Salvanes, K.G.(1997), “Market Rigidities and Labour Market Flexibility: AnInternational Comparison”, Scandinavian Journal of Economics, 99: 315-333.
Schuh, S. and R.K. Triest (2000), “The Role of Firms in Job Creation andDestruction in U.S. Manufacturing”, New England Economic Review
Stiglbauer, A., F. Stahl, R. Winter-Ebmer and J. Zweimüller (2002), “JobReallocation and Job Destruction in a Regulated Labor Market: The Case of Austria”,Working Paper 78, Oesterreichische Nationalbank.
31ECB
Work ing Paper Ser ie s No . 318March 2004

TABLES AND FIGURES
Figure 1
Growth in the Number of Employees.
Comparing Amadeus (NET) with Official Statistics (OECD)
-50
510
1992 19941996 1998 2000 2002 1992 1994 19961998 2000 2002 19921994 1996 1998 2000 2002
1992 19941996 1998 2000 2002
Austria Belgium Denmark Finland
France Germany ire ita
net por spa swe
uk
NET (Amadeus) NET (OECD)
Gro
wth
Rat
es-5
05
10-5
05
10-5
05
10
32ECBWork ing Paper Ser ie s No . 318March 2004
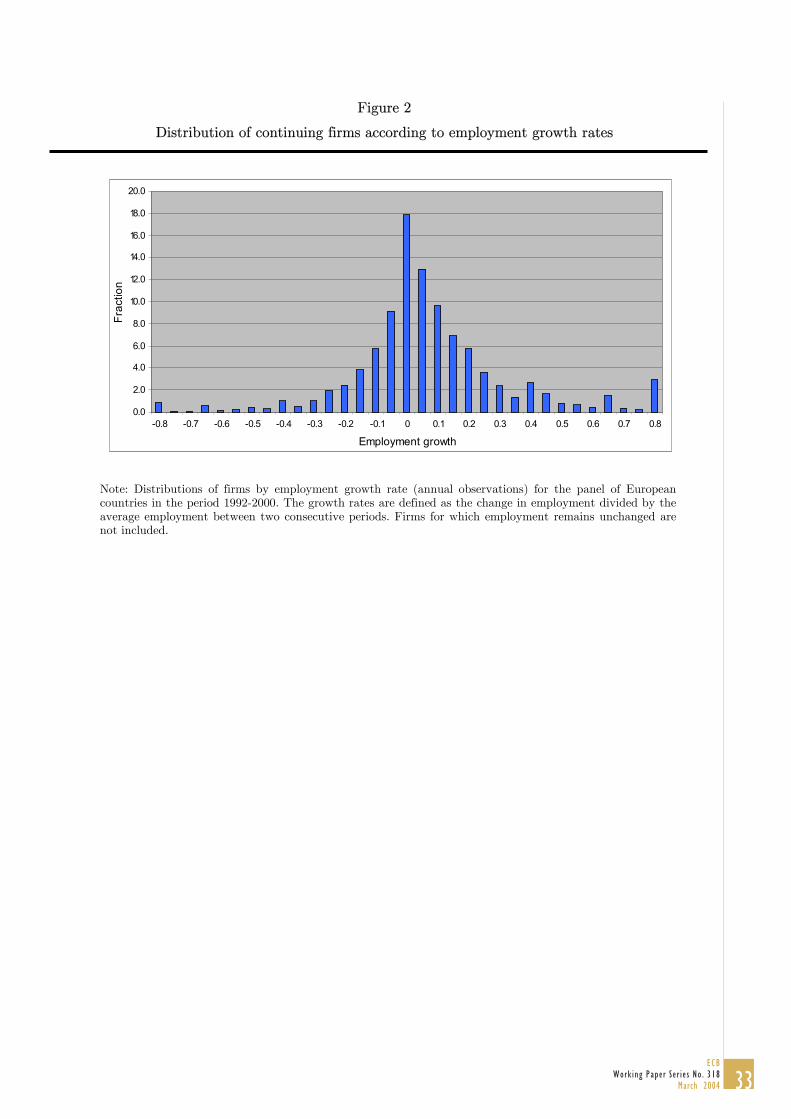
Figure 2
Distribution of continuing firms according to employment growth rates
Note: Distributions of firms by employment growth rate (annual observations) for the panel of Europeancountries in the period 1992-2000. The growth rates are defined as the change in employment divided by theaverage employment between two consecutive periods. Firms for which employment remains unchanged arenot included.
0.0
2.0
4.0
6.0
8.0
10.0
12.0
14.0
16.0
18.0
20.0
-0.8 -0.7 -0.6 -0.5 -0.4 -0.3 -0.2 -0.1 0 0.1 0.2 0.3 0.4 0.5 0.6 0.7 0.8
Employment growth
Frac
tion
33ECB
Work ing Paper Ser ie s No . 318March 2004
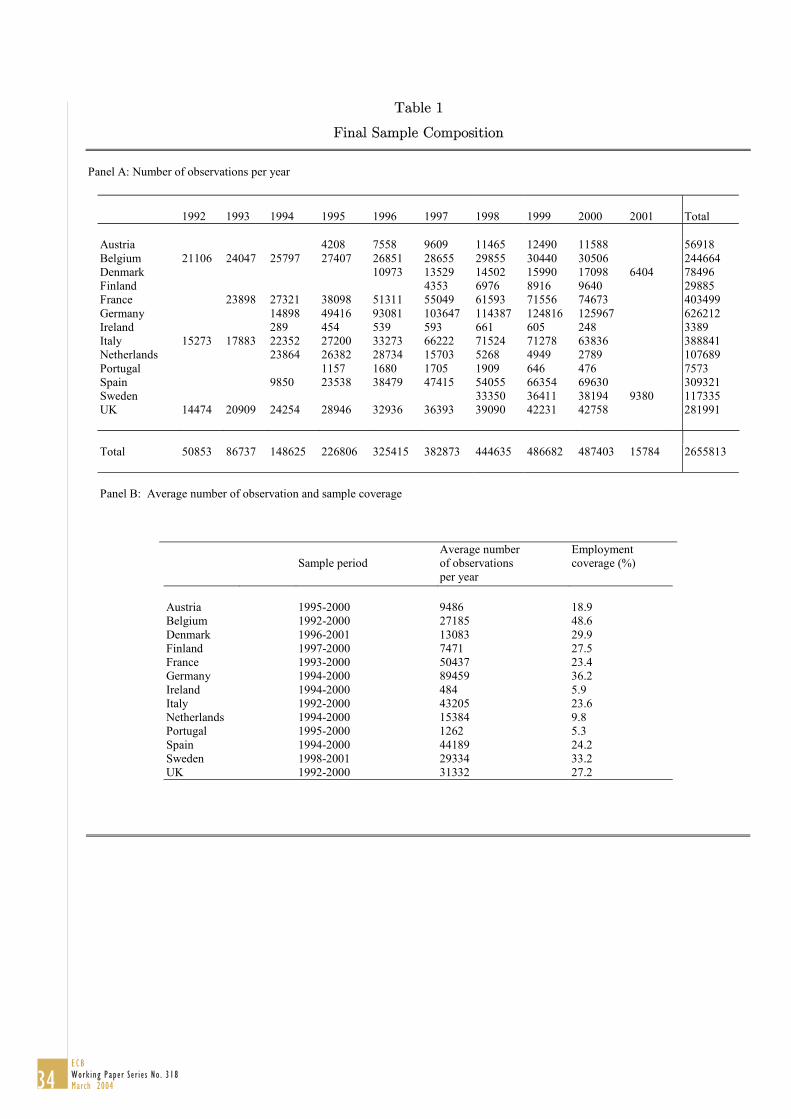
Table 1
Final Sample Composition
Panel A: Number of observations per year
1992 1993 1994 1995 1996 1997 1998 1999 2000 2001 Total
Austria 4208 7558 9609 11465 12490 11588 56918Belgium 21106 24047 25797 27407 26851 28655 29855 30440 30506 244664Denmark 10973 13529 14502 15990 17098 6404 78496Finland 4353 6976 8916 9640 29885France 23898 27321 38098 51311 55049 61593 71556 74673 403499Germany 14898 49416 93081 103647 114387 124816 125967 626212Ireland 289 454 539 593 661 605 248 3389Italy 15273 17883 22352 27200 33273 66222 71524 71278 63836 388841Netherlands 23864 26382 28734 15703 5268 4949 2789 107689Portugal 1157 1680 1705 1909 646 476 7573Spain 9850 23538 38479 47415 54055 66354 69630 309321Sweden 33350 36411 38194 9380 117335UK 14474 20909 24254 28946 32936 36393 39090 42231 42758 281991
Total 50853 86737 148625 226806 325415 382873 444635 486682 487403 15784 2655813
Panel B: Average number of observation and sample coverage
Sample periodAverage numberof observationsper year
Employmentcoverage (%)
Austria 1995-2000 9486 18.9Belgium 1992-2000 27185 48.6Denmark 1996-2001 13083 29.9Finland 1997-2000 7471 27.5France 1993-2000 50437 23.4Germany 1994-2000 89459 36.2Ireland 1994-2000 484 5.9Italy 1992-2000 43205 23.6Netherlands 1994-2000 15384 9.8Portugal 1995-2000 1262 5.3Spain 1994-2000 44189 24.2Sweden 1998-2001 29334 33.2UK 1992-2000 31332 27.2
34ECBWork ing Paper Ser ie s No . 318March 2004
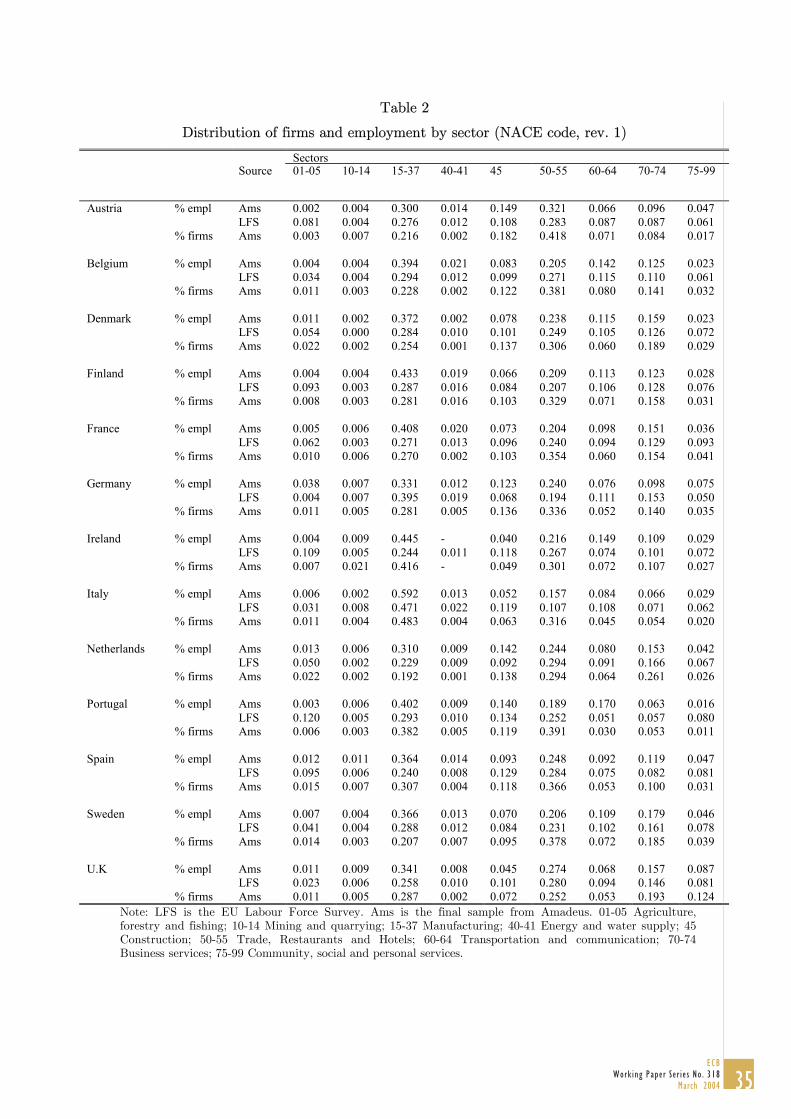
Table 2
Distribution of firms and employment by sector (NACE code, rev. 1)
SectorsSource 01-05 10-14 15-37 40-41 45 50-55 60-64 70-74 75-99
Austria % empl Ams 0.002 0.004 0.300 0.014 0.149 0.321 0.066 0.096 0.047LFS 0.081 0.004 0.276 0.012 0.108 0.283 0.087 0.087 0.061
% firms Ams 0.003 0.007 0.216 0.002 0.182 0.418 0.071 0.084 0.017
Belgium % empl Ams 0.004 0.004 0.394 0.021 0.083 0.205 0.142 0.125 0.023LFS 0.034 0.004 0.294 0.012 0.099 0.271 0.115 0.110 0.061
% firms Ams 0.011 0.003 0.228 0.002 0.122 0.381 0.080 0.141 0.032
Denmark % empl Ams 0.011 0.002 0.372 0.002 0.078 0.238 0.115 0.159 0.023LFS 0.054 0.000 0.284 0.010 0.101 0.249 0.105 0.126 0.072
% firms Ams 0.022 0.002 0.254 0.001 0.137 0.306 0.060 0.189 0.029
Finland % empl Ams 0.004 0.004 0.433 0.019 0.066 0.209 0.113 0.123 0.028LFS 0.093 0.003 0.287 0.016 0.084 0.207 0.106 0.128 0.076
% firms Ams 0.008 0.003 0.281 0.016 0.103 0.329 0.071 0.158 0.031
France % empl Ams 0.005 0.006 0.408 0.020 0.073 0.204 0.098 0.151 0.036LFS 0.062 0.003 0.271 0.013 0.096 0.240 0.094 0.129 0.093
% firms Ams 0.010 0.006 0.270 0.002 0.103 0.354 0.060 0.154 0.041
Germany % empl Ams 0.038 0.007 0.331 0.012 0.123 0.240 0.076 0.098 0.075LFS 0.004 0.007 0.395 0.019 0.068 0.194 0.111 0.153 0.050
% firms Ams 0.011 0.005 0.281 0.005 0.136 0.336 0.052 0.140 0.035
Ireland % empl Ams 0.004 0.009 0.445 - 0.040 0.216 0.149 0.109 0.029LFS 0.109 0.005 0.244 0.011 0.118 0.267 0.074 0.101 0.072
% firms Ams 0.007 0.021 0.416 - 0.049 0.301 0.072 0.107 0.027
Italy % empl Ams 0.006 0.002 0.592 0.013 0.052 0.157 0.084 0.066 0.029LFS 0.031 0.008 0.471 0.022 0.119 0.107 0.108 0.071 0.062
% firms Ams 0.011 0.004 0.483 0.004 0.063 0.316 0.045 0.054 0.020
Netherlands % empl Ams 0.013 0.006 0.310 0.009 0.142 0.244 0.080 0.153 0.042LFS 0.050 0.002 0.229 0.009 0.092 0.294 0.091 0.166 0.067
% firms Ams 0.022 0.002 0.192 0.001 0.138 0.294 0.064 0.261 0.026
Portugal % empl Ams 0.003 0.006 0.402 0.009 0.140 0.189 0.170 0.063 0.016LFS 0.120 0.005 0.293 0.010 0.134 0.252 0.051 0.057 0.080
% firms Ams 0.006 0.003 0.382 0.005 0.119 0.391 0.030 0.053 0.011
Spain % empl Ams 0.012 0.011 0.364 0.014 0.093 0.248 0.092 0.119 0.047LFS 0.095 0.006 0.240 0.008 0.129 0.284 0.075 0.082 0.081
% firms Ams 0.015 0.007 0.307 0.004 0.118 0.366 0.053 0.100 0.031
Sweden % empl Ams 0.007 0.004 0.366 0.013 0.070 0.206 0.109 0.179 0.046LFS 0.041 0.004 0.288 0.012 0.084 0.231 0.102 0.161 0.078
% firms Ams 0.014 0.003 0.207 0.007 0.095 0.378 0.072 0.185 0.039
U.K % empl Ams 0.011 0.009 0.341 0.008 0.045 0.274 0.068 0.157 0.087LFS 0.023 0.006 0.258 0.010 0.101 0.280 0.094 0.146 0.081
% firms Ams 0.011 0.005 0.287 0.002 0.072 0.252 0.053 0.193 0.124Note: LFS is the EU Labour Force Survey. Ams is the final sample from Amadeus. 01-05 Agriculture,forestry and fishing; 10-14 Mining and quarrying; 15-37 Manufacturing; 40-41 Energy and water supply; 45Construction; 50-55 Trade, Restaurants and Hotels; 60-64 Transportation and communication; 70-74Business services; 75-99 Community, social and personal services.
35ECB
Work ing Paper Ser ie s No . 318March 2004
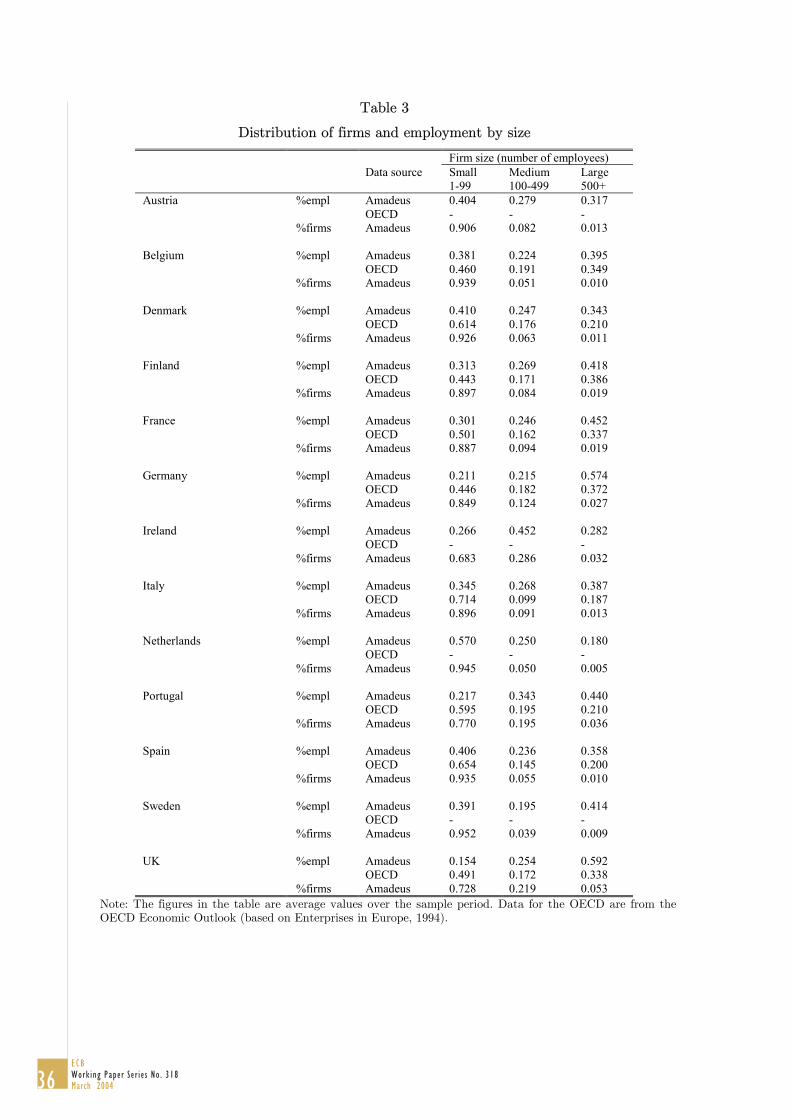
Table 3
Distribution of firms and employment by size
Firm size (number of employees)Data source Small
1-99Medium100-499
Large500+
Austria %empl Amadeus 0.404 0.279 0.317OECD - - -
%firms Amadeus 0.906 0.082 0.013
Belgium %empl Amadeus 0.381 0.224 0.395OECD 0.460 0.191 0.349
%firms Amadeus 0.939 0.051 0.010
Denmark %empl Amadeus 0.410 0.247 0.343OECD 0.614 0.176 0.210
%firms Amadeus 0.926 0.063 0.011
Finland %empl Amadeus 0.313 0.269 0.418OECD 0.443 0.171 0.386
%firms Amadeus 0.897 0.084 0.019
France %empl Amadeus 0.301 0.246 0.452OECD 0.501 0.162 0.337
%firms Amadeus 0.887 0.094 0.019
Germany %empl Amadeus 0.211 0.215 0.574OECD 0.446 0.182 0.372
%firms Amadeus 0.849 0.124 0.027
Ireland %empl Amadeus 0.266 0.452 0.282OECD - - -
%firms Amadeus 0.683 0.286 0.032
Italy %empl Amadeus 0.345 0.268 0.387OECD 0.714 0.099 0.187
%firms Amadeus 0.896 0.091 0.013
Netherlands %empl Amadeus 0.570 0.250 0.180OECD - - -
%firms Amadeus 0.945 0.050 0.005
Portugal %empl Amadeus 0.217 0.343 0.440OECD 0.595 0.195 0.210
%firms Amadeus 0.770 0.195 0.036
Spain %empl Amadeus 0.406 0.236 0.358OECD 0.654 0.145 0.200
%firms Amadeus 0.935 0.055 0.010
Sweden %empl Amadeus 0.391 0.195 0.414OECD - - -
%firms Amadeus 0.952 0.039 0.009
UK %empl Amadeus 0.154 0.254 0.592OECD 0.491 0.172 0.338
%firms Amadeus 0.728 0.219 0.053Note: The figures in the table are average values over the sample period. Data for the OECD are from theOECD Economic Outlook (based on Enterprises in Europe, 1994).
36ECBWork ing Paper Ser ie s No . 318March 2004
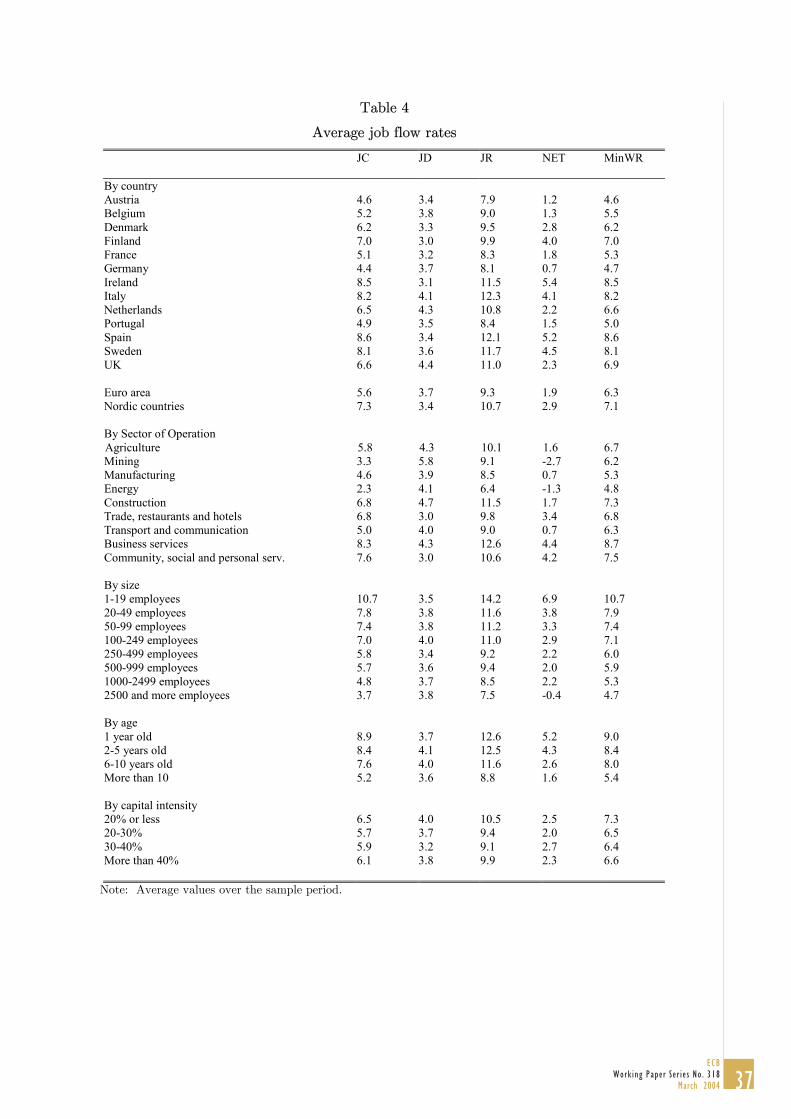
Table 4
Average job flow rates
JC JD JR NET MinWR
By countryAustria 4.6 3.4 7.9 1.2 4.6Belgium 5.2 3.8 9.0 1.3 5.5Denmark 6.2 3.3 9.5 2.8 6.2Finland 7.0 3.0 9.9 4.0 7.0France 5.1 3.2 8.3 1.8 5.3Germany 4.4 3.7 8.1 0.7 4.7Ireland 8.5 3.1 11.5 5.4 8.5Italy 8.2 4.1 12.3 4.1 8.2Netherlands 6.5 4.3 10.8 2.2 6.6Portugal 4.9 3.5 8.4 1.5 5.0Spain 8.6 3.4 12.1 5.2 8.6Sweden 8.1 3.6 11.7 4.5 8.1UK 6.6 4.4 11.0 2.3 6.9
Euro area 5.6 3.7 9.3 1.9 6.3Nordic countries 7.3 3.4 10.7 2.9 7.1
By Sector of OperationAgriculture 5.8 4.3 10.1 1.6 6.7Mining 3.3 5.8 9.1 -2.7 6.2Manufacturing 4.6 3.9 8.5 0.7 5.3Energy 2.3 4.1 6.4 -1.3 4.8Construction 6.8 4.7 11.5 1.7 7.3Trade, restaurants and hotels 6.8 3.0 9.8 3.4 6.8Transport and communication 5.0 4.0 9.0 0.7 6.3Business services 8.3 4.3 12.6 4.4 8.7Community, social and personal serv. 7.6 3.0 10.6 4.2 7.5
By size1-19 employees 10.7 3.5 14.2 6.9 10.720-49 employees 7.8 3.8 11.6 3.8 7.950-99 employees 7.4 3.8 11.2 3.3 7.4100-249 employees 7.0 4.0 11.0 2.9 7.1250-499 employees 5.8 3.4 9.2 2.2 6.0500-999 employees 5.7 3.6 9.4 2.0 5.91000-2499 employees 4.8 3.7 8.5 2.2 5.32500 and more employees 3.7 3.8 7.5 -0.4 4.7
By age1 year old 8.9 3.7 12.6 5.2 9.02-5 years old 8.4 4.1 12.5 4.3 8.46-10 years old 7.6 4.0 11.6 2.6 8.0More than 10 5.2 3.6 8.8 1.6 5.4
By capital intensity20% or less 6.5 4.0 10.5 2.5 7.320-30% 5.7 3.7 9.4 2.0 6.530-40% 5.9 3.2 9.1 2.7 6.4More than 40% 6.1 3.8 9.9 2.3 6.6
Note: Average values over the sample period.
37ECB
Work ing Paper Ser ie s No . 318March 2004
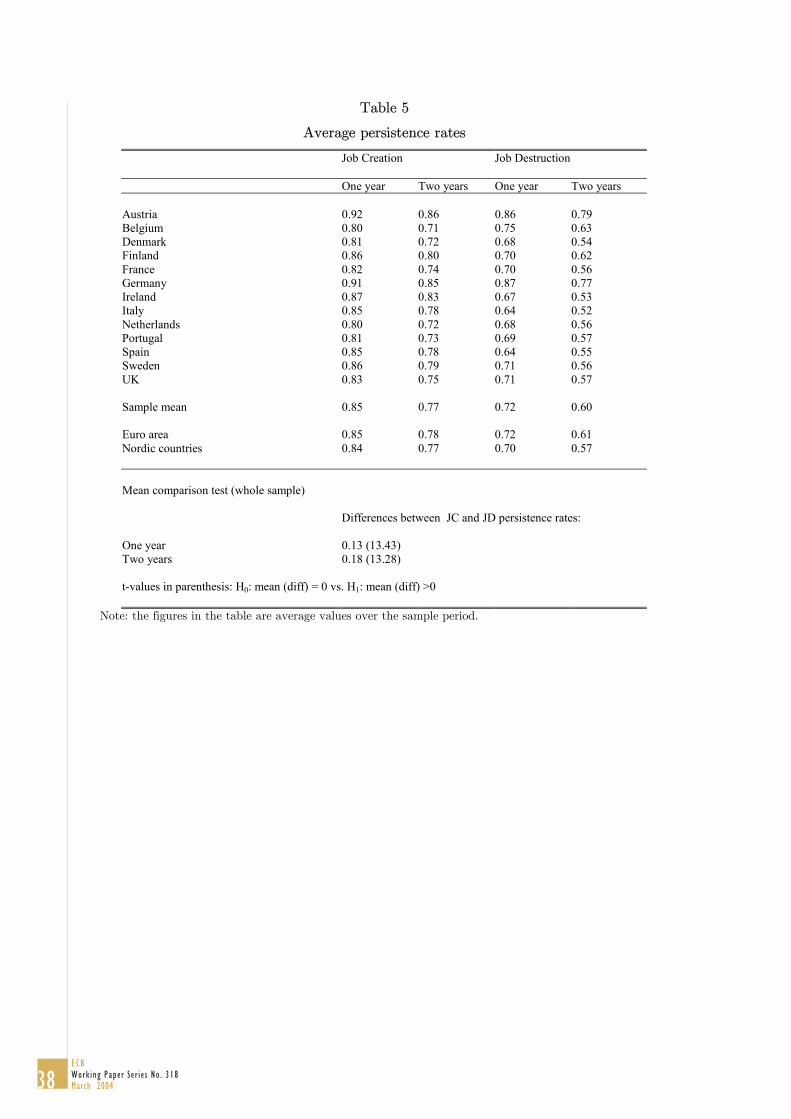
Table 5
Average persistence rates
Job Creation Job Destruction
One year Two years One year Two years
Austria 0.92 0.86 0.86 0.79Belgium 0.80 0.71 0.75 0.63Denmark 0.81 0.72 0.68 0.54Finland 0.86 0.80 0.70 0.62France 0.82 0.74 0.70 0.56Germany 0.91 0.85 0.87 0.77Ireland 0.87 0.83 0.67 0.53Italy 0.85 0.78 0.64 0.52Netherlands 0.80 0.72 0.68 0.56Portugal 0.81 0.73 0.69 0.57Spain 0.85 0.78 0.64 0.55Sweden 0.86 0.79 0.71 0.56UK 0.83 0.75 0.71 0.57
Sample mean 0.85 0.77 0.72 0.60
Euro area 0.85 0.78 0.72 0.61Nordic countries 0.84 0.77 0.70 0.57
Mean comparison test (whole sample)
Differences between JC and JD persistence rates:
One year 0.13 (13.43)Two years 0.18 (13.28)
t-values in parenthesis: H0: mean (diff) = 0 vs. H1: mean (diff) >0
Note: the figures in the table are average values over the sample period.
38ECBWork ing Paper Ser ie s No . 318March 2004

Table 6
Average job reallocation rates for the euro area, the UK and Nordic countries
Euro area UK Nordiccountries
By NACEAgriculture 11.0 6.4 11.9Mining 9.0 10.1 8.5Manufacturing 7.9 10.1 9.1Energy 6.1 7.8 11.7Construction 10.9 14.7 12.4Trade, restaurants and hotels 9.6 10.4 10.4Transport and communication 8.9 10.1 8.9Business services 12.4 13.5 15.3Community, social and personal services 9.6 11.7 12.1
By size1-19 employees 13.9 17.0 13.520-49 employees 10.8 14.2 12.750-99 employees 10.5 12.6 12.7100-249 employees 10.3 12.9 12.2250-499 employees 8.4 11.6 10.2500-999 employees 8.7 11.4 9.51000-2499 employees 7.8 10.8 8.92500 and more employees 7.2 8.8 5.4
By age1 year old 13.9 15.8 18.32-5 years old 12.5 13.7 12.16-10 years old 10.6 13.0 10.4More than 10 7.7 10.3 9.5
By capital intensity20% or less 10.5 11.2 11.020-30% 9.3 10.5 10.230-40% 9.1 9.7 9.8More than 40% 10.0 10.3 10.4
Note: The figures in the table are average values over the sample period.
39ECB
Work ing Paper Ser ie s No . 318March 2004
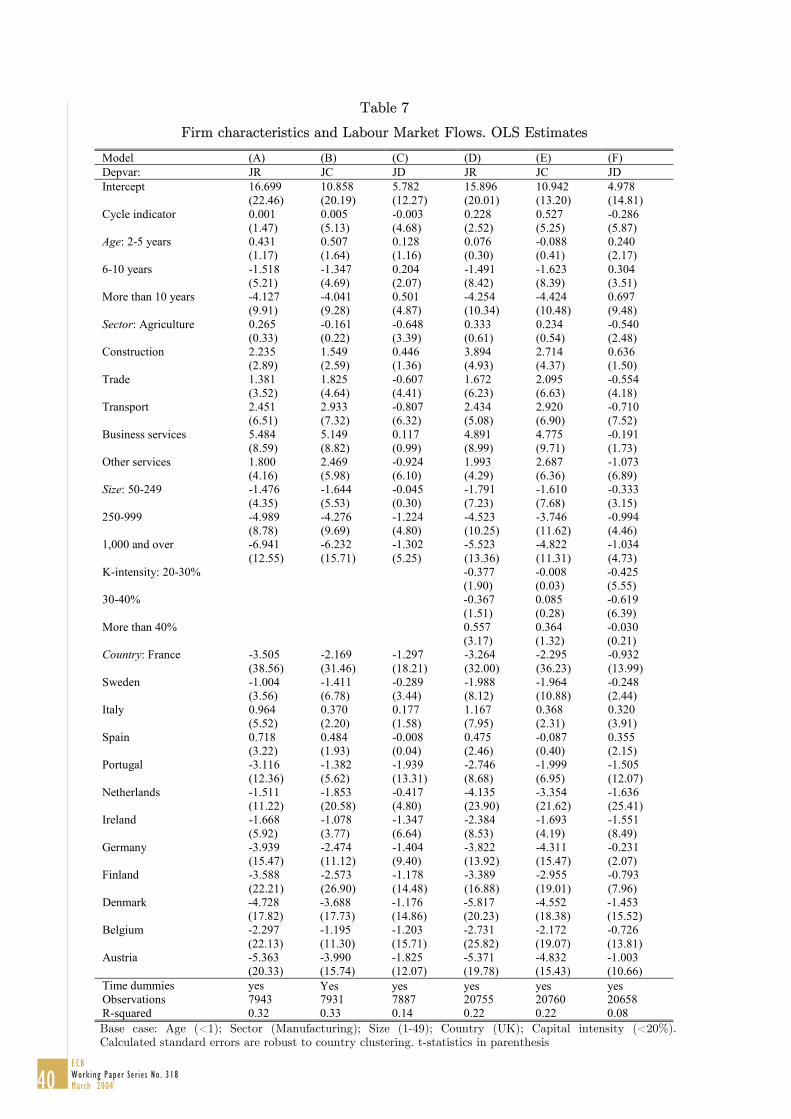
Table 7
Firm characteristics and Labour Market Flows. OLS Estimates
Model (A) (B) (C) (D) (E) (F)Depvar: JR JC JD JR JC JDIntercept 16.699 10.858 5.782 15.896 10.942 4.978
(22.46) (20.19) (12.27) (20.01) (13.20) (14.81)Cycle indicator 0.001 0.005 -0.003 0.228 0.527 -0.286
(1.47) (5.13) (4.68) (2.52) (5.25) (5.87)Age: 2-5 years 0.431 0.507 0.128 0.076 -0.088 0.240
(1.17) (1.64) (1.16) (0.30) (0.41) (2.17)6-10 years -1.518 -1.347 0.204 -1.491 -1.623 0.304
(5.21) (4.69) (2.07) (8.42) (8.39) (3.51)More than 10 years -4.127 -4.041 0.501 -4.254 -4.424 0.697
(9.91) (9.28) (4.87) (10.34) (10.48) (9.48)Sector: Agriculture 0.265 -0.161 -0.648 0.333 0.234 -0.540
(0.33) (0.22) (3.39) (0.61) (0.54) (2.48)Construction 2.235 1.549 0.446 3.894 2.714 0.636
(2.89) (2.59) (1.36) (4.93) (4.37) (1.50)Trade 1.381 1.825 -0.607 1.672 2.095 -0.554
(3.52) (4.64) (4.41) (6.23) (6.63) (4.18)Transport 2.451 2.933 -0.807 2.434 2.920 -0.710
(6.51) (7.32) (6.32) (5.08) (6.90) (7.52)Business services 5.484 5.149 0.117 4.891 4.775 -0.191
(8.59) (8.82) (0.99) (8.99) (9.71) (1.73)Other services 1.800 2.469 -0.924 1.993 2.687 -1.073
(4.16) (5.98) (6.10) (4.29) (6.36) (6.89)Size: 50-249 -1.476 -1.644 -0.045 -1.791 -1.610 -0.333
(4.35) (5.53) (0.30) (7.23) (7.68) (3.15)250-999 -4.989 -4.276 -1.224 -4.523 -3.746 -0.994
(8.78) (9.69) (4.80) (10.25) (11.62) (4.46)1,000 and over -6.941 -6.232 -1.302 -5.523 -4.822 -1.034
(12.55) (15.71) (5.25) (13.36) (11.31) (4.73)K-intensity: 20-30% -0.377 -0.008 -0.425
(1.90) (0.03) (5.55)30-40% -0.367 0.085 -0.619
(1.51) (0.28) (6.39)More than 40% 0.557 0.364 -0.030
(3.17) (1.32) (0.21)Country: France -3.505 -2.169 -1.297 -3.264 -2.295 -0.932
(38.56) (31.46) (18.21) (32.00) (36.23) (13.99)Sweden -1.004 -1.411 -0.289 -1.988 -1.964 -0.248
(3.56) (6.78) (3.44) (8.12) (10.88) (2.44)Italy 0.964 0.370 0.177 1.167 0.368 0.320
(5.52) (2.20) (1.58) (7.95) (2.31) (3.91)Spain 0.718 0.484 -0.008 0.475 -0.087 0.355
(3.22) (1.93) (0.04) (2.46) (0.40) (2.15)Portugal -3.116 -1.382 -1.939 -2.746 -1.999 -1.505
(12.36) (5.62) (13.31) (8.68) (6.95) (12.07)Netherlands -1.511 -1.853 -0.417 -4.135 -3.354 -1.636
(11.22) (20.58) (4.80) (23.90) (21.62) (25.41)Ireland -1.668 -1.078 -1.347 -2.384 -1.693 -1.551
(5.92) (3.77) (6.64) (8.53) (4.19) (8.49)Germany -3.939 -2.474 -1.404 -3.822 -4.311 -0.231
(15.47) (11.12) (9.40) (13.92) (15.47) (2.07)Finland -3.588 -2.573 -1.178 -3.389 -2.955 -0.793
(22.21) (26.90) (14.48) (16.88) (19.01) (7.96)Denmark -4.728 -3.688 -1.176 -5.817 -4.552 -1.453
(17.82) (17.73) (14.86) (20.23) (18.38) (15.52)Belgium -2.297 -1.195 -1.203 -2.731 -2.172 -0.726
(22.13) (11.30) (15.71) (25.82) (19.07) (13.81)Austria -5.363 -3.990 -1.825 -5.371 -4.832 -1.003
(20.33) (15.74) (12.07) (19.78) (15.43) (10.66)Time dummies yes Yes yes yes yes yesObservations 7943 7931 7887 20755 20760 20658R-squared 0.32 0.33 0.14 0.22 0.22 0.08Base case: Age (<1); Sector (Manufacturing); Size (1-49); Country (UK); Capital intensity (<20%).Calculated standard errors are robust to country clustering. t-statistics in parenthesis
40ECBWork ing Paper Ser ie s No . 318March 2004
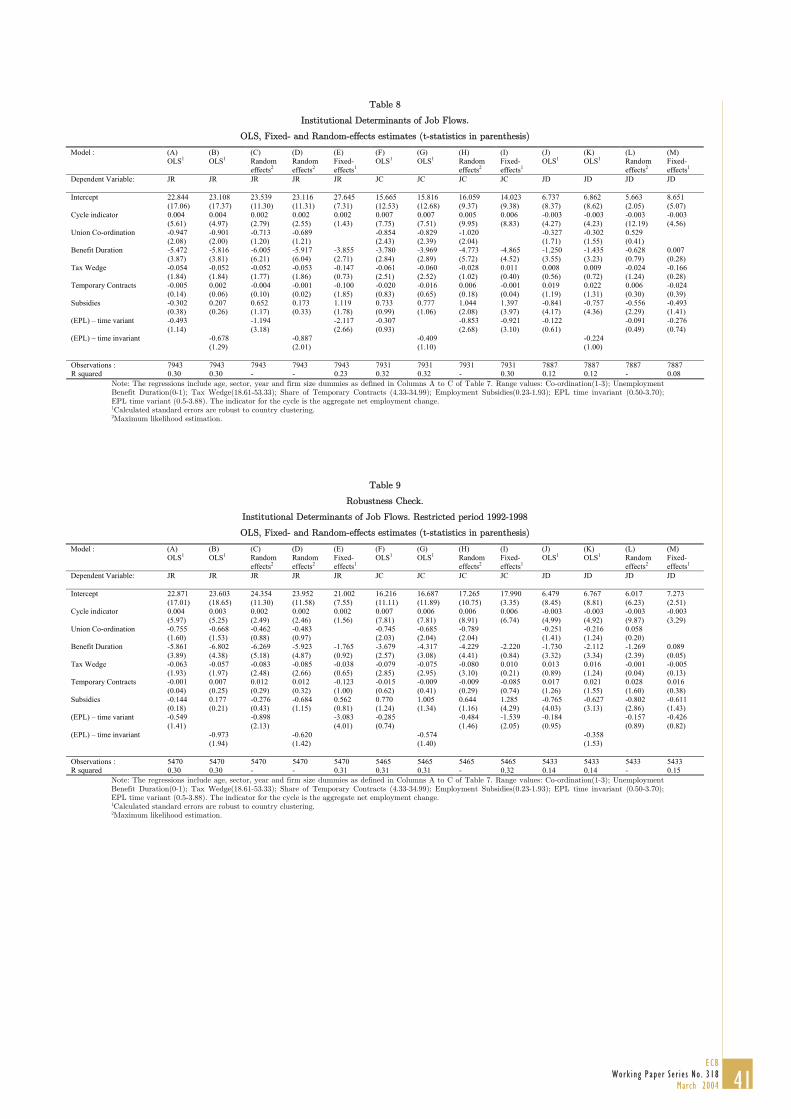
Table 8
Institutional Determinants of Job Flows.
OLS, Fixed- and Random-effects estimates (t-statistics in parenthesis)
Model : (A) (B) (C) (D) (E) (F) (G) (H) (I) (J) (K) (L) (M)OLS1 OLS1 Random
effects2Randomeffects2
Fixed-effects1
OLS1 OLS1 Randomeffects2
Fixed-effects1
OLS1 OLS1 Randomeffects2
Fixed-effects1
Dependent Variable: JR JR JR JR JR JC JC JC JC JD JD JD JD
Intercept 22.844 23.108 23.539 23.116 27.645 15.665 15.816 16.059 14.023 6.737 6.862 5.663 8.651(17.06) (17.37) (11.30) (11.31) (7.31) (12.53) (12.68) (9.37) (9.38) (8.37) (8.62) (2.05) (5.07)
Cycle indicator 0.004 0.004 0.002 0.002 0.002 0.007 0.007 0.005 0.006 -0.003 -0.003 -0.003 -0.003(5.61) (4.97) (2.79) (2.55) (1.43) (7.75) (7.51) (9.95) (8.83) (4.27) (4.23) (12.19) (4.56)
Union Co-ordination -0.947 -0.901 -0.713 -0.689 -0.854 -0.829 -1.020 -0.327 -0.302 0.529(2.08) (2.00) (1.20) (1.21) (2.43) (2.39) (2.04) (1.71) (1.55) (0.41)
Benefit Duration -5.472 -5.816 -6.005 -5.917 -3.855 -3.780 -3.969 -4.773 -4.865 -1.250 -1.435 -0.628 0.007(3.87) (3.81) (6.21) (6.04) (2.71) (2.84) (2.89) (5.72) (4.52) (3.55) (3.23) (0.79) (0.28)
Tax Wedge -0.054 -0.052 -0.052 -0.053 -0.147 -0.061 -0.060 -0.028 0.011 0.008 0.009 -0.024 -0.166(1.84) (1.84) (1.77) (1.86) (0.73) (2.51) (2.52) (1.02) (0.40) (0.56) (0.72) (1.24) (0.28)
Temporary Contracts -0.005 0.002 -0.004 -0.001 -0.100 -0.020 -0.016 0.006 -0.001 0.019 0.022 0.006 -0.024(0.14) (0.06) (0.10) (0.02) (1.85) (0.83) (0.65) (0.18) (0.04) (1.19) (1.31) (0.30) (0.39)
Subsidies -0.302 0.207 0.652 0.173 1.119 0.733 0.777 1.044 1.397 -0.841 -0.757 -0.556 -0.493(0.38) (0.26) (1.17) (0.33) (1.78) (0.99) (1.06) (2.08) (3.97) (4.17) (4.36) (2.29) (1.41)
(EPL) – time variant -0.493 -1.194 -2.117 -0.307 -0.853 -0.921 -0.122 -0.091 -0.276(1.14) (3.18) (2.66) (0.93) (2.68) (3.10) (0.61) (0.49) (0.74)
(EPL) – time invariant -0.678 -0.887 -0.409 -0.224(1.29) (2.01) (1.10) (1.00)
Observations : 7943 7943 7943 7943 7943 7931 7931 7931 7931 7887 7887 7887 7887R squared 0.30 0.30 - - 0.23 0.32 0.32 - 0.30 0.12 0.12 - 0.08
Note: The regressions include age, sector, year and firm size dummies as defined in Columns A to C of Table 7. Range values: Co-ordination(1-3); UnemploymentBenefit Duration(0-1); Tax Wedge(18.61-53.33); Share of Temporary Contracts (4.33-34.99); Employment Subsidies(0.23-1.93); EPL time invariant (0.50-3.70);EPL time variant (0.5-3.88). The indicator for the cycle is the aggregate net employment change.1Calculated standard errors are robust to country clustering.2Maximum likelihood estimation.
Table 9
Robustness Check.
Institutional Determinants of Job Flows. Restricted period 1992-1998
OLS, Fixed- and Random-effects estimates (t-statistics in parenthesis)
Model : (A) (B) (C) (D) (E) (F) (G) (H) (I) (J) (K) (L) (M)OLS1 OLS1 Random
effects2Randomeffects2
Fixed-effects1
OLS1 OLS1 Randomeffects2
Fixed-effects1
OLS1 OLS1 Randomeffects2
Fixed-effects1
Dependent Variable: JR JR JR JR JR JC JC JC JC JD JD JD JD
Intercept 22.871 23.603 24.354 23.952 21.002 16.216 16.687 17.265 17.990 6.479 6.767 6.017 7.273(17.01) (18.65) (11.30) (11.58) (7.55) (11.11) (11.89) (10.75) (3.35) (8.45) (8.81) (6.23) (2.51)
Cycle indicator 0.004 0.003 0.002 0.002 0.002 0.007 0.006 0.006 0.006 -0.003 -0.003 -0.003 -0.003(5.97) (5.25) (2.49) (2.46) (1.56) (7.81) (7.81) (8.91) (6.74) (4.99) (4.92) (9.87) (3.29)
Union Co-ordination -0.755 -0.668 -0.462 -0.483 -0.745 -0.685 -0.789 -0.251 -0.216 0.058(1.60) (1.53) (0.88) (0.97) (2.03) (2.04) (2.04) (1.41) (1.24) (0.20)
Benefit Duration -5.861 -6.802 -6.269 -5.923 -1.765 -3.679 -4.317 -4.229 -2.220 -1.730 -2.112 -1.269 0.089(3.89) (4.38) (5.18) (4.87) (0.92) (2.57) (3.08) (4.41) (0.84) (3.32) (3.34) (2.39) (0.05)
Tax Wedge -0.063 -0.057 -0.083 -0.085 -0.038 -0.079 -0.075 -0.080 0.010 0.013 0.016 -0.001 -0.005(1.93) (1.97) (2.48) (2.66) (0.65) (2.85) (2.95) (3.10) (0.21) (0.89) (1.24) (0.04) (0.13)
Temporary Contracts -0.001 0.007 0.012 0.012 -0.123 -0.015 -0.009 -0.009 -0.085 0.017 0.021 0.028 0.016(0.04) (0.25) (0.29) (0.32) (1.00) (0.62) (0.41) (0.29) (0.74) (1.26) (1.55) (1.60) (0.38)
Subsidies -0.144 0.177 -0.276 -0.684 0.562 0.770 1.005 0.644 1.285 -0.765 -0.627 -0.802 -0.611(0.18) (0.21) (0.43) (1.15) (0.81) (1.24) (1.34) (1.16) (4.29) (4.03) (3.13) (2.86) (1.43)
(EPL) – time variant -0.549 -0.898 -3.083 -0.285 -0.484 -1.539 -0.184 -0.157 -0.426(1.41) (2.13) (4.01) (0.74) (1.46) (2.05) (0.95) (0.89) (0.82)
(EPL) – time invariant -0.973 -0.620 -0.574 -0.358(1.94) (1.42) (1.40) (1.53)
Observations : 5470 5470 5470 5470 5470 5465 5465 5465 5465 5433 5433 5433 5433R squared 0.30 0.30 - - 0.31 0.31 0.31 - 0.32 0.14 0.14 - 0.15
Note: The regressions include age, sector, year and firm size dummies as defined in Columns A to C of Table 7. Range values: Co-ordination(1-3); UnemploymentBenefit Duration(0-1); Tax Wedge(18.61-53.33); Share of Temporary Contracts (4.33-34.99); Employment Subsidies(0.23-1.93); EPL time invariant (0.50-3.70);EPL time variant (0.5-3.88). The indicator for the cycle is the aggregate net employment change.1Calculated standard errors are robust to country clustering.2Maximum likelihood estimation.
41ECB
Work ing Paper Ser ie s No . 318March 2004
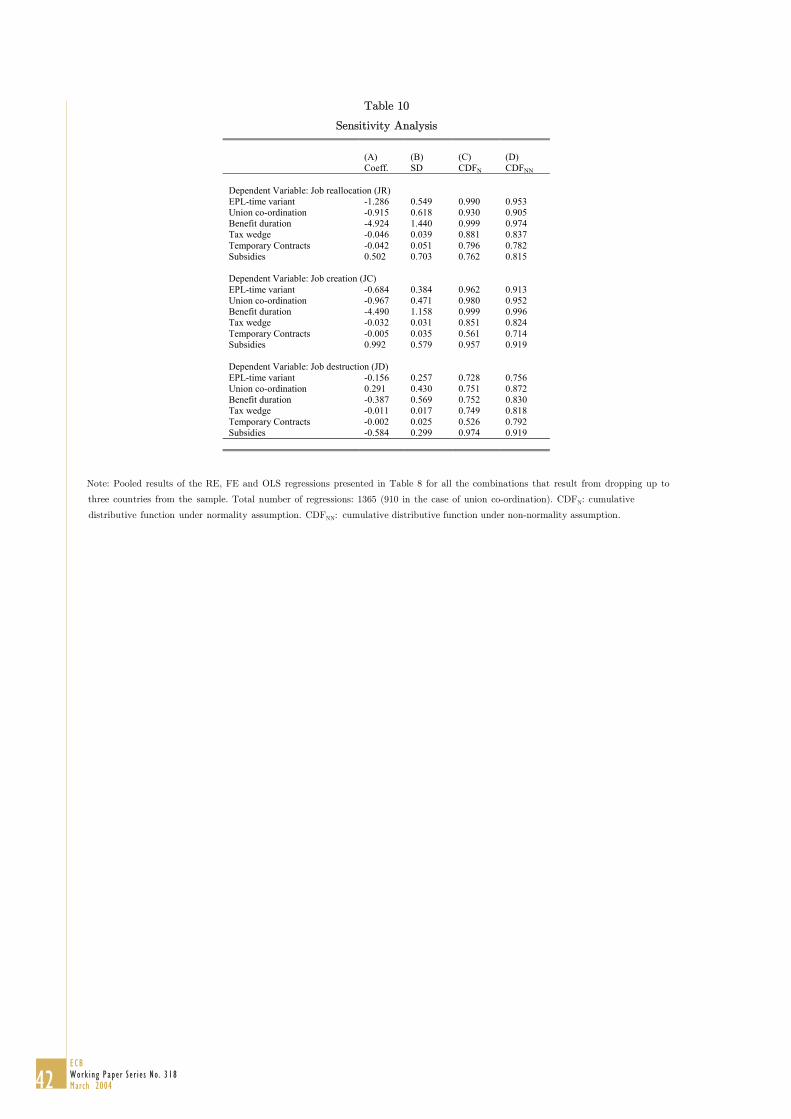
Table 10
Sensitivity Analysis
(A) (B) (C) (D)Coeff. SD CDFN CDFNN
Dependent Variable: Job reallocation (JR)EPL-time variant -1.286 0.549 0.990 0.953Union co-ordination -0.915 0.618 0.930 0.905Benefit duration -4.924 1.440 0.999 0.974Tax wedge -0.046 0.039 0.881 0.837Temporary Contracts -0.042 0.051 0.796 0.782Subsidies 0.502 0.703 0.762 0.815
Dependent Variable: Job creation (JC)EPL-time variant -0.684 0.384 0.962 0.913Union co-ordination -0.967 0.471 0.980 0.952Benefit duration -4.490 1.158 0.999 0.996Tax wedge -0.032 0.031 0.851 0.824Temporary Contracts -0.005 0.035 0.561 0.714Subsidies 0.992 0.579 0.957 0.919
Dependent Variable: Job destruction (JD)EPL-time variant -0.156 0.257 0.728 0.756Union co-ordination 0.291 0.430 0.751 0.872Benefit duration -0.387 0.569 0.752 0.830Tax wedge -0.011 0.017 0.749 0.818Temporary Contracts -0.002 0.025 0.526 0.792Subsidies -0.584 0.299 0.974 0.919
Note: Pooled results of the RE, FE and OLS regressions presented in Table 8 for all the combinations that result from dropping up to
three countries from the sample. Total number of regressions: 1365 (910 in the case of union co-ordination). CDFN: cumulative
distributive function under normality assumption. CDFNN: cumulative distributive function under non-normality assumption
42ECBWork ing Paper Ser ie s No . 318March 2004
.

Appendix. Data Cleaning
The following observations are dropped from the initial sample in Amadeus:
o Firms for which only consolidated accounts are available. In order to avoid
double counting, only unconsolidated accounts are included in the analysis.
o Observations for which employment growth rate is missing value. In this case,
the observations and not the entire firm are dropped from the sample.
o Observations where the growth rate of compensation per employee is less than
—50% or more than 50% within two consecutive years. The aim of this filter is
to clean for possible outliers. We experimented with different cut-off values
always obtaining similar results. Most of the observations dropped are well
above or below these figures.
As regards the latter, we believe that the information on wages is useful, combined
with that of employment, to detect the presence of outliers in our data. A disadvantage
of this filter is that additional noise might be introduced using the wage information.
We checked the consistency of the filter constructing an analogous one using the
information on added value. Both the coverage of the dataset and the results reported
in Tables 2 to 4 are not significantly affected by the use of the alternative filter. The
percentage of observations considered outliers by either the wage or value added filters
is below 5 percent of the initial sample.
43ECB
Work ing Paper Ser ie s No . 318March 2004

European Central Bank working paper series
For a complete list of Working Papers published by the ECB, please visit the ECB�s website(http://www.ecb.int).
202 �Aggregate loans to the euro area private sector� by A. Calza, M. Manrique and J. Sousa,January 2003.
203 �Myopic loss aversion, disappointment aversion and the equity premium puzzle� byD. Fielding and L. Stracca, January 2003.
204 �Asymmetric dynamics in the correlations of global equity and bond returns� byL. Cappiello, R.F. Engle and K. Sheppard, January 2003.
205 �Real exchange rate in an inter-temporal n-country-model with incomplete markets� byB. Mercereau, January 2003.
206 �Empirical estimates of reaction functions for the euro area� by D. Gerdesmeier andB. Roffia, January 2003.
207 �A comprehensive model on the euro overnight rate� by F. R. Würtz, January 2003.
208 �Do demographic changes affect risk premiums? Evidence from international data� byA. Ang and A. Maddaloni, January 2003.
209 �A framework for collateral risk control determination� by D. Cossin, Z. Huang,D. Aunon-Nerin and F. González, January 2003.
210 �Anticipated Ramsey reforms and the uniform taxation principle: the role of internationalfinancial markets� by S. Schmitt-Grohé and M. Uribe, January 2003.
211 �Self-control and savings� by P. Michel and J.P. Vidal, January 2003.
212 �Modelling the implied probability of stock market movements� by E. Glatzer andM. Scheicher, January 2003.
213 �Aggregation and euro area Phillips curves� by S. Fabiani and J. Morgan, February 2003.
214 �On the selection of forecasting models� by A. Inoue and L. Kilian, February 2003.
215 �Budget institutions and fiscal performance in Central and Eastern European countries� byH. Gleich, February 2003.
216 �The admission of accession countries to an enlarged monetary union: a tentativeassessment� by M. Ca�Zorzi and R. A. De Santis, February 2003.
217 �The role of product market regulations in the process of structural change� by J. Messina,March 2003.
44ECBWork ing Paper Ser ie s No . 318March 2004
218 �The zero-interest-rate bound and the role of the exchange rate for monetary policy inJapan� by G. Coenen and V. Wieland, March 2003.
219 �Extra-euro area manufacturing import prices and exchange rate pass-through� byB. Anderton, March 2003.
220 �The allocation of competencies in an international union: a positive analysis� by M. Ruta,April 2003.
221 �Estimating risk premia in money market rates� by A. Durré, S. Evjen and R. Pilegaard,April 2003.
222 �Inflation dynamics and subjective expectations in the United States� by K. Adam andM. Padula, April 2003.
223 �Optimal monetary policy with imperfect common knowledge� by K. Adam, April 2003.
224 �The rise of the yen vis-à-vis the (�synthetic�) euro: is it supported by economicfundamentals?� by C. Osbat, R. Rüffer and B. Schnatz, April 2003.
225 �Productivity and the (�synthetic�) euro-dollar exchange rate� by C. Osbat, F. Vijselaar andB. Schnatz, April 2003.
226 �The central banker as a risk manager: quantifying and forecasting inflation risks� byL. Kilian and S. Manganelli, April 2003.
227 �Monetary policy in a low pass-through environment� by T. Monacelli, April 2003.
228 �Monetary policy shocks � a nonfundamental look at the data� by M. Klaeffing, May 2003.
229 �How does the ECB target inflation?� by P. Surico, May 2003.
230 �The euro area financial system: structure, integration and policy initiatives� byP. Hartmann, A. Maddaloni and S. Manganelli, May 2003.
231 �Price stability and monetary policy effectiveness when nominal interest rates are boundedat zero� by G. Coenen, A. Orphanides and V. Wieland, May 2003.
232 �Describing the Fed�s conduct with Taylor rules: is interest rate smoothing important?� byE. Castelnuovo, May 2003.
233 �The natural real rate of interest in the euro area� by N. Giammarioli and N. Valla,May 2003.
234 �Unemployment, hysteresis and transition� by M. León-Ledesma and P. McAdam,May 2003.
235 �Volatility of interest rates in the euro area: evidence from high frequency data� byN. Cassola and C. Morana, June 2003.
45ECB
Work ing Paper Ser ie s No . 318March 2004
236 �Swiss monetary targeting 1974-1996: the role of internal policy analysis� by G. Rich, June 2003.
237 �Growth expectations, capital flows and international risk sharing� by O. Castrén, M. Millerand R. Stiegert, June 2003.
238 �The impact of monetary union on trade prices� by R. Anderton, R. E. Baldwin andD. Taglioni, June 2003.
239 �Temporary shocks and unavoidable transitions to a high-unemployment regime� byW. J. Denhaan, June 2003.
240 �Monetary policy transmission in the euro area: any changes after EMU?� by I. Angeloni andM. Ehrmann, July 2003.
241 Maintaining price stability under free-floating: a fearless way out of the corner?� byC. Detken and V. Gaspar, July 2003.
242 �Public sector efficiency: an international comparison� by A. Afonso, L. Schuknecht andV. Tanzi, July 2003.
243 �Pass-through of external shocks to euro area inflation� by E. Hahn, July 2003.
244 �How does the ECB allot liquidity in its weekly main refinancing operations? A look at theempirical evidence� by S. Ejerskov, C. Martin Moss and L. Stracca, July 2003.
245 �Money and payments: a modern perspective� by C. Holthausen and C. Monnet, July 2003.
246 �Public finances and long-term growth in Europe � evidence from a panel data analysis� byD. R. de Ávila Torrijos and R. Strauch, July 2003.
247 �Forecasting euro area inflation: does aggregating forecasts by HICP component improveforecast accuracy?� by K. Hubrich, August 2003.
248 �Exchange rates and fundamentals� by C. Engel and K. D. West, August 2003.
249 �Trade advantages and specialisation dynamics in acceding countries� by A. Zaghini,August 2003.
250 �Persistence, the transmission mechanism and robust monetary policy� by I. Angeloni,G. Coenen and F. Smets, August 2003.
251 �Consumption, habit persistence, imperfect information and the lifetime budget constraint�by A. Willman, August 2003.
252 �Interpolation and backdating with a large information set� by E. Angelini, J. Henry andM. Marcellino, August 2003.
253 �Bond market inflation expectations and longer-term trends in broad monetary growth andinflation in industrial countries, 1880-2001� by W. G. Dewald, September 2003.
46ECBWork ing Paper Ser ie s No . 318March 2004
254 �Forecasting real GDP: what role for narrow money?� by C. Brand, H.-E. Reimers andF. Seitz, September 2003.
255 �Is the demand for euro area M3 stable?� by A. Bruggeman, P. Donati and A. Warne,September 2003.
256 �Information acquisition and decision making in committees: a survey� by K. Gerling,H. P. Grüner, A. Kiel and E. Schulte, September 2003.
257 �Macroeconomic modelling of monetary policy� by M. Klaeffling, September 2003.
258 �Interest rate reaction functions and the Taylor rule in the euro area� by P. Gerlach-Kristen, September 2003.
259 �Implicit tax co-ordination under repeated policy interactions� by M. Catenaro andJ.-P. Vidal, September 2003.
260 �Aggregation-theoretic monetary aggregation over the euro area, when countries areheterogeneous� by W. A. Barnett, September 2003.
261 �Why has broad money demand been more stable in the euro area than in othereconomies? A literature review� by A. Calza and J. Sousa, September 2003.
262 �Indeterminacy of rational expectations equilibria in sequential financial markets� byP. Donati, September 2003.
263 �Measuring contagion with a Bayesian, time-varying coefficient model� by M. Ciccarelli andA. Rebucci, September 2003.
264 �A monthly monetary model with banking intermediation for the euro area� byA. Bruggeman and M. Donnay, September 2003.
265 �New Keynesian Phillips Curves: a reassessment using euro area data� by P. McAdam andA. Willman, September 2003.
266 �Finance and growth in the EU: new evidence from the liberalisation and harmonisation ofthe banking industry� by D. Romero de Ávila, September 2003.
267 �Comparing economic dynamics in the EU and CEE accession countries� by R. Süppel,September 2003.
268 �The output composition puzzle: a difference in the monetary transmission mechanism inthe euro area and the US� by I. Angeloni, A. K. Kashyap, B. Mojon and D. Terlizzese,September 2003.
269 �Zero lower bound: is it a problem with the euro area?" by G. Coenen, September 2003.
270 �Downward nominal wage rigidity and the long-run Phillips curve: simulation-basedevidence for the euro area� by G. Coenen, September 2003.
271 �Indeterminacy and search theory� by N. Giammarioli, September 2003.
47ECB
Work ing Paper Ser ie s No . 318March 2004
272 �Inflation targets and the liquidity trap� by M. Klaeffling and V. López Pérez,September 2003.
273 �Definition of price stability, range and point inflation targets: the anchoring of long-terminflation expectations� by E. Castelnuovo, S. Nicoletti-Altimari and D. Rodriguez-Palenzuela, September 2003.
274 �Interpreting implied risk neutral densities: the role of risk premia� by P. Hördahl andD. Vestin, September 2003.
275 �Identifying the monetary transmission mechanism using structural breaks� by A. Beyer andR. Farmer, September 2003.
276 �Short-term estimates of euro area real GDP by means of monthly data� by G. Rünstler,September 2003.
277 �On the indeterminacy of determinacy and indeterminacy" by A. Beyer and R. Farmer,September 2003.
278 �Relevant economic issues concerning the optimal rate of inflation� by D. R. Palenzuela,G. Camba-Méndez and J. Á. García, September 2003.
279 �Designing targeting rules for international monetary policy cooperation� by G. Benignoand P. Benigno, October 2003.
280 �Inflation, factor substitution and growth� by R. Klump, October 2003.
281 �Identifying fiscal shocks and policy regimes in OECD countries� by G. de Arcangelis and S. Lamartina, October 2003.
.
282 �Optimal dynamic risk sharing when enforcement is a decision variable� by T. V. Koeppl,
October 2003.
283 �US, Japan and the euro area: comparing business-cycle features� by P. McAdam,
November 2003.
284 �The credibility of the monetary policy ‘free lunch’� by J. Yetman, November 2003.
285 �Government deficits, wealth effects and the price level in an optimizing model�
by B. Annicchiarico, November 2003.
286 �Country and sector-specific spillover effects in the euro area, the United States and Japan�
by B. Kaltenhaeuser, November 2003.
287 �Consumer inflation expectations in Poland� by T. Łyziak, November 2003.
288 �Implementing optimal control cointegrated I(1) structural VAR models� by F. V. Monti,
November 2003.
289 �Monetary and fiscal interactions in open economies� by G. Lombardo and A. Sutherland,
November 2003.
48ECBWork ing Paper Ser ie s No . 318March 2004
291 �Measuring the time-inconsitency of US monetary policy� by P. Surico, November 2003.
290 �Inflation persistence and robust monetary policy design� by G. Coenen, November 2003.
292 �Bank mergers, competition and liquidity� by E. Carletti, P. Hartmann and G. Spagnolo,
November 2003.
293 �Committees and special interests” by M. Felgenhauer and H. P. Grüner, November 2003.
294 �Does the yield spread predict recessions in the euro area?” by F. Moneta, December 2003.
295 �Optimal allotment policy in the eurosystem’s main refinancing operations?” by C. Ewerhart, N. Cassola, S. Ejerskov and N. Valla, December 2003.
296 �Monetary policy analysis in a small open economy using bayesian cointegrated structural VARs?” by M. Villani and A. Warne, December 2003.
297 �Measurement of contagion in banks’ equity prices� by R. Gropp and G. Moerman, December 2003.
298 �The lender of last resort: a 21st century approach” by X. Freixas, B. M. Parigi and J.-C. Rochet, December 2003.
299 �Import prices and pricing-to-market effects in the euro area� by T. Warmedinger, January 2004.
300 �Developing statistical indicators of the integration of the euro area banking system�
by M. Manna, January 2004.
301 �Inflation and relative price asymmetry” by A. Rátfai, January 2004.
302 �Deposit insurance, moral hazard and market monitoring” by R. Gropp and J. Vesala, February 2004.
303 �Fiscal policy events and interest rate swap spreads: evidence from the EU” by A. Afonso and
R. Strauch, February 2004.
304 �Equilibrium unemployment, job flows and inflation dynamics” by A. Trigari, February 2004.
305 �A structural common factor approach to core inflation estimation and forecasting”
by C. Morana, February 2004.
306 �A markup model of inflation for the euro area” by C. Bowdler and E. S. Jansen, February 2004.
307 �Budgetary forecasts in Europe - the track record of stability and convergence programmes”
by R. Strauch, M. Hallerberg and J. von Hagen, February 2004.
308 �International risk-sharing and the transmission of productivity shocks” by G. Corsetti, L. Dedola
and S. Leduc, February 2004.
309 �Monetary policy shocks in the euro area and global liquidity spillovers” by J. Sousa and A. Zaghini,
February 2004.
310 �International equity flows and returns: A quantitative equilibrium approach” by R. Albuquerque,
G. H. Bauer and M. Schneider, February 2004.
311 �Current account dynamics in OECD and EU acceding countries – an intertemporal approach”
by M. Bussière, M. Fratzscher and G. Müller, February 2004.
49ECB
Work ing Paper Ser ie s No . 318March 2004

312 �Similarities and convergence in G-7 cycles” by F. Canova, M. Ciccarelli and E. Ortega, February 2004.
313 �The high-yield segment of the corporate bond market: a diffusion modelling approach
for the United States, the United Kingdom and the euro area” by G. de Bondt and D. Marqués,
February 2004.
314 �Exchange rate risks and asset prices in a small open economy” by A. Derviz, March 2004.
315 �Option-implied asymmetries in bond market expectations around monetary policy actions of the ECB” by S. Vähämaa, March 2004.
316 �Cooperation in international banking supervision” by C. Holthausen and T. Rønde, March 2004.
317 �Fiscal policy and inflation volatility” by P. C. Rother, March 2004.
318 �Gross job flows and institutions in Europe” by R. Gómez-Salvador, J. Messina and G. Vallanti, March 2004.
50ECBWork ing Paper Ser ie s No . 318March 2004