Green Production of Zero-Valent Iron (ZVI) Using Tea ... - MDPI
14
Citation: Eddy, D.R.; Nursyamsiah, D.; Permana, M.D.; Solihudin; Noviyanti, A.R.; Rahayu, I. Green Production of Zero-Valent Iron (ZVI) Using Tea-Leaf Extracts for Fenton Degradation of Mixed Rhodamine B and Methyl Orange Dyes. Materials 2022, 15, 332. https://doi.org/ 10.3390/ma15010332 Academic Editor: Ilya V. Mishakov Received: 15 December 2021 Accepted: 31 December 2021 Published: 3 January 2022 Publisher’s Note: MDPI stays neutral with regard to jurisdictional claims in published maps and institutional affil- iations. Copyright: © 2022 by the authors. Licensee MDPI, Basel, Switzerland. This article is an open access article distributed under the terms and conditions of the Creative Commons Attribution (CC BY) license (https:// creativecommons.org/licenses/by/ 4.0/). materials Article Green Production of Zero-Valent Iron (ZVI) Using Tea-Leaf Extracts for Fenton Degradation of Mixed Rhodamine B and Methyl Orange Dyes Diana Rakhmawaty Eddy * , Dian Nursyamsiah , Muhamad Diki Permana , Solihudin, Atiek Rostika Noviyanti and Iman Rahayu Department of Chemistry, Faculty of Mathematics and Sciences, Universitas Padjadjaran, Jl. Raya Bandung-Sumedang Km. 21 Jatinangor, Sumedang 45363, Indonesia; [email protected] (D.N.); [email protected] (M.D.P.); [email protected] (S.); [email protected] (A.R.N.); [email protected] (I.R.) * Correspondence: [email protected]; Tel.: +62-81322731173 Abstract: The danger from the content of dyes produced by textile-industry waste can cause environ- mental degradation when not appropriately treated. However, existing waste-treatment methods have not been effective in degrading dyes in textile waste. Zero-valent iron (ZVI), which has been widely used for wastewater treatment, needs to be developed to acquire effective green production. Tea (Camellia sinensis) leaves contain many polyphenolic compounds used as natural reducing agents. Therefore, this study aims to synthesize ZVI using biological reducing agents from tea-leaf extract and apply the Fenton method to degrade the color mixture of rhodamine B and methyl orange. The results show that the highest polyphenols were obtained from tea extract by heating to 90 ◦ C for 80 min. Furthermore, PSA results show that ZVI had a homogeneous size of iron and tea extract at a volume ratio of 1:3. The SEM-EDS results show that all samples had agglomerated particles. The ZVI 1:1 showed the best results, with a 100% decrease in the color intensity of the dye mixture for 60 min of reaction and a degradation percentage of 100% and 66.47% for rhodamine B and methyl orange from LC-MS analysis, respectively. Finally, the decrease in COD value by ZVI was 92.11%, higher than the 47.36% decrease obtained using Fe(II). Keywords: dye degradation; Fenton method; green synthesis; zero-valent iron 1. Introduction The textile industry is one of the fastest-growing sectors in Indonesia, and accord- ing to data from the Indonesian Ministry of Industry, it grew by 15.08% in 2019 [1]. The number of textile industry activities is directly proportional to the amount of wastewater generated. Dyestuff waste produced is toxic because it contains carcinogenic aromatic amines [2,3]. When waste is not appropriately treated, it impacts environmental degrada- tion and disrupts public health. Therefore, effective and environmentally friendly treatment of industrial wastewater, especially dye waste, is needed. The commonly used methods in wastewater treatment to reduce dye content include adsorption, coagulation, and floc- culation methods [4–7]. However, using these methods to minimize dyestuffs is often not perfect because it requires a large amount of coagulant. Other methods used in wastewater treatment are the membrane technique and bacterial biodegradation [8,9]. However, the regeneration process is complex, the cost is high, and the sludge generated from treatment residue is significant [10–12]. Therefore, modifications to existing water-treatment methods are needed. Zero-valent iron (ZVI) was initially used for groundwater remediation. However, along with increasingly complex surface-water problems, ZVI can be applied to surface- water and wastewater treatment to reduce the number of pollutants [13–16]. Zero-valent Materials 2022, 15, 332. https://doi.org/10.3390/ma15010332 https://www.mdpi.com/journal/materials
-
Upload
khangminh22 -
Category
Documents
-
view
3 -
download
0
Transcript of Green Production of Zero-Valent Iron (ZVI) Using Tea ... - MDPI
�����������������
Citation: Eddy, D.R.; Nursyamsiah,
D.; Permana, M.D.; Solihudin;
Noviyanti, A.R.; Rahayu, I. Green
Production of Zero-Valent Iron (ZVI)
Using Tea-Leaf Extracts for Fenton
Degradation of Mixed Rhodamine B
and Methyl Orange Dyes. Materials
2022, 15, 332. https://doi.org/
10.3390/ma15010332
Academic Editor: Ilya V. Mishakov
Received: 15 December 2021
Accepted: 31 December 2021
Published: 3 January 2022
Publisher’s Note: MDPI stays neutral
with regard to jurisdictional claims in
published maps and institutional affil-
iations.
Copyright: © 2022 by the authors.
Licensee MDPI, Basel, Switzerland.
This article is an open access article
distributed under the terms and
conditions of the Creative Commons
Attribution (CC BY) license (https://
creativecommons.org/licenses/by/
4.0/).
materials
Article
Green Production of Zero-Valent Iron (ZVI) Using Tea-LeafExtracts for Fenton Degradation of Mixed Rhodamine B andMethyl Orange DyesDiana Rakhmawaty Eddy * , Dian Nursyamsiah , Muhamad Diki Permana , Solihudin,Atiek Rostika Noviyanti and Iman Rahayu
Department of Chemistry, Faculty of Mathematics and Sciences, Universitas Padjadjaran, Jl. RayaBandung-Sumedang Km. 21 Jatinangor, Sumedang 45363, Indonesia; [email protected] (D.N.);[email protected] (M.D.P.); [email protected] (S.); [email protected] (A.R.N.);[email protected] (I.R.)* Correspondence: [email protected]; Tel.: +62-81322731173
Abstract: The danger from the content of dyes produced by textile-industry waste can cause environ-mental degradation when not appropriately treated. However, existing waste-treatment methodshave not been effective in degrading dyes in textile waste. Zero-valent iron (ZVI), which has beenwidely used for wastewater treatment, needs to be developed to acquire effective green production.Tea (Camellia sinensis) leaves contain many polyphenolic compounds used as natural reducing agents.Therefore, this study aims to synthesize ZVI using biological reducing agents from tea-leaf extractand apply the Fenton method to degrade the color mixture of rhodamine B and methyl orange. Theresults show that the highest polyphenols were obtained from tea extract by heating to 90 ◦C for80 min. Furthermore, PSA results show that ZVI had a homogeneous size of iron and tea extract at avolume ratio of 1:3. The SEM-EDS results show that all samples had agglomerated particles. The ZVI1:1 showed the best results, with a 100% decrease in the color intensity of the dye mixture for 60 minof reaction and a degradation percentage of 100% and 66.47% for rhodamine B and methyl orangefrom LC-MS analysis, respectively. Finally, the decrease in COD value by ZVI was 92.11%, higherthan the 47.36% decrease obtained using Fe(II).
Keywords: dye degradation; Fenton method; green synthesis; zero-valent iron
1. Introduction
The textile industry is one of the fastest-growing sectors in Indonesia, and accord-ing to data from the Indonesian Ministry of Industry, it grew by 15.08% in 2019 [1]. Thenumber of textile industry activities is directly proportional to the amount of wastewatergenerated. Dyestuff waste produced is toxic because it contains carcinogenic aromaticamines [2,3]. When waste is not appropriately treated, it impacts environmental degrada-tion and disrupts public health. Therefore, effective and environmentally friendly treatmentof industrial wastewater, especially dye waste, is needed. The commonly used methodsin wastewater treatment to reduce dye content include adsorption, coagulation, and floc-culation methods [4–7]. However, using these methods to minimize dyestuffs is often notperfect because it requires a large amount of coagulant. Other methods used in wastewatertreatment are the membrane technique and bacterial biodegradation [8,9]. However, theregeneration process is complex, the cost is high, and the sludge generated from treatmentresidue is significant [10–12]. Therefore, modifications to existing water-treatment methodsare needed.
Zero-valent iron (ZVI) was initially used for groundwater remediation. However,along with increasingly complex surface-water problems, ZVI can be applied to surface-water and wastewater treatment to reduce the number of pollutants [13–16]. Zero-valent
Materials 2022, 15, 332. https://doi.org/10.3390/ma15010332 https://www.mdpi.com/journal/materials
Materials 2022, 15, 332 2 of 14
iron material is made by reducing iron(II) or iron(III) using sodium borohydride [17–19].Sodium borohydride is considered less environmentally friendly as a reducing agent.Therefore, several studies have developed a synthesis method that is more environmentallyfriendly. Reducing agents that have been widely used are plant extracts. Subsequently,plants with polyphenol content and high antioxidant capacities, such as strawberries,raspberries, black tea, eucalyptus, mulberry, green tea, pomegranate, and oak leaves, canact as a reducing agent in the production of ZVI [20–26]. Tea leaves (Camellia sinensis)are one of the most abundant commodities, with polyphenols as the essential content inthe form of flavonoids and catechins ranging from 20 to 30% [27,28]. In 2013, productioncapacity reached 152,700 tons/year [29]; therefore, tea-leaf extract can be used as an iron-reducing agent.
The performance of ZVI in degrading organic pollutants can be improved when ap-plied to the Fenton method. This method is widely studied because it is considered effectivein reducing organic pollutants. It is simple, can be carried out at ambient temperature andpressure, is easy to handle, and is safe for the environment [30]. The Fenton method is anadvanced oxidation process (AOPs) system that works by utilizing hydroxyl radicals (•OH)to degrade pollutants [31]. ZVI using this method consists of iron(II) as a catalyst andhydrogen peroxide as an oxidizing agent [32,33]. Several studies have reported that ZVIapplied to the Fenton method is effective in reducing the color intensity of bromothymolblue, methylene blue, a mixture of Remazol brilliant blue R (RBB-R) and direct red (DR),Eriochrome blue-black B (EBB), and malachite green [34–37].
The dyes used in the textile dyeing process are classified into several types, includingnitro, azo, diphenylmethane, triphenylmethane, xanthene, phthalein, indigo, thioindigo,and anthraquinone dyes [2]. Rhodamine B is one of the xanthene classes often used in thetextile dyeing industry because it is cheap and easy to obtain [38]. Subsequently, azo dyesare widely used since about 60–70% of organic dyes produced globally are members ofthe azo group [39]. One of the azo dyes, one of the most easily found is methyl orange,which is soluble in water. Several studies have shown that the Fenton method can degraderhodamine B and methyl orange into simpler intermediates [40–44]. However, no studyhas degraded a mixture of rhodamine B and methyl orange dyes using the Fenton methodwith ZVI as a catalyst.
This study synthesized the ZVI catalyst leaf extract from tea (Camellia sinensis) as anatural reducing agent. Furthermore, the synthesized ZVI was characterized using particlesize analysis (PSA), UV-Vis spectrophotometry, Fourier-transform infrared spectroscopy(FTIR), and electron microscopy. The Fenton method was then tested to degrade a rho-damine B-methyl orange dye mixture. In wastewater treatment, the decrease in the valueof chemical oxygen demand (COD) should be considered to analyze the effectiveness andquality of the treated water. The COD value can indicate the level of water pollution byorganic pollutants [45].
2. Materials and Methods2.1. Materials
The materials used were iron(II) sulfate heptahydrate (FeSO4·7H2O, 99.5%, Merck103965, Kenilworth, NJ, USA,), Folin Ciocalteu reagent, which is a mixture of phospho-molybdate and phosphotungstate (2 mol/L, Merck 109001, Kenilworth, NJ, USA), sodiumcarbonate (Na2CO3, 99.9%, Merck 106392, Kenilworth, NJ, USA), gallic acid (C7H6O5,98%, Merck 842649, Kenilworth, NJ, USA), tea leaves (Camellia sinensis) from the Citen-gah tea plantation, Sumedang, Indonesia (Figure S1), concentrated sulfuric acid (H2SO4,95–97%, Smart Lab A-1092 F), hydrogen peroxide (H2O2, 30%, Merck 107209, Kenilworth,NJ, USA), digestion solution for COD (prepared from mercury(II) sulfate (HgSO4, 98%,Merck 104480, Kenilworth, NJ, USA) and potassium dichromate (K2Cr2O7, 99,9%, Merck104864, Kenilworth, NJ, USA), sodium hydroxide (NaOH, 99%, Merck 1006498, Kenil-worth, NJ, USA), ammonium iron(II) sulfate hexahydrate ((NH4)2Fe(SO4)2·6H2O, 99%,Merck 103792, Kenilworth, NJ, USA), ferroin indicator (prepared from 1,10-phenanthroline
Materials 2022, 15, 332 3 of 14
monohydrate (C12H8N2·H2O, 99,5%, Merck 107225, Kenilworth, NJ, USA) and iron(II)sulfate heptahydrate (FeSO4·7H2O, 99.5%, Merck 103965, Kenilworth, NJ, USA)), rho-damine B (C28H31ClN2O3, 90%, Merck 107599, Kenilworth, NJ, USA), and methyl orange(C14H14N3NaO3S, 85%, Merck 114510, Kenilworth, NJ, USA).
2.2. Tea Extract Preparation
Tea leaves (Camellia sinensis) were taken from the Citengah tea plantation, Sumedang(Figure S1), and dried until the water was gone [20]. The leaves were then separated fromthe stems and cut into small pieces to an area of 1 × 1 cm. Furthermore, they were heatedat 50 ◦C for 48 h and at 105 ◦C for 4 h to determine water content. Finally, the dried tealeaves were ground and then sieved through of 10 mesh.
2.3. Determination of Polyphenol Content in Tea Extract
The tea extract was made by modifying the existing procedures in previous studies [25,46].First, 3.6 g of tea powder of was added to 100 mL of distilled water as a solvent, thenheated at various temperatures of 28–98 ◦C for 20 min, filtered and concentrated. A totalof 10 mg of extract was then dissolved with 50 mL of distilled water. Then, 5 mL of theextract was taken, 0.2 mL of Folin Ciocalteu reagent, 4 mL of 7.5% sodium carbonate wasadded, and distilled water was added to a volume of 25 mL. The solution was incubatedfor 45 min at room temperature and measured using a visible spectrophotometer (HACHDR 3900, Loveland, CO, USA) at a wavelength of 698 nm. Then, the optimum heating timewas found, with time variations of 20–100 min using the same method. Finally, the totalpolyphenol content was calculated using Equation (1).
TPC = (C × V)/m (1)
where TPC is the total phenolic content (mg GAE/g), C is the concentration of tea leaves(mg/L), V represents the volume of solvent (L), and m is the weight of the tea extractused (g).
2.4. Synthesis and Characterization of Zero-Valent Iron (ZVI)
The synthesis of ZVI was carried out using a modified method from a previousstudy [25]. First, the tea extract was added with 0.1 mol/L of iron(II) sulfate solution witha volume ratio of iron(II) to tea extract of 1:1, 1:2, and 1:3 while stirring in a sonicator-900W(BEM-900A, Bueno Biotech) in a stream of nitrogen gas. The remaining water was thenevaporated, and ZVI was obtained.
The synthesized ZVI was characterized using a UV-Vis spectrophotometer (ThermoFisher Scientific Genesys 10S, Waltham, MA, USA) to determine the absorption at a200–600 nm wavelength. ZVI was further described using Fourier-transform infraredspectroscopy (FTIR, Shimadzu IRPrestige-21, Tokyo, Japan) to determine the functionalgroup, while FTIR was used, with a scanning range of 400–4000 cm−1. Scanning electronmicroscope-energy-dispersive X-ray spectrometry analysis (SEM-EDS, Hitachi SU3500,Tokyo, Japan) was performed using 3 kV at 2000× magnification to determine the shape ofthe surface morphology. Finally, particle size was determined using a particle-size analyzer(PSA, Horiba SZ-100, Kyoto, Japan).
2.5. ZVI Catalytic Test for Dyes
Samples of a mixture of rhodamine B and methyl orange, 1:1 (each 50 mg/L), weretested for color intensity. First, the sample was adjusted to pH 2, then, 5 mL of 12% hy-drogen peroxide and ZVI with various concentrations of 50, 100, and 150 mg/L. Next, thesolution was stirred, and the intensity of the color was measured using a UV-Vis spec-trophotometer (Thermo Fisher Scientific Genesys 10S, Waltham, MA, USA) at a wavelengthof 200–600 nm. The measurement process was carried out for 180 min with an interval of30 min. Meanwhile, to determine the presence of degradation and intermediate compounds

Materials 2022, 15, 332 4 of 14
formed, testing was carried out using liquid chromatography-mass spectrometry (LC-MS,Waters Q-tof MS Xevo, Milford, MA, USA).
2.6. Chemical Oxygen Demand (COD) Test
The COD measurement in the sample refers to the measurement of water using theclosed reflux method. First, a total of 2.5 mL of sample was put into a reflux tube. Then,1.5 mL of digestion solution and 3.5 mL of concentrated sulfuric acid were added. The tubewas inserted into the COD reactor (Velp ECO 25, Usmate Velate, Italy) and heated at 165 ◦Cfor 2 h. After cooling, the sample was titrated using a standard solution of 0.1 mol ek/Lammonium iron(II) sulfate with ferroin as an indicator.
COD =(V1−V2)× CFAC × 8× 1000
V3(2)
where chemical oxygen demand (COD) is represented in mg O2/g, CFAC is the concentra-tion of ammonium iron(II) sulfate (mol ek/L), V1 is the blank titration volume (mL), V2 isthe sample titration volume (mL), and V3 is the sample volume (mL).
3. Results and Discussions3.1. Preparation and Polyphenol Content of Tea Extract
The extract was prepared using the shoots to leaves without stems, which had amoisture content of 63.43 ± 0.50%. Polyphenols in catechins found in tea leaves werepolar compounds extracted with water [47]. The experimental results in Figure 1 showthat the higher the heating temperature used, the more concentrated the color of theextract obtained; therefore, more polyphenolic compounds were extracted. The amount ofpolyphenol content in the extract can be confirmed by the Folin Ciocalteu method. Besidespolyphenols, several water-soluble compounds, such as caffeine, amino acids, and sugarsin tea, can also be extracted. As a result, the compound components contained in the extractare not in the form of a single compound [48,49].
Figure 1. Tea extract after heating for 20 min and after the addition of Folin Ciocalteu reagent at:(a) 28; (b) 50; (c) 60; (d) 70; (e) 80; (f) 90; and (g) 98 ◦C.
The polyphenol content in tea extract was determined using the Folin Ciocalteumethod. Folin Ciocalteu reagent is a complex compound formed from phosphomolybdicacid and heteropoly phosphotungstic acid. The working principle is the oxidation ofhydroxyl groups in phenolic compounds by Folin Ciocalteu reagent. Furthermore, theblue color of the solution is the reduced form of the Folin Ciocalteu reagent [50,51]. Gallicacid is used as a standard in the determination of polyphenol content. The maximum
Materials 2022, 15, 332 5 of 14
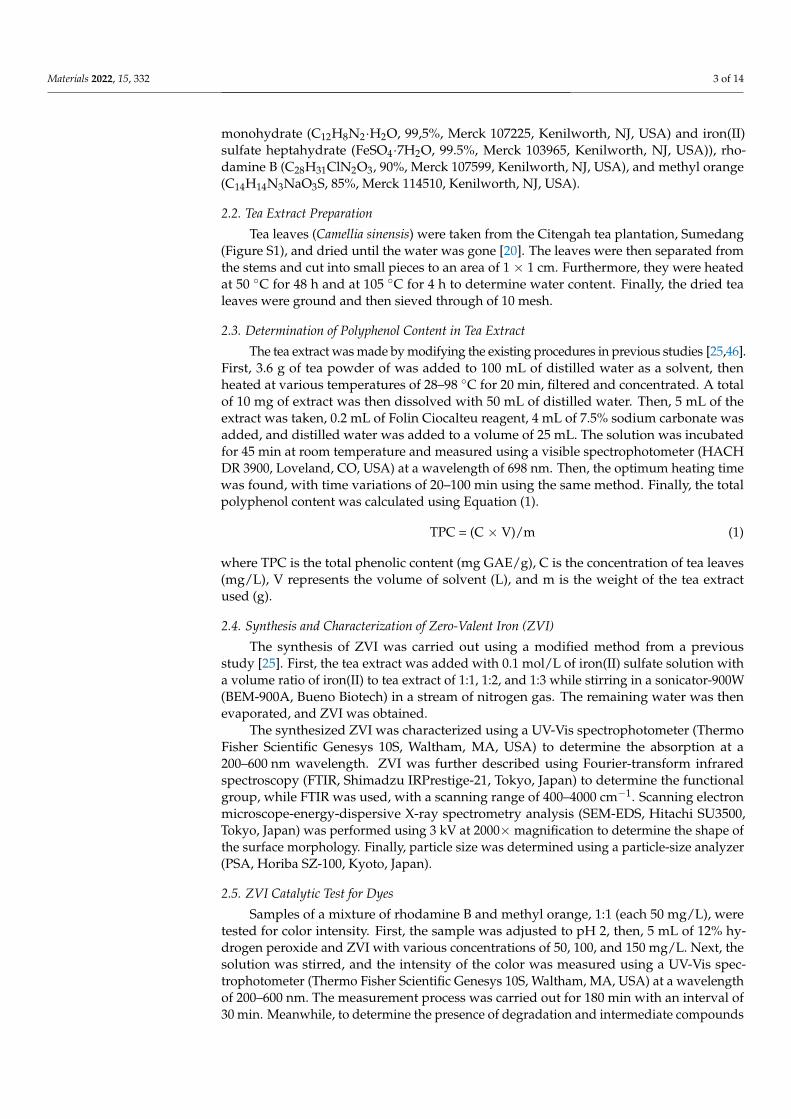
wavelength of standard gallic acid and the optimal incubation time are shown in Figure S2and the calibration curve for gallic acid shown in Figure S3. Polyphenol measurement datashowed that the more concentrated the resulting color (Figure 1), the higher the polyphenolcontent in the extract. Figure 2 shows the redox reaction between polyphenols and theFolin Ciocalteu reagent [51].
Figure 2. Redox reaction between polyphenols and Folin Ciocalteu reagent.
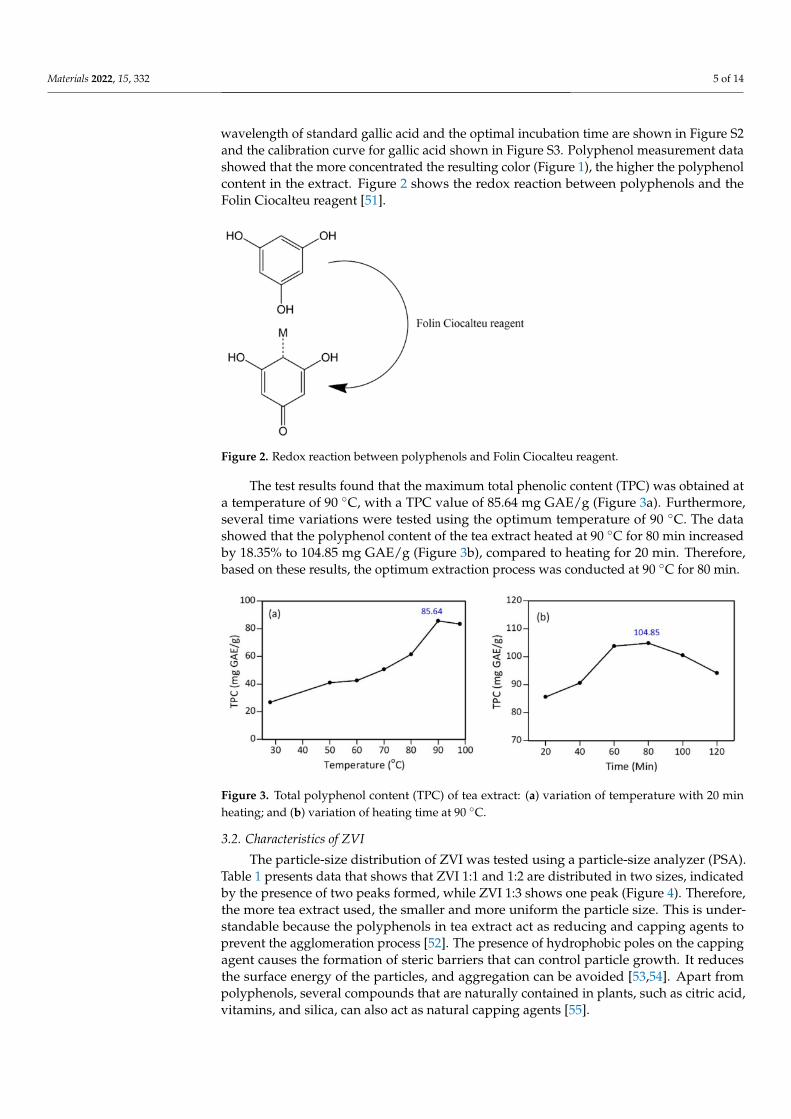
The test results found that the maximum total phenolic content (TPC) was obtained ata temperature of 90 ◦C, with a TPC value of 85.64 mg GAE/g (Figure 3a). Furthermore,several time variations were tested using the optimum temperature of 90 ◦C. The datashowed that the polyphenol content of the tea extract heated at 90 ◦C for 80 min increasedby 18.35% to 104.85 mg GAE/g (Figure 3b), compared to heating for 20 min. Therefore,based on these results, the optimum extraction process was conducted at 90 ◦C for 80 min.
Figure 3. Total polyphenol content (TPC) of tea extract: (a) variation of temperature with 20 minheating; and (b) variation of heating time at 90 ◦C.
3.2. Characteristics of ZVI
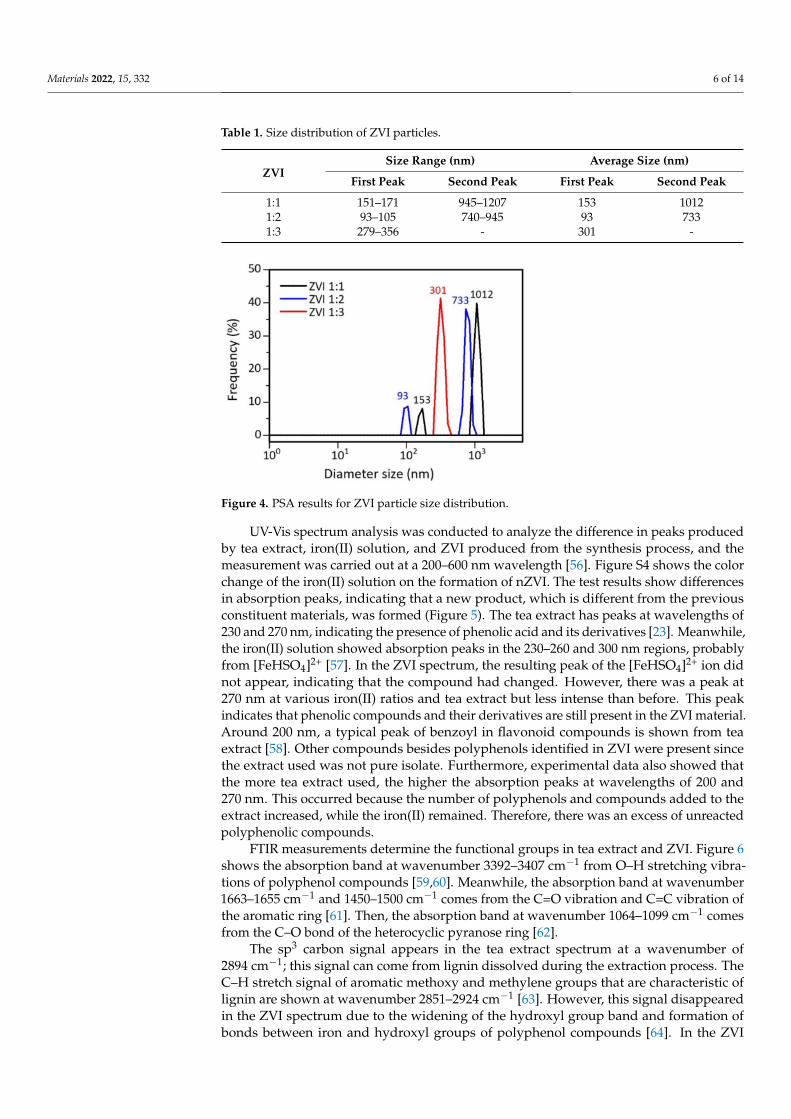
The particle-size distribution of ZVI was tested using a particle-size analyzer (PSA).Table 1 presents data that shows that ZVI 1:1 and 1:2 are distributed in two sizes, indicatedby the presence of two peaks formed, while ZVI 1:3 shows one peak (Figure 4). Therefore,the more tea extract used, the smaller and more uniform the particle size. This is under-standable because the polyphenols in tea extract act as reducing and capping agents toprevent the agglomeration process [52]. The presence of hydrophobic poles on the cappingagent causes the formation of steric barriers that can control particle growth. It reducesthe surface energy of the particles, and aggregation can be avoided [53,54]. Apart frompolyphenols, several compounds that are naturally contained in plants, such as citric acid,vitamins, and silica, can also act as natural capping agents [55].
Materials 2022, 15, 332 6 of 14
Table 1. Size distribution of ZVI particles.
ZVISize Range (nm) Average Size (nm)
First Peak Second Peak First Peak Second Peak
1:1 151–171 945–1207 153 10121:2 93–105 740–945 93 7331:3 279–356 - 301 -
Figure 4. PSA results for ZVI particle size distribution.
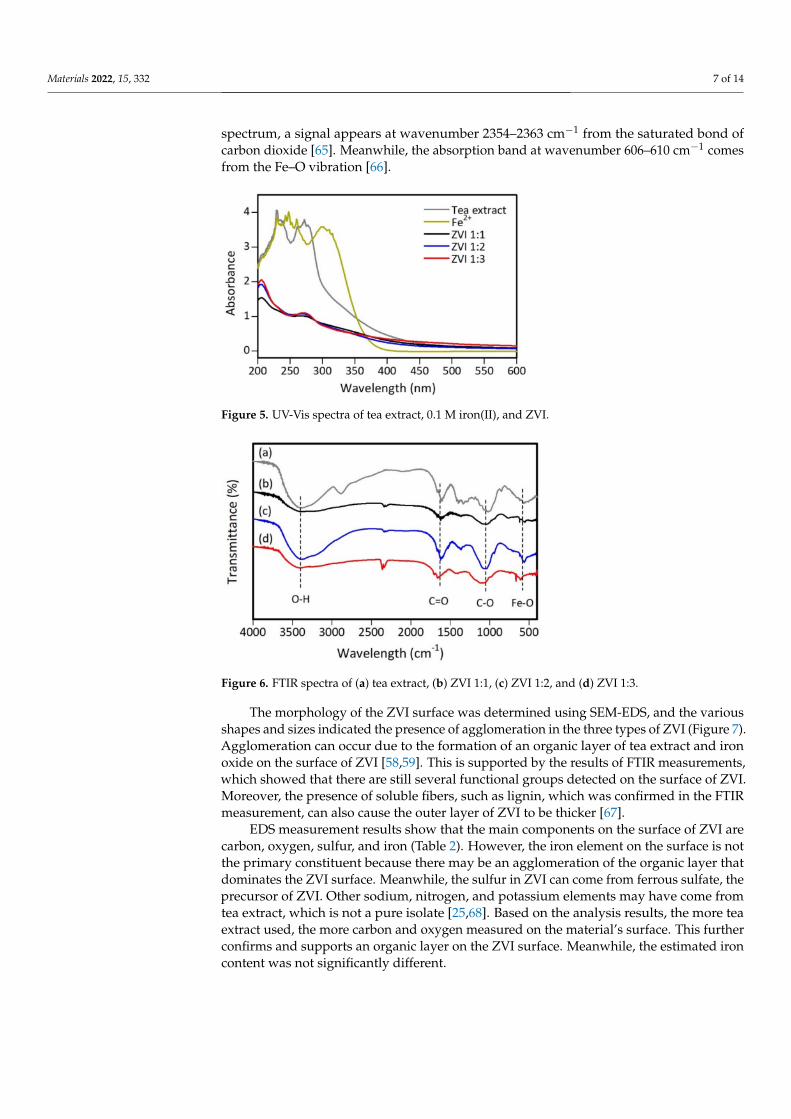
UV-Vis spectrum analysis was conducted to analyze the difference in peaks producedby tea extract, iron(II) solution, and ZVI produced from the synthesis process, and themeasurement was carried out at a 200–600 nm wavelength [56]. Figure S4 shows the colorchange of the iron(II) solution on the formation of nZVI. The test results show differencesin absorption peaks, indicating that a new product, which is different from the previousconstituent materials, was formed (Figure 5). The tea extract has peaks at wavelengths of230 and 270 nm, indicating the presence of phenolic acid and its derivatives [23]. Meanwhile,the iron(II) solution showed absorption peaks in the 230–260 and 300 nm regions, probablyfrom [FeHSO4]2+ [57]. In the ZVI spectrum, the resulting peak of the [FeHSO4]2+ ion didnot appear, indicating that the compound had changed. However, there was a peak at270 nm at various iron(II) ratios and tea extract but less intense than before. This peakindicates that phenolic compounds and their derivatives are still present in the ZVI material.Around 200 nm, a typical peak of benzoyl in flavonoid compounds is shown from teaextract [58]. Other compounds besides polyphenols identified in ZVI were present sincethe extract used was not pure isolate. Furthermore, experimental data also showed thatthe more tea extract used, the higher the absorption peaks at wavelengths of 200 and270 nm. This occurred because the number of polyphenols and compounds added to theextract increased, while the iron(II) remained. Therefore, there was an excess of unreactedpolyphenolic compounds.
FTIR measurements determine the functional groups in tea extract and ZVI. Figure 6shows the absorption band at wavenumber 3392–3407 cm−1 from O–H stretching vibra-tions of polyphenol compounds [59,60]. Meanwhile, the absorption band at wavenumber1663–1655 cm−1 and 1450–1500 cm−1 comes from the C=O vibration and C=C vibration ofthe aromatic ring [61]. Then, the absorption band at wavenumber 1064–1099 cm−1 comesfrom the C–O bond of the heterocyclic pyranose ring [62].
The sp3 carbon signal appears in the tea extract spectrum at a wavenumber of2894 cm−1; this signal can come from lignin dissolved during the extraction process. TheC–H stretch signal of aromatic methoxy and methylene groups that are characteristic oflignin are shown at wavenumber 2851–2924 cm−1 [63]. However, this signal disappearedin the ZVI spectrum due to the widening of the hydroxyl group band and formation ofbonds between iron and hydroxyl groups of polyphenol compounds [64]. In the ZVI
Materials 2022, 15, 332 7 of 14
spectrum, a signal appears at wavenumber 2354–2363 cm−1 from the saturated bond ofcarbon dioxide [65]. Meanwhile, the absorption band at wavenumber 606–610 cm−1 comesfrom the Fe–O vibration [66].
Figure 5. UV-Vis spectra of tea extract, 0.1 M iron(II), and ZVI.
Figure 6. FTIR spectra of (a) tea extract, (b) ZVI 1:1, (c) ZVI 1:2, and (d) ZVI 1:3.
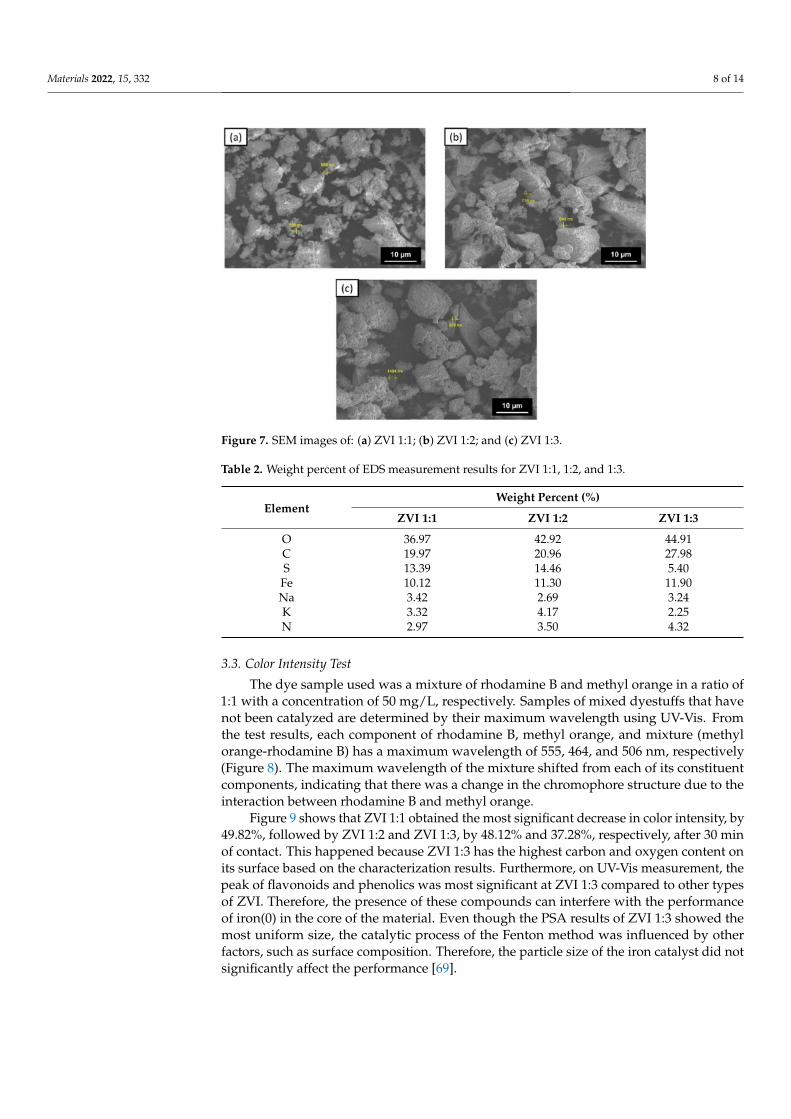
The morphology of the ZVI surface was determined using SEM-EDS, and the variousshapes and sizes indicated the presence of agglomeration in the three types of ZVI (Figure 7).Agglomeration can occur due to the formation of an organic layer of tea extract and ironoxide on the surface of ZVI [58,59]. This is supported by the results of FTIR measurements,which showed that there are still several functional groups detected on the surface of ZVI.Moreover, the presence of soluble fibers, such as lignin, which was confirmed in the FTIRmeasurement, can also cause the outer layer of ZVI to be thicker [67].
EDS measurement results show that the main components on the surface of ZVI arecarbon, oxygen, sulfur, and iron (Table 2). However, the iron element on the surface is notthe primary constituent because there may be an agglomeration of the organic layer thatdominates the ZVI surface. Meanwhile, the sulfur in ZVI can come from ferrous sulfate, theprecursor of ZVI. Other sodium, nitrogen, and potassium elements may have come fromtea extract, which is not a pure isolate [25,68]. Based on the analysis results, the more teaextract used, the more carbon and oxygen measured on the material’s surface. This furtherconfirms and supports an organic layer on the ZVI surface. Meanwhile, the estimated ironcontent was not significantly different.
Materials 2022, 15, 332 8 of 14
Figure 7. SEM images of: (a) ZVI 1:1; (b) ZVI 1:2; and (c) ZVI 1:3.
Table 2. Weight percent of EDS measurement results for ZVI 1:1, 1:2, and 1:3.
ElementWeight Percent (%)
ZVI 1:1 ZVI 1:2 ZVI 1:3
O 36.97 42.92 44.91C 19.97 20.96 27.98S 13.39 14.46 5.40
Fe 10.12 11.30 11.90Na 3.42 2.69 3.24K 3.32 4.17 2.25N 2.97 3.50 4.32
3.3. Color Intensity Test
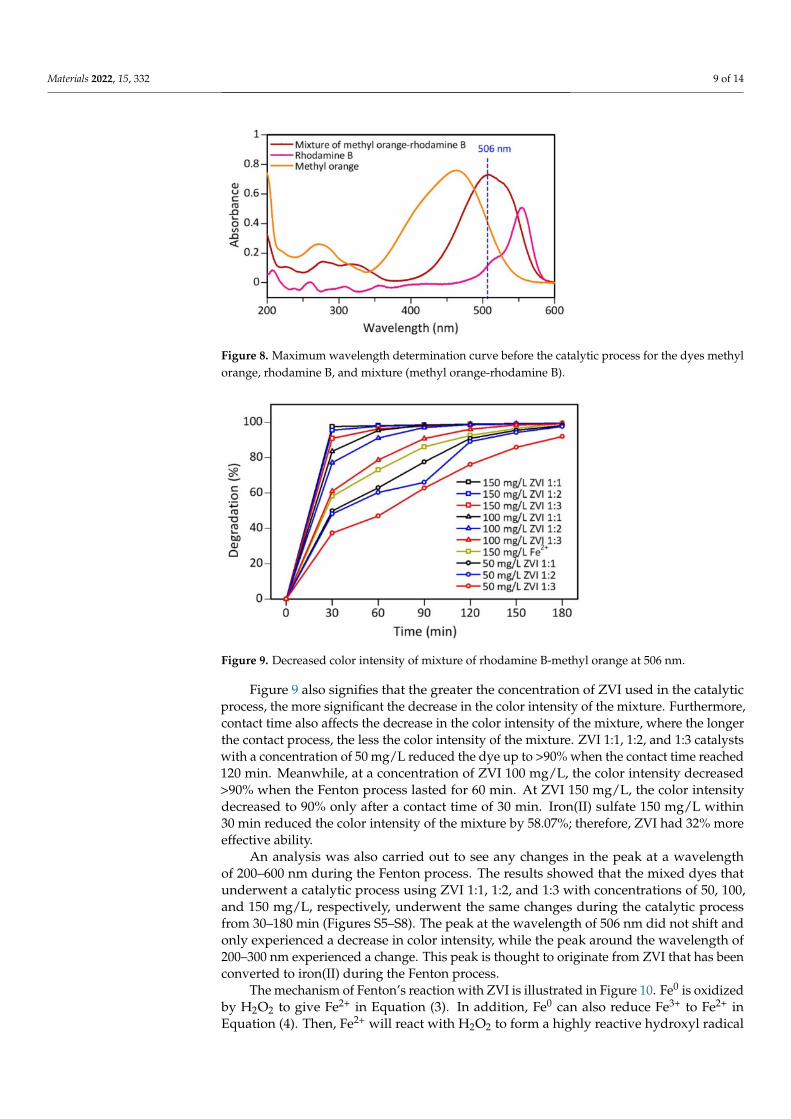
The dye sample used was a mixture of rhodamine B and methyl orange in a ratio of1:1 with a concentration of 50 mg/L, respectively. Samples of mixed dyestuffs that havenot been catalyzed are determined by their maximum wavelength using UV-Vis. Fromthe test results, each component of rhodamine B, methyl orange, and mixture (methylorange-rhodamine B) has a maximum wavelength of 555, 464, and 506 nm, respectively(Figure 8). The maximum wavelength of the mixture shifted from each of its constituentcomponents, indicating that there was a change in the chromophore structure due to theinteraction between rhodamine B and methyl orange.
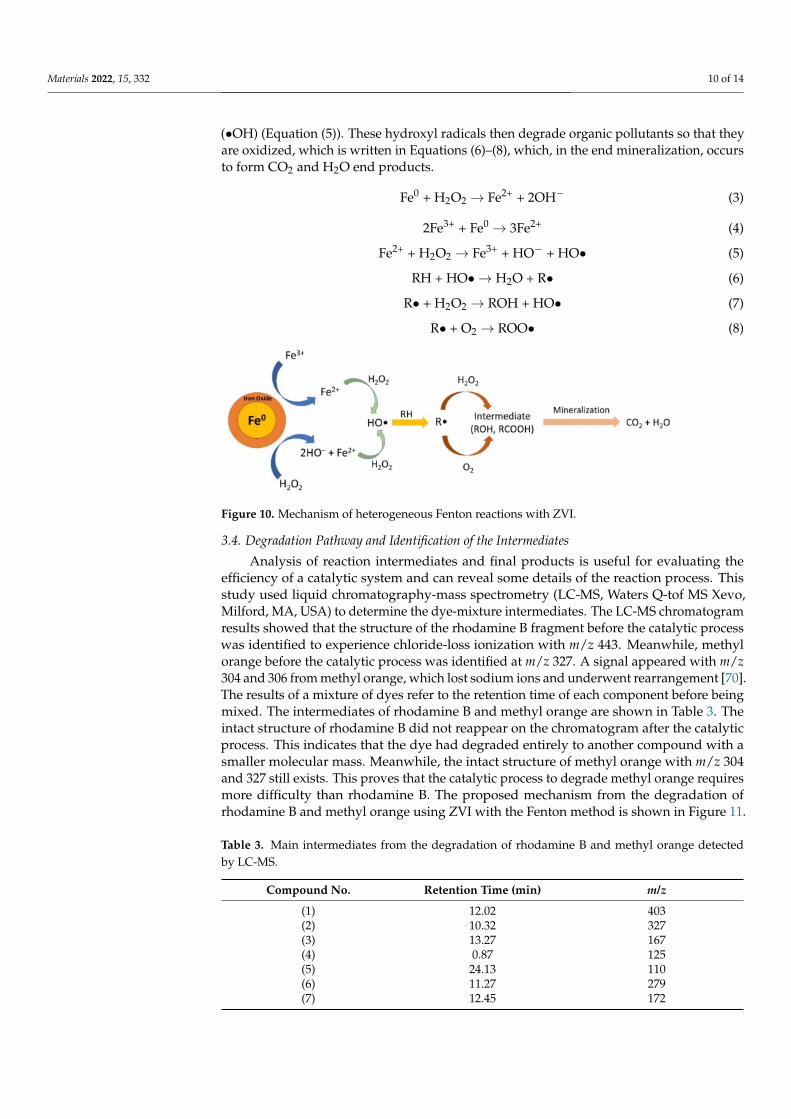
Figure 9 shows that ZVI 1:1 obtained the most significant decrease in color intensity, by49.82%, followed by ZVI 1:2 and ZVI 1:3, by 48.12% and 37.28%, respectively, after 30 minof contact. This happened because ZVI 1:3 has the highest carbon and oxygen content onits surface based on the characterization results. Furthermore, on UV-Vis measurement, thepeak of flavonoids and phenolics was most significant at ZVI 1:3 compared to other typesof ZVI. Therefore, the presence of these compounds can interfere with the performanceof iron(0) in the core of the material. Even though the PSA results of ZVI 1:3 showed themost uniform size, the catalytic process of the Fenton method was influenced by otherfactors, such as surface composition. Therefore, the particle size of the iron catalyst did notsignificantly affect the performance [69].
Materials 2022, 15, 332 9 of 14
Figure 8. Maximum wavelength determination curve before the catalytic process for the dyes methylorange, rhodamine B, and mixture (methyl orange-rhodamine B).
Figure 9. Decreased color intensity of mixture of rhodamine B-methyl orange at 506 nm.
Figure 9 also signifies that the greater the concentration of ZVI used in the catalyticprocess, the more significant the decrease in the color intensity of the mixture. Furthermore,contact time also affects the decrease in the color intensity of the mixture, where the longerthe contact process, the less the color intensity of the mixture. ZVI 1:1, 1:2, and 1:3 catalystswith a concentration of 50 mg/L reduced the dye up to >90% when the contact time reached120 min. Meanwhile, at a concentration of ZVI 100 mg/L, the color intensity decreased>90% when the Fenton process lasted for 60 min. At ZVI 150 mg/L, the color intensitydecreased to 90% only after a contact time of 30 min. Iron(II) sulfate 150 mg/L within30 min reduced the color intensity of the mixture by 58.07%; therefore, ZVI had 32% moreeffective ability.
An analysis was also carried out to see any changes in the peak at a wavelengthof 200–600 nm during the Fenton process. The results showed that the mixed dyes thatunderwent a catalytic process using ZVI 1:1, 1:2, and 1:3 with concentrations of 50, 100,and 150 mg/L, respectively, underwent the same changes during the catalytic processfrom 30–180 min (Figures S5–S8). The peak at the wavelength of 506 nm did not shift andonly experienced a decrease in color intensity, while the peak around the wavelength of200–300 nm experienced a change. This peak is thought to originate from ZVI that has beenconverted to iron(II) during the Fenton process.
The mechanism of Fenton’s reaction with ZVI is illustrated in Figure 10. Fe0 is oxidizedby H2O2 to give Fe2+ in Equation (3). In addition, Fe0 can also reduce Fe3+ to Fe2+ inEquation (4). Then, Fe2+ will react with H2O2 to form a highly reactive hydroxyl radical
Materials 2022, 15, 332 10 of 14
(•OH) (Equation (5)). These hydroxyl radicals then degrade organic pollutants so that theyare oxidized, which is written in Equations (6)–(8), which, in the end mineralization, occursto form CO2 and H2O end products.
Fe0 + H2O2 → Fe2+ + 2OH− (3)
2Fe3+ + Fe0 → 3Fe2+ (4)
Fe2+ + H2O2 → Fe3+ + HO− + HO• (5)
RH + HO• → H2O + R• (6)
R• + H2O2 → ROH + HO• (7)
R• + O2 → ROO• (8)
Figure 10. Mechanism of heterogeneous Fenton reactions with ZVI.
3.4. Degradation Pathway and Identification of the Intermediates
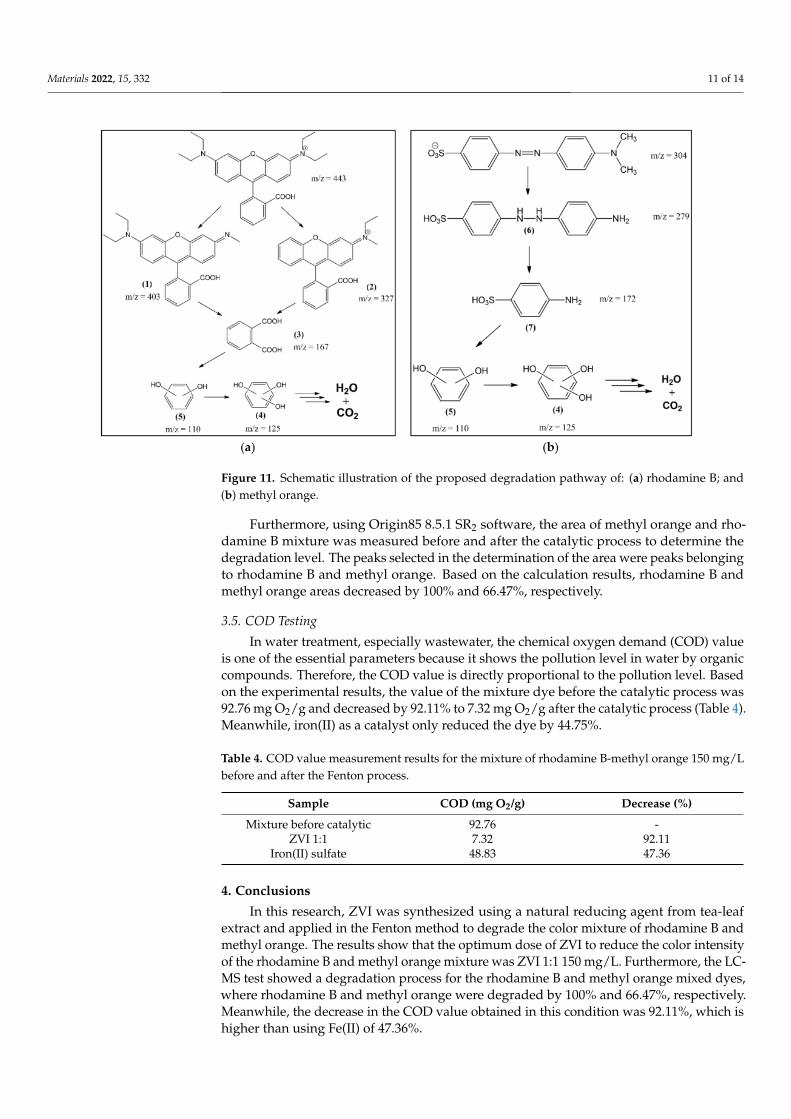
Analysis of reaction intermediates and final products is useful for evaluating theefficiency of a catalytic system and can reveal some details of the reaction process. Thisstudy used liquid chromatography-mass spectrometry (LC-MS, Waters Q-tof MS Xevo,Milford, MA, USA) to determine the dye-mixture intermediates. The LC-MS chromatogramresults showed that the structure of the rhodamine B fragment before the catalytic processwas identified to experience chloride-loss ionization with m/z 443. Meanwhile, methylorange before the catalytic process was identified at m/z 327. A signal appeared with m/z304 and 306 from methyl orange, which lost sodium ions and underwent rearrangement [70].The results of a mixture of dyes refer to the retention time of each component before beingmixed. The intermediates of rhodamine B and methyl orange are shown in Table 3. Theintact structure of rhodamine B did not reappear on the chromatogram after the catalyticprocess. This indicates that the dye had degraded entirely to another compound with asmaller molecular mass. Meanwhile, the intact structure of methyl orange with m/z 304and 327 still exists. This proves that the catalytic process to degrade methyl orange requiresmore difficulty than rhodamine B. The proposed mechanism from the degradation ofrhodamine B and methyl orange using ZVI with the Fenton method is shown in Figure 11.
Table 3. Main intermediates from the degradation of rhodamine B and methyl orange detectedby LC-MS.
Compound No. Retention Time (min) m/z
(1) 12.02 403(2) 10.32 327(3) 13.27 167(4) 0.87 125(5) 24.13 110(6) 11.27 279(7) 12.45 172
Materials 2022, 15, 332 11 of 14
Figure 11. Schematic illustration of the proposed degradation pathway of: (a) rhodamine B; and(b) methyl orange.
Furthermore, using Origin85 8.5.1 SR2 software, the area of methyl orange and rho-damine B mixture was measured before and after the catalytic process to determine thedegradation level. The peaks selected in the determination of the area were peaks belongingto rhodamine B and methyl orange. Based on the calculation results, rhodamine B andmethyl orange areas decreased by 100% and 66.47%, respectively.
3.5. COD Testing
In water treatment, especially wastewater, the chemical oxygen demand (COD) valueis one of the essential parameters because it shows the pollution level in water by organiccompounds. Therefore, the COD value is directly proportional to the pollution level. Basedon the experimental results, the value of the mixture dye before the catalytic process was92.76 mg O2/g and decreased by 92.11% to 7.32 mg O2/g after the catalytic process (Table 4).Meanwhile, iron(II) as a catalyst only reduced the dye by 44.75%.
Table 4. COD value measurement results for the mixture of rhodamine B-methyl orange 150 mg/Lbefore and after the Fenton process.
Sample COD (mg O2/g) Decrease (%)
Mixture before catalytic 92.76 -ZVI 1:1 7.32 92.11
Iron(II) sulfate 48.83 47.36
4. Conclusions
In this research, ZVI was synthesized using a natural reducing agent from tea-leafextract and applied in the Fenton method to degrade the color mixture of rhodamine B andmethyl orange. The results show that the optimum dose of ZVI to reduce the color intensityof the rhodamine B and methyl orange mixture was ZVI 1:1 150 mg/L. Furthermore, the LC-MS test showed a degradation process for the rhodamine B and methyl orange mixed dyes,where rhodamine B and methyl orange were degraded by 100% and 66.47%, respectively.Meanwhile, the decrease in the COD value obtained in this condition was 92.11%, which ishigher than using Fe(II) of 47.36%.
Materials 2022, 15, 332 12 of 14
Supplementary Materials: The following supporting information can be downloaded at: https://www.mdpi.com/article/10.3390/ma15010332/s1, Figure S1: Coordinates of tea leaf sampling loca-tion; Figure S2: (a) The curve of absorption wavelength of gallic acid; and (b) The curve of optimumincubation time for gallic acid at 698 nm; Figure S3: The curve of the gallic acid calibration standard;Figure S4: (a) Color of 0.1 M iron(II) sulfate solution; (b) Tea extract heated at 90 ◦C for 80 min; (c) syn-thesized nZVI before evaporation; (d) nZVI solid 1:1, (e) 1:2, and (f) 1:3; Figure S5: Absorbance of ZVIcatalytic test for 50 mg/L ZVI concentration; Figure S6: Absorbance of ZVI catalytic test for 100 mg/LZVI concentration; Figure S7: Absorbance of ZVI catalytic test for 150 mg/L ZVI concentration;Figure S8: Absorbance of iron(II) sulfate catalytic test for 150 mg/L iron(II) concentration.
Author Contributions: Conceptualization, D.R.E. and S.; methodology, D.N.; software, M.D.P. andD.N.; validation, D.R.E., S., A.R.N., and I.R.; formal analysis, D.N.; investigation, D.N.; resources,D.N.; data curation, D.N.; writing—original draft preparation, D.N.; writing—review and editing,D.R.E. and M.D.P.; visualization, M.D.P.; supervision, D.R.E. and S.; project administration, D.R.E.;funding acquisition, D.R.E. and I.R. All authors have read and agreed to the published version ofthe manuscript.
Funding: This research was funded by Academic Leadership Grant (ALG) Prof. Iman Rahayu,Universitas Padjadjaran, grant number ID: 1959/UN6.3.1/PT.00/2021, and “The APC was fundedby them”.
Institutional Review Board Statement: Not applicable.
Informed Consent Statement: Not applicable.
Data Availability Statement: Not applicable.
Conflicts of Interest: The authors declare no conflict of interest.
References1. Pratiknyo, P. Proyeksi Ketersediaan dan Kebutuhan Air Industri di Kab. Tangerang. In Proceedings of the Nasional Kebumian
XI-FTM UPN Veteran Yogyakarta, Yogyakarta, Indonesia, 3–4 November 2016.2. Singh, K.; Kumar, P.; Srivastava, R. An overview of textile dyes and their removal techniques: Indian perspective. Pollut. Res.
2017, 36, 790–797.3. Haley, T.J. Benzidine revisited: A review of the literature and problems associated with the use of benzidine and its congeners.
Clin. Toxicol. 1975, 8, 13–42. [CrossRef] [PubMed]4. Hassani, A.; Khataee, A.; Karaca, S.; Karaca, M.; Kiransan, M. Adsorption of two cationic textile dyes from water with modified
nanoclay: A comparative study by using central composite design. J. Environ. Chem. Eng. 2015, 3, 2738–2749. [CrossRef]5. Agarwal, S.; Tyagi, I.; Gupta, V.K.; Dastkhoon, M.; Ghaedi, M.; Yousefi, F.; Asfaram, A. Ultrasound-assisted adsorption of Sunset
Yellow CFC dye onto Cu doped ZnS nanoparticles loaded on activated carbon using response surface methodology based oncentral composite design. J. Mol. Liq. 2016, 219, 332–340. [CrossRef]
6. Kasperchik, V.P.; Yaskevich, A.L.; Bil’Dyukevich, A.V. Wastewater treatment for removal of dyes by coagulation and membraneprocesses. Pet. Chem. 2012, 52, 545–556. [CrossRef]
7. Rodrigues, C.S.; Madeira, L.M.; Boaventura, R.A. Treatment of textile dye wastewaters using ferrous sulphate in a chemicalcoagulation/flocculation process. Environ. Technol. 2013, 34, 719–729. [CrossRef]
8. Cheikh S’Id, E.; Kheribech, A.; Degu, M.; Hatim, Z.; Chourak, R.; M’Bareck, C. Removal of Methylene Blue from Water byPolyacrylonitrile Co Sodium Methallylsulfonate Copolymer (AN69) and Polysulfone (PSf) Synthetic Membranes. Prog. ColorColor. Coat. 2021, 14, 89–100.
9. Etezad, S.M.; Sadeghi-Kiakhani, M. Decolorization of Malachite Green Dye Solution by Bacterial Biodegradation. Prog. ColorColor. Coat. 2021, 14, 79–87.
10. Klavarioti, M.; Mantzavinos, D.; Kassinos, D. Removal of residual pharmaceuticals from aqueous systems by advanced oxidationprocesses. Environ. Int. 2009, 35, 402–417. [CrossRef]
11. Seabra, A.B.; Haddad, P.; Duran, N. Biogenic synthesis of nanostructured iron compounds: Applications and perspectives. IETNanobiotechnol. 2013, 7, 90–99. [CrossRef]
12. Krishnan, S.; Rawindran, H.; Sinnathambi, C.M.; Lim, J.W. Comparison of various advanced oxidation processes used inremediation of industrial wastewater laden with recalcitrant pollutants. IOP Conf. Ser. Mater. Sci. Eng. 2017, 206, 012089.[CrossRef]
13. Blowes, D.W.; Ptacek, C.J.; Benner, S.G.; McRae, C.W.; Bennett, T.A.; Puls, R.W. Treatment of inorganic contaminants usingpermeable reactive barriers. J. Contam. Hydrol. 2000, 45, 123–137. [CrossRef]
14. Gavaskar, A.; Tatar, L. Cost and Performance Report Nanoscale Zero-Valent Iron Technologies for Source Remediation; Naval FacilitiesEngineering Service Center Port Hueneme: Port Hueneme, CA, USA, 2005.
Materials 2022, 15, 332 13 of 14
15. Rashmi, S.H.; Madhu, G.M.; Kittur, A.; Suresh, R. Synthesis, characterization and application of zero valent iron nanoparticles forthe removal of toxic metal hexavalent chromium [Cr (VI)] from aqueous solution. Int. J. Curr. Eng. Technol. 2013, 1, 37–42.
16. Nursyamsiah, D.; Solihudin; Eddy, D.R. Green Synthesis of Zero Valent Iron (ZVI) using Tea Leaves Extract and its Application asFenton like Catalyst for Textile Dyes Removal. Asian J. Chem. 2021, 33, 963–968. [CrossRef]
17. Wardiyati, S.; Fisli, A.; Yusuf, S. Sintesis dan Karakterisasi Nano Zero Valent Iron (NZVI) dengan Metode Presipitasi. J. KimiaKemasan 2013, 35, 37–44. [CrossRef]
18. Kanel, S.R.; Manning, B.; Charlet, L.; Choi, H. Removal of arsenic (III) from groundwater by nanoscale zero-valent iron. Environ.Sci. Technol. 2005, 39, 1291–1298. [CrossRef]
19. Nadagouda, M.N.; Castle, A.B.; Murdock, R.C.; Hussain, S.M.; Varma, R.S. In vitro biocompatibility of nanoscale zerovalent ironparticles (NZVI) synthesized using tea polyphenols. Green Chem. 2010, 12, 114–122. [CrossRef]
20. Machado, S.; Pinto, S.L.; Grosso, J.P.; Nouws, H.P.A.; Albergaria, J.T.; Delerue-Matos, C. Application of green zero-valent ironnanoparticles to the remediation of soils contaminated with ibuprofen. Sci. Total Environ. 2013, 445, 323–329. [CrossRef]
21. Hoag, G.E.; Collins, J.B.; Holcomb, J.L.; Hoag, J.R.; Nadagouda, M.N.; Varma, R.S. Degradation of bromothymol blue by‘greener’nano-scale zero-valent iron synthesized using tea polyphenols. J. Mater. Chem. 2009, 19, 8671–8677. [CrossRef]
22. Dhuper, S.; Panda, D.; Nayak, P.L. Green synthesis and characterization of zero valent iron nanoparticles from the leaf extract ofMangifera indica. J. Nanotechnol. Its Appl. 2012, 13, 16–22.
23. Huang, L.; Weng, X.; Chen, Z.; Megharaj, M.; Naidu, R. Synthesis of iron-based nanoparticles using oolong tea extract for thedegradation of malachite green. Spectrochim. Acta Part A Mol. Biomol. Spectrosc. 2014, 117, 801–804. [CrossRef]
24. Murgueitio, E.; Debut, A.; Landivar, J.; Cumbal, L. Synthesis of iron nanoparticles through extracts of native fruits of Ecuador, ascapuli (Prunus serotina) and mortiño (Vaccinium floribundum). Biol. Med. 2016, 8, 1. [CrossRef]
25. Kecic, V.; Kerkez, Ð.; Prica, M.; Lužanin, O.; Becelic-Tomin, M.; Pilipovic, D.T.; Dalmacija, B. Optimization of azo printing dyeremoval with oak leaves-nZVI/H2O2 system using statistically designed experiment. J. Clean Prod. 2018, 202, 65–80. [CrossRef]
26. Desalegn, B.; Megharaj, M.; Chen, Z.; Naidu, R. Green synthesis of zero valent iron nanoparticle using mango peel extract andsurface characterization using XPS and GC-MS. Heliyon 2019, 5, e01750. [CrossRef]
27. Sumpio, B.E.; Cordova, A.C.; Berke-Schlessel, D.W.; Qin, F.; Chen, Q.H. Green tea, the “Asian paradox,” and cardiovasculardisease. Chen. J. Am. Coll. Surg. 2006, 202, 813–825. [CrossRef]
28. Anjarsari, I.R.D. Indonesia tea catechin: Prospect and benefits. J. Kultivasi 2016, 15, 99–106.29. Chang, K. World Tea Production and Trade Current and Future Development. 2015. Available online: http://www.fao.org/3/i4
480e/i4480e.pdf (accessed on 20 May 2020).30. Neyens, E.; Baeyens, J.A. A review of classic Fenton’s peroxidation as an advanced oxidation technique. J. Hazard Mater. 2003,
98, 33–50. [CrossRef]31. Haddad, M.E.; Regti, A.; Laamari, M.R.; Mamouni, R.; Saffaj, N. Use of Fenton reagent as advanced oxidative process for
removing textile dyes from aqueous solutions. J. Mater. Environ. Sci. 2014, 5, 667–674.32. Walling, C. Fenton’s reagent revisited. Acc. Chem. Res. 1975, 8, 125–131. [CrossRef]33. Goi, A. Advanced Oxidation Processes for Water Purification and Soil Remediation. Ph.D. Thesis, Tallinn University of Technology,
Tallinn, Estonia, 2005.34. Shahwan, T.; Sirriah, S.A.; Nairat, M.; Boyacı, E.; Eroglu, A.E.; Scott, T.B.; Hallam, K.R. Green synthesis of iron nanoparticles
and their application as a Fenton-like catalyst for the degradation of aqueous cationic and anionic dyes. Chem. Eng. J. 2011,172, 258–266. [CrossRef]
35. Truskewycz, A.; Shukla, R.; Ball, A.S. Iron nanoparticles synthesized using green tea extracts for the fenton-like degradation ofconcentrated dye mixtures at elevated temperatures. J. Environ. Chem. Eng. 2016, 4, 4409–4417. [CrossRef]
36. Ghanim, D.; Al-Kindi, G.Y.; Hassan, A.K. Green synthesis of iron nanoparticles using black tea leaves extract as adsorbent forremoving eriochrome blue-black B dye. Eng. Technol. J. 2020, 38, 1558–1569. [CrossRef]
37. Xiao, C.; Li, H.; Zhao, Y.; Zhang, X.; Wang, X. Green synthesis of iron nanoparticle by tea extract (polyphenols) and its selectiveremoval of cationic dyes. J. Environ. Manag. 2020, 275, 111262. [CrossRef] [PubMed]
38. Sibarani, J.; Purba, D.L.; Suprihatin, I.E.; Manurung, M. Fotodegradasi Rhodamin B menggunakan ZnO/UV/Reagen Fenton.Cakra Kimia 2016, 4, 84–93.
39. Bafana, A.; Devi, S.S.; Chakrabarti, T. Azo dyes: Past, present and the future. Environ. Rev. 2011, 19, 350–370. [CrossRef]40. Hou, M.F.; Liao, L.; Zhang, W.D.; Tang, X.Y.; Wan, H.F.; Yin, G.C. Degradation of rhodamine B by Fe (0)-based Fenton process
with H2O2. Chemosphere 2011, 83, 1279–1283. [CrossRef]41. Youssef, N.A.; Shaban, S.A.; Ibrahim, F.A.; Mahmoud, A.S. Degradation of methyl orange using Fenton catalytic reaction. Egypt J.
Pet. 2016, 25, 317–321. [CrossRef]42. Yoon, S.; Bae, S. Novel synthesis of nanoscale zerovalent iron from coal fly ash and its application in oxidative degradation of
methyl orange by Fenton reaction. J. Hazard. Mater. 2019, 365, 751–758. [CrossRef]43. Liang, L.; Cheng, L.; Zhang, Y.; Wang, Q.; Wu, Q.; Xue, Y.; Meng, X. Efficiency and mechanisms of rhodamine B degradation in
Fenton-like systems based on zero-valent iron. RSC Adv. 2020, 10, 28509–28515. [CrossRef]44. Devi, L.G.; Kumar, S.G.; Reddy, K.M.; Munikrishnappa, C. Photo degradation of Methyl Orange an azo dye by Advanced Fenton
Process using zero valent metallic iron: Influence of various reaction parameters and its degradation mechanism. J. Hazard. Mater.2009, 164, 459–467. [CrossRef]
Materials 2022, 15, 332 14 of 14
45. Effendi, H.; Romanto; Wardiatno, Y. Water quality status of Ciambulawung River, Banten Province, based on pollution index andNSF-WQI. Procedia Environ. Sci. 2015, 24, 228–237. [CrossRef]
46. Alara, O.R.; Abdurahman, N.H.; Olalere, O.A. Ethanolic extraction of bioactive compounds from Vernonia amygdalina leaf usingresponse surface methodology as an optimization tool. J. Food Meas. Charact. 2018, 12, 1107–1122. [CrossRef]
47. Barchan, A.; Bakkali, M.; Arakrak, A.; Pagán, R.; Laglaoui, A. The effects of solvents polarity on the phenolic contents andantioxidant activity of three Mentha species extracts. Int. J. Curr. Microbiol. Appl. Sci. 2014, 3, 399–412.
48. Unachukwu, U.J.; Ahmed, S.; Kavalier, A.; Lyles, J.T.; Kennelly, E.J. White and green teas (Camellia sinensis var. sinensis): Variationin phenolic, methylxanthine, and antioxidant profiles. J. Food Sci. 2010, 75, C541–C548. [CrossRef]
49. Peng, L.; Song, X.; Shi, X.; Li, J.; Ye, C. An improved HPLC method for simultaneous determination of phenolic compounds,purine alkaloids and theanine in Camellia species. J. Food Compos. Anal. 2008, 21, 559–563. [CrossRef]
50. Khadijah, K.; Jayali, A.M.; Umar, S.; Sasmita, I. Penentuan total fenolik dan aktivitas antioksidan ekstrak etanolik daun samama(Anthocephalus macrophylus) asal Ternate, Maluku Utara. J. Kimia Mulawarman 2017, 15, 11–18.
51. Ford, L.; Theodoridou, K.; Sheldrake, G.N.; Walsh, P.J. A critical review of analytical methods used for the chemical characterisa-tion and quantification of phlorotannin compounds in brown seaweeds. Phytochem. Anal. 2019, 30, 587–599. [CrossRef]
52. Puspitasari, L.; Arief, S.; Zulhadjri, Z. Ekstrak Daun Andalas sebagai Capping Agent dalam Green Hydrothermal SynthesisNanopartikel Mangan Ferrit dan Aplikasinya sebagai Antibakteri. Chim. Nat. Acta 2019, 7, 20–26. [CrossRef]
53. Phan, C.M.; Nguyen, H.M. Role of capping agent in wet synthesis of nanoparticles. J. Phys. Chem. A 2017, 121, 3213–3219.[CrossRef]
54. Yunita, Y.; Nurlina, N.; Syahbanu, I. Sintesis Nanopartikel Zink Oksida (ZnO) dengan Penambahan Ekstrak Klorofil sebagaiCapping Agent. Positron 2020, 10, 123–130. [CrossRef]
55. Gulati, S.; Sachdeva, M.; Bhasin, K.K. Capping agents in nanoparticle synthesis: Surfactant and solvent system. AIP Conf. Proc.2018, 1953, 030214.
56. Yuvakkumar, R.; Elango, V.; Rajendran, V.; Kannan, N. Preparation and characterization of zero valent iron nanoparticles. Dig. J.Nanomater. Biostruct. 2011, 6, 1771–1776.
57. Buckingham, M.A.; Marken, F.; Aldous, L. The thermoelectrochemistry of the aqueous iron (ii)/iron (iii) redox couple: Significanceof the anion and pH in thermogalvanic thermal-to-electrical energy conversion. Sustain. Energy Fuels 2018, 2, 2717–2726. [CrossRef]
58. Joseph, J.; Nagashri, K. Novel copper-based therapeutic agent for anti-inflammatory: Synthesis, characterization, and biochemicalactivities of copper (II) complexes of hydroxyflavone Schiff bases. Appl. Biochem. Biotechnol. 2012, 167, 1446–1458. [CrossRef]
59. Kumar, K.M.; Mandal, B.K.; Kumar, K.S.; Reddy, P.S.; Sreedhar, B. Biobased green method to synthesise palladium and ironnanoparticles using Terminalia chebula aqueous extract. Spectrochim. Acta Part A Mol. Biomol. Spectrosc. 2013, 102, 128–133.[CrossRef]
60. Wang, T.; Lin, J.; Chen, Z.; Megharaj, M.; Naidu, R. Green synthesized iron nanoparticles by green tea and eucalyptus leavesextracts used for removal of nitrate in aqueous solution. J. Clean Prod. 2014, 83, 413–419. [CrossRef]
61. Geng, S.; Shan, S.; Ma, H.; Liu, B. Antioxidant activity and α-glucosidase inhibitory activities of the polycondensate of catechinwith glyoxylic acid. PLoS ONE 2016, 11, e0150412. [CrossRef]
62. Moreno-Vásquez, M.J.; Valenzuela-Buitimea, E.L.; Plascencia-Jatomea, M.; Encinas-Encinas, J.C.; Rodríguez-Félix, F.;Sánchez-Valdes, S.; Rosas-Burgos, E.C.; Ocaño-Higuera, V.M.; Graciano-Verdugo, A.Z. Functionalization of chitosan by a freeradical reaction: Characterization, antioxidant and antibacterial potential. Carbohydr. Polym. 2017, 155, 117–127. [CrossRef]
63. Mohamed, S.E.; Khalifa, M.G.; Sayed, S.A.; Kamel, A.M.; Shalabi, M.E.H. Removal of Lignin from Pulp Waste Water’s BlackLiquor via By-Pass Cement Dust. Eurasian Chem.-Technol. J. 2009, 11, 51–59.
64. D’Souza, L.; Devi, P.; Divya Shridhar, M.P.; Naik, C.G. Use of Fourier Transform Infrared (FTIR) spectroscopy to study cadmium-induced changes in Padina tetrastromatica (Hauck). Anal. Chem. Insights 2008, 3, 135–143. [CrossRef]
65. Dong, H.; Zhao, F.; He, Q.; Xie, Y.; Zeng, Y.; Zhang, L.; Tang, L.; Zeng, G. Physicochemical transformation of carboxymethylcellulose-coated zero-valent iron nanoparticles (nZVI) in simulated groundwater under anaerobic conditions. Sep. Purif. Technol.2017, 175, 376–383. [CrossRef]
66. Mishra, D.; Arora, R.; Lahiri, S.; Amritphale, S.S.; Chandra, N. Synthesis and characterization of iron oxide nanoparticles bysolvothermal method. Prot. Met. Phys. Chem. Surfaces 2014, 50, 628–631. [CrossRef]
67. Fitria, W.; Fatriasari, E.; Hermiati, N.S. Pengaruh lokasi tempat tumbuh terhadap kandungan kimia kayu sengon (Paraserianthesfalcataria) sebagai bahan baku pulp. J. Ilmu Teknol. Has. Hutan 2010, 3, 45–50.
68. Muhammad, F.; Xia, M.; Li, S.; Yu, X.; Mao, Y.; Muhammad, F.; Huang, X.; Jiao, B.; Yu, L.; Li, D. The reduction of chromite oreprocessing residues by green tea synthesized nano zerovalent iron and its solidification/stabilization in composite geopolymer. J.Clean Prod. 2019, 234, 381–391. [CrossRef]
69. Wang, W.; Jin, Z.H.; Li, T.L.; Zhang, H.; Gao, S. Preparation of spherical iron nanoclusters in ethanol–water solution for nitrateremoval. Chemosphere 2006, 65, 1396–1404. [CrossRef]
70. Aziztyana, A.P.; Wardhani, S.; Prananto, Y.P.; Purwonugroho, D.; Darjito. Optimisation of Methyl Orange PhotodegradationUsing TiO2-Zeolite Photocatalyst and H2O2 in Acid Condition. IOP Conf. Ser. Mater. Sci. Eng. 2019, 546, 042047. [CrossRef]