Grain quality and determinants of farmers’ preference for rice varietal traits in three districts...
11
Vol. 5(7), pp. 284-294, July, 2013 DOI 10.5897/JDAE2013.0473 ISSN 2006-9774 © 2013 Academic Journals http://www.academicjournals.org/JDAE Journal of Development and Agricultural Economics Full Length Research Paper Grain quality and determinants of farmers’ preference for rice varietal traits in three districts of Ghana: Implications for research and policy Maxwell Darko Asante 1,2 , Bright Owusu Asante 2,3 *, George Kwasi Acheampong 2 , Alexander Nimo Wiredu 4 , Samuel Kwame Offei 1 , Vernon Gracen 1 , Hans Adu-Dapaah 2 and Eric Yirenkyi Danquah 1 1 West African Centre for Crop Improvement, College of Agriculture and Consumer Sciences, University of Ghana, P. M. B. LG 30, Legon, Ghana. 2 CSIR-Crops Research Institute, P. O. Box 3785, Kumasi, Ghana. 3 Deparment of Agricultural and Resource Economics, Faculty of the Professions, University of New England, Armidale, NSW, 2350, Australia. 4 CSIR-Savanna Agricultural Research Institute, P. O. Box TL 52, Tamale, Ghana. Accepted 21 June, 2013 Rice has become a popular staple in Africa because it is a convenience food for the rapidly increasing urban population. In Ghana about 70% of the rice consumed is imported. Domestic rice is not competitive because of its perceived poor grain quality. This study assessed the influence of grain quality and other factors on farmers’ preference for improved rice varieties. It also investigated how specific grain quality attributes influence farmers’ preference for improved rice varieties. The probit regression model was used to assess the influence of grain quality attributes and other factors on farmers’ preference for improved rice varieties. The results showed that, age, sex, tolerance to pest and diseases, farm size, and good grain quality had a positive influence on farmers’ p reference. Experience in rice cultivation however negatively influenced farmers’ preference for rice varieties. Furthermore, specific grain quality attributes such as, grain length and shape, fragrance, cooking quality, grain color, and absence of foreign matter also positively influenced farmers’ preference for rice varietal traits while chalkiness had a negative influence. Improving grain quality will increase consumer demand for locally produced rice and farmer preferences for improved rice varieties. This has the potential of increasing local rice production and ensuring self-sufficiency in rice production. By implication, there is the need to invest into the development and deployment of rice varieties that have grains that meet the expectations of farmers to propel wide spread adoption and utilization of domestic rice. Key words: Ghana, grain quality, preference, rice varietal traits. INTRODUCTION Rice is a staple food for nearly half of the world population. In Africa, rice has increasingly become popular and it is reported to be the fastest growing food source (Nwanze et al., 2006). Besides being an important food staple for both rural and urban communities across Ghana, it is the most important cash crop in the communities in which it is produced (Asuming–Brempong and Osei-Asare, 2007). According to the 2010 budget *Corresponding author. E-mail: [email protected].
Transcript of Grain quality and determinants of farmers’ preference for rice varietal traits in three districts...
Vol. 5(7), pp. 284-294, July, 2013
DOI 10.5897/JDAE2013.0473
ISSN 2006-9774 © 2013 Academic Journals
http://www.academicjournals.org/JDAE
Journal of Development and Agricultural Economics
Full Length Research Paper
Grain quality and determinants of farmers’ preference for rice varietal traits in three districts of Ghana:
Implications for research and policy
Maxwell Darko Asante1,2, Bright Owusu Asante2,3*, George Kwasi Acheampong2, Alexander Nimo Wiredu4, Samuel Kwame Offei1, Vernon Gracen1, Hans Adu-Dapaah2 and
Eric Yirenkyi Danquah1
1West African Centre for Crop Improvement, College of Agriculture and Consumer Sciences, University of Ghana,
P. M. B. LG 30, Legon, Ghana. 2CSIR-Crops Research Institute, P. O. Box 3785, Kumasi, Ghana.
3Deparment of Agricultural and Resource Economics, Faculty of the Professions, University of New England,
Armidale, NSW, 2350, Australia. 4CSIR-Savanna Agricultural Research Institute, P. O. Box TL 52, Tamale, Ghana.
Accepted 21 June, 2013
Rice has become a popular staple in Africa because it is a convenience food for the rapidly increasing urban population. In Ghana about 70% of the rice consumed is imported. Domestic rice is not competitive because of its perceived poor grain quality. This study assessed the influence of grain quality and other factors on farmers’ preference for improved rice varieties. It also investigated how specific grain quality attributes influence farmers’ preference for improved rice varieties. The probit regression model was used to assess the influence of grain quality attributes and other factors on farmers’ preference for improved rice varieties. The results showed that, age, sex, tolerance to pest and diseases, farm size, and good grain quality had a positive influence on farmers’ preference. Experience in rice cultivation however negatively influenced farmers’ preference for rice varieties. Furthermore, specific grain quality attributes such as, grain length and shape, fragrance, cooking quality, grain color, and absence of foreign matter also positively influenced farmers’ preference for rice varietal traits while chalkiness had a negative influence. Improving grain quality will increase consumer demand for locally produced rice and farmer preferences for improved rice varieties. This has the potential of increasing local rice production and ensuring self-sufficiency in rice production. By implication, there is the need to invest into the development and deployment of rice varieties that have grains that meet the expectations of farmers to propel wide spread adoption and utilization of domestic rice. Key words: Ghana, grain quality, preference, rice varietal traits.
INTRODUCTION Rice is a staple food for nearly half of the world population. In Africa, rice has increasingly become popular and it is reported to be the fastest growing food source (Nwanze et al., 2006). Besides being an important
food staple for both rural and urban communities across Ghana, it is the most important cash crop in the communities in which it is produced (Asuming–Brempong and Osei-Asare, 2007). According to the 2010 budget
*Corresponding author. E-mail: [email protected].
statement of Ghana, the country imports about 70% of the domestic rice requirement, accounting for about USD 600 million per annum (Duffuor, 2009). To bridge this gap, successive governments over the years have been promoting domestic rice production and consumption. However, due to the poor grain quality of the locally produced rice, consumers usually prefer imported rice. Availability of improved rice varieties with good grain quality is therefore necessary in order to boost domestic rice production and consumption.
Although many varieties of rice have been developed, few have been adopted possibly because researchers have not considered farmers’ preferences and perceptions of varieties during the development process (Efisue et al., 2008). Adoption of improved rice varieties may differ depending upon the preferences of the farmers. Farmers assess a new technology such as crop variety, in terms of a range of attributes, including grain quality, straw yield, and input requirements in addition to grain yield (Joshi and Bauer, 2006).
Previous studies on rice grain quality preference in Ghana and other parts of the world have focused on consumers (Bam et al., 1998; Diako et al., 2010; Abansi et al., 1992; Choudhury et al., 1992; Juliano and Duff, 1991). However, little has been done to assess grain quality in relation to the farmer in order to infer how grain quality could influence farmers’ preference for improved rice varieties.
This study assessed the influence of grain quality and other factors affecting farmers’ preference for improved rice varieties. It further investigates how grain quality attributes such as colour, grain length and shape, chalkiness, percent broken grains (related to milling yield), cooking quality, fragrance, absence of foreign materials and grain expansion ratio influences farmers’ preference for improved rice varieties and their implications for research and policy. This study will serve as a guide to policy making by pointing to areas of intervention for effective promotion of domestic rice production and consumption in Ghana. It provides useful information to researchers especially breeders to develop varieties that are consistent with the needs of both farmers, processors, traders and consumers especially in terms of rice grain quality. The remaining sections of this paper are presented as follows. In the next section, we present description of the methodology and the study area; it includes data collection process and the empirical framework for the study. The third and fourth sections present the results and analysis of the empirical findings and their implications. We end with some concluding remarks and policy recommendations. METHODOLOGY
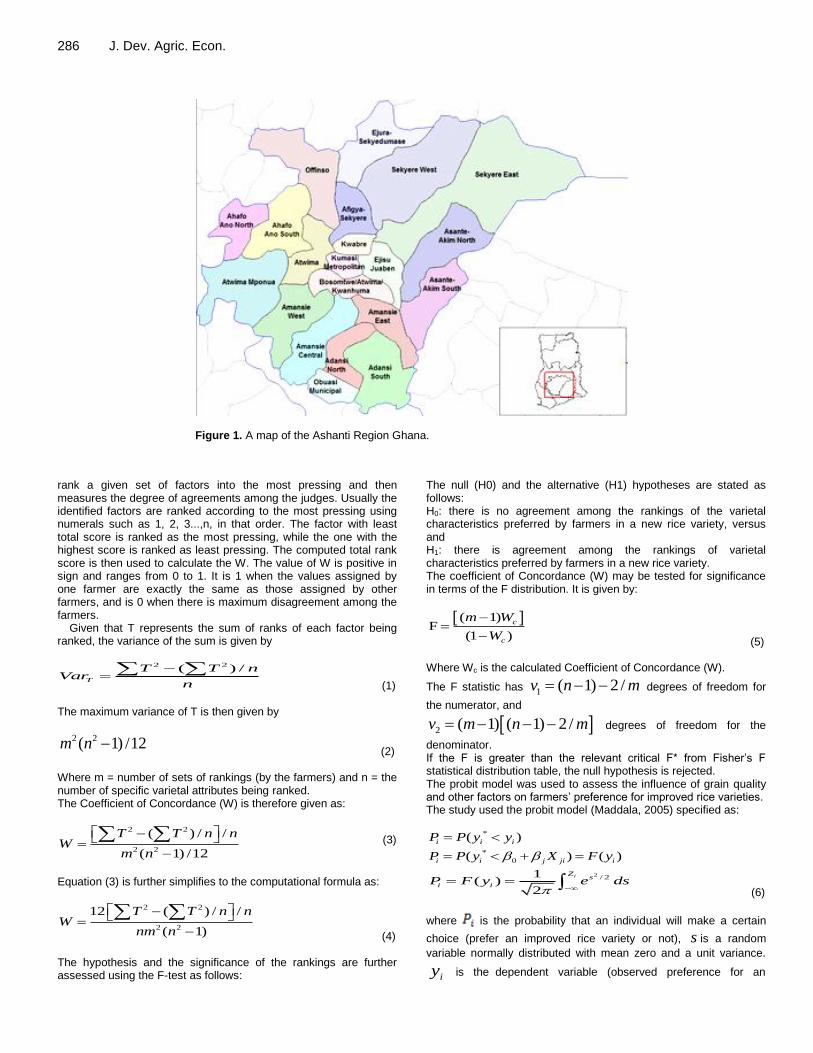
The study area The study was conducted in the Ejisu-Juaben, Atwima Nwabiagya and the Ejura-Sekyedumase districts of the Ashanti region. The
Asante et al. 285 Ashanti region is located in the deciduous forest agro-ecological zone. The zone is characterized by a bi-modal rainfall pattern, the major season beginning from April and ending in July and the minor one beginning in September and ending in October. The annual rainfall ranges between 1500 mm and 1600 mm with an average of about 1300 mm per annum. Temperatures are generally low throughout most of the year with the highest of 28°C in March and April. Lower temperatures are experienced during the major season in June and July. Rice, roots and tuber crops such as cassava, yam, cocoyam and sweet potatoes as well as plantain are the major food crops cultivated in the zone. Rice cultivation is basically in inland valleys. Cocoa (Theobroma cacao) and oil palm (Elaeisguineensis) are the common tree crops that form an integral part of the people’s livelihood.
The study was conducted in 6 communities from the three districts of the Ashanti region of Ghana. The communities comprise of, Nobewam and Besease of the Ejisu-Juaben district, Kyeiase and Nkawie of the Atwima Nwabiagya district, and Aframso and Ejura in the Ejura-Sekyedumase district. These are the major rice growing communities in the region and are among the major rice growing communities in southern Ghana. Farming and rice cultivation is the major occupation in the selected communities as they are endowed with inland valleys suitable for rice cultivation (Figure 1). In all, six rice communities (two communities per district) were randomly selected from a list of major rice producing communities in Ashanti region. A random sample of 30 farmers was further obtained from each of the communities. Although the study intended to obtain a sample of 180, due to discrepancies such as non-response and irrelevant data, consequently, a total of 165 rice farmers were involved in the analysis.
Both formal and informal approaches were employed to collect data for the study. Participatory rural appraisal (PRA) tools were used to generate information on farmer perceptions at the community level. Probing, iteration, observation and preference rating (Obiri, 2003; Grandstaff and Grandstaff, 1987) were the PRA techniques used to retrieve information from farmers. In addition, there was triangulation to test the robustness of the responses from the groups. The respondents were thus encouraged to respond more completely and precisely. In addition, it helped to organize the responses and ensured that all necessary issues were covered.
This was followed by a formal survey with the use of semi-structured questionnaires. This enabled individual farmers to express their own views without any community influence. During the interview, useful demonstrations and drawings were frequently used to illustrate difficult points. Data collected included demographic characteristics, factors influencing varietal preference, and the effect of grain quality on preference for improved varieties. Analytical framework In the first part of the analyses, the study assessed specific varietal characteristics that are preferred by farmers. In the second part, factors influencing farmers’ preference for rice varietal traits were assessed. To assess specific rice varietal characteristics that are most preferred by farmers in a new rice variety, varietal attributes were identified and farmers were made to rank them. The ranking was evaluated using the Kendall’s coefficient of concordance (W) to identify the varietal attributes that is most preferred by the farmers. The Kendall’s coefficient of concordance (W) is a measure of degree of agreement/concordance among m set of n ranks. It is an index that measures the ratio of the observed variance of the sum of ranks to the maximum possible variance of sum of ranks. The essence of this index is to find the sum of the ranks for each attribute/factor being ranked and to examine the variability of this sum. If the rankings are in perfect agreement the variability among these sums is said to be a minimum (Mattson, 1986).
The analysis is a statistical technique that is used to identify and
286 J. Dev. Agric. Econ.
Figure 1. A map of the Ashanti Region Ghana.
rank a given set of factors into the most pressing and then measures the degree of agreements among the judges. Usually the identified factors are ranked according to the most pressing using numerals such as 1, 2, 3...,n, in that order. The factor with least total score is ranked as the most pressing, while the one with the highest score is ranked as least pressing. The computed total rank score is then used to calculate the W. The value of W is positive in sign and ranges from 0 to 1. It is 1 when the values assigned by one farmer are exactly the same as those assigned by other farmers, and is 0 when there is maximum disagreement among the farmers.
Given that T represents the sum of ranks of each factor being ranked, the variance of the sum is given by
2 2( ) /T
T T nVar
n
(1) The maximum variance of T is then given by
2 2( 1) /12m n (2)
Where m = number of sets of rankings (by the farmers) and n = the number of specific varietal attributes being ranked. The Coefficient of Concordance (W) is therefore given as:
2 2
2 2
( ) / /
( 1) /12
T T n nW
m n
(3)
Equation (3) is further simplifies to the computational formula as:
2 2
2 2
12 ( ) / /
( 1)
T T n nW
nm n
(4) The hypothesis and the significance of the rankings are further assessed using the F-test as follows:
The null (H0) and the alternative (H1) hypotheses are stated as follows: H0: there is no agreement among the rankings of the varietal characteristics preferred by farmers in a new rice variety, versus and H1: there is agreement among the rankings of varietal characteristics preferred by farmers in a new rice variety. The coefficient of Concordance (W) may be tested for significance in terms of the F distribution. It is given by:
( 1)F
(1 )
c
c
m W
W
(5)
Where Wc is the calculated Coefficient of Concordance (W).
The F statistic has 1 ( 1) 2 /v n m degrees of freedom for
the numerator, and
2 ( 1) ( 1) 2 /v m n m degrees of freedom for the
denominator. If the F is greater than the relevant critical F* from Fisher’s F statistical distribution table, the null hypothesis is rejected. The probit model was used to assess the influence of grain quality and other factors on farmers’ preference for improved rice varieties. The study used the probit model (Maddala, 2005) specified as:
*( )i i iP P y y
*
0( ) ( )i i j ji iP P y X F y
2 / 21( )
2
iZs
i iP F y e ds
(6)
where is the probability that an individual will make a certain
choice (prefer an improved rice variety or not), s is a random
variable normally distributed with mean zero and a unit variance.
iy
is the dependent variable (observed preference for an
improved rice variety) and *
iy is the threshold value of the
dependent variable.
To obtain an estimate of the index iZ , the inverse of the
cumulative normal function is used:
1
0i ki ki iyi F P x u (7)
The parameter estimates s of the probit apart from the
information on the effect of changes in the explanatory variable on the probability of adoption also provide information on the relative effect of each explanatory variable on the likelihood that a farmer will prefer an improved variety. The latter can be obtained as follows:
* ( )iij i
ji
Pf Z
X
(8)
Where is the mean of estimated probability that a farmer prefers
a variety and
1( ) ( )i if Z F P (9)
The elasticity of the predicted probability is then computed as:
* ( )*iij i
ji i
P Xf Z
X P
(10)
Guided by related studies in the past, (Asrat et al., 2010; Ayamga et al., 2006; Gockowski and Ndoumbe, 2004; Nzomoi et al., 2007), socio-economic attributes as well as varietal traits were identified and hypothesis constructed regarding farmers’ preference for improved rice varieties. These factors either had a bearing on the individual (farmer) or on the improved variety and therefore policy. The variables include age, gender (sex), level of education, farm size, experience in rice production and other attributes of the variety such as high yield, good grain quality, tolerance to biotic stress and tolerance to pest and diseases. A dummy variable was used to specify sex of farmers (SEX). Rice cultivation is labour intensive in southern Ghana. As a result more males are involved in rice cultivation than females. In view of the above, a value of 1 was assigned to males and 0 to females. If this is true, the sex variable is expected to be significant. A person with formal education is expected to have adequate knowledge on the importance of planting improved varieties. Most researchers have found a positive relationship between education and preference for a new technology (Gamba et al., 2002; Nzomoi et al., 2007; Ayamga et al., 2006; Katungi, 2006; Mussei et al., 2001). The variable education (EDUC) is therefore expected to be positive.
Age is represented by AGE and AGE2. Many studies have found a negative relationship between age and preference or adoption (Gockowski and Ndoumbe, 2004; McBride and Daberkow, 2003; Gamba et al., 2002). The hypothesis here is that farming requires strength hence, as one ages, his or her strength begin to decline after a peak age hence beyond this age, farmers’ desire to explore new technologies begin to decrease. In addition, past success of older farmers could make them complacent, affecting their preference for new varieties. Young farmers are therefore more likely to prefer improved varieties. Hence the variable AGE is expected to be negative. The variable FRMSZE is used to represent farm size and it defines the effective land area (in hectares) under rice cultivation and not total land area owned by
Asante et al. 287 farmers. Most researchers have found a positive relationship between farm size and farmers preference for a given technology (Asrat et al., 2010; Adimado, 2001; Kheralla et al., 2001; Langyintuo and Mekuria, 2005). The implication here is that farmers with larger farm sizes for a particular crop tend to require more support in terms of marketing, pricing and inputs than their counterparts with smaller farm sizes hence will prefer an improved variety that will enable them to increase their productivity and income. This variable is thus expected to be positive.
The variable HIGYLD is expected to have a positive influence on farmers’ preference for a new rice variety. Grain quality is an important attribute that farmers consider in selecting a particular rice variety. This is because it has a direct effect on the demand for the produce, its market price and resultant income that accrue to the farmer. A study by Ramasamy et al. (2003) has shown a positive effect of grain quality on the willingness of drop outs to continue cultivating hybrid rice varieties in Tamil Nadu. The variable GGQAP was binary, and was assigned a value of 1 if farmers prefer good grain quality and 0 if otherwise. This variable is expected to be positive.
Biotic and abiotic stresses such as drought, iron toxicity, nitrogen use efficiency, diseases and pests, including weeds have debilitating effects on grain yield, grain quality, market price and farmer income. Farmers will thus prefer improved rice varieties with high tolerance to these stresses. Odendo et al. (2001) found a positive relationship between tolerances to stresses especially striga, drought, diseases and insect pests and farmers’ preference for improved maize varieties in Western Kenya. The variables TBIOSTRSS and TPED representing tolerance to biotic stress and tolerance to pest and diseases, respectively are thus expected to be positive.
The empirical model is specified as:
2
0 1 2 3 4 5
6 7 8 9 10SEX+ TBIOSTRSS+
b
i
y AGE AGE FRMSIZE GGQAP HIGHYLD
EXP TPED EDUCL
(11)
The dependent variable is the farmers’ preference for an
improved rice variety or otherwise and it takes the value of 1 if the farmer prefers an improved variety and 0 if he/she does not. The probit model employed to estimate the effect of factors influencing farmer preference for an improved rice variety included nine explanatory variables. Table 1 presents a description of the explanatory variables used in the model with their means or frequencies.
Further analysis on grain quality attributes The above model will estimate the influence of grain quality on farmers’ preference for an improved rice variety in Ghana. However, the specific quality attributes that significantly bring about this influence were not clear. In view of this, a second analysis which investigates the influence of specific grain quality attributes on farmers’ preference for an improved rice variety was imperative. In this analysis, several grain quality attributes were explored to assess their influence on farmers’ preference for an improved rice variety. The explanatory variables included in the second model include grain colour, cooking quality, expansion ratio, absence of foreign material, fragrance, grain length and shape, percent brokenness and chalkiness.
Colour, cooking quality, absence of foreign materials, fragrance and chalkiness were represented by dummy variables. All these factors except chalkiness are expected to have a positive effect on farmers’ preference. Chalkiness is not preferred among consumers hence is expected to have a negative influence on farmers preferences. The model is specified as:
288 J. Dev. Agric. Econ.
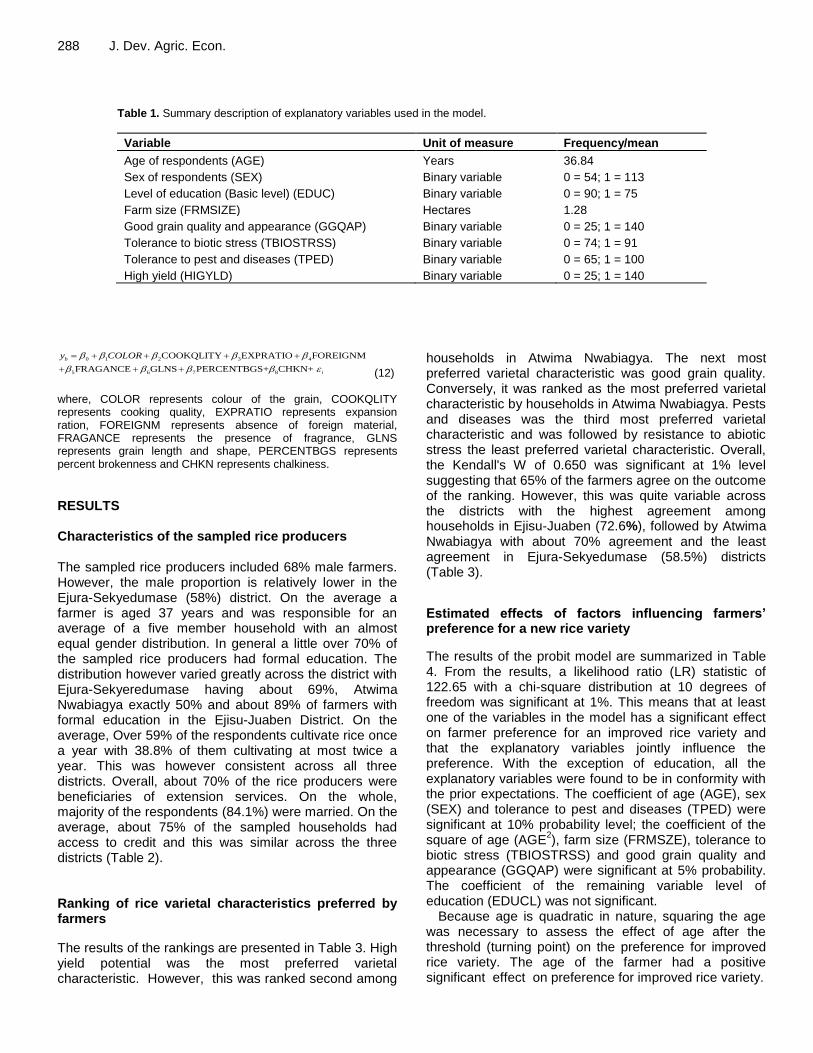
Table 1. Summary description of explanatory variables used in the model.
Variable Unit of measure Frequency/mean
Age of respondents (AGE) Years 36.84
Sex of respondents (SEX) Binary variable 0 = 54; 1 = 113
Level of education (Basic level) (EDUC) Binary variable 0 = 90; 1 = 75
Farm size (FRMSIZE) Hectares 1.28
Good grain quality and appearance (GGQAP) Binary variable 0 = 25; 1 = 140
Tolerance to biotic stress (TBIOSTRSS) Binary variable 0 = 74; 1 = 91
Tolerance to pest and diseases (TPED) Binary variable 0 = 65; 1 = 100
High yield (HIGYLD) Binary variable 0 = 25; 1 = 140
0 1 2 3 4
5 6 7 8
COOKQLITY EXPRATIO FOREIGNM
FRAGANCE GLNS PERCENTBGS+ CHKN+
b
i
y COLOR
(12)
where, COLOR represents colour of the grain, COOKQLITY represents cooking quality, EXPRATIO represents expansion ration, FOREIGNM represents absence of foreign material, FRAGANCE represents the presence of fragrance, GLNS represents grain length and shape, PERCENTBGS represents percent brokenness and CHKN represents chalkiness.
RESULTS Characteristics of the sampled rice producers The sampled rice producers included 68% male farmers. However, the male proportion is relatively lower in the Ejura-Sekyedumase (58%) district. On the average a farmer is aged 37 years and was responsible for an average of a five member household with an almost equal gender distribution. In general a little over 70% of the sampled rice producers had formal education. The distribution however varied greatly across the district with Ejura-Sekyeredumase having about 69%, Atwima Nwabiagya exactly 50% and about 89% of farmers with formal education in the Ejisu-Juaben District. On the average, Over 59% of the respondents cultivate rice once a year with 38.8% of them cultivating at most twice a year. This was however consistent across all three districts. Overall, about 70% of the rice producers were beneficiaries of extension services. On the whole, majority of the respondents (84.1%) were married. On the average, about 75% of the sampled households had access to credit and this was similar across the three districts (Table 2). Ranking of rice varietal characteristics preferred by farmers
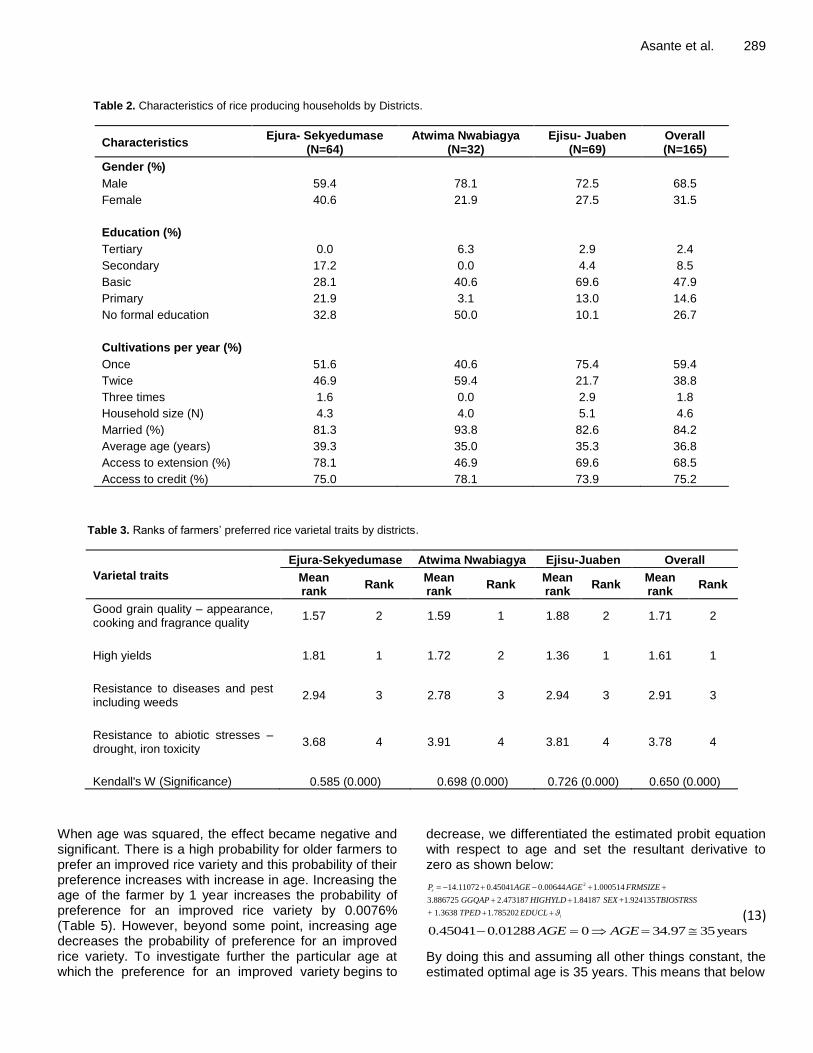
The results of the rankings are presented in Table 3. High yield potential was the most preferred varietal characteristic. However, this was ranked second among
households in Atwima Nwabiagya. The next most preferred varietal characteristic was good grain quality. Conversely, it was ranked as the most preferred varietal characteristic by households in Atwima Nwabiagya. Pests and diseases was the third most preferred varietal characteristic and was followed by resistance to abiotic stress the least preferred varietal characteristic. Overall, the Kendall's W of 0.650 was significant at 1% level suggesting that 65% of the farmers agree on the outcome of the ranking. However, this was quite variable across the districts with the highest agreement among households in Ejisu-Juaben (72.6%), followed by Atwima Nwabiagya with about 70% agreement and the least agreement in Ejura-Sekyedumase (58.5%) districts (Table 3).
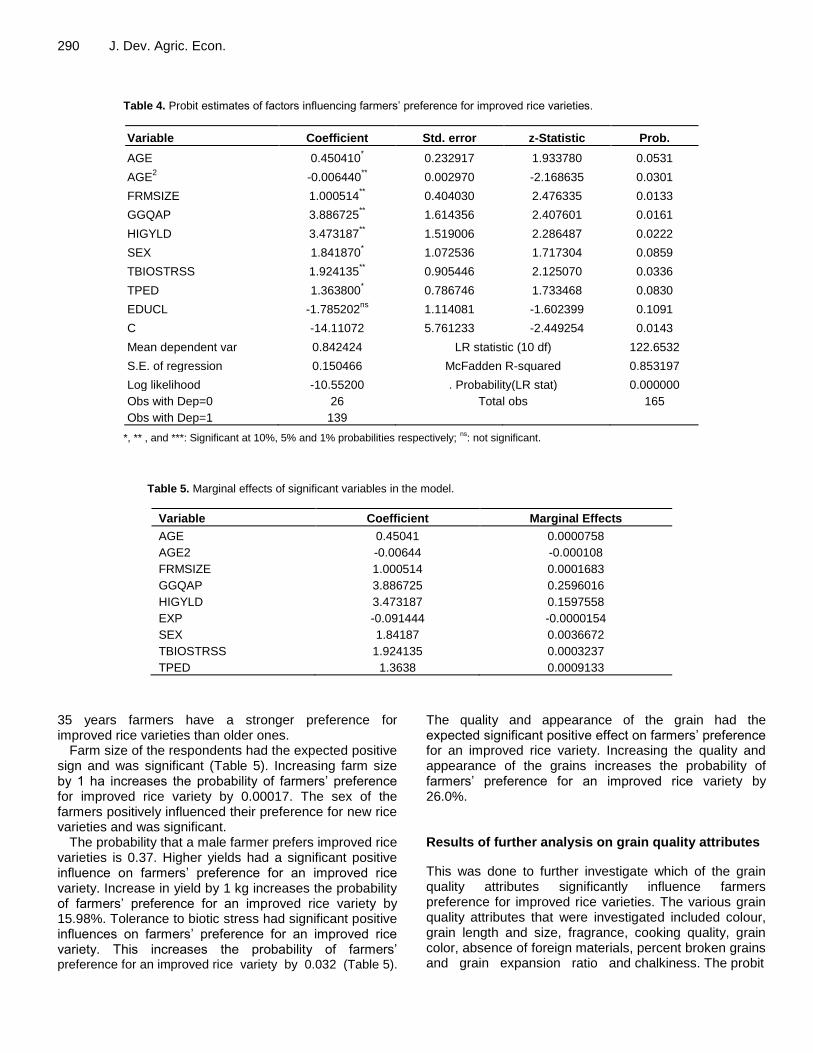
Estimated effects of factors influencing farmers’ preference for a new rice variety
The results of the probit model are summarized in Table 4. From the results, a likelihood ratio (LR) statistic of 122.65 with a chi-square distribution at 10 degrees of freedom was significant at 1%. This means that at least one of the variables in the model has a significant effect on farmer preference for an improved rice variety and that the explanatory variables jointly influence the preference. With the exception of education, all the explanatory variables were found to be in conformity with the prior expectations. The coefficient of age (AGE), sex (SEX) and tolerance to pest and diseases (TPED) were significant at 10% probability level; the coefficient of the square of age (AGE
2), farm size (FRMSZE), tolerance to
biotic stress (TBIOSTRSS) and good grain quality and appearance (GGQAP) were significant at 5% probability. The coefficient of the remaining variable level of education (EDUCL) was not significant.
Because age is quadratic in nature, squaring the age was necessary to assess the effect of age after the threshold (turning point) on the preference for improved rice variety. The age of the farmer had a positive significant effect on preference for improved rice variety.
Asante et al. 289
Table 2. Characteristics of rice producing households by Districts.
Characteristics Ejura- Sekyedumase
(N=64) Atwima Nwabiagya
(N=32) Ejisu- Juaben
(N=69) Overall (N=165)
Gender (%)
Male 59.4 78.1 72.5 68.5
Female 40.6 21.9 27.5 31.5
Education (%)
Tertiary 0.0 6.3 2.9 2.4
Secondary 17.2 0.0 4.4 8.5
Basic 28.1 40.6 69.6 47.9
Primary 21.9 3.1 13.0 14.6
No formal education 32.8 50.0 10.1 26.7
Cultivations per year (%)
Once 51.6 40.6 75.4 59.4
Twice 46.9 59.4 21.7 38.8
Three times 1.6 0.0 2.9 1.8
Household size (N) 4.3 4.0 5.1 4.6
Married (%) 81.3 93.8 82.6 84.2
Average age (years) 39.3 35.0 35.3 36.8
Access to extension (%) 78.1 46.9 69.6 68.5
Access to credit (%) 75.0 78.1 73.9 75.2
Table 3. Ranks of farmers’ preferred rice varietal traits by districts.
Varietal traits
Ejura-Sekyedumase Atwima Nwabiagya Ejisu-Juaben Overall
Mean rank
Rank Mean rank
Rank Mean rank
Rank Mean rank
Rank
Good grain quality – appearance, cooking and fragrance quality
1.57 2 1.59 1 1.88 2 1.71 2
High yields 1.81 1 1.72 2 1.36 1 1.61 1
Resistance to diseases and pest including weeds
2.94 3 2.78 3 2.94 3 2.91 3
Resistance to abiotic stresses – drought, iron toxicity
3.68 4 3.91 4 3.81 4 3.78 4
Kendall's W (Significance) 0.585 (0.000) 0.698 (0.000) 0.726 (0.000) 0.650 (0.000)
When age was squared, the effect became negative and significant. There is a high probability for older farmers to prefer an improved rice variety and this probability of their preference increases with increase in age. Increasing the age of the farmer by 1 year increases the probability of preference for an improved rice variety by 0.0076% (Table 5). However, beyond some point, increasing age decreases the probability of preference for an improved rice variety. To investigate further the particular age at which the preference for an improved variety begins to
decrease, we differentiated the estimated probit equation with respect to age and set the resultant derivative to zero as shown below:
214.11072 0.45041 0.00644 1.000514
3.886725 2.473187 1.84187 +1.924135
+ 1.3638 1.785202
r
i
P AGE AGE FRMSIZE
GGQAP HIGHYLD SEX TBIOSTRSS
TPED EDUCL
(13) 0.45041 0.01288 0 34.97 35yearsAGE AGE
By doing this and assuming all other things constant, the estimated optimal age is 35 years. This means that below
290 J. Dev. Agric. Econ.
Table 4. Probit estimates of factors influencing farmers’ preference for improved rice varieties.
Variable Coefficient Std. error z-Statistic Prob.
AGE 0.450410* 0.232917 1.933780 0.0531
AGE2
-0.006440** 0.002970 -2.168635 0.0301
FRMSIZE 1.000514** 0.404030 2.476335 0.0133
GGQAP 3.886725** 1.614356 2.407601 0.0161
HIGYLD 3.473187** 1.519006 2.286487 0.0222
SEX 1.841870* 1.072536 1.717304 0.0859
TBIOSTRSS 1.924135** 0.905446 2.125070 0.0336
TPED 1.363800* 0.786746 1.733468 0.0830
EDUCL -1.785202ns
1.114081 -1.602399 0.1091
C -14.11072 5.761233 -2.449254 0.0143
Mean dependent var 0.842424 LR statistic (10 df) 122.6532
S.E. of regression 0.150466 McFadden R-squared 0.853197
Log likelihood -10.55200 . Probability(LR stat) 0.000000
Obs with Dep=0 26 Total obs 165
Obs with Dep=1 139
*, ** , and ***: Significant at 10%, 5% and 1% probabilities respectively; ns
: not significant.
Table 5. Marginal effects of significant variables in the model.
Variable Coefficient Marginal Effects
AGE 0.45041 0.0000758
AGE2 -0.00644 -0.000108
FRMSIZE 1.000514 0.0001683
GGQAP 3.886725 0.2596016
HIGYLD 3.473187 0.1597558
EXP -0.091444 -0.0000154
SEX 1.84187 0.0036672
TBIOSTRSS 1.924135 0.0003237
TPED 1.3638 0.0009133
35 years farmers have a stronger preference for improved rice varieties than older ones.
Farm size of the respondents had the expected positive sign and was significant (Table 5). Increasing farm size by 1 ha increases the probability of farmers’ preference for improved rice variety by 0.00017. The sex of the farmers positively influenced their preference for new rice varieties and was significant.
The probability that a male farmer prefers improved rice varieties is 0.37. Higher yields had a significant positive influence on farmers’ preference for an improved rice variety. Increase in yield by 1 kg increases the probability of farmers’ preference for an improved rice variety by 15.98%. Tolerance to biotic stress had significant positive influences on farmers’ preference for an improved rice variety. This increases the probability of farmers’ preference for an improved rice variety by 0.032 (Table 5).
The quality and appearance of the grain had the expected significant positive effect on farmers’ preference for an improved rice variety. Increasing the quality and appearance of the grains increases the probability of farmers’ preference for an improved rice variety by 26.0%. Results of further analysis on grain quality attributes
This was done to further investigate which of the grain quality attributes significantly influence farmers preference for improved rice varieties. The various grain quality attributes that were investigated included colour, grain length and size, fragrance, cooking quality, grain color, absence of foreign materials, percent broken grains and grain expansion ratio and chalkiness. The probit
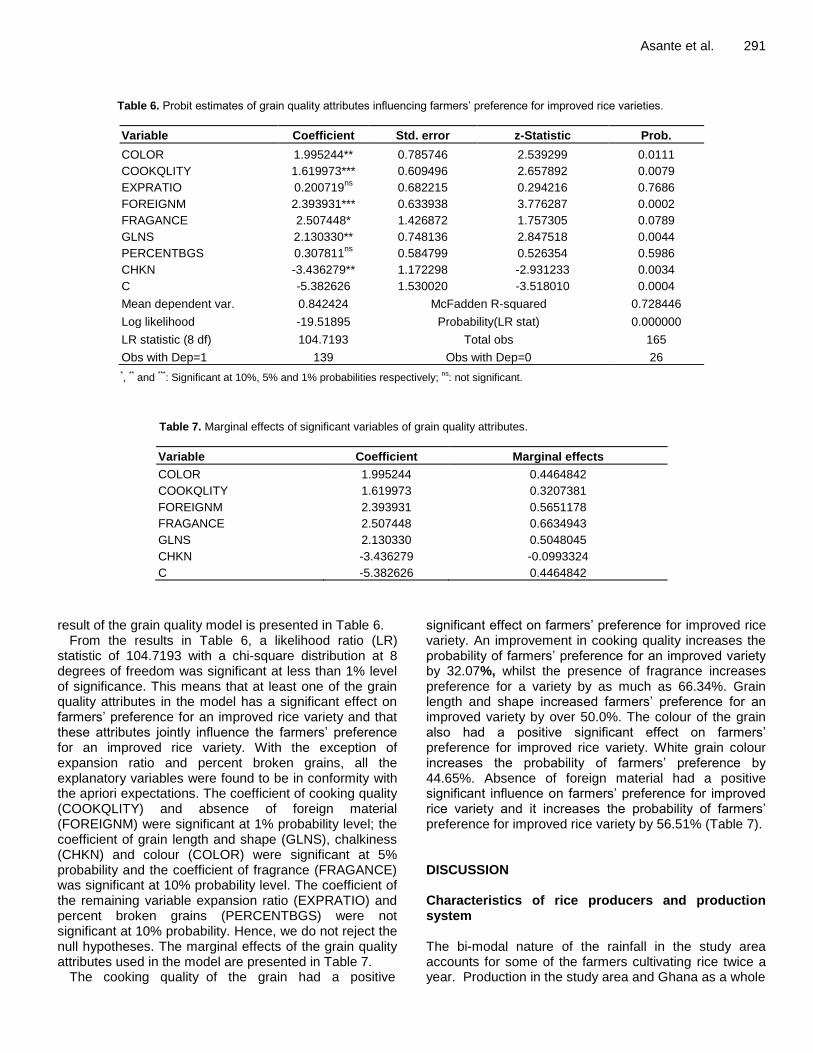
Asante et al. 291
Table 6. Probit estimates of grain quality attributes influencing farmers’ preference for improved rice varieties.
Variable Coefficient Std. error z-Statistic Prob.
COLOR 1.995244** 0.785746 2.539299 0.0111
COOKQLITY 1.619973*** 0.609496 2.657892 0.0079
EXPRATIO 0.200719ns
0.682215 0.294216 0.7686
FOREIGNM 2.393931*** 0.633938 3.776287 0.0002
FRAGANCE 2.507448* 1.426872 1.757305 0.0789
GLNS 2.130330** 0.748136 2.847518 0.0044
PERCENTBGS 0.307811ns
0.584799 0.526354 0.5986
CHKN -3.436279** 1.172298 -2.931233 0.0034
C -5.382626 1.530020 -3.518010 0.0004
Mean dependent var. 0.842424 McFadden R-squared 0.728446
Log likelihood -19.51895 Probability(LR stat) 0.000000
LR statistic (8 df) 104.7193 Total obs 165
Obs with Dep=1 139 Obs with Dep=0 26 *
, ** and
***: Significant at 10%, 5% and 1% probabilities respectively;
ns: not significant.
Table 7. Marginal effects of significant variables of grain quality attributes.
Variable Coefficient Marginal effects
COLOR 1.995244 0.4464842
COOKQLITY 1.619973 0.3207381
FOREIGNM 2.393931 0.5651178
FRAGANCE 2.507448 0.6634943
GLNS 2.130330 0.5048045
CHKN -3.436279 -0.0993324
C -5.382626 0.4464842
result of the grain quality model is presented in Table 6. From the results in Table 6, a likelihood ratio (LR)
statistic of 104.7193 with a chi-square distribution at 8 degrees of freedom was significant at less than 1% level of significance. This means that at least one of the grain quality attributes in the model has a significant effect on farmers’ preference for an improved rice variety and that these attributes jointly influence the farmers’ preference for an improved rice variety. With the exception of expansion ratio and percent broken grains, all the explanatory variables were found to be in conformity with the apriori expectations. The coefficient of cooking quality (COOKQLITY) and absence of foreign material (FOREIGNM) were significant at 1% probability level; the coefficient of grain length and shape (GLNS), chalkiness (CHKN) and colour (COLOR) were significant at 5% probability and the coefficient of fragrance (FRAGANCE) was significant at 10% probability level. The coefficient of the remaining variable expansion ratio (EXPRATIO) and percent broken grains (PERCENTBGS) were not significant at 10% probability. Hence, we do not reject the null hypotheses. The marginal effects of the grain quality attributes used in the model are presented in Table 7.
The cooking quality of the grain had a positive
significant effect on farmers’ preference for improved rice variety. An improvement in cooking quality increases the probability of farmers’ preference for an improved variety by 32.07%, whilst the presence of fragrance increases preference for a variety by as much as 66.34%. Grain length and shape increased farmers’ preference for an improved variety by over 50.0%. The colour of the grain also had a positive significant effect on farmers’ preference for improved rice variety. White grain colour increases the probability of farmers’ preference by 44.65%. Absence of foreign material had a positive significant influence on farmers’ preference for improved rice variety and it increases the probability of farmers’ preference for improved rice variety by 56.51% (Table 7). DISCUSSION Characteristics of rice producers and production system The bi-modal nature of the rainfall in the study area accounts for some of the farmers cultivating rice twice a year. Production in the study area and Ghana as a whole
292 J. Dev. Agric. Econ. is perceived to be very tedious. This may explain why production is dominated by males. The high gender imbalance in rice production can however limit the full potential the rice sector. Contrary to earlier studies, rice production in the study area includes farmers in their middle ages (Asuming-Brempong et al., 2011; Wiredu et al., 2010; Asante et al., 2011). This observation is interesting and can boost efforts to improve rice production in the country. These are farmers who are targeted by various interventions and with their zeal they are more likely to invest in new technologies.
Most studies have shown relatively low level of education among farm households in Ghana; this situation is predominant in northern Ghana (Akudugu et al., 2012; Wiredu et al., 2011; Wiredu et al., 2010). In this study however, the large majority of the heads of rice producing families had at least basic education. This result is interesting because the farmers in question have the ability to assess and evaluate the potential benefits of the improved technologies and make informed decisions. The good farmer contact with extension officers will enhance access to information on new technologies. It is important for development interventions to provide adequate support for institutions such extension and research to ensure effective promotion of agricultural technologies such as improved rice varieties. Factors influencing preference for improved rice varieties Age was used as a proxy for experience in rice cultivation. There was a positive relationship between age and preference. However, this relationship was not stable but reversed after age 35. This shows that farmers below this age are energetic, hence have the physical capability of expanding their rice farms and so are interested in new rice technologies than older farmers. These findings are quite consistent with that of previous research (McBride and Daberkow, 2003; Ayamga et al., 2006; Gamba et al., 2002). Asante et al. (2011) also found a positive relationship between age and farmers’ decision to join farmer based organizations in Ghana. It is therefore important for the country to develop policies that would create incentives to attract and maintain young farmers in rice production. It is necessary to identify the preferences of this age group for effective targeting of such policies.
Some researchers have found a positive relationship between farm size and farmers preference for a given technology (Asrat et al., 2010; Adimado, 2001; Kheralla et al., 2001; Langyintuo and Mekuria, 2005; Asante et al., 2011). The larger the size of the farm, the higher the investments made with the corresponding expected income and higher risks hence farmers will prefer an improved variety that will enable them to increase their productivity and income and at the same time reduce
risks. Promotional strategies for improved rice varieties should also target farmers with relatively large farm sizes with an average of about 1.28 ha. However, expansion of rice area should also come with strategies to increase yields through training in good agricultural practices. More importantly, the use of recommended fertilizer rates and other complementary technologies should be encouraged to help increase yields. Farmers must also be sensitized and encouraged to take advantage of the on-going fertilizer and seed subsidy program in order to obtain the best from increased area of the preferred improved variety. Increase in yields have been a major driving determinant of farmers’ preference for improved varieties (Langyintuo and Mekuria 2005; Ramasamy et al., 2003; Odendo et al., 2001). Farmers with higher yield are motivated to further improve their yields in the subsequent year and this will require them to adopt improved varieties with high yield potential coupled with other factors (Asrat et al., 2010).
Abiotic stresses such as drought, iron toxicity, nitrogen deficiency as well as biotic stresses (pests and diseases) could have adverse effects on yield even when a variety with high yield potential is cultivated. Tolerance to these stresses motivates farmers to prefer improved rice varieties positively. Similar finding was obtained by Odendo et al. (2001) when assessing farmers’ preferences and constraints to maize production in Western Kenya. Kshirsagar et al. (2002) also found tolerance to biotic and abiotic stresses as having positive influence in determining varietal preference of farmers in Orissa. Another important factor that influences farmers’ preference for an improved variety is superior grain quality. Superior grain quality increased farmers’ preference for improved rice varieties by as much 26.0%. Unlike other cereals, rice is mostly consumed as whole grains. The physical appearance of the rice grain is therefore an important attribute when it comes to marketing of the produce. Poor appearance and cooking qualities will reduce demand and hence the price of domestic rice and this will mean low incomes for farmers. Against this background, farmers in recent times consider attributes that interests consumers in their production decision-making. Researchers and policy makers should consider grain quality as one of the major criteria in developing varieties to boost domestic rice production and consumption in Ghana. Grain quality and farmer preference for improved varieties Rice grain quality includes physical appearance of the grain as well as cooking and eating quality. In the present study, appearance related traits including colour, grain length and shape had positive effect on farmers’ preference for improved varieties. Chalkiness on the other had a negative effect on farmers’ preference for a
new variety. These findings are not surprising because most rice consumers in Ghana prefer white coloured, long grain rice that is not chalky but translucent (Bam et al., 1998). Consequently, farmers would need varieties with these consumer preferred attributes to be able to sell their rice. Another consumer preferred attribute is low percentage of broken grains but this attribute did not significantly affect farmers’ preference for rice varieties. This could be because the farmers saw percent broken rice as a trait which is wholly controlled by post-harvest handling and the effectiveness a milling machine. There is however, some genetic control for milling yield (Aluko et al., 2004) and it can therefore be bred for by breeders. Breeders can also breed for preferred cooking and eating attributes of rice including fragrance. The presence of fragrance and the desired cooking quality had significant influence on farmers’ preference for improved varieties. Such varieties will be easier to market because taste, aroma and texture are reported to be the three most critical attributes that Ghanaian consumers look for in cooked rice (Diaka et al., 2010). Another cooking attribute, expansion ratio, did not influence farmer-preference for improved rice varieties possibly because consumers put more emphasis on taste rather than volume expansion for cooked rice (Diaka et al., 2010).
Conclusions
This study assessed the influence of grain quality and other factors in farmers’ preference for improved rice varieties. Key variables that significantly influenced farmers’ preference for a new rice variety were; age, farm size, high yield, experience, sex, tolerance to abiotic and biotic stresses and good grain quality. Grain quality was ranked second to high yield as the most important varietal characteristics that farmers require. Grain quality attributes that significantly influenced farmers’ preference for a new rice variety were grain colour, grain length and shape, chalkiness, fragrance, cooking behaviour and absence of foreign material.
Implication for research
Factors such as age, sex, farm size, experience, tolerance to pest and diseases, tolerance to abiotic stress and good grain quality need to be considered by researchers in the development and dissemination of new rice varieties. It is imperative to assess farmers’ perception and opinion from the beginning of the research process and incorporate them into research programmes. This will enhance the acceptability of research output such as improved varieties.
Grain quality attributes are of keen interest to farmers and are likely to influence their preference for an improved rice variety. Hence researchers should consider grain quality attributes particularly, white coloured, long,
Asante et al. 293 slender and translucent grains (low chalkiness), fragrance and preferred cooking quality in their rice breeding efforts. Breeders of other crops should also consider quality issues to increase adoptability of varieties. This is because like any other economic agent, production decisions of small scale farmers are profit oriented. Hence farmers will choose varieties that are not only high yielding but have grain qualities that will make it easily marketable. Because rice is consumed as whole grains, the quality of the grain greatly influence its demand. Research into superior grain quality would therefore improve consumer acceptability and farmer adoption of improved rice varieties. Policy implications Generally, rice farmers respond to demand signals among other factors to produce. If the demand is high, all things being equal, farmers are likely to produce to meet the high demand given the available resources. Additionally, since the demand for the grain is affected by its quality, efforts towards addressing the quality issues are likely to boost local rice production and consumption. In view of this, efforts should be targeted at enhancing the development of rice varieties with inherent good grain quality attributes. In addition, government could partner with the private sector to invest in the establishment of rice post-harvest centers. Such centers should be equipped with the necessary post-harvest and processing facilities to ensure the production of good quality rice grains. The production of good quality rice will increase consumer and trader acceptability for locally produced rice and result in higher incomes of small scale rice farmers. ACKNOWLEDGEMENTS This work was sponsored by the Alliance for Green Revolution in Africa. Many thanks go to the agricultural extension officers in the study areas for the enormous role they played in organizing farmers for the study. All technicians of the CSIR-Crops Research Institute, Ghana who worked on this study are appreciated for their assistance. REFERENCES Abansi CL, Duff B, Lantican FA, Juliano BO (1992). Consumer demand
for rice grain quality in selected rural and urban markets in the Philippine. in Consumer demand for rice grain quality. International Rice Research Institute, P. O. Box 933, Manila, Philippines. pp. 37-57.
Adimado S (2001). Willingness to Pay for Research Findings: A Case Study of Pineapple Farmers in Ghana. MPhil Thesis Submitted to the Department of Agricultural Economics and Agribusiness, University of Ghana, Legon. pp. 38-50.
Akudugu MA, Guo E, Dadzie SK (2012). Adoption of Modern
294 J. Dev. Agric. Econ. Agricultural Production Technologies by Farm Households in Ghana:
What Factors Influence their Decisions. J. Biol. Agric. Health Care 2(3).
Aluko G, Martinez C, Tohme J, Castano C, Bergman C, Oard JH (2004). QTL mapping of grain quality traits from the interspecific cross Oryza sativa x O. glaberrima. Theor. Appl. Genet. 109:630-639.
Asante BO, Afari-Sefa V, Sarpong DB (2011). Determinants of small-scale farmers’ decision to join farmer based organizations in Ghana. Afr. J. Agric. Res. 6(10):2273-2279.
Asrat S, Yesuf M, Carlsson F, Wale E (2010). Farmers' preferences for crop variety traits: Lessons for on-farm conservation and technology
adoption. J. Ecol. Econ. 69:2394-2401. Asuming-Brempong S, Gyasi KO, Marfo KA, Diagne A, Wiredu AN,
Asuming-Boakye A, Haleegoah J, Frimpong BN (2011). The exposure and adoption of New Rice for Africa (NERICAs) among Ghanaian rice farmers: What is the evidence. Afr. J. Agric. Res. 6(27):5911-5917.
Asuming-Brempong S, Osei-Asare YB (2007). Has imported rice crowded-out domestic rice production in Ghana? What has been the role of policy? African Association of Agricultural Economists (AAAE) Conference proceedings: pp. 91-97.
Ayamga M (2006). Factors influencing the decision to participate in microcredit Programmes: An illustration for Northern Ghana. Ghana J. Dev. Stud. 3(2):57-65.
Bam RK, Anchirinah VM, Manful JT, Ansere-Bioh F, Agyeman A (1998). A preliminary study on consumer preference and price quality relationship in Ghana.Improving the competitiveness of local rice in Ghana, NRI, UK.
Choudhury N, Kabir KA, Biswas SK, Islam R (1992). Influence of rice grain properties on market price in Bangladesh. in Consumer demand for rice grain quality. International Rice Research Institute, P. O. Box 933, Manila, Philippines. pp. 117-133.
Diako C, Sakyi-Dawson E, Bediako-Amoa B, Saalia FK, Manful JT (2010). Consumer perceptions, knowledge and preferences for aromatic rice types in Ghana. Nat. Sci. 8(12):12-19.
Duffuor K (2009). Budget Statement and Economic Policy of the Government of Ghana for the 2010 Fiscal Year.
Efisue A, Tongoona P, Derera J, Langyintuo A, Laing M, Ubi B (2008). Farmers’ Perceptions on Rice Varieties in Sikasso of Mali and their Implications for Rice Breeding. J. Agron. Crop Sci. 194:393-400.
Gamba P, Ngugi C, Verkuijl H, Mwangi W, Kiriswa F (2002). Wheat Farmers’ Seed Management and Varietal Adoption in Kenya. Mexico, D.F.: CIMMYT, Egerton University, Njoro, Kenya, and KARI, Nairobi. P. 22.
Gockowski J, Ndoumbe M (2004). The Adoption of Intensive Monocrop Horticulture in Southern Cameroon. J. Agric. Econ. 30:195-202.
Grandstaff TB, Grandstaff SW (1987). A conceptual basis for methodological development in rapid rural appraisal. In: Proceeding of the 1985 Institutional Conference on Rapid Rural Appraisal. Rural Systems Research Project and Farming Systems Research Project, 69-88. KhonKaen University, KhonKaen, Thailand.
Joshi G, Bauer S (2006). Farmers’ Choice of the Modern Rice Varieties in the Rainfed Ecosystem of Nepal. J. Agric. Rural Dev. Trop. Subtropics 107(2):129-138.
Juliano BO, Duff B (1991). Rice grain quality as an emerging priority in national rice breeding programs.Pages 55-64 in Rice grain marketing and quality issues.International Rice Research Institute, Manila, Philippines.
Katungi EM (2006). Social Capital and Technology Adoption on Small Farms: The Case of Banana Production Technology in Uganda. Doctor of Philosophy Thesis, Department of Agricultural Economics, Extension and Rural Development, Faculty of Natural and Agricultural Sciences, University of Pretoria, South Africa.
Kheralla M, Minet N, Kachule R, Souce BG, Berry P (2001). Impact of
Agricultural Market Reforms on Smallholder Farmers in Benin and Malawi, Research Report, P. 2, IFPRI.
Kshirsagar KG, Pandey S, BellonSource MR (2002). Farmer Perceptions, Varietal Characteristics and Technology Adoption: A Rainfed Rice Villagein Orissa, Economic and Political Weekly, 37(13):1239-1246.
Langyintuo AS, Mekuria M (2005). Accounting for neighborhood influence in estimating factors determining the adoption of improved agricultural technologies. A paper at American Agricultural Economics Association annual meeting, providence, Rode Island: pp. 1-28
Maddala GS (2005). Introduction to Econometrics.3rdEdition, John Wiley
& Sons Ltd, The Atrium, Southern Gate, England: pp. 318-323. Mattson DE (1986). Statistics-Difficult Concepts Understandable
Explanations. Bolchazy-Carducci Pub. Inc. pp. 281-283. McBride WW, Daberkow SG (2003). Information and the Adoption of
Precision Farming Technologies. J. Agribus. 21:21-28. Mussei A, Mwanga J, Mwangi W, Verkuijl H, Mungi R, Elang A (2001).
Adoption of Improved Wheat Technologies by Small-Scale Farmers in Mbeya District, Southern Highlands, Tanzania. Mexico D.F.: International Maize and Wheat Improvement Centre (CIMMYT) and the United Republic of Tanzania.
Nwanze KF, Mohapatra S, Kormawa P, Keya S, Bruce-Oliver S (2006). Rice development in sub-Saharan Africa. J. Sci. Food. Agric. 86(5):675-677.
Nzomoi JN, Byaruhanga JK, Maritim HK, Omboto PI (2007). Determinants of technology adoption in the production of horticultural export produce in Kenya. Afr. J. Bus. Manage. 1(5):129-135.
Obiri BD (2003). Developing and Testing Technologies with Farmers.Natural Resources Systems Programme. Project report, DFID Project No. R7446. 30 pp. http://www.nrsp.org.uk./database/documentation/2950.pdf [accessed 25 May 2007].
Odendo M, De Groote H, Odongo OM (2001). Assessment Of Farmers’ Preferences And Constraints To Maize Production In Moist Mid-altitude Zone Of Western Kenya. Paper presented at the 5
th
International Conference of the African Crop Science Society, Lagos, Nigeria October 21-26, 2001.
Ramasamy C., Aldas J, Selvaraj KN, Hossain M (2003). Hybrid Rice in Tamil Nadu: Evaluation of Farmers' Experience. Econ. Polit. Weekly 38(25):2509-2512.
Wiredu AN, Mensah-Bonsu A, Andah EK, Fosu KY (2011). Hybrid Cocoa and Land Productivity of Cocoa Farmers in Ashanti Region of Ghana. World J. Agric. Sci. 7(2):172-178.
Wiredu NA, Gyasi KO, Abdoulaye T, Sanogo D, Langyintuo A (2010). Characterization of maize producing households in the Northern Region of Ghana. Country Report – Ghana: CSRI/SARI – IITA, Ibadan, Nigeria.