Graduate School of Business
271
i Graduate School of Business Improving Competitiveness of Readymade Garment (RMG) Industry of Bangladesh - Analysis of Supply Chains Md Nuruzzaman This thesis is presented for the Degree of Doctor of Philosophy of Curtin University December 2013
-
Upload
khangminh22 -
Category
Documents
-
view
0 -
download
0
Transcript of Graduate School of Business

i
Graduate School of Business
Improving Competitiveness of Readymade Garment (RMG) Industry of Bangladesh - Analysis of Supply Chains
Md Nuruzzaman
This thesis is presented for the Degree of Doctor of Philosophy
of
Curtin University
December 2013

ii
Declaration
To the best of my knowledge and belief this thesis contains no material previously
published by any other person except where due acknowledgement has been made.
This thesis contains no material which has been accepted for the award of any other
degree or diploma in any university.
Signature:
Date:

iii
ACKNOWLEDGMENTS
In the name of Allah, the Most Gracious and the Most Merciful .....
I received CIPRS and Faculty Doctoral scholarship to pursue my doctoral degree at
the Curtin University in 2010. When I started my programme as a full time student at
CGSB, Curtin University, I realized that its a big responsibility in the way of my
academic journey for being a doctoral student and from thereon I spent four stressful
and meaningful years to achieve my degree. My study, however, was not
accomplished on my own. I wish to express my sincere gratitude and appreciation to
all the people who had helped me throughout my journey to achieve this goal.
My deepest appreciation goes to Prof. Mohammed Quaddus, my supervisor. Thanks
for opening my view to the world of doing a quantitative research. His continuous
supervision, kindness, patience, encouragement, support, understanding, and
valuable guidance in carrying the process and his extended helpful hand in
analysing, reading and writing helped me a lot that could not be expressed in words.
My gratitude also goes to Dr. Ananda Jeeva for his guidance, support, and direction
that guided me through the study and to prepare a good thesis.
Acknowledgement is also made for Graduate School of Business, Curtin Business
School and their staffs for providing support and facilities. Special appreciation goes
to Ms. Jo Boycott, Theresse Jeferson and Prof. Al Rainnie for their caring and helps
during my stay at Curtin. I also would like to express my deep appreciation to my
fellow members at fourth floor of Curtin Graduate School of Business especially
Eijaz, Naeem, Azam, Arief, Moazzem, Hossain, Hossan, Nasir and Enayet. Without
their steady support and encouragement, this process would not have been
materialized. One of my greatest successes in taking a doctoral degree in Curtin was
our friendships.
I sincerely extend my thanks to the participants of the field study and the
Bangladeshi Garments companies’ respondents as the research would not have been
possible without their valuable input.
Last but not least, my deepest thanks for my father, mother, wife, sons, brother-in-
law and all my brothers and sisters for being so understanding.

iv
DEDICATION
To my beloved late father Md. Abdul Hannan, mother Begam Maleka Parvin, my
better half Mist Rebeka and my two lovely Imtiaz and Jubair….. whom I know that
forever will love me… Your pure hearts always motivate me to pursue our dream. I
love you guys….. THIS is for US!

v
ABSTRACT
The textile and garment industry (also known as the clothing industry) is one of the
oldest and largest export industries in the world. In the post Multifibre Agreement
(MFA) period the Ready-made Garment (RMG) business across the world is very
much challenging. To survive in the competitive environment it is also challenging
for the RMG industry of Bangladesh. To face the challenges in the quota free world,
the RMG industry of Bangladesh need to consider it’s present competitiveness. The
competitiveness can be improved through analysing supply chain. Therefore, to fill
up this gap this study attempts to develop a model of improving competitiveness
through analysing the supply chain of RMG industry in Bangladesh.
The supply chain (SC) of garment industry of Bangladesh is very challenging as it
depends on imported raw materials and on the demand of foreign buyers. Supply
Chain Management (SCM) in the RMG sector is characterized by different
organizational co-ordination or relationship management where success lies on how
each organization (related to garment industry and government organizations) or the
members of supply chain coordinate and cooperate with their business partners. The
supply chain of Bangladeshi RMG is specially characterized by vulnerable political
environment and country risk. Therefore success also lies on how the organization
getting integration influenced by different government offices and political actions.
Therefore the objective of this study is to investigate how the country risk, different
political actions from the government and bureaucratic behaviour influence the
activities in the supply chain. The main objective of this study is to investigate the
influence of these external stakeholders’ elements to the demand side and supply
side drivers and barriers for improving competitiveness of RMG industry in the way
of analysing supply chain.
Considering the phenomenon of recent change in the RMG business environment
and the competitiveness issues this study uses the principles of Stakeholder and
Resource Dependence theory and aims to find out some factors which influence to
make an efficient supply chain for improving competitiveness. Following a positivist
vi
paradigm, this study adopts a two phase sequential mixed method research design
consisting of qualitative and quantitative approaches. A tentative research model is
developed first based on extensive literature review. Qualitative field study is then
carried out to fine tune the initial research model. Findings from the qualitative
method are also used to develop measures and instruments for the next phase of
quantitative method. A survey is carried out with sample of top and middle level
executives of different garment companies of Dhaka city in Bangladesh and the
collected quantitative data are analyzed by Partial Least Square-based Structural
Equation Modeling.
Eight hypotheses are supported. From the analysis it is revealed that the external
stakeholders’ elements like bureaucratic behaviour and country risk have significant
influence to the barriers. It is also revealed that from the internal stakeholders’ point
of view the manufacturers’ and buyers’ drivers have significant influence on the
competitiveness. Therefore stakeholders need to take proper action to reduce the
barriers and increase the drivers, as the drivers have positive influence to improve
competitiveness.
This study has both theoretical and practical contributions. This study represents an
important contribution to the theory by integrating two theoretical perceptions to
identify factors of the RMG industry’s SC that affect the competitiveness of the
RMG industry. This research study contributes to the understanding of both external
and internal stakeholders of national and international perspectives in the RMG
(textile and clothing) business. It combines the insights of stakeholder and resource
dependence theories along with the concept of the SC in improving effectiveness. In
a practical sense, this study certainly contributes to the Bangladeshi RMG industry.
In accordance with the desire of the RMG manufacturers, the research has shown
that some influential constructs of the RMG industry’s SC affect the competitiveness
of the RMG industry. The outcome of the study is useful for various stakeholders of
the Bangladeshi RMG industry sector ranging from the government to various
private organisations.
Finally, the applications of this study can be extended through further adaptation in
other industries and various geographic contexts.

vii
ACRONYMS
ADB Asian Development Bank ASEAN Association for South East Asian Nations ATC Agreement on Textile and Clothing BBS Bangladesh Bureau of Statistics BGMEA Bangladesh Garment Manufacturers and
Exporters Association BKMEA Bangladesh Knitwear Manufacturers and
Exporters Association BTMA Bangladesh Textile Manufacturers
Association CEO Chief Executive Officer CMT Cut, Make and Trims C&F Clearing and Forwarding CPD Centre for Policy Dialogue EC European Council EPB Export Promotion Bureau EPZ Export Processing Zone EU European Union FDI Foreign Direct Investment GATT General Agreement on Tariffs and Trade GSP Generalized System of Preferences ILO International Labour Organisation ITC International Trade Centre LC Letter of Credit LDC Least Developed Country MD Managing Director MFA Multi Fibre Arrangement NGO Non Government organization NIE Newly Industrialized Economy R & D Research and Development RMG Readymade garment SAFTA South Asia Free Trade Agreement UNCTAD United Nations Conference on Trade and
Development UNICEF United Nations International Children’s
Fund WB World Bank

viii
Conference papers from this Thesis
Conference presentations:
1. Chowdhury, M., Nuruzzaman, M., Dewan, M. and Quaddus, M. (2012)," An AHP Integrated QFD Appoach for Mitigating Upstream Supply Chain Barriers: A Study On Readymade-Made Garment(RMG) Industry Of Bangladesh", In proceedings of 26th Annual Australian and New Zealand Academy of Management (ANZAM)Conference, 5-7 December, Perth, Western Australia.
2. Nuruzzaman, M. (2012), “The Competitiveness and Supply Chain Management of Ready-Made Garment (RMG) Industry in Developing Nations", In proceedings of The 7th Biennial Conference of Hong Kong Economic Association, December 13-14, Lingnan University, Hong Kong.
3. Nuruzzaman, M., Quaddus, M. and Jeeva, A. (2012), “An Investigation into the Factors Influencing Competitiveness of Ready-Made Garment (RMG) Supply Chain- The Experience from Bangladesh", In proceedings of Annual Conference on Global Economics, Business and Finance (GEBF), December 15-17, Hong Kong.
4. Nuruzzaman, M., Quaddus, M., Jeeva, A. and Khan, E. Ahmed (2013), " The influence of External Stakeholder in the Competitiveness of Ready-Made Garment (RMG) Industry: A study on RMG Supply Chain in Bangladesh", In proceedings of the Business & Economics Society International Conference (B&ESI), January 7-10, Perth, Western Australia
5. Nuruzzaman, M.(2013), " The influence of Bureaucratic Behaviour to Improve the Competitiveness of RMG industry”, In proceedings of Emerging Research Initiatives and Development in Business, CGSB Research Forum, 9-10 May, Curtin University, Perth, Western Australia
6. Nuruzzaman, M., Quaddus, M. and Jeeva, A. (2013), “ Improving Competitiveness and the Role of Stakeholders in Ready-Made Garment(RMG) Supply Chain of Developing Nations: A Qualitative Approach to develop a comprehensive research model” In proceedings of the American Canadian Conference for Academic Disciplines, International Journal of Arts and Sciences, May 20-23, Ryerson University, Toronto, Canada.
7. Nuruzzaman, M., Chowdhury, M., Quaddus, M. and Jeeva, A. (2013), “Achieving Competitiveness through Analysing Supply Chain: A Test of Political Stakeholder’s Action in Readymade Garment (RMG) Industry of Bangladesh”In proceedings of the 3rd International Forum & Conference on Logistics and Supply Chain Management(LSCM), June 27-29, Bali, Indonesia
8. Chowdhury, M., Nuruzzaman, M., Dewan, M. and Quaddus, M. (2013)," Supply Chain Readiness, Response and Recovery for Supply Chain Resilience to Vulnerabilities: A Study on Ready-Made Garment Industry of Bangladesh” In proceedings of the 3rd International Forum & Conference on Logistics and Supply Chain Management(LSCM), June 27-29, Bali, Indonesia

ix
TABLE OF CONTENT
Chapter Page No.
1 INTRODUCTION 1 1.1 Overview 1 1.2 Background of the Research Area 4 1.3 Problem Statement and Research Question 9 1.4 Research Objectives 13 1.5 Definition of the Terms 14 1.6 Significance of Research 16 1.6.1 Contribution to theory 17 1.6.2 Contribution to practice 18 1.7 Structure of the Thesis 18 1.8 Summary 20 2 THE RMG INDUSTRY AND BANGLADESH 23 2.1 Introduction 23 2.2 Motivation for Choice of Bangladesh 23 2.3 Historical Development of RMG Industry in Bangladesh 25 2.4 The RMG Industry and Its Supply Chain 30 2.5 Present Bangladeshi Supply Chain Scenario to Achieve
Competitiveness 35
2.6 Present situation of Competitiveness 36 2.7 Summary 44 3 LITERATURE REVIEW 45 3.1 Introduction 45 3.2 Supply Chain 46 3.3 Supply Chain Management 47 3.4 Textile and Garment Industry 50 3.5 Supply Chain and its management in the Textile and
Garment(Clothing) Industry 52
3.6 Bangladeshi RMG Industry and Its Supply Chain 56 3.7 Competitiveness 61 3.8 Competitiveness of the RMG Industry and Supply Chain 65 3.9 Improving Competitiveness 67 3.10 External Stakeholders (Country factors) 68 3.10.1 Political Action(PA) 69 3.10.2 Bureaucratic Behaviour(BB) 70 3.10.3 Country Risk(CR) 72 3.11 Internal Stakeholders( business factors) 73 3.11.1 Supply Side Drivers(SD) 74 3.11.2 Supply Side Barriers(SB) 75 3.11.3 Demand Side Drivers(DD) 75 3.11.4 Demand Side Barriers(DB) 76 3.12 Review of Underlying Theories 76 3.12.1 Stakeholder Theory 77

x
3.12.2 Resource Dependence Theory 78 3.13 Justification for Adoption of the theories in Current Research
(Conceptual Framework) 79
3.14 Preliminary Research Model 83 3.15 Summary 85 4 RESEARCH METHODOLOGY AND DESIGN 86 4.1 Introduction 86 4.2 Research Paradigm 86 4.3 Research Methods 90 4.4 Research Process 93 4.5 Qualitative Field Study Method 95 4.6 Quantitative Study Method 96 4.6.1 Developing the Questionnaire 97 4.6.2 Pre-testing the Questionnaire 98 4.6.3 Sample Selection and Quantitative Data Collection 98 4.6.4 Quantitative Data Analysis 100 4.6.5 Partial Least Squire( PLS) Data Analysis Procedures 101 4.6.5.1 Assessment of Measurement Model 102 4.6.5.2 Assessment of Structural Model 105 4.7 Summary 107 5 FIELD STUDY ANALYSIS AND DEVELOPMENT OF
A COMPREHENSIVE RESEARCH MODEL 108
5.1 Introduction 108 5.2 Operational Overview of the Field Study 109 5.2.1 Qualitative Research Paradigm 109 5.2.2 Interview Questionnaire Development 109 5.2.3 Sample selection 110 5.2.4 Data Collection 112 5.2.5 Data Analysis 113 5.3 Results and Interpretations 115 5.3.1 Constructs and variables 115 5.3.2 Links Among the Constructs 120 5.3.3 Individual Conceptual models in accordance with Field
Study 122
5.3.4Cross-examination of Conceptual Model 124 5.4 Final Comprehensive Model 124 5.4.1 Constructs from External Stakeholder factors 126 5.4.2 Constructs from Internal Stakeholder factors 128 5.5 Summary 130 6 HYPOTHESIS AND QUESTIONNAIRE
DEVELOPMENT 134
6.1 Introduction 134 6.2 Construction of Hypothesis 134 6.2.1 Hypothesis related to external stakeholders 134 6.2.1.1 Political action 135 6.2.1.2 Bureaucratic Behaviour 137 6.2.1.3 Country Risk 139 6.2.2 Hypothesis related to internal stakeholders 141 6.2.2.1 Supply side drivers 141 6.2.2.2 Supply side barriers 142 6.2.2.3 Demand side drivers 143 6.2.2.4 Demand side barriers 144 6.3 Questionnaire Development 146 6.3.1 Measurement Instrument development 146 6.3.1.1 Questionnaire section one: Demographic measures 149

xi
6.3.1.2 Questionnaire section two: External stakeholders in the RMG industry’s supply chain
149
6.3.1.2.1 Political Action 150 6.3.1.2.2 Bureaucratic Behaviour 151 6.3.1.2.3 Country Risk 152 6.3.1.3 Questionnaire section three: Internal stakeholders in the
RMG industry’s supply chain 153
6.3.1.3.1 Supply side drivers 153 6.3.1.3.2 Supply side barriers 154 6.3.1.3.3 Demand side drivers 155 6.3.1.3.4 Demand side barriers 156 6.3.1.4 Questionnaire section four 157 6.3.1.4.1 Competitiveness 157 6.4 Pretesting the research instrument 159 6.5 Summary 159 7 SURVEY AND QUANTITATIVE DATA ANALYSIS 160 7.1 Introduction 160 7.2 Overview of the survey 161 7.2.1 Administration of the Survey 161 7.2.2 Data Screening 162 7.2.3 Non-response bias assessment 163 7.3 Description Analysis of the Sample 164 7.3.1 Gender 164 7.3.2 Age 164 7.3.3 Level of Education 165 7.3.4 Current Position 165 7.3.5 Years in Current Position 166 7.3.6 Experience in the RMG Industry 166 7.3.7 Type of Organisation 167 7.3.8 Number of Employees 167 7.3.9 Level of Growth 167 7.3.10 Level of Profit 168 7.4 Data Analysis via Structural Equation Modelling ( SEM) 168 7.4.1 Assessment of measurement model 168 7.4.1.1 Assessing for Reflective Constructs 170 7.4.1.2 Assessing for Formative Constructs 176 7.4.2 Assessment of Structural Model 178 7.4.2.1 Explanatory Power or Nomological Validity 179 7.4.2.2 Test of Significance of the hypothesis 181 7.4.2.3 Hypotheses testing 182 7.4.2.3.1 Hypotheses from external stakeholders’ elements 182 7.4.2.3.2 Hypotheses from internal stakeholders’ elements 184 7.5 Summary 185 8 DISCUSSION 186 8.1 Introduction 186 8.2 Interpretation and Discussion of the result 186 8.2.1 Hypotheses related to external stakeholders 187 8.2.1.1 Hypotheses related to Political Action 187 8.2.1.2 Hypotheses related to Bureaucratic Behaviour 191 8.2.1.3 Hypotheses related to Country Risk 195 8.2.2 Hypotheses related to internal stakeholders and
Competitiveness 198
8.2.2.1 Hypothesis H4 199 8.2.2.2 Hypothesis H5 200 8.2.2.3 Hypothesis H6 201 8.2.2.4 Hypothesis H7 202 8.3 Summary 203

xii
9 CONCLUSION AND FUTURE RESEARCH DIRECTION
205
9.1 Introduction 205 9.2 Summary of the Research 205 9.3 Contribution of the Research 207 9.3.1 Methodological Contribution 207 9.3.2 Theoretical Contribution 207 9.3.3 Practical Contribution 209 9.4 Limitations 210 9.5 Future Research Direction 211 10 REFERENCES 213 11 APPENDIX 236
LIST OF TABLES
Table Number
Title of the Table Page no.
Table. 2.1 USA apparel Imports 41 Table. 2.2 Export and market share statistics 42 Table. 2.3 EU-27 Apparel imports 42 Table. 2.4 Increasing rate of RMG export earning 42 Table 3.1 Literature about supply chain management 49 Table. 3.2 Literature about textile and garment industry 51 Table. 3.3 SCM in various industries 52 Table. 3.4 SCM in textile and garment industry 54&55 Table. 3.5 Literature about Bangladeshi RMG 59&60 Table. 3.6 Literature about defining competitiveness 62&63 Table. 3.7 Literature about supply chain competitiveness 64 Table. 3.8 Literature about competitiveness of Bangladeshi
RMG industry through the supply chain 66
Table. 4.1 Research Paradigms 87 Table. 4.2 Stage 1 (assessment of measurement model) 102 Table. 4.3 Stage 2 (assessment of structural model) 105 Table. 4.4 Fi0ur-step assessment procedure of structural
model 106
Table. 5.1 Issues and related questions in the field study 110 Table. 5.2 Field study interview participant’s profiles 111 Table. 5.3 Constructs and variables of RMG supply chain to
improve competitiveness 115,116&117
Table. 5.4 Links between constructs 120 Table. 5.5 Variables in each constructed model and the
comprehensive model 123
Table. 5.6 Constructs and corresponding opinion 124 Table. 5.7 Constructs, sub-constructs and links for the final
research model 125
Table. 6.1 Summary of developed hypothesis 145 Table. 6.2 Differences between formative and reflective
indicators 148

xiii
Table. 6.3 Measurement of demographics 149 Table. 6.4 Measurement of political action 150 Table. 6.5 Measurement of bureaucratic behaviour (BB) 151 Table. 6.6 Measurement of country risk (CR) 152 &153 Table. 6.7 Measurement of supply-side drivers (SD) 154 Table. 6.8 Measurement of supply-side barriers (SB) 155 Table. 6.9 Measurement of demand-side drivers (DD) 156 Table. 6.10 Measurement of demand-side barriers (DB) 157 Table. 6.11 Measurement of competitiveness (COM) 158 Table. 7.1 Response rate 162 Table. 7.2 Mann-Whitney U-Tests for Group 1 and Group 2
samples 163
Table. 7.3 Survey respondent by gender 164 Table. 7.4 Survey respondent by age 165 Table. 7.5 Survey respondent by level of education 165 Table 7.6 Survey respondent by current position 166 Table. 7.7 Survey respondent by years in current position 166 Table. 7.8 Survey respondent by years in RMG industry 166 Table. 7.9 Survey respondent by type of organisation 167 Table. 7.10 Survey respondent by number of employees 167 Table. 7.11 Survey respondent by level of growth 167 Table. 7.12 Survey respondent by level of profit 168 Table. 7.13 Initial item loading of reflective construct 170 & 171 Table. 7.14 Final reflective item loading 171 Table. 7.15 AVE analysis (SQRT of the AVE of reflective
constructs is larger than its correlation with other constructs)
174
Table. 7.16 Cross-loading (loading of an item within a construct is greater than the loading of items in any other construct)
175
Table. 7.17 Initial weight and loading of formative indicators/items
177
Table. 7.18 Final weight and loading 177 Table. 7.19 Degree of multicollinearity (VIF ≤ 10) 178 Table. 7.20 R² values 180 Table. 7.21 Hypothesis test result- 1 181
Table. 7.22 Hypothesis test result- 2 183
LIST Of FIGURES
Figure Number
Title of the Figure Page No.
Fig. 1.1 Supply process for RMG industry 11 Fig 1.2 Summary of the research structure 22 Fig. 2.1 Number of Garment factories 29 Fig. 2.2 Clothing sector supply chain 32

xiv
Fig. 2.3 Apparel commodity chain 32 Fig. 2.4 RMG supply chain 33 Fig. 2.5 Detailed RMG backward and forward supply
chain 34
Fig. 2.6 Influence of External stakeholder 39 Fig. 3.1 Preliminary Research model 84 Fig. 4.1 Mixed Methodology 91 Fig. 4.2 Research process 94 Fig. 5.1 Data analysis process of the field study 113 Fig. 5.2 Preliminary competitiveness model 132 Fig. 5.3 Comprehensive competitiveness model 132 Fig. 5.4 Comprehensive competitiveness model with
details 133
Fig. 7.1 Loading (coefficient) and R² values 180

1
CHAPTER 1
Introduction
1.1 Overview
The textile and garment industry (also known as the clothing industry) is one of the
oldest and largest export industries in the world. In this industry, the clothing or
garment business has been governed since 1974 by a system of quotas known as the
Multi-Fibre Arrangement (MFA). This arrangement has enabled the developed
countries to bilaterally negotiate quotas with various suppliers’ countries, based on
their competitiveness. During the Uruguay round of multilateral trade negotiations
(1986-93), it was decided to integrate the MFA into the new ATC (Arrangement on
Textile and Clothing) and as per the World Trade Organization (WTO) agreement on
the ATC, all quota-imposing member countries were required to lift the entire quota
with a clear 10-year time line in four phases beginning from 1 January 1995
(Adhikari and Weeratunge 2006; Sultana et al. 2011).
The quota system was completely phased out in January 2005 (Haider 2007;
Nuruzzaman 2007). This changed new business environment has created challenges
for all concerned parties, namely, the buyers or importers from the developed
countries and the exporters or suppliers from the developing countries. Certainly,
some developing countries such as Bangladesh had been able to gain a strong
foothold in a quota-driven global garments market over previous years and the quota
system indeed provided developing countries with a certain degree of predictability
and security in assessing the garment markets of developed countries. In the post-
MFA period, developing countries like Bangladesh were no longer provided with
any special trade concession. Therefore, a new challenging environment emerged
from that time.
Countries like Korea, Hong Kong, Malaysia and Taiwan were highly competitive in
this sector until the early 1980s. However, developing countries such as Bangladesh,
China, India, Indonesia, Pakistan, Vietnam, Cambodia, Mauritius and many sub-
Saharan African countries have now taken over the labour-intensive segments of the

2
textile and garment sector and are competing in the garment business(International
Monetary fund 2012). The major challenges for the garment-exporting developing
countries started from the time when Vietnam entered the WTO (in 2007) and the re-
imposed quotas on China were phased out (in 2008). After removal of quotas, buyers
are now free to source garment or apparel items in any amount from any country
(subject only to a system of tariffs). Therefore, fierce competition and unrest has
started in global garment production and trade (Appelbaum 2005; UNCTAD 2005).
The competitiveness issue, that is, the ability to compete globally came into
consideration from that time.
The supply chain of the textile and clothing sector consists of a number of discrete
activities. The supply chain, beginning with sourcing of raw materials, design and
production through to distribution and marketing, is being organised as an integrated
production network. When the decision about location is being made, costs, quality,
reliability of delivery, delivery time, access to quality inputs, and transport and
transaction costs are important factors for achieving competitiveness through the
supply chain (Nordås 2004). In the ready-made garments (RMG) industry,
Bangladesh’s achievements have been recognised mainly to its increased
competitiveness in the manufacture of low-cost high volume RMG items. But in the
post-MFA period, competitors have started to manufacture these low-cost RMG
items. Bangladesh faces difficulties in maintaining its existing competitiveness with
the market share falling in terms of volume and value. The South Asian region as a
whole faces several challenges, some of which can be overcome only through
concerted efforts by various stakeholders (Adhikari and Weeratunge 2006).The
support mechanism provided by the government and bureaucrats should be increased
to achieve effective and efficient collaborative activities among stakeholders
throughout the supply chain.
Bangladesh has been chosen for this study as it is a promising developing nation in
the garment sector and it has large numbers of uneducated, unskilled and
unemployed labour especially the women who are very important for the labour-
intensive garment industry. This industry plays a major role in job creation. At
present, the Bangladeshi economy is largely dependent on the garment sector,
earning 75-78% of foreign currency from this sector. The economy of Bangladesh
will be in jeopardy whenever this sector loses its competitiveness and market share.

3
The main objective of this study is to improve or increase competitiveness via
analysing the supply chain in the garment sector of Bangladesh. Many companies are
implementing supply chain management (SCM) in an effort to increase
competitiveness, profit and customer satisfaction (Nordås 2004). Improving
competitiveness is essential for any industry to survive in the extremely competitive
business environment. Bangladesh can improve its competitiveness in this sector
through developing the supply chain (Awal 2005). A supply chain is defined as a set
of three or more companies directly linked by one or more of the upstream and
downstream flows of the products, services, finances and information from a source
to a customer. A supply chain strategy determines the nature of the procurement of
raw materials, transportation of materials to and from the company. Competitiveness
is actually a company’s competitive strategy which defines the set of customer
demands that it seeks to satisfy through its products and services (Kale 2007)
Bangladesh has a comparatively good supply chain in the knit fabric sector and
sources 80% of knit fabrics from domestic manufacturers although the basic raw
materials are imported. But the textile industry is not as developed as the woven
garment sector. It is able to source only 15% of raw materials from the local market:
the balance has to be imported from countries such as India, Pakistan, Hong Kong
and Taiwan (Rahman 2005) . Developing countries like Bangladesh can make
investments in the backward linkage industries to reduce supply chain constraints
and to enhance competitiveness (Adhikari 2007a). But the textile industry is usually
more capital intensive than the garment industry. It is very difficult for a developing
country like Bangladesh to create backward linkages to the local economy. This
creates the bottleneck of the present garment supply chain. In this situation,
stakeholders in the supply chain and their role may need to change to increase
competitiveness. Therefore, stakeholder theory has been applied in this study to
increase competitiveness. This can be done not only through achieving lower
production costs but also Bangladesh needs to ensure an efficient supply chain
despite its poor financial, physical and institutional infrastructure. Based on
stakeholder theory, external and internal stakeholders may increase competitiveness
through their coordinated and co-operational activities in the supply chain.

4
1.2 Background of Research Area
The cold war has ended but the trade war has begun. Different types of trade bloc,
region, rim, etc. are being constituted. Due to the WTO contract, from January 2005,
wide and fierce competition has taken place in the global garments market in the new
environment of a free-market economy (Nuruzzaman, Haque, and Rafiq 2010) . The
developing countries are no longer provided with any special trade concession in the
garments business. The principle of survival of the fittest is now the norm in the
trade and commerce of garment products.
As global competition in the textile and garment business intensifies under the new
quota-free trading rules, countries around the world are bracing for major changes in
the structure of sourcing and supply of garment products worldwide. In the quota-
free regime, a developed country’s garment producer will no longer have the
protection that the quotas provided and, on the other hand, a developing country’s
producers and suppliers will no longer be restrained by quotas. The formation of a
global garments market comprising entry restrictions and quota premiums has been
replaced by competition and competitive advantages. The expectation in this
situation is that, as the supply network becomes more consolidated post-MFA,
countries with stable supply networks and well-developed capacities for scaling up
will benefit from the elimination of quotas. However, some countries which had
benefited from assured, although limited, access to export markets under the quota
system, will lose out (Nordås 2004; Tewari 2006) .
The supply network and its management is a complex field of study. Supply chain
management (SCM) is concerned with the effectiveness of dealing with final
customer demand by the parties engaged in the provision of the product as a whole
(Cooper, Lambert, and Pagh 1997). Buyers can benefit not only due to the low
production cost arising from the cheapest labour but also from developing countries
ensuring efficient operation of the supply chain network in the face of poor financial,
physical and institutional infrastructure (Nordås 2004).
The practical field of SCM is constantly changing, as the competitiveness of
international companies is more and more dependent on their capability to produce
and deliver customized products and services fast and efficiently all over the world

5
(Halldorsson 2007). For many companies or firms, using their supply chains as
competitive weapons has become a central element of the strategic management
process in recent years. Although SCM has been used as an effective management tool
in the apparel (RMG) sector to reduce lead time and increase performance (Bertolini et
al. 2007; Brito, Carbone, and Blanquart 2008; Lam and Postle 2006), there is a severe
lack of proper applications of the supply chain in the RMG sector in Bangladesh.
The competitive edge of Bangladesh RMG is greatly influenced by, among other
factors, lead time management, the political environment and the government’s role. To
compete successfully in the fiercely competitive post-MFA global free-trade market,
manufacturers must be adequately equipped with the latest knowledge of scientific
management in minimizing lead time and other management deficiencies must be
properly addressed. This sector must be given complete support and build up the
backward linkage industry to minimize lead time. But the development of the backward
linkage industry in the short term is not a very easy task. It is very difficult for a country
like Bangladesh to create backward linkages to the local economy in the present
business environment (Nordås 2004). Therefore, steps have been taken to find out some
alternatives in the supply mechanism to minimize lead time and increase efficiency and
competitive advantage to achieve competitiveness.
From its modest start in the 1970s, the RMG industry has grown considerably. At
present, there are approximately 6,000 garment units. This industry provides many
jobs to the neglected mass of Bangladeshi society. Over the years, the earnings from
RMG exports have increased dramatically from a meagre US$68,000 in 1978 to
US$12.3 billion in 2008-09 (Batexpo 2012; Adhikary 2007). The economy of
Bangladesh is very dependent on the garment sector. Due to their lack of
competitiveness, all garment companies are not doing well and are not viable. Just
after the MFA, Bangladesh found it difficult to maintain its competitiveness with its
market share falling in terms of volume from 24% in 2005 to 20% in 2006 and, in
terms of value, from 13% to 11% in the same period (Adhikari 2007a). Moreover,
the average growth rate of Bangladeshi RMG products was reduced dramatically. It
was 23% (US$ million) in 2005-06 but reduced to 15% in 2008-09 and 1% in 2009-
10 (Hossan, Sarker, and Afroze 2012; Joarder, Hossain, and Hakim 2010).

6
In the post-MFA period, the Asia Foundation launched a regional project on building
competitiveness and recommended that the key actors in the RMG sector be
identified and discuss with different stakeholders to help build the relationship with
the three parties – employers, employees and public authorities. Through discussion,
they identified the key issues which cover a wide range of areas where
improvements and reforms have to be made in order to make the garment industry
more competitive. These issues include inadequate infrastructure, inefficient and
corrupt facilities in port and custom procedures, insufficient business support, low
level of labour standards and compliance, and ineffective policy support. With
regard to public authorities, political action of the government and bureaucrats’
behaviours are also very important areas to be addressed to solve those problems.
Therefore, the three parties, namely, the employers, labour unions and the
government, need to come together to discuss areas of collaboration in order to
improve the competitiveness of the RMG industry.
The Bangladesh Textile Manufacturers Association (BTMA) is a large stakeholder in
the supply chain as they supply fabrics to garment manufacturers. Due to their
opposition, the Bangladesh Garment Manufacturers Association (BGMEA) has
failed to take some effective decisions about the supply chain. Government officials
such as bureaucrats can take the initiative to arrange discussions among stakeholders
to encourage them to make positive decisions in favour of the RMG sector. But due
to a non-cooperational attitude, there is a poor relationship between these two large
stakeholders. It is crucial for different stakeholders of the sector to have dialogue
amongst themselves with the purpose of identifying the main issues that need to be
carried out in order to improve the sector’s competitiveness.
Competitiveness is the capability of producing and delivering customized products and
services fast and efficiently all over the world (Buckley, Pass, and Prescott 1988).
Supply chain activities are very important for delivery. The supply chain activities
transform various resources, raw materials and components into a finished product that
is delivered to the end customer. SCM spans all movement and storage of raw
materials, work-in-process inventory and finished goods from point-of-origin to point-
of-consumption. Many companies are implementing SCM in an effort to increase
competitiveness, profit and customer satisfaction (Nordås 2004). Therefore, analysing
the supply chain is important to improve the competitiveness of the RMG sector.

7
As with other business management principles, SCM also applies to the textile and
apparel industries (Stone 1994). Supply chain members need to cooperate with the
supply chain’s downstream customers or buyers and upstream suppliers or
manufacturers to achieve the supply chain’s goal. Cao (2006) pointed out in his PhD
thesis that quick response (QR) is very important in supply chain activities to create
competitive advantage in the textile and apparel industry.
Most studies in the textile sector have focused on integration and relationship
management for building partnerships between different parties of the chain and
synchronizing activities throughout the chain (Chandra 1997; Zhao et al. 2008). In
the literature (Bowen 2000; Cao et al. 2008; Dossenbach 1999; Rungtusanatham
2003; Wong 1999), coordination, collaborative relationships and partnerships are
described as preferential situations and as beneficial to all parties involved in the
chain. Some studies (Au and Ho 2002; Buxey 2005; Chandra and Sameer 2000;
Lambert and Pohlen 2001; Nuruzzaman 2009; Nuruzzaman, Haque, and Rafiq 2010;
Pramatari 2007) have recommended various technological solutions like applications
of information technology (IT), information and communications technology (ICT),
e-commerce, electronic data interchange (EDI) implementation, etc. to improve
competitive advantage and performance through lead time reduction and supply
chain (SC) collaboration. Many studies (Bruce, Daly, and Towers 2004; Chandra and
Sameer 2000; Mason - Jones and Towill 1999; Perry, Sohal, and Rumpf 1999), have
emphasized creating an information-enriched SC, that is, quick response (QR) and
accurate response (AR) (Hunter and Valentino 1995) in the textile SC. Some studies
have also recommended the just-in-time (JIT) delivery system, production planning
period compression, and lean and agile approaches that effectively synchronize the
manufacturing process in order to reduce cycle time and lead time (Christopher,
Lowson, and Peck 2004; Ferdousi and Ahmed 2009; Mason - Jones and Towill
1999; Toni and Meneghetti 2000). Jin’s (2004) research described how least
developed countries (LDCs) obtained competitive advantage in the garment
(apparel) industry using Vernon’s (1966) product life cycle (PLC) theory and
Frobel’s (1980) New International Division of Labor (NIDL) theory The author also
described how these countries increased their competitive advantages leveraging
industry-specific and country-specific advantages.

8
Besides the above studies, no significant studies were found that dealt with
improving competitiveness through SCM in the clothing sector. However, a number
of studies have effectively used different aspects of SCM for improved management
in various industries. For example, Seuring (2004) illustrated increased cooperation
through an integrated supply chain; Cavinato (1992) considered the inter-firm total
cost concept and value-added management; Rao (2005) and Bacallan (2000)
described and considered the green SC; Stadtler (2005) cited the task of integrating
organisational units along a SC and coordinating materials, information and financial
flows in order to fulfil customer demand; Bhatnagar et al. (2005) explained that
operational competitiveness was influenced by qualitative factors; Gunasekaran et al.
(2001) emphasized improving performance at the strategic, tactical and operational
levels; and Lummus (1999) illustrated the use of collaborative relationships to
improve competitiveness. But in these above studies, the country factors (the
external stakeholders of the SC) were not considered. While there is no right theory
for managing the SC, Halldorsson ( 2007) considered different organisational
theories and models to explain inter-organisational phenomena in order to develop
the SCM paradigm as a scientific discipline.
To gain competitive advantage in an international supply chain, one needs to match
the value-adding activities of a chain with the unique comparative advantages
offered by diverse nations that make up the chain. To do this, an organisation must
identify and control the factors that influence the competitive advantages and, later
on, the competitiveness of the chain ion each of the three areas, namely,
procurement, processing and distribution. Various types of stakeholders are working
for their own interest in the procurement, processing and distribution system.
Although government, political parties and bureaucrats are not directly involved in
the SC process, they are very influential stakeholders in the whole business process
especially from the international perspective. Therefore, political action and
bureaucratic behaviour have been considered as external factors in the supply chain.
Moreover, manufacturers who are the main stakeholders are dependent on fabric
suppliers and buyer demand. According to the resource dependency theory (Pfeffer
and Salancik 1978), dependence should be reduced to improve competitiveness: the
role of external stakeholders is also very important in reducing dependency.
Consequently, stakeholder analysis has become a conceptual device over the past
couple of decades in the fields of business and society, business ethics and

9
management (Reed 2002). Therefore, a conceptual schematic model (See chapter 3,
fig. no. 3.1) has been developed based on the stakeholder and resource dependency
theories to increase competitiveness in the supply chain of the RMG industry of
Bangladesh. These theories have been taken into account in this research by
considering the external and internal environment aspects of the RMG supply chain
in order to explain the proposed model.
There are very limited research works in this area. Many studies have been
conducted on strategies in the post-MFA period and on performance improvement
but very few studies have researched improving competitiveness and lead time
management. Moreover, there are also no sufficient in-depth research works on SCM
in the RMG sector of Bangladesh and on how lead time can be efficiently minimized
by an effective supply chain to improve competitiveness. Some studies have been
conducted on the influence of different country factors or non-business actors such
as bureaucracy, political risk and country risk in the supply chain of international
business (Hadjikhani and Hakansson 1996; Haque 2007; Kim 2006). However, no
significant studies were found about the influence of these factors and how these
factors can affect competitiveness and the RMG supply chain. Countries like
Bangladesh must seek new avenues to retain their position in this dynamic sector. In
this regard, analysing the supply chain is a new issue that has been considered in this
research to improve competitiveness.
1.3 Problem Statement and Research Question
The pace of progress and economic growth of a country is largely dependent upon
industrialization. But industrialization has remained stagnant in Bangladesh for at
least for two decades due to the dearth of investible capital and low productivity. At
that time, the RMG sector within the textile and clothing industry played a
significant role in the industrialization process in Bangladesh. Moreover the MFA
and global quotas on trade in textile and clothing under the WTO ended on 1 January
2005 (Nuruzzaman 2008). This created challenges for the RMG industry especially
in the woven sector (Kabir 2007) when all member countries of the WTO including
Bangladesh entered into the quota-free market. Therefore, it is a big challenge for the
Bangladeshi RMG sector to retain its present market share and increase the business
by improving competitiveness through analysing its existing supply chain (SC).

10
The logistics system is very important for an efficient supply chain and
competitiveness. But infrastructural facilities like road, rail and port facilities are not
sufficient and up to the mark (Ahmed 2009). As it is a buyer-driven market,
manufacturers cannot bargain for a higher price and fail to pay standard wages to
their employees. But buyers are always pressuring them to pay standard wages and
to provide a good working environment (Ahmed 2009). With this existing problem,
there are approximately 6,000 garment units in Bangladesh where garment products
are manufactured by 2.5 million employees, most of whom are women. The export
earnings have increased from a meagre US$68,000 in 1978 to US$12.34 billion in
2008-09 but the average growth rate has decreased from US$24.44 million in 2005-
06 to US$15.34 million in 2008-09 (Joarder, Hossain, and Hakim 2010; World Trade
Organisation 2012) and 1% in 2009-10 (Hossain, Sarker, and Afroze 2012).
The RMG business is a sub-sector of the textile and clothing industry. Buyers from
the USA, European Union (EU) and Canada usually sourced garment products from
Bangladesh under special privileges such as quotas and the Generalized System of
Preference (GSP). To complete the whole process from receiving the order to
exporting the final products takes 90-120 days. This time (the lead time) is twice as
long as the time required for the same process in India and China. The lead time for
similar products in Sri Lanka is approximately 19-45 days, for China 40-50 days and
for India 50-70 days (Rahman and Anwar 2006; Kabir 2007). The long lead time has
arisen due to the process of importing fabrics from foreign suppliers and it is a big
problem in the upstream supply chain of the RMG industry. In the garment industry,
ready-made garments are mostly fashion items and their life cycle is very short.
Therefore, the minimization of lead time is a vital point in this business (Haider
2007).
The supply process of Readymade Garment Industry in Bangladesh is outlined in
figure 1.1.

11
Figure 1.1: Supply process for RMG industry
Source: Nuruzzaman (2007)
According to the Bangladesh Apparel and Textile Exposition’s (BATEXPO) 2012
report, the spot order (The order placed in the exposition) was reduced to 7.1% in
2012 compared to BATEXPO’s 2011. In 2011 the order was 66.35 million US$.
Therefore, the question is how this industry can grasp the opportunity by increasing
its competitiveness. With this prospect, the garment sector of Bangladesh must make
its products more competitive in terms of price, quality, a shorter lead time and by
very efficiently meeting the deadline for supply in order to face the increasingly
tougher competition (Rahman and Anwar 2007; Siddiqi 2007). Price and quality are
manageable for Bangladeshi manufacturers but the problem is the long backward
supply chain resulting in the long lead time.
The major challenges came in the garment sector (Kabir 2007; Nordås 2004;
Nuruzzaman 2008) when all the member countries of the WTO including Bangladesh
entered into the quota-free market. With the phasing out of MFA, developing countries
like Bangladesh were no longer provided with any special trade concession. The
countries of USA and Canada and EU member states could import any amount from
any WTO member state (Nuruzzaman 2008). In addition to the rapid and massive
economic integration in the western world, different types of trade bloc, region, rim,
etc. have appeared as another concern for the RMG sector of Bangladesh ( DCCI
2003; Rashid 2006) . In addition, China is now a member country of the WTO. The
Foreign buyers
Garment company
(manufacturer) Foreign raw materials suppliers
Local raw material
Buying house
Problem area
Order flow Collect raw materials Final product supply Information flow

12
restriction on China was lifted at the end of 2001 and the special restriction in the USA
over China was also lifted in 2008. Vietnam also entered the WTO in 2007 (Saxena
and Salze-Lozac’h 2010). However, this does not mean that there is no room for
exporters like Bangladesh. What it certainly means is that Bangladesh will have to
improve its competitiveness to remain in the heart of buyers. Therefore, the question is
about competitiveness. The garment exporting countries like Bangladesh are at the
crossroads and experiencing problems in the competitive business environment of the
garment sector.
The structure of the Bangladeshi RMG industry is totally different and therefore the
SC in this industry is quite unique. There have been many studies on the RMG
industry, but these are very general in nature and mainly deal with its growth and
development (Azad 2004; Debapriya and Rahman 2003; Quddus and Rashid. 1999;
Rahman and Anwar 2006; Rashid 2006). Many studies have also been conducted on
strategies in the post-MFA period (Ahmed 2004; D'Souza Undated; Nordås 2004;
Kabir 2007; Habib 2009). Few studies have also been conducted specifically on the
SCM in the clothing sector (Hunter and Valentino 1995; Christopher and Lee 2004;
Nordås 2004; Knutsen 2004; Seuring, Goldbach, and Kopline 2004; Magder 2005;
Lam and Postle 2006; Brito, Carbone, and Blanquart 2008). However, most of these
studies have primarily dealt with the applications of ICT and development of
relationships within the members of the SC.
The phasing out of the export-quota system from the beginning of 2005 raised the
issue of the competitiveness of the Bangladesh RMG industry as a top priority issue
(Haider 2007). Due to typical bureaucratic behaviour, political actions and country
risk, the Bangladeshi RMG sector failed to reduce lead time and increase
competitiveness (Absar 2003). Although studies have been conducted on the
influence of different country factors or non-business actors such as bureaucracy,
political risk and country risk in the supply chain of international business
(Hadjikhani and Hakansson 1996; Haque 2007; Kim 2006), no significant study has
explored the influence of these factors on the RMG supply chain (SC) and how these
factors can affect the competitiveness of SC. As the RMG supply chain is
international in nature, these country factors must be considered in developing an
efficient SC. In this research, these issues will be considered to overcome the
problem and make the RMG industry’s SC more competitive in the global market.

13
This study has analysed a theoretical concept to empirically explore and test the
relationships between political action, country risk, bureaucratic behaviours,
demand-side and supply-side issues (drivers and barriers), and ultimately
competitiveness in the context of the RMG industry and its supply chain in
Bangladesh.
The focus on cheap labour to maintain competitiveness is likely to continue a ‘race
to the bottom’ phenomenon which is not sustainable in the long term as this allows
investors to switch from one location to another based on the availability of cheap
labour (Adhikari and Y.Yamamoto 2005). Therefore, a country like Bangladesh
must seek new avenues to retain its position in the garment sector. In this regard,
addressing the issues of SC is a new way to improve the competitiveness of the
RMG industry. In the textile and clothing industry, managing the SC and increasing
competitiveness have been a major research issue in contemporary studies (Bruce,
Daly, and Towers 2004; Kabir 2007; Nuruzzaman, Haque, and Rafiq 2010) . It is
crucial for the RMG industry to identify the sector’s different stakeholders and to
have dialogue amongst them with the purpose of identifying the main issues that
need to be addressed in order to improve the sector’s competitiveness. Considering
the above problems, this research therefore attempts to investigate the following
primary research questions:
RQ1. How external elements like political action, bureaucratic behaviour and the risk of country factors or external stakeholders (political parties, government and bureaucrats) influence the competitiveness of the RMG industry of Bangladesh in terms of analysing the supply chain?
RQ2. How supply-side (suppliers) and demand-side (buyers) drivers (strengths) and barriers (weaknesses) or internal stakeholders (suppliers/manufacturers and buyers) influence the competitiveness of the RMG industry in terms of analysing the supply chain?
RQ3. What are the determinants for improving the competiveness of the RMG industry in Bangladesh?
1.4 Research Objectives
The main objective of this study is to construct a theoretical framework for examining the competitiveness of the RMG industry through examining the competitiveness of the RMG supply chain (SC) in Bangladesh. The specific objectives of the study are:

14
RO1. To analyse the current competitiveness of the RMG sector of Bangladesh
RO2. To investigate the influence of political action and bureaucratic behaviour on improving the competitiveness of the RMG industry
RO3. To study the impact of country risk on the competitiveness of the RMG industry
RO4. To investigate how supply-side (SS) drivers and barriers influence RMG competitiveness in Bangladesh
RO5. To investigate how demand-side (DS) drivers and barriers influence RMG competitiveness in Bangladesh
1.5 Definition of Terms
Buyers: Parties that purchase goods and services. In this study, buyers are the
importers of the final garment products as per their specifications.
Competitiveness: Competitiveness is defined as the ability to sustain trade in the
local and global environment. The European Management Forum (1984) defined
competitiveness as "the immediate and future ability of, and opportunities for,
entrepreneurs to design, produce and market goods worldwide whose price and non-
price qualities form a more attractive package than those of foreign and domestic
competitors" (Buckley, Pass, and Prescott 1988).
RMG industry is 100% export oriented industry (Nuruzzaman 2008) and
competitiveness is basically reflected in exports (Min and Galle 1991a). However,
recent literature on the post-MFA environment (Kelegama 2005; Tewari 2006) has
argued that simply focusing on lower costs in the post-quota era will not be enough to
ensure competitiveness in the garment and textiles industry. In today’s world, SCM is
a key strategic initiative for increasing organisational effectiveness and better
realization of organisational goals such as enhancing competitiveness. They cite
innovation and quality as important factors for firms wanting to retain a share of the
global market: “… a narrow focus on relative prices, low wages and large scales – the
standard attributes of a traditional growth strategy – obscures precisely the factors that
are central to sustaining export competitiveness today … global competitiveness in the
apparel industry today requires competencies that go well beyond traditional factors of
relative price and low wages” (Tewari 2006; Saxena and Salze-Lozac’h 2010).
Therefore considering stakeholders role in the supply chain is very important to
increase competitiveness. In this study, competitiveness is increase the ability to

15
compete and retain market share with more attractive price (by reducing cost through
efficient supply chain) and non-price qualities ( increase efficiency and reduction of
lead time) via improving RMG supply chain in the quota free environment.
Country factors or non-business actors (external stakeholders): Country factors
are variables which basically encourage foreign investment in a specific country and
influence the local and international business environment. In Hadjikhani et al.’s
(1996) study, two main factors were considered, namely: bureaucratic behaviour and
political action. Country risk is another factor which is the ultimate result of these
first two factors which Hadjikhani et al. considered as country factors in their study.
Political action refers to government and opposition parties’ role. In the conceptual
model, we did not consider political parties but we considered their actions which are
called “political action” (Adhikari and Weeratunge 2006).
External and internal stakeholders: External stakeholders are parties who are not
directly part of the RMG supply chain but have sufficient influence on its activities.
Internal stakeholders are parties who are directly part of the RMG supply chain and
are influenced by the external elements.
RMG: RMG means ready-made garments, that is, garments (apparel products) that
are ready to sell and use. According to the Cambridge Dictionary, ‘ready-made’
means “bought or found in a finished form and available to use immediately” or,
according to the AudioEnglish.net Dictionary, “a manufactured artefact (as a
garment or piece of furniture) that is made in advance and available for purchase”.
‘Garment’ means, according to the Oxford Dictionary, “an item of clothing”.
Therefore, RMG means a finished clothing item ready to sell and use. The ready-
made garment industry is the largest industry in Bangladesh. It is a sub-sector of the
textile and clothing industry. This industry produces deals with factories producing
woven, knit and sweater garments (Nuruzzaman 2001; Habib 2009).
A widely accepted definition of the ready-made garment industry is contained in the
International Standard Industrial Classification of all economic activities adopted by
the United Nations (UN) and the ILO which is followed by the Government of
Bangladesh. This definition indicates that “those establishments which do not make

16
fabrics or knitted fabrics but only cut and make garments out of them, could be
covered under the garment industry” (EU 2011).
Stakeholder: For the purpose of this study, stakeholders are “any group or
individual who can affect or is affected by the achievement of the organization’s
objectives” (Freeman 1984). Clarkson (1995) defined stakeholders as persons or
groups that have, or claim, ownership rights, or interests in a corporation and its
activities, be they past, present, or future. Buyers (customers), suppliers
(manufacturers), raw materials suppliers, logistics support providers, government,
bureaucrats, political parties, etc. are the stakeholders in this study. There are many
challenges in the South Asian region, some of which can be overcome only through
concerted efforts by various stakeholders (Adhikari and Weeratunge 2006).
Suppliers: Parties that supply goods and services. In this study, suppliers are the
manufacturers of the final garment products.
Supply chain management: Supply chain management spans all movement and
storage of raw materials, work-in-process inventory and finished goods from point-of-
origin to point-of-consumption. In the garment sector, the supply chain commences
with the sourcing of raw materials, design and production to distribution and
marketing which is organised as an integrated production network (Lee and Ng 1997;
Stock and Boyer 2009; Nordås 2004). The supply chain in the RMG industry consists
of an array of players (RMG manufacturers, fabrics and accessories suppliers,
government agencies, buying offices and sourcing agents, forwarders and carriers, and
buyers) performing different activities and adding value to consumers who purchase
the product (Nuruzzaman 2008; Nuruzzaman, Haque, and Rafiq 2010).
1.6 Significance of the Research
Many countries from South Asia, South East Asia and Africa are involved in the
garments business and earning large amounts foreign currency. The textile and
garment sectors of these countries are now in fierce competition as they are all in a
quota-free world. Countries are very anxious to retain their markets and to capture
more market share in the quota-free world. There are very few countries like
Bangladesh that have some special circumstances. Bangladesh is mostly dependent
on imported fabrics but the RMG sector has surprisingly developed and contributes

17
about 75% to total foreign exchange earnings (Rashid 2006; Abdulla 2008; Kabir
2007; Siddiqi 2007). The trade of textiles and ready-made garments comprises 6% of
the world’s total exports and Bangladesh depends on this trade for 95% of its total
exports (Kabir 2007)
After the phasing-out of the MFA in January 2005, this sector lost its previously
guaranteed access to EU, Canadian and US markets. The restriction on China was
lifted at the end of 2001 and the special restriction in the USA over China was also
lifted in 2008. Vietnam entered as a WTO member country in 2007 and has become
one of Bangladesh’s leading competitors (Saxena and Salze-Lozac’h 2010).
However, this does not mean that there is no room for smaller exporters like
Bangladesh. The sector in Bangladesh is forced to compete with established
suppliers like China, India and others who have sufficient backward linkages and
shortened lead times. Therefore, it is a question of how Bangladesh’s entire economy
will be affected by the present quota-free world if the necessary actions are not
taken. In the new business environment, the likelihood of success is very high for the
RMG industry if it is able to develop an efficient supply chain. But this sector has
been unable to discover a good solution through which they can progress.
Overcoming the present situation by establishing sufficient backward linkage
industries is very difficult for the Bangladeshi garment sector because this would
require huge financial investment. To improve competitiveness, Bangladesh may
need to develop new ideas in backward and forward SCM. With this research, it is
hoped to discover how a country like Bangladesh can create a significant position in
the world’s total garment export trade by managing the supply chain through
developing closer relationships and coordination among stakeholders and reducing
lead time. The significance of the study in its contribution to theory and practice is
discussed below:
1.6.1 Contribution to theory
This research will contribute to the understanding of both external and internal
stakeholders about national and international perspectives in the textile and garment
business. The study combines the insights of stakeholder theory and SCM in
improving the effectiveness, dynamism and competitiveness of the RMG supply
chain and thus achieving better garment industry performance through minimizing

18
lead time. Some research studies have been undertaken in apparel SCM to increase
performance and reduce lead time using IT and focusing on integrated relationship
management, collaborative relationships, etc. (Chandra 1997; Dossenbach 1999;
Bowen 2000; Au and Ho 2002; Buxey 2005; Lambert and Pohlen 2001;
Nuruzzaman 2007; Nuruzzaman, Haque, and Rafiq 2010; Pramatari 2007; Wong
1999; Zhao et al. 2008). This current research considers some new external variables
which previous studies did not consider, such as, political action, bureaucratic
behaviour and country risk to seeking to increase the performance or
competitiveness of the RMG supply chain. Again, due to lack of resources, the
suppliers of garment products are totally dependent on imported raw materials and
buyer demand. To minimize the cost, buyers are also dependent on the Bangladeshi
suppliers as they do not have sufficient labour. In investigating this situation,
resource dependency theory has also been considered in this research. According to
this theory, reducing the dependency through closer relationships among the
stakeholders is very important in increasing competitiveness. The current research
approach is therefore expected to make a unique theoretical contribution in the
ready-made garment SC. Moreover, this research will also make a unique
contribution in the academic literature by dealing with the RMG industry’s SC in a
developing country like Bangladesh.
1.6.2 Contribution to practice
It is expected that the outcomes of the study will make an important contribution in
the supply chain of garment industries in Bangladesh as it draws attention to some
uncovered issues which relate to the development of better customer-oriented SCM.
The outcomes of the study will be useful for various stakeholders of the RMG sector
in Bangladesh ranging from government to various private organisations. For the
first time, stakeholders will be able to see what will make the industry more
competitive and what needs to be done to achieve this result. Various policies can
accordingly be developed and implemented to support the Bangladeshi RMG sector
in competing in the world market.
1.7 Structure of the Thesis
This section presents the overall structure of this thesis which is organised and
presented in nine chapters. These chapters are closely related and complementary to

19
each other. The chronological relationships of these chapters are illustrated through
the diagram in figure 1.2. The brief outline of the chapters is as follows:
Chapter 1: Introduction
This chapter presents a discussion on the importance of the research and the gap in the
existing literature. The discussion actually helps to draw some research questions and
these are followed by the research objectives. Next, some definitions of terms are
described. Chapter 1 then explains the focus of the research as well as its practical and
theoretical significance and finally presents the overall organisation of this thesis.
Chapter 2: The RMG Industry and Bangladesh
This chapter discusses the historical development of the RMG industry in
Bangladesh and its present situation. It also discusses the present competitiveness of
the Bangladeshi RMG industry in the global clothing market.
Chapter 3: Literature Review
Chapter 3 presents an extensive literature review focusing on the RMG industry’s
SC and external and internal stakeholders. It reviews the literature on the SC and its
management, external and internal factors and elements of the RMG industry’s SC,
core theories, and relevant studies related to the SC of the garment industry and
improving competitiveness. Finally, based on the literature review, an initial research
model to improve competitiveness is developed in this chapter.
Chapter 4: Research Methodology and Design
Chapter 4 describes the methodological foundation used by this research to explore
the research questions and objectives. It focuses on determining the appropriate
research approach to conduct this research and discusses the methodology adopted
for this research. Firstly, the choice of research paradigm and mixed-method design
is scrutinised and then the research process for the qualitative field study, pilot test
and quantitative survey are discussed. In addition, the sample selection, data
collection and data analysis process have also been provided in this chapter.
Chapter 5: Field Study Analysis and Development of a Comprehensive Research Model
Chapter 5 presents the process and outcomes of the qualitative field study. This
chapter describes the process for the interviews conducted as part of the field study

20
and the analysis, through content analysis, of the qualitative data. The chapter
presents a brief description of the demographics of the study sample and details the
factors and variables identified during the interviews. Chapter 5 describes how the
initial model was modified based upon the findings and the final development of a
comprehensive research model on the basis of the literature review and field study
results.
Chapter 6: Hypotheses and Questionnaire Development
Chapter 6 develops the hypotheses on the basis of the comprehensive research model
proposed in chapter 5. It also focuses on the development of quantitative research
instruments which resulted from the comprehensive research model. This chapter
provides the details of the questionnaire used for the research survey.
Chapter 7: Survey and Quantitative Data Analysis
Chapter 7 presents the quantitative survey that was undertaken providing details of
the methodology. The chapter then presents a descriptive analysis of the survey
respondents, with this analysis generated by IBM SPSS 21 version in order to
understand the demographics of the sample population. Following this, the empirical
results from the survey are presented and analysed by the partial least squares (PLS)-
based structural equation modelling (SEM) technique. Finally, confirmation of the
research hypotheses is provided based on the results of the analysis.
Chapter 8: Discussion and Implications
Chapter 8 presents the interpretation and discussion of the results obtained from the
survey in chapter 7. It discusses the major research questions and the hypotheses
proposed in this study. More specifically, this chapter discusses the research
findings, based on theoretical and practical perspectives.
Chapter 9: Conclusion and Future Directions
Chapter 9 presents the summary of the research and its theoretical and practical
contributions. This chapter describes the limitations of the current research and this
study’s weaknesses and concludes with future research directions in the area of this
study.

21
1.8 Summary
Competitiveness is the buzzword in the world market of the garment business after
the abolition of the MFA. Organisations in the RMG industry are required to
integrate and be well managed in order to create and improve their competitiveness
while considering the internal resources and influence of external and internal
stakeholders in the SC. This chapter has provided the background of the current
research and has established the scope of the research. It briefly discussed the
existing research in the RMG industry providing an overview of the existing research
gap and outlining how this gap has been addressed by this research. Research
questions were then developed and research objectives were defined based on the
research questions. The chapter concluded by presenting a brief outline of the
structure of this research

22
1.9 Summary
Figure 1.2: Summary of the research structure
Structure
Chapter 1
Chapter 3
Chapter 4
Description Output
i) The overview of the research ii) Establishes the research problem
i) The theoretical background ii) Discussion about the existing gap ii) Conceptual framework
i) Details about the methodology and design of the research
Chapter 5
Chapter 6
i) Details of the field study ii) Develops constructs and items
i) Details hypotheses as per comprehensive research model ii) Development of research instruments
i) Details of the survey method ii) Analyses the survey data using partial least square (PLS) technique
Discussion of the findings
Chapter 7
Chapter 8
Determines the research questions and objectives
Discusses the relevant literature and proposes initial research-models
Presents the methodology adopted for this research
Proposes the comprehensive research model
Provides the hypotheses of the research model
Presents the data and data analysis of the survey
Provides the interpretations of the research findings
Chapter 2 i) Historical development of RMG in Bangladesh ii) Discussion about competitiveness
Provides detail about the area of the research subject and rationale of the study
Chapter 9 Overview of the research and future directions
Summarises the thesis and proposes future works

23
CHAPTER 2
The RMG Industry and Bangladesh1
2.1 Introduction
This chapter discusses the development of the RMG industry in Bangladesh. The
level of competitiveness of this industry is also discussed with statistics provided of
Bangladesh’s relative position in the world market in the post-MFA period. This
chapter also mentions the motivation for considering Bangladesh as a field of study.
2.2 Motivation for Choice of Bangladesh
Bangladesh is a promising developing nation in the global garments market. From a
modest start in the 1970s, the Bangladeshi RMG industry grew considerably over the
period of the MFA during the last 25 years. The number of garment factories
increased from 50 in 1983 to around 4,000 in 2006. In 2008-09, the number of
garment factories was approximately 6,000 although not all were operational. Over
the years, RMG exports have increased dramatically from a meagre US$68,000 in
1978 to US$12.3 billion in 2008-09. In addition, 75-76% of Bangladesh’s total
export earnings came from RMG. According to BATEXPO, this figure was 78.6% in
2012 (Batexpo 2012). In the post-MFA period, the amount of average growth
reduced to US$15.34 million in 2008-09, a figure which had been US$24.44 million
in 2005-06. In terms of the structure of the textile and clothing industry, Bangladesh
has a well-established supply chain in the knit segment and sources 80% of knit
1Part of this chapter has been presented at the following conferences; Nuruzzaman, M. (2012), “The Competitiveness and Supply Chain Management of Ready-Made Garment (RMG)
Industry in Developing Nations", In proceedings of The 7th Biennial Conference of Hong Kong Economic Association, December 13-14, Lingnan University, Hong Kong.
Nuruzzaman, M., Quaddus, M. and Jeeva, A. (2012), “An Investigation into the Factors Influencing Competitiveness of Ready-Made Garment (RMG) Supply Chain- The Experience from Bangladesh", In proceedings of Annual Conference on Global Economics, Business and Finance (GEBF), December 15-17, Hong Kong.
Nuruzzaman, M., Quaddus, M. and Jeeva, A. (2013), “ Improving Competitiveness and the Role of Stakeholders in Ready-Made Garment(RMG) Supply Chain of Developing Nations: A Qualitative Approach to develop a comprehensive research model” In proceedings of the American Canadian Conference for Academic Disciplines, International Journal of Arts and Sciences, May 20-23, Ryerson University, Toronto, Canada.
Nuruzzaman, M.( 2013), " The influence of Bureaucratic Behaviour to Improve the Competitiveness of RMG industry”, In proceedings of Emerging Research Initiatives and Development in Business, CGSB Research Forum, 9-10 May, Curtin University, Perth, Western Australia
24
fabrics from domestic manufacturers and suppliers. The backward linkage industries
are not as well developed in other segments. For example, the RMG industry is able
to source only 15% of the required raw materials for the woven market segment and,
therefore, the balance has to be imported from countries such as China, India,
Pakistan, Hong Kong and Taiwan (Rahman 2005). Moreover, there have been many
changes in the global apparel market. Vietnam and China have joined the WTO and
entered the quota-free market. In addition, many developing nations from Asia and
Africa have entered this sector as it is a labour-intensive industry.
At present, the Bangladeshi economy is highly dependent on the RMG sector which
has emerged as a prime job-creating sector for the neglected masses of Bangladeshi
society especially for women who are uneducated and unskilled. The RMG industry
is a labour-intensive industry with approximately 3.6 to 4 million workers employed,
80% of whom are women (Razzaque and Eusuf 2008; Batexpo 2012). RMG
factories and associated businesses (spinning, dyeing, finishing, accessories, etc.) are
estimated to provide employment for a total of 20 million people (Batexpo 2012).
Well-trained and skilled labourers are not required for this industry. Bangladesh has
a huge number of unemployed labourers who are uneducated and unskilled but
useful for the RMG industry. However, it would be massively destructive for the
economy, if Bangladesh lost its competitiveness and market share. Moreover, the
Bangladeshi RMG sector is under pressure from buyers particularly in terms of poor
working conditions and associated treatment of employees in this sector. In addition,
numerous campaigns about the human rights’ abuses that have frequently resulted in
accidents and deaths have been undertaken by international media and NGOs against
the Bangladeshi RMG sector (Islam and McPhail 2011; Islam and Deegan 2008).
These types of actions and incidents are actually negatively impacting on the RMG
industry in terms of improving its competitiveness. Lastly, and as a result of direct
representation by one of the researchers who is of Bangladeshi origin, the
opportunity arose to access all levels of the information provided by BGMEA and all
kinds of support from its member organisations for the purpose of this research. This
type of access – which is actually difficult for such research in Bangladesh – was
crucial to the research that we sought to undertake.

25
However, until now, there has been a relative lack of research studies that have
investigated the competitiveness of the Bangladeshi RMG industry. Considering this
phenomenon and the points raised above, Bangladesh was considered as the field of
research study.
2.3 Historical Development of RMG Industry in Bangladesh
Bangladesh is an overpopulated developing country. As the statistics show, the total
population is 160 million people (The world Fact Book 2011), 70% of whom depend
on agriculture; however, this sector is saturated and a declining source of livelihood
with natural disasters every year. After the independence of Bangladesh, jute and tea
were the most export-oriented sectors. But with the constant threat of flooding,
declining jute fibre prices and a significant decrease in world demand, the
contribution of the jute sector to the country’s economy has deteriorated (Rahman
2004). In these circumstances, there is a great need to develop other sectors in order
to create employment opportunities for the surplus manpower. Generating
employment opportunities may be possible through the promotion and development
of labour-intensive industries. Therefore, attention has turned to the role of the
manufacturing sector, especially in the garment industry.
Against the backdrop of overpopulation, underemployment and mismanagement in
public sector enterprises resulting in financial burden for the national exchequer, the
export-oriented garment sector emerged as the saviour sector assuring job
opportunities for the unemployed. In the 1980s, this industry gained momentum and
was developing rapidly. Considering the contribution made by the RMG industry,
the Bangladeshi government also began to provide various incentives to the garment
industry, such as the duty-free import of machinery, bonded warehouse facilities and
cash incentives (Quddus and Rashid 2000; Siddiqi 2005). As a result of its rapid
growth, this industry was brought under the MFA quota system in 1986. However,
the quota system was said to have favoured Bangladeshi producers because it
protected them from foreign competition and a more generous export quota had been
given to Bangladesh than to India and Sri Lanka (Montfort and Yongzheng 2004;
Saxena and Wiebe 2005; Siddiqi 2005). During this time, many textile and garment
companies from South Korea and other newly industrialized countries (NIEs) in East

26
Asia followed Daewoo into locating operations in Bangladesh and provided training
to Bangladeshi workers and managers. In addition, the lower labour costs were a
major factor behind the development of this industry but they were not the only
determinant of the development of the RMG industry in Bangladesh. For example,
although the labour costs in Turkey are higher than in Bangladesh and many
competitor countries, garment production has been growing there as rapidly as in
Bangladesh (Mottaleb 2011).
However, at present, the RMG industry in Bangladesh is certainly one of the
promising sectors as it has become the main export sector and a major source of
foreign exchange since 1980. The industry employs about 3.6 million workers of
whom 80% are women (Batexpo 2012) and now ranks among the largest garment
exporters in the world. It accounts for 78.6% of Bangladesh’s export earnings and 10%
of GDP (Batexpo 2012). This sector provides ample job opportunities for females.
In 1994, the international community decided to gradually abolish the MFA. The
phased abolition of the quota system began in 1995 and was completed in 2005.
Because the elimination of the quota now allows global buyers to import as many
garments as they like from their favourite suppliers, the phasing-out of the quota has
increased competitive pressure on suppliers.
The global shift of production to countries which are the least developed and
developing has favoured the growth of developing countries and also developed
countries’ pace of progress. The global economy is now dominated by the relocation
of production where firms from developed countries shift their interests to
developing countries. This relocation of production is most familiar in the clothing
industry. The world textile and apparel industry has undergone several migrations of
production since the 1950s and they all involve Asia. The first migration of garment
production took place from North America and Western Europe to Japan in the
1950s and the early 1960s. Although the trade was ruled by the developed world, for
a second time, garment production experienced a shift, this time from Japan to the
Asian Tigers – South Korea, Taiwan, Hong Kong and Singapore in the 1970s as
Japan turned its interest to more profitable products such as cars, stereos and
computers (Rahman 2004; Saxena and Salze-Lozac’h 2010). But the trend towards

27
the relocation of production did not stabilise there. As the economies of the Asian
Tigers developed, wage levels rose and also trade unions became active. The mid-
1980s through to the 1990s saw a third migration of production, this time from the
Asian Tigers to other developing countries – the Philippines, Malaysia, Thailand,
Indonesia and especially China. The 1990s have been dominated by the final wave of
exporters, which include Bangladesh, Sri Lanka, Pakistan and Vietnam (Hale 2000;
Rahman 2004). In the last decade, due to the low technology requirements and high
labour absorption potential, low-income and middle-income countries from South
Asia and Latin America have come to the fore as important locations for the
production of garments and apparel that are sold throughout Europe and North
America (Saxena and Salze-Lozac’h 2010).
In the early 1970s, RMG as a prospective industry was unknown both to economic
planners and entrepreneurs. Entrepreneurs without help and guidelines from any
government agency started and developed this sector exclusively with their own
efforts. In the mid-1970s when some of the developing countries of South East Asia
like Taiwan, Hong Kong and South Korea were shifting to the manufacture of “high
tech” products, manufacturing of basic and labour-intensive products was being
shifted to the lesser developed countries of the region. This was mainly due to the
phenomenal increase in labour costs in the RMG sectors of Korea, Hong Kong and
Taiwan. In the circumstances, many companies sought to identify a country within
the region which had vast human resources and low per capita income. In this
context, Bangladesh was targeted.
The growth of the garment industry in Bangladesh is comparatively recent. During
the British period, no garment factories existed in this part of the Indo-Pak
subcontinent. In 1960, the first garment factory in Bangladesh was established in
Dhaka and by 1971 the number of factories had risen to five. But these garment
factories were intended to serve the domestic market only. In 1976 and 1977, some
entrepreneurs came forward to set up 100% export-oriented garment factories. Mr
Reaz of Reaz Garments and Mr Ashraf of Ashraf Garments were the pioneers of this
sector and started their garment businesses much earlier (Ahmed 1995). However,
the revolution in this sector came in the 1980s.

28
In 1977, Reaz Garments was one of the first firms to engage in export. In 1978, a
retired civil servant in collaboration with Daewoo, a Korean company, set up a
garment factory named 'Desh'. At that time, trained workers and supervisors for the
garment industry were not available in the country. Daewoo provided free training to
130 Desh supervisors and managers at its ultra-modern Pusan garment plant, the
biggest in the world at the time (Quddus and Rashid 2000). The Daewoo-trained
Desh employees were soon enticed away at significantly increased salary levels by
new garment firms that were being set up in large numbers in Dhaka. Until the mid-
1980s, the number of new entrants in this industry increased rapidly. During the first
half of the 1990s, the garment industry growth picked up and expanded at the rate of
22% on average yearly (International business & Technical Consultants Inc. and
Uniconsult Imternatinal Limited 2000). Since then, the Bangladeshi garment sector
has been playing a dominant role to shape Bangladesh’s economy and export trade.
After the liberation of Bangladesh, when the country’s traditional export items could
not yield expected results, the government and a selection of entrepreneurs who were
young, educated and dynamic in the late 1970s began to emphasize the development
of non-traditional items of export. Starting from the late 1970s, the garment sector of
Bangladesh had come into prominence in the mid-1980s. By 1983, RMG had
emerged as the most promising non-traditional export- oriented sector in the socio-
economic context of the country (Nuruzzaman 2001, 2007; Rahman 2004).
It was revealed in previous research studies that despite the presence of so many
internal constraints like the lack of backward linkage industries, lack of raw
materials, infrastructure problems, poor port facilities, custom delays, financial
sector problems, political instability and lack of government support (World Bank
2005; Nuruzzaman 2007) this sector developed surprisingly from 1985. This was
due to some specific external factors such as the quota facility under MFA,
Generalized System of Preference (GSP) facilities, duty-free access and an
integrated framework for technical assistance for least developed countries (LDCs).
In addition, the role of young entrepreneurs in the private sector, very cheap labour
and government support through the Export Promotion Bureau (EPB) helped this
sector to achieve rapid growth. In 1981, there were only 21 RMG units in the
country but the number of RMG units had increased to 5,400 (see figure 2.1) in 2012
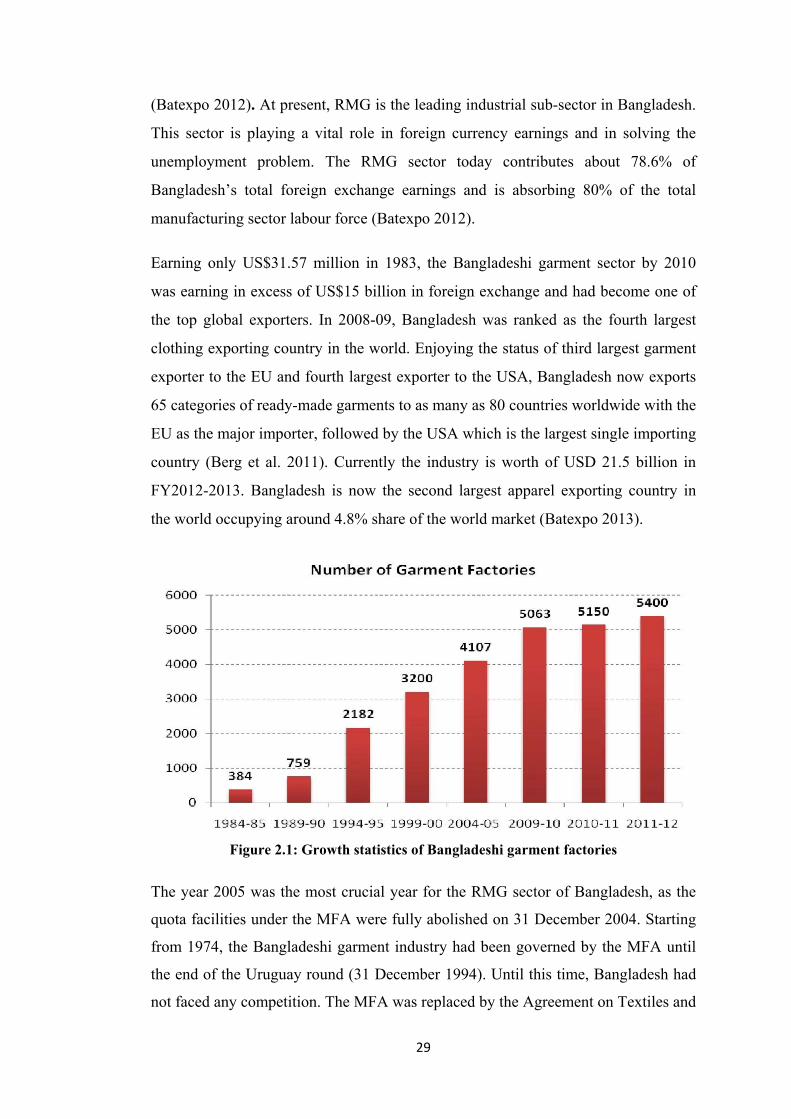
29
(Batexpo 2012). At present, RMG is the leading industrial sub-sector in Bangladesh.
This sector is playing a vital role in foreign currency earnings and in solving the
unemployment problem. The RMG sector today contributes about 78.6% of
Bangladesh’s total foreign exchange earnings and is absorbing 80% of the total
manufacturing sector labour force (Batexpo 2012).
Earning only US$31.57 million in 1983, the Bangladeshi garment sector by 2010
was earning in excess of US$15 billion in foreign exchange and had become one of
the top global exporters. In 2008-09, Bangladesh was ranked as the fourth largest
clothing exporting country in the world. Enjoying the status of third largest garment
exporter to the EU and fourth largest exporter to the USA, Bangladesh now exports
65 categories of ready-made garments to as many as 80 countries worldwide with the
EU as the major importer, followed by the USA which is the largest single importing
country (Berg et al. 2011). Currently the industry is worth of USD 21.5 billion in
FY2012-2013. Bangladesh is now the second largest apparel exporting country in
the world occupying around 4.8% share of the world market (Batexpo 2013).
Figure 2.1: Growth statistics of Bangladeshi garment factories
The year 2005 was the most crucial year for the RMG sector of Bangladesh, as the
quota facilities under the MFA were fully abolished on 31 December 2004. Starting
from 1974, the Bangladeshi garment industry had been governed by the MFA until
the end of the Uruguay round (31 December 1994). Until this time, Bangladesh had
not faced any competition. The MFA was replaced by the Agreement on Textiles and

30
Clothing (ATC) for all 147 member countries under WTO rule beginning from
1 January 1995. The MFA was phased out through four stages over 10 years (1995–
2005) in accordance with the ATC.
The Bangladeshi RMG industry started to face competition from the end of the
phasing-out period. After the abolition of the MFA, Bangladesh so far has been
predicted to be one of the major losers. The MFA was introduced in 1974 to serve as a
short-term protection measure for the textile and clothing industries in developed
countries against the competition and trade imbalances created by low-priced garments
manufactured in developing countries. The MFA did not apply to trade between rich
industrialized countries. After the introduction of the MFA, Bangladesh became the
world's foremost exporter of garments. After the MFA was phased out, Bangladesh
entered a new quota-free business environment. From that time, a new competitive
environment came into being for the garment sector of Bangladesh. Cambodia, Nepal,
Haiti, Laos, Lesotho, Madagascar, Myanmar, many Sub-Saharan African and other
Asian countries emerged as major exporters of manufactured garments (Fiaz 2006).
However, to survive in the global garment business, Bangladesh must immediately
implement pragmatic policies enabling her to compete more efficiently in the
changing business environment. Bangladesh must focus on strategies for
strengthening the competitiveness of the RMG industry to minimize vulnerability
and maximize market share. The best solution is through improving the domestic and
regional supply chain (SC) (Sattar 2005). Montfort and Yongzheng (2004) also
mentioned the SC in terms of improving competitiveness.
2.4 The RMG Industry and its Supply Chain
Managing the SC is vital for the global apparel business and increased exports. The
ultimate objective is to deliver products to the market with variety, responsiveness,
timeliness and efficiency in a competitive manner. The strategic requirements of
global business determine the extent, characteristics and strategic direction of the
SC. However, some businesses are only involved with international operations to
secure a supply of materials and components but their marketing is domestic. Other
businesses manufacture and export from a home base and procure materials
overseas. In Bangladesh, the RMG business resembles this second type of business
in the global garment market. Global corporations take advantage of low-cost
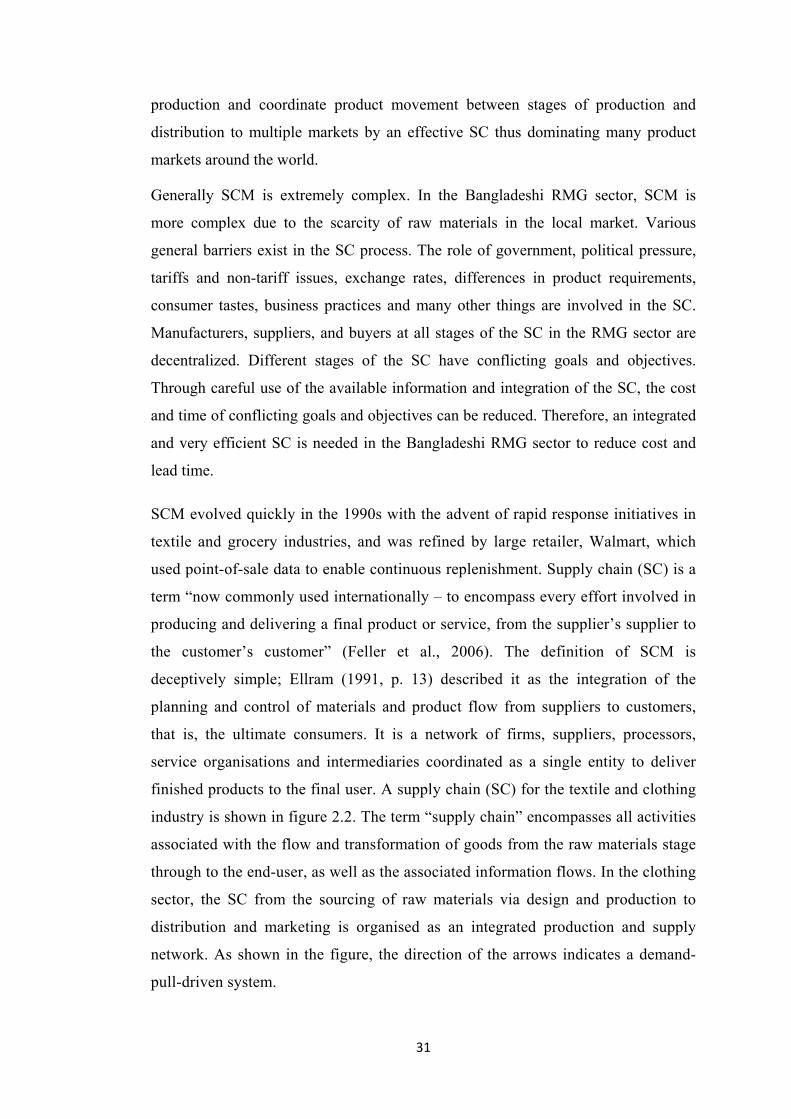
31
production and coordinate product movement between stages of production and
distribution to multiple markets by an effective SC thus dominating many product
markets around the world.
Generally SCM is extremely complex. In the Bangladeshi RMG sector, SCM is
more complex due to the scarcity of raw materials in the local market. Various
general barriers exist in the SC process. The role of government, political pressure,
tariffs and non-tariff issues, exchange rates, differences in product requirements,
consumer tastes, business practices and many other things are involved in the SC.
Manufacturers, suppliers, and buyers at all stages of the SC in the RMG sector are
decentralized. Different stages of the SC have conflicting goals and objectives.
Through careful use of the available information and integration of the SC, the cost
and time of conflicting goals and objectives can be reduced. Therefore, an integrated
and very efficient SC is needed in the Bangladeshi RMG sector to reduce cost and
lead time.
SCM evolved quickly in the 1990s with the advent of rapid response initiatives in
textile and grocery industries, and was refined by large retailer, Walmart, which
used point-of-sale data to enable continuous replenishment. Supply chain (SC) is a
term “now commonly used internationally – to encompass every effort involved in
producing and delivering a final product or service, from the supplier’s supplier to
the customer’s customer” (Feller et al., 2006). The definition of SCM is
deceptively simple; Ellram (1991, p. 13) described it as the integration of the
planning and control of materials and product flow from suppliers to customers,
that is, the ultimate consumers. It is a network of firms, suppliers, processors,
service organisations and intermediaries coordinated as a single entity to deliver
finished products to the final user. A supply chain (SC) for the textile and clothing
industry is shown in figure 2.2. The term “supply chain” encompasses all activities
associated with the flow and transformation of goods from the raw materials stage
through to the end-user, as well as the associated information flows. In the clothing
sector, the SC from the sourcing of raw materials via design and production to
distribution and marketing is organised as an integrated production and supply
network. As shown in the figure, the direction of the arrows indicates a demand-
pull-driven system.
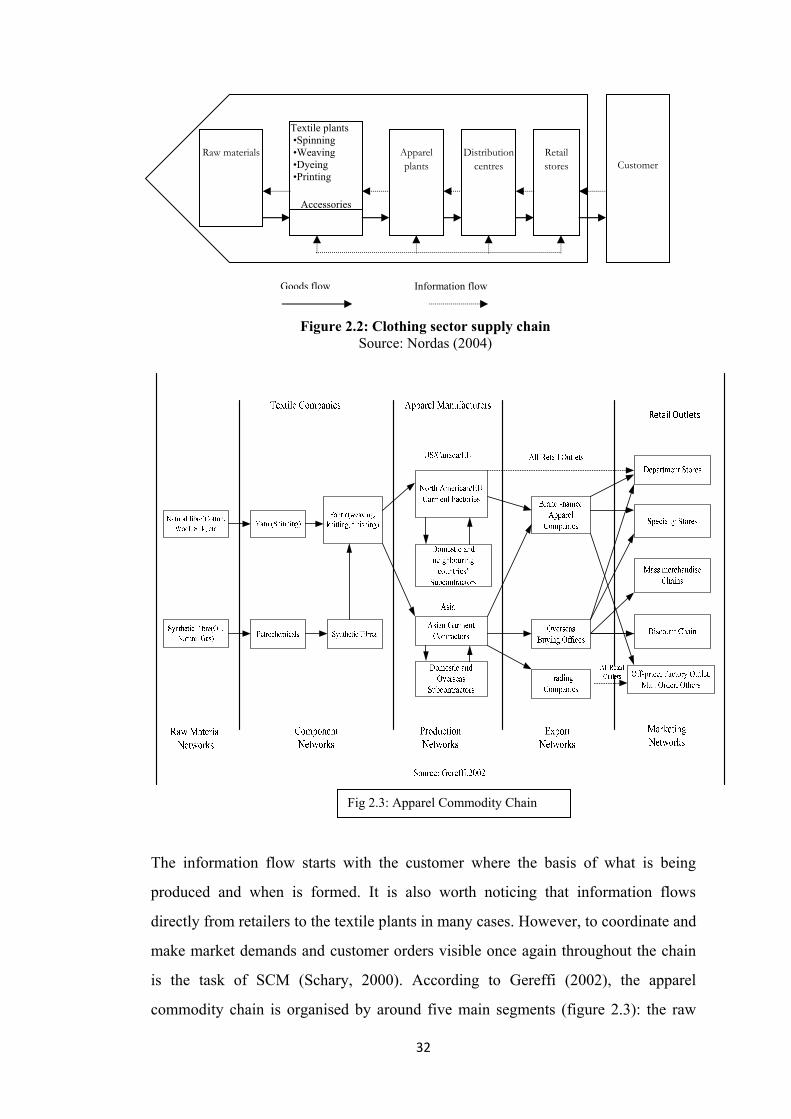
32
The information flow starts with the customer where the basis of what is being
produced and when is formed. It is also worth noticing that information flows
directly from retailers to the textile plants in many cases. However, to coordinate and
make market demands and customer orders visible once again throughout the chain
is the task of SCM (Schary, 2000). According to Gereffi (2002), the apparel
commodity chain is organised by around five main segments (figure 2.3): the raw
Figure 2.2: Clothing sector supply chain Source: Nordas (2004)
Raw materials Apparel plants
Textile plants •Spinning •Weaving •Dyeing •Printing
Accessories
Distribution centres
Retail stores Customer
Goods flow Information flow
Fig 2.3: Apparel Commodity Chain

33
material supply network, component networks under textile companies, production
networks under garments or apparel manufacturers, export networks and marketing
networks. But the RMG industry considers only three networks in its SC. The RMG
industry’s SC is shown in figure 2.4.
Manufacturers collect raw materials after having received the final order from buyers
or from their agent. They purchase fabrics from the local textile companies (local
fabrics suppliers) and foreign textile companies (foreign fabrics suppliers). Then
they cut, make and trim the garment as per order. Finally, they take the necessary
steps to export these garment products via the buying house/local agent or through
the shipping company. So, basically the RMG industry’s SC consists of the
components network, production network and export network. However, the detailed
RMG industry’s SC is shown in figure 2.5.
Order flow Collect raw materials Final product supply flow Information flow
Foreign buyers/ Lead firms
Manufacturer
Foreign fabrics and accessories
Suppliers
Local fabrics and accessories Suppliers
Buying house/ Local agent
Sample making & approval
Subcontractor
Figure 2.4: RMG supply chain Source: Nuruzzaman (2007)

34
Figure 2.5: Detailed RMG backward (upstream) and forward (downstream) supply chain Source: Nuruzzaman (2010)
Private bonded warehouse
Transport Warehousing
Local buying houses/agents
Suppliers/ Manufacturers
Backward SCM
Forward SCM
Suppliers/ Manufacturers
Supporting activities like trimming, packaging, etc.
Shipment Transportation
Subcontractors Company
Local suppliers
Import cotton or yarn
Processed by spinning, weaving or composite mills
Finishing
Foreign suppliers
Shipping lines/land transport
Sea or land port services
Container handling via road and train transport
Importing fabrics
Buyers/
Customers
Sample making and approval
Logistics services providers
Buying house/ buyers’ agent
Place order Collect fabrics/raw materials Communication/exchange information Supply of finished goods

35
2.5 Present Bangladeshi Supply Chain Scenario to Achieve Competitiveness
Now, more than ever, companies are trying to gain a competitive edge and improve
profitability through cutting cost, increasing quality, and improving productivity and
delivery. Companies are concentrating on improving delivery through cutting lead
time and managing the SC to gain competitive advantage. Although Bangladesh has
some promising advantages in certain dimensions, a hurdle like the infrastructure
(transport and SC) is the single largest issue hampering Bangladesh’s RMG industry
(Berg et al. 2011). Therefore, the SC and its management are also very important in
the RMG industry and all stakeholders should be very careful about the SCM of
RMG industry in order to improve competitiveness.
Supply chain management (SCM) means managing the supply of inbound and
outbound goods and services in the most cost-effective and time-sensitive way. This
can be done by designing a strategic route plan for the quickest possible pick-up and
delivery regimen, from the appropriate suppliers, for all points throughout the
assembly line, in order to achieve cost- and time-related efficiency levels. Logistics are
generally used to put the SCM strategy in place physically. But in Bangladesh most
companies have no logistics department to execute the SCM plans (Khandker 2007).
Moreover, the congested roads, limited inland transport alternatives and the lack of a
deep-sea port facility have increased the inefficiencies which sustain a longer lead time
in the garments sector (Berg et al. 2011). With the aim being to achieve a shorter lead
time, reliable and fast transport in the SC is extremely important.
Logistics uses various infrastructure and machinery to bring about the execution of
the SCM strategy. Such a SCM and logistics mechanism can be relevant in the
macro sense as well, encompassing the economic activity of the whole country.
Therefore, roads, railways, waterways, seaport and airport customs facilities, and
regulations of a country need to be seamless and free of corruption. All of the above
fall in the category of logistical infrastructure and are vital for the economic viability
of a country. But in Bangladesh, connectivity and coordination in the logistics
system are not good. Logistical infrastructure has been discussed indirectly at length
in the media in Bangladesh whenever we have seen news related to port facilities but
the significance of SCM and the fact that modern logistical infrastructure is a

36
national priority has not gained any ground in Bangladesh (Khandker 2007). The SC
of the RMG industry is highly dependent on the Dhaka–Chittagong highway and
Chittagong port as the only main transport routes but issues such as: i) highway
congestion increases transport time by up to 20 hours; ii) lead time is increased by
about 10 days due to the lack of a deep-sea port; iii) poor productivity occurs at
Chittagong port due to inefficient processes; and iv) the Dhaka–Chittagong train
connection’s limited capacity all limit the efficiency of the RMG industry’s SC
(Berg et al. 2011).
A strategic plan for the development of logistical infrastructure could be a unique
opportunity for Bangladesh to improve its functional infrastructure but much effort is
needed to improve roads, railway lines, ports, airports, etc. Not only does the
government need to offer an alternative port to ease congestion in the Chittagong
port, internal container depot (ICD) facilities need to be increased so that goods can
be unpacked and delivered to destinations in and around Dhaka if needed. Moreover,
more off-dock facilities in Chittagong port to facilitate quick movement of
containers within the port, and computerisation of customs to shorten customs
formalities and make them more transparent are also needed for a better and efficient
SC. However, SCM and logistics would have to be accepted as integral to the
strategic economic planning done by an economic think-tank in Bangladesh.
2.6 Present Situation and Competitiveness
In January 2005, the Bangladeshi RMG sector entered the post-MFA period
although the four stages of the phasing-out process had started from 1995. The
completion of the phasing out of the export quota system at the beginning of 2005
raised the issue of the competitiveness of Bangladesh’s RMG industry as a top
priority topic. Under the quota system, countries like Bangladesh did not even feel
the need to develop other industries (like cotton, textiles, etc.) because it was more
lucrative to use imported textiles to fulfil the garment product quota (Saxena and
Salze-Lozac’h 2010). Therefore, the present situation of the Bangladeshi RMG
industry is at the crossroads and facing fierce competition from across the world.
Bangladesh is still dependent on imported inputs. Due to the lack of backward
linkage industries, manufacturers are dependent on imported raw material. This
actually makes the SC more complex for Bangladeshi manufacturers (Adhikari

37
2007a; Nuruzzaman, Haque, and Rafiq 2010). Labour productivity in Bangladesh is
less than half that of India and Sri Lanka: the average capital intensity per worker in
the garment factories of Bangladesh is US$1500 while that of China is US$4000
(Kabir 2007). The World Bank has also identified three main sources of comparative
disadvantages for Bangladesh’s export industries: infrastructure, corruption and the
high cost of finance. Electricity supply, telecommunications and the port facilities of
Bangladesh are inefficient which reduces the competitiveness of Bangladeshi
exporters. Due to the lack of electricity supply, most factories maintain their own
generator which is relatively costly (2.5 times the cost of accessing power from the
grid, as noted by the World Bank, 2005). The container terminal at the Chittagong
port can handle merely 100–105 lifts per berth per day, which is far below the
productivity standard of 230 lifts per day.
Foreign direct investment (FDI) in the apparel sector is highly restricted in
Bangladesh. Although this protects local entrepreneurs, the industry suffers in terms
of the restricted flow of modern technology and skills. The real interest rate in
Bangladesh is twice that of the interest rate prevailing in China and also higher than
that in India. In addition to these factors, lead time is two or three times higher than
in China, India, Pakistan, Sri Lanka and other competitor countries (Kabir 2007).
Due to the lack of relationships between stakeholders, the government has failed to
take the necessary steps to reduce the lead time. For example, it can be mentioned
that the BGMEA suggested that the government establish a central bonded
warehouse to reduce lead time but the BTMA opposed this and the government has
not yet taken action to establish a central bonded warehouse. In addition, due to the
lack of significant contribution by the government in many areas such as
infrastructure, logistics, port management, skill development and training facilities,
this sector cannot make its SC efficient in order to reduce lead time (Nuruzzaman
2007; Razzaque and Eusuf 2008).
The government and bureaucrats as important stakeholders do not have a good
monitoring system for this business even in the unsafe working environment of the
country’s thriving garment sector. Therefore, many incidents occur every year
creating a rising death toll due to building collapses and devastating fires. Some
retail buyers have withdrawn their business to protest about these types of incidents.

38
Walt Disney withdrew its US$400 million business due to the recent building
collapse in Savar, Dhaka, Bangladesh (Fox 2013). In addition, in the last four
months, business valued at US$500 million has been transferred to neighbouring
countries due to political unrest and its effect on the SC (The Daily Manab Zamin
2013). From this evidence, it is clear that the competitiveness of Bangladesh’s RMG
industry is not up to the mark. The garment industry employees have frequently
created situations of unrest in their claims for a good wage structure. But the
government, political parties and bureaucrats have not taken appropriate action to
solve this problem. It has now become a permanent problem of the garment industry
which has made the SC inefficient (Razzaque and Eusuf 2008; Saxena and Salze-
Lozac’h 2010).
Competitiveness is the capability of producing and delivering customized products
and services fast and efficiently all over the world (Buckley, Pass, and Prescott
1988). Many companies are implementing SCM in an effort to increase
competitiveness, profit and customer satisfaction (Nordås 2004). Activities within
the SC are very important as they transform various resources, raw materials and
components into a finished product that is delivered to the customer. Therefore,
managing the SC is important in improving competitiveness and increasing exports
in the RMG sector.
However, due to the above situations and the abolition of the quota facility, the issue
of competitiveness needs to be addressed, with special attention given to the long-
term sustainability of the industry. In this regard, the government, political parties
and bureaucrats should act positively to improve the above areas of business
processes. Some other researchers have considered product quality, innovativeness,
distribution networks, transaction costs, institutional factors relating to the
bureaucracy of export procedures and other non-price factors as factors for
measuring competitiveness (Abdel -Latif 1993; Chen, Xu, and Duan 1999). But to
improve these factors, external stakeholders such as the government, political parties
and bureaucrats need to play a considerable role. As shown in figure 2.6, external
stakeholders can influence internal stakeholders and the RMG industry’s SC in
various ways to improve the latter’s efficiency and the competitiveness of the
industry.

39
Figure 2.6: Influence of external stakeholders
Bangladesh’s RMG exports have grown rapidly over the past 25 years. The value of
exports in US dollars has increased more than sixfold, or about 16% per year, during
the period 1990-2002 which is considerably faster than the growth of other
merchandise exports (Montfort and Yongzheng 2004). However, after the decision
was made to abolish the MFA, Bangladesh’s exports of garments to the US market
reduced from US$1956 million to US$1629 million between financial years 2002
and 2004. China’s share of the US import quota for derestricted items has increased
from 9% to 65% as of March 2005. The corresponding share for Bangladesh has
reduced from 7% to 2% (Rahman and Raihan 2003). However, some evidence was
seen of a slow decline in imports from countries like Bangladesh in 2007 and 2008
following the economic slowdown and recession in the major markets of the USA
and EU (Saxena and Salze-Lozac’h 2010).

40
Uddin (2006) mentioned in his research work that the key factors for improving the
competitiveness of the Bangladeshi RMG industry were infrastructure (electricity, gas,
Chittagong port, all modes of transport but especially road, and telecommunications);
compliance issues (good working conditions, fire and safety issues, good wage
structure, human rights); IT (e-communication, software for machinery and daily use,
databases); and capacity building (education, training, etc.). In the above section, these
issues have been discussed and it has been found that Bangladesh is lagging behind in
these key factors. Due to their lack, the SC and the competitiveness of the RMG
industry cannot achieve the level of expectation required.
Saxena and Salze-Lozac’h (2010) has mentioned that the dependency on imported
raw materials and the lack of backward linkage industries are the main barriers to
improving competitiveness. Due to the lack of raw materials like cotton, it is very
difficult to develop the textile sector. Bangladesh can only supply about 13% of the
country's total demand for raw cotton, with imports needing to come from
competitor countries, including India, Pakistan and China. The BTMA’s 1994-95
Annual Report strongly suggested that Bangladesh should expand its cotton-growing
area and use an improved variety of seed. This was considered essential to the
competitiveness of the textile sector that needed to achieve 50% productive capacity
within five years. However, this goal posed a 'very real problem' due to a shortage of
land in the country for such cultivation, especially when the country needed this land
to maintain self-sufficiency in food production (Rock 2001).
Nonetheless, for the export-oriented garments sector, an increase in the domestic
output of fabric – supported by dyeing and finishing facilities – is the way in which
to address this urgent problem. With local textile mills only supplying approximately
less than 15% of the woven fabric and 60% of the knit fabric required for the
industry (World Bank 2005), the Bangladesh Garments Manufacturers and Exporters
Association(BGMEA) has been lobbying the government to prioritize the textile
sector as a major investment opportunity for both local and foreign capital. After
being identified as the 'thrust' sector for investment, the textile sector in 1995 saw 10
composite textile mills in the process of being established by local capital which,
when in operation, would have the productive capacity to increase the supply of
fabrics to about 230 million yards. According to the BTMA’s Annual Report of

41
2004, domestic production of woven and knitting fabric was increased to 1430 and
990 metres respectively in 2003-04. This amount was very low compared to the
required demand. Due to the lack of sufficient textile mills to date, this sector is
facing the problem of losing its competitiveness due to longer lead time. In
summary, unless Bangladesh can produce the raw materials required for the garment
export industry, the sector will be unable to compete in this quota-free environment
and will lose competitiveness (World Bank 2005).
The major recipients of Bangladeshi garments are the USA, Canada and EU countries.
Creating new markets will require garment manufacturers to pursue an aggressive and
penetrating marketing strategy rather than being reactive to demand from buying
agents. As a result, and in concert with the need for further development of backward
linkages, increased government support will be required for the garment export sector
to overcome its overall lack of diversity. However, from tables 2.1, 2.2, 2.3 and 2.4,
the comparative situation and the competitiveness of the Bangladeshi RMG industry in
the post-MFA period can be easily identified. In 2004, the market share of
Bangladeshi RMG in USA was US$3.05 billion but in 2008 it had increased to only
US$4.81 billion. In the same time frame, the market share of its competitors (China,
Vietnam, India and Indonesia) was higher than that of Bangladesh (see table 2.1). In
the EU market, Bangladesh’s market share was 4.1 billion Euros but in 2008 it had
increased to only 4.2 billion Euros whereas the market share of its competitors (China,
India and Vietnam) within the same period had increased remarkably (see table 2.3).
The average growth rate of the Bangladeshi RMG industry decreased dramatically in
2010 (see tables 2.2 and 2.4). In 2005-06, the growth rate was US$23.11% million but
in 2009-10 it had reduced to US$1.20% million.
Table 2.1: USA apparel imports (in USD billions)
Source: Joarder et al. (2010)
Country 2000 2004 2005 2008 Sep, 09 Value Share Value Share Value
Share Value Share Value Share
China 4.50 7.86 8.93 13.78 15.14 22.04 22.92 32.03 17.23 36.36 Vietnam 0.05 0.08 2.56 3.96 2.72 3.97 5.22 7.30 3.78 7.98 Indonesia 2.05 3.59 2.40 3.71 2.88 4.18 4.03 5.63 2.97 6.26 Bangladesh 2.12 3.70 1.98 3.05 2.37 3.45 3.44 4.81 2.66 5.61 Mexico 8.41 14.70 6.68 10.32 6.08 8.85 4.01 5.61 2.53 5.34 India 1.79 3.12 2.22 3.42 2.98 4.33 3.07 4.29 2.27 4.78 Pakistan 0.92 1.61 1.14 1.76 1.26 1.83 1.49 2.08 0.98 2.06 Sri Lanka 1.47 2.57 1.55 2.39 1.65 2.40 1.47 2.05 0.95 2.00

42
Table 2.2: Export and market share statistics
Sources: Joarder et al. (2010); Export Promotion Bureau (EPB) Bangladesh, 2009
Table 2.3: EU-27 Apparel imports (values in Euros billions)
Country 2000
2004 2005 2008 Sep.09
Value Share Value Share Value Share Value Share Value EU27_Intra 41.2 50.8 44.7 49.8 27.6 48.2 51.6 46.2 27.6 China 7.8 9.6 11.5 12.8 14.7 17.8 25.3 22.7 14.7 Turkey 5.4 6.7 7.7 8.6 4.2 8.5 7.9 7.0 4.2 Bangladesh 2.6 3.2 3.7 4.1 3.2 3.7 4.7 4.2 3.2 India 2.0 2.5 2.5 2.8 2.7 3.4 3.9 3.5 2.7 Morocco 2.4 2.9 2.4 2.7 1.2 2.4 2.4 2.1 1.2 Vietnam 0.8 1.0 0.6 0.7 0.7 0.7 1.2 1.1 0.7 Sri Lanka 0.8 1.0 0.8 0.9 0.7 0.8 1.1 1.0 0.7 Pakistan 0.6 0.7 0.9 1.0 0.5 0.8 0.9 0.8 0.5 Hong Kong 3.1 3.9 2.0 2.2 0.3 1.8 0.9 0.8 0.3 Thailand 0.9 1.2 0.9 1.0 0.4 0.8 0.8 0.7 0.4
Source: Joarder et al. (2010)
Table 2.4: Increasing rate of RMG export earnings
Source: EPB Bangladesh, 2010
Moreover, the need to continue education and related training is a vital necessity to
ensure a ready supply of skilled labour for the production and improvement of high
quality garments especially as this is one of the prime determinants for attracting and
maintaining export contracts. With the aim of having a supply of the required skilled
manpower, BGMEA has established a fashion institute but has failed to meet the
demand from manufacturers. The Bangladeshi RMG industry needs to establish
more institutes with the help of the government to supply trained people to this
Country After MFA (05-08) US$b
Market share in USA (US$b)
EU market share (US$b)
Average growth rate (AGR) of Bangladesh RMG (US$m)
Growth Change in Share
2005 2008 2005 2008 A. G.R.
2005-06
2008-09
2009-10
China 17% 9% 22.04 32.03 17.8 22.7 23.11% 15.38% 1.20% Bangla-
desh 17% 1% 3.45 4.81 3.7 4.2
India 8% 0% 4.33 4.29 3.4 3.5 Viet-nam
24% 1% 3.97 7.30 0.7 1.1
Fiscal Year Export earnings (US$m) (+) Increase Rate of Increase 2004-05 6417.67 + 731.67 +12.86% 2005-06 7900.80 +1483.13 +23.11% 2006-07 9211.23 +1310.43 +16.58% 2007-08 10701.65 +1490.42 +16.18% 2008-09 12347.77 +1646.12 +15.38% 2009-10 12497.00 +149.23 +1.20%

43
industry to improve its productivity and competitiveness. To boost the productivity
and competitiveness of the garments export industry, educated and trained people are
highly required but the ability to meet this requirement still lags behind (Saxena and
Salze-Lozac’h 2010)
China is now a member country of the WTO. The restriction on China was lifted at
the end of 2001 and the special restriction in the USA over China was also lifted in
2008. However, this and other changes do not mean that there is no room for smaller
exporters like Bangladesh. What it certainly means is that Bangladesh will have to
improve its competitiveness to remain in the heart of buyers. In terms of labour cost,
Bangladesh is well positioned and in a comparatively favourable position to other
Asian countries.
It is crucial for different stakeholders of the sector to have dialogue and hold
discussions amongst themselves with the purpose of identifying the main issues that
need to be addressed in order to improve the sector’s competitiveness. Discussion
should also cover a wide range of areas where improvements and reforms have to be
made in order to make the garment industry more competitive. These areas include
inadequate infrastructure, inefficient and corrupt facilities in port and custom
procedures, insufficient business support, the low level of labour standards and
compliance, and ineffective policy support. Political action of the government and
bureaucrats’ behaviour are very important to solve these problems. The three parties,
employers, labour unions and the government, need to come together to discuss areas
of collaboration through which to improve the competitiveness of the RMG sector.
In the post-MFA period, the Asia Foundation has launched a regional project on
building competitiveness and has recommended that key actors in the RMG sector be
identified and discuss with different stakeholders to help build relationships with the
three parties, namely, employers, employees and public authorities (Fiaz 2006).
However, buyers are primarily interested in three factors: price, lead time and
quality. Other factors are also important such as design and product development
capability, labour compliance standards, advanced production facilities and a long-
term business relationship (Berg et al. 2011).

44
Rapidly changing buyer behaviour coupled with the demand for low-cost supplies
with minimum lead time has meant that countries with vertically integrated
production structures, critical mass production apparatus and low lead time are
among the most-favoured suppliers. Only those countries with skilled workers, state-
of-the-art machinery and equipment, the ability to source inputs at global prices at
short notice, a good understanding and relationships among external and internal
stakeholders of the SC and infrastructure that allows exporters to process orders at
the lowest possible cost and time can take advantage and create competitiveness in
the present situation of the RMG business. Considering the above-mentioned
perspective, Bangladesh still lags behind the required level of competitiveness.
2.7 Summary
This chapter has introduced the subject of the current research and the rationale for
conducting the research. It was found that the Bangladeshi RMG industry was
significantly affected by the post-MFA period even though it was a significant
contributor to the economy of Bangladesh. Therefore, studying stakeholders in the
SC of the Bangladeshi RMG industry is a vital step in improving the industry’s
competitiveness.

45
CHAPTER 3
Literature Review2
3.1 Introduction
As discussed in chapter 1, improving the competitiveness of the ready-made garment
(RMG) industry of Bangladesh is the main focus of this study. This chapter presents
the literature review which investigates various themes in relation to current
research. Moreover, the main objective of this study is to improve competitiveness
by analysing the supply chain (SC) of the RMG industry. This research deals with
the operational SC and aims to investigate the influence of elements under the
external and internal stakeholders of the RMG industry’s SC in seeking to improve
competitiveness. An operational SC is a set of networked organisations
(stakeholders) working together to source, produce and distribute products to
customers (Lee 2002 ). Analysing the SC has become a major research issue in
contemporary management literature.
The literature review chapter is divided into two parts. The first part considers the
supply chain (SCM), supply chain management (SCM) and supply chain
competitiveness (SCC). The SC and its various issues have been explored from
2 Part of this chapter has been presented at the following conferences: Chowdhury, M., Nuruzzaman, M., Dewan, M. and Quaddus, M. (2012)," An AHP Integrated QFD Appoach for
Mitigating Upstream Supply Chain Barriers: A Study On Readymade-Made Garment(RMG) Industry Of Bangladesh", In proceedings of 26th Annual Australian and New Zealand Academy of Management (ANZAM)Conference, 5-7 December, Perth, Western Australia.
Nuruzzaman, M. (2012), “The Competitiveness and Supply Chain Management of Ready-Made Garment (RMG) Industry in Developing Nations", In proceedings of The 7th Biennial Conference of Hong Kong Economic Association, December 13-14, Lingnan University, Hong Kong.
Nuruzzaman, M., Quaddus, M. and Jeeva, A. (2012), “An Investigation into the Factors Influencing Competitiveness of Ready-Made Garment (RMG) Supply Chain- The Experience from Bangladesh", In proceedings of Annual Conference on Global Economics, Business and Finance (GEBF), December 15-17, Hong Kong.
Nuruzzaman, M., Quaddus, M., Jeeva, A. and Khan, E. Ahmed (2013), " The influence of External Stakeholder in the Competitiveness of Ready-Made Garment (RMG) Industry: A study on RMG Supply Chain in Bangladesh", In proceedings of the Business & Economics Society International Conference (B&ESI), January 7-10, Perth, Western Australia
Nuruzzaman, M.( 2013), " The influence of Bureaucratic Behaviour to Improve the Competitiveness of RMG industry”, In proceedings of Emerging Research Initiatives and Development in Business, CGSB Research Forum, 9-10 May, Curtin University, Perth, Western Australia
Chowdhury, M., Nuruzzaman, M., Dewan, M. and Quaddus, M. (2013)," Supply Chain Readiness, Response and Recovery for Supply Chain Resilience to Vulnerabilities: A Study on Ready-Made Garment Industry of Bangladesh” In proceedings of the 3rd International Forum & Conference on Logistics and Supply Chain Management(LSCM), June 27-29, Bali, Indonesia

46
various literatures. Many researchers have explained supply chain (SC) and supply
chain management (SCM) in various ways, viz. definitions, dimensions, performance
measurement, frameworks, applications, strategy and allied concepts, supported by a
number of empirical studies. The second part explores the issues related to the SC and
its competitiveness in the clothing sector, especially in the RMG industry, to reveal the
research gap which was addressed in the current research.
Drawing on the conceptual base of stakeholder theory and resource dependence
theory, this chapter provides a review of past studies to argue that the
competitiveness of an industry depends on improving the SC efficiency through
developing various measures. After having extensively analysed and discussed the
existing literature, this chapter presents the research concept used in this study and
then proposes the preliminary research model.
3.2 Supply Chain
The subject of ‘supply chain (SC)’ has been explored by numerous researchers and
practitioners from various perspectives and applications. The term ‘supply chain
(SC)’ has been defined in various ways according to the observation of various
researchers and practitioners. The most common aspect of any SC, however, is the
flow of products from its source (production plant, wholesaler, etc.) to its destination
(customers, retail stores, etc.). Landeghem and Vanmaele (2002) identified three
hierarchical levels of the SC: operational, tactical and strategic. The SC is actually a
link among suppliers, manufacturers and the different stakeholders involved in a
specific firm or industry.
The supply chain (SC) is a network of relationships within a firm and between
interdependent organisations and business units consisting of material suppliers,
purchasing, production facilities, logistics, marketing and related systems that
facilitates the forward and reverse flow of materials, services, finances and
information from the original producer to the final customer with the benefits of
adding value, maximizing profitability through efficiencies, and achieving customer
satisfaction (Stock and Boyer 2009). Christopher (1998) stated that the ‘supply chain
(SC)’ was: “[t]he network of organizations that are involved, through upstream and
downstream linkages, in the different processes and activities that produce value in
the form of products and services delivered to the ultimate consumer”. According to

47
Mentzer (2004), a ‘supply chain (SC)’ is a set of three or more entities (organisations
or individuals) directly involved in the upstream and downstream flows of products,
services, finances, and/or information from a source to a customer. Sunhilde (2008)
provided a very short and excellent definition of ‘supply chain (SC)’: “[a] supply
chain is the system of organizations, people, technology, activities, information and
resources involved in moving a product or service from supplier to customer”.
From the above literature, it is clear that the supply chain (SC) is a connected chain
of different types of stakeholders at the upstream and downstream levels who supply
products or services from a manufacturer to the ultimate customer. In this study, the
RMG industry’s SC has been considered from the manufacturer to the customer
(buyer). In the RMG industry, about 90% of woven fabrics and 60% of knit fabrics
are imported to make garments for export (Siddiqi 2007; Abdulla 2008). This sector
therefore needs to maintain a long backward and forward SC and it takes a long lead
time to process an order (Knutsen 2004; Nuruzzaman, Haque, and Rafiq 2010)
which creates problems in achieving competitiveness. However, by properly
managing the SC, efficiency may be increased and competitiveness achieved.
3.3 Supply Chain Management
‘Supply chain management (SCM)’ is “the management of material, information and
finance through a network of organizations (i.e. suppliers, manufacturers, logistics
providers, wholesalers/distributors and retailers) that aims to produce and deliver
products or services for the consumers. It includes the coordination and collaboration
of processes and activities across different functions such as marketing, sales,
production, product design, procurement, logistics, finance, and information
technology within the network of organizations” (Blos et al. 2009). Supply chain
management (SCM) has also been explored by various researchers. Supply chain
(SC) activities are very important in delivering any kind of product or service.
Supply chain (SC) activities actually transform various resources, raw materials and
components into a finished product that is delivered to the end customer. Supply
chain management (SCM) spans all movement and storage of raw materials, work-
in-process inventory and finished goods from point-of-origin to point-of-
consumption (Sunhilde 2008). It integrates supply and demand management within
and across companies. Many companies are implementing SCM in an effort to

48
increase competitiveness, profit and customer satisfaction (Nordås 2004). Therefore,
managing the SC is important for improving competitiveness.
Moreover, a number of studies have effectively used different aspects of SCM for
improving management in various industries. Seuring, Goldbach, and Kopline
(2004) illustrated increased cooperation through an integrated SC; Cavinato (1992)
considered the inter-firm total cost concept and value-added management; Lummus
and Vokurka (1999) has shown a collaborative relationship improving
competitiveness; and Stadlter (2005) cited the task of integrating organisational units
along a SC and coordinating materials, information and financial flows in order to
fulfil customer demand. It is observed that all these studies have placed an emphasis
on coordination and cooperation among organisations. But all these studies were in
relation to internal stakeholders and did not mention external elements. Bhatnagar
and Sohal (2005) explained that operational competitiveness was influenced by
qualitative factors which actually support coordination, cooperation and relational
activities. However, Gunasekaran, Pate, and Tirtiroglu (2001) emphasized improving
performance at the strategic, tactical and operational levels. Selldin and Olhager
(2007) described the relationships between product design and the SC process, with
specific reference to the model by Fisher (1997). In this study, it was clear that
alignment between the type of product and the type of SC was important. In other
research studies, Bacallan (2000) and Rao and Holt (2005) have described and
considered the green supply chain (SC).
Several studies have also been conducted on various aspects of SCM. Most of these
studies are on comparative analysis, conceptual development, increased performance
through development of relationships, coordination and integration among the
partners in the SC, factors affecting the quality of the SC, time management,
production process for an effective SC, etc. (Bertolini et al. 2007; Bozarth,
Blackhurst, and Handfield 2007; Eng 2005; Giannakis and Croom 2004; Halldorsson
2007; Kwon and Suh 2004; Nonino and Panizzolo 2007; Paulraj and Chen 2007;
Prasad and Sounderpandian 2003; Sengupta, Heiser, and Cook 2006; Sila,
Ebrahimpour, and Christiane 2006; Selldin and Olhager 2007; Sunhilde 2008;
Sobhan 2003; Wu et al. 2004). A few studies have been conducted specifically on
SCM in the clothing sector (Hunter and Valentino 1995; Christopher, Lowson, and
Peck 2004; Nordås 2004; Knutsen 2004; Seuring, Goldbach, and Kopline 2004;

49
Magder 2005; Lam and Postle 2006; Brito, Carbone, and Blanquart 2008). But most
of these studies have primarily dealt with ICT applications and the development of
relationships amongst the members of the SC. In these studies, country factors such
as country risk (CR) and elements of external stakeholders were not considered.
There is no right theory for managing the SC but Halldorsson (2007) considered
different organisational theories and models to explain inter-organisational
phenomena in order to develop the SCM paradigm as a scientific discipline.
Kleindorfer and Saad (2005) mentioned in their research that there are two broad
categories of risk affecting SCM. Firstly, risks arise from the problems of
coordinating supply and demand. Secondly, risks arise from disruption to normal
activities like strikes, labour unrest and economic disruption. From this research, the
influence of external stakeholders in the SC becomes evident.
In the clothing or garment sector, the SC can be seen as starting from the sourcing of
raw materials via design and production to distribution and marketing, all of which is
organised in an integrated production network (Lee and Ng 1997; Stock and Boyer
2009; Nordås 2004).
Table 3.1: Literature about supply chain management
(Jones and Riley 1985) The supply chain dealt with the total flow of materials from suppliers through to end-users.
(Johnson 1995) Strategically managing the movement and storage of materials, parts, and finished goods inventory from suppliers through the firm and to the customer.
(Christopher 1998) The management of upstream and downstream relationships with suppliers and customers.
(Giunipero et al. 2008) This study covered a decade of academic research on supply chain management
(Gripsrud, Jahre, and Persson 2006)
This paper presented the distribution arrangements in a business to uncover how they are interrelated and to suggest extensions.
(Kleindorfer and Saad 2005)
This paper provided a conceptual framework that reflects the activities of risk assessment and risk mitigation in the supply chain.
(Wu, Blackhurst, and Chidambaram 2006)
This paper investigated the inbound supply chain risk and its management
(Prasad and Sounderpandian 2003)
In this paper, the researchers have shown how information systems (IS) help to coordinate global SCM networks.
(Wu et al. 2004) This research focused on how to integrate the supply chain management business process.
(Seuring 2008) Supply chain management is the integration of these activities through improved supply chain relationships
(Khandker 2007) Supply chain management (SCM) means managing the supply of inbound and outbound goods and services in the most cost-effective and time-sensitive way. This can be done by designing a strategic route plan for the quickest possible pick-up and delivery regimen, from the appropriate suppliers, for all points throughout the assembly line, in order to achieve cost- and time-related efficiency levels.

50
The SC in a RMG business consists of an array of players (RMG manufacturers,
fabrics and accessories suppliers, government agencies, buying offices and sourcing
agents, forwarders and carriers, and buyers) performing different activities and
adding value to consumers (Nuruzzaman 2008; Nuruzzaman, Haque, and Rafiq
2010). Table 3.1 shows many studies from the literature related to SCM. In these
literatures, the scholars focused on the things that are covered by SCM, how SCM is
defined, upstream downstream relationship, distribution arrangement, risk
assessment and mitigation and integration of activities. However there is no clear
indication of external stakeholder and competitiveness. In the next section, steps
have been taken to discover more literature on SCM as it relates to the textile and
clothing industry.
3.4 Textile and Garment Industry
Relatively speaking, there are some research works in the field of the textile and
garment industry but very little substantial research has been done in this field. Most
of the research works are from the perspective of Western culture and developed
countries but the literature is scarce in relation to developing nations and especially
about South East Asian nations. However, some related research works about the
textile and garment industry were found and carefully reviewed in this study.
Islam and McPhail (2011) investigated the adoption of the ILO’s human rights
standards by major multinational garment retail companies that source products from
developing countries like China, India and Bangladesh. In the study by Perry, Sohal,
and Rumpf (1999) about the textile and garment industries, they investigated the
adoption by developed nations of new technology in the garment industry. Another
research study was undertaken to discover some new strategies to survive the
pressures of globalization (Buxey 2005). The above research works were mostly on
the general development of the garment industry. Toni and Meneghetti (2000)
undertook research on the Benetton group (textile and garments companies) of Italy.
The research investigated the production planning process for a network of firms in
the textile-apparel industry. In their study, it was observed that compression of the
production planning period was helpful for achieving significant improvement in the
external time performance. Oxborrow (2000) studied the UK apparel (garments)
supply chain investigating the changing practices in the UK apparel industry as
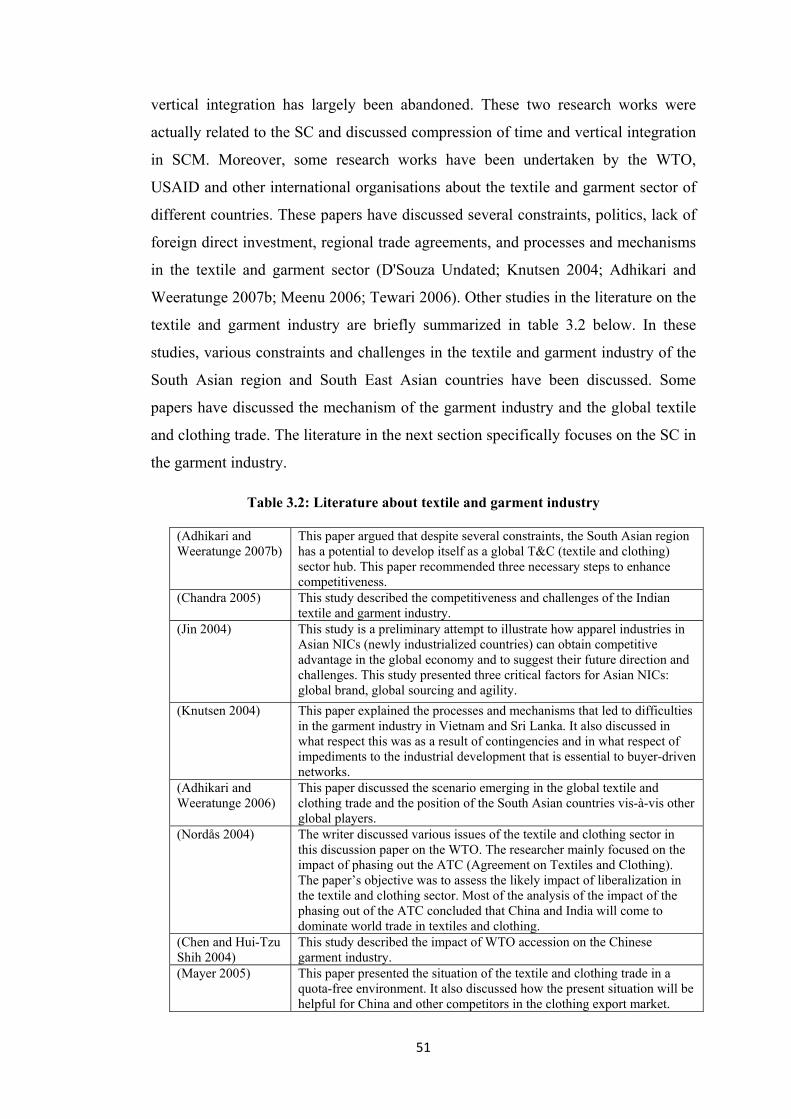
51
vertical integration has largely been abandoned. These two research works were
actually related to the SC and discussed compression of time and vertical integration
in SCM. Moreover, some research works have been undertaken by the WTO,
USAID and other international organisations about the textile and garment sector of
different countries. These papers have discussed several constraints, politics, lack of
foreign direct investment, regional trade agreements, and processes and mechanisms
in the textile and garment sector (D'Souza Undated; Knutsen 2004; Adhikari and
Weeratunge 2007b; Meenu 2006; Tewari 2006). Other studies in the literature on the
textile and garment industry are briefly summarized in table 3.2 below. In these
studies, various constraints and challenges in the textile and garment industry of the
South Asian region and South East Asian countries have been discussed. Some
papers have discussed the mechanism of the garment industry and the global textile
and clothing trade. The literature in the next section specifically focuses on the SC in
the garment industry.
Table 3.2: Literature about textile and garment industry
(Adhikari and Weeratunge 2007b)
This paper argued that despite several constraints, the South Asian region has a potential to develop itself as a global T&C (textile and clothing) sector hub. This paper recommended three necessary steps to enhance competitiveness.
(Chandra 2005) This study described the competitiveness and challenges of the Indian textile and garment industry.
(Jin 2004) This study is a preliminary attempt to illustrate how apparel industries in Asian NICs (newly industrialized countries) can obtain competitive advantage in the global economy and to suggest their future direction and challenges. This study presented three critical factors for Asian NICs: global brand, global sourcing and agility.
(Knutsen 2004) This paper explained the processes and mechanisms that led to difficulties in the garment industry in Vietnam and Sri Lanka. It also discussed in what respect this was as a result of contingencies and in what respect of impediments to the industrial development that is essential to buyer-driven networks.
(Adhikari and Weeratunge 2006)
This paper discussed the scenario emerging in the global textile and clothing trade and the position of the South Asian countries vis-à-vis other global players.
(Nordås 2004) The writer discussed various issues of the textile and clothing sector in this discussion paper on the WTO. The researcher mainly focused on the impact of phasing out the ATC (Agreement on Textiles and Clothing). The paper’s objective was to assess the likely impact of liberalization in the textile and clothing sector. Most of the analysis of the impact of the phasing out of the ATC concluded that China and India will come to dominate world trade in textiles and clothing.
(Chen and Hui-Tzu Shih 2004)
This study described the impact of WTO accession on the Chinese garment industry.
(Mayer 2005) This paper presented the situation of the textile and clothing trade in a quota-free environment. It also discussed how the present situation will be helpful for China and other competitors in the clothing export market.

52
3.5 Supply Chain and its Management in the Textile and Garment (Clothing) Industry
Since the introduction of the term ‘supply chain management (SCM)’ in 1982
(Oliver and Webber 1992), it has received ever-growing interest both in the literature
as well as from industrial practice. Many of the research studies in the literature on
SCM in various industries have been summarised in table 3.3 below. These studies
discussed SCM in the health care, IT, toy and construction industries, among many
others. These studies have been mostly undertaken in the context of developed
countries. Although the SC and its management are still neglected in the textile and
garment industry, some research studies have been undertaken on SCM in the
garment industry.
Table 3.3: SCM in various industries
(Allen, Wade, and Dickinson 2009) Supply chain in health care industry (Sahay, Jatinder N.D. Gupta, and Mohan 2006)
IT industry is studied to explore SCM
(Love, Irani, and Edwards 2004) SCM in construction industry (Koskinen and Hilmola 2008) SCM in paper industry (Danese, Romano, and Vinelli 2006) SCM in pharmaceutical industry (Wong, Arlbjorn, and Johansen 2005) SCM in toy industry (Bertolini et al. 2007) SCM issues for footwear industry in Italy. ICT
application to reduce lead time. (Park and Hartley 2002); (Blos et al. 2009)
SCM in automotive industry
Most studies in textile sector have focused on integration and relationship
management for building partnerships between different parties of the SC and
synchronizing activities throughout the SC (Chandra 1997; Zhao et al. 2008). In the
research work of Dossenbach (1999); Wong, Arlbjorn, and Johansen (2005); Bowen
(2000); Rungtusanatham ( 2003)and Cao et al. (2008), coordination, collaborative
relationships and partnerships are described as preferential situations and as
beneficial to all parties involved in the SC. Some studies (Chandra and Sameer 2000;
Au and Ho 2002; Buxey 2005; Lambert and Pohlen 2001; Nuruzzaman 2007;
Nuruzzaman, Haque, and Rafiq 2010; Pramatari 2007) have recommended the
adoption of various technological applications such as IT, ICT, e-commerce, EDI
implementation to improve competitive advantage and performance through lead
time reduction and SC collaboration. Other studies, for example, those by Mason -
Jones and Towill (1999); Perry, Sohal, and Rumpf (1999); Chandra and Sameer
(2000); and Bruce, Daly, and Towers (2004) have emphasized an information-
enriched SC, for example, quick response (QR) and accurate response (AR) (Hunter
and Valentino 1995) in the textile SC. Some studies have also recommended the JIT

53
delivery system, production planning period compression, and lean and agile
approaches that effectively synchronize the manufacturing process in order to reduce
cycle time and lead time (Mason - Jones and Towill 1999; Toni and Meneghetti
2000; Christopher and Lee 2004; Ferdousi and Ahmed 2009). Jin (2004) described in
his research how the least developed countries (LDCs) obtained competitive
advantage in the garment (apparel) industry using Vernon’s (1966) PLC (product life
cycle) theory and Frobel’s (1980) NIDL (New International Division of Labor)
theory. Jin also described how these countries increased their competitive advantages
leveraging industry-specific and country-specific advantages.
The textile and garment industry has been neglected in terms of extensive SCM
research. More recently, the industry has undergone a great deal of change,
particularly with global sourcing and high levels of price and lead time competition
(Bruce, Daly, and Towers 2004). The textile and garment industries have been facing
three main challenges since the new millennium. The first challenge comprises
consumers’ rigorous demands and rational consumption. The second challenge is the
dominant status of mega-retailers and mega-brands, and the third challenge is the
influence of quota-free international trade. The third and final situation has actually
pushed countries into fierce competition forcing them to think about survival in this
present competitive environment of the clothing or garment business. Garment
products are mostly fashionable. Due to the characteristics of fashionable products,
rapid changes in the apparel or garment industry is normal and occurs faster than in
any other businesses (Ning 2006). In these circumstances, in order for companies to
survive in the competitive garment export business, SCM has become a crucial
factor and much more attention has been given in this industry to making the SC
more efficient and effective. There are several reasons for the increasing interest in
the management of supply chains since the 1990s. Firstly, companies have been
moving away from vertical integration and moving towards specialization; thus, they
have the need to deal with, and rely on, more outside sources (Sunhilde 2008). In
order to reduce production costs, most clothing firms and giant retailers emphasized
outsourcing the production of their goods to low-cost countries and subcontractor
companies are also outsourcing raw materials to specialized low-cost countries.
Thus, the structure of garment (clothing) SCs has become even more complex.
Careful management of the SC is evidently required in order to reduce lead times
and achieve quick responsive actions to the changing business environment.

54
The textile SC is complex and relatively long, involving a number of cross-country
enterprises (Jones 2002). Therefore, Lummus and Vokurka (1999) have given
emphasis to the quick response (QR) system. Without this system, a long supply
chain would result in undesirable losses of resources. A QR system actually enables
the capability of all parties working together. Froza and Vinelli (1997) have
underlined the importance of the QR strategy in the clothing industry. However, the
support of information technologies is very important for this strategy (Perry, Sohal,
and Rumpf 1999; Birtwistle, Siddiqui, and Fiorito 2003).
The above discussion reveals that researchers have studied SCM in the textile
industry with varying purposes and from these varying purposes, one common
objective has been to create competitive advantage through the utilization of SCM. A
supplier selection criterion has possibly been the most researched topic in SCM and
it has also been explored in the textile industry. However, improving
competitiveness through the SC has not yet been explored. Other studies in the
literature about SCM in the textile industry have been reviewed which are
summarised in table 3.4.
Table 3.4: SCM in textile and garment industry
(Fernie and Azuma 2004) Modern SCM is obstructed in the textile industry as it is time consuming and labour intensive. This study described how QR improves SC efficiency.
(Cao et al. 2008) This study explored the coordination of SCM specifically in the textile and garment sector.
(Bruce, Daly, and Towers 2004); (Masson et al. 2007)
Discussed lean and agile SCM in the textile industry. As SCM is neglected in the textile industry, researchers discussed characteristics of the textile and clothing industry and identified the perspective of the lean and agile SC.
(Cetindamar, Çatay, and Basmaci 2005) This study explored SC collaboration and its benefits in the Turkish textile SC.
(Teng and Jaramillo 2005) An evaluation model was developed for textile manufacturers to select suppliers to maintain their competitiveness in the global textile business.
(Ho 2005a) Investigated enhancing the understanding of collective competitive advantage through SCM.
(Nuruzzaman, Haque, and Rafiq 2010) This paper described how to create competitive advantage through SCM.
(Lam and Postle 2006) The concept of SCM in textiles revealed (exposed) that for fashion items, long lead time and short product cycle are some distinctive problems faced by this industry.
(Romano and Vinelli 2001) Operational and strategic consequences due to quality management with the utilization of SCM in the textile industry.
(Kwok and Wu 2009) RFID system was introduced to assist the coordination and integration of the SC function in the textile industry.
(Chen, Murray, and Jones 2007) Identified some insights into clothing SCM on the issue of quality and communication management.

55
(Bozarth, Blackhurst, and Handfield 2007)
Described industry cluster theory within the context of SCM decisions for the textile industry.
(Forman and Jørgensen 2004) Environmental SCM in the Danish textile industry. (Kogg 2003) Investigated Swedish SCs for textiles made from organically
grown cotton in the context of environmental SCM. (Cao et al. 2008) This paper examined the implementation of coordination
for the textile-apparel SC in some Hong Kong-based textile businesses. Three different types of coordination practice in three textile-apparel SC structures were examined.
(Chandra and Sameer 2000) This paper described the application of a system analysis methodology to a garment SC for the US textile industry, utilizing principles of QR and AR strategies in synchronizing activities throughout the system.
(Au and Ho 2002) This paper presented a B2B (business-to-business) electronic commerce model for enabling SCM in a clothing manufacturing company using the notion of harnessing information technologies(the web, email and EDI).
(Rajput and Bakar 2011) This study investigated SCM literature and explored the categories of SCM literature in descending order from the most studied categories to the least studied categories.
(Magder 2005) This paper investigated the global apparel and textile SC. It suggested that using an SC model with shortened lead time would have an impact on profit. This paper actually included the extent to which geography, trade preferences and local production factors might help Egypt’s textile and apparel industry in favour of lean retailing.
(Nordås 2004) This paper assessed the impact of liberalization and also focused on recent developments in SCM in the clothing industry.
(Ning 2006) This paper was designed as an exploratory study to investigate SCM practice and the SC as competitive advantages in the textile and apparel industry.
(Ning 2006) In this thesis, the author developed a model of an SC performance measure in the textile and apparel industry.
(Chandra and Sameer 2000)
A common problem of the SC is coordinating or synchronizing activities through the life cycle of products. In this research, the writer tried to deal with this problem in the US textile industry by achieving quick response (QR) (Perry et al., 1999) in the SC through accurate response (AR) (Hunter, 1990; Hunter & Valentino, 1995).
(Seuring, Goldbach, and Kopline 2004) Discussed managing time and the complexity of the SC in the textile industry.
(Weil 2006) This paper examined how lean retailing and SC restructuring has affected performance and evaluated the supply relationship for judging potential competitors.
(Bruce and Moger 1999) How to develop a strategy to maintain closer control over the SC in efforts to deliver the highest quality product at a competitive price. The paper examined the implications of SCM for innovative developments within the UK clothing industry.
(Sunhilde 2008) The researcher described how SCM was used to increase profit and customer satisfaction.
In these studies, techniques such as QR, lean and agile SC, collaborations, an
evaluation model for suppliers’ selection, introduction of the RFID system, the life

56
cycle of fashionable items and many others have been considered in relation to
competitive advantage and competitiveness but no discussion was found the related
to the co-operational relationship of external stakeholders and internal stakeholders
in the SC. However, the next section of the literature review focuses on the
Bangladeshi garment industry.
3.6 Bangladeshi Garments (RMG) Industry and its Supply Chain
In the above section, the literature about the garment and textile industry has been
discussed from a different perspective being mostly in the context of developed
countries. This section discusses some specific relevant studies in the literature about
the Bangladeshi RMG and textile sector. In the previous section and in chapter 2,
much has been discussed about the garment industry of Bangladesh. The structure of
the Bangladeshi RMG industry is totally different and therefore the SC in the CMT
(cutting, making and trimming)-based industry is quite unique. Moreover, there have
many studies on the RMG industry but these have been very general in nature and
mainly deal with the industry’s problems, prospects, growth and development
(Quddus and Rashid 2000; Debapriya and Rahman 2003; Azad 2004; Rahman and
Anwar 2006; Rashid 2006; Abdin 2008; Nuruzzaman 2001). Many studies have
been conducted on strategies in the post-MFA period (Ahmed 2004; D'Souza
Undated; Nordås 2004; Kabir 2007; Habib 2009). Ahmed (2009), in her research
work, has described the drivers of growth, challenges faced and performance of
RMG manufacturing in Bangladesh following the abolition of the MFA. In a
research report for the Centre for Policy Dialogue (CPD), Sobhan (2003) has
mentioned some drivers and barriers from the demand and supply sides of the RMG
industry. In this research, from the perspective of internal stakeholders, drivers and
barriers of manufacturers and buyers were strongly considered. Adhikari and
Weeratunge (2007b) have also discovered some drivers and barriers on the basis of
the demand and supply sides. But the writers did not focus on the influence of these
drivers and barriers in the SC whereas the World Bank (2005) suggested that
improving the domestic SC would be a strategic option for the Bangladeshi RMG
industry to develop competitiveness.
As the Bangladeshi RMG industry is dependent on imported raw materials, this
sector therefore needs to maintain a long backward supply chain and it takes a long

57
lead time to process an order (Knutsen 2004; Habib 2009; Nuruzzaman, Haque, and
Rafiq 2010). There is huge opportunity for the RMG industry of Bangladesh to
capture more export share in the apparel (garment) sector. But due to the long lead
time, the industry cannot increase its competitiveness and grasp the opportunity
(Haider 2007; Nuruzzaman 2009). Therefore, the question to be asked is: how can
this Bangladeshi RMG industry grasp this opportunity through increasing its
competitiveness?
The phasing-out of the export-quota system from the beginning of 2005 has raised the
issue of the competitiveness of the Bangladesh RMG industry as a top priority (Haider
2007). Due to the influence of non-supportive bureaucratic behaviour, political action
and country risk, the Bangladeshi RMG sector has failed to reduce lead time and
increase competitiveness (Quddus and Rashid. 1999; Adhikari and Weeratunge 2007b;
Nuruzzaman 2008). Some studies have been conducted on the influence of different
country factors derived from external stakeholders such as: bureaucracy, political risk
and country risk in the international SC of international business (Hadjikhani and
Hakansson 1996; Haque 2007; Kim 2006). However, no significant studies were
found of the RMG SC in terms of the influence of these factors and how these factors
could affect the competitiveness of the RMG industry through the SC. The RMG
industry SC is international in nature. To develop an efficient SC, the Bangladeshi
RMG industry must consider these factors which are derived from the external
stakeholders (Hadjikhani and Hakansson 1996; Kabir 2007).
Exporting garments to the global market is currently challenged by the growing
competition from low-cost producers, reduction of consumer shopping time, and the
growth of overseas buyers’ bargaining power (Ho 2005b). Responding to these
challenges, the RMG industry of Bangladesh is seeking new sources of competitive
advantage and to improve its competitiveness through the development of the SC
and its management (Gunasekaran, Pate, and Tirtiroglu 2001; Nordås 2004).
However, some research studies have been found about the garment industry as
stated above but no in-depth study was found on SCM for the Bangladeshi RMG
industry and the improvement of its competitiveness. SCM, in general, is still a
relatively new concept in most developing countries: many companies have not even
begun to consider the formal management of their SC (Blos et al. 2009).

58
In the RMG industry’s SC, buyers (customers) and suppliers (manufacturers) are two
important prime stakeholders (Ertek and Griffin 2002) and their drivers (strengths)
and barriers (weaknesses) are the main internal stakeholder factors (Haider 2007;
Razzaque and Eusuf 2008) in the SC for improving competitiveness. Drivers are
defined as the perceived/expected benefits and barriers are defined as perceived or
likely constraints (Quaddus and Didi 2005). The elements (country factors) come
from external stakeholders affecting these internal factors. Moreover, the
coordination, relationships and capabilities of internal stakeholders are also
influenced by external stakeholders (Sarkis, Zhu, and Lai 2011). A firm’s
competitiveness is associated with the configuration of resources and capabilities as
the markets evolve (Halldorsson 2007). The RMG sector in Bangladesh has some
resources like cheap labour, competitive price, capability, skilled personnel, quality
machinery and significant experience which are the drivers (strengths) of the
manufacturers (suppliers) of the industry (Meenu 2006; Adhikari 2007a; Adhikari
and Weeratunge 2006; Saxena and Salze-Lozac’h 2010). The Bangladeshi RMG
industry has developed dramatically leveraging these resources in the last three
decades (Adhikari and Weeratunge 2007b; Nuruzzaman, Haque, and Rafiq 2010).
The industry’s major barriers include the lack of fabrics supply and of its main
resources, and the long lead time (Tewari 2006; Nuruzzaman, Haque, and Rafiq
2010). On the basis of stakeholder and resource dependence theories (discussed in
the next section), this study has examined how the proper utilization of these
strategic resources (drivers/strengths) and barriers in the SC of the RMG business
process would lead the industry to gain competitive advantage and eventually to the
improvement of its competitiveness by overcoming the main barriers.
Moreover, many of the research studies in the literature about the RMG sector of
Bangladesh have been reviewed. Most of the literature has focused on the necessary
action required in the post-MFA period (Karim 2003; Choudhury and Hossain 2005;
Rahman 2005; World Bank 2005; Adhikari and Weeratunge 2006; Tewari 2006; Kabir
2007; Joarder, Hossain, and Hakim 2010) and about growth (Rock 2001; Rahman
2004; Kee 2005; Rashid 2006; Uddin 2006; Razzaque and Eusuf 2008; Berg et al.
2011; Mottaleb 2011). The research literature, including those studies listed above, is
summarised in table 3.5. However, very few research works (World Bank 2005;
Adhikari and Weeratunge 2007b; Claeys and Brachet 2008; Saxena and Salze-Lozac’h

59
2010) have discussed the SC and competitiveness. Hence, as the main objective of this
research is to improve competitiveness via the SC, the literature related to
competitiveness and improving competitiveness is discussed in the following sections.
Table 3.5: Literature about Bangladeshi RMG
(Claeys and Brachet 2008) This paper discussed Bangladeshi labour rights in the SC of the garment industry.
(Adhikari and Weeratunge 2007b) This paper argued that despite several constraints, the South Asian region has the potential to develop itself as a global T&C hub. This paper recommended three necessary steps to enhance competitiveness but did not mention the SC.
(Rahman 2005) Described the global apparel market and discussed Bangladesh’s RMG industry’s experience and relative strengths for facing the post-MFA period.
(Saxena and Salze-Lozac’h 2010) The authors described the issue of competitiveness in the Bangladeshi RMG industry, mentioning the stakeholders’ roles and comparative advantages and disadvantages of the RMG industry.
(Uddin 2006) This dissertation addressed the history of the Bangladeshi RMG industry and acknowledged both international and national factors that contributed to the enormous growth.
(Rahman and Anwar 2006) In this report, the authors explained the competitiveness of the Bangladeshi RMG industry compared to China in the US market. It also described the comparative advantage scenario of Bangladesh’s RMG.
(Rahman 2004) The author described how the garment business globally shifted and came to Bangladesh. It also described its growth in Bangladesh.
(Choudhury and Hossain 2005) The authors have taken step to define the challenges and opportunities in the post-MFA period in the RMG sector and indicated the government response to combat post-MFA challenges.
(Joarder, Hossain, and Hakim 2010)
This paper made an attempt to analyse the post-MFA export performance of major apparel exporting countries with special concentration on the Bangladeshi RMG industry.
(Berg et al. 2011) Discussed the potentiality of growth and challenges to growth for the RMG industry. Authors gave emphasis to reducing country risk and mentioned the role of three main stakeholders (government, buyers and suppliers) in the RMG industry.
(World Bank 2005) This report actually discovered why Bangladesh achieved competitiveness before the abolition of the MFA and how it could gear up its competency post-MFA period. Emphasis was given to improving domestic and regional SCs.
(Razzaque and Eusuf 2008) Described the three stakeholders, demand and supply-side drivers and barriers. Also focused on the issue of competitiveness through improving productivity and workers’ skill.
(Bhattacharya, Rahman, and Raihan 2002)
Authors presented the contribution of the RMG sector to the Bangladeshi economy.
(Karim 2003) Strategically how the Bangladeshi RMG sector coped with the post-MFA challenges.
(Rock 2001) The author described in this paper how the wave of globalization came to the Bangladeshi RMG sector.
(Mottaleb 2011) The author described in this discussion paper the rapid growth of the garment industry of Bangladesh.

60
(Rashid 2006) In this paper, it was explained how the Bangladeshi RMG industry emerged considering the favourable trade environment and low labour cost and also discussed the sustainability of the RMG industry.
(Habib 2009) In this paper, the author emphasized the backward linkages for minimizing lead time. This paper focused on the policy implications of the backward linkage industries.
(Kee 2005) To increase the firm’s productivity, the author gave emphasis to FDI (foreign direct investment) in his paper indicating the government’s role and that of political action.
(Tewari 2006) After quotas, price and cost competitiveness alone are not enough for a firm to gain market share. Timely supply, short lead times, low inventories, innovation and the ability to contribute to design and full package supply are also very important.
(Kabir 2007) After quotas, the author has given emphasis to preferential trade agreements and political stability for the RMG sector. To promote economic enhancement, political parties need to achieve common consensus about economic growth and long-term vision to run Bangladesh as a prosperous country.
(Quddus 2001) The author discussed the bureaucratic corruption in garment exports from Bangladesh.
(Ferdousi and Ahmed 2009) This study investigated the improvement of manufacturing performance through lean practice in the Bangladeshi garment industry. It has helped to reduce lead time and cost and to improve productivity.
(Hossan, Sarker, and Afroze 2012) This paper discussed the recent unrest in the RMG industry which indicates political action in this industry.
(Islam, Begum, and Rashed 2012) Due to operational disturbances, manufacturers are facing competition with respect to quality, cost and time to market.
(Khondker , Razzak, and Ahmed 2005)
Discussed the exports, employment and working conditions of RMG industry in the post-MFA period. The authors discussed competitiveness in reference to decent work where productivity, the role of government and stakeholders were examined
(CPD 2007) This paper discussed Bangladesh’s apparel sector in the post-MFA period with emphasis given to structural weaknesses and policies for strengthening competitiveness.
(Sultana et al. 2011) Discussed the impact of the abolition of the quota policy and the reality in the RMG industry.
(Ahmed 2009) This paper analysed the main drivers of growth, challenges faced and performance of RMG manufacturing in Bangladesh in the post-MFA period.
(Clark and S.Kanter 2010) Discussed the violence in the RMG sector and country risk. (Kaes and Azeem 2009) This paper mentioned about proper management of
supply chain and shorter lead time. Here the writer mainly discussed on demand forecasting and supplier selection for importing raw materials.
(Ahamed 2013) This study discussed about the poor working conditions in the RMG factories, lack of social compliance and other international labour standards. This study proposes an effective monitoring and surveillance system ( EMSS) model to establish social compliance.
(Khosla 2009) In this paper the author has taken steps to find out means to reduce gender-based social exclusion of women in the RMG industry. The findings have been given importance on the role of stakeholders in reducing social exclusion of women.

61
3.7 Competitiveness
Survival and success in business in such turbulent times increasingly depends on
competitiveness: the ability to compete. The term ‘competitiveness’ itself is a broad
concept. Its meaning, implications, adaptation and achievement vary from firm to
firm, industry to industry, or country to country. Competitiveness is basically
reflected in exports (Min and Galle 1991a). The literature provides no universal
agreement on the definition of competitiveness. Some researchers have considered
the labour cost, exchange rate, interest rate, prices of materials inputs or costs related
as quantitative factors for measuring the competitiveness of a manufacturing industry
(Haider 2007). Other researchers have considered product quality, innovativeness,
design, distribution networks, after-sales service, transaction costs, institution factors
relating to the bureaucracy of export procedures, and other non-price factors as
factors for measuring the competitiveness of a manufacturing industry (Haider
2007). Few definitions of competitiveness exist in the literature; however,
competitiveness was defined in one study as the ability to sustain trade in the local
and global environment (Rooyen, Stroebel, and Esterhuizen 2010). In today’s world,
SCM is a key strategic initiative for increasing organisational effectiveness and for
better realization of organisational goals such as enhancing competitiveness. Porter
(1990) defined, competitiveness as productivity growth that is reflected in either
lower cost or differentiated products that command premium prices. Competitiveness
can be defined as the ability of a firm to design, produce and/or market products
superior to those offered by competitors, considering the price and non-price
qualities (D’Cruz and Rugman 1992; Ambastha and Momaya 2004). According to
the report of the House of Lords (1985) on overseas Trade (the Aldington Report), a
firm is competitive if it can produce products and services of superior quality and
lower costs than its domestic and international competitors.
Competitiveness is synonymous with a firm's long-run profit performance and its
ability to compensate its employees and provide superior returns to its owners. This
suggests that measurement of a company's "competitiveness" should incorporate
quantitative measures of costs, prices and profitability, and qualitative indicators of
non-price factors, specifically quality, if the definition is to be satisfied. A parallel
approach was taken by the European Management Forum (1984), which defined
competitiveness as "the immediate and future ability of, and opportunities for,

62
entrepreneurs to design, produce and market goods worldwide whose price and non-
price qualities form a more attractive package than those of foreign and domestic
competitors" (Buckley, Pass, and Prescott 1988). Competitiveness refers to those
assets and processes within organisations that provide competitive advantage (Porter
1985). Competitiveness is the capability of producing and delivering customized
products and services fast and efficiently all over the world (Buckley, Pass, and
Prescott 1988). Stadtler (2005) also included factors such as fulfilling customer
demand, integrating organisational units along a SC and coordinating materials,
information and financial flows.
Competitiveness is used by many different researchers to mean many different things
(Hagmann and McCahon 1993; Momaya 1998; Serin and Civan 2008; Rooyen,
Stroebel, and Esterhuizen 2010). Sometimes, it is used as an excuse for protectionism,
sometimes for cost cutting or to inspire innovation and increased productivity.
According to the Task Force of Canadian Agrifood Industry, an industry is
competitive if it has "the sustained ability to profitably gain and maintain market share
in domestic and/or foreign markets"(Duren, Martin, and Westgren 1991). This
definition indicates that a competitive industry cannot be created through government
assistance and an efficient SC. The literature in table 3.6 shows various meanings of
competitiveness. But as companies are increasingly relying on the process of the SC as
a source of competitive advantage and increasing competitiveness (Cohen and Roussel
2005; Gunasekaran, Pate, and Tirtiroglu 2001; Gunasekaran, Patel, and McGaughey
2003), the achievement of firm-level or industry-level competitiveness can be gained
by the achievement of SC competitiveness.
Table 3.6: Literature about defining competitiveness
(Rooyen, Stroebel, and Esterhuizen 2010)
The paper explored trade competitiveness and competitive performance in the South African wine industry.
(Serin and Civan 2008) This paper discussed the competitiveness of Turkey’s agriculture, fruit and vegetable industry in the EU.
(Lall 2001) This paper analysed the national competitiveness from the developing countries’ perspective.
(Oral 1986) The paper proposed a model for: (i) measuring the competitiveness level of a given industrial firm, (ii) identifying the strengths and weaknesses of the firm, and (iii) formulating strategies to improve the competitive position of the firm.
(Moon and Newman S.Peery 1995) Here the author defined competitiveness from the perspective of the product, firm, industry and at the national level.

63
(Porter 1990) The author considered factor conditions, demand conditions, supporting industries and firm rivalry to analyse competitiveness.
(Momaya 1998) In this article, the author discussed different levels of competitiveness and reviewed its significance at the industry level.
(Razzaque and Eusuf 2008) Emphasis was given to the wages pattern and productivity and also to the government’s role in improving competitiveness. They also mentioned some barriers.
(Hagmann and McCahon 1993) In this paper, the authors gave emphasis to implementing a strategic information system (IS) for increasing competitiveness in SMEs (small and medium enterprises).
(Hobbs, Kerr, and Klein 1998) In this paper, an assessment was made about creating competitiveness in the Danish pork industry. The competitive strengths, weaknesses, opportunities and threats facing the Danish pork SC were analysed.
(Ahn et al. 1999) This paper addressed the issue of SC competitiveness (SCC) from the manufacturing capability perspective in the context of the Korean home appliance industry.
(IFC 2006) How global trends are influencing competitiveness in the textile and apparel industry
(George and Manasis 2010) The authors used Porter’s diamond model to analyse the competitiveness of Greece’s olive oil sector.
Supply chain competitiveness (SCC) deals with both quantitative and qualitative
factors. Qualitative factors are infrastructure, business services, labour, government,
customers, suppliers, supply chain uncertainty, manufacturing practices, etc. while
quantitative factors are transport cost, exchange rates, labour rates, taxes, etc.
(Bhatnagar and Sohal 2005). According to Bhatnagar and Sohal (2005), a firm’s SC
competitiveness is measured by lead time performance, inventory turnover,
responsiveness to demand variability, customer service, flexibility, time to market
and quality.
Supply chain competitiveness (SCC) cannot be thought of as a single unit but is the
integrated effort of the components of the SC as a whole (Lim et al. 2006). According
to Gunasekaran, Patel, and McGaughey (2003), SCC is comprised of the
competitiveness of all of the SCC components such as suppliers, manufacturers and
distributors. Therefore, creating competitiveness by analysing the SC means that there
is a need to achieve competitiveness in all components of the SC. Different researchers
have described different strategies for achieving competitiveness. To create
competitiveness, many authors have given emphasis to analysing the SC and most of
the literature (La Londe 1997; Williams 1999; Sahay, Jatinder N.D. Gupta, and Mohan
2006; Verma and Seth 2010) has highlighted the importance of internal cooperation
and relationships. A few research studies (Momaya 1998; Bhatnagar and Sohal 2005;
Sahay, Jatinder N.D. Gupta, and Mohan 2006; Kale 2007; Song and Panayides 2008;

64
Verma and Seth 2011) have highlighted the importance and influence of the external
stakeholder element. Moreover, most of the literature, including the above studies, has
considered a wide range of strategies for competitiveness which are summarised in
table 3.7. The literature about SCC in the garment industry including the Bangladeshi
garment sector is discussed in the following section.
Table 3.7: Literature about supply chain competitiveness
(Verma and Seth 2011) This paper highlighted the importance of the concept of competitiveness in the SC and presented a conceptual framework for supply chain competitiveness (SCC). To create competitiveness, it emphasized the activities of manufacturers and suppliers, and the implications of political, legal, technical, socio-cultural, competition and demographic factors.
(Pine 1993) The researcher gave emphasis to mass customization for gaining competitiveness of the SC.
(La londe and Powers 1993)
Information and communication technology. Suggested the use of the internet and other communication systems for SCC.
(La Londe 1997) Agility and flexibility. Develop and manage cooperation and collaboration partnerships.
(Williams 1999)
Supplier–customer relationship (but did not mention supplier- and buyer-side drivers and barriers).
(Mentzer 2004) Identified 12 drivers for competitive advantage in the SC which are necessary for the SC to be competitive.
(Niraj, Gupta, and Narasimhan 2001)
Building relationships with customers for improvements in profitability, serviceability and reduced costs in the SC.
(Verma and Seth 2010) Due to economic globalization, competition has arisen among enterprises and their SCs. SCC has emerged as one of the strongest tools for gaining competitive advantages. This paper identified some issues of competitiveness and presented the role of suppliers, manufacturers and distributors.
(Kale 2007) The researcher mentioned the external factors like political and macro-economic forces and supply-side barriers in the SC for increasing competitiveness. He mentioned that to increase global competitiveness, a company needs to increase its SCC. The researcher also mentioned about the lean SC for increasing competitiveness. Lead time and cost risks were two main risks to improving SC competitiveness.
(Sahay, Jatinder N.D. Gupta, and Mohan 2006)
This paper analysed the current state of SCM practices in order to increase their competitiveness. It is important to coordinate, synchronize and integrate the three dimensions of SC activities (i.e. SC objectives, SC processes and management’s focus on SC) to increase competitiveness.
(Rao and Holt 2005) The research paper identified after analysis that greening the different phases of the SC would lead to competitiveness and economic performance.
(Hult, David, and Mathias 2007)
This paper discussed the influence of a culture of competitiveness and knowledge development on improving SC performance in varied market turbulence conditions.
(Bhatnagar and Sohal 2005)
In this research paper, competitiveness via the SC was examined by emphasizing qualitative (labour, infrastructure, political stability, key competitors’ locations, SC uncertainty) and quantitative (transport cost, exchange rate, labour rate and taxes) factors including operational factors like quality, flexibility, inventory turnover and responsiveness.
(Song and Panayides 2008)
The authors have highlighted the importance of port and terminal integration in the SC to achieve competitiveness.
(Gereffi 2002) This paper highlighted the global textile commodity chains involved in the global sourcing network. It also discussed the competitiveness of Asian economies in the apparel SC. The paper emphasized the buyer-seller linkages in the upstream and downstream segments of the apparel chain.

65
3.8 Competitiveness of the RMG Industry and Supply Chain
Exporting garments to the global market is currently challenged by the growing
competition of low-cost producers, reduction of consumer shopping time, and
growth of overseas buyers’ bargaining power. Responding to the challenges, clothing
companies in Bangladesh and other competitor countries are seeking new ways of
gaining competitive advantage through improving the management and efficiency of
the industry’s SC. Very few studies in the literature have been investigating SCC in
the RMG industry (Gereffi 2002; Bhatnagar and Sohal 2005; IFC 2006).
In the textile and garments industry, managing the SC and increasing
competitiveness has been a major research issue in contemporary studies (Bruce,
Daly, and Towers 2004; Kabir 2007; Nuruzzaman, Haque, and Rafiq 2010). In the
Bangladeshi RMG industry, the competitiveness tends to increase or to retain market
share in the quota-free environment by reducing lead time and increasing
productivity through an efficient supply chain(Duren, Martin, and Westgren 1991;
Nuruzzaman 2007, 2008). The phasing-out of the export-quota system from the
beginning of 2005 has raised the competitiveness issue of Bangladesh’s RMG
industry as a top priority issue (Haider 2007). In a research Asgari and Hoque
(2013) have mentioned about supply chain performance using a system dynamics
approach to increase the RMG industry’s competitiveness. In this research Causal
Loop Diagram has been developed given emphasis to the use of information
technology for reducing lead time and cost. But there is no indication about the role
of stakeholders and their integrated relationship. It can be said from some of the
previous studies (Montfort and Yongzheng 2004; Adhikari and Weeratunge 2006;
CPD 2007; Razzaque and Eusuf 2008; Nuruzzaman, Haque, and Rafiq 2010; Berg et
al. 2011) that due to non-supportive bureaucratic behaviour, unfavourable political
actions and country factors, the Bangladeshi RMG sector failed to reduce lead time,
increase productivity, and develop good understanding and cooperation among the
stakeholders. From the above literature review, it has been found that the above
barriers are faced by the Bangladeshi RMG industry in increasing competitiveness.
Although few studies have been found on the influence of different factors such as
bureaucracy, political risk and country risk in the international SC(Kim 2006; Haque
2007; Hadjikhani and Hakansson 1996), very limited studies (see table 3.8) were
found about the RMG industry’s SC and the influence of those factors on the

66
competitiveness of the SC. As the RMG industry’s SC is international in nature, it
must consider these country factors or the external stakeholder elements to develop
an efficient SC. As the main focus of this study is on improving competitiveness, the
literature about improving competitiveness is discussed in the next section.
Table 3.8: Literature about competitiveness of Bangladeshi RMG industry through the supply chain
(Sattar 2005) The author addressed the post-MFA competitiveness and challenges for the RMG industry. This study described a number of strategic options including the SC of the RMG industry.
(Montfort and Yongzheng 2004)
This paper evaluated the impact on the Bangladeshi economy of the phasing-out of textile and clothing quotas, with a particular focus on the balance of payment, GDP and employment. This paper also evaluated the competitiveness and supply constraints. The author mentioned improving supply management to achieve competitiveness.
(Saxena and Salze-Lozac’h 2010)
The author described the issue of competitiveness in the garment industry of some Asian countries like Bangladesh in the post-quota world. He mentioned the stakeholders’ roles and comparative advantages and disadvantages of the RMG industry.
(Haider 2007) The writer presented how the surface-level and deep-level competitiveness of the Bangladeshi RMG industry can be increased. The writer expressed various factors that should be considered and a model was developed to increase competitiveness.
(Razzaque and Eusuf 2008) This study showed how the RMG industry of Bangladesh played an effective role in poverty alleviation through international trade in the clothing business. It also gave direction to increase competitiveness through improving productivity and workers’ skills.
(Khondker , Razzak, and Ahmed 2005)
This paper presented the most important issues and challenges facing the RMG industry during the current post-MFA regime. This paper also discussed the competitiveness issue in relation to productivity, working environment and stakeholders.
(Berik and Rodgers 2009) This paper examined recent evidence on Bangladesh’s RMG exports and working conditions in the context of trade liberalization since the end of 2004. The financial crisis of 2009 and the resulting resource constraints have made it difficult to initiate the new policy and export diversification for improving competitiveness.
(Haque et al. 2011) In this research study authors have measured the performance of supply chain network of RMG using Supply Chain Operation Reference(SCOR) model. They have measured four Key Performance Indicators which are Timely Delivery, Adherence of Production Target, Quality Capability and On time Shipment. The outcome of the research shows that the overall efficiency of the supply chain was not good enough.
67
3.9 Improving Competitiveness
Besides the above studies, no significant studies were found that dealt with
improving competitiveness through the SC in the clothing sector. However, there
were several studies undertaken on different aspects of SCM for improving
competitiveness in various other industries. For example, Seuring, Goldbach, and
Kopline (2004) illustrated increasing cooperation through an integrated SC; Hult,
David, and Mathias (2007) examined the influence of a culture of competitiveness
and knowledge development on SC performance; a research study by Luchi and
Paladino (2000) explored improving competitiveness in a manufacturing value chain
for the automobile industry; another study undertaken by Čižmana and Černetič
(2004) was on improving competitiveness using a decision support system in the
production of veneers. Rao and Holt (2005) and Bacallan (2000) described and
considered a green SC; Breen and Hing (2002) addressed improving competitiveness
through cooperation. Bramorski (2000) discussed about improving competitiveness
through IT and information management. Thomas and Long (2000) mentioned some
managerial critical success factors (CSFs) namely, market responsiveness, utilization
of resources, management and control, and organisation objectives to create
sustainable growth and finally to improve competitiveness. It has been shown in a
study focused on monitoring and controlling versus supporting process improvement
that promoting overall system optimization and addressing the dynamics of changing
systems improve manufacturing competitiveness (Ghalayini 1997). Stadtler (2005)
stated that improving competitiveness is the task of integrating organisational units
along a SC and coordinating materials, information and financial flows in order to
fulfil customer demand; Bhatnagar and Sohal (2005) explained that operational
competitiveness was influenced by qualitative factors; (Gunasekaran, Pate, and
Tirtiroglu 2001)emphasized improving performance at the strategic, tactical and
operational levels; Lummus and Vokurka (1999) illustrated collaborative
relationships for improving competitiveness. However, in these studies, the country
factors were not considered. While there is no right theory for managing the SC,
Halldorsson ( 2007) considered different organisational theories and models to
explain inter-organisational phenomena in order to develop the SCM paradigm as a
scientific discipline. Some research works (Au and Ho 2002; Eng 2005; Sengupta,
Heiser, and Cook 2006; Suhong et al. 2006; Nonino and Panizzolo 2007) have been

68
conducted on increasing competitive advantage and performance but very little
research has been conducted on the Bangladeshi RMG industry about improving
competitiveness. Hence, there is a big gap in the field of research on improving
competitiveness in the RMG industry of Bangladesh.
At present in the business environment, industries are facing intensified global
competition, rapid technology advances and increasingly more demanding customer
expectations. In this new environment, to improve firms’ competitiveness, the
traditional manufacturing model has been re-engineered and restructured. As
companies have improved their internal operations by increasing product quality
while reducing costs, now they are looking to develop competitive advantages in
areas such as delivery, collaborative relationships, flexibility and innovation. All
these activities emphasize the importance of time. Firms have found that a successful
initiative to accomplish this objective is through SCM (Vokurka, Zank, and Lund
2002). Kleindorfer and Saad (2005) mentioned, problems of coordinating supply and
demand and problems from political actions and economic disruptions that made
SCM inefficient. In this situation, all the internal and external stakeholders and their
actions may come together through co-operational relationships and integrated
activities along the SC. However, from the above literature about the SC and
competitiveness in the garment sector, it is clear that there are very few research
works related to the SC and competitiveness. However, many research scholars have
been quoted in a scattered way in their various research studies on the SC, the role of
internal and external stakeholders, and strengths and barriers of those stakeholders.
Therefore, taking into consideration the research questions and objectives, some
specific stakeholders and their elements have been considered from the previous
literature. In the next section, the elements that were considered from different
stakeholders are discussed in a meaningful way: these are the constructs of our
preliminary research model.
3.10 External Stakeholders (Country Factors)
Freeman (1984) defined a stakeholder as “any group or individual who can affect or
is affected by the achievement of the firm’s objectives”. This includes employees,
customers, suppliers, public interest groups and government bodies. There are two
types of stakeholder in the RMG supply chain: internal and external. Internal

69
stakeholders such as employees, suppliers, manufacturers and buyers (Tsai, C.Yeh,
et al. 2005; Fassin 2009)are directly involved in the process of the SC. External
stakeholders such as the government, political parties, bureaucrats, etc. (Tsai, C.Yeh,
et al. 2005; Fassin 2009) are indirectly involved and influence the process through
their action, pressure and services.
In this study, we considered two external stakeholders, that is, the government or
political parties and bureaucrats. Under these external stakeholders, two main
factors/elements are considered: bureaucratic behaviour and political action. Country
risk was another factor which was the ultimate result of these first two factors. In this
study, these factors were considered as country factors (Hadjikhani and Hakansson
1996).
Although the government, political parties and bureaucrats are not directly involved
in the process of SCM, they are very influential external stakeholders in the whole
business process and especially in the international perspective. Therefore, political
action and bureaucratic behaviour have been considered in the SC as stakeholder
analysis has become a conceptual device over the past couple of decades in the fields
of business and society, business ethics and management (Reed 2002).
3.10.1 Political Action (PA)
Political action (PA) means the role and action of political stakeholders (the ruling
political party, political opposition groups) in business (Hadjikhani and Hakansson
1996; Holtbrugge, Berg, and Puck 2007). Political action or activities are defined as
the efficient design of all relationships with political stakeholders that may affect the
operations of a company in a positive or negative way in order to achieve
competitive advantages (Welge and Holtbrugge 2006; Holtbrugge, Berg, and Puck
2007). Boddewyn and Brewer (1994) have mentioned in their research study that the
international firms which are exporters operate under a great variety of evolving
political regimes that have an impact on the firms’ operations.
In business studies, as an environmental factor, political risk is very important with
this being derived from political action by the ruling government and the opposition
groups (Porter 1985; Grosse and Behrman 1992; Miller 1993; Hillman 2003;
Hillman and Wan 2005). This is obviously the case when a government in a certain

70
country is the actor on the political side and a large multinational corporation is the
actor on the business side. The interplay becomes complex when the government or
some of its units, political opposition groups and units responsible for the
commercial transaction take part in the commercial exchange. This scenario is the
same in several business areas (Hadjikhani and Hakansson 1996) and also in the
RMG business. In the SC of the RMG industry, the government and political parties
play vital roles as national stakeholders through their political action (Choudhury
and Hossain 2005).
Absar (2001) mentioned, economic diplomacy for Bangladesh in which the
government’s role and political action (PA) are very important in any business. So,
in this study, the political action comes from the national stakeholders, that is, from
the government and political parties. Based on stakeholder theory, these are
instrumental stakeholders that management needs to consider when seeking to
achieve the organisations’ goals (Jones 1995; Reed 2002). The action from these
stakeholders may increase or decrease competitiveness directly or indirectly
(Bhatnagar and Sohal 2005; Kale 2007; Verma and Seth 2011). Islam, Begum, and
Rashed (2012) highlighted in their research that the RMG sector needs to focus on
the disruption-free supply of products to international markets. They mainly
highlighted the disruptions caused by political instability. Therefore, political action
(PA) has been considered as an important factor in the proposed model on the basis
of stakeholder theory.
3.10.2 Bureaucratic Behaviour (BB)
Bureaucrats are responsible for executing the decisions of the political leadership
and for maintaining the day-to-day regulatory and service functions of the state
(Nimir and Palmer 1982). The term bureaucracy means any administrative system
based on professionalization and hierarchical subordination (Friedrich 1952).
Dimock and Hyde defined bureaucracy in terms of the subdivision of jurisdiction,
hierarchy and professionalization of personnel (Selznick 1943). Bureaucracy or
bureaucratic behaviour (BB) is concerned with the behaviour of officials while the
actions of, for example, worker groups, may also lead to deflection of an
organisation (Selznick 1943). The capacity of bureaucracy to perform a
developmental function depends on two components: the structure of bureaucracy
and the behaviour of the individuals (Nimir and Palmer 1982). The context of BB is

71
revealed by bureaucratic decisions. The bureaucrats are part of the government of a
country and play an important role in making decisions regarding administration and
development in any sector of a country. In any business process or commercial
transaction, the government, political groups and bureaucrats play important roles
(Hadjikhani and Hakansson 1996). An ideal bureaucratic structure is assumed to
contribute to unity and coordination, precision and speed, obedience and loyalty, the
reduction of friction, continuity across changes in government. Merit-based
bureaucracy fosters economic growth in developing countries (Evans and Rauch
1999; Olsen 2006). According to stakeholder theory, the government and political
groups are important stakeholders (Donaldson and Preston 1995)and as part of the
government, bureaucrats are also important stakeholders. As defined by Freeman
(1984), a stakeholder is ‘any group or individual who can affect or is affected by the
achievements of the organization’. Therefore, BB is an important part of the
proposed model which is supported by stakeholder theory.
The research study by Kim (2007) mentioned that bureaucratic behaviour (BB) was
influenced by political action (PA). The dynamics of political institutions affect
bureaucratic behaviour. This research showed that multi-institutional characteristics
of the political system influence bureaucratic behaviour in predictable ways.
Therefore, BB also affects the SC process. In another research study (Haque 2007), it
was found that diverse national settings and political structures are responsible for
producing their respective patterns of administrative system and its reform. Many
others factors such as one-party dominance, military rule, political instability, violent
political conflict, frequent changes in the ruling party and corruption contribute to
the inability to maintain bureaucratic principles and to causing problems in terms of
making the SC efficient. Quddus (2001) also mentioned the bureaucratic problem
and corruption in the Bangladeshi RMG export business.
In the RMG industry, buyers (demand side) and suppliers (supply side) are involved
directly in their business processes but with some issues they are involved in the
bargaining process with the help of the government and bureaucrats. Much
paperwork and documentation need to be completed in the processes of the SC of the
RMG industry. Buyers can bargain with suppliers for timely delivery with short lead
time, an efficient SC, competitive price, quality product, etc. They also expect
inexpensive sources of raw materials, inexpensive labour, technology and a very

72
good and healthy manufacturing environment. Political government expects to
increase income and employment through manufacturing and exporting, managerial
knowledge and technology, improvement in the balance of payment and soft
conditions (Grosse and Behrman 1992). A political government and bureaucrats
through their political activities can bargain for different issues in RMG export and
create an advantageous position. With stakeholder theory, it will be investigated how
the demand- and supply-side issues are influenced by bureaucrats and negotiated in
the RMG sector to increase competitiveness.
3.10.3 Country Risk (CR)
All business transactions involve some degree of risk. When the clothing business
occurs across borders, this carries additional risks which are not present in domestic
business. These additional risks are called country risk (Meldrum 2000). Others have
attempted to define country risks as factors affecting foreign direct investment
(Picard 1982; Min and Galle 1991a; Bergara, Henisz, and Spiller 1998; Min and
Galle 1991b; Fatehi and Safizadeh 1994). Country risk is the result of political,
social and economic factors (Oetzel, Bettis, and Zenner 2001). It also includes risks
arising from a variety of national differences in economic structures, policies, socio-
political institutions, geography and currencies. Tsai, C.Yeh, et al. (2005) argued in
their research work that according to ‘stakeholder influence strategy theory’, external
stakeholders such as the country, the media or some labour groups have influence on
the internal stakeholders of a business. Due to some actions of political parties, the
government and bureaucrats, a negative influence or risk may arise in a country. In
this study, country risk comprised the ultimate result of the different non-supportive
role of the government, non-cooperation and misunderstanding between the ruling
party and the opposition, and the activities of bureaucrats. When country risk is
higher, it affects the SC and weakens the competitiveness of the RMG industry.
As noted earlier, the RMG sector in Bangladesh is essentially international. In all
activities of international business, country risk is considered to be a significant
factor (Grosse and Behrman 1992; Meldrum 2000). Developed countries are trying
to remain competitive in business by locating their operations in low-wage countries
and sourcing (outsourcing) from those countries (Kogut 1993; Fraering and Prasad
1999). By international outsourcing, firms have been able to reduce costs, improve

73
quality, become more flexible and innovative and reduce lead times for delivery. In
addition to these advantages, outsourcing has some complexity in transport, custom
clearances and tariffs and payment systems (Picard 1982; Min and Galle 1991a;
Frear, Metcalf, and Alguire 1992; Birou and Fawcett 1993; Swamidass 1993).
Moreover, companies select appropriate outsourcing strategies and an attractive
outsourcing platform to achieve competitive advantage in business taking into
consideration the level of country risk.
A country might be an attractive location or outsourcing platform due to its primary,
secondary or tertiary endowment factors (Porter 1986; Prasad and Sounderpandian
2003). These factors include access to low-cost labour or perhaps proximity to raw
materials; the quality of the infrastructure, skilled labour and scientific personnel; the
country demands and operating conditions; cultural nuances and legislation (Bass,
McGregor, and Walters 1977; Kogut 1985; Chikán and Whybark 1990; Goonatilake
1990; Birou and Fawcett 1993; Prasad and Sounderpandian 2003; Porter 1986) .
Various types of risk may arise in all aspects of endowment factors and these are
associated with the involvement of the political role and bureaucratic behaviour. A
firm may source from a specific location or a number of locations to minimize
overall cost and gain competitive advantages by exploiting these factors or
advantages. Therefore, the country risk is very relevant in this study. This research
will look into how country risk influenced buyers in making decisions and how
buyers were motivated to conduct business in Bangladesh.
In a research study, Miller (1993) expressed the view that in the country risk
analysis, the uncertainties are related to political, government policy and
macroeconomic factors but in strategy studies, uncertainties are instead input supply,
product market and competitive uncertainties that are closely related to industrial
organisation economics.
3.11 Internal Stakeholders (Business Factors)
In the development of organisational strategies, firms must realize that they are
responsible for creating good relationships and cooperation between internal and
external stakeholders. In the Bangladeshi RMG industry’s SC, external stakeholders
are non-supportive and non-cooperative in numerous services to internal

74
stakeholders which are intended to make the SC efficient (Adhikari 2007). Each
stakeholder group has a different set of expectations relating to firms’ performance.
These different expectations may cause conflict to arise between the firm and its
stakeholders. Such conflict can be extremely disadvantageous for the RMG
marketer, as RMG marketers tend to be more integrated with their buyers and
suppliers, two key internal stakeholder groups. Any strategic process which reduces
the barriers in the SC, such as the stakeholder management process, should therefore
be extremely beneficial to the manufacturers cum exporters of RMG products. In the
above discussion, we have defined and identified the external and internal
stakeholders in the RMG industry’s SC. The internal stakeholders are, namely, the
suppliers of the final products and the buyers of the final products (Fassin 2009;
Philip et al. 2005). Some studies in the literature about the elements of internal
stakeholders have been reviewed and summarised in the following section.
3.11.1 Supply-side Drivers (SD)
Drivers are defined as the perceived/expected benefits (Quaddus and Didi 2005). In
the SC of the RMG industry, supply-side drivers are the suppliers’ strengths which
passively play positive roles for the SC (Ahmed 2009). These are in the form of a
competitive price, cheap labour, quality products, marketing strength, experience in
working with a reputed brand and with the largest companies such as Wal-Mart,
Tesco, H&M, etc.(Rahman 2005; Rahman and Anwar 2006). Razzaque and Eusuf
(2008) mentioned some supply-side drivers, that is, domestic trade policy and
producers’ response. In another study, Haider (2007) also mentioned some drivers
for the issue of competitiveness such as suppliers who had achieved some level of
product diversification and the upgrading of products in terms of exporting to the
European countries which had added more strength. (Saxena and Salze-Lozac’h
2010) mentioned in her research report that low-cost labour, fast and efficient
workforce, high labour supply, hospitable and cooperative nature of the suppliers,
better price offer and good communication skill are the supply-side drivers. Joarder,
Hossain, and Hakim (2010) mentioned that one of the main reasons for Bangladesh
success in the garment market is price competitiveness for low wage rates.
Therefore, the main driver of the suppliers is cheap labour. Sultana et al. (2011) have
described that the availability of cheap labour, preferential treatment, lowest wage
rates, technological upgrade and trade union-free EPZ (export processing zone) are
also supply-side drivers for the Bangladeshi RMG industry.

75
3.11.2 Supply-side Barriers (SB)
Barriers are defined as perceived or likely constraints (Quaddus and Didi 2005). In
the RMG business, supply-side barriers are the weaknesses (Ahmed 2009) in the SC.
The barriers include poor infrastructure, a long lead time, lack of commitment and
trust, being under pressure to reduce price, weak bargaining power, buyers’ freedom
to choose alternative suppliers from another country, lack of cooperation, etc.
(Nuruzzaman 2001; Nuruzzaman 2009; Adhikari 2007a; Kale 2007; Berg et al.
2011; Sultana et al. 2011; Halder and Kim 2012). In a research study, (Quddus and
Rashid. 1999) mentioned the role of politicians, bankers and bureaucrats who were
creating barriers to suppliers. Uzzaman (2010) also mentioned the political
corruption, bureaucracy and poor customs’ formalities in Bangladesh. Abdin (2008)
has also revealed that anomalies in the banking sector, vindictive political
environment, bureaucratic shackles, lack of policy support from the government,
lack of stakeholders’ relation are the weaknesses for falling competitiveness against
its competitors in the international market.
Razzaque and Eusuf (2008) also mentioned other barriers such as the lack of proper
infrastructure, lack of safety in the workplace, very low wages, wage discrimination,
and lack of skill development and training opportunities. Haider (2007) mentioned
some supply-side barriers in relation to the issue of competitiveness such as the lack
of government support, lack of backward linkage expansion, compliance issues,
price competitiveness, long lead time, and production and distribution time (Islam,
Begum, and Rashed 2012).
3.11.3 Demand-side Drivers (DD)
As previously stated, drivers are defined as the perceived or expected benefits
(Quaddus and Didi 2005). In the Bangladeshi RMG business, demand-side drivers
are the buyers’ strengths which passively play positive roles for the SC (Razzaque
and Eusuf 2008; Ahmed 2009). Demand-side drivers include: strong bargaining
power, ability to choose alternative suppliers from another country, ability to offer a
good price, a bulk customer, brand name, special facility for importing garments
from member countries of the LDCs, trust and commitment, etc. (Wu et al. 2004;
Rahman 2005; Zhao et al. 2008). Razzaque and Eusuf (2008) mentioned another
demand-side driver, that is, a favourable international trade environment. Suppliers

76
are careful about the drivers of the buyers and take the necessary action to fulfil the
buyers’ demands. These types of actions actually make suppliers more competitive.
3.11.4 Demand-side Barriers (DB)
As previously stated, barriers are defined as perceived or likely constraints (Quaddus
& Didi 2005). In the Bangladeshi RMG business, demand-side barriers are the
pressures (Adhikari and Weeratunge 2007b; Ahmed 2009)from the buyers which
play a negative role in the SC. Barriers include pressure for a shorter lead time,
raising the NGOs’ complaints about human rights, different types of conditions and
regulations imposed on the suppliers, and different types of conditions and
regulations imposed by the country’s government (Nuruzzaman 2001; Adhikari and
Weeratunge 2007b; Nuruzzaman, Haque, and Rafiq 2010). The compliance issues,
pressure to reduce price and lead time barriers were raised by the buyers (Rahman
2005; Claeys and Brachet 2008). Razzaque and Eusuf (2008) also mentioned some
barriers that were raised by the buyers such as better working conditions, and
continuous pressures about international labour standards, etc.
Above elements of internal and external stakeholders according to the previous
literature have been considered as parts or components of the SC. As the
stakeholders are dependent on each other, a co-operational relationship is very
important as per dependence theory. Moreover, the supportive theories are discussed
in the next section;
3.12 Review of Underlying Theories
In a research study, Halldorsson (2007) discussed and developed SCM as a scientific
discipline using different theories from non-logistics areas. This paper used various
socio-economic and organisational theories applied in various managerial
disciplines. Four different theories; principal agent theory (PAT), transaction cost
analysis (TCA), network theory (NT) and resource-based theory (RBV) were used to
contribute to selected fields of the SCM research domain, that is, third party logistics
(TPL) and new product development (NPD). In another study Sarkis, Zhu, and Lai
(2011) mentioned about 14 organisational theories applied in the SCM-related
research studies. Stakeholder and Resource Dependence theories are two among
these theories. No substantial number of research works about SCM of textile and

77
garment industries has used stakeholder or resource dependence theories. However,
these two theories are very important and useful specifically in SCM of the RMG
industry to bring together all the stakeholders and their factors to improve
competitiveness. The detail of the theories is discussed in the following section.
3.12.1 Stakeholder theory
For the purpose of this study, stakeholders are ‘any group or individual who can
affect or is affected by the achievement of the organization’s objectives’ (Freeman
1984). According to stakeholder theory, buyers (customer), suppliers
(manufacturers) of raw materials and finished products, logistics support service
providers, the government, bureaucrats, political parties, etc. are stakeholders.
Stakeholder theory suggests that companies produce externalities that affect many
parties (stakeholders) which are both internal and external to the firm. Externalities
often cause stakeholders to increase pressures on companies to reduce negative
impacts and increase positive ones (Sarkis, Zhu and Lai 2011).
Organisations are not limited to interaction with market actors like customers,
suppliers and shareholders in the business. They are also influenced by political
stakeholders like governments, the media and non-government organisations
(NGOs) (Holtbrugge, Berg, and Puck 2007). The insufficient consideration or
ignorance of the stakeholders may create some conflict in different level of activities
in the SC which may lead to poor competitiveness and financial losses. As a
consequence, political parties and their activities, the government (political party and
bureaucrats) and country-specific issues are becoming critical success factors (CSFs)
in business (Hillman 2003; Hillman and Wan 2005; Holtbrugge, Berg, and Puck
2007). Therefore, stakeholder theory has become a crucial part of management
literature (Donaldson and Preston 1995; Tsai, C.Yeh, et al. 2005) and also for this
research. But who are the stakeholders? A variety of criteria has been suggested for
establishing those who hold stakes. Among many criteria, only two have been
considered: a) being necessary for the survival of the firm; and b) being influenced
by or influencing the achievement of the organisation’s objective (Freeman 1984).
Our understanding of who is a stakeholder has been determined by these two criteria.
Stakeholder theory argues that the success of a firm or organisation does not depend
primarily on the efficient coordination and control of its operations, but on the

78
establishment and maintenance of a cooperative dialogue with all relevant internal
and external interest groups or those with stakes who may influence its activities in a
positive or negative way (Clarkson 1995; Freeman, Wicks, and Parmar 2004;
Holtbrugge, Berg, and Puck 2007). Stakeholders are individuals or groups that have
material, political, affiliated, informational, symbolic or spiritual interests in a
company and that are able to advocate these interests through formal, economic or
political power (Freeman 1984; Gioia 1999; Holtbrugge, Berg, and Puck 2007). As
there are many internal and external stakeholders directly or indirectly involved in
the RMG industry’s SC, stakeholder theory has been used in this study. The
discussion about resource dependence theory (RDT) follows in the next section.
3.12.2 Resource dependence theory (RDT)
Resource dependence theory (RDT) suggests that, in the SC, member firms should
be dependent and collaborate to seek higher performance gains in the long-run
instead of pursuing short-term benefits at the expense of others. According to RDT,
firms are dependent on resources provided by others in order to sustain growth, as
well as having other organisations that may be dependent on them (Pfeffer and
Salancik 1978). One important assumption of RDT is that firms cannot be fully self-
sufficient with regards to resources that are strategically critical for survival. They
need to depend on resources from outside parties to compete, and carefully manage
this dependency with other firms to strive for sustainable development (Heide 1994).
This theory proposes that organisations engage in exchanges with their environment
to obtain resources (Pfeffer and Salancik 1978) and it is invoked to examine the
direct relationship between SC uncertainties and strategic supply management
(Paulraj and Chen 2007). Organisational success in RDT is defined as organisations
maximizing their power (Pfeffer 1981). This theory emerged in the late 1960s and
has become an influential theoretical perspective in international business research
(Doh 2005). During this time, RDT has been applied broadly across the research
domain to explain how organisations reduce environmental interdependence and
uncertainty (Hillman, Withers, and Collins 2009). Hillman, Withers, and Collins
(2009) discussed five streams of research, that is, mergers & acquisitions, joint
venture, Board of Directors, political action and executive succession where RDT
has been used to minimize dependences. Resource dependence argues that external

79
pressures—such as competition, regulation and social forces—will cause firms to
seek out environmental linkages (Boyd 1990). In consideration of RDT, (Street
2007) advised to develop relationships with external organisations that have the
potential to assist business development, survival and growth. This theory has been
tested successfully in studies of social service agencies (Aldrich 1976), university
administrative structure (Tolbert 1985), joint ventures (Pfeffer and Nowak 1976),
and corporate mergers (Pfeffer 1972b). Carter and Rogers (2008) presented a
framework of sustainable SCM and developed research propositions based on RDT.
The author has also demonstrated the relationships among environmental, social, and
economic performance within an SCM context.
Sarkis, Zhu, and Lai (2011) mentioned that one important insight from RDT was that
firms lacking the required resources to attain their goals are likely to develop
relationships with others in order to acquire these resources. Sarkis, Zhu, and Lai (2011)
explored green supply chain management (GSCM) practices and their relationship with
organisational performance based on resource dependence theory (RDT).
Resource dependence theory (RDT) centres on how some firms become reliant on
others for needed inputs such as goods and materials, and how firms can manage
such relationships (Pfeffer and Salancik 1978). As SC members work together
closely, they often become more dependent on each other. Thus, RDT has a high
level of value in the SC context (Ketchen 2007).
3.13 Justification for Adoption of the Theories in Current Research (Conceptual Framework) The study has suggested a primary research model based on the two underlying
theories as well as on the review of the applications of those theories in the SCM
fields already discussed in the above sections of this chapter. Various factors,
identified in studies on SCM-related fields, were also taken into consideration. The
model development was done by combining stakeholder theory (ST) by Freeman
(1984) with the resource dependence theory (RDT) by Pfeffer and Salancik (1978).
This combination of theories was adopted in this study by following a specific
research process (see section 4.4 of chapter 4) in order to develop a specific research
model for improving competitiveness in the RMG sector of Bangladesh.

80
Competitiveness can be evaluated at various levels: product, company,
sector/industry, country. Whereas competitiveness at the firm and country levels has
been regularly evaluated, the role of the industry level has not received adequate
attention (Momaya 1998). Not only that, but there is also no substantial number of
research works on improving the competitiveness of the textile and garment industry
or even on analysing the SC using stakeholder theory and resource dependence
theory. But these two theories are very important especially in the SC of the
Bangladeshi RMG industry in bringing together all the stakeholders and their factors
to improve competitiveness.
Justification of Using Resource Dependence Theory (RDT)
RDT considers the customer and supplier relationships as important linkages for
firms to reduce the uncertainty surrounding their operations (Cao and Zhang 2011;
Carter and Rogers 2008). In many instances, inter-organisational relationships are
essential for managing the internal and external coordination required for SCM to
gain the performance outcomes (Zhu, Geng, and Lai 2010). There is also empirical
evidence showing a positive relationship between resources dependency in the form
of relational resources and SC performance (Yang et al. 2008). Therefore, this theory
extends this line of research and is valuable in understanding inter-organisational
behaviours in terms of their SCM implications. Based on RDT, SC members
recognise that dependence can create patience and trust but, in a traditional SC,
members try to avoid becoming dependent on others and try to make others
dependent on themselves (Crook and Combs 2007). In the RMG industry’s SC,
Bangladesh cannot avoid dependence. Therefore, RDT is useful for creating trust
and making others dependent on Bangladeshi RMG.
Justification of Using Stakeholder Theory
Stakeholder theory begins with the postulation that beliefs are necessarily and
explicitly a part of doing business. This theory brings its core stakeholders together.
This drives the firm forward and allows it to generate outstanding performance.
What responsibility does management have to stakeholders? This pushes managers
to articulate how they want to do business and, specifically, what kinds of
relationships they want and need to create with stakeholders to deliver on their
purpose (Freeman, Wicks, and Parmar 2004). Even though many developments and

81
directions for stakeholder theory exist, the basic principle is that internal and external
groups will influence organisational practices (Delmas and Toffel 2004; Street 2007;
Sarkis, Zhu, and Lai 2011). Harrison (1999) used stakeholder theory in social
responsibility and achieved performance. Stakeholder theory gives emphasis to the
two-way relationship between the firm and its stakeholders (Preble and Preble 2005)
which is very important in the Bangladeshi RMG sector. Reed’s (2002) research
work applied stakeholder theory to increase the responsibilities of corporations
active in developing countries. In a research work, Kaler (2006) addressed suitability
and the validity of stakeholder theory for the purposes of business ethics.
Stakeholder theory was also used by Knox and Gruar (2007) and Payne, Ballantyne,
and Christopher (2005) in their research work on development relationship
marketing strategy in a profit and non-profit organisation. However, although this
theory has been used in various aspects of business development, it has had scarce
usage in the competitiveness model.
Justfication of Adoption Theories
In the RMG industry, the firms, that is, the cutting, making and trimming (CMT)-
based manufacturers, are totally dependent on buyers’ wants and demands as they
are not powered by their own brand: this industry is also dependent on fabrics
suppliers, suppliers for the raw materials of fabrics, and some other accessories
suppliers. So, resources dependency is one of the supply-side barriers. We know that
there are many organisations engaged in the RMG sector that are involved in the
SCs. Due to the above supply-side barriers (i.e. scarcity of raw materials and
dependency), organisations are engaged in exchanges. RDT illustrates that actors
facing scarcity in essential resources will seek to establish relationships with others
in order to obtain needed resources (Freeman 1999). Competitiveness can be
increased through minimizing dependency by using this theory; therefore, RDT has
been considered in this study. In the proposed model, the stakeholder elements
(country factors) can play a vital role in reducing dependency. In that case, this study
has examined how elements or country factors influence the RMG manufacturers to
minimize their dependency and maximize their bargaining power.
As shown in the literature review, there are many internal and external stakeholders
directly or indirectly involved in the RMG industry’s SC; therefore, stakeholder

82
theory has been used in this study. In the proposed conceptual model, the
conceptualization of two influential groups, that is, political parties and bureaucrats
has been drawn on the basis of stakeholder theory which may have influence on the
SC. Textile SCs are basically an integrated SC (Seuring, Goldbach, and Kopline
2004). Within this chain, three levels of actors, namely, at the company level, chain
level and the political or societal level were also considered. At the company level,
buyers and suppliers, and at the political and societal level, the government, political
parties and bureaucrats, are the actors of the RMG industry’s SC. As this study is
international in nature, there is a need to extend stakeholder theory into an
international perspective and, therefore, buyers are one kind of international
stakeholder and the others are national stakeholders. In addition to firm-to-firm
relationships, it is important to include business associations (such as the BTMA),
government agencies (such as EPB), trade unions, NGOs, consumer groups and
individuals (Henderson et al. 2002; Knutsen 2004) in the typical SC of labour-
intensive consumer goods such as the textile and garment industry in a developing
nation. Considering the theoretical concepts of stakeholder theory, an attempt has
been made to find out the influence of political parties and bureaucrats in improving
competitiveness through the development of relationships and coordination.
As discussed previously, this current study has applied the two above-mentioned
theories due to their applicability to the idea that an organisation and its stakeholders
are part of the larger social system in which they operate. These theories have
frequently been used in developed countries’ SCM research and, more recently, in
developing countries. As these theories were developed from the broader political
economy theory, therefore emphasis has been placed on the government, political
parties, bureaucrats and country risk as antecedent factors in measuring industry
competitiveness by analysing the SC in a developing nation.
The research objectives for this study are to explore the competitiveness of the RMG
industry of Bangladesh in facing the present situation after the abolition of the MFA.
As stakeholder theory and resource dependence theory appear plausible in
addressing this study’s research questions (see chapter 1), the current study has
adopted these theories to determine to what extent stakeholder theory and resource
dependence theory are appropriate in the improvement of the competitiveness of the
RMG industry in the context of a developing country such as Bangladesh.

83
3.14 Preliminary Research Model The above literature review and the review of underlying theories have justified that the
theories under consideration have sufficient applicability to garment business research.
However, this section explores the theoretical rationale behind the proposed research
model for improving the competitiveness of the SC of the RMG industry in
Bangladesh. Figure 3.1 portrayed the model which was developed from an
understanding of two generic theories that had been defined in the conceptual
framework described in section 3.13. As discussed in the above sections of this
chapter, the external and internal stakeholders factors (constructs) and items used in
the model drew extensively from the combination of stakeholder theory (Freeman
1984), resource dependency theory (Pfeffer and Salancik 1978) and previous literature
relating to SC and competitiveness studies. The preliminary research model sought to
extend these theoretical models to develop a model that would explain the external and
internal factors that influence the competitiveness of RMG companies in Bangladesh,
which would thus result in competitive advantage for these companies.
The model in figure 3.1 shows that the factors or constructs from external
stakeholders has an impact on the dependent factors or constructs of the internal
stakeholders for improving competitiveness. The model also shows two groups of
constructs. The first group has two independent constructs and one dependent
construct from external stakeholders. Political action (PA) and bureaucratic
behaviour (BB) are the independent constructs and country risk (CR) is the
dependent construct. The second group has four dependent constructs, that is,
supply-side drivers (SB), supply-side barriers (SB), demand-side drivers (DD) and
demand-side barriers (DB). These seven constructs are postulated to be the
influencing factors in the RMG supply chain towards improving the competitiveness
of the Bangladeshi RMG industry.
This study proposed that these stakeholders and their capabilities such as their
behaviour, actions, and the drivers and barriers of the stakeholders in the SC would
allow garment companies to sustain competitive advantage and achieve
competitiveness. This was based on the combined activities and capabilities of
stakeholders in the SC that produce good relationships and understanding, reduce
dependency and improve competitiveness by gaining competitive advantage.

84
RDT (resource dependency theory) posits to reduce dependency by establishing
good relationships and ST (stakeholder theory) posits to maintain good relationships
with all stakeholders. Based on ST and considering external stakeholders, this study
also took into account the activities of the government, their officials and opposition
parties in terms of cooperation, policy making, funding, infrastructural development,
Figure 3.1: Preliminary research model
controlling, staffing and training. This study also considered the internal
stakeholders, that is, the buyers’ and suppliers’ strengths and weaknesses as buyers
and suppliers played the main role in the SC and were influenced by the activities of
external stakeholders. The basic principle of ST is that internal and external groups
will influence organisational practices (Delmas and Toffel 2004; Street and Cameron
2007; Sarkis, Zhu, and Lai 2011). Stakeholder theory (ST) gives emphasis to the
two-way relationship between the firm and its stakeholders (Preble and Preble 2005)
which is very important in Bangladeshi RMG sector. RDT considers customer and

85
supplier relationships to be important linkages for firms to reduce the uncertainty
surrounding their operations (Carter and Rogers 2008; Cao and Zhang 2011).
Therefore, the combination of these two theories supports the SC of the Bangladeshi
RMG industry to gain a competitive advantage and finally to improve
competitiveness.
The development of the field study has been guided by the development of this
preliminary research model.
3.15 Summary This chapter presented the previous and related literature of this current research.
Since improving competitiveness is a recent phenomenon in the RMG industry of
Bangladesh, the proven stakeholder and resource dependence theories can be used as
a foundation for improving competitiveness among Bangladeshi garment companies.
Therefore, the relevant details of the theoretical concepts from RDT and ST have
been reviewed. In addition, the well-developed ST provides the basis for proposing
that perceptive factors such as political action, bureaucratic behaviour and country
risk affect the supply- and demand-side issues to improve competitiveness. The
related literature of external and internal stakeholders and their role in the context of
improving competitiveness have been discussed here. Hence, this chapter has
presented a preliminary research model, based on the existing literature, which will
be further improved by integrating the contextual factors.
In the following chapter, the research methodology and design for answering the
research questions and achieving the research objectives are discussed.

86
CHAPTER 4
Research Methodology and Design
4.1 Introduction
This chapter discusses the research methodology including the process used to
explore the research questions and objectives. The selection of the research
methodology and design was determined by the research questions and objectives
drawn in chapter 1. A sequential mixed-method (Creswell 2009) approach
comprising qualitative and quantitative methods was employed as the research
method in this study. The approach was adopted in order to enrich the understanding
of the issues through affirmation of the conclusion, and to extend the knowledge by
implementing new ways of conducting the research (Bazeley 2004).
This chapter starts with the discussion of the research paradigm, which addresses the
rationale and the justification of the mixed-method approach used in the current
research. The definition and research design of the mixed-method approach are then
discussed. This is followed by clear descriptions of the research process. The
research process included three stages that were: qualitative field study, quantitative
pilot study and main quantitative survey which are explained in detail in the second
section. For each stage, the sample selection, data collection and analyses techniques
are presented. Finally, other issues relating to the research methodology used in this
study are also discussed.
4.2 Research Paradigm
The research paradigm is the basic set of beliefs that guide action to achieve research
objectives (Denzin and Lincoln Yvonna S. 2000). Within the research process, the
research paradigm or “world view” (Creswell 2009) reflects how the research is
designed, how data are collected and how the findings are presented. As stated by
Guba and Lincoln Y.S. (1995), “[research] paradigms define for the [researcher]
what it is they are about and what falls within and outside the limits of legitimate
[research] ...” (p. 108). There are three major research paradigms, namely,
positivism, constructivism and pragmatism that have been explored to establish the

87
methodological basis of a study. These paradigms can be visualized broadly as
research methodologies (Neuman 2000). It is also recognised that there are three
approaches, methods or concepts for research: quantitative approach, qualitative
approach and mixed-methods approach (Creswell 2009; Johnson and Onwuegbuzie
A. J. 2004) following the different paradigms. However, the paradigms are also
known as ontological (Guba and Lincoln Y.S. 1995), epistemological (Burrel and
Morgan 1979) and methodological under certain assumptions in research. The
ontological assumption is related to the philosophical belief of the researcher about
the nature of the reality to be investigated in the study; the epistemological
assumption refers to the grounds for the knowledge and understanding that can be
acquired through different types of inquiry in the research (Hirschheim, Klein, and
Lyytinen 1995) and the methodological assumption is related to the qualitative and
quantitative methods used to discover the reality based on the adopted paradigm
(Guba and Lincoln 1994). Two additional assumptions in research are named
“axiological” and “rhetorical” (Creswell 2003).
Table 4.1 presents a precise view of the research paradigms and assumptions as
discussed by the above authors.
Table 4.1: Research paradigms
Assumptions
Paradigms Positivism Constructivism/Inter-
pretivism Pragmatism
Ontological Nature of reality
Naïve realism: reality is objective and singular, and apart from the researcher
Relativism; multiple, subjective, local and specific ‘constructed’ realities
Accept external reality; choose explanations that best produce desired outcomes
Epistemological Relationship of the research to the issue being researched
Objective point of view: researcher and the one being researched are independent
Subjective point of view: researcher and the one being researched are inseparable
Both objective and subjective points of view
Methodological Process of research
Deductive process; quantitative: experiments, surveys, hypothesis testing. Believing in realism
Inductive process; qualitative: in-depth interviews, focus groups, participant observation. Believing in idealism
Both inductive and deductive; both quantitative and qualitative (mixed method)
Sources: Adapted from Creswell (2003); Nelson (2006)

88
The positivism paradigm relies on the paradigm of realism where researchers assume
that reality is independent from the knower (Smith 1983; Johnson and Onwuegbuzie
A. J. 2004). This paradigm is associated with the quantitative research method in
which hypotheses formulation is essential (Creswell 2009; Johnson and
Onwuegbuzie A. J. 2004). Positivism views reality as objective, external to and
independent of the researcher and involves the use of deductive logic and the testing
of hypotheses with rigorous quantitative methods such as experiments, surveys and
statistics (Neuman 2000; Creswell 2009): it seeks to predict and explain causal
relationships among key variables (Gephart 1999).
The second paradigm in conducting research is the interpretivist or constructivist
view. The interpretivism paradigm aims to develop a natural science through social
interpretation (Neuman 2003). This paradigm is typically an approach to qualitative
research by means of in-depth interviews, focus groups and participant observation
from which the researchers develop subjective meanings of their experiences, use
inductive logic and interpret the findings based on the broad complexity of the
context (Guba and Lincoln 1994; Creswell 2009). It is concerned with the subjective
point of view in which a phenomenon is explained through multiple explanations or
realities rather than one causal relationship (Neuman 2000). The third research
paradigm, pragmatism, supports the use of both qualitative and quantitative research
methods based on the research questions or problems. These are more important than
either the method used or the paradigm. Pragmatist researchers are free to choose all
the available methods and techniques to collect, analyse and interpret the data to
meet the research objectives (Teddlie and Tashakkori 2003). Thus, under the
methodological assumption, the pragmatism paradigm is applicable to mixed-
methods research where inquiries can be drawn liberally from both quantitative and
qualitative approaches.
The focus of this research was to create an understanding regarding improving
competitiveness through the management of the SC of the Bangladeshi RMG
industry. This study aimed to discover the measurable and observable determinants
of the RMG supply chain that could be considered in the various contexts of
improving competitiveness. To adopt a paradigm and method for this study, it was
imperative to focus on the research questions and objectives. The research questions

89
and research objectives required the definition of some of the antecedent factors
(such as political action (PA), country risk (CR) and bureaucratic behaviour (BB)) or
the external reality that may influence the performance of the RMG industry’s SC.
This research sought the improvement of competitiveness by developing the
performance or efficiency of the RMG industry’s SC by linking the associated
antecedents and consequences for the RMG industry. The model was developed and
enhanced by combining the background literature and the real-world opinions of
stakeholders working in the garment industry SC. Finally, the objectives of the study
required the model to be tested to determine the important predictors of SC
performance in the garment industry. However, according to our previous
discussion, there is a lack of relevant empirical studies and appropriate scales to
measure the impact of PA, BB and CR issues in the RMG industry’s SC. Therefore,
the mixed-method approach in this research can help in two ways: (i) the qualitative
phase can answer exploratory questions about how and which variable of PA, BB
and CR is related to SC performance which will have impact on internal
stakeholders’ activities and performance and (ii) the quantitative phase can
demonstrate that a particular variable has a predicted relationship with performance
proving relevant policy implications to improve competitiveness of the industry.
Hence, to fulfil the research objectives, the method selected for this research is the
mixed-method approach suggested by Creswell (2009) where combinations of
qualitative and quantitative approaches are involved. The goal of mixed methods is
not to replace either of these approaches but rather to draw from the strengths and
minimize the weaknesses of both in single research studies and across studies. The
pragmatism paradigm has been determined as the most appropriate philosophical
world view for the research. Epistemologically, the pragmatist view can combine
both subjective and objective points of view and can use both inductive and
deductive logic for a better understanding of reality and to explain the findings of
this research. Therefore, the pragmatism paradigm has been chosen in this study as it
is the best paradigm for justifying the use of mixed-method research (Howe 1988;
Tashakkorri and Teddlie 1998).

90
4.3 Research Methods
This research considered elements of both qualitative and quantitative methods,
commonly referred to as the “mixed method” (Teddlie and Tashakkori 2003) which
is as mentioned earlier, the third paradigm, pragmatism. This paradigm recommends
a combination of qualitative and quantitative approaches within different phases of
the research process (Tashakkori and Teddlie 1998). In this method, a qualitative
research approach contributes to the quantitative research work, by identifying
salient variables, facilitating the sampling design and helping to explain the
quantitative findings. Johnson and Onwuegbuzie A. J. (2004) presented mixed
methods as the third research paradigm in educational research and clarified some of
the issues regarding mixed methods such as topology, and strengths and weaknesses
of the methods as well as the research process. Creswell (2009) also argued that the
mixed method approach can help to develop the survey instruments when existing
instruments are not adequate. The sequential mixed-method approach comprising
qualitative and quantitative methods employed in this research is much like the
sequential exploratory strategy that involves all the data collection and analyses
techniques imposed by both methods. It helps to explore a complex research area and
then to design the survey questionnaire combining the components of background
theory and the components that have emerged from the qualitative analysis (Creswell
2009). However, the research can be done by three phases under exploratory and
confirmatory stages as shown in figure 4.1.
Moreover, Creswell (2009) stated that applying the mixed method approach in
research will utilize the capability of data collection and enhance the validity of
research measurements. This is due to the fact that each method, either qualitative or
quantitative, has its own limitations. More specifically, a study followed by a single
method will “inevitably yield biased and limited results” (Greene, Caracelli, and
Graham 1989). Therefore, the combination of qualitative and quantitative methods
would compensate for their mutual and overlapping weaknesses (Greene, Caracelli,
and Graham 1989). The quantitative method, for example, provides a strong
foundation for the theoretical background while the qualitative method provides real
insights into real issues.

91
Research questions and objectives
Initial research model
Qualitative field study and content analysis
Finalise research model and draw hypotheses
Questionnaire development
Pilot test of the survey and analysis ( descriptive statistics and reliability test)
Data collection through survey
Data analysis using PLS
Result interpretation and discussion
Literature review
Question refinement
CONFIRMATORY
STAGE
EXPLORATORY
STAGE
MIXED METHOD
MIXED METHOD
Figure 4.1: Mixed methodology
As discussed in chapter 1, the main aim of this research is to explore the factors arising
from external stakeholders of the SC and the relationships among external and internal
stakeholders and their activities in the RMG industry’s SC. However, as highlighted in

92
our discussion above, under the pragmatism paradigm, the mixture of both methods is
capable of strengthening research results and contributing to the competitiveness of the
RMG industry’s SC. Figure 4.1 therefore shows the three distinct phases of the mixed-
methods research used in this study which are divided into exploratory and
confirmatory stages. It shows that the process of the first phase (exploratory stage)
started with a literature review that led to the development of the research questions,
objectives and the development of a preliminary research model based on previous
theoretical grounds and frameworks, as shown in the preliminary research model in
figure 3.1. On the basis of this model, a field study was conducted on 10 RMG
companies using a semi-structured interview questionnaire to collect information
about stakeholders’ (suppliers/manufacturers) experiences and opinions of the RMG
industry’s SC and their role. The results of these interviews were transcribed and
analysed to extract the important construct variables that related to the RMG industry’s
SC and its competitiveness which were then included in developing the finalised
research model by reconsidering and labelling the variables within the literature. These
results then led to phase 2 (the quantitative part) for the development of constructs,
measurement scales and associated hypotheses: the survey questionnaire was then
developed and pre-tested. Finally, in phase 3 (continuation of the quantitative part), a
survey was conducted and the results were analysed using partial least squares (PLS)-
based structural equation modelling (SEM). The discussion and interpretation of these
results concluded the confirmatory stage.
In the pragmatism paradigm, the qualitative phase can answer exploratory questions
about how and in what way variables such as PA and BB of non-business actors in
the RMG industry’s SC are related to the improvement of RMG industry
competitiveness. This is important for gathering information on external and internal
stakeholders’ activities and developing the survey instruments: the confirmatory
quantitative phase can demonstrate that a particular factor has an influence over
performance which is important for theory development as well as for relevant
policy implications for the competitiveness of the RMG industry. Moreover, this
paradigm can combine both subjective and objective points of view and can use both
inductive and deductive logic for a better understanding of reality and explaining the
findings (Creswell 2003; Nelson 2006). Accordingly, the objectives of the study
have made it suitable to adopt a mixed-method approach (both qualitative and

93
quantitative) with the pragmatism paradigm determined to be the most appropriate
philosophical world view for the research. Since there has been limited previous
research on improving competitiveness, the research process has been divided into a
number of phases and stages to collect more constructive information. The whole
process used in this study is diagrammatically presented in detail in figure 4.1 and in
chapter-wise form in figure 4.2.
4.4 Research Process
The research process has been carried out in three distinct phases, under two stages
and two sequential approaches (figure 4.1). Figure 4.2 illustrates the overview of the
research process with the 14 steps taken in conducting this research. The process
started with a review of the previous literature on topics related to the SC in the
clothing industry, especially in the RMG sector of Bangladesh, and various related
issues such as competitiveness, influencing factors in connection with internal and
external stakeholders, key concepts and gaps. This stage explored the potential key
variables to develop a conceptual preliminary research model. Various printed and
electronic resources such as journals, books, and seminar and conference
proceedings were used to study the research field (see literature review in chapter 3).
By combining all the sources, the initial model was developed and presented for this
research, as illustrated in figure 3.1. In order to test and confirm the research model,
two phases of the data collection process involving qualitative and quantitative
approaches (steps 4, 11 and 12) were followed. In the first phase, the qualitative
approach (step 4), a field study was conducted by interviewing top-level managers of
large RMG companies in Bangladesh. The interviews were transcribed and analysed
using content analysis (step 4). A comparison was then made between the findings
and the initial model. After this step, justifications based on previous theories and
studies were analysed for each selected construct and its variables. Next, a
comprehensive model for this research was proposed considering all individual
models and their links according to the interview results. Based on the
comprehensive model, the second phase, the quantitative approach (step11and12)
was carried out by developing the hypotheses (step 8) to justify the relationship
among the constructs. In the next step, items or variables for each construct were
identified and a questionnaire was designed (step 10).

94
• Identify a theoretical background of the research • Determine the research gaps in existing literature • Develop the initial research model
Chapter 3
Chapter 5
Chapter 7
Chapter 8
• Test the initial model in the field study Develop questions based on initial model for the semi
structured interview Select the interviewees Conduct the interview with managersTranscribe all interviews
Analyse through content analysis
• Interpret and compare the findings with the initial research model • Propose a comprehensive research model
• Establish research hypotheses • Research questionnaires development • Conduct pilot test• Finalize the research questionnaire
• Conduct survey Choose the respondents (managers from large organizations) Distribute the questionnaire
• Analyze the data from the survey using Partial Least Square
• Discussions and implications of the result• Conclusion and future direction
Chapter 9
Step1,2,3
Step 4
Step 5,6
Step 7,8,9,10
Step11,12
Step13,14
Chapter 6
Figure 4.2: Research process
The pilot test (step 9) and manipulation check were conducted to ensure the accuracy
and reliability of the research instrument.
The questionnaires were distributed for the survey among middle- and top-level
managers of marketing and merchandising departments of some large and medium
Bangladeshi garment companies. The two main methods of data collection used

95
within the two phases of the whole research process were a field study and a survey.
The pilot test was also a data collection method within the process but it was done
only to ensure the reliability of the research instrument. Data collected from the
survey were analysed using SPSS and a structural equation modelling (SEM)
technique based on partial least squares (PLS) (Chin 1998a)to test both the
measurement model and structural model. Following this process, in the last step, the
results were interpreted. A detailed description of this research method is described
in the following section.
4.5 Qualitative Field Study Method
This phase of the study attempted to explore the phenomenon of improving
competitiveness in the RMG sector to validate and enhance the constructs/factors
and variables identified as part of the inclusive literature review. This phase was
concerned with understanding the concept of improving competitiveness and, as the
nature of this section of the research was exploratory, the qualitative method was
considered to be the most appropriate. However, as recommended by Kaplan and
Maxwell (1994), a better understanding of a phenomenon can be achieved by
obtaining authentic participants’ point of view in a particular social and institutional
context. Therefore, it was believed that a ‘pseudo case study’ that involved a
qualitative study of a small number of participants would meet the objectives of this
phase of the study.
Patton (1999) and Zikmund (2000) suggested field study as an effective method to
explore existent participants’ perspectives in a specific setting. Qualitative field
study methods permit the evaluator to study selected issues in depth and detail.
Approaching fieldwork without being constrained by predetermined knowledge
contributes to the depth, openness and detail of qualitative inquiry (Patton 1990).
This field study required the researcher to be involved in investigating the factors
influencing the RMG industry’s SC, its competitiveness, and internal and external
stakeholders’ relationships with the aim of developing an effective SC for sustaining
competitive advantage and ultimately improving the competitiveness of the
Bangladeshi RMG industry. The qualitative approach used in this study was the
semi-structured interview.

96
As stated by Patton (1990) "the purpose of interviewing is to allow us to enter the
other person's perspective". The interview participants selected for this study were
based on three criteria: the position of the participant, the availability of the
participant and the location of the organisation. The selection of all interviewees was
based on personal contacts or the convenient sampling procedure (Babbie 1990).
Participants were given a copy of the interview questions with a detailed information
sheet about the study objectives and their role in the study. All participants took part
in this study voluntarily. The general interview guide approach was used to collect
data through open-ended interviews (Patton 1990). A semi-structured interview was
employed where a list of questions were developed to explore the variables of the
study (PA, BB, CR, suppliers’ drivers and barriers, and buyers’ drivers and barriers)
within the SC of the RMG industry. The questions were pilot tested after which
minor adjustments were made. In total, 10 interviews were conducted. Each
interview lasted for about one to two hours. With the permission of the interviewees,
each interview was recorded by a tape recorder and notes were taken during the
interview as well. The transcription of the interview was done on the same day or the
day following the interview. Forty pages of interview transcripts were produced from
the 10 interviews conducted in this stage and were used for analysis. The technique
used to analyse the interview data was content analysis (Berg 2001; Thomas 2003).
Ten individual models were developed for each of the interviews and all these
models were then combined to produce a modified research model where a few
changes were made (demonstrated in chapter 5, figure: 5.13).
4.6 Quantitative Study Method
The initial research model was developed on the basis of the literature review ( see
fig.3.1). After developing that research model and undertaking the qualitative field
study, the next phase involved the confirmation or rejection of the factors and
variables and establishing the linkages among the constructs. This second phase of
the research aimed to find the important factors and variables affecting the
improvement of competitiveness which was reflected in the competitiveness model
developed prior to this phase. A number of hypotheses were derived from the model
with these subjected to empirical testing that focused on verifying or falsifying these
hypotheses (Anderson 1987). Since the methods used in this phase were designed to
be detached and independent of the specific situation under study, a quantitative

97
method was considered to be most appropriate. Furthermore, the sample size was
large and spread over a wide geographical location. Therefore, the survey method
was considered most appropriate for this study and a questionnaire-based survey was
adopted.
4.6.1 Developing the questionnaire
The structure of the questionnaire took a considerable amount of time. Based on the
comprehensive research model, a questionnaire was developed and designed to
explore the important factors and to test the relationships among the constructs. In
designing the survey, this study adopted closed-ended questions.
A 6-point Likert scale questionnaire was intended to measure the factors and
variables of the final competitiveness model defined at the earlier stage. These types
of scales have been subjected to academic debate in several studies. Jöreskog (2005)
claimed that the Likert scale is an ordinal variable in essence due to the fact that it
has origins or units of measurement, its distribution is discrete, and it does not have
values between numbers. In practice, however, it is reported that during the past
15 years, the application of SEM has mostly relied on the Likert scale (Byrne 2008)
and similarly, it has been adopted in this research. The researcher debated over the
optimal number of scale points to use. (Hair, Money, and Samouel. 2007) stated that
the two choices were between using an odd or even number of numbers in selecting
scale categories. Many studies have used a 7-point Likert scale which has a central
‘neutral’ point. This type of scale is used when, based on the experience or judgment
of the researcher, it is believed that some portion of the sample is likely to feel
neutral about the issue being examined. Nonetheless, (Mattel and Jacoby 1972)
advised to either not use or use the neutral point when the scale consisted of many
points. Furthermore, avoiding the central tendency error of respondents is another
reason to use a 6-point scale. Central tendency error is observed when respondents
answer a middle choice ‘neutral’ or ‘neither agree or disagree’ when that is not really
their intention. In addition, the choice of a 6-point Likert scale was also based on the
study by Fong (2005) that anticipated that participants of Asian ethnicity tended to
choose the middle score or to be non-partisan in their responses as this phenomenon
was regarded as producing a non-attractive research result (Fong 2005). As the study
was done in Bangladesh which has an Asian culture, the study used a 6-point Likert
scale.

98
4.6.2 Pre-testing the questionnaire
In the quantitative survey process, a pre-test was conducted to identify any problems
with the survey instrument prior to administering the actual survey. The pre-test
process took a convenient sample of 10 middle- and top-level managers representing
three garment companies but based in one head office. The objective of the pilot
study was not to run the model but rather to examine the descriptive statistics using
SPSS and to determine whether respondents found difficulties in understanding any
of the items or to see if they preferred the survey to be presented in a different style.
The process allowed time for each participant to complete the survey and requested
them to record the time taken. A follow-up interview was conducted with each
participant to identify any weaknesses in the instrument. The questionnaire was then
finalised by making several changes after participants’ opinions were obtained
regarding the meaning and clarity of the questions.
4.6.3 Sample selection and quantitative data collection
In this study, the survey was conducted among more than 70 RMG companies in
Bangladesh. The companies were selected based on their geographical location
especially those which were located in the city of Dhaka and nearby. Moreover, only
garment companies which were members of Bangladesh Garment Manufacturers and
Exporters Association (BGMEA) and which were 100% export-oriented were
selected (www.bgmea.com.bd). The survey questionnaires were distributed to 580
managers in the middle- and top-level management positions of the marketing and
merchandising departments within these companies by personally contacting the
respective person or via the human resource (HR) department managers (in some
cases, employees working in HR were contacted). A number of questionnaires were
given to the HR department to distribute among the managers working in their
company within those two above-mentioned departments. The survey instrument
together with the covering letter explaining the purpose of and instructions for the
survey were sent to the identified contact persons. The main task of the contact
persons was to distribute the questionnaires to the target sample across departments.
They were also expected to collect the questionnaires upon their completion from
respondents. Sometimes, direct contact occurred with the respective contact persons
by telephone and email some selected garment companies and a soft copy of the
questionnaire was sent to them. Thus, a purposive and cluster sampling procedure

99
was applied in this study (Creswell 2003; Malhotra 2004). The study questionnaire
was divided into four sections (see appendix-3)
a. Demographic information about the participants and their organisations;
b. Questionnaire about the influence of external stakeholders in the RMG
industry’s supply chain;
c. Questionnaire about the influence of internal stakeholders in the RMG industry’s
supply chain; and
d. Questionnaire about improving competitiveness of the RMG industry.
The total response rate was 50.77% which was considered adequate for analysis and
reporting (Babbie, 1990) with 253 survey responses returned to the researcher. Of the
70 companies, 21 did not participate in the survey. Moreover, from the 580
questionnaires distributed, 227 were unreturned. However, as PLS was used to analyse
the main survey data, the sample size was appropriate. A number of authors have
declared that PLS is suitable for small sample studies (Barclay, Higgins, and
Thompson. 1995; Gefen, Straub, and Boudreau 2000). A rule of thumb to determine
the proper sample size for PLS analysis is 10 times the number of items in the model
(Barclay, Higgins, and Thompson. 1995; Chin 1998). As is shown in chapter 5( figure-
5.14) , the number of items in the final research model was 56; thus, 560 (56 x 10 =
560) was an appropriate sample size for this study. In terms of the number of cases, the
guidelines in PLS analysis have stated that the sample should have at least 10 times
more data points than the number of items in the most complex formative constructs in
the model (Gefen, Straub, and Boudreau 2000). In this regard, 580 samples was a
suitable number in this research but the low response rate among top-level managers
and executives was also taken into consideration when selecting the sample size.
The first round of survey packages was sent out in mid-April 2012. The researcher
was physically involved in this first round. Respondents were given ample time of
two months to complete the survey. After one-and-half months, a total of
131 completed responses were received (first wave). In an attempt to boost the
response rate, follow-up phone calls and email contact were made with the contact
persons. This process resulted in a further 72 managers and executives responding
with completed surveys within two months of the reminder (2nd wave). At this point,
around mid-June 2012, the survey had generated 203 responses. This figure gave a
response rate of approximately 40.84%. For this third time, the decision was made to

100
pay visits to the contact persons of the companies in an attempt to further improve
the response rate. Therefore, further telephone calls were made and emails consisting
of reminder letters were sent to the contact persons and it was agreed to give
respondents another three weeks to respond. This desperate move was made based
on the earlier understanding that a minimum response of 300 was needed in order to
yield a good result from the PLS data analysis procedure. Finally, after about 4-5
months of continuous process, the total number of returned questionnaires was 253
which gave a relatively high and acceptable response rate of 50.77%.
The data from the respondents were immediately put into an MS Excel spread sheet as
input. The raw data showed some missing values meaning that respondents either
refused to answer or overlooked the question. Either way, data were examined closely
for the analysis stage. Responses deemed to be invalid or incomplete were rejected
from the analyses. Three questionnaires had to be rejected due to invalid responses:
this included respondents who did not fill in their demographics information and some
had some missing answers. However, finally, the survey yielded 253 effective and
accepted responses, excluding the three questionnaires with missing data.
4.6.4 Quantitative data analysis
In this research, data analysis for the quantitative phase was done by utilizing the
structural equation modelling (SEM) approach (Chin 1998; Gefen, Straub, and
Boudreau 2000). SEM techniques such as linear structural relationships (LISREL)
and partial least squire (PLS) are second generation data analysis techniques; either
of these can be used to test the variables/factors affecting the competitiveness of the
RMG industry or to test the research model of this study. SEM also enables
“researchers to answer a set of interrelated research questions in a single, systematic
and comprehensive analysis by modelling the relationships among multiple
independent and dependent constructs simultaneously” (Gefen, Straub, and
Boudreau 2000). The PLS technique with causal modelling works by
“simultaneously assessing the reliability and validity of the measures of the
theoretical constructs and estimating the relationships among these constructs or
variables” (Barclay, Higgins, and Thompson. 1995). The PLS technique is more
efficient in testing complex and sophisticated conceptual models. PLS-SEM is a
causal modelling approach aimed at maximizing the explained variance of the
dependent latent constructs (Hair, Ringle, and Sarstedt 2011).

101
Moreover, PLS is better suited for causal modelling when the sample size is
relatively small and when the model is complex (Hulland 1999; Teo, Wei, and
Benbasat 2003). The literature review and field study had produced a complex
theoretical measurement model; therefore, PLS became the ideal data analysis
method for this study. It was evident that the ability of PLS to model latent
constructs under non-normality conditions and small sample sizes has made it
popular among researchers in recent years (Compeau and Higgins 1995; Chin 1998).
PLS is more appropriate when the measurement items are not well established and
are used within a new measurement context (Barclay, Higgins, and Thompson.
1995). Furthermore, PLS is suitable when the primary objective of the research is the
explanation of the model variance for one or more constructs and when the research
focus is on theory development. Since the existing literature on improving
competitiveness in the RMG industry via analysing the SC was very limited, the
proposed research model in this research was also not based on strong theory. The
model can be observed as an estimate model that combines a relevant theory and
previous empirical research findings. Thus, the concentration of this research was
more on the forecast of application and theory building, rather than testing the
suitability of a strong theory-based model. In addition to its capability of handling
formative as well as reflective indicators and constructs, one of the greatest
advantages of adopting PLS was that LISREL can only be used to measure latent
variables that use reflective items (Chin 1998). As this study would include both
formative and reflective items, PLS was the best option for data analysis (Fornell and
Bookstein 1982; Gefen, Straub, and Boudreau 2000).
In view of the above-stated features and advantages, PLS was considered as the most
appropriate data analysis technique for the quantitative part of this study. This study
thus used PLS to establish the relationship between constructs and thus to test the
hypotheses. As such, the data collected in this study were analysed with the PLS
technique utilizing the PLS-Graph version 3.0 computer software developed by Chin
(2001) (www. en.softonic.com/s/pls-graph-3.0).
4.6.5 Partial least squares (PLS) data analysis procedure
Two distinct stages are involved in the data analysis procedure via the PLS
technique. The two stages are: i) assessment of the measurement model and ii)
assessment of the structural model. These have been illustrated in tables 4.2 and 4.3.
The following section describes how the competitiveness model was tested and

102
evaluated in these two stages as identified by Barclay, Higgins, and Thompson.
(1995) using the PLS technique.
4.6.5.1 Stage 1: Assessment of measurement model
The assessment of measurement model stage is concerned with the relationships
between the observed variables or items and the constructs (Igbaria, Guimaraes, and
Davis 1995). The analysis of the measurement model leads to the calculations of
loadings that provide the researcher with an indication of the strength of the
measures. This assessment is also concerned with the construct validity. Reflective
measurement models should be assessed with regards to their reliability and validity
(Hair, Ringle, and Sarstedt 2011). This stage involves the assessment of reflective
items examining convergent validity and discriminant validity. The examination of
the indicators’ weight and multicollinearity are involved in the assessment of
formative items. We must distinguish between reflective and formative measurement
models to evaluate them (Henseler et al. 2009).
Table 4.2 shows the two-step procedure undertaken in the first stage of the
measurement model assessment in this study: the following sections will discuss the
details of the steps.
Table 4.2: Stage 1 (assessment of measurement model)(Hair et al.2011)
Type of Items in the Construct
Type of Measurement
Assessment Procedure/ Acceptable Value
Reflective 1.Convergent validity i) Item reliability(loading) Item loading ≥ 0.5 and significant t- value
ii) Internal consistency
Composite reliability
Calculated value ≥ 0.7
Average variance extracted (AVE)
Calculated value ≥ 0.5
2.Discriminant validity
i) Construct level AVE analysis: square root of the AVE of construct > correlation between the construct and other constructs
ii) Item level Cross-loading matrix: loading of items under a construct > all other cross item loadings under the constructs
Formative 1. Inward weight Item level Indicators’ weight (relative importance), loading ( absolute importance) and significant t- value
2. Multicollinearity Item level Variance inflation factor (VIF) ≤ 10

103
Assessment of reflective items
Convergent validity:
The first step of the assessment of the measurement model is to test its convergent
validity. Convergent validity actually measures the correlation of items in a single
construct. This is accomplished by examining individual item reliability (item
loading) and internal consistency for the reflective items. Item reliability assessment
refers to an analysis estimating the amount of variance in each individual item’s
measure that is due to the construct (Barclay, Higgins & Thompson 1995). The PLS
assessment procedure is conducted by conducting simple correlations of the
measures with their respective construct. The calculated correlation leads to an item
loading which gives an indication of the item’s strength. Researchers have different
opinions on the assessment of the item loading’s strength but the rule of thumb is
that the higher the item loading, the better it represents its constructs. While item
reliability refers to a measure of items against their constructs, internal consistency is
referred to as the measure of reliability of the constructs (Fornell and Larcker 1981).
Many quantitative researchers had been using Cronbach’s alpha as a measurement
for internal consistency (Bruhn, D., and K. 2008). Fornell and Larcker (1981) have
suggested two types of measurements for assessing internal consistency: (a)
composite reliability and (b) average variance extracted (AVE). Composite
reliability checks the internal consistency of a construct and AVE indicates the
amount of variance shared between a construct and its measures/items.
The minimum requirement for item reliability is 0.5 (Chin 1998). Hair et al. (1998)
have provided guidelines for using item reliability to assess the relative significance
of constructs and suggested three types of significance level for item loadings with
loadings in excess of 0.5 considered to be very significant. The most frequently cited
rule of thumb in the literature, provided by Carmines and Zeller (1981), suggests
retaining only those items with loadings greater than or equal to 0.7. Hair, Ringle,
and Sarstedt (2011) also suggested indicator loading should be higher than 0.7. But
to provide more robust and reliable findings, the more conservative of Hair et al.’s
(1998) assessment guidelines were chosen for this study which has taken a stand by
having item reliability rules of 0.5, the value proposed by Hair et al. (1998). This
approach was considered more practical, given that the competitiveness-related study
was exploratory and very few studies in the literature had investigated factors

104
affecting the SC that led to improved competitiveness of the industry. Therefore,
reflective items with loadings less than 0.5 were not considered in this research: for
measuring internal consistency, the composite reliability and AVE were 0.7 and 0.5
respectively (Fornell and Larcker 1981; Hair, Ringle, and Sarstedt 2011).
Discriminant validity:
The second step of the assessment involved the reflective items being tested by the
measurement of discriminant validity. This was assessed by applying two analytical
procedures suggested by Barclay, Higgins and Thompson (1995). Firstly, the square
roots of the AVE of the items were calculated and these values were compared with
the inter-construct correlation. Barclay, Higgins and Thompson (1995) specified that
discriminant validity is achieved when the square root of the AVE of a construct is
larger than its correlations with other constructs. Secondly, the matrix of loadings
and cross-loadings of items was generated. Gefen, Straub, and Boudreau (2000)
stipulated that the loading of an item within the construct it intends to measure must
be higher than its loading with any other construct. The cross-loading analysis in
PLS measures the correlation of an item with respect to all of the constructs in the
model, including the construct it intends to measure (Chin 1998). The two
techniques examine the extent to which a construct differs from other constructs. The
goal of discriminant validity is to ensure that all the constructs are mutually
exclusive. However, the PLS-Graph 3.0 software used in this study does not produce
these statistics. Thus, the researcher had to manually calculate the output produced
by the software using another statistical software package, namely, SPSS version 21
for Windows.
Assessment of formative items
Convergent validity and discriminant validity could not be applied as the formative
items were not correlated. Instead, indicator weight, which describes the relative
importance of each item towards the formation of the construct, was calculated. The
goal was to ensure that each item contributed towards the construct’s formation. For
items that had a very low indicator weight, the items’ contributions towards
construct conceptualization were reviewed. As recommended by Diamantopoulos
and Winklhofer (2001), conceptual considerations were prioritized before any
indicator was eliminated. Next, multicollinearity was tested by calculating the
variance inflation factor (VIF). This was to ensure that each indicator had distinct

105
influence on the intended latent variable (Diamantopoulos and Winklhofer 2001).
The maximum threshold for the VIF is 10 (Kleinbaum et al. 1998). If items failed to
meet the requirements of multicollinearity, they were eliminated.
The measurement model was assessed and adjusted by eliminating outstanding
items. This was done repeatedly until the requirement for each criterion of
convergent validity and discriminant validity was achieved. In addition, for the
formative indicator, both indicator weight and multicollinearity were tested to delete
problematic formative items. The result of these rigorous procedures was an
assessment model that could be applied in the second stage.
4.6.5.2 Stage 2: Assessment of structural model
The second stage (table: 4.3) involved the assessment of the structural model. The
structural model comprised the hypothesized relationships between latent constructs
in the research model (Santosa, K.Wei, and Chan 2005; Azizah 2011). The first step
was the assessment of the explanatory power, that is, R² of the independent construct
of the proposed model. This was done by estimating the variance associated with the
constructs. The result determined the variance of the RMG companies’
competitiveness in using an effective SC: this could be explained by the constructs in
this model. The second step was to examine the direction of the path coefficient and
the value of t-statistics (Barclay, Higgins, and Thompson. 1995; Santosa, K.Wei, and
Chan 2005)
Table 4.3: Stage 2 (assessment of structural model)(Hair et al.,2011)
Type of Items Type of Measurement Assessment procedure/ acceptable value Reflective and Formative Coefficient of determination R² ≥ 0.1
Test of hypotheses Significant t-value≥1.65
The competitiveness model consisted of seven independent latent variables and one
dependent variable. The independent variables were: political action (PA), country
risk (CR), bureaucratic behaviour (BB), supply-side drivers (SD), supply- side
barriers (SB), demand-side drivers (DD) and demand-side barriers (DB), and the one
dependent variable was competitiveness(COM). The structural relationships were
tested using the SEM approach, which is illustrated by the five-step procedure in
table 4.4. The predictive power of the proposed research model could be assessed by
obtaining the R² values (Hair, Ringle, and Sarstedt 2011; Santosa, K.Wei, and Chan

106
2005). This represented the extent to which the independent constructs explained the
dependent constructs. Interpreting the values of R² in the PLS model is the same as
explaining the R² values produced by multiple regression analysis (Barclay, Higgins
and Thompson 1995). Therefore, R² values would determine the exploratory power
of a component of the model by indicating the amount of variance in the construct
explained by its corresponding independent construct. The values of the construct
produced by the bootstrap method would allow for assessment of the model’s
explanatory power (Chin 1998). The well-accepted value of R² is 0.10 or above (Rai,
Patnayakuni, and Seth 2006). Falk and Miller (1992) also proposed that the
minimum value of R² should be 0.10.
The next test was to evaluate the relationship of the construct as hypothesized in this
research. The statistical analysis was evaluated by assessing the path coefficient and
the t-value. The bootstrap method (using PLS) was used in testing the structural
paths in the competitiveness model. This was accomplished by estimating the value
and significance of every path coefficient of the model. The path coefficient and the
t-value are derived from the bootstrapping procedures. This procedure is a non-
parametric test of significance that produces t-statistics to evaluate the significance
of the structural paths.
Finally, the hypotheses outlined in chapter 6 were tested. The path coefficients and
the positive or negative values of the hypothetical relationships were calculated. The
goal was to determine the constructs that were significant in the model.
Table 4.4: Four-step assessment procedure of structural model
Step Procedure 1 Collect standard path loadings 2 Test significance of path loadings 3 Produce R² values 4 Revise the model where feasible

107
4.7 Summary
This chapter has provided details of the research process and the philosophical and
methodological approaches undertaken throughout the research. In comparing the
current trends of research approaches that have been used within the SC and
competitiveness fields, this chapter has mentioned an appropriate research approach,
that is, the mixed-method approach (both qualitative and quantitative) selected to
guide this particular research. The pragmatist paradigm was determined to be the
most appropriate philosophical world view for the research. This chapter also
presented the systematic overview of the research process and tools that were used
for this research.
In summary, the research process was as follows. After the literature review and
formation of the initial research model, the qualitative field study was conducted to
refine the conceptual model with real-life contextual perspectives. Middle- and top-
level managers from ten large organisations were interviewed. The qualitative data
analysis involved the two-stage approach recommended by Miles and Huberman
(1994). This was followed by the formulation of the survey instruments. The survey
instruments, including the questionnaire, were developed and pre-tested through a
pilot survey on 18 respondents. The refined instrument was then used in the survey
for quantitative data. The quantitative data analysis process utilized the PLS-based
SEM technique. In this chapter, the PLS data analysis procedures for the
measurement model and structural model were discussed in detail.
The literature review and the formation of the initial research model were the first
phase of the research process, which was described in chapter 3. This chapter has
continued with descriptions of the three subsequent major stages comprising the field
study, pilot study and national survey. Details of sample selection, data collection
and data analysis for each stage were also presented. In the next chapter, the
operation of the second phase of the research, the qualitative field study including
the results of data analysis, will be discussed. Chapter 5 will then conclude with the
description of the final comprehensive research model that was tested in the final
survey.

108
CHAPTER 5
Field Study Analysis and Development of a Comprehensive Research Model3
5.1 Introduction
The previous chapter described that a mixed-method approach had been chosen for
this study. Mixed method describes the combination of qualitative and quantitative
methods. A field study was therefore conducted for the qualitative part and, along
with the analysis of the data collected, is presented in this chapter. The field study
was carried out through semi-structured interviews with 10 top- and middle-level
managers of the marketing and merchandising departments of leading garment
factories from the Bangladeshi garment industry. The primary goals of this phase
were to confirm the various constructs and sub-constructs that were identified in the
literature review as well as to discover the significant new sub-constructs and
variables. The qualitative approach was performed so that the results of the field
study could be utilized to refine and fine tune the initial model proposed earlier (as
shown on figure 3.1). The outcomes of this phase helped to develop the final
research model to be used in the quantitative part of this study to develop the survey
questionnaire.
3Part of this chapter has been presented at the following conferences: Nuruzzaman, M. (2012), “The Competitiveness and Supply Chain Management of Ready-Made Garment (RMG)
Industry in Developing Nations", In proceedings of The 7th Biennial Conference of Hong Kong Economic Association, December 13-14, Lingnan University, Hong Kong.
Nuruzzaman, M., Quaddus, M. and Jeeva, A. (2012), “An Investigation into the Factors Influencing Competitiveness of Ready-Made Garment (RMG) Supply Chain- The Experience from Bangladesh", In proceedings of Annual Conference on Global Economics, Business and Finance (GEBF), December 15-17, Hong Kong.
Nuruzzaman, M., Quaddus, M., Jeeva, A. and Khan, E. Ahmed (2013), " The influence of External Stakeholder in the Competitiveness of Ready-Made Garment (RMG) Industry: A study on RMG Supply Chain in Bangladesh", In proceedings of the Business & Economics Society International Conference (B&ESI), January 7-10, Perth, Western Australia
Nuruzzaman, M., Quaddus, M. and Jeeva, A. (2013), “ Improving Competitiveness and the Role of Stakeholders in Ready-Made Garment(RMG) Supply Chain of Developing Nations: A Qualitative Approach to develop a comprehensive research model” In proceedings of the American Canadian Conference for Academic Disciplines, International Journal of Arts and Sciences, May 20-23, Ryerson University, Toronto, Canada.

109
5.2 Operational Overview of the Field Study
5.2.1 Qualitative research paradigm
It was stated earlier that the first phase of the study was undertaken through a field
study using the qualitative research method to explore the SC of the RMG industry
in Bangladesh. The field study carried out as a qualitative research process is
discussed in detail in the following subsections. The findings of the field study were
used to refine the research model and prepare the survey questions for the
quantitative study in the second phase of this research.
5.2.2 Interview questionnaire development
A semi-structured interview approach was adopted for the field study in the
qualitative part of this research. This interview approach is an exchange between the
researcher and the participant and is like a conversation. The researcher here should
not dominate the conversation as the purpose is to provoke the views of the
participant (Jennings 2010). The literature review helped to develop an initial model
and to create a framework for the initial development of the interview questions.
Taking into consideration the initial proposed model, eight questions were designed
and developed for the field study to cover the main topics of the research. As the
qualitative method was used to provide real-world insights, the development of
interview questions was considered very important. Table 5.1 presents the topics
with the respective relevant question.
The first topic reveals the present status of the RMG industry and its
competitiveness. This topic also explores influential stakeholders and the industry’s
SCM. Under this topic, question 1 was developed to reveal some new constructs or
variables which could be considered to increase competitiveness. The last topic
explores the influence of external stakeholders or non-business actors in SC
competitiveness. Questions 6, 7 and 8 were developed for this purpose. In
question 6, interviewees were asked to describe their understanding of the concept of
political action (PA) and its influence on the SC of the garment industry. Through
this question, the role of ruling parties (government) and opposition parties were
discussed in relation to SC development.

110
Table 5.1: Issues and related questions in the field study
Main topic Question no. Brief concept acquired through the question
Constructs and variables influencing the whole process, i.e., to increase competitiveness
1 Present status of SC of RMG industry
Influential stakeholders in the SC
Issues or variables that should be considered to increase competitiveness
Business factor, i.e., internal stakeholders of SC
2 3 4 5
Buyers’ strengths and weaknesses, i.e., buyers’ drivers and barriers
Garment manufacturers ‘or suppliers’ strengths and weaknesses, i.e., suppliers’ drivers and barriers
Non-business factors or country factors, i.e., external stakeholders of SC
6
7
8
Role of government, opposition parties and their political action
Role of bureaucrats
Creation and effect of the country risk
As with previous questions, this question was developed to discover some new
variables. Questions 7 and 8 were developed in relation to bureaucratic behaviour
and country risk. Similarly, these questions were designed to examine these
constructs’ influence on the competitiveness of the SC and the various aspects of
their dimensionality. Based on respondents’ feedback, various issues related to the
SC were obtained from the questions. The outcomes of the literature review were
then revised and combined with feedback from the qualitative phase. Consequently,
the quantitative phase approved the significance of the accepted constructs. The
qualitative and quantitative phases, known as the mixed method of research in
exploratory studies, were used in the order which has been widely supported by past
researchers (Muthusamy 2011; Mustamil 2010; Xu 2003).
A complete set of questions for the field study can be found in appendix- 2. It is
noted that these questions were subjected to Curtin University’s ethical
requirements. The interviews were conducted with 10 top-and middle-level
managers from large Bangladeshi RMG manufacturers. These 10 successful
interviews were taken into consideration for qualitative analysis.
5.2.3 Sample selection
In this research, convenience sampling was employed rather than random sampling
(Jennings 2010). Convenience sampling based on personal contacts was applied. Ten
managers from top- and middle-level management were chosen to be interviewed

111
with their selection based on personal contacts. Participants were provided with a
copy of the interview questions which included a separate information section. They
were invited by mail and telephone to participate in the field study.
Prior to the interview, participants were well briefed on the objectives of the research
and its significance. It was also explained that their participation was fully voluntary
and all information would be kept confidential.
The interviews were recorded with the permission of participants and photographs
were taken during the interviews. After the interview, the qualitative data were
transcribed as soon as possible. As the interviews were conducted mainly in Bengali
(the language of Bangladesh), appropriate attention was given during the data
transcription to maintain the participants’ original meaning.
Participants took part in this study voluntarily. The following table- 5.2 illustrates
the field study interview participants’ profiles and that of the organisations for which
they worked.
Table 5.2: Field study interview participant’s profiles
Participants Position Nationality Organisation Nature of business
Ownership
P1 Managing Director
Bangladeshi Organisation 1 Manufacturing Garments
Private
P2 Director Bangladeshi Organisation 2 Manufacturing Garments
Private
P3 General Manager
Bangladeshi Organisation 3 Manufacturing Garments
Private
P4 Country Manager
Bangladeshi Organisation 4 Manufacturing Garments
Private
P5 General Manager
Bangladeshi Organisation 5 Manufacturing Garments
Private
P6 Deputy Managing Director
Bangladeshi Organisation 6 Manufacturing Garments
Private
P7 Manager Bangladeshi Organisation 7 Manufacturing Garments
Private
P8 General Manager
Bangladeshi Organisation 8 Manufacturing Garments
Private
P9 General Manager
Bangladeshi Organisation 9 Manufacturing Garments
Private
P10 Managing Director
Bangladeshi Organisation 10 Manufacturing Garments
Private

112
5.2.4 Data collection
In the qualitative phase, the data were collected through interviews. To collect
relevant qualitative data in this study, a semi-structured interview questionnaire was
chosen. Taking into consideration the initial proposed model, eight open-ended
questions were developed as discussed previously.
The interviews were scheduled at participants’ convenience to avoid or minimize
any disruptions and interruptions in their working schedule. Before starting the
interview, a brief description about the research study was presented to the
participants as they were requested to participate in an interview session in a specific
time. Some participants took the questionnaire in advance for preparation and gave
the researcher a specific date and time for the interview. The duration of each
interview session was approximately one to two hours. From the 10 garment
companies, a total of 10 interviews were successfully conducted: it was observed
that participants were at ease, welcoming and helpful. They answered all questions
with as much valuable information as they could provide according to their
knowledge and experience. This was due to the fact that they had been contacted
through personal relationships.
Moreover, fruitful discussions were observed during the session where the
interviewer managed to extract some information that had not been pre-defined in
the questions. This may be due to the fact that most participants were aware of the
subject matter and were totally involved in the RMG business. The interviews were
recorded with the permission of participants and photographs were taken. After each
interview, the qualitative data were transcribed as soon as possible to ensure
trustworthiness (Saunders, Lewis, and and Thornhill 1997). As the interviews were
conducted mainly in Bengali, appropriate attention was given during the data
transcription to maintain the participants’ original meaning. The verbatim
transcriptions of all of the recorded interviews were immediately completed for data
analysis to ensure accurate data from participants’ discussions, body language and
other cues (Merriam 1997 ).

113
5.2.5 Data analysis
More than 50 pages of interview transcripts were developed for qualitative analysis
after the field study. A sample of one transcript has been included in appendix-5. The
content analysis technique was adopted to examine and analyse the qualitative data
(Berg 2001; Thomas 2003). This technique was adopted to also determine the
relationship between the concepts, the interview data and the theoretical framework
(Siltaoja 2006). It was used not only for that purpose but also to scrutinise the
transcripts and determine key constructs, variables and the link between the
constructs. Figure 5.1 shows this study’s content analysis procedure.
Figure 5.1: Data analysis process of the field study (Azizah, 2011; Muthusamy,
Gunasegaran. 2011)
There were two phases of content analysis in this study. A combination of inductive
and deductive processes was carried out (Berg 2001) through the two phases using
various methods of content analysis. Both these phases were applied to extract and
classify the sub-constructs and variables. Phase 1 involved the analysis of all
individual verbatim transcripts to explore the key themes/patterns subsequently
Phase 2
Step2. Manually analyse the transcripts to uncover patterns/themes and produce key words
Step3. Produce labels/categories of these key words/phrases and identify high-level factors and corresponding variables
Step4. Scrutinise for links among the variables/constructs from each interview
Step8. Combine similar variables, give a common name and retain unique variables
Step5. Match the constructs, variables or items with the literature then revise and update the result accordingly
Step9. Develop the final table of factors, constructs, variables and their links. Later on, eliminate variables and links which are inconsistent
Step10. Develop the final comprehensive research model
Step6. Develop table of constructs, variables (items) and conceptual model of constructs, variables with the link for each interview
Step7. Cross-examine the conceptual models with the initial model, developed from the literature, and identify the similarities and differences in the variables (items) under each construct
Step1. Conduct interview and transcribe interview
Phase 1
Inductive process
Deductive process

114
identifying themes by using key words. High-level constructs were then identified
the links among the sub-constructs were scrutinised, the constructs were matched
and the conceptual model developed for each interview with these being the
completion steps for the first phase. Phase 2 involved the comparison between the
developed models and the initial one, identification of the similarities and differences
of the variables among the individual transcripts and finally the development of a
comprehensive research model (Xu and Quaddus 2004; Azizah 2011).
As shown in figure 5.1, every step, for example, step1 to step10 in phase 1 and
phase 2, was performed in a sequential procedure. Phase 2 started only after the
successful accomplishment of phase 1.
Phase 1 commenced with conducting and transcribing the interview (Step1). In
Step2, all the interview transcripts were carefully analysed manually by reading each
word, line and sentence of the transcripts to uncover key patterns/themes (variables)
and afterwards recognising or producing themes (variables) by using key words.
After this step, key words were labelled or categorized into relevant variables and
corresponding constructs (Step3). The relationship or link among constructs or
variables from each interview were next sought and identified (Step4). Then, the
constructs and variables or items were matched with similar features previously
found in the literature (Step5). In this way, the variables were updated in the
deductive process obtained from the interviews. Finally, conceptual models were
developed showing the constructs and their links for each interview (Step6).
In the second stage, phase 2 began by comparing the developed models with the
initial model from the literature. In this stage, cross-analysis was undertaken of the
transcripts to put the relevant constructs, variables and links together to develop a
comprehensive research model. At Step7 in the data analysis procedure, similarities
and differences of variables under each construct were identified among the answers
from all participants and were given a new name after being combined. However,
unique variables were retained (Step8). A final table of constructs, variables and
links was then developed and tabulated to give a clear outlook of the findings.
Finally, a new comprehensive model of competitiveness was developed (Step10)
after elimination of variables and links which were inconsistent (Step9). The new
comprehensive model is shown in figure 5.13.

115
5.3 Results and Interpretations
5.3.1 Constructs and variables
The qualitative data, collected through interviews from the field study, were
analysed to identify a number of constructs and variables. Initially, 78 variables
under eight constructs were identified. As mentioned in the previous section, content
analysis was applied to analyse the data. From the content analysis, a total of eight
constructs and 56 variables of first-tier and second-tier constructs, directly or
indirectly influenced by the RMG industry’s SC competitiveness, were identified.
Different participants from different garment companies mentioned either similar or
different variables during the interview sessions. After scrutinising and combining
variables or items that were similar, the final results were achieved which are
presented in table 5.3. The results show eight constructs under two factors and
56 related variables under those constructs which were mentioned by 50-100% of the
corresponding participants. The table shows the frequency (i.e. the number of times)
that each variable was mentioned by participants. The interview data were coded and
categorized by cross-referencing to the constructs and variables of the primary
research model as presented earlier (chapter 3). Section 5.4 provides actual
statements of participants that indicate the existence of some of the constructs and
variables in the comprehensive model.
Table 5.3: Constructs and variables of RMG supply chain to improve competitiveness
Factors Constructs Variables
Participants 1 2 3 4 5 6 7 8 9 10
1. Country factors or external stakeholders
1.Constructs from external stakeholders
a. Political action
Political role in functional services
√
√ √ √ √ √ √ √ √
Political role in utilities support
√ √ √ √ √ √
Insufficient logistics support
√ √ √ √ √ √ √
Stakeholder relationships
√ √ √ √ √ √ √
Trade facilitating services √ √ √ √ √ √ √ √ √ Government role √ √ √ √ √ √ √ √ √ √
b. Country risk
Political environment √ √ √ √ √ √ √ √ Trust and commitment among stakeholders
√ √ √ √ √ √
Business environment √ √ √ √ √ √ Skilled labour and productivity
√ √ √ √ √ √ √
Lack of government control and support
√ √ √ √ √ √ √ √ √
Increased import dependency
√ √ √ √ √ √

116
Factors Constructs Variables
Participants 1 2 3 4 5 6 7 8 9 10
Unawareness of government and bureaucrats
√ √ √ √ √ √ √
c.Bureaucratic behaviour
Administrative support system
√ √ √ √ √ √ √ √
Lack of professionalism √ √ √ √ √ √ √ √ √ Lack of coordination among officials
√ √ √ √ √ √
Documentation process and approval system
√ √ √ √ √ √
Lack of management knowledge and delivery of performance
√ √ √ √ √ √
Non-co-operational attitude
√ √ √ √ √ √
2. Business factors or internal stakeholders
2.Constructs from internal stakeholders
a.Supply-side drivers
Cheap and available labour
√ √ √ √ √ √ √ √ √
Complying with buyers’ standards and needs
√ √ √ √ √ √
GSP facility √ √ √ √ √ √ Price and quality √ √ √ √ √ √ Efficiency √ √ √ √ √ √ Loyalty and devotedness √ √ √ √ √
b.Supply-side barriers
Lack of raw materials √ √ √ √ √ √ √ √ √ Import dependency and long lead time
√ √ √ √ √ √ √ √ √ √
Lack of government knowledge and role
√ √ √ √ √ √ √
Stakeholder relationships √ √ √ √ √ Lack of business and technological knowledge
√ √ √ √ √ √ √ √
Political disturbances √ √ √ √ √ √ √ √ Unfavourable bureaucratic behaviour
√ √ √ √ √ √ √ √ √
Lack of functional support and facility
√ √ √ √ √ √ √ √ √
Lack of skilled labour and productivity
√ √ √ √ √ √
Lack of attention to workers’ rights
√ √ √ √ √ √
c.Demand-side drivers
Favourable bargaining power
√ √ √ √ √ √ √
Flexibility √ √ √ √ √ Buyers’ brand √ √ √ √ √ √ Facilities (duty-free) from local (home) government
√ √ √ √ √
Bulk and frequent purchase
√ √ √ √ √
Buyers’ history √ √ √ √ √ d.Demand-side barriers
Compliance issues √ √ √ √ √ √ √ √ Various terms and conditions (buyers)
√ √ √ √ √ √ √ √ √
Lack of trust √ √ √ √ √ Tariff and regulatory issues (barriers)
√ √ √ √ √ √ √
Use of middlemen √ √ √ √ √ Weak relationships √ √ √ √ √

117
Factors Constructs Variables
Participants 1 2 3 4 5 6 7 8 9 10
Competitiveness Productivity √ √ √ √ √ √ Cost efficiency √ √ √ √ √ √ √ Stakeholder relationships
√ √ √ √ √ √
Delivery time √ √ √ √ √ √ √ √ One-stop service √ √ √ √ √ √ Government control and support
√ √ √ √ √ √ √ √
Quality product and competitive price
√ √ √ √ √ √
Reduction of import dependency
√ √ √ √ √ √
Technology advances √ √ √ √ √ √
Through the content analysis process, attempts were undertaken to examine the reality
and consistency between the data collected from interviews and the variables
identified in the preliminary SC competitiveness model (figure 5.2). However, some
variables were finally selected although there were small differences in meaning
among the variables identified from the literature and field study. Participants
expressed their opinions according to their knowledge, experience and emotion. After
the interviews, as the data were processed taking into consideration their ways of
expression and body language, there might be some differences. The captured data
represented the responses of participants in the context of the RMG industry’s SC
competitiveness in Bangladesh. It was observed from table 5.3 (‘Constructs and
variables of RMG supply chain to improve competitiveness’) that all participants in
field study interviews agreed to the identified constructs with little variation to the
variables. It was acknowledged by participants that the identified constructs and their
variables have direct and indirect negative impacts on the competitiveness of the SC of
the RMG industry. During one interview, a prominent respondent from a large
garment company stated that, “as an entrepreneur of a developing country, we always
expect cooperation and coordination from the government and their officials. If the
government and opposition parties take proper action for the development of the
garment industry, we certainly improve our competitiveness. There are many things in
the supply chain where their (government, political parties and the bureaucrats)
support such as, developing infrastructural facilities, is very important.”
In the field study, 56 variables were finally identified. Remarkably, of this total, only
two variables were recognised by all participants. These variables were one, the
government’s role about political risk and two, import dependency and long lead

118
time. Interestingly, nine variables under different constructs were also recognised by
nine out of the 10 participants. These variables were: political role in functional
services, trade facilitating services, lack of government control and support, lack of
professionalism, cheap and available labour, lack of raw materials, unfavourable
bureaucratic behaviour, lack of functional support and facility and, lastly, various
terms and conditions (buyers). More interestingly, seven variables were recognised
by eight(8) participants, eight variables by seven (7) participants, twenty one
variables by six (6) participants and nine variables by five (5) participants.
Two tiers of constructs were considered in the preliminary competitiveness model of
the RMG industry’s SC. The second-tier constructs were the internal and main
stakeholders of the SC and the first-tier constructs were external stakeholders who
directly or indirectly affected the RMG industry’s SC where the main stakeholders,
such as suppliers, were struggling to increase the competitiveness of the present SC
for the RMG industry of Bangladesh. Considering the time limitation, only one
major stakeholder, that is, suppliers or manufacturers, had been considered in this
research and the focus was on them. Therefore, 10 participants from the top
executive level of different manufacturing companies were approached for
interviews in the field study for the qualitative part of this research. In the interview,
the responses reflected participants’ opinions according to their experiences on how
to increase the competitiveness of the RMG industry’s SC. For instance,
participant #3, top executive of the marketing and merchandising department of the
oldest and very large garment company, provided the highest number of variables
due to his huge amount of experience in this sector. Participant #6, top executive of a
famous large garment company, also focused on the second highest number of
variables influencing the SC, due to his significant knowledge and considerable
experience in the garment sector. Participant #4, top executive of a very famous
group of garment companies provided the third highest number of variables due to
his very good knowledge and experience about this industry. Participants #7 and #9
provided the same number of variables. Other participants have also provided and
focused on many important variables which are depicted in table 5.3, within the
frequency range of 29–46, and also provided the same opinions about the ways to
increase competitiveness in the RMG industry’s SC.

119
Through this field study, it was confirmed by interview participants that the
influence of the first-tier sub-constructs, the external stakeholders, was above that of
the second-tier sub-constructs, the internal stakeholders. This type of influence was
seen to be weakening the competitiveness of the SC. Based on stakeholder theory,
the first-tier constructs were the political action of government and opposition and
bureaucratic behaviour. Another external construct was country risk created through
the interaction of political parties’ actions and bureaucrats’ behaviour. In the field
study, it was observed that participants agreed that these three constructs were
affecting the supply-side and demand-side sub-constructs and ultimately the
industry’s competitiveness. The suppliers were distressed about the present situation
of the SC and the role of political parties and bureaucrats. They are very much alert
about the need to increase competitiveness but faced many hindrances and lack of
support from the first-tier stakeholders. Different types of variables under those
constructs were mentioned by participants which were actually creating hindrances
in the SC. Of these variables mentioned, some were also supported by the literature.
In appendix-4 three sample quotations have been mentioned that reflected the
variables under different constructs. The variables “Lack of raw materials” under
Supply Side Barriers, “Stakeholder relationship” under Competitiveness and “Lack
of management knowledge and delivery of performance” under Bureaucratic
Behaviour were identified and confirmed from the interviews.
However, the constructs (derived from the previous literature) for achieving success
in improving competitiveness received significant support from participants
interviewed in the field study. All the participants from the suppliers’ side agreed
that to improve the competiveness of the RMG industry’s SC, external stakeholders,
such as the government, political parties and bureaucrats, should act positively to
address the issues from the buyers’ and suppliers’ side. Actions responding to the
buyers’ side issues like demand-side drivers (DD) and barriers (DB) would enhance
the response to the suppliers’ side issues. Many participants did not agree with the
role of demand-side drivers in SC competitiveness. Ultimately from the interviews, it
was made clear that the success of SC competitiveness would be possible whenever
actions addressed the suppliers’ side issues like supply-side drivers (SD) and barriers
(SB) were combined with work undertaken to influence the variables of other
external stakeholders. As previously mentioned, the focus of the field study was

120
actually on the validation and enhancement or improvement of the constructs and
variables identified in the initial research model. The following section will discuss
the relationships or links between the constructs that were confirmed by the field
study.
5.3.2 Links among the constructs
The data analysis summary presented the links among the sub-constructs of external
stakeholders and internal stakeholders and, ultimately, those with the
competitiveness construct, with these links presented in table 5.4. The information
about the links between constructs was extracted from the content analysis of the
10 interview transcripts.
Table 5.4: Links between constructs
No. Construct links 1 2 3 4 5 6 7 8 9 10 1. Political action → Supply-side drivers √ √ √ √ √ √ √ √ √ √ 2. Political action → Supply-side barriers √ √ √ √ √ √ √ √ √ √ 3. Political action → Demand-side drivers × √ √ × √ × √ √ × √ 4. Political action → Demand-side barriers √ √ √ √ √ √ √ √ √ √ 5. Political action → Competitiveness √ √ √ × √ × √ × √ √ 6. Political action → Country risk √ √ √ √ √ √ √ √ √ √ 7. Country risk → Supply-side drivers √ √ √ √ √ √ √ √ √ √ 8. Country risk → Supply-side barriers √ √ √ √ √ √ √ √ √ √ 9. Country risk→ Demand-side drivers × × √ × √ × √ √ √ × 10. Country risk → Demand-side barriers √ √ √ √ √ √ √ √ √ √ 11. Country risk → Competitiveness × √ √ × √ √ × √ √ × 12. Bureaucratic behaviour → Supply-side drivers √ √ √ √ √ × √ √ √ √ 13. Bureaucratic behaviour → Supply-side barriers √ √ √ √ √ √ √ √ √ √ 14. Bureaucratic behaviour → Demand-side drivers × × √ × × × √ √ × √ 15. Bureaucratic behaviour → Demand-side barriers √ √ √ √ √ √ √ √ √ √ 16. Bureaucratic behaviour → Competitiveness √ √ √ √ × √ √ × √ √ 17. Bureaucratic behaviour → Country risk √ √ √ √ √ √ √ √ √ √ 18. Demand-side issues (drivers & barriers) → Supply-
side issues (drivers & barriers) √ × × √ × √ × × × √
19. Supply-side drivers → Competitiveness √ √ √ √ √ √ √ √ √ √ 20. Supply-side barriers → Competitiveness √ √ √ √ √ √ √ √ √ √ 21. Demand-side drivers → Competitiveness √ × √ × √ × √ × √ √ 22. Demand-side barriers → Competitiveness √ × × × √ √ √ × √ √
The quotations from the transcripts below provide examples of links mentioned by
the interview participants, respondent # 1 has mentioned that “the government is a
very big external stakeholder, it has direct influence on the competitiveness. By
taking several actions, it can help the buyers and suppliers to play important and
positive roles in the RMG business”. (This indicates the link between “Political
Action → Supply-side issues”; “Political Action → Demand-side issues”; and
“Political Action → Competitiveness”.)

121
He also added that “We are facing [the] main problem in the infrastructural facilities
which are very poor in our country. The government and the opposition parties
through their positive action can improve the infrastructural facilities that improve
our bargaining power and improve the competitiveness”. (This indicates the link
between “Political Action → Supply-side issues”.)
Similarly respondent # 3 says “As it is a buyers’ market, political parties should be
very careful about the buyers. I am sure, by taking necessary action, the government
can reduce the country risk and make the buyers more confident to deal business
with the Bangladeshi suppliers”. (This indicates the link between “Political Action
→ Country Risk”; “Political Action → Demand-side issues”; and Country Risk →
Demand-side issues”.)
In the same way the respondent # 4 says “I believe that the government and their
officials can take necessary action to improve the total business environment in our
country. They can provide financial support, policy support, documentation support,
infrastructural support for the benefit of this industry”. (This indicates the link
between “Supply-side issues → Competitiveness”; “Bureaucratic Behaviour →
Competitiveness”; and Bureaucratic Behaviour→ Supply-side issues”.)
As illustrated in table 5.4, the linkages between the constructs are found in column
one and their corresponding frequencies are found in the respective columns. The
links between political action (PA) and internal constructs, that is, supply-side
drivers (SD) and supply-side barriers (SB) of suppliers and demand-side drivers
(DD) and demand-side barriers (DB) of buyers were recognised and supported by all
participants. In the field study, 100% of participants supported all except two of
these influential links. The link between political action (PA) and demand-side
drivers (DD) was supported by only 60% of participants. From the field study, it was
also shown that political action (PA) also had a direct link to competitiveness with
70% of participants confirming this direct link.
The next stakeholder identified was bureaucrats. Bureaucratic behaviour (BB) was
seen to have sufficient influence on the supply-side and demand-side issues and then
on competitiveness. The relationship or the link between BB → SB and BB → DB
was identified through content analysis supported by all participants with 100%
agreeing with the maximum links. However, the link between BB → SD was

122
supported by 90% of participants and the link between BB → DD was supported by
only 40% of participants. From the field study, a new link identified was that BB had
a direct link to competitiveness (COM) with 80% of participants agreeing with this
link.
Country risk (CR) was another construct that was created by the interaction of
political action (PA) and bureaucratic behaviour (BB). The links between CR → SD,
CR → SB and CR → DB were supported by all participants (i.e. 100%); however,
the link between CR → DD was supported by only 50% of participants. The direct
link between CR → COMP was also supported in the field study by 60% of
participants. So, this new link originated directly from the field study. Finally,
according to the field study, the links between SD → COM and SB → COM were
established with 100% support from the interview participants from the field study
whereas the links between DD → COM and DB → COM were not supported by all
participants. These two links were highlighted by only 60% of participants
respectively. However, from the field study, a new link was discovered that was
pointed out by 40% of participants and rejected: demand-side issues (drivers and
barriers) had direct influence on supply-side issues (drivers and barriers) and supply-
side issues had influence on competitiveness.
5.3.3 Individual conceptual models in accordance with the field study
After the field study, the transcribed interviews were analysed very carefully.
Constructs and many new variables for the competitiveness model of the RMG
industry’s SC were identified and recognised. Those constructs and variables are
presented in table 5.3 with the links among the constructs shown in table 5.4.
Following the data analysis process (figure 5.1) and later taking into consideration
the information on tables 5.3 and 5.4, 10 individual conceptual models were
constructed. These constructed models are consequently shown in appendix no.1. No
new construct was identified but some new variables were derived from the
interviews conducted in the field study. However, constructs consisted of different
types of variables in each of the models. The variables under all the constructs are
shown in table 5.3. The total number of variables under each constructed model (see
the appendix-1 and the figures from A1.1 to A1.10) and the total number of variables
under each construct of the constructed models, according to the field study, are

123
shown in table 5.5. In table 5.5, the first constructed model (figure-A1.1 ) has five
variables under PA, six variables under CR, four variables under BB, two variables
under SD, seven variables under SB, one variable under DD, three variables under
DB and three variables under COM.
Therefore, there are 31 variables in total for this model which have been recognised
and identified according to participant-1’s interview in the field study. The lowest
number of variables (29) was identified from participant-8’s interview and this is
shown in figure A1.8.
Table 5.5: Variables in each constructed model and the comprehensive model
Models Constructs ( Total no. of variables under each construct) Total accepted no. of
variables under each participant
PA CR BB SSD SSB DSD DSB COM
Accepted no. of variables under each construct in 10 figures
Figure A1.1 (P1) 5 6 4 2 7 1 3 3 31 Figure A1.2 (P2) 5 3 2 3 9 4 4 5 35 Figure A1.3 (P3) 6 6 6 4 9 3 4 8 46 Figure A1.4 (P4) 5 5 4 6 9 0 1 8 38 Figure A1.5 (P5) 4 3 4 6 6 4 5 3 35 Figure A1.6 (P6) 5 7 5 5 8 2 5 4 41 Figure A1.7 (P7) 6 6 3 2 8 4 3 6 38 Figure A1.8 (P8) 2 5 0 2 7 4 2 7 29 Figure A1.9 (P9) 4 5 4 3 8 3 4 7 38 Figure A1.10 (P10) 6 4 6 1 6 5 3 5 36 Final model Total accepted
no. of variables for final model
Figure 5. 4 Comprehensive model
6 7 6 6 10 6 6 9 56
The highest number of variables was identified by participant-3 and is shown on
figure A1.3. In this figure, participant-3 identified and agreed with a total of 46
variables. The second highest number (41 variables) was identified by participant-6
as shown in figure A1.6.
Accordingly, from table 5.5, we can easily explain that figure A2 (P2), figure A4
(P4), figure A5 (P5), figure A7 (P7), figure A9 (P9) and figure A10 (P10)
consequently show that their respective participant has recognised 35, 38, 35, 38, 38
and 36 variables.

124
5.3.4 Cross-examination of conceptual models
The second phase of content analysis was the cross-analyses of the individual
conceptual models identified in phase 1. After cross-examination, table 5.5 was
developed to confirm the final number of constructs in the final comprehensive
model. This table was developed based on scrutinising the transcript, examining the
qualitative data in the exploratory stage and the corresponding participant’s opinion,
and considering the tabulated data in tables 5.3 and 5.4. As shown on table 5.6, all
participants gave full consent over the constructs except for only one participant who
did not give consent for bureaucratic behaviour.
Table 5.6: Constructs and corresponding opinion
Factors Constructs 1 2 3 4 5 6 7 8 9 10
External stakeholders Political action √ √ √ √ √ √ √ √ √ √
Country risk √ √ √ √ √ √ √ √ √ √
Bureaucratic behaviour √ √ √ √ √ √ √ √ √
Internal stakeholders Supply-side drivers √ √ √ √ √ √ √ √ √ √
Supply-side barriers √ √ √ √ √ √ √ √ √ √
Demand-side drivers √ √ √ √ √ √ √ √ √ √
Demand-side barriers √ √ √ √ √ √ √ √ √ √
Outcome Competitiveness
5.4 Final Comprehensive Model
In the last stage, the final comprehensive model (figure5.3 and 5.4) were developed
combining the 10 different models constructed according to the field study and
taking into consideration the initial conceptual model which was drawn from the
literature review (figure 3.1 or 5.2). The development of the final comprehensive
model was actually the refinement or modification of the conceptual model after the
field study. In this model, eight constructs with 56 variables or items have been
considered.
There were 19 links between the constructs in the initial model: these links are
identified through the rational justification summarised in table 5.7. After the field
study, only two links were rejected and three new links were accepted. The links
between BB to DD and demand-side issues to supply-side Issues were supported by

125
only 40% of participants. Due to weak support, these were finally rejected
(Muthusamy 2011). The accepted and rejected links are presented in table 5.7.
Table 5.7: Constructs, sub-constructs and links for the final research model
Constructs Links between constructs Justification for Acceptance and Rejection of Constructs
Acceptance/ Rejection
External stakeholders/ Country factors
Political action → Supply-side drivers Supported by literature review Supported by field study
Accepted
Political action → Supply-side barriers
Supported by literature review Supported by field study
Accepted
Political action → Demand-side drivers
Supported by literature review Supported by field study
Accepted
Political action → Demand-side barriers
Supported by literature review Supported by field study
Accepted
Political action →Country risk Supported by literature review Supported by field study
Accepted
Political action → Competitiveness Supported by field study Accepted Country risk → Supply-side drivers Supported by literature review
Supported by field study Accepted
Country risk → Supply-side barriers Supported by literature review Supported by field study
Accepted
Country risk→ Demand-side drivers Supported by literature review Supported by field study
Accepted
Country risk → Demand-side barriers Supported by literature review Supported by field study
Accepted
Country risk → Competitiveness Supported by field study Accepted Bureaucratic behaviour → Supply-side drivers
Supported by literature review Supported by field study
Accepted
Bureaucratic behaviour → Supply-side barriers
Supported by literature review Supported by field study
Accepted
Bureaucratic behaviour → Demand-side drivers
Not supported by field study (only 40%)
Rejected
Bureaucratic behaviour → Demand-side barriers
Supported by literature review Supported by field study
Accepted
Bureaucratic behaviour → Country risk
Supported by literature review Supported by field study
Accepted
Bureaucratic behaviour → Competitiveness
Supported by field study Accepted
Internal stakeholders/SS and DS issues
Demand-side issues (drivers & barriers) → Supply-side issues (drivers & barriers)
Not supported by field study (only 40%)
Rejected
Supply-side drivers → Competitiveness
Supported by literature review Supported by field study
Accepted
Supply-side barriers → Competitiveness
Supported by literature review Supported by field study
Accepted
Demand-side drivers → Competitiveness
Supported by literature review Supported by field study
Accepted
Demand-side barriers → Competitiveness
Supported by literature review Supported by field study
Accepted
However, after considering all aspects, finally a new comprehensive model has been
developed that is shown in figure 5.3. The model with the number of items under
each construct is shown in the same figure 5.4. This final research model was then
utilized in the preparation of the survey instrument. The instrument (questionnaire)
was used to collect quantitative data in the national survey. In the quantitative part of
this study, the statistical significance of the links will be analysed. After that, the
final outcome achieved by the study will be a competitiveness model to arrive at the

126
best effectiveness for the Bangladeshi RMG industry. However, the next section
provides further explanation and justification on the inclusion of each individual
construct in the final research model.
5.4.1 Constructs from external stakeholder factors
In this research, the SC process has been considered as a way to improve the
competitiveness of the RMG industry in Bangladesh. Based on the literature (see
chapter 3), it was found that the roles of external and internal stakeholders in the
RMG industry’s SC were very important in improving competitiveness. From the
previous literature of various research studies (Chandra 1997; Dossenbach 1999;
Wong 1999; Bowen 2000; Rungtusanatham 2003; Cao et al. 2008; Zhao et al. 2008),
it was perceived that competitiveness could be increased through coordination,
collaborative relationships and partnerships, and integrated relationships among
different parties or stakeholders of the SC. It was also observed in the literature of
the Bangladeshi RMG industry (World Bank 2005; Adhikari and Weeratunge 2007b;
Nuruzzaman 2008; Nuruzzaman, Haque, and Rafiq 2010) that the roles of external
stakeholders, such as government and bureaucrats were very important for an
effective SC and to improve competitiveness.
Therefore, three constructs have been considered from external stakeholders based
on the previous literature (see chapter 3 for the literature review). These constructs
are: political action, bureaucratic behaviour and country risk all of which directly
and indirectly influence the competitiveness of RMG industry’s SC. There are many
studies in the literature (Miller 1993; Boddewyn and Brewer 1994; Hadjikhani and
Hakansson 1996; Reed 2002; Tsai, C.Yeh, et al. 2005; Welge and Holtbrugge 2006;
Holtbrugge, Berg, and Puck 2007; Kim 2007; Fassin 2009) that support these
constructs and their role in the SC to improve competitiveness.
In the field study, all participants supported and believed in the important role of
external stakeholders in improving competitiveness. In one interview, participant #1
was quoted as follows: “There are many reasons for which we cannot make our garment
sector more competitive. Absence of government control over the political situation,
unlawful demand of the labour, influence of local political leaders over the business, lack of
uninterrupted gas and electricity supply, unsuccessful law and order situation, Dhaka-based
industrialization are creating many problems in the competitiveness”.

127
He also added that “political influence in all the sectors, inefficient bureaucratic decision-
making system for import and export activities and their disfavourable role are also liable
for this situation. Moreover, due to lack of government support, we cannot provide
undisturbed and peaceful working environment like our competitors. We are lagging behind
in respect of human resource development. We have to give more emphasis on human
resource development. Government needs to take proper action in this regard”.
Another participant mentioned that: “There are many stakeholders among the chain.
Among them buyers are big stakeholders. Suppliers are also a big stakeholder because of
two reasons. One, it’s a buyers’ market when we are suppliers and it’s also a supplier’s
market when we are buyers”. It is also revealed that, “Government, bureaucrats, political
parties are also stakeholders in that sense that there is a scope to play a role to improve the
prevalent environment by escaping us from the dirty and unrest political environment”.
Similarly it was also added that, “Bureaucratic things are those activities directly related to
policy making and implementation, various official paper works for export, import activities
and many issues in the financial services which may create some impediments for the
suppliers”.
Considering the above aspects of external stakeholders, participant #4 stated that “I
would like to say that orders’ cycle time or lead time, delivery performance and
responsiveness are affecting the competitiveness. Here, efficiency is too much important. We
are not doing well to create competitiveness because of industry inefficiency and this is the
main thing in competitiveness issue”. He also added that “We are not losing competitiveness
due to poor infrastructure but it decreases the supply chain efficiency and affects the
competitiveness. Who are my SC partners or members? There are many members like
spinning factories or yarn suppliers, clothes manufacturers, dyeing factories, labelling and
ticketing suppliers, C&F [clearing and forwarding] agents are involved in SC. So, when the
supply chain doesn’t work efficiently and doesn’t maintain good relations among the
partners or stakeholders, in that situation it becomes inefficient and is losing
competitiveness”.
Participant #6 also stated that, “Buyers and manufacturers are definitely influential
stakeholders but political parties and bureaucrats are not directly. Their main role is in the
policy making and implementation. Their support is also very important for exporting
garments and importing raw materials. Here buyers and suppliers are facing main problems
in regards to official formalities and infrastructure development. We can reduce the time in
the road traffic system and port management through development of infrastructure and

128
reduce the paper works. In the banking system we had to open L/C [letters of credit] and all
the transaction is done by the L/C through a bank. Bank usually charges big amount for
these services. In these areas, government, political parties and bureaucrats can help
through policy making”.
From the above opinions as stated in the field study, we can say that the roles of
external stakeholders are very important. Therefore, to improve competitiveness,
government and bureaucrats can play important roles through their positive political
action and good behaviour.
5.4.2 Constructs from internal stakeholder factors
The two main parties in the RMG industry’s SC are buyers and suppliers. Many
parties are involved but buyers and suppliers play the main roles as internal
stakeholders of the SC. Based on various studies in the literature (see the literature
review in chapter 3), the following four constructs were identified in the RMG
industry’s SC. Supply-side drivers, supply-side barriers, demand-side drivers and
demand-side barriers were the main constructs derived from internal stakeholders of
the SC. It was found from the previous literature (Nuruzzaman 2001; Nuruzzaman,
Haque, and Rafiq 2010; Quaddus and Didi 2005; Rahman 2005; Rahman and Anwar
2006; Adhikari 2007a; Kale 2007; Ahmed 2009; Berg et al. 2011; Sultana et al.
2011; Halder and Kim 2012) that different types of strengths and weaknesses of
suppliers were affecting competitiveness; the two supply-side constructs were also
affected by the constructs of external stakeholders and influenced the
competitiveness of the RMG industry.
From the buyers’ point of view, there were also two types of construct: demand-side
drivers and demand-side barriers (see literature review in chapter 3). Based on the
literature review (Wu et al. 2004; Quaddus and Didi 2005; Rahman 2005; Claeys and
Brachet 2008; Razzaque and Eusuf 2008; Zhao et al. 2008), these two constructs had
direct and indirect effects on the competitiveness of the RMG industry’s SC.
Moreover, in the field study, participants also supported these influential constructs
in the RMG industry’s SC. In this regard, participant #5 was quoted as saying that:
“suppliers have many drivers like: availability of cheap labour, lower power generation
cost, very good convincing power to have order, hardworking people, GSP facility and side
by side they have many barriers like: has not sufficient guard of [their] cotton, yarn and

129
fabrics supply, totally dependent on imported raw materials, not conscious and sincere
about delivery in time. Most of the suppliers have no composite facilities and they are
dependent on other suppliers for their raw materials. That is why they cannot offer
competitive price and meet the deadline of supply garments. Suppliers cannot communicate
with the buyers directly. There are three/four middleman between the suppliers and the
buyers. Dealings via middlemen are very difficult and take more time for the final delivery.
In this way, suppliers cannot expect good price from the buyers. For many purposes
government does not come forward with their supportive mind. Our port is not far away but
due to lack of proper management and good transportation facilities, we cannot take the
benefit from our port. As the channel of our port is so narrow, big ships cannot enter the
port”.
The participant also added that: “If the buyer is constant (regular buyer) that is
continuing to buy from us, must reduce the cost. Buyers’ location may be a strength or
weakness. German buyers are always good but the East European, Italian and Jewish
buyers are not good. We should be very careful about our buyer selection because there are
many fraudulent buyers in the market. Those buyers are more powerful and good to the
suppliers who are maintaining less formality. Suppliers feel always good to work with those
buyers who are maintaining few formalities. So maintaining fewer formalities is the strength
of the buyer. Another thing that is, buyers dealing with the mixed items (basic, fancy and
polo) are always better than basic items. The profit margin is always higher in mixed items
than basic items. So buyers dealing with the mixed items are always stronger than the
buyers of basic items”.
Participant #6 mentioned that, “In my opinion our first strength or drive is work spirit and
then sacrificing tendency. In any adverse situation, we, the manufacturers or suppliers, can
work hard. The second strength is our workforce. Though they are exploited but they are
doing their job. If they are not politicised or politically provoked, they are definitely a
wonderful strength of RMG sector. When there is a good relation between workers and
owners, workers are definitely a big strength. Our third strength is a group of people who
are supportive and helping us a lot”. He added that, “The present infrastructure of RMG is
very poor. There are many drawbacks in the present supply chain. Due to lack of proper
logistics support like uninterrupted electricity and gas supply, the present supply chain of
RMG doesn’t work efficiently”.
He further stated that, “When we consider about the barriers, except one or two, every
matter is barrier in the competitiveness of RMG supply chain. First thing is decentralize the

130
garment units. There is no industrial park in our country. As a result, we are all (workers,
buyers, manufacturers) wasting or losing many hours in unproductive way and this is main
reason for facing the long lead time problem. There is huge system loss due to lack of
infrastructural facility but we are not considering that cost. Moreover, there is no uniformity
among the manufacturers. Through a policy, we can fix up a minimum price for a certain
product. If we are united and maintain the uniformity, none can code price under that
minimum level of price. Again, we, the manufacturers, are competing among ourselves by
dropping our price. In this way, we are actually destroying our market”.
He also added that, “Another weakness or barrier is our individualism. Due to lack of unity
among the suppliers, we are giving an opportunity to the buyers to bargain with us. This is the
strength of buyers. Till now as it is a buyers’ market and we are bound to follow all their terms
and conditions. There are very few garment [maker]s in Bangladesh who can bargain with the
buyers. The present situation is known to the buyers and that is why they are imposing some
new terms to the manufacturers. These terms are demand-side barriers like, they are offering
lower price. Now buyers are not issuing L/C, giving the contract sheet or PO for confirmation.
Showing that paper, they are requesting the manufacturer to open L/C, import materials, make
garments and arrange shipment. Buyers are agreed to pay the fare but not the insurance cost.
Buyers are usually making payment after receiving the final products. In this way, buyers can
save the banking cost but manufacturer can’t do it. It is buyers’ advantage. But these are
barriers for us. Buyers don’t want to continue their purchase if we fail to meet their offered
price, even you have good trust and relationship with the buyers. When compliance issues
came to this industry, buyers didn’t give any support”.
Considering the above quotations of the participants in the field study, we can draw a
conclusion about the internal stakeholders’ role in the RMG industry’s supply chain
in improving competitiveness. It is clear from the above statement that the supply-
and demand-side drivers and barriers from internal stakeholders are also influenced
by external stakeholders in improving the competitiveness of the RMG industry by
strengthening the drivers and weakening the barriers.
5.5 Summary
This chapter has dealt with the qualitative phase of mixed-method research. A
comprehensive field study to determine the constructs and items for the
competitiveness model of the Bangladeshi RMG industry were presented in this
chapter. In this field study, 10 interviews were conducting to support the findings of
the literature review. After recording the interviews, all were transcribed and

131
rigorously reviewed by the researcher using content analysis methods. Through this
analysis, finally eight constructs and 56 items were identified and justified for the
competitiveness model.

132
Figure 5.2: Preliminary competitiveness model
Figure 5.3: Comprehensive competitiveness model
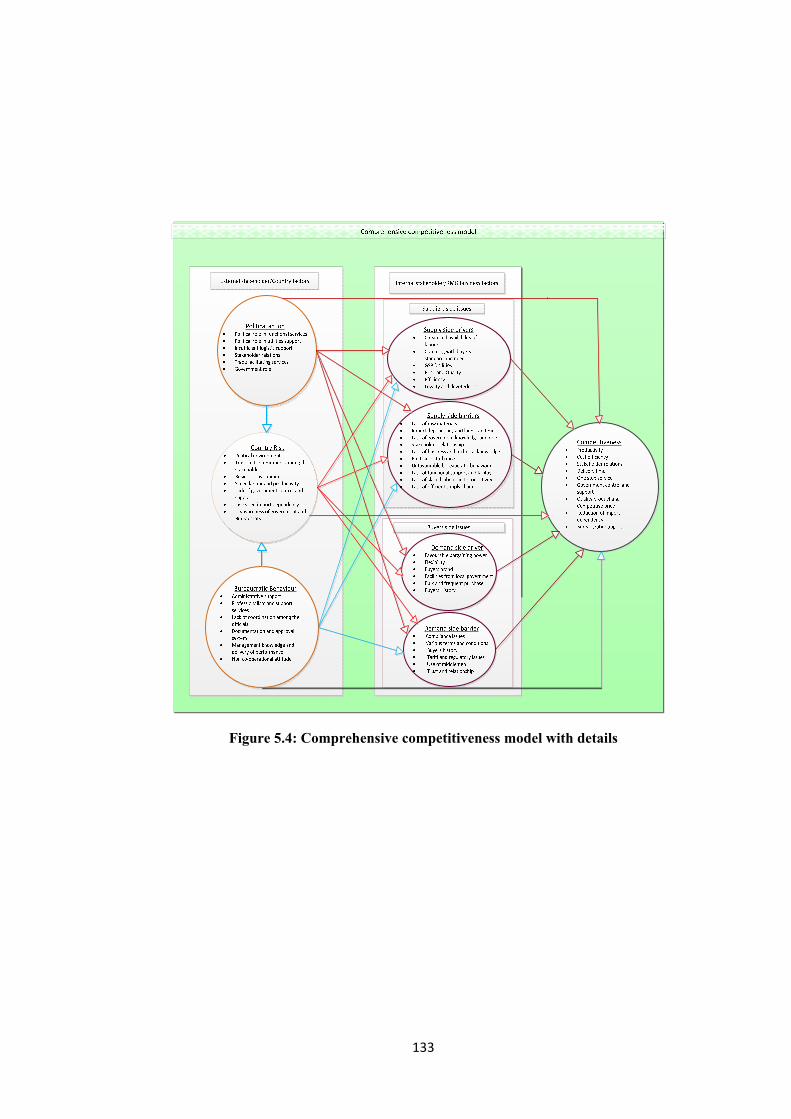
133
Figure 5.4: Comprehensive competitiveness model with details

134
CHAPTER 6
Hypotheses and Questionnaire Development4
6.1 Introduction
The focus of this chapter is the development of the hypotheses and the quantitative
research instruments resulting from the finalised comprehensive research model.
This chapter starts with the construction of hypotheses. Subsequent sections then
present details of the development of the research instruments. Most of the
instruments have been developed from the literature while being contextualised into
the context of the current study. This chapter also presents a table of the
measurement items used with their respective reference sources.
6.2 Construction of Hypotheses
The hypotheses have been constructed based on the comprehensive model that was
shown in figure 5.4 in chapter 5.
6.2.1 Hypotheses related to external stakeholders
A firm can no longer compete effectively in isolation from its suppliers or other
entities in the SC. Collaborative relationships with the internal and external entities
are important to improve competitiveness (Lummus and Vokurka 1999). SCM is an
effort to increase competitiveness (Nordås 2004). The analysis of the SC to improve
competitiveness is an emerging field: it is therefore essential for organisations to
understand the role of different stakeholders in the SC. The government and other
stakeholders (Khondker , Razzak, and Ahmed 2005; Saxena and Salze-Lozac’h
2010) are directly or indirectly involved in the SC of the RMG industry. Their
4Part of this chapter has been presented at the following conferences: Nuruzzaman, M., Quaddus, M., Jeeva, A. and Khan, E. Ahmed (2013), " The influence of External Stakeholder
in the Competitiveness of Ready-Made Garment (RMG) Industry: A study on RMG Supply Chain in Bangladesh", In proceedings of the Business & Economics Society International Conference (B&ESI), January 7-10, Perth, Western Australia
Nuruzzaman, M.( 2013), " The influence of Bureaucratic Behaviour to Improve the Competitiveness of RMG industry”, In proceedings of Emerging Research Initiatives and Development in Business, CGSB Research Forum, 9-10 May, Curtin University, Perth, Western Australia
Nuruzzaman, M., Chowdhury, M., Quaddus, M. and Jeeva, A. (2013), “()Achieving Competitiveness through Analysing Supply Chain: A Test of Political Stakeholder’s Action in Readymade Garment (RMG) Industry of Bangladesh”In proceedings of the 3rd International Forum & Conference on Logistics and Supply Chain Management(LSCM), June 27-29, Bali, Indonesia

135
involvement in the SC of the RMG export business influences the effectiveness and
competitiveness of the RMG industry’s SC and consequently the competitiveness of
the RMG industry. Stakeholders such as the government, bureaucrats and political
parties all influence the RMG industry’s SC as external stakeholders (Tsai, C.Yeh, et
al. 2005; Fassin 2009). Based on these external stakeholders, three external elements
were considered as constructs, namely, political action, country risk and bureaucratic
behaviour, which have been identified through the literature review and field study.
The competitiveness of the RMG industry through SC performance actually depends
on the influence of the external stakeholder element. The following sections present
details of the influence of external stakeholders on improving competitiveness and
the development of relevant hypotheses.
6.2.1.1 Political Action (PA)
Political action (PA) means the role and action of political stakeholders (i.e. the
ruling political party, political opposition groups) in business (Hadjikhani and
Hakansson 1996; Holtbrugge, Berg, and Puck 2007; Hadjikhani 2000) and
improving competitiveness means to improve the ability to compete. Stadtler (2005)
has defined improving competitiveness as the task of integrating organisational units
along a SC and coordinating materials, information and financial flows in order to
fulfil customer demand. After abolition of the MFA, the Bangladeshi RMG sector is
now facing fierce competition in the global apparel market (Tewari 2006;
Nuruzzaman, Haque, and Rafiq 2010). Improving the competitiveness of the RMG
industry in the post-MFA period is top priority (Tewari 2006; Adhikari and
Weeratunge 2007b; CPD 2007).
The RMG sector has developed surprisingly although it has some special conditions
and peculiarities (see chapters 2 and 3). As Bangladesh is a developing nation,
entrepreneurs are dependent on the government and they expect to receive positive
political action from the government for infrastructural development and other
logistics support. That is why the government and bureaucrats as external stakeholders
have a very important role in achieving competitiveness in the SC and improving the
industry’s competitiveness (Kee 2005; Khondker , Razzak, and Ahmed 2005;
Nuruzzaman 2009) . But the government and bureaucrats do not play their role in a
positive way (Quddus 2001; Choudhury and Hossain 2005). Therefore, country risk is
increasing and the RMG industry is losing its competitiveness in the global apparel

136
market (Sultana et al. 2011; Islam, Begum, and Rashed 2012). Supportive political
action from the government and political parties is essential in reducing the political
risk and achieving a good business environment (Porter 1985; Grosse and Behrman
1992; Falk and Miller 1992; Miller 1993; Hillman 2003; Hillman and Wan 2005).
However, in the post-MFA period, there has been no significant development in
infrastructural facilities, productivity, labour management, workers’ livelihoods,
improvement of existing laws and regulations, development of backward linkage
industries, uninterrupted gas and electricity supply, reduction of lead time, ports’
management or labour unrest due to the lack of a supportive government role and
political action (CPD 2007; Haider 2007; Ahmed 2009; Berik and Rodgers 2009;
Sultana et al. 2011; Hossain, Sarker, and Afroze 2012).
Uzzaman (2010) has mentioned in his research work the political corruption,
bureaucracy, corrupt customs administration and many hidden barriers in
Bangladesh due to the lack of appropriate political action. The lack of political action
also has some impact on the internal stakeholder element, dependent constructs in
the SC and, ultimately, on the competiveness of the RMG industry. In connection
with this, many researchers (World Bank 2005; Adhikari and Weeratunge 2007b;
Haider 2007; Ahmed 2009; Clark and S.Kanter 2010; Berg et al. 2011; Sultana et al.
2011; Hossain, Sarker, and Afroze 2012; Islam, Begum, and Rashed 2012) have
mentioned in their research work the influence of political action on the suppliers’
and buyers’ drivers and barriers. The influence of political action over internal
stakeholders’ drivers and barriers is not only supported in the literature but also by
80% of respondents in the field study interviews.
Considering the above support in the literature and field study and the negative role
of the actions of external stakeholders, the following hypotheses related to political
action are proposed:
Hypothesis 1a (H1a): Non-supportive political action (PA) increases the country risk (CR). Hypothesis 1b (H1b): Non-supportive political action (PA) decreases the supply-side drivers (SD) of the RMG industry of Bangladesh. Hypothesis 1c (H1c): Non-supportive political action (PA) increases the supply-side barriers (SB) of the RMG industry of Bangladesh. Hypothesis 1d (H1d): Non-supportive political action (PA) decreases the demand-side drivers (DD) of the RMG industry of Bangladesh. Hypothesis 1e (H1e): Non-supportive political action (PA) increases the demand-side barriers (DB) of the RMG industry of Bangladesh.

137
There was no literature supporting the direct influence of political action (PA) on
competitiveness (COM); however, the field study supported the direct influence of
PA on COM. Therefore, the proposed hypothesis is:
Hypothesis 1f (H1f): Non-supportive political action (PA) decreases the tendency to improve the competitiveness (COM) of the RMG industry of Bangladesh.
6.2.1.2 Bureaucratic Behaviour (BB)
Bureaucrats are responsible for executing the decisions of the political leadership
and for maintaining the day-to-day regulatory and service functions of the state
(Nimir and Palmer 1982). Bureaucracy or bureaucratic behaviour (BB) is concerned
with the behaviour of officials, while the action of, for example, worker groups, may
also lead to deflection of an organisation (Selznick 1943). In any business process or
commercial transaction, the government, political groups and bureaucrats play
important roles (Hadjikhani and Hakansson 1996). According to stakeholder theory,
the government and political groups are important stakeholders (Donaldson and
Preston 1995)and as a part of the government, bureaucrats are also important
stakeholders with Freeman (1984) defining a stakeholder as “any group or individual
who can affect or is affected by the achievements of the organization”.
The role and influence of bureaucratic behaviour are very important in the SC of the
Bangladeshi RMG business but their non-supportive activities create various
problems in international trade and the RMG industry (Quddus and Rashid. 1999;
Quddus 2001; Uzzaman 2010; Islam, Begum, and Rashed 2012). The literature on
political control of bureaucracy reveals that bureaucracies are highly responsive to
political forces (Meier and Jr. 2006). Therefore, bureaucratic behaviour actually
depends on the political role of the government. There are many components in the
RMG industry’s SC in which the involvement of bureaucrats and their supportive
actions are essential. The literature has revealed that these components include:
controlling the law and order situation; policies made and implemented in favour of
the RMG export business; infrastructure development; ports’ management; services
in the banking sector; services in customs clearance; uninterrupted water, gas and
electricity supply; building relationships with the buyers and suppliers through
diplomatic channels; and many other relevant matters related to the RMG business
(Williams 1999; Bhatnagar and Sohal 2005; Adhikari and Weeratunge 2007b; Kale

138
2007; Song and Panayides 2008; Habib 2009; Berg et al. 2011; Verma and Seth
2011; Hossan, Sarker, and Afroze 2012).
Quddus (2001) has mentioned the presence of bureaucratic problem and non-
supportive behaviour in the Bangladeshi RMG export business. The demand- and
supply-side issues are influenced by the bureaucrats and negotiated in the RMG
sector to increase competitiveness. Uzzaman (2010) has mentioned in his research
paper the bureaucracy in different levels of office management in Bangladesh. He
has mentioned their non-supportive role in the customs clearance system of
Bangladesh. Islam, Begum, and Rashed (2012) and Quddus and Rashid. (1999) have
mentioned in their research work that the RMG industry’s SC faces operational
disturbances due to the lack of supportive bureaucratic behaviour and consequently
faces competition with respect to quality, cost and time. Adhikari and Weeratunge
(2007b) and Berg et al. (2011) also mentioned the bureaucratic problems in policy
making, customs clearance, ports’ management and infrastructural development as
well as its influence on the drivers and barriers of the suppliers and buyers in the SC.
In addition to the support in the literature, 64% of respondents in the field study
interviews were supportive of the view that BB had influence over the internal
stakeholders’ drivers and barriers.
However, considering the above situations and the negative role played by external
stakeholders, the following hypotheses related to bureaucratic behaviour are proposed:
Hypothesis 2a (H2a): Non-supportive bureaucratic behaviour (BB) increases the country risk (CR). Hypothesis 2b (H2b): Non-supportive bureaucratic behaviour (BB) decreases the supply-side drivers (SD) of the RMG industry of Bangladesh. Hypothesis 2c (H2c): Non-supportive bureaucratic behaviour (BB) increases the supply-side barriers (SB) of the RMG industry of Bangladesh. Hypothesis 2d (H2d): Non-supportive bureaucratic behaviour (BB) increases the demand-side barriers (DB) of the RMG industry of Bangladesh. There was no literature supporting the direct influence of bureaucratic behaviour
(BB) on competitiveness (COM) but the field study results supported the direct
influence of BB on COM. Therefore, the proposed hypothesis is:
Hypothesis 2e (H2e): Non-supportive bureaucratic behaviour (BB) decreases the tendency to improve the competitiveness (COM) of the RMG industry of Bangladesh.

139
6.2.1.3 Country Risk (CR)
Country risk is the result of political, social and economic factors (Oetzel, Bettis, and
Zenner 2001). Others have attempted to define country risks as factors affecting
foreign direct investment (Kobrin 1978; Bergara, Henisz, and Spiller 1998; Fatehi
and Safizadeh 1994; Nigh 1985). Due to some of the actions of political parties, the
government and bureaucrats, a negative influence or risk may arise in a country. In
this study, country risk comprises the ultimate result arising from the non-supportive
role of government, non-cooperation and misunderstandings between the ruling party
and the opposition, and the non-supportive activities of bureaucrats. Therefore,
country risk is actually derived from the interaction of non-supportive political
action and bureaucratic behaviour (Abdullah 2005; Clark and S.Kanter 2010). In the
post-MFA period, violence in the RMG industry, political unrest, labour unrest,
bureaucratic corruption and poor stakeholder relationships (Quddus 2001; Khondker
, Razzak, and Ahmed 2005; Kabir 2007; Razzaque and Eusuf 2008; Clark and
S.Kanter 2010; Saxena and Salze-Lozac’h 2010; Berg et al. 2011) have all increased
the country risk.
The RMG business is international in nature. Country risk is considered as a
significant factor in all activities of international business (Grosse and Behrman
1992; Meldrum 2000). Buyers from developed countries always try to remain
competitive in business by locating their operations in low-wage countries and
sourcing from those countries (Fraering and Prasad 1999). However, there are some
disadvantages and complexities in addition to the advantages of outsourcing (Frear,
Metcalf, and Alguire 1992; Birou and Fawcett 1993). Buyers select appropriate
suppliers and an attractive outsourcing platform to achieve competitive advantage in
their business taking into consideration the level of country risk. The level of risk
also depends on the level of attraction of the outsourcing platform. A country may be
an attractive outsourcing platform to the buyers when it ensures low-cost labour
access, availability of raw materials, the quality of the infrastructure, skilled labour
and scientific personnel, the country’s demands and operating conditions, cultural
nuances and legislation (Porter 1986; Goonatilake 1990; Birou and Fawcett 1993;
Trompenaars and Hampden-Turner 1997; Prasad and Sounderpandian 2003). But if
there is the lack of supportive political action and bureaucratic behaviour, the level
of country risk becomes higher and, consequently, the country faces competition

140
with respect to quality, cost, time, commitment and compliance issues. When
country risk is higher, it affects the internal stakeholders of the RMG industry’s SC
and weakens the competitiveness of the RMG industry (Kee 2005; Ahmed 2009;
Clark and S.Kanter 2010; Berg et al. 2011) because buyers always try to find other
suppliers to have a secure uninterrupted supply.
In a research work Abdin (2008) has mentioned that vindictive political
environment, bureaucratic shackles, electricity crisis, currency adjustment policy
pursued by the country, anomalies in the banking sectors, problems at the port, and
the lack of some policy support from the government to sustain the country’s falling
competitiveness against its competitors in the international market are other serious
causes to increase the country risk. These types of risk actually increase the barriers
of RMG suppliers and decrease the drivers.
The RMG industry imports raw materials, say, within 7 days but take on additional
15 days to reach warehouse from the Chittagong port. About 54 formalities have to
be observed to release a shipment of raw materials. These formalities increased the
lead-time against overseas competitors (Abdin 2008). As the end consumers of the
garment fashion market are becoming increasingly time-sensitive, a decrease in lead
time, besides quality and cost criteria, is needed to win more orders from
buyers(Asgari and Hoque 2013). This time sensitive risk and other issues demotivate
the buyers to do business with RMG industry.
Moreover, the literature and 66% of respondents in the field study interviews
supported the view that country risk (CR) influences internal stakeholders’ drivers
and barriers.
However, considering the above situations and the negative role of the external
stakeholder element, the following hypotheses related to country risk are proposed:
Hypothesis 3a (H3a): Non-supportive country risk (CR) decreases the supply-side drivers (SD) of the RMG industry of Bangladesh. Hypothesis 3b (H3b): Non-supportive country risk (CR) increases the supply-side barriers (SB) of the RMG industry of Bangladesh. Hypothesis 3c (H3c): Non-supportive country risk (CR) decreases the demand-side drivers (DD) of the RMG industry of Bangladesh. Hypothesis 3d (H3d): Non-supportive country risk (CR) increases the demand-side barriers (DB) of the RMG industry of Bangladesh.

141
There was no literature supporting the direct influence of country risk (CR) on
competitiveness (COM) but the field study results supported the view that CR has a
direct influence on COM. Therefore, the proposed hypothesis is:
Hypothesis 3e (H3e): Non-supportive country risk (CR) decreases the tendency to improve the competitiveness (COM) of the RMG industry of Bangladesh
6.2.2 Hypotheses related to internal stakeholders
In the issue of competitiveness, productivity, the working environment and
stakeholder relationships are very important (Khondker , Razzak, and Ahmed 2005)
in the RMG industry. Two types of stakeholders are involved in the SC of the RMG
industry. The external stakeholders (as discussed above) are non-supportive and non-
cooperative in numerous services needed by the internal stakeholders to make the SC
efficient. The internal stakeholders are the suppliers of the final products and the
buyers of the final products. Some studies in the literature about the internal
stakeholder elements have been reviewed and are presented briefly in the following
section. Berg et al. (2011) have mentioned three main stakeholders of the RMG
industry SC, namely, the government, buyers and suppliers. The two internal
stakeholders, buyers and suppliers, are influenced by the government and
bureaucrats and, consequently, competitiveness is influenced by these internal
stakeholders (Tsai, Yeh, et al. 2005; Verma and Seth 2010). Based on these internal
stakeholders, four internal elements, namely, supply-side drivers, supply-side
barriers, demand-side drivers and demand-side barriers, were considered as
dependent constructs, having been identified through the literature review and field
study (Adhikari and Weeratunge 2007b; Ahmed 2009; Berg et al. 2011; Sultana et
al. 2011). The competitiveness of the RMG industry through SC performance
actually depends on the direct influence of internal stakeholders’ elements. The
following sections present the influence of internal stakeholders on improving
competitiveness and the development of relevant hypotheses.
6.2.2.1 Supply-side Drivers
Supply-side drivers are actually the strength of the suppliers (Ahmed 2009). There are many
studies in the literature about supply-side drivers (SD) of the RMG industry that are playing
a positive role in the RMG industry SC. Razzaque and Eusuf (2008) have mentioned some
supply-side drivers, namely, domestic trade policy and producers’ responses. In another
study, Haider (2007) has also mentioned some drivers such as, the achievement of product

142
diversification and product upgrading in addressing the competitiveness issues. Drivers such
as cheap and available labour, compliance with buyers’ standards and GSP facilities are also
stated in the literature of Adhikari and Weeratunga (2007); Islam and Deegan (2008);
Nuruzzaman, Haque, and Rafiq (2010); and Sultana et al. (2011). Ahmed (2009) also
revealed that low-cost labour, GSP facilities, duty drawback facilities, cash incentives and
back-to-back letters of credit facilities are the suppliers’ drivers and a major source of
competitiveness in the RMG industry. The supportive elements of external stakeholders
such as political action and bureaucratic behaviour increase the drivers of the suppliers and
positively influence the competitiveness of the SC but non-supportive elements decrease the
drivers of the suppliers and subsequently have a negative effect on competitiveness
(Adhikari and Weeratunga 2007; Haider 2007; Ahmed 2009). The above literature and the
field study have supported the influence of supply-side drivers on the competitiveness of the
RMG industry.
Considering the above support and the influence of supply-side drivers (SD), this
study has proposed the following hypothesis related to SD:
Hypothesis 4 (H4): Supply-side drivers (SD) positively influence the improvement of the competitiveness (COM) of the RMG industry of Bangladesh.
6.2.2.2 Supply-side Barriers
Barriers are defined as perceived or likely constraints (Quaddus and Didi 2005). In
the RMG business, supply-side barriers are weaknesses (Ahmed 2009) in the SC.
The barriers are weaknesses such as poor infrastructure, long lead time, lack of
commitment and trust, being under pressure to reduce price, weak bargaining power,
threats of choosing alternative suppliers, being dependent on raw materials, lack of
cooperation, etc. Many researchers such as Adhikari and Weeratunga (2007) have
mentioned barriers such as the lack of an educated and skilled labour force, poor
infrastructure, poor management, lack of equipment, lack of domestic input and poor
banking services. Halder and Kim (2012) have mentioned poor infrastructure
facilities and lack of logistics support; Sultana et al. (2011) have revealed that quota-
based exports, the quality of jobs, lower productivity, shortages of raw materials,
limited market and political unrest are supply-side barriers. Moreover, in much of the
literature (Kale 2007; Ahmed 2009; Berik and Rodgers 2009; Berg et al. 2011;
Hossan, Sarker, and Afroze 2012), problems that are stated relate to backward

143
linkage industries, workers’ rights, lack of skilled labour, lack of productivity, lack
of good working conditions, numerous violations of workers’ rights, the negative
role of politicians, threats from bankers and bureaucrats, dependency on imported
raw materials, low value-adding products, labour compliance, infrastructural
constraints. In another research study, Quddus and Rashid (1999) have mentioned
the politicians, bankers and bureaucrats who are creating barriers for the suppliers.
Razzaque and Eusuf (2008) have also mentioned barriers such as the lack of proper
infrastructure, lack of safety in workplaces, very low wages, wage discrimination,
and lack of skill development and training opportunities. Haider (2007) mentioned
supply-side barriers in the RMG industry such as linkage expansion, compliance
issues, price competitiveness, long lead time, and production and distribution time in
relation to the issue of competitiveness. Moreover, in addition to the above support
in the literature, an average of 76% respondents in the field study interviews
supported the view that SB influences competitiveness.
Taking into consideration the above support from the literature and field study for
the influence of supply-side barriers (SB), this study has proposed the following
hypothesis related to SB:
Hypothesis 5 (H5): Supply-side barriers (SB) negatively influence the
improvement of the competitiveness (COM) of the RMG industry of Bangladesh.
6.2.2.3 Demand-side Drivers
Drivers are defined as the perceived or expected benefits (Quaddus and Didi 2005).
In the RMG business, demand-side drivers are the buyers’ strengths which passively
play positive roles in the SC (Ahmed 2009). Demand-side drivers are: strong
bargaining power, offering a good price, a bulk customer, brand name, having a
special facility for importing garments from member countries of the LDCs, trust
and commitment, etc. (Wu et al. 2004; Rahman 2005; Zhao et al. 2008). Razzaque
and Eusuf (2008) have mentioned the following matters which are treated as
demand-side drivers: a favourable international trade environment, pressure from the
buyers about maintenance of workers’ rights, safe workplaces and good wages.
When external stakeholders support buyers regarding the above matters, suppliers
will be forced to maintain the required compliances. Consequently, the
competitiveness of the RMG industry will improve. Another driver is buyers’
144
capability to outsource (Kale 2007). However, there is not very much support in the
literature about demand-side drivers but there is a significant level of support from
the field study: 54% of respondents in the field study interviews supported the view
that demand-side drivers (DD) influence competitiveness.
Considering these above support and the influence of demand-side drivers (DD), this
study is proposed a hypothesis related to DD;
Hypothesis 6 (H6): Demand-side drivers (DD) positively influence to the improvement of competitiveness (COM) of RMG industry of Bangladesh
6.2.2.4 Demand-side Barriers
As mentioned above, barriers are defined as perceived or likely constraints (Quaddus
and Didi 2005). In the RMG business, demand-side barriers are buyers’ weaknesses
(Ahmed 2009) that play negative roles in the SC. Demand-side barriers include
having a required shorter lead time, pressure of NGOs about suppliers violating
human rights, different types of conditions and regulations imposed on the suppliers
and different types of conditions and regulations imposed by the host government
(Adhikari and Weeratunga 2007; Nuruzzaman 2001; Nuruzzaman, Haque and Rafiq
2010). The compliance issues, pressures to reduce price and issues about the lead
time being raised by the buyers are also barriers (Rahman 2005; Claeys and Brachet
2008). Razzaque and Eusuf (2008) mentioned some barriers derived from buyers
such as pressure to provide better working conditions, no wage discrimination,
continuous pressures about international labour standards, etc. Berg et al. (2011) and
Islam and McPhail (2011) have also stated in their research work about barriers such
as compliance issues raised by the buyers and pressure to reduce operational
disturbances. Information about other barriers such as the buyers’ history, use of
middlemen, trust and relationships came from the field study.
These above various types of pressure from the buyers make adverse situation in the
garment business and pose the manufacturers under threat of losing business and
competitiveness. The supply chain is an integrated manufacturing process wherein
raw materials are converted into final products, then delivered to the buyers. Due to
the complexity of supply chain nature and lack of policy support from the
government, the manufacturers are unable to face the buyers side (demand side)
barriers which negatively influence the improvement of competitiveness (Haque et
al. 2011; Abdin 2008)

145
Nonetheless, besides the above support from the literature, 65% of respondents in the
field study interviews supported the view that the demand-side barriers (DB) had
influence on competitiveness.
Taking into consideration the above support and influence of demand-side barriers
(DB), this study has proposed the following hypothesis related to DB:
Hypothesis 7 (H7): Demand-side barriers (DB) negatively influence the improvement of the competitiveness (COM) of the RMG industry of Bangladesh.
Based on the comprehensive model, 20 hypotheses describing 20 relationships have
been developed. The comprehensive model consists of constructs and items
(variables) explored from both the literature and field study. The following table 6.1
presents all of the hypotheses developed above.
Table 6.1: Summary of developed Hypothesis
Constructs Link Hypothesis Hypothesis statement Political Action(PA)
PA→CR
H1a Non-supportive political action (PA) increases the country risk (CR)
PA→SD
H1b Non-supportive political action (PA) decreases the supply-side drivers (SD) of the RMG industry of Bangladesh
PA→SB
H1c Non-supportive political action (PA) increases the supply-side barriers (SB) of the RMG industry of Bangladesh
PA→DD
H1d Non-supportive political action (PA) decreases the demand-side drivers (DD) of the RMG industry of Bangladesh
PA→DB
H1e Non-supportive political action (PA) increases the demand-side barriers (DB) of the RMG industry of Bangladesh
PA→COM
H1f Non-supportive political action (PA) decreases the tendency to improve the competitiveness (COM) of the RMG industry of Bangladesh
Bureaucratic Behaviour(BB)
BB→CR
H2a Non-supportive bureaucratic behaviour (BB) increases the country risk (CR)
BB→SD
H2b Non-supportive bureaucratic behaviour (BB) decreases the supply-side drivers (SD) of the RMG industry of Bangladesh
BB→SB
H2c Non-supportive bureaucratic behaviour (BB) increases the supply-side barriers (SB) of the RMG industry of Bangladesh
BB→DB
H2d Non-supportive bureaucratic behaviour (BB) increases the demand-side barriers (DB) of the RMG industry of Bangladesh
BB→COM
H2e Non-supportive bureaucratic behaviour (BB) decreases the tendency to improve the competitiveness (COM) of the RMG industry of Bangladesh.
Country Risk(CR)
CR→SD
H3a Non-supportive country risk (CR) decreases the supply-side drivers (SD) of the RMG industry of Bangladesh
CR→SB
H3b Non-supportive country risk (CR) increases the supply-side barriers (SB) of the RMG industry of Bangladesh
CR→DD
H3c Non-supportive country risk (CR) decreases the demand-side drivers (DD) of the RMG industry of Bangladesh
CR→DB
H3d Non-supportive country risk (CR) increases the demand-side barriers (DB) of the RMG industry of Bangladesh.
CR→COM
H3e Non-supportive country risk (CR) decreases the tendency to improve the competitiveness (COM) of the RMG industry of Bangladesh
Supply side Drivers(SD)
SD→COM
H4 Supply-side drivers (SD) positively influence the improvement of the competitiveness (COM) of the RMG industry of Bangladesh.
Supply side Barriers(SB)
SB→COM
H5 Supply-side barriers (SB) negatively influence the improvement of the competitiveness (COM) of the RMG industry of Bangladesh
Demand side Drivers(DD)
DD→COM
H6 Demand-side drivers (DD) positively influence to the improvement of competitiveness (COM) of RMG industry of Bangladesh
Demand side Barriers(DB)
DB→COM
H7 Demand-side barriers (DB) negatively influence the improvement of the competitiveness (COM) of the RMG industry of Bangladesh.

146
6.3 Questionnaire Development
This section describes the development of a questionnaire to conduct the survey and
to test the research hypotheses according to the comprehensive model as proposed in
figure 5.13. This section also describes the development of measurement
scales/instruments based on the final research model. However, the questionnaire
was developed based on the existing relevant literature and the field study. There are
in total eight constructs and 56 variables or items in the comprehensive research
model. Multiple items have been developed for each construct to ensure valid
measurement and reliability. To develop the measurement items, the extensive
literature review was undertaken first followed by the field study.
There are four sections (demographic, external stakeholder, internal stakeholder and
competitiveness) in the questionnaire in accordance with the focus of the study and
the comprehensive model. The first section contains questions about the
demographic background of respondents and about their organisations. Different
types of categorical questions were considered here including gender, age, education,
current position, years in current organisation, years in current position, field of work
and organisation’s growth status. The second and third sections focused on
measuring the influential formative and reflective constructs in the process of the SC
as proposed in the research model. In these two sections, respondents were asked to
rate their opinion on the statements as per a 6-point Likert scale regarding the
elements of external and internal stakeholders involved in the RMG industry SC.
The last section was constructed with questions to measure the final construct
“competitiveness” which is the ultimate goal of the proposed research model. In this
last section, respondents were also asked to rate their opinion on the statements
regarding achieving competitiveness as per a 6-point Likert scale.
6.3.1 Measurement instrument development
This section describes the development of measurement instruments based on the
comprehensive model for improving competitiveness in the RMG sector through the
SC process. The model contains eight constructs and 56 items/variables. Taking into
consideration these items, the questionnaire comprises 56 main questions in addition
to the questions regarding demographic issues. The respondents’ demographics were
measured by nominal and ordinal scales (Malhotra, 2004) and the remainder of the
56 measurement instrument items were measured by interval scale (Malhotra, 2004).

147
Using the interval scale, a 6-point Likert scale was chosen as it is argued that
respondents choosing a neutral default option (through having six points) will be
prevented (Malhotra, 2004). It is also argued that respondents from Asian countries
have a high tendency to choose the neutral response (Trompenaars & Hampden-
Turner, 1997). Therefore, respondents were asked to choose the appropriate number
on a scale of ‘1’ (strongly disagree) to ‘6’ (strongly agree). The 6-point Likert scale
allowed the following options: ‘1’ (strongly disagree), ‘2’ (disagree), ‘3’ (somewhat
disagree), ‘4’ (somewhat agree), ‘5’ (agree) and ‘6’ (strongly agree). These six
options were presented to respondents for all 56 items. Cooper and Schindler (2008)
reiterated that the respondents’ preference to choose the middle response would lead
to a central tendency error. Therefore, the middle response for a 7-point Likert scale
“neither agree nor disagree” was removed and the final result of a 6-point Likert
scale for all items was accepted.
Two types of constructs are broadly used in studies in the literature, that is, reflective
and formative (Roberts and Thatcher 2009). Constructs are not inherently formative or
reflective in nature: a construct can be exhibited as having either formative or reflective
items (indicators) depending upon the relationship between an item and the latent
construct with which it is associated (MacKenzie, Podsakoff, and Podsakoff 2011).
The construct is called reflective when different items of a construct represent
reflection or manifestations of that construct (Fornell and Bookstein 1982; Gefen,
Straub, and Boudreau 2000). Reflective items are deemed to be caused by the latent
construct: any change to or removal of an item does not change the result or the
essential nature of the corresponding latent construct. Therefore, items of the
reflective construct are internally consistent and correlated (Fornell and Bookstein
1982; Nunnally and Bernstein 1994).
On the other hand, formative items (indicators) are viewed as causes of constructs.
Hence, a formative construct is formed or induced by its indicators or items (Fornell
and Bookstein 1982; Roberts and Thatcher 2009). The formative items show the
opposite direction of causal relationship (Diamantopoulos and Winklhofer 2001).
Due to the causal relationship between items and the latent construct, changes in the
items do not cause changes in the construct and changes in the construct do not cause
changes in the items (Jarvis, Mackenzie, and Podsakoff 2003). Therefore, formative
items are not correlated and measure different underlying dimensions of the latent
construct (Chin 1998).

148
Jarvis, MacKenzie and Podsakoff (2003) have developed a set of conceptual criteria
that can be used as a guideline for determining whether the construct is reflective or
formative. In accordance with findings from Roberts and Thatcher (2009), the
differences between formative and reflective constructs and their items (indicators)
are briefly presented in table 6.2.
Taking into consideration the above concepts for defining constructs, this research
has applied Jarvis, Mackenzie, and Podsakoff’s (2003) four primary decision rules
for determining whether the constructs, namely, political action (PA), bureaucratic
behaviour (BB), country risk (CR) should be conceptualized as reflective or
formative. In this study, considering the direction of causality, of the eight constructs
above three have been declared as formative and the other five, that is, supply-side
drivers (SD), supply-side barriers (SB), demand-side drivers (DD), demand-side
barriers (DB) and competitiveness (COM) have been declared as reflective.
Table 6.2: Differences between formative and reflective indicators
Concept Formative Indicators Reflective Indicators Causality Formative indicators are viewed
as causes of constructs. The construct is formed or induced by its measures (Fornell and Bookstein 1982).
Constructs are viewed as causes of reflective indicators (Bollen 1989). Reflective indicators represent manifestations of a construct (Fornell and Bookstein 1982).
Interchangeable Not interchangeable “omitting an indicator is omitting a part of the construct” (Bollen and Lennox 1991).
Interchangeable – the removal of an item does not change the essential nature of the construct. Although every item need not be the same, researchers need to capture it.
Validity Indicators are exogenously determined; hence, correlations are not explained by the measurement model (Bollen 1989).
Validity of indicators can be assessed through the measurement model (Bagozzi, Yi, and Phillips 1991).
Source: Roberts and Thatcher (2009)
Thus of the total number of 56 items under the eight constructs in the comprehensive
model, 19 items were formative and 37 items were reflective.
However, for each of the eight constructs, multiple item measures were applied to
provide a comprehensive evaluation with regard to achieving competitiveness in the
RMG industry SC. As mentioned before, the measurement items of the construct and
the related statements were based on the final model for improving competitiveness
which evolved from the field study and related literature review. Details of the
measurement items for each construct are presented in the following sections.

149
6.3.1.1 Questionnaire section one: Demographic measures
The objective of this section was to collect demographic particulars about the
respondents involved in this research. The demographic particulars included the
respondents’ details such their name, gender, age, education, experience and position
at the garments’ company and the company’s details such as its present status,
growth, competitiveness, etc. Table 6.3 presents the demographic measurement
items, measurement statements and related references.
Table 6.3: Measurement of demographics
Constructs Variables/Items Statement/Measures Sources( references) Demographic Gender (D1) Nominate gender (Morris and Venkatesh 2006;
Moores and Chang 2006) Age (D2) Nominate age group (Moores and Chang 2006) Education(D3) Nominate the highest level
of education (Kelley, Ferrell, and Skinner 1990; Robinson and Sexton 1994)
Current position(D4) Nominate the level of current position
(Ramasamy and Ting 2004)
Experience (D5) Nominate the level of experience
Developed for this study
Size of company(D6) Total number of employees Developed for this study Growth of the company(D7)
Nominate the level of growth
Developed for this study
The questions in this section were measured by nominal and ordinal scales. A
nominal scale was used for only one question in this section, that is, D1. An ordinal
scale was used for the questions D2, D3, D5, D6 and D7. An open-ended question
was used for the question D4.
6.3.1.2 Questionnaire section two: External stakeholders in the RMG industry’s supply chain
Some stakeholders are indirectly involved with the RMG industry’s SC. They are not
directly influencing the internal stakeholders and ultimately the industry’s
competitiveness but they have sufficient influence to make the SC more competitive
and to improve its competitiveness. The government, political parties and
bureaucrats are examples of this type of stakeholder. They influence the internal
stakeholder and the RMG industry’s SC through their different types of activities
and role. Therefore, two constructs, political action (PA) and bureaucratic behaviour
(BB) have been considered to align the questionnaire to the comprehensive research
model. Another construct, country risk (CR), is the ultimate result or interaction of
those two constructs and it has also been considered with regard to the
competitiveness of the RMG industry’s SC.

150
6.3.1.2.1 Political action (PA)
Political action means the political role of the government and the opposition parties.
It reflects the political activities that occur in the development process of
international business such as RMG exports. It refers to the direct influence of
external stakeholders or country factors such as political parties on competitiveness
or via supply-side and demand-side issues. There are many aspects such as
functional support, utilities support, logistics support, development of relationships
among stakeholders, support in trade facilitating services, etc. that need to be
considered in the SC of the RMG business process. Six items were used to measure
the political action (PA) construct as per the final model. These six items were as
follows: political role in policy design (PA1), political role in utilities support (PA2),
insufficient logistics support (PA3), stakeholder relations (PA4), trade facilitating
services (PA5) and government roles (PA6).
Taking into consideration these items, six measurement statements were prepared
and in accordance with these statements, six questions were presented in the
questionnaire to measure the PA construct. Table 6.4 describes the details for the PA
construct including references.
Table 6.4: Measurement of political action
Constructs Variables/Items Statement/ Measures Sources References
Political Action(PA)
Political role in policy design (PA1)
Political parties are not sincere and careful in designing a good and effective policy with ref. to RMG industry.
Literature review/ Field study
Miller 1993; Hadjikhani et al. 1996; Soss 1999; Adhikari et al. 2007; Holtburg et al. 2007; Berik et al. 2009
Political role in utilities support (PA2)
Political parties are not giving proper attention to the uninterrupted utilities supply with ref. to RMG industry.
Literature review/ Field study
Hadjikhani et al. 1996; Soss 1999; Uddin 2006; Adhikari et al. 2007; Holtburg et al. 2007; Cheo et al. 2011
Insufficient logistics support (PA3)
Political parties are not giving proper attention to the development of logistics (transportation, warehousing and shipping) systems.
Literature review/ Field study
Hadjikhani et al. 1996; Razzak 1997; Adhikari et al. 2007; Haider 2007; Holtburg et al. 2007
Stakeholder relations (PA4)
There is no political initiative to develop stakeholder relations.
Literature review/ Field study
Hadjikhani et al. 1996; Reed 2000; Holtburg et al. 2007; Razzaque et al. 2008; Barro et al. 2009; Berg et al. 2011
Trade facilitating services (PA5)
Political parties are not giving proper attention to the development of facilitating services (banking services, customs, export oriented support, etc.).
Literature review/ Field study
Hadjikhani et al. 1996; Adhikari et al. 2007; Holtburg et al. 2007; Nuruzzaman 2007; Nuruzzaman 2008; Uzzaman 2010
Government role (PA6)
The government does not play any role to decrease labour unrest, destructive political action, etc.
Literature review/ Field study
Hadjikhani et al., 1996; Absar, 2003; Hillman, 2003; Hillman & Wan, 2005; Khondker et al., 2005; Adhikari, 2007; Haider, 2007; Holtburg et al., 2007; Berik et al., 2009

151
6.3.1.2.2 Bureaucratic behaviour (BB)
The construct, bureaucratic behaviour (BB), refers to the influence of external
stakeholders like bureaucrats on the RMG industry’s SC competitiveness directly or
via suppliers’ side issues. Bureaucrats are responsible for executing the decisions of
the government or political leaders to maintain the day-to-day regulatory and service
functions of the state. The context of BB is revealed by bureaucratic behaviours and
decisions. The bureaucrats are part of the government of a country and play an
important role in making decisions regarding administration and development in any
sector of that country.
Bureaucrats play an important role in any business process or commercial
transaction. Therefore, as an external stakeholder, BB is a very important and
influential measure with respect to competitiveness. There are six measurement
items or variables to measure the construct. Table 6.5 shows the details of the six
variables with their related references.
Table 6.5: Measurement of bureaucratic behaviour (BB)
Constructs Variables/Items Statement/ Measures Sources References Bureaucratic Behaviour(BB)
Administrative support system (BB1)
Bureaucratic systems in office management are creating hindrances to the increase in competitiveness of the RMG industry of Bangladesh
Literature review/ Field study
Nimir et al. 1982; Hadjikhani et al. 1996; Quddus et al. 1999; Uzzaman 2010
Professionalism and support services (BB2)
Due to lack of professionalism, bureaucrats are not helpful in support services (e.g. banking services, diplomatic support etc.)
Literature review/ Field study
Hadjikhani et al. 1996; Quddus et al. 1999; Adhikari et al. 2007; Berg et al. 2011
Lack of coordination among the officials (BB3)
There is insufficient coordination among the officials of various supporting offices with regard to the RMG business
Literature review/ Field study
Hadjikhani et al. 1996; Quddus 2001; Adhikari et al. 2007; Berg et al. 2011; Islam et al. 2012
Inefficient documentation and approval system (BB4)
Documentation with reference to the RMG business and their approval system is inefficient and slow
Literature review/ Field study
Hadjikhani et al. 1996; Quddus 2001; Adhikari et al. 2007
Poor management, knowledge and delivery of performance (BB5)
Bureaucrats have no proper knowledge about the RMG business and their delivery of services is not good
Literature review/ Field study
Hadjikhani et al. 1996; Quddus et al. 1999; Islam et al. 2012
Corruption and non-co-operational attitude (BB6)
Bureaucrats are always non cooperative and they demand bribes for all types of services
Literature review/ Field study
Hadjikhani et al. 1996; Quddus et al. 1999; Quddus 2001; Uzzaman 2010

152
6.3.1.2.3 Country risk (CR)
The construct, country risk (CR) is the result of political, social and economic
factors. It also includes risks arising from a variety of national differences in
economic structures, policies, socio-political institutions, geography and currencies.
Country risk always increases due to activities of political parties, the government
and bureaucrats.
In this study, country risk encompassed the ultimate result of different government
roles, noncooperation and misunderstanding between the ruling party and the
opposition, and the activities of bureaucrats. The RMG industry’s SC will be
affected when CR is higher which will weaken the competitiveness of the RMG
industry’s SC. Moreover, in this study, CR referred to the influence of external
stakeholders on the RMG industry’s SC competitiveness as being a combined result
of political action and bureaucratic behaviour.
The CR construct was measured by seven items as per the final model. The seven
items were as follows: political environment (CR1), trust and commitment among
the stakeholders (CR2), business environment (CR3), unskilled labour and
productivity (CR4), lack of government support (CR5), import dependency (CR6)
and unawareness of government and bureaucrats (CR7).
These seven measurement items were used to measure the CR construct. All the
items are formative in nature. The CR construct and its measurement items are listed
in the table 6.6.
Table 6.6: Measurement of country risk (CR) Constructs Variables/Items Statement/ Measures Sources References Country Risk (CR)
Political environment (CR1)
Unstable and corrupt political environment in Bangladesh
Literature review/ Field study
Ring et al. 1990; Hadjikhani et al. 1996; Quddus et al. 1999; Otzel et al. 2001; Holtburg et al. 2007; Uzzaman 2010; Hossan et al. 2012
Trust and commitment among the stakeholders (CR2)
Lack of trust and commitment among the government or political parties and suppliers with ref. to RMG industry
Literature review/ Field study
Jones 1995; Hadjikhani et al. 1996; Selnes 1998; Reed 2000; Hadjikhani et al. 2005; Holtburg et al. 2007; Clark et al. 2010; Hossan et al. 2012
Business environment (CR3)
The business environment with ref. to RMG industry is not good in Bangladesh
Literature review/ Field study
Hadjikhani et al. 1996; Haider 2007; Clark et al. 2010; Berg et al. 2011; Hossain et al. 2012; Hossan et al. 2012

153
Constructs Variables/Items Statement/ Measures Sources References Unskilled labour and
productivity (CR4) Labourers’ productivity is not enough as the labourers of the Bangladeshi RMG industry are not educated and trained
Literature review/ Field study
Goonatilake 1990; Nicholas et al. 1995; Prasad 2003; Adhikari et al. 2007; Razzaque et al. 2008; Berg et al. 2011; Hossan et al. 2012
Lack of government support (CR5)
Government does not provide logistics support for the development of RMG business.
Literature review/ Field study
Hadjikhani et al. 1996; Hadjikhani et al. 2005; Haider 2007; Clark et al. 2010; Berg et al. 2011; Hossan et al. 2012
Import dependency (CR6)
The RMG industry, especially the woven sector of this industry, is highly dependent on imported raw materials
Literature review/ Field study
Adhikari et al. 2007; Haider 2007; Nuruzzaman 2009; Nuruzzaman 2001; Nuruzzaman et al. 2010;Berg et al. 2011; Hossan et al. 2012
Unawareness of government and bureaucrats (CR7)
Government and bureaucrats have no clear concept and knowledge about the RMG industry of Bangladesh
Literature review/ Field study
Quddus et al. 1999; Choudhury et al. 2005; Berg et al., 2011; Hossan et al. 2012
6.3.1.3 Questionnaire section three: Internal stakeholders in the RMG industry’s supply chain
The buyers and the manufacturers (suppliers) of RMG products are the two main
internal stakeholders in the RMG industry’s SC. Many issues related to the buyers’
and suppliers’ activities have been identified from the previous literature and field
study according to the comprehensive research model. Some issues are strengths and
some issues are barriers for the suppliers and buyers. Strengths are indicated as
drivers in the supply chain and weaknesses are the barriers of the supply chain.
However, four constructs have been identified from the supply and demand side as
per the research model.
6.3.1.3.1 Supply-side drivers (SD)
In the SC of the RMG industry, the buyers (customers) and suppliers
(manufacturers) are the two main important stakeholders (Berg et al. 2011; Razzaque
and Eusuf 2008). In the RMG business, supply-side drivers are the suppliers’
strengths which passively play positive roles for the SC (Adhikari and Weeratunge
2007; Ahmed 2009).These are in the form of competitive price, cheap labour, quality

154
Table 6.7: Measurement of supply-side drivers (SD)
Constructs Variables/Items Statement/ Measures Sources References Supply-Side Drivers (SD)
Cheap and available labour (SD1)
Labourers are available and cheap in the RMG industry of Bangladesh
Literature review/Field study
Adhikari et al. 2007; Nuruzzaman et al. 2010: Nuruzzaman 2001: Razzaque 2008; Berg et al., 2011; Hossan et al. 2012; Haider 2007
Complying with buyers’ standards and needs (SD2)
Manufacturers are capable of complying with the buyers’ requirements
Literature review/Field study
Islam and Deegan 2008; Razzaque 2008; Adhikari 2006
Favourable international trade environment (GSP facility) (SD3)
Manufacturers are enjoying a favourable international trade environment
Literature review/Field study
Adhikari et al. 2007; Razzaque 2008 ; Haider 2007; Nuruzzaman et al. 2010; Berg et al., 2011; Hossan et al. 2012
Price and quality (SD4)
Manufacturers are capable of offering competitive price and quality
Literature review/Field study
Razzaque 2008 Saxena 2010; Haider 2007; Nuruzzaman 2009
Efficiency (and experience, convincing power, loyalty) (SD5)
Manufacturers are experienced and efficient enough
Literature review/Field study
Razzaque 2008; Nuruzzaman 2008; Adhikari et al 2006
Loyalty and devotedness (work spirit) (SD6)
Manufacturers are loyal and devoted to their buyers
Field study Field study
products, marketing strength, experience in working with reputed brands and the
largest companies like Wal-Mart, Tesco, H&M, etc.( Rahman 2005; Rahman and
Anwar, 2006). However, after undertaking the literature review and field study, six
drivers were finalised under the construct of SD, thus forming the measurement
items of SD. All these items were reflective in nature. The SD construct and its
measurement items are listed in the above table 6.7. These items were finally
considered in developing the questionnaire for the field study.
6.3.1.3.2 Supply-side barriers (SB)
As previously indicated, barriers are defined as perceived or likely constraints
(Quaddus and Didi 2005). In the SC of the RMG business, supply-side barriers are
the weaknesses (Adhikari and Weeratunge 2007; Ahmed 2009) of the RMG
industry. The barriers are factors such as: poor infrastructure, long lead time, lack of
commitment and trust, weak bargaining power, lack of cooperation, lack of
government support, etc. (Nuruzzaman, Haque, and Rafiq 2010; Adhikari and
Weeratunge 2007b; Kale 2007; Nuruzzaman 2001; Berg et al. 2011; Halder and Kim
2012; Sultana et al. 2011). There were 10 supply-side barriers that were confirmed
after the literature review and field study. As supply-side barriers are an important
issue in the RMG industry’s SC, this element has been considered as an important
construct from the internal stakeholders’ point of view.

155
Moreover, as an internal stakeholder, SB is a very important and influential measure of
competitiveness. There were ten measurement items or variables used to measure the
SB construct. Table 6.8 shows the details of the items with their related references.
Table 6.8: Measurement of supply-side barriers (SB)
Constructs Variables/Items Statement/ Measures Sources References Supply-Side Barriers (SB)
Lack of raw materials (SB1)
Manufacturers are facing inadequate and regular lack of raw materials’ supply
Literature review/ Field study
Nuruzzaman 2001: Nuruzzaman et al. 2010; Adhikari et al. 2007; Haider 2007; Islam et al 2012; Habib 2009
Import dependency and long lead time (SB2)
Manufacturers are dependent on imported raw materials that increase the lead time
Literature review/ Field study
Nuruzzaman, 2001; Nuruzzaman et al. 2010; Adhikari et al. 2007; Kaes et al. 2009; Haider 2007; Islam et al 2012
Lack of govt. knowledge and role (SB3)
Manufacturers do not get proper support from the government and bureaucrats due to lack of knowledge about RMG business
Literature review/ Field study
Razzaque et al 2008; Khandker 2011; Ahmed 2009
Stakeholder relationships (SB4)
Relationships are not good among the stakeholders (buyers, suppliers, government officials) in the supply chain
Literature review/ Field study
Jones 1995; Reed 2000; Saxena et al. 2010; Abdin 2008; Nidhi Khosla 2009
Lack of business and technological knowledge (SB5)
Many manufacturers have insufficient business and technical knowledge to run the RMG business
Literature review/ Field study
Adhikari et al. 2007; Adhikari 2006 Islam et al 2012; Ahmed 2009
Political disturbance (SB6)
Manufacturers are always facing various political disturbances
Literature review/ Field study
Hossan et al. 2012; Berg et al 2001; Razzaque et al 2008; Islam et al. 2012
Unfavourable bureaucratic behaviour (SB7)
Bureaucrats are not supportive in the smooth running of RMG supply chain process
Literature review/ Field study
Adhikari et al. 2007; Adhikari 2006; Berg 2011; Razzaque et al 2008; Islam 2012
Lack of functional support and facility (SB8)
Manufacturers are not getting proper support in policy making and other facilitating services
Literature review/ Field study
Adhikari et al. 2007; Adhikari 2006; Berg 2011; Islam 2012;
Lack of skilled labour and productivity (SB9)
Manufacturers are facing problems with the shortage of trained and skilled employees.
Literature review/ Field study
Adhikari et al. 2007; Adhikari 2006; Moazzem 2011; Islam 2012; Claeys 2008; Ahmed 2009
Lack of attention on the workers’ rights (SB10)
Manufacturers are facing the problem of workers’ unrest due to lack of concern about workers’ rights
Literature review/ Field study
Uddin 2006 ; Adhikari 2006; Hossan et al. 2012; Claeys 2008
6.3.1.3.3 Demand-side drivers (DD)
In the SC of the RMG industry, the buyers are one of the most important
stakeholders (Berg et al. 2011; Razzaque and Eusuf 2008). In the RMG business,
demand-side drivers are the buyers’ strengths which passively play positive roles in
the SC (Razzaque and Eusuf 2008; Ahmed 2009). Demand-side drivers include the

156
following: strong bargaining power, ability to choose alternative suppliers from
another country, ability to offer a good price, a bulk customer, brand name, special
facility like GSP or quotas for importing garments from member countries of the
LDCs, trust and commitment, etc. (Wu et al. 2004; Rahman 2005; Zhao et al. 2008).
Two additional strengths were found in the field study, namely, buyers’ capacity to
purchase and credit history. Therefore, after the field study and literature review, six
drivers were selected for this study and to develop the questionnaire.
Furthermore, as an internal stakeholder, buyers’ strengths or demand-side drivers
(DD) have an important role in the RMG business and also in its SC in improving
competitiveness. There were six measurement items or variables used to measure the
DD construct. Table 6.9 shows the details of the items with their related references.
Table 6.9: Measurement of demand-side drivers (DD)
Constructs Variables/Items Statement/ Measures Sources References Demand-Side Drivers (DD)
Favourable bargaining power (DD1)
Buyers have bargaining power as it is the buyers’ market
Literature review/ Field study
Wu et al., 2004; Zhao et al., 2008
Flexibility and less formal (DD2)
Flexible and less formal buyers have more acceptability in doing business with Bangladeshi RMG sector
Field study
Field study
Buyers’ brand (DD3)
Manufacturers are willing to do business with buyers’ reputed brand
Literature review/ Field study
Wu et al., 2004; Adhikari et al., 2007; Zhao et al., 2008
Facilities from the local country’s government (DD4)
Favourable international trade environment for Bangladesh is helpful for the buyers to do business with Bangladeshi RMG sector
Literature review/ Field study
Wu et al., 2004; Razzaque et al., 2008; Zhao et al., 2008
Bulk and frequent purchase (DD5)
Buyers who place bulk orders and purchase regularly get more advantages in RMG business
Field study
Field study
Buyers’ credit history (DD6)
Buyers with good transaction/credit history get greater RMG business
Field study
Field study
6.3.1.3.4 Demand-side barriers (DB)
Demand-side barriers mean barriers that are created by or in regards to the buyers. In
the RMG industry SC, buyers can create a problem in terms of improving the
competitiveness of the RMG industry. In the RMG business, demand-side barriers are
buyers’ weaknesses (Adhikari and Weeratunge 2007; Ahmed 2009) which play
negative roles in the SC. Barriers include the pressure for shorter lead time; raising the
issue of NGOs’ complaints about human rights and better working conditions;

157
pressures with regard to international labour standards; different types of conditions
and regulations imposed on the suppliers; and different types of conditions and
regulations imposed by the local Bangladeshi government (Nuruzzaman 2001;
Nuruzzaman, Haque, and Rafiq 2010; Adhikari and Weeratunge 2007; Razzaque and
Eusuf 2008). Compliance issues, pressure to reduce prices and lead time barriers were
raised by the buyers (Rahman, Bhattacharya, and Moazzem 2008; Rahman 2005;
Claeys and Brachet 2008; Islam, Begum, and Rashed 2012; Islam and Deegan 2008).
Nonetheless, after the above literature review and field study, finally six items were
identified for measuring the demand-side barriers construct. Table 6.10 shows details
of the items with their related references.
Table 6.10: Measurement of demand-side barriers (DB)
Constructs Variables/Items Statement/ Measures Sources References Demand-Side Barriers (DB)
Compliance issues Compliance issues arising from the buyers create obstacles for RMG business
Literature review/ Field study
Islam et al. 2008; Islam et al. 2011; Razzaque et al. 2008
Various terms and conditions (buyers)
Terms and conditions from the buyers create problems for regular RMG business
Literature review/ Field study
Claeys et al 2008; Razzaque et al. 2008; Islam et al. 2008; Adhikari et al. 2007
Tariff and regulatory issues
Buyer-side tariff and regulatory issues create problems for RMG business
Literature review/ Field study
Claeys et al 2008; Razzaque et al. 2008; Islam et al. 2008; Adhikari et al. 2007
Use of middlemen Doing business via middlemen make the supply chain longer
Literature review/ Field study
Uddin, 2006; Adhikari et al. 2007; Razzaque et al. 2008
Trust Buyers’ lack of trust with the suppliers make the supply chain inefficient
Field study
Field study
Relationships Weak relationships between buyers and suppliers make the supply chain inefficient
Literature review/ Field study
Wu et al. 2004; Zhao et al. 2008; Razzaque et al. 2008
6.3.1.4 Questionnaire section four
This was the final stage of the comprehensive model for improving competitiveness.
In this stage, some measures or items were initially finalised to measure the
competitiveness construct. Later on, the questionnaire was developed to collect
quantitative data in connection with improving the competitiveness of the
Bangladeshi RMG industry.
6.3.1.4.1 Competitiveness (COM)
Competitiveness is the ability to compete. A few definitions of competitiveness exist
in the literature. Competitiveness is defined as the ability to sustain trade in the local
and global environment (Rooyen, Stroebel, and Esterhuizen 2010).

158
Porter (1990) defined competitiveness as productivity growth that is reflected in
either lower cost or differentiated products that command premium prices.
Competitiveness can be defined as the ability of a firm to design, produce and/or
market products superior to those offered by competitors, considering the price and
non-price qualities (D’Cruz and Rugman 1992; Ambastha and Momaya 2004). In
this study, competitiveness is defined as the ability to sustain a global export
business by increasing productivity and reducing cost and lead time. Moreover, after
the literature review and field study, nine items were considered to measure the
competitiveness construct of the RMG industry. Table 6.11 presents the items used
to measure competitiveness. Taking into consideration these nine items, statements
were made for the questionnaire which was used to collect quantitative data.
Table 6.11: Measurement of competitiveness (COM)
Constructs Variables/Items Statement/ Measures Sources References Competitiveness(COM)
Productivity (COM1)
Productivity at all stages of supply chain improve competitiveness
Literature review/ Field study
Porter, 1990; Rahman et al. 2006; Quddus et al. 1999 ; Ferdousi et al 2009
Cost efficiency (COM2)
Cost efficiency in different stages of supply chain achieve competitiveness
Literature review/ Field study
D’Cruz, 1992; Ambastha, 2004; Quddus et al. 1999; Ferdousi et al 2009
Stakeholder relations (COM3)
Collaborative relationships among the stakeholders of the supply chain improve competitiveness
Literature review/ Field study
Jones, 1995; Reed, 2000 ; Khondker et al. 2005; Berik et al. 2009; Saxena 2010
Delivery time or lead time (COM4)
Reduction of lead time through appropriate activities(operational and transactional) in the supply chain improves competitiveness
Literature review/ Field study
Bhatnagar, 2005; Quddus et al. 1999; Nuruzzaman 2009; Nuruzzaman 2008; Kaes 2009; Claeys et al 2008; Ferdousi et al 2009
One-stop service (COM5)
One-stop service in domestic RMG-related activities in the upstream and downstream supply chain ensures competitiveness
Literature review/ Field study
Buckley et al., 1988; Nuruzzaman 2001; Nuruzzaman 2007; Razzaque et al. 2008; Ferdousi et al 2009
Government control and support(COM6)
Government support at all levels of RMG-related activities improves competitiveness
Literature review/ Field study
Kee 2005;Absar 2003; Razzaque et al. 2008
Quality product and competitive price (COM7)
Competitive price and quality of RMG products ensure competitiveness
Literature review/ Field study
Absar 2003;Adhikari et al. 2007; Razzaque et al. 2008; Claeys et al 2008;
Reduction of import dependency (COM8)
Reduction of import dependency improves competitiveness
Literature review/ Field study
Adhikari et al. 2007; Nuruzzaman 2009; Nuruzzaman 2008; Razzaque et al. 2008; Halder et al 2012
Technological advances (COM9)
Technological advances at all levels of RMG supply chain improve competitiveness
Literature review/ Field study
Adhikari et al. 2007; Razzaque et al. 2008

159
6.4 Pre-testing the Research Instrument
The questionnaire was carefully investigated to test the validity of the questionnaire
and to rectify any measurement-problem. This was also done to find out if there were
any abnormalities in the questionnaire. The questionnaire was distributed among
10 managers, as suggested by Frazer and Lawley (2000). The whole process of pre-
testing was discussed in greater detail in chapter 4, section 4.6.2. After receiving
feedback, some modifications were made. For example, a question related to the
competitiveness construct (COM1) “Manufacturers’ productivity should be
increased to improve competitiveness” was in the initial questionnaire but, after
feedback, a modification was made so that it then became “Productivity at all stages
of the supply chain improve competitiveness” and this was included in the final
questionnaire. The complete questionnaire has been attached in appendix-3.
6.5 Summary
This chapter presented the development of the 20 hypotheses derived from the
conceptual research model finalised in chapter 5. The rationalisation for each
hypothesis was presented in detail. This chapter also described in detail the
development of the questionnaire, that is, the survey instrument which was based on
the eight constructs identified in the conceptual model. In total, 56 items were
derived for this questionnaire under the eight constructs. The items were thoroughly
referenced from both relevant literature and field study data. To test the validity of
the questionnaire, a pilot study was carried out. The final questionnaire was then
distributed for the survey. The following chapter will discuss the analysis of the
quantitative data in the survey.

160
CHAPTER 7
Survey and Quantitative Data Analysis5
7.1 Introduction
Previous chapters have developed the hypotheses and the questionnaire to test the
comprehensive research model as proposed earlier for enquiring about the
improvement of competitiveness in the RMG industry of Bangladesh. A survey was
conducted on managers of marketing and merchandising departments working in
different garment companies in Bangladesh. As a result, data from 253 valid
respondents were collected. Using these data, chapter 7 presents the empirical results
of the data analysis using partial least squares (PLS) procedure based on the
structural equation modelling (SEM) technique (Chin 1998a). Analysis of the
measurement model for item reliability, internal consistency, convergent validity and
discriminant validity is conducted first. This is followed by the analysis of the
structural model using the bootstrapping procedure to evaluate the significance of the
paths in the model and to measure the explained variance, R².
Therefore, the organisation of this chapter is as follows. This chapter starts with the
overview of the survey that was undertaken to provide the details for this method. A
descriptive analysis of the survey respondents is then presented, generated by IBM
SPSS 21 version in order to understand the demographics of the sample population.
Following this, the empirical results from the survey are presented followed by a
discussion section.
5Part of this chapter has been presented at the following conferences: Nuruzzaman, M., Quaddus, M., Jeeva, A. and Khan, E. Ahmed (2013), " The influence of External Stakeholder
in the Competitiveness of Ready-Made Garment (RMG) Industry: A study on RMG Supply Chain in Bangladesh", In proceedings of the Business & Economics Society International Conference (B&ESI), January 7-10, Perth, Western Australia
Nuruzzaman, M.( 2013), " The influence of Bureaucratic Behaviour to Improve the Competitiveness of RMG industry”, In proceedings of Emerging Research Initiatives and Development in Business, CGSB Research Forum, 9-10 May, Curtin University, Perth, Western Australia
Nuruzzaman, M., Chowdhury, M., Quaddus, M. and Jeeva, A. (2013), “()Achieving Competitiveness through Analysing Supply Chain: A Test of Political Stakeholder’s Action in Readymade Garment (RMG) Industry of Bangladesh” In proceedings of the 3rd International Forum & Conference on Logistics and Supply Chain Management(LSCM), June 27-29, Bali, Indonesia

161
7.2 Overview of the Survey
7.2.1 Administration of the survey
The first phase of the survey was conducted among more than 15 private sector
organisations of RMG industry in the city of Dhaka, Bangladesh. In conducting that
survey, the researcher (the author) himself was physically present and worked for
almost two months with respondents to collect data and questionnaires. The
organisations were selected based on the BGMEA member list (Batexpo, 2010).
Taking into consideration accessibility, 70 organisations were purposively selected
for this survey. In this survey, 580 questionnaires were distributed to different
organisations directed to top- and middle-level executives and managers who had
sufficient job experience in marketing and merchandising departments in the selected
organisations. The questionnaire was distributed personally through the researcher
and the research assistant by contacting the human resource (HR) department
managers, departmental head and, sometimes, directly to the prospective
respondents. Many questionnaires were distributed electronically to respondents’
email addresses. The reason for choosing the HR departments in the targeted
organisations was that they had records of the managers working in their
organisations, thus, it was easier to contact them. During the survey, the researcher
(the author) trained three people. They were employed to distribute and collect the
survey questionnaire. Follow-up calls and face-to-face meetings with the HR
managers were conducted to collect the survey. In the first phase, through two steps,
(131 + 77) 208 questionnaires were collected from the respondents with 34 (10 + 24)
responses received via email. The second phase was started after the researcher’s
return to Curtin University in Australia.
In the second phase, the researcher communicated on a regular basis with the help of
the three research assistants to distribute and collect the questionnaires. In addition,
telephone calls were frequently made and emails sent to the organisations and
directly to the respondents. In this stage, 77 questionnaires were collected within
one-and-a-half months of which 24 responses came through email but the remaining
45 questionnaires were collected by frequently sending reminders and leaving
messages by telephone calls and email for the next three to four months. Of these
45 returned questionnaires, 15 responses were received via email. The purpose of
multiple contacts with respondents was to reduce the non-response bias by

162
increasing the return rate (Bordens and Abbott 2008). The purposive sampling
procedure was the sampling design applied in this study (Creswell 2009; Malhotra
2004). At the end of the second phase of the distribution of the questionnaire, 122
(77 + 45) completed questionnaires were received by the researcher. Of the 70
organisations, 21 organisations did not participate in the survey. Moreover, of the
580 distributed questionnaires, there were 247 that were unreturned. The reasons for
the unreturned questionnaires were as follows:
� Management policies did not allow their employees to be involved in such studies
due to confidentiality reasons.
� Participants were busy and did not have time to fill in the questionnaire.
� Participants had lost the questionnaire copy given to them.
Eventually, the final response rate was 50.77%. In fact, Babbie (1990) has argued
that "a response rate of at least 50 percent is generally considered adequate for
analysis and reporting." Table 7.1 shows the sampling and response rate of this
research.
Table 7.1: Response rate
Subjects
Number of respondents Face-to-face survey Web survey Total
Gross sample 499 81 580 (-) unusable responses 03 00 03 Net sample size 497 81 577 Usable responses 204 49 253 Usable response rate 41.04% 60.49% 50.77%
7.2.2 Data screening
Before the data analysis process took place, the properties of the data had to be
assessed in advance. Researchers have to review the responses of individual
questionnaires, and then transfer the information from the questionnaires to a format
for statistical analysis (Neuman 2000). The data were reviewed to seek out errors in
the form of invalid data including blank questionnaires or missing values. All
questionnaires were sorted out based on inappropriate responses or incompleteness.
Overall, the survey responses were reported as having three invalid responses. This
procedure was carried out to produce clean data for the research analysis (Jackson
2008).

163
7.2.3 Non-response bias assessment Lewis, Templeton, and Byrd (2005) stated that "non-response bias in the returned
sample should be assessed to insure that the sample data adequately reflects the
population." Non-response bias tests check whether there is any difference between
the opinions of respondents and of non-respondents who could have participated in
the survey. The responses from the survey which were received within two-and-a-
half months were considered as early respondents and responses after three months
were considered as late respondents. Therefore, the respondents were grouped into
Group 1 and Group 2. Six variables were selected randomly to calculate the non-
response bias. Based on the results obtained from the Mann-Whitney U-Test, it was
noticed that there were no significant differences between the first wave and the
second wave.
The Mann-Whitney U-Test compared the following key demographics amongst the
different samples:
Level of education
Number of employees
Number of years in current position
The test also compared the following key perspectives on competitiveness in the
RMG industry:
Political parties do not sincerely and carefully design good and effective policies
Labourers are available and cheap in the RMG industry of Bangladesh
Manufacturers don’t get proper support from the government and bureaucrats
Favourable trade environment for Bangladesh is helpful for the buyers
Reducing lead time through appropriate activities in the supply chain.
Table 7.2: Mann-Whitney U-Tests for Group 1 and Group 2 samples
Variables/Items Z value Asymp.Sig.(2 tailed) Significance Level of education -.362 .717 No Number of employees -1.004 .315 No Number of years in current position -.163 .871 No Political parties do not sincerely and carefully design good and effective policies
-1.279 .201 No
Labourers are available and cheap in the RMG industry of Bangladesh
-.120 .904 No
Manufacturers don’t get proper support from the government and bureaucrats
-.181 .856 No
Favourable trade environment for Bangladesh is helpful for the buyers
-.884 .377 No
Reducing lead time through appropriate activities in the supply chain
-.797 .426 No

164
From the above result as shown in table 7.2, it is clear that the randomly selected
demographic variables were not significant. The analysis also showed that none of
the perceptions towards different items of the construct of the competitiveness model
was significant. Therefore, there was no sufficient deviation between the responses
of the two groups. It was reasonable to conclude that the non-response bias was
negligible and the two samples could be combined for data analysis.
7.3 Descriptive Analysis of the Sample (Demographics Information)
Before conducting any organised analysis, it is practical to use demographic data from
the survey to develop a profile of the sample population. This helps to obtain a total
picture of different types of respondent. The survey respondents were from the
Bangladeshi RMG industry and comprised a usable sample of 253 respondents. The
following sections will discuss the characteristics of the respondents, organised by
gender, age, education, current position, work experience, type of organisation,
number of employees, level of growth and level of profit. To understand the
respondents’ demographic backgrounds, SPSS was used in the demographic analyses.
Tables 7.3 to 7.12 present descriptive information about the respondents in this study.
7.3.1 Gender Table 7.3 shows that the survey respondents comprised 99.6% males and 0.4%
females. The gender analysis clearly revealed the dominance of males completing
the questionnaire. It could also be recognised that participants were from the higher-
level decision-making group in garment companies where decision makers are
generally male as compared to female.
Table 7.3: Survey respondent by gender
Gender Frequency Per cent Cumulative Per cent
Male 252 99.6 99.6
Female 1 .4 100.0
7.3.2 Age
In this part of the survey, participants were asked to select an age range rather than
providing a numeric number. Age was divided into five age-group categories. From
table 7.4, it can be seen that most of the responses, that is, 45.1% were from the middle
age group (41-50 years) who are the most experienced in the RMG industry. The next
closest group at 30.8% comprised those aged 31-40 years who are dynamic, energetic

165
and always thinking positively about change. From these statistics, it can be seen that
the more mature and comparatively young executives are playing a major role and
contributing to this industry. Therefore, data from this survey would be definitely
effective in this research. The other most experienced group comprised those aged 51-
60 years with 18.2% of respondents to this research in this category. This group
actually play important roles in decision and policy making for this industry.
Table 7.4: Survey respondent by age
Age Frequency Per cent Cumulative Per cent
20-30 years old 12 4.7 4.7 31-40 years old 78 30.8 35.6 41-50 years old 114 45.1 80.6 51-60 years old 46 18.2 98.8 Over 60 years old 3 1.2 100.0
7.3.3 Level of education
The level of education attained by the survey participants is shown on table 7.5. In
this study, a large number of respondents (87.4%) had the second-highest level of
Table 7.5: Survey respondent by level of education
Education Frequency Per cent Cumulative Per cent
Diploma 1 .4 .4 Bachelor 21 8.3 8.7 Master’s 221 87.4 96.0 Doctorate 7 2.8 98.8 Others 3 1.2 100.0
education, that is, a Master’s degree. A small percentage (8.3%) only had a bachelor
degree and 2.8% had the highest level of education, that is, a PhD degree. This result
could be expected due to the fact that the respondents in this research involved
managers and top executives. Generally, in the Bangladeshi RMG industry these
positions require a higher educational background.
7.3.4 Current position
It is noted from table 7.6 that managers were the highest number of respondents in
this research. There were 21.3% responses from managers of different garment
companies in this survey. Other positions like assistant general managers were
19.0%, deputy general managers were 9.5%, directors were 17.4%, deputy managing
directors were 12.5%, and some other positions were below 9%.

166
Table 7.6: Survey respondent by current position
Current Position Frequency Per cent Cumulative Per cent
Head of Department 11 4.3 4.3 Manager 54 21.3 25.7 Assistant General Manager 48 19.0 44.7 Deputy General Manager 24 9.5 54.2 Deputy Managing Director 32 12.6 66.8 Director 44 17.4 84.2 Managing Director 18 7.1 91.3 Chairman 2 .8 92.1 Chief executive 3 1.2 93.3 Others 17 6.7 100.0
7.3.5 Years in current position
Respondents were also asked about how long they had worked in their current
position. Table 7.7 shows the respondents’ years of experience in their current
position: 48.6% of respondents had been 5-10 years in their current position and
39.5% had 2-5 years in their current position. The number of respondents who were
relatively new in their current position with less than two years was only 13
(approximately 5.1% of total respondents).
Table 7.7: Survey respondent by years in current position
Years in current position
Frequency Per cent Cumulative Per cent
Less than 2 years 13 5.1 5.1 +2 - 5 years 100 39.5 44.7 +5 - 10 years 123 48.6 93.3 +10 - 20 years 17 6.7 100.0
7.3.6 Experience in the RMG industry According to the data shown on table 7.8, the highest number of respondents had 15-
30 years of experience. They comprised 33.6% of total respondents. The next highest
group of respondents (30.8%) had 5-10 years’ experience with 28.5% in the 10-15
years’ experience group. The others were below 5%.
Table 7.8: Survey respondent by years in RMG industry
Years in RMG industry Frequency Per cent Cumulative Per cent
less than 2 years 2 .8 .8 +2 - 5 years 10 4.0 4.7
+ 5 - 10 years 78 30.8 35.6 +10 - 15 years 72 28.5 64.0 +15 - 30 years 85 33.6 97.6
Other 6 2.4 100.0
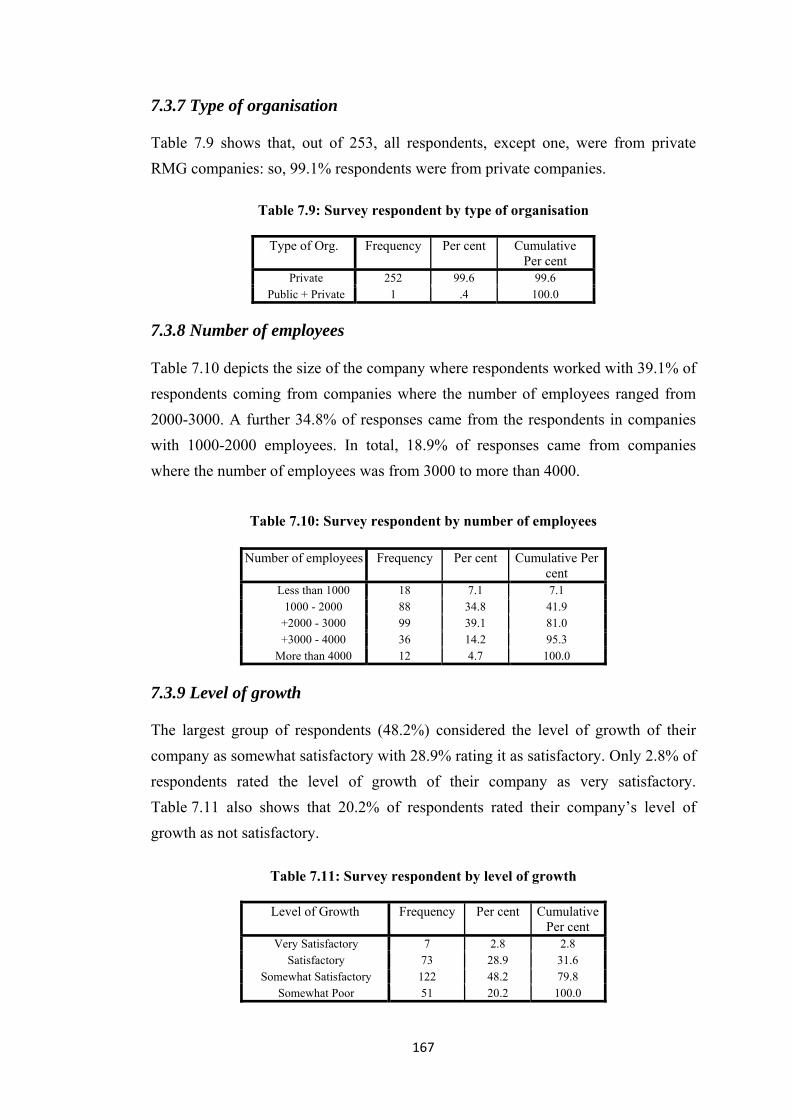
167
7.3.7 Type of organisation Table 7.9 shows that, out of 253, all respondents, except one, were from private
RMG companies: so, 99.1% respondents were from private companies.
Table 7.9: Survey respondent by type of organisation
Type of Org. Frequency Per cent Cumulative
Per cent
Private 252 99.6 99.6
Public + Private 1 .4 100.0
7.3.8 Number of employees
Table 7.10 depicts the size of the company where respondents worked with 39.1% of
respondents coming from companies where the number of employees ranged from
2000-3000. A further 34.8% of responses came from the respondents in companies
with 1000-2000 employees. In total, 18.9% of responses came from companies
where the number of employees was from 3000 to more than 4000.
Table 7.10: Survey respondent by number of employees
Number of employees Frequency Per cent Cumulative Per cent
Less than 1000 18 7.1 7.1 1000 - 2000 88 34.8 41.9
+2000 - 3000 99 39.1 81.0 +3000 - 4000 36 14.2 95.3
More than 4000 12 4.7 100.0
7.3.9 Level of growth The largest group of respondents (48.2%) considered the level of growth of their
company as somewhat satisfactory with 28.9% rating it as satisfactory. Only 2.8% of
respondents rated the level of growth of their company as very satisfactory.
Table 7.11 also shows that 20.2% of respondents rated their company’s level of
growth as not satisfactory.
Table 7.11: Survey respondent by level of growth
Level of Growth Frequency Per cent Cumulative Per cent
Very Satisfactory 7 2.8 2.8 Satisfactory 73 28.9 31.6
Somewhat Satisfactory 122 48.2 79.8 Somewhat Poor 51 20.2 100.0

168
7.3.10 Level of profit It can be seen on table 7.12 that 51.4% of respondents rated the level of profit of their
company as somewhat satisfactory. In this survey, only 1.2% of respondents rated the
level of profit as very satisfactory, with 26.1% rating it as satisfactory but 20.6%
expressed their opinion that their company’s level of profit was somewhat poor.
Table 7.12: Survey respondent by level of profit
Level of profit Frequency Per cent Cumulative Per cent
Very Satisfactory 3 1.2 1.2 Satisfactory 66 26.1 27.3
Somewhat Satisfactory 130 51.4 78.7 Somewhat Poor 52 20.6 99.2
Poor 1 .4 99.6 Very Poor 1 .4 100.0
7.4 Data Analysis via Structural Equation Modelling (SEM)
The industry-wide survey data were analysed using the structural equation modelling
(SEM) technique (Chin, 1998). SEM was chosen to validate the influence of
stakeholders in the RMG industry’s SC and to validate the competitiveness model
for the RMG industry. Figure 5.4 illustrates the model.
In the RMG industry survey, 253 respondents’ questionnaires were finalised with
data collected for 66 items using these questionnaire. Moreover, there were
19 indicators or items for three formative constructs, 37 indicators or items for five
reflective constructs and 10 for the demographic data. In this analysis, indicators
from formative and reflective constructs were considered, with the partial least
squares (PLS) technique designed to accommodate both formative and reflective
constructs (Fornell and Bookstein 1982; Barclay, Higgins, and Thompson. 1995;
Chin and Gopal 1995). As described previously in section 4.6.5, PLS performs
model assessment in two sequential stages:
Assessment of measurement model
Assessment of structural model
7.4.1 Assessment of measurement model
The first essential tests of a model are the tests for reliability and validity. The extent
to which results are consistent over time and an accurate representation of the total
population under study is referred to as ‘reliability’. Reliability is defined as the

169
consistency of measurement and in examining how reliable the measurement is:
validity is defined as the accuracy of a measurement and assessing how accurate the
measurement is (Holmes- Smith 2001; Golafshani 2003).
The first step is to examine the measures’ reliability and validity according to certain
criteria associated with formative and reflective measurement model specification.
Therefore, we needed to distinguish between reflective and formative measurement
models in order to evaluate them (Hair, Ringle, and Sarstedt 2011). The assessment
of the measurement model included the estimation of the reliability coefficients of
the measures, and also an examination of the convergent and discriminant validity of
the research instrument. Convergent validity is actually related to the test for
reliability. The construct reliability measures the reliability of the latent construct
which means examining the internal consistency (composite reliability) of a set of
measures or indicators of all constructs rather than a single indicator. It provides the
information on how well a set of observed indicators reflects the common latent
construct (Holmes- Smith 2001). The higher the construct reliability the better it is. It
is suggested that the measurement of properties needs to first be satisfied before
proceeding to the assessment of the structural model (Barclay, Higgins and
Thompson, 1995).
Overall there were 56 indicators or items for the eight constructs: political action
(PA1-PA6), bureaucratic behaviour (BB1-BB6), country risk (CR1-CR7), supply-
side drivers (SD1-SD6), supply-side barriers (SB1-SB10), demand-side drivers
(DD1-DD6), demand-side barriers (DB1-DB6) and competitiveness (COM1-
COM9). The following section will discuss the measurement model assessment,
carried out as part of the PLS procedure, by measuring individual item reliability
(loading), internal consistency (composite reliability) and average variance extracted
(AVE) under convergent validity (Fornell and Larcker 1981), and under discriminant
validity measuring AVE analysis and cross-loading matrix. All of these are for
reflective constructs. Initially, there were 37 indicators for the reflective constructs.
The strength of the measurement properties was assessed by examining the
convergent validity and discriminant validity of the reflective items.

170
7.4.1.1 Assessing reflective constructs
Convergent validity:
Convergent validity measures the correlations of the items in a single construct.
Convergent validity has to be achieved to ensure that the items in each construct are
highly correlated and reliable. The higher the convergent validity, the more strongly
correlated are the items in each construct. Therefore, the three steps to determine
convergent validity were undertaken.
Item reliability
Item reliability examines how well each item related to their respective construct. Item
reliability assesses the loadings for each individual item. Table 7.13 presents the
detailed item loadings which indicate the correlation of the items with their respective
constructs. The loading score is usually obtained from the bootstrapping result of PLS.
Researchers have proposed that a latent variable should explain a substantial part of
each indicator’s variance (usually at least 50%) (Henseler et al. 2009). The item
reliability analysis provides an estimation of the amount of variance in the item’s
measure that is due to the construct (Barclay, Higgins and Thompson 1995).
There are many ‘rules of thumb’ described and suggested in the literature for the
item loadings’ cut-off point. In chapter 4, section 4.6.5.1, detailed has veen described
with reference for significant level of item loading and 0.5 has been taken as
threshold for item reliability.
Table 7.13: Initial item loading of reflective construct
Reflective constructs
Items/Indicators Loading T-value
CR AVE
SD SD1 0.6061 11.9461 .793 .391 SD2 0.7398 19.6657 SD3 0.6011 11.473 SD4 0.5395 8.5814 SD5 0.6411 12.8294 SD6 0.6084 10.8832
SB SB1 0.6961 15.8826 .915 .520 SB2 0.7089 15.3242 SB3 0.7617 19.9575 SB4 0.6918 17.0497 SB5 0.6666 14.9043 SB6 0.732 18.0893 SB7 0.7608 27.7474 SB8 0.7501 28.1471 SB9 0.7067 21.1196 SB10 0.7274 17.9105

171
Reflective constructs
Items/Indicators Loading T-value
CR AVE
DD DD1 0.5948 10.7727 .816 .426 DD2 0.6516 13.3961 DD3 0.6774 12.732 DD4 0.6663 13.9729 DD5 0.6973 13.9691 DD6 0.6252 9.8982
DB DB1 0.6622 12.6804 .797 .398 DB2 0.724 19.6613 DB3 0.6903 14.7461 DB4 0.5606 9.0542 DB5 0.559 8.5808 DB6 0.5661 8.4688
COM COM1 0.5288 8.5852 .834 .361 COM2 0.6007 12.9228 COM3 0.639 14.7735 COM4 0.4223 5.5221 COM5 0.6967 17.9521 COM6 0.6117 11.3497 COM7 0.5859 12.3201 COM8 0.6163 12.7357 COM9 0.6646 13.2881
Table 7.14: Final reflective item loading
Reflective
Constructs
Items of Reflective construct
Loading T-value Composite reliability
AVE
SD SD1 0.7153 16.9246 0.801 0.503 SD2 0.754 19.9254 SD5 0.646 10.8885 SD6 0.7168 15.6958
SB SB1 0.7 17.8466 0.915 0.52 SB2 0.702 15.2628 SB3 0.7597 19.9186 SB4 0.6941 17.6642 SB5 0.6714 15.4853 SB6 0.731 16.9966 SB7 0.7614 27.4437 SB8 0.7494 26.6994 SB9 0.7067 21.9223
SB10 0.7266 18.1636 DD DD2 0.6445 12.9696 0.804 0.507
DD3 0.7204 14.3051 DD4 0.7415 17.7347 DD5 0.7362 16.7231
DB DB1 0.7591 17.7966 0.8 0.506 DB2 0.7964 28.6011 DB3 0.7303 17.4132 DB6 0.5295 6.3257
COM COM3 0.6857 17.7416 0.815 0.524 COM5 0.7798 24.6699 COM9 0.7358 18.636 COM6 0.6908 15.3964

172
As described in research method in chapter 4, section 4.6.5.1, to fulfil the
requirements of convergent validity, 0.5 was determined as the minimum cut-off
value. Accordingly, only one item, that is, COM4 failed to meet the minimum
criteria. PLS was run again deleting this item. However, to attain the minimum
acceptable value of average variance extracted (AVE) and for the goodness of fit
(GoF) of the measurement model, the following items were discarded; SD3, SD4,
DD1, DD6, DB4, DB5, COM1, COM2, COM4, COM7 and COM8 and PLS was run
again (Hair, Ringle, and Sarstedt 2011; MacKenzie, Podsakoff, and Podsakoff 2011).
After that, the acceptable level of AVE was fulfilled (see details in the next step) and
most of the items’ loadings attained a value of 0.7, except seven items highlighted in
table 7.14 which had loadings higher than 0.5. Finally, the results confirmed that all
26 items in table 7.14 were sufficient to represent their respective construct.
Internal consistency and AVE of constructs
Internal consistency is used to establish the convergent validity to assure that there is
a correlation among the items for a construct (Fornell and Larcker 1981). Internal
consistency is concerned with the measure of reliability of a construct. It is a second-
generation procedure used to measure reliability. The internal consistency of the
constructs in the competitiveness model was calculated by evaluating the value of
composite reliability and average variance extracted (AVE). These two values were
obtained by the bootstrapping result of PLS-Graph and the level of acceptability was
later carefully examined. The suggested acceptable value of composite reliability is
0.7 or higher (Barclay, Higgins, and Thompson. 1995; Igbaria et al. 1997) and value
of AVE should be 0.5 or higher (Fornell and Larcker 1981; Jiang, Klein, and Carr
2002). Hair, Ringle, and Sarstedt (2011) suggested that composite reliability should
be higher than 0.70 (in exploratory research 0.60 to 0.70 is considered acceptable)
and AVE should be higher than 0.50.
Referring to table 7.14, all constructs met the acceptable criteria for internal
consistency and AVE. The values of all constructs exceeded the recommended
values of internal consistency and AVE. Table 7.14 shows that internal consistency
of all constructs are more than 0.7. The highest internal consistency was for
construct SB at 0.915 and the lowest value was for construct DB at 0.8. The high
internal consistency values for all the constructs ensured the reliability of the
measurement model. Moreover, the values of AVE were also more than 0.5. The

173
highest AVE was 0.524 for COM and the lowest AVE was 0.503 for the construct
SD. The average variance extracted (AVE) represents a construct by its
corresponding items with the value for AVE for all constructs exceeding the
recommended threshold. Fornell and Larcker (1981) suggested using the AVE as a
criterion for convergent validity. An AVE value of more than 0.5 indicates that a
latent variable is able to explain more than half of the variance of its items on
average (Henseler et al. 2009; MacKenzie, Podsakoff, and Podsakoff 2011).
From the above analysis and outcome values, it can be said that the measurement
model has satisfied all three necessary criteria and achieved convergent validity.
These results indicated that the items in each construct were highly correlated and
reliable.
Discriminant validity:
The test for discriminant validity is the next step in the assessment of the
measurement model. The discriminant validity of the reflective variables assesses
the degree to which the constructs differ from each other. There are two analytical
procedures for this assessment as recommend by Barclay, Higgins, and Thompson
(1995) and Hulland (1999). These are the square root of average variance extracted
(AVE) analysis and cross-loading matrix evaluation. Actually, PLS assesses
discriminant validity by examining the correlation at both construct and item
levels.
Average variance extracted (AVE) analysis (Construct level)
In the discriminant validity assessment, the first test was to ensure that a construct
should not share more variance with its measures than it shared with other constructs
in the competitiveness model. The first criterion of discriminant validity was
assessed by calculating the square root of average variance extracted (Igbaria,
Guimaraes, and Davis 1995a). To meet the discriminant validity criteria, the off-
diagonal elements (correlation of latent variables) must be less than or equal to the
bolded, diagonal elements, that is, the square root of the average variance (table
7.15) explained in the corresponding rows and columns (Igbaria et al. 1997; Gefen,
Straub, and Boudreau 2000). This value was then compared with the inter-construct
correlation.

174
Table 7.15: AVE analysis (SQRT of the AVE of reflective constructs is larger than its correlation with other constructs)
Constructs PA CR BB SD SB DD DB COM PA 1 CR 0.492 1 BB 0.387 0.63 1 SD 0.272 0.17 0.255 .709 SB 0.293 0.443 0.4 0.131 .721 DD 0.285 0.263 0.358 0.416 0.22 .712 DB 0.348 0.593 0.509 0.248 0.421 0.399 .711 COM 0.318 0.326 0.386 0.485 0.317 0.537 0.382 .723
Barclay, Higgins, and Thompson (1995) also suggested that the model could be
assessed as having acceptable discriminant validity if the square root of the AVE of a
construct was larger than its correlation with other constructs. To meet the
discriminant validity criteria, the square roots of the AVE were calculated and are
represented in the main diagonal line on table 7.15. As PA, CR and BB were
considered formative constructs, there was no need to apply AVE for discriminant
validity. For this study, table 7.15 presents the correlation matrix for all eight
constructs used in the competitiveness model. The bold values are the square root of
AVE of the reflective items. The off-diagonal elements represent the correlations
among the latent variables in table 7.15. This shows that the square root of AVE is
greater than the off-diagonal elements across the row and column. Therefore, it
confirms that the discriminant validity is achieved.
Cross-loading matrix (Item level)
The second criterion for discriminant validity is at item level. Testing discriminant
validity requires a further analytical procedure: loadings and cross-loadings of
measures are to be tested at the item level.
The discriminant validity criterion is achieved when loadings of an item within a
construct are greater than the loading of items of any other construct within the same
column (Barclay, Higgins, and Thompson. 1995; Hulland 1999; Gefen, Straub, and
Boudreau 2000). PLS and, later, SPSS were used for this calculation. The latent
variable scores for each item were calculated through PLS. These scores were then
correlated with the original items. The correlation was done after the two types of
data were copied into SPSS. Bivariate correlation using the non-parametric
Spearman correlation was chosen. The results of the loading and cross-loading
correlations are depicted in table 7.16. The table shows that all items were loaded
higher on the construct they were measuring than on any other construct in the
model. Thus, all reflective constructs in the model met the second criterion of

175
discriminant validity. The implication is that all the reflective constructs in the
measurement model were different from each other and empirical support was
therefore achieved from the results for reliability and convergent & discriminant
validity for the reflective constructs.
Table 7.16: Cross-loading (loading of an item within a construct is greater than the loading of items in any other construct)
Items PA CR BB SD SB DD DB COM PA3 .754** .360** .337** .250** .203** .189** .294** .227**
PA4 .756** .353** .340** .173** .267** .225** .267** .243**
PA5 .782** .411** .227** .206** .207** .238** .240** .258**
CR1 .312** .679** .496** .083 .379** .096 .384** .139*
CR3 .263** .558** .312** .194** .161* .224** .313** .313**
CR4 .425** .762** .438** .161* .291** .235** .440** .300**
CR6 .364** .798** .511** .093 .380** .217** .504** .215**
BB1 .236** .441** .661** .195** .238** .255** .310** .267**
BB2 .292** .485** .788** .214** .296** .325** .425** .311**
BB4 .339** .500** .789** .182** .344** .245** .399** .293**
SD1 .214** .134* .214** .715** .179** .280** .251** .400**
SD2 .204** .176** .259** .769** .009 .327** .204** .320**
SD5 .150* .095 .135* .639** .094 .291** .098 .343**
SD6 .186** .060 .098 .708** .078 .279** .114 .301**
SB1 .278** .400** .295** .073 .704** .095 .388** .198**
SB2 .148* .203** .227** .071 .701** .223** .169** .197**
SB3 .221** .355** .329** .128* .761** .150* .355** .228**
SB4 .128* .327** .257** -.014 .695** .055 .319** .140*
SB5 .150* .277** .221** .021 .673** .107 .314** .135*
SB6 .143* .278** .295** .034 .729** .154* .239** .242**
SB7 .257** .311** .361** .143* .761** .180** .335** .296**
SB8 .273** .362** .339** .177** .748** .221** .319** .305**
SB9 .290** .330** .260** .127* .706** .242** .297** .301**
SB10 .133* .302** .237** .099 .726** .178** .265** .170**
DD2 .213** .351** .369** .232** .305** .662** .372** .318**
DD3 .164** .109 .239** .399** .007 .710** .236** .396**
DD4 .224** .224** .270** .272** .203** .742** .281** .445**
DD5 .204** .030 .121 .286** .087 .727** .214** .353**
DB1 .247** .434** .422** .151* .364** .247** .774** .161*
DB2 .304** .503** .416** .197** .386** .260** .802** .297**
DB3 .217** .436** .369** .126* .248** .242** .733** .226**
DB6 .207** .285** .220** .236** .178** .410** .502** .406**
COM3 .194** .207** .267** .350** .242** .348** .280** .685**
COM5 .226** .239** .308** .407** .235** .409** .238** .775**
COM6 .277** .204** .189** .286** .137* .404** .261** .689**
COM9 .230** .285** .340** .352** .291** .395** .303** .743**
**. Correlation is significant at the 0.01 level (2-tailed). *. Correlation is significant at the 0.05 level (2-tailed).

176
7.4.1.2 Assessing for formative constructs
Diamantopoulos and Siguaw (2006) mentioned (in page-11) that ‘‘reliability
becomes an irrelevant criterion for assessing measurement quality in respect of a
formative measurement model.” Some researchers have argued that the convergent
validity and discriminant validity test for formative constructs was not meaningful
(Bollen 1989; Bagozzi 1994). The assessment of the validity for formative constructs
involves statistical analysis at the construct and indicator levels (Henseler et al.
2009). To assess the formative measurement model, the indicators’ weight and
multicollinearity test have been considered.
Indicators’ weight for formative items
Three constructs comprising 19 items in the measurement model were formative.
Using bootstrapping, ‘indicators or items’ weights were calculated which provided
information on the relative importance of the formative items towards the formation
of the corresponding latent construct. At the same time, that loading was also
calculated which provided information on absolute importance (Hair, Ringle, and
Sarstedt 2011). The weight and loading with the t-value for each item of the
formative constructs are presented in table 7.17.
As table 7.17 shows, weights for 15 formative items had significant t-values whilst
four did not, but at the time of considering the loading, all items were significant. Hair,
Ringle, and Sarstedt (2011) also emphasized the need for all facets, that is, weight and
loading with their significant t-values, to keep all the items of the formative constructs.
But four items did not meet the significant level of weight. Therefore, four items were
deleted. In this regard we can mention previous study for item deletion. For example,
Santosa, Wei and Chan’s (2005) study reported seven out of 13 indicators. They
deleted six items as having low indicator weight including two negative values.
Furthermore, Diamantopoulos and Winklhofer (2001) recommended elimination
only when the breadth of the construct composition was not compromised.
MacKenzie, Podsakoff, and Podsakoff (2011) in their research used the construct
level error term to assess validity. They mentioned construct level error variance
should be small and constitute no more than half of the total variance of the
construct. They recommended the smaller, the better. Therefore, to reduce the

177
construct level error, more formative items were deleted to achieve goodness of fit.
Finally, PA6, CR2, CR5, BB3 and BB6 were deleted to reduce the error variance
and the model was run again by using PLS. The final result is shown in table 7.18.
Table 7.17: Initial weight and loading of formative indicators/items
Formative constructs
Formative items/indicators
Weight
T-value against weight
Loading T-value against loading
PA PA1 0.0392 0.3392 0.3651 3.2741
PA2 0.0839 0.7596 0.5424 5.6919
PA3 0.3191 2.6191 0.7039 7.8536
PA4 0.3843 3.8817 0.7529 11.9885
PA5 0.4237 4.0156 0.7681 12.6005
PA6 0.2079 1.74 0.4846 4.0905
CR CR1 0.2253 2.4339 0.6422 8.4593
CR2 0.184 2.1557 0.5499 6.8763
CR3 0.1885 2.2919 0.6032 8.1741
CR4 0.3823 5.4351 0.7372 14.3215
CR5 0.1567 2.3207 0.4261 5.4626
CR6 0.3792 5.1018 0.7715 17.154
CR7 -0.0013 0.0148 0.5489 6.2732
BB BB1 0.1855 2.3197 0.6028 8.7387
BB2 0.1855 3.5956 0.7335 11.4023
BB3 0.1855 3.3678 0.64 10.1577
BB4 0.1855 5.9472 0.7359 13.5217
BB5 0.1855 1.3415 0.5794 7.5852
BB6 0.1855 2.4397 0.6427 8.6587
Table 7.18: Final weight and loading
Formative construct
Items of Formative construct
Weight T-value Loading T-value
PA PA3 0.3997 2.9261 0.753 8.1332
PA4 0.409 4.0498 0.7561 10.7969
PA5 0.4979 4.5659 0.7829 11.5252
CR CR1 0.3131 3.3832 0.6738 8.2424
CR3 0.1823 1.9618 0.5645 6.5686
CR4 0.434 6.0573 0.7582 14.5574
CR6 0.4452 6.2907 0.8021 18.56
BB BB1 0.2958 3.3121 0.6618 8.5232
BB2 0.4636 5.4163 0.7885 13.0738
BB4 0.5553 6.785 0.79 14.3952

178
Multicollinearity
In addition, the test of multicollinearity was conducted on the formative items. Low
collinearity among items is vital in ensuring the stability of the estimates (Mathieson,
Peacock, and Chin 2001). To examine multicollinearity, the variance inflation factor
(VIF) scores for each item were calculated. The calculation was done on the basis of
mean value and PLS-based latent variables. The VIF scores were the same in both
tests: the higher the VIF score, the higher the degree of multicollinearity. The IBM
SPSS 21 statistical package was utilized to run regression analysis with the PLS
construct scores as the dependent variables and the items as independent variables
(Andreev et al. 2009).
As shown in table 7.19, all the VIF scores were below 5. This number was well
below the recommended maximum threshold of 10 (Kleinbaum et al. 1998).
Furthermore, this value was below the maximum level of 5 suggested by Mathieson,
Peacock and Chin (2001) and Hair, Ringlr, and Sarstedt (2011). Finally, the
formative items as per table 7.18 were retained. Therefore, in the case of the
formative constructs, the items’ weight and the relative importance of the formative
items towards the formation of the related latent construct were appraised.
Table 7.19: Degree of multicollinearity (VIF ≤ 10)
Constructs Item/Indicators VIF (mean value)
VIF (PLS-based latent variable)
PA PA3 1.305 1.305 PA4 1.301 1.301 PA5 1.210 1.210
CR CR1 1.260 1.260 CR3 1.223 1.223 CR4 1.277 1.277 CR6 1.383 1.383
BB BB1 1.305 1.305 BB2 1.365 1.365 BB4 1.147 1.147
7.4.2 Assessment of structural model
All the criteria were met in assessing the measurement model. An assessment could
then be carried out on the structural model. In the structural model assessment, the
proposed model of competitiveness was assessed in terms of the exploratory power
and significance of paths (path coefficients) among the constructs (Chin, Marcolin,
and Newsted 1999). Hanlon (2001) described this as a comparison between the
179
constructs within the model, whereas Barclay, Higgins and Thompson (1995) stated
that this step assessed the statistical significance of the path loadings and path co-
efficient between each construct. Chin, Marcolin, and Newsted (1999) and Hanlon
(2001) indicated that it was inappropriate to use traditional tests to ascertain the
statistical significance between the constructs. In assessing the path coefficient, the t-
values of the hypothesized relationships were calculated to evaluate the significance
of the relationship.
PLS is ideal for assessing the statistical significance of the path loading and path
coefficients between constructs because it does not require a normal distribution of
data (Chin, Marcolin, and Newsted 1999; Hanlon 2001). PLS allows a technique
called bootstrapping to make an assessment of the structural competitiveness model.
Two non-parametric methods were used to test the relationships between constructs
namely ‘bootstrap’ and ‘jackknife’ (Gefen, Straub, and Boudreau 2000; Santosa,
K.Wei, and Chan 2005). ‘Bootstrap’ which is the more advanced method was chosen
for this study. The advantage is that it produces both a t-value and a squared multiple
correlation, that is, R² value. The t-value was equivalent to the traditional t-test and it
evaluated the significance of the hypothesized relationships (i.e. interpreted the
significance of the paths between model constructs). R² values were assessed as a
measure of the predictive power of the model for the endogenous constructs
(Barclay, Higgins, and Thompson. 1995). The R² for the structural equation reflected
the proportion of variance of the dependent construct as explained by the constructs
in the structural equation (Joreskog and Sorbom 1996).
7.4.2.1 Explanatory power/nomological validity of the main model (R² )
The explanatory powers or nomological validity of the model were assessed by
calculating the coefficient of determination (R²) of the endogenous constructs
(Santosa, K.Wei, and Chan 2005). According to Falk and Miller (1992), the
minimum R² should be 0.1. Santosa, K.Wei, and Chan (2005) suggested 0.1 to be an
acceptable R² value. Holmes- Smith (2001) recommended that the value of R² range
from 0 to 1 and R² should exceed 0.5. Table 7.20 shows the R² values within the

180
Table 7.20: R² values
Endogenous Construct When fulfil AVE (.5) value for reflective
constructs
When reduced average error by
deleted items
Country Risk (CR) .586 .469 Supply-Side Drivers (SD) .080 .104 Supply-Side Barriers (SB) .208 .224 Demand-Side Drivers (DD) .088 .101 Demand-Side Barriers (DB) .382 .384 Competitiveness (COM) .426 .426
model while Figure 7.1 illustrates the loadings (coefficient) and R² values within the
model. The table indicates that the R² values of six constructs were above the
requirement (shaded column of table-7.20). Figure 7.1 shows the direction of each
relationship, the loadings (coefficient) on each relationship (the value on the arrow)
and R² values for each dependent construct (the value under the circles).
Figure 7.1: Loading (coefficient) and R² values
Table 7.20 shows 46.9% of the variance for country risk (CR), 10.4% of the variance
for supply-side drivers (SD), 22.4% for supply-side barriers (SB), 10.1% for
demand-side drivers (DD), 38.4% for demand-side barriers (DB) and 42.6% for
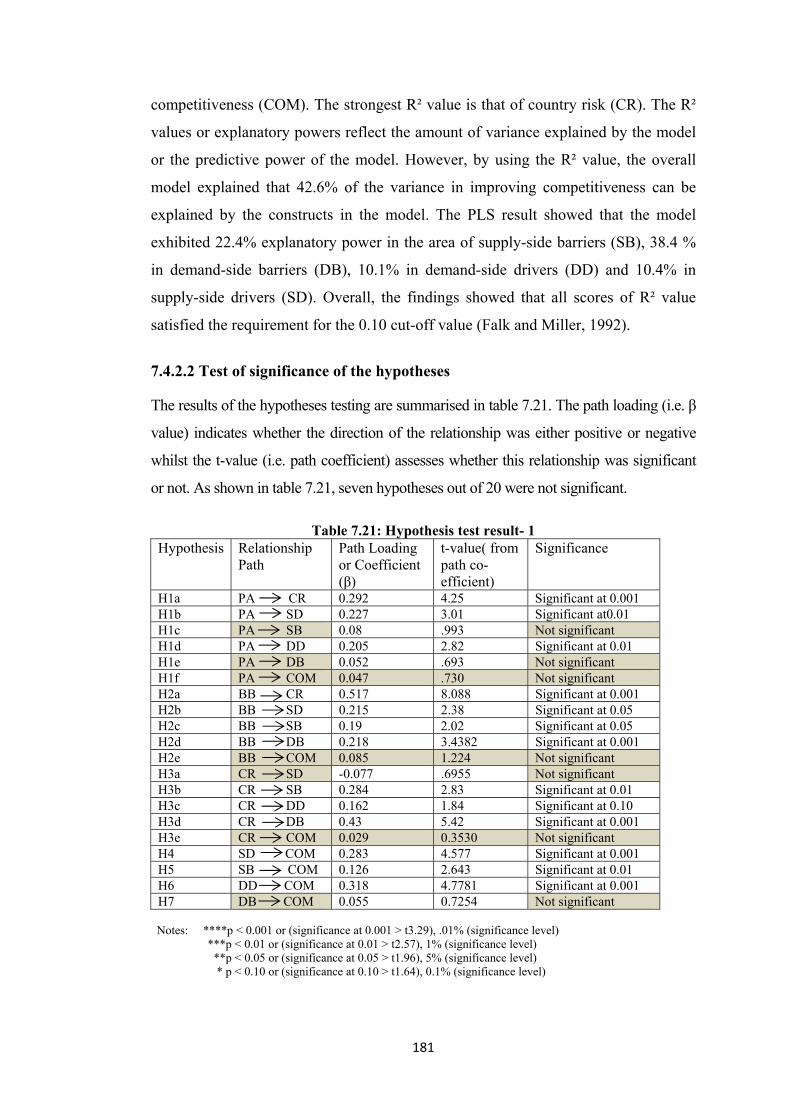
181
competitiveness (COM). The strongest R² value is that of country risk (CR). The R²
values or explanatory powers reflect the amount of variance explained by the model
or the predictive power of the model. However, by using the R² value, the overall
model explained that 42.6% of the variance in improving competitiveness can be
explained by the constructs in the model. The PLS result showed that the model
exhibited 22.4% explanatory power in the area of supply-side barriers (SB), 38.4 %
in demand-side barriers (DB), 10.1% in demand-side drivers (DD) and 10.4% in
supply-side drivers (SD). Overall, the findings showed that all scores of R² value
satisfied the requirement for the 0.10 cut-off value (Falk and Miller, 1992).
7.4.2.2 Test of significance of the hypotheses
The results of the hypotheses testing are summarised in table 7.21. The path loading (i.e. β
value) indicates whether the direction of the relationship was either positive or negative
whilst the t-value (i.e. path coefficient) assesses whether this relationship was significant
or not. As shown in table 7.21, seven hypotheses out of 20 were not significant.
Table 7.21: Hypothesis test result- 1 Hypothesis Relationship
Path Path Loading or Coefficient (β)
t-value( from path co-efficient)
Significance
H1a PA CR 0.292 4.25 Significant at 0.001 H1b PA SD 0.227 3.01 Significant at0.01 H1c PA SB 0.08 .993 Not significant H1d PA DD 0.205 2.82 Significant at 0.01 H1e PA DB 0.052 .693 Not significant H1f PA COM 0.047 .730 Not significant H2a BB CR 0.517 8.088 Significant at 0.001 H2b BB SD 0.215 2.38 Significant at 0.05 H2c BB SB 0.19 2.02 Significant at 0.05 H2d BB DB 0.218 3.4382 Significant at 0.001 H2e BB COM 0.085 1.224 Not significant H3a CR SD -0.077 .6955 Not significant H3b CR SB 0.284 2.83 Significant at 0.01 H3c CR DD 0.162 1.84 Significant at 0.10 H3d CR DB 0.43 5.42 Significant at 0.001 H3e CR COM 0.029 0.3530 Not significant H4 SD COM 0.283 4.577 Significant at 0.001 H5 SB COM 0.126 2.643 Significant at 0.01 H6 DD COM 0.318 4.7781 Significant at 0.001 H7 DB COM 0.055 0.7254 Not significant
Notes: ****p < 0.001 or (significance at 0.001 > t3.29), .01% (significance level) ***p < 0.01 or (significance at 0.01 > t2.57), 1% (significance level) **p < 0.05 or (significance at 0.05 > t1.96), 5% (significance level) * p < 0.10 or (significance at 0.10 > t1.64), 0.1% (significance level)

182
The most significant influence was of bureaucratic behaviour (BB) of external
stakeholders towards country risk (CR). In addition, there were three internal
constructs (SD to COM, SB to COM and DD to COM) directly influencing
competitiveness which were significant, but the directly influence of four constructs
(PA to COM, CR to COM, BB to COM and DB to COM) were not significant. All
the significant relationships show positive directions except country risk to supply
side drivers (CR to SD).
7.4.2.3 Hypotheses testing
7.4.2.3.1 Hypotheses from external stakeholders’ elements
The explanatory power of the competitiveness model was satisfactory at R² = 42.6%.
However, twelve of the 20 hypotheses were not supported by the hypotheses testing.
This section present details of the result for each hypothesis.
Many stakeholders are involved directly or indirectly in the SC process of the RMG
industry. In the first step, this section discusses the hypotheses drawn from the
activities of external stakeholders. The government, opposition political parties and
bureaucrats were considered as external stakeholders. Therefore, political action,
bureaucratic behaviour and country risk that were created by the interaction of
political parties and bureaucrats were considered from the external stakeholders’
point of view. Overall, there were 20 hypotheses considered as shown in the table-
7.22. However, the hypotheses from the political action are discussed first.
Hypotheses H1a to H1f are from political action. The results for these hypotheses are
tabulated in table 7.22. Hypothesis H1a was to test the influence of PA on the country
risk. It was hypothesized that political activities or actions would have a positive
influence on country risk (CR). This means that when the non-supportive PA
increases, then CR will increase and when the non-supportive PA decreases, then CR
will decrease. This statement was supported by the statistical test. The path coefficient
of the hypothesized link was .292 while the t-value was 4.25. The t-value was
significant at 0.001. It can therefore be argued that political action positively
influences country risk. Accordingly, considering the results of the path coefficient
and t-value, decisions were taken for hypotheses H1b to H1f: hypothesis H1b, that is,
PA negatively influences SD; hypothesis H1c, that is, PA positively influences SB;
hypothesis H1d, that is, PA negatively influences DD; hypothesis H1e, that is, PA
positively influences DB; and hypothesis H1f, that is, PA negatively influences COM.

183
Table 7.22: Hypothesis test result- 2
Construct Link Hypotheses Hypotheses Statement t-value Outcome
PA PA CR H1a Non-supportive political action (PA) increases the country risk (CR)
4.25 Supported
PA SD H1b Non-supportive PA decreases the supply-side drivers (SD)
3.01 Not supported
PA SB H1c Non-supportive PA increases the supply-side barriers (SB)
.993 Not supported
PA DD H1d Non-supportive PA decreases the demand-side drivers (DD)
2.82 Not supported
PA DB H1e Non-supportive PA increases the demand-side barriers (DB)
.693 Not supported
PA COM H1f Non-supportive PA decreases the tendency to improve competitiveness (COM)
.730 Not supported
BB BB CR H2a Non-supportive bureaucratic behaviour (BB) increases the CR
8.088 Supported
BB SD H2b Non-supportive BB decreases the SD
2.38 Not supported
BB SB H2c Non-supportive BB increases the SB
2.02 Supported
BB DB H2d Non-supportive BB increases the DB
3.4382 Supported
BB COM H2e Non-supportive BB decreases the tendency to improve COM
1.224 Not supported
CR CR SD H3a Non-supportive CR decreases the SD
.6955 Not supported
CR SB H3b Non-supportive CR increases the SB
2.83 Supported
CR DD H3c Non-supportive CR decreases the DD
1.84 Not supported
CR DB H3d Non-supportive CR increases the DB
5.42 Supported
CR COM H3e Non-supportive CR decreases the tendency to improve COM
0.3530 Not supported
SD SD COM H4 SD positively influence the COM
4.577 Supported
SB SB COM H5 SB negatively influence the COM
2.643 Not supported
DD DD COM H6 DD positively influence the COM
4.7781 Supported
DB DB COM H7 DB negatively influence the COM
0.7254 Not supported
Hypotheses H3a to H3e are from country risk (CR). The results for these hypotheses
are tabulated in table 7.22. Hypothesis H3a was for testing the influence of CR on
the garment suppliers drivers or strengths. It was hypothesized that CR would have a
184
negative influence on the strengths of suppliers. This means that when CR increases,
then SD will decrease and when CR decreases, then SD will increase. This statement
was not supported by the statistical test. The path coefficient was -0.077 while the t-
value was .6955. It can therefore be argued that the direction of the test was right
(i.e. negative association) but the data did not support the significance of the
relationship with the predicted construct, supply-side drivers (SD). Accordingly,
considering the result of the path coefficient and the t-value, decisions were taken for
hypotheses H3b to H3e.
Hypotheses H2a to H2e are from bureaucratic behaviour (BB). The results for these
hypotheses are tabulated in table 7.22. Hypothesis H2a was for testing the influence
of BB on country risk (CR). It was hypothesized that BB would have a positive
influence on CR. This means that when the disturbance of BB increases, then CR
will increase and when the disturbance of BB decreases, then CR will decrease. This
statement was supported by the statistical test. The path coefficient of this
hypothesized link was .517 while the t-value was 8.088. The t-value was significant
at 0.001. It can therefore be argued that bureaucratic behaviour positively influences
the country risk. Accordingly, considering the results of the path coefficient and the
t-value, decisions were taken for hypotheses H2b to H2e.
7.4.2.3.2 Hypotheses from Internal Stakeholders’ elements
In the RMG industry’s SC, manufacturers or suppliers of final products and
customers are the main internal stakeholders. In making the SC effective and
improving competitiveness, their role in the RMG industry’s SC was very important.
Their strengths and weaknesses, considered as drivers and barriers, were very
significant in the SC. Therefore, four hypothesized links that were supported by the
field study have been considered as hypotheses in this research .These hypotheses
are shown in table 7.22. However, the hypothesis H4, that is, the influence of supply-
side drivers was considered first for testing.
Hypothesis H4 is from the supply-side drivers (SD). The result for this hypothesis is
tabulated in table 7.22. Hypothesis H4 was for testing the influence of SD on the
garment SC and ultimately on the improvement of competitiveness. It was
hypothesized that SD would have a positive influence on competitiveness. This
means that when SD increase, then competitiveness will increase and when SD
185
decrease, then competitiveness will decrease. This statement was supported by the
statistical test. The path coefficient was 0.283 while the t-value was 4.577. The t-
value was significant at 0.001. It can therefore be argued that supply-side drivers
positively influence the competitiveness in the RMG industry’s SC. Accordingly
considering the results of the path coefficient and the t-value, the decision was taken
for hypotheses H5 to H7.
7.5 Summary
This chapter has presented the results based on the analysis of the research data that
was collected by industry-wide survey of the Bangladeshi RMG industry through the
primary method of a survey questionnaire. The data analysis was conducted using
SPSS and PLS software. The chapter aimed to develop a profile of the survey
respondents and also to determine the validity and reliability of the constructed
model that focused on the process of competitiveness.
This chapter described the evaluation and adjustment of the measurement model to
achieve convergent validity, discriminant validity and indicator weight for the 56
items or instruments. The results of the structural model assessment were also
detailed. The explanatory power of the conceptual model on improving
competitiveness of the Bangladeshi RMG industry was 42.6%, with all the R² values
of the endogenous constructs above the requirement recommended by Santosa, Wei
and Chan (2005).
Eight of the 20 hypotheses were supported: three constructs, identified by external
stakeholders from the field study and that had direct influence on competitiveness,
were finally rejected. Four internal constructs also had direct influence on
competitiveness with three out of the four accepted and one rejected. Based on the
results from the measurement model and structural model, the hypotheses which
were developed in chapter 6 were tested and evaluated in this chapter. The reported
PLS results of this chapter will be discussed and interpreted in detail in the following
chapter.

186
C HAPTER 8
Discussion
8.1 Introduction
This chapter presents the interpretation and discussion of the results obtained from
the survey that was conducted to examine the influence of external and internal
stakeholders’ actions on the RMG industry’s SC for the improvement of
competitiveness. This chapter actually discusses the findings of the structural
equation modelling (SEM) described in chapter 7. These findings will be discussed
in terms of the major research questions and the 20 hypotheses proposed in
chapter 6. The integrated conceptual model derived from the literature review and
field study analysis substantiated the need for 20 hypotheses. The previous chapter
detailed the results of the hypotheses testing whereby 8 of the hypotheses were
supported. The significant relationships were linked with practical propositions that
could serve as guidelines for implementing effective measures to improve the
competitiveness in the RMG industry. In this discussion, the structural model of
competitiveness addresses the influence of the behavioural actions of stakeholders
and their resources (drivers and barriers) in improving competitiveness in the present
competitive clothing market. Moreover, in this chapter, the accepted hypotheses are
discussed in detail with the implications of and possible explanations for the
rejection of the rejected hypotheses. In the following sections, each construct related
to the hypotheses is discussed with its possible application.
8.2 Interpretation and Discussion of the Result
The analysis from chapter 7 showed that the competitiveness model explained the
external stakeholders and their actions that influenced the internal stakeholders of the
RMG industry’s SC leading to the improvement of competitiveness in the RMG
companies in Bangladesh.
Testing of the hypotheses was performed by examining the t-values and standardized
structural coefficients. The results of the testing of the hypotheses are detailed in
tables 7.21 and 7.22 in chapter 7. This reveals that of 20 hypotheses related to
improving competitiveness, 13 were statistically significant but five hypotheses out

187
of 13 were not significantly associated. Therefore finally eight hypotheses were
accepted or supported. As hypothesized in the study, the external stakeholders’
action/elements on the RMG industry’s SC and the internal stakeholders’ resources
in the RMG industry’s SC were seen to have an influence on the improvement of
competitiveness of the RMG industry. The positive use of these elements and
concepts through the SCM ultimately leads to the competitiveness of organisations
and industries in terms of market share and the economic environment.
These findings confirmed the appropriateness of the research model in using the
stakeholder and resource dependence theories (RDT) as its theoretical bases
underpinning the model. The following sections discuss the findings related to the
individual hypotheses proposed earlier.
8.2.1 Hypotheses related to external stakeholders
The first research question on how the external stakeholders (political parties, the
government and bureaucrats) influence the competitiveness of the RMG industry of
Bangladesh through their activities in regards to the SC was explored through the
hypotheses which were developed in chapter 6. It has been stated and shown in
chapters 3 and 6 that two constructs were developed, that is, political action derived
from the government or political parties and bureaucratic behaviour derived from
bureaucrats, the high officials responsible for implementing the government’s
decisions. The third construct ‘country risk’ is actually the outcome of non-
supportive political action and non-supportive bureaucratic behaviour. Hypotheses
H1 to H3 have been developed taking into consideration these three constructs from
external stakeholders. In the RMG industry’s SC, the suppliers and buyers are the
main internal stakeholders. These internal stakeholders are influenced by the external
stakeholders. According to stakeholder theory, the relationships among the
stakeholders are very important in making the SC more effective and efficient to
improve competitiveness. The competitiveness can be increased through minimizing
dependency as per RDT and the dependency can also be minimized by maintaining
good relationships and co-operational activities. Therefore, based on the concepts of
stakeholder and resource dependency theories, the proposed hypotheses were
developed. After analysing the data in chapter 7, the results of the testing of the
hypotheses are discussed in detail below.
188
8.2.1.1 Hypotheses related to political action (H1a to H1f)
In the RMG industry, companies usually export their garment products through a
SC. The whole SC is divided into two parts, the upstream and downstream SC
(Christopher, 1998; Nuruzzaman et al., 2012). As the Bangladeshi garment industry
is dependent on imported raw materials, they import their materials using the
upstream SC and, after manufacturing, export their products through the downstream
SC. There is involvement of many parties, that is, stakeholders in the whole way
(upstream and downstream) along the SC process. The external stakeholders, the
government and bureaucrats directly and indirectly play various roles in the RMG
industry’s SC process (Khondker , Razzak, and Ahmed 2005; Razzaque and Eusuf
2008; Saxena and Salze-Lozac’h 2010). The government is actually the combination
of the ruling political parties and the opposition whereas the bureaucrats are the
hands of government engaged in implementing the government plan and decisions
(Welge and Holtbrugge 2006; Holtbrugge, Berg, and Puck 2007). Therefore the
influence of political action has been considered as an important construct of the
external stakeholders in the competitiveness model.
Six hypotheses were developed related to political action (PA). Five hypotheses (H1a
to H1e) were developed on the basis of the literature review and field study but only
one hypothesis (H1f) was developed based only on the field study. After analysis, the
influence of PA in the SC process to achieve competitiveness, it was found that the
first hypothesis (H1a) was supportive but the other five hypotheses were not
supportive. According to the first hypothesis, non-supportive political action (PA) has
influence on increasing the country risk (CR) in Bangladesh. The test result supports
the hypothesis and the result was consistent with the results of the field study and the
prior studies on PA and CR (Hadjikhani and Hakansson 1996; Kee 2005; Kabir 2007;
Kim 2007; Clark and S.Kanter 2010; Berg et al. 2011; Hossan, Sarker, and Afroze
2012). Based on the above significant relationship, it is possible to interpret the
meaning as being that the action of political parties, that is, the action of ruling and
opposition parties may create an environment that indicates whether the situation in a
country is risky or not for doing business (Welge and Holtbrugge 2006; Holtbrugge,
Berg, and Puck 2007). There are many problems in Bangladesh which are derived
from the actions of the government and opposition parties. Lack of a proper political
role and lack of the development of good relationships among the stakeholders such as
189
employees, employers and government officials in various stages of the garment
business create an unfriendly environment that leads to a variety of risks related to the
garment business and an inefficient SC in Bangladesh. Political instability, corruption
and a non-cooperative attitude make a country more risky. In this regard, various
studies in the literature (World Bank 2005; Tewari 2006; Hossan, Sarker, and Afroze
2012; Saxena and Salze-Lozac’h 2010; Uzzaman 2010) have mentioned various
anomalies in the SC of the RMG industry.
In the field study, different manufacturers described that as external stakeholders the
government and political parties were not playing an effective role in creating a better
business environment in Bangladesh. Therefore, the manufacturers could not make
appropriate decisions for the development of their garment business to reduce the risk.
In a research Jin (2004) described how least-developed countries (LDCs) obtained
competitive advantage in the garment (apparel) industry using Vernon’s (1966) PLC
(product life cycle) theory and Frobel’s (1980) NIDL (New International Division of
Labor) theory. Jin also described how these countries increased their competitive
advantages leveraging industry-specific and country-specific advantages. Buyers
always tried to locate another market to reduce the risk when CR increased in a
specific country. Berg et al. (2011) also mentioned that the choice of outsourcing
country was dependent on CR and PA. During the last four months(March-
June,2013), due to the unstable political environment and increased CR in
Bangladesh, approximately US$500 million has shifted from Bangladesh to India
(The Daily Manab Zamin 2013). Due to the lack of appropriate political action and
government role, manufacturers have not been careful about providing a good
working environment and good premises. In connection with this, very recently Walt
Disney, one of the giant garment retailers of the world, has decided to discontinue
their business with the Bangladeshi RMG industry due to some life-threatening
occurrences, building disasters and the loss of many lives in some garment
companies. Their business was worth approximately US$400 million per year (The
Daily Amader Shamoy 2013).
Considering the above circumstances, the ruling party and the opposition should take
proper political action to make a good policy to reduce country risk and to ensure a
good business environment for the RMG industry of Bangladesh. In the RMG supply

190
chain stakeholders’ relationship is very important to increase the competitiveness.
Therefore the government and political parties should act properly with the internal
stakeholders. It will certainly encourage the buyers to choose Bangladesh as an
attractive platform for outsourcing garment products.
With regard to the hypotheses, hypotheses H1b, H1c, H1d, H1e and H1f were not
supported. The relationship of H1c and H1e showed the right direction. The positive
relationships of non-supportive PA and internal stakeholders (SB and DB) barriers
indicated that the higher presence of the PA factors led to increased supplier-side
(SB) and buyer-side (DB) barriers. But, unfortunately, the data did not support the
significant association of these constructs in improving competitiveness. This meant
that in the SC of the RMG industry, political action (PA) from the external
stakeholders was not regarded as an important issue in increasing or decreasing the
barriers of internal stakeholders. However, this result contradicted the results of the
field study and literature review. In all, 88.33% of respondents in the field study
supported the impact of political action and many studies in the literature such as
Boddewyn and Brewer (1994); Hadjikhani and Hakansson (1996); Absar (2001);
Choudhury and Hossain (2005); Welge and Holtbrugge (2006); Holtbrugge, Berg,
and Puck (2007); and Kale (2007) supported the influence of political action on
internal stakeholders and consequently on competitiveness. In this research, the
relationship between PA and SB (H1c) and PA and DB (H1e) showed the right and
positive direction but these were not supported owing to the insignificant t-value.
The relationship of hypotheses H1b, H1d and H1f was hypothesized to be negative
but a very contradictory result was found from the analysis in this study with regards
to the relationship between PA and internal stakeholders (SD and DD) drivers. The
result showed that the above hypothesized relationships were significant enough
(except H1f) although the relationship between the constructs was found to be
positive, rather than negative. There was no literature in support of hypothesis H1f
but it was supported by the field study. In all, 70% of respondents to the field study
supported the direct influence of political action on competitiveness but the result
showed the opposite. However, there were many studies in the literature in support
of the hypothesized relationship of H1b and H1d (Adhikari and Weeratuge 2007;
Kale 2007; Verma and Seth 2011) though the test result was the reverse.

191
Actually it was unexpected that the most of the hypotheses related to the political
action were non-significant and non-supportive. Most probably it happened due to
lack of believe over the government and political parties’ action. In the survey the
respondents were from the top and mid-level management. They are educated and
highly experienced. They are also well known about the political culture of
Bangladesh. The unstable political environment and their negative action is a long
term problem in Bangladesh. The garment companies are accustomed to do their
business within this environment. As they are highly experienced, they know about
the political government and their possible action. Possibly they don’t expect
anything good from them and don’t bother about this problem. The manufacturers
expect very few from the government and the political parties. They believe that they
have to do something better by their own effort. These types of cultural shock
actually affected the respondents and result of the hypotheses
At last it can be said that despite strong literature and field study support the
respondents didn’t find the independent variable significantly affecting the
competitiveness. Further study is needed to investigate the reason behind it.
8.2.1.2 Hypotheses related to bureaucratic behaviour (H2a to H2e)
In any business process or commercial transaction, the government, political groups
and bureaucrats play important roles (Hadjikhani and Hakansson 1996). The
bureaucrats are part of the government in a country and play an important role in
making decisions regarding administration and development in any sector of that
country. Bureaucrats are responsible for executing the decisions of the political
leadership and for maintaining the day-to-day regulatory and service functions of the
state (Nimir and Palmer 1982). The term ‘bureaucracy’ means any administrative
system based on professionalization and hierarchical subordination (Friedrich 1952).
Bureaucracy or bureaucratic behaviour (BB) is concerned with the behaviour of
officials, while the action of, for example, worker groups, may also lead to deflection
of an organisation (Selznick 1943). The context of BB is revealed by bureaucratic
decisions. An ideal bureaucratic structure is assumed to contribute to unity and
coordination, precision and speed, obedience and loyalty, reduction of friction,
continuity across changes in government, etc. (Olsen 2006).

192
According to stakeholder theory, the government and political groups are important
stakeholders (Donaldson and Preston 1995). As part of the government, bureaucrats
are also important stakeholders. They may directly influence the supply-side or
demand-side issues that accelerate competitiveness. There are many things that need
to be done in the process of the RMG industry’s supply chain. Policy making and
implementation in favour of the RMG industry, delivery of good infrastructural
facilities in transport management, ports’ management, financial services and many
other things where bureaucratic decisions and their supportive activities are very
important (Quddus 2001; Adhikari and Weeratunge 2007b; Adhikari 2007a; Islam,
Begum, and Rashed 2012). Therefore, the influence of BB is an important part of the
proposed model which is supported by stakeholder theory.
Moreover, taking into consideration the influence of BB, five hypotheses were
developed related to bureaucratic behaviour (BB). Four hypotheses (H2a to H2d)
were developed on the basis of the literature review and field study but only one
hypothesis, namely, H2f was developed based only on the field study. After analysis
of the influence of BB in the SC process for achieving competitiveness, hypotheses
H2a, H2c and H2d were supported but the other two hypotheses, namely H2b and
H2e were not supported. According to the first hypothesis, H2a, non-supportive BB
increases the country risk (CR) in Bangladesh. The test result strongly supported the
hypothesis and the result was consistent with the field study and the prior literature
on BB and CR (Hadjikhani 2000; Hadjikhani and Hakansson 1996; Kee 2005; Kabir
2007; Berg et al. 2011; Hossan, Sarker, and Afroze 2012). The relationship of H2c
and H2d also showed the right direction. The positive relationship of non-supportive
BB and internal stakeholders’ barriers, that is, SB and DB indicated that the higher
presence of BB factors led to increased supply-side (SB) and demand or buyers-side
(DB) barriers. The test result supported the hypotheses and the result was consistent
with the results of the field study and the prior studies on BB, SB and DB
(Hadjikhani 2000; Hadjikhani and Hakansson 1996; Kee 2005; Kabir 2007; Berg et
al. 2011; Hossan, Sarker, and Afroze 2012). Based on the above significant
relationship, it is possible to interpret the meaning as being that the behaviour of
bureaucrats may create an unfavourable environment which indicates a risky and
unfavourable situation in a country for doing business (Welge and Holtbrugge 2006).
193
There are many problems in Bangladesh which are directly or indirectly related to
the SC of the RMG industry and are derived from the actions of the government and
bureaucrats. Lack of proper government action and government officials, that is,
bureaucrats, in various stages of the garment business including the SC process
creating an unfriendly environment which leads to create a variety of risks related to
the garment business and the RMG industry’s SC in Bangladesh. The services in
port management and customs clearances, financial services, documentation related
to import and export management, corruption and a non-cooperative attitude make a
country more risky. In this regards, various literature has mentioned (World Bank
2005; Tewari 2006; Kaes and Azeem 2009; Joarder, Hossain, and Hakim 2010;
Rahman and Hossain 2010; Saxena and Salze-Lozac’h 2010; Uzzaman 2010)
numerous anomalies and irregularities in the SC of the RMG industry.
In the RMG industry due to some external factors the manufacturer failed to take right
action and decision for the development of RMG business and reduce the risk. In this
regard, the external stakeholders like government and bureaucrats can play an effective
role for creating better environment of RMG business in Bangladesh. In a research Jin
(2004) has mentioned the way of obtaining competitive advantage by leveraging
country specific advantages. Berg et al (2011) also mentioned about the choice of
outsourcing in his research work. Due to the lack of government initiatives and the
role of senior bureaucrats, suppliers are taking more time. As a result, the Bangladeshi
RMG industry faces the long lead time problem in supplying its goods to buyers.
From the above analyses, it can be said that the positive role of bureaucratic
behaviour in the supply chain is very important to reduce the lead time and improve
the competitiveness. The government and political parties should act properly with
the bureaucrats to take proper policy in different areas like financial sector, port
management, customs clearance etc. The ruling party and the opposition should take
proper political action to make a good policy to reduce the negative role of
bureaucrats and to ensure a good business environment for the RMG industry of
Bangladesh. To improve competitiveness in the RMG supply chain, stakeholders’
relationship is very important. Therefore the government, political parties and
bureaucrats should act properly with the internal stakeholders for a good policy to
reduce lead time.

194
According to the analyses, hypotheses H2b and H2e were not supported. The
hypothesized relationships of BB to SD and BB to COM were negative but the result
did not show the right direction and the negative association. The result showed the
opposite relationship and the link between BB and SD was significant but the link
between BB and COM was insignificant. It happened due to respondents almost
similar stands for dependent and independent constructs. Likewise probably
bureaucratic behaviour (BB) from the external stakeholders was not observed as an
important issue in increasing or decreasing the barriers of internal stakeholders.
Although the relationship between the construct in the hypothesis H2B was found to
be reversed, the t-value was significant. However, there was much support in the
literature and the field study for the hypothesized relationship of BB and SD
(Adhikari and Weeratunge 2007b; Kale 2007; Verma and Seth 2010; Verma and
Seth 2011) though the test result was the reverse. There was no support in the
literature for hypothesis H2e but it was supported by the field study. In all, 80% of
respondents to the field study supported the direct influence of bureaucratic
behaviour on competitiveness but the result showed the opposite and was
insignificant.
Despite the outcomes, strong support was found from the previous literature and
field study as stated above. In this research, the relationship of BB to CR (H2a), BB
to SB (H2c) and BB to DB (H2e) was supported and the relationship between BB
and SD (H2b) and BB and COM (H2e) showed the opposite and a positive direction.
However it is very important to mention here that when model was run with all the
indicators of BB, SD and COM the results were in the right direction although not
significant. But when non-significant weighted indicators were deleted from the
constructs the result came out to be quite unexpected (not supported). It could be a
measurement issue with the constructs which needs further investigation. Moreover
the hypotheses H2b and H2e were not supported owing to the insignificant t-value
and the reverse direction in the relationship. It happened as the respondents did not
feel the relationships of the hypotheses H2b and H2e as predicted. Furthermore the
respondents didn’t find the independent variable significantly affecting the
competitiveness. Advance study is needed to investigate the reason behind these
relationships.

195
8.2.1.3 Hypotheses related to country risk (H3a to H3e)
The clothing or garment business in the RMG industry is international in nature.
Usually all business transactions involve some degree of risk. When a business
works across borders, it always carries some additional risks not present in domestic
business. These additional risks are called country risk (CR) (Meldrum 2000).
Country risk is actually derived from the interaction of non-supportive political
action and bureaucratic behaviour (Abdullah 2005, 2009; Clark and S.Kanter 2010).
It also includes risks arising from a variety of national differences in economic
structures, policies, socio-political institutions, geography and currencies. Firms are
vulnerable not only to attacks on their own assets, but also to attacks on their
suppliers, customers, transportation providers, communication lines and other
systems. Therefore, in the present business environment, managing SC is very
important under the increased uncertainty of country risk. A non-supportive country
risk always influences the internal stakeholder of the SC and weakens the
competitiveness of the RMG industry.
The Bangladeshi RMG industry is totally dependent on the demand from foreign
buyers. Many buyers from different countries across the world are sourcing finished
garments from Bangladesh. Therefore, buyers are always concerned about the
country risk from the country where they are sourcing their products. Evaluating
country risk or evaluating the influence of country risk is a crucial exercise when
choosing sites for sourcing.
Therefore, five hypotheses were developed related to country risk (H3a to H3e):
these were developed on the basis of the literature review and field study but one
hypothesis (H3e) was developed based only the field study. After analysis of the
influence of CR in the SC process for achieving competitiveness, two hypotheses,
that is, H3b and H3d were supported but the rest of the hypotheses, that is, H3a, H3c
and H3e were not supported. According to the second and fourth hypotheses (H3b
and H3d), the non-supportive country risk (CR) influences internal stakeholders and
increases the supply-side (SB) and demand-side (DB) barriers in the RMG industry’s
SC of Bangladesh. The test result supported these hypotheses, and the result was
consistent with the results of the field study and the prior studies on CR, SB and DB
(Min and Galle 1991a; Frear, Metcalf, and Alguire 1992; Grosse and Behrman 1992;

196
Birou and Fawcett 1993; Swamidass 1993; Hadjikhani and Hakansson 1996;
Meldrum 2000; Tsai, C.Yeh, et al. 2005; Berg et al. 2011; Hossan, Sarker, and
Afroze 2012). The link of these two supported hypotheses, that is, CR to SB and CR
to DB, were positive and in the right direction. Based on the above significant
relationship, it is possible to interpret that the impact of country risk (CR) will
certainly decrease exports, and buyers will decide to discontinue their business with
the Bangladeshi RMG industry. Therefore in the policy making level, the
government, political parties and bureaucrats should act properly with the other
related stakeholders for making a good policy to reduce country risk.
The positive relationships of non-supportive CR and internal stakeholders’ (SB and
DB) barriers indicated that the higher presence of the CR factors led to increased
suppliers-side (SB) and buyers-side (DB) barriers. This meant that in the SC of the
RMG industry, the CR from the external stakeholders was regarded as important
issues in increasing or decreasing the barriers of internal stakeholders. This result was
also supported by the field study and literature review. In all, 82% of respondents to
the field study supported the impact of country risk (CR) and many literature such as
Boddewyn and Brewer (1994); Hadjikhani and Hakansson (1996); Absar (2001);
Choudhury and Hossain (2005) and Kale (2007) also supported the influence of
country risk (CR) on internal stakeholders and, later, on competitiveness.
Tsai et al. (2005) have argued in their research work that according to ‘stakeholder
influence strategy theory’, external stakeholders such as the country, the media or
some labour groups have influence on the internal stakeholders of a business. So
when a country becomes more risky, the RMG exports will certainly decrease and
world market share will be reduced.
Due to the unstable political situation, corruption and the lack of proper steps by the
government in the financial sector to develop the infrastructure facilities, country risk
(CR) has increased in Bangladesh (World Bank 2005; Joarder, Hossain, and Hakim
2010; Rahman and Hossain 2010; Saxena and Wiebe 2005; Saxena and Salze-Lozac’h
2010; Uzzaman 2010). In last four months (January to April 2013), due to increased
country risk, business to the value of US$500 million has been shifted to Bangladesh’s
neighbouring country, India, and Walt Disney has decided to discontinue their
business with the Bangladeshi RMG industry (The Daily Amader Shamoy 2013; The

197
Daily Manab Zamin 2013). There are many problems in Bangladesh derived from the
actions of the government and opposition parties. Lack of a proper political role and
lack of the development of good relationships among the stakeholders such as
employees, employers and government officials in various stages of the garment
business have created an unfriendly environment that leads to the creation of a variety
of risk related to the garment business and an inefficient SC in Bangladesh. Political
instability, corruption and a non-cooperative attitude make a country more risky. In
this regard, various studies in different literature (World Bank 2005; Joarder, Hossain,
and Hakim 2010; Rahman and Hossain 2010; Saxena and Salze-Lozac’h 2010;
Uzzaman 2010; Tewari 2006) have mentioned various disturbances in the SC of the
RMG industry. Moreover country risk (CR) is the result of political, social and
economic factors (Oetzel, Bettis, and Zenner 2001). As the political actions are non-
supportive, country risk is increasing on a daily basis in Bangladesh.
Considering the above analysis about the external stakeholders’ role and the possible
reason for increasing CR, the government and bureaucrats should take proper action
to reduce the country risk. As country risk increases by the negative action of
political parties and bureaucrats, the external stakeholders should make a good
policy to reduce the risk arise from negative political action and bureaucratic
behaviour. When it is possible to reduce the country risk through necessary action,
the suppliers’ strength will be increased and at the same time buyers will be
encouraged to import more garments products from Bangladesh. This will certainly
improve the competitiveness of RMG industry of Bangladesh.
It is shown in the assessment of the structural model that the relationships of
hypotheses, H3a, H3c and H3e are not supported. It happened as the frustration was
reflected to the respondents’ opinion. There are so many anomalies in government
officials, political parties and their actions for doing RMG business in Bangladesh.
The manufacturers (suppliers) are disappointed about the expected positive role and
activities from the government officials and political parties. Already Bangladesh got
35 years of experience in RMG business (Batexpo, 2012). But till now there are so
many anomalies in the RMG supply chain. Therefore frustration came to the
manufacturers mind. Alternatively it happened when all the stakeholders realised the
contribution of garment sector in the economy of Bangladesh. It is clear to all
stakeholders that the garment sector is the backbone of the economy of Bangladesh.

198
Therefore the government, political parties are probably more careful about this
industry and putting more attention to the supply chain of garment products. The
government and opposition parties have taken some important measures specially for
this sector in any unfavourable situation and political crisis. Accordingly political
parties are now committed to put this sector outside of any political unrest and
activities so that it can run and export their items uninterruptedly. It might be the
probable reason for the non-supportive behaviour of the hypotheses H3a, H3c and
H3e. Moreover, there could be issues with the measurement items and/or
respondents perception. Therefore more research is needed.
However it can be said that regardless the opposite outcomes, non-supportive CR
actually had a strong influence on internal stakeholders as there was sufficient
support in the literature and field study for hypothesis H3c. Despite strong literature
and field study support the respondents didn’t find the independent variable
significantly affecting the competitiveness. Further study can be done to explore the
reason behind it. There was no sufficient support in the literature for hypothesis H3e
(CR to COM). Only the field study supported that link.
8.2.2. Hypotheses related to internal stakeholders and competitiveness
In the RMG industry’s SC, the main internal stakeholders are the final product
manufacturers or the suppliers and buyers. Resource dependency theory (RDT)
considers buyers’ and suppliers’ dependency relationships as important linkages for
firms in reducing the uncertainty surrounding their operations (Carter and Rogers
2008). Competitiveness (COM) can be increased through reducing the uncertainty
and minimizing dependency which is possible by developing good relationships and
understanding between the buyers and suppliers using this theory. This relationship
can also be developed by the positive influence of external stakeholders and building
relationships among the stakeholders across the SC.
However, according to the conceptual model, external stakeholders influence
internal stakeholders and internal stakeholders influence competitiveness. External
stakeholders actually influence the drivers (strengths) and barriers
(pressure/weaknesses) of internal stakeholders. Later on, these drivers and barriers
199
actually influence competitiveness. Four hypotheses were developed taking into
consideration the drivers and barriers which are discussed below.
8.2.2.1 Hypothesis H4
According to hypothesis H4, supply-side drivers (SD) positively influence
competitiveness (COM). The results showed that the hypothesis was supported and
the hypothesized relationships were found to be highly significant with a positive
direction. This means that when SD increases, then COM will increase and,
conversely, when SD decreases then COM will decrease. SD means the suppliers’
strengths. The suppliers can increase their competitive advantage through their
strengths and, later on, can increase competitiveness. There are many studies in the
literature that support supply-side drivers and their relationship with COM. The
drivers or strengths are in the form of a competitive price, cheap labour, quality
products, marketing strength, experienced in working with a reputed brand and with
the largest retail chains such as Wal-Mart, Tesco, H&M, etc. (Rahman 2005;
Rahman and Anwar 2006; Rahman, Bhattacharya, and Moazzem 2008; Rahman and
Hossain 2010). Many researchers have also mentioned that product diversification,
product upgrades, low wages rate, fast and efficient workforce, high labour supply,
communication skill, preferential treatment, technological upgrade and trade union-
free production units are the SD of the RMG industry (Haider 2007; Joarder,
Hossain, and Hakim 2010; Saxena and Salze-Lozac’h 2010; Sultana et al. 2011).
Therefore, there are many studies in the literature that are in support of supply-side
drivers and their positive role in increasing performance and competitiveness. In all,
100% respondents in the field study supported this hypothesis. The above studies in
the literature also mentioned that by having these drivers, the suppliers can easily
bargain with the buyers. So, it can be said that SD can increase the COM of the
RMG industry.
The above drivers are not stable for the long run. In a research study, Adhikari and
Weeratunge (2007) stated that the focus on cheap labour for maintaining cost
competitiveness was not sustainable in the long run as this allowed investors to
switch from Bangladesh to another country. Therefore, Bangladesh must seek new
avenues to retain its position and, in this situation, external stakeholders like the
government and bureaucrats need to act appropriately to enhance the suppliers’
200
drivers: steps should be taken to discover new strategies such as an efficient SC to
create new drivers to improve competitiveness.
8.2.2.2 Hypothesis H5
Supply-side barriers (SB) are the negative side in relation to suppliers. These are
actually the suppliers’ weaknesses. According to this hypothesis, SB negatively
influences the competitiveness (COM). This means that when SB increases, then
COM will decrease and, conversely, when SB decreases, then COM will increase.
Unfortunately, the results did not support the hypothesis. The t-value of this
hypothesized relationship was significant but the path-coefficient did not show the
negative relationship or association among the constructs. It happened as the
frustration was reflected to the respondents’ opinion and probably it was not an
important issue to the respondents. Therefore; the hypothesis was rejected even
though it was supported by the literature and field study. In the RMG business,
supply-side barriers are the weaknesses (Ahmed 2009) in the SC which are hindering
the improvement of competitiveness. These barriers include poor infrastructure, long
lead time, lack of commitment and trust, being under pressure to reduce price, weak
bargaining power, buyers’ freedom to choose alternative suppliers from another
country, lack of cooperation, etc. (Nuruzzaman 2001, 2007; Nuruzzaman, Haque,
and Rafiq 2010; Adhikari 2007a; Kale 2007; Berg et al. 2011; Sultana et al. 2011;
Halder and Kim 2012). Islam, Begum, and Rahsed (2012) have identified suppliers’
barriers as being: inadequate development of backward linkage industries;
production of low-value items; high dependency on imports; high lead time; low
foreign direct investment; poor energy supply; poor transportation; poor port
facilities; worker conflicts; low salary of workers; insufficient government policy;
incompetent ports; lack of training; lack of marketing tactics; problematic middle
management; communication gap; credit problem; and dependency on foreign
market demand.
Moreover, the lack of human resource management; labour unrest; inadequate
supply of materials and accessories; inability to diversify products and markets;
irregularities relating to customs, bonds and shipping; low productivity; corruption in
port management, and political instability have also been identified as barriers for
suppliers in the RMG industry (Abdullah 2009; Huda, Karim, and Ahmed 2007;

201
Guest 2007; Hossan, Sarker, and Afroze 2012; Rahman and Anwar 2007; Uddin and
Jahed 2007). Competitiveness will be increased when the above barriers are
decreased by the appropriate action by the government and bureaucrats (Islam,
Begum, and Rashed 2012; Saxena and Salze-Lozac’h 2010). The field study also
supported the above hypothesis. In all, 100% of field study respondents supported
the hypothesis. But the test result did not support the hypothesis.
Most probably this happened due to respondents almost similar stances on the
constructs. Despite strong literature and field study support the respondents didn’t
find the variable significantly affecting the competitiveness. Further study is needed
to investigate the reason behind it.
8.2.2.3 Hypothesis H6
The sixth hypothesis (H6) was developed taking into consideration the hypothetical
relationship between demand-side drivers (DD) and competitiveness (COM). In the
RMG business, demand-side drivers are the buyers’ strengths which passively play
positive roles for the SC (Razzaque and Eusuf 2008; Ahmed 2009). According to
this hypothesis, DD positively influence competitiveness (COM). The test result
supported the hypothesis and this result was consistent with the results of the field
study and the prior studies in the literature on DD and their influence (Rahman 2005;
Razzaque and Eusuf 2008; Wu et al. 2004; Zhao et al. 2008). The link in this
supported hypothesis, that is, DD to COM, was positive and in the right direction.
This means when DD increase, then COM will increase and, conversely, when DD
decrease, then COM will decrease. Based on the above significant relationship, it
was possible to extrapolate that the impact of DD would certainly increase the
business and competitiveness of the RMG industry.
Furthermore, there was much support in the literature for demand-side drivers and
their relationship with COM. These drivers or strengths are in the form of strong
bargaining power; ability to choose alternative sourcing location; offer a good price;
a bulk customer; dealing with a reputed brand; special facilities from the home
country’s government; and trust and commitment (Ahmed 2009; Rahman 2005; Wu
et al. 2004; Zhao et al. 2008). Some drivers were derived from the field study. In all,
60% of field study respondents supported this hypothesis. Drivers such as a good
credit history, direct purchasing and favourable trade agreements were also

202
mentioned by various interviewees in the field study. These types of drivers actually
enhance the bargaining power of the buyers. As it is buyers’ market and suppliers are
dependent on the buyers’ demand, this is an additional driver for the buyers. In the
RMG industry, the suppliers are very careful about the drivers of the buyers and take
the necessary actions to fulfil the buyers’ demand. These types of action actually
make the suppliers more competitive; therefore, it can be said that DD can increase
the COM of the RMG industry.
8.2.2.4 Hypothesis H7
The last hypothesis is related to demand-side barriers (DB). Demand-side barriers
are the negative side of the buyers. These are actually the pressure on the buyers
from the suppliers. According to this hypothesis, DB negatively influences
competitiveness (COM). This means that when DB increase, then COM will
decrease and, conversely, when DB decreases, then COM will increase.
Unfortunately, the result did not support the hypothesis. The t-value of this
hypothesized relationship was also not significant and the path-coefficient did not
show the negative relationship or association among the constructs. Therefore, the
hypothesis was rejected even though it was supported by the literature and field
study.
In the RMG business, demand-side barriers are the various pressures raised from the
buyers’ side (Ahmed 2009). In the RMG industry’s SC, these types of barriers
hamper the improvement of competitiveness and side-by-side with that, any
inducement to gain competitiveness.These barriers include pressure for a shorter lead
time, pressure to maintain commitment and workers’ rights (Adhikari 2007a; Berg et
al. 2011; Kale 2007; Sultana et al. 2011; Nuruzzaman 2009). Moreover, different
types of conditions and regulations imposed by the local country’s government
(Adhikari and Weeratunge 2007b; Nuruzzaman 2007; Nuruzzaman, Haque, and
Rafiq 2010); compliance issues; and pressures to increase workers’ wages and offer
a good working environment, to reduce price and have a shorter lead time are the
buyers-side barriers (Claeys and Brachet 2008; Hossan, Sarker, and Afroze 2012;
Rahman 2005; Rahman and Hossain 2010). Razzaque and Eusuf (2008) also
mentioned some barriers that arose from the buyers such as better working
conditions and continuous pressure about international labour standards, etc.

203
Competitiveness will be increased when the above barriers are decreased by the
appropriate action of the manufacturers or suppliers (Hossan, Sarker, and Afroze
2012; Islam, Begum, and Rashed 2012; Razzaque and Eusuf 2008; Saxena and
Salze-Lozac’h 2010). In all, 60% of field study respondents supported the
hypothesis. But the result did not support the hypothesis.
In conclusion, it can be said that, due to an opposite outcome, the hypothesis H7 was
not supported even though, having support from the literature and field study. It
occurred probably the respondents didn’t find the variable significantly affecting the
competitiveness. More study can be done in this regard to investigate the reason for
this non supportive hypothesis.
8.3 Summary
This chapter presented the interpretation of the results of the PLS analysis of the
comprehensive research model for improving competitiveness. The findings of the
industry-wide survey among the garment industry in Bangladesh were discussed
according to the results of the hypotheses. The results were discussed and compared
with the existing literature and field study analysis.
Among the 20 hypotheses, the proposed hypothesized relationships that were
supported were: i) H1a, that is, relationship between political action (PA) and
country risk (CR); ii) H2a, that is, relationship between bureaucratic behaviour (BB)
and CR; iii) H2c, that is, relationship between BB and supply-side barriers (SB); iv)
H2d, that is, relationship between BB and demand-side barriers (DB); v) H3b, that
is, relationship between CR and SB; vi) H3d, that is, relationship between CR and
DB; vii) H4, that is, relationship between SD and competitiveness (COM); and viii)
H6, that is, relationship between DD and COM. The remaining hypotheses were not
supported. Overall, all the positive relationships were supported. Initially, the
hypotheses were developed based on support from the literature and field study.
After analysis, these relationships were found to be significant and it was proven that
the external stakeholders have influence on internal stakeholders that leads to
improving the competitiveness of the RMG industry. All the negative hypotheses
were not supported.

204
This chapter also provided possible explanations for the hypotheses that were not
supported in the study. Five different hypotheses were significant but the
relationships were not negative as hypothesized. The rest of the hypothesized
relationships did not show the right direction and association. The t-values of these
hypotheses were also insignificant. Plausible explanations for the statistically
insignificant hypotheses were considered. However, the practical implications of the
findings provided suggestions on effective measures that could be undertaken
towards improving competitiveness in the RMG industry.
In the last chapter, the thesis will conclude by presenting the summary of the
research, its contributions and limitations, as well as directions for future research.

205
CHAPTER 9
Conclusions and Future Directions
9.1 Introduction
To investigate the influence of stakeholders in the RMG industry’s SC, this research
was conducted using mixed-method analysis with the aim of improving the
competitiveness of the Bangladeshi RMG industry. Taking into consideration the
aim of this research, a conceptual model was developed in chapter 3: based on the
findings of the field study in chapter 5, the model was then refined and finally a
comprehensive model was developed. The hypothetical relationships, that is,
hypotheses were drawn from the comprehensive model in chapter 6. Based on these
relationships, a questionnaire was developed to collect data for quantitative analysis.
Using the quantitative data, obtained from Dhaka-based garment companies, the
hypotheses were tested by PLS-based SEM. The results of the quantitative data were
presented in chapter 7. Eight hypotheses were accepted of the 20 hypotheses
developed. The discussions about the accepted and rejected hypotheses were
presented in chapter 8 on the basis of the results in chapter 7, the field study analysis
and support from the literature. This concluding chapter 9 provides the summary and
conclusion of the research.
Using the research questions and objectives as its basis, the next section presents a
summary of the research. This chapter also discusses the contribution of the research
in terms of both its theoretical and practical aspects. Moreover, it concludes with the
limitations of the study followed by the future directions for research in the context
of this research area.
9.2 Summary of the Research
This research study on improving competitiveness was conducted based on the gap
in the literature with regard to improving the competitiveness of the RMG industry,
its SC and the influence of the stakeholders involved in the RMG industry’s SC. In
this study, the research model was developed based on the concept of stakeholder

206
and resource dependency theories, as well as incorporating relevant elements
sourced from studies in the literature about political economy and specifically about
SCM in the garments industry and also including other important industries. The
constructs and items of the initial research model were developed from the
comprehensive literature review with this later validated and improved by a
qualitative field study.
This research used the mixed-method approach as discussed in chapter 4.The mixed-
method approach combines qualitative and quantitative methods of research. The
qualitative phase was undertaken to refine and enhance the initial model (chapter 5).
In the qualitative phase, 10 interviews were conducted with top executives of 10
different garment companies. Using a semi-structured questionnaire, the data were
collected from the field study and analysed through using the content analysis
approach (chapter 5). Overall, the findings supported the initial model. A little
modification was done to the initial model after the field study analysis. Finally, by
combining the results from the field study with the relevant literature, an integrated
and comprehensive model was developed for this study (chapter 5). Altogether, eight
constructs were derived from external and internal stakeholders and 56 items were
confirmed for the comprehensive model. Accordingly, hypotheses within the model
were established (chapter 6)
An industry-wide survey was conducted in the second phase of the study. Prior to
that, a structured questionnaire was developed based on the combined research
model. The layout of the questionnaire was slightly revised according to the
feedback after the pilot test (chapter 6). The survey was then administered among
garment companies in Dhaka, Bangladesh. After the survey, the collected data were
analysed using the PLS-based SEM technique (chapter 7). The analysis followed the
PLS framework by sequentially assessing the measurement model and following
that, the structural model. The result of the hypotheses testing found that eight
suggested relationships were statistically significant while the other 13 hypotheses
were not supported (chapter 7). The results were presented and comprehensively
discussed in chapter 8.

207
9.3 Contribution of the Research
The results of the study have made several valuable contributions from both research
and practical points of view.
9.3.1 Methodological contribution
The major contribution of this research focuses on the method that was adopted. This
research applied the mixed-method approach that combined qualitative and
quantitative approaches for analysing data. Initially, in the qualitative approach, the
interviewed data were analysed through content analysis to refine and revise the
model then, based on the final model, quantitative data were collected and analysed
through the PLS-based SEM technique. The mixed-method approach was actually
adopted to collect reliable information from the field which was then combined with
the literature to achieve a better result in the quantitative phase.
This is relatively new methodology in the area of RMG research where the SC has
been analysed with the aim of improving the competitiveness of the RMG industry.
Many research studies have been undertaken to improve performance or competitive
advantages in different industries in the context of developed nations in the Western
culture and using either method, whether qualitative or quantitative, in these research
studies but there has been scarce use of both methods. There was no significant
research for improving competitiveness in the garment industry and in the context of
developing nations like Bangladesh. This research was conducted in the RMG
(clothing) industry of Bangladesh and data were collected on the stakeholders
involved in the RMG industry’s SC.
9.3.2 Theoretical contribution
One of the significant contributions of the research is to the theory and literature of
competitiveness and the SC. This study represents an important contribution to theory
by integrating two theoretical perceptions to identify factors of the RMG industry’s SC
that affect the competitiveness of the RMG industry. This research study contributes to
the understanding of both external and internal stakeholders of the national and
international perspectives in the RMG (textile and clothing) business. It combines the
insights of stakeholder and resource dependence theories along with the concept of the
SC in improving effectiveness, the dynamism of the RMG industry’s SC and finally to
improving the competitiveness of the RMG industry in Bangladesh.

208
Very few research studies have been undertaken in apparel SCM to increase
performance and reduce lead time using information technology and focusing on
integrated relationship management, collaborative relationships, etc. (Au and Ho
2002; Bowen 2000; Buxey 2005; Chandra 1997; Chandra and Sameer 2000;
Dossenbach 1999; Lambert and Pohlen 2001; Pramatari 2007; Rungtusanatham
2003; Wong 1999; Zhao et al. 2008). This research considers some new external
constructs, namely, political action, bureaucratic behaviour and country risk from
external stakeholders’ points of view in increasing the performance and
competitiveness of the RMG industry’s SC, aspects with which previous studies
have not dealt. The current research’s approach is therefore expected to make a
unique theoretical contribution in the RMG industry’s SC. Moreover, this research
will also make a unique contribution to the academic literature by dealing with the
RMG industry’s SC in a developing country like Bangladesh.
In the context of improving competitiveness for sustainable competitive advantage in
the post-MFA period, this study fills a theoretical gap by developing a research
model from the literature and further improving it through qualitative field study
analysis ensuring the use of influential constructs and items. The research model was
assessed by using an empirical data set linking observations of executives from
different garment companies in Bangladesh. Thus, this study contributes to the issue
of competitiveness by way of analysing the SC of the RMG industry in a developing
nation as there has been no previous research on the SC and related stakeholders that
has explained ways of improving competitiveness.
Finally, to the best of the researcher’s knowledge, there are very few studies in the
clothing sector that have attempted to examine competitive advantage and
performance. Most of these studies are on developed countries from the perspective
of Western culture but studies about the competitiveness of the RMG industry in a
developing country like Bangladesh are very scarce. Most of the previous research
studies have been to address issues of problems and prospects: some have been on
competitive advantages in the post-MFA period but these are mostly focused on
information systems. Therefore, the theoretical contribution of this study is
completely new because, firstly, it investigates the issue of competitiveness in the
post-MFA period; secondly, it analyses the SC; thirdly, it is focused on a developing
nation like Bangladesh; fourthly, it analyses the influence of both internal and

209
external stakeholders in the RMG industry’s SC; fifthly, it uses a combination of two
theories; and, lastly, it used a mixed-method approach.
9.3.3 Practical contribution
It has been revealed that the outcomes of the study have made an important
contribution to the SC of the garment industry in Bangladesh as it has drawn
attention to some hidden issues related to the development of better customer-
oriented SCM for improving competitiveness. In a practical sense, this study
certainly contributes to the Bangladeshi RMG industry. In accordance with the desire
of the RMG manufacturers, the research has shown that some influential constructs
of the RMG industry’s SC affect the competitiveness of the RMG industry. The
outcome of the study is useful for various stakeholders of the Bangladeshi RMG
industry sector ranging from the government to various private organisations.
Consequently, the manufacturers and other SC members or stakeholders can take
useful and necessary action in practical ways to achieve a better result. Recognising
the need for the RMG industry in Bangladesh is the most important contributions of
this research. For the first time, stakeholders are able to see what would make the
industry more competitive and what support and assistance needs to be provided to
them. Accordingly, various policies can be developed and implemented in order for
the Bangladeshi RMG sector to compete in the world market.
However, combining the findings of this research, the three main stakeholders – the
government, suppliers and buyers – can accomplish the potential for development
and solve Bangladesh’s RMG growth formula. Most importantly, these stakeholders
need to work hand in hand on their continued efforts to implement the various
measures that are involved in improving the image and competitiveness of the
Bangladeshi RMG industry. The need has been identified for a new level of
collaboration with regard to compliance, in which stakeholders join forces across the
government, suppliers, buyers and other stakeholders to anchor ethical and
sustainable business practices along the SC.
The main contribution of the study is the identification of the industry’s external
stakeholders’ elements or constructs and internal stakeholders’ strengths and
weaknesses that influence the competitiveness of the RMG industry. In this study
“country risk” was identified as a new construct created by the interaction of

210
“political action” and “bureaucratic behaviour”, the two main external stakeholders
constructs. Finally, it has been shown how these three external stakeholders’
elements or constructs influence the internal stakeholders’ constructs in the RMG
industry’s SC.
Another contribution of this research is to make the SC more efficient and
competitive. There has previously been no significant research on how to make the
RMG industry’s SC efficient. There are very few research studies in respect to lead
time reduction or minimization of costs in the SC. Those research works have only
considered some import and export activities. However, this research has contributed
to the SC and has shown the practical influence of external stakeholders, such as the
government and bureaucrats.
Finally, it is our hope that this research project will allow local Bangladeshi garment
manufacturers to undertake steps for future preparedness in the competitive garment
market. Moreover, the study will be helpful for SC academics and practitioners
particularly in Bangladesh but also throughout the world.
9.4 Limitations
This research study also has some limitations as is the case with other research studies.
These limitations could be considered as areas for future research. In regard to
methodological issues, firstly, in using the sampling method, the selection of the
participants’ sample was not purely random. As explained in the research methodology
chapter, data collection from the RMG sector was very difficult; the participants who
took part in the field study were selected based on convenience sampling. In the main
survey, the garment companies were all selected purposively where access was easier.
Considering these difficulties, only garment manufacturers and Dhaka-based garment
companies were allowed to participate in the main survey of this study.
Another limitation was that the samples were limited mostly to large companies
located in the capital city due to time and financial constraints. As the study was
about the competitiveness of the RMG industry, therefore, irrespective of the
company size, a different location including the export processing zone in different
cities should be considered. Therefore, there is still the need to further investigate
garment companies of various sizes in different locations in Bangladesh.

211
The conclusions reached in the study were not of universal application as the
research was conducted in the context of the garment industry in a developing
country like Bangladesh. The generalizability of the results is limited to only those
organisations in developing countries which are export oriented and in which the
SCM is not up to the mark due to the external stakeholders’ role. The developed
model and the interpretations are industry specific, particularly for the Bangladeshi
garment industry. The results of this study might not explain the same problem from
a different perspective even in the same industry in a different country.
9.5 Future Research Directions
The limitations of this study suggest the need for further research. The future
directions of this research are summarised in the following points.
In this research, a model was developed for a specific industry in a specific country,
that is, for Bangladesh which therefore may not be applicable in another country:
however, it could be a milestone for undertaking such research in another developing
country. Considering the findings of this research, researchers from other developing
countries may develop a more country-specific model for a similar industry.
Accordingly, this process might be helpful in increasing the generalizability of this
model in different developing nations for the same or a similar industry.
In future, this research or this research model could be used in other export-oriented
industries in Bangladesh or in other developing countries across the world.
This study was limited to investigating the large and medium garment companies of
Dhaka city, Bangladesh. In future, all sizes of garment companies across the country
including in the export processing zone could be considered. As the RMG industry is
the backbone of the Bangladeshi economy, this research model could be used for a
specific external factor such as the government or political action or country risk to
improve competitiveness or some new external variables could be considered also in
seeking to improve competitiveness.
From the field study, it was found that political action, bureaucratic behaviour and
country risk had direct influence on the competitiveness of the RMG industry but
finally, after quantitative analysis, these hypotheses were rejected. So, in future, this
could be another research study in the RMG industry. Moreover, based on support

212
from the literature and the field study, it was found that political action has a
sufficient level of influence on the elements of internal stakeholders that improve the
competitiveness of the RMG industry but, finally, all the links of the model to
internal stakeholders were rejected. Therefore, this could be another important
research study for the RMG industry of Bangladesh to improve competitiveness.
Last but not least, this research provides a direction for a resource-dependent
environment showing how a developing country could increase the efficiency of its
garment SC and later improve the competitiveness of its garment industry taking into
consideration the contribution of external and internal stakeholders. In future, a
comparative study could be done on how competitors like Vietnam in a resource-
dependent environment are becoming more competitive in this industry. Another
comparative study could be done on competitors like China and India who are doing
business in a resource-based environment.

213
REFERENCES
Abdel -Latif, Abla M. 1993. "The Nonprice Determinants of Export Success or Failure: The Egyptian Ready-Made Garment Industry, 1975-1989 " World development 21 (10): pp. 1677-1684.
Abdin, M. J. 2008. Overall Problems and Prospects of Bangladeshi Ready-Made Garment Industry. Social Science Research Network. Accessed 6th of April, 2012 http://papers.ssrn.com/sol3/papers.cfm?abstract_id=1117186.
Abdulla, M. Abu Yusuf 2008. "Growth History of the Textile and Rmg Industries: Mfa Impact Analysis in the Perspective of Bangladesh." AIUB journal of business and economics 7 (1).
Abdullah, A.Y.M. 2005. "Labor Productivity and Wastage: The Two Sides of a Coin Bangladeshi Rmg Perspective." The AIUB Journal of Business and Economics 4 (2): 37-55.
———. 2009. "The Influence of Work Environment and the Job Satisfaction on the Productivity of the Rmg Workers in Bangladesh." Journal of Management 1 (1): pp.43-55.
Absar, S. S. 2003. "Economic Diplomacy for Bangladesh: A Prescription for Less Developed Countries in the World Trade Organisation Era." South Asia 26 (3): 349.
Absar, S. S. . 2001. "Problems Surrounding Wages: The Ready Made Garments Sector in Bangladesh." Journal of Labor and Management in Development, Asia Pacific Press 2 (7).
Adhikari, R, and Y.Yamamoto. 2005. Flying Colours, Broken Threads: One Year of Evidence from Asia after the Phase out of Textile and Clothings Quotas. Colombo: UNDP REgional Centre in Colombo.
Adhikari, R., and Chatrini Weeratunge. 2007b. "Textiles and Clothing in South Asia: Current Status and Future Potential." South Asia Economic Journal 8 (2): pp171-203.
Adhikari, Ratnakar. 2007a. Government Support to Textiles and Clothing Sector- a Study of Selected Asian Countries. Kathmandu: SAWTEE.
Adhikari, Ratnakar, and Chatrini Weeratunge. 2006. "Textile & Clothing Sector in South Asia: Coping with Post-Quota Challenges." In South Asian Year Book, 109-145.
Ahamed, Ferdous. 2013. "Could Monitoring and Surveillance Be Useful to Establish Social Compliance in the Ready-Made Garment (Rmg) Industry of Bangladesh?" International Journal of Management and Business Studies 3 (3): pp. 088-100.
Ahmed, Nasheet 2004. Surving in a Quota Free World: Will Bangladesh Make It? Dhaka: CPD.
Ahmed, Nazneen 2009. "Sustaining Readymade Garment Export from Bangladesh." Journal of Contemporary Asia 39 (4): 597-618.
Ahmed, R. 1995. "Readymade Garment Industry of Bangladesh." The Monthly Commercial & Industry (94): 14.
Ahn, Hyeon-Soo, Hee-Don Jung, Byong-Hun Ahn and, and Seung-Kyu Rhee. 1999. "Supply Chain Competitiveness and Capabilities of Constituent Firms: An Exploratory Study of the Korean Home Appliance Industry." Supply Chain Management: An International Journal 4(5) pp.242- 253.

214
Aldrich, Howard. 1976. "Resource Dependence and in Terorganiza Tional Relations Local Employment Service Offices and Social Services Sector Organizations." Administration & Society 7 (4): 419-454.
Allen, B. A., E. Wade, and Dickinson. 2009. "Bridging the Divide - Commercial Procurement and Supply Chain Management: Are There Lessons for Health Care Commissioning in England?" Journal of Public Procurement 9 (1): 79-108.
Ambastha, Ajitabh, and K. Momaya. 2004. "Competitiveness of Firms: Review of Theory, Frameworks, and Models." Singapore Management Review 26 (1): 45-61.
Anderson, J. C. . 1987. "An Approach for Confirmatory Measurement and Structural Equation Modeling of Organizational Properties." Management Science 33 (4): pp. 525-541.
Andreev, P., Heart T., Maoz H., and Pliskin N. 2009. "Validating Formative Partial Least Squares(Pls) Models: Methodological Review and Empirical Illustration." In Internatinal Conference on Information Systems(ICIS), Phoenix, Arizona. AIS Electronic Library.
Appelbaum, Richard. 2005. The Emergence of Giant Transnational Contractors in East Asia:Emergent Trend in Global Supply Chains ,Mimeo, University of California at Santa Barbara.
Asgari, Behrooz, and Md Aynul Hoque. 2013. "A System Dynamics Approach to Supply Chain Performance Analysis of the Ready-Made-Garment Industry in Bangladesh " Ritsumeikan Journal of Asia Pacific Studies 32: pp.51-61.
Au, K.F., and C.K. Danny Ho. 2002. "Electronic Commerce and Supply Chain Management: Value Adding Service for Clothing Manufacturers." Integrated Manufacturing system 13 (4): 247-254.
Awal, M.A. 2005. "Presentation on Bangladesh Strategy in Post Mfa Environment." Beijing.
Azad, Rafiq 2004. "Readymade Garments Industry in Bangladesh: Competitiveness and Sustainability." Unpublished Ph.D. Thesis, Department of Marketing, University of Rajshahi, Rajshahi.
Azizah, Ahmad. 2011. "Business Intelligence for Sustainable Competitive Advantage:The Case of Telecommunications Companies in Malaysia." Ph.D. Thesis, Graduate School of Business, Curtin Business School, Curtin University of Technology, Perth, Australia.
Babbie, E . 1990. Survey Research Methods, 2nd Ed.: Wadsworth Publishing Company, Belmont, California, USA.
Bacallan, J.J. 2000. "Greening the Supply Chain " Business and Environment 6 (5): 11-12.
Bagozzi, R. P. . 1994. "Structural Equation Models in Marketing Research: Basic Principles." In Principles of Marketing Research, ed. R.P. Bagozzi, pp. 317-385. Massachusetts: Blackwell Business.
Bagozzi, R. P., Y. Yi, and L. W. Phillips. 1991. "Assessing Construct Validity in Organizational Research." Administrative Science Quarterly 36 (3): pp. 421-458.
Barclay, D., C. Higgins, and R. Thompson. 1995. "The Partial Least Squares (Pls) Approach to Causal Modeling: Personal Computer Adoption and Uses as an Illustration." Technology Studies 2 (2): 285-309.

215
Bass, Bernard M., Donald W. McGregor, and James L. Walters. 1977. "Selecting Foreign Plant Sites: Economic, Social and Political Considerations." The Academy of Management Journal 20 (4): 535-551.
Batexpo. 2012. Bangladesh Apparel and Textile Exposition Souvenir. Dhaka. Batespo. 2013. Bangladesh Apparel and Textile Exposition Souvenir. Dhaka. Bazeley, P. . 2004. Issues on Mixing Qualitative and Quantitative Approaches to
Research, . Edited by J. Gardner and L. Richard R. Buber, Applying Qualitative Method to Marketing Management Research. UK: Palgrave Macmillan.
Berg, B. L. . 2001. Qualitative Research Methods for the Social Sciences. 4th ed: Allyn and Bacon.
Berg, Dr. Achin, Saskia Hedrich, Sebastian Kempf, and Dr. Thomas Tochtermann. 2011. Bangladesh's Ready-Made Garments Landscape: The Challenge of Growth. McKinsey & Company
Bergara, Mario E., Witold J. Henisz, and Pablo T. Spiller. 1998. "Political Institutions and Electric Utility Investment: A Cross-Nation Analysis." California Management Review 40 (2): 18-35.
Berik, Gunseli , and Yana van der Meulen Rodgers. 2009. "Bangladesh's Ready-Made Garments Sector: Exports, Employment and Working Conditions." Journal of Bangladesh Studies, Bangladesh Development Institute, Pennsylvania State University, USA: 1-19.
Bertolini, Massimo, Eleonora Bottani, Antonio Rizzi, and Maurizio Bevilacqua. 2007. "Lead Time Reduction through Ict Application in the Footwear Industry: A Case Study." International Journal of Production Economics 110 (1-2): 198-212. doi: 10.1016/j.ijpe.2007.02.016.
Bhatnagar, Rohit, and Amrik S. Sohal. 2005. "Supply Chain Competitiveness: Measuring the Impact of Location Factors, Uncertainty and Manufacturing Practices." Technovation 25 (5): 443-456. doi: 10.1016/j.technovation.2003.09.012.
Bhattacharya, Debapriya, Mustafizur Rahman, and Ananya Raihan. 2002. Contribution of the Rmg Sector to the Bangladesh Economy. Dhaka.
Birou, L. M., and S.E Fawcett. 1993. "International Purchasing: Benefits, Requirements, and Challenges." The journal of supply chain management 29 (2): pp.27.
Birtwistle, G., N Siddiqui, and S.S. Fiorito. 2003. "Quick Response: Perceptions of Uk Fashion Retailers." International journal of Retail and Distribution Management 31 (2): pp. 118-128.
Blos, M.F, M. Quaddus, H.M. Wee, and K. Watanabe. 2009. "Supply Chain Risk Management (Scrm): A Case Study on the Automotive and Electronic Industries in Brazil." Supply Chain Management: An International Journal 14 (4): pp. 247-52.
Boddewyn, Jean J., and Thomas L. Brewer. 1994. "International-Business Political Behavior: New Theoretical Directions." The Academy of Management Review 19 (1): 119-143.
Bollen, K. L. . 1989. Structural Equations with Latent Variables. New York: John Wiley.
Bollen, K., and R. Lennox. 1991. "Conventional Wisdom on Measurement: A Structural Equation Perspective." Psychological bulletin 110 (2): 305.
Bordens, K.S., and B.B. Abbott. 2008. Research Design and Methods-a Process Approach. 7th ed. New York: Mc Graw Hill.

216
Bowen, K. 2000. "Co-Ordinating an Innovation in Supply Chain Management." European Journal of Operational Research 123: 568-84.
Boyd, Brian. 1990. "Corporate Linkages and Organizational Environment: A Test of the Resource Dependence Model." Strategic Management Journal 11 (6): 419-430. doi: 10.2307/2486374.
Bozarth, C., J. Blackhurst, and R. B. Handfield. 2007. " Following the Thread: Industry Cluster Theory, the New England Cotton Textiles Industry, and Implications for Future Supply Chain Research." Production and Operations Management 16 (1): 154-157.
Bramorski, T. 2000. "Improving Competitiveness of Ready-to-Assemble Manufacturers through Information Technology." Logistics information management 13 (4): 201.
Breen, Helen, and Nerilee Hing. 2002. "Improving Competitiveness through Cooperation: Assessing the Benefits of Cooperative Education Partnerships in Gaming Management." UNLV gaming research & Review journal 6 (1): pp. 57-72.
Brito, De Marisa P., Valentina Carbone, and Corinne Meunier Blanquart. 2008. "Towards a Sustainable Fashion Retail Supply Chain in Europe: Organisation and Performance." International Journal of Production Economics 114 (2): 534-553. doi: 10.1016/j.ijpe.2007.06.012.
Bruce, M. , and S.T. Moger. 1999. "Dangerous Liasons: An Application of Supply Chain Modelling for Styding Innovation within the Uk Clothing Industry." Technology Analysis and Strategic Management 11 (1): p. 113.
Bruce, M., L Daly, and N. Towers. 2004. "Lean or Agile: A Solution for Supply Chain Management in the Textiles and Clothing Industry?" International Journal of Operations & Production Management 24 (2): 151-170.
Bruhn, M., Georgi D., and Hadwich K. 2008. "Customer Equity Management as Formative Second-Order Construct." Journal of Business Research 61 (12): 1292.
Buckley, Peter J., Christopher L. Pass, and Kate Prescott. 1988. "Measures of International Competitiveness: A Critical Survey." Journal of Marketing Management 4 (2): 175-200.
Burrel, G , and G Morgan. 1979. Sociological Paradigms and Organizational Analysis: Elements of the Sociology of Corporate Life. Heidemann; London.
Buxey, G. 2005. "Globalisation and Manufacturing Strategy in the Tcf Industry." International journal of operations & production management 25 (2): 100-113.
Byrne, B.M. . 2008. "Testing for Multigroup Equivalence of a Measuring Instrument: A Walk through the Process." Psicothema 20 (4): pp. 872-882.
Cao, M., and Q. Zhang. 2011. "Supply Chain Collaboration:Impact on Collaborative Advantage and Firm Performance." Journal of Operations Management 29: pp.163–180.
Cao, N., Zhiming Zhang, Man Kin To, Po Keng NG, and 2008. "How Are Supply Chains Coordinated?: An Empirical Observation in Textile-Apparel Businesses." Journal of fashion marketing and management 12 (3): 384-397.
Cao, Ning, Zhiming Zhang, Chester To and, and Roger Ng. 2006. "Supply Chain Management Practice and Conmpetitive Advantage in Textile and Apparel Industries: An Empirical Investigation." Institute of Textile and Clothing, The Hong Kong Polytechnic University.

217
Carmines, E. G. , and R. A. Zeller. 1981. "Reliability and Validity Assessment. In: Sullivan J. L. (Ed.)." In Quantitative Applications in the Social Sciences, pp. 43-48. London: Sage Publications.
Carter, Craig R., and Dale S. Rogers. 2008. "A Framework of Sustainable Supply Chain Management:Moving toward New Theory." International Journal of Physical Distribution & Logistics Management 38 (5): pp.360-387.
Cavinato, Joseph L. 1992. "A Total Cost/Value Model for Supply Chain Competitiveness." Journal of Business Logistics 13 (2): 285-301.
Cetindamar, D., B. Çatay, and O. S. Basmaci. 2005. "Competition through Collaboration: Insights from an Initiative in the Turkish Textile Supply Chain." Supply Chain Management: An International Journal 10 (4): 238-240.
Chandra, C. 1997. Enterprise Architectural Framework for Supply Chain Integration 6th Annual Industrial Engineering Research Conference, Miami Beach, Florida, Institute of Industrial Engineers,Norcross, GA,
Chandra, C., and Kumar Sameer. 2000. "An Application of a System Analysis Methodology to Manage Logistics in a Textile Supply Chain." Supply Chain Management: An International Journal 5 (5): 234-244.
Chandra, Pankaj. 2005. The Textile and Apparel Industry in India. Oxford University Press India: Oxford University Press.
Chen, Chien-Hsun, and Hui-Tzu Shih. 2004. "The Impact of Wto Accession on the Chinese Garment Industry." Journal of Fashion Marketing and Management 8 (2): pp.221 - 229.
Chen, Kevin, Lian Xu, and Yufeng Duan. 1999. "Ex-Post Competitiveness of China's Export in Agri-Food Products: 1980-96." Agribusiness 16 (3): pp. 281-294.
Chen, Z., R. Murray, and R. M. Jones. 2007. "Fashion Supply Chain Organisation and Management between the Uk and China." Journal of Fashion Marketing and Management 11 (3): 380-397.
Chikán, Attila, and D. Clay Whybark. 1990. "Cross-National Comparison of Production—Inventory Management Practices." Engineering Costs and Production Economics 19 (1-3): 149-156. doi: 10.1016/0167-188x(90)90037-i.
Chin, W. W. 1998a. "Commentary: Issues and Opinion on Structural Equation Modeling." MIS Quarterly 22 (1): PP. vii-xvi.
Chin, W. W., and A. Gopal. 1995. "Adoption Intention in Gss: Relative Iimportance of Beliefs. ." Data BaseE Advances 26 (2&3): pp 42-64.
Chin, W.W. 1998. The Partial Least Squares Approach to Structural Equation Modelling, in Modern Methods for Business Research. Edited by G.A. Marcoulides: NJ Lawrence, Erlbaum Associates.
Chin, W.W., B.L. Marcolin, and P.R. Newsted. 1999. "Structural Equation Modeling Analysis with Small Samples Using Partial Least Squires." In Statistical Startegies for Small Sample Research, ed. R.H. Hoyle, pp.307-341. California: Saga Publications.
Choudhury, Siddiqur Rahman , and Md Golam Hossain. 2005. Post-Mfa Issues and Challenges: Social Dimension. Dhaka, Bangladesh: Bangladesh Government.
Christopher, M. 1998. Logistics and Supply Chain Management: Strategies for Reducing Cost and Improving Services: Financial Times Pitman Publishing.

218
Christopher, M., and Hau Lee. 2004. "Mitigating Supply Chain Risk through Improved Confidence." International journal of physical distribution & logistics management 34 (5): 388.
Christopher, M., Robert Lowson, and Helen Peck. 2004. "Creating Agile Supply Chains in the Fashion Industry." International journal of retail & distribution management 32 (8): 367-376.
Čižmana, Anton, and Janko Černetič. 2004. "Improving Competitiveness in Veneers Production by a Simple-to-Use Dss." European Journal of Operational Research 156 (1): pp. 241-260.
Claeys, Priscilla, and Isabelle Brachet. 2008. Bangladesh Labour Rights in the Supply Chain and Corporate Social Responsibility. Bangladesh.
Clark, C., and S.Kanter. 2010. Violence in the Readymade Garments Industry in Bangladesh. USA.
Clarkson, Max B. E. 1995. "A Stakeholder Framework for Analyzing and Evaluating Corporate Social Performance." The Academy of Management Review 20 (1): 92-117.
Cohen, S., and J Roussel. 2005. Strategic Supply Chain Management, the Five Disciplines for Top Performance. New York: McGraw-Hill.
Compeau, D. R., and C. A. Higgins. 1995. "Computer Self-Efficacy: Development of a Measure and Initial Test " MIS Quarterly 19 (2): pp.189-212.
Cooper, D. R, and P. S. Schindler. 2008. Business Research Methods. New York: McGraw Hill.
Cooper, M. C. , D. M. Lambert, and J. S Pagh. 1997. "Supply Chain Management: More Than a New Name for Logistics." International Journal of Logistics Management 8 (1): 1.
CPD. 2007. Banhladeshe's Apparel Sector in Post-Mfa Period- a Benchmarking Study on the Ongoing Restructuring Process. Dhaka, Bangladesh.
Creswell, J.W. 2003. Research Design: Qualitative and Quantitative, and Mixed Method Approaches. 2nd ed. Thousand Oaks, California, USA: Sage Publications.
Creswell, J.W. . 2009. Research Design: Qualitative, Quantitative, and Mixed Methods Approaches. 3rd ed. Thousand Oaks, California, USA: Sage Publications.
Crook, T. Russel, and James G. Combs. 2007. "Sources and Consequences of Bargaining Power in Supply Chains." Journal of operations management 25 (2): 546.
D'Souza, E. Undated. "The Wto and the Politics of India's Textile Sector: From Inefficient Redistribution to Industrial Upgradation."
D’Cruz, J , and A Rugman. 1992. New Concepts for Canadian Competitiveness. Canada: Kodak.
Danese, P., P. Romano, and A. Vinelli. 2006. "Sequences of Improvement in Supply Networks: Case Studies from the Pharmaceutical Industry." International Journal of Operations & Production Management 26 (11): 1199-1222.
DCCI. 2003. Monthly Report of Dhaka Chamber of Commerce and Industry. Dhaka: DCCI.
Debapriya, Bhattacharya, and Mustafizur Rahman. 2003. USA Trade and Development Act 2000: A Response from Bangladesh Perspective. Dhaka: CPD.

219
Delmas, M., and M.W. Toffel. 2004. "Stakeholders and Environmental Management Practices: An Institutional Framework." BusinessStrategyandtheEnvironment 13 (209–222).
Denzin, Norman K. , and Lincoln Yvonna S. 2000. Handbook of Qualitative Research. 2nd ed: Thousand Oaks: Sage.
Diamantopoulos, A., and J. A. Siguaw. 2006. "Formative Versus Reflective Indicators in Organizational Measure Development: A Comparison and Empirical Illustration." British Journal of Management 17: pp. 263-282.
Diamantopoulos, A., and H. M. Winklhofer. 2001. "Index Construction with Formative Indicators: An Alternative to Scale Development." Journal of Marketing Research 38 (2): pp.269-277.
Doh, Jonathan P. 2005. "Offshore Outsourcing: Implications for International Business and Strategic Management Theory and Practice." Journal of Management Studies 42 (3): 695-704.
Donaldson, T, and L.E Preston. 1995. "The Stakeholder Theory of the Corporation: Concepts Evidence and Implication." Academy of Management Review 20 (1): 65-91.
Dossenbach, Tom. 1999. "Basic Supply Chain Management=Greater Profits." Wood & Wood Products 104 (10): 109.
Duren, Erna van, Larry Martin, and Randall Westgren. 1991. "Assessing the Competitiveness of Canada’s Agrifood Industry." CANADIAN JOURNAL OF AGRICULTURAL ECONOMICS 39: pp 727-738.
Eng, Teck-Yong 2005. "The Influence of a Firm’s Cross-Functional Orientation on Supply Chain Performance." The journal of Supply Chain Management Fall 2005: P. 4-16.
Ertek, Guradal, and Paul M. Griffin. 2002. "Supplier- and Buyer-Driven Channels in a Two-Stage Supply Chain." IIE Transactions 34: pp 691–700.
EU. 2011. The Textile and Clothing Sector and Eu Trade Policy. Accessed 02.04/2012, http://trade.ec.europa.eu/doclib/docs/2011/october/tradoc_148259.pdf.
European Management Forum. 1984. Report on Industrial Competitiveness. Switzerland.
Evans, P., and J. Rauch. 1999. "Bureaucracy and Growth: A Cross Ational Analysis of the Effects of Weberian State Structures on Economic Growth." American sociological review 64 (4): 748-65.
Falk, R. F, and N. B. Miller. 1992. A Primer for Soft Modelling. Akron, OH: University of Akron Press.
Fassin, Y. 2009. "The Stakeholder Model Refined." Journal of business ethics 84 (1): 113.
Fatehi, K., and M.H. Safizadeh. 1994. "The Effect of Socio Political Instability on the Flow of Different Types of Foreign Direct Investment." Journal of business research 31: pp. 65-73.
Ferdousi, Farhana , and Amir Ahmed. 2009. "An Investigation of Manufacturing Performance Improvement through Lean Production: A Study on Bangladeshi Garment Firms." International Journal of Business and Management 4 (9): 106-116.
Fernie, J., and N. Azuma. 2004. "The Changing Nature of Japanese Fashion: Can Quick Response Improve Supply Chain Efficiency?" European Journal of Marketing 38 (7): 790-808.

220
Fiaz, Naushad. 2006. Building the Competitveness of Garment -Exporting Countries through Economic Reforms.
Fong, C. C. 2005. "A Pseudo Longitudinal Study of Using Intranet for Supporting Management Accounting: Evidence from Hong Kong Public Hospitals." Graduate School of Business, Curtin University, Australia.
Forman, M., and M. S. Jørgensen. 2004. "Organising Environmental Supply Chain Management: Experience from a Sector with Frequent Product Shifts and Complex Product Chains: The Case of the Danish Textile Sector." Greener Management International 45: 43-62.
Fornell, C., and F. L. Bookstein. 1982. "Two Structural Equations Models: Lisrel and Pls Applied to Consumer Exit-Voice Theory." Journal of Marketing Research 18: pp. 39-50.
Fornell, C., and D.F. Larcker. 1981. "Evaluating Structural Equation Models with Unobservable Variables and Measurement Error." Journal of Marketing Research 18 (1): 39-50.
Fox, Jane. 2013. Disney Pulls out of Bangladesh Factories. CNNMoney Accessed 02/06/2013, http://money.cnn.com/2013/05/02/news/companies/disney-bangladesh/index.html.
Fraering, Martin, and Sameer Prasad. 1999. "International Sourcing and Logistics: An Integrated Model." Logistics information management 12 (6): 451-460.
Frazer, L, and M. Lawley. 2000. Questionnaire Design and Administration: A Practical Guide. Brisbane, Australia: Wiley.
Frear, Carl R, Lynn E Metcalf, and Mary S Alguire. 1992. "Offshore Sourcing: Its Nature and Scope." International Journal of Purchasing and Materials Management 28 (3): 2-11.
Freeman, R. E. 1999. "Divergent Stakeholder Theory." Academy of Management Review 24: pp.233-236.
Freeman, R. Edward, Andrew C. Wicks, and Bidhan Parmar. 2004. "Stakeholder Theory and the Corporate Objective Revisited." Organization Science 15 (3): pp.364-369.
Freeman, R.E. 1984. Strategic Management: A Stakeholder Approach. Boston: Pitman.
Friedrich, C.J. 1952. "Some Observations on Weber's Analysis of Bureaucracy." In Reader in Bureaucracy, eds R.K. Merton, A.P. Gray, B. Hockey and H.C. Selvin, 27-33. Glencoe, Illinoise: Free Press.
Froebel, F., J. Heinrichs, and O. Kreye. 1980. The New International Division of Labour. Cambridge: Cambridge University Press.
Gefen, David, Detmar W. Straub, and Marie-Claude Boudreau. 2000. Structural Equation Modeling and Regression: Guidelines for Research Practice
George, Galanos, and Giannis Manasis. 2010. "Analysis of Competitiveness of Greek’s Olive Oil Sector Using Porter’s Diamond Model." Research Journal of International Studies (16): pp 33-46.
Gephart, R. . 1999. "Paradigms and Research Methods." Academy of Management, Research methods forum 4: 1-8.
Gereffi, Gary. 2002. The International Competitiveness of Asian Economies in the Apparel Commodity Chain, Erd Working Paper Series No. 5, Adb.
Ghalayini, A. M. 1997. "An Integrated Dynamic Performance Measurement System for Improving Manufacturing Competitiveness." International journal of production economics 48 (3): 207.

221
Giannakis, Mihalis, and Simon R Croom. 2004. "Toward the Development of a Supply Chain Management Paradigm: A Conceptual Framework." Journal of Supply Chain Management 40 (2): pp. 27-37.
Gioia, D.A. 1999. "Practicability, Paradigms and Problems in Stakeholder Theorizing." Academy of Management Review 24: PP 228-232.
Giunipero, L. C., R.E. Hooker, S. Joseph-Mathews, T.E. Yoon, and S. Brudvig. 2008. "A Decade of Scm Literature: Past, Present and Future Implications." The journal of supply chain management 44 (4): 66.
Golafshani, N. 2003. "Understanding Reliability and Validity in Qualitative Research." The Qualitative report 8 (4): 597.
Goonatilake, Lalith. 1990. "Inventory Management in the Manufacturing Sector in Developing Countries." Engineering costs and production economics 19 (1): 19-24.
Greene, J.C., V.J. Caracelli, and W.F. Graham. 1989. "Toward a Conceptual Framework for Mixed-Method Evaluation Designs." Educational Evaluation and Policy Analysis 11 (3): pp.255-274.
Gripsrud, G., M. Jahre, and G. Persson. 2006. "Supply Chain Management–Back to the Future?" International journal of physical distribution & logistics management 36 (8): 643.
Grosse, Robert, and N. Jack Behrman. 1992. "Theory in International Business." Transactional corporations 1 (1): 93-126.
Guba, E. G., and Lincoln Y.S., eds. 1995. Competing Paradigm in Qualitative Research., Handbook of Qualitative Research. Thousand Oaks, CA: Sage Publication Inc.
Guba, Egon G, and Yvonna S Lincoln. 1994. "Competing Paradigms in Qualitative Research." Handbook of qualitative research 2: 163-194.
Guest, D. 2007. "Hrm and the Worker: Towards a New Psychological Contract." International Jounal of Human Resource Management 12 (7): pp. 1092-1106.
Gunasekaran, A., l C. Pate, and E. Tirtiroglu. 2001. "Performance Measure and Metrics in a Supply Chain Environment." International Journal of Operations and Production Management 21 (1/2): pp. 71–87.
Gunasekaran, A., C. Patel, and R. C. McGaughey. 2003. "A Framework for Supply Chain Performance Measurement." International Journal of Production Economics 87: 333–347.
Habib, Md Rakib Ibne 2009. "Backward Linkages in Readymade Garment Industry of Bangladesh: Appraisal and Policy Implications." Journal of Textile and Apparel, Technology and Management 6 (2): 1-10.
Hadjikhani, Amjad. 2000. "The Political Behavior of Business Actors: The Case of Swedish Mncs and the Eu." International Studies of Management & Organization 30 (1): 93-117.
Hadjikhani, Amjad, and Hakan Hakansson. 1996. "Political Actions in Business Networks a Swedish Case." International Journal of Research in Marketing 13: 431-447.
Hagmann, Constanza, and Cynthia S. McCahon. 1993. "Strategic Information Systems and Competitiveness." Information & Management 183-192 25: pp.183-192.
Haider, Mohammed Ziaul 2007. "Competitiveness of the Bangladesh Ready-Made Garment Industry in Major International Markets " Asia-Pacific Trade and Investment Review 3 (1): 3-27.

222
Hair, J., A. Money, and P. Samouel. 2007. Research Methods for Business. USA: Wiley.
Hair, Joe F., Christian M. Ringle, and Marko Sarstedt. 2011. "Pls-Sem: Indeed a Silver Bullet." Journal of marketing theory and practice 19 (2): 139.
Hair, Jr., J. F. Anderson, R. E. Tatham, and W. C. R. L. & Black. 1998. Multivariate Data Analysis with Readings. 5th ed: Upper Saddle River: Prentice Hall.
Halder, Sharly Joana , and Wooju Kim. 2012. "A Developed System for Business Management." Business, Economics, Finanacial Sciences and Management- Advances in Intelligent and Soft Computing 143: 277-284.
Hale, Angela. 2000. "What Hope for Ethical Trade in the Globalised Garment Industry." Antipode 32 (4): 349-56.
Halldorsson, Arni 2007. "Complementary Theories to Supply Chain Management." Supply chain management: An International Journal 12 (7): pp. 284-296.
Hanlon, D. . 2001. "Vision and Support in New Venture Start-Ups." In Frontiers for Entrepreneurship Research Conference, Jonkoping: New Zealand.
Haque, Khan Md. Ariful, Md. Mosharraf Hossain, M. Shahriar Jahan Hossain, Md. Ariful Islam, Mehedi Hassan, Md. Shamshuzzaman, and Md. Delwar Hossain. 2011. "Performance Evaluation of Bangladesh Apparel and Textile Supply Chain Network, a Case Study." World Review of Business Research 1 (1): pp. 211-218.
Haque, M Shamsul. 2007. "Theory and Practice of Public Administration in Southeast Asia: Traditions, Directions, and Impacts,." Int Journal of Public Administration: pp. 1297-1326.
Harrison, J. S. 1999. "Stakeholders, Social Responsibility, and Performance: Empirical Evidence and Theoretical Perspectives." Academy of Management Journal 42 (5): 479.
Heide, J.B. 1994. "Interorganizational Governance in Marketing Channels." Journal of Marketing 58 (1): pp. 71-85.
Henderson, Jeffrey, Peter Dicken, Martin Hess, Neil Coe, and Henry Wai-Chung Yeung. 2002. "Global Production Networks and the Analysis of Economic Development." Review of international political economy 9 (3): 436-464.
Henseler, J., M. Christain, R. Ringle, and Sinkovics. 2009. "The Use of Pertial Least Square Path Modelling in International Marketing." Advances in International Marketing 20: pp. 277-319.
Hillman, A. J. 2003. "Determinants of Political Strategies in Us Multinationals." Business & society 42 (4): 455-484.
Hillman, A.J, and W.P. Wan. 2005. "The Determinates of Mne Subsidiaries’ Political Strategies: Evidence of Institutional Duality." Journal of international business studies 36: 322-340.
Hillman, Amy J., Michael C. Withers, and Brian J. Collins. 2009. "Resource Dependence Theory: A Review." Journal of management 35 (6): 1404.
Hirschheim, R., H.K. Klein, and K. Lyytinen. 1995. Information Systems Development and Data Modeling: Conceptual and Philosophical Foundations. Cambridge: Cambridge University Press.
Ho, Chi-Kuen. 2005a. "The Supply Chain Advantage: Development of a Startegic Business Model for the Hong Kong Clothing Industry." Institute of Textile and Clothing, The Hong Kong Politechnic University, Hong Kong.
———. 2005b. "The Supply Chain Advantage: Development of a Strategic Business Model for the Hong Kong Clothing Industry." Institute of Textile and clothing, Hong Kong Polytechnic University, Hong Kong, Hong Kong.
223
Hobbs, J.E., W.A. Kerr, and K.K. Klein. 1998. "Creating International Competitiveness through Supply Chain Management: Danish Pork." Supply Chain Management: An International Journal 3 (2): pp. 68 - 78.
Holmes- Smith, P. 2001. Introduction to Structural Equatin Modeling Using Lisrel. ACSPRI; Perth.
Holtbrugge, D, N. Berg, and F. Jonas Puck. 2007. "To Bribe or to Convince? Political Stakeholders and Political Activities in German Multinational Corpoprations." International Business Review 16: 47-67.
Hossain, Chowdhury Golam, Md. Atiqur Rahman Sarker, and Rumana Afroze. 2012. "Recent Unrest in the Rmg Sector of Bangladesh: Is This an Outcome of Poor Labour Practice?" International Journal of Business and Management 7 (3): pp. 206-218.
Hossan, C. G., Md Atiqur Rahman Sarker, and Rumana Afroze. 2012. "Recent Unrest in the Rmg Sector of Bangladesh: Is This an Outcome of Poor Labour Practices?" International Journal of Business and Management 7 (3): p206.
House of Lords, Select committee on Overseas Trade. 1985. Report from the Select Committee of the House of Lords on Overseas Trade, the Aldington Report. London: HMSO.
Howe, K.R. . 1988. "Against the Quantitative-Qualitative Incompatibility Thesis or Dogmas Die Hard." Educational Researcher 17 (8): pp 10-16.
Huda, K, M Karim, and F. Ahmed. 2007. "Hrm Practices & Challenges of Non-Government Development Organizations: An Empirical Study on Bangladesh." Journal of Management 9 (1): pp. 35-49.
Hulland, J. 1999. "Use of Partial Least Squares (Pls) in Strategic Management Research: A Review of Four Recent Studies." Strategic Management Journal 20: 195-204.
Hult, G. T. M., J. Ketchen Jr David, and Arrfelt Mathias. 2007. "Strategic Supply Chain Management: Improving Performance through a Culture of Competitiveness and Knowledge Development." Strategic Management Journal 28 (10): pp.1035-1052.
Hunter, N.A., and P. Valentino. 1995. "Quick Response- Ten Years Later." International Journal of Clothing Science and Technology: 30-40.
IFC. 2006. Improving Indonesia’s Competitiveness: Case Study of Textile and Farmed-Shrimp Industries. Indonesia.
Igbaria, M., T. Guimaraes, and G.B. Davis. 1995. "Testing the Determinants of Microcomputer Usage Via a Structural Equation Model." Journal of Management Information System 11 (4): 87-114.
Igbaria, M. I., T. Guimaraes, and G. B. Davis. 1995a. "An Assessment of Structure and Causation of Is Usage." The Database for Advances in Information Systems 27 (2): 61-67.
Igbaria, M., N. Zinatelli, P. Cragg, and A. L. M. Cavaye. 1997. "Personal Computing Acceptance Factors in Small Firms: A Structural Equation Model." MIS Quarterly 21 (3): 279-302.
International business & Technical Consultants Inc. and Uniconsult Imternatinal Limited. 2000. Report on Impact of Saarc Cumulation Agreement on Bangladesh Rmg and Textile Sectors and on the Overall Economy of Bangladesh. Dhaka, Bangladesh.
International Monetary fund. 2012. World Economic Outlook. Islam, M. A., and C. Deegan. 2008. "Motivations for an Organisation within a
Developing Country to Report Social Responsibility Information: Evidence

224
from Bangladesh." Accounting, Auditing & Accountability Journal 21 (6): 850-874.
Islam, Md. Ariful , Mst. Nasima Begum, and Choudhury Abul Anam Rashed. 2012. "Operational Disturbances and Their Impact on the Manufacturing Business-an Empirical Study in the Rmg Sector of Bangladesh." International Journal of Research in Management &Technology 2 (2): 184-191.
Islam, Muhammad Azizul, and Ken McPhail. 2011. "Regulating for Corporate Human Rights Abuses: The Emergence of Corporate Reporting on the Ilo's Human Rights Standards within the Global Garment Manufacturing and Retail Industry." Critical Perspective on Accounting The article in Press: 1-21.
Jackson, E.L. 2008. "Behavioural Determinants of the Adoption Forwards Constracts by Western Australian Wool Producers." Curtin Graduate School of Business, Curtin University, Australia.
Jarvis, C. B., S.B. Mackenzie, and P.M. Podsakoff. 2003. "A Critical Review of Construct Indicators and Measurement Model Misspecification in Marketing and Consumer Research." The Journal of consumer research 30 (2): 199.
Jennings, G. . 2010. Tourism Research. Second ed. Queensland: John Wiley & Sons. Jiang, J.J., G. Klein, and C.L. Carr. 2002. "Measuring Information System Service
Quality: Servqual from the Other Side." MIS Quarterly 26 (2): 145-166. Jin, B. 2004. "Apparel Industry in East Asian Newly Industrialized Countries:
Competitive Advantage, Challenge and Implications." Journal of Fashion Marketing and Management 8 (2): 230.
Joarder, Mohammad Abdul Munim , A.K.M. Nurul Hossain, and Md Mahbubul Hakim. 2010. "Post-Mfa Performance of Bangladesh Apparel Sector." International Review of Business Research Papers 6 (4): 134-144.
Johnson, P 1995. "Supply Chain Management: The Past, the Present and the Future." Manufacturing Engineer (Oct.): 213-217.
Johnson, R. B., and Onwuegbuzie A. J. 2004. "Mixed Methods Research: A Research Paradigm Whose Time Has Come." Educational Researcher 33 (7): pp. 14–26.
Jones, R. . 2002. The Apparel Industry: Blackwell Science, Aylesbury. Jones, Thomas M. 1995. "Instrumental Stakeholder Theory: A Synthesis of Ethics
and Economics." The Academy of Management Review 20 (2): 404-437. Jones, Thomas, and Daniel W. Riley. 1985. " Using Inventory for Competitive
Advantage through Supply Chain Management,." International Journal of Physical Distribution and Materials Management 15 (5): 16-26.
Joreskog, K. G., and D. Sorbom. 1996. Prelis 2, User’s Reference Guide, Scientific Software International. Chicago, USA.
Jöreskog, Karl G. 2005. Structural Equation Modeling with Ordinal Variables Using Lisrel.
Kabir, ASM 2007. "The End of Textile Quotas, Dilemma and Vision in the Garment Sector: A Case Study on Bangladesh." MPRA paper no. 7, University of East London.
Kaes, I., and A. Azeem. 2009. "Demand Forecasting and Supplier Selection for Incoming Material in Rmg Industry: A Case Study." International Journal of Business and Management 4 (5): pp. 149-160.
Kale, Shailendrakumar Uttamrao. 2007. "Global Competitiveness: Role of Supply Chain Management." In Conference on Global competition and competitiveness of Indian Corporate, Pune, India, 503-511.

225
Kaplan, B. , and J. A. Maxwell. 1994. "Qualitative Research Methods for Evaluating Computer Information Systems." In Evaluating Health Care Information Systems: Methods and Applications, ed. C.E. Aydin and S.J. Jay J.G. Anderson, pp. 45-68. CA: Sage, Thousand Oaks,.
Karim, Shahrier. 2003. Coping with Post-Mfa Challenges: Strategic Response for Bangladesh Rmg Sector. Dhaka: CPD.
Kee, Hiau Looi. 2005. Foreign Ownership and Firm Productivity in Bangladesh Garment Sector. USA.
Kelegama, Saman. 2005. "Ready-Made Garment Industry in Sri Lanka: Preparing to Face the Global Challenges." Asia-Pacific Trade and Investment Review 1 (1): pp. 51-67.
Kelley, S.W., O. C. Ferrell, and S. J. Skinner. 1990. "Ethical Behavior among Marketing Researchers: An Assessment." Journal of Business Ethics 9 (8): pp.681-689.
Ketchen, D. J. 2007. "Bridging Organization Theory and Supply Chain Management: The Case of Best Value Supply Chains." Journal of operations management 25 (2): 573.
Khandker, Ershad. 2007. "Supply Chain Management in Bangladesh." The Financial Express
Khondker , Bazlul H. , Abdur Razzak, and Nazneen Ahmed. 2005. Exports, Employment and Working Conditions: Emerging Issues in the Post-Mfa Rmg Industry( Revised Draft).
Khosla, Nidhi. 2009. "The Ready-Made Garments Industry in Bangladesh: A Means to Reducing Gender-Based Social Exclusion of Women?" Journal of International Women’s Studies 11 (1): pp. 288-303.
Kim, D. R. 2006. "Political Control and Bureaucratic Autonomy Revisited: A Multi-Institutional Analysis of Osha Enforcement." Journal of public administration research and theory 18 (1): 33.
———. 2007. "Political Control and Bureaucratic Autonomy Revisited: A Multi-Institutional Analysis of Osha Enforcement." Journal of public administration research and theory 18 (1): pp 33-55.
Kleinbaum, G, LL Kupper, KE Muller, and A Nizam. 1998. Applied Regression Analysis and Multivariable Methods: Duxbury Press, Pacific Grove.
Kleindorfer, Paul R., and Germanie H. Saad. 2005. "Managing Disruption Risks in Supply Chains." Production and operations management 14 (1): 53.
Knox, Simon, and Colin Gruar. 2007. "The Application of Stakeholder Theory to Relationship Marketing Strategy Development in a Non-Profit Organization." Journal of business ethics 75 (2): 115.
Knutsen , M. Hege 2004. "Industrial Development in Buyer-Driven Networks: The Garment Industry in Vietnam and Sri Lanka, ." Journal of Economic Geography 4 ( 5): 545-564.
Kobrin, Stephen. 1978. "When Does Political Notability Result in Increased Investment Risk." Columbia Journal of World Business 13 (3): 113-122.
Kogg, B. . 2003. "Greening a Cotton-Textile Supply Chain: A Case Study of the Transition Towards Organic Production without a Powerful Focal Company." Greener Management International 43: 53-64.
Kogut, Bruce. 1985. "Designing Global Strategies: Comparative and Competitive Value-Added Chains." SLOAN MANAGEMENT REVIEW 26 (4): 15-28.

226
———. 1993. "Designing Global Strategies: Profiting from Operational Flexibility." Readings in International Business, The MIT Press, Cambridge, MA: 195-213.
Koskinen, P., and O.P. Hilmola. 2008. "Supply Chain Challenges of North-European Paper Industry." Industrial Management & Data Systems 108 (2): 208-227.
Kwok, S. K., and K. K. W. Wu. 2009. "Rfid-Based Intra-Supply Chain in Textile Industry." Industrial Management + Data Systems 109 (9): 1166-1178.
Kwon, Ik-Whan G, and Taewon Suh. 2004. "Factors Affecting the Level of Trust and Commitment in Supply Chain Relationships." Journal of Supply Chain Management 40 (2): pp.4-14.
La londe, B.J. , and R.F. Powers. 1993. "Disintegration and Reintegration: Logistics of the 21st Century." International Journal of Logistics Management 4 (2): 1-12.
La Londe, Bernard J. . 1997. "Supply Chain Management: Myth or Reality?" Supply Chain Management Review, 1 (spring): 6-7.
Lall, Sanjaya. 2001. "Competitivenessindices and Developing Countries: An Economic Evaluation of the Global Competitiveness Report." World Development 29 (9): 1501-1525.
Lam, K.C. Jimmy , and R. Postle. 2006. "Textile and Apparel Supply Chain Management in Hong Kong." International journal of clothing science and technology 18 (4): 265-277.
Lambert, M. Douglas, and L. Terrance Pohlen. 2001. "Supply Chain Metrics." The international journal of logistics management 12 (1): 1-19.
Lee, H.L. 2002 "Aligning Supply Chain Strategies with Product Uncertainties." California Management Review 44 (3): pp. 104–119.
Lee, H.L., and S.M. Ng. 1997. " Introduction to the Special Issue on Global Supply Chain Management." Production Operations Management 6 (3).
Lewis, Bruce R., Gary F. Templeton, and Terry Anthony Byrd. 2005. "A Methodology for Construct Development in Mis Research." European Journal of Information Systems 14: 388–400
Lim, R.Y.G., T Baines, B. Tjahjono, and W. Chandraprakaikul. 2006. "Integrated Strategic Supply Chain Positioning for Smes: An Empirical Study." The International Journal of Logistics Management 17 (2): 260-276.
Love, P. E. D., Z. Irani, and D. J. Edwards. 2004. "A Seamless Supply Chain Management Model for Construction." Supply Chain Management:An International Journal 9 (1): 43-56.
Luchi, Roberto, and Marcelo Paladino. 2000. "Improving Competitiveness in a Manufacturing Value Chain: Issues Dealing with the Automobile Sector in Argentina and Mercosur." Industrial Management & Data Systems 100 (8): pp.349-358.
Lummus, R.R., and R.J. Vokurka. 1999. "Defining Supply Chain Management: A Historical Perspective and Practical Guidlines." Industrial Management and Data System 99 (1): pp. 11-17.
MacKenzie, Scott B., Philip M. Podsakoff, and Nathan P. Podsakoff. 2011. "Construct Measurement and Validation Procedures in Mis and Behavioural Research: Integrating New and Existing Techniques." MIS Quarterly 35 (2): pp. 293-334.

227
Magder, Dan. 2005. "Egypt after the Multi-Fibre Arrangement: Global Apparel and Textile Supply Chains as a Route for Industrial Upgrading." Institute for International Economica,Working paper seris, Number WP 05-8.
Malhotra, Naresh K. . 2004. Marketing Research- an Applied Orientation. Fourth ed. New Jersey: Pearson Education, Inc.
Mason - Jones, R., and Denis R. Towill. 1999. "Total Cycle Time Compression and the Agile Supply Chain." International Journal of Production Economics 62 (1-2): 61.
Masson, R., L. Iosif, G. MacKerron, and J. Fernie. 2007. "Managing Complexity in Agile Global Fashion Industry Supply Chains." International Journal of Logistics Management 18 (2): 238-254.
Mathieson, K., E. Peacock, and W. W Chin. 2001. "Extending the Technology Acceptance Model: The Influence of Perceived User Resources." The DATA BASE for Advances in Information Systems 32 (3): 86-112.
Mattel, M. S., and J. Jacoby. 1972. "Is There an Optimal Number of Alternatives for Likert-Scale Items?" Journal of Applied Psychology 56: pp. 506-509.
Mayer, Jorg. 2005. "Not Totally Naked: Textiles and Clothing Trade Ina Quota-Free Environment." Journal of World trade 39 (3): pp. 393-426.
Meenu, Tewary. 2006. "Adjustment in India's Textile and Apparel Industry: Reworking Historical Legacies in a Post-Mfa World." Environment and planning 38: 2325-2344.
Meier, K. J., and Laurence J. O'Toole Jr. 2006. "Political Control Versus Bureaucratic Values: Reframing the Debate." Public administration review 66 (2): 177.
Meldrum, H. Duncan. 2000. "Country Risk and Foreign Direct Investment." Business Econimics (January, 2000): pp.33.
Mentzer, J.T. 2004. Fundamentals of Supply Chain Management-Twelve Drivers of Competitive Advantages [Response Books]: University of Tennessee, Knoxville, Response books, New Delhi.
Merriam, S. B. . 1997 Qualitative Research and Case Study Application in Education. San Francisco: Jossey-Bass.
Miles, M.B. , and A.M. Huberman. 1994. An Expanded Sourcebook: Qualitative Data Analysis. Thousand Oaks, California: Sage Publications.
Miller, Kent D. 1993. "Industry and Country Effects on Managers' Perceptions of Environmental Uncertainties." Journal of International Business Studies 24 (4): 693-714.
Min, H., and W.P. Galle. 1991a. "International Purchasing Strategies of Multinational Us Firms." Journal of Purchasing and Materials Management 27 (3): pp. 9-18.
Min, Hokey, and William P Galle. 1991b. "International Purchasing Strategies of Multinational Us Firms." International Journal of Purchasing and Materials Management 27 (3): 9-18.
Momaya, K. 1998. Evaluating International Competitiveness at the Industry Level. Vikalpa, Vol 23. 23 ( 2 ): pp. 39-46,
Montfort, Mlachila., and Yang. Yongzheng. 2004. The End of Textile Quota: A Case Study of the Impact on Bangladesh.
Moon, H. Chang, and Jr. Newman S.Peery. 1995. "Competitiveness of Product, Firm, Industry, and Nation in a Global Business." Competitiveness Review: An International Business Journal incorporating Journal of Global Competitiveness 5 (1): pp.37-43.

228
Moores, T. T., and J. C. Chang. 2006. "Ethical Decision Making in Software Piracy: Initial Development and Test of a Four-Component Model." MIS Quarterly 30 (1): pp.167-180.
Morris, M. G., and V. Venkatesh. 2006. "Age Difference in Technology Adoption Decisions: Implications for a Changing Work Force." Personnel Psychology 53 (2): pp. 375-403.
Mottaleb, K. A. 2011. "An Inquiry into the Rapid Growth of the Garment Industry in Bangladesh." Discussion paper,. GRIPS Policy Research Center. National Graduate Institute for Policy Studies(GRIPS), TOKYO, Japan.
Mustamil, Norizah Mohd 2010. "The Influence of Culture and Ethical Ideology on Ethical Decision Making Process of Malaysian Managers." Ph.D. thesis, Graduate School of Business, Curtin University of Technology, Perth.
Muthusamy, Gunasegaran. 2011. "Behavioral Intention to Use Forensic Accounting Services for the Detection and Prevention of Fraud by Large Malaysian Companies." CGSB, Curtin University, Australia.
Nelson, S.A. . 2006. "Making Fun: Work and Organizational Practices in Australian Aquatic Theme Parks." Department of Management, Griffith University.
Neuman, W. L. 2000. Research Methods: Qualitative and Quantitative Approaches. 4th ed. Boston: Allyn and Bacon.
———. 2003. Social Research Methods: Qualitative and Quantitative Approaches. Boston: Allyn and Bacon.
Nigh, Douglas. 1985. "The Effect of Political Events on United States Direct Foreign Investment: A Pooled Time-Series Cross-Sectional Analysis." Journal of International Business Studies 16: pp.1-17.
Nimir, Al S., and M. Palmer. 1982. "Bureaucracy and Development in Saudi Arabia: A Behavioural Analysis." Public Administartion and development 2 (2): 93-104.
Ning, Cao. 2006. "Supply Chain Performance Measurement in Textile and Apparel Industries." Institute of Textiles and Clothing The Hong Kong Politechnic University, Hong Kong.
Niraj, R., M. Gupta, and C. Narasimhan. 2001. "Customer Profitability in a Supply Chain." Journal of Marketing 65 (3): 1-16.
Nonino, Fabio, and Roberto Panizzolo. 2007. "Integrated Production/ Distribution Planning in the Supply Chain: The Febal Case Study." Supply Chain Management:The International Journal 12 (2): pp.150-163.
Nordås, Hildegunn Kyvik. 2004. The Global Textile and Clothing Industry Post the Agreement on Textiles and Clothing. Geneva, Switzerland: WTO.
Nunnally, J.C., and I.H. Bernstein. 1994. Psychometric Theory. New York: McGraw-Hill.
Nuruzzaman, Ahasanul Haque, and Azad Rafiq. 2010. "Is Bangladeshi Rmg Sector Fit in the Global Apparel Business? Analyses the Supply Chain Management." The South East Asian Journal of Management 4 (1): 53-72.
Nuruzzaman, Md. 2009. "Lead Time Management in the Garment Sector of Bangladesh: An Avenues for Survival and Growth." European Journal of Scienfic Research 33 (4): 617-629.
Nuruzzaman, Md. . 2001. "Global Market Challenges and Opportunities for the Readymade Garments Industry of Bangladesh-an Appraisal of Impacts and Future Requirements." Rajshahi University Studies(Part-C) 9: pp119-140.
———. 2007. "Developing Export of Rmg Products in Bangladesh: Analysisng the Lead Time." Management Trends 4 (1): pp1-11.

229
———. 2008. "Lead Time Reduction and the Application of Process Management-a Study on Selected Rmg Units in Bangladesh." Journal of Business Research 10 (June 2008): pp 63-74.
Oetzel, Jennifer M., Richard A. Bettis, and Marc. Zenner. 2001. "Country Risk Measures: How Risky Are They?" Journal of World Business 36 (2): 128-145
Oliver, R.K., and M.D. Webber. 1992. "Supply-Chain Management: Logistics Catches up with Strategy (Reprint from Outlook 1982)." In Logistics––the Strategic Issues, ed. M. Christopher, pp. 63–75. London.
Olsen, P. Johan 2006. "Maybe It Is Time to Rediscover Bureaucracy." Journal of public administration research and theory 16: 1-24
Oral, Muhittin. 1986. "An Industrial Competitiveness Model." IIE Transactions 18 (2): 148-157.
Park, Seungwook, and Janet L. Hartley. 2002. "Exploring the Effect of Supplier Management on Performance in the Korean Automotive Supply Chain." The Journal of Supply Chain Management: A Global Review of Purchasing and Supply Spring: pp 46-53.
Patton, M. Q. 1999. "Enhancing the Quality and Credibility of Qualitative Analysis." Health Services Research 34 (5): pp. 1189-1208.
Patton, M.Q. 1990. Qualitative Evaluation and Research Methods. 2nd ed. Newbury Park, California: Sage publications.
Paulraj, Antony, and Injazz J. Chen. 2007. "Factors Influencing Global Supply Chain Efficiency: Implications for Information Systems." The journal of supply chain management 43 (3): pp.29-42.
Payne, Adrian, David Ballantyne, and Martin Christopher. 2005. "A Stakeholder Approach to Relationship Marketing Strategy: The Development and Use of the “Six Markets” Model." European Journal of Marketing 39 (7/8): 855.
Perry, M., Amrik S. Sohal, and Peter Rumpf. 1999. "Quick Response Supply Chain Alliances in the Australian Textiles, Clothing and Footwear Industry." International journal of production economics 62 (1-2): 119.
Pfeffer, J., and G. Salancik. 1978. The External Control of Organizations: A Resource Dependence Perspective.: Harper and Row, New York.
Pfeffer, Jeffrey. 1972b. "Merger as a Response to Organizational Interdependence." Administrative science quarterly 17: 382-394.
———. 1981. "Management as Symbolic Action: The Creation and Maintenance of Organizational Paradigms." Research in organizational behavior 3 (1): 1-52.
Pfeffer, Jeffrey, and Phillip Nowak. 1976. "Joint Ventures and Interorganizational Interdependence." Administrative science quarterly: 398-418.
Philip, C.F., C. Rosa Yeh Tsai, Shu-Ling Wu, and Ing-Chung Huang. 2005. "An Empirical Test of Stakeholder Influence Strategy Models: Evidence from Businessdownsizing in Taiwan." Int. J. of Human Resource Management 16 (10): 1862–1885.
Picard, J. 1982. "Typology of Physical Distribution Systems in Multi-National Corporations." International Journal of Physical Distribution & Material Management 12 (6): pp. 26-39.
Pine, B.J. Jr. . 1993. Mass Customization: The New Frontier in Business Competition. Boston: Harvard Business School Press.
Porter, M.E. 1985. Competitive Advantage. New York: Free press/ Macmillan.

230
Porter, Michael E. 1986. Competition in Global Industries: A Conceptual Framework. in porter M.E. ed, Competition in Global Industries. Boston, MA: Harvard Business School Press, pp. 15-60.
Porter, Michel. 1990. The Competitive Advantage of Nations. New York: Free Press. Pramatari, Katerina. 2007. "Collaborative Supply Chain Practices and Evolving
Technological Approaches." Supply Chain management: An International Journal 12 (3): 210-220.
Prasad, Sameer, and Jayavel Sounderpandian. 2003. "Factors Influencing Global Supply Chain Efficiency: Implications for Information Systems." Supply Chain management: An International Journal 8 (3): pp.241-250.
Preble, J. F., and Preble. 2005. "Toward a Comprehensive Model of Stakeholder Management." Business and society review 110 (4): 407.
Quaddus, M., and Achjari Didi. 2005. "A Model for Electronic Commerce Success." Telecommunications policy 29 (2-3): 127.
Quddus, M, and Salim Rashid. 1999. "Garment Exports from Bangladesh: An Update and Evaluation." Journal of International Business Studies 1 (1): 28.
Quddus, M., and Salim Rashid. 2000. Entrepreneurs and Economic Development- the Remarkable Story of Garment Export from Bangladesh. Dhaka, Bangladesh: The University Press Limited.
Quddus, Munir 2001. "Bureaucratic Corruption and Business Ethics: The Case of the Garment Exports from Bangladesh." Journal of Bangladesh Studies, Bangladesh Development Institute, Pennsylvania State University, USA: 16-24.
Rahman, M. A., and M. S Hossain. 2010. "Compliance Practices in Garment Industries in Dhaka City." Journal of Business and Technology V (02): pp.71-87.
Rahman, Mustafizur. 2005. "Bangladesh after Mfa Phases Out." South Asian Journal 8 (April-June).
Rahman, Mustafizur, and Asif Anwar. 2006. Bangladesh Apparel Export to the Us Market: An Examination of Her Competitiveness Vis –a-Vis Chaina. CPD
Rahman, Mustafizur, Debapriya Bhattacharya, and Khondaker Golam. Moazzem. 2008. Bangladesh Apparel Sector in Post Mfa Era: A Study on the Ongoing Restructuring Process. . Dhaka.
Rahman, Mustafizur, and Ananya Raihan. 2003. China's Accession to the Wto: Consequences for Bangladesh's Export-Oriented Rmg Sector.
Rahman, N., and G.M.J. Anwar. 2007. "Sustainability of Rmg Sector of Bangladesh as a Globally Competitive Industry: Porters Diamond Perspective." Journal of Business Studies 28 (2): 99-132.
Rahman, Shahidur. 2004. "Global Shift: Bangladesh Garment Industry in Perspective." Asian Affairs 26 (1): 75-91.
Rai, A., R. Patnayakuni, and N. Seth. 2006. "Firm Performance Impacts of Digitally Enabled Supply Chain Integration Capabilities." MIS Quarterly 30 (2): pp. 225-246.
Rajput, Amer , and Abdul Hamid Abu Bakar. 2011. "A Reprise of Supply Chain Management in Consanguinity to the Industry of Textile." Management & Marketing IX (2): 225-235.
Ramasamy, B , and H.W. Ting. 2004. "A Comparative of Corporate Social Responsibility Awareness." Journal of Corporate Citizenship 13: pp.109-123.
231
Rao, Purba, and Diane Holt. 2005. "Do Green Supply Chains Lead to Competitiveness and Economic Performance?" International Journal of Operations & Production Managemen 25 (9): pp. 898-916.
Rashid, M. Ali. 2006. "Rise of Readymade Garments Industry in Bangladesh: Entrepreneurial Ingenuity or Public Policy." In workshop on Governance and Development Dhaka. world Bank and BIDS.
Razzaque, A. , and A. Eusuf. 2008. The Readymade Garment Industry in Bangladesh in Trade- Development-Poverty Linkages- Reflections from Selected Asian and Sub-Saharan African Countries. Jaipur: CUTS International.
Reed, D. 2002. "Employing Normative Stakeholder Theory in Developing Countries." Business & society 41 (2): 166.
Roberts, N., and J. B. Thatcher. 2009. "Conceptualizing and Testing Formative Constructs: Tutorial and Annotated Example." Data base 40 (3): 9.
Robinson, P. B., and E. A. Sexton. 1994. "The Effect of Education and Experience on Self-Employment Success." Journal of Business Venturing 9 (2): pp. 141-156.
Rock, M. . 2001. "Globalisation and Bangladesh: The Case of Export Oriented Garment Manufacture." South Asia, Journal of South Asian studies 24 (1): 201- 225.
Romano, P., and A. Vinelli. 2001. "Quality Management in a Supply Chain Perspective Strategic and Operative Choices in a Textile-Apparel Network." International Journal of Operations & Production Management 21 (4): 446-460.
Rooyen, Johan van, Lindie Stroebel, and Dirk Esterhuizen. 2010. "Analysing Competitiveness Performance in the Wine Industry:The South African Case." In Australian Agricultural and Resource Economics Society conference, Adelaide, Australia.
Rungtusanatham, M. . 2003. "Supply- Chain Linkages and Operational Performance- a Resource-Based-View Perspective." International Journal of Operational and Production Management 23 (9): 1084-1099.
Sahay, B. S., Jatinder N.D. Gupta, and Ramneesh Mohan. 2006. "Managing Supply Chains for Competitiveness: The Indian Scenario." Supply Chain Management 11 (1): 15.
Santosa, P. I., K. K.Wei, and H. C Chan. 2005. "User Involvement and User Satisfaction with Information-Seeking Activity." European Journal of Information Systems 14: pp.361-370.
Sarkis, Joseph, Qinghua Zhu, and Kee-hung Lai. 2011. "An Organizational Theoretic Review of Green Supply Chain Management Literature." Int. J.Production Economics 130: 1–15.
Sattar, Zaidi. 2005. End of Mfa Quotas: Key Issues and Strategic Options for Bangladesh Readymade Garment Industry. Dhaka.
Saunders, M., P. Lewis, and A. and Thornhill. 1997. Research Methods for Business Studies. London: Pitman Publishing.
Saxena, Dr. Sanchita Banerjee, and Véronique Salze-Lozac’h. 2010. Competitiveness in the Garment and Textiles Industry: Creating a Supportive Environment- a Case Study of Bangladesh.
Saxena, Sanchita Benerjee, and Franck Wiebe. 2005. The Phase-out of the Multi-Fiber Arrangement: Policy Options and Opportunities for Asia. San Francisco: Asia Foundation.

232
Selldin, Erik, and J Olhager. 2007. "Linking Products with Supply Chain: Testing Fisher’s Model." Supply chain management: An International Journal 12 (1): pp.42-51.
Selznick, P. 1943. "An Approach to a Theory of Bureaucracy." American Sociological Review 8 (1): 47-54.
Sengupta, Kaushik, R. Daniel Heiser, and S. Lory Cook. 2006. "Manufacturing and Service Supply Chain Performance: A Comparative Analysis." The Journal of Supply Chain Management: 4-15.
Serin, Vildan, and Abdulkadir Civan. 2008. "Revealed Comparative Advantage and Competitiveness: A Case Study for Turkey Towards the Eu." Journal of Economic and Social Research 10 (2): 25-41.
Seuring, S. 2008. "Sustainability and Supply Chain Management–an Introduction to the Special Issue." Journal of cleaner production 16 (15): 1545.
Seuring, Stefan , Maria Goldbach, and Julia. Kopline. 2004. "Managing Time and Complexity in Supply Chain: Two Cases from the Textile Industry." Int. Journal of Integrated Supply Management 1 (2): 180-196.
Siddiqi, G.A.Hafiz 2007. Banglapedia: Garment Industry. Accessed 12/04/2010, http://banglapedia.search.com.bd/HT/G_0041.htm.
Siddiqi, H.G.A. . 2005. The Ready Made Garment Industry of Bangladesh. 2nd ed. Dhaka: The University Psress Limited.
Sila, Ismail, Maling Ebrahimpour, and Birkholz Christiane. 2006. "Quality in Supply Chains: An Empirical Analysis." Supply Chain Management 11 (6): pp. 491-502.
Siltaoja, M.E. 2006. "Value Priorities as Combining Core Factors between Csr and Reputation - a Qualitative Study." Journal of Business Ethics 68 (1): pp.91-111.
Smith, J.K. . 1983. "Quantitative Versus Qualitative Research: An Attempt to Clarify the Issue." Educational Researcher March: pp.6-13.
Sobhan, Rehman 2003. Coping with Post- Mfa Challenges: Strategic Response for Bangladesh Rmg Sector. Bangladesh.
Song, Dong-Wook, and Photis M. Panayides. 2008. "Global Supply Chain and Port/Terminal: Integration and Competitiveness." Maritime Policy & Management 35 (1): pp. 73-87.
Stadtler, Hartmut. 2005. "Supply Chain Management and Advanced Planning- Basics, Overview and Challenges." European Journal of Operational Research 163: 575-588.
Stock, J. R., and S. L. Boyer. 2009. "Developing a Consensus Definition of Supply Chain Management:A Qualitative Study." International Journal of Physical Distribution & Logistics Management 39 (8): 690-711.
Stone, E. 1994. Exporting and Importing Fashion: A Global Perspective. Albany, N.Y.: Delmar Publishers.
Street, C. T. 2007. "External Relationships and the Small Business: A Review of Small Business Alliance and Network Research*." Journal of Small Business Management 45 (2): 239.
Street, Christopher T., and Ann-Frances Cameron. 2007. "External Relationships and the Small Business: A Review of Small Business Alliance and Network Research." Journal of Small Business Management 45 (2): pp. 239–266.
Suhong, L., B. Ragu-Nathan, T. S. Ragu-Nathan, and S. S. Rao. 2006. "The Impact of Supplychain Management Practices on Competitive Advantage and

233
Organizational Performance." Omega : The International Journal of Management Science 34: 107-124.
Sultana, Shamima, Md. Asharaful Alam, Arup Kumar Saha, U.M. Ashek, and Md. Abu Talha Sarker. 2011. "Likely Impacts of Quota Policy on Rmg Export from Bangladesh: Prediction and the Reality." International Journal of Business and Management 6 (11): 275-284.
Sunhilde, CUC. 2008. "Sustainable Supply Chain Management-the Case of Textile and Apparel Industry." ANNALS of the ORADEA UNIVERSITY VII (XVII): pp2073-2076.
Swamidass, Paul M. 1993. "Import Sourcing Dynamics: An Integrative Perspective." Journal of international business studies 24 (4): 671-691.
Tashakkorri , A. , and C. Teddlie. 1998. Mixed Methodology: Combining Qualitative and Quantitative Approaches. Thousand Oaks, CA: Sage Publications.
Teddlie, C., and A. Tashakkori. 2003. "Major Issues and Controversies in the Use of Mixed Methods in the Social and Behavioral Sciences." In Handbook of Mixed Methods in Social and Behavioral Research, eds A. Tashakkori and C. Teddlie, pp. 3-50. Thousand Oaks, CA.: Sage Publications.
Teng, S. G., and H. Jaramillo. 2005. "A Model for Evaluation and Selection of Suppliers in Global Textile and Apparel Supply Chains." International Journal of Physical Distribution & Logistics Management 35 (7): 503-523.
Teo, H. H., K. K. Wei, and I. Benbasat. 2003. "Predicting Intention to Adopt Interorganizational Linkages: An Institutional Perspective." MIS Quarterly 27 (1): pp.19-49.
Tewari, Meenu. 2006. "Is Price and Cost Competitiveness Enough for Apparel Firms to Gain Market Share in the World after Quotas? A Review." Global Economy Journal 6 (4): 1-46.
The Daily Amader Shamoy. 2013. "Walt Disney Decided to Pull out Order from Banglades." The daily anader shamoy, 3rd of May
The Daily Manab Zamin. 2013. "In Four Months Order of 50 Crore Dollar Has Shifted from Bangladesh to India." The Daily Manab Zamin, 14th of March, Dhaka, Bangladesh
The world Fact Book. 2011. Bangladesh, Cia, USA. CIA. March 26, 2013 Accessed 03/04/2013, https://www.cia.gov/library/publications/the-world-factbook/geos/bg.html.
Thomas, R M. 2003. Blending Qualitative and Quantitative Research Methods in Theses and Dissertations. London: Corwin Press, Inc. Sage Publications Ltd.,.
Thomas, Rhodri, and Jonathan Long. 2000. "Improving Competitiveness : Critical Success Factors for Tourism Development." Local economy 14.
Tolbert, Pamela S. 1985. "Institutional Environments and Resource Dependence: Sources of Administrative Structure in Institutions of Higher Education." Administrative science quarterly: 1-13.
Toni, De Alberto, and Meneghetti. 2000. "The Production Planning Process for a Network of Firms in the Textile-Apparel Industry." International Journal of Production Economics 65: 17-32.
Trompenaars, F , and C. Hampden-Turner. 1997. Riding the Waves of Culture: Understanding Cultural Diversity in Business. 2 ed. London: Nicholas Brealey.
Tsai, C.F. P, Rosa C Yeh, Shu-Ling Wu, and Ing-Chung Huang. 2005. " An Empirical Test of Stakeholder Influence Strategy Models: Evidence from

234
Business Downsizing in Taiwan." Int. Journal of Human Resource Management 16: 1862-1885.
Tsai, C.F. P., Rosa C.Yeh, Shu-Ling Wu, and Ing-Chung Huang. 2005. "An Empirical Test of Stakeholder Influence Strategy Models: Evidence from Business Downsizing in Taiwan." nt. Journal of Human Resource Management 16: pp. 1862-1885
Uddin, M.S., and M.A. Jahed. 2007. "Garments Industry: A Prime Mover of the Social Economic Development of Bangladesh." The Cost and Management 35 (1): 59-70.
Uddin, Md. Abbas 2006. "Readymade Garment Industry of Bangladesh: How the Industry Is Affected in Post Mfa Period?", Department of Design, Curtin University, Perth.
UNCTAD. 2005. Tncs and the Removal of Textiles and Clothing Quotas.Current Studies in Fdi and Development. New York and Geneva.
Uzzaman, Md Almas. 2010. "Political Corruption and the Bangladesh Customs System." In 18th Biennial Conference of the Asian Studies Association of Australia Adelaide, 1-15.
Verma, A. , and N. Seth. 2011. "A Conceptual Framework for Supply Chain Competitiveness." International Journal of Business and Economic Sciences 3 (2): pp. 5-9.
Verma, Ajay, and Dr. Nitin Seth. 2010. "Achieving Supply Chain Competitiveness: Some Critical Issues." International Journal of Engineering Science and Technology 2 (11): 6209-6213.
Vernon, R. 1966. "International Investments and International Trade in the Product Cycle." Quarterly Journal of Economics 80 (May): 190-207.
Vokurka, Robert J., Gail M. Zank, and Carl M. Lund. 2002. "Improving Competitiveness through Supply Chain Management: A Cumulative Improvement Approach." Competitiveness Review 12 (1).
Weil, David. 2006. Lean Retailing and Supply Chain Restructuring: Implications for Private and Public Governance. Princeton University, USA
Welge, M.K., and D. Holtbrugge. 2006. International Management. 4th ed: Stuttgart: Schaffer-Poeschel.
Williams, B. . 1999. "Advanced Supplier Partnerships." Institute of Operation and Management (IOM) and the University of Huddersfield, Huddersfield, UK.
Wong, A. . 1999. "Partnering through Co-Operative Goals in Supply Chain Relationships." Total Quality Management 10 (4/5).
Wong, C. Y., J. S. Arlbjorn, and J. Johansen. 2005. "Supply Chain Management Practices in Toy Supply Chains." Supply Chain Management: An International Journal 10 (5): 367-378.
World Bank. 2005. End of Mfa Quotas: Key Issues and Strategic Options for Bangladesh Readymade Garment Industry. Dhaka.
World Trade Organisation. 2012. Statics Database. WTO. Accessed 12/06/2012, http://stat.wto.org/Home/WSDBHome.aspx?Language=.
Wu, T., Jennifer Blackhurst, and Vellayappan Chidambaram. 2006. "A Model for Inbound Supply Risk Analysis." Computers in industry 57 (4): 350-365.
Wu, W. Y., Chwan-Yi Chiang, Wu Ya-Jung, and Hui-Ju Tu. 2004. "The Influencing Factors of Commitment and Business Integration on Supply Chain Management." Industrial management + data systems 104 (4): 322-333.

235
Xu, . J., and M. Quaddus. 2004. " A Reality-Based Guide to Kms Diffusion." Journal of Management Development 24 (4): 374-389.
Xu, J. . 2003. "A Study of the Factors Influencing Knowledge Management Systems Diffusion in Australia." Ph.D Thesis, Curtin University of Technology, Perth, Australia.
Yang, J., J. Wang, C.W.Y. Wong, and K.H. Lai. 2008. "Relational Stability and Alliance Performance in Supply Chain." Omega : The International Journal of Management Science 36 (4): pp. 600-608.
Zhao, Xiande, Baofeng Huo, Barbara B. Flynn, and Yan Jeff Hoi Yeung. 2008. "The Impact of Power and Relationship Commitment on the Integration between Manufacturers and Customers in a Supply Chain." Journal of operations management 26 (3): 368-388.
Zhu, Q., Y. Geng, and K.H. Lai. 2010. "Circular Economy Practices among Chinese Manufacturers Varying in Environmental-Oriented Supply Chain Cooperation and the Performance Implications." Journal of Environmental Management 91 (6): pp.1324–1331
Zikmund, W. G. . 2000. Business Research Methods. 6th ed: Forth Worth: The Dryden Press.
"Every reasonable effort has been made to acknowledge the owners of copyright material. I would be pleased to hear from any copyright owner who has been omitted or incorrectly acknowledged."

236
Appendix- 1
10 individual constructed model as per interview
Figure A.1: Competitiveness model as per participant #1
Figure A.2: Competitiveness model as per participant #2

237
Figure A.3: Competitiveness model as per participant #3
Figure A.4: Competitiveness model as per participant #4
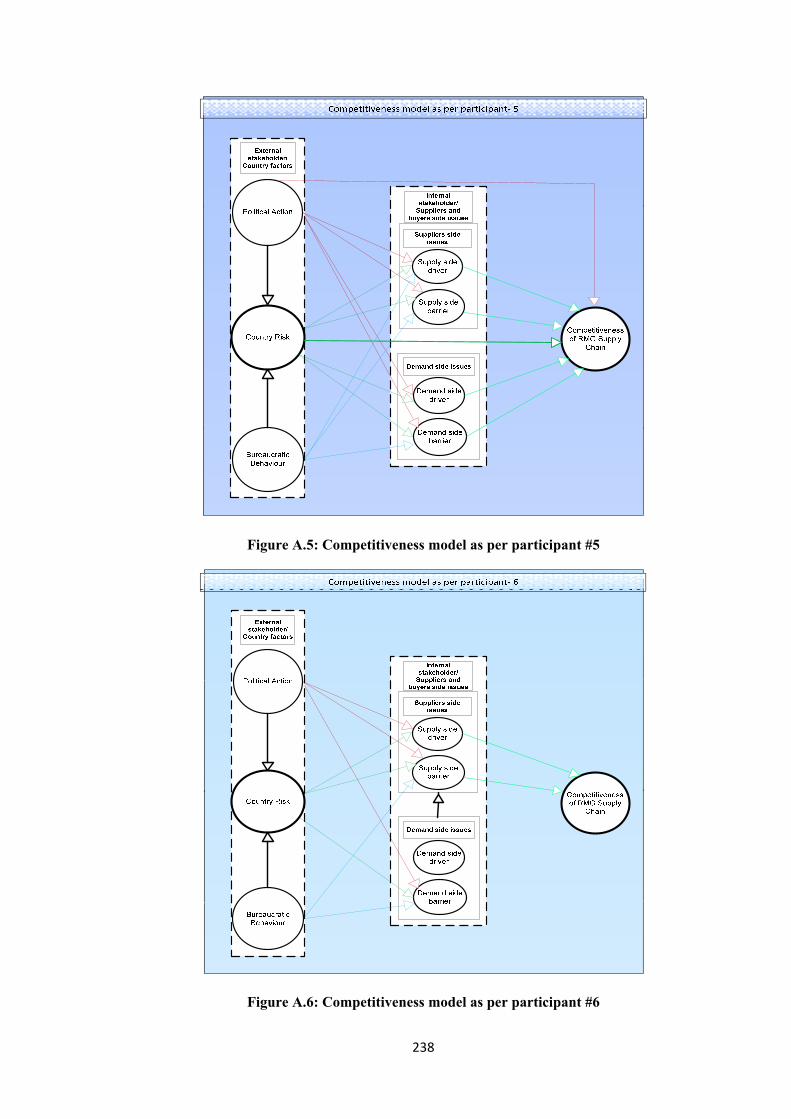
238
Figure A.5: Competitiveness model as per participant #5
Figure A.6: Competitiveness model as per participant #6

239
Figure A.7: Competitiveness model as per participant #7
Figure A.8: Competitiveness model as per participant #8

240
Figure A.9: Competitiveness model as per participant #9
Figure A.10: Competitiveness model as per participant #10

241
Appendix- 2
Semi-structured questionnaire for the qualitative part
Interview Questionnaire
The primary objective of this interview is to understand the present status of supply chain in Readymade Garment (RMG) Industry in Bangladesh. In terms of its competitiveness, stakeholders and various issues related to country environment.
Introductory Questions
Your name................................
Years of Experience......................
Your present position, duties and responsibilities.........................................
Semi structured questions
Competitiveness
European Management Forum(1984) defines competitiveness as "the immediate and future ability of, and opportunities for, entrepreneurs to design, produce and market goods worldwide whose price and non-price qualities form a more attractive package than those of foreign and domestic competitors" ( Buckley et al,1988). In the RMG industry the competitiveness is to increase or retain market share in the quota free environment by reducing lead time after the completion of Multi Fibre Agreement.
Main question
1. What is your perception about competitiveness of Bangladeshi RMG?
Probing questions
i. What are the things you usually consider to increase competitiveness?
(Order cycle time, Delivery performance, lead time, Import dependency, Responsiveness and Stakeholder relationship)
ii. Is it possible to increase competitiveness through supply chain management? In what way?
iii. Could you please tell me about supply chain management (SCM) in the RMG sector of Bangladesh?
vi. Could you tell me about the influential stakeholders in the supply chain?
(Buyers, Manufacturers or suppliers, Government and Political parties, Bureaucrats)
v. How are they influencing the competitiveness of supply chain?

242
vi. Are RMG businesses shifting from Bangladesh to Pakistan, India and China? If yes, provide some reasons for that.
Supply side issues (Business actor)
Main question
2. What are the supply side drivers (strengths) (from the manufacturers’ side) that may enhance the competitiveness of RMG supply chain?
Probing questions (supply side drivers)
i. As a supplier what are your strengths?
(Strength or drivers: lead time, competitive price, cheap labour, quality products, efficient chain, experienced, bargaining power, government role)
ii. Do you think the government, bureaucrats and political environment of Bangladesh support you as suppliers? How?
iii. Do you think the acts of bureaucrats are drivers? How?
Main question
3. What are the supply side barriers (from the manufacturers’ side) that may hinder the competitiveness of RMG supply chain?
Probing questions (supply side barriers)
i. What are the things you face as barriers (disadvantages) in the supply chain during garments supply?
(Barriers: long lead time, non-competitive price, costly labour, quality products, inefficient chain, in experienced, poor bargaining power, import dependency, poor infrastructures, lack of responsiveness, government role)
ii. Do you think the actions of the government, bureaucrats and political environments of Bangladesh hinder you as supplier? How?
iii. Do you think the acts of bureaucrats are barriers? How?
Demand/ buyer side issues (Business actor)
Main Question
4. What are the demand side drivers (strengths) (from the buyers’ side) that may enhance the competitiveness of RMG supply chain?
(Bargaining power, bulk customer, brand image, having special facilities for importing garments from the LDCs, relationship, trust)
Probing questions
i. Could you please tell me about your buyers?
ii. How do you supply your product to the buyer? Do you think that the buyers are satisfied over your supply management?
iii. Is there any issue for which buyers are interested to purchase garments through the existing supply chain?
v. In your opinion in what ways political actions and bureaucratic behaviours may act as demand side drivers?

243
Main question
5. What are the demand side barriers (from the buyers’ side) that may impede the competitiveness of RMG supply chain?
(Suppliers long lead time, complaints against human rights, different conditions and regulations imposed by both governments)
Probing questions
i. How do you supply your product to the buyer? How do you know that the buyers are not satisfied over your supply management? Why?
ii. Are the buyers giving more emphasis on some issues in the supply chain?
iii Is there any issue for which buyers are not interested to purchase garments through the existing supply chain?
iv. Do you think buyers are creating barriers to improve competitiveness? How?
v. In your opinion in what ways political actions and bureaucratic behaviours may act as demand side barriers?
Country factors (Non business actor)
Country factors are some variables which may enhance or hinder the foreign investment in a specific country or influence in negative or positive way on the local and international business environment. In this study the considered two main factors are namely; Bureaucratic Behaviour and Political Action. Country risk is another factor which is the ultimate result of those two factors. In this study bureaucratic behaviour, political actions and country risk are considered as country factors (Hadjikhani et al, 1996).
Main question
6. What is your observation about political actions over your business?
Probing questions
i. Could you tell me please about the political actions in Bangladeshi RMG which may affect the supply side and demand side issues?
ii. How do you think government or political parties are responsible for the competitiveness issue of RMG? iii. How political action becomes as drivers or barriers to the buyers and suppliers?
Main question
7. How do you think that the bureaucratic Behaviours are weakening the competitiveness of supply chain?
Probing questions
i. Could you tell me please about the bureaucratic behaviours in Bangladesh which may affect the supply side and demand side issues in RMG business?
ii. How do you think that the bureaucrats are responsible for influencing the competitiveness of RMG supply chain?
iii. In your opinion, in what ways bureaucratic behaviours may act as drivers or barriers to the buyers and suppliers?
Main question
8. How do you think about country risk for your business? Is there any impact of country risk on the competitiveness?
Probing questions
i. How do you think political actions and bureaucratic behaviours can increase the country risk? ii. In your opinion, in what ways ‘country risk’ may affect on supply side and demand side issues? iii. How do you think country risk is responsible for competitiveness issue in the RMG supply chain?

244
Appendix- 3
Structured Questionnaire for the quantitative part
Questionnaire
Dear Survey Respondent Thank you for agreeing to complete this questionnaire. Your participation in this research is voluntary. The confidentiality and anonymity of the respondents will be respected and protected. I will ensure and guarantee that none of the respondents that cooperate in the research will be identified or be capable of identification in the writing up of the research for academic publication. Any data presented will be aggregated as I am interested in general trends, not in a particular individual or organization. The questionnaire attempts to find out the predominant factors that influence the competitiveness of RMG sector of Bangladesh through achieving competitiveness in the process of RMG supply chain. Your assistance in completing this questionnaire would be valuable not only to me but would also make an important contribution to our knowledge about increasing efficiency in the RMG supply chain in Bangladesh. I will value your honest response to the questionnaire and your kind participation is greatly appreciated. This study has been approved by the Curtin University Human Research Ethics Committee. If needed, verification of approval can be obtained by writing to the Curtin University Human Research Ethics Committee, c/- Office of Research & Development, Curtin University of Technology, GPO Box U1987, Perth 6845, or telephone +618-92662784. If you would like further information about the study, please feel free to contact me. My contact details are provided below. Alternatively, you can contact my supervisor Professor Mohammed Quaddus on +618-92662862 or by e-mail: [email protected] Consent to participate Your involvement in the research is entirely voluntary. You have the right to withdraw at any stage without it affecting your rights or my responsibilities. This survey is divided into four sections. Please make sure that you have completed all the items listed in these sections. Thank you very much for taking your time and effort to complete this survey.
Yours sincerely, Md. Nuruzzaman Ph.D. Candidate Graduate School of Business Curtin University, Australia Tel: +618-92661181, Fax: +618-92663368 Mobile: +61- 0430208827, E-mail: [email protected]
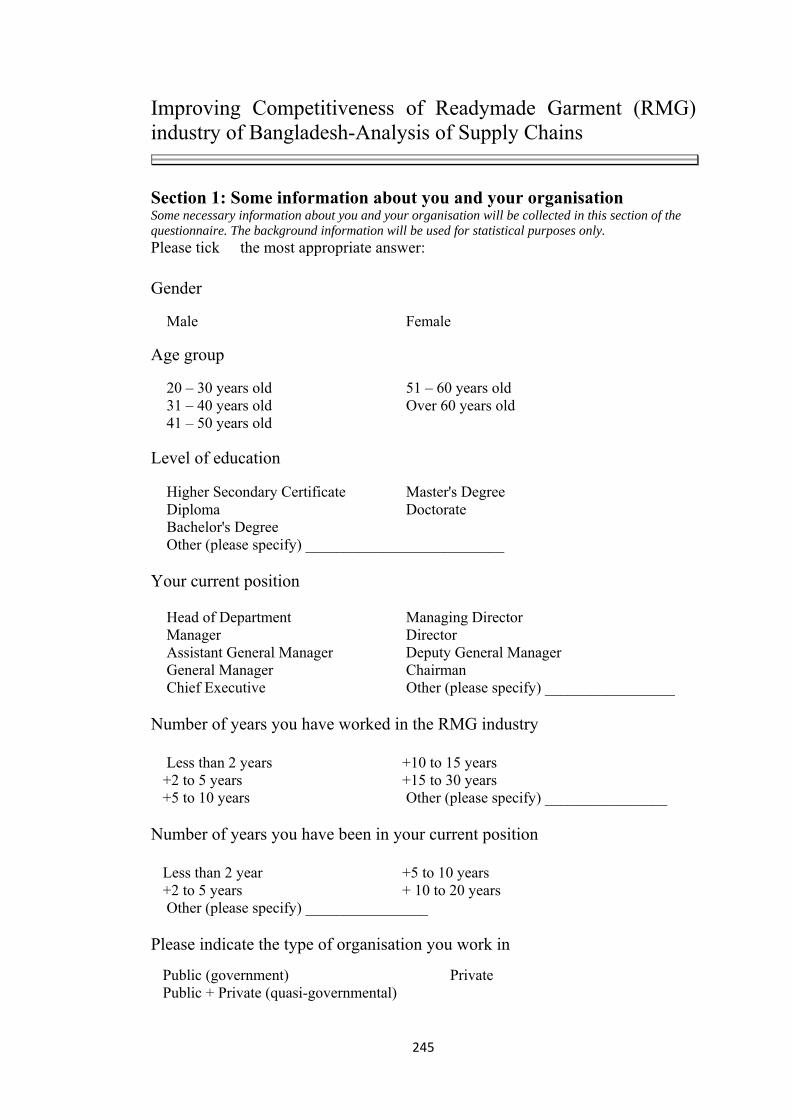
245
Improving Competitiveness of Readymade Garment (RMG) industry of Bangladesh-Analysis of Supply Chains
Section 1: Some information about you and your organisation Some necessary information about you and your organisation will be collected in this section of the questionnaire. The background information will be used for statistical purposes only. Please tick � the most appropriate answer: Gender � Male � Female
Age group � 20 – 30 years old � 51 – 60 years old � 31 – 40 years old � Over 60 years old � 41 – 50 years old Level of education � Higher Secondary Certificate � Master's Degree � Diploma � Doctorate � Bachelor's Degree � Other (please specify) __________________________ Your current position � Head of Department � Managing Director � Manager � Director � Assistant General Manager � Deputy General Manager � General Manager � Chairman � Chief Executive � Other (please specify) _________________ Number of years you have worked in the RMG industry � Less than 2 years �+10 to 15 years �+2 to 5 years �+15 to 30 years �+5 to 10 years � Other (please specify) ________________ Number of years you have been in your current position �Less than 2 year �+5 to 10 years �+2 to 5 years �+ 10 to 20 years � Other (please specify) ________________ Please indicate the type of organisation you work in
�Public (government) �Private �Public + Private (quasi-governmental)
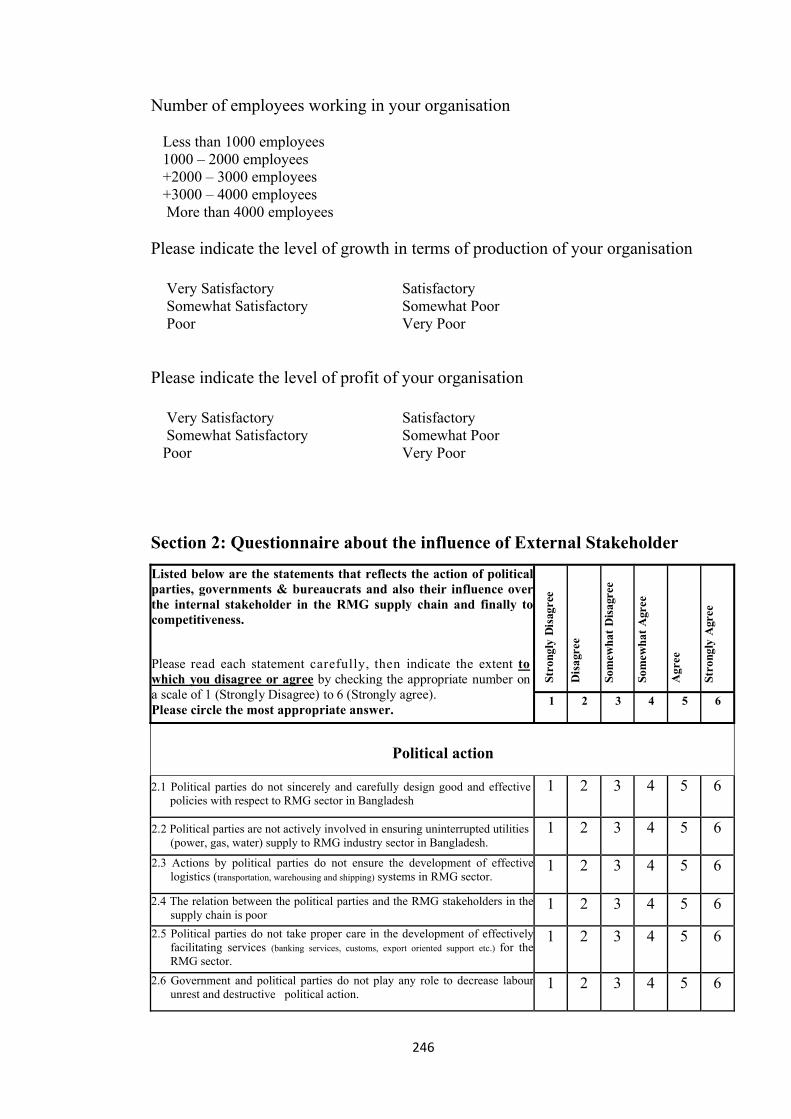
246
Number of employees working in your organisation �Less than 1000 employees �1000 – 2000 employees �+2000 – 3000 employees �+3000 – 4000 employees � More than 4000 employees Please indicate the level of growth in terms of production of your organisation � Very Satisfactory �Satisfactory � Somewhat Satisfactory �Somewhat Poor � Poor �Very Poor Please indicate the level of profit of your organisation � Very Satisfactory �Satisfactory � Somewhat Satisfactory �Somewhat Poor �Poor �Very Poor Section 2: Questionnaire about the influence of External Stakeholder
Listed below are the statements that reflects the action of political parties, governments & bureaucrats and also their influence over the internal stakeholder in the RMG supply chain and finally to competitiveness.
Please read each statement carefully, then indicate the extent towhich you disagree or agree by checking the appropriate number on a scale of 1 (Strongly Disagree) to 6 (Strongly agree). Please circle the most appropriate answer.
Stro
ngly
Dis
agre
e
Dis
agre
e
Som
ewha
t D
isag
ree
Som
ewha
t A
gree
Agr
ee
Stro
ngly
Agr
ee
1 2 3 4 5 6
Political action
2.1 Political parties do not sincerely and carefully design good and effective policies with respect to RMG sector in Bangladesh
1 2 3 4 5 6
2.2 Political parties are not actively involved in ensuring uninterrupted utilities (power, gas, water) supply to RMG industry sector in Bangladesh.
1 2 3 4 5 6
2.3 Actions by political parties do not ensure the development of effective logistics (transportation, warehousing and shipping) systems in RMG sector.
1 2 3 4 5 6
2.4 The relation between the political parties and the RMG stakeholders in thesupply chain is poor
1 2 3 4 5 6
2.5 Political parties do not take proper care in the development of effectively facilitating services (banking services, customs, export oriented support etc.) for the RMG sector.
1 2 3 4 5 6
2.6 Government and political parties do not play any role to decrease labourunrest and destructive political action.
1 2 3 4 5 6

247
Bureaucratic Behaviour Bureaucrats refer to the officials of various Government departments directly associated with the RMG
sector in Bangladesh. 2.7 Bureaucratic behaviour in office management is obstructing the increase of
competitiveness of RMG industry in Bangladesh
1 2 3 4 5 6
2.8 Bureaucratic behaviour is impeding the support services (like banking services,
diplomatic support etc.) for the RMG sector 1 2 3 4 5 6
2.9 There are no sufficient coordination among the external supporting offices(ministry of commerce, export promotion bureau, port authority, customs)with regard to the RMG business
1 2 3 4 5 6
2.10 Import and export related documentation process and approval systemsare inefficient and slow
1 2 3 4 5 6
2.11 Bureaucrats have no proper knowledge about RMG business and theirdelivery of services are not good enough
1 2 3 4 5 6
2.12 Bureaucrats are not co-operative in their dealings with RMG business 1 2 3 4 5 6
Country Risk
Country risk is a more general term that usually refers only to risks affecting all companies operating within a particular country. In reference to RMG industry the interaction of political parties and bureaucrats
increases the likelihood of risk in the supply chain of RMG business in Bangladesh.
2.13 It is risky to do business in Bangladesh due to unstable and corruptpolitical environment.
1 2 3 4 5 6
2.14 Lack of trust and commitment between the political parties and thesuppliers increases the risk of business in RMG sector.
1 2 3 4 5 6
2.15 There is no proper initiative to educate and train the RMG workers inBangladesh
1 2 3 4 5 6
2.16 Government does not provide proper and rational support to thedevelopment of RMG business.
1 2 3 4 5 6
2.17 The high dependency of Bangladesh on imported raw materials in theoven sector of RMG industry significantly increases RMG supply chain lead time
1 2 3 4 5 6
2.18 Government officials has no clear concept and knowledge about theRMG industry of Bangladesh
1 2 3 4 5 6
2.19 Business environment is not good enough due to poor financial services,customs facilities and poor infrastructure
1 2 3 4 5 6
Section 3: Questionnaire about the influence of Internal Stakeholder Listed below are the statements that reflect the strength and barriers of two main internal stakeholders that is buyers and manufacturers of RMG supply chain and their influence to improve the competitiveness. Please read each statement carefully, then indicate the extent towhich you disagree or agree by checking the appropriate number on ascale of 1 (Strongly Disagree) to 6 (Strongly agree). Please circle the most appropriate answer.
Stro
ngly
Dis
agre
e
Dis
agre
e
Som
ewha
t D
isag
ree
Som
ewha
t A
gree
Agr
ee
Stro
ngly
Agr
ee
1 2 3 4 5 6

248
Supply side ( manufacturers’ side) drivers
3.1 Labours are available and cheap in the RMG industry of Bangladesh 1 2 3 4 5 6 3.2 Manufacturers are capable to comply with the buyers requirements
1 2 3 4 5 6
3.3 Manufacturers are enjoying favourable international trade environment 1 2 3 4 5 6
3.4 Manufacturers are capable of offering competitive price and quality 1 2 3 4 5 6
3.5 Manufacturers are experienced and efficient enough 1 2 3 4 5 6
3.6 Manufacturers are loyal and devoted to their buyers 1 2 3 4 5 6
Supply side ( manufacturers’ side) barriers
3.7 Manufacturers are facing adequate and regular lack of raw materials supply
1 2 3 4 5 6
3.8 Manufacturers are dependent on imported raw materials that increase the lead time
1 2 3 4 5 6
3.9 Manufacturers don’t get proper support from the government and bureaucrats due to lack of knowledge about RMG business
1 2 3 4 5 6
3.10 Relationships are not good among the stakeholders( buyers, suppliers, government officials) in the supply chain
1 2 3 4 5 6
3.11 Many manufacturers have no sufficient business and technical knowledge to run the RMG business
1 2 3 4 5 6
3.12 Manufacturers are always facing various political disturbances 1 2 3 4 5 6
3.13 Bureaucrats are not supportive in smooth running of RMG supply chain process.
1 2 3 4 5 6
3.14 Manufacturers are not getting proper support in policy making and other facilitating services
1 2 3 4 5 6
3.15 Manufacturers are facing problems with the shortage of trained and skilled employees.
1 2 3 4 5 6
3.16 Manufacturers are facing the problem of workers’ unrest due to lack of concern about workers’ right
1 2 3 4 5 6
Demand side (buyers side ) drivers
3.17 Buyers have bargaining power as it is the buyers’ market 1 2 3 4 5 6
3.18 Flexible and less formal buyers have more acceptability of doing business with Bangladesh RMG sector
1 2 3 4 5 6
3.19 Manufacturers are willingly to do business with buyers’ reputed brand 1 2 3 4 5 6
3.20 Favourable international trade environment for Bangladesh is helpful for the buyers to do business with Bangladeshi RMG sector
1 2 3 4 5 6
3.21 Buyers who place bulk orders and purchase regularly get more advantages in RMG business.
1 2 3 4 5 6
3.22 Buyers with good transaction/credit history get greater RMG business
1 2 3 4 5 6

249
Demand side (buyers side) barriers
3.23 Compliance issues arising from the buyers create obstacles to for RMG business
1 2 3 4 5 6
3.24 Terms and conditions from the buyers create problems for regular business
1 2 3 4 5 6
3.25 Buyers’ side tariff and regulatory issues create problems for RMG business
1 2 3 4 5 6
3.26 Doing business via middlemen make the supply chain longer 1 2 3 4 5 6
3.27 Buyers’ lack of trust over the suppliers make the supply chain inefficient 1 2 3 4 5 6
3.28 Weak relationships between buyers and suppliers make the supply chain inefficient
1 2 3 4 5 6
Section 4: Questionnaire about improving Competitiveness Listed below are the statements that reflect the action to improve competitiveness of RMG supply chain in Bangladeshi.
Please read each statement carefully, then indicate the extent towhich you disagree or agree by checking the appropriate number on ascale of 1 (Strongly Disagree) to 6 (Strongly agree). Please circle the most appropriate answer.
Stro
ngly
Dis
agre
e
Dis
agre
e
Som
ewha
t D
isag
ree
Som
ewha
t A
gree
Agr
ee
Stro
ngly
Agr
ee
1 2 3 4 5 6
Competitiveness
4.1 Productivity at all stages of RMG supply chain are adequate to improve competitiveness
1 2 3 4 5 6
4.2 Cost efficiency in different stages of supply chain achieve competitiveness 1 2 3 4 5 6
4.3 Collaborative relationships among the stakeholders of the supply chain improves competitiveness
1 2 3 4 5 6
4.4 Reduction of lead time through appropriate activities(operational and transactional) in the supply chain improves competitiveness
1 2 3 4 5 6
4.5 One stop service in domestic RMG related activities in the upstream and downstream supply chain ensures competitiveness
1 2 3 4 5 6
4.6 Government support at all level of RMG related activities improves competitiveness
1 2 3 4 5 6
4.7 Competitive price and quality of RMG products ensures competitiveness 1 2 3 4 5 6
4.8 Reduction on import dependency improves competitiveness 1 2 3 4 5 6
4.9 Technological advances at all level of RMG supply chain improves competitiveness
1 2 3 4 5 6

250
Appendix- 4
Sample Quotes for identifying different variables
Following quotes reflect the variables “lack of raw materials”
According to 3rd interviewee, “In Bangladesh whenever an order is placed then manufacturers need to import raw materials for that order. There are some backward linkage industries in the knit sector but not in the woven sector. Maximum time per 100 dollar order, a supplier needs to spend 75-80 dollar for importing raw materials. So take home income is 20% for the manufacturers or suppliers. So lack of raw materials is the major problem for Bangladeshi RMG industry”
Following quotes reflect the variables “stakeholder relationship”
According to 5th interviewee, “It is possible to reduce country risk through diplomatic relation and involvement in the process of decision making regarding various issues of business. Financial transaction is risky in this sector. Government can take necessary action in the banking sector through central bank and ministry of commerce. Due to various political actions RMG is always facing some problem in business. Government should take supportive action to reduce any kind of unrest in the RMG. Bangladesh is import based country. To maintain the balance of payment we must export. At present RMG is playing vital role to increase export. So government and bureaucrats should be very careful about any kind of unrest in this sector”.
Following quotes reflect the variables “Lack of management knowledge and delivery of performance”
According to 6th interviewee, “If we consider the financial matter like the banking service, they provide special service for the wealthy importer. This service is not in general. As they are quick payer to the exporter so they get quick service and save some valuable time from the basic 60 days (manufacturing and Voyage) of lead time.30 days for make the materials and another 30 days to get the materials in the warehouse. But for the late payer the exporter takes long time and it is not less than 60 days. However when an importer save time from the import process, that time cannot be useful due to the complexity of port management and due to the bureaucratic system in customs clearance. We the manufacturers loss 10-15 days due to inefficiency in the port management. We cannot show the efficiency in this point of our supply chain. We don’t have deep sea port. We are taking our materials through feeder vessel from the mother vessel and feeder vessel takes berth at the port and unloads the materials”.

251
Appendix- 5
Sample Transcript
1. What is your perception about competitiveness of Bangladeshi RMG?
I went through your probing question and thought that I should first discuss with you about SCM. SCM is “the management of a network of interconnected businesses involved in the ultimate provision of product and service packages required by end customers”- it’s a quotation. SCM span all movement and storage of raw materials, work in process inventory and finished good from point of origin to point of consumption.
People in General usually think that supply chain means transportation but actually I do not think so. It is actually a part of SC. I would like to inform here a thing that buyers of different countries determine who will be their transport agent. We the suppliers don’t do it. 99% supply agents are selected by the buyers and only 1% is by the suppliers. Buyers are sometimes reject order for different specific reason like, did not achieve the required quality, have delayed or a nonspecific reason. As a result the ordered products become ‘stock lot’. For exporting these stock lots the suppliers decide about their own supply agent. So the transportation /shipment part of final product is determined by the buyers and the buyers are major role players for the shipment. So, we the manufacturers and the particular shipping agent are suppliers for the buyers. Even when I send product by my own cost then I cannot choose any air forwarder. Because every buyers have their own supply chain dept. and the top official of that dept. decide about their forwarders. They have some selected/enlisted freight forwarders for their business. So they always give preference to those freight forwarders. We do not talk about this matter with the buyer. Some buyers request to send their product to the ICD (inland container depot), Dhaka, some request to send to the Chittagong port and some buyers informed that their agent will collect products from the suppliers production point. After two years most probably some buyers will tell to send their products to Narayangonj port and then through light vessel/ fider vessel those products will be taken to the Chittagong port. The shipment of 80% cargo is done through Chittagong port.
Yes, we don’t have EDI (electronic data interchange) technology but our buyers’ have. When they placed order to the suppliers that is actually information, not a formal order. We do not make garments according to that information. Buyers should place order formally to the suppliers.
At present Bangladesh (BD) is holding the 2nd position in the world clothing business as a whole considering the all RMG products. BD is far behind than the first position holder of china. China’s market share about 120 billion dollar whereas the market share of Bangladeshi garments near about 18-20 billion dollar. India is just behind the Bangladesh.
Bangladeshi RMG is competitive and doing so far well within the all limitation. Now we can go to the first question, off course Bangladeshi readymade garment is competitive. As holding the second position there is huge chance to increase the competitiveness. How can we increase competitiveness? In reply to this question, I would like to say that there is absence of big issue that is price. In competitiveness supply chain is one part but you didn’t consider the price. At this time when we are discussing price is a major factor and in the past it was also but I don’t know about future. I will be happy if it doesn’t exist in future. Other issues like lead time, delivery performance, import dependency, responsiveness and stakeholder relationships are also important. I think order cycle and lead time are same. I don’t know why you make it different. As a supplier lead time and order cycle time is same to me because after finishing the order cycle time we go for shipment and the additional time in the total lead time is for another supplier i.e. buyers transport agent. Here import dependency, responsiveness and what you mentioned all are important but my point of view price is the most important factor. We can reduce the price through efficiency of supply chain. When supply chain will be efficient, definitely it’s impact will go to the price. There are two types of efficiency one is, improve the physical quality of the product but it doesn’t mean that our product is not in good quality at present. Our product definitely very good in

252
quality and that is why we are holding the second position but problem is product range. We produced garments within a very small range but there are a large range of products which are produced by our competitors. There are various high quality and high priced products in the market. But we are producing only basic products. So if we go forward to produce high quality and high priced product and at the same time if we improve supply chain related inefficiency, then we can bargain about our price. My bargaining power will increase at that time when I would become more efficient. So until or unless the increase of quality products range and efficient SC, we cannot increase bargaining power and competitiveness through supply chain.
I think you got the answer of first question. Now second probing question; yes, it is possible to increase the competitiveness. Through better quality product and efficient supply Chain (SC), I can reduce price and lead time, develop responsiveness and develop good relation among the stakeholders and finally increase the competitiveness.
We can improve competitiveness through improvement of SC. Now see, what are the parts of SC. SC includes all movement and storage of raw materials. Usually we start our production process after placing the order though we start it before but SC start after placing the final order. Before placing the final order which we do that is called merchandising. In RMG two groups of people involved in supply chain. One is merchandiser and another is commercial group. After finalisation of order a merchandiser makes a critical path or time of action. If he honestly and sincerely prepares the path then he will understand whether we will be able to deliver on time or not. This critical path will give you clear picture of your action. Critical path actually tell you when and what product you have to collect from different suppliers or placing order and when you will in house the raw materials in your factory warehouse. If the critical path is correct and tell you that you have enough space, time and capacity to deliver the goods on time, then accordingly if you can do everything as per your critical path and other activities like approval. Successfully you can do the job.
Payment term is another thing from booking to in house. Maximum time payment is made by opening letter of credit (L/C). But we have to get buyers L/C first. Then we usually open back to back L/C. Many buyers don’t wait for L/C. They bring a service contract from the buyer which is like purchase order but some contract terms and some L/C terms like payment system will be mentioned there in written. Banks which are involved with these service contract and when they approve this contract then it works i.e. you can open a back to back L/C. Service contracts is a summary like L/C which is printed on a buyers pad signed by buyers. Most of the time we do not receive L/C or service contract in due time and that is why it makes delay to open a back to back L/C. If we can open a L/C in time, in house the materials in factory and all sampling approval is done timely then we start production in time according to the critical path. If we cannot hit the target timely then it would be difficult to manage time. After that it is possible to do it but we have to increase production line. But most of the time it disturb another orders. Then Management shows undecidedness and then 5-6 order disturbed or cancelled. We can run our factory legally 10 hours. Through shifting duty we can also run evening shift but how can we hire and manage workers? You can run one/two department but not a whole factory. So it cannot be a solution. These types of occurrence are happening regularly.
After that storage of raw materials that is store management is very important. Poor store management is a big problem in the RMG industry. Many goods are wasting and at the same time wastages are increasing due to inefficient store management. According to record book the amount of raw materials are oaky and has been stored timely. But during the time of production we are not getting accurate amount. There are two things may be happened, one is it has been stolen or may be misplaced. This is regular phenomenon. So storage of raw materials is very important for us. Suppose all things happened accurately and timely like merchandiser and commercial people perform their duties efficiently, buyers’ documents received and back to back L/C opened timely, raw materials suppliers exported materials in time and in house has been completed in time but when production is started then, it has been observed that the amount of materials in the store is not same like before. As it is the part of supply chain and if it doesn’t work and face the lack of raw materials due to a part of supply chain, there is nothing to do. After this, work in process inventory and lastly finished goods from one point to another are important. When we meet our targeted delivery date, handover

253
the goods to the nominated shipping forwarders within the stipulated time then our job is almost done. Because I am not working as a forwarder, I am working on the basis of FOB. After receiving the bill of lading responsibility goes to the shipping agent. But it poses a little consequence. Because of faulty system that works in Bangladesh and we didn’t go to take any action even the government, bureaucrats, port management, airport management government decision makers are thinking deeply about the faulty system.
We usually provide a packing list at the time of shipment where all the things are described about product and package. Sometimes all things or formats of the packing list are provided by the buyers. After having the all necessary signature from different authority and completion of official formalities the packing list and invoice handed over to the forwarder for shipment. Whenever the goods are received by the buyers at destination we got a message from the buyers’ warehouse about shortages of goods. In that case what can I do? After handed over the goods literally I have nothing to do and no control over the goods though till that time we are owner of that goods. I can firmly tell you that this type of occurrence didn’t happen in my (factory) premises. So in this regard what can we do? We do everything here with emasculate protection. I am telling about the weaknesses of supply chain. How can I remove this inefficiency and develop the supply chain? Factory is a one point of my supply chain. I am sending goods from my factory to a nominated warehouse of Chittagong port. I have no means to look after these goods during transportation. It is really impossible to send a man to look after this matter. If there are five trucks go everyday to Chittagong then I need 30-35 people but how can I manage this people to monitor this task. So it’s really difficult to control the things like theft in the chain.
Is it possible to increase competitiveness? How? Here I will discuss the level or stage of improvement. First we have to improve movement of raw materials and incoming. These are possible through improvement of ourselves. Just after having order we should place booking order for raw materials as soon as possible and try to in house materials as soon as possible. Second storage management that is storage of raw materials and working process inventory. Here we have to control all kind of theft and miss placing of materials. In these areas we have to increase our efficiency. We hire the transport facility. They take 12 hours to carry goods from Dhaka to Chittagong which is too much. BGMEA and other govt. organisations who are involved never uttered for that. Why we are spending 12 hours more. After that for loading, port takes 3-6 hours due to queue in the port. It has some justification but why 18-24 hours to carry goods from Dhaka to Chittagong. Another thing that is port inefficiency during incoming or importing goods. Ship cannot be unloaded timely. Due to lack of space in sea port it cannot dock timely and need to wait 3-4 days for unloading. We need to reduce this vessel turnaround time in Chittagong port. Singapore port takes only 6 hours. So why we cannot reduce two days from here. Government and port authority can do it easily if they take necessary effort. If we import from India, it takes 3 weeks and whenever we import from China it also take 3 weeks. We can easily reduce one week from here. I am not committing that we can deliver by 76 days but we should ensure and confirm that within 90 days delivery is possible. There are two areas to make efficient the SC. One, there is a scope to reduce lead time and another thing is better management in inventory and finished product or in product in process. Sampling also a critical element of supply chain. Without approval of sampling you cannot go to the next stage. Buyers are usually approved 3-4 types of sampling. First one, development sampling. As we are starting after order confirmation so we can avoid development sampling. Buyers want first fit sample, when fit sample is approved then the pattern is approved. The next stage is actual sample. This is also called pre production or red seal sample or contractual sample. On the basis of the approval red seal sample we usually go for production. From the production we sent a sample for final approval which is called gold seal sample. Buyers know that it is that product which is being shifted. If fit sample is not approved then we cannot proceed for pre production sample and when pre production sample is not approved then we cannot go for production and whenever production sample is not approved we cannot go for shipment. So, suppliers need to approve these three samples before shipment. At the same time suppliers need to go for various test and passed. Suppliers always need to arrange test from the buyer’s nominated lab and for some test they need to go outside of the country. Without these formalities suppliers, cannot shipment their products. There are two reasons for taking more time in sampling process. One, most of the buyers approve their sampling from their own country and they have

254
specific date to check sample and issuing approval letter. Unfortunately if I fail to reach by that specific date, I had to wait for next schedule which take long time for approval. Two, when I failed to catch the schedule time for myself and third, when buyers reject the sample. In this way the critical path will be extended and the delivery time will be tightened. Therefore we can improve our efficiency and competitiveness by making all the events white.
There are many stakeholders among the chain. Among them buyers are big stakeholders. Suppliers are also a big stakeholder because of two reasons. One, it’s a buyers’ market when we are suppliers and it’s also a suppliers market when we are buyer. In that sense manufacturers/suppliers also a big stakeholder. Government, bureaucrats, political parties are also stakeholder in that sense that there is a scope to play role to improve the prevalent environment at this moment by escaping us from the dirty and unrest political environment. If the government declare the garment sector as a thrust sector and if they declare to keep the industry free from any kind of political action that can never hamper the RMG production process then it would be a good stimulus and we can continue the production without any interruption. Bureaucratic things are those activities directly related to obtaining official permission for export, import and some financial services which may create some impediments for the suppliers.
I don’t think that the businesses are shifting from Bangladesh. Due to having experience and specialisation, some businesses of special products are going to other countries unless or until we become a pro in producing those particular garment products. Due to competitive price Bangladesh can lose some business. If the buyers sharply consider the lead time then they go to another country because they know Bangladesh requires at least 90 days. Lead time is higher to those countries where value addition is not higher and lead time is smaller where value addition is higher.
2. What are the supply side drivers (from the manufacturers’ side) that may enhance the competitiveness of RMG supply chain?
We would say first, cheap labour and competitive price but cheap labour and competitive price are related to each other. We would say also lead time. The most valuable element for price is labour. If I say competitive price then I cannot say cheap labour and if I say cheap labour then cannot say competitive price. Third, quality of products fourth, experience and then supply chain.
Do you think the government, bureaucrats and political environment of Bangladesh support you? How? Definitely Government and bureaucrats but not political environment. Govt. and bureaucrats are supporting by providing different types of official formalities, procedure, documentation and also some rules & regulations. I do not know how the bureaucrats but as a part of government, bureaucrats are supporting the suppliers but not in an efficient way.
Do you think the acts of bureaucrats are drivers? I don’t know how bureaucrats are drivers.
3. What are the supply side barriers (from the manufacturers’ side) that may hinder the competitiveness of RMG supply chain? Value addition not so good
Well long lead time again, poor bargaining power, inefficient supply chain, import dependency etc are main barriers for hindering competitiveness. Political environment - yes, because of the image of the country. Another is direct action like hartal, create chaos, damage property and indirectly influencing labour unrest. I would say in some way govt. also creates hinder because of their different types of non-action. As a part of the government, bureaucrats are also doing the same. (If we get an efficient port and it is only possible to achieved by govt. action. For other things like good banking services and stoping manipulation are possible whenever government play role).
These non-actions are actually hindering the competitiveness. I am not separating the bureaucrats from the government. Government actions means the action of bureaucrats

255
4. What are the demand side drivers (from the buyers’ side) that may enhance the competitiveness of RMG supply chain?
First thing is bargaining power. When buyers bargaining power will be stronger then seller’s bargaining power will be weaker. I don’t know how this will help to increase competitiveness. It is unlikely both these two country i.e. Bangladesh and USA or whatever the other country. We know this is the time of free trade. Price is made by demand and supply. So there is no question about the influence of Government to control bargaining power. Here we didn’t consider the price as a driver but we can consider it. First thing is that we know our bargaining power when we talk with each other and this power always varies from time to time. Suppose this time in Bangladesh order has been reduced. Hopefully the flow of order may increase in the month of October. This situation is abnormal but buyers are telling that it is normal, not abnormal. In this time many fashion shows are usually arranged. Many designers are attending in those fashion shows. New design will be produced or come out and then order will be placed. These are buyers’ argument but from our experience we didn’t see this type of environment before. These are seems to be true but they are telling like this because of buying power. They will have to import at one point of time and have to place the order but they are taking their time as much as possible because of bargaining power. They are waiting and watching the price. Actually they want to see to what extend price go down.
I am not clear with this question. Actually none can do any business with anyone without a minimum relation or understanding to each other. When we talk with each other then we come to know about bargaining power. Bargaining power is not a driver.
Yes bulk customer is a driver and at the same time as a barrier. As a supplier I will also see the price, image and relationship & trust.
Yes, GSP facility is one kind of strength. Buyers know that facility and that is why they offer minimum price.
Actually we do bargain with all buyers and suppliers. Now everybody is open in pricing. There is nothing to hide. Suppose one of our buyers Marks & Spencer. Our pricing system is open to them. Because I have to purchase all raw material from their nominated suppliers. So buyer knows the price of all raw materials. Buyer’s has fair idea about my pricing system. Pricing is done on the basis of Cutting and Making cost.
Pricing, bulk customer, brand image, having GSP facility, relationship and trust are the demand side drivers but not bargaining power. Some special buyers never get special treatment. It is actually not fair. Wall mart is a single largest buyer of Bangladesh. It’s a bulk customer. This type of customer sometimes good and at the same time risky. I have to realise my strength if I work with such a bulk buyer like Wall Mart. If Wall Mart cancels any order that would be a big loss but if I work with small buyer and if he or she cancel the order that would be a small one. So there is a chance of loss and gain. Gain is not remarkable when dealings with a large buyer. Because large buyer always offers lowest price.
So far I know govt. and bureaucrats are never providing any special treatment to any special buyer. I think this type of treatment never brings any change in the competitiveness. How it make any change? I have told you about a 90 days critical path. If a bulk customer places order, I have to purchase raw materials from china where lead time would be three weeks. Big customer can invest to establish backward linkage industry but due to lack of logistics support govt. of Bangladesh cannot give him permission to do so. It would be another value addition but I have to import raw materials for that industry. Because we don’t have cotton. We have to think about the reality. Actually there are lots of things to increase competitiveness before giving importance to backward linkage. Is there any certainty to get buyer when I will establish backward industry and a good port? Actually not. Before that I have to achieve quality and then fix the cheapest price. To ensure quality and cheaper price we have to increase our efficiency. After a long journey we have arrived in this stage and in the long run we can give a solution but there are some short term problems. We have to meet up those first. Many cloths are produced in Bangladesh but we are importing from china because of better price and better lead time.
I think the government support on demand side drive will never do anything special that increase the competitiveness

256
5. What are the demand side barriers (from the buyers’ side) that may impede the competitiveness of RMG supply chain?
From the buyers point of view there are some barriers which are not product related. There is no benefit if I talk about product related barriers because we are unable to produce quality product. There is no benefit of thinking and shouting if we do not achieve quality. Long lead time, at that time when I get an order from a buyer it would be declared how long time would be taken. If it breaks for any kind of reason, that is suppliers fault. Because I am buyers market. I have nothing to say if buyers delayed to send approval. We have to have approval for each sample. This sample approval procedure is a barrier. Buyers sometimes raise questions about human right (It is politically motivated in that sense that there are some group of people), who are specialised in garment industry which is also a barrier. A man named Den Carnegie has worked a lot on RMG in Bangladesh. He thought seriously about RMG and became a pressure group. He lodges complain against some compliance issues and age. Sometimes buyers raise compliance and age issue in the garment sector. There is no such type of problem in the A and B category factory. But many factories didn’t maintain it. Many buyers didn’t care about that and they are placing order to those suppliers. Few European buyers and buyers specially from UK always disturb us raising these issues. If any reporter of UK makes a report that Bangladeshi manufacturers are using child labour. In that case buyers will definitely fall in a problem to sell their product.
How do I supply? Already we discussed it. We actually supply through buyers nominated agent. Buyers don’t ask about the SC. They told just you are delayed. Then we understand that there was a problem in SC. Buyers in general does not give emphasis on any special issue of supply chain. They are happy with quality garments and deadline maintenance. Buyers always want quality products and delivery within the time. Sometimes buyers impose some restrictions which are barriers in supply chain. A new restriction is, not to buy cotton from Uzbekistan because they use child labour.
Actually it is not a factor from where we are importing cotton. In the world cotton market that is not a factor in which country cotton is producing. The market is controlled by GINNI. Cotton is producing in African countries but through GINNI whole business controlled by the western countries.
Yes, buyers are sometime creating barriers to improve competitiveness. They are expecting quality products and at the same time offering lower or minimum price. We see that in a country same product imported from Bangladesh are sold in different places in different price. You cannot purchase a good quality shirt from Bangladesh by 1.5 pound but you can purchase it with that amount in UK. So how do you expect that particular buyer is enhancing competitiveness to RMG? They are not. Political action and bureaucratic behaviour are also creating barriers to the buyer. They are actually not playing good role and I do not expect from those so-called buyers. Because they have come to do business so, where they will find cheaper they will purchase from there and then they will consider another things like strength, quality etc. Same ways, during hartal buyers come to reschedule. When hartal is continuous then we usually go to neighbouring country to settle everything. You know about the bureaucratic behaviour problem. Okay, you are thinking about backward linkages like textile industry. Forget it just think how many foreign buyers has invested in Garments factory or through joint venture. Why? There are some in EPZ. It’s different things. But you will see there are many big customers in Pakistan, India and china, why not in Bangladesh. Once they were coming but not now.
When the buyers are big, they may create some problem by cancelling the order. At that time suppliers faces huge losses due to a big order cancel. Big buyers are sometimes create problem
6. What is your observation about political actions over your business?
It has already been discussed many times. Political actions are not driver. They are barriers.

257
7. How do you think that the bureaucratic behaviours are weakening the competitiveness of supply chain?
Yes they are weakening the SC competitiveness. To make efficient SC we need one point of service and more efficient entry and exit point by which we can reduce lead time. Not only that but also investors will be encouraged. Should be reduced bureaucratic behaviour, red-tapism and others barriers. But due to bureaucratic behaviour we failed to create competitiveness because of many point of service and inefficient entry and exit point.
8. How do you think about country risk for your business? Is there any impact of country risk on the competitiveness?
Government, bureaucrats and political parties are not playing role which are mentioned as “non-actions” to increase competitiveness. There are two aspects. One, don’t play role which are non-actions and if it is continued then we shall not become competitive. If this condition has been continued then Bangladesh will be treated as ‘Risk Country ’. We shall not be competitive. Order will be transferred to another country. What would be the level of play if they start to play role. One, need to cut the point of service or reduce the windows of services. We need to make more efficient of those agents who are involved in entry and exit point. Political environment should be kept in a tolerable level. There are many representatives of buyers live in Dhaka and Chittagong. Due to bad political environment like Hartal or Strike they cannot continue their work and visit the suppliers place to monitor their order. As their vehicles are attacked by the activist of political parties they cannot move like normal days. This environment is not conducing for trade development. Usually dirty politics and political unrest will demolish the image of a country. Due to hartal when production process are interrupted, buyers and suppliers cannot communicate properly and labour unrest increased then whole industry will fall in a crisis. Another thing i.e. traffic congestion is a big problem. Government should take necessary action otherwise the buyers will go back to another country.
Another things that some entrepreneurs investing in this sector without any knowledge about this sector. It is like fashion in our country. Again who are not getting desired job they are coming in this sector and working here. Due to lack of good structure, this sector is not attractive yet in our country.