Pathways through Graduate School and into Careers
107
Pathways Through Graduate School and Into Careers: Responses to the Student Survey by Degree Level and Field of Study, Part B
-
Upload
independent -
Category
Documents
-
view
0 -
download
0
Transcript of Pathways through Graduate School and into Careers

Pathways Through Graduate School and Into Careers:
Responses to the Student Survey by Degree Level and Field of Study, Part B

Pathways Through Graduate School and Into Careers:
Responses to the Student Survey by Degree Level and Field of Study, Part B
Copyright © 2014 by Educational Testing Service and the Council of Graduate Schools. All rights reserved. ETS, the ETS logo and LISTENING. LEARNING. LEADING. are registered trademarks of Educational Testing Service (ETS). The CGS logo is a registered trademark of the Council of Graduate Schools. All other trademarks are property of their respective owners. 26324

Pathways Through Graduate School and Into Careers: Responses to the Student Survey by Degree Level and Field of Study, Part BPathways Through Graduate School and Into Careers: Responses to the Student Survey by Degree Level and Field of Study, Part B
This report was prepared by Cathy Wendler, Samantha Wendler, Fred Cline, Jennifer Bochenek, and Jeff Allum.
Suggested citation: Wendler, C., Wendler, S., Cline F., Bochenek, J., & Allum, J. (2014). Pathways Through Graduate School and Into Careers: Responses to the Student Survey by Degree Level and Field of Study, Part B. Princeton, NJ: Educational Testing Service.

Pathways Through Graduate School and Into Careers: Responses to the Student Survey by Degree Level and Field of Study, Part B
Commission on Pathways Through Graduate School and Into Careers
Corporate Leaders
William (Bill) D. Green, Chairman, Accenture®
Stanley Litow, Vice President, Corporate Citizenship & Corporate Affairs, IBM® and President, IBM International Foundation
Joseph Miller Jr., Executive Vice President and Chief Technology Officer, Corning®
Russ Owen, President, Strategic Account Development, CSC™
Ronald Townsend, Executive Vice President, Global Laboratory Operations, Battelle Memorial Institute®
University Leaders
Jeffery Gibeling, Dean, Graduate Studies, University of California, Davis
Maureen Grasso, Dean, Graduate School, University of Georgia
Freeman Hrabowski III, President, University of Maryland, Baltimore County
Jean Morrison, Provost and Chief Academic Officer, Boston University
Suzanne Ortega, Senior Vice President, Academic Affairs, University of North Carolina
Patrick Osmer, Chair and Vice Provost, Graduate Studies and Dean, Graduate School, The Ohio State University
Teresa Sullivan, President, University of Virginia
Lisa Tedesco, Vice Provost, Academic Affairs – Graduate Studies and Dean, James T. Laney School of Graduate Studies, Emory University
James Wimbush, Dean, University Graduate School, Indiana University
Ex Officio Members
Kurt M. Landgraf, President and CEO, ETS
Debra W. Stewart, President, Council of Graduate Schools

Table of Contents
Question Content Page(s)
Preface 1-3
Postgraduate School Employment 4-13Question 1 Relation of highest degree field to current position 4Question 2 Degree requirement for current position 6Question 3 Degree requirement for highest desired position 8Question 4 Sector of primary job 10Question 5 Responsibility of primary job 12
Workplace Skills Importance and Preparation 14-65Question 6 A-B Knowledge of the field 14Question 7 A-B Publications 18Question 8 A-B Research skills 22Question 9 A-B Creativity 26Question 10 A-B Oral communication 30Question 11 A-B Writing skills 34Question 12 A-B Analysis/synthesis of data 38Question 13 A-B Teamwork 42Question 14 A-B Resilience 46Question 15 A-B Planning and organization 50Question 16 A-B Ethics and integrity 54Question 17 A-B Technological comfort and savvy 58Question 18 A-B Teaching and training 62
Job Satisfaction 66-101Question 19 A-B Salary 66Question 20 A-B Benefits 70Question 21 A-B Job security 74Question 22 A-B Location 78Question 23 A-B Opportunity for advancement 82Question 24 A-B Intellectual challenge 86Question 25 A-B Level of responsibility 90Question 26 A-B Degree of independence 94Question 27 A-B Contribution to society 98

Page 1
Preface
Graduate schools in the United States are environments in which students acquire the skills and knowledge needed to compete in the global economy as well as to solve problems of national and global scope. We remain strong in the U.S. because our graduate community has sustained a critical eye on how we do graduate education and on what we need to do to improve it. One area where we have begun to evaluate our own performance lies in the critical juncture between education and the U.S. workforce. While the United States is generally recognized as having the most vigorous and dynamic system of graduate education in the world, little is known at the granular level about what our graduates do, how their work life progresses, and how well the preparation they receive equips them for the careers they pursue.
A report published in April 2012, Pathways Through Graduate School and Into Careers,1
This report provides information from the student perspective. It presents the student responses to the survey by field of study and by degree level. Earlier reports presented student responses at an aggregated level (total group, gender, and race/ethnicity).
tackled these questions by examining the views of groups that directly observe and experience this transitional moment from degree completion and into careers— students, universities, and employers. The distinct perspectives of these groups offer an unprecedented opportunity to better understand what these important stakeholders seek, where they find success, and where their needs and goals remain unmet. The current data report is one of a series of reports that provide the details behind the analysis presented in the Pathways study.
What’s in the report
Clear career options for students seeking, or holding graduate degrees are often lacking, especially at the doctoral level. This lack of knowledge may impact students’ decisions to attend graduate school as well as their views of career opportunities during graduate school and upon degree completion.
In order to more fully understand what students know about career opportunities and when they learned it, a sample of students who took the GRE® General Test between 2002 and 2011 were surveyed. The survey, administered online, reflects responses from over 5,500 students. Students accessed the survey through a provided link.
There are two parts to this report. Only responses from students who indicated their field of study and degree level when they completed the survey are included.
1 Council of Graduate Schools and Educational Testing Service. (2012). Pathways Through Graduate School and Into Careers. Report from the Commission on Pathways through Graduate School and Into Careers. Princeton, NJ: Educational Testing Service. The full report can be retrieved at http://pathwaysreport.org/

Page 2
Part A provides responses from students who are either currently enrolled in graduate school or who have completed a graduate degree. It covers questions related to perceived value of graduate school, behavior prior to entering graduate school, and the graduate school experience.
Part B provides responses to questions related to postgraduate school experiences, workplace skills importance and preparation, and job satisfaction. Only students who indicated they have completed their graduate degree and are working are included in this part.
Results are provided by two degree levels (master’s and doctorate) and 11 fields of study. Fields of study were captured using Classification of Instructional Programs (CIP) codes2
Table 1. Number of Students Responding to Survey by Degree Level and Field of Study
which were then further collapsed into 10 categories and one “Other” category. Note that these results do not distinguish among types of degrees (professional versus research) nor do they separate master’s degrees that are terminal from those that are considered “en route” to the doctorate. Table 1 below provides the number of students responding to the survey by degree level and field of study.
Fields of Study*
Student Status Biological/ Agricultural
Sciences
Physical/ Earth
Sciences
Mathematics/ Computer
Science Engineering Health Arts/
Humanities
Enrolled in Graduate School 340 142 143 318 253 244
Completed Master’s Degree**
115 (77)
25 (16)
121 (100)
174 (150)
164 (130)
166 (113)
Completed Doctoral Degree**
61 (48)
39 (30)
47 (41)
31 (24)
28 (23)
27 (12)
Behavioral/ Social
Sciences Education Business Public
Administration Other Total Group
Enrolled in Graduate School 488 321 92 74 170 2,585
Completed Master’s Degree**
245 (180)
297 (218)
95 (73)
112 (84)
157 (113)
1,671 (1,254)
Completed Doctoral Degree**
73 (67)
77 (64)
3 (3)
4 (1)
11 (11)
401 (324)
*Counts include only respondents who provided their degree level and field of study. Results are not presented if the sample size for a group is less than 25 respondents. **Numbers in parentheses include only respondents who indicated they were employed and provided their degree level and field of study.
2 Classification of Instructional Programs (CIP) codes support the tracking and reporting of fields of study at postsecondary institutions. CIP was originally developed by the U.S. Department of Education's National Center for Education Statistics (NCES).

Page 3
How to use the report
This report provides information based only on the students who responded to the survey. While this data source does not capture all individuals who attended, or plan to attend, graduate school during this time period, it does provide access to a large number of students from a variety of demographic groups, fields of study, and institution types. Responses to the survey provide interesting student perspectives regarding career knowledge, but because it is based on a sample of convenience, the results may not accurately represent all graduate students. In addition, caution must be used when interpreting results based on relatively small sample sizes, especially as seen with the field of study categories.3
The data tables for the survey questions indicate the number of students who responded in a particular manner to each question. Each survey question has two sets of data tables, one for students who have completed their master’s degree and one for students who have completed their doctoral degree.
Each table provides responses for the total group of students belonging to a particular category and responses by field of study. Students who did not respond to a question are not included in the corresponding table; therefore, the total number of students responding varies for each question. Only students who indicated they have completed a graduate degree and are working are included in this report.
For questions that asked students to “choose all that apply,” the total percentage will not add up to 100%. For all other questions, percentages are based on the total number of students responding to the question, not the overall number of students. For these questions, the total percentage should be close to 100%, depending on rounding.
3 Results are not presented if the sample size for a group is less than 25 respondents.

Page 4
Total Group
Bio / Agri Sci
Phys / Earth Sci
Math / Comp Sci
Engineer Health
N = 1251 N = 77 N = 100 N = 150 N = 129
3 65% 64% ** 62% 63% 85%
2 25% 23% ** 29% 31% 12%
1 10% 13% ** 9% 6% 2%
Mean 2.54 2.51 2.53 2.57 2.83SD 0.68 0.72 0.66 0.61 0.44
Arts / Human
Behav / Soc Sci
Educ BusinessPublic Admin
Other
N = 112 N = 180 N = 217 N = 73 N = 84 N = 113
3 64% 44% 62% 63% 85% 60%
2 23% 50% 29% 31% 12% 31%
1 13% 6% 9% 6% 2% 9%
Mean 2.21 2.39 2.80 2.36 2.51 2.51SD 0.82 0.77 0.50 0.69 0.67 0.66
SD = Standard Deviation
SD = Standard Deviation
Question 1Postgraduate School Employment
Closely related
Somewhat related
Not related
** Sample too small to report results
How related is your highest degree field to your current position?
Students Who Completed Master's Degree and Are Employed
The majority of students (65%) who have completed their master's degree believed their degree was closely related to their current work position. However, some students (10%) indicated their degree and position were not related. Responses across fields of study were similar although Health (85%) and Public Administration (85%) majors indicated their position was closely related to their degree more frequently than other majors.
Not related
Closely related
Somewhat related
Table A

Page 5
Total Group
Bio / Agri Sci
Phys / Earth Sci
Math / Comp Sci
Engineer Health
N = 322 N = 48 N = 28 N = 41
3 84% 88% 86% 85% ** **
2 12% 8% 7% 12% ** **
1 4% 4% 7% 2% ** **
Mean 2.81 2.83 2.79 2.83SD 0.48 0.48 0.57 0.44
Arts / Human
Behav / Soc Sci
Educ BusinessPublic Admin
Other
N = 67 N = 64
3 ** 85% 84% ** ** **
2 ** 9% 14% ** ** **
1 ** 6% 2% ** ** **
Mean 2.79 2.83SD 0.54 0.42
** Sample too small to report results
Question 1How related is your highest degree field to your current position?
SD = Standard Deviation
** Sample too small to report results
Somewhat related
Not related
Postgraduate School Employment
Most students (84%) who have completed their doctoral degree believed their degree was closely related to their current work position. Very few students (4%) indicated their degree and position were not related. Responses across fields of study were similar.
Students Who Completed Doctoral Degree and Are EmployedTable B
Closely related
Somewhat related
Not related
SD = Standard Deviation
Closely related

Page 6
Total Group
Bio / Agri Sci
Phys / Earth Sci
Math / Comp Sci
Engineer Health
N = 1251 N = 77 N = 99 N = 150 N = 129
1 1% 0% ** 0% 1% 2%
2 47% 51% ** 36% 39% 74%
3 45% 44% ** 59% 57% 21%
4 1% 1% ** 0% 0% 2%
5 7% 4% ** 5% 3% 1%
** Sample too small to report results
Arts / Human
Behav / Soc Sci
Educ BusinessPublic Admin
Other
N = 112 N = 180 N = 218 N = 73 N = 84 N = 113
1 0% 1% 1% 3% 2% 0%
2 29% 56% 45% 49% 39% 45%
3 51% 32% 50% 41% 50% 44%
4 2% 1% 1% 0% 1% 0%
5 18% 10% 3% 7% 7% 11%
What degree is required for your current position?
Question 2Postgraduate School Employment
Table A Students Who Completed Master's Degree and Are Employed
Most students who have completed their master's degree felt that either a master's (47%) or bachelor's (45%) degree were required for their current position. Responses across fields of study were similar although a higher percentage of Health majors (74%) indicated a master's degree was required compared to other majors.
Associate's degree
No degree requirement
Doctoral or professional degree
Master's degree or certificate
Doctoral or professional degree
Master's degree or certificate
Bachelor's degree
Associate's degree
No degree requirement
Bachelor's degree

Page 7
Total Group
Bio / Agri Sci
Phys / Earth Sci
Math / Comp Sci
Engineer Health
N = 324 N = 48 N = 30 N = 41
1 66% 88% 80% 76% ** **
2 20% 2% 7% 10% ** **
3 12% 10% 13% 12% ** **
4 0% 0% 0% 0% ** **
5 2% 0% 0% 2% ** **
Arts / Human
Behav / Soc Sci
Educ BusinessPublic Admin
Other
N = 67 N = 64
1 ** 70% 33% ** ** **
2 ** 19% 48% ** ** **
3 ** 4% 16% ** ** **
4 ** 0% 0% ** ** **
5 ** 6% 3% ** ** **
Table B Students Who Completed Doctoral Degree and Are Employed
Postgraduate School Employment Question 2What degree is required for your current position?
Doctoral or professional degree
Master's degree or certificate
Bachelor's degree
Associate's degree
No degree requirement
** Sample too small to report results
The majority of students (66%) who have completed their doctoral degree felt that a doctoral or professional degree was required for their current position. Results across fields of study were similar although Education majors indicated that either a doctoral (33%) or master's (48%) degree was required for their current position.
Doctoral or professional degree
Master's degree or certificate
Bachelor's degree
Associate's degree
No degree requirement
** Sample too small to report results

Page 8
Total Group
Bio / Agri Sci
Phys / Earth Sci
Math / Comp Sci
Engineer Health
N = 1247 N = 77 N = 100 N = 149 N = 130
1 32% 39% ** 23% 23% 27%
2 53% 49% ** 50% 48% 68%
3 11% 9% ** 17% 25% 3%
4 0% 0% ** 0% 0% 1%
5 5% 3% ** 10% 5% 1%
Arts / Human
Behav / Soc Sci
Educ BusinessPublic Admin
Other
N = 112 N = 178 N = 218 N = 72 N = 84 N = 111
1 39% 37% 47% 26% 26% 17%
2 40% 53% 45% 61% 62% 59%
3 13% 3% 7% 10% 7% 16%
4 0% 0% 0% 0% 0% 0%
5 8% 7% 1% 3% 5% 7%
Doctoral or professional degree
The majority of students (53%) who have completed their master's degree felt that a master's degree was required for their highest desired position. Compared to other majors, a higher percentage of Education (47%) majors felt that a doctoral degree was required for their highest desired position.
Master's degree or certificate
Bachelor's degree
Associate's degree
No degree requirement
Associate's degree
No degree requirement
Bachelor's degree
Question 3Postgraduate School EmploymentWhat degree is required for your highest desired position?
Table A Students Who Completed Master's Degree and Are Employed
Doctoral or professional degree
Master's degree or certificate
** Sample too small to report results

Page 9
Total Group
Bio / Agri Sci
Phys / Earth Sci
Math / Comp Sci
Engineer Health
N = 324 N = 48 N = 30 N = 41
1 83% 88% 83% 88% ** **
2 12% 6% 10% 7% ** **
3 3% 6% 3% 5% ** **
4 1% 0% 3% 0% ** **
5 2% 0% 0% 0% ** **
Arts / Human
Behav / Soc Sci
Educ BusinessPublic Admin
Other
N = 67 N = 64
1 ** 78% 81% ** ** **
2 ** 16% 16% ** ** **
3 ** 0% 2% ** ** **
4 ** 1% 0% ** ** **
5 ** 4% 2% ** ** **
Postgraduate School Employment
** Sample too small to report results
The majority of students (83%) who have completed their doctoral degree felt that a doctoral degree was required for their highest desired position. Results across fields of study were similar.
Doctoral or professional degree
Master's degree or certificate
Bachelor's degree
Question 3What degree is required for your highest desired position?
Table B Students Who Completed Doctoral Degree and Are Employed
** Sample too small to report results
Associate's degree
No degree requirement
Doctoral or professional degree
Master's degree or certificate
Bachelor's degree
Associate's degree
No degree requirement

Page 10
Total Group
Bio / Agri Sci
Phys / Earth Sci
Math / Comp Sci
Engineer Health
N = 1233 N = 77 N = 99 N = 147 N = 124
1 31% 21% ** 63% 72% 15%
2 22% 9% ** 12% 2% 12%
3 9% 29% ** 12% 12% 9%
4 13% 13% ** 2% 1% 16%
5 11% 1% ** 0% 2% 35%
6 11% 23% ** 10% 8% 8%
7 2% 4% ** 0% 0% 3%
8 1% 0% ** 1% 3% 2%
Arts / Human
Behav / Soc Sci
Educ BusinessPublic Admin
Other
N = 110 N = 179 N = 212 N = 73 N = 83 N = 113
1 32% 19% 4% 63% 22% 34%
2 28% 8% 74% 7% 2% 18%
3 4% 11% 2% 4% 8% 6%
4 19% 27% 10% 8% 19% 9%
5 5% 21% 5% 4% 14% 14%
6 5% 11% 5% 7% 33% 15%
7 5% 1% 0% 4% 1% 4%
8 3% 1% 0% 3% 0% 1%
Which of these sectors best describes your primary job?
Question 4Postgraduate School Employment
Table A Students Who Completed Master's Degree and Are Employed
The two top work sectors for students who have completed their master's degree included business/corporate (31%) and faculty/teaching (22%). A higher percentage of Engineering (72%), Mathematics and Computer Science (63%), and Business (63%) majors indicated having a position in the business/corporate sector compared to other majors.
Entrepreneurial
Military
Nonprofit
Community/public service
Business/corporate
Faculty/teaching
Research
Nonprofit
Community/public service
Government
Entrepreneurial
Military
Research
** Sample too small to report results
Government
Faculty/teaching
Business/corporate

Page 11
Total Group
Bio / Agri Sci
Phys / Earth Sci
Math / Comp Sci
Engineer Health
N = 320 N = 47 N = 30 N = 40
1 12% 9% 13% 15% ** **
2 22% 19% 30% 38% ** **
3 31% 66% 43% 38% ** **
4 7% 2% 3% 3% ** **
5 8% 0% 3% 0% ** **
6 6% 4% 3% 5% ** **
7 2% 0% 3% 0% ** **
8 1% 0% 0% 3% ** **
Arts / Human
Behav / Soc Sci
Educ BusinessPublic Admin
Other
N = 66 N = 63
1 ** 6% 8% ** ** **
2 ** 27% 68% ** ** **
3 ** 23% 11% ** ** **
4 ** 8% 6% ** ** **
5 ** 21% 2% ** ** **
6 ** 9% 5% ** ** **
7 ** 5% 0% ** ** **
8 ** 2% 0% ** ** **
Postgraduate School Employment Question 4
Table B Students Who Completed Doctoral Degree and Are Employed
Research
Nonprofit
Community/public service
Government
Entrepreneurial
Military
Faculty/teaching
Which of these sectors best describes your primary job?
Business/corporate
** Sample too small to report results
Business/corporate
Faculty/teaching
The two top work sectors for students who have completed their doctoral degree included research (31%) and faculty/teaching (22%). Most Biological and Agricultural Sciences (66%) majors indicated having a position in the research sector while most Education (68%) majors indicated having a position in the faculty/teaching sector.
Nonprofit
Community/public service
Government
Entrepreneurial
** Sample too small to report results
Military
Research

Page 12
Total Group
Bio / Agri Sci
Phys / Earth Sci
Math / Comp Sci
Engineer Health
N = 1254 N = 77 N = 100 N = 150 N = 1301 45% 61% ** 66% 62% 37%
2 48% 45% ** 27% 16% 44%
3 46% 47% ** 35% 29% 54%
4 37% 38% ** 31% 33% 37%
5 29% 36% ** 15% 20% 22%
6 28% 19% ** 17% 7% 28%
7 22% 10% ** 21% 19% 29%
8 22% 17% ** 31% 54% 11%
9 17% 9% ** 7% 6% 13%
Arts / Human
Behav / Soc Sci
Educ BusinessPublic Admin
Other
N = 113 N = 180 N = 218 N = 73 N = 84 N = 1131 39% 37% 39% 34% 48% 39%
2 65% 48% 61% 41% 58% 60%
3 41% 38% 65% 56% 45% 45%
4 40% 35% 32% 48% 42% 41%
5 27% 27% 29% 47% 37% 42%
6 41% 39% 31% 25% 43% 27%
7 16% 29% 13% 34% 25% 27%
8 25% 11% 14% 19% 10% 27%
9 24% 16% 14% 40% 27% 30%
Question 5Postgraduate School Employment
Production and design
Marketing and analysis
Management and supervision
Operations and logistics
Research and development
Writing and creative
Client support and sales
Operations and logistics
Budgeting and planning
Administrative support
Client support and sales
Management and supervision
What responsibilities does your primary job include?
** Sample too small to report results
Budgeting and planning
Administrative support
Research and development
Writing and creative
Table A Students Who Completed Master's Degree and Are Employed
The top three job responsibilities for students who have completed their master's degree included writing and creative (48%), management and supervision (46%), and research and development (45%). A higher percentage of Mathematics and Computer Science (66%) and Biological and Agricultural Sciences (61%) majors indicated research and development as a top job responsibility while more Arts and Humanities (65%) majors indicated writing and creative as a top job responsibility compared to other majors.
Production and design
Marketing and analysis

Page 13
Total Group
Bio / Agri Sci
Phys / Earth Sci
Math / Comp Sci
Engineer Health
N = 324 N = 48 N = 30 N = 411 66% 83% 83% 78% ** **
2 42% 56% 30% 44% ** **
3 46% 35% 50% 32% ** **
4 21% 23% 23% 10% ** **
5 23% 25% 33% 20% ** **
6 16% 10% 10% 2% ** **
7 10% 10% 7% 7% ** **
8 10% 15% 13% 5% ** **
9 8% 6% 3% 12% ** **
Arts / Human
Behav / Soc Sci
Educ BusinessPublic Admin
Other
N = 67 N = 641 ** 51% 58% ** ** **
2 ** 43% 39% ** ** **
3 ** 39% 63% ** ** **
4 ** 13% 31% ** ** **
5 ** 9% 36% ** ** **
6 ** 13% 33% ** ** **
7 ** 13% 9% ** ** **
8 ** 1% 13% ** ** **
9 ** 7% 11% ** ** **
Postgraduate School Employment Question 5What responsibilities does your primary job include?
Research and development
** Sample too small to report results
Client support and sales
Marketing and analysis
Research and development
Writing and creative
Management and supervision
Operations and logistics
Budgeting and planning
** Sample too small to report results
Production and design
Marketing and analysis
The top job responsibility for students who have completed their doctoral degree was research and development (66%). This was especially apparent for majors in Biological and Agricultural Sciences (83%), Physical and Earth Sciences (83%), and Mathematics and Computer Science (78%).
Table B Students Who Completed Doctoral Degree and Are Employed
Writing and creative
Management and supervision
Operations and logistics
Budgeting and planning
Administrative support
Administrative support
Client support and sales
Production and design

Page 14
Total Group
Bio / Agri Sci
Phys / Earth Sci
Math / Comp Sci
Engineer Health
N = 1240 N = 77 N = 98 N = 146 N = 130
3 80% 74% ** 77% 84% 92%
2 17% 25% ** 22% 15% 7%
1 3% 1% ** 1% 1% 2%
Mean 2.78 2.73 2.76 2.84 2.90SD 0.48 0.48 0.46 0.39 0.35
Arts / Human
Behav / Soc Sci
Educ BusinessPublic Admin
Other
N = 111 N = 180 N = 213 N = 72 N = 84 N = 113
3 68% 73% 90% 83% 74% 81%
2 27% 21% 8% 17% 24% 15%
1 5% 6% 2% 0% 2% 4%
Mean 2.62 2.67 2.87 2.83 2.71 2.78SD 0.59 0.59 0.40 0.38 0.50 0.50
SD = Standard Deviation
How important is knowledge of the field in your current position?
Question 6-AWorkplace Skills Importance and Preparation
Somewhat important
Somewhat important
Not important
SD = Standard Deviation
** Sample too small to report results
Table A Students Who Completed Master's Degree and Are Employed
Nearly all students who have completed their master's degree indicated that knowledge of their field is very important (80%) or somewhat important (17%) in their current job. Responses across fields of study were similar.
Not important
Very important
Very important

Page 15
Total Group
Bio / Agri Sci
Phys / Earth Sci
Math / Comp Sci
Engineer Health
N = 320 N = 48 N = 30 N = 40
3 89% 92% 83% 93% ** **
2 8% 8% 10% 8% ** **
1 2% 0% 7% 0% ** **
Mean 2.87 2.92 2.77 2.93SD 0.40 0.28 0.57 0.27
Arts / Human
Behav / Soc Sci
Educ BusinessPublic Admin
Other
N = 65 N = 63
3 ** 89% 94% ** ** **
2 ** 6% 6% ** ** **
1 ** 5% 0% ** ** **
Mean 2.85 2.94SD 0.48 0.25
Workplace Skills Importance and Preparation
Somewhat important
Not important
SD = Standard Deviation
Question 6-AHow important is knowledge of the field in your current position?
** Sample too small to report results
** Sample too small to report results
Nearly all students who have completed their doctoral degree felt that knowledge of their field is very important (89%) or somewhat important (8%). Responses across fields of study were similar.
Table B Students Who Completed Doctoral Degree and Are Employed
Very important
Somewhat important
Not important
SD = Standard Deviation
Very important

Page 16
Total Group
Bio / Agri Sci
Phys / Earth Sci
Math / Comp Sci
Engineer Health
N = 1236 N = 75 N = 98 N = 146 N = 129
3 59% 61% ** 61% 54% 73%
2 29% 32% ** 34% 36% 22%
1 5% 3% ** 2% 3% 2%
6% 4% ** 3% 7% 2%
Mean 2.58 2.61 2.61 2.54 2.72SD 0.60 0.55 0.58 0.57 0.50
Arts / Human
Behav / Soc Sci
Educ BusinessPublic Admin
Other
N = 111 N = 179 N = 213 N = 72 N = 84 N = 113
3 54% 59% 72% 49% 44% 47%
2 21% 28% 22% 25% 43% 42%
1 13% 5% 4% 11% 5% 6%
13% 8% 2% 15% 8% 5%
Mean 2.47 2.59 2.69 2.44 2.43 2.43SD 0.60 0.69 0.55 0.72 0.59 0.62
Table A Students Who Completed Master's Degree and Are Employed
Over one half of students (59%) who have completed their master's degree indicated that they felt well prepared by their degree program regarding knowledge in their field. A higher percentage of Health (73%) and Education (72%) majors felt they were well prepared compared to other majors.
Not at all
Not a focus
SD = Standard Deviation
Well prepared
Somewhat
Well prepared
Somewhat
Not at all
Not a focus
Question 6-BWorkplace Skills Importance and PreparationHow well do you feel your highest degree program prepared you in knowledge of the field?
SD = Standard Deviation
** Sample too small to report results

Page 17
Total Group
Bio / Agri Sci
Phys / Earth Sci
Math / Comp Sci
Engineer Health
N = 318 N = 47 N = 30 N = 40
3 73% 79% 80% 70% ** **
2 21% 19% 10% 28% ** **
1 3% 2% 0% 3% ** **
3% 0% 10% 0% ** **
Mean 2.72 2.77 2.89 2.68SD 0.52 0.48 0.32 0.53
Arts / Human
Behav / Soc Sci
Educ BusinessPublic Admin
Other
N = 65 N = 62
3 ** 65% 76% ** ** **
2 ** 28% 18% ** ** **
1 ** 5% 3% ** ** **
** 3% 3% ** ** **
Mean 2.62 2.75SD 0.58 0.51
** Sample too small to report results
Almost three quarters of students (73%) who have completed their doctoral degree indicated that they felt well prepared by their degree program regarding knowledge in their field. Responses across fields of study were similar.
Table B
Workplace Skills Importance and Preparation Question 6-BHow well do you feel your highest degree program prepared you in knowledge of the field?
SD = Standard Deviation
Well prepared
Somewhat
Not at all
Not a focus
SD = Standard Deviation
Students Who Completed Doctoral Degree and Are Employed
Well prepared
Somewhat
Not at all
Not a focus
** Sample too small to report results

Page 18
Total Group
Bio / Agri Sci
Phys / Earth Sci
Math / Comp Sci
Engineer Health
N = 1233 N = 77 N = 97 N = 145 N = 129
3 13% 18% ** 9% 8% 16%
2 35% 30% ** 39% 37% 43%
1 52% 52% ** 52% 55% 41%
Mean 1.60 1.66 1.58 1.53 1.74SD 0.70 0.77 0.66 0.65 0.71
Arts / Human
Behav / Soc Sci
Educ BusinessPublic Admin
Other
N = 111 N = 180 N = 211 N = 71 N = 83 N = 113
3 14% 7% 11% 18% 14% 19%
2 21% 32% 41% 28% 27% 38%
1 65% 61% 47% 54% 59% 43%
Mean 1.50 1.47 1.64 1.65 1.55 1.75SD 0.74 0.63 0.68 0.78 0.74 0.75
SD = Standard Deviation
How important are publications in your current position?
Question 7-AWorkplace Skills Importance and Preparation
Somewhat important
Somewhat important
Not important
SD = Standard Deviation
** Sample too small to report results
Table A Students Who Completed Master's Degree and Are Employed
More than one half (52%) of students who have completed their master's degree felt that publications are not important in their current position. About one third (35%) of students felt that publications are somewhat important. Responses across fields of study were similar.
Not important
Very important
Very important

Page 19
Total Group
Bio / Agri Sci
Phys / Earth Sci
Math / Comp Sci
Engineer Health
N = 319 N = 48 N = 30 N = 39
3 49% 77% 60% 59% ** **
2 29% 15% 17% 21% ** **
1 23% 8% 23% 21% ** **
Mean 2.26 2.69 2.37 2.38SD 0.81 0.62 0.85 0.81
Arts / Human
Behav / Soc Sci
Educ BusinessPublic Admin
Other
N = 65 N = 63
3 ** 40% 32% ** ** **
2 ** 23% 52% ** ** **
1 ** 37% 16% ** ** **
Mean 2.03 2.16SD 0.88 0.68
Workplace Skills Importance and Preparation
Somewhat important
Not important
SD = Standard Deviation
Question 7-AHow important are publications in your current position?
** Sample too small to report results
** Sample too small to report results
Almost one half (49%) of students who have completed their doctoral degree felt that publications are very important in their degree field. A higher percentage of Biological and Agricultural Sciences (77%) majors felt that publications are very important compared to other majors.
Table B Students Who Completed Doctoral Degree and Are Employed
Very important
Somewhat important
Not important
SD = Standard Deviation
Very important

Page 20
Total Group
Bio / Agri Sci
Phys / Earth Sci
Math / Comp Sci
Engineer Health
N = 1232 N = 75 N = 98 N = 146 N = 128
3 26% 29% ** 16% 33% 28%
2 37% 37% ** 45% 33% 45%
1 13% 8% ** 15% 10% 9%
24% 25% ** 23% 25% 18%
Mean 2.18 2.29 2.01 2.31 2.24SD 0.69 0.65 0.65 0.69 0.63
Arts / Human
Behav / Soc Sci
Educ BusinessPublic Admin
Other
N = 111 N = 179 N = 213 N = 71 N = 82 N = 113
3 27% 21% 29% 18% 21% 28%
2 31% 40% 35% 25% 39% 37%
1 18% 13% 13% 21% 11% 11%
24% 26% 23% 35% 29% 24%
Mean 2.12 2.11 2.21 1.96 2.14 2.23SD 0.77 0.67 0.71 0.79 0.66 0.68
Somewhat
Not at all
Not a focus
SD = Standard Deviation
Well prepared
Not at all
Question 7-BWorkplace Skills Importance and Preparation
** Sample too small to report results
How well do you feel your highest degree program prepared you in publications?
Not a focus
SD = Standard Deviation
Well prepared
Somewhat
Table A Students Who Completed Master's Degree and Are Employed
More than one third (37%) of students who have completed their master's degree indicated that they felt only somewhat prepared by their degree program regarding publications. About one quarter (24%) of students indicated that publications were not a focus in their program.

Page 21
Total Group
Bio / Agri Sci
Phys / Earth Sci
Math / Comp Sci
Engineer Health
N = 318 N = 47 N = 30 N = 40
3 47% 55% 57% 50% ** **
2 39% 36% 30% 48% ** **
1 8% 6% 7% 3% ** **
6% 2% 7% 0% ** **
Mean 2.41 2.50 2.54 2.48SD 0.65 0.62 0.64 0.55
Arts / Human
Behav / Soc Sci
Educ BusinessPublic Admin
Other
N = 65 N = 62
3 ** 35% 45% ** ** **
2 ** 40% 44% ** ** **
1 ** 17% 5% ** ** **
** 8% 6% ** ** **
Mean 2.20 2.43SD 0.73 0.60
** Sample too small to report results
Workplace Skills Importance and Preparation Question 7-BHow well do you feel your highest degree program prepared you in publications?
** Sample too small to report results
Less than one half (47%) of students who have completed their doctoral degree indicated that they felt well prepared by their degree program regarding publications. In addition, 17% of Behavioral and Social Sciences majors indicated that their program did not prepare them at all regarding publications.
Table B Students Who Completed Doctoral Degree and Are Employed
Well prepared
Somewhat
Not at all
Not a focus
SD = Standard Deviation
Well prepared
Somewhat
Not at all
Not a focus
SD = Standard Deviation

Page 22
Total Group
Bio / Agri Sci
Phys / Earth Sci
Math / Comp Sci
Engineer Health
N = 1238 N = 77 N = 98 N = 146 N = 130
3 33% 53% ** 35% 27% 28%
2 41% 27% ** 38% 43% 46%
1 26% 19% ** 28% 29% 26%
Mean 2.07 2.34 2.07 1.98 2.02SD 0.77 0.79 0.79 0.76 0.74
Arts / Human
Behav / Soc Sci
Educ BusinessPublic Admin
Other
N = 111 N = 180 N = 212 N = 72 N = 83 N = 113
3 32% 27% 28% 31% 42% 46%
2 38% 44% 46% 43% 35% 38%
1 30% 28% 26% 26% 23% 16%
Mean 2.03 1.99 2.02 2.04 2.19 2.30SD 0.79 0.75 0.73 0.76 0.79 0.73
SD = Standard Deviation
How important are research skills in your current position?
Question 8-AWorkplace Skills Importance and Preparation
Somewhat important
Somewhat important
Not important
SD = Standard Deviation
** Sample too small to report results
Table A Students Who Completed Master's Degree and Are Employed
Less than one half (41%) of students who have completed their master's degree felt that research skills are somewhat important in their current position. However, research skills were seen as very important by over one half (53%) of Biological and Agricultural Sciences majors.
Not important
Very important
Very important

Page 23
Total Group
Bio / Agri Sci
Phys / Earth Sci
Math / Comp Sci
Engineer Health
N = 316 N = 47 N = 30 N = 39
3 60% 81% 83% 74% ** **
2 27% 9% 7% 13% ** **
1 13% 11% 10% 13% ** **
Mean 2.47 2.70 2.73 2.62SD 0.72 0.66 0.64 0.71
Arts / Human
Behav / Soc Sci
Educ BusinessPublic Admin
Other
N = 65 N = 62
3 ** 49% 44% ** ** **
2 ** 31% 52% ** ** **
1 ** 20% 5% ** ** **
Mean 2.29 2.39SD 0.79 0.58
Workplace Skills Importance and Preparation
Somewhat important
Not important
SD = Standard Deviation
Question 8-AHow important are research skills in your current position?
** Sample too small to report results
** Sample too small to report results
More than one half (60%) of students who have completed their doctoral degree felt that research skills are very important in their current position. A higher percentage of Physical and Earth Sciences (83%) and Biological and Agricultural Sciences (81%) majors indicated that research skills are very important compared to other majors.
Table B Students Who Completed Doctoral Degree and Are Employed
Very important
Somewhat important
Not important
SD = Standard Deviation
Very important

Page 24
Total Group
Bio / Agri Sci
Phys / Earth Sci
Math / Comp Sci
Engineer Health
N = 1229 N = 74 N = 97 N = 145 N = 129
3 53% 72% ** 52% 52% 53%
2 35% 20% ** 35% 36% 38%
1 5% 1% ** 4% 3% 4%
7% 7% ** 9% 10% 5%
Mean 2.53 2.75 2.52 2.54 2.52SD 0.59 0.47 0.59 0.56 0.58
Arts / Human
Behav / Soc Sci
Educ BusinessPublic Admin
Other
N = 111 N = 179 N = 213 N = 71 N = 83 N = 111
3 54% 48% 49% 44% 53% 65%
2 29% 39% 39% 35% 37% 31%
1 11% 4% 5% 6% 7% 1%
6% 8% 8% 15% 2% 4%
Mean 2.46 2.48 2.48 2.45 2.47 2.66SD 0.70 0.59 0.59 0.62 0.63 0.49
Somewhat
Not at all
Not a focus
SD = Standard Deviation
Well prepared
Not at all
Question 8-BWorkplace Skills Importance and PreparationHow well do you feel your highest degree program prepared you in research skills?
Not a focus
SD = Standard Deviation
Well prepared
Somewhat
** Sample too small to report results
Table A Students Who Completed Master's Degree and Are Employed
More than one half (53%) of students who have completed their master's degree indicated that they felt well prepared by their degree program regarding research skills. Responses across fields of study were similar.

Page 25
Total Group
Bio / Agri Sci
Phys / Earth Sci
Math / Comp Sci
Engineer Health
N = 318 N = 47 N = 30 N = 40
3 70% 77% 90% 80% ** **
2 25% 21% 7% 20% ** **
1 3% 2% 3% 0% ** **
2% 0% 0% 0% ** **
Mean 2.68 2.74 2.87 2.80SD 0.53 0.49 0.43 0.41
Arts / Human
Behav / Soc Sci
Educ BusinessPublic Admin
Other
N = 65 N = 62
3 ** 65% 68% ** ** **
2 ** 28% 26% ** ** **
1 ** 6% 3% ** ** **
** 2% 3% ** ** **
Mean 2.59 2.67SD 0.61 0.54
** Sample too small to report results
Workplace Skills Importance and Preparation Question 8-BHow well do you feel your highest degree program prepared you in research skills?
** Sample too small to report results
Most (70%) of students who have completed their doctoral degree indicated that they felt well prepared by their degree program regarding research skills. Responses across fields of study were similar.
Table B Students Who Completed Doctoral Degree and Are Employed
Well prepared
Somewhat
Not at all
Not a focus
SD = Standard Deviation
Well prepared
Somewhat
Not at all
Not a focus
SD = Standard Deviation

Page 26
Total Group
Bio / Agri Sci
Phys / Earth Sci
Math / Comp Sci
Engineer Health
N = 1238 N = 77 N = 98 N = 146 N = 129
3 55% 49% ** 55% 58% 45%
2 37% 39% ** 40% 34% 48%
1 8% 12% ** 5% 8% 7%
Mean 2.47 2.38 2.50 2.51 2.38SD 0.64 0.69 0.60 0.64 0.61
Arts / Human
Behav / Soc Sci
Educ BusinessPublic Admin
Other
N = 111 N = 180 N = 213 N = 72 N = 83 N = 113
3 57% 47% 74% 51% 43% 53%
2 34% 41% 22% 36% 48% 38%
1 9% 12% 5% 13% 8% 9%
Mean 2.48 2.34 2.69 2.39 2.35 2.44SD 0.66 0.69 0.56 0.70 0.63 0.65
** Sample too small to report results
SD = Standard Deviation
SD = Standard Deviation
How important is creativity in your current position?
Question 9-AWorkplace Skills Importance and Preparation
Somewhat important
Table A Students Who Completed Master's Degree and Are Employed
More than one half (55%) of students who have completed their master's degree indicated that creativity is very important in their current position. A higher percentage of Education (74%) majors indicated that creativity is very important compared to other majors.
Not important
Very important
Very important
Somewhat important
Not important

Page 27
Total Group
Bio / Agri Sci
Phys / Earth Sci
Math / Comp Sci
Engineer Health
N = 319 N = 48 N = 30 N = 40
3 61% 63% 73% 83% ** **
2 33% 33% 17% 18% ** **
1 5% 4% 10% 0% ** **
Mean 2.56 2.58 2.63 2.83SD 0.60 0.58 0.67 0.38
Arts / Human
Behav / Soc Sci
Educ BusinessPublic Admin
Other
N = 65 N = 63
3 ** 54% 63% ** ** **
2 ** 38% 32% ** ** **
1 ** 8% 5% ** ** **
Mean 2.46 2.59SD 0.64 0.59
** Sample too small to report results
** Sample too small to report results
Workplace Skills Importance and Preparation
Somewhat important
Not important
SD = Standard Deviation
Question 9-AHow important is creativity in your current position?
More than one half (61%) of students who have completed their doctoral degree indicated that creativity is very important in their current position. A higher percentage of Mathematics and Computer Science (83%) majors indicated that creativity is very important compared to other majors.
Table B Students Who Completed Doctoral Degree and Are Employed
Very important
Somewhat important
Not important
SD = Standard Deviation
Very important

Page 28
Total Group
Bio / Agri Sci
Phys / Earth Sci
Math / Comp Sci
Engineer Health
N = 1232 N = 75 N = 98 N = 146 N = 129
3 38% 33% ** 39% 41% 32%
2 44% 44% ** 47% 47% 49%
1 10% 8% ** 9% 6% 8%
8% 15% ** 5% 6% 12%
Mean 2.14 2.30 2.31 2.37 2.27SD 0.65 0.63 0.64 0.61 0.61
Arts / Human
Behav / Soc Sci
Educ BusinessPublic Admin
Other
N = 111 N = 179 N = 213 N = 71 N = 83 N = 111
3 53% 36% 44% 35% 36% 28%
2 31% 43% 40% 46% 46% 53%
1 12% 15% 8% 11% 6% 14%
5% 6% 8% 7% 12% 5%
Mean 2.43 2.22 2.39 2.26 2.34 2.15SD 0.70 0.70 0.64 0.66 0.61 0.65
Somewhat
Not at all
Not a focus
SD = Standard Deviation
Well prepared
Not at all
Question 9-BWorkplace Skills Importance and PreparationHow well do you feel your highest degree program prepared you in creativity?
Not a focus
SD = Standard Deviation
Well prepared
Somewhat
** Sample too small to report results
Table A Students Who Completed Master's Degree and Are Employed
About one third (38%) of students who have completed their master's degree indicated that they felt well prepared by their degree program regarding creativity; a higher percentage (44%) of students indicated that they felt only somewhat prepared. Responses across fields of study were similar.

Page 29
Total Group
Bio / Agri Sci
Phys / Earth Sci
Math / Comp Sci
Engineer Health
N = 318 N = 47 N = 30 N = 40
3 41% 38% 60% 53% ** **
2 43% 51% 30% 38% ** **
1 10% 11% 3% 10% ** **
6% 0% 7% 0% ** **
Mean 2.33 2.28 2.61 2.43SD 0.65 0.65 0.57 0.68
Arts / Human
Behav / Soc Sci
Educ BusinessPublic Admin
Other
N = 65 N = 62
3 ** 29% 39% ** ** **
2 ** 48% 40% ** ** **
1 ** 14% 10% ** ** **
** 9% 11% ** ** **
Mean 2.17 2.33SD 0.67 0.67
** Sample too small to report results
Workplace Skills Importance and Preparation Question 9-BHow well do you feel your highest degree program prepared you in creativity?
** Sample too small to report results
Less than one half (41%) of students who have completed their doctoral degree indicated that they felt well prepared by their degree program regarding creativity; a slightly higher percentage (43%) of students felt they were only somewhat prepared. More than one half of Physical and Earth Sciences (60%) and Mathematics and Computer Science (53%) majors felt well prepared by their program regarding creativity.
Table B Students Who Completed Doctoral Degree and Are Employed
Well prepared
Somewhat
Not at all
Not a focus
SD = Standard Deviation
Well prepared
Somewhat
Not at all
Not a focus
SD = Standard Deviation

Page 30
Total Group
Bio / Agri Sci
Phys / Earth Sci
Math / Comp Sci
Engineer Health
N = 1238 N = 77 N = 98 N = 146 N = 129
3 83% 79% ** 72% 77% 90%
2 15% 19% ** 26% 23% 9%
1 2% 1% ** 2% 1% 1%
Mean 2.81 2.78 2.70 2.76 2.89SD 0.44 0.45 0.50 0.44 0.34
Arts / Human
Behav / Soc Sci
Educ BusinessPublic Admin
Other
N = 111 N = 180 N = 213 N = 72 N = 83 N = 113
3 76% 86% 93% 83% 84% 81%
2 22% 12% 5% 14% 14% 14%
1 3% 2% 2% 3% 1% 4%
Mean 2.73 2.83 2.92 2.81 2.83 2.77SD 0.50 0.43 0.34 0.46 0.41 0.52
Workplace Skills Importance and Preparation
Somewhat important
Somewhat important
Not important
How important is oral communication in your current position?
Question 10-A
Very important
Very important
** Sample too small to report results
Table A Students Who Completed Master's Degree and Are Employed
Most students (83%) who have completed their master's degree indicated that oral communication is very important in their current position. A higher percentage of Education (93%) and Health (90%) majors indicated that oral communication is very important compared to other majors.
Not important
SD = Standard Deviation
SD = Standard Deviation

Page 31
Total Group
Bio / Agri Sci
Phys / Earth Sci
Math / Comp Sci
Engineer Health
N = 320 N = 48 N = 30 N = 40
3 81% 81% 73% 70% ** **
2 17% 19% 27% 25% ** **
1 2% 0% 0% 5% ** **
Mean 2.79 2.81 2.73 2.65SD 0.45 0.39 0.45 0.58
Arts / Human
Behav / Soc Sci
Educ BusinessPublic Admin
Other
N = 65 N = 63
3 ** 83% 92% ** ** **
2 ** 15% 8% ** ** **
1 ** 2% 0% ** ** **
Mean 2.82 2.92SD 0.43 0.27
Not important
SD = Standard Deviation
Question 10-AHow important is oral communication in your current position?
** Sample too small to report results
Workplace Skills Importance and Preparation
Somewhat important
Most students (81%) of students who have completed their doctoral degree indicated that oral communication is very important in their current position. A higher percentage of Education (92%) majors indicated that creativity is very important compared to other majors.
Table B Students Who Completed Doctoral Degree and Are Employed
Very important
Somewhat important
Not important
SD = Standard Deviation
Very important
** Sample too small to report results
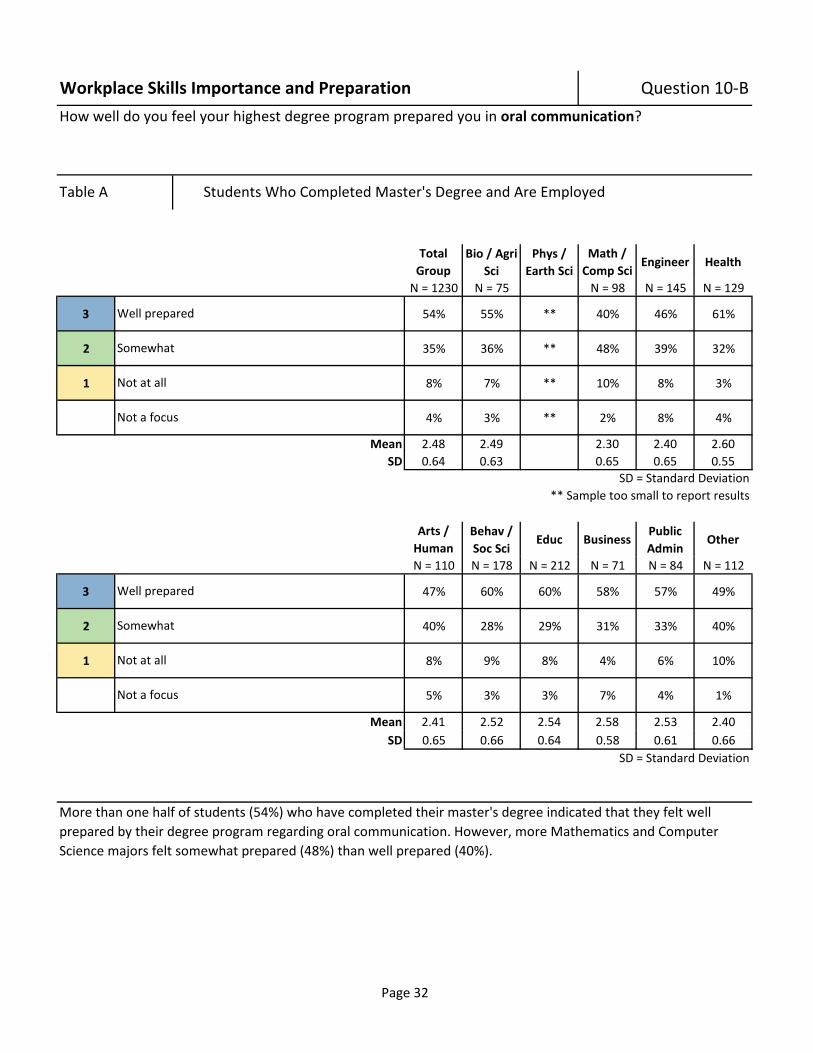
Page 32
Total Group
Bio / Agri Sci
Phys / Earth Sci
Math / Comp Sci
Engineer Health
N = 1230 N = 75 N = 98 N = 145 N = 129
3 54% 55% ** 40% 46% 61%
2 35% 36% ** 48% 39% 32%
1 8% 7% ** 10% 8% 3%
4% 3% ** 2% 8% 4%
Mean 2.48 2.49 2.30 2.40 2.60SD 0.64 0.63 0.65 0.65 0.55
Arts / Human
Behav / Soc Sci
Educ BusinessPublic Admin
Other
N = 110 N = 178 N = 212 N = 71 N = 84 N = 112
3 47% 60% 60% 58% 57% 49%
2 40% 28% 29% 31% 33% 40%
1 8% 9% 8% 4% 6% 10%
5% 3% 3% 7% 4% 1%
Mean 2.41 2.52 2.54 2.58 2.53 2.40SD 0.65 0.66 0.64 0.58 0.61 0.66
Somewhat
Not at all
Not a focus
SD = Standard Deviation
Well prepared
Not at all
Question 10-BWorkplace Skills Importance and PreparationHow well do you feel your highest degree program prepared you in oral communication?
Not a focus
SD = Standard Deviation
Well prepared
Somewhat
** Sample too small to report results
Table A Students Who Completed Master's Degree and Are Employed
More than one half of students (54%) who have completed their master's degree indicated that they felt well prepared by their degree program regarding oral communication. However, more Mathematics and Computer Science majors felt somewhat prepared (48%) than well prepared (40%).

Page 33
Total Group
Bio / Agri Sci
Phys / Earth Sci
Math / Comp Sci
Engineer Health
N = 318 N = 47 N = 30 N = 40
3 55% 66% 67% 50% ** **
2 40% 26% 27% 45% ** **
1 4% 9% 3% 3% ** **
2% 0% 3% 3% ** **
Mean 2.52 2.57 2.66 2.49SD 0.57 0.65 0.55 0.56
Arts / Human
Behav / Soc Sci
Educ BusinessPublic Admin
Other
N = 65 N = 62
3 ** 51% 56% ** ** **
2 ** 43% 37% ** ** **
1 ** 3% 3% ** ** **
** 3% 3% ** ** **
Mean 2.49 2.55SD 0.56 0.57
** Sample too small to report results
Workplace Skills Importance and Preparation Question 10-BHow well do you feel your highest degree program prepared you in oral communication?
** Sample too small to report results
More than one half (55%) of students with a doctoral degree indicated that they felt well prepared by their degree program regarding oral communication. Responses across fields of study were similar.
Table B Students Who Completed Doctoral Degree and Are Employed
Well prepared
Somewhat
Not at all
Not a focus
SD = Standard Deviation
Well prepared
Somewhat
Not at all
Not a focus
SD = Standard Deviation

Page 34
Total Group
Bio / Agri Sci
Phys / Earth Sci
Math / Comp Sci
Engineer Health
N = 1238 N = 77 N = 97 N = 146 N = 130
3 70% 70% ** 55% 64% 72%
2 25% 22% ** 40% 33% 25%
1 4% 8% ** 5% 3% 3%
Mean 2.66 2.62 2.49 2.60 2.68SD 0.56 0.63 0.60 0.56 0.53
Arts / Human
Behav / Soc Sci
Educ BusinessPublic Admin
Other
N = 111 N = 180 N = 213 N = 72 N = 83 N = 113
3 66% 73% 75% 68% 80% 77%
2 26% 22% 23% 22% 19% 20%
1 8% 5% 2% 10% 1% 3%
Mean 2.58 2.68 2.73 2.58 2.78 2.74SD 0.64 0.57 0.48 0.67 0.44 0.50
How important are writing skills in your current position?
** Sample too small to report results
Question 11-AWorkplace Skills Importance and Preparation
Somewhat important
Very important
Somewhat important
Not important
SD = Standard Deviation
SD = Standard Deviation
Table A Students Who Completed Master's Degree and Are Employed
Most students (70%) who have completed their master's degree indicated that writing skills are very important in their current position. Responses across fields of study were similar.
Not important
Very important

Page 35
Total Group
Bio / Agri Sci
Phys / Earth Sci
Math / Comp Sci
Engineer Health
N = 320 N = 48 N = 30 N = 40
3 76% 90% 67% 68% ** **
2 22% 10% 30% 30% ** **
1 2% 0% 3% 3% ** **
Mean 2.74 2.90 2.63 2.65SD 0.48 0.31 0.56 0.53
Arts / Human
Behav / Soc Sci
Educ BusinessPublic Admin
Other
N = 65 N = 63
3 ** 75% 86% ** ** **
2 ** 22% 14% ** ** **
1 ** 3% 0% ** ** **
Mean 2.72 2.86SD 0.52 0.35
Workplace Skills Importance and Preparation Question 11-AHow important are writing skills in your current position?
SD = Standard Deviation
** Sample too small to report results
Somewhat important
Not important
Most students (76%) who have completed their doctoral degree indicated that writing skills are very important in their current position. Responses across fields of study were similar.
Table B Students Who Completed Doctoral Degree and Are Employed
Very important
Somewhat important
Not important
SD = Standard Deviation
Very important
** Sample too small to report results

Page 36
Total Group
Bio / Agri Sci
Phys / Earth Sci
Math / Comp Sci
Engineer Health
N = 1229 N = 74 N = 98 N = 145 N = 129
3 67% 65% ** 51% 56% 71%
2 26% 31% ** 38% 31% 23%
1 5% 3% ** 7% 6% 3%
3% 1% ** 4% 7% 2%
Mean 2.64 2.63 2.46 2.53 2.70SD 0.57 0.54 0.63 0.62 0.53
Arts / Human
Behav / Soc Sci
Educ BusinessPublic Admin
Other
N = 111 N = 179 N = 213 N = 71 N = 82 N = 111
3 74% 71% 70% 61% 74% 69%
2 15% 21% 24% 34% 17% 28%
1 5% 5% 4% 6% 6% 2%
5% 3% 1% 0% 2% 1%
Mean 2.72 2.68 2.67 2.55 2.70 2.68SD 0.56 0.57 0.55 0.60 0.58 0.51
Somewhat
Not at all
Not a focus
SD = Standard Deviation
Well prepared
Not at all
Question 11-BWorkplace Skills Importance and PreparationHow well do you feel your highest degree program prepared you in writing skills?
Not a focus
SD = Standard Deviation
Well prepared
Somewhat
** Sample too small to report results
Table A Students Who Completed Master's Degree and Are Employed
Most (67%) students who have completed their master's degree indicated that they felt well prepared by their degree program regarding writing skills. Responses across fields of study were similar.

Page 37
Total Group
Bio / Agri Sci
Phys / Earth Sci
Math / Comp Sci
Engineer Health
N = 315 N = 47 N = 30 N = 40
3 63% 57% 60% 50% ** **
2 30% 36% 27% 43% ** **
1 5% 6% 7% 8% ** **
1% 0% 7% 0% ** **
Mean 2.58 2.51 2.57 2.43SD 0.59 0.62 0.63 0.64
Arts / Human
Behav / Soc Sci
Educ BusinessPublic Admin
Other
N = 65 N = 61
3 ** 71% 77% ** ** **
2 ** 26% 16% ** ** **
1 ** 3% 5% ** ** **
** 0% 2% ** ** **
Mean 2.68 2.73 SD 0.53 0.55
** Sample too small to report results
Workplace Skills Importance and Preparation Question 11-BHow well do you feel your highest degree program prepared you in writing skills?
** Sample too small to report results
Most (63%) students who have completed their doctoral degree indicated that they felt well prepared by their degree program regarding writing skills. However, only one half (50%) of Mathematics and Computer Science majors indicated that they felt well prepared by their program regarding writing skills.
Table B Students Who Completed Doctoral Degree and Are Employed
Well prepared
Somewhat
Not at all
Not a focus
SD = Standard Deviation
Well prepared
Somewhat
Not at all
Not a focus
SD = Standard Deviation

Page 38
Total Group
Bio / Agri Sci
Phys / Earth Sci
Math / Comp Sci
Engineer Health
N = 1235 N = 77 N = 98 N = 144 N = 129
3 66% 69% ** 76% 81% 71%
2 25% 27% ** 22% 17% 23%
1 8% 4% ** 2% 2% 5%
Mean 2.58 2.65 2.73 2.78 2.66SD 0.64 0.56 0.49 0.46 0.58
Arts / Human
Behav / Soc Sci
Educ BusinessPublic Admin
Other
N = 111 N = 180 N = 213 N = 72 N = 82 N = 113
3 50% 53% 62% 82% 68% 66%
2 32% 32% 31% 11% 26% 20%
1 18% 14% 7% 7% 6% 13%
Mean 2.32 2.39 2.55 2.75 2.62 2.53SD 0.76 0.73 0.62 0.58 0.60 0.72
** Sample too small to report results
SD = Standard Deviation
SD = Standard Deviation
How important is analysis/synthesis of data in your current position?
Question 12-AWorkplace Skills Importance and Preparation
Somewhat important
Table A Students Who Completed Master's Degree and Are Employed
Most students (66%) who have completed their master's degree indicated that analysis/synthesis of data skills are very important in their current position. However, fewer Behavioral and Social Sciences (53%) and Arts and Humanities (50%) majors felt that analysis/synthesis of data skills are very important compared to other majors.
Not important
Very important
Very important
Somewhat important
Not important

Page 39
Total Group
Bio / Agri Sci
Phys / Earth Sci
Math / Comp Sci
Engineer Health
N = 318 N = 48 N = 30 N = 39
3 73% 83% 87% 51% ** **
2 20% 15% 13% 36% ** **
1 7% 2% 0% 13% ** **
Mean 2.66 2.81 2.87 2.38SD 0.60 0.45 0.35 0.71
Arts / Human
Behav / Soc Sci
Educ BusinessPublic Admin
Other
N = 65 N = 63
3 ** 69% 76% ** ** **
2 ** 20% 21% ** ** **
1 ** 11% 3% ** ** **
Mean 2.58 2.73SD 0.68 0.51
** Sample too small to report results
** Sample too small to report results
Workplace Skills Importance and Preparation
Somewhat important
Not important
SD = Standard Deviation
Question 12-AHow important is analysis/synthesis of data in your current position?
The majority (73%) of students who have completed their doctoral degree indicated that analysis/synthesis of data skills are very important in their current position. Responses across fields of study were similar.
Table B Students Who Completed Doctoral Degree and Are Employed
Very important
Somewhat important
Not important
SD = Standard Deviation
Very important

Page 40
Total Group
Bio / Agri Sci
Phys / Earth Sci
Math / Comp Sci
Engineer Health
N = 1231 N = 75 N = 98 N = 144 N = 129
3 62% 76% ** 64% 72% 76%
2 30% 19% ** 30% 24% 21%
1 5% 4% ** 3% 2% 1%
4% 1% ** 3% 1% 2%
Mean 2.60 2.73 2.63 2.71 2.77SD 0.58 0.53 0.55 0.50 0.44
Arts / Human
Behav / Soc Sci
Educ BusinessPublic Admin
Other
N = 111 N = 178 N = 213 N = 72 N = 83 N = 112
3 51% 53% 52% 69% 64% 56%
2 28% 35% 40% 22% 29% 37%
1 12% 5% 5% 7% 6% 4%
9% 7% 4% 1% 1% 4%
Mean 2.44 2.52 2.49 2.63 2.59 2.55SD 0.71 0.60 0.59 0.62 0.61 0.57
Somewhat
Not at all
Not a focus
SD = Standard Deviation
Well prepared
Not at all
Question 12-BWorkplace Skills Importance and Preparation
** Sample too small to report results
How well do you feel your highest degree program prepared you in analysis/synthesis of data?
Not a focus
SD = Standard Deviation
Well prepared
Somewhat
Table A Students Who Completed Master's Degree and Are Employed
Most students (62%) who have completed their master's degree indicated that they felt well prepared by their degree program regarding analysis/synthesis of data. However, only about one half of Arts and Humanities (51%), Behavioral and Social Sciences (53%), and Education (52%) majors indicated that they felt well prepared by their program regarding analysis/synthesis of data.

Page 41
Total Group
Bio / Agri Sci
Phys / Earth Sci
Math / Comp Sci Engineer Health
N = 317 N = 47 N = 30 N = 40
3 71% 74% 83% 53% ** **
2 21% 19% 17% 35% ** **
1 5% 6% 0% 3% ** **
3% 0% 0% 10% ** **
Mean 2.68 2.68 2.83 2.56SD 0.57 0.59 0.38 0.56
Arts / Human
Behav / Soc Sci
EducBusiness
Public Admin Other
N = 65 N = 62
3 ** 69% 74% ** ** **
2 ** 22% 18% ** ** **
1 ** 8% 5% ** ** **
** 2% 3% ** ** **
Mean 2.63 2.72SD 0.63 0.56
** Sample too small to report results
Workplace Skills Importance and Preparation Question 12-BHow well do you feel your highest degree program prepared you in analysis/synthesis of data?
** Sample too small to report results
Nearly three quarters (71%) of students who have completed their doctoral degree indicated that they felt well prepared by their degree program regarding analysis/synthesis of data. However, only about one half (53%) of Mathematics and Computer Science majors indicated they felt well prepared by their graduate program regarding analysis/synthesis of data.
Table B Students Who Completed Doctoral Degree and Are Employed
Well prepared
Somewhat
Not at all
Not a focus
SD = Standard Deviation
Well prepared
Somewhat
Not at all
Not a focus
SD = Standard Deviation

Page 42
Total Group
Bio / Agri Sci
Phys / Earth Sci
Math / Comp Sci
Engineer Health
N = 1238 N = 77 N = 98 N = 145 N = 129
3 78% 74% ** 72% 77% 83%
2 20% 25% ** 27% 20% 13%
1 2% 1% ** 1% 3% 4%
Mean 2.75 2.73 2.71 2.74 2.79SD 0.48 0.48 0.48 0.50 0.49
Arts / Human
Behav / Soc Sci
Educ BusinessPublic Admin
Other
N = 111 N = 180 N = 213 N = 72 N = 84 N = 113
3 70% 74% 89% 76% 76% 74%
2 27% 23% 10% 21% 21% 23%
1 3% 3% 1% 3% 2% 3%
Mean 2.68 2.71 2.87 2.74 2.74 2.72SD 0.53 0.51 0.37 0.50 0.49 0.51
How important is teamwork in your current position?
** Sample too small to report results
Question 13-AWorkplace Skills Importance and Preparation
Somewhat important
Very important
Somewhat important
Not important
SD = Standard Deviation
SD = Standard Deviation
Table A Students Who Completed Master's Degree and Are Employed
More than three quarters (78%) of students who have completed their master's degree felt that teamwork is very important in their current position. Responses across fields of study were similar.
Not important
Very important

Page 43
Total Group
Bio / Agri Sci
Phys / Earth Sci
Math / Comp Sci
Engineer Health
N = 318 N = 48 N = 30 N = 39
3 60% 58% 60% 38% ** **
2 33% 35% 37% 49% ** **
1 7% 6% 3% 13% ** **
Mean 2.53 2.52 2.57 2.26SD 0.62 0.62 0.57 0.68
Arts / Human
Behav / Soc Sci
Educ BusinessPublic Admin
Other
N = 65 N = 63
3 ** 60% 76% ** ** **
2 ** 31% 22% ** ** **
1 ** 9% 2% ** ** **
Mean 2.51 2.75SD 0.66 0.47
Workplace Skills Importance and Preparation Question 13-AHow important is teamwork in your current position?
SD = Standard Deviation
** Sample too small to report results
Somewhat important
Not important
More than one half (60%) of students who have completed their doctoral degree indicated that teamwork is very important in their current position. However, only about one third (38%) of Mathematics and Computer Science majors felt that it is very important; nearly one half (49%) of those students indicated it was only somewhat important.
Table B Students Who Completed Doctoral Degree and Are Employed
Very important
Somewhat important
Not important
SD = Standard Deviation
Very important
** Sample too small to report results

Page 44
Total Group
Bio / Agri Sci
Phys / Earth Sci
Math / Comp Sci
Engineer Health
N = 1233 N = 75 N = 98 N = 145 N = 129
3 51% 43% ** 42% 48% 59%
2 35% 45% ** 44% 39% 32%
1 8% 7% ** 9% 6% 5%
6% 5% ** 5% 7% 5%
Mean 2.46 2.38 2.34 2.44 2.57SD 0.65 0.62 0.65 0.62 0.59
Arts / Human
Behav / Soc Sci
Educ BusinessPublic Admin
Other
N = 111 N = 179 N = 213 N = 72 N = 83 N = 112
3 28% 49% 63% 65% 63% 46%
2 37% 35% 29% 29% 29% 42%
1 19% 12% 4% 6% 4% 7%
16% 5% 3% 0% 5% 4%
Mean 2.11 2.39 2.61 2.60 2.62 2.41SD 0.74 0.70 0.57 0.60 0.56 0.63
Somewhat
Not at all
Not a focus
SD = Standard Deviation
Well prepared
Not at all
Question 13-BWorkplace Skills Importance and PreparationHow well do you feel your highest degree program prepared you in teamwork?
Not a focus
SD = Standard Deviation
Well prepared
Somewhat
** Sample too small to report results
Table A Students Who Completed Master's Degree and Are Employed
About one half (51%) of students who have completed their master's degree indicated that they were well prepared by their degree program regarding teamwork. However, more than one third (35%) of students indicated that they felt only somewhat prepared regarding teamwork.

Page 45
Total Group
Bio / Agri Sci
Phys / Earth Sci
Math / Comp Sci
Engineer Health
N = 316 N = 47 N = 30 N = 40
3 37% 30% 47% 18% ** **
2 40% 43% 27% 40% ** **
1 16% 19% 20% 30% ** **
7% 9% 7% 13% ** **
Mean 2.23 2.12 2.29 1.86SD 0.72 0.73 0.81 0.73
Arts / Human
Behav / Soc Sci
Educ BusinessPublic Admin
Other
N = 64 N = 62
3 ** 39% 45% ** ** **
2 ** 41% 40% ** ** **
1 ** 16% 8% ** ** **
** 5% 6% ** ** **
Mean 2.25 2.40SD 0.72 0.65
** Sample too small to report results
Workplace Skills Importance and Preparation Question 13-BHow well do you feel your highest degree program prepared you in teamwork?
** Sample too small to report results
Many students (40%) who have completed their doctoral degree indicated they felt only somewhat prepared by their degree program regarding teamwork; fewer students (37%) indicated they felt well prepared. Only 18% of Mathematics and Computer Science majors felt well prepared regarding teamwork, less than other majors.
Table B Students Who Completed Doctoral Degree and Are Employed
Well prepared
Somewhat
Not at all
Not a focus
SD = Standard Deviation
Well prepared
Somewhat
Not at all
Not a focus
SD = Standard Deviation

Page 46
Total Group
Bio / Agri Sci
Phys / Earth Sci
Math / Comp Sci
Engineer Health
N = 1233 N = 76 N = 98 N = 144 N = 129
3 68% 58% ** 63% 56% 72%
2 28% 39% ** 34% 40% 26%
1 4% 3% ** 3% 4% 2%
Mean 2.64 2.55 2.60 2.52 2.71SD 0.56 0.55 0.55 0.58 0.49
Arts / Human
Behav / Soc Sci
Educ BusinessPublic Admin
Other
N = 111 N = 180 N = 211 N = 72 N = 83 N = 113
3 62% 72% 81% 61% 66% 67%
2 32% 24% 17% 31% 28% 29%
1 6% 4% 2% 8% 6% 4%
Mean 2.56 2.68 2.79 2.53 2.60 2.64SD 0.61 0.54 0.46 0.65 0.60 0.55
SD = Standard Deviation
Question 14-AWorkplace Skills Importance and Preparation
Somewhat important
Very important
Somewhat important
Not important
How important is resilience in your current position?
** Sample too small to report results
Table A Students Who Completed Master's Degree and Are Employed
Over two thirds (68%) of students who have completed their master's degree indicated that resilience is very important in their current position. In particular, Education (81%) majors felt that resilience is very important in their current position.
Not important
Very important
SD = Standard Deviation

Page 47
Total Group
Bio / Agri Sci
Phys / Earth Sci
Math / Comp Sci
Engineer Health
N = 317 N = 48 N = 30 N = 39
3 69% 77% 77% 56% ** **
2 28% 19% 23% 36% ** **
1 3% 4% 0% 8% ** **
Mean 2.66 2.73 2.77 2.49SD 0.54 0.54 0.43 0.64
Arts / Human
Behav / Soc Sci
Educ BusinessPublic Admin
Other
N = 65 N = 62
3 ** 68% 81% ** ** **
2 ** 31% 18% ** ** **
1 ** 2% 2% ** ** **
Mean 2.66 2.79SD 0.51 0.45
** Sample too small to report results
Workplace Skills Importance and Preparation Question 14-AHow important is resilience in your current position?
SD = Standard Deviation
** Sample too small to report results
Somewhat important
Not important
Over two thirds (69%) of students who have completed their doctoral degree felt that resilience is very important in their current position. Responses across fields of study are similar.
Table B Students Who Completed Doctoral Degree and Are Employed
Very important
Somewhat important
Not important
SD = Standard Deviation
Very important

Page 48
Total Group
Bio / Agri Sci
Phys / Earth Sci
Math / Comp Sci
Engineer Health
N = 1225 N = 73 N = 98 N = 144 N = 128
3 48% 48% ** 42% 49% 52%
2 36% 37% ** 45% 38% 35%
1 7% 4% ** 6% 4% 5%
9% 11% ** 7% 9% 8%
Mean 2.44 2.49 2.38 2.49 2.50SD 0.64 0.59 0.61 0.59 0.61
Arts / Human
Behav / Soc Sci
Educ BusinessPublic Admin
Other
N = 110 N = 179 N = 211 N = 71 N = 83 N = 112
3 46% 45% 50% 48% 57% 40%
2 35% 34% 35% 35% 25% 44%
1 8% 11% 9% 10% 7% 4%
11% 10% 7% 7% 11% 12%
Mean 2.43 2.37 2.44 2.41 2.55 2.40SD 0.66 0.70 0.66 0.68 0.64 0.59
Somewhat
Not at all
Not a focus
SD = Standard Deviation
Well prepared
Not at all
Question 14-BWorkplace Skills Importance and PreparationHow well do you feel your highest degree program prepared you in resilience?
Not a focus
SD = Standard Deviation
Well prepared
Somewhat
** Sample too small to report results
Table A Students Who Completed Master's Degree and Are Employed
Less than one half (48%) of students who have completed their master's degree felt that they were well prepared by their degree program regarding resilience; about one third (36%) of students felt that they were only somewhat prepared. Responses across fields of study were similar.

Page 49
Total Group
Bio / Agri Sci
Phys / Earth Sci
Math / Comp Sci
Engineer Health
N = 317 N = 47 N = 30 N = 40
3 51% 62% 53% 40% ** **
2 32% 23% 33% 38% ** **
1 9% 9% 3% 18% ** **
8% 6% 10% 5% ** **
Mean 2.45 2.57 2.56 2.24SD 0.67 0.66 0.58 0.75
Arts / Human
Behav / Soc Sci
Educ BusinessPublic Admin
Other
N = 65 N = 62
3 ** 43% 58% ** ** **
2 ** 38% 24% ** ** **
1 ** 12% 8% ** ** **
** 6% 10% ** ** **
Mean 2.33 2.55SD 0.70 0.66
** Sample too small to report results
Workplace Skills Importance and Preparation Question 14-BHow well do you feel your highest degree program prepared you in resilience?
** Sample too small to report results
About one half (51%) of students who have completed their doctoral degree felt that they were well prepared by their degree program regarding resilience; about one third (32%) of students felt that they were only somewhat prepared. Responses across fields of study were similar.
Table B Students Who Completed Doctoral Degree and Are Employed
Well prepared
Somewhat
Not at all
Not a focus
SD = Standard Deviation
Well prepared
Somewhat
Not at all
Not a focus
SD = Standard Deviation

Page 50
Total Group
Bio / Agri Sci
Phys / Earth Sci
Math / Comp Sci
Engineer Health
N = 1236 N = 77 N = 98 N = 144 N = 129
3 82% 87% ** 73% 73% 87%
2 16% 12% ** 27% 27% 11%
1 2% 1% ** 0% 0% 2%
Mean 2.41 2.86 2.73 2.73 2.84SD 0.78 0.39 0.44 0.45 0.42
Arts / Human
Behav / Soc Sci
Educ BusinessPublic Admin
Other
N = 111 N = 180 N = 212 N = 72 N = 84 N = 113
3 80% 79% 93% 76% 76% 85%
2 16% 19% 6% 17% 23% 13%
1 4% 1% 1% 7% 1% 2%
Mean 2.77 2.78 2.92 2.69 2.75 2.83SD 0.50 0.44 0.30 0.60 0.46 0.42
Workplace Skills Importance and Preparation
Somewhat important
Somewhat important
Not important
How important is planning and organization in your current position?
Question 15-A
Very important
Very important
** Sample too small to report results
Table A Students Who Completed Master's Degree and Are Employed
Most students (82%) who have completed their master's degree indicated that planning and organization are very important in their current position. In particular, Education (93%) majors felt that planning and organization are very important in their current position.
Not important
SD = Standard Deviation
SD = Standard Deviation

Page 51
Total Group
Bio / Agri Sci
Phys / Earth Sci
Math / Comp Sci
Engineer Health
N = 320 N = 48 N = 30 N = 40
3 72% 79% 57% 50% ** **
2 25% 21% 43% 43% ** **
1 3% 0% 0% 8% ** **
Mean 2.70 2.79 2.57 2.43SD 0.51 0.41 0.50 0.64
Arts / Human
Behav / Soc Sci
Educ BusinessPublic Admin
Other
N = 65 N = 63
3 ** 71% 89% ** ** **
2 ** 26% 11% ** ** **
1 ** 3% 0% ** ** **
Mean 2.68 2.89SD 0.53 0.32
Not important
SD = Standard Deviation
Question 15-AHow important is planning and organization in your current position?
** Sample too small to report results
Workplace Skills Importance and Preparation
Somewhat important
About three quarters (72%) of students who have completed their doctoral degree indicated that planning and organization are very important in their current position. In particular, Education (89%) majors felt that planning and organization are very important in their current position.
Table B Students Who Completed Doctoral Degree and Are Employed
Very important
Somewhat important
Not important
SD = Standard Deviation
Very important
** Sample too small to report results

Page 52
Total Group
Bio / Agri Sci
Phys / Earth Sci
Math / Comp Sci
Engineer Health
N = 1230 N = 75 N = 97 N = 145 N = 128
3 55% 61% ** 49% 48% 63%
2 35% 31% ** 37% 45% 31%
1 5% 3% ** 9% 3% 1%
4% 5% ** 4% 3% 5%
Mean 2.52 2.62 2.42 2.46 2.65SD 0.60 0.54 0.66 0.57 0.50
Arts / Human
Behav / Soc Sci
Educ BusinessPublic Admin
Other
N = 111 N = 178 N = 213 N = 72 N = 84 N = 111
3 44% 52% 62% 58% 64% 47%
2 35% 35% 31% 33% 27% 47%
1 12% 7% 4% 6% 7% 4%
9% 6% 3% 3% 1% 3%
Mean 2.36 2.48 2.60 2.54 2.58 2.44SD 0.70 0.63 0.57 0.61 0.63 0.57
Somewhat
Not at all
Not a focus
SD = Standard Deviation
Well prepared
Not at all
Question 15-BWorkplace Skills Importance and PreparationHow well do you feel your highest degree program prepared you in planning and organization?
Not a focus
SD = Standard Deviation
Well prepared
Somewhat
** Sample too small to report results
Table A Students Who Completed Master's Degree and Are Employed
Over one half (55%) of students have completed their master's degree felt that they were well prepared by their degree program regarding planning and organization. Responses across fields of study were similar.

Page 53
Total Group
Bio / Agri Sci
Phys / Earth Sci
Math / Comp Sci
Engineer Health
N = 316 N = 47 N = 30 N = 40
3 45% 45% 40% 30% ** **
2 38% 36% 43% 40% ** **
1 11% 15% 10% 23% ** **
7% 4% 7% 8% ** **
Mean 2.36 2.31 2.32 2.08SD 0.68 0.73 0.67 0.76
Arts / Human
Behav / Soc Sci
Educ BusinessPublic Admin
Other
N = 65 N = 62
3 ** 38% 56% ** ** **
2 ** 45% 26% ** ** **
1 ** 6% 10% ** ** **
** 11% 8% ** ** **
Mean 2.36 2.51SD 0.61 0.68
** Sample too small to report results
Workplace Skills Importance and Preparation Question 15-BHow well do you feel your highest degree program prepared you in planning and organization?
** Sample too small to report results
Less than one half (45%) of students who have completed their doctoral degree felt that they were well prepared by their degree program regarding planning and organization; over one third (38%) of students felt they were only somewhat prepared. Responses across fields of study were similar.
Table B Students Who Completed Doctoral Degree and Are Employed
Well prepared
Somewhat
Not at all
Not a focus
SD = Standard Deviation
Well prepared
Somewhat
Not at all
Not a focus
SD = Standard Deviation

Page 54
Total Group
Bio / Agri Sci
Phys / Earth Sci
Math / Comp Sci
Engineer Health
N = 1236 N = 77 N = 98 N = 145 N = 129
3 78% 65% ** 76% 70% 89%
2 18% 31% ** 19% 23% 9%
1 4% 4% ** 5% 6% 2%
Mean 2.52 2.61 2.70 2.64 2.87SD 0.64 0.57 0.56 0.60 0.40
Arts / Human
Behav / Soc Sci
Educ BusinessPublic Admin
Other
N = 111 N = 179 N = 213 N = 72 N = 83 N = 113
3 70% 82% 87% 75% 75% 74%
2 23% 15% 10% 17% 23% 23%
1 6% 4% 3% 8% 2% 3%
Mean 2.64 2.78 2.84 2.67 2.72 2.72SD 0.60 0.50 0.44 0.63 0.50 0.51
** Sample too small to report results
SD = Standard Deviation
SD = Standard Deviation
How important is ethics and integrity in your current position?
Question 16-AWorkplace Skills Importance and Preparation
Somewhat important
Table A Students Who Completed Master's Degree and Are Employed
More than three quarters (78%) of students who have completed their master's degree indicated that ethics and integrity are very important in their current position. Responses across all fields of study were similar.
Not important
Very important
Very important
Somewhat important
Not important

Page 55
Total Group
Bio / Agri Sci
Phys / Earth Sci
Math / Comp Sci
Engineer Health
N = 319 N = 48 N = 30 N = 39
3 72% 67% 70% 51% ** **
2 23% 29% 30% 38% ** **
1 5% 4% 0% 10% ** **
Mean 2.68 2.63 2.70 2.41SD 0.56 0.57 0.47 0.68
Arts / Human
Behav / Soc Sci
Educ BusinessPublic Admin
Other
N = 65 N = 63
3 ** 74% 92% ** ** **
2 ** 20% 6% ** ** **
1 ** 6% 2% ** ** **
Mean 2.68 2.90SD 0.59 0.35
** Sample too small to report results
** Sample too small to report results
Workplace Skills Importance and Preparation
Somewhat important
Not important
SD = Standard Deviation
Question 16-AHow important is ethics and integrity in your current position?
Almost three quarters (72%) of students who have completed their doctoral degree indicated that ethics and integrity are very important in their current position. Responses across all fields of study were similar.
Table B Students Who Completed Doctoral Degree and Are Employed
Very important
Somewhat important
Not important
SD = Standard Deviation
Very important

Page 56
Total Group
Bio / Agri Sci
Phys / Earth Sci
Math / Comp Sci
Engineer Health
N = 1229 N = 75 N = 98 N = 144 N = 129
3 55% 41% ** 44% 44% 67%
2 30% 39% ** 35% 38% 29%
1 7% 8% ** 10% 10% 3%
7% 12% ** 11% 8% 2%
Mean 2.32 2.38 2.38 2.36 2.65SD 0.68 0.65 0.69 0.68 0.54
Arts / Human
Behav / Soc Sci
Educ BusinessPublic Admin
Other
N = 110 N = 179 N = 213 N = 71 N = 83 N = 111
3 37% 61% 68% 65% 61% 54%
2 34% 24% 25% 24% 28% 36%
1 15% 8% 4% 3% 2% 7%
15% 7% 3% 8% 8% 3%
Mean 2.27 2.56 2.65 2.68 2.64 2.48SD 0.74 0.65 0.56 0.53 0.53 0.63
Somewhat
Not at all
Not a focus
SD = Standard Deviation
Well prepared
Not at all
Question 16-BWorkplace Skills Importance and PreparationHow well do you feel your highest degree program prepared you in ethics and integrity?
Not a focus
SD = Standard Deviation
Well prepared
Somewhat
** Sample too small to report results
Table A Students Who Completed Master's Degree and Are Employed
More than one half (55%) of students who have completed their master's degree indicated that they felt well prepared by their degree program regarding ethics and integrity. However, about one third (30%) of students felt they were only somewhat prepared. Responses across fields of study were similar.

Page 57
Total Group
Bio / Agri Sci
Phys / Earth Sci
Math / Comp Sci
Engineer Health
N = 316 N = 47 N = 30 N = 40
3 51% 49% 47% 43% ** **
2 33% 38% 27% 25% ** **
1 10% 9% 17% 18% ** **
6% 4% 10% 15% ** **
Mean 2.43 2.42 2.33 2.29SD 0.68 0.66 0.78 0.80
Arts / Human
Behav / Soc Sci
Educ BusinessPublic Admin
Other
N = 65 N = 61
3 ** 63% 54% ** ** **
2 ** 25% 34% ** ** **
1 ** 9% 7% ** ** **
** 3% 5% ** ** **
Mean 2.56 2.50SD 0.67 0.63
** Sample too small to report results
Workplace Skills Importance and Preparation Question 16-BHow well do you feel your highest degree program prepared you in ethics and integrity?
** Sample too small to report results
More than one half (51%) of students who have completed their doctoral degree indicated that they felt well prepared by their degree program regarding ethics and integrity. However, about one third (33%) of students felt they were only somewhat prepared. Responses across fields of study were similar.
Table B Students Who Completed Doctoral Degree and Are Employed
Well prepared
Somewhat
Not at all
Not a focus
SD = Standard Deviation
Well prepared
Somewhat
Not at all
Not a focus
SD = Standard Deviation

Page 58
Total Group
Bio / Agri Sci
Phys / Earth Sci
Math / Comp Sci
Engineer Health
N = 1234 N = 77 N = 97 N = 144 N = 129
3 54% 48% ** 76% 72% 48%
2 41% 47% ** 22% 24% 49%
1 5% 5% ** 2% 3% 3%
Mean 2.49 2.43 2.74 2.69 2.45SD 0.59 0.59 0.48 0.54 0.56
Arts / Human
Behav / Soc Sci
Educ BusinessPublic Admin
Other
N = 111 N = 180 N = 213 N = 72 N = 82 N = 113
3 50% 37% 54% 53% 40% 59%
2 39% 56% 44% 40% 50% 37%
1 11% 7% 2% 7% 10% 4%
Mean 2.40 2.31 2.52 2.46 2.30 2.56SD 0.68 0.59 0.55 0.63 0.64 0.57
How important is technological comfort and savvy in your current position?
** Sample too small to report results
Question 17-AWorkplace Skills Importance and Preparation
Somewhat important
Very important
Somewhat important
Not important
SD = Standard Deviation
SD = Standard Deviation
Table A Students Who Completed Master's Degree and Are Employed
Over one half (54%) of students who have completed their master's degree indicated that technological comfort and savvy are very important in their current position. Technological comfort and savvy were rated as very important more frequently by Mathematics and Computer Sciences (76%) and Engineering (72%) majors compared to other majors.
Not important
Very important

Page 59
Total Group
Bio / Agri Sci
Phys / Earth Sci
Math / Comp Sci
Engineer Health
N = 319 N = 48 N = 30 N = 40
3 46% 54% 57% 55% ** **
2 47% 44% 37% 35% ** **
1 7% 2% 7% 10% ** **
Mean 2.39 2.52 2.50 2.45SD 0.62 0.55 0.63 0.68
Arts / Human
Behav / Soc Sci
Educ BusinessPublic Admin
Other
N = 64 N = 63
3 ** 25% 51% ** ** **
2 ** 61% 48% ** ** **
1 ** 14% 2% ** ** **
Mean 2.11 2.49SD 0.62 0.54
Workplace Skills Importance and Preparation Question 17-AHow important is technological comfort and savvy in your current position?
SD = Standard Deviation
** Sample too small to report results
Somewhat important
Not important
Nearly all students who have completed their doctoral degree indicated that technological comfort and savvy are either very important (46%) or somewhat important (47%) in their current position. However, only one fourth (25%) of students in Behavioral and Social Sciences indicated that technological comfort and savvy are very important.
Table B Students Who Completed Doctoral Degree and Are Employed
Very important
Somewhat important
Not important
SD = Standard Deviation
Very important
** Sample too small to report results

Page 60
Total Group
Bio / Agri Sci
Phys / Earth Sci
Math / Comp Sci
Engineer Health
N = 1229 N = 75 N = 97 N = 145 N = 128
3 40% 45% ** 57% 50% 40%
2 40% 41% ** 34% 40% 47%
1 11% 8% ** 6% 4% 4%
10% 5% ** 3% 6% 9%
Mean 2.34 2.39 2.52 2.49 2.40SD 0.89 0.64 0.62 0.58 0.57
Arts / Human
Behav / Soc Sci
Educ BusinessPublic Admin
Other
N = 111 N = 179 N = 212 N = 72 N = 82 N = 112
3 23% 28% 44% 39% 34% 38%
2 33% 41% 41% 38% 39% 40%
1 23% 16% 9% 14% 15% 12%
21% 16% 6% 10% 12% 11%
Mean 2.01 2.15 2.37 2.28 2.22 2.29SD 0.77 0.71 0.65 0.72 0.72 0.69
Somewhat
Not at all
Not a focus
SD = Standard Deviation
Well prepared
Not at all
Question 17-BWorkplace Skills Importance and PreparationHow well do you feel your highest degree program prepared you in technological comfort and savvy?
Not a focus
SD = Standard Deviation
Well prepared
Somewhat
** Sample too small to report results
Table A Students Who Completed Master's Degree and Are Employed
About 40% of students who have completed their master's degree felt they were well prepared by their degree program regarding technological comfort and savvy, but 40% also felt they were only somewhat prepared. Nearly one quarter (23%) of Arts and Humanities majors felt they were not prepared at all.

Page 61
Total Group
Bio / Agri Sci
Phys / Earth Sci
Math / Comp Sci
Engineer Health
N = 316 N = 47 N = 30 N = 39
3 38% 38% 43% 41% ** **
2 42% 38% 43% 38% ** **
1 10% 11% 7% 5% ** **
10% 13% 7% 15% ** **
Mean 2.32 2.32 2.39 2.42SD 0.66 0.69 0.63 0.61
Arts / Human
Behav / Soc Sci
Educ BusinessPublic Admin
Other
N = 65 N = 62
3 ** 31% 37% ** ** **
2 ** 43% 47% ** ** **
1 ** 9% 10% ** ** **
** 17% 6% ** ** **
Mean 2.26 2.29SD 0.65 0.65
** Sample too small to report results
Workplace Skills Importance and Preparation Question 17-BHow well do you feel your highest degree program prepared you in technological comfort and savvy?
** Sample too small to report results
Over one third (38%) of students who have completed their doctoral degree felt they were well prepared by their graduate program in technological comfort and savvy, but more students (42%) felt they were only somewhat prepared. Responses across fields of study were similar.
Table B Students Who Completed Doctoral Degree and Are Employed
Well prepared
Somewhat
Not at all
Not a focus
SD = Standard Deviation
Well prepared
Somewhat
Not at all
Not a focus
SD = Standard Deviation

Page 62
Total Group
Bio / Agri Sci
Phys / Earth Sci
Math / Comp Sci
Engineer Health
N = 1234 N = 76 N = 98 N = 144 N = 129
3 43% 33% ** 24% 21% 52%
2 40% 42% ** 57% 58% 43%
1 17% 25% ** 18% 22% 5%
Mean 2.26 2.08 2.06 1.99 2.47SD 0.73 0.76 0.66 0.65 0.60
Arts / Human
Behav / Soc Sci
Educ BusinessPublic Admin
Other
N = 110 N = 180 N = 213 N = 72 N = 83 N = 113
3 36% 37% 84% 39% 27% 38%
2 38% 45% 11% 39% 54% 39%
1 25% 18% 5% 22% 19% 23%
Mean 2.11 2.20 2.78 2.17 2.07 2.15SD 0.78 0.72 0.52 0.77 0.68 0.77
** Sample too small to report results
SD = Standard Deviation
SD = Standard Deviation
How important is teaching and training in your current position?
Question 18-AWorkplace Skills Importance and Preparation
Somewhat important
Table A Students Who Completed Master's Degree and Are Employed
About 43% of students who have completed their master's degree indicated that teaching and training are very important in their current position and about 40% indicated it was somewhat important. The majority of Education (84%) majors indicated that teaching and training are very important in their current position, more than any other major.
Not important
Very important
Very important
Somewhat important
Not important

Page 63
Total Group
Bio / Agri Sci
Phys / Earth Sci
Math / Comp Sci
Engineer Health
N = 319 N = 48 N = 30 N = 40
3 48% 31% 30% 33% ** **
2 40% 52% 53% 45% ** **
1 12% 17% 17% 23% ** **
Mean 2.36 2.15 2.13 2.10SD 0.69 0.68 0.68 0.74
Arts / Human
Behav / Soc Sci
Educ BusinessPublic Admin
Other
N = 65 N = 62
3 ** 52% 79% ** ** **
2 ** 31% 19% ** ** **
1 ** 17% 2% ** ** **
Mean 2.32 2.77SD 0.64 0.46
** Sample too small to report results
** Sample too small to report results
Workplace Skills Importance and Preparation
Somewhat important
Not important
SD = Standard Deviation
Question 18-AHow important is teaching and training in your current position?
Nearly one half (48%) of students who have completed their doctoral degree indicated that teaching and training are very important in their current position and about 40% indicated it was somewhat important. The majority of Education (79%) majors felt that teaching and training are very important in their current position, more than any other major.
Table B Students Who Completed Doctoral Degree and Are Employed
Very important
Somewhat important
Not important
SD = Standard Deviation
Very important

Page 64
Total Group
Bio / Agri Sci
Phys / Earth Sci
Math / Comp Sci
Engineer Health
N = 1224 N = 74 N = 6 N = 143 N = 128
3 37% 28% ** 30% 27% 41%
2 39% 43% ** 47% 41% 43%
1 11% 9% ** 9% 13% 5%
13% 19% ** 14% 20% 12%
Mean 2.30 2.23 2.24 2.18 2.41SD 0.68 0.65 0.64 0.68 0.59
Arts / Human
Behav / Soc Sci
Educ BusinessPublic Admin
Other
N = 111 N = 179 N = 211 N = 71 N = 83 N = 112
3 36% 32% 64% 30% 25% 27%
2 40% 39% 27% 39% 45% 40%
1 16% 15% 5% 15% 10% 16%
8% 13% 3% 15% 20% 17%
Mean 2.22 2.44 2.61 2.17 2.20 2.13SD 0.73 0.91 0.59 0.72 0.64 0.71
About three quarters (76%) of students who have completed their master's degree felt they were prepared by their degree program regarding teaching and training, with 37% indicating they were well prepared and 39% somewhat prepared. More Education (64%) majors felt they were well prepared compared to other majors.
Not a focus
SD = Standard Deviation
Well prepared
Somewhat
Well prepared
Somewhat
Not at all
Not a focus
Not at all
Question 18-BWorkplace Skills Importance and PreparationHow well do you feel your highest degree program prepared you for teaching and training?
Table A Students Who Completed Master's Degree and Are Employed
** Sample too small to report results
SD = Standard Deviation

Page 65
Total Group
Bio / Agri Sci
Phys / Earth Sci
Math / Comp Sci
Engineer Health
N = 316 N = 47 N = 30 N = 40
3 42% 32% 37% 38% ** **
2 41% 49% 40% 43% ** **
1 9% 11% 13% 10% ** **
9% 9% 10% 10% ** **
Mean 2.36 2.23 2.26 2.31SD 0.65 0.65 0.71 0.67
Arts / Human
Behav / Soc Sci
Educ BusinessPublic Admin
Other
N = 65 N = 62
3 ** 35% 60% ** ** **
2 ** 43% 34% ** ** **
1 ** 8% 5% ** ** **
** 14% 2% ** ** **
Mean 2.55 2.56SD 0.83 0.59
** Sample too small to report results
The majority (83%) of students who have completed their doctoral degree felt they were prepared by their degree program regarding teaching and training, with 42% indicating they were well prepared and 41% somewhat prepared. More Education (60%) majors felt they were well prepared compared to other majors.
Not at all
Not a focus
SD = Standard Deviation
Well prepared
Somewhat
Not at all
Not a focus
SD = Standard Deviation
Workplace Skills Importance and Preparation Question 18-BHow well do you feel your highest degree program prepared you for teaching and training?
Table B Students Who Completed Doctoral Degree and Are Employed
Well prepared
Somewhat
** Sample too small to report results

Page 66
Total Group
Bio / Agri Sci
Phys / Earth Sci
Math / Comp Sci
Engineer Health
N = 1244 N = 77 N = 98 N = 147 N = 129
5 11% 9% ** 18% 10% 16%
4 45% 40% ** 44% 57% 54%
3 19% 22% ** 26% 16% 17%
2 17% 16% ** 9% 14% 8%
1 7% 13% ** 3% 3% 5%
Mean 3.36 3.17 3.65 3.58 3.70SD 1.12 1.20 0.99 0.95 0.99
Arts / Human
Behav / Soc Sci
Educ BusinessPublic Admin
Other
N = 112 N = 180 N = 216 N = 72 N = 84 N = 113
5 12% 9% 9% 17% 12% 8%
4 38% 37% 44% 43% 48% 41%
3 15% 21% 21% 22% 18% 19%
2 24% 22% 20% 14% 17% 22%
1 12% 11% 6% 4% 6% 11%
Mean 3.13 3.11 3.30 3.54 3.43 3.13SD 1.24 1.18 1.07 1.06 1.09 1.17
Please indicate your level of satisfaction with you’re the salary of your current job.
Question 19-AJob Satisfaction
Very satisfied
Dissatisfied
Very dissatisfied
SD = Standard Deviation
** Sample too small to report results
Satisfied
SD = Standard Deviation
Neutral
Dissatisfied
Very satisfied
Satisfied
Neutral
Table A Students Who Completed Master's Degree and Are Employed
More than one half (56%) of students who have completed their master's degree indicated satisfaction with the salary of their current job, with 11% indicating that were very satisfied and 45% satisfied. Responses across fields of study were similar.
Very dissatisfied

Page 67
Total Group
Bio / Agri Sci
Phys / Earth Sci
Math / Comp Sci
Engineer Health
N = 319 N = 47 N = 30 N = 39
5 17% 2% 13% 28% ** **
4 44% 45% 43% 41% ** **
3 17% 15% 23% 15% ** **
2 16% 23% 17% 13% ** **
1 7% 15% 3% 3% ** **
Mean 3.47 2.96 3.47 3.79SD 1.15 1.18 1.04 1.08
Arts / Human
Behav / Soc Sci
Educ BusinessPublic Admin
Other
N = 66 N = 63
5 ** 17% 17% ** ** **
4 ** 48% 44% ** ** **
3 ** 15% 13% ** ** **
2 ** 14% 21% ** ** **
1 ** 6% 5% ** ** **
Mean 3.56 3.49SD 1.11 1.15
Job Satisfaction Question 19-APlease indicate your level of satisfaction with you’re the salary of your current job.
** Sample too small to report results
Very dissatisfied
SD = Standard Deviation
** Sample too small to report results
Very dissatisfied
Almost two thirds (61%) of students who have completed their doctoral degree indicated satisfaction with the salary of their current job, with 17% indicating that were very satisfied and 44% satisfied. Responses across fields of study were similar.
Table B Students Who Completed Doctoral Degree and Are Employed
SD = Standard Deviation
Very satisfied
Satisfied
Neutral
Dissatisfied
Very satisfied
Satisfied
Neutral
Dissatisfied

Page 68
Total Group
Bio / Agri Sci
Phys / Earth Sci
Math / Comp Sci
Engineer Health
N = 1168 N = 70 N = 96 N = 141 N = 123
1 60% 57% ** 69% 62% 67%
2 30% 27% ** 26% 30% 23%
3 10% 16% ** 5% 9% 11%
Arts / Human
Behav / Soc Sci
Educ BusinessPublic Admin
Other
N = 107 N = 169 N = 196 N = 66 N = 79 N = 106
1 38% 60% 63% 61% 63% 59%
2 47% 27% 31% 30% 29% 29%
3 15% 14% 6% 9% 8% 11%
More than one half (60%) of students who have completed their master's degree believed they would be less satisfied with their current salary if they did not have their master's degree. Responses across fields of study were similar.
I might be more satisfied than I currently am.
I might be less satisfied than I currently am.
I think my satisfaction would be about the same.
Question 19-BJob SatisfactionIf you did not have a graduate degree, do you believe your job satisfaction might differ from your current satisfaction with the salary?
I might be less satisfied than I currently am.
I think my satisfaction would be about the same.
I might be more satisfied than I currently am.
Table A Students Who Completed Master's Degree and Are Employed
** Sample too small to report results

Pae 69
Total Group
Bio / Agri Sci
Phys / Earth Sci
Math / Comp Sci
Engineer Health
N = 304 N = 46 N = 29 N = 39
1 54% 50% 48% 41% ** **
2 28% 20% 24% 33% ** **
3 18% 30% 28% 26% ** **
Arts / Human
Behav / Soc Sci
Educ BusinessPublic Admin
Other
N = 63 N = 56
1 ** 60% 63% ** ** **
2 ** 27% 29% ** ** **
3 ** 13% 9% ** ** **
Job Satisfaction Question 19-BIf you did not have a graduate degree, do you believe your job satisfaction might differ from your current satisfaction with the salary?
I might be more satisfied than I currently am.
More than one half (54%) of students who have completed their doctoral degree believed they would be less satisfied with their current salary if they did not have their doctoral degree. Responses across fields of study were similar.
Table B Students Who Completed Doctoral Degree and Are Employed
I might be less satisfied than I currently am.
I think my satisfaction would be about the same.
I might be more satisfied than I currently am.
I might be less satisfied than I currently am.
I think my satisfaction would be about the same.
** Sample too small to report results
** Sample too small to report results

Page 70
Total Group
Bio / Agri Sci
Phys / Earth Sci
Math / Comp Sci
Engineer Health
N = 1241 N = 77 N = 97 N = 147 N = 129
5 27% 25% ** 27% 26% 26%
4 44% 49% ** 51% 44% 49%
3 17% 17% ** 15% 19% 16%
2 9% 6% ** 6% 9% 8%
1 4% 3% ** 1% 3% 1%
Mean 3.80 3.87 3.96 3.81 3.92SD 1.06 0.95 0.88 1.01 0.90
Arts / Human
Behav / Soc Sci
Educ BusinessPublic Admin
Other
N = 112 N = 179 N = 216 N = 71 N = 84 N = 113
5 29% 22% 23% 31% 35% 27%
4 39% 42% 49% 31% 42% 37%
3 12% 16% 18% 27% 14% 19%
2 9% 13% 7% 7% 8% 12%
1 12% 6% 3% 4% 1% 5%
Mean 3.64 3.61 3.82 3.77 4.00 3.70SD 1.30 1.15 0.96 1.10 0.97 1.15
Please indicate your level of satisfaction the benefits of your current job.
Question 20-AJob Satisfaction
Very satisfied
Dissatisfied
Very dissatisfied
SD = Standard Deviation
** Sample too small to report results
Satisfied
SD = Standard Deviation
Neutral
Dissatisfied
Very satisfied
Satisfied
Neutral
Table A Students Who Completed Master's Degree and Are Employed
About three quarters (71%) of students who have completed their master's degree indicated satisfaction with the benefits of their current job, with 27% indicating that were very satisfied and 44% satisfied. Responses across fields of study were similar.
Very dissatisfied

Page 71
Total Group
Bio / Agri Sci
Phys / Earth Sci
Math / Comp Sci
Engineer Health
N = 320 N = 47 N = 30 N = 39
5 25% 19% 27% 31% ** **
4 45% 40% 40% 41% ** **
3 16% 19% 30% 13% ** **
2 9% 13% 0% 8% ** **
1 4% 9% 3% 8% ** **
Mean 3.76 3.49 3.87 3.79SD 1.07 1.20 0.94 1.20
Arts / Human
Behav / Soc Sci
Educ BusinessPublic Admin
Other
N = 66 N = 64
5 ** 26% 23% ** ** **
4 ** 50% 47% ** ** **
3 ** 11% 19% ** ** **
2 ** 11% 9% ** ** **
1 ** 3% 2% ** ** **
Mean 3.85 3.81SD 1.03 0.96
Job Satisfaction Question 20-APlease indicate your level of satisfaction the benefits of your current job.
** Sample too small to report results
Very dissatisfied
SD = Standard Deviation
** Sample too small to report results
Very dissatisfied
About one quarter (25%) of students who have completed their doctoral degree indicated that they were very satisfied with their benefits in their current job; about 45% indicated they were satisfied. About one quarter (22%) of Biological and Agricultural Sciences majors indicated they were not satisfied with their benefits, with 13% indicating they were dissatisfied and 9% very dissatisfied.
Table B Students Who Completed Doctoral Degree and Are Employed
SD = Standard Deviation
Very satisfied
Satisfied
Neutral
Dissatisfied
Very satisfied
Satisfied
Neutral
Dissatisfied

Page 72
Total Group
Bio / Agri Sci
Phys / Earth Sci
Math / Comp Sci
Engineer Health
N = 1166 N = 69 N = 95 N = 141 N = 123
1 38% 38% ** 36% 37% 45%
2 58% 55% ** 62% 58% 49%
3 4% 7% ** 2% 5% 7%
Arts / Human
Behav / Soc Sci
Educ BusinessPublic Admin
Other
N = 107 N = 169 N = 197 N = 65 N = 79 N = 106
1 30% 40% 30% 45% 41% 43%
2 64% 56% 68% 48% 57% 54%
3 7% 4% 2% 8% 3% 3%
More than one half (58%) of students who have completed their master's degree indicated that they would feel about the same level of satisfaction with their benefits if they did not have their master's degree. More than one third (38%) indicated they would be less satisfied with their benefits without their degree. Responses across fields of study were similar.
I might be more satisfied than I currently am.
I might be less satisfied than I currently am.
I think my satisfaction would be about the same.
I might be less satisfied than I currently am.
I think my satisfaction would be about the same.
I might be more satisfied than I currently am.
If you did not have a graduate degree, do you believe your job satisfaction might differ from your current satisfaction with your benefits?
Question 20-BJob Satisfaction
Table A Students Who Completed Master's Degree and Are Employed
** Sample too small to report results

Page 73
Total Group
Bio / Agri Sci
Phys / Earth Sci
Math / Comp Sci
Engineer Health
N = 304 N = 46 N = 29 N = 39
1 35% 30% 31% 38% ** **
2 53% 46% 48% 46% ** **
3 12% 24% 21% 15% ** **
Arts / Human
Behav / Soc Sci
Educ BusinessPublic Admin
Other
N = 63 N = 56
1 ** 40% 34% ** ** **
2 ** 49% 63% ** ** **
3 ** 11% 4% ** ** **
Job Satisfaction Question 20-BIf you did not have a graduate degree, do you believe your job satisfaction might differ from your current satisfaction with your benefits?
I might be more satisfied than I currently am.
More than one half (53%) of students who have completed their doctoral degree indicated that they would feel about the same level of satisfaction with their benefits if they did not have their doctoral degree. More than one third (35%) indicated they would be less satisfied with their benefits without their degree. Responses across fields of study were similar.
Table B Students Who Completed Doctoral Degree and Are Employed
I might be less satisfied than I currently am.
I think my satisfaction would be about the same.
I might be more satisfied than I currently am.
I might be less satisfied than I currently am.
I think my satisfaction would be about the same.
** Sample too small to report results
** Sample too small to report results

Page 74
Total Group
Bio / Agri Sci
Phys / Earth Sci
Math / Comp Sci
Engineer Health
N = 1240 N = 77 N = 99 N = 147 N = 129
5 26% 22% ** 25% 28% 39%
4 46% 43% ** 52% 46% 49%
3 18% 26% ** 15% 20% 9%
2 7% 6% ** 6% 4% 3%
1 3% 3% ** 2% 3% 1%
Mean 3.86 3.75 3.92 3.92 4.22SD 0.99 0.96 0.91 0.94 0.79
Arts / Human
Behav / Soc Sci
Educ BusinessPublic Admin
Other
N = 112 N = 179 N = 216 N = 69 N = 83 N = 113
5 21% 23% 22% 33% 29% 27%
4 39% 46% 50% 30% 47% 50%
3 24% 17% 18% 26% 18% 11%
2 13% 9% 8% 7% 2% 8%
1 3% 4% 2% 3% 4% 5%
Mean 3.64 3.73 3.80 3.84 3.95 3.84SD 1.04 1.06 0.95 1.07 0.95 1.07
Please indicate your level of satisfaction with the job security of your current job.
Question 21-AJob Satisfaction
Very satisfied
Dissatisfied
Very dissatisfied
SD = Standard Deviation
** Sample too small to report results
Satisfied
SD = Standard Deviation
Neutral
Dissatisfied
Very satisfied
Satisfied
Neutral
Table A Students Who Completed Master's Degree and Are Employed
About three quarters (72%) of students who have completed their master's degree indicated satisfaction with job security in their current job, with 26% indicating that were very satisfied and 46% satisfied. Responses across fields of study were similar.
Very dissatisfied

Page 75
Total Group
Bio / Agri Sci
Phys / Earth Sci
Math / Comp Sci
Engineer Health
N = 320 N = 47 N = 30 N = 39
5 21% 2% 17% 23% ** **
4 43% 51% 37% 49% ** **
3 22% 32% 13% 13% ** **
2 10% 13% 23% 10% ** **
1 4% 2% 10% 5% ** **
Mean 3.67 3.38 3.27 3.74SD 1.03 0.82 1.28 1.09
Arts / Human
Behav / Soc Sci
Educ BusinessPublic Admin
Other
N = 66 N = 64
5 ** 24% 23% ** ** **
4 ** 42% 45% ** ** **
3 ** 20% 23% ** ** **
2 ** 11% 6% ** ** **
1 ** 3% 2% ** ** **
Mean 3.74 3.83SD 1.04 0.92
Job Satisfaction Question 21-APlease indicate your level of satisfaction with the job security of your current job.
** Sample too small to report results
Very dissatisfied
SD = Standard Deviation
** Sample too small to report results
Very dissatisfied
More than one half (64%) of students who have completed their doctoral degree indicated satisfaction with the benefits of their current job, with 21% indicating that were very satisfied and 43% satisfied. Responses across fields of study were similar.
Table B Students Who Completed Doctoral Degree and Are Employed
SD = Standard Deviation
Very satisfied
Satisfied
Neutral
Dissatisfied
Very satisfied
Satisfied
Neutral
Dissatisfied

Page 76
Total Group
Bio / Agri Sci
Phys / Earth Sci
Math / Comp Sci
Engineer Health
N = 1168 N = 69 N = 96 N = 141 N = 123
1 44% 42% ** 41% 40% 54%
2 52% 48% ** 58% 58% 40%
3 4% 10% ** 1% 1% 6%
Arts / Human
Behav / Soc Sci
Educ BusinessPublic Admin
Other
N = 107 N = 169 N = 197 N = 66 N = 79 N = 106
1 36% 47% 44% 45% 44% 47%
2 61% 48% 53% 50% 53% 48%
3 4% 5% 3% 5% 3% 5%
More than one half (52%) of students who have completed their master's degree indicated that they would feel the same level of satisfaction about job security if they did not have their master's degree. About 44% of students indicated they would be less satisfied about job security without their degree. Responses across fields of study were similar.
I might be more satisfied than I currently am.
I might be less satisfied than I currently am.
I think my satisfaction would be about the same.
I might be less satisfied than I currently am.
I think my satisfaction would be about the same.
I might be more satisfied than I currently am.
If you did not have a graduate degree, do you believe your job satisfaction might differ from your current satisfaction with your job security?
Question 21-BJob Satisfaction
Table A Students Who Completed Master's Degree and Are Employed
** Sample too small to report results

Page 77
Total Group
Bio / Agri Sci
Phys / Earth Sci
Math / Comp Sci
Engineer Health
N = 304 N = 46 N = 29 N = 39
1 43% 37% 34% 44% ** **
2 47% 50% 45% 49% ** **
3 10% 13% 21% 8% ** **
Arts / Human
Behav / Soc Sci
Educ BusinessPublic Admin
Other
N = 63 N = 56
1 ** 51% 41% ** ** **
2 ** 37% 55% ** ** **
3 ** 13% 4% ** ** **
Job Satisfaction Question 21-BIf you did not have a graduate degree, do you believe your job satisfaction might differ from your current satisfaction with your job security?
I might be more satisfied than I currently am.
Nearly 47% of students who have completed their doctoral degree indicated that they would feel the same level of satisfaction about job security if they did not have their doctoral degree. About 43% indicated they would be less satisfied about job security without their degree. Responses across fields of study were similar.
Table B Students Who Completed Doctoral Degree and Are Employed
I might be less satisfied than I currently am.
I think my satisfaction would be about the same.
I might be more satisfied than I currently am.
I might be less satisfied than I currently am.
I think my satisfaction would be about the same.
** Sample too small to report results
** Sample too small to report results

Page 78
Total Group
Bio / Agri Sci
Phys / Earth Sci
Math / Comp Sci
Engineer Health
N = 1243 N = 77 N = 99 N = 147 N = 129
5 35% 43% ** 41% 27% 36%
4 36% 27% ** 28% 40% 43%
3 17% 18% ** 12% 20% 12%
2 9% 10% ** 16% 6% 8%
1 3% 1% ** 2% 7% 1%
Mean 3.94 4.00 3.91 3.75 4.05SD 1.05 1.08 1.17 1.13 0.93
Arts / Human
Behav / Soc Sci
Educ BusinessPublic Admin
Other
N = 112 N = 180 N = 216 N = 70 N = 84 N = 113
5 43% 31% 37% 34% 33% 34%
4 28% 43% 36% 36% 38% 37%
3 19% 19% 19% 19% 13% 16%
2 8% 4% 8% 10% 10% 12%
1 3% 3% 0% 1% 6% 2%
Mean 4.00 3.94 4.01 3.91 3.83 3.89SD 1.09 0.98 0.96 1.03 1.17 1.06
Please indicate your level of satisfaction with the location of your current job.
Question 22-AJob Satisfaction
Very satisfied
Dissatisfied
Very dissatisfied
SD = Standard Deviation
** Sample too small to report results
Satisfied
SD = Standard Deviation
Neutral
Dissatisfied
Very satisfied
Satisfied
Neutral
Table A Students Who Completed Master's Degree and Are Employed
Over two thirds (71%) of students who have completed their master's degree indicated satisfaction with the location of their current job, with 35% indicating they were very satisfied and 36% satisfied. Responses across fields of study were similar.
Very dissatisfied

Page 79
Total Group
Bio / Agri Sci
Phys / Earth Sci
Math / Comp Sci
Engineer Health
N = 320 N = 47 N = 30 N = 39
5 35% 30% 27% 51% ** **
4 37% 47% 43% 28% ** **
3 15% 19% 13% 8% ** **
2 10% 4% 13% 8% ** **
1 4% 0% 3% 5% ** **
Mean 3.90 4.02 3.77 4.13SD 1.10 0.82 1.10 1.17
Arts / Human
Behav / Soc Sci
Educ BusinessPublic Admin
Other
N = 66 N = 64
5 ** 30% 38% ** ** **
4 ** 35% 33% ** ** **
3 ** 15% 22% ** ** **
2 ** 15% 8% ** ** **
1 ** 5% 0% ** ** **
Mean 3.71 4.00SD 1.19 0.96
Job Satisfaction Question 22-APlease indicate your level of satisfaction with the location of your current job.
Very dissatisfied
SD = Standard Deviation
** Sample too small to report results
Very dissatisfied
** Sample too small to report results
Over two thirds (72%) of students who have completed their doctoral degree indicated satisfaction with the location of their current job, with 35% indicating they were very satisfied and 37% satisfied. Responses across fields of study were similar.
Table B Students Who Completed Doctoral Degree and Are Employed
SD = Standard Deviation
Very satisfied
Satisfied
Neutral
Dissatisfied
Very satisfied
Satisfied
Neutral
Dissatisfied

Page 80
Total Group
Bio / Agri Sci
Phys / Earth Sci
Math / Comp Sci
Engineer Health
N = 1167 N = 69 N = 96 N = 141 N = 123
1 31% 33% ** 27% 33% 37%
2 64% 59% ** 65% 63% 53%
3 6% 7% ** 8% 4% 10%
Arts / Human
Behav / Soc Sci
Educ BusinessPublic Admin
Other
N = 107 N = 169 N = 197 N = 66 N = 78 N = 106
1 28% 27% 31% 29% 27% 32%
2 66% 66% 66% 67% 68% 63%
3 6% 7% 2% 5% 5% 5%
More than one half (64%) of students who have completed their master's degree indicated that they would feel the same level of satisfaction about job location if they did not have their master's degree. Nearly one third (31%) of students indicated they would be less satisfied about job location without their degree. Responses across fields of study were similar.
I might be more satisfied than I currently am.
I might be less satisfied than I currently am.
I think my satisfaction would be about the same.
I think my satisfaction would be about the same.
I might be more satisfied than I currently am.
I might be less satisfied than I currently am.
If you did not have a graduate degree, do you believe your job satisfaction might differ from your current satisfaction with your job location?
Question 22-BJob Satisfaction
Table A Students Who Completed Master's Degree and Are Employed
** Sample too small to report results

Page 81
Total Group
Bio / Agri Sci
Phys / Earth Sci
Math / Comp Sci
Engineer Health
N = 303 N = 46 N = 29 N = 39
1 29% 26% 24% 38% ** **
2 57% 61% 55% 44% ** **
3 14% 13% 21% 18% ** **
Arts / Human
Behav / Soc Sci
Educ BusinessPublic Admin
Other
N = 63 N = 55
1 ** 24% 29% ** ** **
2 ** 62% 67% ** ** **
3 ** 14% 4% ** ** **
Job Satisfaction Question 22-BIf you did not have a graduate degree, do you believe your job satisfaction might differ from your current satisfaction with your job location?
I might be more satisfied than I currently am.
More than one half (57%) of students who have completed their doctoral degree indicated that they would feel the same level of satisfaction about job location if they did not have their doctoral degree. More than one quarter (29%) of students indicated they would be less satisfied about job location without their degree. Responses across fields of study were similar.
Table B Students Who Completed Doctoral Degree and Are Employed
I might be less satisfied than I currently am.
I think my satisfaction would be about the same.
I might be more satisfied than I currently am.
I might be less satisfied than I currently am.
I think my satisfaction would be about the same.
** Sample too small to report results
** Sample too small to report results

Page 82
Total Group
Bio / Agri Sci
Phys / Earth Sci
Math / Comp Sci
Engineer Health
N = 1244 N = 77 N = 99 N = 147 N = 129
5 15% 21% ** 24% 15% 16%
4 33% 27% ** 28% 37% 37%
3 29% 23% ** 29% 29% 34%
2 16% 17% ** 15% 13% 8%
1 8% 12% ** 3% 6% 5%
Mean 3.31 3.29 3.56 3.41 3.50SD 1.14 1.30 1.11 1.08 1.02
Arts / Human
Behav / Soc Sci
Educ BusinessPublic Admin
Other
N = 112 N = 180 N = 216 N = 71 N = 84 N = 113
5 13% 11% 12% 17% 19% 12%
4 30% 28% 36% 38% 37% 31%
3 25% 26% 32% 27% 24% 30%
2 21% 23% 15% 10% 12% 18%
1 10% 12% 6% 8% 8% 9%
Mean 3.16 3.03 3.33 3.45 3.46 3.20SD 1.20 1.19 1.04 1.14 1.18 1.14
Please indicate your level of satisfaction with the opportunities for advancement of your current job.
Question 23-AJob Satisfaction
Very satisfied
Dissatisfied
Very dissatisfied
SD = Standard Deviation
** Sample too small to report results
Satisfied
SD = Standard Deviation
Neutral
Dissatisfied
Very satisfied
Satisfied
Neutral
Table A Students Who Completed Master's Degree and Are Employed
About one third (33%) of students who have completed their master's degree indicated satisfaction with the opportunities for advancement in their current job. About one quarter (24%) of students indicated that were not satisfied with the opportunities for advancement, with 16% indicating they were dissatisfied and 8% very dissatisfied. Responses across fields of study were similar.
Very dissatisfied

Page 83
Total Group
Bio / Agri Sci
Phys / Earth Sci
Math / Comp Sci
Engineer Health
N = 320 N = 47 N = 30 N = 39
5 19% 13% 27% 31% ** **
4 36% 45% 23% 28% ** **
3 24% 23% 33% 26% ** **
2 15% 15% 13% 8% ** **
1 5% 4% 3% 8% ** **
Mean 3.49 3.47 3.57 3.67SD 1.12 1.04 1.14 1.22
Arts / Human
Behav / Soc Sci
Educ BusinessPublic Admin
Other
N = 66 N = 64
5 ** 15% 17% ** ** **
4 ** 39% 31% ** ** **
3 ** 26% 23% ** ** **
2 ** 15% 25% ** ** **
1 ** 5% 3% ** ** **
Mean 3.45 3.34SD 1.07 1.13
Job Satisfaction Question 23-APlease indicate your level of satisfaction with the opportunities for advancement of your current job.
Very dissatisfied
SD = Standard Deviation
** Sample too small to report results
Very dissatisfied
** Sample too small to report results
More than one half (55%) of students who have completed their doctoral degree indicated satisfaction with the opportunities for advancement in their current job, with 19% indicating that were very satisfied and 36% satisfied. Responses across fields of study were similar.
Table B Students Who Completed Doctoral Degree and Are Employed
SD = Standard Deviation
Very satisfied
Satisfied
Neutral
Dissatisfied
Very satisfied
Satisfied
Neutral
Dissatisfied

Page 84
Total Group
Bio / Agri Sci
Phys / Earth Sci
Math / Comp Sci
Engineer Health
N = 1165 N = 68 N = 96 N = 139 N = 123
1 57% 57% ** 52% 59% 65%
2 36% 35% ** 46% 34% 28%
3 7% 7% ** 2% 7% 7%
Arts / Human
Behav / Soc Sci
Educ BusinessPublic Admin
Other
N = 107 N = 169 N = 197 N = 66 N = 79 N = 106
1 42% 53% 57% 68% 68% 56%
2 53% 36% 37% 23% 29% 39%
3 5% 11% 6% 9% 3% 6%
More than one half (57%) of students who have completed their master's degree indicated that they would be less satisfied about opportunities for advancement if they did not have their master's degree. About one third (36%) of students indicated their level of satisfaction about opportunities for advancement would be about the same without their degree. Responses across fields of study were similar.
I might be more satisfied than I currently am.
I might be less satisfied than I currently am.
I think my satisfaction would be about the same.
I might be less satisfied than I currently am.
I think my satisfaction would be about the same.
I might be more satisfied than I currently am.
If you did not have a graduate degree, do you believe your job satisfaction might differ from your current satisfaction with your opportunities for advancement?
Question 23-BJob Satisfaction
Table A Students Who Completed Master's Degree and Are Employed
** Sample too small to report results

Page 85
Total Group
Bio / Agri Sci
Phys / Earth Sci
Math / Comp Sci
Engineer Health
N = 304 N = 46 N = 29 N = 39
1 60% 59% 45% 56% ** **
2 27% 28% 28% 28% ** **
3 14% 13% 28% 15% ** **
Arts / Human
Behav / Soc Sci
Educ BusinessPublic Admin
Other
N = 63 N = 56
1 ** 63% 68% ** ** **
2 ** 24% 29% ** ** **
3 ** 13% 4% ** ** **
Job Satisfaction Question 23-BIf you did not have a graduate degree, do you believe your job satisfaction might differ from your current satisfaction with your opportunities for advancement?
I might be more satisfied than I currently am.
More than one half (60%) of students who have completed their doctoral degree indicated that they would be less satisfied about opportunities for advancement if they did not have their doctoral degree. Over one quarter (27%) of students indicated they would feel the same level of satisfaction about opportunities for advancement without their degree. Responses across fields of study were similar.
Table B Students Who Completed Doctoral Degree and Are Employed
I might be less satisfied than I currently am.
I think my satisfaction would be about the same.
I might be more satisfied than I currently am.
I might be less satisfied than I currently am.
I think my satisfaction would be about the same.
** Sample too small to report results
** Sample too small to report results

Page 86
Total Group Page 87
Phys / Earth Sci
Math / Comp Sci
Engineer Health
N = 1243 N = 77 N = 99 N = 146 N = 129
5 28% 29% ** 25% 25% 40%
4 40% 38% ** 42% 37% 46%
3 17% 18% ** 17% 21% 7%
2 10% 12% ** 10% 10% 8%
1 5% 4% ** 5% 7% 0%
Mean 3.75 3.75 3.73 3.64 4.17SD 1.12 1.11 1.10 1.16 0.87
Arts / Human
Behav / Soc Sci
Educ BusinessPublic Admin
Other
N = 112 N = 180 N = 216 N = 71 N = 84 N = 113
5 20% 20% 33% 31% 29% 28%
4 34% 42% 42% 32% 35% 45%
3 27% 15% 15% 25% 19% 13%
2 11% 17% 8% 6% 13% 9%
1 9% 7% 2% 6% 5% 4%
Mean 3.45 3.52 3.96 3.77 3.69 3.84SD 1.18 1.18 1.00 1.12 1.16 1.07
Please indicate your level of satisfaction with the intellectual challenge of your current job.
Question 24-AJob Satisfaction
Very satisfied
Dissatisfied
Very dissatisfied
SD = Standard Deviation
** Sample too small to report results
Satisfied
SD = Standard Deviation
Neutral
Dissatisfied
Very satisfied
Satisfied
Neutral
Table A Students Who Completed Master's Degree and Are Employed
More than one third (40%) of students who have completed their master's degree indicated satisfaction with the intellectual challenge of their current job. About one quarter (28%) of students indicated they were very satisfied with the intellectual challenge of their current job. Responses across fields of study were similar.
Very dissatisfied

Page 87
Total Group
Bio / Agri Sci
Phys / Earth Sci
Math / Comp Sci
Engineer Health
N = 319 N = 47 N = 29 N = 39
5 46% 43% 52% 49% ** **
4 36% 51% 34% 33% ** **
3 9% 2% 7% 3% ** **
2 5% 2% 3% 10% ** **
1 4% 2% 3% 5% ** **
Mean 4.16 4.30 4.28 4.10SD 1.03 0.81 1.00 1.19
Arts / Human
Behav / Soc Sci
Educ BusinessPublic Admin
Other
N = 66 N = 64
5 ** 50% 39% ** ** **
4 ** 36% 36% ** ** **
3 ** 8% 14% ** ** **
2 ** 3% 6% ** ** **
1 ** 3% 5% ** ** **
Mean 4.27 3.98SD 0.95 1.11
Job Satisfaction Question 24-APlease indicate your level of satisfaction with the intellectual challenge of your current job.
** Sample too small to report results
Very dissatisfied
SD = Standard Deviation
** Sample too small to report results
Very dissatisfied
Most students who have completed their doctoral degree indicated they were either very satisfied (46%) or satisfied (36%) with the level of intellectual challenge in their current job. Responses across fields of study were similar.
Table B Students Who Completed Doctoral Degree and Are Employed
SD = Standard Deviation
Very satisfied
Satisfied
Neutral
Dissatisfied
Very satisfied
Satisfied
Neutral
Dissatisfied

Page 88
Total Group
Bio / Agri Sci
Phys / Earth Sci
Math / Comp Sci
Engineer Health
N = 1162 N = 69 N = 95 N = 140 N = 121
1 49% 52% ** 41% 46% 64%
2 46% 36% ** 56% 47% 30%
3 5% 12% ** 3% 6% 7%
Arts / Human
Behav / Soc Sci
Educ BusinessPublic Admin
Other
N = 107 N = 169 N = 197 N = 66 N = 79 N = 104
1 37% 56% 39% 50% 59% 49%
2 58% 39% 57% 44% 35% 48%
3 5% 5% 4% 6% 5% 3%
About one half (49%) of students who have completed their master's degree indicated that they would feel less satisfied about the level of intellectual challenge if they did not have their master's degree. Almost the same percentage (46%) of students indicated their satisfaction with the level of intellectual challenge would be about the same. Responses across fields of study were similar.
I might be more satisfied than I currently am.
I might be less satisfied than I currently am.
I think my satisfaction would be about the same.
I might be less satisfied than I currently am.
I think my satisfaction would be about the same.
I might be more satisfied than I currently am.
If you did not have a graduate degree, do you believe your job satisfaction might differ from your current satisfaction with your intellectual challenge?
Question 24-BJob Satisfaction
Table A Students Who Completed Master's Degree and Are Employed
** Sample too small to report results

Page 89
Total Group
Bio / Agri Sci
Phys / Earth Sci
Math / Comp Sci
Engineer Health
N = 304 N = 46 N = 29 N = 39
1 68% 61% 69% 79% ** **
2 26% 33% 24% 15% ** **
3 6% 7% 7% 5% ** **
Arts / Human
Behav / Soc Sci
Educ BusinessPublic Admin
Other
N = 63 N = 56
1 ** 73% 66% ** ** **
2 ** 21% 32% ** ** **
3 ** 6% 2% ** ** **
Job Satisfaction Question 24-BIf you did not have a graduate degree, do you believe your job satisfaction might differ from your current satisfaction with your intellectual challenge?
I might be more satisfied than I currently am.
Most (68%) students who have completed their doctoral degree indicated that they would feel less satisfied about the level of intellectual challenge if they did not have their doctoral degree. About one quarter (26%) of students indicated their satisfaction with the level of intellectual challenge would be about the same. Responses across fields of study were similar.
Table B Students Who Completed Doctoral Degree and Are Employed
I might be less satisfied than I currently am.
I think my satisfaction would be about the same.
I might be more satisfied than I currently am.
I might be less satisfied than I currently am.
I think my satisfaction would be about the same.
** Sample too small to report results
** Sample too small to report results

Page 90
Total Group
Bio / Agri Sci
Phys / Earth Sci
Math / Comp Sci
Engineer Health
N = 1237 N = 75 N = 99 N = 144 N = 129
5 28% 32% ** 29% 23% 41%
4 43% 33% ** 38% 41% 44%
3 18% 24% ** 25% 24% 9%
2 8% 7% ** 6% 10% 5%
1 3% 4% ** 1% 1% 1%
Mean 3.86 3.83 3.89 3.74 4.19SD 1.00 1.08 0.94 0.98 0.87
Arts / Human
Behav / Soc Sci
Educ BusinessPublic Admin
Other
N = 112 N = 180 N = 214 N = 71 N = 84 N = 113
5 23% 16% 37% 39% 24% 19%
4 32% 51% 46% 30% 45% 52%
3 30% 16% 10% 23% 21% 16%
2 7% 12% 6% 6% 7% 10%
1 7% 5% 0% 3% 2% 3%
Mean 3.57 3.62 4.14 3.97 3.81 3.76SD 1.14 1.05 0.85 1.06 0.96 0.97
Please indicate your level of satisfaction with the level of responsibility of your current job.
Question 25-AJob Satisfaction
Very satisfied
Dissatisfied
Very dissatisfied
SD = Standard Deviation
** Sample too small to report results
Satisfied
SD = Standard Deviation
Neutral
Dissatisfied
Very satisfied
Satisfied
Neutral
Table A Students Who Completed Master's Degree and Are Employed
Nearly three quarters of students who have completed their master's degree felt satisfied with their level of responsibility in their current job, with 28% indicating they were very satisfied and 43% satisfied. Responses across fields of study were similar.
Very dissatisfied

Page 91
Total Group
Bio / Agri Sci
Phys / Earth Sci
Math / Comp Sci
Engineer Health
N = 317 N = 47 N = 29 N = 39
5 40% 34% 38% 44% ** **
4 42% 51% 48% 33% ** **
3 11% 6% 10% 13% ** **
2 5% 4% 3% 5% ** **
1 3% 4% 0% 5% ** **
Mean 4.11 4.06 4.21 4.05SD 0.95 0.99 0.77 1.12
Arts / Human
Behav / Soc Sci
Educ BusinessPublic Admin
Other
N = 66 N = 64
5 ** 53% 42% ** ** **
4 ** 36% 36% ** ** **
3 ** 6% 14% ** ** **
2 ** 5% 6% ** ** **
1 ** 0% 2% ** ** **
Mean 4.38 4.11SD 0.80 0.98
Job Satisfaction Question 25-APlease indicate your level of satisfaction with the level of responsibility of your current job.
** Sample too small to report results
Very dissatisfied
SD = Standard Deviation
** Sample too small to report results
Very dissatisfied
Most students who have completed their doctoral degree felt satisfied with their level of responsibility in their current job, with 40% indicating they were very satisfied and 42% satisfied. Responses across fields of study were similar.
Table B Students Who Completed Doctoral Degree and Are Employed
SD = Standard Deviation
Very satisfied
Satisfied
Neutral
Dissatisfied
Very satisfied
Satisfied
Neutral
Dissatisfied

Page 92
Total Group
Bio / Agri Sci
Phys / Earth Sci
Math / Comp Sci
Engineer Health
N = 1166 N = 69 N = 96 N = 140 N = 123
1 47% 51% ** 46% 51% 61%
2 47% 38% ** 50% 42% 33%
3 6% 12% ** 4% 7% 6%
Arts / Human
Behav / Soc Sci
Educ BusinessPublic Admin
Other
N = 107 N = 169 N = 197 N = 65 N = 79 N = 106
1 31% 49% 34% 57% 63% 45%
2 61% 43% 63% 37% 33% 50%
3 8% 8% 3% 6% 4% 5%
Less than one half (47%) of students who have completed their master's degree indicated that they would feel less satisfied about their level of responsibility if they did not have their master's degree. The same percentage (47%) of students indicated their satisfaction with their level of responsibility would be about the same. Responses across fields of study were similar.
I might be more satisfied than I currently am.
I might be less satisfied than I currently am.
I think my satisfaction would be about the same.
I might be less satisfied than I currently am.
I think my satisfaction would be about the same.
I might be more satisfied than I currently am.
If you did not have a graduate degree, do you believe your job satisfaction might differ from your current satisfaction with your level of responsibility?
Question 25-BJob Satisfaction
Table A Students Who Completed Master's Degree and Are Employed
** Sample too small to report results

Page 93
Total Group
Bio / Agri Sci
Phys / Earth Sci
Math / Comp Sci
Engineer Health
N = 303 N = 46 N = 28 N = 39
1 53% 46% 46% 49% ** **
2 38% 43% 46% 31% ** **
3 8% 11% 7% 21% ** **
Arts / Human
Behav / Soc Sci
Educ BusinessPublic Admin
Other
N = 63 N = 56
1 ** 60% 61% ** ** **
2 ** 30% 38% ** ** **
3 ** 10% 2% ** ** **
Job Satisfaction Question 25-BIf you did not have a graduate degree, do you believe your job satisfaction might differ from your current satisfaction with your level of responsibility?
I might be more satisfied than I currently am.
More than one half (53%) of students who have completed their doctoral degree indicated that they would feel less satisfied about their level of responsibility if they did not have their doctoral degree. More than one third (38%) of students indicated their satisfaction with their level of responsibility would be about the same. Responses across fields of study were similar.
Table B Students Who Completed Doctoral Degree and Are Employed
I might be less satisfied than I currently am.
I think my satisfaction would be about the same.
I might be more satisfied than I currently am.
I might be less satisfied than I currently am.
I think my satisfaction would be about the same.
** Sample too small to report results
** Sample too small to report results

Page 94
Total Group
Bio / Agri Sci
Phys / Earth Sci
Math / Comp Sci
Engineer Health
N = 1241 N = 77 N = 99 N = 146 N = 129
5 39% 45% ** 44% 34% 46%
4 39% 38% ** 37% 41% 44%
3 13% 13% ** 14% 16% 6%
2 6% 3% ** 4% 6% 4%
1 2% 1% ** 0% 2% 0%
Mean 4.08 4.23 4.22 3.99 4.32SD 0.97 0.87 0.84 0.97 0.76
Arts / Human
Behav / Soc Sci
Educ BusinessPublic Admin
Other
N = 112 N = 179 N = 215 N = 71 N = 84 N = 113
5 34% 31% 40% 42% 42% 42%
4 34% 46% 43% 28% 32% 36%
3 17% 11% 13% 21% 13% 16%
2 11% 8% 3% 6% 10% 4%
1 4% 3% 2% 3% 4% 2%
Mean 3.82 3.94 4.14 4.01 3.99 4.12SD 1.15 1.02 0.91 1.06 1.12 0.95
Please indicate your level of satisfaction with the degree of independence of your current job.
Question 26-AJob Satisfaction
Very satisfied
Dissatisfied
Very dissatisfied
SD = Standard Deviation
** Sample too small to report results
Satisfied
SD = Standard Deviation
Neutral
Dissatisfied
Very satisfied
Satisfied
Neutral
Table A Students Who Completed Master's Degree and Are Employed
More than three quarters of students who have completed their master's degree felt satisfied with their degree of independence in their current job, with 39% indicating they were very satisfied and 39% satisfied. Responses across fields of study were similar.
Very dissatisfied

Page 95
Total Group
Bio / Agri Sci
Phys / Earth Sci
Math / Comp Sci
Engineer Health
N = 320 N = 47 N = 30 N = 39
5 48% 40% 43% 64% ** **
4 38% 53% 40% 26% ** **
3 9% 2% 10% 5% ** **
2 2% 0% 0% 3% ** **
1 3% 4% 7% 3% ** **
Mean 4.24 4.26 4.13 4.46SD 0.94 0.87 1.07 0.91
Arts / Human
Behav / Soc Sci
Educ BusinessPublic Admin
Other
N = 66 N = 64
5 ** 55% 42% ** ** **
4 ** 35% 42% ** ** **
3 ** 8% 8% ** ** **
2 ** 2% 6% ** ** **
1 ** 2% 2% ** ** **
Mean 4.39 4.17SD 0.82 0.94
Job Satisfaction Question 26-APlease indicate your level of satisfaction with the degree of independence of your current job.
** Sample too small to report results
Very dissatisfied
SD = Standard Deviation
** Sample too small to report results
Very dissatisfied
Most students who have completed their doctoral degree felt satisfied with their degree of independence in their current job, with 48% indicating they were very satisfied and 38% satisfied. Responses across fields of study were similar.
Table B Students Who Completed Doctoral Degree and Are Employed
SD = Standard Deviation
Very satisfied
Satisfied
Neutral
Dissatisfied
Very satisfied
Satisfied
Neutral
Dissatisfied

Page 96
Total Group
Bio / Agri Sci
Phys / Earth Sci
Math / Comp Sci
Engineer Health
N = 1167 N = 70 N = 96 N = 140 N = 123
1 45% 44% ** 35% 46% 62%
2 50% 50% ** 64% 47% 33%
3 4% 6% ** 1% 6% 6%
Arts / Human
Behav / Soc Sci
Educ BusinessPublic Admin
Other
N = 107 N = 169 N = 197 N = 65 N = 79 N = 106
1 34% 51% 37% 51% 52% 46%
2 60% 44% 60% 46% 44% 51%
3 7% 5% 3% 3% 4% 3%
One half (50%) of students who have completed their master's degree indicated their satisfaction about their degree of independence would be about the same if they did not have their master's degree. Less than one half (45%) of students indicated that they would feel less satisfied about their degree of independence. Responses across fields of study were similar.
I might be more satisfied than I currently am.
I might be less satisfied than I currently am.
I think my satisfaction would be about the same.
I might be less satisfied than I currently am.
I think my satisfaction would be about the same.
I might be more satisfied than I currently am.
If you did not have a graduate degree, do you believe your job satisfaction might differ from your current satisfaction with your degree of independence?
Question 26-BJob Satisfaction
Table A Students Who Completed Master's Degree and Are Employed
** Sample too small to report results

Page 97
Total Group
Bio / Agri Sci
Phys / Earth Sci
Math / Comp Sci
Engineer Health
N = 303 N = 46 N = 28 N = 39
1 67% 61% 64% 74% ** **
2 29% 28% 36% 23% ** **
3 4% 11% 0% 3% ** **
Arts / Human
Behav / Soc Sci
Educ BusinessPublic Admin
Other
N = 63 N = 56
1 ** 79% 55% ** ** **
2 ** 16% 43% ** ** **
3 ** 5% 2% ** ** **
Job Satisfaction Question 26-BIf you did not have a graduate degree, do you believe your job satisfaction might differ from your current satisfaction with your degree of independence?
I might be more satisfied than I currently am.
About two thirds (67%) of students who have completed their doctoral degree indicated that they would feel less satisfied about their degree of independence if they did not have their doctoral degree. Nearly one third (29%) of students indicated their satisfaction with their degree of independence would be about the same. Responses across fields of study were similar.
Table B Students Who Completed Doctoral Degree and Are Employed
I might be less satisfied than I currently am.
I think my satisfaction would be about the same.
I might be more satisfied than I currently am.
I might be less satisfied than I currently am.
I think my satisfaction would be about the same.
** Sample too small to report results
** Sample too small to report results

Page 98
Total Group
Bio / Agri Sci
Phys / Earth Sci
Math / Comp Sci
Engineer Health
N = 1241 N = 77 N = 99 N = 146 N = 128
5 41% 36% ** 29% 25% 61%
4 32% 34% ** 30% 34% 27%
3 17% 17% ** 32% 25% 9%
2 6% 8% ** 8% 12% 3%
1 3% 5% ** 0% 4% 0%
Mean 4.02 3.88 3.81 3.63 4.46SD 1.06 1.15 0.95 1.11 0.78
Arts / Human
Behav / Soc Sci
Educ BusinessPublic Admin
Other
N = 111 N = 180 N = 216 N = 71 N = 84 N = 113
5 36% 43% 59% 30% 37% 35%
4 27% 32% 32% 31% 37% 34%
3 22% 13% 6% 25% 18% 24%
2 8% 7% 1% 7% 6% 4%
1 7% 4% 1% 7% 2% 3%
Mean 3.77 4.03 4.47 3.69 4.00 3.95SD 1.23 1.12 0.76 1.18 1.01 1.01
Please indicate your level of satisfaction with the contribution to society of your current job.
SD = Standard Deviation
Very satisfied
Satisfied
Neutral
Dissatisfied
Very dissatisfied
** Sample too small to report results
Question 27-AJob Satisfaction
Very satisfied
Satisfied
SD = Standard Deviation
Neutral
Dissatisfied
Table A Students Who Completed Master's Degree and Are Employed
About 41% of students who have completed their master's degree indicated they were very satisfied with their contribution to society in their current job and about one third (32%) indicated they were satisfied. Responses across fields of study were similar, although Health (61%) and Education (59%) majors indicated they were very satisfied with their contribution to society more than other majors.
Very dissatisfied

Page 99
Total Group
Bio / Agri Sci
Phys / Earth Sci
Math / Comp Sci
Engineer Health
N = 319 N = 47 N = 30 N = 39
5 44% 47% 33% 33% ** **
4 38% 38% 30% 36% ** **
3 10% 11% 20% 21% ** **
2 5% 2% 17% 3% ** **
1 3% 2% 0% 8% ** **
Mean 4.15 4.26 3.80 3.85SD 0.98 0.90 1.10 1.16
Arts / Human
Behav / Soc Sci
Educ BusinessPublic Admin
Other
N = 65 N = 64
5 ** 49% 45% ** ** **
4 ** 45% 42% ** ** **
3 ** 2% 8% ** ** **
2 ** 3% 5% ** ** **
1 ** 2% 0% ** ** **
Mean 4.37 4.28SD 0.80 0.81
** Sample too small to report results
Very dissatisfied
SD = Standard Deviation
Job Satisfaction Question 27-APlease indicate your level of satisfaction with the contribution to society of your current job.
Very dissatisfied
** Sample too small to report results
About 44% of students who have completed their doctoral degree indicated they were very satisfied with their contribution to society in their current job and more than one third (38%) indicated they were satisfied. Responses across fields of study were similar.
Table B Students Who Completed Doctoral Degree and Are Employed
SD = Standard Deviation
Very satisfied
Satisfied
Neutral
Dissatisfied
Very satisfied
Satisfied
Neutral
Dissatisfied

Page 100
Total Group
Bio / Agri Sci
Phys / Earth Sci
Math / Comp Sci
Engineer Health
N = 1165 N = 69 N = 96 N = 140 N = 123
1 38% 35% ** 23% 29% 52%
2 58% 57% ** 73% 66% 45%
3 4% 9% ** 4% 5% 3%
Arts / Human
Behav / Soc Sci
Educ BusinessPublic Admin
Other
N = 107 N = 169 N = 195 N = 66 N = 79 N = 106
1 29% 46% 37% 38% 41% 42%
2 65% 49% 59% 59% 57% 55%
3 6% 5% 3% 3% 3% 4%
More than one half (58%) of students who have completed their master's degree indicated their satisfaction about their contribution to society would be about the same if they did not have their master's degree. Over one third (38%) of students indicated that they would feel less satisfied about their contribution to society. Responses across fields of study were similar.
I might be more satisfied than I currently am.
I might be less satisfied than I currently am.
I think my satisfaction would be about the same.
I might be less satisfied than I currently am.
I think my satisfaction would be about the same.
I might be more satisfied than I currently am.
If you did not have a graduate degree, do you believe your job satisfaction might differ from your current satisfaction with your contribution to society?
Question 27-BJob Satisfaction
Table A Students Who Completed Master's Degree and Are Employed
** Sample too small to report results

Page 101
Total Group
Bio / Agri Sci
Phys / Earth Sci
Math / Comp Sci
Engineer Health
N = 302 N = 45 N = 29 N = 39
1 44% 47% 38% 44% ** **
2 48% 44% 41% 44% ** **
3 8% 9% 21% 13% ** **
Arts / Human
Behav / Soc Sci
Educ BusinessPublic Admin
Other
N = 62 N = 56
1 ** 58% 36% ** ** **
2 ** 39% 59% ** ** **
3 ** 3% 5% ** ** **
Job Satisfaction Question 27-BIf you did not have a graduate degree, do you believe your job satisfaction might differ from your current satisfaction with your contribution to society?
I might be more satisfied than I currently am.
Less than one half (48%) of students who have completed their doctoral degree indicated their satisfaction about their contribution to society would be about the same if they did not have their doctoral degree. About 44% of students indicated that they would feel less satisfied about their contribution to society. Responses across fields of study were similar.
Table B Students Who Completed Doctoral Degree and Are Employed
I might be less satisfied than I currently am.
I think my satisfaction would be about the same.
I might be more satisfied than I currently am.
I might be less satisfied than I currently am.
I think my satisfaction would be about the same.
** Sample too small to report results
** Sample too small to report results

The Commission on Pathways Through Graduate School and Into
Careers — led by the Council of Graduate Schools (CGS) and
Educational Testing Service (ETS) — spearheaded a research effort
to address such issues as graduate student knowledge of career
options, how students learn about occupational opportunities, the
role of graduate programs and graduate faculty in informing and
guiding students along the path to professional occupations, and
career pathways that individuals with graduate degrees actually
follow. Throughout this effort, the Commission helped identify the
appropriate questions to ask, suggested possible data sources and
experts to consult in this work, assisted in the preparation of the final
report findings, and provided advice on policy recommendations.
The ultimate goal of the 14-member Commission — composed of
industry leaders, university presidents, graduate deans, and provosts
— is to encourage a national conversation about why understanding
the pathways through graduate school and into careers is vital to our
nation’s success in the 21st century.
www.pathwaysreport.org