Plant communities along elevational and temporal gradients ...
Upload
washingtonCategory
view
2download
0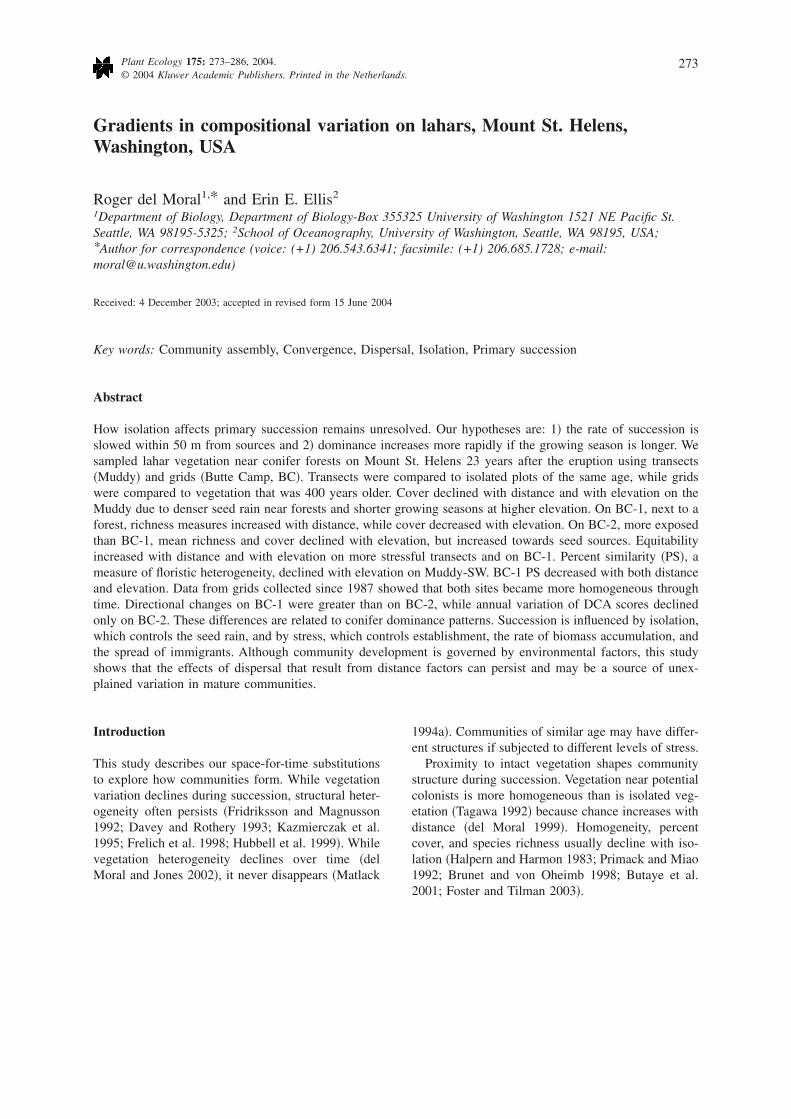
Gradients in compositional variation on lahars, Mount St. Helens,Washington, USA
Roger del Moral1,* and Erin E. Ellis2
1Department of Biology, Department of Biology-Box 355325 University of Washington 1521 NE Pacific St.Seattle, WA 98195-5325; 2School of Oceanography, University of Washington, Seattle, WA 98195, USA;*Author for correspondence (voice: (+1) 206.543.6341; facsimile: (+1) 206.685.1728; e-mail:[email protected])
Received: 4 December 2003; accepted in revised form 15 June 2004
Key words: Community assembly, Convergence, Dispersal, Isolation, Primary succession
Abstract
How isolation affects primary succession remains unresolved. Our hypotheses are: 1� the rate of succession isslowed within 50 m from sources and 2� dominance increases more rapidly if the growing season is longer. Wesampled lahar vegetation near conifer forests on Mount St. Helens 23 years after the eruption using transects�Muddy� and grids �Butte Camp, BC�. Transects were compared to isolated plots of the same age, while gridswere compared to vegetation that was 400 years older. Cover declined with distance and with elevation on theMuddy due to denser seed rain near forests and shorter growing seasons at higher elevation. On BC-1, next to aforest, richness measures increased with distance, while cover decreased with elevation. On BC-2, more exposedthan BC-1, mean richness and cover declined with elevation, but increased towards seed sources. Equitabilityincreased with distance and with elevation on more stressful transects and on BC-1. Percent similarity �PS�, ameasure of floristic heterogeneity, declined with elevation on Muddy-SW. BC-1 PS decreased with both distanceand elevation. Data from grids collected since 1987 showed that both sites became more homogeneous throughtime. Directional changes on BC-1 were greater than on BC-2, while annual variation of DCA scores declinedonly on BC-2. These differences are related to conifer dominance patterns. Succession is influenced by isolation,which controls the seed rain, and by stress, which controls establishment, the rate of biomass accumulation, andthe spread of immigrants. Although community development is governed by environmental factors, this studyshows that the effects of dispersal that result from distance factors can persist and may be a source of unex-plained variation in mature communities.
Introduction
This study describes our space-for-time substitutionsto explore how communities form. While vegetationvariation declines during succession, structural heter-ogeneity often persists �Fridriksson and Magnusson1992; Davey and Rothery 1993; Kazmierczak et al.1995; Frelich et al. 1998; Hubbell et al. 1999�. Whilevegetation heterogeneity declines over time �delMoral and Jones 2002�, it never disappears �Matlack
1994a�. Communities of similar age may have differ-ent structures if subjected to different levels of stress.
Proximity to intact vegetation shapes communitystructure during succession. Vegetation near potentialcolonists is more homogeneous than is isolated veg-etation �Tagawa 1992� because chance increases withdistance �del Moral 1999�. Homogeneity, percentcover, and species richness usually decline with iso-lation �Halpern and Harmon 1983; Primack and Miao1992; Brunet and von Oheimb 1998; Butaye et al.2001; Foster and Tilman 2003�.
Plant Ecology 175: 273–286, 2004.© 2004 Kluwer Academic Publishers. Printed in the Netherlands.
273
Volcanic landscapes provide many examples ofhow differential isolation affects vegetation composi-tion and heterogeneity. Fuller and del Moral �2003;del Moral and Grishin 1999� demonstrated floristicgradients on pumice near remnant vegetation. Isolatedhabitats elsewhere are less diverse, and vegetation inhabitats of similar size and environment differsignificantly �Borgegärd 1990; Matlack 1994b; Fastie1995; Verheyen et al. 2003�. Isolation affects compo-sition because stochastic factors can lead to alterna-tive species assemblies �Tilman 1997�.
The pace of succession is also affected by thelength of the growing season. The growing seasonshrinks with elevation, so species expansion slows,and seedling survival drops �Dlugosch and del Moral1999�. With time, the homogeneity of vegetation in-creases as species establish and expand. The invasionof woody species may then decrease homogeneity bycreating environmental mosaics �Aarssen and Epp1990� and the woody species create a mosaic of en-vironmental and competitive habitats. When thesespecies achieve complete dominance, the vegetationagain becomes more homogeneous.
The 1980 lateral blast of the Mount St. Helens vol-cano produced many lahars �mudflows� that createdbarren sites next to intact vegetation. The transitionfrom intact vegetation to barren surfaces formedstrong gradients of species invasion. Our first hypo-thesis is that even isolation by a few meters retardsthe rate of succession �see del Moral and Eckert2004�. The second is that the development of domi-nance is controlled by the length of the growing sea-son. These hypotheses were tested by exploringcommunity structure and floristic heterogeneity alongseveral distance gradients. We predicted that richnessand cover would decline, but that equitability wouldincrease with distance from colonists and with shortergrowing seasons �Glenn-Lewin 1980; Savage et al.2000; Walker and del Moral 2003�. Equitabilityshould be higher because several species occur, but
none is common at first. At even short distances, allsites are effectively equidistant from a source ofpropagules, so no spatially related pattern is expectedwithin isolated samples.
Methods
Study Sites
Most sampling was conducted on lahars depositedduring the eruption of Mount St. Helens on May 18,1980 �Foxworthy and Hill 1982; Dale et al. 2004;Table 1�. Rapidly melting ice spawned the very largeMuddy River Lahar �henceforth ‘Muddy’�. Thedeposit was over 20 m deep at its maximum and wasat least 1 km wide in the study area.
We established transects from both edges of theMuddy at several elevations. Along the Southwest-facing �SW� edge, forest vegetation was dominatedby Pseudotsuga menziesii, Tsuga heterophylla, Pinuscontorta. var. latifolia, and Pinus monticola. Here,transects started 40 m from the forest with plots es-tablished at 40 m intervals. Transect elevations were985 m �SW-1�, 1025 m �SW-2�, 1075 �SW-3�, and1105 m �SW-4�. The Northeast-facing �NE� edge wasragged. Dominance was similar to that describedabove, but Abies amabilis was also common. Coni-fers alleviated drought by reducing wind and creatingshade, so woody plant establishment was substantial.The lahar edge was also thinner and there wereislands of surviving vegetation near the transects.Therefore, the transects were started farther from in-tact vegetation. The NE transects were at 1050 m�NE-1�, 120 m from forest vegetation, 1100 m �NE-2�, 140 m from the edge, and 1155 m �NE-3�, 280 mfrom surviving vegetation. NE-3 was also isolated bya deep ravine. The nearest vegetation near NE-3 wasdominated by Abies lasiocarpa and shrubs.
Table 1. Designation, sample size, sample design, elevation, and coordinates of each study area. N � the number of 100 m2 plots. Muddy �Muddy River lahar, BC � Butte Camp lahars. Coordinates are near the center of the site in question.
Designation N Sample Design Elevation �m� Latitude Longitude
Muddy-SE 32 4 transects 985–1110 46°10�44� N 122°07�10� WMuddy-NW 23 3 transects 1050–1150 46°10�40� N 122°07�25� WMuddy-Control 42 6 by 7 grid 1210–1240 46°11�16� N 122°08�13� WBC-1 40 10 by 20 grid, selection 1424–1439 46°10�33� N 122°13�32� WBC-2 61 16 by 20 grid, selection 1431–1448 46°10�55� N 122°13�42� WBC-Control 33 10 by 20 grid, selection 1385–1390 46°11�16� N 122°08�13� W
274
Several smaller lahars were spawned near ButteCamp �BC�. Lahar BC-1 terminated near a level area.An intact forest dominated by Abies lasiocarpa andPinus contorta survived along its eastern edge, wherethe lahar is 1 to 2 m deep. The distance from forest toa sample along this edge varied from 4 to 15 m. Thesample plots started 60 m above the lahar terminus.Lahar BC-2 is larger, deeper, and more isolated. Thenearest conifers are 80 m downhill in a forest that wasdamaged by the lahar, so pools of most species wereseveral hundred meters distant. These lahars weresampled on grids monitored since 1987. Eachconsisted of contiguous 10 by 10 m plots �BC-1, 175plots; BC-2, 317 plots�. The intensely sampled plotswere separated by at least 10 m �n � 40 on BC-1; n� 61 on BC-2�.
Vegetation structure was sampled at two other lo-cations in 2003 to serve as baselines. A grid 120 mby 210 m was located 900 m uphill from transects onthe Muddy, isolated from surviving vegetation. Here,42 plots were sampled 30 m between nearest neigh-bors. At Butte Camp, 33 plots were sampled on a400-year old lahar within an area 120 by 400 m,within 400 m of the grids. There was 30 m betweensamples. This site had recovered from a deposit of 30cm of fine pumice �tephra� in 1980 and supports drymeadow vegetation.
Nomenclature
Nomenclature was determined from the IntegratedTaxonomic Information System at http://www.itis.us-da.gov/advanced_search.html on September 10, 2003.A complete list of species names used in this study,and earlier names used in our previous studies ofMount St. Helens vegetation can be found at http://protist.biology.washington.edu/delmoral/.
Sampling
Each plot was sampled by 25 1-m2 quadrats placedso that none was within 1 m of another. The cover ofeach species in each quadrat was determined to thenearest 1%. Mosses, especially Racomitrium cane-scens, have excellent dispersal ability. They were socommon that they obscured patterns found when onlyseed plants were analyzed. Therefore, they were ex-cluded from the analysis of Muddy plots. Plots werearrayed either on transects �Muddy� or in grids �BC�.Plots were separated by a minimum of 40 m ontransects or 10 m on the grids.
To assess the development of homogeneity, datafrom BC-1 and BC-2 from 1987 to the most recentsampling dates were gathered from the same plots assampled in 2002. Grid sampling used this index �seeWood and del Moral 1988�: 1 � one to five plants; 2� six to 20 plants; 3 � � 20 plants or 0.25 to 0.5%cover; 4 � � 0.5% to 1%; 5 � � 1% to 2%; 6 �� 2% to 4%; 7 � � 4% to 8% ; 8� � 8% to 16%;9 � � 16% to 32% and 10 � � 32%. Therefore,similarity values are not comparable to those of theintensive 2002 sampling. Ten sets of data on eachgrid, collected between 1987 and 2002, were ana-lyzed to determine changes in structure and the per-cent similarity among the plots in each year.
Data summary. For each plot, these parameterswere calculated �McCune and Mefford 1999�: rich-ness �number of species�, mean richness per quadrat,total cover, mean species cover, and the standard de-viation of species cover in the plot. Three measure ofcommunity structure were used to describe a plot:Simpson’s diversity index, S �1 � ��Pi * Pi��, even-ness, Eplot �H’/ln�Richness��, and Shannon’s diversityindex, H’plot �-��Pi � lnPi��, where Pi is the propor-tion of a species in a plot. E and H’ were also calcu-lated for each quadrat of a plot and the meansdetermined �Equad and H’quad�. All indices increase asthe species become more equitably distributed.
Heterogeneity. The variation of species composi-tion within a plot may be affected by surface charac-teristics, but it also responds to proximity to colonists.Floristic similarity was calculated among all pair-wisecombinations of the 25 quadrats of a plot. Wepredicted that similarity would decline with distanceand with elevation if samples were initiated nearsources of colonists, which should have higher levelsof similarity than isolated plots. However, moderatelyisolated plots should have similar levels of floristicvariation. In contrast, mature surfaces should havehigh similarity relative to otherwise similar youngersurfaces.
Percent similarity �PS� was calculated from pair-wise comparisons �within-plot similarity� and be-tween the plots of a sample using mean species cover�among-plot similarity� as follows: PSij � 200�min�Xik,Xjk�/ ��Xik � Xjk�, where i and j are two quad-rats, there are k species, X is percent cover, and minis the lower value �Kovach 1998�. Mean similaritieswere compared along transects and within an entiredata set.
Statistical Analyses. Within each set of data, therelationship between structural variables such as per-
275
cent cover and a measure of distance was calculated.For the transects, the coordinates �X meters from theedge; Y meters elevation� were used in multiple re-gression. Linear regression of one variable was alsoused if the other variable was not significant. On thegrids, the plot coordinates were used, first in multipleregressions, then in linear regression. These measureswere used in regression analyses with the severalstructural variables �Analytical Software 2001�. ThePS of the Butte Camp grids though time was com-pared for each sample date by t-test. Detrended cor-respondence analysis �McCune and Mefford 1999�was used to determine changes in floristic composi-tion and variation of plots on BC-1 and BC-2 from1987 to 2003. Graphs were visualized using AXUM7 �Mathsoft 2001�.
Results
Species composition
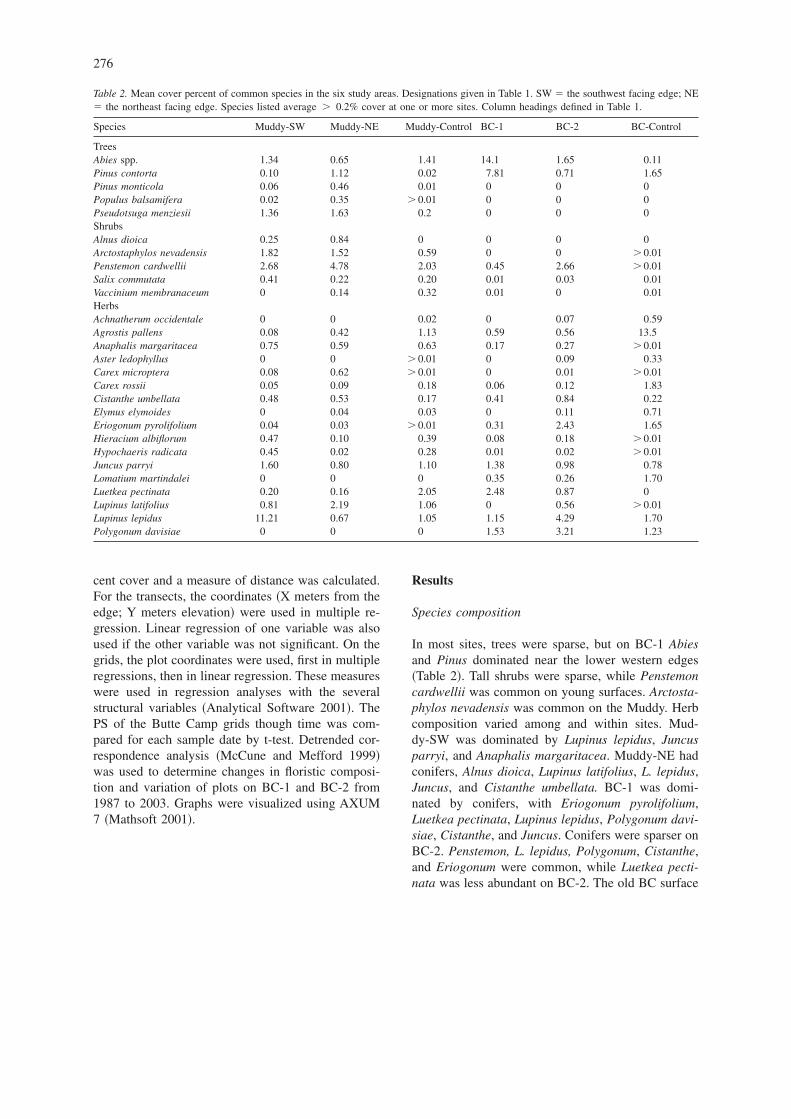
In most sites, trees were sparse, but on BC-1 Abiesand Pinus dominated near the lower western edges�Table 2�. Tall shrubs were sparse, while Penstemoncardwellii was common on young surfaces. Arctosta-phylos nevadensis was common on the Muddy. Herbcomposition varied among and within sites. Mud-dy-SW was dominated by Lupinus lepidus, Juncusparryi, and Anaphalis margaritacea. Muddy-NE hadconifers, Alnus dioica, Lupinus latifolius, L. lepidus,Juncus, and Cistanthe umbellata. BC-1 was domi-nated by conifers, with Eriogonum pyrolifolium,Luetkea pectinata, Lupinus lepidus, Polygonum davi-siae, Cistanthe, and Juncus. Conifers were sparser onBC-2. Penstemon, L. lepidus, Polygonum, Cistanthe,and Eriogonum were common, while Luetkea pecti-nata was less abundant on BC-2. The old BC surface
Table 2. Mean cover percent of common species in the six study areas. Designations given in Table 1. SW � the southwest facing edge; NE� the northeast facing edge. Species listed average � 0.2% cover at one or more sites. Column headings defined in Table 1.
Species Muddy-SW Muddy-NE Muddy-Control BC-1 BC-2 BC-Control
TreesAbies spp. 1.34 0.65 1.41 14.1 1.65 0.11Pinus contorta 0.10 1.12 0.02 7.81 0.71 1.65Pinus monticola 0.06 0.46 0.01 0 0 0Populus balsamifera 0.02 0.35 � 0.01 0 0 0Pseudotsuga menziesii 1.36 1.63 0.2 0 0 0ShrubsAlnus dioica 0.25 0.84 0 0 0 0Arctostaphylos nevadensis 1.82 1.52 0.59 0 0 � 0.01Penstemon cardwellii 2.68 4.78 2.03 0.45 2.66 � 0.01Salix commutata 0.41 0.22 0.20 0.01 0.03 0.01Vaccinium membranaceum 0 0.14 0.32 0.01 0 0.01HerbsAchnatherum occidentale 0 0 0.02 0 0.07 0.59Agrostis pallens 0.08 0.42 1.13 0.59 0.56 13.5Anaphalis margaritacea 0.75 0.59 0.63 0.17 0.27 � 0.01Aster ledophyllus 0 0 � 0.01 0 0.09 0.33Carex microptera 0.08 0.62 � 0.01 0 0.01 � 0.01Carex rossii 0.05 0.09 0.18 0.06 0.12 1.83Cistanthe umbellata 0.48 0.53 0.17 0.41 0.84 0.22Elymus elymoides 0 0.04 0.03 0 0.11 0.71Eriogonum pyrolifolium 0.04 0.03 � 0.01 0.31 2.43 1.65Hieracium albiflorum 0.47 0.10 0.39 0.08 0.18 � 0.01Hypochaeris radicata 0.45 0.02 0.28 0.01 0.02 � 0.01Juncus parryi 1.60 0.80 1.10 1.38 0.98 0.78Lomatium martindalei 0 0 0 0.35 0.26 1.70Luetkea pectinata 0.20 0.16 2.05 2.48 0.87 0Lupinus latifolius 0.81 2.19 1.06 0 0.56 � 0.01Lupinus lepidus 11.21 0.67 1.05 1.15 4.29 1.70Polygonum davisiae 0 0 0 1.53 3.21 1.23
276
was dominated by graminoids �Agrostis pallens,Carex rossii, Elymus elymoides, Achnatherum occi-dentale, and Juncus�, along with Lomatium martinda-lei and Aster ledophyllus.
Structure
Richness. Each study area was examined for patternsin total number of species per plot and the meanquadrat richness. Quadrat richness on Muddy-SW de-
clined with distance �Table 3�, while both plot andmean richness declined on SW-1 due to strong Lupi-nus lepidus dominance on more distant plots. Meanquadrat richness also declined on SW-2 and SW-3.Mean quadrat richness of Muddy-SW was greaterthan that of Muddy-NE �Table 5�.
Both plot richness and mean richness on BC-1 in-creased significantly with distance from the edge andwith elevation �Table 3�. Elevation correlated withgreater exposure and deeper lahar deposits that
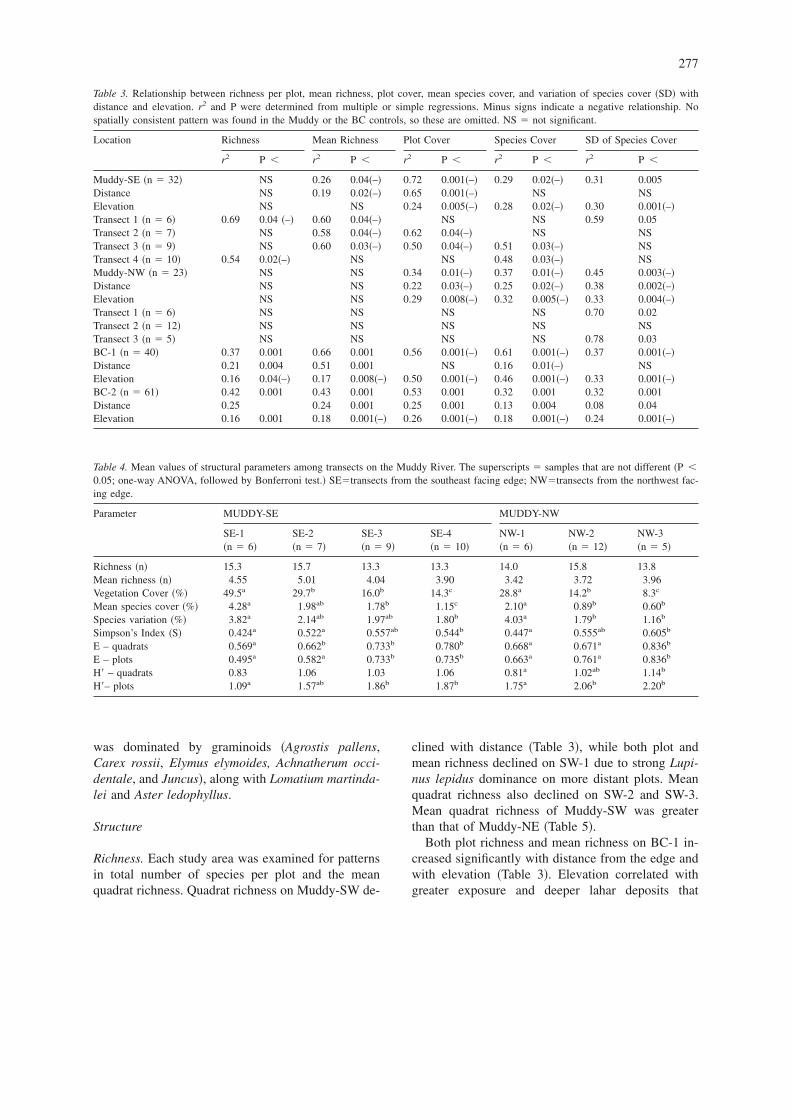
Table 3. Relationship between richness per plot, mean richness, plot cover, mean species cover, and variation of species cover �SD� withdistance and elevation. r2 and P were determined from multiple or simple regressions. Minus signs indicate a negative relationship. Nospatially consistent pattern was found in the Muddy or the BC controls, so these are omitted. NS � not significant.
Location Richness Mean Richness Plot Cover Species Cover SD of Species Cover
r2 P � r2 P � r2 P � r2 P � r2 P �
Muddy-SE �n � 32� NS 0.26 0.04�–� 0.72 0.001�–� 0.29 0.02�–� 0.31 0.005Distance NS 0.19 0.02�–� 0.65 0.001�–� NS NSElevation NS NS 0.24 0.005�–� 0.28 0.02�–� 0.30 0.001�–�Transect 1 �n � 6� 0.69 0.04 �–� 0.60 0.04�–� NS NS 0.59 0.05Transect 2 �n � 7� NS 0.58 0.04�–� 0.62 0.04�–� NS NSTransect 3 �n � 9� NS 0.60 0.03�–� 0.50 0.04�–� 0.51 0.03�–� NSTransect 4 �n � 10� 0.54 0.02�–� NS NS 0.48 0.03�–� NSMuddy-NW �n � 23� NS NS 0.34 0.01�–� 0.37 0.01�–� 0.45 0.003�–�Distance NS NS 0.22 0.03�–� 0.25 0.02�–� 0.38 0.002�–�Elevation NS NS 0.29 0.008�–� 0.32 0.005�–� 0.33 0.004�–�Transect 1 �n � 6� NS NS NS NS 0.70 0.02Transect 2 �n � 12� NS NS NS NS NSTransect 3 �n � 5� NS NS NS NS 0.78 0.03BC-1 �n � 40� 0.37 0.001 0.66 0.001 0.56 0.001�–� 0.61 0.001�–� 0.37 0.001�–�Distance 0.21 0.004 0.51 0.001 NS 0.16 0.01�–� NSElevation 0.16 0.04�–� 0.17 0.008�–� 0.50 0.001�–� 0.46 0.001�–� 0.33 0.001�–�BC-2 �n � 61� 0.42 0.001 0.43 0.001 0.53 0.001 0.32 0.001 0.32 0.001Distance 0.25 0.24 0.001 0.25 0.001 0.13 0.004 0.08 0.04Elevation 0.16 0.001 0.18 0.001�–� 0.26 0.001�–� 0.18 0.001�–� 0.24 0.001�–�
Table 4. Mean values of structural parameters among transects on the Muddy River. The superscripts � samples that are not different �P �
0.05; one-way ANOVA, followed by Bonferroni test.� SE�transects from the southeast facing edge; NW�transects from the northwest fac-ing edge.
Parameter MUDDY-SE MUDDY-NW
SE-1�n � 6�
SE-2�n � 7�
SE-3�n � 9�
SE-4�n � 10�
NW-1�n � 6�
NW-2�n � 12�
NW-3�n � 5�
Richness �n� 15.3 15.7 13.3 13.3 14.0 15.8 13.8Mean richness �n� 4.55 5.01 4.04 3.90 3.42 3.72 3.96Vegetation Cover �%� 49.5a 29.7b 16.0b 14.3c 28.8a 14.2b 8.3c
Mean species cover �%� 4.28a 1.98ab 1.78b 1.15c 2.10a 0.89b 0.60b
Species variation �%� 3.82a 2.14ab 1.97ab 1.80b 4.03a 1.79b 1.16b
Simpson’s Index �S� 0.424a 0.522a 0.557ab 0.544b 0.447a 0.555ab 0.605b
E – quadrats 0.569a 0.662b 0.733b 0.780b 0.668a 0.671a 0.836b
E – plots 0.495a 0.582a 0.733b 0.735b 0.663a 0.761a 0.836b
H� – quadrats 0.83 1.06 1.03 1.06 0.81a 1.02ab 1.14b
H�– plots 1.09a 1.57ab 1.86b 1.87b 1.75a 2.06b 2.20b
277
reduced conifer dominance. Mean plot richness andmean quadrat richness was higher than on BC-1.Richness declined uphill, and increased from east towest �Table 3�. Mean quadrat richness changed in asimilar way to mean plot richness. The control griddemonstrated no spatial patterns, though there weresignificant variations among the plots. Mean speciesrichness per quadrat was much greater than the gridplots �Table 6�.
Cover. Vegetation cover best represents site devel-opment. Plot cover on the Muddy-SW transects de-
clined with increasing distance and with elevation�Table 3�. Cover declined with distance along SW-2and SW-3. Mean species cover declined along SW-3and SW-4, but the variation among species increasedonly on SW-1 �Table 3�. When considering alltransects, mean plot cover, mean species cover, andvariation of species cover all declined with elevation�Table 4�. There were only minor spatially related de-clines in mean plot cover, mean species cover, andvariation of species cover with distance and elevationalong the Muddy-NE transects �Table 3, Table 4�.
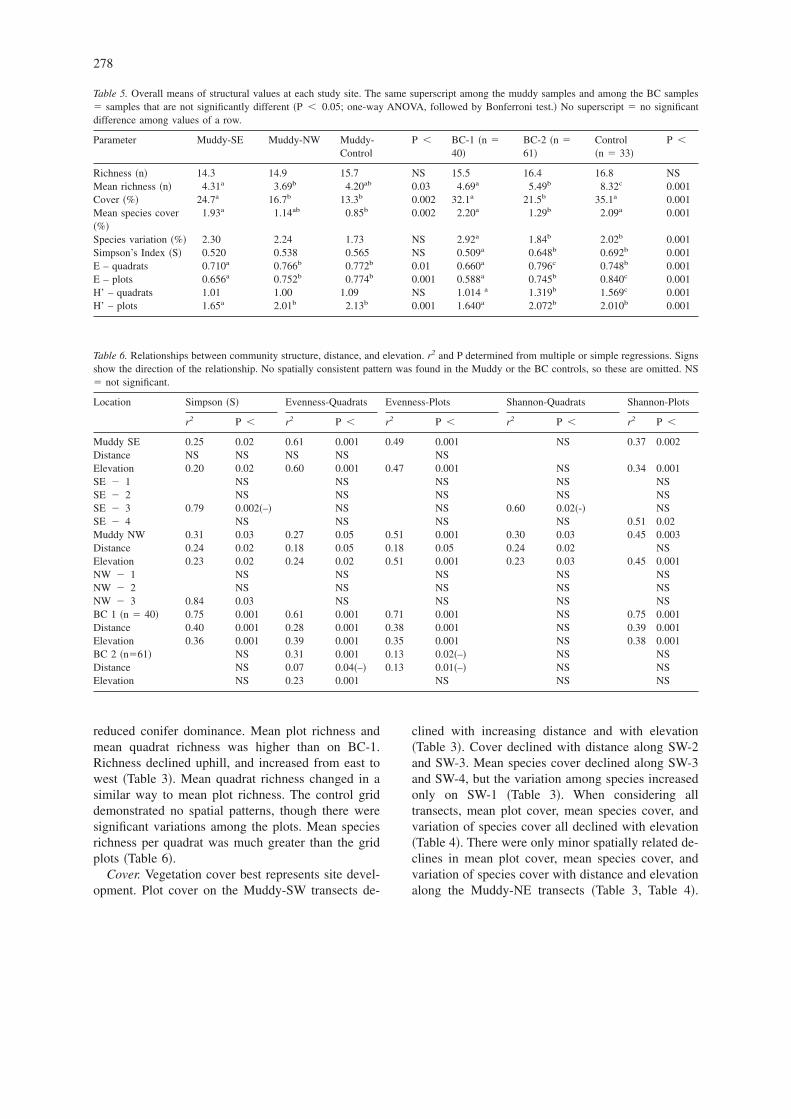
Table 5. Overall means of structural values at each study site. The same superscript among the muddy samples and among the BC samples� samples that are not significantly different �P � 0.05; one-way ANOVA, followed by Bonferroni test.� No superscript � no significantdifference among values of a row.
Parameter Muddy-SE Muddy-NW Muddy-Control
P � BC-1 �n �40�
BC-2 �n �61�
Control�n � 33�
P �
Richness �n� 14.3 14.9 15.7 NS 15.5 16.4 16.8 NSMean richness �n� 4.31a 3.69b 4.20ab 0.03 4.69a 5.49b 8.32c 0.001Cover �%� 24.7a 16.7b 13.3b 0.002 32.1a 21.5b 35.1a 0.001Mean species cover�%�
1.93a 1.14ab 0.85b 0.002 2.20a 1.29b 2.09a 0.001
Species variation �%� 2.30 2.24 1.73 NS 2.92a 1.84b 2.02b 0.001Simpson’s Index �S� 0.520 0.538 0.565 NS 0.509a 0.648b 0.692b 0.001E – quadrats 0.710a 0.766b 0.772b 0.01 0.660a 0.796c 0.748b 0.001E – plots 0.656a 0.752b 0.774b 0.001 0.588a 0.745b 0.840c 0.001H’ – quadrats 1.01 1.00 1.09 NS 1.014 a 1.319b 1.569c 0.001H’ – plots 1.65a 2.01b 2.13b 0.001 1.640a 2.072b 2.010b 0.001
Table 6. Relationships between community structure, distance, and elevation. r2 and P determined from multiple or simple regressions. Signsshow the direction of the relationship. No spatially consistent pattern was found in the Muddy or the BC controls, so these are omitted. NS� not significant.
Location Simpson �S� Evenness-Quadrats Evenness-Plots Shannon-Quadrats Shannon-Plots
r2 P � r2 P � r2 P � r2 P � r2 P �
Muddy SE 0.25 0.02 0.61 0.001 0.49 0.001 NS 0.37 0.002Distance NS NS NS NS NSElevation 0.20 0.02 0.60 0.001 0.47 0.001 NS 0.34 0.001SE � 1 NS NS NS NS NSSE � 2 NS NS NS NS NSSE � 3 0.79 0.002�–� NS NS 0.60 0.02�-� NSSE � 4 NS NS NS NS 0.51 0.02Muddy NW 0.31 0.03 0.27 0.05 0.51 0.001 0.30 0.03 0.45 0.003Distance 0.24 0.02 0.18 0.05 0.18 0.05 0.24 0.02 NSElevation 0.23 0.02 0.24 0.02 0.51 0.001 0.23 0.03 0.45 0.001NW � 1 NS NS NS NS NSNW � 2 NS NS NS NS NSNW � 3 0.84 0.03 NS NS NS NSBC 1 �n � 40� 0.75 0.001 0.61 0.001 0.71 0.001 NS 0.75 0.001Distance 0.40 0.001 0.28 0.001 0.38 0.001 NS 0.39 0.001Elevation 0.36 0.001 0.39 0.001 0.35 0.001 NS 0.38 0.001BC 2 �n�61� NS 0.31 0.001 0.13 0.02�–� NS NSDistance NS 0.07 0.04�–� 0.13 0.01�–� NS NSElevation NS 0.23 0.001 NS NS NS
278
Variation was large and sample size small. However,species variation did increase on both NE-1 andNE-3. There were no spatial patterns on the MuddyControl grid in cover related variables, where plotcover was similar to the NE transects and lower thanthe SW transects. Mean species cover was lower thanthat of both transects due to higher elevation.
On BC-1, plot cover declined up the lahar due tochanges in conifers. Mean species cover was higherthan on the other primary surface. The higher valueswere concentrated near the forest. The mean speciescover declined with distance and elevation, and thevariation of this cover declined up hill �Table 3�.Mean plot cover on BC-2 was lower than on eitherBC-1 or the control. BC-2 also had lower mean spe-cies cover and the lowest variation of cover �Table 5�.Cover declined with elevation, but increased fromeast to west �Table 3�. The BC-control was well veg-etated. Plant cover in adjacent plots has varied in re-sponse to seasonal factors since 1984 �del Moral2000�. 2003 was a dry year and cover was 6 to 10%lower than in 2002. Control cover was the highest ofany site. Both mean species cover and cover standarddeviation were intermediate to BC-1 and BC-2. Thesevariables were not related to spatial factors, thoughthere were significant differences among the plots.
Hierarchical structure. S increased with elevationon the Muddy-SW plots �Table 4�, but only SW-3showed lower S with distance. Both Equad and Eplot
on Muddy-SW increased with elevation, but not withdistance �Table 4, Table 6�. Changes in H’ reflectdominance changes because richness values variedlittle. Mean values of H’quad were similar on alltransects �Table 4�. H’quad of SW-3 decreased withdistance, but H’plot increased with elevation and alongSW-4 �Table 6�.
On the Muddy-NE samples, S increased with dis-tance and elevation, reflecting reduced dominance.NE-3, with little woody vegetation, was the onlytransect to show increased equitability with distancefrom the edge. Combining all NE plots revealed thatEquad increased with distance, but also with elevation�Table 6�. Eplot responded primarily to elevation.H’quad and H’plot presented similar patterns. Both in-creased between the transects, reflecting reduceddominance with elevation. Distance was not consis-tently related to H’plot.
Muddy-control lacked spatially consistent differ-ence in any structural parameter. Both evenness mea-sures were higher on Muddy-NE than Muddy-SW,while Muddy-control was similar to Muddy-NE.
H’plot was higher on Muddy-NE and the control thanon Muddy-SW.
The BC lahars are physically similar except fortheir degree of isolation. Spatially related structuralpatterns were more common on BC-1. S, Equad, Eplot,and H’plot increased with distance from the forestedge and with elevation �Table 6�. On BC-2, Equad
declined with distance and increased with elevation.Eplot declined only with distance.
The hierarchical structure on the Butte Camp gridsdiffered significantly �Table 5�. BC-1 vegetation con-sistently expressed significantly lower S, E and H’values than did BC-2. BC-2 was similar to BC-con-trol in S and H’plot, but less diverse than the controlin Eplot and H’quad.
Heterogeneity
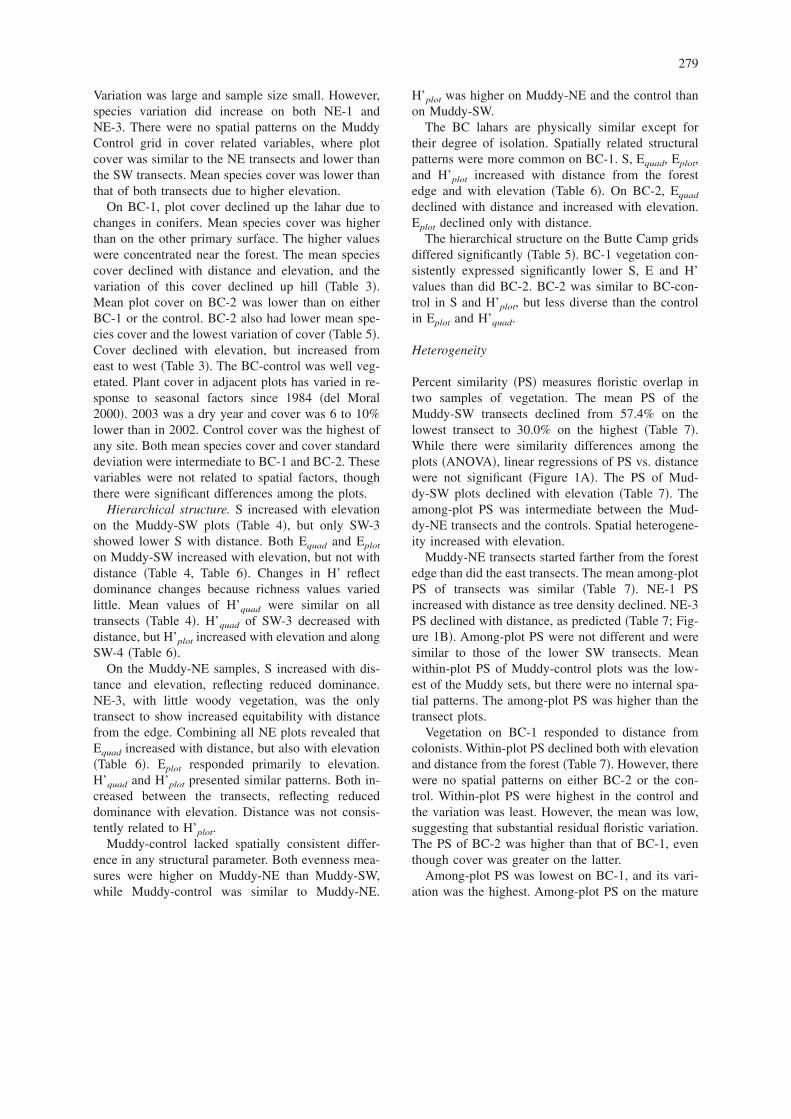
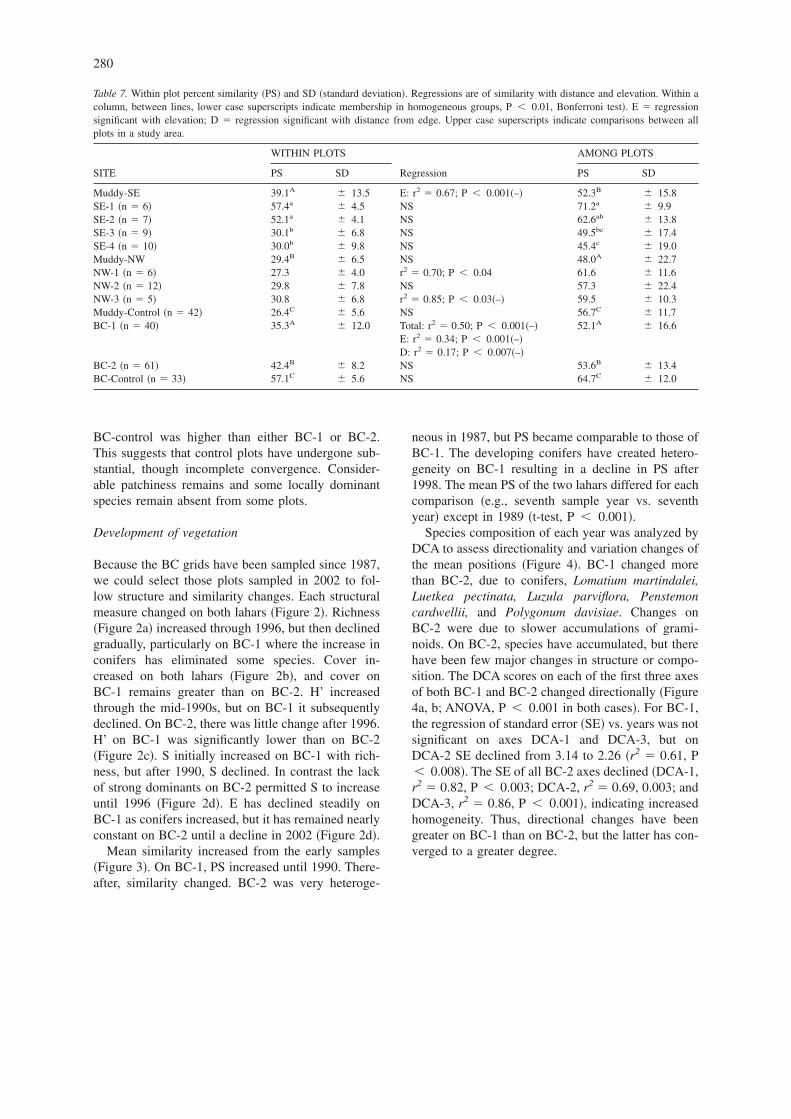
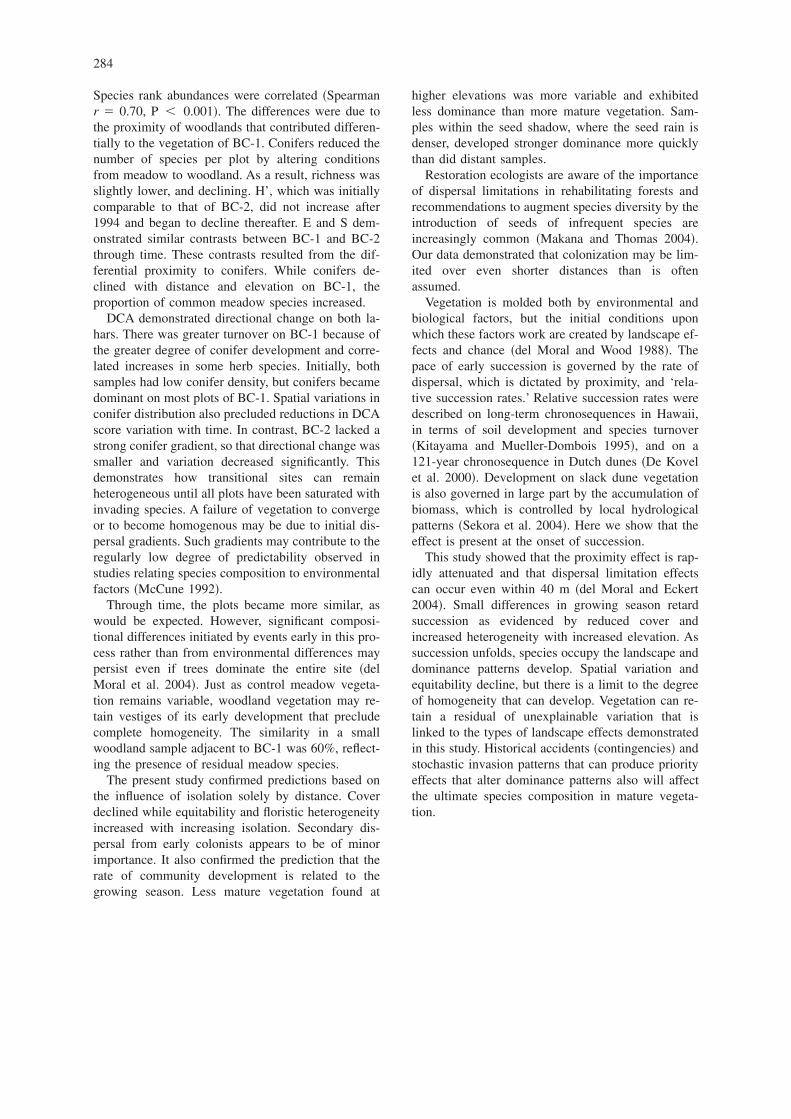
Percent similarity �PS� measures floristic overlap intwo samples of vegetation. The mean PS of theMuddy-SW transects declined from 57.4% on thelowest transect to 30.0% on the highest �Table 7�.While there were similarity differences among theplots �ANOVA�, linear regressions of PS vs. distancewere not significant �Figure 1A�. The PS of Mud-dy-SW plots declined with elevation �Table 7�. Theamong-plot PS was intermediate between the Mud-dy-NE transects and the controls. Spatial heterogene-ity increased with elevation.
Muddy-NE transects started farther from the forestedge than did the east transects. The mean among-plotPS of transects was similar �Table 7�. NE-1 PSincreased with distance as tree density declined. NE-3PS declined with distance, as predicted �Table 7; Fig-ure 1B�. Among-plot PS were not different and weresimilar to those of the lower SW transects. Meanwithin-plot PS of Muddy-control plots was the low-est of the Muddy sets, but there were no internal spa-tial patterns. The among-plot PS was higher than thetransect plots.
Vegetation on BC-1 responded to distance fromcolonists. Within-plot PS declined both with elevationand distance from the forest �Table 7�. However, therewere no spatial patterns on either BC-2 or the con-trol. Within-plot PS were highest in the control andthe variation was least. However, the mean was low,suggesting that substantial residual floristic variation.The PS of BC-2 was higher than that of BC-1, eventhough cover was greater on the latter.
Among-plot PS was lowest on BC-1, and its vari-ation was the highest. Among-plot PS on the mature
279
BC-control was higher than either BC-1 or BC-2.This suggests that control plots have undergone sub-stantial, though incomplete convergence. Consider-able patchiness remains and some locally dominantspecies remain absent from some plots.
Development of vegetation
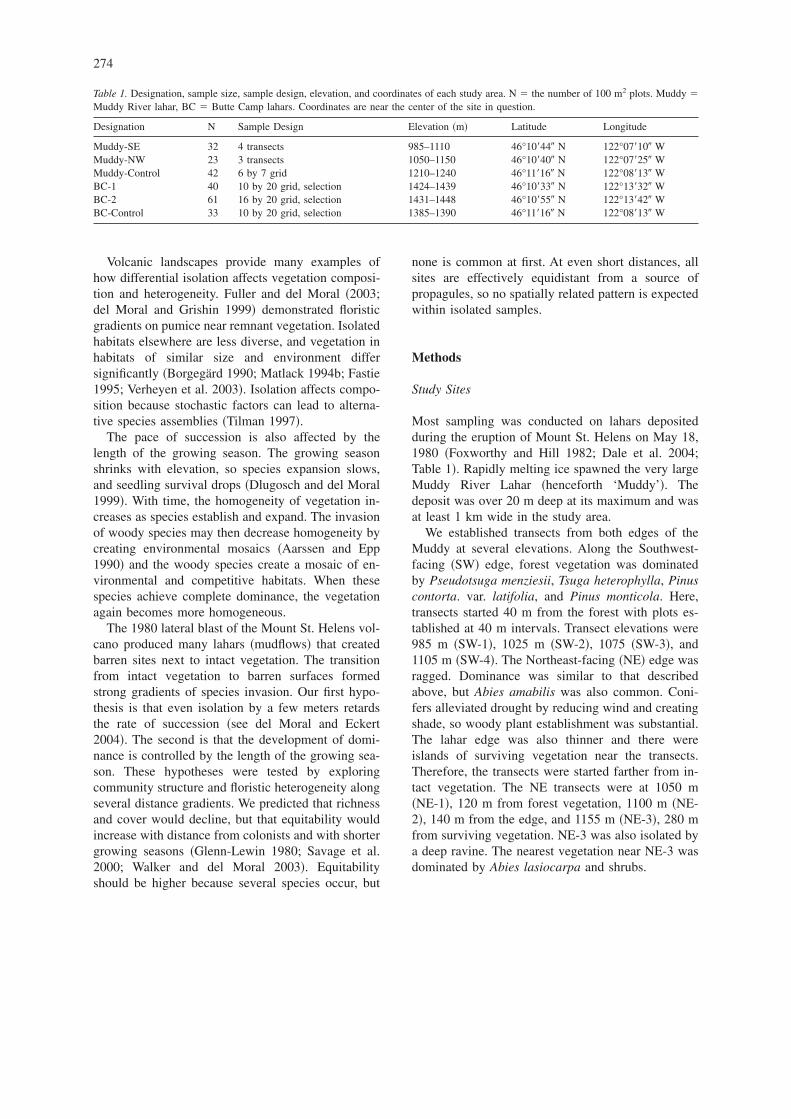
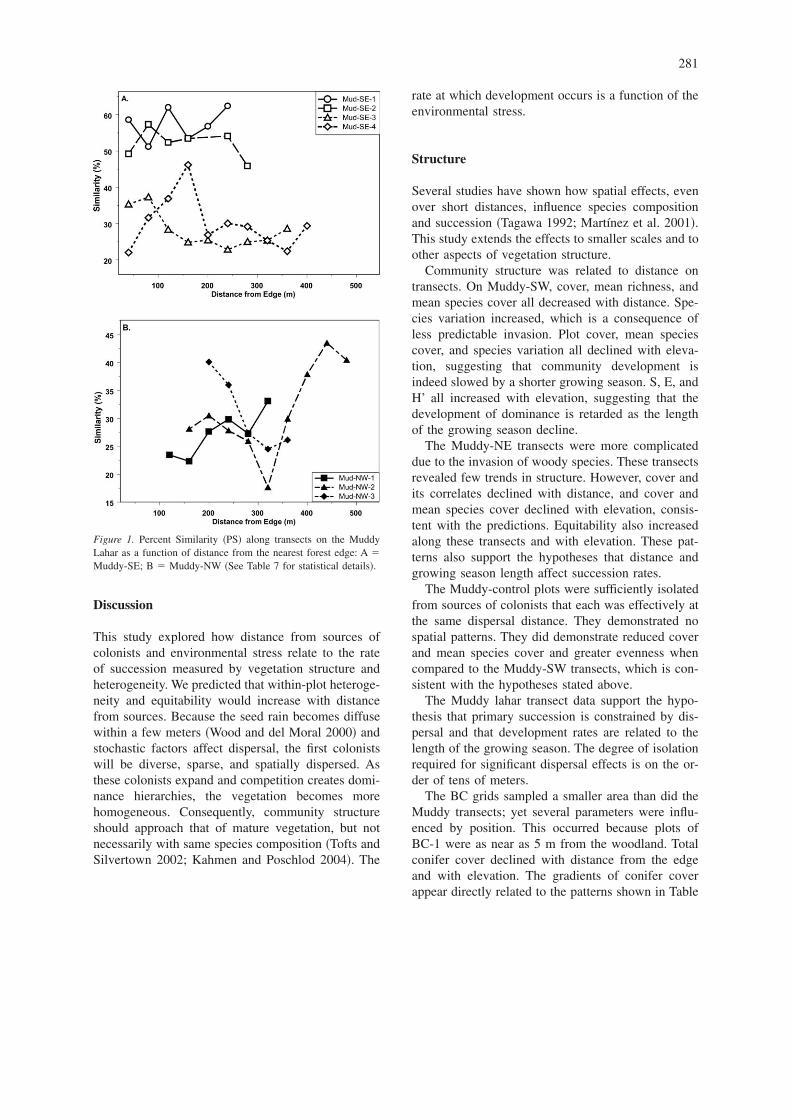
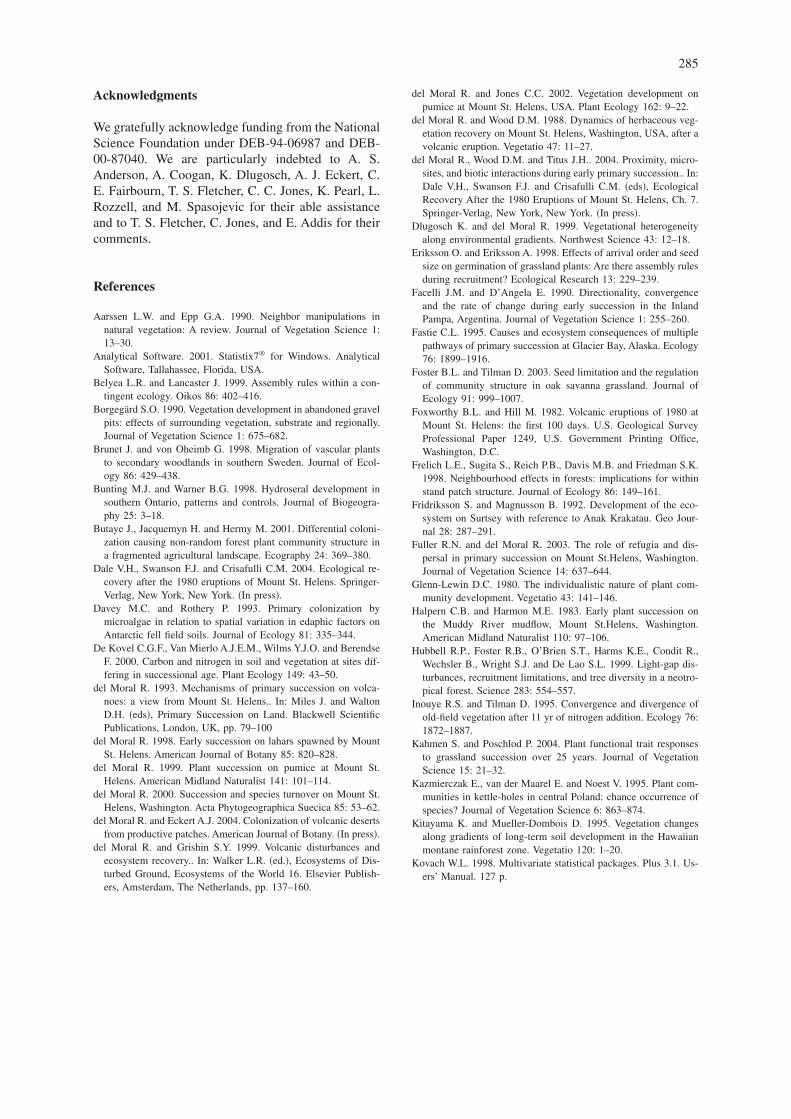
Because the BC grids have been sampled since 1987,we could select those plots sampled in 2002 to fol-low structure and similarity changes. Each structuralmeasure changed on both lahars �Figure 2�. Richness�Figure 2a� increased through 1996, but then declinedgradually, particularly on BC-1 where the increase inconifers has eliminated some species. Cover in-creased on both lahars �Figure 2b�, and cover onBC-1 remains greater than on BC-2. H’ increasedthrough the mid-1990s, but on BC-1 it subsequentlydeclined. On BC-2, there was little change after 1996.H’ on BC-1 was significantly lower than on BC-2�Figure 2c�. S initially increased on BC-1 with rich-ness, but after 1990, S declined. In contrast the lackof strong dominants on BC-2 permitted S to increaseuntil 1996 �Figure 2d�. E has declined steadily onBC-1 as conifers increased, but it has remained nearlyconstant on BC-2 until a decline in 2002 �Figure 2d�.
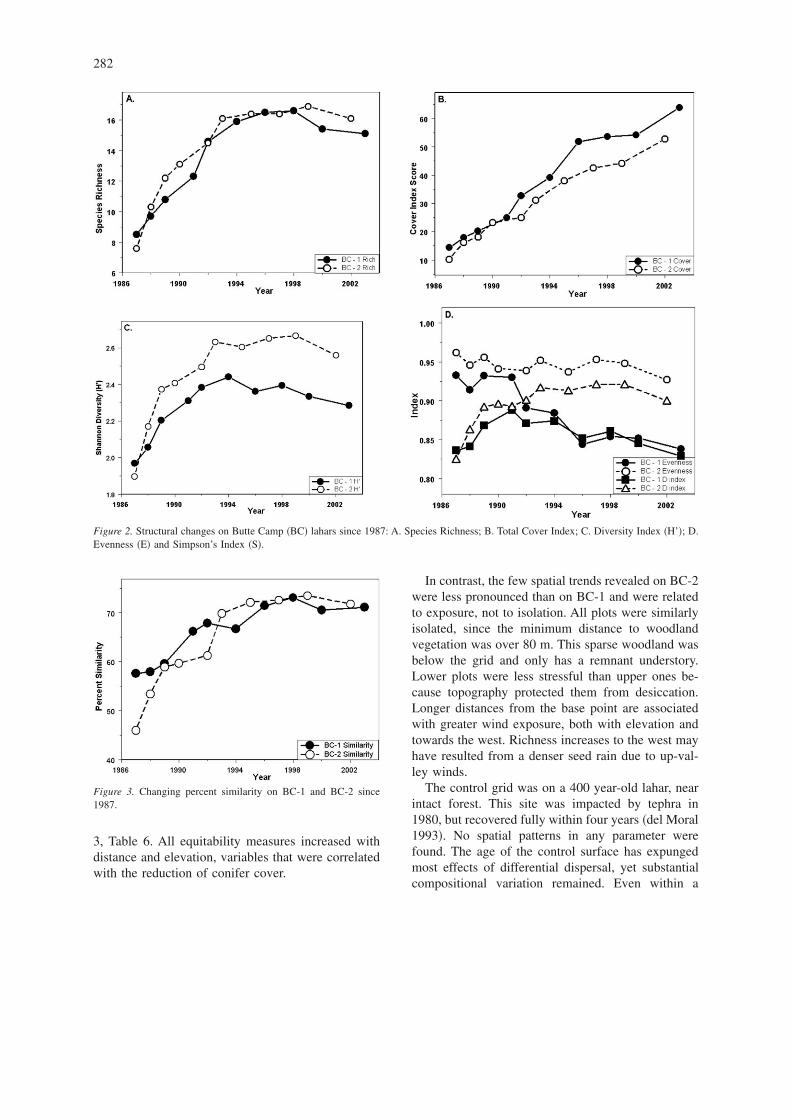
Mean similarity increased from the early samples�Figure 3�. On BC-1, PS increased until 1990. There-after, similarity changed. BC-2 was very heteroge-
neous in 1987, but PS became comparable to those ofBC-1. The developing conifers have created hetero-geneity on BC-1 resulting in a decline in PS after1998. The mean PS of the two lahars differed for eachcomparison �e.g., seventh sample year vs. seventhyear� except in 1989 �t-test, P � 0.001�.
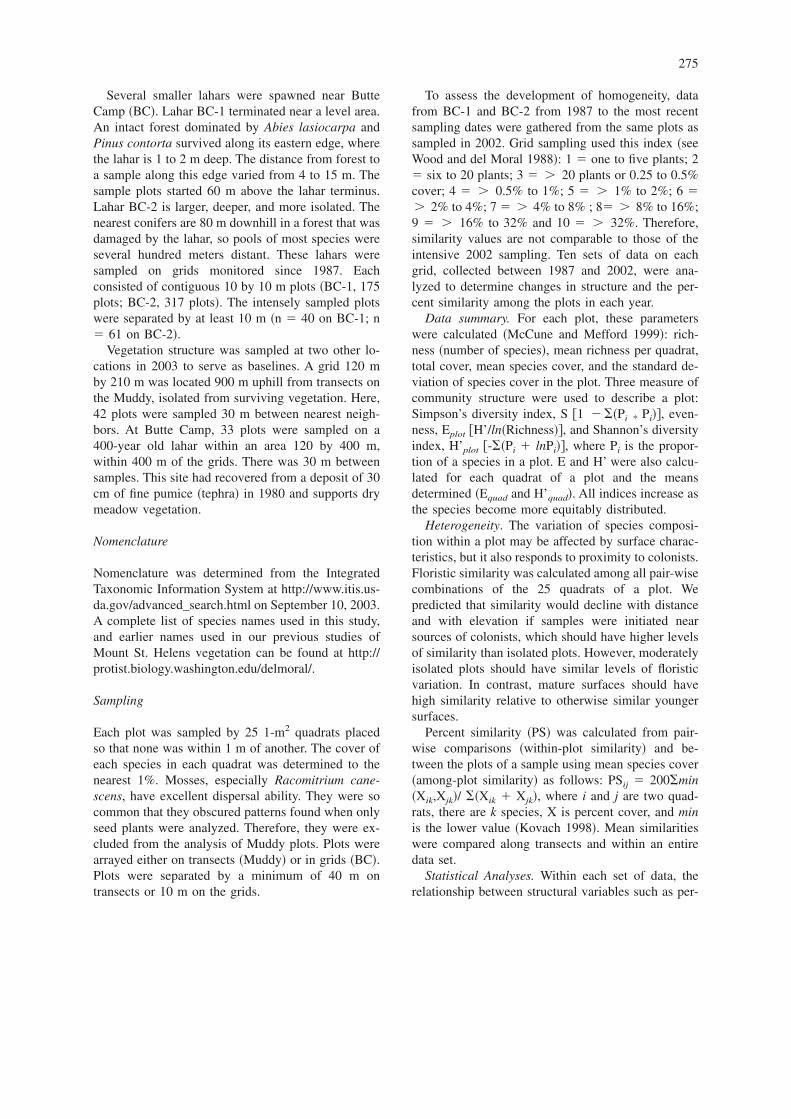
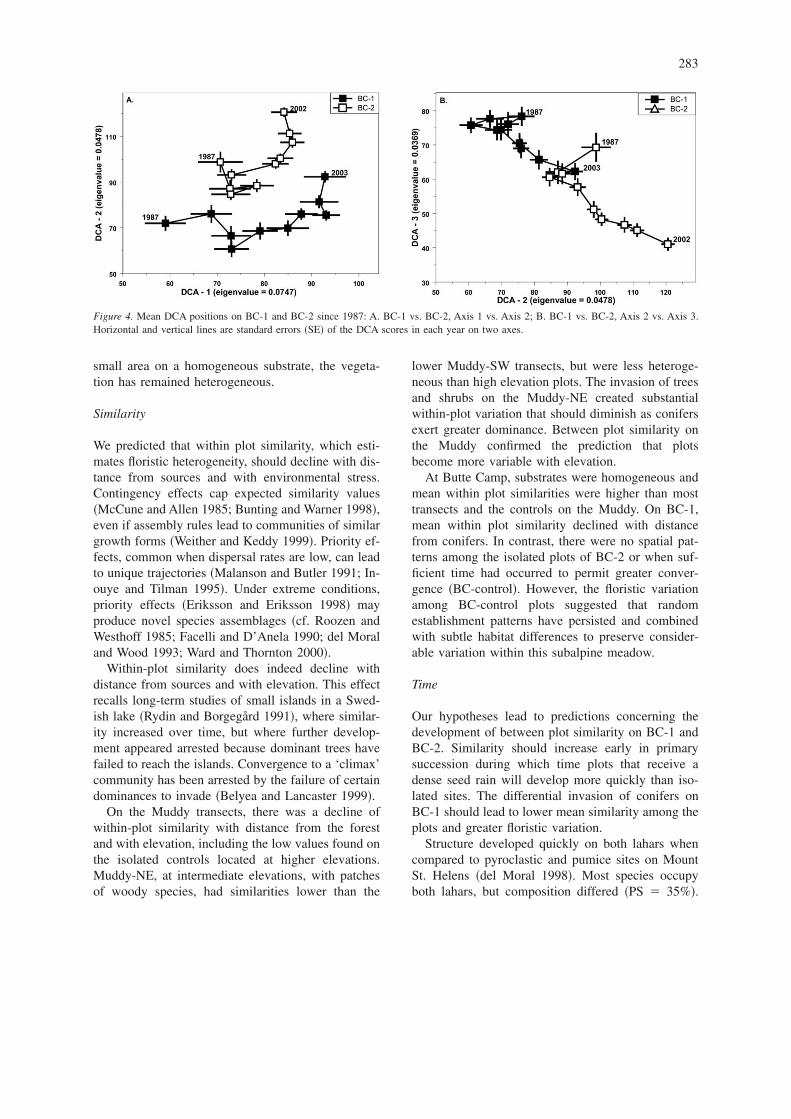
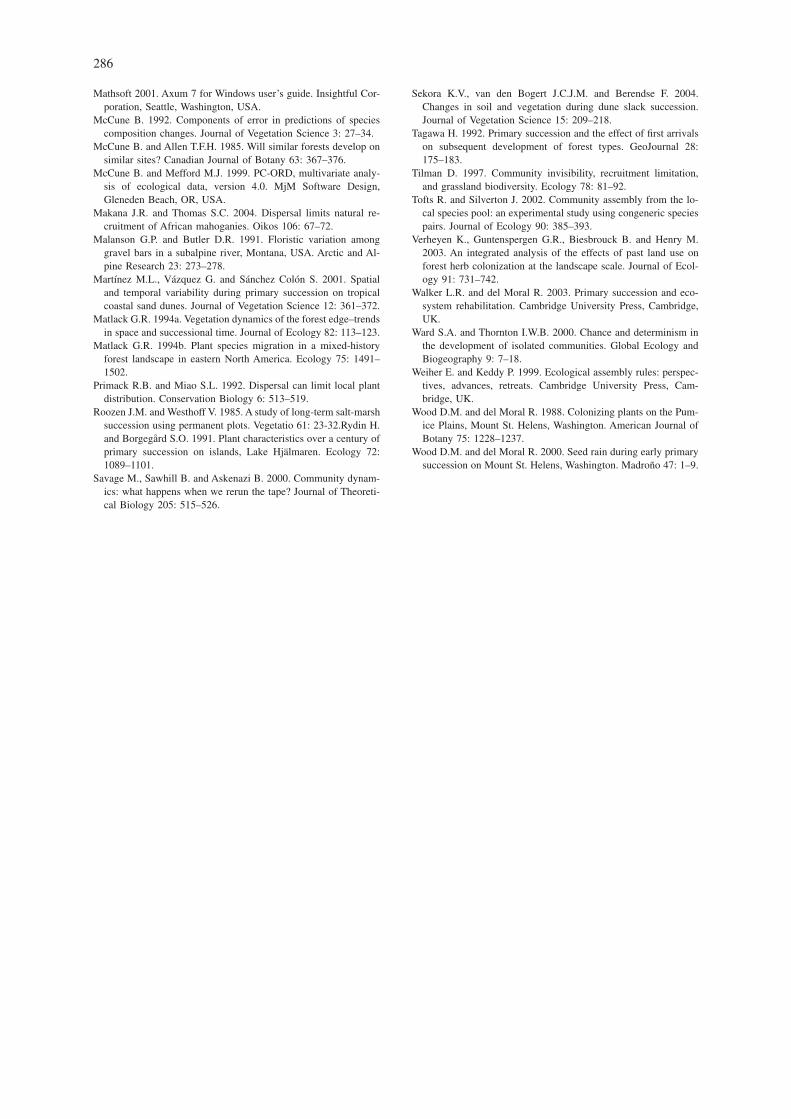
Species composition of each year was analyzed byDCA to assess directionality and variation changes ofthe mean positions �Figure 4�. BC-1 changed morethan BC-2, due to conifers, Lomatium martindalei,Luetkea pectinata, Luzula parviflora, Penstemoncardwellii, and Polygonum davisiae. Changes onBC-2 were due to slower accumulations of grami-noids. On BC-2, species have accumulated, but therehave been few major changes in structure or compo-sition. The DCA scores on each of the first three axesof both BC-1 and BC-2 changed directionally �Figure4a, b; ANOVA, P � 0.001 in both cases�. For BC-1,the regression of standard error �SE� vs. years was notsignificant on axes DCA-1 and DCA-3, but onDCA-2 SE declined from 3.14 to 2.26 �r2 � 0.61, P� 0.008�. The SE of all BC-2 axes declined �DCA-1,r2 � 0.82, P � 0.003; DCA-2, r2 � 0.69, 0.003; andDCA-3, r2 � 0.86, P � 0.001�, indicating increasedhomogeneity. Thus, directional changes have beengreater on BC-1 than on BC-2, but the latter has con-verged to a greater degree.
Table 7. Within plot percent similarity �PS� and SD �standard deviation�. Regressions are of similarity with distance and elevation. Within acolumn, between lines, lower case superscripts indicate membership in homogeneous groups, P � 0.01, Bonferroni test�. E � regressionsignificant with elevation; D � regression significant with distance from edge. Upper case superscripts indicate comparisons between allplots in a study area.
WITHIN PLOTS AMONG PLOTS
SITE PS SD Regression PS SD
Muddy-SE 39.1A � 13.5 E: r2 � 0.67; P � 0.001�–� 52.3B � 15.8SE-1 �n � 6� 57.4a � 4.5 NS 71.2a � 9.9SE-2 �n � 7� 52.1a � 4.1 NS 62.6ab � 13.8SE-3 �n � 9� 30.1b � 6.8 NS 49.5bc � 17.4SE-4 �n � 10� 30.0b � 9.8 NS 45.4c � 19.0Muddy-NW 29.4B � 6.5 NS 48.0A � 22.7NW-1 �n � 6� 27.3 � 4.0 r2 � 0.70; P � 0.04 61.6 � 11.6NW-2 �n � 12� 29.8 � 7.8 NS 57.3 � 22.4NW-3 �n � 5� 30.8 � 6.8 r2 � 0.85; P � 0.03�–� 59.5 � 10.3Muddy-Control �n � 42� 26.4C � 5.6 NS 56.7C � 11.7BC-1 �n � 40� 35.3A � 12.0 Total: r2 � 0.50; P � 0.001�–� 52.1A � 16.6
E: r2 � 0.34; P � 0.001�–�D: r2 � 0.17; P � 0.007�–�
BC-2 �n � 61� 42.4B � 8.2 NS 53.6B � 13.4BC-Control �n � 33� 57.1C � 5.6 NS 64.7C � 12.0
280
Discussion
This study explored how distance from sources ofcolonists and environmental stress relate to the rateof succession measured by vegetation structure andheterogeneity. We predicted that within-plot heteroge-neity and equitability would increase with distancefrom sources. Because the seed rain becomes diffusewithin a few meters �Wood and del Moral 2000� andstochastic factors affect dispersal, the first colonistswill be diverse, sparse, and spatially dispersed. Asthese colonists expand and competition creates domi-nance hierarchies, the vegetation becomes morehomogeneous. Consequently, community structureshould approach that of mature vegetation, but notnecessarily with same species composition �Tofts andSilvertown 2002; Kahmen and Poschlod 2004�. The
rate at which development occurs is a function of theenvironmental stress.
Structure
Several studies have shown how spatial effects, evenover short distances, influence species compositionand succession �Tagawa 1992; Martínez et al. 2001�.This study extends the effects to smaller scales and toother aspects of vegetation structure.
Community structure was related to distance ontransects. On Muddy-SW, cover, mean richness, andmean species cover all decreased with distance. Spe-cies variation increased, which is a consequence ofless predictable invasion. Plot cover, mean speciescover, and species variation all declined with eleva-tion, suggesting that community development isindeed slowed by a shorter growing season. S, E, andH’ all increased with elevation, suggesting that thedevelopment of dominance is retarded as the lengthof the growing season decline.
The Muddy-NE transects were more complicateddue to the invasion of woody species. These transectsrevealed few trends in structure. However, cover andits correlates declined with distance, and cover andmean species cover declined with elevation, consis-tent with the predictions. Equitability also increasedalong these transects and with elevation. These pat-terns also support the hypotheses that distance andgrowing season length affect succession rates.
The Muddy-control plots were sufficiently isolatedfrom sources of colonists that each was effectively atthe same dispersal distance. They demonstrated nospatial patterns. They did demonstrate reduced coverand mean species cover and greater evenness whencompared to the Muddy-SW transects, which is con-sistent with the hypotheses stated above.
The Muddy lahar transect data support the hypo-thesis that primary succession is constrained by dis-persal and that development rates are related to thelength of the growing season. The degree of isolationrequired for significant dispersal effects is on the or-der of tens of meters.
The BC grids sampled a smaller area than did theMuddy transects; yet several parameters were influ-enced by position. This occurred because plots ofBC-1 were as near as 5 m from the woodland. Totalconifer cover declined with distance from the edgeand with elevation. The gradients of conifer coverappear directly related to the patterns shown in Table
Figure 1. Percent Similarity �PS� along transects on the MuddyLahar as a function of distance from the nearest forest edge: A �Muddy-SE; B � Muddy-NW �See Table 7 for statistical details�.
281
3, Table 6. All equitability measures increased withdistance and elevation, variables that were correlatedwith the reduction of conifer cover.
In contrast, the few spatial trends revealed on BC-2were less pronounced than on BC-1 and were relatedto exposure, not to isolation. All plots were similarlyisolated, since the minimum distance to woodlandvegetation was over 80 m. This sparse woodland wasbelow the grid and only has a remnant understory.Lower plots were less stressful than upper ones be-cause topography protected them from desiccation.Longer distances from the base point are associatedwith greater wind exposure, both with elevation andtowards the west. Richness increases to the west mayhave resulted from a denser seed rain due to up-val-ley winds.
The control grid was on a 400 year-old lahar, nearintact forest. This site was impacted by tephra in1980, but recovered fully within four years �del Moral1993�. No spatial patterns in any parameter werefound. The age of the control surface has expungedmost effects of differential dispersal, yet substantialcompositional variation remained. Even within a
Figure 2. Structural changes on Butte Camp �BC� lahars since 1987: A. Species Richness; B. Total Cover Index; C. Diversity Index �H’�; D.Evenness �E� and Simpson’s Index �S�.
Figure 3. Changing percent similarity on BC-1 and BC-2 since1987.
282
small area on a homogeneous substrate, the vegeta-tion has remained heterogeneous.
Similarity
We predicted that within plot similarity, which esti-mates floristic heterogeneity, should decline with dis-tance from sources and with environmental stress.Contingency effects cap expected similarity values�McCune and Allen 1985; Bunting and Warner 1998�,even if assembly rules lead to communities of similargrowth forms �Weither and Keddy 1999�. Priority ef-fects, common when dispersal rates are low, can leadto unique trajectories �Malanson and Butler 1991; In-ouye and Tilman 1995�. Under extreme conditions,priority effects �Eriksson and Eriksson 1998� mayproduce novel species assemblages �cf. Roozen andWesthoff 1985; Facelli and D’Anela 1990; del Moraland Wood 1993; Ward and Thornton 2000�.
Within-plot similarity does indeed decline withdistance from sources and with elevation. This effectrecalls long-term studies of small islands in a Swed-ish lake �Rydin and Borgegård 1991�, where similar-ity increased over time, but where further develop-ment appeared arrested because dominant trees havefailed to reach the islands. Convergence to a ‘climax’community has been arrested by the failure of certaindominances to invade �Belyea and Lancaster 1999�.
On the Muddy transects, there was a decline ofwithin-plot similarity with distance from the forestand with elevation, including the low values found onthe isolated controls located at higher elevations.Muddy-NE, at intermediate elevations, with patchesof woody species, had similarities lower than the
lower Muddy-SW transects, but were less heteroge-neous than high elevation plots. The invasion of treesand shrubs on the Muddy-NE created substantialwithin-plot variation that should diminish as conifersexert greater dominance. Between plot similarity onthe Muddy confirmed the prediction that plotsbecome more variable with elevation.
At Butte Camp, substrates were homogeneous andmean within plot similarities were higher than mosttransects and the controls on the Muddy. On BC-1,mean within plot similarity declined with distancefrom conifers. In contrast, there were no spatial pat-terns among the isolated plots of BC-2 or when suf-ficient time had occurred to permit greater conver-gence �BC-control�. However, the floristic variationamong BC-control plots suggested that randomestablishment patterns have persisted and combinedwith subtle habitat differences to preserve consider-able variation within this subalpine meadow.
Time
Our hypotheses lead to predictions concerning thedevelopment of between plot similarity on BC-1 andBC-2. Similarity should increase early in primarysuccession during which time plots that receive adense seed rain will develop more quickly than iso-lated sites. The differential invasion of conifers onBC-1 should lead to lower mean similarity among theplots and greater floristic variation.
Structure developed quickly on both lahars whencompared to pyroclastic and pumice sites on MountSt. Helens �del Moral 1998�. Most species occupyboth lahars, but composition differed �PS � 35%�.
Figure 4. Mean DCA positions on BC-1 and BC-2 since 1987: A. BC-1 vs. BC-2, Axis 1 vs. Axis 2; B. BC-1 vs. BC-2, Axis 2 vs. Axis 3.Horizontal and vertical lines are standard errors �SE� of the DCA scores in each year on two axes.
283
Species rank abundances were correlated �Spearmanr � 0.70, P � 0.001�. The differences were due tothe proximity of woodlands that contributed differen-tially to the vegetation of BC-1. Conifers reduced thenumber of species per plot by altering conditionsfrom meadow to woodland. As a result, richness wasslightly lower, and declining. H’, which was initiallycomparable to that of BC-2, did not increase after1994 and began to decline thereafter. E and S dem-onstrated similar contrasts between BC-1 and BC-2through time. These contrasts resulted from the dif-ferential proximity to conifers. While conifers de-clined with distance and elevation on BC-1, theproportion of common meadow species increased.
DCA demonstrated directional change on both la-hars. There was greater turnover on BC-1 because ofthe greater degree of conifer development and corre-lated increases in some herb species. Initially, bothsamples had low conifer density, but conifers becamedominant on most plots of BC-1. Spatial variations inconifer distribution also precluded reductions in DCAscore variation with time. In contrast, BC-2 lacked astrong conifer gradient, so that directional change wassmaller and variation decreased significantly. Thisdemonstrates how transitional sites can remainheterogeneous until all plots have been saturated withinvading species. A failure of vegetation to convergeor to become homogenous may be due to initial dis-persal gradients. Such gradients may contribute to theregularly low degree of predictability observed instudies relating species composition to environmentalfactors �McCune 1992�.
Through time, the plots became more similar, aswould be expected. However, significant composi-tional differences initiated by events early in this pro-cess rather than from environmental differences maypersist even if trees dominate the entire site �delMoral et al. 2004�. Just as control meadow vegeta-tion remains variable, woodland vegetation may re-tain vestiges of its early development that precludecomplete homogeneity. The similarity in a smallwoodland sample adjacent to BC-1 was 60%, reflect-ing the presence of residual meadow species.
The present study confirmed predictions based onthe influence of isolation solely by distance. Coverdeclined while equitability and floristic heterogeneityincreased with increasing isolation. Secondary dis-persal from early colonists appears to be of minorimportance. It also confirmed the prediction that therate of community development is related to thegrowing season. Less mature vegetation found at
higher elevations was more variable and exhibitedless dominance than more mature vegetation. Sam-ples within the seed shadow, where the seed rain isdenser, developed stronger dominance more quicklythan did distant samples.
Restoration ecologists are aware of the importanceof dispersal limitations in rehabilitating forests andrecommendations to augment species diversity by theintroduction of seeds of infrequent species areincreasingly common �Makana and Thomas 2004�.Our data demonstrated that colonization may be lim-ited over even shorter distances than is oftenassumed.
Vegetation is molded both by environmental andbiological factors, but the initial conditions uponwhich these factors work are created by landscape ef-fects and chance �del Moral and Wood 1988�. Thepace of early succession is governed by the rate ofdispersal, which is dictated by proximity, and ‘rela-tive succession rates.’ Relative succession rates weredescribed on long-term chronosequences in Hawaii,in terms of soil development and species turnover�Kitayama and Mueller-Dombois 1995�, and on a121-year chronosequence in Dutch dunes �De Kovelet al. 2000�. Development on slack dune vegetationis also governed in large part by the accumulation ofbiomass, which is controlled by local hydrologicalpatterns �Sekora et al. 2004�. Here we show that theeffect is present at the onset of succession.
This study showed that the proximity effect is rap-idly attenuated and that dispersal limitation effectscan occur even within 40 m �del Moral and Eckert2004�. Small differences in growing season retardsuccession as evidenced by reduced cover andincreased heterogeneity with increased elevation. Assuccession unfolds, species occupy the landscape anddominance patterns develop. Spatial variation andequitability decline, but there is a limit to the degreeof homogeneity that can develop. Vegetation can re-tain a residual of unexplainable variation that islinked to the types of landscape effects demonstratedin this study. Historical accidents �contingencies� andstochastic invasion patterns that can produce priorityeffects that alter dominance patterns also will affectthe ultimate species composition in mature vegeta-tion.
284
Acknowledgments
We gratefully acknowledge funding from the NationalScience Foundation under DEB-94-06987 and DEB-00-87040. We are particularly indebted to A. S.Anderson, A. Coogan, K. Dlugosch, A. J. Eckert, C.E. Fairbourn, T. S. Fletcher, C. C. Jones, K. Pearl, L.Rozzell, and M. Spasojevic for their able assistanceand to T. S. Fletcher, C. Jones, and E. Addis for theircomments.
References
Aarssen L.W. and Epp G.A. 1990. Neighbor manipulations innatural vegetation: A review. Journal of Vegetation Science 1:13–30.
Analytical Software. 2001. Statistix7® for Windows. AnalyticalSoftware, Tallahassee, Florida, USA.
Belyea L.R. and Lancaster J. 1999. Assembly rules within a con-tingent ecology. Oikos 86: 402–416.
Borgegärd S.O. 1990. Vegetation development in abandoned gravelpits: effects of surrounding vegetation, substrate and regionally.Journal of Vegetation Science 1: 675–682.
Brunet J. and von Oheimb G. 1998. Migration of vascular plantsto secondary woodlands in southern Sweden. Journal of Ecol-ogy 86: 429–438.
Bunting M.J. and Warner B.G. 1998. Hydroseral development insouthern Ontario, patterns and controls. Journal of Biogeogra-phy 25: 3–18.
Butaye J., Jacquemyn H. and Hermy M. 2001. Differential coloni-zation causing non-random forest plant community structure ina fragmented agricultural landscape. Ecography 24: 369–380.
Dale V.H., Swanson F.J. and Crisafulli C.M. 2004. Ecological re-covery after the 1980 eruptions of Mount St. Helens. Springer-Verlag, New York, New York. �In press�.
Davey M.C. and Rothery P. 1993. Primary colonization bymicroalgae in relation to spatial variation in edaphic factors onAntarctic fell field soils. Journal of Ecology 81: 335–344.
De Kovel C.G.F., Van Mierlo A.J.E.M., Wilms Y.J.O. and BerendseF. 2000. Carbon and nitrogen in soil and vegetation at sites dif-fering in successional age. Plant Ecology 149: 43–50.
del Moral R. 1993. Mechanisms of primary succession on volca-noes: a view from Mount St. Helens.. In: Miles J. and WaltonD.H. �eds�, Primary Succession on Land. Blackwell ScientificPublications, London, UK, pp. 79–100
del Moral R. 1998. Early succession on lahars spawned by MountSt. Helens. American Journal of Botany 85: 820–828.
del Moral R. 1999. Plant succession on pumice at Mount St.Helens. American Midland Naturalist 141: 101–114.
del Moral R. 2000. Succession and species turnover on Mount St.Helens, Washington. Acta Phytogeographica Suecica 85: 53–62.
del Moral R. and Eckert A.J. 2004. Colonization of volcanic desertsfrom productive patches. American Journal of Botany. �In press�.
del Moral R. and Grishin S.Y. 1999. Volcanic disturbances andecosystem recovery.. In: Walker L.R. �ed.�, Ecosystems of Dis-turbed Ground, Ecosystems of the World 16. Elsevier Publish-ers, Amsterdam, The Netherlands, pp. 137–160.
del Moral R. and Jones C.C. 2002. Vegetation development onpumice at Mount St. Helens, USA. Plant Ecology 162: 9–22.
del Moral R. and Wood D.M. 1988. Dynamics of herbaceous veg-etation recovery on Mount St. Helens, Washington, USA, after avolcanic eruption. Vegetatio 47: 11–27.
del Moral R., Wood D.M. and Titus J.H.. 2004. Proximity, micro-sites, and biotic interactions during early primary succession.. In:Dale V.H., Swanson F.J. and Crisafulli C.M. �eds�, EcologicalRecovery After the 1980 Eruptions of Mount St. Helens, Ch. 7.Springer-Verlag, New York, New York. �In press�.
Dlugosch K. and del Moral R. 1999. Vegetational heterogeneityalong environmental gradients. Northwest Science 43: 12–18.
Eriksson O. and Eriksson A. 1998. Effects of arrival order and seedsize on germination of grassland plants: Are there assembly rulesduring recruitment? Ecological Research 13: 229–239.
Facelli J.M. and D’Angela E. 1990. Directionality, convergenceand the rate of change during early succession in the InlandPampa, Argentina. Journal of Vegetation Science 1: 255–260.
Fastie C.L. 1995. Causes and ecosystem consequences of multiplepathways of primary succession at Glacier Bay, Alaska. Ecology76: 1899–1916.
Foster B.L. and Tilman D. 2003. Seed limitation and the regulationof community structure in oak savanna grassland. Journal ofEcology 91: 999–1007.
Foxworthy B.L. and Hill M. 1982. Volcanic eruptions of 1980 atMount St. Helens: the first 100 days. U.S. Geological SurveyProfessional Paper 1249, U.S. Government Printing Office,Washington, D.C.
Frelich L.E., Sugita S., Reich P.B., Davis M.B. and Friedman S.K.1998. Neighbourhood effects in forests: implications for withinstand patch structure. Journal of Ecology 86: 149–161.
Fridriksson S. and Magnusson B. 1992. Development of the eco-system on Surtsey with reference to Anak Krakatau. Geo Jour-nal 28: 287–291.
Fuller R.N. and del Moral R. 2003. The role of refugia and dis-persal in primary succession on Mount St.Helens, Washington.Journal of Vegetation Science 14: 637–644.
Glenn-Lewin D.C. 1980. The individualistic nature of plant com-munity development. Vegetatio 43: 141–146.
Halpern C.B. and Harmon M.E. 1983. Early plant succession onthe Muddy River mudflow, Mount St.Helens, Washington.American Midland Naturalist 110: 97–106.
Hubbell R.P., Foster R.B., O’Brien S.T., Harms K.E., Condit R.,Wechsler B., Wright S.J. and De Lao S.L. 1999. Light-gap dis-turbances, recruitment limitations, and tree diversity in a neotro-pical forest. Science 283: 554–557.
Inouye R.S. and Tilman D. 1995. Convergence and divergence ofold-field vegetation after 11 yr of nitrogen addition. Ecology 76:1872–1887.
Kahmen S. and Poschlod P. 2004. Plant functional trait responsesto grassland succession over 25 years. Journal of VegetationScience 15: 21–32.
Kazmierczak E., van der Maarel E. and Noest V. 1995. Plant com-munities in kettle-holes in central Poland: chance occurrence ofspecies? Journal of Vegetation Science 6: 863–874.
Kitayama K. and Mueller-Dombois D. 1995. Vegetation changesalong gradients of long-term soil development in the Hawaiianmontane rainforest zone. Vegetatio 120: 1–20.
Kovach W.L. 1998. Multivariate statistical packages. Plus 3.1. Us-ers’ Manual. 127 p.
285
Mathsoft 2001. Axum 7 for Windows user’s guide. Insightful Cor-poration, Seattle, Washington, USA.
McCune B. 1992. Components of error in predictions of speciescomposition changes. Journal of Vegetation Science 3: 27–34.
McCune B. and Allen T.F.H. 1985. Will similar forests develop onsimilar sites? Canadian Journal of Botany 63: 367–376.
McCune B. and Mefford M.J. 1999. PC-ORD, multivariate analy-sis of ecological data, version 4.0. MjM Software Design,Gleneden Beach, OR, USA.
Makana J.R. and Thomas S.C. 2004. Dispersal limits natural re-cruitment of African mahoganies. Oikos 106: 67–72.
Malanson G.P. and Butler D.R. 1991. Floristic variation amonggravel bars in a subalpine river, Montana, USA. Arctic and Al-pine Research 23: 273–278.
Martínez M.L., Vázquez G. and Sánchez Colón S. 2001. Spatialand temporal variability during primary succession on tropicalcoastal sand dunes. Journal of Vegetation Science 12: 361–372.
Matlack G.R. 1994a. Vegetation dynamics of the forest edge–trendsin space and successional time. Journal of Ecology 82: 113–123.
Matlack G.R. 1994b. Plant species migration in a mixed-historyforest landscape in eastern North America. Ecology 75: 1491–1502.
Primack R.B. and Miao S.L. 1992. Dispersal can limit local plantdistribution. Conservation Biology 6: 513–519.
Roozen J.M. and Westhoff V. 1985. A study of long-term salt-marshsuccession using permanent plots. Vegetatio 61: 23-32.Rydin H.and Borgegård S.O. 1991. Plant characteristics over a century ofprimary succession on islands, Lake Hjälmaren. Ecology 72:1089–1101.
Savage M., Sawhill B. and Askenazi B. 2000. Community dynam-ics: what happens when we rerun the tape? Journal of Theoreti-cal Biology 205: 515–526.
Sekora K.V., van den Bogert J.C.J.M. and Berendse F. 2004.Changes in soil and vegetation during dune slack succession.Journal of Vegetation Science 15: 209–218.
Tagawa H. 1992. Primary succession and the effect of first arrivalson subsequent development of forest types. GeoJournal 28:175–183.
Tilman D. 1997. Community invisibility, recruitment limitation,and grassland biodiversity. Ecology 78: 81–92.
Tofts R. and Silverton J. 2002. Community assembly from the lo-cal species pool: an experimental study using congeneric speciespairs. Journal of Ecology 90: 385–393.
Verheyen K., Guntenspergen G.R., Biesbrouck B. and Henry M.2003. An integrated analysis of the effects of past land use onforest herb colonization at the landscape scale. Journal of Ecol-ogy 91: 731–742.
Walker L.R. and del Moral R. 2003. Primary succession and eco-system rehabilitation. Cambridge University Press, Cambridge,UK.
Ward S.A. and Thornton I.W.B. 2000. Chance and determinism inthe development of isolated communities. Global Ecology andBiogeography 9: 7–18.
Weiher E. and Keddy P. 1999. Ecological assembly rules: perspec-tives, advances, retreats. Cambridge University Press, Cam-bridge, UK.
Wood D.M. and del Moral R. 1988. Colonizing plants on the Pum-ice Plains, Mount St. Helens, Washington. American Journal ofBotany 75: 1228–1237.
Wood D.M. and del Moral R. 2000. Seed rain during early primarysuccession on Mount St. Helens, Washington. Madroño 47: 1–9.
286
Copyright © 2022 FDOKUMEN