
Government, Venture Capital and the Growth of European High-Tech Start-Ups: A Firm-Level Panel Data...
55
1 Government, venture capital and the growth of European high-tech entrepreneurial firms Luca Grilli a *, Samuele Murtinu a a Politecnico di Milano, Department of Management, Economics and Industrial Engineering, Via R. Lambruschini 4/b, 20156, Milan, Italy * Corresponding author. Phone: +39 02 2399 3955; fax: +39 02 2399 2710. E-mail addresses: [email protected] (L. Grilli), [email protected] (S. Murtinu). Acknowledgments: Financial support from the VICO project financed under the 7th European Framework Programme (Grant agreement no. 217485) is gratefully acknowledged. We are thankful to the editor, two anonymous reviewers, Massimo G. Colombo and all VICO members, to the participants at the 2012 RENT Conference in Lyon, for helpful comments and suggestions. Responsibility for any errors lies solely with the authors.
Transcript of Government, Venture Capital and the Growth of European High-Tech Start-Ups: A Firm-Level Panel Data...

1
Government, venture capital and the growth of European high-tech
entrepreneurial firms
Luca Grillia*, Samuele Murtinu
a
a Politecnico di Milano, Department of Management, Economics and Industrial
Engineering, Via R. Lambruschini 4/b, 20156, Milan, Italy
* Corresponding author. Phone: +39 02 2399 3955; fax: +39 02 2399 2710.
E-mail addresses: [email protected] (L. Grilli), [email protected] (S.
Murtinu).
Acknowledgments: Financial support from the VICO project financed under the 7th European
Framework Programme (Grant agreement no. 217485) is gratefully acknowledged. We are thankful to
the editor, two anonymous reviewers, Massimo G. Colombo and all VICO members, to the
participants at the 2012 RENT Conference in Lyon, for helpful comments and suggestions.
Responsibility for any errors lies solely with the authors.

2
Government, venture capital and the growth of European high-tech
entrepreneurial firms
Abstract
Using a new European Union-sponsored firm-level longitudinal dataset, we assess the impact of government-managed
(GVC) and independent venture capital (IVC) funds on the sales and employee growth of European high-tech
entrepreneurial firms. Our results show that the main statistically robust and economically relevant positive effect is exerted
by IVC investors on firm sales growth. Conversely, the impact of GVC alone appears to be negligible. We also find a
positive and statistically significant impact of syndicated investments by both types of investors on firm sales growth, but
only when led by IVC investors. Our results remain stable after controlling for endogeneity, survivorship bias, reverse
causality, anticipation effects, legal and institutional differences across countries and over time and are stable with respect
to potential non-linear patterns in the growth dynamics of entrepreneurial firms. Overall, our analysis casts doubt on the
ability of governments to support high-tech entrepreneurial firms through a direct and active involvement in VC markets.
Appendices A, B, C, and D provided at the end of the manuscript.
1. Introduction
The gap in public and private R&D spending is reputed by policymakers to be one of the main
factors that is responsible for the slower growth rate that European economies have been experiencing
with respect to international competitors. Although the relationship between R&D and economic
growth is far from finding full support in the scientific literature and cannot be considered to be
automatic (see, for example, the Swedish case and the R&D-growth paradox discussed in Dosi et al.,
2006, and Ejermo et al., 2011), the need to increase R&D spending has been at the center of the
Communitarian policies since the Lisbon 2000 strategy. In this respect, one important cause that is
individuated by the European Commission for explaining the European R&D gap is the low presence
of high-tech rapid-growth entrepreneurial firms on the old continent. In the words of the Europe 2020
agenda (European Commission, 2010: p. 10), 'R&D spending in Europe is below 2%, compared to
2.6% in the US. […] Our smaller share of high-tech firms explains half of our gap with the US'.
One widely shared belief is that the creation of a florid pan-European venture capital (VC) market is
a fundamental pre-requisite to bridging the above-mentioned gap and increasing the European Union
(EU) performances in terms of innovation (Kortum and Lerner, 2000), job creation (Puri and
Zarutskie, 2012) and economic growth (Samila and Sorenson, 2011).
3
However, the development of VC markets in the European Member States has been dramatically
different from the development that is experienced in the US. The ratio between VC and private equity
(PE) investments was estimated in 2009 to be 17% in Europe and 67% in the US,1 and the overall
value of the VC investments over the GDP is nearly three times higher in the US than in Europe
(Bertoni and Croce, 2011; Croce et al., forthcoming). The recent financial crisis has further weakened
the EU VC fundraising capacity in the subsequent years (Kraemer-Eis and Lang, 2011).
The need for an efficient EU VC market to spur economic growth is well understood at the policy
level and has resulted in a series of policy initiatives (the most important initiative is the Risk Capital
Action Plan in 1998) at various playing field-levels (e.g., measures that aim at increasing stock market
openness and/or labor market flexibility or tax incentives), which targeted both the supply of and the
demand for VC. According to market operators, even though some structural problems remain (e.g.,
thin and fragmented exit markets, limited fundraising capacity due to different national regulatory
regimes), these attempts contributed to strengthening the EU VC markets, especially after the dot-com
bubble (EVCA, 2010). Such policy initiatives also led to a specific peculiarity of the EU context: the
relative importance compared to other geographical contexts (the US in primis) of governmental VC
funds (GVCs) (Leleux and Surlemont, 2003). GVCs are not indirect government support programs to
stimulate the supply of VC funds managed by independent companies (IVCs), and they are not public
subsidies that are directed toward the assistance of high-tech entrepreneurial firms.2 Instead, GVCs are
defined as funds that are managed by a company and that are entirely possessed by governmental
1 VC investments include seed, early stage and expansion deals. PE investments also include buyout deals (sources:
European Venture Capital Association, EVCA; National Venture Capital Association, NVCA). 2 With regard to the former type of public support, examples are private/public partnerships in Israel (i.e., the Yozma
program: for more details, see Avnimelech and Teubal, 2006); mutual funds in Canada (i.e., the Canadian Labour
Sponsored Venture Capital Corporation - LSVCC: for more details, see Cumming and MacIntosh, 2006, 2007a) and the
UK (Cumming, 2003); and limited partnerships in IVCs, in which the government invests alongside other private and
institutional investors: e.g., the Australian Innovation Investment Funds (IIFs) (for more details, see Cumming, 2007 and
Cumming and Johan, 2012), the Danish fund Vækstfonden, the Fund for the Promotion of Venture Capital in France, the
German fund ERP-EIF Dachfonds, and the Dutch fund TechnoPartner Seed facility. With regard to public subsidies that
are directed toward high-tech entrepreneurial firms, the main examples are grants (Lerner, 1999, 2002; Wallsten, 2000;
Audretsch et al., 2002; Lach, 2002; Gans and Stern, 2003; Colombo et al., 2011, 2013) and tax credits (Hall and Van
Reenen, 2000).

4
bodies.3 Such funds are intended to complement the thin private supply of VC by entering directly into
VC markets and helping to solve the typical chicken-egg paradox of nascent markets in which the deal
flow is scarce because of a shortage of VC and, at the same time, VC is poorly developed because
there are few potential viable targets. Examples of such programs in Europe are numerous. In Belgium,
the Biotech Fonds Vlaanderen was founded by the Flemish government in 1994 with the aim of
financing promising biotechnology companies and now is managed by another public body: GIMV. In
Finland, SITRA (the Finnish Innovation Fund) was founded in 1967 by the Bank of Finland and now
is managed by public bodies that are affiliated with the Finnish Parliament. In the UK, Scottish
Enterprise is a public agency (born as a merger of the Scottish Development Agency and the Scottish
Training Agency), which is almost fully financed by the Scottish government and selects equity
investments in promising start-ups. Public initiatives that fall into the definition of GVC are also quite
typical in other European contexts (e.g., France, Germany, Italy, Spain, among others), and basically,
they share the same mission of finding and nurturing through public equity(-like) investments the
development and growth of interesting business prospects. In this respect, there are surely less
pronounced country differences than those in which the government is not the general partner of the
fund.
Despite the numeric relevance of GVCs in Europe and their important degree of syndication and co-
financing activities with IVCs, there is a total dearth of contributions that evaluate the role that GVCs
play in fostering the growth of high-tech entrepreneurial firms in Europe. In fact, the extant empirical
literature has prevalently been devoted to examining the characteristics of specific (extra-European)
GVC programs or the moderating role that GVCs exert on the (different from growth) performance of
firms backed by private VC funds (Brander et al., 2012). Alternatively, previous studies have adopted
a macro perspective that highlighted country-specific policy (Cumming and MacIntosh, 2007b) and
3 This study adopts the prevailing criterion followed by the most known commercial datasets in the field (e.g., Thomson
One) that classify the different types of VC funds according to the type of company through which funds are managed. In
particular, here we focus on two basic different types of VC funds: funds managed by a company that is entirely possessed
by governmental sources (GVCs) and the typical 'US style' independent venture capital funds (IVCs). It is worth noting that
we do not have information on the financing sources of the VC funds. In this respect, observe that governmental sources
are unlikely to represent the major source of independent VC fundraising (see Mayer et al., 2005: p. 591). More
importantly, GVCs predominantly invest public financial resources.

5
institutional factors that are aimed at sustaining the European VC industry (Armour and Cumming,
2006; Da Rin et al., 2006).
The present work aims at reducing the above-mentioned gap. Using the VICO dataset, a novel firm-
level longitudinal dataset sponsored by the European Union under the 7° Framework Program (for
more details, see the official website at: http://www.vicoproject.org), we assess the impact of GVCs in
comparison (and in conjunction) with IVCs on the growth of European high-tech entrepreneurial firms.
First, we analyze whether the GVCs and IVCs on their own exert any beneficial effect on the growth
of European high-tech entrepreneurial firms. Second, given the existence of co-financing and
syndication activities between GVCs and IVCs,4 we also investigate whether the sequence between the
GVC and IVC investments is relevant. In particular, we examine whether significant differences in the
firms’ growth emerge if a GVC (IVC) investment occurs after an IVC (GVC) investment and whether
syndication - the presence of both GVC and IVC in the first VC investment received by a portfolio
firm - is otherwise preferable.
The remainder of this paper is organized as follows. Section 2 highlights the background literature.
Section 3 describes the data. Section 4 explains the methodology. Section 5 presents the results.
Section 6 shows additional evidence and robustness tests. Section 7 concludes.
2. Background literature
2.1 VC and firm growth
VC is reputed to be the financing mode that is the most tailored for the growth of high-tech
entrepreneurial firms, as recognized by academics (Gompers and Lerner, 2001) and (European)
policymakers (EU Economic Recovery Plan; European Council, 2008). The available empirical
evidence points steadily toward a positive impact of VCs on firm growth (e.g., Bertoni et al., 2011;
Puri and Zarutskie, 2012). Typically, there are four main reasons that are advocated in support of this
4 We closely adhere to the two definitions that were provided by Tian (2012: pp. 249-250). In particular, our definition of
syndication and co-financing refer to his first and second definition of syndication, respectively. It is worth noting that our
analysis is not at the round level. Thus, we implicitly assume that IVCs and GVCs syndicate when they invest in the focal
portfolio firm in the same year (see Brander et al., 2002 for the same criterion).

6
positive impact. First, VC investors (VCs) are better at screening entrepreneurial firms that have high-
growth potential than are other capital market operators (Sahlman, 1990), and they provide firms with
the financial resources that firms need. Second, VCs 'add value' to portfolio companies through the
provision of both managerial skills and competencies (Hellmann and Puri, 2002) and the monitoring
activity of their managerial conducts and results (Lerner, 1995). Third, VC endorsement represents a
'signal' of the quality of the portfolio firms to uninformed third parties. Hence, VC-backed firms access
external resources and competencies that would be out of reach without VC endorsement (Hsu, 2006).
Finally, VC-backed firms benefit from the network of business contacts (e.g., suppliers, customers,
institutional investors) of their VCs (Hochberg et al., 2007).
2.2 Typology of VC and firm growth: IVC and GVC
VCs diverge along several dimensions, including investment targets, screening evaluation
methods, skills and competencies, governance mechanisms and objectives. While the extant literature
has been focused on how VCs differ in their experience/reputation (e.g., Gompers, 1996; Nahata,
2008), networks (e.g., Hochberg et al., 2007), and in the design of contracts with their portfolio firms
(e.g., Kaplan and Strömberg, 2003, 2004), relatively less is known about how the organizational
structure and, in particular, the type of ownership of the VCs impacts on high-tech entrepreneurial
firms’ growth. According to a recent survey of Da Rin et al. (2011), this aspect is the most contended
dimension of the differences among the VCs, and this heterogeneity is more pronounced in Europe
than in the US. VC funds range from the archetypal US-style independent funds to bank-affiliated
branches, passing through industrial subsidiaries and their corporate VC units and governmental
bodies. Those few studies that have tackled the issue have focused especially on a comparison between
private operators, while leaving aside GVCs, especially due to lack of data.
With respect to GVCs and IVCs, their potential for having different impacts on the growth of
high-tech entrepreneurial firms might be explained by several reasons. First, GVCs and IVCs have
different objectives, although the latter might be directed toward the same goal: to foster the growth of
their portfolio firms. As emphasized in Section 1, the growth of high-tech entrepreneurial firms is a

7
priority from the EU policy perspective and is a consequent mission for EU GVCs. From a different
'objective function', the IVCs have two preferred exit routes: initial public offerings (IPOs) and
acquisitions (i.e., trade-sales). Accordingly, IVCs push the growth of their portfolio firms to increase
the likelihood of an IPO or to make them more attractive for trade-sale (Chemmanur et al., 2011).
Second, IVCs and GVCs could differ in their 'value-added' activities and their consequent ability to
reach their goal. If it is arduous on a priori ground to establish the direction of such differences, public
officers are reputed to be less likely to match the quality level of consultancy services that specialized
IVCs provide to portfolio firms (Leleux and Surlemont, 2003). Then, IVCs actively monitor portfolio
firms (Lerner, 1995) through the use of specific financial instruments and contractual clauses (e.g.,
stage financing, allocation of control rights), which create high-powered incentives for entrepreneurs
to pursue growth (Kaplan and Strömberg, 2003, 2004). Conversely, GVCs use fewer contract
mechanisms for the active monitoring of portfolio firms as well as fewer voting rights than IVCs. An
empirical comparison of the level and composition of value-added activities that are performed by
GVCs and IVCs, as perceived by portfolio firms, is provided by Luukkonen et al. (2013). Using the
VICO dataset, the authors show that IVCs are reputed to contribute more than GVCs in terms of the
development of business ideas, managerial professionalization and exit orientation. Third, IVCs and
GVCs might target different firms, according to their risk profile. For example, Mazzucato (2011) and
Auerswald and Branscomb (2003) show that IVCs often appear to shy away from risky high-tech
entrepreneurial firms (i.e., the financial returns are not high enough to justify the investment risk), and
they prefer business ideas (and associated firms) that are already quite developed. Conversely, GVCs
can present less risk-adverse attitudes in their investment choices to the extent that they also value the
social benefits that are brought in by the selected targets (see discussion in Grilli and Murtinu 2013).
Finally, even though GVCs might not be inferior to IVCs in their screening processes (Lerner, 2002: p.
78), their investment decisions could be subjected to distortions and imperfections (e.g., 'pork barrel'
spending).
2.3 Syndication and co-financing between IVCs and GVCs

8
There is a dearth of studies that focus on syndication and co-financing activities between different
types of VCs from the perspective of portfolio firms. To our knowledge, our work represents the first
attempt to explicitly analyze the impact that co-investments between IVCs and GVCs exert on the
growth of high-tech entrepreneurial firms.
In the extant literature, several reasons are advocated to justify syndication and co-financing.
Syndicated and co-financed investments could be triggered by the willingness of VCs to i) reduce
information asymmetries in the screening process through a 'second opinion' (Lerner, 1994b); ii)
overcome capital constraints and exploit complementary resources, skills, networks and industry
expertise of different VCs (Bygrave, 1987); iii) diversify their investments and reduce overall portfolio
risk (Lerner, 1994b); iv) reduce agency problems with entrepreneurs (Admati and Pfleiderer, 1994);
and v) signal to the capital markets the quality of the focal VC syndicate-backed firm and influence the
likelihood of a successful exit (Tian, 2012).
Usually, syndication between VCs is found to be beneficial for portfolio firms along a series of
dimensions, which include growth. However, the extant literature lacks an appropriate evaluation of
the effectiveness of 'mixed' syndicates, e.g., between IVCs and GVCs. In this respect, the intrinsic
differences between IVCs and GVCs might exacerbate agency and transaction costs between the two
types of investors in the syndicate (e.g., Wright and Lockett, 2003).
3. Data
3.1 The VICO dataset
This work draws on the VICO dataset. The VICO dataset is the result of a research project that is
funded by the 7th Framework Programme of the European Commission (theme SSH-2007-1.2.3 –
Grant Agreement 217485). A full description of the dataset is provided by Bertoni and Martí (2011).
Below, we limit ourselves to describing its most relevant aspects.
The use of the VICO dataset has several advantages compared to other data sources. First, it solves
an important problem that plagues some of the most popular datasets in the VC literature (e.g., the

9
Thomson One database): the misreport of fund types outside of the US. For example, checks over
Canadian and Australian data suggest that over 50% of the transactions registered by commercial
sources could present problems of attribution to the wrong fund type (Cumming et al., 2013). Second,
as testified by a recent report of the European Parliament (2012), the VICO database offers an
extensive representation of the European population of VC-backed companies. This coverage allows
us to overcome the very country-specific nature of the extant studies in the field that address the
impact of GVC on entrepreneurial firms’ growth performance (e.g., Beuselinck and Manigart, 2000 for
Belgium; Balboa et al., 2007 for Spain). Third, the specific data collection process that was pursued to
build up the VICO dataset enables a better coverage of investments that were made by non-
independent VCs (including GVCs), especially in Europe, compared with the collections that are
usually achieved by commercial databases (Ivanov and Xie, 2010: p. 135).
The VICO dataset includes data on high-tech entrepreneurial firms that operate in seven European
countries (Belgium, Finland, France, Germany, Italy, Spain and the United Kingdom). The VICO
dataset stores information on two groups of firms: VC-backed firms and non-VC-backed (but
potentially targetable by VCs) firms, which were less than 20 years old in 2010 and, in addition, were
created as independent entrepreneurial acts (i.e., not controlled by other business organizations) and
are active in high-tech (manufacturing and services) industries (see Table 1). Both groups include
surviving and non-surviving firms (i.e., firms that ceased operations or were acquired).
[Table 1 around here]
For VC-backed firms, data were collected through a random extraction from several proprietary and
commercial sources. Country-specific proprietary sources were the yearbooks of the Belgium Venture
Capital and Finnish Venture Capital Associations, the ZEW Foundation Panel (Germany), the RITA
directory and Private Equity Monitor (Italy), the José Martí Pellón Database (Spain), the Library
House (now Venture Source, UK), press releases and press clippings, and initial public offering (IPO)
prospectuses. Commercial databases were the Thomson One database, VCPro-Database, and Zephyr.
A central data collection unit ensured that the information was consistent and comparable across

10
countries. In particular, data were cross-checked with those data sources that were available from
public sources, e.g., reports provided by the national associations of private equity investors and the
websites and financial reports of the VCs. The number of VC-backed firms was restricted to those that
received their first investment round before the tenth year after the foundation. Because of the data
limitations in the years before the early 1990s and the necessity of a minimum number of post-
investment observations to evaluate the impact of VCs on portfolio firm performances, the VICO
dataset includes VC-backed firms that received their first investment round between 1994 and 2004.
The VICO dataset includes equity (or equity-like) financing that was provided by VCs to
entrepreneurial firms (i.e., seed, early-stage, late-stage and expansion capital), while information on
LBOs, real estate, distressed debt funds and other private equity investments are not included.
For the identification of non-VC-backed firms, we resort to a random extraction from proprietary
and commercial databases. The main commercial source was Amadeus. All of the available vintage
years of Amadeus were used to build a population such that non-surviving firms were included. For
the VC-backed firms, country-specific proprietary sources were also used to improve the coverage of
the dataset (e.g., Credit reform in Germany, Italian business community’s data bank in Italy). To
summarize, the VICO dataset consists of 8,370 firms, 759 of which are VC backed (data accessed on
December 19th
2011).
3.2 Descriptive statistics
The number of IVC- and GVC-backed firms is 538 and 239, respectively. Among them, 126 firms
received VC from both types of investors. Table 2 reports the number and ratio of IVC-backed and
GVC-backed firms and the subset of co-financed firms across countries and industries. Among the
IVC-backed firms, the UK represents the most developed VC market (27.32% of the total IVC-backed
firms), followed by Germany (18.59%) and France (18.22%). The situation is different for the GVC-
backed firms, where France has the greatest share (20.08%), followed by Spain (17.99%) and
Germany (15.06%). France is also the leading country in terms of co-financed investments between
IVCs and GVCs (31.75%), followed by the UK (15.87%) and Germany (14.29%). Among the

11
industries that were investigated herein, software represents the main target for both IVCs (40.52%)
and GVCs (38.08%). ICT manufacturing (18.03%) and biotechnology (24.69%) represent the second
largest target market for IVCs and GVCs, respectively. Co-finance activity is not numerically
negligible. Co-financed investments are mainly targeted to software and biotechnology industries
(41.27% and 24.60%, respectively).
[Table 2 around here]
Table 3 presents statistics about the temporal dynamics of co-financing and syndication between
GVCs and IVCs. In more than a half of the co-financed investments (51.59%), there is syndication
between IVCs and GVCs.
[Table 3 around here]
In Table 4, we report some descriptive statistics about the size (both in terms of the sales value and
the number of employees) and the age for VC-backed and non-VC-backed firms that are included in
the VICO dataset. IVC-backed firms are, on average, larger than both GVC-backed and co-financed
firms but (slightly) smaller than non-VC-backed firms, both in terms of the sales value (on average c.a.
€ 6 million for IVC-backed firms vs. c.a. € 3 million for GVC-backed, € 3.5 million for co-financed
and € 6.5 million for non VC-backed firms) and headcount (on average c.a. 34 employees for IVC-
backed firms vs. c.a. 26 employees for GVC-backed, 29 employees for co-financed and 41 employees
for non VC-backed firms). Age distributions are comparable across all categories (approximately 6
years old).
[Table 4 around here]
4. Econometric framework
4.1 Matching procedure
To appropriately evaluate the average impact that is exerted by different types of VCs on high-tech
entrepreneurial firm growth, we define three different types of 'treated' firms: 1) the IVC-backed firms
(which potentially received a GVC investment after the initial IVC round); 2) the GVC-backed firms

12
(which potentially received an IVC investment after the initial GVC round); and 3) the VC syndicate-
backed firms, which receive an initial syndicated investment by GVCs and IVCs.
For each of these three 'states of nature', we use a propensity score method to match each VC-
backed firm to a similar non-VC-backed firm (see Görg and Strobl, 2007, for an identical approach in
a different context). Matching procedures are well established in the VC literature (e.g., Megginson
and Weiss, 1991; Puri and Zarutskie, 2012; Chemmanur et al., 2011; Tian, 2012; Croce et al., 2013).
In fact, VC financing can hardly be considered to be the result of a random process: entrepreneurial
firms choose whether to search for VC funding, and VCs accurately select their portfolio firms.
Specifically, we built a matched sample of non-VC-backed firms that were comparable to the sample
of VC-backed firms in each of the three categories reported above, according to a set of a priori
characteristics.5 For each category of VC-backed firms that received the first VC financing in the year
t, we performed a one-to-one matching without replacement in the year t. Propensity scores were
obtained through a logit model on a set of independent variables: the firm age, firm size, country and
industry controls. We use a model specification that has covariates that are identical to those that are
used in Puri and Zarutskie (2012), with the only obvious exception being that we have European
countries (and not US regions) as geographical controls. As industry controls, we refer to the industries
that are shown in Table 1. All of the details on the matching procedure(s) and balancing tests that we
performed are provided in Appendix A. The three matched samples are labeled 'IVC vs. no VC
financing', 'GVC vs. no VC financing' and 'Syndication vs. no VC financing', respectively.
4.2 Model specification
5 Before performing propensity score matching (PSM), we remove from the dataset i) firms that are included in the industry
Other (see Table 1) because of the excessive heterogeneity of the industries included; ii) firms that are backed by bank-
affiliated VCs, corporate VCs, university-sponsored VCs; and iii) firms that are backed by VCs that have a missing name,
address and/or contact information in the VICO dataset. We excluded VC-backed firms in categories ii) and iii) from the
year of VC funding onward and not before because they could represent a potential target for IVCs and GVCs in that
period. However, as a robustness check, we exclude from the dataset VC-backed firms in categories ii) and iii) also in the
years before VC funding, and we re-estimate our model(s), which are presented in Section 5. The results are quite
unchanged and are available upon request from the authors.

13
The impact of GVC and IVC investments on firm growth is investigated through the estimation of a
series of augmented Gibrat law panel data models (Evans, 1987) that are derived from the following
model specification:
.' ,1,,21,10, tiiiiititititi WTSCVCLnAgeLnSizeLnGrowth εψααα ++++++++= −− [1]
This equation is a standard specification in the industrial organization literature on firm growth
(e.g., Sutton, 1997; Caves, 1998), which allows us to test whether the growth rates of VC-backed firms
persistently increase after the first round of IVC or GVC (or an initial IVC-GVC syndicated
investment) with respect to non-VC-backed firms. LnGrowthi,t is the natural logarithmic firm growth
between time t-1 and t; LnSizei,t-1 is the logarithm of the firm size at time t-1 (the argument was
augmented by 1 in the case of a value of 0); VCi,t-1 is a vector of step dummy variables that indicate the
VC status of firms (i.e., the variables switch permanently from 0 to 1 in the year following the first VC
round);6 Ci and Si are country and industry dummies, respectively; Ti are year dummies that capture
time-varying macroeconomic shocks; Wi are unobservable firm-specific factors; and εi,t are i.i.d. error
terms.7 We measure the firm size as the number of employees and the sales value (deflated by using
the consumer price index, with the year 2005 the reference year; source: Eurostat), alternatively. The
availability of employment and sales data defines our observation period in the time frame from 1993
(or the year of the firm’s foundation) to 2010 (or the year of the firm’s exit from the dataset).
Overall, the three matched samples 'IVC vs. no VC financing', 'GVC vs. no VC financing' and
'Syndication vs. no VC financing' include 6.59 (6.94), 7.74 (7.84) and 6.73 (7.09) yearly observations
per firm in the sales (employees) growth specification, respectively.
6 Variables are lagged as a very preliminary estimation strategy to reduce the potential reverse causality concerns. Note that
these variables do not switch back to 0 when the VC investors exit. The reason is that VC-backed firms are inherently
different from non-VC-backed firms. For example, VC financing is assumed to signal the quality of a firm to uninformed
third parties, making it easier for the firm to obtain access to additional resources independently of the presence of a VC
investor in the firm (Megginson and Weiss, 1991; Hsu, 2004; Croce et al., 2013). 7 This approach is analogous to the dynamic specification for the test of the Gibrat law that was suggested by Chesher
(1979). In other words, starting from a dynamic equation
tiiiiititititi WTSCVCLnAgeLnSizeLnSize ,1,,21,0, ' εψαβα ++++++++= −− and subtracting from both members
1, −tiLnSize , one obtains equation [1] with α1 equal to (β-1).

14
5. Results
5.1 The impact of IVC and GVC investments on firm growth
Table 5 presents the estimates of the two basic model specifications of equation [1]. In Panel A,
VCi,t-1 is constituted by IVCi,t-1, and regressions are run on the ‘IVC vs. no VC financing’ sample. In
Panel B, VCi,t-1 is constituted by GVCi,t-1, and regressions are run on the ‘GVC vs. no VC financing’
sample.
[Table 5 around here]
Columns (I) to (IV) refer to sales growth, while columns (V) to (VIII) refer to employee growth.
Different panel estimators are used. Pooled OLS estimates that control for country, industry and time
dummies are shown in columns (I) and (V). The estimates highlight a positive and significant impact
of IVC on both the sales and the employee growth. Conversely, the impact of GVC is of much lesser
magnitude than IVC and is never statistically significant.
In columns (II) and (VI), we turn to a fixed effects (FE) estimation, which removes any potential
concerns on the endogeneity of independent variables due to their alleged correlation with Wi.8
Interestingly, the positive and significant impact of IVC is confirmed in the sales growth equation,
while it loses statistical significance (even though it is still positive) in the employee growth
regression. More specifically, becoming an IVC-backed firm results in a short-run increase in the
yearly sales growth of +38.3% (which is significant at 1%). With respect to GVC, the results are in
line with OLS estimates in the sales growth equation. Conversely, they show a negative (although not
significant) coefficient in the employee equation.
In principle, if VCs observe a set of firm-specific time-varying characteristics that we are not able
to control for, and these latter characteristics influence positively (or negatively) both the VCs’
decision to invest and the growth performance of their portfolio firms, the impact of IVCi,t-1 and GVCi,t-
1 on the firm growth estimated through OLS and FE would be biased. Thus, to complement the FE
8 As suggested by Wooldridge (2002), the FE estimator is usually more efficient than first-differences OLS. Moreover, in
our context of analysis, first-differences OLS is a 'too short memory' estimator (Laporte and Windmeijer, 2005).

15
estimation and account for the possible biases that are caused by both the dynamic specification9 and
the unobserved time-varying heterogeneity, we resort to the two-step system generalized method of
moments (GMM-SYS) approach (Blundell and Bond, 1998). We do not consider GMM-SYS to be
strictly valid per se, but we deem it to be a robustness check (among the others that we perform; see
Section 6.2) in that the results that are obtained through the FE estimator were not simply driven by
some omitted time-varying unobserved variables (for a similar use of the GMM-SYS approach, see,
e.g., Stoyanov, 2011; and for applications in the VC literature, see, e.g., Samila and Sorenson, 2011).10
In particular, we make the conservative assumption that the VC variables and the lagged size measure
are potentially endogenous, and we run two different GMM-SYS estimators. The first estimator
(columns III and VII) uses a reduced instrument set, with moment conditions in the interval of t-3 (t-2)
to t-4 (t-3) for instruments in levels (differences).11
The use of this specific time-lag structure is
justified by the fact that the use of a large number of instruments potentially results in a significant
finite-sample bias (Roodman, 2009) and measurement errors could cause potential distortions (Bond,
2002). The second GMM-SYS estimator (columns IV and VIII) uses all of the available moment
conditions of the time series but collapses the instruments set as suggested by Roodman (2009: pp.
148-149). Note that in all of the GMM regressions, we applied a finite-sample correction for the two-
9 We also compute the bias-corrected least-squares dummy variable (LSDV) estimator for standard autoregressive panel
data models, using the bias approximation suggested by Bruno (2005). The dynamic bias in the FE estimates is decreasing
in T (e.g., Bond, 2002). Thus, the dynamic bias should be limited in our analysis because our time frame is sufficiently
long. In fact, results of the bias corrected-LSDV estimates as to the coefficients of both LnSizei,t-1 and the dummy variables
of interest always appear to be quite similar to those that are estimated through the FE method. A series of Hausman tests
(whose results are available upon request from the authors) do not reject the null hypothesis of the equality of the
coefficients between FE and bias corrected-LSDV estimators. 10 Other instrumental variables (IV) methods are less compelling in our context due to the pitfalls in controlling for the
dynamic bias in our model specification. Moreover, it is difficult to find valid and reliable external firm-specific
instruments for the vector VCi,t-1. For more details, see Appendix B. 11
In our GMM-SYS estimates, the ratio between the number of instruments and the number of groups is always far below
1. The ratio between the number of instruments and the number of observations is always extremely low in the first two
samples - 'IVC vs. no VC financing' and 'GVC vs. no VC financing' - (ranging from 0.0101 to 0.0434 and from 0.0290 to
0.1077, respectively), while it sensibly increases in the third matched sample - 'Syndication vs. no VC financing'. It is
worth noting that in the latter case, the Hansen statistics assume the implausibly perfect p-value of 1.000. In this case, the
GMM-SYS results are not reliable and, accordingly, are not presented (see Table 7).

16
step covariance matrix that was suggested by Windmeijer (2005).12
Tests on the reliability of the
instruments in the levels and differences are provided in Appendix B.
The GMM-SYS results are substantially in line with those highlighted by the FE estimator and
reveal that a truly positive and statistically significant impact is exerted only by the IVCs on the sales
growth. The magnitude of this effect is somehow reduced by the GMM-SYS estimators but is still
important in both economic and statistical terms, ranging from +19.5% (significant at 5%) to +33%
(significant at 1%).13
The coefficient of the variable GVCi,t-1 is always found to be not statistically
significant in the GMM-SYS estimates (except for a negative sign that is significant at 5% in column
VII of Panel B). Note, however, that in this case (as in all GMM-SYS estimates of the employee
growth equation in Table 5), the coefficient of LnSizei,t-1 is not significantly different from zero. This
coefficient corresponds to the coefficient of the lagged size variable in Chesher’s dynamic
specification (see footnote 7) being not different from one, which makes the whole GMM approach
highly unreliable.
Finally, let us briefly consider the estimated effects of the firm size and age on the growth rates. The
coefficient for the firm size is always negative and is prevalently significant at the conventional
confidence levels. Similarly, the estimated coefficient for the firm’s age, when statistically significant,
has a negative sign. Both of the results are consistent with the prevailing (but not unanimous) evidence
that is highlighted by the empirical literature on the Gibrat law, which is that smaller and younger
firms tend to grow faster than larger and more mature firms (e.g., Evans, 1987).
5.2 The impact of co-financing on the firm growth
To gain further insights and enrich our understanding of the phenomenon, in Table 6 we explore
whether any differences arise in the VC impact due to co-financing between GVCs and IVCs. In Panel
12 We also employ small-sample formulas for estimating the covariance matrix and the corresponding standard errors. The
results are almost unchanged and are available upon request from the authors. 13
As highly emphasized in the econometric literature (Bond, 2002), the FE estimator produces, by construction, an upward
bias in the absolute value of the coefficient α1 in equation [1], corresponding to a downward bias in the estimate of β in the
Chesher’s specification (see footnote 7). Unavoidably, this leads the FE method to overstate the VC short-run effects herein
reported, and understate the long-run effects that will be presented in Section 6.1.2 (see equation [2]). The misleading
influence of the dynamic bias in FE estimates is very limited in our case (see footnote 9). However, for the sake of
prudence, FE results have to be regarded as extreme bounds of the real impact of the variables of interest on firm growth.

17
A, the vector VCi,t-1 includes IVCi,t-1, and the step dummy variable GVCafteri,t-1, which captures a
possible subsequent GVC investment after the IVC investment. In Panel B, in the same way, VCi,t-1
includes GVCi,t-1, and the step dummy variable IVCafteri,t-1.
[Table 6 around here]
We employ the same set of estimators as in the previous analysis. In the sample 'IVC vs. no VC
financing' (Panel A), the impact of IVC on the sales growth continues to remain positive and strongly
significant (regardless of the estimation technique that is employed), and the magnitude of the effect is
only marginally affected by the addition of the GVC variable. Conversely, GVCafteri,t-1 exerts a
positive and significant effect in the OLS (+19.8% significant at 10%) and FE regressions (+83.4%
significant at 5%), but this effect is strongly reduced in both the magnitude and statistical significance
in the GMM-SYS estimates.
With respect to the employment growth, the IVC variable is not statistically significant in all of the
performed regressions (with the exception of OLS, as in Table 5). GVCafteri,t-1 is positive but is not
statistically significant in the FE estimates, while it increases in magnitude and statistical significance
in the GMM-SYS estimates. However, this latter result is again far from being reliable (the coefficient
of the lagged size variable is not significantly different from 0 in column VII), and we consider it to be
imprudent to draw a conclusion about a positive moderating role of GVC on the employee growth of
the IVC-backed firms.
Turning to the sample 'GVC vs. no VC financing' (Panel B), the role of co-financing appears to
mirror the role highlighted above. Again, the positive impact of IVCafteri,t-1 on the sales growth in the
FE estimates (+43.4%, significant at 10% only) is not confirmed by the GMM analysis. In the same
way, the positive and significant sign of the variable IVCafteri,t-1 on employee growth highlighted by
GMM-SYS estimates appears to be driven more by (ineludible) concerns in the GMM methodology
rather than representing a truly genuine positive impact.
5.3 The impact of syndication on firm growth

18
In Table 7, we focus on the sample 'Syndication vs. no VC financing' and investigate the effects of
syndicated investments by IVCs and GVCs on the growth of high-tech entrepreneurial firms. In Panel
A, VCi,t-1 is composed by a single step dummy variable (VCSyndicatei,t-1), which captures
entrepreneurial firms that receive their first VC investment by IVCs and GVCs in the same year. In
Panel B, we also distinguish whether the leader of the syndicate is a GVC or an IVC investor
(GVCLeaderi,t-1 or IVCLeaderi,t-1, respectively). Within the syndicate, the lead investor provides more
financial resources and adds more value to the portfolio firm than other VCs (Wright and Lockett,
2003). The VICO dataset identifies the lead investor in a syndicated investment on the basis of
secondary information sources and/or data on the distribution of the amount invested and the equity
stakes possessed by syndicated partners.
[Table 7 around here]
In this case, we show only OLS and FE estimates because the conditions for performing GMM
are a priori difficult to meet. In fact, the number of instruments is always higher than the number of
firms. Panel A reveals that the syndication between the GVCs and IVCs does not exert any statistically
significant effect on the VC syndicate-backed firms' growth. This null impact applies to both the sales
and employee growth. In this latter case, the positive and statistically significant coefficient at 10% of
VCSyndicatei,t-1 in the OLS estimates is found to lose statistical significance in the FE regression.
Further insights can be gained by distinguishing syndicates that are led by a GVC investor from
those that are led by an IVC investor. Consistent with all of the exposed findings and in particular with
the results presented in Table 5 (Panel A), the only positive and statistically significant impact of
syndication on entrepreneurial firm growth is exerted when i) the sales growth measure is used, and ii)
the GVCs do not appear as the leaders of the syndicate. Although the robustness of these results cannot
be tested through the GMM estimator(s), they confirm the benefit in terms of the sales growth of being
VC-backed by a specialized independent investor (+59.9% significant at a 10% confidence level). At
the same time, they further suggest the negligible 'direct' role of GVCs in spurring the portfolio firm
growth as measured by the sales value and employees.
19
6. Additional evidence and further robustness checks
The findings that were reported in Section 5 have been further investigated and checked.
6.1 Additional evidence
6.1.1 Value-added and financial effects
In Section 5, the entire set of estimates shows that IVCs spur the sales growth of high-tech
entrepreneurial firms, either alone or as leaders in syndicated investments with GVCs. Conversely, the
impact of GVCs is negligible. With regard to these main results, we ask: 'is it the higher growth
performance of IVC-backed (IVC-led syndicate-backed) firms due to the sole injection of capital or is
it also due to a value-added function that is performed by the IVCs (the syndicates led by the IVCs)?'.
To explore this issue, in Table 8, we re-estimate the sales growth regressions that are shown in Table 5
(columns II and IV) and Table 7 (Panel B, column II), inserting the logarithm of the total VC amount
that was (potentially) provided by IVCs and GVCs in the year t-1 (Panel A) or the logarithm of the
cumulated VC amount that was (potentially) provided by IVCs and GVCs in the years t-1, t-2 and t-3
(Panel B).14
With regard to the sample 'IVC vs. no VC financing' (columns I and II), the results in
Panel A are fully in line with those highlighted in Section 5.1 and reveal a positive and significant (at
1%) coefficient for IVCi,t-1 for the yearly sales growth (ranging from +30.6% to +39.6%). The
coefficient of the total VC amount that was received in the year t-1 (VC Amounti,t-1) does not turn out
to be significantly different from zero, which suggests that the IVCs provide more than mere financial
resources and points to the value-added function that is performed by these investors. Similar results
are obtained when inserting the cumulated VC amount that was received in the years t-1, t-2 and t-3
(Panel B): the coefficient of the total VC amount that was received (VC Amounti,t-1;t-3) is not
statistically significant, and the magnitude of the coefficient that is related to IVC is weakly affected
by its inclusion. Additionally, the results on the sample 'GVC vs. no VC financing' (columns III and
IV) are fully comparable with those highlighted in Section 5.1 and confirm that there is a negligible
14
In the case of no VC funding, the argument of the logarithm was augmented by 1.

20
impact of the GVCs on the sales growth of their portfolio firms. Turning to the sample 'Syndication vs.
no VC financing' (column V), the results in Panel A show that the magnitude of the impact of the
dummy Syndicate IVC Leaderi,t-1 on the firm sales growth is lower but is comparable to the magnitude
shown in Section 5.3 (+52.7% vs. +59.9%), and its effect is now only close to significance.
Interestingly, when we look at the results in Panel B, the magnitude and statistical significance of the
dummy variable remain almost the same as before (+53.5%, again close to significance), but the
coefficient of the cumulated VC amount that was received from t-3 to t-1 is now positive and
statistically significant at 5%. Thus, it appears that the impact of the syndicates that are led by IVCs on
the sales growth is at least partially due to capital injections.15
[Table 8 around here]
6.1.2 Long-run effects
Based on the estimates of Table 5 (columns II and IV) and Table 7 (Panel B, column II), we
computed the long-run effect of being IVC-, GVC- and VC-syndicate-backed on sales and employee
growth through FE and GMM-SYS regressions, respectively. We use the following expression:
||ˆˆ
1
)()( lim α
ψ==
∞→∞ TVC
T
VC EE . [2]
As shown in Table 9, the estimated sales increase of the IVC-backed firms ranges between +60%
and +122%, where the FE estimates represent the lower bound of this impact (the long-run effect
computed with the bias-corrected LSDV is +63%; for more details, see footnote 13). These long-run
effects are statistically significant at 1%. Conversely, we do not detect a statistically significant long-
run effect of IVC backing on employee growth. With regard to GVC-backed firms, there is not a
positive and significant impact, regardless of the growth measure that is employed. Finally, we find a
positive and significant long-run effect of syndicated investments on the sales growth (+141%, which
15
Usually, IVC-led syndicate-backed firms receive more financial resources (median value: 1,514.050 k€) than IVC-
backed (1,425.944 k€) and GVC-backed firms (211.467 k€). This evidence might help to explain the result, and it suggests
that the financial effects on the firms’ growth are produced for only sizeable VC investments.
21
is significant at 10%) when the focal IVC investor is the leading partner.16
These results are consistent
with those provided in Section 5.
[Table 9 around here]
6.2 Robustness checks
To further test the robustness of the results shown in Section 5, we perform several checks.
First, the use of a step variable to model the VC backing implicitly assumes that 'there is no
anticipation effect and no delayed response' of the treatment variable, as suggested by Laporte and
Windmeijer (2005: p. 390). Following the authors’ recommendations, we test if the average yearly
impact of the VC variables on the firm growth hides some important differences over time. From the
estimates of Table 5 and Table 7 (Panel A), we remove the VC-step variable from our specification(s)
and insert a series of impulse dummies from the year before the VC funding to 4 years after the VC
funding. We also add a type of 'long-term variable', i.e., a step variable that equals 1 from the fifth year
after the VC funding onward. As shown in Table 10, IVC-backed firms outperform their matched
sample of non-VC-backed firms in terms of the sales growth in the first two years after the VC funding
(+33.6% and +42.8%, respectively, both significant at 5%). More interestingly, this increase in the
sales value is more pronounced in the long term (+48.3%, significant at 5%). Regarding the employee
growth, we find a positive and significant effect of the IVC only in the first year after the VC funding
(+22.4%, significant at 1%), while the coefficients for all of the subsequent years are largely not
significant. With regard to the GVC-backed and VC syndicate-backed firms, we do not detect any
strong positive and significant impact either on the sales or on the employee growth before, during or
after the first VC round. As a very minor exception, we find that the VC syndicate-backed firms show
a growth in the employees that is 28.2% higher than their matched counterparts two years after the VC
funding (the coefficient is significant at 10%). For the sake of completeness, in unreported regressions
(but available upon request from the authors), the same exercise on the 'anticipated and delayed'
16
To estimate long-run effects, we cannot use the estimated coefficients of LnSizei,t-1 in GMM-SYS specifications where
such coefficients are not statistically different from zero.

22
responses was run, distinguishing syndicates according to the identity of the leader. The analysis
confirms that only the IVC-led syndicates produce a positive and significant effect on the sales growth
of the entrepreneurial firms, with most of the effect concentrated at approximately one year after the
first VC investment. Finally, we also conduct the tests that were suggested by Chemmanur et al. (2011:
p. 4059). More specifically, we compute the net 'post VC investment' effect year-by-year for each of
our three matched samples of VC-backed firms relative to the year prior to the VC funding. Overall,
these results are fully in line with those shown above and are not reported here for the sake of brevity
(they are available upon request from the authors).
[Table 10 around here]
Second, even though the results of the above exposed robustness check proposed by Laporte and
Windmeijer (2005) appear to exclude reverse causality concerns, we perform several additional
‘placebo leads’ tests (Bartel and Harrison, 2005; Samila and Sorenson, 2011) by introducing into our
FE regressions the leads (at time t and t+1) of the VC-step dummies of interest. The results confirm
the positive impact of the IVCs (and the syndicates led by the IVCs) on the sales growth and provide
further evidence that this impact is truly additional and unlikely to be driven by reverse causality
concerns. In fact, all of the F tests do not reject the null hypothesis of the joint insignificance of the
leads at time t and t+1 of the VC-step variables (the results are reported in Appendix C).
Third, the VICO dataset is an unbalanced panel dataset. As suggested by Semykina and Wooldridge
(2010), this unbalancing could be caused by a sample selection issue. More specifically, firm exit
dynamics could bias our estimated results. In the VICO dataset, the firms (potentially) exit and are not
observed anymore because of two distinct events that include the i) cease of operations or ii)
acquisition by another firm. Our three matched samples 'IVC vs. no VC financing', 'GVC vs. no VC
financing' and 'Syndication vs. no VC financing' include 58 (46), 19 (2) and 8 (0) failed (acquired)
firms, respectively. Both of these events could be influenced, either positively or negatively, by the
presence of VC. For example, Puri and Zarutskie (2012) show that VC i) positively impacts the
likelihood that firms are acquired and ii) significantly reduces the probability of failure. If there is a

23
significant correlation (either positive or negative) between VC financing and exit and the likelihood
of exit is significantly correlated with the firm growth, then our estimates would be biased. Following
Wooldridge (1995) and Semykina and Wooldridge (2013), we implement two tests for detecting a
potential survivorship bias in our data (for more details, see Appendix D). The results show that the
coefficient of the exit bias control term (the inverse Mills ratio on the firm exit, IMR) is never
significant, which excludes the presence of any remarkable survivorship bias in our estimates.
Fourth, in our main estimations, we do not account for legal and institutional differences across the
countries. To face this issue, in Table 11, we re-estimate the regressions that are shown in Table 5
(columns I and V) and Table 7 (Panel A, columns I and III), substituting the country dummies with the
following country-level variables suggested by Cumming and Walz (2010): i) a measure of the
tendency of the firms and accountants to report economic gains faster than economic losses, which is
negatively related to accounting conservatism (Country Earnings Aggressiveness Index); a measure of
accounting disclosure measures, which is positively related to disclosure (Country Disclosure Level
Index); and a measure of accounting standards for earning management in private firms, which is
negatively related to accounting disclosure (Private Firm Accounting Aggregate Index).17
We see that
in sales growth regressions (columns I-III), there is a positive and statistically significant (at 1%
confidence level) impact of accounting disclosure measures and accounting standards for earnings
management on the performance of IVC-backed companies (column I), while there is a positive
impact of accounting conservatism on the performance of GVC-backed companies (column II). In the
employee growth equations (columns IV-VI), the accounting conservatism and accounting disclosure
of the countries exert a positive and statistically significant (at 5% and 10%, respectively) impact on
the performance of the IVC-backed companies (column IV). Overall, these results are in line with the
evidence shown in the most relevant works in the literature on international business and accounting
(see e.g. Bhattacharya et al., 2003; Burgstahler et al., 2006; Cumming and Walz, 2010). With regard to
17
For more details on the calculation of the three legal and institutional variables, see Bhattacharya et al. (2003, Table I)
and Burgstahler et al. (2006, Table I). We are grateful to an anonymous referee for this suggestion.

24
the variables of interest, the results mirror those exposed in Section 5, in terms of both sign and
magnitude.18
[Table 11 around here]
Fifth, one can suspect that the timing of the VC entry could be associated with some intrinsic non-
linear patterns in the growth dynamics of the entrepreneurial firms, and in turn, this factor might (at
least partly) explain some of our findings. Strictly following the augmented Gibrat law specification
proposed by Evans (1987), we estimate an augmented equation [1] by introducing as independent
variables the squared terms of the logarithms of the size at time t-1 and the age at time t and their
interaction term.19
The results of these estimates exposed in Table 12 suggest the presence in some
regressions of a non-monotonic relationship between growth and the firm size (see in particular
columns I, V and VI), in line with what is commonly found in the literature (Evans, 1987; Almus and
Nerlinger, 1999). Conversely, in our sample made prevalently by very young firms (see again Table
4), there does not seem to emerge any strong non-linear pattern of 'liability of youth-golden age-
obsolescence', which is instead typical of other more general contexts. More interestingly for our
purposes, the estimates reveal that the introduction of these additional terms does not sensibly affect
either the magnitude or the statistical significance of the effects of the VC variables of interest.
[Table 12 around here]
Sixth, even though we controlled for year dummies, in our main estimates, we do not explicitly
account for a potential 'bubble' effect. Thus, in the unreported regressions (which are available upon
18
For comparison purposes between the results of Table 5 and Table 7, we estimated the models in Table 11 by means of
OLS regressions. We cannot resort to FE regressions because of the time-unvarying nature of the three legal and
institutional variables that were inserted in Table 11. However, we re-estimated the models in Table 5 by substituting the
country dummies with the three legal and institutional variables (which correspond to the models in Table 11 in columns I,
II, IV and V) through the two GMM specifications explained in Section 5.1. These results are fully in line with those
exposed in Table 11 and are available upon request from the authors. We also divide the countries included in the VICO
dataset according to the two legal classifications provided by Berkowitz et al. (2003) and Schmidt (2009), respectively. The
results are in line with those given in Section 5, even though the significance of the variables of interest is sometimes
lower.
19 In the last row of Table 12, we report the F tests on the null hypothesis that all of the coefficients of the squared terms of
the logarithms of the size at time t-1 and age at time t and their interaction term are jointly zero. We are grateful to an
anonymous referee for suggesting to us this check for non-linearity in the growth equation.

25
request from the authors), we re-estimated the models shown in Table 5 (columns II and VI) and Table
7 (Panel A, columns II and IV) before and after the year 2001. These results are in line - both in terms
of sign and magnitude - with those exposed in Section 5, in both the pre-bubble and the post-bubble
period.
Finally, we re-estimate the models shown in Section 5, winsorizing the sales and headcount values
with a 1% cut-off for each tail. In other words, for both variables, we calculated the values that
correspond to the 1st and 99
th percentiles of each variable’s distribution and assigned these values to all
of the observations that fell before the 1st percentile and beyond the 99
th percentile, respectively. This
approach reduces the impact of the outliers and allows the use of a larger number of observations than
would be possible if the outliers were deleted. The results adhere to those that were already exposed,
and they are available upon request from the authors.
7. Conclusions
7.1 Implications
The birth and development of entrepreneurial firms in high-tech industries is recognized as one of
the main vehicles for revitalizing the European economy, closing the innovation gap with other
international competitors, developing a knowledge-based society, and thus propelling 'smart' economic
growth, which represents the ultimate objective of European policymakers. It is almost universally
contended that a florid VC market in the old continent represents a sine qua non condition to realize
this goal. Coherently, policymakers at various levels have proposed several policy initiatives to
strengthen the VC market in the European landscape. These efforts led to the peculiar feature in
Europe with respect to other geographical contexts, the U.S. in primis, of a notable presence of VC
funds that are directly managed by governmental bodies. Despite this 'direct' presence, the ability of
these public funds to accomplish their ultimate goal, i.e., enhancing the growth performance of high-
tech entrepreneurial firms, has never been systematically investigated. Furthermore, the above-
mentioned ability has never been compared with those of private independent VC investors who

26
operate in the same geographic context. The VICO dataset, which was recently built through a
research project funded by the 7th Framework Programme of the European Commission, allows us to
investigate this issue for the first time. Our empirical analysis compares the impact of IVC and GVC
investors on the sales and employee growth of a representative sample of European high-tech
entrepreneurial firms observed from 1993 to 2010. The multiple analyses and the series of robustness
checks that we ran point robustly to a positive, statistically significant and economically relevant
impact of IVC investors on the real sales growth of high-tech entrepreneurial firms. Conversely, GVC
investors are not found to exert any sizeable effect, either in the magnitude or in statistical
significance, regardless of the growth measure employed. Our results relegate the direct involvement
of GVC investors to be positive in terms of the firm growth only when they are non-leading partners in
a VC syndicate. In all of the other cases, whether the GVC investors are alone in the equity capital of a
portfolio firm or their involvement precedes or follows the involvement by IVC investors, GVC
involvement does not impact on the sales and employee growth of European high-tech entrepreneurial
firms. Our findings echo those obtained by Brander et al. (2012), who analyze a large sample of VC-
backed firms. They found that the performance of syndicated-backed firms increases if GVC investors
have a minority position rather than when they are leaders.
Overall, our analysis sheds a negative light on the government’s ability to support high-tech
entrepreneurial firms by operating directly in the VC market. The straightforward policy implication
that can be drawn from our analysis is: if the European VC industry ever needed governmental aid
(and our analysis is not intended to solve this puzzling question), public intervention would preferably
create a favorable environment for private VC initiatives through indirect forms of support20
rather
than adopt a 'hands-on-approach'. Recent EU policy initiatives are in line with this approach (e.g.,
eliminating any unfavorable tax treatment to EU cross-border VC activities; see the European
Commission 'Single Market Act I', April 2011), and our work provides an empirical validation for this
20
There is a rich theoretical and empirical literature that is aimed at individuating the most appropriate indirect policy
measures to sustain the VC industry. The most investigated dimensions range from labor market reforms (e.g., Jeng and
Wells, 2000) to tax incentives (e.g., Keuschnigg and Nielsen, 2002; Keuschnigg, 2004). While the general contention
points to the usefulness of such measures on average, the debate is still very lively, as testified by Cumming (2011).

27
type of indirect intervention. On the other hand, if one wants to conserve the rationale for a direct
public intervention to sustain the growth of high-tech entrepreneurial firms, these findings call for a
deep re-consideration of the way that European GVCs are managed. In this respect, our analysis
suggests that the inefficacy of GVCs in fostering the (sales) growth of European high-tech
entrepreneurial firms is not only related to the scarce availability of financial resources but also might
be due to a lack of value-added skills. A solution might be to replicate the design of the Australian
IIFs, a specific type of public-private co-investment model that resembles the US and the Israeli
programs, which were proven to be effective in enhancing the investments in the start-up and early-
stage high-tech entrepreneurial firms and, more generally, to fostering the development of the
Australian VC industry.
7.2 Directions for future research
This work aims at offering a general assessment on the firm growth-enhancing role that is exerted
by GVC and IVC investors on the European high-tech entrepreneurial firms. However, much remains
to be investigated through additional and more specific analyses. Specifically, we have not considered
in this paper the 'investor perspective'. Preliminary evidence based on the VICO dataset reveals that
IVC-backed companies have better exit performance than GVC-backed companies; however, at the
same time, there could be important synergistic effects that are produced by mixed-syndicates of IVC
and GVC investors in influencing a positive outcome of the investment through a firm’s trade sales or
an initial public offering (Cumming et al., 2013).
In parallel, we are currently investigating if, beyond the general GVC’s inability to foster the firm
growth documented here, there could be important composition effects at work. In other words, we are
analyzing whether the impact of GVCs on portfolio firms is likely to depend on several characteristics
of both governmental investors and portfolio firms. Two important dimensions figure prominently in
our research agenda: the young age (or the thin track record) of the portfolio firm and the differences
within each VC type. With regard to the former aspect, IVCs usually wait to support ventures until
they are capable of presenting a commercial prototype of a product or a service (Block, 2008;

28
Mazzucato, 2011). In this respect, one could hypothesize that GVC investors could exert a 'signaling'
function toward third parties (including IVCs) and that the exerted signal is stronger for a younger
recipient firm because of its lack of a track record. In this domain, using the VICO dataset, Grilli and
Murtinu (2013) show that the reception of a GVC investment in the early stages of life does not
strongly influence a venture’s market penetration performance, but more detailed investigations are
warranted on the presence and nature of a possible enabling function of public funds toward
relationships with third parties (e.g., partners, financiers, consumers). With regard to the differences
within each VC type, the extant works in the field found significant variations in terms of the
reputation capital (Lerner, 1994a; Gompers, 1996; Hsu, 2004; Hochberg et al., 2007; Sorensen, 2007;
Nahata, 2008), fund size (Kaplan and Schoar, 2005; Cumming, 2008; Cumming and Dai, 2011) and
limited attention of the investors (Cumming and Dai, 2011). In our sample, as preliminary qualitative
evidence, we found that there is some degree of within-heterogeneity in the impact on the firm growth
of each VC type. With regard to GVC investors, this effect might be due to several dimensions,
including different structural characteristics of the funds (for example, in terms of the percentage of
public limited partnerships in the total fundraising), dissimilar fund managers’ human capital and
experience, diverse geographic mandates, investment duration, and contractual clauses (e.g., voting
rights). While individuating which dimensions might magnify or hamper the GVC performance and
why this result could occur represents both a theoretical and an empirical challenge, it is clear that the
detection of important moderating factors at work on the GVC side would eventually recover, under
those specific conditions, a raison d'être for a governmental direct intervention in the VC market.

29
References
Abadie, A., Imbens, G., 2006. Large sample properties of matching estimators for average treatment effects. Econometrica
74, 235–267.
Admati, A.R., Pfleiderer, P., 1994. Robust financial contracting and the role of venture capitalists. Journal of Finance 49,
371-402.
Almus, M., Nerlinger, E.A., 1999. Growth of New Technology-Based Firms: Which Factors Matter? Small Business
Economics 13(2), 141-154.
Armour, J., Cumming, D., 2006. The legislative road to Silicon Valley. Oxford Economic Papers 58, 596-635.
Audretsch, D.B., Link, A.N., Scott, J.T., 2002. Public/private technology partnerships: evaluating SBIR supported research.
Research Policy 31, 145–158.
Auerswald, P.E., Branscomb, L.M., 2003. Valleys of death and Darwinian Seas: Financing the Invention to Innovation
Transition in the United States. Journal of Technology Transfer 28, 227-239.
Avnimelech, G., Teubal, M., 2006. Creating venture capital industries that co-evolve with high tech: insights from an
extended industry life cycle perspective of the Israeli experience. Research Policy 35, 1477–1498.
Balboa, M., Martì, J., Zieling N., 2007. Is the Spanish public sector effective in backing venture capital?. In: Gregoriou,
G.N., Kooli, M., Kräussl, R., Kraeussl, R. (Eds.), Venture capital in Europe. Butterworth-Heinemann, pp. 115-128.
Bartel, A.P., Harrison, A.E., 2005. Ownership versus environment: Disentangling the sources of public-sector inefficiency.
Review of Economics and Statistics 87, 135-147.
Berkowitz, D., Pistor, K.,, Richard, J.F., 2003. Economic development, legality, and the transplant effect. European
Economic Review 47, 165-195.
Bertoni, F., Colombo, M.G., Grilli, L., 2011. Venture capital financing and the growth of high-tech start-ups: Disentangling
treatment from selection effects. Research Policy, 40(7), 1028-1043.
Bertoni, F., Croce, A., 2011. Policy reforms for venture capital in Europe, in: Colombo, M.G., Grilli, L., Piscitello, L. and
Rossi, C. (Eds.), Science and innovation policy for the new knowledge economy. Elgar, Cheltenham Glos (UK), pp.
196-229.
Bertoni, F., Martí, J., 2011. Financing Entrepreneurial Ventures in Europe: The VICO Dataset. Available at SSRN:
http://ssrn.com/abstract=1904297.

30
Beuselinck, C., and S. Manigart, 2000. Direct Government Investments in Venture Capital, Proceedings of RENT XIV,
Research in Entrepreneurship and Small Business. Praag, November 2000, 23-24, 6-10.
Bhattacharya, U., Daouk H., and Welker, M. (2003) The world price of earnings opacity, The Accounting Review 78, 641-
678.
Block, F., 2008. Swimming against the current: the rise of a hidden developmental state in the United States. Politics and
Society 36(2), 169-206.
Blundell, R., Bond, S., 1998. Initial conditions and moment conditions in dynamic panel data models. Journal of
Econometrics 87(1), 115–143.
Bond, S., 2002. Dynamic panel data models: a guide to micro data methods and practice. Portuguese Economic Journal 1,
141-162.
Bottazzi, L., Da Rin, M., Hellmann, T., 2008. Who are the active investors?: Evidence from venture capital. Journal of
Financial Economics 89, 488-512.
Brander, J.A., Amit, R., Antweiler, W., 2002. Venture-Capital syndication: Improved venture selection vs. the value-added
hypothesis. Journal of Economics and Management Strategy 11, 423–452.
Brander, J.A., Du, Q., Hellmann, T.F., 2012. The Effects of Government-Sponsored Venture Capital: International
Evidence. Working Paper. Available at: http://strategy.sauder.ubc.ca/hellmann/pdfs/BranderDuHellmannApril2012.pdf.
Bruno, G.S.F., 2005. Approximating the bias of the LSDV estimator for dynamic unbalanced panel data models.
Economics Letters 87, 361-366.
Burgstahler, D., L. Hail and Leuz, C. (2006) The importance of reporting incentives: earnings management in European
private and public firms. The Accounting Review 81(5), 983-1016.
Bygrave, W.D., 1987. Syndicated investments by venture capital firms: A networking perspective. Journal of Business
Venturing 2, 139-154.
Caves, R.E., 1998. Industrial organization and new findings on the turn-over and mobility of firms. Journal of Economic
Literature 36, 1947-1982.
Chemmanur, T.J., Krishnan, K., Nandy, D., 2011. How does venture capital financing improve efficiency in private firms?
A look beneath the surface. Review of Financial Studies 24, 4037-4090.
Chesher, A., 1979. Testing the law of proportionate effects. Journal of Industrial Economics 27, 403-411.

31
Colombo, M.G., Giannangeli, S., Grilli, L., 2013. Public subsidies and the employment growth of high-tech start-ups:
assessing the impact of selective and automatic support schemes. Industrial and Corporate Change 22, 1273-1314.
Colombo, M.G., Grilli, L., Murtinu, S., 2011. R&D Subsidies and the Performance of High-Tech Start-Ups. Economics
Letters 112(1), 97-99.
Croce, A., Grilli, L., Murtinu, S. Venture Capital Enters Academia: An Analysis of University-Managed Funds. The
Journal of Technology Transfer, forthcoming.
Croce, A., Martí, J., Murtinu, S., 2013. The Impact of Venture Capital on the Productivity Growth of European
Entrepreneurial Firms: 'Screening' or 'Value added' Effect?. Journal of Business Venturing 28, 489-510.
Cumming, D.J., 2003. The structure, governance and performance of U.K. venture capital trusts. Journal of Corporate Law
Studies 3, 401–427.
Cumming, D.J., 2007. Government policy towards entrepreneurial finance: Innovation investment funds. Journal of
Business Venturing 22, 193-235.
Cumming, D.J., 2008. Contracts and Exits in Venture Capital Finance. Review of Financial Studies 21(5), 1947-1982.
Cumming, D.J., 2011. Public policy and the creation of active venture capital markets. Venture Capital: An International
Journal of Entrepreneurial Finance 13, 75-94.
Cumming, D.J., Dai, N., 2011. Fund size, limited attention and valuation of venture capital backed firms. Journal of
Empirical Finance 18, 2-15.
Cumming, D.J., Grilli, L., Murtinu, S., 2013. Governmental and independent venture capital investments in Europe: a firm-
level performance analysis. Available at SSRN: http://ssrn.com/abstract=2294746.
Cumming, D. J., Johan, S.A., 2012. Venture's Economic Impact in Australia. Available at SSRN:
http://ssrn.com/abstract=2194450.
Cumming, D. J., MacIntosh, J. G., 2007a. Crowding out private equity: Canadian evidence. Journal of Business Venturing
21, 569-609.
Cumming, D.J., MacIntosh, J.G., 2007b. Mutual funds that invest in private equity? An analysis of labour-sponsored
investment funds. Cambridge Journal of Economics 31, 445–487.
Cumming, D.J., Walz, U., 2010. Private Equity Returns and Disclosure Around the World. Journal of International
Business Studies 41, 727–754.

32
Da Rin, M., Hellmann, T. F., Puri, M., 2011. A Survey of Venture Capital Research. NBER Working Paper no. 17523.
Available at: http://www.nber.org/papers/w17523.
Da Rin, M., Nicodano, G., Sembenelli, A., 2006. Public policy and the creation of active venture capital markets. Journal of
Public Economics 90, 1699-1723.
Dehejia, R.H., Wahba, S., 2002. Propensity score-matching methods for nonexperimental causal studies. Review of
Economics and Statistics 84, 151-161.
Dosi, G., Llerena, P., Labini, M.S., 2006. The relationships between science, technologies and their industrial exploitation:
an illustration through the myths and realities of the so-called ‘European Paradox’. Research Policy 35, 1450–1464.
Ejermo, O., Kander, A., Svensson Henning, M., 2011. The R&D-growth paradox in fast-growing sectors. Research Policy
40, 664-672.
European Commission, 2010. Europe 2020: A Strategy for Smart, Sustainable and Inclusive Growth. Available at:
http://ec.europa.eu/eu2020/.
European Council, 2008. European Economic Recovery Plan. Available at:
http://www.consilium.europa.eu/uedocs/cms_data/docs/pressdata/en/ec/104692.pdf.
European Parliament (2012). Potential of Venture Capital in the European Union. Directorate General for Internal Policies.
Policy Department A: Economic and Scientific Policy Industry, Research and Energy.
European Venture Capital Association (EVCA), 2010. Closing Gaps and Moving Up A Gear: The Next Stage of Venture
Capital's Evolution in Europe. EVCA Venture Capital White Paper. Available at: http://iri.jrc.ec.europa.eu/concord-
2010/presentations/fricke.pdf.
Evans, D.S., 1987. The relationship between firm growth, size, and age: estimates for 100 manufacturing industries. Journal
of Industrial Economics 35, 567-581.
Gans J.S., Stern S., 2003. The product market and the market for “ideas”: commercialization strategies for technology
entrepreneurs. Research Policy 32(2), 333–350.
Gompers, P., 1995. Optimal investment, monitoring, and the staging of venture capital. Journal of Finance 50, 1461-1489.
Gompers, P.A., 1996. Grandstanding in the venture capital industry. Journal of Financial Economics 42, 133-156.
Gompers, P., Lerner, J., 2001. The venture capital revolution. Journal of Economic Perspectives 15, 146-168.
Görg, H., Strobl, E., 2007. The effect of R&D subsidies on private R&D. Economica 74, 215-234.

33
Grilli, L. Murtinu, S., 2013. New technology-based firms in Europe: market penetration, public venture capital and timing
of investment. Available at SSRN: http://ssrn.com/abstract=1892024.
Hall, B., Van Reenen, J., 2000. How effective are fiscal incentives for R&D? A review of the evidence. Research Policy
29, 449–469.
Hellmann, T., Puri, M., 2002. Venture capital and the professionalization of start-up firms: Empirical evidence. Journal of
Finance 57, 169-197.
Hochberg, Y.V., Ljungqvist A., Lu Y., 2007. Whom you know matters: Venture capital networks and investment
performance. Journal of Finance 62, 251-301.
Hsu D.H., 2004. What do entrepreneurs pay for venture capital affiliation? Journal of Finance 59, 1805–1844.
Hsu, D.H., 2006. Venture capitalists and cooperative start-up commercialization strategy. Management Science 52, 204-
219.
Ivanov, V.I., Xie, F., 2010. Do corporate venture capitalists add value to startup firms? Evidence from IPOs and
acquisitions of VC-backed companies. Financial Management 39, 129-152.
Jeng, L.A., Wells, P.C., 2000. The determinants of venture capital funding: Evidence across countries. Journal of Corporate
Finance 6, 241-289.
Kaplan, S. N., Schoar, A., 2005. Private equity returns: persistence and capital flows. Journal of Finance 60, 1791-1823.
Kaplan, S.N., Strömberg, P., 2003. Financial contracting theory meets the real world: An empirical analysis of venture
capital contracts. Review of Economic Studies 70, 281-315.
Kaplan, S.N., Strömberg, P., 2004. Characteristics, contracts and actions: Evidence from venture capitalists analyses.
Journal of Finance 59, 2177-2210.
Keuschnigg, C., 2004. Taxation of a venture capitalist with a portfolio of firms. Oxford Economic Papers 56, 285-306.
Keuschnigg, C., Nielsen, S.B., 2002. Tax policy, venture capital, and entrepreneurship. Journal of Public Economics 87,
175-203.
Kleibergen, F., Paap, R., 2006. Generalized reduced rank tests using the singular value decomposition. Journal of
Econometrics 133, 97–126.
Kortum, S., Lerner, J., 2000. Assessing the contribution of venture capital to innovation. Rand Journal of Economics 31,
674-692.

34
Kraemer-Eis, H., Lang, F., 2011. European Small Business Finance Outlook 2/2011. Working Paper 2011/12 EIF Research
and Market Analysis.
Lach, S., 2002. Do R&D subsidies stimulate or displace private R&D? Evidence from Israel. Journal of Industrial
Economics 50(4), 369–390.
Laporte, A., Windmeijer, F., 2005. Estimation of panel data models with binary indicators when treatment effects are not
constant over time. Economics Letters 88, 389–396.
Leleux, B., Surlemont, B., 2003. Public versus private venture capital: Seeding or crowding out? A pan-European analysis.
Journal of Business Venturing 18, 81-104.
Lerner, J., 1994a. Venture capitalists and the decision to go public. Journal of Financial Economics 35, 293–316.
Lerner, J., 1994b. The syndication of venture capital investments. Financial Management 23, 16-27.
Lerner, J., 1995. Venture capitalists and the oversight of private firms. Journal of Finance 50, 301-318.
Lerner, J., 1999. The government as venture capitalist: the long-run impact of the SBIR program. Journal of Business
72(3), 285-318.
Lerner, J., 2002. When bureaucrats meet entrepreneurs: the design of effective ‘public venture capital’ programmes.
Economic Journal 112, F73-84.
Luukkonen, T., Deschryvere, M., Bertoni, F., 2013. The value added by government venture capital funds compared with
independent venture capital funds. Technovation 33, 154-162.
Mara, A., 2011. Maximizing the returns of government venture capital programs. Defense Horizons 71, 1-11.
Mayer, C., Schoors, K., Yafeh, Y., 2005. Sources of funds and investment activities of venture capital funds: evidence from
Germany, Israel, Japan and the United Kingdom. Journal of Corporate Finance 11, 586-608.
Mazzucato, M., 2011. The Entrepreneurial State. DEMOS, London.
Megginson, W.L., Weiss, K.A., 1991. Venture capitalist certification in initial public offerings. Journal of Finance 46, 879-
903.
Nahata, R. 2008. Venture Capital Reputation and Investment Performance. Journal of Financial Economics 90, 127–51.
Puri, M., Zarutskie, R., 2012. On the lifecycle dynamics of venture-capital- and non-venture-capital-financed firms. Journal
of Finance 67(6), 2247-2293.
Roodman, D.M., 2009. A note on the theme of too many instruments. Oxford Bulletin of Economics and Statistics 71, 135-
158.

35
Rosenbaum, P., 1995. Observational Studies. Springer, New York, US.
Sahlman, W.A., 1990. The structure and governance of venture capital organizations. Journal of Financial Economics 27,
473-521.
Samila, S., Sorenson, O., 2011. Venture capital, entrepreneurship, and economic growth. Review of Economics and
Statistics 93, 338–349.
Schmidt, V.A., 2009. Putting the Political Back into Political Economy by Bringing the State Back in yet Again. World
Politics 61(3), 516-546.
Semykina, A., Wooldridge, J.M., 2010. Estimating panel data models in the presence of endogeneity and selection. Journal
of Econometrics 157, 375-380.
Semykina, A., Wooldridge, J.M., 2013. Estimation of dynamic panel data models with sample selection. Journal of Applied
Econometrics 28(1), 47-61.
Sorensen, M., 2007. How Smart Is Smart Money? A Two-Sided Matching Model of Venture Capital. Journal of Finance,
62(6), 2725-2762.
Staiger, D., Stock, J.H., 1997. Instrumental variables regression with weak instruments. Econometrica 65, 557-586.
Stoyanov, A., 2011. The role of export market participation in the choice of organizational form of production technology.
Oxford Bulletin of Economics and Statistics 73, 365-397.
Sutton, J., 1997. Gibrat’s legacy. Journal of Economic Literature 35, 40-59.
Tian, X., 2012. The role of venture capital syndication in value creation for entrepreneurial firms. Review of Finance 16,
245-283.
Wallsten, S.J., 2000. The effects of government-industry R&D programs on private R&D: the case of Small Business
Innovation Research program. RAND Journal of Economics 31(1), 82-100.
Windmeijer, F., 2005. A finite sample correction for the variance of linear efficient two-step GMM estimators. Journal of
Econometrics 126, 25-51.
Wooldridge, J.M., 1995. Selection corrections for panel data models under conditional mean independence assumptions.
Journal of Econometrics 68, 115-132.
Wooldridge, J.M., 2002. Econometric Analysis of Cross Section and Panel Data. MIT Press, Cambridge (USA).
Wright, M., Lockett, A., 2003. The structure and management of alliances: syndication in the venture capital industry.
Journal of Management Studies 40, 2073-2102.

36
Tables
Table 1. Industry classification
Sector NACE code(s)
Pharmaceutical 24.4
ICT manufacturing 30.02 + 32 + 33
TLC 64.2
Internet 72.60
Software 72.2
Biotech 73.1
Other -
Legend. The residual industry 'Other' includes Robotics (NACE: 29.5), Aerospace (NACE: 35.5), and other industries that
are not explicitly included in the NACE classification: Energy and Nanotech.

37
Table 2. IVC- and GVC-backed firms across countries and industries
IVC-backed firms GVC-backed firms Co-financed firms
N. firms % N. firms % N. firms %
Country
Belgium 58 10.78 33 13.81 16 12.70
Finland 50 9.29 34 14.23 16 12.70
France 98 18.22 48 20.08 40 31.75
Germany 100 18.59 36 15.06 18 14.29
Italy 48 8.92 18 7.53 6 4.76
Spain 37 6.88 43 17.99 10 7.94
United Kingdom 147 27.32 27 11.30 20 15.87
Total 538 100.00 239 100.00 126 100.00
Industry
Pharmaceutical 20 3.72 5 2.09 2 1.59
ICT manufacturing 97 18.03 44 18.41 27 21.43
TLC 32 5.95 9 3.77 4 3.17
Internet 67 12.45 13 5.44 6 4.76
Software 218 40.52 91 38.08 52 41.27
Biotech 87 16.17 59 24.69 31 24.60
Other 17 3.16 18 7.53 4 3.17
Total 538 100.00 239 100.00 126 100.00
Legend. The sample includes VC-backed firms that enter the VICO dataset between 1984 and 2004 that first receive VC
funding in the year that they enter the VICO dataset or in any subsequent year. Columns 1, 3 and 5 show the number of IVC-
backed firms, GVC-backed firms and co-financed firms, according to country and industry, respectively. Columns II, IV and
VI show the percentage of IVC-backed firms (calculated with respect to the total number of IVC-backed firms), the
percentage of GVC-backed firms (calculated with respect to the total number of GVC-backed firms), and the percentage of
co-financed firms (calculated with respect to the total number of co-financed firms), according to country and industry,
respectively.

38
Table 3. Co-financing and syndication between GVC and IVC investors
GVC
Before Syndicated After
N. firms % N. firms % N. firms %
IVC 23 18.25 65 51.59 38 30.16
Legend. Numbers in the cells refer to the total number of co-financed firms reported in Table 2.

39
Table 4. Descriptive statistics
IVC-backed firms GVC-backed firms Co-financed firms Non VC-backed firms
Column I II III IV V VI VII VIII
Mean Std. Dev. Mean Std. Dev. Mean Std. Dev. Mean Std. Dev.
Sales (k€) 6,001.074 25,248.260 3,199.835 7,369.103 3,507.801 8,535.808 6,514.444 67,567.070
Employees 34.051 60.016 26.516 44.442 29.003 40.805 40.791 305.643
Age 5.857 4.215 6.194 4.466 5.903 4.205 6.896 5.066
Legend. Statistics based on the VICO dataset. In columns I, III, V and VII, the mean value of the focal variable related to
IVC-backed firms, GVC-backed firms, co-financed firms and non-VC-backed firms, respectively. In columns II, IV, VI and
VIII, the standard deviation of the focal variable related to IVC-backed firms, GVC-backed firms, co-financed firms and non-
VC-backed firms, respectively. Mean and standard deviation values calculated on all firms included in a category in all years
of operation, both before and after the eventual receipt of VC funding. Deflated sales values are expressed in k€.

40
Table 5. The impact of IVC and GVC investments on European high-tech entrepreneurial firms'
growth
Sales growth Employee growth
OLS FE GMM-SYS
(t-3; t-4)
GMM-SYS
(collapse: t-
3; earlier)
OLS FE GMM-SYS
(t-3; t-4)
GMM-SYS
(collapse t-3;
earlier)
Column I II III IV V VI VII VIII
PANEL A: IVC vs. no VC financing
LnSize (t-1) -0.1521***
(0.0213)
-0.6379***
(0.0466)
-0.2599***
(0.0716)
-0.2710***
(0.0655)
-0.0539***
(0.0129)
-0.4219***
(0.0485)
-0.0551
(0.0379)
-0.0273
(0.0477)
LnAge (t) -0.2256***
(0.0507)
0.1051
(0.1774)
-0.1520
(0.1037)
-0.1335
(0.1148)
-0.1346***
(0.0205)
-0.0755
(0.0869)
-0.1230***
(0.0340)
-0.1308***
(0.0385)
IVC (t-1) 0.2159***
(0.0526)
0.3830***
(0.1186)
0.1948**
(0.0891)
0.3298***
(0.1160)
0.1009***
(0.0263)
0.0934
(0.0762)
-0.0129
(0.0592)
-0.0438
(0.0710)
Time
dummies Yes Yes Yes Yes Yes Yes Yes Yes
Country
dummies Yes - Yes Yes Yes - Yes Yes
Industry
dummies Yes - Yes Yes Yes - Yes Yes
Obs. 2,143 2,143 2,143 2,143 2,375 2,375 2,375 2,375
Groups 325 325 325 325 342 342 342 342
R2 0.1879 0.1187 - - 0.1235 0.0378 - -
AR (1) - - -3.96*** -3.90*** - - -2.39** -3.07***
AR (2) - - 0.06 0.03 - - 0.05 0.03
Hansen test
(p-value) - -
78.26 [76]
(0.407)
30.81 [25]
(0.195) - -
81.96 [74]
(0.246)
67.92 [24]
(0.000)
PANEL B: GVC vs. no VC financing
LnSize (t-1) -0.1301***
(0.0316)
-0.5001***
(0.0599)
-0.2155**
(0.1058)
-0.3594***
(0.1145)
-0.0478***
(0.0169)
-0.3573***
(0.0330)
-0.0524
(0.0385)
-0.1126
(0.0724)
LnAge (t) -0.2219**
(0.0946)
0.0456
(0.2834)
0.0157
(0.2206)
0.1429
(0.2573)
-0.1306***
(0.0345)
-0.1183
(0.1159)
-0.1258***
(0.0473)
-0.0940*
(0.0492)
GVC (t-1) 0.0653
(0.0687)
0.0513
(0.1480)
-0.0203
(0.1273)
0.0474
(0.1554)
0.0321
(0.0320)
-0.1034
(0.1051)
-0.1381**
(0.0686)
-0.0805
(0.0596)
Time
dummies Yes Yes Yes Yes Yes Yes Yes Yes
Country
dummies Yes - Yes Yes Yes - Yes Yes
Industry
dummies Yes - Yes Yes Yes - Yes Yes
Obs. 882 882 882 882 964 964 964 964
Groups 114 114 114 114 123 123 123 123
R2 0.1854 0.0971 - - 0.1100 0.0285 - -
AR (1) - - -2.08** -1.92* - - -4.75*** -4.21***
AR (2) - - -0.19 -0.22 - - 0.11 0.21
Hansen test
(p-value) - -
68.92 [77]
(0.733)
25.50 [27]
(0.546) - -
81.02 [76]
(0.326)
25.65 [28]
(0.592)
Legend. The dependent variables are the sales growth (columns I-IV) and the employee growth (columns V-VIII). Country,
industry and time dummies are included in the estimates (the coefficients are omitted in the table). The estimates are derived
from OLS regressions with standard errors that are robust to heteroskedasticity through the Huber-White method and serial
correlation within firms (columns I and V), FE regressions with robust standard errors (columns II and VI), GMM-SYS with
moment conditions of endogenous variables restricted to the interval t-3 (t-2) and t-4 (t-3) for instruments in levels
(differences) with finite-sample correction for the two-step covariance matrix developed by Windmeijer (2005) (columns III
and VII) and GMM-SYS with 'collapsed' instruments with finite-sample correction for the two-step covariance matrix
developed by Windmeijer (2005) (columns IV and VIII). All of the regressions are estimated with an intercept term. Standard
errors and p-values of Hansen statistics are in round brackets. Degrees of freedom are in square brackets. * p < .10; ** p <
.05; *** p < .01.

41
Table 6. The impact of VC investments on European high-tech entrepreneurial firms' growth:
the role of co-financing
Legend. The dependent variables are sales growth (columns I-IV) and employee growth (columns V-VIII). Country, industry
and time dummies are included in the estimates (the coefficients are omitted in the table). The estimates are derived from
OLS regressions with standard errors that are robust to heteroskedasticity through the Huber-White method and serial
correlation within firms (columns I and V), FE regressions with robust standard errors (columns II and VI), GMM-SYS with
moment conditions of endogenous variables restricted to the interval t-3 (t-2) and t-4 (t-3) for instruments in levels
(differences) with finite-sample correction for the two-step covariance matrix developed by Windmeijer (2005) (columns III
and VII), and GMM-SYS with 'collapsed' instruments with finite-sample correction for the two-step covariance matrix
developed by Windmeijer (2005) (columns IV and VIII). All of the regressions are estimated with an intercept term. Standard
errors and p-values of Hansen statistics are in round brackets. Degrees of freedom are in square brackets. * p < .10; ** p <
.05; *** p < .01.
Sales growth Employee growth
OLS FE GMM-SYS
(t-3; t-4)
GMM-SYS
(collapse: t-
3; earlier)
OLS FE GMM-SYS
(t-3; t-4)
GMM-SYS
(collapse t-3;
earlier)
Column I II III IV V VI VII VIII
PANEL A: IVC vs. no VC financing
LnSize (t-1) -0.1524***
(0.0213)
-0.6401***
(0.0463)
-0.2992***
(0.0692)
-0.3171***
(0.0616)
-0.0538***
(0.0129)
-0.4225***
(0.0485)
-0.0579
(0.0390)
-0.1122**
(0.0465)
LnAge (t) -0.2265***
(0.0509)
0.0875
(0.1748)
-0.0983
(0.1222)
-0.0745
(0.1120)
-0.1344***
(0.0206)
-0.0782
(0.0871)
-0.1361***
(0.0337)
-0.0895**
(0.0422)
IVC (t-1) 0.2027***
(0.0545)
0.3724***
(0.1183)
0.2464**
(0.0993)
0.3458***
(0.1134)
0.1027***
(0.0271)
0.0913
(0.0764)
-0.0290
(0.0643)
0.0339
(0.0640)
GVCafter (t-1) 0.1980*
(0.1021)
0.8337**
(0.3232)
0.0474
(0.2506)
0.1473
(0.1431)
-0.0286
(0.0387)
0.0828
(0.0585)
0.1199**
(0.0526)
0.1151*
(0.0609)
Time
dummies Yes Yes Yes Yes Yes Yes Yes Yes
Country
dummies Yes - Yes Yes Yes - Yes Yes
Industry
dummies Yes - Yes Yes Yes - Yes Yes
Obs. 2,143 2,143 2,143 2,143 2,375 2,375 2,375 2,375
Groups 325 325 325 325 342 342 342 342
R2 0.1887 0. 1194 - - 0.1236 0.0378 - -
AR (1) - - -3.90*** -3.92*** - - -2.70*** -3.03***
AR (2) - - 0.08 0.03 - - 0.05 0.04
Hansen test
(p-value) - -
91.69 [93]
(0.519)
37.40 [34]
(0.316) - -
89.12 [91]
(0.536)
26.72 [33]
(0.772)
PANEL B: GVC vs. no VC financing
LnSize (t-1) -0.1301***
(0.0316)
-0.5054***
(0.0594)
-0.2180**
(0.1034)
-0.3806***
(0.1284)
-0.0497***
(0.0172)
-0.3584***
(0.0321)
-0.0812
(0.0493)
-0.1352*
(0.0724)
LnAge (t) -0.2274**
(0.0970)
0.0387
(0.2808)
-0.0105
(0.2095)
0.1655
(0.3010)
-0.1363***
(0.0343)
-0.1209
(0.1150)
-0.1249**
(0.0518)
-0.1001**
(0.0471)
GVC (t-1) 0.0567
(0.0735)
0.0400
(0.1497)
-0.0204
(0.1263)
0.0948
(0.1711)
0.0232
(0.0318)
-0.1059
(0.1027)
-0.1187*
(0.0669)
-0.0812
(0.0586)
IVCafter (t-1) 0.0883
(0.0970)
0.4343*
(0.2434)
0.2059
(0.1817)
0.2086
(0.2236)
0.1218
(0.0859)
0.0771
(0.2025)
0.3052*
(0.1830)
0.2597**
(0.1271)
Time
dummies Yes Yes Yes Yes Yes Yes Yes Yes
Country
dummies Yes - Yes Yes Yes - Yes Yes
Industry
dummies Yes - Yes Yes Yes - Yes Yes
Obs. 882 882 882 882 964 964 964 964
Groups 114 114 114 114 123 123 123 123
R2 0.1858 0.0974 - - 0.1132 0.0290 - -
AR (1) - - -2.09** -1.87* - - -4.71*** -4.24***
AR (2) - - -0.20 -0.25 - - 0.00 0.12
Hansen test
(p-value) - -
73.24 [95]
(0.952)
34.95 [34]
(0.423) - -
82.44 [94]
(0.797)
29.02 [35]
(0.751)

42
Table 7. The impact of VC investments on European high-tech entrepreneurial firms' growth:
the role of syndication
Sales growth Employee growth
OLS FE OLS FE
Column I II III IV
PANEL A: Syndication vs. no VC financing
LnSize (t-1) -0.2207*** (0.0687) -0.4412*** (0.0956) -0.0507** (0.0218) -0.4300*** (0.0571)
LnAge (t) 0.2594 (0.1652) -0.3617 (0.4539) -0.0313 (0.0971) -0.4517* (0.2588)
VCSyndicate (t-1) 0.1534 (0.1772) 0.1561 (0.3019) 0.1372* (0.0760) 0.1948 (0.1395)
Time dummies Yes Yes Yes Yes
Country dummies Yes - Yes -
Industry dummies Yes - Yes -
Obs. 249 249 312 312
Groups 37 37 44 44
R2 0.2574 0.0732
0.1819 0.0253
PANEL B: Syndication with GVC or IVC leadership vs. no VC financing
LnSize (t-1) -0.2176*** (0.0622) -0.4252*** (0.0940) -0.0572** (0.0213) -0.4211*** (0.0574)
LnAge (t) 0.2794* (0.1390) -0.3647 (0.4582) -0.0273 (0.0927) -0.4302 (0.2581)
GVCLeader (t-1) 0.0096 (0.2172) -0.0194 (0.4035) 0.0442 (0.1202) 0.0723 (0.2473)
IVCLeader (t-1) 0.5074** (0.2013) 0.5987* (0.3320) 0.2123** (0.0877) 0.2097 (0.1628)
Time dummies Yes Yes Yes Yes
Country dummies Yes - Yes -
Industry dummies Yes - Yes -
Obs. 249 249 312 312
Groups 37 37 44 44
R2 0.2917 0.0999 0.1974 0.0274
Legend. The dependent variables are the sales growth (columns I-II) and employee growth (columns III-IV). Country,
industry and time dummies are included in the estimates (coefficients are omitted in the table). Estimates are derived from
OLS regressions with standard errors that are robust to heteroskedasticity through the Huber-White method and serial
correlation within firms (columns I and III) and FE regressions with robust standard errors (columns II and IV). All of the
regressions are estimated with an intercept term. Standard errors are in round brackets. * p < .10; ** p < .05; *** p < .01.

43
Table 8. The impact of IVC and GVC investments on European high-tech entrepreneurial firms'
growth: exploring 'value-adding' and financial effects
PANEL A: VC amount [t-1]
FE GMM-SYS FE GMM-SYS FE
Column I II III IV V
IVC vs. no VC financing GVC vs. no VC financing Syndication vs. no
VC financing
LnSize (t-1) -0.6387*** (0.0472) -0.3078*** (0.0670) -0.5019*** (0.0594) -0.3128** (0.1266) -0.4275*** (0.0953)
LnAge (t) 0.1047 (0.1775) -0.0692 (0.1323) 0.0071 (0.2791) 0.0679 (0.2601) -0.3696 (0.4557)
IVC (t-1) 0.3959*** (0.1228) 0.3059*** (0.1154) - - -
GVC (t-1) - - 0.1092 (0.1511) 0.0295 (0.1168) -
Syndicate IVC
Leader (t-1) - - - - 0.5267 (0.3473)
Syndicate GVC
Leader (t-1) - - - - -0.0617 (0.3995)
VC Amount (t-1) -0.0057 (0.0145) 0.1026 (0.1109) -0.0403* (0.0237) -0.0198 (0.0407) 0.0301 (0.0340)
Time dummies Yes Yes Yes Yes Yes
Country dummies - Yes - Yes -
Industry dummies - Yes - Yes -
Obs. 2143 2143 882 882 249
Groups 325 325 114 114 37
R2 0.1184 - 0.0983 - 0.0981
AR(1) - -4.04*** - -1.93* -
AR(2) - -0.16 - -0.22 -
Hansen (p-value) - 37.56[36] - 33.88[39] -
PANEL B: cumulated VC amount [t-1; t-3]
FE GMM-SYS FE GMM-SYS FE
Column I II III IV V
IVC vs. no VC financing GVC vs. no VC financing Syndication vs. no
VC financing
LnSize (t-1) -0.5663*** (0.0557) -0.2345*** (0.0684) -0.4557*** (0.0787) -0.3331*** (0.0995) -0.3743*** (0.1001)
LnAge (t) 0.0673 (0.2095) 0.0491 (0.1045) 0.0225 (0.4973) 0.1810 (0.1517) -0.7991 (0.6690)
IVC (t-1) 0.3192*** (0.1099) 0.3376*** (0.1168) - - -
GVC (t-1) - - 0.1176 (0.1505) 0.0947 (0.1163) -
Syndicate IVC
Leader (t-1) - - - - 0.5348 (0.4256)
Syndicate GVC
Leader (t-1) - - - - -0.1099 (0.5929)
VC Amount (t-1; t-
3) 0.0011 (0.0098) 0.0010 (0.0078) -0.0005 (0.0106) -0.0325* (0.0186) 0.0295** (0.0136)
Time dummies Yes Yes Yes Yes Yes
Country dummies - Yes - Yes -
Industry dummies - Yes - Yes -
Obs. 1808 1808 751 751 217
Groups 300 300 109 109 36
R2 0.0451 - 0.0400 - 0.0334
AR(1) - -3.00*** - -2.38** -
AR(2) - 0.59 - 1.09 -
Hansen - 40.23[35] - 23.16[38] -
Legend. The dependent variable is the sales growth. Country, industry and time dummies are included in the estimates
(coefficients are omitted in the table). Estimates are derived from FE regressions with robust standard errors (columns I,
III and V), and GMM-SYS with 'collapsed' instruments with finite-sample correction for the two-step covariance matrix
developed by Windmeijer (2005) (column II and IV). All of the regressions are estimated with an intercept term. Standard
errors are in round brackets. Degrees of freedom are in square brackets. * p < .10; ** p < .05; *** p < .01.

44
Table 9. Long-run effects of IVC and GVC investments on firm growth over time
Sales growth Employee growth
FE GMM-SYS FE GMM-SYS
IVC 0.6004*** (0.1814) 1.2173*** (0.4463) 0.2214 (0.1693) -
GVC 0.1026 (0.2956) 0.1319 (0.4405) -0.2895 (0.2879) -
Syndicate IVC Leader 1.4081* (0.8134) - 0.4981 (0.3905) -
Syndicate GVC Leader -0.0456 (0.9507) - 0.1718 (0.5876) -
Legend. The long-run effect of IVC and GVC investments is reported. We refer to the long-run effect calculated from FE
regressions with robust standard errors and GMM-SYS regressions with 'collapsed' instruments with finite-sample
correction for the two-step covariance matrix developed by Windmeijer (2005) reported in Table 5 (columns II and IV for
sales growth and columns VI and VIII for employee growth, respectively) and Table 7 (Panel B, columns II for sales
growth and IV for employee growth, respectively). The GMM-SYS results are reported only if the estimated coefficient of
LnSizei,t-1 is significantly different from zero at conventional confidence levels. Standard errors in round brackets. * p <
.10; ** p < .05; *** p < .01.

45
Table 10. Firm growth dynamics around the year of VC funding
Sales growth Employee growth
Column I II III IV V VI
IVC vs. no
VC financing
GVC vs. no
VC financing
Syndication
vs. no VC
financing
IVC vs. no
VC financing
GVC vs. no
VC financing
Syndication
vs. no VC
financing
LnSize (t-1) -0.6391***
(0.0474)
-0.5078***
(0.0591)
-0.4358***
(0.1016)
-0.4170***
(0.0475)
-0.3581***
(0.0323)
-0.4124***
(0.0548)
LnAge (t) 0.0969
(0.1743)
-0.0286
(0.2833)
-0.3232
(0.4568)
-0.0490
(0.0880)
-0.1098
(0.1187)
-0.4697*
(0.2449)
IVC Before (1) 0.0560
(0.1765) - -
0.0448
(0.0801) - -
IVC (0) -0.0268
(0.1811) - -
0.1086
(0.0994) - -
IVC After (1) 0.3361**
(0.1702) - -
0.2241***
(0.0852) - -
IVC After (2) 0.4280**
(0.1678) - -
0.0935
(0.0854) - -
IVC After (3) 0.2716
(0.1765) - -
0.1414
(0.1014) - -
IVC After (4) 0.0116
(0.1063) - -
-0.0151
(0.0347) - -
IVC After (≥5) 0.4833**
(0.2006) - -
0.1227
(0.1016) - -
GVC Before (1) - -0.1634
(0.1585) - -
0.0321
(0.1361) -
GVC (0) - -0.1318
(0.2498) - -
0.1047
(0.1726) -
GVC After (1) - -0.2547
(0.2475) - -
-0.0164
(0.1790) -
GVC After (2) - -0.0121
(0.2427) - -
-0.0741
(0.1819) -
GVC After (3) - 0.0651
(0.2317) - -
-0.0660
(0.1941) -
GVC After (4) - -0.0721
(0.0900) - -
-0.0398
(0.0607) -
GVC After (≥5) - 0.0598
(0.2477) - -
0.0151
(0.1961) -
SYND Before (1) - - -0.3106
(0.5405) - -
0.0515
(0.2246)
SYND (0) - - -0.2526
(0.7335) - -
-0.0915
(0.1881)
SYND After (1) - - 0.0972
(0.5352) - -
0.2047
(0.2242)
SYND After (2) - - -0.1626
(0.5423) - -
0.2816*
(0.1487)
SYND After (3) - - -0.2110
(0.5546) - -
0.0753
(0.1964)
SYND After (4) - - -0.3191
(0.3434) - -
0.0157
(0.0694)
SYND After (≥5) - - -0.2668
(0.6036) - -
-0.0003
(0.1658)
Time dummies Yes Yes Yes Yes Yes Yes
Obs. 2,143 882 249 2,375 964 312
Groups 325 114 37 342 123 44
R2 0.1198 0.0957 0.0724 0.0429 0.0327 0.0292
Legend. The dependent variables are the sales growth (columns I-III) and employee growth (columns IV-VI). Time dummies
are included in the estimates (the coefficients are omitted in the table). The estimates are derived from FE regressions with
robust standard errors. All of the regressions are estimated with an intercept term. Standard errors are in round brackets. * p <
.10; ** p < .05; *** p < .01.

46
Table 11. Legal and institutional differences across countries
Sales growth Employee growth
Column I II III IV V VI
IVC vs. no
VC financing
GVC vs. no
VC financing
Syndication
vs. no VC
financing
IVC vs. no
VC financing
GVC vs. no
VC financing
Syndication
vs. no VC
financing
LnSize (t-1) -0.1495***
(0.0206)
-0.1237***
(0.0294)
-0.1856**
(0.0679)
-0.0478***
(0.0121)
-0.0363**
(0.0141)
-0.0490**
(0.0203)
LnAge (t) -0.2091***
(0.0500)
-0.2293**
(0.0954)
0.3431*
(0.1762)
-0.1273***
(0.0201)
-0.1333***
(0.0346)
-0.0209
(0.0906)
IVC (t-1) 0.2143***
(0.0531) - -
0.0949***
(0.0257) - -
GVC (t-1) - 0.0723
(0.0685) - -
0.0363
(0.0319) -
VCSyndicate (t-1) - - 0.1858
(0.1883) - -
0.1362*
(0.0757)
Country Earnings
Aggressiveness Index
1.8122
(4.6139)
-16.54***
(5.8762)
7.4326
(17.2429)
-3.8328**
(1.9169)
-2.5495
(2.3740)
2.8334
(5.6547)
Country Disclosure Level
Index
0.0201***
(0.0075)
0.0343
(0.0266)
0.0168
(0.0332)
0.0065*
(0.0036)
0.0095
(0.0102)
0.0133
(0.0132)
Private Firm Accounting
Aggregate Index
0.0089***
(0.0030)
0.0076
(0.0094)
0.0138
(0.0104)
0.0013
(0.0013)
0.0014
(0.0035)
0.0048
(0.0050)
Time dummies Yes Yes Yes Yes Yes Yes
Industry dummies Yes Yes Yes Yes Yes Yes
Obs. 2,143 882 249 2,375 964 312
Groups 325 114 37 342 123 44
R2 0.1848 0.1832 0.2297 0.1177 0.0983 0.1806
Legend. The dependent variables are the sales growth (columns I-III) and employee growth (columns IV-VI). Industry and
time dummies are included in the estimates (coefficients are omitted in the table). Estimates are derived from OLS
regressions with standard errors that are robust to heteroskedasticity through the Huber-White method and serial correlation
within firms. All of the regressions are estimated with an intercept term. Standard errors are in round brackets. * p < .10; ** p
< .05; *** p < .01.
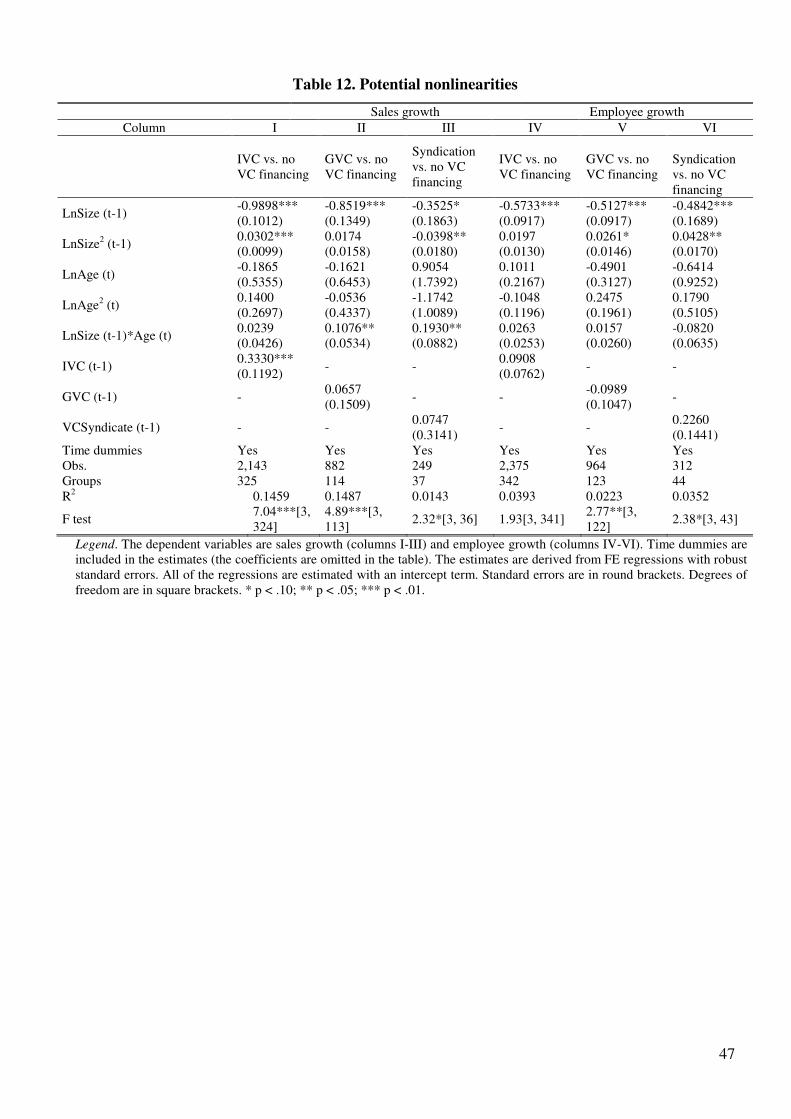
47
Table 12. Potential nonlinearities
Sales growth Employee growth
Column I II III IV V VI
IVC vs. no
VC financing
GVC vs. no
VC financing
Syndication
vs. no VC
financing
IVC vs. no
VC financing
GVC vs. no
VC financing
Syndication
vs. no VC
financing
LnSize (t-1) -0.9898***
(0.1012)
-0.8519***
(0.1349)
-0.3525*
(0.1863)
-0.5733***
(0.0917)
-0.5127***
(0.0917)
-0.4842***
(0.1689)
LnSize2 (t-1)
0.0302***
(0.0099)
0.0174
(0.0158)
-0.0398**
(0.0180)
0.0197
(0.0130)
0.0261*
(0.0146)
0.0428**
(0.0170)
LnAge (t) -0.1865
(0.5355)
-0.1621
(0.6453)
0.9054
(1.7392)
0.1011
(0.2167)
-0.4901
(0.3127)
-0.6414
(0.9252)
LnAge2 (t)
0.1400
(0.2697)
-0.0536
(0.4337)
-1.1742
(1.0089)
-0.1048
(0.1196)
0.2475
(0.1961)
0.1790
(0.5105)
LnSize (t-1)*Age (t) 0.0239
(0.0426)
0.1076**
(0.0534)
0.1930**
(0.0882)
0.0263
(0.0253)
0.0157
(0.0260)
-0.0820
(0.0635)
IVC (t-1) 0.3330***
(0.1192) - -
0.0908
(0.0762) - -
GVC (t-1) - 0.0657
(0.1509) - -
-0.0989
(0.1047) -
VCSyndicate (t-1) - - 0.0747
(0.3141) - -
0.2260
(0.1441)
Time dummies Yes Yes Yes Yes Yes Yes
Obs. 2,143 882 249 2,375 964 312
Groups 325 114 37 342 123 44
R2 0.1459 0.1487 0.0143 0.0393 0.0223 0.0352
F test 7.04***[3,
324]
4.89***[3,
113] 2.32*[3, 36] 1.93[3, 341]
2.77**[3,
122] 2.38*[3, 43]
Legend. The dependent variables are sales growth (columns I-III) and employee growth (columns IV-VI). Time dummies are
included in the estimates (the coefficients are omitted in the table). The estimates are derived from FE regressions with robust
standard errors. All of the regressions are estimated with an intercept term. Standard errors are in round brackets. Degrees of
freedom are in square brackets. * p < .10; ** p < .05; *** p < .01.

48
Appendix
Appendix A. Matching procedure(s) and description of matched samples
In Section 4.1, we defined three different categories of VC-backed firms: 1) the IVC-backed firms; 2) the GVC-backed
firms; and 3) the VC syndicate-backed firms. As a first step, following the suggestions of Dehejia and Wahba (2002), we
randomized our dataset. Second, we chose whether to use a PSM with or without replacement. We opted for matching
without replacement because of the sufficient number of control group firms (Dehejia and Wahba, 2002) that acted as
potential matches of the VC-backed firms. The drawbacks of our choice are: i) a potential increase in the bias; and ii) a
sensitivity of the goodness of the procedure to the order of the firms in the dataset (Rosenbaum, 1995). With regard to the
latter, as previously explained, we randomized the dataset. Regarding the potential high level of the bias, we performed a
balancing test on the variables that are included in the PSM (Table A.1, Panel A).
Once we decided to use a PSM without replacement, we had to choose how many control group firms to match with
each VC-backed firm. Following Puri and Zarutskie (2012), we chose a one-to-one matching. Therefore, we built three
matched samples of non-VC-backed firms that are comparable to the sample of VC-backed firms according to a set of a
priori characteristics (the samples are labeled as: 'IVC vs. no VC financing', 'GVC vs. no VC financing' and 'Syndication
vs. no VC financing'). In particular, the propensity scores were obtained by estimating a logit model in the year of the first
VC round in which the dependent variable is the probability of receiving VC and the independent variables include the firm
age, firm size (number of employees), country and industry dummies. Abadie and Imbens (2006) claim that there is a trade-
off in estimating PSM with balanced or unbalanced numbers of control group observations. As a robustness check, we
performed a nearest-match method with replacement and selected one, two or three control observations for each VC-
backed firm, alternatively. We also performed a caliper matching with replacement (with one, two or three control group
observations) for a range of radius values. The results were almost unchanged.
In Table A.1, we report t-tests for the equality of means before and after matching for all of the covariates that are used
in matching procedures (Panel A) and other tests to verify the correctness of our procedure (Panel B). In Panel A, we verify
whether the specification of the propensity scores that we chose allows us to 'balance' all of the covariates that are included
in the estimation of the propensity scores between the VC-backed firms and the matched non-VC-backed firms. Although
we have no balance for many of the covariates before performing the PSM (e.g., age, the biotech industry, and year 2004 in
all of the three typologies of VC-backed firms); after PSM, in all of the three matching procedures that we implemented,
there is a perfect balance (p-values ≥ 0.1 after matching) for all of the covariates. Thus, it is not necessary to implement any
further balancing algorithm, as suggested by Dehejia and Wahba (2002: p. 161).
In Panel B, we further tested the 'goodness' of the implemented matching procedures. First, pseudo R2 obtained by
estimating the logit models on the matched samples are always lower than pseudo R2 before matching. Second, the p-values

49
referred to the LR test on the joint insignificance of the covariates before and after matching reassures us about the
functional form that we chose to estimate the propensity scores. In fact, the covariates that are included in the logit models
before matching explain the likelihood of obtaining VC funding (p-values < 0.05) in all of the three matching procedures.
At the same time, such covariates after matching are jointly null (all of the p-values are ≥ 0.75).
Appendix B. Instruments
The assumption that we made about a possible endogeneity of VC implies, in the GMM-SYS approach, that the lagged
levels of the VC variables are used as instruments for equations [1] in the differences and that the lagged differences of the
VC variables are used as instruments for equation [1] in the levels. The validity of these instruments has been verified by
means of the Hansen tests, as shown in Table 5 and Table 6. However, we have also to test that these instruments are not
weak, i.e., that they are strongly correlated with the vector VCi,t-1. For this purpose, we ran the following pseudo-first stage
regressions for the 'difference' part and the 'system' part of the GMM-SYS procedure, respectively:21
The two typologies of pseudo-first stage regressions are run on the matched samples 'IVC vs. no VC financing' and
'GVC vs. no VC financing', on each VC variable that is included in the vector VCi,t-1. For the sake of simplicity, we report
the pseudo-first stage regressions in which the dependent variables are IVCi,t-1 and GVCi,t-1. Pseudo-first stage regressions
on IVCAfteri,t-1 and GVCAfteri,t-1 are available upon request from the authors. In Table B.1, we report the F tests on the null
hypothesis that all of the βτ coefficients in the differences and in the levels are jointly zero. In each matched sample, the F
statistic on the null hypothesis of the weak instruments is rejected both on the βτ coefficients in the differences and the βτ
coefficients in the levels (with the exception of column III). However, all of the values of the F statistic that are related to
the pseudo-first stage regressions run on the 'system' ('difference') part of GMM-SYS procedures are above (below,
respectively) the critical value of 10 (Staiger and Stock, 1997), which points to a stronger relevance of the lagged
instruments in the first differences and thus to the importance of the additional instruments that are used by the system part
of the GMM methodology.
Then, as explained in footnote 10 (Section 5.1), in addition to the GMM-SYS estimation, we also attempted to
implement a panel two-stages least squares (TSLS) methodology with fixed effects. The availability of a suitable set of
strong external firm-specific instruments is crucial to implementing the methodology. In our setting, this difficult task is
21
We refer to the GMM-SYS specification with moment conditions in the interval between t-3 (t-2) and t-4 (t-3) for
instruments in levels (differences). See Section 5 for more details.
1,1,
3
2
,
3
2
,1,
1,1,
4
3
,
4
3
,1,
:Levels
:sDifference
−−
−
−=
−
−=
−
−−
−
−=
−
−=
−
+++++∆+∆=
∆++∆++=∆
∑∑
∑∑
tiiiiti
t
t
i
t
t
iti
tiiti
t
t
i
t
t
iti
TSCLnAgeVCLnSizeVC
TLnAgeVCLnSizeVC
ηγβα
ωγβα
τττ
τττ
τττ
τττ

50
even more arduous because the instruments must differentiate VC investors according to their typology. Among the
variables that are identified as good candidates on a theoretical basis, we employed the following measures, which were
used in previous empirical analyses to instrument VC investments at the firm level: the annual ratio between tangible assets
and total assets (TTA) at the industry level (Gompers, 1995; source: the VICO dataset), GDP growth (Jeng and Wells,
2000; source: World Bank), the annual IVC fundraising at the country level (in a similar vein, see Bottazzi et al., 2008;
source: the Thomson One database), the annual number of IPOs at the country level, the annual ratio between the number
of IPOs at the country-level and the GDP at the country level (in a similar vein, see Jeng and Wells, 2000). In fact, these
variables proved to be only marginally correlated with the variables to be instrumented. As shown in Table B.2, these
variables are not strongly correlated to any of the variables that are to be instrumented: IVCi,t-1 in columns I-III; GVCi,t-1 in
columns IV-VI; and VCSyndicatei,t-1 in columns VII-IX. Allegedly, all of the values of the Kleibergen-Paap (2006) statistic
do not reject the null hypothesis of weak identification, in both the LM and Wald versions.
Appendix C. Placebo leads test
The results that are related to the ‘placebo leads’ tests are presented in Table C1.
Appendix D. Survivorship bias
The starting point for testing the possible presence of a survivorship bias in our findings is the procedure developed by
Wooldridge (1995). This procedure makes a normality assumption on the errors in the selection (exit) equation. Such errors
are allowed to be serially correlated and heteroskedastic. From this equation, the researcher computes the inverse Mills
ratio (IMR)-type term (see Wooldridge, 2002: p. 563) that is inserted into the FE estimation of the main equation at the
second step using the unbalanced panel. Following Semykina and Wooldridge (2010), for each year, we estimated an exit
equation on the overall VICO dataset. The dependent variable in these probit models is a dummy variable that equals 1 in
the year that the focal firm exited the VICO dataset. The independent variables included the firm size (i.e., the number of
employees), the firm age, the (potential) receipt of VC financing, and the industry and country dummies. For each year, we
computed the IMR-type term that was to be added as a control for survivorship bias in the main equation at the second step,
as estimated through FE and GMM-SYS. Semykina and Wooldridge (2013) extend their procedure (2010) to avoid the
'weak instruments' problem that is associated with the panel TSLS estimator with fixed effects. With the 'new' procedure,
the main equation is estimated in levels and not in differences. As explained in Section 5, we cannot perform the procedure
suggested by Semykina and Wooldridge (2010, 2013) on the sample of VC syndicate-backed firms because the conditions
to perform the GMM estimations are not met. Note that all of these tests do not require the adjustment of standard errors at
the 2° step (Semykina and Wooldridge, 2010). The results of the tests are presented in Table D1.

51
Appendix Tables
Table A.1. Summary of balancing tests
IVC vs. no VC
financing
GVC vs. no VC
financing
Syndication vs. no VC
financing
Before
matching
After
matching
Before
matching
After
matching
Before
matching
After
matching
PANEL A
Country
Belgium 0.008 1.000 0.693 0.819 0.412 1.000
Finland 0.142 0.336 0.102 0.438 0.126 1.000
France 0.030 0.562 0.285 0.596 0.138 0.748
Germany 0.009 0.400 0.081 0.614 0.771 1.000
Italy 0.113 0.349 0.037 0.755 0.166 0.323
Spain 0.017 0.110 0.000 0.572 - -
United Kingdom 0.999 0.224 - - 0.038 1.000
Industry
Pharmaceutical 0.104 0.147 0.476 0.700 - -
ICT manufacturing 0.019 0.886 0.511 1.000 0.625 0.689
TLC 0.909 1.000 0.189 0.384 - -
Internet 0.000 0.651 0.462 1.000 0.913 0.155
Software 0.015 0.286 0.090 0.718 0.262 0.373
Biotech 0.000 0.313 0.000 0.629 0.006 1.000
Year
1994 0.575 1.000 0.001 0.313 - -
1995 0.292 0.563 0.000 0.548 - -
1996 0.773 0.430 0.000 0.772 - -
1997 0.764 0.262 0.000 0.260 - -
1998 0.980 1.000 0.700 1.000 0.628 0.155
1999 0.349 0.732 0.115 1.000 0.569 1.000
2000 0.000 0.269 0.894 0.333 0.216 1.000
2001 0.130 0.360 0.761 1.000 0.403 0.333
2002 0.199 0.398 0.166 0.413 0.629 0.305
2003 0.000 0.176 0.132 0.514 0.595 1.000
2004 0.022 0.176 0.029 1.000 0.099 0.561
Age 0.000 0.383 0.000 0.509 0.010 1.000
Employees 0.419 0.938 0.565 0.988 0.696 0.618
PANEL B
Pseudo R2 0.099 0.036 0.152 0.042 0.088 0.049
LR chi2 214.26 17.96 131.29 7.41 30.49 2.69
p>chi2 0.000 0.760 0.000 0.998 0.016 0.999
Legend. PANEL A refers to the p-values of the t-tests for the equality of the means before and after the matching for each
variable that was used as a covariate in the matching procedures. PANEL B reports: i) pseudo R2 obtained by means of
logit regressions on the treatment variables (i.e., the VC funding) before and after the matching; ii) LR tests on the joint
insignificance of covariates included in the logit regressions before and after the matching; and iii) p-values referred to the
LR tests.

52
Table B.1. Pseudo-first stage regressions
Sales growth Employees growth
IVC vs. no VC
financing
GVC vs. no VC
financing
IVC vs. no VC
financing
GVC vs. no VC
financing
Equation: Differences Levels Differences Levels Differences Levels Differences Levels
I II III IV V VI VII VIII 4.64*** 101.15*** 1.48 17.68*** 6.87*** 88.37*** 3.57** 19.83***
Adjusted R2 0.0379 0.2063 0.0966 0.1011 0.0551 0.1613 0.0984 0.0675
Legend: * p < .10; ** p < .05; *** p < .01. The first line reports F statistics on the null hypothesis of weak instruments.
0::0 =∀ τβτH

53
Table B.2. First-stage regressions: TSLS
PANEL A: Sales growth
IVC vs. no VC financing GVC vs. no VC financing Syndication vs. no VC financing
Coef. KP LM KP Wald
F Coef. KP LM
KP Wald
F Coef. KP LM
KP Wald
F
I II III IV V VI VII VIII IX
TTA 0.0913
(0.0712) 1.632 1.645
0.1386
(0.0890) 2.349 2.427
-0.2275
(0.8451) 0.078 0.072
GDP growth 0.0158
(0.0133) 1.400 1.398
0.0026
(0.0106) 0.062 0.060
0.0366
(0.0384) 0.941 0.907
IVC
fundraising
-0.0000
(0.0001) 0.330 0.327 - - - - - -
IPO 0.0002
(0.0002) 1.379 1.375
-0.0002
(0.0006) 0.144 0.143
-
0.0014**
(0.0005)
6.090 6.361
IPO/GDP 0.0000*
(0.0000) 3.539 3.621 - - - - - -
PANEL B: Employee growth
TTA 0.1448**
(0.0599) 5.517 5.843
0.1019
(0.0741) 1.784 1.890
-0.3689
(0.6681) 0.321 0.305
GDP growth 0.0077
(0.0114) 0.452 0.449
0.0021
(0.0116) 0.034 0.033
0.0063
(0.0335) 0.039 0.036
IVC
fundraising
0.0000
(0.0001) 0.000 0.000 - - -
-0.0001
(0.0001) 0.243 0.228
IPO 0.0002
(0.0001) 1.328 1.316
-0.0005
(0.0006) 0.629 0.626
-0.0011*
(0.0006) 3.281 3.421
IPO/GDP 0.0000
(0.0000) 2.671 2.695 - - - - - -
Legend. First-stage results of the TSLS panel models with fixed effects are reported. We show the coefficient of the focal
external instrument (columns I, IV and VII), LM (columns II, V and VIII) and Wald versions of the Kleibergen-Paap
statistic (columns III, VI and IX). Standard errors are in round brackets. * p < .10; ** p < .05; *** p < .01.
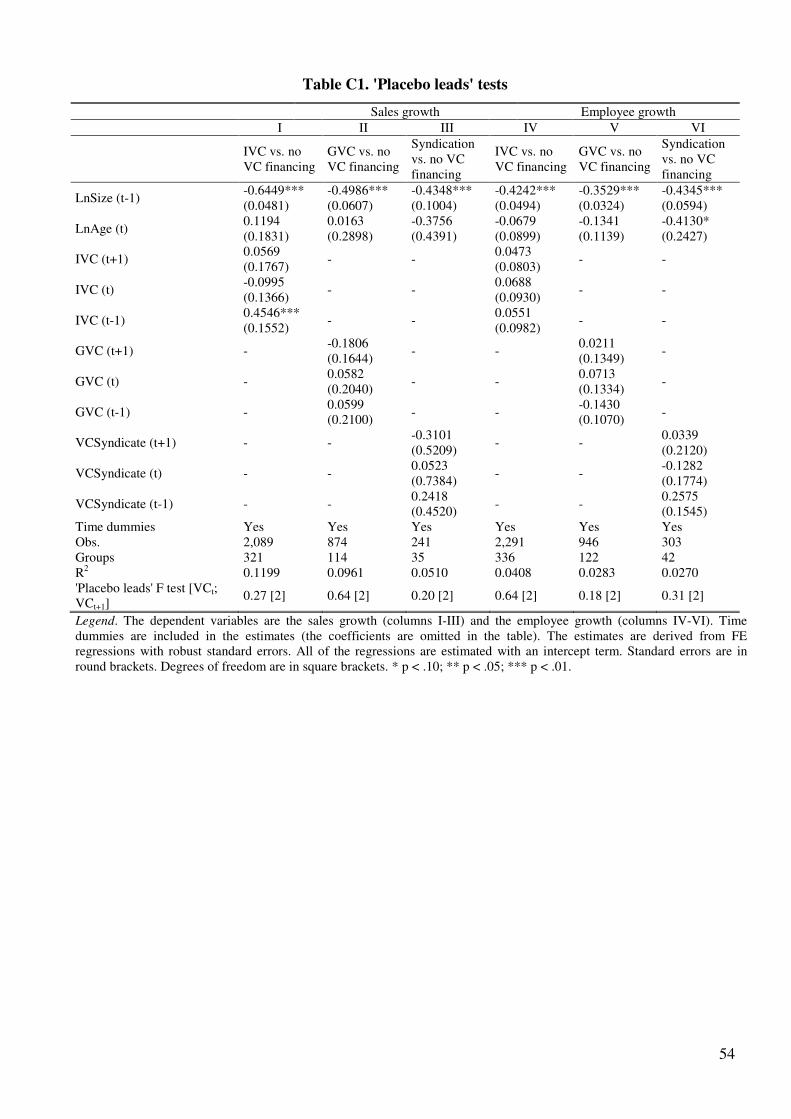
54
Table C1. 'Placebo leads' tests
Sales growth Employee growth
I II III IV V VI
IVC vs. no
VC financing
GVC vs. no
VC financing
Syndication
vs. no VC
financing
IVC vs. no
VC financing
GVC vs. no
VC financing
Syndication
vs. no VC
financing
LnSize (t-1) -0.6449***
(0.0481)
-0.4986***
(0.0607)
-0.4348***
(0.1004)
-0.4242***
(0.0494)
-0.3529***
(0.0324)
-0.4345***
(0.0594)
LnAge (t) 0.1194
(0.1831)
0.0163
(0.2898)
-0.3756
(0.4391)
-0.0679
(0.0899)
-0.1341
(0.1139)
-0.4130*
(0.2427)
IVC (t+1) 0.0569
(0.1767) - -
0.0473
(0.0803) - -
IVC (t) -0.0995
(0.1366) - -
0.0688
(0.0930) - -
IVC (t-1) 0.4546***
(0.1552) - -
0.0551
(0.0982) - -
GVC (t+1) - -0.1806
(0.1644) - -
0.0211
(0.1349) -
GVC (t) - 0.0582
(0.2040) - -
0.0713
(0.1334) -
GVC (t-1) - 0.0599
(0.2100) - -
-0.1430
(0.1070) -
VCSyndicate (t+1) - - -0.3101
(0.5209) - -
0.0339
(0.2120)
VCSyndicate (t) - - 0.0523
(0.7384) - -
-0.1282
(0.1774)
VCSyndicate (t-1) - - 0.2418
(0.4520) - -
0.2575
(0.1545)
Time dummies Yes Yes Yes Yes Yes Yes
Obs. 2,089 874 241 2,291 946 303
Groups 321 114 35 336 122 42
R2 0.1199 0.0961 0.0510 0.0408 0.0283 0.0270
'Placebo leads' F test [VCt;
VCt+1] 0.27 [2] 0.64 [2] 0.20 [2] 0.64 [2] 0.18 [2] 0.31 [2]
Legend. The dependent variables are the sales growth (columns I-III) and the employee growth (columns IV-VI). Time
dummies are included in the estimates (the coefficients are omitted in the table). The estimates are derived from FE
regressions with robust standard errors. All of the regressions are estimated with an intercept term. Standard errors are in
round brackets. Degrees of freedom are in square brackets. * p < .10; ** p < .05; *** p < .01.

55
Table D1. Survivorship bias tests
PANEL A: Sales growth
FE GMM-SYS FE GMM-SYS FE
I II III IV V
IVC vs. no VC financing GVC vs. no VC financing Syndication vs. no VC financing
LnSize (t-1)
-0.6754*** (0.0440)
-0.2366*** (0.0631)
-0.5441*** (0.0546)
-0.2656*** (0.0926)
-0.5362*** (0.0905)
LnAge (t) 0.1898 (0.1742) -0.2197** (0.0946) -0.0012 (0.2510) 0.0340 (0.1928) -0.1685 (0.4363)
IVC (t-1) 0.4561*** (0.1179) 0.2425** (0.1038) - - -
GVC (t-1) - - 0.1259 (0.1445) -0.0028 (0.1293) -
VCSyndicate (t-1) - - - - 0.1311 (0.2973)
IMR (t) 0.2655 (0.2786) -0.0303 (0.1136) -0.2183 (0.3536) -0.0569 (0.2048) -0.0605 (0.6861)
Time dummies Yes Yes Yes Yes Yes
Country dummies - Yes - Yes -
Industry dummies - Yes - Yes -
Obs. 1,943 1,943 755 755 225
Groups 324 324 114 114 37
R2 0.1439 - 0.1471 - 0.0988
AR(1) - -4.00*** - -3.66*** -
AR(2) - 0.97 - -0.18 -
Hansen (p-value) - 79.15 [71] (0.237) - 75.16 [75] (0.473) -
PANEL B: Employee growth
LnSize (t-1) -0.4278*** (0.0495) -0.0566 (0.0399) -0.3729*** (0.0335) -0.0436 (0.0459) -0.4249*** (0.0575)
LnAge (t) -0.0766 (0.0900) -0.1190*** (0.0352) -0.1012 (0.1169) -0.1225** (0.0491) -0.4587* (0.2583)
IVC (t-1) 0.0959 (0.0766) -0.0354 (0.0624) - - -
GVC (t-1) - - -0.0962 (0.1087) -0.1353** (0.0638) -
VCSyndicate (t-1) - - - - 0.1958 (0.1361)
IMR (t) -0.0886 (0.1289) 0.0711 (0.0649) 0.0718 (0.1800) 0.0675 (0.0943) 0.2660 (0.2343)
Time dummies Yes Yes Yes Yes Yes
Country dummies - Yes - Yes -
Industry dummies - Yes - Yes -
Obs. 2,342 2,342 934 934 310
Groups 342 342 123 123 44
R2 0.0347 - 0.0296 - 0.0201
AR(1) - -2.98*** - -4.72*** -
AR(2) - 0.01 - 0.19 -
Hansen (p-value) - 81.06 [70] (0.172) - 83.13 [75] (0.244) -
Legend. The dependent variables are the sales growth (PANEL A) and the employee growth (PANEL B). Country,
industry and time dummies are included in the estimates (the coefficients are omitted in the table). Estimates are derived
from FE regressions with robust standard errors, and the GMM-SYS with moment conditions of endogenous variables
restricted to the interval t-3 (t-2) and t-4 (t-3) for instruments in levels (differences) that have a finite-sample correction
for the two-step covariance matrix developed by Windmeijer (2005). All of the regressions are estimated with an intercept
term. Standard errors and p-values of Hansen statistics are in round brackets. Degrees of freedom are in square brackets. *
p < .10; ** p < .05; *** p < .01.