Amphipod assemblages before and after beach nourishment in the central Adriatic Sea (Italy)
Upload
khangminh22Category
view
3download
0
Iowa State UniversityDigital Repository @ Iowa State University
Retrospective Theses and Dissertations
1962
Glyceride study of lard before and after molecularrearrangementAvery Dean MilloyIowa State University
Follow this and additional works at: http://lib.dr.iastate.edu/rtd
Part of the Organic Chemistry Commons
This Dissertation is brought to you for free and open access by Digital Repository @ Iowa State University. It has been accepted for inclusion inRetrospective Theses and Dissertations by an authorized administrator of Digital Repository @ Iowa State University. For more information, pleasecontact [email protected].
Recommended CitationMilloy, Avery Dean, "Glyceride study of lard before and after molecular rearrangement " (1962). Retrospective Theses and Dissertations.Paper 2015.

This dissertation has been 62—3021 microfilmed exactly as received
MILLOY, Avery Dean, 1932-GLYCERIDE STUDY OF LARD BEFORE AND AFTER MOLECULAR REARRANGEMENT.
Iowa State University of Science and Technology Ph.D., 1962 Chemistry, organic
University Microfilms, Inc., Ann Arbor, Michigan

GLYCERIDE STUDY OF LARD BEFORE AND AFTER
MOLECULAR REARRANGEMENT
by
Avery Dean Milloy
A Dissertation Submitted to the
Graduate Faculty in Partial Fulfillment of
The Requirements for the Degree of
DOCTOR OF PHILOSOPHY
Major Subject : Chemical Engineering
Approved:
Head of Major Department
Iowa State University Of Science and Technology
Ames, Iowa
1962
Signature was redacted for privacy.
Signature was redacted for privacy.
Signature was redacted for privacy.

ii
TABLE OF CONTENTS Page
INTRODUCTION - — - 1
LITERATURE REVIEW — 5
Early Developments 5 Chemical Oxidation 7 Progressive Hydrogénation 8 Low Temperature Crystallization 9 Low Temperature Crystallization and Chemical
Oxidation Compared — 12 Microscopy 13 Partial Enzymatic Hydrolysis 13 Method of Calculating the Glyceride Structure
from Minimum Data 26 Combined Chemical Oxidation and Enzyme
Hydrolysis Study 27 Column Chromatography Studies 28 Thin Layer Chromatography 30 Fatty Acid Analysis 32 Glyceride Separation by Gas-Liquid Chromatography -- 38 Fatty Acid Methyl Ester Preparation 42
EXPERIMENTAL STUDIES AND RESULTS 45
Introduction 45 Kartha Acetic-Acetone Permanganate Oxidation 46 Low Temperature Fractional Crystallization
of Lard 50 Introduction 50 Fractional crystallization No. 1. Analysis
by iodine and saponification values 51 Fractional crystallization No. 2. Analysis
by iodine and saponification values and poly-unsaturated acids by ultraviolet spectrophotometry 52
Fractional crystallization No. 3. Fraction analyses by gas-liquid chromatography and pancreatic lipase hydrolysis 55
Separation of free fatty acids from the lipase hydrolysis products using Amberlite IRA-400 anion exchange resin 56 Separation of monoglycerides from di-and triglycerides using 4x4 completion of squares liquid-liquid extraction 74 Results 78

iii
TABLE OF CONTENTS (Continued) Page
Fractional crystallization No. 4. Fraction analyses by gas-liquid chromatography and pancreatic lipase hydrolysis — --*-- -- -- -- -- -- - 86
Fractional crystallization No. 5. Analyses by gas-liquid chromatography and pancreatic lipase hydrolysis-- 98
Introduction — 98 Methylation of free fatty acids and
glyceride fatty acids 107 Monoglyceride recovery 123 Enzymatic hydrolysis procedure 153 Gas chromatography 175 Fractional crystallization, hydrolyses,
and analyses 182 Trisaturated glyceride determination 219
Combined Oxidation-Hydrolysis Study 222
SUMMARY — - 251
LITERATURE CITED 259
ACKNOWLEDGMENT 269
APPENDIX A: LOW TEMPERATURE CRYSTALLIZATION EQUIPMENT AND PROCEDURE 270
APPENDIX B: DRY ACETONE 284
APPENDIX C: GAS CHROMATOGRAPHY 285
APPENDIX D: RESTN ACTIVATION 306
APPENDIX E: HYDROLYSIS PROCEDURES 309
APPENDIX F: PREPARATION OF FATTY ACID METHYL ESTERS --- 315
APPENDIX G: PREPARATION OF ANHYDROUS HYDROCHLORIC ACID-METHANOL SOLUTION 322

1
INTRODUCTION
Lard enjoyed the position of being the premium shorten
ing until vegetable shortenings slowly started taking over in
the 1920*5 and 1930,s. Vegetable shortening manufacturers
found that hydrogenated vegetable oils were superior to lard
for certain culinary uses, especially in the baking of cakes.
These facts were made known to the homemaker and commercial
bakers in such a convincing manner that hydrogenated vegetable
oil shortenings soon cut deeply into the sales of lard as a
shortening. Vegetable oil shortenings soon surpassed lard in
sales and have continued to do so until the present time.
This competition in the shortening field caused consider
able research to be conducted to determine why lard should be
inferior to hydrogenated vegetable oil shortenings and what
could be done to improve lard for culinary purposes.
Hawley and Holman (29) give the following four short
comings of natural lard as compared to good hydrogenated
vegetable shortenings:
1. a poor oxidative stability, creating off-flavor
problems in storage and in high temperatures uses
such as frying and pastry;
2. a grainy, translucent appearance and texture that is
unattractive compared to the smooth, white appear
ance of vegetable shortenings and causes performance

2
difficulties in some baking uses;
3. a poor plastic range, that is, it usually is too
soft at warm temperatures and too hard at cold
temperatures; and
4. non-uniformity in consistency and flavor* which can
vary with the season, area, and rendering method.
Oxidation stability was improved through the use of
antioxidants and by partial hydrogénation. Random interesteri-
fication of lard can cure the graininess problem. The poor
plastic range can be improved by the addition of 9-12% com
pletely hydrogenated fat (usually cottonseed oil) to the
randomized fat or better yet according to Hawley and Holman
(29), by directed interesterification in which the amount of
trisaturated glycerides is increased and the amount of di-
saturated monounsaturated glycerides decreased.
Rearranged lard is formed (4) by heating lard at a tem
perature of anywhere just above its melting point to about
250°C in the presence of a catalyst. There are many possible
catalysts of which the alkali metal derivatives are the most
effective. A commonly used catalyst in the laboratory is
sodium methoxide. If the temperature is high enough to insure
maintaining a single phase reaction mixture, the rearrangement
is random. That is, the fatty acid radicals move from site
to site in the mixture in a completely random manner until
the catalyst is killed by addition of a weak acid solution or

3
water depending upon the catalyst used. Therefore a random
fatty.acid distribution on all the possible sites is obtained.
But if the temperature is allowed to decrease below the melt
ing point of the trisaturated glycerides, the trisaturated
glycerides are removed from the reaction phase by crystalliza
tion and therefore the reaction is directed toward the removal
of the saturated acids from the reaction phase. This removal
of the trisaturated glycerides from the reaction phase causes
the relative amount s of GS^U, disaturated-monounsaturated;
GSUg, monosaturated-diunsaturated; and GU3, triunsaturated
glycerides to change and the final glyceride structure of the
fat is different for the directed rearrangement than for the
random rearrangement. Hawley and Holraan (29) point out that
the plastic range of lard is greatly affected by the amount
of disaturated glycerides remaining in lard as they give
little or no heat resistance to the shortening because their
melting point is approximately that of room temperature.
By directed rearrangement of lard, a product is obtained
which compares well with hydrogenated vegetable shortenings
in all respects. One of the major problems of lard producers
today is to convince the housewife and the bakers that the
modified lard is as good as the vegetable shortenings. As
early as in 1953, modified lard was being put on the market
to compete with hydrogenated vegetable shortenings as is
pointed out by Slater (87) in that a plant for producing a

4
randomly rearranged lard is described as being in operation
by Armour and Company. In 1957, Placek and Holman (71) re
ported that their directly interesterified lard, Fluffo, was
second in sales only to their own all vegetable shortening,
Crisco, and also describe an all purpose shortening being
sold under the tradename of Pertex and another product for
baking cakes which contains monoglyce ride s and goes under the
tradename of Selex. Both of the latter products are directly
interesterified lard products produced by Procter and Gamble.
In the course of developing modified lard, one of the
most important questions was what makes the rearranged lard
better than natural lard. One way to answer this question
might lie in obtaining complete chemical composition of the
lard and the glyceride composition before and after rearrange
ment. The difficulty here, of course, lies in that there are
not adequate analytical methods today to obtain completely
such data. The chemical composition (glycerol and the various
fatty acid radicals) can be determined by methods already" de
veloped and in common usage, but the glyceride composition
determination before and after molecular rearrangement is an
entirely different matter. The methods of glyceride analysis
are very limited and at best, only a rough estimation can be
made as to the types of glycerides present.
The purpose of this study was to use the best methods
available today to determine the glyceride structure of lard
before and after molecular rearrangement.

5
LITERATURE REVIEW
A natural fat may be defined as a mixture of mixed tri
glycerides. The problem here is therefore the analysis of
the triglyceride mixtures before and after rearrangement.
There has been a considerable amount of work on glyceride
analysis but these studies have included the mono-, di-, and
triglycerides. The main concern here is with only the tri
glycerides.
Hilditch (38) gives a general review of the development
of the methods of glyceride studies from which some of the
main developments described by him are presented here.
Early Developments
It was observed by Chevreul in 1823 that natural fats
were glycerol esters of fatty acids and it was assumed that
the glycerides were simple triglycerides. In 1897, Heise, and
in a few years later, Kilmont, Bomer and others started studies
which showed that natural fats were not simple triglycerides
and that simple triglycerides were the exception rather than
the rule.
The first reports of attempts to separate and isolate
glycerides by low temperature crystallization appeared in the
early 1900fs. The work often consisted of elaborate crystal
lization procedures which in the case of Bomer actually in
volved many hundreds of crystallizations. This work resulted

6
In the isolation of the major triglyceride constituents from
fats made up of a limited number of fatty acids. It is in
teresting to note that Bomer and his collaborators recorded
the isolation of two palmitostearins from lard in 1913 by
these methods and in 1923, Amberger and Wieshahn obtained
similar results for lard and in addition reported 2% oleo-
distearin and 11% oleopalmitostearin.
Between 1920 and 1930, fractional crystallization^ tech
niques were employed after either hydrogenating or brominating
the unsaturated portion of the fat. The results were qualita
tive in nature and did little more than to help confirm the
generalization that natural fats are mixtures of mixed tri
glycerides and that simple triglycerides are very seldom
found naturally.
From about 1927 on, the major contributions in the field
of the glyceride study of fats came out of the laboratory of
Hilditch. Hilditch summarizes this work by listing the methods
of investigation developed at Liverpool as having evolved as
follows:
I. Determination of the fully saturated glycerides
present in natural fats.
II. Determination of the triunsaturated Clg glycerides
(oleic, linoleic, etc.) in fats:
(a) by estimation of the tristearin content of the
completely hydrogenated fat;

7
(b) by study of the glyceride composition of the
fat after hydrogénation to varying extents.
III. (a) More detailed examination of the component
glycerides in solid seed or animal fats by
separating the latter into fractions varying
in solubility in acetone, each fraction being
examined separately for its fatty acid compo
sition and, if desired, its fully saturated
glyceride content, content of triunsaturated
Cis glycerides, etc.
(b) Similar examination of liquid vegetable or
animal fats by systematic crystallization from
acetone or ether at suitable temperatures down
to -70°C, each fraction being examined sepa
rately for its fatty acid composition.
Chemical Oxidation
A method for the determination of the fully saturated
glycerides in a fat was worked out by Hilditch and Lea (35) in
which a fat is oxidized in an acetone solution by the addi
tion of powdered potassium permanganate until all the un
saturated carbon to carbon double bonds have been severed.
The saturated fatty acid radicals are unaffected by this treat
ment and therefore the trisaturated glycerides are unaffected
by the oxidation. It was found that the trisaturated glycer
ides could be separated from the azelaoglycerides by washing

8
with alkali if proper precautions were taken.
This chemical oxidation method was modified somewhat by
Kartha (45) who added acetic acid to the reaction mixture
along with the potassium permanganate to maintain a slightly
acidic solution during the oxidation so that the potassium
hydroxide formed during the reaction was neutralized and
therefore not free to cause hydrolysis of the azelaoglycerides
as Kartha claimed was taking place in the Hilditch and Lea
procedure. Kartha also worked out a method of separation of
the oxidation products by taking advantage of the difference
of the solubility of their magnesium salts. In this method,
the trisaturated glyceride content must be determined by an
independent method, usually by crystallization, and the re
sults of the method are an estimation of each of the four
major types of glycerides present in the fat; GS3, GS2U, GSU2>
and GUg where the G, S, and U represent the glycerol radical,
saturated fatty acid radical, and unsaturated fatty acid
radical respectively.
Progressive Hydrogénation
Of the studies in which a series of progressively hydro
genated fats was prepared and studied to determine the com
ponent glycerides of the fat, the study which is of interest
here is that of Hilditch and Stainsby (37). Here the fat
used was the inner back fat of a sow (component acids:

9
myristic 2.8, palmitic 27.3, stearic 14.4, oleic 40.9,
linoleic 13.5, unsaturated Cgg.gg 1*1 mol percent). The
original inner back fat contained 5.6 mol percent of fully
saturated components (component acids: plamitic 54„0, stearic
46.0 mol percent). Crystallization of the fully saturated
glycerides produced in the hydrogenated fats gave 2-palmitc-
distearin (m.p. 67.0-67.5°C), in amounts corresponding to 80
percent or more of the total palmitodistearin present in these
fully saturated portions of the fat. That the original pig
fat therefore contained 2-palmitoglycerides was confirmed
later by Meara (59).
Low Temperature Crystallization
When solid carbon dioxide became available for common
usage in the laboratory, low temperature fractional crystal
lization techniques were developed to a much higher degree
than the isolation techniques used by the early workers. Again
Hilditch and his collaborators were the leaders in the field.
In general, the methods worked out were the fractionation of
a fat into several fractions starting out as low as -70°C in
some cases and obtaining fractions at successively higher
temperatures by crystallization of the lower melting glycer
ides in either acetone or ether solutions. Each of the frac
tions obtained was further investigated for its fatty acid
composition. By assuming that each fraction contained no more
than two of the four major glyceride types, the overall

10
glyceride composition in terms of GS3, GS2U, GSU2, and GU3
was determined. In cases in which the number of component
fatty acids in the fat was relatively few, the individual
component glycerides of a fat were stated with some degree of
precision. But in the more common situation in which the
number of fatty acids was relatively greater, the results were
less definite. Hilditch and Pedelty (36) investigated pig
perinephric and back fat and obtained the results given in
Table 1.
Table 1. Patty acid composition and major glyceride type composition of pig depot fat by Hilditch and Pedelty (37)
Fig
Perinephric Back
Saturated fatty acids (mol %)
Laurie 0.5 w w w
Myristic 1.3 1.3 Palmitic 31.1 29.0 Stearic 17.6 13.8 Total 50.5 44.1
Unsaturated fatty acids (mol %)
Oleic 40.6 43.9 Linoleic 5.3 7.2 Total 49.5 55.9
Glycerides
GS3 9 5
GS2U 46 36
GSU2 40 52
GU3 5 7

11
American workers in the field followed the same general
procedure of fractional crystallization worked out by Hilditch
and his collaborators. Of these, several investigations have
involved lard. In 1946, Riemenschneider e_t al. (79) obtained
seven fractions of lard and gave the fatty acid and glyceride
compositions for the lard as shown in Table 2.
Table 2. Fatty acid and major glyceride type compositions of lard by Riemenschneider et al. (79)
wt % found
Mol % found
Mol % random (Calc'd)
Fatty acid composition
Linoleic Linolenic Arachidonic Oleic Saturated
12.75 0.82 0.42
49.6 36.1
Glycerides
GS3 1.9 1.9 5.2
GS2U 25.7 25.9 26.3
GSU2 54.4 54.6 44.0
GU3 18.0 17.7 24.5
In 1953, Quimby et_ al. (75) carried out extensive crystal
lizations of lard, beef tallow, and mutton tallow. Fractions
which were representative of each of the four major glyceride
types present were obtained. Studies of these fractions were

12
made which involved obtaining the melting point, X-ray dif
fraction pattern, and cooling curve of completely hydrogenated
fractions before and after random rearrangement. The results
of this study confirmed the findings of Hilditch in that it
was concluded that lard contains 2-palmitoglycerides and very
little if any 1-palmitoglycerides.
Low Temperature Crystallization and Chemical Oxidation Compared
In 1954, Luddy et_ al. (51) determined the glyceride
composition of four fats by both the oxidation and crystal
lization methods. Lard was one of the four fats used in the
work. The results of this work are given below in Table 3.
Table 3. Oxidation and fractional crystallization methods of determining the four glyceride types of lard compared, Luddy <et al. (51)
Calculated5
Found Restricted Oxid. Cryst. random Random
Glycerides
GSg CO
CO 2.8 2.8 5.8
GS2U 24.6 27.4 32.4 27.7
GSU2 58.9 54.8 43.1 43.6
GU3 13.7 15.0 21.7 22.9
Smb 38.8 39.4 38.8 38.8
^Calculated from oxidation experimental data.
t>Sm = mol % of saturated acids (as glycerides).

13
The results of Table 3 were obtained using a fractional
crystallization procedure somewhat different than that in the
work of 1946 but essentially the same type of fractions were
obtained and the same assumption that only two of the four
types of glycerides were present in any one of the fractions
was used. Only five fractions are obtained in the fractional
crystallization procedure used in this work.
This work showed that the oxidation and crystallization
methods gave essentially the same results when applied to
lard, chicken fat, and cottonseed oil but that substantially
different results were obtained for palm oil by these two
methods.
Microscopy
Microscopy has been employed to study lard before and
after rearrangement by Hoerr and Waugh (39) and by Herb ejb
al. (31). It is useful in studying the type of crystals
formed under different conditions of crystallization and also
to study the incorporation of air into cake batters when dif
ferent types of shortenings are used.
Partial Enzymatic Hydrolysis
In recent years there has been a considerable amount of
work conducted in the study of natural fats by carrying out a
partial hydrolysis of the fats in the presence of an enzyme

14
and analyzing the hydrolysis products. In 1948, Desnuelle
et al. (24) studied the enzymatic hydrolysis of triolein and
peanut oils in which they concluded that at a pH of 7.0 in
the absence of calcium salts, the hydrolysis products con
sisted of mainly triglycerides and diglycerides but only small
amounts of monoglycerides. At a pH of 8.0 the results were
similar but a more complete hydrolysis of triglycerides took
place. At a pH of 8.0 in the presence of calcium salts the
triglycerides and diglycerides were more completely hydrolyzed
and monoglycerides accumulated in the hydrolysis products.
In 1950, Desnuelle jet al. (22) showed that as the quantity of
calcium salts are increased in the enzymatic hydrolysis reac
tion mixture, the hydrolysis gradually passed from the type
"generator of diglycerides" to the type "generator of mono
glycerides." They also demonstrated that calcium ions are
much more effective than calcium oleate. In 1951, Desnuelle
et al. (23) described conditions which lead to hydrolysis of
about one-third of the triglycerides molecules and which re
sulted in formation of considerable quantities of glycerol.
The outstanding feature of these conditions was the low fat
concentration in the over-all hydrolysis reaction emulsion.
After it had been learned that lipolyses carried out
under different conditions in the presence of pancreatic lipase
could be made to yield different amounts of hydrolysis products
it became necessary to develop better methods of analysis of

15
the products of hydrolysis. Mattson et al. (56) demonstrated
the determination of 1-monoglycerides by the use of the
periodic acid oxidation method of Pohle and Mehlenbacher (72)
and the determination of the total monoglycerides by first
converting 2-monoglycerides to 1-monoglycerides and the
1-monoglycerides again determined as before. The 2-monogly
cerides were obtained by the difference of the 2 results. The
2-monoglycerides were converted to 1-monoglycerides by use of
55% perchloric acid. The results of their work showed that
almost all of the monoglycerides formed were of the 2-mono
glycerides configuration. They also suggested that the
diglycerides were probably of the 1,2-configuration.
Desnuelle and Constantin (21) presented microanalysis
techniques to determine the amounts of liberated f&tty acids,
monoglycerides, diglycerides, triglycerides and glycerol in
the enzymatic lipolysis products. This work also showed that
in vitro and intraluminar lipolysis possess the same charac
teristics.
In 1952, Borgstrom (9) described the separation of free
fatty acids and glycerides from cholesterol esters by use of
a silicic acid column. Separation of the fatty acids from
the glycerides was accomplished using anion exchange resin to
adsorb the fatty acids as first described by Cason e_t al. (15).
Borgstrom (11) also carried out in vivo and in vitro studies

16
of enzymatic hydrolysis and among other results he found that
in both cases there was a re-synthesis of glyceride ester-
bonds by the use of 0^4 labeled free palmitic acids added to
the glyceride samples. Borgstrom (10), published methods for
the separation of tri-, di-, 1-mono-, and 2-monoglycerides.
The tri-, di-, and monoglycerides were separated on a silicic
acid chromatography column. Borgstrom found that 2-mono
glycerides are partially isomerized to 1-monoglycerides in
passing through the column. He presented a method by which
the monoglycerides can be separated from the tri-, and
diglycerides by partition chromatography. The di- and
triglycerides can then be separated on a silicic acid colunn.
The monoglyceride fraction can be further treated by periodic
acid oxidation of the 1-monoglyceride and separation of the
oxidation product and 2-monoglycerides on a silicic acid col
umn. As in previous work the free fatty acids are adsorbed
on anion exchange resin columns. Passage of synthetic 2-mono-
palmitin through Amberlite IRA-400 anion exchange resin did
not cause any detectable isomerization to 1-monoglycerides.
The partition column separation used the solvent system of
heptane-807» aqueous ethanol developed by Zilch and Button (100)
and used for Craig separations by Mattson e_t aJL. (56).
In 1953 and 1954 Borgstrom (7, 12, 13, 8) published work
on more detailed studies of the mechanism and condition for
enzymatic hydrolysis. Borgstrom (13) found that about 20%
- r

of the monoglycerides formed during enzymatic lipolysis are
of the 1-monoglyceride configuration. He also showed that the
diglycerides formed are of the 1,2-diglyceride type. The
1,2-diglycerides were distinguished from the 1,3-diglycerides
by chromic acid oxidation. By use of labeled free fatty acids
added to glycerides fed to rats (8) it was found that there
was a real synthesis of glyceride-ester bonds and not only
trans-esterification. In a study of the effect of bile acids
on the hydrolysis and the effect of the pH of the reaction mix
ture (7), it was found that a plot of percent hydrolysis vs. pH
curves for different concentrations of tauro-cholic acid, a
maximum at pH = 7.2 with 0.5% tauro-cholic acid, a maximum at
pH = 6.7 with 0.1 tauro-cholic acid, and a maximum at about
pH = 6 for 0.2% tauro-cholic acid. With increasing concen
tration of tauro-cholic acid, a second optimum also appeared
at a pH of about 9. This second pH optimum starts to show up
at a tauro-cholic acid concentration of 0.1%. In a more de
tailed study (12) it was found that there is an exchange be
tween the free fatty acids and the fatty acids in the 1- and
3-position of the glycerides but no exchange was detected for
the 2-position fatty acids. There was also evidence that part
of the exchange between the free fatty acids and the glycer
ides was due to re-synthesis of glyceride-ester bonds. But
no re-synthesis appeared to take place with glycerol and the
free fatty acids, therefore indicating that the overall hy

18
drolysis of glycerides proceeds toward completion in vitro.
This study also confirmed that the hydrolysis proceeds from
1,2-diglycerides to both 1- and 2-monoglycerides with the
2-monoglycerides prevailing. The pH vs. activity curves for
hydrolysis and re-synthesis of glyceride ester bonds in the
absence of bile acids are parallel and have maximums at a pH
of about 8. The effect of calcium ions was to accelerate the
rate of hydrolysis and the increased rate of hydrolysis due
to the calcium ions was parallel to a decreased rate of re-
synthesis of glyceride-ester bonds. This work also indicated
that different fatty acids are built into glycerides during
hydrolysis at different rates.
Savary and Desnuelle (83) describe their method of hy
drolysis product analysis by free fatty acid adsorption on
Amberlite 1RA-400 and separation of mono-, di-, and tri
glycerides on an inverse phase partition column using silica
kieselguhr as solid support, cychohexane as the stationary
phase and ethanol-water as eluant. The separations were
satisfactory except when the glycerides contained short-chain
fatty acids (C^g) and the more usual long chain fatty acids
(Ci6 and C18). They point out though that alcohol causes
isomerization of some 2-monoglycerides to 1-monoglycerides
during passage through the column but that the overall mono
glyceride content remains unchanged. Isomerization can be
avoided by replacing alcohol with acetone.

19
Savary and Desnuelle (85) studied the hydrolysis of
synthetic triglycerides by the action of pancreatic lipase and
some of their results are presented in Table 4.
Table 4. Pancreatic lipase hydrolysis products of synthetic mixed triglycerides, Savary and Desnuelle (85)
Composition of products Unsaturation Glycer- Duration obtained (moles/100 of fractions ide em- of li- moles theoretically (Chains oleic ployed polysis liberated) for 100 chains)
acids MG DG TG Acids MG DG TG
POO 2 hr. 45 min. 29 19 45 35 58 80 71 65 POP 2 hr. 45 min. 38 30 40 25 5 87 48 32 OPP 2 hr. 45 min. 28 21 36 41 51 4 20 34
These results confirm that the hydrolysis hydrolyzes the
1- and 3-position fatty acids in preference to the 2-position
fatty acids. Their work also showed that 1-monoglycerides
arise from the action of the lipase and that isomerization of
2-monoglycerides to 1-monoglycerides during hydrolysis was of
secondary importance. Details of results not reported in the
paper indicated the 1-oleic acid was detached by the lipase
a little faster than the 1-palmitic acid but that this
"specificity of chain" was less clear than the specificity of
position.
In 1955, Mattson and Beck (54) carried out detailed
studies of digestion in vitro of triglycerides by pancreatic
lipase. The conclusions of this study were that the hydroly-

20
sis progresses more rapidly in an electrolyte concentration
of 1-2 molar, bile salts at low concentration promote hy
drolysis but are inhibitory at higher levels, and that an
increase in the amount of enzyme used increases the amount of
digestion products but that the effect was not linear. Hy
drolysis of 2-oleodipalmitin resulted in a diglyceride of
oleopalmitin and the monoglyceride was monoolein. From the
data presented for the 2-oleodipalmitin hydrolysis it was
calculated that 9.0 mol percent of the fatty acids freed were
oleic and that 88.8 mol percent of the monoglycerides formed
were monoolein. By the varying of the length of time of hy
drolysis they found that appreciable quantities of 2-mono
glycerides are present for times of less than 60 minutes but
that at 60 minutes only the equilibrium mixture of 1- and
2-monoglycerides was present. They concluded that 1«mono
glycerides are a result of isomerization of 2-monoglycerides.
By 1956, enough was understood about partial hydrolysis
of triglycerides in the presence of pancreatic lipase to use
the method for the study of the structure of natural tri
glyceride mixtures. In 1956, Mattson and Beck (55) studied
the specificity of pancreatic lipase for the primary hydroxy1
groups of glycerides. Their study included hydrolysis of
2-oleodipalmitin, 2-oleodistearin, 2-palmitodiolein, and
1-oleodipalmitin. Study of these materials confirmed previous

21
work that the hydrolysis proceeded in steps from triglyceride
to 1,2-diglyceride to 2-monoglyceride and that this course
was followed for 16 and 18 carbon saturated fatty acids and
18 carbon unsaturated acids regardless of their location in
the glycerides. To further show that the type of fatty acid
was not important as compared to its location in the molecule,
natural lard and randomly rearranged lard were hydrolyzed and
the results compared. The uniform content of fatty acids in
each of the fractions for the randomized lard showed that the
enzyme presents no specificity for any one of the acids.
Data for the lard samples are presented in Table 5.
Table 5. Fatty acid composition of enzymatic hydrolysis products of lard and randomly rearranged lard by Mattson and Beck (55)
Percent composition Hydrolysis Iodine Satu Lino Lino Arachiproducts value rated Oleic leic lenic donic
Crude lard Unhydrolyzed 71.0 36.0 50.3 12.7 0.5 0.4 Free fatty acids 87.5 21.2 59.8 17.1 0.6 0.3 Monoglycerides 32.6 71.1 22.5 6.3 0.3 0.0
Randomly rearranged lard Unhydrolyzed 70.3 36.7 49.9 12.5 0.6 0.4 Free fatty acids 69.6 38.6 46.6 14.0 0.7 0.2 Monoglycerides 68.5 39.0 47.3 12.9 0.6 0.2
The data of Table 5 show that crude lard has a saturated
acid content in the 2-position of more than twice that of un
saturated acids in this position. As the palmitic acid con
tent of lard (about 25%) is usually about twice that of stearic

22
acid (stearic acid about 12%) and usually the only other
saturated acid of greater than trace amounts is myristic acid
(2-4%), this work definitely confirms the work of Hilditch
and Stainsby (37), Meara (59), and Quimby e_t al. (75), in
which it was found that the glycerides of lard were of the
2-palmito type rather than 1-palmitoglycerides.
Savary and Desnuelle (82) also carried out specificity
studies during the enzymatic hydrolysis of triglycerides in
1956. Three pure glycerides, 2-oleoyl dipalmitin, 2-palmito-
oleopalmitin, and 2-oleooleopalmitin, and several mixtures of
glycerides with random distribution of the chains were studied.
Analysis of the hydrolysis products confirmed that the 1- and
3-position fatty acids are hydrolyzed much more rapidly than
the 2-position fatty acids but that the 2-position fatty acids
are not completely inert in that 10-30% of the monoglycerides
are 1-monoglycerides. They state that it is more probable
that the occurrence of the 1-monoglycerides is due to direct
action of the enzyme system at the 2-position than due to an
isomerization of 1,2-diglycerides and 2-monoglycerides. Mattson
and Beck (54) attributed 1-monoglyceride formation to mainly
isomerization. Savary and Desnuelle also concluded that the
degree of unsaturation of the fatty acids (0-2 double bonds)
and their length (Cig to C^) did not have any appreciable
influence on the rate of hydrolysis. The specificity is due
much more to position than nature of the chain.

23
In 1957, Savary ejt al^ (84) published the results of the
study of the structure of fats employing pancreatic lipase.
They found in all of the animal depot-fats and vegetable fats
of seeds and fruits that the distribution of fatty acids in
the outer and inner positions of the glycerides were not ran
dom. More specifically, in all the cases studied with the ex
ception of pig fat, it was found that there was a great ex
cess of unsaturated acids in the 2-position and that the
predominant isomer for the disaturated-monounsaturated glycer
ides was of the symmetrical one and that for diunsaturated-
monosaturated glycerides, the asymmetrical isomer predominated.
For pig depot-fat regardless of where it occurred in the body
or the state of fattening of the animal, the situation was
exactly reversed. Palmitic and stearic acids were found to
occupy the same positions except in pig fat in which palmitic
occurred in the 2-position to a much higher degree than stear
ic. The distribution of oleic acid and linoleic acid in pig
fat occupied the same positions.
Mattson and Lutton (57) studied the distribution of
fatty acids in the glycerides of 12 vegetable fats and 8 ani
mal fats of which lard was one. The study was made using en
zyme hydrolysis of the fat and an analysis was made of the fatty
acids freed and the monoglycerides formed. The data for pig
fat is essentially the same as that obtained by Mattson and
Beck (55). They also concluded that natural occurring tri

24
glycerides have a high degree of specificity in their fatty
acid distribution and that natural fats whether vegetable or
animal do not have random distributions. The vegetable fat
saturated acids occurred predominantly in the 1- and 3-posi-
tions but a similar generalization could not be made for ani
mal fats. Lard was found to be an exception to all the other
fats studied in that it was the only one in which the satura
ted fatty acids were found predominantly in the 2-position.
Lard was also an exception to the strong tendency of linoleic
acid being found in the 2-position of animal fats.
Desnuelle and Savary (25) wrote a review of their work
on the glyceride structure of some natural fatty substances in
1959. They review the development of work done in the study
of the structure of fats and outline the methods of analysis
employed by themselves in these studies. In their discussion
they point out that none of the natural fats they studied and
that were studied by Mattson and Lutton (57) conformed to a
random distribution. The specificity of position appeared to
be due to whether the fatty acid was saturated or unsaturated.
In vegetable fats the saturated acids were always located pre
ferentially on the external positions with cocoa butter being
an extreme in that only unsaturated acids are found in the
2-position. With animal fats the principle is less well
followed but in general the unsaturation in the external po
sitions is greater than in the internal position. Pork was

25
found to be an exception; the saturated acids were found to
be preferentially on the internal positions. They also found
that in some cases the length of the saturated chains and the
degree of unsaturation corresponded to a given position. Ex
amples of this were the relatively greater proportion of
palmitic acid in the internal position than stearic acid in
pork and the greater abundance of linoleic acid in the in
ternal position than oleic acid in rat, dog, human, and horse
glycerides. Linoleic and oleic acids appeared to occupy the
same positions in pork as was previously reported by Mattson
and Lutton (57).
Savary and Desnuelle (81) made a study of cocoa butter
and the depot fats of mutton and pork by separating the 2-
monoglyceride fraction after enzymatic hydrolysis. This was
accomplished by periodic acid treatment of all the hydrolysis
products followed by column separation. The monoglyceride
fraction consists of 2-monoglycerides only as the 1-monogly
cerides are destroyed by the periodic acid. As reported in
previous work by them, cocoa butter was found to have,100%
unsaturated acids in the 2-position. Mutton was found to
have 80-90% unsaturated acids in the 2-position whereas in
pork 80-90% of the 2-position fatty acids are saturated. Of
these saturated acids in the 2-position of pork, palmitic
acid was found more frequently than stearic acid.

26
The work of Reiser and Reddy (78) was very similar to
that which was done at the same time by Mattson and Lutton
(57). It was somewhat more detailed in that the depot fat
was partially separated by fractional crystallization tech
niques. The fat was obtained from an animal which had been
fed for three months on a diet containing only 1% fat and
0.2% dienoic acid. The results of their study were that oleic
acid was found in the 1-position of each glyceride molecule
and the residual oleic acid was found in the 3-position.
Linoleic acid was found in the 2-position of the resultant
dioleins and that saturated acids complete the structure.
Method of Calculating the Glyceride Structure from Minimum Data
Vander Wal (91) has presented a method of calculating
the distribution of the saturated and unsaturated acyl groups
in fats from a minimum of data. He summarizes the method as
follows: "Evidence has been presented that the proportions
of the glyceride types and isomeric forms in some fats in
which Cj^-C^g chains are greatly in excess can be determined
by calculations based on a) the percentage of saturated acyl
groups in the whole fat, b) the percentage of saturated
groups in the 2-monoglycerides which can be derived from the
fats by hydrolysis, c) the assumption that all the saturated
and unsaturated acyl groups (S and U) present in each of the
three positions in the molecules are dispersed therein at

27
random, and d) the assumption that the proportions of S and
U in the 1-position are identical with those in the 3-posi-
tions. The method may apply to all predominately Ci6""c18
fats and to other fats as well." At the time he wrote this
paper, there was no experimental data for comparison of his
calculated values for the isomeric glyceride types. Since,
Youngs (98) has presented experimental data for comparison.
These results are given in Table 6.
Table 6. Comparison of calculated and experimental values for the six glyceride types present in lard, Youngs (98) and Vander Wal (91)
SSS SSU SUS SUU USU UUU
Youngs 8 29 0 15 36 12 experimental
Vander Wal Dist. 6 29 2 12 36 15
Combined Chemical Oxidation and Enzyme Hydrolysis Study
Youngs (98) presented a method for determination of the
structure of fats by a combination of several techniques used
to study fats. He first quantitatively oxidized the un
saturated acids and separated the oxidation products on a
liquid-liquid partition column into two fractions. Enzymatic
hydrolysis of each fraction, the oxidized sample, and the
original sample was carried out followed by analysis of the
fatty acids freed during the hydrolysis. Patty acid analyses

28
of each fraction, the oxidized sample, and the original sample
and the free fatty acid analyses of the fatty acids freed
during hydrolysis furnished enough data to calculate the
amounts of each of the six types of triglycerides present in
the original fat. These six glycerides types were SSS, SSU,
SUS, SUU, USU, UUU where S corresponds to a saturated fatty
acid and U corresponds to an unsaturated fatty acid. Of all
the glyceride structure studies so far mentioned, this was
the first work that employed gas-liquid partition chroma
tography for the fatty acid analyses.
Column Chromatography Studies
Separations of mono-, di-, and triglycerides by column
chromatography have already been mentioned in the literature
on enzymatic hydrolysis. These were methods presented by
Borgstrom (10) who used a silicic acid column and Savary and
Desnuelle (89) who used an inverse phase partition column
using a solid support of silica kieselguhr and a stationary
phase of cyclohexane. More recently, Quinlin and Weiser (76)
and Ravin e_t al. (77) separated mono-, di-, and triglycerides
on a silica gel column. Different solvent systems were used
but both gave good separations.
Separation of dicarboxylic acids and silicic acid col
umns have been described. Higuchi e_t al. (34) demonstrated
the separation of the dicarboxylic acids C4 to Ciq in 1952

29
and Corcoran (17) extended the separations from Cjh through
C16 as well as separating the straight chain saturated mono-
carboxylic acids C± through Cio* In I960, Smith (88) de
scribed techniques for silicic acid column separation of C4
through C^2 straight-chain dicarboxylic acids which were be
lieved to be considerably easier to use.
Savary and Desnuelle (83) described a method of saturated
and unsaturated fatty acid separations by use of inverse phase
partition chromatography and permanganate hydroxylation of the
unsaturated acids. Of particular interest in this paper were
the details given on the chromatographic techniques. These
details may be of interest to anyone unfamiliar with the ap
paratus required, methods of filling the column, charging the
column, elution of the sample, fraction collection, and an
alysis of the fractions.
In autoxidation studies on fatty acids and their methyl
esters, Frankel ejt al. (26) describe a liquid partition chroma
tographic method to isolate and determine hydroperoxides, un-
oxidized fatty acids or methyl esters, and secondary and poly
meric decomposition products.
In 1960, Wren (97) published a review on the chromato
graphy of lipids on silicic acid. In this 22 page review a
table listing the order of elution of lipids was given and is
shown on the following page.

30
Table 7. Order of elution of lipids from silicic acid, Wren (97)
Hydrocarbons Esters other than steryl esters and diglycerides Steryl esters Fatty aldehydes (7) Triglycerides Long chain alcohols Fatty acids Quinones Sterols Diglycerides Monoglycerides Glycolipids Lipoamino-acids Bile acids Glycerophosphatidic acids Inositol-containing lipids Phosphatidylethanolamines Lysophosphatidylethanolamines Lecithins Sphingomyelins Lysolecithins Ethers Miscellaneous lipids
It is also pointed out in the review that the terms silica,
silica gel, and silicic acid are used synonymously in the
literature and are all powdered solids of silicon dioxide with
varying amounts of water.
Thin Layer Chromatography
The most recent development in the use of silica gel or
silicic acid has been in its application in very thin layers
on strips of plate glass. The lipid to be fractionated is

31
then spotted on one end of the plate glass and the spotted
end of the plate immersed in a suitable solvent and developed
in an ascending manner. Mangold and Malins (53) demonstrated
the separation of fats, oils, and waxes into their constitu
ent lipid classes. Malins and Mangold (52) further separated
classes of lipids obtained from thin layer chromatography in
to their constituents by use of siliconized silicic acid
plates, gas-liquid chromatography, and paper chromatography.
Privett ejt ajL. (74) separated mono-, di-, and triglycerides by
thin layer chromatography and molecular distillation and ob
tained good agreement with known compositions. Densitometrie
analysis of the plates after the separations have been made
was described. Privettand Blank (73) reported a method for
the analysis of component mono-, di-, and triglycerides by
the use of thin layer chromatography. Samples were first re
acted with ozone which attacked the carbon-carbon double bonds
and catalytic hydrogen reduction of these ozonides to aldehyde
groups. Separation of the resultant glyceryl residues was
performed. Procedures for the analysis of four monoglyceride
types, six of the seven possible diglyceride types and four of
the six possible triglyceride types were demonstrated. Re
sults obtained for a sample of lard are given in Table 8.
Wollish ejt al. (96) describe several pieces of improved
equipment in detail and review the current literature and ap
plications in different fields.

32
Table 8. Analysis of the triglyceride types of lard, Privett and Blank (73)
Triglyceride Found Literature values Type Percent (25) (17)
GSg 6.7 2.4 2.8
GS2U 34.6 28.0 27.4
GAIT 42.7 40.1 54.8
GU3 16.0 29.5 15.0
Fatty Acid Analysis
In carrying out glyceride structure studies, fatty acid
analyses are quite often desired. In the Hilditch laboratory,
methods for fractional distillation of methyl esters of the
fatty acids were developed. With the development of the ultra
violet spectrophotometry method of determining the poly
unsaturated acids, a powerful new analytical tool was avail
able to the fat chemist. The ultraviolet method was rapidly
standardized and it has become one of the official methods of
the American Oil Chemists* Society (2). Bergstrom and Borg-
strom (6) in reviewing recent developments in methods present
sections on isolation of fatty acids and separation of fatty
acids. These methods are mainly of the liquid-liquid extrac
tion and column chromatography types. The separations in
general are difficult and very often not complete. For ex
ample , stearic and oleic acid are very difficult to separate

33
or if the separations can be easily made on the basis of dif
ferent degrees of unsaturation, then difficulty is often en
countered with overlap between a shorter chain fatty acid of
lower degree unsaturation and a longer chain fatty acid of
higher degree unsaturation. In general these types of sepa
rations require several hours.
The latest development in fatty acid analysis has been
in the field of gas-liquid partition chromatography. The
first work with fatty acids was by James and Martin (44) in
1952 when they separated the volatile fatty acid esters from
formic to dodecanoic acids. In 1956, James and Martin (43)
presented data for formic to octadecanoic acids. In 1956,
Cropper and Heywood (20) presented data for separation of
methyl esters of the C]i2~C*22 fatty acids. In 1958, several
papers on fatty acid analysis appeared. Orr and Callen (69)
gave the preliminary results obtained in the screening of
partition agents for the fatty acid methyl esters and named
Reoplex 400, a polyoxyalkalene adipate, as the best found to
date. Craig and Murty (19) describe preliminary work with
polyesters as partition liquids and Stoffel et_ al. (89)
describe the satisfactory separation of highly unsaturated
fatty acid methyl esters of C^~(^22 without decomposition or
reaction of these fatty acid methyl esters. In 1959, Orr and
Callen (68) presented detailed results of their screening of
many partition liquids and reported that Reoplex 400 was the

34
best partition liquid of all those tested. Lipsky and
Landovme (46) also presented their findings in screening of
various polyesters as partition liquids for fatty acid analy
sis and describe a polyester called Lac-4-R777, a succinate
polyester of diethylene glycol, which gave results comparable
to those of Reoplex 400.
In 1959, Lipsky et aJL. (47) gave more results on the
study of different stationary liquids for separation of the
long chain fatty acids commonly found in nature. They found
that alkyd resins prepared from shorter dibasic acids than se-
bacic and azelaic acids gave better separation of oleic and
stearic acid as well as being more rapid. They found that di
ethylene glycol succinate polyester was one of the best liquid
substrates for excellent resolution and comparatively short
retention times for chain lengths to They also reported
that columns which yielded the highest number of theoretical
plates were not necessarily the most efficient ones for se
parating two closely related compounds.
Craig and Murty (18) also made a study in 1959 of the
quantitative fatty acid analysis of vegetable oils by gas-
liquid chromatography. They found that the thermal stability
of the polyester polymers could be improved by using 1,4-
butanediol or ethylene glycol instead of diethylene glycol
without loss of resolution. Iodine values calculated from
gas-liquid chromatography analyses were in good agreement with

35
measured iodine values and indicated that gas-liquid partition
chromatography was accurate to within one unit percentage.
The use of gas-liquid chromatography has grown into a
field involving a variety of types of detectors used. In the
field of lipids, Lipsky et. aJL. (48) demonstrated the use of
an ionization detection system and the use of capillary col
umns with which very difficult separations such as the separa
tion of cis-trans isomers a C^g fatty acid with one double
bond (methyl elaidate and methyl oleate) were separated.
Herb ejt al. (33) showed that gas-liquid chromatography
results obtained using thermal conductivity detectors compared
well with known percentage model mixtures and with analysis
by spectrophotometric methods for fatty acid methyl esters of
fats and oils. They also were unsuccessful in trying to de
termine the very small amounts of arachidonic and pentaenoic
acids in lard by gas-liquid chromatography. Herb e_t al. (32)
presented more information about the number of fatty acids
found in lard triglycerides when a detailed study of the trace
quantities was made. Quantitative evidence was obtained for
over 20 esters ranging in chain length from 10 to 22 carbon
atoms. Included were the esters of the following: saturated
acids (10, 12, 14, 15, 16, 17, 18, 19, and 20 carbon-atoms),
monounsaturated acids (14, 16, 18, and 20 carbon-atoms),
polyunsaturated acids (18:2, 20:2 (?), 18:3, 20:4, 20:5, 22:5).

36
Peaks for several additional trace components were also ob
served.
Ackman ejt al. (1) reported that short chain dicarboxylic
acid esters decompose during separation on polyester gas
chromatography media whereas with silicone grease as the par
tition medium, satisfactory results were obtained. The de
composition occurred for methyl esters of oxalic and malonic
acids; longer chain dicarboxylic acids were not decomposed.
This becomes especially important in structure studies of
polyethylenic fatty acids when oxidation products are analyzed
to determine the position of double bonds.
The direct analysis of fatty acids has been reported by
Metcalfe (61). The equipment required is the same as for
methyl ester analyses with the exception of the column, which
is treated with phosphoric acid to prevent tailing. If this
method catches on, it would save much time which is normally
required for preparing the methyl esters of the fatty acids.
This paper is an extension of his original announcement (62).
After chromatographs are obtained, the calculation of
the sample composition must be made. The normal procedure is
to find the area under each peak and set area percent equal
to weight percent of the peak component. Craig and Murty (18)
and Herb et al. (33) found that area percent calculations gave
good results on known samples. Areas can be measured by use

37
of a planimeter or by drawing tangents through the points of
inflection of the peaks and using the base times height of the
triangle formed for calculation of the areas.
The work of Horrocks e_t sal. (41) shows that peak area is
not a simple function of the concentration in mol percent or
weight percent. The percentage compositions calculated from
uncorrected areas was high for low molecular weight esters
and low for high molecular weight esters. They calculated
relative response values for each fatty acid from experimental
data as compared to palmitate to be used for correcting the
measured areas of a chromatogram. The magnitude of these cor
rections can be seen from the data presented in the table 9.
Table 9. Effect of relative response on the composition of known methyl ester mixtures determined by gas-liquid chromatography, Horrocks ejt al. (41)
Pound3 Percent Percent
Ester Known Pound3 error Corrected*3 error
Butyrate 4.6 5.9 28.3 4.7 2.2 Octanoate 9.9 11.5 16.2 10.0 1.0 Laurate 10.5 11.3 7.6 10.5 0 Palmitate 25.2 24.7 2.0 24.7 2.0 Arachidate 49.8 46.6 6.4 50.0 0.4
Decanoate 11.0 12.2 10.9 10.6 3.6 Myristate 22.8 24.6 7.9 23.0 0.9 Stearate 20.5 20.7 1.0 20.7 1.0 Behenate 45.7 42.5 7.0 45.7 0
^Calculated from uncorrected areas.
^Corrected for relative response.

38
In studies involving the oxidation of double bonds in
fatty acids, the resulting oxidation products contain di
carboxylic acids of varying chain lengths depending upon the
position of the double bonds. Nowakowska £t ajL. (64) reported
the preliminary study of the oxidation products of soybean
oil fatty acids, oleic acid, linoleic acid, and linolenic
acid by use of a gas-liquid partition column of Dow Corning
silicon, high-vacuum grease on Celite 545. Several unexpected
peaks were obtained. Further work with oxidation products
by Frankel ejb al. (27) identified an unknown gas chromato
graphic peak which appeared near palmitate when Craig poly
ester succinate was used as the stationary liquid phase. This
peak appeared in autoxidized samples of soybean oil methyl
esters and was identified as methyl azelaaldehydate. This
component is formed when the oxidation of the double bond in
the 9,10-position of a fatty acid produces an aldehyde in
stead of a fatty acid group.
Glyceride Separation by Gas-Liquid Chromatography
Gas-liquid partition chromatography has been very suc
cessful in making fatty acid analyses a routine procedure but
has had only limited success in analyzing higher forms of
lipids. There has been some work done with mono-, di-, and
triglycerides but much more needs to be done before glyceride
analyses can be made by gas-liquid partition chromatography.

39
Mclnnes ejfc al. (58) described the application of gas-
liquid partition chromatography to the quantitative estima
tion of monoglycerides. The monoglycerides were first con
verted to allyl esters by reacting with mesyl chloride in
the presence of pyridine and the resulting dimesyl derivatives
treated with sodium iodide in acetone. When 1- and 2-mono
glycerides were determined, 2 samples were run; the first for
total monoglycerides and the second for just 2-monoglycerides
by first destroying 1-monoglycerides with periodic acid. The
1-monoglycerides were obtained by difference.
In 1959, Huebner (42) reported a preliminary study on
mono- and diglycerides by gas liquid partition chromatography.
The mono- and diglycerides could not be eluted as such but
acetylation with acetyl chloride assured their complete elu
tion from the column.
Fryer ejt al. (28) reported for the first time quantita
tive separation of the triglycerides tributyrin through tri-
stearin. They also presented "fingerprints" of several
edible oils. They also state that "The main problem in ob
taining acceptable curves of the higher homologs is in vapor
izing the oil without thermal decomposition. For triglycerides
up to trimyristin this was obtained by increasing the injec
tion block temperature. However the higher homologs do not
respond as well, and increasing flow rate must be combined

40
with the higher temperatures to obtain the desired result
even though these changes have not given good curves for
molecular weights above 800."
Table 10. Quantitative interpretation of gas-liquid partition chromatography elution, tributyrin through trimyristin, Fryer et al. (28)
Standard mixture Curve I Curve II Triglyceride Mol % Weight % Area % Area %
Butyric 14. .9 8. .11 8. .15 12. .2 Hexanoic 10. ,3 7. .18 11. .2 11. .8 Octanoic 8. .54 7. .25 14. .2 10. .0
Decanoic 17. .9 17. .93 21. .2 23. .4 Laurie 22. .3 25. .71 29. .7 26. .0 Myristic 25. .9 33. .82 15i .3 16. .4
The data presented in Table 10 show that the method is
not developed well enough to be very useful for quantitative
analysis of even a simple mixture of trisaturated glycerides.
Much work needs to be done in this area to include the un
saturated fatty acid and mixed glycerides.
A review (3) of gas-liquid partition chromatography pre
liminary studies on triglycerides was published in 1961. Of
particular interest is a chromatogram of lard triglycerides
using temperature programing furnished by Huebner and is from
results which were presented at the American Oil Chemists1
Society Short Course in Rochester. A 30 inch column, f inch
O.D., packed with 3% SE-30 silicone oil on 100/120 mesh Gas-

41
Chrom P was used with a helium flow rate of 145 ml/min and a
flash heater temperature of 370°C. The components were trapped
as they emerged from the chromatograph and were established
to be triglycerides. The total time of analysis was 12 min
utes and the temperature range of 260 to approximately 390°C
was used. Pour peaks were obtained and the total number of
carbons in the triglyceride of each peak reported. These re
sults are presented below and were taken from the chromato
graph presented.
Table 11. Triglyceride elution of lard with temperature programed gas-liquid partition chromatography (3)
Column Size of No. of Temp., °C. peak3 carbons
353 3-4% 48 359 10-15% 50
365 60-80% 52 369 10-15% 54
^These percents were merely estimated to give an indication of the relative areas of the peaks. The percents were not published in the article cited.
Other chromatograms presented are of butter, trisatura-
ted glyceride mixture, palm kernel oil, triolein, and trilin-
olein.
As more work is carried out with gas-liquid partition
chromatography, the studies become more detailed and cover a
much narrower area of study. Several examples of this type

42
of work follow. The identification of fatty acids by use of
identification constants for mono- and dicarboxylic acids was
described by Miwa et_ al.. (63). Orr (70) considers recorder-
integrator errors in gas chromatography area measurements.
Bens (5) studied the absorption characteristics of C-22 fire
brick, glass spheres, and Tide when used as chromatographic
supports.
Fatty Acid Methyl Ester Preparation
In making fatty acid methyl ester analyses, one of the
major concerns is the preparation of the methyl esters.
Several papers have been published describing different meth
ods of preparation and comparison of results obtained using
different methods.
Stoffel ejt ajL. (90) describe a method in which the esters
or acids to be methylated are treated with 5% hydrochloric
acid (dry) in superdry methanol. The esters are extracted
with ether, dried and neutralized over a mixture of sodium
sulfate and sodium bicarbonate and the methyl esters finally
recovered by microsublimation.
Hornstein (40) presented the method of adsorbing free
fatty acid on anion exchange resin, washing the resin free of
any other fatty material and finally direct conversion of the
adsorbed fatty acids on the resin to methyl esters by the use
of anhydrous methanol-hydrochloric acid.

43
Metcalfe and Schmidtz (60) prepared methyl esters by
using boron trifluoride-methanol which converted fatty acids
to methyl esters in about 2 minutes. Comparison to prepara
tion by use of anhydrous methanol-hydrochloric acid and by
diazomethane showed good agreement of the results. This
method has an advantage over the use of diazomethane in that
the boron trifluoride-methanol solution can be stored whereas
diazomethane must be freshly prepared just before it is used.
Schlenk and Gellerman (86) describe the preparation and
use of etheral diazomethane for preparation of methyl esters
for microanalysis. They found that the reaction was slow in
etheral diazomethane but proceeds very rapidly in the presence
of 10% methanol. They also reported there was no reaction of
the double bonds in linoleic, linolenic, and arachidonic acids
when methylated by their method.
Luddy jet al_. (50) described substantially complete ester
ification of fatty acids in cholesteryl esters, phospholipides,
and glycerides by methanolysis with a large excess sodium or
potassium methoxide in absolute methanol. Glycerides required
only 5 minutes refluxing time., Quantitative conversion of un-
combiqed fatty acids was accomplished by direct esterification /
with absolute methanol containing 4% hydrochloric acid or
sulfuric acid and by methylation with diazomethane.
Vorbeck et al. (95) compared four methods of preparation

44
of methyl esters. The methods compared were methyl esters
prepared by 1) diazomethane, 2) methanol-hydrochloric acid
with sublimation, 3) methanol-hydrochloric acid on ion ex
change resin, and 4) methanol-boron trifluoride. The methods
were comparable for higher molecular weight fatty acids mix
tures but diazomethane appeared to give the best results when
lower weight fatty acids were present.

45
EXPERIMENTAL STUDIES AND RESULTS
Introduction
In general, the details of the experimental work are
given as it was conducted in connection with the major phases
of the research. The major phases of the research were con
sidered to be 1) Kartha*s chemical oxidation method to de
termine the four major glycerides types, 2) low temperature
fractional crystallization to determine the four major gly
ceride types, and 3) Youngs* method of glyceride structure
study utilizing chemical oxidation and enzymatic hydrolysis.
The low temperature crystallization study is further broken
down into a number of phases based upon the method used or
studied for analyzing the lard fractions.
Details of the construction and operation of equipment
are given in appendices. Some procedures, such as methyl
ester preparation, common to several phases of the work are
also given in an appendix when the procedure itself was not
a subject of study.
The lard before and lard after samples used in this work
were obtained from the Rath Packing Company of Waterloo, Iowa.
Some of the lard before rearrangement sample was used to pre
pare the rearranged lard sample. In this work, the terms "lard
before", "lard after", "lard B", and "lard A" are used to refer

46
to the lard samples before and after rearrangement. The let
ters "B" and "A" are also used to designate whether fractions
were obtained from the lard B or lard A samples.
The lard was obtained from the fat of hogs by digestion
in water by bubbling 40-60 psig steam through a fat-water mix
ture. The water was removed by centrifuging. The lard be
fore sample was obtained at this point of the processing. The
lard after sample was prepared by first slightly hydrogenating
the fat, drying the fat under vacuum to less than 0.005% watei;
adding 0.02% by weight sodium methoxide (methyl alcohol solu
tion), and allowing the reaction to take place for 15-20 min
utes. The reaction mixture started at about 100°P and was
allowed to cool during the reaction. At the end of the re
action, the catalyst was destroyed by adding water.
The Kartha oxidation was carried out on different samples
than the fractional crystallizations No. 1 and 2. Fractional
crystallizations No. 3, 4, and 5 were carried out on a third
set of lard B and lard A samples.
Kartha Acetic Acid-Acetone Permanganate Oxidation
When this glyceride study of lard was started, the use
of gas-liquid chromatography and lipase hydrolysis methods
were in the development stage. Kartha1s oxidation and low
temperature crystallization were the best methods of determin

47
ing the structure of a fat. The details of Kartha* s procedure
and methods of calculation are given in detail by Kartha (45).
The procedure involved cleavage of the carbon-carbon
double bonds in the fat sample, separation of magnesium salts
of the oxidation products into a precipitate and a filtrate
fractions, and separation of the saturated acids in each
fraction by magnesium salt precipitation. The weight, iodine
value, and saponification value of the saturated acid fractions
were determined. From this data and an independent determina
tion of the trisaturated glycerides in the fat, the amounts
of GSg, GSgU, GSUg, and GU3 in the fat sample were calculated.
The trisaturated glycerides were determined by crystalliza
tion from acetone as described by Luddy and Riemenschneider
(49).
The oxidation and separation of saturated acids from the
two fractions was successful but poor saponification and iodine
values were obtained. The results did not check published re
sults of Luddy ejt al. (51). Not enough sample remained for
more iodine and saponification value determinations. As the
work was for familiarization with techniques used in this
field and since the results obtained would have little value
other than to confirm other workers results, more oxidations
were not conducted. The considerable amount of time required
would have been great compared to the value of good results

48
obtainede
A number of preliminary oxidations were carried out be
fore the procedure was carried through to the end results.
Some observations were made which are not given in the pub
lished procedure but could be helpful in carrying out potas
sium permanganate oxidations by this procedure.
The oxidation is carried out by refluxing an acetone
solution of the fat and periodic additions of acetic acid and
potassium permanganate. The oxidation is considered complete
when the addition of one gram of permanganate maintains a
colored solution for 45 minutes. A bulk grade acetone of un
known purity sold at Iowa State University Chemical Stores was
used. When one gram of permanganate could not be made to
maintain a colored solution for 45 minutes, the acetone was
suspected of having permanganate consuming impurities or the
acetone itself was actually being attacked. Performance of
analytical reagent grade acetone compared to the bulk grade
acetone showed no detectable difference. Test samples of
acetic acid, acetic acid-acetone, and acetone were refluxed
with small quantities of permanganate. These qualitative
tests indicated that there was very little reaction with gla
cial acetic acid alone, but acetone alone did consume per
manganate and a mixture of glacial acetic acid in acetone re
acted more rapidly than either of the solvents alone. In try
ing to maintain a colored solution for 45 minutes, it was

49
found that as much as over 100 grams of permanganate had to
be added for a 5 gram sample of lard while about 60 grams of
permanganate were actually sufficient.
The time which a colored solution was maintained upon
addition of one gram of permanganate after a given amount of
total permanganate had been added varied with different runs
on the same sample and with the rate of reflux. A better
criterion for insuring complete oxidation appears to be the
total amount of permanganate added. The reaction of perman
ganate can be represented by the following equation.
0 it
H2C-0-C-Sat,d Chain)
I " 3 HC-O-C-CSat'd Chain) + 8 KMn04 -»
I 0
I H H2C-0-C- (CH2)7 - CH=CH-( CH2)7CH3
0 H
H2C-0-C-(Sat*d Chain) 0 0 it ft
3 HC-0-C-(Sat'd chain) + 3 CH3-(CH2)7-C-OK+8 Mn02
" " +2H20 +2 KOH H2C-0-C-(CH2)7 - C-OK
The theoretical amount of permanganate based on an approximate
iodine value of the fat could be calculated and an excess then
used.
After oxidation, the manganese dioxide precipitate causes
a black, viscous, heterogenous solution to form. The acetone

50
was removed under vacuum and a suspension of the residue in
water was treated with sodium bisulfite and sulfuric acid to
dissolve the manganese dioxide. It was found that to com
pletely dissolve the black precipitate required 2-3 hours
with heating. There is a point at which the suspension of
manganese dioxide breaks up and settles out and a clear light
yellow fatty layer forms on top of the solution. There does
not appear to be any need of going beyond this point in dis
solving the manganese dioxide. The fatty material may be
extracted with ether. Carrying the dissolution of manganese
to completion results in the precipitation of large amounts
of sodium sulfate which is just as troublesome in the extrac
tion of the fatty material with ether as is the undissolved
manganese dioxide.
Low Temperature Fractional Crystallization of Lard
Introduction
The details of the low temperature crystallization cabi
net as it was constructed and modified for different crystal
lizations and its operation are given in an appendix. The
crystallization scheme used was that presented by Luddy et al.
(51) which results in a total of five fractions.
The low temperature cabinet was constructed to maintain
a constant sample chamber temperature by turning on and off a
blower fan which forced air through a basket of crushed Dry

51
Ice and circulated the air between the sample chamber and the
Dry Ice chamber.
Several crystallizations were carried out to obtain es
sentially the same fractions but the fractions were analyzed
by different methods. Details of the fractionation scheme
and the procedure are given in an appendix.
The large amounts of dried acetone required for solvent
were obtained by refluxing bulk grade acetone over calcium
chloride to remove water followed by distillation of the ace
tone from the calcium chloride, Details of the apparatus and
procedure are given in an appendix.
Fractional crystallization No. 1. Analysis by iodine and saponification values
Six 50-gram samples, three lard samples before and three
lard samples after rearrangement, were run simultaneously.
Iodine and saponification values were run for each sample but
calculations for the four major glycerides types did not agree
with other published data for lard. The iodine and saponifi
cation values were not reliable. Table 12 is given for the
purpose of demonstrating how the iodine and saponification
values varied when more than one analysis was made for a given
sample.

52
Table 12. Iodine and saponification values of lard fractions
Before After Sample no. -*1 2 3 4 5 6
195.9 195.3 188.0 167.6 178.1 179.2 S.V. 197.6 195.3 189.9 170.0 177.9 177.1
p - 3 219.0 186.8 27.4 27.3 29.2 15.0 14.6 15.9
I.V. 28.3 26.2 25.7 25.2
12.9 15.3
14.9 13.9 12.6
199.8 192.6 192.2 192.4 198.7 197.2 S.V. 203.2 194.3 194.5 194.6 201.1 197.0
p - 6 34.3 42.3 40.7 42.5 44.7 36.1 I.V. 31.9
34.3 44.4 40.4 37.8
33.1 33.4 35.2
171.1 194.4 191.3 184.3
p - 6 S.V. 157.3 192.5 192.4 194.7
55.1 57.4 57.9 53.1 36.6 52.3 I.V. 55.7 55.9 57.1 28.2
52.8 51.4 50.8
50.9
197.3 199.4 174.7 201.1 178.7 191.5 S.V. 209.3 201.4 197.3 202.0 173.7 198.6
67.2 72.1 70.6 68.7 72.2 65.6 I.V. 71.5 73.3 71.3 68.1 62.7 66.3
63.0 67.5 6 6 . 0
S.V. 230.1 233.9
221.7 221.3
222.8 236.5
2065 207.7
207.1 199.5
209.1 240.2
I.V. 78.9 96.3 73.1 80.7 65.9 63.4 65.1 86.1 78.8 76.7 66.3 71.1 78.9 73.1 66.1 68.9
72.4 65.2 74.3 62.7
Fractional crystallization No. 2. Analysis by iodine and saponification values and poly-unsaturated acids by ultraviolet spectrophotometry
Experience from work with the chemical oxidation and the
first crystallization indicated that triplicate analyses were
not necessary because the methods being used do not give

53
precise results and also because of the added work involved
in trying to run 6 samples simultaneously instead of just 2
samples.
The low temperature cabinet was modified to accommodate
just 2 samples. Analysis of the fractions obtained by iodine
and saponification values were again poor and the results
compared poorly with published data.
An attempt to use ultraviolet spectrophotometry for poly
unsaturated acid analysis also resulted in poor results. One
of the major problems involved in the use of this method is
that an experienced operator is needed in order to obtain re
producible results. In this method, oleic acid is obtained
by difference between the amount of unsaturation found by the
iodine value and the amount of unsaturation found by spectro
photometry for the poly-unsaturated acids. Saturated acids
are then found by difference between the sample weight and
the weight of unsaturated acids determined from the iodine
value and spectrophotometry.
Analysis of the progress being made on this research
problem again indicated that the work and time involved in
working out the techniques involved to obtain good results
were not justified by the value of the results obtained.
Therefore further work using iodine values and ultraviolet
spectrophotometry were discontinued. (It should be pointed

54
out that the ultraviolet spectrophotometer being used was not
located in the laboratory in which the research was being
conducted which presented some problems in carrying out the
analyses.)
In the analysis for unsaturation by iodine values and by
spectrophotometry it was learned that sample storage prior to
analysis was important and that the size of the samples being
stored is also an important factor. Samples of lard stored
in large quantities (one pound or more) under refrigeration
at 35-40°p did not undergo appreciable oxidation but small
samples such as 0.15 gram samples for iodine values and 80
milligram spectrophotometry samples showed large changes when
left at room temperature and open to the atmosphere for several
days. The importance of sample size very probably lies in
the relative amount of sample as compared to exposed surface
area. A lard sample for iodine value (iodine value 61.2) left
out on the laboratory bench for 5 days gave an iodine value
of 56.6. One of the major reasons for the poor ultraviolet
spectrophotometric results was thought to be because the 80
milligram samples were stored in a desicator at room tempera
ture for several days. It should be noted that the two pound
lard samples stored under refrigeration for over one year
smelled rancid but their overall fatty acid compositions had
not changed appreciably.

55
Fractional crystallization No. 3. Fraction analyses by gas-liquid chromatography and pancreatic lipase hydrolysis
By the time this work was started, papers had started to
appear on the use of enzyme hydrolysis as a method of study
of fat glyceride structure and papers on successful quantita
tive separation by gas-liquid chromatography of the common
fatty acids found in fats had been published. Therefore it
was decided to incorporate these methods into the study of
lard.
Two lard samples, before and after rearrangement, were
fractionally crystallized. Fresh lard samples were obtained
from the Rath Packing Company of Waterloo, Iowa for this work.
Work was started on constructing a gas chromatograph
suitable for fatty acid methyl ester analysis. The first
column oven and sample injection systems which were constructed
did not work too well. Details of the changes made or where
better separations were required are given in an appendix.
Methyl esters were prepared by refluxing samples with
large excesses of approximately 5% anhydrous hydrochloric
acid-methanol solution. The methyl esters were recovered by
first evaporating most of the excess methanol, adding water
and extracting four times with ethyl ether. The ether solu
tions were combined, washed with distilled water until neutral
to litmus paper, the ether solution dried over granular sodium

56
sulfate, and the dried ether solution transferred to a round
bottom flask and evaporated. The methyl ester samples were
then transferred to screw top glass vials and stored under
refrigeration until run on a gas chromatograph.
This method of methyl ester preparation is suitable for
glycerides as well as fatty acids. Care must be taken to
maintain anhydrous conditions for methyl ester preparation of
glycerides by this method (see appendix on methyl ester pre
paration). The hydrochloric acid-methanol solution was pre
pared as described by Vogel (92) and is presented in detail
in an appendix.
The hydrolyses carried out here were of 30 minutes dura
tion following the procedure of Mattson and Beck (54) except
that no bile salts were used. Analysis of the hydrolysis
products was made by use of Amberlite IRA-400 to adsorb the
fatty acids freed during hydrolysis followed by use of a 4 x 4
completion of squares liquid-liquid extraction method as was
used by Mattson and Beck (54). More details of the hydrolysis
procedure are given in the section on Fractional crystalliza
tion No. 5.
Separation of free fatty acids from the lipase hydrolysis
products using Amberlite IRA-400 anion exchange resin In
all the references made to the use of anion exchange resin
for adsorption of fatty acids, reference is made to Cason et

57
al. (15) and very little detail about the techniques involved
in its use are described. Borgstrom (9) and Savary and
Desnuelle (80) give some information.
Cason e_t al. (15) gave the following information. "The
wet ether solution was passed through a column of 225 grams
(wet weight) of Amberlite IRA-400 which had previously been
washed with alkali and then washed with water until the eluate
was neutral. The eluate was passed through the column a
second time, then the column was washed with two 100 ml por
tions of ether, the second portion leaving only 0.2 grams of
residue on evaporation. Removal of ether from the total
eluate left a residue of 21.1 grams of amide, Elution
of the ion exchange column with a mixture of ether, methanol,
and aqueous hydrochloric acid yielded 15.3 grams of mixed
acid »
Borgstrom (9) reported more details: "The ion exchanger
IRA-400 was slurried into chromatogram tubes with a diameter
of :'0 mm. Usually a column of 100 mm height was used. The
capacity of such a column was about 1 gram of oleic acid.
The preparation of the exchanger was made according to the
preparation of Cason, Sumrell, and Mitchell. Wet ether was
used as solvent for the lipid mixture to be separated. The
fatty acids were eluated with a mixture of 80 parts ethanol
and 20 parts concentrated hydrochloric acid."

58
The article by Savary and Desnuelle (80) had not been
translated at the time this portion of the research was car
ried out but was translated at a later date while making a
more detailed search of the literature on enzymatic hydrolysis
techniques. The portions pertaining to the ion exchange resin
are given here for comparison.
/
"Ten grams (resin saturated with water) of Amberlite IRA-
400 are put in suspension in 1 N sodium hydroxide and the sus
pension is filtered into a column (12 mm ID) through a small
plug of glass wool. The resin is washed with water until
neutral, then it is washed 3 times with 40 cc of 95% ethanol
and 3 times with 30 cc of ethyl ether free of peroxides. Af
ter the washing, the formation of air bubbles is prevented by
chasing the bubbles by gently agitating a fine glass rod. A
sample of the mixture studied (containing a maximum of 300 mg
of fatty acids) is dissolved in 25 cc of ethyl ether and the
solution is poured into the column whose effluent is regu
lated by a stopcock at an average of 1 drop per second. Three
washes with 15 cc of ethyl ether suffices to carry down
quantitatively the glycerides. The acids, which are then
eluted (in a partially esterified state) by washing the column
with a mixture of 95% ethanol (50 vol), 10 N hydrochloric acid
(10 vol), and ethyl ether (75 vol)."
After running some test columns of equal weights of oleic
acid and lard, the following procedure was thought to be nec

59
essary to obtain complete separation of the fatty acid and
glycerides and then to recover all of the fatty acids from the
resin.
1. Dissolve the hydrolysis products (from 2 gram lard
sample) in 50 ml of ethyl ether.
2. Pass the solution through an Amberlite IRA-400 col
umn packed to a depth of 120 mm (24 mm ID). A glass
stopcock in a rubber stopper supporting a glass wool
plug was used to regulate the flow.
3. Pass the solution through the column a second time.
4. Pass 75 ml of ethyl ether through the column to wash
the glycerides through the column.
5. Combine the ether solutions, dry over granular sodium
sulfate, evaporate the ether and set aside the resi
due for further analysis.
6. Elute the column with three 50 ml portions of 80%
ethanol—20% concentrated hydrochloric acid.
7. Dilute the alcohol solution with 150 ml of distilled
water.
8. Extract the free fatty acids 3 or 4 times with a
total of 175-225 ml of ethyl ether. Wash the ether
extracts with distilled water until neutral to lit
mus paper, dry over granular sodium sulfate, evapo
rate the ether and weigh the residue.
9. Wash the column with 100 ml of 15% sodium hydroxide.

60
Wash the column with distilled water until the ef
fluent water is neutral to litmus paper.
The weights of the fatty acids recovered are given in
the table below. A test sample was run with the hydrolyzed
lard and lard fractions as a check.
Table 13. Free fatty acids recovered from hydrolysis products using Amberlite IRA-400 columns^
Wt. of hyd. wt. of free Wt. F.F.A. x 100 Sample sample fatty acids orig. sample wt.
recovered
Trial hyd No. 1 Lard B
2.003 0.806 40.3
Trial hyd No. 2 Lard A
2.001 0.526 26.4
Lard B 2.004 0.640 36.9
Lard A 2.005 0.547 27.3
P-6 B 1.504 0.259 17.2
P-6 A 2.005 0.299 14.9
P-6 B 2.002 0.1895 9.5
P-6 A 2.002 0.381 19.0
F-5 B 2.000 0.159 7.97
F-5 A 2.000 0.212 10.6
F-4 B 1.506 0.149 9.9
F-4 A 2.009 0.377 18.8
Test sample; Lard oleic 2.007 2.015
Not hydrolyzed
Lard Oleic 1.954 1.437
Lard Oleic 94.5 71.4
ap-3 fractions were not hydrolyzed because their melting points were above the temperature at which the hydrolyses were conducted (40°C).

61
The trial No. 1 lard B and lard B samples were run on
the same column; the trial No. 2 lard A and Lard A samples
were run on another column. The remainder of the samples were
run on separate (freshly prepared resin) columns. The results
show very clearly that when approximately the same degree of
hydrolysis was obtained in each sample the fatty acid recovery
was very poor. In other work with these columns it has been
found that the glycerides wash through the column satisfac
torily but the fatty acids are not completely adsorbed and/or
are not completely recovered. The recovery of the fatty acids
from the ethanol-hydrochloric acid solution by ether extrac
tion may not be 100% complete but would not account for the
large loss of fatty acids found in the data.
The question now arises as to whether the fatty acids
which were recovered were representative of the fatty acids
freed during hydrolysis. A second question is whether all
of the free fatty acids were removed from the glycerides.
The second question was answered by weighing the glycer
ides product of P-6 B which passed through the column, dis
solving it in ether and stirring for 5 minutes with 15 grams
of Amberlite IRA-400 resin. The solution was filtered and
resin washed with ether, the ether dried over granular sodium
sulfate, the ether evaporated and the residue weighed. This
residue was treated by the same procedure a second time. The

62
results of these tests are given in Table 14.
Table 14. Free fatty acid adsorption on Amberlite IRA-400 for the P-6 B sample
Weight in grams
Weight of material passing through Amberlite IRA-400 column 1. 8234
Weight of glyceride products after first treatment with 15 grams of Amberlite IRA-400 1. 6653
First loss in weight 0. 1581
Weight of glyceride products after second treatment with 15 grams of Amberlite IRA-400 1. 6060
Second loss of weight Total loss in weight
0. 0.
059 2171
Weight of fatty acids recovered using the Amberlite IRA-400 column 0. 1895
Total weight of free fatty acids adsorbed and recovered from the Amberlite IRA-400 0. ,4066
To check the question as to whether partial recovery of
the free fatty acids yields a representative sample of the
fatty acids freed during hydrolysis, methyl esters were pre
pared of the 3 fatty acid fractions recovered from the P-6 B
hydrolysis products and a gas-liquid chromatogram obtained.
The apparatus being used at this time was a Podbielniak
Chromacon gas chromatograph located in the Dairy Industry De
partment in a laboratory of Dr. E. G. Hammond. The column
being used, Craig polyester (butanediol succinate) on acid

63
washed Chromosorb, had previously given satisfactory resolu
tion of palmitate-palmitoleate and of stearate-oleate. When
these samples were run, good resolution was not obtained and
the results for the amounts of material of different chain
length but not for difference in degree of unsaturation are
given in Table 15.
Table 15. Fatty acid methyl ester composition of free fatty acid fractions recovered from the hydrolysis prod ucts of sample P-6 B
Pree fatty acid fraction Calculated Composition composition, weight percent composition of P-6 B
Col- 1st 15 gram 2nd 15 gram of combined crystalliza->
umn resin treat- resin treat- fractions, tion frac-ment ment weight percent tion, weight
percent
C i 4 4 . 4 2 . 2 2 . 7 3 . 3 2 . 5
C%6 I?"* 3 8 . 6 4 2 . 6 2 9 . 2 3 2 . 2
Gig 78.1 5 9 . 3 5 4 . 6 6 7 . 5 6 5 . 3
The original P-6 B sample analysis and the fatty acids
freed during hydrolysis should be expected to differ more be
cause of the expected difference in the 1- and 3-position
fatty acid composition as compared to the 2-position fatty
acid composition. But the large difference in the free fatty
acid fractions definitely shows that incomplete recovery of
the free fatty acids will not result in a representative
sample of the free fatty acids.

64
Prom the data obtained for the study of the resin up to
this point, it could not be determined for certain whether
the resin is selective for fatty acids of varying chain lengths
and degree of unsaturation or whether the composition of the
small quantities of fatty acids was being altered because of
losses of some of the acids during the ether extraction of
the fatty acids from the ethanol-hydrochloric acid solution.
The resin selectivity was thought to probably be the cause but
the extraction procedure could not be ruled out on the basis
of any of the data. Therefore a series of samples of the same
composition were treated with different amounts of Amberlite
IRA-400 resin by stirring the sample and resin in a solution
of ether (15 minutes), filtering through a fluted filter
paper, washing the resin with two 50 ml portions of ether,
drying the ether solutions over granular sodium sulfate, and
weighing the material which was not adsorbed on the column.
The fatty acids were recovered from the resin by treating it
with three 50 ml portions of 80% ethanol-20% concentrated hy
drochloric acid. Because of the limited solubility of the
fatty acids in ethanol-hydrochloric acid, ethyl ether was
used in all cases for the final wash of the resin and in some
of the latter samples, the ether was added to the ethanol-
hydrochloric acid wash solutions before treating the resin.
Methyl esters of the recovered fatty acids were formed by re-
fluxing with 4% anhydrous hydrochloric acid-methanol solution

65
and the methyl esters recovered by extraction. The results
of these tests are given in Table 16.
A check was made after these fatty acids had been re
covered to determine qualitatively the solubility of fatty
acids in 80% ethanol-20% concentrated hydrochloric acid. A
sample of 1.003 grams of lard B fatty acids could not be dis
solved in 190 ml of the ethanol-hydrochloric acid solution at
room temperature with stirring. Addition of just a few ml of
ethyl ether did not dissolve all of the fatty acids but 40
ml of ether added to the solution did dissolve all of the
fatty acids. Therefore it was apparent that ether was nec
essary for complete recovery of the fatty acids from the resin.
Even though the acids are desorbed from the resin, they may
not be washed from the resin because of their limited solu
bilities.
The samples to be treated with the resin consisted of
one gram of fatty acids of lard B and one gram of mixed gly
cerides of lard A.
The lard fatty acid sample was prepared by saponifying
20-25 grams of lard B with 0.5 N alcoholic potassium hydroxide
and recovery of the fatty acids by acidifying, extracting with
ethyl ether, drying over sodium sulfate and evaporating the
ethyl ether.

66
The mixed glycerides of lard were prepared by refluxing
21 grams of lard A with 7 grams of glycerol in the presence
of a spatula tip of sodium methoxide in 200 ml of dioxan-1,4
for 5 hours. Acetic acid was added to destroy the catalyst,
the dioxane evaporated, the product diluted with 4-5 times
its volume of water, extracted with 100 ml, 50 ml, and 50 ml
portions of ethyl ether. The ether extracts were washed with
sodium bicarbonate 2 times, then twice with water, the ether
solution dried over granular sodium sulfate, and the ether
evaporated. A silica gel column separation of this product
3 months later showed that the weight percent of each of the
glycerides present was: 3.5% monoglycerides, 19.4% diglycer-
ides, and 77.1% triglycerides.
Table 16. Amberlite IRA-400 capacity and selectivity test
Grams Fatty acid Wt % Lard F.A.+lard Overall Sample resin Added Recov. F.A. glyc glyc % rec d
rec'd added Added RecM
A 1 1.011 0.097 9.6 0.999 2.010 1.984 98.7
B 5 1.002 0.381 38.0 1.013 2.015 1.975 98.0
C 10 1.006 0.691 68.7 1.014 2.020 1.946 96.3
D 15 1.007 0.960 95.4 1.009 2.016 1.919 95.2
E 30 1.004 0.940 93.6 1.002 2.006 1.872 93.3
F 30 1.004 0.987 98.3 1.097 2.101 1.928 91.7

67
Samples E and F of Table 16 were run to give some idea
of the reproducibility of the results.
The fatty acid methyl ester analysis using gas-liquid
chromatography on a butanediol succinate column, 20% liquid
substrate on acid washed 60/80 mesh Chromosorb. The column
dimensions were 8 ft x 5 in OD copper tubing.
Table 17. Resin selectivity test; methyl ester composition of lard, fatty acids recovered from Amberlite IRA-400; Ethanol-hydrochloric acid recovery
Sample P.A. Mixed Average mix glyc A B C D E F E and F
Myr. 1.4 1.7 3.6 2.8 2.1 1.5 1.6 1.5 1.6 Pal. 27.6 26.8 40.9 36.3 31.0 26.9 26.4 26.7 26.6 P.O. 2.9 3.5 3.2 3.4 3.4 3,2 3.6 2.9 3.3 Stear. 11.4 12.2 11.4 9.0 10.5 11.2 11.2 11.8 11.5 Oleic 45.7 46.7 34.4 39.3 43.2 46.6 47.4 46.6 47.0 Linol. 11.1 9.0 6.5 9.2 9.8 10.6 9.8 10.5 10.2
Gms of resin 1 5 10 15 30 30 30
Several months later, another series of samples were run
to test the resin selectivity. In this test more attention
was paid to controlling the volume of the solutions more
closely to insure similar conditions for each sample. The
procedure followed was that described by Hornstein et_ al. (40)
in which the fatty acids are converted to methyl ester on the
resin by methanol-hydrochloric acid treatment after adsorption
of the fatty acids. Details of this procedure are given in

68
the section on Fractional crystallization No. 4. The results
of this test are given in Table 18.
Table 18. Resin selectivity test ; methyl ester composition of fatty acids recovered from Amberlite IRA-400; Methyl esters prepared on the resin
Sample A B „ c D E F
Myr. 4 . 0 3 . 1 1 . 7 1 . 5 1 . 2 1 . 4 Pal. 3 4 . 2 3 2 . 1 2 6 . 8 2 6 . 0 2 6 . 2 2 3 . 8 P.O. 4 . 7 4 . 0 3 . 1 2 . 8 2 . 4 3 . 1 Stear. 8 . 0 9 . 0 1 2 . 4 1 2 . 8 12.2 1 1 . 8 Oleic 3 7 . 8 4 0 . 7 4 5 . 3 4 6 . 4 4 7 . 7 4 5 . 3 Linol. 1 1 . 3 1 1 . 1 1 0 . 8 1 0 . 5 1 0 . 2 1 0 . 1
Gms of resin 1 5 1 0 1 5 3 0 0
The results in Tables 17 and 18 are combined into Figure
1 to show more clearly the trends in the compositions and the
comparison of the results of the two tests.
The results of these 2 tests indicate that resin is se
lective: a) it is more selective for short chain fatty acids
than longer chain fatty acids and b) it is more selective for
unsaturated acids than for saturated acids of the same chain
length.
The data also indicate the amount of resin required to
adsorb one gram of fatty acids under the conditions of these
tests is between 10-15 grams. The resin capacity lies between
0.067 to 0.100 grams of fatty acids (Ci4-C^g) per gram of
resin. Based on a molecular weight of 280, the capacity be-

45
35
25
.o •
69
O
•
® - -
• •
o.
0 PALMITIC
• OLEIC
8 Q
METHYL ESTER FORMED : OFF RESIN ON RESIN
RESIN , GRAMS
25
_ — — o- - - — - - - - c
— c
MYRISTIC
PALMITOLEIC
STEARIC
LINOLEIC
15
RESIN, GRAMS
25
-L Ù
FIG. I . RESIN SELECTIVITY

70
comes 0.24 to 0.36 railliequivalents per gram of resin. The
reagent bottle gives the total exchange capacity as 3.3
railliequivalents per gram based on dry resin. The weight in
the railliequivalents is based on a wet resin. Assuming the
water content of the resin was 50% the capacity for fatty
acids would still be only 0.48 to 0.72 railliequivalents of Cj.8
fatty acid per gram of resin. This is only l/7 to l/5 of its
total rated capacity.
After having made the above tests and having obtained
such poor adsorption and recovery of fatty acids from the
hydrolysis products by the use of resin columns, it was con
cluded that theoretically the methods being used were adequate
but in practice another factor predominates all others. This
factor is the packing of the column and its condition during
adsorption and subsequent fatty acid removal.
Amberlite IRA-400 (-OH form) was slurried into the columns
using ethyl ether. Bubbles were removed either by use of a
brass wire used to stir the resin in the column, or by re
peatedly inverting the column to first wash all the resin into
the top part of the column and then reversing the inversion
process to work the resin back into the lower part of the
column. In this process of inverting the column repeatedly,
entrapped air was allowed to escape from the resin. After
these columns were allowed to stand for a few minutes, bubbles

71
would usually start forming throughout the column. These
bubbles were probably caused by the formation of ethyl ether
vapors. Although it was never tried with the resin columns,
a cooling water jacket might slow down or prevent this bubble
formation. Similar difficulty with silica gel columns was
eliminated by the use of a water jacket on the column. But
the cooling might not be as effective with the resin because
it was observed that the resin columns proved to be difficult
vdhile silica gel columns at the same temperature (and using
ethyl ether for elution) behaved very well. Some resin col
umns formed bubbles much worse than others. The reason for
this was never determined. As a result of the bubble forma
tion, poor contact between the fatty acid-glyceride ether
solution and the resin was obtained. This resulted in some
of the fatty acids passing through the column without being
adsorbed and requiring that the sample solution be passed
through the column more than once. The number of passes re
quired depended upon how bad the bubble formation was.
None of the three references (9, 15, 80) describing the
use of the resin columns make any reference to difficulties
as encountered here. Whether they had any difficulties with
bubbles or not, therefore, is not known.
Prior to the publication of Hornstein*s method (40) of
using this resin to recover fatty acids from fats, some addi

72
tional investigations were carried out to develop a suitable
method of recovering free fatty acids from the hydrolisis
products based on a single batch contact of the free fatty
acid-glyceride solution with the resin.
The resin selectivity tests showed that 15 grams of resin
could be expected to adsorb approximately 1 gram of free fatty
acids in the presence of an equal amount of mixed glycerides.
The glycerides could be quantitatively recovered by washing
the resin with portions of ethyl ether.
The recovery of the adsorbed fatty acids was made by the
use of an ether-acetic acid solution. The fatty acids are
much more soluble in this solution than in the ethanol-
hydrochloric acid solution and has the added advantage of
being able to evaporate both the ether and the acetic acid
leaving a residue of just the fatty acids. With the ethanol-
hydrochloric acid solution, the fatty acids were recovered by
extracting the fatty acids with ethyl ether. One disadvantage
of the ether-acetic acid solution as compared to the ethanol-
hydrochloric acid solution is that the acetic acid is weak
acid and requires the use of either more contacts or a higher
acetic acid concentration to recover all the fatty acids from
the resin.
Tests were conducted using a commercial grade oleic acid.
One gram samples of oleic acid were dissolved in 50 ml of wet

73
ethyl ether and the oleic acid adsorbed by stirring the solu
tion with 15 grams of Amberlite IRA-400 (-0H form) for 10
minutes. The ether was decanted from the resin and the resin
was washed with 25 ml of ether. The ether was evaporated and
the weight of the residue determined. The oleic acid was
recovered from the resin by treating it with 50 ml portions
of ethyl ether-acetic acid solution. The resin and each
ether-acetic acid solution were stirred for 10 minutes and
then decanted from the resin. The ether-acetic acid solutions
were evaporated and the weight of the recovered oleic acid
was determined. A summary of some of the tests conducted are
summarized in the following table.
Table 19. Recovery of oleic acid from Amberlite IRA-400 using ethyl ether-acetic acid solution
Sample A B C D E
Wt of oleic acid added 0.970 1.010 1.032 1.010 1.001
Wt of resin 15 15 15 15 15
Wt of mat *1 not exch*d 0.000 0.001 0.001 0.000 0.001
No. of ether-HAc treatments 1 2 2 2 2
Strength (vol:vol) ether: HAc 2:1 2:1 1:1 1:1 1.5:1
Wt of oleic acid recovered 0.730 0.863 0.958 0.938 0.878

74
The results of Table 19 show that the use of 1:1, ethyl
ether:acetic acid (volume basis) was suitable for the recovery
of up to one gram of a commercial grade oleic acid sample ad
sorbed on 15 grams of Amberlite IRA-400 by 10 minute contacts
with stirring of the resin with two 50 ml portions of the
solution.
Separation of monoglycerides from di- and triglycerides
using 4x4 completion of squares liquid-liquid extraction
After the hydrolysis products of the crystallization fractions
and the lards had been passed through Amberlite IRA-400 (-OH
form) columns, the fatty acids which remained in the hydroly
sis products were adsorbed on 15 grams of resin. The material
which was not adsorbed was recovered. No attempt was made to
recover the fatty acids from the resin.
The monoglycerides in the remaining hydrolysis products
were recovered by liquid-liquid extraction as shown schemati
cally in Figure 2 by using four 250 ml separatory funnels.
The solvents were prepared by shaking 80% aqueous ethanol
with Skellysolve F. The layers were separated and these solu
tions were used as solvents and are referred to as the alcohol
and the Skellysolve F solvents even though each solution was
saturated with the other. The glycerides from which the free
fatty acids had been removed, were dissolved and transferred
to the first funnel with enough Skellysolve F to obtain a

75a
solution containing 2-2.5% glycerides. For 1.6 grams of
hydrolysis products and a solution containing approximately
2.5% glycerides, 1.6 x 40 = 64 ml of Skellysolve F were re
quired. The 64 ml of Skellysolve F permitted using sample
sizes ranging from 1.6 to 1.3 grams. This corresponds to 20
to 35% hydrolysis on a weight basis. The same volume of
Skellysolve F was then put in each of the other three funnels.
An equal volume of alcohol was added to the first funnel,
shaken, allowed to settle, and the alcohol layer run into
the second funnel. This alcohol layer was transferred suc
cessively through the four funnels. The alcohol solution
obtained from the fourth funnel was called extract 1. A
second volume of alcohol solution was similarly passed through
the four funnels. This final alcohol solution was called ex
tract 2. To finish the 4x4 completion of squares would re
quire obtaining two more such alcohol extracts but as Mattson
and Beck (54) describe in the procedures being used here, only
two extracts were collected and analyzed. The combined alco
hol extracts were evaporated, a few ml of water added, and the
monoglycerides extracted with ethyl ether, the ether solution
dried over granular sodium sulfate, and the ether evaporated.
When emulsions formed, they were broken by adding a gram or so
of sodium sulfate, shaking, and allowing the layers to sepa-
rate. Methyl esters of the fatty acids in the monoglycerides
were prepared by refluxing the samples with excess anhydrous

75b
SAMPLE
FIG. 2. LIQUID-LIQUID EXTRACTION
OF MONOGLYCERIDES

76
methanol-hydrochloric acid solution and recovering the methyl
esters by extraction with ether.
It was desired to get some idea of how complete the ex
traction of the monoglycerides was using this method of ex
traction. The hydrolysis products of the F-6 B and F-6 A
crystallization fractions were extracted with two more 64 ml
portions of ethanol solution to complete the extraction scheme
for 4x4 completion of squares. The data obtained for these
two samples are given in Table 20.
Table 20. The 4x4 completion of squares liquid-liquid extraction of monoglycerides from the hydrolysis products of F-6 B and F-6 A
Extract Total
Wt of monoglycerides
F-6 B
Wt of monoglycerides
F-6 A
Residual glycerides F-6 B
Residual glycerides
F-6 A
0.0436 0.0335 0.0240 0.0391
0.1205 0.0771 0.0565 0.0438
0.1402
0.2979
1.4814
1.0670

77
A study of the data in Table 20 show that considerable
quantities of material were obtained in extracts 3 and 4. No
tests were conducted to determine whether this material was
monoglycerides or not. The final weights of the F-6 B and
F-6 A hydrolysis products after the Amberlite IRA-400 treat
ments were 1.6060 and 1.3517 grams respectively. The combined
residue and monoglyceride weights from Table 19 for these
same samples were 1.6216 and 1.3649 respectively which cor
respond to increases in the weights of the samples of 9.72% and
9.76%. The most probable sources of these increases were
stopcock grease from the separatory funnels and water left in
the samples after evaporation of the solvent. These data
indicate that considerable amounts of the monoglycerides were
not recovered in the first two extracts. But very little if
any separation of the component monoglycerides would be ex
pected to take place in the four stages used in the extrac
tion. As a quantitative recovery of the monoglycerides was
not necessary, a representative sample of the monoglycerides
is all that was necessary.
The F-6 B extracts were discarded without a fatty acid
analysis having been made. The combined four extracts of
F-6 A were analyzed for their component fatty acids.
Three samples, F-6 B, F-6 A, and lard B were hydrolyzed
as before except that the time of hydrolysis was 15 minutes

78
instead of 30 minutes. The free fatty acids were removed
from the hydrolysis products by batch contact with Amberlite
IRA-400. The fatty acids were not recovered from the resin.
The monoglycerides were separated from the hydrolysis products
by the liquid-liquid extraction method just described.
Methyl ester of the monoglyceride fatty acids were pre
pared by refluxing with anhydrous methanol-hydrochloric acid
and recovering the methyl esters by extraction. The fatty
acid methyl esters were analyzed by gas-liquid partition
chromatography on an ethylene glycol succinate column.
Results The results of the fractional crystallization
and methyl ester fatty acid analyses of the lards, crystal
lization fractions, the fatty acids freed during hydrolysis,
and the monoglycerides formed during hydrolysis are given in
Tables 21 through 26.
Table 22 demonstrates that the fatty acid methyl ester
analyses were not very accurate. The major reasons for the
inaccuracy was due to poor baseline control and the imperfect
separation of palmitate-palmitoleate and stearate-oleate peaks.
The baseline usually changed during the time these peaks were
being formed on the chromatograms of the chromatograph which
was constructed. This caused errors in the area calculations
because of the uncertainty of where the baseline should have
been drawn for portions of the chromatogram in which peaks

79
were being formed and the trace did not return to the base
line between peaks. Several samples were run on a Podbiel-
niak Chromacon gas chromatograph in the Dairy Industry De
partment. Triplicate analysis of lard before gave the aver
age values listed in Table 22. These values were used for
both lard before and after in calculations for Tables 21, 23,
and 25. These values were considered to be more nearly cor
rect than the individual analyses on the chromatograph which
had been constructed. Actually the lard before and after
have slightly different analyses because of the oxidation of
some linoleic and oleic acids during the rearrangement pro
cessing.
In Tables 26 and 27, the fatty acid components designated
by a question mark (?) corresponded to peaks resulting from
the oxidation of the unsaturated acids in these samples. From
work carried out with butanediol succinate columns a year
later, it appears that the two peaks preceeding myristate
correspond to succinate andpimelate. The first peak following
myristate may have been due to a semialdehyde of suberate and
the next three peaks suberate, semialdehyde of azelate, and
azelate. These samples were run on an 8 ft x | in OD copper
tubing column. The butanediol succinate was supported on 48/65
mesh acid washed Chromosorb. Oxidation of the samples took
place at room temperature while the samples of fatty acids
adsorbed on Amberlite IRA-400 and the remaining hydrolysis

80
product residues were left sitting in beakers on the labora
tory bench for several days.
Table 21. Fatty acid methyl ester compositions of lards and lard crystallization fractions
Larda P-3 P-6 F-6 F-5 F-4
B A B A B A B A B A B A
Weight percent
Myr. 1.7 Trace 1.8 1.8 1.6 2.5 1.9 2.4 1.7 2.3 1.7 Pal. 26.8 39.6 55.6 45.8 48.7 29.8 24.4 10.7 15.4 10.9 10.0 P.C. 2.9 — — -— —- 2.4 3.5 • 7.4 5.7 11.3 6.6 Stear. 12.4 39.6 33.2 25.0 22.5 7.0 10.3 3.7 6.0 2.8 1.3 Oleic 46.2 20.9 9.3 27.5 27.2 53.9 52.8 63.6 57.9 50.5 61.9 Linol. 10.0 — — — -- 4.4 7.1 12.4 13.3 22.1 18.5
Mol percent
Myr. 2.0 Trace 2.1 2.1 1.9 3.0 2.3 3.0 2.1 2.8 2.0 Pal. 28.5 42.0 58.0 48.1 51.0 31.6 26.0 11.4 16.5 11.7 10.8 P.O. 3.1 — — — — 2.6 3.7 8.0 6.2 12.1 7.2 Stear.11.9 37.9 31.2 23.6 21.2 6.6 9.9 3.6 5.8 2.7 1.2 Oleic 44.6 20.2 8.8 26.2 25.9 51.9 51.1 62.0 56.5 49.1 60.6 Linol. 9.8 - — 4.2 7.0 12.1 13.1 21.6 18.3
aSee Table 22 and text for more details on the lard fatty acid compositions.
Table 22. Fatty acid methyl ester compositions of lard before and after molecular rearrangement
Podbielniak chromacon Lard Lard Av. of lard Av. 3 chromatographs before after B and A Lard B
Myr. 1.52 1.85 1.68 1.68 Pal. 26.58 26.80 26.69 26.79 P.O. 3.52 3.15 3.33 2.88 Stear. 10.33 11.28 10.80 12.43 Oleic 46.80 47.55 47.18 46.17 Linol. 11.40 9.36 10.38 10.02

81
Table 23. Mol percentage of saturated and unsaturated fatty acids in lard and each of the crystallization fractions
Sample Mol % S Mol % U
Before
After
Lard 42.49 57.47
P-3 79.90 20.16
P-6 73.77 26.22
F-6 41.19 58.73
F-5 17.94 82.13
F-4 17.23 82.77
Lard 42.49 57.47
P-3 91.25 8.80
P-6 74.08 25.86
P-6 38.24 61.77
F-5 24.36 75.69
F-4 14.05 86.02

Table 24. Glyceride composition of lard before and after molecular rearrangement from fractional crystallization data
Wt of Total frac- wt % Mois
Frac- tion Mol F.A. F.A. in of tion gms 100 gm P.A. glyc. glyc,
Mol % of glyc. Mois of glyc. GS3 GS2U GSU2 GU3 GSgx GS2Ux GSU2X GU3X
100 100 100 100
Before P-3 9.59 0.3670 P-6 2.40 0.3709 F-6 26.84 0.3677 F-5 7.83 0.3630 F-4 2.51 0.3645 Totals
49.17
After
P-3 P-6
3.32 0.3742 8.35 0.3724
F-6 22.42 0.3655 F-5 9.11 0.3631 F-4 6.01 0.3616 Totals
49.21
95.62 94.70 95.60 95.64 95.67
94.57 95.56 96.89 96.91 95.45
0.01122 39.5 60.6 0.00281 21.3 78.7 0.03144 23.7 76.3 0.00906 53.8 46.2 0.00292 51.7 48.3
0.05745 Mol %
0.00392 73.6 26.4 0.00990 22.4 77.6 0.02642 14.7 85.3 0.01059 73.1 26.9 0.00690 42.1 57.9
0.05773 Mol %
0.444 0.680 0.060 0.221
0.746 2.400 0.488 0.419 0.151 0.141
0.504 1.647 3.039 0.560 8.75 28.65 52.85 9.75
0.288 0.103 0.222 0.769
0.388 2.255 0.774 0.285 0.291 0.399
0.510 1.260 3.320 0.684 8.84 21.82 57.50 11.83

83
Table 25. Fatty acid balance for lard and the fractional crystallization fractions before and after molecular rearrangement
Wt in Weight of fatty acids in grams Total wt Sample gms Myr. Pal. P.O. Stear. Oleic Linol of F.A.
Before
Lard 50.02 0.80 12.79 1.38 5.96 22.05 4.79 47.77
P-3 9.59 Trace 3.62 3.62 1.92 — - 9.16
P-6 2.40 0.04 1.04 — — 0.57 0.63 — — 2.28
F-6 26.84 0.64 7.65 0.63 1.80 13.82 1.12 25.66
F-5 7.83 0.18 0.80 0.55 0.27 4.75 0.92 7.47
F-4 2.51 0.06 0.26 0.27 0.07 1.21 0.53 2.40
Totals 49.17 0.92 13.37 1.45 6.33 22.33 2.57 46.97%
After
Lard 50.01 0.80 12.79 1.38 5.96 22.05 4.79 47.77
P-3 3.32 0.06 1.73 — 1.05 0.29 — - 3.13
P-6 8.35 0.13 3.89 - - 1.79 2.18 - - 7.99
F-6 22.42 0.42 5.23 0.74 2.38 11.43 1.53 21.73
F-5 9.11 0.15 1.34 0.49 0.52 5.13 1.19 8.82
F-4 6.01 0.10 0.57 0.38 0.07 3.56 1.06 5.74
Totals 49.21 0.86 12.76 1.61 5.81 22.59 3.78 47.51*
aThe weight percent fatty acids in lard before based on the weight of the glycerides was found to be 95.49%. This percentage times the total weight of lard fractions should agree with total weight of fatty acids in the fractions (last column in the tables). 49.17 x 0.9549 = 46.95;
49.21 x 0.9549 = 46.99 The 46.99 value does not agree very well with the 47.41 value obtained as a total in the "after" table. This is probably due to the use of the same lard fatty acid compositions for both the before and after samples. See Table 22.

Table 26. Composition of fatty acids liberated by enzymatic hydrolysis (mainly fatty acids from the 1- and 3- positions); analyses in wt percent fatty acids3
Fatty Lard P-6 F-6 F-5 F-4 acid BB ABABA B A B A
Myr. 1.3 0.6 2.4 1.0 1.7 4.4 2.4 1.4 2.4 1.2
H
(M
? 0.9 - — - - - - - - - -
Pal. 6.0 7.4 19.4 15.9 23.8 14.8 24.0 14.7 18.8 19.1 10.3 P.O. 5.4 3.0 4.0 3.6 2.1 2.7 4.6 2.5 4.9 2.8 6.2 ? 0.6 - - - - - - - - - —
Stear. 8.5 14.1 10.1 15.5 8.7 13.6 10.5 16.8 10.8 15.1 9.8 Oleic 67.1 59.2 54.5 59.0 46.7 59.2 51.6 55.0 54.9 51.2 49.0 Linol 10.1 15.7 9.8 5.0 7.0 5.4 7.1 9.6 8.4 10.6 22.4
aThe second lard before sample was obtained from hydrolysis products obtained from a 15 minute reaction time. All other samples were reacted for 30 minutes.

Table 27. Composition of fatty acids in monoglycerides obtained from enzymatic hydrolysis products; analyses in wt percent fatty acids
15 mini 30 mini 1
2 3 4 5
6 7
8 9 10 11 12
Sample
Lard P-6 F -6 F-5 F-4
Sample B B A B A B A A B A B A
? 1.5 1.4 ? - - - - - - Trace - 1.7 0.9 - Trace Myr. 3.7 4.5 3.1 3.6 1.9 4.2 3.0 2.4 5.9 3.0 6.9 3.3 ? - - 4.6 0.9 1.3 - 3.1 - 5.5 5.8 5.8 7.9 ? — - 2.0 - - - 1.6 - 4.9 4.1 6.8 2.8 ? — - 7.3 2.0 2.3 1.2 4.5 - 7.0 7.7 7.8 12.6 ? — - 5.6 - - - 3.6 - 15.7 11.1 29.8 14.9 Pal. 83.9 67.2 44.5 76.6 62.1 72.8 41.1 36.6 23.7 25.2 17.0 17.6 P.O. 1.7 5.5 - - - 3.3 3.8 2.8 7.0 5.7 5.6 8.8 Stear. 3.5 2.2 12.7 9.8 26 . 3 6.5 14.5 12.2 4.9 6.0 - -
Oleic 7.2 16.4 20.4 5.0 6.2 12.0 24.8 41.7 23.6 29.1 20.4 31.0 Linol. — 4.3 - - - - - 4.2 - - - -

86
Fractional crystallization No. 4. Fraction analyses by gas-liquid chromatography and pancreatic lipase hydrolysis
The purpose of this fractional crystallization and an
alyses was to obtain the same data as in fractional crystal
lization No. 3 and by using the same methods but to avoid oxi
dation of the unsaturated acids.
One major change in the procedures followed involved the
recovery and methylation of the fatty acids freed during hy
drolysis. The Amberlite IRA-400 columns were not very suc
cessful and the batch method followed by recovery of the acids
from the resin by the use of a solution containing an organic
solvent and an acid required considerable more time and chances
for errors than the method used. The method used was that
presented by Horstein jet al. (40) in which the fatty acids are
adsorbed on the resin and then converted to their methyl es
ters by treating the fatty acids while they are still on the
resin with methanol-hydrochloric acid solution. Details of
this procedure are given in an appendix.
The hydrolyses were again carried out according to Mattson
and Beck (54) using a hydrolysis time of 15 minutes but again
without bile salts. Two samples were worked on simultaneously
and it was found that they could be hydrolyzed, the free fatty
acids recovered, the monoglycerides extracted and their fatty
acid methyl esters prepared in the course of about 10 hours.

87
This included transfer of the methyl esters to small vials
for storage under refrigeration until chromatograms were pre
pared. This procedure was followed to keep oxidation of the
samples to a minimum. The results for fractional crystalli
zation No. 4 are given in Tables 29 through 37.
Table 36 is a summary of the fatty acid methyl ester
analyses of the fatty acids freed during hydrolysis, the crys
tallization fractions (triglycerides) and the monoglycerides
formed during the hydrolyses. The values are listed to make
it easy to see whether the analyses followed the inverse lever
rule ; the triglyceride analyses should lie numerically between
the free fatty acid and monoglyceride values. Actually the
triglyceride value should be twice as far from the monoglyceride
value as from the free fatty acid value. The free fatty acids
represent the overall composition of 2 of the 3 possible tri
glyceride sites whereas the monoglycerides represent only 1
of the 3 possible positions. Therefore when mol percents are
considered, the 2:1 relationship should be expected to hold.
A glance at Table 36 shows that there is no need to see whether
the 2:1 relationship is obeyed but whether the triglyceride
composition falls between that of the free fatty acids and the
monoglycerides. Not counting the diacid values and the P-3
column for which hydrolyses were not carried out, there are a
possible 60 sets of yalues which may be compared and 32 of
these do not conform to the correct relative order let alone

88
to the 2:1 relationship.
Oxidation was not the cause of this discrepancy in the
data. Even though the hydrolysis is not 100% specific for
the 1-, and 3-position fatty acids but probably in the range
of 90% specific, the correct relative order of the values
would be obeyed.
A study of the possible cause of these results involves
1) adsorption of the free fatty acids by the resin, 2) com
plete recovery of the fatty acids from the resin, 3) complete
esterification of the recovered free fatty acids, 4) obtain
ing a representative sample of the monoglycerides, 5) com
plete methylation of the monoglyceride fatty acids, and 6)
the proper hydrolysis techniques.
In carrying out fractional crystallization No. 5, each
of the 6 points listed were considered and methods used to
try to avoid errors from these sources.
In order to make the methyl ester analyses for this
crystallization, a considerable amount of time was spent on
improving the gas chromatograph and on separating the oxida
tion products from the monocarboxylic acids of the samples
and identifying these oxidation peaks. The equipment changes
are described in an appendix. Some of the work with the
chromatograph is described below.

The gas chromatograph oven and sample injection system
consisted of an insulated metal box attached to one end of
the thermal conductivity cell for the column oven and a second
smaller box attached to the column oven for the sample in
jection tube and heater. This system did not give satisfac
tory chromatograms so another oven and sample injection system
were constructed. The oven consisted of an insulated cylindri
cal cover and a round base to house the column. The sample
injection system was constructed such that its temperature
changes would not affect the column temperature as was the case
with the previous oven and sample injection system. Vapor lines
were wrapped with resistance heating wire to prevent condensa
tion of the methyl esters in these lines.
With this improved gas chromatograph, chromatograms were
made using columns of 20% ethylene glycol succinate on acid
washed 60/80 mesh Chromosorb. Preliminary analyses were made
on a 6.5 ft x 3/16 in OD and 5 ft x l/4 in OD copper tubing
columns. Thermal conductivity cell bridge currents of 185-200
milliamperes were used and column temperatures of 210°c. A
Sargent SR recording potentiometer was used to make the chroma
tograms using a range plug of 5.0 millivolts. The carrier gas
used was helium and the flowrates used were 70 ml per minute
for the 6.5 ft x 3/16 in column and 65 ml per minute for the
5 ft x l/4" in column. The separations obtained from the

90
6.5 ft x 3/16 in column did not appear to be any better than
on the 5 ft x l/4 in column even when the temperature and
flowrate were varied. The main reason for this was probably
because the 5.0 millivolt range plug was being used in the
recorder and in order to obtain suitable peaks on the chroma
tograms, the sample sizes required were overloading the 3/16
in diameter column.
Figure 3 shows the effect of sample size on the separa
tion of stearate-oleate. A sample of lard B was hydrolyzed
by the method of Mattson and Beck (54) for 15 minutes but with
no bile salts. The fatty acids freed during hydrolysis were
recovered by use of Amberlite IRA-400 and methylating them on
the resin. The resulting fatty acid methyl esters were analyzed.
The chromatograph column temperature varied during the time re
quired to run these two chromatograms but the change was only
from about 215 to 218°C which accounts for the difference in
the retention times for the two chromatograms. The conditions
for the two chromatograms are listed in Table 28.
Table 28. Conditions for the two chromatograms of Figure 3
Chromatogram trace Dashed Solid
Recorder range plug, millivolts 5.0 2.5 Column temperature, °C 215-216 218 Thermal conductivity bridge current, 200 200
milliamperes Helium flowrate, ml per minute 80 80 Total area under peaks, square cm 68 56

As the recorder response for a 2.5 millivolt range is
twice that for the 5.0 millivolt range, the areas put on the
same basis of the 2.5 millivolt range are 136 square cm and
56 square cm which means that the dashed trace corresponds to
a sample 2.4 times larger than the solid trace. A 10 micro
liter syringe was used for sample injection and the sample
size was in the 1 microliter range. But the needle held about
1 microliter of sample when the plunger tip was at the zero
of the syringe scale. When this needle full of sample was
pushed into the sample injection septum as far as possible,
about 0.8 microliter of sample was vaporized. But the amount
of sample vaporized depended upon the length of time the needle
was left in the injection system and with the amount of volatile
solvent in the sample. It was difficult to reproduce sample
sizes and to measure sample sizes less than I microliter up
to about 2 microliters. Therefore the total peak area of each
chromatogram is the best indication of the sample size used.
The column used for the analyses in Figure 3 was a 10 ft
x 3/16 in butanediol succinate plus 1.5 ft x 3/16 in Dow Corn
ing silicone grease column. This column was developed as
described in the section on Fractional crystallization No. 5.
Results of this later work are given here to help explain why
a 6.5 ft column did not appear to give better separations than
a 5 ft column.

Fig. 3. Effect of sample size on separation of methyl stearate and methyl oleate
Fig. 4. Mono- and dicarboxylic acid methyl ester chromatograms
Fig. 5. Chromatogram of crystallization fraction F-4 B

u 5 10 15
TIME , MINUTES
20
F I G
I; -, .-it
X v.
10 TIME , MMJÏES
20
F I G . 4
3 0 • .
20-I I i :
i.o • ' "• :
; . :. ...... .. ' o L i .
0 5 10 15 20
TIME , MINUTES xO CO
0 , , L .
0 5 10 15 20 25
TIME , MINUTES
F : G . 5

93
The set of chromatograms used in the calculations were
obtained using the 5 ft x 1/4 in OD copper tubing column re
packed with new ethylene glycol succinate packing material.
A temperature of approximately 210°C and a helium flowrate
of about 60 ml per minute were used. The time of emergence
of linoleate from the column was between 21 and 24 minutes.
Figure 4 shows the relative positions of the mono- and di-
carboxylic acids separated on a similar column several months
after the samples of this crystallization were run. The chro
matograms were obtained by running the two samples separately
but recorded on the same sheet as shown. The chromatograph
conditions were identical for both samples. A column tempera
ture of 216°C, a helium flowrate of 67 ml per minute, a bridge
current of 200 milliamperes, and a recorder range plug of
5.0 millivolts were used. Under these conditions, palmitoleate
and suberate (DiCg) overlap, oleate and sebacate (DiC^) over
lap, and linoleate and DiC^ would probably be only partially
separated. Not shown on these chromatograms is an azela-
aldehydate peak which would appear between suberate and azelate
and would not overlap with any of the peaks shown.
Figure 5 is a chromatograph of the F-4 B crystallization
fraction and shows the degradation of the sample due to oxida
tion by the presence of the diacid methyl ester peaks and the
azelaaldehydate peak.

94
One of the objectives of this study of lard was to deter
mine whether the fatty acid distribution in the 1- and 3-
position is random or not. Consider the 6 possible types of
glycerides in lard based upon saturated and unsaturated fatty
acids. These are :
SSS (GS3) SUS (GS2U) USS (GS2U) USU (GSU2) SUU (GSUo) UUU (GU3)
In the calculations for the 4 major types of glycerides in
lard, (GS3, GS2U, GSU2 and GU3), it was assumed that there
were no more than 2 of the major glyceride types in a given
crystallization fraction. Based on this, there are three
logical combinations to be expected from the crystallization
separation which contain 2 major glyceride types. These are :
SSS SUS USU SUS USS SUU USS USU UUU
SUU
Suppose that the overall composition of the lard is 60
mol percent unsaturated and 40 mol percent saturated acids.
Also suppose that of the 40% S, that 5% is myristic, 25% is
palmitic, and 10% is stearic. If the lard were completely
randomized, the composition found for the saturated acids in
any one of the positions marked S would be 12.5% myristic,
62.5% palmitic, and 25% stearic. If all the acids in the

95
1-position of the SSS, SUS, and USS fraction were analyzed,
the composition would depend upon the relative amounts of the
three glyceride types because one of the glycerides contributes
unsaturated acids. But the relative amounts of the saturated
acids would remain the same. The relative amounts would be
5 : 25 : 10 = 1 : 5: 2 for myristic : palmitic : stearic.
The same would be true for an analysis of the fatty acids in
a given position for any of the fractions.
Now assume that the lard fatty acids are not completely
randomized but that the composition of the fatty acids in the
1- and 3-positions is different than in the 2-position. As
sume though that the distribution in the 1- and 3-positions is
random and the distribution in the 2-position is random. The
fatty acids for all 1- and 3-positions designated by a S
should have the same composition. But for the fatty acids in
the 1- and 3-positions of a fraction, the composition would
vary with the relative amounts of each glyceride type present.
But as in the case of the completely randomized lard, the
relative amounts of the saturated acids would remain constant
for all of the fractions. The same would be true of the 2-
position fatty acids for each fraction.
These ratios of myristic : palmitic : stearic could be
calculated for each of the lards and. their fractions for both
the 1- and 3-position and the 2-position fatty acids, but the

96
myristic peaks are quite small in many cases to be measured
accurately and the stearic compositions may be in error in
many cases because of the overlapping of stearate-oleate
making accurate area measurement impossible.
The palmitic peak measurements were not hindered by either
of the above difficulties. Therefore it would be better to
find a method of checking the distribution of palmitic on a
basis other than the myristic and stearic compositions alone.
This can be accomplished by comparing the ratio of palmitic
to stearic of the before fraction to the same ratio of the
after fraction. As the after sample has been randomized, its
ratio of palmitic to stearic should remain constant for all
fractions. Errors in the stearic measurement could cause it
to vary though. But the same type of variation should be
present in the before ratio and therefore comparison of the
before and after ratios should tend to cancel the errors in
measuring the stearic peak if the measurements were made in
a consistent manner. The errors in measuring the myristic
peak would be expected to be more random in nature and not as
likely to cancel.
Table 37 is a summary of the calculations of this type
of ratio. It is clearly seen from the table that the ratios
do not remain constant for all fractions which would indicate
that the distribution of the saturated fatty acids in the 1-

97
and 3-positions and in the 2-position of lard B are not ran
dom. But as was shown by the figures in Table 36, the data
for the free fatty acids and/or the monoglycerides is not re
liable because the inverse lever rule is not obeyed. From
the variations observed in Table 36 it is not surprising that
the distribution ratios are not constant for all the fractions.
Table 29. Weights of crystallization fractions and the weights adjusted for losses during fractionation^
Wt of Adjusted Wt of Adjusted fraction wt of fraction wt of
Sample recovered fraction recovered fraction
Lard 50.00 50.00 P-3 8.12 8.33 3.15 3.19 P-6 5.34 5.48 8.24 8.36 F-6 23.84 24.45 15.12 15.34 F-5 8.69 8.91 14.20 14.40 F-4 2.76 2.83 8.59 8.71
Total 48.75 50.00 49.30 50.00
Loss gms 1.25 -- 0.70 - -
% loss 2.5 1.40 — —
aWeight of the original lard sample lost was divided between the fractions directly proportional to their weights.
Table 30. Mol percentage of saturated and unsaturated fatty acids in lards and crystallization fractions
Sample Mol % S Mol % U
40.90 59.10 72.07 27.93 65.84 34.16 35.88 64.12 15.89 84.11 18.82 81.18
Before —— Lard
P-3 P-6 F-6 F-5 F-4

98
Table 30. (Continued)
Sample Mol % S Mol % U
After
Lard 42.54 57.47 P-3 89.43 10.58 P-6 65.63 34.37 P-6 45.99 54.01 F-5 27.71 72.29 F-4 15.97 84.03
Fractional crystallization No. 5. Analyses by gas-liquid chromatography and pancreatic lipase hydrolysis
Introduction Before carrying out this crystallization
several studies were made in an attempt to obtain results
which would obey the inverse lever rule and give reliable data
for determining the distribution of the fatty acids in the
different types of glycerides. Six items were listed under
Fractional crystallization No. 4 as being possible areas in
which errors might be made. The 6 items involved are : 1) ad
sorption of free fatty acids by resin, 2) complete recovery
of fatty acids from the resin, 3) complete methylation of
the recovered free fatty acids, 4) obtaining a representative
sample of the monoglycerides, 5) complete methylation of the
monoglyceride fatty acids and 6) proper enzymatic hydrolysis
techniques.

Table 31. Fatty acid methyl ester composition of lard crystallization fractions
Lard P -3 P--6 F' -6 F -5 F -4
B A B A B A B A B A B A
Weight percent
Myr. 1.7 1.7 0.7 2.5 2.0 1.4 1.2 1.8 2.4 1.6 2.7 1.7 Pal. 26.2 26.8 34.6 53.1 39.6 39.8 26.9 29.7 10.3 17.9 12.8 11.5 P.O. 3.3 3.1 0.9 - 1.4 1.8 2.7 2.7 6.5 3.8 9.4 5.8 Stear. 11.5 12.5 36.1 33.4 23.2 23.4 6.1 13.0 2.1 6.9 2.4 1.9 Oleic 46.7 47.0 22.8 11.2 28.2 29.0 54.7 46.2 57.1 60.3 49.1 61.8 Linol 10.6 8.9 5.0 - 4.7 3.9 8.5 6.6 20.7 9.5 19.3 14.3 Semi-DiCg - - - - 0.9 0. 6 - - - - 3.5 2.0 DiC9 — — - — — — — — 0.9 — 0.9 1.1
Mol percent
Myr. 2.0 2.0 0.8 2.8 2.4 1.6 1.5 2.1 2.9 1.9 3.2 2.0 Pal. 27.0 28.5 36.7 55.2 41.4 41.7 28.6 31.4 10.9 19.2 13.4 12.2 P.O. 3.5 3.3 0.9 - 1.51 1.9 2.9 2.9 7.0 4.1 9.9 6.2 Stear. 11.1 12.0 34.6 31.4 22.0 22.3 5.8 12.5 2.0 6.7 2.3 1.8 Oleic 45.3 45.5 22.1 10.6 27.0 27.7 53.0 44.7 55.6 58.9 46.8 59.7 Linol. 10.4 8.7 4.9 - 4.5 3.8 8.3 6.4 20.3 9.4 18.5 13.9 Semi-DiCg - - - - 1.2 0.9 - - - - 4.9 2.9 DiCg - - - - - - - - 1.2 - 1.2 1.4

Table 32. Glyceride composition of lard before and after molecular rearrangement
Wt of Total frac- wt %
Frac- tion Mol P.A. F.A. in tion gms 100 gm F.A. glyc.
Mois Mol % of glyc. °f GS3 GS2U GSU2 GU3
Mois of glyc.
GS3X GS2Ux GSUox GUgx 100 100 100 100
Before
P-3 8.33 0.3487 P-6 5.48 0.3532 P-6 24.45 0.3480 F-5 8.91 0.3463 F-4 2.83 0.3540
95.77 0.00927 16.21 83.79 95.73 0.00618 95.78 0.02717 95.80 0.00985 95.78 0.00320
0.1503 0.7769 97.52 2.48 0.6023 0.0153 7.64 92.36 0.2075 2.5091
47.67 52.33 0.4697 0.5156 56.46 43.54 0.1806 0.1392
Totals 50.00
After
P-3 P-6 P-6 F-5 F-4
3.19 0.3556 8.36 0.3525
15.34 0.3491 14.40 0.3457 8.71 0.3492
0.05567
Mol %
0.1503 1.5867 3.1747 0.6548
2.7 28.5 57.0 11.8 o o
95.68 0.00362 68.26 31.74 95.73 0.00940 96.89 3.11 95.75 0.01709 37.97 62.03 95.80 0.01589 83.13 16.87 95.81 0.00971 47.91 52.09
0.2470 0.1148 0.9111 0.0292 0.6490 1.0602
1.3213 0.2681 0.4654 0.5060
Totals 50.00 0.05572 0.2470 1.6749 2.8761 0.7741
Mol % 4.4 30.1 51.6 13.9

Table 33. Fatty acid balance of lard crystallization fractions^
Before
Lard P-3 P-6 P-6 F-5 F-4
After
Lard P-3 P-6 P-6 F-5 F-4
Wt in Wt of fatty acids in pams Total wt of gms Myr. Pal. P.O. Stear. Oleic Linol. all fatty acids
50. 00 0. 815 12. 535 1. 560 5. 520 22. 375 5. 080 8. 33 0. 052 2. 757 0. 069 2. 876 1. 822 0. 402 5. 48 0. 106 2. 067 0. 075 1. 214 1. 475 0. 310
24. 45 0. 291 6. 301 0. 628 1. 416 12. 804 1. 978 8. 91 0. 208 0. 872 0. 555 0. 179 4. 856 1. 866 2. 83 0. 073 0. 341 0. 249 0. 063 1. 305 0. 680 50. 00 0. 730 12. 338 1. 576 5. 748 22. 262 5. 236
50. 00 0. 825 12. 855 1. 470 5. 970 22. 510 4. 260 3. 19 0. 075 1. 619 — — 1. 018 0. 340 - -
8. 36 0. 111 3. 174 0. 145 1. 869 2. 313 0. 390 15. 34 0. 261 4. 360 0. 402 1. 905 6 . 793 0. 968 14. 40 0. 213 2. 470 0. 521 0. 955 8. 322 1. 315 8. 71 0. 137 0. 950 0. 478 0. 154 5. 087 1. 539
50. 00 0. 797 12. 573 1. 546 5. 901 22. 855 4. 212
47.885 7.987 5.247
23.418 8.536 2.711
47.890
47.890 3.052 8.002
14.689 13.796 8.345
47.884
^The weight of the oxidation products was converted to an equivalent weight of linoleic acid in these calculations.

Table 34. Composition of 1-and 3-position fatty acids in lards and crystallization fractions
Lard P^ô F^ô F-5 F-4 B A B A B A B A B A
Weight percent
Myr. 0, .7 1. .9 0. . 6 1, .7 0, .9 2, .0 1, .0 1, .7 0, .6 1. .7 Pal. 6 < .9 27. .3 15. .1 40. .1 11. .2 28. .4 11, .9 25. .9 8. .8 14. .1 P.O. 1. .9 2. .8 1. .8 1, . 6 1. .9 3. .1 2, . 6 3, .3 4. .5 5. .8 Semi-DiCg 0. .5 0. » 6 0. .9 DiCg 0. .8 1. .4 2. .2 1. .7 Stear. 15, .7 16. .6 22. .9 , 26. .8 13. .6 15. .2 13. .7 19. .3 9. .2 5. .3 Oleic 61. .4 42. .8 48. .6 26. .9 64. .8 45. .6 57. .1 41. .8 44. .8 55. ,9 Linol. 13. .5 7. .8 10. .5 2. .9 7. . 6 5. .8 13. .7 6. .5 29. .3 14. .7
Mol percent
Myr. 0. .8 2. ,3 0. .7 2. .0 1. .1 2. ,4 1. .2 2. .0 0. .8 2. .1 Pal. 7. .5 28. .9 16. .2 42. .2 12. .1 30. .1 12. .8 27. .4 9. .4 14. .9 P.O. 2. ,0 3. .0 1. .9 1. .7 2. .1 3. ,3 2. .9 3. .5 4. .8 6. .2 Semi-DiC, g 0. ,8 0. .9 1. .2 DiC 9 1. ,0 1. .9 3. ,0 2. ,3 Stear. 15. ,4 15. .9 22. ,3 25. . 6 13. .3 14. , 6 13. ,4 18, .5 8. ,9 5. ,1 Oleic 60. ,8 41. ,3 47. ,7 25. ,8 63. ,9 44. .1 56. .2 40. .3 43. . 6 54. .0 Linol. 13. ,5 7. ,6 10. ,4 2. ,8 7. ,5 5. 6 13. ,5 6. ,3 28. ,7 14. ,3

Table 35. Composition of 2-position fatty acids in lards and lard fractions
Lard P-6 P-6 F-5 F-4
B A B A B A B A B A
Weight percent
Myr. 4.7 2.4 5.5 2.6 4.9 2.9 5.8 2.5 4.5 2.2 DiCy - - - - - - -
31.6 0.8 0.5
Pal. 66.1 28.4 85.9 45.6 61.3 37.9 34.3 31.6 29.0 17.5 P.O. 5.4 4.1 — 2.8 4.3 3.0 9.1 3.6 10.4 5.4 Semi-DiCg - 1.9 - 1.5 - 1.0 2.3 3.4 2.3 2.9 DiCg 0.5 - - - - 0.9 0.7 1.4 0.8 Stear. 2.7 9.9 4.8 21.7 5.1 13.5 4.6 14.8 3.3 3.4 Oleic 16.0 44.2 3.8 23.8 21.0 37.7 35.8 38.7 30.3 55.1 Linol. 5.1 8.7 - 2.1 3.4 4.3 7.3 4.9 16.8 12.3 DiCi2a - - - — - — — — 1.9 —
Mol percent
M y r . 5 . 3 2.8 6.2 3.0 5.6 3.4 6.6 2.9 5.1 2.5
DiC 7 - — - - - -
32.7 1.2 0.7
Pal. 67.1 29.7 86.0 47.2 62.5 40.1 35.1 32.7 29.5 18.3 P.O. 5.6 4.3 - 2.9 4.4 3.2 9.4 3.7 10.7 5.7 Semi-DiCg - 2.6 - 2.1 - 1.4 3.2 4.8 3.1 4.1 DiCg 0.7 — - - - 1.2 0.9 1.8 1.1 Stear. 2.5 9.4 4.4 20.3 4.7 12.9 4.3 13.9 3.0 3.2
Oleic 14.8 42.2 3.4 22.5 19.6 34.9 33.4 36.5 28.1 52.6 Linol. 4.7 8.4 — 2.0 3.2 4.2 6.8 4.6 15.7 11.8 DiC12a - - - - - — - - 2.0 —
arhis peak had a retention time corresponding to DiCi2 on a plot of logarithm of retention time ratio (unknown peak/palmitate) vs number of carbons for the diacid series. This was not sufficient evidence to prove this peak was DiC%2 but was listed in this manner for identification.

Table 36. Summary of fatty acid compositions
Lard p--3 P--6 P-6 P-5 P-4
B A B A B A B A B A B A
P.P.A. 0.8 2.3 —— 0.7 2.0 1.1 2.4 1.2 2.0 0.8 2.1 Triglyc. Myr. 2.0 2.0a 0.8 2.8 2.4 1.6* 1.5 2.1* 2.9 1.9* 3.2 2.0* 2-mg 5.3 2*8 — — — 6.2 3.0 5.6 3.4 6.6 2.9 5.1 2.5
F.F.A. 7.5 28 «9 — — 16.2 42.2 12.1 30.1 12.8 27.4 9.4 14.9 Triglyc. Pal.27.8 28.5*36.7 55.2 41.4 41.7& 28.6 31.4 10.9a19.2 13.4 12.2a
2-mg 67.1 29.7 - - 86.0 47.2 62.5 40.1 35.1 32.7 29.5 18.3
F.F.A. 2.0 3.0 1.9 1.7 2.1 3.3 2.9 3.5 4.8 6.2 Triglyc. P.O. 3.5 3.3 0.9 1.5 1.9 2.9 2.9* 7.0 4.1a 9.9 6.2a
2-mg 3.6 4.3 — — — — 2.9 4.4 3.2 9.4 3.7 10.7 5.7
F.F.A. 15.4 15.9 — •* 22.3 25.6 13.3 14.6 13.4 18.5 8.9 5.1 Triglyc. Stear. 11.1 12.0 34.6 31.4 22.0*22.3 5.8 12.5* 2.0a 6.7* 2.3* 1.8a
2—mg 2.5 9.4 — — 4.4 20.3 4.7 12.9 4.3 13.9 3.0 3.2
F.F.A. 60.8 41.3 • ew 47.7 25.8 63.9 44.1 56,2 40.3 43.6 54.0 Triglyc.Oleic 45.3 45.5a22.1 10.6 27.0 27.7* 53.0 44.7* 55.6*58.9a 46.8a59.7a
2-mg 14.8 42.2 — — — 3.4 22.5 19.6 34.9 33.4 36.5 28.1 52.6
F.F.A. 13.5 7.6 —- — — 10.4 2.8 7.5 5.6 13.5 6.3 28.7 14.3 Triglyc. Linol. 10.4 8.7a 4.9 — — 4.5 3.8* 8.3* ' 6.4* 20.3* 9.4* 18.5 13.9 2-mg 4.7 8.4 —— — - — — 2.0 3.2 4.2 6.8 4.6 15.7 11.8
F.F.A. Di— — 1.0 ** M 0.8 « «* — — — 1.9 3.0 2.3 Triglyc. acids — — 1. 2a ' 0.9 — —
a 1.2 —-a 6.1 4.3 2—mg — 3.3 — — — — 2.1 1.4 4.4 5.7 8.1 5.9
&The triglyceride fatty acid composition does not lie between the free fatty acid (1- and 3-position) and the monoglyceride (2-position) fatty acid compositions.

105
Table 37. Saturated fatty acid distribution in lard crystallization fractions
Lard P-6 P-6 F-5 F-4 Position Position Position Position Position 2 1 and 3 2 1 and 3 2 1 and 3 2 1 and 3 2 1 and 3
MyrR Myr, " A 0.84 1.13 1.06 2.12 1.26
Palg PalA 1.34 0.91 1.14 1.28 0.60
Pal Pal» B A 8.48 8.37 4.28 3.47 1.72
Stearg StearA 0.27 0.44 0.94 0.65 0.36
StearB stear a Myro Mvr'a °-140 0.105 0.221 0.136 0.459
A 2.79 2.49 1.99 1.21 4.57
Items 1) and 2) were studied under Fractional crystal
lization No. 3. Items 3) and 5) both concern methylation and
can be studied together. Items 4) and 6) are treated sepa
rately and in considerable detail.
Some qualitative information was also obtained about the
oxidation of glyceride samples and fatty acid methyl esters
during storage under refrigeration.
Again, improvements on the gas chromatograph were made
and a search was made for a column which would give better
separation of the monocarboxylic acid methyl esters and the
methyl esters of the oxidation products. Although it was
not absolutely necessary to obtain complete separation of all

106
the monocarboxylic acids and the oxidation product methyl
esters for studying the lards, crystallization fractions and
the 1- and 3-position and 2-position fatty acid methyl esters,
it was anticipated that such a gas-liquid chromatography
column would be needed for the next phase of the study in
which complete oxidation of the unsaturated portions of the
fat were to be studied.
In studying the distribution of the fatty acids in the
different positions of the glycerides, it was assumed that
the lard after sample was randomized. Even if the rearrange
ment as conducted by the Rath Packing Company were not com
pletely random but was a directed rearrangement, the calcula
tions would still be valid. As trisaturated glycerides were
crystallized from the reaction mixture the proportion of
saturated and unsaturated acids remaining in the liquid por
tion of the reaction mixture would change but the relative
amounts of the saturated acids remaining in the liquid portion
of the reaction mixture would remain constant because the in
ter ester if icat ion process proceeds in a random manner. A
similar statement would be true for the relative amount of un
saturated acids in the liquid phase.
In order to determine whether the lard after sample was
completely randomized or directly rearranged it was compared
to a sample of the lard before which was randomized such that

107
a second phase was not formed during interesterification.
This randomized lard sample was carried through the same pro
cedures as were the lard before and after samples. The ran
domized sample is referred to as "lard random" and "lard R".
The letter "R" is used to designate fractions from this ran
domized lard.
Methylation of free fatty acids and glyceride fatty
acids A check was made on whether or not the fractional
crystallization No. 4 samples had oxidized during storage for
approximately 9 months in 125 ml Erlenmeyer flasks under re
frigeration. Seven to eight drops of P-4 A glycerides were
refluxed with 5 ml of 0.5% anhydrous hydrochloric acid-
methanol solution for 15 minutes, the alcohol solution evapo
rated under a water aspirator vacuum and the methyl esters
transferred to a % dram vial. A sample of F-5 A glycerides
was treated in a similar manner. Table 38 includes the re
sults for these two samples. The results compared to the
original compositions of these two fractions indicated that
there were now more oxidation products in the F-4 A sample
but not in the F-5 A sample. A closer study of the results
indicates that the F-5 A sample had considerably higher
saturated acid compositions than the original analysis showed.
The F-4 A sample compositions agreed fairly well except for
the 18-carbon components. Here there are two effects involved.
First is the expected decrease in the unsaturated acid compo

108
sitions because of oxidation in which the linoleic acid com
position would be expected to decrease by a greater amount
than the oleic acid composition. Second is the effect of the
baseline changing during the time a trace above the baseline
is being made and the resultant error caused by trying to es
timate where the baseline should be drawn. The second effect
appears to have been predominate in the case of the F-4 A
samples.
More F-5 A sample was available for study than the F-4
A sample and was used in continuing the study. Four samples
were prepared by varying the amount and type of catalyst used
for the methylation and by using different methods of recover
ing the methyl esters. The time of reflux for these four
samples was 30 minutes.
In preparing these methyl esters, it was observed that
the triglycerides were not completely soluble in the hydro
chloric acid-methanol solution. As the time of reflux was
increased from 15 to 30 minutes, the composition of oleic and
linoleic acids increased in the methyl ester analysis. This
indicated that under these conditions methylation of the
saturated acids took place more readily than for the unsatu
rated acids. It was also observed that it took more methyl
ester sample of column 3 (Table 38) than for the sample of
column 4 to obtain the same total peak area on the chromato-

109
grams. This indicated that there had been incomplete methyla
tion of the sample which did not vaporize and pass through
the chromatograph column.
Luddy ejt al. (50) gave data which show that methanolysis
of glycerides is complete in 5 minutes using a 0.2 N methanol
solution of potassium methoxide but for the use of hydro
chloric acid-methanol, the minimum time used in their study
was 30 minutes for which complete methylation was accomplished.
The conclusions of these tests on the F-4 A and F-5 A
samples were:
1. The glyceride fraction F-5 A had undergone some oxi
dation during storage as the linoleic acid composition dropped
from 9.5 to 6.8%.
2. The methyl esters used for the original analysis of
the F-5 A fraction were oxidized to about the same degree, as
the same methyl ester sample run at a later date gave a lino
leic acid composition of 6.6% as compared to 9.5% when
originally run.
3. The amount of oxidation of the linoleic acid chains
in the F-5 A triglyceride fraction was approximately 2.7%
of the total fatty acids in the fraction and 28.4% of the
linoleic acid originally present. It should be noted that
the first methyl ester sample prepared (original methyl esters)
were not chromatographed until about 4 months after they were

Table 38. Oxidation during storage and methylation tests3
Composition of F-4 A triglycerides Composition of F-5 A triglycerides
After storage
Orig. composition
1 2 Orig. After methyl storage ester of orig. anal, methyl
esters
After storage of triglyc,
Myr. 1.7 1.7 Pal. 11.8 11.5 P.O. 5.0 5.8 Semi-DiCg 0.3 2.0 DiCg 0.7 1.1 Stear. 1.6 1.9 Oleic 66.1 61.8 Linol. 12.9 14.3
No. chromato g. 1 Catalyst 0.5% HC1 About
5% HC1
1.6 17.9 3.8
6.9 60.3 9.5
3 About 5% HC1
1.7 18.9 3.9 0.5 0.3 6.7
61.5 6.6
1.9 24.6 3.6 0.3 0.2
12.3 52.4 4.7
1.7 19.2 3.8 0.9 0.5 7.6
59.9 6.5
1.7 18.7
3 . 8 0.3 0.5 7.3
61.1 6.7
1.6 19.9 3.6 0.3 0.5 8.5 58.6 6.9
1.6 19.1 3.8 0.4 0.4 7.1
60.9 6 . 8
2 2 3 2 3 2 About 0.5% HC1 2.4% HC1 2.4%HC1 0.5% NaOCHj 5% HC1 HC1
Reflux,min.
Recovery*3
15 over 60 over 60
Bvap. Extr. Extr.
over 6 0 15
Extr. Bvap,
\ 30 30 30 30
Extr. Evap. Evap. Extr.
aArea percents,
^Evap. means methyl esters were recovered by evaporating the hydrochloric acid-methanol solution under vacuum. Extr. means the methyl esters were recovered by extracting from the reflux solution by use of ethyl ether.

113
prepared. The time of storage of the methyl esters after the
first chromatogram was prepared until the second chromatogram
was prepared was about 3 months.
4. In forming the methyl esters from the glycerides,
at least 30 minutes reflux time should be used when anhydrous
hydrochloric acid is used as the catalyst.
5. A hydrochloric acid concentration of 2.4% is pre
ferable to 0.5%.
6. The methods of recovering the fatty acid methyl
esters did not affect the compositions obtained; evaporation
of the alcohol and extraction of the methyl esters gave the
same compositions.
7. Incomplete methylation of the glycerides gave a dif
ferent methyl ester composition than when the methylation
was complete. Incomplete methylation gave high compositions
for the unsaturated acids. No conclusions were drawn as to
the effect of chain length of the fatty acids.
In preparing chromatograms of the methyl esters of the
fatty acids freed during hydrolysis for fractional crystal
lization No. 4, it was observed that considerably more sample
was required to obtain the desired peak areas for measurement.
The methyl esters of the free fatty acids formed from P-6 A
were particularly difficult in that this sample was always
accompanied by bad baseline drift and an unsteady signal to
the recorder.

112
The remaining methyl esters (one or two drops) of the
free fatty acids from the P-6 A hydrolysis were refluxed for
1 hour with 10 ml of 2.4% anhydrous hydrochloric acid-methanol
solution followed by evaporating the alcohol under vacuum. A
peak now appeared before myristate and comparison to a known
diacid methyl ester sample indicated that this new peak was
dimethyl succinate (DiC^). The results of four chromatograms
of this sample compared to the original sample composition are
given in Table 39.
Again, the data of Table 39 indicate that incomplete
esterification gave high compositions for the saturated fatty
acids and a low value for linoleic acid but very little dif
ference for oleic. The differences between the compositions
before and after re-esterification are quite small compared
to the differences obtained for glycerides in Table 38.
Table 39. Re-esterification of the fatty acid freed during hydrolysis of P-6 A crystallization fraction
Area percent Original methyl esters
Chromatogram 12 3 4 Average Av. of 3
DiCT 1/78 ÏÏ63 ÏTÔO 1763 O = Myr. 1.71 1.71 1.67 1.89 1.7 2.0 Pal. 27.67 27.19 27.54 27.16 27.3 28.4 P.O. 2.96 2.51 2.63 2.60 2.7 3.1 Semi-DiCg 0.55 trace 0.41 0.25 0.4a trace DiCg 0.36 trace 0.26 0.28 0.4a trace Stear. 13.54 13.91 13.79 14.40 13.9 15.2 Oleic 44.78 45.92 46.04 45.38 45.4 45.6 Linol. 6.64 7.13 6.04 6.41 6.6 5.8
^Calculated by putting 0.55 and 0.36 in the semi-DiCg and DiCg spaces for chromatogram 2 and normalizing the values in column 2 before calculating the average.

113
When Amberlite IRA-400 is used to recover free fatty
acids from an ether solution of the free fatty acids and mixed
glycerides, it becomes necessary to insure that all of the
fatty acids are recovered. If not, a representative sample
is not obtained as the resin selectivity tests showed. There
fore a series of samples were run to determine the best pro
cedure to be followed when using Amberlite IRA-400 to recover
the free fatty acids and when the methyl esters of the ad
sorbed fatty acids were formed by adding hydrochloric acid-
methanol solution to the resin.
In the method used by Hornstein ert al. (40), it was re
ported that 60-95% absolute recoveries of free fatty acids in
fat were obtained. As their procedure was for the quantita
tive determination of free fatty acids in a fat sample, it
was necessary for them to use an internal standard. A weighed
amount of a fatty acid not present in the sample was added to
the sample and the calculations then based upon the fat sample
weight, the weight of free fatty acid added, and the composi
tion of the fatty acids, including the internal standard, re
covered from the fat.
As a quantitative determination of the free fatty acids
in the hydrolysis products was not necessary, it was desired
only to insure that a representative sample of the free fatty
acids was obtained. Therefore an internal standard was not
used.

114
The general procedure followed for all the samples in
this series of tests was to use about 1 gram of fatty acids
dissolved in 50 ml of ethyl ether, 15 grams of Amberlite
IRA-400 (-OH form) added, stirred 5 minutes, the ether de
canted from the resin, and the resin washed twice with 20 ml
portions of ether. Methylation and recovery of the fatty
a c i d s a d s o r b e d o n t h e r e s i n w a s a c c o m p l i s h e d b y s t i r r i n g 2 5
ml of hydrochloric acid-methanol solution and the resin for 25
minutes. The hydrochloric acid-methanol solution was decanted
from the resin and the resin washed 2 times with either 15 ml
portions of the hydrochloric acid-methanol solution and/or
with 20 ml portions of ether. The combined hydrochloric
acid-methanol solution and the washes were then treated to
recover the methyl esters by evaporating the ether and meth
anol, adding 50 ml of ether to the residue, and washing the
ether solution with water. The ether solution was then dried
over anhydrous sodium sulfate and the methyl esters trans
ferred to ̂ dram vials. Table 40 lists the procedure condi
tions and the chromatographic results of these tests.
Sample 1 was the preparation of the methyl esters of the
lard fatty acid sample used in these tests to use for compari
son of the methyl ester compositions obtained for the test
samples.
For samples 2 and 3, the amount of methyl esters recovered
indicated that neither of these samples had been completely

115
recovered. The amount of fatty acids which were not adsorbed
was not determined but the amount of methyl esters trans
ferred to the §• dram vials was considerably less than the
original sample. Chromatograms of all three samples were run
on the same sheet of paper using the same sample size and the
same chromatograph conditions. Sample 2 had about the same
total area as sample 1 but sample 2 had a taller palmitate
peak which the resin tests showed to be true when only part
of a fatty acid sample was adsorbed. Sample 3 gave about 3/4
the area of samples 1 and 2 which indicated that the 1%
hydrochloric acid-methanol solution had not been adequate in
forming the methyl esters. Chromatogram peak areas were not
calculated. The conclusions for samples 2 and 3 were that the
resin had not adsorbed all the fatty acids and that the 1%
hydrochloric acid-methanol solution did not completely methy-
late the adsorbed fatty acids.
Difficulty with the resin capacity dropping below its
expected capacity of about 1 gram of fatty acids for 15 grams
of resin had been observed in other work with the resin. The
cause of this was never determined even though tests were con
ducted using different strengths of sodium hydroxide to con
vert the chloride form to the hydroxide from as well as dif
ferent organic solvents for removing some of the water from
the resin. It was found that satisfactory results could be
obtained by preparing the resin just before it was needed but

116
if stored for more than several hours, the resin could not be
used with confidence. In the remainder of these tests, the
resin was prepared as it-was used.
Sample 4 was run to determine whether resin from the
batch used for samples 2 and 3 could be converted to the hy
droxide form again and recover its lost capacity. The resin
was treated by adding 50 ml of 5% aqueous sodium hydroxide to
15 grams of the resin and occasionally stirred during a 10
minute period. The resin was washed with distilled water un
til the wash water was neutral to litmus paper, washed 3 times
with acetone and finally washed 2 times with ether. This resin
wet with ether, was used without further drying. Sixty drops
of oleic acid were then treated by the same procedure as were
samples 2 and 3 using 9.6% hydrochloric acid-methanol solution.
The ether decanted from the resin after adsorbing the fatty
acids and the ether washes were combined and evaporated. There
was only about one drop of fatty acids of the original 60
drop sample which had not been adsorbed. A chromatogram of
the recovered methyl esters indicated that the sample had been
completely methylated based on the area obtained from the in
jection sample size used. Peak areas were not calculated.
The conclusion was that the resin could be regenerated to its
original capacity and that 9.6% hydrochloric acid-methanol
gave good results.

117
Sample 5 was run using resin prepared as described above
and by using the conditions listed in Table 40. The 3%
hydrochloric acid-methanol solution did not give complete
methylation. A chromatograph indicated that the sample con
sisted of l/5 or less methyl esters. The methyl ester sample
was then treated with 5.0% hydrochloric acid-methanol to com
plete the methylation. The results of a chromatogram of the
re-esterified sample are shown in Table 40 under sample 6.
Sample 7 was run using 5% hydrochloric acid-methanol
which gave satisfactory results. Sample 8 demonstrated the
use of 1-25 ml portion of 5% hydrochloric acid-methanol and
10 minutes contact time with the resin. The point being checked
here was that the methylation actually continues during the
evaporation of the ether and methanol and that the contact
time with the resin needed to be only long enough for the resin
color to change from dark yellow-brown to light yellow. There
must be enough hydrochloric acid remaining in the solution to
catalyze the methylation reaction after the resin has been
completely converted to the chloride form. Ether was used to
insure all the desorbed fatty acids were recovered from the
resin. The results of the chromatogram of sample 8 indicated
that the myristate, palmitate and palmitoleate values were
slightly high. To check whether this was due to incomplete
methylation, the methyl esters of sample 8 were again methyla
ted and the results of this chromatogram are shown as sample 9.

118
The results of sample 8 and 9 are in good agreement indicating
that the slightly high values were due to selectivity of the
resin.
Sample 10 was run under the identical conditions of
sample 8 except that 7.6% hydrochloric acid-methanol solution
was used and the hydrochloric acid-methanol-ether solution was
dried over anhydrous granulated sodium sulfate before evaporat
ing the ether and alcohol. The methyl ester residues were not
washed with water either before or after the evaporation.
This test indicated that it was not necessary to wash the
methyl esters after evaporating the ether and alcohol.
The conclusions of the study were :
1. The resin used to adsorb the fatty acids should al
ways be checked to insure it has sufficient capacity to pick
up all the fatty acids in the sample.
2. If all the fatty acids are not adsorbed from the
solution by the resin, those adsorbed will not be a repre
sentative sample of the fatty acids. The shorter chain fatty
acid compositions will be high.
3. A representative methyl ester sample can be obtained
by the use of 5% or stronger hydrochloric acid-methanol solu
tion. One 10 minute contact of the adsorbed fatty acids-resin
with 25 ml of the 5% solution followed by 2 ether washes and
evaporation of the solvents gives a satisfactory methyl ester

Table 40. Study of free fatty acid recovery on Amberlite IRA-400 and methylation on the resin
Procedure conditions Sample 123456789 10 no.
Patty acid Lard Lard Lard sample P.A. P.A. P.A.
Oleic Lard acid P.A.
Drops of sample not adsorbed
Drops of samples used
Cone, of HCl-MeOH 7.6%
Portions of HCl-MeOH used/min stirred
Not Not About all all 1 adsorb.adsorb.
About About 60 60 60
About
1-2
60
M.E. Lard Lard 5 P.A. P.A.
About About
M.E, 8
60
5.0% 5.0%
60
5.0% 7.6% 9.6% 1.0% 9.6% 3.0%
1-25 ml 1-25 ml 1-25 ml 1-25 ml 25 min 25 min 25 min 25 min -- 25 min 10 min
1-25 ml 1-25 ml
2-15 ml 2-15 ml 2-15 ml 5 min 5 min 5 min
2-15 ml 1 min
Ether washes -- No No No
Water washes yes yes yes
Methylation complete yes yes no yes no
M.E. P.A.
About 3
60
7.6%
1-25 ml 10 min
2—20 ml — — 1—15 ml 2—20 ml — — 2—20 ml
yes yes yes yes
yes yes
yes yes no
yes yes

Table 40. (Continued)
Sample \ Procedure conditions no. 123456789 10
Chromatograph area percent
DiC4 o
CO
0.3 trace trace 0.4 0.3
Myr. 1.6 1.6 1.6 1.9 1.6 1.6
Pal. 27.5 26.9 27.6 28.3 28.3 28.8
P.O. 3.1 2.9 3.0 3.5 3.3 3.4
Semi-DiCç 0.7 0.4 0.8 0.7 0.7 0.9
DiC9 0.3 0.2 0.2 0.4 0.3 0.3
Stear. 12.8 12.6 12.8 12.4 13.3 12.5
Oleic 47.4 48.9 47.7 46.6 46.6 46.2
Linol. 6.5 6.3 6.3 6.2 5.5 6.0

121
sample. Washing with water to remove hydrochloric acid is not
necessary for preparing gas-liquid chromatograph samples.
Drying of the ether-methanol-fatty acid methyl ester solution
over sodium sulfate may be used to remove water from the sample
before evaporation.
The use of Amberlite IRA-400 for recovery of free fatty
acids from a fat sample or from enzymatic hydrolysis products
is probably the best method available to do the job when the
actual separation is necessary. If the exact amount of the
free fatty acids is not necessary, but the composition of the
free fatty acids is desired, then another method is available
which avoids the difficulties encountered with the resin but
adds the hazards of a poisonous gas.
The method referred to is the use of diazomethane to form
methyl esters of free fatty acids in the presence of mono-,
di-, and triglycerides. Details of the preparation of ethereal
diazomethane are given in an appendix describing methyl ester
preparation.
This method of determining the free fatty acid composition
involves treating a small sample of fat containing free fatty
acids with an excess of freshly prepared ethereal solution of
diazomethane. The ether and excess diazomethane are then
evaporated leaving behind a residue consisting of the fatty

122
acid methyl esters and unreacted fat. A sample of this residue
is injected into a chromatograph to analyze the methyl esters
present. The mono-, di-, and triglycerides do not vaporize
and remain in the first few inches of the column. The chroma
tograph sample size depends upon the amount of methyl esters
in the sample. By comparing the total peak area of a pure
methyl ester sample and the sample of fat and methyl esters, a
rough approximation of the amount of fatty acids in the fat
sample can be made. When the amount of methyl esters in the
sample is low, the sample size injected into the chromatograph
is several microliters. When several such large amounts of
fatty material containing only a small amount of methyl esters
have been injected into a column, the difficult separations
become noticeably poorer and the column separation power can
only be partially recovered by bleeding the column for several
hours. By bleeding is meant to run helium gas through the
column at its normal or slightly above operating temperature
to elute material which is passing very slowly through the col
umn and reducing its separation efficiency.
An estimation of the amount of free fatty acids in the fat
may be made by this method. Comparison of the total peak areas
obtained for identical sample sizes of the unknown sample and
of a pure methyl ester sample gives an estimate of the amount
of methyl esters in the unknown sample.

123
Monoglyceride recovery In recovery of the monoglycer-
ides from the enzymatic hydrolysis products by liquid-liquid
extractions, no tests were conducted to determine whether or
not diglycerides were also extracted. The monoglycerides ob
tained by this method are probably representative of the mono
glycerides in the sample regardless of whether or not all of
them are recovered because of the difficulty of separating
1-mono- and 2-monoglycerides and of separating monoglycerides
differing only in the length of chain or degree of unsaturation
in the fatty acid chain.
Because of the uncertainty above, it was thought to be
necessary either to study the raonoglyceride extraction in more
detail or to use a method for which the degree of separation
was known. Later work anticipated was to involve the use of
silica gel chromatographic columns. Therefore further study
of the extraction method was not made but the use of silica gel
columns was studied.
Quinlin and Weiser (76) and Ravin et_ aJL. (77) gave details
of methods of separating mono-, di-, and triglycerides using
silica gel columns but used different solvent. The method of
Quinlin and Weiser (76) used a benzene-ethyl ether solvent
system whereas Ravin e_t a_l. (77) used isopropyl ether-ethyl
ether-isooctane-ethanol. Familiarization columns using the
method of Quinlin and Weiser (76) were run. It was then de-

124
cided that it would be better to try to develop a solvent sys
tem in which benzene was eliminated because of its toxic ef
fects. In analyzing a large number of samples, sufficient hood
space was not available to handle both the columns and evapo
ration of the fractions collected which required running the
columns on the laboratory bench open to the atmosphere unless
hoods were constructed.
A solvent system of Skellysolve B and ethyl ether was de
veloped to separate the mono-, di-, and triglycerides. The
results of what appeared to be a satisfactory separation are
shown in the data of Table 41 and Figure 6. The three major
peaks, 2, 3, and 5, were expected to be mono-, di-, and tri
glyceride in that order, but the smaller peaks obtained re
quired more study. Other chromatograms indicated that peak 2
could be further separated into two components. This re-
chroma tographed peak is also shown on Figure 6. The problem
now was to identify the component in each of these peaks. In
looking for a method of analysis it was found that the sample
size required for hydroxyl analyses by the method of Pohle and
Mehlenbacher (72) and of Ogg et. _al.. (67) was larger than the
total weight of the smaller peaks. The use of infrared spec
trophotometry was then considered. In a review of the use of
infrared spectrophotometry in the fat and oil field, O'Connor
(65) mentioned the work of O'Connor et aJL. (66) with mono-,
di-, and triglycerides which gave qualitative results with the

125
possibility of being able to give quantitative results. In
frared spectra of the seven peaks were obtained through the
Iowa State University Chemistry Department. These spectra are
shown in Figures 7 and 8 for 6 of the total 7 peaks obtained
in Figure 6. The portions of O'Connor £t a_l. (66) used to in
terpret these spectra are quoted below.
The 3.0 micron O-H stretching vibration. Two bands with maxima at about 2.7 and 2.8 microns are found in this region (Table III). The combined intensities of these bands are considerably greater in the spectra of the monoglycerides than in those of the diglycerides and they are completely absent in the spectra of triglycerides. The 2.7 micron band arises from a stretching vibration of a free O-H group. According to.... the 2.8 micron band most probably arises from an O-H stretching vibration of the single bridged dimer. The stretching vibration of more highly hydrogen bonded O-H is masked by the strong C-H stretching vibration at 3.3 microns.
Observations of the infrared spectra of a triglyceride at these wave-lengths provide a ready check as to the presence of any mono- or diglyceride impurity. For example,....
It would not be possible, from measurements in the 3 micron region, to determine whether or not the impurity in a triglyceride was a mono- or diglyceride. Nor could the presence of raonoglyceride in diglyceride, or conversely the presence of diglyceride in a raonoglyceride be detected. Fortunately, as will be shown, it does seem possible to make these distinctions in the region of C-0 stretching."
The 9.0 micron C-0 stretching vibrations. All long-chain glycerides exhibit bands at 8.9 and 9.1 microns, as shown in Table IV. The weaker baqd at 8.9 microns is not observed in the spectra of the mixed short- and long-chain glycerides (TAble IV).
Bands about the region 8.9 to 9.1 microns have been assigned to the C-0 stretching vibration of the C-O-C ether

126
group and probably arise in these compounds from stretching vibrations in the C-O-C portion of the COOR ester group. This group would give rise to two C-0 stretching vibrations, R-C^-Og-C, (1) dif-
fering in frequency from (2) by reason of the unsaturated nature of the carbon atom.
has been
demonstrated that substitution on the carbon atom, alpha to the hydroxylated carbon, will produce a considerable shift of band maxima to lower frequencies and cause considerable overlapping of bands characteristic of the C-0 stretching of the C-O-H group in the spectra of glycerides at longer wavelength. The bands are observed at 9.5 and 9.6 microns in the spectra of all glycerides which contain the C-O-H group.
The band with maximum at 9.6 microns is observed only in the spectra of diglycerides (with the single exception of dipalmitolactin, the spectra of which resembles that of a diglyceride). It would appear logical therefore to assign this band to the C-0 stretching of an alpha substituted secondary alcohol, ....The band arising from C-0 stretching of alpha substituted primary alcohols (at 9.6 microns in the spectra of straight-chain unsubstituted compounds) would be shifted above the 9 micron region considered here. It is significant perhaps to observe that the spectra of all monoglycerides which contain a primary alcohol exhibit bands with maxima between 10.1 and 10.2 microns, not observed in the spectra of di-and triglycerides. In the spectra of the monoglycerides the shift in frequency of the C-0 stretching band of the secondary alcohol might be expected to be somewhat different from that exhibited by the diglycerides. In the spectra of all monoglycerides a band is exhibited with maxima at 9.5 microns, and an inflection is noted at 9.4 microns. The band at 9.5 microns could be correlated with a C-0 stretching of an alpha substituted secondary alcohol in a raonoglyceride as distinguished from the similar stretching in a diglyceride at 9.6 microns.
Whether these suggested correlations are entirely correct, a significant fact from the standpoint of use of the spectra for analytical purposes evolves. Mono-

127
glycerides can be detected by observation of a band with maximum at 9.5 microns and determined by consideration of the intensity of this band. Diglycerides can be detected and determined by use of the 9.6 micron band. Triglycerides can then be obtained by difference. Absence of any bands between 9.1 and 10.0 microns can be construed as evidence for a pure triglyceride.
The 10.0 micron C-H bending vibration about the trans C=C group. An absorption band with maximum at 10.3 microns, which has been shown to arise from C-H bending about a trans C=C (reference) has been used to determine quantitatively trans-isomers in mono-unsaturated fatty acids, esters, and glycerides.
Information obtained from two other sources are also ap
plicable to the study of the glycerides. Chapman (16) studied
the polymorphism of glycerides by infrared and noted that the
H bonding to the OH groups was stronger in 1-monoglycerides as
compared to 2-monoglycerides. The spectra of 1- and 2-mono
glycerides of different polymorphic forms showed differences
in the 3500-3650 cm~* range. The chief difference between
2-monostearin, 2-monolaurin, 2-monopalmitin, and monolaurin
was the number of bands in the 1350-1184 cm"^ region. Helme
and Molines (30) mentioned absorption at the following wave
lengths as corresponding to the group given with it. These
were 1) presence of 0 compounds at 2.85 microns, 2) olefin
bonds at 6.1 microns, 3) nonconjugated trans-isomers at 10.35
microns, and 4) cis-isomer at 10.95 microns.
A study of the spectra of peak 1 and 2 of Figure 6 showed
that they were very similar. Neither had absorption bands in
the 2.7-2.8 micron region which indicated that there were no

128
mono- or diglycerides present. The absorption maxima from 6.8
to 9.5 microns were very nearly the same except that for peak
1, the absorption was a little greater in general and the
maximum at 9.0 microns was relatively a little less (for peak
1) than in peak 2. Comparison of spectra for pure tristearin,
tripalmitin, and triolein absorption spectra given in O'Connor
et al. (66) showed that the trisaturated glycerides had greater
absorption maxima than triolein at 9.0-9.1 microns. If there
were a separation of the triglycerides on the basis of un-
saturation of the fatty acid chains present, then peak 1 should
have been expected to have the greater maximum at 9.0 microns
but the opposite was actually true. (Unsaturated material is
more strongly adsorbed by silica gel than saturated material.)
Therefore more must have been involved in the separation into
peaks 1 and 2 than just the degree of unsaturation in the tri
glycerides. Neither peak 1 or 2 showed absorption at 10.3
microns. The infrared spectra for peak 1 was not shown be
cause it was so nearly the same as peak 2.
The spectra for peak 2a was very nearly the same as for
peak 2. The major differences occurred at 6.25, 9.0-9.2, and
10.3 microns. For peak 2a the maximum at 5.77 microns over
lapped with the maximum at 6.25 which did not occur for the
spectra of peaks 1 and 2. O'Connor ejt al. (66) listed absorp
tion at 5.71-5.77 microns as being due to C=0 stretching
(COOR). This is a strong indication that unsaturated chains

129
which had been oxidized to give carboxylic acid groups had
been separated into this peak and the additional absorption
due to the C=0 caused overlapping with the next maximum. The
absorption maximum at 10.3 microns for peak 2a might have been
an indication of trans-isomer of the C=C group but as will be
seen when the other spectra are studied, the absorption maxi
mum at 10.3 microns and the overlap of the C=0 absorption
maximum with the maximum at 6.25 microns always occurred to
gether ; neither were ever present alone. If the overlapping
was actually being caused by the formation of more C=0 groups,
then possibly the maximum at 10.3 microns was being caused by
something other than trans-isomers such as intermediate oxida
tion productions which had not undergone cleavage or the
-COOH group formed upon cleavage.
The spectra of peaks 3 and 4 were very similar. Both had
small maxima at 2.8 microns indicating the presence of mono-
or diglycerides. Both had very small absorption maxima at
about 9.5 and possibly at 9.65-9.7 microns but were not very
clearly defined. Peak 4 had an absorption maximum at 10.3
microns with the accompanying overlap of the maxima at 5.77
and 6.25 microns. It would be very difficult to determine
whether peaks 3 and 4 were mono- or diglycerides from the
spectra alone. But because they are considerably different
from the next peak spectra and because elution of known samples
by other workers from silica gel columns have shown the order

130
of elution to be tri-, di-, and raonoglyceride, it was concluded
that peaks 3 and 4 were diglycerides.
Peak 5 and 6 also gave similar spectra. Both had pro
nounced maxima at 9.5-9.6 microns but that for peak 5 was 3 or
4 times larger. Peak 6 showed a maximum at 10.3 microns with
the accompanying overlap between the 5.77 and 6.25 microns
absorption maxima. Peak 5 had a much larger maxima at 2.8
microns than peaks 3 and 4 indicating that it was raonoglyceride
rather than diglyceride. The maximum at 2.8 microns for peak
6 was greater than for peaks 3 and 4 but less than for peak 5.
Peak 5 also had a maximum at 10.1 microns indicating the pres
ence of primary hydroxyl groups in monoglycerides whereas peak
6 did not exhibit absorption at 10.1 microns.
The conclusion of the study of the peaks obtained in the
chromatogram of Figure .6- were that peaks 1, 2, and 2a consis
ted of triglycerides; peaks 3 and 4 consisted of diglycerides;
and peak 5 consisted of monoglycerides. Peaks 2a, 4, and 6
probably consisted of tri-, di-, and monoglycerides respec
tively in which some of the unsaturated fatty acid chains had
undergone oxidation. Peak 6 may have consisted of both mono-
and diglycerides which had undergone oxidation; the diglycerides
having been oxidized to a further extent than the monoglycerides.
Probably little or no oxidized triglycerides were present in
peak 6. Later work showed that glycerol would also appear in
peak 6 if present.

</> s s o
LU 3 g t/) LU CE
130-
110
60
40
20
O
/
2 5 MILLILITER
F R A C T I O N S
Z\ /
2a
10 20 30 40 50
FRACTION NUMBER
2 CL
/"-X. _L.
10 15
w
FIG. 6. SEPARATION OF LARD MIXED GLYCERIDES

132
Table 41. Separation of lard mixed glycerides on silica gel column3
Frac Eluting Flow rate Residue, Peak tion solvent ml/min mg assign.
1 1.25% 1.7 -1.5 2 ether- 1.7 -0.8 3 Sk.B. 0.9 -0.9 4 1.6 -0.9 None 5 1.6 -0.9 6 1.7 -1.0 7 1.4 -1.0 8 1.3 -1.3 9 7.5% 1.7 2.0 10 ether- 1.7 4.2 11 Sk.B. 1.7 10.4 1 12 1.7 0.9 13 1.7 1.3 14 1.6 1.0 15 1.2 8.5 16 1.7 16.3 17 15% 1.8 33.2 18 ether- - 136.1 2 19 Sk.B. 1.8 5.2 +
20 1.7 4.6 2a 21 1.8 2.1 22 1.7 0.5 23 1.3 0.1 24 1.1 0.1
25 25% 1.8 0.3 26 ether- 1.8 23.3 27 Sk.B. 1.8 31.4 28 1.7 16.0 29 1.8 13.0 3 30 1.7 9.7 31 1.3 6.9 32 1.1 3.1
33 50% 1.8 1.7 34 ether- 1.8 15.3 35 Sk.B. 1.9 5.9 36 1.8 3.8 4 37 2.0 3.0 38 1.9 1.7 39 1.4 1.0 40 1.2 0.6
^Original lard mixed glyc. sample 497.5 mg; frac, vol, 25 ml.

133
Table 41. (Continued)
Frac Eluting Flow rate Residue, Peak tion solvent ml/min mg assign.
41 1.9 3.9 42 100% 2.4 34.9 43 ether 2.1 23.7 5 44 2.4 6.4 45 2.5 3.9 46 100% 2.4 1.8 47 ether 2.4 1.6 48 1.7 0.0 5
49 100% 1.0 50 MeOH 1.3 0.5 51 1.1 27.0 52 - 1.5 6 53 - 0.45 54 0.45
Re-chromatog raph of peak 2-2a
1 75% . 2.5 1.1 2 ether- 2.3 28.1 3 Sk.B. 2.3 132.9 4 2.2 20.9 5 2.2 4.5 2 6 2.3 3.1 7 2.3 2.5 8 1.8 2.0
9 15% 2.5 1.7 10 ether- 2.4 5.2 11 Sk.B. 2.4 4.5 12 2.2 2.2 13 2.2 1.3 2a 14 2.5 1.0 15 2.1 1.6 16 - 0.4
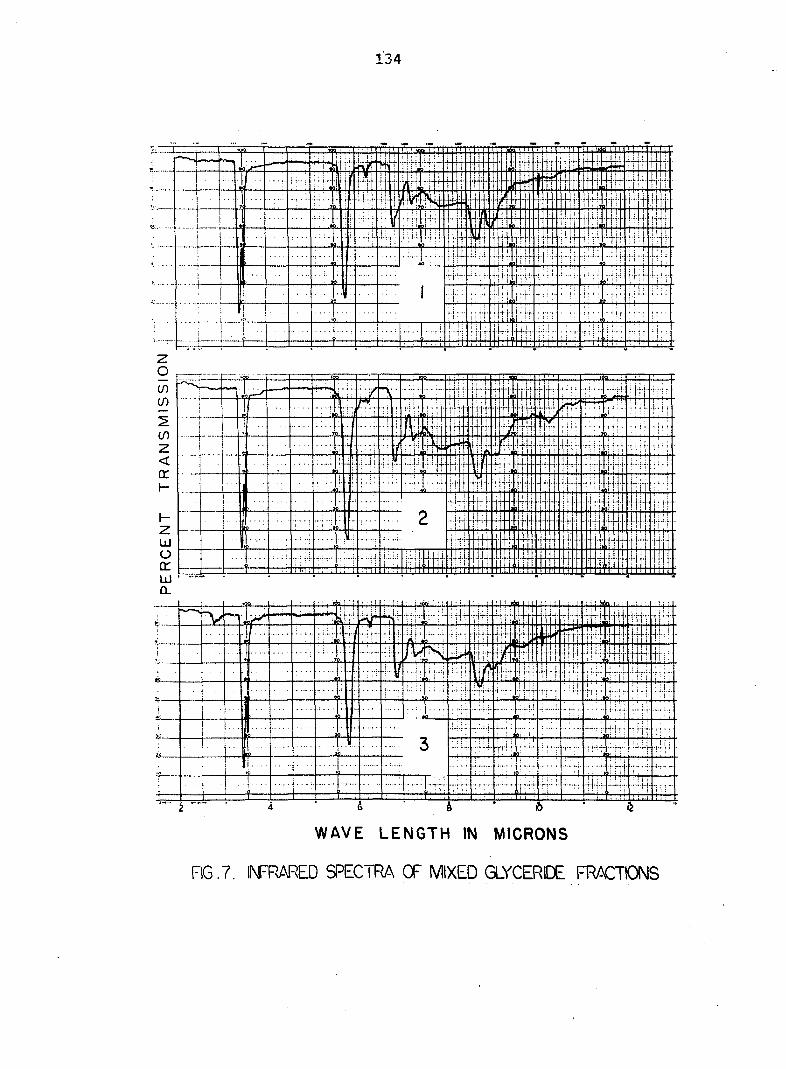
134
WAVE LENGTH IN MICRONS
FIG.7. INFRARED SPECTRA OF MIXED GLYCERIDE FRACTIONS

135
V-
—T" —n 1o
, "*>
-r 1 i f - - #0 / f
V , " • I • • • i 7 • ' !
! .
I- • • • • ! •
( V -1 T • ' !
l':" ; i 'd' : • 1 • • • • —T— 1 V ! —
1 • • • r - i i /
—
1 • • • r - i i / •Jn f —
! 1"" - • * • | '
r "Y ' ' • !
!" - j : • -M" 6
| . !
1: ; ....
If!'!' ! , : •» 6 ... | •1 • !
.... f j . . |rf-iT • 1 i
-Mr F J. ! ; 1 i •Hïifr: - V" —Î -4- *
WAVE LENGTH IN MICRONS
FIG. 8 • INFRARED SPECTRA OF MIXED GLYCERIDE FRACTIONS

136
The mixed glyceride sample used for the silica gel column
separations was prepared as described below. Twenty-one grams
of lard A and 7.0. grams of glycerol were placed in a 50 ml
round bottom flask with 42 milligrams of sodium methoxide and
heated in a wax bath at 150-180°C for 3 hours. The mixture of
lard and glycerol was agitated with a stream of nitrogen which
also served to protect the lard from further oxidation. The
first vapors from the lard consisted mainly of water but later
were cloudy and had a rancid smell. The sodium methoxide was
added after the water had been evaporated from the sample. Af
ter heating, the sample was allowed to cool under the nitrogen
stream and then cooled by water to room temperature. Acetic
acid, 4.5 ml of a 1% aqueous solution of the acid, was added
to the sample to react with the catalyst. Ethyl ether was
used to dissolve the fatty material and to transfer it to a
2 50 ml separatory funnel. The ether and aqueous acetic acid
were shaken well and allowed to separate. There had been a
glycerol layer under the fatty material layer after the gly-
cerolysis reaction and most of the glycerol went into this
aqueous acetic acid layer. The ether-fatty layer was washed
several (3-4) times with water, the ether layer dried over
sodium sulfate, and the ether evaporated. Emulsions formed
during the washes were broken by the use of methanol, sodium
sulfate granules, and by heating. The resulting triglyceride,
diglyceride, and raonoglyceride sample was stored in a rubber
stoppered 125 ml Erlenmeyer flask under refrigeration. The

137
sample was reddish brown in color; the color developed during
the 3 hour heating period at near 180°C.
The column used to carry out the separation of the mono-,
di-, and triglycerides consisted of a 16 mm ID glass tube ap
proximately 60 cm long. The silica gel was supported on a
glass wool plug | to 1 in thick. The flow through the column
was regulated when needed by use of a glass stopcock held in
place in the bottom of the column by a rubber stopper.
Davison Silica Gel, grade 922 (which passes through a 200
mesh screen) was screened to obtain the 200-250 mesh size par
ticles. Thirty grams of the silica gel and 1.5 ml of water
were stirred thoroughly in a 150 ml beaker with a glass stirring
rod. Stirring was continued for a minute or two after all
lumps had been completely broken into the 200-250 mesh size
particles. The silica gel was suspended in Skellysolve B and
the slurry poured into the column through a small funnel. The
beaker and funnel were washed with Skellysolve B to recover
all of the silica gel. The stopcock was then opened and the
silica gel allowed to settle as the Skellysolve B was drained
from the column. In earlier work with these columns, the col
umn was tapped lightly to help pack the silica gel but it was
found that the silica gel could become too tightly packed
causing excessively slow flowrates. In later columns the col
umn was not tapped at all. No difference was observed in the

138
separations obtained because of the difference in degree of
packing. Care was exercised to not allow the liquid level to
drop below the top of the silica gel bed. The weighed sample
was then dissolved in the solution to be used first in eluting
the column and poured into the column, using as little solvent
as necessary. A 25 ml graduated cylinder was placed under the
stopcock to collect the first fraction. The sample solvent
was then allowed to drain into the packing, the walls of the
top of the column washed down with small portions of solvent
and after all of the sample had entered the silica gel, the
top of the column was filled to the desired height to obtain
the desired flowrate. Flowrates of 1.5-2.5 ml per minute were
maintained. As 25 ml fractions were collected, 25 ml of solvent
were added to the top of the column. The fractions were
poured into weighed 50 ml beakers, the solvent evaporated and
the residue weight obtained.
The evaporations were made on a steam plate in a hood.
When the solvent was completely evaporated, the beakers were al
lowed to cool to room temperature and to equilibrate with the
moisture in the air. The same method of drying the cleaned
beakers was followed to insure against large differences in
weight of the beakers because of the difference in their
temperature and water vapor adsorbed on the surface of the
glass. Beakers washed in soap and water, dried at 110°C and

139
cooled as described above consistently weighed within about
0.5 milligram during day after day use. When washed and
weighed twice on the same day the beaker weight normally
checked within 0.1-0.2 milligram.
The silica gel was discarded after using once. Some
checks were made to determine whether or not it could be used
over again but the silica gel activity changed slightly and
peaks came out slightly faster. Also samples with strongly
adsorbed components are liable to accumulate in the silica
gel.
The column run to obtain Figure 6 had first been eluted
with 1.25% ether in Skellysolve B rather than the planned 2.5%
ether solution. Another column wâs run and the 2.5% ether-
Skellysolve B solution used and the results obtained are shown
in Table 42 and Figure 9 which show clearly that peak 2-2a
of Figure 6 did consist of separable materials without the
need to rechromatograph the peak. Comparison of the weights
of the combined peak fractions for the two column separations
of the same sample are given in Table 43 and show good agree
ment considering that the errors of over 100 weighings are in
volved in the calculations for each sample chromatographed.
Methyl esters of each of the first 6 peaks of Figure 9
were prepared and chromatograms of the methyl esters prepared.

140
i i 1 1 1 i 20 30 40
FRACTION NUMBER
FIG. 9. SEPARATION OF LARD MIXED GLYCERIDES

141
Table 42. Separation of lard mixed glycerides on silica geia
Fraction
Eluting solvent
Flowrate ml/min
Residue, mg
1 2.5% 2.1 0.2 2 ether- 2.1 0.8 3 Sk.B. 2.1 0.3 4 2.2 1.2 5 1.8 1.9 6 1.9 4.2 7 2.0 10.6 3 1.6 9.7 9 2.0 0.6 10 7.5% 2.0 68.4 11 ether- 2.1 99.5 12 Sk.B. 2.2 25.2 13 1.9 4.1 14 2.1 0.6 15 2.0 0.2 16 1.7 0.2 17 2.1 1.0 18 2.2 5.2 19 15% 2.1 6.5 20 ether- 2.2 3.7 21 Sk.B. 2.2 1.3 22 2.2 1.3 23 2.0 2.2 24 1.5 4.7 25 2.5 9.0 26 25% 2.4 25.9 27 ether- 1.9 21.9 28 Sk.B. 2.1 13.2 29 2.0 10.5 30 2.0 7.8 31 1.9 5.0 32 1.5 2.1 33 1.9 1.0 34 50% 2.3 13.4 35 ether- 2.1 7.2 36 Sk.B. 2.0 3.8 37 2.3 5.4 38 2.2 2.0 39 2.3 1.8 40 1.7 1.2
Peak assign.
a500.0 mg sample of lard mixed glycerides; fraction volume, 25 ml.

142
Table 42. (Continued)
Fraction
Eluting solvent
Flowrate ml/min
Residue, mg
Peak assign.
41 2.1 1.2 42 100% 2.2 21.8 43 ether 2.4 32.5 44 2.4 12.6 6 45 2.6 5.7 46 2.7 3.4 47 1.2 2.0 48 1.9 1.6 49 1.4 1.7 50 100% 1.3 27.6 51 MeOH - 3.0 7 52 - 1.5
The gas-liquid chromatogram results are given in Table 44.
These results indicate that each peak had very nearly the
same fatty acid composition. Notice that peak 1 did analyze
a little higher in oleic acid than did peak 2 which was in
dicated by the infrared spectra study. Peak 7 which was
eluted from the column using methanol was not analyzed at
this time but gas-liquid chromatograms of the similar peaks
were prepared for each of 3 such peaks obtained from later
columns. Acetone was used in place of methanol for the
elution of this peak. The gas-liquid chromatogram areas were
not calculated but indicated that peak 7 of the silica gel
column consisted mainly of pelargonic acid (Cg), and some
glycerides containing oxidation products. No determination
for glycerol was made.

143
From this data obtained for the lard mixed glycerides
fractionations, the eluting solvent compositions were then
selected to obtain the separation shown in Figure 10.
Table 43. Comparison of silica gel column chromatograms for lard mixed glycerides fractionation3
Chromatogram Fig. 6 Fig. 9 Fig. 11 peak, Fig. 9 wt % wt %
0 — — 1.2 1 4.2 6.8 2 (2+2a) 44.0 39.7 42.4 3 3.5 13.4 4 22.3 20.9 21.2 5 6.7 7.2 8.7 6 16.5 16.3 4.9 7 6.3 6.4 1.4
^Calculations based on individual residue weighings; combined peak fractions were not weighed. Calculations do not account for material which was not eluted from the column (more strongly adsorbed than MeOH or acetone).
Table 44. Fatty acid methyl ester composition of lard mixed glyceride fractions of Figure 6
Silica gel column peak
1 2 2a 3 4 5
Myr. 0.6 1.7 1.4 1.6 1.9 1.4 Semi-DiCo - - - - 1.0 -
DiCg - - - - 0.7 -
Pal. 23.5 31.3 29.4 28.4 27.1 30.7 P.O. 2.2 3.1 3.1 3.1 3.4 2.8 Stear. 18.1 15.3 15.7 16.2 13.4 15.5 Oleic 52.5 43.0 46.7 46.1 44.1 45.6 Linol. 3.2 5.6 3.7 4.7 2.5 4.0 ? - - - - 2.8 -
? - - - - 3.2 -
No. of chromatog. 2 2 2 1 2 2

144a
220
Z 210 o
q200 < DC T
90
10 CSJ
80
70
111 D O CO LU £C
U. O
(/) 3 < DC <9 •
60
50
40
30
20
10
TG
\ \
V
1 i » » • • » » i i i » » i i i » » i \_/\J
M 1 I I I I I I I I I I 0 10 20
FRACTION NUMBER 250 ML
30
H 200 ML 200 ML I00ML
15% ETHER *50% ETHER KX)%ETHER DRIED ( ETHER IN SKELLYSOLVE B ) ACETONE
FIG. 10. SEPARATION OF LARD MIXED GLYCERIDES

144 b
In analyzing the hydrolysis products, it is desired to ob
tain the compositions of the 1- and 3-position fatty acids from
an analysis of the fatty acids freed during the hydrolysis.
The composition of the 2-position fatty acids may be obtained
by an analysis of the monoglyceride fatty acids. But the hy
drolysis is not 100% specific for the 1- and 3-position fatty
acids and as a result, some 1-monoglycerides may be formed.
If these 1-monoglycerides were separated from the 2-monoglycer-
ides and only the 2-monoglycerides analyzed, the analysis should
give better data for the 2-position fatty acid composition.
Another factor involved is that the 2-monoglycerides are less
stable than 1-monoglycerides. Savary and Desnuelle (81) pointed
out that 2-monoglycerides isomerize easily when in contact with
solvents containing alcohol. They also used the method of
treating enzymatic hydrolysis products with periodic acid to
destroy 1-monoglycerides and separation of the 2-monoglycerides
from the mixture by use of a partition column. Their method
does not separate the diglycerides, triglycerides, and oxidation
products of the 1-monoglycerides. Use of their partition column
required equipment to control the temperature of the column.
Borgstrom (10) described the use of a silicic acid column for
separation of mono-, di-, and triglycerides but it was found
that 2-monoglycerides isomerized during passage through such a
column. Where isomerization was not desired, a partition col
umn separation of the monoglycerides from the di- and tri-

145
glyceride fraction was described.
From the separations obtained by silica gel columns in
separating the lard mixed glycerides it was thought that
separation of the tri-, di-, and 2-monoglycerides as well as
the glycolic aldehyde formed from the 1-monoglycerides could be
attained on one column. As the 1-monoglycerides are quantita
tively destroyed before passage through the column, the only
monoglycerides remaining in the hydrolysis products would be
those of the 2-isomer. If isomerization occurred during passage
through the column, it would not affect the results as both 1-
and 2-monoglycerides appear in the same peak. Analysis of the
fatty acids in the monoglyceride peak would be an analysis of
the original 2-monoglyceride fatty acids.
This separation was found to be possible and is shown in
Figure 11. The weight percentage of each peak is given in
Table 43 for comparison to the same weight percents obtained
for the peaks shown in Figure 9, a chromatogram of the same
sample before the periodic acid oxidation. Data for Figure 11
are given in Table 45.
The separation of peaks 3 and 4 was not good in Figure 11
but the sample size used for that column was 945.8 milligrams.
By decreasing the sample size to about 500 milligrams, much
better separation is obtained. If the separation was still less
than desired, more 15% ether-Skellysolve B could be used and

146
possibly use of a slightly lower ether content would aid in
obtaining better separation. As the separation of the glycolic
aldehyde was not necessary in this work, better separations
were not studied but the data are presented here to show where
the glycolic aldehyde emerges in relation to the monoglyceride
peak 6. The data of Table 43 clearly indicate that much of
the monoglyceride peak 6 of the sample before oxidation appears
as peak 3 of the oxidized sample.
It should be noted here that the silica gel column work
discussed so far as well as some preliminary work with these
columns for separation of periodate-permanganate oxidized lard
has been carried out prior to knowledge of the closely related
work of Privett and Blank (73). Their work involved the use of
thin layer chromatography and oxidation of the unsaturated fat
ty acid chains to yield aldehydes rather than the carboxylic
acid groups obtained by the periodate-permanganate oxidation.
They showed data for separation of 2-monoglyceride and the peri
odic acid oxidized 1-monoglyceride which confirmed the emergence
of the glycolic aldehydes before monoglycerides, but they did
not show the relation of these peaks to diglyceride emergence.
This paper proved to be helpful in proceeding with the periodate -
permanganate oxidized lard fractionation on silica gel columns.
It was found from experience with these columns that the
results were reproducible in that the peaks emerged in the very

147
225
175
Z
2 I25L H =r O 100 < £T Ll
90
m CM
80
70
y 60
a
UJ 50 a:
o 40
co
5 30 a o 3 20
5 ,o
\
8
1 " " " • 1 1 • • • • • " "
\/
i u 1 1 1 1 1 1 m 1 1 1 i i i 10 20 30 40
FRACTION NUMBER 50
|t 200 ML. 2 0 0 M L . 2 0 0 M L . 200 ML. 2 0 0 M L . 2 0 0 M L 1 .100 ML 2.5% E 7.5 %E 15% E 25% E 50% E 100 % E 100%
( ETHER IN SKELLYSOLVE B ) MeOH
FIG. II. SEPARATION OF PERIODIC ACID OXIDIZED LARD MIXED GLYCERIDES

148
Table 45. Separation of periodic acid oxidized lard mixed glycerides (Figure 11)
Fraction Eluting Flowrate, Residue, Peak solvent ml./min. mg. assign.
1 2.0 6.6 2 . 1.9 0.9 3 2.5% 1.8 0.6 4 Ether- 1.9 1.0 5 Sk.B. 2.0 0.9 6 1.4 1.0 7 2.4 37.5 8 1.4 22.1 1 9 1.9 5.1 10 7.5% 1.8 212.1 11 Ether- 1.8 136.8 12 Sk.B. 2.0 26.9 13 2.0 8.7 2 14 1.9 6.5 15 1.7 5.1 16 1.5 4.4 17 1.8 4.2 18 15% 2.0 34.0 19 Ether- 1.8 19.4 20 Sk.B. 1.9 17.6 3 21 1.9 21.4 22 1.9 20.6 23 1.7 15.4 24 1.4 16.7 25 1.8 19.7 26 25% 1.9 52.1 27 Ether- 1.9 36.4 28 Sk.B. 1.9 26.5 4 29 2.0 19.0 30 1.7 12.5 31 2.0 8.4 32 1.6 6.0 33 2.0 5.3 34 50% 2.1 35.7 35 Ether- 1.9 19.5 36 Sk.B. 1.9 11.8 37 1.9 6.0 5 38 1.8 5.4 39 1.9 3.8 40 1.7 1.3

149
Table 45. (Continued)
Fraction Eluting solvent
Flowrate, Residue, ml./min. mg.
Peak assign
41 42 43 44 45 46 47 48 49 50 51 52
100% Ether
100% MeOH
1.8 2.5 2 . 1 1.9 2 . 0 2 .1 2 . 0 1.8 2.1 1.3 1.4
6.4 16.1 4.7 3.4 3.1 2.6 2.2 4.3 3.9 13.6 0.1 -0.5
6
7
same fractions when columns were run using the same techniques.
Therefore, when a large number of samples need to be run, sever
al columns can be run at one time by one operator. There is no
need to collect 25 ml fractions but just one large fraction
corresponding to the peak being eluted as shown by a chromato-
gram such as Figure 10. When only the monoglyceride peak is
desired, then the initial eluting solution may be made strong
enough to elute the diglycerides as well as the triglycerides
and glycolic aldehydes, if present, into one fraction and then
the monoglycerides in a second fraction. Figure 12 shows that
this method is valid. Here, 250 ml of 50% ether-Skellysolve B
were used to elute the tri- and diglycerides of the lard mixed
glycerides sample into one fraction and then 25 ml fractions
taken for the rest of the fractions to demonstrate that if the
next eight fractions had been collected together, the pure mono-

150
glyceride peak would have been obtained. The acetone fractions
collected were one of the three samples checked to determine
the fatty acid composition of the peak following the monoglycer
ide peak as mentioned earlier.
One difficulty encountered with the use of the silica gel
columns occurred whenever the temperature in the laboratory was
about 85°P or above. When ethyl ether was being used in the
solutions to elute the columns at this temperature, ether vapors
formed in the column and appeared as white specks and/or streaks
in the silica gel packing. They did not seem to affect the
separations obtained unless the vapor formation was so bad that
it actually caused shifting of the bed resulting in visible
cracks in the bed. Later, in work on the separation of the
periodate-permanganate oxidized lard, a water jacket was used
on the column and the temperature of the water controlled by
passing tap water through a coil (l/4 in copper tubing) sub
merged in a temperature controlled water bath.
The periodic acid oxidation of the 1-monoglycerides was
carried out as described by Savary and Desnuelle (81) which is
an application of the method as presented by Pohle and Mehlen-
bacher (72). The procedure is given below.
The hydrolysis products of 1.2 grams of fat were extracted,
washed, and the solvent evaporated under vacuum. The residue

151
60
SO
LU 3 O (Ô40
m a :
to 2 < CE O
30
20
10
V/ \.
J I L J I I I I I I I I I L
250 ML 5 <!)•/. K
IN SK. B
200 ML
6 9 12 FRACTION NUMBER
200 ML
15
100% ETHER DRIED ACETONE
18
100 % ETHER
FIG. 12. COLLECTION OF THE MONOGLYCERIDE PEAK FRACTIONS

152
was taken up in 10-20 ml of 3:2 by volume acetic acid:chloroform,
1.5 times the necessary 0.2 N periodic acid was added and the
mixture was allowed to react at room temperature for 30 minutes.
The excess periodate was destroyed with 15% potassium iodide,
50 ml of water added, and the iodine formed was destroyed with
sodium thiosulfate, a slight excess being used. All the opera
tions were conducted at room temperature to prevent iodine from
reacting with any unsaturated material present. The resulting
solution was poured into a separatory funnel and the container
was rinsed with three 5 ml portions of chloroform. The chloro
form layer was separated from the aqueous phase and the aqueous
phase extracted two more times with 5 ml portions of chloroform.
The chloroform extracts were washed with an equal volume of
water, the chloroform evaporated at 25°C under vacuum until
there were only 3-4 ml of residue remaining. This residue was
dissolved in 30 ml of ethyl ether and passed through an Amber-
lite IRA-400 column containing sufficient resin to adsorb all
of the free fatty acids as well as the acetic acid remaining in
the residue. The fatty material which passed through the column
was recovered and separated on a chromatographic column to ob
tain the monoglyceride fraction.
The 0.2 N periodic acid solution was prepared by dissolving
0.7 grams of H^IO^ in 10 ml of water and 90 ml of glacial acetic
acid. The thiosulfate solution used was 0.25 N and was prepared
by dissolving 62.05 grams of Na^S^O^.5H^O in one liter of water.

153
In order to carry out the above procedure, it is necessary
to determine the amount of periodic acid, potassium iodide, and
thiosulfate solutions required for the sample. When running a
sample, the expected amount of monoglyceride to be oxidized
must be estimated and the required amount of periodic acid
solution calculated. Based on the molecular weight of mono-
olein, 0.1373 ml of 0.2 N H510^ is required per milligram of
1-monoolein to be oxidized. The other two solutions may be
very roughly estimated by the use of 0.238 ml of 15% KI per ml
of 0.2 N H510^ used and 1.2 ml of 0.25 N Na2S20g per ml of 0.2 N
H5IO6 used.
The equation representing the oxidation of the 1-mono
glyceride to glycolic aldehyde is shown below.
8 8 H2C-O-C-R H2C-O-C-R HC-OH + H104 • HC=0 + H2C=0 + HIO3
H2C-OH
1-mono- periodic glycolic formaldehyde iodic glyceride acid aldehyde acid
Enzymatic hydrolysis procedure The enzymatic hydrolysis
procedures followed by several workers (11, 24, 54, 55, 82, 98)
are included in an appendix. The hydrolyses conducted on the
samples in Fractional crystallizations No. 3 and No. 4 followed
the procedure of Mattson and Beck (54, 55).
The hydrolysis studies on fractionated natural fats and

154
oils gave very little data for the fatty acid compositions of
the hydrolysis product components. When fatty acid composition
data was given it was usually from a determination of the poly
unsaturated acids by ultraviolet spectrophotometry and did not
give the component saturated acid compositions.
It was desired to obtain more information about the fatty
acid composition of the hydrolysis products obtained under dif
ferent conditions. Samples of lard B were hydrolyzed by the
method of Mattson and Beck (55) and by a somewhat modified
method of Youngs (98).
Youngs (98) used a homogenizer but apparently did not con
trol the temperature so samples were probably hydrolyzed at
near room temperature. He also used a 30 minute hydrolysis as
compared to 15 minutes in the Mattson and Beck procedure. As a
homogenizer was not available for this work, the samples were
run at 40°C and were stirred by use of an electric motor and
glass stirring rod with an L-shaped bend at its end. Also,
the amount of reaction mixture was made to correspond to ap
proximately the same total volume of about 16.9 ml of the Mattson
and Beck procedure. So in Youngs method, 18 ml of phosphate
buffer, 120 milligrams of lard B and 48 milligrams of steapsin
were used. Bile salts were not used in either method.
One change in the Mattson and Beck procedure was that the
steapsin was added to the reaction mixture in its dry form

155
rather than suspended in 2.3 ml of water. The water was in
cluded in the reaction mixture.
A pH meter was used to follow the pH of the solution in
both methods. The pH of the Mattson and Beck sample changed
very rapidly at first and more slowly near the end of 15 minutes.
The pH of the Youngs sample did not vary from 8.0. The samples
were run in 50 ml beakers which permitted the use of 5 in pH
meter electrodes.
The free fatty acids were recovered from the hydrolysis
products of the 2 gram lard B sample run by the Mattson and
Beck method by using 20 grams of Amberlite IRA-400 (-OH form).
The adsorbed acids were recovered by treating the fatty acids-
resin with 25-30 ml of 9.6% hydrochloric acid-methanol solution
and washing the resin with ethyl ether. Part of the ether-
methanol solution was then slowly evaporated to complete the
methylation and remove some of the alcohol. The methyl esters
were recovered by extracting with ether.
The free fatty acid recovery for the 120 milligram lard B
sample was the same except that only 5 grams of resin were used
and 7.6% hydrochloric acid-methanol solution were used.
The above two samples were run on one day and the same
procedures carried out on two more samples the next day to check
the reproducibility of the results. The results of these an

156
alyses are shown in Table 46 which show that the results of the
same sample run on different days checked very well but the re
sults by the two methods differ considerably. The Youngs sam
ples had more degradation products present than the Mattson
and Beck samples. The Youngs samples contained more myristic,
about the same palmitic, and less stearic acids than the Mattson
and Beck samples. This indicated a difference due to chain
length in the saturated acids. When the unsaturated acids are
considered, the same trend is noted; the Youngs samples con
tained four times as much myristoleic, over twice as much pal-
mitoleic, just a little more oleic, and less linoleic acids than
the Mattson and Beck samples. The conclusion is that in Youngs
method, more short chain fatty acids (both saturated and un
saturated) were hydrolyzed than in the Mattson and Beck sample.
The unsaturated acids were more easily hydrolyzed than saturated
acids of the same chain length in the Youngs samples than in the
Mattson and Beck samples. No mention of this difference in
composition of the free fatty acids obtained under different
hydrolysis conditions had been made in the literature.
The problem then existed as to whether an extensive study
of the enzymatic hydrolysis method should be made or to find a
way of standardizing the conditions such that reproducible re
sults could be obtained. Even though the results of a given
sample might not be of much value in themselves, they could be
used to compare with samples run under the same conditions. Be

157
fore more hydrolyses were run, an analysis was made of the
possible reasons for obtaining these differing results.
Table 46. Comparison of hydrolysis methods
Method: Mattson and Beck
Sample 1 3
Area percent Youngs Average
M and B Youngs
Myr. M.O. Pal. P.O.
? ?
Stear. Oleic Linol.
0.3 1.3 0.5 6.8 3.6
14.7 61.5 11.4
0.2 0.9 0.3 7.3 3.3
15.1 61.3 11.7
0.6 2.7 1.5 6.9 8.2 0.9 1.2 6.9 63.8 7.2
0.6 2.9 1.6 6.8 8.1 0.5 1.1 6.8 64.4 7.4
0.3 1.1 0.4 7.0 3.5
14.9 61.4 11.5
0.6 2.8 1.6 6 . 8 8.2 0.7 1.1 6.9 64.1 7.3
Two factors which could account for different results for
different hydrolysis conditions were that the enzyme was specif
ic for fatty acids differing in type as well as position and
that the specificity of the enzyme for the 1- and 3-positions
was much less than 100%. Data are presented by Mattson and
Beck (54, 55) which indicated that neither of these two factors
are true for their hydrolysis conditions. They showed that the
hydrolysis of 1-oleodipalmitin (OPP) was not more specific for
either palmitic or oleic acids in the 1- and 3-positions. In
the hydrolysis of 2-o1eodipaImitin (POP) the iodine value of
the free fatty acids indicated that there was 9 mol percent oleic
acid which originated from the 2-position. Further, they showed

158
that the hydrolysis products of randomized lard had very nearly
the same compositions; the monoglyceride fatty acids and the
free fatty acids had the same compositions. They reported 21.2%
saturated, 59.8% oleic, 17.1% linoleic, 0.6% linolenic and 0.3%
arachidonic acids in the free fatty acids of crude lard. The
corresponding values from Table 46 are 23.0% saturated, 61.4%
oleic and 11.5% linoleic acids which is a good check for two
entirely different lard samples.
Assuming that the Mattson and Beck sample free fatty acid
compositions were correct, the reason for Youngs values being
different has not been explained. The same results would be
expected even though the same degree of hydrolysis had not been
obtained in the samples run by the two different methods, un
less one of the samples had been hydrolyzed beyond 67%. Hy
drolysis beyond 67% would take place with the 2-position chains
since all of the 1- and 3-position fatty acids would have been
hydrolyzed. The data of Mattson and Beck (54) indicated that
68 mol percent of the original triglycerides had been hydrolyzed
by the end of 15 minutes. If the Youngs sample had hydrolyzed
to a greater degree, then the 2-position chains would have been
hydrolyzed. The Youngs free fatty acid palmitic acid content
should then have been expected to be greater than for the
Mattson and Beck sample. Table 46 shows that the two palmitic
compositions were very nearly the same. This indicates that
there was a specificity on the basis of chain length and degree

159
of unsaturation of the 1- and 3-position fatty acids. The
reason for this specificity can not be explained by the dis
cussion above.
The modified Youngs method gave results for which there
was no published data available to support or explain the re
sults. Therefore the method of Mattson and Beck appeared to be
the more reliable method to follow if a choice between the two
was to be made. The choice was not this simple though because
of the large difference in the amount of sample required by the
two methods. The Mattson and Beck method required 2 grams
whereas the modified Youngs method used only 0.12 gram. This
became important in this work because some of the crystalliza
tion fractions were expected to be only 1.5-2.0 grams. It
was therefore desirable to use a method which did not require
such a large hydrolysis sample. One other disadvantage of the
Mattson and Beck procedure was the use of electrodes to follow
the pH throughout the hydrolysis. Because of the high concen
tration of the fat in the Mattson and Beck samples, fat coated
the electrodes and often coated them so badly that pH measure
ments were not possible without cleaning the tip of the calomel
electrode.
A series of hydrolyses were conducted under the conditions
shown in Table 47. The procedures followed were the same as
used for the first samples run to compare the methods of hy

160
drolysis except for the changes appearing in Table 47. In
general only one variable was changed in each run so that it
could be compared to some other run to determine the effect of
changing the variable.
Comparison of the results obtained for the Mattson and
Beck samples to the Youngs run 2,4 indicated that by decreas
ing the amount of fat and steapsin (run 7) gave results com
parable to those obtained by Youngs method. Decrease of just
the amount of fat (run 5) or the fat and time (run 6) did not
give the same results as the Youngs run 2,4. This indicated
that the ratio of steapsin to fat is important and that the ef
fect of the calcium chloride of the Mattson and Beck procedure
did not give greatly different results than in the Youngs method
(runs 7 and 2,4). These results also indicated that in the
presence of calcium chloride and a high steapsin to fat ratio
(run 5), more short chain and saturated fatty acids were ob
tained than in the Youngs run 2,4. This indicated that at low
fat concentrations and conditions which increase the rate of
hydrolysis, high steapsin to fat ratio and the presence of cal
cium chloride, the hydrolysis gave free fatty acids which had
approached the overall lard composition (see Table 47). This
indicated that the degree of hydrolysis was probably beyond 67%.
In comparison of the effects caused by variations in Youngs
method, run 8 indicated that the use of bile salts increased
the amount of all the saturated acids as compared to decreases

161
for the unsaturated acids except linoleic acid. The changes
were not very great, on the order of 10%. Run 9 with bile salts,
room temperature and 34 minutes hydrolysis time gave results
very nearly the same as run 8.
Runs 10, 11, and 14 were identical except for temperatures
of 40, 50, and 60°C. All three runs were for five minutes. At
50°C the short chain (C14 and Ci&), both saturated and unsatura
ted, increased slightly as compared to the 40°C run and all
three of the C^g fatty acids showed decreases. At 60°C greater
increases in the 0^4 and Cj^ saturated and unsaturated acids
were obtained but only the oleic acid content decreased (from
64.6 to 54.3%) whereas stearic and linoleic increased slightly.
Comparison of the effect of increased temperature to the ef
fect of the increased amount of steapsin in run 13 showed a
major difference. Increased temperature increased the amounts
of shorter chain fatty acids of both saturated and unsaturated
chains whereas the increased amount of steapsin increased the
amounts of all the saturated acids and these increases were
greater for the long chain saturated acids. The increased
amount of steapsin caused a decrease in the amounts of all the
unsaturated acids; increased temperature had caused a decrease
for all Cig acids at 50°C and for just oleic at 60°C. The ef
fect of increased steapsin therefore appeared to be selective
on the basis of chain length as well as on the basis of being
saturated or unsaturated acids. The effect of temperature was

162
selective on the basis of chain length only.
Run 12 showed the effect of increasing the buffer solution
concentration from 0.5 to 1.0 M. The changes observed were
quite small but the trend was the same as for increased tem
perature; increase for all the and chains and decrease
for all the C^g chains.
This study of the data of Table 47 indicated that a de
tailed examination of all the variables affecting the free fat
ty acid composition of the hydrolysis products was beyond the
scope of this problem. It appeared at this point that the next
best step to take was to run all samples under identical condi
tions and obtain results which were only relative rather than
true compositions of the 1- and 3-position fatty acids.
As it was desired to use small fat samples and eliminate
the need of using a pH meter for each run, Youngs method as it
was first modified was considered the best method to follow. A
series of samples were run in which the only variable was the
time of hydrolysis. The purpose was to determine more accurate
ly the effect of time and also to investigate the possibility
of finding an area in which changes in time did not affect the
free fatty acid compositions appreciably. The results of this
series of samples are given in the first portion of Table 48.
These data indicated that runs 10 and 2,4 did not fit in very
well with the runs 15, 16, 17, 18, and 19 which were run to
gether but at a different time than either run 10 or runs 2 and

163
4. When the compositions were studied leaving out runs 2,4 and
10, the changes with time were not very great. The myristoleic,
and palmitoleic decreased with increase in time. Oleic remained
constant and linoleic increased by a factor of almost two in
60 minutes. Myristic appeared to decrease slightly, palmitic
remained nearly constant, and stearic stayed constant except
for an increase of about 1/5 in going from 30 to 60 minutes.
The effect of time therefore did not seem to be very great
for the saturated acids but did affect the unsaturated acid
compositions appreciably. What appeared to be just as signifi
cant was that the two analyses carried out previously to the
last five runs gave results which did not fit in with the other
five results. One possible reason for the poor agreement was
that the resin was not performing as expected. Poor resin
performance could have been due to poor conversion to the -OH
form and variations in the amount of ether used to dissolve the
hydrolysis products for contact with the resin. As an equili
brium is established between the fatty acids on the resin and
in the solution, changes in concentration could cause changes
in the relative amounts of the fatty acids adsorbed.
The effects of the resin were then eliminated by using
diazomethane to convert the free fatty acids to methyl esters
without first separating them from the other hydrolysis pro
ducts. The procedure followed was the same as in the modified
Youngs method except that the volumes and weights of the reac

164
tion mixture were decreased by a factor of six which made them
the same as in the procedure given by Youngs. A temperature of
40°C and variable times were used. Experience showed that 7
drops of lard B weighed very close to 0.12 gram or 1 drop con
tained about 17 milligrams. Youngs method requires only that
10-20 milligrams be used. One drop lard B samples were used
for the hydrolyses except the 15 minute sample for which a 7
drop sample was used with the corresponding increase in the
other weights and volumes of materials used. The samples were
run in 20 mm ID test tubes which had been cut off to a length
of approximately 6.5-7.0 cm. Both the 1 drop and the 7 drop
sample were run in these test tubes. A pH meter was not needed
as the 60 minute sample of the previous series of samples
showed that the pH did not change during the one hour hydrolysis.
The results of this series of samples are given in the second
portion of Table 48 and à graph of the fatty acid compositions
vs time of hydrolysis is shown in Figure 13.
Figure 13 shows very definite trends in the fatty acid
compositions as the hydrolysis time was increased. The unsatu
rated acid compositions each increased with time and the satu
rated acid contents decreased. The trend for myristic acid is
not clear because of analytical errors in measuring this very
small myristate peak of the gas chromatograms. A ten microliter
syringe was used for sample injection into the gas chromatograph

165
and as has been previously explained, the exact amount of sample
injected was not known. Therefore accurate data for the rela
tive total peak areas obtained for the samples is not available.
The amount of hydrolysis did not appear to have been as great
as 67% for even the two hour sample.
The most apparent differences between these two series of
hydrolyses for different lengths of time was the size of the
samples and the method of obtaining the free fatty acid methyl
esters. As will be discussed later, the difference in sample
size was by far the more important factor.
An attempt to overcome the difficulties encountered with
the modified Youngs method was made by trying to compromise be
tween the conditions of the Mattson and Beck procedure and the
modified Youngs procedure.
A summary of conditions used in different hydrolysis pro
cedures is given in tabular form at the end of the appendix
giving these procedures. Prom a study of these figures and
consideration of the needs of this glyceride structure study the
"proposed" hydrolysis conditions were listed. The sample size
could be limited to 0.5 grams by using 5 ml of buffer solution.
It was desired to use conditions more nearly the same as Mattson
and Beck than Youngs. The use of the ammonium chloride-ammonium
hydroxide buffer permitted the use of calcium chloride and the
decreased fat concentration was made to help eliminate coating

166
of the pH meter electrodes with fat. No bile salts were used
as they did not appear to have much effect on the hydrolysis.
A series of samples were run using this compromise method and
lard B samples sizes of 0.5 and 2.0 grams. As the pH meter
electrodes could not be accommodated by the short test tubes
used to run the 0.5 gram samples (1, 3, 5, 10, and 15 minute
samples), the pH was allowed to decrease during the first 15
minutes. For the longer time samples (30, 60, 90, 120, and 300
minute samples), 2.0 grams of lard B were used and were run in
50 ml beakers which allowed the use of the pH meter electrodes.
It was found that the pH dropped to about 7.0 during the first
15 minutés of hydrolysis. Therefore the pH was adjusted to 8.0
whenever it had dropped to 7.0 for the remainder of the samples.
The free fatty acids were recovered by passing the hydrolysis
products through 10 mm columns containing 10 grams of Amberlite
IRA-400. A test column was run to check each batch of resin
prepared to insure it had been properly activated and would
pick up 500 milligrams of oleic acid. Twenty drops of the hy
drolysis products of the 30-300 minute samples were passed
through the resin columns. The hydrolysis products passing
through the resin columns were then treated with periodic acid
to destroy the 1-monoglycerides and the 2-monoglycerides were
separated on silica gel columns. The results of this series of
samples are given in Table 49.

167
There were variations in the compositions when compared
with successive hydrolysis times but on the whole the composi
tions were fairly constant with increasing time. The erratic
tendency of the data was not entirely due to the method used to
adjust the pH. The first five samples were not adjusted. A
closer study of the data also showed that both the free fatty
acids and the 2-monoglycerides showed the same trends. For
example, the stearic acid compositions for the five minute
sample was greater than either the three or ten minute samples
for both the free fatty acids and the 2-monoglycerides. This
erratic tendency was due to the hydrolysis rather than the
analytical techniques used for studying the hydrolysis products.
More hydrolyses were conducted in which erratic results
were obtained. From the data presented and the erratic results
obtained on lards and crystallization fractions, it was conclud
ed that the one most important variation which would help ac
count for the widely varying results involved the formation of
the fat-aqueous solution emulsion. Looking back over some of
the effects observed for variations of one variable at a time
and keeping in mind that the better the emulsion the better the
results, the following observations were made. Some of the
variables which were studied might be expected to affect the
ease of forming an emulsion. By increasing the temperature,
fat near its melting point would become less viscous and would

168
be easier to break into smaller particles. The use of an
emulsifying agent, bile salts, might help in forming the emul
sion or stabilize the emulsion after it had been formed. In
creasing the amount of electrolyte in the aqueous solution
might help in forming better emulsions. Increasing the degree
of agitation would be expected to be the most important vari
able of any mentioned so far. By varying the size and shape
of the hydrolysis container, large variations in the mixing or
shearing action of the stirrer could result. This appeared to
be the case when the small volume solutions were run in test
tubes and stirred with a L-shaped stirring rod. The velocity
of the stirrer tip was decreased due to the shorter bottom leg
used because of the decreased diameter of the container. So
for a small stirrer, less finely divided emulsion was formed.
Based upon the above, another series of samples were hydrolyzed
with the only variable being time. The modified Youngs method
was used. Bile salts were used as prescribed by Youngs and his
proportions scaled up by a factor of six (conditions of a 120
milligram fat sample). The samples were run in 50 ml beakers
and stirred with the largest L-shaped stirrer which could be
used in the beakers without scraping the beaker wall. The glass
rod diameter used was 3 mm. The samples were heated and stirred
with the buffer-bile salt solution to form an emulsion before
the dry steapsin was added. The stirrer was turned by a vari
able speed motor rated at a maximum .speed of 833 rpm. The speed

169
used for stirring was the maximum and was decreased only when
excessive foam was formed. Free fatty acid methyl esters were
prepared using diazomethane. The results of this series of
samples are shown in the third section of Table 48. There are
slight variations in the compositions but in general the com
positions did not vary with the time of hydrolysis. The first
section of data in Table 48 was run under the same conditions
except for the bile salts and the attention to the rate of
stirring, but considerably different results were obtained for
all of the components except palmitic and oleic acids.
Table 50 is a summary of the results obtained by the dif
ferent methods of hydrolysis studied. All of the samples were
for 15 minute hydrolyses except in column 5 in which the ten
minute hydrolysis results are given. Column 3 is the 15 minute
data for the same series of samples as column 5 but was not as
representative of the series of samples as was the data of col
umn 5. The data obtained by the Mattson and Beck procedure
checks well with only the data of column 6. The data of column
6 were obtained using the modified Youngs hydrolysis with bile
salts, 0.12 grams of fat, a 50 ml beaker for the hydrolysis con
tainer and rapid stirring. As the data of column 1 checked
published data quite well, it was used as the basis of the com
parisons and was considered to be correct. Therefore it was
concluded that in order to obtain free fatty acids representa
tive of the 1- and 3-positions, the Mattson and Beck procedure

Table 47. Enzymatic hydrolysis tests
Hydrolysis conditions Method: Run:
Mattson and Beck 1+3 5 6 7 2+4 8 9 10
Youngs 11 12 13 14
Lard Btgm. 2 0.12 0.12 0.12 0.12 0.12 0.12 0.12 0.12 0.12 0.12 0.12 Steapsin,mg. 156 156 156 48 48 48 48 48 48 48 156 48 Bile salts,mg. 0 0 0 0 0 30 30 0 0 0 0 0 Temp.,°C 40 40 40 40 40 40 rm. 40 50 40 40 60 Time, min. 15 15 15 15 15 15 34 5 5 5 5 5 Buffer conc. M.1.0 1.0 1.0 1.0 0.5 0.5 0.5 0.5 0.5 1.0 0.5 0.5
Gas chroraatogram area % Lard Ba
? 0.3 N.C.bN.C. — — 0.6 N.C. N.C. N.C. 1.0 0.9 0.5 1.3 -
Myr. 1.1 1.8 2.5 2.3 2.8 3.1 2.8 2.8 3.3 3.4 3.0 3.7 1.5 M.O. 0.4 0.8 1.4 1.1 1.6 1.5 1.5 1.7 1.9 2.0 1.4 2.2 -
Pal. 7.0 12.4 7.0 7.9 6.8 7.7 7.6 7.2 7.5 7.4 12.3 10.1 26.1 P.O. 3.5 5.1 6.5 6.3 8.2 7.6 7.5 8.6 9.2 8.7 7.4 10.8 2.2 ? — — - — — 0.7 - - - — - — — —
? - 0.6 " 1.0 0.9 1.1 1.1 1.1 1.1 1.4 1.3 1.0 1.5 —
Stear. 14.9 14.1 8.5 9.8 6.9 8.0 7.8 6.6 5.8 5.9 13.6 7.5 12.3 Oleic. 61.4 56.3 63.0 61.9 64.1 62.1 62.6 64.6 63.7 63.7 54.3 55.4 46.9 Linol. 11.5 8.1 9.2 8.4 7.3 8.2 7.8 6.5 5.7 6.0 5.6 6.6 11.0 Arach.0 N.C. 0.8 1.0 1.5 N.C. 0.8 1.2 0.9 0.6 0.9 0.9 1.0 -
®Overall lard B composition given for comparison to other results.
^N.C. for not calculated.
°Arachidonic acid, C20 with 4 double bonds•

Table 48. Enzymatic hydrolysis time tests, modified Youngs procedure
Free fatty acids—Amberlite lRA-400a
Run: 15 16 10 17 2 and 4 18 19 1 and Time, min. : 1 3 5 10 15 30 60 15
Gas chromatogram area % ? 1.1 2.1 N.C.C 1.3 0.6 2.0 1.5 0.3 Myr 3.1 2.6 2.8 3.0 2.8 2.3 2.6 1.1 M.O. 1.8 1.3 1.7 1.5 1.6 0.9 0.9 0.4 Pol. 10.5 10.7 7.2 9.1 6.8 9.5 10.7 7.0 P.O. 8.7 8.1 8.6 7.4 8.2 6.6 5.5 3.5 ? — - - - 0.7 - - —
? 1.4 1.3 1.1 1.1 1.1 1.1 0.7 —
Stear. 9.9 9.9 6.6 9.6 6.9 10.2 12.4 14.9 Oleic 57.6 56.8 64.6 58.7 64.1 59.1 56.2 61.4 Linol. 5.0 5.2 6.5 7.3 7.3 7.5 9.5 11.5 Arach. d 0.9 2.2 0.9 1.1 N.C. 0.8 0.6 N.C.
Free fatty acids--diazomethane6
Time, min. : 1 3 5 10 15 ' 30 60 120 Gas chromatogram area %
Myr. 0.6 0.7 0.7 0.7 0.7 0.6 0.5 0.8 Pal. 29.5 24.4 20.2 16.4 14.0 10.8 9.3 12.0 P.O. - 1.2 1.3 1.6 1.7 2.0 4.9 2.1 Stear. 39.9 35.6 30.5 27.0 23.7 21.5 18.4 18.2 Oleic 27.0 32.4 39.5 44.8 49.0 52.6 53.4 54.4 Linol. 3.0 5.8 7.9 8.9 10.2 11.6 12.4 11.8 Arach. - - - 0.7 0.6 1.1 1.0 0.7
^Modified Youngs method, 120 milligram lard B sample, no bile salts.
^Mattson and Beck method.
cN.C., not calculated.
dArach., arachidonic acid; CgO, 4 double bonds.
^Modified Youngs method, 10-20 milligram lard B sample, no bile salts.

Table 48. (Continued)
Free fatty acids—diazomethanef
Time, min.: 5 10 15 20 25 30 60 9 0 120 300
Gas chromatogxaph area %
? 0.5 0.4 _ Trace 0.4 0.6 — — 0.2 —
Myr. 0.6 0.7 0.5 0.5 0.5 0.3 0.4 0.3 0.6 0.6 Pal. 10.4 8.5 8.4 8.7 8.7 8.5 9.3 9.7 8.4 9.2 P.O. 2.3 2.4 1.7 2.0 2.2 1.6 1.7 2.3 1.4 2.8 Stear. 16.0 14.1 14.5 14.1 16.3 14.1 14.5 14.7 11.6 14.1 Oleic 58.7 62.3 63.2 63.6 63.8 61.5 62.7 60.1 67.9 60.5 Linol. 11.6 11.8 11.7 11.2 8.1 13.4 11.3 13.0 10.0 12.9
^Modified Youngs method, 120 milligram lard B samples, 30 milligrams of bile salts, maximum stirring rate.

173
Table 49. Enzymatic hydrolysis time test, compromise of Mattson and Beck and of Youngs procedures
Time: 1 3 5 10 15 30 60 90 120 300 Peak: Chromatogram area percent
Free fatty acids
? 4.1 ? 13.2 1.0 0.4 - - 0.4 ? 6.8 1.0 0.5 — 0.3 ? 2.7 1.0 0.4 -- 0.3 — - — — — — — — —
Myr. — — — — — — — — Trace Trace TraceO. Semi-DiCg -- -- 0.6 0.7 - - - - - - - -
Pal. 14.2 6.4 7.3 5.6 5.4 5.2 8.5 9.4 11.0 8. P.O. — — 1.6 1.9 1.4 1.3 1.1 1.8 1.8 1.9 2. DiCio 10.1 -- — — — — - - — — -- — — — —
DiCn 12.0 — — — — — — — — — — — — — — — —
Stear. 16.6 23.1 20.8 22.5 21.7 24.6 21.3 20.4 18.8 9. Oleic 12.2 60.4 59.5 62.8 62.7 62.3 59.9 59.6 58.6 66. Linol. 7.2 5.6 8.1 7.7 7.2 6.1 8.5 8.8 9.8 12.
2 -mono gl y ce r ide s
Myr. 4.0 2.6 2.7 3.1 2.8 4.4 3.2 4.3 3.8 3.3 Semi-DiCg — — 1.4 0.8 1.2 1.1 DiCo — — 0.7 0.7 0.7 — — — — — — — — — — — —
Pal. 33.8 50.1 61.0 54.1 58.3 69.0 70.5 76.4 71.2 68.6 P.O. 8.4 2.9 2.8 4.0 3.9 4.5 3.4 2.9 5.1 4.4 ? — — 0.8 —- 1.2 — — »* — — — — — —
DiCn 6.3 -- — — - — - - w -- - "" — —
Stear. 15.0 11.6 9.8 9.1 8.4 3.5 3.1 3.8 3.7 4.2 Oleic 25.8 27.0 19.4 23.9 21.5 15.3 16.8 11.0 13.7 15.9 Linol. 6.7 3.8 2.1 3.9 2.9 3.3 3.0 1.7 2.5 3.5

174
60 15.0 6
50 12.5
40 10.0
30 7.5
20 5.0
10 2.5
1—i—i—r 1—i—i—r I—I—i—r 1—i—i—r
O MYRISTIC • PALMITIC • PALMlTOLEIC
STEARIC A OLEIC ALINOLEIC
J I L J 1 L 1 J L M J—I L 10 20 30"60
TIME OF HYDROLYSIS, MINUTES
FIG. 13. ENZYMATIC HYDROLYSIS TEST, DIAZOMETHANE METHYL ESTERS
120

175
Table 50. Enzymatic hydrolysis tests, summary
Column: 1 2 3 4 5 6 Run: 1,3* — — 2,4a 17 M — — —
Method M and B Comp.b Mod.Ygs. Modified Ygs.c
Time 15 15 15 15 10 15 Sample size, gm. 2.0 0.5 0.12 0.12 0.010- 0.12 size, gm.
0.020 Container 50 ml Test 50 ml 50 ml Test 50 ml
bkr. tube bkr. bkr. tube bkr. F.F.A. Resin Resin Resin Resin CHgNg
Chromatogram area percent
Myr. 1.1 — — 2.8 3.0 0.7 0.5 M.O. 0.4 — — 1.6 1.5 — — — —
Pal. 7.0 5.4 6.8 9.1 14.0 8.4 P.O. 3.5 1.3 8.2 7.4 1.7 1.7 Stear. 14.9 21.7 6.9 9.6 23.7 14.5 Oleic 61.4 62.7 64.1 58.7 49.0 63.2 Linol. 11.5 7.2 7.3 7.3 10.2 11.7 Other 0.3 1.6 2.4 3.5 0.6 —
aFrom Table 47.
bprom Table 48.
cFrom Table 49.
or the modified Youngs procedure as conducted for the data of
column 6 were the only suitable methods of those represented
in Table 50.
Gas chromatography The gas chromatograph constructed
and used in the previous fractional crystallizations gave
excellent separation of the monocarboxylic acids found in lard
when ethylene glycol succinate (EGS) substrate was used for
the columns. But when the unsaturated monocarboxylic acids
were oxidized, complete separation of all of the peaks could
not be achieved by use of the EGS columns. Youngs (98)

176
obtained good separation of palmitate and azelate (DiCç)
using 15% butanediol succinate (BDS) on C-22 firebrick, but
it was found here that columns of 15% BDS on Chromosorb did
not give separation of the palmitate and azelate. After more
study, it was concluded that the reason for the difference
in the separations was not because of the equipment being
used but because of the difference in the two inert supports
used. A column of 15% BDS on C-22 firebrick was prepared
later and the separations obtained by Youngs (98) could not
be achieved. A column of 5% BDS on aqua regia treated C-22
firebrick gave good separation of the monocarboxylic acids
and the dicarboxylic acid methyl esters but the retention
times were somewhat longer than for the C-22 firebrick and
Chromosorb columns because of the large pressure drop across
the column due to the smaller mesh size of the solid support
required to obtain good separations. BDS on Chromosorb W
gave no separation of the palmitate-azelate pair and in gen
eral gave poorer separation of the C%g group. The column
which gave the best all around performance was a column con
sisting of 10 ft x 3/16 in OD copper tubing with 15% BDS on
60/80 mesh Chromosorb plus 1.5 ft x 3/16 in OD copper tubing
with 15% Dow Corning hi-vacuum silicone grease (DCSG) on
35/48 mesh aqua regia treated C-22 firebrick. The chromato-
grams of Figure 3 were obtained using such a column. The
major disadvantage of this column was that the 1.5 ft section

177
of DCSG had the tendency to reverse the order of emergence of
the saturated and unsaturated acids of a given chain length
and therefore gave poorer separation of the stearate-oleate
pair than BDS alone. But the DCSG was very effective in
causing all of the dicarboxylic acids to emerge from the col
umn in a shorter time than when the BDS column was used alone.
By using the correct length of DCSG column, the desired sepa
ration of the myristate-pimelate(DiCy) and palmitate-azelate
(DiCg) pairs could be obtained whereas with the BDS column
alone, these separations were poor.
In the course of obtaining better separation of the
monocarboxylic and dicarboxylic acid mixtures, several im
provements were made in the gas chromatograph equipment. De
tails of these changes are given in the appendix. The im
provements included the installation of a blower in the column
oven to circulate the air and the use of a voltage regulator
to help regulate the current supplied to the column oven heater.
Baseline stability was improved by these changes but insta
bility was not completely eliminated. The control of current
to the oven heater could not overcome baseline instability
due to changing ambient conditions. Rather than invest in
equipment for a temperature control for the gas chromatograph,
arrangements were made to use an F and M Model 500 gas chroma
tograph in the Chemical Engineering Department.
The F and M Model 500 gas chromatograph used Swagelok

178
fittings whereas the constructed gas chromatograph employed
brass compression fittings using a single compression ring.
These two fittings are not interchangeable. Therefore a new
column consisting of 10 ft of BDS and 1.5 ft of DCSG was pre
pared. Quite different results were obtained using this new
column. Comparable results were obtained by cutting off por
tions of the DCSG section until only 4 in of it remained.
Similar columns prepared later also showed that the length
of the DCSG section varied. This indicated that the same de
gree of packing was not obtained for the different BDS sec
tions which resulted in different separations and therefore
different lengths of DCSG were required.
One difficulty was encountered in the use of diazomethane
for preparation of free fatty acid methyl esters for gas
chromatograph samples. When the amount of esters in the
samples was very low, larger injection samples were required.
When the sample size required was over about one microliter,
continued use of the same column gave progressively poorer
separations. When the amount of esters was in the range of
40% of the sample, this difficulty was not noticeable. Some
of the resolving efficiency could be recovered by several
hours of bleeding the column at or slightly above the normal
operating temperature but the columns did not return to their
original efficiencies. The chromatograms obtained for the
free fatty acid methyl esters in the hydrolysis (bile salts

179
and rapid stirring) products of the lards and the crystalli
zations fractions were not as good as desired. Figure 14 was
typical of the separations obtained. The column used for
Figure 14 was a 10 ft x 3/16 in OD copper tubing with 5% BDS
on 80/100 mesh aqua regia treated C-22 firebrick. The condi
tions used were 220°C, helium flowrate of 54 ml per minute,
and a bridge current of 200 milliamperes. The sample was run
on the F and M Model 500 gas chromatograph and the sample
size used was 0.5 microliters as measured by the use of a 1.0
microliter syringe.
The analyses of the lards and crystallization fractions
were made on a 5 ft x l/4 in OD EGS column and gave excellent
separations as shown in Figure 4.
The data presented later for the fatty acid analyses of
the 2-monoglycerides were obtained from a column consisting
of 10 ft x 3/16 in OD copper tubing of 15% BDS on Chromosorb
plus 4 in x 3/16 in OD copper tubing of 15% DCSG on 35/48
mesh aqua regia treated C-22 firebrick. Figure 15 shows the
trace obtained for the 2-monoglyceride fatty acids methyl
esters of F-4 R. The column temperature was 220°c, the
helium flowrate 65 ml per minute, the bridge current 200
milliamperes, the sample size 0.6 microliters. The samples
were run on the F and M Model 500 gas chromatograph.

180
0.5
0.4
O 0.3
2
0
8 4 6 10 0 2
TIME, MINUTES
FIG. 14. FREE FATTY ACID METHYL ESTER ANALYSIS OF Tl

Ui
8 10 12 14 16 18 20
, MINUTES
ER ANALYSIS OF THE HYDROLYSIS PRODUCTS OF F-5 A

M I L L I V O L T S
p
en
PO i
O CD
Q o m 2 o m
-H -<
ro
m
CD
m
MYRISTATE
MYRISTOLEATE
SUBERATE
AZELAALDEHYDATE
AZELATE
PALMITATE
PALMITOLEATE N>

12 14 o 18 20 22 24
î , M I N U T E S
A T T Y A C I D M E T H Y L E S T E R S O F F - 4 R

182
Fractional crystallization, hydrolyses, and analyses
The fractional crystallization procedure was carried out
simultaneously on three 25 gram samples; lard B, lard A,
and lard R. The low temperature cabinet was modified slightly
to accommodate the three samples instead of just two. Pre
vious crystallizations had used flasks with outlets in the
bottom and the filtrations were slow and difficult. In this
crystallization, the samples were crystallized in beakers
supported on a false bottom made of hardware cloth. The
filtration flasks and funnels were kept in the Dry Ice chamber
until needed for the filtration. They were then placed in
the sample chamber one at a time and the clear acetone solu
tion poured through the funnel before the precipitate was
poured into the funnel. The filter cakes were pressed and
washed as in previous crystallizations. An attempt to use
filter sticks for the first filtration was not any better
than using the flasks with outlets in the bottom. The filter
sticks were only a few cm in diameter. They would have to be
as large as the funnels required to do the same job if they
were to be successful.
The randomized lard sample was prepared from 36.2 grams
of lard A by first heating on a wax bath 30-45 minutes at
120-150°c while bubbling nitrogen through the lard to remove
water present in the lard. Sodium methoxide, 72 milligrams

183
(0.2% by weight of the lard), was then added to the lard and
the heating continued for two hours at 115°C while bubbling
nitrogen through the sample. The catalyst was destroyed by
adding acetic acid. The sample was cooled, dissolved in ethyl
ether and transferred to a 250 ml separatory funnel. The
first water washing resulted in the separation of an ether
and a water layer but the water layer was very milky. This
milky water layer was separated and further treated. It was
found to be alkaline or near neutral as blue litmus did not
turn red. Dilute hydrochloric acid was added to acidify the
water and the water layer was extracted twice with ether.
The water layer became clear during the first extraction.
These ether extracts were added to the lard sample in the
separatory funnel and washed three more times with water.
Emulsions formed which did not persist for more than a few
minutes. The ether solution was then dried over anhydrous
granular sodium sulfate and the ether evaporated. The last
traces of ether were removed with the aid of a water aspirator
vacuum. The sample was then stored under refrigeration in a
125 ml Erlenmeyer flask stoppered with a rubber stopper after
flushing the flask with nitrogen.
Methyl esters of the fatty acids in each of the lards
and the fractions were prepared using anhydrous 5% hydrochloric
acid-methanol and the methyl esters were recovered by adding

184
water and extracting with ethyl ether. The methyl esters
were transferred to l/2 dram screw top vials and stored under
refrigeration.
During the study of the hydrolysis procedures, each lard
and its fractions were hydrolyzed under the compromise condi
tions. These samples were run in 10 ml beakers using 0.5
gram samples and the pH maintained at 8.0 throughout the 15
minute hydrolysis time. One change made here was the use of
2.0 M buffer solution instead of 1.0 M ammonium chloride-
ammonium hydroxide buffer as was used before in this com
promise method and as is used in the Mattson and Beck method.
The pH was measured using a Beckman Model G (2-1/2 in elec
trodes) pH meter. As this pH meter uses a completely enclosed
metal chamber to protect the electrode leads from stray cur
rents and magnetic fields caused by relay coils, motor wind
ings, etc., it was necessary to put a shield on the calomel
electrode lead and ground this shield. The instrument case
was also grounded. The pH meter operated very well when
grounded in this manner even with a water bath motor only
inches from the electrodes in the sample being maintained in
the bath at 40°C. The shielding for the electrode lead was
made from the flexible shielding removed from a piece of three
strand shielded cable. Care must be taken to insure that the
shield does not come in contact with the bare lead wire where

185
the pin is attached to the lead wire or that it does not
touch the jack in the pH meter.
These conditions were used at that time to promote the
formation of monoglycerides (see the hydrolysis procedures
summary in the appendix on hydrolysis). The 1-monoglycerides
in the hydrolysis products were destroyed by periodic acid
oxidation and the 2-monoglycerides recovered on silica gel
columns as previously described. It was thought that even
though the free fatty acids liberated by the enzyme hydrolysis
might not be representative of the 1- and 3-positions, that
the 2-monoglycerides would be representative of the 2-position
fatty acids. A study of the results showed that the inverse
lever rule was not obeyed in many instances. The triglyceride
(lards and crystallization fractions) fatty acid analyses and
the free fatty acid analyses of the hydrolysis products were
probably more reliable than these 2-monoglyceride fatty acid
analyses. As was mentioned before, difficulty was encountered
with ether vapors forming in the silica gel columns and when
ten columns were run simultaneously, the flowrates may have
been higher than used in the test columns in developing the
method. Either of these two factors could have caused the
triglycerides, fatty acids, glycolic aldehydes, and di-
glycerides peak to overlap the monoglyceride peak.
The lards and crystallization fractions were finally

186
hydrolyzed using the modified Youngs method described in the
hydrolysis time tests. The conditions used were 0.12 gram
sample size, 18 ml of buffer solution, a 50 ml beaker con
tainer, bile salts, and a maximum stirring rate to insure the
formation of a finely divided, stable emulsion. The free
fatty acids were converted to methyl esters using diazomethane.
The weights of the crystallization fractions obtained
are given in Table 51 and a summary of the saturated and un
saturated fatty acid contents of the lards and their fractions
is given in Table 52. The lards and their crystallization
fraction fatty acid compositions are given in Table 53. The
glyceride compositions obtained from the methyl ester compo
sitions and weights of the fractions are given in Table 54.
Table 55 shows the material balance obtained from the frac
tion weights and their fatty acid methyl ester compositions
as compared to the lard compositions. Tables 56 and 57 give
the methyl ester compositions of the hydrolysis product
analyses of the liberated fatty acids and of the 2-monoglycer
ides. The free fatty acids and the 2-monoglycerides were
obtained from different hydrolyses of the same samples. Table
58 is a summary of the compositions of the lards, crystalliza
tion fractions, the free fatty acids and the 2-monoglycerides
arranged such that a check of the inverse lever rule can be
easily obtained.

187
Table 51. Crystallization fraction weights'
P-3 P-6 P-6 F-5 F-4 Total
Before After Ifrac. Adj.frac. Frac.
Random Adj. frac, Adj.frac. Frac.
weight weight weight weight weight weight
4.219 2.460
4.223 2.462
10.791 10.801 5.003 5.008 2.504 2.506 24.977 25.000
1.675 5.534b 7.026 5.738 4.607
24.580
1.681 5.889 7.050 5.758 4.623 25.001
1.558 5.051 6.388 5.823 6.033 24.853
1.567 5.081 6.426 5.857 6.069
25.000
^The loss in weight of the lard samples was proportioned between the fractions directly proportional to the fraction weights.
bpart of the P-6 A fraction bumped out of its container while solvent was being evaporated. The P-6 A fraction weight was estimated by subtracting the total fraction weights of lard A from the average total weight of the lard B and lard R fractions and adding the difference to the weight of the P-6 A remaining. The remaining weight of P-6 A was 5.534 grams and the difference added was 0.335 gram.
Table 52. Saturated and unsaturated acids in lards and lard fractions
Mol % saturated Mol % unsaturated
B A R B A R
Lard 41.38 43.38 P-3 73.44 90.51 P-6 66.56 63.25 F-6 38.15 43.44 F-5 20.68 24.75 F-4 17.67 15.14
45. 74 58 .62 56.62 54 .26 91. 32 26 .56 9.48 8 .68 65. 24 33 .43 36.75 34 .76 48. 14 61 .86 56.56 51 .87 35. 05 79 .31 75.25 64 .95 16. 31 82 .32 84.87 83 .68

Table 53. Fatty acid methyl ester compositions of the lards and lard crystallization fractions
Lard B A R
Myr. 1.50 1.45 1.73 Pal. 26.12 27.29 28.98 P.O. 2.21 2.61 3.28 Stear.12.26 13.16 13.54 Oleic 46.92 46.86 46.87 Linol 10.99 8.64 5.62
B
0.59 35.16 0.71 36.90 22.91 3.74
100.00100.01 100.02 100.01
P-3 A R B
Weight %
1.93 2.02 1.70 52.85 55.18 38.91 Trace 0.23 0.72 35.26 33.68 24.71 9.42 8.89 29.04 0.55 Trace 4.94
100.01 100.00 100.02
P-6 R
1.58 1.46 39.66 40.54 1.18 1.74
20.64 21.98 32.28 31.01 4.67 3.29
100.01 100.02
P-6 F-5 F-4
B A R B A R B A R
1.71 1.67 1.66 1.76 1.57 1.63 2.05 1.60 1.60 28.31 27.51 30.33 14.89 16.04 23.66 12.70 10.61 11.85 1.97 2.24 2.78 4.96 3.69 4.31 8.82 5.63 7.00 6.31 12.72 14.67 2.72 5.85 8.28 1.72 1.88 1.76 55.93 49.65 45.72 59.15 63.13 54.85 51.35 62.77 68.42 5.78 6.22 4.86 16.53 9.73 7.29 23.37 17.53 9.39
100.01100 . 01 100.02 100.01 100.01 100.02 100.01 100.02 100.02
Lard mol % P-3 mol % P-6 mol %
B A R B A R B A R
Myr. 1.78 1.72 2.03 0.69 2.25 2.33 1.99 1.85 1.71 Pal. 27.78 28.99 30.71 37.29 55.01 57.30 40.99 41.74 42.61 P.O. 2.36 2.79 3.49 0.75 Trace 0.25 0.77 1.25 1.85 Stear. 11.82 12.67 13.00 35.46 33.25 31.69 23.58 19.66 20.92 Oleic 45.53 45.42 45.29 22.17 8.95 8.43 27.88 30.98 29.73 Linol. 10.73 8.42 5.47 3.64 0.53 Trace 4.78 4.52 3.18
100.00 100.01 99.99 100.00 99.99 100.00 99.99 100.00 100.00

Table 53. (Continued)
Lard mol % P-3 mol % P-6 mol %
B A R B A R B A R
Mol % total satd. 41.38 43.38 45.74 73.44 90.51 91.32 66.56 63.25 65.24
P-6 mol % F-5 mol % F-4 mol %
B R B A R B R
Myr. 2.04 1.98 1.95 2.11 1.88 1.93 2.45 1.92 1.91 Pal. 30.05 29.22 32.13 15.94 17.19 25.16 13.55 11.39 12.69 P.O. 2.10 2.38 2.98 5.35 3.97 4.63 9.49 6.10 7.56 Stear. 6.06 12.24 14.06 2.63 5.68 7.96 1.67 1.83 1.71 Oleic 54.13 48.12 44.16 57.73 61.71 53.19 49.94 61.49 66.88 Linol. 5.63 6.06 4.73 16.23 9.57 7.13 22.89 17.28 9.24
100.01 100.00 100.01 99.99 100.00 100.00 99.99 100.01 99.99
Mol % total satd. 38.15 43.44 48.14 20.68 24.75 35.05 17.67 15.14 16.31

Table 54. Glyceride composition of the lards
Frac- Wt.of MCL F.A. Total Mois Mol % of glyc. Mois of glyc. tion frac. 100 gm F.A. wt % F.A. of GS3 GSoU GSU? GU3 GS3X GSoU x GSU2 x GU3 x
gms m glyc. glyc. ̂ ̂ 100 100 100 100 Before
P-3 4.22 0. 3486 95. 76 0.004696&20.32 79. 68 0.0954 0.3742 P-6 2.46 0. 3511 95. 73 0.002756 99. 71 0. 29 0.2748 0.0008 P-6 10.80 0. 3484 95. 76 0.012011 14. 45 85. 55 0.1736 1.0275 F-5 5.01 0. 3456 95. 79 0.005529 62. 05 37. 95 0.3431 0.2098 F-4 2.51 0. 3468 95. 77 0.002779 53. 01 46. 99 0.1473 0.1306
25.00 0.027771 0.0954 0.8226 1.5187 0.3404 3.44% 29.62% 54.69% 12.26%
After P-3 1.68 0. 3552 95. 68 0.001903 71.56 28. 44 0.1362 0.0541 P-6 5.89 0. 3515 95. 72 0.006606 89. 75 10. 25 0.5929 0.0677 P-6 7.05 0. 3481 95. 75 0.007833 30. 32 69. 68 0.2375 0.5458 F-5 5.76 0. 3450 95. 80 0.006346 74. 25 25. 75 0.4712 0.1634 F-4 4.62 0. 3443 95. 79 0.005079 45. 42 54. 58 0.2307 0.2772
25.00 0.027767 0.1362 0.8845 1.3154 0.4406 4.91 31.85 47.37 15.87
Random P-3 1.57 0. 3560 95. 68 0.001783 73.96 26. 04 0.1319 0.0464 P-6 5.08 0. 3518 95. 71 0.005702 95. 72 4. 28 0.5458 0.0244 P-6 6.43 0. 3492 95. 74 0.007166 44. 42 55. 58 0.3183 0.3983 F-5 5.86 0. 3478 95. 76 0.006506 5. 15 94. 85 0.0335 0.6171 F-4 6.07 0. 3451 95. 79 0.006689 48. 93 51. 07 0.3273 0.3416
25.01 0.027846 0.1319 0.9440 1.3671 0.3416 4.74 33.90 49.10 12.27
glyceride s " (S,°L.e) :(^)
(•jj = 0.004696.

191
Table 55. Fatty acid balance of lard crystallization fractions
Wt of fatty acids in gms Total wt Before Wt, Myr. Pal. P.O. Stear. Oleic Linol. fatty
gms acids
Lard 25. 00 0. 360 6. 255 0 .530 2.935 11.235 2. 633 23.948 P-3 4. 22 0. 024 1. 421 0 .029 1.491 0.926 0. 151 4.042 P-6 2. 46 0. 040 0. 916 0 .017 0.582 0.684 0. 116 2.355 F—6 10. 80 0. 177 2. 928 0 .204 0.652 5.784 0. 597 10.342 F-5 5. 01 0. 085 0. 714 0 .238 0.131 2.839 0. 793 4.800 F-4 2. 51 0. 049 0. 305 0 .212 0.041 1.234 0. 562 2.403
25. 00 0. 375 6. 284 0 .700 2.897 11.467 2. 219 23.942 23.942
After
Lard P-3 P-6 P-6 F-5 F-4
Random
25.00 0. 348 6.533 0.625 3. 150 11 .218 2. 068 23. 942 1.68 0. 031 0.850 Trace 0. 567 0 .151 0. 009 1. 608 5.89 0. 089 2.236 0.067 1. 164 1 .820 0. 263 5. 639 7.05 0. 113 1.857 0.151 0. 859 3 .352 0. 420 6 . 752 5.76 0. 086 0.885 0.204 0. 323 3 .484 0. 537 5. 519 4.62 0. 071 0.469 0.249 0. 083 2 .778 0. 776 4. 426 25.00 0. 390 6.297 0.671 2. 996 11 .585 2. 005 23.
23. 944 944
Lard 25.00 0. 415 6.938 0.785 3. 240 11.218 1.345 23.941 P-3 1.57 0. 030 0.829 0.003 0. 506 0.134 Trace 1.502 P-6 5.08 0. 071 1.971 0.085 1. 069 1.508 0.160 4.864 F-6 6.43 0. 102 1.867 0.171 0. 903 2.814 0.299 6.156 F-5 5.86 0. 091 1.328 0.242 0. 465 3.078 0.409 5.613 F-4 6.07 0. 093 0.689 0.407 0. 103 3.978 0.546 5.816
25.01 0. 387 6.684 0.908 3. 046 11.513 1.414 23.951 23.952

Table 56. Fatty acid compositions of free fatty acids in hydrolysis products of lards and lard fractions
Lard P -3 P-6 B A R B A R B A R
Weight %
Myr. 0.5 1.5 1.7 0.3 2.4 2.0 0.3 1.6 1.1 Pal. 8.4 26.9 26.2 11.0 47.5 47.6 15.7 36.5 39.0 P.O. 1.7 2.6 3.0 1.0 0.9 1.6 1.1 1.6 2.6 Stear. 14.5 13.0 14.7 43.9 27.7 28.6 29.1 19.5 19.6 Oleic 63.2 48.9 50.2 37.3 19.2 18.7 45.7 35.4 33.5 Linol. 11.7 6.9 4.1 6.6 2.5 1.4 8.2 5.5 4.2 Total 100.0 99.8 99.9 100.1 100.2 99.9 100.1 100.1 100.0
Mol %
Myr. 0.6 1.8 2.0 0.4 2.8 2.1 0.4 1.9 1.3 Pal. 9.1 28.6 27.9 11.9 49.5 43.6 16.9 38.5 41.0 P.O. 1.8 2.8 3.2 1.1 1.0 1.5 1.2 1.7 2.8 Stear. 14.3 12.6 14.2 43.2 26.1 36.0 28.4 18.6 18.7 Oleic 62.5 47.5 48.7 36.9 18.3 15.6 45.0 34.0 32.2 Linol. 11.6 6.7 4.0 6.6 2.4 1.2 8.1 5.3 4.1 Total 99.9 100.0 100.0 100.1 100.1 100.0 100.0 100.0 100.1
Mol % total satd. 24.0 43.0 44.1 55.5 78.4 81.7 45.7 59.0 61.0

Table 56. (Continued)
F-6 F-5 F-4
B A R B A R B A R
Weight %
Myr. 0.8 1.9 1.5 0.7 1.4 1.0 0.3 1.2 1.3 Pal. 11.6 31.3 31.0 11.5 24.6 27.7 8.4 14.4 12.5 P.O. 0.6 2.7 2.1 2.8 3.2 3.0 3.5 5.3 4.3 Stear. 12.1 17.3 20.6 7.4 14.1 12.4 5.8 2.9 4.1 Oleic 68.7 41.8 40.2 60.8 49.3 50.0 61.1 62.4 68.2 Linol. 6.2 4.9 4.6 16.7 7.4 5.9 20.9 13.8 9.5 Total 100.0 99.9 100.0 99.9
Mol %
100.0 100.0 100.0 100.0 99.9
Myr. 1.0 2.2 1.8 0.8 1.7 1.2 0.4 1.4 1.6 Pal. 12.6 33.1 32.9 12.4 26.2 29.4 9.1 15.4 . 13.4 P.O. 0.6 2.9 2.2 3.0 3.4 3.2 3.8 5.7 4.7 Stear. 11.9 16.6 19.8 7.2 13.6 11.9 5.7 2.8 4.0 Oleic 67.8 40.4 38.9 59.9 47.9 48.5 60.3 61.0 66.9 Linol. 6.2 4.8 4.5 16.6 7.2 5.8 20.8 13.6 9.4 Total 100.1 100.0 100.1 99.9 100.0 100.0 100.1 99.9 100.0
Mol % total satd. 25.5 51.9 54.5 20.4 41.5 42.5 15.2 19.6 19.0

194
Table 57. Patty acid methyl ester compositions of the 2-monoglycerides of the hydrolysis products (mol %)
Lard P^3
B A R B A R B A R
Myr. 3.99 2.03 2.01 2.52 3. 48 3. 28 4.86 2 .13 2 .36 M.O. - - - - -
DiC 8 - - - - 0.19 Semiaz 2.94 0.71 1.90 - 2. 81 0.24 0 .73 DiC 9 — 0.46 1.93 3.65 0. 83 0. 62 -
Pal. 48.66 30.10 32.11 54.48 42. 79 50. 14 82.23 43 .70 47 .62 P.O. 2.24 3.52 2.52 1.25 1. 64 1. 52 0.57 1 .93 1 .60 DiCio 0.58 - - - 0. 84 0.68 - 0 .68 Semi (DiCn) 0.78 - - 0.78 1. 95 - - -
DiCn 1.00 Stear. 8.06 12.24 12.52 24.83 23. 58 27. 67 6.46 17 .58 21 .53 Oleic 28.63 43.65 40.07 10.63 20. 96 14. 90 4.40 32 .08 23 .95 Linol 4.13 5.29 2.69 0.86 1. 97 1. 04 0.38 2 .58 1 .52 LinolenJ-0 0.01 - 1.90 100.00 100.01 - 99 .99 Arach. 2.00 2.35 -
100.00 100.00 100.01 100.01 100.00 F-6 F-5 F-4
Myr. 5.21 2 .65 2.66 5.01 2.26 2.26 4.20 2.08 2.50 M.O. - - - - - 0.93 0.63 1.00 DiC§ 0.27 - - - - - 0.46 0.81 Semiaz 0.25 0 .71 1.22 0.97 1.07 1.23 7.30 3.33 4.12 DiC 9 - 0.28 - - 0.80 1.37 2.22 5.57 Semi (DiCn) 0.19 0.11 0.97 - 0.60 0.33 - 0.42 Pal. 73.79 32 .20 38.73 38.75 12.75 20.80 27.04 13.51 17.59 P.O. 2.43 2 .48 2.06 10.25 4.11 4.32 8.70 6.23 5.07 DiCio 0.52 - 0.20 0.31 — - - - -
DiC ii Stear. 3.30 11 .84 13.29 1.81 2.87 6.15 3.05 2.47 3.40 Oleic 12.49 47 .03 39.33 35.52 66.71 58.07 37.55 53.92 54.83 Linol 1.55 3 .08 2.12 6.41 6.69 5.78 9.53 8.56 4.70 Linolfn JD0.00 - 100.00 100.00 1.39 100.01100.00 2.70100.01 Arach. - 2.14 3.90
99 .99 99.99 100.01

Table 58. Summary of fatty acid compositions, mol percent
Lard P-3 P-6
R B A R B A R
PPA 0, . 6 1. 8 2, .0 0, .4 2. 8 2. 1 0, .4 1. 9 1 .3 Myr. TG 1 .8 1. 7 2, .0 0, .7 2. 3 2. ,3 2, .0 1. 9 1 .7 Myr.
2-MG 4, .0 2. 0 2, .0 2, .5 3. 5 3. 3 4, .9 2. 1 2, .4
PPA 9, .1 28. 6 27, .9 11, .9 49. 5 43. 6 16, .9 38. 5 41, .0 Pal. TG 27, .8 29. 0 30, .7 37, .3 55. 0 57. 3 41, .0 41. 7 42, .6
2-MG 48, .7 30. 1 32, .1 54, .5 42. 8 50. 1 82, .2 43. 7 47. .6
PPA 1. .8 2. 8 3. .2 1. .1 1. 0 1. 5 1. .2 1. 7 2. .8 P.O. TG 2. .4 2. 8 3 « .5 0. .8 Trace 0. 3 0. ,8 1. 3 1. .9
2-MG 2. .2 3. 5 2. .5 1. .3 1. 6 1. 5 0. .6 1. 9 1. , 6
F PA 14. .3 12. 6 14. ,2 43. .2 26. 1 36. 0 28. .4 18. 6 18. .7 Stear. TG 11. .8 12. 7 13. ,0 35. .5 33. 3 31. 7 23. ,6 19. 7 20. .9
2-MG 8. ,1 12. 2 12. ,5 24. .8 23. 6 27. 7 6. ,5 17. 6 21. .5
PPA 62. ,5 47. 5 48. .7 36. .9 18. 3 15. 6 45. 0 34. 0 32. ,2 Oleic. TG 45. ,5 45 A 45. ,3 22. ,2 9. 0 8. 4 27. ,9 31. 0 29. .7
2-MG 28. ,6 43. 7 40. ,1 10. , 6 21. 0 14. 9 4. 4 32. 1 24. ,0
PPA 11. .6 6. 7 4.0 6. . 6 2. 4 1. 2 8. 1 5. 3 4. ,1 Linol. TG 10. .7 8. 4 5. ,5 3. 16 0. 5 Trace 4. ,8 4. 5 3. ,2
2-MG 4. 1 5. 3 2. 7 0. 9 2. 0 1. 0 0. 4 2. 6 1. 5
PPA -
Diacids TG - - -
and others 2-MG 4. 3 3. 2 8. 1 5. 4 5. 6 1. 5 1. 1 0 1. ,4

Table 58. (Continued)
F-i 6 F-5 P-4
B A R B A R B A R
F FA 1 .0 2, .2 1, .8 0. .8 1 .7 1 .2 0, .4 1. 4 1 .6 Myr. TG 2 .0 2, .0 2. .0 2, .1 1, .9 1 .9 2. .5 1. 9 1, .9 Myr.
2-MG 5.2 2, .7 2. .7 5. .0 2, .3 2 .3 4. .2 2. 1 2. .5
F FA 12, .6 33, .1 32. .9 12. .4 26, .2 29 .4 9. .1 15. 4 13. .4 Pal. TG 30. .1 29. .2 32. .1 15. .9 17, .2 252. 13. .6 11. 4 12. .7
2-MG 73. .8 32, .2 38. .7 38. .8 12. .8 20 .8 27. .0 13. 5 17. »6
F FA 0. .6 2, .7 2. .2 3. .0 3. .4 3 .2 3. .8 5. 7 4. .7 P.O. TG 2. .1 2. .4 3. .0 5. .4 4. .0 4 . 6 9. .5 6. 1 7. . 6
2-MG 2. .4 2. .5 2. .1 10. .3 4. .1 4 .3 8. .7 6 . 2 5. .1
F FA 11. .9 16. . 6 19. .8 7. >2 13. , 6 11 .9 5. .7 2.8 4.0 Stear. TG 6. .1 12. .2 14. .1 2. .6 5. .7 8 .0 1. .7 1. 8 1. .7
2-MG 3. .3 11. .8 13. .3 1. .8 2. .9 6 .2 3. .1 2. 5 3. .4
F FA 67. .8 40. .4 38. .9 59. .9 47. .9 48 .5 60. ,3 61. 0 66. .9 Oleic. TG 54. .1 48. ,1 44. .2 57. ,7 61. .7 53 .2 49. .9 61. 5 66. .9
2-MG 12. ,5 47. ,0 39. .3 3 5 . ,5 66. .7 58 .1 37. .6 53. 9 54. .8
F FA 6. ,2 4.8 4. 5 16. 16 7. ,2 5 .8 20. 8 13. 6 9. ,4 Linol. TG 5. .6 6. 1 4. ,7 16. 2 9. , 6 7 .1 22. 9 17. 3 9. ,2
2-MG 1. 6 3. 1 2. 1 6. 4 6. .7 5 .8 9. ,5 8. 6 4. 7
F FA «. — — — — —
Diacids TG - - - - - - - -
and others 2-MG 1. 2 0. 7 1. 8 2. 3 4. 6 2 .6 9. 9 13. 2 11. 9

197
The inverse lever rule was not obeyed in many instances
but as has been pointed out, the 2-monoglyceride fatty acid
compositions are probably the least reliable data. A study
of the 2-monoglyce ride s was desired so as to have a better
check on the data by making material balances such as the
2:1 ratio of the mol percentage difference between the 2-
monoglyceride and the triglyceride fatty acids and the dif
ference between the free fatty acid and triglyceride fatty
acid compositions. But the 2-monoglyceride compositions are
not necessary to make the study. If the 2-monoglyceride
compositions are desired they can be calculated from the
triglyceride and free fatty acid compositions.
Ratios of the mol percentages of two fatty acids in
each of the lards, lard fractions, free fatty acids, and the
2-monoglycerides were calculated. The ratios used here were
myristic:palmitic, stearic:palmitic, palmitoleic:oleic, and
linoleicsoleic. The purpose of the calculations was to de
termine whether or not the fatty acid distribution in the
three different position groups (1-, 2-, and 3-positions;
1- and 3-positions; and 2-positions) was random for any of
the three types of samples (before, after, and random). If
the distribution for the acids was random, then the ratios
vo uld have been constants for the lard and each of its frac
tions. None of the three samples gave constant ratios for

198
each fraction. The before samples showed much greater dif
ferences in the ratios than the after and random samples.
This indicated that none of the three lard samples was com
pletely random as a whole or even in the 1- and 3-positions
or in the 2-positions. The before samples were further re
moved from random distribution than were the after and ran
dom samples. These calculations have not been included here
but the similar information is presented in a different man
ner. These ratios can be calculated from the data in Table
58 if desired.
Youngs and Sallans (99) presented a method of corre
lating fractionation data to provide information on the gly-
ceride structure of fats and in particular showed the dis
tribution of the unsaturated fatty acids among the GSgU,
GSU2» and GUg glyceride types. They made a graph of the
percentage of the major component fatty acid found in each
fraction versus the iodine value of the fraction. This curve
was compared to the straight line formed by plotting the cal
culated data for GS3, GSgU, GSl^» and GU3 obtained gy as
suming the unsaturated acids were distributed at random in
all of the glycerides. If the curve of the experimental re
sults coincided with the calculated curve, then the distribu
tion of the unsaturated acid plotted as the ordinate was dis
tributed at random in the fat. They presented data and graphs
for a completely random synthetic fat prepared from a mixture

199
of stearic, oleic, and linoleic acids; for sunflower oil; for
cottonseed oil, and for beef tallow. All of these graphs
gave experimental curves which coincided with the calculated
curve based on random distribution of the unsaturated acids.
This did not of course rule out the possibility of differ
ent distributions in the 1- and 3-positions and in the 2-
position but did show that the overall distribution in the
triglycerides was random for the unsaturated fatty acids.
The data used for the beef tallow were obtained from the
paper of Riemenschneider e£ al^. (79). This same paper also
gave data for the fractionation of lard but Youngs and Sallans
(99) did not include the lard data in their study. These
data have been presented here in Table 59 and a graph such as
they suggested was prepared and is shown in Figure 16. The
experimental and calculated curves clearly show that oleic
acid did not correspond to a random distribution. Also in
cluded in Figure 16 are the same type of graphs for the lard
B studied here. The before sample agrees very well with the
sample of lard studied by Riemenschneider _et al. (79).
Consider a sample in which the major component fatty
acid is oleic acid and that it is distributed at random but
that linoleic acid is not. The calculated iodine values for
GS3, GSgU, GSUg, and GU3 assume a random distribution of both.
Therefore a graph of oleic acid (the major component) compo
sition versus iodine value would produce curves which coincide

200
PUBLISHED THESIS
< 80
O 40
< 40
0 2 0 4 0 6 0 80 100 120 0 2 0 40 6 0 8 0 100 120
IODINE VALUE
FIG. 16. FATTY ACID DISTRIBUTION IN LARD

201
Table 59. Data for graphs in Figure 16
Wt. % Wt. % Iodine Fraction oleic linol. value
Riemenschneider e_t al. (79) Experimental
P-2 4.8 0.19 4.45 P-4 27.0 6.38 35.6 P-6 53.7 7.70 61.3 P-8 60.8 14.56 81.1 P-10 61.9 21.34 95.6 P-12 52.1 34.20 119.7 F 50.8 36.51 134.1
Calculated
GS3 GSgU GSUg GU3
Wt. % oleic 0 25.9 51.8 77.7 Wt. % linol. 0 6.7 13.3 20.0 Iodine value 0 37.0 74.0 111.0
Thesis data Experimental
Wt. % Wt. % Iodine Fraction oleic linol. value3
P-3 21.9 3.6 26.8 P-6 27.8 4.7 34.2 F-6 53.6 5.5 60.0 F-5 56.7 15.8 84.0 F-4 49.2 22.4 92.9
Calculated
GS3 GS2U GSU2 GU3
Wt. % oleic 0 27.0 53.0 78.0 Wt. % linol. 0 6.3 12.4 18.3 Iodine value 0 37.5 72.5 106.8
^Calculated from gas chroraatogram peak areas.

202
and the conclusion at first might be that the unsaturated
acids were distributed at random. But if a plot of the
percentage linoleic acid composition versus iodine value
were prepared, the experimental curve and the calculated
curve would not coincide because the actual linoleic acid
distribution was not random but the iodine value calculations
for the calculated curve assumed that it was. The point
being made here is that conclusions can be drawn only for
whatever is plotted on the ordinate. Generalizations about
the saturated or unsaturated acids can be made only if curves
of each component are studied.
The choice of the abscissa for these graphs depends upon
the type of fatty acid analyses made for the samples. If
iodine values were obtained, then this choice is convenient.
If a spectrophotometry determination of the polyunsaturated
acids were made, then iodine values would have been necessary
to obtain the amount of oleic acid. But if the analyses were
made using a chromatographic column separation or by gas
chromatography, then iodine values probably were not obtained
and the choice of iodine value for the abscissa would be in
convenient. The iodine values may be calculated from the
individual fatty acid compositions but this is really a step
backwards as the iodine value does not give as much informa
tion as the individual composition itself. The total mol

203
percent of the unsaturated acids would serve the same pur
pose for these graphs. The iodine values would give an in
dication of whether the majority of the unsaturated acids
were mono-, di-, tri-, etc. unsaturated fatty acids but this
is not of any particular value in making these graphs or in
their interpretation. Therefore the choice of the abscissa
would be more logically some variable other than the iodine
value which would have to be calculated. The choice could
actually be any one of the individual fatty acids or any
convenient group of acids. If an individual acid is chosen
though, then both the ordinate and the abscissa would involve
calculations from experimental data to obtain the calculated
curve. The choice of either the total mol percentage satu
rated or unsaturated acids would eliminate the use of any
experimental data for calculating the abscissa values of the
calculated curve. This latter method was used to correlate
the fractionation and hydrolysis data of this study.
Suppose that instead of plotting mol percentage of an
individual fatty acid versus the total mol percentage satu
rated acids that the ordinate was chosen to be the ratio of
the mol percentages of two fatty acids. Deviations of the
experimental data from the calculated curve based upon random
distribution of these two acids would be more difficult to
interpret than a similar graph of just one of the individual

204
acids used as the ordinate. Therefore ordinates of the mol
percentage of an individual acid and an abscissa of the total
mol percentage saturated fatty acids was used to correlate
the data.
An extension of the above method was made to include
graphs based on just 1- and 3-position fatty acids. There
are six types of glycerides possible when only the saturated
and unsaturated acids are considered. These types are SSS,
SUS, SSU, SUU, USU, and UUU. When only the 1- and 3-positions
are considered, these become S-S, S-S, S-U, S-U, U-U, and U-U
which reduce to only the three types S-S, S-U, and U-U. The
data obtained for the free fatty acids of the hydrolysis
products of the lards and lard fractions were used to pre
pare graphs of the mol percentage of an individual acid in
the 1- and 3-positions versus the total mol percentage satu
rated acids in the 1- and 3-positions. The calculated curve
has only three points representing the three possible com
binations of saturated and unsaturated acids in the 1- and
3-positions. The calculated curve is based upon random dis
tribution of the acid plotted on the ordinate and deviation
of the experimental data from the calculated curve represents
the amount of deviation from random distribution of this com
ponent in the 1- and 3-positions.
Graphs were prepared to show the distribution of each

205
of the six fatty acids of lard in each of the three lard
samples and for both the lard and lard fraction triglycerides
and the free fatty acids obtained from the hydrolysis of the
lards and lard fractions. These graphs are shown in Figures
17-22. The data for the experimental curves were obtained
from Tables 53 and 56. Data for the calculated distribution
curves are given in Table 60.
Study of these figures showed that the distribution of
the fatty acids in the 1- and 3-positions was very nearly
the same as in the 1-, 2-, and 3-positions. Even though the
ratios of saturated to unsaturated acids in the 1- and 3-
positions and in the 2-positions are quite different for the
lard B sample, these curves show that the distribution of
the individual fatty acids in each of the two groups of po
sitions was nearly the same.
The lard A and lard R samples appeared to be nearly
identical. By studying the curves for palmitic and oleic
acids (the two major component fatty acids) it was indicated
that possibly the after sample was not quite completely
randomized whereas the random sample was. Deviations due to
experimental error may account for most of the differences
observed but in particular, the triglyceride after curve for
oleic acid showed that the oleic acid content in the first
fraction on the left was low just as in the triglyceride be

206
fore sample whereas the triglyceride random point was just
barely below the random distribution curve. The free fatty
acid after and random curves also showed this same tendency
but was less pronounced. This indicated that the 1- and 3-
position fatty acids were more easily randomized than the
2-position fatty acids.
None of the six fatty acids showed distribution curves
which were random for the before samples. It is interesting
to note though that all of the fatty acids in one of the two
groups, saturated and unsaturated acids, did not deviate from
a random distribution in the same manner. The saturated fatty
acids, myristic and palmitic, showed similar trends and
stearic showed the opposite trend. The amount of myristic
and palmitic acid was high for the unsaturated fractions and
low for the saturated fractions. The amount of stearic acid
was low for the unsaturated fractions and high for the satu
rated fractions. These differences tended to balance each
other such that it would not be expected to find the amount
of any one of the six glyceride types to be higher or lower
than what would be predicted from random distribution of
saturated and unsaturated acids in the 1- and 3-positions
and the 2-position for all six of the glyceride types. This
was one of the assumptions made by Vander Wal (91) in his
method of calculating the amounts of each of the six glyceride

207
types from just the mol percentage saturated acids in a fat
and the mol percentage saturated acids in the 2-positions
of the fat. This assumption does not exclude the possibility
of the individual fatty acids having different distributions
as has been found above for lard B. If all of the saturated
acids showed the same deviation from random distribution,
then the relative amounts of the six glyceride types would be
different than if the deviations tended to balance each other.
This can easily be seen by considering the glyceride types
SSS» SSU, and SUS. Suppose that all of the saturated acids
have higher than random amounts in these glycerides. Then
there would be fewer saturated fatty acids remaining to form
the SUU and USU glycerides than would be true if all of the
fatty acid distributions were random.
A similar study of the unsaturated fatty acid distribu
tions showed that the amounts of palmitoleic and linoleic
acids were higher than the random distribution for the un
saturated fractions and oleic acid was low. Palmitoleic and
linoleic acids showed the larger deviations from random than
the major component fatty acid, oleic acid. Again the differ
ence in the distributions tended to balance each other such
that the unsaturated acids were distributed at random between
all six of the glyceride types.
One other observation made was that the saturated acids

208
showed the largest deviations from random in the more satu
rated fractions and the unsaturated acids showed the largest
deviations from random in the unsaturated fractions. Linoleic
acid would be expected to decrease the melting point of a
triglyceride more than oleic acid. Linoleic acid was found
in less than random amounts in the saturated fractions.
Similarly stearic acid was in lower than random amounts in
the unsaturated fractions. The combined effects of these two
deviations would be to give a fat with a higher melting point
range than would be true in a fat which had random distribu
tions.
Reiser and Reddy (78) found that linoleic acid in the
triunsaturated fractions of the fat of a pig reared on a fat
free diet was found mainly in the 2-position. The unsatura
ted fractions in this study contained nearly the same pro
portion of linoleic acid in the 1- and 3-positions and in
the 2-positions but more linoleic acid in the 1- and 3-
positions than in the 2-positions of the saturated portions
(see Table 58 for these compositions).
The figures in Table 58 for the lard B sample also
showed that myristic, palmitoleic, and palmitic acids were
found more predominately in the 2-positions than in the 1-
and 3-positions. Stearic, oleic, and linoleic acids were
found to be more predominate in the 1- and 3-positions than

209
in the 2-positions. This indicated that chain length was
more important in determining the position of a fatty acid
than was the factor of whether the fatty acid was saturated
or unsaturated. Published results for lard very often indi
cate that it is the saturated acids that are predominate in
the 2-positions. This is true but might be misleading in
that it is the short chain fatty acids which are found pre
dominately in the 2-position and in lard the major C14 and
component is palmitic acid. Stearic acid makes up 11.8
mol percent of the total fatty acids in lard whereas palmitic
accounts for 27.8 percent.
Table 61 gives the glyceride compositions found for the
lards of fractional crystallizations No. 4 and No. 5. The
data obtained by Riemenschneider et al. (79) are also given
for comparison. The percentages of each glyceride type which
would result if the saturated and unsaturated acids of each
lard were completely randomized on all the available glvceride
sites are also shown. The results of the two fractional
crystallizations of lard B show good agreement ; the lard A
results are not in quite as good agreement in that the two
GSUg compositions differ by 4.2% in a total of about 50%. The
compositions for the lard A,and lard R sample should be ex
pected to agree more closely with the calculated random com
positions than they did. The fatty acid compositions of the
lards and lard fractions, the hydrolysis product free fatty

210
acid compositions, and the fatty acid distribution curves
indicated that the lard A was very nearly randomized and that
the lard R sample was completely randomized. The data of
Table 61 indicate that either these samples were not random
ized or that the fractional crystallization results for the
GSg and GU^ compositions were low. It is thought that the
fractional crystallization method gave low results but no
separations of a synthetic mixture were made by fractional
crystallization to substantiate this.
If the assumption that the crystallization fractions
contained no more than two major glyceride types was correct,
then data for the fatty acid distribution in the SSU, SUS,
SUU, and USU glyceride types could be obtained froro^the crystal
lization and hydrolysis data presented. The glycerides ex
pected to be found in the three logically possible fractions
would be:
The free fatty acids found in the hydrolysis products of the
first fraction would contain unsaturated acids from only the
SSU glycerides. The overall fatty acid composition of this
fraction would include unsaturated acids from only the SUS
fraction. Therefore from the total weight of the fraction aid
the fatty acid compositions, the amounts of each of the three
SSS SSU SUS
SSU USU SUS SUU USU UUU SUU

211
TRIGLYCERIDES FREE FATTY ACIDS
GS2U
AFTER
G S g U
RANDOM
0 20 40 60 80 100 0 20 40 60 80 100
MOL % TOTAL SATD. ACIDS FIG. 17. MYRISTIC ACID DISTRIBUTION

212
TRIGLYCERIDES FREE FATTY ACIDS
100 BEFORE
80
GS 60
40 S —S
GSU 20
U-U
Û 100 AFTER
80 GS S-S
40 S-U
GSU2 20
GU U-U
100 RANDOM
80 GS
S—S 60
40
S-U 20
U-U
0 20 40 60 80 100 0 20 40 60 80 100
MOL % TOTAL SATD. ACIDS FIG. 18. PALMITIC ACID DISTRIBUTION

213
TRIGLYCERIDES FREE FATTY ACIDS
50 BEFORE
40
30 S-U
20 GSoU
GSU
U-U
O 50 AFTER
40
CC 30 S—S
GS 20
GSU
U-U
50 RANDOM
40
30 GS
20
S—u GSU
U-U
O 20 40 60 80 .100 0 20 40 60 60 100
MOL % TOTAL SATD. ACIDS FIG. 19. STEARIC ACID DISTRIBUTION

214
TRIGLYCERIDES FREE FATTY ACIDS
a o <
o u _i o H
Z
2
_l o 3E
GS2U
A FTER
KGSUP
GS2U
RANDOM
GU3 \
0 20 40 60 80 100 0 20 40 60 80 100
M0L % TOTAL SATD. ACIDS
FIG.20. PALMITOLEIC ACID DISTRIBUTION

215
TRIGLYCERIDES FREE FATTY ACIDS
BEFORE
GSU2X\
O 100 AFTER
< 80
o 40
RANDOM U-U
20 40 60 80 100 0 20 40 60 80 100
MOL % TOTAL SATD. ACIDS FIG.2I. OLEIC ACID DISTRIBUTION

216
TRIGLYCERIDES FREE FATTY ACIDS
Q
O <
O UJ -I o
o z
GS2U
AFTER
rx^GSUg
RANDOM
0 20 40 60 80 100 0 20 40 60 80 100
M0L % TOTAL SATD. ACIDS FIG. 22. LINOLEIC ACID DISTRIBUTION

217
Table 60. Data for calculated distribution curves of Figures 17-22 (all values for mol percentages)
Lard F .F '.A. of lard
B A R B A R
Myr. 1 .78 1. 72 2.03 0.6 1.8 2.0 Pal. 27 .78 28. 99 30.71 9.1 28.6 27.9 Stear. 11 .82 12. 67 13.00 14.3 12.6 14.2 P.O. 2 .36 2. 79 3.49 1.8 2.8 3.2 Oleic 45 .53 45. 42 45.29 62.5 47.5 48.7 Linol. 10 .73 8. 42 5.47 11.6 6.7 4.0 % total satd. 41 .38 43. 38 45.74 24.0 43.0 44.1 % total unsatd. 58 .62 56. 63 54.25 75.9 57.0 55.9
Myr. 4 .30 3. 96 4.44 2.5 4.2 4.5 Pal. 67 .13 66. 83 67.14 37.9 66.5 63.3 Stear. 28 .56 29. 21 28.42 59.6 29.3 32.2
P.O. 4 .03 4. 93 6.43 2.4 4.9 5.7 Oleic 77 .67 80. 20 83.48 82.3 83.3 87.1 Linol. 18 .30 14. 87 10.08 15.3 11.8 7.2
Triglycerides F.F.A. GSG GS2U GSU2 GU 3 S-S S-U U-U
Before
Myr. 4.30 2.87 1.43 0 2. 5 1.25 0 Pal. 67.13 44.75 22.38 0 37. 9 18.95 0 Stear. 28.56 19.04 9.52 0 59. 6 29.8 0 P.O. 0 1.34 2.69 4. 03 0 1.2 2.4 Oleic 0 25.89 51.78 77. 67 0 41.15 82.3 Linol. 0 6.10 12.20 18. 30 0 7.65 15.3
After
Myr. 3.96 2.64 1.32 0 4. 2 2.1 0 Pal. 66.83 44.55 22.28 0 66. 5 33.25 0 Stear. 29.21 19.47 9.74 0 29. 3 14.65 0 P.O. 0 1.64 3.29 4. 93 0 2.45 4.9 Oleic 0 26.73 53.47 80. 20 0 41.65 83.3 Linol. 0 4.96 9.91 14. 87 0 5.9 11.8 Random
Myr. 4.44 2.96 1.48 0 4. 5 2.25 0 Pal. 67.14 44.76 22.38 0 63. 3 31.65 0 Stear. 28.42 18.95 9.47 0 32. 2 16.1 0 P.O. 0 2.14 4.29 6. 43 0 2.85 5.7 Oleic 0 27.83 55.65 83. 48 0 43.55 87.1 Linol. 0 3.36 6.72 10. 08 0 3.6 7.2 % total satd .100. 0 66.7 33.3 0 100. ,0 50.0 0

218
Table 61. Comparison of lard glyceride compositions
Mol % Mol % Mol percent satd. acids
unsatd. qo
acids 3 GSGU CSUA GU3
Fractional crystallization No. 4
Lard B, Calc.
found random
40.9 59.1 2.7 6.8
28.5 29.7
57.0 42.9
11.8 20.6
Lard A, Calc.
found random
42.5 57.5 4.4 7.7
30.1 31.1
51.6 42.2
13.9 19.0
Fractional crystallization No. 5
Lard B, Calc.
found random
41.4 58.6 3.4 7.1
29.6 30.1
54.7 42.6
12.3 20.1
Lard A, Calc.
found random
43.4 56 .6 4.9 8.2
31.8 32.0
47.4 41.7
15.9 18.1
Lard R, Calc.
found random
45.7 54.3 4.7 9.5
33.9 34.0
49.1 40.4
12.3 16.0
Riemenschneider et al. (79)
Lard, found Calc. random
37.4 62.6 1.9 5.2
25.9 26.3
54.6 44.0
17.6 24.5
glyceride types present could be calculated and the actual
distribution of the unsaturated acids would be known. The
same type of calculations could be made for the third type
of fraction obtained but this time the actual distribution
of the saturated acids in the USU and SUU glycerides would be
obtained. The distribution curves showed that the fatty acid
distributions for the triglycerides and the free fatty acids
were very nearly the same. Therefore there was little point

219
in carrying out these calculations as the assumption may not
be entirely correct.
Trisaturated glyceride determination
Luddy and Riemenschneider (49) presented a method for
the determination of trisaturated glycerides in lard, hydro-
genated lard, and tallow by crystallization from acetone.
They used 25-50 grams of sample dissolved in dried acetone
in the ratio of 40:1, ml of solvent:grams of fat. This solu
tion was held at 15Î0.3°C for 30 hours without stirring. The
precipitate was filtered, pressed, washed and pressed again
to remove the filtrate. The precipitate was then dissolved
in dried acetone using a ratio of 60:1, ml of solvent :grams
of fat. This solution was held at 15*0.3°C for 24 hours,
filtered, pressed, washed, pressed again, and the remaining
solvent removed under vacuum with heating on a water or steam
bath.
They also gave several sets of crystallization conditions
used which gave nearly quantitative precipitation of GS3. The
above procedure requires 2-3 days time; another set of condi
tions required only about one day. These conditions were to
use 35 ml of dried acetone per gram of fat, hold at 10°C for
two hours while stirring, filter, press, wash, and press the
precipitate. The precipitate was then dissolved in dried

220
acetone using 200 ml of solvent per gram of precipitate.
This solution was held at 10°C for two hours with stirring,
filtered, pressed, washed and finally pressed as dry as possi
ble. The remaining solvent was removed under vacuum with
heating.
Samples were run for the before and after lard samples
using both methods and are referred to as the short and long
procedures below. The GS^ precipitates were analyzed by
forming methyl esters of the fatty acids and obtaining a gas
chromatogram of these methyl esters. In calculating the
amount of GS^ in the precipitate, it was assumed that for
every mol of unsaturated fatty acid there was a mol of mono-
unsaturated disaturated triglyceride in the precipitate. The
results of these determinations are given in Table 62 with the
GSg determination from the complete lard fractional crystal
lizations No. 4 and No. 5.
Table 62. Lard trisaturated glyceride determination
Mol percentage GS3 in lard
B A R
Short procedure 2.0 3.6 Long procedure 2.1 3.2 Fractional crystn. No. 4 2.7 4.4 Fractional crystn. No. 5 3.4 4.9 4.7
Av. independent GS3 determn. 2.1 3.4 Av. fractional crystn. determn. 3.1 4.7 4.7

221
The long and short procedures gave nearly the same re
sults and the two fractional crystallizations gave nearly the
same results, but the independent GS3 determinations did not
agree with the GS3 determinations from the fractional crystal
lizations. The independent GS3 determinations were 68% and
72% of the results from the fractional crystallizations for
the before and after samples respectively.
The conclusions of these tests were that there was little
advantage of using 54 hours crystallization time for the GS3
determination as compared to just four hours crystallization
time for the same determination. The independent GS3 deter
mination and the GS3 determination obtained from fractionation
of the lard samples did not agree. The independent deter
minations were 30% lower than the fractionation results. From
these data alone, there was no way of knowing which results
are more nearly correct.
One indication that these GS3 determinations were low
can be seen by the data given in Table 61. The calculated
percentage of GS3 for randomized samples were 40-50% higher
than what was obtained from the fractional crystallization
data. Two possibilities are that the lard random used was
not completely randomized or that the fractional crystalliza
tion method gave low results. Probably the actual situation
is between these two possibilities. The methyl ester compo

222
sitions of the crystallization fractions indicated that the
lard random sample was very nearly completely randomized
when the fatty acid distribution curves were studied. It
is therefore thought that the fractional crystallization gave
low results and had more affect on the low results than did
incomplete randomization of the lard sample.
Combined Oxidation-Hydrolysis Study
The fractions obtained from the fractional crystalliza
tion of lard were mixtures of two or more glyceride types.
It was not possible to determine even the six glyceride types
based on the saturated and unsaturated acids. Calculations
were made for just the four major types of glycerides, GS3,
GS2U , GSU21 and GU3.
Youngs (98) has described a method of determining the
six glyceride types, SSS, SSU, SUS, SUU, USU, and UUU. The
method involved oxidation of the fat to destroy all the carbon-
carbon double bonds and separation of the oxidized fat into
two fractions consisting of GS3 + GS2A and GSA2 +GA3 where A
represents the azelaic acid radical remaining after oxidation.
Methyl ester analyses of the original fat, the oxidized fat
and the two fractions were made. Samples of the original fat,
oxidized fat, and the two fractions were hydrolyzed using pan
creatic lipase and the free fatty acids converted to the methyl
esters using diazomethane and analyzed by gas chromatography.

223
These eight analyses provided sufficient data to calculate
the fraction of each of the six glyceride types present in
the fat.
The above work suggested a method of studying the dis
tribution of the individual saturated acids in lard. Only
general information would be obtained for the unsaturated
acids because they are destroyed during the oxidation and it
is not possible to determine from which unsaturated acid the
oxidation products originated. Youngs (98) used a partition
column of 90% ethanol-10% water on silicic acid to separate
the oxidized fat into two fractions. He presented a figure
for the separation of oxidized cocoa butter into four fractions
using countercurrent distribution between an alcohol phase
and a Skellysolve B phase. He simplified the method by using
a partition column and obtained only two fractions using the
same solvent system in the column.
After having worked with silica gel columns on the sepa
ration of mono-, di-, and triglycerides it appeared that the
oxidized fats could probably be separated into six fractions
corresponding to the six glyceride types. The oxidized fat
was found to be much more difficult to separate than the mixed
glycerides but by using the solvent system of ethyl ether in
Skellysolve B and acetic acid in ethyl ether the separations
shown in Figures 23-26 were obtained. Tables 63-66 give the

224
details of the eluting solvents, flowrates, and the fraction
weights obtained. Table 67 give the fractions combined to
give the numbered peaks of the figures and the weights and
weight percentages of each peak. Table 68 is a comparison
of the weigh t percentage of each peak for the four figures.
Tables 69-71 give the methyl ester compositions of the fatty
acids found in each of the peaks for three of the figures.
Table 72 gives the compositions of the lards before and after
oxidation.
The columns used were 16 mm ID glass tubes about 60 cm
long and were fitted with a water jacket. Tap water was
passed through a copper coil in a temperature controlled
water bath to maintain the temperature of the water at 21-24°C.
Three and one-half ml of water were stirred very thoroughly
with 35 grams of Davison Grade 923 (100/200 mesh) silica gel
until no lumps remained. The silica gel was then slurried
into the columns with Skellysolve B and allowed to settle of
its own accord. The Skellysolve B was run from the column un
til it was just above the silica gel level. The first 25 ml
of eluting solution was then used to transfer as much of the
oxidized lard into the column as could be dissolved in the
25 ml. Each successive 25 ml of eluting solution was added
to the sample container to dissolve more of the sample and
poured into the column. As the amount of ether in the eluting

225
solution was increased more sample kept dissolving but the
process was very slow* Therefore when 1 ml or so of ether
was being used in the 25 ml of eluting solution, the ether
was first put in the sample beaker to dissolve as much sample
as possible and then the 24 ml or so of Skellysolve B was
added to the sample beaker and this poured into the column.
The material which was so difficult to dissolve was the com
ponents of very high azelaic acid content. As these com
ponents were held up in the very first cm or two of the silica
gel until near the end of the eluting process, it was not
necessary that they be put on the column with the first
eluting solvent fraction. Twenty-five ml fractions were col
lected from the bottom of the column, the solution put in
weighed 50 ml beakers, the solvent evaporated on a steam
plate in a hood, cooled and weighed again to obtain the resi
due weights. The silica gel was supported on a glass wool
plug and flow from the column controlled by the use of a stop
cock and by the height of the solvent head on the column. The
sample size for this column should be about 500 milligrams.
Larger samples give overlapping peaks and with smaller samples
the weighing errors and silica gel in the residue become pro
portionally larger.
The fat was oxidized under the conditions given by
Youngs (98), who had modified the oxidation method worked out
by von Rudloff (94). The oxidation was carried out at room

226
temperature and took several hours as von Rudloff presented
the method. Youngs used the same conditions except that he
réfluxed the oxidation solution and obtained complete oxida
tion in one hour. The oxidized lard samples were prepared
by weighing 1.0 gram of lard in a small beaker and using 100
ml of tertiary-butyl alcohol to transfer the lard to a one
liter round bottom flask with a ground glass fitting. Sodium
periodate, 5.484 grams, and 103.3 milligrams of potassium
permanganate were dissolved in 268 ml of water and added to
the lard solution in the one liter flask. Then 332 milligrams
of potassium carbonate and 300 ml more of tertiary-butyl alco
hol were added and the solution refluxed for one hour on a
water bath (b.p. t-BuOH, 82.9°C). After the solution was
cooled, sodium meta-bisulfite was added with stirring until
the originally deep purple solution went through several color
changes and finally became milky green. Ten percent sulfuric
acid was added with stirring until the milky light green
solution became clear light green. The fatty material was
then extracted four times with ethyl ether. The ether-butanol
extracts were combined and evaporated on a water bath with the
aid of a water aspirator. The residue was dissolved in ether,
washed with water until neutral to litmus, the ether solution
dried over sodium sulfate and the ether evaporated.
Whenever a portion of the oxidized fat was needed, the
sample was dissolved in ether and an aliquot of the solution

227
taken. If the sample was just melted and a few drops taken,
a representative sample was not always obtained. The azelaic
acid content of the sample taken was found to be low when the
sample was not first dissolved in ether.
In carrying out the oxidation, the solution must remain
deep purple in color. If not, the oxidation will not be com
plete. More periodate-permanganate must be added if the deep
purple color disappears.
Sodium periodate was not available at the Iowa State
University Chemical Stores but potassium periodate was. The
sodium periodate is completely dissolved when used in the
procedure above, but an equivalent molar amount of potassium
periodate was only partially dissolved. It was found, however,
that by swirling the container during the start of the re-
fluxing until enough of the potassium periodate had reacted
that all of the potassium periodate went into solution.
Methyl ester analyses of oxidized lard at the end of one and
two hours gave identical results and showed that the oxida
tion was complete in one hour (no oleic acid peak was obtained
in the chromatogram).
The oxidized lard samples were separated on the silica
gel columns in the same form as obtained from the oxidation
procedure. But in order to hydrolyze the oxidized lard or
its fractions, Youngs (98) showed that it was necessary to

228
methylate the acid groups formed during the oxidation by the
use of diazomethane. If the oxidized samples were not
methylated, it was found that the monocarboxylic acid chains
were more easily removed than the azelaic acids.
Methyl esters of the fatty acids of the peaks of the
chromatograms were prepared using anhydrous 5% hydrochloric
acid-methanol. After refluxing 30-60 minutes, the alcohol
was evaporated with the aid of a water aspirator vacuum. A
total of about 15 ml of ethyl ether was used to wash down the
distilling neck and walls of the 50 ml round bottom flask,
sodium sulfate added and allowed to stand a few minutes. The
ether was decanted and the sodium sulfate washed 3-4 times
with more ether. The ether solutions and washes were combined
and evaporated. The methyl ester residue was transferred to
l/2 dram screw top vials.
Enzymatic hydrolyses were carried out on the peaks ob
tained from the silica gel columns shown in Figures 23 and
24. The size of the samples was limited in many cases be
cause both an overall composition methyl ester sample and a
hydrolysis sample were required. The hydrolysis method of
Youngs (98) was modified in that 40°c was used instead of
room temperature and the samples were stirred at 833 rpm with
a glass stirring rod in place of the homogenizer. The samples
were run in the short test tubes, 20 mm ID x 6.5-7.0 cm.

229
Sample sizes ranged from 2.9 to 29.5 milligrams. Steapsin
was weighed out for each sample and an amount equal to 40%
of the weight of the fat was used. The time of hydrolysis
was 15 minutes in each case. Samples which had high melting
points were first heated in a water bath to melt the fatty
material, the buffer and bile salts added and the mixture
stirred vigorously to form an emulsion and then set in the
40°C bath to allow the sample and buffer temperature to be
come 40°c. The weighed steapsin was then added to the emulsion.
The hydrolysis products were extracted with ethyl ether,
washed with water and the ether evaporated. The free fatty
acid methyl esters were prepared using diazomethane. The
results of the gas chromatograms indicated that the hydrolyses
had proceeded much as the test samples of the second section
of Table 48. The results for stearic acid appeared to be
much too high and the palmitic acid compositions a little too
high. A lard B sample hydrolyzed under the same conditions
also gave similar high results for the stearic and palmitic
acids. Therefore the results of the hydrolyses are not in
cluded.
The silica gel column for the oxidized lard R sample
(Figure 26) was one of the first of the more successful at
tempts to obtain fractionation of the oxidized lards. The
first five peaks were not completely separated. By making

230
the increase of ether in each of the successive 25 ml fractions
of eluting solution in smaller increments, better separations
were obtained. This figure also shows that the peaks tail
badly (peak 5). The effect of tailing is shown by the data
of Figure 24 for the fractionation of oxidized lard A. Peaks
8 and 9 are not completely separated here. But in Figure 25
these two peaks were separated much better. Data in Table
68 shows that the total weight of the two peaks (including the
material between peaks) was 51.7 and 50.2 weight percent of
the total samples but that the individual peaks were 33.3,
7.2 (between), and 11.2 weight percent for one and 27.5 and
22.7 weight percent for the other. Where the peak separation
was very poor, the second peak weight percent was much too
large because of the overlapping of the tail of the preced
ing peak. No methyl ester analyses were made for the peaks
of Figure 25 so the composition of the material between the
peaks was not known.
Table 68 was made in an attempt to compare the peaks of
the different silica gel column chromatographs. The compari
son was difficult to make because different eluting solutions
were used for each column. The results for the two oxidized
lard A columns give some indication of the reproducibility
of the results. In order to make an accurate comparison of
the samples, columns would have to be run for each sample

231
using the same conditions and comparison made of the residues
of the same fractions.
The oxidized lard B sample gave peaks which when analyzed,
indicated that there was some oleic acid present in the sample .
The oxidized lard B sample consisted of the combined residues
remaining from two separate oxidations of lard B. One of
these fractions had been checked for unoxidized material by
gas chromatography and none was found. This fraction con
sisted of about 73% of the final sample. The other lard B
sample was obtained by the use of potassium periodate and
there was no indication of incomplete oxidation but a methyl
ester analysis was not made of this fraction. It could have
been incompletely oxidized.
In eluting the last two large peaks from the silica gel
columns, it was necessary to use increasing amounts of acetic
acid in ethyl ether. When these fractions containing acetic
acid were evaporated on the steam plate, the evaporations
took increasingly longer times. When pure glacial acetic
acid was used, the 25 ml fractions required 15-20 hours to
completely evaporate the acetic acid. The residues became
tacky and very difficult to redissolve. The original sample
was not completely soluble in Skellysolve B but dissolved
easily in ethyl ether. The residues from the column after
evaporation of the acetic acid could not be dissolved in ether.

232
They were more soluble in methyl aclohol and/or acetone but
not completely. The methyl ester compositions of the last
peak obtained were particularly low for azelaic acid which
would be expected to be the major constituent if the last
peak corresponded to GA3. This indicated that the azelaic
acid (and other diacids) had undergone reaction and was no
longer methylated when treated with hydrochloric acid-methanol
solution. A possible improvement in the evaporation of the
acetic acid would be the use of a rotary vacuum film evapora
tor if available. This very probably would not prevent all
of the diacids from reacting but might help considerably to
reduce the amount which did react.
After this work had been started, the work of Privett
and Blank (73) was studied. They used ozonolysis of the
double bonds followed by reduction of the ozonides to aldehyde
groups by selective hydrogénation. The separation of these
aldehydes appeared to be much easier than the separation of
the oxidation products containing carboxylic acid groups.
Therefore even though thin layer chromatography was not used
as in the work of Privett and Blank (73), the column sepa
rations could possibly be made without having to use acetic
acid and better methyl ester compositions obtained. This
method of oxidation was considered for this work but equipment
for producing ozone and for carrying out the hydrogénations was

233
not available. There are several published methods for pro
ducing ozone. Two of these appeared to be of possible inter
est if equipment was to be built for producing ozone. In a
paper by von Lindlar (93), the details of an ozonizer which
can be built of glass was described. The major item for this
apparatus appeared to be the equipment required to maintain
the center electrode at 22,000 volts. A second paper, Bovee
and Robinson (14), described the use of a small ultraviolet
lamp, GE 0Z4S11, to produce ozone.
The use of column chromatography has the advantage of
being able to fractionate larger samples than thin layer
chromatography but has the disadvantage of requiring much
more time and considerable extra work in weighing and evaporat
ing the fractions. The fractionation in Figure 23 required 22
hours eluting time plus several hours more time preparing for
the run and finishing the weighings, combining samples, etc.
This represents an extreme case but shows that the time in
volved is in hours or almost days. The separation of the oxi
dation products containing the aldehyde groups and using thin
layer chromatography required times measured in minutes as
carried out by Privett and Blank (73). The disadvantage of
thin layer chromatography as compared to column chromatography
is that the sample size used in thin layer chromatography is
on the order of 50 micrograms whereas about 500 milligrams were
separated on the columns. This becomes important when it is

234
desired to hydrolyze each of the peaks (or spots) obtained
as well as obtain the overall fatty acid methyl ester compo
sitions.
In measuring the gas chromatogram peak areas for test
samples containing both mono- and dicarboxylic acids, Youngs
(98) found that the peak areas of the monocarboxylic acids
(both saturated and unsaturated) corresponded to the weight
of the components but that the diacids formed by the oxida
tion had peak areas consistently lower than for the mono
carboxylic acids. Multiplication by a factor of 1.10 gave
good results for the test sample mixtures over a wide range
of compositions.
Table 72 gives the composition of the oxidized lards and
gives the total saturated acid mol percentages and the total
diacid mol percentages with and without the use of the 1.10
factor. The mol percentage of saturated and unsaturated acids
for the original lard samples are.also given for comparison.
The total mol percentage of diacids obtained should agree
with the total mol percentage of unsaturated acids in the
original sample. The use of the 1.10 factor gave diacid com
positions which were about half way between the diacid com
positions calculated from the area percentages and the mol
percentage of unsaturated acids in the original lards. This
indicated that a factor of about 1.2 would be required to give
diacid compositions corresponding to the unsaturated acid com-

235
position of the original lards. It was from calculations such
as these that it was observed that the azelaic acid composi
tion varied for analyses of the same sample indicating that
the sampling technique was important. The samples of Table 72
were obtained by dissolving the oxidized lard in ether and tak
ing an aliquot. The diacid contents still appeared to be too
low. Starting with complicated mixtures such as these and
trying to work out a multiplication factor for all of the di
acids is subject to considerable error if more information
about the response of the detector and recorder for each of
the components is not known. Some additional work with the
relative response of the mono- and diacids was conducted. The
details of the work are given in the appendix on gas chro
matography.
The Literature Review cited several examples of the
separation of triglycerides using gas chromatography. If a
mixture such as trimyristin, tripalmitin, and tristearin can
be successfully separated by gas chromatography, then it does
not seem unreasonable to expect that the oxidation products of
lard could be separated in this manner. Rather than use the
oxidized lard sample with the carboxylic acid groups at the
points of cleavage, it would be better to use methylated sam
ples or possibly completely hydrogenated oxidized lard samples.
This appears to be a very good area for a problem using gas
chromatography in the field of glyceride structure determina
tion of fats and oils.

MILLIGRAMS
G)
rvi in
ro
OJ
ZJ > o —I
o Z > H
O
m O
X) Cn > O —I
o o o
cz
OF RESIDUE IN 25 ML FRACTION
~T~
t rx)
t OJ
r\j 00
IX) CO CT>
in
en

i u i i i i 100 125 150 175 200
.CTION NUMBER
NATION OF OXIDIZED LARD B
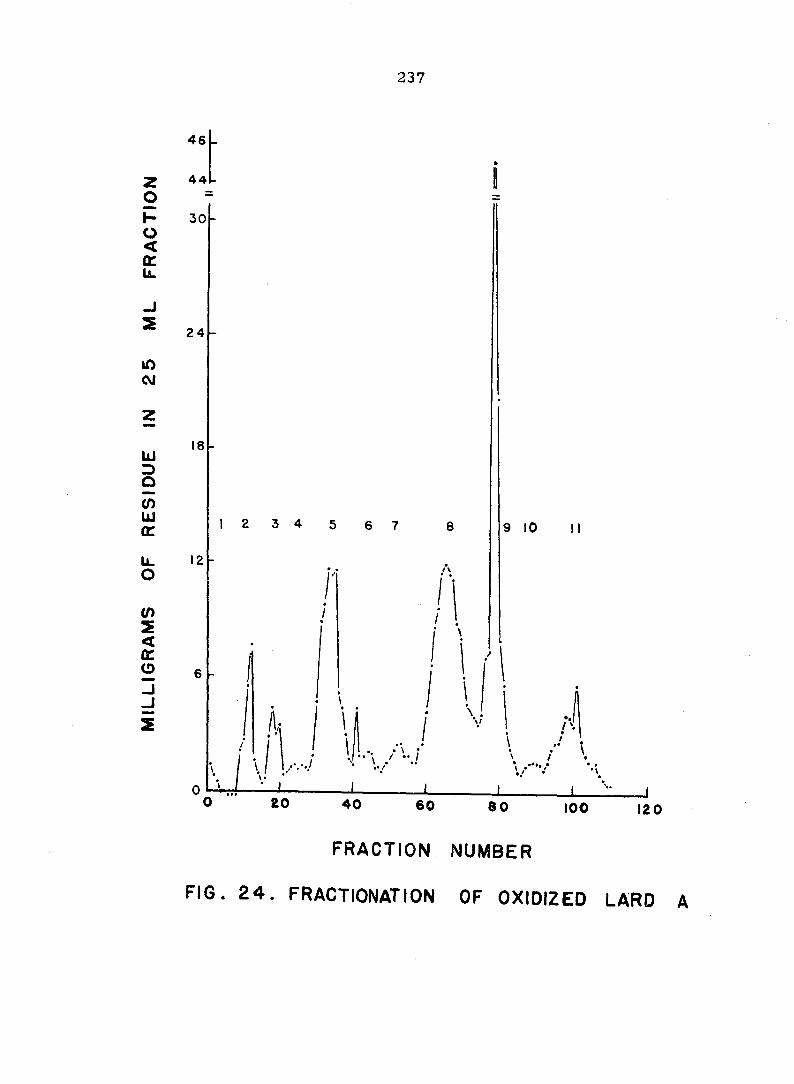
237
FRACTION NUMBER
FIG. 24. FRACTIONATION OF OXIDIZED LARD A

4- 4 -4 •k •74»—8-H
20
o
O 16 oc
S 12
w 3 Q en ui oc
8
CO 2 < tr o
"A * i I I
I I I I I I 11 I I M 1 I I I I 1 I I I I I I I I I 1 I I I I
\ \
_L 1 1 1 i i 1 1 i i i I i i i i 1 1 i 1 1 1 1 i i
V
1 1 1 1 1 1 1 1 1 1 1 1 1 1
CO w 00
10 2.0 3 0 4 0 5 0 6 0 FRACTION NUMBER
7 0 80 9 0 100
FIG. 25. FRACTIONATION OF OXIDIZED LARD A

239
I 2 6
v-.-.
J I I I I L J I L J I I I I L 6 12 18 24 30 36 42 48 64 60 66
FRACTION NUMBER
FIG. 26. FRACTIONATION OF OXIDIZED LARD R

240
Table 63. Fractionation data for Figure 23, oxidized lard B
% ether Flow- Resi % ether Flow- Resi Frac in rate, due , Frac in rate, due, tion Sk. B. ml/min mg tion Sk. B. ml/min mg
1 0 5.0 0.3 46 20 4.3 1.3 2 1 4.3 2.4 47 20 4.2 2.2 3 2 5.3 1.5 48 20 4.0 2.8 4 3 5.6 0.1 49 21 3.9 3.3 5 4 5.2 0.0 50 21 3.9 4.1 6 5 5.2 0.1 51 21 3.8 4.7 7 6 3.6 0.3 52 21 3.8 4.5 8 7 3.8 2.3 53 22 3.6 4.7 9 8 3.4 3.8 54 22 4.0 4.2 10 9 3.7 2.1 55 22 3.5 4.9 11 10 4.0 3.1 56 22 3.8 3.7 12 11 3.9 1.2 57 23 4.2 3.2 13 12 4.0 2.8 58 23 4.0 3.7 14 12 3.1 1.1 59 23 4.2 4.3 15 12 3.3 2.8 60 23 3.9 4.3 16 12 3.0 7.8 61 24 3.9 1.1 17 13 3.5 5.7 62 24 4.0 0.8 18 13 3.7 4.6 63 24 3.7 0.6 19 13 2.7 4.4 64 24 3.5 0.2 20 13 2.6 3.5 65 25 3.4 0.2 21 14 3.7 2.5 66 25 4.5 0.1 22 14 3.9 1.2 67 25 4.4 0.5 23 14 4.0 0.9 68 25 4.4 0.0 24 14 3.8 0.4 69 26 3.8 0.6 25 15 4.4 0.3 70 26 3.9 0.5 26 15 4.5 0.4 71 26 4.0 0.2 27 15 4.5 1.1 72 26 4.0 0.2 28 15 3.7 1.3 73 27 3.6 0.7 29 16 4.0 1.4 74 27 4.3 0.6 30 16 4.4 1.7 75 27 5.0 0.6 31 16 4.9 1.2 76 27 4.0 0.6 32 16 3.7 1.1 77 28 4.3 0.6 33 17 4.3 0.9 78 28 4.4 0.6 34 17 4.5 0.7 79 28 4.4 0.4 35 17 4.2 0.8 80 28 3.7 0.3 36 17 3.9 1.5 81 29 4.4 0.2 37 18 3.9 0.9 82 29 4.4 0.2 38 18 4.0 0.8 83 29 4.1 0.3 39 18 4.0 0.6 84 29 4.1 0.2 40 18 4.4 0.6 85 30 4.1 0.5 41 19 4.0 0.7 86 30 4.2 0.4 42 19 4.3 0.9 87 30 4.6 0.4 43 19 4.4 0.9 88 30 3.8 0.3 44 19 3.9 0.9 89 31 4.2 0.4 45 20 4.0 0.8
89 31

241
Table 63. (Continued)
% ether Flow- Resi % ether Flow- Resi Frac in rate, due , Frac in rate , due, tion Sk. B. ml/rain mg tion Sk. B. ml/min mg
90 31 4.2 0.4 135 3.9 3.0 91 31 4.3 0.4 136 4.5 2.7 92 31 4.0 0.5 137 43 4.2 2.6 93 32 4.3 0.7 138 4.2 2.7 94 32 4.2 0.8 139 4.2 1.3 95 32 4.2 0.9 140 3.8 2.1 96 32 4.2 0.9 141 44 3.8 2.0 97 33 4.4 0.8 142 4.4 2.8 98 33 4.0 0.7 143 4.7 2.6 99 33 4.3 0.9 144 4.2 2.3 100 33 4.2 1.0 145 45 4.2 2.1 101 34 4.2 0.9 146 4.1 2.0 102 4.2 1.1 147 4.3 1.9 103 4.2 0.8 148 4.2 1.5 104 4.2 0.7 149 46 3.2 1.3 105 35 4.1 0.7 150 47 3.9 1.0 106 4.2 0.6 151 48 3.6 1.3 107 3.7 0.3 152 49 3.7 1.2 108 4.0 0.6 153 50 4.2 2.1 109 36 3.9 0.8 154 51 3.6 2.0 110 4.3 0.4 155 52 4.0 2.1 111 4.3 0.7 156 53 3.8 2.1 112 4.4 0.7 157 54 4.1 1.9 113 37 4.0 1.1 158 55 4.0 0.3 114 4.0 1.3 159 60 3.9 1.7 115 4.0 2.2 160 65 4.0 2.0 116 3.9 2.5 161 70 4.3 2.1 117 38 3.8 2.9 162 75 4.2 2.3 118 4.5 3.5 163 80 4.2 2.3 119 4.2 3.6 164 85 4.3 2.3 120 4.1 3.6 165 90 4.5 2.4 121 39 3.3 3.0 166 95 3.7 2.9 122 4.2 3.0 167 100 4.6 2.8 123 4.2 3.1 % HAC in ether 124 3.9 2.8 168 2.5 4.2 2.8 125 40 4.2 2.7 169 5.0 4.6 2.1 126 4.2 2.8 170 7.5 4.5 58.4 127 4.0 3.1 171 10.0 4.1 18.1 128 4.5 2.9 172 12.5 3.9 10.4 129 41 4.2 2.9 173 15.0 3.7 4.4 130 4.5 3.3 174 17.5 3.6 2.6 131 3.9 2.7 175 20.0 3.3 1.9 142 3.9 3.1 176 22.5 3.7 1.3 133 42 4.1 2.5 177 25.0 3.7 1.4 134 3.9 2.8 178 27.5 3.4 1.3

242
Table 63. (Continued)
% ether Flow- Resi % ether Flow- ResiFrac in rate, due, Frac in rate, due, tion Sk. B. ml/min mg tion Sk. B. ml/min mg
179 30.0 3.9 1.2 189 80 2.3 3.5 180 32.5 3.9 1.4 190 90 2.1 3.7 181 35 4.2 1.4 191 100 2.2 4.2 182 40 4.0 1.5 192 100 2.2 3.9 183 45 3.9 1.4 193 100 2.2 3.1 184 50 3.4 2.9 194 100 2.3 2.4 185 55 2.9 2.7 195 100 2.3 2.0 186 60 2.8 2.5 196 100 1.9 1.6 187 65 2.5 2.9 197 100 1.9 1.5 188 70 2.4 3.4 198 100 1.9 1.0
199 100 1.9 1.2
Table 64. Fractionation data for Figure 24 , oxidized lard A
% ether Flow- Resi % ether Flow- ResiFrac in rate, due, Frac• in rate, due , tion Sk. B. ml/min mg tion Sk. B. ml/min mg
1 0 5.8 1.5 24 19 5.3 1.5 2 1 5.0 0.9 25 19.5 5.1 1.3 3 2 5.0 0.6 26 20 5.2 1.5 4 3 5.7 0.0 27 20.5 5.2 1.4 5 4 5.8 0.0 28 21 5.1 1.2 6 5 5.4 -0.1 29 21.5 4.8 2.0 7 6 5.8 —0.1 30 22 5.1 4.8 8 7 5.4 -0.1 31 22.5 5.0 9.1 9 8 5.8 2.2 32 23 5.1 10.0 10 9 5.6 2.8 33 23.5 5.0 11.9 11 10 4.9 5.6 34 24 5.0 11.5 12 11 5.1 7.8 35, 25 4.8 11.8 13 12 4.6 1.7 36 26 5.0 5.3 14 13 4.9 1.0 37 27 5.0 4.5 15 14 4.7 0.5 38 28 4.6 3.1 16 15 5.0 0.8 39 29 4.8 1.9 17 15.5 5.1 3.0 40 30 4.7 1.6 18 16 5.0 4.5 41 31 5.2 4.5 19 16.5 5.2 3.1 42 32 4.6 2.0 20 17 4.9 3.6 43 33 4.5 2.0 21 17.5 5.1 1.0 44 33.5 4.8 2.2 22 18 5.2 1.1 45 34 5.0 2.1 23 18.5 5.3 1.4 46 34.5 5.0 1.4

243
Table 64. (Continued)
% ether Flow- Resi % ether Flow- ResiFrac in rate, due, Frac in rate, due, tion Sk. B. ml/min rag tion Sk. B. ml/rain rag
47 35 5.0 1.4 87 30.0 4.0 1.5 48 36 4.9 1.2 88 32.5 5.1 1.7 49 38 5.0 1.7 89 35.0 4.2 1.7 50 40 5.1 1.9 90 40 4.1 1.7 51 41 5.1 2.3 91 45 4.0 1.6 52 42 4.9 2.6 92 50 3.7 1.3 53 43 4.9 2.4 93 55 3.8 1.7 54 44 4.6 2.0 94 60 3.5 2.4 55 45 4.8 2.0 95 65 3.2 2.7 56 45.5 4.4 1.7 96 70 2.9 2.8 57 46 4.6 1.7 97 80 2.7 3.4 58 46.5 4.8 2.2 98 90 2.4 4.2 59 47 4.7 2.7 99 100 2.1 4.1 60 48 4.7 4.3 100 100 2.1 3.6 61 50 5.0 6.8 101 100 2.3 5.7 62 52 4.9 8.8 102 100 2.3 2.9 63 54 5.1 9.8 103 100 2.2 2.1 64 56 5.0 11.7 104 100 2.1 1.8 65 58 5.0 12.1 105 100 2.1 1.5 66 60 5.1 11.6 106 100 2.2 1.7 67 62 5.2 11.3 107 100 2.2 1.1 68 64 4.8 9.0 108 100 2.1 0.9 69 66 4.8 8.2 109 100 2.0 0.6 70 68 4.9 8.2 110 100 2.1 0.6 71 70 4.8 4.8 72 75 5.0 4.3 73 80 5.2 4.1 74 90 5.2 3.7 75 100
% HAC in 5.4
ether 4.2
76 2.5 5.2 7.2 77 5.0 5.3 7.5 78 7.5 4.7 45.4 79 10.0 4.6 20.9 80 12.5 4.5 8.1 81 15.0 4.6 5.8 82 17.5 4.3 3.3 83 20.0 4.5 2.4 84 22.5 4.2 1.8 85 25.0 4.0 1.2 86 27.5 4.0 1.1

244
Table 65. Fractionation data for Figure 25, oxidized lard A
% ether Flow- Resi % ether Flow- Resi Frac in rate, due, Frac in rate, due, tion Sk. B. ml/min rag tion Sk. B. ml/min mg
1 0 2.1 0.6 44 43 2.7 1.4 2 1 2.3 0.7 45 44 2.7 1.7 3 2 3.1 -0.1 46 45 1.6 1.4 4 3 2.9 -0.5 47 46 2.5 1.6 5 4 2.5 -0.3 48 47 3.3 2.6 6 5 2.5 -0.4 49 48 - 5.4 7 6 2.4 -0.2 50 49 - 11.5 8 7 2.3 0.3 51 50 - 16.9 9 8 2.1 1.0 52 51 2.7 18.3
10 9 2.3 6.2 53 52 2.5 19.0 11 10 3.6 9.9 54 53 2.6 14.9 12 11 2.6 1.7 55 54 2.7 10.6 13 12 2.4 0.5 56 55 2.7 8.0 14 13 2.5 0.1 57 56 2.4 6.0 15 14 2.2 4.0 58 57 2.4 3.9 16 15 2.4 5.1 59 58 2.3 3.1 17 16 2.2 3.0 60 59 2.6 2.4 18 17 2.2 —0.1 61 60 2.8 2.0 19 18 2.1 1.1 62 61 2.1 1.5 20 19 3.1 0.6 63 62 2.2 1.8 21 20 2.7 0.5 64 63 2.7 1.5 22 21 2.5 0.2 65 64 2.7 1.5 23 22 2.5 2.4 66 65 2.8 0.6 24 23 2.5 3.0 67 66 2.8 0.8 25 24 2.5 2.4 68 67 2.8 1.4 26 25 2.5 2.7 69 68 2.8 1.5 27 26 1.5 8.9 70 69 2.5 1.5 28 27 1.5 14.2 71 70 2.4 1.6 29 28 1.7 14.7 72 71 2.3 1.7 30 29 2.0 10.7 73 72 2.3 1.7 31 30 2.1 7.3 74 73 2.1 1.8 32 31 2.3 5.2 75 74 2.2 2.0 33 32 2.3 3.4 76 75 2.3 1.9 34 33 1.9 2.3 77 76 2.2 1.5 35 34 2.5 1.7 78 77 2.3 2.1 36 35 2.3 2.4 79 78 2.9 2.3 37 36 2.1 3.4 80 80 2.6 2.3 38 37 2.1 2.5 81 85 2.4 2.2 39 38 1.8 2.8 82 90 2.4 2.1 40 39 3.1 1.7 83 95 2.3 1.9 41 40 2.6 1.3 84 100 2.4 2.1 42 41 2.5 1.3 % HAc in e t he r 43 42 2.6 1.1 85 5 ' 2.4 2.3

245
Table 65. (Continued)
% ether Flow- Resi % ether Flow- ResiFrac in rate due, Frac in rate, due, tion Sk. B. ml/min mg tion Sk. B. ml/min mg
% HAc in ether (continued)
86 10 2.3 13.1 94 80 1.6 5.0 87 15 2.3 17.6 95 100 1.9 6..2 88 20 2.3 8.8 96 100 1.6 7.3 89 25 2.5 4.3 97 100 2.2 7.6 90 30 2.3 2.2 98 100 2.2 5.1 91 40 2.2 2.0 99 100 2.2 3.7 92 50 1.9 2.7 100 100 — 2.8 93 60 1.8 3.3 101 100 1.2
Table 66. Fractionation data for Figure 26, oxidized lard R
% ether Flow- Resi % ether Flow- ResiFrac in rate due , Frac - in rate, due , tion Sk. B. ml/min mg tion Sk. B. ml/min mg
1 0 2.3 0.9 26 50 2.3 7.7 2 2 2.6 0.9 27 52 2.3 7.1 3 4 2.0 1.5 28 54 1.9 6.7 4 6 1.9 0.3 29 56 2.4 6.0 5 8 2.0 1.9 30 58 2.4 23.1 6 10 2.9 0.5 31 60 2.3 56.2 7 12 2.7 18.5 32 62 - 41.4 8 14 3.0 7.3 33 64 2.3 35.2 9 16 1.7 2.0 34 66 2.3 21.1
10 18 2.0 28.0 35 68 2.3 19.8 11 20 1.9 35.3 36 70 2.3 14.6 12 22 2.5 18.1 37 72 2.3 9.8 13 24 1.9 14.2 38 74 2.3 7.5 14 26 2.5 8.0 39 76 3.3 6.0 15 28 2.3 7.0 40 78 2.9 5.2 16 30 2.3 9.6 41 80 2.8 5.1 17 32 2.2 8.6 42 82 1.9 4.6 18 34 1.9 20.0 43 84 2.9 3.9 19 36 2.1 29.8 44 86 2.2 3.1 20 38 3.0 27.2 45 88 2.2 2.9 21 40 2.3 12.3 46 90 2.1 2.5 22 42 2.3 6.0 47 92 1.7 2.0 23 44 2.3 5.8 48 94 2.6 1.5 24 46 2.3 6.1 49 96 2.2 1.4 25 48 2.3 8.9 50 98 2.1 1.0

246
Table 66. (Continued)
% ether Flow- Resi-Frac- in rate, due, Fraction Sk. B. ml/min mg tion
% ether Flow- Resi-in rate, due, Sk. B. ml/min mg
51 100 2.0 1.1 61 30 1.7 1.7 % HAc in ether 62 33 2.6 1.0
52 3 1.9 1.4 63 36 2.2 1.4 53 6 1.9 0.9 64 39 1.8 1.9 54 9 2.2 23.5 65 42 2.7 2.0 55 12 2.8 23.1 66 45 2.1 2.1 56 15 2.0 11.5 67 48 3.3 2.2 57 18 2.1 5.2 68 — — — — 2.7 58 21 2.2 3.6 59 24 2.2 2.5 60 27 1.9 2.0
Table 67. Data for peaks of the fractionated oxidized lards
Oxidized lard B, Figur e 23 Oxidized lard A, Figure 24 Fractions Peak Wt, mg Wt % Fractions Peak Wt,mg Wt %
1-5 1 4.4 1.0 1-7 1 3.8 0.9 6-13 2 15.6 3.5 8-15 2 23.7 5.4 14-25 3 35.2 8.0 16-21 3 14.0 3.2 26-44 4 18.4 4.2 22-27 4 11.6 2.6 45-65 5 58.6 13.3 28-41 5 86.8 19.6 66-106 6 22.2 5.0 42-47 6 11.1 2.5 107-150 7 98.8 22.4 48-56 7 17.1 3.9 151-157 8 12.7 2.9 57-74 8 121.6 27.5 158-168 9 24.4 5.5 75-85 9 100.3 22.7 169-179 10 103.1 23.4 86-91 10 6.3 1.4 180-199 11 48.2 10.9 92-110 11 46.4 10.5
Total - 441.6 100.1 Total - 442.7 100.2
Oxidized lard A, Figure 25 Oxidized lard R, Figure 26 1-12 1 28.1 6.7 1-9 1 33.8 4.4 13-20 2 20.7 4.9 10-15 2 110.6 14.5 21-36 3 88.3 21.0 16-23 3 119.3 15.6 37-45 4 18.4 4.4 24-29 4 42.5 5.6 46-66 5 140.2 33.3 30-53 5 271.3 35.6 67—84 6 30.1 7.2 54-62 6 74.1 9.7 85-90 7 47.1 11.2 63-69 7 12.3 1.6 91-101 8 48.0 11.4 — — — Loss 99.2 13.0
Total - 420.9 100.1 Total - 763.1 100.0

247
Table 68. Comparison of the peaks of the oxidized lards
Figure : 23 24 25 26 Oxid. lard: B A A R
Peak Wt % Peak Wt % Peak Wt % Peak Wt %
1 1.0 1 0.9 2 3.5 2 5.4 1 6.7 1 4.4 3 8.0 3 3.2 . 2 4.9 2 14.5 4 4.2 4 2.6 5 13.3 5 19.6 3 21.0 3 15.6 6 5.0 6
7 2.5 3.9 4 4.4
4 5.6
7 22.4 8 27.5 5 6
33.3 7.2
5 35.6
8 2.9 9 5.5
10 23.4 9 10
22.7 1.4
7 11.2 6 9.2
11 10.9 11 10.5 8 11.4 7 loss
1.6 13.0
Original, mg 468.7 404.7 406.4 763.1 Recovered,mg 441.6 446.4 420.9 663.9
Table 69. Oxidized lard B, peak fatty acid compositions (Figure 23)
Silica gel col. peak: 1 2 3 4 5 6 7 Glc. Peak Mol percent3
DiC? •j-b T - - - T Myr. 3.1 2.6 1.1 1.6 1.2 1.8
0.9 DiCg . T T - - 3.3 1.8 0.9
Semi-DiCg - T - - -
DiC 9 - 4.0 2.9 34.7 48.2 19.5
40.3 38.2 Pal. — 50.8 51.6 32.0 30.0 48.2
19.5 40.3 38.2
Sol0 : — 3.5 1.4 ? K
1.8
Semi-DiCii - - 0.6 - -u « J
T DiCn - T - T 2.4 6.1 Stear. 46.1 41.1 18.6 19.9 o 1 10.8 rp Oleic - - 39.6 12.5 13.6
10.8 rp
Linol. - - 2.3 -13.6 JL
a Chromatogram area percent assumed equal to area percent
and converted to mol percent.
kf = trace.

248
Table 69. (Continued)
Silica gel col. peak: 12 3 4 5 6 7 Glc. Peak Mol percent3
Mol % satd. - 100.0 95.4 51.7 30.0 30.0 50.9 Mol % unsatd. - 0 4.6 48.3 48.6 70.0 49.1
8 9 10 11
DiC? T T T -
Myr. 2.1 2.7 1.4 1.9 DiCo 1.2 1.6 2.9 1.6 Semi-DiCg T T T -
DiC 9 48.7 47.5 62.7 39.1 Pal. 39.7 40.7 20.8 30.1 DiClO 1.9 T 1.3 -
P.O. - - - 4.5 Semi-DiCi, - T T —
DiC ii 0.4 1.2 5.0 1.6 Stear. 5.7 6.0 4.9 10.2 Oleic 0.2 0.4 0.9 11.0 Linol. - - - -
Mol % satd. 47.5 49.4 27.1 42.2 Mol % unsatd. 52.5 50.6 72.9 57.8
Table 70. Oxidized lard A, peak fatty acid compositions (Figure 24)
Silica gel col. peak: Peak
1 2 3 Mol
4 percent
5 6
DiC? - T T T T T Myr. - 3.1 3.2 3.4 3.2 2.4 Dies - T T T 0.9 0.9 Semi-DiC9 - T T T T T DiC 9 - - 3.6 1.2 23.0 32.4 Palmitic - 62.7 62.4 63.2 48.7 38.9 DiCio - - - T T 3.5 P.O. - - - - - -
DiCio+P.0. — - - - - -
Semi-DiCn - 0.6 T 0.9 0.4 T

249
Table 70. (Continued)
Silica gel col. peak: 12 3 4 Peak Mol percent
DiC — — T — 2.0 2.1 Stear. - 33.6 30.9 31.3 21.8 18.7 Oleic — — — — — 0.9 Linol. — — — — — —
Mol % satd. - 99.4 96.4 97.9 73.7 60.1 Mol % unsatd. - 0.6 3.6 2.1 26.3 39.9
7 8 9 10 11
DiC? T T 0.5 T 0.8 Myr. 1.7 1.6 0.7 T 0.8 DiCg 1.2 1.2 2.0 1.2 2.3 Semi-DiC9 - T - 0.7 0.3 DiC 9 37.2 52.9 75.6 51.2 46.0 Pal. 34.9 26.6 9.5 16.4 19.4 DiC io - 1.3 0.8 - -
P.O. - - - - -
DiCiQ+P.C. 2.3 - - 1.9 2.3 Semi-DiCii - - - T 1.2 DiCn 3.1 4.6 7.1 7.4 4.3 Stear. 18.0 11.8 3.5 12.7 13.7 Oleic 1.6 - 0.4 8.6 9.0 Linol. - - - - -
Mol % satd. 54.6 40.0 13.5 29.1 66.1 Mol % unsatd. 45.4 60.0 86.5 70.9 33.9
Table 71. Oxidized lard R, peak fatty acid compositions (Figure 26)
Silica gel col. peak: 1234 56 7 2 Glc. peak Mol percent Pelargonic - a - - - - ~ 38.1 Myristic 3.4 4.1 3.5 2.4 1.5 - - 2.5 DiCs - 1.8 1.7 9.6 3.5 DiCg - - 19.6 29.4 55.3 71.4 12.0
^Pelargonic acid left out of these calculations. See last column for calculations with pelargonic acid included.

250
Table 71. (Continued)
Silica gel col. peak: Glc. peak
1 2 3 4 5 Mol percent
6 7 2
Palmitic 63 .4 65.0 53.1 39.7 24.5 7.7 30.4 40.3 P.O. - - — — — - 3.1 -
DiCn - - 4.3 5.7 5.9 1.6 -
Stearic 33 .2 30.9 23.9 19.8 11.2 3.6 22.7 19.1 Oleic - - 2.7 2.0 25.1 -
Linol. - - — — — - 1.6 -
Table 72. Oxidized lard compositions and the saturated and unsaturated acids of the original lards
Lard Before Oxidized lards
After Random Lard Chromatogram area percenta
Pelargonic(Cg) 5.9 2.2 2.5
Mol percent*3
Myr. 2.0 2.8 2.1 DiC 8 1.9 1.9 2.0 DiC 9 45.1 43.3 41.0 Pal. 32.4 32.7 33.8 DiCio 0.4 0.4 0.4 Semi-DiCil 0.4 0.4 0.4 DiCn 4.1 3.9 4.0 Stear. 13.9 14.8 16.3
Total satd. 48.2 50.2 52.2 Total diacid 51.8 49.8 47.8
Diacids multiplied by 1 .10 Mol % satd. 45.9 47.8 49.8 Mol % diacid 54.1 52.2 50.2
Original lards Mol % satd. 41.4 43.4 45.7 Mol % unsatd. 58.6 56 .6 54.3
^Pelargonic acid is one of major short chain fatty acids cleaned from glyceride molecule during the oxidation. Some of the acid was not stripped from sample after oxidation. It was not included in calculations for glyceride residue composition.
^Chromatogram area percents were assumed to be equal to wt % and the mol % calculated from the wt %.

251
SUMMARY
The purpose of this research was to study the glyceride
structure of lard before and after molecular rearrangement.
The rearranged lard was prepared using sodium methylate. The
methods used were fractionation of the lards by crystalliza
tion and the lard samples and crystallization fractions were
further studied by employing enzymatic hydrolysis with steap-
sin. The fractional crystallizations were conducted in a low
temperature cabinet cooled by circulating air through crushed
Dry Ice. Details of the construction of the apparatus and
the temperature control are described in an appendix. Fatty
acid analyses were made by converting the acids to methyl
esters and the methyl ester compositions determined by gas
chromatography.
Methyl esters of the fatty acids of glycerides and of
pure free fatty acids were prepared by the use of hydrochloric
acid-methanol solution. Methylation of free fatty acids in a
mixture of glycerides was conducted using ethereal solutions
of diazomethane.
The hydrolysis products were analyzed by treating one
sample with diazomethane and obtaining the free fatty acid
compositions by gas chromatography. The free fatty acids in
the hydrolysis products originated from the 1- and 3-positions
of the original triglycerides. A second sample of the hy

252
drolysis products was treated with periodic acid to destroy
the 1-monoglycerides. The 2-monoglycerides were separated
from the remainder of the hydrolysis products by use of silica
gel column chromatography using ether-Skellysolve B for elu-
tion. The 2-monoglyceride fractions were analyzed for their
fatty acid contents by gas chromatography of the fatty acid
methyl esters. The 2-monoglyceride fatty acid composition
data was not considered to be reliable because of ethyl ether
vapor formation in the silica gel columns. Only the methyl
ester compositions for the lard and lard fraction triglycerides
and the free fatty acid methyl ester compositions of the hy
drolysis products were studied in detail.
A study of different methods of hydrolysis using differ
ent conditions of hydrolysis was made. The conclusion was
that all of the methods employed were satisfactory but the
formation of the fat-buffer solution-steapsin emulsion was
the determining factor in whether or not reliable results were
obtained. If the emulsion was not finely divided and stable,
the hydrolysis showed a specificity for the different types
of fatty acid chains present in the triglyceride sample. The
apparatus used to produce the emulsion therefore was more im
portant than the hydrolysis conditions used.
The use of Amberlite IRA-400 anion exchange resin was
studied for recovering free fatty acids from mixtures contain

253
ing free fatty acids, mono-, di-, and triglycerides. The use
of columns of resin were in general very troublesome and did
not completely remove all of.the fatty acids from the mixtures.
The formation of ethyl ether vapor bubbles in the resin was
the cause of the poor recoveries. One contact batch treatment
with resin of a mixture of free fatty acids and glycerides in
an ethereal solution was found to give better results. If
enough resin was not used to recover all of the fatty acids,
the resin was more selective for short chain fatty acids than
long chains and more selective for unsaturated than saturated
acids of the same chain length and the fatty acids recovered
by the resin were not representative of the fatty acids origin
ally present in the mixture. It was found that the most con
venient method of recovering adsorbed fatty acids from the
resin was to treat the resin-fatty acids with hydrochloric
acid-methanol of 5% or higher acid concentration and to wash
the resin with ethyl ether to insure all of the fatty acids
and/or methyl esters were dissolved. The ether-hydrochloric
acid-methanol solutions were then heated to complete the
methylation and to evaporate the solvent. Traces of solvent
and hydrochloric acid were removed under vacuum. The residue
of methyl esters could then be injected directly into a gas
chromatograph. If traces of water were present it was removed
by adding anhydrous sodium sulfate to an ethereal solution of
the methyl esters. The use of the resin was finally eliminated

254
by using diazomethane to obtain the free fatty acid composi
tions. The free fatty acids in the sample used to recover
the 2-monoglyce rides were eluted with the tri- and diglycer-
ides and the glycolic aldehydes.
The analyses of the lard and lard fractions and of the
free fatty acids formed during enzymatic hydrolyses gave data
which were the basis of the following conclusions. The short
chain fatty acids (both saturated and unsaturated) were found
to be more predominate in the 2-position than in the 1- and
3-positions of the lard before rearrangement. Palmitic acid
was by far the major short chain fatty acid (C14 and
chains). All of the C^Q fatty acids of lard were found to be
more predominate in the 1- and 3-positions of the lard before
rearrangement. This included the saturated C^g acid, stearic
acid, which was 12.3 mol percent of the total fatty acids.
None of the individual fatty acids corresponded to a random
distribution in the 1-, 2-, 3-positions or in just the 1- and
3-positions of lard fractions for the sample before rearrange
ment. The distributions for the individual fatty acids found
in the 1-, 2-, and 3-positions and in the 1- and 3-positions
showed similar deviations from random distribution for the
same fractions.
The samples after rearrangement corresponded very closely
to a random distribution of the individual fatty acids in the

lard fractions. The rearranged sample treated with sodium
methylate for just 15-20 minutes indicated that the randomiza
tion may not have been quite complete. The 15-20 minutes re
arranged sample after heating for 2 hours more with sodium
methylate appeared to be completely randomized when the in
dividual fatty acid distribution curves were studied. The
fractional crystallization data gave lower trisaturated and
triunsaturated glyceride contents for the rearranged samples
than completely randomized samples would have but the differ
ences were probably due to the assumptions made in making the
glyceride composition calculations.
The distribution of the saturated acids among each of
the six glyceride types, SSS, SSU, SUS, SUU, USU, and UUU ap
peared to be random even though none of the individual satura
ted acids showed a random distribution in these glycerides.
This was possible because the deviations from random distribu
tion for the individual saturated acids were not all higher or
all lower than the calculated random distribution. The devia
tions of the individual fatty acids tended to cancel and the
result was that the saturated fatty acid distribution tended
to be random among the crystallization fractions. The same
was found to be true for the unsaturated acids.
The deviations of the individual saturated fatty acids
from random were in general larger for the saturated frac-

256
tions. The deviations of the individual unsaturated acids
were larger for the unsaturated fractions and very nearly ran
dom for the saturated fractions.
Trisaturated glyceride determinations conducted as de
scribed in the literature by fractional crystallization gave
results about 30% lower than obtained from the lard fraction
ation data. The amount of trisaturated glycerides calculated
for random distribution of all the fatty acids on all the
glyceride sites indicated that the fractionation data were
also lower than the true value.
An attempt was made to study the individual saturated
fatty acid distributions in each of the six glyceride types
by first completely oxidizing the carbon-carbon double bonds
of the lard to form carboxylic acid groups and fractionation
of the oxidation products on silica gel columns. The frac
tionation of the oxidation products appeared to give separa
tion into peaks corresponding to the six glyceride types but
the methyl ester analyses did not indicate that pure fractions
had been obtained except for the trisaturated glycerides. The
diacid contents were probably unreliable because heating of
the fractions during evaporation of solvent, particularly when
acetic acid was present, caused the diacids to react. Methy-
lation of the residues, after evaporation, using hydrochloric
acid-methanol did not form methyl esters of all of the diacids
originally present in the fraction before passage through the

257
silica gel column. Attempts to hydrolyze 3-30 milligram sam
ples were also unsuccessful because the emulsions formed were
not adequate. Recommendations for the continuation of this
work are the formation of aldehyde groups instead of carboxylic
acid groups in the oxidation step. These products should be
more easily eluted and separated on silica gel columns and
avoids the need to use acetic acid to elute the more polar
components from the column. Adequate equipment to prepare
emulsions of samples of approximately 3 ml in size would be
necessary for carrying out successful hydrolyses.
The gas chromatograms obtained for most of the work were
obtained from a gas chroraatograph constructed in the labora
tory. The final analyses used for the crystallization frac
tions were made on a F and M Model 500 gas chromatography De
tails of the various stages of construction of the gas chroraa
tograph are described in an appendix. The best monocarboxylic
acid separations were obtained using ethylene glycol succinate
on acid washed Chromosorb. The separation of a mixture of
mono- and dicarboxylic acids was accomplished by the use of
10 ft of 15% butanediol succinate on acid washed Chromosorb
plus 4 to 18 in of 15% Dow Corning hi-vacuum silicone grease
on aqua regia treated C-22 firebrick. The supports used for
the liquid substrates were found to affect the separations ob
tained. The use of butanediol succinate on acid washed C-22

258
firebrick did not give satisfactory separations whereas aqua
regia treated C-22 firebrick gave good separations. Butanediol
succinate on Chromosorb W was found to be inadequate for
separation of the Cis saturated and unsaturated series of
fatty acid methyl esters and for the separation of pimelate-
myristate and of azelate-palmitate.

259
LITERATURE CITED
1. Ackman, R. G., Bannerman, M. A., and Vandenheuvel, F. A. Decomposition of short-chain dicarboxylic acid esters during separation on polyester gas chromatography media. Anal. Chem. 32:1209. I960.
2. A. 0. C. S. Official Method Cd 7-58. Poly-unsaturated acids; ultraviolet spectrophotometry method. In American Oil Chemists* Society. Official and tentative methods of the American Oil Chemists® Society. 2nd ed. Chicago, Illinois, Author. Revision 1959.
3. Applied Science Laboratories, (State College, Pa.). Report on triglyceride analyses at Applied Science Labs brings reader comments. Gas-Chrom Newsletter 2, No. 4: 1. Sept. 1961.
4. Bailey, Alton E. Industrial oil and fat products. 2nd ed. New York, Interscience Publishers, Inc. 1951.
5. Bens, Everett M. Adsorption characteristics of some gas-liquid chromatographic supports. Anal. Chem. 33: 178-182. 1961.
6. Bergstrom, Sune and Borgstrom, Bengt. The intestinal absorption of fats. In Holman, Lundberg, and Malkin, eds. Progress in the chemistry of fats and other lipids. Vol. 3. pp. 351-394 . New York, Pergamon Press. 1955.
7. Borgstrom, Bengt. Effect of tauro-cholic acid on the pH/activity curve of rat pancreatic lipase. Biochim. Biophys. Acta 13:149-150. 1954.
8. Borgstrom, Bengt. The formation of new glyceride-ester bonds during the digestion of glycerides in the lumen of the small intestine of the rat. Archives of Biochemistry and Biophysics 49:268-275.
9. Borgstrom, Bengt. Investigation on lipid separation methods; separation of cholesterol esters, glycerides, and free fatty acids. Acta Physiol. Scand. 25:111-119. 1952.
10. Borgstrom, Bengt. Investigation on lipid separation methods. III. Separation of tri-, di-, 1-mono-, and 2-monoglycerides. Acta Physiol. Scand. 25:231-239. 1953.

260
11. Borgstrom, Bengt. On the action of pancreatic lipase on triglycerides in vivo and vitro. Acta Physiol. Scand. 25:328-347. T933.
12. Borgstrom, Bengt. On the mechanism of pancreatic lipoly-sis of glycerides. Biochim. Biophys. Acta 13:491-504. 1954.
13. Borgstrom, Bengt. On the mechanism of the hydrolysis of glycerides by pancreatic lipase. Acta Chem. Scand. 7: 557-558. 1953.
14. Bovee, H. H. and Robinson, Rex J. Sodium diphenylamine-sulfonate as an analytical reagent for ozone. Anal. Chem. 33:1115-1118. 1961.
15. Cason, James, Sumrell, Gene, and Mitchell, Robert S. Branched-chain fatty acids. XV. Syntheses of dimethyl-octadecanoic acids. J. Org. Chem. 15:850-859. 1950.
16. Chapman, I. D. Infrared spectra and the polymorphism of glycerides. J. Chem. Soc. (London) 1956:55-60. 1956.
17. Corcoran, Geraldine. Chromatographic separation and determination of straight-chain saturated monocarboxylic acids Ci through Cio and dicarboxylic acids C4 through Ci6* Anal. Chem. 28:168-171. 1956.
18. Craig, B. M. and Murty, N. L. Quantitative fatty acid analysis of vegetable oils by gas-liquid chromatography. J. Am. Oil Chemists* Soc. 36:549-552. 1959.
19. Craig, B. M= and Murty, N. L. The separation of saturated and unsaturated fatty acid methyl esters by gas-liquid chromatography. Can. J. Chem. 36:1297-1301. 1958.
20. Cropper, R. R. and Heywbod, A. The analysis of fatty acids and fatty alcohols by vapour phase chromatography. In Desty, D. H. Vapor phase chromatography, pp. 316-331. New York, Academic Press, Inc., Publishers. 1956.
21. Desnuelle, P. and Constantin, M. J. Formation de glycerides partiels pendant la lipolyse des triglycerides dans 1*intestin. Biochim. Biophys. Acta 9:531-537. 1952.
22. Desnuelle, P., Naudet, M., and Constantin, M. J. Action des sels,de calcium sur l'hydrolyse des triglycerides par la pancreatine et le suc pancréatique. Biochim. Biophys. Acta 5:561-568. 1950.

261
23. Desnuelle, P., Naudet, M., and Constantin, M. J. Sur un nouveau type de lipolyse in vitro une lipolyse "génératrice de glycérol". Biochim. Biophys. Acta 7: 251-256. 1951.
/
24» Desnuelle, P., Naudet, M., and Rouzier, J. Etude quantitative de la formation de glycerides partiels au cours de l'hydrolyse fermentaire des triglycerides. Biochim. Biophys. Acta 2:561-574. 1948.
25. Desnuelle, P. and Savary, P. Sur la structure glycér-idique de quelques corps gras naturels. Fette, Seifen, Anstrichmittel 61:871-876. 1959,
26. Frankel, E. N., Evans, C. D., McConnell, D. G., and Jones, E. P. Analysis of lipids and oxidation products by partition chromatography ; fatty acid hydroperoxides. J. Am. Oil Chemists' Soc. 38:134-137. 1961.
27. Frankel, E. N., Nowakowska, Janina, and Evans, C. D. Formation of methyl azelaaldehydate on autoxidation of lipids. J. Am. Oil Chemists' Soc. 38:161-162. 1961.
28. Fryer, F. H., Ormand, W. L., Crump, G. B. Triglyceride elution by gas chromatography. J. Am. Oil Chemists' Soc. 37:589-590. I960.
29. Hawley, H. K. and Holman, G. W. Directed interesterifi-cation as a new processing tool for lard. J. Am. Oil Chemists' Soc. 33:29-35. 1956.
30. Helme, J. P. and Molines, J. Infrared spectra of linseed oil. Application to stand oils, glycerophihalate resin, and modified oils. Peintures, Pigments, Vernis. 33:524-543. 1957.
31. Herb, S. F., Audsley, M. C., and Riemenschneider, R. W. Some observations on the microscopy of lard and rearranged lard. J. Am. Oil Chemists' Soc. 33:189-193. 1956.
32. Herb, S. P., Magidman, Paul, Luddy, Francis E., and Riemenschneider, R. W. The fatty acid composition of lard including minor components. Paper presented at 52nd Annual Meeting of the American Oil Chemists' Society, St. Louis, Missouri, April 30-May 3, 1961. [Abstracted in printed program of the 52nd Annual Meeting] Chicago, Illinois, American Oil Chemists' Society. 1961.

262
33. Herb, S. P., Magidman, Paul, and Riemenschneider, R. W. Analysis of fats and oils by gas-liquid chromatography and ultraviolet spectrophotometry. J. Am. Oil Chemists' Soc. 37:127-129. I960.
34. Higuchi, Takeru, Hill, Norman, and Corcoran, Geraldine. Chromatographic separation and determination of dicarboxylic acids C4 to Cio. Anal. Chem. 24:491-493. 1952.
35. Hilditch, Thomas Percy and Lea, Colin Henry. Investigation of the constitution of glycerides in natural rats; a preliminary outline of two new methods. J. Chem. Soc. (London) 1927:3106-3117. 1927.
36. Hilditch, Thomas Percy and Pedelty, William Hopper. The body fats of the pig. V. Component glycerides of perinephric and outer back fats from the same animal. Biochemical Journal 34:971-979. 1940.
37. Hilditch, Thomas Percy and Stainsby, William John. The body fats of the pig. IV. Progressive hydrogénation as an aid in the study of glyceride structure. Biochemical Journal 29:90-99. 1935. .
38. Hilditch, Thomas Percy. The chemical constitution of natural fats. 3rd ed. New York, John Wiley and Sons, Inc. 1956.
39. Hoerr, C. W. and Vfaugh, D. F. Some physical characteristics of rearranged lard. J. Am. Oil Chemists' Society. 32:37-41. 1955.
40. Hornstein, Irwin, Alford, John A., Elliott, L. E., and Crowe, P. E. Determination of free fatty acids in fat. Anal. Chem. 32:540-542. I960.
41. Horrocks, Lloyd A., Cornwell, David G., and Brown, J. B. Quantitative gas-liquids chromatography of fatty acids methyl esters with the thermal conductivity detector. J. Lipid Research 2:92-94. 1961.
42. Huebner, V. R. Preliminary studies on the analysis of mono- and diglycerides by gas-liquid partition chromatography. J. Am. Oil Chemists' Soc. 36:262-263. 1959.
43. James, A. T. and Martin, A. J. P. Gas-liquid chromatography: the separation and identification of the methyl esters of saturated and unsaturated acids from formic acid to n-octadecanoic acid. Biochemical Journal 63:144-152. 1956.

263
44. James, A. T. and Martin, A. J. P. Gas-liquid chromatography; the separation and micro-estimation of volatile fatty acids from formic acid to dodecanoic acid. Biochemical Journal 50:679-690. 1952.
45. Kartha, A. R. S. The glyceride structure of natural fats. I. A technique for the quantitative determination of glyceride types in natural fats. (Edited and revised by R. J. Vander Wal). J. Am. Oil Chemists1
Soc. 30:280-282. 1953.
46. Lipsfcy, S. R. and Landowne, R. A. Evaluation of a stationary phase for fatty acid analysis by gas-liquid chromatography. Annals of the New York Academy of Sciences 72:666-674. 1959.
47. Lipsky, S. R., Landowne, R. A., and Godet, M. R. The effects of varying the chemical composition of the stationary liquid on the resolution of the long chain saturated and unsaturated fatty acid esters by gas-liquid chromatography. Biochim. Biophys. Acta 31:336-347. 1959.
48. Lipsky, S- R., Landowne, R. A., and Lovelock, J. E. Separation of lipids by gas-liquid chromatography. Anal. Chem. 31:851-856. 1959.
49. Luddy, P. E. and Riemenschneider, R. W. Determination of trisaturated glycerides in lard, hydrogenated lard, and tallow. Oil and Soap 23:385-389. 1946.
50. Luddy, Francis E., Barford, R. A., and Riemenschneider, R. W. Direct conversion of lipid components to their fatty acid methyl esters. J. Am. Oil Chemists* Soc. 37:447-451. I960.
51. Luddy, Francis E., Fertsch, George R., and Riemenschneider, Roy W. Glyceride composition of fats and oils determined by oxidation and crystallization methods. J. Am. Oil Chemists* Soc. 31:266-268. 1954.
52. Malins, Donald C. and Mangold, Helmut K. Analysis of complex lipid mixtures by thin layer chromatography and complementary methods. J. Am. Oil Chemists* Soc. 37: 576-578. I960.
53. Mangold, Helmut K. and Malins, Donald C. Fractionation of fats, oils, and waxes on thin layers of silicic acid. J. Am. Oil Chemists* Soc. 37:383-385. I960.

264
54. Mattson, F. H. and Beck, L. W. The digestion in vitro of triglycerides by pancreatic lipase. J. Biol. cKem. 214: 115-125. 1955.
55. Mattson, F. H. and Beck, L. W. The specificity of pancreatic lipase for the primary hydroxy1 groups of glycerides. J. Biol. Chem. 219:735-740. 1956.
56. Mattson, F. H., Benedict, J. H., Martin, J. B., and Beck, L. W. Intermediates formed during the digestion of triglycerides. J. Nutrition 48:335-344. 1952.
57. Mattson, F. H. and Lutton, E. S. The specific distribution of fatty acids in the glycerides of animal and vegetable fats. J. Biol. Chem. 233:868-871. 1958.
58. Me Innés, A. G., Tattrie, N. H., and Kates, M. Application of gas-liquid partition chromatography to the quantitative estimation of monoglycerides. J. Am. Oil Chemists1 Soc. 37:7-11. I960.
59. Meara, M. L. The configuration of naturally occurring mixed glycerides. Part II. The configuration of some monopalmitoglycerides from various sources. J. Chem. Soc. (London) 1945:23. 1945.
60. Metcalfe, L. D. and Schmidtz, A. A. The rapid preparation of fatty acid esters for gas chromatographic analysis. Anal. Chem. 33:363-364.
61. Metcalfe, Lincoln D. Direct analysis of fatty acids. Facts and Methods for Scientific Research 2, No. 1:1-3. New Castle, Delaware, F and M Scientific Corporation. Spring 1961.
62. Metcalfe, Lincoln D. Gas chromatography of unesterified fatty acids using polyester columns treated with phosphoric acid. Nature 188:142-143. 1960.
63. Miwa, Thomas K., Mikolajczak, Kenneth L., Earle, Fontaine R., and Wolff, Ivan A. Gas chromatographic characterization of fatty acids; identification constants for mono-and dicarboxylic methyl esters. Anal. Chem. 32:1739-1742. 1960.
64. Nowakowska, Janina, Melvin, E. H., and Wiebe, Richard. Separation of the oxidation products of fatty acids by means of gas-liquid partition chromatography. J. Am. Oil Chemists' Soc. 34:411-414. 1957.

265
65. O'Connor, Robert T. Infrared absorption spectra. J. Am. Oil Chemists' Soc. 32:624-633. 1955.
66. O'Connor, Robert T., DuPre, Elsie, P, and Feuge, R. 0. The infrared spectra of mono-, di-, and triglycerides. J. Am. Oil Chemists' Soc. 32:88-93. 1955.
67. Ogg, C. L., Porter, W. L., and Willits, C. 0. Determining the hydroxy1 content of certain organic compounds. Ind. Eng. Chem., Anal. Ed. 17:394-397. 1945.
68. Orr, C. H. and Callen, J. E. Recent advances in the gas chromatographic separation of methyl esters of fatty acids. Annals of the New York Academy of Sciences 72: 649-665. 1959.
69. Orr, C. H. and Callen, J. E. Separation of polyunsaturated fatty acid methyl esters by gas chromatography. J. Am. Chem. Soc. 80:249. 1958.
70. Orr, Charles H. Recorder-integrator errors in gas chromatography area measurements. Anal. Chem. 33:158-159. 1961.
71. Placek, Chester and Holman, George W. Directed inter-esterification of lard. Ind. Eng. Chem. 49:162-169. 1957.
72. Pohle, W. D. and Mehlenbacher, V. C. A modification of the periodic acid method for the determination of mono-glycerides and free glycerol in fats and oils. J. Am. Oil Chemists' Soc. 27:54-56. 1950.
73. Privett, O. S. and Blank, M. L. A new method for the analysis of component mono-, di-, and triglycerides. J. Lipid Research 2:37-44. 1961.
74. Privett, O. S., Blank, M. L., and Lundberg, W. 0. Determination of mono-, di-, and triglycerides by molecular distillation and thin layer chromatography. J. Am. Oil Chemists* Soc. 38:312-316. 1961.
75. Quimby, 0. T., Wille, R. L», and Lutton, E. S. On the glyceride composition of animal fats. J. Am. Oil Chemists* Soc. 30:186-190. 1953.
76. Quinlin, Patricia and Weiser, Jr., Herman J. Separation and determination of mono-, di-, and triglycerides in monoglyceride concentrates. J. Am. Oil Chemists* Soc. 35:325-327. 1958.

266
77. Ravin, Louis J., Meyer, Robert J., and Higuchi, Takeru. Chromatographic analysis of mixtures of mono-, di-, and tristearin containing mineral oil. J. Am. Oil Chemists* Soc. 34:261-263. 1957.
78. Reiser, Raymond and Reddy, H. G. Ramakrishna. The gly-ceride structure of swine depot fat. J. Am. Oil Chemists' Soc. 36:97-99. 1959.
79. Riemenschneider, R. W., Luddy, F. E., Swain, M. L., and Ault, W. C. Fractionation of lard and tallow by systematic crystallization. Oil and Soap 23:276-282. 1946.
80. Savary, P. and Desnuelle, p. Analyse chromatographique des melanges contenant des acides gras, des monogly-cérides, des diglycérides et des triglycérides. Bull. Soc. Chim. (France) 1954:936-940. 1954.
/ A 81. Savary, P. and Desnuelle, P. Etude des chaînes internes
dans quelques triglycérides mixtes naturels. Biochim. Biophys. Acta 31:26-33. 1959.
82. Savary, P. and Desnuelle, P. Sur quelques éléments de spécificité pendant l'hydrolyse enzymatique des triglycérides. Biochim. Biophys. Acta 21:349-360. 1956.
83. Savary, P. and Desnuelle, P. Fractionnement quantitatif des acides gras saturés et insaturés par hydroxylation peraanganique et chromatographic de partage en phases inversées. Bull. Soc. Chim. (France) 1953:939-945. 1953.
84. Savary, P., Flanzy, J., and Desnuelle, P. Emploi de la lipase pancréatique pour l'étude de la structure des corps gras naturels. Biochim. Biophys. Acta 24:414-423. 1957.
85. Savary, Pierre and Desnuelle, Pierre. Étude chromatographique de l'action de la lipase pancréatique sur des triglycérides mixtes. Comptes Rendus Hebdomadaires des Séances de L'Académie des Sciences 240:2571-2573. 1955.
86. Schlenk, Hermann and Gellerman, Joanne L. Esterifica-tion of fatty acids with diazomethane on a small scale. Anal. Chem. 32:1412-1414. I960.
87. Slater, Lloyd E. Lard scores again. Food Eng. 25, No. 9:72-73, 100, 102-105. 1953.
88. Smith, Edgar G. Simplified chromatographic separation and analysis of C4 through Cl2 dibasic acids. Anal. Chem. 32:1301-1304. 1960.

267
89. Stoffel, W., Insull, Jr., W., and Ahrens, Jr., E. H. Gas-liquid chromatography of highly unsaturated fatty acid methyl esters. Proceedings of the Soc. for Experimental Biology and Medicine 99:238-241. 1958.
90. Stoffel, Wilhelm, Chu, Florence, and Ahrens, Jr., Edward H. Analysis of long-chain fatty acids by gas-liquid chromatography ; micromethod for preparation of methyl esters. Anal. Chem. 31:307-308. 1959.
91. Vander Wal, R. J. Calculation of the distribution of the saturated and unsaturated acyl groups in fats, from pancreatic lipase hydrolysis data. J. Am. Oil Chemists' Soc. 37:18-20. I960.
92. Vogel, Arthur I. Practical organic chemistry including qualitative organic analysis. 2nd ed. London, Longmans, Green and Co. 1951.
93. von H. Lindlar. Bin neuer Katalysator fur selective Hydrierungen. Helvetica Chiiuica Acta 35:446-450. 1952.
94. von Rudloff, E. Periodate-permanganate oxidations. V. Oxidation of lipids in media containing organic solvents. Can. J. Chem. 34:1413-1418. 1956.
95. Vorbeck, Marie L., Mattick, Leonard R., Lee, Frank A., and Pedeson, Carl S. Preparation of methyl esters of fatty acids for gas-liquid chromatography; quantitative comparison of methylation techniques. Anal. Chem. 33: 1512-1514. 1961.
96. Wollish, E. G., Schmall, Morton; and Hawrylyshyn, Mary. Thin-layer chromatography; recent developments in equipment and applications. Anal. Chem. 33:1138-1142. 1961.
97. Wren, J. J. Review: Chromatography of lipids on silicic acid. J. Chromatography 4:173-195. 1960.
98. Youngs, C. G. Determination of the glyceride structure of fats. J. Am. Oil Chemists' Soc. 38:62-67. 1961.
99. Youngs, C. G. and Sallans, H. R. Fractionation and glyceride composition of fats. J. Am. Oil Chemists' Soc. 35:388-393. 1958.
100. Zilch, K. T. and Dutton, H. J. Analysis of fat acid oxidation products by countercurrent distribution methods. Anal. Chem. 23:775-778. 1951.

268
101. Zlatkis, Albert, Ling, Resolution of isomeric chromatography. Anal.
Su-Yu, and Kaufman, H. R. xylenes by gas-liquid Chem. 31:945-947. 1959.

269
ACKNOWLEDGMENT
The author is grateful to Dr. L. K. Arnold for continued
guidance, encouragement and help throughout the problem;
to the Chemical Engineering Department and the Iowa
Engineering Experiment Station for financial support;
to the Rath Packing Company of Waterloo, Iowa and to the
Procter and Gamble Company of Cincinnati, Ohio for research
fellowships;
and to Mr. Paul Bond, Electrical Engineering graduate
student, for advice on problems concerning electrical equip
ment .

270
APPENDIX A: LOW TEMPERATURE CRYSTALLIZATION
EQUIPMENT AND PROCEDURE
The fractional crystallization procedure described by
Luddy ejt al. (51) was followed. Figure 27 shows the steps and
temperatures used in the fractionation scheme. Table 73 sum
marizes more clearly the nature of the glycerides in each of
the fractions obtained. The P-3 fraction contains the glycer
ides with the lowest iodine value and fraction F-4 contains
the glycerides with the highest iodine value. The P-6, F-6,
and F-5 fractions each contain glycerides with progressively
higher iodine values.
Table 73. Temperature range in which the glycerides of each fraction precipitate
Fraction Contains glycerides which ppt.
P-3 above 15°C P-6 between 15° to 0°c F-6 between 0° to -25°C F-5 between -2!P to -45°C F-4 below -45°C
The low temperature cabinet was constructed of l/2 in
plywood and 4 in corkboard insulation. The overall outside
dimensions of the cabinet were 4 ft 9 in long, 2 ft 11 in
high, and 2 ft 4 in wide. The cabinet was mounted on casters
to facilitate moving it about in the laboratory.
The cabinet was divided into a sample section and a Dry

271
STEP
P-3
50 GRAMS FAT
STEP 1 — 25° C
STEP II 1
0°C F- 1
-2
1 I5°C
F--2 -2
1 I5°C
F- 3
STEPrV
0
to 1
pi«
STEPV | -25'
1 F— 4
'C
P-5
1
1 F-5
STEP VI
o
0 O
P-6 F-6
FIG. 27. STEPS IN THE FRACTIONAL CRYSTALLIZATION OF FATS FROM ACETONE . (30 ML/GM FOR EACH STEP).

272
Ice section by a partition wall. The Dry Ice side contained
a wire basket for holding crushed Dry Ice and had an automobile
heater fan and its housing mounted on the back wall of this
section. The fan sucked air through a 4 in galvanized iron
pipe which served as a duct from the sample section to the
suction side of the fan. The fan forced this air to rise
through the Dry Ice, causing the air to be cooled. This
cooled air filled the Dry Ice section and passed into the
sample chamber because of the small difference in pressure
developed between the two sections by the Dry Ice fan.
The Dry Ice fan was turned by a V-belt which was driven
by a l/4 horse power electric motor mounted on the outside
back of the cabinet. The power to this motor was on-off con
trolled by use of a bimetallic spiral thermoswitch connected
in the electrical circuit shown in Figure 28. The series
of relays was found to be necessary because of the low cur
rent capacity of the thermoswitch points which were rated at
a maximum load of l/8 watt. A mercury contact switch was
used in the motor power supply line because the high inductive
load of the motor caused other types of contact points to burn
badly and eventually caused them to fuse together.
Because of vibration of the cabinet by motors mounted on
the cabinet, the thermoswitch points chattered when they were
very close to making or breaking contact. This caused the

273
electric motor to be turned on and off at a rate of many times
per minute causing the motor to overheat and a thermoguard
switch automatically broke the power line circuit of the
motor. This difficulty was overcome by putting a time delay
in the electrical system. This was accomplished through the
use of a vacuum tube pentode with a grid bias consisting of a
variable resistance and a capacitor. By varying the resistance
the time of the delay could be varied from zero to over l/2
minute. This resistance setting was made by trial and error
such that the motor did not turn on and off rapidly enough
to cause the thermoguard to break the power line circuit.
The pentode was driven by the diode in the 117L7/M7GT
vacuum tube. The grid bias dc-source was originally supplied
by the use of a transformer and a copper-copper oxide recti
fier. But this was later changed to the use of a transformer
and a transistor diode, GE 1N538. The change was made when
the copper-copper oxide rectifier could not be made to rectify
a dc supply sufficient to put a potential on the grid high
e n o u g h t o s t o p t h e f l o w o f c u r r e n t t h r o u g h t h e p e n t o d e T h e
zero signal current flow through the pentode was large enough
to hold the relay in the plate circuit closed and therefore
the Dry Ice fan motor kept running when it should have been
shut off.
The temperature of the samples were maintained by the

MOTOR MO V. A.C. SOURCE
MERCURY CONTACT SWITCH
12-24 V. D C. 400 OHM
COIL 0.5
ME6 OHM
AMMETER MEG OHM 33,000
OHMS SOURCE VACUUM TUBE
117 L?/ -M7GT 750 OHMS
30 _|_ MF T 1280 OHM L
_ COIL ± 40 T MF MO TO 18 VOLTS
TRANSFORMER THERMOSWITCH
GE IN 538
FIG. 28. SCHEMATIC WIRING DIAGRAM OF THE TEMPERATURE CONTROL WITH A TIME DELAY FOR THE LOW TEMPERATURE FRACTIONAL CRYSTALLIZATION CABINET

275
following series of steps. As the temperature in the sample
chamber increased, the thermoswitch points were closed. This
caused the relay coil in the same circuit as the thermoswitch
to become energized and closed the contact points in the relay.
These points were connected in a grid circuit and when closed,
the grid potential became the same as the cathode potential.
Current then passed through the tube and energized the relay
coil in the plate circuit. The ammeter in this circuit was
used to insure that the maximum tube plate current of 43
milliamperes was not exceeded. The plate current could be
adjusted by varying the one-half million ohm variable resist
ance in the screen grid circuit. When the coil in the plate
circuit relay was energized, the relay contact points in the
Dry Ice fan motor circuit were closed and the Dry Ice fan was
turned. Air sucked from the sample chamber passed up through
Dry Ice in the wire basket and this cooled air was forced
back into the sample chamber. When the sample chamber tempera
ture decreased, the thermoswitch contact points opened. This
caused the contact point of the relay in the thermoswitch
circuit to open. The potential on the grid then changed from
that of the cathode to a potential negative to that of the
cathode by an amount equal to the output voltage of the
transistor diode. This change in potential could be made
to take place more or less rapidly by changing the variable
resistance hooked in parallel with the 25 microfarad capaci

276
tor. The time in seconds can be estimated from time in seconds
equals resistance in ohms times the capacitance in farads.
The 25 microfarad capacitor is charged when the relay contacts
in the thermoswitch circuit are closed. When the relay con
tacts in the grid circuit open, the charged capacitor slowly
discharges across the resistance in parallel with it. As the
capacitor discharges, the potential on the grid slowly de
creases to that of the diode output. The grid is hooked to
the negative side of the diode and the cathode is hooked to
the positive side. The grid is therefore negative with re
spect to the cathode and the current flow through the tube is
cut to a very low value of only a few milliamperes. This
small current is not enough to hold the relay in the plate
circuit closed and the Dry Ice fan motor is shut off.
The sample section contained a fan which kept the air
in this section well mixed. It was belt driven by a l/4
horse power electric motor mounted on the outside back of the
cabinet., The thermoswitch was located in this section near
the opening in the partition through which air passed into
the Dry Ice chamber to be cooled.
Round bottom flasks with outlets in the center of the
bottom of the flasks were mounted in the cabinet using labora
tory clamps. The outlets were fitted with short pieces of

277
rubber tubing and these were pinched shut by screw clamps.
The screw clamps were brazed to metal mounting bars which
were fastened to the cabinet walls. The screws were turned
by means of number 9 wire handles passing out through the
front wall of the cabinet.
The solutions in the flasks were stirred by means of
stirrers mounted on a removable bar which was attached to
the cabinet walls. The stirrer shafts and stirrer blades
were made of stainless steel. The shafts passed through
loose fitting porous metal bushings which were firmly mounted
on the removable bar. The shafts were kept from sliding
through the bushings by the pulleys mounted on the upper end
of the shafts. The stirrers were turned by means of a belt
made of l/4 in round leather belting. The drive pulley on
a 90 degree change of direction gear box was driven by means
of a l/4 horse power electric motor mounted on the outside
back of the cabinet.
A Buchner funnel was mounted below each flask* The fun
nel stems were connected by means of rubber vacuum hoses and
L-shaped adapters, which fit on the funnel stems, to copper
tubes passing through the front wall of the cabinet. The
external ends of the copper tubes were fitted with rubber
vacuum hoses which were connected to filtration flasks. The
filtration flasks were connected by means of rubber vacuum

278
hoses and a manifold to a single line leading to a water as
pirator. Screw clamps were used to control the vacuum to
each of the filtration flasks.
Iron-constantan thermocouples were used to measure the
temperature of the solutions and the air at various points in
the cabinet. The thermocouple wires were connected to a po
tentiometer through a multiple contact switch. The reference
junction was placed in a thermosbottle filled with ice. To
prevent rusting of the iron wire, the thermocouple was placed
in a mercury well which was placed in the ice.
The entire top of the cabinet formed the lid for the
cabinet and a seal between the lid and the box was made using
strips of felt covered with polyethylene film and strips of
rubber tubing placed on top of the felt. When the lid was
latched down, the rubber tubing was crushed slightly and
formed an air tight seal between the polyethylene cover and
the underside of the lid.
The sample section was initially built to handle six
samples. It was then modified to run only two samples by
placing a partition in the sample chamber.
The partition between the sample chamber and the Dry
Ice chamber had a 3-1/2 by 4 in hole to allow the cooled air
in the Dry Ice chamber to pass into the sample chamber. When

279
the sample chamber was being maintained at near room tempera
ture it was found that the circulation caused by the sample
chamber fan was enough to keep the sample chamber at a tem
perature lower than desired without the Dry Ice fan ever run
ning. This difficulty was overcome by threading the end of a
l/8 in welding rod. Nuts with threads of the same size were
then brazed to a piece of galvanized iron sheeting cut just
slightly larger than the hole in the partition. This plate
and threaded rod were then mounted such that the rod extended
through the front of the low temperature cabinet and when
rotated, aoved the plate across the hole in the partition.
In this manner it was possible to vary the size of the open
ing without opening the low temperature cabinet.
The air temperature of the sample chamber cycled through
several degrees of temperature when the low temperature cabi
net was in operation. Thermocouples in the solutions indi
cated that the temperature of the two solutions in the small
sample chamber could be maintained within approximately t 0.3°C
of the desired temperature. This temperature range varied
with the temperature trying to be maintained. At -45°C, the
variation from the desired temperature was more than the vari
ation at near room temperature.
Samples were fractionated by dissolving the fat samples
in dried acetone and diluting to the correct volume in ap

280
propriate sized round bottom flasks. The flasks, Buctmer
funnels, stirrers, thermocouples, and acetone for washing
the precipitates were all put in place in the cabinet. Dry
Ice was crushed and placed in the wire basket. The lid was
closed and the stirrers, circulating fan in the sample sec
tion, and the Dry Ice fan were turned on. The contact points
on the bimetallic spiral thermoswitch were adjusted to main
tain the proper temperature in the sample section. The tem
peratures of the solutions, measured by the use of thermo
couples, were observed and used to determine the thermoswitch
adjustments required.
After the samples were held at a constant temperature
for the required length of time, the circulation fan in the
sample section and the stirrers were turned off, the lid was
opened, and the stirrers removed from the cabinet. The sample
section was then covered with strips of plate glass and the
Dry Ice section was covered with a large piece of pressed
fiber board. This arrangement allowed the thermoswitch to
maintain a constant temperature during the filtration step.
The samples were filtered one at a time, the filter cakes
pressed, and the cakes washed with 2-3 ml of precooled, dried
acetone per gram of precipitate and the filter cakes were
pressed again. The filter cakes were then transferred to
flasks and the acetone removed by evaporation to determine
the weight of the precipitates. Similarly, the filtrates

281
were evaporated to remove excess acetone in preparation for
the next crystallization. Having once obtained the precipi
tate weights for each of the crystallization steps, use of
these weights for another run on the same sample eliminated
a considerable amount of evaporating and weighing of samples.
The longer the time allowed for the crystallization to
take place, the better but some time limit had to be set.
Approximate times used in this work were 15 hours for runs
made at 0 and 15°C. and 8 hours for runs at -25 and -45°C.
for preliminary fractionations. These times were picked to
correspond favorably to the times used in other studies by
other workers. In the case of lower temperatures the time
was shorter because of the much higher Dry Ice consumption
rates.
In Fractional crystallization No. 5 the low temperature
cabinet was modified to accommodate three samples. This re
quired reducing the lard samples from 50 to 25 grams in order
to be able to put three samples in the small sample chamber
previously used for running two samples. A third stirrer
was added to the stirrer mount. A false bottom made of hard
ware cloth was constructed to support the sample solutions
contained in beakers. The hardware cloth permitted the cir
culation fan below it to circulate the air in the sample cham
ber. The ftitrations were conducted by placing a filtration

282
flask fitted with the appropriate sized Buchner funnel on
the hardware cloth, decanting the clear solution into the
funnel and finally the precipitate was poured into the funnel.
The funnels and flasks were left in the Dry Ice chamber until
needed for filtration.
The belt drives on the stirrer motor and the motor for
the sample chamber circulation fan were also eliminated. They
were replaced by direct couplings between the motor shafts
and the fan and gear box shafts.
A total of 208 pounds of Dry Ice were required for frac
tional crystallization No. 5. Dry Ice was obtained from the
Iowa State University Chemical Stores and stored in the empty
sample chamber section until needed. Cooling of the sample
chamber to -25°C for the first crystallization required con
siderably more Dry Ice than the -25°C crystallization step
later in the procedure because the low temperature cabinet
had to be cooled from room temperature. But once the cabinet
was in operation and not allowed to come to room temperature,
less Dry Ice was needed and the time required to cool to the
crystallization temperature was shorter. Table 74 gives a
summary of some of the fractional crystallization procedure
used for the 50 and 25 gram lard samples.

283
Table 74. Fractional crystallization procedure information
Time at crystn. Temp, of Time for temp., hours* Funnels for
Frac- crystn., cooling, Crystn. Crystn. filtering" Step tion °C. hours No. 4 No. 5 Lard B Lard A
I p-1 -25 2i 4 n No. 3 No. 3 II P-2 0 1 12 n 2A 2A
III P-3 15 i 24 15 2A 1 IV P-4 -45 2 8 8 3 3 V P-5 -25 li 9 8 3 3
VI P-6 0 l 12 17 i 1 2A
aIn fractional crystallization No. 4, 50 gram lard samples were used. In fractional crystallization No. 5, 25 gram lard samples were used.
brhe same size Buchner funnels were used in both the 50 gram and 25 gram lard sample fractionations. The same size funnels were used for the lard R sample as were used for the lard A sample.

284
APPENDIX B: DRY ACETONE
The acetone used as solvent in the fractional crystalli
zations was a commercial bulk grade acetone obtained by the
Iowa State University Chemical Stores in 50 gallon drums.
This acetone was dried over 8 mesh calcium chloride by re-
fluxing 1600 ml of acetone with 50 grams of calcium chloride
for 1-2 hours and distilling the acetone from the calcium
chloride. Two-liter Erlenmeyer flasks were fitted with lab
oratory Liebig condensers and cork stoppers were used for
making connections. A water bath was constructed which could
handle six such flasks and condensers at one time. The bath
was held off the floor by legs long enough to allow the re
flux condensers to be removed from the rack above the water
bath and used to condense the evaporated acetone and drain
it into one gallon bottles sitting on the floor. The water
bath was heated by passing 80-90 psig steam through a l/4
in OD copper tube immersed in the water. The flow of steam
was controlled by a solenoid operated valve and the solenoid
was actuated by the opening and closing of a Fenwal thermo
switch connected in series with the solenoid and a 110 volt
alternating current source. A second copper coil in the bath
was used to rapidly cool the water bath in case refluxing be
came too vigorous by passing cooling water through the copper
tubing. The dried acetone was stored in tightly capped one
gallon bottles.

285
APPENDIX C: GAS CHROMATOGRAPHY
The major components of a gas chromatograph are the
column and its oven, a detector to detect the separated sample
components as they emerge from the column and an automatic
recording device to produce a record of the variations in the
signal produced in the detector. Also needed are a carrier
gas supply for eluting the column and a device for intro
ducing a vapor sample into the carrier gas just before the
gas enters the column.
All of the gas chromatographs used in this work employed
thermal conductivity cell detectors (TC cell). This type of
detector requires a constant direct current source. The TC
cell consists of a Wheatstone resistance bridge and is con
nected to the direct current source as shown in Figure 29.
The TC cell used in the construction of the chromatograph was
a Gow-Mac model TR-II-B, geometry 9193 thermal conductivity
cell.
The power for the above TC cell was supplied by lead
storage batteries. The resistances of the hot wire filaments,
the bridge trimmer, and the current control required that a
12-volt source be used in order to obtain a bridge current of
about 200 milliamperes. The batteries were charged after
each few hours of use to maintain them at full charge to pre

286
vent baseline drift due to slowly decreasing battery voltage.
A six ampere-12 volt battery charger was used.
The current control and bridge trimmer for the TC cell
were modified somewhat from what is shown in Figure 29 in the
later stages of the work. The current control resistance con
sisted of a 30 ohm resistor and a 2 ohm resistor connected
in series to allow easier adjustment of the TC cell current.
The bridge trimmer (zero control) was left as a 2 ohm resistor,
but a resistor was put in series with one of the lower re
sistance hot wire filaments to aid in balancing the bridge
currents.
The carrier gas used was helium and the flowrate was
controlled by a Mathe son two stage regulator, model number 8.
The flowrate was measured by means of a soap bubble flowmeter
attached to the exit lines from the sample and reference gas
lines of the TC cell.
In the early stages of the work with the gas chromatograph
a Bristol model IPH-570 Dynamaster recording potentiometer
was used. It had a minimum range of 5 millivolts for full
scale deflection (0-5 millivolt range) to a maximum range of
50 millivolts for full scale deflection (0-50 millivolt range).
It was desired to use a lower range than 0-5 millivolts for
some of the methyl ester analyses. An unknown range of be-

PACKED COLUMN WITH PARTITION LIQUID
SAMPLE INJECTION
CARRIER OAS-
REFERENCE GAS EXIT-
REFERENCE SAMPLE
ZERO CONTRO
OHM SYNCHRO- INPUT TRANSFORMER
AMPLIFIER
MANGANINv' / \ CURRENT
CONTROL 0-20 OHMS
SHUNT WITCH O— 300 X
MILLIAMMETERX
SAMPLE RECORDING MECHANISM [Tililrjilil Ll ilj
REFERENC E
BALANCING MOTOR DC.
AC. POTENTIOMETRIC CIRCUIT
SENSITIVITY CONTROL
100 OHMS
HOT-WIRE FILAMENT BRIDGE RECORDER TO
FLOW METER CARRIER
GAS SUPPLY AND EXHAUST ( CYLINDER)
FIG.29. SCHEMATIC OF GAS CHROMATOGRAPH OVERALL WIRING DIAGRAM AND FLOW OF CARRIER GAS

288
tween 0-1 and 0-3 millivolts was obtained by shorting out the
resistance M in Figure 30. This recorder also had an auto
matic standardization mechanism which standardized the work
ing cells against a standard cell every 15 minutes. The
duration of the standardization was 20 seconds which often
occurred when the trace was forming a peak. The automatic
standardization was made inoperative by holding up a lever
which rode on the edge of a rotating disc. Standardization
took place when this lever dropped into a notch in the disc
which caused the contact points of a relay to close.
For the methyl ester samples run for fractional crystal
lizations No. 4 and No. 5, a Sargent SR recording potentio
meter was used. This instrument had range plugs of 1.0, 2.5,
and 5.0 millivolts.
The column oven used for the crystallization No. 3
sample analyses consisted of a double walled metal box of 5 in
x 5 in x 5 in inside dimensions and was attached to one end of
the TC cell. The double walls were 1-1/2 in apart and were
filled with glass wool insulation. The oven was heated by
means of number 24 gage B and S, nichrome resistance wire
wrapped on a 4-1/2 in length of iron pipe attached in a hori
zontal position on the inside wall opposite the TC cell. Two
layers of glass cloth tape were used to insulate the heating
wire from the iron pipe. Current to the oven was controlled

COARSE ZERO 500 OHMS
RHEOSTAT ,5 V. 500 0HMS
lllll 1 v\AAA
yWv
STD R 6.3V-
UUJUUJJU TRIMMER
SS
t-VVWVW-SLIDEWIRE
MECHANICAL LINKAGE TO PEN AND BALANCING MOTOR.
TYTTÏ WWW
C : 522 K = 11.37 H =61 6 M = 773.91 T = 1970.1 D,= 9 .4-049 J = 3656.0 0 = 220.0 B 22,319 F=7872 G = 14,840 E = 3856.0 Z = 4 0,000 SPAN = 40,000 R = 10,000
B yw—"-vvv-j >—vVVvW—'
A SPAN
SYNCHROVERTER SWITCH
INPUT TRANSFORMER
AMPLIFIER
TO BALANCING
MOTOR f-UNKNOWN EMF
FIG. 30. POTENTIOMETRIC CIRCUIT OF THE BRISTOL MODEL 1PH— 570 DYNAMASTER RECORDER

290
by use of a variable transformer. The temperature was meas
ured by use of a thermometer. The oven had a removable top
for access to the column. The coiled column was placed in
the oven with the heater in the center of the coil.
A metal box 4 in x 4 in x 2-1/2 in was mounted on the
outside wall of the oven opposite the TC cell and contained
a short piece of pipe wrapped with glass cloth tape and re
sistance wire to form the sample injection tube heater. The
injection tube extended through the heater pipe and the wall
of the metal box. Glass wool insulation was packed around
the heater. The end of the injection tube had one end of a
threaded brass fitting brazed to the tubing. A small metal
disc with a small hole in its center and a silicone rubber
disc were held in place by a tubing brass fitting nut. Sam
ples were injected into the gas stream by means of a syringe
needle pushed through the silicone rubber disc. The injec
tion tube temperature was measured by use of an iron-constantan
thermocouple, a manual potentiometer, and a millivolt-
temperature conversion table.
Results using this oven and injection system were not as
good as published chromatograms using similar columns. Another
column oven and injection system were constructed. These are
represented in Figures 31 and 32. The dimensions of the col
umn oven are not given but would accommodate columns of 3/4 in

291
mo i or
/ z
/
/
b
c
d
e
a blower
b outer wall
c glass wool insulation
d inner wall
e heating wire support
f insulated nichrome resistance wire
g column
h thermometer
i base
FIG . 31. CHROMATOGRAPH COLUMN
OVEN

393
sample
I
•:-Y I
i !\
THERMOCOUPLE / WELL
IL to
column
.32. SAMPLE INJECTION BLOCK

293
OD copper tubing which had been coiled on a 4 in OD mandrel.
The column oven was first constructed with the resistance
wire heater wrapped on pipe mounted in the center of the oven
base and there was no blower in the oven. Later, better
temperature control was desired and the oven was modified by
the addition of the blower fan and the pipe heater was replaced
by resistance wire wrapped around the 5 in diameter metal
cylinder shown in Figure 31. Access to the column in the oven
was possible by removal as a single unit the cylinders making
up the oven walls and the motor mounted on top leaving only
the base and column in place.
The injection block was made from a 3 in length of 2 in
diameter solid brass. The gas passages were drilled as shown
in Figure 32. The end of a threaded brass fitting silver
soldered on top of the block and fitted with a metal disc
with a hole in the center and a silicone rubber disc held in
place by a brass fitting nut (for tubing fittings) permitted
sample injection into the gas stream. A single turn of cop
per tubing was silver soldered to the brass nut and water was
passed through the tubing to cool the silicone rubber disc.
The brass block was electrically insulated by wrapping with
two layers of glass cloth tape and then wrapped with nichrome
resistance wire for heating the block. The block was mounted
in a 5 in diameter x 4 in high cylindrical container and glass
wool insulation was placed around the block.

294
A voltage regulator (Sorenson model 175, serial number
177, ac-voltage regulator, Î 0.2% rms regulation) was later
used to help maintain a constant temperature by controlling
the current input into the column oven heater. This worked
quite well when there were no ambient air temperature and
circulation changes.
The voltage to the column oven heater was controlled by
the use of a variable transformer. The variable transformer
was plugged into the voltage regulator.
The copper tubing lines between the sample injection
block and the column, between the column and the TC cell, and
the TC cell helium-sample gas exit line were insulated with
two layers of glass cloth tape. These lines were then wrapped
with nichrome resistance wire and this wire covered with about
l/2 in of glass wool insulation. The three line heaters were
connected in series and their current controlled by the use
of a variable transformer.
The current to the sample injection block heater was
also controlled by a variable transformer. The transformer
settings for the line heaters and the injection block were
determined by using a thermocouple to measure temperatures
at different settings.
Columns were prepared by packing copper tubing with

295
liquid substrates on inert supports. The packing material
was poured into the tubing through a small funnel while vi
brating the tubing with a laboratory vibrating tool or by
holding the tubing against a short piece of flattened tubing
turned rapidly by a laboratory stirrer motor. When the tubing
was filled, it was tapped on the floor while being vibrated
to aid in settling the packing until the desired degree of
packing was obtained. The ends of the tubing were plugged
with wads of glass wool to hold the packing in place.
Johns-Manville C-22 firebrick which had been crushed and
screened to the desired size range was acid washed by treating
with approximately 20% aqueous hydrochloric acid followed by
washing with distilled water until the wash water was neutral
to blue litmus paper. The firebrick was then dried by spread
ing into a thin layer and left overnight in an oven at 110°C.
Aqua regia treated (ART) firebrick was suggested as a better
support for some types of separation by Zlatkis e_t al. (101).
It was prepared by covering firebrick with aqua regia (three
parts hydrochloric acid-one part nitric acid) and allowed to
react for one hour. Stirring during this time was necessary
to allow the gas formed to escape from the slurry. The aqua
regia was decanted from the packing, the packing washed sever
al times with distilled water, and then washed with dilute
sodium hydroxide solution until the wash solution was neutral
to litmus paper. The firebrick was then washed several more

296
times with water, spread out in a thin layer and dried over
night in an oven at 110°C.
Dow Corning hi-vacuum silicone grease (DCSG) was prepared
for use as a liquid substrate by suspending the grease in
n-butyl acetate. The grease was coagulated by adding ethanol
and the solution decanted from the grease. The grease was
washed 4-5 times with ethanol to remove the butyl acetate.
This grease was spread on ART C-22 firebrick by suspending a
weighed amount of DCSG in toluene and then adding the desired
weight of firebrick. The mixture was then stirred on a hot
plate in a hood to remove the toluene.
Butanediol succinate (BDS or Craig polyester) was pur
chased from Wilkens Instrument and Research, Inc., P.O. Box
313, Walnut Creek, Calif. It was put on the supports by dis
solving a weighed quantity in chloroform, adding solid support
and the solvent evaporated while stirring until all of the
solvent had been removed.
The methods available for obtaining the areas under the
individual chromatogram peaks were by measurement with a
planimeter or by drawing tangents through the points of in
flection of the peak slopes and obtaining the product of the
height and the width of the triangle formed by these two lines
and the base line. Also checked was the product of the re
tention time times the height of the triangle constructed as

297
above. Percentages of each component were calculated from
measurements by the three methods for four chromatograms of
the same sample. The average of the result for the four
chromatograms were found for each method and are listed in
Table 75.
Table 75. Comparison of chromatograph peak measurement methods
Peak Planimeter Peak ht. x base width
Peak ht. x ret. time
Myristate 1.8 1.8 1.6 Palmitate 29.9 29.9 29.3 Palmitoleate 2.9 2.9 2.8 Stearate 13.0 13.3 13.6 Oleate 46.9 46.2 46.2 Linoleate 5.6 6.1 6.5
The three methods gave results which agreed very well.
The planimeter method is by far the most tedious and therefore
was not used. The method involving the retention time was
also eliminated because it was more subject to errors such as
slipping of the recorder paper or changes in temperature of
the column during the running of a sample. The triangulation
method was therefore used for measuring peak areas in this
research. The F and M model 500 chromatograph used a disc
integrator which should be expected to give the same results
as the planimeter method although this comparison was not made.
On another series of eight samples, the area percentages

298
were measured by triangulation. The average component per
centages were calculated and the individual determinations
subtracted from the average value obtained. The deviations
from the average value were then averaged irrespective of
sign. The results of these measurements and calculations
were myristate 1.75 t 0.13, palmitate 26.40 t 0.43, palini-
toleate 3.05 t 0.23, stearate 12.25 t 0.53, oleate 46.85 t 0.68, and linoleate 9.80 ± 0.35.
A sample containing 20% of each of five methyl esters
shown in Table 76 was analyze: on a 5 ft x l/4 in OD copper
tubing column of 20% ethylene glycol succinate on 60/80 mesh
acid washed Chromosorb. The sample was obtained from the
Hormel Institute, Austin, Minnesota. The chromatograms
showed only minute traces of oxidation product methyl esters
present in the samples but this did not prove that the sample
had not undergone oxidation as it was not methylated again
before obtaining the chromatograms. The results of three
chromatograms are given in Table 76 with the ratio of the
known weight percentages to the chromatogram area percentages.
These ratios were also calculated for data from the litera
ture and are given for comparison. These figures showed that
the results obtained on different chromatographs and columns
show similar trends but do not give the exact same results.
For precise work, then, calibration samples should be chromato-
graphed.

299
Table 76. Relative mass response of monocarboxylic acids
Known Ratio of known to exp. comp.Known calc.from data in lit.
Chromatogram wt. exper. Horrocks Craig* Herb area percent % et al. Murty et al.
~ï 2 3 Âv7~ t4lTâ (19) TTsT"
Pal. 22.6 22.6 Stear.22.0 21.4 Oleic 22.3 22.2 Linol.17.1 17.3 Lin 16.1 16.5
22.5 22.6 20.0 21.2 21.5 20.0 22.6 22.4 20.0 17.1 17.2 20.0 16.6 16.4 20.0
0.885 0.885 0.930 0.944 0.893 1.004 1.163 0.973 1.220 1.043
0.882 0.855 1.020 0.914 0.955 0.979 1.002 1.064 1.146 1.186
^The relative mass response values were divided into 100 and these numbers multiplied by 0.885 to put the ratios on the same basis as those calculated from the experimental data and known composition presented in thé table.
Before this known composition sample had been obtained,
comparison of the relative response of the mono- and dicar-
boxylic acids was made on a 5 ft x l/4 in OD copper tubing
column of 20% ethylene glycol succinate on 60/80 mesh acid
washed Chromosorb. The monocarboxylic acids used were ob
tained by saponifying lard, recovering the fatty acids and
methylating the recovered fatty acids. Samples of dicarboxy-
lic acids of 95-98% purity were obtained and used to prepare
a dicarboxylic acid methyl ester sample of unknown composi
tion. A sample consisting of a mixture of the mono- and
diacids was prepared by weighing portions of the above two
mixtures. The monoacid-diacid mixture consisted of 38.1
milligrams of the monoacid sample and 44.6 milligrams of the
diacid sample which corresponded to 46.07 weight percent

300
monoacids and 53.93 weight percent diacids. Ghromatogram
area percentages for these samples are given in Table 77.
Table 77. Change in response of mono- and diacids when mixed
Ghromatogram area %
Monoacid sample3
Diacid
Calcd. area % for
sample^ Mixture0 mixture
Chrom. area % Calcd. area %
DiC?
33$ Myr.
Pal. P.O. DiCB PO+DiCg DiCg Stear. Oleic
DiCio Oleic+DiC Linol. DiCnd _ Linol+DiCii
10
5.17 2.33 2.38 0.979 18.56 9.84 8.54 1.152 6.31 3.55 2.91 1.220
1.83 0.75 0.99 0.7576 20.48 12.43 9.44 1.317 10.94 6.57 5.04 1.304
27.76 11.93 14.97 0.7969 3.23
12.13 8.70 7.33 1. 187
17.68 10.89 8.15 1.336 12.96 5.71 6.99 0.8169 47.39
7.62 ) 24.19 29.07 0. 8321 6.83
1.12 4.20 3.12 4.20 0. 7429
^Average of 4 chromatograms.
^Average of 3 chromatograms.
(-Average of 4 chromatograms.
^This component was an impurity in the DiC^Q sample and had a retention time corresponding to that of DiC^.
The expected area percentage of each peak of the mixture
was calculated from the weight of the monoacid and of the di
acid samples mixed and the chromatogram area percentages ob
tained for these two samples. The calculated area percentages

301
were compared with the actual areas measured for the mixture
by calculating their ratio. The fact that the calculated and
measured area percentages were different for each monoacid
and for each diacid showed that the relative response of a
component varied depending upon what other components were
present in the sample. It is not known whether or not the
relative response of a component would vary with its per
centage in the mixture nor whether or not it would vary as
the composition of some other component was varied. The ratio
of the measured areas of the mixture to the calculated areas
showed that the relative area of the monoacids was decreased
and the areas of shorter chains were decreased more than the
longer chains. The relative area of all the diacids except
D1C2 were increased and the increase was greater for the
longer chains.
The results of the mono- and diacid sample mixture indi
cated that the areas obtained for the diacids were greater
than the areas of the monoacids when compared on a weight
basis. The paper of Youngs (98) indicated that the diacid
peak areas had to be multiplied by a factor of 1.10 to obtain
area percentages equal to the weight percentages of the com
ponents present in the sample. This is exactly the opposite
of what the data of Table 77 indicated. This difference
could be accounted for if the lard fatty acid methyl ester

302
sample contained a considerable amount of non-fatty acid ma
terial or if the fatty acids were not completely methylated.
Assume that the monoacid sample was not pure methyl es
ters. Then the ratio of the mixture chromatograra areas to
the calculated areas would be expected to be less than 1.0 as
was found to be true (range of 0.75 to 0.82). By multiplying
the diacid ratios by the ratio for the nearest monoacid peak
would give values for the diacid ratios based upon monoacid
ratios of 1.0. That is:
1.2200 x 0.7576 = 0.924 (DiCs-myristate) 1.3167 x 0.7576 = 0.998 (DiC.-myristate) 1.3036 x 0.7969 = 1.039 (DiCy-palmitate) 1.3362 x 0.8169 = 1.092 (DiCg-stearate)
A graph of these four sets of values was prepared, adjusted
ratio versus number of carbons in the diacid and values read
for each of the diacids. These values were found to be:
DiCtr 0.924 DiC& 0.998 DiC? 1.039 DiCo 1.067 DiCn 1.092 DiCj_0 1-112 DiCii 1.127 DiC12 1.135
These adjusted ratios indicate how much larger the areas ob
tained for the diacids were than obtained for an equal weight
of a monoacid which appeared close to the diacid peak on the
chromatogram.
Mixtures of a palmitic acid methyl ester sample and a

303
DiC9 methyl ester sample were prepared. The palmitate sample
contained impurities of laurate and myristate. The total
area percentage of the monocarboxylic acids was measured and
compared with the area percentage of the DiCg peak. These
results are given in Table 78. These results again indicated
that the area of the diacids was greater than for the mono
acids on a weight basis. The data also indicated that the
difference may change with composition. More work needs to
be done to check these results. Pure methyl ester samples
should be used. The purity of the samples used in this work
was not known.
Table 78. Comparison of area percentages and known weight compositions
Sample : 1 2 3 Chrora. Weighed Chrom. Weighed Chrom. Weighed area % area % area %
Monoacids 71.98 72.30 41.19 41.61 70.93 73.87 DiCg 28.02 27.70 58.81 58.39 29.05 26.13
Number of 3 3 1 chromatograms
Correction factor-mult. 0.984 0.983 0.864 x DiCg area
Figure 33 is a graph of the logarithm of the retention
time of the mono- and dicarboxylic acids versus the number of
carbons in the chain. The saturated monocarboxylic acids lie
on a straight line. Only two monounsaturated monocarboxylic

304
It) 0.7
0.09
6 8 10 12 14
NUMBER OF CARBONS
FIG. 33. RELATIVE RETENTION TIME VERSUS NUMBER OF CARBONS

305
acids are plotted but they lie on a line parallel to the
saturated acids. The dicarboxylic acids lie on a curve above
the monocarboxylic acid curves. The dotted line through DiCg
is parallel to the saturated monocarboxylic acid line.
306
APPENDIX D: RESIN ACTIVATION
The resin used in this work was the anion exchange resin
Amberlite IRA-400. Amberlite is a tradename of the Rohm and
Haas Company, Philadelphia 5, Penn. This resin is a strongly
basic, quanternary ammonium (polystyrene) type and was ob
tained in the chloride form. It was necessary to convert the
resin to the hydroxide form before adsorption of fatty acids
would take place. The chloride form of the resin was very
stable even after several months storage in a tightly closed
container but the hydroxide form prepared as described below
was quite unstable. After standing in a closed container for
several days, the hydroxide form of the resin smelled very
strongly of ammonia. The fatty acid adsorption capacity of
the hydroxide form decreased after standing just a few hours.
The hydroxide form which had lost much of its capacity to ad
sorb fatty acids could be recovered by treating the resin in
the same manner as in the conversion of the chloride form to
the hydroxide form.
The chloride form of the resin was converted to the hy
droxide form by treating the resin with an aqueous solution
of sodium or potassium hydroxide. Solutions as strong as 15%
by weight hydroxide were used but this strength hydroxide
solution caused the resin to turn dark brown and the resin

307
appeared to break into finer particles more easily when used
in columns or stirred in beakers with organic solvent solu
tions. It was found that treatment of the resin with 1 N
sodium hydroxide (4%) with occasional stirring for 10 minutes
gave satisfactory conversion without discoloration of the
resin. The amount of hydroxide solution used was enough to
give a liquid level one-half again as high as the resin in
the container.
After the conversion to the hydroxide form had taken
place, the hydroxide solution was decanted from the resin and
the resin washed with distilled water until the wash water
was neutral to red litmus paper. Water was partially removed
from the resin by washing with an organic solvent which was
miscible with water. Acetone or methyl alcohol were normally
used. The amount of organic solvent used was enough to cover
the resin in the container. The number of washes used depend
ed upon how much water was desired to be removed from the
resin. Two or three washes removed the free water in the
resin. The acetone or alcohol were then washed from the resin
by using the same solvent to be used to dissolve the fatty
acids to be adsorbed on the resin. Ethyl ether was used in
this work and was used to wash the resin three times. The
resin was then spread on paper towels to allow the excess
ether to evaporate. The resin was not recovered after it had
been used once.

308
If a procedure for treating 10 grams of wet resin giving
specific volumes of each solution is desired, see the details
of the method followed by Hornstein ejt zvl. (40) given in
Appendix F.

309
APPENDIX E: HYDROLYSIS PROCEDURES
The hydrolysis procedure followed by Matt son and Beck
(54) was used in parts of the work in this thesis and is given
as described by them. "The digestion conditions used in
these studies were essentially those described by Desnuelle
et al. (24), except that the buffer concentration was in
creased to 1.0 M. Unless otherwise indicated, the digestion
mixture consisted of 13.6 ml of 1.0 M ammonium chloride-
ammonium hydroxide buffer adjusted to pH 8.0, 0.3 ml of a
0.15 percent aqueous solution of bile salts (Difco), 1.0 ml
of a 4 5 percent aqueous calcium chloride solution, 2.3 ml of
anaqueous suspension of 156 mg of stenpsin (Difico), and 2.0
gm of triglyceride. In all of the scudies but one, 'winter
ized' cottonseed oil was the substrate used. During the di
gestion period (15 minutes) at 40 Î 0.5°C, the mixture was
continuously agitated and a pH of 8.0 was maintained by the
addition of 4 M ammonium hydroxide."
"At the end of the digestion period the pH was adjusted
to 2 with N hydrochloric acid, 25 ml of ethyl alcohol were
added, and the lipides were extracted with ethyl ether. The
ethyl ether solution was washed with water and the lipides
were treated in the same manner as in the in vivo studies."
In a later paper, Mattson and Beck (55) changed the
conditions above slightly. "With two exceptions the digestion

310
conditions used in these studies were the same as those em
ployed in the previous study (54). Since the earlier results
had demonstrated that bile salts have little effect on the
hydrolysis of triglycerides, bile salts were not added to the
digest in the present studies. When 2-oleoyl distearin was
used as the substrate, the temperature of the digest was in
creased to 45°C, since the melting point of this triglyceride
is 43°C."
The description of the hydrolysis as given by Desnuelle
et al. (24) is "1.2 grams of triolein are placed in a ground
glass fitted tube with 6.5 ml of 0.1 M phosphate buffer, pH =
7.0, 7.S mg of pancreatin (Byla) in suspension in 1.3 ml of
water and 0.15 ml of a 10% solution of bile salts (Hoffman-
la-Roche). The tube was supported in a 37°C bath and during
the first hour was agitated frequently. After 18 hours con
tact, lipolysis was arrested by adding 1.3 ml of glacial acetic
acid. The final pH of the hydrolysis mixture (before adding
the acid to stop the hydrolysis) was 6.9. In cases in which
calcium ions are used, the phosphate buffer can not be used
and therefore a buffer of 0.1 M ammonium chloride-ammonium
hydroxide at a pH = 8.0 was used and the pH maintained at 8.0
by the addition of 4 M ammonium hydroxide." Desnuelle et al.
(22) correct an error in this procedure. The amount of pan
creatin should be 78 milligrams, not 7.8 milligrams.
In a more recent paper Savary and Desnuelle (82) give the

311
following description of the hydrolysis. "The glycerides
POP, OPP, and POO have been treated by the enzymatic system
of pancrease by 2 different methods. In the experiments
'without calcium1 1.2 grams of glyceride was hydrolyzed at
37°C in a small (ground glass) tube by pork pancreatin (78 mg
in 1.3 ml of water) in the presence of 0.1 M phosphate buffer
at pH = 7.0 (6.5 ml) and of bile salts of beef (0.15 ml of a
10% solution). In the experiments 'with calcium', the calcium
ions (sensibly l/2 atom per liberable chain) is applied by 1
ml of a solution of 24% calcium chloride, the phosphate is
replaced by a buffer of 0.02 M ammonium chloride-ammonium
hydroxide of pH = 8.0 and the pH is maintained constant by
addition of 4 M ammonium hydroxide. After a vigorous agita
tion during the first minutes, the tube is agitated only
occasionally during the rest of the test."
Borgstom (11) described the following hydrolysis method.
"The pH of 80 ml of bile-panereatic juice (from rats) was ad
justed to pH = 6.3 by addition of 16 ml of 0.1 N hydrochloric
acid. Six ml of this mixture were pipetted into Pyrex test
tubes 16 x 150 mm and about 150 mg of the respective fat mix
tures were added to eight tubes in each series. The tubes
were immediately closed and placed in a water bath of 40°C
equipped with arrangements for rotating the tubes with a speed
of about 40 rpm. After l/2, 1, 2, 3, 4, 6, 9, and 12 hours

312
one tube from each series was removed and analyzed for compo
sition and isotope content as described above. The pH was
measured in each tube after the end of the respective incu
bation times and was found to correspond well to the initial
pH, the limits were 6.2-6.4."
The hydrolysis procedure followed by Youngs (98) is given
below. "The proportions of the positional isomers in the frac
tions were determined by a specific hydrolysis of the 1- and
3-positions of the glycerides using pancreatic lipase. The
lipase used was a commercial steapsin which had been hot ex
tracted for six hours with Skellysolve F to remove residual
fat. Ten to 20 mgs of fat, or of oxidized fat which had been
methylated with diazomethane, were placed in the 'transition'
flask of a VirTis 45 homogenizer, high speed, top entering
blender manufactured by the VirTis Company, Gardiner, New
York. Three ml of 0.5 M K2HPO4 buffered to pH = 8 with 0.5 M
NaHgPO^ were added to the fat along with 5 mgs of bile salts.
If necessary the flask was warmed until the fat sample was
liquid and the homogenizer then run at high speed to give a
stable emulsion. A weight of lipase equal to 40% of the weight
of the fat was added and hydrolysis allowed to proceed for 30
minutes with the homogenizer running at low speed. At the end
of the 30 minutes the reaction mixture was added to 3 ml of 1
N hydrochloric acid, the resulting solution saturated with
sodium chloride and the total lipids recovered by 4 extractions

313
with ethyl ether. The ether was evaporated in a stream of
air, the residue treated with an excess of diazomethane in
ether and after again evaporating the ether and excess dia
zomethane a sample was injected directly into the gas chroma
tographic unit. Under the condition used only the hydrolysed
fatty acids, converted to their methyl esters by the diazo
methane , came through the column. The mono-, di-, and tri
glycerides in the sample remained on the column without any
noticeable effect on the operation of the column even after
a comparatively large number of samples had been run.
Comparison of peak areas for a given sample size of the
hydrolyzed material with the areas for a similar sample size
of pure fatty acids methyl esters showed that there was 30
to 40% hydrolysis under the conditions used."
Table 79 gives a summary of the hydrolysis conditions
used by several different workers in their investigations.
These conditions were studied to determine the "proposed
conditions" which best suited the needs of this problem.

Table 79. Summary of hydrolysis conditions
Glycerol Mono-glyc. Di-glyc. Borg- Mattson Proposed generator generator generator strom Beck Youngs condition
Reference : Gms of fat Ml of soin. Buffer soin.molarity Gms bile salts pH Mg of pancreatin Temp.°C
Gm. fat
Gm. f at Ml. aq. soin.
Gm. steapsin
Ml. aq. soin.
Gm. bile salt
Ml. aq. soin.
Gm. Ca++
%
Ml. aq. soin.
%
%
(23) 2.4
125.8 0.02 1 . 8 8.0 360 40
15.0
1.91
0.286
1.43
0.382
(22) 1.2 7.95 0.10 0.015 8 . 0 78 37
6.5
15.1
0.982
0.189
6.04
(24) 1.2 7.95 0.10 0.015 7.0 78 37
6.5
15.1
0.982
0.262
(11) 0.150 6
6.3
40
2.5
(54) 2 .0
17.2 1.0
0.00045 8 . 0 156
(98) 0.020 3 0.5 0.005 8.0
8
7.8 40.0
16.3 0.667
0.907 0.266
0.262 0.167
2 None
8 . 0
40 Room temp. 40
(8.5 mg %) None 0.85 2.62 None
10.0
10.0
1.0
None
0.635

315
APPENDIX F: PREPARATION OF FATTY ACID METHYL ESTERS
The method used by Hornstein et. al. (40) is quoted below.
"Pretreatment of Resin. Ten grams of Amberlite IRA-400
are stirred with 25 ml of IN sodium hydroxide for 5 minutes.
The resin is allowed to settle and the supernatant liquid is
discarded. The resin is successively washed with several
portions of distilled water to remove free alkali, then with
three 25 ml portions of anhydrous ethyl alcohol to remove
water, and finally with three 25 ml portions of petroleum
ether to displace the ethyl alcohol.
"Separation of Fatty Acids from Fat. If fat....For un-
emulsified fat samples, 0.1 to 1.0 gram is dissolved directly
in petroleum ether.
In either case 10 to 25 mg, accurately weighed, of n-
heptadecanoic acid are added to the petroleum ether solution,
which is decanted onto 10 grams of the pretreated resin in a
250 ml Erlenmeyer flask; Two 5 ml portions of petroleum
ether are used to wash the residual solution into the flask.
The solution, plus resin, is stirred (magnetic stirrer) for
5 minutes. The resin, plus adsorbed fatty acids, is allowed
to settle and the supernatant liquid discarded. The residue
is then washed free of fat by stirring with three successive
25 ml portions of petroleum ether and discarding the washings.

316
"Preparation of Methyl Esters. The adsorbed fatty acids
are converted to the esters directly on the resin. A 25 ml
portion of anhydrous methanol-hydrochloric acid is added to
the resin and the mixture stirred for 25 minutes. The meth
anol solution is decanted through a rapid filter paper into
a 250 ml separatory funnel. The resin is washed by stirring
for 5 minutes with two successive 15 ml portions of anhydrous
methanol-hydrochloric acid, again decanting each wash through
the filter. Then 10 ml of distilled water are added to the
combined methanol extracts and the solution is extracted with
50 ml portions of petroleum ether. The aqueous phase is
drained into a second separatory funnel and extracted twice
with 20 ml portions of petroleum ether. The combined petroleum
ether extract is washed with 50 ml portions of water until
free of acid, dried over anhydrous sodium sulfate, and then
concentrated by a stream of dry nitrogen on a steam bath.
The fatty acid esters are quantitatively transferred with
petroleum ether to a 1 ml volumetric flask; an aliquot is then
used for the gas chromatographic separations."
Throughout the procedure as given above, petroleum ether
was replaced by ethyl ether. In drying the resin during pre-
treatment, methyl alcohol was used in place of ethyl alcohol
and in recovery of the methyl esters from the methanol-
hydrochloric acid solution, 100 ml of water were added instead

317
of just 10 ml and the extractions were made using ethyl ether.
As quantitative determination of the fatty acids was not re
quired here, the addition of a weighed quantity of an acid
not present in the free fatty acids was not necessary.
Stoffel eit a_l. (90) described the use of hydrochloric
acid-methanol for preparation of fatty acid methyl esters of
cholesterol esters, phosphatides, and glycerides. They
stressed the need for the absence of water when the methyla-
tion takes place by interesterification as is the case with
the three types of lipids mentioned. The desired reaction is
RlCOQRg + CH30H H+ R1œOCIi3 + R20H
but in the presence of water
R3COOR2 + H20 H+ ^ RiCOOH + R2OH
also takes place and gives low yields of methyl esters. Their
micromethod is quoted below.
"Interesterification. The esters or acids to be methy
lated (1 to 10 mg) are dissolved in 4 ml of 5% hydrochloric
acid in superdry methanol and 0.5 ml of dry benzene in a 15
ml microsublimation tube to which a condenser with a calcium
chloride moisture trap is connected. The mixture is refluxed
in a silicone bath at 80 to 100°C for 2 hours, with frequent
shaking at the start to dissolve the lipide mixture. After
cooling to room temperature, two volumes of water are added,

318
and the methyl esters are extracted three times with 3 ml of
petroleum ether. The pooled extracts are simultaneously
neutralized and dried over sodium sulfate-sodium bicarbonate
mixture for 1 hour. The esters are then quantitatively trans
ferred with petroleum ether to a second microsublimation tube
and the solvent is evaporated to dryness at reduced pressure
in a 40°C water bath.
"Microsublimation. After the microsublimation tube is
fitted to the cold finger, a vacuum of 0.2 t 0.15 mm of mercury
is produced. The tube is then lowered into a silicone bath
at 60 t 2°C for 60 minutes. The assembly is disconnected
after cooling, and the sublimed methyl esters are rinsed off
with petroleum ether into a glass-stoppered tube. After evapo
ration of solvent, the preparation is now ready for applica
tion to the gas-liquid chromatography column."
The above method gives pure methyl ester samples but re
quires considerable time and equipment. Therefore methyl
ester preparation of glycerides and of free fatty acids were
prepared as described below*
Sample sizes of a few milligrams (20-100) and as large
as 1 gram were refluxed with 15-20 ml of hydrochloric acid-
methanol solution for 30 minutes in a 25 ml round bottom flask.
A small boiling chip was used to prevent superheating of the

319
solutions. If the samples were not soluble in the methanol
solution, a few ml of anhydrous ethyl ether were added to the
sample. The reflux condenser was fitted with a calcium chlo
ride drying tube. After refluxing, the alcohol (and ether if
added) were partly evaporated and an equal or greater amount
ofr water was added. The methyl esters were then extracted
3—4 times with ethyl ether, the ether extracts washed once
or twice with water (wash water checked with blue litmus paper
to insure hydrochloric acid was removed) and the ether solu
tion dried over anhydrous granular sulfate. The ether was
decanted from the sulfate and the sulfate rinsed three times
with ether. The combined ether solutions were then evaporated
and the methyl ester residues transferred to l/2 dram screw
top glass vials for storage until gas chromatograms were pre
pared.
It was found that this procedure could be shortened
considerably by eliminating the extraction of the methyl es
ters with ether. After refluxing, the hydrochloric acid-
methanol was evaporated using a vacuum to remove the last
traces. Samples of the residue were injected directly into
the gas chromatograph. Traces of hydrochloric acid, if present,
d£d not interfere with the methyl ester analyses.
When it was desired to prepare methyl esters of free
fatty acids in the presence of glycerides, ethereal diazomethane

320
was used. This method was also used to methylate the carboxy-
lic acid groups of oxidized lard samples.
The diazomethane solution was prepared by the instruc
tions furnished with diazald (N-methyl-N-nitroso-p-toluene-
sulfonamide) obtained from the Aldrich Chemical Company, 2369
North 29th Street, Milwaukee 10, Wisconsin.
"Preparation of ethereal-alcoholic solutions of diazo
methane : Ethanol (95%, 25 ml) is added to a solution of potas
sium hydroxide (5 g) in water (8 ml) in a 100 ml distilling
flask fitted with dropping-funnel and an efficient condenser
set downward for distillation. The condenser is connected to
two receiving flasks in series, the second of which contains
20-30 ml ether. The inlet tube of the second receiver dips
below the surface of the ether, and both receivers are cooled
to 0°C.
"The flask containing the alkali solution is heated in a
water-bath to 65°, and a solution of 21.5 g (0.1 mole) of
"Diazald" in about 130 ml of ether is added through the drop
ping funnel in about 25 minutes. The rate of distillation
should about equal the rate of addition. When the dropping
funnel is empty, another 20 ml of ether is added slowly and
the distillation is continued until the distilling ether is
colorless. The combined ethereal distillate contains about
3 g of diazomethane."

321
Milligram quantities of the material to be methylated
were treated with enough of the ethereal diazomethane solu
tion to have 300% excess diazomethane present at the start of
the reaction. The methylation container was covered (not
stoppered) with a piece of paper or a beaker to retard the es
cape of the diazomethane. A qualitative estimate of the
amount of diazomethane in solution could be made by observing
the yellow color of the solution. Freshly prepared ethereal
diazomethane was straw yellow in color and became lighter
yellow as the diazomethane reacted or escaped. A clear color
less ether solution remained when no diazomethane remained
in the solution. Under the conditions used here, the solu
tions were used at room temperature and the yellow color per
sisted for longer than one hour. After one hour reaction
time, the ether and diazomethane were evaporated leaving be
hind the methyl ester residue and any side reaction products
which may have formed. Where desired, 10-15% methyl alcohol
may be added to the reaction solution to insure complete re
action of the carboxylic acid groups in a shorter period of
time as described by Schlenk and Gellerman (86).

322
APPENDIX G: PREPARATION OF ANHYDROUS HYDROCHLORIC
ACID •-METHANOL SOL UT ION
The procedure used in this preparation was obtained from
Vogel (92). The equipment consisted of common laboratory
glassware, rubber stoppers, and Tygon tubing for making glass
to glass tubing connections. Vogel presents a diagram of the
apparatus if desired and the procedure is presented below.
One-hundred ml of concentrated hydrochloric acid were
slowly run into 150 ml of concentrated sulfuric acid. The
hydrochloric acid was placed in a small separatory funnel
fitted with a 3 5-40 cm length of glass capillary tubing on the
funnel stem. The sulfuric acid was placed in a second separa
tory funnel and the capillary tubing was extended through a
rubber stopper to just a cm or two from the bottom of the
sulfuric acid funnel. The hydrochloric acid vapors formed
in the sulfuric acid funnel were conducted through a sulfuric
acid trap to dry the gas, then through an empty safety trap
and finally below the surface of anhydrous methyl alcohol in
an Erlenmeyer flask cooled in an ice bath. The flow of hy
drochloric acid through the capillary leg was started by rais
ing the end of the capillary tubing out of the sulfuric acid
until the hydrochloric acid had forced all of the air out of
the capillary tubing. The capillary tubing was then put back
in place. The flow of hydrochloric acid was controlled by use

323
of the stopcock in the hydrochloric acid funnel. Thirty-one
to 33 grams of anhydrous hydrochloric acid were produced by
this method. The sulfuric acid trap was fitted with a thistle
tube extending just below the acid surface to prevent the
build-up of pressure in the system. A precaution which is not
mentioned by Vogel is that the capillary tube should extend
to nearly the bottom of the sulfuric acid funnel to prevent
the formation of two layers in this funnel. If two layers
were suddenly mixed, a bad accident could result. The strength
of the hydrochloric acid-methanol solution can be determined
by titrating a sample with standard base or estimated from the
increase in weight of the methyl alcohol.
Copyright © 2022 FDOKUMEN


![[The Emperor's physician before and after the Empire].](https://static.fdokumen.com/doc/165x107/6344bc856cfb3d40640959cf/the-emperors-physician-before-and-after-the-empire.jpg)


![2011. The utopian moment, now? ["Before and After Utopia" Exhibit]](https://static.fdokumen.com/doc/165x107/632523534643260de90d9866/2011-the-utopian-moment-now-before-and-after-utopia-exhibit.jpg)