Dynamics of the Douro estuary sand spit before and after breakwater construction
17
Dynamics of the Douro estuary sand spit before and after breakwater construction L. Bastos a, b , A. Bio a, * , J.L.S. Pinho c , H. Granja a, d , A. Jorge da Silva e a CIMAR/CIIMAR e Centro Interdisciplinar de Investigação Marinha e Ambiental, Universidade do Porto, Rua dos Bragas, 289, 4050-123 Porto, Portugal b Departamento de Geociências, Ambiente e Ordenamento do Território, Faculdade de Ciências da Universidade do Porto, Portugal c Departamento de Engenharia Civil, Universidade do Minho, Campus de Gualtar, 4710-057 Braga, Portugal d Departamento de Ciências da Terra, Universidade do Minho, Campus de Gualtar, 4710-057 Braga, Portugal e IH e Instituto Hidrográfico, Rua das Trinas 49, 1249-093 Lisboa, Portugal article info Article history: Received 10 December 2010 Accepted 10 May 2012 Available online xxx Keywords: coastal morphology sand spits DGPS surveys breakwater impact abstract The Douro estuary sand spit (NW Portugal) is an important natural defence against the impact of storm events. Aiming to improve navigation safety, a breakwater was built to stabilise the spit. In 2001, a monitoring programme was set up to understand the dynamics of the sand spit and, later, to evaluate breakwater efficiency on stabilising the spit’s shape and volume. Nine years of periodic, accurate 3D digital elevation models obtained from kinematic differential Global Positioning System surveys were used to assess spatial and temporal changes in the spit morphology before and after the breakwater construction. Temporal and spatial spit dynamics were further related to river discharge flows, wave action and wind energy. Although the breakwater had a stabilising effect on most of the spit’s area and volume, it caused a clear change in the morphology of the spit’s head and in the previously observed patterns of erosion and accretion. Before breakwater construction, erosion was significantly correlated with extreme river discharge and wind conditions; accretion was significantly correlated with extreme wind conditions; and spit area and volume at 1e2 m elevation with extreme wave conditions. After breakwater construction, these correlations were not found, but the eastern (inland) face of the spit and particularly its southern part became more susceptible to the observed extreme river discharge flows, wave and wind conditions. The instability in the SE part of the spit may pose a threat to an existing local Nature Reserve. Furthermore, before breakwater construction, the spit often breached during severe floods favouring river discharges. The strengthening of the spit after breakwater construction may reduce the likelihood of breaching and lead to more severe flood effects in the estuary. Ó 2012 Elsevier Ltd. All rights reserved. 1. Introduction Spits are sub-aerial landforms that are formed and shaped by longshore sediment transport. Their morphology depends on currents, wave and wind climate, sediment budget, tidal range and on human induced changes. Spits are dynamic in their position and shape, migrating in response to eustatic fluctuations and revealing short-term changes related with meteorological events. They are more frequent in shallow coastal waters where large volumes of sand are available (Schwartz, 1982). Sand spits are very sensitive to river discharges (e.g. Sakho et al., 2011) and to extreme storm events (e.g. Suursaar et al., 2008; Liu et al., 2010). But their dynamics is not only associated with short- term events, they can also respond to events that take place at larger temporal scales. Besides the natural forcing factors on spits, they also suffer the impact of human induced changes (e.g. Hedge and Raveendra, 2000). Several works across the world have tried to characterise both short and long-term spit evolution in order to contribute to sound coastal zone management practices (e.g. Bryan et al., 2008). Sand spits have a natural defence function in estuarine and coastal environments. Especially in densely occupied areas, spits therefore receive particular attention and sometimes human intervention. The effect of spit stabilisation is particularly impor- tant once changes in their natural dynamics may affect flood and erosion risk to landward areas. The present work analyses the effect of a detached breakwater on the morphodynamics of an estuarine sand spit, using nearly a decade of periodic Global Positioning System (GPS)-based field surveys and historical information. Systematic surveys allow * Corresponding author. E-mail addresses: [email protected] (L. Bastos), [email protected] (A. Bio), [email protected] (J.L.S. Pinho), [email protected] (H. Granja), jorge.silva@hidrografico.pt (A. Jorge da Silva). Contents lists available at SciVerse ScienceDirect Estuarine, Coastal and Shelf Science journal homepage: www.elsevier.com/locate/ecss 0272-7714/$ e see front matter Ó 2012 Elsevier Ltd. All rights reserved. doi:10.1016/j.ecss.2012.05.017 Estuarine, Coastal and Shelf Science xxx (2012) 1e17 Please cite this article in press as: Bastos, L., et al., Dynamics of the Douro estuary sand spit before and after breakwater construction, Estuarine, Coastal and Shelf Science (2012), doi:10.1016/j.ecss.2012.05.017
Transcript of Dynamics of the Douro estuary sand spit before and after breakwater construction
at SciVerse ScienceDirect
Estuarine, Coastal and Shelf Science xxx (2012) 1e17
Contents lists available
Estuarine, Coastal and Shelf Science
journal homepage: www.elsevier .com/locate/ecss
Dynamics of the Douro estuary sand spit before and after breakwater construction
L. Bastos a,b, A. Bio a,*, J.L.S. Pinho c, H. Granja a,d, A. Jorge da Silva e
aCIMAR/CIIMAR e Centro Interdisciplinar de Investigação Marinha e Ambiental, Universidade do Porto, Rua dos Bragas, 289, 4050-123 Porto, PortugalbDepartamento de Geociências, Ambiente e Ordenamento do Território, Faculdade de Ciências da Universidade do Porto, PortugalcDepartamento de Engenharia Civil, Universidade do Minho, Campus de Gualtar, 4710-057 Braga, PortugaldDepartamento de Ciências da Terra, Universidade do Minho, Campus de Gualtar, 4710-057 Braga, Portugale IH e Instituto Hidrográfico, Rua das Trinas 49, 1249-093 Lisboa, Portugal
a r t i c l e i n f o
Article history:Received 10 December 2010Accepted 10 May 2012Available online xxx
Keywords:coastal morphologysand spitsDGPS surveysbreakwater impact
* Corresponding author.E-mail addresses: [email protected] (L. Bastos), a
[email protected] (J.L.S. Pinho), [email protected]@hidrografico.pt (A. Jorge da Silva).
0272-7714/$ e see front matter � 2012 Elsevier Ltd.doi:10.1016/j.ecss.2012.05.017
Please cite this article in press as: Bastos, L., eCoastal and Shelf Science (2012), doi:10.101
a b s t r a c t
The Douro estuary sand spit (NW Portugal) is an important natural defence against the impact of stormevents. Aiming to improve navigation safety, a breakwater was built to stabilise the spit. In 2001,a monitoring programme was set up to understand the dynamics of the sand spit and, later, to evaluatebreakwater efficiency on stabilising the spit’s shape and volume. Nine years of periodic, accurate 3Ddigital elevation models obtained from kinematic differential Global Positioning System surveys wereused to assess spatial and temporal changes in the spit morphology before and after the breakwaterconstruction. Temporal and spatial spit dynamics were further related to river discharge flows, waveaction and wind energy. Although the breakwater had a stabilising effect on most of the spit’s area andvolume, it caused a clear change in the morphology of the spit’s head and in the previously observedpatterns of erosion and accretion. Before breakwater construction, erosion was significantly correlatedwith extreme river discharge and wind conditions; accretion was significantly correlated with extremewind conditions; and spit area and volume at 1e2 m elevation with extreme wave conditions. Afterbreakwater construction, these correlations were not found, but the eastern (inland) face of the spit andparticularly its southern part became more susceptible to the observed extreme river discharge flows,wave and wind conditions. The instability in the SE part of the spit may pose a threat to an existing localNature Reserve. Furthermore, before breakwater construction, the spit often breached during severefloods favouring river discharges. The strengthening of the spit after breakwater construction may reducethe likelihood of breaching and lead to more severe flood effects in the estuary.
� 2012 Elsevier Ltd. All rights reserved.
1. Introduction
Spits are sub-aerial landforms that are formed and shaped bylongshore sediment transport. Their morphology depends oncurrents, wave and wind climate, sediment budget, tidal range andon human induced changes. Spits are dynamic in their position andshape, migrating in response to eustatic fluctuations and revealingshort-term changes related with meteorological events. They aremore frequent in shallow coastal waters where large volumes ofsand are available (Schwartz, 1982).
Sand spits are very sensitive to river discharges (e.g. Sakho et al.,2011) and to extreme storm events (e.g. Suursaar et al., 2008; Liu
[email protected] (A. Bio),ct.uminho.pt (H. Granja),
All rights reserved.
t al., Dynamics of the Douro e6/j.ecss.2012.05.017
et al., 2010). But their dynamics is not only associated with short-term events, they can also respond to events that take place atlarger temporal scales. Besides the natural forcing factors on spits,they also suffer the impact of human induced changes (e.g. Hedgeand Raveendra, 2000). Several works across the world have triedto characterise both short and long-term spit evolution in order tocontribute to sound coastal zone management practices (e.g. Bryanet al., 2008).
Sand spits have a natural defence function in estuarine andcoastal environments. Especially in densely occupied areas, spitstherefore receive particular attention and sometimes humanintervention. The effect of spit stabilisation is particularly impor-tant once changes in their natural dynamics may affect flood anderosion risk to landward areas.
The present work analyses the effect of a detached breakwateron the morphodynamics of an estuarine sand spit, using nearlya decade of periodic Global Positioning System (GPS)-based fieldsurveys and historical information. Systematic surveys allow
stuary sand spit before and after breakwater construction, Estuarine,
L. Bastos et al. / Estuarine, Coastal and Shelf Science xxx (2012) 1e172
quantification of erosion and/or accretion trends (e.g. Norcrosset al., 2002; Zhang et al., 2002; Esteves et al., 2011), of recessionrates and degrees of recovery after storm events (e.g. Morton et al.,1994; List and Farris, 1999; Cooper et al., 2004), as well as theresponse to engineering works (e.g. Turner et al., 2006; Ojeda andGuillen, 2008; Rosa-Santos et al., 2009). Both short and long-termmonitoring are critical to understand trends in beach and near-shore coastal systems (Barnard and Warrick, 2010).
Although the sand spit at the Douro estuary protects inlandmargins and harbours from storm effects, its morphodynamics,determined by both natural and human processes, is still poorlyunderstood (Portela, 2008). Natural factors include precipitationand river flow, wave energy, winds, tides and surges, whereasanthropic effects result from resource exploitation, and theconstruction of dams and breakwaters (Dias et al., 2002; Soares deCarvalho et al., 2006; Coelho et al., 2009). The spit’s variable sizeand shape have caused frequent nuisance to navigation, affectingwidth and depth of the navigation channel. On a larger (centennial)timescale the spit has moved landwards exposing the end of theright bank (Foz do Douro) to storm events. Therefore, between2004 and 2008, a breakwater was constructed in an attempt toachieve the following objectives: stabilise the estuary’s banks,especially at the sand spit and the estuary inlet; improve naviga-bility and navigation safety under any tide conditions; reducepropagation of storm waves into the estuary; preserve environ-mental values (most of the sand spit and the adjacent São Paio Bayconstitute a Nature Reserve); and reduce the dredging effortneeded to maintain the navigation channel.
In June 2001, a monitoring programme was set up to survey andevaluate sand spit evolution. Digital elevation models (DEM),derived from seasonal GPS-based field surveys, were analysed toassess changes in sand spit position, shape and volume. During thesurvey period (2001e2010), the monitoring method evolved fromGPS only to more innovative Mobile Mapping techniques whichinclude simultaneous image acquisition, supported by directgeorreferencing.
The main goals of the programme were: (1) relating spitdynamics to river discharge flows, ocean waves and wind actions,and (2) evaluate the impact of the recently built breakwater on spitvulnerability to extreme river discharges, wave and wind condi-tions. This study attempts to quantify the changes that occur in theDouro sand spit and to correlate them with main driving forces.
In Section 2 the study area is characterised in terms of riverbasin hydrology andwave climate and a description of the sand spitand its breakwater is presented. Section 3 presents a brief overviewof the monitoring methods used for data collection and processing,with a special emphasis on the efficiency of different MobileMapping systems developed at the University of Porto. Section 4presents the analysis of the DEMs derived from the surveyresults, and their relation to river discharge flow, ocean wave andwind patterns, and a comparison between the periods before andafter the breakwater construction. In the final sections, results arediscussed and directions for further work pointed out.
2. Study area
The Douro river has the largest basin in the Iberian Peninsulawith an area of almost 100,000 km2. Being the second largest riverin the northern Portuguese territory, it flows to a coastal area withintense and long-standing human occupation. This river hassuffered numerous interventions, most importantly the construc-tion of several dams, between 1950 and 1985, which definitelychanged the river’s hydrodynamics and sediment transportpotential (though themost important damwas built in 1970). Theseinterventions are reflected in the behaviour of the estuary and
Please cite this article in press as: Bastos, L., et al., Dynamics of the Douro eCoastal and Shelf Science (2012), doi:10.1016/j.ecss.2012.05.017
adjacent coastal areas, which also suffered impacts of coastalworks, in the late nineteenth century, when the Leixões harbourwas constructed north of the Douro river mouth.
The Douro river has a torrential regime with recurrent severefloods. Strong river currents have caused serious damages to theriverside populations and problems in maritime navigation. Theriver is regulated by 15 dams, seven on Spanish and eight onPortuguese territory. Reservoirs management and consequent riverdischarges into the estuary depend on meteorological conditions(associated with the hydrological cycle and rainfall conditions) andon hydro-power generation schedules. There are consequentlyfrequent zero river discharges, mostly during parts of summer days,as well as floods (with peak flows of more than 13,000 m3 s�1) inwinter or spring, when the reservoirs water storage capacity isachieved. Several historical records (at the Douro and Leixõesharbours administration entity e APDL) show sand spit rupture orpartial destruction with river discharge flows consistently at orabove 10,000 m3 s�1.
On average, 85% of the annual precipitation in the Douro regionoccurs between October and May, generating distinct wet and dryseasons. Precipitation in the driest month is less than one third ofthat in the wettest. The climate is temperate, with a meantemperature of 14.4 �C, humid, with a relative humidity of 81% at09:00 h, and rainy, with a mean annual precipitation of 1236 mm.
At latitudes from 40� to 42�N, the north-western Portuguesecoast is highly energetic (Cruz, 2008), with offshore mean signifi-cant wave heights of 2e3 m, and mean wave periods of 8e12 s. Inwinter, storms generated in the North Atlantic are frequent and canpersist for up to five days, with significant wave heights reaching8 m (Costa et al., 2001). Tides are semi-diurnal, with tidal rangesfrom 2 m to 4 m during neap and spring tides, respectively. Wavesare usually coming from the NW, inducing a drift current fromNorth to South. This current is in some areas inverted due to thepresence of obstacles that promote wave diffraction. The coastalwind regime is characterised by a high seasonal variability. FromApril to August there are predominant WNWand NWwinds, whilein other periods of the year the EeSSE wind is more frequent.WeSW winds are not frequent, although very important duringstorm events.
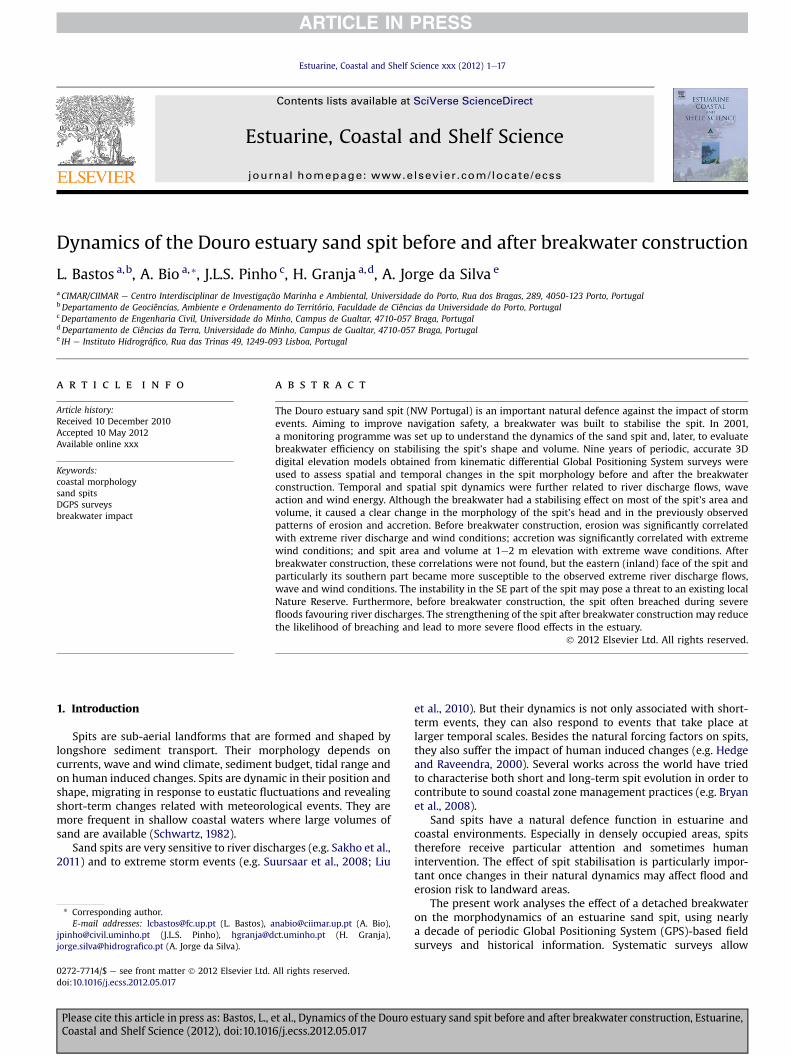
The Douro estuary is funnel-shaped (Fig. 1) and lies embeddedin a steep valley, extending 21.6 km from its upstream boundary atthe CrestumaeLever dam (Fig. 1B) to the river mouth (Portela,2002). Tide and wave effects on the estuary are conditioned byestuary morphology, particularly by the presence of the Dourosand spit, which constrains the opening towards the sea (Fig. 1B).This sand spit has slowly shifted inland with time (Fig. 2) e about500 m during the past century (Consulmar, 1995; Silva et al.,2005). Consequently the estuary and particularly the northernriver bank became increasingly exposed to storms, and navigationwas periodically conditioned due to rough weather and waveconditions. The sand spit shape has been highly dynamic andparticularly influenced by river discharge flows and oceandynamics, with accretion repeatedly causing progression of thespit head towards the north and leading to the obstruction of thenavigation channel.
The Douro sand spit (Figs. 1 and 2) is rooted on the south bank ofthe Douro river estuary and is, nowadays, about 300 mwide (EeW)and 800 m long (NeS). Its eastern part is stabilised by plants likeElymus farctus and Ammophila arenaria and connects with the SãoPaio Bay, a mostly submerged (1e2 m below vertical chart datum,CD), hydrodynamically still wetland of ecological relevance.Composed of fine to medium-coarse sand, the spit is influenced byaero-fluvio-marine conditions, including sedimentary transport bythe river, swell and tide effects, as well as sand transport by winds(Consulmar, 1995; Silva et al., 2005).
stuary sand spit before and after breakwater construction, Estuarine,
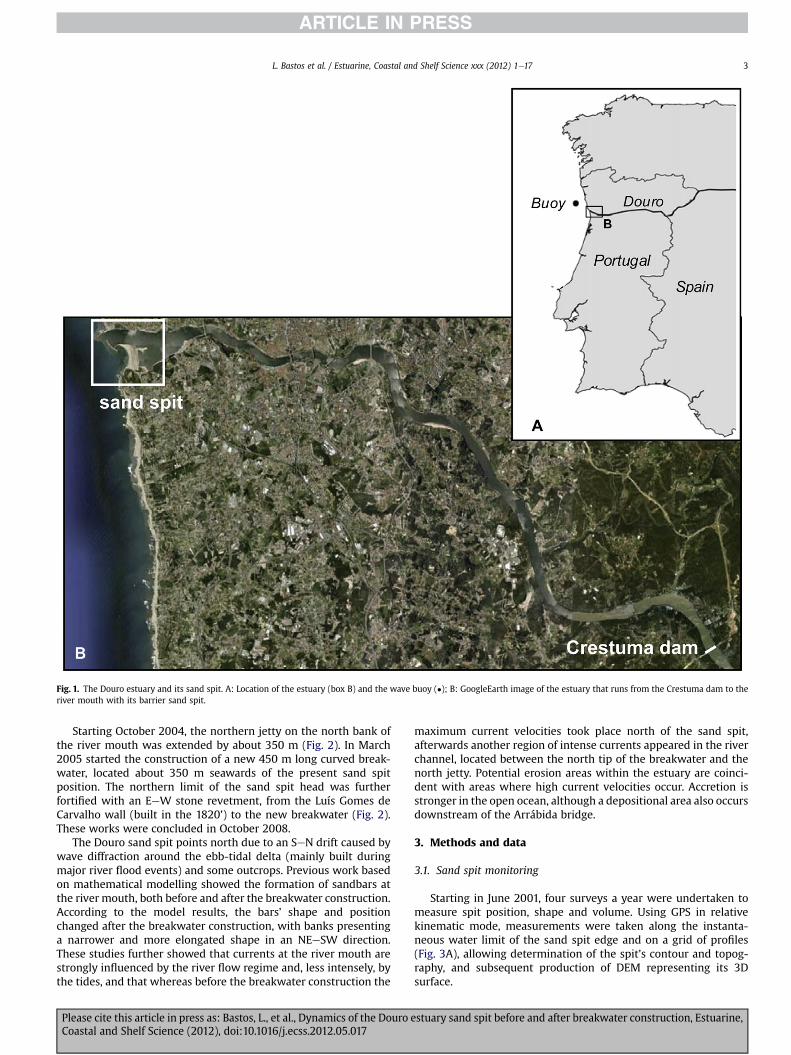
Fig. 1. The Douro estuary and its sand spit. A: Location of the estuary (box B) and the wave buoy (�); B: GoogleEarth image of the estuary that runs from the Crestuma dam to theriver mouth with its barrier sand spit.
L. Bastos et al. / Estuarine, Coastal and Shelf Science xxx (2012) 1e17 3
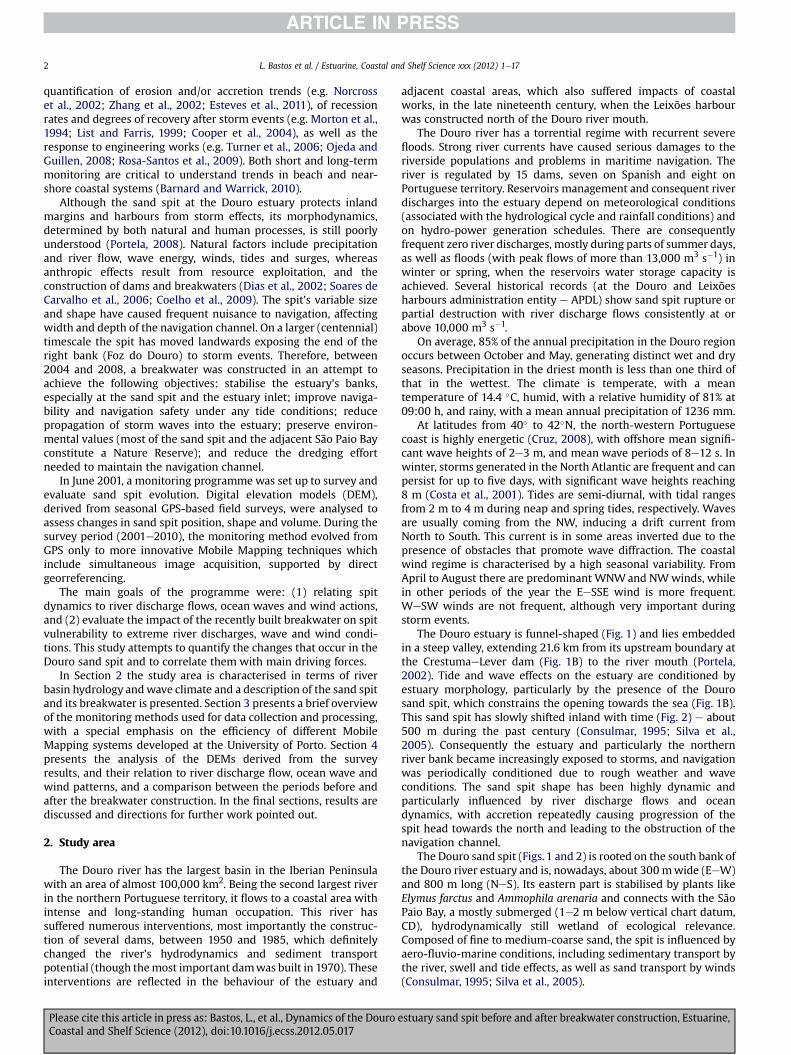
Starting October 2004, the northern jetty on the north bank ofthe river mouth was extended by about 350 m (Fig. 2). In March2005 started the construction of a new 450 m long curved break-water, located about 350 m seawards of the present sand spitposition. The northern limit of the sand spit head was furtherfortified with an EeW stone revetment, from the Luís Gomes deCarvalho wall (built in the 1820’) to the new breakwater (Fig. 2).These works were concluded in October 2008.
The Douro sand spit points north due to an SeN drift caused bywave diffraction around the ebb-tidal delta (mainly built duringmajor river flood events) and some outcrops. Previous work basedon mathematical modelling showed the formation of sandbars atthe river mouth, both before and after the breakwater construction.According to the model results, the bars’ shape and positionchanged after the breakwater construction, with banks presentinga narrower and more elongated shape in an NEeSW direction.These studies further showed that currents at the river mouth arestrongly influenced by the river flow regime and, less intensely, bythe tides, and that whereas before the breakwater construction the
Please cite this article in press as: Bastos, L., et al., Dynamics of the Douro eCoastal and Shelf Science (2012), doi:10.1016/j.ecss.2012.05.017
maximum current velocities took place north of the sand spit,afterwards another region of intense currents appeared in the riverchannel, located between the north tip of the breakwater and thenorth jetty. Potential erosion areas within the estuary are coinci-dent with areas where high current velocities occur. Accretion isstronger in the open ocean, although a depositional area also occursdownstream of the Arrábida bridge.
3. Methods and data
3.1. Sand spit monitoring
Starting in June 2001, four surveys a year were undertaken tomeasure spit position, shape and volume. Using GPS in relativekinematic mode, measurements were taken along the instanta-neous water limit of the sand spit edge and on a grid of profiles(Fig. 3A), allowing determination of the spit’s contour and topog-raphy, and subsequent production of DEM representing its 3Dsurface.
stuary sand spit before and after breakwater construction, Estuarine,
Fig. 2. Douro sand spit evolution. Aerial photography taken in November 2008, with spit contours for 1862 and 1950. 1: Luís Gomes de Carvalho wall built in the 1820’, 2: São PaioBay, 3: northern breakwater, 4: sand spit breakwater and 5: its access road. Contours were extracted from georreferenced historical maps (Sousa and Alves, 2002).
L. Bastos et al. / Estuarine, Coastal and Shelf Science xxx (2012) 1e174
Themonitoring data comprise 36 seasonal surveys (33 completetopographies, in 3 surveys only contours could be obtained), per-formed in low spring-tide conditions, with local tides (duringobservation) varying between 0.1 m and 0.9 m above CD. Tominimise the error due to the different instantaneous survey waterheights, comparisons of spit areas and volumes between campaignswere based on the part of the sand spit DEM exceeding the height of1 m above CD.
Several methods have been proposed for coastal morphody-namic monitoring. Surveys using conventional techniques, such asclassic geodetic devices (e.g. Holland et al., 2009; Cowart et al.,2010), are both costly and labour-intensive, and generally lack thespatial and temporal resolution needed to identify and quantify
Fig. 3. Sand spit mobile mapping survey. A: Distribution of samples collected during in Jun(coordinates are in Datum 73, HayfordeGauss, IPCC); B: single-antenna one-wheel on-foarticulate arm; D: four-wheel vehicle with two kinematic antennas and videogrammetric e
Please cite this article in press as: Bastos, L., et al., Dynamics of the Douro eCoastal and Shelf Science (2012), doi:10.1016/j.ecss.2012.05.017
short-term changes as well as long-term trends (Huang et al., 2002;Short and Trembanis, 2004). Airborne photogrammetry, morerecently with digital images, is a useful method to quantify shore-line retreat and morphodynamic changes (Fletcher et al., 2003;Cowart et al., 2010), but its use implies more complicated logisticsand therefore higher costs. Satellite radars, particularly SyntheticAperture Radar (SAR), have been used to extract shoreline infor-mation (Niedermeier et al., 2000; Trebossen et al., 2005; Wu andLee, 2007). Spaceborne methods are however dependent onsatellite coverage and usually lack the short temporal resolutionthat is needed for detailed local studies or after storm changeevaluation. Airborne laser techniques (such as LiDAR e LightDetection and Ranging) are very effective for DEM extraction
e 2009 (each dot is an observation) and delimitation of the four spit sectors analysedot equipment; C: quad bike equipped with two kinematic antennas mounted on anquipment.
stuary sand spit before and after breakwater construction, Estuarine,
L. Bastos et al. / Estuarine, Coastal and Shelf Science xxx (2012) 1e17 5
(Sallenger et al., 2003; Hobbs et al., 2010). The use of dual frequencylaser systems for coastal surveys has the advantage of allowing thesimultaneous extraction of onshore altimetric information and alsobathymetric information in the nearshore. These techniques candeliver good accuracy (10e20 cm) in the vertical component andmay constitute a good alternative for coastal monitoring, but theyare extremely expensive (Young et al., 2010). Compared to terres-trial systems, aerial surveys are in general more expensive and theequipment is not as easily deployed. Airborne and spaceborneimage acquisition techniques are furthermore more dependent onmeteorological conditions than terrestrial methods. They arehowever better suited for large scale monitoring, as vast areas(hundreds of kilometres) can easily be observed in a short time.Terrestrial laser systems can also be used to extract accurate (at thecentimetre level) DEM, but still at a high cost (Young et al., 2010).
GPS basedmethods combine rapid data collection at high spatialresolutions with the advantage of being easily accessible andaffordable (Battiau-Queney et al., 2003; Barnard and Warrick,
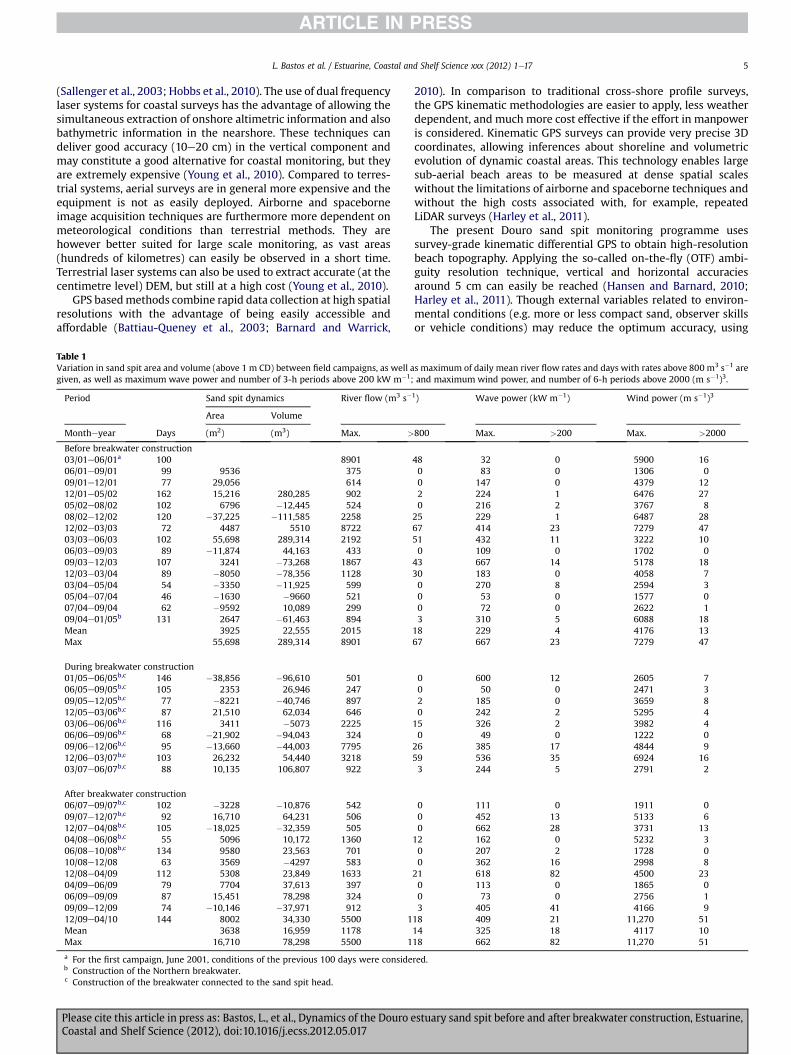
Table 1Variation in sand spit area and volume (above 1 m CD) between field campaigns, as well agiven, as well as maximum wave power and number of 3-h periods above 200 kW m�1;
Period Sand spit dynamics River flow (m3 s�
Area Volume
Montheyear Days (m2) (m3) Max. >
Before breakwater construction03/01e06/01a 100 890106/01e09/01 99 9536 37509/01e12/01 77 29,056 61412/01e05/02 162 15,216 280,285 90205/02e08/02 102 6796 �12,445 52408/02e12/02 120 �37,225 �111,585 225812/02e03/03 72 4487 5510 872203/03e06/03 102 55,698 289,314 219206/03e09/03 89 �11,874 44,163 43309/03e12/03 107 3241 �73,268 186712/03e03/04 89 �8050 �78,356 112803/04e05/04 54 �3350 �11,925 59905/04e07/04 46 �1630 �9660 52107/04e09/04 62 �9592 10,089 29909/04e01/05b 131 2647 �61,463 894Mean 3925 22,555 2015Max 55,698 289,314 8901
During breakwater construction01/05e06/05b,c 146 �38,856 �96,610 50106/05e09/05b,c 105 2353 26,946 24709/05e12/05b,c 77 �8221 �40,746 89712/05e03/06b,c 87 21,510 62,034 64603/06e06/06b,c 116 3411 �5073 222506/06e09/06b,c 68 �21,902 �94,043 32409/06e12/06b,c 95 �13,660 �44,003 779512/06e03/07b,c 103 26,232 54,440 321803/07e06/07b,c 88 10,135 106,807 922
After breakwater construction06/07e09/07b,c 102 �3228 �10,876 54209/07e12/07b,c 92 16,710 64,231 50612/07e04/08b,c 105 �18,025 �32,359 50504/08e06/08b,c 55 5096 10,172 136006/08e10/08b,c 134 9580 23,563 70110/08e12/08 63 3569 �4297 58312/08e04/09 112 5308 23,849 163304/09e06/09 79 7704 37,613 39706/09e09/09 87 15,451 78,298 32409/09e12/09 74 �10,146 �37,971 91212/09e04/10 144 8002 34,330 5500 1Mean 3638 16,959 1178Max 16,710 78,298 5500 1
a For the first campaign, June 2001, conditions of the previous 100 days were consideb Construction of the Northern breakwater.c Construction of the breakwater connected to the sand spit head.
Please cite this article in press as: Bastos, L., et al., Dynamics of the Douro eCoastal and Shelf Science (2012), doi:10.1016/j.ecss.2012.05.017
2010). In comparison to traditional cross-shore profile surveys,the GPS kinematic methodologies are easier to apply, less weatherdependent, and much more cost effective if the effort in manpoweris considered. Kinematic GPS surveys can provide very precise 3Dcoordinates, allowing inferences about shoreline and volumetricevolution of dynamic coastal areas. This technology enables largesub-aerial beach areas to be measured at dense spatial scaleswithout the limitations of airborne and spaceborne techniques andwithout the high costs associated with, for example, repeatedLiDAR surveys (Harley et al., 2011).
The present Douro sand spit monitoring programme usessurvey-grade kinematic differential GPS to obtain high-resolutionbeach topography. Applying the so-called on-the-fly (OTF) ambi-guity resolution technique, vertical and horizontal accuraciesaround 5 cm can easily be reached (Hansen and Barnard, 2010;Harley et al., 2011). Though external variables related to environ-mental conditions (e.g. more or less compact sand, observer skillsor vehicle conditions) may reduce the optimum accuracy, using
s maximum of daily mean river flow rates and days with rates above 800 m3 s�1 areand maximum wind power, and number of 6-h periods above 2000 (m s�1)3.
1) Wave power (kW m�1) Wind power (m s�1)3
800 Max. >200 Max. >2000
48 32 0 5900 160 83 0 1306 00 147 0 4379 122 224 1 6476 270 216 2 3767 8
25 229 1 6487 2867 414 23 7279 4751 432 11 3222 100 109 0 1702 0
43 667 14 5178 1830 183 0 4058 70 270 8 2594 30 53 0 1577 00 72 0 2622 13 310 5 6088 18
18 229 4 4176 1367 667 23 7279 47
0 600 12 2605 70 50 0 2471 32 185 0 3659 80 242 2 5295 4
15 326 2 3982 40 49 0 1222 0
26 385 17 4844 959 536 35 6924 163 244 5 2791 2
0 111 0 1911 00 452 13 5133 60 662 28 3731 13
12 162 0 5232 30 207 2 1728 00 362 16 2998 8
21 618 82 4500 230 113 0 1865 00 73 0 2756 13 405 41 4166 9
18 409 21 11,270 5114 325 18 4117 1018 662 82 11,270 51
red.
stuary sand spit before and after breakwater construction, Estuarine,
L. Bastos et al. / Estuarine, Coastal and Shelf Science xxx (2012) 1e176
proper approaches, this errors can be controlled and an accuracy of5 cm is feasible.
The observing methodologies applied in our study evolvedduring the observation period, changing from an on-foot GPSequipment (used until 2002; Fig. 3B), to a two-antenna systeminstalled on a moto-quad (from 2003 to 2009; Fig. 3C) (Baptistaet al., 2008) and, more recently (since 2009), to a video-grammetric Mobile Mapping System (MMS) (Fig. 3D), which can beused with different direct georreferencing systems, developed atthe University of Porto (Madeira, 2007; Madeira et al., 2010).
Errors associated with the on-foot method highly depend on theoperator skills to keep the rod vertical; there is also degradation inprecision resulting from the degree of inclination or sinking of therod. Multi-antenna systems improve the accuracy of field data,allowing a correction of the vertical deviations of the GPS antennascaused by ground slope variations. Harley et al. (2007) reportedmeasurement errors due to vehicle sinking, tilting and shakingwithin the accuracy of the kinematic GPS, but as shown in Baptistaet al. (2008) these errors can be controlled and kept small.
A
0
1000
2000
3000
4000
03
-0
1
06
-0
1
09
-0
1
12
-0
1
03
-0
2
06
-0
2
09
-0
2
12
-0
2
03
-0
3
06
-0
3
09
-0
3
12
-0
3
03
-0
4
06
-0
4
09
-0
4
12
-0
4
03
-0
5
06
-0
5
riv
er flo
w (m
3s
−1)
B
0
200
400
600
03
/01
06
/01
09
/01
12
/01
03
/02
06
/02
09
/02
12
/02
03
/03
06
/03
09
/03
12
/03
03
/04
06
/04
09
/04
12
/04
03
/05
06
/05
wa
ve
po
we
r (kW
m−1
)
0
4000
8000
12000
03
-0
1
06
-0
1
09
-0
1
12
-0
1
03
-0
2
06
-0
2
09
-0
2
12
-0
2
03
-0
3
06
-0
3
09
-0
3
12
-0
3
03
-0
4
06
-0
4
09
-0
4
12
-0
4
03
-0
5
06
-0
5
win
d p
ow
er (m
s−1
)3
05/03/2001 27/12/2002
8901 8722
C
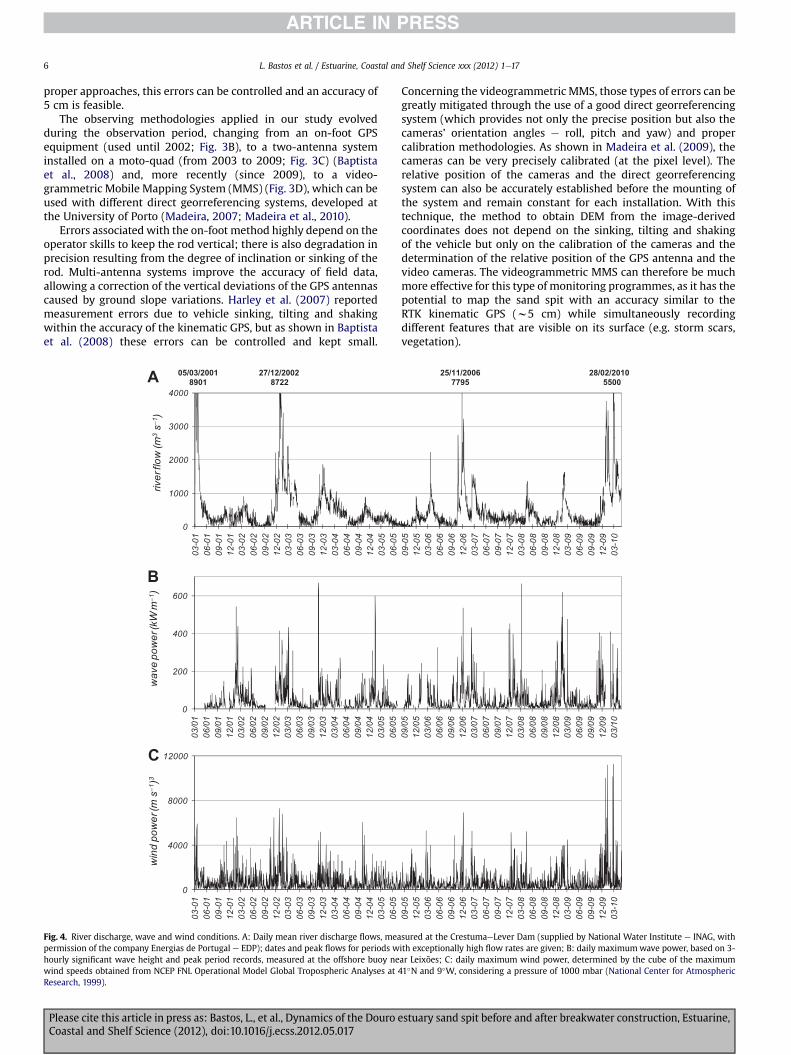
Fig. 4. River discharge, wave and wind conditions. A: Daily mean river discharge flows, meapermission of the company Energias de Portugal e EDP); dates and peak flows for periods whourly significant wave height and peak period records, measured at the offshore buoy newind speeds obtained from NCEP FNL Operational Model Global Tropospheric Analyses atResearch, 1999).
Please cite this article in press as: Bastos, L., et al., Dynamics of the Douro eCoastal and Shelf Science (2012), doi:10.1016/j.ecss.2012.05.017
Concerning the videogrammetric MMS, those types of errors can begreatly mitigated through the use of a good direct georreferencingsystem (which provides not only the precise position but also thecameras’ orientation angles e roll, pitch and yaw) and propercalibration methodologies. As shown in Madeira et al. (2009), thecameras can be very precisely calibrated (at the pixel level). Therelative position of the cameras and the direct georreferencingsystem can also be accurately established before the mounting ofthe system and remain constant for each installation. With thistechnique, the method to obtain DEM from the image-derivedcoordinates does not depend on the sinking, tilting and shakingof the vehicle but only on the calibration of the cameras and thedetermination of the relative position of the GPS antenna and thevideo cameras. The videogrammetric MMS can therefore be muchmore effective for this type of monitoring programmes, as it has thepotential to map the sand spit with an accuracy similar to theRTK kinematic GPS (w5 cm) while simultaneously recordingdifferent features that are visible on its surface (e.g. storm scars,vegetation).
09
-0
5
12
-0
5
03
-0
6
06
-0
6
09
-0
6
12
-0
6
03
-0
7
06
-0
7
09
-0
7
12
-0
7
03
-0
8
06
-0
8
09
-0
8
12
-0
8
03
-0
9
06
-0
9
09
-0
9
12
-0
9
03
-1
0
09
/05
12
/05
03
/06
06
/06
09
/06
12
/06
03
/07
06
/07
09
/07
12
/07
03
/08
06
/08
09
/08
12
/08
03
/09
06
/09
09
/09
12
/09
03
/10
09
-0
5
12
-0
5
03
-0
6
06
-0
6
09
-0
6
12
-0
6
03
-0
7
06
-0
7
09
-0
7
12
-0
7
03
-0
8
06
-0
8
09
-0
8
12
-0
8
03
-0
9
06
-0
9
09
-0
9
12
-0
9
03
-1
0
25/11/2006 28/02/2010
7795 5500
sured at the CrestumaeLever Dam (supplied by National Water Institute e INAG, withith exceptionally high flow rates are given; B: daily maximumwave power, based on 3-ar Leixões; C: daily maximum wind power, determined by the cube of the maximum41�N and 9�W, considering a pressure of 1000 mbar (National Center for Atmospheric
stuary sand spit before and after breakwater construction, Estuarine,
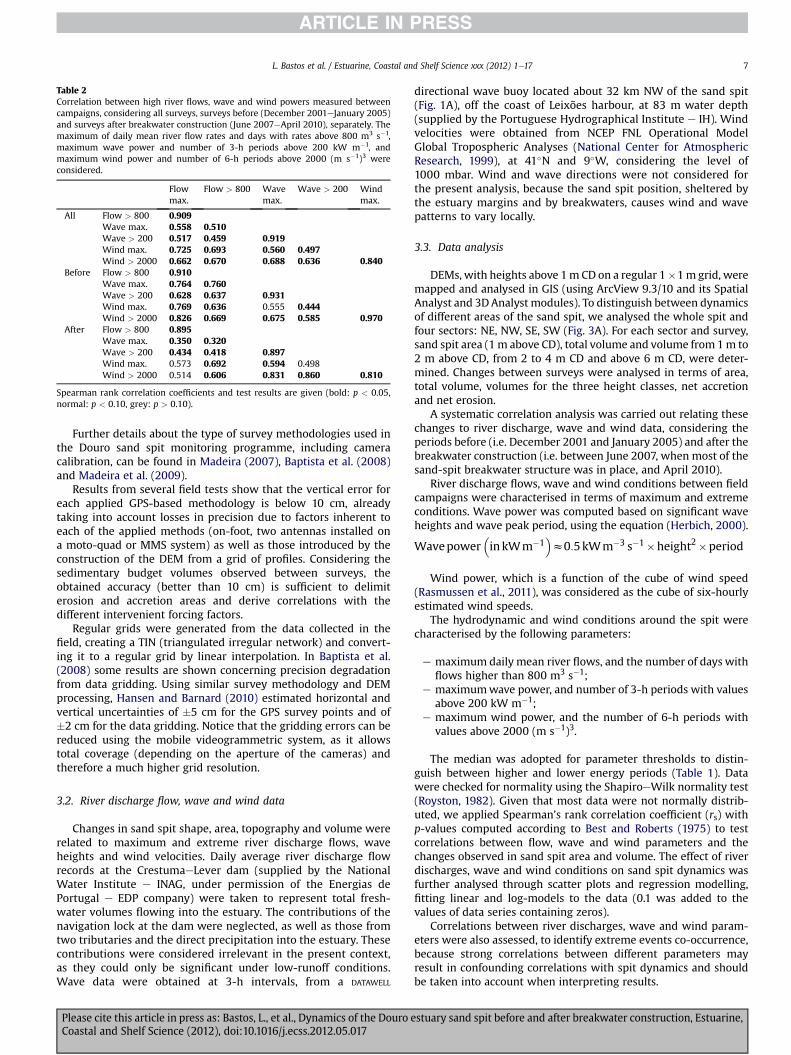
Table 2Correlation between high river flows, wave and wind powers measured betweencampaigns, considering all surveys, surveys before (December 2001eJanuary 2005)and surveys after breakwater construction (June 2007�April 2010), separately. Themaximum of daily mean river flow rates and days with rates above 800 m3 s�1,maximum wave power and number of 3-h periods above 200 kW m�1, andmaximum wind power and number of 6-h periods above 2000 (m s�1)3 wereconsidered.
Flowmax.
Flow > 800 Wavemax.
Wave > 200 Windmax.
All Flow > 800 0.909Wave max. 0.558 0.510Wave > 200 0.517 0.459 0.919Wind max. 0.725 0.693 0.560 0.497Wind > 2000 0.662 0.670 0.688 0.636 0.840
Before Flow > 800 0.910Wave max. 0.764 0.760Wave > 200 0.628 0.637 0.931Wind max. 0.769 0.636 0.555 0.444Wind > 2000 0.826 0.669 0.675 0.585 0.970
After Flow > 800 0.895Wave max. 0.350 0.320Wave > 200 0.434 0.418 0.897Wind max. 0.573 0.692 0.594 0.498Wind > 2000 0.514 0.606 0.831 0.860 0.810
Spearman rank correlation coefficients and test results are given (bold: p < 0.05,normal: p < 0.10, grey: p > 0.10).
L. Bastos et al. / Estuarine, Coastal and Shelf Science xxx (2012) 1e17 7
Further details about the type of survey methodologies used inthe Douro sand spit monitoring programme, including cameracalibration, can be found in Madeira (2007), Baptista et al. (2008)and Madeira et al. (2009).
Results from several field tests show that the vertical error foreach applied GPS-based methodology is below 10 cm, alreadytaking into account losses in precision due to factors inherent toeach of the applied methods (on-foot, two antennas installed ona moto-quad or MMS system) as well as those introduced by theconstruction of the DEM from a grid of profiles. Considering thesedimentary budget volumes observed between surveys, theobtained accuracy (better than 10 cm) is sufficient to delimiterosion and accretion areas and derive correlations with thedifferent intervenient forcing factors.
Regular grids were generated from the data collected in thefield, creating a TIN (triangulated irregular network) and convert-ing it to a regular grid by linear interpolation. In Baptista et al.(2008) some results are shown concerning precision degradationfrom data gridding. Using similar survey methodology and DEMprocessing, Hansen and Barnard (2010) estimated horizontal andvertical uncertainties of �5 cm for the GPS survey points and of�2 cm for the data gridding. Notice that the gridding errors can bereduced using the mobile videogrammetric system, as it allowstotal coverage (depending on the aperture of the cameras) andtherefore a much higher grid resolution.
3.2. River discharge flow, wave and wind data
Changes in sand spit shape, area, topography and volume wererelated to maximum and extreme river discharge flows, waveheights and wind velocities. Daily average river discharge flowrecords at the CrestumaeLever dam (supplied by the NationalWater Institute e INAG, under permission of the Energias dePortugal e EDP company) were taken to represent total fresh-water volumes flowing into the estuary. The contributions of thenavigation lock at the dam were neglected, as well as those fromtwo tributaries and the direct precipitation into the estuary. Thesecontributions were considered irrelevant in the present context,as they could only be significant under low-runoff conditions.Wave data were obtained at 3-h intervals, from a DATAWELL
Please cite this article in press as: Bastos, L., et al., Dynamics of the Douro eCoastal and Shelf Science (2012), doi:10.1016/j.ecss.2012.05.017
directional wave buoy located about 32 km NW of the sand spit(Fig. 1A), off the coast of Leixões harbour, at 83 m water depth(supplied by the Portuguese Hydrographical Institute e IH). Windvelocities were obtained from NCEP FNL Operational ModelGlobal Tropospheric Analyses (National Center for AtmosphericResearch, 1999), at 41�N and 9�W, considering the level of1000 mbar. Wind and wave directions were not considered forthe present analysis, because the sand spit position, sheltered bythe estuary margins and by breakwaters, causes wind and wavepatterns to vary locally.
3.3. Data analysis
DEMs, with heights above 1m CD on a regular 1�1m grid, weremapped and analysed in GIS (using ArcView 9.3/10 and its SpatialAnalyst and 3DAnalyst modules). To distinguish between dynamicsof different areas of the sand spit, we analysed the whole spit andfour sectors: NE, NW, SE, SW (Fig. 3A). For each sector and survey,sand spit area (1 m above CD), total volume and volume from 1m to2 m above CD, from 2 to 4 m CD and above 6 m CD, were deter-mined. Changes between surveys were analysed in terms of area,total volume, volumes for the three height classes, net accretionand net erosion.
A systematic correlation analysis was carried out relating thesechanges to river discharge, wave and wind data, considering theperiods before (i.e. December 2001 and January 2005) and after thebreakwater construction (i.e. between June 2007, when most of thesand-spit breakwater structure was in place, and April 2010).
River discharge flows, wave and wind conditions between fieldcampaigns were characterised in terms of maximum and extremeconditions. Wave power was computed based on significant waveheights and wave peak period, using the equation (Herbich, 2000).
Wavepower�in kWm�1
�z0:5kWm�3 s�1�height2�period
Wind power, which is a function of the cube of wind speed(Rasmussen et al., 2011), was considered as the cube of six-hourlyestimated wind speeds.
The hydrodynamic and wind conditions around the spit werecharacterised by the following parameters:
e maximum daily mean river flows, and the number of days withflows higher than 800 m3 s�1;
e maximumwave power, and number of 3-h periods with valuesabove 200 kW m�1;
e maximum wind power, and the number of 6-h periods withvalues above 2000 (m s�1)3.
The median was adopted for parameter thresholds to distin-guish between higher and lower energy periods (Table 1). Datawere checked for normality using the ShapiroeWilk normality test(Royston, 1982). Given that most data were not normally distrib-uted, we applied Spearman’s rank correlation coefficient (rs) withp-values computed according to Best and Roberts (1975) to testcorrelations between flow, wave and wind parameters and thechanges observed in sand spit area and volume. The effect of riverdischarges, wave and wind conditions on sand spit dynamics wasfurther analysed through scatter plots and regression modelling,fitting linear and log-models to the data (0.1 was added to thevalues of data series containing zeros).
Correlations between river discharges, wave and wind param-eters were also assessed, to identify extreme events co-occurrence,because strong correlations between different parameters mayresult in confounding correlations with spit dynamics and shouldbe taken into account when interpreting results.
stuary sand spit before and after breakwater construction, Estuarine,
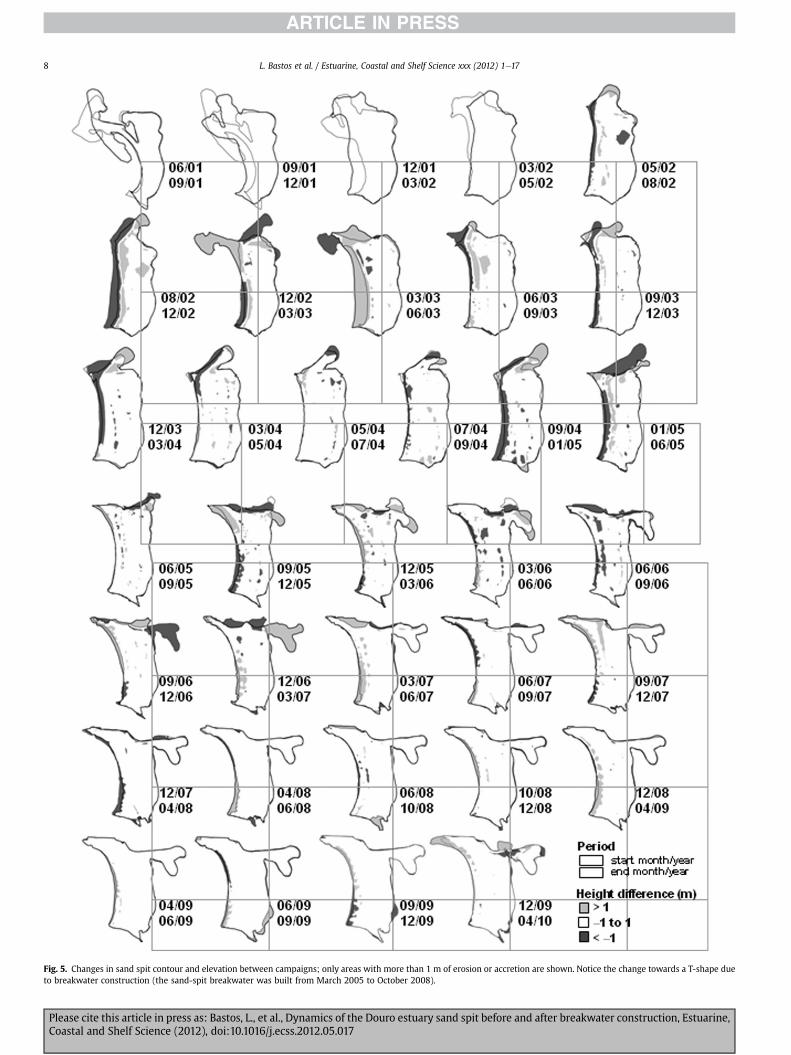
Fig. 5. Changes in sand spit contour and elevation between campaigns; only areas with more than 1 m of erosion or accretion are shown. Notice the change towards a T-shape dueto breakwater construction (the sand-spit breakwater was built from March 2005 to October 2008).
L. Bastos et al. / Estuarine, Coastal and Shelf Science xxx (2012) 1e178
Please cite this article in press as: Bastos, L., et al., Dynamics of the Douro estuary sand spit before and after breakwater construction, Estuarine,Coastal and Shelf Science (2012), doi:10.1016/j.ecss.2012.05.017
L. Bastos et al. / Estuarine, Coastal and Shelf Science xxx (2012) 1e17 9
All statistical analyses were done using the software “R”(R Development Core Team, 2009).
4. Results
4.1. River discharge, wave and wind power
River discharge, wave and wind power during the monitoringperiod are presented in Fig. 4 and summarised in Table 1. Variables
-50
0
50
100
12/0
106
/02
12/0
206
/03
12/0
306
/04
12/0
406
/05
12/0
506
/06
12/0
606
/07
12/0
706
/08
12/0
806
/09
12/0
9
0
200
400
600
0
200
400
600
-50
0
50
100
12/0
106
/02
12/0
206
/03
12/0
306
/04
12/0
406
/05
12/0
506
/06
12/0
606
/07
12/0
706
/08
12/0
806
/09
12/0
9
Vo
lu
me
(1
00
0 m
3
)C
ha
ng
e (%
)
Vo
lu
me
(1
00
0 m
3
)C
ha
ng
e (%
)
NW
NW
SW
SW
Volume >6Volume 4-6Volume 2-4Volume 1-2Area
Area
Volume
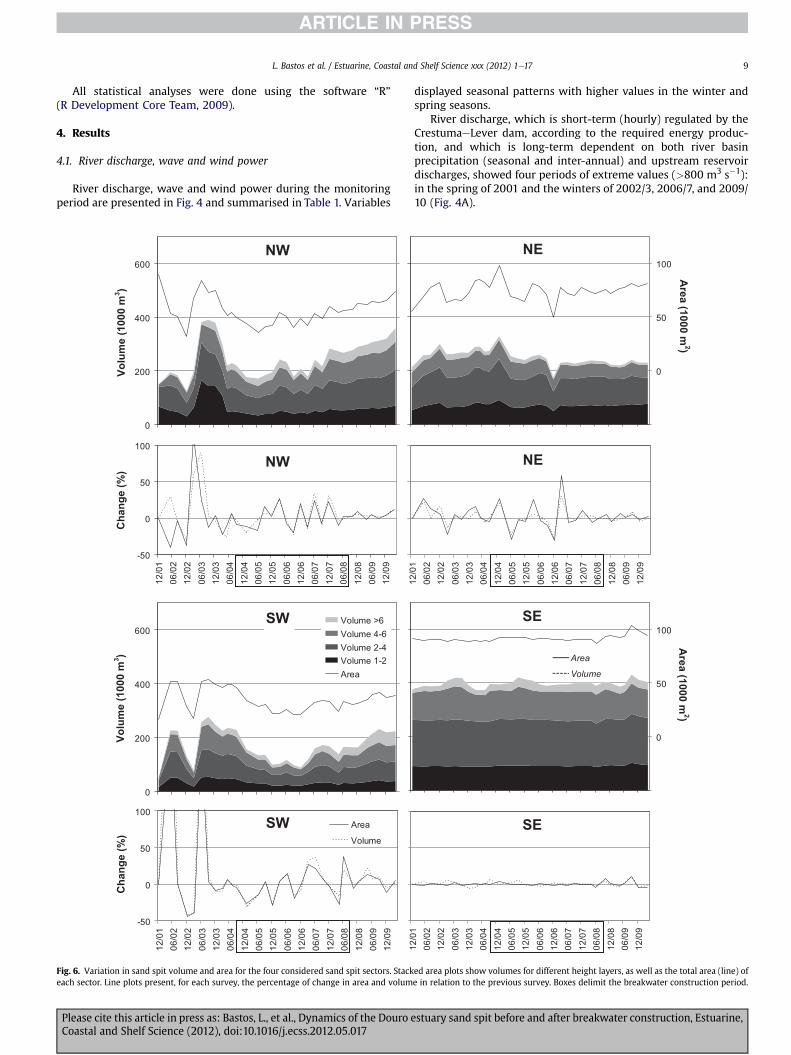
Fig. 6. Variation in sand spit volume and area for the four considered sand spit sectors. Stackeach sector. Line plots present, for each survey, the percentage of change in area and volum
Please cite this article in press as: Bastos, L., et al., Dynamics of the Douro eCoastal and Shelf Science (2012), doi:10.1016/j.ecss.2012.05.017
displayed seasonal patterns with higher values in the winter andspring seasons.
River discharge, which is short-term (hourly) regulated by theCrestumaeLever dam, according to the required energy produc-tion, and which is long-term dependent on both river basinprecipitation (seasonal and inter-annual) and upstream reservoirdischarges, showed four periods of extreme values (>800 m3 s�1):in the spring of 2001 and the winters of 2002/3, 2006/7, and 2009/10 (Fig. 4A).
12/0
106
/02
12/0
206
/03
12/0
306
/04
12/0
406
/05
12/0
506
/06
12/0
606
/07
12/0
706
/08
12/0
806
/09
12/0
9
0
50
100
12/0
106
/02
12/0
206
/03
12/0
306
/04
12/0
406
/05
12/0
506
/06
12/0
606
/07
12/0
706
/08
12/0
806
/09
12/0
9
0
50
100
Area
Volume
Area (100
0 m
2
)A
rea (100
0 m
2
)
NE
NE
SE
SE
ed area plots show volumes for different height layers, as well as the total area (line) ofe in relation to the previous survey. Boxes delimit the breakwater construction period.
stuary sand spit before and after breakwater construction, Estuarine,
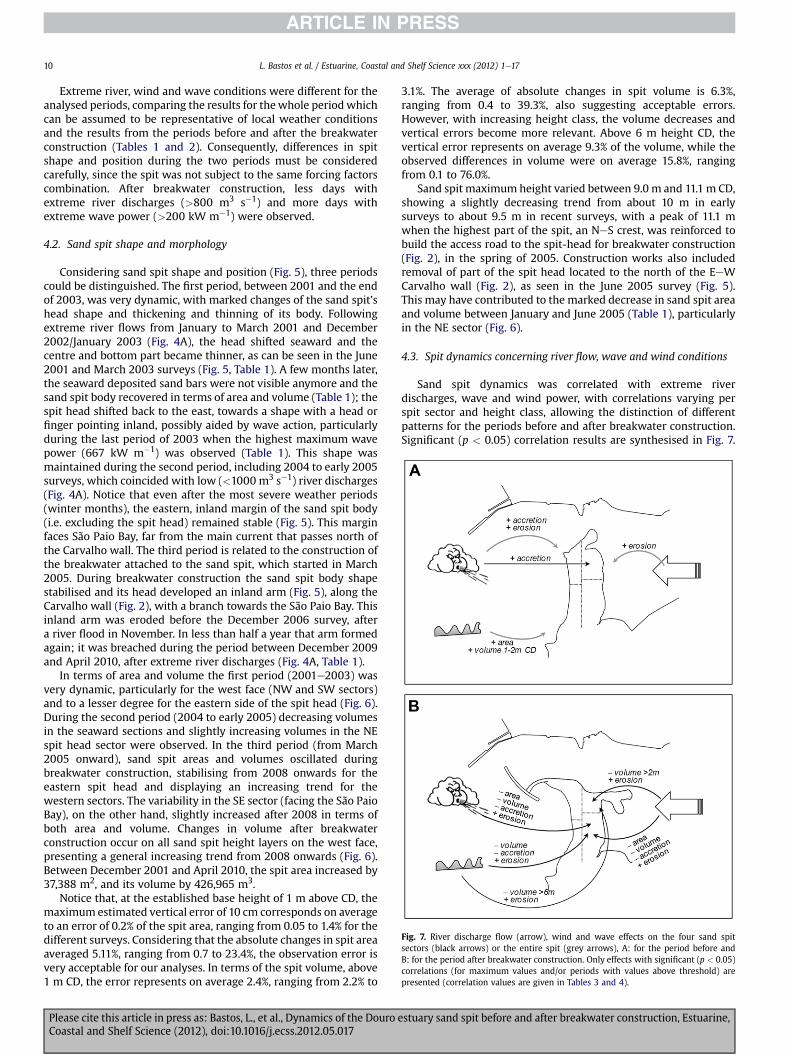
Fig. 7. River discharge flow (arrow), wind and wave effects on the four sand spitsectors (black arrows) or the entire spit (grey arrows), A: for the period before andB: for the period after breakwater construction. Only effects with significant (p < 0.05)correlations (for maximum values and/or periods with values above threshold) arepresented (correlation values are given in Tables 3 and 4).
L. Bastos et al. / Estuarine, Coastal and Shelf Science xxx (2012) 1e1710
Extreme river, wind and wave conditions were different for theanalysed periods, comparing the results for thewhole period whichcan be assumed to be representative of local weather conditionsand the results from the periods before and after the breakwaterconstruction (Tables 1 and 2). Consequently, differences in spitshape and position during the two periods must be consideredcarefully, since the spit was not subject to the same forcing factorscombination. After breakwater construction, less days withextreme river discharges (>800 m3 s�1) and more days withextreme wave power (>200 kW m�1) were observed.
4.2. Sand spit shape and morphology
Considering sand spit shape and position (Fig. 5), three periodscould be distinguished. The first period, between 2001 and the endof 2003, was very dynamic, with marked changes of the sand spit’shead shape and thickening and thinning of its body. Followingextreme river flows from January to March 2001 and December2002/January 2003 (Fig. 4A), the head shifted seaward and thecentre and bottom part became thinner, as can be seen in the June2001 and March 2003 surveys (Fig. 5, Table 1). A few months later,the seaward deposited sand bars were not visible anymore and thesand spit body recovered in terms of area and volume (Table 1); thespit head shifted back to the east, towards a shape with a head orfinger pointing inland, possibly aided by wave action, particularlyduring the last period of 2003 when the highest maximum wavepower (667 kW m�1) was observed (Table 1). This shape wasmaintained during the second period, including 2004 to early 2005surveys, which coincided with low (<1000 m3 s�1) river discharges(Fig. 4A). Notice that even after the most severe weather periods(winter months), the eastern, inland margin of the sand spit body(i.e. excluding the spit head) remained stable (Fig. 5). This marginfaces São Paio Bay, far from the main current that passes north ofthe Carvalho wall. The third period is related to the construction ofthe breakwater attached to the sand spit, which started in March2005. During breakwater construction the sand spit body shapestabilised and its head developed an inland arm (Fig. 5), along theCarvalho wall (Fig. 2), with a branch towards the São Paio Bay. Thisinland arm was eroded before the December 2006 survey, aftera river flood in November. In less than half a year that arm formedagain; it was breached during the period between December 2009and April 2010, after extreme river discharges (Fig. 4A, Table 1).
In terms of area and volume the first period (2001e2003) wasvery dynamic, particularly for the west face (NW and SW sectors)and to a lesser degree for the eastern side of the spit head (Fig. 6).During the second period (2004 to early 2005) decreasing volumesin the seaward sections and slightly increasing volumes in the NEspit head sector were observed. In the third period (from March2005 onward), sand spit areas and volumes oscillated duringbreakwater construction, stabilising from 2008 onwards for theeastern spit head and displaying an increasing trend for thewestern sectors. The variability in the SE sector (facing the São PaioBay), on the other hand, slightly increased after 2008 in terms ofboth area and volume. Changes in volume after breakwaterconstruction occur on all sand spit height layers on the west face,presenting a general increasing trend from 2008 onwards (Fig. 6).Between December 2001 and April 2010, the spit area increased by37,388 m2, and its volume by 426,965 m3.
Notice that, at the established base height of 1 m above CD, themaximum estimated vertical error of 10 cm corresponds on averageto an error of 0.2% of the spit area, ranging from 0.05 to 1.4% for thedifferent surveys. Considering that the absolute changes in spit areaaveraged 5.11%, ranging from 0.7 to 23.4%, the observation error isvery acceptable for our analyses. In terms of the spit volume, above1 m CD, the error represents on average 2.4%, ranging from 2.2% to
Please cite this article in press as: Bastos, L., et al., Dynamics of the Douro eCoastal and Shelf Science (2012), doi:10.1016/j.ecss.2012.05.017
3.1%. The average of absolute changes in spit volume is 6.3%,ranging from 0.4 to 39.3%, also suggesting acceptable errors.However, with increasing height class, the volume decreases andvertical errors become more relevant. Above 6 m height CD, thevertical error represents on average 9.3% of the volume, while theobserved differences in volume were on average 15.8%, rangingfrom 0.1 to 76.0%.
Sand spit maximum height varied between 9.0 m and 11.1 m CD,showing a slightly decreasing trend from about 10 m in earlysurveys to about 9.5 m in recent surveys, with a peak of 11.1 mwhen the highest part of the spit, an NeS crest, was reinforced tobuild the access road to the spit-head for breakwater construction(Fig. 2), in the spring of 2005. Construction works also includedremoval of part of the spit head located to the north of the EeWCarvalho wall (Fig. 2), as seen in the June 2005 survey (Fig. 5).This may have contributed to the marked decrease in sand spit areaand volume between January and June 2005 (Table 1), particularlyin the NE sector (Fig. 6).
4.3. Spit dynamics concerning river flow, wave and wind conditions
Sand spit dynamics was correlated with extreme riverdischarges, wave and wind power, with correlations varying perspit sector and height class, allowing the distinction of differentpatterns for the periods before and after breakwater construction.Significant (p < 0.05) correlation results are synthesised in Fig. 7.
stuary sand spit before and after breakwater construction, Estuarine,
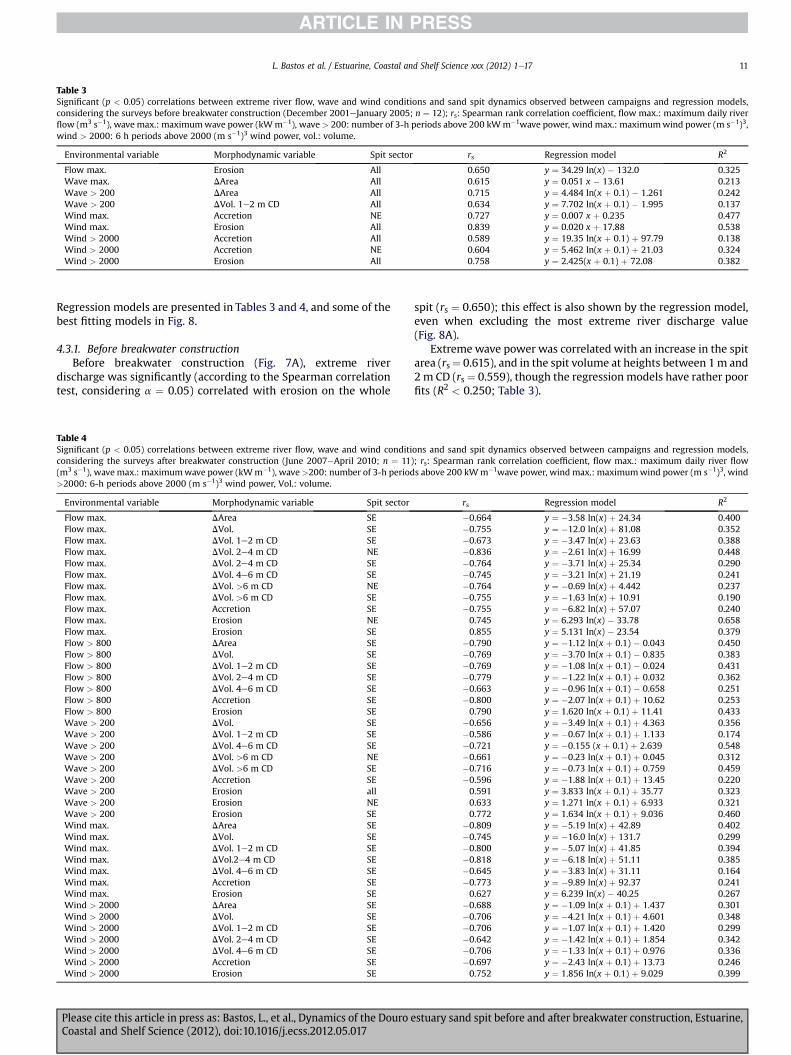
Table 3Significant (p < 0.05) correlations between extreme river flow, wave and wind conditions and sand spit dynamics observed between campaigns and regression models,considering the surveys before breakwater construction (December 2001eJanuary 2005; n ¼ 12); rs: Spearman rank correlation coefficient, flow max.: maximum daily riverflow (m3 s�1), wave max.: maximumwave power (kWm�1), wave> 200: number of 3-h periods above 200 kWm�1wave power, wind max.: maximumwind power (m s�1)3,wind > 2000: 6 h periods above 2000 (m s�1)3 wind power, vol.: volume.
Environmental variable Morphodynamic variable Spit sector rs Regression model R2
Flow max. Erosion All 0.650 y ¼ 34.29 ln(x) � 132.0 0.325Wave max. DArea All 0.615 y ¼ 0.051 x � 13.61 0.213Wave > 200 DArea All 0.715 y ¼ 4.484 ln(x þ 0.1) � 1.261 0.242Wave > 200 DVol. 1e2 m CD All 0.634 y ¼ 7.702 ln(x þ 0.1) � 1.995 0.137Wind max. Accretion NE 0.727 y ¼ 0.007 x þ 0.235 0.477Wind max. Erosion All 0.839 y ¼ 0.020 x þ 17.88 0.538Wind > 2000 Accretion All 0.589 y ¼ 19.35 ln(x þ 0.1) þ 97.79 0.138Wind > 2000 Accretion NE 0.604 y ¼ 5.462 ln(x þ 0.1) þ 21.03 0.324Wind > 2000 Erosion All 0.758 y ¼ 2.425(x þ 0.1) þ 72.08 0.382
L. Bastos et al. / Estuarine, Coastal and Shelf Science xxx (2012) 1e17 11
Regression models are presented in Tables 3 and 4, and some of thebest fitting models in Fig. 8.
4.3.1. Before breakwater constructionBefore breakwater construction (Fig. 7A), extreme river
discharge was significantly (according to the Spearman correlationtest, considering a ¼ 0.05) correlated with erosion on the whole
Table 4Significant (p < 0.05) correlations between extreme river flow, wave and wind conditiconsidering the surveys after breakwater construction (June 2007�April 2010; n ¼ 11)(m3 s�1), wave max.: maximumwave power (kWm�1), wave>200: number of 3-h period>2000: 6-h periods above 2000 (m s�1)3 wind power, Vol.: volume.
Environmental variable Morphodynamic variable Spit sector
Flow max. DArea SEFlow max. DVol. SEFlow max. DVol. 1e2 m CD SEFlow max. DVol. 2e4 m CD NEFlow max. DVol. 2e4 m CD SEFlow max. DVol. 4e6 m CD SEFlow max. DVol. >6 m CD NEFlow max. DVol. >6 m CD SEFlow max. Accretion SEFlow max. Erosion NEFlow max. Erosion SEFlow > 800 DArea SEFlow > 800 DVol. SEFlow > 800 DVol. 1e2 m CD SEFlow > 800 DVol. 2e4 m CD SEFlow > 800 DVol. 4e6 m CD SEFlow > 800 Accretion SEFlow > 800 Erosion SEWave > 200 DVol. SEWave > 200 DVol. 1e2 m CD SEWave > 200 DVol. 4e6 m CD SEWave > 200 DVol. >6 m CD NEWave > 200 DVol. >6 m CD SEWave > 200 Accretion SEWave > 200 Erosion allWave > 200 Erosion NEWave > 200 Erosion SEWind max. DArea SEWind max. DVol. SEWind max. DVol. 1e2 m CD SEWind max. DVol.2e4 m CD SEWind max. DVol. 4e6 m CD SEWind max. Accretion SEWind max. Erosion SEWind > 2000 DArea SEWind > 2000 DVol. SEWind > 2000 DVol. 1e2 m CD SEWind > 2000 DVol. 2e4 m CD SEWind > 2000 DVol. 4e6 m CD SEWind > 2000 Accretion SEWind > 2000 Erosion SE
Please cite this article in press as: Bastos, L., et al., Dynamics of the Douro eCoastal and Shelf Science (2012), doi:10.1016/j.ecss.2012.05.017
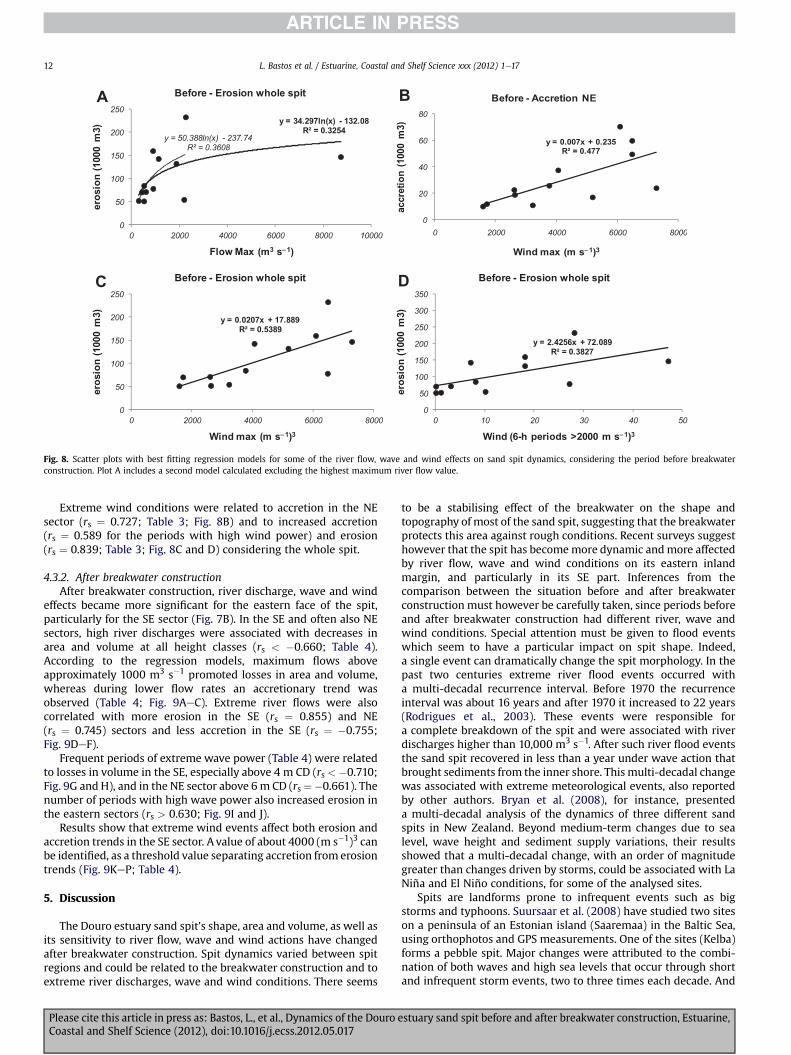
spit (rs ¼ 0.650); this effect is also shown by the regression model,even when excluding the most extreme river discharge value(Fig. 8A).
Extreme wave power was correlated with an increase in the spitarea (rs¼ 0.615), and in the spit volume at heights between 1m and2m CD (rs ¼ 0.559), though the regression models have rather poorfits (R2 < 0.250; Table 3).
ons and sand spit dynamics observed between campaigns and regression models,; rs: Spearman rank correlation coefficient, flow max.: maximum daily river flows above 200 kWm�1wave power, wind max.: maximumwind power (m s�1)3, wind
rs Regression model R2
�0.664 y ¼ �3.58 ln(x) þ 24.34 0.400�0.755 y ¼ �12.0 ln(x) þ 81.08 0.352�0.673 y ¼ �3.47 ln(x) þ 23.63 0.388�0.836 y ¼ �2.61 ln(x) þ 16.99 0.448�0.764 y ¼ �3.71 ln(x) þ 25.34 0.290�0.745 y ¼ �3.21 ln(x) þ 21.19 0.241�0.764 y ¼ �0.69 ln(x) þ 4.442 0.237�0.755 y ¼ �1.63 ln(x) þ 10.91 0.190�0.755 y ¼ �6.82 ln(x) þ 57.07 0.2400.745 y ¼ 6.293 ln(x) � 33.78 0.6580.855 y ¼ 5.131 ln(x) � 23.54 0.379
�0.790 y ¼ �1.12 ln(x þ 0.1) � 0.043 0.450�0.769 y ¼ �3.70 ln(x þ 0.1) � 0.835 0.383�0.769 y ¼ �1.08 ln(x þ 0.1) � 0.024 0.431�0.779 y ¼ �1.22 ln(x þ 0.1) þ 0.032 0.362�0.663 y ¼ �0.96 ln(x þ 0.1) � 0.658 0.251�0.800 y ¼ �2.07 ln(x þ 0.1) þ 10.62 0.2530.790 y ¼ 1.620 ln(x þ 0.1) þ 11.41 0.433
�0.656 y ¼ �3.49 ln(x þ 0.1) þ 4.363 0.356�0.586 y ¼ �0.67 ln(x þ 0.1) þ 1.133 0.174�0.721 y ¼ �0.155 (x þ 0.1) þ 2.639 0.548�0.661 y ¼ �0.23 ln(x þ 0.1) þ 0.045 0.312�0.716 y ¼ �0.73 ln(x þ 0.1) þ 0.759 0.459�0.596 y ¼ �1.88 ln(x þ 0.1) þ 13.45 0.2200.591 y ¼ 3.833 ln(x þ 0.1) þ 35.77 0.3230.633 y ¼ 1.271 ln(x þ 0.1) þ 6.933 0.3210.772 y ¼ 1.634 ln(x þ 0.1) þ 9.036 0.460
�0.809 y ¼ �5.19 ln(x) þ 42.89 0.402�0.745 y ¼ �16.0 ln(x) þ 131.7 0.299�0.800 y ¼ �5.07 ln(x) þ 41.85 0.394�0.818 y ¼ �6.18 ln(x) þ 51.11 0.385�0.645 y ¼ �3.83 ln(x) þ 31.11 0.164�0.773 y ¼ �9.89 ln(x) þ 92.37 0.2410.627 y ¼ 6.239 ln(x) � 40.25 0.267
�0.688 y ¼ �1.09 ln(x þ 0.1) þ 1.437 0.301�0.706 y ¼ �4.21 ln(x þ 0.1) þ 4.601 0.348�0.706 y ¼ �1.07 ln(x þ 0.1) þ 1.420 0.299�0.642 y ¼ �1.42 ln(x þ 0.1) þ 1.854 0.342�0.706 y ¼ �1.33 ln(x þ 0.1) þ 0.976 0.336�0.697 y ¼ �2.43 ln(x þ 0.1) þ 13.73 0.2460.752 y ¼ 1.856 ln(x þ 0.1) þ 9.029 0.399
stuary sand spit before and after breakwater construction, Estuarine,
y = 34.297ln(x) - 132.08
R² = 0.3254
y = 50.388ln(x) - 237.74
R² = 0.3608
0
50
100
150
200
250
0 2000 4000 6000 8000 10000
ero
sio
n (1000 m
3)
Flow Max (m3
s−−1
)
Before - Erosion whole spit
y = 0.007x + 0.235
R² = 0.477
0
20
40
60
80
0 2000 4000 6000 8000
accretio
n (1000 m
3)
Wind max (m s−1
)3
Before - Accretion NE
y = 0.0207x + 17.889
R² = 0.5389
0
50
100
150
200
250
0 2000 4000 6000 8000
ero
sio
n (1000 m
3)
Wind max (m s−1
)3
Before - Erosion whole spit
y = 2.4256x + 72.089
R² = 0.3827
0
50
100
150
200
250
300
350
0 10 20 30 40 50
ero
sio
n (1000 m
3)
Wind (6-h periods >2000 m s−1
)3
Before - Erosion whole spit
A B
C D
Fig. 8. Scatter plots with best fitting regression models for some of the river flow, wave and wind effects on sand spit dynamics, considering the period before breakwaterconstruction. Plot A includes a second model calculated excluding the highest maximum river flow value.
L. Bastos et al. / Estuarine, Coastal and Shelf Science xxx (2012) 1e1712
Extreme wind conditions were related to accretion in the NEsector (rs ¼ 0.727; Table 3; Fig. 8B) and to increased accretion(rs ¼ 0.589 for the periods with high wind power) and erosion(rs ¼ 0.839; Table 3; Fig. 8C and D) considering the whole spit.
4.3.2. After breakwater constructionAfter breakwater construction, river discharge, wave and wind
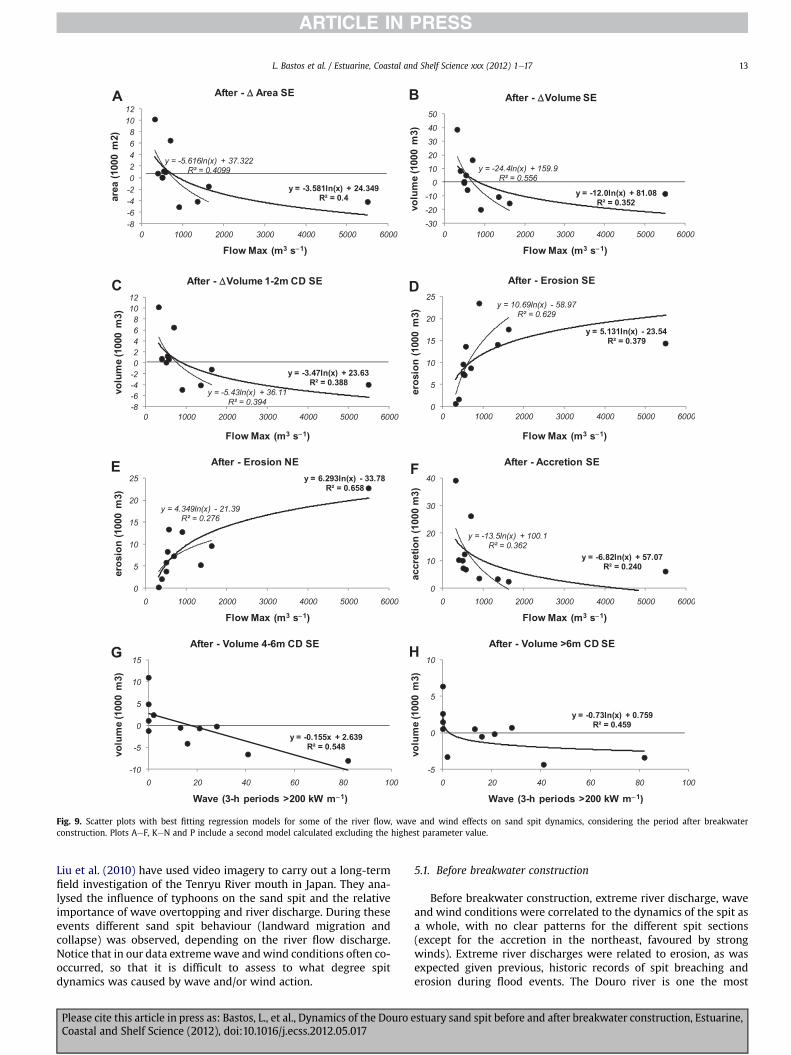
effects became more significant for the eastern face of the spit,particularly for the SE sector (Fig. 7B). In the SE and often also NEsectors, high river discharges were associated with decreases inarea and volume at all height classes (rs < �0.660; Table 4).According to the regression models, maximum flows aboveapproximately 1000 m3 s�1 promoted losses in area and volume,whereas during lower flow rates an accretionary trend wasobserved (Table 4; Fig. 9AeC). Extreme river flows were alsocorrelated with more erosion in the SE (rs ¼ 0.855) and NE(rs ¼ 0.745) sectors and less accretion in the SE (rs ¼ �0.755;Fig. 9DeF).
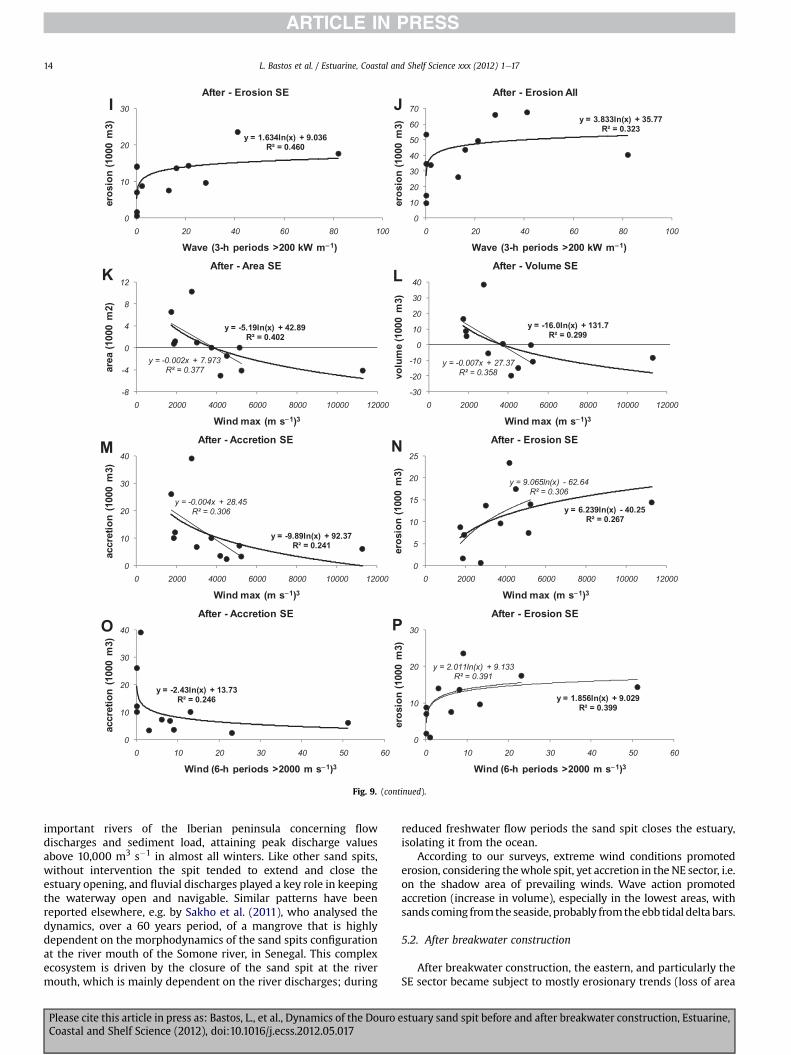
Frequent periods of extreme wave power (Table 4) were relatedto losses in volume in the SE, especially above 4 m CD (rs < �0.710;Fig. 9G and H), and in the NE sector above 6m CD (rs ¼�0.661). Thenumber of periods with high wave power also increased erosion inthe eastern sectors (rs > 0.630; Fig. 9I and J).
Results show that extreme wind events affect both erosion andaccretion trends in the SE sector. A value of about 4000 (m s�1)3 canbe identified, as a threshold value separating accretion from erosiontrends (Fig. 9KeP; Table 4).
5. Discussion
The Douro estuary sand spit’s shape, area and volume, as well asits sensitivity to river flow, wave and wind actions have changedafter breakwater construction. Spit dynamics varied between spitregions and could be related to the breakwater construction and toextreme river discharges, wave and wind conditions. There seems
Please cite this article in press as: Bastos, L., et al., Dynamics of the Douro eCoastal and Shelf Science (2012), doi:10.1016/j.ecss.2012.05.017
to be a stabilising effect of the breakwater on the shape andtopography of most of the sand spit, suggesting that the breakwaterprotects this area against rough conditions. Recent surveys suggesthowever that the spit has becomemore dynamic andmore affectedby river flow, wave and wind conditions on its eastern inlandmargin, and particularly in its SE part. Inferences from thecomparison between the situation before and after breakwaterconstruction must however be carefully taken, since periods beforeand after breakwater construction had different river, wave andwind conditions. Special attention must be given to flood eventswhich seem to have a particular impact on spit shape. Indeed,a single event can dramatically change the spit morphology. In thepast two centuries extreme river flood events occurred witha multi-decadal recurrence interval. Before 1970 the recurrenceinterval was about 16 years and after 1970 it increased to 22 years(Rodrigues et al., 2003). These events were responsible fora complete breakdown of the spit and were associated with riverdischarges higher than 10,000 m3 s�1. After such river flood eventsthe sand spit recovered in less than a year under wave action thatbrought sediments from the inner shore. This multi-decadal changewas associated with extreme meteorological events, also reportedby other authors. Bryan et al. (2008), for instance, presenteda multi-decadal analysis of the dynamics of three different sandspits in New Zealand. Beyond medium-term changes due to sealevel, wave height and sediment supply variations, their resultsshowed that a multi-decadal change, with an order of magnitudegreater than changes driven by storms, could be associated with LaNiña and El Niño conditions, for some of the analysed sites.
Spits are landforms prone to infrequent events such as bigstorms and typhoons. Suursaar et al. (2008) have studied two siteson a peninsula of an Estonian island (Saaremaa) in the Baltic Sea,using orthophotos and GPS measurements. One of the sites (Kelba)forms a pebble spit. Major changes were attributed to the combi-nation of both waves and high sea levels that occur through shortand infrequent storm events, two to three times each decade. And
stuary sand spit before and after breakwater construction, Estuarine,
y = -3.581ln(x) + 24.349
R² = 0.4
y = -5.616ln(x) + 37.322
R² = 0.4099
-8
-6
-4
-2
0
2
4
6
8
10
12
0 1000 2000 3000 4000 5000 6000
area (1000 m
2)
Flow Max (m3
s−−1
)
After - Δ Area SE
y = -12.0ln(x) + 81.08
R² = 0.352
y = -24.4ln(x) + 159.9
R² = 0.556
-30
-20
-10
0
10
20
30
40
50
0 1000 2000 3000 4000 5000 6000
vo
lu
me (1000 m
3)
Flow Max (m3
s−1
)
After - ΔVolume SE
y = -3.47ln(x) + 23.63
R² = 0.388
y = -5.43ln(x) + 36.11
R² = 0.394-8
-6
-4
-2
0
2
4
6
8
10
12
vo
lu
me (1000 m
3)
Flow Max (m3
s−1
)
After - ΔVolume 1-2m CD SE
y = 5.131ln(x) - 23.54
R² = 0.379
y = 10.69ln(x) - 58.97
R² = 0.629
0
5
10
15
20
25
ero
sio
n (1000 m
3)
Flow Max (m3
s−1
)
After - Erosion SE
y = 6.293ln(x) - 33.78
R² = 0.658
y = 4.349ln(x) - 21.39
R² = 0.276
0
5
10
15
20
25
0 1000 2000 3000 4000 5000 6000
ero
sio
n (1000 m
3)
Flow Max (m3
s−1
)
After - Erosion NE
y = -6.82ln(x) + 57.07
R² = 0.240
y = -13.5ln(x) + 100.1
R² = 0.362
0
10
20
30
40
0 1000 2000 3000 4000 5000 6000
accretio
n (1000 m
3)
Flow Max (m3
s−1
)
After - Accretion SE
y = -0.155x + 2.639
R² = 0.548
-10
-5
0
5
10
15
0 20 40 60 80 100
vo
lu
me (1000 m
3)
Wave (3-h periods >200 kW m−1
)
After - Volume 4-6m CD SE
y = -0.73ln(x) + 0.759
R² = 0.459
-5
0
5
10
0 20 40 60 80 100
vo
lu
me (1000 m
3)
Wave (3-h periods >200 kW m−1
)
After - Volume >6m CD SE
A B
C D
E F
G H
0 1000 2000 3000 4000 5000 6000 0 1000 2000 3000 4000 5000 6000
Fig. 9. Scatter plots with best fitting regression models for some of the river flow, wave and wind effects on sand spit dynamics, considering the period after breakwaterconstruction. Plots AeF, KeN and P include a second model calculated excluding the highest parameter value.
L. Bastos et al. / Estuarine, Coastal and Shelf Science xxx (2012) 1e17 13
Liu et al. (2010) have used video imagery to carry out a long-termfield investigation of the Tenryu River mouth in Japan. They ana-lysed the influence of typhoons on the sand spit and the relativeimportance of wave overtopping and river discharge. During theseevents different sand spit behaviour (landward migration andcollapse) was observed, depending on the river flow discharge.Notice that in our data extremewave andwind conditions often co-occurred, so that it is difficult to assess to what degree spitdynamics was caused by wave and/or wind action.
Please cite this article in press as: Bastos, L., et al., Dynamics of the Douro eCoastal and Shelf Science (2012), doi:10.1016/j.ecss.2012.05.017
5.1. Before breakwater construction
Before breakwater construction, extreme river discharge, waveand wind conditions were correlated to the dynamics of the spit asa whole, with no clear patterns for the different spit sections(except for the accretion in the northeast, favoured by strongwinds). Extreme river discharges were related to erosion, as wasexpected given previous, historic records of spit breaching anderosion during flood events. The Douro river is one the most
stuary sand spit before and after breakwater construction, Estuarine,
30
y = 1.634ln(x) + 9.036
R² = 0.460
0
10
20
0 20 40 60 80 100
ero
sio
n (1000 m
3)
Wave (3-h periods >200 kW m−−1
)
After - Erosion SE
y = 3.833ln(x) + 35.77
R² = 0.323
0
10
20
30
40
50
60
70
0 20 40 60 80 100
ero
sio
n (1000 m
3)
Wave (3-h periods >200 kW m−1
)
After - Erosion All
y = -5.19ln(x) + 42.89
R² = 0.402
y = -0.002x + 7.973
R² = 0.377
-8
-4
0
4
8
12
0 2000 4000 6000 8000 10000 12000
area (1000 m
2)
Wind max (m s−1
)3
After - Area SE
y = -16.0ln(x) + 131.7
R² = 0.299
y = -0.007x + 27.37
R² = 0.358
-30
-20
-10
0
10
20
30
40
0 2000 4000 6000 8000 10000 12000
vo
lu
me (1000 m
3)
Wind max (m s−1
)3
After - Volume SE
y = -9.89ln(x) + 92.37
R² = 0.241
y = -0.004x + 28.45
R² = 0.306
0
10
20
30
40
0 2000 4000 6000 8000 10000 12000
accretio
n (1000 m
3)
Wind max (m s−1
)3
After - Accretion SE
y = 6.239ln(x) - 40.25
R² = 0.267
y = 9.065ln(x) - 62.64
R² = 0.306
0
5
10
15
20
25
0 2000 4000 6000 8000 10000 12000
ero
sio
n (1000 m
3)
Wind max (m s−1
)3
After - Erosion SE
y = -2.43ln(x) + 13.73
R² = 0.246
0
10
20
30
40
0 10 20 30 40 50 60
accretio
n (1000 m
3)
Wind (6-h periods >2000 m s−1
)3
After - Accretion SE
y = 1.856ln(x) + 9.029
R² = 0.399
y = 2.011ln(x) + 9.133
R² = 0.391
0
10
20
30
0 10 20 30 40 50 60
ero
sio
n (1000 m
3)
Wind (6-h periods >2000 m s−1
)3
After - Erosion SE
I
K L
J
M N
O P
Fig. 9. (continued).
L. Bastos et al. / Estuarine, Coastal and Shelf Science xxx (2012) 1e1714
important rivers of the Iberian peninsula concerning flowdischarges and sediment load, attaining peak discharge valuesabove 10,000 m3 s�1 in almost all winters. Like other sand spits,without intervention the spit tended to extend and close theestuary opening, and fluvial discharges played a key role in keepingthe waterway open and navigable. Similar patterns have beenreported elsewhere, e.g. by Sakho et al. (2011), who analysed thedynamics, over a 60 years period, of a mangrove that is highlydependent on the morphodynamics of the sand spits configurationat the river mouth of the Somone river, in Senegal. This complexecosystem is driven by the closure of the sand spit at the rivermouth, which is mainly dependent on the river discharges; during
Please cite this article in press as: Bastos, L., et al., Dynamics of the Douro eCoastal and Shelf Science (2012), doi:10.1016/j.ecss.2012.05.017
reduced freshwater flow periods the sand spit closes the estuary,isolating it from the ocean.
According to our surveys, extreme wind conditions promotederosion, considering thewhole spit, yet accretion in the NE sector, i.e.on the shadow area of prevailing winds. Wave action promotedaccretion (increase in volume), especially in the lowest areas, withsands coming fromthe seaside, probably fromtheebb tidal delta bars.
5.2. After breakwater construction
After breakwater construction, the eastern, and particularly theSE sector became subject to mostly erosionary trends (loss of area
stuary sand spit before and after breakwater construction, Estuarine,
L. Bastos et al. / Estuarine, Coastal and Shelf Science xxx (2012) 1e17 15
and volume); river discharges enhanced erosion, while wind hada combined effect of erosion and accretion (depending on windstrength).
Surprising is the correlation between highwave power and lossesin volume in the SE sector, which faces a wetland in the east andshould be quite protected from sea conditions. This fact could beexplained by a change in wave propagation trails due to bathymetricmodifications inducedby thebreakwater constructionandnavigationchannel dredging. Indeed, sedimentation occurs now at higherdepths, seawards from the previous position, creatingmore energeticwave regimes near the spit root, which can enhance overwashing.
The inland spit head arm that formed after breakwaterconstruction has caused changes in the circulation patterns in theSão Paio Bay, which has progressively filled up with sedimentlosing its wetland characteristics, and local authorities considereddredging a channel between the sand spit and the bay to re-establish water circulation. Conditions in the bay improvedhowever with the November 2009 flood, which has broken theinland spit head arm (Fig. 5) and removed part of the accumulatedsediment (in situ observation).
Results suggest that the spit, particularly its western part, isgrowing since the breakwater construction. A short-term growth ofthe sand spit had been predicted in the Environmental ImpactAssessment of the Breakwater Construction Project (IPTM, 2003),with the breakwater causing changes in the water circulation andless erosive impact of river flow on the spit. On the long term, thesame report expects a stabilisation of the spit volume, allowingmore sediment to be transported along and out of the navigationchannel to nourish especially the southern Atlantic beaches, whichhave been suffering severe erosion (Veloso-Gomes et al., 2004;Carvalho et al., 2005). An analysis of the erosion at these southernbeaches, based on recent data, is presently under study by theauthors. The strengthening of the spit bears however also risks forthe riparian communities. Prior to its breakwater construction, thesand spit used to break under severe floods, facilitating thedischarge of the river flow. A strengthened spit may constitute animpassable barrier, causing higher floodwater levels and increasingflood damages. Given that the Douro water flow is essentiallycontrolled by its dams, a careful discharge management becomeshence increasingly important.
Impacts of human induced changes on sand spits have beenassessed, for instance by Hedge and Raveendra (2000), who studiedtwo sand spits located at the Gurpur and Netravati river mouths inMangalore, India. They used topographical maps and aerial photos toanalysesuccessiveperiodsbetween1912and1996, anddetermine theeffect of manmade coastal structures on sand spit morphodynamics.
It would be interesting to also assess long-term dynamics of theDouro spit, such as the spit’s inland migration identified throughthe analysis of historic maps, which may have been caused by thedecrease in river discharge intensity (due to dam construction anddischarge control) causing more upriver sediment deposition. Asshown in the sand spit studies by Bryan et al. (2008), morphologicaladjustment of the coast occurring at multi-decadal scales is muchlarger than short-term dynamics.
5.3. Learnt lessons
The landward spit migration observed in the last two centuriescan probably be seen as a response to relative sea level rise andmore recently related with the construction of dams (that have asmain consequence the lowering of the flood peak discharges)driving the spit to a re-equilibrium position. During the monitoringperiod, the spit maintained its position both before and after thebreakwater construction, though shape and volume have locallychanged.
Please cite this article in press as: Bastos, L., et al., Dynamics of the Douro eCoastal and Shelf Science (2012), doi:10.1016/j.ecss.2012.05.017
Observations show that the breakwater has a significant impacton the behaviour of the northern end of the spit. The presentconfiguration disables the growing of the spit to the NE (before thebreakwater construction, littoral drift to the N pushed the sedimentlandward curving the spit end to the NE and contributing to theinfilling of the navigation channel). The breakwater seems to beeffective in the stabilisation of the navigation channel since theinlet is now narrower and the river transport potential conse-quently higher. It is also evident that the breakwater has inducednew local changes particularly in the São Paio Bay wetland,promoting its infilling.
Finally, an improved evaluation of the breakwater efficiency canonly be carried out after the observation of the effects of majorstorm and river flood events (with multi-decadal recurrence periodand high magnitude).
6. Conclusions
This study shows how a new breakwater changed an estuarinesand spit’s sensitivity to river flow, wave and wind actions,improving our understanding of the interactions between spitmorphology and natural (river, ocean, wind) and anthropogenic(hard defence structure) factors.
The breakwater construction strongly affected both shape anddynamics of the Douro barrier sand spit. It seems to have, so far, thedesired effect: most of the sand spit is stabilised in terms of areaand volume, and will likely continue to protect the inland estuarymargins; the established T-shape, with little extension to the North,does not obstruct the navigation channel; and, together with thenew sand-spit breakwater, the Carvalho wall, built between 1820and 1825, finally seems to fulfil its projected function of ensuringthe navigability between the sea and the several small estuarineharbours.
Effects of extreme river discharges, wave and wind conditionsdepended on spit sector and height, and therefore exposure. Whileoverall shape and volume stabilised with breakwater constructionand most of the sand spit seems now less vulnerable to extremeconditions, its south-eastern part has become less stable and moresusceptible to these conditions, threatening the local NatureReserve. A study focussed on the wetland, its morphology andrecent dynamics, would help to identify the causes for theincreased vulnerability of this sector. Similarly, a study concerningthe new morphology of the shoreface and its consequences forwave propagation regimes would also be fundamental. Whetherthe observed relationships consolidate or result from interannualvariability in natural processes can only be answered by a long termmonitoring effort.
Thepresentedmonitoring approachmay further contribute to thesetupof other coastalmorphodynamic assessmentprogrammes. Theapplied surveymethods and (GIS) analyses provideddetaileddata onspit topography and changes. And the easily deployed and cost-effective survey equipment allowed for repeated seasonal moni-toring, providing the necessary insights into seasonal and inter-annual dynamics. Similar monitoring programmes can hence beimplemented for sandy beaches elsewhere, adapting the surveyfrequency to local dynamics and survey methods to local conditions(in coastal stretcheswith limited accessibility for terrestrial vehicles,MMS may, for instance, be complemented or substituted by topo-graphic surveys using aerial photography, which constitute a moreexpensive yet more efficient and non-invasive alternative).
Acknowledgements
The Douro sand spit monitoring programme is being sponsoredby the Administração dos Portos do Douro e Leixões (APDL). We
stuary sand spit before and after breakwater construction, Estuarine,
L. Bastos et al. / Estuarine, Coastal and Shelf Science xxx (2012) 1e1716
thank the APDL for their funding and support of this type of studies.We also acknowledge the supply of river data by INAG and EDP andfurther thank Américo Magalhães and Paulo Baptista for their helpin the collection and processing of the GPS data used in this study.
Appendix A. Supplementary material
Supplementary data related to this article can be found online atdoi:10.1016/j.ecss.2012.05.017.
References
Baptista, P., Bastos, L., Bernardes, C., Dias, J., 2008. Monitoring sandy shoresmorphologies by DGPS e a practical tool to generate digital elevation models.Journal of Coastal Research 24, 1516e1528.
Barnard, P.L., Warrick, J.A., 2010. Dramatic beach and nearshore morphologicalchanges due to extreme flooding at a wave-dominated river mouth. MarineGeology 271, 131e148.
Battiau-Queney, Y., Billet, J.F., Chaverot, S., Lanoy-Ratel, P., 2003. Recent shorelinemobility and geomorphologic evolution of macrotidal sandy beaches in thenorth of France. Marine Geology 194, 31e45.
Best, D.J., Roberts, D.E., 1975. Algorithm AS 89: the upper tail probabilities ofSpearman’s rho. Applied Statistics 24, 377e379.
Bryan, K.R., Kench, P.S., Hart, D.E., 2008. Multi-decadal coastal change in NewZealand: evidence, mechanisms and implications. New Zealand Geographer 64,117e128.
Carvalho, G.S., Granja, H., Henriques, R., 2005. Recent coastal defence by engi-neering structures and their consequences (problems in the coastal zone of NWPortugal). In: Viggosson, G. (Ed.), Second International Coastal Symposium ICS2005. Hofn, Iceland, pp. 188e192.
Coelho, C., Silva, R., Veloso-Gomes, F., Taveira-Pinto, F., 2009. Potential effects ofclimate change on northwest Portuguese coastal zones. ICES Journal of MarineScience 66, 1497e1507.
Consulmar, 1995. Estudos das obras necessárias à melhoria da acessibilidade e dascondições de segurança na barra do Douro. Consulmar Report, Lisbon (inPortuguese).
Cooper, J.A.G., Jackson, D.W.T., Navas, F., McKenna, J., Malvarez, G., 2004. Identifyingstorm impacts on an embayed, high-energy coastline: examples from westernIreland. Marine Geology 210, 261e280.
Costa, M., Silva, R., Vitorino, J., 2001. Contribuição para o Estudo do Clima de Agi-tação Marítima na Costa Portuguesa (Contribution to the knowledge of thewave climate in the Portuguese coast). Actas das 2as Jornadas Portuguesas deEngenharia Costeira e Portuária. Associação Internacional de Navegação, Sines,Portugal (in Portuguese).
Cowart, L., Walsh, J.P., Corbett, D.R., 2010. Analyzing estuarine shoreline change:a case study of Cedar Island, North Carolina. Journal of Coastal Research 26,817e830.
Cruz, J., 2008. Ocean Wave Energy. Current Status and Future Perspectives. In:Green Energy and Technology. Springer, Berlin.
Dias, J.M.A., Jouanneau, J.-M., Gonzalez, R., Araújo, M.F., Drago, T., Garcia, C.,Oliveira, A., Rodrigues, A., Vitorino, J., Weber, O., 2002. Present day sedimentaryprocesses on the northern Iberian shelf. Progress in Oceanography 52,249e259.
Esteves, L.S., Williams, J.J., Brown, J.M., 2011. Looking for evidence of climate changeimpacts in the eastern Irish Sea. Natural Hazards and Earth System Sciences 11,1641e1656.
Fletcher, C., Rooney, J., Barbee, M., Lim, S.C., Richmond, B., 2003. Mapping shorelinechange using digital orthophotogrammetry on Maui, Hawaii. Journal of CoastalResearch 38, 106e124. Special issue.
Hansen, J.E., Barnard, P.L., 2010. Sub-weekly to interannual variability of a high-energy shoreline. Coastal Engineering 57, 959e972.
Harley, M.D., Turner, I.L., Short, A.D., Ranasinghe, R., 2007. Monitoring beachprocesses using conventional, RTK-GPS and image-derived survey methods:Narrabeen Beach, Australia. In: Woodroffe, C.D., Bruce, E.M., Puotinen, M.,Furness, R.A. (Eds.), GIS for the Coastal Zone: a Selection of Papers fromCoastGIS 2006. University of Wollongong, Australia, pp. 151e164.
Harley, M.D., Turner, I.L., Short, A.D., Ranasinghe, R., 2011. Assessment and inte-gration of conventional, RTK-GPS and image-derived beach survey methods fordaily to decadal coastal monitoring. Coastal Engineering 58, 194e205.
Hedge, A.V., Raveendra, B., 2000. Short-term and long-term geomorphologicaldynamics of Mangalore spits using IRS-1A/1C data. Journal of the Indian Societyof Remote Sensing 28, 243e247.
Herbich, J.B., 2000. Handbook of Coastal Engineering. McGraw-Hill Professional, p.A.117.
Hobbs, P., Gibson, A., Jones, L., Poulton, C., Jenkins, G., Pearson, S., Freeborough, K.,2010. Monitoring coastal change using terrestrial LiDAR. In: Fleming, C.,Marsh, S., Giles, J. (Eds.), Elevation Models for Geosciences. Geological Society ofLondon, pp. 117e127.
Holland, K.T., Vinzon, S.B., Calliari, L.J., 2009. A field study of coastal dynamics ona muddy coast offshore of Cassino beach, Brazil. Continental Shelf Research 29,503e514.
Please cite this article in press as: Bastos, L., et al., Dynamics of the Douro eCoastal and Shelf Science (2012), doi:10.1016/j.ecss.2012.05.017
Huang, J., Jackson, D.W.T., Cooper, J.A.G., 2002. Morphological monitoring of a highenergy beach system using GPS and total station techniques, Runkerry, Co.Antrim, Northern Ireland. Journal of Coastal Research 36, 390e398. SpecialIssue.
IPTM e Instituto Portuário e dos Transportes Marítimos, 2003. Estudo de impacteambiental das obras de melhoria de assessibilidade e segurança da barro doDouro. Report (in Portuguese).
List, J.H., Farris, A.S., 1999. Large-scale shoreline response to storms and fairweather. In: Kraus, N.C., McDougal, W.G. (Eds.), Coastal Sediments ’99.Hauppauge, NY, pp. 1324e1338.
Liu, H., Tajima, Y., Sato, S., 2010. Long-term monitoring on the sand spit morpho-dynamics at the Tenryu River mouth. In: Smith, J.M., Lynett, P. (Eds.),Proceedings of the 32nd International Conference on Coastal Engineering.Shanghai, China, pp. 1e15.
Madeira, S., 2007. Sistema Móvel Terrestre de Levantamento com Integração emSIG. PhD thesis, Universidade do Porto (in Portuguese).
Madeira, S., Gonçalves, J., Bastos, L., 2009. Fast Camera Calibration for Low CostMobile Mapping. Proceedings of the 6th International Symposium on MobileMapping Technology (MMT09), 21�24 July 2009, Presidente Prudente, SãoPaulo, Brazil.
Madeira, S., Gonçalves, J.A., Bastos, L., 2010. Photogrammetric mapping andmeasuring application using MATLAB. Computers and Geosciences 36 (6),699e706.
Morton, R.A., Paine, J.G., Gibeaut, J.C., 1994. Stages and durations of post-stormbeach recovery, southeastern Texas coast, USA. Journal of Coastal Research 10,884e908.
National Center for Atmospheric Research, 1999. Dataset ds083.2: NCEP FNL oper-ational model global tropospheric analyses. Boulder, Colorado. http://dss.ucar.edu/datasets/ds083.2.
Niedermeier, A., Romaneessen, E., Lehner, S., 2000. Detection of coastlines in SARimages using wavelet methods. IEEE Transactions on Geoscience and RemoteSensing 38, 2270e2281.
Norcross, Z.M., Fletcher, C.H., Merrifield, M., 2002. Annual and interannual changeson a reef-fringed pocket beach: Kailua Bay, Hawaii. Marine Geology 190,553e580.
Ojeda, E., Guillen, J., 2008. Shoreline dynamics and beach rotation of artificialembayed beaches. Marine Geology 253, 51e62.
Portela, L.I., 2002. Plano específico de extracção de inertes do rio Douro: caracter-ização morfodinâmica do estuário do rio Douro. Report 215/02-NEC. LNEC,Lisbon (in Portuguese).
Portela, L.I., 2008. Sediment transport and morphodynamics of the Douro Riverestuary. Geo-Marine Letters 28, 77e86.
R Development Core Team, 2009. R: a Language and Environment for StatisticalComputing. R Foundation for Statistical Computing, Vienna, Austria. http://www.R-project.org.
Rodrigues, R., Brandão, C., Costa, J., 2003. As cheias no Douro ontem, hoje eamanhã. Instituto da Água, Direcção dos Serviços de Recursos Hídricos,Lisbon. 29.
Rasmussen, D.J., Holloway, T., Nemet, G.F., 2011. Opportunities and challenges inassessing climate change impacts on wind energy e a critical comparison ofwind speed projections in California. Environmental Research Letters 6.doi:10.1088/1748-9326/6/2/024008.
Rosa-Santos, P., Veloso-Gomes, F., Taveira-Pinto, F., Silva, R., Pais-Barbosa, J., 2009.Evolution of coastal works in Portugal and their interference with local mor-phodynamics. Journal of Coastal Research 56, 757e761. Special Issue.
Royston, P., 1982. Algorithm AS 181: the W test for normality. Applied Statistics 31,176e180.
Sallenger Jr., A.H., Krabill, W.B., Swift, R.N., Brock, J., List, J., Hansen, M., Holman, R.A.,Manizade, S., Sontag, J., Meredith, A., Morgan, K., Yunkel, J.K., Frederick, E.B.,Stockdon, H., 2003. Evaluation of airborne topographic lidar for quantifyingbeach changes. Journal of Coastal Research 19, 125e133.
Sakho, I., Mesnage, V., Deloffre, J., Lafite, R., Niang, I., Faye, G., 2011. The influenceof natural and anthropogenic factors on mangrove dynamics over 60 years:the Somone Estuary, Senegal. Estuarine, Coastal and Shelf Science 94,93e101.
Schwartz, M. (Ed.), 1982. The Encyclopedia of Beaches and Coastal Environments.In: Fairbridge, R. (Ed.), Encyclopedia of Earth Sciences Series, vol. XV. Hutch-inson Ross Publishing Company, USA, p. 940.
Short, A.D., Trembanis, A.C., 2004. Decadal scale patterns in beach oscillation androtation Narrabeen Beach, Australia e time series, PCA and wavelet analysis.Journal of Coastal Research 20, 523e532.
Silva, A.J.R., Abecasis, C., Leitão, J.C., 2005. Improving the navigability and safetyconditions in Douro estuary inlet. In: Smith, J.M. (Ed.), 2005. Coastal Engi-neering 2004, 19e24 September 2004, vol. 3. World Scientific, Singapore,pp. 3277e3289.
Soares de Carvalho, G., Granja, H., Costa, A.L., 2006. Dois casos de mudançasantrópicas na faixa costeira (praias e dunas) do noroeste de Portugal. Seg-mentos costeiros de Leça da Palmeira-estuário do Douro e de Aguda-Espinho.Geonovas 20, 9e15.
Sousa, F., Alves, J.F., 2002. Leixões: uma história portuária. Administração dos PortosDouro e Leixões, Porto de Leixões. 367.
Suursaar, U., Jaagus, J., Kont, A., Rivis, R., Tõnisson, H., 2008. Field observations onhydrodynamic and coastal geomorphic processes off Harilaid Peninsula (BalticSea) in winter and spring 2006e2007. Estuarine, Coastal and Shelf Science 80,31e41.
stuary sand spit before and after breakwater construction, Estuarine,

L. Bastos et al. / Estuarine, Coastal and Shelf Science xxx (2012) 1e17 17
Trebossen, H., Deffontaines, B., Classeau, N., Kouame, J., Rudant, J.-P., 2005.Monitoring coastal evolution and associated littoral hazards of FrenchGuiana shoreline with radar images. Comptes Rendus Geosciences 337,1140e1153.
Turner, I.L., Aarninkhof, S.G.J., Holman, R.A., 2006. Coastal imaging applications andresearch in Australia. Journal of Coastal Research 22, 37e48.
Veloso-Gomes, F., Taveira-Pinto, F., Das Neves, L., Barbosa, J.P., Coelho, C., 2004.Erosion risk levels at the NW Portuguese coast: the Douro Mouth e CapeMondego Stretch. Journal of Coastal Conservation 10, 43e52.
Please cite this article in press as: Bastos, L., et al., Dynamics of the Douro eCoastal and Shelf Science (2012), doi:10.1016/j.ecss.2012.05.017
Wu, T.D., Lee, M.T., 2007. Geological Lineament and Shoreline Detection in SARImages. Proceedings of IEEE Geosciences and Remote Sensing Symposium(IGARSS 2007). Barcelona, Spain.
Young, A.P., Olsen, M.J., Driscoll, N., Flick, R.E., Gutierrez, R., Guza, R.T., Johnstone, E.,Kuester, F., 2010. Comparison of airborne and terrestrial lidar estimates ofseacliff erosion in southern California. Photogrammetric Engineering andRemote Sensing 76, 421e427.
Zhang, K.Q., Douglas, B., Leatherman, S., 2002. Do storms cause long-term beacherosion along the U.S. East Barrier Coast? Journal of Geology 110, 493e502.
stuary sand spit before and after breakwater construction, Estuarine,