Non-AIDS defining diseases before and after HIV diagnosis
109
Non-AIDS defining diseases before and after HIV diagnosis: Characteristics of risk, prognosis, and their usefulness in HIV screening PhD dissertation Ole Schmeltz Søgaard Faculty of Health Sciences Aarhus University 2011
-
Upload
khangminh22 -
Category
Documents
-
view
0 -
download
0
Transcript of Non-AIDS defining diseases before and after HIV diagnosis

Non-AIDS defining diseases before and
after HIV diagnosis: Characteristics of risk,
prognosis, and their usefulness in HIV
screening
PhD dissertation
Ole Schmeltz Søgaard
Faculty of Health Sciences Aarhus University
2011
0
Non-AIDS defining diseases before and after HIV
diagnosis: Characteristics of risk, prognosis, and
their usefulness in HIV screening
PhD dissertation
Ole Schmeltz Søgaard
Faculty of Health Sciences
Aarhus University
Department of Infectious Diseases
Aarhus University Hospital, Skejby, Denmark
1
Forord
Det er ingen hemmelighed at forskning er min store passion, og gennem de sidste 4 år har forskningen både
været min hobby og mit arbejde. Årene som klinisk assistent og ph.d.-studerende ved infektionsmedicin har
været fyldt med mange sjove, spændende, lærerige og udfordrende oplevelser - og ikke mindst af mødet med
utallige fantastiske kolleger indenfor såvel som udenfor kælderen's mure. Mange af Jer betragter jeg i dag som
mine venner, og tusind tak til Jer for den faglige sparring og for at være med til at holde humøret højt.
At det endte med at blive en ph.d.-afhandling bygget på data fra den danske HIV kohorte(DDHK) skyldes
udelukkende én person, Nicolai Lohse. Nicolai's evne til at begå sig fagligt på allerhøjeste internationale niveau
har uden tvivl været stærkt medvirkende til at manuskripterne, som denne afhandling er baseret på, alle er
blevet godt modtaget af såvel kolleger som tidsskrifter. Nicolai har fungeret som en altid motiveret og engageret
indpisker, der også har sørget for at kurere mine "børnesygdomme" indenfor epidemiologien og statistik. Vores
nære venskab er den direkte årsag, at det tredje studie overhovedet blev søsat, idet Nicolai under en
sommerhustur overdrog studieudkast såvel som de indledende analyser til mig hen over et par flasker rødvin.
Mange, mange tak for din hjælpsomhed og tålmodighed.
En af hovedårsagerne til, at jeg stortrives i forskningsmiljøet på infektionsmedicinsk afdeling, er den kolossale
tillid og opbakning jeg gennem alle årene har fået fra Lars Østergaard. Lige siden jeg trådte ind på hans kontor
og proklamerede, at jeg ville lave forskning for snart 10 år siden, har hans altid gode humør og optimisme haft
en yderst positiv effekt på min lyst til at engagere og fordybe mig i diverse forskningsprojekter. Med Lars ombord
er livet som forsker aldrig kedeligt eller ensformigt - og Lars har åbnet uendelig mange døre for mig og lært mig
at tænke "ud af boksen". Han har om nogen æren for at tiden som ph.d.-studerende ikke kun har været
inspirerende og lærerig, men også særdeles sjov og underholdende.
Mange andre skylder jeg også en stor tak. Henrik Schønheyder har været den, jeg kunne komme til, når jeg
havde brug for råd og hjælp inden for mikrobiologien og immunologien. Udover at være en særdeles vidende og
behagelig person, har Henrik også været en stor hjælp og støtte på mange af mine projekter, som ganske vist
ikke er medtaget i denne afhandling. Niels Obel har med sin fantastiske indsigt i HIV kohorten og HIV
epidemiologi generelt været kraftigt medvirkende til at forme og drive disse tre studier fremad - det har aldrig
skortet på hverken hjælpsomhed eller uddybende forklaringer, når analyser eller manuskripter voldte kvaler. Jan
Gerstoft, Court Pedersen og resten af styregruppen for DDHK har med deres input også været kraftigt
medvirkende til at udvide mit kendskab til HIV samt højne kvaliteten af arbejderne. Henrik Toft Sørensen har
med sin kæmpemæssige viden indenfor klinisk epidemiologi sørget for at holde mig og studierne på ret kurs. En
stor, stor tak skylder jeg også alle patienterne som udgør HIV kohorten - I har min dybeste sympati og respekt.
Den sidste, men største tak går til min efterhånden ikke helt lille familie - min hustru Ane og mine børn Liv, Bjørn
og Rose - fordi I, trods al min begejstring for forskningen, har holdt mit fokus på det, der betyder mest, Jer.

2
Preface
This thesis is based on three original papers and a review of the supporting literature. Originally, the thesis was
only supposed to include two studies on the Danish HIV cohort study but along the way came the idea to do the
"indicator" study which ended up adding an extra dimension to the first two papers.
The thesis is meant as a supplement to the three papers and I have tried not to repeat too many details from
these papers.
3
1. Background ............................................................................................................................. 7
1.1 The beginning of the HIV epidemic ..........................................................................................................7
1.2 AIDS before and after the introduction of highly active antiretroviral therapy ..........................................7
1.3 Non-AIDS defining comorbidities ..............................................................................................................8
1.4 Lower respiratory tract infections in HIV ...................................................................................................9
1.5 Identification of individuals with undiagnosed HIV infection ...................................................................12
2. Aims ........................................................................................................................................ 14
3 Methodological considerations ......................................................................................... 15
3.1 Data sources ...........................................................................................................................................15
3.1.1 An introduction to Danish medical databases ........................................................................................ 15
3.1.2 Danish HIV cohort study (DHCS) ............................................................................................................. 15
3.1.3 Danish Civil Registration System (CRS) ................................................................................................. 16
3.1.4 The Danish National Hospital Registry (NHR) ....................................................................................... 16
3.1.5 The Danish Cancer Registry ..................................................................................................................... 16
3.2 Methods ..................................................................................................................................................16
3.2.1 Literature search ......................................................................................................................................... 16
3.2.2 Sampling of general population controls ................................................................................................. 17
3.3 Definition of main exposures and outcomes ...........................................................................................17
3.3.1 HIV ................................................................................................................................................................ 17
3.3.2 Pneumonia ................................................................................................................................................... 17
3.3.3 Death ............................................................................................................................................................ 18
3.3.4 HAART ......................................................................................................................................................... 19
3.3.5 CD4+ cell count and HIV viral load (VL) as time-updated variables ................................................... 19
3.4 Chance, bias, and confounding factors ..................................................................................................19
3.4.1 Chance ......................................................................................................................................................... 19
3.4.2 Bias ............................................................................................................................................................... 19

4
3.4.3 Confounding factors ................................................................................................................................... 20
3.4.4 Handling of bias and confounding ............................................................................................................ 21
4 Study design and statistical analysis ............................................................................... 23
4.1 Cohort analysis of the risk of hospitalization for pneumonia ..................................................................23
4.2 Cohort analysis of mortality following hospitalization for pneumonia .....................................................25
4.3 Cohort analysis of associations between diseases diagnosed in hospitals and risk of subsequent HIV diagnosis .............................................................................................................................................................25
5 Results ................................................................................................................................... 27
5.1 Paper I ....................................................................................................................................................27
Hospitalization for Pneumonia among Individuals With and Without HIV Infection, 1995-2007: A Danish Population-Based Nationwide Cohort Study ............................................................................................................ 27
5.2 Paper II ...................................................................................................................................................30
Mortality after Hospitalization for Pneumonia among Individuals with HIV, 1995-2008: A Danish Cohort Study .............................................................................................................................................................................. 30
5.3 Paper III ..................................................................................................................................................31
Morbidity and Risk of Subsequent Diagnosis of HIV Infection: A Population Based case control study identifying Indicator Diseases for HIV infection ....................................................................................................... 31
6 Strengths and weaknesses of the studies ....................................................................... 36
6.1 Considerations about study design ........................................................................................................36
6.1.1 Considerations about random and systematic error .............................................................................. 36
7 Conclusions, interpretation, and perspectives ............................................................... 39
7.1 Main conclusions ....................................................................................................................................39
7.2 Interpretation ...........................................................................................................................................39
7.3 Generalizability of study results ..............................................................................................................41
7.4 Perspectives ...........................................................................................................................................42
8 Summary ................................................................................................................................ 43
8.1 In English ................................................................................................................................................43
8.2 In Danish .................................................................................................................................................45
References ....................................................................................................................................... 47

5
LIST OF ABBREVIATIONS
AIDS Acquired immune deficiency syndrome
ART Antiretroviral treatment
CCI Charlson Comorbidity Index
CD4 Cluster of differentiation 4
CDC Center for disease control and prevention
CRS The civil registration system
DHCS The Danish HIV cohort study
HAART Highly active antiretroviral therapy
HIV Human immunodeficiency virus
ICD International classification of diseases
IDU Injection drug use
IQR Interquartile range
IR Incidence rate
IRR Incidence rate ratio
MR Mortality rate
MRR Mortality rate ratio
MSM Men who have sex with men
NHR The national hospital registry of patients
OR Odds ratio
PCP Pneumocystis Carinii (now Jiroveci) pneumonia
PPV Positive predictive value
RNA Ribonucleic acid
VL Viral load
TB Tuberculosis

6
This thesis is based on the following papers:
I. Hospitalization for Pneumonia among Individuals with and without HIV in Denmark 1995-2007: A Population Based Nationwide Cohort study. Søgaard OS, Lohse N, Gerstoft J, Kronborg G, Ostergaard L, Pedersen C, Pedersen G, Sorensen HT, Obel N; Clin Infect Dis; 2008 Nov 15;47(10):1345-53.
II. Mortality after hospitalization for pneumonia among individuals with HIV, 1995-2008: a Danish cohort study. Søgaard OS, Lohse N, Gerstoft J, Kronborg G, Østergaard L, Pedersen C, Pedersen G, Sørensen HT, Obel N. PLoS One. 2009 Sep 14;4(9):e7022.
III. Morbidity and Risk of Subsequent Diagnosis of HIV Infection: A Population Based Case Control Study Identifying Indicator Diseases for HIV infection. Søgaard OS, Lohse N, Østergaard L, Kronborg G, Røge B, Gerstoft J, Sørensen HT, Obel N. submitted 2011

7
1. BACKGROUND
1.1 THE BEGINNING OF THE HIV EPIDEMIC
In June 1981, the US Center for Disease Control and Prevention (CDC) published a report about Pneumocystis
carinii pneumonia in five homosexual men in Los Angeles.1 Pneumocystis pneumonia is almost exclusively
limited to severely immunosuppressed patients. The occurrence of pneumocystis pneumonia in five previously
healthy individuals without a clinically apparent underlying immunodeficiency was unusual and demanded
special attention. This was the first published report of what, a year later, became known as acquired
immunodeficiency syndrome (AIDS). In 1983, French researchers led by Francoise Barré-Sinoussi and Luc
Montagnier found that AIDS was caused by a novel human retrovirus, which was later named human
immunodeficiency virus (HIV).2
HIV originates from African non-human primates. It is currently believed that humans acquired chimpanzee
simian immunodeficiency virus (SIVcpz) by cross-species contamination, probably predation, around 1910 in what
is now known as the Democratic Republic of Congo (former Belgian Congo).3 Although the spread of the virus in
humans was initially slow, this ancestor of HIV-1 group M would subsequently fuel one of the most devastating
epidemics in modern human history. In 2010, UNAIDS estimated that almost 60 million people have been
infected with HIV and more than 25 million people have died of HIV-related causes since the beginning of the
epidemic.4 Some 33.3 million people are currently living with HIV. Further, 2.6 million new infections and 1.8
million AIDS-related deaths occur annually.
1.2 AIDS BEFORE AND AFTER THE INTRODUCTION OF HIGHLY ACTIVE
ANTIRETROVIRAL THERAPY
Within 10 years after infection with HIV, most individuals develop symptoms. The CD4+ T lymphocyte counts
have usually dropped below 200 cells/µL, HIV viral loads are high, and both the humoral and cellular immunity
are severely dysfunctional.5 The immune system becomes susceptible to opportunistic infections and infection-
related cancers, which under normal circumstances rarely cause disease in immunocompetent individuals.
These conditions are known as AIDS-defining and mark the end-state of HIV infection.6 The median survival
following AIDS diagnosis in the absence of antiretroviral treatment is 3.7 years if the CD4+ cell count is less than
200 cells/μL.7 Hence, without treatment for HIV more than 95% of infected individuals will die within 12-14 years
from the day of infection.

8
Recognizing the causative agent of HIV as a retrovirus led to an immediate emphasis on arresting the replicative
cycle of the virus. A compound that had been previously synthesized for potential use against cancer, 3´-azido-
3´-deoxythymidine (AZT or zidovudine), substantially inhibited viral reverse transcriptase and HIV replication in
vitro. Early reports of AZT therapy for HIV infection yielded promising results.8 However, the clinical effect of the
drug was short-term and appeared to be greatest in the late course of disease. Other compounds were
subsequently tested as monotherapy, but all gave rise to treatment resistant HIV strains which abrogated the
antiretroviral effect.9 In 1996, researchers discovered that combining three different antiretroviral drugs
dramatically decreased viral replication and led to undetectable HIV levels in peripheral blood.10 This treatment
strategy, known as highly active antiretroviral therapy (HAART) almost instantly became widely used in the
Western world. Not only did combination treatment block viral replication, CD4+ cell counts increased greatly
and immune function recovered in HIV patients on HAART.5
1.3 NON-AIDS DEFINING COMORBIDITIES
With the introduction of HAART, AIDS became increasingly less common in well-controlled HIV patients.11
Treatment with the early antiretroviral drugs was associated with numerous side effects including renal, hepato,
and mitochondrial toxicities, as well as metabolic changes and bone marrow depression.12-14 As more and less
toxic compounds were developed, these major side effects from HAART were significantly reduced. However,
during the past years it has become apparent that typical AIDS-defining illnesses have been substituted by new
comorbid conditions (often referred to as non-AIDS defining conditions) that threaten even those patients who
maintain virologic suppression.15
The most intensely studied of these conditions are: atherosclerotic cardiovascular disease, non-AIDS defining
malignancies, liver disease and renal disease.16 There appears to be a clear association between increasing risk
of non-AIDS defining conditions and decreasing CD4+ count counts (e.g., fatal liver disease and fatal non-AIDS
malignancies are more common in people with lower CD4 counts).13,17 However, even people with high CD4 cell
counts remain at risk of serious non-AIDS events.
The exact mechanisms underlying the increased risk of serious non-AIDS conditions associated with HIV-
induced immunodeficiency remain to be defined. Immune activation, a marker of HIV disease progression and a
key determinant of CD4 depletion has been shown to persist in HAART-treated persons with undetectable virus,
albeit at a lower level.18 People who cease antiretroviral therapy have elevated risk of developing serious non-
AIDS events and also of experiencing elevated levels of immune activation.19,20 Thus, immune activation has
been suggested to be one of the driving mechanisms in the pathogenesis of these conditions, but other factors
such as lifestyle (smoking, drug use, and alcohol) and drug toxicity are also likely to play a role.15

9
1.4 LOWER RESPIRATORY TRACT INFECTIONS IN HIV
As mentioned, an unexpected accumulation of Pneumocystis Jiroveci (formerly Carinii) pneumonia episodes led
to the discovery of the HIV/AIDS epidemic, and its association with severe immunodepression led to the
inclusion of the infection as an AIDS-defining disease. While this was one of the most commonly encountered
infections in the early phases of the epidemic, pneumocystis pneumonia is now primarily observed in people
who are first diagnosed at a late stage of HIV infection.21,22 It is rarely observed in well-controlled HIV patients22
and hence, other lower respiratory tract infections are now dominating the clinical picture in infectious diseases
departments in developed countries.23
Globally, mycobacterium tuberculosis (TB) is a major cause of pulmonary infections among HIV patients.24 Like
pneumocystis pneumonia, pulmonary TB is closely associated with severe immunodepression and pulmonary
TB in a person with HIV infection is also categorized as an AIDS-defining disease.6 However, active TB infection
can also be observed in HIV patients with low CD4+ cell counts after initiation of HAART - probably due to
immune reconstitution.25,26 The greatest burden of HIV-associated tuberculosis is found in sub-Saharan Africa,
but a regional epidemic of HIV-associated tuberculosis is also raging in parts of Eastern Europe.24,27 In Denmark,
HIV-associated tuberculosis is primarily observed in immigrants from Eastern Europa and sub-Saharan Africa.
Due to the difference in aetiology, pathogenesis, and their status as AIDS-defining diseases, pneumocystis
pneumonia and tuberculosis were not in included in our studies of pneumonia (paper I+II).
Early in the HIV epidemic it was recognized that morbidity and mortality due to bacterial pneumonia were higher
in HIV-infected persons than in the general population.28 In 1993 the US CDC categorized two or more episodes
of bacterial pneumonia within a 1-year period as an AIDS-defining event.6 The introduction of HAART also led to
fewer pneumonia-related hospitalizations, but a study by Kohli et al. suggested that the risk of bacterial
pneumonia in the HAART era remained higher among persons with HIV than those without HIV.29 Infection with
Streptococcus pneumoniae is the most common cause of bacterial pneumonia among people with human
immunodeficiency virus (HIV) and a major cause of morbidity and mortality.30 Whether the incidence of invasive
pneumococcal disease (IPD) has declined after the introduction of HAART is uncertain, and IPD may be up to
100 times more frequent among HIV-infected persons than non-HIV-infected persons.31,32
A number of risk factors for pneumonia and pneumococcal disease have been identified over the past twenty
years. Low CD4+ cell count is an example of a well-known risk factor for pneumonia and pneumococcal
disease.33-39 Other risk factors related to progression of HIV-infection are viral load (HIV RNA)34,38,40,41 and
clinical disease stage.33,36,37 Increased risk of pneumonia has also been associated with certain comorbidities
and abnormal paraclinical findings including: Pulmonary tuberculosis,42 chronic obstructive pulmonary disease,40

10
cirrhosis,39,40 hepatitis C,34 low albumin,34,37 and anaemia.34,37 Previous pneumonia is also a risk factor29-31,33
whereas use of HAART has been shown to be protective.35,36,38,40,42 Prophylactic antibiotic use with azithromycin
or trimethoprim-sulfamethoxazole,36,38,40,43 pneumococcal,32,44 and influenza vaccination43 have a protective
effect in some studies.
Other factors such as sex and race may also play a role, as black people appear to have an increased risk of
both all-cause pneumonia as well as pneumococcal disease37,38 and women may have an increased risk of
pneumonia.38 Lifestyle and socio-economic risk factors for pneumococcal disease in HIV-infected people
include: Smoking,35,39,41,42 cannabis use,41 injecting drug use,34,36,38-43 alcohol abuse,35,36,38,40 having close
contact with children,42 level of education,36,42 and poor housing.42
Despite their commonness, acute lower respiratory infections have received relatively little attention in studies of
non-AIDS defining conditions. A range of studies which have estimated pneumonia incidences in HIV-infected
and uninfected populations is listed below (Table 1). Collectively, these studies suggest that in spite of
widespread use of HAART, HIV-infected individuals remain at high risk of non-AIDS defining infections and lower
respiratory tract infections in particular.

11
Table 1. Effect of HIV infection on the incidence and outcome of all-cause pneumonia in adults in population-based studies.
References Time period HIV status Incidence (events / person-years)
Case-fatality
Hirschtick45 Pre-HAART Positive
Negative
55/1000
9/1000
≈6%
Floris-Moore46 Pre-HAART Positive (male)
Positive (female)
104/1000
120/1000
-
-
Sullivan47 Pre-HAART Positive 227/1000 -
Tumbarello48 Pre-HAART Positive 125/1000 -
Kohli29 Pre- and post HAART
Positive
Negative
85/1000
7/1000
≈7.7%
-
Floris-Moore46 Post-HAART Positive (male)
Positive (female)
82/1000
180/1000
-
-
Sullivan47 Post-HAART Positive 91/1000
Gordin49 Post-HAART Positive (DC)
Positive (VS)
20/1000
13/1000
-
-
Tumbarello48 Post-HAART Positive 88/1000 -
Lopez-Palomo50 Post-HAART Positive ≈44/1000 -
Curran51 Post-HAART Positive ≈20-32/1000 ≈9.1%

12
1.5 IDENTIFICATION OF INDIVIDUALS WITH UNDIAGNOSED HIV INFECTION
Despite three decades of efforts, controlling the HIV epidemic remains a tremendous public health challenge.52-54
Many individuals newly diagnosed with HIV present at a late stage of the disease with severe immune depletion,
resulting in delayed initiation of HAART which undermines their prognosis.55,56 Further, HIV viral load is
predictive of transmission risk.57 The highest levels of viremia are seen during acute infection and advanced HIV-
1 disease.58 If persons with undiagnosed HIV infection can be identified early in the course of the infection or
before they progress to AIDS, this may reduce onward transmission of HIV.59-61 Thus, in the light of the
significant benefits associated with early identification of people with undiagnosed HIV infection (Table 2)
intensified HIV testing and treatment has been advocated to control the HIV epidemic.62,63
The U.S. CDC recommend routine HIV testing for all persons under age 65 who come into contact with the US
health care system.64 While this approach might be beneficial in terms of prolonging life expectancy56 and cost-
effective in areas with high HIV prevalence,65,66 alternative approaches such as targeted HIV testing may be
more appropriate in low prevalence areas such as Denmark.54 In addition, although access to care is free at the
point of delivery in most European countries, limited availability of HIV care and stigma associated with the
disease remain widespread.67 Consequently, targeted HIV testing rather than universal HIV testing may be the
most acceptable strategy for individuals as well as authorities at the present time.68
Targeted HIV testing requires knowledge of special characteristics (behavior, signs, symptoms, and diseases),
which may indicate undiagnosed HIV infection in the general population. CDC’s revised classification of AIDS-
defining illnesses contains a list of 21 conditions,69 which are well known to be strongly associated with HIV
infection. Targeted HIV testing based on the presence of diseases associated with HIV, so-called indicator
diseases,68 has been put forward as a way to identify persons with undiagnosed HIV. During recent years, the
concept of indicator-disease based HIV testing has received a great deal of attention in the European AIDS
Clinical Society. In 2008, Brian Gazzard and colleagues published an important paper in which they reviewed
the current literature on HIV indicator diseases and recommended a broader implementation of this HIV
screening strategy.68 However, as the authors acknowledged, guidance is based mainly on expert opinion in the
absence of data68 and a comprehensive study of HIV indicator diseases using appropriate HIV negative controls
has not been conducted to date.

13
Table 2. Potential benefits and drawbacks from earlier presention of people with undiagnosed HIV infection.
Potential benefits from earlier
presentation
Mechanism
Lower HIV transmission Reduced sexual risk behavior70
Prevention of mother-to-child transmission71-73
Viral suppression following HAART initiation reduce risk of
onward HIV transmission57,60,62
Lower morbidity / mortality Fewer AIDS events before diagnosis74
Lower risk of immune reconstitution syndrome (IRIS) after
HAART initiation75,76
Improved CD4+ cell recovery77,78
Reduced loss of immunological memory79,80
Improved prognosis on HAART74,81
Lower risk of non-AIDS defining morbidity (e.g., cancer,
neuropathy, cardiovascular, liver, and renal disease)19,81
Cost reduction of HIV care Lower costs associated with treatment of AIDS and non-AIDS
defining conditions82
Fewer new HIV cases66,83
Lower demand on health care resources related to treatment
and monitoring of HIV infection.65,78
Potential drawbacks from earlier presentation
Increased drug expenses Short term increases in drug expenses due to more people on
HAART
Adverse events from HAART Increased exposure to antiretrovirals may increase the risk of
adverse events15
Resistance development Due to longer HAART exposure14
Increased discrimination Due to known HIV seropositivity54
14
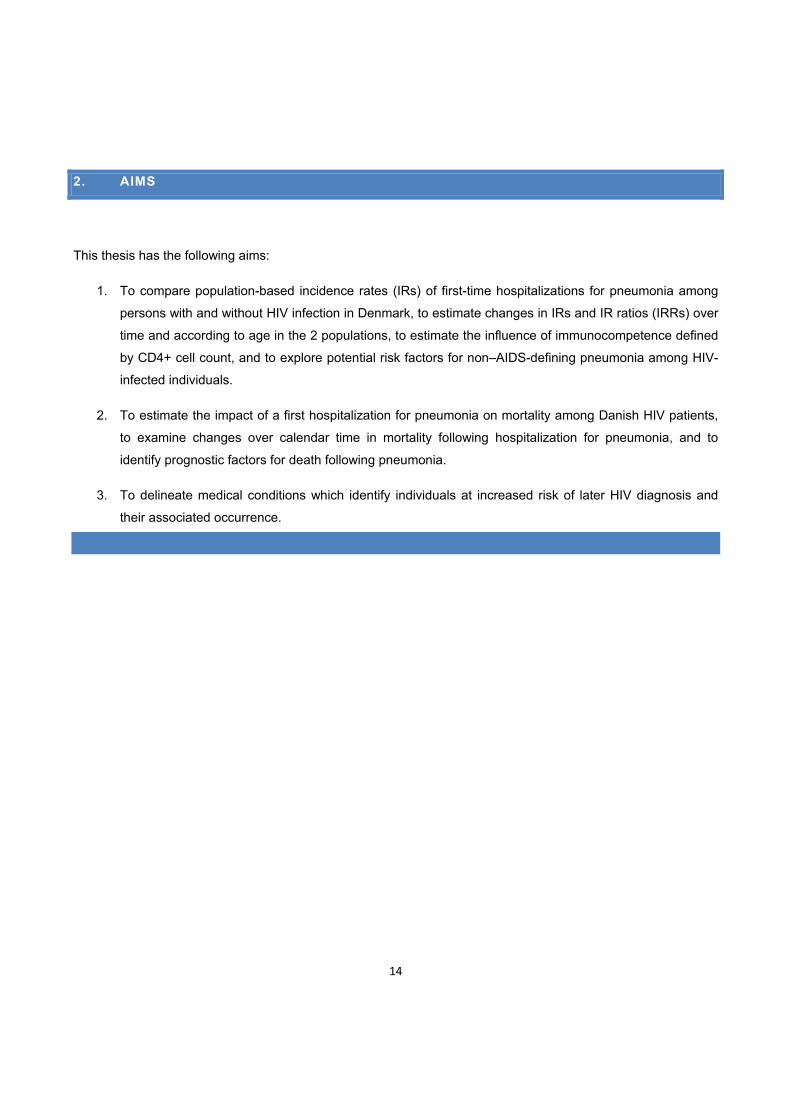
2. AIMS
This thesis has the following aims:
1. To compare population-based incidence rates (IRs) of first-time hospitalizations for pneumonia among
persons with and without HIV infection in Denmark, to estimate changes in IRs and IR ratios (IRRs) over
time and according to age in the 2 populations, to estimate the influence of immunocompetence defined
by CD4+ cell count, and to explore potential risk factors for non–AIDS-defining pneumonia among HIV-
infected individuals.
2. To estimate the impact of a first hospitalization for pneumonia on mortality among Danish HIV patients,
to examine changes over calendar time in mortality following hospitalization for pneumonia, and to
identify prognostic factors for death following pneumonia.
3. To delineate medical conditions which identify individuals at increased risk of later HIV diagnosis and
their associated occurrence.

15
Figure 1. Sampling of population controls matched to patients in DHCS
is done in the Civil Registration System by data managers at the Danish
Board of Health. This subsequently allows for linkage of both DHCS
patients and controls to other medical databases using the unique
personal registration numbers.
3 METHODOLOGICAL CONSIDERATIONS
3.1 DATA SOURCES
3.1.1 AN INTRODUCTION TO DANISH MEDICAL DATABASES
The Danish Civil Registration System, established in 1968, allows for personal identification and the possibility of
collecting information about the same person in several registries through a 10-digit personal registration
number (CPR number), assigned at birth, which uniquely identifies each person. This CPR number is the key to
linking data from different medical
databases. Apart from the Danish HIV
cohort study, data used for studies in this
thesis were obtained from medical
databases under administration of the
Danish National Board of Health (Figure 1).
These primary data sources offers great
advantages due to the fact that they
already exist, which effectively eliminates
the need for additional data collection,
sparring time, effort, and money.
3.1.2 DANISH HIV COHORT STUDY
(DHCS)
The DHCS is an open, prospective cohort
study initiated in 1998 as the HIV cohort
study in Western Denmark.84 This
population-based study was expanded in
2004 to cover all Danish HIV clinics and
became a nationwide cohort. Data reaching
back to 1 January 1995 were retrieved from
medical files and entered into the database.
National Hospital Registry of Patients
Danish
Cancer
Registry
Danish HIV
Cohort
Study
The Civil
Registration
System

16
DHCS thus covers all prevalent HIV cases as of 1 January 1995 and all incident HIV cases since then. Study
data are updated annually with individual information on antiretroviral treatment, development of opportunistic
infections and other AIDS-defining illnesses, and laboratory data including plasma HIV RNA (viral load) and
CD4+ cell count.85 Cross-checking and validation algorithms are incorporated in the database management in
order to catch data retrieval and typing errors. DHCS is based at Rigshospitalet, Copenhagen, and headed by
Professor Niels Obel.
3.1.3 DANISH CIVIL REGISTRATION SYSTEM (CRS)
CRS is a national registry of all Danish residents, which contains information on date of birth, sex, date of
migration, and date of death.86 The CPR number, assigned at birth, uniquely identifies each person since 1968.
Further, those who live or work in Denmark legally for a certain amount of time must register with the CRS. The
purpose of the CRS is to administrate the personal identification number system and general personal data
forwarded by the municipal registration offices to the CRS. The CRS is updated within a week of a person’s birth,
death, or emigration. Use of the CPR number enables Danish HIV clinics to avoid multiple registrations of the
same patient and allows tracking of deaths and persons lost to follow-up due to emigration.87
3.1.4 THE DANISH NATIONAL HOSPITAL REGISTRY (NHR)
NHR contains information on all patients discharged from Danish hospitals since 1977. Records for each
hospitalization include CPR number, hospital department, inpatient and outpatient discharge diagnoses, and
dates of admission and discharge. Diagnoses are coded by the treating physician according to the International
Classification of Diseases, 8th revision (ICD-8) until the end of 1993 and 10th revision (ICD-10) thereafter.
3.1.5 THE DANISH CANCER REGISTRY
Since 1943, the registry has recorded all incident cases of carcinoma, sarcoma, leukaemia, lymphoma, multiple
myeloma, and mycosis fungoides in Denmark. In addition, a number of tumour-like and benign lesions have also
been recorded. During the period 1943-2003, tumours were classified according to a modified Danish version of
the International Classification of Diseases, 7th revision (ICD-7) as well as International Classification of
Diseases for Oncology (ICD-O) from 1 January 1978 and onwards. From 1 January 2004, tumours were
classified according to ICD-10. In addition, tumours diagnosed in the period 1978-2003 were reclassified
according to ICD-10 by conversion of the ICD-O codes.
3.2 METHODS
3.2.1 LITERATURE SEARCH

17
A versatile approach was used to keep track of the quickly evolving field of HIV research.
Regular searches on Pubmed using combinations of keywords such as “HIV”, “pneumonia”,
“epidemiology”, “pneumococcal infections”, “mortality”, “HIV screening”, “comorbidity”, and “HIV
transmission”.
Table of contents (TOC) email alerts from major medical journals (New England Journal of Medicine,
JAMA, Lancet, BMJ, and PLoS Medicine), basic science journals (Nature, Nature Medicine, and Nature
Immunology) and infectious diseases-related journals (Lancet Infectious Diseases, Clinical Infectious
Diseases, Journal of Infectious Diseases, AIDS, JAIDS, Current Opinion in HIV research).
Literature updates from professional websites such as Medscape and UNAIDS.
Subscription to HIV mailing list from Greg Folkers at NIH/NIAID.
Frequent communication with supervisors and colleagues in the field of HIV research and epidemiology.
Participation in international scientific HIV and infectious disease conferences.
3.2.2 SAMPLING OF GENERAL POPULATION CONTROLS
Up to 99 population controls for each HIV patient were sampled from CRS, matched on age and gender at HIV
diagnosis (and registration in the same municipality in paper I). The control cohort was used to compare risk of
hospitalization for pneumonia (paper I) and specific hospital discharge diagnoses (paper III) in persons with HIV
compared to the general population.
3.3 DEFINITION OF MAIN EXPOSURES AND OUTCOMES
3.3.1 HIV
HIV infection was the main exposure of interest in paper I and the primary outcome in paper III. HIV patients in
DHCS were identified from hospital records and electronic laboratory reports of CD4+ cell counts and HIV-RNA
viral loads. As these tests were conducted on all HIV patients in the HIV clinics as part of initial screening, the
risk that a patient is missed in DHCS is negligible. The date of HIV diagnosis was defined as the date of first
contact to an HIV clinic, first HIV-RNA measurement, or first CD4+ cell count (whichever came first).
3.3.2 PNEUMONIA
Pneumonia was used as the primary outcome in paper I and as exposure in papers II+III. We used the NHR to
identify all hospital contacts with a discharge diagnosis of pneumonia using ICD-8 codes 480.XX-486.XX,

18
073.XX and 471.XX, and ICD-10 codes J11.0 (influenza with pneumonia), J12.x–J18.x (pneumonia), A481.x,
(ornithosis), or A709.x (legionellosis). Thus, both community-acquired and hospital-acquired pneumonias were
included. We defined the onset of pneumonia as the date of hospital admission. AIDS-defining Pneumocystis
jiroveci pneumonia (PCP, ICD-10 codes B.20.6 and B.59.x) was not counted as an episode of pneumonia.
For a sample of 77 HIV-infected patients with a discharge diagnosis of pneumonia, reviewing medical records
validated the diagnoses identified in the NHR. We confined the review to Aarhus County, since data quality in
the NHR is considered uniform throughout the country.88 Pneumonia diagnoses recorded in the NHR for patients
without HIV had been validated previously,89 and we used the same criteria for the HIV patients. A discharge
diagnosis of pneumonia was considered confirmed when an infiltrate was documented in a chest X-ray and at
least one of the following clinical or laboratory findings was present: body temperature ≥37.5°C; cough;
dyspnoea; chest pain or rales coincident with the area of infiltrate; increased sputum; purulent sputum;
microorganism isolated from blood culture, leukocyte count ≥12×109 L 1 or C-reactive protein concentration
>100 mg×dL 1. We computed the percentage of episodes recorded in the NHR fulfilling the above criteria.
73 of 77 HIV patients, corresponding to 95% (95% confidence interval [CI]: 87%-98%), registered with
pneumonia in the NHR, had their diagnosis confirmed by data in their medical records. In an earlier validation of
pneumonia diagnoses among 100 non-HIV patients, the diagnosis was confirmed for 90 patients (90%, 95% CI:
82-95%) on the basis of their medical records.89
As noted in the discussion section of paper I, data on the etiology of pneumonia would have strengthened the
study. Most of the pneumonia episodes in were registered by the treating physician as unspecified bacterial
pneumonia. Although information on the etiology of pneumonia was included in the ICD-8 and ICD-10 diagnosis
in some instances this information presumably is incomplete and (to my knowledge) has not been validated. In
paper I, a thorough investigation of causative agents would have required a complete review of medical records
for all HIV patients [n=582] and controls [n=7,042] who were hospitalized for pneumonia. This was beyond the
scope of the paper and we were also worried that the diagnostic testing would be more extensive in HIV patients
than among persons with HIV which would bias the comparison of causative agents between the two groups.
3.3.3 DEATH
The primary outcome in paper II was all-cause mortality following the hospital admission date for pneumonia.
Causes of death, extracted from patient files and available in the DHCS database, were divided into HIV-related
causes (AIDS-defining illnesses and bacterial infections, serious non–AIDS causes (cardiovascular disease [i.e.
myocardial infarction or stroke], end stage renal and liver disease, COPD, and non-AIDS-defining malignancies),
unnatural causes (i.e. drug overdose, suicide, accident), and other/unknown causes. We were unable to

19
classified deaths as “directly related to pneumonia” due to insufficient information in the medical records and the
DHCS database.
3.3.4 HAART
HAART was defined as either a 3-drug regimen that included a non-nucleoside reverse transcriptase inhibitor, a
protease inhibitor, and/or abacavir; or a 2-drug regimen with a combination of a non-nucleoside reverse
transcriptase inhibitor and a boosted protease inhibitor.
3.3.5 CD4+ CELL COUNT AND HIV VIRAL LOAD (VL) AS TIME-UPDATED VARIABLES
Measurements of CD4+ cell count and VL are unevenly distributed over time. In papers I+II we used the
principle of “last observation carried forward” to determine CD4+ cell count and VL between measurements.
Nadir CD4+ cell count was defined as the lowest CD4+ cell count ever measured at a previous point in time.
3.4 CHANCE, BIAS, AND CONFOUNDING FACTORS
3.4.1 CHANCE
The observations on which this thesis is based were made on a sample of HIV patients (those included in
DHCS). This sample, even though it was selected without bias, may misrepresent the situation in the global HIV
population because of chance. However, results of an unbiased sample tend to approximate the true value. The
divergence of an observation on a sample from the true population value, due to chance alone, is called random
variation. Random variation can never be eliminated totally, so chance has to be considered when assessing the
results of clinical observations.
3.4.2 BIAS
Selection bias, which occurs when comparisons are made between groups of persons that differ in the
determinants of outcome other than the ones under study, are likely to have occurred in papers I+III. Berkson's
selection bias results from the greater probability of hospital admission for people with two or more conditions
than for people with one condition. In paper I, clinicians may have had a lower threshold for hospital admission
of an HIV-infected person presenting with signs and symptoms of pneumonia than for a person without HIV. If
so, pneumonia would be diagnosed in hospitals more frequently in HIV-infected persons than in the general
population and the relative risks in our study would tend to be overestimate the effect of HIV infection. In paper
III, HIV diagnosis is the outcome of interest, but in-patient or out-patient hospital visits may have increased the
risk of being HIV tested as part of the diagnostic work-up and thus, hospital contact may by itself be a risk factor
for subsequent HIV diagnosis.

20
Bias in estimating an effect can be caused by measurement errors in the needed information. Such bias is often
referred to as information bias. Different types of information bias may have occurred in all three papers. In
paper I, the admitting clinician’s awareness of a person’s HIV status may have increased the subsequent
diagnostic procedures and thus the validity of the pneumonia diagnosis. If so, this would be an example of
differential misclassification, because underdiagnosis of pneumonia (failure to detect pneumonia), would occur
more frequently among non-HIV-infected compared to HIV-infected individuals. In paper II, causes of death were
in many cases uncertain and, in some cases, multifactorial. Causes of death registered in DHCS were based on
information extracted from medical records. Although misclassification of causes of death is likely, this bias is
unlikely to be associated with the exposure (pneumonia) and can be considered as an example of non-
differential misclassification. Misclassification is also likely to have occurred in coding of hospital discharge
diagnosis in paper III. The positive predictive value (PPV) of NHR discharge diagnoses for numerous diseases
compared to medical chart reviews have been assessed. Though the PPV varies from one diagnosis to another,
the predictive value of registry diagnoses compared to medical records is generally high (70%-99%).88
3.4.3 CONFOUNDING FACTORS
A variable that is associated with both the exposure (e.g., HIV) and the outcome (e.g., pneumonia) is a potential
confounding variable. We controlled for various confounding variables in the studies. Age is a well established
risk factor for many diseases including pneumonia, for which the highest risk of disease is observed at the
extremities of age. The median age of the DHCS population at study entry was 37 years in paper I. To control for
the effect of age on the risk of pneumonia, we matched HIV patients to the general population controls by age at
the time of study entry. Also in paper I, we used stratification to control for the effect of age. In papers I+III we
also controlled for gender by matching HIV patients to population controls in the study design.
Comorbidity was assessed with the Charlson Comorbidity Index (CCI). The index, which includes 19 major
disease categories, has been adapted and validated for use with hospital discharge data in ICD databases for
predicting short- and long-term mortality.90 In paper II, a CCI score was computed for each patient based on all
available foregoing NHR discharge diagnoses. A previous AIDS diagnosis (conferring 6 CCI points) was not
included in our computations.91 Hence, adjustment for CCI score takes multiple comorbidities into account but
limited, of course to the comorbidities that we know of (i.e., those registered in the NHR).
Some potential confounding variables could not be adjusted for. For example, we did not have data on smoking,
a well-known risk factor for pneumonia that may be more common in HIV-infected individuals, particularly among
injection drug users. A recent cohort study found that 40% of HIV-infected individuals were smokers,92 compared
to a smoking rate of 27% in the Danish population as a whole in 2006.93 In this example, smoking may cause us
to overestimate the relative risk of pneumonia among HIV patients compared to the background population.
21
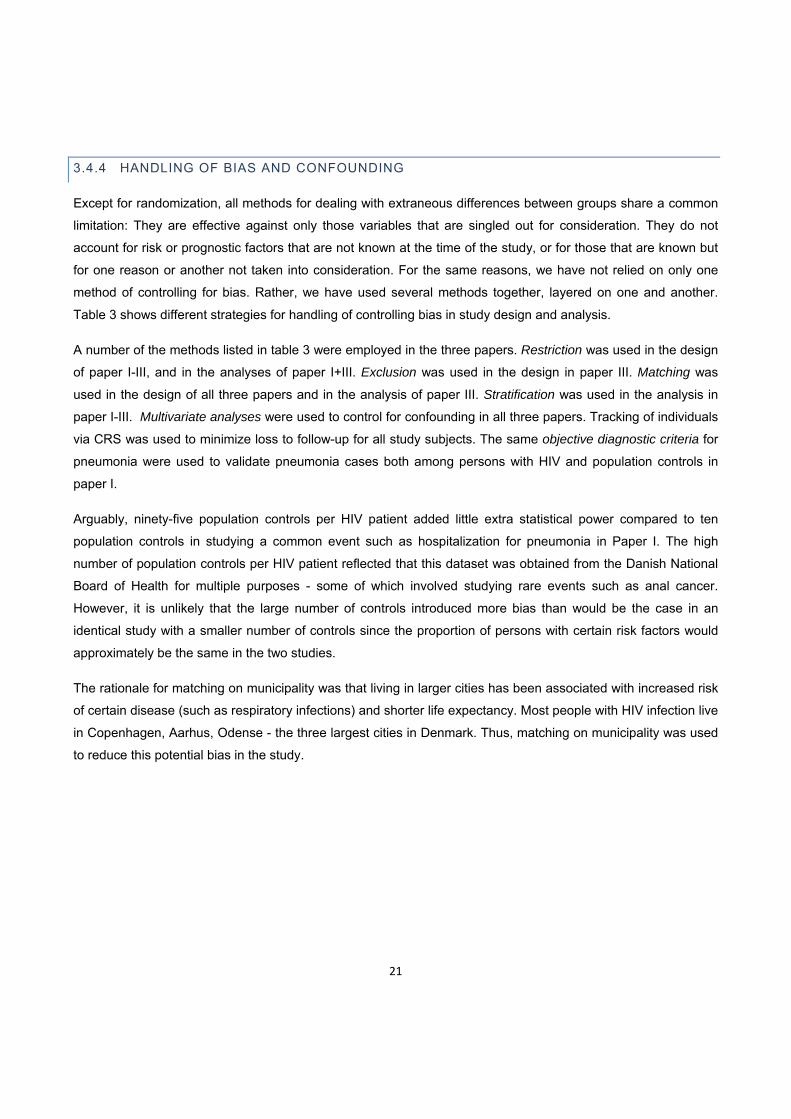
3.4.4 HANDLING OF BIAS AND CONFOUNDING
Except for randomization, all methods for dealing with extraneous differences between groups share a common
limitation: They are effective against only those variables that are singled out for consideration. They do not
account for risk or prognostic factors that are not known at the time of the study, or for those that are known but
for one reason or another not taken into consideration. For the same reasons, we have not relied on only one
method of controlling for bias. Rather, we have used several methods together, layered on one and another.
Table 3 shows different strategies for handling of controlling bias in study design and analysis.
A number of the methods listed in table 3 were employed in the three papers. Restriction was used in the design
of paper I-III, and in the analyses of paper I+III. Exclusion was used in the design in paper III. Matching was
used in the design of all three papers and in the analysis of paper III. Stratification was used in the analysis in
paper I-III. Multivariate analyses were used to control for confounding in all three papers. Tracking of individuals
via CRS was used to minimize loss to follow-up for all study subjects. The same objective diagnostic criteria for
pneumonia were used to validate pneumonia cases both among persons with HIV and population controls in
paper I.
Arguably, ninety-five population controls per HIV patient added little extra statistical power compared to ten
population controls in studying a common event such as hospitalization for pneumonia in Paper I. The high
number of population controls per HIV patient reflected that this dataset was obtained from the Danish National
Board of Health for multiple purposes - some of which involved studying rare events such as anal cancer.
However, it is unlikely that the large number of controls introduced more bias than would be the case in an
identical study with a smaller number of controls since the proportion of persons with certain risk factors would
approximately be the same in the two studies.
The rationale for matching on municipality was that living in larger cities has been associated with increased risk
of certain disease (such as respiratory infections) and shorter life expectancy. Most people with HIV infection live
in Copenhagen, Aarhus, Odense - the three largest cities in Denmark. Thus, matching on municipality was used
to reduce this potential bias in the study.

22
Table 3. Methods to minimize bias in the study design and analysis phases.
Type of bias
Method Description Design Analysis
Confounding / Selection bias
Randomization A way to give each patient an equal chance of falling into one or the other group
√
Restriction Limit the range of characteristics of persons in the study
√ √
Exclusion Excluding persons with unwanted characteristics in the study
√ √
Matching For each patient in one group, select one or more patients with the same characteristics (except the one under study) for a comparison group
√ √
Stratification Compare rates within subgroups √
Multivariate adjustment and mathematical modelling
Adjust for differences in a large number of factors related to the outcome
√
Minimizing “lost to follow-up”
Implementing procedures to track those who drop out
√
Information bias
Blinding Assesing outcomes without knowledge of individual group allocation
√
Standardization Standardizing the measurement process √
Using objective criteria
Using predefined, validated criteria for defining exposure and outcome
√
adapted from "Clinical epidemiology: the essentials" 3rd edition by Fletcher and Fletcher94

23
4 STUDY DESIGN AND STATISTICAL ANALYSIS
All three studies were population-based cohort studies. In paper I and III, population controls without HIV were
sampled from the CRS and used for comparative analyses. We had to use different approaches to analyze the
effect of HIV on risk of pneumonia and the effect of pneumonia on mortality, and to identify diseases associated
with subsequent HIV infection.
4.1 COHORT ANALYSIS OF THE RISK OF HOSPITALIZATION FOR PNEUMONIA
In paper I, subjects were followed from 1 January 1995 or date of HIV diagnosis, which ever came last.
Population controls entered the study on the same day as their matched HIV-infected person. We computed time
at risk from date of first observation until the date of first hospitalization for pneumonia, death, emigration, or 1
May 2007, whichever came first (Figure 2).
Incidence rates (IR) of pneumonia hospitalization were computed for HIV-infected patients and controls as the
number of events per 1000 person-observation years. In an analysis restricted to HIV-infected patients with
current CD4+ counts >500 cells/µL and their respective HIV-uninfected controls, we compared IRs in the last time
period. We computed incidence rate ratios ([IRR]=IRHIV/IRcontrols) and 5- and 10-year cumulative risk of
pneumonia after 1 January 1997. We used a Poisson regression model to explore risk factors for first-time
hospitalization for pneumonia for all individuals with HIV. Variables entered into the model included both constant
covariates such as race and sex, and time-dependent covariates such as HAART use and current CD4+ cell
count.

24
Figure 2. Schematic illustration of the study design used in paper I. Persons in DHCS are followed from the date of
HIV diagnosis (squares). Matched population controls were sampled and followed from the date of HIV diagnosis of
their corresponding HIV case (circles). The incidence rate (IR) for persons in one group is defined as the number of
new events (X) per time unit. The incidence rate ratio (IRR or relative risk) is defined as: IRR=IRHIV/IRCONTROLS. In
order to limit the study to first-time pneumonia hospitalizations, individuals with a recorded episode of pneumonia
between 1977 and 1 January 1995 were excluded. Exclusion of persons with HIV subsequently led to exclusion of
their matched control persons (illustrated at the bottom of the figure).

25
4.2 COHORT ANALYSIS OF MORTALITY FOLLOWING HOSPITALIZATION FOR PNEUMONIA
This study was also restricted to persons in DHCS who were at least 16 years old on the date of HIV diagnosis
and who had no recorded hospitalization for pneumonia before entering DHCS. Study subjects were followed
from their registration in DHCS to death, loss to follow-up, or 1 July 2008, whichever came first.
We first computed 30-day and 90-day cumulative mortality following the first hospitalization for pneumonia and
constructed Kaplan-Meier survival curves, stratified into 3 calendar periods. We then assessed the effect of a
first hospitalization for pneumonia on mortality. We compared the mortality rate in persons who had no previous
history of pneumonia (reference group) with that of persons with a first hospitalization for pneumonia within the
last 0-90 days, within the last 91-365 days, and more than 365 days ago. Poisson regression analysis was used
to adjust for potential confounders. In this regression model, pneumonia was entered as a time-dependent
covariate and "death" as the outcome. Finally, we used logistic regression to identify prognostic factors for 30-
day and 90-day mortality following hospitalization for pneumonia.
4.3 COHORT ANALYSIS OF ASSOCIATIONS BETWEEN DISEASES DIAGNOSED IN HOSPITALS AND RISK OF SUBSEQUENT HIV DIAGNOSIS
In paper III, we extracted hospital diagnoses from all outpatient contacts and hospital stays from the NHR and
the Danish Cancer Registry, up to the day prior to the index date. ICD-10 codes were the primary source for
grouping diseases. We defined 22 disease categories of interest according to the type and anatomical location
of the disease (paper III, Appendix Table 1). ICD-8 codes were matched to the corresponding ICD-10 disease
categories and first-time diagnoses were assigned to the appropriate category. In addition, a total of 161
subcategories were created for the 22 disease categories. Except for tuberculosis, we excluded AIDS-defining
diseases, as their association with HIV infection is well established.6
Analysis 1: For each of the 22 disease categories diagnosed in the 5-year period prior to the index date,
conditional logistic regression analysis was used to estimate odds ratios (OR) as an unbiased estimate of the
incidence rate ratio95 for subsequent HIV diagnosis (unadjusted and adjusted for hospital contacts for the
remaining 21 disease categories). The 161 subcategories were also analyzed in the 5-year period prior to the
index date - however, adjustments were only made for other diseases within the same category (e.g., the OR for
syphilis was adjusted for diagnosis of condyloma, anogenital herpes simplex, hepatitis A, non "A" viral hepatitis,
and other sexually transmitted infections).

26
Analysis 2: Individual observation data was then stratified into three time periods prior to the index date (Figure
3) to explore changes in ORs leading up to the index date. For every time period, risk estimates were calculated
for each disease category (adjusted for the remaining 21 disease categories). For each of these analyses, only
the cases and their respective controls followed from the beginning of a given time period up to the index date
were included.
Exploratory subanalysis: To identify specific HIV-indicator diseases, we explored risk estimates for the 161
specific subcategories within each of the 22 disease categories. In all analyses, only first-time diagnoses for a
given disease/disease category were utilized.
Figure 3. The outline of the two types of analysis used in paper III. Analysis 1 investigates medical events in 5
years prior to HIV diagnosis/sampling date. Analysis 2 investigates associations between time of hospital contact
and time of HIV diagnosis / sampling date.

27
5 RESULTS
5.1 PAPER I
HOSPITALIZATION FOR PNEUMONIA AMONG INDIVIDUALS WITH AND WITHOUT HIV
INFECTION, 1995-2007: A DANISH POPULATION-BASED NATIONWIDE COHORT STUDY
Background: Compared with the general population, persons with HIV infection have increased rates of non–
AIDS-defining malignancies17 and cardiovascular,96,97 liver,98 and renal diseases,99 even among patients with full
virological suppression and high CD4+ cell counts. Bacterial pneumonia (first-time or recurring) is a common
hospital diagnosis in persons with HIV, including those receiving HAART,46,100 and respiratory failure is the
leading cause of ICU admissions among HIV-infected patients.101 A number of studies have reported increased
rates of pneumonia in persons with HIV compared to the general population, but the impact of HAART and CD4+
cell count on risk of pneumonia in HIV-infected patients is still controversial.
Methods: Individuals in the DHCS were matched with up to 99 persons from the CRS according to sex, date of
birth, and municipality of residence at the time of HIV diagnosis. Data on hospital discharge diagnoses were
obtained from the NHR; mortality and emigration data from the CRS. Subjects were observed from HIV
diagnosis until first hospitalization for pneumonia (excluding pneumocystis jiroveci), death, emigration, or 1 May
2007. We computed incidence rates and ratios, and used Poisson regression to identify risk factors for
pneumonia in the HIV population.
Main results: We found that the risk of first-time hospitalization for pneumonia remained 6-fold higher in HIV-
infected individuals than in the general population until 2007, despite a decrease in incidence after the
introduction of HAART (Figure 4a). The increased risk was observed even in persons with near-normal CD4+ cell
counts. The strongest risk factors for pneumonia were low current CD4+ cell count, IDU as the mode of HIV
transmission, and, among HAART-naïve patients, a high current viral load. Interestingly, use of HAART was
associated with a decreased risk of pneumonia. The CD4+ cell count independent effect of HAART on crude and
adjusted IRR was investigated for the five levels of current CD4+ cell counts, comparing HAART-naïve to
HAART-experienced individuals. However, the protective effect of HAART was only observed at CD4+ counts
≤200 cells/µL.
As shown in Figure 4b, all transmission groups except IDU experienced a decline in the risk of hospitalization for
pneumonia during the time of the study. On the contrary, the risk of pneumonia remained largely unchanged
throughout the study in the group with IDU as mode of transmission (IR≈60/1000

28
PYFU).
Figure 4a. Incidence of first-time hospitalization for pneumonia in Denmark among HIV and non-HIV-infected individuals, 1995-2007.

29
Figure 4b. Impact of mode of HIV transmission on temporal trends in IRs of pneumonia.
Comments: This study has some important implications:
1) Use of HAART is associated with significant decline in the risk of pneumonia among people with HIV infection.
This lowered risk is primarily related to the reconstitution of the immune system as evidenced by increasing
CD4+ cell counts, but HAART also has beneficial effects on the immune system that reaches beyond CD4+
cells.
2) Despite this positive effect of HAART, people with HIV remain at significantly higher risk of hospitalization for
pneumonia than people without HIV infection. The question is why this excess risk persists despite near-normal
immune status (using CD4+ as a surrogate marker). This difference in risk could either be a “real” phenomenon
or be the result of residual confounding which will be discussed in detail later in this thesis.
30
3) Past or present injection drug users with HIV infection may be the group of individuals who would benefit most
from prophylactic measures such as pneumococcal immunization.
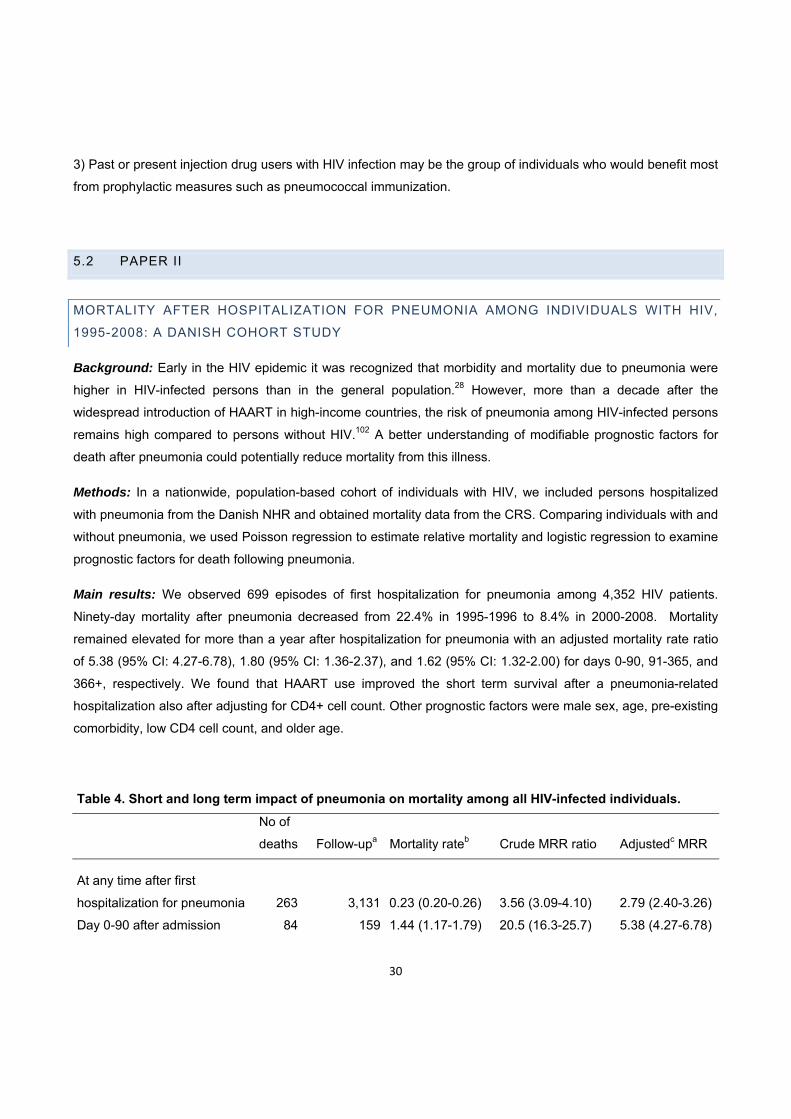
5.2 PAPER II
MORTALITY AFTER HOSPITALIZATION FOR PNEUMONIA AMONG INDIVIDUALS WITH HIV,
1995-2008: A DANISH COHORT STUDY
Background: Early in the HIV epidemic it was recognized that morbidity and mortality due to pneumonia were
higher in HIV-infected persons than in the general population.28 However, more than a decade after the
widespread introduction of HAART in high-income countries, the risk of pneumonia among HIV-infected persons
remains high compared to persons without HIV.102 A better understanding of modifiable prognostic factors for
death after pneumonia could potentially reduce mortality from this illness.
Methods: In a nationwide, population-based cohort of individuals with HIV, we included persons hospitalized
with pneumonia from the Danish NHR and obtained mortality data from the CRS. Comparing individuals with and
without pneumonia, we used Poisson regression to estimate relative mortality and logistic regression to examine
prognostic factors for death following pneumonia.
Main results: We observed 699 episodes of first hospitalization for pneumonia among 4,352 HIV patients.
Ninety-day mortality after pneumonia decreased from 22.4% in 1995-1996 to 8.4% in 2000-2008. Mortality
remained elevated for more than a year after hospitalization for pneumonia with an adjusted mortality rate ratio
of 5.38 (95% CI: 4.27-6.78), 1.80 (95% CI: 1.36-2.37), and 1.62 (95% CI: 1.32-2.00) for days 0-90, 91-365, and
366+, respectively. We found that HAART use improved the short term survival after a pneumonia-related
hospitalization also after adjusting for CD4+ cell count. Other prognostic factors were male sex, age, pre-existing
comorbidity, low CD4 cell count, and older age.
Table 4. Short and long term impact of pneumonia on mortality among all HIV-infected individuals.
No of
deaths Follow-upa Mortality rateb Crude MRR ratio Adjustedc MRR
At any time after first
hospitalization for pneumonia 263 3,131 0.23 (0.20-0.26) 3.56 (3.09-4.10) 2.79 (2.40-3.26)
Day 0-90 after admission 84 159 1.44 (1.17-1.79) 20.5 (16.3-25.7) 5.38 (4.27-6.78)

31
Day 91-365 after admission 54 420 0.35 (0.27-0.46) 4.98 (3.77-6.57) 1.80 (1.36-2.37)
Day 366+ after admission 125 2,552 0.13 (0.11-0.16) 1.90 (1.57-2.30) 1.62 (1.32-2.00)
No previous pneumonia 691 26,775 0.07 (0.07-0.08) 1 (ref) 1 (ref) a In years. b Per 1000 days. cAdjusted for use of HAART, history of AIDS, years since entering the DHCS,
Charlson Comorbidity Index score, age, and current CD4+ cell count.
Comments: The evidence emerging from this study demonstrates that the chance of surviving an episode of
pneumonia for an HIV-infected individual has greatly increased during the last decade. In a study of non-HIV
infected individuals aged 40-64 hospitalized for the first time with pneumonia, 30-day mortality was 7.8%, and
90-day mortality was 11.6%89. These estimates are comparable to what we found in HIV-infected individuals.
Further, the overall impact on risk of death following a first hospitalization pneumonia was similar to the
increased risk reported for “mild” AIDS-defining events (i.e., pulmonary and extrapulmonary tuberculosis,
pneumocystis jiroveci (carinii) pneumonia and esophageal candidiases).103
However, we did not include population controls in paper II. It is possible that the decline in mortality following
hospitalization for pneumonia over time was caused by general improvements in management of pneumonia
rather than by improvement in the management of HIV. Although this association has not been reported in other
Danish studies (e.g. by RW Thomsen)89 it cannot be ruled out that changes in pneumonia management
guidelines during the study also had an impact on the prognosis.This study was the first to show that HAART
use also affects prognosis in the presence of a pneumonia-related hospitalization. Other studies also suggested
a CD4+ independent beneficial effect from HAART. In a CD4+ cell-count-adjusted subgroup analysis from the
Strategies for Management of Antiretroviral Therapy (SMART) trial, the risk of opportunistic diseases and death
was increased in HAART-naïve patients or those off-HAART for 6 months compared to those with suppressed
HIV viral load in plasma.20 In an observational study of asymptomatic HIV patients with CD4+ counts of 351 to
500 cells/µL, deferring HAART vs. initiating early HAART was associated with a mortality ratio of 1.7.81 The
finding of a CD4+ independent positive effect of HAART on survival after pneumonia created an important basis
for further research into this area..
5.3 PAPER III
MORBIDITY AND RISK OF SUBSEQUENT DIAGNOSIS OF HIV INFECTION: A POPULATION
BASED CASE CONTROL STUDY IDENTIFYING INDICATOR DISEASES FOR HIV INFECTION

32
Background: Many individuals newly diagnosed with HIV present at a late stage of the disease with severe
immune depletion, resulting in delayed initiation of antiretroviral therapy which worsens their prognosis 56 and
increases further transmission of HIV.57,59,60 High risk behavior (e.g., injection drug use) 55 or the presence of
diseases associated with HIV, so-called indicator diseases,68 can be used to guide targeted HIV testing. HIV
indicator diseases may be a result of individual risk behaviors or coexisting HIV infection. Several studies have
attempted to identify indicator diseases within a narrow spectrum of conditions,104-107 but to date there has been
no comprehensive study of HIV indicator diseases. In the absence of adequate data, guidance is based mainly
on expert opinion.68 The goal of this study was to delineate medical conditions that identify individuals at
increased risk of subsequent HIV diagnosis.
Methods: In this population-based case control study, cases were persons with incident HIV infection
diagnosed in Denmark between 1 January 1995 and 1 June 2008. Risk-set sampling was used to identify up to
19 age- and gender-matched population controls for each case, using the HIV diagnosis date as the index date
for both cases and controls. We obtained prior hospital diagnoses for cases and controls from Danish medical
databases. We first categorized these diagnoses into 22 major disease categories (excluding AIDS-defining
diseases except tuberculosis) and then subdivided them into 161 subcategories, allowing us to examine specific
diseases as potential HIV indicators by conditional logistic regression.
Results: The study included 2,036 HIV cases and 35,718 controls. In the first analysis, we studied associations
between major disease categories and risk of subsequent HIV diagnosis. Several disease categories recorded in
the 5 years prior to the index date were associated with an increased risk of HIV diagnosis. As expected, the
strongest associations were found among categories of infections, hematological diseases, and substance
abuse, but other disease categories were also associated with increased risk of HIV diagnosis including: non–
AIDS defining cancers, ‘ear, nose, and throat’ diseases, skin diseases, and gastrointestinal diseases. In the
following analysis, we studied associations between time of hospital contact and risk of subsequent HIV
diagnosis. The main conclusion from this analysis was that different patterns of association occurred with some
disease categories showing a gradually increased risk over time (lower respiratory tract infections, CNS
infections, skin infections, other infections, and ‘ear, nose, and throat’ diseases); while other disease categories
showed a near persistent increased risk (sexual transmitted infections [STIs] and viral hepatitis, substance
abuse, and poisoning). In the final analysis, we subdivided the 22 major disease categories into 161
subcategories to pinpoint specific diseases as potential HIV indicators (Table 5). Not surprisingly, we found
strong associations between all groups of STIs and viral hepatitis and subsequent HIV diagnosis. Several other
specific groups of infectious diseases, including meningitis, herpes zoster, endocarditis, and malaria, were
closely associated with later HIV diagnosis. Among hematological diseases and cancers, thrombocytopenia,
anemia, lymphadenitis, non-AIDS defining lymphomas, and secondary and unspecified malignant neoplasm of
lymph nodes were associated with later HIV diagnosis. Interestingly, genital cancers were not. In the group of

33
gastrointestinal diseases, diseases of the oral cavity, liver diseases, and fissures/abscesses of the anal cavity
were strongly associated with later HIV diagnosis. Among skin diseases, seborrheic dermatitis was associated
with increased risk of HIV diagnosis. Ischemic heart disease, including myocardial infarction and other
cardiovascular diseases, were not associated with later HIV diagnosis, with the notable exception of
thrombophlebitis. Overall, in the HIV cohort of 2,036 individuals, 782 (38.4%) had at least one hospital contact
for one of the 52 specific diseases with an OR≥3, while this occurred for only 2,475 (6.9%) of 35,718 controls.
34
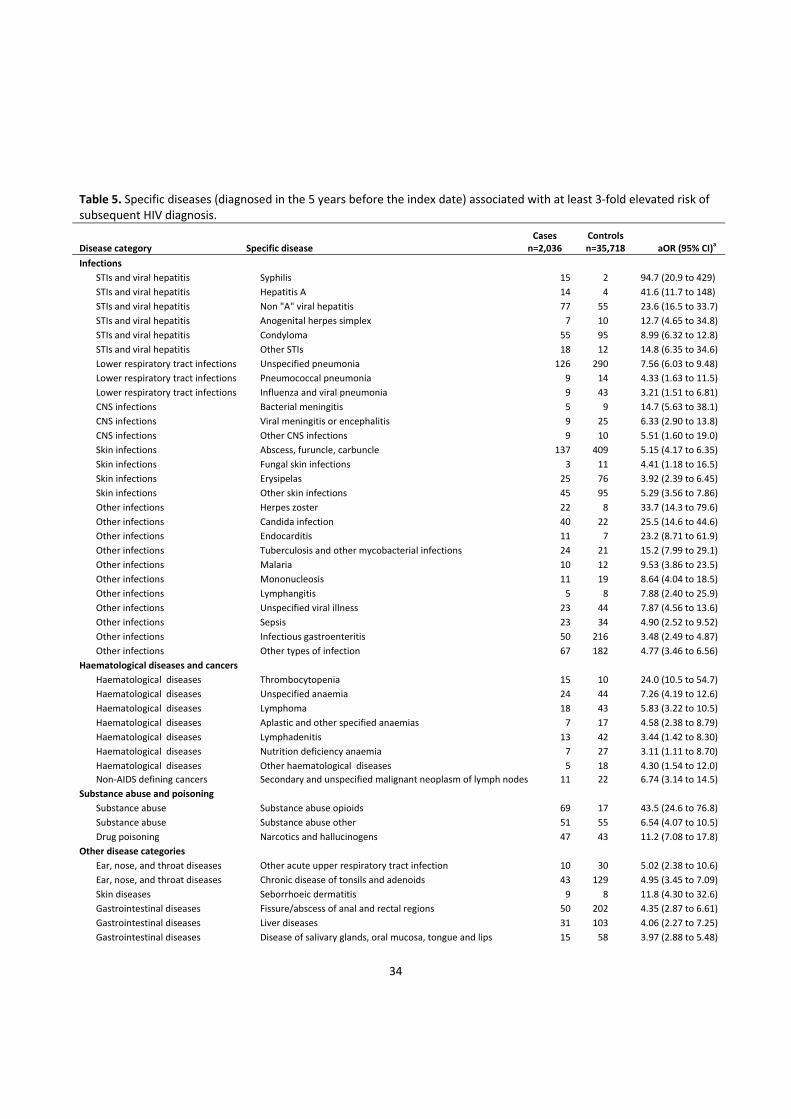
Table 5. Specific diseases (diagnosed in the 5 years before the index date) associated with at least 3‐fold elevated risk of subsequent HIV diagnosis.
Disease category Specific disease Cases n=2,036
Controls n=35,718 aOR (95% CI)
a
Infections
STIs and viral hepatitis Syphilis 15 2 94.7 (20.9 to 429)
STIs and viral hepatitis Hepatitis A 14 4 41.6 (11.7 to 148)
STIs and viral hepatitis Non "A" viral hepatitis 77 55 23.6 (16.5 to 33.7)
STIs and viral hepatitis Anogenital herpes simplex 7 10 12.7 (4.65 to 34.8)
STIs and viral hepatitis Condyloma 55 95 8.99 (6.32 to 12.8)
STIs and viral hepatitis Other STIs 18 12 14.8 (6.35 to 34.6)
Lower respiratory tract infections Unspecified pneumonia 126 290 7.56 (6.03 to 9.48)
Lower respiratory tract infections Pneumococcal pneumonia 9 14 4.33 (1.63 to 11.5)
Lower respiratory tract infections Influenza and viral pneumonia 9 43 3.21 (1.51 to 6.81)
CNS infections Bacterial meningitis 5 9 14.7 (5.63 to 38.1)
CNS infections Viral meningitis or encephalitis 9 25 6.33 (2.90 to 13.8)
CNS infections Other CNS infections 9 10 5.51 (1.60 to 19.0)
Skin infections Abscess, furuncle, carbuncle 137 409 5.15 (4.17 to 6.35)
Skin infections Fungal skin infections 3 11 4.41 (1.18 to 16.5)
Skin infections Erysipelas 25 76 3.92 (2.39 to 6.45)
Skin infections Other skin infections 45 95 5.29 (3.56 to 7.86)
Other infections Herpes zoster 22 8 33.7 (14.3 to 79.6)
Other infections Candida infection 40 22 25.5 (14.6 to 44.6)
Other infections Endocarditis 11 7 23.2 (8.71 to 61.9)
Other infections Tuberculosis and other mycobacterial infections 24 21 15.2 (7.99 to 29.1)
Other infections Malaria 10 12 9.53 (3.86 to 23.5)
Other infections Mononucleosis 11 19 8.64 (4.04 to 18.5)
Other infections Lymphangitis 5 8 7.88 (2.40 to 25.9)
Other infections Unspecified viral illness 23 44 7.87 (4.56 to 13.6)
Other infections Sepsis 23 34 4.90 (2.52 to 9.52)
Other infections Infectious gastroenteritis 50 216 3.48 (2.49 to 4.87)
Other infections Other types of infection 67 182 4.77 (3.46 to 6.56)
Haematological diseases and cancers
Haematological diseases Thrombocytopenia 15 10 24.0 (10.5 to 54.7)
Haematological diseases Unspecified anaemia 24 44 7.26 (4.19 to 12.6)
Haematological diseases Lymphoma 18 43 5.83 (3.22 to 10.5)
Haematological diseases Aplastic and other specified anaemias 7 17 4.58 (2.38 to 8.79)
Haematological diseases Lymphadenitis 13 42 3.44 (1.42 to 8.30)
Haematological diseases Nutrition deficiency anaemia 7 27 3.11 (1.11 to 8.70)
Haematological diseases Other haematological diseases 5 18 4.30 (1.54 to 12.0)
Non‐AIDS defining cancers Secondary and unspecified malignant neoplasm of lymph nodes 11 22 6.74 (3.14 to 14.5)
Substance abuse and poisoning
Substance abuse Substance abuse opioids 69 17 43.5 (24.6 to 76.8)
Substance abuse Substance abuse other 51 55 6.54 (4.07 to 10.5)
Drug poisoning Narcotics and hallucinogens 47 43 11.2 (7.08 to 17.8)
Other disease categories
Ear, nose, and throat diseases Other acute upper respiratory tract infection 10 30 5.02 (2.38 to 10.6)
Ear, nose, and throat diseases Chronic disease of tonsils and adenoids 43 129 4.95 (3.45 to 7.09)
Skin diseases Seborrhoeic dermatitis 9 8 11.8 (4.30 to 32.6)
Gastrointestinal diseases Fissure/abscess of anal and rectal regions 50 202 4.35 (2.87 to 6.61)
Gastrointestinal diseases Liver diseases 31 103 4.06 (2.27 to 7.25)
Gastrointestinal diseases Disease of salivary glands, oral mucosa, tongue and lips 15 58 3.97 (2.88 to 5.48)
35
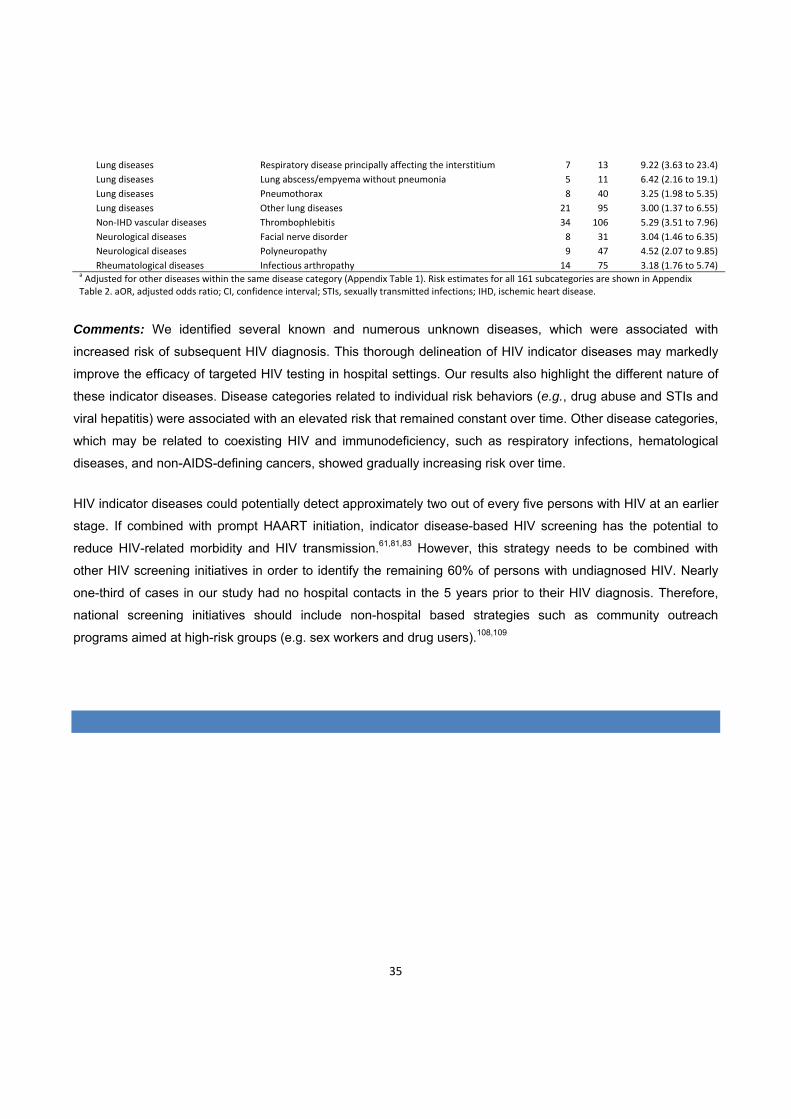
Lung diseases Respiratory disease principally affecting the interstitium 7 13 9.22 (3.63 to 23.4)
Lung diseases Lung abscess/empyema without pneumonia 5 11 6.42 (2.16 to 19.1)
Lung diseases Pneumothorax 8 40 3.25 (1.98 to 5.35)
Lung diseases Other lung diseases 21 95 3.00 (1.37 to 6.55)
Non‐IHD vascular diseases Thrombophlebitis 34 106 5.29 (3.51 to 7.96)
Neurological diseases Facial nerve disorder 8 31 3.04 (1.46 to 6.35)
Neurological diseases Polyneuropathy 9 47 4.52 (2.07 to 9.85)
Rheumatological diseases Infectious arthropathy 14 75 3.18 (1.76 to 5.74) a Adjusted for other diseases within the same disease category (Appendix Table 1). Risk estimates for all 161 subcategories are shown in Appendix Table 2. aOR, adjusted odds ratio; CI, confidence interval; STIs, sexually transmitted infections; IHD, ischemic heart disease.
Comments: We identified several known and numerous unknown diseases, which were associated with
increased risk of subsequent HIV diagnosis. This thorough delineation of HIV indicator diseases may markedly
improve the efficacy of targeted HIV testing in hospital settings. Our results also highlight the different nature of
these indicator diseases. Disease categories related to individual risk behaviors (e.g., drug abuse and STIs and
viral hepatitis) were associated with an elevated risk that remained constant over time. Other disease categories,
which may be related to coexisting HIV and immunodeficiency, such as respiratory infections, hematological
diseases, and non-AIDS-defining cancers, showed gradually increasing risk over time.
HIV indicator diseases could potentially detect approximately two out of every five persons with HIV at an earlier
stage. If combined with prompt HAART initiation, indicator disease-based HIV screening has the potential to
reduce HIV-related morbidity and HIV transmission.61,81,83 However, this strategy needs to be combined with
other HIV screening initiatives in order to identify the remaining 60% of persons with undiagnosed HIV. Nearly
one-third of cases in our study had no hospital contacts in the 5 years prior to their HIV diagnosis. Therefore,
national screening initiatives should include non-hospital based strategies such as community outreach
programs aimed at high-risk groups (e.g. sex workers and drug users).108,109

36
6 STRENGTHS AND WEAKNESSES OF THE STUDIES
6.1 CONSIDERATIONS ABOUT STUDY DESIGN
In 1946-48, the US Public Health Service conducted trials in which vulnerable populations in Guatemala—
mentally incapacitated patients, prison inmates, sex workers, and soldiers— were intentionally exposed to
sexually transmitted infections (syphilis, gonorrhea, and chancroid).110 This appalling and unethical use of
humans as research subjects fortunately belongs to the past, but this implies that the only way to study HIV (and
other serious diseases) as exposure is through observational studies. As mentioned in previous sections,
observational studies come with a range of limitations and are subjects to numerous sources of bias and
confounding.
6.1.1 CONSIDERATIONS ABOUT RANDOM AND SYSTEMATIC ERROR
In paper I, we used various strategies to minimize bias and confounding including matching of HIV patients with
population controls (on age, gender, and municipality of residence), exclusion of persons with previous
pneumonia-related hospitalization, age-stratification, minimizing loss to follow-up by tracking persons via CRS,
multivariate analyses, and standardization of pneumonia classification. However, we could not control for two
likely candidates for confounding and bias – smoking and knowledge of HIV status.
Knowledge of HIV status is a source of bias if physicians have a lower threshold for hospital admission of HIV-
infected patients presenting with signs and symptoms of pneumonia than for a person without HIV. In that case,
pneumonia would be diagnosed in hospitals more frequently in HIV-infected persons than in the general
population, leading to overestimation of the IRRs. We could potentially have adjusted for this if we had had
information on pneumonia severity on hospital admission (e.g. scoring by the Pneumonia Severity Index or
CURB-65). The impact of this potential bias on our results is thus difficult to assess, but in paper II111 we found
that among people with HIV the mortality following first hospitalization for pneumonia was similar to that reported
for people without HIV.89 This may indicate that the severity of pneumonia is comparable for HIV and non-HIV
infected individuals. Further, validation of diagnosis of pneumonia in HIV and non-HIV infected patients yielded
similar results indicating that the pneumonia diagnosis was reliable in both populations.
Smoking is a well-established risk factor for pneumonia and may thus have affected the study results. Despite
numerous registries in Denmark, there are no valid national registry data on individual smoking habits. Also,
there are no reliable surrogate markers for smoking (e.g., chronic obstructive pulmonary disease) in this
relatively young study population. Data from HIV cohorts suggests that smoking doubles the risk of
37
pneumonia.29,49 If 40% of the HIV population and 25% of the background population were smokers in our study,
smoking could hypothetically account for 12% of the observed effect (60*1+40*2 / 75*1+25*2=1.12). Although
smoking is a likely source of bias in this study, it is unlikely to account for the large difference in risk of
pneumonia between people with and without HIV infection.
The comparison of IRs between HIV- and non-HIV-infected individuals could have been strengthened by
inclusion of other known risk factors for pneumonia. We had incomplete data on BMI but useful information on
alcohol abuse and comorbidity could have been retrieved from hospital diagnoses in the NHR. Although we
failed to include this information in the published study, the impact comorbidty was subsequently
investigated.Contrary to paper I, we used Charlson’s Comorbidity Index (CCI)91 to adjust for comorbidity in paper
II. Comorbidity is a major prognostic factor in pneumonia (as shown in paper II), but it has also been found to be
a risk factor for pneumonia.48,89,112 Therefore, the lack of adjusting for comorbidity in paper I could be considered
a limitation in the design. During the analyses for paper II, we repeated the main analyses from paper I
incorporating the CCI score in both stratified and adjusted models. Interestingly, people without HIV had a mean
CCI of 1.0 whereas people with HIV had a mean CCI of 0.5 (AIDS diagnosis was not included in the CCI score).
Adjustment for comorbidity increased the IRR for pneumonia in people with HIV compared with people without
HIV. Thus, lack of adjustment for comorbidity may actually have caused us to underestimate the effect of HIV
infection in paper I.
However, as mentioned in the introduction there are many other risk factors for pneumonia than comorbidity,
smoking, and age. As highlighted by paper III, individual risk behaviors in the HIV population may be different
from the general population. For instance, drug and alcohol abuse, which are more common in the HIV
population than in the general population, are well known risk factors for pneumonia and pneumococcal
disease.32,44,48,112,113 Both types of abuse are often associated with other factors that predispose individuals to
pneumonia such as poor housing, low socio-economic status, and low educational level.44,114 Controlling for
these covariates may also have changed our risk estimates in paper I, but whether or not this would bring us
closer to the “true” impact of HIV infection on the risk of pneumonia is debatable. Paper III and other recent
studies80,81 suggest that the risk profile and lifestyle associated with a proportion of persons who subsequently
become infected with HIV is a priori different from those who do not become infected with HIV. Hence, paper III
illustrates some of the limitations in paper I and even when the most stringent methodological approaches are
used, some degree of residual confounding will probably remain when comparing HIV with non-HIV-infected
individuals.
We made no distinction between hospital-acquired pneumonia (HAP) and community-acquired pneumonia
(CAP) in paper I or paper II. HAP is known to be associated with a poorer outcome than CAP. It is not possible
to distinguish between HAP and CAP from the ICD-codes alone but the placement of the pneumonia code as
primary or secondary diagnosis could have been used as a proxy to differentiate between CAP and HAP.

38
Temporal differences in the occurrence of CAP and HAP could explain some of the observed improvement in the
prognosis following an episode of pneumonia from 1995 to 2008.
In paper III, although numerous diseases and conditions and their potential association with undiagnosed HIV
infection were analyzed, some gender-specific conditions were not included in the study. For example, HIV
screening is offered routinely to all pregnant women in Denmark. Pregnant women are not generally considered
a high-risk group in our country but identifying those with undiagnosed HIV infection significantly reduce
morbidity and mortality among the mothers and the risk of mother-to-child HIV transmission can be greatly
reduced.73,115 It could be considered a weakness of the study that such gender-specific events were not
analyzed and it is certainly an area of research that demands further attention.

39
7 CONCLUSIONS, INTERPRETATION, AND PERSPECTIVES
7.1 MAIN CONCLUSIONS
Paper I. In Denmark, the risk of pneumonia in persons with HIV has declined substantially after the introduction
of HAART, but HIV remains a strong risk factor for hospitalization for pneumonia even in persons with high CD4+
cell counts. Use of HAART has a CD4+ cell count independent protective effect against pneumonia.
Paper II. The first hospitalization for pneumonia among HIV-infected individuals was associated with elevated
risk of death up to more than a year later. Use of HAART decreased the risk, independent of current CD4+ cell
count. The prognosis following pneumonia improved over calendar time.
Paper III. A wide range of medical conditions can identify persons with increased risk of HIV infection. These
"HIV indicator diseases" identified more than one-third of all individuals diagnosed with HIV in the subsequent 5-
year period.
7.2 INTERPRETATION
As mentioned in the introduction of this thesis, one of the major questions in today's HIV research field is which
long term effects HIV infection and HAART have on morbidity and the expected lifespan of an HIV-infected
individual. The 6-fold increased risk of hospitalization for pneumonia even among well-controlled HIV-infected
persons compared with the background population suggests that there is an excess susceptibility to infections in
this group of patients despite near-normal CD4+ cell counts (paper 1). However, the comparison of HIV-infected
with HIV-uninfected individuals is not straightforward. How much of this excess morbidity is due to HIV infection
in itself and how much can be attributed to other causes, for example lifestyle-associated factors, comorbidity,
and chronic antiretroviral drug exposure (see Figure 5 below). Certainly, results from one of the sub-analysis in
paper III indicate that a proportion of persons diagnosed with HIV in Denmark have a life-style, based on their
medical history, which is a-priori different from those who do not become infected with HIV. This risk-taking
behavior may also have a negative effect on their general health and predispose them to other diseases such as
pneumonia. This argument is supported by studies showing excess risk of cardiovascular disease and other
serious conditions in close relatives of HIV patients 116,117. Thus, risk differences of common diseases (i.e.
pneumonia, bone fracture, liver, kidney, and cardiovascular diseases) between HIV-infected populations and
HIV-uninfected population may not only be due to the HIV infection itself, but also due to fundamental disparities
between the two populations.

40
Figure 5. In HAART treated persons with undetectable viral load, several factors may play a role in the observed
excess risk of pneumonia and other diseases such as non-AIDS defining cancers.
Selection (Berkson's) bias may also play a role in this finding as physicians may have lower threshold for
hospital admission of HIV-infected patients presenting with signs and symptoms of pneumonia than for a person
without HIV. This bias could have been addressed by studying disease severity - unfortunately, we did have not
the data to do this. On the other hand, results from paper 3 show that the prognosis following pneumonia has
significantly improved since the advent of HAART among people with HIV - and is now comparable to that of
people without HIV infection. Similar prognosis following pneumonia indicates similar pneumonia severity in the
two groups.
Current or cumulative exposure to certain antiretroviral drugs may increase the risk of renal disease, myocardial
infarction, bone loss, and psychiatric disorders. In this thesis, we did not assess the effect of individual
antiretroviral drug class exposure on pneumonia but we did show that HAART use was protective against
pneumonia and against death following pneumonia independently of CD4+ cell count. In vitro data indicate that
certain antiretroviral drugs may have immunomodulatory properties which affect the innate immune responses to
bacterial pathogens (e.g. pretreatment with tenofovir shifts the interleukin-10 / interleukin-12 balance after
infection with live bacteria in human peripheral blood mononuclear cells).118 Altogether, our results (paper I+II)
HIV infection
(persistent immune
activation and immune
dysfunction) Lifestyle /
risk‐taking behavior
(e.g. drug abuse,
smoking, alcohol
misuse)
Drug toxicities (e.g.
tenofovir‐>renal toxicity
and altered IL‐10 / IL‐12
balance in monocytes)
Increased disease risk
(e.g. pneumonia, non‐
AIDS defining cancer)
Berkson's
bias

41
point towards significant CD4+ dependent and independent benefits from HAART use and for initiating treatment
at an early stage of HIV infection.
In paper 3, we explored a great many diseases and disease groups, many of which were associated with later
HIV infection. Due to the exploratory nature of the study we have not yet shown that testing patients with these
diseases is an effective way to screen for HIV. Could implementation of indicator disease-based HIV screening
improve the identification of undiagnosed HIV infection? We and others68 argue that it could. In our study, HIV
indicator diseases could potentially detect approximately two out of every five persons with HIV at an earlier
stage. If combined with prompt HAART initiation, indicator disease-based HIV screening has the potential to
reduce HIV-related morbidity and HIV transmission.61,81,83 However, this strategy is not a "magic bullet" and
needs to be combined with other HIV screening initiatives in order to identify the remaining 60% of persons with
undiagnosed HIV. Even if the US CDC's recommendations of routine HIV testing for all persons under the age of
65 who come into contact with health care system64 were implemented in Denmark, we would still fail to identify
the one-third of all incident cases who had no hospital contacts in the 5 years prior to their HIV diagnosis.
Therefore, national screening initiatives should also include non-hospital based strategies such as community
outreach programs aimed at high-risk groups (e.g. sex workers and drug users).108,109
7.3 GENERALIZABILITY OF STUDY RESULTS
All three studies were based on data obtained from Danish clinical and administrative medical databases. The
Danish health care system provides free, tax-supported medical care for all residents, including antiretroviral
treatment of HIV. This implies that our results may not reflect trends in other settings due to population
characteristics (race, age, sexual practices, immune status) and differences in health care systems (e.g.,
restricted/unrestricted access to HAART, organization, medical professionals' experience, vaccination policies).
As far as for the excess risk of pneumonia and the prognosis following pneumonia, our data are comparable to
those data from HIV cohorts in other developed countries.
Risk estimates for the HIV indicator diseases found in our study also reflect some general trends in the general
population - for example outbreak of hepatitits A among men who have sex with men119 and malaria among non-
Caucasian immigrants. Disease patterns are likely to differ between countries, which affect the strength of
association between "indicator diseases" and undiagnosed HIV infection. However, a large HIV indicator
diseases survey across Europe initiated in July 2010 focuses on a subset of diseases which we found also to be
strongly associated with subsequent HIV infection (i.e., sexually transmitted diseases, malignant lymphoma,
cervical or anal dysplasia or cancer, herpes zoster, hepatitis B or C virus infection, ongoing mononucleosis-like
illness, leukocytopenia or thrombocytopenia, and seborrheic dermatitis / exanthema. Hence, although the risk

42
estimate between indicator diseases and subsequent HIV infection will vary between countries, most of the
indicator diseases in our study probably also indicate potentially undiagnosed HIV infection in other countries.
7.4 PERSPECTIVES
The challenges of treating HIV infection and controlling the HIV epidemic have changed dramatically over the
past 30 years in the developed world. Today, 80-90% of HIV-infected individuals have undetectable viral load 6
months after initiating HAART, side effects from antiretroviral drug have diminished, and their life expectancy
now approaches that of non-HIV-infected persons. Following the tremendous success of HAART, much attention
has now been directed towards limiting residual non-AIDS morbidity such as liver, kidney and cardiovascular
disease among those living with HIV. Our work shows that non-AIDS defining infections such as pneumonia
should be included in this group of morbidities - regardless of its causes - and that preventing pneumonia is
likely to reduce morbidity and mortality in HIV patients. Unfortunately, the effectiveness of the 23-valent
pneumococcal polysaccharide vaccine against pneumococcal disease is far from perfect in immunosuppressed
individuals but considerable effort are being made to develop more effective pneumococcal vaccines. We have
also shown that use of HAART has both CD4+ cell count dependent and independent protective effects in
pneumonia and thus, adds another good argument to the list for initiating HAART early during the course of HIV
infection. However, despite three decades of concerted effort, controlling the HIV epidemic remains a
tremendous public health challenge. Data from our study of HIV indicator diseases reveal a significant potential
for earlier identification of individuals with undiagnosed HIV infection using disease-targeted HIV screening.
Targeted testing for HIV in patients diagnosed with diseases associated with HIV can identify those with
undiagnosed HIV infection, leading to earlier treatment and reduced HIV transmission. Implementation of
indicator disease-based screening in national HIV testing programs should be strongly considered and its'
impact on new HIV diagnoses, immune status on diagnose, and HIV transmission documented. Although the
use of indicator diseases may enhance the identification of undiagnosed HIV-infected individuals, this strategy
can only be supplementary to systematic HIV testing of risk groups identified through information about their
behavioral risk-taking profiles.

43
8 SUMMARY
8.1 IN ENGLISH
This PhD thesis consists of three original research papers and a literature review. In 2007, when the work
leading to this thesis was initiated, emerging evidence suggested that the risk of non-AIDS defining morbidity
was increased among both treated and untreated HIV patients compared to HIV-uninfected individuals. Part of
this excess morbidity was thought to be associated with late HIV diagnosis, resulting in severe immune depletion
and delayed initiation of HIV treatment. Extensive research focusing on cardiovascular, liver, kidney, and
metabolic disease was being conducted, whereas non-AIDS defining infections received relatively little attention.
The aims of this thesis were therefore 1) to investigate temporal changes in the incidence of pneumonia among
people with and without HIV infection and to identify risk factors for pneumonia in the HIV population; 2) to
determine mortality among HIV patients following pneumonia and to identify prognostic factors; 3) to examine
the relation between diseases diagnosed in hospitals and risk of subsequent HIV diagnosis. The studies were
based on data from the Danish HIV cohort study and from Danish medical administrative databases.
We found that the risk of first-time hospitalization for pneumonia remained 6-fold higher in HIV-infected
individuals than in the general population until 2007, despite a decrease in incidence after the introduction of
HAART. The increased risk was observed even in persons with near-normal CD4+ cell counts. The strongest risk
factors for pneumonia are low current CD4+ cell count, IDU as the mode of HIV transmission, and, among
HAART-naïve patients, a high current viral load. HAART was associated with a decreased risk of pneumonia,
but the protective effect of HAART was only observed at CD4+ counts ≤200 cells/µL. Reassuringly, short-term
mortality after a first hospitalization for pneumonia among HIV-infected individuals decreased from the pre-
HAART to the late-HAART era. Despite this decrease over time, an episode of hospitalization due to pneumonia
remains associated with an increased mortality among HIV patients. Prognostic factors are male sex, age, pre-
existing comorbidity, low CD4 cell count, older age, and absence of HAART treatment.
Use of HAART and current CD4+ cell count appear to be major independent risk and prognostic factors for
pneumonia. Thus, early identification of newly infected individuals and prompt initiation of treatment could
potentially reduce pneumonia-related morbidity and mortality among people with HIV. In the third study, we used
prior hospital diagnoses to examine specific diseases as potential HIV indicators which could be used for
targeted HIV screening in hospital settings. We found that several general disease categories were associated
with an increased risk of subsequent HIV diagnosis including: sexually transmitted infections and viral hepatitis,
hematological diseases, lower respiratory tract infections, CNS infections, skin infections, other infections, and
substance abuse. Several specific diseases were associated with adjusted odds ratios above 20.

44
During recent years, national and international HIV treatment guidelines have emphasized the potential
advantages from early initiation of antiviral therapy and increasingly higher CD4+ cell counts have been used as
lower target for starting therapy among HIV patients. Our results supports a general protective effect from having
high CD4+ cell counts against hospitalization for pneumonia and against dying following an episode of
pneumonia, independent from use of HAART - likely due to reconstitution of other lymphocyte subsets and/or
reduced immune activation. Considerable efforts are now being made to identify people with undiagnosed HIV
infection - both to reduce the risk of severe immune depletion from occurring but also reduce the risk of onward
HIV transmission. Our third study demonstrates the potential of using non-AIDS defining conditions to guide
targeted HIV testing. In this study, HIV indicator diseases could potentially detect approximately two out of every
five persons with HIV in Denmark at an earlier stage. If combined with prompt treatment, indicator disease-based
HIV screening has the potential to reduce HIV-related morbidity and HIV transmission - though the exploratory
nature of the study need confirmation from clinical studies. Thus, at the beginning of the forth decade of HIV
epidemic mounting evidence calls for increased attention directed towards identifying people with undiagnosed
HIV infection and initiating treatment before severe immune depletion occurs.

45
8.2 IN DANISH
Denne Ph.d.-afhandling består af original artikler og en litteraturgennemgang. I 2007, da det indledende arbejde
til denne afhandling blev påbegyndt, var der begyndende tegn på, at risikoen for ikke-AIDS definerende sygdom
var øget blandt både ubehandlede og behandlede HIV patienter sammenlignet med baggrundsbefolkningen. En
del af denne øgede sygelighed mentes at være associeret med sen diagnose af HIV-smittede med betydeligt tab
af immunfunktion og forsinket behandlingsopstart til følge. En del forskningsprojekter omhandlede
kardiovaskulær, lever-, nyre- og metaboliske sygdomme, hvorimod relativt få havde interesseret sig for ikke-
AIDS definerende infektioner.
Formålene med denne afhandling var derfor 1) at udforske ændringer i forekomsten af lungebetændelse over tid
blandt folk med eller uden HIV infektion og at identificere risikofaktorer for lungebetændelse i HIV populationen;
2) at bestemme dødeligheden blandt HIV patienter efter lungebetændelse og at identificere prognostiske
faktorer; 3) at undersøge sammenhængen mellem hospitalsdiagnoser og den efterfølgende risiko for at få stillet
en HIV diagnose. Studierne blev lavet på baggrund af data fra den danske HIV kohorte og udtræk fra danske
medicinske databaser.
Vi fandt at risikoen for førstegangsindlæggelse for lungebetændelse var 6 gange højere for HIV-smittede
sammenlignet med baggrundsbefolkningen indtil 2007, selvom forekomsten faldt umiddelbart efter indførelse af
HAART behandlingen i slutningen af 1996. Den øgede risiko blev også observeret blandt folk med god
immunstatus og næsten-normale CD4+ celletal. De stærkeste risikofaktorer for lungebetændelse var lavt aktuelt
CD4+ celletal, stofmisbrug som HIV smittemåde, og blandt ubehandlede patienter, høj virus mængde i blodet.
HAART var associeret med en nedsat risiko for lungebetændelse, som dog kun sås ved CD4+ celletal under
200/µL. Heldigvis faldt dødeligheden efter en førstegangsindlæggelse for lungebetændelse fra perioden før
HAART blev indført og frem til nu i (den "sene" HAART periode). Trods dette fald i dødelighed over tid, er en
indlæggelse for lungebetændelse fortsat associeret med en betydelig dødelighed blandt HIV patienter.
Prognostiske faktorer var at være mand, komorbiditet, lavt CD4+ celletal, høj alder og ingen HAART behandling.
Brug af HAART and nuværende CD4+ celletal synes at være betydningsfulde, uafhængige risiko- og
prognostiske faktorer. Derfor kan tidlig identifikation af ny-smittede personer og hurtig behandlingsopstart være
en måde at reducere sygelighed og dødelighed på blandt folk med HIV. I det tredje studie, brugte vi tidligere
hospitalsdiagnoser til undersøge specifikke sygdomme som potentielle HIV indikatorer, som kunne bruges til
målrettet HIV screening på hospitaler. Vi fandt, at adskillige overordnede sygdomskategorier var associeret med
øget risiko for efterfølgende HIV diagnose, herunder: seksuelt overførte infektioner og viral hepatitis,
hæmatologiske sygdomme, nedre luftvejsinfektioner, CNS-infektioner, hud-infektioner, andre infektioner og
stofmisbrug. Nogle specifikke sygdomme var associeret med en justeret odds ratio på over 20.

46
Nationale og internationale retningslinjer for HIV behandling har gennem de senere år lagt stadig vægt på de
potentielle fordele ved tidlig opstart af HAART. Det CD4+ celletal, der benyttes som grænse for hvornår
behandling iværksattes, er gradvist blevet højere, hvilket har medført at flere personer er kommet i behandling
på et tidligere tidspunkt end tilfældet var for bare 5 år siden. Vores resultater understøtter en generel
beskyttende effekt af høje CD4+ celletal mod indlæggelse for lungebetændelse og mod død efter en
lungebetændelse. De antyder også at HAART har en CD4+ celletal's uafhængig beskyttende effekt -
sandsynligvis relateret til genetablering af andre lymfocyt populationer og reduceret immunaktivering. Betydelige
tiltag er nu iværksat for at identificere for med udiagnosticeret HIV infektion - både for at reducere risikoen for
irreversibelt tab af immunfunktion, men også for at reducere risikoen for HIV transmission. Vores tredje studie
viste at HIV testning målrettet mod specifikke sygdomme kan bruges til opsporing af folk med udiagnosticeret
HIV infektion. I dette studie kunne disse HIV indikatorsygdomme potentielt detektere 2 ud af 5 patienter med HIV
på et tidligere stadie end det rent faktisk skete. Hvis indikator-baseret HIV screening kombineres med
øjeblikkelig opstart af HAART, så har det potentialet til at kunne reducere både sygelighed og HIV transmission -
selvom effekten af denne strategi selvsagt skal bekræftes i kliniske studier. Ved begyndelsen af HIV epidemiens
fjerde årti peger tungtvejende data derfor på vigtigheden af øget opmærksomhed rettet mod at identificere folk
med udiagnosticerede infektion og tilbyde dem hurtig behandlingsopstart før der sker en omfattende destruktion
af deres immunforsvar og/eller de når at transmittere HIV til andre.

47
REFERENCES
1. Pneumocystis pneumonia‐‐Los Angeles. MMWR Morb Mortal Wkly Rep 1981;30:250‐2.
2. Barre‐Sinoussi F, Chermann JC, Rey F, et al. Isolation of a T‐lymphotropic retrovirus from a patient at risk for acquired immune deficiency syndrome (AIDS). Science 1983;220:868‐71.
3. Worobey M, Gemmel M, Teuwen DE, et al. Direct evidence of extensive diversity of HIV‐1 in Kinshasa by 1960. Nature 2008;455:661‐4.
4. UNAIDS report on the global AIDS epidemic 2010. Joint United Nations Programme on HIV/AIDS (UNAIDS), 2010. (Accessed 7 April, 2011, at http://www.unaids.org/globalreport/Global_report.htm.)
5. Simon V, Ho DD, Abdool Karim Q. HIV/AIDS epidemiology, pathogenesis, prevention, and treatment. Lancet 2006;368:489‐504.
6. 1993 revised classification system for HIV infection and expanded surveillance case definition for AIDS among adolescents and adults. MMWRRecommendations and reports : Morbidity and mortality weekly reportRecommendations and reports / Centers for Disease Control 1992;41:1‐19.
7. Fauci AS, Pantaleo G, Stanley S, Weissman D. Immunopathogenic mechanisms of HIV infection. Ann Intern Med 1996;124:654‐63.
8. Dournon E, Matheron S, Rozenbaum W, et al. Effects of zidovudine in 365 consecutive patients with AIDS or AIDS‐related complex. Lancet 1988;2:1297‐302.
9. Reiss P, Lange JM, Boucher CA, Danner SA, Goudsmit J. Resumption of HIV antigen production during continuous zidovudine treatment. Lancet 1988;1:421.
10. Li TS, Tubiana R, Katlama C, Calvez V, Ait Mohand H, Autran B. Long‐lasting recovery in CD4 T‐cell function and viral‐load reduction after highly active antiretroviral therapy in advanced HIV‐1 disease. Lancet 1998;351:1682‐6.
11. Gandhi T, Wei W, Amin K, Kazanjian P. Effect of maintaining highly active antiretroviral therapy on AIDS events among patients with late‐stage HIV infection and inadequate response to therapy. Clin Infect Dis 2006;42:878‐84.
12. Safrin S, Grunfeld C. Fat distribution and metabolic changes in patients with HIV infection. AIDS (London, England) 1999;13:2493‐505.
13. Weber R, Sabin CA, Friis‐Moller N, et al. Liver‐related deaths in persons infected with the human immunodeficiency virus: the D:A:D study. Arch Intern Med 2006;166:1632‐41.
14. Walmsley S. Protease inhibitor‐based regimens for HIV therapy: safety and efficacy. Journal of acquired immune deficiency syndromes (1999) 2007;45 Suppl 1:S5‐13; quiz S28‐31.
15. Deeks SG, Phillips AN. HIV infection, antiretroviral treatment, ageing, and non‐AIDS related morbidity. BMJ 2009;338:a3172.
48
16. Mocroft A, Reiss P, Gasiorowski J, et al. Serious fatal and nonfatal non‐AIDS‐defining illnesses in Europe. J Acquir Immune Defic Syndr 2010;55:262‐70.
17. Grulich AE, van Leeuwen MT, Falster MO, Vajdic CM. Incidence of cancers in people with HIV/AIDS compared with immunosuppressed transplant recipients: a meta‐analysis. Lancet 2007;370:59‐67.
18. Brenchley JM, Price DA, Schacker TW, et al. Microbial translocation is a cause of systemic immune activation in chronic HIV infection. Nature medicine 2006;12:1365‐71.
19. El‐Sadr WM, Lundgren JD, Neaton JD, et al. CD4+ count‐guided interruption of antiretroviral treatment. N Engl J Med 2006;355:2283‐96.
20. Emery S, Neuhaus JA, Phillips AN, et al. Major clinical outcomes in antiretroviral therapy (ART)‐naive participants and in those not receiving ART at baseline in the SMART study. J Infect Dis 2008;197:1133‐44.
21. Hanna DB, Gupta LS, Jones LE, Thompson DM, Kellerman SE, Sackoff JE. AIDS‐defining opportunistic illnesses in the HAART era in New York City. AIDS Care 2007;19:264‐72.
22. Podlekareva D, Mocroft A, Dragsted UB, et al. Factors associated with the development of opportunistic infections in HIV‐1‐infected adults with high CD4+ cell counts: a EuroSIDA study. J Infect Dis 2006;194:633‐41.
23. Crothers K, Huang L, Goulet JL, et al. HIV infection and risk for incident pulmonary diseases in the combination antiretroviral therapy era. Am J Respir Crit Care Med 2011;183:388‐95.
24. Harries AD, Zachariah R, Corbett EL, et al. The HIV‐associated tuberculosis epidemic‐‐when will we act? Lancet 2010;375:1906‐19.
25. Lawn SD, Myer L, Edwards D, Bekker LG, Wood R. Short‐term and long‐term risk of tuberculosis associated with CD4 cell recovery during antiretroviral therapy in South Africa. Aids 2009;23:1717‐25.
26. Kesselring AM, Gras L, Wit FW, et al. Immune restoration and onset of new AIDS‐defining events with combination antiretroviral therapy in HIV type‐1‐infected immigrants in the Netherlands. Antiviral Therapy 2010;15:871‐9.
27. Serraino D, Puro V, Boumis E, et al. Epidemiological aspects of major opportunistic infections of the respiratory tract in persons with AIDS: Europe, 1993‐2000. AIDS (London, England) 2003;17:2109‐16.
28. Polsky B, Gold JW, Whimbey E, et al. Bacterial pneumonia in patients with the acquired immunodeficiency syndrome. Ann Intern Med 1986;104:38‐41.
29. Kohli R, Lo Y, Homel P, et al. Bacterial pneumonia, HIV therapy, and disease progression among HIV‐infected women in the HIV epidemiologic research (HER) study. Clin Infect Dis 2006;43:90‐8.
30. Feikin DR, Feldman C, Schuchat A, Janoff EN. Global strategies to prevent bacterial pneumonia in adults with HIV disease. Lancet Infect Dis 2004;4:445‐55.
31. Barry PM, Zetola N, Keruly JC, Moore RD, Gebo KA, Lucas GM. Invasive pneumococcal disease in a cohort of HIV‐infected adults: incidence and risk factors, 1990‐2003. AIDS (London, England) 2006;20:437‐44.
49
32. Grau I, Pallares R, Tubau F, et al. Epidemiologic changes in bacteremic pneumococcal disease in patients with human immunodeficiency virus in the era of highly active antiretroviral therapy. Archives of Internal Medicine 2005;165:1533‐40.
33. Gilks CF, Ojoo SA, Ojoo JC, et al. Invasive pneumococcal disease in a cohort of predominantly HIV‐1 infected female sex‐workers in Nairobi, Kenya. Lancet 1996;347:718‐23.
34. Barry PM, Zetola N, Keruly JC, Moore RD, Gebo KA, Lucas GM. Invasive pneumococcal disease in a cohort of HIV‐infected adults: incidence and risk factors, 1990‐2003. AIDS 2006;20:437‐44.
35. Grau I, Pallares R, Tubau F, et al. Epidemiologic changes in bacteremic pneumococcal disease in patients with human immunodeficiency virus in the era of highly active antiretroviral therapy. ArchInternMed 2005;165:1533‐40.
36. Dworkin MS, Ward JW, Hanson DL, Jones JL, Kaplan JE. Pneumococcal disease among human immunodeficiency virus‐infected persons: incidence, risk factors, and impact of vaccination. Clinical Infectious Diseases 2001;32:794‐800.
37. Gebo KA, Moore RD, Keruly JC, Chaisson RE. Risk factors for pneumococcal disease in human immunodeficiency virus‐infected patients. Journal of Infectious Diseases 1996;173:857‐62.
38. Teshale EH, Hanson D, Flannery B, et al. Effectiveness of 23‐valent polysaccharide pneumococcal vaccine on pneumonia in HIV‐infected adults in the United States, 1998‐2003. Vaccine 2008.
39. Tumbarello M, Tacconelli E, De Gaetano K, et al. Bacterial pneumonia in HIV‐infected patients: Analysis of risk factors and prognostic indicators. Journal of Acquired Immune Deficiency Syndromes and Human Retrovirology 1998;18:39‐45.
40. Penaranda M, Falco V, Payeras A, et al. Effectiveness of polysaccharide pneumococcal vaccine in HIV‐infected patients: a case‐control study. Clinical Infectious Diseases 2007;45:e82‐e7.
41. Payeras A, Martinez P, Mila J, et al. Risk factors in HIV‐1‐infected patients developing repetitive bacterial infections: Toxicological, clinical, specific antibody class responses, opsonophagocytosis and Fc(gamma)RIIa polymorphism characteristics. Clinical and Experimental Immunology 2002;130:271‐8.
42. Veras MA, Enanoria WT, Castilho EA, Reingold AL. Effectiveness of the polysaccharide pneumococcal vaccine among HIV‐infected persons in Brazil: a case control study. BMCInfectDis 2007;7:119.
43. Guerrero M, Kruger S, Saitoh A, et al. Pneumonia in HIV‐infected patients: a case‐control survey of factors involved in risk and prevention. AIDS 1999;13:1971‐5.
44. Dworkin MS, Ward JW, Hanson DL, et al. Pneumococcal disease among human immunodeficiency virus‐infected persons: incidence, risk factors, and impact of vaccination. Clin Infect Dis 2001;32:794‐800.
45. Hirschtick RE, Glassroth J, Jordan MC, et al. Bacterial pneumonia in persons infected with the human immunodeficiency virus. Pulmonary Complications of HIV Infection Study Group. The New England journal of medicine 1995;333:845‐51.

50
46. Floris‐Moore M, Lo Y, Klein RS, et al. Gender and hospitalization patterns among HIV‐infected drug users before and after the availability of highly active antiretroviral therapy. In: Journal of acquired immune deficiency syndromes (1999). United States; 2003:331‐7.
47. Sullivan JH, Moore RD, Keruly JC, Chaisson RE. Effect of antiretroviral therapy on the incidence of bacterial pneumonia in patients with advanced HIV infection. Am J Respir Crit Care Med 2000;162:64‐7.
48. Tumbarello M, Tacconelli E, de Gaetano Donati K, Cauda R. HIV‐associated bacterial pneumonia in the era of highly active antiretroviral therapy. Journal of acquired immune deficiency syndromes and human retrovirology : official publication of the International Retrovirology Association 1999;20:208‐9.
49. Gordin FM, Roediger MP, Girard PM, et al. Pneumonia in HIV‐infected persons: increased risk with cigarette smoking and treatment interruption. Am J Respir Crit Care Med 2008;178:630‐6.
50. Lopez‐Palomo C, Martin‐Zamorano M, Benitez E, et al. Pneumonia in HIV‐infected patients in the HAART era: incidence, risk, and impact of the pneumococcal vaccination. Journal of medical virology 2004;72:517‐24.
51. Curran A, Falco V, Crespo M, et al. Bacterial pneumonia in HIV‐infected patients: use of the pneumonia severity index and impact of current management on incidence, aetiology and outcome. HIV Med 2008;9:609‐15.
52. Valdiserri RO. Late HIV diagnosis: Bad medicine and worse public health. PLoS Med 2007;4:975‐6.
53. Hall HI, Song R, Rhodes P, et al. Estimation of HIV incidence in the United States. Jama 2008;300:520‐9.
54. Coenen T, Lundgren J, Lazarus JV, Matic S. Optimal HIV testing and earlier care: the way forward in Europe. HIV Med 2008;9 Suppl 2:1‐5.
55. Mathers BM, Degenhardt L, Ali H, et al. HIV prevention, treatment, and care services for people who inject drugs: a systematic review of global, regional, and national coverage. Lancet 2010;375:1014‐28.
56. Chadborn TR, Delpech VC, Sabin CA, Sinka K, Evans BG. The late diagnosis and consequent short‐term mortality of HIV‐infected heterosexuals (England and Wales, 2000‐2004). Aids 2006;20:2371‐9.
57. Quinn TC, Wawer MJ, Sewankambo N, et al. Viral load and heterosexual transmission of human immunodeficiency virus type 1. Rakai Project Study Group. N Engl J Med 2000;342:921‐9.
58. Wawer MJ, Gray RH, Sewankambo NK, et al. Rates of HIV‐1 transmission per coital act, by stage of HIV‐1 infection, in Rakai, Uganda. J Infect Dis 2005;191:1403‐9.
59. Donnell D, Baeten JM, Kiarie J, et al. Heterosexual HIV‐1 transmission after initiation of antiretroviral therapy: a prospective cohort analysis. Lancet 2010;375:2092‐8.
60. Montaner JS, Lima VD, Barrios R, et al. Association of highly active antiretroviral therapy coverage, population viral load, and yearly new HIV diagnoses in British Columbia, Canada: a population‐based study. Lancet 2010;376:532‐9.
51
61. Wood E, Kerr T, Marshall BD, et al. Longitudinal community plasma HIV‐1 RNA concentrations and incidence of HIV‐1 among injecting drug users: prospective cohort study. BMJ 2009;338:b1649.
62. Montaner JS, Hogg R, Wood E, et al. The case for expanding access to highly active antiretroviral therapy to curb the growth of the HIV epidemic. Lancet 2006;368:531‐6.
63. Check Hayden E. 'Seek, test and treat' slows HIV. Nature 2010;463:1006.
64. Branson BM, Handsfield HH, Lampe MA, et al. Revised recommendations for HIV testing of adults, adolescents, and pregnant women in health‐care settings. MMWR Recomm Rep 2006;55:1‐17; quiz CE1‐4.
65. Krentz HB, Auld MC, Gill MJ. Thehigh cost of medical care for patients who present late (CD4 < 200 cells/mu L) with HIV infection. HIV Med 2004;5:93‐8.
66. Paltiel AD, Weinstein MC, Kimmel AD, et al. Expanded screening for HIV in the United States ‐ An analysis of cost‐effectiveness. New England Journal of Medicine 2005;352:586‐95.
67. Mounier‐Jack S, Nielsen S, Coker RJ. HIV testing strategies across European countries. HIV Med 2008;9 Suppl 2:13‐9.
68. Gazzard B, Clumeck N, d'Arminio Monforte A, Lundgren JD. Indicator disease‐guided testing for HIV‐‐the next step for Europe? HIV Med 2008;9 Suppl 2:34‐40.
69. Ancelle‐Park R. Expanded European AIDS case definition. Lancet 1993;341:441.
70. Marks G, Crepaz N, Senterfitt JW, Janssen RS. Meta‐analysis of high‐risk sexual behavior in persons aware and unaware they are infected with HIV in the United States: implications for HIV prevention programs. J Acquir Immune Defic Syndr 2005;39:446‐53.
71. Connor EM, Sperling RS, Gelber R, et al. Reduction of maternal‐infant transmission of human immunodeficiency virus type 1 with zidovudine treatment. Pediatric AIDS Clinical Trials Group Protocol 076 Study Group. The New England journal of medicine 1994;331:1173‐80.
72. Humphrey JH, Marinda E, Mutasa K, et al. Mother to child transmission of HIV among Zimbabwean women who seroconverted postnatally: prospective cohort study. Bmj 2010;341:c6580.
73. Lallemant M, Jourdain G. Preventing mother‐to‐child transmission of HIV‐protecting this generation and the next. The New England journal of medicine 2010;363:1570‐2.
74. Sterne JA, May M, Costagliola D, et al. Timing of initiation of antiretroviral therapy in AIDS‐free HIV‐1‐infected patients: a collaborative analysis of 18 HIV cohort studies. Lancet 2009;373:1352‐63.
75. Muller M, Wandel S, Colebunders R, Attia S, Furrer H, Egger M. Immune reconstitution inflammatory syndrome in patients starting antiretroviral therapy for HIV infection: a systematic review and meta‐analysis. Lancet Infect Dis 2010;10:251‐61.
76. Lawn SD, Wood R. Immune reconstitution inflammatory syndrome. Lancet Infect Dis 2010;10:833‐4.

52
77. Emery S, Neuhaus JA, Phillips AN, et al. Major clinical outcomes in antiretroviral therapy (ART)‐naive participants and in those not receiving ART at baseline in the SMART study. J Infect Dis 2008;197:1133‐44.
78. Sabin CA, Smith CJ, Gumley H, et al. Late presenters in the era of highly active antiretroviral therapy: uptake of and responses to antiretroviral therapy. Aids 2004;18:2145‐51.
79. Titanji K, De Milito A, Cagigi A, et al. Loss of memory B cells impairs maintenance of long‐term serologic memory during HIV‐1 infection. Blood 2006;108:1580‐7.
80. Sogaard OS, Schonheyder HC, Bukh AR, et al. Pneumococcal conjugate vaccination in persons with HIV: the effect of highly active antiretroviral therapy. Aids 2010;24:1315‐22.
81. Kitahata MM, Gange SJ, Abraham AG, et al. Effect of Early versus Deferred Antiretroviral Therapy for HIV on Survival. N Engl J Med 2009.
82. Paltiel AD, Walensky RP, Schackman BR, et al. Expanded HIV screening in the United States: Effect on clinical outcomes, HIV transmission, and costs. Annals of Internal Medicine 2006;145:797‐806.
83. Granich RM, Gilks CF, Dye C, De Cock KM, Williams BG. Universal voluntary HIV testing with immediate antiretroviral therapy as a strategy for elimination of HIV transmission: a mathematical model. Lancet 2009;373:48‐57.
84. Jensen‐Fangel S, Pedersen C, Larsen CS, Tauris P, Moller A, Obel N. Changing demographics in an HIV‐infected population: results from an observational cohort study in Western Denmark. Scandinavian journal of infectious diseases 2001;33:765‐70.
85. Obel N, Engsig FN, Rasmussen LD, Larsen MV, Omland LH, Sorensen HT. Cohort Profile: The Danish HIV Cohort Study. Int J Epidemiol 2008.
86. Pedersen CB, Gotzsche H, Moller JO, Mortensen PB. The Danish Civil Registration System. A cohort of eight million persons. Danish medical bulletin 2006;53:441‐9.
87. Frank L. Epidemiology. When an entire country is a cohort. Science 2000;287:2398‐9.
88. Nickelsen TN. Data validity and coverage in the Danish National Health Registry. A literature review. Ugeskrift for laeger 2001;164:33‐7.
89. Thomsen RW, Riis A, Norgaard M, et al. Rising incidence and persistently high mortality of hospitalized pneumonia: a 10‐year population‐based study in Denmark. Journal of internal medicine 2006;259:410‐7.
90. de Groot V, Beckerman H, Lankhorst GJ, Bouter LM. How to measure comorbidity. a critical review of available methods. J Clin Epidemiol 2003;56:221‐9.
91. Charlson ME, Pompei P, Ales KL, MacKenzie CR. A new method of classifying prognostic comorbidity in longitudinal studies: development and validation. J Chronic Dis 1987;40:373‐83.
92. Carr A, Grund B, Neuhaus J, et al. Asymptomatic myocardial ischaemia in HIV‐infected adults. AIDS (London, England) 2008;22:257‐67.

53
93. Danish National Board of H. Tobaksskaderaadet. In: Danish National Board of Health; 2008.
94. Fletcher RWF, S. W. Clinical epidemiology: the essentials. Fourth ed: Lippincott Williams & Wilkins; 2005.
95. Richardson DB. An incidence density sampling program for nested case‐control analyses. Occup Environ Med 2004;61:e59.
96. Friis‐Moller N, Reiss P, Sabin CA, et al. Class of antiretroviral drugs and the risk of myocardial infarction. N Engl J Med 2007;356:1723‐35.
97. Obel N, Thomsen HF, Kronborg G, et al. Ischemic heart disease in HIV‐infected and HIV‐uninfected individuals: a population‐based cohort study. Clin Infect Dis 2007;44:1625‐31.
98. Thio CL, Seaberg EC, Skolasky R, Jr., et al. HIV‐1, hepatitis B virus, and risk of liver‐related mortality in the Multicenter Cohort Study (MACS). Lancet 2002;360:1921‐6.
99. Kimmel PL, Barisoni L, Kopp JB. Pathogenesis and treatment of HIV‐associated renal diseases: lessons from clinical and animal studies, molecular pathologic correlations, and genetic investigations. Annals of Internal Medicine 2003;139:214‐26.
100. Betz ME, Gebo KA, Barber E, et al. Patterns of diagnoses in hospital admissions in a multistate cohort of HIV‐positive adults in 2001. Medical care 2005;43:III3‐14.
101. Morris A. Intensive Care of Human Immunodeficiency Virus‐infected Patients during the Era of Highly Active Antiretroviral Therapy. Am J Respir Crit Care Med 2002;166:262‐7.
102. Sogaard OS, Lohse N, Gerstoft J, et al. Hospitalization for Pneumonia among Individuals With and Without HIV Infection, 1995‐2007: A Danish Population‐Based, Nationwide Cohort Study. Clinical infectious diseases : an official publication of the Infectious Diseases Society of America 2008.
103. Mocroft A, Sterne JA, Egger M, et al. Variable impact on mortality of AIDS‐defining events diagnosed during combination antiretroviral therapy: not all AIDS‐defining conditions are created equal. Clin Infect Dis 2009;48:1138‐51.
104. Bini EJ, Currie SL, Shen H, et al. National multicenter study of HIV testing and HIV seropositivity in patients with chronic hepatitis C virus infection. J Clin Gastroenterol 2006;40:732‐9.
105. Bottieau E, Clerinx J, Van den Enden E, et al. Infectious mononucleosis‐like syndromes in febrile travelers returning from the tropics. J Travel Med 2006;13:191‐7.
106. Klein D, Hurley LB, Merrill D, Quesenberry CP, Jr. Review of medical encounters in the 5 years before a diagnosis of HIV‐1 infection: implications for early detection. J Acquir Immune Defic Syndr 2003;32:143‐52.
107. Noskin GA, Glassroth J. Bacterial pneumonia associated with HIV‐1 infection. Clin Chest Med 1996;17:713‐23.
108. de la Fuente L, Delgado J, Hoyos J, et al. Increasing early diagnosis of HIV through rapid testing in a street outreach program in Spain. AIDS Patient Care STDS 2009;23:625‐9.

54
109. Wolfe D, Carrieri MP, Shepard D. Treatment and care for injecting drug users with HIV infection: a review of barriers and ways forward. Lancet 2010;376:355‐66.
110. Frieden TR, Collins FS. Intentional infection of vulnerable populations in 1946‐1948: another tragic history lesson. Jama 2010;304:2063‐4.
111. Sogaard OS, Lohse N, Gerstoft J, et al. Mortality after hospitalization for pneumonia among individuals with HIV, 1995‐2008: a Danish cohort study. PLoS One 2009;4:e7022.
112. Penaranda M, Falco V, Payeras A, et al. Effectiveness of polysaccharide pneumococcal vaccine in HIV‐infected patients: a case‐control study. Clin Infect Dis 2007;45:e82‐7.
113. Teshale EH, Hanson D, Flannery B, et al. Effectiveness of 23‐valent polysaccharide pneumococcal vaccine on pneumonia in HIV‐infected adults in the United States, 1998‐‐2003. Vaccine 2008;26:5830‐4.
114. Veras MA, Enanoria WT, Castilho EA, Reingold AL. Effectiveness of the polysaccharide pneumococcal vaccine among HIV‐infected persons in Brazil: a case control study. BMC Infect Dis 2007;7:119.
115. Moszynski P. Global elimination of mother to child HIV transmission is now achievable, say agencies. Bmj 2010;341:c5152.
116. Hansen AB, Lohse N, Gerstoft J, et al. Cause‐specific excess mortality in siblings of patients co‐infected with HIV and hepatitis C virus. PLoS One 2007;2:e738.
117. Rasmussen LD, Omland LH, Pedersen C, et al. Risk of myocardial infarction in parents of HIV‐infected Individuals: a population‐based Cohort Study. BMC Infect Dis 2010;10:169.
118. Melchjorsen J, Risør RW, Søgaard OS, et al. Tenofovir selectively regulates production of inflammatory cytokines and shifts the IL‐12 / IL‐10 balance in human primary cells. JAIDS 2011;in press.
119. Mazick A, Howitz M, Rex S, et al. Hepatitis A outbreak among MSM linked to casual sex and gay saunas in Copenhagen, Denmark. Euro Surveill 2005;10:111‐4.

56
109. Wolfe D, Carrieri MP, Shepard D. Treatment and care for injecting drug users with HIV infection: a review of barriers and ways forward. Lancet 2010;376:355‐66.
110. Frieden TR, Collins FS. Intentional infection of vulnerable populations in 1946‐1948: another tragic history lesson. Jama 2010;304:2063‐4.
111. Sogaard OS, Lohse N, Gerstoft J, et al. Mortality after hospitalization for pneumonia among individuals with HIV, 1995‐2008: a Danish cohort study. PLoS One 2009;4:e7022.
112. Penaranda M, Falco V, Payeras A, et al. Effectiveness of polysaccharide pneumococcal vaccine in HIV‐infected patients: a case‐control study. Clin Infect Dis 2007;45:e82‐7.
113. Teshale EH, Hanson D, Flannery B, et al. Effectiveness of 23‐valent polysaccharide pneumococcal vaccine on pneumonia in HIV‐infected adults in the United States, 1998‐‐2003. Vaccine 2008;26:5830‐4.
114. Veras MA, Enanoria WT, Castilho EA, Reingold AL. Effectiveness of the polysaccharide pneumococcal vaccine among HIV‐infected persons in Brazil: a case control study. BMC Infect Dis 2007;7:119.
115. Moszynski P. Global elimination of mother to child HIV transmission is now achievable, say agencies. Bmj 2010;341:c5152.
116. Hansen AB, Lohse N, Gerstoft J, et al. Cause‐specific excess mortality in siblings of patients co‐infected with HIV and hepatitis C virus. PLoS One 2007;2:e738.
117. Rasmussen LD, Omland LH, Pedersen C, et al. Risk of myocardial infarction in parents of HIV‐infected Individuals: a population‐based Cohort Study. BMC Infect Dis 2010;10:169.
118. Melchjorsen J, Risør RW, Søgaard OS, et al. Tenofovir selectively regulates production of inflammatory cytokines and shifts the IL‐12 / IL‐10 balance in human primary cells. JAIDS 2011;in press.
119. Mazick A, Howitz M, Rex S, et al. Hepatitis A outbreak among MSM linked to casual sex and gay saunas in Copenhagen, Denmark. Euro Surveill 2005;10:111‐4.
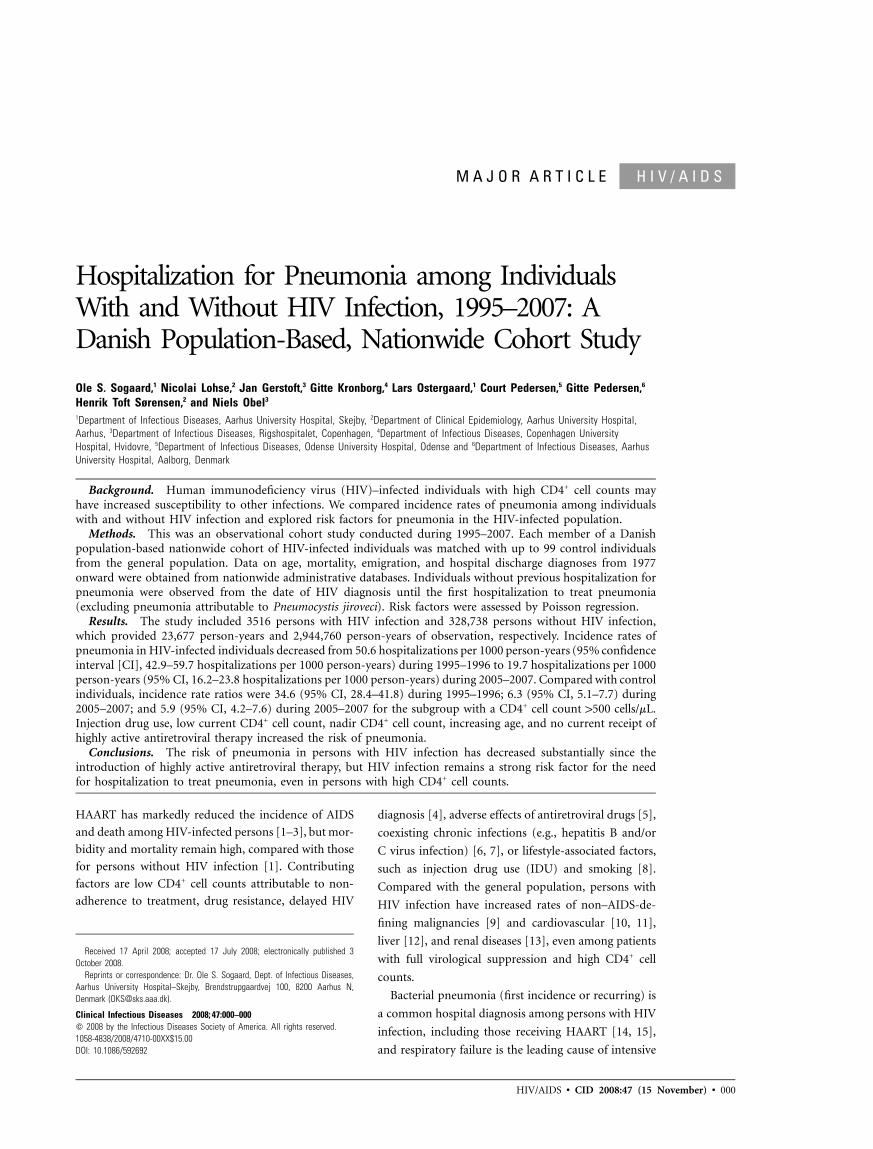
HIV/AIDS • CID 2008:47 (15 November) • 000
H I V / A I D SM A J O R A R T I C L E
Hospitalization for Pneumonia among IndividualsWith and Without HIV Infection, 1995–2007: ADanish Population-Based, Nationwide Cohort Study
Ole S. Sogaard,1 Nicolai Lohse,2 Jan Gerstoft,3 Gitte Kronborg,4 Lars Ostergaard,1 Court Pedersen,5 Gitte Pedersen,6
Henrik Toft Sørensen,2 and Niels Obel3
1Department of Infectious Diseases, Aarhus University Hospital, Skejby, 2Department of Clinical Epidemiology, Aarhus University Hospital,Aarhus, 3Department of Infectious Diseases, Rigshospitalet, Copenhagen, 4Department of Infectious Diseases, Copenhagen UniversityHospital, Hvidovre, 5Department of Infectious Diseases, Odense University Hospital, Odense and 6Department of Infectious Diseases, AarhusUniversity Hospital, Aalborg, Denmark
Background. Human immunodeficiency virus (HIV)–infected individuals with high CD4+ cell counts mayhave increased susceptibility to other infections. We compared incidence rates of pneumonia among individualswith and without HIV infection and explored risk factors for pneumonia in the HIV-infected population.
Methods. This was an observational cohort study conducted during 1995–2007. Each member of a Danishpopulation-based nationwide cohort of HIV-infected individuals was matched with up to 99 control individualsfrom the general population. Data on age, mortality, emigration, and hospital discharge diagnoses from 1977onward were obtained from nationwide administrative databases. Individuals without previous hospitalization forpneumonia were observed from the date of HIV diagnosis until the first hospitalization to treat pneumonia(excluding pneumonia attributable to Pneumocystis jiroveci). Risk factors were assessed by Poisson regression.
Results. The study included 3516 persons with HIV infection and 328,738 persons without HIV infection,which provided 23,677 person-years and 2,944,760 person-years of observation, respectively. Incidence rates ofpneumonia in HIV-infected individuals decreased from 50.6 hospitalizations per 1000 person-years (95% confidenceinterval [CI], 42.9–59.7 hospitalizations per 1000 person-years) during 1995–1996 to 19.7 hospitalizations per 1000person-years (95% CI, 16.2–23.8 hospitalizations per 1000 person-years) during 2005–2007. Compared with controlindividuals, incidence rate ratios were 34.6 (95% CI, 28.4–41.8) during 1995–1996; 6.3 (95% CI, 5.1–7.7) during2005–2007; and 5.9 (95% CI, 4.2–7.6) during 2005–2007 for the subgroup with a CD4+ cell count 1500 cells/mL.Injection drug use, low current CD4+ cell count, nadir CD4+ cell count, increasing age, and no current receipt ofhighly active antiretroviral therapy increased the risk of pneumonia.
Conclusions. The risk of pneumonia in persons with HIV infection has decreased substantially since theintroduction of highly active antiretroviral therapy, but HIV infection remains a strong risk factor for the needfor hospitalization to treat pneumonia, even in persons with high CD4+ cell counts.
HAART has markedly reduced the incidence of AIDS
and death among HIV-infected persons [1–3], but mor-
bidity and mortality remain high, compared with those
for persons without HIV infection [1]. Contributing
factors are low CD4+ cell counts attributable to non-
adherence to treatment, drug resistance, delayed HIV
Received 17 April 2008; accepted 17 July 2008; electronically published 3October 2008.
Reprints or correspondence: Dr. Ole S. Sogaard, Dept. of Infectious Diseases,Aarhus University Hospital–Skejby, Brendstrupgaardvej 100, 8200 Aarhus N,Denmark ([email protected]).
Clinical Infectious Diseases 2008; 47:000–000� 2008 by the Infectious Diseases Society of America. All rights reserved.1058-4838/2008/4710-00XX$15.00DOI: 10.1086/592692
diagnosis [4], adverse effects of antiretroviral drugs [5],
coexisting chronic infections (e.g., hepatitis B and/or
C virus infection) [6, 7], or lifestyle-associated factors,
such as injection drug use (IDU) and smoking [8].
Compared with the general population, persons with
HIV infection have increased rates of non–AIDS-de-
fining malignancies [9] and cardiovascular [10, 11],
liver [12], and renal diseases [13], even among patients
with full virological suppression and high CD4+ cell
counts.
Bacterial pneumonia (first incidence or recurring) is
a common hospital diagnosis among persons with HIV
infection, including those receiving HAART [14, 15],
and respiratory failure is the leading cause of intensive

000 • CID 2008:47 (15 November) • HIV/AIDS
care unit admissions among HIV-infected patients [16]. A
number of studies have reported increased rates of pneumonia
among persons with HIV infection, compared with rates in the
general population [17–20], but the impact of HAART and
CD4+ cell count on risk of pneumonia in HIV-infected patients
is still controversial.
We aimed to compare population-based incidence rates (IRs)
of first-time hospitalizations for pneumonia among persons
with and without HIV infection in Denmark, to estimate
changes in IRs and IR ratios (IRRs) over time and according
to age in the 2 populations, to estimate the influence of im-
munocompetence defined by CD4+ cell count, and to explore
potential risk factors for non–AIDS-defining pneumonia
among HIV-infected individuals.
PATIENTS AND METHODS
Study design and setting. We conducted a nationwide pop-
ulation-based cohort study among persons with and without
HIV infection in Denmark during 1995–2007. The estimated
prevalence of HIV infection in the adult population of Den-
mark, with a population of 5.4 million, is 0.07% [21]. Treatment
for HIV infection occurs in only 8 specialized health care cen-
ters. The Danish health care system provides free, tax-supported
medical care for all residents, including antiretroviral treatment
of HIV infection.
Study Population
Inclusion criteria. We included persons who were �16 years
of age and had no recorded hospitalization for pneumonia
before study inclusion.
Persons with HIV infection. The Danish HIV Cohort
Study is a prospective, open, nationwide, population-based co-
hort of all HIV-infected individuals seen in Danish HIV clinics
since 1 January 1995. Study methods were described in detail
elsewhere [21, 22]. The study is ongoing, with continual en-
rollment of both patients with new diagnoses and new im-
migrants to Denmark who have HIV infection. Use of the
Danish 10-digit personal identification number prevents mul-
tiple registrations of the same patient and allows tracking of
deaths and losses to follow-up because of emigration. Study
data are updated annually, with information about antiretro-
viral treatment, development of opportunistic infections and
other AIDS-defining illnesses, and laboratory values, including
viral load and CD4+ cell count.
Population control individuals without HIV infection.
The Danish Civil Registration System includes information
about each individual’s personal identification number, sex,
date and place of birth, place of residence, citizenship status,
and continually updated information on vital status [23]. For
each person living in Denmark at the time of HIV diagnosis,
we aimed to identify 99 population control individuals—
matched on the basis of sex, age (month and year of birth),
and municipality—as the corresponding patient on the day the
patient received the diagnosis of HIV infection. Because of
shortage of eligible control individuals in some municipalities,
we identified an average of 94.8 population control individuals
per HIV-infected patient.
Identification of patients hospitalized with pneumonia.
The Danish National Hospital Registry contains information
about all patients discharged from Danish hospitals since 1977.
Its records for each hospitalization include personal identifi-
cation number, hospital department involved, discharge diag-
noses, and dates of admission and discharge. Diagnoses are
coded by the treating physician according to the International
Classification of Diseases, 8th Revision (ICD-8), through the end
of 1993 and, likewise, to the 10th revision (ICD-10) thereafter.
For persons with HIV infection and the general population
control individuals, we used the National Hospital Registry to
identify all hospital stays with a discharge diagnosis of pneu-
monia, through identification of ICD-8 codes 480.XX–486.XX,
073.XX, and 471.XX and ICD-10 codes J11.0 (influenza with
pneumonia), J12.X–J18.X (pneumonia), A481.X, (ornithosis),
or A709.X (legionellosis). Thus, both community-acquired and
hospital-acquired incidences of pneumonia were included. Cri-
teria for hospital admission of HIV-infected patients and the
general population were unchanged during the study. The onset
of pneumonia was defined as the date of hospital admission.
Because HIV-infected patients have an increased risk of re-
ceiving a diagnosis of pneumonia while visiting HIV centers,
outpatient visits were not included. Also, AIDS-defining Pneu-
mocystis jiroveci pneumonia was not included as an episode of
pneumonia. To limit the study to first-time hospitalizations to
treat pneumonia, individuals with a recorded episode of pneu-
monia between 1977 and 1 January 1995 were excluded.
Validation of discharge diagnoses. For a sample of 77 HIV-
infected patients with a discharge diagnosis of pneumonia, we
validated pneumonia diagnoses identified in the National Hos-
pital Registry by reviewing medical records. We confined the
review to Aarhus County, because data quality in the National
Hospital Registry is considered to be uniform throughout the
country [24]. Pneumonia diagnoses recorded in the National
Hospital Registry for patients without HIV infection were val-
idated previously [25], and we used the same criteria for pa-
tients with HIV infection. A discharge diagnosis of pneumonia
was considered to be confirmed if an infiltrate was documented
in a chest radiograph and if �1 of the following clinical or
laboratory findings was present: body temperature �37.5�C,
cough, dyspnea, chest pain or rales coincident with the area of
infiltrate, increased amount of sputum, purulent sputum, mi-
croorganism isolated from blood culture, leukocyte count
� cells/L, or C-reactive protein concentration 1100 mg912 � 10
per dL. We computed the percentage of episodes recorded in

HIV/AIDS • CID 2008:47 (15 November) • 000
Table 1. Characteristics of the HIV-infected and control populations at study entry.
VariableHIV-infected patients
(n p 3516)Control individuals
(n p 328,738)
Age at entry, median years (interquartile range) 37.0 (31.0–44.5) 36.6 (30.8–44.2)Duration of follow-up, median years (interquartile range) 6.6 (3.1–10.8) 10.1 (5.9–12.3)Lost to follow-up 141 (4.0) 12,833 (3.9)Sex
Female 797 (22.7) 76,008 (23.1)Male 2719 (77.3) 252,730 (76.9)
EthnicityWhite 2890 (82.2) …Black 425 (12.1) …Asian 111 (3.2) …Inuit 28 (0.8) …Other 60 (1.7) …
Mode of or risk group for HIV exposureMSM 1682 (47.8) …Heterosexual intercourse 1265 (36.0) …Injection drug use 375 (10.7) …Other 69 (2.0) …Unknown 117 (3.3) …
AIDS status at study entryPositive 463 (13.2) …Negative 3053 (86.8) …
CD4+ cell count at study entry,a median cells/mL (interquartile range) 313 (100–460) …
NOTE. Data are no. (%) of individuals, unless otherwise indicated. MSM, men having sex with men.a Date of measurement closest to date of entry and not 1180 days apart.
the National Hospital Registry that fulfilled the aforementioned
criteria.
Definitions. HAART was defined as either a 3-drug regi-
men that included a nonnucleoside reverse-transcriptase in-
hibitor, a protease inhibitor, and/or abacavir or a 2-drug reg-
imen with a combination of a nonnucleoside reverse-transcrip-
tase inhibitor and a boosted protease inhibitor.
CD4+ cell count and viral load were estimated by using the
most recent measurement. Nadir CD4+ cell count was defined
as the lowest CD4+ cell count ever previously measured for that
patient.
Statistical Analyses
Variables. The following variables were used in our analyses:
sex, ethnicity, most likely mode of HIV acquisition, AIDS status
[26, 27], and the time-varying covariates (TVCs) of current
CD4+ cell count, nadir CD4+ cell count (TVC), current viral
load (TVC), receipt of HAART (yes vs. no; TVC), and age (15–
39 years, 40–49 years, 50–59 years, and �60 years; TVC). Me-
dian and interquartile ranges were determined for age and CD4+
cell count. For other variables, frequencies and percentages were
computed.
Time at risk. Subjects were observed from 1 January 1995
or the date of HIV diagnosis, whichever was later. Population
control individuals entered the study on the same day as their
matched HIV-infected person. We computed time from the
date of first observation until the date of first hospitalization
for pneumonia, death, emigration, or 1 May 2007, whichever
came first.
IR, IRR, and cumulative risk. IRs of pneumonia hospi-
talization were computed for HIV-infected patients and for
control individuals in the 4 age strata and in 6 time periods
(1995–1996, 1997–1998, 1999–2000, 2001–2002, 2003–2004,
and 2005–1 May 2007). In an analysis restricted to HIV-infected
patients with current CD4+ cell counts 1500 and their respective
uninfected control individuals, we compared IR in the last time
period. We computed IRRs and 5- and 10-year cumulative risk
of pneumonia after 1 January 1997.
Poisson regression analysis. We used a Poisson regression
model to explore risk factors for first-time hospitalization for
pneumonia for all individuals with HIV infection. Variables
entered into the model were ethnicity (white vs. nonwhite),
most likely mode of infection (IDU vs. non-IDU), sex, age,
receipt of HAART (yes vs. no), and nadir and current CD4+
cell counts. Viral load values were log-transformed, and the
effect of current viral load was examined in a separate model
limited to HAART-naive subjects. The effect of nadir CD4+ cell
count among individuals receiving HAART was estimated for

000 • CID 2008:47 (15 November) • HIV/AIDS
Figure 1. Incidence of first-time hospitalization to treat pneumonia in Denmark among individuals with and without HIV infection, 1995–2007
Figure 2. Incidence rates of first-time hospitalization to treat pneumonia by HIV infection status and age group, 1995–2007
subjects with current CD4+ cell counts 1300 cells/mL. The effect
of HAART was estimated in 5 strata of CD4+ cell counts. In
addition, we conducted a sensitivity analysis that excluded in-
dividuals with IDU as their most likely mode of HIV trans-
mission. We did not include AIDS in these analyses, because
nadir CD4+ cell count and AIDS are dependent covariates, and
adjustment for AIDS could cancel out the effect of nadir CD4+
cell count. We used Stata software, version 9.2 (StataCorp) for
statistical analyses. The study was approved by the Danish Data
Protection Agency.
RESULTS
Study population. There were 3944 HIV-infected individuals
and 373,856 matched population control individuals initially
eligible for the study. We excluded 428 HIV-infected patients
and 5996 members of the general population who had been
hospitalized for pneumonia before study entry. Exclusion of
the 428 HIV-infected patients entailed exclusion of an addi-
tional 39,121 matched control individuals from the general
population. A total of 3516 HIV-infected patients and 328,738

HIV/AIDS • CID 2008:47 (15 November) • 000
Table 2. Incidence rate ratios for HIV-infected individuals by time and age.
Period
Incidence rate ratio (95% CI)
16–39 years 40–49 years 50–59 years �60 years All ages
1995–1996 54.2 (40.5–72.0) 31.9 (21.8–45.8) 24.9 (15.1–39.5) 8.0 (2.1–21.7) 34.6 (28.4–41.8)1997–1998 18.7 (13.0–26.3) 13.8 (8.8–20.8) 5.6 (2.2–11.8) 4.8 (1.3–12.5) 12.2 (9.5–15.5)1999–2000 17.9 (11.9–26.3) 13.5 (8.6–20.5) 4.9 (2.2–9.4) 1.5 (0.2–5.3) 9.3 (7.2–12.0)2001–2002 21.5 (15.1–30.0) 9.2 (5.8–14.1) 4.9 (2.6–8.5) 4.2 (1.9–8.1) 9.0 (7.1–11.2)2003–2004 15.5 (10.5–22.3) 12.8 (9.0–17.8) 6.8 (4.2–10.3) 2.8 (1.2–5.5) 8.6 (7.0–10.5)2005–2007a 11.3 (7.3–16.8) 9.5 (6.6–13.4) 6.1 (4.1–9.0) 2.7 (1.5–4.6) 6.3 (5.1–7.7)
a Through 1 May 2007.
population control individuals were included in the analysis,
contributing 23,767 and 2,944,760 person-years of follow-up,
respectively. Characteristics of study populations are shown in
table 1. One hundred forty HIV-infected individuals (4.0%)
and 12,833 control individuals (3.9%) were lost to follow-up,
primarily because of emigration (116 [3.3%] and 10,096
[3.1%], respectively). A first-time hospitalization for pneu-
monia was identified for 582 persons with HIV infection and
for 7042 persons without HIV infection.
Validation of pneumonia diagnoses. Seventy-three (95%)
of 77 patients with HIV infection (95% CI, 87%–98%) who
were registered as having pneumonia in the National Hospital
Registry had their diagnoses confirmed by data in their medical
records. In an earlier validation of pneumonia diagnoses among
100 patients without HIV infection, the diagnosis was con-
firmed for 90 (90%; 95% CI, 82%–95%) on the basis of their
medical records [25].
IR, IRR, and cumulative risk. The overall IRs of hospi-
talization with pneumonia among HIV-infected persons de-
creased from 50.6 hospitalizations per 1000 person-years (95%
CI, 42.9–59.7 hospitalizations per 1000 person-years) during
1995–1996 to 18.3 hospitalizations per 1000 person-years (95%
CI, 14.4–23.2 hospitalizations per 1000 person-years) during
1999–2000 (figure 1) and remained stable, with a rate of 19.7
hospitalizations per 1000 person-years (95% CI, 16.2–23.8 hos-
pitalizations per 1000 person-years) during 2005–2007. The IR
among persons without HIV infection during 1995–2007 was
2.4 hospitalizations per 1000 person-years (95% CI, 2.3–2.4
hospitalizations per 1000 person-years) and increased from 1.5
hospitalizations per 1000 person-years (95% CI, 1.3–1.6 hos-
pitalizations per 1000 person-years) during 1995–1996 to 3.1
hospitalizations per 1000 person-years (95% CI, 3.0–3.3 hos-
pitalizations per 1000 person-years) during 2005–2007. Figure
2 shows that the decrease over time occurred in all age groups.
The 5-year risk of pneumonia after 1 January 1997 was 11.0%
(95% CI, 9.5%–12.7%) for HIV-infected patients and 1.0%
(95% CI, 1.0%–1.0%) for control individuals. The correspond-
ing 10-year risk was 21.3% (95% CI, 19.4%–23.4%) for HIV-
infected patients and 2.4% (95% CI, 2.3%–2.5%) for control
individuals. The overall IRR for hospitalization to treat pneu-
monia among HIV-infected patients, compared with control
individuals, decreased over time, from 34.6 (95% CI, 28.4–
41.8) during 1995–1996 to 9.3 (95% CI, 7.2–12.0) during 1999–
2000 and to 6.3 (95% CI, 5.1–7.7) during 2005–2007 (table 2).
During 2005–2007, IRs of pneumonia for those with CD4+ cell
counts 1500 cells/mL and their corresponding control individ-
uals were 16.1 hospitalizations per 1000 person-years (95% CI,
12.0–21.6 hospitalizations per 1000 person-years) and 2.8 hos-
pitalizations per 1000 person-years (95% CI, 2.6–3.0 hospital-
izations per 1000 person-years), respectively, resulting in an
IRR of 5.9 hospitalizations per 1000 person-years (95% CI,
4.2–7.9 hospitalizations per 1000 person-years).
Risk factors for hospitalization with pneumonia among per-
sons with HIV infection. Table 3 shows IRs of a first pneu-
monia hospitalization for persons with HIV infection, by po-
tential risk factors for pneumonia, as well as crude and adjusted
IRRs. Factors associated with increased risk of pneumonia were
low current CD4+ cell count, low nadir CD4+ cell count, IDU,
and male sex, whereas current receipt of HAART was protective.
Among HAART-naive individuals, high current viral load was
associated with an increased risk of pneumonia in the adjusted
estimates. A sensitivity analysis excluding individuals with IDU
as their most likely mode of HIV transmission provided esti-
mates very similar to those displayed in table 3. Among patients
receiving HAART with current CD4+ cell counts 1300 cells/mL,
nadir CD4+ cell count was not associated with increased risk
of pneumonia; adjusted IRRs were 1.1 (95% CI, 0.7–1.8), 1.1
(95% CI, 0.7–1.9), 0.8 (95% CI, 0.4–1.6), and 1.3 (95% CI,
0.8–2.3) for nadir CD4+ cell counts of 201–300, 101–200, 51–
100, and �50 cells/mL, respectively, compared with those whose
CD4+ cell counts were never !300 cells/mL. Figure 3 shows the
CD4+ cell count–independent protective effect of HAART on
crude and adjusted IRRs for the 5 levels of current CD4+ cell
counts, comparing HAART-naive with HAART-experienced
individuals.

000 • CID 2008:47 (15 November) • HIV/AIDS
Table 3. Incidence rates of a first hospitalization to treat pneumonia in persons with HIV infection,by potential risk factors for pneumonia and with crude and adjusted incidence rate ratios.
Variable
No. ofcases of
pneumoniaIncidence ratea
(95% CI)
Incidence rate ratio (95% CI)
Crude Adjustedb
Current CD4+ cell countc
�501 103 11.8 (9.7–14.3) 1 (Reference) 1 (Reference)
401–500 45 12.7 (9.7–17.0) 1.1 (0.7–1.5) 1.0 (0.7–1.4)
301–400 88 22.9 (18.6–28.3) 2.0 (1.5–2.6) 1.7 (1.3–2.3)
201–300 84 26.3 (21.2–32.6) 2.3 (1.7–3.0) 1.6 (1.2–2.2)
101–200 80 36.6 (29.4–45.5) 3.2 (2.4–4.3) 2.3 (1.6–3.3)
51–100 55 76.7 (59.9–100) 6.7 (4.8–9.2) 5.0 (3.3–7.6)
0–50 84 117 (94.2–144) 11.1 (8.3–14.8) 9.2 (6.0–14.3)
Nadir CD4+ cell countc
�301 75 12.5 (10.0–15.7) 1 (Reference) 1 (Reference)
201–300 96 19.8 (16.2–24.2) 1.6 (1.2–2.1) 1.7 (1.2–2.4)
101–200 128 24.2 (20.3–28.7) 1.9 (1.5–2.6) 2.0 (1.4–2.9)
51–100 82 29.2 (23.5–36.2) 2.3 (1.7–3.2) 1.7 (1.1–2.6)
0–50 158 39.9 (34.1–46.6) 4.1 (2.8–5.9) 1.7 (1.1–2.5)
Age,c years
15–39 247 22.6 (19.9–25.5) 1 (Reference) 1 (Reference)
40–49 192 25.0 (21.7–28.8) 1.1 (0.9–1.3) 1.1 (0.9–1.4)
50–59 102 26.3 (21.7–32.0) 1.2 (0.9–1.5) 1.5 (1.2–1.9)
�60 41 32.3 (23.8–43.9) 1.4 (1.0–2.0) 2.1 (1.5–3.0)
Ethnicity
White 498 25.3 (23.1–27.6) 1 (Reference) 1 (Reference)
Nonwhite 83 20.5 (16.5–25.4) 0.8 (0.6–1.0) 1.1 (0.9–1.4)
Injection drug used
No 453 20.9 (19.0–23.0) 1 (Reference) 1 (Reference)
Yes 129 60.5 (50.9–71.9) 2.9 (2.4–3.5) 2.6 (2.1–3.3)
Receipt of HAARTc
Naive 321 33.6 (29.7–37.9) 1 (Reference) 1 (Reference)
Experienced 261 20.0 (18.0–22.4) 0.6 (0.5–0.7) 0.7 (0.5–0.8)
Sex
Female 116 20.5 (17.1–24.6) 1 (Reference) 1 (Reference)
Male 466 25.7 (23.5–28.2) 1.3 (1.0–1.5) 1.3 (1.0–1.6)
Viral load,c,e copies/mL
!103 12 14.3 (8.1–25.2) 1 (Reference) 1 (Reference)
103–105 64 18.8 (14.7–24.0) 1.4 (1.1–1.7) 1.2 (0.7–2.3)
1105 27 58.1 (39.8–84.7) 3.8 (2.9–4.9) 2.0 (1.0–4.1)
NOTE. Missing values are not shown.a No. of hospitalizations per 1000 person-years.b Adjusted for all variables in the table except viral load.c Time-varying covariate.d The most likely mode of HIV acquisition.e Includes HAART-naive individuals only.
DISCUSSION
To our knowledge, this population-based study is the first to
explore on a national level the relative risk of pneumonia among
HIV-infected patients. We found that the risk of first-time hos-
pitalization for pneumonia remained 6-fold higher for HIV-
infected individuals than for the general population until 2007,
despite a decrease in incidence of pneumonia among HIV-
infected persons after the introduction of HAART. The in-
creased risk was observed even in persons with nearly normal
CD4+ cell counts. The strongest risk factors for pneumonia
were low current CD4+ cell count, IDU as the mode of HIV
transmission, and, among HAART-naive patients, a high cur-
rent viral load. HAART was associated with a decreased risk of
pneumonia, but the protective effect of HAART was observed
only for patients with CD4+ counts �200 cells/mL.
The strengths of our study include the use of population-
based, nationwide cohorts; access to complete hospitalization
data; minor loss to follow-up; and availability of electronically
collected longitudinal data on viral load and CD4+ cell counts.
This is one of the largest studies of the incidence of pneumonia

HIV/AIDS • CID 2008:47 (15 November) • 000
Figure 3. Relationship between use of HAART and risk of pneumonia,in comparison of HAART-naive and HAART-experienced individuals, byCD4+ cell count strata. Point estimates and 95% CIs are indicated byvertical and horizontal bars, respectively. Gray bars indicate crude esti-mates. Black bars indicate estimates adjusted for nadir CD4+ cell count,age, injection drug use as mode of HIV transmission, sex, and ethnicity.IRR, incidence rate ratio.
among HIV-infected individuals, yielding estimates with high
statistical precision. Because we considered only the first hos-
pitalization for pneumonia, our estimates were not biased by
multiple pneumonia episodes occurring in highly susceptible
individuals.
Our study also had limitations. Data on specific pathogens
and pneumococcal vaccination status were not available. There-
fore, we do not know the percentage of pneumonia cases caused
by bacteria and whether this percentage differed between per-
sons with and without HIV infection. Previous studies have
found identifiable bacterial pathogens in 24%–38% of HIV-
infected patients with pneumonia [17, 28], which is comparable
to findings in persons without HIV infection [29]. In Denmark,
the 23-valent polysaccharide vaccine is not routinely admin-
istered to HIV-infected individuals or to elderly persons (age,
�65 years). Recruitment for a recent Danish trial showed that
!10% of HIV-infected persons had been vaccinated within the
previous 5 years (O.S.S., unpublished data). We therefore as-
sume that pneumococcal vaccination had very little influence
on our results.
Physicians may have a lower threshold for hospital admission
of HIV-infected patients presenting with signs and symptoms
of pneumonia than for a person without HIV infection. In that
case, pneumonia would be diagnosed in hospitals more fre-
quently among HIV-infected persons than among the general
population, leading to an overestimation of the IRR. However,
this information bias is unlikely to be the sole cause of the
higher risks observed. First, validation of diagnosis of pneu-
monia among patients with and without HIV infection was
found to be comparable. Second, the general improvement in
the immunocompetence of the HIV-infected population during
the study period has made their hospitalization pattern ap-
proach what is seen in control individuals (N.O., unpublished
data).
Finally, we did not have data on smoking, a well-known risk
factor for pneumonia that may be more common among HIV-
infected individuals, particularly among injection drug users.
A recent cohort study found that 40% of HIV-infected indi-
viduals were smokers [30], compared with 27% of the Danish
population as a whole in 2006 [31]. This difference is small
and could not have accounted for our findings.
Our data extend previous research. Grau et al. [18] reported
a 3-fold decrease in the incidence of invasive pneumococcal
disease in the HAART era (1997–2002), compared with the
pre-HAART era (1986–1996), that was similar to the decrease
we observed in incidence of pneumonia between 1995–1996
and 1999–2000. Although our overall IRR for pneumonia did
decrease between 1999–2000 and 2005–2007, the IR of pneu-
monia among persons with HIV infection remained stable for
each age stratum during the same period (figure 2). The 12-
fold higher incidence among HIV-infected versus HIV-unin-
fected individuals that was determined in the HIV Epidemio-
logic Research study by Kohli et al. [17] of primarily female
injection drug users was based on incidence data from 1993–
2000; therefore, it did not fully capture the decrease in IRRs
over time that we observed between the pre-HAART and the
late-HAART era. Many studies based on data from the early-
HAART and pre-HAART era would, therefore, produce higher
IRs than we observed after 2000 [17–20]. Availability of less
toxic antiretroviral drugs in recent years has increased drug
adherence, leading to the improved immune status of many
HIV-infected individuals [32]. IRs for pneumonia increased
over time in the background population; this is in line with
results from a recent study [25]. Most risk factors identified in
our study corroborated the findings of other studies [17–20,
28]. However, the increased risk of pneumonia in individuals
with a current CD4+ cell count as high as 301–400 cells/mL
supports recommendations for HAART initiation for patients
with higher CD4+ cell counts [33].
The increased incidence of pneumonia among persons with
HIV infection, even among those with nearly normal CD4+ cell
counts, indicates that HIV infection increases the susceptibility
to pneumonia beyond what is indicated by CD4+ cell counts.
Possible mechanisms could be loss of immunological and ep-

000 • CID 2008:47 (15 November) • HIV/AIDS
ithelial integrity [34, 35], fibrosis of lymphatic tissue [36], and
loss of IL-17–expressing CD4+ T lymphocytes from the gastro-
intestinal tract, leading to microbial translocation and gener-
alized immune activation [34, 37], as shown in patients who
had effective treatment despite high CD4+ cell counts. In animal
studies, HAART seems to reduce microbial translocation [34],
which may explain why HAART was associated with a decreased
risk of pneumonia in treatment-naive and treatment-experi-
enced individuals in the same low CD4+ cell strata. In addition,
some reports have shown that HIV-infected persons in the
HAART era may have a high prevalence of other chronic con-
ditions (e.g., heart disease and cirrhosis), which may be ad-
ditional risk factors for pneumonia [10–12].
In conclusion, introduction of HAART has substantially de-
creased the risk of pneumonia in HIV-infected patients. Al-
though a high CD4+ count protects against pneumonia, persons
with HIV infection and high CD4+ cell counts still have in-
creased risk of the need for hospitalization to treat pneumonia
compared with persons without HIV infection.
Acknowledgments
We thank the staff of our clinical departments for their continuoussupport and enthusiasm.
Financial support. The Danish AIDS Foundation, Rigshospitalet,Odense University Hospital, Preben and Anna Simonsen’s Foundation, theFoundation of the Danish Association of Pharmacists, and the ClinicalInstitute at the University of Southern Denmark.
Potential conflict of interest. N.O. has received research funding fromRoche, Bristol-Myers Squibb, Merck Sharp & Dohme, GlaxoSmithKline,Abbott, Boehringer Ingelheim, Janssen-Cilag, and Swedish Orphan. J.G.has received research funding from Abbott, Roche, Bristol-Myers Squibb,Merck Sharp & Dohme, Pharmasia, GlaxoSmithKline, Swedish Orphan,and Boehringer Ingelheim. All other authors: no conflicts.
References
1. Lohse N, Hansen AB, Pedersen G, et al. Survival of persons with andwithout HIV infection in Denmark, 1995–2005. Ann Intern Med2007; 146:87–95.
2. Palella FJ Jr, Baker RK, Moorman AC, et al. Mortality in the highlyactive antiretroviral therapy era: changing causes of death and diseasein the HIV outpatient study. J Acquir Immune Defic Syndr 2006; 43:27–34.
3. Hogg RS, Heath KV, Yip B, et al. Improved survival among HIV-infected individuals following initiation of antiretroviral therapy. JAMA1998; 279:450–4.
4. Lohse N, Jorgensen LB, Kronborg G, et al. Genotypic drug resistanceand long-term mortality in patients with triple-class antiretroviral drugfailure. Antivir Ther 2007; 12:909–17.
5. Safrin S, Grunfeld C. Fat distribution and metabolic changes in patientswith HIV infection. AIDS 1999; 13:2493–505.
6. Weis N, Lindhardt BO, Kronborg G, et al. Impact of hepatitis C viruscoinfection on response to highly active antiretroviral therapy andoutcome in HIV-infected individuals: a nationwide cohort study. ClinInfect Dis 2006; 42:1481–7.
7. Hansen AB, Lohse N, Gerstoft J, et al. Cause-specific excess mortalityin siblings of patients co-infected with HIV and hepatitis C virus. PLoSONE 2007; 2:e738.
8. Saves M, Chene G, Ducimetiere P, et al. Risk factors for coronary heart
disease in patients treated for human immunodeficiency virus infectioncompared with the general population. Clin Infect Dis 2003; 37:292–8.
9. Grulich AE, van Leeuwen MT, Falster MO, Vajdic CM. Incidence ofcancers in people with HIV/AIDS compared with immunosuppressedtransplant recipients: a meta-analysis. Lancet 2007; 370:59–67.
10. DAD Study Group, Friis-Moller N, Reiss P, et al. Class of antiretroviraldrugs and the risk of myocardial infarction. N Engl J Med 2007; 356:1723–35.
11. Obel N, Thomsen HF, Kronborg G, et al. Ischemic heart disease inHIV-infected and HIV-uninfected individuals: a population-based co-hort study. Clin Infect Dis 2007; 44:1625–31.
12. Thio CL, Seaberg EC, Skolasky R Jr, et al. HIV-1, hepatitis B virus,and risk of liver-related mortality in the multicenter cohort study(MACS). Lancet 2002; 360:1921–6.
13. Kimmel PL, Barisoni L, Kopp JB. Pathogenesis and treatment of HIV-associated renal diseases: lessons from clinical and animal studies, mo-lecular pathologic correlations, and genetic investigations. Ann InternMed 2003; 139:214–26.
14. Betz ME, Gebo KA, Barber E, et al. Patterns of diagnoses in hospitaladmissions in a multistate cohort of HIV-positive adults in 2001. MedCare 2005; 43(Suppl 9):III3–14.
15. Floris-Moore M, Lo Y, Klein RS, et al. Gender and hospitalizationpatterns among HIV-infected drug users before and after the avail-ability of highly active antiretroviral therapy. J Acquir Immune DeficSyndr 2003; 34:331–7.
16. Morris A, Creasman J, Turner J, Luce JM, Wachter RM, Huang L.Intensive care of human immunodeficiency virus-infected patients dur-ing the era of highly active antiretroviral therapy. Am J Respir CritCare Med 2002; 166:262–7.
17. Kohli R, Lo Y, Homel P, et al. Bacterial pneumonia, HIV therapy, anddisease progression among HIV-infected women in the HIV Epide-miologic Research (HER) study. Clin Infect Dis 2006; 43:90–8.
18. Grau I, Pallares R, Tubau F, et al. Epidemiologic changes in bacteremicpneumococcal disease in patients with human immunodeficiency virusin the era of highly active antiretroviral therapy. Arch Intern Med2005; 165:1533–40.
19. Barry PM, Zetola N, Keruly JC, Moore RD, Gebo KA, Lucas GM.Invasive pneumococcal disease in a cohort of HIV-infected adults:incidence and risk factors, 1990–2003. AIDS 2006; 20:437–44.
20. Tumbarello M, Tacconelli E, de Gaetano Donati K, Cauda R. HIV-associated bacterial pneumonia in the era of highly active antiretroviraltherapy. J Acquir Immune Defic Syndr Hum Retrovirol 1999; 20:208–9.
21. Lohse N, Hansen AB, Jensen-Fangel S, et al. Demographics of HIV-1infection in Denmark: results from the Danish HIV Cohort Study.Scand J Infect Dis 2005; 37:338–43.
22. Jensen-Fangel S, Pedersen C, Larsen CS, Tauris P, Moller A, Obel N.Changing demographics in an HIV-infected population: results froman observational cohort study in western Denmark. Scand J Infect Dis2001; 33:765–70.
23. Pedersen CB, Gotzsche H, Moller JO, Mortensen PB. The Danish civilregistration system: a cohort of eight million persons. Dan Med Bull2006; 53:441–9.
24. Nickelsen TN. Data validity and coverage in the Danish national healthregistry: a literature review. Ugeskr Laeger 2001; 164:33–7.
25. Thomsen RW, Riis A, Norgaard M, et al. Rising incidence and persis-tently high mortality of hospitalized pneumonia: a 10-year population-based study in Denmark. J Intern Med 2006; 259:410–7.
26. Centers for Disease Control and Prevention. 1993 Revised classificationsystem for HIV infection and expanded surveillance case definition forAIDS among adolescents and adults. MMWR Recomm Rep 1992;41(RR-17):1–19.
27. Ancelle-Park R. Expanded European AIDS case definition. Lancet1993; 341:441.
28. Hirschtick RE, Glassroth J, Jordan MC, et al. Bacterial pneumonia inpersons infected with the human immunodeficiency virus: pulmonary

HIV/AIDS • CID 2008:47 (15 November) • 000
complications of HIV infection study group. N Engl J Med 1995; 333:845–51.
29. Fine MJ, Stone RA, Singer DE, et al. Processes and outcomes of carefor patients with community-acquired pneumonia: results from thepneumonia Patient Outcomes Research Team (PORT) cohort study.Arch Intern Med 1999; 159:970–80.
30. Carr A, Grund B, Neuhaus J, et al. Asymptomatic myocardial ischaemiain HIV-infected adults. AIDS 2008; 22:257–67.
31. Danish National Board of Health. Tobaksskaderaadet. 2008. Availableat: http://www.sst.dk/Forebyggelse/Alkohol_narkotika_og_tobak/To-bak/Tal_og_undersoegelser/Danskernes_rygevaner/Udvikling_2006.aspx?langpda. Accessed 1 April 2008.
32. Walmsley S. Protease inhibitor-based regimens for HIV therapy: safetyand efficacy. J Acquir Immune Defic Syndr 2007; 45(Suppl 1):S5–13.
33. Hammer SM, Saag MS, Schechter M, et al. Treatment for adult HIV
infection: 2006 recommendations of the international AIDS society—USA panel. Top HIV Med 2006; 14:827–43.
34. Brenchley JM, Price DA, Schacker TW, et al. Microbial translocationis a cause of systemic immune activation in chronic HIV infection.Nat Med 2006; 12:1365–71.
35. Mehandru S, Poles MA, Tenner-Racz K, et al. Lack of mucosal immunereconstitution during prolonged treatment of acute and early HIV-1infection. PLoS Med 2006; 3:e484.
36. Schacker TW, Brenchley JM, Beilman GJ, et al. Lymphatic tissue fibrosisis associated with reduced numbers of naive CD4+ T cells in humanimmunodeficiency virus type 1 infection. Clin Vaccine Immunol2006; 13:556–60.
37. Raffatellu M, Santos RL, Verhoeven DE, et al. Simian immunodefi-ciency virus–induced mucosal interleukin-17 deficiency promotes Sal-monella dissemination from the gut. Nat Med 2008; 14:421–8.

Mortality after Hospitalization for Pneumonia amongIndividuals with HIV, 1995–2008: A Danish Cohort StudyOle S. Søgaard1*, Nicolai Lohse2, Jan Gerstoft3, Gitte Kronborg4, Lars Østergaard1, Court Pedersen5,
Gitte Pedersen6, Henrik Toft Sørensen2, Niels Obel3
1 Department of Infectious Diseases, Aarhus University Hospital, Skejby, Denmark, 2 Department of Clinical Epidemiology, Aarhus University Hospital, Aarhus, Denmark,
3 Department of Infectious Diseases, Rigshospitalet, Copenhagen, Denmark, 4 Department of Infectious Diseases, Copenhagen University Hospital, Hvidovre, Denmark,
5 Department of Infectious Diseases, Odense University Hospital, Odense, Denmark, 6 Department of Infectious Diseases, Aarhus University Hospital, Aalborg, Denmark
Abstract
Background: HIV–infected persons are at increased risk of pneumonia, even with highly active antiretroviral treatment(HAART). We examined the impact of pneumonia on mortality and identified prognostic factors for death among HIV–infected.
Methodology/Principal Findings: In a nationwide, population-based cohort of individuals with HIV, we included personshospitalized with pneumonia from the Danish National Hospital Registry and obtained mortality data from the Danish CivilRegistration System. Comparing individuals with and without pneumonia, we used Poisson regression to estimate relativemortality and logistic regression to examine prognostic factors for death following pneumonia. From January 1, 1995, toJuly 1, 2008, we observed 699 episodes of first hospitalization for pneumonia among 4,352 HIV patients. Ninety-daymortality after pneumonia decreased from 22.4% (95% confidence interval [CI]: 16.5%–28.9%) in 1995–1996 to 8.4% (95% CI:6.1%–11.6%) in 2000–2008. Mortality remained elevated for more than a year after hospitalization for pneumonia: adjustedmortality rate ratio 5.38 (95% CI: 4.27–6.78), 1.80 (95% CI: 1.36–2.37), and 1.62 (95% CI: 1.32–2.00) for days 0–90, 91–365, and366+, respectively. The following variables predicted mortality within 90 days following hospitalization for pneumonia(adjusted Odds Ratios): male sex (3.77, 95% CI: 1.37–10.4), Charlson Comorbidity Index score $2 (3.86, 95% CI: 2.19–6.78); nocurrent HAART (3.58, 95% CI: 1.83–6.99); history of AIDS (2.46, 95% CI: 1.40–4.32); age per 10 year increase (1.43, 95% CI:1.11–1.85); and CD4+ cell count #200 (2.52, 95% CI: 1.37–4.65).
Conclusions/Significance: The first hospitalization for pneumonia among HIV–infected individuals was associated withelevated risk of death up to more than a year later. Use of HAART decreased the risk, independent of current CD4+ cellcount. Prognosis following pneumonia improved over calendar time.
Citation: Søgaard OS, Lohse N, Gerstoft J, Kronborg G, Østergaard L, et al. (2009) Mortality after Hospitalization for Pneumonia among Individuals with HIV, 1995–2008: A Danish Cohort Study. PLoS ONE 4(9): e7022. doi:10.1371/journal.pone.0007022
Editor: Sean Emery, University of New South Wales, Australia
Received May 4, 2009; Accepted August 20, 2009; Published September 14, 2009
Copyright: � 2009 Søgaard et al. This is an open-access article distributed under the terms of the Creative Commons Attribution License, which permitsunrestricted use, distribution, and reproduction in any medium, provided the original author and source are credited.
Funding: The Danish HIV Cohort study receives grant support from the Danish AIDS Foundation, Rigshospitalet, Odense University Hospital, Preben and AnnaSimonsens Foundation, the Foundation of the Danish Association of Pharmacists, and the Clinical Institute at the University of Southern Denmark. The fundershad no role in study design, data collection and analysis, decision to publish, or preparation of the manuscript.
Competing Interests: Niels Obel has received research funding from Roche, Bristol-Myers Squibb, Merck Sharp & Dohme, GlaxoSmithKline, Abbott, BoehringerIngelheim, Janssen-Cilag and Swedish Orphan. Jan Gerstoft has received research funding from Abbott, Roche, Bristol-Myers Squibb, Merk Sharp & Dohme,Pharmasia, GlaxoSmithKline, Swedish Orphan and Boehringer Ingelheim. Ole S. Søgaard, Nicolai Lohse, Gitte Kronborg, Lars Østergaard, Court Pedersen, GittePedersen, Henrik Toft Sørensen have reported no conflicts of interest.
* E-mail: [email protected]
Introduction
Early in the HIV epidemic it was recognized that morbidity and
mortality due to pneumonia were higher in HIV-infected persons than
in the general population [1]. In 1993 the United States Centers for
Disease Control and Prevention categorized two or more episodes of
bacterial pneumonia as an AIDS-defining event [2]. The introduction
of highly active antiretroviral therapy (HAART) markedly reduced the
incidence of AIDS and death among HIV-infected persons [3,4,5],
and improved immune function also led to fewer pneumonia-related
hospitalizations [6,7]. However, more than a decade after the
widespread introduction of HAART in high-income countries, the
risk of pneumonia among HIV-infected persons remains high
compared to persons without HIV [7]. A better understanding of
modifiable prognostic factors for death after pneumonia could
potentially reduce mortality from this illness. In this cohort study we
estimated the impact of a first hospitalization for pneumonia on
mortality among Danish HIV patients, examined changes over
calendar time in mortality following hospitalization for pneumonia,
and identified prognostic factors for death following pneumonia.
Methods
Study design and settingWe conducted a nationwide, population-based cohort study
among HIV-infected persons in Denmark from 1995 to 2008.
Treatment for HIV infection in Denmark is restricted to 8
specialized centers. The Danish health care system provides free,
tax-supported medical care for all residents, including antiretro-
viral treatment of HIV.
PLoS ONE | www.plosone.org 1 September 2009 | Volume 4 | Issue 9 | e7022

The Danish HIV Cohort Study (DHCS)The DHCS has established a prospective, dynamic, nationwide,
population-based cohort of all HIV-infected individuals seen in
Danish HIV clinics since 1 January 1995. DHCS has been
described in detail elsewhere [8,9]. The study is ongoing, with
continuous enrolment of both newly diagnosed patients and
immigrants with HIV infection. Study data are updated annually
with information on antiretroviral treatment, development of
opportunistic infections and other AIDS-defining illnesses, and
laboratory data including plasma HIV RNA (viral load (VL)) and
CD4+ cell count.
Danish Civil Registration System (CRS)CRS is a national registry of all Danish residents, which
contains information on date of birth, sex, date of migration, and
date of death. A 10-digit personal registration number (CPR
number), assigned at birth, uniquely identifies each person since
1968. The CRS is updated within a week of a person’s birth,
death, or emigration. Use of the CPR number enables Danish
HIV clinics to avoid multiple registrations of the same patient and
allows tracking of deaths and persons lost to follow-up due to
emigration.
The Danish National Hospital Registry (NHR)NHR contains information on all patients discharged from
Danish hospitals since 1977. Records for each hospitalization
include CPR number, hospital department, inpatient and outpa-
tient discharge diagnoses, and dates of admission and discharge.
Diagnoses are coded by the treating physician according to the
International Classification of Diseases, 8th revision (ICD-8) until
the end of 1993 and 10th revision (ICD-10) thereafter.
Identification of pneumoniaWe identified the first hospitalization for pneumonia following
HIV diagnosis. We used the NHR to identify all hospital stays with
a discharge diagnosis of pneumonia using ICD-8 codes 471.x
(influenza with pneumonia), 480.x-486.x (pneumonia), 073.x
(ornithosis) and ICD-10 codes J11.0 (influenza with pneumonia),
J12.x–J18.x (pneumonia), A481.x, (ornithosis), or A709.x (legion-
ellosis). Thus, both community-acquired and hospital-acquired
pneumonias were included. The pneumonia diagnoses recorded in
the NHR were validated in a previous report [7]. Pneumonia
onset was defined as the date of hospital admission. Since we have
not validated pneumonia diagnoses in emergency room and
outpatient settings, outpatient diagnoses were not included. AIDS-
defining Pneumocystis jiroveci pneumonia was not counted as an
episode of pneumonia.
Study populationOur study population consisted of persons in DHCS who were
at least 16 years old on the date of HIV diagnosis and who had no
recorded hospitalization for pneumonia before entering DHCS.
Study subjects were followed from their registration in DHCS to
death, loss to follow-up or 1 July 2008, whichever came first.
DefinitionsHAART was defined as either a 3-drug regimen that included a
non-nucleoside reverse transcriptase inhibitor, a protease inhibi-
tor, and/or abacavir; or a 2-drug regimen with a combination of a
non-nucleoside reverse transcriptase inhibitor and a boosted
protease inhibitor.
CD4+ cell counts and viral load (VL) were estimated between
measurements by carrying forward the value from the most recent
measurement. Nadir CD4+ cell count was defined as the lowest CD4+
cell count ever measured for a given patient.
Comorbidity was assessed with the Charlson Comorbidity Index
(CCI). The index, which includes 19 major disease categories, has
been adapted and validated for use with hospital discharge data in
ICD databases for predicting short- and long-term mortality [10]. A
CCI score was computed for each patient based on all available
foregoing NHR discharge diagnoses. A previous AIDS diagnosis
(conferring 6 CCI points) was not included in our computations [11].
Hepatitis C co-infection was defined as patients having at least 1
positive result on a hepatitis C virus (HCV)-antibody test or a
positive result on HCV RNA test.
The endpoint, defined a priori, was all-cause mortality following
the hospital admission date for pneumonia. Causes of death,
extracted from patient files and available in the DHCS database,
were divided into HIV-related causes (AIDS-defining illnesses and
bacterial infections, corresponding to ICD-10 codes A02, A07.2–
07.3, A15–19, A31, A81.2, B00, B20–25, B37–39, B45, B58, C46,
C53, C83.4,C83.9, F02.4, and J13–17 [pneumonia]), serious non–
AIDS causes (cardiovascular disease [i.e. myocardial infarction or
stroke], end stage renal and liver disease, COPD, and non-AIDS-
defining malignancies), unnatural causes (i.e. drug overdose,
suicide, accident) and other/unknown causes.
Statistical analysesWe first computed 30-day and 90-day cumulative mortality
following the first hospitalization for pneumonia and constructed
Kaplan-Meier survival curves, stratified into 3 calendar periods:
1995–1996 (‘‘pre-HAART era’’), 1997–1999 (‘‘early HAART
era’’), and 2000–2008 (‘‘late HAART era’’).
We then assessed the effect of a first hospitalization for
pneumonia on mortality. We compared the mortality rate in
persons who had no previous history of pneumonia (reference
group) with that of persons with a first hospitalization for
pneumonia within the last 0–90 days, within the last 91–365
days, and more than 365 days ago. Poisson regression analysis was
used to adjust for potential confounders. The following time-
dependent variables were forced into the model based on their
presumed association with pneumonia and/or effect on mortality:
CCI score (0–1/2+), age (10-year intervals), and CD4+ cell count
(continuous). Other variables were examined and included in the
final model if they changed the effect measure by 10% or more.
Constant variables were sex (male/female), hepatitis C coinfection
(yes/no), injection drug use (IDU) as presumed mode of HIV
infection (yes/no), and race (Caucasian/non-Caucasian). Time-
dependent variables were history of AIDS (yes/no), current
HAART (yes/no), years since entering the DHCS, and calendar
time period (1995–96 vs. 1997–2008). Causes of death were
tabulated for all four time periods.
Finally, we used logistic regression to identify prognostic factors
for 30-day and 90-day mortality following hospitalization for
pneumonia. In the unadjusted analyses we included all the
variables listed above as of the time of admission, as well as log-
transformed HIV RNA (continuous). In the adjusted analyses of
30-day and 90-day mortality we included all variables from the
unadjusted analyses in the models, except: nadir CD4+ cell count
because this variable and history of AIDS are interdependent
(adjustment for nadir CD4+ cell count thus could cancel out the
effect of previous AIDS); IDU as mode of HIV exposure which is
interdependent with hepatitis C status; and HIV RNA which is
interdependent with use of HAART.
We used Stata software, version 9.2 (StataCorp, College Station,
TX, USA) for statistical analyses. The study was approved by the
Danish Data Protection Agency. In Denmark, a national board
HIV Mortality from Pneumonia
PLoS ONE | www.plosone.org 2 September 2009 | Volume 4 | Issue 9 | e7022

(The Danish Data protection Agency) approved the studies.
Informed consent was waived. Informed consent was not required
by Danish law in order to conduct cohort studies.
Results
DHCS study populationBetween 1 January 1995 and 1 July 2008, 699 episodes of an
initial hospitalization for pneumonia were observed among 4,352
persons who were at least 16 years old and had no recorded
hospitalization for pneumonia before entering the DHCS cohort.
Characteristics of persons in our study population at the time of
the initial hospitalization for pneumonia are shown in Table 1.
Less than half (43.3%) received HAART and the median CD4+cell count was 281 cells/ml.
Impact of hospitalization for pneumonia on survivalamong HIV patients
Overall 30-day risk of death after first hospitalization for
pneumonia was 6.4% (95% CI: 4.8%–8.5%) (see Figure 1). It was
7.9% (95% CI: 4.6%–13.5%) in 1995–1996, 7.6% (95% CI:
4.1%–13.6%) in 1997–1999, and 5.5% (95% CI: 3.7%–8.2%) in
2000–2008. Overall 90-day risk of death was 12.0% (95% CI:
9.8%–14.7%), decreasing from 22.4% (95% CI: 16.5%–28.9%) in
1995–1996 to 11.4% (95% CI: 7.0%–18.1%) in 1997–1999, and
to 8.4% (95% CI: 6.1%–11.6%) in 2000–2008.
The effect of first-time hospitalization for pneumonia on
mortality among all HIV-infected persons is shown in Table 2.
Adjusting for use of HAART, history of AIDS, years since entering
the DHCS, CCI score, age, and current CD4+ cell count, the
relative mortality during the first 90 days after an initial
hospitalization for pneumonia, compared to those with no previous
hospitalization for this indication, was 5.38 (adjusted mortality rate
ratio [MRRadj], 95% CI: 4.27–6.78). Mortality was also elevated for
days 91–365 (MRRadj = 1.80, 95% CI: 1.36–2.37) and days 366+(MRRadj = 1.62, 95% CI: 1.32–2.00). Causes of death for persons in
all four time strata are presented in Table 3. Among those who died
within days 0–90, days 91–365, and after 365 days, 61.9%, 53.7%,
and 28.8%, respectively, had an HIV-related cause of death.
Prognostic factors for short-term mortality followinghospitalization for pneumonia
In the adjusted logistic regression analysis, the following
variables were associated with increased 30-day mortality after a
first hospitalization for pneumonia (Table 4): CCI score $2
(ORadj = 4.07, 95% CI: 2.03–8.17), male sex (ORadj = 3.86, 95%
CI: 1.05–14.2), no current HAART (ORadj = 3.19, 95% CI: 1.42–
7.16), history of AIDS (ORadj = 2.78, 95% CI: 1.34–5.78), latest
CD4+ cell count #200 cells/ml (ORadj = 2.72, 95% CI: 1.28–5.78)
and age (ORadj = 1.53 per 10 year increase, 95% CI: 1.11–2.12).
Variables associated with increased 90-day mortality were
(Table 5): CCI score $2 (ORadj = 3.86, 95% CI: 2.19–6.78), male
sex (ORadj = 3.77, 95% CI: 1.37–10.4), no current HAART
(ORadj = 3.56, 95% CI: 1.83–6.99), previous AIDS (ORadj = 2.46,
95% CI: 1.40–4.32), CD4+ cell count #200 (ORadj = 2.52, 95%
CI: 1.37–4.65) and age (ORadj = 1.43 per 10 year increase, 95%
CI: 1.11–1.85). Among patients on HAART neither the duration
of HAART use or HIV RNA (,50 vs. $50 copies/mL) were
protective (data not shown).
Discussion
This study found that short-term mortality after a first hospital-
ization for pneumonia among HIV-infected individuals decreased
from the pre-HAART to the late-HAART era. Despite this decrease
over time, an episode of hospitalization due to pneumonia remains
associated with an increased mortality among HIV patients.
Prognostic factors were male sex, age, pre-existing comorbidity, low
CD4 cell count, older age, and absence of HAART treatment.
Several studies have shown that persons on HAART have a reduced
Table 1. Baseline charactaristics of HIV–infected individualsat time of first admission for pneumonia.
VariableNumbers(N = 699)
Median age, years (interquartile range) 42.2 (35.2–50.1)
Sex, n (%)
Female 146 (20.9)
Male 553 (79.1)
Race, n (%)
Caucasian 588 (84.2)
Black 73 (10.5)
Asian 12 (1.7)
Inuit 10 (1.4)
Other 15 (2.2)
Mode of HIV exposure, n (%)
MSM 299 (42.8)
Heterosexual 204 (29.2)
IV drug use 147 (21.0)
Other 28 (4.0)
Unknown 21 (3.0)
Hepatitis C co-infected, n (%)
Yes 191 (27.3)
No 508 (72.7)
History of AIDS, n (%)
Yes 236 (33.8)
No 463 (66.2)
Years since entering DHCSa,(interquartile range)
3.30 (1.18–7.01)
On HAART, n (%)
Yes 403 (57.7)
No 296 (43.3)
Median current CD4+ cell countb,cells/ml (interquartile range)
281 (117–462)
Median days since last CD+ cellcount measurement, (interquartile range)
47 (17–87)
Nadir CD4+ cell count, cells/ml(interquartile range)
139 (48–240)
Median HIV RNAa, log(copies/ml),(interquartile range)
On HAART 1.6 (1.3–4.1)
HAART-naı̈ve 4.6 (4.0–5.0)
Median days since last HIV RNAmeasurement, (interquartile range)
48 (19–85)
Charlson Comorbidity Index score, n (%)
0–1 532 (76.1)
$2 167 (23.9)
aDHCS: Danish HIV Cohort Study.bLast measurement before date of pneumonia.doi:10.1371/journal.pone.0007022.t001
HIV Mortality from Pneumonia
PLoS ONE | www.plosone.org 3 September 2009 | Volume 4 | Issue 9 | e7022
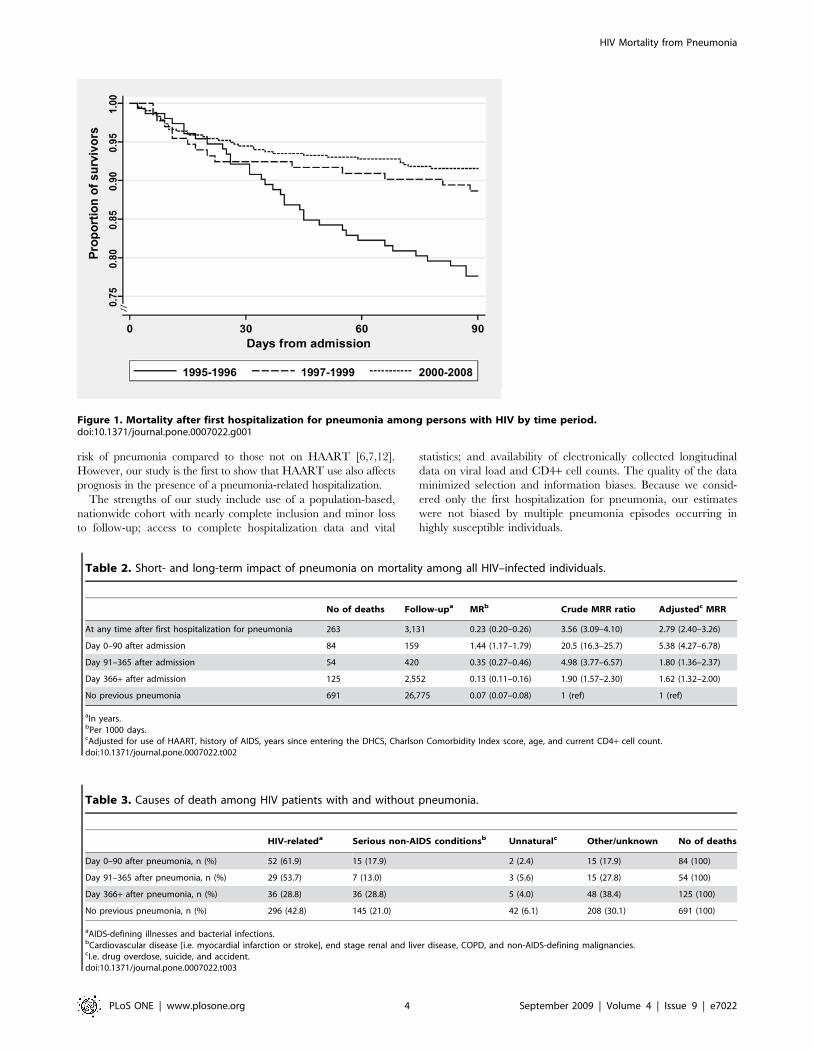
risk of pneumonia compared to those not on HAART [6,7,12].
However, our study is the first to show that HAART use also affects
prognosis in the presence of a pneumonia-related hospitalization.
The strengths of our study include use of a population-based,
nationwide cohort with nearly complete inclusion and minor loss
to follow-up; access to complete hospitalization data and vital
statistics; and availability of electronically collected longitudinal
data on viral load and CD4+ cell counts. The quality of the data
minimized selection and information biases. Because we consid-
ered only the first hospitalization for pneumonia, our estimates
were not biased by multiple pneumonia episodes occurring in
highly susceptible individuals.
Figure 1. Mortality after first hospitalization for pneumonia among persons with HIV by time period.doi:10.1371/journal.pone.0007022.g001
Table 2. Short- and long-term impact of pneumonia on mortality among all HIV–infected individuals.
No of deaths Follow-upa MRb Crude MRR ratio Adjustedc MRR
At any time after first hospitalization for pneumonia 263 3,131 0.23 (0.20–0.26) 3.56 (3.09–4.10) 2.79 (2.40–3.26)
Day 0–90 after admission 84 159 1.44 (1.17–1.79) 20.5 (16.3–25.7) 5.38 (4.27–6.78)
Day 91–365 after admission 54 420 0.35 (0.27–0.46) 4.98 (3.77–6.57) 1.80 (1.36–2.37)
Day 366+ after admission 125 2,552 0.13 (0.11–0.16) 1.90 (1.57–2.30) 1.62 (1.32–2.00)
No previous pneumonia 691 26,775 0.07 (0.07–0.08) 1 (ref) 1 (ref)
aIn years.bPer 1000 days.cAdjusted for use of HAART, history of AIDS, years since entering the DHCS, Charlson Comorbidity Index score, age, and current CD4+ cell count.doi:10.1371/journal.pone.0007022.t002
Table 3. Causes of death among HIV patients with and without pneumonia.
HIV-relateda Serious non-AIDS conditionsb Unnaturalc Other/unknown No of deaths
Day 0–90 after pneumonia, n (%) 52 (61.9) 15 (17.9) 2 (2.4) 15 (17.9) 84 (100)
Day 91–365 after pneumonia, n (%) 29 (53.7) 7 (13.0) 3 (5.6) 15 (27.8) 54 (100)
Day 366+ after pneumonia, n (%) 36 (28.8) 36 (28.8) 5 (4.0) 48 (38.4) 125 (100)
No previous pneumonia, n (%) 296 (42.8) 145 (21.0) 42 (6.1) 208 (30.1) 691 (100)
aAIDS-defining illnesses and bacterial infections.bCardiovascular disease [i.e. myocardial infarction or stroke], end stage renal and liver disease, COPD, and non-AIDS-defining malignancies.cI.e. drug overdose, suicide, and accident.doi:10.1371/journal.pone.0007022.t003
HIV Mortality from Pneumonia
PLoS ONE | www.plosone.org 4 September 2009 | Volume 4 | Issue 9 | e7022

Our study had a number of limitations. First, previous studies
have found identifiable bacterial pathogens in 24%–38% of HIV-
infected patients with pneumonia [13,14]. As data on specific
pathogens were not available, we do not know the percentage of
pneumonia cases in our study population caused by bacteria and
how this may have affected prognosis. Second, causes of death
registered in DHCS were based on information extracted from
medical records. Thus the exact cause of death may be uncertain
or, in some cases, multifactorial. For this reason we chose to group
causes of death into broader categories to determine whether HIV
was the key factor. We were unable to adjust for use of
opportunistic infection prophylaxis, smoking status, and/or
pneumococcal vaccination status since these data were not
available in DHCS database. Our results are restricted to
inpatients. Finally, despite our efforts to control for potential
confounders, it is possible that the observed protective effect of
HAART was due to confounding by indication (i.e., patients on
HAART had an a priori reduced risk of death for example due to a
healthier lifestyle compared to HAART-naı̈ve patients).
The incidence rates of pneumonia in HIV-infected individuals
decreased from 51 hospitalizations per 1000 person-years during
1995–1996 to 20 hospitalizations per 1000 person-years during
2005–2007 [7]. In our study population, 30-day mortality did not
change over calendar time and was comparable to the mortality
risk of 6%–8% following pneumonia found in other studies of
HIV-infected persons [6,13], and consistent with the finding that
most pneumonia-related deaths occur within 30 days of hospital
admission [15].
Contrary to studies on invasive pneumococcal disease [16], we
found a decline in 90-day mortality from the pre-HAART era to
the HAART era. We even may have underestimated the decline in
mortality over calendar time because the median age in our cohort
increased from 1995 to 2008. Therefore, while the acute course of
pneumonia has change little over time, the reduction in 90-day
mortality may be due to reduced risk of death from sequelae
following the initial episode of pneumonia [17], perhaps stemming
from a general improvement in immune function after introduc-
tion of HAART.
In a study of non-HIV infected individuals aged 40–64
hospitalized for the first time with pneumonia, 30-day mortality
was 7.8%, and 90-day mortality was 11.6% [18]. These estimates
are comparable to what we found in HIV-infected individuals.
Table 4. Prognostics factors associated with 30-day mortality after first hospitalization for pneumonia among HIV–infectedindividuals.
30 day mortality
n Deaths Mortality (%) OR (95% CI) p ORadj (95% CI)a Coefficient (SE) p
Intercept 27.29 (1.11)
Age (per 10 year increase) 699 45 6.4 1.47 (1.13–1.90) 0.004 1.53 (1.11–2.12) 0.43 (0.17) 0.010
CD4+ cell countb ,200 cells/ml No 411 16 3.9 1 (ref) 1 (ref) 0 (ref)
Yes 241 27 11.1 3.11 (1.64–5.91) 0.001 2.72 (1.28–5.78) 1.00 (0.38) 0.009
missing data 47 2 4.3 1.10 (0.24–4.93) 0.904 1.50 (0.29–7.74) 0.40 (0.84) 0.631
Charlson Comorbidty index 0–1 532 20 3.8 1 (ref) 1 (ref) 0 (ref)
$2 167 25 15.0 4.51 (2.43–8.35) ,0.001 4.07 (2.03–8.17) 1.40 (0.36) ,0.001
History of AIDS No 236 18 3.9 1 (ref) 1 (ref) 0 (ref)
Yes 463 27 11.4 3.19 (1.72–5.93) ,0.001 2.78 (1.34–5.78) 1.02 (0.37) 0.006
On HAART Yes 347 17 4.9 1 (ref) 1 (ref) 0 (ref)
No 352 28 7.9 1.68 (0.90–3.12) 0.103 3.19 (1.42–7.16) 1.16 (0.41) 0.005
Sex Female 146 3 2.0 1 (ref) 1 (ref) 0 (ref)
Male 553 42 7.6 3.92 (1.20–12.8) 0.024 3.86 (1.05–14.2) 1.35 (0.66) 0.042
Race Non-caucasian 111 5 4.5 1 (ref) 1 (ref) 0 (ref)
Caucasian 588 40 6.8 1.55 (0.60–4.01) 0.369 0.47 (0.16–1.43) 20.75 (0.57) 0.185
Calender period 1995–1996 152 12 7.9 1 (ref) 1 (ref) 0 (ref)
1997–2008 547 33 6.0 0.75 (0.38–1.49) 0.409 0.61 (0.23–1.57) 20.50 (0.49) 0.305
Hepatitis C co-infected No 31 6.1 1 (ref) 1 (ref) 0 (ref)
Yes 14 7.3 1.22 (0.63.2–34) 0.556 1.58 (0.74–3.39) 0.46 (0.39) 0.240
Mode of HIV exposure Non-IDU 552 35 6.3 1 (ref)
IDU 147 10 6.8 1.08 (0.52–2.23) 0.839 … … …
699 45 6.4 0.78 (0.61–0.99) 0.046 … … …
Nadir CD4+ cell count(per 100 cells/ml decrease)
HIV RNA, (per log10 increasein copies/ml)b
On HAART 403 24 6.0 2.76 (0.40–19.2) 0.304 … … …
HAART-naı̈ve 296 21 7.1 0.36 (0.02.5.57) 0.468 … … …
aThis logistic regression model is adjusted for all variables in the table except: IDU as mode of HIV exposure which is interdependent to hepatitis C status, Nadir CD4+cell count which is interdependent to AIDS and HIV RNA which is interdependent to use of HAART.
bLast measurement before date of pneumonia. adj = Adjusted; OR = Odds Ratio; CI = Confidence Interval.doi:10.1371/journal.pone.0007022.t004
HIV Mortality from Pneumonia
PLoS ONE | www.plosone.org 5 September 2009 | Volume 4 | Issue 9 | e7022

Further, the overall impact on risk of death following a first
hospitalization pneumonia was similar to the increased risk
recently reported for ‘‘mild’’ AIDS-defining events (i.e., pulmonary
and extrapulmonary tuberculosis, pneumocystis jiroveci (carinii)
pneumonia and esophageal candidiases) [19].
Others have found a four to five-fold increased risk of death
(follow-up #51 months) among HIV-infected persons with
pneumonia, compared to those without pneumonia [6,13], which
is in accordance with our findings. Contrary to other studies [20],
however, we found that the increased risk of death persisted
beyond one year. Although unmeasured confounding factors
cannot be ruled out as a contributory cause of the increased long
term risk of death, pneumonia could also be viewed as a marker of
immune system frailty that may not be reflected by the CD4+ cell
count.
We found that HAART use improved the prognosis after a
pneumonia-related hospitalization also after adjusting for CD4+cell count, which is in line with results from earlier studies
[21,22,23]. In a CD4+ cell-count-adjusted subgroup analysis from
the Strategies for Management of Antiretroviral Therapy
(SMART) trial, the risk of opportunistic diseases and death was
increased in HAART-naı̈ve patients or those off-HAART for 6
months compared to those with suppressed HIV viral load in
plasma [21]. In an observational study of asymptomatic HIV
patients with CD4+ counts of 351 to 500 cells/ml, deferring
HAART vs. initiating early HAART was associated with a
mortality ratio of 1.7 [23]. Brenchley and colleagues demonstrated
that microbial translocation and immune activation were higher
among HAART-naı̈ve than those on HAART [24]. Whether
increased immune activation influences an individual’s ability to
survive a serious infection such as pneumonia remains to be
determined.
We observed a lower short term mortality among females than
males. In the HIV Epidemiologic Research (HER) Study on
pneumonia Kohli et al. found in-hospital mortality after bacterial
pneumonia to be 7.7% among females [6,7]. In our study, in
which only 20.9% of the subjects were females, 30 day mortality
was very low (2.0% compared to 7.6% for males). All-cause
mortality rates may be moderately lower among females than
males with HIV [4], but the considerable effect of gender on short
term mortality found in our study may have been caused by
chance and should be interpreted with caution.
In conclusion, a first hospitalization for pneumonia in HIV-
infected individuals predicted an increased risk of death beyond
one year. Among those hospitalized with pneumonia, use of
HAART was associated with a reduced risk of death, independent
Table 5. Prognostics factors for 90-day mortality after first hospitalization for pneumonia among HIV–infected individuals.
90 day mortality
n Deaths Mortality (%) OR (95% CI) p ORadj (95% CI)a Coefficient (SE) p
Intercept 26.82 (1.01)
Age (per 10 year increase) 699 84 12.0 1.36 (1.11–1.66) 0.003 1.43 (1.11–1.85) 0.36 (0.13) 0.007
CD4+ cell countb ,200 cells/ml No 411 28 6.8 1 (ref) 1 (ref) 0 (ref)
Yes 241 49 20.3 3.49 (2.13–5.73) ,0.001 2.52 (1.37–4.65) 0.93 (0.31) 0.003
missing data 47 7 14.9 2.39 (0.98–5.83) 0.055 1.91 (0.67–5.43) 0.65 (0.53) 0.223
Charlson Comorbidty index 0–1 532 44 8.2 1 (ref) 1 (ref) 0 (ref)
$2 167 40 24.0 3.49 (2.18–5.59) ,0.001 3.86 (2.19–6.78) 1.35 (0.29) ,0.001
History of AIDS No 236 35 7.6 1 (ref) 1 (ref) 0 (ref)
Yes 463 49 20.8 3.20 (2.01–5.11) ,0.001 2.46 (1.40–4.32) 0.90 (0.29) 0.002
On HAART Yes 347 25 7.2 1 (ref) 1 (ref) 0 (ref)
No 352 59 16.8 2.59 (1.58–4.25) ,0.001 3.58 (1.83–6.99) 1.27 (0.34) ,0.001
Sex Female 146 5 3.4 1 (ref) 1 (ref) 0 (ref)
Male 553 79 14.3 4.40 (1.79–10.9) 0.001 3.77 (1.37–10.4) 1.33 (0.52) 0.010
Race Non-caucasian 111 5 4.5 1 (ref) 1 (ref) 0 (ref)
Caucasian 588 79 13.4 3.29 (1.30–8.32) 0.012 1.15 (0.41–3.24) 0.14 (0.53) 0.791
Calender period 1995–1996 152 34 22.4 1 (ref) 1 (ref) 0 (ref)
1997–2008 547 50 9.1 0.35 (0.22–0.56) ,0.001 0.80 (0.39–1.64) 20.22 (0.36) 0.548
Hepatitis C co-infected No 508 63 12.4 1 (ref) 1 (ref) 0 (ref)
Yes 191 21 11.0 0.87 (0.52–1.47) 0.610 1.13 (0.61–2.11) 0.12 (0.32) 0.701
Mode of HIV exposure Non-IDU 552 66 12.0 1 (ref)
IDU 147 8 12.3 1.03 (0.59–1.79) 0.924 … … …
Nadir CD4+ cell count(per 100 cells/ml decrease)
699 84 12.0 1.38 (1.13–1.69) 0.002 … … …
HIV RNA, (per log10 increasein copies/ml)b
On HAART 403 39 9.2 2.27 (0.43–12.1) 0.337 … … …
HAART-naı̈ve 296 45 14.9 0.24 (0.03–2.18) 0.206 … … …
aThis logistic regression model was adjusted for all variables in the table except: IDU as mode of HIV exposure which is interdependent to hepatitis C status, Nadir CD4+cell count which is interdependent to AIDS and HIV RNA which is interdependent to use of HAART.
bLast measurement before date of pneumonia. adj = Adjusted; OR = Odds Ratio; CI = Confidence Interval.doi:10.1371/journal.pone.0007022.t005
HIV Mortality from Pneumonia
PLoS ONE | www.plosone.org 6 September 2009 | Volume 4 | Issue 9 | e7022
of CD4 cell counts. While the former finding may indicate that
acquisition of pneumonia is a marker of frailty, the latter may
indicate that this frailty can be partly offset by use of HAART.
These findings support the need for additional research to assess
the role of HAART in reducing morbidity and mortality
associated with non-AIDS-defining infections. Promotion of early
HAART initiation may not only lead to reduced mortality after
pneumonia, it may also reduce the risk of acquiring pneumonia
severe enough to require hospitalization [6,7]. Finally, it is
reassuring that the prognosis following pneumonia has improved
over calendar time.
Acknowledgments
The authors thank the staff of their clinical departments for their
continuous support and enthusiasm.
Author Contributions
Conceived and designed the experiments: OSS NL HS NO. Performed the
experiments: OSS. Analyzed the data: OSS NL HS. Contributed reagents/
materials/analysis tools: OSS JG GK L CP GP NO. Wrote the paper: OSS
NL JG GK L CP GP HS NO.
References
1. Polsky B, Gold JW, Whimbey E, Dryjanski J, Brown AE, et al. (1986) Bacterialpneumonia in patients with the acquired immunodeficiency syndrome. Ann
Intern Med 104: 38–41.2. (1992) 1993 revised classification system for HIV infection and expanded
surveillance case definition for AIDS among adolescents and adults. MMWR
Recommendations and reports: Morbidity and mortality weekly report 41: 1–19.3. Hogg RS, Heath KV, Yip B, Craib KJ, O’Shaughnessy MV, et al. (1998)
Improved survival among HIV-infected individuals following initiation ofantiretroviral therapy. JAMA 279: 450–454.
4. Lohse N, Hansen AB, Pedersen G, Kronborg G, Gerstoft J, et al. (2007) Survival
of persons with and without HIV infection in Denmark, 1995-2005. Ann InternMed 146: 87–95.
5. Palella FJ, Jr., Delaney KM, Moorman AC, Loveless MO, Fuhrer J, et al. (1998)Declining morbidity and mortality among patients with advanced human
immunodeficiency virus infection. HIV Outpatient Study Investigators.
N Engl J Med 338: 853–860.6. Kohli R, Lo Y, Homel P, Flanigan TP, Gardner LI, et al. (2006) Bacterial
pneumonia, HIV therapy, and disease progression among HIV-infected womenin the HIV epidemiologic research (HER) study. Clin Infect Dis 43: 90–98.
7. Sogaard OS, Lohse N, Gerstoft J, Kronborg G, Ostergaard L, et al. (2008)Hospitalization for Pneumonia among Individuals With and Without HIV
Infection, 1995-2007: A Danish Population-Based, Nationwide Cohort Study.
Clin Infect Dis 47: 1347–1353.8. Obel N, Engsig FN, Rasmussen LD, Larsen MV, Omland LH, et al. (2008)
Cohort Profile: The Danish HIV Cohort Study. Int J Epidemiol.9. Lohse N, Hansen AB, Jensen-Fangel S, Kronborg G, Kvinesdal B, et al. (2005)
Demographics of HIV-1 infection in Denmark: results from the Danish HIV
Cohort Study. Scand J Infect Dis 37: 338–343.10. de Groot V, Beckerman H, Lankhorst GJ, Bouter LM (2003) How to measure
comorbidity. a critical review of available methods. J Clin Epidemiol 56:221–229.
11. Charlson ME, Pompei P, Ales KL, MacKenzie CR (1987) A new method ofclassifying prognostic comorbidity in longitudinal studies: development and
validation. J Chronic Dis 40: 373–383.
12. Gordin FM, Roediger MP, Girard PM, Lundgren JD, Miro JM, et al. (2008)Pneumonia in HIV-infected persons: increased risk with cigarette smoking and
treatment interruption. Am J Respir Crit Care Med 178: 630–636.13. Hirschtick RE, Glassroth J, Jordan MC, Wilcosky TC, Wallace JM, et al. (1995)
Bacterial pneumonia in persons infected with the human immunodeficiency
virus. Pulmonary Complications of HIV Infection Study Group. N Engl J Med333: 845–851.
14. Fine MJ, Stone RA, Singer DE, Coley CM, Marrie TJ, et al. (1999) Processesand outcomes of care for patients with community-acquired pneumonia: results
from the Pneumonia Patient Outcomes Research Team (PORT) cohort study.
Arch Intern Med 159: 970–980.15. Mortensen EM, Coley CM, Singer DE, Marrie TJ, Obrosky DS, et al. (2002)
Causes of death for patients with community-acquired pneumonia: results fromthe Pneumonia Patient Outcomes Research Team cohort study. Arch Intern
Med 162: 1059–1064.
16. Grau I, Pallares R, Tubau F, Schulze MH, Llopis F, et al. (2005) Epidemiologicchanges in bacteremic pneumococcal disease in patients with human
immunodeficiency virus in the era of highly active antiretroviral therapy. ArchIntern Med 165: 1533–1540.
17. Mortensen EM, Kapoor WN, Chang CC, Fine MJ (2003) Assessment of
mortality after long-term follow-up of patients with community-acquiredpneumonia. Clin Infect Dis 37: 1617–1624.
18. Thomsen RW, Riis A, Norgaard M, Jacobsen J, Christensen S, et al. (2006)Rising incidence and persistently high mortality of hospitalized pneumonia: a
10-year population-based study in Denmark. J Intern Med 259: 410–417.19. Mocroft A, Sterne JA, Egger M, May M, Grabar S, et al. (2009) Variable impact
on mortality of AIDS-defining events diagnosed during combination antiretro-
viral therapy: not all AIDS-defining conditions are created equal. Clin Infect Dis48: 1138–1151.
20. Kaplan V, Clermont G, Griffin MF, Kasal J, Watson RS, et al. (2003)Pneumonia: still the old man’s friend? Arch Intern Med 163: 317–323.
21. Emery S, Neuhaus JA, Phillips AN, Babiker A, Cohen CJ, et al. (2008) Major
clinical outcomes in antiretroviral therapy (ART)-naive participants and in thosenot receiving ART at baseline in the SMART study. J Infect Dis 197:
1133–1144.22. Mocroft A, Ledergerber B, Katlama C, Kirk O, Reiss P, et al. (2003) Decline in
the AIDS and death rates in the EuroSIDA study: an observational study.Lancet 362: 22–29.
23. Kitahata MM, Gange SJ, Abraham AG, Merriman B, Saag MS, et al. (2009)
Effect of Early versus Deferred Antiretroviral Therapy for HIV on Survival.N Engl J Med.
24. Brenchley JM, Price DA, Schacker TW, Asher TE, Silvestri G, et al. (2006)Microbial translocation is a cause of systemic immune activation in chronic HIV
infection. Nature Med 12: 1365–1371.
HIV Mortality from Pneumonia
PLoS ONE | www.plosone.org 7 September 2009 | Volume 4 | Issue 9 | e7022
1
Morbidity and Risk of Subsequent Diagnosis of
HIV Infection: A Population Based Case Control
Study Identifying Indicator Diseases for HIV
infection
Ole S. Søgaard, research scientist,1 Nicolai Lohse, research scientist,2 Lars Østergaard, head,1
Gitte Kronborg, senior consultant,3 Birgit Røge, medical doctor,4 Jan Gerstoft, senior consultant,5
Henrik Toft Sørensen, head2 and associate professor,6 and Niels Obel, senior consultant,5
1Department of Infectious Diseases, Aarhus University Hospital, Skejby, Denmark
2Department of Clinical Epidemiology, Aarhus University Hospital, Aarhus, Denmark
3Department of Infectious Diseases, Copenhagen University Hospital, Hvidovre, Denmark
4Department of Infectious Diseases, Odense University Hospital, Odense, Denmark
5Department of Infectious Diseases, Rigshospitalet, Copenhagen, Denmark
6Department of Epidemiology, Boston University School of Public Health, Boston, Massachusetts
Word counts: abstract 255; manuscript: 3,096
Corresponding author:
Ole S Søgaard, MD,
Department of Infectious Diseases, Aarhus University Hospital - Skejby
Brendstrupgaardvej 100, 8200 Aarhus N, Denmark
Tel.: +45 8949 8492 Fax: +45 8949 8490 E-mail: [email protected]

2
ABSTRACT
Objective To examine associations between diseases diagnosed in hospitals and risk of
subsequent HIV diagnosis.
Design Population-based case control study.
Setting All hospitals in Denmark.
Participants Cases were persons with incident HIV infection diagnosed in Denmark between 1
January 1995 and 1 June 2008. Risk-set sampling was used to identify 19 age- and gender-
matched population controls for each HIV case, using the HIV diagnosis date as the index date for
both cases and controls.
Main outcome measures Prior hospital diagnoses were obtained from Danish medical databases.
These diagnoses were first categorized into 22 major disease categories (excluding AIDS-defining
diseases except tuberculosis) and then subdivided them into 161 subcategories, allowing us to
examine specific diseases as potential HIV indicators by conditional logistic regression.
Results The study included 2,036 HIV cases and 35,718 controls. Persons with the following
disease categories had a high risk of HIV diagnosis during the subsequent 5-year period: sexually
transmitted infections and viral hepatitis (adjusted odds ratio [aOR]=12.3 (95% CI, 9.60 to 15.7),
haematological diseases (aOR=4.28 (3.13 to 5.85)), lower respiratory tract infections (aOR=3.98
(3.14 to 5.04)), CNS infections (aOR=3.44 (1.74 to 6.80)), skin infections (aOR=3.05, (2.47 to
3.75)), other infections (aOR=4.64 (3.89 to 5.54)), and substance abuse (aOR=2.60, (2.06 to
3.29)). Several specific diseases were associated with aORs >20 including syphilis, hepatitis A,
non “A” viral hepatitis, herpes zoster, candida infection, endocarditis, thrombocytopenia, and opioid
abuse.

3
Conclusion: Targeted testing for HIV in patients diagnosed with diseases associated with HIV
may lead to earlier treatment and thereby reduced morbidity, mortality and HIV transmission.

4
INTRODUCTION
Despite three decades of concerted effort, the HIV epidemic remains a tremendous public health
challenge in both low- and high-income countries.1 2 Many individuals newly diagnosed with HIV
present at a late stage of the disease with severe immune depletion, resulting in delayed initiation
of antiretroviral therapy (ART) which worsens their prognosis3 and increases further transmission
of HIV.4-6 Recently, the European Center for Disease Control and Prevention's Dublin Declaration
Progress Report 2010 concluded that “the rates of late diagnosis remain unacceptably high” in
Europe and Central Asia.7 Thus, intensified HIV testing and treatment has been advocated to lower
the prevalence of undiagnosed HIV infection and to control the HIV epidemic.8 9
The U.S. Centers for Disease Control and Prevention (CDC) recommend routine HIV testing for all
persons under age 65 who come into contact with the US health care system.10 While this
approach may be cost-effective in areas with high HIV prevalence11 and does prolong life
expectancy,3 alternative approaches such as targeted HIV testing may be more appropriate in
other settings with lower HIV prevalence or in different health care systems.2
Targeted HIV testing based on risk groups (e.g. injecting drug users [IDU])12, presence of AIDS-
defining illnesses, or coming from a high-HIV prevalence country is practised in most European
countries.13 However, many opportunities for HIV testing are missed by the health care system
prior to HIV diagnosis.14 In 2007, the pan-European initiative "HIV in Europe" recommended that
targeted testing based on the presence of diseases associated with HIV, so-called indicator
diseases,15 should be developed as an additional tool to guide targeted HIV testing. HIV indicator
diseases may be a result of individual risk behaviours or coexisting HIV infection. Several studies
have identified indicator diseases within a narrow spectrum of conditions,16-19 but to date there has
been no comprehensive study of HIV indicator diseases. In the absence of adequate data,
guidance is based mainly on expert opinion.15 There is substantial information regarding the
prevalence of indicator diseases in the HIV-infected population. In contrast, the relative risk of HIV
5
among patients with indicator diseases remains poorly described. The goal of this study was to
delineate medical conditions that identify individuals at increased risk of subsequent HIV diagnosis.
METHODS
We conducted a population-based nested case control study among persons with and without an
incident HIV diagnosis in Denmark. The adult population of Denmark is 4.3 million with an
estimated HIV infection prevalence of 0.09%.20 The Danish healthcare system provides free, tax-
supported medical care for all residents, including antiretroviral treatment of HIV.
Data sources
The civil registration system (CRS) number, assigned at birth, uniquely identifies each person living
in Denmark since 1968 and is used for personal identification in all Danish administrative and
medical databases. Further, those who live or work in Denmark legally for a certain amount of time
must register with the CRS. We used this unique 10-digit CRS-number to link data among the
following registries: The Danish HIV Cohort Study (DHCS) is a prospective, open, nationwide,
population-based cohort of all HIV-infected individuals receiving care in Danish HIV clinics since 1
January 1995.20 The study is ongoing, with continuous enrolment of newly diagnosed patients. The
Danish Civil Registration System records demographic information, vital status, and immigration
and emigration dates for all Danish citizens beginning in 1967.21 The Danish National Registry of
Patients (DNRP) contains information on all patients discharged from Danish hospitals since
1977.22 It includes diagnoses coded by the treating physician according to the International
Classification of Diseases, 8th revision (ICD-8) up to the end of 1993 and according to the 10th
revision (ICD-10) thereafter. The registry covers public as well as private hospitals and so
constitutes a virtually complete population-based database. The Danish Cancer Registry (DCR)
has recorded all incident cancers in Denmark since 1943, classifying cancers registered after 1977
according to ICD-10.23

6
Study population
Cases. Cases were identified from DHCS and included all individuals who (I) were diagnosed with
HIV between 1 January 1995 and 1 June 2008; (II) were at least 16 years of age on the date of
HIV diagnosis; and (III) were living in Denmark for at least 5 years prior to HIV diagnosis.
Population controls. Controls not diagnosed with HIV were identified from the CRS using
incidence density sampling, which involves matching each case to a sample of those who are at
risk at the time of case occurrence. 24 To ensure sufficient statistical power to detect differences in
the occurrence of rare events, we sampled for each case 19 random population controls that were
alive on the HIV diagnosis date of their respective case, had the gender and were born on the date
of birth of the HIV patient. Population controls could only be sampled once. The date of HIV
diagnosis/sampling constituted the index date for both cases and controls. Controls who, according
to the CRS, had not been living in Denmark for at least 5 years prior to the index date were
excluded. Hence, although some controls (and cases) did not go to hospital in the 5-year period
prior to their sampling date / HIV diagnosis, they were all living in Denmark during this period and
therefore at risk of both exposure and outcome.
Identification of hospital diagnoses and grouping of disease categories
For all study subjects we extracted hospital diagnoses from all outpatient contacts and hospital
stays from the DNRP and DCR, up to the day prior to the index date. ICD-10 codes were the
primary source for grouping diseases. We defined 22 disease categories of interest according to
the type and anatomical location of the disease (Appendix Table 1). ICD-8 codes were translated
to the corresponding ICD-10 disease categories and first-time diagnoses were assigned to the
appropriate category. In addition, a total of 161 subcategories were created for the 22 disease
categories, allowing us to examine specific diseases as potential HIV indicators (Appendix Table
1). Except for tuberculosis, we excluded AIDS-defining diseases, because their association with
HIV infection is well established.25

7
Statistical analyses
For cases and controls, we tabulated gender, age (16 to 39 years, 40 to 49 years, 50 to 59 years,
and 60+ years), and hospital contact(s) in the 5-year period prior to the index date for each of the
22 disease categories (yes/no). For cases, the following variables were also included: race, most
likely mode of HIV acquisition, presence of AIDS25 at diagnosis, first CD4+ cell count, and HIV RNA
measurement (within 180 days of HIV diagnosis). Frequencies and percentages were computed
for all variables.
Conditional logistic regression analyses
For each of the 22 disease categories, conditional logistic regression analysis was used to
estimate odds ratios (OR), which is an unbiased estimate of the incidence rate ratio (IRR) for
subsequent HIV diagnosis; unadjusted ORs as well as ORs adjusted for the remaining 21 disease
categories were estimated.24 Observation data were subsequently stratified into three time periods
prior to the index date (less than 1 year, 1 to 2 years, and 3 to 5 years, ) to explore changes in ORs
in the years following a given disease or disease category. We used first-time diagnoses registered
within each time stratum for a given disease/disease category. Adjusted ORs were calculated for
each disease category and time period (adjusted for the remaining 21 disease categories). To
identify specific HIV-indicator diseases, we explored risk estimates for the 161 specific
subcategories within each of the 22 disease categories. We computed both unadjusted odds ratios
for each subcategory and odds ratios adjusted for other diseases within the same disease category
(Appendix Table 1). In all analyses, only first-time diagnoses for a given disease/disease category
were utilized.
The Danish Data Protection Agency approved the establishment of the cohort and the linkage
between the four registries in this study (J. no. 2008-41-1781). The study was not subject to
approval by the ethics committee because data collection did not involve direct patient contact.
8
RESULTS
We identified 2,363 individuals diagnosed with HIV between 1 January 1995 and 1 June 2008 and
38,684 controls. Of these, 327 cases and 2,966 controls were excluded because they immigrated
to Denmark less than 5 years prior to their index date. Thus, a total of 2,036 cases and 35,718
controls were included resulting in an average of 17.5 controls per case.
In the 5 years prior to their index date, there were a total of 138,416 hospital contacts for both
cases and controls, of which 34,520 represented a first-time diagnosis for one of the 22 disease
categories. Table 1 shows characteristics of cases and controls on their index date. In the 5 years
preceding the index date, 69.8% of cases (1,421 of 2,036 cases) and 53.6% of controls (19,148 of
35,718 controls) had at least one hospital contact for one of the 22 disease categories delineated
below.
Disease category and risk of subsequent HIV diagnosis
Several disease categories were associated with an increased relative risk of HIV diagnosis during
the following 5-year period (Figure 1). Persons diagnosed for the first time with a disease in the
category “sexually transmitted infections (STIs) and viral hepatitis” had the highest risk of
subsequent HIV diagnosis (adjusted OR [aOR] = 12.3 [95% CI, 9.60 to 15.7). Also persons with
infections (lower respiratory tract infections (aOR=3.98 (3.14 to 5.04)), CNS infections (aOR=3.44
(1.74 to 6.80)), skin infections (aOR=3.05 (2.47 to 3.75)), other infections (aOR=4.64 (3.89 to
5.54))), haematological diseases (aOR=4.28 (3.13 to 5.85)), non-AIDS defining cancers
(aOR=1.72 (1.24 to 2.40)), substance abuse (aOR=2.60 (2.06 to 3.29)), poisoning (aOR=2.00
(1.54 to 2.60)), ear, nose, and throat diseases (aOR=1.84 (1.53 to 2.21)), skin diseases (aOR=1.52
(1.16 to 2.01)), and gastrointestinal diseases (aOR=1.39 (1.20 to 1.60)) had higher risk of HIV
diagnosis during the following 5 years. Seven disease categories were not associated with
subsequent HIV diagnosis: eye diseases, kidney diseases, lung diseases, ischemic heart disease

9
(IHD), non-IHD vascular diseases, neurological diseases, and trauma. A decreased risk of
subsequent HIV diagnosis was found for persons with rheumatological diseases (aOR=0.72 (0.62
to 0.85), non-diabetes endocrine diseases (aOR=0.60 (0.42 to 0.86), and diabetes (aOR=0.40
(0.23 to 0.69).
Time trends in risk of HIV diagnosis following hospital contact
Figure 2 shows the relative risk of subsequent HIV in 3 time periods: <1 year, 2-3 years, and 3-5
years after each of the 22 disease categories. The time trends can be categorized in four main
groups: 1) no time trend (eye diseases, lung diseases, kidney diseases, IHD, neurological
diseases, trauma, rheumatological diseases, non-diabetic endocrine diseases, and diabetes); 2) A
highly increased risk of HIV in the first year after diagnosis and no or only a slightly increased risk
thereafter (haematological diseases, non-AIDS malignancy, skin diseases, gastrointestinal
diseases, and non-IHD vascular diseases); 3) gradually decreased risk of HIV over time (lower
respiratory tract infections, CNS infections, skin infections, other infections, and ear, nose, and
throat diseases); 4) persistently increased risk both in the short and the long term (STIs and viral
hepatitis, substance abuse, and poisoning).
Specific HIV-indicator diseases
To determine whether any specific diseases were strong indicators of subsequent HIV diagnosis,
we further divided the 22 disease categories into 161 subcategories. Table 2 reports risk estimates
for subcategories associated with at least a 3-fold elevated risk of subsequent HIV diagnosis (all
161 subcategories shown in Appendix Table 2). We found strong associations between all groups
of STIs and viral hepatitis and subsequent HIV diagnosis. Several other specific groups of
infectious diseases, including meningitis, herpes zoster, endocarditis, and malaria, were closely
associated with later HIV diagnosis. Among haematological diseases and cancers:
thrombocytopenia, anaemia, lymphadenitis, non-AIDS defining lymphomas, and secondary and

10
unspecified malignant neoplasm of lymph nodes were associated with later HIV diagnosis. Genital
cancers were not. In the group of gastrointestinal diseases, diseases of the oral cavity, liver
diseases, and fissures/abscesses of the anal cavity were strongly associated with later HIV
diagnosis. Among skin diseases, seborrheic dermatitis was associated with increased risk of HIV
diagnosis. Ischaemic heart disease, including myocardial infarction (aOR=0.81 (0.39 to 1.69)) and
other cardiovascular diseases, were not associated with later HIV diagnosis, with the notable
exception of thrombophlebitis (aOR=5.29 (3.51 to 7.96)).
Among fourteen individuals diagnosed with hepatitis A infection, 12 (85.7%) were men who had
sex with men (MSM). Five (50%) of ten cases with malaria were non-Caucasian immigrants. In 62
of 68 cases (91.2%) with opioid abuse-related diagnoses, IDU was registered as the mode of HIV
transmission.
First-time diagnoses for the 52 diseases in Table 2 represented 3,257 (1.9%) of all 138,416
hospital contacts registered in the 5 years prior to the index date. In the HIV cohort of 2,036
individuals, 782 (38.4%) had at least one hospital contact for an indicator disease, while this
occurred for only 2,475 (6.9%) of 35,718 controls. For the 1,826 cases not reporting IDU as mode
of HIV infection, 613 (34.1%) had a first-time hospital contact for diseases listed in Table 2.
DISCUSSION
We found that HIV indicator diseases identified over one-third of all individuals who would become
diagnosed with HIV in the subsequent 5-year period. Recognition of these HIV indicator diseases
could aid healthcare personnel in identifying individuals at increased risk of undiagnosed HIV. The
time-dependent association between the date of diagnosis of some disease categories and HIV
diagnosis suggests that for several categories repeated (e.g. yearly) HIV testing is advisable.

11
To our knowledge, this is the first population-based study conducted to identify HIV indicator
diseases across all disease categories. While some indicator diseases we identified were
previously recognized,15-17 26 the size of our study population and completeness of hospitalization
data allowed us to provide risk estimates with high statistical precision for the majority of disease
groups. Our results thus can be used to guide strategies for targeted HIV testing in the hospital
settings.
Our study also had some limitations. As in other observational HIV cohort studies, an unknown
proportion of people with HIV may have died without being diagnosed with the condition. Thus, we
may have underestimated the relative risk of subsequent HIV diagnosis after life-threatening
conditions such as cancer.26 Additionally, we had access only to hospital diagnoses, which may
have caused us to underestimate the occurrence of diseases diagnosed outside the hospital
system, such as syphilis, fungal skin infections, and herpes zoster. If patients at risk of HIV are
more prone to be diagnosed in a hospital setting this will lead to a potential overestimation of the
predictive value of some HIV predictor diseases if compared with those from a non-hospital setting.
Another potential shortcoming is inaccuracies in diagnoses reported to national hospital databases.
However, the positive predictive value of registry diagnoses (i.e. the proportion of subjects with a
given registry diagnosis which is correct when compared to medical records) is generally high
(70% to 99%).22 27 Furthermore, risk of subsequent HIV diagnosis may be elevated if a given
disease diagnosis increases the likelihood of HIV testing, regardless of its actual association with
HIV infection. This phenomenon would produce a close association between the timing of the
disease and HIV diagnoses. Although persons with some disease categories had increased risk of
HIV in the first year thereafter (Figure 2), the increased risk of subsequent HIV diagnosis was also
observed more than 1 year after the disease. Hence, this phenomenon could only have a
moderate effect on the 5-year estimates. Finally, it should be noted that due to our use of hospital
diagnoses, we were unable to identify clinical features that may further enhance the predictive
value of given indicator diseases (e.g. “florid or hard to treat” fungal skin infection).
12
HIV indicator diseases can be grouped into three major types. First, disease manifestations of
acute HIV infection (e.g. acute viral illness or lymphadenitis); second, diseases associated with
coexisting HIV infection (e.g. herpes zoster or thrombocytopenia); and third, diseases associated
with behaviour that increases the risk of acquiring HIV (e.g. hepatitis and opioid abuse). The latter
group is highlighted in Figure 2, which shows that disease categories related to individual risk
behaviours (e.g. STIs and viral hepatitis) are associated with an elevated risk that remained
constant over time. Other disease categories which may be related to coexisting HIV, such as
respiratory infections, haematological diseases, and non-AIDS-defining cancers, showed a highly
increased risk of HIV in the first year after the diagnosis. The close connection between the date of
hospital contact and date of HIV diagnosis suggests that the hospital contacts led to subsequent
HIV testing as part of the recommended medical work-up (e.g. following lymphoma diagnosis).15
Among specific HIV indicator diseases, acute hepatitis A virus (HAV) infection was associated with
high risk of subsequent HIV diagnosis. The strong association between acute HAV infection and
MSM suggests that HAV infection is a proxy for high-risk sexual behaviour in our study
population.28 Our data also indicate that endocrine and rheumatological diseases (except infectious
arthropathy) are associated with decreased risk of HIV which may be related to lowe-risk sexual
behaviour among individuals with these chronic diseases.29
Targeted HIV testing is practiced in many countries2 13 15 and may be more cost-effective than
universal HIV testing in low HIV prevalence regions like Denmark.30 31 However, until now the lack
of a thorough delineation of HIV indicator diseases has markedly reduced the efficacy of targeted
HIV testing 2. Another barrier to HIV screening is the acceptance of testing among patients 32.
While the acceptance of universal opt-out HIV testing among emergency department patients has
varied greatly33 34 and was as low as 24% in a recent trial,35 physician recommended HIV testing is
more acceptable for most patients.32 Thus, expanding targeted HIV testing using indicator diseases
may be an agreeable approach for patients. In our study, HIV indicator diseases could potentially
detect approximately two out of every five persons with HIV at an earlier stage. If the earlier
13
diagnosis leads to earlier ART initiation, indicator disease-based HIV screening has the potential to
reduce both HIV-related morbidity and HIV transmission.36-38 This screening strategy should of
course be added to the usual HIV screening initiatives to ensure un-delayed diagnosis of the
remaining 60% of persons with HIV. Almost one-third of cases in our study had no hospital
contacts in the 5 years prior to their HIV diagnosis. Therefore, national screening initiatives could
aim to expand current non-hospital based strategies such as community outreach programs aimed
at high-risk groups (e.g. sex workers and drug users).39 40
In conclusion, knowledge of HIV indicator diseases may optimize national HIV testing programs but
the effectiveness of indicator disease-based HIV screening needs confirmation in clinical studies.
Although the use of indicator diseases may enhance the identification of undiagnosed HIV-infected
individuals, this strategy can only be supplementary to systematic HIV testing of risk groups
identified through information about their behavioural risk-taking profiles.

14
What is already known on this subject
Certain diseases are associated with increased risk of undiagnosed HIV infection
Targeted HIV screening based on these diseases has been proposed as the next step in
controlling the HIV epidemic in Europe
However, to date, indicator diseases for HIV infection have not been delineated thoroughly
What this paper adds
HIV indicators diseases can be found within a wide range of medical specialties
Targeted HIV screening based on these newly identified indicator diseases can identify people with
undiagnosed HIV infection at an earlier disease stage, which improves their prognosis and reduces
further transmission of HIV
15
Acknowledgments
The authors thank the staff of their clinical departments for their continuous support and
enthusiasm. They also thank the Institute of Clinical Medicine at Aarhus and Copenhagen
University for founding the study.
Conflicts of interest
All authors have completed the Unified Competing Interest form at
www.icmje.org/coi_disclosure.pdf (available on request from the corresponding author) and
declare that (1) no authors have support from any companies for the submitted work; (2) all
authors have no relationships with companies that might have an interest in the submitted work in
the previous 3 years; (3) their spouses, partners, or children have no financial relationships that
may be relevant to the submitted work; and (4) all authors have no non-financial interests that may
be relevant to the submitted work.
Role of the funding sources
No funding sources had roles in the study design, data collection and analysis, decision to publish,
or preparation of the manuscript. All authors had full access to all of the data (including statistical
reports and tables) in the study and can take responsibility for the integrity of the data and the
accuracy of the data analysis. The corresponding author had the final responsibility to submit for
publication.
Contributors
OSS, NL, JG, HTS, and NO contributed to conception and design of the study. Data collection and
linkages were undertaken by OSS, LØ, GK, BR, JG, and NO. Data analysis was performed by
OSS and NL. OSS, NL, LØ, GK, BR, JG, HTS, and NO interpreted the results. OSS drafted the
report. OSS, NL, LØ, GK, BR, JG, HTS, and NO contributed to editing and review of the report.
16
Copyright
The Corresponding Author has the right to grant on behalf of all authors and does grant on behalf
of all authors, an exclusive licence (or non exclusive for government employees) on a worldwide
basis to the BMJ Publishing Group Ltd and its licensees, to permit this article (if accepted) to be
published in BMJ editions and any other BMJPG products and to exploit all subsidiary rights, as set
out in our licence.
17
REFERENCES
1. Hall HI, Song R, Rhodes P, Prejean J, An Q, Lee LM, et al. Estimation of HIV incidence in the United States. Jama 2008;300(5):520-9.
2. Coenen T, Lundgren J, Lazarus JV, Matic S. Optimal HIV testing and earlier care: the way forward in Europe. HIV Med 2008;9 Suppl 2:1-5.
3. Chadborn TR, Delpech VC, Sabin CA, Sinka K, Evans BG. The late diagnosis and consequent short-term mortality of HIV-infected heterosexuals (England and Wales, 2000-2004). Aids 2006;20(18):2371-9.
4. Donnell D, Baeten JM, Kiarie J, Thomas KK, Stevens W, Cohen CR, et al. Heterosexual HIV-1 transmission after initiation of antiretroviral therapy: a prospective cohort analysis. Lancet 2010;375(9731):2092-8.
5. Montaner JS, Lima VD, Barrios R, Yip B, Wood E, Kerr T, et al. Association of highly active antiretroviral therapy coverage, population viral load, and yearly new HIV diagnoses in British Columbia, Canada: a population-based study. Lancet 2010;376(9740):532-39.
6. Quinn TC, Wawer MJ, Sewankambo N, Serwadda D, Li C, Wabwire-Mangen F, et al. Viral load and heterosexual transmission of human immunodeficiency virus type 1. Rakai Project Study Group. N Engl J Med 2000;342(13):921-9.
7. Prevention ECfDCa. HIV testing: increasing uptake and effectiveness in the European Union.: ECDC, Stockholm 2010.
8. Marks G, Crepaz N, Janssen RS. Estimating sexual transmission of HIV from persons aware and unaware that they are infected with the virus in the USA. Aids 2006;20(10):1447-50.
9. Montaner JS, Hogg R, Wood E, Kerr T, Tyndall M, Levy AR, et al. The case for expanding access to highly active antiretroviral therapy to curb the growth of the HIV epidemic. Lancet 2006;368(9534):531-6.
10. Branson BM, Handsfield HH, Lampe MA, Janssen RS, Taylor AW, Lyss SB, et al. Revised recommendations for HIV testing of adults, adolescents, and pregnant women in health-care settings. MMWR Recomm Rep 2006;55(RR-14):1-17; quiz CE1-4.
11. Paltiel AD, Weinstein MC, Kimmel AD, Seage GR, Losina E, Zhang H, et al. Expanded screening for HIV in the United States - An analysis of cost-effectiveness. N Engl J Med 2005;352(6):586-95.
12. Mathers BM, Degenhardt L, Ali H, Wiessing L, Hickman M, Mattick RP, et al. HIV prevention, treatment, and care services for people who inject drugs: a systematic review of global, regional, and national coverage. Lancet 2010;375(9719):1014-28.
13. Mounier-Jack S, Nielsen S, Coker RJ. HIV testing strategies across European countries. HIV Med 2008;9 Suppl 2:13-9.
14. Burns FM, Johnson AM, Nazroo J, Ainsworth J, Anderson J, Fakoya A, et al. Missed opportunities for earlier HIV diagnosis within primary and secondary healthcare settings in the UK. Aids 2008;22(1):115-22.
15. Gazzard B, Clumeck N, d'Arminio Monforte A, Lundgren JD. Indicator disease-guided testing for HIV--the next step for Europe? HIV Med 2008;9 Suppl 2:34-40.
16. Bini EJ, Currie SL, Shen H, Brau N, Schmidt W, Anand BS, et al. National multicenter study of HIV testing and HIV seropositivity in patients with chronic hepatitis C virus infection. J Clin Gastroenterol 2006;40(8):732-9.
17. Bottieau E, Clerinx J, Van den Enden E, Van Esbroeck M, Colebunders R, Van Gompel A, et al. Infectious mononucleosis-like syndromes in febrile travelers returning from the tropics. J Travel Med 2006;13(4):191-7.
18. Klein D, Hurley LB, Merrill D, Quesenberry CP, Jr. Review of medical encounters in the 5 years before a diagnosis of HIV-1 infection: implications for early detection. J Acquir Immune Defic Syndr 2003;32(2):143-52.

18
19. Noskin GA, Glassroth J. Bacterial pneumonia associated with HIV-1 infection. Clin Chest Med 1996;17(4):713-23.
20. Obel N, Engsig FN, Rasmussen LD, Larsen MV, Omland LH, Sorensen HT. Cohort Profile: The Danish HIV Cohort Study. Int J Epidemiol 2008.
21. Pedersen CB, Gotzsche H, Moller JO, Mortensen PB. The Danish Civil Registration System. A cohort of eight million persons. Danish medical bulletin 2006;53(4):441-49.
22. Nickelsen TN. Data validity and coverage in the Danish National Health Registry. A literature review. Ugeskrift for laeger 2001;164(1):33-37.
23. Olsen JH, Andersen A, Dreyer L, Pukkala E, Tryggvadottir L, Gerhardsson de Verdier M, et al. Summary of avoidable cancers in the Nordic countries. APMIS Suppl 1997;76:141-6.
24. Richardson DB. An incidence density sampling program for nested case-control analyses. Occup Environ Med 2004;61(12):e59.
25. 1993 revised classification system for HIV infection and expanded surveillance case definition for AIDS among adolescents and adults. MMWR. Recommendations and reports: 1992;41(RR-17):1-19.
26. Chiao EY, Dezube BJ, Krown SE, Wachsman W, Brock MV, Giordano TP, et al. Time for oncologists to opt in for routine opt-out HIV testing? Jama 2010;304(3):334-9.
27. Sogaard OS, Lohse N, Gerstoft J, Kronborg G, Ostergaard L, Pedersen C, et al. Hospitalization for pneumonia among individuals with and without HIV infection, 1995-2007: a Danish population-based, nationwide cohort study. Clin Infect Dis 2008;47(10):1345-53.
28. Mazick A, Howitz M, Rex S, Jensen IP, Weis N, Katzenstein TL, et al. Hepatitis A outbreak among MSM linked to casual sex and gay saunas in Copenhagen, Denmark. Euro Surveill 2005;10(5):111-4.
29. Lindau ST, Gavrilova N. Sex, health, and years of sexually active life gained due to good health: evidence from two US population based cross sectional surveys of ageing. BMJ 2010;340:c810.
30. Paltiel AD, Walensky RP, Schackman BR, Seage GR, Mercincavage LM, Weinstein MC, et al. Expanded HIV screening in the United States: Effect on clinical outcomes, HIV transmission, and costs. Ann Intern Med 2006;145(11):797-806.
31. Sanders GD, Bayoumi AM, Sundaram V, Bilir SP, Neukermans CP, Rydzak CE, et al. Cost-effectiveness of screening for HIV in the era of highly active antiretroviral therapy. N Engl J Med 2005;352(6):570-85.
32. Haukoos JS, Hopkins E, Byyny RL. Patient acceptance of rapid HIV testing practices in an urban emergency department: assessment of the 2006 CDC recommendations for HIV screening in health care settings. Ann Emerg Med 2008;51(3):303-9, 09 e1.
33. Brown J, Shesser R, Simon G, Bahn M, Czarnogorski M, Kuo I, et al. Routine HIV screening in the emergency department using the new US Centers for Disease Control and Prevention Guidelines: results from a high-prevalence area. J Acquir Immune Defic Syndr 2007;46(4):395-401.
34. Kendrick SR, Kroc KA, Couture E, Weinstein RA. Comparison of point-of-care rapid HIV testing in three clinical venues. Aids 2004;18(16):2208-10.
35. Haukoos JS, Hopkins E, Conroy AA, Silverman M, Byyny RL, Eisert S, et al. Routine opt-out rapid HIV screening and detection of HIV infection in emergency department patients. Jama 2010;304(3):284-92.
36. Granich RM, Gilks CF, Dye C, De Cock KM, Williams BG. Universal voluntary HIV testing with immediate antiretroviral therapy as a strategy for elimination of HIV transmission: a mathematical model. Lancet 2009;373(9657):48-57.
37. Kitahata MM, Gange SJ, Abraham AG, Merriman B, Saag MS, Justice AC, et al. Effect of Early versus Deferred Antiretroviral Therapy for HIV on Survival. N Engl J Med 2009.
38. Wood E, Kerr T, Marshall BD, Li K, Zhang R, Hogg RS, et al. Longitudinal community plasma HIV-1 RNA concentrations and incidence of HIV-1 among injecting drug users: prospective cohort study. BMJ 2009;338:b1649.

19
39. de la Fuente L, Delgado J, Hoyos J, Belza MJ, Alvarez J, Gutierrez J, et al. Increasing early diagnosis of HIV through rapid testing in a street outreach program in Spain. AIDS Patient Care STDS 2009;23(8):625-9.
40. Wolfe D, Carrieri MP, Shepard D. Treatment and care for injecting drug users with HIV infection: a review of barriers and ways forward. Lancet 2010;376(9738):355-66.

20
Table 1. Baseline characteristics* of HIV cases and HIV-uninfected controls.
Cases Controls
(n=2,036) (n=35,718)
Sex, n (%)
Female 380 (18.7) 6,555 (18.4)
Male 1,656 (81.3) 30,819 (81.6)
Age at diagnosis, n (%)
16-39 years 1,122 (55.1) 18,899 (52.91)
40-49 years 510 (25.1) 9,266 (25.9)
50-59 years 290 (14.2) 5,410 (15.2)
60+ years 114 (5.6) 2,143 (6.0)
Hospital contact, n (%)†
Yes 1,421(69.8) 19,148 (53.6)
No 615 (30.2) 16,570 (46.4)
Race, n (%)
Caucasian 1,798 (88.7) –
Black 119 (5.9) –
Asian 55 (2.7) –
Inuit 19 (0.9) –
Other 36 (1.8) –
Mode of HIV exposure, n (%)
MSM 975 (47.9) –
Heterosexual 722 (35.5) –
IDU 210 (10.3) –
Other 49 (2.4) –
Unknown 80 (3.9) –
AIDS at diagnosis, n (%)
No 1,847 (90.7) –
Yes 189 (9.3) –
First CD4+
count (cells/µL)‡
<350 999 (49.1) –
≥350 829 (40.7) –
missing 208 (10.2)
First HIV RNA measurement (copies/mL)‡
≤104 343 (16.9) –
>104 & ≤10
5 622 (30.6) –
>105
660 (32.4) –
missing 411 (20.2)
* Baseline was defined as the index date which was the date of HIV diagnosis
for cases and their corresponding controls (matched on the day the case was
diagnosed with HIV). † In the 5 years prior to the index date for at least one
of the 22 disease categories in Appendix Table 1. ‡ Within 180 days of HIV
diagnosis. The table shows data on HIV cases and HIV-uninfected controls
with at least 5 years of continuous observation prior to the index date. MSM,
men who have sex with men; IDU, injection drug use
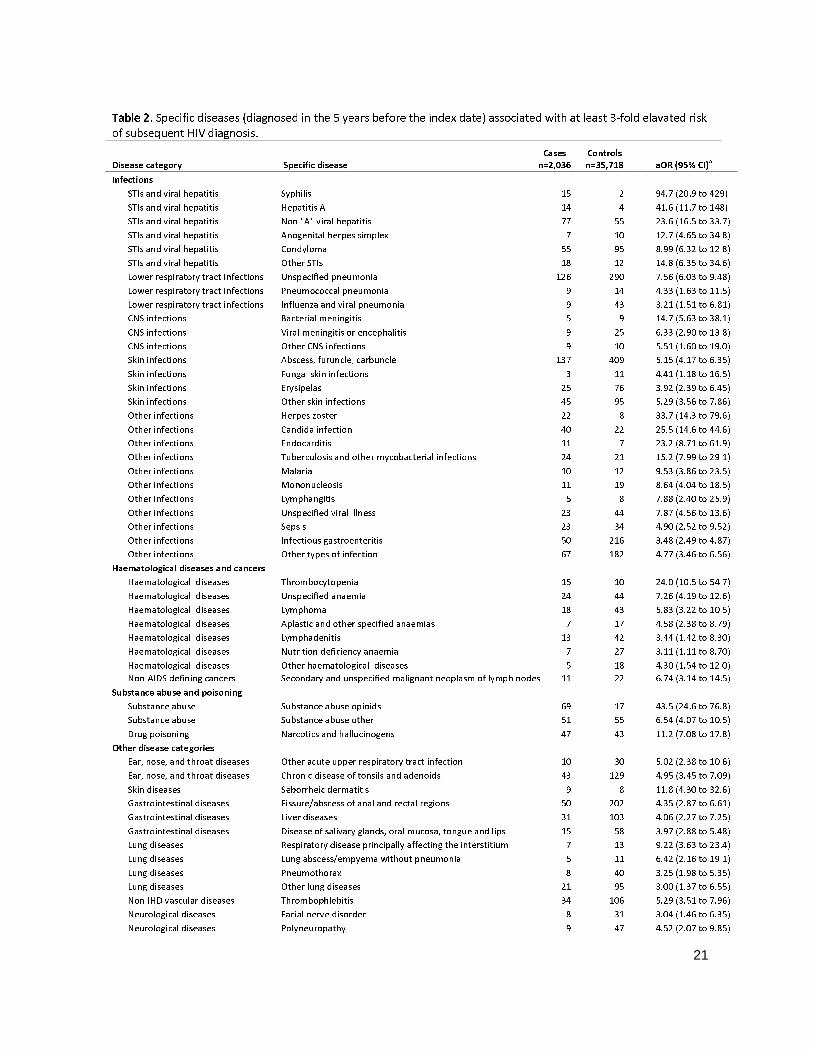
21
Table 2. Specific diseases (diagnosed in the 5 years before the index date) associated with at least 3-fold elavated risk
of subsequent HIV diagnosis.
Disease category Specific disease
Cases
n=2,036
Controls
n=35,718 aOR (95% CI)a
Infections
STIs and viral hepatitis Syphilis 15 2 94.7 (20.9 to 429)
STIs and viral hepatitis Hepatitis A 14 4 41.6 (11.7 to 148)
STIs and viral hepatitis Non "A" viral hepatitis 77 55 23.6 (16.5 to 33.7)
STIs and viral hepatitis Anogenital herpes simplex 7 10 12.7 (4.65 to 34.8)
STIs and viral hepatitis Condyloma 55 95 8.99 (6.32 to 12.8)
STIs and viral hepatitis Other STIs 18 12 14.8 (6.35 to 34.6)
Lower respiratory tract infections Unspecified pneumonia 126 290 7.56 (6.03 to 9.48)
Lower respiratory tract infections Pneumococcal pneumonia 9 14 4.33 (1.63 to 11.5)
Lower respiratory tract infections Influenza and viral pneumonia 9 43 3.21 (1.51 to 6.81)
CNS infections Bacterial meningitis 5 9 14.7 (5.63 to 38.1)
CNS infections Viral meningitis or encephalitis 9 25 6.33 (2.90 to 13.8)
CNS infections Other CNS infections 9 10 5.51 (1.60 to 19.0)
Skin infections Abscess, furuncle, carbuncle 137 409 5.15 (4.17 to 6.35)
Skin infections Fungal skin infections 3 11 4.41 (1.18 to 16.5)
Skin infections Erysipelas 25 76 3.92 (2.39 to 6.45)
Skin infections Other skin infections 45 95 5.29 (3.56 to 7.86)
Other infections Herpes zoster 22 8 33.7 (14.3 to 79.6)
Other infections Candida infection 40 22 25.5 (14.6 to 44.6)
Other infections Endocarditis 11 7 23.2 (8.71 to 61.9)
Other infections Tuberculosis and other mycobacterial infections 24 21 15.2 (7.99 to 29.1)
Other infections Malaria 10 12 9.53 (3.86 to 23.5)
Other infections Mononucleosis 11 19 8.64 (4.04 to 18.5)
Other infections Lymphangitis 5 8 7.88 (2.40 to 25.9)
Other infections Unspecified viral illness 23 44 7.87 (4.56 to 13.6)
Other infections Sepsis 23 34 4.90 (2.52 to 9.52)
Other infections Infectious gastroenteritis 50 216 3.48 (2.49 to 4.87)
Other infections Other types of infection 67 182 4.77 (3.46 to 6.56)
Haematological diseases and cancers
Haematological diseases Thrombocytopenia 15 10 24.0 (10.5 to 54.7)
Haematological diseases Unspecified anaemia 24 44 7.26 (4.19 to 12.6)
Haematological diseases Lymphoma 18 43 5.83 (3.22 to 10.5)
Haematological diseases Aplastic and other specified anaemias 7 17 4.58 (2.38 to 8.79)
Haematological diseases Lymphadenitis 13 42 3.44 (1.42 to 8.30)
Haematological diseases Nutrition deficiency anaemia 7 27 3.11 (1.11 to 8.70)
Haematological diseases Other haematological diseases 5 18 4.30 (1.54 to 12.0)
Non-AIDS defining cancers Secondary and unspecified malignant neoplasm of lymph nodes 11 22 6.74 (3.14 to 14.5)
Substance abuse and poisoning
Substance abuse Substance abuse opioids 69 17 43.5 (24.6 to 76.8)
Substance abuse Substance abuse other 51 55 6.54 (4.07 to 10.5)
Drug poisoning Narcotics and hallucinogens 47 43 11.2 (7.08 to 17.8)
Other disease categories
Ear, nose, and throat diseases Other acute upper respiratory tract infection 10 30 5.02 (2.38 to 10.6)
Ear, nose, and throat diseases Chronic disease of tonsils and adenoids 43 129 4.95 (3.45 to 7.09)
Skin diseases Seborrheic dermatitis 9 8 11.8 (4.30 to 32.6)
Gastrointestinal diseases Fissure/abscess of anal and rectal regions 50 202 4.35 (2.87 to 6.61)
Gastrointestinal diseases Liver diseases 31 103 4.06 (2.27 to 7.25)
Gastrointestinal diseases Disease of salivary glands, oral mucosa, tongue and lips 15 58 3.97 (2.88 to 5.48)
Lung diseases Respiratory disease principally affecting the interstitium 7 13 9.22 (3.63 to 23.4)
Lung diseases Lung abscess/empyema without pneumonia 5 11 6.42 (2.16 to 19.1)
Lung diseases Pneumothorax 8 40 3.25 (1.98 to 5.35)
Lung diseases Other lung diseases 21 95 3.00 (1.37 to 6.55)
Non-IHD vascular diseases Thrombophlebitis 34 106 5.29 (3.51 to 7.96)
Neurological diseases Facial nerve disorder 8 31 3.04 (1.46 to 6.35)
Neurological diseases Polyneuropathy 9 47 4.52 (2.07 to 9.85)

22
Rheumatological diseases Infectious arthropathy 14 75 3.18 (1.76 to 5.74) a
Adjusted for other diseases within the same disease category (Appendix Table 1). Risk estimates for all 161 subcategories are shown in Appendix
Table 2. aOR, adjusted odds ratio; CI, confidence interval; STIs, sexually transmitted infections; IHD, ischemic heart disease.

23
FIGURE LEGENDS
Figure 1. Association between subsequent risk of HIV diagnosis and hospital contact for 22 major
disease categories in the 5 years prior to the index date.
Figure 2. Association between risk of subsequent HIV diagnosis and time of hospital contact.

Figure 1.
Adjusted risk ratio of HIV diagnosis for 22 major disease categories with 95% con�dence intervals was determined by conditional logistic regression. Risk estimates are shown as squares with the corresponding con�dence intervals shown as lines. The analyses included cases (n=2,036) and their matched controls (n=35,718) witha minimum of 5 years of continuous follow-up prior to the index date, cases and controls. aOR, adjusted odds ratio (adjustment for all other disease categories); CI, con�dence interval; i.d., index date; STIs, sexually transmitted infections; IHD, ischaemic heart disease.
No of hospital contactsCases Controls aOR (95% CI)
InfectionsSTIs and viral hepatitisLower respiratory tract infectionsCNS infectionsSkin infectionsOther infections
Haematological diseases and cancersHaematological diseasesNon-AIDS defining cancers
Substance abuse and poisoningSubstance abusePoisoning
Other disease categoriesEar, nose, and throat diseasesSkin diseasesGastrointestinal diseasesEye diseasesLung diseasesKidney diseasesNon-IHD vascular diseasesIHDNeurological diseasesTraumaRheumatological diseasesNon-diabetic endocrine diseases
Diabetes
.3 .6 1 2 3 6 10 15Decreased risk of HIV Increased risk of HIV
n=2,036 n=35,718OR (95% CI)
170 172 18.5 (14.9 to 23.1) 12.3 (9.60 to 15.7)154 410 7.38 (6.08 to 8.97) 3.98 (3.14 to 5.04)
22 42 9.67 (5.73 to 16.4) 3.44 (1.74 to 6.80)184 643 5.40 (4.55 to 6.40) 3.05 (2.47 to 3.75)277 690 8.06 (6.94 to 9.36) 4.64 (3.89 to 5.54)
85 209 7.75 (5.98 to 10.1) 4.28 (3.13 to 5.85)57 378 2.89 (2.16 to 3.85) 1.72 (1.24 to 2.40)
165 563 5.59 (4.66 to 6.70) 2.60 (2.06 to 3.29)117 543 3.92 (3.19 to 4.82) 2.00 (1.54 to 2.60)
173 1,393 2.33 (1.97 to 2.75) 1.84 (1.53 to 2.21)89 559 2.89 (2.30 to 3.63) 1.52 (1.16 to 2.01)
313 2,776 2.20 (1.94 to 2.50) 1.39 (1.20 to 1.60)85 919 1.67 (1.33 to 2.10) 1.27 (0.98 to 1.64)75 524 2.64 (2.06 to 3.39) 1.17 (0.85 to 1.60)40 364 1.98 (1.42 to 2.75) 1.16 (0.80 to 1.69)
161 1,749 1.78 (1.50 to 2.11) 1.07 (0.87 to 1.31)29 483 1.12 (0.76 to 1.64) 0.99 (0.65 to 1.52)86 941 1.65 (1.32 to 2.07) 0.93 (0.71 to 1.22)
761 12,380 1.12 (1.02 to 1.23) 0.87 (0.78 to 0.97)246 4,220 1.04 (0.90 to 1.19) 0.72 (0.62 to 0.85)
50 755 1.20 (0.90 to 1.61) 0.60 (0.42 to 0.86)17 451 0.68 (0.42 to 1.11) 0.40 (0.23 to 0.69)
aOR (95% CI)Disease category
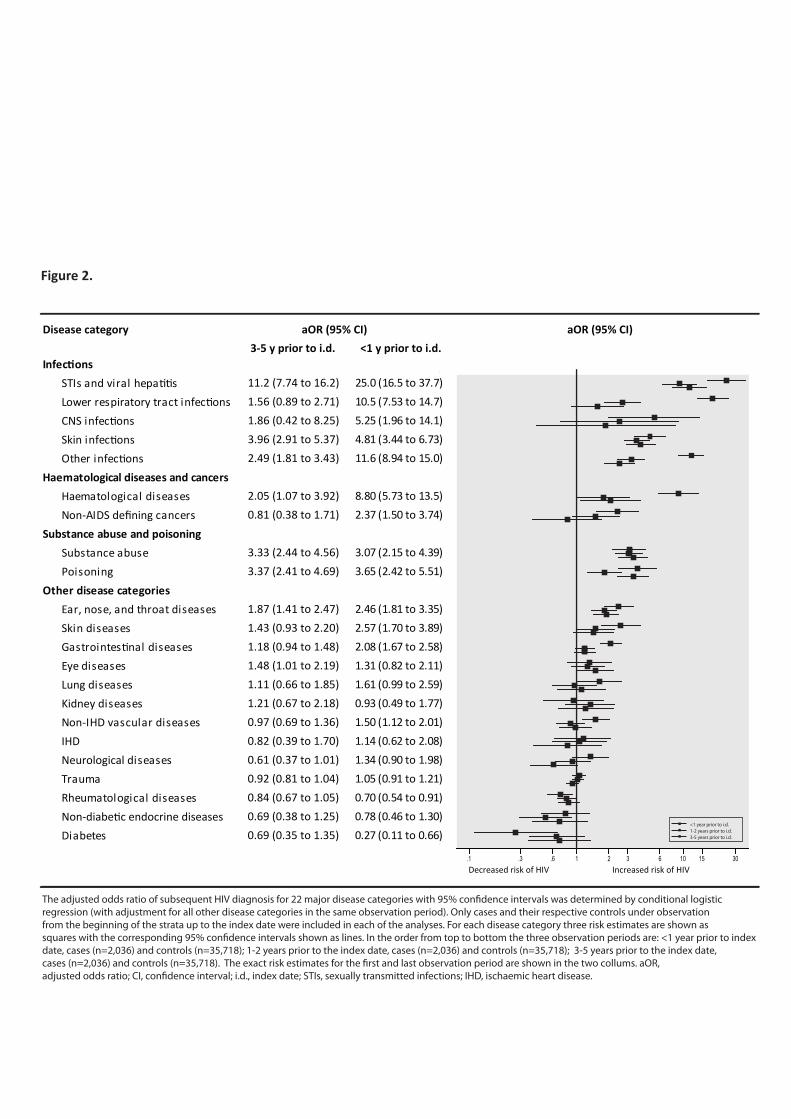
Figure 2.
aOR (95% CI)
InfectionsSTIs and viral hepatitisLower respiratory tract infectionsCNS infectionsSkin infectionsOther infections
Haematological diseases and cancersHaematological diseasesNon-AIDS defining cancers
Substance abuse and poisoningSubstance abusePoisoning
Other disease categoriesEar, nose, and throat diseasesSkin diseasesGastrointestinal diseasesEye diseasesLung diseasesKidney diseasesNon-IHD vascular diseasesIHDNeurological diseasesTraumaRheumatological diseasesNon-diabetic endocrine diseases
Diabetes
aOR (95% CI)
.3 .6 1 2 3 6 10 15Decreased risk of HIV Increased risk of HIV
.1 30
11.2 (7.74 to 16.2) 25.0 (16.5 to 37.7)1.56 (0.89 to 2.71) 10.5 (7.53 to 14.7)1.86 (0.42 to 8.25) 5.25 (1.96 to 14.1)3.96 (2.91 to 5.37) 4.81 (3.44 to 6.73)2.49 (1.81 to 3.43) 11.6 (8.94 to 15.0)
2.05 (1.07 to 3.92) 8.80 (5.73 to 13.5)0.81 (0.38 to 1.71) 2.37 (1.50 to 3.74)
3.33 (2.44 to 4.56) 3.07 (2.15 to 4.39)3.37 (2.41 to 4.69) 3.65 (2.42 to 5.51)
1.87 (1.41 to 2.47) 2.46 (1.81 to 3.35)1.43 (0.93 to 2.20) 2.57 (1.70 to 3.89)1.18 (0.94 to 1.48) 2.08 (1.67 to 2.58)1.48 (1.01 to 2.19) 1.31 (0.82 to 2.11)1.11 (0.66 to 1.85) 1.61 (0.99 to 2.59)1.21 (0.67 to 2.18) 0.93 (0.49 to 1.77)0.97 (0.69 to 1.36) 1.50 (1.12 to 2.01)0.82 (0.39 to 1.70) 1.14 (0.62 to 2.08)0.61 (0.37 to 1.01) 1.34 (0.90 to 1.98)0.92 (0.81 to 1.04) 1.05 (0.91 to 1.21)0.84 (0.67 to 1.05) 0.70 (0.54 to 0.91)0.69 (0.38 to 1.25) 0.78 (0.46 to 1.30)0.69 (0.35 to 1.35) 0.27 (0.11 to 0.66)
3-5 y prior to i.d. <1 y prior to i.d.
The adjusted odds ratio of subsequent HIV diagnosis for 22 major disease categories with 95% con�dence intervals was determined by conditional logistic regression (with adjustment for all other disease categories in the same observation period). Only cases and their respective controls under observation from the beginning of the strata up to the index date were included in each of the analyses. For each disease category three risk estimates are shown as squares with the corresponding 95% con�dence intervals shown as lines. In the order from top to bottom the three observation periods are: <1 year prior to index date, cases (n=2,036) and controls (n=35,718); 1-2 years prior to the index date, cases (n=2,036) and controls (n=35,718); 3-5 years prior to the index date, cases (n=2,036) and controls (n=35,718). The exact risk estimates for the �rst and last observation period are shown in the two collums. aOR, adjusted odds ratio; CI, con�dence interval; i.d., index date; STIs, sexually transmitted infections; IHD, ischaemic heart disease.
<1 year prior to i.d. 1-2 years prior to i.d. 3-5 years prior to i.d.
Disease category

Supplementary Table 1. International Classification of Diseases , version 8 and version 10 codes used for the analyses.
ICD‐8 codes ICD‐10 codes
Sexually transmitted infections (STI) and viral hepatitis
07000‐07099, 09000‐09999 A50‐A649, B15‐B199
SubcategorySyphilis 09000‐09799 A50‐A539Condyloma 09990‐09999 A630, A630AAnogenital herpes simplex A60‐A609Hepatitis A B15‐B159Non "A" viral hepatitis 07000‐07099 B16‐B199Other STIs 09800‐09989 A54‐A599, A61‐A629, A631‐A649
Lower respiratory tract infections (LRTI)
46600‐48699, 07399 J09‐J229, A481, A709, J851
SubcategoryBronchitis and non‐specific LRTIs 46600‐46699 J20‐J229Influenza and viral pneumonia 47000‐48099 J09‐J129Pneumococcal pneumonia 48100‐48199 J13‐J139Other bacterial pneumonia 07399, 48200‐48299 A481, A709, J14‐J159Unspecified pneumonia 48300‐48699 J16‐J189, J851
CNS infections 03609, 06200‐06599, 07929 32000‐32409
G00‐G099, A390, A81‐A899
SubcategoryBacterial meningitis 03609, 32000‐32019 A390, G00‐G019Viral meningitis or encephalitis 06200‐06599, 07929 A81‐A899Other CNS infections 32020‐32409 G02‐G099
Skin infections 68000‐68299, 68400‐68699, 03599
L00‐L039, L05‐L089, A46‐A469, B35‐B369
SubcategoryErysipelas 03599 A46‐A469, L032Pilonidal cyst 68500‐68599 L05‐L059Abscess, furuncle, carbuncle 68200‐68299 L02‐L031, L033‐L039Fungal skin infections B35‐B369Other skin infections 68000‐68199, 68400‐68499,
68600‐68699L00‐L019, L08‐L089
Other infections 00009‐03590, 03610‐06199, 06600‐06999, 07100‐07390, 07400‐07982, 07984‐08999, 10000‐13499,13600‐13609, 42100‐42199, 57193, 59009‐59099, 59500‐59509, 59700‐59709
A00‐A020, A022‐A071, A078‐A099, A15‐A310‐389, A391‐A459, A47‐A480, A482‐A499, A65‐A708,A71‐A809, A900‐B149, B25‐B251, B258‐B299, B31‐B349, B370, B372‐B379, B40‐B450, B459‐B581, B583‐B589, B60‐B999, I33‐I339, I38‐I399, I891‐I891C, K930, N10‐N129, N300‐N309, N34‐N341, N390, O230‐D0234
SubcategoryInfectious gastroenteritis 00009‐00999 A00‐A020, A022‐A071, A078‐A099Malaria 08400‐08499 B50‐B549Mononucleosis 07500‐07509 B27‐B279Candida infections B370, B372‐B379Herpes zoster 05300‐05399 B019‐B029Sepsis 03800‐03899 A40‐A419Pyolonephritis 59000‐59019 N10‐N129Cystitis 59500‐59509 N300‐N309Endocarditis 42100‐42199 I33‐I339, I38‐I399

Mycobacterial infections including tuberculosis
01100‐01999 A15‐A199, A311‐A319, B90‐B909
Lymphangitis I891‐I891CUnspecified viral illness 07999 B349Other specified infections remaining codes remaining codes
Haematological disease 20100‐20199, 28000‐28999 C81‐C833, C835‐C836, C838‐C859, D50‐D779, I880‐I889
SubcategoryNutrition deficiency anaemia 28000‐28199 D50‐D539Hemolytic anaemia 28200‐28399 D50‐D539Unspecified anaemia 28599 D649Aplastic and other specified anaemia 28400‐28589 D60‐D648Coagulation defect, purpura and non‐thrombocytopenic hemorrhagic dis.
28600‐28709, 28720‐28799 D65‐D692, D698‐D699
Thrombocytopenia 28710‐28719 D693‐D696Lymphadenitis 28910‐28939, 68300‐68399 L04‐L049, I880‐I889Lymphoma 20100‐20199 C81‐C833, C835‐C836, C838‐C859Other haematological diseases remaining codes remaining codes
Non‐AIDS defining cancers 14009‐17409, 18100‐20799 C00‐C459, C47‐C529, C54‐C833, C835‐C836, C838‐C999
SubcategoryDigestive tract cancer 14009‐15999 C00‐C269Respiratory tract cancer 16000‐16999 C30‐C399Malignant skin cancer 17200‐17399 C43‐C449Secondary and unspecified malignant neoplasm of lymph nodes
19600‐19699 C77‐C779
Genital cancer 18100‐18799 C51‐C529, C54‐C639Other cancer type remaining codes remaining codes
Substance abuse 29100‐29199, 30309‐30499 F10‐F199SubcategorySubstance abuse alcohol 29100‐29199, 30300‐30399 F10‐F109Substance abuse opiods 30400‐30419 F11‐F119Substance abuse other 30420‐30499 F12‐F199
Drug poisoning 96000‐98999 T36‐T659Subcategory (poisoning by)Narcotics and hallucinogens 96500‐96509, 96790‐96799 T40‐T409Other psychotropic drugs 97000‐97199 T43‐T439Nonopioid analgesics, antipyretics and antirheumatics
96510‐96599 T39‐T399
Antiepileptic, sedative‐hypnotic and antiparkinsonism drugs
96700‐96789 T42‐T429
Systemic antibiotics, other systemic anti‐infectives and antiparasitics
96000‐96199 T36‐T379
Alcohol 97900‐98099 T51‐T519Other substances remaining codes remaining codes
Ear, nose, and throat diseases 38000‐38999, 46000‐46599, 50000‐50999
H60‐H959, J00‐J069, J30‐J399
Acute pharyngitis and sinusitis 46100‐46299 J01‐J029Acute tonsillitis 46300‐46399 J03‐J039Other acute upper resp. tract infections
46000‐46099, 46400‐46599 J00‐J009, J04‐J069
Chronic pharyngitis and sinusitis 50200‐50399 J31‐J329Chronic disease of tonsils and adenoids 50000‐50099 J35‐J359

Peritonsilar abscess 50100‐50199 J36‐J369Other chronic upper respiratory tract disorders
50400‐50999 J30‐J309, J33‐J349, J37‐J399
Diseases of external ear 38000‐38099 H60‐H629Diseases of middle ear and mastoid 38100‐38399, 38700‐38799 H65‐H759Diseases of inner ear 38400‐38699 H80‐H839Other ear disorders 38800‐38999 H90‐H959
Skin diseases 69000‐69539, 69550‐70999 L10‐L999SubcategoryAtopic dermatitis 69100‐69199 L20‐L209Seborrhoeic dermatitis 69000‐69099 L21‐L219Other dermatitis and eczema 69200‐69299 L22‐L309Papulosquamous disorder 69600‐69799 L40‐L459Urticaria and erythema 69500‐69539, 69550‐69559,
70800‐70899L50‐L549
Other skin diseases remaining codes remaining codes
Gastrointestinal diseases 52009‐57192, 57194‐57799 K00‐K929, K931‐K939SubcategoryDisorder of jaws, teeth and supporting structures
52009‐52699 K00‐K109
Disease of salivary glands, oral mucosa, tongue and lips
52700‐52999 K11‐K149
Disease of esophagus 53000‐53099 K20‐K239Gastric, duodenal, peptic, and gastro‐jejunal ulcer
53100‐53499 K25‐K289
Gastritis and duodenitis 53500‐53599 K29‐K299Dyspepsia 53600‐53699 K30‐K309Appendicitis 54000‐54299 K35‐K379Hernia 54400‐55399 K40‐K469Non‐infective enteritis and colitis 56100‐56199 K50‐K529Fissure/abscess of anal and rectal regions
56500‐56699 K60‐K619
Other disease of intestines and peritoneum
56200‐56499, 56700‐56999 K55‐K599, K62‐K679
Liver disease 57000‐57192, 57194‐57399 K70‐K779Disorder of gallbladder and biliary tract 57400‐57699 K80‐K839Pancreatitis 57700‐57719 K85‐K862Other gastrointestinal disease remaining codes remaining codes
Eye diseases 36000‐37999 B30‐B309, H00‐H279, H281‐H359, H361‐H599
SubcategoryDisorder of eyelid, lacrimal system, and orbit
36100‐36299, 36800‐36899 H00‐H069
Conjunctivitis 36100‐36199 H10‐H109Disorder of sclera, cornea, iris, and ciliary body
36300‐36599 H15‐H229
Disorders of lens 37400‐37499 H25‐H279, H281‐H289Other eye disease remaining codes remaining codes
Lung diseases 49000‐49999, 51000‐51999 J40‐J850, J852‐J999SubcategoryChronic bronchitis 49000‐49199 J40‐J429COPD J44‐J449Asthma 49300‐49399 J45‐J469Pneumothorax 51200‐51299 J93‐J939
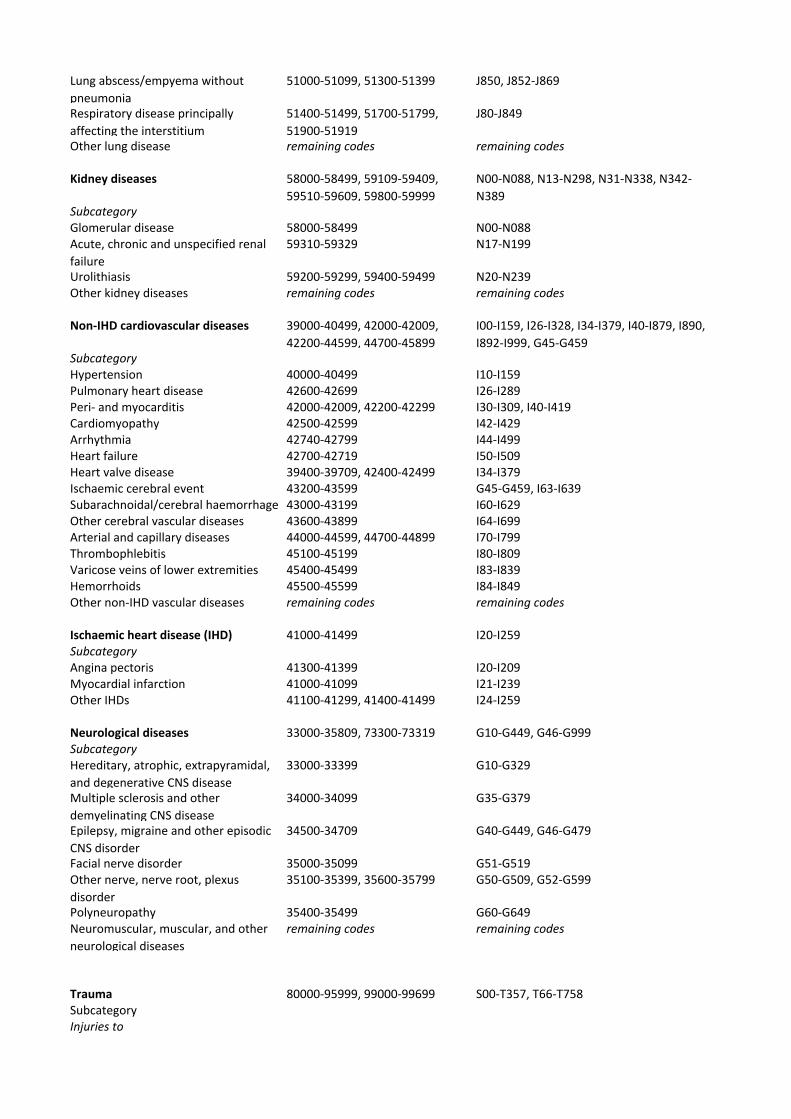
Lung abscess/empyema without pneumonia
51000‐51099, 51300‐51399 J850, J852‐J869
Respiratory disease principally affecting the interstitium
51400‐51499, 51700‐51799, 51900‐51919
J80‐J849
Other lung disease remaining codes remaining codes
Kidney diseases 58000‐58499, 59109‐59409, 59510‐59609, 59800‐59999
N00‐N088, N13‐N298, N31‐N338, N342‐N389
SubcategoryGlomerular disease 58000‐58499 N00‐N088Acute, chronic and unspecified renal failure
59310‐59329 N17‐N199
Urolithiasis 59200‐59299, 59400‐59499 N20‐N239Other kidney diseases remaining codes remaining codes
Non‐IHD cardiovascular diseases 39000‐40499, 42000‐42009, 42200‐44599, 44700‐45899
I00‐I159, I26‐I328, I34‐I379, I40‐I879, I890, I892‐I999, G45‐G459
SubcategoryHypertension 40000‐40499 I10‐I159Pulmonary heart disease 42600‐42699 I26‐I289Peri‐ and myocarditis 42000‐42009, 42200‐42299 I30‐I309, I40‐I419Cardiomyopathy 42500‐42599 I42‐I429Arrhythmia 42740‐42799 I44‐I499Heart failure 42700‐42719 I50‐I509Heart valve disease 39400‐39709, 42400‐42499 I34‐I379Ischaemic cerebral event 43200‐43599 G45‐G459, I63‐I639Subarachnoidal/cerebral haemorrhage 43000‐43199 I60‐I629Other cerebral vascular diseases 43600‐43899 I64‐I699Arterial and capillary diseases 44000‐44599, 44700‐44899 I70‐I799Thrombophlebitis 45100‐45199 I80‐I809Varicose veins of lower extremities 45400‐45499 I83‐I839Hemorrhoids 45500‐45599 I84‐I849Other non‐IHD vascular diseases remaining codes remaining codes
Ischaemic heart disease (IHD) 41000‐41499 I20‐I259SubcategoryAngina pectoris 41300‐41399 I20‐I209Myocardial infarction 41000‐41099 I21‐I239Other IHDs 41100‐41299, 41400‐41499 I24‐I259
Neurological diseases 33000‐35809, 73300‐73319 G10‐G449, G46‐G999SubcategoryHereditary, atrophic, extrapyramidal, and degenerative CNS disease
33000‐33399 G10‐G329
Multiple sclerosis and other demyelinating CNS disease
34000‐34099 G35‐G379
Epilepsy, migraine and other episodic CNS disorder
34500‐34709 G40‐G449, G46‐G479
Facial nerve disorder 35000‐35099 G51‐G519Other nerve, nerve root, plexus disorder
35100‐35399, 35600‐35799 G50‐G509, G52‐G599
Polyneuropathy 35400‐35499 G60‐G649Neuromuscular, muscular, and other neurological diseases
remaining codes remaining codes
Trauma 80000‐95999, 99000‐99699 S00‐T357, T66‐T758SubcategoryInjuries to

Head 80000‐80499, 83000‐83099, 85000‐85999, 87000‐87399, 91000‐91099, 92000‐92199
S00‐S099
Neck 80500‐80619, 87400‐87499 S10‐S199Thorax 80700‐80799, 80900‐80999,
86000‐86299, 87500‐87699, 91100‐91199, 92200‐92299
S20‐S299
Abdomen, lower back, lumbar spine, pelvis
80620‐80699, 80800‐80899, 84600‐84799, 86300‐86999, 87700‐87899
S30‐S399
Shoulder and upper arm 81000‐81299, 83100‐83199, 84000‐84099, 88000‐88099, 91200‐91299, 92300‐92399
S40‐S499
Elbow and forearm 81300‐81399, 83200‐83299, 84100‐84199, 88100‐88199, 91300‐91399, 92400‐92499
S50‐S599
Wrist and hand 81400‐81799, 83300‐83499, 84200‐84299, 88200‐88399, 88500‐88699, 91400‐91599, 92500‐92699
S60‐S699
Hip and thigh 82000‐82199, 83500‐83599, 84300‐84399, 89000‐89099
S70‐S799
Knee and lower leg 82200‐82399, 83600‐83699, 84400‐84499, 89100‐89199
S80‐S899
Ankle and foot 82400‐82699, 83700‐83899, 84500‐84599, 89200‐89399, 89500‐89699, 91700‐91799, 92800‐92899
S90‐S999
Multiple body regions or unspecified part of trunk, limb or body region
82700‐82999, 81800‐81999, 83900‐83999, 84800‐84899, 87900‐87999, 88400‐88499, 88700‐88799, 89400‐89499, 89700‐89799, 90000‐90999, 91600‐91699, 91800‐91899, 92700‐92799, 92900‐92999
T00‐S149
Effects of foreign body entering through natural orifice
93000‐93999 T15‐T199
Burns, corrosions, and frostbites 94000‐94999, 99100‐99199 T20‐T357Other/unspecified effects of external cause
99000‐99099, 99200‐99699 T66‐T758
Other injuries remaining codes remaining codes
Rheumatological diseases 44600‐44699, 69549, 71000‐73299, 73320‐73809
M00‐M999
SubcategoryInfectious arthropathy 71000‐71199, 71490 M00‐M039Inflammatory arthropathy 71200‐71299 M05‐M149Arthrosis M15‐M199Other joint disorders 71300‐71489, 71500‐71599 M20‐M259Systemic connective tissue disorders 71600‐71699, 73400‐73499,
44600‐44699M30‐M369
Dorsopathy 72500‐72699, 72800‐72899, 73500‐73599
M40‐M549
Disorder of muscle, synovium, tendon 73100‐73399 M60‐M689
Disorders of bone density and structure
72300‐72309 M80‐M859
Other rheumatological diseases remaining codes remaining codes

Non‐diabetic endocrine diseases 24000‐24609, 25100‐27909 E00‐E079, E15‐E909SubcategoryThyroid diseases 24000‐24609 E00‐E079Obesity 27700‐27799 E65‐E689Metabolic disorder 27000‐27699, 27800‐27909 E70‐E909Other endocrine disorder remaining codes remaining codes
Diabetes mellitus (DM) 24900‐25099 E10‐E149, G590, G632, H280, H360, M142, N083
SubcategoryDM insulin dependent 24900‐24999 E10‐E109DM insulin independent 25000‐25099 E11‐E119Unspecified DM E12‐E149, G590, G632, H280, H360, M142,
N083
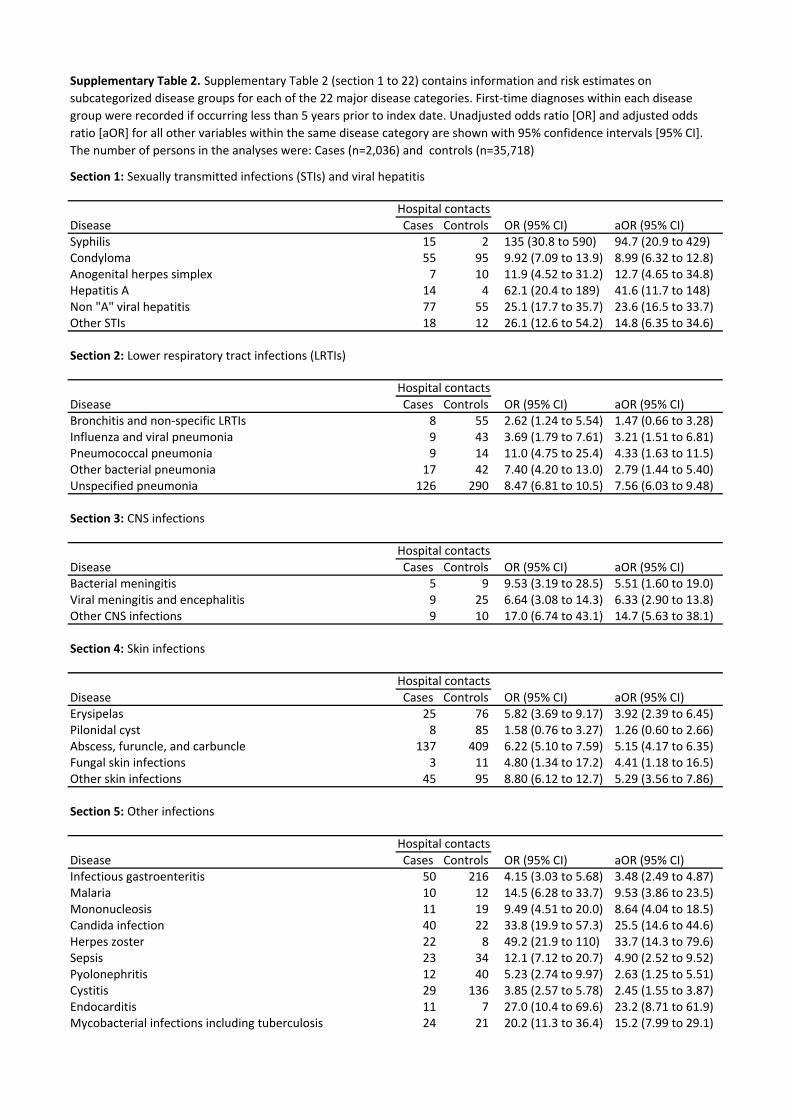
Section 1: Sexually transmitted infections (STIs) and viral hepatitis
Disease Cases Controls OR (95% CI) aOR (95% CI) Syphilis 15 2 135 (30.8 to 590) 94.7 (20.9 to 429)Condyloma 55 95 9.92 (7.09 to 13.9) 8.99 (6.32 to 12.8)Anogenital herpes simplex 7 10 11.9 (4.52 to 31.2) 12.7 (4.65 to 34.8)Hepatitis A 14 4 62.1 (20.4 to 189) 41.6 (11.7 to 148)Non "A" viral hepatitis 77 55 25.1 (17.7 to 35.7) 23.6 (16.5 to 33.7)Other STIs 18 12 26.1 (12.6 to 54.2) 14.8 (6.35 to 34.6)
Section 2: Lower respiratory tract infections (LRTIs)
Disease Cases Controls OR (95% CI) aOR (95% CI) Bronchitis and non‐specific LRTIs 8 55 2.62 (1.24 to 5.54) 1.47 (0.66 to 3.28)Influenza and viral pneumonia 9 43 3.69 (1.79 to 7.61) 3.21 (1.51 to 6.81)Pneumococcal pneumonia 9 14 11.0 (4.75 to 25.4) 4.33 (1.63 to 11.5)Other bacterial pneumonia 17 42 7.40 (4.20 to 13.0) 2.79 (1.44 to 5.40)Unspecified pneumonia 126 290 8.47 (6.81 to 10.5) 7.56 (6.03 to 9.48)
Section 3: CNS infections
Disease Cases Controls OR (95% CI) aOR (95% CI) Bacterial meningitis 5 9 9.53 (3.19 to 28.5) 5.51 (1.60 to 19.0)Viral meningitis and encephalitis 9 25 6.64 (3.08 to 14.3) 6.33 (2.90 to 13.8)Other CNS infections 9 10 17.0 (6.74 to 43.1) 14.7 (5.63 to 38.1)
Section 4: Skin infections
Disease Cases Controls OR (95% CI) aOR (95% CI) Erysipelas 25 76 5.82 (3.69 to 9.17) 3.92 (2.39 to 6.45)Pilonidal cyst 8 85 1.58 (0.76 to 3.27) 1.26 (0.60 to 2.66)Abscess, furuncle, and carbuncle 137 409 6.22 (5.10 to 7.59) 5.15 (4.17 to 6.35)Fungal skin infections 3 11 4.80 (1.34 to 17.2) 4.41 (1.18 to 16.5)Other skin infections 45 95 8.80 (6.12 to 12.7) 5.29 (3.56 to 7.86)
Section 5: Other infections
Disease Cases Controls OR (95% CI) aOR (95% CI) Infectious gastroenteritis 50 216 4.15 (3.03 to 5.68) 3.48 (2.49 to 4.87)Malaria 10 12 14.5 (6.28 to 33.7) 9.53 (3.86 to 23.5)Mononucleosis 11 19 9.49 (4.51 to 20.0) 8.64 (4.04 to 18.5)Candida infection 40 22 33.8 (19.9 to 57.3) 25.5 (14.6 to 44.6)Herpes zoster 22 8 49.2 (21.9 to 110) 33.7 (14.3 to 79.6)Sepsis 23 34 12.1 (7.12 to 20.7) 4.90 (2.52 to 9.52)Pyolonephritis 12 40 5.23 (2.74 to 9.97) 2.63 (1.25 to 5.51)Cystitis 29 136 3.85 (2.57 to 5.78) 2.45 (1.55 to 3.87)Endocarditis 11 7 27.0 (10.4 to 69.6) 23.2 (8.71 to 61.9)Mycobacterial infections including tuberculosis 24 21 20.2 (11.3 to 36.4) 15.2 (7.99 to 29.1)
Hospital contacts
Hospital contacts
Supplementary Table 2. Supplementary Table 2 (section 1 to 22) contains information and risk estimates on subcategorized disease groups for each of the 22 major disease categories. First‐time diagnoses within each disease group were recorded if occurring less than 5 years prior to index date. Unadjusted odds ratio [OR] and adjusted odds ratio [aOR] for all other variables within the same disease category are shown with 95% confidence intervals [95% CI]. The number of persons in the analyses were: Cases (n=2,036) and controls (n=35,718)
Hospital contacts
Hospital contacts
Hospital contacts
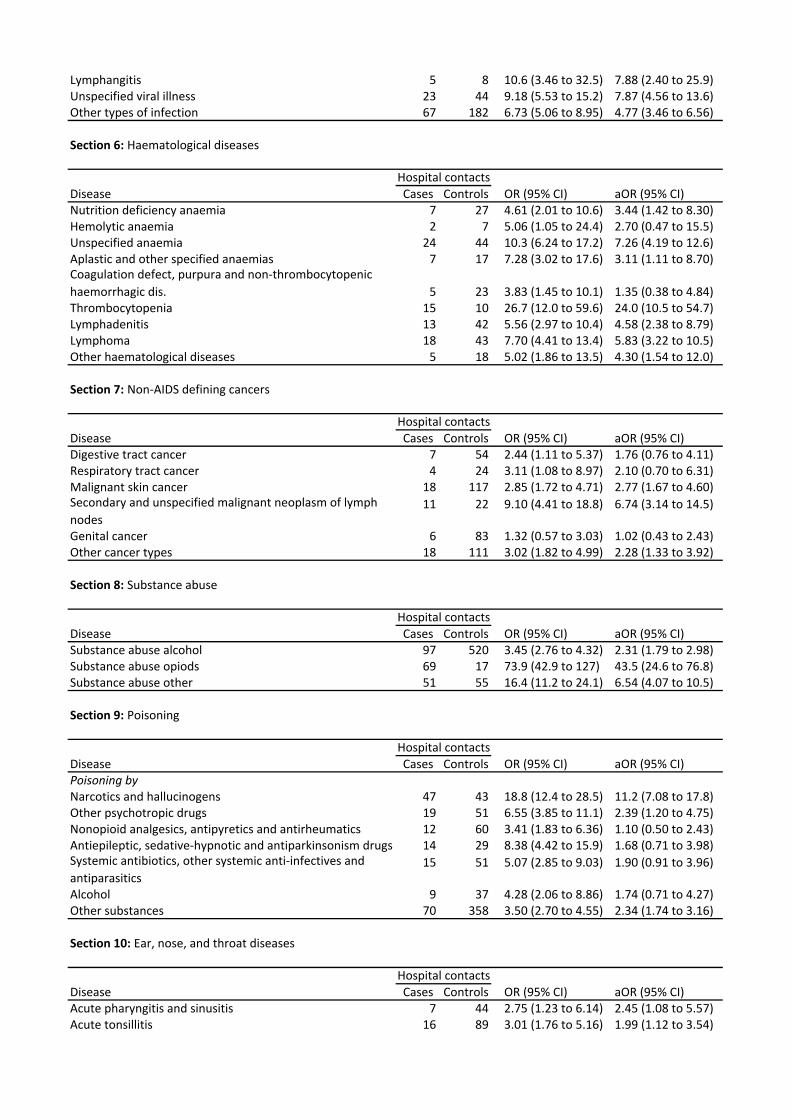
Lymphangitis 5 8 10.6 (3.46 to 32.5) 7.88 (2.40 to 25.9)Unspecified viral illness 23 44 9.18 (5.53 to 15.2) 7.87 (4.56 to 13.6)Other types of infection 67 182 6.73 (5.06 to 8.95) 4.77 (3.46 to 6.56)
Section 6: Haematological diseases
Disease Cases Controls OR (95% CI) aOR (95% CI) Nutrition deficiency anaemia 7 27 4.61 (2.01 to 10.6) 3.44 (1.42 to 8.30)Hemolytic anaemia 2 7 5.06 (1.05 to 24.4) 2.70 (0.47 to 15.5)Unspecified anaemia 24 44 10.3 (6.24 to 17.2) 7.26 (4.19 to 12.6)Aplastic and other specified anaemias 7 17 7.28 (3.02 to 17.6) 3.11 (1.11 to 8.70)Coagulation defect, purpura and non‐thrombocytopenic haemorrhagic dis. 5 23 3.83 (1.45 to 10.1) 1.35 (0.38 to 4.84)Thrombocytopenia 15 10 26.7 (12.0 to 59.6) 24.0 (10.5 to 54.7)Lymphadenitis 13 42 5.56 (2.97 to 10.4) 4.58 (2.38 to 8.79)Lymphoma 18 43 7.70 (4.41 to 13.4) 5.83 (3.22 to 10.5)Other haematological diseases 5 18 5.02 (1.86 to 13.5) 4.30 (1.54 to 12.0)
Section 7: Non‐AIDS defining cancers
Disease Cases Controls OR (95% CI) aOR (95% CI) Digestive tract cancer 7 54 2.44 (1.11 to 5.37) 1.76 (0.76 to 4.11)Respiratory tract cancer 4 24 3.11 (1.08 to 8.97) 2.10 (0.70 to 6.31)Malignant skin cancer 18 117 2.85 (1.72 to 4.71) 2.77 (1.67 to 4.60)Secondary and unspecified malignant neoplasm of lymph nodes
11 22 9.10 (4.41 to 18.8) 6.74 (3.14 to 14.5)
Genital cancer 6 83 1.32 (0.57 to 3.03) 1.02 (0.43 to 2.43)Other cancer types 18 111 3.02 (1.82 to 4.99) 2.28 (1.33 to 3.92)
Section 8: Substance abuse
Disease Cases Controls OR (95% CI) aOR (95% CI) Substance abuse alcohol 97 520 3.45 (2.76 to 4.32) 2.31 (1.79 to 2.98)Substance abuse opiods 69 17 73.9 (42.9 to 127) 43.5 (24.6 to 76.8)Substance abuse other 51 55 16.4 (11.2 to 24.1) 6.54 (4.07 to 10.5)
Section 9: Poisoning
Disease Cases Controls OR (95% CI) aOR (95% CI) Poisoning by Narcotics and hallucinogens 47 43 18.8 (12.4 to 28.5) 11.2 (7.08 to 17.8)Other psychotropic drugs 19 51 6.55 (3.85 to 11.1) 2.39 (1.20 to 4.75)Nonopioid analgesics, antipyretics and antirheumatics 12 60 3.41 (1.83 to 6.36) 1.10 (0.50 to 2.43)Antiepileptic, sedative‐hypnotic and antiparkinsonism drugs 14 29 8.38 (4.42 to 15.9) 1.68 (0.71 to 3.98)Systemic antibiotics, other systemic anti‐infectives and antiparasitics
15 51 5.07 (2.85 to 9.03) 1.90 (0.91 to 3.96)
Alcohol 9 37 4.28 (2.06 to 8.86) 1.74 (0.71 to 4.27)Other substances 70 358 3.50 (2.70 to 4.55) 2.34 (1.74 to 3.16)
Section 10: Ear, nose, and throat diseases
Disease Cases Controls OR (95% CI) aOR (95% CI) Acute pharyngitis and sinusitis 7 44 2.75 (1.23 to 6.14) 2.45 (1.08 to 5.57)Acute tonsillitis 16 89 3.01 (1.76 to 5.16) 1.99 (1.12 to 3.54)
Hospital contacts
Hospital contacts
Hospital contacts
Hospital contacts
Hospital contacts

Other acute upper respiratoty tract infections 10 30 5.91 (2.87 to 12.2) 5.02 (2.38 to 10.6)Chronic pharyngitis and sinusitis 8 53 2.68 (1.27 to 5.66) 1.95 (0.89 to 4.30)Chronic disease of tonsils and adenoids 43 129 5.68 (4.01 to 8.05) 4.95 (3.45 to 7.09)Peritonsilar abscess 13 68 3.28 (1.81 to 5.94) 2.44 (1.30 to 4.56)Other chronic upper respiratory tract disorders 28 372 1.32 (0.90 to 1.95) 1.04 (0.70 to 1.56)Diseases of external ear 9 65 2.43 (1.21 to 4.88) 1.89 (0.92 to 3.89)Diseases of middle ear and mastoid 31 154 3.56 (2.41 to 5.25) 2.88 (1.91 to 4.34)Diseases of inner ear 14 229 1.13 (0.65 to 1.94) 0.98 (0.55 to 1.73)Other ear disorders 28 398 1.30 (0.88 to 1.92) 1.15 (0.76 to 1.74)
Section 11: Skin diseases
Disease Cases Controls OR (95% CI) aOR (95% CI) Atopic dermatitis 4 28 2.43 (0.85 to 6.94) 1.40 (0.46 to 4.26)Seborrhoeic dermatitis 9 8 20.3 (7.83 to 52.6) 11.8 (4.30 to 32.6)Other dermatitis and eczema 25 120 3.73 (2.42 to 5.76) 2.83 (1.78 to 4.50)Papulo‐squamous disorder 11 68 2.93 (1.54 to 5.57) 1.68 (0.83 to 3.40)Urticaria and erythema 11 72 2.69 (1.43 to 5.08) 2.21 (1.14 to 4.29)Other skin diseases 44 314 2.50 (1.82 to 3.44) 2.11 (1.51 to 2.95)
Section 12: Gastrointestinal diseases
Disease Cases Controls OR (95% CI) aOR (95% CI) Disorder of jaws, teeth and supporting structures 33 224 2.59 (1.79 to 3.74) 2.25 (1.54 to 3.28)Disease of salivary glands, oral mucosa, tongue and lips 15 58 4.57 (2.59 to 8.07) 4.06 (2.27 to 7.25)Disease of esophagus 31 269 2.09 (1.44 to 3.05) 1.55 (1.04 to 2.32)Gastric, duodenal, peptic, and gastro‐jejunal ulcer 25 193 2.36 (1.55 to 3.58) 1.43 (0.91 to 2.26)Gastritis and duodenitis 39 211 3.36 (2.38 to 4.74) 2.33 (1.60 to 3.38)Dyspepsia 19 183 1.86 (1.16 to 2.99) 1.48 (0.90 to 2.41)Appendicitis 14 234 1.03 (0.60 to 1.77) 1.00 (0.58 to 1.72)Hernia 38 690 0.99 (0.71 to 1.38) 0.82 (0.58 to 1.15)Non‐infective enteritis and colitis 28 209 2.40 (1.62 to 3.57) 1.75 (1.14 to 2.67)Fissure/abscess of anal and rectal regions 50 202 4.41 (3.23 to 6.04) 3.97 (2.88 to 5.48)Other disease of intestines and peritoneum 42 431 1.76 (1.27 to 2.42) 1.12 (0.80 to 1.59)Liver diseases 31 103 5.42 (3.62 to 8.10) 4.35 (2.87 to 6.61)Disorder of gallbladder and biliary tract 27 248 1.97 (1.32 to 2.95) 1.53 (1.01 to 2.33)Pancreatitis 15 93 2.89 (1.67 to 5.00) 1.64 (0.92 to 2.94)Other gastrointestinal diseases 22 118 3.39 (2.14 to 5.36) 1.80 (1.09 to 2.97)
Section 13: Eye disease
Disease Cases Controls OR (95% CI) aOR (95% CI) Disorder of eyelid, lacrimal system, orbit 11 102 1.91 (1.02 to 3.58) 1.80 (0.96 to 3.39)Conjunctivitis 36 291 2.20 (1.55 to 3.13) 2.13 (1.50 to 3.04)Disorders of sclera, cornea, iris, and ciliary body 12 119 1.76 (0.97 to 3.19) 1.51 (0.82 to 2.77)Disorders of lens 6 137 0.80 (0.35 to 1.82) 0.69 (0.30 to 1.60)Other eye diseases 28 399 1.26 (0.85 to 1.85) 1.20 (0.81 to 1.78)
Section 14: Lung diseases
Disease Cases Controls OR (95% CI) aOR (95% CI) Chronic bronchitis 5 62 1.48 (0.59 to 3.69) 0.72 (0.27 to 1.92)COPD 18 109 3.19 (1.91 to 5.31) 2.69 (1.56 to 4.67)Asthma 25 272 1.62 (1.07 to 2.45) 1.33 (0.86 to 2.05)Pneumothorax 8 40 3.56 (1.66 to 7.62) 3.00 (1.37 to 6.55)
Hospital contacts
Hospital contacts
Hospital contacts
Hospital contacts

Lung abscess/empyema without pneumonia 5 11 8.00 (2.77 to 23.1) 6.42 (2.16 to 19.1)Respiratory disease principally affecting the interstitium 7 13 9.60 (3.83 to 24.1) 9.22 (3.63 to 23.4)Other lung diseases 21 95 4.03 (2.50 to 6.49) 3.25 (1.98 to 5.35)
Section 15: Kidney diseases
Disease Cases Controls OR (95% CI) aOR (95% CI) Glomerular disease 6 38 2.78 (1.17 to 6.60) 2.60 (1.03 to 6.54)Acute, chronic and unspecified renal failure 4 48 1.51 (0.55 to 4.20) 0.96 (0.32 to 2.90)Urolithiasis 17 196 1.56 (0.95 to 2.57) 1.48 (0.89 to 2.44)Other kidney diseases 14 124 2.01 (1.15 to 3.49) 1.82 (1.03 to 3.22)
Section 16: Non‐IHD cardiovascular diseases
Disease Cases Controls OR (95% CI) aOR (95% CI) Hypertension 19 504 0.69 (0.43 to 1.09) 0.58 (0.36 to 0.93)Pulmonary heart disease 7 36 3.52 (1.57 to 7.92) 1.60 (0.65 to 3.93)Peri‐ and myocarditis 2 35 1.02 (0.24 to 4.26) 0.85 (0.20 to 3.58)Cardiomyopathy 4 38 1.86 (0.66 to 5.22) 1.03 (0.33 to 3.25)Arrhythmia 22 328 1.22 (0.79 to 1.89) 1.09 (0.69 to 1.73)Heart failure 12 85 2.62 (1.42 to 4.83) 2.31 (1.16 to 4.63)Heart valve diseases 4 62 1.18 (0.43 to 3.24) 0.86 (0.30 to 2.44)Ischaemic cerebral event 19 143 2.50 (1.54 to 4.06) 2.59 (1.46 to 4.58)Subarachnoidal/cerebral haemorhage 2 46 0.78 (0.19 to 3.20) 0.63 (0.15 to 2.67)Other cerebral vascular diseases 13 158 1.54 (0.87 to 2.73) 0.96 (0.48 to 1.90)Arterial and capillary diseases 16 176 1.70 (1.01 to 2.85) 1.36 (0.79 to 2.34)Thrombophlebitis 34 106 5.87 (3.97 to 8.69) 5.29 (3.51 to 7.96)Varicose veins of lower extremities 15 192 1.41 (0.83 to 2.40) 1.23 (0.72 to 2.12)Hemorrhoids 19 217 1.57 (0.98 to 2.52) 1.56 (0.97 to 2.50)Other non‐IHD vascular diseases 14 106 2.33 (1.33 to 4.07) 1.77 (0.98 to 3.18)
Section 17: Ischemic heart disease (IHD)
Disease Cases Controls OR (95% CI) aOR (95% CI) Angina pectoris 19 331 1.07 (0.67 to 1.71) 0.97 (0.55 to 1.72)Myocardial infarction 10 195 0.95 (0.50 to 1.81) 0.81 (0.39 to 1.69)Other IHDs 16 242 1.24 (0.74 to 2.08) 1.38 (0.71 to 2.66)
Section 18: Neurological diseases
Disease Cases Controls OR (95% CI) aOR (95% CI) Hereditary, atrophic, extrapyramidal, and degenerative CNS disease 6 38 2.83 (1.19 to 6.72) 2.43 (1.00 to 5.93)Multiple sclerosis and other demyelinating CNS disease 1 49 0.37 (0.05 to 2.67) 0.36 (0.05 to 2.59)Epilepsy, migraine and other episodic CNS disorder 46 482 1.70 (1.25 to 2.31) 1.64 (1.21 to 2.24)Facial nerve disorder 8 31 4.53 (2.08 to 9.86) 4.52 (2.07 to 9.85)Other nerve, nerve root, plexus disorder 13 252 0.93 (0.53 to 1.62) 0.87 (0.50 to 1.54)Polyneuropathy 9 47 3.49 (1.71 to 7.12) 3.04 (1.46 to 6.35)Neuromuscular, muscular, and other neurological diseases 6 103 1.03 (0.45 to 2.34) 0.85 (0.37 to 1.96)
Section 19: Trauma
Disease Cases Controls OR (95% CI) aOR (95% CI) Injuries to
Hospital contacts
Hospital contacts
Hospital contacts
Hospital contacts
Hospital contacts
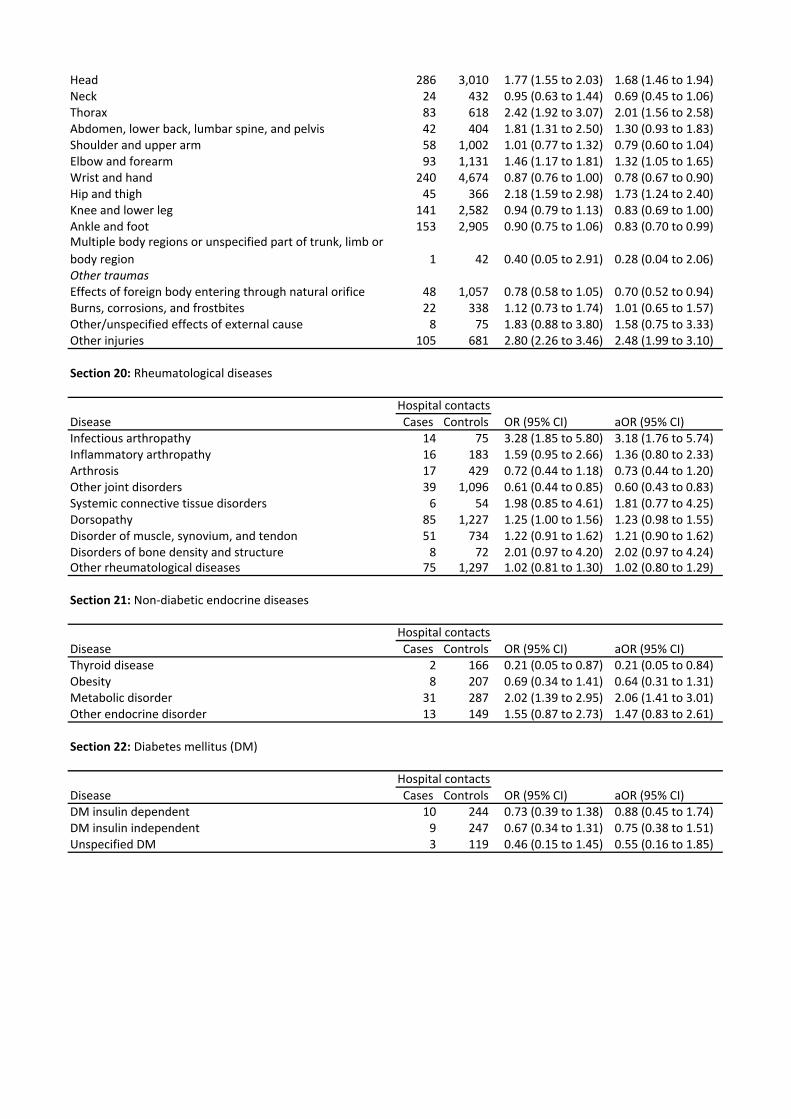
Head 286 3,010 1.77 (1.55 to 2.03) 1.68 (1.46 to 1.94)Neck 24 432 0.95 (0.63 to 1.44) 0.69 (0.45 to 1.06)Thorax 83 618 2.42 (1.92 to 3.07) 2.01 (1.56 to 2.58)Abdomen, lower back, lumbar spine, and pelvis 42 404 1.81 (1.31 to 2.50) 1.30 (0.93 to 1.83)Shoulder and upper arm 58 1,002 1.01 (0.77 to 1.32) 0.79 (0.60 to 1.04)Elbow and forearm 93 1,131 1.46 (1.17 to 1.81) 1.32 (1.05 to 1.65)Wrist and hand 240 4,674 0.87 (0.76 to 1.00) 0.78 (0.67 to 0.90)Hip and thigh 45 366 2.18 (1.59 to 2.98) 1.73 (1.24 to 2.40)Knee and lower leg 141 2,582 0.94 (0.79 to 1.13) 0.83 (0.69 to 1.00)Ankle and foot 153 2,905 0.90 (0.75 to 1.06) 0.83 (0.70 to 0.99)Multiple body regions or unspecified part of trunk, limb or body region 1 42 0.40 (0.05 to 2.91) 0.28 (0.04 to 2.06)Other traumasEffects of foreign body entering through natural orifice 48 1,057 0.78 (0.58 to 1.05) 0.70 (0.52 to 0.94)Burns, corrosions, and frostbites 22 338 1.12 (0.73 to 1.74) 1.01 (0.65 to 1.57)Other/unspecified effects of external cause 8 75 1.83 (0.88 to 3.80) 1.58 (0.75 to 3.33)Other injuries 105 681 2.80 (2.26 to 3.46) 2.48 (1.99 to 3.10)
Section 20: Rheumatological diseases
Disease Cases Controls OR (95% CI) aOR (95% CI) Infectious arthropathy 14 75 3.28 (1.85 to 5.80) 3.18 (1.76 to 5.74)Inflammatory arthropathy 16 183 1.59 (0.95 to 2.66) 1.36 (0.80 to 2.33)Arthrosis 17 429 0.72 (0.44 to 1.18) 0.73 (0.44 to 1.20)Other joint disorders 39 1,096 0.61 (0.44 to 0.85) 0.60 (0.43 to 0.83)Systemic connective tissue disorders 6 54 1.98 (0.85 to 4.61) 1.81 (0.77 to 4.25)Dorsopathy 85 1,227 1.25 (1.00 to 1.56) 1.23 (0.98 to 1.55)Disorder of muscle, synovium, and tendon 51 734 1.22 (0.91 to 1.62) 1.21 (0.90 to 1.62)Disorders of bone density and structure 8 72 2.01 (0.97 to 4.20) 2.02 (0.97 to 4.24)Other rheumatological diseases 75 1,297 1.02 (0.81 to 1.30) 1.02 (0.80 to 1.29)
Section 21: Non‐diabetic endocrine diseases
Disease Cases Controls OR (95% CI) aOR (95% CI) Thyroid disease 2 166 0.21 (0.05 to 0.87) 0.21 (0.05 to 0.84)Obesity 8 207 0.69 (0.34 to 1.41) 0.64 (0.31 to 1.31)Metabolic disorder 31 287 2.02 (1.39 to 2.95) 2.06 (1.41 to 3.01)Other endocrine disorder 13 149 1.55 (0.87 to 2.73) 1.47 (0.83 to 2.61)
Section 22: Diabetes mellitus (DM)
Disease Cases Controls OR (95% CI) aOR (95% CI) DM insulin dependent 10 244 0.73 (0.39 to 1.38) 0.88 (0.45 to 1.74)DM insulin independent 9 247 0.67 (0.34 to 1.31) 0.75 (0.38 to 1.51)Unspecified DM 3 119 0.46 (0.15 to 1.45) 0.55 (0.16 to 1.85)
Hospital contacts
Hospital contacts
Hospital contacts