
Characterizing the stress/defense transcriptome of Arabidopsis
Upload
independentCategory
view
2download
0
Global Transcriptome Analysis in Influenza-InfectedMouse Lungs Reveals the Kinetics of Innate and AdaptiveHost Immune ResponsesClaudia Pommerenke1., Esther Wilk1., Barkha Srivastava1¤, Annika Schulze1, Natalia Novoselova2,
Robert Geffers3, Klaus Schughart1*
1Department of Infection Genetics, Helmholtz Centre for Infection Research and University of Veterinary Medicine Hannover, Braunschweig, Germany, 2United Institute
of Informatics Problems, National Academy of Sciences of Belarus, Minsk, Belarus, 3 Research Group Genome Analytics, Helmholtz Centre for Infection Research,
Braunschweig, Germany
Abstract
An infection represents a highly dynamic process involving complex biological responses of the host at many levels. Todescribe such processes at a global level, we recorded gene expression changes in mouse lungs after a non-lethal infectionwith influenza A virus over a period of 60 days. Global analysis of the large data set identified distinct phases of the hostresponse. The increase in interferon genes and up-regulation of a defined NK-specific gene set revealed the initiation of theearly innate immune response phase. Subsequently, infiltration and activation of T and B cells could be observed by anaugmentation of T and B cell specific signature gene expression. The changes in B cell gene expression and precedingchemokine subsets were associated with the formation of bronchus-associated lymphoid tissue. In addition, we comparedthe gene expression profiles from wild type mice with Rag2 mutant mice. This analysis readily demonstrated that thedeficiency in the T and B cell responses in Rag2 mutants could be detected by changes in the global gene expressionpatterns of the whole lung. In conclusion, our comprehensive gene expression study describes for the first time the entirehost response and its kinetics to an acute influenza A infection at the transcriptome level.
Citation: Pommerenke C, Wilk E, Srivastava B, Schulze A, Novoselova N, et al. (2012) Global Transcriptome Analysis in Influenza-Infected Mouse Lungs Reveals theKinetics of Innate and Adaptive Host Immune Responses. PLoS ONE 7(7): e41169. doi:10.1371/journal.pone.0041169
Editor: George Kassiotis, MRC National Institute for Medical Research, United Kingdom
Received March 22, 2012; Accepted June 18, 2012; Published July 17, 2012
Copyright: � 2012 Pommerenke et al. This is an open-access article distributed under the terms of the Creative Commons Attribution License, which permitsunrestricted use, distribution, and reproduction in any medium, provided the original author and source are credited.
Funding: This work was supported by intramural grants from the Helmholtz-Association (Program Infection and Immunity) and a research grant FluResearchNet(No. 01KI07137) from the German Ministry of Education and Research to KS. The funders had no role in study design, data collection and analysis, decision topublish, or preparation of the manuscript.
Competing Interests: The authors have declared that no competing interests exist.
* E-mail: [email protected]
¤ Current address: Comprehensive Pneumology Centre, Ludwig-Maximillians University Munich, University Hospital Grosshadern, and Helmholtz ZentrumMunchen, Munchen, Germany
. These authors contributed equally to this work.
Introduction
Influenza A virus has caused major pandemics in recent human
history with millions of deaths. The most severe pandemic in 1918
resulted in about 30 million fatal casualties [1]. In addition,
seasonal influenza infections represent a major health problem
causing enormous losses of work force and deaths every year [2].
The course and outcome of an influenza A virus infection is
influenced by several viral and host factors. It is thus important to
understand the host response to an influenza infection in a more
comprehensive fashion and to relate abnormalities of the
phenotype with changes at the cellular and molecular level.
During an acute virus infection, highly dynamic and inter-
related responses are triggered in the host at multiple levels
which eventually result in clearance of the pathogen and
establishment of a long-lasting immunity. In the early phase,
infected cells and immune cells detect the presence of infectious
microbes via membrane-associated and intracellular pathogen
recognition receptors (PRRs). Activation of PRRs results in the
stimulation of signaling pathways that lead to transcription of
early response genes, mainly interferons, chemokines and
cytokines (reviewed in [3,4,5,6,7,8,9]). Chemokines and cyto-
kines are induced in the infected tissue and activate resident
immune cells, mainly macrophages and dendritic cells (DCs),
resulting in a coordinated and sustained chemokine/cytokine
production and attracting infiltrating cells of the innate immune
system, such as macrophages, granulocytes, NK cells, and DCs
(reviewed in [4,6,7,10]). The importance of NK cells for the
host response has been confirmed in mice knock-out mutants in
which the Ncr1 gene has been deleted [11]. DCs take up
antigens by direct infection or phagocytosis of infected dead
cells, migrate to the draining lymph nodes where they activate
T cells and present pathogen-specific antigens to them (reviewed
in [7,10]). This process causes the generation of antigen-specific
T cells and the production of neutralizing antibodies (reviewed
in [7,10,12,13]). Finally, through the combined action of innate
and adaptive immune responses, the infectious pathogen
becomes inactivated and cleared from the body, repair processes
start to resolve the tissue damages and long-term immunity will
PLoS ONE | www.plosone.org 1 July 2012 | Volume 7 | Issue 7 | e41169
be established, including the formation of local bronchus-
associated lymphoid tissues (reviewed in [7]).
Many individual aspects of these host-pathogen interactions
during the course of an influenza infection have been studied.
However, the dynamic changes over the entire time course of an
infection were not described yet in a single experimental setting
but rather individual aspects were studied with varying circum-
stances, experimental conditions and for limited time periods.
Here, we performed a systematic study by determining the
global changes in gene expression patterns in the lungs over
a period of 60 days in mice infected with influenza A virus,
thereby capturing the dynamics of the system and relating changes
in the transcriptome to immunological processes at the cellular
and organ level. Our studies revealed that the different phases of
the host response, such as infiltration of NK, T and B cells are well
reflected by the changes in the transcriptome. Furthermore,
analysis of gene expression changes in Rag2 mutant mice after
infection and in comparison to wild type expression profiles clearly
highlighted the deficiency in the T and B cell response in Rag2
mutant mice and verified the specificity and sensitivity of our
analyses. In conclusion, our transcriptome analysis will provide an
important basis for future systems biology studies to investigate
and model host-pathogen interactions during an acute viral
infection.
Results
Global Transcriptome Analysis of the Lung distinguishesDifferent Phases of the Host Response after InfluenzaVirus InfectionWild type C57BL/6J mice were infected with the mouse-
adapted influenza A virus PR8 (H1N1) and genome-wide gene
expression patterns were analyzed for 60 days post infection (p.i.;
Figure 1). During this time period, infected mice lost weight until
day 6–8 p.i. and subsequently started to regain body weight and
the initial weight was resumed at about 14 days p.i. (Figure 1A).
Lungs were collected from infected mice and gene expression
profiling was performed for whole lungs using microarrays. A
principal component analysis (PCA) of all preprocessed probe data
showed a temporal progression of global expression changes over
time and a high reproducibility of measurements between
biological replicates (Fig. 1B). The transcriptomes from all infected
lungs were different from mock-infected controls, and the strongest
difference to mock-infected mice was observed at day 8 p.i.
However, from day 18 to day 60 p.i., minimal changes were
observed over time but they still differed from mock-infected
controls (see also below, Expression of late host response genes indicates
lung repair processes). These observations are also reflected in the
quantitative changes of differentially expressed (DE) genes
(Figure 1C). The number of DE genes peaked at day 8 p.i. and
Figure 1. Global analysis of gene expression changes in the lungs of influenza infected C57BL/6J mice. (A) Weight loss of PR8M-infectedC57BL/6J mice over two months after infection showing mean values +/2 SEM. (B) A Principle Component Analysis (PCA) of all samples taken overthe investigated time interval on the basis of the expression of all genes was conducted and single replicates were plotted with reference to the firsttwo principal components (PC1, PC2) covering 57.3% of the variance. Symbols and colors indicate biological replicate samples prepared at the sameday p.i. from different individuals. (C) A total of 3,595 differentially expressed (DE) genes were identified over the course of two months after infection.Bars indicate the number of DE genes on each day p.i. Colors indicate the number of DE genes that were newly detected at any given day, e.g. darkred: DE genes newly identified on day 1 p.i. compared to controls; dark green: DE genes that appeared at day 8 p.i. and were not differentiallyexpressed at any time before. y-axis: total number of DE genes, x-axis: day after infection.doi:10.1371/journal.pone.0041169.g001
Influenza Host Interaction
PLoS ONE | www.plosone.org 2 July 2012 | Volume 7 | Issue 7 | e41169
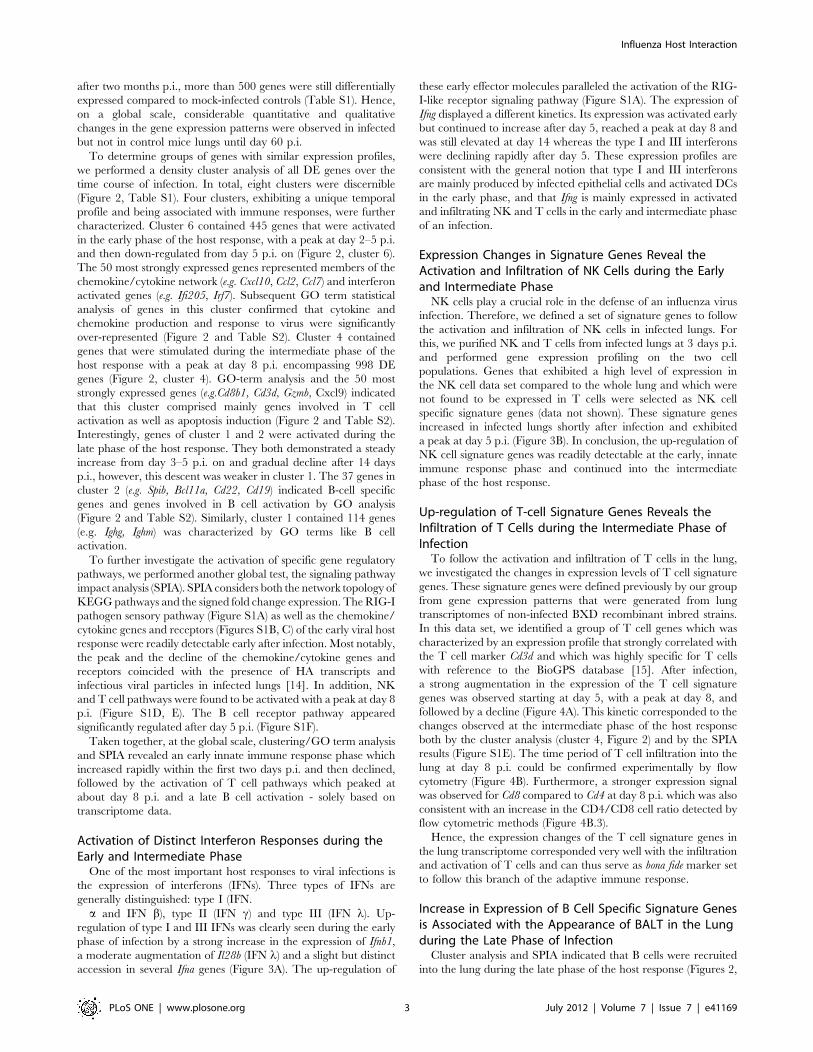
after two months p.i., more than 500 genes were still differentially
expressed compared to mock-infected controls (Table S1). Hence,
on a global scale, considerable quantitative and qualitative
changes in the gene expression patterns were observed in infected
but not in control mice lungs until day 60 p.i.
To determine groups of genes with similar expression profiles,
we performed a density cluster analysis of all DE genes over the
time course of infection. In total, eight clusters were discernible
(Figure 2, Table S1). Four clusters, exhibiting a unique temporal
profile and being associated with immune responses, were further
characterized. Cluster 6 contained 445 genes that were activated
in the early phase of the host response, with a peak at day 2–5 p.i.
and then down-regulated from day 5 p.i. on (Figure 2, cluster 6).
The 50 most strongly expressed genes represented members of the
chemokine/cytokine network (e.g. Cxcl10, Ccl2, Ccl7) and interferon
activated genes (e.g. Ifi205, Irf7). Subsequent GO term statistical
analysis of genes in this cluster confirmed that cytokine and
chemokine production and response to virus were significantly
over-represented (Figure 2 and Table S2). Cluster 4 contained
genes that were stimulated during the intermediate phase of the
host response with a peak at day 8 p.i. encompassing 998 DE
genes (Figure 2, cluster 4). GO-term analysis and the 50 most
strongly expressed genes (e.g.Cd8b1, Cd3d, Gzmb, Cxcl9) indicated
that this cluster comprised mainly genes involved in T cell
activation as well as apoptosis induction (Figure 2 and Table S2).
Interestingly, genes of cluster 1 and 2 were activated during the
late phase of the host response. They both demonstrated a steady
increase from day 3–5 p.i. on and gradual decline after 14 days
p.i., however, this descent was weaker in cluster 1. The 37 genes in
cluster 2 (e.g. Spib, Bcl11a, Cd22, Cd19) indicated B-cell specific
genes and genes involved in B cell activation by GO analysis
(Figure 2 and Table S2). Similarly, cluster 1 contained 114 genes
(e.g. Ighg, Ighm) was characterized by GO terms like B cell
activation.
To further investigate the activation of specific gene regulatory
pathways, we performed another global test, the signaling pathway
impact analysis (SPIA). SPIA considers both the network topology of
KEGGpathways and the signed fold change expression. TheRIG-I
pathogen sensory pathway (Figure S1A) as well as the chemokine/
cytokine genes and receptors (Figures S1B, C) of the early viral host
response were readily detectable early after infection. Most notably,
the peak and the decline of the chemokine/cytokine genes and
receptors coincided with the presence of HA transcripts and
infectious viral particles in infected lungs [14]. In addition, NK
and T cell pathways were found to be activated with a peak at day 8
p.i. (Figure S1D, E). The B cell receptor pathway appeared
significantly regulated after day 5 p.i. (Figure S1F).
Taken together, at the global scale, clustering/GO term analysis
and SPIA revealed an early innate immune response phase which
increased rapidly within the first two days p.i. and then declined,
followed by the activation of T cell pathways which peaked at
about day 8 p.i. and a late B cell activation - solely based on
transcriptome data.
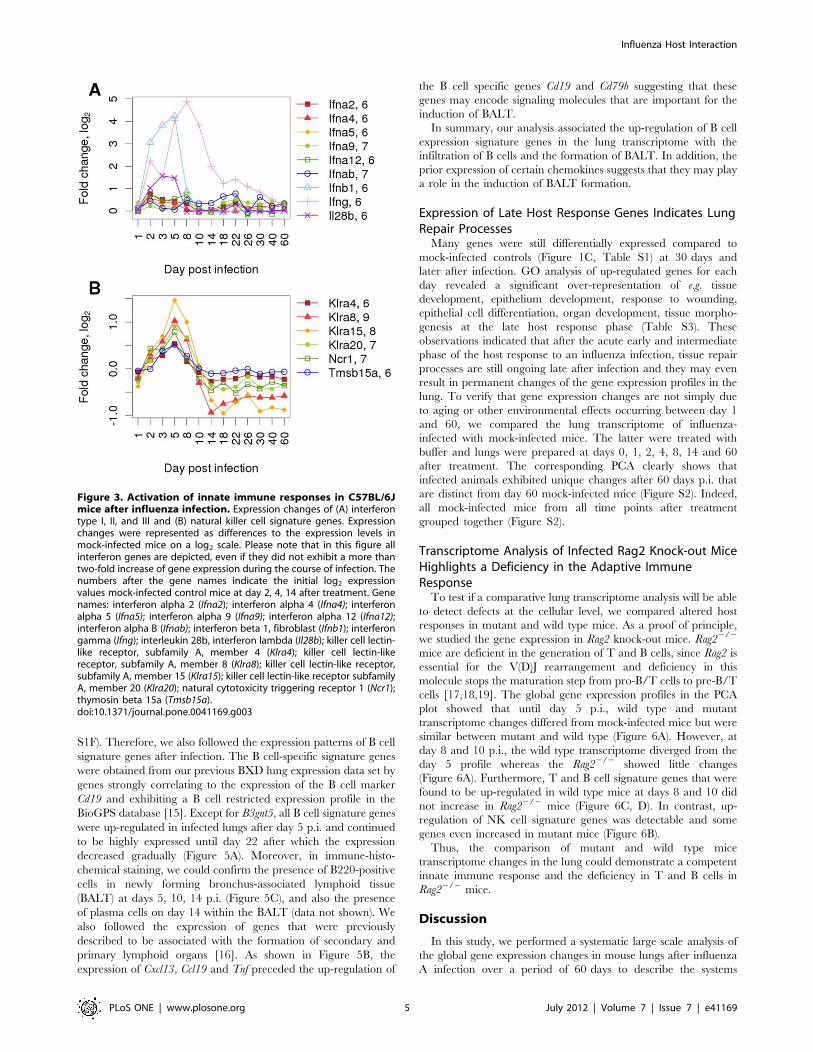
Activation of Distinct Interferon Responses during theEarly and Intermediate PhaseOne of the most important host responses to viral infections is
the expression of interferons (IFNs). Three types of IFNs are
generally distinguished: type I (IFN.
a and IFN b), type II (IFN c) and type III (IFN l). Up-
regulation of type I and III IFNs was clearly seen during the early
phase of infection by a strong increase in the expression of Ifnb1,
a moderate augmentation of Il28b (IFN l) and a slight but distinct
accession in several Ifna genes (Figure 3A). The up-regulation of
these early effector molecules paralleled the activation of the RIG-
I-like receptor signaling pathway (Figure S1A). The expression of
Ifng displayed a different kinetics. Its expression was activated early
but continued to increase after day 5, reached a peak at day 8 and
was still elevated at day 14 whereas the type I and III interferons
were declining rapidly after day 5. These expression profiles are
consistent with the general notion that type I and III interferons
are mainly produced by infected epithelial cells and activated DCs
in the early phase, and that Ifng is mainly expressed in activated
and infiltrating NK and T cells in the early and intermediate phase
of an infection.
Expression Changes in Signature Genes Reveal theActivation and Infiltration of NK Cells during the Earlyand Intermediate PhaseNK cells play a crucial role in the defense of an influenza virus
infection. Therefore, we defined a set of signature genes to follow
the activation and infiltration of NK cells in infected lungs. For
this, we purified NK and T cells from infected lungs at 3 days p.i.
and performed gene expression profiling on the two cell
populations. Genes that exhibited a high level of expression in
the NK cell data set compared to the whole lung and which were
not found to be expressed in T cells were selected as NK cell
specific signature genes (data not shown). These signature genes
increased in infected lungs shortly after infection and exhibited
a peak at day 5 p.i. (Figure 3B). In conclusion, the up-regulation of
NK cell signature genes was readily detectable at the early, innate
immune response phase and continued into the intermediate
phase of the host response.
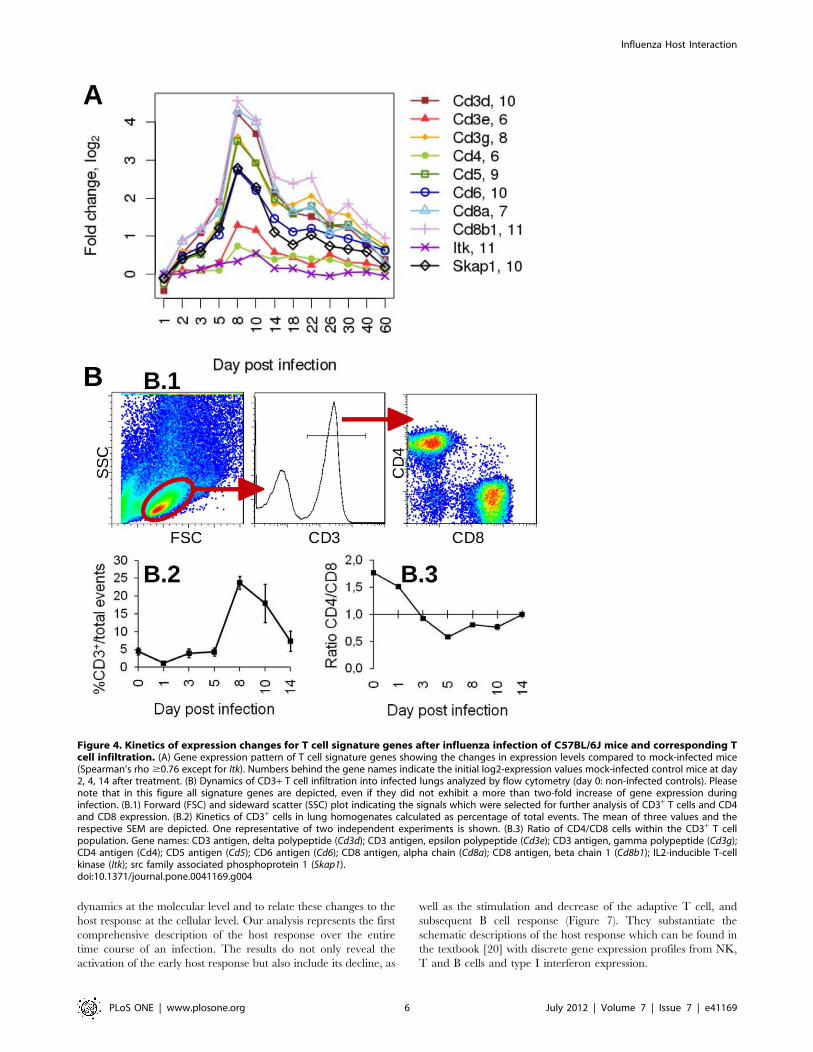
Up-regulation of T-cell Signature Genes Reveals theInfiltration of T Cells during the Intermediate Phase ofInfectionTo follow the activation and infiltration of T cells in the lung,
we investigated the changes in expression levels of T cell signature
genes. These signature genes were defined previously by our group
from gene expression patterns that were generated from lung
transcriptomes of non-infected BXD recombinant inbred strains.
In this data set, we identified a group of T cell genes which was
characterized by an expression profile that strongly correlated with
the T cell marker Cd3d and which was highly specific for T cells
with reference to the BioGPS database [15]. After infection,
a strong augmentation in the expression of the T cell signature
genes was observed starting at day 5, with a peak at day 8, and
followed by a decline (Figure 4A). This kinetic corresponded to the
changes observed at the intermediate phase of the host response
both by the cluster analysis (cluster 4, Figure 2) and by the SPIA
results (Figure S1E). The time period of T cell infiltration into the
lung at day 8 p.i. could be confirmed experimentally by flow
cytometry (Figure 4B). Furthermore, a stronger expression signal
was observed for Cd8 compared to Cd4 at day 8 p.i. which was also
consistent with an increase in the CD4/CD8 cell ratio detected by
flow cytometric methods (Figure 4B.3).
Hence, the expression changes of the T cell signature genes in
the lung transcriptome corresponded very well with the infiltration
and activation of T cells and can thus serve as bona fide marker set
to follow this branch of the adaptive immune response.
Increase in Expression of B Cell Specific Signature Genesis Associated with the Appearance of BALT in the Lungduring the Late Phase of InfectionCluster analysis and SPIA indicated that B cells were recruited
into the lung during the late phase of the host response (Figures 2,
Influenza Host Interaction
PLoS ONE | www.plosone.org 3 July 2012 | Volume 7 | Issue 7 | e41169
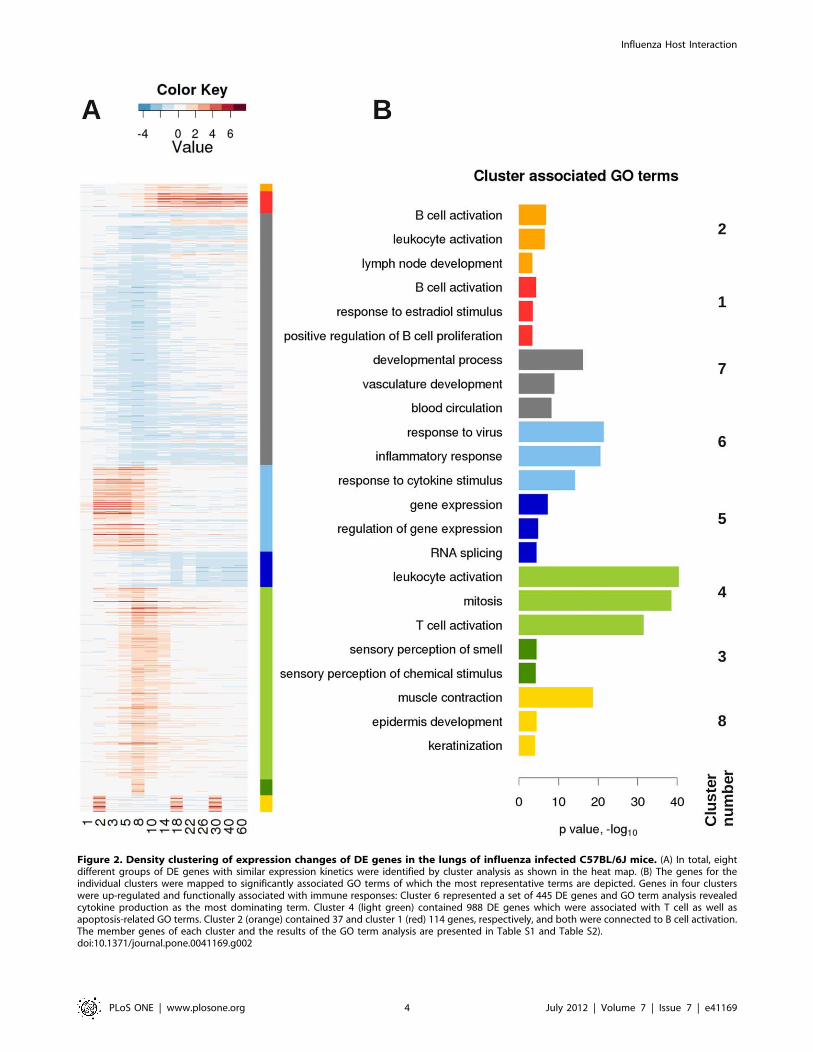
Figure 2. Density clustering of expression changes of DE genes in the lungs of influenza infected C57BL/6J mice. (A) In total, eightdifferent groups of DE genes with similar expression kinetics were identified by cluster analysis as shown in the heat map. (B) The genes for theindividual clusters were mapped to significantly associated GO terms of which the most representative terms are depicted. Genes in four clusterswere up-regulated and functionally associated with immune responses: Cluster 6 represented a set of 445 DE genes and GO term analysis revealedcytokine production as the most dominating term. Cluster 4 (light green) contained 988 DE genes which were associated with T cell as well asapoptosis-related GO terms. Cluster 2 (orange) contained 37 and cluster 1 (red) 114 genes, respectively, and both were connected to B cell activation.The member genes of each cluster and the results of the GO term analysis are presented in Table S1 and Table S2).doi:10.1371/journal.pone.0041169.g002
Influenza Host Interaction
PLoS ONE | www.plosone.org 4 July 2012 | Volume 7 | Issue 7 | e41169
S1F). Therefore, we also followed the expression patterns of B cell
signature genes after infection. The B cell-specific signature genes
were obtained from our previous BXD lung expression data set by
genes strongly correlating to the expression of the B cell marker
Cd19 and exhibiting a B cell restricted expression profile in the
BioGPS database [15]. Except for B3gnt5, all B cell signature genes
were up-regulated in infected lungs after day 5 p.i. and continued
to be highly expressed until day 22 after which the expression
decreased gradually (Figure 5A). Moreover, in immune-histo-
chemical staining, we could confirm the presence of B220-positive
cells in newly forming bronchus-associated lymphoid tissue
(BALT) at days 5, 10, 14 p.i. (Figure 5C), and also the presence
of plasma cells on day 14 within the BALT (data not shown). We
also followed the expression of genes that were previously
described to be associated with the formation of secondary and
primary lymphoid organs [16]. As shown in Figure 5B, the
expression of Cxcl13, Ccl19 and Tnf preceded the up-regulation of
the B cell specific genes Cd19 and Cd79b suggesting that these
genes may encode signaling molecules that are important for the
induction of BALT.
In summary, our analysis associated the up-regulation of B cell
expression signature genes in the lung transcriptome with the
infiltration of B cells and the formation of BALT. In addition, the
prior expression of certain chemokines suggests that they may play
a role in the induction of BALT formation.
Expression of Late Host Response Genes Indicates LungRepair ProcessesMany genes were still differentially expressed compared to
mock-infected controls (Figure 1C, Table S1) at 30 days and
later after infection. GO analysis of up-regulated genes for each
day revealed a significant over-representation of e.g. tissue
development, epithelium development, response to wounding,
epithelial cell differentiation, organ development, tissue morpho-
genesis at the late host response phase (Table S3). These
observations indicated that after the acute early and intermediate
phase of the host response to an influenza infection, tissue repair
processes are still ongoing late after infection and they may even
result in permanent changes of the gene expression profiles in the
lung. To verify that gene expression changes are not simply due
to aging or other environmental effects occurring between day 1
and 60, we compared the lung transcriptome of influenza-
infected with mock-infected mice. The latter were treated with
buffer and lungs were prepared at days 0, 1, 2, 4, 8, 14 and 60
after treatment. The corresponding PCA clearly shows that
infected animals exhibited unique changes after 60 days p.i. that
are distinct from day 60 mock-infected mice (Figure S2). Indeed,
all mock-infected mice from all time points after treatment
grouped together (Figure S2).
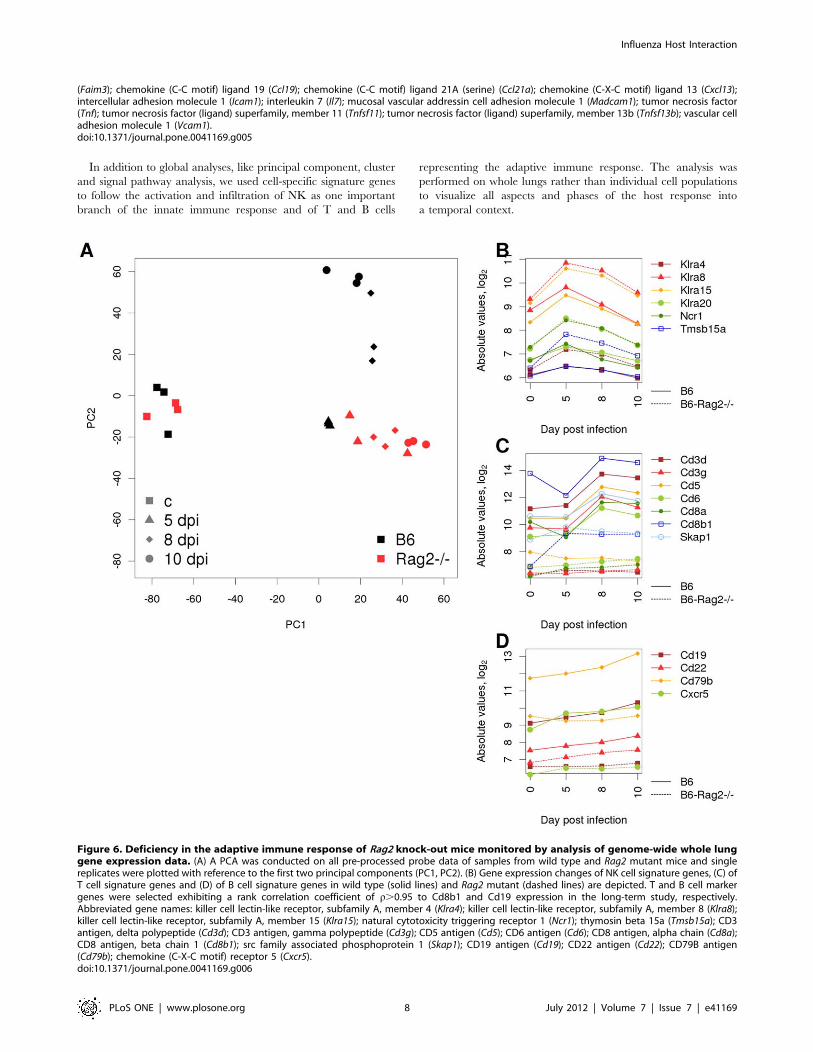
Transcriptome Analysis of Infected Rag2 Knock-out MiceHighlights a Deficiency in the Adaptive ImmuneResponseTo test if a comparative lung transcriptome analysis will be able
to detect defects at the cellular level, we compared altered host
responses in mutant and wild type mice. As a proof of principle,
we studied the gene expression in Rag2 knock-out mice. Rag22/2
mice are deficient in the generation of T and B cells, since Rag2 is
essential for the V(D)J rearrangement and deficiency in this
molecule stops the maturation step from pro-B/T cells to pre-B/T
cells [17,18,19]. The global gene expression profiles in the PCA
plot showed that until day 5 p.i., wild type and mutant
transcriptome changes differed from mock-infected mice but were
similar between mutant and wild type (Figure 6A). However, at
day 8 and 10 p.i., the wild type transcriptome diverged from the
day 5 profile whereas the Rag22/2 showed little changes
(Figure 6A). Furthermore, T and B cell signature genes that were
found to be up-regulated in wild type mice at days 8 and 10 did
not increase in Rag22/2 mice (Figure 6C, D). In contrast, up-
regulation of NK cell signature genes was detectable and some
genes even increased in mutant mice (Figure 6B).
Thus, the comparison of mutant and wild type mice
transcriptome changes in the lung could demonstrate a competent
innate immune response and the deficiency in T and B cells in
Rag22/2 mice.
Discussion
In this study, we performed a systematic large scale analysis of
the global gene expression changes in mouse lungs after influenza
A infection over a period of 60 days to describe the systems
Figure 3. Activation of innate immune responses in C57BL/6Jmice after influenza infection. Expression changes of (A) interferontype I, II, and III and (B) natural killer cell signature genes. Expressionchanges were represented as differences to the expression levels inmock-infected mice on a log2 scale. Please note that in this figure allinterferon genes are depicted, even if they did not exhibit a more thantwo-fold increase of gene expression during the course of infection. Thenumbers after the gene names indicate the initial log2 expressionvalues mock-infected control mice at day 2, 4, 14 after treatment. Genenames: interferon alpha 2 (Ifna2); interferon alpha 4 (Ifna4); interferonalpha 5 (Ifna5); interferon alpha 9 (Ifna9); interferon alpha 12 (Ifna12);interferon alpha B (Ifnab); interferon beta 1, fibroblast (Ifnb1); interferongamma (Ifng); interleukin 28b, interferon lambda (Il28b); killer cell lectin-like receptor, subfamily A, member 4 (Klra4); killer cell lectin-likereceptor, subfamily A, member 8 (Klra8); killer cell lectin-like receptor,subfamily A, member 15 (Klra15); killer cell lectin-like receptor subfamilyA, member 20 (Klra20); natural cytotoxicity triggering receptor 1 (Ncr1);thymosin beta 15a (Tmsb15a).doi:10.1371/journal.pone.0041169.g003
Influenza Host Interaction
PLoS ONE | www.plosone.org 5 July 2012 | Volume 7 | Issue 7 | e41169
dynamics at the molecular level and to relate these changes to the
host response at the cellular level. Our analysis represents the first
comprehensive description of the host response over the entire
time course of an infection. The results do not only reveal the
activation of the early host response but also include its decline, as
well as the stimulation and decrease of the adaptive T cell, and
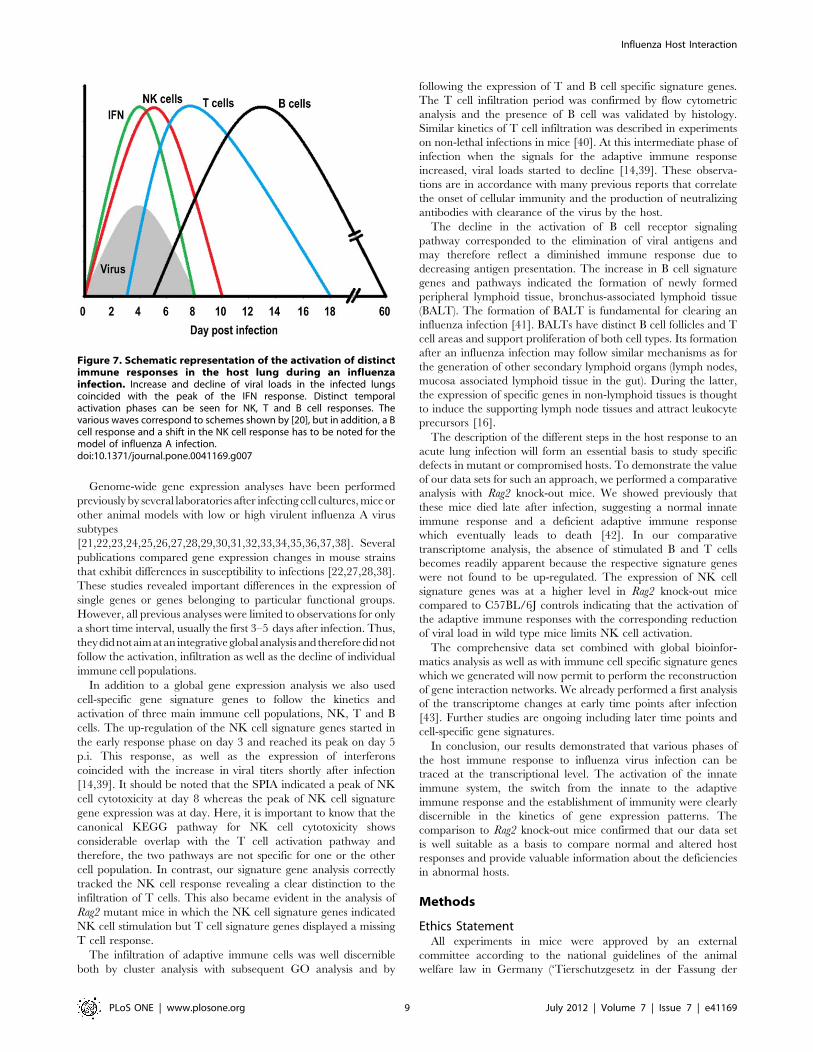
subsequent B cell response (Figure 7). They substantiate the
schematic descriptions of the host response which can be found in
the textbook [20] with discrete gene expression profiles from NK,
T and B cells and type I interferon expression.
Figure 4. Kinetics of expression changes for T cell signature genes after influenza infection of C57BL/6J mice and corresponding Tcell infiltration. (A) Gene expression pattern of T cell signature genes showing the changes in expression levels compared to mock-infected mice(Spearman’s rho $0.76 except for Itk). Numbers behind the gene names indicate the initial log2-expression values mock-infected control mice at day2, 4, 14 after treatment. (B) Dynamics of CD3+ T cell infiltration into infected lungs analyzed by flow cytometry (day 0: non-infected controls). Pleasenote that in this figure all signature genes are depicted, even if they did not exhibit a more than two-fold increase of gene expression duringinfection. (B.1) Forward (FSC) and sideward scatter (SSC) plot indicating the signals which were selected for further analysis of CD3+ T cells and CD4and CD8 expression. (B.2) Kinetics of CD3+ cells in lung homogenates calculated as percentage of total events. The mean of three values and therespective SEM are depicted. One representative of two independent experiments is shown. (B.3) Ratio of CD4/CD8 cells within the CD3+ T cellpopulation. Gene names: CD3 antigen, delta polypeptide (Cd3d); CD3 antigen, epsilon polypeptide (Cd3e); CD3 antigen, gamma polypeptide (Cd3g);CD4 antigen (Cd4); CD5 antigen (Cd5); CD6 antigen (Cd6); CD8 antigen, alpha chain (Cd8a); CD8 antigen, beta chain 1 (Cd8b1); IL2-inducible T-cellkinase (Itk); src family associated phosphoprotein 1 (Skap1).doi:10.1371/journal.pone.0041169.g004
Influenza Host Interaction
PLoS ONE | www.plosone.org 6 July 2012 | Volume 7 | Issue 7 | e41169
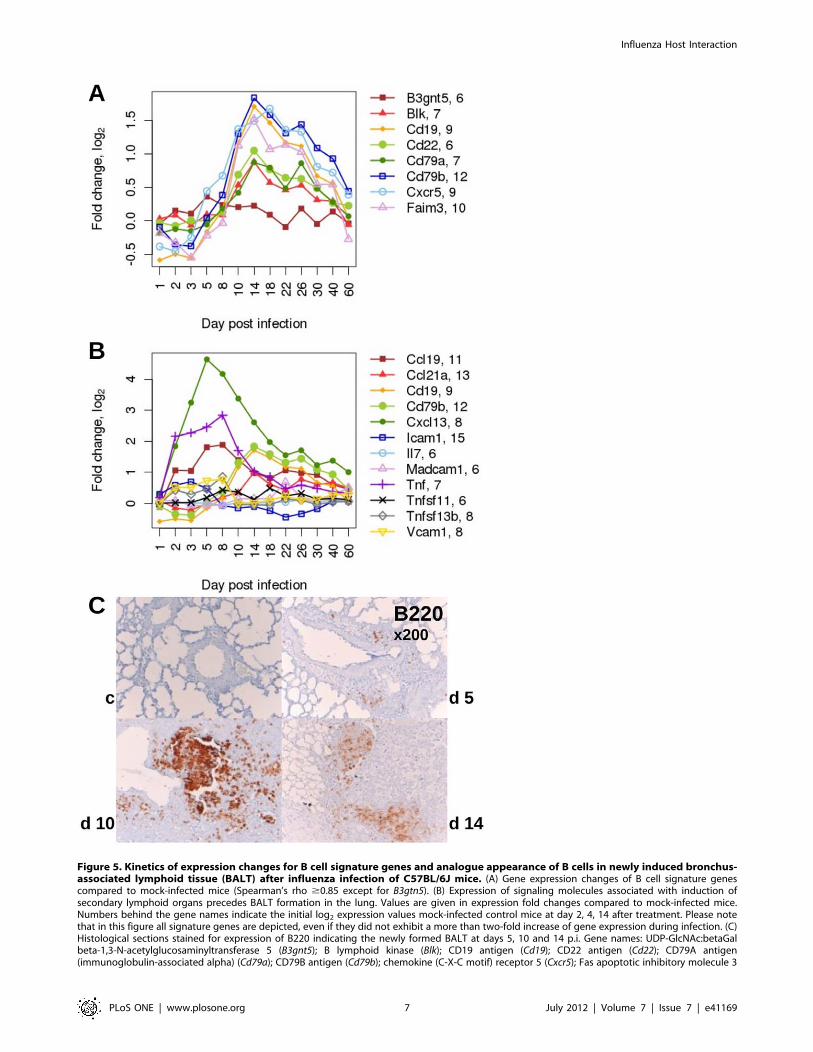
Figure 5. Kinetics of expression changes for B cell signature genes and analogue appearance of B cells in newly induced bronchus-associated lymphoid tissue (BALT) after influenza infection of C57BL/6J mice. (A) Gene expression changes of B cell signature genescompared to mock-infected mice (Spearman’s rho $0.85 except for B3gtn5). (B) Expression of signaling molecules associated with induction ofsecondary lymphoid organs precedes BALT formation in the lung. Values are given in expression fold changes compared to mock-infected mice.Numbers behind the gene names indicate the initial log2 expression values mock-infected control mice at day 2, 4, 14 after treatment. Please notethat in this figure all signature genes are depicted, even if they did not exhibit a more than two-fold increase of gene expression during infection. (C)Histological sections stained for expression of B220 indicating the newly formed BALT at days 5, 10 and 14 p.i. Gene names: UDP-GlcNAc:betaGalbeta-1,3-N-acetylglucosaminyltransferase 5 (B3gnt5); B lymphoid kinase (Blk); CD19 antigen (Cd19); CD22 antigen (Cd22); CD79A antigen(immunoglobulin-associated alpha) (Cd79a); CD79B antigen (Cd79b); chemokine (C-X-C motif) receptor 5 (Cxcr5); Fas apoptotic inhibitory molecule 3
Influenza Host Interaction
PLoS ONE | www.plosone.org 7 July 2012 | Volume 7 | Issue 7 | e41169
In addition to global analyses, like principal component, cluster
and signal pathway analysis, we used cell-specific signature genes
to follow the activation and infiltration of NK as one important
branch of the innate immune response and of T and B cells
representing the adaptive immune response. The analysis was
performed on whole lungs rather than individual cell populations
to visualize all aspects and phases of the host response into
a temporal context.
(Faim3); chemokine (C-C motif) ligand 19 (Ccl19); chemokine (C-C motif) ligand 21A (serine) (Ccl21a); chemokine (C-X-C motif) ligand 13 (Cxcl13);intercellular adhesion molecule 1 (Icam1); interleukin 7 (Il7); mucosal vascular addressin cell adhesion molecule 1 (Madcam1); tumor necrosis factor(Tnf); tumor necrosis factor (ligand) superfamily, member 11 (Tnfsf11); tumor necrosis factor (ligand) superfamily, member 13b (Tnfsf13b); vascular celladhesion molecule 1 (Vcam1).doi:10.1371/journal.pone.0041169.g005
Figure 6. Deficiency in the adaptive immune response of Rag2 knock-out mice monitored by analysis of genome-wide whole lunggene expression data. (A) A PCA was conducted on all pre-processed probe data of samples from wild type and Rag2 mutant mice and singlereplicates were plotted with reference to the first two principal components (PC1, PC2). (B) Gene expression changes of NK cell signature genes, (C) ofT cell signature genes and (D) of B cell signature genes in wild type (solid lines) and Rag2 mutant (dashed lines) are depicted. T and B cell markergenes were selected exhibiting a rank correlation coefficient of r.0.95 to Cd8b1 and Cd19 expression in the long-term study, respectively.Abbreviated gene names: killer cell lectin-like receptor, subfamily A, member 4 (Klra4); killer cell lectin-like receptor, subfamily A, member 8 (Klra8);killer cell lectin-like receptor, subfamily A, member 15 (Klra15); natural cytotoxicity triggering receptor 1 (Ncr1); thymosin beta 15a (Tmsb15a); CD3antigen, delta polypeptide (Cd3d); CD3 antigen, gamma polypeptide (Cd3g); CD5 antigen (Cd5); CD6 antigen (Cd6); CD8 antigen, alpha chain (Cd8a);CD8 antigen, beta chain 1 (Cd8b1); src family associated phosphoprotein 1 (Skap1); CD19 antigen (Cd19); CD22 antigen (Cd22); CD79B antigen(Cd79b); chemokine (C-X-C motif) receptor 5 (Cxcr5).doi:10.1371/journal.pone.0041169.g006
Influenza Host Interaction
PLoS ONE | www.plosone.org 8 July 2012 | Volume 7 | Issue 7 | e41169
Genome-wide gene expression analyses have been performed
previously by several laboratories after infecting cell cultures,mice or
other animal models with low or high virulent influenza A virus
subtypes
[21,22,23,24,25,26,27,28,29,30,31,32,33,34,35,36,37,38]. Several
publications compared gene expression changes in mouse strains
that exhibit differences in susceptibility to infections [22,27,28,38].
These studies revealed important differences in the expression of
single genes or genes belonging to particular functional groups.
However, all previous analyses were limited to observations for only
a short time interval, usually the first 3–5 days after infection. Thus,
theydidnotaimatan integrativeglobal analysis and thereforedidnot
follow the activation, infiltration as well as the decline of individual
immune cell populations.
In addition to a global gene expression analysis we also used
cell-specific gene signature genes to follow the kinetics and
activation of three main immune cell populations, NK, T and B
cells. The up-regulation of the NK cell signature genes started in
the early response phase on day 3 and reached its peak on day 5
p.i. This response, as well as the expression of interferons
coincided with the increase in viral titers shortly after infection
[14,39]. It should be noted that the SPIA indicated a peak of NK
cell cytotoxicity at day 8 whereas the peak of NK cell signature
gene expression was at day. Here, it is important to know that the
canonical KEGG pathway for NK cell cytotoxicity shows
considerable overlap with the T cell activation pathway and
therefore, the two pathways are not specific for one or the other
cell population. In contrast, our signature gene analysis correctly
tracked the NK cell response revealing a clear distinction to the
infiltration of T cells. This also became evident in the analysis of
Rag2 mutant mice in which the NK cell signature genes indicated
NK cell stimulation but T cell signature genes displayed a missing
T cell response.
The infiltration of adaptive immune cells was well discernible
both by cluster analysis with subsequent GO analysis and by
following the expression of T and B cell specific signature genes.
The T cell infiltration period was confirmed by flow cytometric
analysis and the presence of B cell was validated by histology.
Similar kinetics of T cell infiltration was described in experiments
on non-lethal infections in mice [40]. At this intermediate phase of
infection when the signals for the adaptive immune response
increased, viral loads started to decline [14,39]. These observa-
tions are in accordance with many previous reports that correlate
the onset of cellular immunity and the production of neutralizing
antibodies with clearance of the virus by the host.
The decline in the activation of B cell receptor signaling
pathway corresponded to the elimination of viral antigens and
may therefore reflect a diminished immune response due to
decreasing antigen presentation. The increase in B cell signature
genes and pathways indicated the formation of newly formed
peripheral lymphoid tissue, bronchus-associated lymphoid tissue
(BALT). The formation of BALT is fundamental for clearing an
influenza infection [41]. BALTs have distinct B cell follicles and T
cell areas and support proliferation of both cell types. Its formation
after an influenza infection may follow similar mechanisms as for
the generation of other secondary lymphoid organs (lymph nodes,
mucosa associated lymphoid tissue in the gut). During the latter,
the expression of specific genes in non-lymphoid tissues is thought
to induce the supporting lymph node tissues and attract leukocyte
precursors [16].
The description of the different steps in the host response to an
acute lung infection will form an essential basis to study specific
defects in mutant or compromised hosts. To demonstrate the value
of our data sets for such an approach, we performed a comparative
analysis with Rag2 knock-out mice. We showed previously that
these mice died late after infection, suggesting a normal innate
immune response and a deficient adaptive immune response
which eventually leads to death [42]. In our comparative
transcriptome analysis, the absence of stimulated B and T cells
becomes readily apparent because the respective signature genes
were not found to be up-regulated. The expression of NK cell
signature genes was at a higher level in Rag2 knock-out mice
compared to C57BL/6J controls indicating that the activation of
the adaptive immune responses with the corresponding reduction
of viral load in wild type mice limits NK cell activation.
The comprehensive data set combined with global bioinfor-
matics analysis as well as with immune cell specific signature genes
which we generated will now permit to perform the reconstruction
of gene interaction networks. We already performed a first analysis
of the transcriptome changes at early time points after infection
[43]. Further studies are ongoing including later time points and
cell-specific gene signatures.
In conclusion, our results demonstrated that various phases of
the host immune response to influenza virus infection can be
traced at the transcriptional level. The activation of the innate
immune system, the switch from the innate to the adaptive
immune response and the establishment of immunity were clearly
discernible in the kinetics of gene expression patterns. The
comparison to Rag2 knock-out mice confirmed that our data set
is well suitable as a basis to compare normal and altered host
responses and provide valuable information about the deficiencies
in abnormal hosts.
Methods
Ethics StatementAll experiments in mice were approved by an external
committee according to the national guidelines of the animal
welfare law in Germany (‘Tierschutzgesetz in der Fassung der
Figure 7. Schematic representation of the activation of distinctimmune responses in the host lung during an influenzainfection. Increase and decline of viral loads in the infected lungscoincided with the peak of the IFN response. Distinct temporalactivation phases can be seen for NK, T and B cell responses. Thevarious waves correspond to schemes shown by [20], but in addition, a Bcell response and a shift in the NK cell response has to be noted for themodel of influenza A infection.doi:10.1371/journal.pone.0041169.g007
Influenza Host Interaction
PLoS ONE | www.plosone.org 9 July 2012 | Volume 7 | Issue 7 | e41169
Bekanntmachung vom 18. Mai 2006 (BGBl. I S. 1206, 1313), das
zuletzt durch Artikel 20 des Gesetzes vom 9. Dezember 2010
(BGBl. I S. 1934) geandert worden ist.’). The protocol used in
these experiments has been reviewed by an ethics committee and
approved by the ‘Niedersachsiches Landesamt fur Verbrau-
cherschutz und Lebensmittelsicherheit, Oldenburg, Germany’
(Permit Number: 33.9.42502-04-051/09).
Virus, Mouse Strains, and InfectionThe mouse-adapted virus strain influenza A/Puerto Rico/8/34
(H1N1; PR8; lvPR8/Mun2/EMG/0209) was produced in the
allantoic cavity of 10-day-old embryonated hen eggs for 48 h at
37uC. Original stocks of the PR8 virus (Munster variant, see [39]
for details) were received from the strain collection at the Institute
of Molecular Virology, Muenster, Germany. C57BL/6J mice were
obtained from Janvier, France. The generation of Rag2 mutant
mice was described previously [18]. Rag2 mutant mice were on
a C57BL/6J background. Female, 10–12 weeks old mice were
anesthetized by intra-peritoneal injection with Ketamine/Xyla-
zine (85% NaCl (0.9%), 10% Ketamine, 5% Xylazine) with doses
adjusted to the individual body weight. Mice were then intra-
nasally infected with a dose of 26103 FFU PR8 virus or mock-
infected with PBS for controls as described previously [28]. At day
1, 2, 3, 5, 8, 14, 18, 22, 26, 30, 40, 60 post infection (p.i.) mice
were sacrificed, each entire lung extracted and stored separately in
RNAlater solution (Qiagen) at280uC. Mice were infected in three
independent rounds covering the time spans of 1–5, 1–14 and 1–
60 days, respectively. For every day p.i. at least three mice were
prepared as three independent biological replicates. For some days
samples were repeatedly taken, e.g. controls were collected in all
rounds and thus all controls add up to nine biological replicates.
The comparison of Rag22/2 with C57BL/6J wild type mice was
performed accordingly with three replicates for each strain on day
5, 8 and 10 plus non-infected controls. We confirmed that mice
were infected by quantitative RT-PCRs for elevated transcript
levels of Il6, Cxcl10, and Ccl2 (for the early times) and by
monitoring weight loss for later times. Weight loss curves reflected
our previously described curves [14,44]. All mice were maintained
under specific pathogen free conditions.
RNA Extraction and Microarray ExperimentIsolation of RNA from total lungs was performed as described
previously [28]. For DNA microarray hybridization and analysis,
the quality and integrity of the total RNA was controlled on a 2100
Bioanalyzer (Agilent Technologies; Waldbronn, Germany).
500 ng of total RNA were applied for Cy3-labelling reaction
using the one color Quick Amp Labeling protocol (Agilent
Technologies; Waldbronn, Germany). Labeled cRNA was hy-
bridized to Agilent’s mouse 4644 k microarrays for 16 h at 68uCand scanned using the Agilent DNA Microarray Scanner.
Expression values were calculated by the software package Feature
Extraction 10.5.1.1 (Agilent Technologies; Waldbronn, Germany).
The expression of Ccl2, Cxcl10, and Il6 was also analyzed by
quantitative RT-PCR analysis and they were consistent with the
results from the expression arrays (data not shown). The complete
data set has been deposited at the ArrayExpress database under
the accession number E-MTAB-764.
Data AnalysisData were analyzed using the R software, several packages from
BioConductor including the packages Agi4644PreProcess, affy-
coretools, annotate, RankProd, GOstats, SPIA, KEGGSOAP,
Cairo, psych, gplots, RColorBrewer, mgug4122a.db, and gtools.
Preprocessing steps included background correction (‘‘normexp’’),
quantile normalization, probe summarization, and log2 trans-
formation. For background correction, fitted intensities were
calculated by the convolution of normal and exponential
distributions to the observed foreground and background in-
tensities [45]. For a robust analysis, median values were calculated
for each gene of 3–9 replicates. We then identified all genes that
were differentially expressed (DE) genes. DE genes were defined as
genes that exhibited at least a two-fold change in expression levels
compared to the controls and the fold-changes had to be
significant with an FDR corrected p-value of 0.1 using the rank
product method [46,47]. Cluster analysis (density clustering, which
eliminates non-associated genes; data normalized to the mean and
standard deviation, Euclidean distance derived by transformation
of the Pearson correlation coefficient [48,49]) was used to find
genes with similar expression profiles. In order to further
functionally characterize DE genes, GOstats was applied to
determine the over-representation of gene ontology terms [50] and
SPIA, the signaling pathway impact analysis, to examine KEGG
pathways [51]. NK cell signature genes were derived from the
transcriptomes of sorted NK cells compared to T cells and whole
lungs (using a threshold of differential NK cell expression of 20.5
fold, data not published).
Preparation of Cell Suspensions and Flow CytometricAnalysisMice were euthanized by CO2 asphyxiation and lungs were
homogenized through a 40 mm nylon (BD Pharmingen, Heidel-
berg, Germany) mesh. Leukocytes were enriched and erythrocytes
and lung tissue removed via density gradient centrifugation
(Lympholyte M, Cedarlane, Ontario, CN) followed by washing
with PBS/3%FCS. After pre-incubation with 2.4G2 mAb cells
were incubated for 20 min at 4uC in the dark with the respective
monoclonal antibodies (mAbs). Controls of medium and isotypes
were performed simultaneously. After washing, cells were analyzed
in a multi-color flow cytometer (FACSCalibur, Becton Dickinson,
Heidelberg, Germany) running Cell Quest Pro software. FACS
data were analyzed using FLOWJO 7.6.1 software (Tree Star,
Inc.,Ashland, Oregon, USA). CD16/32 mAb (2.4G2)
(eBioscience, San Diego, CA, USA) was used to block FccRII/III receptor-mediated unspecific binding. For specific attaining,
the following mAbs were used: anti-CD3 (145-2C11) AlexaFlour
647 (eBioscience), anti-CD4 (RM4–5) PerCP, anti-CD8 (53-6.7)
FITC, PE (BD Pharmingen, Heidelberg, Germany), Isotype-
matched mAbs were used as negative controls.
Histological AnalysisLungs were extracted from mice in toto on indicated days after
infection and immersion-fixed for 24–72 h in 4% buffered
formaldehyde solution (pH 7.4), dehydrated in a series of graded
alcohols and embedded in paraffin. Sections (0.5 mm) were cut
with the microtome (Microm HM340E, Thermo Scientific,
Walldorf, Germany). Three sections from three different levels of
the lungs were stained overnight with the primary biotinylated
antibody CD45R/B220 (BD Pharmingen, Heidelberg, Germany)
at 4uC. Sections were incubated for 30 min with the secondary
antibody (rabbit anti-goat-biotin from KPL, MA, USA). The
primary and secondary antibodies were diluted 1:800 and 1:250
respectively. Finally, the sections were slightly counterstained with
haematoxylin.
Supporting Information
Figure S1 Activation of innate and adaptive immune response
pathways in the lungs of influenza infected C57BL/6J mice. The
Influenza Host Interaction
PLoS ONE | www.plosone.org 10 July 2012 | Volume 7 | Issue 7 | e41169
SPIA algorithm was applied for all DE genes in PR8 infected lungs
for different KEGG pathways. Selected pathways of the innate
and adaptive immune system are depicted which exhibited
a significant change over the time period studied. As criterion
for pathway activation, a total net accumulated perturbation of an
FDR-corrected p-value of ,0.05 was chosen. Please note that no
data points are shown for days p.i. that do not exhibit a significant
change in the respective pathway. (A) RIG-I receptor signaling
pathway, (B) Cytokine-cytokine receptor interaction, (C) Chemo-
kine signaling pathway, (D) Natural Killer cell mediated
cytotoxicity pathway, (E) T cell receptor signaling pathway, (F) B
cell receptor signaling pathway.
(TIFF)
Figure S2 Gene expression of mock-infected mice is similar at
different days after treatment but different to infected mice. The
Principle Component Analysis (PCA) of mock-infected and
infected mouse lung transcriptomes taken over the investigated
time interval reveals the grouping together of all mock-infected
samples compared to infected samples. Single replicates were
plotted with reference to the first two principal components (PC1,
PC2) covering 54.3% of the total variance. Symbols indicate
biological replicates prepared at the same day p.i. from different
individuals. The red and black colors represent infected and mock-
infected mice, respectively.
(TIF)
Table S1 Gene expression values from all genes described in
Figure 2. The information on cluster number, gene symbols,
Entrez gene identifier, fold changes over time as log2 values, and
descriptions of genes is listed. NA: missing values, gene not
differentially expressed at the corresponding day after infection.
(XLS)
Table S2 GO term analysis for all DE cluster genes depicted in
Figure2. GOBPID: GO term identifier; Pvalue: hypergeometric
test; ExpCount: expected count, number of genes expected if
randomly selected; Count: observed number of genes; size:
number of all genes detected on the microarray chip associated
with the GO term; Term: description of the GO term; cluster:
number of cluster as described in Figure 2.
(XLS)
Table S3 GO term analysis of all DE genes per day for each day
p.i. GOBPID: GO term identifier; Pvalue: hypergeometric test;
ExpCount: expected count, number of genes expected if randomly
selected; Count: observed number of genes; size: number of all
genes detected on the microarray chip associated with the GO
term; Term: description of the GO term; day: day post infection.
(XLS)
Acknowledgments
We wish to thank Frank Klawonn for valuable advice on the statistical
analyses, Verena Haist for help with the histological analysis and Christin
Fricke, Anna Rinkel and Manuela Holscher for excellent technical
assistance, Rudi Alberts for extremely valuable support during the initial
expression and signature gene analyses. Mice for these experiments were
maintained by the animal caretakers of the Central Animal Facilities at the
HZI. We thank Rob Williams for critical reading of the manuscript,
Stephan Ludwig for providing the original stock of PR8 virus and Sorin
Draghici for his support with the SPIA algorithm.
Author Contributions
Conceived and designed the experiments: EW KS. Performed the
experiments: EW BS AS RG. Analyzed the data: NN EW CP. Wrote
the paper: CP EW KS.
References
1. Johnson NP, Mueller J (2002) Updating the accounts: global mortality of the
1918–1920 ‘‘Spanish’’ influenza pandemic. Bull Hist Med 76: 105–115.
2. Fauci AS (2006) Seasonal and pandemic influenza preparedness: science and
countermeasures. J Infect Dis 194 Suppl 2: S73–76.
3. Takeuchi O, Akira S (2009) Innate immunity to virus infection. Immunol Rev
227: 75–86.
4. Pichlmair A, Reise SC (2007) Innate recognition of viruses. Immunity 27: 370–
383.
5. Haller O, Weber F (2009) The interferon response circuit in antiviral host
defense. Verh K Acad Geneeskd Belg 71: 73–86.
6. Kato A, Schleimer RP (2007) Beyond inflammation: airway epithelial cells are at
the interface of innate and adaptive immunity. Curr Opin Immunol 19: 711–720.
7. Kohlmeier JE, Woodland DL (2009) Immunity to respiratory viruses. Annu RevImmunol 27: 61–82.
8. Julkunen I, Melen K, Nyqvist M, Pirhonen J, Sareneva T, et al. (2000)Inflammatory responses in influenza A virus infection. Vaccine 19 Suppl 1: S32–
37.
9. Julkunen I, Sareneva T, Pirhonen J, Ronni T, Melen K, et al. (2001) Molecular
pathogenesis of influenza A virus infection and virus-induced regulation ofcytokine gene expression. Cytokine Growth Factor Rev 12: 171–180.
10. McGill J, Heusel JW, Legge KL (2009) Innate immune control and regulation ofinfluenza virus infections. J Leukoc Biol 86: 803–812.
11. Gazit R, Gruda R, Elboim M, Arnon TI, Katz G, et al. (2006) Lethal influenzainfection in the absence of the natural killer cell receptor gene Ncr1. Nat
Immunol 7: 517–523.
12. Thomas PG, Keating R, Hulse-Post DJ, Doherty PC (2006) Cell-mediated
protection in influenza infection. Emerg Infect Dis 12: 48–54.
13. Doherty PC, Topham DJ, Tripp RA, Cardin RD, Brooks JW, et al. (1997)
Effector CD4+ and CD8+ T-cell mechanisms in the control of respiratory virusinfections. Immunol Rev 159: 105–117.
14. Srivastava B, Blazejewska P, Hessmann M, Bruder D, Geffers R, et al. (2009)Host genetic background strongly influences the response to influenza a virus
infections. PLoS ONE 4: e4857.
15. Alberts R, Lu L, Williams RW, Schughart K (2011) Genome-wide analysis of
the mouse lung transcriptome reveals novel molecular gene interaction networks
and cell-specific expression signatures. Respir Res 12: 61.
16. van de Pavert SA, Mebius RE (2010) New insights into the development of
lymphoid tissues. Nat Rev Immunol 10: 664–674.
17. Mombaerts P, Iacomini J, Johnson RS, Herrup K, Tonegawa S, et al. (1992)
RAG-1-deficient mice have no mature B and T lymphocytes. Cell 68: 869–877.
18. Shinkai Y, Rathbun G, Lam KP, Oltz EM, Stewart V, et al. (1992) RAG-2-
deficient mice lack mature lymphocytes owing to inability to initiate V(D)J
rearrangement. Cell 68: 855–867.
19. Spanopoulou E, Roman CA, Corcoran LM, Schlissel MS, Silver DP, et al.
(1994) Functional immunoglobulin transgenes guide ordered B-cell differentia-
tion in Rag-1-deficient mice. Genes Dev 8: 1030–1042.
20. Janeway CA, Travers P, Walport MJ, Shlomchik MJ (2001) Immunobiology:
The Immune System in Health and Disease: Garland Science.
21. Cameron CM, Cameron MJ, Bermejo-Martin JF, Ran L, Xu L, et al. (2008)
Gene expression analysis of host innate immune responses during Lethal H5N1
infection in ferrets. J Virol 82: 11308–11317.
22. Ding M, Lu L, Toth LA (2008) Gene expression in lung and basal forebrain
during influenza infection in mice. Genes Brain Behav 7: 173–183.
23. Kash JC, Tumpey TM, Proll SC, Carter V, Perwitasari O, et al. (2006) Genomic
Analysis of Increased Host Immune and Cell Death Responses Induced by 1918
Influenza Virus. Nature 443: 578–581.
24. Kobasa D, Jones SM, Shinya K, Kash JC, Copps J, et al. (2007) Aberrant innate
immune response in lethal infection of macaques with the 1918 influenza virus.
Nature 445: 319–323.
25. Rosseau S, Hocke A, Mollenkopf H, Schmeck B, Suttorp N, et al. (2007)
Comparative transcriptional profiling of the lung reveals shared and distinct
features of Streptococcus pneumoniae and influenza A virus infection.
Immunology 120: 380–391.
26. Seki M, Kosai K, Hara A, Imamura Y, Nakamura S, et al. (2009) Expression
and DNA microarray analysis of a platelet activating factor-related molecule in
severe pneumonia in mice due to influenza virus and bacterial co-infection.
Jpn J Infect Dis 62: 6–10.
27. Boon AC, deBeauchamp J, Hollmann A, Luke J, Kotb M, et al. (2009) Host
genetic variation affects resistance to infection with a highly pathogenic H5N1
influenza A virus in mice. J Virol 83: 10417–10426.
28. Alberts R, Srivastava B, Wu H, Viegas N, Geffers R, et al. (2010) Gene
expression changes in the host response between resistant and susceptible inbred
mouse strains after influenza A infection. Microbes Infect 12: 309–318.
29. Zaas AK, Chen M, Varkey J, Veldman T, Hero AO, 3rd, et al. (2009) Gene
expression signatures diagnose influenza and other symptomatic respiratory viral
infections in humans. Cell Host Microbe 6: 207–217.
Influenza Host Interaction
PLoS ONE | www.plosone.org 11 July 2012 | Volume 7 | Issue 7 | e41169
30. Kash JC, Basler CF, Garcia-Sastre A, Carter V, Billharz R, et al. (2004) Global
host immune response: pathogenesis and transcriptional profiling of type Ainfluenza viruses expressing the hemagglutinin and neuraminidase genes from
the 1918 pandemic virus. J Virol 78: 9499–9511.
31. Cilloniz C, Shinya K, Peng X, Korth MJ, Proll SC, et al. (2009) Lethal influenzavirus infection in macaques is associated with early dysregulation of in-
flammatory related genes. PLoS Pathog 5: e1000604.32. Zhang H, Su YA, Hu P, Yang J, Zheng B, et al. (2006) Signature patterns
revealed by microarray analyses of mice infected with influenza virus A and
Streptococcus pneumoniae. Microbes Infect 8: 2172–2185.33. Baskin CR, Garcia-Sastre A, Tumpey TM, Bielefeldt-Ohmann H, Carter VS, et
al. (2004) Integration of clinical data, pathology, and cDNA microarrays ininfluenza virus-infected pigtailed macaques (Macaca nemestrina). J Virol 78:
10420–10432.34. Viemann D, Schmolke M, Lueken A, Boergeling Y, Friesenhagen J, et al. (2010)
H5N1 Virus Activates Signaling Pathways in Human Endothelial Cells
Resulting in a Specific Imbalanced Inflammatory Response. J Immunol.35. Wang J, Nikrad MP, Phang T, Gao B, Alford T, et al. (2011) Innate Immune
Response to Influenza A Virus in Differentiated Human Alveolar Type II cells.Am J Respir Cell Mol Biol.
36. Lee SM, Chan RW, Gardy JL, Lo CK, Sihoe AD, et al. (2010) Systems-level
comparison of host responses induced by pandemic and seasonal influenza AH1N1 viruses in primary human type I-like alveolar epithelial cells in vitro.
Respir Res 11: 147.37. Chakrabarti AK, Vipat VC, Mukherjee S, Singh R, Pawar SD, et al. (2010) Host
gene expression profiling in influenza A virus-infected lung epithelial (A549)cells: a comparative analysis between highly pathogenic and modified H5N1
viruses. Virol J 7: 219.
38. Bottomly D, Ferris MT, Aicher LD, Rosenzweig E, Whitmore A, et al. (2012)Expression quantitative trait Loci for extreme host response to influenza a in pre-
collaborative cross mice. G3 (Bethesda) 2: 213–221.39. Blazejewska P, Koscinski L, Viegas N, Anhlan D, Ludwig S, et al. (2011)
Pathogenicity of different PR8 influenza A virus variants in mice is determined
by both viral and host factors. Virology 412: 36–45.
40. Toapanta FR, Ross TM (2009) Impaired immune responses in the lungs of aged
mice following influenza infection. Respir Res 10: 112.
41. Moyron-Quiroz JE, Rangel-Moreno J, Kusser K, Hartson L, Sprague F, et al.
(2004) Role of inducible bronchus associated lymphoid tissue (iBALT) in
respiratory immunity. Nat Med 10: 927–934.
42. Wu L, Estrada O, Zaborina O, Bains M, Shen L, et al. (2005) Recognition of
host immune activation by Pseudomonas aeruginosa. Science 309: 774–777.
43. Dimitrakopoulou K, Tsimpouris C, Papadopoulos G, Pommerenke C, Wilk E,
et al. (2011) Dynamic gene network reconstruction from gene expression data in
mice after influenza A (H1N1) infection. J Clin Bioinforma 1: 27.
44. Wu H, Haist V, Baumgartner W, Schughart K (2010) Sustained viral load and
late death in Rag22/2 mice after influenza A virus infection. Virol J 7: 172.
45. Ritchie ME, Silver J, Oshlack A, Holmes M, Diyagama D, et al. (2007) A
comparison of background correction methods for two-colour microarrays.
Bioinformatics 23: 2700–2707.
46. van Iterson M, t Hoen PA, Pedotti P, Hooiveld GJ, den Dunnen JT, et al. (2009)
Relative power and sample size analysis on gene expression profiling data. BMC
Genomics 10: 439.
47. Breitling R, Armengaud P, Amtmann A, Herzyk P (2004) Rank products:
a simple, yet powerful, new method to detect differentially regulated genes in
replicated microarray experiments. FEBS Lett 573: 83–92.
48. Yang M-J, Wu K-L (2004) A Similarity-Based Robust Clustering Method. IEEE
Trans Pattern Anal Mach Intell 26: 434–448.
49. Chung S, Jun J, McLeod D (2004) Mining gene expression datasets using
density-based clustering. Proceedings of the thirteenth ACM international
conference on Information and knowledge management (CIKM ‘04) ACM,
New York, NY, USA: 150–151.
50. Falcon S, Gentleman R (2007) Using GOstats to test gene lists for GO term
association. Bioinformatics 23: 257–258.
51. Tarca AL, Draghici S, Khatri P, Hassan SS, Mittal P, et al. (2009) A novel
signaling pathway impact analysis. Bioinformatics 25: 75–82.
Influenza Host Interaction
PLoS ONE | www.plosone.org 12 July 2012 | Volume 7 | Issue 7 | e41169
Copyright © 2022 FDOKUMEN