Global Reorganization of the Nuclear Landscape in Senescent Cells
14
Article Global Reorganization of the Nuclear Landscape in Senescent Cells Graphical Abstract Highlights d SAHF cells show sequence- and LAD-dependent loss of heterochromatin (HC) structure d Senescence HC behavior is mirrored in Hutchinson-Gilford progeria d Senescence-specific spatial clustering of HC leads to a new model for SAHF formation d Comparing ESCs, somatic, and senescent cells links senescence to differentiation Authors Tamir Chandra, Philip Andrew Ewels, ..., Peter Fraser, Wolf Reik Correspondence [email protected] In Brief Chandra, Ewels, et al. map changes in genome organization in cellular senescence using Hi-C. Contrary to the believed increase in heterochromatin in senescence-associated heterochromatic foci formation, they describe a loss of local interactions in heterochromatic regions. This is in agreement with changes observed in progeria cells. Chandra et al., 2015, Cell Reports 10, 471–483 February 3, 2015 ª2015 The Authors http://dx.doi.org/10.1016/j.celrep.2014.12.055
-
Upload
scilifelab -
Category
Documents
-
view
0 -
download
0
Transcript of Global Reorganization of the Nuclear Landscape in Senescent Cells

Article
Global Reorganization of t
he Nuclear Landscape inSenescent CellsGraphical Abstract
Highlights
d SAHF cells show sequence- and LAD-dependent loss of
heterochromatin (HC) structure
d Senescence HC behavior is mirrored in Hutchinson-Gilford
progeria
d Senescence-specific spatial clustering of HC leads to a new
model for SAHF formation
d Comparing ESCs, somatic, and senescent cells links
senescence to differentiation
Chandra et al., 2015, Cell Reports 10, 471–483February 3, 2015 ª2015 The Authorshttp://dx.doi.org/10.1016/j.celrep.2014.12.055
Authors
Tamir Chandra, Philip Andrew Ewels, ...,
Peter Fraser, Wolf Reik
In Brief
Chandra, Ewels, et al. map changes in
genome organization in cellular
senescence using Hi-C. Contrary to the
believed increase in heterochromatin in
senescence-associated heterochromatic
foci formation, they describe a loss of
local interactions in heterochromatic
regions. This is in agreement with
changes observed in progeria cells.

Cell Reports
Article
Global Reorganization of the Nuclear Landscapein Senescent CellsTamir Chandra,1,2,7,* Philip Andrew Ewels,1,7,8 Stefan Schoenfelder,3 Mayra Furlan-Magaril,3 Steven William Wingett,3
Kristina Kirschner,4 Jean-Yves Thuret,5 Simon Andrews,6 Peter Fraser,3 and Wolf Reik1,21Epigenetics Programme, The Babraham Institute, Cambridge CB22 3AT, UK2The Wellcome Trust Sanger Institute, Cambridge CB10 1SA, UK3Nuclear Dynamics Programme, The Babraham Institute, Cambridge CB22 3AT, UK4Cambridge Institute for Medical Research, University of Cambridge, Cambridge CB2 0XY, UK5CEA, iBiTec-S, SBIGeM/CNRS FRE3377 I2BC/Universite Paris-Sud, Gif-sur-Yvette 91191, France6Bioinformatics Group, The Babraham Institute, Cambridge CB22 3AT, UK7Co-first author8Present address: Department of Biochemistry and Biophysics, Science for Life Laboratory, Stockholm University, Stockholm 106 91,
Sweden
*Correspondence: [email protected]
http://dx.doi.org/10.1016/j.celrep.2014.12.055This is an open access article under the CC BY license (http://creativecommons.org/licenses/by/3.0/).
SUMMARY
Cellular senescence has been implicated in tumorsuppression, development, and aging and is accom-panied by large-scale chromatin rearrangements,forming senescence-associated heterochromaticfoci (SAHF). However, how the chromatin is reorgan-ized during SAHF formation is poorly understood.Furthermore, heterochromatin formation in senes-cence appears to contrast with loss of heterochro-matin in Hutchinson-Gilford progeria. We mappedarchitectural changes in genome organization incellular senescence using Hi-C. Unexpectedly, wefind a dramatic sequence- and lamin-dependentloss of local interactions in heterochromatin. Thischange in local connectivity resolves the paradoxof opposing chromatin changes in senescence andprogeria. In addition, we observe a senescence-spe-cific spatial clustering of heterochromatic regions,suggesting a unique second step required for SAHFformation. Comparison of embryonic stem cells(ESCs), somatic cells, and senescent cells shows aunidirectional loss in local chromatin connectivity,suggesting that senescence is an endpoint ofthe continuous nuclear remodelling process duringdifferentiation.
INTRODUCTION
Cellular senescence is an irreversible cell-cycle arrest, originally
described for primary cells after long-term cell culture and attrib-
uted to telomere attrition (Hayflick and Moorhead, 1961). More
recently, cellular senescence has been established as a cellular
response to a variety of stresses such as DNA double-strand
breaks or oncogene activation (Di Leonardo et al., 1994; Lin
et al., 1998; Serrano et al., 1997).
Oncogene-induced senescence (OIS) is an intrinsic tumor
suppressor mechanism, involving activation of the key tumor
suppressor pathways p53 and pRB/p16INK4a. Inactivation of
one or both of these pathways is found in themajority of cancers.
Markers of senescence, such as p16 upregulation, are particu-
larly prevalent in benign lesions and are often lost upon malig-
nancy (Braig et al., 2005; Haugstetter et al., 2010; Michaloglou
et al., 2005). Reactivation of p53 in mouse models of liver can-
cer leads to senescence with subsequent immune clearance of
cancer cells (Xue et al., 2007). A key aspect of the senescence
response implicated in the immune clearance is the senes-
cence-associated secretory phenotype (SASP) (Acosta et al.,
2008; Coppe et al., 2008; Kuilman et al., 2008). SASP is char-
acterized through the secretion of cytokines, which are able
to induce paracrine senescence in neighboring cells (Acosta
et al., 2013). Recent work has implicated cellular senescence
in normal developmental processes (Munoz-Espın et al., 2013;
Storer et al., 2013).
In addition to its role in oncogenesis, a role for senescence in
organismal aging has recently been substantiated; the depletion
of senescent cells has been shown to relieve symptoms in
mouse models of age-related diseases, suggesting that cellular
senescence may be a useful model system for organismal aging
(Baker et al., 2011; Lopez-Otın et al., 2013).
Previous work has shown that cellular senescence in human
diploid fibroblasts is accompanied by a large-scale spatial
rearrangement of chromatin, forming nuclear structures known
as senescence-associated heterochromatic foci (SAHF). SAHF
are enriched in constitutive heterochromatic markers, such as
H3K9me3 and HP1 proteins (Narita et al., 2003). However,
SAHF formation does not occur in all senescent cells. The
proportion of cells exhibiting SAHF depends on the method of
senescence induction, ranging from a few percent in replicative
senescence to nearly 90% in c-raf OIS (Jeanblanc et al., 2012). In
contrast, other cellular models of organismal aging such as cells
Cell Reports 10, 1–13, February 3, 2015 ª2015 The Authors 1
Please cite this article in press as: Chandra et al., Global Reorganization of the Nuclear Landscape in Senescent Cells, Cell Reports (2015), http://dx.doi.org/10.1016/j.celrep.2014.12.055
from Hutchinson-Gilford progeria syndrome (HGPS) patients
show a decrease in heterochromatin and are devoid of SAHF
(Scaffidi and Misteli, 2006; Shumaker et al., 2006). Cellular
models of HGPS and cellular senescence of fibroblasts have
proven to be relevant models for organismal aging. It is therefore
important to understand the seemingly contradictory roles of
heterochromatin in cellular aging and SAHF formation.
We have recently shown that SAHF chromosomes show an
inversion of euchromatin, facultative heterochromatin (fHC), and
constitutive heterochromatin (cHC), with cHCmoving to the cen-
ter of chromosomal territories (see also Figure 4C; Chandra et al.,
2012). This inversion is due to a physical reorientation of the chro-
matin rather than a redistribution of repressive histone marks,
questioning a causal role for classical heterochromatic marks,
H3K9me3 (cHC) andH3K27me3 (fHC), in the formation of hetero-
chromatin in somatic cells. A key featureof the senescent nucleus
and strong correlate with SAHF formation is the loss of lamin
B1 (Sadaie et al., 2013; Shah et al., 2013). Other factors involved
in SAHF formation, such as the cell-cycle regulator pRb, high
mobility group proteins HMGA1/HMGA2, histone chaperones
HIRAandASF1a, canonicalWnt signaling, chromatin remodelling
proteins p400 and BRG1, and linker histone H1, have been iden-
tified; however, knowledge of how the chromosome structure is
changed is still lacking (Chan et al., 2005; Chicas et al., 2010; Fu-
nayama et al., 2006; Narita et al., 2003, 2006; Tu et al., 2013; Ye
et al., 2007a, b; Zhang et al., 2005).More importantly, the function
ofSAHF is controversial.Whereas the role ofSAHFwas initially re-
ported as being tumor and cell-cycle suppressive (Narita et al.,
2003, 2006), recent work has suggested that SAHF may in fact
be proproliferative (Di Micco et al., 2011).
To gain insight into the function of SAHF, we decided to
unravel the physical structure of senescent chromatin in un-
precedented detail, combining fluorescence in situ hybridization
(FISH) with Hi-C to map the physical changes that accompany
SAHF formation. We find dramatic changes in both the global
interaction network and local neighborhood of genomic regions.
Surprisingly, we find distinct global changes in the interactions
and compaction of certain classes of lamin-associated domains,
defined by continuous genomic fragments of homogenous gua-
nine-cytosine (GC) content (isochores; Bernardi, 2012). Contrary
to the current view of enhanced heterochromatinization in SAHF
formation, we find a loss of internal structure in constitutive het-
erochromatic (cHC) regions in cellular senescence. This loss of
internal structure is accompanied by spatial clustering of the
cHC regions. We further show that HGPS cells behave similarly
to senescent cells in their local interaction changes but do not
exhibit the spatial clustering of cHC, suggesting a two-step
mechanism for SAHF formation. Finally, we investigate embry-
onic stem cells (ESCs) and senescent cells and find a fundamen-
tally opposing local architecture with somatic cells representing
an intermediate state.
RESULTS
Senescence Causes Global Shifts in Local ChromatinInteractionsTo study OIS, we used the WI-38hTERT/GFP-RAF1-ER model
system (Jeanblanc et al., 2012). Senescence is induced by
the activation of the GFP-RAF1-ER kinase by addition of 4-hy-
droxy-tamoxifen. The nuclear phenotype in these cells is highly
homogenous compared to other OIS systems such as Ras-
induced senescence, with a high percentage of SAHF-positive
cells (�86%; Figures 1A and S1A). Analyses of bromodeoxyuri-
dine (BrdU) incorporation and abundance of key senescence
markers at 48 hr after induction confirmed an OIS phenotype
(Figures S1A and S1B).
Previous work on the reorganization of chromatin in senes-
cence has revealed a complex change in nuclear architec-
ture; intrachromosomal heterochromatin clusters within SAHF
without redistribution of repressive histone marks along the
linear DNA sequence (Chandra et al., 2012; see also Figure 4C).
These observations suggest a dynamic remodelling of the nu-
cleus driven by spatial changes, as opposed to a change in chro-
matin identity (Chandra and Narita, 2013). To further understand
these changes in nuclear architecture in growing and senescent
cells, we performed Hi-C, a proximity-based ligation assay that
measures the frequency of close chromatin interactions, as sum-
marized in Figure S1C (Lieberman-Aiden et al., 2009). Two inde-
pendently grown and fixed batches of cells were sequenced to a
depth of at least 114 million reads. Data were processed using
the HiCUP pipeline (S.W.W. and S.A., unpublished data; Fig-
ure S1D). For initial inspection, we plotted Hi-C interaction
heatmaps using HOMER (Figure 1B; Heinz et al., 2010). The
heatmaps show a typical pattern of self-interacting topologically
associated domains (TADs) (Dixon et al., 2012; Nora et al., 2012).
Although the global chromosomal interaction pattern appears
largely unchanged between growing and senescent cells, closer
inspection shows striking differences in the strength of internal
interactions within TADs (Figures 1B and 1C). To further investi-
gate this phenomenon, we calculated the number of interactions
in which both interacting regions are located within a single
TAD versus those spanning the TAD boundaries (Figure 1C).
This revealed a loss of interactions within the TAD and a corre-
sponding gain of cross-boundary interactions in senescent cells
(Figure 1C). To assess the consequences of loss of local con-
tacts for chromatin compaction, we measured the distance
between two FISH probes (separated by�2.2Mb)—one approx-
imately 100 kb upstream of the TAD and the corresponding
probe inside the TAD (Figures 1D and 1F for probe locations).
We found a substantial shift in the mean distance separating
the probes from 0.57 mm in growing to 0.86 mm in senescent cells
(Wilcoxon-Mann-Whitney test; p = 0.00003). This observation
confirms for this TAD that a loss of local interactions leads to a
change in physical compaction in senescence.
To study this change in local interaction frequency more pre-
cisely, we developed a measure to examine the difference in
local versus distal interactions genome wide, which we call
open chromatin index (OCI) (Figure 1E). This analysis counts
the number of interactions with both Hi-C reads within a window
and compares these to a control. Initially, we used interaction
counts across the remainder of the chromosome as a control
but found that results were biased due to the varying lengths
of chromosomes. As an alternative, we used the number of inter-
chromosomal contacts. The distal and interchromosomal inter-
action counts behaved concordantly (Figure 1C), and the latter
provided a more stable metric. We measured the ratios of these
2 Cell Reports 10, 1–13, February 3, 2015 ª2015 The Authors
Please cite this article in press as: Chandra et al., Global Reorganization of the Nuclear Landscape in Senescent Cells, Cell Reports (2015), http://dx.doi.org/10.1016/j.celrep.2014.12.055

OCI low
Local LowHigh Distal
OCI high
Local HighLow Distal
5 µm Growing
WI-38
Senescence
WI-38
+ c-raf-ERhTert
G
G
S
S
G TADs
Local Distal
FISH Probes
G TADs
Growing
Senescent
chr18:48Mb-78Mb
A
C
E
B
chr18:58.7Mb-67.7Mb
G TADs
Growing
Senescent
0 20 40 60 80
Senescent
Normalised Internal Read Count (thousands)
Growing
0 50 100 150 200
Senescent
Normalised External Read Count (thousands)
GrowingcistransTAD - external
Interactions
TAD - internalInteractions
−10 −5 0 5 10 15 20
−10
−5
0
5
10
15
20
48
44
40
36
% G
C C
onte
nt
Local DistalGrowing
−10 −5 0 5 10 15 20
−10
−5
0
5
10
15
20
7.5
8.0
8.5
9.0
log
(Gr o
win
g D
NA
se C
ount
)
Local DistalGrowing
Loca
lD
ista
lS
enes
cent
G
D
GrowingSenescence
5 µm
F
0.5 1.0 1.5
G
S
Separation (µm)
***
Figure 1. Senescence Is Accompanied by Local and Global Changes in the Interaction Pattern of the Genome
(A) WI-38 hTERT/GFP-RAF1-ER cells show the characteristic SAHF phenotype upon senescence induction.
(B) Interaction heatmaps for chr18q for growing (top) and senescence (bottom). Strong interactions are shown in redwhereas weak interactions are in blue. Green
lines (center) represent topologically associating domains (TADs) determined in growing cells. Highlighted TAD (black rhombus and pink TAD line) suggests a loss
of internal interactions.
(C) Top: genome browser shot of interactions reaching into and from within the depicted TAD. Growing cells showmore TAD internal interactions than senescent
cells. Bottom: normalized read counts from highlighted TAD. Internal contacts confirm loss of TAD internal interactions and external interactions increase in
senescence, both in cis (light gray) and in trans (dark gray).
(D) DNA-FISH showing separation between probes located within and adjacent to the highlighted TAD. Separation increases in senescence p = 0.00003 (Mann-
Whitney-Wilcoxon test). Shown to the right are representative confocal microscopy planes of the FISH separation experiment.
(E) Top: schematic of the open chromatin index (OCI), which describes regions changing their ratio between local and distal contacts.
(F) Browser shot of OCI in two biological replicates (G, growing; S, senescence) over highlighted TAD (pink) shows a loss of local interactions.
(G) Scatterplots comparing genome-wide OCI in 200 kb windows between growing and senescence. Points are colored by DNase accessibility as measured in
growing fibroblasts (left) and %GC content (right). A cluster of points can be seen to deviate from the diagonal, which shows a loss of local contacts in
senescence. These regions are the least accessible in the genome and have a low GC content.
Cell Reports 10, 1–13, February 3, 2015 ª2015 The Authors 3
Please cite this article in press as: Chandra et al., Global Reorganization of the Nuclear Landscape in Senescent Cells, Cell Reports (2015), http://dx.doi.org/10.1016/j.celrep.2014.12.055

interactions in windows across the genome and normalized by
subtracting the median chromosomal value from each window
and then by smoothing values in a rolling 20 Mb window. The
resulting OCI values give insight into the propensity of a region
to form local or distal interactions. Our measurement bears
some resemblance to the previously described interchromo-
somal contact propensity (ICP) (Kalhor et al., 2012), which itself
has been found to correlate with active marks such as RNA po-
lymerase II occupancy (Kalhor et al., 2012). When visualized over
the TAD shown in Figures 1B and 1C, we find a rise in the OCI in
senescence, suggesting OCI may be a suitable metric to mea-
sure a switch from local to distal interactions (Figure 1F). To
explore OCI changes genome wide, we plotted OCI values in
growing and senescence in a scatterplot (Figure 1G). A popula-
tion of regions appears to follow the behavior of the TAD
described above: an initially low OCI in growing cells with a
rise in senescent cells, indicating a loss of local interactions. It
has been previously suggested that high ICP values could be
affected by proximity to the periphery of chromosomal territories
(Kalhor et al., 2012). To rule out any such effect in our measure-
ments, we calculated the OCI using only cis contacts, counting
any interaction spanning more than 20 Mb as a distal contact
(Figures S1E and S1F). We readily identified the same changing
regions, confirming OCI as a suitable metric to measure changes
in local architecture.
Based on the TAD shown in Figures 1B, 1C, and 1F, a low OCI
in growing cells would suggest a compact structure with strong
local interactions. To test this hypothesis, we correlated OCI with
DNase accessibility in growing cells (Figure 1G). Corroborating
our hypothesis, we found a striking overlap between the least-
accessible regions in growing cells (dark blue) and regions
showing the strongest rise in OCI. Next, we analyzed whether
genomic regions with changing chromosomal interactions
display a characteristic sequence-composition signature. We
highlighted the GC content of each point within the ICP scatter-
plot and again identified a strong correlation, with those regions
losing internal contacts strongly enriched for low GC content
(Figure 1G).
Using OCI, we have identified regions of chromatin losing in-
ternal structure. These regions are the least accessible in the
genome in growing cells and are rich in adenine-thymine (AT)
content.
Sequence Composition Predicts Structural ChromatinDynamics in SenescenceThe bias in the GC content of regions showing changing OCI
(Figure 1G) led us to investigate the role of sequence composi-
tion within senescent nuclear reorganization. We used a recently
published annotation to split the genome into isochores, large
blocks of similar GC content (in GC%: L1 <37; L2 37–41; H1
41–46; H2 46–53; and H3 >53), which show little compositional
heterogeneity (Costantini et al., 2006). Isochores were originally
resolved according to their behavior in density gradient centrifu-
gation, adding a dimension of macromolecular behavior to our
analysis of sequence content (Macaya et al., 1976; Thiery
et al., 1976).
To see how isochores behave in growing and senescent cells,
we plotted the OCI for each isochore (Figures 2A and S2A). We
observe a large difference in the behavior between L-isochores
(L1 and L2) and H-isochores (H1, H2, and H3), with the majority
of regions losing their local interactions within the GC-poor iso-
chores (Figure 2A). Our data extend the role of the sequence
composition in higher-order chromatin dynamics in senescence
to the physical entities of isochores.
TADs are self-interacting domains with boundaries defined by
a change in the directionality bias of interacting fragments. We
calculated the position of TAD boundaries within growing and
senescent cells, as previously described (Dixon et al., 2012).
We found a high 89.3% percent of the domains to be conserved
between growing and senescent cells.
TAD boundary strength and decreased TAD internal contacts
have been shown to be affected by acute loss of a functional
cohesion complex (Sofueva et al., 2013). Interestingly, a recent
report suggests a loss of CTCF atCDKN2A in oncogene-induced
senescence (Hirosue et al., 2012). To test whether TAD bound-
aries are affected by a change in OCI, we calculated the ratio
of interactions found within TADs versus those spanning a
boundary (Figure 2B). We found a change in insulation strength
that correlates with isochores. L1 TAD boundaries show a strik-
ing loss of boundary strength (‘‘opening’’), whereas H2 and H3
TAD boundaries appear to strengthen slightly (‘‘closing’’; Fig-
ures 2B and 2C). Thus, whereas the position of TAD boundaries
remains largely unchanged in senescent cells, their quality is
affected by changes in local and distal interactions, with a signif-
icant fraction of TADs losing insulation strength and a smaller
fraction gaining insulation strength.
To test the changing TADs for enrichment in genomic features,
we selected regions based on the significance of the difference
in insulation strength (p < 0.05 for opening TADs; p < 0.25 for
closing TADs; Figure 2C). We find opening TADs are enriched
in H3K9me3, late replication timing (RT), and lamina-associated
domains (LADs). TADs with stronger boundary insulation show a
strong underrepresentation in these features and are instead en-
riched in regions of early replication and H3K36me3.
Sequence Composition and Lamin Association PredictOCI Increase in SenescenceRecent research has highlighted the importance of LADs and the
loss of LMNB1 for the senescence phenotype (Sadaie et al.,
2013; Shah et al., 2013; Shimi et al., 2011). The level of LMNB1
reduction was shown to predict SAHF-positive cells in a hetero-
geneous population, and ectopic expression of LMNB1was able
to reduce the number of SAHF-positive cells (Sadaie et al., 2013).
L1 isochores showed the strongest loss of local interactions (Fig-
ure 2A) and TAD isolation strength (Figure 2B) and were strongly
enriched in LADs (Figure 2C). To understand the behavior of
LADs, we plotted the change in average OCI across LADs (Fig-
ure S2B). We find a strong correlation between isochore class
and LAD OCI behavior, with L1 LADs losing and H-LADs gaining
local interactions. These observations allow us to predict LAD
behavior by sequence content alone.
To exclude the possibility that this observation is due only to
the enrichment of LADs within AT-rich regions of the genome,
we calculated OCI changes across LAD and inter-LAD regions
of each isochore (Figure 3A). We find that the loss of internal
contacts for L-isochores (a rise in OCI) is LAD dependent, with
4 Cell Reports 10, 1–13, February 3, 2015 ª2015 The Authors
Please cite this article in press as: Chandra et al., Global Reorganization of the Nuclear Landscape in Senescent Cells, Cell Reports (2015), http://dx.doi.org/10.1016/j.celrep.2014.12.055

L-inter LADs showing no change in OCI. This suggests that
the combination of being in an AT-rich L-isochore and a LAD
predicts the dramatic OCI gain in senescence. For H2 and H3
isochores, the OCI change is not dependent on lamin binding
(Figure 3A), suggesting that other features control the behavior
of these LADs.
Senescence is accompanied by a major loss of LMNB1, and
recent chromatin immunoprecipitation sequencing (ChIP-seq)
experiments have identified the majority of the regions losing
LMNB1 occupancy in senescence (Sadaie et al., 2013). Despite
this dramatic loss, a subset of regions not bound by LMNB1 in
growing cells appears to gain binding in senescence (Sadaie
et al., 2013). We calculated the enrichment of these growing-
and senescent-specific LMNB1 regions across the isochore
LADs and inter-LAD regions (Figure 3B). We observe a strong
enrichment for areas losing LMNB1 in L-isochore lamin-
associated domains (L-LADs), suggesting the loss of LMNB1
may be involved in the architectural changes we have uncov-
ered. There was no enrichment of LMNB1-gaining regions
in any LAD category, supporting the previous observation
that these regions are unique to senescence. GC-rich inter-
LADs were enriched for senescence-specific LMNB1 binding,
showing the opposite isochore pattern to the loss of lamin. We
tested the overlap between opening and closing TADs and
B
-10
05
10
Sen
esce
nt
-5
Loca
lD
ista
l
-10 0 5 10
Growing
-5
Local Distal
-10 0 5 10
Growing
-5
Local Distal
H2 46-53% GC
-10 0 5 10
Growing
-5
Local Distal
H1 41-46% GC
-10 0 5 10
Growing
-5
Local Distal
L2 37-41% GC
-10 0 5 10
Growing
-5
Local Distal
A
0.05 0.10 0.15 0.20 0.25 0.30
0.05
0.10
0.15
0.20
0.25
0.30
Growing
Sen
esce
nt
TAD cross-boundary ratios
More cross-boundary interactions in Growing
More cross-boundary interactions in Senescence
H3H2H1L2L1
46 - 5341 - 4637 - 41
%GC
Internal contacts
External contacts= TAD cross-boundary ratio
TADs
0.05 0.10 0.15 0.20 0.25 0.30
0.05
0.10
0.15
0.20
0.25
0.30
Growing
Sen
esce
nt
Closing
Opening
C
80-8
log2 Obs / Expected Enrichment
*H3
H2
H1
L2
L1
K9me3
K27me3
K36me3
K4me3Early
Medium
Late
Lamin B1Replication
TimingHistoneMarks
Op Cl Op Cl Op Cl
Figure 2. Sequence Composition Predicts Structural Chromatin Dynamics in Senescence(A) Scatterplots showing OCI calculated in 200 kb windows for growing and senescence cells, separated by overlap with isochores. The greatest changes can be
seen to occur in the L1 isochores.
(B) Top: schematic of TAD boundary strength calculation. Bottom: scatterplot comparing the cross-boundary ratios over TADs genome wide, colored by iso-
chore. The L-isochores can be seen to gain cross-boundary interactions in senescence.
(C) Top: selection of opening and closing TADs highlighted in scatter plot (a less-stringent cutoff was chosen for closing TADs, in order to reach a comparable
number). Bottom: enrichment for overlap with genomic features (log2 obs/exp; also see Experimental Procedures) for opening (Op) and closing (Cl) TADs.
Cell Reports 10, 1–13, February 3, 2015 ª2015 The Authors 5
Please cite this article in press as: Chandra et al., Global Reorganization of the Nuclear Landscape in Senescent Cells, Cell Reports (2015), http://dx.doi.org/10.1016/j.celrep.2014.12.055

Dis
tanc
e (µ
m)
G SG S
Distance from Nuclear Periphery
01
23
45
L1-LADH2-LAD
****
GrowingOCI
SenescenceOCI
Chr 18 : 42 - 66 Mb
Growing LADs
FISH Probes
H2-LAD L1-LAD
Dis
tal
Loca
l
Growing Senescence
H2-LAD
5 µm
Growing Senescence
L1-LAD
C D
E
H3 H2 H1 L2 L1
Early Replication
Medium Replication
Late Replication
LMNB1 Grow + Sen
LMMB1 Growing only
LMNB1 Sen only
K9me3
K27me3
K36me3
K4me3
H3 H2 H1 L2 L1
LADsInter-LADs
5.3
0
-5.3
log2
Obs
/ E
xpec
ted
Enr
ichm
ent
H3
H2
H1
L2
L1
LADs Inter-LADs
Change in OCI
-10 -5 0 5 10
More localin Senescence
More distalin Senescence
> 53% GC
46 - 53% GC
41 - 46% GC
37 - 41% GC
< 37% GC
A B
Focal Plane
Distance fromnuclear periphery
Figure 3. Combined Sequence Composition and Lamin Association Predict the Strongest OCI-Gaining Regions, which Are Changing Their
Nuclear Positioning
(A) Change in OCI levels in senescence for regions overlapping LADs (purple) and inter-LADs (iLADs, green).
(B) Enrichment of LADs and iLADs for replication timing, LMNB1 regions, and several chromatin marks.
(C) Browser shot indicating genomic location for FISH probes designed against two adjacent H2-LAD and L1-LAD regions (green vertical lines).
(D) Distances of FISH signals to the nuclear periphery.
(E) Left: representative confocal microscopic images of FISH-treated growing and senescent cells. Right: schematic showing the measurements made for the
DNA-FISH from the central focal plane.
6 Cell Reports 10, 1–13, February 3, 2015 ª2015 The Authors
Please cite this article in press as: Chandra et al., Global Reorganization of the Nuclear Landscape in Senescent Cells, Cell Reports (2015), http://dx.doi.org/10.1016/j.celrep.2014.12.055
growing/senescence-specific LMNB1 regions (Figure S3A). We
find a strong enrichment for the newly forming senescence-spe-
cific LADs within TADs exhibiting greater insulation, suggesting
a functional role for the senescence-specific gain of LMNB1.
Our data suggest a role for the chromosomal redistribution of
LMNB1 in the architectural changes we described.
To investigate whether the changes in LAD OCI are accompa-
nied by changes in positioning in the nucleus, we used DNA-
FISH microscopy to measure the distance of specific LADs to
the nuclear periphery. We designed probes within two adjacent
L1- and H2-LADs (Figure 3C); the L1-LAD showed a significant
increase in the mean distance to the periphery (Figures 3D and
3E; p < 0.006). Interestingly, the H-LAD also showed a significant
change, moving closer to the periphery (Figures 3D and 3E; p <
0.009). We tested another L1-LAD in close proximity to the
CDKN2A locus and observed a similar move away from the
nuclear periphery (Figure S3B; p < 0.002). These observations
suggest that the consequences of chromatin restructuring go
beyond the change in local interactions described by OCI and
could additionally entail a change in nuclear positioning, with
L1 LADs moving away from the periphery and H-LADs moving
closer to it.
Local Changes Are Accompanied by the Formation ofSpecific Distal InteractionsThrough changes in OCI and TAD insulation strength, we
observe a redistribution of local interactions to more distal
interactions for L-LADs. To test whether these new distal con-
tacts are distributed randomly or form specific interactions, we
mapped the change in normalized interaction count between
different LADs. We calculated all reads linking selected features
while ignoring interactions separated by less than 2 Mb to avoid
any distance effects (Figure 4A). We observe a strong increase in
the number of interactions between L-LADs, with the strongest
gain found between L1-LADs (Figure 4B). In contrast, we do
not observe any major changes in interactions between H-LADs.
Whereas L-LADs lose internal contacts, they increase their in-
teractions between each other across the genome, indicating
that they cluster together in nuclear space. This observation is
reminiscent of the rearrangement of heterochromatin observed
with microscopy during SAHF formation in Ras-induced senes-
cence (Figure 4C; Chandra et al., 2012). We therefore analyzed
whether interactions between domains defined by specific his-
tone marks change in senescence. Consistent with previous mi-
croscopy data, we find that H3K9me3 domains come together in
a specific manner during senescence (Figure 4D).
The concerted local loss of internal contacts and global clus-
tering of L-LADs leads us to the model depicted in Figure 4E,
whereby lamin-bound regions detach from the nuclear periphery
and cluster within the nuclear interior. Some GC-rich H2/H3 re-
gions appear to have gained internal structure and relocate to
the periphery, consistent with a scenario of nuclear reshuffling
resulting from LAD relocation.
Analyzing distal contacts of regions dramatically changing
their local structure (L1-LADs and H3K9me3 domains) suggests
a clustering of these regions within the nucleus. Previous work
has speculated that SAHF may represent a special heterochro-
matic compartment, supported by immunofluorescence studies
using DNA stains such as DAPI which show a very high intensity
signal within the SAHF core. Contrary to this theory, our initial ob-
servations using Hi-C data suggest a loss of internal structure
and possible decompaction of DNA enriched in the SAHF core.
The clustering shown here can now explain the perceived expan-
sion and clustering of heterochromatin and provides a newdepth
of understanding of the structural organization of senescent
chromatin.
Pre-senescent Replication Timing Predicts ChromatinChangesOIS shows an accumulation of cells arrested in S phase. This
has been linked to replication-stress-induced DNA damage
signaling, possibly caused by an initial hyperproliferative burst
following oncogene activation (Bartkova et al., 2006; Di Micco
et al., 2006). Although the relationship between structural chro-
matin changes and cellular senescence is not well understood,
one key protein required for SAHF formation is pRB, linking
higher-order chromatin changes and replication (Narita et al.,
2003). The interplay between replication timing and SAHF archi-
tecture has also been shown by pulse-chase studies, tracking
nucleoside analogue incorporation (Chandra et al., 2012).
Having identified the regions with the most dynamic structural
changes in the Hi-C data, we tested whether these regions show
any change in pre-senescence replication timing (RT). We rean-
alyzed whole-genome replication timing data from IMR90 ER-
Ras cells, comparing growing cells and presenescent cells
(48 hr after induction of Ras; Chandra et al., 2012). SAHF forma-
tion takes longer in ER-Ras cells, and kinetics of senescence
establishment are better described, suggesting that changes
observed at 48 hr would precede SAHF formation (Young
et al., 2009). To compare the two data sets, we measured the
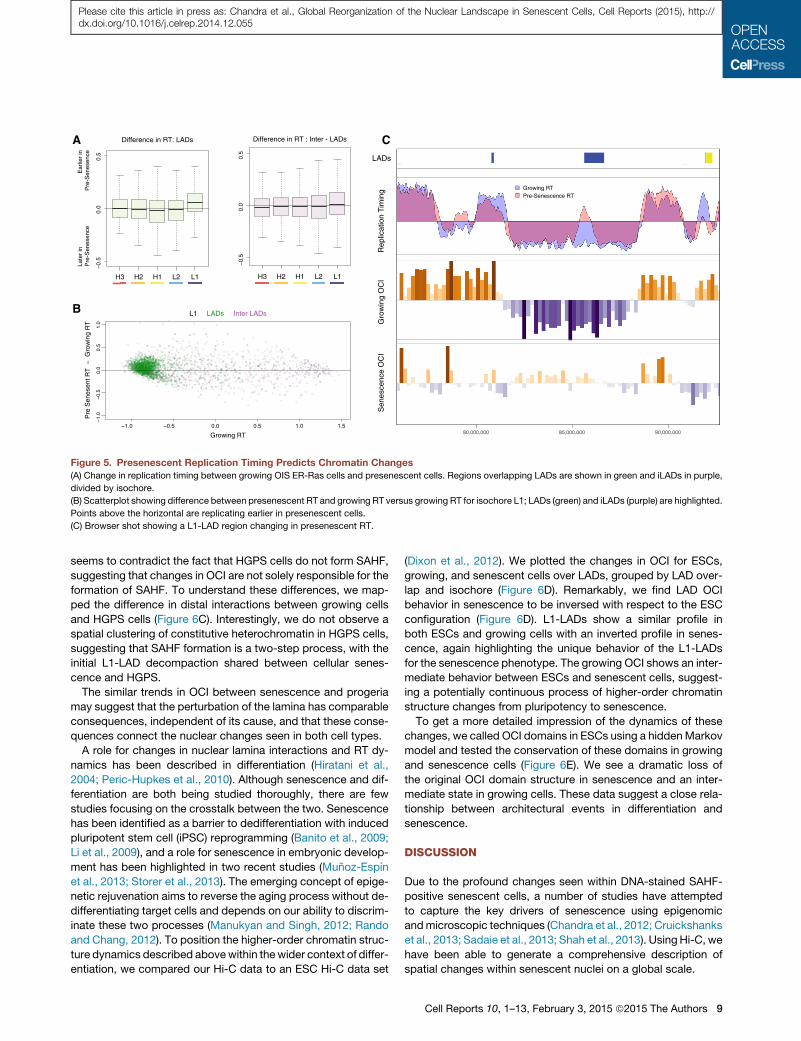
change in normalized replication timing (Figure 5A). We split
the genome into LADs and inter-LADs and then isochores. We
see a shift toward earlier RT for L1-LADs, whereas L1 iLADs
show little change. The scatterplots for the L1 isochore indicates
a split between LADs (green) and iLADs (purple) into late and
early replication timing, respectively (Figure 5B). A subpopula-
tion of L1 LADs appears to be biased toward earlier RT in prese-
nescence. An example of a locus exhibiting this shift can be seen
in Figure 5C,which shows a region surrounding an L1-LAD losing
its internal contact bias and changing in presenescence RT.
We find a correlation between the most significant structural
changes in senescence as revealed by Hi-C and RT changes
in hyperproliferating presenescent cells. This observation may
indicate a role for replication timing in shaping the senescence
chromatin landscape.
Higher-Order Chromatin Dynamics in SenescenceReflect Changes in Progeria and May Represent theEndpoint of a Continuous Remodelling Process inDifferentiationThe role of p16-dependent senescence in organismal aging
highlights the importance of cellular senescence as an in vitro
aging model (Baker et al., 2011). Fibroblasts belonging to pa-
tients suffering from Hutchinson-Gilford progeria syndrome
(HGPS) undergo premature senescence and also provide an
important model to study aging. However, OIS and HGPS cells
Cell Reports 10, 1–13, February 3, 2015 ª2015 The Authors 7
Please cite this article in press as: Chandra et al., Global Reorganization of the Nuclear Landscape in Senescent Cells, Cell Reports (2015), http://dx.doi.org/10.1016/j.celrep.2014.12.055

have distinct chromatin features; for example, SAHF formation is
exclusive to OIS.Whereas OIS is accompanied by amajor loss in
LMNB1, premature aging in HPGS is due to the accumulation of
progerin, a mutated version of LMNA/LMNC (Eriksson et al.,
2003). As such, a commonality found within both models is the
destabilization of the nuclear lamina. To investigate the breadth
of our findings regarding local chromatin changes in senescence
and to examine similarities between OIS and HGPS fibroblasts,
we compared our data to recently published Hi-C data sets in
HGPS fibroblasts (McCord et al., 2013).
Unsupervised hierarchical clustering of OCI in growing, senes-
cent, and progeroid fibroblasts split the data into six classes,
which show strong correlation with GC content (Figure 6A). Clas-
ses 1 and 5 show similar trends for senescence and progeria and
represent 58%of the genome (Figure S4). Class 1 is GCpoor and
highly enriched in L1-LADs (Figure 6B), suggesting a common
loss of internal structure for these regions in both senescence
and progeria. Cluster 5 shows the strongest enrichment of all
clusters for regions gaining LMNB1 in senescence, suggesting
that a commonmechanismmay lead to the compaction of these
regions.
Whereas the decompaction of heterochromatin for HGPScells
is consistent with previous observations (Scaffidi and Misteli,
2006; Shumaker et al., 2006), the congruency in changing OCI
B
-100
-50
0
50
100
150
200
250
300
Inte
ract
ion
Cha
nge
H3 LADsH2 LADsH1 LADsL2 LADsL1 LADs
> 53% GC
46-53% GC
41-46% GC
37-41% GC
< 37% GC
H3 LADs H2 LADs H1 LADs L2 LADs L1 LADs
Mor
e co
ntac
tsin
Sen
esce
nce
Less
con
tact
sin
Sen
esce
nce
-100
-50
0
50
100
150
200
250
300
350
H3K9me3H3K27me3H3K36me3H3K4me3In
tera
ctio
n C
hang
e
H3K9me3
H3K27me3
H3K36me3
H3K4me3
Mor
e co
ntac
tsin
Sen
esce
nce
Less
con
tact
sin
Sen
esce
nce
D
2 Mb Features of interest
Interaction Change = (ig × cg) – (is × cs)
ic
= Interaction count with features of interest
= Correction factor based on total Hi-C read count
A
C
E
K9me3
K27me3
K36me3
DAPI
Schematic SAHF Structure
Growing Senescence
Senescence -specific LADs
SAHF
LADs
Figure 4. Local Changes Are Accompanied by the Formation of Specific Distal Interactions
(A) Schematic showing how the change in interaction strength between features was calculated. g and s supertext denotes growing and senescence. Note the
avoidance of features within 2 Mb.
(B) Change in interaction strength calculated between isochore LADs comparing growing and senescence
(C) Schematic depicting the chromatin organization of histone marks in SAHF as described in Chandra et al. (2012).
(D) Change in interaction strength calculated between regions associated with histone marks.
(E) Model depicting the change of the chromatin architecture. We propose that L-LAD regions with strong local interactions (high OCI) in growing (green) detach
from the nuclear lamina and lose their internal structure (potentially forming the core of the SAHF). Other regions, such as selected H-LADs, move toward the
nuclear periphery.
8 Cell Reports 10, 1–13, February 3, 2015 ª2015 The Authors
Please cite this article in press as: Chandra et al., Global Reorganization of the Nuclear Landscape in Senescent Cells, Cell Reports (2015), http://dx.doi.org/10.1016/j.celrep.2014.12.055
seems to contradict the fact that HGPS cells do not form SAHF,
suggesting that changes in OCI are not solely responsible for the
formation of SAHF. To understand these differences, we map-
ped the difference in distal interactions between growing cells
and HGPS cells (Figure 6C). Interestingly, we do not observe a
spatial clustering of constitutive heterochromatin in HGPS cells,
suggesting that SAHF formation is a two-step process, with the
initial L1-LAD decompaction shared between cellular senes-
cence and HGPS.
The similar trends in OCI between senescence and progeria
may suggest that the perturbation of the lamina has comparable
consequences, independent of its cause, and that these conse-
quences connect the nuclear changes seen in both cell types.
A role for changes in nuclear lamina interactions and RT dy-
namics has been described in differentiation (Hiratani et al.,
2004; Peric-Hupkes et al., 2010). Although senescence and dif-
ferentiation are both being studied thoroughly, there are few
studies focusing on the crosstalk between the two. Senescence
has been identified as a barrier to dedifferentiation with induced
pluripotent stem cell (iPSC) reprogramming (Banito et al., 2009;
Li et al., 2009), and a role for senescence in embryonic develop-
ment has been highlighted in two recent studies (Munoz-Espın
et al., 2013; Storer et al., 2013). The emerging concept of epige-
netic rejuvenation aims to reverse the aging process without de-
differentiating target cells and depends on our ability to discrim-
inate these two processes (Manukyan and Singh, 2012; Rando
and Chang, 2012). To position the higher-order chromatin struc-
ture dynamics described abovewithin thewider context of differ-
entiation, we compared our Hi-C data to an ESC Hi-C data set
(Dixon et al., 2012). We plotted the changes in OCI for ESCs,
growing, and senescent cells over LADs, grouped by LAD over-
lap and isochore (Figure 6D). Remarkably, we find LAD OCI
behavior in senescence to be inversed with respect to the ESC
configuration (Figure 6D). L1-LADs show a similar profile in
both ESCs and growing cells with an inverted profile in senes-
cence, again highlighting the unique behavior of the L1-LADs
for the senescence phenotype. The growing OCI shows an inter-
mediate behavior between ESCs and senescent cells, suggest-
ing a potentially continuous process of higher-order chromatin
structure changes from pluripotency to senescence.
To get a more detailed impression of the dynamics of these
changes, we called OCI domains in ESCs using a hiddenMarkov
model and tested the conservation of these domains in growing
and senescence cells (Figure 6E). We see a dramatic loss of
the original OCI domain structure in senescence and an inter-
mediate state in growing cells. These data suggest a close rela-
tionship between architectural events in differentiation and
senescence.
DISCUSSION
Due to the profound changes seen within DNA-stained SAHF-
positive senescent cells, a number of studies have attempted
to capture the key drivers of senescence using epigenomic
andmicroscopic techniques (Chandra et al., 2012; Cruickshanks
et al., 2013; Sadaie et al., 2013; Shah et al., 2013). UsingHi-C, we
have been able to generate a comprehensive description of
spatial changes within senescent nuclei on a global scale.
H3 H2 H1 L2 L1
−0.
50.
00.
5
Late
r in
P
re-S
enes
ence
Difference in RT: LADs
Ear
lier
inP
re-S
enes
ence
H3 H2 H1 L2 L1
−0.
50.
00.
5
Difference in RT : Inter - LADsA
B
C
80,000,000 85,000,000 90,000,000
LADs
Rep
licat
ion
Tim
ing
Gro
win
g O
CI
Sen
esce
nce
OC
I
Pre-Senescence RTGrowing RT
−1.0 −0.5 0.0 0.5 1.0 1.5
−1.
0−
0.5
0.0
0.5
1.0
Growing RT
Pre
Sen
esen
t RT
− G
row
ing
RT
L1 LADs Inter LADs
Figure 5. Presenescent Replication Timing Predicts Chromatin Changes
(A) Change in replication timing between growing OIS ER-Ras cells and presenescent cells. Regions overlapping LADs are shown in green and iLADs in purple,
divided by isochore.
(B) Scatterplot showing difference between presenescent RT and growing RT versus growing RT for isochore L1; LADs (green) and iLADs (purple) are highlighted.
Points above the horizontal are replicating earlier in presenescent cells.
(C) Browser shot showing a L1-LAD region changing in presenescent RT.
Cell Reports 10, 1–13, February 3, 2015 ª2015 The Authors 9
Please cite this article in press as: Chandra et al., Global Reorganization of the Nuclear Landscape in Senescent Cells, Cell Reports (2015), http://dx.doi.org/10.1016/j.celrep.2014.12.055

SAHF were originally described as a gene-silencing compart-
ment, and cellular senescence has since been associated with
an increase in constitutive heterochromatin (cHC) (Narita et al.,
2003; Reimann et al., 2010). Contrary to these expectations,
we find a dramatic loss of local interactions in the cHC compart-
ment, as described by an increase in OCI. Although this observa-
tion challenges the current view of SAHF, it resolves the previ-
ously paradoxical relationship between senescence and aging
by correlating both with the loss of heterochromatin observed
in premature and healthy aging (Scaffidi and Misteli, 2006). A
loss of heterochromatin in senescence is also supported by a
recent study showing the activation of satellite repeats early in
cellular senescence, termed senescence-associated distension
of satellites (SADS) (Swanson et al., 2013). If loss of cHC unifies
senescent and aging cells, what is unique to senescence that
enables SAHF formation?
Further to the general loss of heterochromatin, we show
a spatial clustering of decondensing regions in cellular sen-
escence, but not in Hutchinson-Gilford progeria syndrome
(HGPS) cells. These interactionsmay represent a unique consec-
utive step required for SAHF formation, leading to a two-step
mechanism where heterochromatin decondensation is followed
by spatial clustering (Figure S5). A two-step mechanism for
SAHF formation has also been proposed in the recent study un-
covering SADS, in agreement with our findings (Swanson et al.,
2013).
Whereas we can only speculate about the reason behind the
L-LADs decompaction, one possible mechanism is the recently
described activation of long interspersed nuclear elements
involved in replicative senescence (De Cecco et al., 2013). This
activation and retrotransposition was implicated in reinforcing
the senescence phenotype through DNA damage.
Whereas a higher OCI could suggest an activation of the cHC
compartment within senescence, a deeper investigation into the
relationship with transcriptional changes will be necessary to
better understand SAHF function or to break with the concept
of SAHF as a silencing compartment. For example, it may be
that the retention of repressive chromatin marks such as
H3K9me3 and an increase in HP1 proteins is sufficient for
gene silencing, despite chromatin decondensation.
Our data suggest common chromatin changes between
senescence and progeria; however, we can only speculate
about the upstreammechanisms leading to these similar nuclear
phenotypes. Some possible crosstalks have been described in
the literature, such as the activation of p53 and pRb due to pro-
gerin overexpression via a telomeric DNA damage response
A
Dis
tal
Loca
l
-2
-1
0
1
2
Growing
Proge
ria
45%
38%
41.5%
% G
C C
onte
nt1
2
3
4
5
6
% G
C (avg
)
% G
C
Early Replication
Medium Replication
Late Replication
LMNB1 - Grow & Sen
LMNB1 - Growing only
LMNB1 - Sen only
H3 LADs
H2 LADs
H1 LADs
L2 LADs
L1 LADs
H3K9me3
H3K27me3
H3K36me3
H3K4me3−3
0
3
Feature E
nrichment
1 2 3 4 5 6
Cluster
*
Fre
quen
cy
0.0 0.2 0.4 0.6 0.8 1.0
0
100
200
300
400
500
Fre
quen
cy
0.0 0.2 0.4 0.6 0.8 1.00
50
100
150
200
Fre
quen
cy
0.0 0.2 0.4 0.6 0.8 1.00
100
200
300
ES Cells
Growing
Senescent
Conservation of ES OCI domains
DB
E
C
0
100
200
300
400
500
K9me3 K27me3 K36me3 K4me3
K9me3
K27me3
K36me3
K4me3
Progeria Histone Interactions
Figure 6. Higher-Order Chromatin Dynamics in Senescence Reflect Changes in Progeria and May Represent the Endpoint of a Continuous
Remodelling Process in Differentiation
(A) Hierarchical clustering of OCI values in 1 Mb of genomic windows for growing, senescence, and progeria. Columns to the right show GC content per genomic
window and the average %GC per cluster.
(B) Enrichment of clusters over genomic features. Note that clusters 1 and 5 show similar behavior in growing and senescence.
(C) Change of interactions calculated between regions associated with histone marks. Progeria shows no clustering of H3K9me3 regions or other histone marks
compared to growing cells. Enrichment calculated as shown in Figure 4A.
(D) Average OCI over LADs (top) and iLADs (bottom) split by isochore in ESCs, growing, and senescence.
(E) Conservation of OCI domains called using a hidden Markov model (see Experimental Procedures) in ESCs. The x axis shows percentage of windows within
domains classed as local (0) or distal (1). ESCs show a bimodal distribution as expected. Growing and senescent cells show a decaying conservation of
interaction state within these domains.
10 Cell Reports 10, 1–13, February 3, 2015 ª2015 The Authors
Please cite this article in press as: Chandra et al., Global Reorganization of the Nuclear Landscape in Senescent Cells, Cell Reports (2015), http://dx.doi.org/10.1016/j.celrep.2014.12.055

(Benson et al., 2010). Likewise, telomere erosion in replicative
senescence was shown to induce progerin expression in normal
fibroblasts (Cao et al., 2011). However, the same study found no
progerin induction in oncogene-induced (telomere-independent)
senescence (Cao et al., 2011). Our study establishes a link be-
tween oncogene-induced senescence and HGPS in the loss of
local contacts of GC-poor LADs, suggesting a common destabi-
lization of the nuclear lamina phenocopied by the loss of LMNB1
in senescence and the expression of progerin in HGPS.
In addition to the dramatic changes we see in L-LADs, we
consistently find a GC-rich compartment of the genome gaining
internal contacts in senescence. This compartment is enriched in
H2 and H3 isochores and overlaps those TADs gaining boundary
insulation. When compared to LMNB1 ChIP-seq data, these re-
gions overlap with regions gaining LMNB1 in senescence (Sa-
daie et al., 2013). Based on our FISH data, they may locate to
the nuclear periphery. It will be interesting to characterize these
senescence-acquired LADs further, especially to see whether
they are a senescence-specific feature or whether they exist in
other cellular states.
The global extent to which regions switch their OCI in senes-
cence is reminiscent of an inversion of the global interaction
pattern. This global response starts to take effect after a few
hours of c-raf induction and affects the whole population of cells
after 48 hr. SAHF formation has been shown to occur down-
stream of several different cellular stresses. The extent of the in-
teractome change, the response time, and the variety of triggers
leads us to speculate that this nuclear restructuring may be
a fundamental hardwired response of the cell. Our data show
a strong correlation between OCI change and isochores; iso-
chores may have physical properties beyond simple sequence
recognition that allow the genome to rearrange its architecture
during a stress response. A relationship between isochore struc-
ture and stress response would have important implications for
evolution and could go some way to explaining the differences
between the integration and fixation rates seen for some repeti-
tive elements (Costantini et al., 2012).
Senescent cells share similarities with terminally differenti-
ated cells, such as those having permanently exited the cell
cycle. Furthermore, effectors of senescence like p53 and p16
have been shown to critically regulate self-renewal in adult
stem cells (Janzen et al., 2006). However, there have been
few studies on the relationship between senescence and
differentiation. The emerging concept of epigenetic rejuvena-
tion aims to reverse the aging process without dedifferentiating
target cells (as opposed to iPSC reprogramming), thereby
avoiding risks associated with pluripotency, such as cancer.
Any realization of epigenetic rejuvenation depends on our abil-
ity to discriminate differentiation and senescence (Manukyan
and Singh, 2012). ESCs and senescent cells show globally in-
verted domains of local compaction whereas somatic cells
show an intermediate state between ESCs and senescence.
Our observations suggest that the remodelling of the higher-or-
der structure we describe for senescence is a continuation
of ESC to somatic differentiation. Based on this preliminary
observation, reversing these architectural changes may reboot
the nuclear architecture in an undifferentiated ESC-like state,
contrary to the concept of rejuvenation. However, a deeper
understanding of distinct architectural features, distinguishing
early differentiation and senescence, could provide a rationale
for rejuvenation approaches.
EXPERIMENTAL PROCEDURES
Hi-C
Hi-C was performed essentially as described in Lieberman-Aiden et al. (2009),
with some modifications described in the Supplemental Experimental
Procedures.
FISH
FISH labeling was performed as described in Bolland et al. (2013). FISH
probes were ordered prelabeled from empire genomics. A list of clones can
be found in the Supplemental Experimental Procedures. FISH data were
analyzed from confocal sections using Volocity software. Top and bottom
focal planes were discarded, and the analysis was restricted to central focal
planes showing a clear FISH signal. Volocity software was used for automated
object detection and distance measurements.
Cell Culture
WI-38hTERT/GFP-RAF1-ER was a generous gift from Carl Mann. Cells were
cultured with 10% fetal bovine serum under 5% O2 and handled as described
in Jeanblanc et al. (2012). Senescent cells were harvested 48 hr after induction
with 4-OH tamoxifen.
Cell Proliferation Assays
BrdU (anti-BrdU; PharMingen) and DAPI staining were carried out as
described in Narita et al. (2003).
Computational Data Analysis
Please refer to the Supplemental Experimental Procedures for details about
the data analysis.
ACCESSION NUMBERS
The ENA accession number for the sequencing data reported in this paper is
PRJEB8073.
SUPPLEMENTAL INFORMATION
Supplemental Information includes Supplemental Experimental Procedures
and five figures and can be found with this article online at http://dx.doi.org/
10.1016/j.celrep.2014.12.055.
AUTHOR CONTRIBUTIONS
T.C., P.F., and W.R. designed the study. T.C., S.S., M.F.-M., J.-Y.T., and K.K.
performed experiments. T.C., P.A.E., S.W.W., and S.A. analyzed the data.
T.C., P.A.E., and W.R. wrote the manuscript.
ACKNOWLEDGMENTS
This study was funded by the following grants: BBSRC (BB/K010867/1);
BBSRC (BBS/E/B/000C0404); and Wellcome Trust (095645/Z/11/Z). Thanks
to Roland Schwarz for useful discussion and to Jesus Gil, Oliver Bischof, David
Bazett-Jones, David Gilbert, and Ben Pope for critical reading of the manu-
script. Figure icons in the graphical abstract were created by OCHA, Freepik
under Creative Commons license 3.0. W.R. is a consultant to Cambridge
Epigenetix Ltd.
Received: July 31, 2014
Revised: November 13, 2014
Accepted: December 22, 2014
Published: January 29, 2015
Cell Reports 10, 1–13, February 3, 2015 ª2015 The Authors 11
Please cite this article in press as: Chandra et al., Global Reorganization of the Nuclear Landscape in Senescent Cells, Cell Reports (2015), http://dx.doi.org/10.1016/j.celrep.2014.12.055
REFERENCES
Acosta, J.C., O’Loghlen, A., Banito, A., Guijarro, M.V., Augert, A., Raguz, S.,
Fumagalli, M., Da Costa, M., Brown, C., Popov, N., et al. (2008). Chemokine
signaling via theCXCR2 receptor reinforces senescence. Cell 133, 1006–1018.
Acosta, J.C., Banito, A., Wuestefeld, T., Georgilis, A., Janich, P., Morton, J.P.,
Athineos, D., Kang, T.-W., Lasitschka, F., Andrulis, M., et al. (2013). A complex
secretory program orchestrated by the inflammasome controls paracrine
senescence. Nat. Cell Biol. 15, 978–990.
Baker, D.J., Wijshake, T., Tchkonia, T., LeBrasseur, N.K., Childs, B.G., van de
Sluis, B., Kirkland, J.L., and van Deursen, J.M. (2011). Clearance of p16Ink4a-
positive senescent cells delays ageing-associated disorders. Nature 479,
232–236.
Banito, A., Rashid, S.T., Acosta, J.C., Li, S., Pereira, C.F., Geti, I., Pinho, S.,
Silva, J.C., Azuara, V., Walsh, M., et al. (2009). Senescence impairs successful
reprogramming to pluripotent stem cells. Genes Dev. 23, 2134–2139.
Bartkova, J., Rezaei, N., Liontos, M., Karakaidos, P., Kletsas, D., Issaeva, N.,
Vassiliou, L.-V.F., Kolettas, E., Niforou, K., Zoumpourlis, V.C., et al. (2006).
Oncogene-induced senescence is part of the tumorigenesis barrier imposed
by DNA damage checkpoints. Nature 444, 633–637.
Benson, E.K., Lee, S.W., and Aaronson, S.A. (2010). Role of progerin-induced
telomere dysfunction in HGPS premature cellular senescence. J. Cell Sci. 123,
2605–2612.
Bernardi, G. (2012). The genome: an isochore ensemble and its evolution. Ann.
N Y Acad. Sci. 1267, 31–34.
Bolland, D.J., King, M.R., Reik, W., Corcoran, A.E., and Krueger, C. (2013).
Robust 3D DNA FISH using directly labeled probes. J. Vis. Exp, e50587.
Braig, M., Lee, S., Loddenkemper, C., Rudolph, C., Peters, A.H.F.M., Schle-
gelberger, B., Stein, H., Dorken, B., Jenuwein, T., and Schmitt, C.A. (2005).
Oncogene-induced senescence as an initial barrier in lymphoma develop-
ment. Nature 436, 660–665.
Cao, K., Blair, C.D., Faddah, D.A., Kieckhaefer, J.E., Olive, M., Erdos, M.R.,
Nabel, E.G., and Collins, F.S. (2011). Progerin and telomere dysfunction
collaborate to trigger cellular senescence in normal human fibroblasts.
J. Clin. Invest. 121, 2833–2844.
Chan, H.M., Narita, M., Lowe, S.W., and Livingston, D.M. (2005). The p400
E1A-associated protein is a novel component of the p53 —> p21 senescence
pathway. Genes Dev. 19, 196–201.
Chandra, T., and Narita, M. (2013). High-order chromatin structure and the
epigenome in SAHFs. Nucleus 4, 23–28.
Chandra, T., Kirschner, K., Thuret, J.-Y., Pope, B.D., Ryba, T., Newman, S.,
Ahmed, K., Samarajiwa, S.A., Salama, R., Carroll, T., et al. (2012). Indepen-
dence of repressive histone marks and chromatin compaction during senes-
cent heterochromatic layer formation. Mol. Cell 47, 203–214.
Chicas, A., Wang, X., Zhang, C., McCurrach, M., Zhao, Z., Mert, O., Dickins,
R.A., Narita, M., Zhang, M., and Lowe, S.W. (2010). Dissecting the unique
role of the retinoblastoma tumor suppressor during cellular senescence. Can-
cer Cell 17, 376–387.
Coppe, J.-P., Patil, C.K., Rodier, F., Sun, Y., Munoz, D.P., Goldstein, J.,
Nelson, P.S., Desprez, P.-Y., and Campisi, J. (2008). Senescence-associated
secretory phenotypes reveal cell-nonautonomous functions of oncogenic RAS
and the p53 tumor suppressor. PLoS Biol. 6, 2853–2868.
Costantini, M., Clay, O., Auletta, F., and Bernardi, G. (2006). An isochore map
of human chromosomes. Genome Res. 16, 536–541.
Costantini, M., Auletta, F., and Bernardi, G. (2012). The distributions of ‘‘new’’
and ‘‘old’’ Alu sequences in the human genome: the solution of a ‘‘mystery’’.
Mol. Biol. Evol. 29, 421–427.
Cruickshanks, H.A., McBryan, T., Nelson, D.M., Vanderkraats, N.D., Shah,
P.P., van Tuyn, J., Singh Rai, T., Brock, C., Donahue, G., Dunican, D.S.,
et al. (2013). Senescent cells harbour features of the cancer epigenome.
Nat. Cell Biol. 15, 1495–1506.
De Cecco, M., Criscione, S.W., Peckham, E.J., Hillenmeyer, S., Hamm, E.A.,
Manivannan, J., Peterson, A.L., Kreiling, J.A., Neretti, N., and Sedivy, J.M.
(2013). Genomes of replicatively senescent cells undergo global epigenetic
changes leading to gene silencing and activation of transposable elements.
Aging Cell 12, 247–256.
Di Leonardo, A., Linke, S.P., Clarkin, K., and Wahl, G.M. (1994). DNA damage
triggers a prolonged p53-dependent G1 arrest and long-term induction of Cip1
in normal human fibroblasts. Genes Dev. 8, 2540–2551.
Di Micco, R., Fumagalli, M., Cicalese, A., Piccinin, S., Gasparini, P., Luise, C.,
Schurra, C., Garre’, M., Nuciforo, P.G., Bensimon, A., et al. (2006). Oncogene-
induced senescence is a DNA damage response triggered by DNA hyper-
replication. Nature 444, 638–642.
Di Micco, R., Sulli, G., Dobreva, M., Liontos, M., Botrugno, O.A., Gargiulo, G.,
dal Zuffo, R., Matti, V., d’Ario, G., Montani, E., et al. (2011). Interplay between
oncogene-induced DNA damage response and heterochromatin in senes-
cence and cancer. Nat. Cell Biol. 13, 292–302.
Dixon, J.R., Selvaraj, S., Yue, F., Kim, A., Li, Y., Shen, Y., Hu, M., Liu, J.S., and
Ren, B. (2012). Topological domains in mammalian genomes identified by
analysis of chromatin interactions. Nature 485, 376–380.
Eriksson, M., Brown, W.T., Gordon, L.B., Glynn, M.W., Singer, J., Scott, L., Er-
dos, M.R., Robbins, C.M., Moses, T.Y., Berglund, P., et al. (2003). Recurrent
de novo point mutations in lamin A cause Hutchinson-Gilford progeria syn-
drome. Nature 423, 293–298.
Funayama, R., Saito,M., Tanobe, H., and Ishikawa, F. (2006). Loss of linker his-
tone H1 in cellular senescence. J. Cell Biol. 175, 869–880.
Haugstetter, A.M., Loddenkemper, C., Lenze, D., Grone, J., Standfuss, C., Pe-
tersen, I., Dorken, B., and Schmitt, C.A. (2010). Cellular senescence predicts
treatment outcome in metastasised colorectal cancer. Br. J. Cancer 103,
505–509.
Hayflick, L., and Moorhead, P.S. (1961). The serial cultivation of human diploid
cell strains. Exp. Cell Res. 25, 585–621.
Heinz, S., Benner, C., Spann, N., Bertolino, E., Lin, Y.C., Laslo, P., Cheng, J.X.,
Murre, C., Singh, H., and Glass, C.K. (2010). Simple combinations of lineage-
determining transcription factors prime cis-regulatory elements required for
macrophage and B cell identities. Mol. Cell 38, 576–589.
Hiratani, I., Leskovar, A., and Gilbert, D.M. (2004). Differentiation-induced
replication-timing changes are restricted to AT-rich/long interspersed nuclear
element (LINE)-rich isochores. Proc. Natl. Acad. Sci. USA 101, 16861–16866.
Hirosue, A., Ishihara, K., Tokunaga, K., Watanabe, T., Saitoh, N., Nakamoto,
M., Chandra, T., Narita, M., Shinohara, M., and Nakao, M. (2012). Quantitative
assessment of higher-order chromatin structure of the INK4/ARF locus in hu-
man senescent cells. Aging Cell 11, 553–556.
Janzen, V., Forkert, R., Fleming, H.E., Saito, Y., Waring, M.T., Dombkowski,
D.M., Cheng, T., DePinho, R.A., Sharpless, N.E., and Scadden, D.T. (2006).
Stem-cell ageing modified by the cyclin-dependent kinase inhibitor
p16INK4a. Nature 443, 421–426.
Jeanblanc, M., Ragu, S., Gey, C., Contrepois, K., Courbeyrette, R., Thuret, J.-
Y., and Mann, C. (2012). Parallel pathways in RAF-induced senescence and
conditions for its reversion. Oncogene 31, 3072–3085.
Kalhor, R., Tjong, H., Jayathilaka, N., Alber, F., and Chen, L. (2012). Genome
architectures revealed by tethered chromosome conformation capture and
population-based modeling. Nat. Biotechnol. 30, 90–98.
Kuilman, T., Michaloglou, C., Vredeveld, L.C.W., Douma, S., van Doorn, R.,
Desmet, C.J., Aarden, L.A., Mooi, W.J., and Peeper, D.S. (2008). Oncogene-
induced senescence relayed by an interleukin-dependent inflammatory
network. Cell 133, 1019–1031.
Li, H., Collado, M., Villasante, A., Strati, K., Ortega, S., Canamero, M., Blasco,
M.A., and Serrano, M. (2009). The Ink4/Arf locus is a barrier for iPS cell reprog-
ramming. Nature 460, 1136–1139.
Lieberman-Aiden, E., van Berkum, N.L., Williams, L., Imakaev, M., Ragoczy,
T., Telling, A., Amit, I., Lajoie, B.R., Sabo, P.J., Dorschner, M.O., et al.
(2009). Comprehensive mapping of long-range interactions reveals folding
principles of the human genome. Science 326, 289–293.
12 Cell Reports 10, 1–13, February 3, 2015 ª2015 The Authors
Please cite this article in press as: Chandra et al., Global Reorganization of the Nuclear Landscape in Senescent Cells, Cell Reports (2015), http://dx.doi.org/10.1016/j.celrep.2014.12.055

Lin, A.W., Barradas,M., Stone, J.C., van Aelst, L., Serrano, M., and Lowe, S.W.
(1998). Premature senescence involving p53 and p16 is activated in response
to constitutive MEK/MAPK mitogenic signaling. Genes Dev. 12, 3008–3019.
Lopez-Otın, C., Blasco, M.A., Partridge, L., Serrano, M., and Kroemer, G.
(2013). The hallmarks of aging. Cell 153, 1194–1217.
Macaya, G., Thiery, J.P., and Bernardi, G. (1976). An approach to the organi-
zation of eukaryotic genomes at a macromolecular level. J. Mol. Biol. 108,
237–254.
Manukyan, M., and Singh, P.B. (2012). Epigenetic rejuvenation. Genes Cells
17, 337–343.
McCord, R.P., Nazario-Toole, A., Zhang, H., Chines, P.S., Zhan, Y., Erdos,
M.R., Collins, F.S., Dekker, J., and Cao, K. (2013). Correlated alterations in
genome organization, histone methylation, and DNA-lamin A/C interactions
in Hutchinson-Gilford progeria syndrome. Genome Res. 23, 260–269.
Michaloglou, C., Vredeveld, L.C.W., Soengas, M.S., Denoyelle, C., Kuilman,
T., van der Horst, C.M.A.M.,Majoor, D.M., Shay, J.W., Mooi,W.J., and Peeper,
D.S. (2005). BRAFE600-associated senescence-like cell cycle arrest of human
naevi. Nature 436, 720–724.
Munoz-Espın, D., Canamero, M., Maraver, A., Gomez-Lopez, G., Contreras,
J., Murillo-Cuesta, S., Rodrıguez-Baeza, A., Varela-Nieto, I., Ruberte, J., Col-
lado, M., and Serrano, M. (2013). Programmed cell senescence during
mammalian embryonic development. Cell 155, 1104–1118.
Narita, M., N~unez, S., Heard, E., Narita, M., Lin, A.W., Hearn, S.A., Spector,
D.L., Hannon, G.J., and Lowe, S.W. (2003). Rb-mediated heterochromatin for-
mation and silencing of E2F target genes during cellular senescence. Cell 113,
703–716.
Narita, M., Narita, M., Krizhanovsky, V., Nunez, S., Chicas, A., Hearn, S.A.,
Myers, M.P., and Lowe, S.W. (2006). A novel role for high-mobility group a
proteins in cellular senescence and heterochromatin formation. Cell 126,
503–514.
Nora, E.P., Lajoie, B.R., Schulz, E.G., Giorgetti, L., Okamoto, I., Servant, N.,
Piolot, T., van Berkum, N.L., Meisig, J., Sedat, J., et al. (2012). Spatial partition-
ing of the regulatory landscape of the X-inactivation centre. Nature 485, 381–
385.
Peric-Hupkes, D., Meuleman, W., Pagie, L., Bruggeman, S.W.M., Solovei, I.,
Brugman, W., Graf, S., Flicek, P., Kerkhoven, R.M., van Lohuizen, M., et al.
(2010). Molecular maps of the reorganization of genome-nuclear lamina inter-
actions during differentiation. Mol. Cell 38, 603–613.
Rando, T.A., and Chang, H.Y. (2012). Aging, rejuvenation, and epigenetic re-
programming: resetting the aging clock. Cell 148, 46–57.
Reimann, M., Lee, S., Loddenkemper, C., Dorr, J.R., Tabor, V., Aichele, P.,
Stein, H., Dorken, B., Jenuwein, T., and Schmitt, C.A. (2010). Tumor stroma-
derived TGF-beta limits myc-driven lymphomagenesis via Suv39h1-depen-
dent senescence. Cancer Cell 17, 262–272.
Sadaie, M., Salama, R., Carroll, T., Tomimatsu, K., Chandra, T., Young, A.R.J.,
Narita, M., Perez-Mancera, P.A., Bennett, D.C., Chong, H., et al. (2013). Redis-
tribution of the Lamin B1 genomic binding profile affects rearrangement of het-
erochromatic domains and SAHF formation during senescence. Genes Dev.
27, 1800–1808.
Scaffidi, P., and Misteli, T. (2006). Lamin A-dependent nuclear defects in
human aging. Science 312, 1059–1063.
Serrano, M., Lin, A.W., McCurrach, M.E., Beach, D., and Lowe, S.W. (1997).
Oncogenic ras provokes premature cell senescence associated with accumu-
lation of p53 and p16INK4a. Cell 88, 593–602.
Shah, P.P., Donahue, G., Otte, G.L., Capell, B.C., Nelson, D.M., Cao, K., Ag-
garwala, V., Cruickshanks, H.A., Rai, T.S., McBryan, T., et al. (2013). Lamin
B1 depletion in senescent cells triggers large-scale changes in gene expres-
sion and the chromatin landscape. Genes Dev. 27, 1787–1799.
Shimi, T., Butin-Israeli, V., Adam, S.A., Hamanaka, R.B., Goldman, A.E., Lu-
cas, C.A., Shumaker, D.K., Kosak, S.T., Chandel, N.S., and Goldman, R.D.
(2011). The role of nuclear lamin B1 in cell proliferation and senescence. Genes
Dev. 25, 2579–2593.
Shumaker, D.K., Dechat, T., Kohlmaier, A., Adam, S.A., Bozovsky, M.R., Er-
dos, M.R., Eriksson, M., Goldman, A.E., Khuon, S., Collins, F.S., et al.
(2006). Mutant nuclear lamin A leads to progressive alterations of epigenetic
control in premature aging. Proc. Natl. Acad. Sci. USA 103, 8703–8708.
Sofueva, S., Yaffe, E., Chan, W.-C., Georgopoulou, D., Vietri Rudan, M., Mira-
Bontenbal, H., Pollard, S.M., Schroth, G.P., Tanay, A., and Hadjur, S. (2013).
Cohesin-mediated interactions organize chromosomal domain architecture.
EMBO J. 32, 3119–3129.
Storer, M., Mas, A., Robert-Moreno, A., Pecoraro, M., Ortells, M.C., Di Gia-
como, V., Yosef, R., Pilpel, N., Krizhanovsky, V., Sharpe, J., and Keyes,
W.M. (2013). Senescence is a developmental mechanism that contributes to
embryonic growth and patterning. Cell 155, 1119–1130.
Swanson, E.C., Manning, B., Zhang, H., and Lawrence, J.B. (2013). Higher-or-
der unfolding of satellite heterochromatin is a consistent and early event in cell
senescence. J. Cell Biol. 203, 929–942.
Thiery, J.P., Macaya, G., and Bernardi, G. (1976). An analysis of eukaryotic ge-
nomes by density gradient centrifugation. J. Mol. Biol. 108, 219–235.
Tu, Z., Zhuang, X., Yao, Y.-G., and Zhang, R. (2013). BRG1 is required for for-
mation of senescence-associated heterochromatin foci induced by oncogenic
RAS or BRCA1 loss. Mol. Cell. Biol. 33, 1819–1829.
Xue, W., Zender, L., Miething, C., Dickins, R.A., Hernando, E., Krizhanovsky,
V., Cordon-Cardo, C., and Lowe, S.W. (2007). Senescence and tumour clear-
ance is triggered by p53 restoration in murine liver carcinomas. Nature 445,
656–660.
Ye, X., Zerlanko, B., Kennedy, A., Banumathy, G., Zhang, R., and Adams, P.D.
(2007a). Downregulation ofWnt signaling is a trigger for formation of facultative
heterochromatin and onset of cell senescence in primary human cells. Mol.
Cell 27, 183–196.
Ye, X., Zerlanko, B., Zhang, R., Somaiah, N., Lipinski, M., Salomoni, P., and
Adams, P.D. (2007b). Definition of pRB- and p53-dependent and -independent
steps in HIRA/ASF1a-mediated formation of senescence-associated hetero-
chromatin foci. Mol. Cell. Biol. 27, 2452–2465.
Young, A.R.J., Narita, M., Ferreira, M., Kirschner, K., Sadaie, M., Darot, J.F.J.,
Tavare, S., Arakawa, S., Shimizu, S., Watt, F.M., and Narita, M. (2009). Auto-
phagy mediates the mitotic senescence transition. Genes Dev. 23, 798–803.
Zhang, R., Poustovoitov, M.V., Ye, X., Santos, H.A., Chen, W., Daganzo, S.M.,
Erzberger, J.P., Serebriiskii, I.G., Canutescu, A.A., Dunbrack, R.L., et al.
(2005). Formation of MacroH2A-containing senescence-associated hetero-
chromatin foci and senescence driven by ASF1a and HIRA. Dev. Cell 8, 19–30.
Cell Reports 10, 1–13, February 3, 2015 ª2015 The Authors 13
Please cite this article in press as: Chandra et al., Global Reorganization of the Nuclear Landscape in Senescent Cells, Cell Reports (2015), http://dx.doi.org/10.1016/j.celrep.2014.12.055