Global mapping of binding sites for Nrf2 identifies novel targets in cell survival response through...
17
Global mapping of binding sites for Nrf2 identifies novel targets in cell survival response through ChIP-Seq profiling and network analysis Deepti Malhotra 1 , Elodie Portales-Casamar 2 , Anju Singh 1 , Siddhartha Srivastava 2 , David Arenillas 2 , Christine Happel 1 , Casper Shyr 2 , Nobunao Wakabayashi 1 , Thomas W. Kensler 1 , Wyeth W. Wasserman 2, * and Shyam Biswal 1,3,4, * 1 Department of Environmental Health Sciences Department, Johns Hopkins Bloomberg School of Public Health, Baltimore, MD 21205, USA, 2 Centre for Molecular Medicine and Therapeutics, Child and Family Research Institute, Department of Medical Genetics, University of British Columbia, Vancouver, BC V5Z 4H4, Canada, 3 Division of Pulmonary and Critical Care Medicine, and 4 Department of Oncology, Johns Hopkins School of Medicine, Baltimore, MD 21287, USA Received January 29, 2010; Revised March 12, 2010; Accepted March 15, 2010 ABSTRACT The Nrf2 (nuclear factor E2 p45-related factor 2) transcription factor responds to diverse oxidative and electrophilic environmental stresses by circum- venting repression by Keap1, translocating to the nucleus, and activating cytoprotective genes. Nrf2 responses provide protection against chemical carcinogenesis, chronic inflammation, neuro- degeneration, emphysema, asthma and sepsis in murine models. Nrf2 regulates the expression of a plethora of genes that detoxify oxidants and electro- philes and repair or remove damaged macromol- ecules, such as through proteasomal processing. However, many direct targets of Nrf2 remain un- defined. Here, mouse embryonic fibroblasts (MEF) with either constitutive nuclear accumulation (Keap1 / ) or depletion (Nrf2 / ) of Nrf2 were utilized to perform chromatin-immunoprecipitation with parallel sequencing (ChIP-Seq) and global tran- scription profiling. This unique Nrf2 ChIP-Seq dataset is highly enriched for Nrf2-binding motifs. Integrating ChIP-Seq and microarray analyses, we identified 645 basal and 654 inducible direct targets of Nrf2, with 244 genes at the intersection. Modulated pathways in stress response and cell proliferation distinguish the inducible and basal programs. Results were confirmed in an in vivo stress model of cigarette smoke-exposed mice. This study reveals global circuitry of the Nrf2 stress response emphasizing Nrf2 as a central node in cell survival response. INTRODUCTION Nuclear factor E2 p45-related factor 2 (symbol Nfe2l2; commonly called Nrf2), a basic-region leucine zipper tran- scription factor (TF), binds to the cis-regulatory, antioxi- dant response element (ARE) and transcriptionally upregulates an environmental stress response gene battery (1). The Nrf2 response is critical for protection against pulmonary inflammation and emphysema, asthma, acute lung injury, hyperoxia, pulmonary fibrosis, innate immune response, hepatotoxicity, carcino- genesis, neurodegeneration, cardiovascular disease and aging (2–11). A decline in the Nrf2 pathway is associated with severe chronic obstructive pulmonary disease (COPD) (12–15). In addition, several classes of small mol- ecules such as 1,2-dithiolethiones (e.g. oltipraz), isothio- cyanates (e.g. sulforaphane) and triterpenoids (e.g. CDDO-Im) induce expression of Nrf2 target genes and protect against chemical carcinogenesis, acute hepatotox- icity and cigarette smoke (CS)-induced emphysema (16–19). On the other hand, studies show that many cancers such as non small cell (NSCLC) and squamous cell lung tumors develop inactivating mutations in the Keap1 and Nrf2 genes, respectively, thereby constitutively *To whom correspondence should be addressed. Tel: +1 410 955 4728; Email: [email protected] Correspondence may also be addressed to Wyeth Wasserman. Tel: +1 604 875 3812; Email: [email protected] The authors wish it to be known that, in their opinion, the first two authors should be regarded as joint First Authors. 5718–5734 Nucleic Acids Research, 2010, Vol. 38, No. 17 Published online 11 May 2010 doi:10.1093/nar/gkq212 ß The Author(s) 2010. Published by Oxford University Press. This is an Open Access article distributed under the terms of the Creative Commons Attribution Non-Commercial License (http://creativecommons.org/licenses/ by-nc/2.5), which permits unrestricted non-commercial use, distribution, and reproduction in any medium, provided the original work is properly cited.
Transcript of Global mapping of binding sites for Nrf2 identifies novel targets in cell survival response through...
Global mapping of binding sites for Nrf2 identifiesnovel targets in cell survival response throughChIP-Seq profiling and network analysisDeepti Malhotra1, Elodie Portales-Casamar2, Anju Singh1, Siddhartha Srivastava2,
David Arenillas2, Christine Happel1, Casper Shyr2, Nobunao Wakabayashi1,
Thomas W. Kensler1, Wyeth W. Wasserman2,* and Shyam Biswal1,3,4,*
1Department of Environmental Health Sciences Department, Johns Hopkins Bloomberg School of Public Health,Baltimore, MD 21205, USA, 2Centre for Molecular Medicine and Therapeutics, Child and Family ResearchInstitute, Department of Medical Genetics, University of British Columbia, Vancouver, BC V5Z 4H4, Canada,3Division of Pulmonary and Critical Care Medicine, and 4Department of Oncology, Johns Hopkins School ofMedicine, Baltimore, MD 21287, USA
Received January 29, 2010; Revised March 12, 2010; Accepted March 15, 2010
ABSTRACT
The Nrf2 (nuclear factor E2 p45-related factor 2)transcription factor responds to diverse oxidativeand electrophilic environmental stresses by circum-venting repression by Keap1, translocating to thenucleus, and activating cytoprotective genes. Nrf2responses provide protection against chemicalcarcinogenesis, chronic inflammation, neuro-degeneration, emphysema, asthma and sepsis inmurine models. Nrf2 regulates the expression of aplethora of genes that detoxify oxidants and electro-philes and repair or remove damaged macromol-ecules, such as through proteasomal processing.However, many direct targets of Nrf2 remain un-defined. Here, mouse embryonic fibroblasts (MEF)with either constitutive nuclear accumulation(Keap1�/�) or depletion (Nrf2�/�) of Nrf2 wereutilized to perform chromatin-immunoprecipitationwith parallel sequencing (ChIP-Seq) and global tran-scription profiling. This unique Nrf2 ChIP-Seqdataset is highly enriched for Nrf2-binding motifs.Integrating ChIP-Seq and microarray analyses, weidentified 645 basal and 654 inducible directtargets of Nrf2, with 244 genes at the intersection.Modulated pathways in stress response and cellproliferation distinguish the inducible and basalprograms. Results were confirmed in an in vivo
stress model of cigarette smoke-exposed mice.This study reveals global circuitry of the Nrf2stress response emphasizing Nrf2 as a centralnode in cell survival response.
INTRODUCTION
Nuclear factor E2 p45-related factor 2 (symbol Nfe2l2;commonly called Nrf2), a basic-region leucine zipper tran-scription factor (TF), binds to the cis-regulatory, antioxi-dant response element (ARE) and transcriptionallyupregulates an environmental stress response genebattery (1). The Nrf2 response is critical for protectionagainst pulmonary inflammation and emphysema,asthma, acute lung injury, hyperoxia, pulmonaryfibrosis, innate immune response, hepatotoxicity, carcino-genesis, neurodegeneration, cardiovascular disease andaging (2–11). A decline in the Nrf2 pathway is associatedwith severe chronic obstructive pulmonary disease(COPD) (12–15). In addition, several classes of small mol-ecules such as 1,2-dithiolethiones (e.g. oltipraz), isothio-cyanates (e.g. sulforaphane) and triterpenoids (e.g.CDDO-Im) induce expression of Nrf2 target genes andprotect against chemical carcinogenesis, acute hepatotox-icity and cigarette smoke (CS)-induced emphysema(16–19). On the other hand, studies show that manycancers such as non small cell (NSCLC) and squamouscell lung tumors develop inactivating mutations in theKeap1 and Nrf2 genes, respectively, thereby constitutively
*To whom correspondence should be addressed. Tel: +1 410 955 4728; Email: [email protected] may also be addressed to Wyeth Wasserman. Tel: +1 604 875 3812; Email: [email protected]
The authors wish it to be known that, in their opinion, the first two authors should be regarded as joint First Authors.
5718–5734 Nucleic Acids Research, 2010, Vol. 38, No. 17 Published online 11 May 2010doi:10.1093/nar/gkq212
� The Author(s) 2010. Published by Oxford University Press.This is an Open Access article distributed under the terms of the Creative Commons Attribution Non-Commercial License (http://creativecommons.org/licenses/by-nc/2.5), which permits unrestricted non-commercial use, distribution, and reproduction in any medium, provided the original work is properly cited.
enhancing the Nrf2 pathway and promotingtumorigenecity and resistance to an array ofchemotherapeutic compounds (20,21). Hence, due to thedual role of Nrf2 in carcinogenesis and degenerativechronic diseases and the diversity of target genes under avariety of stresses, understanding the pathway compo-nents and regulators is critical for effectively targetingthe pathway for prophylactic and therapeutic purposes.
Gene-expression profiling studies using different tissueand cell-culture systems exposed to diverse conditions(chemical or environmental) reveal the pleiotropicproperties of Nrf2 in stress response and cell survival.Keap1 (Kelch ECH associating protein 1), a cytosolic re-pressor of the Nrf2 pathway, plays a central role in regu-lation of the Nrf2 response. Under normal conditions,Nrf2 is targeted by Keap1, which promotes Nrf2proteasomal degradation via interactions with an ubiqui-tin ligase (22). Keap1 further functions as a sensor ofstress signals, through stress-induced oxidation of keycysteine residues that lead to conformational changesand the inability to bind Nrf2 (23). Nrf2 then accumulatesin the nucleus, where it binds to AREs in a heterodimericcomplex with one of a subset of the small Maf-family ofTFs (24,25).
Using Nrf2-knockout (Nrf2�/�) murine models in dif-ferent organs and with various stressors, Nrf2 was foundto coordinately regulate a suite of targets genes such asantioxidant genes, xenobiotic-metabolizing enzymes,many of which have been traditionally classified as partof the phase II detoxification system, glutathione homeo-stasis, solute channels, proteome maintenance and innateimmune response (8,26–32). Disruption of Keap1(Keap1�/�) leads to enhanced nuclear accumulation ofNrf2 and elevated expression of Nrf2-regulated genes(33). Largely, the Nrf2 regulated genes are associatedwith pathways related to cell survival—batteries ofproteins that provide protection against a variety of oxi-dative and electrophilic stressors.
Although, many genes are regulated in an Nrf2-dependent manner, no large-scale studies have distin-guished between direct and indirect targets of Nrf2, thelatter perhaps emerging from Nrf2 cross-talk with othersignaling pathways (34–36). In this report, we evaluatedthe concordance between global mRNA expressionprofiles at the transcriptomic levels (i.e., oligonucleotidemicroarray analyses) and genome-wide Nrf2-DNA-binding analysis using high-throughput methodologies(ChIP-Seq). This approach is important for establishinga systems level view of Nrf2-dependent processesoccurring within cells. In the ChIP-Seq analysis, over1200 Nrf2-bound regions were observed from Keap1�/�
MEFs. These regions were strongly enriched forNrf2-binding site patterns, with the motifs clustered nearthe maxima of the ChIP-Seq peaks. The gene-expressionanalysis identified 7155 genes significantly downregulatedin Nrf2�/� compared with wild-type (WT) MEFs (basaltargets) and 7832 significantly upregulated genes inKeap1�/� compared with WT MEFs (inducible targets),with 2489 modulated genes intersecting between the twodatasets (common targets). Integrating the results fromChIP-Seq and expression profiling data, signatures were
observed for gene groups that include detoxificationresponse, cell proliferation, cell cycle and survival regula-tion networks. Strikingly, the proliferation and stressresponses segregate between the direct Nrf2 target expres-sion classes, with proliferation linked to basal expressionand detoxification linked to inducibleactivation. Thehigh-throughput results were validated using quantitativereal-time polymerase chain reaction (qRT-PCR) andsite-specific ChIP assays in MEFs and CS-exposedmouse lungs to demonstrate the Nrf2 response in vivo.The integrated analysis of the experimental data highlightsthe broad influence of Nrf2, providing a blueprint for theregulation of cytoprotective genes and genes involved incritical homeostatic function such as cell proliferation.
MATERIALS AND METHODS
Growth and viability of mouse embryonic fibroblasts
WT, Keap1�/�, and Nrf2�/� cell lines, were generated asdescribed previously (33). Cells were grown to 90%confluency in 100-mm plates in Iscove’s modifiedDulbecco’s medium (Invitrogen, CA) containing 10%FBS. Cells were harvested and processed for microarrayand chromatin immunoprecipitation (ChIP) analyses asdescribed below. Cell viability was assessed using theMTT assay as described previously (33).
CS exposure
WT and Nrf2�/� male mice (CD-1 strain, 8–10weeks)were exposed to CS for 5 h/day using a TE-10 smokingmachine (Teague Enterprises, Davis, CA) and 3R4F ref-erence cigarettes (University of Kentucky, TobaccoResearch Institute, Lexington, KY) as described previ-ously (8). The study protocols were approved by theJohns Hopkins Institutional Review Board for animalstudies.
ChIP
The ChIP was performed as described previously (37).MEFs were fixed �1% formaldehyde in cell growthmedia for 10min followed by glycine fixation. Cells werethen sonicated in ChIP–lysis buffer containing proteaseinhibitor cocktail after incubation on ice for 30min.Upon sonication, the samples were spun at maximumspeed for 12min in a cold microcentrifuge. The super-natants were then addressed to as Input samples. A partof the input sample was precleared using 50% slurry ofProtein A/G beads prepared in immunoprecipitation (IP)buffer for 2 h in cold, following which the beads werecentrifuged out and supernatant was used for IP. Thenthe precleared samples were incubated with 2 mg ofeither of two distinct anti-Nrf2 antibodies that recognizedifferent portions of Nrf2 protein. The rabbit-anti-Nrf2monoclonal antibody from Epitomics Inc., CA, recognizesthe C-terminal domain in all three cell lines, while therabbit-anti-Nrf2 polyclonal antibody from Santa CruzBiotech., CA, recognizes domains spanning theN-terminus in all three cell lines as well. For control, we
Nucleic Acids Research, 2010, Vol. 38, No. 17 5719
used anti-rabbit IgG antibody for 1 h in cold. Theseantibodies have been used extensively in our laboratoryfor western and EMSA analysis [Figure 1A(i) and data notshown]. Protein A/G bead slurry was added to eachreaction and was rotated overnight. Next day, beadswere washed extensively, DNA was reverse crosslinkedand eluted in elution buffer and stored at �80�C untilused for sequencing or PCR validation assays. Theeluted DNA was checked for 100- to 300-bp fragmentenrichments using 8% polyacrylamide gel electrophoresis(data not shown).
Massive parallel sequencing
We generated two DNA libraries using two Nrf2-specificantibodies [one monoclonal, rabbit-anti-Nrf2 (EpitomicsInc., CA), and one polyclonal, rabbit-anti-Nrf2 (SantaCruz Biotech., CA)] incubated with crosslinked andsonicated DNA from Keap1�/� MEFs. A third controllibrary contains the input DNA from Keap1�/� MEFs.The sequencing and reads alignment to the mousegenome (NCBI build 37) was performed at the GenomeScience Centre (Vancouver, Canada) as described previ-ously (38).
ChIP-Seq library peak finding
To identify significant Nrf2-bound regions in the data weused the FindPeaks software (39) with the following par-ameters: Triangle dist.=100 low/200 median/300 high;Sub-peaks=0.8; Trim-peaks=0.2; Filter
Duplicates=On; Filter out reads quality lower than 10.The false discovery rate estimation (FDR) was based on aLander-Waterman calculation integrated in the FindPeakssoftware. An artifactual cluster of peaks was found at thebeginning of chromosome 11 in all three libraries and wasdiscarded from the analysis.
Peak overlap determination between the three ChIP-Seqlibraries
The peak height is defined by the number of tagsoverlapping at a specific genomic location. All peaksabove a height of 5 from each of the three libraries wereconsidered in this analysis. Peaks were considered asoverlapping when their maximum heights were locatedwithin 100 bp of each other.
Peak sequence extraction and analysis
One hundred nucleotides on each side of the peakmaximum height location were extracted from theEnsEMBL database using Perl scripts. These sequenceswere analyzed for A, C, G, T and dinucleotide content.For the background, the sequences were extracted simi-larly for all peaks with a height �5 and only the ones witha composition similar to the Nrf2 ChIP-Seq peak se-quences were retained.
To plot the peak distribution relative to transcriptionstart sites (TSS), the closest TSS from each peak was ex-tracted from the EnsEMBL database using Perl scriptsand the distance computed.
Nrf2
Lamin B1
Kea
p1-/
-
Nrf
2-/-
WT
NQO1
GSTA3
Kea
p1-/
-In
put
Kea
p1-/
-Ig
G
Kea
p1-/
-an
ti-N
rf2
Nrf
2-/-
Inpu
t
Nrf
2-/-
IgG
Nrf
2-/-
anti-
Nrf
2
WT
Inpu
t
WT
IgG
WT
ant
i-Nrf
2
*
*
* *
*
(i) (ii)
(iv)(iii)
Nqo1
Gsta3
Kea
p1-/
-
Nrf
2-/-
WT
-Actin
A
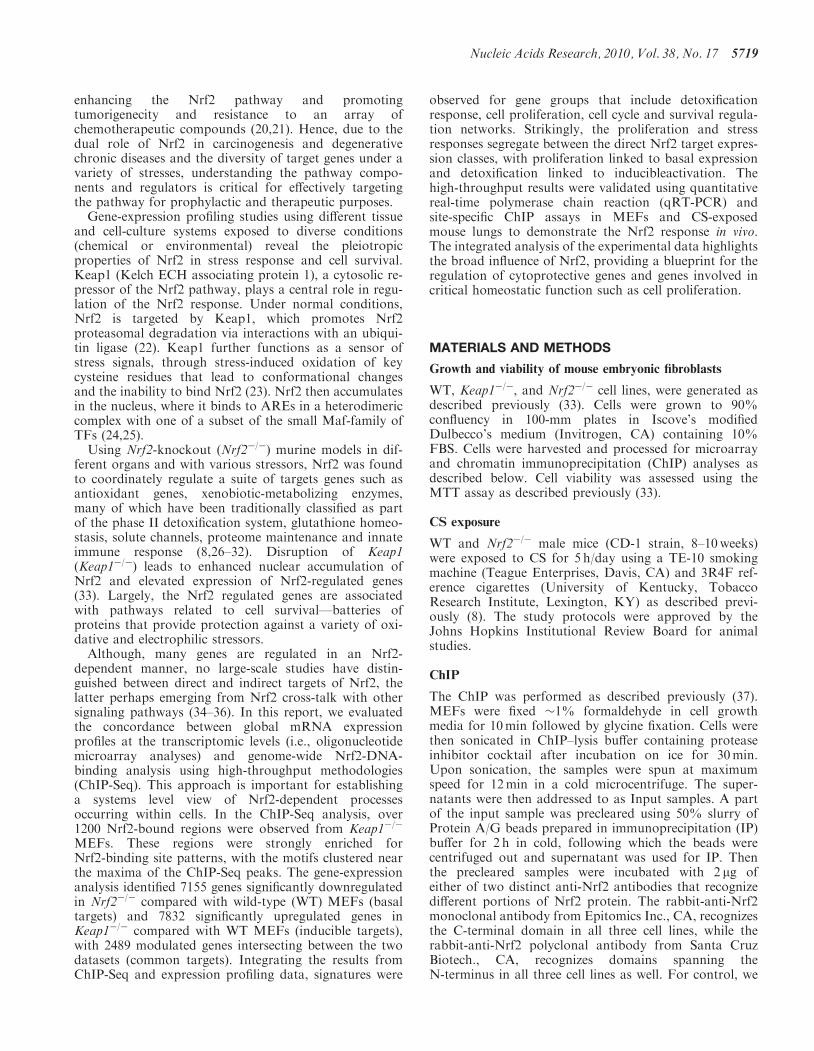
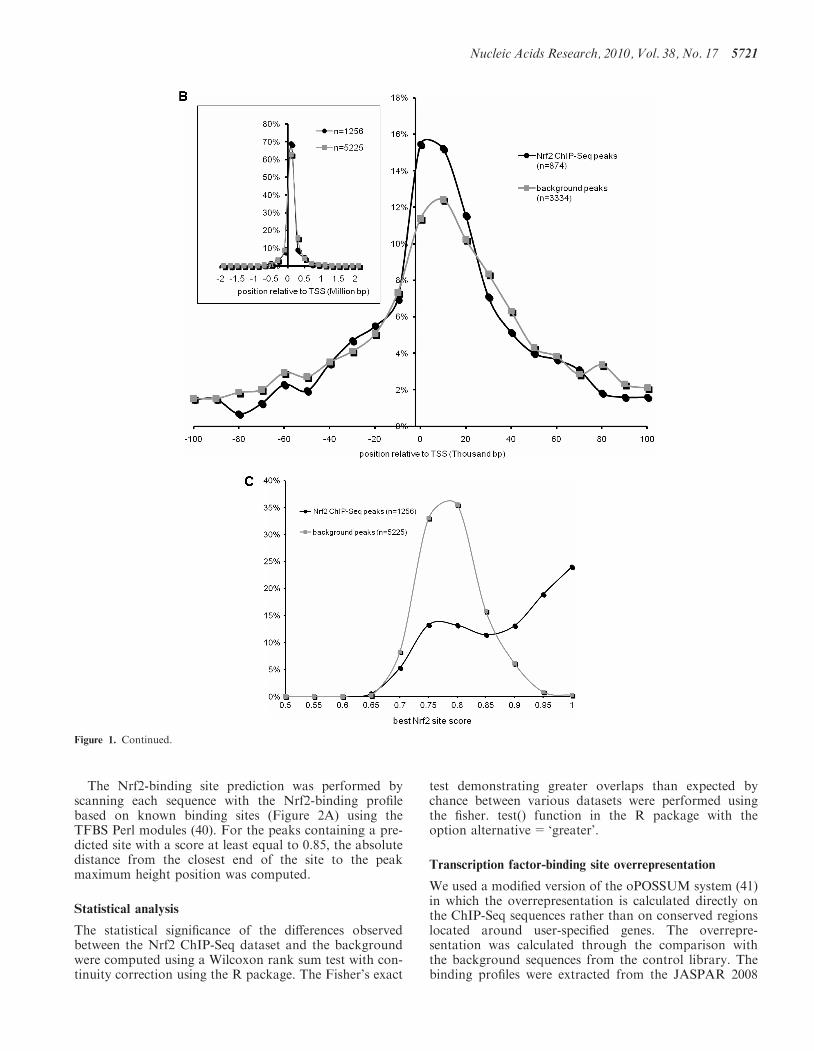
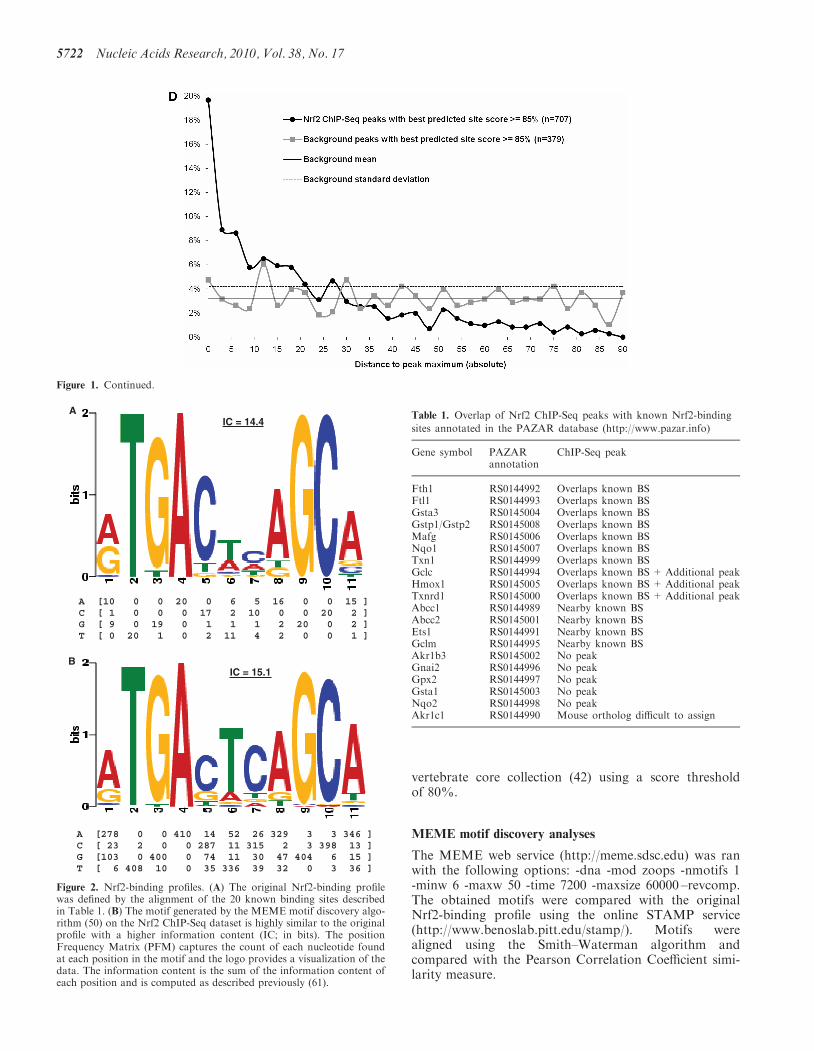
Figure 1. Nrf2 genome-wide ChIP-Seq dataset. (A) Keap1�/� MEFs have constitutive transcriptional activation of Nrf2 target genes (i) Nuclear Nrf2protein levels in Keap1�/�, WT and Nrf2�/� MEFs using immunoblot analysis, (ii) ChIP–PCR and densitometry quantification analysis for knownNrf2-binding site in promoter of Nqo1 and Gsta3, (iii) qRT-PCR analysis of known Nrf2 targets, Nqo1 and Gsta3 and (iv) Immunoblot analysis forNqo1 and Gsta3 in the MEFs. b-Actin was used as the loading control. (B) The distribution of Nrf2 ChIP-Seq peaks relative to the closest genetranscription start sites is similar to background. (C) Nrf2 ChIP-Seq peaks are enriched for high-scoring Nrf2 predicted motifs compared withbackground. (D) High-scoring predicted sites are preferentially located near the peak maximum height in the ChIP-Seq peaks whereas they areuniformly distributed in the background sequences. *P-value< 0.01, as analyzed by ANOVA analysis.
5720 Nucleic Acids Research, 2010, Vol. 38, No. 17
The Nrf2-binding site prediction was performed byscanning each sequence with the Nrf2-binding profilebased on known binding sites (Figure 2A) using theTFBS Perl modules (40). For the peaks containing a pre-dicted site with a score at least equal to 0.85, the absolutedistance from the closest end of the site to the peakmaximum height position was computed.
Statistical analysis
The statistical significance of the differences observedbetween the Nrf2 ChIP-Seq dataset and the backgroundwere computed using a Wilcoxon rank sum test with con-tinuity correction using the R package. The Fisher’s exact
test demonstrating greater overlaps than expected bychance between various datasets were performed usingthe fisher. test() function in the R package with theoption alternative= ‘greater’.
Transcription factor-binding site overrepresentation
We used a modified version of the oPOSSUM system (41)in which the overrepresentation is calculated directly onthe ChIP-Seq sequences rather than on conserved regionslocated around user-specified genes. The overrepre-sentation was calculated through the comparison withthe background sequences from the control library. Thebinding profiles were extracted from the JASPAR 2008
Figure 1. Continued.
Nucleic Acids Research, 2010, Vol. 38, No. 17 5721
vertebrate core collection (42) using a score thresholdof 80%.
MEME motif discovery analyses
The MEME web service (http://meme.sdsc.edu) was ranwith the following options: -dna -mod zoops -nmotifs 1-minw 6 -maxw 50 -time 7200 -maxsize 60000 –revcomp.The obtained motifs were compared with the originalNrf2-binding profile using the online STAMP service(http://www.benoslab.pitt.edu/stamp/). Motifs werealigned using the Smith–Waterman algorithm andcompared with the Pearson Correlation Coefficient simi-larity measure.
Figure 1. Continued.
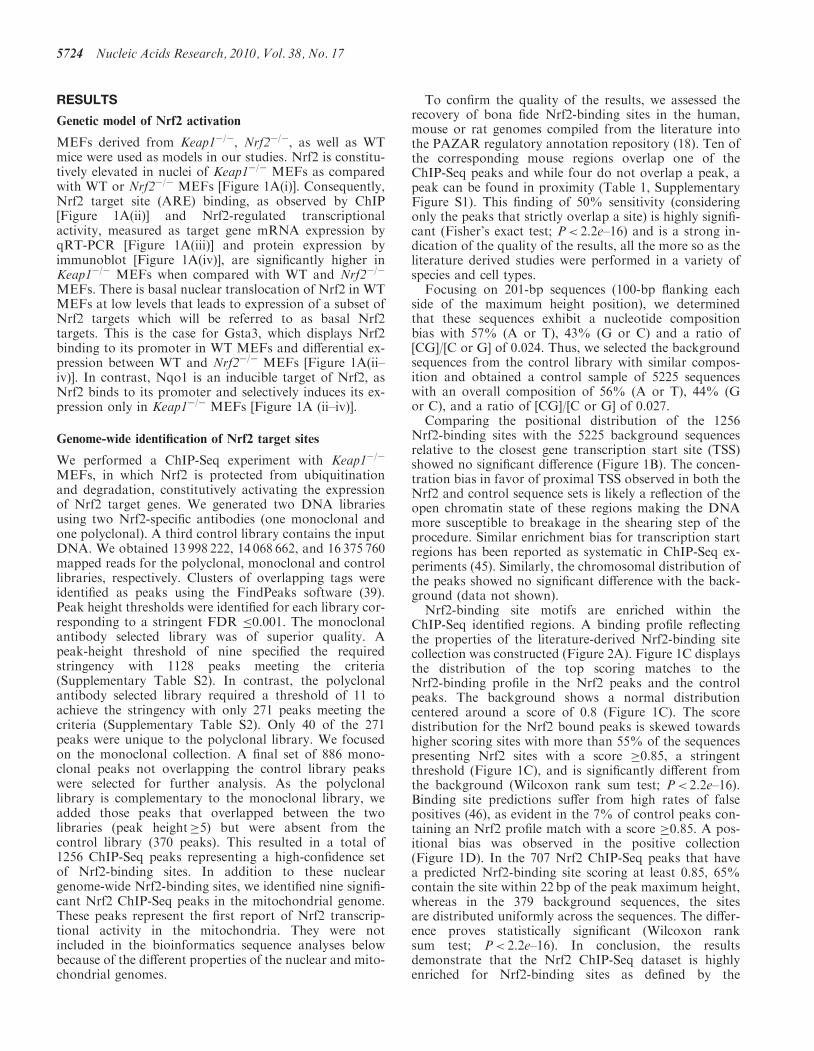
Table 1. Overlap of Nrf2 ChIP-Seq peaks with known Nrf2-binding
sites annotated in the PAZAR database (http://www.pazar.info)
Gene symbol PAZARannotation
ChIP-Seq peak
Fth1 RS0144992 Overlaps known BSFtl1 RS0144993 Overlaps known BSGsta3 RS0145004 Overlaps known BSGstp1/Gstp2 RS0145008 Overlaps known BSMafg RS0145006 Overlaps known BSNqo1 RS0145007 Overlaps known BSTxn1 RS0144999 Overlaps known BSGclc RS0144994 Overlaps known BS+ Additional peakHmox1 RS0145005 Overlaps known BS+ Additional peakTxnrd1 RS0145000 Overlaps known BS+ Additional peakAbcc1 RS0144989 Nearby known BSAbcc2 RS0145001 Nearby known BSEts1 RS0144991 Nearby known BSGclm RS0144995 Nearby known BSAkr1b3 RS0145002 No peakGnai2 RS0144996 No peakGpx2 RS0144997 No peakGsta1 RS0145003 No peakNqo2 RS0144998 No peakAkr1c1 RS0144990 Mouse ortholog difficult to assign
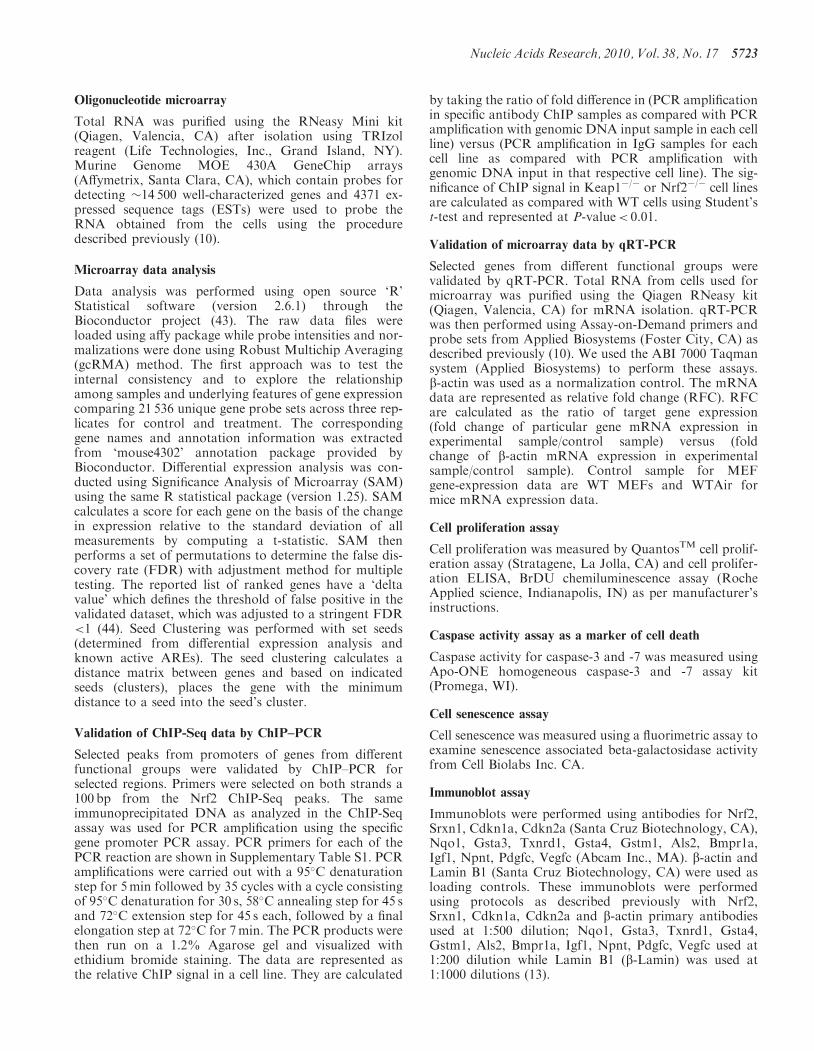
A [10 0 0 20 0 6 5 16 0 0 15 ]C [ 1 0 0 0 17 2 10 0 0 20 2 ]G [ 9 0 19 0 1 1 1 2 20 0 2 ]T [ 0 20 1 0 2 11 4 2 0 0 1 ]
A [278 0 0 410 14 52 26 329 3 3 346 ]C [ 23 2 0 0 287 11 315 2 3 398 13 ]G [103 0 400 0 74 11 30 47 404 6 15 ]T [ 6 408 10 0 35 336 39 32 0 3 36 ]
IC = 14.4
IC = 15.1B
A
Figure 2. Nrf2-binding profiles. (A) The original Nrf2-binding profilewas defined by the alignment of the 20 known binding sites describedin Table 1. (B) The motif generated by the MEME motif discovery algo-rithm (50) on the Nrf2 ChIP-Seq dataset is highly similar to the originalprofile with a higher information content (IC; in bits). The positionFrequency Matrix (PFM) captures the count of each nucleotide foundat each position in the motif and the logo provides a visualization of thedata. The information content is the sum of the information content ofeach position and is computed as described previously (61).
5722 Nucleic Acids Research, 2010, Vol. 38, No. 17
Oligonucleotide microarray
Total RNA was purified using the RNeasy Mini kit(Qiagen, Valencia, CA) after isolation using TRIzolreagent (Life Technologies, Inc., Grand Island, NY).Murine Genome MOE 430A GeneChip arrays(Affymetrix, Santa Clara, CA), which contain probes fordetecting �14 500 well-characterized genes and 4371 ex-pressed sequence tags (ESTs) were used to probe theRNA obtained from the cells using the proceduredescribed previously (10).
Microarray data analysis
Data analysis was performed using open source ‘R’Statistical software (version 2.6.1) through theBioconductor project (43). The raw data files wereloaded using affy package while probe intensities and nor-malizations were done using Robust Multichip Averaging(gcRMA) method. The first approach was to test theinternal consistency and to explore the relationshipamong samples and underlying features of gene expressioncomparing 21 536 unique gene probe sets across three rep-licates for control and treatment. The correspondinggene names and annotation information was extractedfrom ‘mouse4302’ annotation package provided byBioconductor. Differential expression analysis was con-ducted using SigniEcance Analysis of Microarray (SAM)using the same R statistical package (version 1.25). SAMcalculates a score for each gene on the basis of the changein expression relative to the standard deviation of allmeasurements by computing a t-statistic. SAM thenperforms a set of permutations to determine the false dis-covery rate (FDR) with adjustment method for multipletesting. The reported list of ranked genes have a ‘deltavalue’ which defines the threshold of false positive in thevalidated dataset, which was adjusted to a stringent FDR<1 (44). Seed Clustering was performed with set seeds(determined from differential expression analysis andknown active AREs). The seed clustering calculates adistance matrix between genes and based on indicatedseeds (clusters), places the gene with the minimumdistance to a seed into the seed’s cluster.
Validation of ChIP-Seq data by ChIP–PCR
Selected peaks from promoters of genes from differentfunctional groups were validated by ChIP–PCR forselected regions. Primers were selected on both strands a100 bp from the Nrf2 ChIP-Seq peaks. The sameimmunoprecipitated DNA as analyzed in the ChIP-Seqassay was used for PCR amplification using the specificgene promoter PCR assay. PCR primers for each of thePCR reaction are shown in Supplementary Table S1. PCRamplifications were carried out with a 95�C denaturationstep for 5min followed by 35 cycles with a cycle consistingof 95�C denaturation for 30 s, 58�C annealing step for 45 sand 72�C extension step for 45 s each, followed by a finalelongation step at 72�C for 7min. The PCR products werethen run on a 1.2% Agarose gel and visualized withethidium bromide staining. The data are represented asthe relative ChIP signal in a cell line. They are calculated
by taking the ratio of fold difference in (PCR amplificationin specific antibody ChIP samples as compared with PCRamplification with genomic DNA input sample in each cellline) versus (PCR amplification in IgG samples for eachcell line as compared with PCR amplification withgenomic DNA input in that respective cell line). The sig-nificance of ChIP signal in Keap1�/� or Nrf2�/� cell linesare calculated as compared with WT cells using Student’st-test and represented at P-value< 0.01.
Validation of microarray data by qRT-PCR
Selected genes from different functional groups werevalidated by qRT-PCR. Total RNA from cells used formicroarray was purified using the Qiagen RNeasy kit(Qiagen, Valencia, CA) for mRNA isolation. qRT-PCRwas then performed using Assay-on-Demand primers andprobe sets from Applied Biosystems (Foster City, CA) asdescribed previously (10). We used the ABI 7000 Taqmansystem (Applied Biosystems) to perform these assays.b-actin was used as a normalization control. The mRNAdata are represented as relative fold change (RFC). RFCare calculated as the ratio of target gene expression(fold change of particular gene mRNA expression inexperimental sample/control sample) versus (foldchange of b-actin mRNA expression in experimentalsample/control sample). Control sample for MEFgene-expression data are WT MEFs and WTAir formice mRNA expression data.
Cell proliferation assay
Cell proliferation was measured by QuantosTM cell prolif-eration assay (Stratagene, La Jolla, CA) and cell prolifer-ation ELISA, BrDU chemiluminescence assay (RocheApplied science, Indianapolis, IN) as per manufacturer’sinstructions.
Caspase activity assay as a marker of cell death
Caspase activity for caspase-3 and -7 was measured usingApo-ONE homogeneous caspase-3 and -7 assay kit(Promega, WI).
Cell senescence assay
Cell senescence was measured using a fluorimetric assay toexamine senescence associated beta-galactosidase activityfrom Cell Biolabs Inc. CA.
Immunoblot assay
Immunoblots were performed using antibodies for Nrf2,Srxn1, Cdkn1a, Cdkn2a (Santa Cruz Biotechnology, CA),Nqo1, Gsta3, Txnrd1, Gsta4, Gstm1, Als2, Bmpr1a,Igf1, Npnt, Pdgfc, Vegfc (Abcam Inc., MA). b-actin andLamin B1 (Santa Cruz Biotechnology, CA) were used asloading controls. These immunoblots were performedusing protocols as described previously with Nrf2,Srxn1, Cdkn1a, Cdkn2a and b-actin primary antibodiesused at 1:500 dilution; Nqo1, Gsta3, Txnrd1, Gsta4,Gstm1, Als2, Bmpr1a, Igf1, Npnt, Pdgfc, Vegfc used at1:200 dilution while Lamin B1 (b-Lamin) was used at1:1000 dilutions (13).
Nucleic Acids Research, 2010, Vol. 38, No. 17 5723
RESULTS
Genetic model of Nrf2 activation
MEFs derived from Keap1�/�, Nrf2�/�, as well as WTmice were used as models in our studies. Nrf2 is constitu-tively elevated in nuclei of Keap1�/� MEFs as comparedwith WT or Nrf2�/� MEFs [Figure 1A(i)]. Consequently,Nrf2 target site (ARE) binding, as observed by ChIP[Figure 1A(ii)] and Nrf2-regulated transcriptionalactivity, measured as target gene mRNA expression byqRT-PCR [Figure 1A(iii)] and protein expression byimmunoblot [Figure 1A(iv)], are significantly higher inKeap1�/� MEFs when compared with WT and Nrf2�/�
MEFs. There is basal nuclear translocation of Nrf2 in WTMEFs at low levels that leads to expression of a subset ofNrf2 targets which will be referred to as basal Nrf2targets. This is the case for Gsta3, which displays Nrf2binding to its promoter in WT MEFs and differential ex-pression between WT and Nrf2�/� MEFs [Figure 1A(ii–iv)]. In contrast, Nqo1 is an inducible target of Nrf2, asNrf2 binds to its promoter and selectively induces its ex-pression only in Keap1�/� MEFs [Figure 1A (ii–iv)].
Genome-wide identification of Nrf2 target sites
We performed a ChIP-Seq experiment with Keap1�/�
MEFs, in which Nrf2 is protected from ubiquitinationand degradation, constitutively activating the expressionof Nrf2 target genes. We generated two DNA librariesusing two Nrf2-specific antibodies (one monoclonal andone polyclonal). A third control library contains the inputDNA. We obtained 13 998 222, 14 068 662, and 16 375 760mapped reads for the polyclonal, monoclonal and controllibraries, respectively. Clusters of overlapping tags wereidentified as peaks using the FindPeaks software (39).Peak height thresholds were identified for each library cor-responding to a stringent FDR �0.001. The monoclonalantibody selected library was of superior quality. Apeak-height threshold of nine specified the requiredstringency with 1128 peaks meeting the criteria(Supplementary Table S2). In contrast, the polyclonalantibody selected library required a threshold of 11 toachieve the stringency with only 271 peaks meeting thecriteria (Supplementary Table S2). Only 40 of the 271peaks were unique to the polyclonal library. We focusedon the monoclonal collection. A final set of 886 mono-clonal peaks not overlapping the control library peakswere selected for further analysis. As the polyclonallibrary is complementary to the monoclonal library, weadded those peaks that overlapped between the twolibraries (peak height�5) but were absent from thecontrol library (370 peaks). This resulted in a total of1256 ChIP-Seq peaks representing a high-confidence setof Nrf2-binding sites. In addition to these nucleargenome-wide Nrf2-binding sites, we identified nine signifi-cant Nrf2 ChIP-Seq peaks in the mitochondrial genome.These peaks represent the first report of Nrf2 transcrip-tional activity in the mitochondria. They were notincluded in the bioinformatics sequence analyses belowbecause of the different properties of the nuclear and mito-chondrial genomes.
To confirm the quality of the results, we assessed therecovery of bona fide Nrf2-binding sites in the human,mouse or rat genomes compiled from the literature intothe PAZAR regulatory annotation repository (18). Ten ofthe corresponding mouse regions overlap one of theChIP-Seq peaks and while four do not overlap a peak, apeak can be found in proximity (Table 1, SupplementaryFigure S1). This finding of 50% sensitivity (consideringonly the peaks that strictly overlap a site) is highly signifi-cant (Fisher’s exact test; P< 2.2e–16) and is a strong in-dication of the quality of the results, all the more so as theliterature derived studies were performed in a variety ofspecies and cell types.
Focusing on 201-bp sequences (100-bp flanking eachside of the maximum height position), we determinedthat these sequences exhibit a nucleotide compositionbias with 57% (A or T), 43% (G or C) and a ratio of[CG]/[C or G] of 0.024. Thus, we selected the backgroundsequences from the control library with similar compos-ition and obtained a control sample of 5225 sequenceswith an overall composition of 56% (A or T), 44% (Gor C), and a ratio of [CG]/[C or G] of 0.027.
Comparing the positional distribution of the 1256Nrf2-binding sites with the 5225 background sequencesrelative to the closest gene transcription start site (TSS)showed no significant difference (Figure 1B). The concen-tration bias in favor of proximal TSS observed in both theNrf2 and control sequence sets is likely a reflection of theopen chromatin state of these regions making the DNAmore susceptible to breakage in the shearing step of theprocedure. Similar enrichment bias for transcription startregions has been reported as systematic in ChIP-Seq ex-periments (45). Similarly, the chromosomal distribution ofthe peaks showed no significant difference with the back-ground (data not shown).
Nrf2-binding site motifs are enriched within theChIP-Seq identified regions. A binding profile reflectingthe properties of the literature-derived Nrf2-binding sitecollection was constructed (Figure 2A). Figure 1C displaysthe distribution of the top scoring matches to theNrf2-binding profile in the Nrf2 peaks and the controlpeaks. The background shows a normal distributioncentered around a score of 0.8 (Figure 1C). The scoredistribution for the Nrf2 bound peaks is skewed towardshigher scoring sites with more than 55% of the sequencespresenting Nrf2 sites with a score �0.85, a stringentthreshold (Figure 1C), and is significantly different fromthe background (Wilcoxon rank sum test; P< 2.2e–16).Binding site predictions suffer from high rates of falsepositives (46), as evident in the 7% of control peaks con-taining an Nrf2 profile match with a score �0.85. A pos-itional bias was observed in the positive collection(Figure 1D). In the 707 Nrf2 ChIP-Seq peaks that havea predicted Nrf2-binding site scoring at least 0.85, 65%contain the site within 22 bp of the peak maximum height,whereas in the 379 background sequences, the sitesare distributed uniformly across the sequences. The differ-ence proves statistically significant (Wilcoxon ranksum test; P< 2.2e–16). In conclusion, the resultsdemonstrate that the Nrf2 ChIP-Seq dataset is highlyenriched for Nrf2-binding sites as defined by the
5724 Nucleic Acids Research, 2010, Vol. 38, No. 17
enriched presence and positional distribution of Nrf2-binding site motifs.
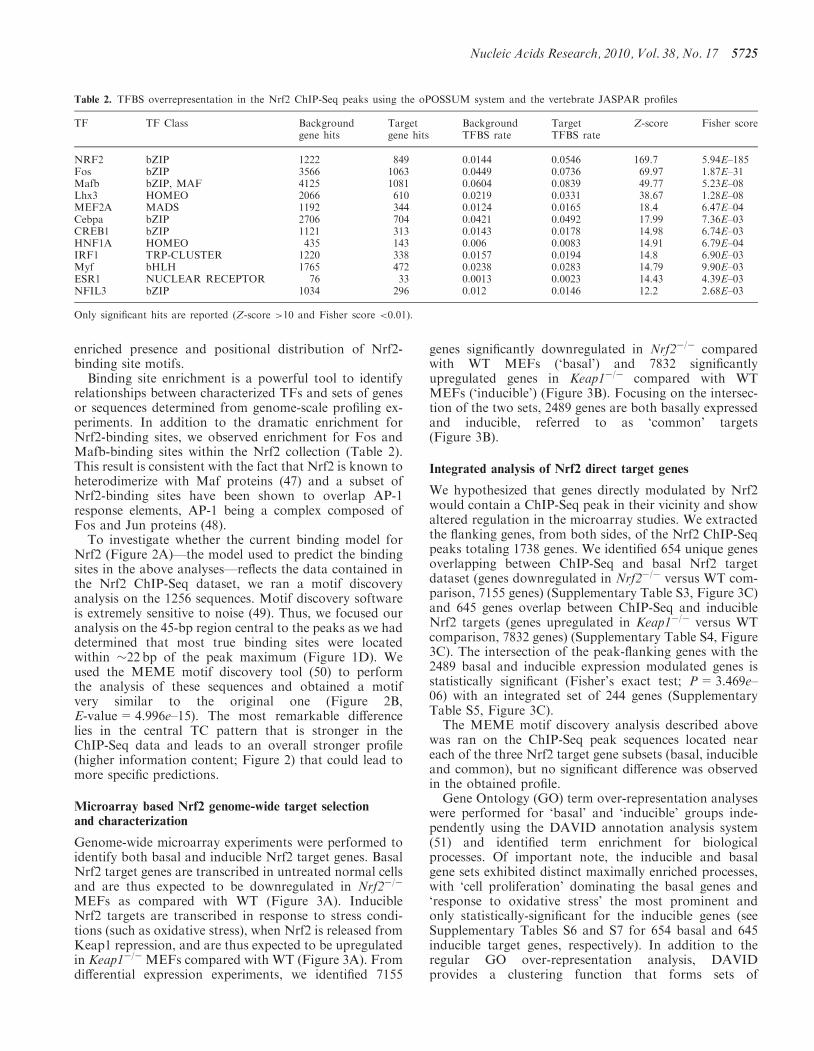
Binding site enrichment is a powerful tool to identifyrelationships between characterized TFs and sets of genesor sequences determined from genome-scale profiling ex-periments. In addition to the dramatic enrichment forNrf2-binding sites, we observed enrichment for Fos andMafb-binding sites within the Nrf2 collection (Table 2).This result is consistent with the fact that Nrf2 is known toheterodimerize with Maf proteins (47) and a subset ofNrf2-binding sites have been shown to overlap AP-1response elements, AP-1 being a complex composed ofFos and Jun proteins (48).
To investigate whether the current binding model forNrf2 (Figure 2A)—the model used to predict the bindingsites in the above analyses—reflects the data contained inthe Nrf2 ChIP-Seq dataset, we ran a motif discoveryanalysis on the 1256 sequences. Motif discovery softwareis extremely sensitive to noise (49). Thus, we focused ouranalysis on the 45-bp region central to the peaks as we haddetermined that most true binding sites were locatedwithin �22 bp of the peak maximum (Figure 1D). Weused the MEME motif discovery tool (50) to performthe analysis of these sequences and obtained a motifvery similar to the original one (Figure 2B,E-value=4.996e–15). The most remarkable differencelies in the central TC pattern that is stronger in theChIP-Seq data and leads to an overall stronger profile(higher information content; Figure 2) that could lead tomore specific predictions.
Microarray based Nrf2 genome-wide target selectionand characterization
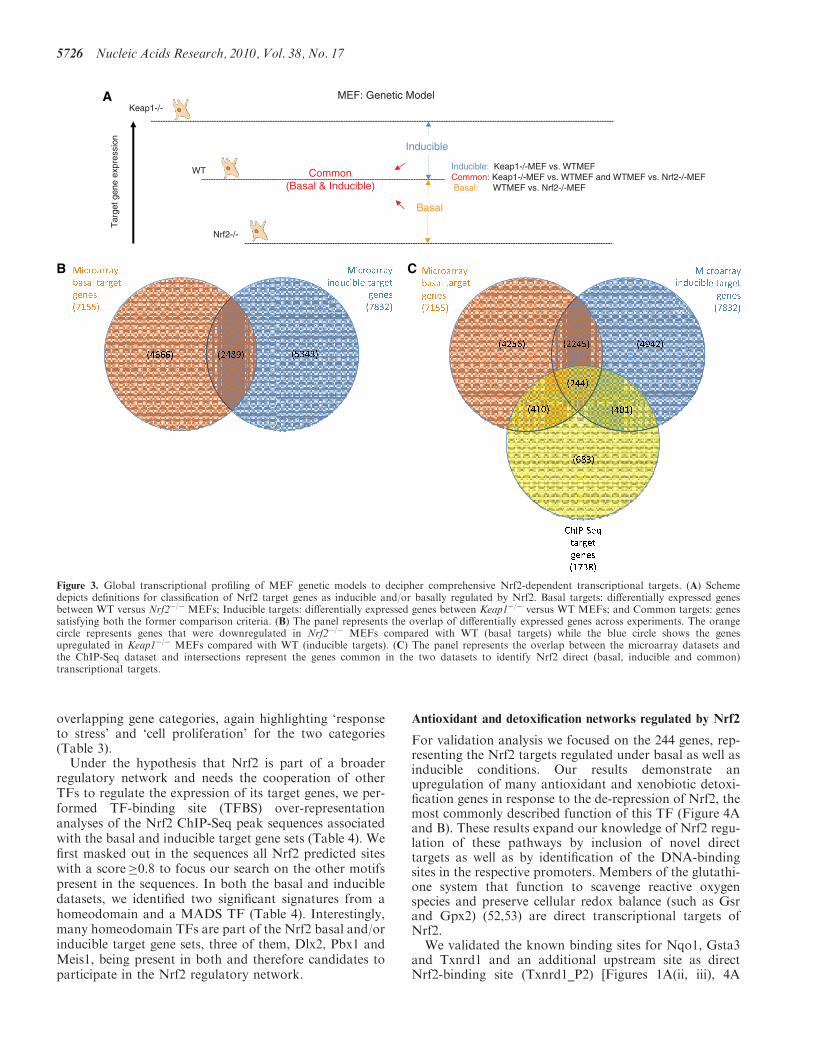
Genome-wide microarray experiments were performed toidentify both basal and inducible Nrf2 target genes. BasalNrf2 target genes are transcribed in untreated normal cellsand are thus expected to be downregulated in Nrf2�/�
MEFs as compared with WT (Figure 3A). InducibleNrf2 targets are transcribed in response to stress condi-tions (such as oxidative stress), when Nrf2 is released fromKeap1 repression, and are thus expected to be upregulatedin Keap1�/�MEFs compared with WT (Figure 3A). Fromdifferential expression experiments, we identified 7155
genes significantly downregulated in Nrf2�/� comparedwith WT MEFs (‘basal’) and 7832 significantlyupregulated genes in Keap1�/� compared with WTMEFs (‘inducible’) (Figure 3B). Focusing on the intersec-tion of the two sets, 2489 genes are both basally expressedand inducible, referred to as ‘common’ targets(Figure 3B).
Integrated analysis of Nrf2 direct target genes
We hypothesized that genes directly modulated by Nrf2would contain a ChIP-Seq peak in their vicinity and showaltered regulation in the microarray studies. We extractedthe flanking genes, from both sides, of the Nrf2 ChIP-Seqpeaks totaling 1738 genes. We identified 654 unique genesoverlapping between ChIP-Seq and basal Nrf2 targetdataset (genes downregulated in Nrf2�/� versus WT com-parison, 7155 genes) (Supplementary Table S3, Figure 3C)and 645 genes overlap between ChIP-Seq and inducibleNrf2 targets (genes upregulated in Keap1�/� versus WTcomparison, 7832 genes) (Supplementary Table S4, Figure3C). The intersection of the peak-flanking genes with the2489 basal and inducible expression modulated genes isstatistically significant (Fisher’s exact test; P=3.469e–06) with an integrated set of 244 genes (SupplementaryTable S5, Figure 3C).The MEME motif discovery analysis described above
was ran on the ChIP-Seq peak sequences located neareach of the three Nrf2 target gene subsets (basal, inducibleand common), but no significant difference was observedin the obtained profile.Gene Ontology (GO) term over-representation analyses
were performed for ‘basal’ and ‘inducible’ groups inde-pendently using the DAVID annotation analysis system(51) and identified term enrichment for biologicalprocesses. Of important note, the inducible and basalgene sets exhibited distinct maximally enriched processes,with ‘cell proliferation’ dominating the basal genes and‘response to oxidative stress’ the most prominent andonly statistically-significant for the inducible genes (seeSupplementary Tables S6 and S7 for 654 basal and 645inducible target genes, respectively). In addition to theregular GO over-representation analysis, DAVIDprovides a clustering function that forms sets of
Table 2. TFBS overrepresentation in the Nrf2 ChIP-Seq peaks using the oPOSSUM system and the vertebrate JASPAR profiles
TF TF Class Backgroundgene hits
Targetgene hits
BackgroundTFBS rate
TargetTFBS rate
Z-score Fisher score
NRF2 bZIP 1222 849 0.0144 0.0546 169.7 5.94E–185Fos bZIP 3566 1063 0.0449 0.0736 69.97 1.87E–31Mafb bZIP, MAF 4125 1081 0.0604 0.0839 49.77 5.23E–08Lhx3 HOMEO 2066 610 0.0219 0.0331 38.67 1.28E–08MEF2A MADS 1192 344 0.0124 0.0165 18.4 6.47E–04Cebpa bZIP 2706 704 0.0421 0.0492 17.99 7.36E–03CREB1 bZIP 1121 313 0.0143 0.0178 14.98 6.74E–03HNF1A HOMEO 435 143 0.006 0.0083 14.91 6.79E–04IRF1 TRP-CLUSTER 1220 338 0.0157 0.0194 14.8 6.90E–03Myf bHLH 1765 472 0.0238 0.0283 14.79 9.90E–03ESR1 NUCLEAR RECEPTOR 76 33 0.0013 0.0023 14.43 4.39E–03NFIL3 bZIP 1034 296 0.012 0.0146 12.2 2.68E–03
Only significant hits are reported (Z-score >10 and Fisher score <0.01).
Nucleic Acids Research, 2010, Vol. 38, No. 17 5725
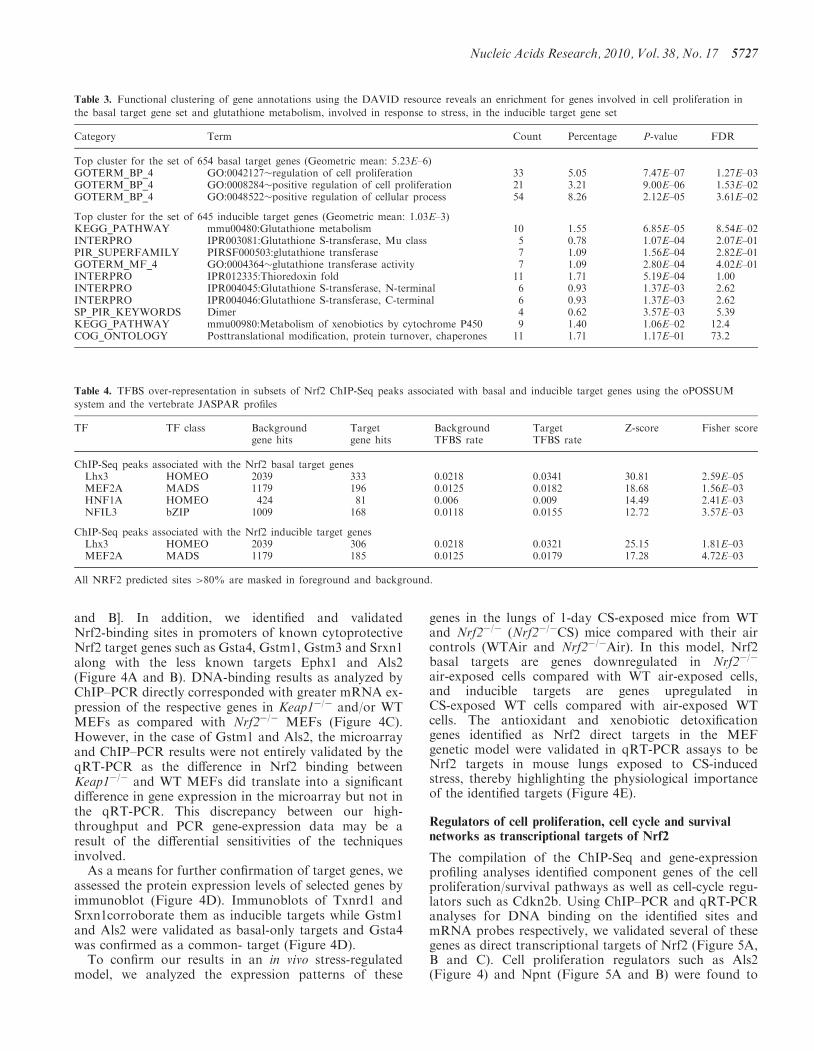
overlapping gene categories, again highlighting ‘responseto stress’ and ‘cell proliferation’ for the two categories(Table 3).Under the hypothesis that Nrf2 is part of a broader
regulatory network and needs the cooperation of otherTFs to regulate the expression of its target genes, we per-formed TF-binding site (TFBS) over-representationanalyses of the Nrf2 ChIP-Seq peak sequences associatedwith the basal and inducible target gene sets (Table 4). Wefirst masked out in the sequences all Nrf2 predicted siteswith a score�0.8 to focus our search on the other motifspresent in the sequences. In both the basal and inducibledatasets, we identified two significant signatures from ahomeodomain and a MADS TF (Table 4). Interestingly,many homeodomain TFs are part of the Nrf2 basal and/orinducible target gene sets, three of them, Dlx2, Pbx1 andMeis1, being present in both and therefore candidates toparticipate in the Nrf2 regulatory network.
Antioxidant and detoxification networks regulated by Nrf2
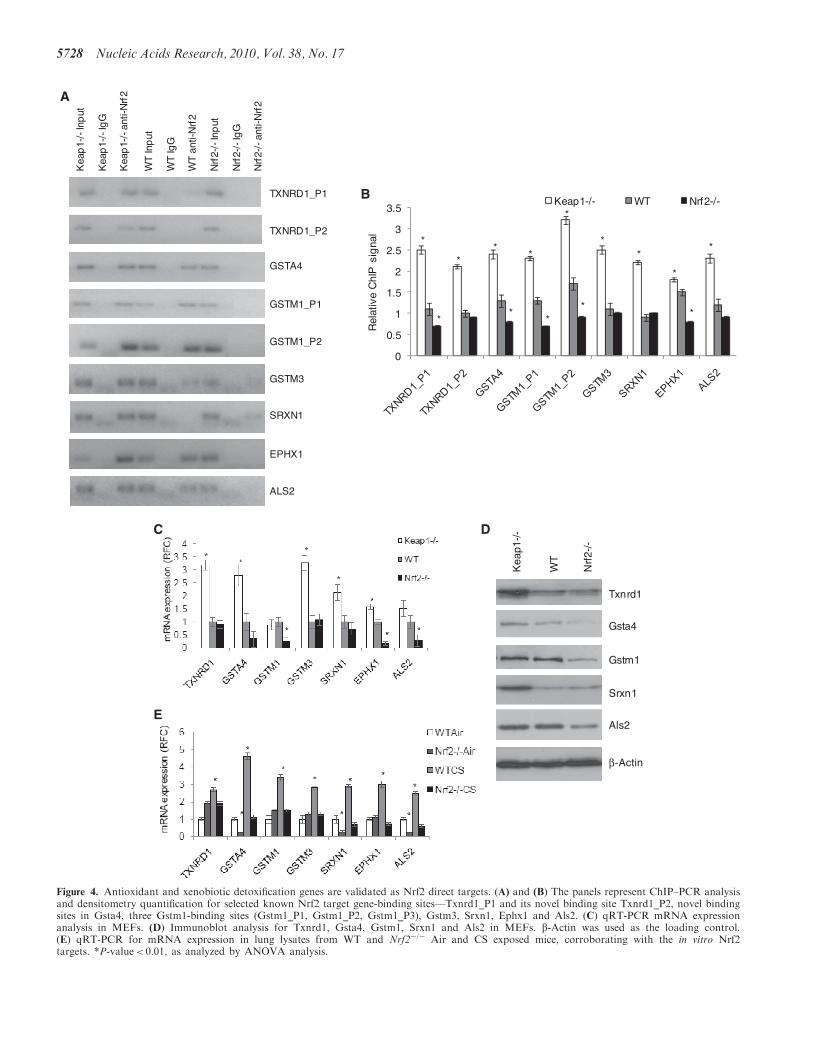
For validation analysis we focused on the 244 genes, rep-resenting the Nrf2 targets regulated under basal as well asinducible conditions. Our results demonstrate anupregulation of many antioxidant and xenobiotic detoxi-fication genes in response to the de-repression of Nrf2, themost commonly described function of this TF (Figure 4Aand B). These results expand our knowledge of Nrf2 regu-lation of these pathways by inclusion of novel directtargets as well as by identification of the DNA-bindingsites in the respective promoters. Members of the glutathi-one system that function to scavenge reactive oxygenspecies and preserve cellular redox balance (such as Gsrand Gpx2) (52,53) are direct transcriptional targets ofNrf2.
We validated the known binding sites for Nqo1, Gsta3and Txnrd1 and an additional upstream site as directNrf2-binding site (Txnrd1_P2) [Figures 1A(ii, iii), 4A
Keap1-/-
Nrf2-/-
WT
MEF: Genetic Model
Tar
get g
ene
expr
essi
on Inducible
Basal
Common(Basal & Inducible)
Inducible: Keap1-/-MEF vs. WTMEF Common: Keap1-/-MEF vs. WTMEF and WTMEF vs. Nrf2-/-MEF Basal: WTMEF vs. Nrf2-/-MEF
A
B C
Figure 3. Global transcriptional profiling of MEF genetic models to decipher comprehensive Nrf2-dependent transcriptional targets. (A) Schemedepicts definitions for classification of Nrf2 target genes as inducible and/or basally regulated by Nrf2. Basal targets: differentially expressed genesbetween WT versus Nrf2�/� MEFs; Inducible targets: differentially expressed genes between Keap1�/� versus WT MEFs; and Common targets: genessatisfying both the former comparison criteria. (B) The panel represents the overlap of differentially expressed genes across experiments. The orangecircle represents genes that were downregulated in Nrf2�/� MEFs compared with WT (basal targets) while the blue circle shows the genesupregulated in Keap1�/� MEFs compared with WT (inducible targets). (C) The panel represents the overlap between the microarray datasets andthe ChIP-Seq dataset and intersections represent the genes common in the two datasets to identify Nrf2 direct (basal, inducible and common)transcriptional targets.
5726 Nucleic Acids Research, 2010, Vol. 38, No. 17
and B]. In addition, we identified and validatedNrf2-binding sites in promoters of known cytoprotectiveNrf2 target genes such as Gsta4, Gstm1, Gstm3 and Srxn1along with the less known targets Ephx1 and Als2(Figure 4A and B). DNA-binding results as analyzed byChIP–PCR directly corresponded with greater mRNA ex-pression of the respective genes in Keap1�/� and/or WTMEFs as compared with Nrf2�/� MEFs (Figure 4C).However, in the case of Gstm1 and Als2, the microarrayand ChIP–PCR results were not entirely validated by theqRT-PCR as the difference in Nrf2 binding betweenKeap1�/� and WT MEFs did translate into a significantdifference in gene expression in the microarray but not inthe qRT-PCR. This discrepancy between our high-throughput and PCR gene-expression data may be aresult of the differential sensitivities of the techniquesinvolved.
As a means for further confirmation of target genes, weassessed the protein expression levels of selected genes byimmunoblot (Figure 4D). Immunoblots of Txnrd1 andSrxn1corroborate them as inducible targets while Gstm1and Als2 were validated as basal-only targets and Gsta4was confirmed as a common- target (Figure 4D).
To confirm our results in an in vivo stress-regulatedmodel, we analyzed the expression patterns of these
genes in the lungs of 1-day CS-exposed mice from WTand Nrf2�/� (Nrf2�/�CS) mice compared with their aircontrols (WTAir and Nrf2�/�Air). In this model, Nrf2basal targets are genes downregulated in Nrf2�/�
air-exposed cells compared with WT air-exposed cells,and inducible targets are genes upregulated inCS-exposed WT cells compared with air-exposed WTcells. The antioxidant and xenobiotic detoxificationgenes identified as Nrf2 direct targets in the MEFgenetic model were validated in qRT-PCR assays to beNrf2 targets in mouse lungs exposed to CS-inducedstress, thereby highlighting the physiological importanceof the identified targets (Figure 4E).
Regulators of cell proliferation, cell cycle and survivalnetworks as transcriptional targets of Nrf2
The compilation of the ChIP-Seq and gene-expressionprofiling analyses identified component genes of the cellproliferation/survival pathways as well as cell-cycle regu-lators such as Cdkn2b. Using ChIP–PCR and qRT-PCRanalyses for DNA binding on the identified sites andmRNA probes respectively, we validated several of thesegenes as direct transcriptional targets of Nrf2 (Figure 5A,B and C). Cell proliferation regulators such as Als2(Figure 4) and Npnt (Figure 5A and B) were found to
Table 3. Functional clustering of gene annotations using the DAVID resource reveals an enrichment for genes involved in cell proliferation in
the basal target gene set and glutathione metabolism, involved in response to stress, in the inducible target gene set
Category Term Count Percentage P-value FDR
Top cluster for the set of 654 basal target genes (Geometric mean: 5.23E–6)GOTERM_BP_4 GO:0042127�regulation of cell proliferation 33 5.05 7.47E–07 1.27E–03GOTERM_BP_4 GO:0008284�positive regulation of cell proliferation 21 3.21 9.00E–06 1.53E–02GOTERM_BP_4 GO:0048522�positive regulation of cellular process 54 8.26 2.12E–05 3.61E–02
Top cluster for the set of 645 inducible target genes (Geometric mean: 1.03E–3)KEGG_PATHWAY mmu00480:Glutathione metabolism 10 1.55 6.85E–05 8.54E–02INTERPRO IPR003081:Glutathione S-transferase, Mu class 5 0.78 1.07E–04 2.07E–01PIR_SUPERFAMILY PIRSF000503:glutathione transferase 7 1.09 1.56E–04 2.82E–01GOTERM_MF_4 GO:0004364�glutathione transferase activity 7 1.09 2.80E–04 4.02E–01INTERPRO IPR012335:Thioredoxin fold 11 1.71 5.19E–04 1.00INTERPRO IPR004045:Glutathione S-transferase, N-terminal 6 0.93 1.37E–03 2.62INTERPRO IPR004046:Glutathione S-transferase, C-terminal 6 0.93 1.37E–03 2.62SP_PIR_KEYWORDS Dimer 4 0.62 3.57E–03 5.39KEGG_PATHWAY mmu00980:Metabolism of xenobiotics by cytochrome P450 9 1.40 1.06E–02 12.4COG_ONTOLOGY Posttranslational modification, protein turnover, chaperones 11 1.71 1.17E–01 73.2
Table 4. TFBS over-representation in subsets of Nrf2 ChIP-Seq peaks associated with basal and inducible target genes using the oPOSSUM
system and the vertebrate JASPAR profiles
TF TF class Backgroundgene hits
Targetgene hits
BackgroundTFBS rate
TargetTFBS rate
Z-score Fisher score
ChIP-Seq peaks associated with the Nrf2 basal target genesLhx3 HOMEO 2039 333 0.0218 0.0341 30.81 2.59E–05MEF2A MADS 1179 196 0.0125 0.0182 18.68 1.56E–03HNF1A HOMEO 424 81 0.006 0.009 14.49 2.41E–03NFIL3 bZIP 1009 168 0.0118 0.0155 12.72 3.57E–03
ChIP-Seq peaks associated with the Nrf2 inducible target genesLhx3 HOMEO 2039 306 0.0218 0.0321 25.15 1.81E–03MEF2A MADS 1179 185 0.0125 0.0179 17.28 4.72E–03
All NRF2 predicted sites >80% are masked in foreground and background.
Nucleic Acids Research, 2010, Vol. 38, No. 17 5727
GSTA4
GSTM1_P1
GSTM1_P2
EPHX1
GSTM3
SRXN1
ALS2
Kea
p1-
/-In
put
Kea
p1-
/-Ig
G
Kea
p1-
/-an
ti-N
rf2
Nrf
2-/-
Inp
ut
Nrf
2-/-
IgG
Nrf
2-/-
anti-
Nrf
2
WT
Inp
ut
WT
IgG
WT
anti-
Nrf
2TXNRD1_P1
TXNRD1_P2
0
0.5
1
1.5
2
2.5
3
3.5
Rel
ativ
e C
hIP
sig
nal
Keap1-/- WT Nrf2-/-
*
**
*
*
*
**
*
*
*
***
A
B
Kea
p1-/-
Nrf
2-/-
WT
Gstm1
Txnrd1
Gsta4
Srxn1
Als2
b-Actin
C
E
D
Figure 4. Antioxidant and xenobiotic detoxification genes are validated as Nrf2 direct targets. (A) and (B) The panels represent ChIP–PCR analysisand densitometry quantification for selected known Nrf2 target gene-binding sites—Txnrd1_P1 and its novel binding site Txnrd1_P2, novel bindingsites in Gsta4, three Gstm1-binding sites (Gstm1_P1, Gstm1_P2, Gstm1_P3), Gstm3, Srxn1, Ephx1 and Als2. (C) qRT-PCR mRNA expressionanalysis in MEFs. (D) Immunoblot analysis for Txnrd1, Gsta4, Gstm1, Srxn1 and Als2 in MEFs. b-Actin was used as the loading control.(E) qRT-PCR for mRNA expression in lung lysates from WT and Nrf2�/� Air and CS exposed mice, corroborating with the in vitro Nrf2targets. *P-value< 0.01, as analyzed by ANOVA analysis.
5728 Nucleic Acids Research, 2010, Vol. 38, No. 17
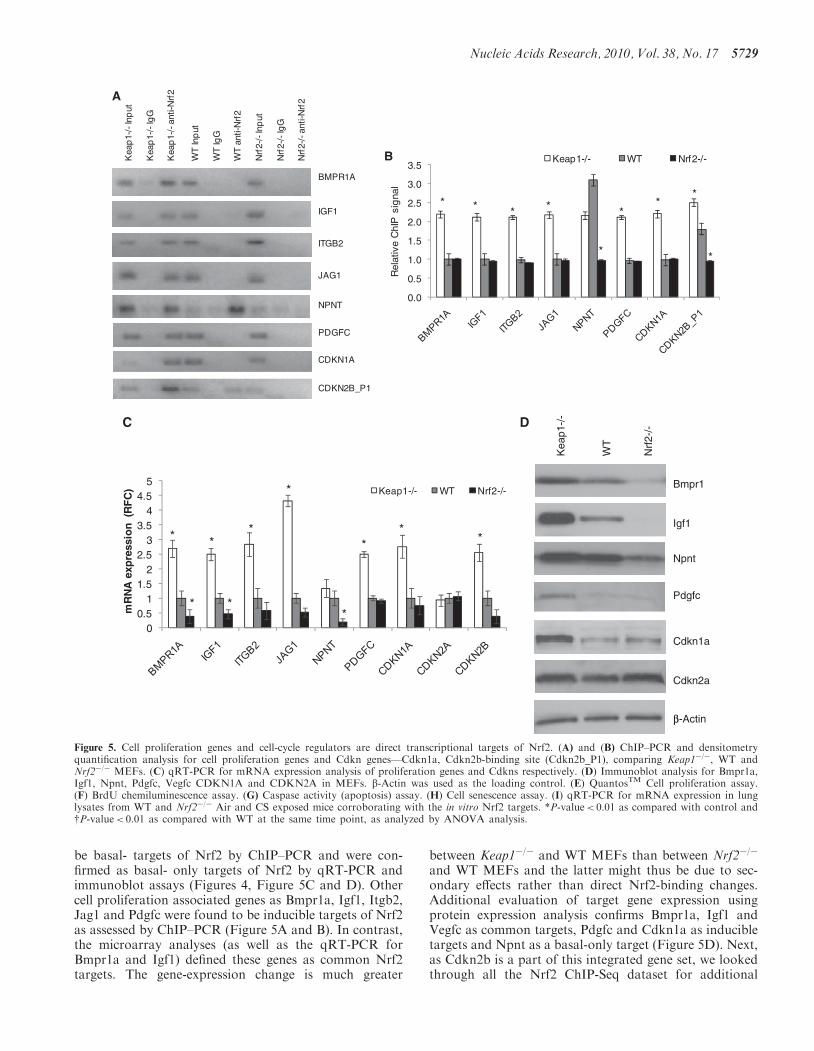
be basal- targets of Nrf2 by ChIP–PCR and were con-firmed as basal- only targets of Nrf2 by qRT-PCR andimmunoblot assays (Figures 4, Figure 5C and D). Othercell proliferation associated genes as Bmpr1a, Igf1, Itgb2,Jag1 and Pdgfc were found to be inducible targets of Nrf2as assessed by ChIP–PCR (Figure 5A and B). In contrast,the microarray analyses (as well as the qRT-PCR forBmpr1a and Igf1) defined these genes as common Nrf2targets. The gene-expression change is much greater
between Keap1�/� and WT MEFs than between Nrf2�/�
and WT MEFs and the latter might thus be due to sec-ondary effects rather than direct Nrf2-binding changes.Additional evaluation of target gene expression usingprotein expression analysis confirms Bmpr1a, Igf1 andVegfc as common targets, Pdgfc and Cdkn1a as inducibletargets and Npnt as a basal-only target (Figure 5D). Next,as Cdkn2b is a part of this integrated gene set, we lookedthrough all the Nrf2 ChIP-Seq dataset for additional
Kea
p1-
/-In
put
Kea
p1-
/-Ig
G
Kea
p1-
/-an
ti-N
rf2
Nrf
2-/-
Inp
ut
Nrf
2-/-
IgG
Nrf
2-/-
anti-
Nrf
2
WT
Inp
ut
WT
IgG
WT
anti-
Nrf
2
IGF1
PDGFC
ITGB2
JAG1
NPNT
BMPR1A
CDKN1A
CDKN2B_P1
0.0
0.5
1.0
1.5
2.0
2.5
3.0
3.5
Rel
ativ
e C
hIP
sig
nal
Keap1-/- WT Nrf2-/-
* * * *
*
**
*
*
A
B
Kea
p1-/
-
Nrf
2-/-
WT
Npnt
Bmpr1
Igf1
Pdgfc
Cdkn1a
Cdkn2a
b-Actin
00.5
11.5
22.5
33.5
44.5
5
mR
NA
exp
ress
ion
(R
FC
) Keap1-/- WT Nrf2-/-
*
*
*
*
*
*
*
**
*
C D
Figure 5. Cell proliferation genes and cell-cycle regulators are direct transcriptional targets of Nrf2. (A) and (B) ChIP–PCR and densitometryquantification analysis for cell proliferation genes and Cdkn genes—Cdkn1a, Cdkn2b-binding site (Cdkn2b_P1), comparing Keap1�/�, WT andNrf2�/� MEFs. (C) qRT-PCR for mRNA expression analysis of proliferation genes and Cdkns respectively. (D) Immunoblot analysis for Bmpr1a,Igf1, Npnt, Pdgfc, Vegfc CDKN1A and CDKN2A in MEFs. b-Actin was used as the loading control. (E) QuantosTM Cell proliferation assay.(F) BrdU chemiluminescence assay. (G) Caspase activity (apoptosis) assay. (H) Cell senescence assay. (I) qRT-PCR for mRNA expression in lunglysates from WT and Nrf2�/� Air and CS exposed mice corroborating with the in vitro Nrf2 targets. *P-value< 0.01 as compared with control andyP-value< 0.01 as compared with WT at the same time point, as analyzed by ANOVA analysis.
Nucleic Acids Research, 2010, Vol. 38, No. 17 5729
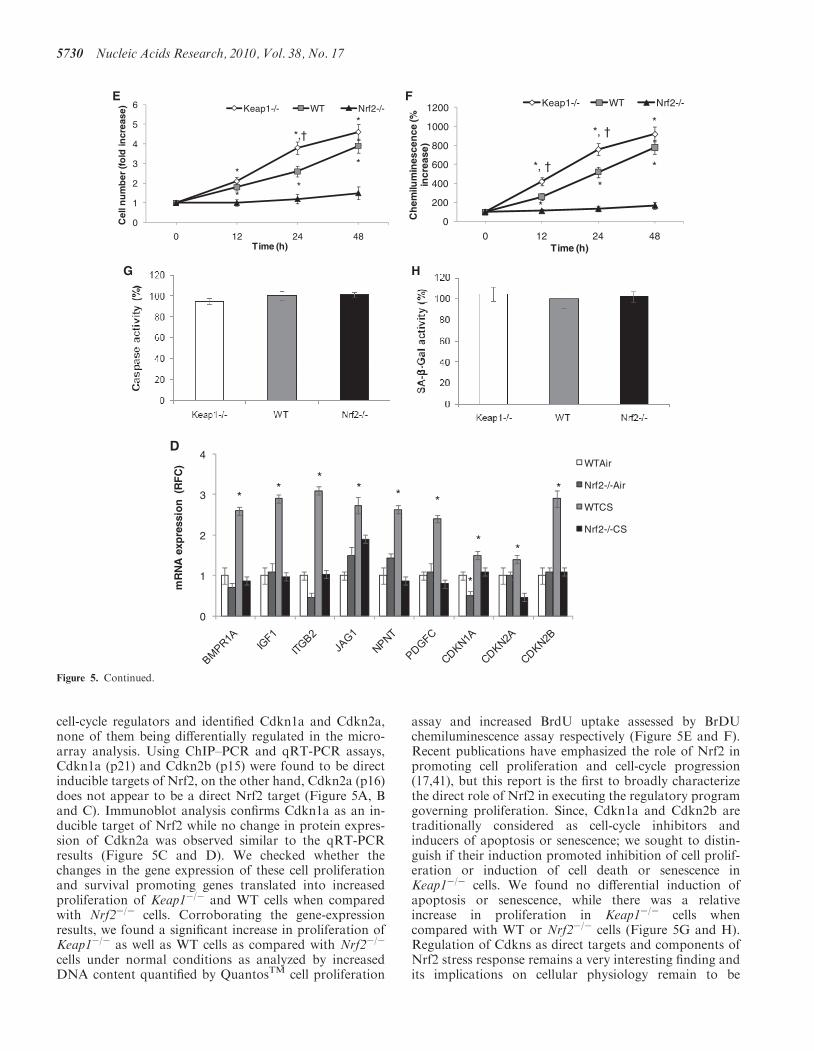
cell-cycle regulators and identified Cdkn1a and Cdkn2a,none of them being differentially regulated in the micro-array analysis. Using ChIP–PCR and qRT-PCR assays,Cdkn1a (p21) and Cdkn2b (p15) were found to be directinducible targets of Nrf2, on the other hand, Cdkn2a (p16)does not appear to be a direct Nrf2 target (Figure 5A, Band C). Immunoblot analysis confirms Cdkn1a as an in-ducible target of Nrf2 while no change in protein expres-sion of Cdkn2a was observed similar to the qRT-PCRresults (Figure 5C and D). We checked whether thechanges in the gene expression of these cell proliferationand survival promoting genes translated into increasedproliferation of Keap1�/� and WT cells when comparedwith Nrf2�/� cells. Corroborating the gene-expressionresults, we found a significant increase in proliferation ofKeap1�/� as well as WT cells as compared with Nrf2�/�
cells under normal conditions as analyzed by increasedDNA content quantified by QuantosTM cell proliferation
assay and increased BrdU uptake assessed by BrDUchemiluminescence assay respectively (Figure 5E and F).Recent publications have emphasized the role of Nrf2 inpromoting cell proliferation and cell-cycle progression(17,41), but this report is the first to broadly characterizethe direct role of Nrf2 in executing the regulatory programgoverning proliferation. Since, Cdkn1a and Cdkn2b aretraditionally considered as cell-cycle inhibitors andinducers of apoptosis or senescence; we sought to distin-guish if their induction promoted inhibition of cell prolif-eration or induction of cell death or senescence inKeap1�/� cells. We found no differential induction ofapoptosis or senescence, while there was a relativeincrease in proliferation in Keap1�/� cells whencompared with WT or Nrf2�/� cells (Figure 5G and H).Regulation of Cdkns as direct targets and components ofNrf2 stress response remains a very interesting finding andits implications on cellular physiology remain to be
0
1
2
3
4
5
6
0 12 24 48
Cel
l nu
mb
er (f
old
incr
ease
)
Time (h)
Keap1-/- WT Nrf2-/-
*
*
*,†
*
*
*
0
200
400
600
800
1000
1200
0 12 24 48
Ch
emilu
min
esce
nce
(%
incr
ease
)
Time (h)
Keap1-/- WT Nrf2-/-
*, †
*
*, †
*
*
*
E F
G H
0
1
2
3
4
mR
NA
exp
ress
ion
(R
FC
) WTAir
Nrf2-/-Air
WTCS
Nrf2-/-CS
**
** * *
*
*
*
*
D
Figure 5. Continued.
5730 Nucleic Acids Research, 2010, Vol. 38, No. 17
Rbm9
Gli2
Maml2
G6pdx
Nrf2 targets involved inCell Proliferation
Nrf2 targets involved inGlutathione metabolism
Nfe2l2
Gstm1Gstm1
Basal targets (N= 47)Inducible targets (N=31)Common targets (N=15)
Basal targets (N= 5)Inducible targets (N=10)Common targets (N=12)
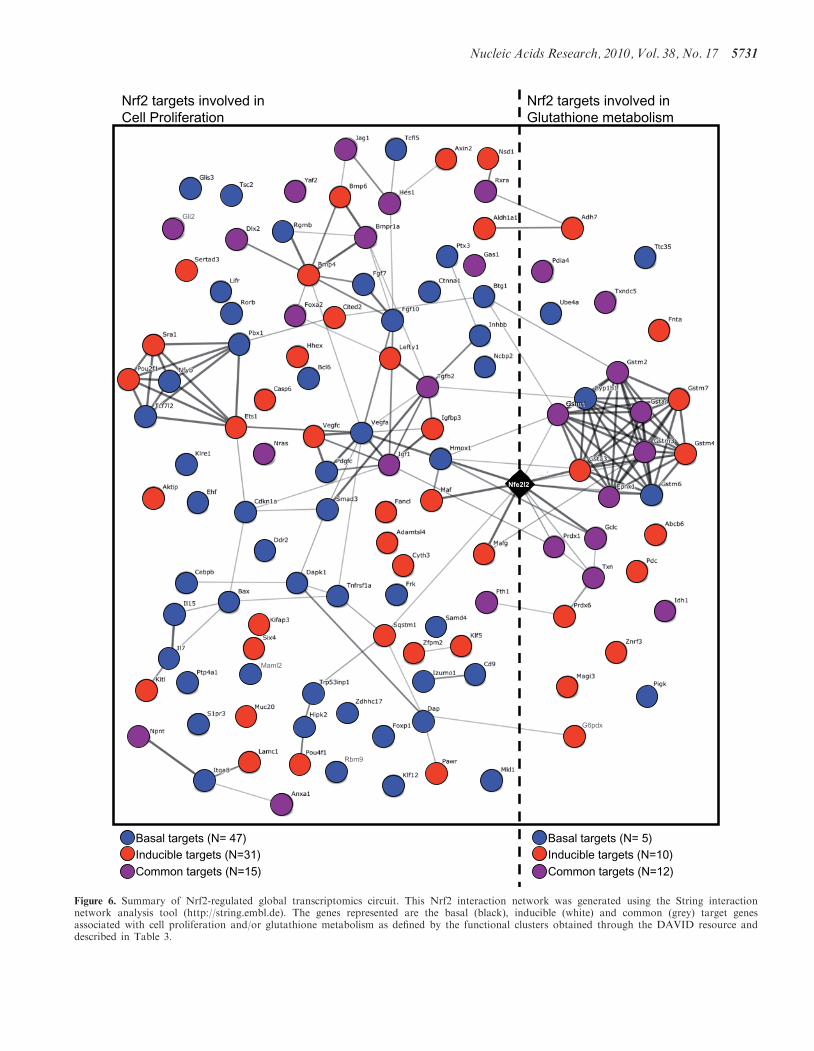
Figure 6. Summary of Nrf2-regulated global transcriptomics circuit. This Nrf2 interaction network was generated using the String interactionnetwork analysis tool (http://string.embl.de). The genes represented are the basal (black), inducible (white) and common (grey) target genesassociated with cell proliferation and/or glutathione metabolism as defined by the functional clusters obtained through the DAVID resource anddescribed in Table 3.
Nucleic Acids Research, 2010, Vol. 38, No. 17 5731
unraveled. These genes were also validated as Nrf2 targetsin vivo in mice lungs under CS-induced stress (Figure 5I).These two observations implicate novel probable roles forCdkn1a and Cdkn2b in Nrf2-regulated cell survival and/or proliferation.
DISCUSSION
We have described a genome-scale analysis of the regula-tory network governed by the Nrf2 TF using a combin-ation of high-throughput sequencing for ChIP andmicroarray-based gene-expression profiling. The genome-scale experiments were performed with MEFs isolatedfrom mice lacking Keap1, the key mediator of Nrf2 deg-radation, and mice lacking Nrf2 as well as WT mice. Theresults agree with the recognized role of Nrf2 in regulatingthe expression of protective genes that attenuate cytotox-icity in response to chemical toxins, and reveal a strongrole for Nrf2 in the direct regulation of cellular prolifer-ation. The segregation of ‘cell proliferation’ gene enrich-ment to a basal gene-expression cluster contrasts with‘stress response’ enrichment in an inducible cluster. Anunbiased binding profile derived from the experimentaldata extends a previous model for the binding specificityof Nrf2. The validity of the high-throughput results wereconfirmed by independent ChIP and qRT-PCR assays. Toconfirm the functional relevance of the findings in thetransgenic cells, the results were confirmed using lungsamples from mice exposed to concentrated CS in com-parison to air controls. These findings represent the firstcomprehensive genome-wide study of Nrf2 binding and,coupled with the expression profiling, reveal the broadrole of Nrf2 in protecting cells against toxic conditions.The central role of Nrf2 in activating protective gene
expression is long recognized, but its role in the regulationof cell proliferation has received less attention. Studieson the control of cellular differentiation in both adipocytes(54) and osteoblasts (55) have indicated that activa-tion of the Nrf2 pathway can inhibit differentiation.Given the relationship between the maintenance of aproliferative state and the cell cycle, these studies aresuggestive of a link between Nrf2 and the cell cycle. Ourown studies have shown a potential link between Nrf2 andthe oxidative-stress induced inhibition of proliferation(56,57). The current study also allows for speculationabout novel roles of Nrf2 pathway in regulation ofdiseases. For example, Nrf2 target gene, Pdgf is involvedin a prenatal placental disorder, preeclampsia, because ofincreasing levels of their antagonist, fms-like tyrosinekinase 1 (Flt1) (58,59). In addition, Nrf2 regulated geneexpression has been linked previously with vascularhomeostasis and oxidative stress response in endothe-lial and smooth muscle cells in protection againstdiseases such as atherosclerosis and preeclampsia (60).These observations along with our data on positive regula-tion of Pdgf by Nrf2 indicate a more important role ofNrf2 pathway in developmental diseases such aspreeclampsia.The segregation of ‘proliferation’ targets and ‘stress’
targets to genetically distinct expression groups is
noteworthy. The distinction suggests a potential complex-ity to the Nrf2 regulatory network (Figure 6). The analysisof transcription factor motif over-representation did notreveal an enriched binding site for any TF that segregatesbetween the sets. It is possible that the distinction resultsfrom an alternative mechanism such as a microRNAactivity.
The Nrf2 pathway has been studied in diverse tissuecontexts, due to potential roles in stroke recovery,COPD and cancer prevention in multiple organs. Theprofiling of gene-expression changes mediated by theNrf2 pathway has been well documented. The interpret-ation of such studies, however, has been hamperedby the inability to distinguish genes modulated directlyby Nrf2 from genes induced secondarily by Nrf2-sensitiveTFs. The availability of the ChIP-Seq technology anda high-quality antibody have provided this first oppor-tunity to intersect the two classes of genomic data andconsequently define direct gene targets of the pathway.The genomic regions directly bound by Nrf2 in thevicinity of Nrf2-responsive genes constitute a richstarting set for the study of Nrf2 regulation. The down-stream analysis of such target regions could reveal here-tofore under-appreciated properties of the elements thatcould distinguish inducible cis-regulatory elements fromother sequences bound by Nrf2 with no functionaloutcome.
The development of a high-throughput ChIP-Seq pro-cedure provides a direct path for future experimentalstudies. As the cost of ChIP-Seq experiments declines, itwill be possible to perform temporal studies of binding inresponse to inducing conditions and to perform compara-tive analyses of responses between different tissues. Suchstudies will be an important focus as researchers seek todiscern the tissue-specific properties of the pathway andidentify functional targets for interventions, bothto induce the protective enzymes in healthy tissue and tosuppress the system in cancer cells where the pathway hasbecome deregulated.
The identification of a well-defined Nrf2 regulatoryprogram is a critical step in advancing translationalresearch. Nrf2 plays an important role in the susceptibilityto COPD and other diseases; moreover, it protects cellsagainst a variety of environmental stressors and carcino-gens. Thus, the full discovery of the global circuitry ofNrf2 as a master protector is a significant step in ourunderstanding of its function.
SUPPLEMENTARY DATA
Supplementary Data are available at NAR Online.
ACKNOWLEDGEMENTS
The authors thank the team at the British ColumbiaGenome Sciences Center for assistance with the prepar-ation and analysis of the ChIP-Seq data, with special rec-ognition to Anthony Fejes and Richard Varhol. Theywould also like acknowledge Vikas Misra and
5732 Nucleic Acids Research, 2010, Vol. 38, No. 17
Hannah Lee for their input for the microarrayexperiments.
FUNDING
Funding for open access charge: Operating support fromthe Canadian Institutes of Health Research; infrastructuresupport from Canada Foundation for Innovation (toW.W.W.); Scholar of the Michael Smith Foundation forHealth Research and a New Investigator of the CIHR (toW.W.W.); National Institutes of Health (R01 HL081205,R01 CA140492-01A1, R01 GM079239, 1P50HL074945-01, 1P50ES015903, 4P50CA058184, 5R21/R33AI080541,P01ES018176, 5P30ES003819 to S.B.); (CA94076 toT.W.K.); Clinical innovator award from FlightAttendant Medical Research Institute (to S.B.).
Conflict of interest statement. None declared.
REFERENCES
1. Kensler,T.W., Wakabayashi,N. and Biswal,S. (2007) Cell survivalresponses to environmental stresses via the Keap1-Nrf2-AREpathway. Annu. Rev. Pharmacol. Toxicol., 47, 89–116.
2. Chan,K. and Kan,Y.W. (1999) Nrf2 is essential for protectionagainst acute pulmonary injury in mice. Proc. Natl Acad. Sci.USA, 96, 12731–12736.
3. Cho,H.Y., Jedlicka,A.E., Reddy,S.P., Kensler,T.W.,Yamamoto,M., Zhang,L.Y. and Kleeberger,S.R. (2002) Role ofNRF2 in protection against hyperoxic lung injury in mice.Am. J. Respir. Cell Mol. Biol., 26, 175–182.
4. Collins,A.R., Lyon,C.J., Xia,X., Liu,J.Z., Tangirala,R.K., Yin,F.,Boyadjian,R., Bikineyeva,A., Pratico,D., Harrison,D.G. et al.(2009) Age-accelerated atherosclerosis correlates with failure toupregulate antioxidant genes. Circ. Res., 104, e42–e54.
5. Duan,W., Zhang,R., Guo,Y., Jiang,Y., Huang,Y., Jiang,H. andLi,C. (2009) Nrf2 activity is lost in the spinal cord and itsastrocytes of aged mice. In Vitro Cell Dev. Biol. Anim., 45,388–397.
6. Okawa,H., Motohashi,H., Kobayashi,A., Aburatani,H.,Kensler,T.W. and Yamamoto,M. (2006) Hepatocyte-specificdeletion of the keap1 gene activates Nrf2 and confers potentresistance against acute drug toxicity. Biochem. Biophys. Res.Commun., 339, 79–88.
7. Papaiahgari,S., Kleeberger,S.R., Cho,H.Y., Kalvakolanu,D.V. andReddy,S.P. (2004) NADPH oxidase and ERK signaling regulateshyperoxia-induced Nrf2-ARE transcriptional response inpulmonary epithelial cells. J. Biol. Chem., 279, 42302–42312.
8. Rangasamy,T., Cho,C.Y., Thimmulappa,R.K., Zhen,L.,Srisuma,S.S., Kensler,T.W., Yamamoto,M., Petrache,I.,Tuder,R.M. and Biswal,S. (2004) Genetic ablation of Nrf2enhances susceptibility to cigarette smoke-induced emphysema inmice. J. Clin. Invest., 114, 1248–1259.
9. Rangasamy,T., Guo,J., Mitzner,W.A., Roman,J., Singh,A.,Fryer,A.D., Yamamoto,M., Kensler,T.W., Tuder,R.M.,Georas,S.N. et al. (2005) Disruption of Nrf2 enhancessusceptibility to severe airway inflammation and asthma in mice.J. Exp. Med., 202, 47–59.
10. Thimmulappa,R.K., Lee,H., Rangasamy,T., Reddy,S.P.,Yamamoto,M., Kensler,T.W. and Biswal,S.(2006) Nrf2 is acritical regulator of the innate immune response and survival duringexperimental sepsis J. Clin. Invest., 116, 984–995.
11. Wang,J., Fields,J., Zhao,C., Langer,J., Thimmulappa,R.K.,Kensler,T.W., Yamamoto,M., Biswal,S. and Dore,S. (2007) Roleof Nrf2 in protection against intracerebral hemorrhage injury inmice. Free Radic. Biol. Med., 43, 408–414.
12. Goven,D., Boutten,A., Lecon-Malas,V., Marchal-Somme,J.,Amara,N., Crestani,B., Fournier,M., Leseche,G., Soler,P.,
Boczkowski,J. et al. (2008) Altered Nrf2/Keap1-Bach1 equilibriumin pulmonary emphysema. Thorax, 63, 916–924.
13. Malhotra,D., Thimmulappa,R., Navas-Acien,A., Sandford,A.,Elliott,M., Singh,A., Chen,L., Zhuang,X., Hogg,J., Pare,P. et al.(2008) Decline in NRF2-regulated antioxidants in chronicobstructive pulmonary disease lungs due to loss of its positiveregulator, DJ-1. Am. J. Respir. Crit. Care Med., 178, 592–604.
14. Malhotra,D., Thimmulappa,R., Vij,N., Navas-Acien,A., Sussan,T.,Merali,S., Zhang,L., Kelsen,S.G., Myers,A., Wise,R. et al. (2009)Heightened endoplasmic reticulum stress in the lungs of patientswith chronic obstructive pulmonary disease: the role ofNrf2-regulated proteasomal activity. Am. J. Respir. Crit. CareMed., 180, 1196–1207.
15. Suzuki,M., Betsuyaku,T., Ito,Y., Nagai,K., Nasuhara,Y.,Kaga,K., Kondo,S. and Nishimura,M. (2008) Down-regulatedNF-E2-related factor 2 in pulmonary macrophages of agedsmokers and patients with chronic obstructive pulmonary disease.Am. J. Respir. Cell Mol. Biol., 39, 673–682.
16. Hu,R., Xu,C., Shen,G., Jain,M.R., Khor,T.O., Gopalkrishnan,A.,Lin,W., Reddy,B., Chan,J.Y. and Kong,A.N. (2006) Geneexpression profiles induced by cancer chemopreventiveisothiocyanate sulforaphane in the liver of C57BL/6J mice andC57BL/6J/Nrf2 (-/-) mice. Cancer Lett., 243, 170–192.
17. Osburn,W.O., Yates,M.S., Dolan,P.D., Chen,S., Liby,K.T.,Sporn,M.B., Taguchi,K., Yamamoto,M. and Kensler,T.W. (2008)Genetic or pharmacologic amplification of nrf2 signaling inhibitsacute inflammatory liver injury in mice. Toxicol Sci., 104,218–227.
18. Portales-Casamar,E., Kirov,S., Lim,J., Lithwick,S., Swanson,M.I.,Ticoll,A., Snoddy,J. and Wasserman,W.W. (2007) PAZAR: aframework for collection and dissemination of cis-regulatorysequence annotation. Genome Biol., 8, R207.
19. Sussan,T.E., Rangasamy,T., Blake,D.J., Malhotra,D., El-Haddad,H., Bedja,D., Yates,M.S., Kombairaju,P., Yamamoto,M.,Liby,K.T. et al. (2009) Targeting Nrf2 with the triterpenoidCDDO-imidazolide attenuates cigarette smoke-inducedemphysema and cardiac dysfunction in mice. Proc. Natl Acad.Sci. USA, 106, 250–255.
20. Singh,A., Misra,V., Thimmulappa,R.K., Lee,H., Ames,S.,Hoque,M.O., Herman,J.G., Baylin,S.B., Sidransky,D.,Gabrielson,E. et al. (2006) Dysfunctional KEAP1-NRF2interaction in non-small-cell lung cancer. PLoS Med., 3, e420.
21. Singh,A., Boldin-Adamsky,S., Thimmulappa,R.K., Rath,S.K.,Ashush,H., Coulter,J., Blackford,A., Goodman,S.N., Bunz,F.,Watson,W.H. et al. (2008) RNAi-mediated silencing of nuclearfactor erythroid-2-related factor 2 gene expression in non-smallcell lung cancer inhibits tumor growth and increases efficacy ofchemotherapy. Cancer Res., 68, 7975–7984.
22. Sun,Z., Zhang,S., Chan,J.Y. and Zhang,D.D. (2007) Keap1controls postinduction repression of the Nrf2-mediatedantioxidant response by escorting nuclear export of Nrf2.Mol. Cell. Biol., 27, 6334–6349.
23. Yamamoto,T., Suzuki,T., Kobayashi,A., Wakabayashi,J.,Maher,J., Motohashi,H. and Yamamoto,M. (2008) Physiologicalsignificance of reactive cysteine residues of Keap1 in determiningNrf2 activity. Mol. Cell. Biol., 28, 2758–2770.
24. Blank,V. (2008) Small Maf proteins in mammalian gene control:mere dimerization partners or dynamic transcriptional regulators?J. Mol. Biol., 376, 913–925.
25. Katsuoka,F., Motohashi,H., Ishii,T., Aburatani,H., Engel,J.D.and Yamamoto,M. (2005) Genetic evidence that small mafproteins are essential for the activation of antioxidant responseelement-dependent genes. Mol. Cell. Biol., 25, 8044–8051.
26. Cho,H.Y., Reddy,S.P. and Kleeberger,S.R. (2006) Nrf2 defendsthe lung from oxidative stress. Antioxid. Redox. Signal, 8, 76–87.
27. Kwak,M.K., Wakabayashi,N., Itoh,K., Motohashi,H.,Yamamoto,M. and Kensler,T.W. (2003) Modulation of geneexpression by cancer chemopreventive dithiolethiones through theKeap1-Nrf2 pathway. Identification of novel gene clusters for cellsurvival. J. Biol. Chem., 278, 8135–8145.
28. Lee,J.M., Calkins,M.J., Chan,K., Kan,Y.W. and Johnson,J.A.(2003) Identification of the NF-E2-related factor-2-dependentgenes conferring protection against oxidative stress in primary
Nucleic Acids Research, 2010, Vol. 38, No. 17 5733
cortical astrocytes using oligonucleotide microarray analysis.J. Biol. Chem., 278, 12029–12038.
29. Lee,J.M., Li,J., Johnson,D.A., Stein,T.D., Kraft,A.D.,Calkins,M.J., Jakel,R.J. and Johnson,J.A. (2005) Nrf2, amulti-organ protector? FASEB J., 19, 1061–1066.
30. Purdom-Dickinson,S.E., Lin,Y., Dedek,M., Morrissy,S.,Johnson,J. and Chen,Q.M. (2007) Induction of antioxidant anddetoxification response by oxidants in cardiomyocytes: evidencefrom gene expression profiling and activation of Nrf2transcription factor. J. Mol. Cell. Cardiol., 42, 159–176.
31. Shen,G., Xu,C., Hu,R., Jain,M.R., Nair,S., Lin,W., Yang,C.S.,Chan,J.Y. and Kong,A.N. (2005) Comparison of (-)-epigallocatechin-3-gallate elicited liver and small intestine geneexpression profiles between C57BL/6J mice and C57BL/6J/Nrf2(-/-) mice. Pharm. Res., 22, 1805–1820.
32. Stacy,D.R., Ely,K., Massion,P.P., Yarbrough,W.G.,Hallahan,D.E., Sekhar,K.R., Freeman,M.L. et al. (2006)Increased expression of nuclear factor E2 p45-related factor 2(NRF2) in head and neck squamous cell carcinomas. Head Neck,28, 813–818.
33. Wakabayashi,N., Itoh,K., Wakabayashi,J., Motohashi,H.,Noda,S., Takahashi,S., Imakado,S., Kotsuji,T., Otsuka,F.,Roop,D.R. et al. (2003) Keap1-null mutation leads to postnatallethality due to constitutive Nrf2 activation. Nat. Genet., 35,238–245.
34. Li,W., Khor,T.O., Xu,C., Shen,G., Jeong,W.S., Yu,S. andKong,A.N. (2008) Activation of Nrf2-antioxidant signalingattenuates NFkappaB-inflammatory response and elicits apoptosis.Biochem. Pharmacol., 76, 1485–1499.
35. Pitha-Rowe,I., Liby,K., Royce,D. and Sporn,M. (2009) Synthetictriterpenoids attenuate cytotoxic retinal injury: cross-talk betweenNrf2 and PI3K/AKT signaling through inhibition of the lipidphosphatase PTEN. Invest. Ophthalmol. Vis. Sci., 50, 5339–5347.
36. Shin,S., Wakabayashi,N., Misra,V., Biswal,S., Lee,G.H.,Agoston,E.S., Yamamoto,M. and Kensler,T.W. (2007) NRF2modulates aryl hydrocarbon receptor signaling: influence onadipogenesis. Mol. Cell. Biol., 27, 7188–71897.
37. Euskirchen,G.M., Rozowsky,J.S., Wei,C.L., Lee,W.H.,Zhang,Z.D., Hartman,S., Emanuelsson,O., Stolc,V., Weissman,S.,Gerstein,M.B. et al. (2007) Mapping of transcription factorbinding regions in mammalian cells by ChIP: comparison ofarray- and sequencing-based technologies. Genome Res., 17,898–909.
38. Robertson,G., Hirst,M., Bainbridge,M., Bilenky,M., Zhao,Y.,Zeng,T., Euskirchen,G., Bernier,B., Varhol,R., Delaney,A. et al.(2007) Genome-wide profiles of STAT1 DNA association usingchromatin immunoprecipitation and massively parallel sequencing.Nat. Methods, 4, 651–657.
39. Fejes,A.P., Robertson,G., Bilenky,M., Varhol,R., Bainbridge,M.and Jones,S.J. (2008) FindPeaks 3.1: a tool for identifying areasof enrichment from massively parallel short-read sequencingtechnology. Bioinformatics, 24, 1729–1730.
40. Lenhard,B. and Wasserman,W.W. (2002) TFBS: Computationalframework for transcription factor binding site analysis.Bioinformatics, 18, 1135–1136.
41. Ho Sui,S.J., Mortimer,J.R., Arenillas,D.J., Brumm,J., Walsh,C.J.,Kennedy,B.P. and Wasserman,W.W. (2005) oPOSSUM:identification of over-represented transcription factor binding sitesin co-expressed genes. Nucleic Acids Res., 33, 3154–3164.
42. Bryne,J.C., Valen,E., Tang,M.H., Marstrand,T., Winther,O.,da Piedade,I., Krogh,A., Lenhard,B., Sandelin,A. et al. (2008)JASPAR, the open access database of transcription factor-bindingprofiles: new content and tools in the 2008 update. Nucleic AcidsRes., 36, D102–D106.
43. Gentleman,R.C., Carey,V.J., Bates,D.M., Bolstad,B., Dettling,M.,Dudoit,S., Ellis,B., Gautier,L., Ge,Y., Gentry,J. et al. (2004)Bioconductor: open software development for computationalbiology and bioinformatics. Genome Biol., 5, R80.
44. Tusher,V.G., Tibshirani,R. and Chu,G. (2001) Significanceanalysis of microarrays applied to the ionizing radiation response.Proc. Natl Acad. Sci. USA, 98, 5116–5121.
45. Teytelman,L., Ozaydin,B., Zill,O., Lefrancois,P., Snyder,M.,Rine,J. and Eisen,M.B. (2009) Impact of chromatin structures onDNA processing for genomic analyses. PLoS ONE, 4, e6700.
46. Wasserman,W.W. and Sandelin,A. (2004) Applied bioinformaticsfor the identification of regulatory elements. Nat. Rev. Genet., 5,276–287.
47. Itoh,K., Igarashi,K., Hayashi,N., Nishizawa,M. andYamamoto,M. (1995) Cloning and characterization of a novelerythroid cell-derived CNC family transcription factorheterodimerizing with the small Maf family proteins.Mol. Cell Biol., 15, 4184–4193.
48. Friling,R.S., Bergelson,S. and Daniel,V. (1992) Two adjacentAP-1-like binding sites form the electrophile-responsive element ofthe murine glutathione S-transferase Ya subunit gene. Proc. NatlAcad. Sci. USA, 89, 668–672.
49. Tompa,M., Li,N., Bailey,T.L., Church,G.M., De Moor,B.,Eskin,E., Favorov,A.V., Frith,M.C., Fu,Y., Kent,W.J. et al.(2005) Assessing computational tools for the discovery oftranscription factor binding sites. Nat. Biotechnol., 23, 137–144.
50. Bailey,T.L. and Elkan,C. (1994) Fitting a mixture model byexpectation maximization to discover motifs in biopolymers.Proc. Int. Conf. Intell. Syst. Mol. Biol., 2, 28–36.
51. Huang da,W., Sherman,B.T. and Lempicki,R.A. (2009) Systematicand integrative analysis of large gene lists using DAVIDbioinformatics resources. Nat. Protoc., 4, 44–57.
52. Harvey,C.J., Thimmulappa,R.K., Singh,A., Blake,D.J., Ling,G.,Wakabayashi,N., Fujii,J., Myers,A. and Biswal,S. (2009)Nrf2-regulated glutathione recycling independent of biosynthesis iscritical for cell survival during oxidative stress. Free Radic. Biol.Med., 46, 443–453.
53. Singh,A., Rangasamy,T., Thimmulappa,R.K., Lee,H.,Osburn,W.O., Brigelius-Flohe,R., Kensler,T.W., Yamamoto,M.and Biswal,S. (2006) Glutathione peroxidase 2, the majorcigarette smoke-inducible isoform of GPX in lungs, is regulatedby Nrf2. Am. J. Respir. Cell. Mol. Biol., 35, 639–650.
54. Takahashi,T., Tabuchi,T., Tamaki,Y., Kosaka,K., Takikawa,Y.and Satoh,T. (2009) Carnosic acid and carnosol inhibit adipocytedifferentiation in mouse 3T3-L1 cells through induction of phase2enzymes and activation of glutathione metabolism. Biochem.Biophys. Res. Commun., 382, 549–554.
55. Hinoi,E., Fujimori,S., Wang,L., Hojo,H., Uno,K. and Yoneda,Y.(2006) Nrf2 negatively regulates osteoblast differentiation viainterfering with Runx2-dependent transcriptional activation.J. Biol. Chem., 281, 18015–18024.
56. Reddy,N.M., Kleeberger,S.R., Yamamoto,M., Kensler,T.W.,Scollick,C., Biswal,S. and Reddy,S.P. (2007) Genetic dissection ofthe Nrf2-dependent redox signaling-regulated transcriptionalprograms of cell proliferation and cytoprotection. Physiol.Genomics, 32, 74–81.
57. Reddy,N.M., Kleeberger,S.R., Bream,J.H., Fallon,P.G.,Kensler,T.W., Yamamoto,M. and Reddy,S.P.(2008) Geneticdisruption of the Nrf2 compromises cell-cycle progressionby impairing GSH-induced redox signaling. Oncogene, 27,5821–5832.
58. Maynard,S.E., Min,J.Y., Merchan,J., Lim,K.H., Li,J., Mondal,S.,Libermann,T.A., Morgan,J.P., Sellke,F.W., Stillman,I.E. et al.(2003) Excess placental soluble fms-like tyrosine kinase1 (sFlt1) may contribute to endothelial dysfunction,hypertension, and proteinuria in preeclampsia. J. Clin. Invest.,111, 649–658.
59. Luttun,A. and Carmeliet,P. (2003) Soluble VEGF receptor Flt1:the elusive preeclampsia factor discovered? J. Clin. Invest., 111,600–602.
60. Mann,G.E., Niehueser-Saran,J., Watson,A., Gao,L., Ishii,T., deWinter,P. and Siow,R.C. (2007) Nrf2/ARE regulated antioxidantgene expression in endothelial and smooth muscle cells inoxidative stress: implications for atherosclerosis and preeclampsia.Sheng Li Xue Bao, 59, 117–27.
61. Schneider,T.D. and Stephens,R.M. (1990) Sequence logos: a newway to display consensus sequences. Nucleic Acids Res., 18,6097–6100.
5734 Nucleic Acids Research, 2010, Vol. 38, No. 17