Example Explained @BULLET The DOCTYPE declaration defines the document type
Upload
khangminh22Category
view
0download
0
RESEARCH Open Access
High-resolution Repli-Seq defines thetemporal choreography of initiation,elongation and termination of replicationin mammalian cellsPeiyao A. Zhao†, Takayo Sasaki† and David M. Gilbert*
Abstract
Background: DNA replication in mammalian cells occurs in a defined temporal order during S phase, known as thereplication timing (RT) programme. Replication timing is developmentally regulated and correlated with chromatinconformation and local transcriptional potential. Here, we present RT profiles of unprecedented temporal resolutionin two human embryonic stem cell lines, human colon carcinoma line HCT116, and mouse embryonic stem cellsand their neural progenitor derivatives.
Results: Fine temporal windows revealed a remarkable degree of cell-to-cell conservation in RT, particularly at thevery beginning and ends of S phase, and identified 5 temporal patterns of replication in all cell types, consistentwith varying degrees of initiation efficiency. Zones of replication initiation (IZs) were detected throughout S phaseand interacted in 3D space preferentially with other IZs of similar firing time. Temporal transition regions wereresolved into segments of uni-directional replication punctuated at specific sites by small, inefficient IZs. Sites ofconvergent replication were divided into sites of termination or large constant timing regions consisting of manysynchronous IZs in tandem. Developmental transitions in RT occured mainly by activating or inactivating individualIZs or occasionally by altering IZ firing time, demonstrating that IZs, rather than individual origins, are the units ofdevelopmental regulation. Finally, haplotype phasing revealed numerous regions of allele-specific and allele-independent asynchronous replication. Allele-independent asynchronous replication was correlated with thepresence of previously mapped common fragile sites.
Conclusions: Altogether, these data provide a detailed temporal choreography of DNA replication in mammalian cells.
IntroductionDNA replication in eukaryotes proceeds in a definedtemporal order known as the replication timing (RT)programme [1]. RT is dynamically regulated during de-velopment and exhibits cell-type-specific RT signatures[2, 3]. RT is also closely correlated with the A/B com-partment of chromatin structure, the local chromatin
environment and the transcription potential of theregion [4–7]. One of the primary assays for genome-wide RT in mammalian cells has been E/L Repli-Seq inwhich cells labelled with BrdU for 10–20% of S phaseare sorted into early and late S fractions and RT profilesare generated from the log2 ratio of read enrichment inthe BrdU-immunoprecipitated early fraction to that inthe late fraction (E/L) [8]. Previous studies have alsoreported multi-fraction Repli-Seq approaches using 4–6fractions or stages of S phase [9–11] or have generated
© The Author(s). 2020 Open Access This article is licensed under a Creative Commons Attribution 4.0 International License,which permits use, sharing, adaptation, distribution and reproduction in any medium or format, as long as you giveappropriate credit to the original author(s) and the source, provide a link to the Creative Commons licence, and indicate ifchanges were made. The images or other third party material in this article are included in the article's Creative Commonslicence, unless indicated otherwise in a credit line to the material. If material is not included in the article's Creative Commonslicence and your intended use is not permitted by statutory regulation or exceeds the permitted use, you will need to obtainpermission directly from the copyright holder. To view a copy of this licence, visit http://creativecommons.org/licenses/by/4.0/.The Creative Commons Public Domain Dedication waiver (http://creativecommons.org/publicdomain/zero/1.0/) applies to thedata made available in this article, unless otherwise stated in a credit line to the data.
* Correspondence: [email protected]†Peiyao A. Zhao and Takayo Sasaki contributed equally to this work.Department of Biological Science, Florida State University, 319 Stadium Drive,Tallahassee, FL 32306, USA
Zhao et al. Genome Biology (2020) 21:76 https://doi.org/10.1186/s13059-020-01983-8

replication timing profiles from the copy number ofsequences in proliferating cell populations [12].RT profiles reveal large constant timing regions
(CTRs) of early and late replication manifesting as plat-eaus and punctuated by timing transition regions (TTRs)of rightward or leftward slopes [13]. Early and late CTRsmust contain sites of replication initiation as they repli-cate too rapidly to be accounted for by elongation alone.By contrast, TTRs are hypothesised to consist mainly ofuni-directional forks, occasionally accelerated by originfiring [2, 14, 15]. However, measurements supportingthese hypotheses derive from prior RT profiling methodsthat smoothed data over hundreds of kilobases (kbs)and/or relied on long metabolic labels incorporated overlarge stretches (> 200 kb) of DNA and so lacked theresolution to identify sites of replication initiation withinCTRs and TTRs. Moreover, since these methods averageall stochastic variation in a cell population, they do notpermit one to determine the degree of cell-to-cell RT vari-ation. We previously developed a single-cell Repli-Seqmethod to address this problem, concluding that the RTprogramme is stable from cell to cell, but this methodsuffers from low resolution due to the limited breadth ofwhole genome single-cell sequencing and the singletemporal snapshot obtained from each cell [16, 17].Mammalian replication origin mapping poses a signifi-
cant challenge due to the high flexibility of sites that caninitiate replication and their varying efficiencies [18, 19].Moreover, frequently, clusters of origins used at varyingefficiencies produce what have been called ‘initiationzones’ (IZs). Small nascent strand sequencing (SNS-seq)and Okazaki fragment sequencing (OK-seq) methodshave produced comprehensive maps of replication ori-gins and fork polarities, respectively, in several humanand mouse cell lines [20–24]. SNS can map sites to kbresolution, but the sites detected must fire frequentlyenough to detect above noise; clusters of inefficient ori-gins escape detection. OK-seq detects transitions in forkpolarity that defines bi-directional replication to kb reso-lution in yeast [25], but in mammalian cells, these transi-tions are more gradual, consistent with the prevalenceof IZs. Mapping origins on single DNA molecules can, inprinciple, measure the frequency of initiation at specificsites, but existing methods are extremely low throughput.Studies analysing hundreds of DNA fibres from a singlegenomic location have revealed that some regions initiateat defined sites while other genomic locations can initiateat many sites distributed broadly, with each site used inless than 2% of S phases [26–28]. By contrast, RT showslittle cell-to-cell variation [16, 17]. Thus, the prevailingview is that a deterministic RT programme emerges fromstochastic origin selection [29]. However, there is a needfor more sensitive methods to map the landscape of originand fork distributions genome-wide in mammalian cell.
To address these gaps, we developed an approach thatcan delineate IZs, TTRs and termination sites with un-precedented temporal resolution in 3 human cell linesand 2 mouse cell types. We identify specific sites of rep-lication initiation activity within TTRs and resolve themfrom stretches of uni-directional replication or trueTTRs. We detect a remarkable homogeneity in the tem-poral order of replication in cell populations, at consid-erably higher resolution than achieved by our priorsingle-cell measurements [16]. Whereas active histonemodifications were consistently correlated with earlyfiring IZs, repressive histone marks varied between celltypes in their relationship with IZ initiation time.However, initiation time was intimately linked to Hi-Ccompartment and early IZs were enriched at Hi-C(insulation score defined) domain boundaries. We showthat developmental transitions are regulated primarily byturning on or off initiation activity within single IZs,suggesting that the multiple initiation sites within an IZare regulated as a unit. The temporal resolution permit-ted the identification of biphasically replicated regionsand the extensive read depth and breadth permittedhaplotype phasing, which revealed both allele-specificreplication asynchrony and allele-independent asyn-chrony, the latter of which was associated with longtranscribed genes and common fragile sites (CFS).
Results16 fraction Repli-seq reveals patterns of replication withhigh temporal resolutionWe performed high-resolution Repli-Seq in 5 cell types:three human cell lines, male and female human embry-onic stem cell (hESC) lines H1 (WA01) and H9 (WA09)hESCs and human colorectal cancer line HCT116 aswell as mouse embryonic stem cell (mESC) line F121-9derived from hybrid castaneusXmusculus mouse em-bryos and finally neural progenitor cells (mNPCs) de-rived from F121-9 (‘Materials and methods’ section,Additional file 1: Fig. S1). Cells were labelled with BrdUfor 30 min, stained with propidium iodide and sorted byFACS into 16 equal S phase fractions (Fig. 1a). Sixteenfractions were chosen due to their approximate equiva-lence to the fraction of S phase labelled with BrdU (30min of an 8–10-h S phase) as well as convenience with4-way FACS sorting. BrdU-immunoprecipitated DNAfrom each fraction was validated by qPCR on HBA(alpha-globin) and HBB (beta-globin) whose RT wasknown from prior E/L Repli-Seq data and validated inhigh-resolution Repli-Seq (Additional file 1: Fig. S2a,b).BrdU pull-down efficiency was measured using spike-into ensure consistency between S phase fractions(‘Materials and methods’ section, Additional file 1: Fig.S3a). The raw read counts per 50-kb bin for each Sphase fraction were corrected for mappability using G1
Zhao et al. Genome Biology (2020) 21:76 Page 2 of 20

Fig. 1 (See legend on next page.)
Zhao et al. Genome Biology (2020) 21:76 Page 3 of 20

whole genome sequencing (Additional file 1: Fig. S3b,c).To ensure that the G1 control did not contain replicatedDNA from early S-phase cell contamination, we per-formed BrdU immunoprecipitation of DNA purifiedfrom G1 phase cells (the ‘Materials and methods’ sec-tion) and found no evidence of specific BrdU incorpor-ation (Additional file 1: Fig. S4). We plotted the rangesof log2 (E/L) RT associated with bins that were filteredout as a result of mappability normalisation and foundthat the RT values of filtered bins excluded those thatwere representative of the corresponding S phase frac-tion (Additional file 1: Fig. S3d), confirming that mapp-ability correction removes noise without compromisingsignal. Furthermore, Repli-Seq heatmaps of correctedmappability were visually inspected (Additional file 1:Fig. S5a) to ensure that features such as diffused peaksin the heatmap, which represent less efficient IZs, werepreserved. Datasets were subsequently Gaussiansmoothed and normalised between fractions by scalingcolumn-wise between bins so that the sum for anyindividual column amounted to 100 (‘Materials andmethods’ section, Fig. 1a, Additional file 1: Fig. S5b).High-resolution Repli-Seq heatmaps show high concord-ance with E/L Repli-Seq while providing insights intothe finer features of replication that we will further ex-pound in the next section (Fig. 1b–d). After normalisa-tion and scaling, there occasionally could be seenresidual noise manifesting as faint pixels in late S phasefractions for very early replicating bins (see Fig. 1b H1Repli-Seq heatmap) or in early S phase fractions for verylate replicating bins (see Fig. 1c unparsed F121-9 mESCRepli-Seq heatmap). We plotted the normalised read dis-tributions in 16 S phase fractions for top 10% earliestreplicating regions and 10% latest replicating regions de-fined using E/L Repli-Seq datasets and determined thatthis source of noise accounts for < 2% replication for allcell lines studied (Additional file 1: Fig. S6). We specu-late that this noise could result from non-specific BrdUpulldown at extreme ends of S phase. It is unlikely to bebiological because it is not genome-wide and not presentin every dataset. Comparing our H1 data to H1 hESCdatasets from prior 6-stage Repli-seq [9] that were nor-malised and scaled in the same manner, we found thathigh-resolution Repli-Seq captured all replication fea-tures present in datasets from [9] with high correlation
(Additional file 1: Fig. S7a, b). However, the considerablyhigher temporal resolution of the datasets in this workallowed the identification of features that previouslyescaped detection such as diffused peaks and biphasi-cally replicated regions (indicated by black arrows)(Additional file 1: Fig. S7a). Consistent with the priorknowledge that RT profiles are cell type specific, wefind high genome-wide similarity between H1 and H916 fraction datasets while the HCT116 dataset showsless correlation with hESCs (Additional file 1: Fig.S8).Mouse heatmaps are generated for both maternalmusculus (mus) and paternal castaneous (cas) ge-nomes after allele parsing. The two genomes inmESCs and those in mNPCs show high correlationwithin the same cell type and lower correlation acrosscell types (Additional file 1: Fig. S8).
Defining features in Repli-seq heatmaps: IZs, TTRs, TTRbreakages, termination sites and late CTRsUsing high-resolution Repli-Seq, we were able to identify5 distinct features in the landscape of DNA replicationacross the genome (Fig. 1d). We first clustered the nor-malised and scaled Repli-Seq arrays by applying BIRCHalgorithm [30] to assign bins to clusters characterised bycluster centroids, which were first sorted according tothe fraction where maximum replication occurs fromearly to late then sorted according to the magnitude ofreplication in the fraction where maximum replicationoccurred (Additional file 1: Fig. S9a). We subsequentlygenerated the cluster centroid rank profile for all bins(top row in Additional file 1: Fig. S9b) with earlier repli-cating bins being assigned to clusters with earlier cen-troids (left end of Additional file 1: Fig. S9a) and laterones being assigned to clusters with increasingly latercentroids (right end of Additional file 1: Fig. S9a). Sinceorigins are replicated earlier than their surrounding re-gions, and since the window size is 50 kb and cannotdistinguish single highly efficient origins from < 50-kbclusters of less efficient origins, we defined ‘initiationzones’ (IZs) as sites manifesting as vertical peaks in thecentroid profile. Emanating from IZs are segments ofconstant slope traversing through several S phase tem-poral windows, which represent the TTRs, presumablyconsisting of replication forks moving away from initi-ation sites during the progression of S phase. Depending
(See figure on previous page.)Fig. 1 High-resolution Repli-Seq produces robust and reproducible heatmaps that annotate features of replication at fine temporal resolution.a Experimental and analysis flow for high-resolution Repli-seq. b E/L Repli-seq for H1 hESCs (top), normalised High-Res Repli-seq heatmaps forchr1:30,000,000–60,000,000 in H1, H9 and HCT116. c E/L Repli-seq for F121-9 mESCs and mNPCs, normalised High-Res Repli-seq heatmaps forchr1:125,000,000–155,000,000 in unparsed mus allele and cas allele in mESC and mNPC. d 5 Features observed in high-resolution Repli-Seqheatmap. Top row: line plots showing the rank of the cluster centroid with which the current bin is associated (red indicates the bins of interestthat constitute the corresponding feature and black indicates the surrounding bins). Bottom row: corresponding heatmaps of IZs, leftward TTR,rightward TTR, breakages in TTR, short termination sites (≤ 100 kb) and late CTRs. e Percentage of genome constituted by features in d
Zhao et al. Genome Biology (2020) 21:76 Page 4 of 20

on the directionality of progression of the forks emer-ging from IZs, in Fig. 1d, TTRs are illustrated as eitherleftward or rightward TTRs (ascending or descending)but are considered a single feature of the data. Fre-quently found flanked by TTRs are small decreases inslope (hereafter referred to as ‘breakages’) that had es-caped detection in prior lower resolution datasets. Theseregions likely signify origin firing accelerating the rate ofDNA replication at these regions. Breakage bins weredefined as continuous bins assigned to the same clustercentroid whose neighbouring bins on one end wereassigned to earlier replicating cluster centroids whileneighbouring bins on the other end were assigned tolater replicating cluster centroids. Therefore, breakageswere flanked by TTRs on both sides yet were not calledas part of TTRs. V-shaped features represent definedsites of replication termination (< 100 kb) where oppo-sing replication forks fuse. Finally, large U-shaped lateCTRs are too large and synchronously replicated to beexplained by fork fusion and therefore must contain rep-lication origins [31]. While IZs constitute less than 10%of the genome (Fig. 1e), more than half of the genomeconsists of breakages or late CTRs, indicating that themajority of the genome has detectable replication initi-ation potential. Origin-free regions, which constituteTTRs and termination sites (< 100 kb), constitute ~ 15–30% of the genome. Altogether, these results provide acomprehensive view of the kinetics of DNA replicationgenome-wide conserved in several mammalian celltypes.We identified ~ 3000 IZs in human cell lines and ~
2400 IZ in mouse cell lines. We classified IZs into early(S1–3), early-mid (S4–6), late-mid (S7–9) and late S(S10–12) IZs depending on the S phase fractions wherethe highest read density was identified (see the ‘Materialsand methods’ section). Pile-up heatmap images centredon each of these temporally defined IZs in each cell typeare shown in Fig. 2a. In both human and mouse, weidentified constitutive IZs that are shared between celltypes as well as cell-type-specific IZs (Fig. 2b). A signifi-cant proportion of IZs are shared between cell types(1933 in human cell lines and 991 in mouse for IZsshared between cell types as well as between alleles). H1and H9 share an intersecting set of 670 IZs that areunique to hESCs while 746 IZs are unique to HCT116.mESC mus and cas alleles share 650 mESC-specific IZswhile mNPC mus and cas alleles share 464 mNPC-specific IZs.Next, we aligned our IZs with IZs and initiation sites
identified through other origin mapping methods ap-plied in these cell lines, namely small nascent strand se-quencing (SNS-seq) [22–24] and Okazaki fragmentsequencing (OK-seq) [21]. For H9, HCT116 and themusculus genome in mESCs, the SNS-seq shows an
enrichment of SNS signal centred around early IZs butnot late IZs (Fig. 2c). Moreover, the magnitude of SNS-seq signal within and surrounding the IZs decreases asthe timing of initiation within IZs becomes later in Sphase. The trend was true across all human and mousecell types examined, although quantitative cell-type-specific differences exist. On the other hand, IZs showthe expected transition in fork polarity that signifies thepresence of initiation sites in Ok-seq dataset of the samecell type (mESCs) for all IZs regardless of their S phaseinitiation time (Fig. 2 c and d (i)). Even the very late IZsthat are devoid of SNS-seq origin signal correspond toregions of OK-seq polarity transition showing that OK-seq and high-resolution Repli-Seq validate each otherand identify IZs of the same dynamic characteristics. Re-ciprocally by centring on all called OK-seq IZs [21] andplotting the pile-up of high-resolution Repli-Seq signal,we show that called OK-seq IZs are primarily early repli-cating (Additional file 1: Fig. S10a,b). mESC OK-seqidentified 2844 IZs while high-resolution Repli-Seqidentified 2441 IZs. We further identified IZs that areunique to OK-seq (n = 850) and Repli-seq (n = 604)(Additional file 1: Fig. S10c). Out of 850 OK-seq uniqueIZs, 667 overlapped with Repli-Seq TTR breakages thatwere not called as IZs but are consistent with the presenceof initiation activities within these regions. The rest were ei-ther embedded in large late CTRs (Additional file 1: Fig.S10cii,d), still consistent with Repli-seq IZs, or simply didnot align, being found within TTRs or termination sites (<100 kb) in Repli-Seq heatmaps. Indeed, the OKseq uniqueIZs closer to Repli-Seq IZs tended to be earlier replicatingand those that were at a greater distance to Repli-Seq IZswere later replicating (Additional file 1: Fig. S10e); we specu-late that these may be false positives. On the other hand,Repli-Seq unique IZs were associated with an ascending gra-dient of OK-seq replication fork directionality (RFD), consist-ent with the presence of initiation activity but the magnitudeof ascension was small (Additional file 1: Fig. S10f) poten-tially accounting for why these RFD transitions were notcalled as OK-seq IZs. Overall, we conclude that the SNSmethod is primarily able to detect early replicating origins,while OK-seq detects polarity shifts at every temporal transi-tion in the data.Due to the high consistency between Repli-Seq IZs
and OK-seq signal, we examined OK-seq signal centredaround all of the dynamic features of replication de-scribed in Fig. 1d. TTRs were divided into either right-ward or leftward TTRs and associated with positive ornegative OK-seq signal values, respectively, consistentwith uni-directional fork movement (Fig. 2d (ii)). Inaddition, SNS-seq signal around rightward or leftwardTTRs aligned at TTR centres revealed a sharp drop overthe span of ~ 50 kb (equivalent of one genomic bin) insignal enrichment, indicating that TTRs were indeed
Zhao et al. Genome Biology (2020) 21:76 Page 5 of 20
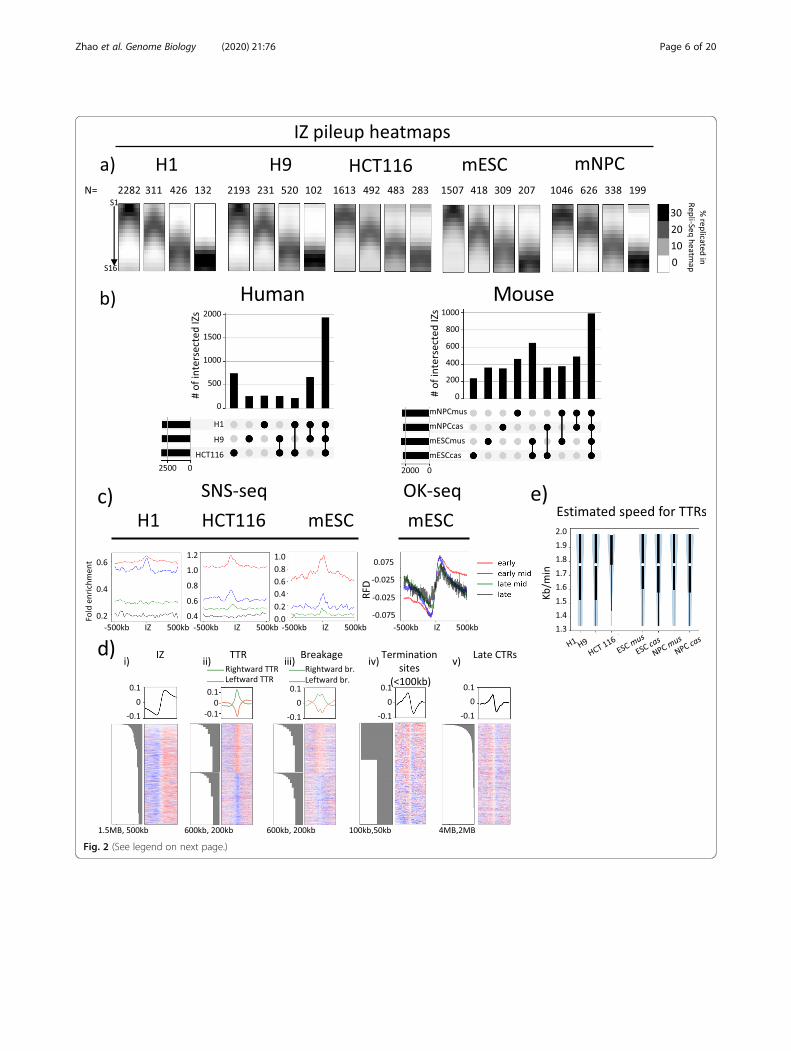
Fig. 2 (See legend on next page.)
Zhao et al. Genome Biology (2020) 21:76 Page 6 of 20

depleted of SNS-detected origins and segregated IZs thatwere rich in efficient origins from termination sites thatcontained either no origins or inefficient origins(Additional file 1: Fig. S11). TTR breakages and lateCTRs are expected to contain origin activity to replicateso rapidly (albeit small ones could, in principle, beregions of unusually rapid fork movement). In fact, TTRbreakages were detected as a drop in fork polarity in ei-ther rightward or leftward fork movement depending onthe directionality of the TTR in which the breakage is lo-cated, consistent with origin activity causing diminishedpolarity bias of Okazaki fragments within TTRs (Fig. 2d(iii)). The presence of breakages shows that TTRs as pre-viously defined contain origin activity, thus contributingto variation in smoothed TTR slope gradients. Asexpected, termination sites, regardless of their size, showred to blue (positive to negative) transition in OK-seqthat represents the fusion of opposing replication forksin termination zones (Fig. 2d (iv), Fig. 2d (v)). Whilesmaller termination sites (< 100 kb) may be devoid oforigin activity, late CTRs must contain origins to repli-cate so rapidly. Consistently, polarity transitions at lateCTRs are of a lower magnitude overall than those atsmaller termination sites (< 100 kb) (compare the max-ima and minima between line plots at the top of Fig. 2d(iv) and Fig. 2d (v), which represent the degrees of uni-formity in terms of fork polarity of leftward and right-ward forks, respectively), suggesting the presence ofincreased origin activity that diminishes the polarity biasof Okazaki fragments. In addition, the fact that polaritytransitions at termination sites (red to blue) are lessuniform than those at IZs (blue to red) suggests thattermination is more heterogeneous than initiation.
TTRs are highly uniform and consistent with long uni-directional forksOur demonstration that TTR breakages represent smallIZs that disrupt TTR slope implies that removing break-ages from TTR analysis should enable more accurate
estimation of fork speed within TTRs. In fact, we foundthat such ‘breakage-free’ TTRs are remarkably uniformin slope and defined in replication timing within thepopulation. In order to estimate the frequency of activeorigin firing within TTRs, we calculated the distributionof fork speed inferred by dividing TTR sizes by fractionsof S phase traversed by TTRs in human and mouse celllines. Assuming a 10-h S phase (the maximum for the 5cell lines profiled), the median speed of fork progressionfor both human and mouse was between 1.7 and 1.8 kb/min (with the exception of HCT116, which has a medianof 2 kb/min) and agrees with the range of estimated forkspeed measured directly by DNA fibre methods byothers (Fig. 2e) [32, 33]. Although we cannot rule outthe possibility of sequential origin firing with inter-origin distances < 50 kb (our limit of detection), therewould need to be a nearly uniform density and firingefficiency of origins along the length of each TTR toescape detection. Neither OK-seq nor the SNS data norsingle DNA fibre mapping data [28] support such an ini-tiation pattern in any of the cell lines analysed. We con-clude that TTRs are remarkably uniform in replicationspeed within a population and can be accounted for byuni-directional fork movements devoid of origin firing.
Measuring RT heterogeneity genome-wideThe strong enrichment of nascent DNA within only afew temporal windows of S phase indicates a high degreeof cell-to-cell conservation for all kinetic features of theRT programme genome-wide. However, there are alsoregions where nascent DNA signal was spread over abroader temporal interval. To measure the degree oftemporal variability across the genome and within thedifferent patterns identified in Fig. 1d, we examined therelationship between two important indices of replica-tion dynamics, Trep (the time point at which 50% of allcells have finished replicating the locus) and Twidth (thetime difference between the locus being replicated in25% of all cells and 75% of all cells) [34]. Since the 16
(See figure on previous page.)Fig. 2 High-resolution Repli-Seq identifies features highly concordant with Ok-seq. a Pile-ups of IZs that are categorised into four categories:early, early-mid, late-mid and late by the timing of initiation in H1 and H9 hESCs, HCT116, F121-9 mESCs and mNPCs. The number of IZs in eachcategory is shown on top of the pile-up heatmap. b UpSet plots showing numbers of IZs either unique to each cell type alone or uniquely incommon between the connected cell types in human and mouse cell lines. Black bars on the lower left are total IZs in each cell type. c Meanline plots showing SNS-seq signal (for H9, HCT116 and mESCs) and OK-seq signal (for mESCs) centred at IZs of early (red), early-mid (blue), late-mid (green) and late (black) RT ± 500 kb. d Mean line plots (top row) and heatmaps (bottom row) showing mESC OK-seq signal centred atcentres of IZs (i), TTRs (ii), breakages (iii), termination sites (< 100 kb) (iv) and termination sites (> 100 kb) (v) ± 1 MB from feature centre. Negativevalues indicate an enrichment for Okazaki fragments at leftward fork and positive values indicate an enrichment for Okazaki fragments atrightward fork. Each row in a heatmap represents a single site of any feature. Heatmaps are sorted by row using site size. Barplots indicatingfeature size associated with the corresponding row are on the left of the heatmap. TTR (ii) and breakage (iii) heatmaps are arranged so thatrightward TTR/breakages are stacked on top of leftward TTR/breakage and sorted separately. Green and orange mean line plots represent therightward and left leftward TTRs, respectively. e Distribution of estimated TTR speed in kb/min for H1, H9, HCT116, mESC and mNPC. White dotsrepresent the medians of distribution. Thick black lines mark the distribution between the first quartile to the third quartile. Thin black linesindicate the complete distribution of TTR speeds
Zhao et al. Genome Biology (2020) 21:76 Page 7 of 20

fraction heatmap values are representative of the per-centage of cells in the population that have replicatedthe genomic bin in each time interval, we can estimateTrep and Twidth by performing a sigmoidal fit on thecolumn-wise cumulative sum of the bin values (Fig. 3a).Briefly, the cumulative sum for any genomic locus is cal-culated as such: at S phase fraction 1 (S1), the cumula-tive sum equals the value the genomic bin assumes inS1, increases to the sum of S1 and S2 at the end of S2and eventually reaches 100%, the sum of S1, S2, S3through to S16 at the end of S phase. The value of Twidth
represents the variation in replication time. IZs were
divided into four categories (early, early-mid, late-mid,late) as in Fig. 2a. For all cell types assayed, the Twidth in-creased as S phase progressed towards mid S phase anddecreased from mid S phase to late S phase (Fig. 3b (i,ii)). The relationship between Twidth and Trep of TTRsassumes a similar pattern to that of IZs. Variability is thehighest for mid S phase for all features measured. As-suming a 10-h S phase, by converting 16 S phase frac-tions into fractions of 10 h, we found that almost allregions went from being 25% replicated to 75% repli-cated in 1.25–2.5 h. We conclude that the time at whicheach IZ will initiate replication is remarkably uniform
Fig. 3 RT heterogeneity fluctuates throughout S phase and peaks in the middle of S phase. a Schematic showing the fitting of a sigmoidal curveon the bin wise cumulative percentage replicated plotted against time into S phase. Example datapoints (blue) of cumulative percentage ofreplication in high-resolution Repli-Seq heatmap. Black line represents the fitted sigmoidal curve. Green dotted line represents trep , which is the Sphase time at which replication is 50% completed in the cell population. Distance between grey dotted lines represents twidth, which is the timeit takes for replication to be from 25% replicated to 75% replicated in the cell population. b (i) Cumulative replication percentage for IZs of early(red), early-mid (blue), late-mid (green) and late (black) timing where each line represents an individual IZ. b (ii) Scatter plots showing therelationship between Twidth and Trep calculated from fitted sigmoidal curves for early (red), early-mid (blue), late-mid (green) and late (black) IZs inH1, H9, HCT116 and F121-9 mESC. b (iii–vi) Scatter plots showing the relationship between Twidth and Trep for TTRs (iii), breakages (iv), terminationsites (< 100 kb) (v) and late CTRs (vi) in H1, H9, HCT116 and F121-9 mESC
Zhao et al. Genome Biology (2020) 21:76 Page 8 of 20
within the majority of cells in the population. In fact, allfeatures of the RT programme, including TTRs andtermination sites (< 100 kb), which both appear devoidof origin activity by the measurements described above,also display the pattern of increased variability duringmid S phase, consistent with their control by nearby IZs(Fig. 3b (iii, iv, v, vi)).
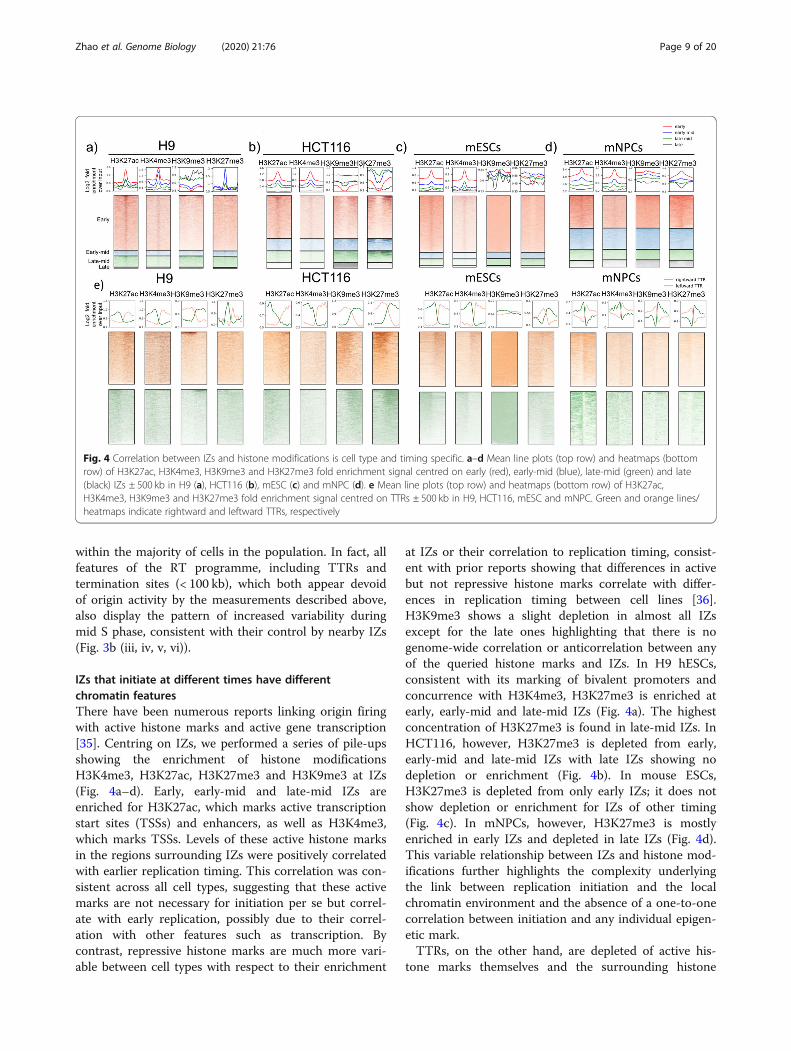
IZs that initiate at different times have differentchromatin featuresThere have been numerous reports linking origin firingwith active histone marks and active gene transcription[35]. Centring on IZs, we performed a series of pile-upsshowing the enrichment of histone modificationsH3K4me3, H3K27ac, H3K27me3 and H3K9me3 at IZs(Fig. 4a–d). Early, early-mid and late-mid IZs areenriched for H3K27ac, which marks active transcriptionstart sites (TSSs) and enhancers, as well as H3K4me3,which marks TSSs. Levels of these active histone marksin the regions surrounding IZs were positively correlatedwith earlier replication timing. This correlation was con-sistent across all cell types, suggesting that these activemarks are not necessary for initiation per se but correl-ate with early replication, possibly due to their correl-ation with other features such as transcription. Bycontrast, repressive histone marks are much more vari-able between cell types with respect to their enrichment
at IZs or their correlation to replication timing, consist-ent with prior reports showing that differences in activebut not repressive histone marks correlate with differ-ences in replication timing between cell lines [36].H3K9me3 shows a slight depletion in almost all IZsexcept for the late ones highlighting that there is nogenome-wide correlation or anticorrelation between anyof the queried histone marks and IZs. In H9 hESCs,consistent with its marking of bivalent promoters andconcurrence with H3K4me3, H3K27me3 is enriched atearly, early-mid and late-mid IZs (Fig. 4a). The highestconcentration of H3K27me3 is found in late-mid IZs. InHCT116, however, H3K27me3 is depleted from early,early-mid and late-mid IZs with late IZs showing nodepletion or enrichment (Fig. 4b). In mouse ESCs,H3K27me3 is depleted from only early IZs; it does notshow depletion or enrichment for IZs of other timing(Fig. 4c). In mNPCs, however, H3K27me3 is mostlyenriched in early IZs and depleted in late IZs (Fig. 4d).This variable relationship between IZs and histone mod-ifications further highlights the complexity underlyingthe link between replication initiation and the localchromatin environment and the absence of a one-to-onecorrelation between initiation and any individual epigen-etic mark.TTRs, on the other hand, are depleted of active his-
tone marks themselves and the surrounding histone
Fig. 4 Correlation between IZs and histone modifications is cell type and timing specific. a–d Mean line plots (top row) and heatmaps (bottomrow) of H3K27ac, H3K4me3, H3K9me3 and H3K27me3 fold enrichment signal centred on early (red), early-mid (blue), late-mid (green) and late(black) IZs ± 500 kb in H9 (a), HCT116 (b), mESC (c) and mNPC (d). e Mean line plots (top row) and heatmaps (bottom row) of H3K27ac,H3K4me3, H3K9me3 and H3K27me3 fold enrichment signal centred on TTRs ± 500 kb in H9, HCT116, mESC and mNPC. Green and orange lines/heatmaps indicate rightward and leftward TTRs, respectively
Zhao et al. Genome Biology (2020) 21:76 Page 9 of 20

modification patterns are consistent with the presence ofIZs upstream and downstream of rightward and leftwardTTRs, respectively (Fig. 4e). H3K4me3 and H3K27ac areenriched on the IZ side of the TTR for all cell lines.H3K9me3 and H3K27me3 show cell-type-specificfeatures that echoes their relationship with IZs. For in-stance, mESC IZs show no depletion of H3K9me3 con-sistent with its even distribution across TTRs (Fig. 4c, e).HCT116, on the other hand, shows depletion of bothH3K9me3 and H3K27me3 at its IZs, which is in agree-ment with its preferential colocalisation on the termin-ation side of TTRs (Fig. 4b, e). Together, this shows thatTTRs and IZs are differentiated by their distinct epigen-etic features. TTRs lack the active marks that exist atIZs, which could potentially explain their lack of originactivity. Therefore, TTRs punctuate both chromatinmarks and initiation potential.Moreover, we show that sites of termination are associ-
ated with a paucity of active marks and enriched for re-pressive marks regardless of their sizes (Additional file 1:Fig. S12). Cell line-specific differences are also observed.For instance, H3K27me3 is enriched in both types of ter-mination sites in HCT116 yet depleted in those in H1 andH9 hESCs. Overall, despite the origin activity present inlate CTRs, they are enriched for repressive marks to thesame extent as small termination sites (< 100 kb) that aredevoid of origin activity suggesting that origins in lateCTRs are activated independently from the enhancingeffects of active marks. This is supported by the observa-tion that late IZs (Fig. 4a–d) are the most similar of all IZsto the chromatin features of termination sites. Perhapsadditional mechanisms come into play late in S phase toensure completion of replication prior to mitosis.
Developmental regulation of replication timing by IZsWe next investigated whether high-resolution Repli-Seqcould provide novel insight into the developmental con-trol of RT. Changes in RT could be mediated by eitherturning IZs on or off or by changing the initiation timeof specific IZs. We found that both mechanisms occur.First, we defined IZs that were active uniquely in mESCsor mNPCs (Fig. 2b). In the cell line where the IZs werenot initiating, the loci were passively replicated by anearby IZ and did not show significant log2 (E/L) RTchange, remaining early replicating (Fig. 5a,Additional file 1: Fig. S13a). To determine whether cell-type-specific IZs are coordinately activated or suppressedin clusters, we calculated the median distance betweenmESC and mNPC unique IZs, which was approximately2MB, with the upper quartile being around 5MB; there-fore, in the majority of cases, developmental IZs wereindividually regulated (Additional file 1: Fig. S13b).Interestingly, loss of initiation activity was not always ac-companied by the loss of transcriptional activity and vice
versa (Fig. 5b) despite the general correlation betweeninitiation/early replication with increased transcription[37, 38] (Fig. 5c). Overall, more NPC unique IZs wereassociated with increased transcription in mNPC thanmESC unique IZs with increased transcription in mESC.Together, we show that developmentally regulated initi-ation activity is independent from transcription activa-tion globally. To define the histone associations atdevelopmentally controlled IZs, we examined H3K27aclocalisation around mESC- and mNPC-specific IZs. Wefound that H3K27ac showed slightly higher enrichmentin the cell line where the IZs initiated, albeit even in thecell line where the IZs did not initiate, H3K27ac wasmore enriched within the IZs than in the surroundingregions (Additional file 1: Fig. S13c). We subsequentlyidentified IZs that were common between mESC andmNPC yet initiated at significantly different times(Additional file 1: Fig. S13d). H3K27ac showed similartrends of enrichment at these timing variable IZs as itdid at cell-type-specific IZs (Additional file 1: Fig. S13e).Overall, we show that developmental IZs were controlledby regulation of both their initiation potential and timing,which was largely independent from transcriptionaland epigenetic alterations on a genome-wide level.
IZs form strong compartmental interactionsA prior study has suggested the formation of long-rangeinteraction hubs around replication origins [39]. Wethus queried the A/B compartment in which IZs reside.Earliest IZs are mostly A compartment associating andthose that initiate at later times in S phase are increas-ingly B compartment associating (Fig. 6a). However, IZsof all timing are more A compartment associating thantheir immediate surrounding regions (Fig. 6b), consistentwith their preferential colocalisation with active histonemarks compared to the neighbouring sequences (Fig. 4a).To investigate if IZs nucleate compartmental interac-tions, we compared IZ-IZ interactions that were binnedand sorted into increasing PC1 intervals to interactionsbetween non-IZ regions in immediate proximity to IZsthat occupy the same genomic volume and show thatIZs form stronger intra-compartmental (diagonal) inter-actions (Fig. 6c). At developmentally regulated IZs, theassociation with B compartment increased in the celltype where IZs became more late replicating showingthat IZ timing changes were accompanied by concordantcompartmental interaction changes (Additional file 1:Fig. S13f).Active chromatin marks and active gene transcription
have been shown to correlate with high insulation onHi-C chromatin contact heatmaps, sometimes referredto as topologically associated domain (TAD) boundaries[40, 41]. Consistently, we find that early and early-midIZs, which are characterised by active chromatin marks,
Zhao et al. Genome Biology (2020) 21:76 Page 10 of 20

Fig. 5 Developmentally controlled IZs show minimal RT switches and occasional transcriptional changes. a mESC and mNPC Log2E/L RT centredat ESC unique IZs (left panel) and NPC unique IZs (right panel) ± 1 MB. Line plots were colour-coded with blue and red representing negativeand positive log2E/L RT. b Distributions of expression differences of genes overlapping with ESC and NPC unique IZs (calculated as log2(mESCRPKM/mNPC RPKM)). Expression differences were colour-coded by false discovery rate (FDR) from 0 to 1. c Scatter plots showing that theexpression differences were colour-coded by FDR from 0 to 1
Zhao et al. Genome Biology (2020) 21:76 Page 11 of 20

also generally correspond to loci of high levels ofinsulation (Fig. 6d) while late IZs, which lack active his-tone marks, do not colocalise with increased insulation.Moreover, initiation zones called by [20] using OK-seqdata were shown to fire preferentially at TAD boundar-ies and those were predominantly early replicating.Surprisingly, mNPCs did not conform to the correlationseen in hESCs, mESCs and HCT116 in that early IZs inmNPCs showed decreased insulation compared to IZs oflater initiation timing (Fig. 6d). In summary, the correlationof IZs to TAD boundaries is incomplete and cell type spe-cific, potentially driven indirectly by other factors that colo-calise with IZs and share the same histone marks. It will beimportant to examine these correlations in other cell types.
Biphasically replicated regions contain long transcribedgenes, suggesting a link to genome fragilityWe observed biphasic patterns of replication in H1, H9hESCs and HCT116 (Fig. 7a, b), which are defined asregions with two distinct times of replication. We firstconsidered whether these were regions of imprinting,known to show allele-specific asynchrony [42]. Wefound that some imprinted genes show smearing inRepli-Seq heatmaps, indicative of small and stochasticdifferences in the RT (Additional file 1: Fig. S14a). How-ever, their RT differences did not reach our threshold ofbiphasic patterns, which required an intervening tem-poral interval when we could not detect replication ofeither allele. As a whole, the correlation between alleles
Fig. 6 IZs form strong compartmental interactions. a Boxplot showing the distribution of PC1 values associated with IZs of early (red), early-mid(blue), late-mid (green) and late (black) timing in H9, H1, HCT116, mESC and mNPC. Black lines indicate medians of distribution. b Average PC1eigenvector values (top) and pile-up heatmap of PC1 eigenvector values (bottom) centred on H1 IZs ± 1 MB. c Intra-IZ (left) and intra-control(bins in direct proximity to IZs occupying the same genomic space) (right) log10 (obs/exp) interactions binned according to the Hi-C PC1 valuesassociated with the IZ from most the negative to the most positive. d Mean line plots of insulation scores centred at for IZs of early (red), early-mid (blue), late-mid (green) and late (black) timing ± 500 kb in H9, H1, HCT116, mESC and mNPC
Zhao et al. Genome Biology (2020) 21:76 Page 12 of 20

at imprinted genes remained high and the majority ofbiphasic loci did not contain imprinted genes(Additional file 1: Fig. S14b). Surprisingly, however, wefound that the biphasic sites in human cells were associ-ated with common fragile sites (CFS) and/or transcribedlarge genes (> 200 kb), which are known to be correlated
with genome instability and CFSs [43, 44]. This is alsoconsistent with the prior observation [9] of one fragilesite (FRA3B) that appeared to replicate biphasically in 6-stage Repli-seq. The biphasic locus shown in Fig. 7a doesnot show detectable biphasic replication in H1 hESCdatasets from [9] (Additional file 1: Fig. S15a) showing
Fig. 7 Biphasically replicated loci overlap with long genes that suggest genome fragility. a High-resolution Repli-Seq heatmaps and RNA-seqprofiles for FRA1B (chr1:55,750,000–59,000,000), in HCT116, H1 and H9 hESCs. b High-resolution Repli-Seq heatmaps and RNA-seq profiles forFRA2F (chr2:147,250,000–148,650,000), a mapped HCT116 CFS, which is replicated biphasically in HCT116. c Fractions of biphasic loci overlappingwith annotated CFS and long genes (> 200 kb) in hESCs and HCT116. d Boxplot showing distributions of gene sizes of those that overlap withbiphasic sites in H9 and HCT116 (purple boxes) and distributions of gene sizes of those that overlap with randomly selected shuffled genomesegments that occupied the same genomic space as biphasic sites (grey boxes) (Mann-Whitney U test ***p < 0.05). Distribution of TPM of genes> 200 kb genome-wide or genes > 200 kb overlapping with biphasic regions in HCT116, H9 and H1 hESCs. Red lines represent the medians ofTPM. f F121-9 mESC allele resolved Repli-Seq heatmaps and RNA-seq tracks at genome independent (chr17:83,250,000-85,250,000) and dependentloci (chr6:144,000,000-147,200,000). Orange highlight indicates the genome-independent biphasic site in chr17, which actively transcribed on both musand cas alleles. Blue highlight indicates the genome-dependent biphasic site in chr6, which is replicated earlier in cas allele accompanied by activetranscription. g Correlation between log2 (gene expression differences) and RT differences of mus over cas calculated using high-resolution Repli-Seqaccording to the formula mus log 2(Sum(S1 ∗ 8, S2 ∗ 7, S3 ∗ 6,…S8 ∗ 1)/Sum(S9 ∗ 1, S10 ∗ 2, S11 ∗ 3…S16 ∗ 8)) − cas log 2(Sum(S1 ∗ 8, S2 ∗ 7, S3 ∗ 6,…S8 ∗ 1)/Sum(S9 ∗ 1, S10 ∗ 2, S11 ∗ 3…S16 ∗ 8)) at genome-dependent biphasic sites. h Distribution of log2(gene size) of genes overlapping withgenome-dependent or genome-independent biphasic sites. Red lines represent the medians of log2(gene size)
Zhao et al. Genome Biology (2020) 21:76 Page 13 of 20

that the temporal resolution achieved by our method isnecessary for the comprehensive detection of replicationbimodality. This is further supported by the comparisonbetween Repli-Seq profiles of FRA3B from H1 hESCdatasets from [9] and cell lines in this study shown inAdditional file 1: Fig. S15b. Together, our resultsdemonstrate that the temporal resolution afforded bydatasets used in this study was necessary for the compre-hensive identification of biphasic patterns genome-wide.Biphasic replication sites were cell-type-specific, as
were CFSs [43, 45]. We identified 340 biphasic replica-tion sites in H1/H9 hESCs, 144 of which (42%) wereCFSs (annotated in other cell lines) and 116 have notbeen shown to be fragile in any cell line but containedlarge genes (> 200 kb). HCT116 contained 26 biphasicsites. CFSs have been mapped cytogenetically inHCT116 [46], and 9 out of 10 of those that map to auto-somes displayed biphasic replication patterns, validatingthe fragility of sites detected by high-resolution Repli-Seq (Fig. 7b, c). The single undetected CFS in HCT116was fragile in only 1.3% of total CFS breaks. Ten of theremaining 17 HCT1216 biphasic sites that did not over-lap with mapped CFSs nonetheless contained large genesor overlapped with CFSs mapped in other cell types andcould be potential novel fragile sites. The overlap be-tween biphasic sites and large genes was statistically sig-nificant (Fig. 7d). We found that biphasic regions weremarked by active histone marks such as H3K4me3 andH3K27ac, which suggests that they were potentiated fortranscription or under active transcription (Add-itional file 1: Fig. S15c). We compared the levels of tran-scription of large genes overlapping with biphasic lociagainst those of large genes genome-wide in HCT116,H9 and H1 hESCs and found the medians of transcriptsper million (TPM) distribution were higher in biphasicgenes, suggesting that they were generally expressed(Fig. 7e). In conclusion, biphasic patterns are a potentialreplication signature of genome fragility induced bytranscribed long genes.To determine whether bimodality arose from replica-
tion asynchrony between maternal and paternal allelesor replication asynchrony on a population level, we plot-ted separate maternal and paternal Repli-Seq heatmapsin hESC line H1 in which SNPs have been phased forthe region [47] (Additional file 1: Fig. S16). The highsimilarity between maternal and paternal heatmaps forthe locus shown in Fig. 7a and the biphasic patterns thatwere vaguely visible in allele-parsed heatmaps did notsupport an allelic difference argument, but the sparsityof SNPs in human cells posed a challenge for a statisti-cally sound conclusion. For this reason, we examinedthe F121-9 cell line, which allows effective allele parsingdue to its high SNP density. There are 59 sites in F121-9mESCs that were found to be biphasically replicated, 36
of these were found to be due to allelic differences. Theremaining 23 sites were found to be allele independent;the biphasic patterns were retained in heatmaps for indi-vidual alleles (Fig. 7f). Moreover, allele-dependent bimo-dality was associated with differential gene expressionsbetween alleles whereas allele-independent biphasic sitesexhibited equal transcription output from both alleles.In the example shown in Fig. 7f, the earlier replicatinglocus on the cas allele coincides with higher transcriptionof the Tuba3b gene on the same allele. The same trendholds true genome-wide in that the earlier replicatinglocus on either allele was associated with higher levels ofgene transcription within the locus (Fig. 7g). In contrast toallele-independent loci, allele-dependent loci showed nopreferential affiliation with large genes. Indeed, we findthat larger genes correlate better with allele-independentthan allele dependent biphasic sites (Fig. 7h). We concludethat biphasic replication at allele-dependent and allele-independent loci are orchestrated by distinct mechanisms,with allele-independent asynchrony associated with largeexpressed genes that in humans are linked to CFSs andallele-dependent asynchrony potentially encoded by poly-morphic differences between the genomes.
DiscussionThe apparent paradox between highly stochastic replica-tion origin usage in mammalian cells and the consider-ably more deterministic nature of their RT patterns hasbeen the focus of many studies [29]. By using a shortnascent DNA labelling time and increased number of Sphase fractions, we have produced Repli-Seq profileswith exquisitely high temporal resolution, revealingfinely choreographed temporal structure in genome rep-lication that is remarkably uniform between cells in apopulation. The data reveal discrete initiation zones at50-kb resolution that initiate at various time throughoutS phase. Bi-directional replication forks can be detectedemanating from all temporally distinct IZs but thosewith different initiation times are differentiated bycharacteristics such as SNS origins and chromatin markenrichment. We show that when sparse regions of ini-tiation, which escaped detection in previous datasets, arefiltered out of TTRs, the remaining ‘true TTRs’ showtight distributions of gradients and can be accounted forby single, very long, uni-directional replication forks.When all features of the genome consistent with initi-ation are compiled, we estimate that > 70% of 50-kb seg-ments of the genome harbour initiation sites. IZ activityand timing are both regulated during differentiation atthe level of individual IZs. Finally, our data reveal previ-ously undetected regions of replication bimodality someof which are linked to allelic polymorphisms and somethat are sites of random asynchrony, the latter of which
Zhao et al. Genome Biology (2020) 21:76 Page 14 of 20

overlap with CFSs or large genes (> 200 kb) associatedwith genome instability.We identified IZs as peaks in high-resolution Repli-
Seq heatmaps throughout S phase, which are subse-quently cross referenced with origin mapping methodssuch as SNS-seq and OK-seq. Early IZs show enrich-ment in SNS-seq while late IZs do not. On the contrary,IZs of all timing show the corresponding directionalityswitch in fork polarity in OK-seq data suggesting thathigh-resolution Repli-Seq and OK-seq identify initiationevents of similar characteristics. Both methods can de-tect broad zones of initiation containing origin clustersas well as zones with one or a few more efficient sitesthat are detected at higher resolution by the SNS-seqmethod and so OK-seq and Repli-seq are less sensitivethan SNS-seq to the decrease in individual origin effi-ciency as S phase progresses. In addition to providingcross-validation, Repli-Seq and OK-seq were comple-mentary methods that could identify sets of IZs thateluded detection by the other method. Repli-Seq identi-fied low efficiency IZs that manifested as shallow ascen-sion in OK-seq RFD, thus were below the threshold ofOK-seq IZ calling whereas OK-seq could identify IZsembedded in late CTRs that did not manifest as peaks inRepli-seq heatmaps. The enrichment of SNS-seq signalin early IZs is also consistent with the preferential colo-calisation of early IZs with active histone marks, a defin-ing characteristic of origins identified through SNS-seq.In accordance with the depletion of SNS-seq signal inlate IZs, late IZs are also devoid of active histone marks.We also show cell-type-specific correlation betweenhistone modifications and origin firing; thus, while apermissive chromatin environment might enhance theprobability of firing and the formation of origin clustersmanifesting as IZs, origins can fire in an environmentdefined by repressive histone marks.In addition to IZs, we defined TTRs in high-resolution
Repli-Seq heatmaps and approximated the fork speedthat would give rise to the slopes seen in TTRs in a 10-hlong S phase. The approximated speeds are in good con-cordance with the range of fork speeds obtained throughDNA combing and other methods [27, 48]. The primarymode of replication in TTRs has been controversial, withsome reports consistent with passive uni-directional forkmovement [2] and others claiming that slopes of TTRsare too fast and must contain sequentially activated ori-gins [14]. Our results demonstrate that prior datasetswere not able to resolve true TTRs from small inefficientzones or shoulders of origin activity (breakages). High-resolution Repli-Seq allowed us to remove these break-ages in the slopes, thus filtering for only true TTRs withcontinuous slopes. Overall, the human and mouse stemcell lines show very similar median TTR speed that is inthe range of previously measured singular fork velocity
and tight distribution of limited gradient variation inthese cell types.We estimated the relationship between Twidth and Trep
by performing sigmoidal fitting on the 5 features identi-fied from high-resolution Repli-Seq and found that midS phase had the highest Twidth, with early and late Sphases showing decreased Twidth representing decreasedheterogeneity. This conclusion relies on the assumptionthat all bins finish replicating by the end of S16 and thusthe sigmoidal curves finish at 100 for all bins includingvery late replicating regions. However, we cannot ruleout the possibility that some cells did not finish replicat-ing the very late regions, in which case the sigmoidalcurves would have a larger Twidth. However, this obser-vation is consistent with the correlation heatmap ofhigh-resolution Repli-Seq showing lower correlationthus, more variations between middle S fractions(Additional file 1: Fig. S6b) as well as prior Twidth calcu-lations resulted from single-cell Repli-Seq using mid Sphase cells [17]. Previous work [49] has shown increasedinitiation events in the middle S phase on a populationlevel, which could potentially be the source of increasedvariation in terms of initiation time.High-resolution Repli-Seq heatmaps reveal biphasic
replication patterns that were previously undetected inE/L Repli-Seq. Surprisingly, these were not imprinted re-gions; imprinted regions showed very small and hetero-geneous differences in RT. Biphasic sites can be eitherallele dependent or allele independent. Allele-dependentbimodality is typically associated with a higher genetranscription rate in the earlier initiating allele. However,not all transcriptional differences result in replicationasynchrony and vice versa hence ruling out an absolutecorrelation between active transcription and replicationinitiation [17]. Allele-independent bimodality is enrichedfor large genes, which were implicated in genome fragil-ity [50] and cytogenetically mapped CFSs. Previous stud-ies have concluded that CFSs exhibit delayed replicationby using E/L Repli-Seq [51]. However, E/L Repli-Seqproduces an averaged RT profile, and a read enrich-ment in both early and late S phase fractions wouldrender a locus seemingly mid-replicating. Throughhigh-resolution Repli-Seq, we have found biphasicreplication signatures, which could exhibit early peak bias,late peak bias or equal signal from both early and latepeaks. Such signatures were associated with large genesand potential genome fragility and hence provide a meansto predict novel CFSs. The precise cause for biphasic rep-lication at large genes is elusive. Prior works have linkedgenome fragility with transcription-dependent replicationdelay at large genes [44, 50]. We hypothesise that the bi-phasic patterns are due to heterogeneous random mono-allelic levels of transcription at these large genes in the cellpopulation causing varying extents of replication delay.
Zhao et al. Genome Biology (2020) 21:76 Page 15 of 20

Materials and methodsCell cultureH1 and H9 cells were cultured in mTeSR1 (StemCellTechnologies #85850) on hESC-qualified Matrigel(Corning #354277)-coated dishes according to WiCellinstruction. For the maintenance and expansion, cellswere detached using ReLeSR (StemCell Technologies#95872). When the cell reached approximately 70%confluent, cells were pulse-labelled with 400 μM BrdUfor 30 min. To obtain single-cell suspension easily, theBrdU-labelled H1 and H9 cells were harvested usingGentle Cell Dissociating Reagent (StemCell Technolo-gies #07174). HCT116 cells were cultured in McCoy’s5A medium supplemented with 10% FBS. When thecells were approximately 70% confluent, cells werepulse-labelled with 400 μM BrdU for 30 min. The BrdU-labelled HCT116 cells were harvested using trypsin-EDTA. F121-9 mouse embryonic stem cell was culturedin 2i media on gelatin-coated dish as described in [52].F121-9 differentiation to NPC was performed usingRHB-A (TakaraBio #Y40001) as described in [52] for 10days. F121-9 ESC and NPC were pulse-labelled with400 μM BrdU for 30 min and harvested using ESGROComplete Accutase (Millipore Sigma #SF006). NPCdifferentiation was confirmed per 4DN standard by cellmorphology as well as qPCR for marker genes: Oct4(ESC marker), Dppa2/4 (ESC marker), Nestin (NPCmarker) and Sox1 (NPC marker). For qPCR, total RNAwas extracted using Direct-zol RNA Mini Prep (ZymoR2050) without DNase treatment. From 0.5 μg totalRNA, cDNA was synthesised by ProtoScript® II FirstStrand cDNA Synthesis Kit (NEB E6560) using dT23primer. Ct was normalised against GAPDH.
E/L Repli-seq library preparation and sequenceprocessingThe experiments and analyses of E/L Repli-Seq werecarried out as described in [8]. Briefly, the libraries weresequenced on Hi-Seq 2500. The fastq reads weremapped to human genome hg38 or mouse genomemm10 with the parameters --no-mixed, --no-discordant.PCR duplicates were removed using samtools rmdup.Log2 E/L ratio was calculated for 50-kb bins. The finalprofiles were Loess smoothed and quantile normalisedusing all profiles used in this paper.
16 fraction high-resolution Repli-seq processing andlibrary preparationThe BrdU-labelled cells were fixed in 70% ethanol andstained with propidium iodide as described in [8] thensorted by BD FACSAria SORP according to the DNAcontent. Eighty thousand cells were collected for eachfraction. In order to obtain reproducible sorting win-dows easily, the region from G1 peak to mid-point
between G2 peak and the end of G2 was equally slicedinto 16 to make S1–S16 fractions (H1 and H9). As wefound S15–S16 fractions did not contain detectableBrdU-labelled DNA, in the later experiments, the regionfrom G1 peak to G2 peak was equally sliced into 16 tomake S1–S16 fractions (HCT116, F121-9 ESC and NPC).Any cells on the left of G1 peak were considered non-replicating and collected as G1 fraction. From cells in eachfraction, total genomic DNA was extracted. 0.1 ng of BrdUincorporated cross-species mitochondrial DNA (primers in-cluded in Additional file 2 Table S1) and 1 ng of BrdUnegative cross-species DNA (primers included in Add-itional file 2 Table S1) were used as spike control and addedto purified genomic DNA. qPCRs against spike-in DNAwere performed to monitor BrdU pull-down efficiency.DNA from S fractions S1–S16 were made into libraries asdescribed in [8] with the following modifications: after thegenomic DNA was sheared and adaptors were ligated,adaptor-ligated DNA from 80K cells was used for BrdU im-munoprecipitation (using 0.5 μg of anti-BrdU BD #555627and 20 μg of anti-mouse IgG Sigma #M7023) and subse-quently purified and indexed as previously described. ForHCT116, F121-9 ESC and NPC, adaptor-ligated DNA from80K cells was first incubated with 0.5 μg of anti-BrdU in100 μL PSBT (0.137M NaCl, 0.0027M KCl, 0.01MNa2HPO4, 0.0018M KH2PO4, 0.1% Tween 20) for 20minat room temperature, the BrdU-DNA/anti-BrdU complexwas subsequently captured by 2 μL of Dynabeads Protein G(Thermofisher #10003D) directly added this reaction for20min at room temperature. The BrdU-DNA/anti-BrdU/Protein G bead complexes were washed with 200 μL ofPBST for 3 times (5min each) before the release of BrdU-DNA by Proteinase K digestion and purification describedin [8] before library indexing.
Sequencing, mapping and normalisation of high-resolution Repli-Seq dataRepli-Seq libraries were sequenced on Hi-Seq 2500. Readswere aligned to human genome hg38 or mouse mm10using bowtie-2 with the same parameters as those usedfor E/L Repli-Seq. Reads per million (RPM) was calculatedwith 50-kb bin size for BrdU pull-down libraries of each Sphase fraction as well as G1 control. The log2 ratio be-tween RPM of BrdU pulldown and that of G1 WGS wascalculated for each S phase fraction, which was subse-quently used to construct a matrix consisting of 16 rowswhere each row represented an S phase fraction rangingfrom S1 to S16 and each column represented a 50-kb gen-omic bin. Fifty-kilobase genomic bin was chosen due tothe following considerations: assuming a fork speed of 1.8kb/min, 30 min of BrdU labelling would have enabledincorporation of the analogue in at least 50-kb DNA perfork. Therefore, we estimate the technical limit ofresolution to be approx. 50 kb. Bins with values below
Zhao et al. Genome Biology (2020) 21:76 Page 16 of 20

zero, i.e. bins that were associated with less signalthan the corresponding ones in G1 WGS, were con-verted to zero. Sex chromosomes were removed andexcluded from further analyses. The Repli-Seq heat-map matrix was smoothed by applying a Gaussianfilter with sigma of 1:
12πσ2
e−x2þy2
2σ2 ð1Þ
Sigma of 1 was chosen because it was the minimum ker-nel size so that over-smoothing could be avoided. Effectively,each genomic bin is smoothed using the values of its 8neighbouring bins: 2 bins upstream and downstream of thetarget bin in the same S phase fraction, 3 bins in the previ-ous S phase fraction and 3 bins in the ensuing S phase frac-tion. For the bins in the first and the last S phase fractions,the Repli-Seq heatmap maxis is padded column-wise withthe first and last S phase fractions, respectively. Subse-quently, assuming that all bins should finish replicating atthe end of S phase and should therefore be given equalweight when summing column-wise across all 16 fractions,each column was assigned a total arbitrary value of 100and Gaussian smoothed value for the bin wassubstituted by its original value divided by the columnsum multiplied by 100.
Hi-C analysesHi-C datasets are downloaded from sources as stated inAdditional file 2 Table S2 and aligned to hg38 or mm10using HICUP (https://www.bioinformatics.babraham.ac.uk/projects/hicup/). The raw bam files are converted to .coolfiles using cooler and raw contact matrices are normalisedeither using ICE available in cooler or distance normalisedas log2 (observed/expected) contacts where the expectedcontacts are calculated as diagonal sum divided by thenumber of valid bins in the diagonal. Eigenvectordecomposition is performed using the cooltool package(https://github.com/mirnylab/cooltools) and rankedusing GC content. Insulation scores were calculatedaccording to [53] as the sum of ICE normalised inter-actions within a diamond window size of 500 kb for every5-kb bin.
ChIP-seq analysesChIP-seq and Cut-and-Run reads were downloaded fromGEO as stated in Additional file 2 Table S2 and aligned tohg38 or mm10 using bowtie2. The bam files from align-ment were used as input for MACS2 to call peaks andgenerate fold enrichment bigwig files, which were usedsubsequently for heatmap generation in the context of fea-ture alignment such as IZ or TTR alignment. These align-ment heatmaps were generated by constructing a matrixwith each row representing a feature centred on featurecentres and each column representing a genomic bin. The
values in the matrix represent the ChIP-seq fold enrich-ment signal at the defined genomic distance from thecentre of the region of interest.
SNS-seq and Okazaki fragment seqThe sources of SNS-seq raw reads are stated inAdditional file 2 Table S2. SNS-seq was aligned to hg38using bowtie-2 and further processed according to [54].The source of OKseq signal bigwig files and calledOKseq initiation zones for mESCs is stated inAdditional file 2 Table S2. The files were converted tomm10 using UCSC utility liftOver.
Defining 5 features in high-resolution Repli-Seq: IZs, TTRs,breakages, small termination sites (< 100 kb) and late CTRsFeatures were identified through the clustering algo-rithm BIRCH proposed in [30] implemented in thepython package scikit-learn (https://scikit-learn.org/stable/index.html). Briefly, the BIRCH algorithm is amemory effective clustering algorithm used for imageclassification. It constructs a clustering feature (CF)tree consisting of sub-CF trees where CF is defined as(N,LS,SS) where N is the number of items in the sub-clusters, LS being the linear sum of N points and SSis the square sum of N points. The algorithm returnsa set of clusters that captures the main patterns ofthe dataset, each column in Repli-Seq heatmap (i.e.each genomic bin) is assigned to a cluster that ischaracterised by a cluster centroid as shown in Add-itional file 1: Fig. S8. Features were identified depend-ing on the S phase fractions where the maxima of thecluster centroids were located relative to the neigh-bouring bins. IZs were identified as consecutive bins,which were assigned to the same cluster and flankedby upstream and downstream bins that were assignedto later clusters. Leftward TTRs were identified asconsecutive bins that were assigned to increasinglyearlier clusters and were flanked by upstream anddownstream bins that were assigned to later and earl-ier clusters, respectively. Rightward TTRs were identi-fied as consecutive bins that were assigned toincreasingly later clusters and were flanked by up-stream and downstream bins that were assigned toearlier and later clusters, respectively. Breakages inTTR were identified as consecutive bins flanked onboth sides by TTRs and were assigned to the samecluster. Small termination sites (< 100 kb) were identi-fied as 1 or 2 50-kb bins flanked by upstream anddownstream bins that were assigned to earlier clus-ters. Late CTRs were identified as consecutive bins (>2) which were assigned to the same cluster andflanked by upstream and downstream bins that wereassigned to earlier clusters.
Zhao et al. Genome Biology (2020) 21:76 Page 17 of 20

Timing heterogeneity estimationThe degree of heterogeneity of replication timing of IZsand TTRs was estimated by performing a sigmoidalfitting on the column-wise cumulative replicationpercentage. Briefly, the sigmoidal function
f xð Þ ¼ e−kx
1þ e−kxð2Þ
was fitted using curve_fit function in scipy, which mini-mises the mean squared error. Trep used in the timing-variation measurement is f(x) when x is 0.5 which meansthe bin is 50% replicated in the cell population andTwidth used in the timing-variation measurement isf(0.75) – f(0.25) which is the time difference between75% replicated and 25% replicated for any genomic bin.
Identification of biphasically replicating regions anddefinition of overlap with CFS and long genesBiphasically replicating regions are characterised by the pres-ence of two maxima in the column-wise cumulative sum forany bin in normalised Repli-Seq heatmaps. Therefore, con-tinuous bins that had two maxima in their column-wise cu-mulative sum were merged and identified as biphasic regions.Overlap of biphasic sites with CFS or long genes was definedas at least half of continuous genomic bins of biphasic sites be-ing contained within corresponding CFSs or long genes.
RNA-seq analysesRNA-seq data for HCT116 and H9 were downloaded fromthe sources stated in Additional file 2 Table S2 and aligned tohg38 using STAR to generate bigwig signal files and reads pergene counts. mESC RNA-seq was downloaded from 4DNdata portal (Additional file 2 Table S2) and aligned to mm10using STAR. Allele parsing was performed on parsed bam filesusing SNPsplit with the SNP VCF file downloaded fromhttps://www.sanger.ac.uk/science/data/mouse-genomes-pro-ject. TPM is generated based on the output SAM files fromSTAR using RSEM (https://deweylab.github.io/RSEM/).
CFS databaseGenomic coordinates of human CFSs used to overlapwith biphasically replicating loci were from https://webs.iiitd.edu.in/raghava/humcfs/. Cytogenetically mappedHCT116-specific fragile sites were obtained from [46].
Supplementary informationSupplementary information accompanies this paper at https://doi.org/10.1186/s13059-020-01983-8.
Additional file 1: Figure S1. Validation of NPC differentiation by qPCRusing primers against Oct4, Dppa2, Nestin, Sox1. Figure S2. Validation ofBrdU pull-down by qPCR using primers against alpha- and beta globin.Figure S3. RPM of each S phase fraction is corrected using G1 WGS.Figure S4. G1 mappability control fraction was devoid of DNA
replication. Figure S5. Normalisation of Repli-Seq heatmaps preservessignal. Figure S6. Percentage of replication in S1-S16 for top 10% earliestand latest replicated E/L Repli-Seq bins in mESC, mNPC, H1, H9 andHCT116. Figure S7. Comparison between H1 hESC datasets from [9] andH1 hESC datasets from this work. Figure S8. Correlation heatmapsshowing concordance between High-Resolution Repli-Seq datasets ofhuman and mouse cell lines. Figure S9. Schematic showing theidentification of replication features using BIRCH. Figure S10. OK-seq IZsare primarily early replicating. Figure S11. SNS-seq signal centred aroundrightward (dark green) and rightward (orange) TTRs in HCT116, H9 andmESCs. Figure S12. Mean line plots of H3K27ac, H3K4me3, H3K9me3and H3K27me3 fold enrichment signal centred on late CTRs andtermination sites (< 100 kb) +/− 500 kb in HCT116, H1 and H9. FigureS13. Identification of developmentally regulated IZs in mESC and mNPC.Figure S14 Imprinted genes do not exhibit biphasic patterns. FigureS15 Biphasic sites overlap with CFSs and are enriched for active histonemarks. Figure S16 H1 hESC unparsed and allele-parsed Repli-Seqheatmaps for chr1:55,750,000 – 59,000,000, the locus shown in Fig. 6a.
Additional file 2 : Table S1 Primer lists for human and mouse. TableS2 Resource table stating sources of external datasets.
AcknowledgementsWe thank D. Janssens and S. Henikoff for sharing H1 Cut-and-Run datasetswith us prior to publication; M.K. Parsi, J. Gibcus, S. Venev, B.A.Oksuz, R. Maehrand J. Dekker for sharing H1 Hi-C datasets with us prior to publication; andR. Didier for FACS. We are grateful to N. Rhind, J. Ma, and B.V.Steensel fortheir helpful comments on the manuscript.
Peer review informationBarbara Cheifet was the primary editor of this article and managed its editorialprocess and peer review in collaboration with the rest of the editorial team.
Authors’ contributionsPAZ carried out data processing, computational analyses and interpretation.TS prepared the samples and developed, carried out and validated high-resolution Repli-Seq. PAZ, TS and DMG designed the study. PAZ and DMGwrote the manuscript. The authors read and approved the final manuscript.
FundingThis work was supported by the National Institutes of Health 4D Nucleomeconsortium (NIH U54 DK107965 to DMG).
Availability of data and materialsAccession codes for all datasets used in the paper can be found inAdditional file 2: Table S2. All data generated in this study have beendeposited to the GEO depository (GSE137764) [55]. The python code for dataprocessing can be found on https://github.com/oliviacamel/High-Resolution-RepliSeq [56] and is released under Apache License 2.0.
Ethics approval and consent to participateNot applicable.
Competing interestsThe authors declare that they have no competing interests.
Glossary
Abbreviation Term Explanation
CTR Constant timingregion
CTRs are synchronously replicating regionsthat span hundreds of kilobases tomegabases.
IZ Initiation zone IZs are regions of DNA containing multiplespatially clustered sites of replicationinitiation.
RFD Replication forkdirectionality
RFD is calculated as the difference betweenrightward and leftward replication forks asmeasured by Okazaki fragment sequencing.
Zhao et al. Genome Biology (2020) 21:76 Page 18 of 20

(Continued)
Abbreviation Term Explanation
TTR Timing transitionregion
TTRs are slopes in Repli-Seq data connect-ing early and late CTRs.
Received: 14 January 2020 Accepted: 4 March 2020
References1. Rhind N, Gilbert DM. DNA replication timing. Cold Spring Harb Perspect
Biol. 2013;5(8):a010132.2. Hiratani I, Ryba T, Itoh M, Yokochi T, Schwaiger M, Chang CW, et al. Global
reorganization of replication domains during embryonic stem celldifferentiation. PLoS Biol. 2008;6(10):e245.
3. Rivera-Mulia JC, Buckley Q, Sasaki T, Zimmerman J, Didier RA, Nazor K, et al.Dynamic changes in replication timing and gene expression during lineagespecification of human pluripotent stem cells. Genome Res. 2015;25(8):1091–103.
4. Moindrot B, Audit B, Klous P, Baker A, Thermes C, de Laat W, et al. 3Dchromatin conformation correlates with replication timing and is conservedin resting cells. Nucleic Acids Res. 2012;40(19):9470–81.
5. Sima J, Chakraborty A, Dileep V, Michalski M, Klein KN, Holcomb NP, et al.Identifying cis elements for spatiotemporal control of mammalian DNAreplication. Cell. 2019;176(4):816–30 e18.
6. Pope BD, Ryba T, Dileep V, Yue F, Wu W, Denas O, et al. Topologicallyassociating domains are stable units of replication-timing regulation. Nature.2014;515(7527):402–5.
7. Muller CA, Nieduszynski CA. DNA replication timing influences geneexpression level. J Cell Biol. 2017;216(7):1907–14.
8. Marchal C, Sasaki T, Vera D, Wilson K, Sima J, Rivera-Mulia JC, et al. Genome-wide analysis of replication timing by next-generation sequencing with E/LRepli-seq. Nat Protoc. 2018;13(5):819–39.
9. Hansen RS, Thomas S, Sandstrom R, Canfield TK, Thurman RE, Weaver M,et al. Sequencing newly replicated DNA reveals widespread plasticity inhuman replication timing. Proc Natl Acad Sci U S A. 2010;107(1):139–44.
10. Chen CL, Rappailles A, Duquenne L, Huvet M, Guilbaud G, Farinelli L, et al.Impact of replication timing on non-CpG and CpG substitution rates inmammalian genomes. Genome Res. 2010;20(4):447–57.
11. Desprat R, Thierry-Mieg D, Lailler N, Lajugie J, Schildkraut C, Thierry-Mieg J,et al. Predictable dynamic program of timing of DNA replication in humancells. Genome Res. 2009;19(12):2288–99.
12. Koren A, Handsaker RE, Kamitaki N, Karlic R, Ghosh S, Polak P, et al. Geneticvariation in human DNA replication timing. Cell. 2014;159(5):1015–26.
13. Dileep V, Rivera-Mulia JC, Sima J, Gilbert DM. Large-scale chromatinstructure-function relationships during the cell cycle and development:insights from replication timing. Cold Spring Harb Symp Quant Biol.2015;80:53–63.
14. Guilbaud G, Rappailles A, Baker A, Chen CL, Arneodo A, Goldar A, et al.Evidence for sequential and increasing activation of replication originsalong replication timing gradients in the human genome. PLoS ComputBiol. 2011;7(12):e1002322.
15. Farkash-Amar S, Lipson D, Polten A, Goren A, Helmstetter C, Yakhini Z, et al.Global organization of replication time zones of the mouse genome.Genome Res. 2008;18(10):1562–70.
16. Dileep V, Gilbert DM. Single-cell replication profiling to measure stochasticvariation in mammalian replication timing. Nat Commun. 2018;9(1):427.
17. Takahashi S, Miura H, Shibata T, Nagao K, Okumura K, Ogata M, et al.Genome-wide stability of the DNA replication program in singlemammalian cells. Nat Genet. 2019;51(3):529–40.
18. Hyrien O. Peaks cloaked in the mist: the landscape of mammalianreplication origins. J Cell Biol. 2015;208(2):147–60.
19. Gilbert DM. Making sense of eukaryotic DNA replication origins. Science.2001;294(5540):96–100.
20. Petryk N, Kahli M, d’Aubenton-Carafa Y, Jaszczyszyn Y, Shen Y, Silvain M,et al. Replication landscape of the human genome. Nat Commun. 2016;7:10208.
21. Petryk N, Dalby M, Wenger A, Stromme CB, Strandsby A, Andersson R, et al.MCM2 promotes symmetric inheritance of modified histones during DNAreplication. Science. 2018;361(6409):1389–92.
22. Fu H, Besnard E, Desprat R, Ryan M, Kahli M, Lemaitre JM, et al. Mappingreplication origin sequences in eukaryotic chromosomes. Curr Protoc CellBiol. 2014;65:22 0 1–17.
23. Besnard E, Babled A, Lapasset L, Milhavet O, Parrinello H, Dantec C, et al.Unraveling cell type-specific and reprogrammable human replication originsignatures associated with G-quadruplex consensus motifs. Nat Struct MolBiol. 2012;19(8):837–44.
24. Cayrou C, Ballester B, Peiffer I, Fenouil R, Coulombe P, Andrau JC, et al. Thechromatin environment shapes DNA replication origin organization anddefines origin classes. Genome Res. 2015;25(12):1873–85.
25. Smith DJ, Whitehouse I. Intrinsic coupling of lagging-strand synthesis tochromatin assembly. Nature. 2012;483(7390):434–8.
26. Demczuk A, Gauthier MG, Veras I, Kosiyatrakul S, Schildkraut CL, BusslingerM, et al. Regulation of DNA replication within the immunoglobulin heavy-chain locus during B cell commitment. PLoS Biol. 2012;10(7):e1001360.
27. Anglana M, Apiou F, Bensimon A, Debatisse M. Dynamics of DNAreplication in mammalian somatic cells: nucleotide pool modulates originchoice and interorigin spacing. Cell. 2003;114(3):385–94.
28. Klein K, Wang W, Borrman T, Chan S, Zhang D, Weng Z, et al. Genome-wideidentification of early-firing human replication origins by optical replicationmapping. bioRxiv. 2017:214841.
29. Rhind N, Yang SC, Bechhoefer J. Reconciling stochastic origin firing withdefined replication timing. Chromosom Res. 2010;18(1):35–43.
30. Zhang T, Ramakrishnan R, Livny M. BIRCH: an efficient data clusteringmethod for very large databases. SIGMOD Rec. 1996;25(2):103–14.
31. Conti C, Sacca B, Herrick J, Lalou C, Pommier Y, Bensimon A. Replication forkvelocities at adjacent replication origins are coordinately modified duringDNA replication in human cells. Mol Biol Cell. 2007;18(8):3059–67.
32. Pereira PD, Serra-Caetano A, Cabrita M, Bekman E, Braga J, Rino J, et al.Quantification of cell cycle kinetics by EdU (5-ethynyl-2′-deoxyuridine)-coupled-fluorescence-intensity analysis. Oncotarget. 2017;8(25):40514–32.
33. Wilson KA, Elefanty AG, Stanley EG, Gilbert DM. Spatio-temporal re-organization of replication foci accompanies replication domainconsolidation during human pluripotent stem cell lineage specification. CellCycle. 2016;15(18):2464–75.
34. Yang SC, Rhind N, Bechhoefer J. Modeling genome-wide replication kinetics revealsa mechanism for regulation of replication timing. Mol Syst Biol. 2010;6:404.
35. Fragkos M, Ganier O, Coulombe P, Mechali M. DNA replication originactivation in space and time. Nat Rev Mol Cell Biol. 2015;16(6):360–74.
36. Yue F, Cheng Y, Breschi A, Vierstra J, Wu W, Ryba T, et al. A comparativeencyclopedia of DNA elements in the mouse genome. Nature. 2014;515(7527):355–64.
37. Cayrou C, Coulombe P, Vigneron A, Stanojcic S, Ganier O, Peiffer I, et al.Genome-scale analysis of metazoan replication origins reveals theirorganization in specific but flexible sites defined by conserved features.Genome Res. 2011;21(9):1438–49.
38. Comoglio F, Schlumpf T, Schmid V, Rohs R, Beisel C, Paro R. High-resolution profiling of Drosophila replication start sites reveals a DNAshape and chromatin signature of metazoan origins. Cell Rep.2015;11(5):821–34.
39. Boulos RE, Arneodo A, Jensen P, Audit B. Revealing long-rangeinterconnected hubs in human chromatin interaction data using graphtheory. Phys Rev Lett. 2013;111(11):118102.
40. Bonev B, Mendelson Cohen N, Szabo Q, Fritsch L, Papadopoulos GL, LublingY, et al. Multiscale 3D genome rewiring during mouse neural development.Cell. 2017;171(3):557–72 e24.
41. Dixon JR, Selvaraj S, Yue F, Kim A, Li Y, Shen Y, et al. Topological domains inmammalian genomes identified by analysis of chromatin interactions.Nature. 2012;485(7398):376–80.
42. Donley N, Thayer MJ. DNA replication timing, genome stability and cancer:late and/or delayed DNA replication timing is associated with increasedgenomic instability. Semin Cancer Biol. 2013;23(2):80–9.
43. Debatisse M, Rosselli F. A journey with common fragile sites: from S phaseto telophase. Genes Chromosomes Cancer. 2019;58(5):305–16.
44. Brison O, El-Hilali S, Azar D, Koundrioukoff S, Schmidt M, Nahse V, et al.Transcription-mediated organization of the replication initiation programacross large genes sets common fragile sites genome-wide. Nat Commun.2019;10(1):5693.
Zhao et al. Genome Biology (2020) 21:76 Page 19 of 20

45. Letessier A, Millot GA, Koundrioukoff S, Lachages AM, Vogt N, Hansen RS,et al. Cell-type-specific replication initiation programs set fragility of theFRA3B fragile site. Nature. 2011;470(7332):120–3.
46. Le Tallec B, Millot GA, Blin ME, Brison O, Dutrillaux B, Debatisse M. Commonfragile site profiling in epithelial and erythroid cells reveals that mostrecurrent cancer deletions lie in fragile sites hosting large genes. Cell Rep.2013;4(3):420–8.
47. Selvaraj S, RD J, Bansal V, Ren B. Whole-genome haplotype reconstructionusing proximity-ligation and shotgun sequencing. Nat Biotechnol. 2013;31(12):1111–8.
48. Fu H, Martin MM, Regairaz M, Huang L, You Y, Lin CM, et al. The DNA repairendonuclease Mus81 facilitates fast DNA replication in the absence ofexogenous damage. Nat Commun. 2015;6:6746.
49. Goldar A, Marsolier-Kergoat MC, Hyrien O. Universal temporal profile ofreplication origin activation in eukaryotes. PLoS One. 2009;4(6):e5899.
50. Blin M, Le Tallec B, Nahse V, Schmidt M, Brossas C, Millot GA, et al.Transcription-dependent regulation of replication dynamics modulatesgenome stability. Nat Struct Mol Biol. 2019;26(1):58–66.
51. Pelliccia F, Bosco N, Curatolo A, Rocchi A. Replication timing of two humancommon fragile sites: FRA1H and FRA2G. Cytogenet Genome Res. 2008;121(3–4):196–200.
52. Rivera-Mulia JC, Dimond A, Vera D, Trevilla-Garcia C, Sasaki T, Zimmerman J,et al. Allele-specific control of replication timing and genome organizationduring development. Genome Res. 2018;28(6):800–11.
53. Mizuguchi T, Fudenberg G, Mehta S, Belton JM, Taneja N, Folco HD, et al.Cohesin-dependent globules and heterochromatin shape 3D genomearchitecture in S. pombe. Nature. 2014;516(7531):432–5.
54. Smith OK, Kim R, Fu H, Martin MM, Lin CM, Utani K, et al. Distinct epigeneticfeatures of differentiation-regulated replication origins. EpigeneticsChromatin. 2016;9:18.
55. Zhao PA, Sasaki T, Gilbert DM. High resolution Repli-Seq defines thetemporal choreography of initiation, elongation and termination ofreplication in mammalian cells. GSE137764. 2019. Gene Expression Omnibus.https://www.ncbi.nlm.nih.gov/geo/query/acc.cgi?acc=GSE137764. Accessed9 Mar 2020.
56. Zhao PA, Sasaki T, Gilbert DM. High resolution Repli-Seq defines thetemporal choreography of initiation, elongation and termination ofreplication in mammalian cells. 2020. Github. https://github.com/oliviacamel/High-Resolution-RepliSeq. Accessed 9 Mar 2020.
Publisher’s NoteSpringer Nature remains neutral with regard to jurisdictional claims in publishedmaps and institutional affiliations.
Zhao et al. Genome Biology (2020) 21:76 Page 20 of 20
Copyright © 2022 FDOKUMEN