Targeted Inhibition of Anti-Inflammatory Regulator Nrf2 ... - MDPI
29
Biomedicines 2021, 9, 1119. https://doi.org/10.3390/biomedicines9091119 www.mdpi.com/journal/biomedicines Article Targeted Inhibition of Anti-Inflammatory Regulator Nrf2 Results in Breast Cancer Retardation In Vitro and In Vivo Venugopal R. Bovilla 1,2,3 , Mahadevaswamy G. Kuruburu 1,2 , Vidya G. Bettada 1,2 , Jayashree Krishnamurthy 4 , Olga A. Sukocheva 5, *, Rajesh K. Thimmulappa 1,2 , Nanjunda Swamy Shivananju 6 , Janardhan P. Balakrishna 7 and SubbaRao V. Madhunapantula 1,2,8, * 1 Department of Biochemistry (DST-FIST Supported Department), JSS Medical College, JSS Academy of Higher Education & Research, Mysore 570015, Karnataka, India; [email protected] (V.R.B.); [email protected] (M.G.K.); [email protected] (V.G.B.); [email protected] (R.K.T.) 2 Center of Excellence in Molecular Biology and Regenerative Medicine (CEMR) Laboratory (DST-FIST Supported Center), JSS Medical College, JSS Academy of Higher Education & Research, Mysore 570015, Karnataka, India 3 Public Health Research Institute of India (PHRII), Mysuru 570020, Karnataka, India 4 Department of Pathology, JSS Medical College, JSS Academy of Higher Education & Research, Mysore 570015, Karnataka, India; [email protected] 5 College of Nursing and Health Sciences, Flinders University, Bedford Park, SA 5042, Australia 6 Department of Biotechnology, JSS Technical Institutions Campus, JSS Science and Technology University, Mysore 570006, Karnataka, India; [email protected] 7 Department of Stem Cell Biology, Stellixer Biotech Pvt Ltd., Banglore 560058, Karnataka, India; [email protected] 8 Leader, Special Interest Group in Cancer Biology and Cancer Stem Cells (SIG-CBCSC), JSS Academy of Higher Education & Research, Mysore 570015, Karnataka, India * Correspondence: [email protected] (O.A.S.); [email protected] or [email protected] (S.V.M.); Tel.: +91-810-527-8621(S.V.M.) Abstract: Nuclear factor erythroid-2 related factor-2 (Nrf2) is an oxidative stress-response transcriptional activator that promotes carcinogenesis through metabolic reprogramming, tumor promoting inflammation, and therapeutic resistance. However, the extension of Nrf2 expression and its involvement in regulation of breast cancer (BC) responses to chemotherapy remain largely unclear. This study determined the expression of Nrf2 in BC tissues (n = 46) and cell lines (MDA- MB-453, MCF-7, MDA-MB-231, MDA-MB-468) with diverse phenotypes. Immunohistochemical (IHC)analysis indicated lower Nrf2 expression in normal breast tissues, compared to BC samples, although the difference was not found to be significant. However, pharmacological inhibition and siRNA-induced downregulation of Nrf2 were marked by decreased activity of NADPH quinone oxidoreductase 1 (NQO1), a direct target of Nrf2. Silenced or inhibited Nrf2 signaling resulted in reduced BC proliferation and migration, cell cycle arrest, activation of apoptosis, and sensitization of BC cells to cisplatin in vitro. Ehrlich Ascites Carcinoma (EAC) cells demonstrated elevated levels of Nrf2 and were further tested in experimental mouse models in vivo. Intraperitoneal administration of pharmacological Nrf2 inhibitor brusatol slowed tumor cell growth . Brusatol increased lymphocyte trafficking towards engrafted tumor tissue in vivo, suggesting activation of anti-cancer effects in tumor microenvironment. Further large-scale BC testing is needed to confirm Nrf2 marker and therapeutic capacities for chemo sensitization in drug resistant and advanced tumors. Keywords: breast cancer; Nrf2; brusatol; Ehrlich Ascites Carcinoma cells; chemo sensitization; tumorigenesis Citation: Bovilla, V.R.; Kuruburu, M.G.; Bettada, V.G.; Krishnamurthy, J.; Sukocheva, O.A.; Thimmulappa, R.K.; Shivananju, N.S.; Balakrishna, J.P.; Madhunapantula, S.V. Targeted Inhibition of Anti-Inflammatory Regulator Nrf2 Results in Breast Cancer Retardation In Vitro and In Vivo. Biomedicines 2021, 9, 1119. https://doi.org/10.3390/ biomedicines9091119 Academic Editor: Chiara Brignole Received: 29 July 2021 Accepted: 26 August 2021 Published: 30 August 2021 Publisher’s Note: MDPI stays neutral with regard to jurisdictional claims in published maps and institutional affiliations. Copyright: © 2021 by the authors. Licensee MDPI, Basel, Switzerland. This article is an open access article distributed under the terms and conditions of the Creative Commons Attribution (CC BY) license (http://creativecommons.org/licenses /by/4.0/).
-
Upload
khangminh22 -
Category
Documents
-
view
1 -
download
0
Transcript of Targeted Inhibition of Anti-Inflammatory Regulator Nrf2 ... - MDPI
Biomedicines 2021, 9, 1119. https://doi.org/10.3390/biomedicines9091119 www.mdpi.com/journal/biomedicines
Article
Targeted Inhibition of Anti-Inflammatory Regulator Nrf2
Results in Breast Cancer Retardation In Vitro and In Vivo
Venugopal R. Bovilla 1,2,3, Mahadevaswamy G. Kuruburu 1,2, Vidya G. Bettada 1,2, Jayashree Krishnamurthy 4,
Olga A. Sukocheva 5,*, Rajesh K. Thimmulappa 1,2, Nanjunda Swamy Shivananju 6, Janardhan P. Balakrishna 7
and SubbaRao V. Madhunapantula 1,2,8,*
1 Department of Biochemistry (DST-FIST Supported Department), JSS Medical College, JSS Academy of
Higher Education & Research, Mysore 570015, Karnataka, India; [email protected] (V.R.B.);
[email protected] (M.G.K.); [email protected] (V.G.B.); [email protected] (R.K.T.) 2 Center of Excellence in Molecular Biology and Regenerative Medicine (CEMR) Laboratory (DST-FIST
Supported Center), JSS Medical College, JSS Academy of Higher Education & Research, Mysore 570015,
Karnataka, India 3 Public Health Research Institute of India (PHRII), Mysuru 570020, Karnataka, India 4 Department of Pathology, JSS Medical College, JSS Academy of Higher Education & Research,
Mysore 570015, Karnataka, India; [email protected] 5 College of Nursing and Health Sciences, Flinders University, Bedford Park, SA 5042, Australia 6 Department of Biotechnology, JSS Technical Institutions Campus, JSS Science and Technology University,
Mysore 570006, Karnataka, India; [email protected] 7 Department of Stem Cell Biology, Stellixer Biotech Pvt Ltd., Banglore 560058, Karnataka, India;
[email protected] 8 Leader, Special Interest Group in Cancer Biology and Cancer Stem Cells (SIG-CBCSC), JSS Academy of
Higher Education & Research, Mysore 570015, Karnataka, India
* Correspondence: [email protected] (O.A.S.);
[email protected] or [email protected] (S.V.M.); Tel.: +91-810-527-8621(S.V.M.)
Abstract: Nuclear factor erythroid-2 related factor-2 (Nrf2) is an oxidative stress-response
transcriptional activator that promotes carcinogenesis through metabolic reprogramming, tumor
promoting inflammation, and therapeutic resistance. However, the extension of Nrf2 expression
and its involvement in regulation of breast cancer (BC) responses to chemotherapy remain largely
unclear. This study determined the expression of Nrf2 in BC tissues (n = 46) and cell lines (MDA-
MB-453, MCF-7, MDA-MB-231, MDA-MB-468) with diverse phenotypes. Immunohistochemical
(IHC)analysis indicated lower Nrf2 expression in normal breast tissues, compared to BC samples,
although the difference was not found to be significant. However, pharmacological inhibition and
siRNA-induced downregulation of Nrf2 were marked by decreased activity of NADPH quinone
oxidoreductase 1 (NQO1), a direct target of Nrf2. Silenced or inhibited Nrf2 signaling resulted in
reduced BC proliferation and migration, cell cycle arrest, activation of apoptosis, and sensitization
of BC cells to cisplatin in vitro. Ehrlich Ascites Carcinoma (EAC) cells demonstrated elevated levels
of Nrf2 and were further tested in experimental mouse models in vivo. Intraperitoneal
administration of pharmacological Nrf2 inhibitor brusatol slowed tumor cell growth . Brusatol
increased lymphocyte trafficking towards engrafted tumor tissue in vivo, suggesting activation of
anti-cancer effects in tumor microenvironment. Further large-scale BC testing is needed to confirm
Nrf2 marker and therapeutic capacities for chemo sensitization in drug resistant and advanced
tumors.
Keywords: breast cancer; Nrf2; brusatol; Ehrlich Ascites Carcinoma cells; chemo sensitization;
tumorigenesis
Citation: Bovilla, V.R.;
Kuruburu, M.G.; Bettada, V.G.;
Krishnamurthy, J.; Sukocheva, O.A.;
Thimmulappa, R.K.;
Shivananju, N.S.; Balakrishna, J.P.;
Madhunapantula, S.V. Targeted
Inhibition of Anti-Inflammatory
Regulator Nrf2 Results in Breast
Cancer Retardation In Vitro and In
Vivo. Biomedicines 2021, 9, 1119.
https://doi.org/10.3390/
biomedicines9091119
Academic Editor: Chiara Brignole
Received: 29 July 2021
Accepted: 26 August 2021
Published: 30 August 2021
Publisher’s Note: MDPI stays
neutral with regard to jurisdictional
claims in published maps and
institutional affiliations.
Copyright: © 2021 by the authors.
Licensee MDPI, Basel, Switzerland.
This article is an open access article
distributed under the terms and
conditions of the Creative Commons
Attribution (CC BY) license
(http://creativecommons.org/licenses
/by/4.0/).
Biomedicines 2021, 9, 1119 2 of 29
1. Introduction
Despite the therapeutic progress and introduction of various public health programs,
breast cancer (BC) incidence and mortality rates continue to increase [1]. Current BC
clinical interventions include a large variety of surgical procedures, chemotherapeutic
agents, hormonal therapy, radiotherapy, and immunotherapeutic approaches [2–5].
However, the highly successful BC chemotherapeutic agents, including
doxorubicin/epirubicin, docetaxel, and paclitaxel [6,7], target early-stage tumors.
Advanced stage BCs are managed by carboplatin, cisplatin, gemcitabine, capecitabine,
vinorelbine, abraxane [8–10], or combined therapies [11,12]. Despite reasonable success,
extensive and prolonged treatment often results in the development of BC resistance [3],
accompanied by systemic toxicity [13]. The benefits of advanced genetic testing and
personalized medicine-based approaches for BC treatment are not yet available for the
wider population, especially in developing countries [14–16]. Therefore, identifying
multi-functional key regulatory proteins that can be effectively targeted to control
malignant transformation, spreading, and therapy resistance, has become increasingly
important.
Nuclear factor erythroid-2 related factor-2 (Nrf2) is a transcription factor that directs
host responses to inflammation and intracellular oxidative stress via modulation of a
diverse group of effectors. During induction of oxidative burst and anti-inflammatory
signaling, Nrf2 translocates into the nucleus, binds to electrophile response element
(EpRE), and triggers EpRE-mediated transcription of various genes with an antioxidant
response element (ARE)-containing promoter region [17,18]. Among those genes are
cytoprotective NADPH quinone oxidoreductase 1 (NQO1), superoxide dismutase (SOD),
glutathione S-transferase (GST), heme oxygenase 1 (HO1), and hypoxia inducible factor
1-α (HIF1α) [19,20]. Nrf2 is known to protect normal cells from oxidative stress and
inflammation-induced cellular damage. Unfortunately, the elevated Nrf2 also protects
cancer cells from chemotherapeutic- and radiation-induced damage [21–23]. Nrf2-
regulated antioxidant response was suggested to play a crucial role in controlling BC cell
survival [24] and development of drug resistance [25].
The diversity of Nrf2-activated network is mediated by potential interaction of
different Nrf2 domains with transcription coactivators, including CHD6 (chromo-
ATPase/helicase DNA-binding protein), CBP (cAMP-response-element-binding protein
(CREBP)-binding protein) [11], and the nuclear cofactor RAC3/AIB1/SRC-3 [26]. Complex
and often contradictory relationships were demonstrated for Nrf2 and NF-κB signaling
network (the leading cancer-related intracellular effector) linked to various cellular
responses to stress, inflammation, and oncogenesis [27,28]. For instance, Nrf2 and NF-κB
were shown to compete for CBP and other co-activators during resolution of
inflammation and cancer progression [17,27]. During cancer treatment with bortezomib,
both signaling pathways promoted chemoresistance in acute myeloid leukemia cells [28].
Accordingly, targeted inhibition of Nrf2 using siRNA or pharmacological agents was
shown to inhibit the development of lung, colon, and rectal carcinomas [29,30]. In BCs,
elevated levels of Nrf2 trigger proliferation and metastatic behavior via activation of the
RhoA/ROCK pathway and G6PD/HIF1α/Notch signaling cascades [21]. Increased Nrf2
expression stimulates anabolic pathways and tumor-promoting inflammation in BCs [31].
Estrogen receptor positive (ER+) but human epidermal growth factor receptor 2 negative
(HER2-) BCs expressing high levels of Nrf2 are more resistant to treatments compared to
those tumors with very low Nrf2 [21,32]. However, it remains to be confirmed whether
the expressed Nrf2 is functionally active in BCs. Furthermore, Nrf2 inhibition as a method
to sensitize BC cells to chemotherapeutic agents has not been sufficiently explored. Nrf2
can be inhibited by various synthetic and naturally occurring pharmacological agents,
including ML385, AEM1, brusatol, apigenin, trigonelline, berberine, and parthenolide
[33].
Brusatol is a natural compound (quassinoid) isolated from Brucea javanica. Anti-
cancer properties of the compound and its ability to inhibit Nrf2 signaling were
Biomedicines 2021, 9, 1119 3 of 29
demonstrated in different malignancies [30,33,34]. However, specific molecular targets of
brusatol and associated in vivo pharmacological and systemic effects of the agent remain
largely unclear. Recent study reported brusatol-activated increases in the intrinsic
metabolic burden in cancer cells, thus, making this agent increasingly attractive for future
drug development [35]. Several studies have shown anti-proliferative capacity of brusatol
in cancers that were mediated by deregulated Nrf2 signaling [29,36,37]. Despite the
observed pro-apoptotic effects, majority of Nrf2 inhibitors were shown to have only
modest success in clinical trials [38], suggesting that Nrf2 is associated with a complex
mechanism of signaling which remains unexplored. Therefore, we used Brusatol to inhibit
Nrf2 in BC cell lines and aimed to clarify the systemic effects of this agent in vivo.
Accordingly, Nrf2 activation of its downstream signaling effectors in BC cell lines
was addressed in this study. Although Nrf2 was linked to BC progression, the question
of whether Nrf2 can be exploited as a key therapeutic target to inhibit BC growth remains
uncertain. This study aimed to test the levels of Nrf2 expression and cell responses to Nrf2
inhibition in a set of BC tissues and cell lines. The expression pattern of Nrf2 was assessed
in grade-II and grade-III BCs and compared to proximal normal tissues. Ehrlich Ascites
Carcinoma (EAC) cells were found to have a significantly increased level of Nrf2. Using a
preclinical animal model, the current study investigated whether grafted EAC cells are
suitable for testing the anti-cancer efficacy of Nrf2 inhibitors. A significant reduction in
grafted tumor size was observed upon the administration of brusatol in Swiss albino mice,
indicating that Nrf2 inhibition could be a potentially viable anti-BC strategy. Inhibition of
Nrf2 signaling in combination with an established chemotherapeutic agent cisplatin was
also tested to assess the suitability of combination strategies for effective tumor inhibition.
2. Materials and Methods
2.1. Collection of Tumor Samples and Used Chemicals
The current study was approved by the Institutional Ethics Committee, which
allowed collecting tumor and normal breast samples from BC patients (approval no.
JSSMC/IEC/14/1991/2017–2018, dated 5 June, 2017). The patients visited JSS Hospital and
were referred for pathological examinations. The consent approved using the collected
tissues for research purposes. Patient tumors and normal tissues were paraffin-embedded
at the Department of Pathology, JSS Medical College, JSS Academy of Higher Education
& Research, Mysore, Karnataka.
BC cell lines MCF-7 (passage #40–55), T47D (passage #60–75), MDA-MB 453 (passage
#70–90), MDA-MB-231(passage #30–50), MDA-MB-468 (passage #50–65), and lung cancer
cell line A549 (passage #30–50) were procured from National Center for Cell Science,
Pune, Maharashtra, India. Normal lung epithelial cell line BEAS-2B (passage #20–40) was
provided by Dr. Rajeshkumar Thimmulappa (JSS Medical College, JSS AHER, Mysore,
Karnataka). EAC cells were provided by Dr. Prabhakar B.T (Molecular Biomedicine
Laboratory, Post Graduate Department of Studies and Research in Biotechnology
Sahyadri Science College Kuvempu University, Shimoga, Karnataka, India). Cell line
phenotypes were confirmed and characterized annually for morphological and cell line
specific markers as described previously [39]. Primary antibodies for Nrf2 (cat#: ab62352), NQO1 (cat#: 62262), were obtained from
Abcam (Cambridge, MA, USA) and Cell Signaling Technologies (Danvers, MA, USA).
Secondary antibodies (Rabbit cat#: SC2357 and Goat cat#:SC2020) and α-Enolase (cat#:SC-
7455) were from Santa Cruz Biotechnology (Santa Cruz, CA, USA). Ki67 (cat#: PM210) and
CD31 (cat#: PR021) were from PathnSitu Biotechnologies Pvt Ltd., (Secunderabad,
Telangana State,, India). SiRNA to Nrf2 (HSS 181506, HSS 181505, HSS107130) and
lipofectamine RNAiMAX (cat#:13778150), FBS (cat#:10270106), Pen-Strep (cat#:150763),
cDNA Reverse Transcription Kit (cat#: 4388950), DyNAmo Flash SYBR Green qPCR Kit
(cat#: F-415L), and TRIzol (cat#:15596026) reagents were from Thermo Fisher Scientific
(Waltham, MA, USA).
Biomedicines 2021, 9, 1119 4 of 29
Pharmacological agents brusatol (cat#:SML 1868), diallyl disulfide (DADS) (cat#:
SMB00378), dicoumarol (cat#: M1390-5G), cell culture grade DMSO (cat#: D2650), glucose-
6-phosphate (G6P) dehydrogenase (G6PDH) (cat#: 10165875001), 3-(4,5-dimethylthiazol-
2-yl)-2,5-diphenyltetrazolium bromide tetrazolium (MTT) (cat#: M5655), menadione (cat#:
M9429), NP40 (cat#: 492016), radioimmunoprecipitation assay (RIPA) buffer (cat#: R0278),
protease inhibitor cocktail (cat#: S8820), G6P (cat#:G7250), nicotinamide adenine
dinucleotide phosphate (NADP) (cat#: N5755), flavin adenine dinucleotide (FAD) (cat#:
F6625), bovine serum albumin (BSA) (cat#: 05479), camptothecin (cat#: 390238),
itraconazole (cat#: I6657), and cisplatin (cat#:1134357) were from Sigma Chemical
Company (St. Louis, MO, USA). All cell culture plastics were from Techno Plastic
Products (TPP) Pvt Ltd. (Bengaluru, Karnataka, India). Cell culture media Dulbecco’s
Modified Eagle Medium (DMEM) with high glucose (4.5g/L) (cat#: AL111), trypsin-EDTA
(0.25%) (cat#: T001), Dulbecco’s phosphate buffered saline (DPBS) (cat#: TL1OO6),
ciprofloxacin (cat#: A032), acridine orange (AO, cat#: TC262), and ethidium bromide (EtBr,
cat#: MB071) were from HiMedia Laboratories Pvt Ltd. (Bengaluru, Karnataka, India).
Swiss albino mice were purchased from Biogen Laboratory Animal Facility (Bengaluru,
Karnataka, India).
2.2. Collection of Breast Cancer Tissues, Construction of a Tissue Array, and
Immunohistochemistry (IHC)
Breast tissues were collected, fixed, paraffin-embedded, and stained using
Hematoxylin and Eosin (H&E). The tissue sections were screened and representative
malignant areas were identified by an experienced pathologist. The corresponding areas
in the paraffin blocks were marked and tissue cores of about 4 mm in size were punched
out using a tissue punch. Tissue array (TA) blocks were constructed manually in rows and
columns by incorporating tissue cores (Supplementary Figure S1). Sections from the TA
blocks were stained using H&E and processed for immunohistochemical (IHC) analysis
to measure Nrf2 expression as described previously [40].
To assess Nrf2 expression, the selected slides were deparaffinized and antigens were
retrieved by dipping in an antigen retrieval buffer (10 mM sodium citrate, pH 6.0).
Hydrogen peroxide (3%) was applied for 10 min to quench the endogenous peroxidases.
The sections were incubated with primary anti-Nrf2 antibodies (1:200 dilution i.e., 5
µg/mL) for 12 h at 4 °C and washed with TBS (3 times, 5 min each). Tumor tissues were
stained using antibodies for Ki67 (for proliferation), CD31 (for vessel density), and NQO1
(oxidative stress marker). The sections were incubated with secondary antibody
conjugated with horseradish peroxidase (HRP) for 30 min at room temperature; and
washed with TBS (3 times, 5 min each). The bound antibodies were visualized using a 3,3′-
diaminobenzidine (DAB)-chromogen substrate (50 µL of DAB Chromogen in 1.0 mL of
DAB buffer). The sections were rinsed in running water and counter stained with
hematoxylin. Excess hematoxylin was removed by rinsing in water for 5 min.
The H&E stained and IHC processed slides were assessed under a light microscope
and photographed to determine the tissue morphology and level of cancer marker
expression. Representative photomicrographs were captured using Olympus (BX 53,
Olympus Corporation Shinjuku, Tokyo, Japan) microscope operating with 40×
magnifying lenses. The expression grading was conducted by two experienced
pathologists who independently counted the number of positively stained cells
(represented as percentage of stained cells in the field/per slide) and estimated the
intensity of staining. The staining intensity was graded as 0 (no staining), 1+ (weakly
stained), 2+ (moderately stained), and 3+ (strongly stained) [41].
2.3. Isolation, Estimation of Total Protein, and Western Blotting Analysis
To isolate total proteins from tumor and normal tissues, the samples were washed
with PBS, and chopped into smaller pieces. The chopped tissue was snap frozen in liquid
nitrogen, powdered, and homogenized in pre-chilled lysis buffer (0.8% NP40 and 2 mM
Biomedicines 2021, 9, 1119 5 of 29
EDTA) solution containing protease inhibitor cocktail mix. The solution was sonicated for
1.0 min (PCI Analytics, Mumbai, Maharashtra, India), centrifuged at 21,000× g for 30 min
at 4 °C. Protein content was estimated using bicinchoninic acid (BCA) method with BSA
standards. Contrary to tissue homogenates, the protein lysates were harvested from cell
cultures using lysis buffer (50 mM HEPES (pH 7.5), 150 mM NaCl, 10 mM EDTA, 10%
glycerol, 1% Triton X-100, 1 mM sodium orthovanadate, 0.1 mM sodium molybdate, 1
mM phenylmethylsulfonyl fluoride (PMSF), 20 g/mL aprotinin, and 5 g/mL leupeptin
according to a procedure described previously [42]. The total protein content was
estimated using a commercially available BCA kit from Pierce (Thermo Fisher Scientific,
Rockford, IL, USA).
Expression of Nrf2 was measured by western blotting as described previously [43].
Total protein (50 µg) was loaded per lane onto SDS-PAGE gels (4–12%, NuPAGE) and
subjected to electrophoresis. Blots were probed with antibodies (1:1500 dilution of
primary antibody from Abcam and Cell Signaling Technologies, USA and 1:4000 dilution
of secondary antibody from Santa Cruz Biotechnology, Santa Cruz, CA, USA).
Immunoblots were developed using an enhanced chemiluminescence (ECL) detection
system (Thermo Fisher Scientific, Rockford, IL, USA). The intensity of protein bands was
quantitated using Image-J software. Intensity of each band was normalized to Enolase
loading control; and the data were represented as fold change compared to vehicle treated
or normal controls.
2.4. Measurement of NQO1 Activity
NQO1 activity was measured using standard reaction of glucose-6-phosphate (G6P)
incubation with G6P dehydrogenase (G6Pdase) that produced NADPH, which, in turn,
was used to reduce menadione into menadiol [44]. The level of blue colored formazan was
measured at 610 nm using a multimode plate reader. Dicoumarol was used to measure
the background activity contributed by other reductases. Aliquots of total protein (10 µg
of a protein in a total volume of 40 µL) were incubated with 200 µL of NQO1 cocktail with
or without dicoumarol (three with and three without dicoumarol; six wells for each test).
The absorbance was read at 610 nm for a period of 30 min with 1 min interval. NQO1
activity was calculated by subtracting the readings of samples with inhibitor from the ones
without the inhibitor. Following this, the optical density (OD) value per minute was
calculated and mole units were determined by multiplying the OD/minute/molar
extinction coefficient of MTT (11300 M−1 cm) with protein concentration of a sample [43].
The NQO1 activity was expressed as µmol/min/mg protein. The method was also used to
assess NQO1 activity in cell lines.
2.5. siRNA Mediated Nrf2 Knockdown Using Lipofectamine RNAi Max Reagent
Expression of Nrf2 was transiently inhibited by transfecting cells with siRNA (from
Thermo-Fisher Scientific, Waltham, MA,, USA) using a reverse transfection protocol.
Before transfection, cells were grown in a medium without antibiotics and harvested
using trypsin. The transfection was conducted according to the manufacturer instructions.
The collected RNAs and protein were analyzed using quantitative real-time PCR (qRT-
PCR) and western blotting, respectively. To assess the knockdown effect on cell viability,
1 × 10⁴ control and transfected cells/well in 100 µL media were plated and allowed to grow
for 48 and 72 h. Cell viability was determined using MTS (3-(4,5-dimethylthiazol-2-yl)-5-
(3-carboxymethoxyphenyl)-2-(4-sulfophenyl)-2H-tetrazolium))assay (cat#: G111A,
Promega, Madison, WI, USA).
2.6. Analysis of Gene Expression Using qRT-PCR and Gel Electrophoresis of Total RNA
Quantification of gene expression was carried out using qRT-PCR as described
previously [45]. RNA was isolated according to the standard procedure [46] using the
TRIzol reagent. The RNA quality and quantity were estimated using a spectrophotometer.
Biomedicines 2021, 9, 1119 6 of 29
Additionally, the quality of RNA was determined using 1% bleach gel electrophoresis as
described previously [47]. The samples were stored at −80 °C for further usage. Quality of
isolated RNA was measured using bleach gel electrophoresis. The bleach gel (1%) was
prepared by mixing 1 g of agarose in 100 mL 1X TAE buffer (40 mM Tris (pH 7.6), 20 mM
acetic acid, and 1 mM EDTA), containing 600.0 µL 5% sodium hypochlorite. The samples
were mixed with 6X loading dye (30% glycerol and 0.25% (W/V) bromophenol blue) and
loaded into gel-loaded cassette. Samples (24 µL) were separated at 100 volts (1–5 volts/cm)
during 60 min. The separated RNA bands were visualized using UV light in a UV-
transilluminator (Syngene G-BOX XR5, Syngene, Frederick, MD , USA). Appearances of
28S and 18S RNA bands at a ratio of 2:1 indicated the presence of intact RNA.
Reverse transcription reaction was performed using High-Capacity cDNA Reverse
Transcription Kit. The final sample volume of 20.0 µL contained 1000 ng of total RNA, 100
ng of random hexamers, 2.0 µL reverse transcription buffer, 2.5 mM MgCl2, 1 mM dNTP,
20 U of superscript reverse transcriptase, and nuclease free diethyl pyrocarbonate
(DEPC)-treated water as detailed in High-Capacity cDNA Reverse Transcription kit
protocol. The reaction steps and conditions were as follows: Step 1: 25 °C for 10 min; Step
2: 37 °C for 120 min; Step 3: 85 °C for 5 min; Step 4: 4 °C. After completion of cDNA
synthesis, 80 µL nuclease free water was added to vials (final concentration of the cDNA
was 10 ng/µL) and samples were stored at 4 °C.
Human Nrf2, its target gene NQO1, and the house keeping control gene GAPDH were
quantified using specific primers and DyNAmo Color Flash SYBR Green QPCR Kit
(Finnzymes) according to the manufacturer’s instruction. Reaction mixture composition
(for 20 µL) was as following: 1) SYBR green dye −10 µL; 2) primers: forward −0.2 µM and
reverse −0.2 µM (Table 1); 3) template: 50 ng; 4) nuclease free water. All primers were
purchased from Sigma (Bengaluru, Karnataka, India). Quantitative RT-PCR experiment
was performed using Qiagen Rotor Gene-Q (Qiagen Rotor Gene-Q-5 Plex, Qiagen,
Antwerp, Belgium). Relative fold change was calculated using 2-ΔΔct method as described
previously [45]; ΔΔCT = (CT of gene of interest in TEST sample—CT of internal control of
test sample)—(CT gene of interest in CONTROL sample—CT internal control of control
sample).
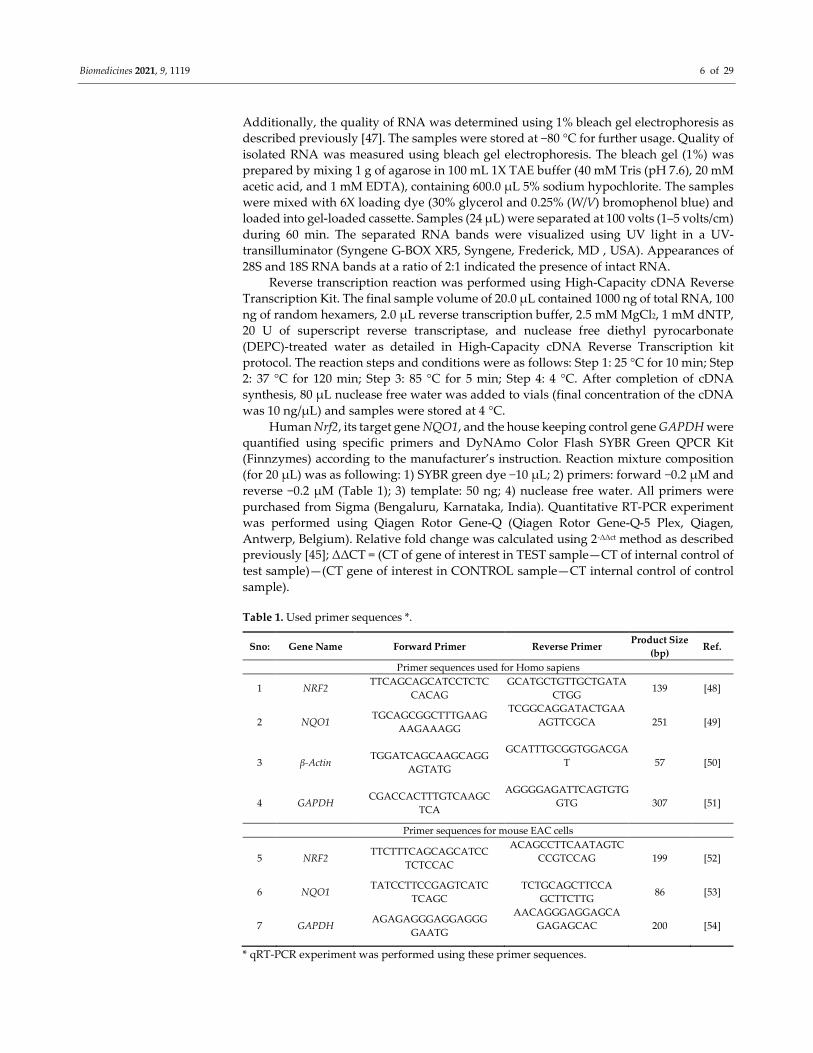
Table 1. Used primer sequences *.
Sno: Gene Name Forward Primer Reverse Primer Product Size
(bp) Ref.
Primer sequences used for Homo sapiens
1 NRF2 TTCAGCAGCATCCTCTC
CACAG
GCATGCTGTTGCTGATA
CTGG 139 [48]
2 NQO1 TGCAGCGGCTTTGAAG
AAGAAAGG
TCGGCAGGATACTGAA
AGTTCGCA
251 [49]
3 β-Actin TGGATCAGCAAGCAGG
AGTATG
GCATTTGCGGTGGACGA
T
57 [50]
4 GAPDH CGACCACTTTGTCAAGC
TCA
AGGGGAGATTCAGTGTG
GTG
307 [51]
Primer sequences for mouse EAC cells
5 NRF2 TTCTTTCAGCAGCATCC
TCTCCAC
ACAGCCTTCAATAGTC
CCGTCCAG
199 [52]
6 NQO1 TATCCTTCCGAGTCATC
TCAGC
TCTGCAGCTTCCA
GCTTCTTG 86 [53]
7 GAPDH AGAGAGGGAGGAGGG
GAATG
AACAGGGAGGAGCA
GAGAGCAC
200 [54]
* qRT-PCR experiment was performed using these primer sequences.
Biomedicines 2021, 9, 1119 7 of 29
2.7. Cytotoxic Potential of Nrf2 Inhibitor Brusatol
The anti-cancer activity of brusatol was measured as described previously [55].
Various BC cells (MCF-7, MDA-MB-231, or MDA-MB-468) (1.0 × 10⁴ cells in 100 µL DMEM
with 10% FBS) were seeded in 96-well plates and cultured in an incubator at 37 °C with
5% CO2 and 90% relative humidity. Following this, when cell confluence reached about
60 to 70% (36 h later), the cells were exposed to gradual concentrations of brusatol (ranging
from 0.31 to 10 µM) for 24 or 48 h. Following this treatment, cell viability was measured
using sulforhodamine B (SRB) and MTT(3-(4,5-Dimethylthiazol-2-yl)-2,5-
Diphenyltetrazolium Bromide) assays [56,57]. Diallyl disulfide (DADS) (1 mM) was used
as positive control.
2.8. Cell Cycle Analysis Using Propidium Iodide (PI) Staining
Cell cycle analysis was carried out as described previously [58]. MDA-MB-468 or
MCF-7 cells (3 × 10⁵ in 2 mL medium) were cultured in 6-well plates for 24 h in a CO2
incubator at 37 °C. Moreover, 60–70% confluent cells were washed with PBS and exposed
to gradually increasing concentrations of brusatol for 48 h. Camptothecin (25 µM) was
used as positive control. DMSO (0.1%) served as vehicle control. Cells grown in medium
with no treatments served as untreated control. Following 48 h incubation, the medium
was removed. The cells were washed with PBS, trypsinized, and collected into a 15 mL
polystyrene tube. The collected cells were centrifuged (5 min at 300× g at 25 °C) and the
medium was discarded. The cell pellet was washed with PBS and fixed using 4 mL of cold
70% ethanol, and the fixed cells were centrifuged at ~500× g for 5 min. The pelleted cells
were washed twice with PBS.
To ensure that only DNA is stained, the cells were treated with 5 µg/mL RNase (50
µL) and the cells were incubated with PI (400 µL PI solution per million cells) for 10 min
at room temperature. The stained cells were analyzed using flow cytometry (BD
FACSCalibur, model: 343202-FACSCALIBUR 4 CLR, BD Biosciences, San Jose, CA,
USA) with three filters (GFP-515/15, YFP-540/20BP, RFP—610/20BP). Cell quest pro v.6.0
software was used for cell analysis.
2.9. Assessment of Cell Migration Using Scratch Assay
Scratch assay was carried out as described previously [59,60]. BC cells (1 × 10⁵
cells/well) were seeded in 12-well plates and incubated in a CO2 incubator until cells
reached 80% confluence. Following this, a linear wound (~0.7 mm width) was produced
using a sterile pipette tip (10 µL). Then, loosely bound cancer cells were washed carefully
with PBS and the cells were treated with brusatol (19, 78, 312, or 1250 nM), or a positive
control itraconazole (5 µg/mL), or vehicle control [61]. Photomicrographs were captured
at 0, 24, 48, and 72 h. The scratch area was calculated using Image-J software. To exclude
the impact of proliferation (when growing in 10% FBS medium) on gap closure, the BC
cells were grown in DMEM supplemented with 1% FBS and the scratch assay carried out
as detailed elsewhere [62,63].
2.10. Apoptosis Assay with Acridine Orange (AO) and Ethidium Bromide (EtBr)
To determine cell death related changes, an AO and EtBr staining method was
adopted. Control and pre-treated cells (0.5 × 10⁶) were trypsinized and mixed gently to
obtain a single cell suspension. Trypsin was neutralized by the addition of complete
medium, and the cell suspension was centrifuged at 900× g for 5 min. The cell pellet was
resuspended in 20 µL PBS. The cell suspension was incubated with 10 µL EtBr (100 µg/mL
in PBS) and 10 µL AO (100 µg/mL in PBS) mixture for 10 min. The stained cells were
assessed using an Olympus fluorescence microscope (BX 53, Olympus Corporation
Shinjuku, Tokyo, Japan) operating with TRITC and FITC filters. All images were captured
using green and red channels, and subsequently merged to visualize a combined image
showing green (live) and orange/red (apoptotic) cells. At least five different fields were
Biomedicines 2021, 9, 1119 8 of 29
considered for quantification of live and apoptotic cells. The percentage of cells
undergoing apoptosis over total cells/field is represented as bar graph.
2.11. Assessment of Lymphocytic Infiltration in Solid Tumors
Lymphocytic infiltration was assessed in H&E-stained tumor sections as detailed by
[64]. The stained sections were examined using light microscopy at 10× and 40×
magnifications for the presence of reactive lymphocytes in tumor and surrounding
tissues. The percentage of lymphoid cells surrounding the tumor was scored (1–3),
according to the density of lymphocytic infiltration; wherein 1 refers to mild infiltration,
2 refers to moderate infiltration and 3 refers to dense infiltration.
2.12. In-Vivo Evaluation of Brusatol Effects in Swiss Albino Mouse Model
Animal experiments were approved by Institutional Animal Ethics Committee from
JSS College of Pharmacy, Mysore (approval no. IAEC/JSSCPM/319/2018 4 September,
2018). Swiss albino mice (6–8 weeks old) weighing around 26–30 g was divided into four
groups with six animals in each group. Viable EAC cell (5 × 10⁶) suspension was injected
into right thigh tissue of six experimental animals as described previously [65]. Six normal
control animals were injected with vehicle solution. Volume of developing tumors was
measured once in two days using a Vernier Caliper. Beginning from the seventh day after
injection, the mice brusatol (0.5 mg/kg and 2 mg/kg body weight) was administered every
other day intraperitoneally. The treatment continued for two weeks, and the experiment
was terminated on day 23 after injection of tumor cells. Animals were humanely
sacrificed, and tumor tissues were collected. The length and width of the tumor was
measured and the volume calculated using (W2 × L)/2 formula [66]. The collected tumors
were washed and processed for further IHC staining analysis. Tumor proteins were also
isolated to measure NQO1 activity as described above.
2.13. Statistical Analysis
All experiments were repeated three or more times. Data were expressed as mean of
three independent experiments ± SD. GraphPad Prism version 6.0 (Graphpad Software,
CA, USA) was used for statistical analyses. The results were subjected to one-way
ANOVA to compare differences between control and test groups. Tukey’s post hoc test
was used as indicated and the “p” value of <0.05 was considered significant.
3. Results
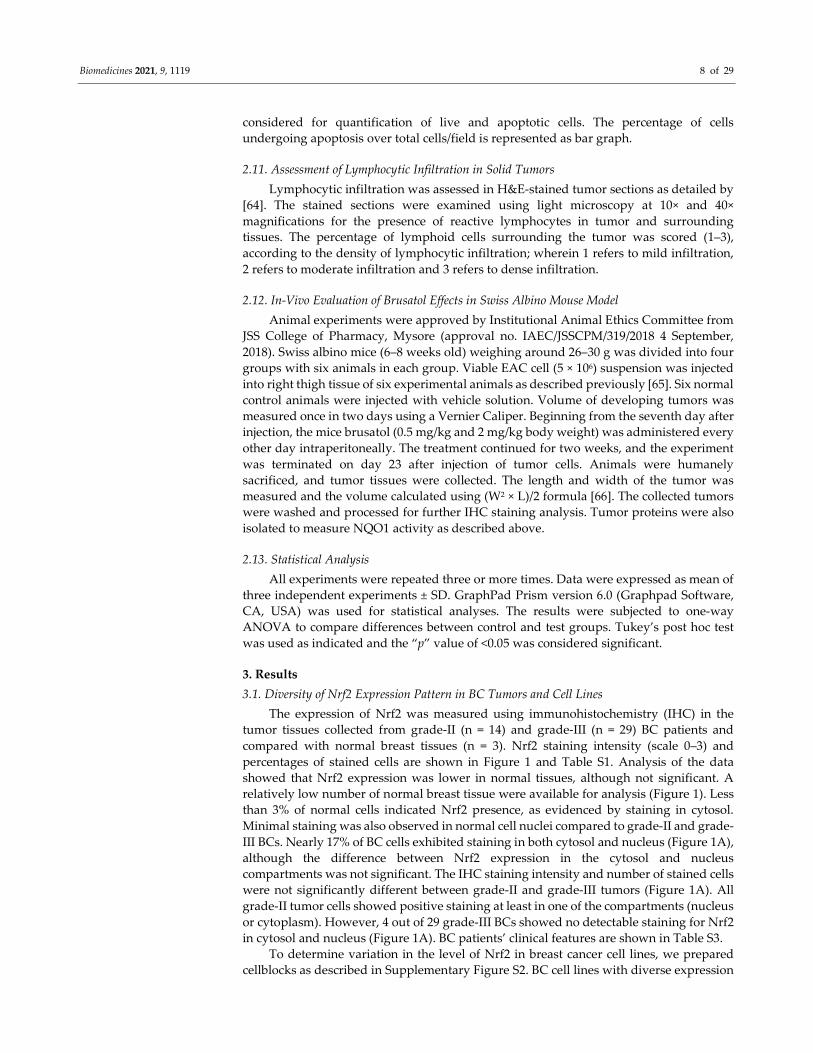
3.1. Diversity of Nrf2 Expression Pattern in BC Tumors and Cell Lines
The expression of Nrf2 was measured using immunohistochemistry (IHC) in the
tumor tissues collected from grade-II (n = 14) and grade-III (n = 29) BC patients and
compared with normal breast tissues (n = 3). Nrf2 staining intensity (scale 0–3) and
percentages of stained cells are shown in Figure 1 and Table S1. Analysis of the data
showed that Nrf2 expression was lower in normal tissues, although not significant. A
relatively low number of normal breast tissue were available for analysis (Figure 1). Less
than 3% of normal cells indicated Nrf2 presence, as evidenced by staining in cytosol.
Minimal staining was also observed in normal cell nuclei compared to grade-II and grade-
III BCs. Nearly 17% of BC cells exhibited staining in both cytosol and nucleus (Figure 1A),
although the difference between Nrf2 expression in the cytosol and nucleus
compartments was not significant. The IHC staining intensity and number of stained cells
were not significantly different between grade-II and grade-III tumors (Figure 1A). All
grade-II tumor cells showed positive staining at least in one of the compartments (nucleus
or cytoplasm). However, 4 out of 29 grade-III BCs showed no detectable staining for Nrf2
in cytosol and nucleus (Figure 1A). BC patients’ clinical features are shown in Table S3.
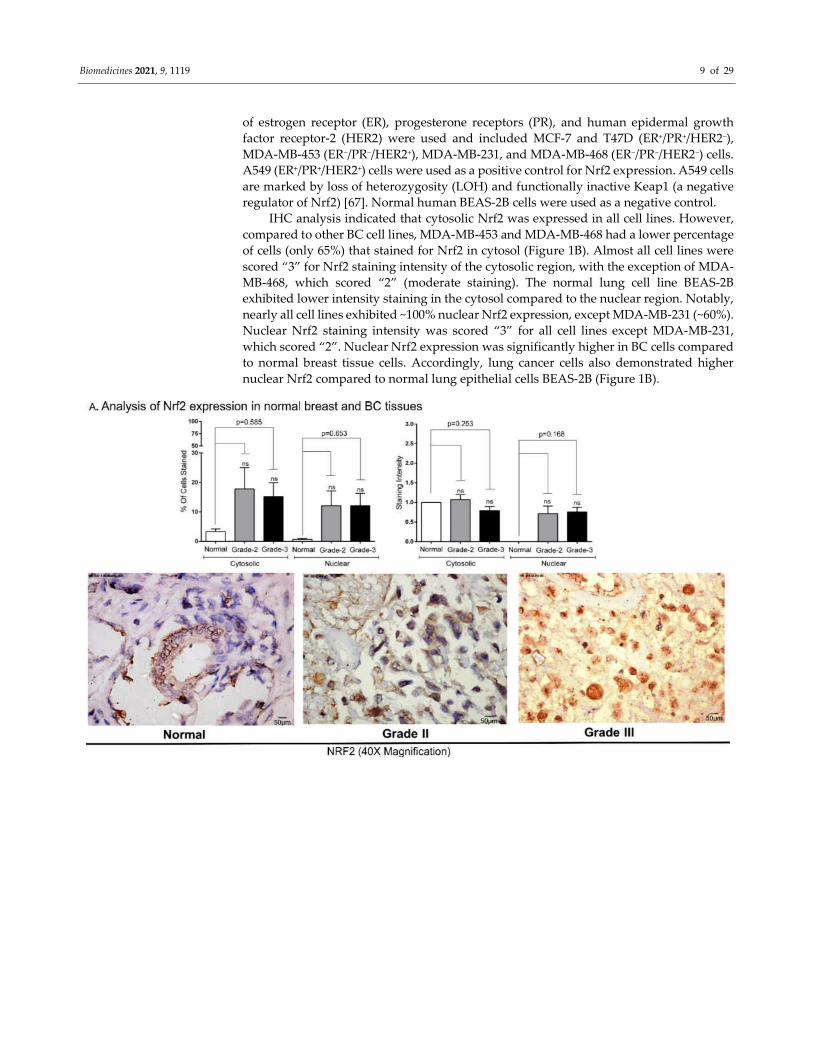
To determine variation in the level of Nrf2 in breast cancer cell lines, we prepared
cellblocks as described in Supplementary Figure S2. BC cell lines with diverse expression
Biomedicines 2021, 9, 1119 9 of 29
of estrogen receptor (ER), progesterone receptors (PR), and human epidermal growth
factor receptor-2 (HER2) were used and included MCF-7 and T47D (ER+/PR+/HER2−),
MDA-MB-453 (ER−/PR−/HER2+), MDA-MB-231, and MDA-MB-468 (ER−/PR−/HER2−) cells.
A549 (ER+/PR+/HER2+) cells were used as a positive control for Nrf2 expression. A549 cells
are marked by loss of heterozygosity (LOH) and functionally inactive Keap1 (a negative
regulator of Nrf2) [67]. Normal human BEAS-2B cells were used as a negative control.
IHC analysis indicated that cytosolic Nrf2 was expressed in all cell lines. However,
compared to other BC cell lines, MDA-MB-453 and MDA-MB-468 had a lower percentage
of cells (only 65%) that stained for Nrf2 in cytosol (Figure 1B). Almost all cell lines were
scored “3” for Nrf2 staining intensity of the cytosolic region, with the exception of MDA-
MB-468, which scored “2” (moderate staining). The normal lung cell line BEAS-2B
exhibited lower intensity staining in the cytosol compared to the nuclear region. Notably,
nearly all cell lines exhibited ~100% nuclear Nrf2 expression, except MDA-MB-231 (~60%).
Nuclear Nrf2 staining intensity was scored “3” for all cell lines except MDA-MB-231,
which scored “2”. Nuclear Nrf2 expression was significantly higher in BC cells compared
to normal breast tissue cells. Accordingly, lung cancer cells also demonstrated higher
nuclear Nrf2 compared to normal lung epithelial cells BEAS-2B (Figure 1B).
Biomedicines 2021, 9, 1119 10 of 29
Figure 1. IHC analysis of Nrf2 expression in BC tissues and cell lines: (A) Nrf2 expression in normal and grade-II/III BC
tissues: The expression of Nrf2 in normal breast tissues (n = 3), grade-II (n = 14), and grade-III (n = 29) BC tissues was
analyzed by IHC. Representative microphotographs (40X magnification images) are shown. Please refer to Supplementary
Figure 1 for the tissue array preparation procedure. Expression of Nrf2 in cytosolic and nuclear compartments of the same
cells/tissues was compared and was not found significantly different. (B) Elevated Nrf2 was observed in breast cancer cell
lines MCF-7, T47D, MDA-MB-453, MDA-MB-231, MDA-MB-468, and in lung cancer cell line A549. Expression of Nrf2 was
visualized using immunocytochemistry (IHC). Irrespective of ER, PR, and HER2 expression status, all BC cell lines and
A549 exhibited higher level of Nrf2 compared to normal breast tissue and lung cells. Total cell number was counted for
each image. Representative microphotographs (40X magnification, Scale:50 µm) are shown.
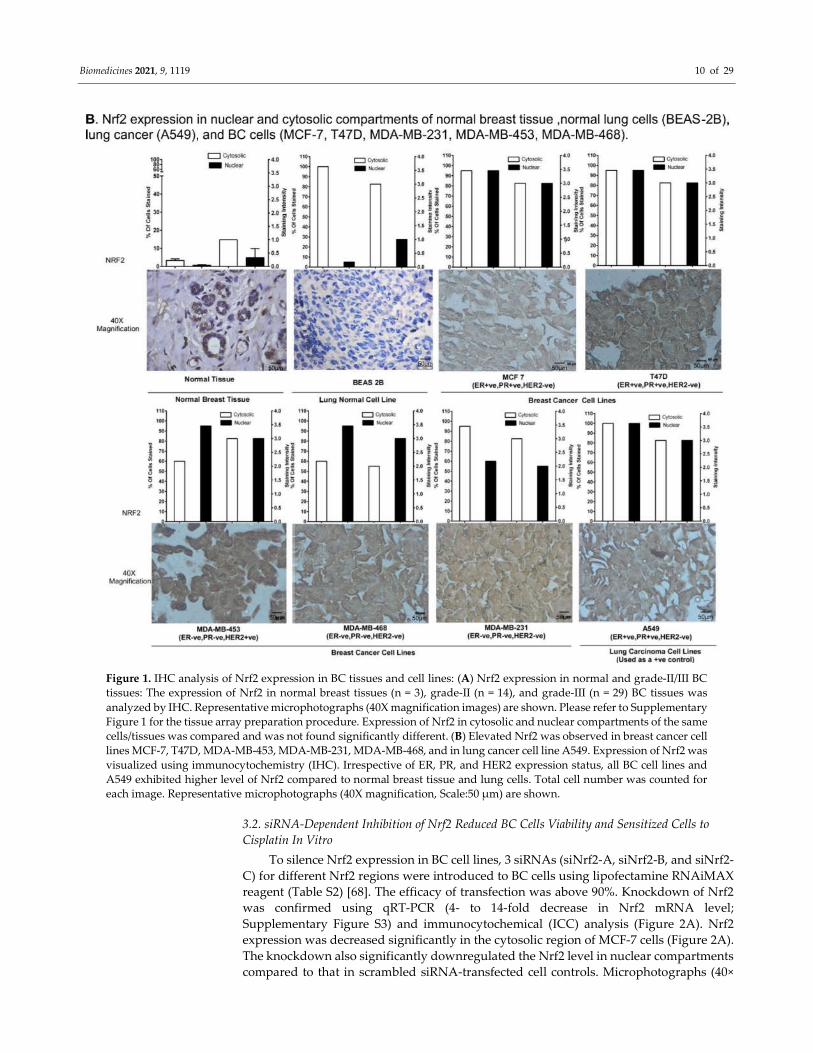
3.2. siRNA-Dependent Inhibition of Nrf2 Reduced BC Cells Viability and Sensitized Cells to
Cisplatin In Vitro
To silence Nrf2 expression in BC cell lines, 3 siRNAs (siNrf2-A, siNrf2-B, and siNrf2-
C) for different Nrf2 regions were introduced to BC cells using lipofectamine RNAiMAX
reagent (Table S2) [68]. The efficacy of transfection was above 90%. Knockdown of Nrf2
was confirmed using qRT-PCR (4- to 14-fold decrease in Nrf2 mRNA level;
Supplementary Figure S3) and immunocytochemical (ICC) analysis (Figure 2A). Nrf2
expression was decreased significantly in the cytosolic region of MCF-7 cells (Figure 2A).
The knockdown also significantly downregulated the Nrf2 level in nuclear compartments
compared to that in scrambled siRNA-transfected cell controls. Microphotographs (40×
Biomedicines 2021, 9, 1119 11 of 29
magnification) indicate a decrease in Nrf2 in both the cytosol and nucleus (Figure 2A).
These results are supported by the data obtained using RT-PCR to measure the expression
of Nrf2 mRNA (Supplementary Figure S3) and western blot analysis of whole cell lysates
to measure Nrf2 protein expression. Our data indicated a decrease in Nrf2 RNA as well
as protein in siRNA-transfected MCF-7, MDA-MB-231, and MDA-MB-468 cells compared
to controls (Supplementary Figures S3 and S4). The activity of NQO1 (a direct target of
Nrf2) [69] was assessed in cell lysates to further confirm successful knockdown of Nrf2.
NQO1 activity was found to be significantly decreased in MDA-MB-468 and MCF-7 cells
(Figure 2B).
SiRNA-transfected cells viability was tested using MTT assay at 24 h (no effects
observed; data not shown), 48 h, and 72 h after transfection. Nrf2-targeting siRNAs
induced a significant reduction in cell viability compared to scrambled siRNA-transfected
MDA-MB-468 cells (Figure 2C). The viability was also significantly decreased in Nrf2-
silenced MCF-7 cells (Figure 2C). A non-significant decrease (>10%) in cell viability was
observed in Nrf2-silenced MDA-MB-231 cells (Supplementary Figure S5).
Biomedicines 2021, 9, 1119 12 of 29
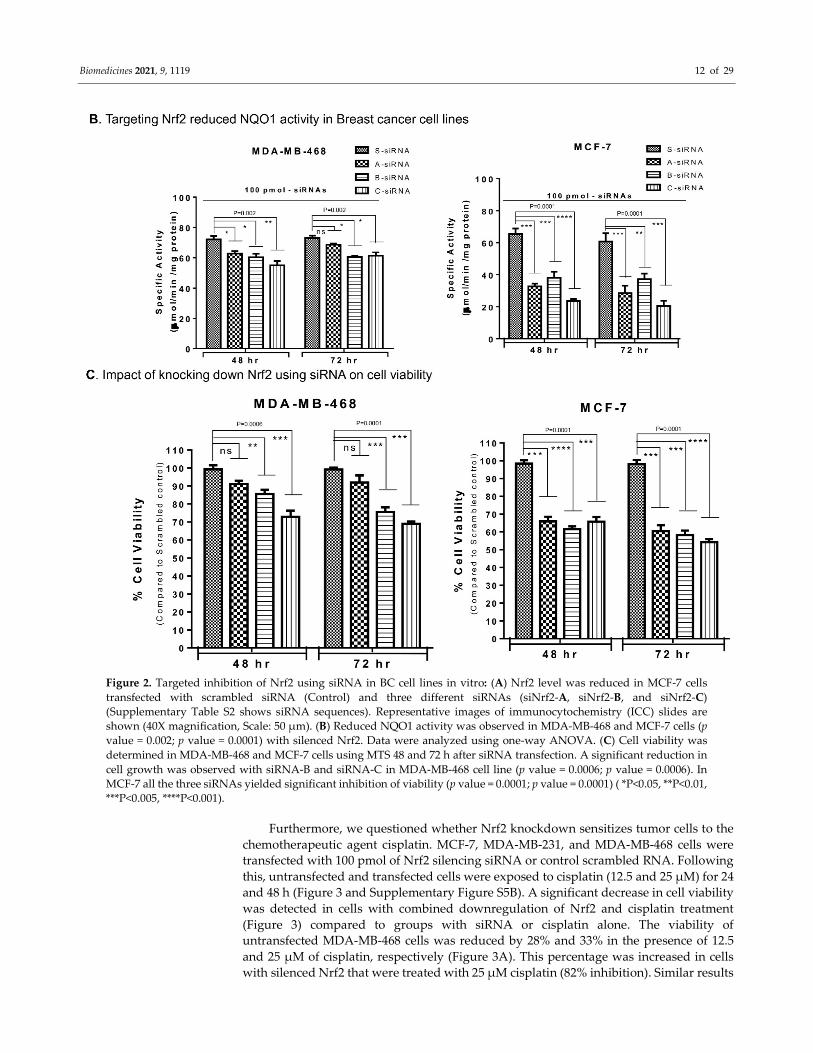
Figure 2. Targeted inhibition of Nrf2 using siRNA in BC cell lines in vitro: (A) Nrf2 level was reduced in MCF-7 cells
transfected with scrambled siRNA (Control) and three different siRNAs (siNrf2-A, siNrf2-B, and siNrf2-C)
(Supplementary Table S2 shows siRNA sequences). Representative images of immunocytochemistry (ICC) slides are
shown (40X magnification, Scale: 50 µm). (B) Reduced NQO1 activity was observed in MDA-MB-468 and MCF-7 cells (p
value = 0.002; p value = 0.0001) with silenced Nrf2. Data were analyzed using one-way ANOVA. (C) Cell viability was
determined in MDA-MB-468 and MCF-7 cells using MTS 48 and 72 h after siRNA transfection. A significant reduction in
cell growth was observed with siRNA-B and siRNA-C in MDA-MB-468 cell line (p value = 0.0006; p value = 0.0006). In
MCF-7 all the three siRNAs yielded significant inhibition of viability (p value = 0.0001; p value = 0.0001) ( *P<0.05, **P<0.01,
***P<0.005, ****P<0.001).
Furthermore, we questioned whether Nrf2 knockdown sensitizes tumor cells to the
chemotherapeutic agent cisplatin. MCF-7, MDA-MB-231, and MDA-MB-468 cells were
transfected with 100 pmol of Nrf2 silencing siRNA or control scrambled RNA. Following
this, untransfected and transfected cells were exposed to cisplatin (12.5 and 25 µM) for 24
and 48 h (Figure 3 and Supplementary Figure S5B). A significant decrease in cell viability
was detected in cells with combined downregulation of Nrf2 and cisplatin treatment
(Figure 3) compared to groups with siRNA or cisplatin alone. The viability of
untransfected MDA-MB-468 cells was reduced by 28% and 33% in the presence of 12.5
and 25 µM of cisplatin, respectively (Figure 3A). This percentage was increased in cells
with silenced Nrf2 that were treated with 25 µM cisplatin (82% inhibition). Similar results
Biomedicines 2021, 9, 1119 13 of 29
were observed in MCF-7 (Figure 3B) and MDA-MB-231 cells (Supplementary Figure S5B).
These data indicate the downregulation of Nrf2 using siRNA sensitized cells to cisplatin.
Surprisingly, decreased cell viability was also observed in some scrambled siRNA-
transfected cells treated with 12.5 and 25.0 µM of cisplatin compared to cells treated with
cisplatin or scrambled siRNA alone (Figure 3A). The data suggest that there is cell damage
associated with the transfection of cells with scrambled siRNA loaded RNAiMAX
particles.
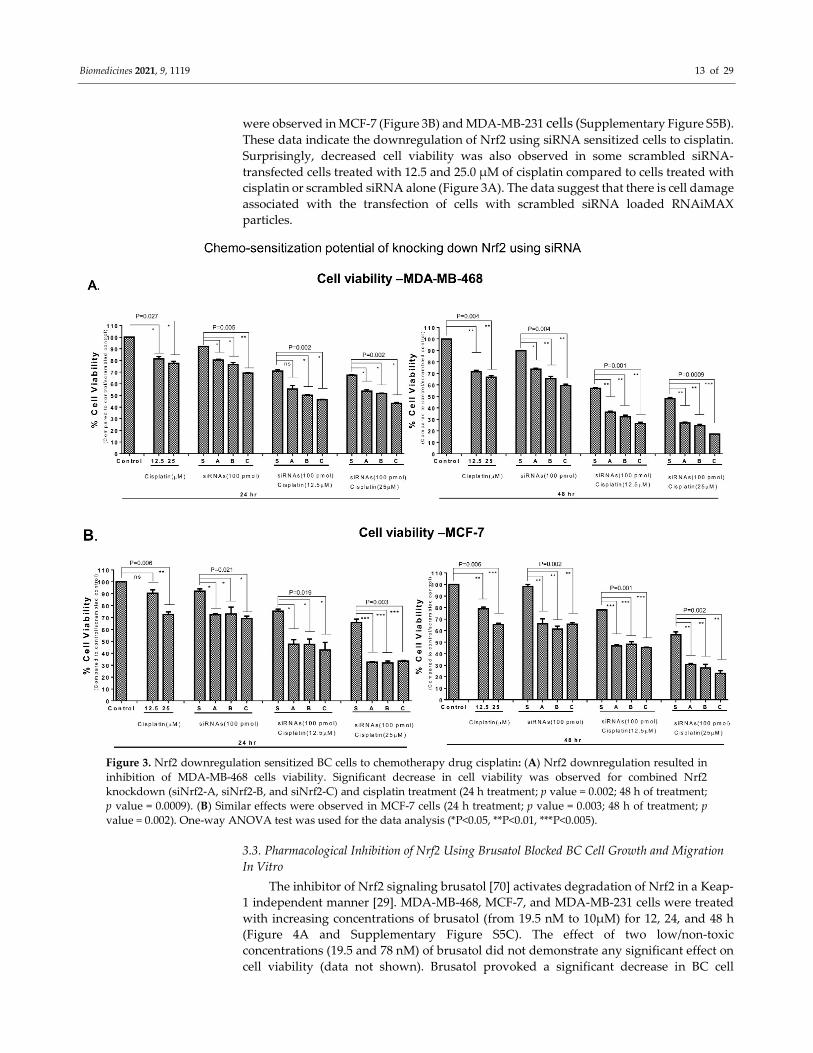
Figure 3. Nrf2 downregulation sensitized BC cells to chemotherapy drug cisplatin: (A) Nrf2 downregulation resulted in
inhibition of MDA-MB-468 cells viability. Significant decrease in cell viability was observed for combined Nrf2
knockdown (siNrf2-A, siNrf2-B, and siNrf2-C) and cisplatin treatment (24 h treatment; p value = 0.002; 48 h of treatment;
p value = 0.0009). (B) Similar effects were observed in MCF-7 cells (24 h treatment; p value = 0.003; 48 h of treatment; p
value = 0.002). One-way ANOVA test was used for the data analysis (*P<0.05, **P<0.01, ***P<0.005).
3.3. Pharmacological Inhibition of Nrf2 Using Brusatol Blocked BC Cell Growth and Migration
In Vitro
The inhibitor of Nrf2 signaling brusatol [70] activates degradation of Nrf2 in a Keap-
1 independent manner [29]. MDA-MB-468, MCF-7, and MDA-MB-231 cells were treated
with increasing concentrations of brusatol (from 19.5 nM to 10µM) for 12, 24, and 48 h
(Figure 4A and Supplementary Figure S5C). The effect of two low/non-toxic
concentrations (19.5 and 78 nM) of brusatol did not demonstrate any significant effect on
cell viability (data not shown). Brusatol provoked a significant decrease in BC cell
Biomedicines 2021, 9, 1119 14 of 29
viability; however, this effect was not dose- or time-dependent (Figure 4A and
Supplementary Figure S5C). The highest cytotoxic effects of brusatol were observed at 24
and 48 h of treatment (Figure 4A).
Effects of various doses of brusatol (0.05 to 5 µM) on NQO1 activity were tested in
MDA-MB-468, MCF-7, and MDA-MB-231 cell lysates at 4, 8, and 24 h of treatment (Figure
4B and Supplementary Figure S5D). Data analysis revealed dose- and time-dependent
decreases in NQO1 activity at 4 and 8 h, but not at 24 h of brusatol treatment in all cell
lines (Figure 4B and Supplementary Figure S5D). No further decreases in NQO1 activity
were observed in MDA-MB-468 and MDA-MB-231 cells treated with higher
concentrations of brusatol after 24 h treatment (Figure 4B and Supplementary Figure S5D).
These observations indicate potential saturation of Nrf2 inhibition by high brusatol doses
(5 µM), which warrants further investigation. Thus, brusatol-induced downregulation of
NQO1 activity preceded inhibition of BC cell growth.
Next, the ability of brusatol to inhibit cancer cell migration was tested using a scratch
assay [71]. Brusatol strongly inhibited MCF-7 cell migration during 48 h of incubation
(Figure 4C). A significant dose-dependent decrease in percentage of area covered by
migrating cells was observed for all BC cell lines (Figure 4C–E). Major changes in MDA-
MB-468 cell migration were recorded 72 h after introduction of the scratch (Figure 4D).
Cell migration of brusatol-treated MDA-MB-231 differed from the control at 24 h (Figure
4E). To exclude the role of cell proliferation in gap closure, MDA-MB-231 cells were also
grown in 1% FBS medium as detailed previously [62,63]. Cell migration rate was reduced
under low serum conditions in our experiments (Figure 4F) and reported previously [72].
Brusatol (1250 nM) significantly reduced the migration of cells in a dose-dependent
manner in low-serum conditions compared to vehicle-treated controls (Figure 4F). Cell
count was found to be similar in vehicle- and brusatol-treated wells (Figure 4G). Cell
proliferation in closing scratch wounds was not observed (data not shown) in reduced
serum concentration (1% FBS). Moreover, significantly decreased migration was observed
along with a reduction in cell number in MDA-MB-231 treated with 312 nM of brusatol
(Figure 4G), suggesting that this dose of brusatol also activated apoptosis. Itraconazole (5
µg/mL), an inhibitor of cell invasion and migration, served as a positive control [61].
Itraconazole treatment resulted in 60–80% migration inhibition in MDA-MB-231 and
MCF-7 cell lines (Figure 4C, E). Representative microphotographs are shown in
Supplementary Figure S6A–D.
Biomedicines 2021, 9, 1119 15 of 29
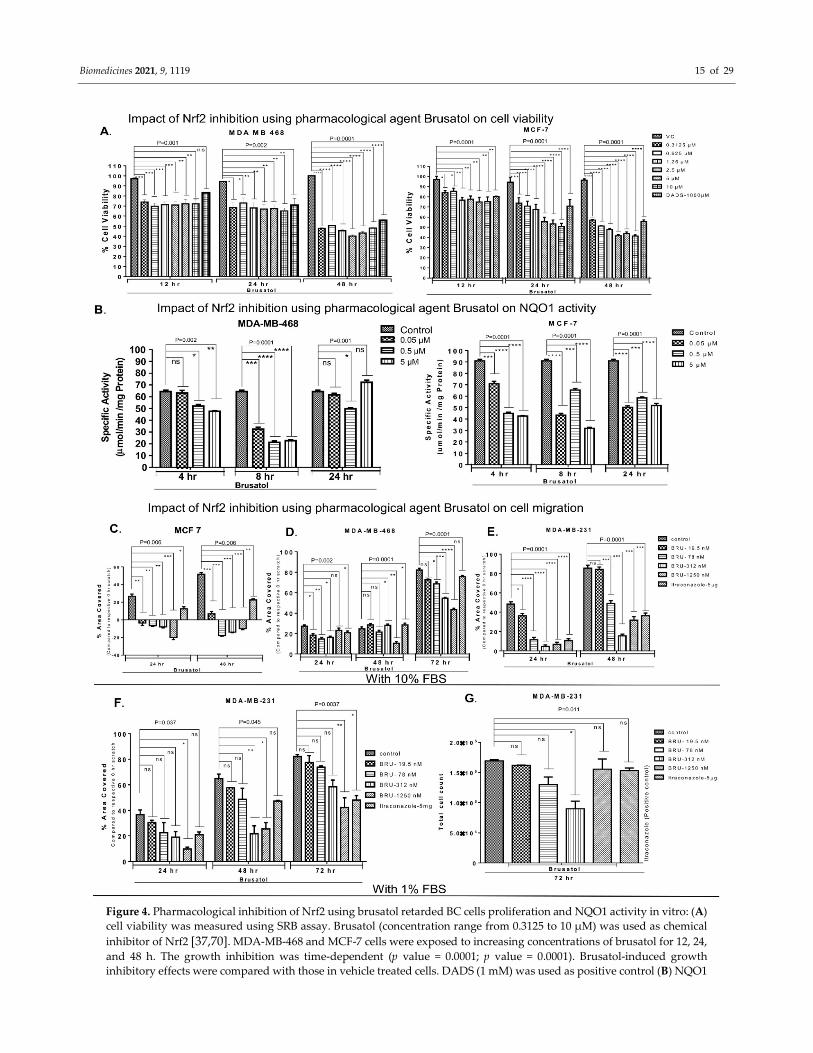
Figure 4. Pharmacological inhibition of Nrf2 using brusatol retarded BC cells proliferation and NQO1 activity in vitro: (A)
cell viability was measured using SRB assay. Brusatol (concentration range from 0.3125 to 10 µM) was used as chemical
inhibitor of Nrf2 [37,70]. MDA-MB-468 and MCF-7 cells were exposed to increasing concentrations of brusatol for 12, 24,
and 48 h. The growth inhibition was time-dependent (p value = 0.0001; p value = 0.0001). Brusatol-induced growth
inhibitory effects were compared with those in vehicle treated cells. DADS (1 mM) was used as positive control (B) NQO1
Biomedicines 2021, 9, 1119 16 of 29
activity was assessed in MDA-MB-468 and MCF-7 cells treated with vehicle control or different concentrations of brusatol
(0.05–5 µM). (C–G) Nrf2 inhibition by brusatol retards BC cell migration: Cells migration was assessed using a scratch
assay. All cell lines were treated with non-toxic concentrations of brusatol (19.5 nM to 1250 nM) or vehicle control. (C–E)
MCF-7, MDA-MB-468, and MDA-MB-231 cells were grown in media supplemented with 10% FBS. The inhibitory impact
of brusatol treatment was the strongest in MCF-7 cells. (F) MDA-MB-231 were grown in 1% FBS. Brusatol treatment
significantly decreased the percentage area covered by migrating cells. Itraconazole (5.0 µg/mL) was used as a positive
control for inhibiting cell migration [61]. (G) Cell count was found similar in vehicle- and brusatol-treated wells. One-
way ANOVA test was used for the data analysis (*P<0.05, **P<0.01, ***P<0.005, ****P<0.001).
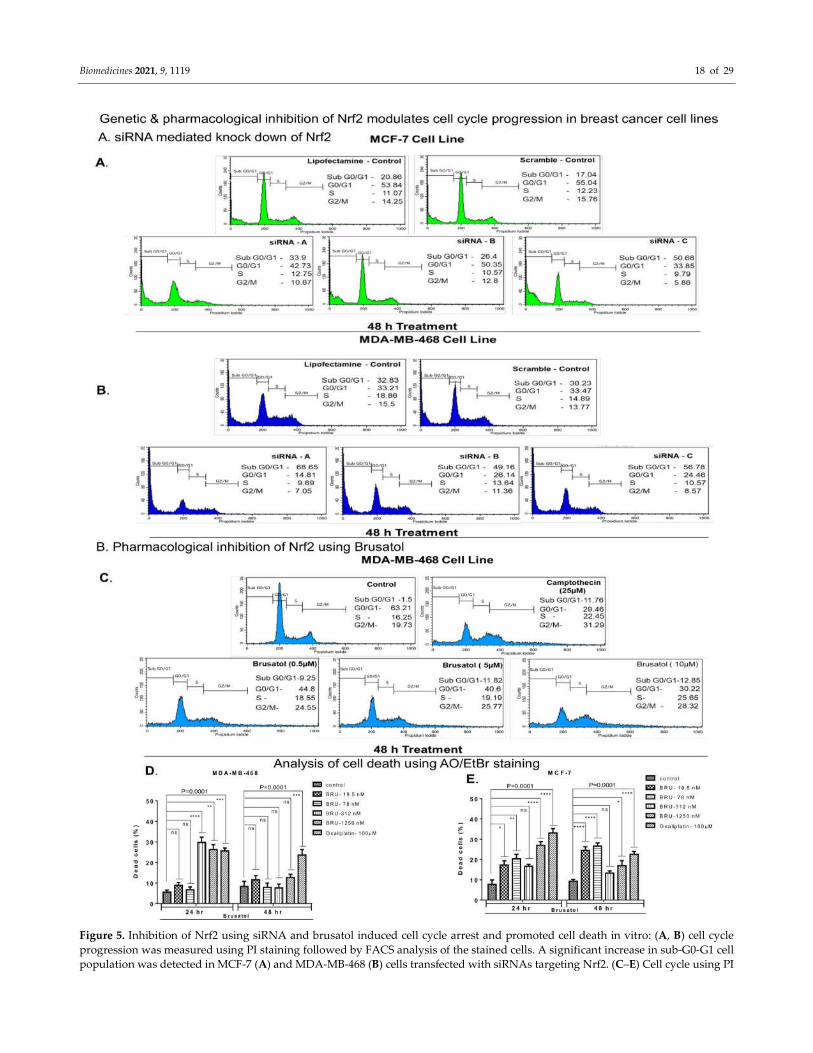
3.4. Genetic and Pharmacological Inhibition of Nrf2 Induced Accumulation of Cells in Sub-G0-
G1 and G2/M Phases of Cell Cycle
To elucidate the mechanism of Nrf2-related effects in BC, MCF-7, and MDA-MB-468
cell lines were subjected to cell cycle analysis. To downregulate Nrf2, MCF-7, and MDA-
MB-468 cells were transfected with 100 pmol of three different siRNAs (siNrf2-A, siNrf2-
B, and siNrf2-C). A significant increase in sub-G0-G1 cell population was observed, along
with a decrease in cell populations at other cell cycle stages (G0/G1, S, and G2/M). The
effect could be associated with the elevated cell death observed in Nrf2 siRNA-transfected
cells compared to control lipofectamine RNAiMAX reagent or scrambled siRNA-
transfected cells (Figure 5). MCF-7 cells exposed to lipofectamine RNAiMAX reagent or
transfected with scrambled siRNA had 20.86% and 17.04% of sub-G0-G1 cells,
respectively (Figure 5A). The sub-G0-G1 percentage of cells increased to 33.9%, 26.4%, and
50.68% with siNrf2-A, siNrf2-B, and siNrf2-C, respectively. MDA-MB-468 cells exposed
to lipofectamine RNAiMAX reagent had 32.83% of cells in the sub-G0-G1 stage, while
siScrambled RNA had 38.23%. The percentage of sub-G0-G1 cells increased to 68.65%,
49.16%, and 56.78% as a result of transfecting the cells with siNrf2-A, B, and C,
respectively (Figure 5B).
Cell cycle analysis was also performed using staining with propidium iodide (PI) and
FACS in MDA-MB-468 cells exposed to or not exposed to Nrf2 inhibitor Brusatol (Figure
5C). A significant increase in G2/M phase cell population was detected in cells treated
with 0.5, 5.0, and 10.0 µM of brusatol after 48 h of treatment (Figure 5C). A significantly
increased sub-G0-G1 population was also registered in brusatol-treated cells.
3.5. Nrf2 Inhibitor Brusatol Stimulates BC Cell Death
The pro-apoptotic effects of brusatol were assessed using acridine orange (AO) and
ethidium bromide (EB) dual staining procedure (Figure 5D, E and Supplementary Figure
S7). Healthy live cells appear green due to the uptake of membrane permeable AO, while
the pro-apoptotic cells are red due to the formation of broken DNA complexes with EB
[73]. We found an increased percentage of dead MDA-MB-468 and MCF-7 cells treated
with increasing concentrations of brusatol (19.5 to 1250 nM). The increased percentage of
dead cells was not dose-dependent in either cell line (Figure 5D, E and Supplementary
Figure S7A, B). Treatment with 100 µM oxaliplatin (the positive control) induced cell
death in ~26% of MDA-MB-468 cells at 24 h and 48 h. However, in MCF-7, 100 µM
oxaliplatin treatment induced cell death in ~33% and 23% of cells at 24 and 48 h of
exposure, respectively (Figure 5E). Similar results were observed in MDA-MB-231 cells
(Supplementary Figure S7C, D).
To assess the level of apoptosis in siRNA-transfected BC cells, MDA-MB-468, MCF-
7, and MDA-MB-231 were transfected with 100 pmol of siRNA. Percentages of live
(green), apoptotic (yellow), and dead (red) cells were counted. Analysis of the data
showed a significant increase in apoptosis in MDA-MB-468 cells with downregulated
Nrf2. The highest level of apoptosis was detected 72 h after transfection (Supplementary
Figure S8A). An increased level of apoptosis was also observed in MCF-7 cells transfected
with siNrf2-A and siNrf2-C (Supplementary Figure S8B). Downregulation of Nrf2 did not
influence apoptosis in the MDA-MB-231 cell line (Supplementary Figure S8C).
Biomedicines 2021, 9, 1119 17 of 29
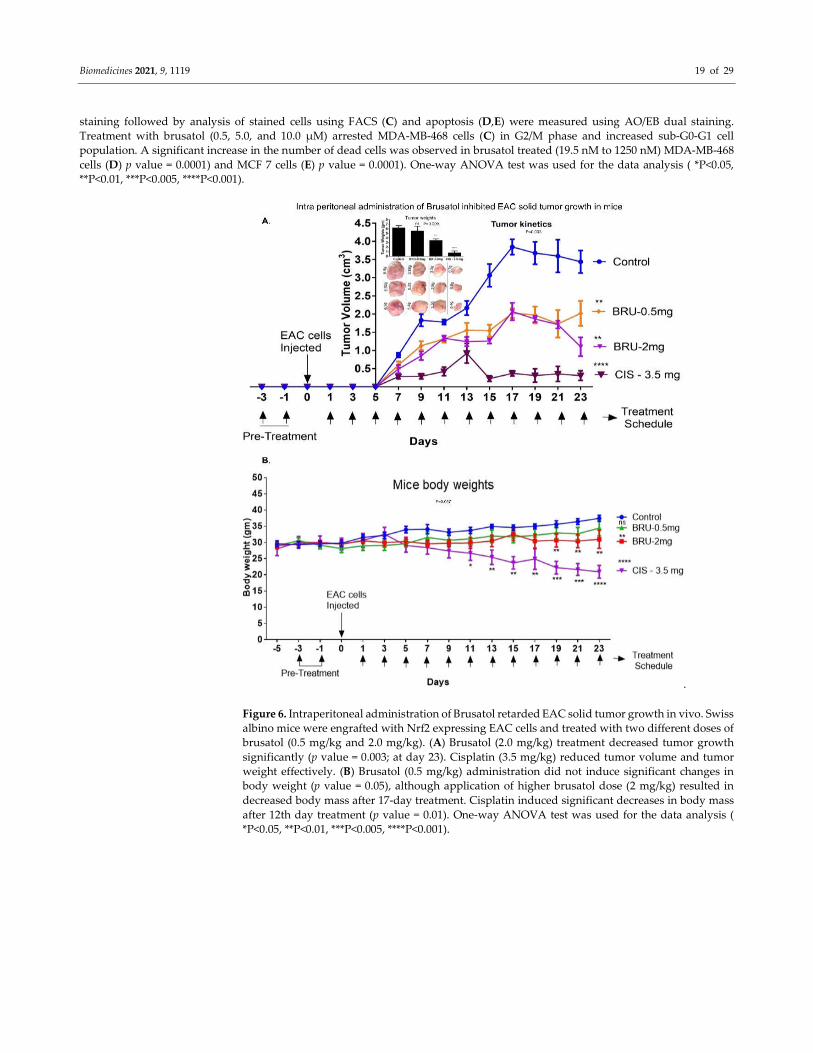
3.6. Intraperitoneal Administration of Brusatol Inhibited EAC Solid Tumors Development in
Mice In Vivo
We detected high level of Nrf2 expression in EAC cells using qRT-PCR
(Supplementary Figure S9A, B). EAC cells express higher Nrf2 levels than that in A549
lung carcinoma cells (Supplementary Figure S9A, B). Therefore, we used EAC cells in
tumor engraftment model in vivo. EAC-engrafted mice were administered brusatol (0.5
mg/kg or 2.0 mg/kg every other day) and tumor volume was recorded (Figure 6 and
Supplementary Figure S10A). Brusatol provoked a significant 40–70% reduction in tumor
volume (Figure 6A), but not in animal body mass until day 17 (Figure 6B, BRU-2 mg only).
Cisplatin (positive control) strongly reduced the tumor volume, although a significant
reduction in body mass was also observed (day 13; Figure 6A, B). Low dose brusatol did
not stimulate a significant reduction in the extracted tumor mass at day 23 compared to
vehicle control group. However, higher dose of brusatol resulted in a significant reduction
of tumor mass (Figure 6A and Supplementary Figure S10B). Cisplatin (3.5 mg/kg) reduced
the tumor mass by 88% at day 23 (Figure 6A).
3.7. Brusatol Treatment Reduced Nrf2 Activity/Expression and the Activity of Nrf2-Target Gene
NQO1 in Tumors In Vivo
IHC was used to determine Nrf2 and its target gene expressions in tumor-engrafted
and brusatol-treated mice. No significant changes in the nuclear Nrf2 expression were
detected, although the cytosolic Nrf2 expression was significantly decreased in brusatol
(0.5 mg/kg)-treated animals (Figure 7A–C). Nuclear NQO1 was significantly decreased in
lower dose brusatol-treated (0.5 mg/kg) tumors, compared to cisplatin (3.5 mg/kg; a
nonsignificant decrease) treated animals (Figure 7D–F). Alternatively, higher brusatol
doses and cisplatin stimulated significant decreases in cytosolic NQO1 (Figure 7E). No
changes in the intensity of staining were observed for all treatments. To confirm the
observed effects, NQO1 activity was also determined using colorimetric method [44,69].
Administration of brusatol (2.0 mg/kg) reduced NQO1 activity by 5-fold. Interestingly, a
2.5-fold decrease in NQO1 activity was also observed in tumors harvested from cisplatin-
treated animals (Figure 7G).
3.8. Brusatol-Induced Tumor Growth Inhibition Is Mediated by Decreased Expression of Ki67,
CD31, and Enhanced Lymphocyte Invasion
To assess the cell division rate, the number of proliferating cells was quantified using
Ki67 staining [74]. Analysis of Ki67 staining intensity confirmed the nuclear Ki67
expression pattern (Figure 8A, B). We detected a significant decrease in the percentage of
Ki67-positive tumor cells from mice in 2.0 mg/kg brusatol-treated animals (Figure 8A). In
cisplatin-treated animals, a non-significant decrease in percentage of Ki67 positive cells
was observed (62% in control vs 40% in cisplatin group; Figure 8A).
The blood vessel number, indicated by CD31 + cells, was significantly decreased in
2.0 mg/kg brusatol-treated animals compared to controls (Figure 8C). Staining intensity
assessment showed no significant reductions in CD31 expression (Figure 8C, D). Cisplatin
(3.5 mg/kg) treatment did not induce significant decreases in the number of CD31 + cells
(Figure 8C, D). Low dose brusatol (0.5 mg/kg) showed no significant decreases in CD31 +
vessel density (Figure 8C). However, the lymphocytic invasion was elevated in brusatol-
treated tumors (Figure 8E). The lymphocyte invasion score was higher in tumors exposed
to 2.0 mg/kg of brusatol compared to 0.5 mg/kg brusatol-treated animals (Figure 8E).
Brusatol-induced stimulation of lymphocyte migration indicates an activation of anti-
tumor immune responses in Nrf2-inhibited tumors.
Biomedicines 2021, 9, 1119 18 of 29
Figure 5. Inhibition of Nrf2 using siRNA and brusatol induced cell cycle arrest and promoted cell death in vitro: (A, B) cell cycle
progression was measured using PI staining followed by FACS analysis of the stained cells. A significant increase in sub-G0-G1 cell
population was detected in MCF-7 (A) and MDA-MB-468 (B) cells transfected with siRNAs targeting Nrf2. (C–E) Cell cycle using PI
Biomedicines 2021, 9, 1119 19 of 29
staining followed by analysis of stained cells using FACS (C) and apoptosis (D,E) were measured using AO/EB dual staining.
Treatment with brusatol (0.5, 5.0, and 10.0 µM) arrested MDA-MB-468 cells (C) in G2/M phase and increased sub-G0-G1 cell
population. A significant increase in the number of dead cells was observed in brusatol treated (19.5 nM to 1250 nM) MDA-MB-468
cells (D) p value = 0.0001) and MCF 7 cells (E) p value = 0.0001). One-way ANOVA test was used for the data analysis ( *P<0.05,
**P<0.01, ***P<0.005, ****P<0.001).
.
Figure 6. Intraperitoneal administration of Brusatol retarded EAC solid tumor growth in vivo. Swiss
albino mice were engrafted with Nrf2 expressing EAC cells and treated with two different doses of
brusatol (0.5 mg/kg and 2.0 mg/kg). (A) Brusatol (2.0 mg/kg) treatment decreased tumor growth
significantly (p value = 0.003; at day 23). Cisplatin (3.5 mg/kg) reduced tumor volume and tumor
weight effectively. (B) Brusatol (0.5 mg/kg) administration did not induce significant changes in
body weight (p value = 0.05), although application of higher brusatol dose (2 mg/kg) resulted in
decreased body mass after 17-day treatment. Cisplatin induced significant decreases in body mass
after 12th day treatment (p value = 0.01). One-way ANOVA test was used for the data analysis (
*P<0.05, **P<0.01, ***P<0.005, ****P<0.001).
Biomedicines 2021, 9, 1119 20 of 29
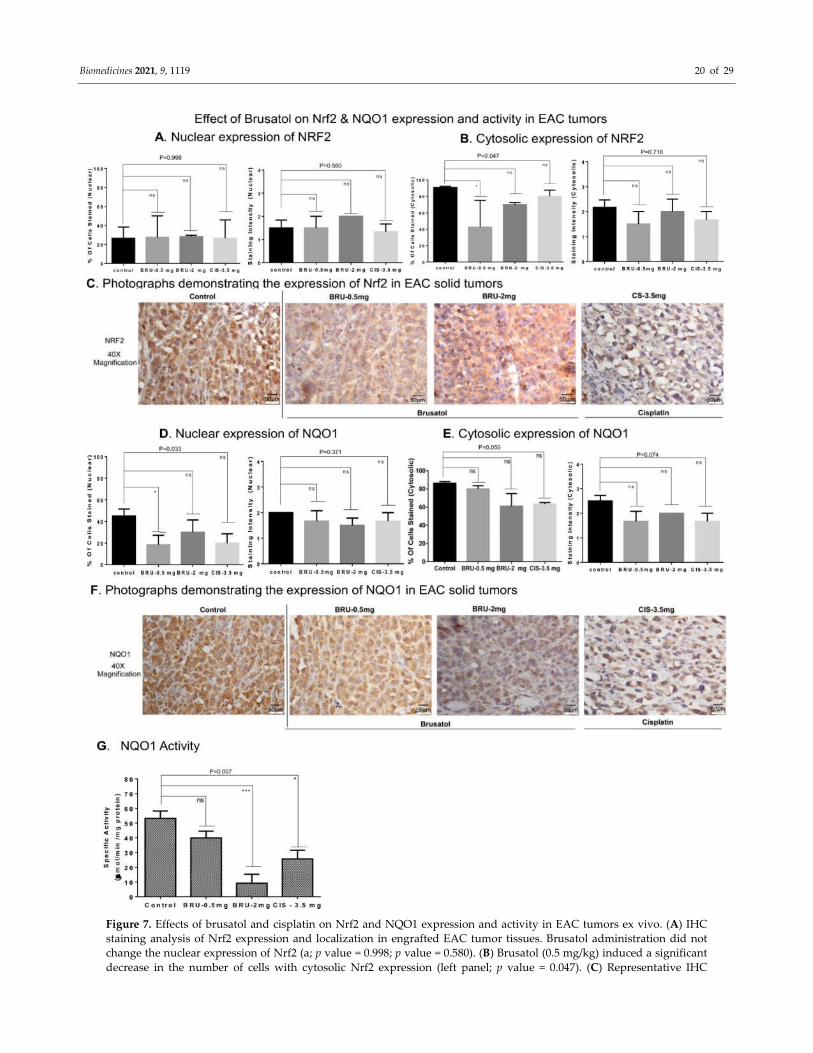
Figure 7. Effects of brusatol and cisplatin on Nrf2 and NQO1 expression and activity in EAC tumors ex vivo. (A) IHC
staining analysis of Nrf2 expression and localization in engrafted EAC tumor tissues. Brusatol administration did not
change the nuclear expression of Nrf2 (a; p value = 0.998; p value = 0.580). (B) Brusatol (0.5 mg/kg) induced a significant
decrease in the number of cells with cytosolic Nrf2 expression (left panel; p value = 0.047). (C) Representative IHC
Biomedicines 2021, 9, 1119 21 of 29
microphotographs of Nrf2 stained tumor tissues are shown (Scale: 50 µm). (D) Brusatol (0.5 mg/kg) induced a significant
decrease in number of cells expressing nuclear NQO1 (left panel; p value = 0.033). (E) The cytosolic expression of NQO1
was assessed in EAC tumors treated with brusatol and cisplatin (p value = 0.050 vs control). No significant changes were
observed in NQO1 staining intensity. (F) Representative IHC microphotographs of NQO1 stained tumor tissues are shown
(Scale: 50 µm). (G) Brusatol (2 mg/kg) stimulated a significant decrease in NQO1 activity in the tumor lysates (p value =
0.007). The positive control cisplatin also reduced NQO1 activity. One-way ANOVA test was used for the data analysis (
*P<0.05, ***P<0.005).
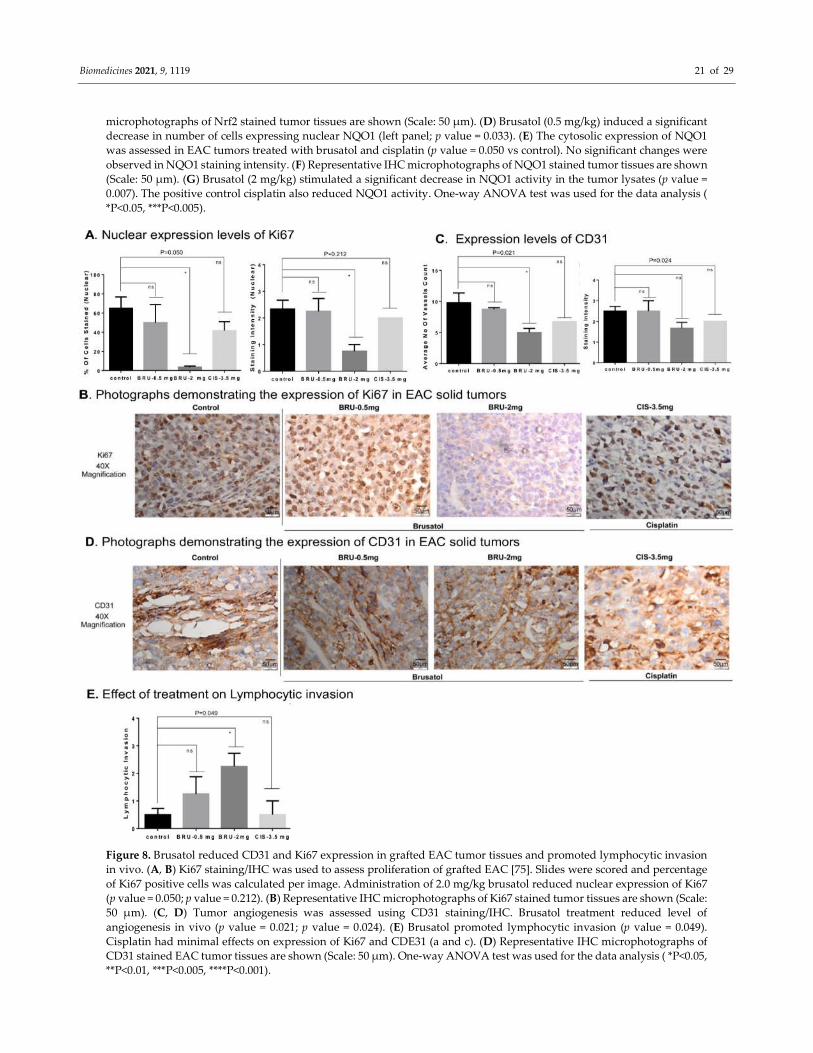
Figure 8. Brusatol reduced CD31 and Ki67 expression in grafted EAC tumor tissues and promoted lymphocytic invasion
in vivo. (A, B) Ki67 staining/IHC was used to assess proliferation of grafted EAC [75]. Slides were scored and percentage
of Ki67 positive cells was calculated per image. Administration of 2.0 mg/kg brusatol reduced nuclear expression of Ki67
(p value = 0.050; p value = 0.212). (B) Representative IHC microphotographs of Ki67 stained tumor tissues are shown (Scale:
50 µm). (C, D) Tumor angiogenesis was assessed using CD31 staining/IHC. Brusatol treatment reduced level of
angiogenesis in vivo (p value = 0.021; p value = 0.024). (E) Brusatol promoted lymphocytic invasion (p value = 0.049).
Cisplatin had minimal effects on expression of Ki67 and CDE31 (a and c). (D) Representative IHC microphotographs of
CD31 stained EAC tumor tissues are shown (Scale: 50 µm). One-way ANOVA test was used for the data analysis ( *P<0.05,
**P<0.01, ***P<0.005, ****P<0.001).
Biomedicines 2021, 9, 1119 22 of 29
4. Discussion
Our data support a growing body of evidence indicating that Nrf2 is a key tumor-
regulating effector. We detected elevated nuclear Nrf2 expression and activity in
advanced grade II and III BCs (Figure 1), confirming cancer-promoting functions of Nrf2.
Other recent studies have reported an elevated Nrf2 expression in BC tissues and cells,
although the correlation between Nrf2 expression, BC treatment-related markers (ER, PR,
and HER2), and BC cell sensitivity to apoptosis were not addressed comprehensively
[23,31,76]. In this study we determined that Nrf2 expression levels are elevated in triple
negative BCs (Supplementary Table S1), although the difference in Nrf2 expression was
not found to be significant (normal breast tissues (n = 3) vs BCs (n = 46)). Furthermore, we
detected induction of apoptosis in BC cells stimulated with pharmacological Nrf2
inhibitor brusatol (Figure 5). SiRNAs-induced inhibition of Nrf2 resulted in increased
sensitivity to cisplatin treatment (Figure 3). Nrf2 knockdown was marked by inhibition of
its downstream effector NQO1 (the oxidative stress regulator) [77]. Nrf2–NQO1 signaling
pair was linked to the detoxification of quinone substrates, highly reactive compounds
associated with both apoptosis and carcinogenesis [78].
Previous investigations demonstrated that targeted inhibition of Nrf2 blocked
migration of cancer cells and sensitized them to chemotherapy [79,80]. For instance, Nrf2
knockdown sensitized A549 lung cancer cells to cisplatin, doxorubicin, and etoposide [81].
Pharmacological inhibition of Nrf2 using trigonelline sensitized pancreatic cells to
apoptosis [82]. Synergistic anti-cancer effects of brusatol and trastuzumab (HER2
targeting agent) were reported in HER2 positive BC and associated with induction of
reactive oxygen species (ROS) production and apoptosis [83]. Furthermore, cooperative
effects of brusatol and other anticancer agents, including gemcitabine (in pancreatic
carcinomas) [84], cytarabine (Ara-C) (in acute myeloid leukemia) [85], luteolin (in gastric
cancers) [86], and paclitaxel (in BCs) [87,88], were observed. Other studies supported
clinical applications of Nrf2 inhibition by brusatol in different cancers [30,35,89]. The
disruption of Nrf2 nuclear export prevented the nuclear accumulation of this protein and
sensitized A549 cells to cisplatin and carboplatin [80]. The expression of Nrf2 was
estimated using IHC that indicated nuclear localization of Nrf2 in 44% of BCs [76]. Nrf2
was suggested to serve as an independent adverse prognostic factor for both recurrence
and disease-free survival [76,90]. IHC data from this study has also shown elevated
nuclear accumulation of Nrf2 in grade II and III BCs compared to normal breast cells
highlighting the potential of nuclear Nrf2 to serve as a biomarker protein.
Enhanced Nrf2 expression has been associated with activation of Nrf2 downstream
signaling effectors [58]. Under oxidative stress conditions, Nrf2 was shown to translocate
into the nucleus and trigger the transcription of antioxidant response proteins, including
NQO1, SOD, and catalase [91]. Accordingly, we found that brusatol-induced Nrf2
inhibition resulted in reduced NQO1 activity (Figure 4). Furthermore, a link between
inhibition of NQO1 activity and activation of apoptosis was observed previously [92]. Our
data indicate that inhibition of Nrf2/NQO1 signaling results in cell cycle arrest and
decreased cell viability. The inhibited cell proliferation may be associated with cell cycle
arrest [93]. Inhibition of Nrf2 using siRNA is also known to induce apoptosis [70]. Genetic
disruption of Nrf2 expression in alveolar epithelium induced cell cycle arrest in the G2/M
phase [94]. Interestingly, we also detected G2/M arrest in MDA-MB-468 cells treated with
brusatol (Figure 5). However, no G2/M arrest was observed when Nrf2 was
downregulated by siRNA. This discrepancy may be caused by the siRNA-mediated
downregulation of Nrf2, which coincided with the increased size of sub-G0-G1 population
that could compensate for the earlier cell deaths. Similar effects were observed previously
[95], as G2/M arrest is one of the early events before a cell undergoes apoptosis [96].
However, the mechanism of the direct activation of apoptosis/cell death by brusatol-
dependent inhibition of Nrf2 and downregulation of NQO1 activity in BC cells remains
to determine.
Biomedicines 2021, 9, 1119 23 of 29
We are the first to report that EAC cells express high levels of Nrf2 and respond to
brusatol treatment in Swiss albino mice. Brusatol treatment in vivo significantly reduced
engrafted EAC tumor volume, while inducing much smaller changes in body mass,
compared to cisplatin, which significantly reduced body weight in our experiments
(Figure 6). Our data indicate less pronounced systemic effects of brusatol compared to
cisplatin-induced effects, although systemic toxicity of brusatol requires further
investigation. The previous in vivo study used A549 lung cancer tumors with genetically
lowered Nrf2 expression, which sensitized cancer cells to cisplatin/carboplatin pro-
apoptotic effects in nude mice [37]. Using CRISPR-Cas9 technology, another study
demonstrated that xenografted Nrf2-null lung tumors develop slower and exhibit
increased sensitivity to chemotherapy [80]. Pharmacological inhibition of Nrf2 with
brusatol has been shown to reduce colon tumor growth in mice [30].
Nrf2 scavenges reactive oxygen species, promotes cell survival, inhibits apoptosis,
and increases cell proliferation and migration [97,98]. Additionally, Nrf2 increases anti-
cancer drug resistance, especially under hypoxic conditions [19]. Hypoxic conditions were
associated with the activation of Nrf2, which facilitated the development of cisplatin
resistance in MCF-7 cells [99]. Initiated by downregulation and inhibition of Nrf2,
chemosensitization to cisplatin was also observed in the present study. The effect of anti-
cancer drug chemosensitization can be mediated by the enhanced level of ROS, one of the
most powerful pro-apoptotic stimulators [100]. Suggestively, the level of ROS maybe
increased when the level of Nrf2 (oxidative stress repressor) is low or downregulated in
the presence of siRNAs. Supporting this hypothesis, constitutive Nrf2 activation was
shown to defend malignant cells against oxidative stress [101]. However, the role of ROS
requires further investigation in brusatol-treated BC cells.
Nrf2 signaling facilitates BC cell migration [21] and metastasis [102]. It has been
demonstrated that overexpression of Nrf2 in MCF-7 and MDA-MB-231 resulted in
elevated G6PD, HIF1α, Notch1, and HES1 signaling [103]. The same study detected
enhanced cell migration and proliferation in Nrf2 overexpressing BC cells. Tumor
progression also relies on angiogenesis and decreased anti-tumor lymphocyte invasion
(non-aggressive tumor microenvironment) [104,105]. In the present study, a significant
decrease in tumor cell migration and proliferation was observed in cells exposed to the
Nrf2 inhibitor brusatol (Figure 4). Furthermore, we observed a reduction in blood
vessel/CD31+ staining in brusatol-exposed tumors, while the lymphocytic invasion was
elevated (Figure 8). The lymphocyte invasion score was higher in tumors exposed to 2.0
mg/kg of brusatol, suggesting that Nrf2 inhibition stimulates lymphocyte migration and
potentially activates anti-tumor immunity (Figure 8). Activated lymphocyte migration
may be a sign of increased cell aggressiveness in the tumor microenvironment. However,
this effect requires further investigation. Co-staining with specific tumor-infiltrating
lymphocyte marker and anti-Nrf2 antibodies maybe used in future studies to address the
role of Nrf2 expression in activation of lymphocyte trafficking.
In conclusion, our data indicate that there is a tendency for increased Nrf2 levels in a
set of BC tissues. This observation suggests a need to test Nrf2 expression in a larger set
of normal and BC tissues to confirm potential benefit of targeted Nrf2 inhibition. The
observed anti-migratory and pro-apoptotic effects of brusatol support this hypothesis.
Larger clinical investigations are warranted to confirm percentage of BC patients who will
benefit from Nrf2-targeting treatment. The development and testing of non-toxic and
more efficient Nrf2 inhibitors is needed. The benefits of combined treatment (brusatol and
other anticancer agents) should be assessed in advanced BCs. This study demonstrated
that EAC-based in vivo model could be successfully used for differential testing of Nrf2
inhibitors.
5. Conclusions
The results of our study demonstrate that the higher-grade BC tissues have a
tendency to express enhanced levels of Nrf2. Nuclear Nrf2 localization was increased in

Biomedicines 2021, 9, 1119 24 of 29
advanced BCs. Targeted inhibition of Nrf2 using siRNA or the pharmacological agent
brusatol sensitized BC cells to cisplatin, inhibited BC cell migration and division,
decreased xenografted tumor growth, and stimulated lymphocyte migration towards
tumor tissues in mice in vivo. Our data support biomarker characteristics of Nrf2 in
advanced BCs. Nrf2 inhibition triggers cell cycle arrest and sensitizes tumor cells to pro-
apoptotic and growth-inhibiting effects of chemotherapeutic agents.
Supplementary Materials: Supplementary Figure S1: Schematic representation of the procedure for
preparing tissue array. Supplementary Figure S2: Flow chart depicting the procedure for preparing
cell blocks. Supplementary Figure S3: siRNA-mediated knockdown of Nrf2 reduced its expression
at mRNA level in breast cancer cell lines. Supplementary Figure S4: Targeting Nrf2 using siRNA
reduced the expression of Nrf2 at protein level. Supplementary Figure S5: Targeting Nrf2 using
siRNAs reduced the viability of MDA-MB-231 breast cancer cells in vitro. Supplementary Figure S6:
Pharmacological inhibition of Nrf2 using brusatol retarded cell migration in breast cancer cells.
Supplementary Figure S7: Treatment with brusatol induced death in breast cancer cells.
Supplementary Figure S8: Targeted inhibition of Nrf2 using siRNA induced cell death in breast
cancer cells. Supplementary Figure S9: EAC cells expressed elevated Nrf2 compared to positive
control A549 cell line. Supplementary Figure S10: Schematic representation of in vivo study protocol
and the photographs of mice. Supplementary Table S1: Immunohistochemical staining scores of
normal, grade-II and grade-III breast cancer tissues. Table S2: Nucleotide sequence of siRNAs used
in this study. Supplementary Table S3: The clinical features of the grade-II and grade-III tumors and
keys to master chart.
Author Contributions: Conceptualization, V.R.B. and S.V.M.; methodology, V.R.B., S.V.M., R.K.T.,
M.G.K., V.G.B.; software, V.R.B., M.G.K., V.G.B.; validation, S.V.M., R.K.T., J.K., and N.S.S.; formal
analysis, V.R.B., S.V.M., J.K., and J.P.B.; investigation, S.V.M., and O.A.S.; resources, S.V.M., N.S.S.,
J.K., J.P.B.; data curation, S.V.M. and O.A.S.; writing—original draft preparation, V.R.B., S.V.M.,
writing—review and editing, S.V.M., R.K.T., and O.A.S.; visualization, V.R.B., M.G.K., V.G.B.;
supervision, S.V.M.; project administration S.V.M. All authors have read and agreed to the
published version of the manuscript.
Funding: This research received no external funding.
Institutional Review Board Statement: The human subjects’ study was approved by the
Institutional Ethics Committee from JSS Medical College, JSS Academy of Higher Education &
Research, Mysore, Karnataka, India. Approval no. JSSMC/IEC/14/1991/2017–2018, dated 5 June
2017. The animal study was conducted according to the guidelines of the Committee for the Purpose
of Control and Supervision of Experiments on Animals, Ministry of Fisheries, Animal Husbandry
and Dairying Department of Animal Husbandry and Dairying, Government of India., and
approved by the Institutional Animal Ethics Committee from JSS College of Pharmacy, Mysore,
Karnataka, India. Approval no. IAEC/JSSCPM/-319/2018 4 September 2018.
Informed Consent Statement: Informed consent was obtained from all human subjects involved in
this study and written informed consent was obtained from the patient(s) to publish this paper.
Data Availability Statement: Exclude this statement as this study did not report any data.
Acknowledgments: The authors would like to acknowledge (a) the infrastructure support provided
by the Department of Science & Technology to CEMR Laboratory (CR-FST-LS-1/2018/178) and to
the Department of Biochemistry (SR/FST/LS-1-539/2012); (b) the laboratory facilities provided by
CEMR laboratory (DST-FIST supported center), the Department of Biochemistry (DST-FIST
supported department), and the Special Interest Group on Cancer Biology and Cancer Stem Cells
(SIG-CBCSC), JSS Academy of Higher Education & Research (Mysore, Karnataka, India).
Venugopal R. Bovilla is grateful to the Indian Council of Medical Research (ICMR), and the
Government of India for the Senior Research Fellowship (SRF) award (fellowship sanction no:
3/2/2/5/2018/online Onco Fellowship (Fship)/NCD-III), and would also like to acknowledge the
Post-Doctoral Fellowship from the Global Health Equity Scholars (GHES) fellowship Program of
the NIH Fogarty International Center (award number D43 TW010540). M.G.K. is grateful to Indian
Council of Medical Research (ICMR), Government of India for Senior Research Fellowship (SRF)
award (Fellowship sanction No. 3/2/3/105/2019/NCD-III). N.S. is thankful for the financial support
under seed money grant from TEQIP Phase -III, SJCE, Mysore. The authors would like to

Biomedicines 2021, 9, 1119 25 of 29
acknowledge Arun Gopi (Department of Community Medicine, JSS Medical College, JSS AHER) for
his valuable support of statistical analysis.
Conflicts of Interest: The authors declare no conflict of interest.
References
1. DeSantis, C.E.; Ma, J.; Gaudet, M.M.; Newman, L.A.; Miller, K.D.; Goding Sauer, A.; Jemal, A.; Siegel, R.L. Breast cancer
statistics, 2019. CA Cancer J. Clin. 2019, 69, 438–451, doi:10.3322/caac.21583.
2. Bayraktar, S.; Batoo, S.; Okuno, S.; Gluck, S. Immunotherapy in breast cancer. J. Carcinog. 2019, 18, 2, doi:10.4103/jcar.JCar_2_19.
3. Masoud, V.; Pages, G. Targeted therapies in breast cancer: New challenges to fight against resistance. World J. Clin. Oncol. 2017,
8, 120–134, doi:10.5306/wjco.v8.i2.120.
4. Yoo, B.; Fuchs, B.C.; Medarova, Z. New Directions in the Study and Treatment of Metastatic Cancer. Front. Oncol. 2018, 8, 258,
doi:10.3389/fonc.2018.00258.
5. Koury, J.; Lucero, M.; Cato, C.; Chang, L.; Geiger, J.; Henry, D.; Hernandez, J.; Hung, F.; Kaur, P.; Teskey, G.; et al.
Immunotherapies: Exploiting the Immune System for Cancer Treatment. J. Immunol. Res. 2018, 2018, 9585614,
doi:10.1155/2018/9585614.
6. Cai, F.; Luis, M.A.F.; Lin, X.; Wang, M.; Cai, L.; Cen, C.; Biskup, E. Anthracycline-induced cardiotoxicity in the chemotherapy
treatment of breast cancer: Preventive strategies and treatment. Mol. Clin. Oncol. 2019, 11, 15–23, doi:10.3892/mco.2019.1854.
7. Saloustros, E.; Mavroudis, D.; Georgoulias, V. Paclitaxel and docetaxel in the treatment of breast cancer. Expert Opin
Pharmacother. 2008, 9, 2603–2616, doi:10.1517/14656566.9.15.2603.
8. Wahba, H.A.; El-Hadaad, H.A. Current approaches in treatment of triple-negative breast cancer. Cancer Biol. Med. 2015, 12, 106–
116, doi:10.7497/j.issn.2095-3941.2015.0030.
9. Hernandez-Aya, L.F.; Ma, C.X. Chemotherapy principles of managing stage IV breast cancer in the United States. Chin. Clin.
Oncol. 2016, 5, 42, doi:10.21037/cco.2016.04.01.
10. Tong, C.W.S.; Wu, M.; Cho, W.C.S.; To, K.K.W. Recent Advances in the Treatment of Breast Cancer. Front. Oncol. 2018, 8, 227,
doi:10.3389/fonc.2018.00227.
11. Taherkhani, M.; Mahjoub, S.; Moslemi, D.; Karkhah, A. Three cycles of AC chemotherapy regimen increased oxidative stress in
breast cancer patients: A clinical hint. Caspian J. Intern. Med. 2017, 8, 264–268, doi:10.22088/cjim.8.4.264.
12. Cocconi, G.; Bisagni, G.; Bella, M.; Acito, L.; Anastasi, P.; Carpi, A.; Di Costanzo, F.; Frassoldati, A.; Mosconi, A.; Borrini, A.; et
al. Comparison of CMF (cyclophosphamide, methotrexate, and 5-fluorouracil) with a rotational crossing and a sequential
intensification regimen in advanced breast cancer: A prospective randomized study. Am. J. Clin. Oncol. 1999, 22, 593–600,
doi:10.1097/00000421-199912000-00010.
13. Nurgali, K.; Jagoe, R.T.; Abalo, R. Editorial: Adverse Effects of Cancer Chemotherapy: Anything New to Improve Tolerance
and Reduce Sequelae? Front. Pharmacol. 2018, 9, 245, doi:10.3389/fphar.2018.00245.
14. Fayanju, O.M.; Park, K.U.; Lucci, A. Molecular Genomic Testing for Breast Cancer: Utility for Surgeons. Ann. Surg. Oncol. 2018,
25, 512–519, doi:10.1245/s10434-017-6254-z.
15. Green, N.; Al-Allak, A.; Fowler, C. Benefits of introduction of Oncotype DX((R)) testing. Ann. R Coll. Surg. Engl. 2019, 101, 55–
59, doi:10.1308/rcsann.2018.0173.
16. Wuerstlein, R.; Kates, R.; Gluz, O.; Grischke, E.M.; Schem, C.; Thill, M.; Hasmueller, S.; Kohler, A.; Otremba, B.; Griesinger, F.;
et al. Strong impact of MammaPrint and BluePrint on treatment decisions in luminal early breast cancer: Results of the WSG-
PRIMe study. Breast Cancer Res. Treat. 2019, 175, 389–399, doi:10.1007/s10549-018-05075-x.
17. Saha, S.; Buttari, B.; Panieri, E.; Profumo, E.; Saso, L. An Overview of Nrf2 Signaling Pathway and Its Role in Inflammation.
Molecules 2020, 25, doi:10.3390/molecules25225474.
18. Hayes, J.D.; McMahon, M.; Chowdhry, S.; Dinkova-Kostova, A.T. Cancer chemoprevention mechanisms mediated through the
Keap1-Nrf2 pathway. Antioxid. Redox Signal. 2010, 13, 1713–1748, doi:10.1089/ars.2010.3221.
19. Jessen, C.; Kress, J.K.C.; Baluapuri, A.; Hufnagel, A.; Schmitz, W.; Kneitz, S.; Roth, S.; Marquardt, A.; Appenzeller, S.; Ade, C.P.;
et al. The transcription factor NRF2 enhances melanoma malignancy by blocking differentiation and inducing COX2 expression.
Oncogene 2020, 39, 6841–6855, doi:10.1038/s41388-020-01477-8.
20. Tonelli, C.; Chio, I.I.C.; Tuveson, D.A. Transcriptional Regulation by Nrf2. Antioxid. Redox Signal. 2018, 29, 1727–1745,
doi:10.1089/ars.2017.7342.
21. Zhang, C.; Wang, H.J.; Bao, Q.C.; Wang, L.; Guo, T.K.; Chen, W.L.; Xu, L.L.; Zhou, H.S.; Bian, J.L.; Yang, Y.R.; et al. NRF2
promotes breast cancer cell proliferation and metastasis by increasing RhoA/ROCK pathway signal transduction. Oncotarget
2016, 7, 73593–73606, doi:10.18632/oncotarget.12435.
22. De Blasio, A.; Di Fiore, R.; Pratelli, G.; Drago-Ferrante, R.; Saliba, C.; Baldacchino, S.; Grech, G.; Scerri, C.; Vento, R.; Tesoriere,
G. A loop involving NRF2, miR-29b-1-5p and AKT, regulates cell fate of MDA-MB-231 triple-negative breast cancer cells. J. Cell
Physiol. 2020, 235, 629–637, doi:10.1002/jcp.29062.
23. Qin, S.; He, X.; Lin, H.; Schulte, B.A.; Zhao, M.; Tew, K.D.; Wang, G.Y. Nrf2 inhibition sensitizes breast cancer stem cells to
ionizing radiation via suppressing DNA repair. Free Radic. Biol. Med. 2021, 169, 238–247,
doi:10.1016/j.freeradbiomed.2021.04.006.
Biomedicines 2021, 9, 1119 26 of 29
24. Gorrini, C.; Baniasadi, P.S.; Harris, I.S.; Silvester, J.; Inoue, S.; Snow, B.; Joshi, P.A.; Wakeham, A.; Molyneux, S.D.; Martin, B.; et
al. BRCA1 interacts with Nrf2 to regulate antioxidant signaling and cell survival. J. Exp. Med. 2013, 210, 1529–1544,
doi:10.1084/jem.20121337.
25. Ryoo, I.G.; Choi, B.H.; Ku, S.K.; Kwak, M.K. High CD44 expression mediates p62-associated NFE2L2/NRF2 activation in breast
cancer stem cell-like cells: Implications for cancer stem cell resistance. Redox. Biol. 2018, 17, 246–258,
doi:10.1016/j.redox.2018.04.015.
26. Kim, J.H.; Yu, S.; Chen, J.D.; Kong, A.N. The nuclear cofactor RAC3/AIB1/SRC-3 enhances Nrf2 signaling by interacting with
transactivation domains. Oncogene 2013, 32, 514–527, doi:10.1038/onc.2012.59.
27. Bellezza, I.; Mierla, A.L.; Minelli, A. Nrf2 and NF-kappaB and Their Concerted Modulation in Cancer Pathogenesis and
Progression. Cancers 2010, 2, 483–497, doi:10.3390/cancers2020483.
28. Rushworth, S.A.; Zaitseva, L.; Murray, M.Y.; Shah, N.M.; Bowles, K.M.; MacEwan, D.J. The high Nrf2 expression in human
acute myeloid leukemia is driven by NF-kappaB and underlies its chemo-resistance. Blood 2012, 120, 5188–5198,
doi:10.1182/blood-2012-04-422121.
29. Panieri, E.; Saso, L. Potential Applications of NRF2 Inhibitors in Cancer Therapy. Oxid. Med. Cell Longev. 2019, 2019, 8592348,
doi:10.1155/2019/8592348.
30. Evans, J.P.; Winiarski, B.K.; Sutton, P.A.; Jones, R.P.; Ressel, L.; Duckworth, C.A.; Pritchard, D.M.; Lin, Z.X.; Fretwell, V.L.;
Tweedle, E.M.; et al. The Nrf2 inhibitor brusatol is a potent antitumour agent in an orthotopic mouse model of colorectal cancer.
Oncotarget 2018, 9, 27104–27116, doi:10.18632/oncotarget.25497.
31. Kovacs, P.; Csonka, T.; Kovacs, T.; Sari, Z.; Ujlaki, G.; Sipos, A.; Karanyi, Z.; Szeocs, D.; Hegedus, C.; Uray, K.; et al. Lithocholic
Acid, a Metabolite of the Microbiome, Increases Oxidative Stress in Breast Cancer. Cancers 2019, 11, 1255,
doi:10.3390/cancers11091255.
32. Lu, K.; Alcivar, A.L.; Ma, J.; Foo, T.K.; Zywea, S.; Mahdi, A.; Huo, Y.; Kensler, T.W.; Gatza, M.L.; Xia, B. NRF2 Induction
Supporting Breast Cancer Cell Survival Is Enabled by Oxidative Stress-Induced DPP3-KEAP1 Interaction. Cancer Res. 2017, 77,
2881–2892, doi:10.1158/0008-5472.CAN-16-2204.
33. Robledinos-Anton, N.; Fernandez-Gines, R.; Manda, G.; Cuadrado, A. Activators and Inhibitors of NRF2: A Review of Their
Potential for Clinical Development. Oxid. Med. Cell. Longev. 2019, 2019, 9372182, doi:10.1155/2019/9372182.
34. Wang, T.; Dou, Y.; Lin, G.; Li, Q.; Nie, J.; Chen, B.; Xie, J.; Su, Z.; Zeng, H.; Chen, J.; et al. The anti-hepatocellular carcinoma effect
of Brucea javanica oil in ascitic tumor-bearing mice: The detection of brusatol and its role. Biomed. Pharmacother. 2021, 134,
111122, doi:10.1016/j.biopha.2020.111122.
35. Cai, S.J.; Liu, Y.; Han, S.; Yang, C. Brusatol, an NRF2 inhibitor for future cancer therapeutic. Cell Biosci. 2019, 9, 45,
doi:10.1186/s13578-019-0309-8.
36. Panieri, E.; Buha, A.; Telkoparan-Akillilar, P.; Cevik, D.; Kouretas, D.; Veskoukis, A.; Skaperda, Z.; Tsatsakis, A.; Wallace, D.;
Suzen, S.; et al. Potential Applications of NRF2 Modulators in Cancer Therapy. Antioxidants 2020, 9, 193,
doi:10.3390/antiox9030193.
37. Ren, D.; Villeneuve, N.F.; Jiang, T.; Wu, T.; Lau, A.; Toppin, H.A.; Zhang, D.D. Brusatol enhances the efficacy of chemotherapy
by inhibiting the Nrf2-mediated defense mechanism. Proc. Natl. Acad. Sci. USA 2011, 108, 1433–1438,
doi:10.1073/pnas.1014275108.
38. Preul, M.C.; Stratford, J.; Bertrand, G.; Feindel, W. Neurosurgeon as innovator: William V. Cone (1897–1959). J. Neurosurg. 1993,
79, 619–631, doi:10.3171/jns.1993.79.4.0619.
39. Prashanth, T.; Avin, B.R.V.; Thirusangu, P.; Ranganatha, V.L.; Prabhakar, B.T.; Sharath Chandra, J.N.N.; Khanum, S.A. Synthesis
of coumarin analogs appended with quinoline and thiazole moiety and their apoptogenic role against murine ascitic carcinoma.
Biomed. Pharmacother. 2019, 112, 108707, doi:10.1016/j.biopha.2019.108707.
40. Goud, K.I.; Dayakar, S.; Vijayalaxmi, K.; Babu, S.J.; Reddy, P.V. Evaluation of HER-2/neu status in breast cancer specimens using
immunohistochemistry (IHC) & fluorescence in-situ hybridization (FISH) assay. Indian J. Med. Res. 2012, 135, 312–317.
41. Krishnamurthy, J.; Kumar, P.S. Significance of prognostic indicators in infiltrating duct carcinoma breast: Scenario in
developing country. Indian J. Cancer 2016, 53, 34–38, doi:10.4103/0019-509X.180834.
42. Gowda, R.; Madhunapantula, S.V.; Kuzu, O.F.; Sharma, A.; Robertson, G.P. Targeting multiple key signaling pathways in
melanoma using leelamine. Mol. Cancer Ther. 2014, 13, 1679–1689, doi:10.1158/1535-7163.MCT-13-0867.
43. Madhunapantula, S.V.; Sharma, A.; Robertson, G.P. PRAS40 deregulates apoptosis in malignant melanoma. Cancer Res. 2007,
67, 3626–3636, doi:10.1158/0008-5472.CAN-06-4234.
44. Prochaska, H.J.; Santamaria, A.B. Direct measurement of NAD(P)H:quinone reductase from cells cultured in microtiter wells:
A screening assay for anticarcinogenic enzyme inducers. Anal. Biochem. 1988, 169, 328–336, doi:10.1016/0003-2697(88)90292-8.
45. Livak, K.J.; Schmittgen, T.D. Analysis of relative gene expression data using real-time quantitative PCR and the 2(-Delta Delta
C(T)) Method. Methods 2001, 25, 402–408, doi:10.1006/meth.2001.1262.
46. Chomczynski, P.; Sacchi, N. The single-step method of RNA isolation by acid guanidinium thiocyanate-phenol-chloroform
extraction: Twenty-something years on. Nat. Protoc. 2006, 1, 581–585, doi:10.1038/nprot.2006.83.
47. Aranda, P.S.; LaJoie, D.M.; Jorcyk, C.L. Bleach gel: A simple agarose gel for analyzing RNA quality. Electrophoresis 2012, 33, 366–
369, doi:10.1002/elps.201100335.
48. Zou, X.; Gao, J.; Zheng, Y.; Wang, X.; Chen, C.; Cao, K.; Xu, J.; Li, Y.; Lu, W.; Liu, J.; et al. Zeaxanthin induces Nrf2-mediated
phase II enzymes in protection of cell death. Cell Death Dis. 2014, 5, e1218, doi:10.1038/cddis.2014.190.
Biomedicines 2021, 9, 1119 27 of 29
49. Seng, S.; Avraham, H.K.; Birrane, G.; Jiang, S.; Li, H.; Katz, G.; Bass, C.E.; Zagozdzon, R.; Avraham, S. NRP/B mutations impair
Nrf2-dependent NQO1 induction in human primary brain tumors. Oncogene 2009, 28, 378–389, doi:10.1038/onc.2008.396.
50. Wang, R.; An, J.; Ji, F.; Jiao, H.; Sun, H.; Zhou, D. Hypermethylation of the Keap1 gene in human lung cancer cell lines and lung
cancer tissues. Biochem. Biophys. Res. Commun. 2008, 373, 151–154, doi:10.1016/j.bbrc.2008.06.004.
51. Lister, A.; Nedjadi, T.; Kitteringham, N.R.; Campbell, F.; Costello, E.; Lloyd, B.; Copple, I.M.; Williams, S.; Owen, A.;
Neoptolemos, J.P.; et al. Nrf2 is overexpressed in pancreatic cancer: Implications for cell proliferation and therapy. Mol. Cancer
2011, 10, 37, doi:10.1186/1476-4598-10-37.
52. Vargas, M.R.; Johnson, D.A.; Sirkis, D.W.; Messing, A.; Johnson, J.A. Nrf2 activation in astrocytes protects against
neurodegeneration in mouse models of familial amyotrophic lateral sclerosis. J. Neurosci. 2008, 28, 13574–13581,
doi:10.1523/JNEUROSCI.4099-08.2008.
53. Nam, S.T.; Hwang, J.H.; Kim, D.H.; Park, M.J.; Lee, I.H.; Nam, H.J.; Kang, J.K.; Kim, S.K.; Hwang, J.S.; Chung, H.K.; et al. Role
of NADH: Quinone oxidoreductase-1 in the tight junctions of colonic epithelial cells. BMB Rep. 2014, 47, 494–499.
54. Hendrickx, A.; Pierrot, N.; Tasiaux, B.; Schakman, O.; Kienlen-Campard, P.; De Smet, C.; Octave, J.N. Epigenetic regulations of
immediate early genes expression involved in memory formation by the amyloid precursor protein of Alzheimer disease. PLoS
ONE 2014, 9, e99467, doi:10.1371/journal.pone.0099467.
55. Madhunapantula, S.V.; Desai, D.; Sharma, A.; Huh, S.J.; Amin, S.; Robertson, G.P. PBISe, a novel selenium-containing drug for
the treatment of malignant melanoma. Mol. Cancer Ther. 2008, 7, 1297–1308, doi:10.1158/1535-7163.MCT-07-2267.
56. Orellana, E.A.; Kasinski, A.L. Sulforhodamine B (SRB) Assay in Cell Culture to Investigate Cell Proliferation. Bio Protoc. 2016,
6, doi:10.21769/BioProtoc.1984.
57. van Meerloo, J.; Kaspers, G.J.; Cloos, J. Cell sensitivity assays: The MTT assay. Methods Mol. Biol 2011, 731, 237–245,
doi:10.1007/978-1-61779-080-5_20.
58. Hrgovic, I.; Doll, M.; Kleemann, J.; Wang, X.F.; Zoeller, N.; Pinter, A.; Kippenberger, S.; Kaufmann, R.; Meissner, M. The histone
deacetylase inhibitor trichostatin a decreases lymphangiogenesis by inducing apoptosis and cell cycle arrest via p21-dependent
pathways. BMC Cancer 2016, 16, 763, doi:10.1186/s12885-016-2807-y.
59. Liang, C.C.; Park, A.Y.; Guan, J.L. In vitro scratch assay: A convenient and inexpensive method for analysis of cell migration in
vitro. Nat. Protoc. 2007, 2, 329–333, doi:10.1038/nprot.2007.30.
60. Varankar, S.S.; Bapat, S.A. Migratory Metrics of Wound Healing: A Quantification Approach for in vitro Scratch Assays. Front.
Oncol. 2018, 8, 633, doi:10.3389/fonc.2018.00633.
61. Chen, K.; Cheng, L.; Qian, W.; Jiang, Z.; Sun, L.; Zhao, Y.; Zhou, Y.; Zhao, L.; Wang, P.; Duan, W.; et al. Itraconazole inhibits
invasion and migration of pancreatic cancer cells by suppressing TGF-beta/SMAD2/3 signaling. Oncol. Rep. 2018, 39, 1573–1582,
doi:10.3892/or.2018.6281.
62. Jonkman, J.E.; Cathcart, J.A.; Xu, F.; Bartolini, M.E.; Amon, J.E.; Stevens, K.M.; Colarusso, P. An introduction to the wound
healing assay using live-cell microscopy. Cell Adh. Migr. 2014, 8, 440–451, doi:10.4161/cam.36224.
63. Grada, A.; Otero-Vinas, M.; Prieto-Castrillo, F.; Obagi, Z.; Falanga, V. Research Techniques Made Simple: Analysis of Collective
Cell Migration Using the Wound Healing Assay. J. Investig. Dermatol. 2017, 137, e11–e16, doi:10.1016/j.jid.2016.11.020.
64. Pujani, M.; Jain, H.; Chauhan, V.; Agarwal, C.; Singh, K.; Singh, M. Evaluation of Tumor infiltrating lymphocytes in breast
carcinoma and their correlation with molecular subtypes, tumor grade and stage. Breast Dis. 2020, 39, 61–69, doi:10.3233/BD-
200442.
65. Thirusangu, P.; Vigneshwaran, V.; Prashanth, T.; Vijay Avin, B.R.; Malojirao, V.H.; Rakesh, H.; Khanum, S.A.; Mahmood, R.;
Prabhakar, B.T. BP-1T, an antiangiogenic benzophenone-thiazole pharmacophore, counteracts HIF-1 signalling through
p53/MDM2-mediated HIF-1alpha proteasomal degradation. Angiogenesis 2017, 20, 55–71, doi:10.1007/s10456-016-9528-3.
66. Faustino-Rocha, A.; Oliveira, P.A.; Pinho-Oliveira, J.; Teixeira-Guedes, C.; Soares-Maia, R.; da Costa, R.G.; Colaco, B.; Pires, M.J.;
Colaco, J.; Ferreira, R.; et al. Estimation of rat mammary tumor volume using caliper and ultrasonography measurements. Lab.
Anim. 2013, 42, 217–224, doi:10.1038/laban.254.
67. Singh, A.; Misra, V.; Thimmulappa, R.K.; Lee, H.; Ames, S.; Hoque, M.O.; Herman, J.G.; Baylin, S.B.; Sidransky, D.; Gabrielson,
E.; et al. Dysfunctional KEAP1-NRF2 interaction in non-small-cell lung cancer. PLoS Med. 2006, 3, e420,
doi:10.1371/journal.pmed.0030420.
68. Wang, T.; Larcher, L.M.; Ma, L.; Veedu, R.N. Systematic Screening of Commonly Used Commercial Transfection Reagents
towards Efficient Transfection of Single-Stranded Oligonucleotides. Molecules 2018, 23, 2564, doi:10.3390/molecules23102564.
69. Shen, J.; Rasmussen, M.; Dong, Q.R.; Tepel, M.; Scholze, A. Expression of the NRF2 Target Gene NQO1 Is Enhanced in
Mononuclear Cells in Human Chronic Kidney Disease. Oxid. Med. Cell Longev. 2017, 2017, 9091879, doi:10.1155/2017/9091879.
70. Olayanju, A.; Copple, I.M.; Bryan, H.K.; Edge, G.T.; Sison, R.L.; Wong, M.W.; Lai, Z.Q.; Lin, Z.X.; Dunn, K.; Sanderson, C.M.; et
al. Brusatol provokes a rapid and transient inhibition of Nrf2 signaling and sensitizes mammalian cells to chemical toxicity-
implications for therapeutic targeting of Nrf2. Free Radic. Biol. Med. 2015, 78, 202–212, doi:10.1016/j.freeradbiomed.2014.11.003.
71. Kabala-Dzik, A.; Rzepecka-Stojko, A.; Kubina, R.; Jastrzebska-Stojko, Z.; Stojko, R.; Wojtyczka, R.D.; Stojko, J. Migration Rate
Inhibition of Breast Cancer Cells Treated by Caffeic Acid and Caffeic Acid Phenethyl Ester: An In Vitro Comparison Study.
Nutrients 2017, 9, 1144, doi:10.3390/nu9101144.
72. Yue, P.Y.; Leung, E.P.; Mak, N.K.; Wong, R.N. A simplified method for quantifying cell migration/wound healing in 96-well
plates. J. Biomol. Screen 2010, 15, 427–433, doi:10.1177/1087057110361772.

Biomedicines 2021, 9, 1119 28 of 29
73. Atale, N.; Gupta, S.; Yadav, U.C.; Rani, V. Cell-death assessment by fluorescent and nonfluorescent cytosolic and nuclear
staining techniques. J. Microsc. 2014, 255, 7–19, doi:10.1111/jmi.12133.
74. Fung, A.S.; Jonkman, J.; Tannock, I.F. Quantitative immunohistochemistry for evaluating the distribution of Ki67 and other
biomarkers in tumor sections and use of the method to study repopulation in xenografts after treatment with paclitaxel.
Neoplasia 2012, 14, 324–334, doi:10.1593/neo.12346.
75. Basilio-de-Oliveira, R.P.; Pannain, V.L. Prognostic angiogenic markers (endoglin, VEGF, CD31) and tumor cell proliferation
(Ki67) for gastrointestinal stromal tumors. World J. Gastroenterol. 2015, 21, 6924–6930, doi:10.3748/wjg.v21.i22.6924.
76. Onodera, Y.; Motohashi, H.; Takagi, K.; Miki, Y.; Shibahara, Y.; Watanabe, M.; Ishida, T.; Hirakawa, H.; Sasano, H.; Yamamoto,
M.; et al. NRF2 immunolocalization in human breast cancer patients as a prognostic factor. Endocr. Relat. Cancer 2014, 21, 241–
252, doi:10.1530/ERC-13-0234.
77. Favreau, L.V.; Pickett, C.B. The rat quinone reductase antioxidant response element. Identification of the nucleotide sequence
required for basal and inducible activity and detection of antioxidant response element-binding proteins in hepatoma and non-
hepatoma cell lines. J. Biol. Chem. 1995, 270, 24468–24474, doi:10.1074/jbc.270.41.24468.
78. Giudice, A.; Barbieri, A.; Bimonte, S.; Cascella, M.; Cuomo, A.; Crispo, A.; D'Arena, G.; Galdiero, M.; Della Pepa, M.E.; Botti, G.;
et al. Dissecting the prevention of estrogen-dependent breast carcinogenesis through Nrf2-dependent and independent
mechanisms. Oncol. Targets Ther. 2019, 12, 4937–4953, doi:10.2147/OTT.S183192.
79. Singh, A.; Boldin-Adamsky, S.; Thimmulappa, R.K.; Rath, S.K.; Ashush, H.; Coulter, J.; Blackford, A.; Goodman, S.N.; Bunz, F.;
Watson, W.H.; et al. RNAi-mediated silencing of nuclear factor erythroid-2-related factor 2 gene expression in non-small cell
lung cancer inhibits tumor growth and increases efficacy of chemotherapy. Cancer Res. 2008, 68, 7975–7984, doi:10.1158/0008-
5472.CAN-08-1401.
80. Bialk, P.; Wang, Y.; Banas, K.; Kmiec, E.B. Functional Gene Knockout of NRF2 Increases Chemosensitivity of Human Lung
Cancer A549 Cells In Vitro and in a Xenograft Mouse Model. Mol. Ther. Oncolytics 2018, 11, 75–89, doi:10.1016/j.omto.2018.10.002.
81. Wang, X.J.; Sun, Z.; Villeneuve, N.F.; Zhang, S.; Zhao, F.; Li, Y.; Chen, W.; Yi, X.; Zheng, W.; Wondrak, G.T.; et al. Nrf2 enhances
resistance of cancer cells to chemotherapeutic drugs, the dark side of Nrf2. Carcinogenesis 2008, 29, 1235–1243,
doi:10.1093/carcin/bgn095.
82. Arlt, A.; Sebens, S.; Krebs, S.; Geismann, C.; Grossmann, M.; Kruse, M.L.; Schreiber, S.; Schafer, H. Inhibition of the Nrf2
transcription factor by the alkaloid trigonelline renders pancreatic cancer cells more susceptible to apoptosis through decreased
proteasomal gene expression and proteasome activity. Oncogene 2013, 32, 4825–4835, doi:10.1038/onc.2012.493.
83. Yang, Y.; Tian, Z.; Guo, R.; Ren, F. Nrf2 Inhibitor, Brusatol in Combination with Trastuzumab Exerts Synergistic Antitumor
Activity in HER2-Positive Cancers by Inhibiting Nrf2/HO-1 and HER2-AKT/ERK1/2 Pathways. Oxid. Med. Cell Longev. 2020,
2020, 9867595, doi:10.1155/2020/9867595.
84. Xiang, Y.; Ye, W.; Huang, C.; Yu, D.; Chen, H.; Deng, T.; Zhang, F.; Lou, B.; Zhang, J.; Shi, K.; et al. Brusatol Enhances the
Chemotherapy Efficacy of Gemcitabine in Pancreatic Cancer via the Nrf2 Signalling Pathway. Oxid. Med. Cell Longev. 2018, 2018,
2360427, doi:10.1155/2018/2360427.
85. Karathedath, S.; Rajamani, B.M.; Musheer Aalam, S.M.; Abraham, A.; Varatharajan, S.; Krishnamurthy, P.; Mathews, V.;
Velayudhan, S.R.; Balasubramanian, P. Role of NF-E2 related factor 2 (Nrf2) on chemotherapy resistance in acute myeloid
leukemia (AML) and the effect of pharmacological inhibition of Nrf2. PLoS ONE 2017, 12, e0177227,
doi:10.1371/journal.pone.0177227.
86. Farhad Pouremamali, F.J., Nasser, S. Nrf2-ME-1 axis is associated with 5-FU resistance in gastric cancer cell line. Process. Biochem.
2020, in press, doi:10.1016/j.procbio.2020.01.033.
87. Woo, Y.; Oh, J.; Kim, J.S. Suppression of Nrf2 Activity by Chestnut Leaf Extract Increases Chemosensitivity of Breast Cancer
Stem Cells to Paclitaxel. Nutrients 2017, 9, 760, doi:10.3390/nu9070760.
88. Chandrasekaran, J.; Balasubramaniam, J.; Sellamuthu, A.; Ravi, A. An in vitro study on the reversal of epithelial to mesenchymal
transition by brusatol and its synergistic properties in triple-negative breast cancer cells. J. Pharm. Pharmacol. 2021, 73, 749–757,
doi:10.1093/jpp/rgab018.
89. Xiao-qi Yu, X.-y.S., Xiao-xiao Huang, Guo-dong Yao, Shao-jiang Song. Brusatol: A potential anti-tumor quassinoid from Brucea
javanica. Chin. Herb. Med. 2020, 12, 359–366, doi:10.1016/j.chmed.2020.05.007.
90. Rojo de la Vega, M.; Chapman, E.; Zhang, D.D. NRF2 and the Hallmarks of Cancer. Cancer Cell 2018, 34, 21–43,
doi:10.1016/j.ccell.2018.03.022.
91. Torrente, L.; Sanchez, C.; Moreno, R.; Chowdhry, S.; Cabello, P.; Isono, K.; Koseki, H.; Honda, T.; Hayes, J.D.; Dinkova-Kostova,
A.T.; et al. Crosstalk between NRF2 and HIPK2 shapes cytoprotective responses. Oncogene 2017, 36, 6204–6212,
doi:10.1038/onc.2017.221.
92. Zhao, X.Z.; Wu, X.H. A small compound spindlactone A sensitizes human endometrial cancer cells to TRAIL-induced apoptosis
via the inhibition of NAD(P)H dehydrogenase quinone 1. Oncol. Targets Ther. 2018, 11, 3609–3617, doi:10.2147/OTT.S165723.
93. Gerard, C.; Goldbeter, A. The balance between cell cycle arrest and cell proliferation: Control by the extracellular matrix and by
contact inhibition. Interface Focus 2014, 4, 20130075, doi:10.1098/rsfs.2013.0075.
94. Reddy, N.M.; Kleeberger, S.R.; Bream, J.H.; Fallon, P.G.; Kensler, T.W.; Yamamoto, M.; Reddy, S.P. Genetic disruption of the
Nrf2 compromises cell-cycle progression by impairing GSH-induced redox signaling. Oncogene 2008, 27, 5821–5832,
doi:10.1038/onc.2008.188.
Biomedicines 2021, 9, 1119 29 of 29
95. Marton, M.; Tihanyi, N.; Gyulavari, P.; Banhegyi, G.; Kapuy, O. NRF2-regulated cell cycle arrest at early stage of oxidative stress
response mechanism. PLoS ONE 2018, 13, e0207949, doi:10.1371/journal.pone.0207949.
96. Pucci, B.; Kasten, M.; Giordano, A. Cell cycle and apoptosis. Neoplasia 2000, 2, 291–299, doi:10.1038/sj.neo.7900101.
97. Niture, S.K.; Kaspar, J.W.; Shen, J.; Jaiswal, A.K. Nrf2 signaling and cell survival. Toxicol Appl. Pharmacol. 2010, 244, 37–42,
doi:10.1016/j.taap.2009.06.009.
98. Wu, S.; Lu, H.; Bai, Y. Nrf2 in cancers: A double-edged sword. Cancer Med. 2019, 8, 2252–2267, doi:10.1002/cam4.2101.
99. Syu, J.P.; Chi, J.T.; Kung, H.N. Nrf2 is the key to chemotherapy resistance in MCF7 breast cancer cells under hypoxia. Oncotarget
2016, 7, 14659–14672, doi:10.18632/oncotarget.7406.
100. Nogueira, V.; Hay, N. Molecular pathways: Reactive oxygen species homeostasis in cancer cells and implications for cancer
therapy. Clin. Cancer Res. 2013, 19, 4309–4314, doi:10.1158/1078-0432.CCR-12-1424.
101. Sporn, M.B.; Liby, K.T. NRF2 and cancer: The good, the bad and the importance of context. Nat. Rev. Cancer 2012, 12, 564–571,
doi:10.1038/nrc3278.
102. Ham, S.L.; Nasrollahi, S.; Shah, K.N.; Soltisz, A.; Paruchuri, S.; Yun, Y.H.; Luker, G.D.; Bishayee, A.; Tavana, H. Phytochemicals
potently inhibit migration of metastatic breast cancer cells. Integr. Biol. 2015, 7, 792–800, doi:10.1039/c5ib00121h.
103. Zhang, H.S.; Zhang, Z.G.; Du, G.Y.; Sun, H.L.; Liu, H.Y.; Zhou, Z.; Gou, X.M.; Wu, X.H.; Yu, X.Y.; Huang, Y.H. Nrf2 promotes
breast cancer cell migration via up-regulation of G6PD/HIF-1alpha/Notch1 axis. J. Cell Mol. Med. 2019, 23, 3451–3463,
doi:10.1111/jcmm.14241.
104. Nishida, N.; Yano, H.; Nishida, T.; Kamura, T.; Kojiro, M. Angiogenesis in cancer. Vasc. Health Risk Manag. 2006, 2, 213–219,
doi:10.2147/vhrm.2006.2.3.213.
105. Grivennikov, S.I.; Greten, F.R.; Karin, M. Immunity, inflammation, and cancer. Cell 2010, 140, 883–899,
doi:10.1016/j.cell.2010.01.025.