Global Food Price Hike is a Burden to the Poor
15
International Journal of Information Technology and Business Management 29 th Nov 2013. Vol.19 © 2012 - 2013 JITBM & ARF. All rights reserved ISSN 2304-0777 www.jitbm.com 1 GLOBAL FOOD PRICE HIKE IS A BURDEN TO THE POOR Haradhan Kumar Mohajan Faculty of Business Studies, Premier University, Chittagong, Bangladesh Email: [email protected] ABSTRACT This paper discusses the global food price hike and the effects of it among the poor of developing countries. Increase of food price became severe during 2007 and 2008, which was high in the last fifty years and more than half of the populations of the world affected due to this price hike. Biofuels production is one of the main causes of food price increase. Rapid increase of world population is another cause of soar of food price. Global supply and demand of food commodities, low harvest and natural calamities are also some other causes of increasing of the food prices. Soaring food prices have generated global concern about threats to food security, shaking the satisfaction created by many years of comparatively low commodity prices. Right of food is a fundamental right of every citizen of the state; unfortunately citizens of the most countries are deprived from this right. Many developing countries use food price subsidies or price controls to mitigate hunger and improve the nutrition of the poor but this is not a permanent solution to control food price hike. Keywords: Child malnutrition, Biofuels, Food prices, Inflation, Poverty, Subsidies in food. 1. INTRODUCTION All the living organisms as well as human beings must eat to survive. So that everyone is affected to some degree when food price increases. Food price increase depends on the consumer’s demand. Consumer demand is influenced by some economic factors such as own-price, the price of close substitutes, and the price of complementary items. The non-economic factors including tastes and preferences, family size, age of family members, geographic location, shopping behavior, and lifestyle choices are related to commodity price hike. The poor are more vulnerable than the rich during the period of food price hike. In June 2008 representatives of 180 countries, including many heads of state, met in Rome to express their conviction “that the international community needs to take urgent and coordinated action to combat the negative impacts of soaring food prices on the world’s most vulnerable countries and populations” [11]. Economists call the relationship between changes in consumer income and the quantity of an item purchased an Engel curve. An Engel curve describes how household expenditure on a particular good or service varies with household income, which states that the lower a family’s income, the greater is the proportion of it spent on food. This relationship is used by economists to classify goods as follows [32]: For a normal goods, consumers buy more of it as their incomes increase, but at a decreasing rate such that its average budget share declines for higher income levels. For a luxury goods, consumers buy more of it as their incomes increase and at an increasing rate such that its budget share increases at higher income levels. For an inferior goods, consumers buy less of it as their incomes increase. Choice of food varies according to age. Young children and adolescents generally need both more calories and a higher portion of protein-based calories to meet nutritional demands of rapid physical growth and high activity levels. The mothers of infants need some additional food to provide breast feeding their infants. The family spends more to buy meat and dairy products for the children and mothers. The older family members need normal foods. As a result, population demographics such as household composition, size, and age structure often play an
-
Upload
premieruniversity -
Category
Documents
-
view
0 -
download
0
Transcript of Global Food Price Hike is a Burden to the Poor
International Journal of Information Technology and Business Management 29
th Nov 2013. Vol.19
© 2012 - 2013 JITBM & ARF. All rights reserved
ISSN 2304-0777 www.jitbm.com
1
GLOBAL FOOD PRICE HIKE IS A BURDEN TO THE POOR
Haradhan Kumar Mohajan Faculty of Business Studies, Premier University, Chittagong, Bangladesh
Email: [email protected]
ABSTRACT
This paper discusses the global food price hike and the effects of it among the poor of developing countries.
Increase of food price became severe during 2007 and 2008, which was high in the last fifty years and more than
half of the populations of the world affected due to this price hike. Biofuels production is one of the main causes of
food price increase. Rapid increase of world population is another cause of soar of food price. Global supply and
demand of food commodities, low harvest and natural calamities are also some other causes of increasing of the
food prices. Soaring food prices have generated global concern about threats to food security, shaking the
satisfaction created by many years of comparatively low commodity prices. Right of food is a fundamental right of
every citizen of the state; unfortunately citizens of the most countries are deprived from this right. Many developing
countries use food price subsidies or price controls to mitigate hunger and improve the nutrition of the poor but this
is not a permanent solution to control food price hike.
Keywords: Child malnutrition, Biofuels, Food prices, Inflation, Poverty, Subsidies in food.
1. INTRODUCTION
All the living organisms as well as human beings
must eat to survive. So that everyone is affected to
some degree when food price increases. Food price
increase depends on the consumer’s demand.
Consumer demand is influenced by some economic
factors such as own-price, the price of close
substitutes, and the price of complementary items.
The non-economic factors including tastes and
preferences, family size, age of family members,
geographic location, shopping behavior, and lifestyle
choices are related to commodity price hike. The
poor are more vulnerable than the rich during the
period of food price hike. In June 2008
representatives of 180 countries, including many
heads of state, met in Rome to express their
conviction “that the international community needs to
take urgent and coordinated action to combat the
negative impacts of soaring food prices on the
world’s most vulnerable countries and populations”
[11].
Economists call the relationship between changes in
consumer income and the quantity of an item
purchased an Engel curve. An Engel curve describes
how household expenditure on a particular good or
service varies with household income, which states
that the lower a family’s income, the greater is the
proportion of it spent on food. This relationship is
used by economists to classify goods as follows [32]:
For a normal goods, consumers buy more of
it as their incomes increase, but at a
decreasing rate such that its average budget
share declines for higher income levels.
For a luxury goods, consumers buy more of
it as their incomes increase and at an
increasing rate such that its budget share
increases at higher income levels.
For an inferior goods, consumers buy less of
it as their incomes increase.
Choice of food varies according to age. Young
children and adolescents generally need both more
calories and a higher portion of protein-based calories
to meet nutritional demands of rapid physical growth
and high activity levels. The mothers of infants need
some additional food to provide breast feeding their
infants. The family spends more to buy meat and
dairy products for the children and mothers. The
older family members need normal foods. As a result,
population demographics such as household
composition, size, and age structure often play an
International Journal of Information Technology and Business Management 29
th Nov 2013. Vol.19
© 2012 -2013 JITBM & ARF. All rights reserved
ISSN 2304-0777 www.jitbm.com
2
important role in consumer price sensitivity and
income responsiveness. If price of meat and dairy
products increases then the children, adolescents and
mothers suffer with malnutrition if the income of the
family is not increased.
During the 2008–09 period global economic crises;
increased unemployment, income decreased, and
lower effective household purchasing power
happened globally. Increase of salary and wage of the
employees is also another main reason of food price
hike in developing countries.
The G20 ministers of agriculture started working
together in 2011 and designed an action plan to tackle
food price volatility and food insecurity. The five
objectives of the G20 ministers of agriculture are as
follows:
improving agricultural production and
productivity,
increasing market information and
transparency,
reducing the effects of price volatility for the
most vulnerable,
strengthening international policy
coordination, and
improving the functioning of agricultural
commodity derivatives’ markets.
In the first decade of the 21st century the prices of
energy has increased by a larger amount. The
domestic sector was liable for 26% of final energy
consumption in 2010 in the UK. Gas use is 65%,
electricity is 25%, petroleum is 7% and solid fuel is
2%. This increase of energy prices influences the
increase of global food prices, because energy is used
to produce, packaging and carrying food.
2. OBJECTIVE OF THE STUDY
The objective of this study is to investigate the global
food price soar and its effects on the poor of the
developing countries. Most of the poor of the world
lives in the developing countries and more than half
of their income are spent for buying food. As a result
they cannot buy other necessary household articles by
their limited income. This paper highlighted the
relationship between food and nutrition and causes of
malnutrition of the poor. The developed countries are
producing biofuels for their vehicle from food and
the poor of the developing countries are suffering for
this. The study will create consciousness among the
poor of the developing countries about the reasons of
food price hike. Hence, they can save food and
money to adjust them during the food price inflations
in future.
3. GLOBAL BIOFUELS PRODUCTION
AFFECTS FOOD PRICES
Biofuels are combustible materials directly or
indirectly derived from biomass, commonly produced
from wood, agricultural crops and products, aquatic
plants, forestry products, wastes and residues, and
animal wastes. In the late 19th
century, Rudolph
Diesel used peanut oil to power compression engines.
Henry Ford was also an early proponent of biofuels.
Ford built a factory that began making biofuels, but
oil soon became the mainstream fuel of choice. In the
19th
and the 20th
centuries, fossil fuels were main
source of vehicle fuel.
Necessity of biofuels has increased in response due to
global environmental and economical difficulties.
Gaseous biofuels include methane gas and producer
gas. Methane gas is produced from the anaerobic
fermentation of animal wastes, wastewater treatment
sludge and municipal wastes in landfills. Current
biofuels are often made from feedstock crops which
also serve as food. To produce biofuels, supply of
food is decreasing and many people are starving due
to shortage of food, so that people of poorer countries
are suffering from malnutrition and prices of foods
are increasing in these countries. To produce
biofuels sometimes habitats are destroyed, so that
ecosystems are broken and harms high biodiversity
and services which are crucial to our economies and
human life.
Biofuels for transport are generally denoted
according to their current or future availability as
first, second or third generation biofuels as follows
[19]:
First generation biofuels are commercially produced
using conventional technology. The basic feedstocks
are seeds, grains, or whole plants from crops such as
corn, sugar cane, rapeseed, wheat, sunflower seeds,
jatropha curcas, soy or oil palm. These plants and
grains were originally selected as food and most are
International Journal of Information Technology and Business Management 29
th Nov 2013. Vol.19
© 2012 -2013 JITBM & ARF. All rights reserved
ISSN 2304-0777 www.jitbm.com
3
still mainly used to feed people. Biofuels are
produced from these feedstocks. The most common
first generation biofuels are bioethanol, biodiesel, and
biogas (CH4 and other hydrocarbons). Biodiesel are
obtained from edible oil or from animal oils which
are transformed by a chemical process called
transesterification. Biodiesel can be blended with
fossil fuels without any motor’s transformation and
also can be used as pure biodiesel. Bioethanol are
produced by the fermentation of sugars or starches
from sugar cane, cassava, maize, potatoes, sorghum,
sugar beet, wheat etc. We also find oilcake, glycerin,
fertilizer etc. as by product when prepare first
generation biofuels.
Second generation biofuels can be produced from a
variety of non-food sources such as waste biomass,
residues, non-food cellulosic (wood) and ligno-
cellulosic material (freeing the sugar molecules from
cellulose using enzymes), corn stover, the stalks of
wheat, and special energy or biomass crops. Second
generation biofuels use biomass to liquid technology,
by thermochemical conversion (mainly to produce
biodiesel) or fermentation (to produce cellulosic
ethanol). Many second generation biofuels are under
development such as biohydrogen, biomethanol,
dimethylfuran (DMF), Bio-DME (dimethyl ether),
Fischer-Tropsch diesel, biohydrogen diesel, and
mixed alcohols [24].
Algae fuel (oilgae) is a biofuel from algae and
denoted as a third generation biofuel [19]. Algae are
feedstocks from aquatic cultivation for production of
triglycerides to produce biodiesel. The processing
technology is basically the same as for biodiesel from
second generation feedstocks. Other third generation
biofuels include alcohols like bio-propanol or bio-
butanol but because of production difficulties these
will not be marketed before 2050 [19]. Second and
third generation biofuels are also called advanced
biofuels.
World ethanol production for transport fuel tripled
between 2000 and 2007 from 17 to more than 52
billion liter, while biodiesel expanded eleven-fold
from less than 1 to almost 11 billion liter. These fuels
together provided 1.8% of the world’s transport fuel
by energy value [25]. Investment into biofuels
production capacity probably exceeded $4 billion
worldwide in 2007 and increasing continually
rapidly.
In Europe there has been a continuing increase in the
use of biofuels in road transport over the past decade
from 0.1% in 1997 to 2.6% in 2007 [6]. New
biodiesel capacity has developed throughout Europe
which is about 7 billion liter per annum at the end of
2006. Plans for new biodiesel and increased palm oil
and Jatropha plantations were announced in several
countries during 2006–07. Serious commercial
investment in second generation biofuels began
during 2006–07 in many countries, like Canada, the
USA, Japan and the EU [28]. The world’s first
commercial wood-to-ethanol plant run by BioEthanol
Japan Kansai Co. began operation in Osaka in 2007,
with a capacity of 1.4 million liter per annum. In the
USA, the first commercial cellulosic ethanol facility
to convert waste wood materials into a renewable
fuel went into production near Upton, Wyoming in
2008, run by KL Process Design Group. In Europe,
the Dutch firm Royal Nedalco was building a $200
million plant that would produce 200 million liter per
annum from wheat chaff and other wastes by late
2008 [25]. Global trade in fuel ethanol is estimated to
have been about 3 billion liter per annum over 2006–
07.
Brazil and the USA are the leaders for bioethanol
production in the world generating 90% of the total
production, with sugarcane in Brazil and mainly corn
in the USA. It is estimates that about 90% US ethanol
is obtained from maize [31]. The rapidly increasing
petroleum prices and uncertainties concerning its
availability, growing concern of the environment and
the effect of greenhouse gases (GHGs) during the last
decades, has revived more and more interests in the
use of vegetable oils as a substitute of fossil fuel.
A new US renewable fuels standard implies that 20%
of gasoline for road transport would be blend of
biofuels by 2022. In 2007, the German government
proposed a national total biofuels target of 17% of
energy consumption for road transport by 2020. The
EU has adopted a new EU-wide binding target of
10% of transport energy from renewable sources by
2020 [9].
By cultivating biofuels, most countries will be able to
grow one or more types of crops in which they
possess a comparative advantage and use them to
meet either domestic or foreign demand or both. This
increased demand for agriculture is expected to
International Journal of Information Technology and Business Management 29
th Nov 2013. Vol.19
© 2012 -2013 JITBM & ARF. All rights reserved
ISSN 2304-0777 www.jitbm.com
4
increase farm income and raise income for farmers,
and reduce the need for subsidies for income support.
These countries can produce their own fuel, and
reduce their dependence on foreign sources for
energy [18].
Due to increase of biofuels production the prices all
food commodities increased and stock depleted
globally. From early 2007 to mid 2008 wheat prices
have increased by over 40%, rice prices jumped by
more than 60% and soybean prices also raised by
40% (United Nations Conference on Trade and
Development, [34]). Palm oil went up 200% between
January 2005 and June 2008, soybean oil followed
with an increase of 192% over the same period. The
International Monetary Fund’s (IMF’s) index of
internationally traded food commodities prices raised
130% between January 2002 and June 2008 and 56%
between January 2007 and June 2008 [23].
At present more than two billion people in the world
are suffering from hunger and more are suffering
from nutritional deficits. On the other hand
developed countries like the USA are using the food
grains to produce biofuels. If the production of
ethanol be increased continually, more than half of
the people of the world will starve around 2020 and
most of them will suffer in poorer nations. The
developed nations must be conscious that biofuel
production shall not impair food security and take
steps to avoid negative impacts on biodiversity and
ecosystems. They must be strict that the cultivators of
biomass should not face violation of land rights,
human rights or labor rights.
About two-thirds of global freshwater (non-toxic
water) uses for agriculture and as a result, water
labels are dropping significantly in some of the most
productive areas of US farmland. To product 1 gallon
of ethanol requires 1,700 gallons of freshwater both
for corn production and for the fermentation
processing of ethanol. Much of US farm land drains
into the Mississippi River and eventually into the
Gulf of Mexico. The water runoff from these farm
lands already causes eutrophication in the Gulf, and
the size of this dead zone is expanding. The dead
zone has averaged about 4,800 square miles since
1990; the record of 8,500 square miles occurred in
2002 [27]. The Gallagher Review [33] has estimated
that there is sufficient land available to satisfy
demand for food, feed and fuel to 2020, but this
needs to be confirmed in a local and regional context
before global supply of bioenergy increases
significantly. Again to product these crops usually
require more fertilizers and pesticides than traditional
ones.
3.1 Statistics of Global Biofuel Production
The use of maize for ethanol grew rapidly from 2004
to 2007 and used 70% of the increase in global maize
production. From 2004 to 2007 global maize use for
food was 65% and global use increase only 1.5%. On
the other hand during the same period global ethanol
use increase was 36%. The USA is the largest
producer of ethanol from maize and in the 2007–08
crop year it used about 81 million tons of maize for
ethanol, which is 25% of its production for ethanol in
2007–08. On the other hand Canada, China and the
European Union (EU) used roughly an additional 5
million tons of maize for ethanol in 2007. These 86
million tons is the 11% of global maize production
[35].
The largest biodiesel producers in the world are the
EU, the USA, Argentina, Australia, and Brazil. These
countries together use about 8.6 million tons of
vegetable oils for biodiesel in 2007 compared with
global vegetable oils production of 132 million tons
[37]. About 7% of global vegetable oil supplies were
used for biodiesel production in 2007. Also about
one-third of the increase in consumption from 2004
to 2007 was due to biodiesel. At the same times the
EU and the USA have increased significantly the
imports of vegetable oils to produce biodiesel. The
EU-27 increased imports from 4.4 to 6.9 million tons
from 2000 to 2007 and the USA increased imports
from 1.7 to 2.9 million tons.
Brazil uses about half of its sugar cane to produce
ethanol for domestic consumption and exports and
the rest half portion is used to produce sugar. But
Brazilian ethanol production from sugar cane has not
affected the recent increase in food prices. Because
Brazil increased rapidly the production of sugar cane
and also increased the sugar exports. It increased
sugar production from 17.1 million tons in 2000 to
32.1 million tons in 2007 and exports increased from
7.7 million tons to 20.6 million tons. The EU
countries aimed at replacing 5.75% of all transport
fossil fuels with biofuels by 2010. Food and
Agricultural Policy Research Institute (FAPRI)
International Journal of Information Technology and Business Management 29
th Nov 2013. Vol.19
© 2012 -2013 JITBM & ARF. All rights reserved
ISSN 2304-0777 www.jitbm.com
5
expressed that the EU increased the biodiesel
production from 0.28 billion gallons in 2001 to 1.78
billion gallons in 2007 [13].
The USA imposed a tax credit to blenders of ethanol
of $0.51/gallon and an import tariff of $0.54/gallon,
and a biodiesel blender tax credit $1.00/gallon. The
USA mandated 7.5 billion gallons of renewable fuels
by 2012 in its 2005 legislation and raised the mandate
to 15 billion gallons of ethanol from conventional
sources by 2022 and 1 billion gallons of biodiesel by
2012 in energy legislation passed in late 2007. Hence
the new US mandates will require ethanol production
to more than double and biodiesel production to triple
if they are met from domestic production [23]. The
EU imposed a specific tariff of $1.10/gallon and an
ad valorem duty of 6.5% on biodiesel. EU member
states are permitted to reduce excise taxes on biofuels
[15].
The USA expanded its biodiesel production
following legislation passed in 2004. It provides an
excise tax credit of $1.00/gallon of biodiesel made
from agricultural products, which increase in
biodiesel production in the USA from 0.03 billion
gallons in 2005 to 0.44 billion gallons in 2007 and
used 3 million tons of soybean oil and 0.3 million
tons of other fats and oils. As a result soybean oil
prices rose from $354/ton in 2001 to $881/ton in
2007, and soybean oil prices rose to $1,522/ton in
June 2008. The USA expanded maize area 23% in
2007 in due to high maize prices and rapid demand
growth for maize for ethanol production. This
expansion resulted in a 16% decline in soybean area
which reduced soybean production, and increased
75% in soybean prices between April 2007 and April
2008.
The expansion of biodiesel production in the EU
diverted land for wheat. So that it slowed the increase
in wheat production which caused to keep wheat
stocks higher. On the other hand food production is
decreased due to weather related calamities such as
draught and flood in Australia, the USA, the EU,
Canada, Russia and Ukraine (Organization for
Economic Co-operation and Development (OECD)
and Food and Agriculture Organization of the United
Nations (FAO), [26]).
A number of countries have imposed export
restrictions or even bans on grain exports to contain
domestic price increases. Poor crops production in
the EU and Ukraine reduced their food grains exports
by an additional 10 million tons in 2007. These
countries are Argentina, India, Kazakhstan, Pakistan,
Ukraine, Russia and Vietnam. Rice is not using for
biofuels production, but the increase in prices of
other commodities effected to the rapid rise in rice
prices. Global rice prices become tripled from
January to April 2008. Global consumption of wheat
and rice grew by only 0.8 and 1% per annum,
respectively, from 2000 to 2007, while maize
consumption grew only by 2.1%.
4. GLOBAL INFLATION OF FOOD
In 2007 and 2008 the global economic crisis began in
various sectors and food price hike attacked the poor
of the developing countries severely. Increases in
global food prices have led to widespread hunger and
social unrest worldwide in the human life. Almost
every country has experienced of increasing price of
food commodities. The world’s food import bill rose
in 2007 to $745 billion (up 21% from the previous
year) and more than $233 billion of which in
developing countries [10]. Food and Agriculture
Organization [12] expresses that from January 2007
to June 2008 the world food prices increased by more
than 60%, while the world oil price increased by
about 125% over the same period. The dominant
causes of price increases from 2004 to 2012 were due
to investor rumor and ethanol conversion. The FAO
food price index increased in the first quarter of
2012. The world economists and rulers started to
think for higher inflation, food security and poverty
reduction. The rapid rise in food prices has been a
burden on the poor in the developing countries.
Higher oil prices, adverse weather conditions and
strong demand from Asia have pushed global food
prices up. Due to financial crisis employment,
poverty, agriculture investment and social sector
expenditures increased globally. von Braun [41]
showed that there is a positive correlation on the
financial stability, food security and political
security. Globally women and children are more
vulnerable in the increase of food prices.
Lustig [22] expressed that there are major five
reasons of rising global food prices, which are as
follows:
long-term supply problems,
International Journal of Information Technology and Business Management 29
th Nov 2013. Vol.19
© 2012 -2013 JITBM & ARF. All rights reserved
ISSN 2304-0777 www.jitbm.com
6
rise in fuel prices,
changes in demand due to biofuels,
depreciation in dollar and low interest rate in
the USA and tentative activities, and
export restrictions of developing countries.
At present food grains and edible oilseeds are using
to produce biofuels. That is why prices of food
increase rapidly. The prices of soybean are in the
highest since 2008 and are likely to rise further due to
tight supplies and steady demand from China. In
developing countries, like Bangladesh, the poor and
extremely poor spend half or more than half of their
household incomes to buy food. At the first decade of
the 21st century the price of fossil fuels increases
rapidly. The developed nations are searching for the
alternate fuels and biofuels are their first choice. The
increased production of biofuels from food grains and
oilseeds, global wheat and maize stocks have
declined significantly, oilseed prices have tripled.
Internationally traded food commodities prices have
increased sharply since 2002, but between 2005 and
2007 the price increased very sharply. World food
prices increased 130% from January 2002 to June
2008. During these period individual agricultural
commodities, such as, corn, wheat, rice and soybeans
prices rose up by 190, 162, 318 and 246%
respectively. Since July 2008, food prices began to
fall and increased significantly in 2010 and 2011. The
main reasons of global price hike of the agricultural
commodities are as follows:
the devaluation of the US dollar,
rapid growth of world population (in 2011
the populations of the world became 7
billion),
poor harvest,
increasing meat consumption in China and
India,
poor government policies such as bans of
food grain and oil seeds export,
imbalance in demand and supply of food
commodities,
investor rumor on commodity markets,
natural calamities such as flood, draught,
cyclone, tsunami etc.,
long-term underinvestment in agricultural
research, technology and rural
infrastructures,
growing foreign exchange holdings by
major food-importing countries,
recent policies by some exporting countries
to mitigate their own food-price inflation,
the increase cost in food production
(increased prices of seed, fertilizer,
chemicals, fuel, lubricants and electricity),
high interest rate of bank loan,
increased pressure on land and water
resources,
food grains use for the production of ethanol
for biofuel,
oilseeds use for the production of biodiesel,
transportation cost,
the political instability,
the change of government, and
higher labor cost.
Rising prices of food grains and oil seeds have
caused food riots in several countries of Asia and
Africa. More poor families of these regions have to
starve for a long time at a stretch or live with few
foods which are not making a balance diet. As a
result the family members of the starving individuals
become sick and in future they will be burden for
their native land.
The International Monetary Fund’s [20] index of
internationally traded food commodities prices
increased 130% from January 2002 to June 2008 and
56% from January 2007 to June 2008. Global stocks
of food grains increased in 2004-05 crop year but
declined in 2005-06 crop year, as demand increased
more than production. Crop year starts with harvest
and continue until the next harvest. From January
2005 to June 2008, maize prices almost tripled, wheat
prices increased 127% and rice prices increased
170%. Prices of oilseeds increased parallel to the
food grains prices. Palm oil prices increased 200%
from January 2005 to June 2008, soybean oil prices
increased 192% and other vegetable oils prices
increased by similar ways. Other foods prices such as
sugar, citrus, bananas, shrimp and meats increased
48% from January 2005 to June 2008 [23]. The IMF
estimated that the increased demand for biofuels
reported that 70% of the increase in maize prices and
40% of the increase in soybean prices [21].
Production costs per acre for US corns, soybeans and
wheat increased 32.3, 25.6 and 31.4%, respectively,
from 2002 to 2007 [36]. During the 1991 to 2006
period, the US food prices were fairly stable and
annual food price inflation, as measured by the
International Journal of Information Technology and Business Management 29
th Nov 2013. Vol.19
© 2012 -2013 JITBM & ARF. All rights reserved
ISSN 2304-0777 www.jitbm.com
7
Consumer Price Index (CPI) for all foods and
average inflammation was 2.5%. Several economic
factors appeared in late 2005 and began to gradually
push market prices higher for both raw agricultural
commodities and energy costs, and ultimately the US
food price increased at a rate of 4% in 2007 and at
5.5% in 2008, which is the highest since 1990.
Annual food price inflation dropped to 1.8% in 2009
and 0.8% in 2010, before rising to 3.7% in 2011
driven by improving the US and global economic
conditions. Record Midwest heat in 2012 sparked the
worst US drought since 1956, which caused damage
to major field crops. USDA forecasts that annual
food price inflation will range from 2.5% to 3.5% in
2012 and rise to 3%-4% in 2013 [32].
Drought in Australia in two consecutive years 2006
and 2007 and poor crops in Europe in 2007 increases
prices of food grains and oilseeds. On the other hand
rapid import demand increases for oilseeds by China
to feed its growing livestock and poultry industry
influenced to oilseed price increases [23]. In 2012
wheat production decreased in the USA, Russia, and
Australia due to draught, but biofuel production from
wheat is not decreased. As a result there is a
probability of price hike of wheat in 2013.
The rising food grains and oil seeds prices have
increased 41 million hungry in Asia and 24 million
hungry in sub-Saharan Africa (SSA). Economic
growth in SSA since the late 1990s increased the
demand for meat, milk, wheat and rice for the
citizens. Similarly economic growth in Asia
increased demand for wheat, meat, milk, oils and
vegetables. As a result the food prices increase in
these regions.
Researchers at International Food Policy Research
Institute (IFPRI), [41] have conducted a study in
which they compare the real prices for a number of
grains over the period 2000 to 2007 to simulated
prices under a number of scenarios. The sharp change
in biofuel production, largely caused by policy-driven
demand, accounted for 30% of the actual increase in
production-weighted average real price for grains
over the seven years period. The real grain price is
the production weighted average of rice, wheat,
maize and other coarse grains. The percentage share
is calculated as follows [14]:
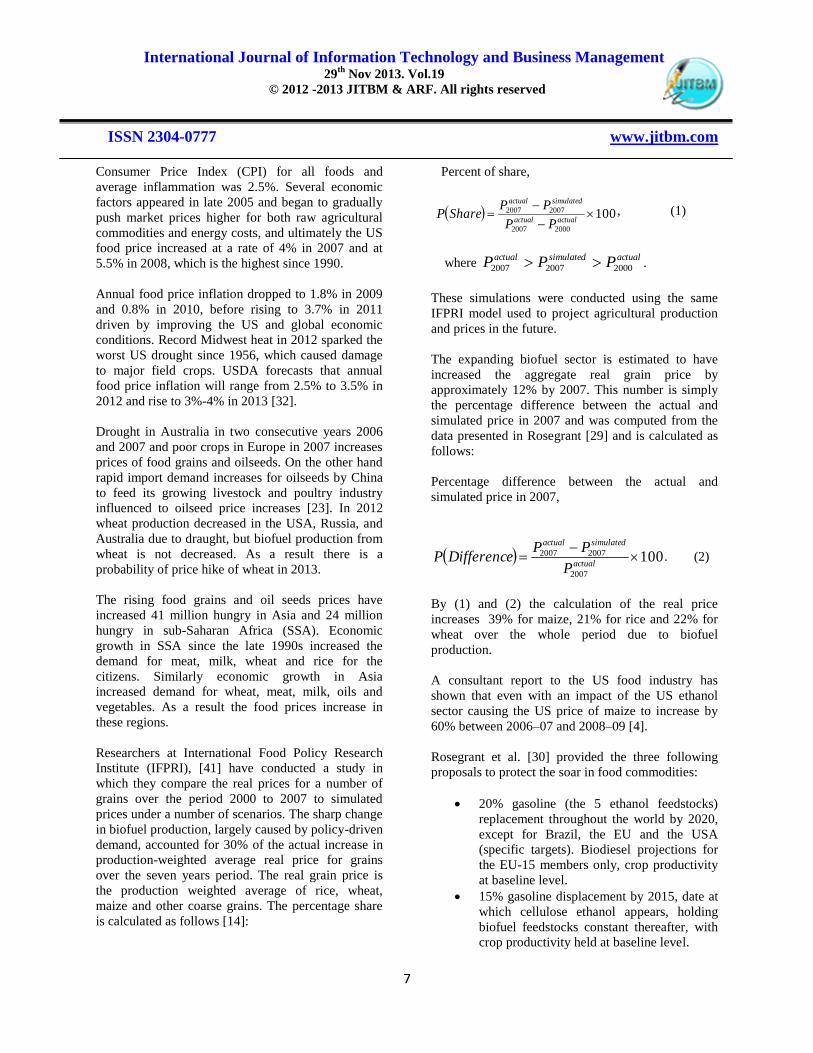
Percent of share,
10020002007
20072007
actualactual
simulatedactual
PP
PPShareP , (1)
where actualsimulatedactual PPP 200020072007 .
These simulations were conducted using the same
IFPRI model used to project agricultural production
and prices in the future.
The expanding biofuel sector is estimated to have
increased the aggregate real grain price by
approximately 12% by 2007. This number is simply
the percentage difference between the actual and
simulated price in 2007 and was computed from the
data presented in Rosegrant [29] and is calculated as
follows:
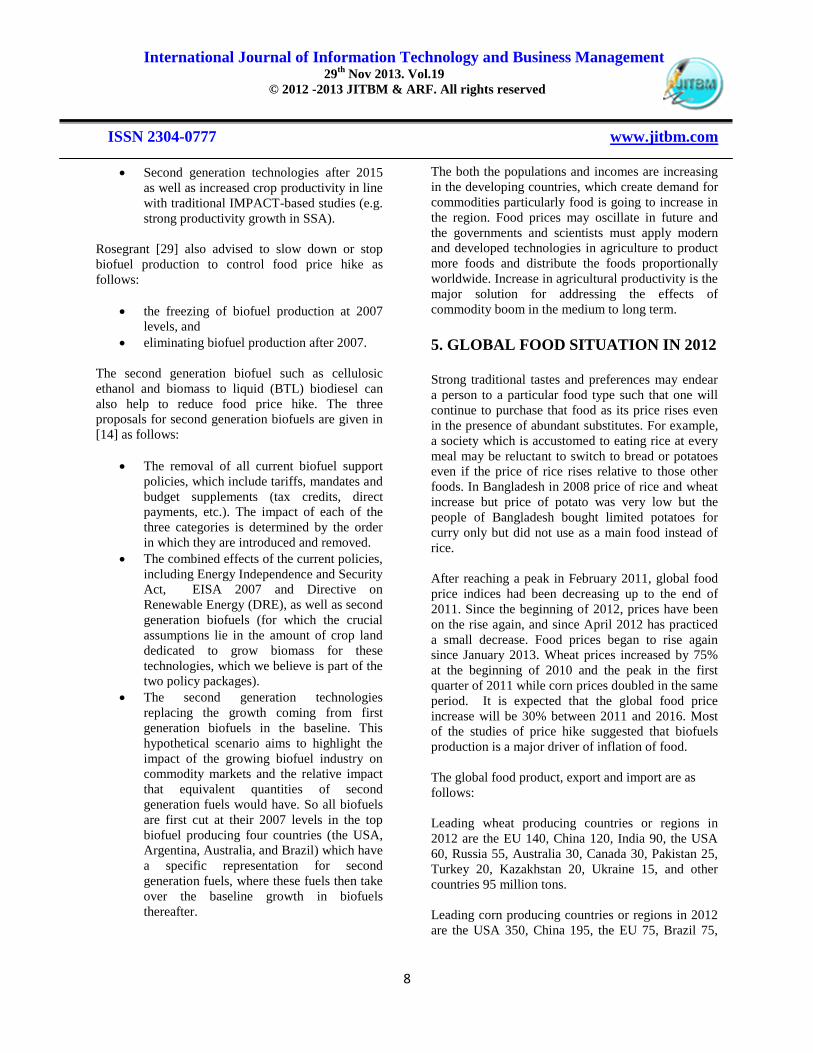
Percentage difference between the actual and
simulated price in 2007,
1002007
20072007
actual
simulatedactual
P
PPDifferenceP . (2)
By (1) and (2) the calculation of the real price
increases 39% for maize, 21% for rice and 22% for
wheat over the whole period due to biofuel
production.
A consultant report to the US food industry has
shown that even with an impact of the US ethanol
sector causing the US price of maize to increase by
60% between 2006–07 and 2008–09 [4].
Rosegrant et al. [30] provided the three following
proposals to protect the soar in food commodities:
20% gasoline (the 5 ethanol feedstocks)
replacement throughout the world by 2020,
except for Brazil, the EU and the USA
(specific targets). Biodiesel projections for
the EU-15 members only, crop productivity
at baseline level.
15% gasoline displacement by 2015, date at
which cellulose ethanol appears, holding
biofuel feedstocks constant thereafter, with
crop productivity held at baseline level.
International Journal of Information Technology and Business Management 29
th Nov 2013. Vol.19
© 2012 -2013 JITBM & ARF. All rights reserved
ISSN 2304-0777 www.jitbm.com
8
Second generation technologies after 2015
as well as increased crop productivity in line
with traditional IMPACT-based studies (e.g.
strong productivity growth in SSA).
Rosegrant [29] also advised to slow down or stop
biofuel production to control food price hike as
follows:
the freezing of biofuel production at 2007
levels, and
eliminating biofuel production after 2007.
The second generation biofuel such as cellulosic
ethanol and biomass to liquid (BTL) biodiesel can
also help to reduce food price hike. The three
proposals for second generation biofuels are given in
[14] as follows:
The removal of all current biofuel support
policies, which include tariffs, mandates and
budget supplements (tax credits, direct
payments, etc.). The impact of each of the
three categories is determined by the order
in which they are introduced and removed.
The combined effects of the current policies,
including Energy Independence and Security
Act, EISA 2007 and Directive on
Renewable Energy (DRE), as well as second
generation biofuels (for which the crucial
assumptions lie in the amount of crop land
dedicated to grow biomass for these
technologies, which we believe is part of the
two policy packages).
The second generation technologies
replacing the growth coming from first
generation biofuels in the baseline. This
hypothetical scenario aims to highlight the
impact of the growing biofuel industry on
commodity markets and the relative impact
that equivalent quantities of second
generation fuels would have. So all biofuels
are first cut at their 2007 levels in the top
biofuel producing four countries (the USA,
Argentina, Australia, and Brazil) which have
a specific representation for second
generation fuels, where these fuels then take
over the baseline growth in biofuels
thereafter.
The both the populations and incomes are increasing
in the developing countries, which create demand for
commodities particularly food is going to increase in
the region. Food prices may oscillate in future and
the governments and scientists must apply modern
and developed technologies in agriculture to product
more foods and distribute the foods proportionally
worldwide. Increase in agricultural productivity is the
major solution for addressing the effects of
commodity boom in the medium to long term.
5. GLOBAL FOOD SITUATION IN 2012
Strong traditional tastes and preferences may endear
a person to a particular food type such that one will
continue to purchase that food as its price rises even
in the presence of abundant substitutes. For example,
a society which is accustomed to eating rice at every
meal may be reluctant to switch to bread or potatoes
even if the price of rice rises relative to those other
foods. In Bangladesh in 2008 price of rice and wheat
increase but price of potato was very low but the
people of Bangladesh bought limited potatoes for
curry only but did not use as a main food instead of
rice.
After reaching a peak in February 2011, global food
price indices had been decreasing up to the end of
2011. Since the beginning of 2012, prices have been
on the rise again, and since April 2012 has practiced
a small decrease. Food prices began to rise again
since January 2013. Wheat prices increased by 75%
at the beginning of 2010 and the peak in the first
quarter of 2011 while corn prices doubled in the same
period. It is expected that the global food price
increase will be 30% between 2011 and 2016. Most
of the studies of price hike suggested that biofuels
production is a major driver of inflation of food.
The global food product, export and import are as
follows:
Leading wheat producing countries or regions in
2012 are the EU 140, China 120, India 90, the USA
60, Russia 55, Australia 30, Canada 30, Pakistan 25,
Turkey 20, Kazakhstan 20, Ukraine 15, and other
countries 95 million tons.
Leading corn producing countries or regions in 2012
are the USA 350, China 195, the EU 75, Brazil 75,
International Journal of Information Technology and Business Management 29
th Nov 2013. Vol.19
© 2012 -2013 JITBM & ARF. All rights reserved
ISSN 2304-0777 www.jitbm.com
9
Argentina 20, Ukraine 20, India 18, Indonesia 15 and
other countries 180 million tons.
Leading rice producing countries or regions in 2012
are China 140, India 110, Indonesia 45, Bangladesh
35, Vietnam 30, Thailand 25, Myanmar 20,
Philippines 15, Brazil 10, Japan 10, Pakistan 8, the
USA 7 and other countries 55 million tons.
Major rice exporting countries or regions in 2012 are
Thailand 7.5, Vietnam 7, India 6, the USA 3,
Pakistan 3.5 and other countries 7 million tons.
Major oil crop exporting countries or regions in 2012
are the USA 37, Brazil 36, Canada 12, Argentina 12
and other countries 17 million tons.
Major corn importing countries or regions in 2012
are Japan 16, Mexico 9, China 9.8, Korea 8, Egypt 6,
and the EU 5.5 million tons.
Major wheat importing countries or regions in 2012
are Egypt 10, the EU 7.5, Brazil 7, Japan 6, Indonesia
5.5, Korea 5, China 4 and Nigeria 3.5 million tons.
5.1 Global Short-term Attempts to Control Price
Hike
Globally few short-term steps are taken to control the
food price hike. Some of them are as follows:
The use of corn for biofuel production in the
USA is slowing down to control food price
hike. It stressed on sugar cane to produce
biofuels. After years of annual growth above
10%, it remains unchanged for 2011–12.
Most countries increased their lands to
cultivate food crops. For example, the
cultivation areas have increased for corn in
China and Brazil, for rice in India and
Pakistan, for wheat in Russia and the USA.
According to the FAO, for the increased
plantings and good yields, record about 2.4
billion tons cereal crops are expected in
2012–13 crop year globally, which is a 1.9%
increase compared to 2011–12 crop year,
when it was already 4% higher than in
2010–11.
6. PHYSICAL AND MENTAL EFFECTS
ON CHILDREN DURING THE FOOD
PRICE HIKE
When food prices increase the children become first
victim. The prevalence of underweight amongst
children rises in response to a higher inflation rate for
basic food products. Infants depend on breast
feeding. If food prices raise mothers find less food or
have to starve. Sometimes mothers have to eat cheap
foods which have only starch. Infants find only starch
rich breast feedings. So the malnutrition measures are
mostly insensitive to the inflation rate. As a result the
infant morbidity or infant mortality rate increases in
the poor families. The children grow with ill health
and in future they will suffer from various
malnutrition diseases. The poor have to spend more
of their household income to buy food and the family
budget run short and cannot buy other necessary
things. In winter season the children suffer much than
other elder family members. Because, the families
cannot provide sufficient clothes to the infants to
protect themselves from cold, as the families spend
much or all earnings to buy food to mitigate hunger.
Children of the poor families find less or no health
and education facilities. Sub-Saharan African (SSA)
and Asian children suffer much than the children of
the other continents; because more poor live in these
regions and inflation of food items attack them
severely. The children of the poor families find
limited opportunities of recreation. Most of the poor
families send their children in risky works instead of
education.
The very high food inflation during 2008–09 was
responsible for an extra 39,000 moderately
underweight and 24,000 severely underweight
children in Mozambique [2].
The US Department of Agriculture (USDA)
administers several domestic food and nutrition
programmes that provide a nutritional safety net for
millions of low-income households, as well as school
children and nutritionally vulnerable groups such as
pregnant and/or lactating mothers and federal
expenditures totaled $103.3 billion in fiscal year (FY)
2011. The five largest food and nutrition assistance
programs in FY 2011 accounted for 96% of USDA’s
expenditures for food and nutrition assistance and
those are as follows:
International Journal of Information Technology and Business Management 29
th Nov 2013. Vol.19
© 2012 -2013 JITBM & ARF. All rights reserved
ISSN 2304-0777 www.jitbm.com
10
the Supplemental Nutrition Assistance
Program (SNAP),
the National School Lunch Program,
the Special Supplemental Nutrition Program
for Women, Infants, and Children (WIC),
the Child and Adult Care Food Program, and
the School Breakfast Program.
In the USA the SNAP monthly benefit costs have
grown from $2.8 billion in January 2008 to $6.2
billion in June 2012, with average per-person
monthly benefit spending rising from $100 to $133.
Total outlays for the national school lunch, school
breakfast, and special milk programs totaled $14.4
billion in FY 2011 [39]. WIC participation peaked at
9.2 million women, infants, and children in 2010,
while the total cost of food and administration has
crept upward to a high of $7.2 billion in FY 2011
[38].
The US federally supported child nutrition programs
during the food price hike are as follows [40]:
the National School Lunch Program,
the School Breakfast Program,
the Special Milk Program,
the Child and Adult Care Food Program, and
the Summer Food Service Program.
This programme initiative reaches about 32 million
children. In FY 2011, federal spending on these
programs totaled nearly $17.5 billion, which is the
second-largest federal commitment to domestic food
assistance. The basic goals of federal child nutrition
programs are to improve children’s nutrition, increase
lower-income children’s access to nutritious meals
and snacks, and help support the agricultural
economy.
7. FOOD CRISIS IN SOUTHERN ASIA
About 3.3 billion people live in Southern Asia and it
is the more densely populated region in Asia. So that
Southern Asia is vulnerable in food crisis than other
countries of the Asia-Pacific region. Dev [5] shows
that the effects of food prices hike in Southern Asia
are severe than any other part of the Asia. Due to
global financial crisis, and food and oil price hike
most of the Southern Asian countries suffered
alarmingly. Economies in Asia and Pacific would
lose 1.5% point of gross domestic product (GDP)
growth cumulative over 2011 and 2012 due to higher
fuel and food prices as compared to 2010 (Economic
and Social Commission for Asia and the Pacific, [7].
On the other hand, ESCAP [8] has estimated that
additional 19.4 million people in the Southern Asian
region remained in poverty due to increased food and
energy prices in 2010. It is true that about 50% of the
undernourished in the world today live in India.
In Southern Asian region Bangladesh, Maldives,
Nepal, Pakistan, and Sri Lanka had unfavorable terms
of trade during 2001 to 2010. Only India had
favorable terms of trade during this period but it had
deficit of nearly 4% of GDP and later it is facing a
balance of payments problem. Afghanistan was more
vulnerable in food inflation due to political
instability. These South Asian countries adopted
different short-term responses in dealing with price
hike in agricultural commodities. Bangladesh has
taken several measures to tackle food price inflation
during 2007-08 and it imported 1 million tons of rice
for food-based programmes. India banned rice and
wheat export during 2006-08 food crises and later it
started to export food grains [5]. Southern Asian
countries must work together to increase food
production to feed the hungry mouths of this region.
Asian Development Bank [1] expressed that,
“A 10% rise in domestic food prices in developing
Asia could push an additional 64.4 million into
poverty, or lead to 1.9 percentage increase in poverty
incidence based on the $1.25 a day poverty line.”
ADB [1] had done a survey among developing
member countries about the domestic policies to deal
with the rising food prices. The policies were
classified as follows:
food price stabilization, such as through
removal or cuts in import taxes or value-
added taxes, increases in buffer food grain
stocks, export restrictions, or price controls
and consumer subsidies,
self sufficiency programmes, such as
largely producer subsidies, and
safety nets, such as targeted or conditional
cash transfers, food-for-work programmes,
food-aid programmes, or feeding
programmes.
International Journal of Information Technology and Business Management 29
th Nov 2013. Vol.19
© 2012 -2013 JITBM & ARF. All rights reserved
ISSN 2304-0777 www.jitbm.com
11
More than 80% of agricultural holdings in Southern
Asia are small farms (less than 2 hectares). Two
countries of Southern Asia, India and Bangladesh
have, respectively, 93 million and 14 million small
farmers. The average size of operational holdings is
only 0.5 hectares in Bangladesh, 0.8 hectares in
Nepal and Sri Lanka, 1.4 hectares in India and 3
hectares in Pakistan [5].
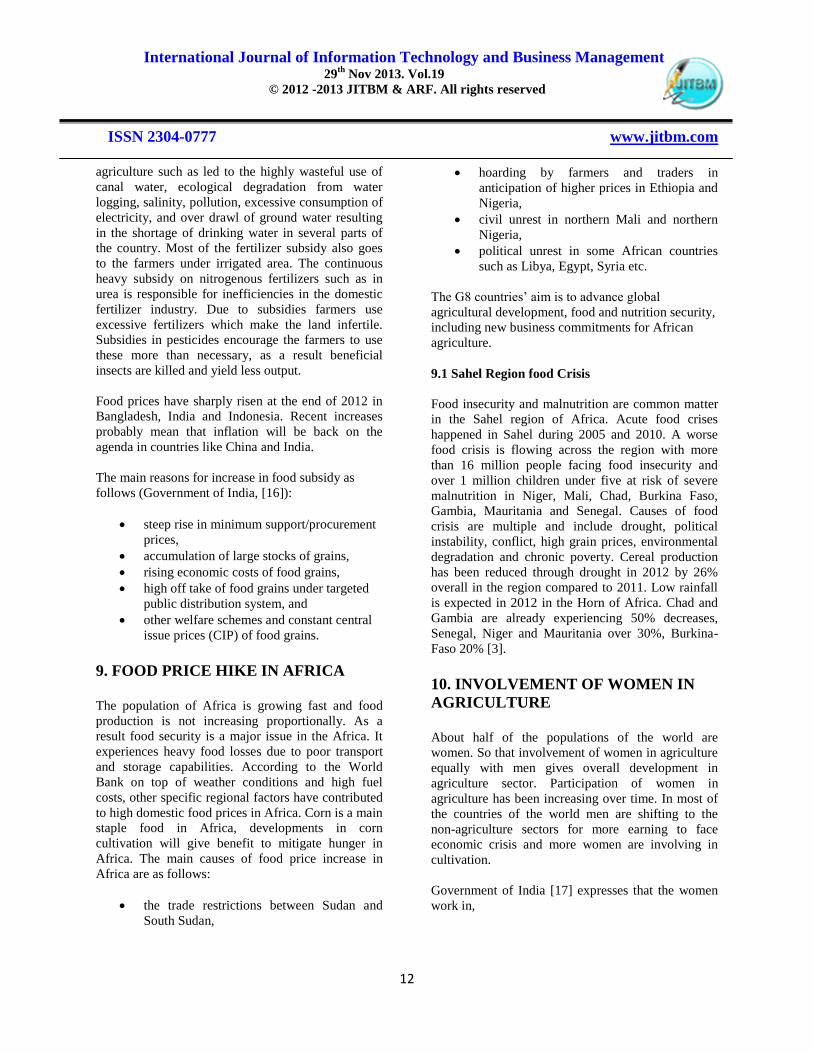
Main source of income of Southern Asia is
agriculture sector but yields of top ten producers for
paddy shows that yields in Bangladesh and India are
much lower than the world average of 4.31 tons per
hectare (table 1). The yields in these countries can be
improved to reach at least world average and try to
reach the 6.56 tons per hectare in China.
From the table 1 we see that Asia is in advance for
paddy yields tons per hectare but South Asian
countries are backward. In 2008, China produces
6.56 tons per hectare and Japan is second position
with 6.49 tons per hectare in paddy production.
Of course rice is the main food of the Asian
countries. At present rice is not using to produce
biofuels. The large amount of these paddies is using
to feed the people of densely populated Asian region.
If paddy production is increased rapidly then poverty
of Asia must be reduced.
Table 1: Yields for top ten global paddy producers,
Source: [5].
Countries Yields tons per hectare in 2008
China 6.56
Japan 6.49
Vietnam 5.22
Indonesia 4.90
World 4.31
Brazil 4.23
Bangladesh 4.00
Myanmar 3.72
Philippines 3.70
India 3.37
Thailand 2.97
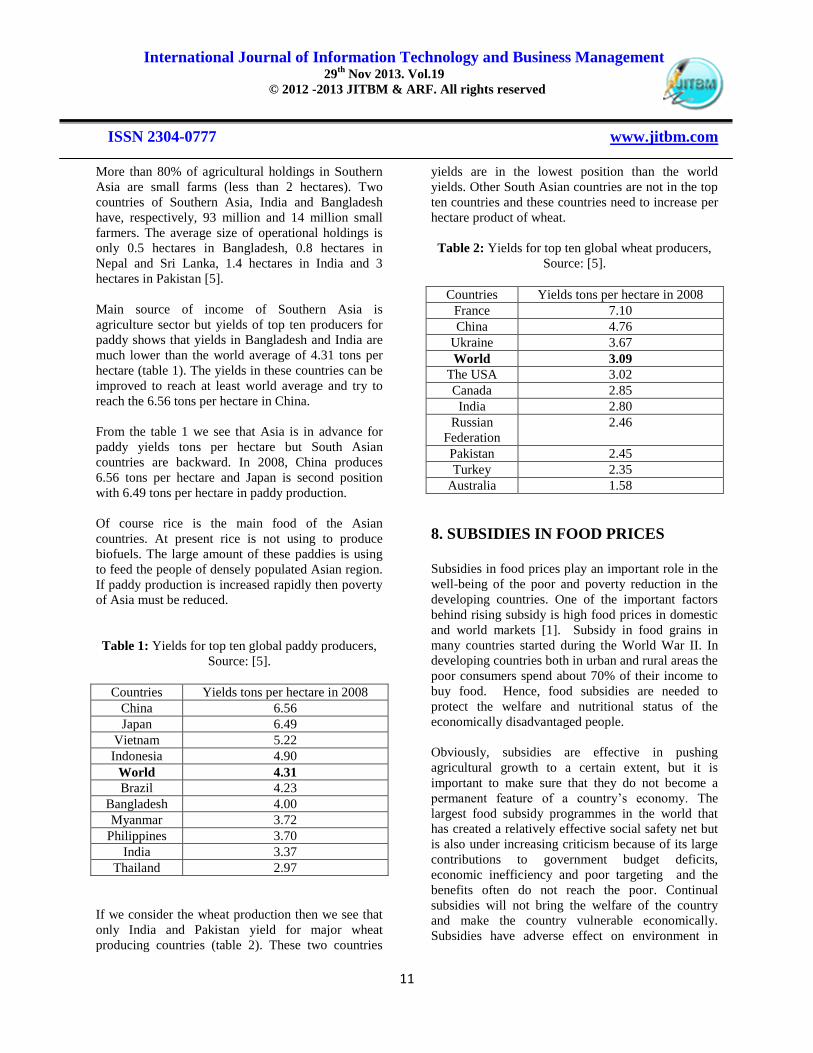
If we consider the wheat production then we see that
only India and Pakistan yield for major wheat
producing countries (table 2). These two countries
yields are in the lowest position than the world
yields. Other South Asian countries are not in the top
ten countries and these countries need to increase per
hectare product of wheat.
Table 2: Yields for top ten global wheat producers,
Source: [5].
Countries Yields tons per hectare in 2008
France 7.10
China 4.76
Ukraine 3.67
World 3.09
The USA 3.02
Canada 2.85
India 2.80
Russian
Federation
2.46
Pakistan 2.45
Turkey 2.35
Australia 1.58
8. SUBSIDIES IN FOOD PRICES
Subsidies in food prices play an important role in the
well-being of the poor and poverty reduction in the
developing countries. One of the important factors
behind rising subsidy is high food prices in domestic
and world markets [1]. Subsidy in food grains in
many countries started during the World War II. In
developing countries both in urban and rural areas the
poor consumers spend about 70% of their income to
buy food. Hence, food subsidies are needed to
protect the welfare and nutritional status of the
economically disadvantaged people.
Obviously, subsidies are effective in pushing
agricultural growth to a certain extent, but it is
important to make sure that they do not become a
permanent feature of a country’s economy. The
largest food subsidy programmes in the world that
has created a relatively effective social safety net but
is also under increasing criticism because of its large
contributions to government budget deficits,
economic inefficiency and poor targeting and the
benefits often do not reach the poor. Continual
subsidies will not bring the welfare of the country
and make the country vulnerable economically.
Subsidies have adverse effect on environment in
International Journal of Information Technology and Business Management 29
th Nov 2013. Vol.19
© 2012 -2013 JITBM & ARF. All rights reserved
ISSN 2304-0777 www.jitbm.com
12
agriculture such as led to the highly wasteful use of
canal water, ecological degradation from water
logging, salinity, pollution, excessive consumption of
electricity, and over drawl of ground water resulting
in the shortage of drinking water in several parts of
the country. Most of the fertilizer subsidy also goes
to the farmers under irrigated area. The continuous
heavy subsidy on nitrogenous fertilizers such as in
urea is responsible for inefficiencies in the domestic
fertilizer industry. Due to subsidies farmers use
excessive fertilizers which make the land infertile.
Subsidies in pesticides encourage the farmers to use
these more than necessary, as a result beneficial
insects are killed and yield less output.
Food prices have sharply risen at the end of 2012 in
Bangladesh, India and Indonesia. Recent increases
probably mean that inflation will be back on the
agenda in countries like China and India.
The main reasons for increase in food subsidy as
follows (Government of India, [16]):
steep rise in minimum support/procurement
prices,
accumulation of large stocks of grains,
rising economic costs of food grains,
high off take of food grains under targeted
public distribution system, and
other welfare schemes and constant central
issue prices (CIP) of food grains.
9. FOOD PRICE HIKE IN AFRICA
The population of Africa is growing fast and food
production is not increasing proportionally. As a
result food security is a major issue in the Africa. It
experiences heavy food losses due to poor transport
and storage capabilities. According to the World
Bank on top of weather conditions and high fuel
costs, other specific regional factors have contributed
to high domestic food prices in Africa. Corn is a main
staple food in Africa, developments in corn
cultivation will give benefit to mitigate hunger in
Africa. The main causes of food price increase in
Africa are as follows:
the trade restrictions between Sudan and
South Sudan,
hoarding by farmers and traders in
anticipation of higher prices in Ethiopia and
Nigeria,
civil unrest in northern Mali and northern
Nigeria,
political unrest in some African countries
such as Libya, Egypt, Syria etc.
The G8 countries’ aim is to advance global
agricultural development, food and nutrition security,
including new business commitments for African
agriculture.
9.1 Sahel Region food Crisis
Food insecurity and malnutrition are common matter
in the Sahel region of Africa. Acute food crises
happened in Sahel during 2005 and 2010. A worse
food crisis is flowing across the region with more
than 16 million people facing food insecurity and
over 1 million children under five at risk of severe
malnutrition in Niger, Mali, Chad, Burkina Faso,
Gambia, Mauritania and Senegal. Causes of food
crisis are multiple and include drought, political
instability, conflict, high grain prices, environmental
degradation and chronic poverty. Cereal production
has been reduced through drought in 2012 by 26%
overall in the region compared to 2011. Low rainfall
is expected in 2012 in the Horn of Africa. Chad and
Gambia are already experiencing 50% decreases,
Senegal, Niger and Mauritania over 30%, Burkina-
Faso 20% [3].
10. INVOLVEMENT OF WOMEN IN
AGRICULTURE
About half of the populations of the world are
women. So that involvement of women in agriculture
equally with men gives overall development in
agriculture sector. Participation of women in
agriculture has been increasing over time. In most of
the countries of the world men are shifting to the
non-agriculture sectors for more earning to face
economic crisis and more women are involving in
cultivation.
Government of India [17] expresses that the women
work in,
International Journal of Information Technology and Business Management 29
th Nov 2013. Vol.19
© 2012 -2013 JITBM & ARF. All rights reserved
ISSN 2304-0777 www.jitbm.com
13
“Land preparation, seed selection and seed
production, sowing, in applying manure, fertilizer
and pesticides, weeding, transplanting, threshing,
winnowing and harvesting etc. as well as in animal
husbandry and dairying, fish processing, collection
of non-timber forest produces (NTFPs), back yard
poultry, and collection of fuel wood, fodder and other
products for family needs.”
In most of the countries women are paid less than
men which is a discrimination of gender in the
society. All the governments and social organizations
of the world must ensure the equal rights of men and
women to develop the agriculture sector and to
increase in food production. If unemployed women
are involved in agriculture, then the food production
will increase and food price hike remain in the
sustainable level.
11. RECOMMENDATIONS
To face financial crisis microfinance prommames are
needed in broad range in the developing countries.
Banks and microfinance institutions should provide
low interest loans to develop small and medium
enterprises (SME). Loan facilities must be easy to the
farmers and high quality seed must be provided to the
farmers. The government and traders must be
conscious that long-term exports be much more than
imports.
Social policy is a major function of the governments
all over the world to respond to the shocks and
vulnerabilities of the poor. Social protection
programmes cover food based programmes such as
public distribution systems and nutrition programs,
wage employed programmes such as road, dam and
bridge construction in the rural areas and pay wage
employing the poor during the food price hike to buy
food, self employed programmes (women’s groups in
Bangladesh and India) and other cash transfer
programmes. Social pensions must be added to this
list because the number of old age persons is
increasing in the region. Social pensions which are
generally cash transfers, not linked to contributions,
and are instruments for expanding old age security
which can be universal.
12. CONCLUDING REMARKS
In this paper we have discussed global food price
hike and mitigation policies to keep the food price in
the sustainable level to protect poverty in the
developing countries. In the energy hungry world the
prices of fossil fuels are increasing day by day. Also
the global use of fossil fuels is increasing in a rapid
rate. On the other hand the greenhouse gas emissions
are increasing due to human activities. The
environment analysts and the governments of
developed and some developing nations are thinking
for alternate fuels. Biofuels are the favorite choice of
all alternative fuels. But at present biofuels are
produced from corns, wheat, sugarcane and edible
oils. Biofuel production is increasing in the USA, the
EU, Brazil and some other countries. More than half
of the populations of the world are affected due to the
price hike; especially those are at the bottom of the
income ladder. The developed nations are using food
items to mitigate the hunger of the vehicles and not
thinking for the starving people of the developing
countries. The global food price increased severely
during the period 2007–08. Also during the 2008–09
period global economic crises; increased
unemployment, income decreased, and lower
effective household purchasing power happened
globally.
REFERENCES
1. ADB (2011). Global Food Price Inflation and
Developing Asia, Asian Development Bank, Manila,
Philippines.
2. Arndt, C.; Hussain, M.A. and Østerdal, L.P. (2012).
Effects of Food Price Shocks on Child Malnutrition:
The Mozambican Experience 2008/09, Working
Paper No. 2012/89,,United Nations University
(UNU), World Institute for Development Economics
Research (WIDER), Finland.
3. Chattergee, C.S. (2012). Food Prices: Food Price
Index up in Q1 but Wheat and Rice under Downward
Pressure, Deutsche Bank Research, Germany.
4. Collins, K. (2008). The Role of Biofuels and other
Factors in Increasing Farm and Food Prices: A
Review of Recent Developments with a Focus on
Feed Grain Markets and Market Prospects,
Supporting Material for a Review Conducted by
Kraft Foods Global, Inc.
5. Dev, S.M. (2013). Rising Food Prices in South Asia:
A Policy Framework to Mitigate Adverse Effects,
Economic and Social Commission for Asia and the

International Journal of Information Technology and Business Management 29
th Nov 2013. Vol.19
© 2012 -2013 JITBM & ARF. All rights reserved
ISSN 2304-0777 www.jitbm.com
14
Pacific (ESCAP), South and South-West Asia
Development Papers 1301, United Nations.
6. EEA (2008). Climate for a Transport Change. TERM
2007: Indicators Tracking Transport and
Environment in the European Union EEA Report No
1/2008 plus updates in Transport at a Crossroads.
TERM 2008: Indicators Tracking Transport and
Environment in the European Union.
http://www.eea.europa.eu/publications/transport-at-a-
crossroads
7. ESCAP (2011a). Economic and Social Survey of
Asia and the Pacific: Sustaining Dynamism and
Inclusive Development, Bangkok.
8. ESCAP (2011b). Rising Food Prices and Inflation in
the Asia-Pacific Region: Causes, Impact and Policy
Response, MPDD Policy Briefs, no.7.
9. EU (2009). The Promotion of the Use of Energy from
Renewable Sources. Directive 2009/28/EC, OJ L 140
Vol. 52, p. 16 of 5.6.2009.
10. FAO (2007). Food Outlook, November 2007.
11. FAO (2008). Declaration of the High-level
Conference on World Food Security: The Challenges
of Climate Change and Bioenergy, June 5, Rome.
12. FAO (2012). World Food Situation, May 2012.
Rome: Food and Agriculture Organization of the
United Nations.
13. Food and Agricultural Policy Research Institute
(FAPRI) (2008). The Energy Independence Act of
2007: Preliminary Evaluations of Selected Provisions,
Web:
http://www.fapri.missouri.edu/outreach/publications/
2008/FAPRI_MU_Report_01_08.pdf
14. Gerber, N.; Eckert van, M. and Breuer, T. (2008).
The Impacts of Biofuel Production on Food Prices: A
Review, Zentrum für Entwicklungsforschung (ZEF),
Center for Development Research, ZEF Discussion
Papers No. 125 on Development Policy.
15. Global Subsidies Initiative (2008). International
Institute for Sustainable Development, Geneva,
Switzerland, Web:
http://www.globalsubsidies.org/en/research/biofuel-
subsidies
16. GOI (2007). Report of the Steering Committee on
Agriculture for 11th Five Year Plan, Yojana Bhavan,
New Delhi.
17. GOI (2012). Economic Survey 2011–12 and Earlier
Issues, Department of Economic Affairs, Ministry of
Finance, Government of India.
18. Hazell, P. and Pachauri, R.K. (2006). (eds.),
Bioenergy and Agriculture: Promises and
Challenges, International Food Policy Research
Institute 2020, Focus No. 14.
19. IEA (2008). Energy Technology Perspectives,
Scenarios and Strategies to 2050, Paris.
20. IMF (2008). Food and Fuel Prices, Recent
Developments, Macroeconomic Impact, and Policy
Response.
21. Lipsky, J. (2008). Commodity Prices and Global
Inflation, First Deputy Managing Director, IMF,
Remarks at the Council on Foreign Relations, New
York City.
22. Lustig, N. (2008). Thought for Food: The Challenges
of Coping with Soaring Food Prices, Working Paper
No. 155, Centre for Global Development.
23. Mitchell, D. (2008). A Note on Rising Food Prices,
The World Bank Development Prospects Group,
Policy Research Working Paper-4682.
24. Mohajan, H.K. (2012). Present and Future of Biofuels
Production for Sustainability, International Journal
of Economics and Research, 3(3): 12–23.
25. OECD (2008). Economic Assessment of Biofuel
Support Policies, Paris.
26. OECD and FAO (2007). Agricultural Outlook 2007–
2016,
Web:http://www.oecd.org/dataoecd/6/10/38893266.p
df
27. Patzek, T.W. (2006). The Earth, Energy, and
Agriculture, Paper Presented at Climate Change and
the Future of the American West-Exploring the Legal
and Policy Dimensions, Boulder, Colorado.
28. REN21 (2008). Renewables 2007 Global Status
Report (Paris: REN21 Secretariat and Washington,
DC: Worldwatch Institute), 2008 Deutsche
Gesellschaftf? Technische Zusammenarbeit (GTZ)
GmbH.
29. Rosegrant, M.W. (2008). Biofuels and Grain Prices:
Impacts and Policy responses, IFPRI, Testimony for
the US Senate Committee on Homeland Security and
Government Affairs.
30. Rosegrant, M.W.; Msangi, S.; Sulser, T. and
Valmonted-Santos, R. (2006). Biofuels and the
Global Food Balance. In “Bioenergy and agriculture:
promises and challenges”, Hazell, P. and Pachauri
R.K. editors, IFPRI 2020 Focus 14.
31. Schnepf, R. (2005). Agriculture-Based Renewable
Energy Production, Report No. RL32712,
Congressional Research Service.
32. Schnepf, R. (2012). Consumers and Food Price
Inflation, CRS Report for Congress.
33. The Gallagher Review of the Indirect Effects of
Biofuels Production (2008). July 2008:
http://www.dft.gov.uk/rfa/_db/_documents/Report_of
_the_Gallagher_review.pdf
34. UNCTAD (2008). Addressing the Global Food
Crisis: Key Trade, Investment and Commodity
Policies in Ensuring Sustainable Food Security and
Alleviating Poverty, The High-Level Conference on
World Food Security: The Challenges of Climate
Change and Bioenergy, Rome, Italy.
35. US Department of Agriculture (USDA) (2008a).
Agricultural Projections to 2017,Web:
http://www.ers.usda.gov/Publications/OCE081/OCE2
0081.pdf
International Journal of Information Technology and Business Management 29
th Nov 2013. Vol.19
© 2012 -2013 JITBM & ARF. All rights reserved
ISSN 2304-0777 www.jitbm.com
15
36. USDA (2008b). Cost-of-Production Forecasts, Data
Sets, Web:
http://www.ers.usda.gov/Data/CostsAndReturns/
37. USDA (2008c). Oilseeds: World Markets and Trade,
Web:
http://www.fas.usda.gov/oilseeds/circular/Current.asp
38. USDA (2011). Food and Nutrition Service (FNS),
WIC Program, Annual Data-National Level: FY1974-
FY2011, Web:
http://www.fns.usda.gov/pd/wisummary.htm
39. USDA (2012a). Food and Nutrition Service (FNS),
Supplemental Nutrition Assistance Program, Web:
http://www.fns.usda.gov/pd/snapmain.htm
40. USDA (2012b). FNS, Program Data-Child Nutrition
Tables, Web:
http://www.fns.usda.gov/pd/cnpmain.htm.
41. von Braun, J. (2008). Food and Financial Crisis:
Implications for Agriculture and the Poor,
International Food Policy Research Institute (IFPRI),
Washington, DC.