Transparent quantification into hyperintensional objectual attitudes
Upload
khangminh22Category
view
0download
0
metals
Article
Global and High-Resolution Damage Quantificationin Dual-Phase Steel Bending Samples with VaryingStress States
Rickmer Meya 1,*, Carl F. Kusche 2, Christian Löbbe 1, Talal Al-Samman 2,Sandra Korte-Kerzel 2 and A. Erman Tekkaya 1
1 Institute of forming technology and lightweight components, TU Dortmund University, Baroper Str. 303,44227 Dortmund, Germany; [email protected] (C.L.);[email protected] (A.E.T.)
2 Institute of physical metallurgy and metal physics, RWTH Aachen, Kopernikusstr. 14, 52056 Aachen,Germany; [email protected] (C.F.K.); [email protected] (T.A.-S.);[email protected] (S.K.-K.)
* Correspondence: [email protected]; Tel.: +49-231-755-2669
Received: 31 January 2019; Accepted: 6 March 2019; Published: 12 March 2019�����������������
Abstract: In a variety of modern, multi-phase steels, damage evolves during plastic deformation inthe form of the nucleation, growth and coalescence of voids in the microstructure. These microscopicsites play a vital role in the evolution of the materials’ mechanical properties, and therefore thelater performance of bent products, even without having yet led to macroscopic cracking. However,the characterization and quantification of these diminutive sites is complex and time-consuming,especially when areas large enough to be statistically relevant for a complete bent product areconsidered. Here, we propose two possible solutions to this problem: an advanced, SEM-basedmethod for high-resolution, large-area imaging, and an integral approach for calculating the overallvoid volume fraction by means of density measurement. These are applied for two bending processes,conventional air bending and radial stress superposed bending (RSS bending), to investigate andcompare the strain- and stress-state dependent void evolution. RSS bending reduces the stresstriaxiality during forming, which is found to diminish the overall formation of damage sites andtheir growth by the complimentary characterization approaches of high-resolution SEM and globaldensity measurements.
Keywords: damage; characterization; automated void recognition; density; bending;stress superposition
1. Introduction
Over the past years, processes of damage formation have yielded tremendous interest in thefield of materials science, due to the rising demand for advanced metallic materials combining highstrength and excellent formability. For many of those materials, damage formation is a point that hasto be addressed due to their intrinsic microstructural heterogeneity [1]. Typically, damage formationand accumulation take place during plastic deformation and are most commonly observed as theformation and growth of voids [2]. The interaction of these voids ultimately leads to failure; however,the mechanisms of damage formation and evolution themselves are not part of the process of materialfailure. During plastic deformation, processes of void nucleation, evolution and coalescence take placeand lead to a continuous degradation of mechanical properties, and ultimately, failure.
Before the interaction and coalescence of voids start, void growth is the main mechanism ofdamage evolution. This process has been extensively researched, especially in the field of modeling,
Metals 2019, 9, 319; doi:10.3390/met9030319 www.mdpi.com/journal/metals

Metals 2019, 9, 319 2 of 18
ranging from the fundamental modelling of void growth [3] and also nucleation [4] to advanced,high-resolution microstructural simulations [5]. As experimental approaches as well as the modellingof void growth have shown, the growth behavior of microstructural voids is largely dependent notonly on the magnitude of strain, but in a significant way on the applied stress state [6].
For structural parts in the automotive industry, high-strength values combined with goodformability are required; this objective has, recently, mainly been achieved by the usage ofadvanced high-strength steels (AHSS). A widely used variety of this class are the dual-phase steels.These combine low production costs compared to other AHSS with beneficial ductility, high yieldstrength values and near-linear strain hardening properties [7]. These properties are realized bya microstructure made up of ferritic and martensitic constituents. However, the complementaryproperties of these constituents typically cause a strong contrast in plastic deformation betweenthe two phases, leading to a stress and strain partitioning behavior in the local microstructure.This incompatibility leads to the nucleation of voids, caused by distinct mechanisms [8]; the hardmartensite islands are prone to locally brittle damage initiation, i.e. martensite cracking. These crackstypically occur at prior austenite grain boundary sites [9]. In addition to this mechanism, decohesionprocesses at interfaces such as phase boundaries between martensite and ferrite or at ferrite grainboundaries can take place [10]. In many cases, the local morphology [11] and heterogeneity of themicrostructure [12] is the main factor determining the dominant damage mechanism, and a widevariety of intermediate forms or combinations of the above-mentioned mechanisms are observed.Commercially used dual-phase steels such as the one employed in this work often show a significantbanding of martensite, leading to a pattern of voids often described in the literature as “necklaces” [12].These agglomerations of voids, typically observed at large strains, are caused by the basic mechanismsof martensite cracking, phase boundary and grain boundary decohesion, but represent a distinctpattern of damage sites in their own right.
In order to link damage formation and stress state, independent parameters—namely the Lodeangle parameter, θ, and the stress triaxiality η—are used. Both parameters influence the damageevolution [13]. The stress triaxiality, η, is defined as the ratio of hydrostatic stress, σh, and the vonMises equivalent stress, σvM:
η =σhσvM
(1)
The hydrostatic stress is thought to be responsible for the growth, or if negative, even shrinkingof already nucleated voids in the microstructure. It is therefore expected for stress states with lowerstress triaxialities to cause a delayed void evolution for forming-induced damage. With the deviatoricstress tensor, σdev, the third normalized invariant, ξ, can be derived:
ξ =27det
(σdev)
2 σ3vM
=27/2·(σ1 − σh)·(σ2 − σh)·(σ3 − σh)
{[(σ1 − σ2)2 + (σ2 − σ3)
2 + (σ3 − σ1)2]/2}
2/3 (2)
This invariant ξ is defined in the range of −1 ≤ ξ ≤ 1. The normalized Lode angle parameter, θ,is defined as
θ = 1− 2π
arccos(ξ) (3)
During plane strain plastic forming, the second principal stress is always
σ2 =σ1 + σ3
2(4)
In the bending of sheet with a much larger width compared to the thickness, plane straindeformation conditions can be assumed. This leads to a constant normalized Lode angle parameter,θ = 0.
Anderson et al. [14] revealed that the strain to fracture for a lower triaxiality is lower comparedto higher triaxialities for a constant Lode angle parameter in DP800 steels. Thus, the stress state is

Metals 2019, 9, 319 3 of 18
important for material failure, but it also influences damage evolution, as failure can be the consequenceof damage. Technologically, the stress state during bending must then be influenced to reduce damage.Technological solutions are, for instance, bending with a solid counter punch [15], roll bendingwith additional rolls [16], bending with an elastomer [17] and radial stress superposed bending [18].Bending using elastomers is capable of reducing the stress triaxiality during bending by applying acounter pressure due to the inserted elastomer. This leads to a delayed damage evolution in termsof void nucleation, which subsequently influences the fatigue lifetime of bent products [19]. Thus,the accumulation of damage during forming is important for lightweight design and has to be takeninto account as it affects the product performance. For industrial purposes, elastomer-bending is notfeasible for controlling the stress state, as the elastomer does not apply reproducible counter pressuresduring forming and is limited in the magnitude of applicable stresses (the maximum pressure is lessthan 150 MPa), as well as showing a rapid degradation over its lifetime. Recently, a new bendingprocess with predetermined stress states was introduced [20]. The so-called radial stress superposedbending (RSS bending) is capable of reducing the stress triaxiality and applying pressures up to theflow stress of the material in a reproducible way. It has already been shown to protract damagenucleation, leading to a reduced number of voids [20].
For the product design or process modeling, the amount of damage can be expressed directly as thearea or volume fractions of voids or indirectly via certain mechanical properties. Lemaitre and Dufailly(1987) showed eight methods for direct and indirect damage measurement techniques and ratedtheir suitability [21]. Direct measurements include microscopic analysis, X-ray analysis and densitymeasurements. Indirect damage measurements are, for example, the decrease in Young’s modulus,micro hardness or indentation modulus [22]. For damage quantification, direct measurementsare preferable as there is no mathematical model connected to the calculation of damage quantity.A damage variable, Ds, in surface observations is proposed by Lemaitre and Dufailly as the ratio of thevoid area, Sd, and the undamaged area, S [21].
For a DP600, the void volume fraction before failure is usually below 1–2% of the wholevolume [22]. Consequently, the preparation of specimens for direct surface measurements ischallenging. Samuels et al. showed that mechanical polishing might introduce strain hardeningin the material surface [23]. Also, a void smearing effect could be shown due to different polishingsteps [24]. Isik et al. revealed that ion beam slope cutting is capable of analyzing void sizes downto 0.05 µm2 [25]. Another quantification method is radiography. Using X-ray microtomography,specimens can be analyzed without metallographic preparation in a non-destructive way; this methodis, however, limited by its spatial resolution [26].
For an integral approach to measuring void volume fractions, density measurements can beapplied. Ratcliffe presented a method for measuring small density changes in solids using theArchimedean principle [27]. Schmitt et al. showed that different strain paths lead to different relativedensity changes [28]. Bompard proved the possibility of measuring density changes in a tensilespecimen and correlated this to damage [29]. The method has equally been applied by Lemaitre andDufailly to quantify damage evolution [21].
Lapovok et al. measured the density of specimens in a continuously cast aluminum alloyformed in an equal channel angular drawing process with the help of the Archimedean principle [30].Tetrachloroethylene with a density of 1.62 g/cm3 was used instead of distilled water for higher accuracy.They correlated the change in density to the stress and strain state that is responsible for different pathsof damage evolution. Tasan et al. stated that tactile density measurements are not capable of analyzingdamage for specimens with a volume of as low as 1 mm3 for spatially resolved measurements [22] asthe scatter observed for small volumes dominates the measurements.
Thus, in the current state of the art, it is shown that stress superposition during bending leadsto delayed fracture. Despite this, it is not clear what influence the lowered stress triaxiality has onthe void evolution and damage mechanisms. To quantify and characterize damage in bent samples,the methods for automated void recognition and density measurements have to be adopted to the
Metals 2019, 9, 319 4 of 18
requirements set by bending samples. With these characterization tools, the influence of the alterationin stress state on damage evolution can be quantified and subsequently used for the modelling orprediction of the expected service life time.
2. Materials and Methods
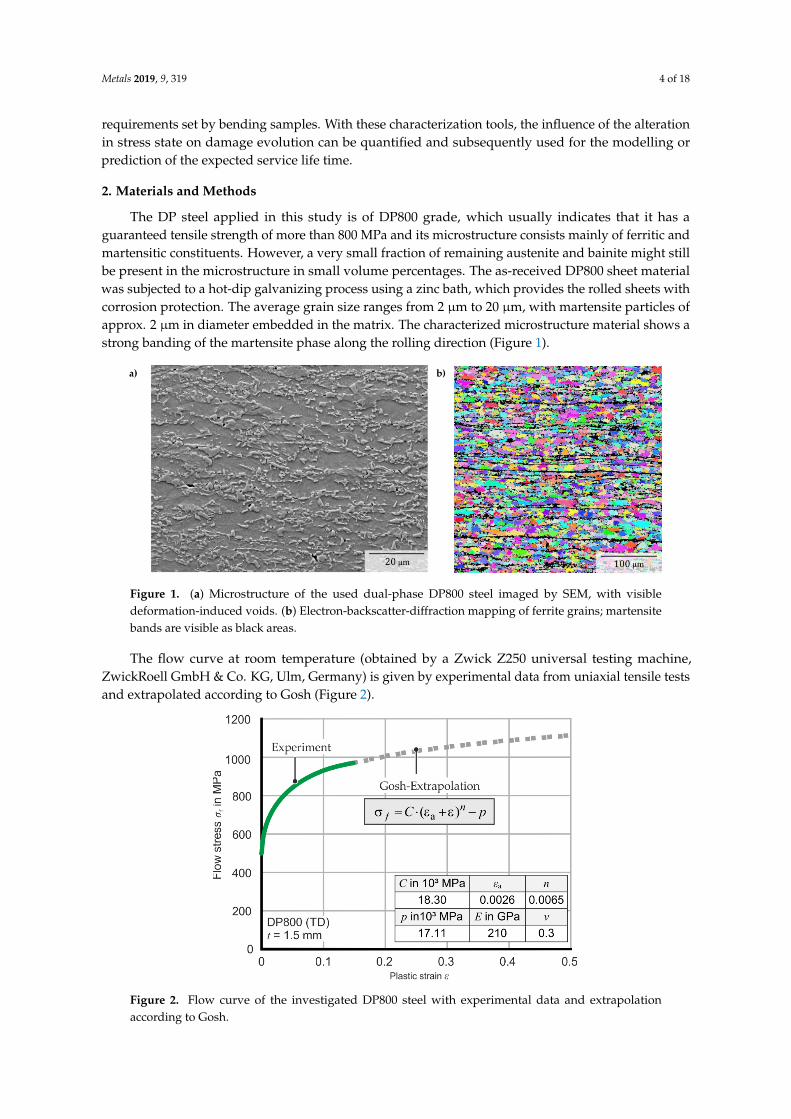
The DP steel applied in this study is of DP800 grade, which usually indicates that it has aguaranteed tensile strength of more than 800 MPa and its microstructure consists mainly of ferritic andmartensitic constituents. However, a very small fraction of remaining austenite and bainite might stillbe present in the microstructure in small volume percentages. The as-received DP800 sheet materialwas subjected to a hot-dip galvanizing process using a zinc bath, which provides the rolled sheets withcorrosion protection. The average grain size ranges from 2 µm to 20 µm, with martensite particles ofapprox. 2 µm in diameter embedded in the matrix. The characterized microstructure material shows astrong banding of the martensite phase along the rolling direction (Figure 1).
Metals 2019, 9, x FOR PEER REVIEW 4 of 17
in stress state on damage evolution can be quantified and subsequently used for the modelling or
prediction of the expected service life time.
2. Materials and Methods
The DP steel applied in this study is of DP800 grade, which usually indicates that it has a
guaranteed tensile strength of more than 800 MPa and its microstructure consists mainly of ferritic
and martensitic constituents. However, a very small fraction of remaining austenite and bainite might
still be present in the microstructure in small volume percentages. The as-received DP800 sheet
material was subjected to a hot-dip galvanizing process using a zinc bath, which provides the rolled
sheets with corrosion protection. The average grain size ranges from 2 µm to 20 µm, with martensite
particles of approx. 2 µm in diameter embedded in the matrix. The characterized microstructure
material shows a strong banding of the martensite phase along the rolling direction (Figure 1).
Figure 1. (a) Microstructure of the used dual-phase DP800 steel imaged by SEM, with visible
deformation-induced voids. (b) Electron-backscatter-diffraction mapping of ferrite grains; martensite
bands are visible as black areas.
The flow curve at room temperature (obtained by a Zwick Z250 universal testing machine,
ZwickRoell GmbH & Co. KG, Ulm, Germany) is given by experimental data from uniaxial tensile
tests and extrapolated according to Gosh (Figure 2).
Figure 2. Flow curve of the investigated DP800 steel with experimental data and extrapolation
according to Gosh.
Figure 1. (a) Microstructure of the used dual-phase DP800 steel imaged by SEM, with visibledeformation-induced voids. (b) Electron-backscatter-diffraction mapping of ferrite grains; martensitebands are visible as black areas.
The flow curve at room temperature (obtained by a Zwick Z250 universal testing machine,ZwickRoell GmbH & Co. KG, Ulm, Germany) is given by experimental data from uniaxial tensile testsand extrapolated according to Gosh (Figure 2).
1
Figure 2. Flow curve of the investigated DP800 steel with experimental data and extrapolationaccording to Gosh.

Metals 2019, 9, 319 5 of 18
The tensile tests were conducted with a specimen geometry (DIN 50125—H 20 × 80) according toDIN EN ISO 6892-1 with a velocity of 0.0067 s−1 to ensure a constant strain rate. The measurement ofthe elongation was done directly on the test sample with a tactile macro-extensometer (Gauge lengthof 80 mm, ZwickRoell GmbH & Co. KG, Ulm, Germany). The flow curve is derived up to the uniformelongation experimentally and then extrapolated. The extrapolation parameters (εa: strain at yielding,n: hardening exponent, C and p: fitting parameters) according to Gosh are derived with the leastsquare fitting method. The Young’s modulus E and Poisson’s ratio ν are given in Figure 2.
2.1. SEM Panoramic Imaging, Void Recognition and Area Determination
Deformation-induced damage in these grades of dual-phase steels typically occurs in the formof microscopic voids with sizes in the range of several hundred nm [8] to a few µm [26]. To reliablyquantify voids at such small scales, high-resolution measurements of large micrographs in the order ofmm2 are required. This was achieved in the present work by employing advanced scanning electronmicroscopy (LEO 1530, Carl Zeiss Microscopy GmbH, Jena, Germany) combined with panoramicimaging and an image stitching algorithm based on the VLFeat Matlab toolbox [31]. All panoramicimages have been obtained at the tip of the bending sample (Figure 3) at a resolution of 32 nm/pxusing secondary electrons (SE) and a 20% area overlap. The field width of a single image was100 µm, resulting in a total panoramic image size of 1000 µm × 500 µm. Respective specimens weremechanically polished to 0.25 µm and subsequently etched in 1% Nital for 10 s. A consistent, lightetching is critical for this method, as shadowing effects of the protruding martensite phase have to beminimized for a reliable automated image recognition. The panoramic images are subsequently splitinto 5 slices that follow a radial direction. This approach is chosen to ensure an accurate measurementof the respective distance to the outer radius, which would be altered as, in bending samples, the upperedge cannot be straight. A binning of 3000 pixels in a radial direction was applied, and each data pointwas attributed to the middle of this bin, resulting in the outermost value for the distance to the outerradius being calculated as 48 µm from the edge.
Metals 2019, 9, x FOR PEER REVIEW 5 of 17
The tensile tests were conducted with a specimen geometry (DIN 50125—H 20 × 80) according
to DIN EN ISO 6892-1 with a velocity of 0.0067 s−1 to ensure a constant strain rate. The measurement
of the elongation was done directly on the test sample with a tactile macro-extensometer (Gauge
length of 80 mm, ZwickRoell GmbH & Co. KG, Ulm, Germany). The flow curve is derived up to the
uniform elongation experimentally and then extrapolated. The extrapolation parameters (εa: strain at
yielding, n: hardening exponent, C and p: fitting parameters) according to Gosh are derived with the
least square fitting method. The Young’s modulus E and Poisson’s ratio ν are given in Figure 2.
2.1. SEM Panoramic Imaging, Void Recognition and Area Determination
Deformation-induced damage in these grades of dual-phase steels typically occurs in the form
of microscopic voids with sizes in the range of several hundred nm [8] to a few µm [26]. To reliably
quantify voids at such small scales, high-resolution measurements of large micrographs in the order
of mm2 are required. This was achieved in the present work by employing advanced scanning
electron microscopy (LEO 1530, Carl Zeiss Microscopy GmbH, Jena, Germany) combined with
panoramic imaging and an image stitching algorithm based on the VLFeat Matlab toolbox [31]. All
panoramic images have been obtained at the tip of the bending sample (Figure 3) at a resolution of
32 nm/px using secondary electrons (SE) and a 20% area overlap. The field width of a single image
was 100 µm, resulting in a total panoramic image size of 1000 µm × 500 µm. Respective specimens
were mechanically polished to 0.25 µm and subsequently etched in 1% Nital for 10 s. A consistent,
light etching is critical for this method, as shadowing effects of the protruding martensite phase have
to be minimized for a reliable automated image recognition. The panoramic images are subsequently
split into 5 slices that follow a radial direction. This approach is chosen to ensure an accurate
measurement of the respective distance to the outer radius, which would be altered as, in bending
samples, the upper edge cannot be straight. A binning of 3000 pixels in a radial direction was applied,
and each data point was attributed to the middle of this bin, resulting in the outermost value for the
distance to the outer radius being calculated as 48 µm from the edge.
Figure 3. Schematic representation of void area measurements from panoramic SEM imaging.
Individual images are stitched and voids recognized via a grayscale threshold. The identified voids
are then individually processed using a watershed algorithm to measure their size.
Voids are identified using a grayscale threshold and the located sites from the original image
processed further by the use of a watershed algorithm [32]. Here, by altering the grayscale threshold
around the individual void, the optimum value for measuring the entire void area, but none of the
surrounding microstructure, is determined. The calculation of the pixel areas results in a separate
measurement for each individual void. This approach makes it possible to collect data not only for
Figure 3. Schematic representation of void area measurements from panoramic SEM imaging.Individual images are stitched and voids recognized via a grayscale threshold. The identified voids arethen individually processed using a watershed algorithm to measure their size.
Voids are identified using a grayscale threshold and the located sites from the original imageprocessed further by the use of a watershed algorithm [32]. Here, by altering the grayscale thresholdaround the individual void, the optimum value for measuring the entire void area, but none of thesurrounding microstructure, is determined. The calculation of the pixel areas results in a separate

Metals 2019, 9, 319 6 of 18
measurement for each individual void. This approach makes it possible to collect data not only foroverall void area fractions, but for any type of measurement where information about each individualdamage site is required. To calculate area fractions over one spatial coordinate, a moving bin is appliedto smooth out peaks in the area fraction generated by single, larger voids, made possible by theindividual identification and localization of damage sites.
A considerable error in the void area measurements of deformation-induced damage voids isgenerated by inclusions. These, in commercial DP steel, typically being TiN, can be caused to fallout of the polished surface during preparation, leaving voids of a similar, slightly larger diameter inthe observed images. Examples of this type of voids as well as the above-mentioned fundamentalmechanisms of damage nucleation and formation are shown in Figure 4. These voids at the sites ofinclusions have a very different morphology from martensite cracks or interface decohesion sites,making them an ideal subject for recognition by deep learning [33]. In this work, neural networkshave been trained using an initial data set, with the goal of automatically detecting voids that havebeen caused by inclusions in the microstructure. A system for recognizing these inclusions from SEMpictures has been developed and tested to an accuracy of over 95% and is applicable to the SEMpanoramas used in this study [33]; here, it is used for inclusion void recognition only. With smallerplastic equivalent strains towards the sheet center, voids caused by inclusions become increasinglydominant, as this type of observed void is in the majority of cases an artefact of metallographicpreparation by mechanical polishing. Non-metallic inclusions leave the surface during this process,and therefore cause surface voids that did not develop during plastic deformation and are thereforenot to be measured simultaneously with plasticity-induced damage. The error normally introduced bymeasuring these inclusions as part of the void fraction is avoided by the recognition and exclusion ofthese particular voids.
Metals 2019, 9, x FOR PEER REVIEW 6 of 17
overall void area fractions, but for any type of measurement where information about each individual
damage site is required. To calculate area fractions over one spatial coordinate, a moving bin is
applied to smooth out peaks in the area fraction generated by single, larger voids, made possible by
the individual identification and localization of damage sites.
A considerable error in the void area measurements of deformation-induced damage voids is
generated by inclusions. These, in commercial DP steel, typically being TiN, can be caused to fall out
of the polished surface during preparation, leaving voids of a similar, slightly larger diameter in the
observed images. Examples of this type of voids as well as the above-mentioned fundamental
mechanisms of damage nucleation and formation are shown in Figure 4. These voids at the sites of
inclusions have a very different morphology from martensite cracks or interface decohesion sites,
making them an ideal subject for recognition by deep learning [33]. In this work, neural networks
have been trained using an initial data set, with the goal of automatically detecting voids that have
been caused by inclusions in the microstructure. A system for recognizing these inclusions from SEM
pictures has been developed and tested to an accuracy of over 95% and is applicable to the SEM
panoramas used in this study [33]; here, it is used for inclusion void recognition only. With smaller
plastic equivalent strains towards the sheet center, voids caused by inclusions become increasingly
dominant, as this type of observed void is in the majority of cases an artefact of metallographic
preparation by mechanical polishing. Non-metallic inclusions leave the surface during this process,
and therefore cause surface voids that did not develop during plastic deformation and are therefore
not to be measured simultaneously with plasticity-induced damage. The error normally introduced
by measuring these inclusions as part of the void fraction is avoided by the recognition and exclusion
of these particular voids.
Figure 4. (a) Examples of fundamental damage mechanisms of martensite/ferrite interface
decohesion, martensite cracking, ferrite grain boundary (GB) decohesion and “necklace” type voids
between two adjacent martensite particles; (b) void observed due to (partly) removed inclusions from
the surface, recognized by a deep learning algorithm; (c) void coalescence near the outer surface of an
air bending sample.
The panoramic imaging method was carried out in the x–y plane (“in-plane”) of a bending
sample. To analyze all spatial directions, a second measurement was taken on a plane in the middle
of the bending zone, parallel to the bending axis in z direction (“cross-section”) (Figure 5).
Figure 4. (a) Examples of fundamental damage mechanisms of martensite/ferrite interface decohesion,martensite cracking, ferrite grain boundary (GB) decohesion and “necklace” type voids betweentwo adjacent martensite particles; (b) void observed due to (partly) removed inclusions from thesurface, recognized by a deep learning algorithm; (c) void coalescence near the outer surface of an airbending sample.
Metals 2019, 9, 319 7 of 18
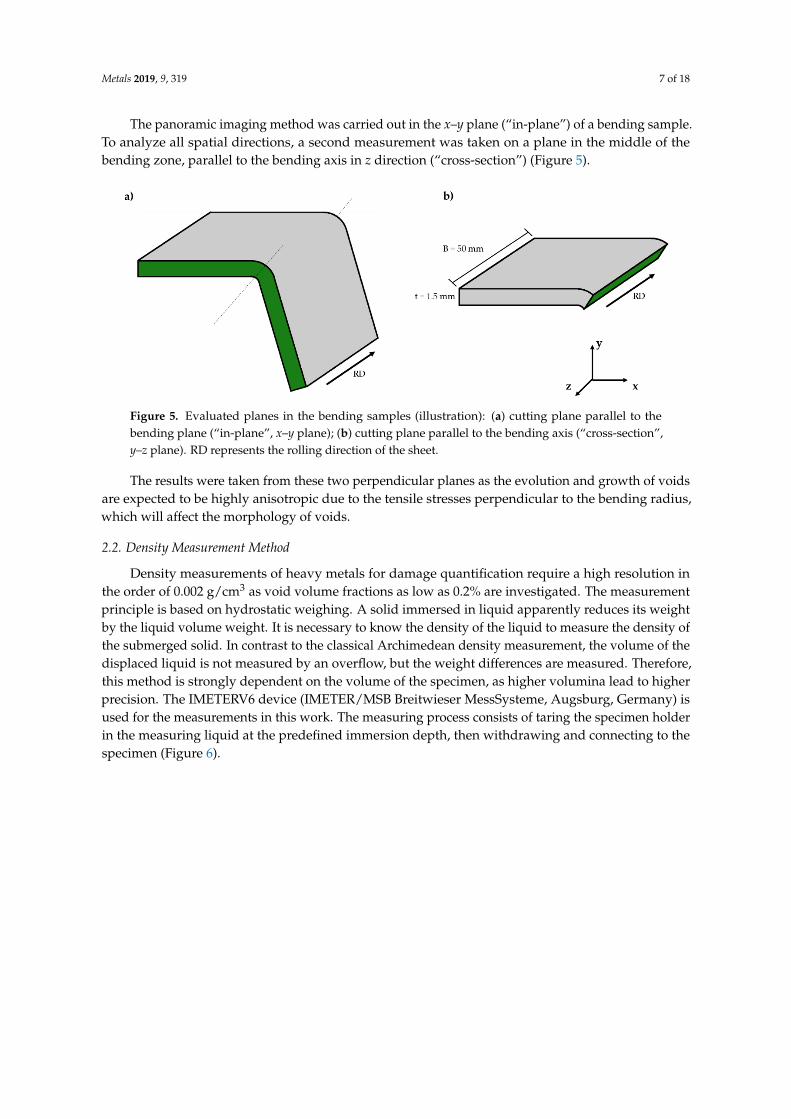
The panoramic imaging method was carried out in the x–y plane (“in-plane”) of a bending sample.To analyze all spatial directions, a second measurement was taken on a plane in the middle of thebending zone, parallel to the bending axis in z direction (“cross-section”) (Figure 5).Metals 2019, 9, x FOR PEER REVIEW 7 of 17
Figure 5. Evaluated planes in the bending samples (illustration): (a) cutting plane parallel to the
bending plane (“in-plane”, x–y plane); (b) cutting plane parallel to the bending axis (“cross-section”,
y–z plane). RD represents the rolling direction of the sheet.
The results were taken from these two perpendicular planes as the evolution and growth of
voids are expected to be highly anisotropic due to the tensile stresses perpendicular to the bending
radius, which will affect the morphology of voids.
2.2. Density Measurement Method
Density measurements of heavy metals for damage quantification require a high resolution in
the order of 0.002 g/cm3 as void volume fractions as low as 0.2% are investigated. The measurement
principle is based on hydrostatic weighing. A solid immersed in liquid apparently reduces its weight
by the liquid volume weight. It is necessary to know the density of the liquid to measure the density
of the submerged solid. In contrast to the classical Archimedean density measurement, the volume
of the displaced liquid is not measured by an overflow, but the weight differences are measured.
Therefore, this method is strongly dependent on the volume of the specimen, as higher volumina
lead to higher precision. The IMETERV6 device (IMETER/MSB Breitwieser MessSysteme, Augsburg,
Germany) is used for the measurements in this work. The measuring process consists of taring the
specimen holder in the measuring liquid at the predefined immersion depth, then withdrawing and
connecting to the specimen (Figure 6).
Figure 6. Buoyancy principle for density measurement: (a) calibration of the suspension in ambient
air; (b) weighing of the specimen in ambient air; (c) weighing of the specimen in the measuring liquid.
Subsequently, the weighing of the specimen takes place in ambient air. Afterwards, specimens
are immersed to exactly the same immersion depth with the same contact angle of the attached wire
likewise at taring and weighing the buoyancy after the same predefined diving time. The same
contact angle of the wire and liquid as well as the predefined immersion time are important for the
Figure 5. Evaluated planes in the bending samples (illustration): (a) cutting plane parallel to thebending plane (“in-plane”, x–y plane); (b) cutting plane parallel to the bending axis (“cross-section”,y–z plane). RD represents the rolling direction of the sheet.
The results were taken from these two perpendicular planes as the evolution and growth of voidsare expected to be highly anisotropic due to the tensile stresses perpendicular to the bending radius,which will affect the morphology of voids.
2.2. Density Measurement Method
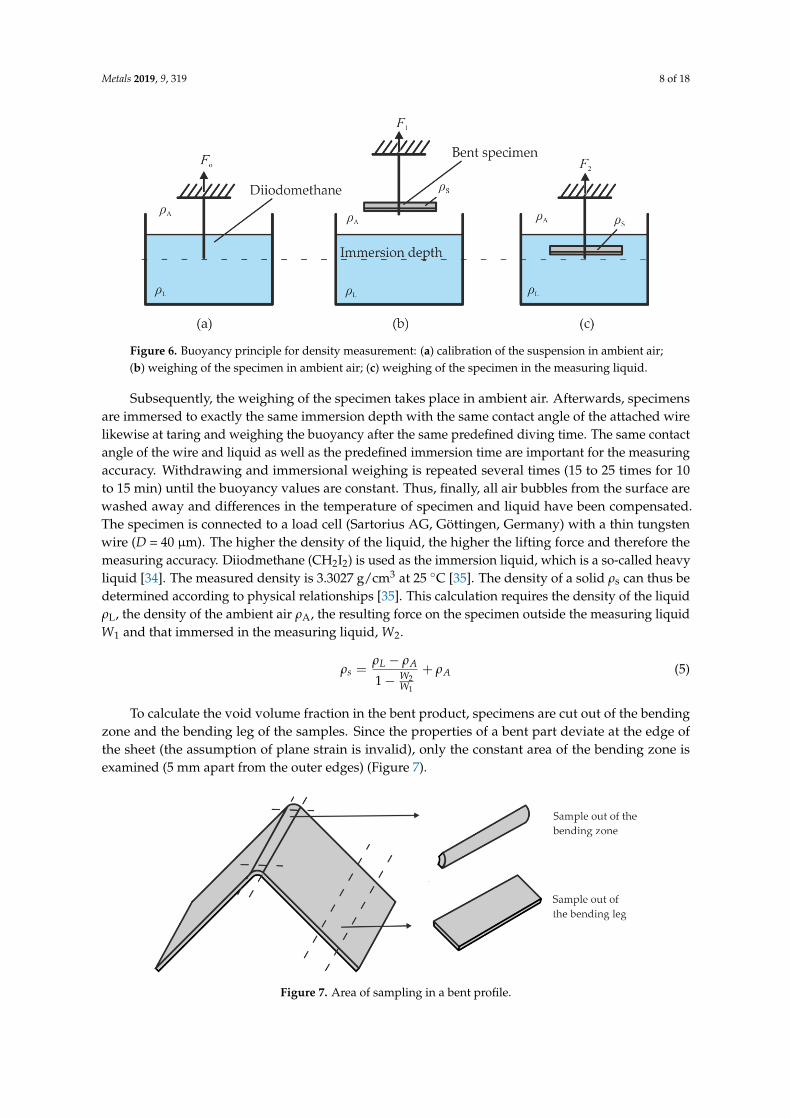
Density measurements of heavy metals for damage quantification require a high resolution inthe order of 0.002 g/cm3 as void volume fractions as low as 0.2% are investigated. The measurementprinciple is based on hydrostatic weighing. A solid immersed in liquid apparently reduces its weightby the liquid volume weight. It is necessary to know the density of the liquid to measure the density ofthe submerged solid. In contrast to the classical Archimedean density measurement, the volume of thedisplaced liquid is not measured by an overflow, but the weight differences are measured. Therefore,this method is strongly dependent on the volume of the specimen, as higher volumina lead to higherprecision. The IMETERV6 device (IMETER/MSB Breitwieser MessSysteme, Augsburg, Germany) isused for the measurements in this work. The measuring process consists of taring the specimen holderin the measuring liquid at the predefined immersion depth, then withdrawing and connecting to thespecimen (Figure 6).
Metals 2019, 9, 319 8 of 18
Metals 2019, 9, x FOR PEER REVIEW 7 of 17
Figure 5. Evaluated planes in the bending samples (illustration): (a) cutting plane parallel to the
bending plane (“in-plane”, x–y plane); (b) cutting plane parallel to the bending axis (“cross-section”,
y–z plane). RD represents the rolling direction of the sheet.
The results were taken from these two perpendicular planes as the evolution and growth of
voids are expected to be highly anisotropic due to the tensile stresses perpendicular to the bending
radius, which will affect the morphology of voids.
2.2. Density Measurement Method
Density measurements of heavy metals for damage quantification require a high resolution in
the order of 0.002 g/cm3 as void volume fractions as low as 0.2% are investigated. The measurement
principle is based on hydrostatic weighing. A solid immersed in liquid apparently reduces its weight
by the liquid volume weight. It is necessary to know the density of the liquid to measure the density
of the submerged solid. In contrast to the classical Archimedean density measurement, the volume
of the displaced liquid is not measured by an overflow, but the weight differences are measured.
Therefore, this method is strongly dependent on the volume of the specimen, as higher volumina
lead to higher precision. The IMETERV6 device (IMETER/MSB Breitwieser MessSysteme, Augsburg,
Germany) is used for the measurements in this work. The measuring process consists of taring the
specimen holder in the measuring liquid at the predefined immersion depth, then withdrawing and
connecting to the specimen (Figure 6).
Figure 6. Buoyancy principle for density measurement: (a) calibration of the suspension in ambient
air; (b) weighing of the specimen in ambient air; (c) weighing of the specimen in the measuring liquid.
Subsequently, the weighing of the specimen takes place in ambient air. Afterwards, specimens
are immersed to exactly the same immersion depth with the same contact angle of the attached wire
likewise at taring and weighing the buoyancy after the same predefined diving time. The same
contact angle of the wire and liquid as well as the predefined immersion time are important for the
Figure 6. Buoyancy principle for density measurement: (a) calibration of the suspension in ambient air;(b) weighing of the specimen in ambient air; (c) weighing of the specimen in the measuring liquid.
Subsequently, the weighing of the specimen takes place in ambient air. Afterwards, specimensare immersed to exactly the same immersion depth with the same contact angle of the attached wirelikewise at taring and weighing the buoyancy after the same predefined diving time. The same contactangle of the wire and liquid as well as the predefined immersion time are important for the measuringaccuracy. Withdrawing and immersional weighing is repeated several times (15 to 25 times for 10to 15 min) until the buoyancy values are constant. Thus, finally, all air bubbles from the surface arewashed away and differences in the temperature of specimen and liquid have been compensated.The specimen is connected to a load cell (Sartorius AG, Göttingen, Germany) with a thin tungstenwire (D = 40 µm). The higher the density of the liquid, the higher the lifting force and therefore themeasuring accuracy. Diiodmethane (CH2I2) is used as the immersion liquid, which is a so-called heavyliquid [34]. The measured density is 3.3027 g/cm3 at 25 ◦C [35]. The density of a solid ρs can thus bedetermined according to physical relationships [35]. This calculation requires the density of the liquidρL, the density of the ambient air ρA, the resulting force on the specimen outside the measuring liquidW1 and that immersed in the measuring liquid, W2.
ρs =ρL − ρA
1− W2W1
+ ρA (5)
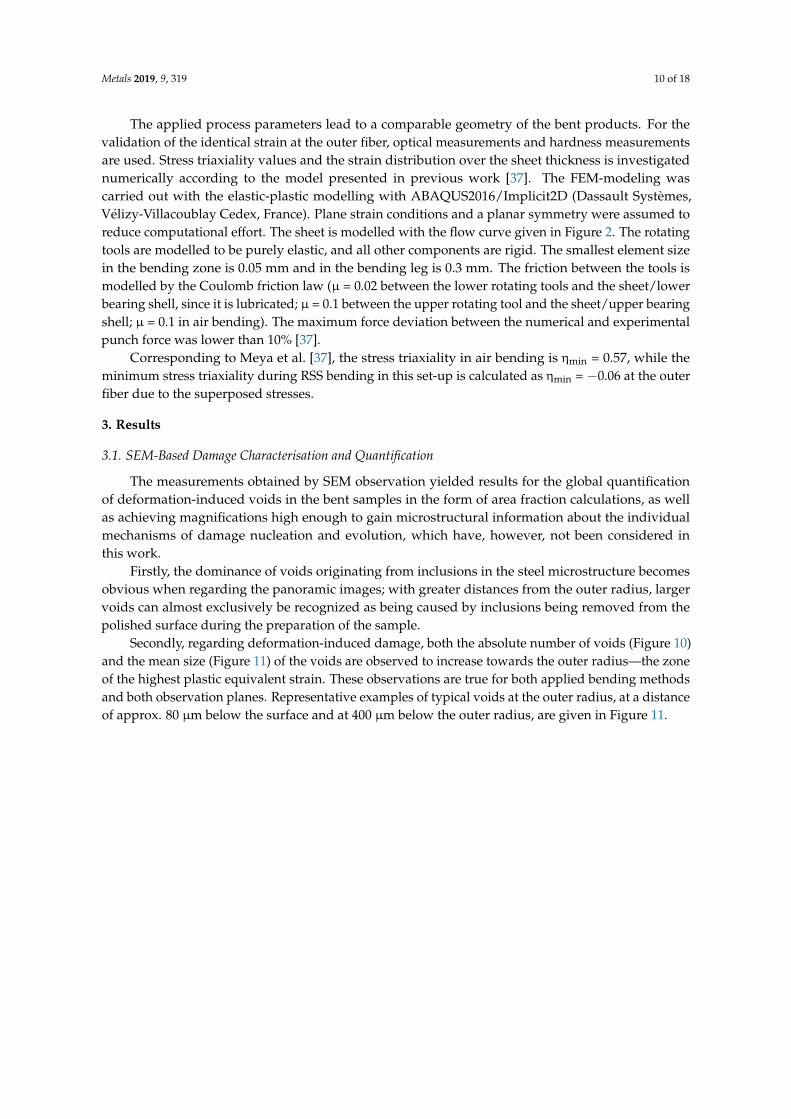
To calculate the void volume fraction in the bent product, specimens are cut out of the bendingzone and the bending leg of the samples. Since the properties of a bent part deviate at the edge ofthe sheet (the assumption of plane strain is invalid), only the constant area of the bending zone isexamined (5 mm apart from the outer edges) (Figure 7).
Metals 2019, 9, x FOR PEER REVIEW 8 of 17
measuring accuracy. Withdrawing and immersional weighing is repeated several times (15 to 25
times for 10 to 15 min) until the buoyancy values are constant. Thus, finally, all air bubbles from the
surface are washed away and differences in the temperature of specimen and liquid have been
compensated. The specimen is connected to a load cell (Sartorius AG, Göttingen, Germany) with a
thin tungsten wire (D = 40 µm). The higher the density of the liquid, the higher the lifting force and
therefore the measuring accuracy. Diiodmethane (CH2I2) is used as the immersion liquid, which is a
so-called heavy liquid [34]. The measured density is 3.3027 g/cm3 at 25 °C [35]. The density of a solid
ρs can thus be determined according to physical relationships [35]. This calculation requires the
density of the liquid ρL, the density of the ambient air ρA, the resulting force on the specimen outside
the measuring liquid W1 and that immersed in the measuring liquid, W2.
𝜌𝑠 =𝜌𝐿 − 𝜌𝐴
1 −𝑊2
𝑊1
+ 𝜌𝐴 (5)
To calculate the void volume fraction in the bent product, specimens are cut out of the bending
zone and the bending leg of the samples. Since the properties of a bent part deviate at the edge of the
sheet (the assumption of plane strain is invalid), only the constant area of the bending zone is
examined (5 mm apart from the outer edges) (Figure 7).
Figure 7. Area of sampling in a bent profile.
Comparative samples from the bending leg are examined. To further increase the measurement
accuracy, three bent samples are simultaneously measured to increase the total volume to ~1 cm3.
2.3. Air and Stress Superposed Bending Processes
The investigated air-bending process is defined by the geometrical parameters: die width wd,
punch radius rp and die radius rd (Figure 8). The sheet is laser cut (100 mm × 50 mm × 1.5 mm) and
bent parallel to the rolling direction to an unloaded bending angle of 66°.
Figure 8. Air-bending process.
Figure 7. Area of sampling in a bent profile.

Metals 2019, 9, 319 9 of 18
Comparative samples from the bending leg are examined. To further increase the measurementaccuracy, three bent samples are simultaneously measured to increase the total volume to ~1 cm3.
2.3. Air and Stress Superposed Bending Processes
The investigated air-bending process is defined by the geometrical parameters: die width wd,punch radius rp and die radius rd (Figure 8). The sheet is laser cut (100 mm × 50 mm × 1.5 mm) andbent parallel to the rolling direction to an unloaded bending angle of 66◦.
Metals 2019, 9, x FOR PEER REVIEW 8 of 17
measuring accuracy. Withdrawing and immersional weighing is repeated several times (15 to 25
times for 10 to 15 min) until the buoyancy values are constant. Thus, finally, all air bubbles from the
surface are washed away and differences in the temperature of specimen and liquid have been
compensated. The specimen is connected to a load cell (Sartorius AG, Göttingen, Germany) with a
thin tungsten wire (D = 40 µm). The higher the density of the liquid, the higher the lifting force and
therefore the measuring accuracy. Diiodmethane (CH2I2) is used as the immersion liquid, which is a
so-called heavy liquid [34]. The measured density is 3.3027 g/cm3 at 25 °C [35]. The density of a solid
ρs can thus be determined according to physical relationships [35]. This calculation requires the
density of the liquid ρL, the density of the ambient air ρA, the resulting force on the specimen outside
the measuring liquid W1 and that immersed in the measuring liquid, W2.
𝜌𝑠 =𝜌𝐿 − 𝜌𝐴
1 −𝑊2
𝑊1
+ 𝜌𝐴 (5)
To calculate the void volume fraction in the bent product, specimens are cut out of the bending
zone and the bending leg of the samples. Since the properties of a bent part deviate at the edge of the
sheet (the assumption of plane strain is invalid), only the constant area of the bending zone is
examined (5 mm apart from the outer edges) (Figure 7).
Figure 7. Area of sampling in a bent profile.
Comparative samples from the bending leg are examined. To further increase the measurement
accuracy, three bent samples are simultaneously measured to increase the total volume to ~1 cm3.
2.3. Air and Stress Superposed Bending Processes
The investigated air-bending process is defined by the geometrical parameters: die width wd,
punch radius rp and die radius rd (Figure 8). The sheet is laser cut (100 mm × 50 mm × 1.5 mm) and
bent parallel to the rolling direction to an unloaded bending angle of 66°.
Figure 8. Air-bending process. Figure 8. Air-bending process.
During air bending, the outer fibers are formed under a tensile stress state, whereas the innerfibers are contracted. The plastic strains increase towards the outer fiber. Therefore, forming-inducedvoids and the final failure occur at the outer fiber [36]. To delay the void evolution, radial stresssuperposed bending can be used [20]. In this process, defined compressive stresses are superposedduring bending. A normal force Nr rotates around the outer bending fiber and superposes stresses.The technological implementation of the process is done by rotating tools in bearing shells driven by ahydraulic cylinder (Figure 9). The hydraulic cylinder is connected to the lower moveable bearing shelland is capable of applying a given, constant pressure.
Metals 2019, 9, x FOR PEER REVIEW 9 of 17
During air bending, the outer fibers are formed under a tensile stress state, whereas the inner
fibers are contracted. The plastic strains increase towards the outer fiber. Therefore, forming-induced
voids and the final failure occur at the outer fiber [36]. To delay the void evolution, radial stress
superposed bending can be used [20]. In this process, defined compressive stresses are superposed
during bending. A normal force Nr rotates around the outer bending fiber and superposes stresses.
The technological implementation of the process is done by rotating tools in bearing shells driven by
a hydraulic cylinder (Figure 9). The hydraulic cylinder is connected to the lower moveable bearing
shell and is capable of applying a given, constant pressure.
Figure 9. Technological implementation of radial stress superposed (RSS) bending
The applied process parameters lead to a comparable geometry of the bent products. For the
validation of the identical strain at the outer fiber, optical measurements and hardness measurements
are used. Stress triaxiality values and the strain distribution over the sheet thickness is investigated
numerically according to the model presented in previous work [37]. The FEM-modeling was carried
out with the elastic-plastic modelling with ABAQUS2016/Implicit2D (Dassault Systèmes, Vélizy-
Villacoublay Cedex, France). Plane strain conditions and a planar symmetry were assumed to reduce
computational effort. The sheet is modelled with the flow curve given in Figure 2. The rotating tools
are modelled to be purely elastic, and all other components are rigid. The smallest element size in the
bending zone is 0.05 mm and in the bending leg is 0.3 mm. The friction between the tools is modelled
by the Coulomb friction law (µ = 0.02 between the lower rotating tools and the sheet/lower bearing
shell, since it is lubricated; µ = 0.1 between the upper rotating tool and the sheet/upper bearing shell;
µ = 0.1 in air bending). The maximum force deviation between the numerical and experimental punch
force was lower than 10% [37].
Corresponding to Meya et al. [37], the stress triaxiality in air bending is ηmin = 0.57, while the
minimum stress triaxiality during RSS bending in this set-up is calculated as ηmin = −0.06 at the outer
fiber due to the superposed stresses.
3. Results
3.1. SEM-Based Damage Characterisation and Quantification
The measurements obtained by SEM observation yielded results for the global quantification of
deformation-induced voids in the bent samples in the form of area fraction calculations, as well as
Figure 9. Technological implementation of radial stress superposed (RSS) bending.
Metals 2019, 9, 319 10 of 18
The applied process parameters lead to a comparable geometry of the bent products. For thevalidation of the identical strain at the outer fiber, optical measurements and hardness measurementsare used. Stress triaxiality values and the strain distribution over the sheet thickness is investigatednumerically according to the model presented in previous work [37]. The FEM-modeling wascarried out with the elastic-plastic modelling with ABAQUS2016/Implicit2D (Dassault Systèmes,Vélizy-Villacoublay Cedex, France). Plane strain conditions and a planar symmetry were assumed toreduce computational effort. The sheet is modelled with the flow curve given in Figure 2. The rotatingtools are modelled to be purely elastic, and all other components are rigid. The smallest element sizein the bending zone is 0.05 mm and in the bending leg is 0.3 mm. The friction between the tools ismodelled by the Coulomb friction law (µ = 0.02 between the lower rotating tools and the sheet/lowerbearing shell, since it is lubricated; µ = 0.1 between the upper rotating tool and the sheet/upper bearingshell; µ = 0.1 in air bending). The maximum force deviation between the numerical and experimentalpunch force was lower than 10% [37].
Corresponding to Meya et al. [37], the stress triaxiality in air bending is ηmin = 0.57, while theminimum stress triaxiality during RSS bending in this set-up is calculated as ηmin = −0.06 at the outerfiber due to the superposed stresses.
3. Results
3.1. SEM-Based Damage Characterisation and Quantification
The measurements obtained by SEM observation yielded results for the global quantificationof deformation-induced voids in the bent samples in the form of area fraction calculations, as wellas achieving magnifications high enough to gain microstructural information about the individualmechanisms of damage nucleation and evolution, which have, however, not been considered inthis work.
Firstly, the dominance of voids originating from inclusions in the steel microstructure becomesobvious when regarding the panoramic images; with greater distances from the outer radius, largervoids can almost exclusively be recognized as being caused by inclusions being removed from thepolished surface during the preparation of the sample.
Secondly, regarding deformation-induced damage, both the absolute number of voids (Figure 10)and the mean size (Figure 11) of the voids are observed to increase towards the outer radius—the zoneof the highest plastic equivalent strain. These observations are true for both applied bending methodsand both observation planes. Representative examples of typical voids at the outer radius, at a distanceof approx. 80 µm below the surface and at 400 µm below the outer radius, are given in Figure 11.
Metals 2019, 9, 319 11 of 18
Metals 2019, 9, x FOR PEER REVIEW 10 of 17
achieving magnifications high enough to gain microstructural information about the individual
mechanisms of damage nucleation and evolution, which have, however, not been considered in this
work.
Firstly, the dominance of voids originating from inclusions in the steel microstructure becomes
obvious when regarding the panoramic images; with greater distances from the outer radius, larger
voids can almost exclusively be recognized as being caused by inclusions being removed from the
polished surface during the preparation of the sample.
Secondly, regarding deformation-induced damage, both the absolute number of voids (Figure
10) and the mean size (Figure 11) of the voids are observed to increase towards the outer radius—the
zone of the highest plastic equivalent strain. These observations are true for both applied bending
methods and both observation planes. Representative examples of typical voids at the outer radius,
at a distance of approx. 80 µm below the surface and at 400 µm below the outer radius, are given in
Figure 11.
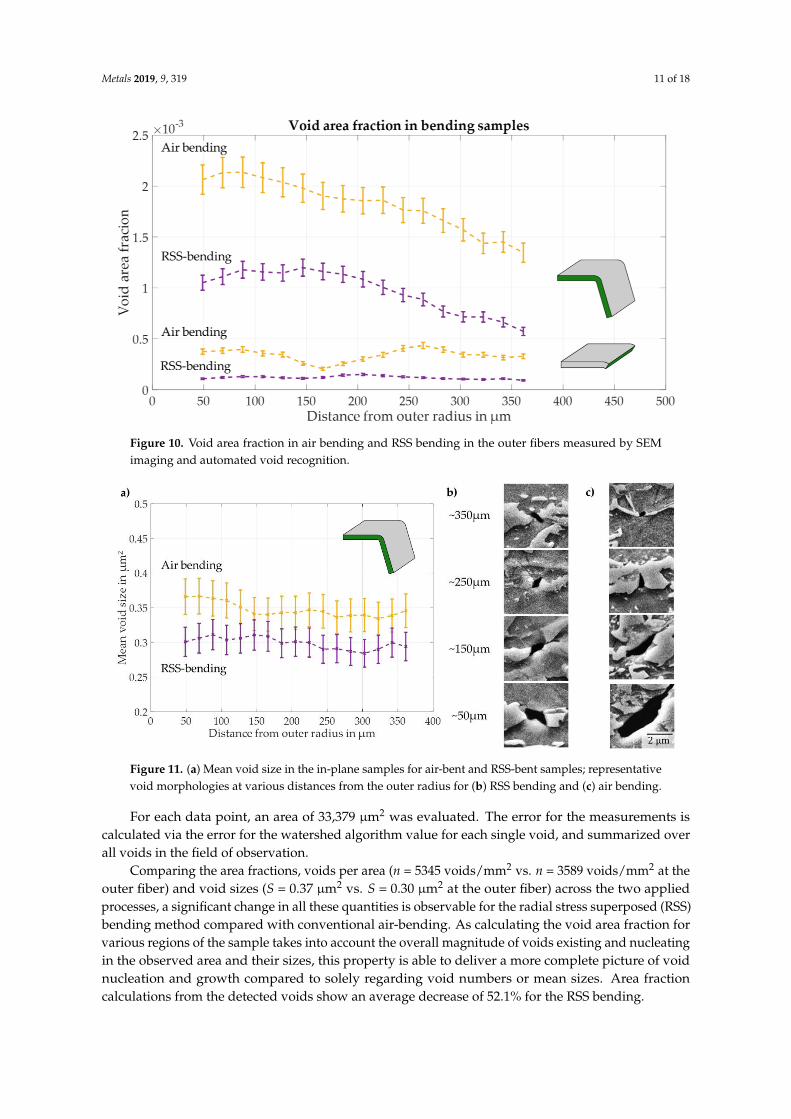
Figure 10. Void area fraction in air bending and RSS bending in the outer fibers measured by SEM
imaging and automated void recognition.
For each data point, an area of 33,379 µm2 was evaluated. The error for the measurements is
calculated via the error for the watershed algorithm value for each single void, and summarized over
all voids in the field of observation.
Comparing the area fractions, voids per area (n = 5345 voids/mm2 vs. n = 3589 voids/mm2 at the
outer fiber) and void sizes (S = 0.37 µm2 vs. S = 0.30 µm2 at the outer fiber) across the two applied
processes, a significant change in all these quantities is observable for the radial stress superposed
(RSS) bending method compared with conventional air-bending. As calculating the void area fraction
for various regions of the sample takes into account the overall magnitude of voids existing and
nucleating in the observed area and their sizes, this property is able to deliver a more complete picture
of void nucleation and growth compared to solely regarding void numbers or mean sizes. Area
fraction calculations from the detected voids show an average decrease of 52.1% for the RSS bending.
The void area fractions measured in the cross-section are significantly smaller (up to 4 times), as
the imaging plane is perpendicular to the bending strain εx and no macroscopic strain in the z-
direction occurs. However, in these images an average decrease in void area fractions up to 69% for
the triaxiality-reduced RSS-bending process is also visible.
Measurements in as-received, undeformed samples only found 3 to 5 voids that could not be
reliably attributed to being caused by inclusions on the same field of view as used in the
Figure 10. Void area fraction in air bending and RSS bending in the outer fibers measured by SEMimaging and automated void recognition.
Metals 2019, 9, x FOR PEER REVIEW 11 of 17
measurements above. Therefore, the void area fractions for the undeformed state of the sheet metal
are assumed to be non-existent.
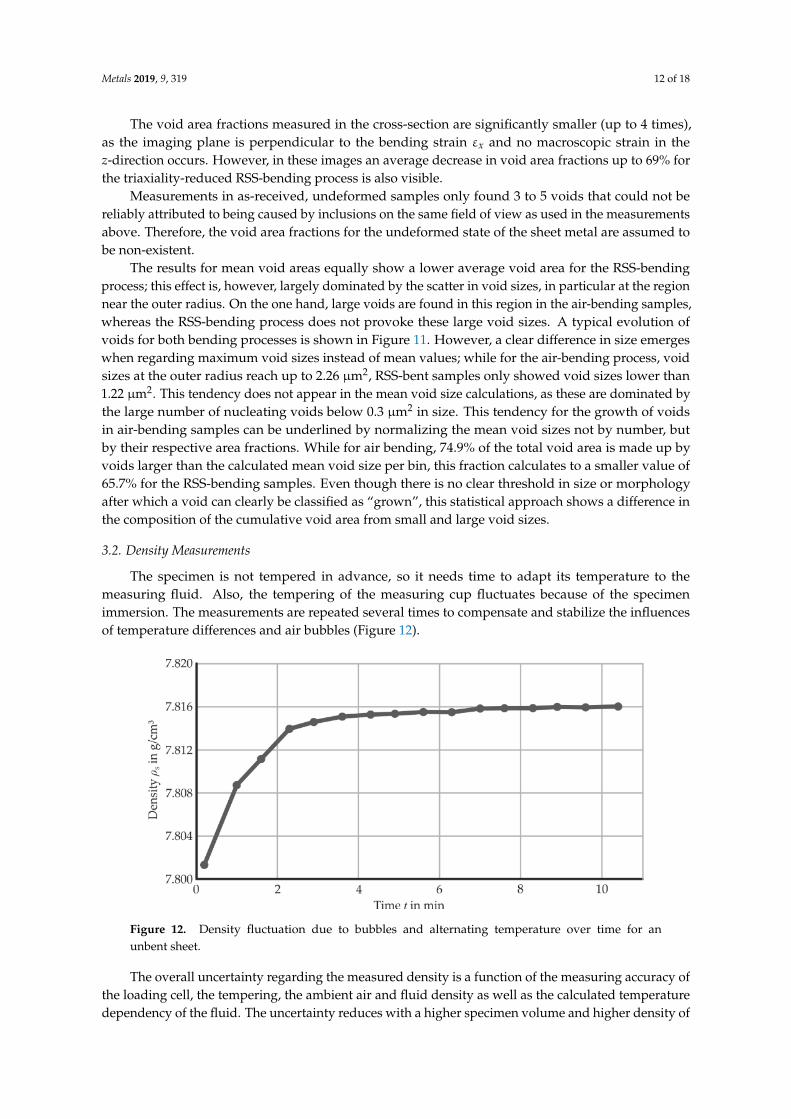
Figure 11. (a) Mean void size in the in-plane samples for air-bent and RSS-bent samples;
representative void morphologies at various distances from the outer radius for (b) RSS bending and
(c) air bending.
The results for mean void areas equally show a lower average void area for the RSS-bending
process; this effect is, however, largely dominated by the scatter in void sizes, in particular at the
region near the outer radius. On the one hand, large voids are found in this region in the air-bending
samples, whereas the RSS-bending process does not provoke these large void sizes. A typical
evolution of voids for both bending processes is shown in Figure 11. However, a clear difference in
size emerges when regarding maximum void sizes instead of mean values; while for the air-bending
process, void sizes at the outer radius reach up to 2.26 µm2, RSS-bent samples only showed void sizes
lower than 1.22 µm2. This tendency does not appear in the mean void size calculations, as these are
dominated by the large number of nucleating voids below 0.3 µm2 in size. This tendency for the
growth of voids in air-bending samples can be underlined by normalizing the mean void sizes not
by number, but by their respective area fractions. While for air bending, 74.9% of the total void area
is made up by voids larger than the calculated mean void size per bin, this fraction calculates to a
smaller value of 65.7% for the RSS-bending samples. Even though there is no clear threshold in size
or morphology after which a void can clearly be classified as “grown”, this statistical approach shows
a difference in the composition of the cumulative void area from small and large void sizes.
3.2. Density Measurements
The specimen is not tempered in advance, so it needs time to adapt its temperature to the
measuring fluid. Also, the tempering of the measuring cup fluctuates because of the specimen
immersion. The measurements are repeated several times to compensate and stabilize the influences
of temperature differences and air bubbles (Figure 12).
Figure 11. (a) Mean void size in the in-plane samples for air-bent and RSS-bent samples; representativevoid morphologies at various distances from the outer radius for (b) RSS bending and (c) air bending.
For each data point, an area of 33,379 µm2 was evaluated. The error for the measurements iscalculated via the error for the watershed algorithm value for each single void, and summarized overall voids in the field of observation.
Comparing the area fractions, voids per area (n = 5345 voids/mm2 vs. n = 3589 voids/mm2 at theouter fiber) and void sizes (S = 0.37 µm2 vs. S = 0.30 µm2 at the outer fiber) across the two appliedprocesses, a significant change in all these quantities is observable for the radial stress superposed (RSS)bending method compared with conventional air-bending. As calculating the void area fraction forvarious regions of the sample takes into account the overall magnitude of voids existing and nucleatingin the observed area and their sizes, this property is able to deliver a more complete picture of voidnucleation and growth compared to solely regarding void numbers or mean sizes. Area fractioncalculations from the detected voids show an average decrease of 52.1% for the RSS bending.
Metals 2019, 9, 319 12 of 18
The void area fractions measured in the cross-section are significantly smaller (up to 4 times),as the imaging plane is perpendicular to the bending strain εx and no macroscopic strain in thez-direction occurs. However, in these images an average decrease in void area fractions up to 69% forthe triaxiality-reduced RSS-bending process is also visible.
Measurements in as-received, undeformed samples only found 3 to 5 voids that could not bereliably attributed to being caused by inclusions on the same field of view as used in the measurementsabove. Therefore, the void area fractions for the undeformed state of the sheet metal are assumed tobe non-existent.
The results for mean void areas equally show a lower average void area for the RSS-bendingprocess; this effect is, however, largely dominated by the scatter in void sizes, in particular at the regionnear the outer radius. On the one hand, large voids are found in this region in the air-bending samples,whereas the RSS-bending process does not provoke these large void sizes. A typical evolution ofvoids for both bending processes is shown in Figure 11. However, a clear difference in size emergeswhen regarding maximum void sizes instead of mean values; while for the air-bending process, voidsizes at the outer radius reach up to 2.26 µm2, RSS-bent samples only showed void sizes lower than1.22 µm2. This tendency does not appear in the mean void size calculations, as these are dominated bythe large number of nucleating voids below 0.3 µm2 in size. This tendency for the growth of voidsin air-bending samples can be underlined by normalizing the mean void sizes not by number, butby their respective area fractions. While for air bending, 74.9% of the total void area is made up byvoids larger than the calculated mean void size per bin, this fraction calculates to a smaller value of65.7% for the RSS-bending samples. Even though there is no clear threshold in size or morphologyafter which a void can clearly be classified as “grown”, this statistical approach shows a difference inthe composition of the cumulative void area from small and large void sizes.
3.2. Density Measurements
The specimen is not tempered in advance, so it needs time to adapt its temperature to themeasuring fluid. Also, the tempering of the measuring cup fluctuates because of the specimenimmersion. The measurements are repeated several times to compensate and stabilize the influencesof temperature differences and air bubbles (Figure 12).Metals 2019, 9, x FOR PEER REVIEW 12 of 17
Figure 12. Density fluctuation due to bubbles and alternating temperature over time for an unbent
sheet.
The overall uncertainty regarding the measured density is a function of the measuring accuracy
of the loading cell, the tempering, the ambient air and fluid density as well as the calculated
temperature dependency of the fluid. The uncertainty reduces with a higher specimen volume and
higher density of the fluid. In this set-up, the average uncertainty of the density is 0.0021 g/cm3 for a
specimen volume of 1 cm3. The influence of the altered stress triaxiality on macroscopic density and
the uncertainty of different specimens shows a maximum fluctuation of ± 0.0008 g/cm3 (Figure 13).
Figure 13. Density of different bent products in comparison to the as-received material.
The density of the air-bent part (ηmin = 0.57) is reduced by 0.15% compared to the as-received
material. In comparison, the RSS-bent (ηmin = −0.06) product’s density is reduced by 0.10%. Thus, a
reduction of 33% in density loss is achieved by using the applied stress superposition during bending.
3.3. Resulting Strains and Stresses in Bending
The maximum curvature is measured by light optical microscopy and is revealed to be 0.307 ±
0.002 mm−1 for air bending and 0.310 ± 0.004 mm−1 for RSS-bending samples at the symmetry axis of
the bending area. This difference of around 1% in curvature indicates similar plastic strains at the
outer fiber. The numerically investigated strain distribution is also comparable, since the deviation
of the equivalent plastic strain over the investigated area is less than 10% (Figure 14).
Figure 12. Density fluctuation due to bubbles and alternating temperature over time for anunbent sheet.
The overall uncertainty regarding the measured density is a function of the measuring accuracy ofthe loading cell, the tempering, the ambient air and fluid density as well as the calculated temperaturedependency of the fluid. The uncertainty reduces with a higher specimen volume and higher density of
Metals 2019, 9, 319 13 of 18
the fluid. In this set-up, the average uncertainty of the density is 0.0021 g/cm3 for a specimen volumeof 1 cm3. The influence of the altered stress triaxiality on macroscopic density and the uncertainty ofdifferent specimens shows a maximum fluctuation of ± 0.0008 g/cm3 (Figure 13).
Metals 2019, 9, x FOR PEER REVIEW 12 of 17
Figure 12. Density fluctuation due to bubbles and alternating temperature over time for an unbent
sheet.
The overall uncertainty regarding the measured density is a function of the measuring accuracy
of the loading cell, the tempering, the ambient air and fluid density as well as the calculated
temperature dependency of the fluid. The uncertainty reduces with a higher specimen volume and
higher density of the fluid. In this set-up, the average uncertainty of the density is 0.0021 g/cm3 for a
specimen volume of 1 cm3. The influence of the altered stress triaxiality on macroscopic density and
the uncertainty of different specimens shows a maximum fluctuation of ± 0.0008 g/cm3 (Figure 13).
Figure 13. Density of different bent products in comparison to the as-received material.
The density of the air-bent part (ηmin = 0.57) is reduced by 0.15% compared to the as-received
material. In comparison, the RSS-bent (ηmin = −0.06) product’s density is reduced by 0.10%. Thus, a
reduction of 33% in density loss is achieved by using the applied stress superposition during bending.
3.3. Resulting Strains and Stresses in Bending
The maximum curvature is measured by light optical microscopy and is revealed to be 0.307 ±
0.002 mm−1 for air bending and 0.310 ± 0.004 mm−1 for RSS-bending samples at the symmetry axis of
the bending area. This difference of around 1% in curvature indicates similar plastic strains at the
outer fiber. The numerically investigated strain distribution is also comparable, since the deviation
of the equivalent plastic strain over the investigated area is less than 10% (Figure 14).
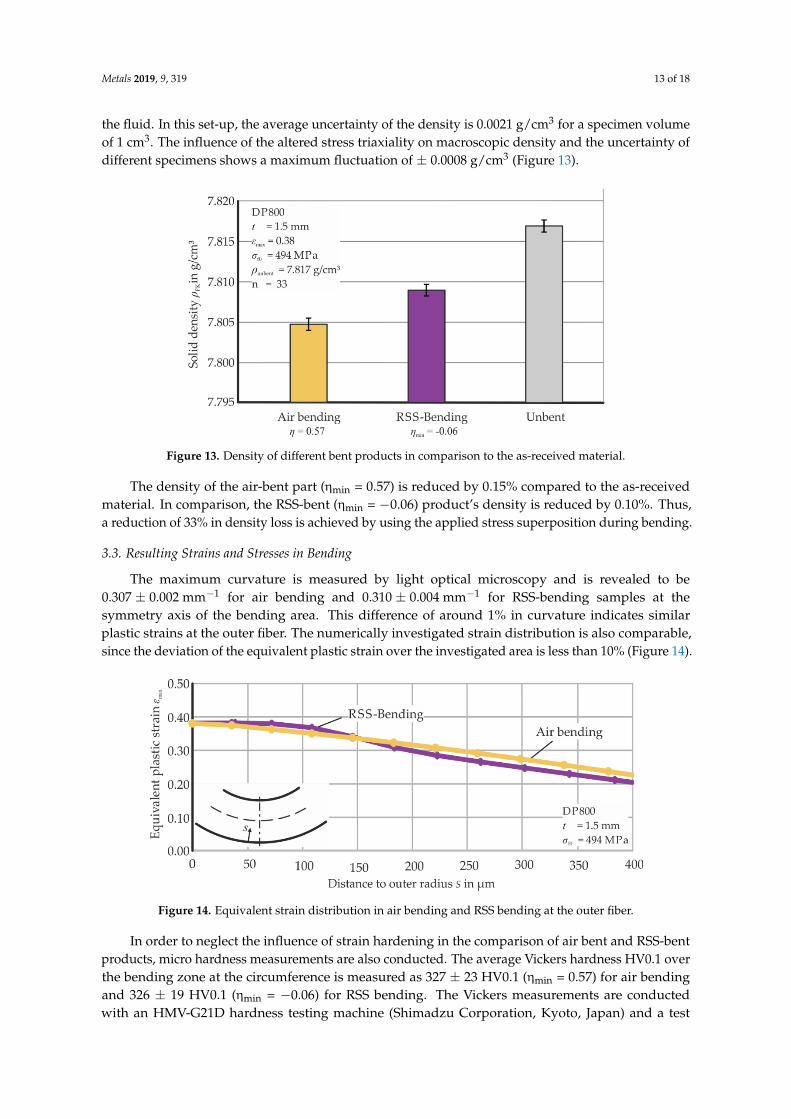
Figure 13. Density of different bent products in comparison to the as-received material.
The density of the air-bent part (ηmin = 0.57) is reduced by 0.15% compared to the as-receivedmaterial. In comparison, the RSS-bent (ηmin = −0.06) product’s density is reduced by 0.10%. Thus,a reduction of 33% in density loss is achieved by using the applied stress superposition during bending.
3.3. Resulting Strains and Stresses in Bending
The maximum curvature is measured by light optical microscopy and is revealed to be0.307 ± 0.002 mm−1 for air bending and 0.310 ± 0.004 mm−1 for RSS-bending samples at thesymmetry axis of the bending area. This difference of around 1% in curvature indicates similarplastic strains at the outer fiber. The numerically investigated strain distribution is also comparable,since the deviation of the equivalent plastic strain over the investigated area is less than 10% (Figure 14).Metals 2019, 9, x FOR PEER REVIEW 13 of 17
Figure 14. Equivalent strain distribution in air bending and RSS bending at the outer fiber.
In order to neglect the influence of strain hardening in the comparison of air bent and RSS-bent
products, micro hardness measurements are also conducted. The average Vickers hardness HV0.1
over the bending zone at the circumference is measured as 327 ± 23 HV0.1 (ηmin = 0.57) for air bending
and 326 ± 19 HV0.1 (ηmin = −0.06) for RSS bending. The Vickers measurements are conducted with an
HMV-G21D hardness testing machine (Shimadzu Corporation, Kyoto, Japan) and a test load of 980.7
mN. The duration time of indention is 10 s and 40 indentations with a distance of 0.075 mm between
the measuring were done per sample. For each bending process, two samples were investigated.
Due to this neglectable difference in sample geometry and applied strains, the undergone stress
state during forming can be thought to be responsible for any measured deviations in damage
characteristics. The stress triaxiality values calculated over the sheet thickness in the outer fiber differ
from air bending to RSS bending (Figure 15).
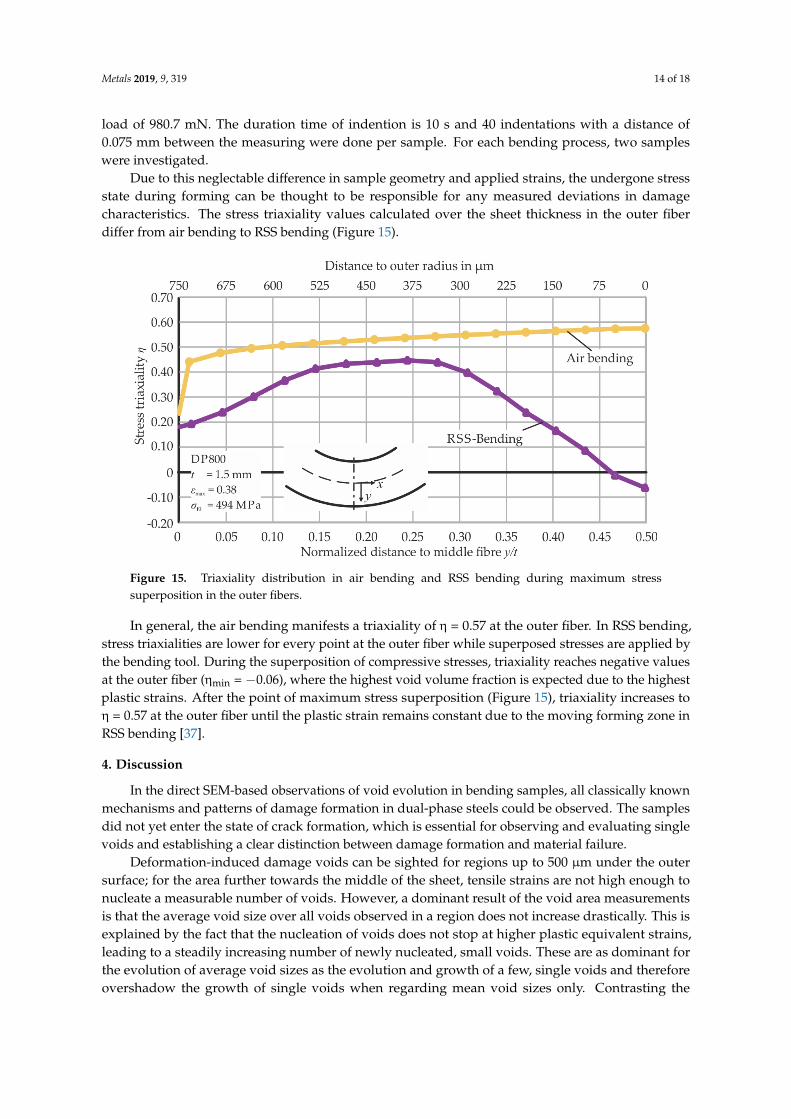
Figure 15. Triaxiality distribution in air bending and RSS bending during maximum stress
superposition in the outer fibers.
In general, the air bending manifests a triaxiality of η = 0.57 at the outer fiber. In RSS bending,
stress triaxialities are lower for every point at the outer fiber while superposed stresses are applied
by the bending tool. During the superposition of compressive stresses, triaxiality reaches negative
values at the outer fiber (ηmin = −0.06), where the highest void volume fraction is expected due to the
highest plastic strains. After the point of maximum stress superposition (Figure 15), triaxiality
increases to η = 0.57 at the outer fiber until the plastic strain remains constant due to the moving
forming zone in RSS bending [37].
Figure 14. Equivalent strain distribution in air bending and RSS bending at the outer fiber.
In order to neglect the influence of strain hardening in the comparison of air bent and RSS-bentproducts, micro hardness measurements are also conducted. The average Vickers hardness HV0.1 overthe bending zone at the circumference is measured as 327 ± 23 HV0.1 (ηmin = 0.57) for air bendingand 326 ± 19 HV0.1 (ηmin = −0.06) for RSS bending. The Vickers measurements are conductedwith an HMV-G21D hardness testing machine (Shimadzu Corporation, Kyoto, Japan) and a test
Metals 2019, 9, 319 14 of 18
load of 980.7 mN. The duration time of indention is 10 s and 40 indentations with a distance of0.075 mm between the measuring were done per sample. For each bending process, two sampleswere investigated.
Due to this neglectable difference in sample geometry and applied strains, the undergone stressstate during forming can be thought to be responsible for any measured deviations in damagecharacteristics. The stress triaxiality values calculated over the sheet thickness in the outer fiberdiffer from air bending to RSS bending (Figure 15).
Metals 2019, 9, x FOR PEER REVIEW 13 of 17
Figure 14. Equivalent strain distribution in air bending and RSS bending at the outer fiber.
In order to neglect the influence of strain hardening in the comparison of air bent and RSS-bent
products, micro hardness measurements are also conducted. The average Vickers hardness HV0.1
over the bending zone at the circumference is measured as 327 ± 23 HV0.1 (ηmin = 0.57) for air bending
and 326 ± 19 HV0.1 (ηmin = −0.06) for RSS bending. The Vickers measurements are conducted with an
HMV-G21D hardness testing machine (Shimadzu Corporation, Kyoto, Japan) and a test load of 980.7
mN. The duration time of indention is 10 s and 40 indentations with a distance of 0.075 mm between
the measuring were done per sample. For each bending process, two samples were investigated.
Due to this neglectable difference in sample geometry and applied strains, the undergone stress
state during forming can be thought to be responsible for any measured deviations in damage
characteristics. The stress triaxiality values calculated over the sheet thickness in the outer fiber differ
from air bending to RSS bending (Figure 15).
Figure 15. Triaxiality distribution in air bending and RSS bending during maximum stress
superposition in the outer fibers.
In general, the air bending manifests a triaxiality of η = 0.57 at the outer fiber. In RSS bending,
stress triaxialities are lower for every point at the outer fiber while superposed stresses are applied
by the bending tool. During the superposition of compressive stresses, triaxiality reaches negative
values at the outer fiber (ηmin = −0.06), where the highest void volume fraction is expected due to the
highest plastic strains. After the point of maximum stress superposition (Figure 15), triaxiality
increases to η = 0.57 at the outer fiber until the plastic strain remains constant due to the moving
forming zone in RSS bending [37].
Figure 15. Triaxiality distribution in air bending and RSS bending during maximum stresssuperposition in the outer fibers.
In general, the air bending manifests a triaxiality of η = 0.57 at the outer fiber. In RSS bending,stress triaxialities are lower for every point at the outer fiber while superposed stresses are applied bythe bending tool. During the superposition of compressive stresses, triaxiality reaches negative valuesat the outer fiber (ηmin = −0.06), where the highest void volume fraction is expected due to the highestplastic strains. After the point of maximum stress superposition (Figure 15), triaxiality increases toη = 0.57 at the outer fiber until the plastic strain remains constant due to the moving forming zone inRSS bending [37].
4. Discussion
In the direct SEM-based observations of void evolution in bending samples, all classically knownmechanisms and patterns of damage formation in dual-phase steels could be observed. The samplesdid not yet enter the state of crack formation, which is essential for observing and evaluating singlevoids and establishing a clear distinction between damage formation and material failure.
Deformation-induced damage voids can be sighted for regions up to 500 µm under the outersurface; for the area further towards the middle of the sheet, tensile strains are not high enough tonucleate a measurable number of voids. However, a dominant result of the void area measurementsis that the average void size over all voids observed in a region does not increase drastically. This isexplained by the fact that the nucleation of voids does not stop at higher plastic equivalent strains,leading to a steadily increasing number of newly nucleated, small voids. These are as dominant forthe evolution of average void sizes as the evolution and growth of a few, single voids and thereforeovershadow the growth of single voids when regarding mean void sizes only. Contrasting the
Metals 2019, 9, 319 15 of 18
observations of single, significantly larger voids near the outer radius, however, no increase in meanvoid size is observed for the RSS-bending process.
In comparison with the conventional air-bending process, the reduced triaxialities in the radialstress superposed bending process lead to a significant decrease in void area fractions. Compared tomean void size calculations, regarding area fractions yields a more complete picture of the damagestate, as it takes both void nucleation and growth into account in its cumulative approach. This effectis particularly underlined by the previously-mentioned pronounced growth of voids that can be seenin the samples deformed with the conventional air-bending process. As shown in Figure 11, a clearevolution pattern of voids in a radial direction towards the outer radius could be observed; startingwith mainly small voids, typically in the form of martensite cracking of void nucleation in martensitebands, the increasing tensile strains in all bending samples lead to a pronounced growth and additionalnucleation of voids in that direction. Up to the outer radius of the sample, where significantly larger,evolved voids are observed, a considerate difference in void evolution behavior could be observed,as incidents of largely evolved voids over 2 µm2 in area are solely found in the air-bending samples,and not in the RSS-bent samples. This behavior of damage evolution is explained with the reducedtriaxiality depicted in Figure 15 for the RSS-bending process. Corresponding to the damage modelof Oyane [38], the measurements show a decrease in void area fraction for lower triaxialities in theRSS-bending process and equally in the maximum observed void sizes of 2.26 µm2 compared to1.22 µm2.
The area fractions observed for the cross-section measurements range significantly under thein-plane measurements, but still show a clear distinction between air- and RSS-bending samples. Asplane strain bending can be assumed in the middle of the sheet, no macroscopic strains in any ofthe plane directions for this observation plane occur. Here, tensile strains are perpendicular to theobservation plane. The void morphology in the in-plane measurements was dominated by the growthof voids in the x-direction, this being the direction of tensile strains. Therefore, the growth in size ofthese voids is not to be observed in a cross-section of the sample. Void area fractions are thereforeexpected to be significantly higher for in-plane measurements as the major part of the void growth canbe observed and measured.
The density measurements reveal a decrease in density of 0.15% for air bending and 0.10% forRSS bending compared to the unbent material. This implies an increase of void volume fraction by33% for the air-bending process. Compared to the results of the undergone SEM analysis, values in acomparable magnitude are calculated: for RSS bending, the average decrease in void area fraction iscalculated to be 44.7%.
Compared to previous work on bending processes, a drastic improvement in bothdamage-reduced bending technology and damage quantification is realized. Solid counter punches [15]as well as elastomer bending [17] reduce the tendency of cracking and reduce damage; however, theseeffects on damage void formation and growth have so far not been able to be quantified in a detailedway. The predicted damage reduction due to compressive stress superposition according to Lemaitre [3]has been calculated for elastomer bending [39]. In this work, the applied advanced characterizationmethods enable the experimental determination of damage quantity and its correlation to stresstriaxiality. Additionally, in contrast to the aforementioned bending processes, RSS bending does notonly reduce triaxiality and therefore damage, but also proves more controllable and reproducible.
5. Conclusions
A quantitative approach for the characterization of forming-induced damage is mandatory foraccurately estimating product performance.
High-resolution SEM imaging coupled to automated void recognition has proven to enable thearea measurement of a statistically significant proportion of microstructural, forming-induced voids.This leads to a large-area observation of void sizes and subsequent calculation of void area fractions.A detailed analysis of all occurring voids is therefore made possible.

Metals 2019, 9, 319 16 of 18
Void area fractions as well as density measurements show a decrease in the same order ofmagnitude for damage quantity in the RSS-bending process, which is correlated to its lower triaxialityvalues, as differences in plastic strain are negligible.
Both the overall number of forming-induced voids and their maximum size is measured to beaffected by the altered stress state. The nucleation as well as the growth of voids is therefore assumedto be dependent on the magnitude of triaxiality.
Compared to other bending processes that use superposed stresses to increase formability,the RSS-bending process has proven to also reduce microstructural damage occurring before theonset of fracture without their typical loss in reproducibility or restrictions in the magnitude ofsuperposed stresses.
Designing geometrically identical bent parts using alternative load paths has proven to reducedamage, which will consequently lead to an increased performance. This will contribute to lightweightdesign via the realization of thinner sheet metal parts while maintaining their mechanical performance.
Author Contributions: R.M. performed the bending experiments and analyzed the data of the bending processesand the density measurements. C.F.K. performed the SEM-measurements and developed the methodology ofautomatic SEM-analysis. R.M. and C.F.K. wrote the manuscript. C.L., T.A.-S., S.K.-K. and A.E.T. reviewed theresults and conclusions.
Funding: The investigations are kindly supported by the German Research Foundation in context of theCollaborative Research Centre CRC/Transregio 188 “Damage-Controlled forming processes”, projects A05and B02.
Acknowledgments: The investigations are kindly supported by the German Research Foundation in context ofthe Collaborative Research Centre CRC/Transregio 188 “Damage-Controlled forming processes”, projects A05and B02. We thank Mr. Michael Breitwieser for the density measurements and his lecture of the density theory.
Conflicts of Interest: The authors declare no conflict of interest.
References
1. Ghadbeigi, H.; Pinna, C.; Celotto, S.; Yates, J.R. Local plastic strain evolution in a high strength dual-phasesteel. Mater. Sci. Eng. A 2010, 527, 5026–5032. [CrossRef]
2. Tasan, C.C.; Diehl, M.; Yan, D.; Bechtold, M.; Roters, F.; Schemmann, L.; Zheng, C.; Peranio, N.; Ponge, D.;Koyama, M.; et al. An Overview of Dual-Phase Steels: Advances in Microstructure-Oriented Processing andMicromechanically Guided Design. Annu. Rev. Mater. Res. 2015, 45, 391–431. [CrossRef]
3. Lemaitre, J. A Continuous Damage Mechanics Model for Ductile Fracture. J. Eng. Mater. Technol. 1985, 107,83–89. [CrossRef]
4. Gurson, A.L. Continuum Theory of Ductile Rupture by Void Nucleation and Growth: Part I—Yield Criteriaand Flow Rules for Porous Ductile Media. J. Eng. Mater. Technol. 1977, 99, 2–15. [CrossRef]
5. Tasan, C.C.; Diehl, M.; Yan, D.; Zambaldi, C.; Shanthraj, P.; Roters, F.; Raabe, D. Integratedexperimental—Simulation analysis of stress and strain partitioning in multiphase alloys. Acta Mater. 2014,81, 386–400. [CrossRef]
6. McClintock, F.A. A Criterion for Ductile Fracture by the Growth of Holes. J. Appl. Mech. 1968, 35, 363–371.[CrossRef]
7. Mukherjee, K.; Hazra, S.S.; Militzer, M. Grain Refinement in Dual-Phase Steels. Metall. Mater. Trans. A 2009,40, 2145–2159. [CrossRef]
8. Kadkhodapour, J.; Butz, A.; Ziaei Rad, S. Mechanisms of void formation during tensile testing in acommercial, dual-phase steel. Acta Mater. 2011, 59, 2575–2588. [CrossRef]
9. Archie, F.; Li, X.; Zaefferer, S. Micro-damage initiation in ferrite-martensite DP microstructures: A statisticalcharacterization of crystallographic and chemical parameters. Mater. Sci. Eng. A 2017, 701, 302–313.[CrossRef]
10. Landron, C.; Bouaziz, O.; Maire, E.; Adrien, J. Characterization and modeling of void nucleation by interfacedecohesion in dual phase steels. Scr. Mater. 2010, 63, 973–976. [CrossRef]
11. Erdogan, M. The effect of new ferrite content on the tensile fracture behaviour of dual phase steels. J. Mater.Sci. 2002, 37, 3623–3630. [CrossRef]
Metals 2019, 9, 319 17 of 18
12. Lai, Q.; Bouaziz, O.; Gouné, M.; Brassart, L.; Verdier, M.; Parry, G.; Perlade, A.; Bréchet, Y.; Pardoen, T.Damage and fracture of dual-phase steels: Influence of martensite volume fraction. Mater. Sci. Eng. A 2015,646, 322–331. [CrossRef]
13. Bai, Y.; Wierzbicki, T. A new model of metal plasticity and fracture with pressure and Lode dependence.Int. J. Plast. 2008, 24, 1071–1096. [CrossRef]
14. Anderson, D.; Butcher, C.; Pathak, N.; Worswick, M.J. Failure parameter identification and validation for adual-phase 780 steel sheet. Int. J. Solids Struct. 2017, 124, 89–107. [CrossRef]
15. Cupka, V.; Nakagava, T.; Tiyamoto, H. Fine bending with Counter Pressure. Ann. CIRP 1973, 22, 73–74.16. Gänsicke, B. Verbesserung des Formänderungsvermögen bei der Blechumformung Mittels Partiell
Überlagerter Druckspannung. Ph.D. Thesis, Ruhr Universität Bochum, Bochum, Germany, 2002.17. Schiefenbusch, J. Untersuchungen zur Verbesserung des Umformverhaltens von Blechen beim Biegen. Ph.D.
Thesis, Universität Dortmund, Dortmund, Germany, 1983.18. Meya, R.; Löbbe, C.; Tekkaya, A.E. Stress State Control by a novel bending process and its effect on damage
evolution. In Proceedings of the 2018 Manufacturing Science and Engineering Conference MSEC, CollegeStation, TX, USA, 18–22 June 2018.
19. Tekkaya, A.E.; Ben Khalifa, N.; Hering, O.; Meya, R.; Myslicki, S.; Walther, F. Forming-induced damage andits effects on product properties. CIRP Ann. Manuf. Technol. 2017, 66, 281–284. [CrossRef]
20. Meya, R.; Löbbe, C.; Hering, O.; Tekkaya, A.E. New bending process with superposition of radial stressesfor damage control. In Proceedings of the Forming Technology Forum, Enschede, The Netherlands,12–13 October 2017.
21. Lemaitre, J.; Dufailly, J. Damage measurements. Eng. Fract. Mech. 1987, 28, 643–661. [CrossRef]22. Tasan, C.C.; Hoefnagels, J.P.M.; Geers, M.G.D. Identification of the continuum damage parameter:
An experimental challenge in modeling damage evolution. Acta Mater. 2012, 60, 3581–3589. [CrossRef]23. Samuels, L.E. The nature of mechanically polished metal surfaces: The surface deformation produced by the
abrasion and polishing of 70: 30 brass. Wear 1957, 1, 261. [CrossRef]24. Zhong, Z.; Hung, N.P. Grinding of alumina/aluminum composites. J. Mater. Process. Technol. 2002, 123,
13–17. [CrossRef]25. Isik, K.; Gerstein, G.; Clausmeyer, T.; Nürnberger, F.; Tekkaya, A.E.; Maier, H.J. Evaluation of Void Nucleation
and Development during Plastic Deformation of Dual-Phase Steel DP600. Steel Res. Int. 2016, 87, 1583–1591.[CrossRef]
26. Maire, E.; Bouaziz, O.; Di Michiel, M.; Verdu, C. Initiation and growth of damage in a dual-phase steelobserved by X-ray microtomography. Acta Mater. 2008, 56, 4954–4964. [CrossRef]
27. Ratcliffe, R.T. The measurement of small density changes in solids. Br. J. Appl. Phys. 1965, 16, 1193–1196.[CrossRef]
28. Schmitt, J.H.; Jalinier, J.M.; Baudelet, B. Analysis of damage and its influence on the plastic properties ofcopper. J. Mater. Sci. 1981, 16, 95–101. [CrossRef]
29. Bompard, D.P. Effets Endommageants de la Porosité sur la Propagation des Fessiures Dans le Nickel Fritté.Ph.D. Thesis, Universite de Technologie de Compiegne, Compiegne, France, 1986.
30. Lapovok, R. Damage evolution under severe plastic deformation. Int. J. Fract. 2002, 115, 159–172. [CrossRef]31. Vedaldi, A.; Fulkerson, B. Vlfeat. In Proceedings of the International Conference on Multimedia—MM 2010,
Firenze, Italy, 25–29 October 2010; ACM Press: New York, NY, USA, 2010; p. 1469.32. Vincent, L.; Soille, P. Watersheds in digital spaces: An efficient algorithm based on immersion simulations.
IEEE Trans. Pattern Anal. Mach. Intell. 1991, 13, 583–598. [CrossRef]33. Kusche, C.; Reclik, T.; Freund, M.; Al-Samman, T.; Kerzel, U.; Korte-Kerzel, S. High-resolution, yet statistically
relevant, analysis of damage in DP steel using artificial intelligence. arXiv, 2018; arXiv:1809.09657.34. Rappoport, Z. CRC Handbook of Tables for Organic Compund Identification; CRC Press: Boca Raton, FL,
USA, 1967.35. Breitwieser, M. Bestimmungsmethoden der Dichte—IMETER. Available online: www.imeter.de (accessed on
15 January 2019).36. Akeret, R. Versagensmechanismen beim Biegen von Aluminiumblechen und Grenzen der Biegefähigkeit.
Aluminium 1978, 54, 117–123.37. Meya, R.; Löbbe, C.; Tekkaya, A.E. Stress state analysis of radial stress superposed bending. Int. J. Precis.
Eng. Manuf. 2018, 20, 53–66. [CrossRef]

Metals 2019, 9, 319 18 of 18
38. Oyane, M.; Sato, T.; Okimoto, K.; Shima, S. Criteria for ductile fracture and their applications. J. Mech. Work.Technol. 1980, 4, 65–81. [CrossRef]
39. El Budamusi, M.; Becker, C.; Clausmeyer, T.; Gebhard, J.; Chen, L.; Tekkaya, A.E. Erweiterungder Formänderungsgrenzen von Höherfesten Stahlwerkstoffen bei Biegeumformprozessen Durch InnovativeProzessführung und Werkzeuge; IGF-Nr. 16585 N/FOSTA P930; Verl. Und Vertriebsges. Mb: Düsseldorf,Germany, 2015.
© 2019 by the authors. Licensee MDPI, Basel, Switzerland. This article is an open accessarticle distributed under the terms and conditions of the Creative Commons Attribution(CC BY) license (http://creativecommons.org/licenses/by/4.0/).
Copyright © 2022 FDOKUMEN