Glacier Evolution in the Tropical Andes during the Last Decades of the 20th Century: Chacaltaya,...
8
AMBlO AJOURNALOFTHE HUMAN ENVIRONMENT PUBLISHED BY THE ROYAL SWEDISH ACADEMY OF SCIENCES Glacier Evolution in the Tropical Andes during the Last Decades of the 20fh Century: Chacaltaya, Bolivia, and Antizana, Ecuador By Bernard Francou, Edson Ramirez, Bolivar Cáceres and Javier Mendoza r,onds Documentaire IRD I REPRINT
Transcript of Glacier Evolution in the Tropical Andes during the Last Decades of the 20th Century: Chacaltaya,...

AMBlO AJOURNALOFTHE HUMAN ENVIRONMENT
PUBLISHED BY THE ROYAL SWEDISH ACADEMY
OF SCIENCES
Glacier Evolution in the Tropical Andes during the Last Decades of the 20fh Century:
Chacaltaya, Bolivia, and Antizana, Ecuador
By Bernard Francou, Edson Ramirez, Bolivar Cáceres and Javier Mendoza
r,onds Documentaire I R D I
REPRINT

Bernard Francou, Edson Ramirez, Bolivar Cáceres and Javier Mendoza
Glacier Evolution in the Tropical Andes during the Last Decades ofthe 20fh Century: Chacaltaya, Bolivia, and Anti ana, Ecuador
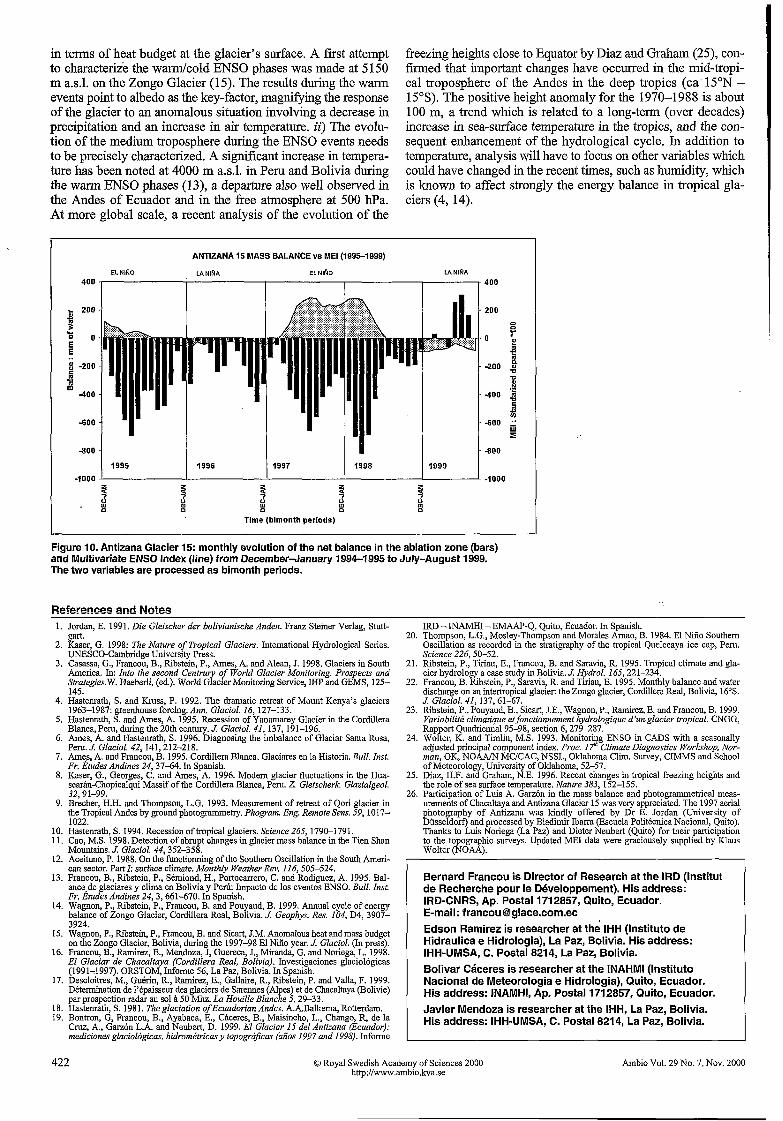
Mass balance has been continuously monitored on Chacal- taya Glacier (16"S, Cordillera Real, Bolivia) since 1991, and on the Antizana Glacier 15 (O", Ecuador) since 1995. In ablation areas, mass balance has been surveyed on a monthly scale, providing interesting details about the sea- sonal pattern in 2 contrasting tropical environments. Inter- mittent information about ice recession exists in both regions for the last 4 decades. The data point to a clear acceleration in glacier decline during this decade; ablation rates have been 3-5 times higher than during the former decades. Fluctuations measured before on 3 glaciers in northern Peru, allow the assumption that the rate at which the glaciers retreated in the tropical Andes increased in the late 1970s. The present situation is particularly dra- matic for the small-sized glaciers (< 1 km') and many such as Chacaltaya, could disappear in the next 10 years. As evidenced by the data collected, ablation increases significantly during the warm phases of ENS0 (EI Niño) and decreases during the cold phases (La Niña). Warm events becoming more frequent and intense since the late 197Os, it can be assumed that they have played an important role in the recent glacier decline in the central Andes, together with the global warming.
10 "N
INTRODUCTION In the 1970s tropical glaciers represented 5% of the world's mountain glaciers, covering a surface comparable to the gla- O" ciers of the Alps (1, 2). Glaciers are scattered over 3 conti- nents, America, Africa, and Indonesia, but 99% are concen- trated in the Andes, with 70% in Peru, 20% in Bolivia and the rest in the northern Andes, Ecuador, Colombia, and Ven- lo os
ezuela. In spite of their reduced importance in terms of wa- ter volume, these glaciers are believed to play an important role as climatic indicators for at least 3 reasons: i) they bring a synthetic view of the climatic evolution of the medium troposphere in the tropics; fi) they are very sensitive to the 2o Os
climate variation due to the absence of a season without ab- lation which favors a strong activity at low elevation; iii) for this reason and because of their reduced size, these glaciers react rapidly to climate fluctuations. In terms of water re- 30 Os
sources, glaciers have an important economic value on the regional scale, particularly when the pluviometric regime in- cludes sharp seasonal variability.
BACKGROUND In contrast to the mid-latitude mountains, glaciers which have supplied continuous and accurate series of mass-balance in- formation in the past, are very seldom found in the tropics (3). This can be explained by the economic restrictions ex- isting in the tropical countries and the relative inaccessibil- ity of these glaciers-generally at more than 4500 m a.s.1. Be- fore the 199Os, only the Lewis glacier in Africa and 4 gla-
40 "S
of glacier mass-balance evolution due to poor resolution have been supplied by photogrammetric restitution methods (8). Since the early 199Os, the IRD (l'Institut de Recherche pour le Développement, France), has together with the South Ameri- can partners, paid a great deal of attention to these glaciers and has developed a monitoring network which regularly supplies accurate data about mass, hydrology and energy balances from an area between the 16"s and the Equator (Fig. 1). All previ- ous studies had pointed to an accelerated recession of the gla- ciers in the tropical Andes (5-10). From well-surveyed termi- nus of 3 small-sized glaciers of the Cordillera Blanca, Peru, it was shown that the recession rates probably increased dramati- cally from the late 1970s (Fig. 2) (7). Although this important "break date" in glacier evolution has to be confirmed from other places in the Andes, some glaciers monitored for a long period of time in middle latitude areas show the same pattern (1 1).
80 "W 70 "W 60 "W
- - a
f
South Tropic
3cuator .i\ ívia
1
Of northern Peru had been monitored for more than a decade (4-7)- Other a large period of the 20h century but difficult to extrapolate in terms
Figure 1. Map of glaciers and rock glaciers monitored in the Central Andes over the last decades. The white triangles refer to sporadic monitorings in ablation areas.
416 Q Royal Swedish Academy of Sciences 2000 http://www.amhio.kva.se
Ambio Vol. ?? No. 7, Nov. 2000
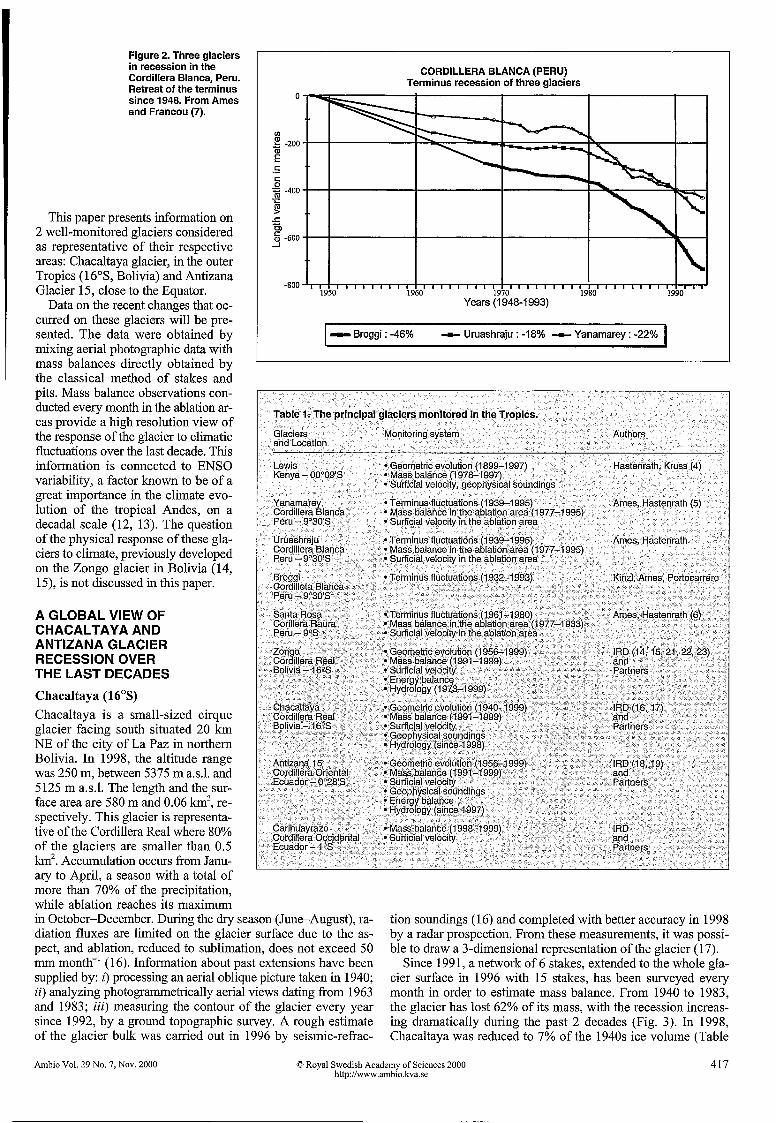
Figure 2. Three glaciers in recession in the Cordillera Blanca, Peru. Retreat of the terminus since 1948. From Ames and Francou (7).
This paper presents information on 2 well-monitored glaciers considered as representative of their respective areas: Chacaltaya glacier, in the outer Tropics ( 16"S, Bolivia) and Antizana Glacier 15, close to the Equator.
Data on the recent changes that oc- curred on these glaciers will be pre- sented. The data were obtained by mixing aerial photographic data with mass balances directly obtained by the classical method of stakes and pits. Mass balance observations con- ducted every month in the ablation ar- eas provide a high resolution view of the response of the glacier to climatic fluctuations over the last decade. This information is connected to ENS0 variability, a factor known to be of a great importance in the climate evo- lution of the tropical Andes, on a decadal scale (12, 13). The question of the physical response of these gla- ciers to climate, previously developed on the Zongo glacier in Bolivia (14, 15), is not discussed in this paper.
CORDILLERA BLANCA (PERU) Terminus recession of three glaciers
I - Broggi : -46% -i- Uruashraju : -18% - Yanamarey : -22% I
A GLOBAL VIEW OF CHACALTAYA AND ANTIZANA GLACIER RECESSION OVER THE LAST DECADES
Chacaltaya (16's) Chacaltaya is a small-sized cirque glacier facing south situated 20 km NE of the city of La Paz in northern Bolivia. In 1998, the altitude range was 250 in, between 5375 m a.s.1. and 5 125 m a.s.1. The length and the sur- face area are 580 m and 0.06 km2, re- spectively. This glacier is representa- tive of the Cordillera Real where 80% of the glaciers are smaller than 0.5 km2. Accumulation occurs from Janu- ary to April, a season with a total of more than 70% of the precipitation, while ablation reaches its maximum in October-December. During the dry season (June-August), ra- diation fluxes are limited on the glacier surface due to the as- pect, and ablation, reduced to sublimation, does not exceed 50 mm month-' (16). Information about past extensions have been supplied by: i) processing an aerial oblique picture taken in 1940; ii) analyzing photogrammetrically aerial views dating from 1963 and 1983; iii) measuring the contour of the glacier every year since 1992, by a ground topographic survey. A rough estimate of the glacier bulk was carried out in 1996 by seismic-refrac-
tion soundings (16) and completed with better accuracy in 1998 by a radar prospection. From these measurements, it was possi- ble to draw a 3-dimensional representation of the glacier (17).
Since 199 1, a network of 6 stakes, extended to the whole gla- cier surface in 1996 with 15 stakes, has been surveyed every month in order to estimate mass balance. From 1940 to 1983, the glacier has lost 62% of its mass, with the recession increas- ing dramatically during the past 2 decades (Fig. 3). In 1998, Chacaltaya was reduced to 7% of the 1940s ice volume (Table
Ambio Vol. 29 No. 7, Nov. 2000 Q Royal Swedish Academy of Sciences 2000 http:iiwww.ambio.kva.se
417

2). On average, ice wasting has increased in the ratio of 1:3 be- tween the 2 periods 1940-1983 and 1983-1998; a trend which has tended to accelerate since 1992 (Table 3 j. As indicated by the Figure 4, the balance has been generally negative between 1991 and 1998, with an average loss of water as high as 1400 p" y-'. This information is consistent which the 1359 mm yr-
directly estimated by the topographic surveys for the same pe- riod. For 7 years the regressed Equilibrium Line Altitude (ELA) was located at the top of the glacier or above. Thus, lacking ac-
Figure 3. Chacaltaya Glacier. Area and volume depletion estimations for the last six decades.
Evolution of Chacaltaya glacier (Bolivia) 1940-1 998
0.30
T O c m
cumulation area, the glacier could disappear in the near future. Given a maximum thickness of 15 m, by simple extrapolation of the recent average mass balance (i.e. 1400 mm yf'j, Chacaltaya may not survive more than 10 years. Assuming melt- ing to be the principal cause of the increasing ablation, and given the latent heat of melting, L, = 33 x lo4 J kg-', the supplement of energy required to dispose of 1400 mm of ice is estimated to be about 14 W m?. By comparison with the 2.1 km* Zongo Gla- cier 40 km away and situated in a same environment, it can be
1940 1950 1960 1970 1980 1990 2000
years (AD)
6
5
4 f
- 5 2 s
O T-
3;
1
O
I 'oblicuous view 'in m2 2photogrammetryfmm aerial view 'ground topographic survey
'In m'of ice O% of ice lost since 1940
41 8 Q Royal Swedish Academy of Sciences 2000 http://www.ambio.kva.se
Ambio Vol. 29 No. 7, Nov. 2000

assumed that the deficit radically affects the small-sized glaciers, which cannot re- cover mass during more favorable climatic conditions (Fig. 5).
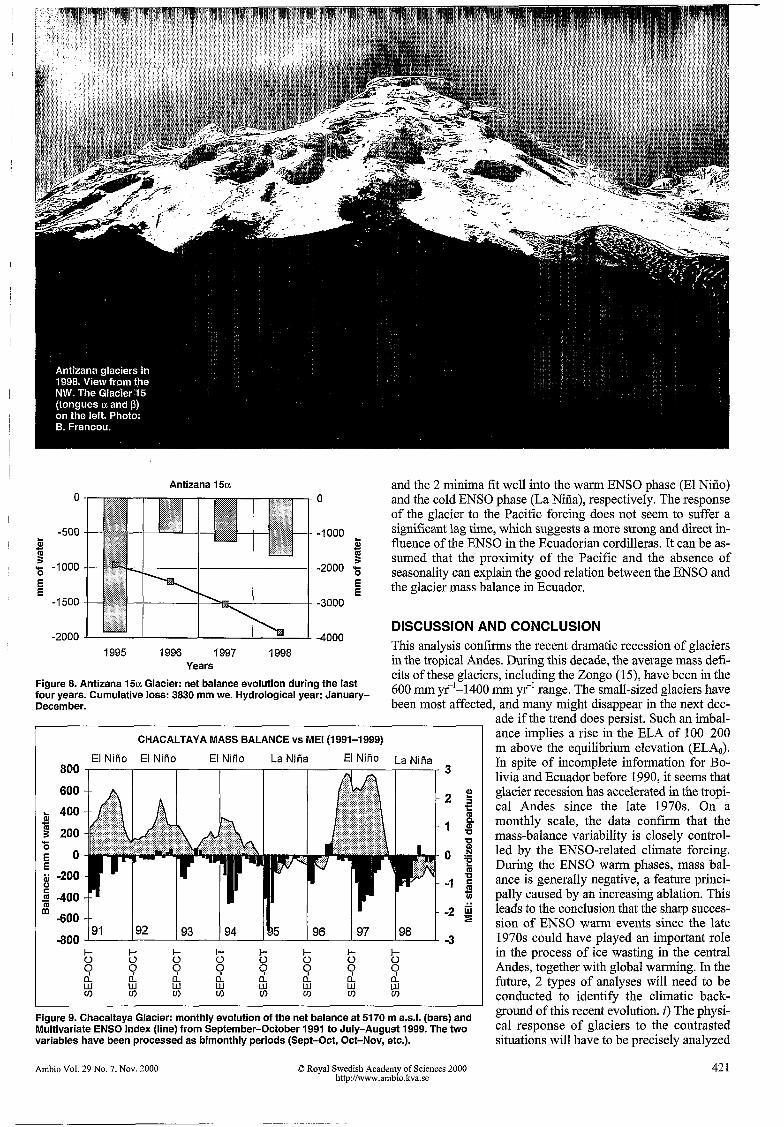
Antizana Glacier 15 (O"2S'S) Antizana 15 is an ice cap and a slope gla- cier located 40 km east of Quito, Ecuador, at the head of an important hydraulic sys- tem which supplies water to the city. Fac- ing NW, between 4800 m and 5760 m a.s.1. this 2-km long glacier covered, in 1998, an area of about 0.74 km'. The sum- mit forms an extensive ice cap located on a volcano, considered to be active. Since 1956, the low part (< 5000 m a.s.1.) has been separated into two tongues, named 15a and ISß, respectively. Antizana area is representative of the eastern Cordillera directly exposed to the moist winds com- ing from the lnazon Basin. Precipitation falls all year round, generally, with a slight decrease in November-January during the "veranillo" ("little summer"), but the tem- perature has no seasonal trend. Informa- tion concerning the past extensions of gla- ciers is rare in Ecuador, in spite of impor- tant archival material covering the last 2 centuries (1 8). On Antizana Glacier 15, 3 methods have been used to analyze the re- cent evolution: i) photogrammetric resti- tution of aerial views dating from 1956, 1965, 1993 and 1997, which provide in- formation on glacier fluctuations over the last 4 decades; ii) a survey once a year since 1996 of the terminus contour and the ablation stakes; and iii) a network of 15 ablation stakes (surveyed once a month) in the ablation area and 5 pits dug twice a year (19).
The evolution of the glacier is mapped in the Figure 6. The agreement between
Table 4. Length (L) and surface (S) evolution of Antizana Glacier 15 (1 956-1 998).
Time L(u) L(P) S(a+P)
1956 2235 2380 967638 1965 2193 2359 924595 1993 2103 2216 804673 1996 2019 2158 771636 1997 1989 2104 747180 1998 1963 2065 737305 L langlh in m S area tola1 (alpha + bela) in m2
1 o00
O
-1000 L c
f 's -2000
E E
-3000
-4000
-5000
Table 5. Arealvolume evolution of Antizana Glacier 15a and mass balance reconstruction over the past 41 years.
Years Meanarea' AV AH3 Bn' Bn5,,
19561965 452 660 -1 136590 2.51 -279 -251 19654993 407465 -1855895 4.55 -163 -146 1993-1997 358080 -957487 2.67 -668 -602
' in mn
'difference in hsight (an m\
' net balmee in mm ICS per yaar) 6 nat balance lin mm water equiviient per yoar. dilferenca in Ica volume m m')
wdh d, = O 9 gem ')
CHACALTAYA
Years
O
-2000
-m ài L
f -6ooo 'i;
E E
-8000
- l o m
- 1 2 m
Figure 4. Chacaltaya Glacier. Specific net balance (hydrological year September-August). Cumulative water loss for the eight years: 11 515 mm.
ài P
E E
c m
O .I-
Zongo and Chacaltaya mass balances
Years
Figure 5. Mass balance evolution of Zongo and Chacaltaya glaciers. In August 1999, the cumulated loss amounted 11 500 mm on Chacaltaya and 3350 mm on Zongo.
Table 3. Arealvolume evolution of Chacaltaya Glacier and mass balance reconstruction over the past 58 years.
Years Mean area' AV2 AH3 Bn' Bn5,,
1940-63 208922 1178000 5.63 -245 -220 1963-83 I67696 2098678 12.51 -626 -563 1983-92 122140 873800 7.15 -795 -715 1992-98 81 675 710073 9.06 -1510 -1359
' in m' e aitference in ice volume in m'j
difference in he ghl ~n m\ nat balance in mm ice per year) nel balance [ln mm wster e q ~ valent per yoar. wtih d, = O 9 g cm")
Ambio Vol. 29 No. 7. Nov. 2000 Q Royal Swedish Academy of Sciences 2000 http://www.ambio.kva.se
419
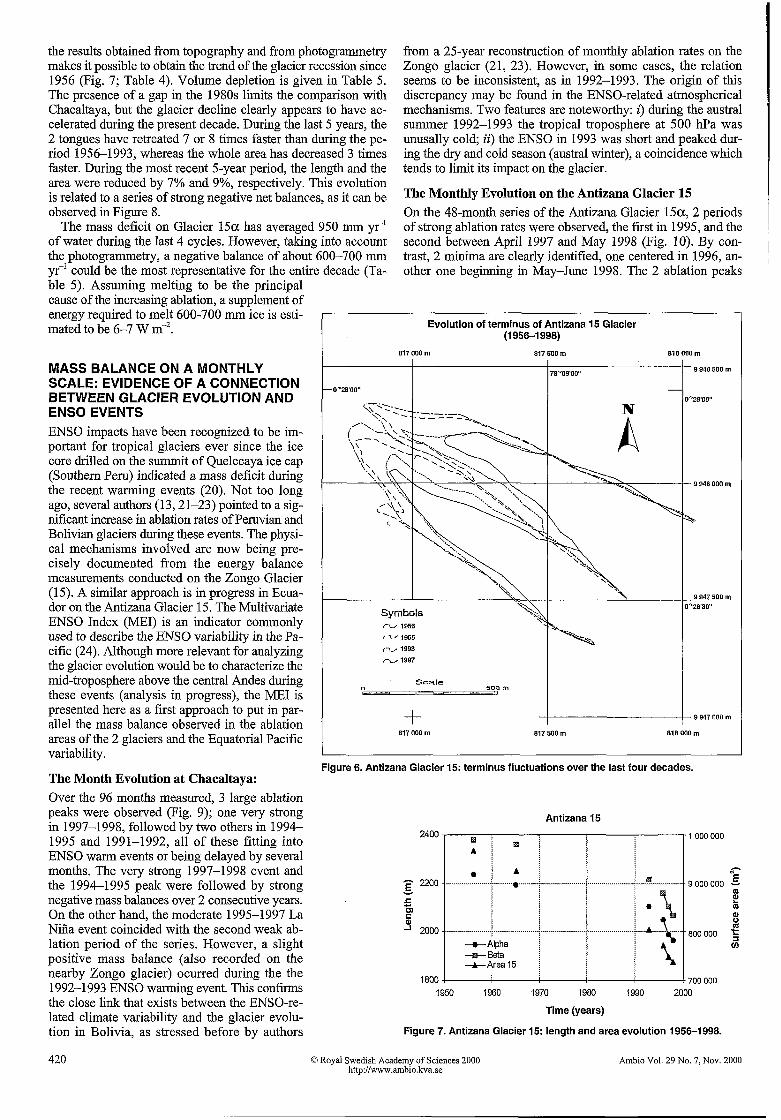
the results obtained from topography and from photogrammetry makes it possible to obtain the trend of the glacier recession since 1956 (Fig. 7; Table 4). Volume depletion is given in Table 5. The presence of a gap in the 1980s limits the comparison with Chacaltaya, but the glacier decline clearly appears to have ac- celerated during the present decade. During the last 5 years, the 2 tongues have retreated 7 or 8 times faster than during the pe- riod 1956-1993, whereas the whole area has decreased 3 times faster. During the most recent 5-year period, the length and the area were reduced by 7% and 9%, respectively. This evolution is related to a series of strong negative net balances, as it can be observed in Figure 8.
The mass deficit on Glacier 15a has averaged 950 mm y-' of water during the last 4 cycles. However, taking into account the photogrammetry, a negative balance of about 600-700 mm yr-' could be the most representative for the entire decade (Ta- ble 5). Assuming melting to be the principal cause of the increasing ablation, a supplement of energy required to melt 600-700 mm ice is esti- mated to be 6-7 W m-'.
MASS BALANCE ON A MONTHLY SCALE: EVIDENCE OF A CONNECTION BETWEEN GLACIER EVOLUTION AND ENS0 EVENTS ENS0 impacts have been recognized to be im- portant for tropical glaciers ever since the ice core drilled on the summit of Quelccaya ice cap (Southern Peru) indicated a mass deficit during the recent warming events (20). Not too long ago, several authors (13,21-23) pointed to a sig- nificant increase in ablation rates of Peruvian and Bolivian glaciers during these events. The physi- cal mechanisms involved are now being pre- cisely documented from the energy balance measurements conducted on the Zongo Glacier (1 5). A similar approach is in progress in Ecua- dor on the Antizana Glacier 15. The Multivariate ENS0 Index (MEI) is an indicator commonly used to describe the ENS0 variability in the Pa- cific (24). Although more relevant for analyzing the glacier evolution would be to characterize the mid-troposphere above the central Andes during these events (analysis in progress), the ME1 is presented here as a first approach to put in par- allel the mass balance observed in the ablation areas of the 2 glaciers and the Equatorial Pacific variability.
from a 25-year reconstruction of monthly ablation rates on the Zongo glacier (21, 23). However, in some cases, the relation seems to be inconsistent, as in 1992-1993. The origin of this discrepancy may be found in the ENSO-related atmospherical mechanisms. Two features are noteworthy: i) during the austral summer 1992-1993 the tropical troposphere at 500 hPa was unusally cold; ii) the ENS0 in 1993 was short and peaked dur- ing the dry and cold season (austral winter), a coincidence which tends to limit its impact on the glacier.
The Monthly Evolution on the Antizana Glacier 15 On the 48-month series of the Antizana Glacier 15a, 2 periods of strong ablation rates were observed, the first in 1995, and the second between April 1997 and May 1998 (Fig. 10). By con- trast, 2 minima are clearly identified, one centered in 1996, an- other one beginning in May-June 1998. The 2 ablation peaks
Evolution of terminus of Antizana 15 Glacier (1 956-1 998)
817 000 m 817 500 m 818 O00 m I I I
9 948 500 m 78'09'00"
T'V 1997
o 500 m Scale
b-.
+ 817 O00 m
9 947 O00 m
817 500 m 818 O00 m
Figure 6. Antizana Glacier 15: terminus fluctuations over the last four decades. The Month Evolution at Chacaltaya:
Antizana 15
Over the 96 months measured, 3 large ablation peaks were observed (Fig. 9); one very strong in 1997-1998, followed by two others in 1994- 1995 and 1991-1992, all of these fitting into ENS0 warm events or being delayed by several months. The very strong 1997-1998 event and the 1994-1995 peak were followed by strong negative mass balances over 2 consecutive years. On the other hand, the moderate 1995-1997 La Niña event coincided with the second weak ab-
2400
p 2200
3 2000
v
5 m
1 O00 O00
a-
m m al
9000000 E
E
800000 lation period of the series. However, a slight cn positive mass balance (also recorded on the nearby Zongo glacier) ocurred during the the
the close link that exists between the ENSO-re- lated climate variability and the glacier evolu- tion in Bolivia, as stressed before by authors
1800 700 O00 1992-1993 ENS0 warming event. This confirms 1950 1960 1970 1980 1990 2000
Time (years)
Figure 7. Antizana Glacier 15: length and area evolution 1956-1998.
a A
a
420 Cn Royal Swedish Academy of Sciences 2000 http://www.amhio.kva.se
Ambio Vol. 29 No. 7, Nov. 2000
Antizana 15a and the 2 minima fit well into the warm ENSO phase (El Niño) and the cold ENSO phase (La Niña), respectively. The response of the glacier to the Pacific forcing does not seem to suffer a significant lag time, which suggests a more strong and direct in- fluence of the ENSO in the Ecuadorian cordilleras. It can be as- sumed that the proximity of the Pacific and the absence of seasonality can explain the good relation between the ENSO and
O
-500
O
-1000 5 $
-2000 Ö
c & $
E E 2 the glacier mass balance in Ecuador. -1000
-1 500 -3000
DISCUSSION AND CONCLUSION This analysis confirms the recent dramatic recession of glaciers in the tropical Andes. During this decade, the average mass defi- cits of these glaciers, including the Zongo (1 5), have been in the 6oo l" p-'-1400 l" p-' range. The glaciers have been most affected. and manv might disamear in the next dec-
-2000 -4000 1995 1996 1997 1998
Years
Figure 8. Antizana 15a Glacier: net balance evolution during the last four years. Cumulative loss: 3830 mm we. Hydrological year: January- December.
CHACALTAYA MASS BALANCE VS ME1 (1991-1999)
EI Niño EI Niño EI Niño La Niña EI Niño
91 -800 1 + I- + I- l- I- I- I- o o o
W
o o o o
W W 2 W w
u) u) u) u) u) u) u) u)
2 a z 8 w W
z W
n 9 2 z
a Niña -
38
Figure 9. Chacaltaya Glacier: monthly evolution of the net balance at 5170 m a.s.1. (bars) and Multivariate ENSO Index (line) from September-October 1991 to July-August 1999. The two variables have been processed as bimonthly periods (Sept-Oct, Oct-Nov, etc.).
Ambio Vol. 29 No. 7, Nov. 2000 Q Royal Swedish Academy of Sciences 2000 http://www.ambio.kva.se
'ade if the-treni does ;&sist. Such an imbal- ance implies a rise in the ELA of 100-200 m above the equilibrium elevation (EL&). In spite of incomplete information for Bo- livia and Ecuador before 1990, it seems that glacier recession has accelerated in the tropi- cal Andes since the late 1970s. On a monthly scale, the data confirm that the mass-balance variability is closely control- led by the ENSO-related climate forcing. During the ENSO warm phases, mass bal- ance is generally negative, a feature princi- pally caused by an increasing ablation. This leads to the conclusion that the sharp succes- sion of ENSO warm events since the late 1970s could have played an important role in the process of ice wasting in the central Andes, together with global warming. In the future, 2 types of analyses will need to be conducted to identify the climatic back- ground of this recent evolution. i) The physi- cal response of glaciers to the contrasted situations will have to be precisely analyzed
42 1
in terms of heat budget at the glacier's surface. A first attempt to characterize the w a d c o l d ENSO phases was made at 5150 m a.s.1. on the Zongo Glacier (15). The results during the warm events point to albedo as the key-factor, magnifjmg the response of the glacier to an anomalous situation involving a decrease in precipitation and an increase in air temperature. ii) The evolu- tion of the medium troposphere during the ENSO events needs to be precisely characterized. A significant increase in tempera- ture has been noted at 4000 m a.s.1. in Peru and Bolivia during the wann ENSO phases (13), a departure also well observed in the Andes of Ecuador and in the free atmosphere at 500 hPa. At more global scale, a recent analysis of the evolution of the
freezing heights close to Equator by Diaz and Graham (25), con- k e d that important changes have occurred in the mid-tropi- cal troposphere of the Andes in the deep tropics (Ca 15"N - 15's). The positive height anomaly for the 1970-1988 is about 100 my a trend which is related to a long-term (over decades) increase in sea-surface temperature in the tropics, and the con- sequent enhancement of the hydrological cycle. In addition to temperature, analysis will have to focus on other variables which could have changed in the recent times, such as humidity, which is known to affect strongly the energy balance in tropical gla- ciers (4, 14).
400
b 200
1 b
O 0 E E I -200
1 m -
-400
-600
-800
-1000
ANTIZANA 15 MASS BALANCE YS ME1 (1995-1999)
ELNINO LA NINA ELNINO LA NINA
1995 I 1996 I 1997 I 1998
7 P 7 P Time (bimonth periods)
400
200 o
o r f: 3
-200 0 P
-400 5 i
600 .. P I
-800
-1000
Figure 10. Antizana Glacier 15: monthly evolution of the net balance in the ablation zone (bars) and Multivariate ENSO Index (line) from DecemberAanuary 1994-1995 to July-August 1999. The two variables are processed as bimonth periods.
References and Notes 1. Jordan, E. 1991. Die Gletscher der bolivianische Anden. Franz Steiner Verlag, Stutt-
gart. 2. Kaser. G. 1998: The Nature of TroDical Glaciers. International Hvdroloeical Series.
I I
UNESCO-Cambridge UniverGty Press. 3. Casassa, G., Francou, B., Ribstein, P., Ames, A. and Alean, J. 1998. Glaciers in South
America. In: Into the second Centnay of World Glacier Monitoring. Prospects and Strategies.W. Haeberli, (ed.). World Glacier Monitoring Service, M P and GEMS, 125- 145.
4. Hastenrath, S. and KIUSS, P. 1992. The dramatic retreat of Mount Kenya's glaciers 1963-1987 greenhouse forcing. Ann. Glaciol. 16,127-133.
5 . Hastenrath, S. and Ames, A. 1995. Recession of Yanamarey Glacier in the Cordillera Blanca, Peru, during the 20th century. J. Glaciol. 41,137,191-196.
6. Ames, A. and Hastenrath, S. 1996. Diagnosing the imbalance of Glaciar Santa Rosa, Peru. J. Glaciol. 42, 141,212-218.
7. Ames, A. and Francou, B. 1995. Cordillera Blanca. Glaciares en la Historia. Bull. Inst. Fr. Éhides Andines 24,3764. In Spanish.
8. Kaser, G., Georges, C. and Ames, A. 1996. Modem glacier fluctuations in the Hua- scarán-Chopicalqui Massif of the Cordillera Blanca, Peru. Z. Gletscherk Glazialgeol. 32,91-99.
9. Brecher, H.H. and Thompson, L.G. 1993. Measurement of retreat of Qori glacier in the Tropical Andes by ground photogmmmehy. Phogram. Eng. Remote Sens. 59,1017- 1022.
10. Hastenrath, S. 1994. Recession of tropical glaciers. Science 265, 1790-1791. 11. Cao, M.S. 1998. Detection of abrupt changes in glacier mass balance in the Tien Shan
Mountains. J. Glaciol. 44,352-358. 12. Aceituno, P. 1988. On the functionning of the Southem Oscillation in the South Ameri-
can sector. Part I: surface climate. Monthly Weather Rev. 116,505-524. 13. Francou, B., Ribstein, P., Sémiond, H., Portocarrero, C. and Rodiguez, A. 1995. Bal-
ance de glaciares y clima en Bolivia y Peni Impacto de los eventos ENSO. Bull. Inst. Fr. &hides Andines 24,3,661-670. In Spanish.
14. Wagnon, P., Ribstein, P., Francou, B. and Pouyaud, B. 1999. Annual cycle of energy balance of Zongo Glacier, Cordillera Real, Bolivia. J. Geophys. Res. 104, D4, 3907- 3924.
15. Wagnon, P., Ribstein, P., Francou, B. and Sicart, J.M. Anomalous heat and mass budget on the Zongo Glacier, Bolivia, during the 1997-98 EI Niño year. J. Glaciol. (In press).
16. Francou, B., Ramirez, E., Mendoza, J, Guereca, J., Miranda, G. andNoriega, L. 1998. El Glaciar de Chacaltaya (Cordillera Real, Bolivia). Investigaciones glacio1Ógica.s (19914997). ORSTOM, Informe 56, La Paz, Bolivia. In Spanish.
17. Descloitres, M., Guérin, R., Fhnirez, E., Gallaire, R., Ribstein, P. and Valla, F. 1999. Détermination de l'épaisseur des glaciers de Sarennes (Alpes) et de Chacaltaya (Bolivie) par prospection radar au sol à 50 Mhz. La Houille Blanche 5,29-33.
18. Hastenrath, S. 1981. nie glaciation of Ecuadorian Andes. A.A.Balkema, Rotterdam. 19. Bontron, G, Francou, B., Ayabaca, E., Cáceres, B., Maisincho, L., Chango, R, de la
Cruz, A., Garzón L.A. and Neubert, D. 1999. EI Glaciar I5 del Antizana (Ecuador): mediciones glacioldgicas, hidrométricas y topográj'ìcas (años 1997 and 1998). Informe
IRD - INAMHI - E M - Q , Quito, Ecuador. In Spanish. 20. Thompson, L.G., Mosley-Thompson and Morales Amao, B. 1984. EI Niño Southem
Oscillation as recorded in the stratimauhv of the trouical Ouelccava ice can Peru.
21.
22.
23.
I . _ . . _ Science 226,50-52. Ribstein, P., Tiriau, E., Francou, B. and Saravia, R. 1995. Tropical climate and gla- cier hydrology a case study in Bolivia. J. Hydrol. 165,221-234. Francou, B. Ribstein, P., Saravia, R. and Tiriau, E. 1995. Monthly balance and water discharge on an intertropical glacier: the Zongo glacier, Cordillera Real, Bolivia, 16"s. J. Glaciol. 41, 137,61-67. Ribstein, P., Pouyaud, B., Sicart, J.E., Wagnon, P., Ramiez, E. andFrancou, B. 1999. Variabilité cliniatiaue et fonctionnement hvdroloeiaue d'un elacier trouical. CNGG. Rapport Quadriedal 95:98, section 6,275-287.-
24. Wolter, K. and Timlin, M.S. 1993. Monitoring ENSO in CADS with a seasonally adiusted orincioal comoonent index. Proc. Irh Climate Diamostics Workshoo. Nor-
- m&, O c N O h MUCAC, NSSL, Oklahoma Clim. SGey , CIMMS andASchool of Meteorology, University of Oklahoma, 52-57.
25. Diaz. H.F. and Graham. N.E. 1996. Recent chanees in trouical freezing heights and - - the role of sea surface temperature. Nahire 383,132-155. I
26. Participation of Luis A. Garzón in the mass balance and photogrammetrical meas- urements of Chacaltaya and Antizana Glacier 15 was very appreciated. The 1997 aerial photography of Antizana was kindly offered by Dr E. Jordan (University of Düsseldorf) and processed by Bladimir Ibarra (Escuela Politécnica Nacional, Quito). Thanks to Luis Noriega (La Paz) and Dieter Neubert (Quito) for their participation to the topographic surveys. Updated ME1 data were graciousely supplied by Klaus Wolter (NOAA).
Bernard Francou is Director of Research at the IRD (Institut de Recherche pour le Développement). His address: IRD-CNRS, Ap. Postal 1712857, Quito, Ecuador. E-mail: francou @glace.com.ec Edson Ramirez is researcher at the IHH (Instituto de Hidraulica e Hidrologia), La Paz, Bolivia. His address: IHH-UMSA, C. Postal 8214, La Paz, Bolivia. Bolivar Cáceres is researcher at the INAHMI (Instituto Nacional de Meteorologia e Hidrologia), Quito, Ecuador. His address: INAMHI, Ap. Postal 1712857, Quito, Ecuador. Javier Mendoza is researcher at the IHH, La Paz, Bolivia. His address: IHH-UMSA, C. Postal 8214, La Paz, Bolivia.
422 Q Royal Swedish Academy of Sciences 2000 http:llwww.ambio.!wa.se
Ambio Vol. 29 No. 7, Nov. 2000