Glacial stratigraphy of the Pine Point Pb-Zn mining site, Northwest Territories
17
Glacial stratigraphy of the Pine Point Pb-Zn mine site, Northwest Territories J.M. Rice, R.C. Paulen, J.M. Menzies, M.B. McClenaghan, and N.M. Oviatt Geological Survey of Canada Current Research 2013-5 2013
Transcript of Glacial stratigraphy of the Pine Point Pb-Zn mining site, Northwest Territories

Glacial stratigraphy of the Pine Point Pb-Zn mine site, Northwest Territories
J.M. Rice, R.C. Paulen, J.M. Menzies, M.B. McClenaghan, and N.M. Oviatt
Geological Survey of Canada
Current Research 2013-5
2013

Geological Survey of Canada
Current Research 2013-5
Glacial stratigraphy of the Pine Point Pb-Zn mine site, Northwest Territories
J.M. Rice, R.C. Paulen, J.M. Menzies, M.B. McClenaghan, and N.M. Oviatt
2013

©Her Majesty the Queen in Right of Canada 2013
ISSN 1701-4387Catalogue No. M44-2013/5E-PDFISBN 978-1-100-21632-4doi: 10.4095/292184
A copy of this publication is also available for reference in depositorylibraries across Canada through access to the Depository Services Program’sWeb site at http://dsp-psd.pwgsc.gc.ca
This publication is available for free download through GEOSCANhttp://geoscan.ess.nrcan.gc.ca
Recommended citationRice, J.M., Paulen, R.C., Menzies, J.M., McClenaghan, M.B., and Oviatt, N.M., 2013. Glacial stra-
tigraphy of the Pine Point Pb-Zn mine site, Northwest Territories; Geological Survey of Canada, Current Research 2013-5, 14 p. doi: 10.4095/292184
Critical review L. Jackson
AuthorsJ.M. Rice ([email protected])J.M. Menzies ([email protected])Department of Earth Sciences Brock University St. Catharines, Ontario L2S 3A1 M.B. McClenaghan ([email protected]) R.C. Paulen ([email protected])Geological Survey of Canada 601 Booth Street Ottawa, Ontario K1A 0E8
N.M. Oviatt ([email protected]) Department of Earth and Atmospheric Sciences University of Alberta Edmonton, Alberta T6G 2E3
Correction date:
All requests for permission to reproduce this work, in whole or in part, for purposes of commercial use, resale, or redistribution shall be addressed to: Earth Sciences Sector Copyright Information Officer, Room 622C, 615 Booth Street, Ottawa, Ontario K1A 0E9. E-mail: [email protected]

1Current Research 2013-5 J.M. Rice et al.
Glacial stratigraphy of the Pine Point Pb-Zn mine site, Northwest Territories
J.M. Rice, R.C. Paulen, J.M. Menzies, M.B. McClenaghan, and N.M. Oviatt
Rice, J.M., Paulen, R.C., Menzies, J.M., McClenaghan, M.B., and Oviatt, N.M., 2013. Glacial stratigraphy of the Pine Point Pb-Zn mine site, Northwest Territories; Geological Survey of Canada, Current Research 2013-5, 14 p. doi: 10.4095/292184
Abstract: With increased focus on the practical applications of glacial-drift prospecting, especially in northern Canadian regions, a firm understanding of the glacial history of the region is becoming increas-ingly important. The past-producing Pine Point mine, Northwest Territories, offers an ideal location to further this understanding as it provides large sections of unaltered till facies, which overlie low-relief bed-rock. Field research in the area has used visual observations, clast fabrics, grain-size analysis, geochemical analysis, heavy-mineral concentrates, striation measurements, and pebble lithologies to determine the gla-cial history of the region. This information will then be used in conjunction with indicator-mineral work in the area to develop a better understanding of how to explore for Mississippi Valley–type Pb-Zn deposits and the transportation history of their indicator minerals.
Résumé : Vu l’intérêt accru pour les applications pratiques des méthodes de prospection glaciosédi-mentaires, en particulier dans le Nord canadien, il devient de plus en plus important d’avoir une solide compréhension de l’histoire glaciaire de la région. L’ancienne mine Pine Point, dans les Territoires du Nord-Ouest, constitue un site idéal pour améliorer cette compréhension, car elle renferme d’amples suc-cessions de tills non altérés, qui recouvrent un substratum rocheux peu accidenté. Afin d’établir l’histoire glaciaire de la région, des études de terrain ont été menées, comportant observations visuelles, mesure de la fabrique des clastes, analyse granulométrique, analyse géochimique, étude des concentrés de minéraux lourds, mesure des stries et lithologie des cailloux. Les informations obtenues seront utilisées de concert avec les résultats des travaux sur les minéraux indicateurs menés dans la région pour mieux comprendre comment effectuer l’exploration à la recherche des gîtes plombo-zincifères de type Mississippi-Valley, et pour mieux connaître l’histoire du transport de leurs minéraux indicateurs.

2 J.M. Rice et al.Current Research 2013-5
INTRODUCTIONMining within the Northwest Territories has a rich his-
tory dating back to the Klondike Gold rush of 1889, which brought prospectors up through the Slave Lake region (Campbell, 1966). It was around this time that prospectors discovered ores of lead and zinc in and around the Pine Point area. Ten years later, Dr. R. Bell of the Geological Survey of Canada was sent out to investigate prospector reports of lead and copper ores in the Great Slave Lake region (Bell, 1899). The remote location, vegetated overburden, and low contents of precious metals made exploration and develop-ment difficult; however, with the construction of a railway to the region, Cominco was able to commence operations at the mine (Kyle, 1976). Considering the extensive past mining history, there has been very little research conducted in terms of the overall glacial history of the region. The Geological Survey of Canada (GSC), in collaboration with Brock University, conducted preliminary fieldwork to col-lect samples and make visual observations in order to obtain a better understanding of glacial history of the lower Great Slave Lake region, with the Pine Point mine site being the focal point of this study. This paper, through a lithofacies analysis and grain-size analysis, outlines the glacial history of the Pine Point region. This particular research site will also give a better understanding of the dynamics of the west-ern region of the Laurentide Ice Sheet. The low relief of the underlying bedrock further allows an unimpeded insight into the glacial dynamics that affected the region.
Location and geological settingThe past-producing Pine Point Pb-Zn mine site is
located on the southern shore of Great Slave Lake in the Northwest Territories (Fig. 1), approximately 800 km north of Edmonton, Alberta. It is located about 50 km east-south-east of the town of Hay River and about 180 km south, across Great Slave Lake, of Yellowknife. The Pine Point area
has relatively low relief (less than 15 m), with a landscape dominated by black spruce peatlands (Lemmen, 1990). The Pb-Zn deposits are hosted within platformal carbonate rocks on the eastern edge of the Western Canada Sedimentary Basin (Hannigan, 2007).
The major Pine Point Pb-Zn orebodies are hosted within middle Devonian carbonates which are located in, or are in close proximity to, the dolomitized Presqu’ile barrier com-plex (Okulitch, 2006; Hannigan, 2007). The barrier complex is a reef-like complex that acts as the transition between the shallow marine sediments to the south and the deep marine sediments to the north. To the west of the mine site lies the foothills belt of the Cordilleran Orogen, and to the east is the Precambrian shield (Rhodes et al., 1984). The Presqu’ile Formation consists of the upper Keg River and Sulphur Point formations. The Sulphur Point Formation overlies the Keg River Formation, which is characterized by flat, lens-oid beds of carbonate mudstone and sandstones (Rhodes et al., 1984). The Pine Point barrier complex developed dur-ing the Givetian stage of the Devonian and subcrops at a gentle incline of approximately 2° toward the west (Skall, 1975). The Sulphur Point Formation is composed of bioclas-tic limestones and carbonate sandstones that are the primary hosts of the orebodies (Skall, 1975). The orebodies are predominantly positioned along weakened bedrock planes associated with the Great Slave Lake Shear Zone (Eaton and Hope 2003), with the primary control of ore deposition being karstification, which includes both surface and sub-surface features and pore spaces (Rhodes et al., 1984). The primary ore minerals are galena and sphalerite, which are the only minerals that occur at an economical level for mining (Hannigan, 2007).
The Laurentide Ice Sheet has had a profound effect on the geomorphology of the Pine Point mining district, especially in terms of glacial-sediment deposition. The sediment was determined to be till, based on the Dreimanis (1982) defi-nition indicating it had been transported and subsequently deposited by or from glacier ice with no or little sorting by
Figure 1. The geological and geographic setting of the past-producing Pine Point mine district, Northwest Territories. The study area is located at the eastern margin of the Western Canada Sedimentary Basin.

3Current Research 2013-5 J.M. Rice et al.
water. This was supported by the sediments’ matrix, which varies slightly throughout its entirety, but usually consists of sandy silt with varying fissility and contains subrounded to subangular, faceted and striated clasts, ranging in size from granules to boulders. The Laurentide Ice Sheet has deposited till to a thickness of over 20 m in the region. Due to the gentle regional westward dip of the otherwise low-relief bedrock surface, the sediment thickens westward from less than 1 m on the east side of the mine site to over 25 m exposed in the westernmost open pits of the mine site. Thicker sections of glacial sediment fill in karst-collapse structures. After the retreat of the Laurentide Ice Sheet, the area was inundated by glacial Lake McConnell, which winnowed the till surface and deposited thin (<2 m) beach and littoral glaciolacustrine sediments across the entire area (Lemmen et al., 1994).
Previous workSurficial mapping was carried out in the Pine Point area
by the GSC from 1989 to 1994, mainly to expand the knowl-edge of glacial Lake McConnell and associated deposits (Lemmen, 1990; Lemmen et al., 1994). Surficial geology maps of the Buffalo Lake (NTS 85-B; Lemmen, 1998b), Klewi River (NTS 85-A; Lemmen, 1998a), and Breynat Point (NTS 85-B/15; Oviatt and Paulen, 2013) areas have been published.. Till and glaciolacustrine sediments were determined to be the primary surficial deposits (Lemmen, 1990). One phase of ice flow to the west was identified during the surficial mapping. There is very little published information on the ice-flow history of the region (Prest et al., 1968; Paulen et al., 2011) due to the lack of access to bedrock outcrop.
Fieldwork conducted in 2010 by the GSC has docu-mented cross-striated bedrock surfaces on the shoulders (i.e. bedrock benches) of the exposed open pits (Oviatt et al., 2011). Striation measurements taken in the field, coupled with aerial-photo and satellite-imagery landform analysis, have determined a minimum of three ice-flow tra-jectories. The earliest flow was to the southwest (~230°). An intermediate flow to the northwest (~300°) and a later westward-southwestward (~250°) flow also occurred. There was a single striation record that indicated a short-lived flow toward the northwest (~330°); crosscutting relation-ships indicate that this phase must have taken place before the intermediate northwestward (~300°) phase and the late westward-southwestward (~250°) phase. Landforms in the region are streamlined parallel to the last phase (~250°) of ice flow (Fig. 2), reshaping older oriented landforms that were formed during the intermediate (~300°) glacial event.
METHODSTill sections around the mine site were surveyed, and sev-
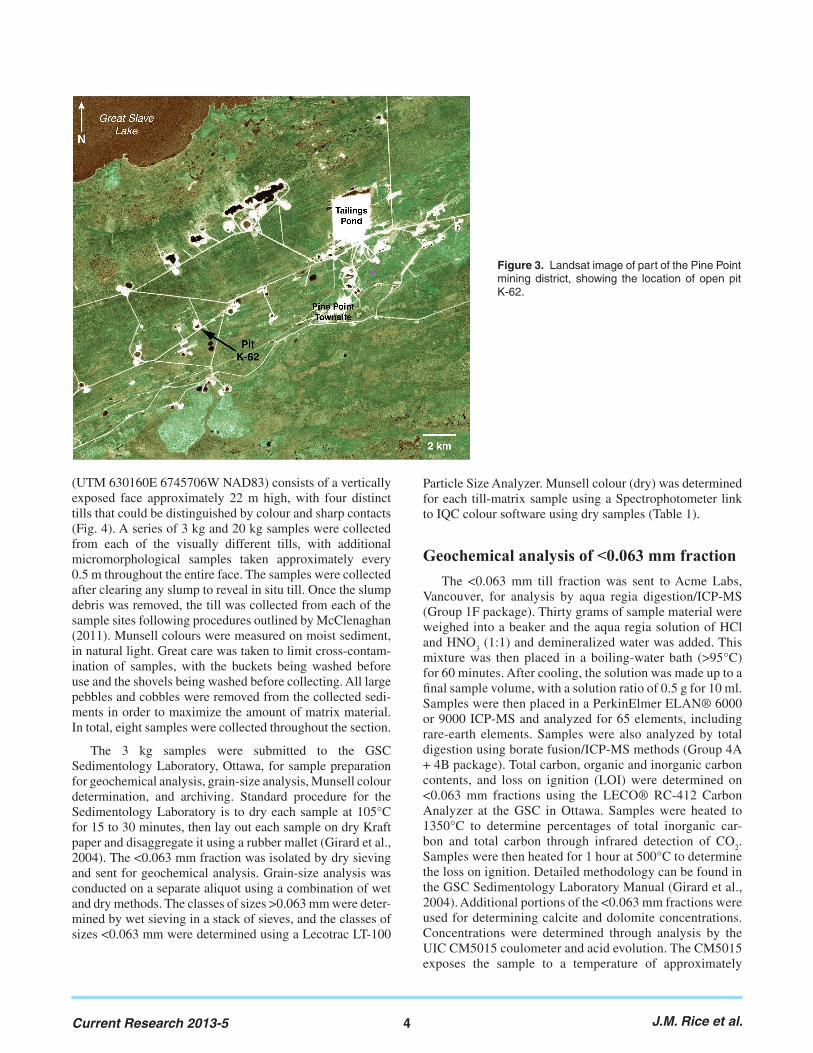
eral well exposed sections were available for detailed study. The section exposed along the north face of pit K-62 (Fig. 3) displayed the largest depositional record (>20 m) that was still accessible enough to allow samples to be collected by hand. The units showed a large variance in clast size, rang-ing from large boulders to clay-sized fractions, and showed signs of reworking, with many clasts being striated and polished, indicating the diamicton is a subglacial till. The selected sites were then visually categorized into different units based on colour and grain-size changes. This section
Figure 2. SPOT satellite image of Highway 5, southwest of Pine Point, showing the older, large northwest-trending glacial landforms (dashed arrows) crosscut by finer southwest-trending flutings.
4 J.M. Rice et al.Current Research 2013-5
(UTM 630160E 6745706W NAD83) consists of a vertically exposed face approximately 22 m high, with four distinct tills that could be distinguished by colour and sharp contacts (Fig. 4). A series of 3 kg and 20 kg samples were collected from each of the visually different tills, with additional micromorphological samples taken approximately every 0.5 m throughout the entire face. The samples were collected after clearing any slump to reveal in situ till. Once the slump debris was removed, the till was collected from each of the sample sites following procedures outlined by McClenaghan (2011). Munsell colours were measured on moist sediment, in natural light. Great care was taken to limit cross-contam-ination of samples, with the buckets being washed before use and the shovels being washed before collecting. All large pebbles and cobbles were removed from the collected sedi-ments in order to maximize the amount of matrix material. In total, eight samples were collected throughout the section.
The 3 kg samples were submitted to the GSC Sedimentology Laboratory, Ottawa, for sample preparation for geochemical analysis, grain-size analysis, Munsell colour determination, and archiving. Standard procedure for the Sedimentology Laboratory is to dry each sample at 105°C for 15 to 30 minutes, then lay out each sample on dry Kraft paper and disaggregate it using a rubber mallet (Girard et al., 2004). The <0.063 mm fraction was isolated by dry sieving and sent for geochemical analysis. Grain-size analysis was conducted on a separate aliquot using a combination of wet and dry methods. The classes of sizes >0.063 mm were deter-mined by wet sieving in a stack of sieves, and the classes of sizes <0.063 mm were determined using a Lecotrac LT-100
Particle Size Analyzer. Munsell colour (dry) was determined for each till-matrix sample using a Spectrophotometer link to IQC colour software using dry samples (Table 1).
Geochemical analysis of <0.063 mm fractionThe <0.063 mm till fraction was sent to Acme Labs,
Vancouver, for analysis by aqua regia digestion/ICP-MS (Group 1F package). Thirty grams of sample material were weighed into a beaker and the aqua regia solution of HCl and HNO
3 (1:1) and demineralized water was added. This
mixture was then placed in a boiling-water bath (>95°C) for 60 minutes. After cooling, the solution was made up to a final sample volume, with a solution ratio of 0.5 g for 10 ml. Samples were then placed in a PerkinElmer ELAN® 6000 or 9000 ICP-MS and analyzed for 65 elements, including rare-earth elements. Samples were also analyzed by total digestion using borate fusion/ICP-MS methods (Group 4A + 4B package). Total carbon, organic and inorganic carbon contents, and loss on ignition (LOI) were determined on <0.063 mm fractions using the LECO® RC-412 Carbon Analyzer at the GSC in Ottawa. Samples were heated to 1350°C to determine percentages of total inorganic car-bon and total carbon through infrared detection of CO
2.
Samples were then heated for 1 hour at 500°C to determine the loss on ignition. Detailed methodology can be found in the GSC Sedimentology Laboratory Manual (Girard et al., 2004). Additional portions of the <0.063 mm fractions were used for determining calcite and dolomite concentrations. Concentrations were determined through analysis by the UIC CM5015 coulometer and acid evolution. The CM5015 exposes the sample to a temperature of approximately
Figure 3. Landsat image of part of the Pine Point mining district, showing the location of open pit K-62.

5Current Research 2013-5 J.M. Rice et al.
950°C in an oxygen-rich atmosphere, rapidly oxidizing all carbon within the sample to CO
2. Concentrations are then
automatically measured using absolute coulometric titra-tion. During the acid evolution, samples are mixed with hydrochloric acid (1:1 concentration) and the concentration of calcite and dolomite is determined through analysis of the volume of CO
2 evolved in a Chittick gasometric appa-
ratus, with the calcite being liberated and measured first and the slower-reacting dolomite being liberated and mea-sured second. Methodology of the procedure is described in detail in the GSC Sedimentology Lab Manual (Girard et al., 2004).
Heavy-mineral concentratesEach till facies identified in the field was sampled
for heavy-mineral concentrate analysis (11-PTA-022, -023A, -023B, -025, -030, -035, -037, and -042). These samples (~15 kg) were submitted to Overburden Drilling Management Limited, Nepean, for disaggregation and pro-duction of heavy-mineral concentrates. Each till sample was disaggregated in water then wet sieved to 2.0 mm. The >2.0 mm fraction was washed with oxalic acid to remove iron staining and discolouration, and set aside for pebble-lithology determinations. The <2.0 mm till fraction was passed over a shaking table where a table concentrate was created by the separation of light and heavy minerals. The
table concentrate was then panned, and precious metals and sulphide grains counted and set aside. The heavy fraction was then dried and sieved to remove the <0.25 mm fraction. The 0.25 to 2.0 mm fraction was concentrated using heavy-liquid separation in methylene iodide diluted to a specific gravity of 3.2. The >3.2 heavy fraction was then run through a ferromagnetic separator. The nonferromagnetic fraction was subjected to an oxalic-acid wash to remove Fe stains and secondary coatings, and then dry sieved into 0.25, 0.5, and 1.0 mm fractions. The 0.25 to 0.5 mm fraction then under-went paramagnetic separation. The paramagnetic fractions, along with the 0.5 to 1.0 mm and the 1.0 to 2.0 mm fractions, were selected and analyzed for abundance, composition, and paramagnetism. The sample-processing procedure is sum-marized in Figure 5.
Clast fabricsClast-fabric measurements were completed at seven of
the eight aforementioned sites across the till face (Fig. 4; Table 2); a till-fabric measurement was not conducted at the 11-PTA-025 sample location, as it was deemed unnec-essary due to its close proximity to the 11-PTA-031 sample location. Using elongated-clast orientations to reconstruct ice-flow directions has been practiced for more than a hun-dred years (e.g. Miller, 1884; Krumbein, 1938; Holmes, 1941). This is a process in which the a-axis orientation of
Figure 4. North face of open pit K-62, with four different till units (A to D) overlain by glacial Lake McConnell littoral sediments (unit E). Total height of the section is 23 m. Dashed lines indicate the approximate till contacts. Sample locations and labels are indicated, with till-fabric locations marked by larger white boxes. Photograph by R.C. Paulen. 2013-005

6 J.M. Rice et al.Current Research 2013-5
multiple prolate (meaning the a-axis is twice as long as the b-axis) clasts within a sample area is measured. The a-axis is the measured axis because it is susceptible to rotation under applied stress and may become shifted parallel to the stress orientation (Hooyer and Iverson, 2000). These clasts typically dip up-ice as the particle orients itself to pose the least resistance to flow (Hooyer and Iverson, 2000); there-fore, the dip of the clast is also measured. For the purpose of this field study, a minimum of 50 clast fabrics were measured within an approximately 1 m3 sample area, as suggested by Ringrose and Benn (1997). Only clasts with an a:b ratio of at least 2:1 were selected, as these pebbles allow for the most practical measurement that is sensi-tive enough to indicate flow direction (Andrews, 1971). A bench area was cleared off at each sample area, as it has been suggested that the most accurate measurements are taken from horizontal surfaces (Andrews, 1971). Clasts were carefully uncovered and removed using a till knife and trowel. An aluminum knitting needle was then placed in the cast of the removed clast in the direction of the elon-gated axis and in the dip direction of the a/b plane. Both the azimuth and dip of each clast were measured and recorded. This process was repeated for a minimum of 50 pebbles at each sample location (c.f. Hirvas and Nenonen, 1990; McMartin and Paulen, 2009).
Pebble lithologiesThe lithologies of pebbles in till reflect the bedrock
geology of the area and of areas up-ice. By comparing the lithology, size, shape, and abundance of the pebbles found within a till, a relative estimate of transport distance and source area can be made. The subcropping margin of the Precambrian Canadian Shield with the Paleozoic rock at the eastern boundary of the Western Canada Sedimentary Basin, approximately 175 km due east (Fig. 1) of the Pine Point region, provides a unique opportunity for this type of study.
Samples collected in the field for heavy-mineral con-centrate were also used for lithological analysis, and were processed as mentioned above. The >2.0 mm fractions were received from Overburden Drilling Management Limited, and the 2.0 to 5.6 mm granules and clasts were removed and examined visually for sulphide minerals. The >5.6 mm fraction was counted by clast lithology follow-ing the general outline of Bridgland (1986). Each sampled yielded approximately 2 to 3 kg of 2.0 to 5.6 mm material. The remaining >5.6 mm fractions consisted of 800 to 900 clasts per sample, which were then coned and quartered, in order to randomly select 300 to 400 clasts. These pebbles were classified under nine categories (Table 3) based on bedrock lithologies known to occur in the Pine Point region and up-ice thereof (c.f. Skall, 1975).
Po
ten
tial
ind
icat
ors
of
met
amo
rph
ose
d C
u-Z
n-P
b-A
g m
iner
aliz
atio
n (
gra
ins)
(0.
25-0
.5 m
m)
Car
bo
nat
es (
CO
2 %
)
Sam
ple
T
ill u
nit
Top
sam
ple
d
epth
fro
m
surf
ace
(m)
Mu
nse
ll
Co
lou
r (d
ry)
Tota
l C
(± 0
.1%
)In
org
anic
C
(± 0
.1%
)O
rgan
ic C
(±
0.2
%)
Lo
ss o
n
ign
itio
n
(%)
Des
crip
tio
nC
last
co
nte
nt
(%)
%
san
d%
silt
(63-
2mm
)%
cla
y
(<2m
m)
Pyr
ite/
m
arca
site
Ch
alco
-p
yrit
eS
ph
aler
ite
Gal
ena
Her
cyn
ite
Kya
nit
eS
illim
anit
eS
tau
rolit
eC
alci
teD
olo
mit
e
11-P
TA-0
22A
1710
YR
6/2
2.6
2.1
0.5
2.3
Ligh
t bro
wni
sh-g
rey,
sl
ight
ly fi
ssile
, san
d le
nses
1358
.235
.95.
9n/
an/
an/
an/
an/
an/
an/
an/
a1.
635.
89
11-P
TA-0
23B
A16
.25Y
5/2
1.8
1.4
0.4
2.1
Oliv
e gr
ey, d
arke
r cl
asts
, mor
e fis
sile
839
.249
.211
.650
000
120
16
250
250
101.
193.
64
11-P
TA-0
23A
B16
.110
YR
7/2
8.8
8.4
0.4
1.3
Ligh
t gre
y, ir
on-
stai
ned
clas
ts, l
ight
er
colo
ured
cla
sts
1332
.049
.618
.430
002
400
1420
2040
27.
9422
.63
11-P
TA-0
25C
12.5
10Y
R 6
/29.
18.
80.
31.
1Li
ght b
row
nish
gre
y,
mor
e sa
nd-r
ich
1133
.748
.118
.1n/
an/
an/
an/
an/
an/
an/
an/
a7.
6523
.94
11-P
TA-0
30C
9.8
10Y
R 7
/28.
68.
30.
31.
2Li
ght g
rey,
mor
e sa
nd-r
ich
1634
.947
.617
.630
000
400
300
510
07.
7421
.84
11-P
TA-0
35A
C6.
210
YR
6/2
8.6
8.1
0.4
1.2
Ligh
t bro
wni
sh-g
rey,
fis
sile
, cla
y-ric
h17
33.4
48.0
18.6
3000
110
010
33
150
18.
9820
.23
11-P
TA-0
37D
4.2
2.5Y
7/2
8.9
8.7
0.2
1.3
Ligh
t gre
y w
ith ir
on
stai
ning
on
join
ts12
30.8
50.1
19.1
100
57
2260
101
7.83
23.0
0
11-P
TA-0
42D
1.2
2.5Y
7/2
9.0
8.9
0.1
1.3
Ligh
t gre
y, h
ighl
y fis
sile
1834
.549
.815
.620
00
04
800
07.
2424
.56
Tab
le 1
Sam
ple
resu
lts (
Mun
sell
colo
urs,
car
bon,
gra
in s
ize,
and
indi
cato
r m
iner
als)
from
eig
ht s
ampl
es c
olle
cted
at p
it K
-62.

7Current Research 2013-5 J.M. Rice et al.
Figure 5. Flowchart outlining the sample-processing procedure heavy-mineral fractions recovered from till samples submitted to Overburden Drilling Management Limited.

8 J.M. Rice et al.Current Research 2013-5
RESULTS
StratigraphyFour distinct tills were visually identified in the field on
the basis of colour and their contacts. These four units were labelled in stratigraphic sequence, assuming the oldest (unit A) is lowest in the sequence, and unit D is the youngest at the top of the section. The bedrock exposed at the bedrock bench of the open pit showed two striation sites, with a sin-gle striation direction ranging from 223° to 232°, parallel to the oldest known striation direction mapped by Oviatt et al. (2011).
Unit ATill unit A is very dark greyish-brown till (wet: 2.5 Y 3/2;
dry: 10 YR 6/2). This till has a silty-sand matrix (58% sand) with a clast content of 13%; it is fissile and contains sev-eral sand lenses. Clasts in this unit were observed to be subrounded, with multiple observations of well rounded quartzite pebbles, possibly of Cordilleran origin. This unit is rarely seen preserved on low-relief bedrock surfaces, but accumulations are preserved in areas where there are karst-collapse depressions in the bedrock surface. This unit may have been eroded by later glaciations or may have been squeezed into the depression by advancing glacial ice; fur-ther investigation is needed to determine which occurred.
The current water level within the abandoned K-62 open pit made getting multiple samples within this layer impractical. A clast-fabric measurement was completed at the site and although no clear trend was obtained (S
1 = 0.05), the steep
plunges of the clasts may indicate that the till flowed directly down into the karst-collapse structure, possibly during the initial stages of glaciation. Total carbon within this section varied from 1.8 to 2.6% (1.3–2.1% inorganic and 0.4–0.5% organic) with 2.2 to 2.3% being lost on ignition. These values were slightly lower than any other values observed within the section. This unit also exhibits higher amounts of pyrite/marcasite grains (3333 gr/10 kg) in comparison to the other sections (ranging from 7 to 2041 gr/10 kg). A simi-lar pattern emerged when analyzing kyanite grains in which higher amounts (167 gr/10 kg) were observed in unit A in comparison to the other units (2–62 gr/10 kg). Calcite and dolomite concentrations within this unit were significantly lower (Table 1) (calcite = 1.63% and 1.19%, and dolo-mite = 5.89% and 3.64%) than in overlying units.
Unit BUnit B is pale brown till (wet: 10 YR 6/3; dry: 10 Y 7/2),
has a sandy-silt matrix (32% and 50%, respectively) and con-tains 13% clasts. This layer has much lighter-coloured clasts, with iron and manganese staining found on some clasts and on joint-plane surfaces. A shearing contact between this till layer and unit A is commonly observed (Fig. 6), with
SampleTill unit Depth (m) n
Eigenvalues
K1 Mean vector R2S1 S2 S3
11-PTA-022 A 17.0 51 0.047 0.352 0.181 0.424 321.7 / 65.1 0.610
11-PTA-023A B 16.1 63 0.539 0.361 0.100 0.312 161.8 / 00.4 0.322
11-PTA-031 C 9.0 51 0.771 0.182 0.047 1.078 043.4 / 11.5 0.667
11-PTA-034 C 7.2 50 0.645 0.232 0.123 1.611 229.6 / 01.3 0.385
11-PTA-035 C 6.2 53 0.693 0.254 0.053 0.640 072.1 / 08.2 0.493
11-PTA-037 D 4.2 52 0.606 0.265 0.129 1.153 341.6 / 06.9 0.387
11-PTA-042 D 1.2 52 0.681 0.267 0.052 0.575 065.0 / 05.5 0.3231 K = clustering 2 R = correlation coefficient
Table 2 Summary statistics for clast fabrics measured in the open pit K-62 north section, as shown in Figure 4.
Precambrian (%) Proterozoic (%) Paleozoic (%) Mixed (%)Total
Canadian Shield
Total basin
Paleozoic SampleFelsic
intrusiveMafic
intrusive Metavolcanic MedasedimentVein
quartzSubarkose red
sandstone Limestone Dolomite Other
11-PTA-023B 41.9 6.9 1.7 4.1 0.8 6.1 14.3 23.7 0.6 61.4 38.0
11-PTA-023A 22.0 1.2 0.9 3.8 0.0 2.0 45.7 24.3 0.3 29.8 69.9
11-PTA-030 20.6 3.2 1.0 5.6 0.0 2.2 22.5 44.9 0.0 32.6 67.4
11-PTA-035 17.5 2.1 0.0 2.6 0.0 2.9 41.3 33.6 0.0 25.1 74.9
11-PTA-037 16.2 3.7 0.5 0.7 1.5 0.0 23.9 53.5 0.0 22.6 77.4
11-PTA-042 15.1 3.0 0.0 0.9 0.3 0.0 52.4 28.1 0.3 19.2 80.5
Table 3 Pebble-count categories and results from >5.6 mm fraction of the till samples collected at pit K-62.

9Current Research 2013-5 J.M. Rice et al.
evidence of re-entrainment and rip-up clasts. Samples were taken above (11-PTA-023A) and below (11-PTA-023B) this contact. A clast fabric measured above this contact (11-PTA-023A) indicated an ice-flow direction to the northwest (S
1 = 0.54). Total carbon content within this unit is 8.6–9.1%
(8.3-8.8% inorganic and 0.3-0.4% organic); total amount lost on ignition was 1.1– 1.3%. This section also produced higher concentrations of sphalerite grains (272 gr/10 kg) than other units within the facies (0–80 gr/10 kg). Calcite and dolomite concentrations in this unit (7.94% and 22.63%, respectively) were significantly higher than in underlying units, but close to those of overlying units (Table 1).
Unit CUnit C is light olive brown till (wet: 2.5 Y 5/3; dry:
10 YR 6/2) and has a sandy-silt matrix (34% sand) with 13% clasts, a large number of them being faceted and polished. A clast fabric measured in this till weakly indicated a south-westward flow direction; this unit is the thickest (~12 m) and is fairly consistent throughout the entire section. This till unit is defined by a sharp lower contact, with occasional boulders lodged at the contact (Fig. 7). These boulders vary in size from pebbles to boulders approximately 1 m in diam-eter, have faceted, polished surfaces, are contained in fine sand-silt matrix, and occur roughly along a horizontal plane (Fig. 8). Clast-fabric measurements completed near the top of this unit revealed a stronger correlation to the northwest (S
1 = 0.65–0.77); these coincide with the middle striations
previously found in the area, and can be seen through the glacial-landform orientations (Fig. 2). We tentatively sug-gest that the clast fabrics, striations, and northwest-trending landforms are from the same glacial event; however, further investigation is required. Fabrics measured from this till unit
show the strongest clustering of all four of the till units, and the landforms associated with it are most prevalent on the landscape. Total carbon within this section was 8.6% (8.1% inorganic and 0.4% organic), and total amount lost on igni-tion was 1.2%. This unit had low concentrations of kyanite (2 gr/10 kg), and moderate amounts of sphalerite and pyrite/marcasite (75 and 2256 gr/10 kg respectively), in comparison to the rest of the units. Calcite and dolomite concentrations in this unit are similar to those of units B and D, ranging from 7.65% to 8.98% calcite and 20.23% to 23.94% dolo-mite, with the concentration of calcite increasing slightly toward the top of the unit, and dolomite decreasing (Table 1).
Unit DUnit D is brown till (wet: 10 YR 5/3; dry: 2.5 Y 7/2). The
matrix is dominantly sandy silt (35% and 50%), containing 17% clasts. This unit is fissile and contains a smaller boul-der/cobble horizon. This boulder horizon contains abundant smaller boulders and cobbles and was observed to occur along a horizontal plane with a fine sandy-silt matrix in the interstices. A clast fabric measured in this unit indicates a southwestward flow direction (S
1 = 0.60–0.68). Total carbon
within this section was 8.9 to 9.0% (8.7 -8.9% inorganic and 0.1-0.2% organic), and total amount lost on ignition was 1.3%. Calcite and dolomite concentrations within this unit are similar to those in underlying units C and B, with calcite concentrations of 7.84% and 7.24%, and dolomite values of 23.00% and 24.56% (Table 1).
Unit E — glacial Lake McConnellDeglaciation of the site occurred approximately at the
end of the Late Wisconsin (Dyke, 2004). The Laurentide Ice Sheet margin retreated to east of the Slave River, and the Pine
Figure 6. Shearing contact and mixed zone between the lowest tills, units A and B. Intact sediment rip-up clasts of unit A are com-monly observed above the contact in unit B. Canadian five-cent coin (21 mm diameter) for scale. Photograph by R.C. Paulen. 2013-007
Figure 7. Sharp planar contact between till units C and D, show-ing the subtle differences in till colour and fissility. Boulders occur along this contact, with the tops of the boulders typically fac-eted and striated. Handle of pick is approximately 60 cm long . Photograph by R.C. Paulen. 2013-004

10 J.M. Rice et al.Current Research 2013-5
Point mine site was inundated by glacial Lake McConnell, a large proglacial lake that covered Great Bear Lake, Lake Athabasca, and Great Slave Lake (Dyke and Prest, 1987; Lemmen et al., 1994). The surficial unit exposed at pit K-62 is beach sediments (Fig. 9), showing a typical open frame-work of clast-supported gravel, predominantly composed of Canadian Shield lithologies originating from the underlying till. Unit E is approximately 1 m thick along the northern face of pit K-62.
Organic layerOverlying the glacial Lake McConnell sediments is
approximately 0.5 m of organic material, deposited in the broad peatland that occurs at the surface. Mining operations and construction of the open pit had disturbed much of the peatland surface. Present-day vegetation, including small black spruce trees, currently grows in this unit.
Pebble lithologiesThe percentage of Precambrian clasts found in each
sample gradually increases with distance from the natural land surface, with a slight exception for 11-PTA-030, which contains a higher percentage of Precambrian clasts than the underlying sample 11-PTA-023A (Table 3, Fig. 10). There is a significant increase in Precambrian clast percentage for the sample furthest from the natural land surface (11-PTA-023B). This was an unexpected finding, since the bedrock directly underneath is limestone with minor dolomite in composition. Complete pebble lithologies are described in Table 3.
DISCUSSIONAnalysis of the clast-fabric data (Table 2; Fig. 11), in par-
allel with the observed glacial landforms in the area and the erosional record encompassed by the striations on bedrock (Oviatt et al., 2011), demonstrates that the glacial history of the Pine Point region is much more complex than previ-ously reported. The erosional record indicates three ice-flow trajectories: the youngest to the southwest (~230°), an inter-mediate flow to the northwest (~300°), a possible short-lived flow to the north-northwest (~330°), and a later westerly-southwesterly flow (~250°). The predominant streamlined landforms in the area (Fig. 2) coincide with the latest flow phase (250°), crosscutting the landforms parallel to the northwesterly intermediate flow (~300°). These erosional and depositional records within the landscape are reinforced by the clast fabrics within the till facies.
Based on the results of the clast-fabric measurements, the uppermost sample in unit D (11-PTA-042) did have a mod-erately strong orientation in the youngest ice-flow direction (~260°, S
1 = 0.68), which is similar to the striation record, as
well as in the crosscutting landforms in the area. This fabric
Figure 8. Oblique photo showing the boulder horizon between till units C and D. The location of Figure 7, showing the contact between the tills in detail, is outlined. Photograph by R.C. Paulen. 2013-003
Figure 9. Uppermost till (unit D) overlain by a thin veneer of stony glacial Lake McConnell littoral sediments. Rock hammer for scale. Photograph by R.C. Paulen. 2013-006

11Current Research 2013-5 J.M. Rice et al.
and striation record can also be seen in the sample underly-ing the uppermost sample site (11-PTA-037), which exhibited a weaker fabric (S
1 = 0.61) with an orientation (~140°) that
coincides with the second observed, brief ice flow (~330°) and runs parallel to the older streamlined landforms trending southwest in the area. The next clast-fabric measurement fur-ther down in the lithofacies was from unit C (11-PTA-035) and had a moderately strong (S
1 = 0.69) trend (270°) that closely
resembled the third-oldest striation record (300°). Samples 11-PTA-031 and 11-PTA-034 were also taken from till unit
C, but had stronger fabrics (S1 = 0.77 and S
1 = 0.65) with
orientations (240° and 230°) close to the oldest striations on record (230°). The next-oldest till unit, unit B (11-PTA-023A) (S
1 = 0.54), provided an orientation (~290°) not observed in
the striation record. This till unit is only about 2.5 m thick, indicating a possible short-lived glacial episode or erosion of deposited material by a later ice flow. The preservation of the dark-coloured till in the karst-collapse structure, and lack of deposited material from this unit on exposed bedrock in the area, suggest the latter. The lowest clast measurement taken
Figure 10. Results of the pebble-lithology counts. a) Relative percent-ages of each pebble lithology in stratigraphic sequence. b) Simplified plot highlighting the percentage of clasts from the Canadian Shield and Paleozoic carbonate basin. c) Line graph showing relative per-centages of each lithology from each bulk sample.

12 J.M. Rice et al.Current Research 2013-5
Figure 11. Stratigraphy and lithofacies of the northern exposure at open pit K-62. Bedrock is depicted to include the karst-collapse structures seen in the open pits at Pine Point.

13Current Research 2013-5 J.M. Rice et al.
in unit A indicated a weak (S1 = 0.05) fabric with no clear ori-
entation. The clasts are nearly vertical; this, coupled with the sample’s location near a karst-collapse feature, suggests the till flowed into the karst-collapse depression during deposi-tion, probably at the onset of glaciation.
There are four distinct tills in the glacial record at Pine Point, based upon visual differences between units, clast-fabric measurements taken within each unit, analyses of the sediments in the facies, calcite and dolomite concentrations, and the striations in the area. The oldest glacial-sediment unit preserved (unit A) had no clear flow direction due to its nearly vertical clast angles. This till was much sandier than the over-lying tills, and contained evidence of reworked older fluvial sediments, with abundant subrounded to well rounded small pebbles, some even of Cordilleran origin. Karst-collapse fea-tures in the area are infilled with unit A sediments. The second distinct till recorded within the section (unit B) indicated an ice-flow direction to the west-southwest. This unit also con-tained far less carbon-rich material than all overlying units, possibly indicative of distal transportation distance or origin. The third unit (unit C) was the thickest and contained a clast fabric indicating polyphase ice flow in several directions, of which several correlated with existing striations. Clast fabrics within the unit align between the northwest and the southwest, coinciding with the single striation occurrence recorded to the west-northwest. The fourth till facies (unit D) also contains a polyphase clast fabric, which correlates with striation records in the area, which themselves coincide with streamlined land-forms found near the mining district. Lastly, glacial Lake McConnell littoral sediments and Holocene organic sedi-ments overlie the glacial sequence.
CONCLUSIONSThe erosional history observed in the striation records and
landforms at Pine Point generally correlates with the subgla-cial depositional sequences. All observed exposures at the Pine Point mine site show continuous sequences of conformable, thick subglacial till deposits, with no occurrences of intertill sediments or tills with oxidized horizons of any kind. South of Pine Point, in western Alberta, there is evidence of only one glaciation, during the Late Wisconsin (Jackson et al., 2011). Southeast of Pine Point, in northeastern Alberta, older glacial sediments are preserved in buried valleys (Andriashek, 2003; Paulen, 2009). There is no evidence at Pine Point to support that these multiple tills reflect separate glaciations. The gen-eral thickness of the continuous till sequences, particularly till unit C, at the western margin of the Canadian Shield probably reflects continuous glaciation of the Pine Point region during the entire Wisconsin. Dyke et al. (2002) mapped the Laurentide Ice Sheet margin during the Middle Wisconsin at approximately the edge of the Canadian Shield. We postulate that since there is no evidence of ice-margin advance and retreat sequences in the glacial stratigraphy, the Middle Wisconsin ice margin was prob-ably north and west of the Pine Point area, and ice occupied
the Great Slave Lake basin during the Wisconsin. The variable ice-flow trajectories reflect changes in the western sector of the Laurentide Ice Sheet during its lifespan.
The relatively flat bedrock surface at the eastern margin of the Western Canada Sedimentary Basin provided an environ-ment that was suitable for continuous glacial sedimentation. The till sequences observed at Pine Point provide a unique insight into glacial dynamics of the Laurentide Ice Sheet throughout the entire Wisconsin glaciation, and research into the nature of the tills, through micromorphological study and glacial dispersal studies from the orebodies, is ongoing and will be published in subsequent papers.
ACKNOWLEDGMENTSThis research was funded by the GSC’s Geo-Mapping for
Energy and Minerals (GEM) Program (2008–2013) under the Tri-Territorial Indicator Mineral Project. The authors would like to thank Carl Ozyer (Northwest Territories Geoscience Office) for his enthusiastic assistance with the till-fabric measurements at pit K-62. Lionel Jackson (GSC Vancouver) is thanked for his thoughtful and critical review of the manuscript.
REFERENCESAndrews, J.T., 1971. Techniques of till fabric analysis; British
Geomorphological Research Group, Technical Bulletin no. 6, 43 p.
Andriashek, L.D., 2003. Quaternary geological setting of the Athabasca Oil Sands (in situ) area, northeast Alberta; EUB/AGS Earth Sciences Report 2002–03, 286 p.
Bell, R., 1899. Summary Report of the Geological Survey depart-ment for the year 1899, by the director. Mackenzie District; Annual Report of the Geological Survey of Canada, v. 12, p. 103A–110A.
Bridgland, D.R., 1986. Clast lithological analysis; Quaternary Research Association, Technical Guide no. 3, 207 p.
Campbell, N., 1966. The lead-zinc deposits of Pine Point; Canadian Mining and Metallurgical Bulletin, v. 59, p. 953–960.
Dreimanis, A., 1982. INQUA — Commission on genesis and lithology of Quaternary deposits. Work Group (1) — Genetic classification of tills and criteria for their differentiation. Progress report on activities 1977–1982, and definitions of gla-cigenic terms; in INQUA Commission on genesis and lithol-ogy of Quaternary deposits, Report on activities 1977–1982, (ed.) C. Schluchter, Zurich, p. 12–31.
Dyke, A.S., 2004. An outline of North American deglaciation with emphasis on central and northern Canada; in Quaternary glaciations — extent and chronology, Part II. North America, (ed.) J. Ehlers and P.L. Gibbard, Elsevier B.V., Amsterdam, Development in Quaternary Science Series, v. 2, p. 373–424.
Dyke, A.S. and Prest, V.K., 1987. Late Wisconsin and Holocene history of the Laurentide Ice Sheet; Géographie physique et Quaternaire, v. 41, p. 237–263.

14 J.M. Rice et al.Current Research 2013-5
Dyke, A.S., Andrews, J.T., Clark, P.U., England, J.H., Miller, G.H., Shaw, J., and Veillette, J.J., 2002. The Laurentide and Innuitian ice sheets during the Last Glacial Maximum; Quaternary Science Reviews, v. 21, p. 9–31. doi:10.1016/S0277-3791(01)00095-6
Eaton, D.W. and Hope, J., 2003. Structure of the crust and upper mantle of the Great Slave Lake shear zone, northwestern Canada, from teleseismic analysis and gravity modeling; Canadian Journal of Earth Sciences, v. 40, p. 1203–1218. doi:10.1139/e03-038
Girard, I., Klassen, R.A., and Laframboise, R., 2004. Sedimentology laboratory manual, Terrain Sciences Division; Geological Survey of Canada, Open File 4823, 137 p. doi:10.4095/216141
Hannigan, P., 2007. Metallogeny of the Pine Point Mississippi Valley-Type lead-zinc district, southern Northwest Territories; in Mineral deposits of Canada: A synthesis of major deposit-types, district metallogeny, the evolution of geological provinces, and exploration methods, (ed.) W.D. Goodfellow; Geological Association of Canada, Mineral Deposits Division, Special Publication no. 5, p. 609–632.
Hirvas, H. and Nenonen, K., 1990. Field methods for glacial indi-cator tracing; in Glacial indicator tracing, (ed.) R. Kujansuu and M. Saarnisto; A.A. Balkema, Rotterdam, p. 217–248.
Holmes, C.D., 1941. Till Fabric; Bulletin of the Geological Society of America, v. 52, p. 1299–1354.
Hooyer, T.S. and Iverson, N.R., 2000. Clast-fabric devel-opment in a shearing granular material: implica-tions for subglacial till and fault gouge; Geological Society of America Bulletin, v. 112, p. 683–692. doi:10.1130/0016-7606(2000)112<683:CDIASG>2.0.CO;2
Jackson, L.E., Andriashek, L.D., and Phillips, F.M., 2011. Limits of successive Middle and Late Pleistocene continental ice sheets, Interior Plains of southern and central Alberta and adja-cent areas; in Quaternary glaciations — extent and chronology: a closer look, (ed.) J. Ehlers, P.L. Gibbard, and P.D. Hughes, Elsevier B.V., Amsterdam, Development in Quaternary Science Series, v. 15, p. 575–589.
Krumbein, W.C., 1938. Size frequency distributions of sediment and the normal phi curve; Journal of Sedimentary Petrology, v. 8, p. 84–90.
Kyle, J.R., 1976. Geology of the Pine Point lead-zinc district; in Handbook of strata-bound and strataform ore: Regional studies and specific deposits, (ed.) K.H. Wolf; Elsevier, v. 9, ser. 3, p. 643–741.
Lemmen, D.S., 1990. Surficial materials associated with glacial Lake McConnell, southern District of Mackenzie; in Current Research, Part D; Geological Survey of Canada, Paper 90-1D, p. 79–83. doi:10.4095/131332
Lemmen, D.S., 1998a. Surficial geology, Klewi River, District of Mackenzie, Northwest Territories; Geological Survey of Canada, Map 1905A, scale 1:250 000. doi:10.4095/209686
Lemmen, D.S., 1998b. Surficial geology, Buffalo Lake, District of Mackenzie, Northwest Territories; Geological Survey of Canada, Map 1906A, scale 1:250 000. doi:10.4095/209687
Lemmen, D.S., Duk-Rodkin, A., and Bednarski, J.M., 1994. Late glacial drainage systems along the northwestern margin of the Laurentide Ice Sheet; Quaternary Science Reviews, v. 13, p. 805–828. doi:10.1016/0277-3791(94)90003-5
McClenaghan, M.B., 2011. Overview of common process-ing methods for recovery of indicator minerals from sedi-ment and bedrock in mineral exploration; Geochemistry Exploration Environment Analysis, v. 11, p. 265–278. doi:10.1144/1467-7873/10-IM-025
McMartin, I. and Paulen, R.C., 2009. Ice-flow indicators and the importance of ice-flow mapping for drift prospecting; in Application of till and stream sediment heavy mineral and geo-chemical methods to mineral exploration in western and north-ern Canada, (ed.) R.C. Paulen and I. McMartin; Geological Association of Canada, Short Course Notes 18, p. 15–34.
Miller, H., 1884. On boulder glaciation; Royal Physical Society; Edinburgh Proceedings, v. 8, p. 156–189.
Okulitch, A.V., 2006. Phanerozoic bedrock geology, Slave River, District of Mackenzie, Northwest Territories; Geological Survey of Canada, Open File 5281, scale 1:1 000 000. doi:10.4095/223451
Oviatt, N.M. and Paulen, R.C., 2013. Surficial geology, Breynat Point, Northwest Territories, NTS 85-B/15; Geological Survey of Canada, Canadian Geoscience Map 114 (preliminary), scale 1:50 000. doi:10.4095/292247
Oviatt, N., Paulen, R.C., McClenaghan, M.B., Gleeson, S.A., and Paradis, S., 2011. Drift prospecting research at the Pine Point Pb-Zn Mississippi Valley Type (MVT) deposit, Northwest Territories; Geohydro 2011, Québec, 1 p.
Paulen, R.C., 2009. Drift prospecting in northern Alberta — A unique glacial terrain for exploration; in Application of till and stream sediment heavy mineral and geochemical methods to mineral exploration in western and northern Canada, (ed.) R.C. Paulen and I. McMartin; Geological Association of Canada, Short Course Notes 18, p. 185–205.
Paulen, R.C., Paradis, S., Plouffe, A., and Smith, I.R., 2011. Pb and S isotopic composition of indicator minerals in glacial sediments from northwest Alberta, Canada: impli-cations for Zn-Pb base metal exploration; Geochemistry Exploration Environment Analysis, v. 11, p. 309–320. doi:10.1144/1467-7873/10-IM-032
Prest, V.K., Grant, D.R., and Rampton, V.N., 1968. Glacial map of Canada; Geological Survey of Canada, Map 1253A, scale 1:5 000 000. doi:10.4095/108979
Rhodes, D., Lantos, E.A., Lantos, J.A., Webb, R.J., and Owens, D.C., 1984. Pine Point ore bodies and their relation-ship to the stratigraphy, structure, dolomitization and karsti-fication of the Middle Devonian Barrier Complex; Economic Geology and the Bulletin of the Society of Economic Geologists, v. 79, p. 991–1055. doi:10.2113/gsecongeo.79.5.991
Ringrose, T. and Benn, D.I., 1997. Confidence regions for fabric shape diagrams; Journal of Structural Geology, v. 19, p. 1527–1536. doi:10.1016/S0191-8141(97)00077-1
Skall, H., 1975. The paleoenvironment of the Pine Point lead-zinc district; Economic Geology and the Bulletin of the Society of Economic Geologists, v. 70, p. 22–47. doi:10.2113/gsecongeo.70.1.2
Geological Survey of Canada Project GKM 008