Giving less by doing more? Dynamics of social policy expansion and dismantling in 18 OECD countries
23
This article was downloaded by: [University of Konstanz] On: 25 March 2014, At: 08:41 Publisher: Routledge Informa Ltd Registered in England and Wales Registered Number: 1072954 Registered office: Mortimer House, 37-41 Mortimer Street, London W1T 3JH, UK Journal of European Public Policy Publication details, including instructions for authors and subscription information: http://www.tandfonline.com/loi/rjpp20 Giving less by doing more? Dynamics of social policy expansion and dismantling in 18 OECD countries Carsten Jensen, Christoph Knill, Kai Schulze & Jale Tosun Published online: 13 Jan 2014. To cite this article: Carsten Jensen, Christoph Knill, Kai Schulze & Jale Tosun (2014) Giving less by doing more? Dynamics of social policy expansion and dismantling in 18 OECD countries, Journal of European Public Policy, 21:4, 528-548, DOI: 10.1080/13501763.2013.866262 To link to this article: http://dx.doi.org/10.1080/13501763.2013.866262 PLEASE SCROLL DOWN FOR ARTICLE Taylor & Francis makes every effort to ensure the accuracy of all the information (the “Content”) contained in the publications on our platform. However, Taylor & Francis, our agents, and our licensors make no representations or warranties whatsoever as to the accuracy, completeness, or suitability for any purpose of the Content. Any opinions and views expressed in this publication are the opinions and views of the authors, and are not the views of or endorsed by Taylor & Francis. The accuracy of the Content should not be relied upon and should be independently verified with primary sources of information. Taylor and Francis shall not be liable for any losses, actions, claims, proceedings, demands, costs, expenses, damages, and other liabilities whatsoever or howsoever caused arising directly or indirectly in connection with, in relation to or arising out of the use of the Content. This article may be used for research, teaching, and private study purposes. Any substantial or systematic reproduction, redistribution, reselling, loan, sub- licensing, systematic supply, or distribution in any form to anyone is expressly
Transcript of Giving less by doing more? Dynamics of social policy expansion and dismantling in 18 OECD countries

This article was downloaded by: [University of Konstanz]On: 25 March 2014, At: 08:41Publisher: RoutledgeInforma Ltd Registered in England and Wales Registered Number: 1072954Registered office: Mortimer House, 37-41 Mortimer Street, London W1T 3JH, UK
Journal of European Public PolicyPublication details, including instructions for authors andsubscription information:http://www.tandfonline.com/loi/rjpp20
Giving less by doing more?Dynamics of social policyexpansion and dismantling in 18OECD countriesCarsten Jensen, Christoph Knill, Kai Schulze & Jale TosunPublished online: 13 Jan 2014.
To cite this article: Carsten Jensen, Christoph Knill, Kai Schulze & Jale Tosun (2014)Giving less by doing more? Dynamics of social policy expansion and dismantlingin 18 OECD countries, Journal of European Public Policy, 21:4, 528-548, DOI:10.1080/13501763.2013.866262
To link to this article: http://dx.doi.org/10.1080/13501763.2013.866262
PLEASE SCROLL DOWN FOR ARTICLE
Taylor & Francis makes every effort to ensure the accuracy of all the information(the “Content”) contained in the publications on our platform. However, Taylor& Francis, our agents, and our licensors make no representations or warrantieswhatsoever as to the accuracy, completeness, or suitability for any purposeof the Content. Any opinions and views expressed in this publication are theopinions and views of the authors, and are not the views of or endorsed by Taylor& Francis. The accuracy of the Content should not be relied upon and should beindependently verified with primary sources of information. Taylor and Francisshall not be liable for any losses, actions, claims, proceedings, demands, costs,expenses, damages, and other liabilities whatsoever or howsoever caused arisingdirectly or indirectly in connection with, in relation to or arising out of the use ofthe Content.
This article may be used for research, teaching, and private study purposes.Any substantial or systematic reproduction, redistribution, reselling, loan, sub-licensing, systematic supply, or distribution in any form to anyone is expressly

forbidden. Terms & Conditions of access and use can be found at http://www.tandfonline.com/page/terms-and-conditions
Dow
nloa
ded
by [U
nive
rsity
of K
onst
anz]
at 0
8:41
25
Mar
ch 2
014
Giving less by doing more? Dynamicsof social policy expansion anddismantling in 18 OECD countriesCarsten Jensen, Christoph Knill, Kai Schulze andJale Tosun
ABSTRACT Protection against social risks is generally popular among voters andshould enjoy the benefits of institutional inertia. Yet retrenchment occurs rather fre-quently in advanced welfare states without this systematically leading to electoralpunishment. We solve this paradox by, first, arguing that governments can avoidthe blame of retrenchment by pursuing a strategy of ‘expansionary dismantling’where new policies and instruments are used to compensate reform losers and toobfuscate cutbacks. Second, we test our argument with a huge new dataset consistingof changes in unemployment legislation and replacement rates in 18 OECDcountries from 1976 to 2000. The statistical tests provide robust support for ourargument, suggesting that the introduction of new policies and instruments leadsto cutbacks in replacement rates. We also find that left-leaning governments areleast likely to engage in expansionary dismantling.
KEY WORDS Policy change; policy dismantling; social policy; welfare stateretrenchment
INTRODUCTION
Income support for the needy is endorsed by a majority of citizens in theadvanced industrialized countries (Jæger 2012), and cutbacks are generally per-ceived as electorally risky for incumbent governments (Bauer and Knill 2012;Pierson 1994, 2001). At the same time, newly collected data unambiguouslyshow that the social rights of the sick, disabled and unemployed have been slip-ping since the mid-1980s (Allan and Scruggs 2004; Korpi and Palme 2003),apparently without governments being systematically punished by voters(Armingeon and Giger 2008; Giger 2011; Giger and Nelson 2011). This isthe paradox of retrenchment.We solve the paradox by, first, presenting a novel argument on how govern-
ments avoid the blame for retrenchment by employing a strategy of expansionarydismantling. We argue that policy-makers will be more successful in cuttingsocial rights when their efforts are paired with an expansionist agenda of – rela-tively costless and symbolic – new policies and instruments. Such expansion
# 2013 Taylor & Francis
Journal of European Public Policy, 2014
Vol. 21, No. 4, 528–548, http://dx.doi.org/10.1080/13501763.2013.866262
Dow
nloa
ded
by [U
nive
rsity
of K
onst
anz]
at 0
8:41
25
Mar
ch 2
014
might partly compensate existing beneficiaries, but will more importantlyobfuscate the extent of cutbacks. Second, we collect a huge new cross-nationaldataset designed to test the argument on unemployment protection. The datasetcontains manually coded information on the total number of new policies andinstruments for 18 countries and a quarter of a century. Using this dataset andtwo different measures of unemployment protection, we are able to confirm theargument in a series of demanding statistical tests. We also find that Left gov-ernments, owing to their ideological commitment, are less likely to rely onexpansionary retrenchment. Both the theoretical argument and the innovativedata contribute to the state of research and help us to better understand thedynamics of welfare policy change.
THE PARADOX OF RETRENCHMENT
We begin by outlining what we see as three stylized facts from the social policyliterature of the past decades, which in combination constitute a major paradox:protection against social risks is generally popular among voters and shouldenjoy the benefits of institutional inertia, yet retrenchment nevertheless occursat frequent intervals without this systematically leading to electoral punishment.Inspired especially by Pierson’s seminal work (1994, 1996, 2001), it is widely
accepted that welfare state retrenchment is an unpopular endeavour and hencepolitically difficult to pursue. First, retrenchment initiatives are usually dislikedamong electorates (Brooks and Manza 2006; Jæger 2012; Taylor-Gooby 2001).This is further reinforced by the formation of ‘anti-termination’ coalitions,emerging as previous expansion produced new constituency groups ready tomobilize against any retreat from the status quo. Although there might be vari-ation in the extent to which voters actually dislike and punish retrenchment(depending on issue salience, the degree of retrenchment, the number ofaffected winners and losers, etc.), clearly visible activities of dismantlingfavour the strong mobilization of societal resistance. Second, the deep institutio-nalization of welfare state arrangements reduces the likelihood of fundamentalrestructuring. Existing power structures, as well as the high social and politicallegitimacy of long-established arrangements, favour a path-dependent logic ofpolicy development dominated by incremental adjustment (see Peters, Pierreand King 2005). This constellation renders attempts at retrenchment generallyunattractive for office-seeking politicians. This is even more the case as voterscan be expected to react more strongly to losses than to gains, as for instanceargued by the literature on asymmetric economic voting (Kosmidis 2013;Soroko 2006).The second observation emerging from the literature is that – notwithstand-
ing these obstacles – retrenchment does actually take place (Allan and Scruggs2004; Korpi and Palme 2003). From the end of World War II until the begin-ning of the 1980s, i.e., well into the so-called era of permanent austerity(Pierson 1998), citizens’ social rights expanded in all Western nations, althoughwith significant cross-national variation. Then, from the mid-1980s a period of
C. Jensen et al.: Dynamics of social policy expansion and dismantling in 18 OECDcountries 529
Dow
nloa
ded
by [U
nive
rsity
of K
onst
anz]
at 0
8:41
25
Mar
ch 2
014

retrenchment began, notably in the area of unemployment protection, with allnations seeing reduced social rights (Ferrera 2008), though depending on thestrength of the traditional proponents of the welfare state: in countries wherethe Left has dominated the past three decades, retrenchment has been compar-ably modest (see Swank 2005).The final observation follows mostly from the work of Giger and her collab-
orators (Armingeon and Giger 2008; Giger 2011; Giger and Nelson 2011). Theperplexing conclusion from this work is that governments on average are notpunished electorally for enacting retrenchment. Partly, this may be a conse-quence of other salient factors crowding out the effect of unpopular legislation,but even more likely it may reflect, as Giger and Nelson (2011: 20) note, thatgovernments often are able to apply varying strategies of blame avoidance. Ifretrenchment is implemented in the guise of a blame avoidance strategy,there is no reason to suspect will governments suffer at the subsequent election.This is corroborated by the finding that governments actually are electorallypunished if retrenchment is made an issue in the election campaign; that is, ifblame avoidance proved impossible or unsuccessful (Armingeon and Giger2008).
GIVING LESS BY DOING MORE: THE STRATEGY OFEXPANSIONARY DISMANTLING
The notion of blame avoidance strategies as a shelter against public outcry orig-inates from the work of Weaver (1986), Arnold (1990) and Pierson (1994).Two of the most prominent strategies of blame avoidance are compensationand obfuscation. Compensation is about offering side payments to specificgroups perceived to be central for the mobilization of political opposition.Obfuscation, by contrast, means making it more difficult for voters to constructa causal chain between governmental decisions and the corresponding effects onpeople’s lives. Alternatively, governments may seek consent with the oppositionfor retrenchment decisions or rely on strategies of ‘grandfathering’ painfuldecisions (i.e., they are only enacted in the future in the hope that voters willhave forgotten who to blame). In countries with a large number of institutionalveto players, obfuscation is a likely strategy of diffusing blame, while incountries with a Westminster polity and a lower number of veto players,more direct strategies of blame avoidance such as compensation tend to be prac-tised (see Zohlnhofer 2007). At the same time, however, both strategies arerelated insofaras ‘successful obfuscation’ depends on the extent to whichvoters ‘feel’ compensated. The crucial point is the ‘compensatory frame’ of anissue, which can be based on objective compensation or mere obfuscation.Generally speaking, strategies of obfuscation and compensation are facilitated
by the fact that rational voters are constrained in their resources and informationprocessing capacities. Bounded rationality implies that the more complex policyreforms become, the more difficult it is for citizens to understand them (Jones1999; Simon 1947). It also implies, among other things, a limited attention
530 Journal of European Public Policy
Dow
nloa
ded
by [U
nive
rsity
of K
onst
anz]
at 0
8:41
25
Mar
ch 2
014

span so that only a select number of issues can be attended to at any given pointin time. What is more, in the realm of reform politics, it is amplified by the ten-dency for news media to focus on easy-to-grasp stories. This is what Pierson(1994: 21) calls the ‘Dan Rather test’, named after a famous American televisionreporter. If Dan Rather, or any other news reporter, cannot explain the impli-cations of a reform in 15 second or less, it is unlikely to cause public blame.Based on these considerations, we put forth the novel notion of expansionary
dismantling, by which we mean governments’ use of the number of policies andpolicy instruments as a vehicle for retrenchment. By proposing and implement-ing new – but, we argue, relatively costless and therefore mostly symbolic – pol-icies and policy instruments, governments create an image as being committedto dealing with a social problem. Behind the screen of expansionary activity,however, governments can reduce social rights without having to carry the pol-itical costs these unpopular measures would have otherwise entailed. The reasonis, first of all, that when the dominant government activity is expansion, paralleldismantling activities will be more acceptable to the public because they feel thatthey are being compensated via the new initiatives. Just as importantly,retrenchment may even go unnoticed by ordinary citizens when supplementedwith a flurry of other activities. Given their limited attention span, citizensmight concentrate their focus on expansionary measures (especially in constella-tions in which many of such activities are on the political agenda), while over-looking parallel activities of dismantling. This is why giving less by doing more– or expansionary dismantling – can be expected to be an attractive strategy ofsocial policy retrenchment.It should be noted that we talk about the effect of the sheer number of policies
and instruments, not their content. This is an unconventional, possibly evencounter-intuitive, claim. A priori, there is no reason for this number to correlatewith the generosity of social rights. A change in social rights can occur by alter-ing the settings of existing policies and instruments, e.g., reducing benefit levelsof an existing social programme. Alternatively, a reduction in social rights oughtto come about by simply removing a policy or instrument altogether. Bothmechanisms of retrenchment are likely to be applied from time to time, butour claim is that the expansion of policies and instruments also constitutessuch a mechanism.To exemplify the mechanism, consider the work on the dualization of labour
markets, which relates to the observation that reforming different aspects oflabour regulation such as activation and employment protection may mobilizevery different constituencies (Bonoli and Hausermann 2009; Rueda 2005). Thiswork documents an increasing number of specially designed programmes forselect groups; very often entailing de facto reduced benefit levels for thosesingled out for special treatment (Clasen and Clegg 2011; Emmenegger et al.2012). A good case in point is the youth-directed employment policies thathave seen the light of day during the past few decades. In most Westernnations a large number of policies and instruments aimed at reducing youthunemployment have been enacted, including not least a wellspring of training
C. Jensen et al.: Dynamics of social policy expansion and dismantling in 18 OECDcountries 531
Dow
nloa
ded
by [U
nive
rsity
of K
onst
anz]
at 0
8:41
25
Mar
ch 2
014
and employability programmes. Almost always, however, these new initiativeshave been supplemented by a reduction in the benefits to which the youngunemployed are entitled; a move that has been easily justified on the groundthat young unemployed are being appropriately helped via the new pro-grammes. Similar trends can be found when it comes to other marginalizedgroups, e.g., immigrants and the long-term sick.Even more concretely, we can also consider two examples from a least likely
case of social policy retrenchment, namely the universal and very popularwelfare state of Denmark (Andersen 2008). In 1995, an activation schemewas introduced for the under-25-year-olds. In meant that young unemployedhad the right, but also the duty, to receive publicly sponsored training for18 months after 26 months of unemployment as a way to become re-qualified.At the same time unemployment insurance benefits were cut by 50 per cent forthe group, an event that caused almost no public rallying or opposition. In 2002a programme aimed specifically at immigrants saw the light of day, the Starth-jælp (literally ‘start help’). Officially the new programme would facilitate immi-grants’ entrance into the labour market, but it cut unemployment assistance bymore than 30 per cnet of the normal benefit level (Blauenfelt, Hansen andJohansen 2006). Again the public refrained from protesting, although a fewLeft parties and immigrants’ organizations raised concern about the potentialproblem of racial discrimination.We posit that these examples in fact are part of a general phenomenon where
the introduction of new policies and instruments goes hand in hand with thereduction of benefits. This becomes our first expectation:
Expectation 1: Retrenchment of social rights is inversely related to the intro-duction of new policies and instruments.
The willingness to engage in far-reaching reform may not only depend on theavailability of blame-avoidance strategies, but also on the involved actors’ ideo-logical position; that is, if they want to use the strategy to introduce retrench-ment. While the logic of the ‘new politics of the welfare state’ wouldgenerally ascribe a limited role to the classic left–right partisan differences inthe politics of retrenchment (Kittel and Obinger 2003; Pierson 1994, 1996),we have consistent aggregate evidence that Left governments are actually lesslikely to be involved in retrenchment activities than Right governments(Allan and Scruggs 2004; Amable, Gatti and Schumacher 2006; Finseraasand Vernby 2011; Korpi and Palme 2003). As observed by Jensen (2014), gov-ernment ideology is particularly important when it comes to unemploymentprotection – i.e., the programmes we study – because these programmesprotect against risks that correlate strongly with class position. Other social pro-grammes, like healthcare and old age pensions, tend to receive more bipartisansupport because they protect against risks that are salient for all social groups insociety; that is, not least when studying unemployment protection, we wouldexpect to see differences in who uses expansionary dismantling. Left governmentmight introduce as many new policies as the Right, but the content of these
532 Journal of European Public Policy
Dow
nloa
ded
by [U
nive
rsity
of K
onst
anz]
at 0
8:41
25
Mar
ch 2
014

policies will be distinct: while the Right will use new policies as a cover for cut-backs, the Left will not. In other words: density expansion offers the opportunity(but nothing more) for retrenchment-oriented politicians. Retrenchment orien-tation, however, is more pronounced for Right than Left governments.
Expectation 2: Left governments are less likely to engage in strategies ofexpansionary dismantling.
INTRODUCING THE KEY CONCEPTS
To explore the empirical relevance of our arguments, we focus in the followingon developments in unemployment policy. To measure retrenchment, we usethe high-quality Comparative Welfare Entitlements Dataset, which containsreplacement rates covering 18 OECD countries from 1976 to 2000.1 Replace-ment rates are suitable for our purpose, since they constitute a reliable andwidely comparable measure of social rights. By directly assessing the benefitlevels continuously paid to citizens from basic insurance schemes in case ofunemployment, replacement rates are the theoretically most valid indicator ofthe social rights of citizens available to researchers today (for an elaborate discus-sion of the merits of social rights data, see Allan and Scruggs [2004: 497–8];Clasen and Clegg [2011]; Esping-Andersen [1990: 18–23]; Green-Pedersen[2004]; Korpi and Palme [2003: 432–3]).2
The major challenge when it comes to testing the hypothesized strategy ofexpansionary dismantling is the comparative measurement of governmentactivity in the field of unemployment policy. What is required is a comprehen-sive measure of unemployment policy outputs composed of policies and instru-ments a government could plausibly claim credit for and use to balance and/orconceal cuts in basic benefit levels. For this purpose, we have collected data onsocial policy outputs covering both expansive and dismantling policy decisionscoded from legislative documents covering the same countries and time periodas the Comparative Welfare Entitlements Dataset. This dataset was developedby the CONSENSUS project over three years and involved a massive data col-lection effort.3 The data collection is based on a comprehensive coding schemedeveloped by the project team. It involved over 30 country experts who weretrained to collect data on legislative outputs. To ensure a maximum level of con-sistency, coding of the data was handled exclusively by the project team. Thedata had to pass through tests of inter-coder reliability as well as extensivecross-checks with existing data sources of social legislation in the countriesunder study. The available data provide an unprecedented and extensive over-view of changes in the scope of unemployment policy legislation.To assess unemployment policy outputs we focus on the number of policy
items and policy instruments. By policy item, we refer to a specific governmen-tal activity to achieve a given political objective. Based on this conception, apolicy item should not be confused with the existence or adoption of a single
C. Jensen et al.: Dynamics of social policy expansion and dismantling in 18 OECDcountries 533
Dow
nloa
ded
by [U
nive
rsity
of K
onst
anz]
at 0
8:41
25
Mar
ch 2
014
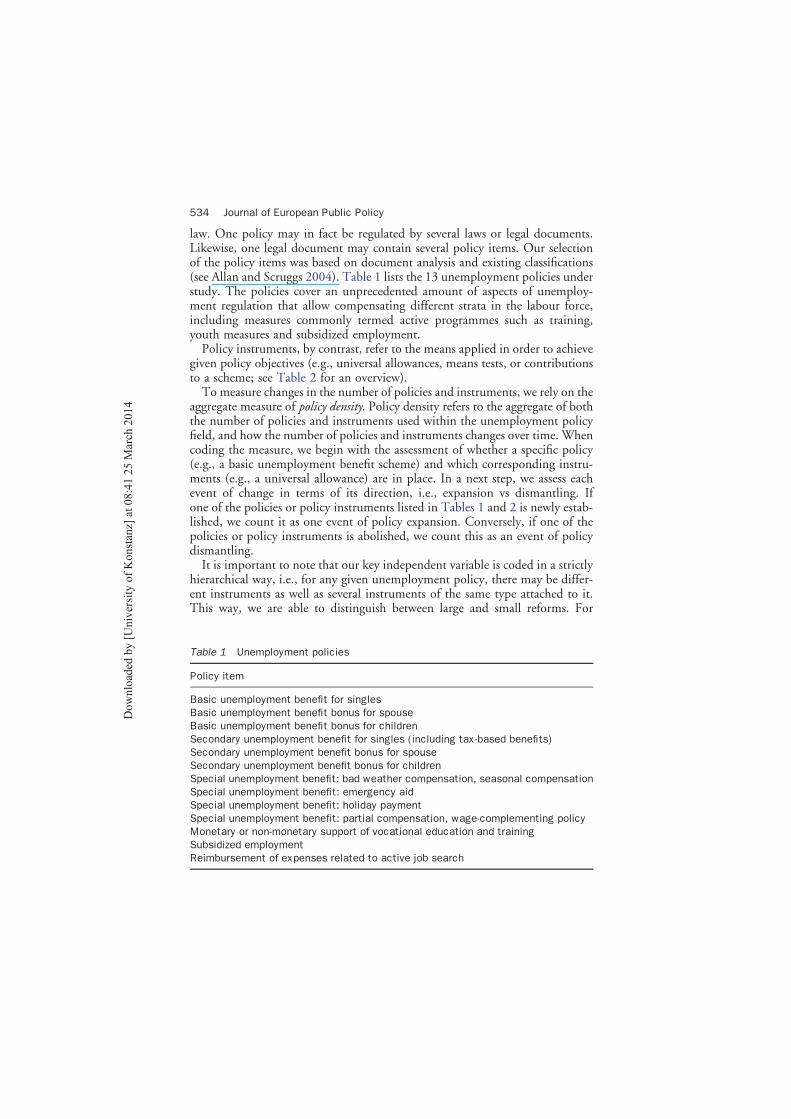
law. One policy may in fact be regulated by several laws or legal documents.Likewise, one legal document may contain several policy items. Our selectionof the policy items was based on document analysis and existing classifications(see Allan and Scruggs 2004). Table 1 lists the 13 unemployment policies understudy. The policies cover an unprecedented amount of aspects of unemploy-ment regulation that allow compensating different strata in the labour force,including measures commonly termed active programmes such as training,youth measures and subsidized employment.Policy instruments, by contrast, refer to the means applied in order to achieve
given policy objectives (e.g., universal allowances, means tests, or contributionsto a scheme; see Table 2 for an overview).To measure changes in the number of policies and instruments, we rely on the
aggregate measure of policy density. Policy density refers to the aggregate of boththe number of policies and instruments used within the unemployment policyfield, and how the number of policies and instruments changes over time. Whencoding the measure, we begin with the assessment of whether a specific policy(e.g., a basic unemployment benefit scheme) and which corresponding instru-ments (e.g., a universal allowance) are in place. In a next step, we assess eachevent of change in terms of its direction, i.e., expansion vs dismantling. Ifone of the policies or policy instruments listed in Tables 1 and 2 is newly estab-lished, we count it as one event of policy expansion. Conversely, if one of thepolicies or policy instruments is abolished, we count this as an event of policydismantling.It is important to note that our key independent variable is coded in a strictly
hierarchical way, i.e., for any given unemployment policy, there may be differ-ent instruments as well as several instruments of the same type attached to it.This way, we are able to distinguish between large and small reforms. For
Table 1 Unemployment policies
Policy item
Basic unemployment benefit for singlesBasic unemployment benefit bonus for spouseBasic unemployment benefit bonus for childrenSecondary unemployment benefit for singles (including tax-based benefits)Secondary unemployment benefit bonus for spouseSecondary unemployment benefit bonus for childrenSpecial unemployment benefit: bad weather compensation, seasonal compensationSpecial unemployment benefit: emergency aidSpecial unemployment benefit: holiday paymentSpecial unemployment benefit: partial compensation, wage-complementing policyMonetary or non-monetary support of vocational education and trainingSubsidized employmentReimbursement of expenses related to active job search
534 Journal of European Public Policy
Dow
nloa
ded
by [U
nive
rsity
of K
onst
anz]
at 0
8:41
25
Mar
ch 2
014

example, a large expansive reform that introduces a new unemployment policywill usually also be accompanied by a range of new instruments used to put thepolicy into practice. Conversely, the abolishment of an entire policy (a very rareevent) would automatically involve counting also the abolishment of allattached policy instruments. A smaller reform, by contrast, typically involvesa change in the number of instruments rather than a change in the numberof policies. Basic unemployment benefit programmes, for example, oftenentail a basic allowance paid to beneficiaries and contributions paid by employ-ees and employers. Yet they may also entail other instruments like means-testedelements or bonus payments, etc., which can be established or abolished whilethe number of unemployment policies remains constant over time. Thus, policydensity captures the magnitude of a given reform by measuring the number ofchanges.On the basis of policy density change, we obtain our key explanatory variable
net density, which is the difference between all expansive and dismantling events,regardless of whether they concern policies or instruments. Put differently, thismeasure captures the net change in policies and instruments in a country for agiven year. The basic unit is, thus, the country-year with 418 units in total (18countries and 24 years, with 14 missing owing to lack of data). The variableranges from –3 to 11, which in substantial terms means that the largestamount of net dismantling events in a country-year is three, while the largestnumber of net expansion is eleven. Only 6 per cent of the observations take anegative value, indicating that the variable is asymmetrical, with a very largemajority of observations being either zero or positive. This means that our find-ings are not driven by net density dismantling leading to higher replacementrates – something which would clearly be unexpected and not particularly intui-tive either. To further ensure that the few negative observations do not have an
Table 2 Social policy instruments
Instrument Description
Universal benefit/allowance
Payment by the state (no means testing)
Means-tested benefit Means-tested benefit (typically eligibility criteria do notinclude the payment of contributions to an insurancescheme but a needs calculation)
Contribution/fee Contribution to a state agency, a public insurance scheme,etc.
Tax exemption/subsidy
A reduction of tax payments in order to provide income taxsavings
Bonus/grant One-off grant (no means testing)Retention period Non-payment of a certain allowanceOther Any instrument that cannot be assigned to the other
categories
C. Jensen et al.: Dynamics of social policy expansion and dismantling in 18 OECDcountries 535
Dow
nloa
ded
by [U
nive
rsity
of K
onst
anz]
at 0
8:41
25
Mar
ch 2
014

unwarranted influence, we will show that the results can be reproduced whenexcluding them from the estimations.Finally, given that the countries in our sample had basic unemployment
protection schemes in place at the beginning of our observational period,our observed changes in net density refer to the introduction of new formsof unemployment and labour market policies. This is crucial because we geta measure of add-ons to existing policies, and it is exactly these new sup-plementary policies and instruments that we suspect will work as cover forretrenchment.
A PRELIMINARY TEST
In this section we analyse the bivariate relationship between density and repla-cement rates to get a sense of its strength and magnitude. In the next section weconduct a much tougher test of the relationship using a series of different esti-mation setups and control variables. For now, we begin by visually inspectingthe relationship between density and replacement rates in Figure 1. Even atthis level of analysis, i.e., uncontrolled for other factors and across all 18countries in the sample, a clear pattern emerges. If net density increases oneyear, replacement rates fall the next. The relationship between the (one-year)lagged net density measure and the replacement rate in country i in year t
Figure 1 The relationship between net density and replacement ratesNote: The full line represents the (one-year lagged) net density; the dashed line rep-resents unemployment replacement rates
536 Journal of European Public Policy
Dow
nloa
ded
by [U
nive
rsity
of K
onst
anz]
at 0
8:41
25
Mar
ch 2
014

may be expressed as a simple regression model:4
Replacement rateit = 62.965− 0.1665t−1
SE = 1.889( )(0.0761)R2 = 0.701
It turns out that net density alone can account for roughly two-thirds of thevariation in replacement rates and that the relationship is highly statistically sig-nificant (p ¼ 0.004). Judging from Figure 1, it might appear that the relation-ship is most clear-cut after around 1985, but weaker before. To gauge if this isborne out of the data, the regression was re-estimated with a dummy variable forthe period before/after 1985 and an interaction term between this dummy andthe density measure, but with an insignificant result. In other words, the basicrelationship is not moderated by the time period.The risk of reverse causation, i.e., that dropping replacement rates leads to
more net density, is not big, whereas there are good theoretical reasons toexpect the opposite, as outlined above. A Granger causality test reported inTable 3 lends credibility to this view. It shows that the one-year (t–1) laggednet density measure is a very good predictor of replacement rates, whereas repla-cement rates cannot explain density. Table 3 also documents that a one-year lagis the proper specification since the two- or three-year lags are much weaker aspredictors of replacement rates. This is important information for the moreexacting test we will present in the next section.
EMPIRICAL TESTING
In the full statistical test we choose to use not only Allan and Scruggs’s (2004)data on replacement rates, but also their basic regression specification. This isdone for the simple reason of maximizing the credibility of the results. Allanand Scruggs’s American Journal of Political Science article from 2004 is widely
Table 3 A Granger causality test
Net density " replacement rates Replacement rates " net density
t–1 –0.2524 ∗∗ –0.0261(0.0831) (0.0156)
t–2 –0.1858 –0.0172(0.1022) (0.0195)
t–3 –0.0400 0.0163(0.0801) (0.0159)
Notes: Standard errors in brackets.∗∗ ¼ p-value , 0.01.
C. Jensen et al.: Dynamics of social policy expansion and dismantling in 18 OECDcountries 537
Dow
nloa
ded
by [U
nive
rsity
of K
onst
anz]
at 0
8:41
25
Mar
ch 2
014

cited and the findings are considered robust (see, e.g., Korpi and Palme [2003]for similar results). We will show that net density negatively affects replacementrates in a specification that uses their model as a template, in fact even includessome tougher and more elaborate tests, while still reproducing their mainresults.Allan and Scruggs test the effect of a series of independent variables on their
measure of replacement rates, including political, economic and institutionalfactors. The principal political factor is, of course, cabinet partisanship, whichis measured as the percentage of cabinet seats a given year occupied by theLeft. Finseraas and Vernby (2011) show that the distance between the Leftand the Right has remained pronounced throughout the last decades, althoughthe median position has changed. This implies that the conventional cabinetshare variable remains a valid measure of partisan differences. The economic vari-ables are trade openness (exports and imports), financial openness (restrictionson financial transactions), gross domestic product (GDP) growth, the unem-ployment rate and budget deficit. The institutional variables, finally, are ameasure of the number of institutional veto points and the level of corporatism.Details on these variables are listed in the Appendix, and interested readers mayconsult the original article for further justification on the appropriateness ofeach of them.A Hausman test reveals that fixed unit effect ought to be included (chi2 ¼
35.90; p , 0.01). This is also appropriate for substantial reasons, since fixedunit effects control for factors that only vary between countries. By includingfixed unit effects, it becomes possible to see what happens with the replacementrate within individual countries when net density changes. As such, this may beviewed as a better and more accurate test of the causality implied in our argu-ment. In any event, the results we show below are insensitive to the inclusionof fixed effects. We also include fixed year effect, i.e., dummies for each year.This controls for common shocks across all countries, like the oil price increasein 1979 or the Gulf War in 1990. Such shocks may drive replacement rates in anunwarranted way. The results can easily be reproduced without these fixed yeareffects.The regressions are also estimated with a trend, or counter, variable. The
trend variable exhibits perfectly linearly rising increase from year to year. Thisway, the trend variable controls for any variables that systematically augmentover time. The trend variable serves a similar purpose as the final variable, thecumulative density score. Since net density is mostly positive, the absoluteamount of legislative density will automatically be rising over time. Includingthe cumulative density score alongside the yearly net density measure ensuresthat it really is year-to-year net density that causes changes in replacementrates. Not that it would be a falsification of our argument if it was cumulativedensity that drove the results, but the underlying mechanism would probablyhave to be reconsidered if it actually is the more slow-moving stock of legislationin a country that matters.
538 Journal of European Public Policy
Dow
nloa
ded
by [U
nive
rsity
of K
onst
anz]
at 0
8:41
25
Mar
ch 2
014

A Fischer test indicates that the dependent variable is non-stationary, so weestimate our models with the first difference, i.e., changes rather than levels.A modified Wald test reveals that group-wise heteroskedasticity is a problem(Chi2 ¼ 1744.97; p , 0.01), so panel-corrected standard errors are included.To correct for autocorrelation, which is present at a mild degree, an AR(1) termand a lagged dependent variable are both included. As shown by Keele and Kelly(2006), when the dependent variable is stationary, as ours is after first differing,a lagged dependent variable is highly appropriate. Effectively, then, the statisti-cal setup follows Beck and Katz’s (1995, 2009) recommendations and matchesthe original one of Allan and Scruggs (2004).
Findings
The findings are displayed in Table 4. Model I estimates a regression withoutour theoretical variables. The results are similar to those reported by Allanand Scruggs (2004), even though we have included a trend variable and fixedyear effects. Like the original article, the lagged dependent variable is negativelycorrelated with replacement rates, indicating convergence, while left-wingincumbency and corporatism both are positively correlated with them. Wenow have a baseline to see what happens when the density measure is included(Model II). The effect is strong (b ¼ –0.33; p , 0.001) and does not alter thebasic effect of the other covariates in the model, although the coefficients of Leftincumbency, trade openness and deficits are marginally changed. In substantialterms, the regression coefficient indicates that a move from zero to 11 in netdensity expansion (i.e., the maximum change found in our data) would leadto a 3.3 percentage point drop in replacement rates. This is a sizable effect,especially given that successful blame avoidance strategies often requires thatpoliticians do not make too big cuts in order to avoid drawing excessive atten-tion.5
Model III includes the cumulative density variable, which boosts the coeffi-cient of the density measure slightly, but otherwise has no effect at all. ModelIV breaks the analysed period into two, namely 1976–1985 and 1986–1999. This reflects partly that we want to ascertain that there really is noperiod effect even though Figure 1 hinted that there might be, and partlythat Allan and Scruggs – and many others – have found that the politicalclimate changed radically during the 1980s. It is evident from Model IV thatthe periods before and after 1985 indeed are different, in the sense that replace-ment rates on average were significantly lower here even when the density didnot change (cf. the dummy variable). Yet, the interaction term betweendensity and the period dummy is insignificant, so the effect is not driven bydensity suddenly being used much more often as a new vehicle of retrenchment.In this way, our results confirm the conventional wisdom of the literature, butalso highlight how our argument has universal pedigree – at least across the1970s, 1980s and 1990s.
C. Jensen et al.: Dynamics of social policy expansion and dismantling in 18 OECDcountries 539
Dow
nloa
ded
by [U
nive
rsity
of K
onst
anz]
at 0
8:41
25
Mar
ch 2
014

Table
4Theeffectofnetdensity
onreplacementratesandpublic
unemploym
entsp
ending
ModelI(D
RR)
ModelII(D
RR)
ModelIII(D
RR)
ModelIV
(DRR)
ModelV(Leve
lRR)
ModelVI(D
RR)
Dens
ity
–0.3136
∗∗–0.3602
∗∗–0.3376
∗–0.2625
∗–0.3473
∗∗
(0.0920)
(0.0966)
(0.1433)
(0.1166)
(0.1212)
Cum.density
0.0914
0.0928
0.0186
0.0750
(0.0650)
(0.0648)
(0.0438)
(0.0806)
Post-1985
–1.633
∗∗
(0.1689)
Dens
ityxpost-1985
–0.0372
(0.1829)
LaggedDV
–.1584
∗∗–0.1636
∗∗–0.1595
∗∗–0.1594
∗∗0.9740
∗∗–0.1463
∗∗
0(.0381)
(0.0415)
(0.0408)
(0.0408)
(0.0163)
(0.0448)
Left
1.591
∗∗1.419
∗∗1.394
∗∗1.394
∗∗1.038
∗1.480
∗
(0.5024)
(0.4709)
(0.4950)
(0.4950)
(0.4514)
(0.6666)
Tradeopenness
–2.640
–5.059
–5.352
–5.378
–1.498
–4.797
(3.375)
(3.356)
(3.430)
(3.443)
(1.338)
(5.328)
Financialopenness
0.0048
0.1346
0.1467
0.1454
–0.0175
0.0855
(0.1762)
(0.1698)
(0.1704)
(0.1708)
(0.1274)
(0.2557)
Unem
ploym
entrate
–0.0721
–0.0788
–0.0700
–0.0689
–0.0179
–0.0411
(0.1277)
(0.1324)
(0.1289)
(0.1297)
(0.0945)
(0.1479)
Growth
–0.0243
–0.0184
–0.0024
0.0026
0.0848
0.0506
(0.0943)
(0.0965)
(0.0967)
(0.0966)
(0.1089)
(0.1081)
Deficits
–0.1175
–0.1302
–0.1442
–0.1433
–0.0848
–0.1554
(0.0763)
(0.0748)
(0.0745)
(0.0750)
(0.0598)
(0.0958)
Veto
points
–0.2984
0.0062
0.2129
0.2253
–0.0373
0.0358
(0.6113)
(0.6034)
(0.6184)
(0.6241)
(0.1177)
(0.6042)
Corporatism
2.7844
∗∗3.322
∗∗3.361
∗∗3.358
∗∗0.5799
2.308
(1.1553)
(1.177)
(1.174)
(1.172)
(0.3100)
(1.239)
540 Journal of European Public Policy
Downloaded by [University of Konstanz] at 08:41 25 March 2014

Trend
–0.0035
–0.0013
–0.0003
–0.0009
–0.0003
0.0014
(0.0035)
(0.0032)
(0.0037)
(0.0037)
(0.0008)
(0.0038)
R2
0.2131
0.2286
0.2329
0.2330
0.9752
0.2477
Numberofobs.
432
414
414
414
391
388
Coun
tryeffects
Yes
Yes
Yes
Yes
No
Yes
Yeareffects
Yes
Yes
Yes
Yes
Yes
Yes
Notes:∗∗
¼p-value,
0.01;∗¼
p-value,
0.05.
Allindepend
entvariableslagged
oneyear.
Allmodelsestimated
withan
AR(1)term
.
C. Jensen et al.: Dynamics of social policy expansion and dismantling in 18 OECDcountries 541
Downloaded by [University of Konstanz] at 08:41 25 March 2014
We have now shown that density can explain within-country changes inreplacement rates. Arguably, this is the strongest and most relevant test giventhe argument of the article. Nevertheless, it is interesting to see if density alsomight be able to explain between-country variation. Model IV is estimated tothat effect. It contains two changes. First, rather than estimating changes,levels are now our choice of specification because this much better capturessuch cross-national variation. Second, as a consequence of this choice, weexclude the fixed country effects because these systematically eliminate bothbetween-country variation and variation in the levels of variables (Plumper,Troeger andManow 2005). Model V clearly shows that cross-country variationsin net density explain cross-country variations in replacement rates.As mentioned, in a few country-years net density takes on a negative value,
indicating net density dismantling – the rest of observations are either zeroor positive, indicating stability or net density expansion. We want to makesure that the findings reported so far are not simply an artefact of these netdecreases leading to expansion of replacement rates, something which wouldbe counter-intuitive and basically outside the scope of our argument. ModelVI therefore reproduces Model III while excluding all negative observations.Clearly, this does not alter the substantial conclusions made so far. Conversely,reproducing Model III with only those observations that takes a negative or zerovalue makes the net density variable turn insignificant (b ¼ –0.71; p ¼ 0.38).6
The conclusion is straightforward: net density expansion causes unemploymentreplacement rate retrenchment.
The partisan condition
Increasing legislative density is used as a vehicle for retrenchment. Yet, a largeliterature indicates that not all political parties will be equally likely to introducecutbacks in the unemployment protection enjoyed by workers. As discussedabove, modern-day versions of the power resource theory argues that Leftparties will be less inclined than the Right to introduce retrenchment even ifthey have the opportunity. Hence, governments led by Left parties tend torefrain from using increasing legislative density as a means to reduce replace-ment rates. To test if this expectation is correct, two interaction models are esti-mated, reported in Table 5 and the associated Figure 2.Model I estimates whether an interaction term between density and Left
cabinet share can explain some of the within-country variation in changingreplacement rates. It is evident that in governments without Left parties,density has a strong negative effect. The interaction term itself is insignificant,but, given that the moderator is continuously scaled, it is not possible to deter-mine whether there is a conditioning effect of government partisanship fromthis. As Brambor, Clark and Golder (2006: 74) note ‘it is perfectly possiblefor the marginal effect of X on Y to be significant for substantively relevantvalues of the modifying variable Z even if the coefficient on the interactionterm is insignificant’. Panel A in Figure 2 therefore displays the marginal
542 Journal of European Public Policy
Dow
nloa
ded
by [U
nive
rsity
of K
onst
anz]
at 0
8:41
25
Mar
ch 2
014

effects of density at various levels of Left cabinet share. Note that around 45 percent of the time there are no Left parties in government (that is, the Left variableis zero); 15 per cent of the time there are only Left parties in government (Leftequals one); leaving around 40 per cent of the time for centre-based coalitiongovernments.7
It turns out that the negative effect of density indeed vanishes with rising Leftcabinet share. Especially when Left parties dominate the cabinet, density is nolonger used as a mechanism for retrenchment. Model II shifts specification by
Table 5 The effect of net density and Left cabinet share on replacement rates
Model I (D RR) Model II (Levels)
Density –0.4013 ∗∗ –0.3777 ∗∗
(0.1113) (0.1280)Left cabinet share 1.339 ∗∗ 0.8898
(0.5118) (0.4833)Density x Left cabinet share 0.1455 0.3954
(0.2571) (0.3115)Cumulative density 0.0898 0.0170
(0.0649) (0.0442)Lagged DV –0.1591 ∗∗ 0.9742 ∗∗
(0.0408) (0.0162)Trade openness –5.399 –1.445
(3.412) (1.340)Financial openness 0.1426 –0.0179
(0.1712) (0.1263)Unemployment rate –0.0726 –0.0241
(0.1293) (0.0951)Growth 0.0008 0.0915
(0.0970) (0.1092)Deficits –0.1431 –0.0883
(0.0742) (0.0599)Veto points 0.2044 –0.0397
(0.6115) (0.1165)Corporatism 3.324 ∗∗ 0.5765
(1.171) (0.3097)Trend –0.0002 –0.0002
(0.0037) (0.0008)R2 0.2334 0.9753Number of obs. 414 391Country effects Yes NoYear effects Yes Yes
Notes: ∗∗ ¼ p-value , 0.01; ∗ ¼ p-value , 0.05.All independent variables lagged one year.All models estimated with an AR(1) term.
C. Jensen et al.: Dynamics of social policy expansion and dismantling in 18 OECDcountries 543
Dow
nloa
ded
by [U
nive
rsity
of K
onst
anz]
at 0
8:41
25
Mar
ch 2
014

changing to the levels measure of replacement rates and dropping the fixedcountry effects, allowing us to see if the interaction also explains between-country variation. Panel B in Figure 2 indicates that it does, perhaps evenmore so, since the off-setting effect of Left partisanship sets in at a lower levelof cabinet share. The difference between the two models is not big, however,so the most prudent conclusion is simply this: increasing legislative density isused as a strategy to introduce retrenchment by parties that are traditionallyopposed to the welfare state, whereas the welfare state’s traditional advocatesrefrain from using the strategy.
CONCLUSION
Social rights are a popular and continuously reformed part of modern welfarestates. Despite their popularity among voters, social rights have been slippingsince the 1980s without this leading to extensive electoral punishment. Inthis article we introduced the logic of expansionary dismantling in an effortto solve this paradox of welfare retrenchment in advanced democracies.Essentially, expansionary dismantling is a strategy of policy-makers where
they increase legislative activities to give voters the feeling that they are beingcompensated for reduced benefits and/or minimize the awareness of a loss inthe first place. Our empirical data composed of both established and newly col-lected data sources provide a striking confirmation of this argument. Our find-ings also show that Right governments are more likely to use this strategy.Governments interested in reducing basic benefits can pursue their ideologicalpredispositions by using the strategy of expansionary dismantling, which effec-tively protects them from electoral backlash.A few limitations of the study deserve to be mentioned. First, our data does
not allow us to trace individual policy processes or the motives of politicians,
Figure 2 Marginal effects of net density at various levels of Left cabinet shareNotes: Panel A is estimated using Model I in Table 5; Panel B is estimated usingModel II in Table 5. Left cabinet share is plotted on the x axis, with zero indicatingno presence of Left parties in the cabinet and one indicating that only Left partiesare members of the government.
544 Journal of European Public Policy
Dow
nloa
ded
by [U
nive
rsity
of K
onst
anz]
at 0
8:41
25
Mar
ch 2
014

only the aggregated consequences as deduced from our theory. Second, we makeno claim regarding the social outcomes or broader political implications of theunemployment policy reforms studied here. The standard rationale for cuttingemployment protection regulation and introducing activating programmeswould be, for example, to raise levels of employment, which is per se a respect-able goal. New data seem to provide little support for the expected effect,however (Armingeon and Baccaro 2012). Third, we have dealt with unemploy-ment policies only. Strategies of expansionary dismantling may well, however,extend to related areas. Governments may, for example, stress an expansionaryagenda in education policy as a way to obfuscate cutbacks in basic unemploy-ment benefits. Identifying strategies of expansionary dismantling acrossrelated policy areas would thus be a promising avenue for future research (seealso Bonoli 2012).
Biographical notes: Carsten Jensen is associate professor at the Department ofPolitical Science and Government at Aarhus University. Christoph Knill is pro-fessor of political science and public administration at the University of Kon-stanz. Kai Schulze is research associate at the University of Potsdam. JaleTosun is junior professor at the Institute of Political Science at Heidelberg Uni-versity.
Addresses for correspondence: Carsten Jensen, Department of PoliticalScience, Aarhus University, Bartholins Alle, Building 1331, Aarhus, DK-8200, Denmark. email: [email protected] / Christoph Knill, University ofKonstanz, Box D 91, D-78457 Konstanz, Germany. email: [email protected] / Kai Schulze, University of Potsdam, August-Bebel-Straße89, D-14482 Potsdam, Germany. email: [email protected] / JaleTosun, University of Heidelberg, Bergheimer Straße 58, D-69115 Heidelberg,Germany.
ACKNOWLEDGEMENTS
This research is based on generous funding from the European Commissionwithin the 7th Framework Programme. The project CONSENSUS analysespatterns of social and environmental policy expansion and policy dismantlingfor 24 OECD countries over a period of 30 years (1976–2005). We alsowish to thank the three JEPP referees for their very helpful suggestions.
NOTES
1 We use the replication dataset for the article by Allan and Scruggs, as detailed below.However, following Scruggs (2013), we have corrected a few mistakes in the originaldataset.
2 Other datasets with replacement rates exists, but none that is suitable for our purpose.The Social Citizenship Indicator Program only contains data for every five years,making time series–cross-section regression difficult, while OECD only has collected
C. Jensen et al.: Dynamics of social policy expansion and dismantling in 18 OECDcountries 545
Dow
nloa
ded
by [U
nive
rsity
of K
onst
anz]
at 0
8:41
25
Mar
ch 2
014
data since 2001 (see Scruggs 2013). Since our data series ends in 2005, this wouldyield a very low number of observations over time.
3 For more information visit: http://www.polver.uni-konstanz.de/knill/forschung-projekte/confronting-social-and-environmental-sustainability-with-economic-pressure-balancing-trade-offs-by-policy-dismantling-consensus/.
4 As discussed below, the data exhibit cross-panel heteroskedasticity and (mild) auto-correlation, so all regressions in the article are estimated with panel-corrected stan-dard errors and an AR(1) term.
5 We have also run Model II without the lagged dependent variable without alteringthe substantial findings (b ¼ –0.28; p-value ¼ 0.005).
6 When excluding the positive observations from the dataset there is no longer enoughpower to estimate the preferred regression, as specified above. We therefore had torun a slightly altered version without panel-corrected standard errors, but includingrobust standard errors instead. Results are available upon request.
7 This fits well with what we know from the literature on coalition formation and Leftgovernments. In party systems with many parties, Left parties rarely gain a majorityon their own, but will often form coalitions with centre parties (Iversen and Soskice2006).
REFERENCES
Allan, J.P. and Scruggs, L. (2004) ‘Political partisanship and welfare state reform inadvanced industrial societies’, American Journal of Political Science 48(3): 496–512.
Amable, B., Gatti, D. and Schumacher, J. (2006) ‘Welfare-state retrenchment: the par-tisan effect revisited’, Oxford Review of Economic Policy 22(3): 426–44.
Andersen, J.G. (2008) ‘Public support for the Danish welfare state’, in E. Albæk, L.Eliason, A.S. Nørgaard and H. Schwartz (eds.), Crisis, Miracles, and Beyond,Aarhus: Aarhus University Press, pp. 75–114.
Armingeon, K. and Baccaro, L. (2012) ‘Do labor market liberalization reforms pay off?’,Working Paper, University of Bern.
Armingeon, K. and Giger, N. (2008) ‘Conditional punishment: a comparative analysisof electoral consequences of welfare state retrenchment in OECD nations, 1980–2003’, West European Politics 31(3): 558–80.
Arnold, R.D. (1990) The Logic of Congressional Action, Princeton, NJ: Princeton Uni-versity Press.
Bauer, M. and Knill, C. (2012) ‘Understanding policy dismantling: an analytical frame-work’, in M. Bauer, A. Jordan, C. Green-Pedersen and A. Heritier (eds),DismantlingPublic Policy: Preferences, Strategies and Effects, Oxford: Oxford University Press, pp.30–56.
Beck, N. and Katz, J.N. (1995) ‘What to do (and not to do) with time-series cross-section data’, American Political Science Review 89(3): 634–47.
Beck, N. and Katz, J.N. (2009) ‘Modeling dynamics in time-series-cross-section politi-cal economy data’, Social Science Working Paper 1304, California Institute of Tech-nology.
Blauenfelt, M, Hansen, H. and Johansen, A. (2006) Flygtninge pa Starthjælp. Copenha-gen: Casa Forlag.
Bonoli, G. (2012) ‘Blame avoidance and credit claiming revisited’, in G. Bonoli and D.Natali (eds), The Politics of the New Welfare State, Oxford: Oxford University Press,pp. 93–110.
Bonoli, G. and Silja Hausermann. 2009. ‘Who Wants What from the Welfare State?Socio-structural Cleavages in Distributional Politics: Evidence from Swiss Referen-dum Votes.’ European Societies 11 (2): 211–32.
546 Journal of European Public Policy
Dow
nloa
ded
by [U
nive
rsity
of K
onst
anz]
at 0
8:41
25
Mar
ch 2
014

Brambor, T., Clark, W.R. and Golder, M. (2006) ‘Understanding interaction models:improving empirical analysis’, Political Analysis 14(1): 63–82.
Brooks, C. and Manza, J. (2006) ‘Why do welfare states persist?’, The Journal of Politics68(4): 816–27.
Clasen, J. and Clegg, D. (2011) Regulating the Risk of Unemployment. National Adap-tations to Post-Industrial Labour Markets in Europe, Oxford: Oxford University Press.
Emmenegger, P., Hausermann, S., Palier, B. and Seeleib-Kaiser, M. (2012) The Age ofDualization: The Changing Face of Inequality in Deindustrializing Societies,New York: Oxford University Press
Esping-Andersen, G. (1990) The Three Worlds of Welfare Capitalism, Cambridge: PolityPress.
Ferrera, M. (2008) ‘The european welfare state: golden achievements, silver prospects’,West European Politics 31(1–2): 82–107.
Finseraas, H. and Vernby, K. (2011) ‘What parties are and what parties do: partisanshipand welfare state reform in an era of austerity’, Socio-Economic Review 9(4): 613–38.
Giger, N. (2011) The Risk of Social Policy? The Electoral Consequences of Welfare StateRetrenchment and Social Policy Performance in OECD Countries, London: Routledge.
Giger, N. and Nelson, M. (2011) ‘The electoral consequences of welfare state reform.Blame avoidance or credit claiming in the era of permanent austerity?’, EuropeanJournal of Political Research 50(1): 1–23.
Green-Pedersen, C. (2004) ‘The dependent variable problem within the study ofwelfare state retrenchment: defining the problem and looking for solutions’,Journal of Comparative Policy Analysis 6(1): 3–14.
Iversen, T. and Soskice, D. (2006) ‘Electoral institutions and the politics of coalitions:why some democracies redistribute more than others’, American Political ScienceReview 100(2): 165–81.
Jæger, M.M. (2012) ‘Do we all (dis)like the same welfare state? Configurations of publicsupport for the welfare state in comparative perspective’, in J. Kvist, J. Fritzell, B.Hvinden and O. Kangas (eds), Changing Social Equality. The Nordic WelfareModel in the 21st Century, Bristol: Policy Press, pp. 45–87.
Jensen, C. (2014). The Right and the Welfare State, Oxford: Oxford University Press.Jones, B.D. (1999) ‘Bounded rationality’, Annual review of Political Science 2(1): 297–
321.Keele, L.J. and. Kelly, N.J. (2006) ‘Dynamic models for dynamic theories: the ins and
outs of LDVs’, Political Analysis 14(2): 186–205.Kittel, B. and Obinger, H. (2003) ‘Political parties, institutions, and the dynamics of
social expenditure in times of austerity’, Journal of European Public Policy 10(1):20–45.
Korpi, W. and Palme, J. (2003) ‘New politics and class politics in the context of aus-terity and globalization: welfare state regress in 18 countries, 1975–1995’, AmericanPolitical Science Review 97(3): 425–46.
Kosmidis, S. (2013) ‘Government constraints and economic voting in Greece’, HellenicObservatory papers on Greece and Southeast Europe, 70, London: Hellenic Observa-tory, London School of Economics and Political Science.
Peters, B.G., Pierre, J. and King, D.S. (2005) ‘The politics of path dependency: politicalconflict in historical institutionalism’, The Journal of Politics 67(4): 1275–300.
Pierson, P. (1994) Dismantling the Welfare State. Reagan, Thatcher, and the Politics ofRetrenchment, Cambridge: Cambridge University Press.
Pierson, P. (1996) ‘The new politics of the welfare state’,World Politics 48(2): 143–79.Pierson, P. (1998) ‘Irresistible forces, immovable objects: post-industrial welfare states
confront permanent austerity’, Journal of European Public Policy 5(4): 539–60.
C. Jensen et al.: Dynamics of social policy expansion and dismantling in 18 OECDcountries 547
Dow
nloa
ded
by [U
nive
rsity
of K
onst
anz]
at 0
8:41
25
Mar
ch 2
014
Pierson, P. (2001) ‘Coping with permanent austerity: welfare state restructuring inaffluent democracies’, in P. Pierson (ed.), The New Politics of the Welfare State,Oxford: Oxford University Press, pp. 369–406.
Plumper, T., Troeger, V.E. and Manow, P. (2005) ‘Panel data analysis in comparativepolitics: linking method to theory’, European Journal of Political Research 44(2):337–54.
Rueda, D. (2005) ‘Insider-outsider politics in industrialized democracies: the challengeto social democratic parties’, American Political Science Review 99(1): 61–74.
Scruggs, L. (2013) ‘Measuring and validating social program replacement rates’, Journalof European Public Policy 20(9): 1267–84.
Simon, H.A. (1947) Administrative Behavior, New York: Free Press.Soroka, S.N. (2006) ‘Good news and bad news: asymmetric responses to economic
information’, The Journal of Politics 68(2): 372–85.Swank, D. (2005) ‘Globalisation, domestic politics, and welfare state retrenchment in
capitalist democracies’, Social Policy and Society 4(2): 183–95.Taylor-Gooby, P. (2001) ‘Risk, contingency and the third way: evidence from the
BHPS and qualitative studies’, Social Policy and Administration 35(2): 195–211.Weaver, R.K. (1986) ‘The politics of blame avoidance’, Journal of Public Policy 6(4):
371–98.Zohlnhofer, R. (2007) ‘The politics of budget consolidation in Britain and Germany.
The impact of blame avoidance opportunities’, West European Politics 30(5):1120–38.
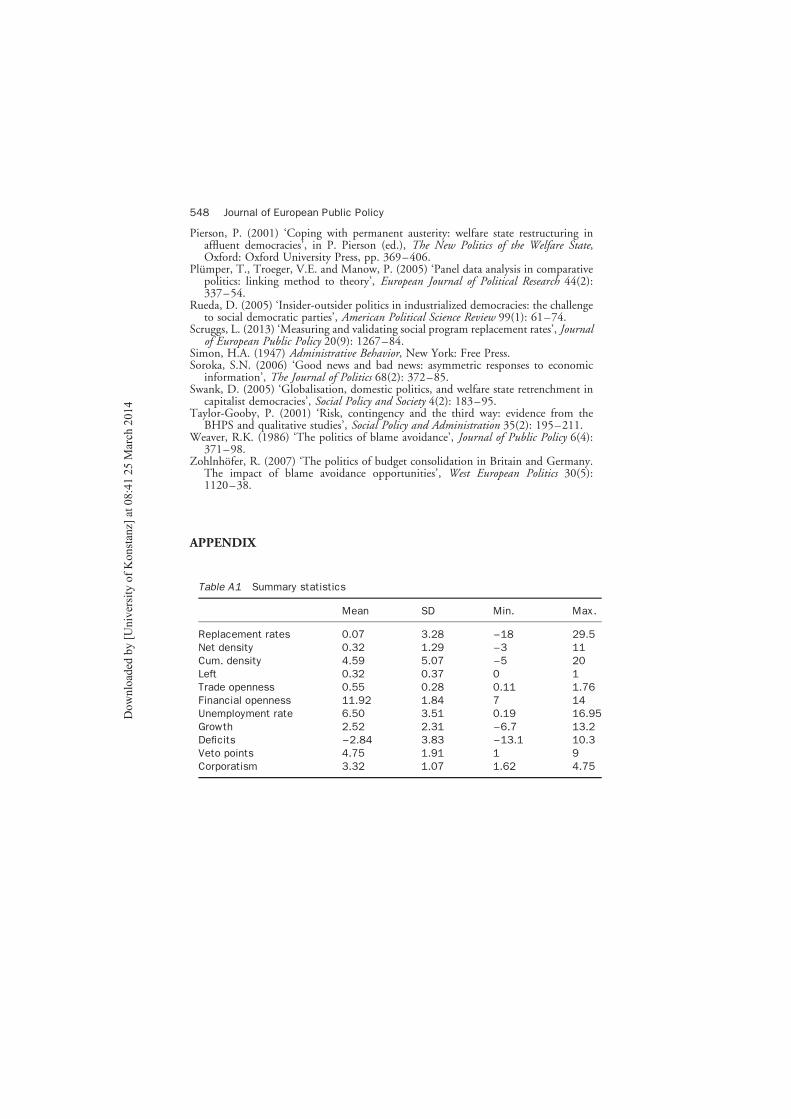
APPENDIX
Table A1 Summary statistics
Mean SD Min. Max.
Replacement rates 0.07 3.28 –18 29.5Net density 0.32 1.29 –3 11Cum. density 4.59 5.07 –5 20Left 0.32 0.37 0 1Trade openness 0.55 0.28 0.11 1.76Financial openness 11.92 1.84 7 14Unemployment rate 6.50 3.51 0.19 16.95Growth 2.52 2.31 –6.7 13.2Deficits –2.84 3.83 –13.1 10.3Veto points 4.75 1.91 1 9Corporatism 3.32 1.07 1.62 4.75
548 Journal of European Public Policy
Dow
nloa
ded
by [U
nive
rsity
of K
onst
anz]
at 0
8:41
25
Mar
ch 2
014