giving & solidarity - IssueLab
332
Free download from www.hsrcpress.ac.za resource flows for poverty alleviation and development in South Africa edited by Adam Habib & Brij Maharaj giving & solidarity
-
Upload
khangminh22 -
Category
Documents
-
view
0 -
download
0
Transcript of giving & solidarity - IssueLab

Free
dow
nloa
d fr
om w
ww
.hsr
cpre
ss.a
c.za
resource flows for poverty alleviation and development in South Africa
edited by Adam Habib & Brij Maharaj
giving & solidarity
C
M
Y
CM
MY
CY
CMY
K
giving & solidarity title.pdf 2007/10/03 11:08:08 AM

Free
dow
nloa
d fr
om w
ww
.hsr
cpre
ss.a
c.za
Published by HSRC Press Private Bag X9182, Cape Town, 8000, South Africa www.hsrcpress.ac.za
First published 2008
ISBN 978-0-7969-2201-4
© 2008 Human Sciences Research Council
The views expressed in this publication are those of the authors. They do not necessarily reflect the views or policies of the Human Sciences Research Council (‘the Council’) or indicate that the Council endorses the views of the authors. In quoting from this publication, readers are advised to attribute the source of the information to the individual author concerned and not to the Council.
CopyedItINg: Vaun Cornell typeSettINg: Nimblemouse CoveR deSIgN: Farm Design pRINt maNagemeNt: comPress
Distributed in Africa by Blue Weaver tel: +27 (0) 21 701 4477 Fax: +27 (0) 21 701 7302 www.oneworldbooks.com
Distributed in Europe and the United Kingdom by Eurospan Distribution Services (edS) tel: +44 (0) 20 7240 0856 Fax: +44 (0) 20 7379 0609 www.eurospanbookstore.com
Distributed in North America by Independent Publishers Group (Ipg) Call toll-FRee: (800) 888 4741 Fax: +1 (312) 337 5985 www.ipgbook.com

Free
dow
nloa
d fr
om w
ww
.hsr
cpre
ss.a
c.za
Tables 5
Figures 7
Preface 9
Acronyms and abbreviations 15
1 Giving, development and poverty alleviation 17
AdamHabib,BrijMaharajandAnnsillaNyar
2 A nation of givers? Results from a national survey of social giving 45
DavidEverattandGeeteshSolanki
3 Religion and development 79
BrijMaharaj,AdamHabib,IrwinChetty,MerleFavis,SultanKhan,PearlSitholeand
ReshmaSookrajh
4 Resource flows in poor communities: a reflection on four case studies 121
MandlaSeleoane
5 New whims for old? Corporate giving in South Africa 159
StevenFriedman,JudiHudsonandShaunMackay
6 The colour of giving: racial identity and corporate social investment 207
StevenFriedman,JudiHudsonandShaunMackay
Contents

Free
dow
nloa
d fr
om w
ww
.hsr
cpre
ss.a
c.za
7 Foreign donor funding since 1994 241
DeborahEwingandThulaniGuliwe
8 Contextualising social giving: an analysis of state fiscal expenditure and
poverty in South Africa, 1994–2004 281
MarkSwilling,JohnvanBredaandAlbertvanZyl
Contributors 326
Index 327

Free
dow
nloa
d fr
om w
ww
.hsr
cpre
ss.a
c.za
�
taBle 2.1: Reported giving behaviour (all respondents) 49
taBle 2.2: Total money and time given (all respondents) 51
taBle 2.3: Total giving by race and sex (all respondents) 49
taBle 2.4: Total giving by province and socio-economic status (all
respondents) 52
taBle 2.5: Amount given to organisation (among those who gave: 54 per
cent of sample) 55
taBle 2.6: Causes supported (by respondents who gave money) 55
taBle 2.7: Amount of money given to beggar/street child/person asking
for help (among those who gave: 45 per cent of sample) 60
taBle 2.8: Items given to poor people (among those who gave: 45 per cent
of sample) 62
taBle 2.9: Giving to non-household family members by province, sex, race
and socio-economic status (all respondents) 63
taBle 2.10: Giving behaviour (respondents who gave by social capital
index) 71
taBle 5.1: Average CSI budgets of 25 companies 195
taBle 7.1: The 2004 CdI ranking 244
taBle 7.2: Main donors to Rdp Fund by volume, 2001–2003 253
taBle 7.3: Sectoral focus of donors 253
Tables

Free
dow
nloa
d fr
om w
ww
.hsr
cpre
ss.a
c.za
�
taBle 7.4: Funding to South Africa by the largest private foreign donors
for 2003/04 266
taBle a1: National fiscal framework, 1994/95 – 2004/05 308
taBle a2: Consolidated national and provincial expenditure 309
taBle a3: Consolidated national and provincial expenditure as % shares
of total 310
taBle a4: Expenditure trends in national government 311
taBle a5: Expenditure trends in national government as % shares 312
taBle a6: Actual capital expenditure in national departments 313
taBle a7: Actual capital expenditure in national departments as %
share 314
taBle a8: National divergence between budgeted and actual
expenditure 315
taBle a9: Extra governmental transfers from national departments by
destination 316
taBle a10: Extra governmental transfers from national departments by
source 317
taBle a11: Poverty alleviation and job-creation fund transfers 318
taBle a12: Provincial expenditure by department 319
taBle a13: Provincial expenditure by department (% share) 319
taBle a14: Provincial capital expenditure by department 320
taBle a15: Provincial capital expenditure (% of total expenditure) 49
taBle a16: Provincial divergence between budgeted and actual
expenditure 321
taBle a17: Transfers to provincial public entities 321
taBle a18: Local government 2002/03 capital expenditure by main
function 322
taBle a19: Local government 2002/03 operational expenditure by main
function 322
taBle a20: Transfers to local government from national and provincial
government 323

Free
dow
nloa
d fr
om w
ww
.hsr
cpre
ss.a
c.za
�
FIguRe 2.1: Causes supported by giving goods, food or clothes (among
those who gave: 31% of sample) 58
FIguRe 2.2: Giving money directly to the poor (all respondents by
education) 61
FIguRe 2.3: Attitudes to paying for relatives (all respondents) 65
FIguRe 2.4: What do you think is the most deserving cause that you would
support if you could? (all respondents) 65
FIguRe 2.5: Attitudes to local and international causes (all respondents) 67
FIguRe 2.6: Attitudes to giving (all respondents, ‘neutral’ not shown) 69
FIguRe 2.7: ‘Help the poor because...’ (all respondents) 69
FIguRe 2.8: Most deserving cause (by social capital index) 71
FIguRe 2.9: Attitudes to giving (all respondents) 73
FIguRe 2.10: Short-term need vs. long-term solutions? (all respondents) 73
FIguRe 7.1: Global aid by donor in 2003 243
FIguRe 7.2: Fluctuation in aid flows (R millions) 250
Figures

Free
dow
nloa
d fr
om w
ww
.hsr
cpre
ss.a
c.za
Free
dow
nloa
d fr
om w
ww
.hsr
cpre
ss.a
c.za
�
This volume presenTs an analysis of the results of the first comprehensive
investigation into giving by non-state stakeholders in South Africa. The
investigation, while undertaken by a research team assembled by the
Centre for Civil Society (CCS) at the University of KwaZulu-Natal, was jointly
initiated by the leaderships of the CCS, the National Development Agency
(Nda), and the Southern African Grantmakers’ Association (Saga). This
partnership among the worlds of the academy, governance and the market
represents one among many attempts to undertake research that makes a
difference, and to transmit this into the arena of policy and practice. Given
the experimental nature of this partnership, many lessons were learnt
during this period of institutional collaboration, and so we must record our
heartfelt thanks to the leaderships of Saga, in particular Colleen du Toit, and
the Nda, in the persons of Tlalane Teffo and Godffrey Mokate. Our gratitude
must also be extended to Patrick Bond and Vishnu Padayachee, current
director of the CCS and ex-director of the School of Development Studies,
respectively, who provided wise counsel at various points in the life of the
project.
We wish to place on record our deep gratitude and appreciation to our
donors, Atlantic Philanthropies, Charles Stewart Mott Foundation, the Ford
Preface

Free
dow
nloa
d fr
om w
ww
.hsr
cpre
ss.a
c.za
10
Foundation and the National Development Agency, all of whom generously
supported this project. The researchers, who numbered about 30 at the
height of the project, and the research team leaders, must be remembered
for their great work, camaraderie and ultimately for their patience with
institutional bureaucracies. Members of the reference group, Ms Sheila
Gastrow, Mr Elliott Osrin, Mr Gil Mahlati, Mr Ashwin Trikamjee, Dr Moshe
More, Ms Sibongile Mkhabela and Mr Mathole Motshekga helped facilitate
access to organisations.
We must also record our collective thanks to the many government,
corporate and societal leaders and our fellow citizens who at one or other
time participated in this study. Finally, we must in particular acknowledge
the important role of Annsilla Nyar, the programme manager of this project
at CCS. Her patience with the egocentric personality of many a researcher was
critical in facilitating a resolution to the most intractable of problems, and
ultimately enabled the completion of this project.
This study represents an excavation of patterns of giving in South
Africa through an interrogation of this phenomenon in the worlds of rich
and poor, the mobilisation of resources within religious communities and
the distribution thereof, the extent and nature of caring and support within
extended family networks, the character of corporate social responsibility
initiatives, the scale of official development assistance (oda) and foreign
private foundation support, the changing philosophies and practices of
the state in this regard, and the effects of South Africa’s democratisation
on the processes of giving and, finally, their impact on development,
poverty alleviation and democratic consolidation. The research process was
structured to address the macro-character of, and the diverse thematic issues
to be addressed in, the study.
Five research teams, each managed by a senior research leader, were
deployed to cover the range of issues identified above. All of the research
leaders came together in regular research management meetings with
responsibility for addressing matters pertaining to methodology, focus and
giving and solidarity

Free
dow
nloa
d fr
om w
ww
.hsr
cpre
ss.a
c.za
11
overlap. Such meetings also served as a forum, which facilitated debate and
critical intellectual reflections of the work undertaken within the different
research teams.
The research process was structured into two phases. Phase one,
undertaken by the first research team, involved the design, implementation
and analysis of a national sample survey on individual-level giving behaviour.
The sample, a random stratified one comprising 3 000 respondents, is
representative of all South Africans aged 18 and above. It thus speaks to
both the urban and rural and the formal and informal dimensions of our
social context. A second sample, drawn specifically to boost the weight of
minority religious groups – Hindus, Jews and Muslims – was also surveyed,
but analysed separately as part of the more qualitative reflections on giving
processes in South Africa.
The survey and the analysis thereof, undertaken in the first phase
was used to support a second, more qualitative phase of the research process
undertaken by four other research teams, each responsible for a specific
area. The second team focused on excavating the character of individual-level
giving through an analysis of these processes within different religious
communities – Christian, Muslim, Hindu, Jewish and indigenous African.
Giving was also investigated outside the religious dimension, mainly
through a focus on private domestic foundations and trusts. In all these
areas the focus is on who is doing the giving, who the beneficiary is, how
patterns of giving are organised, and how they differ across various religious
communities. Methodological instruments utilised to unravel patterns of
giving within communities included documentary analysis, interviews and
focus groups.
The third team focused on the corporate sector. It must be stated
at the outset that the priority of this team was not to provide a definitive
measure of corporate giving. Indeed, this would have been impossible to
achieve given the time constraints and the financial and human resources at
our disposal. In any case these measures have been provided by the Centre
preface

Free
dow
nloa
d fr
om w
ww
.hsr
cpre
ss.a
c.za
12
for Development Enterprise in a study undertaken in 1998, and in the
more regular estimates provided through the CSIHandbook published by
Trialogue. The focus of this team, then, was to build on this earlier work
and assess, through key informant interviews and analysis, the extent to
which current estimates are accurate. More importantly, the team focused
on the qualitative dimensions of corporate giving, understanding the
motives for it, how preferences are chosen, and how corporates measure
success in their social investment initiatives. In addressing these questions,
particular attention was focused on understanding how identity (racial and
other) and world views coloured the decision-making processes of corporate
giving in South Africa. Again, documentary analysis and key informant
interviews served as the core methodological elements of this research
enterprise.
The fourth team focused on externally funded resources, which
included both oda and resources from private agencies, including
foundations, trusts and other non-governmental organisations. Some prior
work had already been undertaken in these areas, like the Development
CooperationReportIIforSouthAfrica1994–1999. This team updated these
research findings and mapped previously unexplored aspects of externally
funded resources in South Africa. The research collated information on
numerical values, showed trends, conditions and objectives of oda and
foreign private aid flows, and provided analysis of how aid is targeted to a
variety of social sectors.
The final research team focused on the resource flows from the
state to poverty alleviation and development. Of course, resource flows
from the state are of a qualitatively different character from those of other
stakeholders, in particular since they constitute part of what we have termed
the ‘economy of obligation’. Nevertheless, assessments of resource flows by
the state were undertaken for a number of reasons. Firstly, because they act
as a reference point enabling us to understand the significance of giving by
the other stakeholders. Secondly, they are useful in their own right because
giving and solidarity

Free
dow
nloa
d fr
om w
ww
.hsr
cpre
ss.a
c.za
13
they enable a comprehensive understanding of resource flows to poverty
alleviation and development in South Africa. This study of resource flows
from the state was undertaken at two levels: first through analysis of the
budget over the last ten years, and then through an investigation of special
funds. The former explored the flows of resources into fixed social and
economic infrastructure, as well as expenditures on social and economic
services. The latter identified the key funds, related the stories of how they
were established, and indicated how much of spending had occurred within
each fund and to what causes these were directed, and analysed the patterns
and significance of giving through these funds.
This research process, then, informs the structure of the manuscript.
The chapters that follow focus on the thematic concerns of the various
research teams. Chapter 1 provides a synthesis of the findings, draws together
the strands of the analysis emanating from the volume, and provides some
generic reflections on giving, its processes, and their consequences for
poverty alleviation and development in South Africa. Chapter 2 provides a
quantitative picture of the state of individual giving in South Africa. The
remaining chapters of the book offer more qualitative reflections. Chapter 3
focuses on giving within religious communities, while Chapter 4 focuses on
the flow of resources and the survivalist strategies within poor communities.
Chapters 5 and 6 focus on the corporate sector, while Chapter 7 explores
these issues in relation to oda and foreign foundations and trusts. Chapter
8 acts as a reference to the others by detailing resource flows from the state
towards poverty alleviation and development.
All these chapters and their analyses are, of course, founded on the
voluminous information generated by the various research teams. It would
be impossible to detail all of this information in the pages that follow. The
following chapters must thus be treated as analytical summaries of more
micro-directed and detailed studies, published mainly as research reports,
on the websites of the CCS and the Nda. These reports are freely available
and easily accessible in the interests of transparency, and with the hope that
preface

Free
dow
nloa
d fr
om w
ww
.hsr
cpre
ss.a
c.za
14
they will not only facilitate further studies, but will also promote debate
occasioned by the analysis and conclusions contained in the pages that
follow.
Adam Habib and Brij Maharaj
Projectleadersandvolumeeditors
giving and solidarity

Free
dow
nloa
d fr
om w
ww
.hsr
cpre
ss.a
c.za
1�
aFRodad – African Forum and Network on Debt and Development
Bee – black economic empowerment
Bt – Business Trust
CCS – Centre for Civil Society
CdI – Commitment to Development Index
Cgd – Center for Global Development
CSI – corporate social investment
CSo – civil society organisation
daC – Development Assistance Committee
dFId – Department for International Development
Fp – Foreign Policy
geaR – Growth, Employment and Redistribution
gdp – gross domestic product
IdC – International Development Cooperation
INgo – international non-governmental organisation
ISKCoN – International Society for Krishna Consciousness
Jet – Joint Education Trust
mdg – Millennium Development Goal
NBI – National Business Initiative
Acronyms and abbreviations

Free
dow
nloa
d fr
om w
ww
.hsr
cpre
ss.a
c.za
1� giving and solidarity
Nda – National Development Agency
Nepad – New Partnership for Africa’s Development
Ngo – non-governmental organisation
oda – official development assistance
SaCC – South African Council of Churches
Saga – Southern African Grantmakers’ Association
Sme – small and medium enterprises
uNdp – United Nations Development Program

Free
dow
nloa
d fr
om w
ww
.hsr
cpre
ss.a
c.za
17
Development and poverty alleviation have over the last decade been
the almost exclusive preoccupation of some of the best academic and policy
minds in South Africa. Indeed, development, economics, geography, politics,
and sociology departments and institutes at universities, government
research departments and parastatals, and non-governmental research
organisations have churned out numerous articles, books, policy papers,
and reports on the subject. Many of these studies have been immersed in
an analytical contestation about the state’s economic and social policies,
focusing on whether they enable or undermine development and poverty
alleviation. The dividing line in this contestation has been between state and
labour-aligned policy researchers, with the former supportive and the latter
critical of the state’s policy orientation.
In the last few years, government research departments and
parastatals, and some academics, have also invested significant effort in
exploring the spatial effects of the state’s investment patterns. This research,
which culminated in the development of the National Spatial Development
Perspective, concluded with the controversial policy recommendation that
the state’s infrastructural investment should be directed to geographic
1
Giving, development and poverty alleviation
Adam Habib, Brij Maharaj and Annsilla Nyar

Free
dow
nloa
d fr
om w
ww
.hsr
cpre
ss.a
c.za
18 giving and solidarity
areas distinguished by the coincidence of two features: a high potential for
sustainable economic development and significant concentrations of poor
communities (PCAS 2003b). This policy recommendation and the studies
supporting it are also likely to reinforce the dividing line between state and
labour-aligned policy researchers. But what is interesting to note is that
despite their differing conclusions, state and labour-aligned researchers
share one common methodological feature: their analytical focus remains
the state.
Perhaps this is understandable. After all, the state is without doubt
the primary agency through which poverty alleviation and development can
be enabled. Its exclusive control over the legislative and policy arenas, and
its command over significant fiscal resources, ensure that it can either make
or break a human-centred developmental agenda. Nowhere has this been
more evident than in South Africa in the last 12 years. The Department of
Social Development’s Committee of Inquiry into a Comprehensive System of
Social Security for South Africa found that between 45 and 55 per cent of the
population are living below the poverty datum level, and that this percentage
increases to almost 75 per cent in the two poorest provinces, Limpopo and
the Eastern Cape (DOSD 2002). These findings were corroborated by the
report of the United Nations Development Program, which indicated that
not only are 48 per cent of the country’s citizens afflicted by poverty, but
that inequality in South Africa has increased in recent years. The report
concluded that the Gini coefficient rose from 0.596 in 1995 to 0.635 in
2001, and that South Africa’s ranking in the Human Development Index
deteriorated from 0.73 in 1995 to 0.67 in 2003 (UNDP 2003: 5).
It should be noted that this conclusion provoked significant
controversy and was hotly contested by the state. Indeed, the state’s own
research, undertaken by the Presidency as part of a ten-year review,
suggested that significant advances had been recorded in the struggle
against poverty (PCAS 2003a). This ten-year review study emphasised the
delivery record of government by empirically demonstrating the outcomes
of housing, water, electricity, land and employment policies. It argued that

Free
dow
nloa
d fr
om w
ww
.hsr
cpre
ss.a
c.za
giving, development and poverty alleviation 19
if these social provisions to citizens are taken into account, then one has to
conclude that poverty rates have declined significantly in the first ten years
of the democratic transition. The study does recognise that problems do
exist, and that much more needs to be done. But it maintains that where
problems exist, these are the result of poor implementation emanating
from institutional capacity constraints, rather than inappropriate policy.
This message has also been consistently advanced by President Mbeki in
his annual State of the Nation addresses, which have underscored both the
weaknesses of public institutions and the appropriateness of post-apartheid
policy (Mbeki 2004).
This issue, then, has become the defining feature of contestation
in the discourse on poverty alleviation and development. State officials
and researchers aligned with government assume that the problem is one
of human capacity and skills deficits (Mbeki 2004; PCAS 2003a). Others,
including the Congress of South African Trade Unions and the South
African Communist Party – both partners with the African National
Congress in the ruling tripartite alliance – and many independent
researchers within the universities hold that while human capacity and skills
deficits are definitely problems, poverty has also been a product of post-
apartheid policy that prioritises the interests of the business community and
black entrepreneurs (Bond 2000; COSAtU 2006; Desai 2002; SACP 2006a,
2006b; Terreblanche 2002). Other researchers, like Jeremy Seekings and
Nicoli Nattrass, arrive at a similar conclusion, while laying the blame for
this state of affairs on what they see as the elite alliance between business,
government and organised labour. The real victims, they maintain, are the
unemployed who constitute the real underclasses of South African society
(Seekings & Nattrass 2006). In any case, this policy contestation has been
a principal source of conflict between both the ruling party and its political
partners, as well as within the political system as a whole.
It may be useful to note here that there are two significant problems
with the policy discourse as it is presently organised. First, almost all sides
in the ideological divide make the implicit assumption that state policy and
Free
dow
nloa
d fr
om w
ww
.hsr
cpre
ss.a
c.za
20 giving and solidarity
strategy has remained consistent throughout the transition. However, as
has been noted elsewhere, this is simply not true (Habib 2004; Padayachee
& Valodia 2001). Habib, for instance, has argued that not only has social
expenditure risen significantly since 1999, but privatisation has also been
placed on the back burner and parastatals have in recent years increasingly
been used to drive a state-led public investment agenda. He concludes that
a new policy agenda is definitely under way, even though it may be unstated
and may still contain contradictory elements (Habib 2004).
Second, the policy discourse on poverty alleviation is almost
entirely focused on the state without any reflection being undertaken on
other stakeholders who could or may be impacting on poverty alleviation
and development. Even if one is to accept the centrality of the state in any
process of human-oriented development, it has to be recognised that an
exclusive focus on the latter comes at the cost of not having a comprehensive
picture of the variables that impact on, and the flow of resources directed
to, development and poverty alleviation. In a world where the richest people
command far greater resources than many of the world’s governments, where
some multinational corporations have a greater turnover than some nations’
GDP, and where the state’s control over the policy arena is increasingly
challenged by international financial and political agencies, multinational
corporations and civil society organisations, an exclusive focus on the state is
intellectually unsustainable.
This is clearly the case in South Africa. There is already substantial
anecdotal, and some empirical, evidence to suggest that significant resources
flow to development and poverty alleviation initiatives from a variety of
other stakeholders in South Africa. A study of corporate social investment
(CSI) in South Africa in 2000 concluded that the levels of social investment
per capita by the country’s corporate sector were on a par with, if not higher
than, their North American counterparts in the United States and Canada
(Rockey 2000). The South African study on the non-profit sector, part of
the global study of the sector coordinated by the Centre for Civil Society in

Free
dow
nloa
d fr
om w
ww
.hsr
cpre
ss.a
c.za
giving, development and poverty alleviation 21
Johns Hopkins University, supported the conclusion that significant social
investments are made by South African corporates when it estimated that
some R3 billion per annum is made available in this regard (Swilling &
Russell 2002: 36). Further, the study demonstrated that of the 98 920 civil
society organisations in the country in 1998, some 53 per cent were informal
organisations located in and managed by the country’s most marginalised
and under-resourced communities (Swilling & Russell 2002: 20). This
suggests that there is a significant flow of resources within marginalised
and poor communities towards poverty alleviation in particular.
A comprehensive understanding of poverty alleviation and
development, and assessments of progress towards these goals, must
involve investigations of stakeholders beyond the state. As South Africa’s
most famous philanthropist, Nelson Mandela, has stated, ‘Government
cannot by itself meet these socio-economic challenges. The private sector,
non-governmental organisations and ordinary people have to make their
contribution.’1 And, they might very well be doing so; hence this study into
the contribution of corporate actors, foreign governments, multilateral
institutions and foreign private foundations, private individuals and poor
and marginalised communities. Investigations into the flow of resources for
poverty alleviation and development from stakeholders other than the state
and multilateral institutions would in the United States and western Europe
be captured under the terminological description of philanthropic studies.
But philanthropy is not an adequate description of the flow of resources
towards poverty alleviation and development in South Africa; after all, the
term tends to have the connotation of extra resources being devoted on a
voluntary basis by financially well-endowed individuals to strangers in need.
Yet South Africa, like many developing nations, defies this description
in two important respects. First, for some stakeholders, like marginalised
communities, these are not extra resources. Rather, they represent the
sharing of what are already inadequate resources among greater and greater
numbers of individuals in order to enable these communities to simply

Free
dow
nloa
d fr
om w
ww
.hsr
cpre
ss.a
c.za
22 giving and solidarity
survive the ravages of their economic circumstances. Second, a significant
amount of giving in South Africa defies the description of ‘voluntary’, or
for that matter ‘stranger’ for ‘beneficiary’. This is due to the fact that for
large sectors of South Africa’s population, the extended family serves as the
basic unit of the community. For these sectors of the population, giving is
not directed to strangers and is not informed by voluntarism, but rather by
patterns of obligation that extend beyond the nuclear family as a result of the
cultural context within which they are located.
Giving in South Africa can perhaps best be understood by initially
resorting to the use of Emile Durkheim’s (1972) theories about the modes
of social exchange, which he saw as the primary determinant of social
relations in a society. In the contemporary era, five modes of exchange tend
to predominate: economy of commerce involving market actors; economy
of obligation incorporating the state and nuclear family; economy of fear,
which is essentially about crime; economy of affection, which focuses on
the extended family; and the economy of volition reflecting voluntary giving
by all role-players. Giving in South Africa effectively involves the latter two
modes of exchange. Retaining the economies of affection and volition as
two distinct categories is useful for it enables comparisons with other parts
of the world where the former does not play a significant role. On the other
hand, the distinction also enables us to remain contextually relevant given
the importance of both categories in South Africa, thereby facilitating richer
empirical detail and greater nuance.
Any macro-study of giving in current-day South Africa would have
to confront the problem of a dearth of academic literature on the subject.2
This is not to suggest that nothing has been written on the issue. Indeed,
there is a sizable literature on giving in South Africa. But, like in many other
parts of the world, this literature is largely descriptive, focused on either
the philanthropic acts of financially successful individuals and families, or
the patterns of support and behaviour within particular religious and/or
ethnic communities. In the corporate social responsibility arena, where the

Free
dow
nloa
d fr
om w
ww
.hsr
cpre
ss.a
c.za
giving, development and poverty alleviation 23
literature is less religiously inspired, it tends to take a practitioner-oriented
form, providing advice and recommendations on how to professionalise
giving and support by corporate business. Both sets of literature are useful,
then, for providing empirical insights into processes of giving in particular
contexts, but they do not naturally lend themselves to assisting with the
development of theoretical levers that would be required for any macro
excavation of giving in South Africa. For assistance in this regard, a review
of the academic literature on philanthropy developed in other parts of the
world is required.
Reflections, assumptions and investigative questions
Much of the literature on philanthropy and giving originates from scholars
located in the United States and western Europe. This is not only a result
of the skewed character of the global economy, but also a consequence of
the fact that a significant part of professionalised giving, in the form of
corporates and foundations, has been concentrated on these continents. This
near monopoly of philanthropic focus, however, has begun to change in the
last two decades. In part, this has got to do with the increasing importance
of the Asian economy to global prosperity, and the resultant emergence of
a significant number of private trusts and foundations, which are making
important contributions to advancing the social development agenda in
this part of the world (Estes 1998). But the phenomenon is not limited to
Asia – as Salamon points out: ‘a global “associational revolution” appears
to be underway around the world…a striking upsurge of organised, private,
voluntary activity in virtually every corner of the globe’ (1999: 5).
Notwithstanding these developments, ‘philanthropic study’ is an
academic term coined only in the 1980s and ‘even today it is not a widely
accepted or understood term in American academic life’ (Katz 1999: 74).
As the noted philanthropy scholar Payton contended, ‘there are few fields of
such vast magnitude that have stimulated so little curiosity among scholars’

Free
dow
nloa
d fr
om w
ww
.hsr
cpre
ss.a
c.za
24 giving and solidarity
(1995: 3). Indeed, it is ironic that despite the high level of professionalisation
of the philanthropic sector in many parts of the world, very few people have
any idea of what the concept means, its intellectual derivations or, more
significantly, how it applies to various cultural, social and political contexts in
different parts of the world.
Philanthropy and giving is often seen as the domain of professionals
such as fund-raisers, grant makers and executive directors of foundations.
It does not form a significant field of enquiry in its own right. Two
consequences flow from this. First, the field is seen to have narrow
intellectual horizons. Where philanthropy is conceptualised in terms
of human services, then it tends to be limited to the field of social work
with a focus on helping the disadvantaged. Where it is seen as part of
the non-profit world, then it focuses on legal and institutional issues, on
distinctions between ‘public’ and ‘private’ institutions, on relations between
government financing and activities and modern infrastructure. The study
of philanthropy comes from other fields such as anthropology, economic
history, economics, sociology, political science or public administration,
and even business management, all of which come with their own training
and concepts. Second, scholarship in this field is inevitably more practical
than academic. The limited number of academic studies on the subject
are not of a reflective, scholarly character but rather written to stimulate
operational practice in the non-profit sector. This also leads it to be defined
almost exclusively in Euro-American terms, thereby ignoring the richness of
traditions of giving in other cultural contexts in different parts of the world.
The result: the literature either tends to take the form of ‘how to’
manuals or, where there is the retention of some veneer of the academy, it
tends to be narrowly descriptive and/or empiricist. Either way, it does not
allow for the comparative reflections that would enable the identification and
development of common analytic themes. Despite this negative assessment
of the macro-philanthropic literature, a review does permit, in both a positive
and negative sense, the conceptualisation of theoretical levers or hypotheses,

Free
dow
nloa
d fr
om w
ww
.hsr
cpre
ss.a
c.za
giving, development and poverty alleviation 25
based on widely-held assumptions, which would serve as investigative tools
that enable the beginning of an excavation of processes of giving in South
Africa.
Five assumptions implicit in the philanthropy literature will be tested
in the investigation of giving in South Africa. First is the assumption that
giving is an act undertaken largely by richer, more resourced sections of the
community and is directed toward more under-resourced sectors. Donati
(2003), for instance, suggests that giving is more likely to come from people
who have been financially successful and from those who have retired and
accumulated wealth and assets. Olson (1965), Becker (1974) and Wright
(2002) argue that giving is primarily driven by psychosocial motives – to
gain status, prestige and respect – all of which can be achieved by the wealthy
who have extra resources to dispense. Similarly, Brown et al. (2000) associate
philanthropy with the benevolence and paternalism of the wealthy elite.
This assumption is also implicit in a set of philanthropy literature
concerned with its undemocratic consequences. For instance, Salamon
(1995) argues that the philanthropy sector tends to be shaped by the needs
of wealthy individuals rather than the community as a whole. Consequently,
some services desired by the affluent (such as art and music) may receive
priority while others required by the poor are neglected. Since such private
donations are tax-deductible, ‘they have the effect not only of allocating
private expenditures, but also of allocating foregone public revenues as
well, though without the benefit of any public decision process’ (Salamon
1995: 47). This leads to an undemocratic situation where the rich are able
to exercise control over their resources, while the poor become dependent
on charity (Salamon 1995). Implicit in all this literature is that giving is an
act undertaken by the rich and wealthy. But is this true, especially in more
developing world contexts?
Anyone familiar with countries of the south would recognise
that there are numerous collective instruments within marginalised
communities that are either part of traditional or indigenous life (Moyo
2004), or that have been developed to assist people in the harsh economic

Free
dow
nloa
d fr
om w
ww
.hsr
cpre
ss.a
c.za
26 giving and solidarity
circumstances in which they find themselves. Much of this is captured in the
sociological and anthropological literature on the southern African region. A
great deal, for instance, has been written on the place of stokvels, which are
a well-known self-help phenomenon in South Africa that has assisted and
allowed poor people to survive their economic circumstances.3 However, as
Wilkinson-Maposa et al. note: ‘We haven’t been able to tap into this tradition
and don’t usually think of its various expressions as development tools’
(2005: xiv).
Stokvels are community-based financial arrangements which have
been used for different purposes. Some are directed to serving individual
interests, like buying furniture that would have been otherwise unaffordable
or paying lobola (bride price),4 while others have broader developmental
purposes oriented to the community. Burial societies are another well-
documented expression of the intersection of economic necessity and
associational giving traditions. Funeral costs are generally high in black
communities because of the belief that burial has to take place in the land
of the ancestors, which is the area where the person was born (Dandala &
Moroka 1990). Burial societies have also assumed greater importance in
the lives of poor people in the context of increasing fluidity and flexibility
of borders due to high unemployment and conflict in the region as a whole.
For example, there are a number of burial societies formed by Zimbabwean
refugees living in South Africa, who pool money and other resources in order
to transport the dead back to their home country (Moyo 2004).
This literature, the results from the Johns Hopkins study on the
non-profit sector discussed earlier, as well as anecdotal evidence all suggest
that giving in South Africa must not be conceived in a unilinear direction
from rich to poor communities. Indeed, giving must be assumed to occur in
the worlds of both rich and poor. This is borne out by the research reported
in this volume. Chapter 2 categorically demonstrates that poverty is not a
deterrent to giving. Indeed, as Chapters 2, 3 and 4 indicate, giving within
poor communities is crucial to their very survival, for without it, starvation,
malnutrition and strife would be more widespread. The crucial point to note,

Free
dow
nloa
d fr
om w
ww
.hsr
cpre
ss.a
c.za
giving, development and poverty alleviation 27
however, is that the form and character of giving in poor communities differ
significantly from that generated in more well-off sections of society.
Two significant differences exist. First, given their lack of money,
poor people tend to give more time. This is reflected, as Everatt and Solanki
demonstrate in Chapter 2, in the fact that poor provinces like the Eastern
Cape and Limpopo tend to register the highest amounts of volunteering.
Paradoxically, the converse is not true. Wealthy provinces like Gauteng do
not necessarily give more money. In fact, as is demonstrated in Chapter 2,
Gauteng gives both less money and less time than the Eastern Cape. Second,
as Chapter 4 indicates, patterns of giving in poor communities in both
urban and rural areas are fundamentally different from those practised in
better-resourced sections of society. Whereas patterns of giving are more
individually oriented in the latter, they take on a more collective character in
marginalised communities. In the poorer communities, they are also more
survivalist in orientation – stokvels, burial societies, garden clubs, collective
buying clubs, all of which represent the pooling of inadequate resources by
poor and marginalised communities to enable them to survive the ravages of
their circumstances.
A second assumption in the philanthropy literature is that a great
deal of giving is inspired by religious belief. The different religions
emphasise that giving is associated with a deep sense of responsibility, duty
and commitment in order to realise spiritual salvation. Zakaat, tzedalah,
dana and tithes regulate compulsory giving for Muslims, Jews, Hindus
and Christians, respectively. As a result, then, religious leaders of all faiths
cultivate the habit of charity with the consequence that their adherents tend
to give more time and money to both faith-based and secular initiatives.
Religious congregations in the United States, for instance, collected $81.2
million in 1996 (Independent Sector 2002).
Is a similar pattern of religiously inspired giving evident in South
Africa? After all, South Africa is a religiously active country. Almost the
whole spectrum of world religions, as well as indigenous alternatives, have
adherents in the country. How effective are these religious institutions

Free
dow
nloa
d fr
om w
ww
.hsr
cpre
ss.a
c.za
28 giving and solidarity
in mobilising individual and public resources? What are the motivations
that underlie this mobilisation of resources and what are its net effects?
Chapter 2 addresses these issues directly. It demonstrates that faith-based
philanthropy is the single largest component of South African giving. Of
the 89 per cent of respondents who profess some sort of religious belief,
96 per cent gave money, time and goods. This figure dropped to 80 per cent
for atheists. Eighty per cent of respondents gave to religious institutions,
while organisations of the poor followed at a distant second with 29 per
cent of respondents privileging them with their resources. Religious
organisations were also dominant in receiving goods and food, with 60 per
cent of such giving being directed to these institutions. Again, the more
secular organisations of the poor came a distant second with 31 per cent of
respondents directing their resources to them.
It needs to be noted, however, that despite the fact that South Africans
privilege religious institutions in their giving, their primary motivation is to
alleviate poverty. As Chapter 2 indicates, respondents in the survey defined
children and youth, HIV/AIDS and the poor as the primary stakeholders
deserving of support. Respondents thus gave to religious institutions in the
belief that it would be directed to worthy individuals who were confronted
with hardships. This is disconcerting since, as Chapter 3 intimates, a
significant proportion of this giving is actually used for the reproduction
of the religious institutions themselves. Although it was not possible to
assess what proportion of giving was devoted for these purposes, as most
religious institutions were reluctant to open their financial books, there can
be no doubt that institutional reproduction absorbs a significant share of the
resources.
The most dramatic case of this is the Shembe and Nazareth churches
which are mainly located in poverty-stricken and marginalised communities.
Sithole’s (2006) report on these religious communities, which serves as one
of the empirical foundations for Chapter 3, carefully describes in heart-
wrenching terms how poor people pool their very few resources at religious
ceremonies to enable their religious leadership to travel and live in relatively
Free
dow
nloa
d fr
om w
ww
.hsr
cpre
ss.a
c.za
giving, development and poverty alleviation 29
more comfortable circumstances. This and other reports in this stable of
studies suggest that more research is required in determining how much of
public resources is devoted to religious institutional reproduction, and what
the implications of this are for determining their responsiveness to the South
African public’s philanthropic intentions.
A third assumption is that the philanthropy literature tends to portray
giving as a voluntary act inspired by generosity, religious conviction or
other more altruistic motives. Implicit in this depiction is the assumption
that the nuclear family is the basic unit of all societies. Yet we know that in
large parts of the world, and in the developing world in particular, nuclear
families are a component of more extended families. Patterns of obligation
therefore occur in ways fundamentally different to those of the industrialised
world. Family and informal networks are highly personalised and giving
is influenced by specific identity categories such as relatives, friends and
neighbours. While there may well be altruistic or selfish motives, such giving
is not motivated by profit, is not enforced by law, and is not entirely voluntary.
And more often than not this informal system of sharing and caring is taken
for granted (Wolfenden Committee 1978).
The report of the Wolfenden Committee (1978) distinguishes among
three categories of informal sharing and caring: provision of care for the
young and the weak, especially the sick, the handicapped and the elderly;
the transfer of material resources, particularly between members of a family,
from those with a surplus to those with a deficit; and the provision of advice
and psychological support from the experienced to the inexperienced.
None of these three categories are regarded as philanthropy or charity by
the giver when the recipient is a member of their extended family, group
or community. Rather, these actions are conceptualised in terms of mutual
obligation – part of the responsibility of belonging to an extended family,
group or community. An underlying reciprocity is understood, even as givers
do not literally expect gifts to be returned in any direct way.
Hyden (1983) captures this experience by coining the term the
‘economy of affection’ which refers to ‘a network of support, communications

Free
dow
nloa
d fr
om w
ww
.hsr
cpre
ss.a
c.za
30 giving and solidarity
and interactions amongst structurally defined groups connected by blood,
kin, community and other affinities for example, religion’ (1983: 9). These,
he informs us, tend to be ad hoc and informal, rather than regular and
formalised. The economy of affection thus points us to an enormous amount
of what would be considered giving in a western context, but would, in the
South African context, simply be seen as patterns of obligation and duty
similar to those undertaken within the nuclear family. It is important to be
aware of this because it enabled us to encapsulate it within our study, thereby
facilitating comparative reflections.
Chapter 2, which reports the results of the survey that specifically
addressed the issue, demonstrates that a significant amount of giving
occurs within this arena of the economy of affection. Fifty-five per cent of all
respondents gave money, goods and food to non-household family members;
over a third had children living in the household that were not those of the
head of the household; and over 55 per cent of respondents believed that
paying for the upkeep of relatives’ children was an obligation and could not
be described as giving. These indicators of the economy of affection were of
course more pronounced in certain geographic areas and among particular
social groups. African and Indian South Africans were more inclined to
disburse resources to members of their extended family, with 59 and 58
per cent respectively indicating that they did so. The practice was also more
common in the Eastern Cape and Limpopo, two of the country’s poorest
provinces, which again suggests that the practice is more pronounced at
lower levels of the class hierarchy.
A fourth assumption in the philanthropy literature is that corporate
giving is governed by a strategic drive to assist the financial bottom line. In
the corporate world, giving is assumed to seldom take place with altruistic
motives. Donati (2003) suggests that giving is always subordinate to the
profit motive. Mullen maintains that, ‘Corporations increasingly want
added value for their charitable giving activities, with the creative strategies
that produce tangible benefits’ (1997: 42). And, others have suggested that
‘philanthropic capitalism’ is nothing ‘more than a new construction of the

Free
dow
nloa
d fr
om w
ww
.hsr
cpre
ss.a
c.za
giving, development and poverty alleviation 31
labour/capital compromise, which also serves an effective public relations
exercise of corporations’ (Brown et al. 2000: 83).
Giving in the marketplace is thus seen to have ulterior motives: to
sell more products, increase profits, obtain community support, improve
relations with labour and capital, and enhance the image of a firm (Burt
1983; Donati 2003; Nevarez, 2000; Silver 2001). Corporate giving is
therefore understood as ‘a form of strategic philanthropy’, ‘giving of
corporate resources to address non-business community issues that also
benefit the firm’s strategic position and ultimately, its bottom line’ (Saiia
et al 2003: 170). Some also maintain that this is not only necessary but
also appropriate. Hoggett, for instance, has emphasised that if a company
‘subordinates this priority to an outside interest it fails to discharge its
trust. Ultimately, it fails to attract and generate the resources for survival’
(2003: 29).
Is such a cynical and pessimistic portrayal of corporate giving
warranted? Of course giving in the corporate world would be influenced
by a desire to enhance the business enterprise. But is this the whole story?
Are there not other factors that influence corporates to give? For instance,
how are we to understand the rise of corporate social responsibility, a
phenomenon that includes strategies to protect the environment, to support
community development, charity and workplace equity, and to provide
improved consumer services (Mullen 1997)? These initiatives, which are
the result of greater community and environmental awareness – itself a
product of the willingness of civic groups to protest and make their voices
heard – suggest that corporate behaviour can be influenced by variables other
than profit.
This is even more so in a society undergoing a dramatic political
transition. Corporate giving in South Africa has been on the rise in recent
years. Statistics indicate that R2.2 billion is spent annually by companies
on CSI (Rockey 2000). The non-profit sector study put the figure even
higher, claiming that the private sector contributed about R3 billion in
1998 (Swilling & Russell 2002: 36). Many companies have specifically set
Free
dow
nloa
d fr
om w
ww
.hsr
cpre
ss.a
c.za
32 giving and solidarity
up CSI departments in order to coordinate these activities. The Southern
African Grantmakers’ Association was set up in 1994 in order to
professionalise and coordinate corporate giving in South Africa.5 Even
the Johannesburg Stock Exchange has got in on the act and announced a
voluntary social responsibility index to which corporates can subscribe.
Two factors underlie South African businesses’ shift to corporate
social responsibility. First is the issue of apartheid guilt emanating from the
corporate sector’s recognition that there is a political need for it to be seen to
be making amends for its complicity in the establishment and maintenance
of apartheid. Second is the desire of South African corporates to be seen
as being at the cutting edge of business trends in the United States and
Europe. Both factors have prompted corporate South Africa in the direction
of what has come to be known as ‘social auditing’, that is, assessments of
companies conducted on the basis of their socio-economic impact on staff,
clients, consumers (the general public) and communities. This ‘corporate
citizenship’ model has increasingly been adopted by businesses and
companies looking to contribute to the processes of social change under way
in South Africa.6
It needs to be noted that corporate giving need not necessarily be
directed only to poor or needy communities and broader developmental
causes. It can also be directed to organisations that provide services to
middle and upper middle-class groups like private schools, universities
and hospitals. Wealthy philanthropist Donald Gordon, for example, has
recently made a grant to the University of the Witwatersrand to establish a
private hospital. Private schools are generously funded by large corporations,
a custom very common in the United States where private universities
and hospitals have long been the recipients of philanthropic grants. This
phenomenon may be described as a collective social wage for the privileged
sectors of society, ensuring that resources are concentrated within elite
circles for their privileged consumption alone (Steidlmeier 1992).
Free
dow
nloa
d fr
om w
ww
.hsr
cpre
ss.a
c.za
giving, development and poverty alleviation 33
An excavation of giving in South Africa must thus unearth the
character of corporate social responsibility initiatives. Who in the corporate
sector is giving, to what causes, what motivates them, and what do they hope
to achieve as a result? Moreover, how significant a contribution are such
initiatives when compared with giving by other stakeholders and, ultimately,
what impact do they have on South African society?
Some of these questions are addressed in Chapters 5 and 6, which
deal with corporate philanthropy. Although neither chapter engages in a
quantitative exercise to assess the magnitude of corporate giving, both reflect
on who gives to whom, and how this giving is organised. Friedman, Hudson
and Mackay argue in Chapter 5, for instance, that professionalisation need
not necessarily lead to more responsible giving with greater impact. Instead,
they argue that the need to be innovative in the giving process may be more
important. Moreover, they insist on the legitimacy of corporate funding for
ostensibly middle- and upper-class pursuits like the ‘arts’. In an environment
where government is forced to cut back funding for the high arts like
orchestras and playhouses so that it can pour more resources into poverty
alleviation initiatives, these authors recommend that corporates should make
up the resource slack by taking responsibility for sponsoring these cultural
pursuits.
Finally, and related to the above, is the issue of the political context
within which giving occurs. Of course, it has long been recognised in
the philanthropy literature that both the proportions of giving and their
character are crucially influenced by the political systems of various
societies. The philanthropy literature on tax regimes, for instance, maintains
that tax concessions afforded by states have the effect of facilitating a
philanthropic culture in society. Others like Donati (2003) suggest that some
tax regimes facilitate the social altruism of a society towards the needy by
enabling government to tax the wealthy and thereby redistribute resources
to those who are poor and weak. This issue has taken on a particular
relevance currently because global restructuring has put pressure on the

Free
dow
nloa
d fr
om w
ww
.hsr
cpre
ss.a
c.za
34 giving and solidarity
ability of industrialised states to meet the social and welfare needs of their
citizens. Giving, philanthropy and voluntarism are thus being ‘increasingly
presented in political and academic discourses as a “panacea” to social and
political problems facing liberal democracies’ (Fyfe & Milligan 2003: 397).
However, philanthropy does not have the capacity to ensure that all those in
need receive equitable redress, or that there is no discrimination in terms
of ethnicity, race or religion. In contrast, governments have the potential to
generate a more dependable and consistent flow of resources; to prioritise
and respond to the needs of the poor on the basis of a democratic process
rather than reacting to the desires and idiosyncrasies of the wealthy (Hall
2000; Salamon 1995).
Chapter 8 provides significant empirical evidence for this in South
Africa. This chapter demonstrates that, contrary to popular belief, social
expenditure has risen dramatically throughout the transition period, from
R70.2 billion in 1995/96 to R196.6 billion in 2004/05. Moreover, it explains
the philosophy and rationale behind the rise and fall of special funds, which
is essentially a story of the post-apartheid regime’s institutional attempts to
target resources toward poverty alleviation, development and transformation.
Yet the chapter recognises that, despite this increase in state expenditure
on economic and social services, poverty appears to have increased in the
transformation period. It explains this anomaly through a focus on macro-
economic policy, especially the liberalisation of capital flows, and the lack of
human capacities – both of which counteracted the poverty alleviation effects
of the increased flow of resources to poor and marginalised communities.
But the state is not the only actor to have been impacted upon by the
political context. Indeed, other stakeholders were as significantly influenced
by the transition from apartheid to democracy, which transformed the
character of giving in two fundamental ways. First, whereas early giving
activities were defined along the lines of race, more contemporary processes
have tended to evolve in non-racial directions. For example, given the absence
of state resources for the development of black communities under apartheid,
Indian entrepreneurs gave to causes that supported this community, like the

Free
dow
nloa
d fr
om w
ww
.hsr
cpre
ss.a
c.za
giving, development and poverty alleviation 35
establishments of the ML Sultan Technikon and the University of Durban
Westville. Similarly, entrepreneurs of other racial groups tended to confine
their philanthropic activities within their communities, with the result
that racial labels have tended to attach themselves to different caregiving
institutions. As a result, the Avril Elizabeth home is even today seen as a
‘white’ cause for disabled children while the Aryan Benevolent Home is
conceived as an ‘Indian’ charity.
But racial labelling and associated patterns of giving are increasingly
eroding in the post-apartheid phase. Inspired by the broader goal of nation
building and the drive to establish a national identity, entrepreneurs of
all racial groups have begun to see giving as an important mechanism by
which to incorporate the African community, the most marginalised and
disadvantaged group in society, into the formal economic system. This began
soon after the 1976 revolt when Anton Rupert of the Rembrandt Group and
Harry Oppenheimer of the Anglo American Corporation established the
Urban Foundation as a private sector initiative to address urban development
issues in townships, part of which involved encouraging the development of
a middle class within the African population (Fig 2002).
Since then there have been numerous initiatives directed at bringing
the African population into the socio-economic mainstream. Such initiatives
include bursaries for needy black university students, seed capital for
entrepreneurs to start businesses, and preferential loans for housing. Part of
the motive for this was the self-interested desire to avoid a bloody revolution in
South Africa which, in many senses, it did. Democracy entered South Africa
through a negotiated transition and much of what was attempted before
1994 has been carried through and similar measures are still undertaken in
South Africa by both old and new entrepreneurs. Some new entrepeneurs
may reject the many vocal demands articulating their obligation to assist
the poor, claiming their lack of complicity in apartheid absolves them from
having to pay back into the communities from which they came, but many
others have succumbed to the pressure. The Ploughback Trust is one such
initiative, which harnesses the resources of successful black entrepreneurs

Free
dow
nloa
d fr
om w
ww
.hsr
cpre
ss.a
c.za
36 giving and solidarity
and professionals so that they can be ‘ploughed back’ into needy and under-
resourced communities. Most post-1994 black entrepreneurs, including
Cyril Ramaphosa, Tokyo Sexwale, and Patrice Motsepe, have established
foundations through which they hope to channel their already considerable
resources to worthy causes. And as Chapter 6 indicates, there is nothing to
suggest that patterns of giving in the corporate sector are likely to change in
significant ways as black entrepreneurs conquer the commanding heights of
the South African economy.
But the political transition did not only impact on the giving of
the business community. Indeed, it has had as important an influence
on giving by religious institutions. Chapter 3 demonstrates that whereas
religious institutions focused previously on giving primarily within their
communities, a discernible change occurred in their patterns of giving
in the post-1994 period. Religious institutions in the contemporary era
have explicitly begun to disburse resources across racial and even religious
boundaries. This is particularly marked in the Jewish and Muslim
communities, although it is not confined to them. The political transition has
thus shifted patterns of giving of a number of stakeholders in a non-racial
and national direction.
Furthermore, giving is seen to have evolved into purely ameliorative
kinds of activities, which assist in alleviating but not fundamentally resolving
social problems. The significance of this point needs to be understood
against the backdrop of the debate on whether giving and philanthropy
actually address the issue of structural change in society and make a
difference to the lives of people. Philanthropic giving, it is often argued,
does not challenge the status quo. Instead, the philanthropic sector is
accused of colluding with the forces of inequality that ultimately reinforce
a fundamentally unjust system. It is worth recalling the words of Martin
Luther King: ‘Philanthropy may be commendable, but it must not overlook
the circumstances of economic injustice that make philanthropy necessary.’7
Giving can, of course, be directed to challenging the structural
causes of serious social problems. The American literature often refers to
Free
dow
nloa
d fr
om w
ww
.hsr
cpre
ss.a
c.za
giving, development and poverty alleviation 37
these kinds of activities as ‘social justice philanthropy’ (Shaw 2002). Social
justice philanthropy involves radical challenges to existing wealth and
power structures, particularly by advocating the interests of disadvantaged,
marginalised or under-represented groups in society. It is founded on the
implicit understanding that social and/or developmental services are the job
of the government and should not be left to private individuals or institutions.
It emphasises a bottom-up approach with the goal of encouraging democracy
by involving those most affected by social problems in determining how to
address the inequities they labour under (Milner 2003).
Ironically, the transition to democracy in South Africa is seen to
have shifted giving from a social justice orientation to one that is largely
ameliorative. Whereas in the 1980s philanthropic foundations, organisations
and individuals were open to supporting activities that were directed to
changing the status quo, they were less willing to do so in the aftermath
of the establishment of the democratic state, a consequence largely of the
conditioning effects of the ideology of national unity. Moreover, Habib and
Taylor (1999) have argued that the very necessary demands of accountability,
transparency and financial self-sufficiency imposed by donors on NGOs, have
had the unintended effect of distancing these organisations from the very
poor and marginalised constituencies they are meant to serve.
None of the chapters in this volume proves otherwise. Indeed, if
anything, they indicate that this process is consolidating itself. As Maharaj et
al. argue in Chapter 3, even though religious institutions have a development
focus, their initiatives to establish orphanages, old age homes and medical
and educational facilities, while beneficial, nevertheless have the effect of
legitimising the state’s withdrawal from the provision of these services.
And as is indicated in Chapter 7, most external funding, including official
development assistance and private foundation support, does not reach the
most marginalised communities and is largely in line with state policy and
priorities. The only counter-indication is the fact, pointed out in Chapter
7, that some foundations do tend to support some of the social movements
involved in contesting one or other government policy. But even here,

Free
dow
nloa
d fr
om w
ww
.hsr
cpre
ss.a
c.za
38 giving and solidarity
support for such initiatives is small when compared to the resources devoted
to ‘in-system’ activities. And as Deborah Ewing and Thulani Guliwe argue
in Chapter 7, private foundation support for social movements is limited to
ensuring that civil society is activated and citizens’ voices are heard in the
corridors of political power.
In sum then: the contemporary patterns of giving in South Africa,
described by the authors of this volume, tend to reinforce some findings of
the international literature, but challenge others. They support the findings
that suggest, for example, that religion is a driving force in inspiring and
organising giving. But they challenge other findings, for instance that giving
occurs in both rich and poor communities; in fact, giving is more common
among the poor than the rich, even though the latter (predictably) give
greater amounts. The authors also add rich empirical detail by exposing
giving processes within extended families and demonstrating how these are
conditioned by patterns of obligation rather than pure voluntarism. But the
results of this research do not only speak to the interests of and debates in
the international academy. They also hold lessons of a policy-oriented and
strategic nature for political elites and activists in South Africa, and it is to
these lessons that we now turn our attention.
Policy and strategic implications
The chapters in this volume raise three policy and strategic implications
relevant for governance in contemporary South Africa. The first relates to
the issue of social grants and the perceptions among some, especially in the
Treasury, that these create a dependency syndrome that inhibits innovation
and entrepreneurship. The analysis in Chapter 4 speaks directly to this issue.
Mandla Seleoane demonstrates categorically that social grants are absolutely
crucial for the survival of poor and marginalised communities, especially in
rural areas. Both Chapters 4 and 8 indicate in different ways that the only
resources reaching poor rural communities are from government – through
the social support grants which now reach 10 million recipients. These grants
Free
dow
nloa
d fr
om w
ww
.hsr
cpre
ss.a
c.za
giving, development and poverty alleviation 39
are crucial to the survival of not only the individual recipients, but also their
entire extended family. Moreover, Chapter 4 indicates that the grants are in
many cases being used to lever further resources. Some individuals use the
grant to purchase goods that they subsequently sell, either through spaza
shops or road stalls, while others use it to purchase basic equipment that
enables them to play the role of artisans. Withdrawal of social grants would
thus not only create widespread immiseration, but might also stifle the
emergence of entrepreneurialism in poor and marginalised communities.
Second, all the chapters in this volume expose the lack of
transparency in the giving of a number of stakeholders. The problem is
particularly serious in the case of religious institutions since they are meant
to be the institutional conduits of the vast majority of individual giving.
This lack of transparency aggravates duplication, which is recognised as
a serious problem by most observers familiar with the poverty alleviation
and development sector. The massive waste of resources is indeed a tragedy,
especially if one remembers the scale of the problem and the fact that there
are inadequate resources to address it. Coordination would thus be beneficial
for it could enable maximum gain and impact from limited investment.
But how to achieve such coordination? No stakeholder, other
than government, has either the authority or the ability to organise this
coordination. But if government were to do so, it would create enormous
unhappiness among significant sections of civil society. Moreover, there is a
danger that if government were to do this, it might be tempted to co-ordinate
giving towards poverty alleviation and development in such a manner
that non-state resources are channelled in directions that would support
the priorities of political elites. Again, this may not be good for poverty
alleviation and development, especially if one bears in mind that political
elites’ track record in this regard has not been very good. Perhaps the
answer lies in the need for transparency. It would be entirely legitimate for
government to demand, and even legislate, the need for transparency, for it
would simply facilitate the accountability of multiple stakeholders to citizens.
Free
dow
nloa
d fr
om w
ww
.hsr
cpre
ss.a
c.za
40 giving and solidarity
Greater transparency, if it were realised, would be enormously beneficial
because it would allow stakeholders to know what other actors are doing
without demanding conformity. A plurality of giving would be maintained,
but greater transparency in the environment would facilitate giving that
could result in a greater impact.
Finally, the implicit message of this entire volume, as raised earlier,
is that philanthropy on its own cannot address the problem of poverty
alleviation and development. Indeed, it is worth noting that poverty,
inequality and underdevelopment are problems that have worsened at a
time when civil society and philanthropy have greatly expanded in the
world. Nowhere is this more evident than in South Africa where we have
had poverty and inequality increasing simultaneously with an expansion in
philanthropy and in state expenditure on social and economic services. This
coincidence of increasing poverty and underdevelopment with expanding
philanthropy suggests two strategic implications. First, the state must be
seen as the primary actor in poverty alleviation and development. Chapter 8
brings this fact to the fore in a dramatic way merely by demonstrating the
sheer scale of resources deployed by the state, relative to other stakeholders,
in relation to poverty alleviation and development. Second, a socially
responsible state and political regime is an absolute necessity to address
poverty and underdevelopment. Chapter 8 is essentially a story of the
different struggles within the state to institutionalise development. Its
message is that the contemporary political struggle is one to transform
the philosophical parameters of governance and development both
internationally and locally. Failure in this struggle, the chapter concludes,
would lead to a society spiralling towards human disaster.
The fundamental lesson of this volume is that while philanthropy
and giving by non-state stakeholders may have a role to play in poverty
alleviation and development, they, on their own, cannot be seen as a
solution to these challenges. Indeed, philanthropy and non-state giving will
only have a positive effect on poverty, inequality and underdevelopment if
Free
dow
nloa
d fr
om w
ww
.hsr
cpre
ss.a
c.za
giving, development and poverty alleviation 41
they are integrated within a national political and economic system that
is people-oriented. This suggests the need for a political system in which
marginalised citizens have voice and leverage so that political elites are
conditioned to become responsive to their interests (Ballard et al. 2006). It
requires a political regime that prioritises the interests of the nation’s most
dispossessed and marginalised. Without such a moral centre underpinning
South African society, poverty, inequality and underdevelopment, and their
consequences, are likely to be with its citizens for the foreseeable future.
Notes
1 See http://www.mandelachildren.com.
2 A notable contemporary exception is Wilkinson-Maposa et al. (2005).
3 It should be noted that Mandla Seleoane argues that the phenomenon of stokvels
is overemphasised in the South African literature on poor communities. Indeed,
his study of poor communities, reported in Chapter 4, found that stokvels
appeared in only one case. For an explanation of this, see Chapter 4.
4 Lobola is a payment in cash or kind by a prospective husband to the bride’s
family, and is a practice observed by some cultures in southern Africa.
5 Unfortunately this organisation closed down at the end of 2005.
6 See http://www.corporatecitizenship-africa.com.
7 See www.brainyquote.com/quotes/quotes/m/martinluth132468.html.

Free
dow
nloa
d fr
om w
ww
.hsr
cpre
ss.a
c.za
42 giving and solidarity
References
Ballard R, Habib A & Valodia I (Eds) (2006) Voices of protest: Social movements in post-
apartheid South Africa. Pietermaritzburg: UKZN Press
Becker GS (1974) A theory of social interactions. Journal of Political Economy 82:
1063–1093
Bond P (2000) Elite transition: From apartheid to neoliberalism in South Africa.
Pietermaritzburg: University of Natal Press
Brown KM, Kenny S & Turner BS (2000) Rhetorics of welfare: Uncertainty, choice and
voluntary associations. London: Macmillan
Burt RS (1983) Corporate philanthropy as a cooptive relation. Social Forces 62:
419–449
COSAtU (Congress of South African Trade Unions) (2006) Cosatu political discussion
document: Possibilities for fundamental change. Prepared for the 9th National
Congress, 18–21 September
Dandala H & Moraka K (1990) Burial societies. Johannesburg: Skotaville
Desai A (2002) The poors of South Africa. New York: Monthly Review Press
Donati P (2003) Giving and social relations: The culture of free giving and its
differentiation today. International Review of Sociology 13: 243–272
DOSD (Department of Social Development, Republic of South Africa) (2002)
Transforming the present: Protecting the future. Report of the Committee of Inquiry
into a Comprehensive System of Social Security for South Africa, RP/53/2002. Pretoria
Durkheim E (1972) Selected writings. London: Cambridge Press
Estes RJ (1998) Emerging Chinese foundations: The role of private philanthropy in the
new China. Nonprofit Sector Research Fund, Working Paper Series, The Aspen
Institute
Fig D (2002) Corporate, social and environmental responsibility. SA Labour Bulletin
2(2) 81–85
Fyfe NR & Milligan C (2003) Out of the shadows: Exploring contemporary
geographies of voluntarism. Progess in Human Geography 27: 397–413
Habib A (2004) The politics of economic policy-making: Substantive uncertainty,
political leverage, and human development. Transformation 56 page nos
Habib A & Taylor R (1999) South Africa: Apartheid NGOS in transition. Voluntas 10:
73–82

Free
dow
nloa
d fr
om w
ww
.hsr
cpre
ss.a
c.za
giving, development and poverty alleviation 43
Hall PD (2000) Philanthropy, the welfare state, and the transformation of American
public and private institutions, 1945–2000. The Hauser Centre for Nonprofit
Organisations, Harvard University, Working Paper No. 5
Hoggett J (2003) Beyond philanthropy lies compulsion. Review June: 28–29
Hyden G (1983) No shortcuts to progress. London: Heinemann
Independent Sector (2002) Faith and philanthropy: The connection between
charitable behaviour and giving to religion. Accessed November 2004. www.
independentsector.org
Katz SN (1999) Where did the serious study of philanthropy come from, anyway?
Nonprofit and Voluntary Sector Quarterly 28: 74–82
Mbeki T (2004) State of the Nation Address of the President of South Africa, Thabo
Mbeki. Houses of Parliament, Cape Town, 6 February
Milner A (2003) Change or charity? Alliance. Accessed 2004. http://www.allavida.
org/alliance
Moyo B (2004) Philanthropy in the 21st century: Challenges and opportunities, a study
of southern Africa. Prepared for the Ford Foundation Philanthropy Retreat, Jinja,
Uganda, 28 March–02 April
Mullen J (1997) Performance-based corporate philanthropy: How ‘giving smart’ can
further corporate goals. Public Relations Quarterly 42: 42–48
Nevarez L (2000) Corporate philanthropy in the new urban economy. Urban Affairs
Review 36: 197–227
Olson M (1965) The logic of collective action. Harvard: Harvard University Press
Padayachee V & Valodia I (2001) Changing GEAR? The 2001 Budget and economic
policy in South Africa. Transformation 46: 71–83
Payton RL (1995) Philanthropy: Voluntary action for the public good. Accessed 2004.
http://www.paytonpapers.org
PCAS (Policy Coordination and Advisory Services, The Presidency) (2003a) Towards
a ten year review: Synthesis report on implementation of government programmes.
Pretoria: PCAS
PCAS (2003b) National Spatial Development Perspective. Pretoria: PCAS
Rockey V (2000) CSI Handbook. Johannesburg: Trialogue
SACP (South African Communist Party) (2006a) Class, national and gender struggle
in South Africa: The historical relationship between the ANC and the SACP, Part 1.
Bua Komanisi, Special Edition, May: 3–16
SACP (2006b) Class struggles and the post-1994 state in South Africa, Part 2. Bua
Komanisi, Special Edition, May: 16–31
Free
dow
nloa
d fr
om w
ww
.hsr
cpre
ss.a
c.za
44 giving and solidarity
Saiia DH, Carroll AB and Buchholtz AK (2003) Philanthropy as strategy: When
corporate charity begins at home. Business and Society 42: 169–201.
Salamon LM (1995) Partners in public service. Baltimore: Johns Hopkins University
Press
Salamon LM (1999) The non-profit sector at the crossroads: The case of America.
Voluntas 10: 5–23
Seekings J & Nattrass N (2006) Class, race and inequality in South Africa.
Pietermaritzburg: UKZN Press
Shaw A (2002) Social justice philanthropy: An overview. Prepared for the Synergos
Institute, New York
Silver I (2001) Strategically legitimising philanthropists’ indentity claims: Community
organisations as key players in the making of corporate social responsibility.
Sociological Perspectives 44: 233–252
Sithole P (2006) Non-arithmetic giving: The ethnography of giving amongst the
Shembe and Zionist followers in KwaZulu-Natal and Mpumalanga. Report
prepared for the State of Giving Project, University of KwaZulu-Natal
Steidlmeier P (1992) People and profits: The ethics of capitalism. New Jersey: Prentice
Swilling M & Russell B (2002) The size and scope of the non-profit sector. Center for
Civil Society, Johns Hopkins University Institute for Policy Studies
Terreblanche S (2002) A history of inequality in South Africa 1652–2002.
Pietermaritzburg: University of Natal Press
UNDP (United Nations Development Program) (2003) South African human
development report. Cape Town: Oxford University Press
Wilkinson-Maposa S, Fowler A, Oliver-Evans C & Mulenga FN (2005) The poor
philanthropist – How and why the poor help each other. Cape Town: UCt Graduate
School of Business
Wolfenden Committee (1978) The future of voluntary organisations. London: Croom
Helm
Wright K (2002) Generosity versus altruism: Philanthropy and charity in the US and UK.
Civil Society Working Paper No. 17, London School of Economics

Free
dow
nloa
d fr
om w
ww
.hsr
cpre
ss.a
c.za
45
This chapTer provides a summary of the results of a national sample
survey that focused on giving behaviour among South Africans to provide
a macro-picture of the state of giving in South Africa. The survey measured
both giving behaviour and attitudes to giving. Its focus was on individual-
level giving behaviour. Giving is fairly easily defined as transferring
ownership gratuitously; social giving is less easily defined, since one person’s
just cause is another’s bête noire. Assessing the state of social giving is
therefore complicated by the fact that giving is, to coin a phrase, often ‘in the
hand of the giver’. The survey had to measure what is generally understood
by social giving, such as donating money or goods or time to people living
in poverty and/or organisations working with them. But it also measured
behaviours that respondents thought of as ‘giving’ but which involved
economic exchange in return for a service, such as paying money to ‘car
guards’ regardless of their capacity to actually guard a car, but because
‘they’re trying’ (a widely held sentiment among focus group participants).
The bulk of this chapter analyses the survey findings, which seem
to offer a very positive picture of social giving and the strength of the social
fabric in South Africa. Towards the end of the chapter, we stand back from
2
A nation of givers? Results from a national survey
of social giving
David Everatt and Geetesh Solanki

Free
dow
nloa
d fr
om w
ww
.hsr
cpre
ss.a
c.za
46 giving and solidarity
the survey results to ask broader questions about what the data are really
telling us. Is it good news? Or is giving an unavoidable product of the
particular economic growth path chosen by the ruling party after 1994,
which has seen levels of poverty (at best) remain static, and has thus forced
people into reciprocal giving as a survival strategy? Or does giving reflect
deeper, more positive bonds and ties that bind the population together in the
face of poverty now, as it did before in the face of colonialism and apartheid?
Methodology and limitations
The survey began with a set of focus groups across the country in order to
inform questionnaire design, and to reveal different understandings of what
people give, why they do so, and to whom (as well as the reverse – what, and
to whom, people do not give and why). Groups were recruited using a range
of demographic and other criteria, such as religion, in order to ensure a wide
range of views were canvassed. The focus groups highlighted the importance
of religion as a particularly salient factor, given that many religions practise
giving in an ongoing way and/or during religious festivals or holy days.
Although we include some comments about the impact of religion on giving,
this is more thoroughly covered in Chapter 3 of this volume.
A draft questionnaire was piloted in two provinces, involving urban
and rural respondents and covering all races. The pilot tested specific
questions and the broader methodological attempt to quantify giving. A
revised questionnaire went into the field towards the end of 2003. Wherever
possible, local residents with matric or higher education levels were trained
to act as fieldworkers, thus transferring both skills and finances into the
communities being studied. This also limited the ‘outsider’ effect evident
when fieldworkers from other areas attempt to access communities and
ask personal questions. This was important given the number of election-
related surveys being conducted at the same time. In our view, training local
residents to act as fieldworkers also enhanced the quality of the data.
Free
dow
nloa
d fr
om w
ww
.hsr
cpre
ss.a
c.za
a nation of givers? 47
A random survey sample was drawn, stratified by race and province at
the first level, and by area (rural/urban, etc.) at the second. The sample frame
used was the total population of South Africa according to Census 2001
(we were unable to extract data related to only those individuals aged 18 and
older because the data were not available at the time). The realised sample
comprised 3 000 respondents, yielding an error bar of 1.8 per cent. The
results are, however, representative of all South Africans aged 18 and above,
in all parts of the country, including formal and informal dwellings. Unlike
many surveys, the project partners ensured that the rural component of the
sample (commonly the most expensive for logistical reasons) was large and
did not require heavy weighting (where a small number of respondents have
to represent the views of a far larger community).
Randomness was built into the selection of starting points (from
which fieldworkers began their work) – every fifth dwelling was selected
after a randomly selected starting point had been identified. Randomness
was also built into the selection of respondents, where the birthday rule was
applied; that is, a household roster was completed, all those aged 18 and above
were listed, and the householder whose birthday came next was identified as
the respondent. Three callbacks were undertaken to interview the selected
respondent; if s/he was unavailable, the household was substituted. Some
problems of access were encountered in predominantly white suburbs, where
fieldworkers battled to get past high gates and intercoms as well as suspicion
that the survey was ‘yet another political poll’. The data were coded and
captured, and analysed using SAS software.
The data presented here have the strengths and weaknesses common
to surveys. The data provide a robust snapshot, strong on the ‘what’ but less
so on the ‘why’ of giving. An obvious danger with this survey is that of over-
claim, where respondents may have felt some pressure to provide ‘socially
acceptable’ answers that they give, or give more, than may be the case.
Because we measured all forms of giving – including giving a cooldrink to a
person begging on the street – we may have missed some giving behaviours
because respondents may not have remembered.

Free
dow
nloa
d fr
om w
ww
.hsr
cpre
ss.a
c.za
48 giving and solidarity
A possibly more serious design flaw was our failure to include
expenditure on lottery (‘Lotto’) tickets as a category of giving.1 We did include
a Likert item dealing with the Lotto, however, which found that 68 per cent
of respondents agreed or strongly agreed that ‘buying a Lotto ticket is a way
of helping the poor’.2 We can assume from this that a number of respondents
may have included buying a Lotto ticket when asked about giving money to
the poor, but we were unable to analyse it as a discrete category.
This chapter mimics the structure of the survey instrument,
constructed around a set of five questions, namely: who gives (and who
doesn’t); how much do they give; what do they give (money, goods, time);
who do they give to; and why do they give?
The chapter analyses the level and type of resources mobilised by
citizens for poverty and development, detailing who contributes to which
cause/s and why, and thereby fills a large gap in our knowledge about
individual giving in contemporary South Africa.3
Who gives?
One of the basic questions the survey was designed to answer is ‘who
gives?’4 An understanding of this will enable us to assess what ordinary
South Africans are doing to help the poor,5 and thereby allow the design of
policy, programmatic, organisational and other initiatives to support this. All
respondents were asked about their giving behaviour in the month preceding
the interview (October/November 2003). We have noted the possibility of
over-claim; we did not attempt to verify or ‘test’ respondents’ answers, since
we were asking about a wide range of behaviours from paying tithes to giving
someone a sandwich or cooldrink when stopped at a traffic light. We asked
about five main categories of ‘giving’, set out below.
TAble 2.1 gave us the title of this chapter: South Africa appears to
be a nation of givers, where over half of respondents (54%) gave money
and a third (31%) gave goods to charities or other causes, while slightly less
than one-fifth (17%) volunteered time.6 In addition to giving to formalised

Free
dow
nloa
d fr
om w
ww
.hsr
cpre
ss.a
c.za
a nation of givers? 49
institutions or causes, slightly less than half of respondents told us they gave
money and/or goods (45% respectively) directly to the poor – street children,
people begging on the street and so on.
If we combine these different forms and methods of giving, we find
that a massive 93 per cent of respondents gave – time, money or goods, to
a cause or an individual – in the month before being interviewed. This is
calculated by counting all respondents who gave money to a charity or gave
goods to a charity or volunteered or gave money to the poor or gave goods to
the poor. In measuring giving we deliberately cast the net as wide as possible:
these figures include respondents who made monthly financial contributions
to a charity, regular payments to a religious institution, as well as those who
gave a sandwich or cooldrink to a street child begging at a traffic light. It is
notable that respondents appear to be more comfortable giving to formal
structures than to the poor directly, if we measure this by the amounts given
to formal structures rather than directly to the poor. That said, there are still
very high levels of direct transactional giving to people in need in the form of
cash and/or goods, with nearly half the sample giving in this way.
Given such high levels of giving, differences across demographic
categories are slender. Analysed by race, Indian respondents emerge as the
most active givers, with 96 per cent having given in the month prior to the
interview, dropping to 94 per cent of African respondents, 90 per cent of
coloured and 89 per cent of white respondents. Although the differences are
slight, this pattern is repeated throughout the survey. Gender differences
were also small: 92 per cent of male respondents told us they gave in one
Table 2.1 Reported giving behaviour (all respondents)
Thinking about the last month, have you personally % yes
Given money to a charity or other cause? 54
Given goods, food or clothes to a charity or other cause? 31
Given time (i.e. volunteered) to a charity or other cause? 17
Given money to a beggar/street child/someone asking for help? 45
Given food, goods, time to a beggar/street child/someone asking for help? 45
Free
dow
nloa
d fr
om w
ww
.hsr
cpre
ss.a
c.za
50 giving and solidarity
form or another in the month before being interviewed, rising to 95 per cent
among female respondents. Very slight variations emerged when giving
behaviour was analysed across age cohorts, being slightly lower among the
youngest cohort (including scholars and students) at 91 per cent, rising to
96 per cent among those aged 60 and above. Measured across educational
categories, 92 per cent of respondents with no formal education gave in the
month before being interviewed, as did 94 per cent of those with tertiary
level education.
Importantly, poor and non-poor respondents were equally likely
to have given in the month prior to being interviewed.7 Giving seems to
be ingrained in respondents. Moreover, ‘giving’ is not the domain of the
wealthy; it is part of everyday life for all South Africans, rich and poor alike.
How much do people give?
A key objective of the survey was to measure the level of resource
mobilisation occurring among South Africans, bearing in mind the
limitations of survey research mentioned earlier. To do so, we first asked if
people had given money, time or goods to either a charity or an organisation
or directly to a poor person in need, in the month prior to being interviewed
for the survey. For respondents who told us they had given in any of these
categories, we asked them to tell us how much money or time they had given,
or what type of goods. When calculating total monies given, we used the
midpoint in each of the categories offered to respondents (R1 to R20, R21
to R50 and so on). We did not attempt to quantify goods and services in the
same way.
Three items were quantified: money given to a charity, cause or
organisation; money given directly to the poor; and the amount of time
given (volunteering). TAble 2.2 provides the mean or average (in the middle
column) across all respondents in the sample – not merely the mean of those
who gave – while the right-hand column extrapolates this to the population
as a whole.

Free
dow
nloa
d fr
om w
ww
.hsr
cpre
ss.a
c.za
a nation of givers? 51
TAble 2.2 suggests that each month South Africans give an average of
R27 to organisations, R6.60 directly to poor people, or R33.60 in all. (Among
people who give money the mean is of course higher, at R44/month.) If
we extrapolate this to all South Africans aged 18 and above (reflecting our
sample), R921 million is given by South Africans per month to social causes.
The data in TAble 2.2 also show that South Africans, on average, volunteer
1.9 hours per month for charities and organisations. This amounts to a total
of 52 million hours per month.
Analysing these across demographic categories (see TAble 2.3), we find
on average that men gave more money than women, both to organisations and
directly to the poor. Women, on the other hand, gave more time than men.
Item Sample mean National extrapolation
Money given to a charity/cause/organisation R27.00 R740 797 000
Money given directly to the poor R6.60 R181 084 000
Time given to a charity/cause/organisation 1.9 hours 52 000 000 (hours/month)
Total money given (formal and informal) R33.60 R921 881 000
Table 2.2 Total money and time given (all respondents)
Table 2.3 Total giving by race and sex (all respondents)
Average money to organisation(R per month)
Average money to individual (R per month)
Total average money giving(R per month)
Average time volunteered(hrs per month)
All 27 7 34 1.9
Sex
Male 29 7 36 1.7
Female 26 6 32 2.2
Race
African 16 5 21 2.2
Indian 58 22 80 2.1
Coloured 62 5 67 1.1
White 80 17 97 0.6

Free
dow
nloa
d fr
om w
ww
.hsr
cpre
ss.a
c.za
52 giving and solidarity
Looking at race we find that white respondents gave more money on average
to organisations than other races did, reflecting the economic status given to
them under apartheid; where white respondents gave an average of R80 to
organisations, this dropped to R17 given directly to poor people begging on
the street. But where whites tend to give money, they give less time – white
respondents on average volunteered for just 0.6 hours in the month before
being interviewed. The close correlation between education and economic
status is reflected in the finding that those with no or low formal education
gave lower amounts of money than those with higher levels of education.
In all, 17 per cent of respondents volunteered time in the month
before being interviewed; during that month, they gave an average of 11 hours
Table 2.4 Total giving by province and socio-economic status (all respondents)
Average money to organisation(R per month)
Average money to individual (R per month)
Total average money giving(R per month)
Average time volunteered(hrs per month)
All 27 7 34 1.9
Province
Eastern Cape 34 8 41 5.2
Free State 26 11 37 0.6
Gauteng 21 6 28 1.5
KwaZulu-Natal 19 6 25 1.1
Mpumalanga 25 7 32 0.2
Northern Cape 23 3 26 1.0
Limpopo 17 6 23 3.6
North West 18 5 23 0.7
Western Cape 67 7 74 1.3
Socio-economic status
High 29 7 37 1.8
Low 17 3 20 2.8

Free
dow
nloa
d fr
om w
ww
.hsr
cpre
ss.a
c.za
a nation of givers? 53
each. (The average across the entire sample – including those who did
not volunteer – is 1.9 hours.) This extrapolates to some 4.6 million people
volunteering their time.8
Looking first at the bottom two rows of TAble 2.4, we find again
that those with low socio-economic status gave less money and more
time, reversed among those with high socio-economic status. Analysed
by province, we find that the poorer provinces tend to have the highest
levels of volunteering (Eastern Cape followed by Limpopo); but the
wealthier provinces are not necessarily those giving most money (Gauteng
respondents, for example, gave less money and less time than respondents
from the Eastern Cape). Broadly speaking, there is an inverse relationship
between giving money or time – those in privileged economic positions
tend to give money, while those lacking money give more time. African
respondents on average gave the lowest amounts of money to organisations
(R16) or individuals (R5), but the largest amount of time (2.2 hours). Indian
respondents were the exception, giving both money and time.
In all, 77 per cent of respondents told us they gave money (any
amount) directly to charities, causes or organisations or to poor people
directly. Measured across the entire sample, the average respondent gave
R33.60. As a nationally representative sample, we can extrapolate these
findings to the population as a whole. According to Census 2001, there are
27 436 917 South Africans aged 18 and above. If each of those people gave
R44 (the mean per month among those who give money) to a charity or
directly to the poor, then South African citizens mobilised slightly less than
R930 million in an average month for development and anti-poverty work.
From one perspective, this is a massive amount of money. However, it should
be seen in context: Census 2001 found that the total monthly income for
the working-age population (that is, excluding those aged 65+ who we have
included in our sample) was R42 billion. The survey results suggest that
2.2 per cent of this is given away to organisations or to the poor.
Free
dow
nloa
d fr
om w
ww
.hsr
cpre
ss.a
c.za
54 giving and solidarity
What do people give and to whom?
As noted, 93 per cent of respondents were involved in some form of social
giving in the month prior to being interviewed. For the majority, this took
the form of contributing to organised charities or similar causes. But just
less than half of respondents (45%) told us they had given money or goods to
street children or poor people asking for help. This reflects the contribution
of citizens to the social fabric in South Africa, and shows social capital
transformed into economic capital.
Giving money to causes, charities and organisations
Just over half (54%) of respondents told us they had had given money to
a cause, charity or organisation in the month prior to being interviewed
(see TAble 2.1). If we focus on incidence of giving – not the amounts given
– we find that women (56%) were slightly more likely to have done so than
men (53%), although men gave more money than women (see TAble 2.3).
Measured by race, we find that African respondents were least likely to
have given money (52%), while Indian respondents were most likely to have
done so (70%); coloured (66%) and white (62%) respondents were situated
between the two. This presumably reflects the fact that Africans comprise 95
per cent of South Africa’s poor, estimated between 45 and 55 per cent of the
total population (Everatt 2003). Lack of financial resources may explain why
giving money is lowest among younger age cohorts, but rises with education
levels (from 49 per cent among those with no formal education to 64 per cent
among respondents with tertiary education).
But ‘poverty’ is inadequate as a single explanatory variable: those
classified as poor (using the adapted Statistics South Africa matrix)
were more likely (60%) to have given money in the month prior to being
interviewed than the non-poor (54% of whom gave money). The poor seem
more likely to help others financially than the non-poor, albeit with smaller
sums of money. We asked respondents who had given money to a charity,

Free
dow
nloa
d fr
om w
ww
.hsr
cpre
ss.a
c.za
a nation of givers? 55
How much did you give? %
Less than R1 5
R1 to R20 50
R21 to R50 22
R51 to R100 14
R101 to R500 6
R501 to R1 000 1
R1 001 to R 2000 0
More than R2 000 0
Cause/organisation supported %
Church/mosque/synagogue/temple 80
The disabled (e.g. dogs for the blind) 14
Hiv/aids 14
The poor 29
The environment 3
Children 18
The aged 11
The homeless 14
Animals 4
Victims of violence 3
Victims of emergencies (e.g. floods) 3
The unemployed 10
International issue (e.g. Iraq war) 1
Sport 4
People selling things on the street 14
Car guards 11
Other 4
Table 2.5 Amount given to organisation (among those who gave: 54 per cent of sample)
Table 2.6 Causes supported (by respondents who gave money)

Free
dow
nloa
d fr
om w
ww
.hsr
cpre
ss.a
c.za
56 giving and solidarity
cause or organisation in the month prior to being interviewed how much
they had given (see TAble 2.5).
Over half of respondents (55%) had given up to R20 in the month
before being interviewed. Over a third (36%) had given between R21 and
R100; the remainder had given more. Respondents who gave money to
charities, causes or organisations gave an average of R44 each in the month
prior to being interviewed. This is a substantial mobilisation of resources by
organisations. We asked respondents who had given money which charity,
cause or organisation they had given it to. Respondents could give more than
one answer, so figures do not add up to 100 per cent (see TAble 2.6).
Four out of five respondents (80%) who had given money had
given it to a religious body of some sort, while a third (29%) had given it to
organisations working for the poor. Organisations working for children were
also well supported (18%), followed by a clutch of issues including HIV/AIDS,
people with disabilities and homeless people (14% respectively).
If we look at the two rows before ‘other’ – namely paying money to
people selling on the street or car guards – we could argue that this is less
an act of giving than are of purchasing a service. These categories have
been included because focus group respondents insisted that they regard
such behaviour as giving. It could be argued that these categories should be
removed; for this chapter they have been retained.
Giving goods, food or clothes to causes, charities and organisations
A third (31%) of respondents gave goods, food or clothes to a charity, cause
or organisation in the month before being interviewed (see TAble 2.1). More
women (34%) gave than men (28%). Analysed by race, Indian respondents
(55%) were most likely to have given food, clothes or goods to a charity or
cause; they were followed by white (40%), African (30%) and coloured (27%)
respondents. Giving rose with age and with education, as it did where giving
money was concerned.
Analysed across the nine provinces, a rather different picture
emerges from what we saw regarding those who gave money (see TAble 2.4).

Free
dow
nloa
d fr
om w
ww
.hsr
cpre
ss.a
c.za
a nation of givers? 57
Respondents from the Western Cape were most likely to give money, but least
likely to give goods, food or clothes. Eastern Cape respondents continued
to give in far higher proportions than respondents from other provinces.
Respondents from North West were least likely to give clothes, goods or food
to a charity or cause.
People living in rural areas were the most generous with goods, food
and clothes: 36 per cent gave in the month prior to being interviewed, as
did 35 per cent of people in formal dwellings and 19 per cent in informal
dwellings in metropolitan areas; and 30 per cent in formal and 23 per cent in
informal dwellings in urban areas.
Religion remained important, but with people from faiths other
than Christianity (40%) more likely to have given food, clothes or goods in
the month prior to interview than Christians (33%); respondents without a
religion or faith trailed some way behind both (17%).
Over three-quarters (78%) had given food or drink in the month
before being interviewed, while two-thirds (68%) had given clothes. One
in seven (15%) had given blankets in the month prior to being interviewed,
with the remainder giving items such as books (6%), toys (6%), medicinal
supplies (6%) and so on.
As we can see from FIgure 2.1, religious institutions were most
likely to have received donations of goods, food or clothes, followed by
respondents giving to ‘the poor’ and HIV/AIDS-related causes. Religious
institutions may of course in turn distribute goods to causes such as the
poor, HIV/AIDS and so on. Religious bodies are the most likely recipients of
both money and goods.
Volunteering
Just less than a fifth (17%) of respondents gave time to a charity, cause or
organisation in the month before being interviewed (see TAble 2.1). The
gender gap narrows slightly here, with 19 per cent of female and 17 per cent
of male respondents having volunteered, although women tend to give more

Free
dow
nloa
d fr
om w
ww
.hsr
cpre
ss.a
c.za
58 giving and solidarity
time than men. Indian respondents were the most likely to volunteer (23%
had done so), followed by Africans (19%), whites (12%) and coloureds (11%).
The pattern established earlier remained constant: incidence
of volunteering increased with age and education. Importantly, poor
respondents (23%) were more likely to have volunteered than non-poor
(17%). Volunteering in South Africa is not the preserve of the middle class
with time and resources at its disposal, which was also true of other types of
giving.
Rural dwellers were most likely to volunteer (23%), followed by
people living in formal dwellings in small towns (16%). In metropolitan
areas, formal and informal dwellers were equally likely to have volunteered
(15% respectively). This was reflected when results were analysed across
the provinces, where two predominantly rural provinces had the largest
proportions of volunteers.
Figure 2.1 Causes supported by giving goods, food or clothes (among those who gave: 31% of sample)
Religio
us
The poor
The age
d
Children
Homele
ss
Disable
d
Unemploye
d0
10
20
30
40
50
6060
23
31
19 1815
1310
Hiv/aid
s
Perc
enta
ge

Free
dow
nloa
d fr
om w
ww
.hsr
cpre
ss.a
c.za
a nation of givers? 59
Substantial potential exists for deepening voluntarism, and the
non-profit sector has to become better at tapping this. In the Eastern Cape –
which exhibits consistently high levels of giving in various forms – one-third
of respondents volunteered, compared with one in 20 in Mpumalanga.
Poverty seems not to determine giving behaviour, including voluntarism.
We asked the 17 per cent of respondents who had volunteered to tell us
how much time they had given to their chosen cause in the month prior to
being interviewed. Four in ten respondents (39%) volunteered between one
and two hours, while a third (35%) volunteered from two hours to a day of
their time and a fifth (21%) volunteered in excess of three days in the month
before being interviewed.
We asked respondents who had volunteered to tell us the cause for
which they had given their time. Religious bodies again topped the list (60%),
followed by ‘the poor’ and HIV/AIDS. Significant proportions had volunteered
in support of the aged (19%), children (18%) and the homeless (15%).
Giving money directly to poor people
Moving from giving to organisations to direct transactions with the poor, the
questionnaire asked about giving money to ‘a beggar/street child/someone
asking for help’, In the next section we analyse those who gave food, clothes or
goods directly to the poor. In both instances, 45 per cent of respondents said
they had given to the poor (see TAble 2.1). We asked respondents who had given
money how much they had given in the month prior to being interviewed (see
TAble 2.7). The figures in the third column show, for comparative purposes,
the percentage of respondents who gave money to an organisation (although
the amounts donated differ).
Over half of respondents (54%) had given up to R5 in the month
before being interviewed. Another third (31%) had given between R6
and R20, while the remainder had given larger amounts. Overall, more
respondents had given to a cause or charity (54%) than to poor people (45%).
The total amount given differs because more respondents give, and give
more, to formal structures.
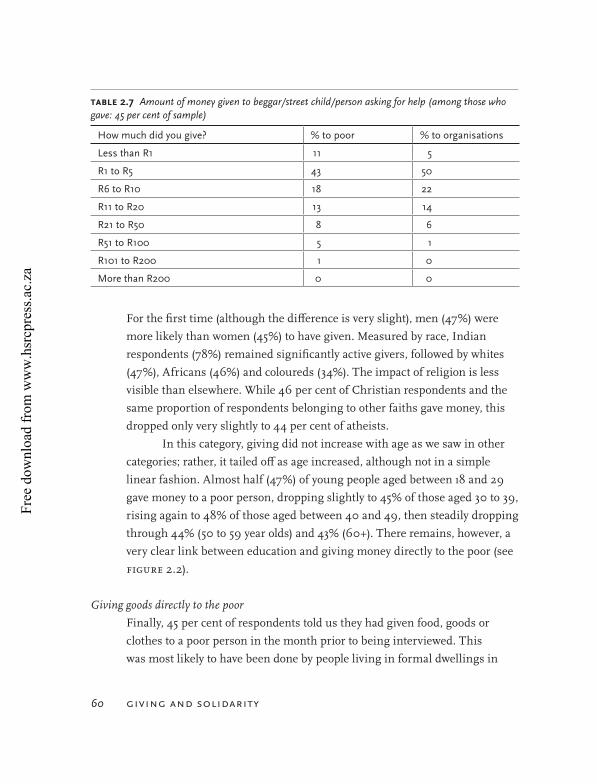
Free
dow
nloa
d fr
om w
ww
.hsr
cpre
ss.a
c.za
60 giving and solidarity
For the first time (although the difference is very slight), men (47%) were
more likely than women (45%) to have given. Measured by race, Indian
respondents (78%) remained significantly active givers, followed by whites
(47%), Africans (46%) and coloureds (34%). The impact of religion is less
visible than elsewhere. While 46 per cent of Christian respondents and the
same proportion of respondents belonging to other faiths gave money, this
dropped only very slightly to 44 per cent of atheists.
In this category, giving did not increase with age as we saw in other
categories; rather, it tailed off as age increased, although not in a simple
linear fashion. Almost half (47%) of young people aged between 18 and 29
gave money to a poor person, dropping slightly to 45% of those aged 30 to 39,
rising again to 48% of those aged between 40 and 49, then steadily dropping
through 44% (50 to 59 year olds) and 43% (60+). There remains, however, a
very clear link between education and giving money directly to the poor (see
FIgure 2.2).
Giving goods directly to the poor
Finally, 45 per cent of respondents told us they had given food, goods or
clothes to a poor person in the month prior to being interviewed. This
was most likely to have been done by people living in formal dwellings in
Table 2.7 Amount of money given to beggar/street child/person asking for help (among those who gave: 45 per cent of sample)
How much did you give? % to poor % to organisations
Less than R1 11 5
R1 to R5 43 50
R6 to R10 18 22
R11 to R20 13 14
R21 to R50 8 6
R51 to R100 5 1
R101 to R200 1 0
More than R200 0 0

Free
dow
nloa
d fr
om w
ww
.hsr
cpre
ss.a
c.za
a nation of givers? 61
Figure 2.2 Giving money directly to the poor (all respondents by education)
0
10
20
30
40
50
60
37
4347
54
None
Perc
enta
ge
Primary
Level of educationSecondary Tertiary
metropolitan (57%) or urban (53%) areas, followed by those living in informal
dwellings in metropolitan (45%) or urban (47%) areas, while rural dwellers
were least likely to have done so (36%). Women (49%) were again more likely
than men (43%) to have given. The racial profile is slightly different from
what we have seen: Indian respondents (79%) remained the most likely to
give, followed in this instance by coloured (67%), white (47%) and African
(42%) respondents.
In TAble 2.8 we have again inserted a column allowing comparison
between goods given directly to the poor (the middle column) and to
charities and organisations ( the right-hand column). Food and/or drink
were the most likely items to have been given in both instances, followed by
clothing. It should be recalled, however, that where 31 per cent of respondents
gave goods to a charity, cause or organisation, 45 per cent gave directly to
poor people. More people are motivated to give goods (rather than money)
directly to the poor than to charities or organisations.

Free
dow
nloa
d fr
om w
ww
.hsr
cpre
ss.a
c.za
62 giving and solidarity
Other forms of ‘giving’
Focus group participants mentioned other forms of giving that the survey then
tracked. Key among these was giving to family members who do not live in the
respondent’s household (see TAble 2.9). Just over half of respondents (55%) said
they had given money, goods, food or other items to members of their family
not living in their household in the month preceding being interviewed. Money
was most commonly mentioned, followed by food and drink, and clothing.
Women (58%) were more likely than men (53%) to give money, goods
or other items to non-household family members, although when men did
so they were more likely to give money (75%) than women (66%). Helping
non-household family members differs considerably by race. African (59%)
and Indian (58%) respondents were considerably more likely to do so than
coloured (42%) and white (39%) respondents. This kind of giving was also
influenced by religion, with two-thirds (64%) of non-Christians helping non-
family members, the figure dipping slightly among Christians.
Taking the point further, a third of respondents with children aged
below 18 told us their household included children who were not the children
What did you give to the poor? % to poor (% to organisation)
Food/drink 89 78
Clothes 52 68
Blankets 9 15
Goods for recycling 8 4
Piece work 7 7
Stationery 4 4
Books/educational materials 4 6
Toys 4 6
Medicine/medical supplies 4 6
Other 3 4
Tools 2 2
Building materials 1 1
Table 2.8 Items given to poor people (among those who gave: 45 per cent of sample)

Free
dow
nloa
d fr
om w
ww
.hsr
cpre
ss.a
c.za
a nation of givers? 63
of the head of the household. We tested all respondents’ attitudes to this,
and found that a third (34%) felt that paying for their own children was their
duty, but paying for the children of relatives was giving. Over half (55%) felt
that duty extended to paying for both their own and relatives’ children; giving
began where they paid for children outside the family (see FIgure 2.3). These
Giving to non-household family members % giving
All 55
Province
Eastern Cape 75
Free State 57
Gauteng 63
KwaZulu-Natal 44
Mpumalanga 38
Northern Cape 52
Limpopo 73
North West 47
Western Cape 34
Sex
Male 53
Female 58
Race
African 59
Indian 58
Coloured 42
White 39
Socio-economic status
High 55
Low 58
Table 2.9 Giving to non-household family members by province, sex, race and socio-economic status
(all respondents)

Free
dow
nloa
d fr
om w
ww
.hsr
cpre
ss.a
c.za
64 giving and solidarity
answers reflect a very different set of perspectives on the notion of giving,
where it begins and ends, and what it covers.
A pattern emerges from the survey – also reflected here – with giving
higher among respondents from the poorest provinces, notably the Eastern
Cape and Limpopo, among women, among African and Indian respondents,
and among those in the low socio-economic status category. Giving, it seems,
is a considerable distance from traditional notions of philanthropy.
What causes do people give to?
We asked what respondents thought was ‘the most deserving cause that
you would support if you could?’ (see FIgure 2.4). This was an open-ended
question where respondents could give any answer they wished; answers
were later categorised and given numeric codes. It was phrased so as to allow
all respondents to tell us what they would support regardless of whether or
not they currently either do so or are in a position to do so.
Responses were dominated by three categories: children or youth
(22%), HIV/AIDS (21%) and ‘the poor’ (20%). These were followed by a
set of smaller categories, including people with disabilities (8%) and the
elderly (5%). It is notable that 2 per cent of respondents believed that their
preferred political party was the most deserving cause, perhaps reflecting
how recently South Africa began normalising and the ongoing importance of
politics in many people’s lives. One per cent of respondents were sufficiently
cynical to say ‘nothing’ was a sufficiently deserving cause. The ‘other’
category included a wide-ranging set of answers including animal welfare,
environmental concerns and others.
The high scores for children and youth, HIV/AIDS and poverty suggest
that respondents have a progressive and pro-poor understanding of South
Africa and societal priorities. Men were likely to cite children/youth (21%),
HIV/AIDS (20%) and ‘the poor’ (21%) as the most deserving causes, followed
by the disabled (10%) and the aged (5%). Similarly, women were most likely to
cite children/youth (24%), followed by HIV/AIDS (22%) and ‘the poor’ (20%),

Free
dow
nloa
d fr
om w
ww
.hsr
cpre
ss.a
c.za
a nation of givers? 65
followed by the disabled (7%) and the aged (6%) as most deserving. Analysed
across race groups, a somewhat more complex pattern emerges. For example,
children/youth were cited as most deserving by 33 per cent of coloured
Figure 2.3 Attitudes to paying for relatives (all respondents)
0 10 20 30 40 50 60
55
34
Paying for relatives’
children is duty
Paying for relatives’ children
is giving
Percentage
Figure 2.4 What do you think is the most deserving cause that you would support if you could? (all respondents)
5
0
10
15
20
25
Children
/youth
The poor
Disable
d
The elderl
y
Religio
us body
Politica
l part
y
Nothing
Other
2221
8
3 1
20
5
2
12
Hiv/aid
s
Perc
enta
ge

Free
dow
nloa
d fr
om w
ww
.hsr
cpre
ss.a
c.za
66 giving and solidarity
respondents, 30 per cent of Indian, 22 per cent of African and 19 per cent of
white respondents. HIV/AIDS, on the other hand, was mentioned by just 11 per
cent of Indian and 14 per cent of white respondents, rising to 18 per cent of
coloured and 23 per cent of African respondents. ‘The poor’ was mentioned
by 25 per cent of Indian respondents, 22 per cent of African, 17 per cent of
white and 13 per cent of coloured respondents.
When we turn to less frequently mentioned issues, things are slightly
clearer. For example, animal welfare was cited by 8 per cent of white and 2
per cent of coloured respondents, but not by Indian or African respondents.
Religious institutions were mentioned as most deserving by 8 per cent of
Indian respondents, 4 per cent of white, 3 per cent of African and 2 per cent
of coloured respondents. Political parties were cited by 3 per cent of African
respondents and 1 per cent of coloured respondents, but not by white or
Indian respondents.
Concern with ‘the poor’ declined as education levels rose: it was
mentioned by 24 per cent of respondents without formal education, 22 per
cent with primary education, 20 per cent with secondary and just 14 per cent
of those with tertiary level education. HIV/AIDS showed the reverse pattern,
rising from 16 per cent among those without education, through 20 per
cent with primary, 22 per cent with secondary and 25 per cent of those with
tertiary education.
Giving to international causes
South Africans are highly motivated to give to local causes, but significantly
less so to international causes. (The survey went into field prior to the 2004
tsunami, which may have affected the perceptions reported here.) Less than
one in ten respondents (8%) told us they had ever given money specifically
to international causes. This is a not insignificant proportion of respondents.
However, internationalism does not seem to have permeated equally in South
African society. For example, while 7 per cent of African and 6 per cent of
coloured respondents told us they had given money to an international cause,
this was true of 14 per cent of white and 22 per cent of Indian respondents.

Free
dow
nloa
d fr
om w
ww
.hsr
cpre
ss.a
c.za
a nation of givers? 67
We also tested respondents’ attitudes to giving to local and international
causes. As FIgure 2.5 makes clear, the majority (65%) of respondents regard
domestic causes as more deserving than international causes, while a fifth
(20%) regard local and international as equally deserving. A further one in
ten (9%) had no response, while a tiny 4 per cent told us international causes
were more deserving than local causes.
Why do people give?
We tested respondents’ attitudes to giving via a series of Likert items
(see FIgure 2.6). Many of the statements were taken from focus group
participants. Helping the poor is widely regarded as an important part of
building the new South Africa – 93 per cent agreed or strongly agreed with
the statement – indicating broad popular support for pro-poor policies and
programmes. This view was widely shared among African respondents (95
per cent agreed or strongly agreed), dropping to 90 per cent of Indian and
coloured respondents and then to three-quarters (77%) of whites.
A positive attitude to helping the poor is not mere altruism: there is
an apocalyptic edge to the issue, indicated by the 57 per cent of respondents
Figure 2.5 Attitudes to local and international causes (all respondents)
0 10 20 30 40 50 60 70
Don't know 9
Local moredeserving 65
Local/internationalequally deserving 20
Internationalmore deserving
4
Percentage

Free
dow
nloa
d fr
om w
ww
.hsr
cpre
ss.a
c.za
68 giving and solidarity
who agreed or strongly agreed that ‘if we do not help the poor now we might
lose everything later’; just a quarter (26%) rejected the notion. Helping the
poor is both a moral act and (for some) linked to self-preservation. This
was strongest among African respondents (62 per cent agreed or strongly
agreed – Indian respondents were next highest at 44 per cent), and among
respondents living in the Free State (80%), where a year later violence broke
out in a number of areas over dissatisfaction with service delivery.
Helping the poor is widely regarded as the responsibility of citizens,
not (just) government. Almost two-thirds of respondents (61%) disagreed or
strongly disagreed with the statement, ‘It is government’s responsibility to
help the poor, not mine.’ A quarter (24%) of respondents agreed or strongly
agreed with the notion that helping the poor was the sole responsibility of
government. Intriguingly, agreement was highest among Indian respondents
(38%), who also show the highest levels of giving. Among other race groups,
agreement with the statement ranged from 29 per cent of whites and
coloureds to 23 per cent of Africans.
We asked respondents to complete the following sentence: ‘Help
the poor because…’ This was an open-ended question; answers are shown
in FIgure 2.7. For two-thirds (68%) of respondents, giving to the poor is
motivated by feelings of human solidarity – we should give because the
poor have nothing, or are suffering, or are in need, or deserve something
from us. For others it seems to be more of a rational decision to try and help
tackle poverty (10%). Almost one in ten respondents answered the question
in religious terms, with 3 per cent telling us they gave because their God
required it of them and 6 per cent because by giving they will be blessed.
Social capital and giving
In much of the literature on ‘philanthropy’, the existence of social capital
is seen as a key requirement for giving to occur. To analyse the issue more
closely, we created a fairly simple social capital index. The variables used
included: access to media, attitudes to reciprocal giving (with neighbours),
trust, attitudes towards the motives of other community members,

Free
dow
nloa
d fr
om w
ww
.hsr
cpre
ss.a
c.za
a nation of givers? 69
Figure 2.6 Attitudes to giving (all respondents, ‘neutral’ not shown)
0
20
40
60
80
90
70
50
30
10
100
93
2457
2
61
26
Agree Disagree
Helping poor important for new
South Africa
Help poor or lose all Government must help the poor not me
Perc
enta
ge
Figure 2.7 ‘Help the poor because...’ (all respondents)
Percentage

Free
dow
nloa
d fr
om w
ww
.hsr
cpre
ss.a
c.za
70 giving and solidarity
membership of civil society organisations (CSOs) and/or community-based
organisations, as well as Likert items dealing with alienation and anomie. For
ease of analysis we dichotomised the results into a ‘high’/’low’ index.
It should be noted that the social capital index covers a wide range of
variables, from simple engagement via membership of CSOs (which is very
high) through to trust, alienation and the local social fabric (which vary
widely). When dichotomised, we found that 46 per cent of respondents fell
into the ‘high’ category and 54 per cent into the ‘low’ category. This reflects
the impact of including attitudinal questions alongside simple membership
questions.
Although there are slight differences in giving behaviour, overall
it appears from the survey that in South Africa social capital is not a
precondition for giving. Combining all the forms of giving analysed earlier,
we found that 95 per cent of those with ‘high’ social capital gave in the month
prior to being interviewed, dropping to 93 per cent among those with ‘low’
social capital. Analysing the open-ended question – ‘What do you think is the
most deserving cause that you support or would support if you could?’ – we
found slender differences between those with ‘high’ and ‘low’ social capital
(see FIgure 2.8). These are some predictable nuances – more of those with
low social capital supporting ‘the poor’ and more of them saying there was
no cause they would support. Analysing giving behaviour across the social
capital index provides some interesting insights.
Social capital does affect giving at a general level, with giving
behaviour more common among those with high than those with low social
capital (see TAble 2.10). But the differences are slight – for example, 18 per
cent of those with high social capital volunteered for a cause or charity
in the month prior to being interviewed, dropping slightly to 17 per cent
among those with low social capital. The two categories where differences
are more significant are giving money to a charity/cause and giving money
to a beggar/person asking for help. Those low in social capital are less likely
to have given money in the month prior to being interviewed than those

Free
dow
nloa
d fr
om w
ww
.hsr
cpre
ss.a
c.za
a nation of givers? 71
with high social capital. But this pattern is less evident when analysed by
voluntarism or giving goods, either to a charity/cause or directly to the poor.
% High social capital giving % Low social capital giving
Gave money to cause 58 52
Gave goods to cause 33 30
Volunteered 18 17
Gave money to beggar 51 42
Gave goods to beggar 48 44
Figure 2.8 Most deserving cause (by social capital index)
Table 2.10 Giving behaviour (respondents who gave by social capital index)
Children
/youth
The poor
Disable
d
The elderl
y
Religio
us body
Politica
l part
y
Nothing
0
5
10
15
20
25
2322 22
2120
21
98
5 5
34
23
1
3
High Low
Hiv/aid
s

Free
dow
nloa
d fr
om w
ww
.hsr
cpre
ss.a
c.za
72 giving and solidarity
I give because…
Giving – transferring ownership gratuitously – should be good for both
giver and recipient. It has its own power dynamics, particularly in a society
as unequal as South Africa, but those should not detract from the fact that
giving is an inherently positive act. As FIgure 2.9 makes clear, four out of
five respondents (82%) agreed with the statement ‘I give because it makes
me feel better’ – just 8 per cent disagreed. Among those who disagreed with
the statement were 7 per cent of African respondents, 10 per cent of Indian,
15 per cent of coloured and 18 per cent of white respondents. No significant
gender differences emerged.
Slightly fewer respondents (78%) agreed with the statement: ‘I give to
make the country a better place.’ Racial differences were clear: while 83 per
cent of African and 72 per cent of coloured respondents agreed or strongly
agreed, just 59 per cent of white and Indian respondents respectively did so.
It would be interesting to pursue further why these respondents are giving,
although the survey did not do so.
The third Likert item – ‘I give because I have more than I need’ –
generated high levels of disagreement (72% disagreed or strongly disagreed).
We saw earlier that poor respondents are more likely to give than their
wealthier counterparts – but while 77 per cent of respondents classified as
poor rejected the statement, so did 72 per cent of the non-poor respondents.
Indian respondents were most likely to agree or strongly agree (31% did so),
followed by white (22%), coloured (15%) and African respondents (14%),
reflecting the racial profile of wealth and poverty in the country.
‘Charity’ or ‘change’?
One issue that may determine giving behaviour is the distinction between
immediate need and longer-term solutions, an issue which permeates
the development literature. We posed this as a set of statements made by
two people which were read out to respondents: ‘I give to needy causes or
campaigns that help people who are in trouble right now’ was the first, and
‘I prefer to give to causes or campaigns that will change the way things are

Free
dow
nloa
d fr
om w
ww
.hsr
cpre
ss.a
c.za
a nation of givers? 73
Figure 2.9 Attitudes to giving (all respondents) I give because…
It makes me feel better
I give because …
It helps makeSouth Africa a better place
I have more thanI need
0
20
40
60
80
90
70
50
30
10
100
82 1578
8
72
7
Agree Disagree
Perc
enta
ge
Figure 2.10 Short-term need vs. long-term solutions? (all respondents)
0
10
20
30
40
50
BothHelp people inimmediate need
Help findlong-term solutions
21
34
44
Perc
enta
ge

Free
dow
nloa
d fr
om w
ww
.hsr
cpre
ss.a
c.za
74 giving and solidarity
done in the long term’ was the second. Respondents could choose either, or
both if they wished (see FIgure 2.10).
The question was difficult to phrase, since it seemed to suggest that
longer-term solutions were the more appropriate destination for giving. This
may have occurred – but even so, a third (34%) of respondents told us they
give to people in immediate need, and a fifth (21%) responded that both
short-term need and long-term solutions deserve their support. The data
suggest that both charity and development have a support base to draw on.
Analysed across the nine provinces, some interesting patterns
emerge. ‘Change’ was generally the dominant view when analysed across
provinces; in the Free State (the only province where respondents were likely
to say they give to make South Africa a better place), it was far and away
the dominant view. Given the pervasive nature of poverty in South Africa,
it is perhaps surprising that ‘both’ was less commonly stated – millions of
South Africans do rely on ‘charity’ for survival, while presumably desirous of
change in their personal situation. Respondents from informal settlements
in metropolitan (48%) and peri-urban areas (55%) were more likely to
support ‘change’ than their counterparts living in formal areas, dropping
slightly to 45 per cent among rural respondents. No significant gender
differences emerged. Analysed across race groups, we found that ‘charity’
was the dominant view among Indian (64%) and coloured (53%) respondents;
‘change’ was dominant among African respondents (50%); while 42% of
whites opted for ‘both’.
Responses were also analysed across the socio-economic categories.
However, differences were less marked than expected, with results in the
three categories (short-term need, long-term change or both) varying only
by a matter of 1 to 2 per cent. If we were to try and extract a pattern from
these slight differences, it would be that the poorer the respondent, the more
likely they were to support causes that seek to change rather than provide
amelioration.
Overall, the dominant view was that people prefer giving to causes
that seek longer-term solutions to our problems than to short-term charitable

Free
dow
nloa
d fr
om w
ww
.hsr
cpre
ss.a
c.za
a nation of givers? 75
interventions, although a significant proportion sees the value of the latter.
There seems to be a solid support base for a wide range of organisations and
campaigns, from social movements through to more traditional charities.
This is a positive finding for the non-profit sector as a whole, particularly
organisations that use advocacy, lobbying and local organisational work
alongside developmental work.
Conclusion
The survey data suggest that an overwhelming proportion of South Africans
give in some form or another. The data also suggest that measuring giving
has to be sensitive to the cultural norms of a society. Giving, as measured
in this survey, is far more widespread among South Africans than a study
of ‘philanthropy’ would suggest, for example, by accounting for reciprocal
exchange, giving to non-household family members and so on, as well as
measuring the giving of small items such as food and clothing and not
just cash donations. Measured in ways that reflect the lived experiences
of respondents may reveal a very different world map of giving and, in
particular, may show how much money, time and goods the poor give to
others, rather than merely trumpeting the giving of a tiny wealthy elite.
It is not surprising that non-poor, highly educated respondents gave
more money than poor and less educated respondents. But what is important
is the level of giving among the poor and less educated. Even if they (fairly
obviously) give smaller amounts of money, more poor people give than non-
poor people; and those who cannot afford to give money, tend to give of their
time. The poor continue to bear a large part of the burden of maintaining the
social fabric after apartheid, as they had to during apartheid.
The reported levels of giving in South Africa seem to be very high,
although finding similarly designed comparative studies in developing
countries proved very difficult. But it is important to ask why levels of giving
are so high. One answer may be our research methodology, which may have
suffered from over-claim by respondents who felt it more socially appropriate

Free
dow
nloa
d fr
om w
ww
.hsr
cpre
ss.a
c.za
76 giving and solidarity
to say they do give rather than that they do not give. However, it may simply
be that giving is common to South Africans, driven by various factors
including religious, ethical and moral issues and/or by political and socio-
economic motivations.
For example, we saw that 82 per cent of respondents give because it
makes them feel better, while 68 per cent said giving to the poor is motivated
by feelings of human solidarity. Over half (57%) felt that if we do not help the
poor we might lose everything in the future, 93 per cent felt helping the poor
is an important part of building the new South Africa, and 78 per cent give to
make the country a better place. In other words, there is a complex mixture
of motivations lying behind the facts of giving, which reflect the current state
of the post-apartheid project.
‘Giving’ is by definition voluntary. But it may be fair to qualify this in
a number of ways in the South African context. At a broad, structural level,
socio-economic conditions may make giving a survival strategy rather than
an altruistic impulse. When 45 to 55 per cent of the population live in poverty,
and unemployment accounts for three or four in ten adults (depending on
whose figures are used), giving may be a critical mechanism for household
reproduction. This may range from sharing with other poor households in
the neighbourhood, to giving to non-household family members and caring
for AIDS orphans. It is notable that giving was highest in provinces that are
economically poor but which are rich in social capital, such as the Eastern
Cape and Limpopo. When the axe of unemployment hangs over so many
heads, and the prospect of paid employment dims on the horizon, giving may
be a requirement of the economic condition of the country.
This has a further edge to it when we recall the widespread sense
of urgency attached to giving, namely that if redistribution and equity are
not dramatically speeded up, ‘we may lose everything in the future’. This
sentiment was most widespread among African respondents (rather than
economically privileged whites, who perhaps might be thought to be feeling
this most keenly). Tellingly, it was also most common in the Free State

Free
dow
nloa
d fr
om w
ww
.hsr
cpre
ss.a
c.za
a nation of givers? 77
province where, a year after the survey, violence broke out over non-delivery
of services to the poor by local authorities. It may be argued that people feel
obliged to give because government is moving very slowly (via its laissez-faire
economic approach) on redistribution; ordinary citizens are sharing what
they have with those who have less, and doing what government should be
doing.
Finally, however, it is important to note the progressive, social-
democratic biases of respondents. Giving is not restricted to survivalist
reciprocal or intra-household transactions, but focuses on key areas –
children and youth, HIV/AIDS and helping the poor. These are the priorities
of the populace, and thus of the electorate, who are digging into their own
pockets to help. The onus is on government to respond appropriately.
Notes
1 This was partly deliberate: the Centre for Civil Society had published a detailed
report on the national lottery immediately prior to the survey, and we wished to
avoid duplicating existing research.
2 A Likert scale is a measurement technique based on standard categories, here
using a 5-point scale running from ‘strongly agree’ and ‘agree’ through a neutral
midpoint to ‘disagree’ and ‘strongly disagree’. Likert items can be appropriately
used for scales or indexes. For more, see Babbie (1995)
3 But we also wanted the survey results to have utilitarian value to the non-profit
sector by allowing organisations to develop domestic fund-raising strategies
based on a targeting strategy informed by the survey data. A series of tables were
developed that covered all forms of giving, broken down by giving money, goods or
time. The tables identified who is already giving to causes, analysed by province,
race, area/type of dwelling, sex, age, education level, religion, and socio-economic
status; and those giving on a regular and/or irregular basis, who we assume
have the potential to be firmed up into a broader support base. Then, using a
fairly simple algorithm: if (a) the level of giving across the different groups for a
particular measure is statistically significant (p<0.05) and (b) respondents in any
given group are more likely to give than the average, then we assume this group

Free
dow
nloa
d fr
om w
ww
.hsr
cpre
ss.a
c.za
78 giving and solidarity
to be a target group for organisations working in different sectors. These data are
voluminous, and are available from the Centre for Civil Society, and the National
Development Agency. The data can be used by non-profits to tailor fund-raising
strategies or the identification of volunteers and so on. 4 If we know who gives, and can begin to understand why they do so, it should allow
the non-profit sector to develop and consolidate a domestic resource base (be it
volunteers, cash, goods, donations and so on). The sector should also be better able
to understand how to segment the population and target fund-raising activities.
5 Use of the term ‘the poor’ – as opposed to the less static ‘people living in
poverty’ – is unavoidable, reflecting language used in the focus groups and the
survey instrument; it should be understood in that context.
6 ‘Volunteer’ appears throughout this chapter, reflecting the language of focus
group participants, which was translated into survey design. In South Africa,
many unemployed people describe themselves as volunteers because they are not
remunerated for work they do.
7 We adapted Statistics South Africa’s socio-economic status measure (to apply to
individuals rather than households) in order to segment the sample. Indicators
included: sanitation, water access, refuse removal, energy source for lighting and
employment status.
8 This figure is considerably higher than that given in the non-profit survey,
although it is derived in a very different manner (see Swilling & Russell 2002).
References
Babbie E (1995) The practice of social research. California: Wadsworth Publishing
Everatt D (2003) The politics of poverty. In D Everatt & V Maphai (Eds) The (real) state
of the nation: South Africa after 1990. Johannesburg: Interfund
Swilling M & Russell B (2002) The size and scope of the non-profit sector. Center for
Civil Society, Johns Hopkins University Institute for Policy Studies

Free
dow
nloa
d fr
om w
ww
.hsr
cpre
ss.a
c.za
79
Issues relatIng to relIgIon and associated matters have been largely
ignored in much of the international literature on development (Marshall
2001; Selinger 2004; Sweetman 1999; Ver Beek 2002). Ver Beek, for
example, observed that faith and spirituality are ‘conspicuously under-
represented in development literature and in the policies and programmes of
development organizations’ (2002: 68). This is, in part, because liberal and
radical thought had for long ignored religion and its institutions as actors
in modernity. The former, grounded in the principle of secularity and in
the separation of state and religion, tended to either prioritise the market as
an agency in development, or the state in the case of its social democratic
variant. Radical thought not only focused on the state as the agent of
progressive development, but also seemed to be blinded to the developmental
virtues of religion, either by the violent history of religious persecution
in Europe and the Middle East, or by the complicity of its institutions in
colonialism. The architect of the Russian revolution, Vladimir Lenin, who
maintained that religion is merely the opium of the masses, perhaps best
summed up the scepticism of radical intellectuals towards religion.
3
Religion and development
Brij Maharaj, Adam Habib, Irwin Chetty, Merle Favis, Sultan Khan,
Pearl Sithole and Reshma Sookrajh

Free
dow
nloa
d fr
om w
ww
.hsr
cpre
ss.a
c.za
80 giving and solidarity
In the decades that followed, religion was unable to rehabilitate its
image in the eyes of Europe’s liberal and radical intellectuals even though it
spawned quite an impressive set of progressive credentials in the developing
world. Liberation theology’s emergence in Latin America was accompanied
by at least some religious institutions and leaders challenging military rule
and bureaucratic authoritarianism, even though some of their predecessors
in the 1960s supported the rise of these very institutions and processes
(Brown 1993). The churches, mosques, synagogues and temples were at
the forefront of the struggle against apartheid, and could with good cause
claim some of the credit for South Africa’s peaceful transition to democracy
(Kuperus 1999). Similar things can be said of religious institutions and
leaders in the struggles from tyranny in both Eastern Europe and Asia. Yet,
despite all of these progressive accomplishments, religion did not emerge on
the developmental landscape as a serious agent of change (Ver Beek 2002).
Only today is this being given consideration. Two reasons underlie
this. First is the rising prominence of civic action and the increasing
recognition that civil society is a necessary actor in successful development.
This view is advanced by both state elites of a neo-liberal bent and progressive
activists and intellectuals. For the former it is hoped that non-profit activity
in the developmental arena may reduce the social burden on the state and
thereby enable its partial withdrawal from economic life (Van Rooy 2002).
The latter envisage that civil society’s involvement in development would not
only lend it a participatory character, but also facilitate it in the direction of
the particular country’s most dispossessed and marginalised citizens (Clark
1992). Either way, significant support exists for civil society’s involvement
in developmental activities, and since religious institutions comprise a
significant component of the civic universe, it is natural that greater attention
is paid to these institutions and their developmental mandate.
Second, empirical research on the non-profit sector and philanthropy
over the last decade or two has categorically demonstrated that religious
institutions are the dominant players in the sector. Philanthropic studies
in the United States suggest that religious institutions are the largest
Free
dow
nloa
d fr
om w
ww
.hsr
cpre
ss.a
c.za
religion and development 81
beneficiaries of citizens’ philanthropic gestures (Independent Sector 2002).
Similarly in South Africa, the first survey of individual giving indicated that
a massive 80 per cent of financial giving from citizens is directed through
religious institutions. It does seem as if citizens across the globe tend to feel
more comfortable with directing their philanthropic impulses through the
medium of religious institutions. These institutions are, then, the recipients
of significant resources, a fact that necessitates their consideration as players
in the developmental equation.
This is of course increasingly being recognised. ‘Words such as
“spirituality”, “spiritual vision”, and ”spiritual development” are to be
found ever more frequently in official documents addressing the issue of
sustainability’ and development (Girard 2004: 29). A number of private
foundations and official development agencies have targeted for research
and study the relationship between faith-based communities/institutions
and development. South Africa’s political elites have similarly been moved
to consider these issues. President Mbeki, for instance, has established a
multi-faith leadership forum to advise him on developmental activities.
These initiatives suggest that there is an increasing need to understand the
engagement of these institutions in the developmental enterprise. Not only is
this necessary to gain a better understanding of what is going on in the arena
of development, it may also enable researchers and development practitioners
to professionalise the engagements of religious institutions in the sector with
the hopeful result that it would lead to a better impact and improve the lives
of poor and marginalised citizens.
This chapter focuses on the engagement of religion in development
in South Africa. The next section explores the philosophical underpinnings
of giving and development in a variety of religious traditions. Thereafter, it
investigates the giving and developmental initiatives of religious institutions
in South Africa. There is also some reflection on the gender dimensions of
resource mobilisation and management. The chapter concludes with some
critical reflections on the limits and weaknesses of religious institutions’
developmental engagements, and advances some recommendations on how

Free
dow
nloa
d fr
om w
ww
.hsr
cpre
ss.a
c.za
82 giving and solidarity
these could be strengthened with a view to enhancing their impact for the
poor and marginalised in South Africa.
Obligatory giving within the different faiths
‘Religion is the mother of philanthropy’ (Moe 1961: 141). This maxim,
articulated by Moe some 45 years ago, is as relevant today as it was when it
was first written. All religions emphasise the need to support charity, welfare
and the disadvantaged. Obligatory giving is thus a manifestation of a deep
sense of religious responsibility, duty and commitment in order to realise
salvation. This is why religious communities are capable, like no other sector
of society, of mobilising enormous resources for poverty alleviation and
development initiatives. In the United States, for instance, revenue collected
by religious congregations amounted to US$81.2 billion in 1996, the bulk of
which comprised private contributions by individuals (Independent Sector
2002: 7). In South Africa, on the other side of the world, the first national
survey of private giving in the country revealed that 96 per cent of those who
adhere to a faith regularly give money, goods or services (Everatt & Solanki
2005). Moreover, it needs to be noted that those who give financial and other
resources for religious purposes are likely to support other social and civic
causes as well. It is, then, difficult not to concur with Independent Sector’s
concluding evaluation that:
The power of faith-based giving and volunteering is clear, compelling
and measurable. The belief, values, attitudes, and commitments of
those who contribute to religion translate into high levels of generosity
to other causes as well. Undoubtedly, there are a number of other
factors that influence levels of giving, including income and home
ownership, but religious belief is without question one of the most
important factors independent of economic status. (2002: 8)

Free
dow
nloa
d fr
om w
ww
.hsr
cpre
ss.a
c.za
religion and development 83
So where does this impetus to give within faith-based communities actually
come from? Different religions have, of course, very distinct philanthropic
traditions which determine how much is given and why. Within the
Christian faith, charity or ‘love in action’ is seen as one of three fundamental
virtues, the other two being faith and hope. The spirit of giving infuses
Christian scriptures and is succinctly reflected in the New Testament adage
that it is ‘better to give than to receive’ (Chetty 2005). All Christians are
expected to contribute 10 per cent of their monthly earnings (which is called
a tithe) towards their local church. This tithe is a compulsory requirement
commanded by both the Old and New Testaments of the Bible. Christians
are also expected to make additional voluntary contributions, which over the
centuries has spawned many social and humanitarian endeavours across the
globe.
Jewish philanthropy is influenced by three basic factors – tzedakah;
reinforcing cultural, religious and ethnic identity; and protection from
external threats (Tobin 2000). Tzedakah means righteousness and refers to
the ancient religious obligation to provide for the indigent, both Jews and non-
Jews. The Torah – the first written law – provided the written instructions on
how to carry this out. Philanthropy serves to entrench the ethnic and cultural
identity of Jews by, for example, supporting religious education. It also plays
a role in providing for the protection of Jews from external threats. This is
important, given the persistence of anti-Semitism (Tobin 2000).
Jewish giving is thus significantly influenced by the historical
experiences across the world, and especially the discrimination and anti-
Semitism to which the community has been subjected. Throughout the last
two centuries, waves of Jewish immigrants have been supported by their
established diasporic brethren with a range of welfare, self-help and social
programmes in their new countries. As a result of rival schools of religious
thought, and the associated difference in the interpretation of Jewish
scriptures, two separate philanthropic traditions have emerged. There is a
division between institutions that only support Jews, and others that also

Free
dow
nloa
d fr
om w
ww
.hsr
cpre
ss.a
c.za
84 giving and solidarity
give to the non-Jewish poor in the host country. Political factors, historical
experiences and the nature of endowments determine which philanthropic
tradition dominates in different countries (Favis 2005).
Compulsory contribution to charity is a basic tenet of Islam. All
Muslims are obliged to contribute 2.5 per cent of their yearly income towards
charity, which is called Zakaat. Zakaat funds are used to support the
indigent and address socio-economic problems in the Muslim community.
Muslims are also expected to contribute voluntarily to support the
establishment of places of worship, religious education and other community
projects.
In Muslim countries such contributions are state regulated, and an
institution called the Bait ul Mal is responsible for collecting and allocating
Zakaat funds. In countries with Muslim minorities, voluntary non-profit
organisations located within the civil society sector are responsible for these
tasks. Muslims also give voluntarily to support causes outside the community
(Khan 2005). The relationship between Muslim giving and spirituality is
aptly summarised by Khan:
It is a basic belief amongst Muslims that life on earth is a temporary
one and another exists after death. Unselfish conformity and belief
in the fundamental principles of prescribed charitable acts, decreed
religiously, constitutes the central article of faith amongst Muslims
which promises a better life on earth and thereafter. Hence, the act of
giving in material and cash forms irrespective of the financial value
attached to it is not the only criterion for the derivation of spiritual
satisfaction and benefit by the giver. It is the religious intention
followed by a sense of emotional loss, humility and satisfaction that
one experiences by parting with charitable goods most treasured by
individuals purely for the pleasure of Almighty God that counts in the
final analysis for the attainment of spiritual satisfaction. (2005: 12)

Free
dow
nloa
d fr
om w
ww
.hsr
cpre
ss.a
c.za
religion and development 85
Finally, identifying an established pattern of giving within the Hindu faith
is difficult for there is no explicit level of philanthropy mandated by religious
doctrine. Rather, the requirement of giving is integrated in an implicit code
of behaviour expected of all Hindus, defined by values such as compassion
and hospitality. The Hindu term for philanthropic giving is dana, which
is viewed as an essential part of seva (selfless service to those in need) and
dharma (religious duty) (Anand 2004). Four key motives drive giving or dana
amongst Hindus:
◆ Punya – the performance of good deeds which helps to attain moksha
or liberation from the cycle of birth and death.
◆ Prayaschitta – this is an act of repentance by someone who has sinned,
and penance would take the form of giving material resources or
money to those in need.
◆ Aparigraha – the focus here is on living with bare essentials and
renunciation of wealth, and is only observed by those who lead a very
spiritual life.
◆ Karuna – demonstrating concern for the poor and underprivileged.
(Anand 2004: 10)
The principles of generosity, hospitality, philanthropy and charity are major
hallmarks of Hindu culture. Voluntarism in India played an important role
in the social and economic development of the society. It operated in the
fields of education, medicine and cultural promotion and, in particular,
in crises such as droughts, floods, epidemics and foreign invasions. The
disadvantaged and the poor were taken care of by social mechanisms outside
the state – through the extended family, solidarity of colleagues, guilds,
and individual religious philanthropy. In this sense, giving, altruism and
hospitality are the distinctive hallmarks of Vedic culture. Philanthropy is
thus seen in this religious tradition to facilitate the development of selfless
qualities like altruism and humanitarianism, and is therefore defined as a
means through which one can serve God (Sookraj 2005).
Free
dow
nloa
d fr
om w
ww
.hsr
cpre
ss.a
c.za
86 giving and solidarity
This cursory review of giving traditions within faith-based
communities indicates that it is not only mandated by the scriptures of
these faiths, but is seen as necessary if one seeks spiritual cleansing and
salvation. The fact that it is a duty to God for which you get rewarded in
the afterlife is a powerful incentive encouraging giving among those of
religious inclination. This then enables faith-based communities and their
institutions to be perhaps the single most powerful agency outside the state
for mobilising financial and in-kind resources from the citizenry. Not only
do these resources permit faith-based communities and their institutions
to reproduce themselves, but they also allow them to establish support for
poverty alleviation and development causes in their respective communities,
further cementing these very communities to their faith-based institutions.
Moreover, sometimes these resources are used for the provision of social
welfare in other, often more deprived, communities, as a means of spreading
the faith and facilitating religious recruitment.
But what are the specific patterns of, and mechanisms for, this
giving? An answer to this requires a more contextual analysis that
investigates existing patterns of giving within specific communities, and for
this we turn to a case study of South Africa.
Religious giving: a national perspective
South Africa is a multi-religious society, where freedom of worship and
religion are constitutionally protected. Although Christianity is dominant,
Islam, Judaism and Hinduism are also active religions in South Africa.
About 84 per cent of South Africans belong to the Christian faith, 0.2
per cent adhere to Judaism, and 1.5 per cent are Hindus and Muslims
respectively.1 According to the 2001 Census, about 40 per cent of the
population belong to a charismatic church and, more specifically, 10 million
belong to African independent churches such as the Zion Christian Church.2
As a religiously active country, it should not come as a surprise that
religion is the dominant factor in informing giving in South Africa. The

Free
dow
nloa
d fr
om w
ww
.hsr
cpre
ss.a
c.za
religion and development 87
national survey conducted in 2003 (Everatt & Solanki 2005), found that
89 per cent of a random sample of 3 000 adhered to one or other religion.
Furthermore, on average, 96 per cent of this group had given either
cash, goods or volunteered their time in the month prior to the survey.
Respondents believed that those who belonged to a religion were more likely
to give. More specifically, ‘86% agreed or strongly agreed that “[m]y faith
requires me to give to the poor”, while 73 per cent agreed or strongly agreed
that “[g]iving to people in need brings me closer to God”’ (Everatt & Solanki
2005: 18).
But whatever the motivations of ordinary citizens when they give,
how is religious giving organised and effected? How do religious institutions
mobilise resources from their adherents? How do they redistribute these
resources? What causes are supported? Who are the beneficiaries of these
resource flows? And, finally, what are the gender dimensions of these
processes? Answers to these questions can only be derived from more
microscopic analyses of religious communities, their institutions and their
philanthropic engagements.
Structure and organisation of giving
There are different ways of organising giving and raising funds among
the faith groups. In the Jewish community there are two approaches to
fund-raising. Firstly, there is a single campaign targeting businesses and
professionals that focuses on supporting the majority of Jewish voluntary
organisations and institutions. Secondly, there is a communal list whereby
every Jewish household is a target for fund-raising. In Cape Town the
Jewish Board of Deputies has a full-time employee to maintain and update
the communal list. This list has a record of all Jews in the city, their place
of residence and employment, and is drawn from the membership rolls of
synagogues, schools and sports clubs (Favis 2005).
The main source of income of most churches is tithes. Churches
often engage in fund-raising projects, and also approach major business
organisations for financial support. Many churches have been registered as

Free
dow
nloa
d fr
om w
ww
.hsr
cpre
ss.a
c.za
88 giving and solidarity
non-profit organisations, which means that donors receive tax exemptions.
In addition to tithes and fund-raising, the Christian sector receives a
considerable amount of international funding. This is especially so in the
case of the South African Council of Churches (SACC), a facilitating body
for a wide fellowship of churches. The SACC is made up of 26 member
denominations, together with a number of associated church-based
organisations.3 The SACC is the national ecumenical enabler and co-ordinator
of inter-church debate and action, and represents the majority of Christians
in South Africa (Chetty 2005).
The SACC has a number of global partners who sponsor some of
their projects.4 This represents a continuation of funding that started in the
apartheid era, and which was used in the struggle for democracy, human
rights, dignity and Christian values. The continuation of this funding in the
post-apartheid era enables the SACC to assist in the rebuilding of the nation,
spiritually as well as materially, and to give disadvantaged groups in the
society new opportunities and hope (Chetty 2005).
The Pentecostal movement is another Christian sector that receives
significant external funding, particularly from the United States and the
influence of the United States is clearly evident in this sector. According
to a newspaper report, the ‘American version of evangelical ministry has
spread like wild fire in South Africa, with these modern churches promising
their converts both spiritual and economic fulfilment as they compete for
the prize target market, the black middle class’ (Business Report 19 March
2006). In South Africa, the ‘Evangelical Alliance has 3 million members in
29 denominations nationally’.5 Apart from the obligatory tithe, adherents
are encouraged to ‘when in need sow a seed’. This is called ‘seed faith’ and is
largely practised by Pentecostals, with both ‘insiders’ and ‘outsiders’ being
the beneficiaries. It has been estimated that more than 50 per cent of the
congregations of the charismatic churches were ‘tithing a full 10 per cent
of their often sizable professional incomes’.6 However, a concern expressed
by Moss Ntlha, the general secretary of the Evangelical Alliance, was that it
was ‘very unfortunate that the balance sheet of the church has overtaken the

Free
dow
nloa
d fr
om w
ww
.hsr
cpre
ss.a
c.za
religion and development 89
spiritual well-being of members particularly in the charismatic churches’
(Business Report 19 March 2006).
A different picture emerges from the traditional African
religious sector, for example the Shembe and Zionist followers, where no
accumulation of church resources is evident. This is because these churches
draw their membership from poor communities with a survivalist or
subsistence background. In this context the social activities of the church,
such as religious sacrifices, stokvels and burial schemes, have a higher level
of significance for people as they provide social security networks through
which poor people support each other in times of need (Sithole 2005).
In the Hindu community there is no robust effort that organises
giving in any particular way. With the exception of a few individuals, no
systematic payroll giving is evident. Hindu priests and community leaders
argue that because giving takes several forms, organised monetary fund-
raising does not feature strongly. Payroll givers were also reluctant to disclose
amounts. However, when fund-raising does occur, it is often related to
specific projects such as flood relief. There was a view that Hindus generally
respond more spontaneously and generously to crisis situations. Socially
responsive giving often occurred when there were emergencies, for example
bursaries for needy university students, especially in their first year of study,
and deaths – in this case Hindus work together to facilitate funerals and
ceremonies for the deceased (Sookraj 2005).
Since Hindu giving is generally not systematically planned, religious
organisations have to employ unique models of collection. Professionals
as well as business people are solicited by Hindu organisations each year,
especially during the festive periods, to garner financial support. In the case
of the Divine Life Society of South Africa, mandatory monthly donations of
stipulated amounts are collected through personalised visits by dedicated
members. This entails door-to-door physical collections. In this strategy,
the amounts to be given are negotiated between the organisational collector
agents and the giver. Similarly, the Ramakrishna Mission of South Africa,
Free
dow
nloa
d fr
om w
ww
.hsr
cpre
ss.a
c.za
90 giving and solidarity
with a monthly operational budget of R50 000, depends on financial support
from its congregation and from business people (Sookraj 2005).
In contrast, giving in the Muslim community is highly organised and
structured. Since the act of charity is mandatory on all Muslims of financial
means, a self-regulating mechanism comprising rigid norms and values
governs the manner in which alms are given, received and administered.
As mentioned earlier, all Muslims are compelled to contribute 2.5 per cent
of their annual earnings towards the upliftment of their community, in
the form of Zakaat. Apart from Zakaat, there are other optional charities
(for example Lillah, Fitra and Sadaqah) that become due for specific
religious purposes. However, Zakaat constitutes the primary act of charity
(Khan 2005). Sophisticated networks (both formal and informal) have
developed over the years for facilitating the collection and distribution of
these resources. Various community and religious organisations collect
and distribute Zakaat funds in keeping with their particular aims and
objectives. Volunteer participation within organisations is heightened
during the implementation of special projects such as disaster relief and
feeding schemes. In order to prevent abuse of such charity and to ensure
that beneficiaries receive their rightful dues in keeping with the teachings
of Islam, formal organisations have been set up. However, despite this, not
all organisations adhere or conform to a united, coherent and systematic
method in the collection and distribution of charities. Hence, the collection,
distribution and regulation of Muslim charity is fragmented, duplicated
and insufficiently coordinated, resulting in strong competition amongst
charitable organisations. Currently, there are approximately 1 328 Muslim
organisations7 that collect, distribute and provide a diverse number of
services essential to those in need. These constitute social welfare and
relief-giving agencies, community-based organisations, and theological and
humanitarian aid organisations, focusing on local and international needs
(Khan 2005).
In the organisational composition of Muslim charitable institutions,
class, ethnic, ideological and theological differentiation is noticeable. Very

Free
dow
nloa
d fr
om w
ww
.hsr
cpre
ss.a
c.za
religion and development 91
often successful business entrepreneurs, professionals and politically
influential persons occupy important positions within these organisations.
Ethnic and racial exclusivity in organisational membership often exists,
although newer and progressive structures are moving away from this
tradition and embracing the spirit of the country’s new democracy.
Organisations that have a history of supporting a particular theological or
ideological thought are less open to membership from an opposing group.8
It needs to be noted, however, that Muslims of African ancestry feature less
prominently in most of these organisations (Khan 2005).
Forms of giving
Poverty alleviation strategies
But how do these religious communities deploy the considerable resources
they mobilise? Broadly speaking, their giving activities can be described as
taking two distinct forms: poverty alleviation and development. The former
focuses on alleviating the consequences of poverty and marginalisation
through the disbursement of cash, goods and services. The latter is directed
towards institution-building and the establishment of an infrastructure
that enables the development of a more human-oriented society. A poverty
alleviation programme can of course involve very different types of activities.
As there are interesting similarities and differences among the various
religious groups, it is necessary to focus separately on the giving activities
oriented towards poverty alleviation within each of these communities.
Jewish institutions primarily support causes associated with HIV/AIDS,
poverty, crime and violence, the environment, and animal rights. The focus
is on the provision of welfare and support for the less privileged sectors
within the Jewish community. Priority areas for assistance include: family
counselling; caring for the elderly and the young; medical assistance to
those in need, including the mentally handicapped; bursaries for students;
seeking employment opportunities for the unemployed; and burial and grief
counselling services. Such welfare-oriented initiatives are organised and

Free
dow
nloa
d fr
om w
ww
.hsr
cpre
ss.a
c.za
92 giving and solidarity
administered through a range of institutions that were established over many
decades, and include children’s and old age homes, schools, mental health
facilities, community medical centres, employment agencies, and a 24-hour
crisis hotline. The infrastructure for these projects was established by the
Chevrah Kadisha9 (‘Holy Society’) during the early part of the twentieth
century. Chevrah Kadisha was originally established in 1888 as a burial
society and was primarily concerned with completing the last rights for the
deceased and providing comfort and support for the bereaved family. The
Chevrah subsequently merged with another existing body, Bikkur Cholim,
which was primarily intended to support the sick and frail. After the merger,
the Chevrah gradually expanded the range and capacity of its welfare and
poverty alleviation strategies in the Jewish community (Favis 2005).
Many Hindus give because they believe it represents responsiveness
to the needs of the community. Charitable giving amongst Hindus is
considered to be a social contract in which no household should have more
than what is deemed necessary in comparison to another. This is related to
a sense of social solidarity referred to as samajic sangathan. Several Hindu
leaders referred to the concept of Ramrajya,10 which was associated with
notions of an ideal community in which the ruler and the ruled were seen as
one, and a community in which poverty and suffering were non-existent.
Hindus believe that serving food to the poor and the needy
contributes to good karma.11 Food is also distributed to people at the end
of many religious ceremonies. Many Hindu temples distribute food freely
daily to the visiting devotees.12 The International Society for Krishna
Consciousness (ISKCON) Food for Life programme (anna dhan) is one such
example. Since 1974, Food for Life has served more than 200 million free
hot meals in over 70 countries. In South Africa alone, a staggering 1 million
plates of food were served in 2002. Food for Life is currently one of the
largest vegetarian free-meal programmes in South Africa.13 More than
150 000 hot meals are served every month to those in need, regardless of
race, creed or culture. An important goal of the Food for Life programme is
the development of ‘hunger-free zones’ within underprivileged communities.

Free
dow
nloa
d fr
om w
ww
.hsr
cpre
ss.a
c.za
religion and development 93
This strategy operates on the principle that no one should go hungry within
a 20 kilometre radius of the food distribution points. The ultimate aim of
this initiative is to have an entire network of hunger-free zones regionally and
nationally (Sookraj 2005).
According to President Thabo Mbeki, the philosophy underlying the
food-giving initiative run by ISKCON should be extended to the entire country:
This understanding that, if I have a plate of food, let me share it with
my neighbour, let those who are hungry come and eat, let those who
are feeling sad come together with us and together we can share this
burden, this understanding should be taken from Food for Life and
transmitted to the entire country.14
Other Hindu organisations are also involved in giving food, although on a
smaller scale. The South African Tamil Federation, for example, distributes
about 1 800 food hampers during the Deepavali (Festival of Lights) period.
Whatever their size, all the organisations operate with what one interviewee
described as their collective motto: ‘Great, indeed, is the power to endure
hunger. Greater still is the power to relieve others’ hunger.’15 The Sarva
Dharma Ashram provides sandwiches for schools, and also distributes
second-hand clothing in the low-income area of Welbedacht, located on the
outskirts of Chatsworth (Sookraj 2005).
There are many charitable and social welfare organisations in
the Muslim community in South Africa. However, a large proportion of
Muslims tend to first give to causes within their immediate family, followed
by needy persons in the community. As recipients, Muslim charitable and
social welfare organisations are ranked third on the priority list of giving by
Muslims. It is a commonly held belief amongst Muslims that when giving
religiously mandatory charity, one needs to personally identify a person in
need. In addition, meeting the financial needs of immediate family members
within the norms of religious prescriptions enjoys preference. Furthermore,
giving to secular organisations with broader humanitarian goals is of lesser
Free
dow
nloa
d fr
om w
ww
.hsr
cpre
ss.a
c.za
94 giving and solidarity
importance.16 The Holy Quran stipulates the different categories of destitute
persons and causes worthy of support. These injunctions are stringent and
are accepted by adherents to Islam, for whom charity is compulsory (Khan
2005).
The most common tradition is to give financial and material
resources to organisations that support specific projects according to
religious scripture. Such causes include supporting destitute children, the
homeless, widows, elderly, disabled and those who are poverty stricken.
Moreover, support for building and maintaining places of worship, religious
propagation and causes that contribute to social progress in the community
receive priority. Muslims fulfil their prescribed charitable duty in this
material form as well, and this includes donating clothing, food, building
materials, medicines, land, vehicles, crockery and any other tangible goods
to those in need. In 2003, the South African National Zakaat Fund (SANZAF)
spent R19 million supporting 60 000 Muslim families. In Durban, SANZAF
feeds 25 000 people in different parts of the city on a monthly basis, and
about 400 outpatients are fed daily by SANZAF at the King Edward and
Addington hospitals (Khan 2005).
The Mustadafin Foundation demonstrates the nature, scope and
scale of the different forms of material and financial charity contributed
by South African Muslims. Historically, the Foundation was a Muslim
scheme to assuage the atrocious social and economic circumstances of
informal-settlement dwellers. It was established in the mid-1980s in the
Western Cape in the context of the non-racial political struggle against
apartheid. It was significant that its membership was comprised largely of
women. The primary aim of the Foundation was to alleviate the problems
of poverty by providing financial and material resources to the communities
living in informal settlements; offering skills-training programmes for the
unemployed; providing educational facilities for pre-school children; and
networking with the different faith-based groups and non-governmental
organisations serving these settlements in order to reduce fragmentation,
duplication and the inefficient use of scarce resources. The Foundation

Free
dow
nloa
d fr
om w
ww
.hsr
cpre
ss.a
c.za
religion and development 95
has been active for about 18 years and the value of the material resources it
has mobilised has exceeded R6 million annually. The Foundation has an
established track record in terms of organisational efficiency and delivery,
and it no longer has to solicit public donations as members of the Muslim
community spontaneously and regularly support its different humanitarian
programmes with material and financial contributions (Khan 2005).
In the past decade another Muslim relief-giving organisation called
Gift of the Givers, with its headquarters in Pietermaritzburg in KwaZulu-
Natal, contributed R60 million to different humanitarian causes nationally
and internationally. The beneficiaries included:
◆ Mozambique f loods in 2000 – food, clothing, medicine and shelter to
the value of R1.5 million was airlifted to the victims.
◆ India earthquake in 2001 – R1.1 million was spent on the reconstruc-
tion of schools, houses, clinics and hospitals and R100 000 in cash
was made available.
◆ Goma volcanic eruptions in 2002 – R1 million of aid comprising food,
medicine, blankets and water purification tablets was mobilised in
just three days for this disaster.
◆ Somalia 2004 – R3 million of aid supplies containing food, medicine,
water purification tablets and tents was provided.
◆ Tsunami disaster 2004 – R12 million of aid was provided to the dif-
ferent areas aff licted by this disaster. In Sri Lanka, a Gift of the Givers
housing village was established, comprising 500 homes at a cost of
R6 000 per unit. (Khan 2005)
The different Christian church denominations, as well as para-Christian
organisations, are also heavily involved in numerous poverty relief activities.
The Development and Welfare Agency of the Catholic Church supports
poverty alleviation programmes and projects for the indigent and most
disadvantaged groups. The aim is to create a facilitating environment
for community participation in development projects, taking maximum
advantage of the Catholic networks and their potential to play a critical role

Free
dow
nloa
d fr
om w
ww
.hsr
cpre
ss.a
c.za
96 giving and solidarity
in poverty alleviation in South Africa, and to respond to the call for social
reconstruction through strengthening partnerships among community,
government, private and public sectors (Chetty 2005).
Food security is an important goal of the Adventist Development and
Relief Agency. The Rhema Ministries, a Pentecostal church, included in its
mission:
a responsibility to the poor, the broken-hearted, the downtrodden,
the oppressed, the captives and the prisoners. We minister to and aid
the poor, sick, elderly, widows, orphans, abused women, traumatized
people, dysfunctional families, street children, prisoners, prostitutes,
drug abusers, the illiterate and any other individual or group that have
need.17
The Salvation Army, an evangelical branch of the Christian church, has
cared for South Africans since 1883, and operates 375 centres across the
country. It provides nearly 4 million meals and 600 000 beds a year for the
poor, the neglected and the marginalised. The Salvation Army also set up
goodwill centres and family missions, which care for people experiencing
unemployment, illness, and drug and alcohol problems. These centres
provide counselling and practical assistance to help people get their lives
back on track. The Salvation Army is committed to social justice, political
neutrality and equal opportunities for both men and women.
Economic woes, unemployment and a dramatic influx of illegal
immigrants have compounded the homelessness problem in South Africa
(Maharaj 2002). The Salvation Army has provided accommodation to
many needy people in the form of hostels for homeless men and overnight
emergency accommodation for transients. The SACC has similar initiatives
to support such uprooted individuals and families, including victims of
disaster, more rapidly than the government. One full-time staff member
at the SACC national office works directly with volunteers across South
Africa. This ministry helps people to deal with trauma, find temporary

Free
dow
nloa
d fr
om w
ww
.hsr
cpre
ss.a
c.za
religion and development 97
accommodation, and treat injuries, and also attends to the emotional needs
of disaster victims.
Many churches are engaged in similar poverty alleviation strategies at
the local level. The following poverty alleviation strategies were evident:
◆ Financial giving in terms of household utilities (such as paying for
water and lights) is offered to members of congregations who are in
dire straits through the welfare department of the local church.
◆ Monthly food hampers are given to members in need. Non-members
are only considered if they are perceived to be destitute by the welfare
department of the local church.
◆ Christmas hampers are especially distributed to non-members via the
welfare department of the local church.
◆ Voluntarism, which includes cleaning, gardening, repairs and
maintenance of church property, prison ministry, hospice duty, and
counselling.
Attempts to support victims of HIV/AIDS (both infected and affected) are a
priority across all Christian sectors. The Adventist Church has managed
to secure European Union funding for its HIV/AIDS projects. All the SACC’s
affiliates are expected to incorporate HIV/AIDS education in their activities, as
well as develop a culture of acceptance and caring for people living with the
virus. Many of the church-based women’s organisations have increased their
involvement in caring for those dying of AIDS through hospices and home-
based care. Doctors for Life International and Crossroads International are
also involved in supporting similar projects. The Salvation Army is a pioneer
in caring for those affected and infected by HIV/AIDS, providing counselling
and support for those afflicted, as well as establishing homes for abandoned
babies and mothers living with HIV. The first of these, Bethesda House,
opened in Soweto in 1993 (Chetty 2005).
To conclude at the micro level, a vignette of the Christian Centurion
Church is presented. This Pentecostal church is five years old and its

Free
dow
nloa
d fr
om w
ww
.hsr
cpre
ss.a
c.za
98 giving and solidarity
congregation comprises 3 000 members, of which 50 per cent are poor.
It is affiliated to the Five Fold Ministries of Harold Weitzs, and part of
its mission includes reaching out to the poor. A regular feature of their
social giving programme includes the provision of clothing, blankets and
hampers. Although members receive priority, anyone in need is assisted.
The Centurion Church does not receive any external funding from either
government or foreign sources. Approximately 25–30 per cent of the total
budget is used for a feeding scheme, which feeds about 7 000 children at
seven schools. In order to receive food, the children have to attend school.
Centurion Church has a social worker on its full-time staff, the majority of
whom come from the townships surrounding Centurion (Chetty 2005).
In some low-income areas, cooperative church organisations assist the
poor by providing loans for basic needs. According to the general manager of
the Ecumenical Development Co-operative Society, women play a critical role
in such projects:
Our recovery rate on loans, lending to the poorest of the poor is 90%,
the highest of any financial institution in the world. We emphasise
women participation. Women never let their children down; if school
fees, shoes and food for their children depend on the success of the
business, women will fight for it; their commitment is existential, as
compared with men, whose commitment is more entrepreneurial.18
Among the poor the church is a vital support structure in times of need as
it provides a social network of people taking care of each other in difficult
times. Amongst the Shembes and Zionists, devotion to church means
generosity and sacrifice of time, attention and resources towards spiritual
fulfilment and the well-being of others. Members regard the church as
an extended family, constituting brothers and sisters who stand together,
especially in difficult circumstances. These churches draw their membership
from people of poor economic or survivalist working-class backgrounds.
Under such circumstances, the sustenance of the church is thus a day-to-day

Free
dow
nloa
d fr
om w
ww
.hsr
cpre
ss.a
c.za
religion and development 99
or activity-by-activity issue. No accumulation of church resources is evident
(Sithole 2005).
Apart from regular tithes, there is often donation in response to
a need. While the need is often to support a church member who might
require a visit from other church members, sometimes it is a donation in
response to illness or bereavement. In the Shembe and Zionist churches
there is also charity-oriented giving whereby people donate money and
organise prayer visits in order to express condolences to the family of the
departed during their bereavement. Sometimes women spend time with the
bereaved family at their home and help with funeral preparations (Sithole
2005).
Development initiatives
All the religious groups were also involved in philanthropic activities
that were more developmentally orientated, with a focus on training,
empowerment and sustainability, where the beneficiaries were not
necessarily from their faith. There is an increasing tendency for such giving
activities to transcend religious boundaries, especially in the post-apartheid
era.
In addition to the very sophisticated and well-established institutional
infrastructure already discussed in this chapter, the Jewish community
established the MaAfrika Tikkun initiative in the post-apartheid era. Tikkun
was formed as a fully independent entity with initial support from a few
wealthy Jewish manufacturers. Tikkun’s roots – a Hebrew word meaning
‘repair’ or ‘helping to put things right’ – were related to South Africa’s
transition to democracy, a process that generated some anxiety among some
members of the Jewish community. Initially, Tikkun received a ‘luke-warm’
reaction from the South African Jewish Board of Deputies (SAJBD). It was
rejected by many Jewish welfare agencies for ideological reasons, as well as
for the perceived competition for donors and funds that the new organisation
was likely to generate. However, within a relatively short period, these

Free
dow
nloa
d fr
om w
ww
.hsr
cpre
ss.a
c.za
100 giving and solidarity
negative perceptions were surmounted and the SAJBD subsequently accepted
Tikkun as ‘the official outreach programme of the Jewish community’,
dedicated to ‘making a meaningful difference to the upliftment of
disadvantaged people in South Africa’.19
Tikkun manages various projects from two centres based in
Johannesburg and Cape Town respectively. These include a farmers’ project
and school in Rietfontein; an HIV/AIDS project in Orange Farm; a project for
the elderly in Alexandra township; and community centre initiatives and
crèches in both Hillbrow and Diepsloot informal settlement (Favis 2005). In
Johannesburg, Tikkun initially adopted a ‘handout approach’ in its projects.
More recently, there has been some realisation of the limitations of this
approach:
The reality is that the bridge between the relief of abject poverty,
for which Tikkun originally earned its reputation, and the goal of
establishing vibrant, self-assertive development projects, is a difficult
one to cross successfully. Tikkun has learned from experience that
progress is only made through consultation, negotiation and careful
planning…As Tikkun has progressed from ‘handouts’ to project
management, it has learned valuable lessons.20
There have also been some concerns that Tikkun’s projects in Johannesburg
focused almost exclusively on disadvantaged communities, with very few
attempts to create connections between members of the Jewish community
and the poor. This was very evident in the case of the Hillbrow Tikkun
project. Even though many of the local Temple Israel synagogue congregants
in Hillbrow were disadvantaged, there was no structured interaction with
recipients of Tikkun’s creche, income generation, skills building and feeding
scheme projects.21 This is in contrast with the approach which characterises
the Cape Town Tikkun operation, where the focus is on ‘fostering better
understanding between the Jewish and black communities’, whilst
simultaneously ‘bringing the Jewish face into (disadvantaged) communities’.22
Free
dow
nloa
d fr
om w
ww
.hsr
cpre
ss.a
c.za
religion and development 101
Apart from promoting social welfare projects within its own
community, South African Muslims are historically known for making
generous philanthropic contributions to special humanitarian causes that
transcend religious boundaries, both nationally and internationally. In the
apartheid era, Muslim organisations like the Lockhats Charities, ML Sultan
Charitable Trust, MH Joosubs Trust and the AI Kajee Trust, for example,
made generous contributions to support the educational and social welfare
advancement of all communities. The benefits from such social investments
continue to be reaped today. Furthermore, Muslim anti-apartheid movements
such as the Call of Islam, Qibla, and the Muslim Youth Movement generated
considerable resources from local communities to pursue the fight against
racism and oppression. In the 1980s Muslim businesses supported the
United Democratic Front (UDF). The political conflict and violence in the
UDF era resulted in hundreds of thousands of Africans in the KwaZulu-Natal
province being displaced from the rural hinterlands to informal settlements
in the city of Durban. Muslim welfare and charitable organisations provided
generous compassionate assistance for these traumatised communities
(Khan 2005).
Another interesting organisation, the Islamic Relief Agency (ISRA),
was established in response to the disastrous September 1987 floods
in KwaZulu-Natal, and against a background of political turmoil in the
province. A founding member of ISRA recalled some of the challenges faced
by the organisation in providing humanitarian assistance to the ravaged
areas:
The greatest challenge was to convince Muslim donors to channel
their charitable resources to these afflicted areas without any
political, religious and ideological interest...This human tragedy was
a turning point in the history of the Muslim community – especially
in KwaZulu-Natal torn by different religious, ideological and political
interests – to formulate a strongly co-ordinated Muslim response
to human disasters such as this with speed, efficiency, and above

Free
dow
nloa
d fr
om w
ww
.hsr
cpre
ss.a
c.za
102 giving and solidarity
all, compassion. The organisation over the years has established
meaningful and lasting working relationships with both Muslim and
non-Muslim philanthropic organisations in championing the cause of
human misery of all sorts. (Khan 2005: 24)
The Islamic Medical Association (IMA) is another important humanitarian
organisation. It is a nationally-based organisation, with more than 2 000
members from different sectors of the medical and healthcare professions.
The IMA volunteers its members’ professional expertise to remote and rural
parts of the country, where there are only rudimentary healthcare facilities.
It has established several mobile clinics, which visit these rural areas on
a regular basis, with an emphasis on primary and preventative healthcare
programmes. In the late 1990s, the IMA played an important role in curbing
the outbreak of cholera in KwaZulu-Natal by providing doctors and medicine.
At an international level, the IMA adopted an innovative and creative approach –
equipping shipping containers with sophisticated medical equipment and
facilities, which were sent to Chechnya, Herzegovina and Bosnia, regions
plagued by violent political conflict. Many medical professionals also
volunteered their services, and risked their personal safety and security in
order to fulfil their personal philanthropic commitment (Khan 2005).
Some Muslim organisations have served poor communities with a
twofold purpose – to fulfil humanitarian goals, and to recruit adherents to join
the faith. In the sprawling township of Umlazi, south of Durban, the World
Assembly of Muslim Youth initiated an impressive mosque-cum-community
centre development project valued at more than R1 million. This organisation
worked actively in Umlazi for a long time, and maintained close community
links amongst the new adherents. In Kwa-Mashu, north of Durban, a similar
project was completed in partnership with local converts, at which regular
worship takes place, and welfare and social support is offered to new converts,
as well as to prospective adherents to the faith (Khan 2005).
Amongst Hindus, socially responsive giving occurs when there are
natural disasters such as droughts and floods. However, organisations like
Free
dow
nloa
d fr
om w
ww
.hsr
cpre
ss.a
c.za
religion and development 103
ISKCON and the Divine Life Society are engaged in many sustainable projects
which extend beyond the Hindu community. ISKCON liaises with community-
based organisations like orphanages, HIV/AIDS support programmes, old age
homes and crisis relief centres in KwaZulu-Natal. Networks have been forged
with the South African Police Services and Metro Police Community Service
and several youth character-building initiatives have been conducted in
various communities. ISKCON volunteers also provide psychological support
for prisoners. In South Africa, ISKCON volunteer teams are a welcome sight in
townships and informal settlements, hospitals, crèches, schools, universities
and homes for the elderly and handicapped. Voluntary work is done in a
selfless way – the Sanskrit term for such action without reward is nishkaam
karma. This concept implies that people who serve are entitled to action but
not to the fruits of these actions (Sookraj 2005).
An intensive Outreach Health Programme was undertaken in the
1980s by the Divine Life Society, influenced by the view of their spiritual
master, Swami Sivananda: ‘Watch, watch, and watch for every opportunity of
rendering service to humanity. Service alone can purify the heart’ (cited in
Divine Life 2004: 2). The Ramakrishna Mission has medical volunteers who
provide free medical screening in mobile clinics for the poor and indigent
living in informal settlements, where access to such facilities is inadequate
or inaccessible. All workers in the mobile clinics, including doctors, serve in
a voluntary capacity. The dispensary is stocked with medicines donated from
pharmacies and from doctors in private practice, who obtain free samples
from pharmaceutical representatives (Cunnan & Maharaj 2000). The
Chidananda Medical and Resource Centre, established by the Sarva Dharma
Ashram, provides basic healthcare support for 20 000 poor residents
occupying 6 000 one-room units in Welbedacht, a low-income settlement
adjacent to Chatsworth in Durban (Sookraj 2005).
The Divine Life Society has also established several centres to promote
self-help initiatives and skills acquisition for the poor and indigent. In the
greater Durban metropolitan area, sewing centres were established in Tongaat,
Chatsworth and Merebank. In 2004, 46 sewing machines were in operation

Free
dow
nloa
d fr
om w
ww
.hsr
cpre
ss.a
c.za
104 giving and solidarity
with 70 African women trained as machinists. The Divine Life Society has been
involved in the following projects in KwaZulu-Natal over the past 25 years:
◆ 179 schools have been built or renovated;
◆ Financial aid has been provided to 39 Hindu spiritual organisations;
◆ 255 homes have been constructed for displaced Africans and Indians
in Waterloo, Verulam (north of Durban);
◆ Baptismal centres have been constructed at Port Dumford and Inanda;
◆ Disposal of cremated ashes – the ghat project – has been set up in
Clare Estate, Durban; and
◆ Sandwiches are provided for school children at five different centres
in KwaZulu-Natal.23
The premier of KwaZulu-Natal, Sbu Ndebele, noted that there was a
partnership between the Divine Life Society and the province in which
the Society had contributed in excess of R70 million towards community
projects. The Society was very active in building schools, as was
acknowledged by the MEC for Education in KwaZulu-Natal, Ina Cronje:
Since January 2004, the Society has completed over 50 schools, with
300 classrooms in total. The Society is also engaged in sanitation and
water programmes in schools around the province. Currently, Divine
Life Society of South Africa is building schools in the Okahlamba,
Ethekwini, Zululand and South Coast regions. We commend the
Society for its support in trying to relieve the backlog of classrooms
in rural areas. We also want to compliment Divine Life Society for its
speedy delivery, quality and cost effectiveness.24
Another project worthy of mention was the construction of the Ganga
Baptismal Centre for the Nazareth Baptist Church at Ebuhleni in KwaZulu-
Natal. This is an example of how the development projects of the Divine
Life Society extend beyond religious, ethnic, cultural and racial divides. The
contribution by Divine Life Society was received with great appreciation by

Free
dow
nloa
d fr
om w
ww
.hsr
cpre
ss.a
c.za
religion and development 105
the Shembe community, and the growing multicultural networking and
cooperation it fostered went beyond merely the building of the physical
structure.25 The centre was designed in such a way that it can also be used for
cultural and educational purposes (Sookraj 2005).
Many Christian organisations and churches have a particular interest
in issues relating to development. Churches are involved in a variety of
development projects in urban and rural communities, which focus on job
creation for the unemployed, capacity building for women, counselling
families in crisis, building crèches and pre-schools, and providing life
skills training for teenagers. The SACC is perhaps unique in that it explicitly
incorporates poverty reduction and empowerment in its mission statement:
As a National Council of Churches and Institutions, the SACC, acting
on behalf of its member churches, is called by the Triune God to
work for moral reconstruction in South Africa, focusing on issues
of justice, reconciliation, integrity of creation and the eradication of
poverty and contributing towards the empowerment of all who are
spiritually, socially and economically marginalised.26
Many of the Christian programmes have a development orientation, with
a strong focus on empowerment. Illiteracy, unemployment and hunger are
the outward manifestations of widespread poverty in many parts of South
Africa. The Adventist Church has focused on the training and empowerment
of unemployed youth, and networks with organisations that can invest in
their skills acquisition. Para-Christian organisations, such as Dream for
Africa, Doctors for Life International, and Crossroads International, are
involved in similar projects. The SACC promotes community independence
by developing programmes that meet the daily needs of low-income families
and stress leadership development. The capacity-building programme of the
Catholic Church aims at increasing the ability of people to determine their
own solutions to development challenges, and providing support for them to
engage in sustainable livelihoods. The objectives of the programme include:

Free
dow
nloa
d fr
om w
ww
.hsr
cpre
ss.a
c.za
106 giving and solidarity
◆ Supporting income-generating activities using traditional crafts and
accessing markets;
◆ Transforming and reviving land, water and other agricultural
resources;
◆ Providing care and support to the aged;
◆ Providing assistance to the unemployed in order to empower them to
find or create employment;
◆ Providing sporting and other recreational activities to rural youth, as a
means of facilitating their personal growth and their assimilation into
society; and
◆ Combating the incidence and effects of domestic violence.
(Chetty 2005)
Churches can have a greater development impact when they work with
other concerned groups on social and civic issues such as human rights
and hunger. The SACC facilitates this cooperation, and helps to educate local
congregations about issues relating to peace, justice, democracy, human
rights and development policy. The Public Policy Liaison Office of the SACC,
located close to the national Parliament in Cape Town, demonstrates its
dedication to ensuring that the voices of poor and marginalised groups are
heard in the government policy arena. The Policy Liaison Office monitors
legislation and government policy, supports advocacy around issues of
concern to the church, informs church bodies about current policy debates,
conducts advocacy training workshops, and offers pastoral support to
Members of Parliament.
Another important area of Christian intervention is providing
support for abused women. South African statistics on the abuse of women
are alarming. Experts report that as many as one in four women are
emotionally or physically abused by their partners. The existing facilities
to provide support and protection for the abused are extremely inadequate.
Many churches are attempting to fill this vacuum. For example, in 1990 the
Salvation Army opened Carehaven in Cape Town, which provides shelter,

Free
dow
nloa
d fr
om w
ww
.hsr
cpre
ss.a
c.za
religion and development 107
counselling, reassurance, guidance, support and love to many abused
women and children. Shortly thereafter, similar projects were started in
Johannesburg and Pretoria (Chetty 2005).
In the traditional African churches, burial clubs and stokvels are
important projects. This can be ascribed to the direct returns and benefits
that these projects yield, and to the associated social capital or ‘socially
rooted insurance’ they generate. Many of these projects occur through or
are organised by the churches. Members that have more limited financial
resources can also volunteer time and labour to church activities. Such
church-oriented financial and labour investments seem to provide the
investors with emotional and social support, which they regard as necessary
to address the vagaries and vulnerabilities of life that tend to buffet the poor
(Sithole 2005).
In summary, it is evident that giving in the religious sector has
focused on poverty alleviation strategies as well as development initiatives.
Poverty alleviation initiatives include feeding schemes (food hampers, and
meals in schools), blankets in winter, response to disasters, and providing
welfare support like counselling (including for HIV/AIDS), addressing
alcohol and drug abuse, medical attention, and assisting with emergency
accommodation. Such services were initially offered to members of
congregations, but are increasingly being extended to anyone in need.
Development initiatives include the building of schools, skills training and
empowerment. There is an increasing focus on rural areas, and especially on
initiatives to empower youth and women.
Gender dimensions of resource mobilisation and management
Women have always played an active role in mobilising resources for giving,
but because of the prevailing patriarchal systems in all the faiths, were
not allowed to actively participate in decision-making which determined
allocation priorities. However, women are beginning to play a more
important role in such procedures.

Free
dow
nloa
d fr
om w
ww
.hsr
cpre
ss.a
c.za
108 giving and solidarity
The history of Jewish giving in South Africa demonstrates a clear
gender division of labour. Visible public fund-raising and organisation of
the key campaigns, and management of the main giving institutions in the
Jewish community, have been almost exclusively the domain of men. Even in
the few instances where women held leadership positions, they constituted
an absolute minority within such structures. The tendency for Jewish women
has been to set up separate structures and initiatives to respond to the urgent
basic needs of the community (Favis 2005).
The Union of Jewish Women (UJW) is one such example. Operating in
the national and regional arenas, the UJW has a branch structure to mobilise
women at the local level, where they can identify areas of need and respond
accordingly. Most of these projects are related to issues that women identify
with closely: childcare, abuse, nutrition and education. However, in the past
men made the final decisions about how a significant proportion of funds
raised by the UJW would be allocated. In 2004, the UJW resolved to retain
control over the funds it raised, and decide how funds would be administered
and allocated. Although this decision was accepted without any controversy,
there is no indication that it reflected a more general tendency for women to
assert themselves in a conservative, patriarchal community (Favis 2005).
Hindu women similarly function in a highly patriarchal, male-
dominated social structure. They are actively involved in the different facets
of giving, but have very little decision-making power or influence. Very few
women hold executive positions in the different Hindu organisations in
South Africa. Hindu women’s roles go beyond the issues of voluntary work to
include a broader conceptualisation of care giving. Women see themselves as
responsible for the protection, preservation and continuity of the community,
galvanising support for special functions, crises and events. The idea of
the woman as ‘community-maker’ assumes a central role in the identity
of Hindu women givers. In general, Hindu women understand giving in a
more organic way, as pranidaya, which suggests compassion for all forms of
life – ‘not even a dog must go hungry’ (Sookraj 2005).
Free
dow
nloa
d fr
om w
ww
.hsr
cpre
ss.a
c.za
religion and development 109
Traditionally, the patriarchal structure of Islamic society placed great
emphasis and responsibility on the male head of the household to fulfil
his charitable obligations according to scriptural tenets. In South Africa
the Muslim population comprises an extremely small minority, and many
Muslim women are highly educated and skilled in an environment where
patriarchal influence is less dominating. Since many are economically
active, Muslim women also contribute to philanthropic causes. Muslim
women who are not economically active volunteer their time and labour, for
example cooking for feeding schemes and organising fund-raising events
(Khan 2005). Notwithstanding this, Muslim men control most charitable
organisations. However, some progressive organisations are taking tentative
transformative measures to become more gender representative in their
composition. At its biennial conference in 2004, the South African National
Zakaat Fund made special provision for the nomination of three female
trustees from a total of 20 elected males (Khan 2005).
Women have always played an important role in the fund-raising
activities of the Christian church. However, they have been unable to
influence decision-making processes, especially around how resources
are utilised, which has been the preserve of the male-dominated church
councils. Women have, for example, been alienated from the treasury and
financial boards of many church councils. A notable exception is the case of
the Anglican Church, where from the office of the Archbishop downwards,
the policy is to be gender inclusive. Women are therefore also very active in
leading and managing giving in the Anglican Church as opposed to being
only recipients. The Full Gospel Church is actively involved in building
leadership capacity among women, who are viewed as the foundations of
families and society (Chetty 2005). In 2003 the Reformed Church, which has
414 congregations and 250 000 members nationally, first allowed women
to hold the position of church deacon. However, in a retrogressive move,
in January 2006 the Reformed Church resolved that women would not be
allowed to become ministers or elders in their congregations.27

Free
dow
nloa
d fr
om w
ww
.hsr
cpre
ss.a
c.za
110 giving and solidarity
Although the traditional African religious sector is patriarchal,
women do play an active role in giving. In this sector giving sometimes
occurs in a form of exchange and is viewed as a matter of love and support,
especially amongst women in the same church. This occurs, for example,
by giving a member of the church gifts like food, blankets and grass mats,
particularly during ceremonies or special occasions observed at their homes.
A good example of such an occasion would be umemulo (a young woman’s
ceremony that declares her to be of marriageable status). At an umemulo the
young women receives an amazing accumulation of gifts (especially money
and blankets) from her church and community members. These forms of
exchange are often reciprocal, and women in church take turns to give and
receive (Sithole 2005).
In sum, it is evident that the reasons why people give are complex,
and are linked to the socio-economic conditions and material circumstances
of both givers and recipients. It is clear that in South Africa a great deal of
giving is inspired by religious belief. In South Africa, Christian (the majority
faith) giving dominates, and there has been a phenomenal increase in the
neo-Pentecostal charismatic churches. In addition to tithes and fund-raising
projects, many churches under the banner of the SACC receive grants from
international Christian organisations for welfare and development activities.
This is a continuation of funding from the 1980s which provided support
for those who were involved in the anti-apartheid struggle. In the case
of Shembe and Zionist groups, the church served as a catalyst for social
networks, where there was sharing and caring amidst poverty.
However, the other religious communities (Jewish, Muslim and
Hindu), which comprise under 2 per cent of the population collectively, are
very active in the giving arena, and also reach out to other communities
that do not necessarily belong to their faith. The smaller wealthy Jewish
community is able to mobilise financial resources quickly, and more recently
has been giving in an attempt to address the socio-economic contradictions
of the country. The Tikkun brings into focus larger political issues
concerning the Jewish community’s relationship with the ruling elite of

Free
dow
nloa
d fr
om w
ww
.hsr
cpre
ss.a
c.za
religion and development 111
the day. Hindu giving is seen as more than mere charity, but as an act with
a deep sense of sharing. Smaller, less noticeable and quantifiable giving
happens at the Hindu family and community level. Amongst Muslims,
the most prominent causes supported within the community are social
welfare, establishment and maintenance of places of worship, and religious
education. Causes that receive generous support outside of the community
are child and social welfare societies, natural disasters and humanitarian
crises.
However, natural disasters and humanitarian crises tend to draw
out the best among all the faith-based communities. There is no better
example of this than in the recent tsunami disaster in South-East Asia. The
outpouring of concern and financial and material support from citizens
across the world can only be described as astounding. Religion in this case
was not a source of division and friction. Instead, it collectively became the
cement of humanity where all supported those in need.
Religion and development
It is evident that religiously-inspired giving is extensive in South Africa,
and it is the essential fiscal foundation on which the activities of faith-based
communities and institutions are founded. Religious institutions not only
ensure their own reproduction through this giving, but they are also enabled
as a result to undertake socio-economic support for marginalised and
disadvantaged members of the community. The Fourth World Conference
on Women in Beijing acknowledged that: ‘Religion, spirituality and belief
play a central role in the lives of millions of women and men, in the way they
live and in the aspirations they have for the future’ (Girard 2004: 30). It has
been suggested that the ‘culture of giving is an essential component for the
humanisation of…development…It provides the spiritual energy necessary to
sustain a true project for human development’ (Girard 2004: 29).
It needs to be borne in mind that these support activities are not
simply of a charitable orientation, as is commonly believed. Rather, as the

Free
dow
nloa
d fr
om w
ww
.hsr
cpre
ss.a
c.za
112 giving and solidarity
analysis of the initiatives of faith-based institutions in the preceding pages
demonstrates, religious institutions are as much involved in developmental
initiatives – the building of schools, the teaching of skills, the establishment
of old age homes – as they are in poverty alleviation ones – the feeding
schemes and the provision of social welfare. There clearly can be no false
divide between poverty alleviation and development – both are obviously
required in South Africa, and for that matter in much of the world. Moreover,
poverty alleviation and developmental initiatives are mutually supportive
of each other. It is as essential to provide children with food, as it is to
build them a school so they can develop the required skills to change the
circumstances of their lives. Without the former the latter is unlikely to
have the desired effect. Religious institutions in the main tend to recognise
this. Of course the balance between poverty alleviation and development
differs among these communities and between their institutions and,
as has been argued, this balance is determined by a variety of variables
including religious traditions, spatial location, political pressures and wealth
endowments. But overall there are indications that many of these religious
institutions are beginning to professionalise, and as a result understand
the mutually reinforcing effects of poverty alleviation and development
initiatives.
Despite this positive analysis of religious institutions and their
philanthropic interventions, we would be remiss if we did not at least
recognise the limits of these institutions and their potential negative
consequences. Two such consequences come to mind. First is the traditional
concern of liberal and radical intellectuals that religious institutions’
engagements in public life tend to result in societal fissures, producing
tensions which have the effect of polarising citizens. There is of course
much historical evidence to support their concern. Recently this concern was
raised by no less a notable literary (and religiously persecuted) figure than
Salman Rushdie, who expressed concern about the increasing involvement
of religion in the public life of the United States and Britain, and warned
that political elites in both societies would rue the divisive consequences of

Free
dow
nloa
d fr
om w
ww
.hsr
cpre
ss.a
c.za
religion and development 113
their appeasement of these religious institutions and communities (Sunday
Times 27 March 2005).
Could the philanthropic intervention of religious institutions not have
the same effect? After all, these interventions are often targeted at addressing
public concerns like poverty and underdevelopment. There is of course a
real danger that Rushdie’s fears could materialise. But averting this outcome
would require a much more engaged response than Rushdie seems to realise.
The problem lies in his historically decontextualised analysis of political
elites and their behaviour in the United States and Britain, which are a
reflection of the distribution of power among social actors in these societies.
It is no use bemoaning the presence and strength of religion in public life;
rather, the task is to recognise this reality, and manage it, so that the societal
fissures and political polarisation produced by more extremist religious
interventions can be avoided. This is even more necessary in a context like
South Africa. The underdevelopment heritage bequeathed by apartheid
is enormous and the post-apartheid regime cannot address the racially
constructed historical backlogs on its own. If religious institutions are
generating the scale of resources suggested in the analysis of the preceding
pages, then is it not legitimate that they be engaged to assist in addressing
the developmental challenges of post-apartheid South Africa?
This, then, raises the second potentially negative consequence of
religiously inspired philanthropic engagements, emanating mainly from
the character and intentions of these interventions. Much religious giving
is directed within communities rather than across them. Moreover, even
when it is directed across religious boundaries, the intention is often the
recruitment of new people to the faith. Both the parochial intra-community
focus of religious institutions and their intentions when this is transcended
could skew the developmental agenda in dramatically negative ways. This
of course would provoke the kind of societal fissures and political tensions
that Rushdie warns of. But again, the answer to this dilemma is the
public management of, and engagement with, religious institutions and
communities.

Free
dow
nloa
d fr
om w
ww
.hsr
cpre
ss.a
c.za
114 giving and solidarity
At one level this seems to have been recognised by some political
elites. As was indicated earlier, President Thabo Mbeki has already
established a multi-faith forum of national religious leaders with whom to
engage on poverty alleviation and development. Initial indications suggest
that Mbeki’s immediate interest in engaging these religious leaders is not
on coordinating their own resources, but rather on using their grassroots
institutional expressions – local parishes, mosques, synagogues and
temples – as mechanisms for the dissemination of public social welfare
grants and other funds. This is because the apartheid legacy has ensured that
state institutions are often not present in areas where the most marginalised
and dispossessed citizens reside. Using the religious institutions thus
enables the state to distribute resources to where they are most needed
without waiting for the establishment of the necessary public institutional
infrastructure.
There is much that is positive in this proposal for it creates
the possibility of a more equal partnership between the state and one
significant expression of civil society. But care must be taken to ensure
that this initiative does not run aground on religious turf wars. The forum
must continue to have a multi-faith character, and institutions must be
monitored to ensure that these state resources are not disbursed in a
religiously parochial way. Moreover, the forum must transform from being
a dissemination agent to an institutional expression, which informs the
character of the national development agenda, and enables coordination
between religious institutions and the state on the disbursement of their
respective developmental resources. This will not only allow for the necessary
coordination that is required in a successful development enterprise, but
will enable the disbursement of resources by religious institutions in a
socially responsive way. The net effect would hopefully be a more efficient
and effective development undertaking that reinforces the common bonds of
kinship among South African citizens, rather than the divisions bequeathed
to them by their apartheid past.
Free
dow
nloa
d fr
om w
ww
.hsr
cpre
ss.a
c.za
religion and development 115
Acknowledgements
Brij Maharaj and Adam Habib wrote this synthesis chapter. The authors of
the individual commissioned reports appear as co-authors to this chapter in
alphabetical order.
Notes
1 C Bower, Spread the truth, not the word, Mail & Guardian 24 December 2004.
2 R Philip, F Ntshingila, P Sukhraj, N Gules & J van der Merwe, Glory hallelujah!
Sunday Times 27 March 2004.
3 The SACC comprises the following Christian organisations: African Catholic
Church, African Methodist Episcopal Church, Apostolic Faith Mission of South
Africa, Baptist Convention, Church of the Province of Southern Africa, Coptic
Orthodox Church, Council of African Instituted Churches, Dutch Reformed
Church (Nederduitse Gereformeerde Kerk), Ethiopian Episcopal Church,
Evangelical Church in South Africa, Evangelical Lutheran Church in Southern
Africa, Evangelical Lutheran Church in South Africa (Natal/Transvaal),
Evangelical Presbyterian Church in South Africa, Greek Orthodox Archbishopric
of Johannesburg and Pretoria, Hervormde Kerk in Suidelike Afrika, International
Federation of Christian Churches, Methodist Church of Southern Africa,
Moravian Church in Southern Africa, Presbyterian Church in Africa, Religious
Society of Friends (Quakers), Salvation Army, Southern African Catholic
Bishops’ Conference, United Congregational Church of Southern Africa, United
Presbyterian Church in Southern Africa, Uniting Reformed Church of Southern
Africa, Volkskerk van Afrika.
4 International funding is received from the following global partners: Action
by Churches Together; Africa Action, United States; All Africa Conference
of Churches; Anglican Church of Canada; Berliner Missionswerk Germany;
Bread For The World, Germany; Christian Aid, United Kingdom; Christian
World Service, New Zealand; Church of Norway; Church of Scotland; Church of
Sweden; Churches in Action, Netherlands; Danchurchaid, Denmark; Diakonia,
Sweden; Evangelical Church in Germany (EKD); Evangelische Zentralstelle fur
Entwicklungshilfe (EZE); Evangelisches Missionswerk in Deutchland (EMW);

Free
dow
nloa
d fr
om w
ww
.hsr
cpre
ss.a
c.za
116 giving and solidarity
Global Ministries, Christian Church/United Church of Christ, United States;
HEKS, Switzerland; ICCO, Netherlands; Kirchenkreis Hildesheim-Sarstedt,
Germany; Kirchenkreis Storman, Germany; Lutheran World Relief, United States;
Mennonite Central Committee, United States; Morehouse College, United States;
National Council of Churches of Christ, United States; Norwegian Church Aid;
Presbyterian Church (United States); Refugiado Foundation, Netherlands; The
Riverside Church, United States; United Church of Canada; United Methodist
Church, General Board of Global Ministries, United States; Uniting Protestant
Churches, Netherlands; World Council of Churches, Switzerland.
5 T Mokopanele, New churches eye bottom line of black middle class, Business
Report 19 March 2006.
6 R Philip, F Ntshingila, P Sukhraj, N Gules & J van der Merwe, Glory hallelujah!
Sunday Times 27 March 2004.
7 This is estimated from the directory of Muslim organisations compiled by
Murshid Davids in 1996. It must be noted that some organisations may no longer
exist whilst new ones may have formed since this period. Currently, this is the
only available directory of Muslim organisations that informs the study.
8 Muslims in South Africa are theologically, spiritually and ideologically divided,
comprising different groupings such as Sunnis, Soofies, Tabligh, Shafi, Hanafi,
Shite, etc. In addition, within these groupings one finds those that rigidly adhere
to the traditional teachings of Islam, the modernists and postmodernists.
9 Also known as the Johannesburg Jewish Helping Hand and Burial Society.
10 Voluntarism in India received the maximum impetus and incentive from Gandhi,
who believed that voluntary action was the only path to India’s development.
Gandhi’s concept of development included all aspects of life: social, political,
economic, cultural and spiritual. His notion of rural development was
constructing self-supporting, self-governing and self-reliant village communities
where everyone’s needs were satisfied and everyone lived in harmony and
cooperation. The major shift in the organisation of voluntary work was through
Gandhi’s voluntarism. It emphasised empowerment and transformation of the
society and bestowed a political context on Ramrajya (Interview with Dasarath
Bundhoo, philanthropist and community welfarist, Pietermaritzburg, 23 July
2004, cited in Sookraj 2005).
11 He is liberal who gives to anyone who asks for alms, to the homeless, distressed
man who seeks food; success comes to him in the challenge of battle, and for

Free
dow
nloa
d fr
om w
ww
.hsr
cpre
ss.a
c.za
religion and development 117
future conflicts he makes an easy ally. http://www.beliefnet.com/features/charity_
chaart2.html (cited in Sookraj 2005).
12 http://.suntimes.co.za/articles//article.aspx?ID=ST6A95523 (cited in Sookraj 2005).
13 Food for Life fund-raising brochure (2002) (cited in Sookraj 2005).
14 Smita Krsna Dasa (n.d.): Food for Life Fundraising Brochure, ISKCON (cited in
Sookraj 2005).
15 Interview with representatives from five Hindu organisations in the KwaZulu-
Natal region, 5 November 2004 (cited in Sookraj 2005).
16 This trend is not surprising as most religiously mandatory charity is prescribed
for Muslims only.
17 http://www.rhema.co.za (cited in Chetty 2005).
18 Submission to the Truth and Reconciliation Commission Faith Communities
Hearings, http://web.uct.ac.za/depts/ricsa/trc/wom_sub.htm, accessed 30 March
2005.
19 Interview with Herby Rosenberg, CEO, Tikkun (cited in Favis 2005).
20 Anne Harris, Chairperson, Tikkun Projects, South African Jewish Report, 14–21
May 2004 (cited in Favis 2005).
21 Interview with Reeva Forman, Chairperson, Temple Israel and Tikkun, Hillbrow
(cited in Favis 2005).
22 Interview with Barbara Miller,Director, Tikkun Intra-Communal Development,
Cape Town (cited in Favis 2005).
23 See www.sivananda.dls.org.za for further information on services rendered by the
Society.
24 See http://www.sivanda.dls.org.za
25 Guru Bhakti Yoga – 36, September–October 2003 (cited in Sookraj 2005).
26 http://www.sacc.org.za (cited in Chetty 2005).
27 H Geldenhuys, Church slams door on women leaders, Sunday Times 15 January
2006.
Free
dow
nloa
d fr
om w
ww
.hsr
cpre
ss.a
c.za
118 giving and solidarity
References
Anand P (2004) Hindu diaspora and religious philanthropy in the US. Paper
presented at the 6th International Society for Third Sector Research, Toronto, July
Brown RM (1993) Liberation theology: An introductory guide. Westminister: John Knox
Press
Chetty I (2005) Christian social giving in South Africa. Working Paper, Centre for Civil
Society, University of KwaZulu-Natal
Clark J (1992) Democratising development: NGOs and the state. Development in
Practice 2: 151–162
Cunnan P & Maharaj B (2000) Against the odds: Health care in an informal settlement
in Durban. Development South Africa 17: 667–686
Divine Life (2004) Sivananda Day-to-Day No. 69. Durban: Divine Life Society
Everatt D & Solanki G (2005) A nation of givers: Social giving among South Africans.
The state of social giving in South Africa Project, Report 1, Centre for Civil Society,
University of KwaZulu-Natal
Favis M (2005) The state of giving in the South African Jewish community. Working
Paper, Centre for Civil Society, University of KwaZulu-Natal
Girard LF (2004) Introduction. In LF Girard, B Forte, M Cerreta, P De Toro & F Forte
(Eds) The human sustainable city – Challenges and perspectives from the Habitat
agenda. London: Ashgate
Independent Sector (2002) Faith and philanthropy – The connection between charitable
behaviour and giving to religion. Accessed on 18 November 2004.
www.independentsector.org
Khan S (2005) The state of social giving amongst Muslims in South Africa. Working
Paper, Centre for civil Society, University of KwaZulu-Natal
Kuperus T (1999) Building democracy: An examination of religious associations in
South Africa and Zimbabwe. The Journal of Modern African Studies 37: 643–668
Maharaj B (2002) Economic refugees in post-apartheid South Africa – Assets or
liabilities? Implications for progressive migration policies. GeoJournal 56: 47–57
Marshall K (2001) Development and religion: A different lens on development debates.
Peabody Journal of Education 76: 339–375
Moe HA (1961) Notes on the origin of philanthropy in Christendom. Proceedings of the
American Philosophical Society 105: 141
Free
dow
nloa
d fr
om w
ww
.hsr
cpre
ss.a
c.za
religion and development 119
Selinger L (2004) The forgotten factor: The uneasy relationship between religion and
development. Social Compass 51: 523–543
Sithole MP (2005) Non-arithmetic giving: The ethnography of giving amongst the Shembe
and Zionist followers in KwaZulu-Natal and Mpumalanga. Working Paper, Centre
for Civil Society, University of KwaZulu-Natal
Sookraj R (2005) The state of giving in South Africa: A Hindu perspective. Working
Paper, Centre for Civil Society, University of KwaZulu-Natal
Sweetman C (1999) Editorial. Gender and Development 7: 2–6
Tobin GA (2000) The transition of communal values and behaviour in Jewish
philanthropy. Paper presented at the Forum on Philanthropy, Public Policy and
the Economy, University of California, Los Angeles
Van Rooy (2002) Strengthening civil society in developing countries. In V Desai &
RB Potter (Eds) The companion to development studies. London: Arnold
Ver Beek KA (2002) Spirituality: A development taboo. In D Eade (Ed.) Development
and culture. Oxford: Oxfam

Free
dow
nloa
d fr
om w
ww
.hsr
cpre
ss.a
c.za

Free
dow
nloa
d fr
om w
ww
.hsr
cpre
ss.a
c.za
121
The inTernaTional liTeraTure on philanthropy assumes that giving is an
act undertaken largely by richer, more resourced sections of the community
and is directed towards more under-resourced sectors (see Chapter 1 of this
volume). The South African case, however, contests this assumption. The
results of the national survey reported on in this volume demonstrate that
giving is an act as common in poor and marginalised communities as it is
in the better-endowed sectors of society. Indeed, the results even suggest
that giving in poorer provinces is more widespread than that exhibited in the
richer, more industrialised provinces of South Africa (see Chapter 2).
This chapter builds on the data generated by the national survey
and investigates patterns of giving and resource flows in poor and
marginalised communities of South Africa. It is based on four sectoral
reports focusing on Mdantsane, Mandela Village, Graskop, and Mokasa 2.
The first two areas are located on the periphery of an economically growing
urban metropole, whereas the other two are situated in more rural areas
of the most underdeveloped provinces. These four case studies were
selected to enable a comparative analysis between places that fall within
government’s planned development node(s) and those that do not. Not only
4
Resource flows in poor communities:
a reflection on four case studies
Mandla Seleoane
Free
dow
nloa
d fr
om w
ww
.hsr
cpre
ss.a
c.za
122 giving and solidarity
does this allow for comparisons to be made on how flows of governmental
development resources impact on communities’ patterns of giving, but
it also demonstrates that patterns of giving are very similar in poor and
marginalised communities across the urban–rural divide.
The chapter also reflects on the issue of whether social security
grants promote a dependency syndrome. This is important because, as is
demonstrated in Chapter 8 of this book, up to 55 per cent of South Africans
live in conditions of poverty. In this context, the suggestion that the state
may have to reconsider the notion of social grants on the basis that they
lead to dependency is of concern. Even more disturbing, as demonstrated in
Chapter 8, is that the correlation between poverty and race and poverty and
gender is still strong in post-apartheid South Africa.
The chapter is structured as follows: the first section focuses on
the methodology used in the research and provides brief background
information on the spatial contexts of the case studies. Then, I reflect on
definitions of poverty and review the literature on how poor people cope.
Thereafter, I describe and analyse the findings of the four case studies with
a particular emphasis on the roles of the state, business, churches, NGOs, and
individuals. The chapter concludes with a reflection on the value of stokvels1
in poor communities and the potentially entrepreneurial effects of social
support grants.
Methodology and context
The four case studies were conducted in 2004. All used focus groups – some
were single-sex and others included men and women. Some focus groups
comprised unemployed members of the community and others included
both employed and unemployed people. In-depth interviews were also
conducted with some leading members of the communities from which the
focus group members were drawn.2
The case studies were a part of the wider study conducted by the
University of KwaZulu-Natal on ‘giving’ in South Africa. The four areas

Free
dow
nloa
d fr
om w
ww
.hsr
cpre
ss.a
c.za
resource flows in poor communities 123
chosen were located in four different provinces, namely: Mdantsane (Eastern
Cape); Mokasa 2 (North West); Mandela Village (Gauteng); and Graskop
(Mpumalanga). Mdantsane is an urban township located some 30 kilometres
outside East London. It falls within the jurisdiction of the Buffalo City
Municipality. It is arguably the second biggest township in South Africa after
Soweto. Mokasa 2 is a rural village in Taung,3 some 600 kilometres north-
west of Pretoria, and falls under traditional leadership. Mandela Village lies
some 30 kilometres to the east of Pretoria. It is mostly an informal settlement
area, but falls within the jurisdiction of the City of Tshwane Metropolitan
Municipality. Although this chapter refers to Graskop, the area that was case
studied was Glory Hill, a small township some 5 kilometres outside of the
town of Graskop. The case studies therefore comprise two areas located in an
urban setting, one in a rural area and one in a semi-urban area.
While the case studies were selected to cover urban, rural, formal and
informal settings, it must be emphasised that a case study, by definition, is
only ever a study of a particular case. As McNeil writes:
A case study involves the detailed study of a single example of
whatever it is that the sociologist wishes to investigate. It may prompt
further, more wide-ranging research, providing ideas to be followed
up later, or it may be that some broad generalization is brought to
life by a case study. There is no claim to representativeness, and the
essence of the technique is that each subject studied, whether it be an
individual, a group, an event, or an institution, is treated as a unit on
its own. (1985: 87)4
However, this does not mean that case studies can therefore not yield
information that is socially useful. Case studies, as indicated, may provide
ideas to be followed up later or throw up concrete issues to be investigated
through other research techniques. In themselves these are already socially
significant. But, as the citation above suggests, it is possible to arrive at
broad generalisations from results yielded by case studies (clearly within the
Free
dow
nloa
d fr
om w
ww
.hsr
cpre
ss.a
c.za
124 giving and solidarity
limitations imposed by the research technique itself). But more significantly
a case study:
…provides a unique example of real people in real situations, enabling
readers to understand ideas more clearly than simply by presenting
them with abstract theories or principles. Indeed a case study can
enable readers to understand how ideas and abstract principles can
fit together. Case studies can penetrate situations in ways that are not
always susceptible to numerical analysis. (Cohen et al. 2000: 181)
In this chapter I shall therefore proceed on the basis that it is not possible
to generalise the results yielded by the four case studies to the country as
a whole. Nor is it possible to generalise the results even to the community
constituting the universe from which the interviewees were extracted in the
statistical sense. Nevertheless, some important hypotheses can be postulated
in respect of the entire country, based on the findings yielded by the four
cases.
Definition of poverty
In a study of this nature it is necessary to try and define poverty in order
to limit the scope of one’s enquiry, even if one fails to produce a definition
of the subject that has general acceptance. There are various factors that
militate against the production of a generally accepted definition of poverty.
One such factor is ideology. Poverty throws up ideological questions
in such a manner that it is often hard to canvass the issues involved in the
debate without the risk of being accused of making an ideological argument
(Crow 1992; Seitz 1988). If this is accepted, and if it is also agreed that it is
difficult to concur on issues that involve ideology, it stands to reason that
there be will vehement disagreements every time we try to define poverty.
However, there is hardly a sphere of human knowledge that is immune to
ideological intrusion. Therefore, the question is not so much whether what

Free
dow
nloa
d fr
om w
ww
.hsr
cpre
ss.a
c.za
resource flows in poor communities 125
we say is mediated by ideology, but rather how we can approach the subject
of poverty in a manner that enables us to communicate meaningfully,
notwithstanding the ideological baggage we all bring into the debate.
Another factor militating against the possibility of a generally
accepted definition of poverty is that the concept is relative (De Beer &
Swanepoel 2000). If we accept that poverty can only be understood in
relative terms, that people can only be poor in relational terms, then the
concept ‘poverty’ can only be defined relationally. In other words, there are
no objective external criteria against which we can judge whether this or
that person is poor. Hence, it can be argued that people cannot be poor as
such – but only in relation to others.
If this were the case, then one might very quickly and easily conclude
that anybody can be defined as poor relative to another, and then one might
just as well give up the enquiry. However, irrespective of what theories on
poverty tell us, every day we see people who appear to us to be obviously poor
and others who appear to us to be obviously well off. Further, in the normal
course of events, we are quite able to say of a person that he/she is poor or
rich without, in our minds, undertaking any comparative analysis. It is
only when we switch into a different mode that we think of people as poor
or rich in relational terms, whereas when I meet a beggar at a traffic light I
do not bother at all with comparing him/her with the drivers waiting at the
intersection.
It could be argued that, in learning the language in which we express
ourselves, we also learn the comparisons embedded in the language in such
a manner that we make those comparisons automatically. In this context, it
would hardly be surprising that we use terms that are inherently comparative
without fully realising that we are comparing entities.
Yet, the realm of the academic calls upon us to embark quite
deliberately on analyses of words like ‘poor’. If such deliberate analysis is
required, it remains necessary, while admitting the relativity of poverty, to
nevertheless find a language that allows us to articulate phenomena that we

Free
dow
nloa
d fr
om w
ww
.hsr
cpre
ss.a
c.za
126 giving and solidarity
witness, such as seeing people who are obviously poor, and that we feel are far
too significant to go unaccounted for because of our theories on the subject.
To this end I have found useful May’s definition of poverty in Poverty
and Inequality in South Africa: poverty is ‘the inability of individuals,
households, or entire communities, to command sufficient resources to
satisfy a socially acceptable minimum standard of living’ (1998: 3). Using
this definition, there is a socially accepted standard of living – if anyone
lives below that standard, then they are poor. All those who live below that
minimum standard will be considered poor even if one admits that they are
not poor to the same degree – different people will sink lower than others
below that standard, and therefore some will be poorer than others.
Furthermore, according to this definition, access to resources as such
does not necessarily mean the absence of poverty. Absence of poverty only
occurs when the resources are available in the correct quantity and quality.
The question then must arise as to what constitutes the correct quantity and
quality of resources as to denote the absence of poverty. Differently put, when
do we say an individual has sunk below the minimum standard of living in
such a manner as to entitle us to call them poor?
Food that has a dietary energy supply which is ‘less than the
nutritional requirements of a human being’ is generally considered
inadequate. Similarly, the World Bank Hunger and Poverty Report considers
the ‘energy potential of food’ to be an essential element in judging the
adequacy of the diet (cited in Crow 1992: 18). From this perspective, we must
therefore say that a person is poor in the first instance if they have no access
to food – the condition, in other words, which De Beer and Swanepoel call
‘absolute poverty’, where a person’s ‘next meal may mean the difference
between life and death’ (2000: 2). But we must also judge a person as poor
even when they have access to food, but such food is inadequate to meet
bodily nutritional requirements or when, in the words of the World Bank
Report, such food is of a lower energy potential than that required for the
normal functioning of the body.

Free
dow
nloa
d fr
om w
ww
.hsr
cpre
ss.a
c.za
resource flows in poor communities 127
It seems to me that the term ‘access’ is very important to the
operationalisation of this definition of poverty. What it conveys is that if
people choose to live on food that is sub-standard in terms of the definition,
while nutritionally adequate food is available (accessible) to them, such
people must not be pronounced poor. Caution is, however, required when
using this definition, because a socially accepted standard is a relative
matter too. For a very poor society, a socially acceptable standard would be
low relative to other societies. A poor society or community comes to a point
where it accepts its poverty as normal so that it is trapped in what Robert
Chambers called ‘the poverty cycle’ (De Beer & Swanepoel 2000).
Wilson and Ramphele (1989) argue that it is difficult to have a
homogeneous definition of poverty because poverty manifests itself in
various forms. Thus they write about the many faces of poverty and argue
that ‘poverty is like an illness; it shows itself in different ways in different
historical situations and it has diverse causes’ (1989: 14). This implies that
various indicators should be used to define poverty.
One could say, therefore, that it is not only access to food (of correct
nutritional quantity and quality) that one must consider in evaluating
whether any given person is poor or not. Shelter and clothing are just as
important. Indeed, as Rotberg has noted, ‘The story of human history,
reduced to essentials, revolves around the basic requirements for life’ (cited
in Crow 1992: 18). Seitz sees these ‘essentials for life’ as inclusive of ‘air,
energy, food, space, non-renewable resources, heat, and water’ (1988: 39).
For the purposes of this chapter, we can summarise the definition of
poverty as:
◆ Lack of access to the necessities of life in the form of food, clothing
and shelter in such a manner that one’s life becomes precarious;
◆ Limited access to the necessities of life in the form of food, clothes,
and shelter in such a manner that, whilst one’s life is not necessarily
precarious, it is nevertheless not possible to maintain a healthy body.
Free
dow
nloa
d fr
om w
ww
.hsr
cpre
ss.a
c.za
128 giving and solidarity
A view on how poor people cope
There is a substantial literature dealing with the coping mechanisms of
poor people and/or communities. Stokvels are arguably the most important
manifestation of such mechanisms.
It is not clear when stokvels originated in South Africa. Irving
suggests that the word ‘stokvel’ has its origins hundreds of years back (cited
in Scott 2005: 1). She traces it back to ‘stock fairs’ where poor farmers pooled
their savings to buy livestock. An article in The Daily News (22 December
2005), on the other hand, suggests that stokvels surfaced in South Africa
some 50 years ago. Be that as it may, in their origins stokvels were quite
informal and members relied on goodwill. There were certainly no founding
documents. This was possible largely because members knew one another –
as friends, neighbours or colleagues.
In some areas, stokvels were a product of South Africa’s migrant
labour system, which removed people from their home towns and/or villages
and drew them to mines and similar workplaces. In these new settings,
people who came from the same area saw the need to organise themselves
in order to provide for costs like transport to and from their home town or
village and the workplace. In the case of death, funeral expenses (including
transportation of the corpse back to their home town or village) were paid for
from such pooled funds (Economist 13 January 1996).
Stokvels evolved over time into fairly formal arrangements with
constitutions and banking accounts. The development was arguably positive
and some even saw it as inevitable, signalling the modernisation of stokvels
– there had been a view that stokvels showed the general ignorance of black
South Africans about the existence of ‘white insurance companies’. Much
has also been made of the fact that stokvels keep their money ‘buried under
mattresses or in vases’ (Economist 13 January 1996).
The formalisation of stokvels, however, also meant that they were
becoming less and less personal, a factor that opened them up to abuse.
For example, pyramid schemes, unable to find comfort in the law,5 sought
Free
dow
nloa
d fr
om w
ww
.hsr
cpre
ss.a
c.za
resource flows in poor communities 129
refuge under the umbrella of stokvels. Sun Multiserve is a case in point (see
the Economist 13 January 1996). When pyramid schemes, masquerading as
stokvels, eventually go bust, many people who invested in them lose their
money. It would be understandable if people who lose their life’s savings
like this failed to distinguish between stokvels, as they have always known
them, and pyramid schemes presented to them as stokvels. It would also be
understandable if the denial of legal status to pyramid schemes, presenting
themselves as stokvels, bred confusion that reached far beyond the mischief
that the law seeks to suppress.
In this light it is debatable whether recent developments in terms
of commercialising stokvels have been entirely positive. Be that as it may,
stokvels remain an important savings scheme for people who are not always
able to access funds through banks. It is estimated that approximately 25
per cent of black South Africans are members of one or another variant
of stokvels (Economist 13 January 1996). In an address to a conference in
Johannesburg in March 2006, Leila Moonda, Transformation Manager of
the South African Insurance Association, estimated that stokvels command a
combined cash flow of R12 billion per annum (The Star 10 March 2006).
Findings of the case studies
Turning now to our findings from the four case studies, resources
flowed principally from five sources: the state, business, churches, non-
governmental organisations (NGOs); and individual members of the
community.
The state
All four case studies indicated that social grants from the state are a
significant source of livelihood amongst the poor. Interviewees identified the
following types of state grants provided on a monthly basis to the poor:6
◆ Old age pension (R700);
◆ Disability grant (R700);

Free
dow
nloa
d fr
om w
ww
.hsr
cpre
ss.a
c.za
130 giving and solidarity
◆ Child support grant (R160);
◆ Foster child grant (R500);
◆ Care dependency grant (R700);
◆ Grant in aid (R150);
◆ Social relief of distress (R120);7
◆ War veterans’ grant (R718).
Should the state play a role in the provision of grants? Seitz (1988) outlines
three approaches to the role of the state, namely, the orthodox approach,
the radical approach, and the growth-with-equity approach. According to
the orthodox approach, the state’s involvement in matters to do with the
economy must be seriously limited. The radical approach contends that the
state must be involved in matters relating to the economy in order to ensure
that proceeds obtained from production are ploughed back to benefit the
entire community rather than only the propertied elite. The growth-with-
equity approach attempts to bridge the orthodox and radical approaches, and
appropriates what it considers to be positive proposals from them.8
De Beer and Swanepoel, apparently following the orthodox approach,
write that:
In most Third World countries the state is regarded as benefactor.
If infrastructure is lacking, the state must provide it. If the health
situation is worrisome, the state must rectify it. If development
costs money, the state must finance it. This is a very narrow and
self-defeating way of looking at the role of the state…It is quite
understandable that these demands should be made on the state.
The poverty situation is so grave that people have lost all hope of
redeeming the situation. The state is therefore looked upon as the
only saviour. The state reacts by formulating development policies
that are broad, ambitious and often unrealistic. Policies are often not
statements of intent, but…of belief. These are statements of belief

Free
dow
nloa
d fr
om w
ww
.hsr
cpre
ss.a
c.za
resource flows in poor communities 131
of how things should be, and therefore they are often utopian and
impossible to implement. (2000: 92)
A healthy debate is possible on whether or not South Africa is part of the
‘Third World’. There can, however, be no denying that South Africa is part
of the developing world, nor of the fact that the ‘poverty situation’, described
by De Beer and Swanepoel (2000) in the quote, is very characteristic of the
majority of the population. In this context, De Beer and Swanepoel’s critique
of the ‘benefactor’ role of the state is also a critique of the role the South
African state is trying to play in alleviating poverty. It seems to me that it is
necessary to separate two lines of inquiry that are implicit in this critique.
The first is whether the state should play the role under consideration. The
second is whether, if the first question is answered in the affirmative, the
state’s benefactor role is sustainable. The first question is normative and the
second one relates to the means available to the state.
It could be argued that ‘the normative question’ can only be answered
meaningfully in the context of ‘the means question’. I am, however, of
the view that, conceptually, these are two questions. If we conflate them,
we allow resource constraints to dictate what is possible and what is not,
thereby limiting our ability to think about the problems we face in creative
ways – that is, the availability of resources, rather than social actors, would
determine responses. Moreover, we free the state from normative thinking,
and thereby undermine our ability to evaluate how the state prioritises the
application of its resources. Indeed, the fact that states that can ill afford
the obligations imposed by the benefactor role that they try to take on, but
nevertheless do so is, in my view, an indication that it is desirable to treat
these as two separate questions.
Regarding the first question, De Beer and Swanepoel (2000)9
effectively dismiss it as ideological – it leads the state into seeing policy as an
expression of belief systems and to utopianism. First, it must be pointed out
that the opposite view – that the state should not play a benefactor role – is
also informed by particular belief systems. As I argued earlier, all views on

Free
dow
nloa
d fr
om w
ww
.hsr
cpre
ss.a
c.za
132 giving and solidarity
how society ‘should be’ carry ideological baggage. The question is rather how,
given all of our ideological baggage, we can address poverty in such a way
that it does not threaten the very society that affords us the space to disagree
about its ordering.
Second, at least in the South African context, any view that the state
must not take steps to deal with poverty – which is ‘so grave that people have
lost all hope of redeeming the situation’ – must contend with the Bill of
Rights. The Bill of Rights requires the state to take positive steps to relieve
the plight of people who lack the means to deal with their own desperate
situation, however weakly the obligation is formulated in some instances (see
sections 26, 27, 28 and 29 of the Constitution, Act 108 of 1996).
Third, the view that human beings cannot be left exposed to the
unbridled forces of the market, and therefore that the state must intervene
where people cannot help themselves, is deeply ingrained in South Africa’s
history. To some extent, the World Bank recognises this point:
Thus, a major challenge for government and formal institutions is to
be more welcoming and supportive of private actors with appropriate
safeguards to ensure the public interest is not compromised. (World
Bank 2003: 39)
In the 1930s and beyond, after the first Carnegie Inquiry into Poverty in
South Africa, the government of the day adopted measures to address poverty
among whites. However, it left out of consideration the continuing poverty
of far larger sections of the population whose members were born a shade
too dark. The state’s failure to address this larger-scale poverty did not go
unchallenged. It helped to shape the agenda of the liberation movement, as
can be gleaned from the basic documents of many organisations involved in
the liberation struggle.
Some religious groupings also took issue with the dispensation.
Significant among these was the SPRO-CAS10 economic commission report of
1972. In outlining what it saw as South Africa’s long-term goals, the report

Free
dow
nloa
d fr
om w
ww
.hsr
cpre
ss.a
c.za
resource flows in poor communities 133
sought to define ‘the responsible society’. The report cited Dr WA Visser
Hooft with approval where the latter opined, inter alia, that:
The second dimension is that, in a responsible society, members
accept an individual and a collective responsibility for the well-being
of their fellow citizens…the tremendous gulf between the rich and the
poor in so many countries shows that we have not really understood
what social solidarity means and what its implications are. (Randall
1972: 9)
The SPRO-CAS commission had the following to say about development and
poverty:
In a society where there is great poverty an enormous gap between
rich and poor is obscene. One mark of the responsible society is
surely that it will be structured to eliminate as far as possible poverty,
hunger, and damp, overcrowded housing. The provision of a social
security net, below which the helpless and the weak may not be
allowed to fall, should be top priority for any true development.
(Randall 1972: 13)
Thus, the notion that it would be intolerable to leave vulnerable people
without any form of social security has a long history in South Africa. The
discussion on social grants under consideration by various stakeholders
over the past few years must be seen against this backdrop. The question of
whether the state should play the benefactor role was already foregrounded
before the current state came into existence.
Turning now to the question of whether such a benefactor role is
sustainable, I must point out that this is a factual inquiry. It must therefore
be answered concretely. In other words, this is not a question that admits
an a priori answer. Therefore, there can be no general answer that is valid
Free
dow
nloa
d fr
om w
ww
.hsr
cpre
ss.a
c.za
134 giving and solidarity
for all situations and for all times. It cannot be argued that in principle state
intervention in the alleviation of poverty is unsustainable.
If that is granted, I suggest that the answer to the question depends
on various factors that cannot all be apprehended at any single moment.
Some are already clear while others will still make themselves evident. The
interplay between these factors cannot be predicted with certainty (World
Bank 2003). Consequently, the proposition put forward by De Beer and
Swanepoel (2000) and others about the notion of a benefactor state being
unsustainable must, to some extent at least, be speculative.
I take the view that the question must be posed for each situation and
answered for that situation. If in any given context the notion of a benefactor
state proves to be unsustainable, then a case must be made for the state in
that context not to fulfil this role for the limited time that such a position
would be untenable. Here we must acknowledge that social security is
only one among many demands that are made on the state. If the question
of sustainability must be raised, there needs to be some justification for
limiting it to social security, and for allowing all the other demands on the
state which have monetary implications to go unchallenged.
More importantly, the question of whether or not state intervention in
trying to mediate poverty is sustainable must not be posed as if social grants
are the only strategy available to the state (Narayan 2002). The question must
also not be posed as if we are resigned to the reality that an ever-increasing
number of people must remain trapped in the poverty cycle. Reference has
already been made to different approaches to the problem of dealing with
poverty (see Seitz 1988). The growth-with-equity approach advocates job
creation as a possible way of combating poverty (Narayan 2002; Seitz 1988).
If this is accepted – whether the responsibility to create jobs falls on the state,
the market or private individuals – the envisaged effect is that people are
able to step out of poverty or at least levels of it. I contend that this must be
taken into account when considering whether state intervention in mediating
poverty is sustainable.

Free
dow
nloa
d fr
om w
ww
.hsr
cpre
ss.a
c.za
resource flows in poor communities 135
The case studies provided interesting examples of grant recipients who
use their grants in innovative – if somewhat unintended by the state – ways
that provide some potential for breaking out of the poverty cycle. Instead of
purchasing only what is required immediately, some recipients buy extra
things to sell and thus generate more income. (In other words, they use their
grants as seed money to generate more money.)
The Department of Social Development (DOSD 2003) stipulates that
its social grants are subject to review and may be suspended if the recipient’s
circumstances change after the date of application. In principle there can
be no objection to recipients also being required to declare their income
on the date of this review. In the absence of such declaration, the review
would in any event be pointless and hardly likely to indicate the changed
circumstances that might lead to the suspension of the grant. It is thus
possible to take some recipients off the social security net on the basis of
their changed circumstances. Whether or not this works well will of course
depend on whether grant recipients report truthfully to the review. There
were some encouraging reports in the case studies, which indicated that
many interviewees were not happy with grant recipients who abuse and
spend their money on liquor or even gambling.
Some social workers interviewed acknowledged that they were aware
of how grants were abused and of how people were manipulating the system
for their benefit. One social worker, for instance, said that the provision of
social grants had produced, among others, the following effects:
◆ An increase in the number of grants – an ever-increasing number of
people are applying for and receiving grants;
◆ Many people have begun testing for HIV with the view that, if they test
positive, they could access social grants;
◆ People have begun to organise themselves into groups in order to
explore how they could become eligible for one or another social
grant;
◆ There is evidence of children who had left home trickling back to their
families once their families began receiving social grants;

Free
dow
nloa
d fr
om w
ww
.hsr
cpre
ss.a
c.za
136 giving and solidarity
◆ Some people had adopted street-children and were applying for foster
child grants;
◆ Volunteers had started forming groups to access funding;
◆ Some women who receive child support grants leave the child or
children in respect of whom they receive the grant with their grand-
parents in the rural areas and spend the money on themselves.
Not all of these examples constitute abuse of the grant system, even if
this was the opinion of some interviewees. For example, why should it be
considered ‘abuse’ of grants if people test for HIV in order to ensure that they
can benefit from public funds available for HIV-positive people if they are
eligible to do so? In my view, the fact that they would probably not take the
test if their HIV-positive status did not attract a grant is inconsequential to the
correctness of their action. However, some of the conduct cited does amount
to abuse, and this may influence the state to review the grant system.
Social security grants were not the only form of resource flows from
the state. In the Mandela Village case study, for instance, it was found
that the state supports crèches established by local community members,
providing food parcels to these institutions and paying for the training of
childminders to staff them.
It is evident, then, that grants emanating from the state fulfil an
important function and that entire families may depend on them for their
survival. Hopefully it is also clear that they do not necessarily lead to the
dependency syndrome that many fear: the evidence on the ground suggests
that at least some of the recipients try not to depend only on grants, but use
these funds to generate more income. As noted earlier, it is true that there
was no evidence that such ‘innovative’ use of social grants influenced people
to wean themselves off the grants. I would, however, argue that this scenario
is possible with a proper rethinking of the grant system.

Free
dow
nloa
d fr
om w
ww
.hsr
cpre
ss.a
c.za
resource flows in poor communities 137
Business
The findings insofar as business is concerned were very different across
the four case studies. The Mokasa 2 case study did not reveal any resources
flowing from business outside of the area in order to address poverty. In the
case of Mandela Village, there was one joint initiative involving First National
Bank (FNB), Momentum Insurance and the Umsobomvu Youth Fund, aimed
at promoting entrepreneurship among black youth.
In Mdantsane, business has partnered with the state (in a public–private
partnership) to help fund community projects to alleviate poverty. Businesses
that featured prominently were South African Breweries, Old Mutual, Daimler
Chrysler South Africa, Johnson & Johnson, Spar and Score supermarkets.
South African Breweries supported community-based initiatives largely
through the purchase of furniture and equipment. Old Mutual supported
initiatives with IT equipment. Daimler Chrysler South Africa builds houses for
its employees. The Spar and Score supermarkets donate food to community-
based organisations (CBOs) trying to alleviate poverty in the area. Johnson &
Johnson provided hygiene and sanitation equipment at a home for people living
with HIV/AIDS. The East London Rotary Club has also partnered with business
in community initiatives to alleviate poverty.
In Graskop some businesses make donations directly to members
of the public and to CBOs, mostly the Home-Based Care Centre. These
businesses did not seek out state interventions and try to supplement them,
but acted on their own initiative. Mostly they donate food to the poor. The
businesses that featured prominently were Shaya Maize, Spar Supermarket,
Summit Lodge and Loco Inn.
Most of the interventions by business reviewed in the case studies
were intended as palliative measures, rather than as initiatives to eradicate
poverty. Indeed, when some business people were asked why they do what
they do, it was clear that the eradication of poverty was the farthest thing
from their minds. Many said that they help poor people because they owe it
to God to do so. In certain cases it appeared that some business people might
be helping the poor as some kind of ‘insurance’ against criminal elements:
Free
dow
nloa
d fr
om w
ww
.hsr
cpre
ss.a
c.za
138 giving and solidarity
if people in the township know that a particular business supports poor
people in the community, they are unlikely to break into that business or to
stand by and watch when others do so. There can, of course, be no doubt that
businesses also give to the poor to gain some tax relief.
It is not my intention to argue that giving to the poor is acceptable
only if it helps eradicate poverty. As Middleton and O’Keefe argue: ‘To
palliate is not always and everywhere a bad thing, but it should not be
confused with enabling a larger justice to prevail’ (2001: 14). Nor is it my
intention to argue that giving to the poor should never be accompanied by
self-interest. If my very survival depended on handouts, I would not be overly
interested in critiquing the long-term effects of the handouts that might put
bread on my table.
The critique of the benefactor state, however, makes it necessary to
make this point so that we are able to examine the assumptions underlying
the critique: the fundamental assumption of the critique is that poverty
eradication is the province of the private sector, and to some extent it is. The
reality, however, is that the market also creates unemployment, and therefore
poverty. Some will argue, of course, that state interference must partly be
blamed for this – when it legislates minimum wages, thus making ‘the cost
of labour higher to local industry than it should be…[and] discouraging the
use of labour’ (Seitz 1988: 10).
In response to this argument, it seems to me that we must raise the
stakes and indicate that the market does not only create poverty through
creating unemployment. The market creates poverty even for people who are
employed. As Middleton and O’Keefe appropriately remark: ‘The greatest
economic myth of all is that the market has as its principal purpose the
service of human needs rather than the aggrandisement of capitalists and
their corporations’ (2001: 15). The case studies showed that there are many
people who are employed, but who still live in abject poverty.
Furthermore, it is necessary to bear in mind that the state does not
generally legislate minimum wages out of its own benevolence towards
working people. Legislated minimum wages are usually the product of

Free
dow
nloa
d fr
om w
ww
.hsr
cpre
ss.a
c.za
resource flows in poor communities 139
struggles by working people, thrown up precisely by the realisation that they
could not survive on hitherto existing wages. Hence, when the suggestion is
made that the state must steer clear of social initiatives aimed at assisting poor
people, and that this space belongs to the private sector, we must look at the
suggestion from the perspective that business itself seems to seek out state
interventions of this nature and collaborate with the state. The one exception
was the joint initiative mentioned earlier between the FNB, Momentum
and Umsobomvu Youth Fund in Mandela Village, which seeks to promote
entrepreneurship among the youth. If this works successfully, it would be safe
to hypothesise that it will go some way towards addressing poverty.
The data across the four case studies suggest that business
involvement with the community around poverty alleviation was very
uneven. As indicated, the Mokasa 2 case study revealed no evidence of
business involvement and the other three case studies revealed various
degrees of business involvement. Whereas Mdantsane showed the highest
amounts donated by business, these were once-off. Graskop showed smaller
amounts of money and other types of donation by business, but these were
being made on an ongoing basis.
Churches
The Mandela Village and the Mdantsane case studies omitted to inquire into
the resources flowing from the church. In the case of Mdantsane, however,
the involvement of the church was evident in some of the community
initiatives that were reported. For instance, the Good Samaritan Children’s
Home, ministering to the needs of ‘street children’, is a church-based
initiative. The Masiphatisane Home-Based Caregivers, dedicated to assisting
people living with HIV/AIDS, also depends partly on sponsorships from
contact with church people.
While these examples indicate some church involvement with poor
people in Mdantsane, canvassing the question of the church’s involvement
explicitly might yield a better and more complete picture. Similarly, I am
only able to report, in respect of Mdantsane, that there are some church-

Free
dow
nloa
d fr
om w
ww
.hsr
cpre
ss.a
c.za
140 giving and solidarity
based initiatives assisting poor or vulnerable people, but iti s not clear which
specific churches do what.
The Mokasa 2 case study revealed that there are some 17 Apostolic
churches in the village, all of which raise money from congregants during
church services. Within each church, much of this money is used to support
orphans who belong to the church. Money thus collected is also occasionally
used to assist church members when their homes are ravaged by the
elements. The Apostolic churches acknowledged the assistance of the Roman
Catholic Church in town, which occasionally donates clothes and blankets on
request, and which are then distributed to needy members.
A similar picture emerged from the Graskop case study. Churches in
Glory Hill mobilise resources from sister churches in town. They also raise
donations from their own members, and from sister churches in other parts
of the country and abroad. These resources may take the form of food parcels
or clothes, which are initially distributed among members of the church.
Once the needs of their own members are provided for, these churches will
consider poor people of other denominations or those who are not church-
goers.
When one pastor was asked if poor people in other churches or even
outside of the church should not also be their concern as ‘God’s children
too’, he agreed but asserted that ‘their own’ poor are constantly before them
and they see them, whereas ‘the other poor people are not immediately on
the radar screen of the church dispensing the goodies’. When the question
was put to him whether the manner in which the churches distribute ‘the
goodies’ is not perhaps aimed at recruiting people to specific denominations,
he denied this and presented a strong moral-cum-religious case for ‘minding
the poor’. However, he did acknowledge that: ‘It has made a great difference.
Because if that wasn’t done, I know some families were encouraged to join
our church.’
The case studies confirmed that the churches do a fair amount of
work to cushion the impact of poverty. Since church members are also
members of the community, it seems fair to include the contributions they

Free
dow
nloa
d fr
om w
ww
.hsr
cpre
ss.a
c.za
resource flows in poor communities 141
make to the church for the purposes of alleviating poverty in an assessment
of the role played by individuals. The fact that individuals choose to make
their contributions through the church should not detract from the role they
play as members of the community in alleviating poverty. Since they are
aware of the manner in which the church distributes the resources that it
collects from different quarters, including their own contributions, it must
be assumed that they intend, at least in part, that their contributions should
be used to grow their churches.
Whereas it is perfectly understandable that churches would compete
with one another for membership, and therefore use their resources to
advance themselves, it is possible that they might be narrowing the base
of people who wish to contribute but prefer to be non-sectarian. This could
explain why the churches rely mainly on the (limited) donations of their
own members or on sister churches in town, and do not make a broad-based
appeal for assistance.
The fact that the Roman Catholic Church (Mokasa 2 case study)
assists the Apostolic churches indicates that interdenominational cooperation
is possible. Similarly, the involvement of churches in Mdantsane with the
Masiphatisane Home-Based Caregivers and the Good Samaritan Children’s
Home, both of which are community-based and not denomination-specific,
shows that it is possible for churches to tackle community problems on a
non-sectarian basis.
Non-governmental organisations
In all four case studies we found NGOs and/or community organisations that
try to soften the effects of poverty. The Mdantsane case study revealed a far
larger number of such organisations than any of the other case studies. The
NGOs in Mdantsane also enjoyed much better support from business and,
given the size of the township, this is perhaps not surprising.11
An interesting feature of all four case studies was the extent to which
HIV/AIDS drives initiatives that aim to soften the impact of poverty. Many of
these initiatives involved caring for people living with HIV/AIDS or children

Free
dow
nloa
d fr
om w
ww
.hsr
cpre
ss.a
c.za
142 giving and solidarity
who had been orphaned by the pandemic. Care and concern for people
affected by HIV and AIDS is a noble cause. However, the epistemological
challenge it throws up for a study like this is how to figure out the boundary
between concern with poverty and concern with the plight created by the
pandemic. Mercifully it is not really necessary to agonise about that here, for
the distinction would have academic value only, since the people in the study
were poor whether or not they were also HIV-positive or orphaned by AIDS.
The concept of ‘home-based care’ is another interesting feature
common to all four case studies. The strain placed on the formal health
system in the country by the incidence of AIDS-related diseases has led to
a dramatic increase in patient numbers in clinics and hospitals. Through
home-based care, sick and dying patients are able to receive some medical
attention at home.
In Graskop, the Home-Based Care Centre was established initially in
order to educate young people about HIV/AIDS and help prevent the spread
of the epidemic. As one of the co-founders stated: ‘We realised however that
it was late already, and so we changed from peer-group education to home-
based care although in some areas we continue with peer-group education.’
NGOs mobilise resources from a variety of sources, and apply these
to help needy people in their communities. Some NGOs have become adept
at what they do, and show interesting innovation in how they mobilise
resources.
In the Graskop case study, for instance, we came across a regional
NGO called Project Support Association of Southern Africa (PSASA) operating
in South Africa, Zambia, Zimbabwe and Mozambique. Through one of its
schemes, it distributes maize meal. Instead of raising donations in maize
meal from single sources, it raises donations of maize from different farms.
After the maize is collected it is taken to a different set of farmers who are
asked for equivalent maize meal in exchange for the maize. The logic behind
the scheme is fascinating:
◆ If PSASA asked for maize meal from both sets of farmers, they would
all compute their ‘losses’ – both in terms of producing the maize

Free
dow
nloa
d fr
om w
ww
.hsr
cpre
ss.a
c.za
resource flows in poor communities 143
and then of producing the maize meal. The farmers would want to
mitigate their losses which, so viewed, would be significantly higher.
The result: they would give much less.
◆ As things stand, the first set of farmers only loses in relation to maize
production and is willing to give more than it would if it were asked to
donate maize meal.
◆ The second set of farmers, on the other hand, has its losses mitigated
by the fact that it will recover something through the maize it gets
in exchange for the maize meal. Therefore it is willing to give a little
more than it would were it asked to make a straight donation of maize
meal – in other words, there is a transaction as well as a donation
here.
◆ Both sets of farmers quantify what they give in bags. A bag of maize
after milling, however, produces less than an equivalent bag of maize
meal. If PSASA took the maize to the miller, it would get much less out
of the transaction than it gets for exchanging its bags of maize for
bags of maize meal.
Most of the activities NGOs embark on are geared at poverty amelioration,
rather than at eradication. Mandela Village is, as pointed out previously, an
exception in that there is a project that explicitly promotes entrepreneurship
among the youth which, if successful, has the potential to combat poverty.
Mdantsane offers another interesting exception in this regard – the National
Youth Development Forum trains young people in poor communities and
equips them with various skills and expertise so that they can either create
jobs for themselves or seek employment.
Individual community members
The case studies investigated what members of the community themselves
do in order to respond to the poverty around them. Outside of the work
of NGOs and/or community organisations, there were examples both of
collective action (where individuals act together) and of individual action.

Free
dow
nloa
d fr
om w
ww
.hsr
cpre
ss.a
c.za
144 giving and solidarity
(The Mdantsane case study tended to focus on the role played by NGOs
and CBOs and paid little attention to actions taken by community
members outside these organisations to address poverty in their
community.)
Collective action Examples of collective action appeared at times to be the result of
a conscious decision by individuals to act together in particular ways, and at
other times to be spontaneous and organic. The Mokasa 2 case study revealed
the following examples of collective action:
◆ A young person buys a newspaper and shares it with friends for the
purposes of job hunting. These youngsters do not decide whose turn
it is to buy a newspaper at any given moment – whoever has money to
buy a newspaper does so and then they sit together and check what job
opportunities and tenders are advertised.
◆ Women buy items like vegetables and washing materials and share
these as neighbours. Again, this is not something that is con-
sciously coordinated. These women need all the things they share,
but they are unable to each buy all of them. So they buy what they
can afford and then share these so that they all have the basics they
need.
Although no evidence of the existence of stokvels was found in Mokasa 2, the
activities of these women could be seen as a manifestation of the philosophy
that underlies stokvels. As pointed out earlier, stokvels were informal in their
origins. These women pool their resources informally in order to secure
items for all that they would be unable to acquire simultaneously if each
relied only on their own resources.
In Mandela Village, people assist one another, especially new arrivals,
to construct shacks for no charge. This is not discussed or planned; people
just do it. Similarly, people who have recently arrived in the settlement
often do not have access to water. Those who are already established allow
newcomers to draw water from their taps without question.

Free
dow
nloa
d fr
om w
ww
.hsr
cpre
ss.a
c.za
resource flows in poor communities 145
In Graskop, as in the other case studies, there were many people who
gave their time to tend the sick and other vulnerable groups like orphaned
children and the aged. Graskop differed from the other case studies,
however, in that members of the community who are gainfully employed give
money to volunteers from time to time to minister to others less fortunate.
This practice was not discussed among those involved – the actors just do it.
Across all four case studies there was evidence that in the case of
bereavement members of the community rally around the affected family
and render assistance such as:
◆ Making donations to help the affected family towards funeral
expenses;
◆ Lending the affected family pots, dishes and utensils for use on the
day of the funeral;
◆ Slaughtering, if there is a beast, and cooking the food that is served on
the day of the funeral;
◆ Spending considerable time comforting and praying with the affected
family;
◆ Pitching and dismantling the tent that is used for holding the vigil as
well as the service on the day of the funeral.
There were also examples of people who ‘lend’ their neighbours electricity
in these sorts of circumstances. None of these things are discussed. The
affected family does not ask. People just know what to do and how to act in
the face of a bereavement.
On the other hand, there were also examples of collective action that
is consciously decided upon, where people form distinct groups in order to do
specific things. In this respect the Mandela Village case study was the most
instructive. We found women who formed vegetable clubs and produced for
their own consumption as well as for sale. These women also provide some
of their needy neighbours with free vegetables. These women do not have
their own land or access to the sort of water needed for irrigation on the scale
Free
dow
nloa
d fr
om w
ww
.hsr
cpre
ss.a
c.za
146 giving and solidarity
required for their produce. Instead, they have negotiated the use of municipal
land and water to cultivate their vegetables. The land is securely fenced off
so that they are protected against petty thieving. In exchange, they clean the
community hall situated in the same premises once a week.
In Graskop and Mokasa 2, some people run small vegetable gardens
to provide for domestic consumption. The difference in Mandela Village
is that these women have decided to work together. They are able to satisfy
their own needs and more; for them this is a job under circumstances where
people cannot find formal employment. The Mandela Village case study
further differed from the other case studies where there was no evidence of
stokvels. Interviewees in these areas mentioned stokvels but were unable
to identify any operating in the area, or any stokvel members. Where
community members referred to burial societies, it turned out that they had
commercial insurance companies in mind. But in Mandela Village there
were clear indications of stokvels, including burial societies which are a
variant of stokvels.
The Mandela Village case study provided an interesting case of a
stokvel run by owners of tuckshops. Later in the chapter, I describe how
some of the tuckshops in Mandela Village were established. But after they
had been set up, sustaining them proved a major challenge. One of the major
concerns raised in this case study was that, whilst people are aware of banks
and other formal finance institutions, including Khula,12 the interest rates as
well as the collateral required in order to raise a loan are beyond the means of
poor people starting from scratch. Conscious of this problem, the tuck-shop
owners teamed up and established a revolving credit scheme dedicated to the
development and growth of their businesses. Ten tuck-shop owners subscribe
to this scheme. They meet weekly, taking turns to host the meeting. Each
time they meet, every tuck-shop owner pays R250 to the host. But the money
is paid to a supplier, who then furnishes the host’s tuck-shop with stock. This
helps ensure that the money is used only for the business, and that stocks are
constantly replenished. Over and above this, the members give a minimum

Free
dow
nloa
d fr
om w
ww
.hsr
cpre
ss.a
c.za
resource flows in poor communities 147
of R100 to the host member. The expectation is that the host will use this
money for structural improvements to the tuck shop or to acquire other
things, not necessarily stock, that the business needs. A strict record is kept
of how much each member contributes and the host is expected to return at
least the same amount when that member has a turn to be the host.
Evidence from the case studies revealed that individual members
of the communities act together in various instances and forms in order to
address problems that arise because of their poverty. Some of the examples
cited from the case studies could, of course, also be seen as individual
instances of ‘giving’. However, I have cited them as instances of collective
action because, whilst it is ultimately individuals who act, they nevertheless
act in concert. Sometimes, as pointed out, a conscious decision is taken to
work together but at other times the joint action is spontaneous. It would
therefore appear that there must be a sense of community that makes these
types of spontaneous action possible.
Community members acting individually There are a number of ways in which poor
people attempt to deal with their poverty, dictated by the conditions under
which they live, for example, while old people have some guaranteed income
from their old age pensions, their age and frailty often prevent them from
doing certain things for themselves. Interesting relations of exchange have
been established between old and younger people:
◆ The lack of health facilities in Mokasa 2 led to the state providing a
mobile clinic. As the clinic is not available every day, there are long
queues of patients on the day that it arrives. Old people need the
services provided at the mobile clinic just as much as, and perhaps
more than, other people in the village and so must either stand in the
long queues or ensure that they are at the rendezvous very early before
others arrive. Both options are difficult given their age so instead they
ask young people to queue up on their behalf. This enables them to
come to the clinic in a leisurely way and without having to wait for too

Free
dow
nloa
d fr
om w
ww
.hsr
cpre
ss.a
c.za
148 giving and solidarity
long once they are there. In exchange the elderly provide food for the
youngsters.
◆ Access to water in Mokasa 2 is a serious problem. There are very few
people who have taps on their premises and the rest have to fetch
water from communal taps. Not all communal taps are functional,
resulting in people having to fetch water some 500 metres away.
Old people who live alone face a serious challenge in this regard so
youngsters help them out in exchange for a meal.
The actors involved in these scenarios would in all likelihood not think
of them as ‘relations of exchange’ – especially in a rural setting such as
Mokasa 2. It is more likely that children do what they have to do out of
respect and deference to the senior citizens who, for their part, give food
to the children as a way of thanking them, without ever thinking of the
interaction as a transaction.
One should guard against romanticising social relations in
the areas studied however. Pensioners no doubt manifested amazing
generosity – some of them take care of their grandchildren with their meagre
allowances whilst the parents of these children squander not only their own
earnings, but also the child grants from the state that are intended to provide
for these children. There was sad evidence of pensioners being exploited
quite mercilessly and even physically abused by their own children and
grandchildren for their puny pension allowances.
The support by family members of those who do not have any
income was a common feature across case studies. Inhabitants of Mandela
Village have a sense, rightly or wrongly, of being excluded from jobs that
are available around Pretoria. This has given rise to a sense of solidarity, so
that the people support one another in interesting ways. Family members
give loans to other members to start up tuck shops. The loan is not seen
as a normal loan, which is extinguished just as soon as you have paid back
the debt fully. The idea is that if the tuck shop is successful, it will become
Free
dow
nloa
d fr
om w
ww
.hsr
cpre
ss.a
c.za
resource flows in poor communities 149
a source of income for the family. The tuck shops that are successful
deliberately employ inhabitants of Mandela Village.
Individuals also give generously outside their family circles.
Notwithstanding their own poverty, people still found it possible to donate
clothes and food to members of the community who were even less fortunate.
Even schoolchildren shared their luch with poorer pupils and occasionally
gave away some of their clothes. People generally volunteered their time to
care for the infirm and assist with community causes.
The strong spirit of voluntarism sometimes gets rewarded. At
other times it is driven by the hope that when a job presents itself, the
actor will have gained useful experience. There can be no doubt that
voluntarism in these circumstances adds meaning to life – not only for
the beneficiary but also for the benefactor, providing something to live for
and look forward to.
It was evident from the various case studies that poor people do not
necessarily sit by and wait for handouts, whether from the state or any other
source. They are quite capable of acting in order to address the poverty that
defines their lives. They are able to organise themselves, as opposed to being
organised by others, in grappling with the day-to-day problems that confront
them. This must be recognised and assigned due weight when devising
strategies to deal with poverty, rather than seeing poor people as passive
recipients of aid.
Conclusion
The purpose of this chapter was not to give a detailed account of the
individual case studies but to reflect on them. It is not necessary, in
summing up, to reiterate points already made. There are, however, two points
that I would like to address in concluding: stokvels, and the notion of social
grants possibly leading to a dependency syndrome.

Free
dow
nloa
d fr
om w
ww
.hsr
cpre
ss.a
c.za
150 giving and solidarity
Stokvels
As indicated in this chapter, there was no evidence of the existence of
stokvels except in the case of Mandela Village. In the light of the received
opinion about the numbers of black South Africans who are members of
stokvels, it was expected that these associations would be widespread even
in the areas selected for this study. This finding remains curious, but not
incomprehensible.
I outlined the notion of stokvels earlier on in some detail to provide
some understanding of how they work. They presuppose not only that
members have some income, but that they have enough to save as well –
because the purpose of stokvels generally is to save money without necessarily
going to formal banking institutions. However, when one deals with people
who live from hand to mouth, there is nothing to save. There is nothing
to take to the common pool in the way that stokvels normally function. So
perhaps it is not really surprising that, bar in the Mandela Village case study,
we did not find evidence of stokvels in the other case studies.
I want to return to address the statistics on stokvels cited
earlier. People who write about stokvels, I suggest, are guilty of some
misrepresentation, not because they say 25 per cent of all black South
Africans are members of stokvels when in fact the percentage is probably
lower, but rather because they present stokvels as an increasing, even
booming phenomenon. The 25 per cent is stated in terms that are not
calculated to reveal that a minority of black South Africans are involved.
It is not my intention to convey that a phenomenon that enjoys the
support of 25 per cent of all black people is insignificant or, to put it slightly
differently, that the support of 25 per cent of any unit of analysis in respect
of any phenomenon is insignificant. I argue merely that the expectation
that stokvels would be quite a widespread phenomenon in our case studies
would have been misguided. I argue merely that it is understandable that the
phenomena was largely absent.
It needs to be pointed out that the literature says 25 per cent of all
black South Africans are members of one or another stokvel. It does not
Free
dow
nloa
d fr
om w
ww
.hsr
cpre
ss.a
c.za
resource flows in poor communities 151
refer to 25 per cent of all poor black South Africans. In fact, there are a good
number of people who are members of stokvels that one could call poor
only with great reservation. Some of them are situated in the professions, in
business and in senior government positions. They could easily use banks,
and arguably with better returns, instead of receiving back the money they
put into circulation among members of the stokvel at the end of the cycle.
Many do not necessarily buy anything when the money is returned that they
could not have bought before.
ANC Member of Parliament (mP) Tsietsi Tolo, for instance, belongs
to a stokvel called ‘Seven Men on a Mission’. The stokvel was not part of
the case studies but comprises people who live in different places – some
in Middelburg, Witbank (in Mpumalanga), and others in Pretoria and
Johannesburg. Tolo is an mP and others in the stokvel are senior government
officials. Asked whether he feels there are things he is able to buy as a
member of the stokvel that he might otherwise not be able to, he chuckles
and states that the stokvel is for them more a social thing where they get
together as friends. It is not helping them do anything they might otherwise
not be able to do. Asked why they call themselves ‘Seven Men on a Mission’,
he answered that they had once had a mission but no longer. They had
dreamt that they might set up businesses but they have long since abandoned
that dream (Tolo interview).
Sometimes money is not even regularly exchanged among stokvel
members – occasionally money may be deposited into a joint account and
divided among the members over an agreed period. Frans Maluka, for
instance, belonged to a stokvel called ‘Operation Self-Help’, comprising
20 businessmen in Mamelodi (also not part of the case studies). The
businessmen concerned reasoned that they would get better returns on their
money if they invested it in money markets than if they kept it in banks. So
they each contributed, initially, R100 per person per week and invested the
money with a view to dividing the returns among themselves at some future
date. Stokvel members could also take loans from time to time from the
account (Maluka interview).
Free
dow
nloa
d fr
om w
ww
.hsr
cpre
ss.a
c.za
152 giving and solidarity
In considering the reported prevalence of stokvels in the black
community, one must factor in the reality that it is not necessarily poor
people who are involved in the stokvel movement. In my view stokvels in
the black community are not necessarily established in order to respond to
poverty as envisaged in this study, and this helps to explain why it was not
necessarily surprising that we found no evidence of stokvels in our study
except in the case of Mandela Village.
Social security grants and dependency
Middleton and O’Keefe do not write specifically about South Africa, but
they are very apposite where they comment: ‘Democratic rights are not
a substitute for social justice and social justice itself cannot be delivered
without tackling property relations’ (2001: 1). If then, as Swilling et al.
indicate in Chapter 8, the dawn of democratic rights has not freed access
to resources from race and from gender, I would suggest that we need to
think hard and long before we tamper with the only resources to which poor
people might still have access. We have to begin to address the ‘property
relations’ that the pursuit of ‘social justice’ requires, and until we have
done so, it would be unwise to revisit social grants without proper and full
consideration.
Turning now to the question of whether social security grants
promote a dependency syndrome, I have indicated that a number of
recipients of these grants apply them in ways that clearly do not support
the thesis that they lead to dependency. Quite the opposite: some recipients
appear to take the view that the grants are inadequate for their needs. They
appear to accept that they will not receive more money by way of security
grants and that it is necessary to augment the grants they receive. They
appear to accept that if they rely entirely on the grants received, their
resources will be depleted before the next grant cycle.
Therefore, before these grant recipients use the money they receive,
they often ‘invest’ it and buy things they can sell so that they have more
money at their disposal and for a longer period than would otherwise be

Free
dow
nloa
d fr
om w
ww
.hsr
cpre
ss.a
c.za
resource flows in poor communities 153
possible. It seems to me that this displays a refusal by these recipients to be
dependent on the grant system even if they continue to receive the grant and
that therefore, with different political and social arrangements, it would be
possible to get them off the grant database.
This would require a rethinking of the social security system. Grants
as we know them today would not necessarily have to disappear, but they
would have to be more narrowly focused in order to address emergencies.
Parallel to these, grants may be introduced with a more specifically
developmental agenda in mind. The mandate of such grants would be
precisely what some recipients are already using these grants for as indicated
in this study, but they would have to be more realistic in view of that
objective.
In other words, the recipients of the grant would not act
surreptitiously in using it to generate income because that would be the
explicit objective of the grant. The recipients would not fear that if they
appeared to have more income, they would be punished by being removed
from the beneficiary list. The requirement for receiving the grant would,
from the beginning, have been that they gain income precisely so that they
can stand on their feet and then get off the list. The recipient would have
to understand that failure, rather than success, would attract some form of
‘punishment’ by way of withdrawal of the grant. The system would, in this
way, remove the inhibition to succeed on the part of those who currently use
their grants creatively, if surreptitiously, in order to generate more income.
There is no illusion on my part that, at least initially, this would be a
much more expensive exercise for the state to embark on than might be the
case with social grants as they are currently configured. To make a success of
this, the state would have to provide grants that are equal to the job. It would
also be necessary to embark on training programmes that would enable
recipients of such development grants to make a success of the system.
However, as Dean Scerri13 has commented, the cost of poverty to the country
is in the long term much higher than any amount of money we might be

Free
dow
nloa
d fr
om w
ww
.hsr
cpre
ss.a
c.za
154 giving and solidarity
called upon to invest in the meaningful development of our people in order
to ensure they can stand on their own feet.
It appears that this kind of grant would be welcomed by the poor
people in the areas studied. Many interviewees made the point that they
do not want handouts but projects that might give them independence. In
Graskop, for instance, many interviewees emphasised the need for training
and provision of seed money to start up ‘self-sustaining’ projects. They also
spoke about fertile land that could be released to them for farming purposes
with some initial assistance from the state.
As this study has indicated, there are already elaborate forms of
cooperation and mutual support among poor people. I suggest that this
might form a basis for building cooperative projects with a view to dealing
with poverty. If the state provided grants for this purpose, conditions might
be stipulated that would ensure that, as far as possible, the money was used
in a manner that would lead to the desired outcomes. This could be done in
more or less the same way that the state has compelled the corporate world
to take action to mediate racism and sexism by withholding contracts from
those who do not show evidence of progress on these matters.
I have referred to Dean Scerri’s view that the cost of poverty is higher
than any amount of money we might be called upon to apply in ensuring
meaningful development. I end this chapter with a reminder about the
dangers of failing to deal timeously and decisively with poverty, as pointed
out by Bryant and Kappaz:
But what about the less observable relationships between poverty
and violence? When and under what circumstances can it be really
said that poverty, inequality, and social exclusion create the climate
for wars? There is insufficient research to draw a direct [causal] link.
And yet, mounting evidence suggests a deep interdependence. Of the
eighty-two major armed conflicts that took place between 1989 and
1992, all but three occurred within rather than between states – and
most of these states were poor…Paul Collier points out that when

Free
dow
nloa
d fr
om w
ww
.hsr
cpre
ss.a
c.za
resource flows in poor communities 155
there are lootable resources that rebels can use to buy arms, wars in
poor countries develop a war economy quickly, which makes it much
harder to end, as has been the case in Colombia, Congo, and Angola.
(2005: 25)
Bryant and Kappaz discuss various political theories about the behaviour
of ‘chronically’ poor people, suggesting that for generations the poor, far
from rebelling, have actually tried to find accommodation in a society that
consistently and systematically excludes them. They comment:
But do their aspirations mean they are never available for mobilization
into violence? When and under what circumstances do poverty, social
exclusion, and inequality create conditions for people to become
terrorists, agitators, rioters, and rebels? That does happen. Often
rebels or agitators, or revolutionaries, will react to circumstances of
poverty and inequality and explain their actions as being on behalf of
others…Few of the leaders bringing about the French Revolution grew
up in poverty. But there can be no doubt that Danton and others were
keenly aware of, and apparently offended by, extremes of inequality.
(Bryant & Kappaz 2005: 25–26)

Free
dow
nloa
d fr
om w
ww
.hsr
cpre
ss.a
c.za
156 giving and solidarity
Notes
1 Stokvels take a variety of forms ranging from associations to clubs to burial
societies. Usually members make a regular contribution to a common pool
and take turns to draw on the pool to buy things they need, pay for funeral
arrangements, etc.
2 Unless specifically cited in this chapter, the names of focus group members and
individuals interviewed in the case studies are provided in the individual case
study reports. These are available from the author.
3 Taung is famous for the human skull found there in 1924 by archaeologists from
the University of the Witwatersrand.
4 See also Cohen et al. (2000: 181); Mouton (2001: 149); Terre Blanche & Durrheim
(2002: 255).
5 Pyramid schemes in South Africa are outlawed and also hounded by the country’s
banking laws, whose regulative authority they have always sought to evade.
6 I have verified the existence of all the grants mentioned with the Department of
Social Development. It is neither possible nor necessary to discuss them all in
detail here. In order to better appreciate the difficulties that have been raised about
the various grants, an explanatory note in respect of some of the less obvious ones
is offered:
◆ The war veterans’ grant: available to people who served in World War II or the
Korean War, either aged over 60 years or disabled.
◆ The care dependency grant: available for persons between the ages of 1–18
years. The person in respect of whom application is made must produce a valid
medical certificate confirming his/her disability. The applicant and the child
in respect of whom the grant is sought must be resident in South Africa.
◆ The foster child grant: available for children resident in South Africa.
Applicants must also be resident in South Africa and there must be a court
order granting foster care status.
◆ The child support grant: available for children younger than nine years of age.
The applicant must be the primary caregiver of the child or children in respect
of whom the grant is sought.
◆ The social relief of distress grant: available to persons in dire material need
who are unable to meet their needs or those of their families. It is a temporary
measure (given for three months only) and meant to assist people while they

Free
dow
nloa
d fr
om w
ww
.hsr
cpre
ss.a
c.za
resource flows in poor communities 157
are waiting for other forms of assistance. A person who is a member of a
household already receiving another social grant from the state is disqualified
from applying.
◆ Grant in aid: available to persons who, because of physical or mental
disabilities, require another person to look after them full-time. Whereas it
is a requirement with reference to most of the other grants that the person in
respect of whom the application is made should not be a recipient of another
social grant, a grant in aid is specifically meant to be in addition to another
grant the beneficiary may already be receiving, such as an old age pension or
disability grant (DoSD 2003: 2–5).
7 Whereas the grant amounts are specified in respect of other social grants, the
Department of Social Development does not specify the amount in respect of
social relief of distress. The amount of R120 should therefore not be taken as
the maximum possible but as an indication of what the specific persons who
mentioned it were probably receiving.
8 For a critique of the growth-with-equity approach, see Middleton and O’Keefe
(2001: 3–4).
9 And they are not alone in this – see the authorities they cite on p. 92.
10 Study Project on Christianity in Apartheid Society.
11 Mdantsane is arguably the second biggest township in South Africa after Soweto.
12 Khula is an initiative created by government under the auspices of the Department
of Trade and Industry that aims to assist emergent businesses, particularly those
run by members of previously disadvantaged communities.
13 Dean: Faculty of Economic Sciences and Finance, Tshwane University of
Technology, Pretoria, in comments on an earlier version of this chapter.
References
Bryant C & Kappaz C (2005) Reducing poverty, building peace. Conneticut: Kumarian
Press
Cohen L, Manion L & Morrison K (2000) Research methods in education. London:
Routledge
Crow B (1992) Understanding famine and hunger. In T Allen & A Thomas (Eds) Poverty
and development in the 1990s. Oxford: Oxford University Press

Free
dow
nloa
d fr
om w
ww
.hsr
cpre
ss.a
c.za
158 giving and solidarity
De Beer F & Swanepoel H (2000) Introduction to development studies. Oxford: Oxford
University Press
DOSD (Department of Social Development, South Africa) (2003) You and your grants.
Accessed 2005. www.socdev.gov.za
May J (Ed.) (1998) Poverty and inequality in South Africa. Report prepared for the Office
of the Executive Deputy President and the Inter-Ministerial Committee for Poverty
and Inequality. Durban: Praxis Publishing
McNeil P (1985) Research methods. London: Tavistock Publications
Middleton N & O’Keefe P (2001) Redefining sustainable development. London: Pluto
Mouton J (2001) How to succeed in your master’s and doctoral studies. Cape Town:
Van Schaik
Narayan D (Ed.) (2002) Empowerment and poverty reduction: A sourcebook. Washington:
World Bank
Randall P (1972) Power, privilege and poverty: Report to the SPRO-CAS economic
commission. Johannesburg: SPRO-CAS
Scott C (2005) South Africa: Rare insights into the people’s bank. Inter Press Service
Accessed 2004. http://www.ips.org
Seitz JL (1988) The politics of development. New York: Blackwell
Terre Blanche M & Durrheim K (2002) Research in practice: Applied methods for the
social sciences. Cape Town: UCT Press
Wilson F & Ramphele M (1989) Uprooting poverty: The South African challenge. Cape
Town: David Philip
World Bank (2003) Sustainable development in a dynamic world: Transforming
institutions, growth, and quality of life. Oxford: Oxford University Press
Interviews
Tolo T, Member of ‘Seven Men on a Mission’ stokvel, 5 August 2006
Maluka F, Member of ‘Operation Self-Help’, 3 August 2006

Free
dow
nloa
d fr
om w
ww
.hsr
cpre
ss.a
c.za
159
Why do businesses operating in South Africa invest in social needs?
And why do they choose some needs over others? On the first question, it
is widely accepted in business – although some major companies do not
devote funds to social investment – that it is highly risky to assume that the
welfare of a poor majority can be overlooked in a society in which the gap
between rich and poor is wide and wealth can be seen as a product of racial
privilege. But even this is not straightforward. Is South African corporate
social investment (CSI) an attempt to stabilise the business environment or
to win the favour of governing politicians? Is South African CSI a marketing
exercise or a serious attempt to address social needs?
For some critics, giving can deflect attention from companies’ wider
social responsibility. Some corporations ‘may be using the procrustean
formulae of corporate social and environmental responsibility to deflect
attention from the fundamentals’ (Fig 2003: 4). CSI can, therefore, hide
a multitude of socially irresponsible sins. Hamann and Bezuidenhout
(2003) argue that companies which devote substantial resources to CSI are
externalising social and environmental costs through outsourcing – paying
others to repair the damage they created. ‘CSI needs to be placed in the
5
New whims for old? Corporate giving in South Africa
Steven Friedman, Judi Hudson and Shaun Mackay

Free
dow
nloa
d fr
om w
ww
.hsr
cpre
ss.a
c.za
160 giving and solidarity
framework of general corporate social responsibility to detect contradictions
which undermine the credibility of CSI – such as polluting rivers and
producing bird booklets’ (Rumney interview). The contrary view argues
that business, by its nature, plays an underestimated part in development
and can also have beneficial political effects: ‘unintentionally, the mining
sector pushed back influx control’ (Slabbert interview). Godsell et al. argue
that, ‘by dint of its existence outside state-created organizations, [business]
can contribute to greater pluralism and diversity in a society, thereby
strengthening the pressures for democratisation’ (1998: 3). It can also
promote modernisation as well as a ‘thickening’ of civil society. In this view,
CSI is not a fig leaf to hide exploitation; it is a further dimension to an already
socially useful role.
The extent to which giving is a priority for South African corporates
is also controversial: for some, the amount given is trivial, for others it is
high by world standards. Whether business has a conscience – and should
have one – are subjects of fierce disagreement. Why particular priorities
are chosen over others remains more complicated; motives, individual or
corporate, are difficult to understand. How and why companies choose
what to support and what to ignore, therefore, eludes straightforward
explanations. But South African businesses command enough resources
to make a pronounced impact if their CSI funds are deployed in appropriate
amounts in ways which promote development. So CSI is an important public
policy issue – yet almost the only analysis of corporate giving is produced
by consultants offering a resource to CSI practitioners. Understanding the
decision-making processes which shape giving is vital if we are to develop
viable proposals on how this crucial source of human and physical resources
can best be used to tackle the society’s development needs.
This chapter tries to tackle that task. Using qualitative interviews
with key informants, it seeks to understand the decision-making processes,
values and assumptions which shape CSI and to propose ways in which social
actors – the government, civil society organisations and businesses – can
foster forms of social investment which enhance development.
Free
dow
nloa
d fr
om w
ww
.hsr
cpre
ss.a
c.za
Corporate giving in south afriCa 161
From whim to what?
For many analysts and practitioners, the common understanding of current
CSI trends can be summed up as ‘beyond the chairperson’s whim’. Corporate
giving, the story has it, was once the product of whim, not careful assessment
of need. The company chair or chief executive, moved by personal
preferences or by whoever they had been buttonholed by at a social event,
would set the giving agenda. The only assessment of need which contributed
to decisions was the impulse of the person permitted to indulge their whim.
This approach, it is argued, is now being ‘professionalised’ (du Toit 2001;
Trialogue 2003). CSI, it is argued, is part of a company’s core business and so
ought to be approached as seriously as any other activity.1 Decisions should
be guided by development criteria, not fancy. This approach seeks to move
beyond a time when companies saw CSI as low-level public relations – and
assigned it to junior managers or employees for whom they had no other
use. Social investment has been, in this view, ‘the item which is discussed
late at Board meetings when everyone is tired’.2 Alternatively, it is an attempt
to move beyond trying to please politically influential persons. Particularly
since majority rule came to be seen as inevitable in the 1990s, projects are
selected, it is argued, on their ability to satisfy politicians in the hope of
winning favours, not to aid development.
Now, we are told, ‘professionalisation’, ensuring that decisions are
based on serious consideration of development impact and company strategy,
is increasingly influential (Trialogue 2003): ‘When companies are exposed
to a development agenda, they can shift a lot’ (Favis interview). In the
words of Reg Rumney of BusinessMap Foundation: ‘There has been a clear
move to a more developmental thrust. Companies have sometimes used
technology to solve development problems in innovative ways and have been
more inclined to involve communities. There is a trend to longer projects’
(Rumney interview). While progress remains partial – tensions between CSI
practitioners and the chair or CEO may be resolved by agreements that the
latter will be able to call on a discretionary fund to indulge their whims – the

Free
dow
nloa
d fr
om w
ww
.hsr
cpre
ss.a
c.za
162 giving and solidarity
scope for whim is being progressively reduced (Favis interview). Some
practitioners and analysts dismiss this understanding of past giving motives
as a caricature: ‘There has been careful CSI over at least two decades…Key
business leaders had long-term development visions.’3 And, as we shall show
below, some are dubious about the virtues of professionalisation. But the
dichotomy of a whimsical past and a professional future is widely held within
the CSI ‘community’.
But what does professionalising CSI mean? Could the past have been
more like the present than this account would have us believe? And, if there
has been a change, is it one towards more appropriate giving? Or could
professionalisation have elevated the fads of a small group of specialists,
squeezing out important areas of giving because they are not fashionable?
Before tackling these questions it is necessary to examine competing
meanings of professionalisation.
Substance or process?
Despite the influence of professionalisation, there is no unanimity on
what professionalising CSI means. This does not invalidate the concept,
but it does mean that it requires clarification. For some in the CSI debate,
professionalisation is substantive – it means producing better development
outcomes by doing the job better (Logan & Tuffrey 2000). In this view, CSI
decisions are more ‘professional’ when they are taken by people who are
more technically proficient at investing in society.
For those who hold this view, CSI is becoming more professionalised
either because those who make giving decisions have become better at
determining what society needs or because companies have become more
inclined to use the services of people who understand these needs – or both.
Perhaps the most extreme form is that of the Liberty Life Foundation which
has professionalised by reducing its activities to one – the use of media to
deliver learning and teaching materials. Having funded a variety of projects
in consultation with ‘communities’, it decided to concentrate on one activity

Free
dow
nloa
d fr
om w
ww
.hsr
cpre
ss.a
c.za
Corporate giving in south afriCa 163
within its capacity which could make a measurable difference. Today, it
devotes itself entirely to producing educational material designed to improve
the education and health system (Appelbaum interview).
An intermediate, and more frequently cited, example is Tshikululu
Social Investments (TSI), a CSI management company headed by Margie
Keeton, formerly of the Anglo American and De Beer’s Chairman’s Fund.
TSI was established to provide professional CSI management to companies in
the Anglo American family and now serves some other corporates, such as
FirstRand. It is said to provide clients with a high quality of decision-making
(Friedman et al. 2005).
But some interviewees insist that there is no science of giving –
determining whether a project will produce lasting development is a matter
of judgement or ‘feel’. Some worry that professionalisation is a cloak for
a new set of arbitrary decisions. Thus a corporate executive warns of the
damage caused by ‘missionaries’ in development agencies who impose
their fads on beneficiaries. While ostensibly highly professional, this form
of giving is a ‘profound form of selection because it is based on criteria
which no one understands’ (Godsell interview). ‘Professional’ giving
may simply replace the prejudices of chief executives with the fashions of
development technicians, with no evidence of improved impact. Sceptics
argue that CSI practitioners who insist that giving is a matter of technique
‘are dangerous since they believe that they are applying a science when
they are not’. An interviewee argues that professional CSI approaches have
proved to be fads which failed to produce results. ‘We professionalise in
a different way – by trial and error. We need diversity – you learn from
hare-brained schemes’ (Appelbaum interview). Indeed, Keeton herself warns
that professionalisation could create a new ‘insider–outside’ divide in which
causes and beneficiaries favoured by the professionals are supported while
those with equally valid claims are ignored: ‘The key danger is moving from
one form of patronage to another’ (M Keeton interview). ‘Professionalisation
runs the risk that you won’t make an impact on very vulnerable people – it

Free
dow
nloa
d fr
om w
ww
.hsr
cpre
ss.a
c.za
164 giving and solidarity
would be more quantifiable and concrete but have less social impact. There is
no scientific way of choosing priorities’ (Abedian interview).
Discretionary funds, dismissed by some as vehicles of whim,
may be necessary for flexibility: ‘If you are too rigid, efficacy suffers. So
some money must be set aside for worthy causes. The one project with a
national impact might come out of this’ (Abedian interview). A practitioner
complains of the ‘tick boxes’ approach in which apostles of technique
impose their preferences by devising checklists with which companies
seeking to be seen as serious givers must comply, even though the rationale
remains obscure (CSI practitioner interview). Professionalisation of this sort
can also deter innovation: ‘The chairman’s folly is sometimes good because
it is visionary – the arts, for example, may lose out because decisions are
very often devolved to functionaries who are scared of not being promoted’
(Danby interview).
Some interviewees, however, insist that professionalisation is not
a matter of applying an unassailable technique. It does not, they insist,
claim that there is a recipe for ‘better’ development outcomes. Rather, it is a
matter of attitude and process. Margie Keeton describes it as ‘a considered
process of decision-making in which experience, learning, wisdom and
judgement are applied’.
Far from being based on technique, it is based on an important
insight which she attributes to Michael O’Dowd who arguably pioneered
professional giving at the Chairman’s Fund and who she sees as an
important influence. The crucial lesson he taught was:
the importance of the people behind the project you are considering
for possible support. It is not whether the project is a good idea or
not, but whether the people behind it will be able to make it work.
Successful CSI is all about ordinary citizens rising above themselves
to make a difference. This is what the CSI technocrats miss – for
them, one project is the same as another. But if you lose sight of the

Free
dow
nloa
d fr
om w
ww
.hsr
cpre
ss.a
c.za
Corporate giving in south afriCa 165
people – and especially those who are supposed to be the beneficiaries
– then you lose everything.4
No special training is required to ‘graduate’ as a CSI professional because
there is no single technique which ensures ‘professional’ giving. But
professionalism in this view requires seriousness of purpose: money must
be disbursed according to clear and consistent criteria; giving must be the
outcome of careful consideration and not be designed to win favour from
influential persons nor blur the divide between personal and company
interests (on the latter point, an interviewee decried donating to the school
attended by the children of the relevant corporate executive5) (Godsell
interview). It need not mean ‘scientific’ or ‘always accurate’ giving. It means,
rather, that CSI needs to stem from seriousness of purpose. In the words of
one interviewee:
The structure of CSI has changed: it has evolved from being part
of the chairman’s discretionary fund, and many companies have
renegotiated their CSI so that it is rule-based and run by professional
staff. Boards now have a greater say. There is a danger that the
chairman’s whim will be replaced by the whim of professionals
running CSI but the way to minimise this is by developing a clear
set of rules to which professionals can be held accountable. Policies
and guidelines will stipulate preference, what areas CSI should be
channelled into, and under what conditions, making it less vulnerable
to whim. In today’s CSI environment, things are driven by multiple
voices and not a single person. (Mahuma interview)
In this view, the fact that some companies have established trusts or
foundations is itself an indication of greater professionalisation because it
indicates a willingness to bind CSI to a set of rules rather than to rely purely
on whim.

Free
dow
nloa
d fr
om w
ww
.hsr
cpre
ss.a
c.za
166 giving and solidarity
Professionalisation is about ‘being bound by a set of principles’. A
policy must be developed and steps must be taken which ensure that nothing
is supported outside the policy framework. But good grantmaking is still
dependent on good judgement (Favis interview). It must also, an interviewee
suggests, be part of a wider commitment to social responsibility. Where
companies are under pressure for what are seen as socially irresponsible
practices, CSI is unlikely to improve their image – indeed, it may be counter-
productive, giving activists a lever (Rumney interview). ‘We are looking for
an alignment with company goals, not just an attempt to keep blacks happy
or giving charity to raise the profile of the company – can they tread a line
between good CSI and brand marketing?’ asks an analyst evaluating CSI for
the Johannesburg Securities Exchange (Reichardt interview, April 2004).
Some companies, it seems, ‘professionalised’ without knowing it:
We moved our CSI away from the chairman’s hobby horse by insisting
on proper governance. There must be auditing and the CEO must
be involved, must have answers if asked why we do things. We have
annual reviews and quarterly assessments of spending. Evaluation is
very subjective but we have a network of people to consult. We didn’t
see this as professionalisation, just seeking greater effectiveness.
(Abedian interview)
Advocates of professionalisation plan a course in giving to be offered by
the University of the Witwatersrand’s Faculty of Public and Development
Management. They stress that it will concentrate on professional grant-
making procedure, not a ‘magic bullet’ to superior development decisions
(Favis interview). A brief course (not for degree or diploma purposes) is
currently offered by the University of South Africa’s Centre for Corporate
Citizenship (UNISA 2005).
Another view sees professionalism as ensuring that decisions are
taken by more than one person: ‘The appropriate trend may be toward
democratisation, not professionalisation’ (Fine interview, 21 October 2003).

Free
dow
nloa
d fr
om w
ww
.hsr
cpre
ss.a
c.za
Corporate giving in south afriCa 167
This entails accountability – decisions must be defensible in public: ‘It is
necessary to define our prejudices in an open fashion’ (Godsell interview).
Indeed, for some proponents of this view, accountability lies at the core
of professional CSI – the problem with the ‘chairman’s whim’ is not that
decisions are idiosyncratic or iconoclastic, but that it is unaccountable: no
rationale is given for decisions which are enforced simply because the chair
or some other powerful company actor says they must be taken.6 ‘In Britain,
shareholders and churches have created an environment in which CSI must
be defended: we are nowhere near that’ (Favis interview). ‘Shareholder
activists do not look at CSI. It is not inevitable that shareholders would impose
inappropriate standards – it could be another area of greater accountability’
(Reichardt interview, April 2004).
We tried to gain a clearer sense of opinion by asking how companies
would respond to a university course in CSI. Some were sceptical in principle,
suggesting that ‘three days with practitioners would probably be better’
(Maphai interview). Others enthused, provided that it is for ‘people who
already have experience so that they have an idea of the world of work’
(Landman interview), and is aimed at ‘enabling people to align what we
do with the company’s interests and objectives’ (Mollo interview). Some
suggested it would need to concentrate ‘on accounts rather than social
sciences’ and on specific techniques, such as how to leverage money
(Landman interview). Still others simply enthused: ‘There is a desperate
need for professionalisation of the sector. We will support some sort of
professional training’ (Naidoo interview). One interviewee wanted it to help
professionals to deal with non-governmental organisations (NGOs) or ‘deal
with the bigger picture such as political issues’ (Appelbaum interview).
Teaching international trends was also suggested – an interviewee added
that there should be two types of courses, one for practitioners and the other
for corporate executives who need to be exposed to CSI principles (Abedian
interview). A course is offered at the University of South Africa in non-
financial reporting and it was argued that CSI training could be a course
module (Reichardt interview, October 2004). Few interviewees rejected
Free
dow
nloa
d fr
om w
ww
.hsr
cpre
ss.a
c.za
168 giving and solidarity
the idea out of hand, suggesting that enthusiasm for professionalisation is
strong. In the words of one interviewee:
The terrain has changed and most corporates now make decisions
on who to fund based on written policies and guidelines. There are
clearer criteria and a more scientific way of selecting projects. On
major projects, interviews are carried out with people in the funded
organisations and members of communities that are benefiting:
perceptions are also sought from opinion-makers. (Naidoo interview)
Some interviewees suggested that a key component of professionalisation
was that corporates not use CSI to market themselves; they ought to be
motivated by development impact, not image. It was argued also that
marketing means that: ‘Failures are never reported – companies are reluctant
to evaluate themselves publicly. They don’t understand that it can build
credibility. There is a struggle to create a due diligence for CSI. Companies
are not set up to ensure continuing learning. There is no self-correcting
faculty’ (Reichardt interview, April 2004). Interestingly, using CSI as a
marketing tool seems also to have been opposed by O’Dowd: ‘He believed
in doing good by stealth – don’t stand up and talk about your good deeds’
(G Keeton interview). Companies’ propensity to contribute to development
rather than to seek marketing advantage is one criteria used in the Mail &
Guardian annual CSI awards. The trend towards creating CSI foundations in
corporations is seen as a way of preventing CSI from becoming a marketing
tool because they separate off this function (Rumney interview). An analyst
complained, however, that companies are not transparent about the way in
which they use foundations. ‘There are still cases where a chairman tells the
fund what to do’ (Reichardt interview, April 2004).
A contrary view argued that giving will be taken more seriously only
if companies see it as a means of raising their profile and thereby enhancing
the business. ‘There is an almost direct match between the degree of CSI
spending and how loved companies are’ (Danby interview). CSI, another view

Free
dow
nloa
d fr
om w
ww
.hsr
cpre
ss.a
c.za
Corporate giving in south afriCa 169
suggested, is ‘corporate image management’. It is not marketing – selling a
brand – but is about ‘defining the character of the organisation’ to the wider
public (Abedian interview). Indeed, it could be argued that companies have
an obligation to publicise their CSI programmes so that they are accountable.
One feature of the responses to the JSE’s initiative to produce a sustainability
index is that some companies do not bother to report fairly substantial
CSI programmes.7 A key effect of the index will be to publicise companies’
CSI – obvious fuel for marketing departments.
Corporate giving: what and how much?
Quantifying what companies give is more difficult than many in the field
tend to assume. Estimates of how much is given abound. But they seem to
be guesses more than calculations. CSI budgets or foundations only account
for part of giving in many corporates. Budgets under the control of the
chief executive or other company officials are also used to meet requests
for funding. Nor are the boundaries of giving always clear. Educational or
other support for employees, including HIV/AIDS interventions, is usually
considered employee benefits. But support for schools or clinics in an area
is seen as CSI by mining companies. Is supporting political parties CSI?
Sponsoring sport or the arts? There is some uncertainty on these questions
even among practitioners. Corporate giving does not always mean the same
to every company – some still include sponsorship of the local golf day. And,
while it might be logical to expect exaggeration, it was argued by CSI analysts
that understating can be as much of a distortion (Reichardt interview, April
2004; Rockey interview).
This makes it impossible to clarify an important question: the degree
to which companies might exaggerate their impact on the poor by including
support for middle-class facilities such as private schools or cultural activities
which serve affluent people as CSI. While some studies offer substantial
detail on spending targets (South Africa Foundation 2004; Trialogue 2001),
these do not tell us precisely to which facilities and activities CSI funds are

Free
dow
nloa
d fr
om w
ww
.hsr
cpre
ss.a
c.za
170 giving and solidarity
devoted. Thus a study of major corporates by the South Africa Foundation
(2004) lists substantial amounts spent on, for example, primary schools.
It is unclear how much, if any, went to those in affluent areas. A Trialogue
study (2001) found that about 1 per cent of CSI in its sample of companies was
spent on dance, theatre and drama, but this does not tell us who participated
in these activities. And, while Trialogue (2003: 108) finds that 15 per cent is
spent on employees or their families and the remainder on ‘communities’,
this tells us little about who is getting what within those categories. Clearly,
some companies include as CSI activities which may not be intended to
address poverty – the South Africa Foundation’s sample spends on average
R11.1 million of an average CSI spend of R35.8 million (31%) on ‘sport and
competitions’ – an amount so significant that the study offers a separate
calculation of CSI without sport (see below). While some corporates are
careful to separate sponsorship from CSI (Hollesen interview), not all do.
Signs of a bias towards the less poor may also be refelected in Trialogue’s
finding that poorer provinces are ‘neglected’ – it found that 48 per cent of CSI
was spent in Gauteng and Western Cape (2001: 98). This trend is attributed
to ‘the complexities associated with rural development, the fact that company
workforces and markets are mostly urban, and the large metropolitan
development demands’ (Trialogue 2003: 107). But it obviously tells us little
about the social and economic profile of recipients.
Another grey area is non-monetary giving. CSI practitioners insist
that businesses contribute more than funding to social needs: time and
effort, expertise, knowledge, relationships and ability to innovate or ‘get
things done’ are important: ‘In a sense money is the easiest thing to give.
Imparting skills by giving time is more critical’ (Shongwe interview). As one
interviewee said of non-monetary giving: ‘It is a major, often unrecognised,
part of giving’ (Landman interview). But measuring it is fraught with
difficulty. Some companies also encourage employees to devote part of their
leisure time to society (Naidoo interview); some use a model devised by the
Charities Aid Foundation in which firms match employee contributions
in some way.8 This creates even greater problems of definition and

Free
dow
nloa
d fr
om w
ww
.hsr
cpre
ss.a
c.za
Corporate giving in south afriCa 171
measurement. Does an animal lover’s time at the SPCA qualify? Or a parent’s
election to the school PTA committee? Or the election of a mine employee to
the local council? And what of cases where company personnel participate
in public processes such as integrated development planning, which
determines local government’s development priorities, or community–police
forums? ‘Are you looking out for the company or addressing the needs of the
community?’ (Fine interview, 14 October 2003). Any attempt to quantify non-
monetary giving is likely to be open to substantial objection. An interviewee
suggested that businesses’ non-monetary giving amounted to some 40 per
cent of corporate giving, but was unable to substantiate this.
CSI estimates are also biased towards listed companies because little
hard information is available on giving by small and medium firms – which
are important contributors according to several interviewees. Inevitably,
claims about how much business gives are vague: interviewees reported
an impression that ‘South African corporates are definitely giving more
than they used to, but how much more in relation to increased turnover is
not clear’ (Schlemmer interview), or that ‘our percentage of giving is up in
the right category internationally’ (van Heerden interview). ‘South African
corporates are slightly below the United States average and maintaining
that position. South Africa is way above Europe relative to turnover. South
African corporates are giving despite an enormous amount of government
intervention’ (Schlemmer interview). One reason is that ‘there is always
pressure by government on business to spend’ (Rumney interview).
Attempts have been made to quantify CSI. In 1999, the business-
friendly Centre for Development and Enterprise (CDE) conducted two surveys
to quantify businesses’ contribution to South Africa – in their core activities
as well as voluntary social expenditure. One was conducted among 75 of
the largest corporations, the second among a random sample of 545 of all
sizes. On CSI, it found that corporates spent R725 million in 1997/98, with
education as the major beneficiary. SMEs with fewer than 100 employees
made more modest contributions but the sample spent up to R230 million
on welfare, education and sport in 1997/98. By comparison, government

Free
dow
nloa
d fr
om w
ww
.hsr
cpre
ss.a
c.za
172 giving and solidarity
spent R88.6 billion on education, housing, health and social services in that
period (Bezuidenhout et al. 2003: 31). The study concluded that business
probably spent R4–R5 billion on CSI, including sport, in 1997/98 – about the
size of the budget of a medium-sized national government department such
as prisons or agriculture. On average, the major corporations were spending
1.3 per cent of after-tax profits on CSI in 1997, higher than the United States
(0.9% in 1996) and Canada (0.8% in 1994).
The CDE stressed that CSI is a relatively minor resource flow to society
compared to routine business operations. Curiously using the metaphor
of a ‘hamburger’, it claimed that CSI and in-kind contribution to social
development are the ‘salad and sauce’, taxes and levies the ‘bite which
the state takes’; but the generation of export earnings, new investment,
wages, and the satisfaction of market need for products are the ‘real beef’.
CSI amounts to only R1.30 for every R100 in profits, training to R13 and
outsourcing to and partnerships with emerging business to some R9
(Schlemmer 1999).
In 2004, this quantification exercise was repeated by the South Africa
Foundation. It used a sample of 25 companies, all but one among the top
50 companies listed on the JSE or major multinationals. It found that they
each spend on average R28 million on CSI per year, excluding sport. CSI
amounted to 0.13 per cent of gross income and just under 0.87 per cent of
net profits (South Africa Foundation 2004: 4). Other calculations include
that of Colleen du Toit of the, now defunct, Southern African Grantmakers’
Association (SAGA) who reportedly put CSI at about R4 billion including non-
cash contributions,9 and Trialogue, producers of The CSI Handbook, which
estimates total CSI for 2004 at R2.4 billion, a nominal 2 per cent increase
over the previous year (but a real decline) (Trialogue 2004: 74).
While these studies devote considerable effort to generating
accurate accounts of spending in the companies they sample, calculations
of CSI throughout the economy can only be a guess since there is no way
of knowing whether the data gathered from a sample of companies can
be reliably said to provide information for all. Also, Trialogue ‘leaves it to

Free
dow
nloa
d fr
om w
ww
.hsr
cpre
ss.a
c.za
Corporate giving in south afriCa 173
the corporate to decide what is CSI’ (Rockey interview), ensuring that no
consistent criteria are used. The judgement of one interviewee that, on
CSI, ‘quants are not doable’ (CSI practitioner interview) is hard to fault.
Nor does quantification necessarily tell us anything about contribution to
development: ‘Small grants may not change the world but are important to
those who receive them – even the acknowledgement of their existence is
important to them’ (M Keeton interview).
Small is beautiful?
How significant is giving by SMEs? Common sense might suggest that
many are so absorbed in survival that they have neither the resources nor
the inclination to give. But one interviewee suggested that ‘what SMEs give
is not peanuts’ (Schlemmer interview). Interviewees suggested that, ‘Small
business giving is often directed at the very micro level – money for book
prizes or trophies at schools. There is involvement in the goodwill of the local
community. In this way, small-business giving builds the fabric of society.
When it comes to SMEs, there is often a very thin line between
individual and corporate giving’ (Coovadia interview). ‘Soup kitchens,
orphanages, church schools get lots from SMEs. But the targets are not
sexy. There is no heroism here, but sheer charity. By contrast, many big
corporates see CSI as an opportunity to get a spanking annual report, a
photo opportunity’ (Schlemmer interview). An interviewee suggested
that large companies are better able to ‘gear up and do novel things’ at a
bigger scale. SMEs tend to get involved with the local hospice, for example
– ‘important but different’ (G Keeton interview). Two interviewees argued
that SMEs needed CSI tools and that an institution such as the National
Business Initiative (NBI) should provide them. But it is not clear how this
would improve giving by SMEs.
It is difficult to assess these claims. But a survey conducted for this
study suggests that reliance on local businesses for social investment is
relatively low – particularly among Africans (Everatt & Solanki 2005).

Free
dow
nloa
d fr
om w
ww
.hsr
cpre
ss.a
c.za
174 giving and solidarity
This could mean that the role of SMEs is less significant than these
responses suggest.
The drivers of giving
What motivates businesses to give? Explanations in interviews include
the role of champions, the threat of penalties, anticipated legislation, local
context, and reputational jockeying. Also important is greater exposure to
international pressures, and issues of competitiveness, particularly in an
international context. Civil society may also be effective in raising the profile
of issues such as the environment (UNDP 2004).
Many are influenced by the notion, first raised in 1972 by Meyer
Feldberg in his inaugural lecture as professor of business administration
at the University of Cape Town, that while business was not responsible
for creating apartheid, self-interest dictated that it take social responsibility
seriously (Bezuidehout et al. 2003). This is perhaps the most frequently
mentioned motive. Several interviewees noted that emphasis on education
and skills development is a product of ‘enlightened self-interest’, as is mines’
commitment to developing the areas where they mine. Indeed, some CSI
practitioners see appeals to self-interest as the only way of gaining ‘buy-in’
from company decision-makers: ‘Giving without self-interest is charity,
which fails because people do not take it seriously’ (Maphai interview).
Similarly, CSI is ‘most sustainable where there is a coincidence between
it and the interests of the company’ (Fine interview, 21 October). In this
view, aligning CSI priorities with those of the company is vital if CSI is to
receive the attention it merits. Development may thus be seen as a means
of securing growth and legitimacy. Godsell et al. note: ‘The legitimacy of
business will be strongly affected by the way in which (it) is perceived as
caring about and helping to bring about development’ (1998: 31). It is also
trite but true that steady economic policies will only be maintained in a
transition to democracy if they are accompanied by adequate development.
Free
dow
nloa
d fr
om w
ww
.hsr
cpre
ss.a
c.za
Corporate giving in south afriCa 175
This requires business to play a developmental role. CSI initiatives have
immediate business benefits: Standard Bank funds homes for children living
with AIDS whose parents died leaving an unpaid bond. This enables it to get
back the property – a hard-nosed business decision but with an important
social impact. More specific drivers also shape CSI behaviour.
One driver, discussed in Chapter 6, is guilt – or, more generally, a
desire by executives to feel good (Rumney interview). These decisions are
likely to be heavily influenced by who has access to, and who is respected
by, the decision-maker. Others saw giving as a consequence of the culture
of particular companies or industries, inculcated by prominent people in
the company over a long period. Corporate giving, an interviewee notes, is
‘cultural within companies, not universal’ (G Keeton interview). ‘There are
perceptions that IT companies could have had a higher CSI profile when they
were deep in cash in boom times’ (van Heerden interview). There is thus
a need ‘to inculcate the value that CSI is important for your business and
the environment within which you operate’ as a corrective to ‘some of the
enrichment and consumerism that is about now’ (Coovadia interview).
CSI can also be seen as a way of ‘building a good brand’. The desire of
individuals seeking to be Mr AIDS orphans or Ms Fynbos may also play a role.
Brands signal ‘something wholesome about the company’ (The Economist
6 September 2001) and CSI may be seen as a contributor: ‘Larger-scale firms
have brand reputation concerns and have more incentive [and resources] to
devote to improving their corporate citizenship profiles’ (Fig 2003: 8). In
mass consumer companies, there is a tendency to keep corporate giving close
to the core business (Friedman et al. 2005). Key gains are extending brand
recognition and reputation enhancement. There is a joke which goes that for
every R50 000 spent on saving the dolphins, R5 million goes on advertising
that they’re saved. Brand reputation is a powerful incentive for companies
to contribute. If they have to compete with rivals for customers and workers,
they will worry about their reputation for caring and this encourages a degree
of reputational jockeying or competition. But if CSI is meant to enhance
business’s reputation for philanthropy, it seems not to have succeeded.

Free
dow
nloa
d fr
om w
ww
.hsr
cpre
ss.a
c.za
176 giving and solidarity
A survey conducted for the study, and discussed in Chapter 2 of this volume,
asked respondents to comment on the statement: ‘Big companies only give as
a way of advertising themselves’ – two-thirds agreed or strongly agreed, with
just 16 per cent rejecting it and the rest choosing a neutral option. Indian
respondents were most likely to agree or strongly agree (73%), followed by
Africans and coloureds, both at 68 per cent, and dropping to just over four in
ten whites or 46 per cent (Everatt & Solanki 2005: 31).
A further motive cited by interviewees, and noted earlier, is a
desire to head off regulation. Litigation in United States courts against
companies accused of benefiting from apartheid was also mentioned by two
interviewees as a driver for looking beyond the factory gate. The Truth and
Reconciliation Commission prompted business to recognise the need to
‘head reparations off at the pass’ (Spicer interview). In mining, the stakes are
high as licences depend on satisfying the Mining Charter scorecard and so
pressure to choose projects on whether they will impress political office-
holders rather than their impact on development is great (Fine interview, 14
October 2003). Some interviewees suggested that regulation might stifle CSI
by imposing costs on companies: ‘The second Business Trust (BT) is unlikely
to be of the same magnitude as the first. Companies have other obligations
now, many of them statutory’ (van Heerden interview). ‘Corporate giving
has reached its peak in South Africa – charters and government intervention
will lead to a decline’ (Schlemmer interview). This suggests that the threat
of regulation acts as a spur to giving, but that introducing regulations stifles
it, which holds out intriguing challenges to government strategists. But
one attempt to use regulation to guide CSI priorities thus far is of unclear
effect – the use of tax incentives. Opinion is divided on whether concessions
granted under section 18A of the Income Tax Act (No. 58 of 1962) affect CSI
behaviour. Keeton insists they do – particularly as, in recent years, the giving
covered by concessions has expanded ‘massively’ (M Keeton interview). An
analyst believes changes in the tax regime have prompted more innovation
and lateral thinking (Rumney interview). ‘Tax does make a difference,
particularly among American firms which are used to rebates – I know of
Free
dow
nloa
d fr
om w
ww
.hsr
cpre
ss.a
c.za
Corporate giving in south afriCa 177
organisations whose funds have dried up because their donors did not get
rebates’ (Danby interview). But others insisted that it made no difference and
that more generous concessions were needed if giving behaviour was to be
altered (Landman interview).10 What is clear is that the culture of structuring
giving around tax concessions for donations, found in some countries, is not
yet entrenched.
More specifically, the charters may, several interviewees suggested,
negatively affect the quality and quantity of CSI. Giving is said not to be
a priority in charters: the financial services charter gives CSI a 3 per cent
weighting with companies required to spend 0.5 per cent of post-tax profits –
less than what companies are said to be spending now. The mining charter
gives no weighting to CSI – an interviewee said this was partly out of fear that
it would enable companies to get away with reducing their black economic
empowerment (BEE) responsibilities. But others noted that the charter
does not rely on weighting generally and does award points for giving to
communities around mines’ operations. ‘Will this mean that Wits [university]
does not get its bridging programme funded?’ (G Keeton interview). On
quality, an interviewee argues that the charters invite companies to engage
in ‘box-ticking’ – ‘corporate involvement becomes part of a patronage system
tied to politicians and their desires. Corporates want to know: do we get the
credits? It should be about getting the balance right.’ In addition, ‘Charters
and scorecards can be imprecise’ (Spicer interview). More important, perhaps,
the Ministry of Mineral and Energy Affairs is reportedly insisting that
mining CSI in towns where mines are situated conform with the Integrated
Development Plans (IDPs) of the area, a stipulation which, some specialists
feel, imposes an inappropriate straitjacket. There is also a widespread feeling
that in response to charters, CSI should simply ‘work with local structures’
(M Keeton interview). Some argue that BEE has replaced CSI as a priority, for
the government and, as a result, for corporates – BEE is seen by some white-
owned companies as a contribution to CSI, enhancing the possibility that they
will devote less attention to giving. Whether or not this is accurate, the South
Africa Foundation study found that spending to facilitate BEE ‘now absorbs

Free
dow
nloa
d fr
om w
ww
.hsr
cpre
ss.a
c.za
178 giving and solidarity
around ten times what corporations spend on CSI’ (2004: 8). It concluded
that corporates ‘would do well to reflect on the possibility that they might
be drawn into a broader process that offers more benefits to the emerging
middle class and elites than the poor’.
In principle, giving to comply with regulation is not unethical since it
does not imply an attempt to secure special treatment. Where the criteria that
CSI must meet are predictable and clearly defined, the requirement, it was
argued, is ethical (Godsell interview). And charter pressure is, it was noted,
having an impact (Reichardt interview, April 2004). ‘The social plan in the
charter made people more willing to publicise what we are doing. There
is also more planning now. People do talk about the charter openly – ask
where we are on the scorecard. It is forcing senior executives to think more
seriously about social issues’ (Mollo interview).
Many corporates also use CSI as a lever to maintain influence in a
democratic South Africa. As Godsell et al. point out, ‘in most ethnically
divided societies…corporations and retail businesses are owned and managed
by individuals belonging to an ethnic minority’ (1998: 3). South Africa is no
exception and this obviously affected responses to the transition. ‘Companies’
worlds were shaken up by 1994, all the stakeholders changed, government
had very different people in it. The relationships between stakeholders
changed too and business did not understand this. Giving became a
mechanism to help companies negotiate this change’ (Kapelus interview).
Inevitably, perhaps, giving motivated by this consideration will be
particularly sensitive to government concerns. ‘Many give to ensure that
they get into the good books of government rather than for developmental
reasons’ (Mahuma interview). By implication, this giving is, in reality, buying
– giving with the expectation of something in return. In some cases, there
may be an explicit hope of, for example, winning a tender. In others, there
may not be a hope of direct advantage but ‘people will give just to be close
to power’ (Landman interview). Government, it is said, sees business as a
‘flexible resource’ willing to meet its need for development funds. Much
of this operates on unspoken understandings in which ‘boundaries are

Free
dow
nloa
d fr
om w
ww
.hsr
cpre
ss.a
c.za
Corporate giving in south afriCa 179
stretched without an awareness that there is a problem’ (Favis interview). The
relationship may not, however, be quite that simple: ‘The government has a
love–hate relationship with CSI: it wants business help but does not want to
be outshone’ (Maphai interview).
Some of this sort of giving, typified by the ‘Madiba school’ (schools
built at the request of former President Mandela), is portrayed as a relatively
benign but misguided attempt to show respect to revered political figures.
No respondents saw these projects as developmental (although perceived
flaws in the Madiba schools are reportedly being addressed by the Nelson
Mandela Foundation),11 but most saw them as almost inevitable since some
political figures could not be ignored for fear of appearing to disrespect
national icons. Nor, some practitioners insist, is working with government
necessarily an attempt to gain influence. Some argued that partnership is
essential to development: ‘We want partnerships with government because
they add to our impact and because this is a people’s government. And we
don’t approve everything – government sometimes thinks we are too hands-
on because we do not simply write a cheque. But we want to add capacity’
(Vukuza interview). ‘We need a partnership with government if our projects
are to work. There is no point in building clinics if no doctors are there or
placing computers in schools where there is no electricity’ (Mollo interview).
Repositioning can also respond to social pressures, not those of the
government: many interviewees noted a ‘general expectation that companies
act responsibly to support local development’.
Global pressures were also cited. South African companies that moved
their primary listing abroad were said to have been forced to focus more on
‘soft’ issues. ‘We’re more exposed to global pressure groups. Greenpeace
can cause some embarrassment,’ as it did for Shell in 1995 to extraordinary
effect.12 Companies that have become multinationals need to harmonise
CSI across countries (Mollo interview). Foreign corporations which are
forced to live up to global reporting standards are said to have prompted
larger local firms to adapt. The influence and scrutiny of NGOs – often
media-savvy, particularly Internet friendly, documenting and publicising

Free
dow
nloa
d fr
om w
ww
.hsr
cpre
ss.a
c.za
180 giving and solidarity
abuses, chivvying governments and business and arousing public opinion
– is pervasive internationally. ‘Companies have learnt the hard way that they
live in a CNN world, in which bad behaviour in one country can be seized
on by local campaigners and beamed on the evening TV news to customers
back home. As [NGOs] vie with each other for publicity and membership, big
companies are especially vulnerable to hostile campaigns.’ (The Economist
20 April 2000)
Closer to home, ‘the growth in the voice of civil society is more
evident. No company is remote enough to be off the radar screen of
international NGOs and the media’ (Kapelus interview).
Interviewees suggest that in South Africa, NGOs have been fairly
flat-footed. ‘NGOs could get their act together more, in the same way as
international NGOs have done. They’ve had to reinvent themselves and
grapple with a new set of issues now that the struggle is over’ (G Keeton
interview). But the success of the anti-apartheid campaign in the 1980s
illustrates how vulnerable firms can be to public pressure on human rights
issues. This ‘forced SA corporates to think about apartheid as an issue’.
Evidence suggests that the impact left by the anti-apartheid campaign still
influences business responses.
Following the herd? The soft role of champions and peer pressure
Business decision-making is not purely about responding to an external
environment. Like other human beings, business people are influenced
by their peers, by those they consider leaders – and by fashion. Contrary to
the claims of Marxist analysts, some neoclassical economists and sections
of the financial press, business people are not endowed with a strategic
omniscience which enables them to understand perfectly their social and
political environment and then act on it entirely in accordance with their
interests – most are not trained social analysts and there is no reason why
they should have a superior analysis of society compared to, say, a bus driver.

Free
dow
nloa
d fr
om w
ww
.hsr
cpre
ss.a
c.za
Corporate giving in south afriCa 181
Is business thinking on social and political interests therefore particularly
driven by champions and peer pressure?
Some interviewees stress the diversity of CSI – ‘there has never
been such a thing as “conventional CSI” – everyone follows their own path’
(M Keeton interview). But there do seem to be fashions, set not only by
the external environment but by the influence of important figures in
business. Within companies, while many interviewees suggested that ‘the
chairman’s whim’ was declining, it has not disappeared as a motive for CSI
(Friedman et al. 2005). And one aspect which does make a difference is the
influence of individuals championing CSI, whatever their title. Interviewees
consistently identified this as a key driver: ‘Without champions to drive
corporate giving, nothing would happen’ (Spicer interview). ‘A champion
is always needed in an organisation because it usually takes someone in
a powerful position to pull the strings before a CSI programme can be
initiated’ (Mahuma interview). ‘The Sasol Outlook Programme which gives
to mentally challenged kids was championed by one middle-manager who
was passionate about this and convinced the firm’ (Landman interview).
Many spoke of special individuals who were uniquely able to recognise good
ideas. They also stressed the importance of ‘gut feel’ here. Research for the
JSE Sustainability Index found that CSI is more likely to add value and involve
stakeholders if prompted by a ‘senior champion’ (Reichardt interview, April
2004). This is cited as one argument in favour of the ‘whim’ of a CEO: ‘It
means that CSI is pursued by a person with vision – however misguided – as
well as power within a company to make things happen’ (Spicer interview).
Less clear is the power of ‘horizontal’ peer influence and
championing – ideas or approaches which travel from one company to
another. Some CSI practitioners do report comparing notes with colleagues in
other companies but this is far less widespread than we might expect. One or
two networks enable CSI practitioners to talk to each other, but participation
in them – and their influence – seems limited (Hollesen interview). SAGA,
now defunct, was an attempt to institutionalise horizontal influence for
greater professionalisation, but interviewees reported that it failed to attract

Free
dow
nloa
d fr
om w
ww
.hsr
cpre
ss.a
c.za
182 giving and solidarity
key CSI decision-makers. Among many of our interviewees, SAGA, it seems,
failed to develop a reputation as a credible source of support to corporate
grantmakers: ‘SAGA no longer knew whether it represented the interests of
NGOs or those of corporates’ (Mahuma interview).
That fashions in giving are not spreading from one company to
another is, according to one interviewee, confirmed by the JSE study,
which found that ‘there are no clear trends’ (Reichardt interview, April
2004). ‘There is too much duplication. There needs to be a forum that
gets CSI executives together to align synergies and cut duplication to
ensure maximum impact’ (Naidoo interview). But peer discussion is
constrained by the fact that people are busy and there is a disincentive to
sharing experiences: ‘it can backfire because people can be fired’ (Hollesen
interview). An interviewee suggested that the absence of role models
was not restricted to CSI. In contrast to the past, South African business
lacked opinion-leaders: ‘There is now no one of similar stature to Harry
Oppenheimer’ (G Keeton interview). There are cross-company champions,
‘but they are not as pervasive as one might assume’ (Reichardt interview,
April 2004). While another insisted that business thinking was now shaped
by ‘a more diverse group which includes people like Tokyo Sexwale and
Patrice Motsepe’, we found no evidence that they are shaping opinion on CSI.
Saki Macozoma sought to shape CSI patterns through his involvement in
the BT but his influence on black-owned companies’ approach to CSI seems
limited. Cyril Ramaphosa’s Shanduka initiative seems potentially to place
him as a leader in black business CSI but it is too early to evaluate this.
There are periodic attempts to provide institutionalised influences
on CSI. An obvious one is the BT, a business–government partnership which
has tackled education, tourism and criminal justice and is to be renewed
once its current mandate ends, with a probable focus on public works. But,
while an interviewee noted ‘lots of peer pressure’ in the Trust’s approach,
another observed: ‘there are some very high-profile names that are not part
of the Trust’ (G Keeton interview). The BT was formed primarily to build

Free
dow
nloa
d fr
om w
ww
.hsr
cpre
ss.a
c.za
Corporate giving in south afriCa 183
bridges to government. CEO Brian Whittaker says it was formed partly
because ‘the political question at the time was not “what is your company
doing?” but “what is business doing?”’(Whittaker interview). But the BT can
also be seen as an attempt to place giving in the hands of a vehicle staffed by
professionals. Whittaker believes an advantage of this collective approach is
that ‘an individual company doing this would be suspected of just pushing
its brand’ (Whittaker interview).
Professionalisation was not, however, an explicit reason for forming
the BT. Whittaker insists that it grew out of a particular understanding of the
business–government relationship. This was based on the understanding
that business in this country faces ‘extraordinary challenges’ because ‘it
is under the control of an ethnic minority in a newly democratised state
and…is seen to be in control of a substantial resource and appears to many
to constitute an island of plenty in a sea of poverty.’ The government faces
‘extraordinary challenges’ and ‘one of the greatest factors affecting business’s
ability to face the challenges that confront it is determined by the way in
which the government behaves’ while ‘one of the greatest influences on the
government’s abilities to face its challenges is the way in which business
behaves’. These interdependent needs make ‘a case for cooperation’ which
does not deny the ‘sometimes opposing interests’ of the parties but does ‘rest
on the belief that properly managed cooperation…can be good for business,
good for government and good for the society…’ Whittaker believes that
the BT’s record in areas such as tourism promotion, integrating the justice
system and creating a new technical college sector demonstrates that ‘co-
operation adds value to the society which outweighs the costs to individual
businesses of a loss of profile.’13 It is, therefore, a desire to strengthen
business–government partnership, not to professionalise giving, which
underpins the BT.
Supporters of the BT say it also enables small and medium businesses
that do not have CSI departments to contribute to society by donating to a
trust staffed by professionals. But the collective ‘advantage’ is, in a context
in which firms compete for favourable public images, a drawback to some.

Free
dow
nloa
d fr
om w
ww
.hsr
cpre
ss.a
c.za
184 giving and solidarity
Thus an interviewee in the financial services sector says that a challenge
for the BT is that companies want CSI to promote their brands and give
them a competitive edge. Initiatives such as the BT and the Joint Education
Trust (JET), are not, it is said, seen by companies as alternative CSI vehicles
since they ‘don’t want to outsource their identity or priorities’ (M Keeton
interview).
In one view, the BT was not a new model but a ‘one off, designed to
take advantage of political opportunity’. JET (an education project supported
by business and political organisations) also arose because business realised
it had to build a relationship with government. But these initiatives may
have unintended consequences: ‘partnerships lead to professionalisation’
(Taylor interview). JET’s Nick Taylor insists that this model is also a genuine
partnership between business and professionals. ‘Business people do
not simply rubber-stamp what we do: they force us to account for our
performance and results. And they ask intelligent questions’ (Taylor
interview). But whether this also improves effectiveness is hotly debated:
‘The Trust [BT] centralises giving and reduces it to the lowest common
denominator. For the corporate sector, risk is a four-letter word’ (Appelbaum
interview). And ‘What [BT] is doing is no different to what is being done in
companies’ (Mahuma interview). BT, the NBI and JET may indicate a potential
shift towards relying on professionals in much the same way as American
foundations do, but they have not replaced traditional company CSI. Nor do
they seem to have reshaped giving agendas significantly.
Initiatives such as the Mail & Guardian award and Trialogue, which
has a peer to peer rating involving 100 NGOs and 100 corporates, are other
examples of attempts to influence CSI decisions. But perhaps potentially the
most significant is the JSE Sustainability Index, based on the FTSE4Good
in London and thus a response to an international trend towards greater
social accountability by business (Fine interview, 21 October 2003). The
JSE index seeks to measure corporate social responsibility generally, but
CSI is one aspect. Participation is voluntary; the ‘carrot’ is the prospect that

Free
dow
nloa
d fr
om w
ww
.hsr
cpre
ss.a
c.za
Corporate giving in south afriCa 185
inclusion has the ‘potential to provide firms with a competitive edge’ (Fig
2003: 9). This initiative must be seen in the context of King II, the 2002 King
Report on Corporate Governance for South Africa, which urges companies to
‘[recognise] that stakeholders such as the community in which the company
operates, its customers, its employees and its suppliers amongst others, need
to be considered when developing the strategy of a company’. (Institute of
Directors 2002: 6). It requires that all JSE-listed companies report at least
annually on the nature and extent of…social, transformation, ethical, safety,
health, and environmental management policies and practices (Institute of
Directors 2002). King II has been accepted by many listed companies and
the resultant ‘sustainability reports’ offer useful information on CSI. How
will the JSE index seek to influence CSI? ‘We look for capacity and consistency.
Why were some people refused? Was the money used to good effect? As a
shareholder, how do I know this?’(Reichardt interview, April 2004). There
are doubts about whether the JSE measure is speaking to the need for more
professional CSI – an interviewee complains that ‘it misses much of the detail
and nuance’. But it may reshape agendas (M Keeton interview).
The JSE index reflects a wider interest among business strategists in
‘corporate citizenship’, which sees the relationship between company and
society as a core element of operating a business. It too has an institutional
champion in the African Institute of Corporate Citizenship. The idea of a
‘triple bottom line’ in which economic and social sustainability occupy as
important a place in corporate priorities as their financial equivalent has
permeated the language of many business people: ‘the triple bottom line
philosophy has made a big impact on CSI’ (Landman interview). Whether this
has led to substantial shifts in behaviour is less clear but one view argues
that the consequence is to relegate CSI in importance because it must fight for
its place with broader sustainability concerns. The idea that CSI must be seen
as only a facet of a broader social responsibility is strongly advocated by some
(Rumney interview). However, advocates of broader social responsibility
insist that CSI should not be jettisoned when companies take their social
obligations more seriously, but should be integrated into a responsibility

Free
dow
nloa
d fr
om w
ww
.hsr
cpre
ss.a
c.za
186 giving and solidarity
approach: ‘Where the safety or health implications of company products have
been challenged, firms ought to fund research which seeks to discover and
assess the dangers’ (Fig interview). In the business mainstream, mining
companies might see CSI in mining communities as an attempt to integrate it
into a wider social responsibility approach.
The JSE index and the initiatives discussed here may provide new
influences on CSI and ensure greater spread of ideas across firms. But for
now, while CSI within companies is apparently often shaped by champions,
cross-company championing and peer pressure seem relatively insignificant –
although this does not necessarily mean there are no CSI fashions.
Wellsprings of CSI
What are current trends in CSI practices and priorities? And what influences
them? Several interviewees felt it would be easier to understand motives
for and trends in CSI by periodising changes in corporate giving in South
Africa as the agenda was modified by pressure and new needs. Prior to 1976,
they argued, funding was reactive and relatively small, despite exceptions
which saw giving as important to defuse radicalism and show opposition
to apartheid. Between 1976 and 1990, corporates increasingly funded
initiatives to change public policy or remedy apartheid’s effects. Using
NGOs as intermediaries became more common. Between 1990 and 1994,
the NBI became the vehicle to show business commitment to South Africa.
Giving was ‘outsourced’ and the ‘cheque book mode’ became most common.
Money used for development was highlighted in annual reports and CSI
took on a heavy marketing flavour. Between 1994 and 1998, companies
began to form CSI trusts and to link CSI slowly to business strategy. CSI
became a mechanism to help negotiate change and the ‘triple bottom line’
gained importance. In this view, between 1998 and 2002, CSI became more
coherent and a professionalised approach emerged. The BT suggested a turn
to funding within government policy which could fit comfortably in the
minds of business decision-makers with notions of ‘corporate citizenship’,

Free
dow
nloa
d fr
om w
ww
.hsr
cpre
ss.a
c.za
Corporate giving in south afriCa 187
although a ‘good corporate citizen’ is not necessarily one who works within
government policy but one who may also respond to wider social pressures
(BCCCC 2003; Ward et al. 2002). The sustainability issue rapidly moved up
the agenda with social responsibility maturing to become an integral part
of business strategy. This was accompanied by changes in the way in which
projects were managed. From 2002, this process continued with boards and
executive management seeking ways to align CSI more closely with corporate
goals and strategy. Corporate citizenship became ‘the new buzzword’ and
CSI became linked to corporate strategy. Scorecards and charters potentially
transform the way we see CSI. One interviewee summed it up thus: ‘In
apartheid days, corporates [gave] because of guilt, enlightened self-interest,
and to show liberal opposition to apartheid. Now it is much more about
the business imperative. We’re more exposed to global pressure groups’
(G Keeton interview).
If this periodisation is accepted, CSI patterns have evolved out of an
interplay between external pressures and internal influences. The former
have arguably been dominant. Companies have been motivated first by
external realities, and the way in which these are filtered through changes in
thinking and fashion within business shapes the quantity and nature of CSI.
Increasingly formalised procedures for managing giving have
developed. Vision and mission statements, summing up the company’s
strategy, typically stress the triple bottom line. Giving tends to be managed
in public or corporate or external affairs divisions, or through foundations.
Budgets for sponsorships are usually seen as marketing department
activities. Trusts for CSI have been set up with their own sources of revenue,
independent of marketing budgets, and trustees are apparently ‘jealous of
their power’ (Tucker interview), although this does not prevent turf wars
between marketing and corporate affairs departments. CSI managers are
said to be turning into sustainability managers with key performance
areas. ‘We’re moving away to a more strategic calculation around CSI and its
integration into the business model of companies. It is no longer relegated

Free
dow
nloa
d fr
om w
ww
.hsr
cpre
ss.a
c.za
188 giving and solidarity
to the 13TH drawer’ (Coovadia interview). This is seen as a result of attempts
to give coherence to company strategy, the professionalising of management
and staffing, tax advantages, the size of the funds managed and a desire to
keep the pressure of requests away from senior executives.
The raised level of awareness and strategic importance of CSI means
that quality of staff becomes an issue. A constraint to professionalism is
that practitioners are often ‘transient people on a job ladder, setting their
sights on higher jobs’; people who will not develop expertise but rely on
instructions from the chair. CSI is a vocation to only a small group of people
(Favis interview). But the creation of company CSI foundations is said also to
coincide with a trend to buy in expertise (Rumney interview). In some cases,
there is a trend towards hiring more staff with social research backgrounds.
And an interviewee suggests that specialists may be in increasing demand:
‘There is certainly a marketplace for professional CSI people and entities’
(Shongwe interview). The move to more strategic projects has also created a
need for impact assessments: ‘When corporate giving wasn’t such a strategic
issue, it was difficult to demonstrate impact. There were also moral reasons
for getting involved. Nowadays companies only carry on if they can recognise
the benefits’ (Kapelus interview).
But professionalisation can make companies less pioneering and
flexible. The arts are, as noted earlier, said to have suffered as a result of
the desire to become more developmental. Development is seen in narrow
terms: ‘Many businesses do not understand the potential for the arts…to
generate employment,’14 despite the launch by the government of a non-
profit company, Business and Arts South Africa, with President Mbeki as
patron, to encourage partnership on arts promotion. Organisations which
offer alternative ideas have also been neglected, an interviewee believes: ‘CSI
should reinforce civil society organisations, especially those which deal with
ideas – society needs think tanks. But they are poorly supported by local CSI’
(Landman interview).
Nor may the theory of professionalisation reflect practice: ‘There is a
lot of professionalised giving with rigorous criteria. But watch out for a set

Free
dow
nloa
d fr
om w
ww
.hsr
cpre
ss.a
c.za
Corporate giving in south afriCa 189
of self-validating interests. Professionalisation can lead to bureaucracy, to
form without substance’ (Spicer interview). Another interviewee observed
that ‘corporates are aware of professional criteria, but often not able to apply
them’ (Schlemmer interview). There is now a veritable giving industry,
complete with consultancies, conferences, and e-news journals. An unkind
observer might argue that it has been a bonanza for those who design
company strategy and are paid to monitor it but that enhanced performance
is not a necessary outcome. The claim that companies are now less concerned
with simply writing a cheque and hoping the money will be well used is
also disputed: ‘Research suggests that the cheque-writing mentality is very
much alive – few companies are willing and able yet to put in place a CSI
framework which can deliver a coherent approach.’ Thus, in a sample of
major corporates, ‘just under half’ seemed engaged not in development but
in cheque writing: ‘The biggest continued CSI trend is one-way hand-outs’
(Reichardt interview, April 2004). This seems confirmed by a recent claim
that major companies do not build lasting relationships through CSI efforts
and are still guilty of ‘cheque-book’ development (NBI 2004). And measuring
impact will always be problematic, ‘largely because everybody is grateful for
getting some form of handout’ (Schlemmer interview). One measurement
method is the ‘sustainable livelihoods’ approach for the assessment of
corporate impacts on local communities. Hamann and Bezuidenhout (2003)
argue that this entails a stakeholder analysis which considers how local
groups affected by corporate activity stand to benefit or suffer from particular
interventions. But at present, impact assessment seems relatively ad hoc.
It suggests that, while talk of more ‘professional’ CSI may have permeated
business thinking, translation into action is far slower.
And, as suggested above, some suggest that professionalisation has
merely replaced one orthodoxy with another. They argue for a ‘chaos theory
of giving’: ‘You listen to people, go with your sense of what seems like a good
project and, if you are right more than half the time you are doing well.’
This assumes many grants rather than few, and few principles to guide
giving rather than many. It inevitably produces significant errors, but can be

Free
dow
nloa
d fr
om w
ww
.hsr
cpre
ss.a
c.za
190 giving and solidarity
justified if the lessons they teach are learnt. It is also an important rationale
for humility (Godsell interview). Most important, it also allows for innovation
and comparison between projects.
The limits of professionalisation were confirmed by two case studies
we researched: AngloGold and Pick ’n Pay (see Friedman et al. 2005).
AngloGold is a long-standing exemplar of ‘professional’ CSI. By contrast,
Pick ’n Pay’s social investment is widely seen as the product of decisions by
its founder, Raymond Ackerman, who has no background in social analysis
and whose strong personality and preference for ‘hands-on’ decision-making
make him the archetypical whimsical chairman. The two examples seem
tailor-made to test the contrast between expertise and impulse. To a degree,
the case studies confirm the conventional wisdom. But a closer look suggests
that the difference between the two is not nearly as great as it seems. The
research presents further evidence of the dangers of formulating a stark
contrast between ‘whim’ and professionalism.
AngloGold is hardly the only company which seems to find it difficult
to make decisions based on considered policy alone – the problem is almost
universal. This is illustrated by the ‘Madiba schools’ mentioned earlier. Not
a single interviewee suggested that they were an appropriate contribution to
development. All who considered their CSI more professional acknowledged
that their policy did not provide for giving in response to requests by saintly
individuals, and yet just about all acknowledged having funded one of these
schools. The example might be considered as evidence that not even the most
elaborate CSI policy can withstand an appeal from an icon. But interviews
suggest that the Madiba schools are not the only case in which policy can be
overturned by a strategic appeal to the company or by the enthusiasm of a
senior official.
The case studies suggest that ‘the chairman’s whim’ may be a far
more inexorable feature of CSI decision-making than current orthodoxy
suggests. Corporations are not parliamentary democracies: their chief
executives are, despite accountability to shareholders, expected to exercise far
wider prerogatives than those meant to be afforded to elected politicians –

Free
dow
nloa
d fr
om w
ww
.hsr
cpre
ss.a
c.za
Corporate giving in south afriCa 191
they are expected to take charge of decisions and to be judged by their results
rather than their responsiveness or accountability. It is therefore perhaps
inevitable that, where a CSI decision seems essential to company well-being,
the chief executive will insist that it is made, whether or not policy allows
for it. Also, most companies’ relationship with South Africa’s society and
its governing elite makes them unusually vulnerable to special pleading or
personalised appeals. Most are white-owned businesses that are considered
to have benefited from apartheid and are therefore under some pressure to
show they are committed to a democratic South Africa. This raises the stakes
of saying ‘no’ to politicians and activists. Then, whim may be less whimsical
than it seems.
One interviewee suggests that business people (like other humans)
are motivated by a desire to impress those whose opinions they value or
whose approval is important to them, whether for strategic or psychological
reasons – CSI decisions are prompted by an assessment of what that target
audience values (Favis interview). In this view, the decisions of a whimsical
chair are not simply impulses but assessments of what the audience
important to the chair values. Given Pick ’n Pay’s assiduous attempts to
demonstrate its friendliness to consumers, its chairman’s ‘whim’ may be an
attempt to appeal to the average shopper rather than the political scientist
or development professional. Other decision-makers may be motivated by a
desire to win approval from people of a similar background and social status
or of politicians whose goodwill is assumed to be necessary. There is nothing
arbitrary about this – decisions are a product of social networks, cultural
backgrounds and strategic calculations. Finally, since there is little consensus
in South Africa on which interventions work and which do not, we have
no way of demonstrating that a CSI decision taken as a result of a chance
conversation at a cocktail reception is any less able to produce development
than one taken by a sociologist turned business executive. This analysis
illustrates the importance of diversity in approaches rather than an attempt
to shoehorn CSI into a single, ‘professional’ paradigm.

Free
dow
nloa
d fr
om w
ww
.hsr
cpre
ss.a
c.za
192 giving and solidarity
Listening to beneficiaries?
Implicit in the notion of more professional CSI is often the idea that
companies should work with those to whom they give, rather than taking
decisions unilaterally. Whether firms are writing out cheques or engaging
in longer-term projects, they need to ensure, it is argued, that those to whom
they are giving want that which is given. But some interviewees pointed to
limits to consultation: ‘How do you prevent misidentification of community
needs? If you rely on people rooted in the community, they could become
a powerful clique and block you’ (Maphai interview); ‘We also don’t just
accept what communities want – we open them to new possibilities’ (Vukuza
interview). But consultation has become orthodoxy among practitioners and
analysts: ‘By not simply writing cheques, but becoming involved in projects,
companies avoid just giving to a shacklord – some form of community
involvement is necessary’ (Rumney interview). There is, therefore, much
talk of working ‘with communities’. Mining companies who give priority
to the areas in which they operate tend to stress this particularly. But they
are not alone in talking of ‘communities’ as identifiable stakeholders in
development. This raises two problems. One is how serious corporates are
about consultation; the other is whether it is possible to achieve effective
consultation.
On the first score, there are, as noted, doubts about the degree to
which companies really do work with beneficiary partners. Some clearly do
but, it is argued, they remain a small minority. It may be significant that CSI
foundations rarely, if ever, include as trustees people who are not employees
of the company. Nor, it seems, do most have institutionalised mechanisms
for consultation. In many cases, the fact that someone has asked for money
is presumably deemed sufficient to demonstrate a perceived need among
beneficiaries.
Where companies do seem to consult ‘communities’ or ‘stakeholders’,
the problem is how to determine whether those with whom they engage
do speak for beneficiaries. This is difficult enough for development
Free
dow
nloa
d fr
om w
ww
.hsr
cpre
ss.a
c.za
Corporate giving in south afriCa 193
professionals (Friedman 1993), let alone for CSI officials inexperienced
in social dynamics. Where interviewees acknowledged the problem, two
responses were offered. One is to commission the expertise of social
researchers. As a result, ‘we have never had a problem with people getting
something they don’t want’ (Maphai interview). The other, specific to
mining companies, is to take seriously the perspectives of local mine
personnel: ‘Business people are also part of the community in which they
operate’ (Godsell interview). A variant – in companies not similarly rooted
in a small geographic area – is a move to greater staff choice in CSI. The
Charities Aid Foundation runs a ‘give as you earn’ project in which staff
give to an organisation of their choice, often actively participating in where
the money goes, via field trips. Priorities which emerged during surveys
among corporates are: HIV/AIDS, particularly AIDS orphans; the elderly;
children; disability; and animal welfare. This can be seen as an attempt
to identify need by relying on employees’ understanding of the society in
which they live. A practitioner warns, however: ‘Giving which involves staff
as champions is often not so popular at a time when the company is doing
badly and retrenchments are occurring; staff begin to question the validity
of giving to a community when their jobs are being threatened’ (Mahuma
interview). Also, devolving to staff the power to set CSI agendas (albeit to
a limited extent) by identifying priorities would seem to erode the trend
towards professionalisation since staff members are, of course, not CSI
professionals.
Relying on staff to identify priorities is open to two other objections.
Firstly, South Africa is a divided society and identification of needs may
differ depending on the identifier’s race – deciding whose needs take
precedence would require a difficult balancing act. Secondly, the poor do
not work for corporates – indeed, most are unemployed. There is therefore
no guarantee that company employees know anything more about their
preferences than CSI officers do. The only empirical guide we have suggests
that companies that do seek partnerships may be less connected than they
think. The survey commissioned for this study found little recognition at the

Free
dow
nloa
d fr
om w
ww
.hsr
cpre
ss.a
c.za
194 giving and solidarity
grass roots of business as a contributor to development (Everatt & Solanki
2005). Whether partnerships between business and the beneficiaries of
development are possible is open to debate; but it is clear that, if partnerships
are possible, they do not yet exist.
A subset of the business–stakeholder arrangement is the relationship
between businesses and NGOs. While businesses do work with NGOs,
particularly those that deliver services as opposed to advocacy groups, a
degree of resentment is evident. Some interviewees suggested that NGOs
were unaccountable and ought to subject themselves to the accountability
they expected from business (Godsell interview). This perception that NGOs
hold business to standards to which they do not have to adhere is hard to
understand: many NGOs which solicit business funding are subject to legal
accountability since they are often non-profit companies or trusts which
must account for the funds. What is clear is that the relationship between CSI
practitioners and NGOs is complicated, involving conflict and cooperation.
‘Business and NGO have very different world views’ (Hollesen interview).
What’s hot, what’s not: giving priorities
Despite the lack of CSI trends in the responses to the JSE questions, there
seems to be a convergence on ‘fashionable projects’. Education has tended
to take the biggest slice and not only because of tax concessions, since much
funding goes to projects for which concessions are not available. According
to the South Africa Foundation (2004) study, education and training do
continue to dominate (see TABlE 5.1). One interviewee complained of ‘too
narrow a focus on education’ (Saldanha interview). Spending on HIV/AIDS
is growing, partly the result of a perceived inadequacy of government action
and its impact on productivity and the survival of companies. Environmental
concerns are also moving up the agenda – witness the amalgamation of the
Business Council for Sustainable Development into the NBI. In the context of
high unemployment, job creation and entrepreneurial development are seen

Free
dow
nloa
d fr
om w
ww
.hsr
cpre
ss.a
c.za
Corporate giving in south afriCa 195
as vital. Business linkages between large corporates and SMEs are seen as an
important route to tackling this challenge (SBP 2003)
Trialogue also finds that education dominated priorities in 2004
although, because it separates education and training, it finds that only
36 per cent of CSI budgets went to education (and another 10 per cent
to training). This is still way ahead of health (12%), social development
(12%) and ‘job creation and small business development’ (10%) (Trialogue
2004: 85). Trialogue also finds that, over the longer term, the emphasis on
education is declining sharply – it comprised 66 per cent in 1991. Health
is the rising funding target, an obvious response to the HIV/AIDS epidemic;
it accounted for 13 per cent in 2002 compared to 9 per cent in 2001. An
estimated 60 per cent of health spending is allocated to HIV/AIDS, or nearly
8 per cent of all CSI spending. But Trialogue’s most recent calculations
suggest a more uneven pattern for education which increased as a priority
in 2003 compared to 2002, and then declined in 2004. Health, it finds,
rose in priority in 2003 and 2004 (Trialogue 2004: 85). These broad trends
are supported by an examination of the sustainability reports of the top 100
Area of investment R (million)
Education and training 6.95
Small business development 5.00
Welfare and benevolent agencies 3.20
Health 2.20
Arts, music and drama 1.90
ngos (research, policy or publishing) 1.60
Environment or conservation 0.80
Other 2.30
Total social investment (excluding sport) 23.95
Table 5.1 Average CSI budgets of 25 companies
Source: South Africa Foundation 2004:5

Free
dow
nloa
d fr
om w
ww
.hsr
cpre
ss.a
c.za
196 giving and solidarity
companies, which finds that education continues to occupy first place while
HIV/AIDS is a growing focus.
Emphasis falls heavily on development projects rather than attempts
to influence public policy. While in the late 1970s, 1980s and early 1990s
corporates funded the Consultative Business Movement and the Urban
Foundation, which sought to promote policy change, this waned with the
end of apartheid. AngloGold’s decision to fund political parties, which was
followed by some other corporates, indicates a revived interest in the political
environment but, while it received much publicity, only a few corporates
followed suit. Others concluded that the intervention was too risky and too
likely to offend parties which are not funded (Maphai interview). In general,
business has shifted in the post-apartheid period from a concern to be seen
to be pursuing change to a desire to show that it is fitting into the new
political reality. Potentially offending government by supporting political
activism is not consistent with this. And, as noted, the arts and intellectual
activity are low priorities: ‘Once a middle class has been built through
education and employment, one can begin to think about funding art. There
needs to be a hierarchy of needs in social giving’ (Shongwe interview).
There is no evidence, however, that the shifts in funding patterns
are a result of professionalisation. They seem more to reflect changes in the
climate of opinion and business’s response to them. This, an interviewee
worries, has costs: ‘The problem is that corporates keep on changing
the focus of their giving and projects and programmes are suddenly left
destitute’ (Shongwe interview).
Conclusion
The most important finding of this study is that the current stress on CSI
professionalisation is, in an important sense, inappropriate. Certainly,
professionalisation has brought significant advances in CSI thinking. The
insistence that decisions ought to be seriously considered and accountable;

Free
dow
nloa
d fr
om w
ww
.hsr
cpre
ss.a
c.za
Corporate giving in south afriCa 197
that CSI ought to be governed by principles such as the need for clear and
coherent procedures and criteria; that there should be broader participation
in decisions; and that it should not be used to gain personal advantage
(by using shareholder funds to support something in which the relevant
executive has a personal stake) or to curry favour with politicians in the
hope of special treatment, establish important principles to which any CSI
vehicle ought to account. It may also have ensured more rigorous scrutiny
of recipients and their books, ensuring that money is spent on the intended
purpose. But it is open to question whether ‘professionalisation’ is the
appropriate term for these changes. The idea that CSI should be more
accountable and that people who are responsible for it ought to consider
carefully their reasons for giving is a plea for higher ethical standards,
including the duty to take seriously the disbursement of other people’s
money. It could be argued that calling this ‘professionalisation’ does no great
harm if it serves to make CSI more considered and accountable. However,
nomenclature does matter and the term ‘professionalisation’ can all too easily
be understood as the insistence that there is a superior technique available
and that all can agree on what it is. It is this which is inappropriate.
The reason for this judgement is not simply that there is no clear
way of distinguishing between ‘worse’ or ‘better’ giving. It is also that the
pressure for professionalisation may be foreclosing important options and
preventing companies from spending their money on some important
priorities. Of course, ’whim’ also does this, particularly when, as it often
does, it consists of acting on conventional wisdoms among senior business
people. But the fact that ‘professionalism’ presents itself as a higher order
of decision-making may make its conformities more difficult to dislodge. It
was noted earlier that current trends seem to be affording priority to material
development rather than intangibles such as the arts, advocacy or policy
formulation. But it may be precisely to these latter activities that CSI resources
are best directed. Firstly, material development is arguably best undertaken
by governments which are meant to command the capacities to deliver
on a far greater scale than anyone funded by CSI. If governments do not

Free
dow
nloa
d fr
om w
ww
.hsr
cpre
ss.a
c.za
198 giving and solidarity
have that capacity, it seems more appropriate to encourage its development
than to substitute for it. Secondly, to concede the funding of creative and
intellectual activity and of political advocacy to governments (by excluding
it from CSI budgets) is to stultify it or risk eliminating it altogether given
that the government is unlikely to support alternatives to its perspective. If
a workable democracy must consist both of freedom and effective material
provision, then it is precisely in the first category that a multiple of private
choices is needed. The second can, in principle, be assigned to a democratic
government acting on expressed public preferences.
Professionalisation can also encourage the adoption of uniform
approaches on the grounds that they are ‘professional.’ As some interviewees
suggested, fad could become even further elevated by demands for ‘state of
the art’ approaches. At present, this seems to be accompanied by an attempt
by the government to ensure that CSI is aligned with its policy. It could be
argued that aligning CSI with priorities identified by government – including
the local variety through IDPs – means that giving priorities are determined
by elected representatives rather than by unaccountable businesses (Vukuza
interview). But CSI is private giving and it should arguably be no more
bound by government priorities than NGOs should be forced to do what the
government tells them to do. While government spending should seek to
be consistent with goals endorsed by political majorities, corporate giving
should be governed by principles such as innovation and diversity if it
is to play its appropriate role, which is to focus on some of the priorities
which government cannot and will not fund. This is not a libertarian
argument which implies that business knows better than government. If
governments wish to set development priorities and raise corporate funds
to support them, they may do this by raising taxes. It is contradictory to give
companies discretion to spend CSI and then demand to determine how that
discretion should be exercised as, for example, in the requirement that CSI be
consistent with local IDPs. If there is an argument for CSI – and not everyone
agrees that there is (Rumney interview) – it lies precisely in the notion
that private discretion is needed so that important social activities which

Free
dow
nloa
d fr
om w
ww
.hsr
cpre
ss.a
c.za
Corporate giving in south afriCa 199
would otherwise be ignored receive funding. Directing CSI into channels
identified by government defeats that purpose and narrows the range of
CSI. Conformity with government wishes is not a necessary consequence
of professionalisation. Competent professionals may lead it in precisely
the opposite direction. But the risk that many companies will interpret
professionalisation as a rationale for uniform approaches which fit neatly into
government intentions is real.
Even if government was not seeking to direct CSI, the trend towards
uniformity would impair effectiveness. As we argue elsewhere (Friedman et
al. 2005), innovation, not ‘professionalism’, seems to be the most desirable
goal for a CSI programme for two broad reasons. First, as several interviewees
suggested, greater development effectiveness is far more likely to emerge
by trial and error, by attempting new approaches and learning from the
attempt to implement them, than by the adoption of development fashions.
Because CSI is well entrenched in some companies, professionalisation
can also reinforce bureaucratic stodginess – initiatives will be funded
simply because the company has been doing this for years. Second, private
companies can afford to experiment in a way in which public institutions
cannot and are thus ideally placed to try new approaches which may enrich
development practice. The more CSI produces new ideas and projects, and
the more it penetrates the nooks and crannies where governments do not go,
the more it will serve society and the goals of the businesses who initiate it.
The enthusiasm for professionalisation, with the government’s increasing
interest in directing where CSI should go, risks imposing a uniformity on CSI
spending which is likely to impede progress towards a workable democratic
future because it may divert resources away from vital activities for which CSI
may be the most likely source of support. Diversity in CSI priorities must be
maintained if corporate giving is to fill gaps left by other funding sources.
As noted earlier, this does not mean that unbridled whim should
dictate CSI priorities. The argument presented here does not disregard the
contribution which competent CSI professionals can make to development.
Nor does it argue against taking CSI more seriously. It merely insists

Free
dow
nloa
d fr
om w
ww
.hsr
cpre
ss.a
c.za
200 giving and solidarity
that we ought to judge CSI by whether it brings something new to the
society’s development efforts, not by whether it fits into a mould (however
sophisticated that mould may be). Just as we rejected total relativism in
assessing CSI, so we do not argue that an effective corporate contribution to
society’s needs requires no scrutiny of CSI decisions or attempts to improve
CSI decision-making. Both are important if CSI is to become more effective.
The demand for more accountable CSI (which may well be what many
advocates of ‘professionalisation’ are endorsing) is appropriate because it
forces practitioners to defend their decisions. This is an important principle
for anyone disbursing money on behalf of others, but is also a likely route
to greater effectiveness because decision-makers who are forced to account
have much greater incentives for success and disincentives for failure.
Greater scrutiny of how and why companies take CSI decisions is vital. Where
companies are listed on the JSE, they have no more right to place their CSI
beyond scrutiny than any of their other activities. Companies which are non-
listed are, like any other institution in society whose activities affect others,
also obliged to account for their actions if for no other reason than that their
stakeholders are entitled to know whether they are dealing with a firm whose
social investment they find appropriate.
It is precisely the assumption that CSI should be scrutinised and
evaluated which gave birth to initiatives such as the Mail & Guardian CSI
awards, and which underlies the inclusion of CSI reporting in King II
requirements and those of the JSE Sustainability Index. The challenge,
however, is to encourage scrutiny and informed public debate on what
companies do with their CSI funds without imposing uniformity. And, since
awards and indices can influence corporate behaviour just as government
prescription can, uniformity is a real danger.
There is no handy antidote, except to encourage a way of thinking
about CSI which recognises that the public has a right to know about and
debate CSI, but that diverse approaches are essential. Demands that all
companies are transparent about their CSI may be appropriate – demands
Free
dow
nloa
d fr
om w
ww
.hsr
cpre
ss.a
c.za
Corporate giving in south afriCa 201
that they pursue particular approaches are likely to cost the society far more
than the presumed benefits.
There is an important policy pointer here for the government as well
as for business. While the temptation to inspan CSI behind government
development goals must be great, it is counterproductive, not only to society
but also to government.
Firstly, as argued above, it will deter the innovation which can
ultimately assist government efforts as much as those of private development
practitioners. Encouraging diversity in CSI is likely to lead to better
development and thus to enhance the progress which the government
desires.
Secondly and perhaps less obviously, CSI can fund essential parts of
social life which governments cannot or will not fund. Thus, for example,
even if the arts are not recognised as a major source of development, a
society in which the arts are marginalised is unlikely to be able to meet its
development challenges. Since it may be an inappropriate use of resources
for a government facing great development challenges to pay for dance
workshops for township youth, let alone opera and ballet, CSI can fill the
gap, ensuring that a vital social activity continues without straining the
fiscus. And, as several interviewees suggested, the funding of new ideas and
information has even more obvious development effects and may be an even
more appropriate funding target for business, as opposed to government,
given the need for intellectual activity not to be beholden to the political
authorities. And even advocacy activities, which governments are likely to
find most threatening, are likely to contribute to more effective government
by identifying problems and pointing to solutions.
CSI is, therefore, most likely to fulfil its social role if it is seen as
the vehicle not of a spurious ‘professionalism’, nor as a ready source of
government development funds outside the tax system, but as a source of
innovation and as a means of providing for those social needs which are
essential to society, but which are inappropriate destinations for government

Free
dow
nloa
d fr
om w
ww
.hsr
cpre
ss.a
c.za
202 giving and solidarity
funding. If that view is accepted, the innovation and enterprise which is
increasingly denounced as ‘whim’ may be seen as the key to effective and
developmental CSI, provided that it adheres to the concern for accountability
which is the most important contribution of current CSI thinking.
Companies that do the unusual and the unpopular, but are open about what
they are doing and why they are doing it, are the key to responsible and
developmentally useful CSI.
Notes
1 Email communication, Margie Keeton, 2 March 2005.
2 Comments by Khehla Shubane at meeting of project reference group, 15 July 2003.
3 Email communication, Michael Spicer, 22 February 2005.
4 Email communication, Margie Keeton, 2 March 2005.
5 The extent to which this actually happens cannot be determined from the
available data.
6 Email communication, Margie Keeton, 2 March 2005.
7 A food chainstore gives substantial quantities of food away to the poor but has
never thought to publicise this – or even to regard it as a CSI initiative (Reichardt
interview) .
8 The model has been adopted, among others, by AngloGold Ashanti and ABSA
(Simelane interview).
9 Temkin S, More companies embrace corporate governance, Business Day
14 January 2003.
10 But there is also resistance to the idea that philanthropy should attract tax
concessions (Appelbaum interview).
11 Among the perceived flaws are a concentration on building school buildings
rather than on fully capacitating schools, and not harmonising projects with the
programmes of provincial education authorities. Current Foundation approaches
are influenced by a study of rural education conducted for it (NMF 2005).
12 Greenpeace prevented Shell from disposing of its Brent Spar oil in the North
Sea and caused reputational damage by highlighting the oil company’s failure to
oppose the Nigerian junta’s execution of human rights activist, Ken Saro-Wiwa, in
a part of Nigeria where it had extensive operations.

Free
dow
nloa
d fr
om w
ww
.hsr
cpre
ss.a
c.za
Corporate giving in south afriCa 203
13 Email communication, Brian Whittaker, 17 February 2005.
14 Danby, quoted in E Webster, Firms need to shift thinking to see potential of the
arts, Business Day 7 May 2002.
References
BCCCC (Boston College Centre for Corporate Citizenship) (2003) The voice of corporate
citizenship: Public pressure influences business. Accessed January 2004.
http://www.imakenews.com/cccbc/e_article000116540.cfm,
Bezuidenhout A, Fig D, Hamann R & Omar R (2003) A political economy of corporate
social and environmental responsibility in South Africa. Johannesburg: Sociology of
Work Unit, University of the Witwatersrand
Du Toit C (2001) CSI: A SAGA status report. In The CSI handbook 2001. Cape Town:
Trialogue
Everatt D & Solanki G (2005) A nation of givers: Social giving among South Africans.
The state of social giving in South Africa Project, Report 1, Centre for Civil Society,
University of KwaZulu-Natal
Fig D (2003) Corporate social and environmental responsibility in the South African
food and drink industry. Johannesburg: Sociology of Work Unit, University of the
Witwatersrand
Friedman S (1993) The elusive ‘community’: The dynamics of negotiated urban
development. Johannesburg: Centre for Policy Studies
Friedman S, Hudson J & Mackay S (2005) Like chalk, like cheese? Professionalism
and whim in corporate giving at AngloGold Ashanti and Pick ’n Pay. Social Giving
Project, Centre for Civil Society, Report No. 2
Godsell B, Bernstein A & Berger P (1998) Introduction. In Business and democracy:
Cohabitation or contradiction? London: Pinter Publishers
Hamann R & Bezuidenhout A (2003) Case study of corporate social responsibility
in the South African mining sector. A case study for a project coordinated by the
United Nations Research Institute for Social Development and the Sociology of
Work Unit, University of the Witwatersrand
Institute of Directors (2002) King Report on Corporate Governance for South Africa.
Johannesburg: IOD in Southern Africa

Free
dow
nloa
d fr
om w
ww
.hsr
cpre
ss.a
c.za
204 giving and solidarity
Logan D & Tuffrey M (2000) Companies in communities, assessing the impact: Using the
London Benchmarking Group model to assess how the community and company benefit
from corporate community involvement. London: Charities Aid Foundation
NBI (National Business Initiative) (2004) ‘Johannesburg +2’: Reflection on the role of
business in sustainable development. NBI Quick Brief 7 September
NMF (Nelson Mandela Foundation) (2005) Emerging voices: A report on education in
South African rural communities. Cape Town: HSRC Press
SBP (Small Business Project) (2003) Business growing business: SBP’s business linkages
programme 1998–2003. Johannesburg: Small Business Project
Schlemmer L (1999) Corporate business in a wider role. Johannesburg: Centre for
Development and Enterprise
South Africa Foundation (2004) Business in change. Occasional paper 2/2004, SA
Foundation
Trialogue (2001) The CSI handbook 2001. Cape Town: Trialogue
Trialogue (2003) The CSI handbook (Sixth edition). Cape Town: Trialogue
Trialogue (2004) The CSI handbook (Seventh edition). Cape Town: Trialogue
UNDP (United Nations Development Program) (2004) Unleashing entrepreneurship:
Making business work for the poor. New York: United Nations Development Program
UNISA (University of South Africa) (2005) Corporate social investment brochure.
Tshwane: UNISA, Centre for Corporate Citizenship
Ward H, Borregaard N & Kapelus P (2002) Corporate citizenship: Revisiting the
relationship between business, good governance and sustainable development. WSSD
Briefing Paper, International Institute for Environment and Development, London
Interviews
Abedian, Iraj, then Group Chief Economist, Standard Bank, 3 October 2003
Appelbaum, Hylton, Liberty Life Foundation, 28 October 2003
Coovadia, Cas, Banking Council, 13 January 2004
CSI analyst, 5 April 2004
CSI practitioner, October 2003
Danby, Nicola, Executive Director, Business and Arts South Africa, 10 March 2004
Favis, Merle, Grantmaking Consultant, 5 October 2003
Fig, David, Social Researcher, 9 July 2003
Fine, Alan, AngloGold Ashanti, 14 October 2003, 21 October 2003
Godsell, Bobby, Executive Chair, AngloGold Ashanti, 11 March 2004

Free
dow
nloa
d fr
om w
ww
.hsr
cpre
ss.a
c.za
Corporate giving in south afriCa 205
Hollesen, Paul, Social Policy Manager, AngloGold Ashanti, 18 March 2004
Kapelus, Paul, Africa Institute of Corporate Citizenship, 24 November 2003
Keeton, Gavin, Anglo American Corporation, 4 December 2003
Keeton, Margie, Chief Executive, Tshikululu Social Investments, 3 June 2004
Landman, JP, Investment Analyst, 26 April 2004
Mahuma, Teboho, AVMIN, 31 May 2004
Maphai, Vincent, then Corporate Affairs Director, South African Breweries, now
Chair, BHP Billiton South Africa, 29 March 2004
Mollo, Joe, then BHP Billiton, 5 April 2004
Naidoo, Ricky, Director Social Strategy, Standard Bank, 15 April 2004
Reichardt, Markus, Director, Sustainability Research and Intelligence, 1 April 2004,
29 October 2004
Rockey, Nick, Trialogue, 10 February 2004
Rumney, Reg, BusinessMap Foundation, 2 October 2003
Saldanha, Eugene, then Charities Aid Foundation, 3 December 2003
Schlemmer, Lawrence, Helen Suzman Foundation, 27 January 2004
Shongwe, Isaac, Chair, Letsema Foundation, Letsema Consulting and BusinessMap
Foundation, 17 November 2003
Simelane, Yedwa, Chair, AngloGold Fund, 18 March 2004
Slabbert, Frederick van Zyl, Independent Analyst, 3 February 2004
Spicer, Michael, then Anglo American Corporation, 20 October 2004
Taylor, Nick, Executive Director, Joint Education Trust, 19 March 2004
Tucker, Bob, CEO, Banking Council, 4 December 2003
van Heerden, Neil, South Africa Foundation, 3 December 2004
Vukuza, Nolitha, South African Breweries, 10 March 2004
Whittaker, Brian, CEO, Business Trust, 5 November 2003

Free
dow
nloa
d fr
om w
ww
.hsr
cpre
ss.a
c.za
Free
dow
nloa
d fr
om w
ww
.hsr
cpre
ss.a
c.za
207
The Truism ThaT business decision-makers are human beings, with
histories, identities and beliefs, would seem to be obvious. And yet, it is
often ignored. On both the left and right, analysis often tends to assume
that business decision-making is motivated purely by considerations such
as ‘class interest’ or ‘maximising marginal utility’. The logic of operating a
profit-making business, in this view, inevitably dictates that decision-making
will instrumentally weigh costs and benefits in an attempt to produce the
best possible outcome for the business – or for business in general. This is
dictated, it is assumed, by the logic of the market (for those sympathetic to
business) or the imperative of class interest (for those who are not). Whatever
identities people bring with them into their business decision-maker role,
their decisions must, it is assumed, transcend this background if their
business is to succeed or their dominance of economy and society is to
endure (Hayek 1952; Marx 1964). In other words, the logic of their position
forces them to make instrumental decisions regardless of their race, religion
or political preferences. Clearly, if this is true of all business decisions,
it must apply to corporate social investment (CSI) as well. From the left
perspective, CSI is thus assumed to be an instrumental means of ensuring
6
The colour of giving: racial identity and corporate
social investment
Steven Friedman, Judi Hudson and Shaun Mackay

Free
dow
nloa
d fr
om w
ww
.hsr
cpre
ss.a
c.za
208 giving and solidarity
that those who dominate the economy continue to do so. From a mainstream
business perspective, it is understood as an attempt by the company to
maximise its effectiveness in its environment.1
Of course, as many adherents of this view would no doubt
acknowledge, this does not mean that all CSI decisions must be rational
and appropriate. After all, human beings make mistakes. And, if these
errors occur regularly, it may be because they are incompetent, or that they
lack the knowledge to act instrumentally in a way which maximises their
advantage. If all business decisions were based on an accurate assessment
of a company’s strategic needs and appropriate action on them, there would
be no presumed need for business schools to teach executives how to make
effective decisions, and there would not be the pressure to ‘professionalise’
CSI, which is discussed in Chapter 5 of this volume.2 But it does mean that
the logic of operating a business is assumed to compel people to place the
company’s strategic interests ahead of their ‘prejudices’.
There are, however, two problems presented by this approach. First,
it is not at all automatic that this is the way in which economic decisions
are actually taken: pioneering empirical research is, for example, showing
the important role of ‘non-rational’ factors such as intuition and culture in
economic decision-making (Henrich et al. n.d.; Kahneman 2002; Tversky
& Kahneman 1992). If non-instrumental decision-making is a necessary
feature of economic decisions, then the ‘norm’ of a homo economicus able
to decide purely on instrumental grounds is a myth and business success
must be accompanied by a fair degree of decision-making which stems from
intuition or other factors which are not instrumental – such as identity.
Second, even within the conventional view which insists that there
is no possibility of ‘non-rational’ business decisions producing effective
outcomes, if we accept the conventional wisdom which underpins the
‘professionalisation’ approach to South African CSI, then the logic of the
market which punishes ‘irrational’ decision-making does not operate in
relation to CSI since it is widely agreed that corporate giving has been based
on irrational ‘whim’ for decades – and yet the companies whose decisions

Free
dow
nloa
d fr
om w
ww
.hsr
cpre
ss.a
c.za
racial identity and corporate social investment 209
are driven by this ‘whimsy’ remain going concerns. The reason, of course, is
that CSI spending affects a small proportion of company revenues – around
1 per cent of after-tax profit is the sum most frequently mentioned (Naidoo
interview; Mollo interview; Landman interview) – and this is not nearly
enough to threaten the company’s health. Whatever the strategic functions
imputed to CSI by analysts on the left, the fact that it is not an operational
expense and that companies cap the amount they are willing to invest in
social programmes means that there is no necessary relationship between
the effectiveness of CSI spending and the performance of a company.3 The
chances that non-instrumental considerations would influence corporate
giving are, therefore, enhanced by the reality that market discipline does not,
in the main, apply to CSI.
Chapter 5, therefore, discussed the degree to which personal choice or
‘whim’ may shape CSI decision-making. But if we leave the matter there, we
are left only with the ‘chaos’ theory of CSI (Godsell interview) in which a host
of unexplained personal preferences shape the patterns of corporate giving,
leaving us entirely unable to explain why some priorities rather than others
are chosen. It may, however, be possible to assume that personal preferences
play an important role in decisions but to insist also that, to a considerable
degree, they can be explained. People do not make choices in a vacuum – our
decisions are shaped by those who are able to influence us and, therefore,
by our work and social environments. And they are also influenced by our
personal histories and identities. If there is a causal relationship between
particular types of identities and histories on the one hand, and social
giving on the other, we need to unearth it if we are to understand CSI and to
recommend ways of improving its contribution to the society.
In South Africa, race is often assumed to be the most important
social identity (Friedman 2004). This is obviously a product of a past in
which, until 1994, race determined access to status and rights. This means
that, to a considerable extent, personal history and identity are inextricably
linked – people old enough to have grown up under apartheid will have been
shaped by experiences which were determined by their place in the apartheid

Free
dow
nloa
d fr
om w
ww
.hsr
cpre
ss.a
c.za
210 giving and solidarity
racial hierarchy. If, therefore, there is one pervasive identity and history
which shapes corporate giving in this society, we would expect it to be race.
And, if race is indeed important as an influence on CSI behaviour, we should
expect the deracialisation of South African business and the consequent rise
of black-owned companies to promote significant shifts in corporate giving,
making this issue one of great importance to the future of corporate giving
in the country. This chapter examines the proposition that racial identity
plays an important role in shaping CSI behaviour in an attempt to add to our
understanding of possible future CSI trajectories.
The two dimensions of identity giving
There are two ways in which racial identity may shape corporate giving in
this society. First, there may be a causal link between racial ownership of
businesses and CSI patterns. While the pace of black economic empowerment
(BEE) is often criticised, some large companies are now owned by black
people. The extent to which we can discern different social investment
patterns in black- and white-owned companies is a lively and, inevitably,
highly politically charged point of discussion. On one extreme is the
frequently heard view that black-owned companies do not invest in social
causes. On the other, the claim that black business people, given that they
will have personally experienced apartheid (and are in many cases graduates
of the anti-apartheid ‘struggle’), should be expected to be particularly open
to addressing social needs4 – and particularly equipped to know what these
needs are.
Second, the role of black CSI practitioners in white-owned companies
may be different to that of their white colleagues. While people who dispense
corporate funds do not, of course, have unlimited latitude to decide on
priorities, they are presumably appointed to bring their perspective to the
task of choosing social priorities. If there is indeed a difference between a
‘black’ and a ‘white’ approach to CSI, and white-owned companies are willing
to listen to their black CSI specialists, then we would expect the racial identity

Free
dow
nloa
d fr
om w
ww
.hsr
cpre
ss.a
c.za
racial identity and corporate social investment 211
of the CSI practitioner to influence patterns of giving, even if whites own the
company. The extent to which there are racial differences in CSI decision-
making and practice and, if there are, the extent to which they influence
corporate spending decisions, is an important determinant of South African
corporate giving patterns.
The beneficiary as giver: racial ownership and corporate social spending
Do black-owned businesses respond differently to CSI? A common wisdom
has it that new black-owned corporates give little or nothing to social causes
because they see themselves as disadvantaged recipients of development
resources, not as their disbursers. This claim is directed specifically at
formal businesses which have become black owned as a result of the BEE
project of the past decade. Indeed, one interviewee suggests that BEE seems
to offer something of an exemption from CSI responsibilities: in some cases,
it was claimed, a joint venture between white and black business served as a
shield against corporate social responsibility in all its forms, ranging from
fair labour practices to CSI (CSI analyst interview). What evidence we have,
however, suggests that smaller, locally-based black businesses may also
not be seen as substantial givers. The survey commissioned for the study
of social giving suggests that black-owned local businesses are seen as a
potential source of development funds, but far less than their equivalents
in other racial groups. It asked respondents who they would approach if
they wanted funding to start a community project. The three main answers
– at 13 per cent each – were local business, local government and a bank
or other financial institution, followed by large corporations and religious
institutions at 10 per cent. However, only 10 per cent of African respondents
said they would approach a local business for funds, compared with 22 per
cent of white, 29 per cent of coloured and 30 per cent of Indian respondents.
White respondents were most likely to approach a large corporation (18%),
Free
dow
nloa
d fr
om w
ww
.hsr
cpre
ss.a
c.za
212 giving and solidarity
twice as many as respondents of other races (Everatt & Solanki 2005: 31).
Since, despite change over the past ten years, most South Africans continue
to live in areas peopled predominantly by members of their racial group, it
seems reasonable to assume that black-owned local businesses are less likely
to be seen as a potential source of help in their neighbourhoods.
Some of our interviewees, however, insisted that reality is more
complicated than the image of a black business community unwilling or
unable to give might suggest. First, it is suggested, there are clear cases in
which black corporates do give – Armgold chair Patrice Motsepe’s support
for football development is cited as one example5 (Mahuma interview).
One key black business figure who does seem set on promoting a socially
conscious image and stressing CSI is Shanduka Group chair (and former
ANC Secretary General) Cyril Ramaphosa. Last year, he seemed to pioneer
a new departure on CSI by black business by launching the Shanduka
Foundation, a CSI trust which, he said, aimed to spend R100 million
over ten years in CSI programmes such as skills and human resource
development. This appears to be the first dedicated CSI trust established
by a black-owned business and is consistent with his repeatedly expressed
public position that BEE companies ought to accept a social responsibility.
Indeed, he seems to see CSI partly as a means of demonstrating that BEE can
be socially conscious.6 While Ramaphosa does not seem to have attracted
the same attention among CSI practitioners as some other key black business
figures, he does appear to be projecting a far more overtly socially concerned
profile than other black business leaders – and devoting resources to social
investment.
One interviewee also reported that: ‘There does appear to be an
upward trend in giving from BEE companies. And the financial charter
will ensure that even more begin to give’ (Naidoo interview). Second, some
insist that ‘high-profile black business people give as individuals’, reflecting
a financial reality in which their companies are still vulnerable but their
personal wealth allows them to contribute. ‘They know that they will be held

Free
dow
nloa
d fr
om w
ww
.hsr
cpre
ss.a
c.za
racial identity and corporate social investment 213
to account if only a small group of black people prosper while others remain
in poverty. So they do see a need to give as individuals.’7 And an interviewee
questioned the assumption that black businesses should be singled out as
non-givers: ‘There are many examples of white corporates who don’t give
either’ (Rockey interview).
Nevertheless, there is a widespread view that social giving is not
an activity in which new black-owned companies significantly engage:
several interviewees insisted that black companies are not giving as much
as they might. Certainly, of the 145 companies that support the Business
Trust (BT), only a few are black: ‘A problem with the Trust is that there are
not that many significant black empowerment companies in it, or at least
there were not when it started’ (Sikhakhane interview, 22 September 2004).
Black companies’ membership of the National Business Initiative (NBI), a
vehicle for business social involvement, is also low – NBI hopes to target
black businesses in its membership drive. While this may be explained by
the fact that NBI was initially a white business initiative and black business
people may therefore not feel comfortable in it, the BT was a joint initiative by
white and black business people, whose participation is considered essential
to the venture’s success: ‘Without the involvement of [black businessman]
Saki Macozoma the first Business Trust would not have worked. Without the
enthusiastic buy-in of people such as Patrice Motsepe and Tokyo Sexwale, the
second will hit hard times’ (Spicer interview). This insight reflects, of course,
a wider reality – if business leadership is likely to become increasingly black,
then black business attitudes will increasingly shape future CSI patterns.
But initiatives with a substantial white business presence may be
unreliable indicators of black business attitudes – black owners may stay
away from them because they are seen as white business projects rather than
because they are reluctant to contribute to social causes. While there is wide
agreement that black-owned businesses are not giving much, views differ on
the reasons. One frequent explanation is that the BEE companies are simply
not well-resourced enough yet to give in great quantity – interviewees noted

Free
dow
nloa
d fr
om w
ww
.hsr
cpre
ss.a
c.za
214 giving and solidarity
that ‘many BEE companies have insufficient resources to give’ (Sikhakhane
interview, 25 August 2003). Others spoke about the ‘huge pressures on
BEE companies to succeed’: ‘they are the new kids on the block and have to
demonstrate their financial prowess’; ‘they don’t have deep pockets’ (Kapelus
interview); ‘are any paying dividends?’ (G Keeton interview). In the words of
another, ‘Companies need to establish themselves first before turning their
attention to CSI and related issues. Black companies have not reached this
point yet’ (Spicer interview). ‘Oppenheimer showed that once you have a level
of largesse you can afford philanthropy’ (Slabbert interview).
A black CSI practitioner notes that many people believe that all BEE
companies are making an enormous amount of money, but many were
leveraged by borrowing large amounts of capital from banks or foreign
investors. Many have failed to even realise a profit and, even if they do make
one, they have to pay their debts to investors and their taxes. So they are
often left with little to maintain their own lifestyles, let alone give to others.
Most giving by companies is based on a percentage of profits – and many
BEE companies are not making any profits yet (Mahuma interview). The
notion that levels of giving improve as levels of affluence increase may receive
indirect support from the survey noted earlier which finds that those with
a high socio-economic status are more likely to approach local businesses
(Everatt & Solanki 2005: 30). This is fairly tenuous evidence but does
suggest that local business philanthropy is most active in areas where there
is least need because the better off the neighbourhood – and, presumably,
the businesses in it – the more active the role in giving. Since black-owned
businesses are usually in a more parlous state than their white-owned
counterparts, this would inhibit CSI by black-owned companies.
Others, however, insisted or implied that BEE corporates could give
more than they did: ‘It does not matter how little a BEE business is making,
part of this profit can be ploughed back into the community through giving.
Many BEE people still have “short arms” that cannot seem to reach into their
pockets to give. Even many black professionals who can afford to give don’t’
(Shongwe interview). ‘Far too few BEE companies are giving’ (Mahuma

Free
dow
nloa
d fr
om w
ww
.hsr
cpre
ss.a
c.za
racial identity and corporate social investment 215
interview). An interviewee complained that BEE companies ‘are too busy
pursuing wealth’ (Maxwell-Stuart interview). Yet another questioned the
claim that black business people are giving as individuals: ‘What proof
is there?’ (Schlemmer interview). And some insist that this is indeed the
consequence of an approach which suggests that BEE companies are exempt:
many harbour a feeling that ‘this is now the time for their place in the sun.
They’ve fought hard and now can just get on with business’ (Middleton
interview). Others said black businesses have ‘no historical memory of
giving, which white companies have’ (Kapelus interview).
One fragmentary piece of evidence suggests that black-owned
businesses’ CSI patterns may be influenced by the complex workings
of identities rather than their size and profitability. Some have donated
to Synergos, a New York-based centre of international corporate social
investment which raises money from businesses throughout the world
and is similarly engaged in funding globally. The donations were made
at a gathering called by the now defunct Southern African Grantmakers’
Association (SAGA) and a visiting Synergos delegation to solicit contributions
(CSI practitioner interview). The donations to Synergos are social investment.
But it is, of course, of interest that local black business people should find
an international fund (which does support South African projects but is
involved in many other countries too) a more appropriate CSI vehicle than
local causes. Since Synergos is supported by many prominent businesses
and entrepreneurs around the globe, the logical conclusion is that black
businesses who donate to it value the status attached to giving to a fund
supported by leading companies in the affluent north more than seeking to
raise their credibility at home, suggesting that winning the esteem of the
international business ‘club’ is a greater priority than gaining the respect
and affection of local constituencies. While there are no doubt many white
business people who feel the same, it is an interesting phenomenon in the
light of suggestions that black business people are likely to feel more ‘rooted’
here than their white counterparts. Since black business leaders may be
concerned to dispel prejudices by showing that they are full members of the

Free
dow
nloa
d fr
om w
ww
.hsr
cpre
ss.a
c.za
216 giving and solidarity
international business community, supporting an international fund may
well be a more ‘logical’ identity-based response than giving to local causes.
Another partial explanation, and an important factor in explaining
motivation to spend on society more generally, is that black business people
arguably have less reason to demonstrate their credibility than white-owned
companies for the obvious reason that they cannot be accused of benefiting
from apartheid. White businesses’ CSI is a consequence at least partly of a
desire to show that white businesses do care about apartheid’s victims. It
is partly a response to codes of conduct and calls by black leaders to show
concern for the majority, which would be deeply ingrained in the thinking of
white business people but not in their black counterparts. Business people
who have no need to demonstrate local credibility are obviously less likely to
see CSI as a means to do this.
If BEE companies’ limited involvement in CSI is a consequence
of a world view which insists that black owners should, because of their
historical disadvantage, be exempt from CSI, it is likely to face increasing
pressure since there was no support among interviewees for the notion that
black-owned companies should not give. ‘CSI is a mindset thing and people
need to be brought on board this mindset of giving. A mindset thus needs
to be cultivated which encourages black business to give. Black business
people need to endow chairs at the universities, for instance’ (Shongwe
interview). ‘There is definitely a need for BEE firms to plough back into
the broad South African community as they begin to make profits. Black
empowerment companies need to accept the same obligations to give as
their white counterparts’ (Naidoo interview). One interviewee cites the
history of sections of Afrikaans business which also emerged from relative
marginalisation as a beneficiary of deliberate public policies:
One per cent is not a great deal to give. The principle is that all
corporates should be giving – whether BEE or not. Anton Rupert of
Rembrandt gave 2 per cent of after-tax profits from day one. The
Rembrandt Group has over the years sponsored arts and museums.

Free
dow
nloa
d fr
om w
ww
.hsr
cpre
ss.a
c.za
racial identity and corporate social investment 217
Such CSI should be expected of all groups. All of the emerging tycoons
can afford to give at least something. (Landman interview)
Indeed, some black business people argued that being fortunate enough to
participate in a BEE deal imposed a responsibility to give, not an exemption:
‘We need to acknowledge that for a good measure of the time, a BEE deal
means that someone has given you a break somehow and so you need to give
back. We need to cultivate a culture of giving among this emergent group
of business people’ (Shongwe interview). Another added: ‘Resources have
been devoted to BEE policies, therefore they have obligations’ (Sikhakhane
interview, 25 August 2003). He stressed the point made earlier – that social
inequality could come to haunt black business people: ‘The black elite run
the risk of being targeted ten years down the line by those who have not been
as fortunate. Therefore there is a measure of self-interest for them to give’
(Sikhakhane interview, 25 August 2003). An explicitly identity-based reason
is also offered for enhanced black CSI – the need to foster black self-reliance:
‘For black people there is also the challenge of growing our own people and
communities without always relying on external [read white or overseas]
sources’ (Mahuma interview).
Another potential pressure for black-owned companies to enhance
their CSI activities is that the mining charter, for example, calls on all
companies, regardless of the race of the owners, to give. ‘The charters will
hopefully push black people (and whites) who hid behind all kinds of reasons
for not giving, into giving’ (Mahuma interview). This climate of opinion does
seem to be influencing black business thinking. Our interviews did uncover
evidence of a shift in thinking in black empowerment companies – business
leaders who once insisted that black businesses build their capacity before
engaging in CSI are now acknowledging that they must contribute to society
or risk becoming targets of popular ire later. And, while there is little
evidence yet of this translating into increased giving, there are suggestions
that this may be in the offing too – Armgold, for example, will now be giving
through a structured department (Mahuma interview).

Free
dow
nloa
d fr
om w
ww
.hsr
cpre
ss.a
c.za
218 giving and solidarity
Reading the signs
What are we to make of these often conflicting perspectives? First, it should
be stressed that the divide between white givers and black skinflints is, as
some interviewees pointed out, a caricature. There are white companies –
indeed entire industries – that give little or nothing: ‘media companies have
particularly poor records’ (Reichardt interview). Information technology
(IT) companies are seen to have done less than they could (see van Heerden
comment in Friedman et al. 2005). The white owners of these companies,
says one analyst, ‘didn’t grow up with the guilt feeling – for want of a better
term – that Anglo would have had, nor any socio-political involvement. So
they just were not interested. Hence, they have this image of arrogant young
white males just out to make money’ (Sikhakhane interview, 22 September
2004). This not only sets the record straight, contradicting simplistic views
about race and generosity. It also raises the possibility that new white-owned
companies may be less inclined to give than the previous generation because
they have less perceived reason to feel guilt about apartheid. If so, in future it
may be newer white-owned companies that abandon interest in CSI, whatever
their black counterparts do. Indeed, an analyst argued that black owners
of IT companies may face more pressure to give than whites – particularly
where they have a history in politics and government, which several do. Thus
former telecommunications director-general Andile Ngcaba has become
chair of IT company Dimension Data: ‘One can expect him to infuse a
different way of thinking into the company. By virtue of where he comes
from and his political connections, even if he does not want to, he will come
under a lot of pressure’ (Sikhakhane interview, 22 September 2004).
One implication of the importance of guilt, however, is that it does
seem plausible that the apartheid past has made CSI seem like a far more
appropriate activity to white than to black business people. While some see
references to guilt as a spur to white corporate giving as ‘a one-dimensional
and simplistic interpretation of a more complex reality’,8 guilt was cited by
Free
dow
nloa
d fr
om w
ww
.hsr
cpre
ss.a
c.za
racial identity and corporate social investment 219
several interviewees as a motive. They noted the view that business benefited
from apartheid and therefore has an obligation to play a developmental role
in post-apartheid South Africa. In the words of one interviewee: ‘In some
areas issues are so in your face that [white] corporates had to get involved’
(Rockey interview). The BT – apparently the largest vehicle of corporate
giving in South Africa – was a ‘concerted, well-organised effort to rectify
the apartheid past’ (Sikhakhane interview, 25 August 2003), ‘an attempt to
show that business is socially aware and a caring partner to government in
meeting South Africa’s development challenges’ (van Heerden interview), by
applying private sector principles and approaches to developmental problems.
Similar initiatives include the NBI and Joint Education Trust. This is, of
course, not a new phenomenon: the Urban Foundation, established in the
mid-1970s in response to the Soweto uprisings of 1976, could be seen as the
pioneer – if giving as a response to apartheid is at least 30 years old, then it
may well have become ingrained. While the motives for the BT’s formation
cannot be reduced purely to a desire to atone for the past (see Friedman et al.
2005), some white-owned companies are susceptible to being ‘scolded’ into
giving. This kind of CSI is reactive, giving those outside business who shape
its agenda – government or civil society organisations – considerable latitude
to determine its form and spending priorities.
Guilt may not be the only motivation for CSI which this produces –
strategic calculation may, as some of the views mentioned suggest, also
play its part in the form of a desire to win some protection from pressure
or to cultivate a relationship with government or, more generally, the new
South Africa. Whatever the precise motive, South African corporates have,
since the early 1970s when exposés of the labour conditions of British-
owned firms were followed by the Durban strikes of 1973, faced pressures
to distance themselves from statutory race discrimination (Friedman 1985).
These solidified into the adoption of codes of conduct designed to stave
off disinvestment in the case of foreign-owned firms but which were also
adopted by many of their locally-owned counterparts. The effect was to create
a pattern in which demonstrating social responsibility to black people in

Free
dow
nloa
d fr
om w
ww
.hsr
cpre
ss.a
c.za
220 giving and solidarity
particular has become deeply embedded in corporate culture. And this may
explain why, for example, a new industry such as IT, which did not develop in
the environment in which CSI became entrenched, seems to feel little need to
engage in it and why new entrants may be less inclined to give.
It is perhaps of interest to mention here that, if CSI has become
embedded in white corporate culture, this is not necessarily a result of an
unusually active social conscience. We are aware of one attempt to research
the social attitudes of, among others, white business leaders. It attempted
to test the concept of ‘social consciousness’ proposed by the sociologist
Abram de Swaan as a measure of elites’ sensitivity to poverty and confidence
that it was possible to alleviate it. It found that white business leadership
rated rather low (Manor & Kalati 1999). Many might wish to challenge that
finding.9 But it could be seen to indicate that the fact that white companies
continue to engage in CSI ten years after apartheid’s end has less to do with
‘social consciousness’ than with ingrained practice or strategic calculation.
And that, in turn, would tend to suggest that white-owned businesses are
likely to continue to engage in CSI for the foreseeable future since it has
become part of their established practice and way of relating to their social
and political environment.
The key question is whether we should expect black business people
to join them since the dynamic discussed here clearly does not affect BEE
companies. As we have seen already, this does not mean that black business
is closed to CSI – but it may help to explain why most BEE companies appear
not to have adopted CSI programmes yet. Under what circumstances is this
likely to change? One explanation offered here, of course, implies that the
progression to active CSI programmes is purely a developmental issue – once
black-owned businesses are of a particular size, they can be expected to
begin contributing. This claim can either rest on the assumption that all
businesses begin engaging in CSI once they reach a certain size, or it may
start from the premise that the experiences of poverty which many new black
business leaders bring with them make them more likely to give once they
Free
dow
nloa
d fr
om w
ww
.hsr
cpre
ss.a
c.za
racial identity and corporate social investment 221
have the means to do so. Thus one interviewee suggests that IT companies do
not give because they experienced a relatively easy route to wealth (Coovadia
interview). By implication, those who have experienced personal hardship
would be more inclined to give, even if they enjoyed a fairly meteoric rise to
business success. It may even be possible to see the eagerness of some black
businesses to support an international fund as a sign that they are in an early
growth phase – one in which they are eager to announce their presence by
joining donor ‘clubs’ to which major international businesses belong. It could
be argued that, once they have established themselves and have less need to
seek recognition, they will give priority to local CSI.
There is, of course, no way of testing these speculations. But, if
they imply that all companies in the South African environment can be
expected to recognise their CSI obligations once they become successful,
we have already shown that this is unwarranted, since some well-heeled
white-owned industries seem able to avoid pressure for social spending.
An interviewee also implied that one determinant of willingness to give CSI
was the way in which businesses acquired their wealth: ‘old business came
up the hard way through difficult times to the realisation that an awareness
of social responsibility is vital’ (Coovadia interview). While there seems
to be no evidence to support this, the fact that new BEE business owners
acquired their wealth quickly would, in this analysis, make energetic giving
less likely. There is also some evidence that developmental CSI is not an
automatic consequence of black business growth. Thus Tokyo Sexwale’s
Mvelaphanda has graduated to the stage where it can generously sponsor
professional football and donate money to the ANC-NNP alliance during the
2004 election campaign, but appears far less enthusiastic about CSI projects
as understood here (although it is said to have donated money to some
domestic CSI causes). Clearly, it is difficult to see the decision to give or not
give CSI as a development issue if by that we mean that businesses which
reach a particular size are likely to graduate to investing in society; adopting
CSI programmes is a conscious choice, which entails a selection of priorities,
regardless of corporate size.

Free
dow
nloa
d fr
om w
ww
.hsr
cpre
ss.a
c.za
222 giving and solidarity
A practitioner notes, perceptively, that ‘peer pressure is also a part
of the motivation for CSI giving’ (Mahuma interview). Like all other people,
business people are influenced by those with whom they associate; norms
of acceptable or unacceptable behaviour emerge and these play an important
role in shaping behaviour. Among business people, this may be particularly
true of behaviour related to social responsibility since this has not been seen
historically as a core function of businesses and, therefore, is not something
in which they will necessarily possess great expertise. Indeed, one prominent
white businessman acknowledged cheerfully in 1993 that he and his peers
were, on political and social issues, ‘open to suggestion in an almost sheep-
like fashion’,10 adding that there is, of course, no reason in principle why
a person skilled in running a business should also know how to invest in
society. Whether CSI becomes an established part of black business behaviour
will, presumably, depend on the extent to which peer pressure emerges in
support of it.
If the interviews conducted for this project are a guide, then this
peer pressure is probable – as noted, there seemed to be a wide consensus
that BEE companies ought to give, and some evidence that black-owned
corporates which had rejected this notion are beginning to embrace it.
Continuing public criticism of the current brand of BEE on the grounds that
it ‘enriches only a few’ does seem to be creating a climate in which black-
owned businesses are unlikely to feel that the fact that they are owned by
the previously disadvantaged exempts them from social responsibility. Since
pressures for social investment are likely to affect black as well as white
businesses, it seems reasonable to expect black-owned companies to give as
they establish themselves.
Only at that stage will we begin to learn whether the patterns of
giving by black-owned corporates will differ from those of their white
counterparts. One straw in the wind is that Sexwale was the only business
leader to publicly donate money only to the ANC and its ally the NNP in the
2004 election campaign.11 This suggests that black-owned companies’ CSI
could be much more closely aligned with governing party objectives than

Free
dow
nloa
d fr
om w
ww
.hsr
cpre
ss.a
c.za
racial identity and corporate social investment 223
the current version. However, this may be premature: Sexwale, of course,
was ANC premier of Gauteng. His support for the ANC is, therefore, hardly
surprising and may not be the rule for black business leaders, many of whom
have less intimate links with the ANC. And, given the oft-made criticism
that many white-owned corporates’ CSI is an attempt to win favour with the
ruling party, it may well be that the only difference will be that black chairs
and CEOs may feel less need to dress up their support for its goals in the guise
of an independent development contribution. In any event, CSI projects which
seek to strengthen the provision of public services such as education and
healthcare must work with government to some degree, whoever is funding
them. And so, if black-owned businesses’ CSI does prove to be more overtly
supportive of the government (although so far there is little evidence of BEE
companies funding government programmes – even Mvelephanda supported
the ANC, not the government), the change could well rest purely in what
businesses say about their CSI programmes, not in what they actually do.
A donor of a different colour: racial identities and giving in established corporates
If we agree that it is too early to judge the difference, if any, between the
CSI patterns of black and white business people, we do have a means, in
theory, of judging whether there is any difference between black and white
CSI priorities. In established companies, black people have been part of
CSI departments for decades. So a comparison between the attitudes and
preferences of white and black CSI practitioners in these firms might offer
us a means of examining whether race does play a role in shaping decision-
making.
An important caveat needs mentioning, however. If racial identity
does play a role in shaping CSI decisions, it does not necessarily follow that
this would manifest itself under current circumstances. Black practitioners
are responsible to a predominantly white Board and senior management

Free
dow
nloa
d fr
om w
ww
.hsr
cpre
ss.a
c.za
224 giving and solidarity
and it remains possible that their decision-making is being tailored to the
preferences of those for whom they work.
It is, of course, difficult to assess the extent to which black CSI
practitioners would take different decisions if they were not working for
white-owned corporates. One interviewee implied that they would, arguing
that black participants in discussions on CSI priorities do not express their
opinions:
People have reservations which they don’t express. Black people have
never been exposed to a boardroom situation. The meetings go over
issues quite quickly, treat them like a fait accompli. It is not easy
in this environment to put your hand up and object; there is a fear
of sounding foolish. People do sometimes say after a meeting that
they had doubts which they did not voice and add that they have only
themselves to blame because they should have said something. (Mollo
interview)
Black CSI officials’ preferences, it was suggested, may have little effect on
actual decisions because the culture of company decision-making prompted
black CSI officers to endorse the prevailing view, whether they agreed with it
or not: ‘It is not that they fear reprisals – it is simply that they find the way in
which decisions are taken culturally alien and they go along because they feel
uncomfortable’ (Mollo interview).
Does this mean that it is impossible to establish whether racial
identity influences social giving decisions because all information we
receive is likely to be distorted by the reality that black CSI practitioners are
unlikely to say what they feel? The suggestion that black people could feel
uncomfortable about expressing opinions in white-owned companies is
hardly fanciful. Indeed, it seems highly likely, given that newcomers might
well find the environment intimidating and the way in which decisions are
debated unfamiliar. Since, however, no one we interviewed suggested that
black CSI practitioners were liable to be disciplined for anything they said,

Free
dow
nloa
d fr
om w
ww
.hsr
cpre
ss.a
c.za
racial identity and corporate social investment 225
we assume that this reticence, if it does exist, is a product of factors (such
as corporate culture) which are unlikely to operate in an interview with
independent researchers. Our black interviewees were articulate people with
considerable reputations in their field and we had no reason to believe that
any of them were hiding their opinions from us. We are, therefore, confident
that the answers we were given in our interviews do reflect the attitudes of
the interviewees and the analysis which follows is based on this assumption.
At first glance, we might expect black practitioners to make better
judgements than their white counterparts purely because they would
be expected to have a clearer grasp of needs and dynamics among black
beneficiaries. Some of our black interviewees did suggest that they believed
there was an element of truth to this expectation. Two rationales were
given for this. First, many black CSI people had ‘grown up in a township’
and therefore knew more about the dynamics in areas in which CSI is
invested than their white colleagues. Second, black people were better able
to crack black cultural codes and therefore to distinguish between potential
beneficiaries who are serious about development and those who are not:
‘If you grow up in a township, you do have a feel for who is taking you for
a ride and who is not…We may also bring more sensitivity to dealing with
the community (Maphai interview). ‘On occasions we feel whites are being
gullible – they can’t distinguish between a con artist and the real thing’
(Mollo interview).
But interviewees, black and white, strongly questioned the notion
that a black practitioner is necessarily better equipped to discern grass-
roots social dynamics and needs. ‘People don’t know more about needs just
because they are black’ (Abedian interview). ‘I would trust [a competent
white social researcher] to go to a squatter camp and come up with a better
product than a black person who does not have the required skills and
training’ (Maphai interview). Indeed, the simplistic view that black people
have a superior insight into the needs of the poor could be seen as a hold-
over of the apartheid-era corporate practice of latching onto a black company
official who was assumed to ‘know what black people think’ and who was

Free
dow
nloa
d fr
om w
ww
.hsr
cpre
ss.a
c.za
226 giving and solidarity
thus given a platform at meetings to discuss ‘the black point of view’ merely
by virtue of the fact that the person was black. The idea that millions of
people with a variety of interests and values all think the same because they
belong to the same race group was implausible even during the apartheid
period, when black people were largely united against the system and were
far less socially and economically diverse. It is clearly even less plausible now.
Given the substantial diversity in ‘black society’, the idea that someone will
automatically understand the dynamics of a group of people with whom she
or he may be entirely unfamiliar simply because they share a racial identity is
a symptom of prejudice, not a reading of reality.
The two views are less contradictory than they appear. It is plausible
that black practitioners may, in some cases, be better able to distinguish
between the genuine local leader and the fraud because, in many cases,
people who share similar languages, experiences and identities may well
be able to discern meanings and nuances which escape outsiders. On the
other hand, as implied above, the notion that black people are automatically
better able to understand dynamics among the black poor is based on the
questionable assumption that a shared racial identity is enough to equip
someone to understand dynamics in a location about which she or he may
know nothing and among people who he or she does not know. Social
research skills, whatever the race of the researcher, are surely a much surer
guide to understanding grass-roots realities than relying on a middle-class
black person without the required training in research to somehow gain
insight into the minds of shack dwellers. A black CSI practitioner observes,
therefore:
More black people are certainly needed in the profession: they often
do understand better some of the issues and sentiments in the
communities that CSI is aimed at as well as beneficiaries’ approach to
solutions. But it is not necessarily so that just because a trust is being
run by a black person, she or he will automatically know the needs
of black communities. In some cases, [black CSI practitioners] may
Free
dow
nloa
d fr
om w
ww
.hsr
cpre
ss.a
c.za
racial identity and corporate social investment 227
no longer be as connected to these communities as they used to be:
they may no longer be living in a predominantly black community,
for instance. And research still has to be conducted and background
checks done regardless of the race of the people involved in deciding
on the CSI. (Mahuma interview)
It was also suggested, indirectly, that there may be a particular constraint
to the competence of black CSI practitioners because black people may
be appointed to CSI positions by white corporations, not because they are
assumed to possess any great expertise but because, in a still racialised
corporate environment in which whites still find it hard to accept that
blacks have business expertise, CSI is considered a ‘safe’ activity in which to
increase the number of black appointments because it has no great impact
on profitability. One interviewee noted that there is a venerable history to
the practice of using black people in ‘harmless’ CSI posts: ‘The origin of
CSI in this country was the Bantu personnel officer who would take people
to soccer and give charity’ (Maphai interview). It is worth noting, however,
that similar claims are made about many white CSI practitioners – that they
are not appointed because of their expertise but because it is convenient
for some or other internal reason to appoint them. And, of course, some
black CSI practitioners are widely respected for their social science training
and their insight into CSI. It is feasible that black people are more likely to
be appointed to CSI posts without the requisite enthusiasm and expertise
because companies are eager to enhance their racial diversity quotas and are
still reluctant to accept that black people can contribute in other areas of the
business. But we came across no evidence to suggest that black practitioners
were likely to be any less competent than their white colleagues.
Given the society’s history, we might expect differing identities to
produce different approaches to CSI even if they do not ensure differing
competencies. One view suggests that black practitioners are likely to be
more sympathetic to the poor because of an identity affinity: ‘White business
people say what will this do for my business, black people may look at the
Free
dow
nloa
d fr
om w
ww
.hsr
cpre
ss.a
c.za
228 giving and solidarity
softer side and say what will this do for our people’ (Mollo interview). This
view seems to be supported by the account, for example, of the way in which
black CSI practitioners at one major corporation, South African Breweries
(SAB), placed CSI more firmly on the strategic agenda:
Our task was to understand development priorities and imperatives,
interpret them to the company and align them with company strategy.
When we spoke like activists, they turned a deaf ear. Then we started
talking the language of cost-benefit analysis. What we were doing
evolved in their minds from do-gooding to self-serving activity which
resonates with national objectives. (Vukuza interview)
But there is nothing necessarily racial in practitioners seeking to sell a role in
social giving to company decision-makers – zealous white CSI officers might
have done the same. Nevertheless, one interviewee suggests that there may
be issues which have a greater resonance with black people: ‘An issue like
alcohol abuse does reflect a racial divide’ (Maphai interview). In other words,
people’s CSI priorities will be shaped by their experience of reality and people
who grew up in low-income environments scarred by substance abuse are
therefore more likely to see it as a problem requiring intervention than CSI
decision-makers who did not experience this.
Our research unearthed no strong evidence that concern for the poor
was a black monopoly (although, in fairness, it also found that this concern
is not the overwhelming reason for CSI by white companies). There also
seems to be a strong uniformity in many companies’ CSI spending patterns,
whether their practitioners are black or white. Certainly, none of the black
practitioners who we interviewed suggested that they favoured pursuing a
significantly different set of priorities to their white colleagues. There is also
some resistance to the notion that there is anything necessarily different in
the approaches of black and white CSI decision-makers: ‘There may well be
black and white CSI priorities, but there need not be’ (Maphai interview). This
suggests that, where it has not already happened, there may be a need for

Free
dow
nloa
d fr
om w
ww
.hsr
cpre
ss.a
c.za
racial identity and corporate social investment 229
practitioners on both sides of the divide to transcend their cultural baggage
and meet in the middle on some common vision of CSI priorities. But what
evidence we have suggests that, to a degree, it may already have happened.
Another litmus test of identity divides should be attitudes to
government and the ANC. Not only would common sense suggest that
black practitioners would be closer to both – this is also the expectation of
white-owned corporates who delegate liaison with the government to a black
person on the assumption that this will smooth the relationship: ‘I am meant
to make our job easier with government. If you talk to government and
company faces are all pale, while those on the government side are all black,
you have a problem’ (Mollo interview). Black interviewees were, on the whole,
more likely to express enthusiasm about the government than their white
counterparts. And, as we might expect, white executives are more likely to
need to establish a special link to government than black colleagues who are
well connected. Former SAB Corporate Affairs director (now Billiton South
Africa chair) Vincent Maphai’s assertion that ‘I don’t need a government
liaison officer – I know who to call and they know me’ (Maphai interview), is
obviously far less likely to apply to a white business leader. More generally,
relations between black business and government are likely to be better than
those between government and white business, not only because of a shared
identity but also, in many cases, as a result of a common political history and
loyalty (Sikhakhane interview, 22 September 2004).
But reality seems rather more complicated. Relations between
the government and black business leaders are not always harmonious.
President Mbeki (while deputy president) criticised the ‘greed’ of the new
black economic elite (Mbeki 1998). Sexwale, Ramaphosa and Matthews
Phosa were, in a notorious incident, accused by former Safety and Security
Minister, the late Steve Tshwete, of plotting against Mbeki, (Dispatch Online,
4 May 2001), while Macozoma was pilloried by then Public Enterprises
Minister Jeff Radebe in a dispute over a severance payment to the former
chief executive of South African Airways (Radebe 2001). The bonds between

Free
dow
nloa
d fr
om w
ww
.hsr
cpre
ss.a
c.za
230 giving and solidarity
the two may exceed their differences, but that does not alter the reality that
there are differences.
Some black interviewees were at pains to stress that an entrée to
government was not what they felt they contributed: ‘A relationship with
the government is not what I brought to the party – in fact, black corporate
affairs people would sometimes advise holding horses on government’
(Maphai interview). This suggests that the desire to work with government
is often strong among white executives eager to form a relationship with a
new political elite which they may not understand. CSI, precisely because
it is often not seen as a core strategic activity, is seen as an ideal conduit for
doing precisely what government wants (Favis interview). So the desire to
please government may not be shared by their black counterparts who are
more confident of their ability to relate to government. Ensuring that CSI
practitioners are black is also not a prerequisite for building partnerships
with the government. To name but two examples, the school building
programme funded by Tshikululu Social Investments, which manages
the CSI funds of several major corporations, has achieved this through
technological innovation rather than the racial identity of its executives
(M Keeton interview).12 Liberty Life Foundation’s media programme has
cemented a partnership by providing a support for key government activities
(Appelbaum interview). Again, the fact that the Foundation’s head is white
has not inhibited the partnership. As a result, it could be argued that it is
not particularly difficult for CSI to attract government partnership – and that
productive partnerships depend more on the quality of the projects which are
supported and the degree to which they help the government solve problems,
than on empathy born of a shared identity.
Nor can it be assumed that black CSI practitioners are automatically
more likely to fit in with the goals of the ANC. At the time most interviews
were conducted, the publicity surrounding AngloGold Ashanti’s decision to
support political parties, but to weight donations in favour of the opposition,
seemed to offer black CSI practitioners an opportunity to declare their support
for the governing party by enthusiastically advocating party funding – but
Free
dow
nloa
d fr
om w
ww
.hsr
cpre
ss.a
c.za
racial identity and corporate social investment 231
in proportion to electoral support. But some black CSI practitioners were
among the most reticent to support parties: ‘We gave money to four political
parties in relation to their support. But I was uneasy about party funding
because I was worried about offending some parties. I don’t want people to
think we buy the government with money’ (Maphai interview); ‘Our company
did not want to be associated with one or other political party. But there was
a lot of pressure, especially peer pressure, after Anglo decided to do this’
(Mahuma interview). The origin of the peer pressure was unclear and so it
is possible that, while the black CSI practitioners we interviewed were much
more cautious than their white counterparts about supporting parties, there
is a groundswell of support for party funding among practitioners to whom
we did not speak. But the notion that being black neatly translates into
enthusiasm for funding the ANC was not supported by the interviews. And it
may well be significant that Mvelephanda’s decision to fund the ANC and NNP
was not publicly emulated by other companies. A senior black CSI strategist
who insists, ‘We would not put money into Luthuli House [ANC headquarters],
only into a project which works’ (Maphai interview), may not be expressing a
majority view. But nor is it a unique one.
It is important to qualify this observation. We have noted that black
CSI practitioners are, in the main, more enthusiastic about government
and its initiatives than their white counterparts: they are, for example,
likely to be more positive about the government-initiated charters which
are seeking to shape corporate behaviour.13 It does seem likely that, if black
CSI practitioners are the sole decision-makers, some companies may be less
inclined to donate to political beneficiaries which are seen to be hostile to
the governing party, such as opposition think tanks or research institutes.
White practitioners might be inclined to support these institutions because
they are more likely personally to support the opposition, even while their
companies seek the approval of the government. A black practitioner
insists that this presumed response would not be automatic: ‘I would not
automatically throw out funding to the Institute of Race Relations [which
is seen by many to be sympathetic to the white-led opposition]. But I would

Free
dow
nloa
d fr
om w
ww
.hsr
cpre
ss.a
c.za
232 giving and solidarity
want to know what purpose it serves’ (Maphai interview). It does seem likely,
however, that black decision-makers will be less convinced of the beneficial
purpose of an oppositional organisation than their white counterparts – not
necessarily because it is run by a white director and most of its leadership
is white, but because its political stance seems at variance with that of most
black business people. So it is feasible that the ascendancy of black decision-
makers would further reduce corporates’ willingness to fund those areas of
national life which the government will not fund. But like many hypotheses
on this issue, this remains inevitably speculative – particularly in the light of
our finding that a divide between black CSI practitioners eager to use funds to
support the government and white ones enthusiastic about opposition causes
oversimplifies reality.
Another hypothetical question is whether established corporates will
face greater pressure to contribute as senior executive posts pass from whites
to blacks. One practitioner insists that they will. Anticipating Maphai’s
then imminent move to Billiton as executive chair of its South African
operations, he predicted that ‘the new chair will receive all kinds of requests’
(Mollo interview) which his predecessor did not. However, there seems little
evidence that the arrival of, say, Saki Macozoma at Standard Bank has had
any significant effect on the CSI requests submitted to the company. There
is no hard evidence that black people are likely to make more CSI demands
because a company is run by a black person.14
Our general finding that racial differences between CSI practitioners
are less evident and more complicated than conventional wisdom might
suggest does not mean that these differences are absent or insignificant.
Racial identities remain highly significant in South Africa and it would be
strange if CSI practitioners were immune to them. An interviewee claims,
therefore, that the appointment of a white person as the first director of SAGA
‘greatly antagonised many members, particularly as they claim they were
promised that a black person would be appointed’ (CSI practitioner interview).
While these disputes may be important, they revolve around who should
speak for grantmakers, not necessarily around clashing, identity-based

Free
dow
nloa
d fr
om w
ww
.hsr
cpre
ss.a
c.za
racial identity and corporate social investment 233
views of what CSI programmes should be doing. As in some other areas of
national life, the issue may not be what priorities ought to be, but rather who
should occupy decision-making posts – quite possibly without any significant
difference to what is done.
Conclusion: mistaken identity?
Will the emergence of a substantial black business class significantly change
the extent and nature of corporate giving? While we have stressed that it
is too early to answer the question definitively, the information gathered
here does enable us to offer some pointers to the future, if current trends
continue.
It seems unlikely that an increasing black presence in corporate
decision-making will prompt a substantial decline in corporate giving. The
very fact that many of our interviewees felt that black-owned businesses were
not contributing sufficiently suggests that black businesses are unlikely to
be immune from pressure to give. While some companies may, in the view
of their critics, be able to escape their social responsibilities because they
are empowering black business, the climate of opinion does, our interviews
suggest, seem to be moving in a direction in which being a black business
will not be seen as a ticket to some sort of CSI exemption. Indeed, some
of our sources insisted that it already was not one and that black business
people were increasingly realising that they could not evade their CSI
responsibilities. ‘CSI by black empowerment companies of any significance
has only really got going in the last year or so. Mvelaphanda, Patrice Motsepe,
Ramaphosa’s initiative, have happened in the last year or so’ (Sikhakhane
interview, 22 September 2004). Black owners are taking over companies
in a context in which CSI has become an entrenched part of the corporate
landscape and it is highly unlikely that they will be able to jettison it, even if
they want to (and there is no particular evidence that they do).
Whether CSI patterns will remain the same as black executives
become increasingly prominent is far harder to predict. The very little

Free
dow
nloa
d fr
om w
ww
.hsr
cpre
ss.a
c.za
234 giving and solidarity
evidence we have might suggest continuity rather than change: the presence
of black executives in the BT has not prompted any dramatically new
departures in its agenda. While it could be argued that a vehicle in which
black business people participate alongside their white counterparts may not
be an accurate guide to the preferences which are likely when black business
comes to set the CSI agenda (particularly since, as noted, the number of black
business people participating in the BT is small), on the available evidence
it does seem unlikely that CSI by black-owned business will be substantially
different to the patterns which are evident currently.
There may be differences of degree. Thus black business people, like
many black CSI practitioners, may be less inclined to support critical advocacy
groups or areas of activity not considered important by the government. But,
as the evidence presented here shows, this may well be a generalisation given
that black CSI practitioners’ attitude to aligning their spending objectives
with those of the government are rather more complex than the general
trend – of more overt support for the government – might suggest. And even
if black business’s CSI is aligned with government objectives, this may not
mean a startling change, merely a strengthening of an existing trend. Black
business may support government goals out of a sense of loyalty while their
white counterparts are spurred by a desire to please. The outcome, however,
would be much the same.
On actual CSI priorities, there may be some obvious, identity-driven
differences such as support for soccer rather than the kinds of sports
favoured by Pick ’n Pay (Friedman et al. 2005). There may in some cases
be greater sensitivity to the needs of some black beneficiaries (or at least
those organised enough to gain access to decision-makers) and, as some
interviewees suggested, a greater propensity to know the difference between
appropriate and inappropriate beneficiaries. But there is little if any evidence
thus far of a distinctively black approach to CSI which is starkly at variance
with white spending patterns. Some degree of change is probably inevitable,
but it may be a change in detail, not substance.

Free
dow
nloa
d fr
om w
ww
.hsr
cpre
ss.a
c.za
racial identity and corporate social investment 235
It does seem possible that an increased black presence in decision-
making will change some of the texture and nuance of CSI. In general, the
way in which successful requests need to be phrased and the sorts of triggers
which determine how particular funding areas become popular, while others
decline, may alter. But current evidence suggests that this will occur within a
framework not all that different to that which we see now.
A far more difficult question is the sort of influences which will
shape black CSI. A study of the societal networks which underpin individual
giving by black business leaders may tell us much about possible future
CSI patterns. Also, research may throw some light on the extent to which
black decisions are likely to be shaped – as white businesses’ preferences
were for many years and, apparently, are no longer – by a few prominent
individuals. While some see figures such as Sexwale, Macozoma and
Motsepe as the opinion-shapers of the future, as the Oppenheimers and
Ruperts were of an earlier white business generation, this seems based on
surmise, not hard evidence. (Oddly, as noted above, Ramaphosa, despite
establishing a pioneering black CSI foundation, rarely received a mention in
this context from interviewees.) So it is not yet clear whether we are likely
to see CSI trends shaped by figures who attract widespread admiration or a
more diffuse form of giving guided by the preferences of CSI managers in
particular corporations.
In general, despite the analysis offered here, it is important to be alive
to the possibility that aspects of CSI will indeed change as black decision-
makers play increasingly dominant roles. As noted at the outset, this is an
important corrective to the view that CSI decision-making is an instrumental
process entirely independent of the values of those who make decisions and
of the social networks which produce them. If we do not understand that
white and black CSI decision-makers’ perspectives are largely shaped by
their identity and that this will have some impact on decisions, we will miss
important nuances – even as we insist that the broad trends may remain
largely unaffected.

Free
dow
nloa
d fr
om w
ww
.hsr
cpre
ss.a
c.za
236 giving and solidarity
But it is equally important not to fall into the sort of crude racial
determinism which produced the ‘Bantu personnel officer’ and the view
that ‘blacks understand their own people’ simply because they are black.
Just as white CSI is not uniform, so may we expect its black practitioners to
differ among themselves in their attitudes, priorities and preferences. As
this chapter shows, black CSI decision-makers often disagree – as white ones
do – and that will continue to ensure different patterns of black CSI decision-
making. And, because ‘black society’ is itself diverse, composed of a variety
of interests and values, the view that black CSI practitioners will automatically
tap into ‘black opinion’ is misguided. Black practitioners may often have to
work as hard as their white colleagues to understand beneficiaries, even if
their identity sometimes enables them to unlock codes which remain far
more impenetrable to white CSI professionals. And there are constants in CSI
decision-making patterns, regardless of the identity of the decision-maker,
which will ensure cross-racial continuity.
Finally, CSI priorities are not set in a vacuum. They are, rather, the
product of the interaction between CSI decision-makers and their social
environment as well as between business people. While new patterns
of interaction between business people might produce slightly different
fashions in corporate giving, CSI priorities may be as much, if not more,
a result of current trends in the environment and a policy agenda set by
a host of opinion-formers – government, civil society organisations and
the media – as of the preferences of CSI decision-makers. In that case, the
increasing changing of the guard may herald a new and interesting phase
in corporate social spending, but one which will share most of its broad
characteristics with the trends of the present.
The evidence suggests, therefore, that CSI will not change significantly
as black people come to play an increasing role in business decision-making.
Just as the expectation of supporters of BEE that it will prompt bigger
and better giving as black executives ‘look after their people’ are likely to
be disappointed, so too may those opponents who expect black business
people to avoid giving on the grounds that they ought to be the beneficiaries

Free
dow
nloa
d fr
om w
ww
.hsr
cpre
ss.a
c.za
racial identity and corporate social investment 237
of corrective action, not its architects, find their predictions of change
contradicted by events.
Notes
1 This chapter must be read in conjunction with the conceptual discussion in
Chapter 5.
2 For a discussion of the professionalisation of corporate social investment see
Friedman et al. (2005).
3 This does not deny that CSI may, on occasions, contribute to enhanced company
performance. In Friedman et al. (2005) we argue that Pick ’n Pay’s CSI may have
done precisely that. We are simply concerned to point out that companies can do
very well even if their CSI is considered by specialists to be incompetent.
4 Jordan P, New role models or new Randlords, Mail & Guardian 6 March 1998.
5 Motsepe owns a prominent professional football club but the interviewee was
referring to funding earmarked specifically for development rather than the club.
6 Njobeni S, Ramaphosa’s millennium changes name, Business Day
12 August 2004.
7 Comments by Jabulani Sikhakhane at Project Reference group meeting,
15 July 2003.
8 Email communication, Michael Spicer, 22 May 2005.
9 One interviewee describes the notion that CSI does not stem from social
consciousness as ‘an easy simplistic view’ which he contrasts to ‘the nuance and
complexity which characterise the real world’ (Email communication, Michael
Spicer, 22 February 2005).
10 Interview for unpublished research report, Friedman (1993).
11 Ancer J, Now we’re throwing funds, not stones, at FW, The Star 17 March 2004.
9 See also Friedman et al. (2005) for a discussion of Tshikululu Social Investment’s
role and activities.
10 See, for example, Yedwa Simelane, Chair, AngloGold Fund, 18 March 2004,
quoted in Friedman et al. (2005).
11 The survey evidence quoted here may point tentatively in the opposite direction.

Free
dow
nloa
d fr
om w
ww
.hsr
cpre
ss.a
c.za
238 giving and solidarity
References
Everatt D & Solanki G (2005) A nation of givers: Social giving among South Africans.
The state of social giving in South Africa Project, Report 1, Centre for Civil Society,
University of KwaZulu-Natal
Friedman S (1985) Building tomorrow today: African workers in trade unions.
Johannesburg: Ravan Press
Friedman S (1993) Trading in turbulent tides. Unpublished report for Urban
Foundation
Friedman S (2004) South Africa: Building democracy after apartheid. In E Gyimah-
Boadi (Ed.) Democratic reform in Africa: The quality of progress. Boulder, London:
Lynne Rienner
Friedman S, Hudson J & Mackay S (2005) Like chalk, like cheese? Professionalism and
whim in corporate giving at AngloGold Ashanti and Pick ’n Pay. State of Giving
Project, Centre for Civil Society, Report No. 2. University of KwaZulu Natal,
Durban
Hayek F (1952) The counter-revolution of science, studies on the abuse of reason. London:
George Allen and Unwin
Henrich J, Boyd R & Bowles S (n.d.) ‘Economic man’ in cross-cultural perspective:
Behavioral experiments in 15 small-scale societies. American Journal of Economics
and Sociology. Accessed 2004. http://www.sscnet.ucla.edu/anthro/faculty/boyd/
MacGamesBBSFinal.pdf
Kahneman D (2002) Maps of bounded rationality: A perspective on intuitive
judgment and choice. Nobel Prize Lecture 2002. Accessed 2004. http://www.
nobel.se/economics/laureates/2002/kahneman-lecture.html
Manor J & Kalati N (1999) Elite perceptions of poverty: South Africa. IDS Bulletin,
April. Institute of Development Studies, University of Sussex
Marx K (1964) Selected writings in sociology and social philosophy (translated by TB
Bottomore). London: McGraw-Hill
Mbeki T (1998) Statement of Deputy President Thabo Mbeki on the Occasion of the
Debate on the Budget Vote of the Office of the Deputy President. Cape Town, National
Assembly, 3 June
Radebe J (2001) Statement by Minister of Public Enterprises, Mr Jeff Radebe, on the
controversy surrounding South African Airways. National Assembly, 13 June.
Accessed 2004. http://www.info.gov.za/ speeches/2001/010614245p1001.htm
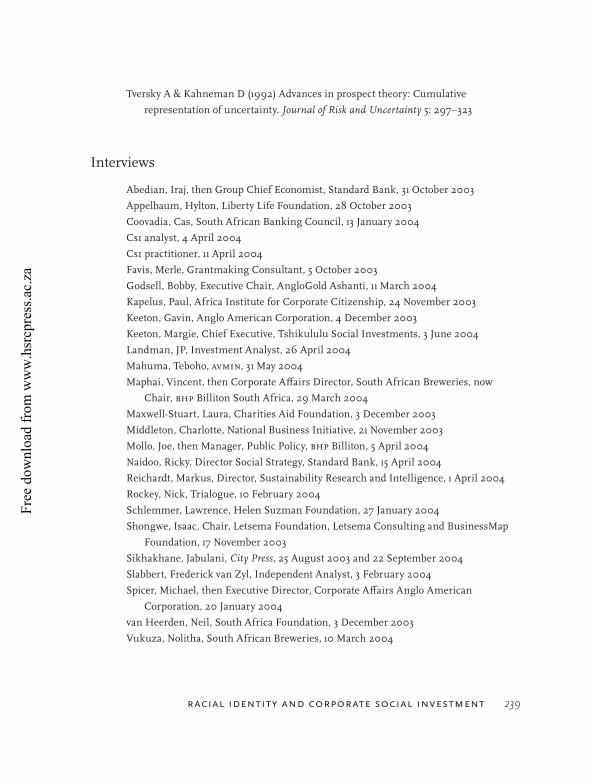
Free
dow
nloa
d fr
om w
ww
.hsr
cpre
ss.a
c.za
racial identity and corporate social investment 239
Tversky A & Kahneman D (1992) Advances in prospect theory: Cumulative
representation of uncertainty. Journal of Risk and Uncertainty 5: 297–323
Interviews
Abedian, Iraj, then Group Chief Economist, Standard Bank, 31 October 2003
Appelbaum, Hylton, Liberty Life Foundation, 28 October 2003
Coovadia, Cas, South African Banking Council, 13 January 2004
CSI analyst, 4 April 2004
CSI practitioner, 11 April 2004
Favis, Merle, Grantmaking Consultant, 5 October 2003
Godsell, Bobby, Executive Chair, AngloGold Ashanti, 11 March 2004
Kapelus, Paul, Africa Institute for Corporate Citizenship, 24 November 2003
Keeton, Gavin, Anglo American Corporation, 4 December 2003
Keeton, Margie, Chief Executive, Tshikululu Social Investments, 3 June 2004
Landman, JP, Investment Analyst, 26 April 2004
Mahuma, Teboho, AVMIN, 31 May 2004
Maphai, Vincent, then Corporate Affairs Director, South African Breweries, now
Chair, BHP Billiton South Africa, 29 March 2004
Maxwell-Stuart, Laura, Charities Aid Foundation, 3 December 2003
Middleton, Charlotte, National Business Initiative, 21 November 2003
Mollo, Joe, then Manager, Public Policy, BHP Billiton, 5 April 2004
Naidoo, Ricky, Director Social Strategy, Standard Bank, 15 April 2004
Reichardt, Markus, Director, Sustainability Research and Intelligence, 1 April 2004
Rockey, Nick, Trialogue, 10 February 2004
Schlemmer, Lawrence, Helen Suzman Foundation, 27 January 2004
Shongwe, Isaac, Chair, Letsema Foundation, Letsema Consulting and BusinessMap
Foundation, 17 November 2003
Sikhakhane, Jabulani, City Press, 25 August 2003 and 22 September 2004
Slabbert, Frederick van Zyl, Independent Analyst, 3 February 2004
Spicer, Michael, then Executive Director, Corporate Affairs Anglo American
Corporation, 20 January 2004
van Heerden, Neil, South Africa Foundation, 3 December 2003
Vukuza, Nolitha, South African Breweries, 10 March 2004

Free
dow
nloa
d fr
om w
ww
.hsr
cpre
ss.a
c.za

Free
dow
nloa
d fr
om w
ww
.hsr
cpre
ss.a
c.za
241
The profile of foreign missions and major donors in South Africa might
suggest that international aid is a major component of the post-apartheid
development project. A review of the role of external resources in the
country’s efforts to address poverty and inequality, however, points to a
different conclusion. It also raises several questions about the nature of
relations between government, civil society and funders.
Almost every government and multilateral donor is engaged in ‘giving’
to South Africa. At any moment, Treasury and service delivery departments
are between them dealing with up to 30 official donors and managing more
than 1 000 projects. Yet official development assistance (ODA) comprises
a minute proportion of the South African national Budget and an even
smaller proportion of national wealth as measured by the GNP. This raises
the question: is it worth it? Is the value of international aid greater than its
volume? At the same time, all the major foreign private foundations, many
of the smaller ones, and some official donors are ‘giving’ both to government
and to a wide range of South African civil society organisations (CSOs). Some
CSOs (from national grantmakers to community-based organisations [CBOs])
are completely dependent on foreign funding for their survival while many
7
Foreign donor funding since 1994
Deborah Ewing and Thulani Guliwe

Free
dow
nloa
d fr
om w
ww
.hsr
cpre
ss.a
c.za
242 giving and solidarity
more have no idea how to access donor funding. This raises questions about
how private donor funding is targeted and also why civil society does not, or
cannot, generate enough local income to do its work.
In this chapter, official aid and private foreign giving are discussed
with an overall focus on external resources available for poverty alleviation
and development in South Africa. They are linked inasmuch as official and
private donors support both government and civil society. However, there are
important differences in the motivation for giving and the significance of the
funding for government and non-government beneficiaries. Therefore, this
chapter explores the two streams of international aid separately, draws some
conclusions specific to each and then looks at the confluence of the findings.
The chapter covers: who is doing the giving – which countries and
agencies; the volumes, trends and patterns of giving; the motivation for
giving; types and channels of funding; focus areas and target groups;
criteria and conditions; management of resources; and mechanisms for
impact assessment. It does not evaluate the impact of aid. Given South
Africa’s history and its political and economic position in relation to the
rest of the continent, the discussion is preceded by an overview of the
international context for ODA and for giving by foreign private foundations
and international NGOs.
Global ODA: the international context
Global ODA rose significantly in 2003, continuing to reverse the downward
trend that had prevailed from 1992 until 1997. According to the Development
Assistance Committee (DAC) figures released in 2004, ODA from the 22 DAC
donors increased from US$58.3 billion in 2002 to US$68.5 billion in 2003
(Randel et al. 2004). However, in real terms, the figures for 2003 represented
a rise of 3.9 per cent (to US$60.54 billion at 2002 prices), so that the increase
only took global ODA back up to the 1992 level.
Aid levels remain far short of what is needed to achieve the
Millennium Development Goals (MDGs).1 Official donors highlight the
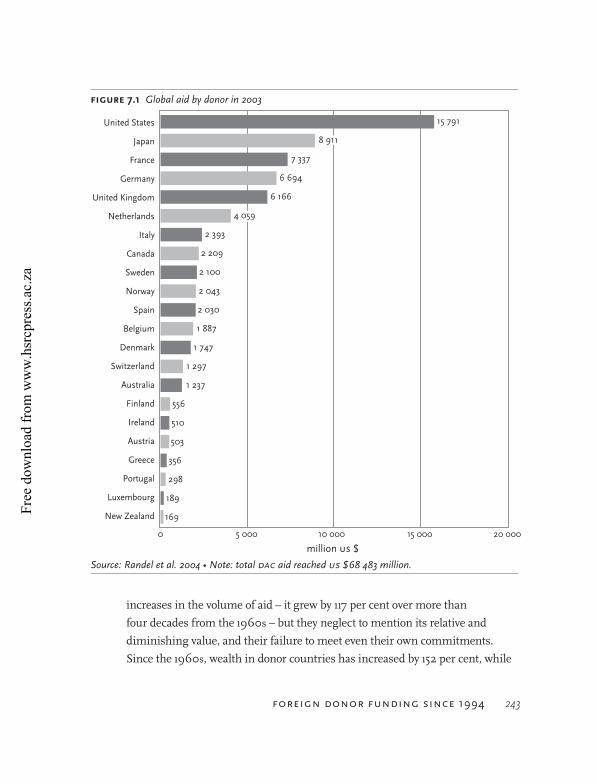
Free
dow
nloa
d fr
om w
ww
.hsr
cpre
ss.a
c.za
Foreign donor Funding since 1994 243
increases in the volume of aid – it grew by 117 per cent over more than
four decades from the 1960s – but they neglect to mention its relative and
diminishing value, and their failure to meet even their own commitments.
Since the 1960s, wealth in donor countries has increased by 152 per cent, while
Figure 7.1 Global aid by donor in 2003
Source: Randel et al. 2004 • Note: total DAC aid reached US $68 483 million.
15 791
7 337
6 694
6 166
2 393
2 209
2 100
2 043
2 030
1 887
1 747
1 297
1 237
556
510
503
356
298
189
169
0 5 000 10 000 15 000 20 000
New Zealand
Luxembourg
Portugal
Greece
Austria
Ireland
Finland
Australia
Switzerland
Denmark
Belgium
Spain
Norway
Sweden
Canada
Italy
Netherlands
United Kingdom
Germany
France
Japan
United States
8 911
4 059
million �� $

Free
dow
nloa
d fr
om w
ww
.hsr
cpre
ss.a
c.za
244 giving and solidarity
aid per person has risen by less than 10 per cent. If donors had met the agreed
UN target for ODA, of 0.7 per cent of gross national income (GNI), aid would
be almost double what it is. Only five DAC donors – Norway, Denmark, the
Netherlands, Luxembourg and Sweden – gave 0.7 per cent GNI or more in 2003.
The United States, Japan, France, Germany, the United Kingdom,
Netherlands and Italy (in descending order of volume) together provided
almost three-quarters of DAC aid in 2003. The United States gave the least as
a percentage of GNI – 0.14 per cent in 2003 – even though it gave by far the
most in volume.
The Center for Global Development (CGD) and Foreign Policy magazine
have created the Commitment to Development Index (CDI),2 a ranking of
rich nations determined not just by how much aid they give but by how
their policies are judged to help or hinder social and economic development
in impoverished countries (Roodman 2004). The CDI, funded by the
Rockefeller Foundation, reflects facts such as that most rich nations accepted
Rank Country Rank Country
1 Denmark 12 Austria
1 Netherlands 13 Belgium
3 Sweden 14 Italy
4 Australia 14 Portugal
4 United Kingdom 16 New Zealand
6 Canada 17 Greece
7 France 18 Ireland
7 Germany 18 Switzerland
7 Norway 20 Spain
7 United States 21 Japan
11 Finland
Table 7.1 The 2004 CDI ranking
Source: CGD 2004

Free
dow
nloa
d fr
om w
ww
.hsr
cpre
ss.a
c.za
Foreign donor Funding since 1994 245
provisions to allow poorer countries to import generics, thus opening the
door to cheaper medicine for Africa. Then it shows how donors give with one
hand and take with the other, particularly through restrictive trade practices.
Foreign Policy magazine’s online analysis of donor performance notes:
‘rich countries – led by the United States, Japan, and France – remained
intransigent on removing their agricultural tariffs and subsidies.’3 Using
seven categories, including aid levels, to rank donor commitment, the CDI for
2004 placed Denmark first and the United States equal seventh alongside
France, Germany and Norway (see TABle 7.1).
While the CDI provides for a more complex analysis than a
straightforward comparison of aid volumes, that analysis leads to much the
same conclusion as the Reality of Aid Report (ROA 2004): ‘Ultimately, for
all the CDI’s focus on winners and losers, no wealthy country lives up to its
potential to help poor countries.’ 4
Lower middle-income countries, including South Africa, receive
around a third of global aid, or around US$23 billion. That is about the same
as the poorest countries, which immediately indicates that poverty is not
the only criterion for giving, in case anyone thought this was so. The Reality
of Aid report (ROA 2004) emphasises how, globally, aid continues to go to
projects that have more to do with export promotion and winning geopolitical
influence (and, latterly, military-based security) than with poverty alleviation.
USAID is upfront about its motives. Its publication for new staff says:
‘USAID plays a vital role in promoting US national security, foreign policy, and
the War on Terrorism’ (USAID 2006: 4). Its website used to describe its mandate
as giving ‘foreign assistance and humanitarian aid to advance the political and
economic interests of the United States’ but this has been subtly changed to
read: ‘United States’ foreign assistance has always had the twofold purpose
of furthering America’s foreign policy interests in expanding democracy and
free markets while improving the lives of the citizens of the developing world.’ 5
USAID’s strategic plan is developed with the Department of State to support the
United States’ national security strategy. The mission of the two organisations
states they exist to ‘[c]reate a more secure, democratic, and prosperous world

Free
dow
nloa
d fr
om w
ww
.hsr
cpre
ss.a
c.za
246 giving and solidarity
for the benefit of the American people and the international community’ (USDS
& USAID 2003). The meaning of this depends on the beneficiary’s location. In
South Africa, it means supporting projects to strengthen the justice, education
and health systems, while in countries perceived to present a direct threat to
American interests, it can extend to propping up the military and occupation.
AUSAID, the Australian official aid agency, is similarly transparent about the
national security goal of its aid programme. Other donors, including the United
Kingdom’s Department for International Development (DFID) and Norway’s
NORAD, stress that they are acting from humanitarian motives to reduce poverty
but their aid allocations still reflect strategic foreign policy and (military)
security imperatives (see below).
Official aid rarely goes directly to impoverished communities and
much of it haemorrhages between donor and beneficiary. As Randel et al.
note, ‘[t]he dangers of aid being spent on projects where the benefits to
northern and southern élites are obvious but the benefits to poor people are
at best speculative, are shown all too well’ (2004: 188). Research by Action
Aid (2005) into ODA found that, corruption aside, 61 per cent of official aid
was ‘phantom’ – only around 40 per cent of ODA was reaching the intended
beneficiaries while the rest benefited consultants, foreign companies, or was
lost on excessive bureaucracy.
Several major donors have also made so-called ‘counter-terrorism/
security’ central to their development cooperation strategy – so-called
because these terms are used to describe ideologies and policies that
prescribe military might, coercion and attrition to achieve United States-
driven foreign policy objectives that undermine the human security of their
target countries. The United States is now spending annually more than five
times the global aid budget on arms. In 2002, it spent US$349 billion on
arms and the United Kingdom, France, Germany and Japan collectively spent
another US$149 billion.6
‘Security’ considerations have impacted on ODA in three ways in the
last decade or so: they have been used to justify inadequate and reduced
responses to humanitarian crises; they have resulted in the diversion of

Free
dow
nloa
d fr
om w
ww
.hsr
cpre
ss.a
c.za
Foreign donor Funding since 1994 247
ODA from poverty-focused spending to allocations in regions and to sectors
considered strategically important for the ‘war on terror’; and they have led to
more conditions linking aid to the economic and foreign policy of recipient
governments. The United States has diverted aid from Africa and Latin
America to fund its ‘war on terror’, as well as increased its military budget.
Australia, Canada, Denmark, the eU/eC, France, Japan and the United
Kingdom have all made security and ‘counter-terrorism’ considerations
central to their aid policy. Other donors have not stressed the role of ODA as
a security/foreign policy tool but their aid spending has still been affected
by political events such as the invasion of Iraq. A few – Finland, Germany,
Ireland and New Zealand – prioritise development and poverty alleviation
with a focus on issues such as justice and self-determination.
All donors, including the international finance institutions, have
a focus on governance but this is interpreted in different ways depending
on the recipient. Donors that see strengthening their national security
and political hegemony as a legitimate use of ODA tend to be more
prescriptive about what governance entails (for example, acting against the
donor’s perceived enemies as a condition of aid). Donors that see aid as a
development/poverty alleviation tool tend to see governance in terms of
human rights and transparency. The irony is that while ‘good governance’
is a condition of aid, the practice of good governance (in the sense of rooting
out corruption and wastage, and putting in place efficient tax systems) could
render aid unnecessary.7
It was estimated in 2002 that financing development in Africa
through NePAD would require US$64 billion a year. AFRODAD (the African
Forum and Network on Debt and Development) cites this amount as the
resource gap between what African countries can raise and what they need to
spend annually. But AFRODAD’s Opa Kapijimpanga says: ‘The gap could easily
be filled by closing the leakages of financial outflows from Africa. These are
estimated at more than US$75 billion, which includes terms of trade losses of
over US$60 billion, unpayable illegitimate debt of US$10 billion and barriers

Free
dow
nloa
d fr
om w
ww
.hsr
cpre
ss.a
c.za
248 giving and solidarity
to markets of US$5 billion per year.8 But the “gap” continues to provide the
rationale for development aid’ (Kapijimpanga 2004).
In 2003, UN Secretary General Kofi Annan told the third Tokyo
Conference on African Development, which focused on aligning support for
regional priorities with NePAD and promoting the MDGS, that: ‘the principle
of African ownership is still too often compromised by tied aid. Moreover,
the aid developed countries give is often undercut by their trade policies,
particularly by agricultural subsidies. These hinder Africa’s ability to export
its way out of poverty and dependence, and they must be phased out.’9 This
issue needs to be looked at further in the context of South Africa’s relative
independence of aid and its role in NePAD. NePAD, driven by South Africa,
has endorsed the MDGs. As noted, at present rates of giving, there is no hope
of them being met. The question arises: what leverage over resources, or
political will, does South Africa have via NePAD to bridge the gap? Further, is
this really where the energy should be directed?
The whole question of ownership and conditionality is addressed in
the context of South Africa’s approach to management of ODA. On one hand,
South Africa quickly and publicly promised to forfeit US$7.2 million United
States military aid rather than give in to the demand to exempt American
military personnel from prosecution in the International Criminal Court. On
the other hand, the government accepted a range of conditions attached to
ODA that have proved problematic (for example, in respect of channelling of
funds, decentralisation and use of foreign consultants).
Official aid to South Africa: looking through the fog
The lack of a comprehensive framework to monitor ODA to South Africa up
to 2003 poses problems in terms of quantifying the development assistance
received since 1994. The Reconstruction and Development Programme (RDP)
Fund is one of the main tools for managing ODA but it is used to channel only
the grant portion of total ODA, and does not reflect loans or technical assistance.
In addition, much official aid is still channelled directly to government

Free
dow
nloa
d fr
om w
ww
.hsr
cpre
ss.a
c.za
Foreign donor Funding since 1994 249
departments and to NGOs. The agreements between individual donors and
some recipients (for example direct funding to NGOs, and sometimes to
parastatals) do not involve, and are not monitored by, government.
The Development Cooperation Report for South Africa (IOD 2000)
found numerous problems trying to quantify ODA, including inaccurate
data capturing, problems emanating from currency conversion, and poor
responses from donor organisations. The report found there was no single
organisation with authoritative knowledge of the total volume of ODA to
South Africa. Although the International Development Cooperation (IDC)
unit within the South African National Treasury has since produced a
policy framework for managing ODA (National Treasury 2003a), this is still
the case. There are major discrepancies in estimates of ODA. The reasons
include different means of calculating based on different categories of aid
(grants, in-kind assistance and loans), different reporting requirements,
multiple channels of ODA, different reporting periods and project/funding
cycles, cumulative rollovers of funding and currency fluctuations. The
increasing influx of donor funding for HIV/AIDS has further complicated the
picture. The national Department of Health (DOH) has developed a donor
matrix10 to monitor funding for health services, listing donor funds in terms
of commitments, disbursements, objectives, activities and implementing
bodies. This is, however, based on financial commitments, not allocations or
disbursements, and figures cover different periods, so it is difficult to track
and compare donor and government spending reliably (Ndlovu 2005).
The total ODA to the South African government, according to Treasury,
is currently around R1.7 billion a year, representing around 0.44 per cent
of the national Budget.11 Treasury estimates that ODA has accounted for 0.5
per cent to 1.5 per cent of the national Budget since 1998 (Marais interview),
compared to 2.2 to 2.5 per cent between 1994 and 1998.12 As a proportion
of GNP, ODA is even less significant (around 0.4 per cent at 2001). For the
five-year period 1994–99, Bratton and Landsberg (1999) reported that South
Africa’s main bilateral and multilateral donors gave more than US$6 billion
(around R36 billion or an average of R7.2 billion a year) in development

Free
dow
nloa
d fr
om w
ww
.hsr
cpre
ss.a
c.za
250 giving and solidarity
cooperation. This included grants and loans to the government (loans
accounted for about a third of the total) and direct grants to NGOs. The
Department of Foreign Affairs estimated that the total ODA (channelled
through government) during that period was R20 billion (DFA 2003). During
the late transition period (1997–2000), aid flows fell significantly (see FIGURe
7.2). During that period, South Africa received about US$300 million (R1.8
billion) a year. For the financial year 2000/01, ODA to South Africa increased
to US$428.5 million (R2.5 billion) and by 2002/03 it was down to about
US$200 million (R1.2 billion) per year, although the country was receiving
ODA from more than 30 bilateral and multilateral foreign donors.13
The grant portion of ODA to government goes through the RDP
Fund. The volume of ODA received through the RDP Fund in 2001–02
was R979 million. For the year 2002–03, it rose to R1 143 million and for
2003–04, it fell to R1 088 million. The difference in estimated flows and
the financial statements for ODA is partly explained by the fact that technical
Figure 7.2 Fluctuation in aid flows (R millions)
0
1 000
2 000
3 000
4 000
5 000
6 000
7 000
8 000
2004200119971994
R m
illio
n
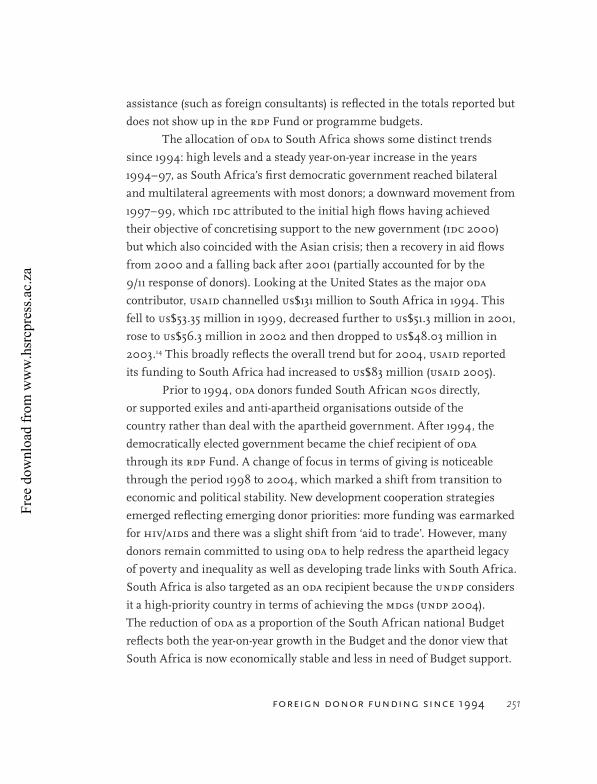
Free
dow
nloa
d fr
om w
ww
.hsr
cpre
ss.a
c.za
Foreign donor Funding since 1994 251
assistance (such as foreign consultants) is reflected in the totals reported but
does not show up in the RDP Fund or programme budgets.
The allocation of ODA to South Africa shows some distinct trends
since 1994: high levels and a steady year-on-year increase in the years
1994–97, as South Africa’s first democratic government reached bilateral
and multilateral agreements with most donors; a downward movement from
1997–99, which IDC attributed to the initial high flows having achieved
their objective of concretising support to the new government (IDC 2000)
but which also coincided with the Asian crisis; then a recovery in aid flows
from 2000 and a falling back after 2001 (partially accounted for by the
9/11 response of donors). Looking at the United States as the major ODA
contributor, USAID channelled US$131 million to South Africa in 1994. This
fell to US$53.35 million in 1999, decreased further to US$51.3 million in 2001,
rose to US$56.3 million in 2002 and then dropped to US$48.03 million in
2003.14 This broadly reflects the overall trend but for 2004, USAID reported
its funding to South Africa had increased to US$83 million (USAID 2005).
Prior to 1994, ODA donors funded South African NGOs directly,
or supported exiles and anti-apartheid organisations outside of the
country rather than deal with the apartheid government. After 1994, the
democratically elected government became the chief recipient of ODA
through its RDP Fund. A change of focus in terms of giving is noticeable
through the period 1998 to 2004, which marked a shift from transition to
economic and political stability. New development cooperation strategies
emerged reflecting emerging donor priorities: more funding was earmarked
for HIV/AIDS and there was a slight shift from ‘aid to trade’. However, many
donors remain committed to using ODA to help redress the apartheid legacy
of poverty and inequality as well as developing trade links with South Africa.
South Africa is also targeted as an ODA recipient because the UNDP considers
it a high-priority country in terms of achieving the MDGs (UNDP 2004).
The reduction of ODA as a proportion of the South African national Budget
reflects both the year-on-year growth in the Budget and the donor view that
South Africa is now economically stable and less in need of Budget support.
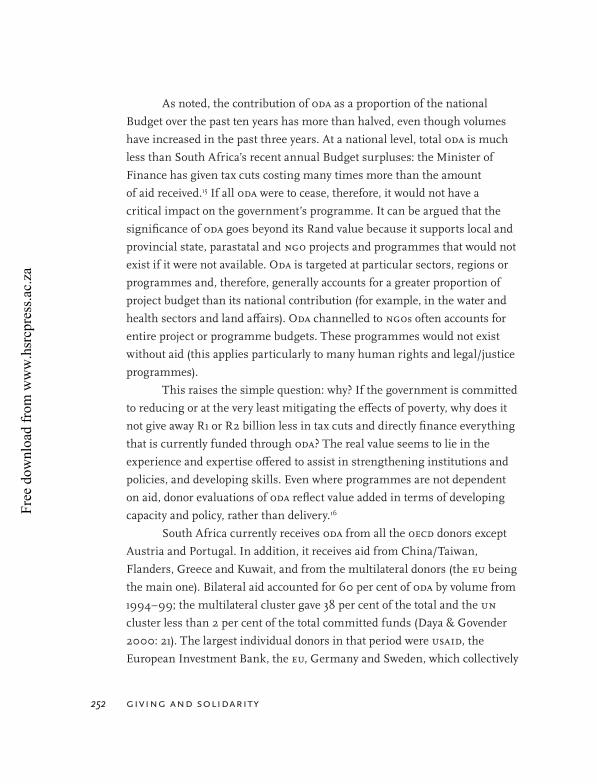
Free
dow
nloa
d fr
om w
ww
.hsr
cpre
ss.a
c.za
252 giving and solidarity
As noted, the contribution of ODA as a proportion of the national
Budget over the past ten years has more than halved, even though volumes
have increased in the past three years. At a national level, total ODA is much
less than South Africa’s recent annual Budget surpluses: the Minister of
Finance has given tax cuts costing many times more than the amount
of aid received.15 If all ODA were to cease, therefore, it would not have a
critical impact on the government’s programme. It can be argued that the
significance of ODA goes beyond its Rand value because it supports local and
provincial state, parastatal and NGO projects and programmes that would not
exist if it were not available. ODA is targeted at particular sectors, regions or
programmes and, therefore, generally accounts for a greater proportion of
project budget than its national contribution (for example, in the water and
health sectors and land affairs). ODA channelled to NGOs often accounts for
entire project or programme budgets. These programmes would not exist
without aid (this applies particularly to many human rights and legal/justice
programmes).
This raises the simple question: why? If the government is committed
to reducing or at the very least mitigating the effects of poverty, why does it
not give away R1 or R2 billion less in tax cuts and directly finance everything
that is currently funded through ODA? The real value seems to lie in the
experience and expertise offered to assist in strengthening institutions and
policies, and developing skills. Even where programmes are not dependent
on aid, donor evaluations of ODA reflect value added in terms of developing
capacity and policy, rather than delivery.16
South Africa currently receives ODA from all the OeCD donors except
Austria and Portugal. In addition, it receives aid from China/Taiwan,
Flanders, Greece and Kuwait, and from the multilateral donors (the eU being
the main one). Bilateral aid accounted for 60 per cent of ODA by volume from
1994–99; the multilateral cluster gave 38 per cent of the total and the UN
cluster less than 2 per cent of the total committed funds (Daya & Govender
2000: 21). The largest individual donors in that period were USAID, the
European Investment Bank, the eU, Germany and Sweden, which collectively
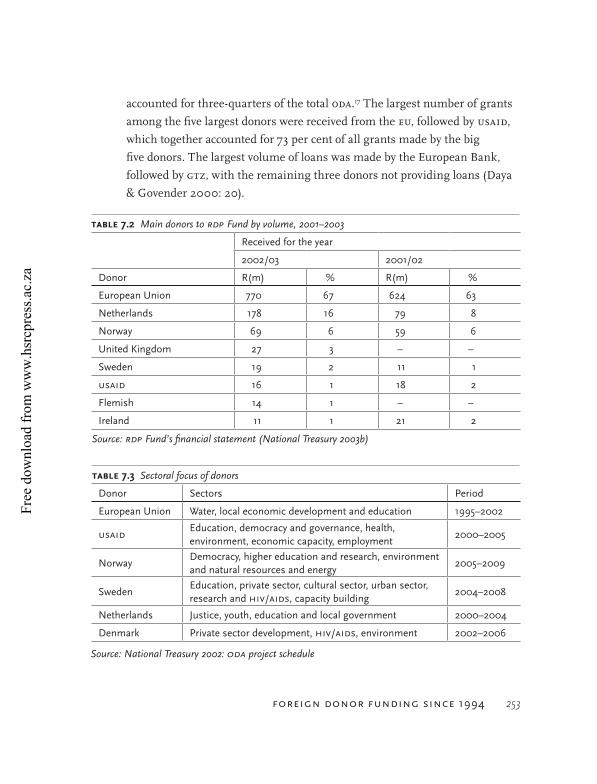
Free
dow
nloa
d fr
om w
ww
.hsr
cpre
ss.a
c.za
Foreign donor Funding since 1994 253
accounted for three-quarters of the total ODA.17 The largest number of grants
among the five largest donors were received from the eU, followed by USAID,
which together accounted for 73 per cent of all grants made by the big
five donors. The largest volume of loans was made by the European Bank,
followed by GTZ, with the remaining three donors not providing loans (Daya
& Govender 2000: 20).
Received for the year
2002/03 2001/02
Donor R(m) % R(m) %
European Union 770 67 624 63
Netherlands 178 16 79 8
Norway 69 6 59 6
United Kingdom 27 3 – –
Sweden 19 2 11 1
usaid 16 1 18 2
Flemish 14 1 – –
Ireland 11 1 21 2
Table 7.2 Main donors to RDP Fund by volume, 2001–2003
Source: RDP Fund’s financial statement (National Treasury 2003b)
Donor Sectors Period
European Union Water, local economic development and education 1995–2002
usaidEducation, democracy and governance, health, environment, economic capacity, employment
2000–2005
NorwayDemocracy, higher education and research, environment and natural resources and energy
2005–2009
SwedenEducation, private sector, cultural sector, urban sector, research and Hiv/aids, capacity building
2004–2008
Netherlands Justice, youth, education and local government 2000–2004
Denmark Private sector development, Hiv/aids, environment 2002–2006
Table 7.3 Sectoral focus of donors
Source: National Treasury 2002: ODA project schedule
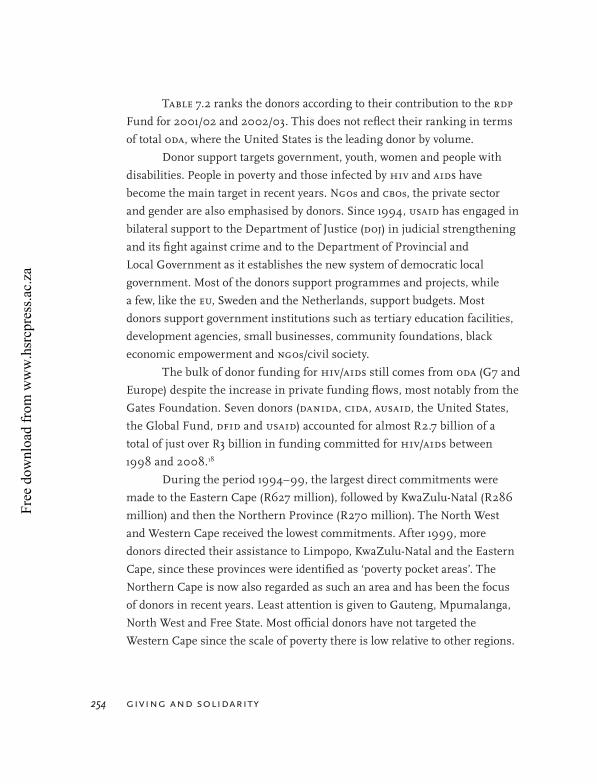
Free
dow
nloa
d fr
om w
ww
.hsr
cpre
ss.a
c.za
254 giving and solidarity
TABle 7.2 ranks the donors according to their contribution to the RDP
Fund for 2001/02 and 2002/03. This does not reflect their ranking in terms
of total ODA, where the United States is the leading donor by volume.
Donor support targets government, youth, women and people with
disabilities. People in poverty and those infected by HIV and AIDS have
become the main target in recent years. NGOs and CBOs, the private sector
and gender are also emphasised by donors. Since 1994, USAID has engaged in
bilateral support to the Department of Justice (DOJ) in judicial strengthening
and its fight against crime and to the Department of Provincial and
Local Government as it establishes the new system of democratic local
government. Most of the donors support programmes and projects, while
a few, like the eU, Sweden and the Netherlands, support budgets. Most
donors support government institutions such as tertiary education facilities,
development agencies, small businesses, community foundations, black
economic empowerment and NGOs/civil society.
The bulk of donor funding for HIV/AIDS still comes from ODA (G7 and
Europe) despite the increase in private funding flows, most notably from the
Gates Foundation. Seven donors (DANIDA, CIDA, AUSAID, the United States,
the Global Fund, DFID and USAID) accounted for almost R2.7 billion of a
total of just over R3 billion in funding committed for HIV/AIDS between
1998 and 2008.18
During the period 1994–99, the largest direct commitments were
made to the Eastern Cape (R627 million), followed by KwaZulu-Natal (R286
million) and then the Northern Province (R270 million). The North West
and Western Cape received the lowest commitments. After 1999, more
donors directed their assistance to Limpopo, KwaZulu-Natal and the Eastern
Cape, since these provinces were identified as ‘poverty pocket areas’. The
Northern Cape is now also regarded as such an area and has been the focus
of donors in recent years. Least attention is given to Gauteng, Mpumalanga,
North West and Free State. Most official donors have not targeted the
Western Cape since the scale of poverty there is low relative to other regions.

Free
dow
nloa
d fr
om w
ww
.hsr
cpre
ss.a
c.za
Foreign donor Funding since 1994 255
Why do donors give to South Africa?
Although South Africa is a middle-income country, its Human Development
Profile qualifies it to be a recipient of aid. It ranks low in terms of social
indicators (life expectancy, health, education, safe water, etc.) and among
the highest in terms of income inequality and unequal access to services
(UNDP 2004). Given its wealth, South Africa could afford to feed, house,
educate and provide healthcare for all its citizens if that wealth were more
equitably distributed. While poverty and inequality are cited by donors as
criteria for accessing aid, these same donors are generally supportive of a
macroeconomic policy that focuses on growth-driven job creation rather than
redistribution.
As pertinent as the question ‘Why do donors give to South Africa?’
is the question ‘Why does South Africa accept aid?’ Given that ODA accounts
for such a small proportion of the national Budget, any impact assessment
of aid to South Africa would need to weigh its value in terms of indicators
such as international relations and diplomacy, policy development, terms of
trade and investment, and political sphere of influence. Fundamental to any
country’s access to aid is its capacity and readiness to meet donor criteria.
Human rights, democracy and ‘good governance’ (including economic and
institutional reforms) are key to enticing donor funding to South Africa.
Entrenching South Africa as a stabilising and supportive presence in the
SADC region is also one of the driving motives of donors (Pather interview).
Beyond financial management and reporting requirements,
conditions are largely related to donors’ strategic objectives and political/
ideological outlook. Good governance is one of the more common
requirements, though its meaning differs from donor to donor. Sound
financial management, track record, capacity and poverty reduction
strategies are usually prerequisites. South Africa’s relationship with the
United States provides an example of tensions relating to the conditions
and criteria for giving. Before and after the transition, USAID consistently
emphasised the strengthening of civil society as the centrepiece of open and
Free
dow
nloa
d fr
om w
ww
.hsr
cpre
ss.a
c.za
256 giving and solidarity
accountable government. Its aid programme included grants to independent
watchdog organisations, such as the IDASA and the South African Institute
for Race Relations, which have challenged aspects of the government’s record
on delivering services, protecting minority rights and combating nepotism
and corruption (Bratton & Landsberg 1999).
The eU, DFID and Flanders attach conditions relating to economic
policy, good governance, human rights, security, gender equity and
environmental protection. Decentralisation of decision-making and
involvement of civil society in planning and programming are also common
conditions. In providing budget support to the Masibambane programme,
the eU set a precondition that 25 per cent of funding should go to NGOs via
the programme. The eU saw this as promoting accountability but it also
caused tensions between government and NGOs, and between larger NGOS
and CBOs (Galvin & Habib 2003).
The widespread use of aid conditionality by donors to determine
developing country economic policy (historically through structural
adjustment programmes and more recently through nominally locally
‘owned’ poverty reduction strategies, and the ignominious role of
conditionality related to debt) has driven the perception that aid is of net
benefit to the donor. Major donors state that it is a precondition of their ODA
that it should be aligned with recipient country government priorities and
policies. In the case of South Africa, such policies are clearly not determined
by donors. One of the sets of conditionalities that has most affected South
Africa has been the requirement to use foreign expertise or technical
assistance. Tensions have been most explicit with respect to German aid, a
large portion of which is made up of technical assistance.
USAID, the eU, and Japan all have ‘tied aid’ components to their ODA.
Both Japan and USAID support South Africa to ensure that it successfully
completes its transformation to an open, market-based economy.19 Japanese
aid is driven more overtly by economic considerations, in contrast to the
political concerns that motivate American economic assistance.20 As with

Free
dow
nloa
d fr
om w
ww
.hsr
cpre
ss.a
c.za
Foreign donor Funding since 1994 257
the eU, the Japanese government’s primary objective is to improve the ability
of African nations to buy its exports, while enhancing its prospects for
obtaining raw materials and natural resources that African nations possess.21
A trade-off between aid and trade relations is evident. Part of the
agreement between the eU and South Africa is that the latter has to purchase
40 per cent of its imports from the eU. The eU remains South Africa’s most
important trading partner, and in 2002 accounted for approximately 40 per
cent of imports to and 30 per cent of exports from South Africa (eU 2002: 4).
Denmark promised to follow suit but in a different way. The Danish embassy
aims at identifying business opportunities or trade ties with South Africa in
the next few years rather than granting ODA (Spanner interview).
ODA comes in the form of grants, technical assistance and loans.
According to the 2002 ODA project schedule drawn up by Treasury, the
largest number of donors (9) prefer to give ODA as combined grants
and technical assistance; Canada gives all its aid this way. A significant
number (7) give only technical assistance; the largest of these is Australia
and four of them are multilateral donors. The United Kingdom divides its
ODA fairly evenly between mixed grants/technical assistance and technical
assistance only, and seven bilateral donors give all or most of their aid as
grants. These include small donors such as Belgium and Greece, as well as
bigger donors such as Spain, Ireland and the Netherlands. Flanders splits
its aid between mixed grants/technical assistance, technical assistance only
and grants only. Only three donors – Kuwait, the European Investment Bank
and the World Bank – gave loans in the period covered by the schedule. Japan
gives more technical assistance than grants. Between 1999 and 2001, almost
half of Japanese ODA was technical assistance compared to 42 per cent for
grants (Japan Ministry of Foreign Affairs 2002).
According to the Reality of Aid 2004 report, most beneficiaries of
technical assistance were experts from donor countries rather than the stated
ODA recipients, so-called ‘boomerang aid’ (ROA 2004). It has been estimated
that nearly one-third of global ODA goes to consultants (The Observer 29 May
2005). The eU has challenged South Africa’s preference for local people to
Free
dow
nloa
d fr
om w
ww
.hsr
cpre
ss.a
c.za
258 giving and solidarity
provide the technical assistance on donor projects. However, since most
donors give both grants and technical assistance and the proportions are not
easily established, the question of who ‘owns’ ODA, both in terms of access to
resources and control over how they are spent, is very fraught.
The management of ODA
ODA goes directly to government departments, parastatals and NGOs.
To date, only government-to-government ODA, in the form of grants
channelled through the RDP Fund, has been systematically monitored.
For the first time, in 2002, the IDC drew up a comprehensive project
schedule for ODA to South Africa that shows which donors were supporting
projects in which sectors. It shows the monetary value of the aid, the type
of support (whether a grant, technical assistance or both), the time frame
for the projects and their status. It details the implementing agency and
the funding channel for each project (for example, it might be that the
implementing agency is the DOJ but the work is subcontracted to an NGO
and the money is paid directly to that NGO). The schedule also shows
whether the project is for a specific province. A total of 1 050 projects were
documented in the 2002 schedule – 23 bilateral and seven multilateral
donors supported these projects.
While the bulk of ODA funding goes directly to the spending agencies,
the IDC uses the RDP account because the programme serves as a vehicle for
the government’s efforts to fight poverty, create jobs, redress inequalities and
so on (Naidoo interview). The schedule provides the most comprehensive
data available on aid flows into South Africa. However, there are significant
gaps with regard to time frames and actual amounts of funding. Most donor
currencies were not converted into Rands and the fall in the Rand from
1997 until 2002 makes it difficult to give actual figures. Since 2003, there
has been a policy framework, which provides a mechanism for tracking all
ODA flows more accurately. Treasury has started to ‘invite’ donors to provide

Free
dow
nloa
d fr
om w
ww
.hsr
cpre
ss.a
c.za
Foreign donor Funding since 1994 259
information on their support to NGOs and any such information will be
documented but there is no requirement to monitor funding to civil society.
The National Treasury is responsible for managing donor funding,
while the Department of Foreign Affairs ensures that ODA is aligned with
South Africa’s foreign policy and manages the overall relationship with the
relevant donor. Departments or spending agencies entrusted with managing
donor funds have to report their expenditures to the National Treasury.
While Treasury states that South Africa takes the lead role in determining
the channels of giving, the role of some donors in terms of ODA management
is not clear. Some donors, such as Japan and Canada, are directly involved
in the management of ODA. Most donors have disbursed less ODA than they
committed. Throughout the period from 1994 to 2004, the gap between
commitments and disbursements has grown. National Treasury attributes
this to donor procedures (Naidoo interview), while Chris Landsberg
maintains that the South African government is largely responsible for the
delays in the release of aid (Landsberg interview). In either event, clashes
between foreign and local procedures have emerged.
The National Treasury determines the procedures for the monitoring
of ODA in South Africa (Naidoo interview). It normally invites donors to
participate in workshops and meetings to discuss the monitoring and
management of ODA. Procedures for managing resources are in line with
government policies. Each department or spending agency has its own
reporting system and style of management, but they use government policies
as a guideline for their activities.
Many donors report that they have experienced corruption or
mismanagement of funds but decline to identify the culprits. This reticence
might be partly because donors are responsible for monitoring or overseeing
expenditure (Marais interview). It is argued that, rather than being deliberate
mismanagement, many spending agencies have internal capacity problems
that make it difficult to manage funds (Pather interview). However, the lack
of coherence and transparency in donors’ own disbursement and reporting
requirements exacerbates these capacity problems. In the case of misspent

Free
dow
nloa
d fr
om w
ww
.hsr
cpre
ss.a
c.za
260 giving and solidarity
or unreported funds, most donors reclaim their money; in terms of unspent
funds, some require funding to be sent back and others extend the time
frame, for example, the eU and Sweden. Few donors, of whom Japan is a
notable example, say they have never experienced mismanagement of funds.
Japan’s task-team approach to managing projects and programmes seems to
be effective – alongside their unexpected visits (Matsui interview).
The RDP Fund acts as a clearing house for money donated to the South
African government by foreign governments for its social and economic
development programmes. The annual financial statements of the RDP Fund
show that despite a 71 per cent increase in disbursements by the Fund, to
R1.343 billion, R889 million in accumulated cash remains on its books.
The Fund statement also shows refunds to donors of R79 million (8%) in
2002, compared to R40 million (3.6%) in 2003 and R66 million (6%) in
2004. This is due to capacity problems, which affect departmental spending
of government funds in general, not just ODA (National Treasury 2003a,
2003b). More than R40 million in aid money has been returned to European
governments that donated it.
The specific reason cited for the unspent money was delayed requests
for funding by the various spending agencies. Another cause of unspent
funds is unrealistic time frames. Financial statements are incomplete
and inaccurate in relation to the donations received. Treasury cites donor
non-compliance with the ODA guidelines as the reason for this problem. The
Departments of Trade and Industry, Housing and Justice were most efficient
at drawing on Norwegian funding; the Departments of Water Affairs and
Forestry, Environmental Affairs and Education had the biggest accumulated
balances at the time of writing, reportedly due to capacity problems. In
2002/03, the Department of Education received R136 million through the
RDP Fund, but its accumulated balance increased from R194 million to
R213 million. This reflects the keenness of donors to fund large numbers of
projects in this sector and the difficulties of the department in implementing
them.

Free
dow
nloa
d fr
om w
ww
.hsr
cpre
ss.a
c.za
Foreign donor Funding since 1994 261
Most donors do not have the capacity to measure the impact of
their assistance directly. Many rely on meetings, and quarterly, yearly and
annual reports, while a few, including the Japanese government, have task
teams to conduct follow-up research. Some donors, such as Canada, cited
capacity problems and understaffing in this regard, while some contract
independent research institutions (such as the HSRC and STATS SA) to conduct
monitoring for them. The reliance of donors on a variety of monitoring
and reporting mechanisms and time frames, operated through a range of
institutions and consultants, means there is not a very coherent approach
to measuring impact. The lack of a comprehensive picture of what ODA has
achieved or failed to achieve in the past decade is problematic in the light of
the impending shift of donors from aid to business relations in the next few
years.
USAID South Africa undertakes ongoing performance monitoring and
evaluation jointly with partners. The eU conducts full evaluations of its aid
to South Africa, which it uses as the basis for shaping future partnerships.
Some donors, such as DFID and the Netherlands, finance local evaluations of
their development cooperation as part of their bilateral ODA (Adams 2000).
Norway conducts joint reviews of its development cooperation with South
Africa. The South African government also commissions its own evaluations
of donors’ evaluations through the IDC.
The use of different monitoring and evaluation system, and reporting
formats, and the inflexibility of standard reporting frameworks have long
been identified as problematic. Monitoring and evaluation requirements
tend to be highly quantitative, focused on completion of projects and proper
financial accounting but with less attention paid to qualitative outcomes.
This is particularly problematic in terms of assessing impact on poverty
or development. While many evaluations highlight lessons learnt from a
process perspective, analysis of benefits to target groups in terms of quality
of life has a lower profile.

Free
dow
nloa
d fr
om w
ww
.hsr
cpre
ss.a
c.za
262 giving and solidarity
Private foundation giving: the global context
There are tens of thousands of foreign-based private foundations, family
trusts, faith-based grantmakers and international NGOs (INGOs), based
mainly in the United States, Canada, Europe and Australia – which are
making grants and/or running programmes in their home countries and
in the ‘developing’ world. There are increasing numbers of philanthropy
institutes originating in developing countries (such as India, Brazil and
Mexico), which operate on a regional basis. Their grantmaking covers the
whole spectrum of human activity, from promotion of democracy and
human rights to social development in health, education and welfare,
sport and culture, to environmental protection, business development and
information technology.
There are an estimated 62 000 grantmaking foundations in
the United States alone (Foundation Center 2003) – just over 1 000 of
those account for three-quarters of all international giving by American
foundations. In 2002, total American foundation giving for international
programmes worldwide was US$3.1 billion. That was almost double what they
gave in 1998 (76 per cent adjusted for inflation) but a 5 per cent decrease on
2001, when American foundation giving for international programmes was
US$3.3 billion (over the same period, support for American programmes
declined by only 0.7 per cent) (Council on Foundations & Foundation Center
2004). The 9/11 attacks were a factor and the 2002 economic downturn
especially hit the large endowed foundations that provide most of the
international support. The Mott Foundation lost a third of its assets (depleted
from US$3 billion to under US$2 billion). However, private foundations have
tended to be consistent in their support for particular countries or sectors,
changing their patterns of giving for strategic rather than purely economic
reasons. The United States International Grantmaking website notes
that an increasing number of American foundations are beginning to
consider funding activities outside the United States but that such potential
grantmakers are inhibited by new American laws governing philanthropy.22

Free
dow
nloa
d fr
om w
ww
.hsr
cpre
ss.a
c.za
Foreign donor Funding since 1994 263
The private foreign contribution to all developing countries is a
fraction of the philanthropic resources dispersed within donor countries.
During the 1990s, international giving accounted for only 10–12 per cent of
all American foundation giving. There are many huge private foundations
and trusts that only make grants within the United States. The Heinz
Foundation is one. Another is the Starr Foundation, founded by the head of
the insurance giant, American International Group. After the 9/11 attacks,
American charities alone raised US$3 billion to help the victims.23
Overall, international giving by private foundations increased rapidly in
the late 1990s, parallel to an increase in official ODA. The most rapid growth, in
terms of programme areas, within an overall 360 per cent rise in international
grantmaking by American foundations from 1998 to 2003, was in funding
for health and family planning (Buchanan 2004). In fact, that is less a
trend than a phenomenon (see discussion of the Gates Foundation below).
Following the 9/11 attack on the United States in 2001, international official
aid volumes started to decrease and private giving (especially from American-
based foundations) also declined (Renz & Atienza 2003). In 2001, of the top
1 000 American funders, 636 gave to international programmes. The larger
American foundations allocated, on average, 15 per cent of their overall budgets
to international programmes. However, this was skewed by Gates, which
allocated 70 per cent of its giving to international programmes. Only ten other
foundations created since 1990 gave in excess of US$5 million internationally in
2001 (Buchanan 2004). One commentator noted that ‘If you were to factor the
Gates money out, it [the funding trend] would probably look flat as opposed to a
modest increase in the last half decade or so’ (Gaberman 2004: 25).
The Bill and Melinda Gates Foundation became the largest
American foundation in 1999, and has retained that status. In 2000, the
Gates Foundation topped the list of American foundations making grants
outside of the United States, awarding 34 grants totalling US$317 928 183
(Foundation Center 2000). The much longer-established Ford Foundation
was second, awarding 1 312 grants outside of the United States, to a value
of US$204 637 148. The Ford Foundation increased its total international
Free
dow
nloa
d fr
om w
ww
.hsr
cpre
ss.a
c.za
264 giving and solidarity
programme spending from US$384 million in 1998 to US$616 million in
2001. Meanwhile, the Gates Foundation’s total international spending
increased a hundredfold – from US$5.5 million in 1998 to US$528 million in
2001.
Private foreign foundation and INGO support to South Africa
More than 70 foreign-based private foundations and almost 60 faith-based
organisations and INGOs with a poverty/development focus are currently
active in South Africa.24 These include many foundations/INGOs that receive
official and corporate funds, so their grantmaking constitutes ‘private’ funds
but with a government, corporate or individual component. There are also
special funds that combine official, corporate and private funds, such as the
Global Fund, which is included in the study.
A major distinction between ODA and private external funding is that
most official donors did not channel aid to South Africa under apartheid,
in order to avoid propping up the racist government. Many private donors,
however, assisted NGOs that were resisting and undermining the regime
and supporting welfare and developmental services that the state failed to
provide to the black population. They operate in various ways. Some are
foreign-based bodies with no South African presence (for example, the Gates
Foundation). Others have field offices and a few even have headquarters in
South Africa. Some are grantmakers, some both make grants and support
specific projects while others run their own programmes. Some provide only
volunteers; some professional services and material resources; some run
exchange programmes. In general the international NGOs are operational,
even if they are grantmaking. They may have project partners in the same
way as private foundations (such as Oxfam) or they may provide volunteer
support or professional expertise and material support (for example,
Médecins Sans Frontiers).
Aside from the different areas of geographic and sectoral focus,
and the different criteria for funding, all the foundations have their own

Free
dow
nloa
d fr
om w
ww
.hsr
cpre
ss.a
c.za
Foreign donor Funding since 1994 265
application procedures. In the past, foundations would publish their
criteria and grantseekers could send in individual applications providing
the information stipulated. More recently, grantmakers have accepted
applications according to deadlines tied to their funding cycles. Increasingly,
the trend is to issue calls for proposals according to standardised terms of
reference, and not to accept any applications that are not submitted strictly to
the required format or outside of the call. Funding to rural and community-
based organisations has always been hindered by their lack of information
and knowledge about funding opportunities. Many such organisations
rely on personal contacts or referrals to identify donors. They still lack the
resources – such as computers with internet facilities – and the expertise
needed to respond to published calls for proposals.
In general, the most popular sectors for support since 1994 have been
education, development, technology/communications, capacity building,
environment, AIDS, health, culture, justice, women, children, peace/conflict
resolution, poverty, and civil society. Looking at individual donors, the
prioritisation of HIV/AIDS becomes apparent from about 1998 and again
the picture is skewed by the Gates Foundation’s investment in HIV/AIDS
programming. From 2001, support for HIV/AIDS initiatives was one of the top
priorities but was reported within an overall focus on health (29 per cent of
total international giving, up from 15 per cent in 1998), followed by education
and international development. Education consistently ranked first by far,
even up to 2003/04.
It is not possible to quantify accurately the volume of international
private aid flows to South Africa on an annual basis. This is because not
all grantmakers publish their giving by country – some report on regions
or programmes; many donors fund organisations on a sectoral basis and
they in turn support activities in Africa but not always in South Africa; and
grants may run over more than one financial year. Also, there is some giving
between private donors that makes it difficult to track funding in a linear
fashion from a specific donor to a specific beneficiary. For example, among
its grants in 2003, the Gates Foundation made a grant of US$9 500 000 over

Free
dow
nloa
d fr
om w
ww
.hsr
cpre
ss.a
c.za
266 giving and solidarity
five years to support the Global Health Council’s efforts to advocate and
network for global health issues. A proportion of that may have ended up in
South Africa, or may contribute to advances in health that benefit the local
people, but the reporting methods do not make this clear. Gates also gave the
Henry J Kaiser Family Foundation US$2 132 425 over two years ‘to support a
range of efforts to improve quality and quantity of global health reporting
in the US and abroad’ (Bill and Melinda Gates Foundation 2003b). The
combined contribution of the top foundations in South Africa for 2003 gives
a relative picture of the amount of international private funding allocated
to the country compared to ODA, corporate funding and state spending.
This shows that for 2003/04, foreign private foundation funding (that is,
excluding INGOs) was at least R615 million (see TABle 7.4). This amounted to
over a half of the total of ODA, at around R1.2 billion for the same year.
Table 7.4 Funding to South Africa by the largest private foreign donors for 2003/04
Donor Million Rand
Kaiser Family Foundation 195.00a
Atlantic Philanthropies 124.50
Gates Foundation 114.00
Ford Foundation 78.00
Open Society Foundation for South Africa 47.70
Kellogg Foundation 21.40
Mott Foundation 17.97b
Bernard van Leer Foundation 7.22
Joseph Rowntree Charitable Trust 3.50
Rockefeller 3.40
Carnegie 2.25
Total 614.94
Notes: a This includes R75 million to loveLife, which has since become Kaiser’s main beneficiary in South Africa.b Note that the Mott Foundation’s volume is down from R27.22 million in 2002.Source: compiled from various sources including the foundations’ databases, the Mott Foundation Grant Database South Africa 2003, and an interview with Stephanie Jones, Grants Inquiry Administrator for the Gates Foundation who indicated a disbursement of $19 million.

Free
dow
nloa
d fr
om w
ww
.hsr
cpre
ss.a
c.za
Foreign donor Funding since 1994 267
The relative value of international funding, to CSOs in particular, varies
greatly depending on the type of funder and the situation of the beneficiary.
Overseas funding accounts for the entire budget of some organisations while
it supplements the core costs or supports specific projects of others. The
value behind the volume of funding needs to be further explored. Where an
organisation is dependent for funding on an international donor, there will be
the risk of it being ‘donor-driven’ and/or not being sustainable. At the same
time, where an established international donor is providing project or general
budget support to a small organisation, there is potential for that organisation
to access extensive knowledge, research and experience that may add value
to its longer-term strategic planning and programme design. But, again, this
needs to be evaluated. For example, international giving for HIV/AIDS in South
Africa has a very high profile but its direct impact at community level seems to
be very small. It has been estimated that 96 per cent of assistance to orphaned
and vulnerable children comes from kin and community, with only 4 per cent
from government and external sources (Richter 2005).
Private donors state many motives for giving to South Africa. Historically,
the motivation has been philanthropic in the broadest sense, including both
material support to victims of apartheid and financial/political support to the
liberation movements to challenge the apartheid regime. Most donor funding
during apartheid started out by targeting ‘poor and disadvantaged’ communities,
directly or through local organisations. Post-apartheid support has continued
this focus but with a commitment to strengthening institutions of the state
and civil society to address poverty alleviation and development. The growing
emphasis on HIV/AIDS has been framed in terms of the fact that the epidemic is
seriously undermining the developmental gains the country has made.
Although several of the larger donors were active in South Africa
before 1994, many private foundations and international NGOs chose to have
a presence in other African countries during the apartheid era, even if they
supported anti-apartheid campaigns (such as Oxfam, for example). There was
an influx of private foundations and INGOs after 1995, peaking in 1998. As
Smith and Bornstein (2001) point out, the profile of northern NGOs’ funding

Free
dow
nloa
d fr
om w
ww
.hsr
cpre
ss.a
c.za
268 giving and solidarity
programmes in South Africa tends to reflect the historic relationships
between South Africa and northern countries. The comparatively large
number of British and European agencies in South Africa reflects the
significance of the United Kingdom (DFID) and the eU as major donors to
South Africa. The number of Scandinavian agencies reflects the support of
these countries for the anti-apartheid liberation movement.
Patterns of giving to South Africa mirror the international agendas
of donors, but also the growing demand from the south for a partnership
approach to philanthropy, with priority shifting from welfarist/charity
approaches to ostensibly developmental funding. The headline issues over
the years have changed from general poverty/emergency relief to human
rights, gender equity, environmental protection, HIV/AIDS, citizenship and
democratic decentralisation. The bigger foundations tend to have broad
mission statements, focusing on global development, poverty relief, human
rights and justice, whereas the smaller donors tend to highlight narrower
sectors or target groups, where they will be able more clearly to demonstrate
that they are making a difference.
International private donors draw on a range of funding sources:
primarily trust funds; corporate investment; endowments; ODA; and
individual donations (from the general public and from individual
philanthropists). Most of the bigger foundations emerged from corporate
trusts. There are also foreign-based private foundations that emerged
from family trusts, which have been in existence longer than corporate
foundations. The Andrew Mellon Foundation was initially a family trust,
which was then turned into a foundation. Many smaller foundations have
emerged since the early 1990s.
INGOs are considered to be ‘independent’ and are categorised under
‘private’ giving. It has been argued that private funding means ‘privatised’
funding, since INGOs derive increasingly large proportions of their income
from governments. A report cited in the Economist says that by 1994, the
eU was channelling more than two-thirds of its emergency relief funds
through NGOs. It estimated that Oxfam received a quarter of its £98 million

Free
dow
nloa
d fr
om w
ww
.hsr
cpre
ss.a
c.za
Foreign donor Funding since 1994 269
(US$162 million) income in 1998 from the British government and the eU.
World Vision United States, ‘which boasts of being the world’s “largest
privately funded Christian relief and development organisation”, collected
$55 million’s worth of goods that year from the American government.
Medécins Sans Frontières, the winner of last year’s Nobel peace prize, gets
46 per cent of its income from government sources’ (Economist 29 January
2000). Research conducted by the Charities Aid Foundation for an NGO
umbrella body, BOND, revealed that 44 per cent of international NGOs claim
to be reliant on DFID for funding.25 Donors cite efficiency, decentralisation
and strengthening civil society as the reason for funding NGOs, while
southern partners see northern policy influence as the driving force. Donor
approaches to environmental protection and gender equality are examples of
areas where the motivation for public funding of INGOs (and acceptance of it
by these NGOs) is questioned.
The smaller donors tend to channel their resources, whether funds
or material aid, straight to the organisations they support in South Africa
and maintain direct contact with them. Bigger foundations do channel
resources directly but also make grants to other grantmakers. The use of
intermediaries is sometimes for logistical reasons, such as streamlining
administration and managing reporting more effectively. It also reflects
recognition of local knowledge of the sector and efforts to strengthen the
capacity of local grantmakers.
Information from interviews and from a literature survey shows
a difference in the kinds of giving between the larger foundations and
the smaller and more recently established ones. In summary: the largest
proportion of resources from the main foundations comes in the form of
grants, whereas material aid accounts for the greatest proportion of giving
by the smaller donors. The second largest proportion of support from the
main private donors is channelled via scholarships and bursaries, while
the second largest proportion of support from smaller donors comprises
human and technical resources. A significant proportion of giving from the
larger foundations is in the form of loans but the smaller foundations rarely

Free
dow
nloa
d fr
om w
ww
.hsr
cpre
ss.a
c.za
270 giving and solidarity
provide loans. Some of the larger private donors give grants to government
departments as well as to NGOs – for example, the Kaiser Family Foundation
has supported the Health Department to develop the public health system,
and the South African Parks Board at Skukuza is supported by the Mellon
Foundation.
International private foundations give funding to registered
organisations that have formalised constitutions and an active board of
directors/trustees, and can demonstrate a record of good governance, sound
financial management and sustainability – or at least clear potential and
a strategy to become sustainable. More recently, donors have looked for
evidence of transformation, requiring diversity tables to reflect growing
representation of black people and women on the boards and staff of non-
profit organisations, as well as a focus on black constituencies. The criteria
are, on the one hand, imperative for accountability and effective monitoring
of funds where the donor is remote from management and implementation.
On the other hand, they risk excluding smaller, newer CBOs that may be
doing quality work but do not have constituted boards, a track record or
audited statements.
All the main private donors have standardised M&e systems,
which typically include a requirement for narrative and financial reports
submitted according to set formats and deadlines. Where funding is given
in instalments, payment of each tranche is generally contingent upon
submission of satisfactory reports. The larger donors require quantitative
and qualitative indicators of delivery of service. Few donors report significant
resources remaining unspent by recipients. Where this happens, larger
donors are more likely to allow project partners to roll over funds, while
smaller private foundations tend to require their return.
Beneficiaries are generally expected to monitor themselves. While
most donors do make project visits, these tend to be annual or less frequent
and serve more to confirm the existence and functioning of projects rather
than assess their progress and quality. In an interview, Gerry Salole, Ford
Foundation southern Africa representative until mid-2005, said: ‘South
Free
dow
nloa
d fr
om w
ww
.hsr
cpre
ss.a
c.za
Foreign donor Funding since 1994 271
Africa is phenomenal in its proportion of people who don’t report well; we
don’t make new grants if they don’t report or they are late. Often, people have
done the work but seem to lose interest in reporting. The list of “expended
but not closed” projects is longer in South Africa than anywhere else in the
world’ (Salde interview).
Prospects for private giving
The three main themes emerging from the analysis of the international
funding climate and the role of foreign private giving in South Africa are:
◆ A willingness to continue supporting poverty alleviation and
development programmes, to strengthen democracy and reduce
inequality;
◆ A concern that South Africa should be able to mobilise local (public,
corporate and private) resources for both national and regional/
continental development;
◆ Recognition of the importance of consolidating and disseminating
information to grantseekers and grantmakers about funding f lows –
both to improve access to funding and to improve coherence.
While aid flows from foreign private agencies are much lower than official
flows, one of the major differences is that ODA constitutes a minute
proportion of state spending, while private foreign funding is the mainstay
of many non-profit organisations. Given that few NGOs have been able to
tap into local funds, until and unless there is an effective and efficient
mechanism for channelling donor funding to the non-profit sector, this
dependency (and unsustainability) is likely to continue. The demise of
Interfund is sobering in this regard: if a major grantmaker with a long
history and relatively broad funding base was unable to retain external
support or generate sufficient local support to replace foreign funding, how
will NGOs and CBOs fare?

Free
dow
nloa
d fr
om w
ww
.hsr
cpre
ss.a
c.za
272 giving and solidarity
There is still significant international private funding available to
support development and poverty alleviation in South Africa. Most of the
major donors expect to continue supporting South Africa in the medium
term. The major challenge is to bridge the gap between the tens of thousands
of unsupported CBOs delivering services to communities and households
and the plethora of foreign agencies wanting to target funds that will make
a difference at that level, but in a way that can be properly monitored and
contribute to broader development goals. Gerry Salole believes the road to
mobilising local resources to address local problems will be a long one, but
that the role of external resources needs to be more strategically planned and
managed:
The belief that outside funding is needed in this country is a joke.
South African corporate business must begin picking up the slack –
there are three Ferrari outlets and a Lamborghini outlet in Gauteng.
The dynamic between outside and local funding must change. Power
relations must change. Africans must say to other Africans ’get your
act together, produce your report on time, and be efficient’. Such a
scenario is not tomorrow – its years ahead. (Salole interview)
There is a need to address the lack of coordination of private donor funding
to the non-profit sector in a way that does not result in over-regulation by
the state. The upside of the current funding environment is that there is
space for autonomy and creativity on the part of donors and recipients. The
downside is that it is difficult to take full account of the role and potential
of the NGO sector, let alone to align NGO programmes with government
development priorities. As Christa Kuljian, former Director of the Mott
Foundation, says:
You don’t want government to regulate the entire spectrum of civil
society; you want space for social movements to develop around needs
that aren’t being addressed and you want CBOs to exist without having

Free
dow
nloa
d fr
om w
ww
.hsr
cpre
ss.a
c.za
Foreign donor Funding since 1994 273
to register with government. So departments of government have
to be able to find organisations that want to partner and non-profit
organisations have to be able to decide whether to accept government
funding. (Kuljian interview)
Efforts to improve networking among donors and between donors
and grantseekers are critically important in an era of growing, but
concentrated, private wealth and extensive poverty at community level.
Much of the information being generated remains beyond the reach of
smaller grantseekers. On the one hand, there is loveLife,26 funded to the
tune of hundreds of millions of Rands by the South African government,
international donors, local corporates and the lottery, to roll out HIV
prevention and teen health campaigns. On the other there are innumerable
CBOs working directly with people affected by HIV/AIDS, which have no idea
these funding agencies exist, let alone the means to approach them. Surely
this is an expression of the inequity in South Africa that no amount of
foreign-funded ‘capacity building’ can address. It requires a national strategy
to link local projects into information and support networks that will equip
them to source available funding.
Government is critical of NGOs that accept foreign funding, assuming
that CSOs are choosing foreign rather than available local funding, or that
foreign funding is supporting activities that are either unnecessary or
subversive. The suspicion of foreign-funded CSOs overlooks several important
aspects of the role of such funding. Firstly, within their areas of focus,
private foreign donors generally support organisations and projects whose
objectives are aligned with national development priorities. Secondly, private
foreign donors are often funding activities that the state supports in principle
but for which there are inadequate resources (for example, early childhood
development service provision). At the same time, foreign donors actively
encourage CSOs both to diversify and to localise their funding base. Thirdly,
private foreign donors are supporting CSOs that are engaged in legitimate
advocacy and protest, for which they would never get state or corporate

Free
dow
nloa
d fr
om w
ww
.hsr
cpre
ss.a
c.za
274 giving and solidarity
funding. This is not because the activities are intended to undermine
government but because they are upholding the constitutional rights of
citizens where these are being violated or neglected.
Conclusion
In 2003, Tanzania declared a four-month ‘mission holiday’, reportedly
telling donors to please stay away so that government officials could get some
work done (CGD 2004). This captures something of the external resources
dilemma. International aid is analogous to the office volunteer. If an
organisation is well resourced, has strong leadership, a clear vision, efficient
administrative and financial systems and is able to identify some specific
gaps, then an enthusiastic and well-intentioned intern from the other side of
the world can really add value. If, however, it is overwhelmed by challenges,
the arrival of a fresh-faced overseas volunteer who knows just how to solve
all the problems – and who needs a house, a 4x4, a stipend, three full-time
assistants and a monthly report for the sponsors – can be more trouble than
it’s worth. In summary, foreign aid may be ‘a good thing’ where it enhances
or supplements local endeavours but where its accommodation requires
the redirection and stretching of scarce resources, it may be help one can
do without. Both donors and recipients need to be clear about how an aid
relationship helps them reach their respective goals. If it’s about the money,
what is the real cost and benefit? If it’s about knowledge and expertise, what
difference does it make and how? It it’s about diplomacy and international
relations, who is setting the agenda? Impact assessment needs to go beyond
checking whether money was spent as intended and whether specific
projects delivered the planned outcomes. It needs to demonstrate how
external resources contribute to development and poverty reduction in ways
that would not otherwise be achievable.
Towards the end of the first term of office of the democratic
government, almost all of South Africa’s donors proposed exit strategies.

Free
dow
nloa
d fr
om w
ww
.hsr
cpre
ss.a
c.za
Foreign donor Funding since 1994 275
Some saw 1999 as a watershed year, during which power-sharing
arrangements would expire, second elections would be held, and Nelson
Mandela would step down from the presidency (Bratton & Landsberg 1999).
However, all the main donor countries remain involved in South Africa,
though some are becoming engaged in business-to-business relations.
Whether the move from ODA to foreign direct investment is of net benefit to
South Africa requires further investigation. Some of South Africa’s bilateral
aid relations that are on the brink of expiry may not be renewed. The central
argument for a decrease of donor funding is that South Africa’s economy and
its democracy have now been stabilised. Canada, for example, has stressed
its intention to fund other countries as South Africa steadily ‘graduates’ from
being a recipient (Pather interview). Japan also talks of South Africa having
graduated from being a donor-funded recipient (Matsui interview).
Given the growing income disparities in South Africa, the millions
of people living in absolute and chronic poverty, and the proportion of the
population that is excluded from the social and political economy of the
country and unable to access their basic rights, the notion that the country
‘no longer needs aid’ might simply provide a convenient cover for engaging
in business relations that benefit the former donor and perpetuate economic
relations that impoverish large sections of the population.27 Some donors
expect to continue providing ODA for poverty alleviation, democratisation
and human rights, and several have highlighted the need to fund the fight
against HIV/AIDS, with more than 6 million people infected in South Africa.
Since ODA assists the South African government in service delivery,
through capacity building and support for water, health, education and other
programmes, donor exit would affect the poorest sections of society unless
the government realigned the Budget accordingly (which it could do, for
example, through modest taxation). At present, aid is generally something
of a vicious circle, with ODA globally helping to mitigate the impact of
macroeconomic policies and onerous trade relations that the major donors
have pressed upon aid recipients. South Africa is one country that is in a
Free
dow
nloa
d fr
om w
ww
.hsr
cpre
ss.a
c.za
276 giving and solidarity
position to do without aid, making up any shortfall by budgeting for funded
projects, or adopting a more redistributive tax system (for example, through
a basic income grant). But this is unlikely to happen given government’s
existing political and socio-economic priorities, and its ideological leanings.
A dramatic decline in foreign donor funding, then, would under present
circumstances impact adversely on the most marginalised in South African
society.
Notes
1 At the Earth Summit in Rio in 1992, donors pledged US$2.5 billion, or an extra
4 per cent in aid. In fact, aid fell by 24 per cent in real terms between 1992 and
1997, reaching a low point of US$44.077 billion (Randel et al. 2004).
2 For an overview, see http://www.foreignpolicy.com/story/cms.php?story_
id=2540#1. Note that each country’s overall score on the CGD/FP Commitment
to Development Index is the average of its scores in seven categories. A
comprehensive explanation of the index’s methodology is available on the Center
for Global Development’s website at www.cgdev.org.
3 FP Online Journal May/June 2004: 1.
4 FP Online Journal May/June 2004: 1.
5 See www.usaid.gov/about_usaid/index.html.
6 See http://www.cdi.org/news/mrp/global-graph.pdf.
7 Uganda is cited as a prime example here. The country is lauded for its ‘locally
owned’ Poverty Reduction Strategy Paper, which qualifies it to become more
indebted to the World Bank and other donors. However, its record on corruption
is putting its relations with donors in jeopardy and, ironically, it is argued that
if it dealt with corruption, tax evasion and overspending on defence and public
administration, it would not need aid. See Andrew M Mwenda’s article, ‘Aid
Simply Supports Govt Incompetence, Corruption’ in The Monitor. Uganda.
6 March 2005.
8 Christian Aid (2005) recently estimated that trade liberalisation imposed
on Africa in the past 20 years as a condition of aid had cost the continent
US$272 billion, which was roughly equivalent to the total aid received during that
period.

Free
dow
nloa
d fr
om w
ww
.hsr
cpre
ss.a
c.za
Foreign donor Funding since 1994 277
9 Read on his behalf by his special adviser on Africa, Ibrahim Gambari, on
29 September 2003. Quoted in The Post (Lusaka). See http://allafrica.com/
stories/200309300640.html.
10 Funded by the United Nations Development Program and the United Nations
Theme Group on HIV and AIDS, cited in Ndlovu (2005).
11 The Treasury estimate includes all government-to-government grants, loans and
technical assistance but not direct funding to NGOs or parastatals (which it is not
able to estimate).
12 1.5 per cent of the national Budget (R386 billion) would be close to R6 billion,
which is the estimate for 2003/04 (Marais interview).
13 See http://www.sida.se/.
14 See http://www.sn.apc.org/usaidsa/budget.html.
15 R13.3 billion was given back in personal income tax cuts in the 2003/04 Budget –
a benefit that by definition excluded the millions of people living in poverty.
16 See evaluations of ODA to South Africa from the European Union and DFID, for
example.
17 However, this is based on an estimate of total ODA that is much lower than the
Bratton and Landsberg (1999) and the DFA figures.
18 R2,682 811 290 out of R3,095 870 204 according to the DOH Donor Matrix 2004,
cited in Ndlovu (2005).
19 See http//:www.usaid.gov/main.
20 See http//:www.usaid.gov/main.
21 See http//:www.usaid.gov/main.
22 See www.usig.org.
23 New York Times, quoted in PND news, 10 September 2004, http://fdncenter.
org/pnd/news/story.jhtml?id=79100002.
24 This aspect of the study was based on a database of international private
foundations and NGOs compiled using the SAGA list, the last available Prodder
directory, the USAID list, the membership lists of the Africa Grantmakers’ Affinity
Group, the BOND (British Overseas NGOs for Development) network, the United
States Council on Foundations and cross-checking with a range of databases
(for example, Synergos) and NGO networks to pick up the smaller and more
recently established private donors. Of an original list of more than 100 private
foundations listed as operating in South Africa, some 25 have either closed or were
not operating in the country during the period of the study.

Free
dow
nloa
d fr
om w
ww
.hsr
cpre
ss.a
c.za
278 giving and solidarity
25 Report released at the launch of BOND’s new Futures Programme on 28 April
2004.
26 The Global Fund approved two projects for loveLife, totalling US$12 million
(around R78 million), in its first round of funding. LoveLife receives a third of
its current annual budget from the South African government and most of the
balance from the Henry J Kaiser Family Foundation. It is also supported by the
Anglo American Chairman’s Fund, the South African National Lottery, the South
African Broadcasting Corporation, the Independent Newspaper Group and the
Vodacom Foundation. The Global Fund has since stopped its funding to loveLife.
27 See Christian Aid (2005) report on the impact of trade liberalisation on Africa.
References
Action Aid (2005) Real aid report 1: An agenda for making aid work. London: Action Aid
Adams M (2000) Evaluation of ODA to the land sector. In Development Co-operation
Report II: South Africa 1994–1999. Pretoria: National Treasury
Bill and Melinda Gates Foundation (2002) Audited Financial Statements 2002. KPMG
Bill and Melinda Gates Foundation (2003a) Audited Financial Statements 2003. KPMG
Bill and Melinda Gates Foundation (2003b) Gates Foundation grant highlights.
Accessed 2004. www.gatesfoundation.org/Grants/default.htm?showYear=2003
Bill and Melinda Gates Foundation (2003c) Responding to the needs of others. Annual
Report 2003. Seattle
Bratton M & Landsberg C (1999) From promise to delivery: Official assistance to South
Africa, 1994–1998. Johannesburg: Centre for Policy Studies
Buchanan R (2004) New study tracks US foundation giving trends. Alliance 9: 61
CGD (Center for Global Development) (2004) Ranking the rich 2004. Accessed 2004.
http://www.foreignpolicy.com/story/cms.php?story_id=2540#1
Christian Aid (2005) The economics of failure: The real cost of ‘free’ trade for poor
countries. A briefing paper. London: Christian Aid
Council on Foundations & Foundation Center (2004) International grantmaking
III: An update on U.S. foundation trends. 3rd ed. Washington, DC: The Council.
Accessed 2006. http://www.cof.org/files/Documents/International_Programs/
2004Publications/intlhlts.pdf

Free
dow
nloa
d fr
om w
ww
.hsr
cpre
ss.a
c.za
Foreign donor Funding since 1994 279
Daya P & Govender R (2000) ODA Database for the Development Cooperation Report II
for South Africa 1994–1999, Database and analysis for ODA to South Africa for the
period 1994–1999. International Organization Development
EU (European Union) (2002) Annual report, 2002. Delegation of European
Commission in South Africa
Foundation Center (2000) Top 50 U.S. foundations awarding grants outside the U.S.,
circa 1999. Accessed 2004. http://foundationcenter.org/findfunders/statistics/
pdf/03_fund_geo/1999/int_fdn_99.pdf
Foundation Center (2003) International grantmaking: Update, 2003. New York: The
Foundation Center
FP Online (Foreign Policy Online Journal 2004. Accessed 2004.
www.foreignpolicy.com/story/files/story2540.php
Gaberman B (2004) What would it take to really get global philanthropy going?
Alliance, 9: 25
Galvin M & Habib A (2003) The politics of decentralisation and donor funding in
South Africa’s rural water sector. Journal of Southern African Studies 29: 865–884
IOD (International Organisation Development) (2000) Development Cooperation Report
II for South Africa 1994–1999: Synthesis report. http://www.iod.uk.com
Japan Ministry of Foreign Affairs (2002) Official development assistance White Paper,
‘Strategy’ and ‘Reform’. Economic Cooperation Bureau.
Kapijimpanga O (2004) Governance and promotion of human rights in international
cooperation. In The reality of aid report 2004. Quezon City: Reality of Aid
National Treasury (Republic of South Africa) (2003a). Policy framework and procedural
guidelines for the management of ODA: Version 11: Final draft for submission to
Cabinet. September
National Treasury (2003b) Reconstruction and Development Programme Fund, Annual
Financial Statements
Ndlovu N (2005) An exploratory analysis of HIV and AIDS donor funding in South Africa.
Budget Brief 155. Cape Town: IDASA
Randel J, German T & Ewing D (Eds) (2004) The reality of aid. London: Zed Books
Renz L & Atienza J (2003) International grantmaking update. United States: The
Foundation Center
Richter L (2005) On scaling up households and schools as nodes of support for
orphaned and vulnerable children. Presentation at the Raising Africa’s Children
conference, Durban, September

Free
dow
nloa
d fr
om w
ww
.hsr
cpre
ss.a
c.za
280 giving and solidarity
ROA (Reality of Aid Network) (2004) Reality of Aid Report 2004. Accessed 2004.
http://www.realityofaid.org/
Roodman D (2004) The commitment to development index: 2004 edition. Washington:
Center for Global Development
Smith T & Bornstein L (2001) Northern NGOs in South Africa: programmes and
partnerships, Research Report No 46. Durban: University of Natal
UNDP (United Nations Development Program) (2004) Human development report,
2004: cultural liberty in today’s diverse world. New York: UNDP
USAID (2006) USAID primer: What we do and how we do it. Accessed 2006.
http://www.usaid.gov/about_usaid/primer.html
USAID (2005) USAID contribution to South Africa. Pretoria: USAID
USDS (United States Department of State and USAID) (2003) Strategic plan fiscal years
2004–2009. USDS and USAID. Publication 11084
Interviews
Kuljian, Christa, former Director, Mott Foundation, 8 October 2004
Landsberg, Chris, Centre for Policy Studies, 27 May 2004
Marais, Denise, Deputy Director, Programme Management, National Treasury,
29 June 2004
Matsui, Keiichi, First Secretary, Embassy of Japan, Pretoria, 24 May 2004
Naidoo, Sharmala, National Treasury, 20 January 2004
Pather, Jayshree, CIDA, Pretoria, 10 May 2004
Salole, Gerry, Ford Foundation, southern Africa representative, Johannesburg,
15 June 2004
Spanner, Lone, Counsellor, Royal Danish Embassy, 18 May 2004

Free
dow
nloa
d fr
om w
ww
.hsr
cpre
ss.a
c.za
281
The primary aim of this chapter is to determine the resource flows into
poverty eradication and the development process in general. Although the
focus of this book has been on non-state actors (individuals, corporations,
communities, non-profit organisations, local and international donors
and faith-based institutions), this chapter was commissioned to provide a
contextual framework for understanding these non-state resource flows.1
Therefore, the primary question this chapter seeks to answer is: How much
has the South African state spent since 1994 to address the challenge of
poverty and promote development?
The answer to this question is that during the first decade of
democracy, the South African state increased expenditure on social and
economic services as a percentage of total expenditure. Expenditure on
social services increased in real terms by 57.5 per cent, from R70.2 billion
in 1995/96 to R196.6 billion in 2004/05. The result of this trend is that
the relative share of social services of consolidated expenditure increased
from 45.4 per cent in 1995/96 to 50.9 per cent in 2004/05. Expenditure on
economic services2 increased in real terms by 71.5 per cent, from R16.2 billion
in 1995/96 to R49.4 billion in 2004/05. As a result, its share of expenditure
8
Contextualising social giving: an analysis of state fiscal
expenditure and poverty in South Africa, 1994–2004
Mark Swilling, John van Breda and Albert van Zyl

Free
dow
nloa
d fr
om w
ww
.hsr
cpre
ss.a
c.za
282 giving and solidarity
grew from 10.5 per cent in 1995/96 to a projected 12.8 per cent in 2004/05.
Furthermore, this has been achieved by slightly lowering total expenditure
as a percentage of GDP from 30.8 per cent in 1995/96 to 28.6 per cent in
2004/05. Nor did state revenues increase – they remained at around 25 per
cent of GDP per annum for most of the period. At the same time, in the six
years to 2003/04, personal income tax paid to the South African Revenue
Services (SARS) decreased in real terms by 0.9 per cent per annum, while
company tax increased in real terms by 12.3 per cent per annum (Gelb 2004).
This pattern of fiscal expenditure is consistent with government policies
that have tended to focus on redistribution via development and poverty
eradication programmes of various kinds.
The expenditure figures cited above include both operating and
capital expenditure. However, given the focus of the preceding chapters,
of particular interest are the so-called ‘extra-governmental transfers’ to
households, non-profits and special funds (explained in detail in a section
later in this chapter). During the five-year period 2000/01 – 2004/05,
the total value of direct transfers to households alone is estimated to be
R6.7 billion. The total value of transfers aimed directly at poverty eradication
and development promotion to special agencies/funds (not controlled by
government departments), plus the non-profits and households for the five-
year period 2000/01–2004/05, was R58.7 billion. On its own, this figure may
not have much significance, but it does provide a useful contextual reference
point for assessing the contributions by the non-state actors surveyed in the
wider study.
A more detailed analysis of the 14 ‘special funds’ that were either
transformed or created from scratch over the past decade to institutionalise
the delivery of developmental funding found that they had available for
spending (via grants, loans and/or investments) a total of nearly R33.8 billion
during the period 1994–2003. Although relatively minor spenders in the
larger scheme of things, how they were configured and what their challenges
were tell a story about the complexities of building developmental state

Free
dow
nloa
d fr
om w
ww
.hsr
cpre
ss.a
c.za
state fiscal expenditure and poverty 283
institutions in the context of a small developing economy that is highly
dependent on global economic processes.
The story of the ‘special funds’ begins with the rise and fall of the
Reconstruction and Development Programme (RDP) Fund – the archetypal
general purpose ‘development fund’. This was followed by the emergence
of a rash of ‘special funds’ during the 1998/99 period when the state was
running the dualist framework of ‘macroeconomic stabilisation’ alongside
‘ameliorative’ interventions, culminating in today’s ‘developmental state’
approach.
The current developmental state approach combines state-led
investments with massive interventions in physical infrastructure
and human skills via a new generation of mega-funds – the Municipal
Infrastructure Fund, the National Skills Fund (plus the Sector Education
and Training Authorities), plus various others, some of which span the
public–private divide (for example, the Public Investment Commission and
the National Empowerment Fund). This is a remarkable, largely untold story
of large-scale, vision-led institutional engineering driven by the need to
find vehicles for spending money to realise developmental policy objectives
without raising the spectre of ‘fiscal populism’. In every case there was
an underlying theory of development, an institutional methodology, a set
of developmental practices and a set of predictions about the relationship
between inputs, outputs and impacts. Frequently, however, these grand
ambitions foundered on the rocks of institutional incapacity, but not always.
This story stills needs to be told in greater detail by researchers.
The single most striking feature of post-1994 South Africa is
that despite the general picture described above of rising levels of state
expenditure on social and economic services, coupled to ambitious
institutional projects to mobilise resources for development, poverty has
nevertheless increased. According to the authoritative UNDP South Africa
Human Development Report: ‘Poverty gap, which reflects the depth of
poverty…has increased between 1995 and 2002, especially when using lower
poverty lines’ (UNDP 2000: 42). Furthermore, the Report states:

Free
dow
nloa
d fr
om w
ww
.hsr
cpre
ss.a
c.za
284 giving and solidarity
Income distribution in South Africa, as measured by the Gini
coefficient, is very skewed compared to other countries and has been
worsening in recent years. In 1995, the Gini coefficient for South
Africa was 0.596; it rose to 0.635 in 2001, suggesting that income
inequality is worsening. (UNDP 2000: 43)
How is this possible? Part of the answer is that rising social and economic
expenditures have taken place within a context shaped by macroeconomic
policies that have favoured excessively rapid liberalisation of capital inflows
and outflows that have not been strategically aligned with developmental
priorities. This mismatch between social spending and the liberalisation
of capital flows goes some way towards explaining the rising levels of
poverty and inequality during the first decade of democracy. However,
to complete the picture, we must address what most economistic and
reductionist analyses fail to address, namely the complex and challenging
task of institutionalising developmental state institutions. Measuring
inputs (expenditures) and outputs (delivery), bemoaning the impacts (rising
poverty) and then blaming the macroeconomy ignores the quintessential
message of institutional economics, namely that financial flows are mediated
by institutional transactions that are time bound, constrained by human
capacity and costly. If these institutional arrangements are inappropriately
configured and/or are rendered ineffective by dysfunctional power
relations, inadequate capacity and/or corruption, expenditures will have
limited impacts. It follows, therefore, that spending more via dysfunctional
institutions could result in qualitatively poorer outcomes than spending less
via more functional institutions.
The ideal is, of course, spending more via functionally superior
institutions that are staffed by people who understand the meaning of ‘deep
development’ and who are allowed to operate according to procedures that
are functional and effective, in other words, that development is about more
than spending money. The problem is that plans and budgets take up very
little time and require very small groups of highly skilled people to assemble,

Free
dow
nloa
d fr
om w
ww
.hsr
cpre
ss.a
c.za
state fiscal expenditure and poverty 285
whereas institutionalisation of the capacity for implementation is a long,
time-consuming process, involving large numbers of people who have a mix
of skills and who are often geographically separated from one another. When
there is a mismatch between the lead times for planning and budgeting
and the lead times for institutional transformation, strategic managers and
politicians look for people to blame for failures or for ways to short-circuit
formal structures. Though initially logical, this response can compound the
complexity of aligning plans, budgets and institutional capacity as new layers
of decision-making slow down, rather than speed up, the process. When
all this gets over-determined by impatient and frustrated political leaders,
logjams can turn into meltdowns.
The focus of this chapter is limited to a quantitative analysis of
state expenditures and the institutions that have been set up by the state
to manage expenditures. This chapter will not address the vexed question
of the relationship between expenditures and the actual impact of these
expenditures on poverty reduction/eradication. Others have attempted to
do this (Bhorat & Kanbur 2006; May 2001; Nattrass & Seekings 2001). In
other words, this chapter does not tell us what the money was spent on at
the programme and project level, how it was spent and whether the intended
poverty reduction targets were achieved or not. In order to explain why
poverty increases when state expenditures to reduce poverty increase, further
research will be required based on a more refined analysis of expenditures at
the programme and project level, coupled to qualitative case studies of actual
impact within the context of macroeconomic policy.
Defining poverty
According to the Committee of Inquiry into a Comprehensive System of
Social Security for South Africa (RSA 2002) (hereafter referred to as the
Taylor Committee), between 20–28 million South Africans (45–55 per cent
of the population) are living in poverty, depending on which poverty line is
used.3 The incidence of poverty varies substantially between provinces. With
Free
dow
nloa
d fr
om w
ww
.hsr
cpre
ss.a
c.za
286 giving and solidarity
the exception of Gauteng and the Western Cape, over half the population in
all provinces live in poverty. The highest poverty rates are in the Limpopo
province and the Eastern Cape, where on average three out of four people
live in poverty, whereas in Gauteng and the Western Cape poverty rates are
around 30 per cent.
Poverty is concentrated in rural areas. About 70 per cent of people
living in rural areas are living in poverty, compared to about 30 per cent of
people in urban areas. Although less than 50 per cent of the total population
lives in rural areas, 70 per cent of all poor people in South Africa live in rural
areas (May 2001). In other words, the majority of people living in rural areas
are poor and the majority of the poor live in rural areas.
So far, statistics referred to as a measurement of the scale of poverty
in South Africa are derived from an income-based definition of poverty.
The level and depth of poverty becomes even more obvious if we include
indicators that measure the extent to which socio-economic rights are
satisfied (see page 287). The section of this chapter dealing with conceptual
issues will discuss the multi-dimensional nature of poverty in greater detail.
For now, it suffices to refer to these various statistics as indicators of poverty.
Despite an internationally acclaimed Constitution and substantial
progress in addressing apartheid service delivery backlogs and inequalities,
for a large proportion of the South African population the situation across
a range of social development indicators seems to have worsened since the
mid-1990s (Nattrass & Seekings 2001). Unemployment levels have risen
consistently during the 1990s. Between 1995 and 1999, there was an absolute
increase of 653 000 informal dwellings, mainly in urban areas (SAIRR 2001).
In its report, the Taylor Committee notes that the distribution of income
seems to have become more unequal between 1991 and 1996. Whereas inter-
racial inequalities have declined, intraracial inequalities have become more
stark.
The problem with the traditional quantifications of poverty of the
sort provided above is that they generate conclusions about the amount of
money required to ‘meet basic needs’. What flows from this is a complex

Free
dow
nloa
d fr
om w
ww
.hsr
cpre
ss.a
c.za
state fiscal expenditure and poverty 287
Unemployment
◆ In 1999, official unemployment was between 23.3 per cent (strict
definition) and 36.2 per cent (expanded definition)
◆ Unemployment levels are highest among Africans, reaching between
20 per cent (strict definition) and 44 per cent (expanded definition)
◆ In each race group, women show a higher unemployment rate than men
Food security
◆ 14 million people have no food security and 2.5 million people are
malnourished
Housing
◆ In 2000, the housing shortage was estimated at between 3–4 million
units
Basic services
◆ In 1999, only 39 per cent of the 11 million households in South Africa
had running tap water inside their dwellings and almost 40 per
cent of non-urban households did not have access to piped water (in
dwelling, on site or at a public tap)
◆ In 1999, 21 million South Africans had inadequate sanitation
Education
◆ 29 per cent of the adult population is functionally illiterate
◆ Only 80 per cent of children of school-going ages are in school
Health
◆ There is an estimated shortfall of almost 800 clinics and gross
disparities between private–public healthcare facilities are noted
Selected socio-economic indicators

Free
dow
nloa
d fr
om w
ww
.hsr
cpre
ss.a
c.za
288 giving and solidarity
policy-making and institutional design process aimed primarily at finding
(public, private and donor) funds to spend on well-intentioned and often
carefully designed programmes and projects (often articulated using the highly
rationalistic logical framework methodology). There is nothing wrong in and
of itself with this traditional approach to development intervention, but it does
tend to obscure the complex and largely unquantifiable relationship between
poverty and the capacity of individuals and communities to actively understand,
access and use resources aimed at extracting them from the poverty trap. The
validity of this statement is revealed by its converse: there is enough evidence
from numerous studies that poverty is not reduced simply by spending money
to ‘provide’ for basic needs. Unless spending is coupled to processes that
gradually build the intellectual, psychological, cultural, organisational and
technical capacity of the ‘beneficiaries’, development in general and poverty
reduction in particular will be an unlikely outcome. The passage from the ‘basic
needs’ approach to the ‘empowerment’ approach came about as mainstream
thinking started to agree with developmental NGOs who had been arguing for
the importance of empowerment for decades. However, it is the ‘basic needs’
paradigm that remained dominant in determining fiscal expenditure patterns
during the first decade of democracy in South Africa. The problem here, though,
is that an empowerment approach may impact on poverty, but the lessons
from the ‘special funds’ are that it is extremely difficult to institutionalise an
empowerment approach that results in large-scale expenditures.
Fiscal policy and social spending: an empirical analysis
The implications of the Growth, Employment and Redistribution
strategy (GEAR) for policy implementation and service delivery were
twofold. First, attempts to reduce the Budget deficit from about 5 per
cent to less than 3 per cent within a five-year period entailed severe
restrictions on expenditure, the impact of which was felt most forcefully
in government’s capital investment, and thus most noticeably in social
and economic infrastructure development. (UNDP 2000: 3)

Free
dow
nloa
d fr
om w
ww
.hsr
cpre
ss.a
c.za
state fiscal expenditure and poverty 289
Although there are many statements in the polemical, academic and policy
literature that equate the adoption of neo-liberal economic policies with
expenditure cutbacks, the above quote from the respected UNDP report
captures a general consensus that spans a range of ideological perspectives,
from those who think that cutbacks are evidence of state withdrawal in line
with a commitment to ‘sensible’ market-based economics, right through
to those who see withdrawal as evidence of the perpetuation of economic
apartheid disguised as ‘neo-liberalism’. The evidence presented in this
section does not support this consensus.4
Macro-level fiscal expenditures
The reduction in the Budget deficit is one of the key features of government
finance over the last ten years (see TAblE A1 in the appendix to this chapter).5
Between 1994/95 and 2004/05 the budget deficit as a percentage of the GDP
was reduced from 5.6 per cent in 1994/95 to a low of 1 per cent in 2002/03.
After remaining at between 5 per cent and 6 per cent until 1997/98, it
declined dramatically after the introduction of GEAR in 1997. After the
2002/03 low, it was allowed to move up in a controlled and purposeful
manner in order to fund additional infrastructure investment.
During this same period revenue as a percentage of the GDP reached
a high of 26.9 per cent in 1997/98, after which it declined to a low of 24.6
per cent in 2000/01. It was also allowed to drift upwards to reach a projected
25.7 per cent of GDP in 2004/05. Since 1998/99, the reconstituted SARS
has consistently over-collected on its targets. This has allowed systematic
reductions, especially of personal income tax rates, without affecting the
levels of revenue collected. Over this same period expenditure reached a high
of 31.7 per cent of GDP in 1996/97, before declining to a low of 26.6 per cent
in 2000/01. Expenditure, too, was allowed to drift back up to 28.6 per cent
of GDP in 2004/05. As mentioned above, this increase in expenditure was
largely applied to increased investment in infrastructure.
In summary, the general picture is of rising revenue, expenditure
and deficit levels until roughly 1997/98. With the introduction of GEAR,

Free
dow
nloa
d fr
om w
ww
.hsr
cpre
ss.a
c.za
290 giving and solidarity
revenue and deficit levels showed rapid decline and remained at lower levels.
Expenditure increased overall as a percentage of GDP from 1998/99 onwards.
Over the period 2003–05 expenditure and the deficit showed further
increases, while revenue remained steadily below 26 per cent of the GDP. It
is therefore possible to conclude that, while the Budget was generally less
expansionary between 1994/95 and 2002/03, the deficit was not reduced by
cutting expenditure, as is commonly believed.
The 1997/98 moment is significant because it was also during this
period that a number of new ‘special funds’ were initiated. As is well known,
the second quarter of 1996 marked a key turning point in macroeconomic
policy management when the RDP office was closed and GEAR adopted as
South Africa’s ‘macroeconomic stabilisation’ policy. This policy decision
triggered the changes reflected in the figures for 1997/98. However, more
significantly, it would appear that this decision bifurcated the policy process
into ‘macroeconomic policy’ managed by the Department of Finance, and
sectoral initiatives that resulted in the creation of a new set of ‘sectoral RDP-
type funds’ aimed at facilitating expenditures to realise a wide range of policy
goals in the enterprise, infrastructure, human skills and social development
fields. Unlike other countries where ‘macroeconomic stabilisation’ resulted
in reduced revenues, deficits and expenditures, in the South African case
expenditures dropped briefly and then continued to rise. The struggle to
find ways of institutionalising the structures and processes to manage these
expenditures is a story of the search for appropriate ways of institutionalising
developmental state institutions within national policy management that had
decided to focus on ‘macroeconomic stabilisation’, with ‘development’ left to
the sectors, provinces and local governments.
Consolidated national and provincial expenditure
Allocations to social services in particular grew steadily over the period
under review (see TAblE A2 in the appendix to this chapter). While growth
in this sector relented briefly in 1998/99 and 2000/01, it resumed after that.
Free
dow
nloa
d fr
om w
ww
.hsr
cpre
ss.a
c.za
state fiscal expenditure and poverty 291
Similar patterns can be detected in the economic and protection service
sectors, albeit from a lower base.
The decline of money spent on interest repayments is particularly
striking. Debt servicing costs declined by a total of 7.4 per cent between
1995/96 and 2004/05 (see TAblE A2). The real reason why expenditure
could continue to grow strongly in the face of a declining deficit is this
reduction in debt service costs. Payments on interest took up over 20 per cent
of expenditure in 1998/99, but dropped to 13.1 per cent of expenditure by
2004/05 (see TAblE A3 in the appendix to this chapter).
Social services expenditure increased by an average of 6.4 per cent
over this period. In fact, real growth in this sector outstripped overall
expenditure growth by 1.9 percentage points. The result of this trend is
that the relative share that social services take of consolidated expenditure
increased from 45.4 per cent in 1995/96 to 50.9 per cent in 2004/05 (see
TAblE A3). While all four social services functions benefited from these
increases, increases to education and welfare account for more than two-
thirds (69%) of this growth.
Over the same period, allocations to economic services increased by
an annual average of 7.9 per cent in real terms. The main reasons for these
increases are increases in the allocations to transport and communication
and other economic services. Together these two account for 63 per cent
of growth in expenditure on economic services. Expenditure growth on
economic services also outstrips total real expenditure growth. As a result,
its share of expenditure grows from 10.5 per cent in 1995/96 to a projected
12.8 per cent in 2004/05. It is, however, important to note that its share of
expenditure only started increasing in 2001/02 after dropping to a low of
8 per cent in 2000/01.
The only sector growing more slowly than overall expenditure is
protection services which declined to a low of 14.5 per cent in 1999/2000
before recovering. Despite the decline in its share of expenditure, this sector
still shows real growth.

Free
dow
nloa
d fr
om w
ww
.hsr
cpre
ss.a
c.za
292 giving and solidarity
The trends reflected in TAblES A1, A2 and A3 contradict some of the
original projections of neo-liberal economic modelling exercises that took
place in government think tanks in the period leading up to the adoption of
GEAR in 1996. For example, the highly influential Macro Economic Working
Group comprising key experts from the Department of Finance, Reserve
Bank, Development Bank of Southern Africa, Central Economic Advisory
Services, business and the World Bank, estimated that if the salary bill could
be reduced by 10 per cent (by service cutbacks, eliminating inefficiencies and
resisting wage/salary increases) in order to finance substantial increases in
capital expenditure on infrastructure, the result would be rising levels of
growth – the infamous ‘increase fixed investment by 1 per cent and you get a
1 per cent increase in the growth rate’ formula. Instead, social and economic
spending went up (including solid real growth in capital spending), without
evidence of a substantial increase in capital spending as a percentage of total
spending in these clusters (see section below). Even the phenomenal 95 per
cent real change in housing expenditures (most of which consists of capital
subsidies for households) was dwarfed by the fact that education (mainly
teacher salaries) and welfare (mainly transfers to households) accounted
for 69 per cent of all growth in the social services sectors. Overall over the
period, social spending increased at a rate faster than the growth in total
expenditure, whereas economic spending declined from what was already
quite a low base before rising rapidly to reach a point where it also exceeded
the overall rate of expenditure growth. Even if capital spending had increased
more steeply, persistent underspending raises doubt as to whether the
capacity was in place to manage increases in spending.
National expenditure
The previous section described trends in consolidated national and
provincial expenditure. Below is a reflection on the two components of this
expenditure, namely national and provincial.

Free
dow
nloa
d fr
om w
ww
.hsr
cpre
ss.a
c.za
state fiscal expenditure and poverty 293
National expenditure increased by an annual average of 2.9 per
cent between 1996/97 and 2004/05 (see TAblE A4 in the appendix to this
chapter). The main driver of these increases was again the social sector that
grew by a real annual average of 19 per cent over this period. It is, however,
important to note that these figures are slightly inflated by changes in the
composition of the national Department of Social Development as a result of
the establishment of the National Development Agency (NDA).
The result of these increases was that national social service
expenditure grew from 5.84 per cent of all expenditure in 1996/97 to
12.54 per cent in 2004/05 (see TAblE A5 in the appendix to this chapter). The
three main drivers of this increase were increased allocations to the Health,
Education, Social Development and Local Government departments.
The economic sector increased by an annual average of 1.4 per
cent (TAblE A4), although this is reduced by R1.3 billion as water provision
was removed from the Water Affairs budget and channelled through the
Municipal Infrastructure Grant from 2004/05 onwards.
Any comparison of pre- and post-2000/01 budgetary data organised
by economic classification is perilous, given the major reclassification of
government expenditure that resulted in the new Standard Chart of Accounts
in 2000. Capital expenditure is a case in point. For this reason we present
data from 1995/96 to date, but only analyse the data for the period from
2000/01 to 2004/05.
National capital expenditure shows solid growth in both the social and
economic sectors over the period from 2000/01 to 2004/05 (see TAblE A6 in
the appendix to this chapter). In the social sector capital expenditure grew
by an annual average of 16.7 per cent per year over this period, with strong
growth in the Department of Arts, Culture, Science and Technology, Labour,
Health and Public Works being the main drivers of growth. The result of this
steady growth is that capital expenditure remained at around 2 per cent of
total social service expenditure over this period (see TAblE A7 in the appendix
to this chapter).
Free
dow
nloa
d fr
om w
ww
.hsr
cpre
ss.a
c.za
294 giving and solidarity
Over this period, capital expenditure in economic services grew by
an annual average of 6.5 per cent (TAblE A6). The main growth driver in this
case is Water Affairs and Forestry, and Environmental Affairs and Tourism.
These increases resulted in the share of capital expenditure in economic
services also remaining at between 2 per cent and 3 per cent (TAblE A7).
National government has generally spent quite high percentages of
its budgets (TAblE A8 shows the share of budgeted expenditure that was
actually spent in national budgets since 2001/02). The common trend of
governments being less able to spend capital than current expenditure is
present here, but not nearly as pronounced as is the case in the provinces (see
TAblE A16 in the appendix to this chapter).
Extra-governmental transfers from national departments
Given the overall goal and focus of this study, a significant question that
needs to be answered in order to contextualise the magnitude of giving by
non-state institutions, households and individuals is: How much money
does the state transfer directly into dedicated independent agencies/accounts
(that are not directly controlled by national, provincial or local governments),
non-profit organisations and households to promote development and
eradicate poverty? Fortunately, it has been possible to calculate this, but
only for the past five years due to the introduction of the Standard Chart of
Accounts. National Treasury now provides a breakdown of these so-called
‘extra-governmental transfers’ in terms of both destination (that is, agencies/
accounts, universities/technikons, foreign governments and international
organisations, public corporations and private enterprises, non-profits and
households) and sources (that is, the national departments themselves and
the clusters they fall into). For the purposes of this study, the transfers to
sectoral agencies/accounts, non-profits and households are of particular
interest. The direct transfers to households are of greatest interest because
it is possible to assume that these represent actual amounts transferred to
households without deductions for overhead costs.

Free
dow
nloa
d fr
om w
ww
.hsr
cpre
ss.a
c.za
state fiscal expenditure and poverty 295
Before proceeding, it is important to provide a summary and
definitions of these transfer categories:
Summary explanation of transfer categories
◆ Departmental agencies and accounts: includes public entities listed in
the Public Finance Management Act (PFMA), such as social security
funds, unemployment insurance funds and other funds and accounts.
Taking the example of the Department of Trade and Industry (DTI),
such transfers would include transfers to Khula, Ntsika and the
National Empowerment Fund;
◆ Universities and technikons: routine transfers;
◆ Foreign governments and international organisations: again, taking the
DTI example this would include the South African contribution to UNDP;
◆ Public corporations and private enterprises: subsidies on production
and other transfers to public corporations and private enterprises.
DTI examples would include transfers to the Industrial Development
Corporation (IDC);
◆ Non-profits: including privately owned educational institutions. A DTI
example would be transfers to the Proudly South Africa campaign;
◆ Households: social benefits and other transfers to households.
It is worth quoting extensively from the National Treasury’s Economic
Reporting Format Guide to clarify the detailed definition of these categories:
Definitions for transfers and subsidies
Transfers and subsidies include all unrequited payments made by
the government unit. A payment is unrequited provided that the
government unit does not receive anything directly in return for the
transfer to the other party.
Both current and capital transfers are included in this item. The
main reason for including both current and capital transfers under
the same heading is that in practice it is often difficult to differentiate

Free
dow
nloa
d fr
om w
ww
.hsr
cpre
ss.a
c.za
296 giving and solidarity
between these two categories. In addition, both have the same effect
on net worth of government. Capital transfers should be accounted for
as a note to the budget statement.
Examples of current transfers are social security benefits paid to
households, fines, penalties, compulsory fees and compensation for
injuries or damages paid to another unit.
An example of a capital transfer is a payment that is conditional on
the recipient unit using the funds to acquire capital assets. Another
example is a transfer to enterprises (publicly or privately owned) to
cover large operating deficits accumulated over at least two years or
to finance their cost of purchasing capital assets. Debt forgiveness
extended to others is also considered a capital transfer.
Capital transfers can also take the form of capital taxes payable
to other government units. Government units need to distinguish
between the following transfer categories:
◆ Transfers to provinces (including the Provincial Revenue
Fund; provincially owned entities, like hospitals, clinics and
other entities engaged in providing health services; as well as
provincially owned development organisations, but excluding
universities and technikons)
◆ Transfers to municipalities (including development organi-
sations owned by municipalities and other municipal entities)
◆ Transfers to departmental agencies and accounts (including
national public entities listed in the PFMA, such as social
security funds, unemployment insurance funds and other
funds and accounts)
◆ Transfers to universities and technikons
◆ Transfers to public corporations and private enterprises:
◆ Subsidies on production
◆ Other transfers to public corporations and private
enterprises
Free
dow
nloa
d fr
om w
ww
.hsr
cpre
ss.a
c.za
state fiscal expenditure and poverty 297
◆ Transfers to foreign governments and international
organisations
◆ Transfers to non-profit institutions (including privately owned
educational institutions)
◆ Transfers to households:
◆ Social benefits
◆ Other transfers to households. All these transfer categories
are self-explanatory, except subsidies on production, other
transfers to public corporations and private enterprises,
social benefits, and other transfers to households.
Social benefits
Social benefits are current transfers to households, but not all
transfers to households are included under this category. Included are
the transfers made to households to protect them against events that
may adversely affect their social welfare. Examples include the child
support grant; payments for medical, convalescent and dental care
and home care. Social benefits also encompass the cost to provide free
housing and housing below market prices.
Other government units can also pay social benefits, like the
Unemployment Insurance Fund.
Other transfers to households
Other transfers to households consist of all other transfers to
households. All capital transfers to households are included here.
This category also includes payments of bursaries (but excluding
bursaries to government employees, which are recorded under goods
and services), fines and penalties paid to households. It also includes
compensation for injuries and damages caused by natural disasters or
government units if paid to households.
Transfer payments from national government to entities other than
provincial and local government have increased by a real annual average rate

Free
dow
nloa
d fr
om w
ww
.hsr
cpre
ss.a
c.za
298 giving and solidarity
of 7.4 per cent from 2000/01 and 2004/05 (see TAblE A9 in the appendix to
this chapter). While all six categories of transfer have increased, the largest
single contributors to this increase are transfers to departmental agencies
and accounts (62.8 per cent of the increase), transfers to universities
and technikons (13.5 %) and transfers to public corporations and private
enterprises (15 per cent of the increase). Other categories of transfer such as
transfers to non-profits show large percentage increases, but these all came
from much lower bases.
Social services as a whole accounts for about 37.5 per cent of the total
increase in such transfers. Within the social services category the largest
beneficiaries of this growth in transfers were transfers to departmental
agencies and accounts as well as the above-mentioned increase in transfers to
universities and technikons (see TAblE A10 in the appendix to this chapter).
The two key departments in this regard were education and health.
Economic services transfers grew by an annual average of 6.1 per
cent over this period. Increased transfers to public corporations and private
enterprises drive the increase in the economic sector. The economic service
departments benefiting from this increase are largely the Departments of
Transport, Land Affairs, Mineral and Energy Affairs, and Environmental
Affairs and Tourism (see TAblE A10).
The total value of transfers to agencies/accounts, non-profits and
households for the five-year period under review is R58.7 billion (see
TAblE A9. A significant figure is the National Treasury’s estimate of the total
funds transferred to households.6 For the five years 2000/01 to 2004/05,
the total value of transfers to households over this period was estimated
to be R6.7 billion comprising R1.5 billion from the social services cluster
and R5.2 billion from the economic services cluster. However, an equally
significant figure for the purposes of this chapter is the increase in transfers
to departmental agencies and accounts from R6.6 billion in 2000/01 to
R12.4 billion in 2004/05, with the transfers in the social services cluster
to these agencies and accounts rocketing up by 97.3 per cent. Total funds

Free
dow
nloa
d fr
om w
ww
.hsr
cpre
ss.a
c.za
state fiscal expenditure and poverty 299
transferred to agencies/accounts for this five-year period was R50 billion.
Although proceeding from a very low base, the transfers to non-profits also
increased substantially from just below R120 million in 2000/01 to just
below R250 million. The total transferred for the five-year period was R2
billion. However, this figure is misleading because these are direct transfers
from national government departments to non-profits, which is not the level
of government directly involved in transfers to non-profits.
The rapid rise in the size of transfers to sectoral agencies and
accounts provides the empirical context for the discussion in the companion
paper about the way the South African state has tried to institutionalise its
developmental mandate via a wide range of transfers into special purpose
institutions.
Poverty alleviation and job-creation fund allocations
Allocations to the Poverty Alleviation and Jobs Summit Fund grew from
R1 billion in 1999/00 to R1.567 billion in 2003/04 (see TAblE A11 in the
appendix to this chapter). There were significant shifts between departments
over this period. While allocations to the Departments of Public Works
and Water Affairs remained at relatively high levels throughout, the largest
increases came in allocations to the Department of Environment and
Tourism (DEAT). By 2003/04 these three departments accounted for almost
60 per cent of all allocations from this fund. After initial high allocations to
the Department of Social Development, a litany of underspending resulted in
a significant scale back.
The Poverty Alleviation and Jobs Summit Fund ceased to exist at the
end of the 2003/04 financial year. While some of the associated programmes
were still funded, this was incorporated into their core funding. The balance
of the fund was divided between allocations to the Provincial and Municipal
Infrastructure Grants and the Extended Public Works Programmes (see
TAblE A11.

Free
dow
nloa
d fr
om w
ww
.hsr
cpre
ss.a
c.za
300 giving and solidarity
Provincial expenditure
Total expenditure by provinces increased by an annual average of 4.2 per
cent between 1995/96 and 2003/04 (see TAblE A12 in the appendix to this
chapter). By 2003/04 provincial Departments of Education, Health and
Social Development accounted for 81 per cent of all provincial expenditure
(see TAblE A13 in the appendix to this chapter).
Of these three, the largest beneficiary of additional expenditure was
social development, which grew at an annual average of 6.8 per cent (see
TAblE A12). While both other functions show solid average growth over this
period, they grew at the substantially slower rates of 2.1 per cent (education)
and 4.3 per cent (health) respectively. The data for provincial expenditure by
departments shows that, as a result, the relative share of social development
grew over this period, while that of education and health declined (see
TAblE A13). The data also show a stabilisation in the share of other provincial
expenses since 2000/01 at around 18 per cent of provincial budgets (see
TAblE A13).
There was a healthy growth in provincial capital expenditure
between 1995/96 and 2003/04 of over 25 per cent annually (see TAblE A14
in the appendix to this chapter). This increase was mostly driven by large
increases outside of the social services. In the social sector education saw
large increases, while provincial capital expenditure in health also grew
substantially. Non-social sector capital expenditure, however, accounts for
63 per cent of all growth in provincial capital expenditure between 1995/96
and 2002/03.
Capital expenditure as a share of total expenditure has been growing
impressively from 1999/00 (16.1 per cent of total) to 2003/04 (31.6 %) (see
TAblE A15 in the appendix to this chapter). By 2003/04 over 20 per cent of all
non-social service expenditure was committed to capital expenditure. Health
and education committed about 5 per cent each while, by the nature of its
function, social development spent substantially less on capital projects.

Free
dow
nloa
d fr
om w
ww
.hsr
cpre
ss.a
c.za
state fiscal expenditure and poverty 301
Since the late 1990s, provinces have significantly improved their
ability to spend (see TAblE A16). Provinces are, however, still unable to spend
significant amounts of money allocated for capital expenditure, with a
number of provinces not spending more than 75 per cent. The main culprit
in this regard is generally provincial Departments of Housing where a variety
of coordination challenges with both national and local government continue
to hamper implementation.
Provincial transfers to public entities
Between 2002/03 and 2003/04, provinces transferred around 2 per cent of
their budgets to provincial public enterprises (see TAblE A17 in the appendix
to this chapter). There was significant variance between provinces, with
Limpopo, North West and the Eastern Cape committing around 3 per cent
of their budgets in this manner, while the Northern Cape and Gauteng
transferred less than 1 per cent of their budgets to such entities.
Local government expenditure
A key trend over the last five years has been the rapid growth in national
and provincial transfers to local government. This reflects the increasing
role of local government in the delivery of developmental services to
combat poverty as a result of a decade of fundamental reforms to the local
government system, as well as a desire by the state in general to improve the
fiscal capacity of this sphere. In 2002/03 the total capital budget for all local
governments was R13.2 billion. A significant portion of this was covered by
transfers from non-local governments. In the short three-year period 2001/02
to 2003/04, total transfers from national and provincial governments to
local government increased in real terms from R7.7 billion in 2001/02 to
R14.4 billion in 2003/04 (see TAblE A20 in the appendix to this chapter).
However, unlike most other countries in the world, South African local
governments are still largely dependent on their own municipal tax bases.
For example, the transfers to local government from provincial and national
government in 2002/03 were just over R11 billion (see TAblE A20), whereas

Free
dow
nloa
d fr
om w
ww
.hsr
cpre
ss.a
c.za
302 giving and solidarity
the total combined operating and capital budgets of all South African local
governments in this year were R77.5 billion (South African Cities Network
2003), that is, transfers from non-local governments were 14 per cent of total
local government revenue in 2002/03.
While spread fairly evenly, the single largest share of local
governments’ capital budgets in 2002/03 was committed to housing
provision (see TAblE A18 in the appendix to this chapter). Metropolitan
councils spent over a quarter of their capital budgets on housing-related
infrastructure and services in 2002/03, while the largest capital expenditure
item in other local authorities was water, reservoirs and reticulation. Metros
only committed about half their budgets to the latter, but committed a much
smaller share of their budgets to electricity reticulation.
With regard to local authorities’ operational budgets, salaries
and associated expenses take up about 31 per cent, while electricity bulk
services account for about 17 per cent of operational budgets (see TAblE A19
in the appendix to this chapter). Unlike capital budgets, there is less
significant deviation between metropolitan and other local authorities in the
composition of their operational budgets.
Transfers to local government from national and provincial
government grew by an annual average of 29 per cent between 2001/02 and
2003/04 (see TAblE A20).
The two largest increases have occurred in the size of the local
government equitable share and the CMIP transfer, each of which almost
doubled in this period. Although the consolidation of transfers took place
in parallel to the growth of the Consolidated Municipal Infrastructure
Programme (CMIP) transfers, the equitable share and CMIP transfers remain
the single largest drivers behind growth in municipal transfers. Finally, it is
also significant that transfers from provincial to local government grew by
almost 70 per cent over this period. This confirms the trend articulated in
policy which assigned increasingly important roles to a level of government
that tended to receive very little attention during the first years of democracy.

Free
dow
nloa
d fr
om w
ww
.hsr
cpre
ss.a
c.za
state fiscal expenditure and poverty 303
Overview of the special funds
A remarkable feature of the post-1994 era has been the way the state has
promoted the proliferation of ‘special funds’ and institutions that in some
way target poverty and development. The purpose of this section is to review
some of these initiatives in order to ascertain the magnitude of funds that
were channelled through these various funds, agencies and institutions.
Fourteen different institutional configurations were selected for
analysis, namely:
◆ Special Poverty Relief Account (SPRA);
◆ Independent Development Trust (IDT);
◆ Isibaya Fund;
◆ Khula;
◆ the NDA;
◆ National Lottery Board;
◆ National Skills Fund;
◆ Operation Jumpstart Association;
◆ Ntsika;
◆ South African Women’s Entrepreneur Network;
◆ Umsobomvu Youth Fund;
◆ National Empowerment Fund;
◆ Local Economic Development Fund (lED Fund);
◆ uTshani Fund.
The IDC is a fascinating state structure that is probably one of the most
important state-controlled institutions for driving up investment levels in
the South African economy. However, given that it was established over 50
years ago and that it does not get state funding on an annual basis (in fact, it
is now a net contributor of funds to the Treasury), it does not have the same
character as all the other ‘special funds’ that we have looked it. According to
this logic, the Development Bank of Southern Africa has also been excluded

Free
dow
nloa
d fr
om w
ww
.hsr
cpre
ss.a
c.za
304 giving and solidarity
from this study despite the fact that it is also as important and interesting as
the IDC.
Strictly speaking the 14 funds that were analysed are not all
‘special funds’. Instead, this is shorthand for a wide range of institutional
arrangements that have in one way or another been configured to serve
some kind of ‘special purpose’ within the wider developmental process and,
in some cases, explicitly established to fight poverty. Not all the ‘special
purpose’ funds have been selected for analysis, nor is it possible to defend
this list on the grounds that they are in any way institutionally similar. They
differ enormously, but what is common is that they were created – and in some
cases recreated – by the post-1994 state to serve a clear public purpose to promote
development, increase investment and contribute to the alleviation/reduction/
eradication of poverty. They are not all institutions as such because some are
just ‘special funds’ or ‘accounts’ within state structures (for example, the
SPRA), while others operate completely autonomously (for example, IDT and
uTshani).
It is our estimate that the total revenue of the 14 funds that we
analysed was R33.8 billion for the period 1994–2003. Between them they
invested, using various mechanisms, a total of R10.5 billion for the same
period. Direct transfers from government to these funds account for R27.5
billion of the total funds received. The rest came from donors (R489 million),
loans (R152 million), returns on investments (R135.3 million), interest (R1.2
billion) and various other sources (e.g. the ticket sales for the national lottery)
(R4.2 billion). The bulk of the difference between revenue and expenditure
consists of interest-bearing savings and investments of various kinds, minus
overheads (which in some cases are considerable), and minus funds allocated
but not transferred from Treasury to the ‘fund’. The unspent funds in the
Isibaya Fund alone account for a large chunk of the variation.
Although transfers to the ‘special funds’ have been taking place since
1994, there is a substantial increase from 1999/2000 onwards (even if one
excludes the R11 billion allocated to the Isibaya Fund). A similar pattern is
Free
dow
nloa
d fr
om w
ww
.hsr
cpre
ss.a
c.za
state fiscal expenditure and poverty 305
evident with respect to expenditure. This confirms that 1998/99 marks a
key watershed when the state triggered the proliferation of strategic funds to
balance out the impact of macroeconomic stabilisation measures.
The large proportion of total expenditure on infrastructure is
a significant indicator of the purpose of these funds. According to our
research, just over R5 billion was spent on infrastructure (which includes
assets such as housing, schools, clinics, etc. as well as the more traditional
meaning of infrastructure such as roads, water and sanitation services,
energy, etc.). This is followed by human resource development at R2.7 billion,
and SMMEs at R1.38 billion. Expenditures on poverty relief at R661 million
and job creation at R253 million may appear to indicate a lower priority for
these issues, but in reality this has probably got to do with the difficulty
of increasing expenditures in small projects with limited capacity to take
delivery of funds, and/or the limited capacity within the funds to identify
and process a sufficient number of small-scale projects. The fact that asset
building and human resource development are the largest items, confirms
that these reflect the state’s two most important areas of intervention
in general and constitute the ‘twin pillars’ of the developmental state’s
approach to poverty eradication. However, all this needs to be qualified by the
statement that the expenditure priorities of the ‘special funds’ are not a good
indicator of government priorities as a whole because it is expenditure by
government departments that is the best indicator of priorities. Instead, the
‘special funds’ reflect expenditures that have a special purpose that could not
be easily achieved by government departments.
When put into context, an amount of nearly R35 billion available to
these ‘special funds’ for the whole period seems relatively insignificant.
For example, it has been estimated that total transfers from government to
independent non-profit organisations in 1998 alone were equal to R5.3 billion
and contributions from the private sector to non-profits for the same year
were equal to just below R3 billion (Swilling & Russell 2002: 36). The IDC
invested just over R38 billion for the period 1994–2003, and this was entirely
in for-profit businesses across numerous sectors. Another useful contextual

Free
dow
nloa
d fr
om w
ww
.hsr
cpre
ss.a
c.za
306 giving and solidarity
comparison might be the fact that, as demonstrated in TAblE A9, the total
value of transfers to agencies/accounts, non-profits and households for the
five-year period ending 2003/04 was R58.7 billion. We can only assume that
a large part of this figure includes the funds that were transferred to the
special funds. However, it would be a mistake to conflate this figure with the
R35 billion allocated by government to the special funds. The point being
made here is simple: given the hype that surrounded these special funds and
the amount of energy that went into them, compared to related expenditures,
this R35 billion does not represent a large amount of money. There is not
much evidence to support the notion that this was because of a shortage
of funds. Instead, the evidence suggests that additional funds were held
back in many cases because what was allocated was spent more slowly than
initially expected. This, in turn, provides indirect confirmation for the ‘weak
capacity to spend’ argument. Where, precisely, this weakness lies is difficult
to locate – within the administrations charged with spending the funds?
Decision-making bodies? Recipients? It is most likely a mix of all three, but
differing in the balance from case to case.
Summary and conclusion
Unlike other countries where neo-liberal macroeconomic policies resulted
in fiscal restraint, the evidence suggests that since 1994 state expenditure
on social and economic services has substantially increased as a percentage
of total spending. This is not to suggest that enough was spent to reduce
poverty levels, because it is clear that needs grew faster than the fiscal
capacity of the state; nor does this say anything about how the money was
spent in order to ensure lasting developmental impacts.
Moreover, since 1994, the South African state has experimented with
a wide range of innovative institutional models aimed at building capacity
for spending money in various ways to address poverty and stimulate
development processes. The bulk of the funds that these institutions
deployed went into infrastructure, with project assessment criteria that
Free
dow
nloa
d fr
om w
ww
.hsr
cpre
ss.a
c.za
state fiscal expenditure and poverty 307
should have generated more significant developmental spin-offs. The results
have been mixed, with disappointingly low levels of expenditure, due mainly
to a failure to adequately manage the institutionalisation of these various
strategies and approaches. A shortage of funds was never the problem.
Nevertheless, this has generated lessons that should inform the practice
of the next generation of mega-funds aimed at managing investment in
infrastructure, human resources development, and those that strengthen
black empowerment and broad-based black empowerment positions in
private sector institutions.
The overall conclusion is that however significant the investments
have been in development and poverty reduction by individuals,
communities, corporates, donors, and faith-based institutions, the scale and
ambit of the resources deployed by the state are of a much greater magnitude
and therefore impact. This suggests that the state is the primary actor in
poverty alleviation and development, a lesson worth noting especially given
the implicit assumption in much of the current neo-liberal discourse that
the role of the state must be reduced and its social welfare functions taken
over by the non-profit and private sectors. Non-state stakeholders can make
a significant contribution to poverty alleviation and development, but only if
they see themselves in partnership and/or in engagement with, rather than
replacements of, state institutions.

Free
dow
nloa
d fr
om w
ww
.hsr
cpre
ss.a
c.za
308 giving and solidarity
Appendix
1994
/95
1995
/96
1996
/97
1997
/98
1998
/99
1999
/00
2000
/01
2001
/220
02/0
320
03/0
420
04/0
5
Reve
nue
112
200
126
058
146
519
163
492
184
328
207
181
223
687
257
460
290
500
314
468
342
356
Expe
nditu
re13
7 00
015
1 83
117
6 29
119
0 60
720
1 53
422
2 64
524
2 23
927
1 15
730
1 80
034
1 60
638
1 28
0
Defi
cit
-24
800
-25
773
-29
772
-27
115
-17
206
-15
464
-18
552
-13
697
-11
300
-27
138
-38
924
gd
p44
4 90
049
7 29
555
6 20
660
6 97
375
4 72
982
1 14
491
0 50
01
007
810
1 12
4 00
01
223
198
1 33
1 79
6
Defi
cit/
gd
p-5
.6%
-5.2
%-5
.4%
-4.5
%-2
.3%
-1.9
%-2
.0%
-1.4
%-1
.0%
-2.2
%-2
.9%
Expe
nditu
re/g
dp
30.8
%30
.5%
31.7
%31
.4%
26.7
%27
.1%
26.6
%26
.9%
26.9
%27
.9%
28.6
%
Reve
nue/
gd
p25
.2%
25.3
%26
.3%
26.9
%24
.4%
25.2
%24
.6%
25.5
%25
.8%
25.7
%25
.7%
Tabl
e a1
Nat
iona
l fisc
al fr
amew
ork
1994
/95
– 20
04/0
5 (R
mill
ion)
Sour
ce: N
atio
nal T
reas
ury,
Bud
get R
evie
w, v
ario
us y
ears

Free
dow
nloa
d fr
om w
ww
.hsr
cpre
ss.a
c.za
state fiscal expenditure and poverty 309
Tabl
e a2
Con
solid
ated
nat
iona
l and
pro
vinc
ial e
xpen
ditu
re (
R m
illio
n)
Sour
ce: N
atio
nal T
reas
ury,
Bud
get R
evie
w, v
ario
us y
ears
1995
/96
1996
/97
1997
/98
1998
/99
2001
/02
2002
/03
2003
/04
2004
/05
Real
ch
ange
(Tot
. %)
Ann
ual
real
ch
ange
(A
ve %
)
Tota
l ch
ange
Shar
e of
in
crea
se(%
)A
ctua
lA
ctua
lA
ctua
lA
ctua
lA
ctua
lA
ctua
lRe
vise
des
timat
eB
udge
t
Prot
ectio
n Se
rvic
es26
673
27 9
5231
214
34 0
7546
893
53 3
3558
327
63 2
4733
.53.
736
574
15.8
0
Soci
al S
ervi
ces
70 2
9486
650
99 2
3010
3 16
812
9 56
015
3 34
117
7 33
019
6 68
557
.56.
412
6 39
154
.61
Educ
atio
n34
214
42 1
4044
997
45 3
4855
395
62 7
5769
824
75 8
6224
.82.
841
648
18.0
0
Hea
lth16
078
24 8
1523
001
24 6
6331
713
34 9
4039
677
42 5
8649
.15.
526
508
11.4
5
Wel
fare
(in
cl. S
ocia
l Sec
urity
)14
737
16 0
8923
640
25 4
1834
082
41 9
6651
486
59 9
3612
8.9
14.3
45 1
9919
.53
Hou
sing
5 26
53
606
7 59
27
739
8 37
013
678
16 3
4318
301
95.6
10.6
13 0
365.
63
Econ
omic
Ser
vice
s16
218
18 7
8518
123
19 0
1326
993
36 2
4244
999
49 4
1371
.57.
933
195
14.3
4
Wat
er &
Rel
ated
Ser
vice
s1
157
1 96
82
469
2 89
43
555
4 54
05
832
6 15
019
9.2
22.1
4 99
32.
16
Fuel
and
Ene
rgy
29
638
479
291
859
1 50
82
264
2 46
146
76.2
519.
62
432
1.05
Agr
icul
ture
, Fis
hing
& F
ores
try
2 97
52
652
3 68
23
950
5 29
25
729
6 63
67
109
34.5
3.8
4 13
41.
79
Min
ing,
Man
u. a
nd C
onst
r.1
250
190
1 08
71
262
1 35
81
503
1506
2 05
3-7
.6-0
.880
30.
35
Tran
spor
t & C
omm
unic
atio
n7
203
8 70
67
315
7 78
910
012
13 8
2516
285
17 3
2935
.43.
910
126
4.38
Oth
er e
cono
mic
ser
vice
s3
604
4 63
13
091
2 82
75
917
9 13
712
476
14 3
1112
3.5
13.7
10 7
074.
63
Gen
eral
ser
vice
s &
una
lloca
ted
10 9
9221
952
17 0
2012
290
20 9
8120
063
23 4
8323
987
22.8
2.5
12 9
955.
62
Tota
l Allo
cate
d Ex
pend
iture
124
177
155
339
165
587
168
546
224
427
262
981
304
139
333
332
51.1
5.7
209
155
90.3
8
Inte
rest
30 6
6133
160
38 8
2042
669
47 5
1547
250
47 3
2650
432
-7.4
-0.8
19 7
718.
54
Una
lloca
ted
00
00
00
02
500
0.0
0.0
2 50
01.
08
Cons
olid
ated
Exp
endi
ture
154
838
188
499
204
407
211
215
271
942
310
231
351
465
386
264
40.4
4.5
231
426
100.
00

Free
dow
nloa
d fr
om w
ww
.hsr
cpre
ss.a
c.za
310 giving and solidarity
Tabl
e a3
Con
solid
ated
nat
iona
l and
pro
vinc
ial e
xpen
ditu
re a
s %
sha
res
of to
tal
Sour
ce: N
atio
nal T
reas
ury,
Bud
get R
evie
w, v
ario
us y
ears
1995
/96
1996
/97
1997
/98
1998
/99
1999
/00
2000
/01
2001
/02
2002
/03
2003
/04
2004
/05
Act
ual
(%)
Act
ual
(%)
Act
ual
(%)
Act
ual
(%)
Act
ual
(%)
Act
ual
(%)
Act
ual
(%)
Act
ual
(%)
Revi
sed
estim
ate
(%)
Bud
get
(%)
Prot
ectio
n Se
rvic
es17
.214
.815
.316
.114
.516
.717
.217
.216
.616
.4
Soci
al S
ervi
ces
45.4
46.0
48.5
48.8
45.9
47.5
47.6
49.4
50.5
50.9
Educ
atio
n22
.122
.422
.021
.521
.421
.520
.420
.219
.919
.6
Hea
lth10
.413
.211
.311
.713
.411
.111
.711
.311
.311
.0
Wel
fare
(in
cl. S
ocia
l Sec
urity
)9.
58.
511
.612
.08.
812
.412
.513
.514
.615
.5
Hou
sing
3.4
1.9
3.7
3.7
2.3
2.5
3.1
4.4
4.6
4.7
Econ
omic
Ser
vice
s10
.510
.08.
99.
08.
58.
09.
911
.712
.812
.8
Wat
er &
Rel
ated
Ser
vice
s0.
71.
01.
21.
41.
01.
21.
31.
51.
71.
6
Fuel
and
Ene
rgy
0.0
0.3
0.2
0.1
0.2
0.1
0.3
0.5
0.6
0.6
Agr
icul
ture
, Fis
hing
& F
ores
try
1.9
1.4
1.8
1.9
1.6
1.8
1.9
1.8
1.9
1.8
Min
ing,
Man
u. a
nd C
onst
r.0.
80.
10.
50.
60.
10.
60.
50.
50.
40.
5
Tran
spor
t & C
omm
unic
atio
n4.
74.
63.
63.
74.
13.
13.
74.
54.
64.
5
Oth
er e
cono
mic
ser
vice
s2.
32.
51.
51.
31.
51.
12.
22.
93.
53.
7
Gen
eral
ser
vice
s &
una
lloca
ted
7.1
11.6
8.3
5.8
11.1
9.1
7.7
6.5
6.7
6.2
Tota
l Allo
cate
d Ex
pend
iture
80.2
82.4
81.0
79.8
80.1
81.2
82.5
84.8
86.5
86.3
Inte
rest
19.8
17.6
19.0
20.2
19.9
18.8
17.5
15.2
13.5
13.1
Una
lloca
ted
0.0
0.0
0.0
0.0
0.0
0.0
0.0
0.0
0.0
0.6
Cons
olid
ated
Exp
endi
ture
100.
010
0.0
100.
010
0.0
100.
010
0.0
100.
010
0.0
100.
010
0.0

Free
dow
nloa
d fr
om w
ww
.hsr
cpre
ss.a
c.za
state fiscal expenditure and poverty 311
1996
/97
1997
/98
1999
/00
2001
/02
2002
/03
2003
/04
2004
/05
Tota
l rea
l ch
ange
(%)
Aver
age
annu
al re
al
chan
ge
(%)
Act
ual
Act
ual
Act
ual
Act
ual
Act
ual
Revi
sed
Estim
ate
Bud
gete
d
Art
s &
Cul
ture
533
200
671
504
858
050
1 14
4 33
61
394
711
1 99
4 44
52
417
790
173.
2419
.2
Educ
atio
n5
319
400
5 97
4 86
17
111
602
8 61
6 36
69
314
413
10 5
84 5
2511
344
957
28.5
23.
2
Hea
lth65
6 00
051
3 06
25
858
821
6 22
3 92
17
059
188
7 69
5 75
08
787
865
707.
2478
.6
Labo
ur64
9 00
063
4 35
886
5 54
81
396
844
1 28
3 02
61
054
138
1 19
1 73
310
.65
1.2
Soci
al D
evel
opm
ent
66 9
0014
5 01
349
9 69
72
327
982
639
424
2 10
0 23
34
548
410
3996
.89
444.
1
Spor
t & R
ecre
atio
n 54
500
118
352
128
143
101
093
171
826
228
439
286
221
216.
4724
.1
Publ
ic W
orks
2 45
6 60
02
796
501
3 15
9 20
93
705
202
4 20
2 18
74
651
985
4 81
9 92
318
.23
2.0
Loca
l Gov
ernm
ent
561
700
1 11
0 44
23
301
521
4 65
3 06
66
556
760
9 46
1 92
112
850
768
1278
.62
142.
1
Tota
l Soc
ial S
ervi
ces
10 2
97 3
0011
964
093
21 7
82 5
9128
168
810
30 6
21 5
3537
771
436
46 2
47 6
6717
0.64
19.0
Agr
icul
ture
820
100
978
271
675
697
871
134
917
273
1 23
4 09
11
306
228
-4.0
2-0
.4
Com
mun
icat
ions
571
600
464
000
766
939
1 12
8 33
8 8
84 5
881
634
962
875
200
-7.7
4-0
.9
Envi
ro. A
ffairs
& T
ouris
m35
6 00
039
6 50
550
5 97
71
064
065
1 36
3 08
61
465
978
1 62
3 40
717
4.79
19.4
Hou
sing
2 07
0 10
04
520
028
3 49
4 37
63
721
240
4 21
3 13
04
523
890
4 84
8 94
141
.15
4.6
Land
Affa
irs27
6 70
041
7 25
068
4 90
597
6 15
61
077
196
1 65
4 99
71
788
152
289.
4232
.2
Min
eral
s &
Ene
rgy
734
300
825
171
611
456
1 23
3 39
61
853
208
1 79
0 68
01
934
494
58.7
56.
5
Trad
e an
d In
dust
ry32
13
800
2 46
9 95
81
827
025
2 01
5 88
82
393
327
2 69
4 58
32
848
423
-46.
59-5
.2
Tran
spor
t3
130
300
3 60
3 73
14
061
621
4 93
6 92
85
710
025
6 28
9 43
56
759
044
30.1
13.
3
Wat
er A
ffairs
& F
ores
try
2 35
7 50
02
820
337
2 67
6 29
73
483
055
3 68
0 62
5 4
639
180
3 30
2 14
4-1
5.60
-1.7
Tota
l Eco
nom
ic S
ervi
ces
13 5
30 4
0016
495
251
15 3
04 2
9319
430
200
22 0
92 4
5825
927
796
25 2
86 0
3312
.61
1.4
Tota
l Nat
iona
l Exp
endi
ture
176
291
000
190
607
000
222
645
000
262
904
548
291
529
069
331
685
179
368
903
926
26.1
02.
9
Tabl
e a4
Exp
endi
ture
tren
ds in
nat
iona
l gov
ernm
ent (
R m
illio
n)
Sour
ce: N
atio
nal T
reas
ury,
Est
imat
es o
f Nat
iona
l Exp
endi
ture
, var
ious
yea
rs
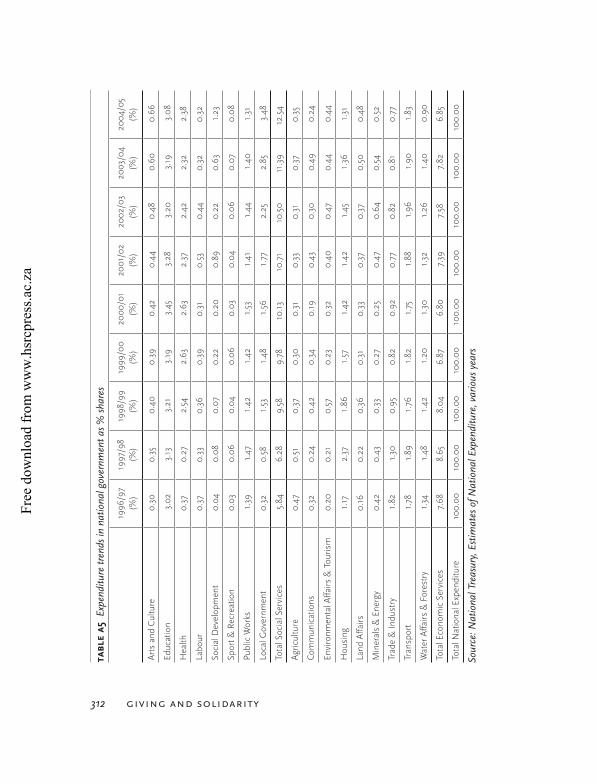
Free
dow
nloa
d fr
om w
ww
.hsr
cpre
ss.a
c.za
312 giving and solidarity
1996
/97
(%)
1997
/98
(%)
1998
/99
(%)
1999
/00
(%)
2000
/01
(%)
2001
/02
(%)
2002
/03
(%)
2003
/04
(%)
2004
/05
(%)
Art
s an
d C
ultu
re0.
300.
350.
400.
390.
420.
440.
480.
600.
66
Educ
atio
n3.
023.
133.
213.
193.
453.
283.
203.
193.
08
Hea
lth0.
370.
272.
542.
632.
632.
372.
422.
322.
38
Labo
ur0.
370.
330.
360.
390.
310.
530.
440.
320.
32
Soci
al D
evel
opm
ent
0.04
0.08
0.07
0.22
0.20
0.89
0.22
0.63
1.23
Spor
t & R
ecre
atio
n0.
030.
060.
040.
060.
030.
040.
060.
070.
08
Publ
ic W
orks
1.39
1.47
1.42
1.42
1.53
1.41
1.44
1.40
1.31
Loca
l Gov
ernm
ent
0.32
0.58
1.53
1.48
1.56
1.77
2.25
2.85
3.48
Tota
l Soc
ial S
ervi
ces
5.84
6.28
9.58
9.78
10.1
310
.71
10.5
011
.39
12.5
4
Agr
icul
ture
0.47
0.51
0.37
0.30
0.31
0.33
0.31
0.37
0.35
Com
mun
icat
ions
0.32
0.24
0.42
0.34
0.19
0.43
0.30
0.49
0.24
Envi
ronm
enta
l Affa
irs &
Tou
rism
0.20
0.21
0.57
0.23
0.32
0.40
0.47
0.44
0.44
Hou
sing
1.17
2.37
1.86
1.57
1.42
1.42
1.45
1.36
1.31
Land
Affa
irs0.
160.
220.
360.
310.
330.
370.
370.
500.
48
Min
eral
s &
Ene
rgy
0.42
0.43
0.33
0.27
0.25
0.47
0.64
0.54
0.52
Trad
e &
Indu
stry
1.82
1.30
0.95
0.82
0.92
0.77
0.82
0.81
0.77
Tran
spor
t1.
781.
891.
761.
821.
751.
881.
961.
901.
83
Wat
er A
ffairs
& F
ores
try
1.34
1.48
1.42
1.20
1.30
1.32
1.26
1.40
0.90
Tota
l Eco
nom
ic S
ervi
ces
7.68
8.65
8.04
6.87
6.80
7.39
7.58
7.82
6.85
Tota
l Nat
iona
l Exp
endi
ture
100.
0010
0.00
100.
0010
0.00
100.
0010
0.00
100.
0010
0.00
100.
00
Tabl
e a5
Exp
endi
ture
tren
ds in
nat
iona
l gov
ernm
ent a
s %
sha
res
Sour
ce: N
atio
nal T
reas
ury,
Est
imat
es o
f Nat
iona
l Exp
endi
ture
, var
ious
yea
rs
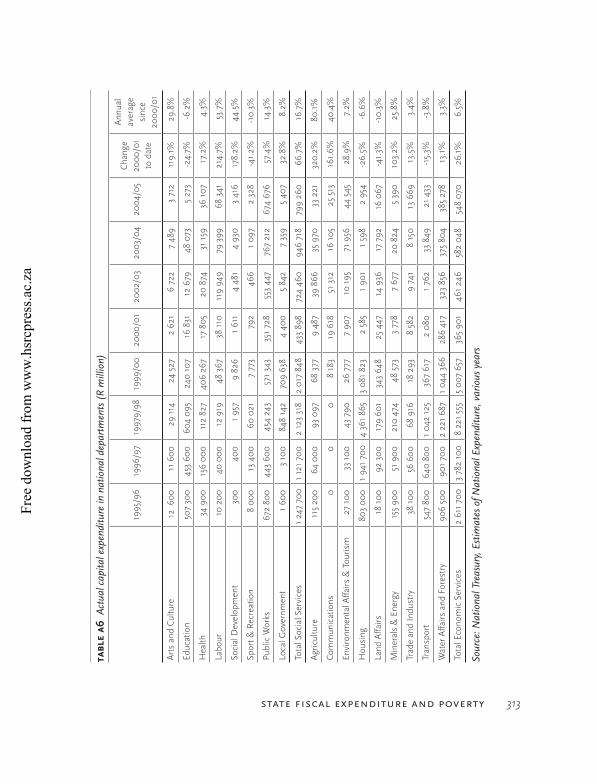
Free
dow
nloa
d fr
om w
ww
.hsr
cpre
ss.a
c.za
state fiscal expenditure and poverty 313
1995
/96
1996
/97
1997
9/98
1999
/00
2000
/01
2002
/03
2003
/04
2004
/05
Cha
nge
2000
/01
to d
ate
Ann
ual
aver
age
sinc
e 20
00/0
1
Art
s an
d C
ultu
re12
600
11 6
0029
114
24 5
272
621
6 72
27
489
3 71
211
9.1%
29.8
%
Educ
atio
n50
7 30
045
3 60
060
4 09
524
0 10
716
831
12 6
7948
073
5 27
3-2
4.7%
-6.2
%
Hea
lth34
900
156
000
112
827
406
267
17 8
0520
874
31 1
5936
107
17.2
%4.
3%
Labo
ur10
200
40 0
0012
919
48 3
6738
110
119
949
79 3
9968
341
214.
7%53
.7%
Soci
al D
evel
opm
ent
300
400
1 95
79
826
1 61
14
481
4 93
03
416
178.
2%44
.5%
Spor
t & R
ecre
atio
n8
000
13 4
0060
021
7 77
3 7
92 4
661
097
2 32
8-4
1.2%
-10.
3%
Publ
ic W
orks
672
800
443
600
454
243
571
343
351
728
553
447
767
212
674
676
57.4
%14
.3%
Loca
l Gov
ernm
ent
1 60
03
100
848
142
709
638
4 40
05
842
7 35
95
407
32.8
%8.
2%
Tota
l Soc
ial S
ervi
ces
1 24
7 70
01
121
700
2 12
3 31
82
017
848
433
898
724
460
946
718
799
260
66.7
%16
.7%
Agr
icul
ture
115
200
64 0
0093
097
68 3
779
487
39 8
6635
970
33 2
2132
0.2%
80.1
%
Com
mun
icat
ions
0 0
08
183
19 6
1851
312
16 1
0525
513
161.
6%40
.4%
Envi
ronm
enta
l Affa
irs &
Tou
rism
27 1
0033
100
43 7
9026
777
7 90
710
195
71 9
5644
545
28.9
%7.
2%
Hou
sing
803
000
1 94
1 70
04
361
865
3 08
1 82
32
585
1 90
11
598
2 95
4-2
6.5%
-6.6
%
Land
Affa
irs18
100
92 3
0017
9 60
134
3 64
825
447
14 9
3617
792
16 0
67-4
1.3%
-10.
3%
Min
eral
s &
Ene
rgy
155
900
51 9
0021
0 47
448
573
3 77
87
677
20 8
245
390
103.
2%25
.8%
Trad
e an
d In
dust
ry38
100
56 6
0068
916
18 2
938
582
9 74
18
150
13 6
6913
.5%
3.4%
Tran
spor
t54
7 80
064
0 80
01
042
125
367
617
2 08
01
762
33 8
4921
433
-15.
3%-3
.8%
Wat
er A
ffairs
and
For
estr
y90
6 50
090
1 70
02
221
687
1 04
4 36
628
6 41
732
3 85
637
5 80
438
5 27
813
.1%
3.3%
Tota
l Eco
nom
ic S
ervi
ces
2 61
1 70
03
782
100
8 22
1 55
55
007
657
365
901
461
246
582
048
548
070
26.1
%6.
5%
Tabl
e a6
Act
ual c
apita
l exp
endi
ture
in n
atio
nal d
epar
tmen
ts (
R m
illio
n)
Sour
ce: N
atio
nal T
reas
ury,
Est
imat
es o
f Nat
iona
l Exp
endi
ture
, var
ious
yea
rs
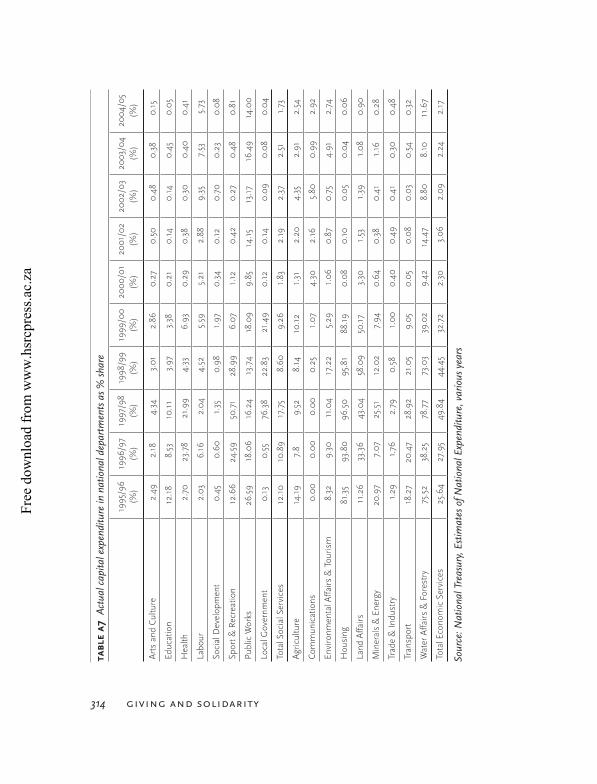
Free
dow
nloa
d fr
om w
ww
.hsr
cpre
ss.a
c.za
314 giving and solidarity
1995
/96
(%)
1996
/97
(%)
1997
/98
(%)
1998
/99
(%)
1999
/00
(%)
2000
/01
(%)
2001
/02
(%)
2002
/03
(%)
2003
/04
(%)
2004
/05
(%)
Art
s an
d C
ultu
re2.
492.
184.
343.
012.
860.
270.
500.
480.
380.
15
Educ
atio
n12
.18
8.53
10.1
13.
973.
380.
210.
140.
140.
450.
05
Hea
lth2.
7023
.78
21.9
94.
336.
930.
290.
380.
300.
400.
41
Labo
ur2.
036.
162.
044.
525.
595.
212.
889.
357.
535.
73
Soci
al D
evel
opm
ent
0.45
0.60
1.35
0.98
1.97
0.34
0.12
0.70
0.23
0.08
Spor
t & R
ecre
atio
n12
.66
24.5
950
.71
28.9
96.
071.
120.
420.
270.
480.
81
Publ
ic W
orks
26.5
918
.06
16.2
413
.74
18.0
99.
8514
.15
13.1
716
.49
14.0
0
Loca
l Gov
ernm
ent
0.13
0.55
76.3
822
.83
21.4
90.
120.
140.
090.
080.
04
Tota
l Soc
ial S
ervi
ces
12.1
010
.89
17.7
58.
609.
261.
832.
192.
372.
511.
73
Agr
icul
ture
14.1
97.
89.
528.
1410
.12
1.31
2.20
4.35
2.91
2.54
Com
mun
icat
ions
0.00
0.00
0.00
0.25
1.07
4.30
2.16
5.80
0.99
2.92
Envi
ronm
enta
l Affa
irs &
Tou
rism
8.32
9.30
11.0
417
.22
5.29
1.06
0.87
0.75
4.91
2.74
Hou
sing
81.3
593
.80
96.5
095
.81
88.1
90.
080.
100.
050.
040.
06
Land
Affa
irs11
.26
33.3
643
.04
58.0
950
.17
3.30
1.53
1.39
1.08
0.90
Min
eral
s &
Ene
rgy
20.9
77.
0725
.51
12.0
27.
940.
640.
380.
411.
160.
28
Trad
e &
Indu
stry
1.29
1.76
2.79
0.58
1.00
0.40
0.49
0.41
0.30
0.48
Tran
spor
t18
.27
20.4
728
.92
21.0
59.
050.
050.
080.
030.
540.
32
Wat
er A
ffairs
& F
ores
try
75.5
238
.25
78.7
773
.03
39.0
29.
4214
.47
8.80
8.10
11.6
7
Tota
l Eco
nom
ic S
ervi
ces
25.6
427
.95
49.8
444
.45
32.7
22.
303.
062.
092.
242.
17
Tabl
e a7
Act
ual c
apita
l exp
endi
ture
in n
atio
nal d
epar
tmen
ts a
s %
sha
re
Sour
ce: N
atio
nal T
reas
ury,
Est
imat
es o
f Nat
iona
l Exp
endi
ture
, var
ious
yea
rs

Free
dow
nloa
d fr
om w
ww
.hsr
cpre
ss.a
c.za
state fiscal expenditure and poverty 315
2001
/02
(%)
2002
/03
(%)
2003
/04
(%)
Cur
rent
Capi
tal
Tota
lC
urre
ntCa
pita
lTo
tal
Cur
rent
Capi
tal
Tota
l
Cent
ral G
over
nmen
t Ser
vice
s10
0.6
89.1
98.3
99.6
96.6
98.9
99.2
90.5
97.3
Fina
ncia
l & A
dmin
istr
ativ
e Se
rvic
es96
.510
0.6
97.2
94.0
99.1
95.2
95.4
97.7
96.0
Soci
al S
ervi
ces
98.4
101.
499
.098
.998
.398
.798
.397
.098
.2
Just
ice
& P
rote
ctio
n Se
rvic
es10
0.3
82.9
99.4
100.
686
.299
.910
0.4
77.6
99.4
Econ
omic
& In
fras
truc
ture
Dev
elop
men
t97
.094
.396
.394
.810
2.6
97.1
94.1
101.
396
.7
Tota
l99
.094
.998
.498
.897
.998
.698
.595
.498
.0
Tabl
e a8
Nat
iona
l div
erge
nce
betw
een
budg
eted
and
act
ual e
xpen
ditu
re
Sour
ce: N
atio
nal T
reas
ury
Pres
s Re
leas
es, v
ario
us y
ears
• N
ote:
The
se p
erce
ntag
es e
xpre
ss a
ctua
l exp
endi
ture
as
a sh
are
of th
e bu
dget
as
adju
sted
in th
e A
djus
tmen
ts E
stim
ates
of t
he re
leva
nt y
ear.
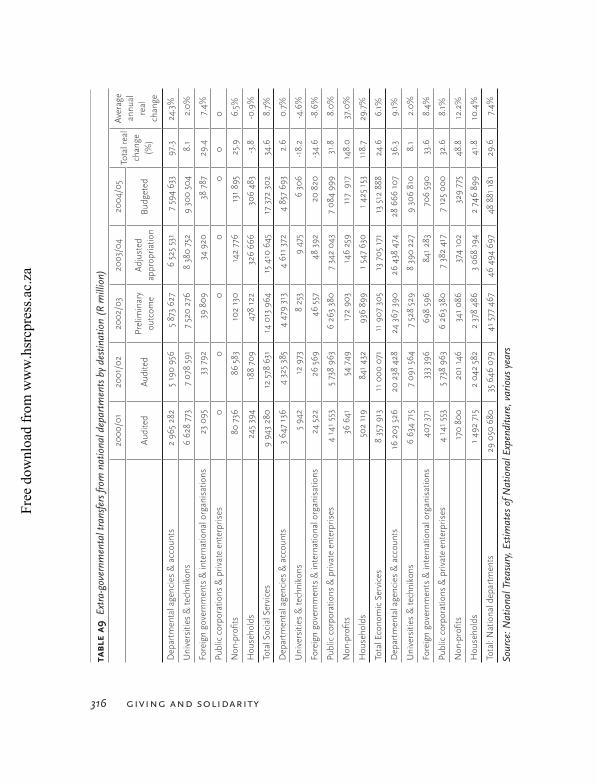
Free
dow
nloa
d fr
om w
ww
.hsr
cpre
ss.a
c.za
316 giving and solidarity
2000
/01
2001
/02
2002
/03
2003
/04
2004
/05
Tota
l rea
l ch
ange
(%)
Aver
age
annu
al
real
ch
ange
Aud
ited
Aud
ited
Prel
imin
ary
outc
ome
Adj
uste
d ap
prop
riatio
n B
udge
ted
Dep
artm
enta
l age
ncie
s &
acc
ount
s2
965
282
5 19
0 95
65
873
627
6 52
5 53
17
594
633
97.3
24.3
%
Uni
vers
ities
& te
chni
kons
6 62
8 77
37
078
591
7 52
0 27
68
380
752
9 30
0 50
48.
12.
0%
Fore
ign
gove
rnm
ents
& in
tern
atio
nal o
rgan
isat
ions
23
095
33
792
39 8
0934
920
38 7
8729
.47.
4%
Publ
ic c
orpo
ratio
ns &
priv
ate
ente
rpris
es0
0 0
00
00
Non
-pro
fits
80 7
3686
583
102
130
142
776
131
895
25.9
6.5%
Hou
seho
lds
245
394
188
709
478
122
326
666
306
483
-3.8
-0.9
%
Tota
l Soc
ial S
ervi
ces
9 94
3 28
012
578
631
14 0
13 9
6415
410
645
17 3
72 3
0234
.68.
7%
Dep
artm
enta
l age
ncie
s &
acc
ount
s3
647
136
4 32
5 38
54
479
313
4 61
1 37
24
857
693
2.6
0.7%
Uni
vers
ities
& te
chni
kons
5 94
212
973
8 2
539
475
6 3
06-1
8.2
-4.6
%
Fore
ign
gove
rnm
ents
& in
tern
atio
nal o
rgan
isat
ions
24 5
2226
569
46 5
5748
392
20 8
20-3
4.6
-8.6
%
Publ
ic c
orpo
ratio
ns &
priv
ate
ente
rpris
es4
141
553
5 73
8 96
36
263
380
7 34
2 04
37
084
999
31.8
8.0%
Non
-pro
fits
36 6
4154
749
172
903
146
259
117
917
148.
037
.0%
Hou
seho
lds
502
119
841
432
936
899
1 54
7 63
01
425
153
118.
729
.7%
Tota
l Eco
nom
ic S
ervi
ces
8 35
7 91
311
000
071
11 9
07 3
0513
705
171
13 5
12 8
8824
.66.
1%
Dep
artm
enta
l age
ncie
s &
acc
ount
s16
203
526
20 2
38 4
2824
367
390
26 4
38 4
7428
666
107
36.3
9.1%
Uni
vers
ities
& te
chni
kons
6 63
4 71
57
091
564
7 52
8 52
98
390
227
9 30
6 81
08.
12.
0%
Fore
ign
gove
rnm
ents
& in
tern
atio
nal o
rgan
isat
ions
407
371
333
396
698
596
841
283
706
590
33.6
8.4%
Publ
ic c
orpo
ratio
ns &
priv
ate
ente
rpris
es4
141
553
5 73
8 96
36
263
380
7 38
2 41
77
125
000
32.6
8.1%
Non
-pro
fits
170
800
201
146
341
086
374
102
329
775
48.8
12.2
%
Hou
seho
lds
1 49
2 71
52
042
582
2 37
8 48
63
068
194
2 74
6 89
941
.810
.4%
Tota
l: N
atio
nal d
epar
tmen
ts29
050
680
35 6
46 0
7941
577
467
46 4
94 6
9748
881
181
29.6
7.4%
Tabl
e a9
Ext
ra-g
over
nmen
tal t
rans
fers
from
nat
iona
l dep
artm
ents
by
dest
inat
ion
(R m
illio
n)
Sour
ce: N
atio
nal T
reas
ury,
Est
imat
es o
f Nat
iona
l Exp
endi
ture
, var
ious
yea
rs

Free
dow
nloa
d fr
om w
ww
.hsr
cpre
ss.a
c.za
state fiscal expenditure and poverty 317
2000
/01
2001
/02
2002
/03
2003
/04
2004
/05
Tota
l rea
l ch
ange
(%
)
Aver
age
annu
al re
al
chan
geA
udite
dA
udite
dPr
elim
inar
y O
utco
me
Adj
uste
d A
ppro
pria
tion
Bud
gete
d
Art
s an
d C
ultu
re33
9 6
6537
3 88
250
5 05
474
4 72
394
6 00
911
4.6
28.6
%
Educ
atio
n7
094
219
7 55
4 36
68
056
942
8 97
2 81
69
935
074
7.9
2.0%
Hea
lth16
0 6
46 2
65 7
3928
0 76
231
2 56
139
8 08
490
.922
.7%
Labo
ur1
220
173
3 42
3 06
23
874
224
3 99
5 99
14
623
346
192.
048
.0%
Scie
nce
& T
echn
olog
y54
8 51
665
5 45
9 7
19 6
21 9
67 7
531
165
742
63.8
15.9
%
Soci
al D
evel
opm
ent
301
663
206
391
447
995
256
207
130
722
-66.
6-1
6.7%
Spor
t & R
ecre
atio
n54
391
43 1
0060
407
67 6
3773
977
4.8
1.2%
Publ
ic W
orks
170
638
18 6
3528
289
38 5
7743
422
-80.
4-2
0.1%
Loca
l Gov
ernm
ent
53 3
6937
997
40 6
7054
380
55 9
26-1
9.3
-4.8
%
All
Soci
al S
ervi
ces
9 94
3 28
012
578
631
14 0
13 9
6415
410
645
17 3
72 3
0234
.68.
7%
Agr
icul
ture
307
256
396
155
392
639
573
713
366
419
-8.1
-2.0
%
Com
mun
icat
ions
334
015
945
117
655
215
1 40
3 56
464
7 02
449
.312
.3%
Envi
ronm
enta
l Affa
irs &
Tou
rism
491
698
823
850
1 09
8 39
51
084
102
1 20
7 47
989
.222
.3%
Hou
sing
195
604
295
634
191
758
69 5
6259
842
-76.
4-1
9.1%
Land
Affa
irs36
2 82
055
8 44
362
4 20
41
012
889
1 08
5 46
513
0.5
32.6
%
Min
eral
s &
Ene
rgy
405
566
1 01
0 02
51
358
922
1 22
4 62
71
282
302
143.
635
.9%
Trad
e &
Indu
stry
1 82
4 78
31
567
865
1 82
7 55
01
908
927
2 07
5 06
4-1
2.4
-3.1
%
Tran
spor
t3
927
139
4 71
5 05
75
355
018
5 85
4 69
26
238
512
22.4
5.6%
Wat
er A
ffairs
& F
ores
try
509
032
687
925
403
604
573
095
550
781
-16.
6-4
.2%
Tota
l Eco
nom
ic S
ervi
ces
8 35
7 91
311
000
071
11 9
07 3
0513
705
171
13 5
12 8
8824
.66.
1%
Tota
l: N
atio
nal d
epar
tmen
ts29
050
680
35 6
46 0
7941
577
467
46 4
94 6
9748
881
181
29.6
7.4%
Tabl
e a1
0 E
xtra
-gov
ernm
enta
l tra
nsfe
rs fr
om n
atio
nal d
epar
tmen
ts b
y so
urce
(R
mill
ion)
Sour
ce: N
atio
nal T
reas
ury,
Est
imat
es o
f Nat
iona
l Exp
endi
ture
, var
ious
yea
rs
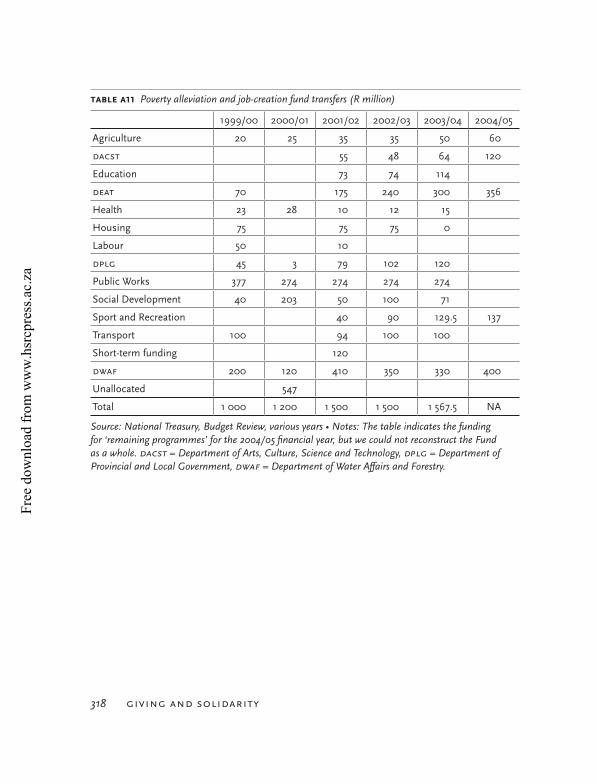
Free
dow
nloa
d fr
om w
ww
.hsr
cpre
ss.a
c.za
318 giving and solidarity
1999/00 2000/01 2001/02 2002/03 2003/04 2004/05
Agriculture 20 25 35 35 50 60
dacst 55 48 64 120
Education 73 74 114
deat 70 175 240 300 356
Health 23 28 10 12 15
Housing 75 75 75 0
Labour 50 10
dplg 45 3 79 102 120
Public Works 377 274 274 274 274
Social Development 40 203 50 100 71
Sport and Recreation 40 90 129.5 137
Transport 100 94 100 100
Short-term funding 120
dWaf 200 120 410 350 330 400
Unallocated 547
Total 1 000 1 200 1 500 1 500 1 567.5 NA
Table a11 Poverty alleviation and job-creation fund transfers (R million)
Source: National Treasury, Budget Review, various years • Notes: The table indicates the funding for ‘remaining programmes’ for the 2004/05 financial year, but we could not reconstruct the Fund as a whole. DACST = Department of Arts, Culture, Science and Technology, DPLG = Department of Provincial and Local Government, DWAF = Department of Water Affairs and Forestry.

Free
dow
nloa
d fr
om w
ww
.hsr
cpre
ss.a
c.za
state fiscal expenditure and poverty 319
1995
/96
1996
/97
1997
/98
1998
/99
2000
/01
2002
/03
2003
/04
% T
otal
real
ch
ange
Aver
age
annu
al re
al
chan
ge (
%)
Act
ual
Act
ual
Act
ual
Act
ual
Act
ual
Act
ual
Bud
gete
d
Educ
atio
n29
671
36 6
0638
570
22 9
4943
223
53 1
0258
897
172.
1
Hea
lth16
098
20 6
4022
376
22 9
4926
403
33 2
3836
852
354.
3
Soci
al D
evel
opm
ent
14 4
0015
938
17 6
6918
440
20 8
9731
247
37 8
0854
6.8
Oth
er12
585
14 3
9114
632
31 6
6319
884
27 3
0031
652
486.
0
Tota
l72
754
87 5
7593
247
96 0
0111
0 40
714
4 88
716
5 20
934
4.2
Tabl
e a1
2 P
rovi
ncia
l exp
endi
ture
by
depa
rtm
ent (
R m
illio
n)
Sour
ce: N
atio
nal T
reas
ury,
Inte
rgov
ernm
enta
l Fisc
al R
evie
w, v
ario
us y
ears
1995
/96
1996
/97
1997
/98
1998
/99
1999
/00
2000
/01
2001
/02
2002
/03
2003
/04
Act
ual (
%)
Act
ual (
%)
Act
ual (
%)
Act
ual (
%)
Act
ual (
%)
Act
ual (
%)
Act
ual (
%)
Act
ual (
%)
Budg
eted
(%)
Educ
atio
n40
.841
.841
.423
.939
.839
.138
.336
.735
.6
Hea
lth22
.123
.624
.023
.924
.123
.924
.322
.922
.3
Soci
al D
evel
opm
ent
19.8
18.2
18.9
19.2
19.4
18.9
19.4
21.6
22.9
Oth
er17
.316
.415
.733
.016
.818
.018
.018
.819
.2
Tota
l10
0.0
100.
010
0.0
100.
010
0.0
100.
010
0.0
100.
010
0.0
Tabl
e a1
3 P
rovi
ncia
l exp
endi
ture
by
depa
rtm
ent (
% s
hare
)
Sour
ce: N
atio
nal T
reas
ury,
Inte
rgov
ernm
enta
l Fisc
al R
evie
w, v
ario
us y
ears

Free
dow
nloa
d fr
om w
ww
.hsr
cpre
ss.a
c.za
320 giving and solidarity
1995
/96
1996
/97
1997
/98
1998
/99
2000
/01
2002
/03
2003
/04
Tota
l rea
l ch
ange
(% )
Aver
age
an
nual
real
ch
ange
(%
)A
ctua
lA
ctua
lA
ctua
lA
ctua
lA
ctua
lA
ctua
lB
udge
ted
Educ
atio
n38
199
950
780
167
218
5131
6738
948
.6
Hea
lth47
980
284
080
113
1524
3130
2927
234
.0
Soci
al D
evel
opm
ent
3551
2552
5914
718
521
126
.4
Oth
er27
3727
8334
2045
6462
0893
3612
225
163
20.3
Tota
l3
632
4 63
54
792
6 21
88
254
13 7
6518
606
201
25.2
Tabl
e a1
4 P
rovi
ncia
l cap
ital e
xpen
ditu
re b
y de
part
men
t (R
mill
ion)
Sour
ce: N
atio
nal T
reas
ury,
Inte
rgov
ernm
enta
l Fisc
al R
evie
w, v
ario
us y
ears
Tabl
e a1
5 P
rovi
ncia
l cap
ital e
xpen
ditu
re (
% o
f tot
al e
xpen
ditu
re)
Sour
ce: N
atio
nal T
reas
ury,
Inte
rgov
ernm
enta
l Fisc
al R
evie
w, v
ario
us y
ears
1995
/96
(%)
1996
/97
(%)
1997
/98
(%)
1998
/99
(%)
1999
/00
(%)
2000
/01
(%)
2001
/02
(%)
2002
/03
(%)
2003
/04
(%)
Educ
atio
n1.
32.
71.
33.
51.
21.
62.
93.
55.
4
Hea
lth1.
62.
22.
23.
52.
53.
04.
84.
65.
1
Soci
al D
evel
opm
ent
0.1
0.1
0.1
0.2
0.1
0.1
0.2
0.3
0.3
Oth
er9.
27.
68.
919
.912
.314
.416
.217
.620
.8
Tota
l12
.212
.712
.427
.116
.119
.124
.225
.931
.6
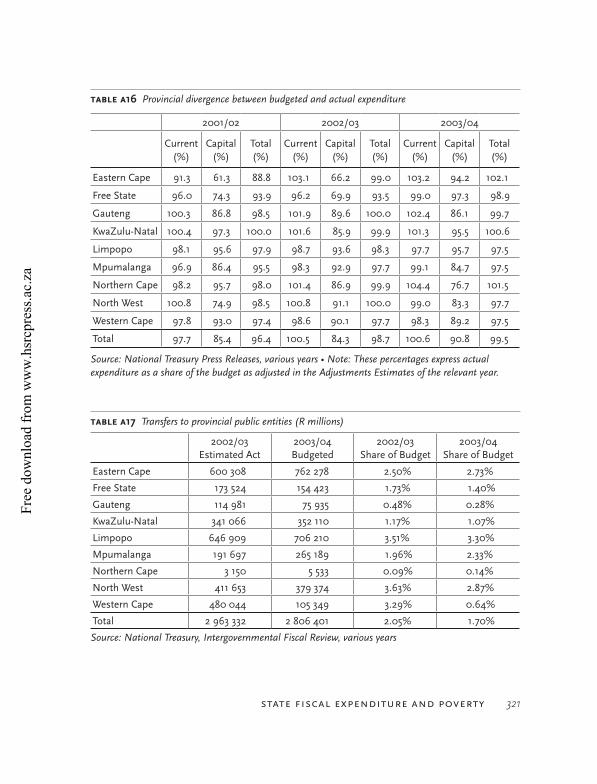
Free
dow
nloa
d fr
om w
ww
.hsr
cpre
ss.a
c.za
state fiscal expenditure and poverty 321
2001/02 2002/03 2003/04
Current (%)
Capital (%)
Total (%)
Current (%)
Capital (%)
Total (%)
Current (%)
Capital (%)
Total (%)
Eastern Cape 91.3 61.3 88.8 103.1 66.2 99.0 103.2 94.2 102.1
Free State 96.0 74.3 93.9 96.2 69.9 93.5 99.0 97.3 98.9
Gauteng 100.3 86.8 98.5 101.9 89.6 100.0 102.4 86.1 99.7
KwaZulu-Natal 100.4 97.3 100.0 101.6 85.9 99.9 101.3 95.5 100.6
Limpopo 98.1 95.6 97.9 98.7 93.6 98.3 97.7 95.7 97.5
Mpumalanga 96.9 86.4 95.5 98.3 92.9 97.7 99.1 84.7 97.5
Northern Cape 98.2 95.7 98.0 101.4 86.9 99.9 104.4 76.7 101.5
North West 100.8 74.9 98.5 100.8 91.1 100.0 99.0 83.3 97.7
Western Cape 97.8 93.0 97.4 98.6 90.1 97.7 98.3 89.2 97.5
Total 97.7 85.4 96.4 100.5 84.3 98.7 100.6 90.8 99.5
Table a16 Provincial divergence between budgeted and actual expenditure
Source: National Treasury Press Releases, various years • Note: These percentages express actual expenditure as a share of the budget as adjusted in the Adjustments Estimates of the relevant year.
2002/03Estimated Act
2003/04Budgeted
2002/03Share of Budget
2003/04Share of Budget
Eastern Cape 600 308 762 278 2.50% 2.73%
Free State 173 524 154 423 1.73% 1.40%
Gauteng 114 981 75 935 0.48% 0.28%
KwaZulu-Natal 341 066 352 110 1.17% 1.07%
Limpopo 646 909 706 210 3.51% 3.30%
Mpumalanga 191 697 265 189 1.96% 2.33%
Northern Cape 3 150 5 533 0.09% 0.14%
North West 411 653 379 374 3.63% 2.87%
Western Cape 480 044 105 349 3.29% 0.64%
Total 2 963 332 2 806 401 2.05% 1.70%
Table a17 Transfers to provincial public entities (R millions)
Source: National Treasury, Intergovernmental Fiscal Review, various years

Free
dow
nloa
d fr
om w
ww
.hsr
cpre
ss.a
c.za
322 giving and solidarity
Sala
ries,
wag
es a
nd
allo
wan
ces
(%
)
Elec
tric
ity b
ulk
pu
rcha
ses
(%
)
Wat
er b
ulk
purc
hase
s (%
)
Repa
irs a
nd
mai
nten
ance
(%
)
Oth
er
(%)
Tota
l
(%)
Met
ros
29.7
17.9
7.7
7.3
37.4
100.
0
Oth
er32
.616
.05.
16.
240
.110
0.0
Tota
l30
.817
.26.
76.
938
.410
0.0
Road
s,
pave
men
ts,
brid
ges
(%)
Wat
er
rese
rvoi
rs &
re
ticul
atio
n (%
)
Elec
tric
ity
retic
ulat
ion
(%)
Hou
sing
(%
)
Oth
er in
fra-
stru
ctur
e (%
)
Com
mun
ity
proj
ects
(%
)O
ther
ass
ets
(%)
Spec
ialis
ed
vehi
cles
(%
)O
ther
(%
)To
tal
(%)
Met
ros
12.7
10.1
15.6
26.0
7.7
4.4
11.7
0.9
10.9
100.
0
Oth
er14
.720
.87.
59.
510
.17.
310
.21.
518
.410
0.0
Tota
l13
.615
.111
.918
.38.
85.
811
.01.
214
.410
0.0
Tabl
e a1
8 L
ocal
gov
ernm
ent 2
002/
03 c
apita
l exp
endi
ture
by
mai
n fu
nctio
n
Sour
ce: N
atio
nal T
reas
ury,
Inte
rgov
ernm
enta
l Fisc
al R
evie
w, v
ario
us y
ears
Tabl
e a1
9 L
ocal
gov
ernm
ent 2
002/
03 o
pera
tiona
l exp
endi
ture
by
mai
n fu
nctio
n
Sour
ce: N
atio
nal T
reas
ury,
Inte
rgov
ernm
enta
l Fisc
al R
evie
w, v
ario
us y
ears

Free
dow
nloa
d fr
om w
ww
.hsr
cpre
ss.a
c.za
state fiscal expenditure and poverty 323
2001/02 2002/03 2003/04 Total real
change (%)
Average annual real
change
Equitable share 2 618 3 964 6 343 106.4 53.2%
Transition grant 250 223 -100.0 -50.0%
Water and sanitation operating 692 700 836 2.9 1.5%
Subtotal: Equitable share & related 3 560 4 887 7 179 71.8 35.9%
cMip 994 1 671 2 246 92.5 46.2%
Water Services Project 822 999 1 102 14.2 7.1%
cBpWp 374 260 260 -40.8 -20.4%
led Fund 76 111 117 31.1 15.6%
Sport & recreation facilities 40 76 123 161.9 81.0%
nef 0 228 240 0.0 0.0%
Urban Transport Fund 81 40 9 -90.5 -45.3%
isrdp 0 32 0 0.0 0.0%
Mig 0 0 47 0.0 0.0%
Unallocated 0 0 0 0.0 0.0%
Subtotal Capital 2 387 3 417 4 144 47.9 23.9%
Restructuring Grant 350 250 315 -23.3 -11.7%
Financial Management Grant 60 154 212 201.0 100.5%
lg Support Grant 160 0 0 -100.0 -50.0%
Municipal Systems Improvement 30 94 150 325.9 163.0%
Subtotal: capacity building & restruct. 600 498 677 -3.9 -1.9%
Provincial transfers 1 210 2 277 2 410 69.6 34.8%
Total 7 757 11 079 14 410 58.2 29.1%
Table a20 Transfers to local government from national and provincial government
Source: National Treasury, Intergovernmental Fiscal Review, various years • Note: CBPWP = Community-Based Public Works Programme; LED = local economic development; NEF = National Empowerment Fund; ISRDP = Integrated Sustainable Rural Development Programme; MIG = Municipal Infrastructure Grant

Free
dow
nloa
d fr
om w
ww
.hsr
cpre
ss.a
c.za
324 giving and solidarity
Notes
1 This chapter is based on two base documents that were commissioned as inputs
for the original synthesis chapter. They were written in accordance with specific
instructions and criteria developed by Mark Swilling. The authors of the base
documents appear as second authors to this chapter. However, Mark Swilling
wrote the final synthesis chapter. The contents of the two base documents will be
referred to throughout the chapter without, in most cases, specifically cross-
referencing to the base documents.
2 ‘Economic services’ refers to the cluster of sectors in government that includes
agriculture, communications, environmental affairs and tourism, housing, land
affairs, minerals and energy, trade and industry, transport, water affairs and
forestry. See TAblE A4 for details.
3 This section on poverty includes extracts from an unpublished paper by Mirjam
van Donk and Edgar Pieterse which was commissioned by Sedibeng, but which
was subsequently edited and reworked by these two authors and Mark Swilling
into a paper entitled ‘State, civil society and capacity building for poverty
eradication in South Africa’, presented at the Winelands Conference, University of
Stellenbosch, September 2003. The authors thank Edgar Pieterse and Mirjam van
Donk for allowing extracts from this 2003 version of their research to be included
in this chapter.
4 The rest of this section draws entirely on commissioned research compiled by
Albert van Zyl, Sociology Department, University of Stellenbosch.
5 The analysis provided in this section is based on a review captured in the tables in
the appendix to this chapter, of standard data provided by the National Treasury.
The following approach was adopted:
◆ All growth rates are real, unless indicated otherwise. The allocations listed
in the tables are, however, in nominal terms. Inflation adjustments were
calculated using the CPIX where available. For other years the CPI was used.
◆ The data were compiled from official National Treasury documentation.
◆ Under national expenditure we classified the Departments of Provincial and
Local Government and Public Works to Social Services because of the poverty
relief projects that they are involved in.
The periods for which data are reflected in these tables vary according to the
availability and reliability of data. Where data were obviously unreliable, we chose

Free
dow
nloa
d fr
om w
ww
.hsr
cpre
ss.a
c.za
state fiscal expenditure and poverty 325
not to use them. To get the tables into a comparable base, we calculated average
annual growth rates throughout.
At the time of writing this particular section, the National Budget had been
released, enabling us to give national time-series up to 2004/05.
6 It is important to note that the total amount transferred from national
departments is greater than the totals for economic services and social services.
The reason for this is that TAblE A9 was compiled to only reflect financial transfers
from the economic and social service categories, and none of the other categories.
The gap between the total amounts transferred from national departments
and the amounts transferred from the ‘economic’ and ‘social’ clusters would,
therefore, be the transfers from other clusters.
References
Bhorat H & Kanbur R (Eds) (2006) Poverty and policy in post-apartheid South Africa. Cape
Town: HSRC Press
Gelb S (2004) The South African economy, 1994–2004. Paper presented at Wits Institute for
Social and Economic Research, University of the Witwatersrand, 26 July
May J (2001) Meeting the challenge? The emerging agenda for poverty reduction in post-
apartheid South Africa. In F Wilson, N Kanji & E Braathen (Eds) Poverty reduction:
What role for the state in today’s globalized economy? Cape Town: New Africa Education
Publishing
Nattrass N & Seekings J (2001) Democracy and distribution in highly unequal economies: the
case of South Africa. Journal of Modern African Studies 39(3): 470–498
RSA (Republic of South Africa) (2002) Transforming the present: Protecting the future. Pretoria
SAIRR (South African Institute of Race Relations) (2001) Informal dwellings skyrocket.
Johannesburg: SAIRR. Accessed 31 January 2002. http:\\www.sairr.org.za
South African Cities Network (2003) State of the cities report. Johannesburg: South African
Cities Network
Swilling M & Russell B (2002) The size and scope of the non-profit sector in South Africa.
Durban: Centre for Civil Society
UNDP (United Nations Development Program) (2000) UNDP South Africa human development
report 2000. Accessed December 2005. http://www.undp.org.za/sadhr2002.html

Free
dow
nloa
d fr
om w
ww
.hsr
cpre
ss.a
c.za
326 giving and solidarity
Irwin Chetty
Full Gospel Church of God
College
David Everratt
Strategy and Tactics
Gauteng
Deborah Ewing
iMEDIATE Development
Consultants
Durban
Merle Favis
CSI Consultant
Gauteng
Steven Friedman
IDASA, Gauteng and
Visiting Professor of Politics
Rhodes University,
Grahamstown
Thulani Guliwe
Independent Researcher
Gauteng
Adam Habib
Deputy Vice-Chancellor
University of Johannesburg
Judi Hudson
Independent Consultant
Gauteng
Sultan Kahn
School of Sociology and
Social Studies
University of KwaZulu-Natal
Brij Maharaj
Discipline Chair, Geography
University of KwaZulu-Natal
Shaun Mackay
Centre for Policy Studies
Gauteng
Annsilla Nyar
Centre for Civil Society
University of KwaZulu-Natal
Mandla Seleoane
Ga-Rankuwa Campus
Director
Tshwane Institute of
Technology
Pearl Sithole
Democracy and Governance
Programme
Human Sciences Research
Council
Geetesh Solanki
Fifth Quadrant Actuaries
and Consultants
Johannesburg
Reshma Sookrajh
School of Education
University of KwaZulu-Natal
Mark Swilling
School of Public
Management and Planning
University of Stellenbosch
John van Breda
School of Public
Management and Planning
University of Stellenbosch
Albert van Zyl
School of Public
Management and Planning
University of Stellenbosch
Contributors

Free
dow
nloa
d fr
om w
ww
.hsr
cpre
ss.a
c.za
327
Aabuse of social grants 135–136Adventist Church 96, 97, 105African Forum and Network on Debt and
Development (AFRODAD) 247–248African religious sector 28–29, 89, 98–99, 107,
110Anglican Church 109AngloGold Ashanti 190, 196, 230animal welfare 66Annan, Kofi 248apartheid 101, 180, 209–210, 218–219arts and culture 188, 197–198, 201
BBEE (black economic empowerment) 177–178,
211–217Bill and Melinda Gates Foundation 263–264,
265–266Bill of Rights 132black economic empowerment see BEEblack-owned businesses 210, 211–223BT see Business Trustburial traditions 26, 89, 107, 145businesses 137–139 See also corporate social investment (CSI)business–government relationship 179, 183Business Trust (BT) 182–184, 186, 213, 219, 234
Ccar guards 45, 56case studies 123–124case studies of resource flows business 137–139 churches 139–141 individual giving 143–149 methodology 122–124 non-governmental organisations (NGOs)
141–143 poor people 128–129 poverty 124–127 social security grants 152–155 state 129–136 stokvels 150–152Catholic Church 95–96, 105–106causes, local and international 64–67CDI (Commitment to Development Index)
244–245Centre for Development and Enterprise (CDE)
171–172Centurion Church 97–98champions 180–186charters 177–178, 217Chevrah Kadisha 92 children 62–65, 147–148Christian faith 83Christian institutions 87–89, 95–99, 105–107, 109
Index
References to figures and tables are indicated by ‘&fig’. References to endnotes are indicated by an ‘n’ (e.g. 41n4).

Free
dow
nloa
d fr
om w
ww
.hsr
cpre
ss.a
c.za
328 giving and solidarity
churches 139–141civil society 80civil society organisations (CSOs) 241–242 See also foundations; NGOs; non-profit sector;
religious institutionscollective action 143–147Commitment to Development Index see CDICommittee of Inquiry into a Comprehensive
System of Social Security for South Africa 285–286
community consultation 192–194conflict and poverty 154–155consolidated national and provincial expenditure
290–292, 309–310 &figconsulting with communities 192–194cooperation, interdenominational 81, 114, 141coping mechanisms of poor people 128–129corporate social investment (CSI) 20–21, 30–33 amount 169–173 arts and culture 188, 197–198, 201 benefits 160 champions 180–186 community consultation 192–194 drivers 174–180 future trends 233–237 global pressures 179–180 and government 178–179 and marketing 168–169, 175–176 peer pressure 180–186, 222 practitioners 210–211, 223–233 priorities 186–191, 194–196, 198–201 professionalisation 161–169, 188–190,
196–202 racial identity 207–237 small and medium enterprises (SMEs) 173–174 staff choice 193corruption 276n7counter-terrorism 245–247courses in CSI 166, 167–168CSI see corporate social investmentCSOs (civil society organisations) 241–242 See also foundations; NGOs; non-profit sector;
religious institutions
DDBSA see Development Bank of Southern Africadebt 291Department of Foreign Affairs 259Department of Health (DOH) 249dependency, social security grants 38–39, 122, 136,
152–155De Swaan, Abram 220development 17–21, 40–41, 111–114Development Bank of Southern Africa 303–304Development Cooperation Report for South Africa
249development initiatives 99–107development nodes 121–122disabled 64–65discretionary funds 164Divine Life Society 89, 103–105donor criteria 255–256donor matrix 249drivers of CSI 174–180Durkheim, Emile 22dysfunctional institutions 284–285
EEconomic Reporting Format Guide 295–296economic services 281–282, 291, 324n2economy of affection 22, 29–30economy of commerce 22economy of fear 22economy of obligation 22economy of volition 22education 194–196elderly 65, 147–148empowerment 288environmental concerns 194exaggeration 47, 48, 75–76, 169extended families 22, 29
Ffaith 27–29, 57, 68, 79–120faith-based institutions 36, 56, 66, 79–120,
112–114, 139–141Feldberg, Meyer 174fieldworkers 46fiscal expenditure 281–325

Free
dow
nloa
d fr
om w
ww
.hsr
cpre
ss.a
c.za
index 329
fiscal policy 288–292food 126–127Food for Life 92–93Ford Foundation 263–264foreign donor funding 241–280foreign expertise 256, 257–258forum of multi-faith leaders 81, 114foundations, private 262–274FTSE4Good 184Full Gospel Church 109fund-raising 87–91fund transfers 282, 294–299, 301–302, 321 &fig,
323 &fig See also social security grantsfuture trends in CSI 233–237
GGanga Baptismal Centre 104–105Gates Foundation 263–264, 265–266GEAR 288, 289–290gender equality 107–111Gift of the Givers 95Gini coefficient 18, 284giving, definition 45global ODA 242–248global pressures 179–180Glory Hill see Graskop (Mpumalanga province)goods 56–57, 60–62, 170–171governance 247government and business 178–179, 229–232grantmaking foundations 262–271Graskop (Mpumalanga province) 121, 123, 137, 139,
140–141, 142–143, 145, 146, 154
Hhealth services 103Hindu faith 85Hindu institutions 89–90, 92–93, 103–105, 108HIV/AIDS epidemic 64–66, 97, 141–142, 194,
195–196, 251, 267Holy Society 92home-based care 142Human Development Index (HDI) 18, 255Hunger and Poverty Report 126
IIDC see Industrial Development CorporationIDT see Independent Development TrustIMA (Islamic Medical Association) 102immediate need vs long-term change 72–75impact measurement see monitoring and
evaluation systemsIndependent Development Trust (IDT) 303–306individual giving 143–149, 212–213Industrial Development Corporation (IDC) 251,
258, 303INGOs see international non-governmental
organisationsinterdenominational cooperation 81, 114, 141Interfund 271international aid 88, 241–280international non-governmental organisations
(INGOs) 264–271International Society for Krishna Consciousness
(ISKCON) 92–93, 103Isibaya Fund 303–306ISKCON see International Society for Krishna
ConsciousnessIslamic faith 84, 117n8Islamic institutions 90–91, 93–95, 101–102, 109Islamic Medical Association (IMA) 102Islamic Relief Agency (ISRA) 101–102
JJET see Joint Education TrustJewish faith 83–84Jewish institutions 87, 91–92, 99–100, 108job creation funds 299Johannesburg Jewish Helping Hand and Burial
Society 92Joint Education Trust (JET) 184, 219JSE Sustainability Index 169, 181, 184–186, 200
KKeeton, Margie 163Khula 146, 157n12, 303–306King Report on Corporate Governance for South
Africa 185KwaZulu-Natal province 104 See also provinces

Free
dow
nloa
d fr
om w
ww
.hsr
cpre
ss.a
c.za
330 giving and solidarity
LLED Fund see Local Economic Development FundLiberty Life Foundation 162–163, 230Likert scale 77n2Local Economic Development Fund (LED Fund)
303–306local government expenditure 301–302, 322–323
&figlong-term change vs immediate need 72–75lotto 48loveLife 273
MMaAfrika Tikkun initiative 99–100Macozoma, Saki 182Macro Economic Working Group 292macro-level fiscal expenditure 289–290, 308 &figMadiba schools 179, 190Mail & Guardian annual CSI awards 168, 184, 200Mandela, Nelson 21Mandela Village (Gauteng province) 121, 123, 137,
143, 144–145, 146–147, 148–149marketing and CSI 168–169, 175–176Masibambane programme 256Mbeki, Thabo 19, 81, 93, 114, 188, 229Mdantsane (Eastern Cape province) 121, 123, 137,
139–140, 141, 143MDGs see Millennium Development Goalsmeasurement of impact 189, 261, 270–271, 274methodology case studies of resource flows 122–124 national survey of social giving 46–48Millennium Development Goals (MDGS) 242, 248minimum wages 138–139mining charter 177, 217modes of exchange 22Mokasa 2 (North West province) 121, 123, 137, 139,
140, 144, 146, 147–148monitoring and evaluation systems 189, 261,
270–271, 274motivation for giving businesses 30–33, 174–180, 186–191 individual giving 28, 67–75, 76–77 to South Africa 255–258, 267
multi-faith leadership forum 81, 114Muslim see Islamic Mustadafin Foundation 94–95Mvelaphanda 221, 223, 231, 233
NNational Business Initiative (NBI) 213National Development Agency (NDA) 293, 303–306National Empowerment Fund (NEF) 303–306national expenditure 290–299, 309–318 &figNational Lottery Board (NLB) 303–306National Skills Fund (NSF) 303–306National Spatial Development Perspective (NSDP)
17–18national survey of social giving 87 amount 50–53 causes 64–67 extended families 62–64 introduction 45–46 limitations of 47–48 methodology 46–48 money 54–56, 59–60 motivation for giving 67–75, 76–77 non-monetary giving 56–57, 60–62 poor people 59–62 recipients 54–64 volunteering 51–53, 57–59 who gives 48–50, 75National Treasury 249, 258–259Nazareth Church see African religious sectorNBI see National Business InitiativeNDA see National Development AgencyNEF see National Empowerment FundNEPAD 248NGOs (non-governmental organisations) 141–143,
194, 264–271NLB see National Lottery Boardnon-governmental organisations (NGOS) 141–143,
194, 264–271non-monetary giving 56–57, 60–62, 170–171non-profit sector 20–21, 80–81NSDP see National Spatial Development PerspectiveNSF see National Skills FundNTSIKA 303–306

Free
dow
nloa
d fr
om w
ww
.hsr
cpre
ss.a
c.za
index 331
Oobligatory giving 82–86ODA see official development assistanceO’Dowd, Michael 164–165, 168official development assistance (ODA) 241–280Operational Jumpstart Association (OJA) 303–306over-claim 47, 48, 75–76, 169
PParliamentary Office, SACC 106partnerships 179, 183peer pressure 180–186, 222Pentecostal Church 88, 97–98philanthropy 21–34, 80–81Pick ‘n Pay 190–191Ploughback Trust 35–36policy 17–18, 38–41political parties 64–66, 222–223, 231poor people 18, 26–27, 59–62, 75, 128–129poverty 18, 34, 124–127, 154–155, 281–325poverty alleviation 17–20, 40–41, 91–99, 107, 112,
288, 299private foundations 262–274professionalisation of CSI 161–169, 188–190,
196–202Project Support Association of Southern Africa
(PSASA) 142–143provinces 18, 27, 52 &fig, 53, 59, 63 &fig, 64provincial expenditure 290–292, 300–302,
309–310 &fig, 319–321 &figPSASA see Project Support Association of Southern
AfricaPublic Policy Liaison Office, SACC 106pyramid schemes 128–129
Rracial identity 34–35, 207–240Ramakrishna Mission of South Africa 89–90, 103Ramaphosa, Cyril 182, 212, 235Ramrajya 92, 117n10RDP Fund 248, 250–251, 253 &fig, 254, 258, 260,
283Reality of Aid Report 245, 257reasons for giving see motivation for giving
recipients 54–64Reconstruction and Development Programme see
RDP Fund Reformed Church 109regulations 176–178religion 27–29, 57, 68, 79–120religious institutions 36, 56, 66, 79–120, 112–114,
139–141Rhema Ministries 96Rushdie, Salman 112–113
SSACC see South African Council of ChurchesSAGA see Southern African Grantmakers’
AssociationSalamon, Lester M 25Salole, Gerry 272Salvation Army 96, 97, 106–107SANZAF see South African National Zakaat FundSarva Dharma Ashram 93, 103saving schemes see stokvelsSAWEN see South African Women’s Entrepreneur
Networksecurity 245–247Sexwale, Tokyo 222–223Shanduka Foundation 182, 212Shembe Church see African religious sectorsmall and medium enterprises (SMEs) 171, 173–174,
183social auditing 32social benefits 297social capital 68–71social giving 45–78social justice philanthropy 37–38social security grants 122, 129–130, 135–136,
152–155, 156n6social services 281, 291socio-economic indicators 287South African Council of Churches (SACC) 88,
96–97, 105–106, 116n3, 116n4South African Foundation 172, 194South African National Zakaat Fund (SANZAF) 84,
90, 94, 109South African Tamil Federation 93
Free
dow
nloa
d fr
om w
ww
.hsr
cpre
ss.a
c.za
332 giving and solidarity
South African Women’s Entrepreneur Network (SAWEN) 303–306
Southern African Grantmakers’ Association (SAGA) 32, 172, 181–182, 232
special funds 34, 282–283, 290, 303–306Special Poverty Relief Account (SPRA) 303–306SPRO-CAS see Study Project on Christianity in
Apartheid Societystaff choice 193state 20, 40–41, 129–136, 307state expenditure 34, 281–325state grants 122, 129–130, 135–136, 152–155, 156n6stokvels 26, 41n4, 89, 107, 128–129, 146–147,
150–152, 156n1strategy 38–41street vendors 56structure of religious institutions 87–91Study Project on Christianity in Apartheid Society
(SPRO-CAS) 132–133survey of social giving, national see national
survey of social givingsustainability 133–135Synergos 215
TTamil Federation 93Tanzania 274tax 33, 176–177, 252Taylor Committee 285–286technical assistance 256, 257–258ten-year review study 18–19terrorism 245–247tied aid 256–257Tikkun 99–100tithes 83, 87–88Towards a ten year review 18–19trade relations 256–257training in CSI 166, 167–168transfers 282, 294–299, 301–302, 321 &fig, 323 &fig See also social security grantstransparency 39–40Treasury 249, 258–259trends in CSI 186–191Trialogue 172–173, 184, 195
triple bottom line 185, 186, 187Tshikululu Social Investments (TSI) 163, 230tuck shops 146–147
UUganda 276n7UJW see Union of Jewish WomenUmsobomvu Youth Fund (UYF) 303–306UNDP Human Development Report 283–284Union of Jewish Women (UJW) 108United States International Grantmaking (USIG)
262United States of America 27, 82Urban Foundation 35, 196, 219USAID 245–246, 251, 254USAID SA 261USIG see United States International GrantmakinguTshani Fund 303–306UYF see Umsobomvu Youth Fund
Vvegetable gardens 145–146volunteering 27, 51–53, 57–59, 78n6, 149
Wwhite-owned businesses 210, 211–223women 98, 107–110World Assembly of Muslim Youth 102
Yyouth 64–65, 147–148
ZZakaat funds 84, 90, 94, 109Zionist Church see African religious sector