GIS Project ROSA: FAIR Principles in the Petroleum Industry
7
Odintsova, A, et al. 2020. GIS Project ROSA: FAIR Principles in the Petroleum Industry. Data Science Journal, 19: 13, pp. 1–7. DOI: https://doi.org/10.5334/dsj-2020-013 PRACTICE PAPER GIS Project ROSA: FAIR Principles in the Petroleum Industry Anastasia Odintsova 1 , Alena Rybkina 1,2 , Julia Nikolova 1 and Anna Korolkova 1 1 Geophysical Center of the Russian Academy of Sciences (GC RAS), Moscow, RU 2 The Schmidt Institute of Physics of the Earth of the Russian Academy of Sciences (IPE RAS), Moscow, RU Corresponding author: Anastasia Odintsova ([email protected]) The ROSA Project is focused on the investigations of oil and gas industry progress in Russia and other countries. The primary objective is to examine and evaluate data on worldwide hydrocarbon occurrences. Major aim is to construct a comprehensive map of the allocation of oil and gas fields with large reserves for further analogy estimation and reconstruction of geological history. The main contribution of this work is the development of a multidimensional and multilevel database and the corresponding GIS Project for visualization. The set of multidisciplinary backgrounds in combination with a spatial algorithmic tools are used as a basis for an analyti- cal study of worldwide hydrocarbon occurrences and estimation establishment of petroleum industry. Keywords: database; oil and gas deposits; GIS Project; web service; FAIR; Systems Analysis Introduction Creating and support of verified databases is one of the priorities for the development of geoinformatics. A database provides the availability of reliable and comparable data as a prerequisite for effective analysis on issues affecting oil and gas industry. However, before approaching the issue of elaborating the idea of creation a thematically oriented data- base, the authors solved a number of challenges related directly to the data – their search, collection, sys- tematization, storage and management for the purpose of further analysis. The primary objective of ROSA GIS Project is to investigate and evaluate the distribution of oil and gas in the world, identify their accumulations, compare the history of geological development and conduct a large- scale analytical study. Due to economical, political and other reasons investigated data could be slightly associated with the classic definitions of Big Data (Roberts 2016). That opens new challenges in the way we search, manage and analyze data. Presented approaches could be further applied to other fields where the data is not well distributed within research community. In our Project the data are treated as a strategic asset. Therefore, it is important to approve a number of principles that could help to organize a methodical process of extracting and systematizing the necessary data. As a part of the Project implementation, the authors discovered that guidelines on aggregation, sys- tematization, improvement and analysis of ROSA data set were positively correlated with FAIR principles (Findable, Accessible, Interoperable and Reusable) despite the fact that original oil and gas data by its nature do not meet those principles. ROSA GIS Project might be a part of the future solution in this area due to comprehensive approach to data management and analysis. One of the tools that helps to meet the described above requirements is Systems Analysis (SA). We used various methods and approaches of SA to collect and integrate data, as well as to approve the structure of the ROSA database for further studies. To advance the tools for data analysis the database is constructed as multidimensional and multilevel environment. The first one reflects the mul- tidimensional space of database parameters describing the deposits. Multilevel is attributable primarily to the rank of deposits according to the volume of reserves (levels ROSA 1.0, ROSA 2.0, ROSA 3.0).
-
Upload
khangminh22 -
Category
Documents
-
view
3 -
download
0
Transcript of GIS Project ROSA: FAIR Principles in the Petroleum Industry
Odintsova, A, et al. 2020. GIS Project ROSA: FAIR Principles in the Petroleum Industry. Data Science Journal, 19: 13, pp. 1–7. DOI: https://doi.org/10.5334/dsj-2020-013
PRACTICE PAPER
GIS Project ROSA: FAIR Principles in the Petroleum IndustryAnastasia Odintsova1, Alena Rybkina1,2, Julia Nikolova1 and Anna Korolkova1
1 Geophysical Center of the Russian Academy of Sciences (GC RAS), Moscow, RU2 The Schmidt Institute of Physics of the Earth of the Russian Academy of Sciences (IPE RAS), Moscow, RUCorresponding author: Anastasia Odintsova ([email protected])
The ROSA Project is focused on the investigations of oil and gas industry progress in Russia and other countries. The primary objective is to examine and evaluate data on worldwide hydrocarbon occurrences. Major aim is to construct a comprehensive map of the allocation of oil and gas fields with large reserves for further analogy estimation and reconstruction of geological history.
The main contribution of this work is the development of a multidimensional and multilevel database and the corresponding GIS Project for visualization. The set of multidisciplinary backgrounds in combination with a spatial algorithmic tools are used as a basis for an analyti-cal study of worldwide hydrocarbon occurrences and estimation establishment of petroleum industry.
Keywords: database; oil and gas deposits; GIS Project; web service; FAIR; Systems Analysis
IntroductionCreating and support of verified databases is one of the priorities for the development of geoinformatics. A database provides the availability of reliable and comparable data as a prerequisite for effective analysis on issues affecting oil and gas industry.
However, before approaching the issue of elaborating the idea of creation a thematically oriented data-base, the authors solved a number of challenges related directly to the data – their search, collection, sys-tematization, storage and management for the purpose of further analysis.
The primary objective of ROSA GIS Project is to investigate and evaluate the distribution of oil and gas in the world, identify their accumulations, compare the history of geological development and conduct a large-scale analytical study. Due to economical, political and other reasons investigated data could be slightly associated with the classic definitions of Big Data (Roberts 2016). That opens new challenges in the way we search, manage and analyze data. Presented approaches could be further applied to other fields where the data is not well distributed within research community.
In our Project the data are treated as a strategic asset. Therefore, it is important to approve a number of principles that could help to organize a methodical process of extracting and systematizing the necessary data. As a part of the Project implementation, the authors discovered that guidelines on aggregation, sys-tematization, improvement and analysis of ROSA data set were positively correlated with FAIR principles (Findable, Accessible, Interoperable and Reusable) despite the fact that original oil and gas data by its nature do not meet those principles.
ROSA GIS Project might be a part of the future solution in this area due to comprehensive approach to data management and analysis. One of the tools that helps to meet the described above requirements is Systems Analysis (SA). We used various methods and approaches of SA to collect and integrate data, as well as to approve the structure of the ROSA database for further studies. To advance the tools for data analysis the database is constructed as multidimensional and multilevel environment. The first one reflects the mul-tidimensional space of database parameters describing the deposits. Multilevel is attributable primarily to the rank of deposits according to the volume of reserves (levels ROSA 1.0, ROSA 2.0, ROSA 3.0).
Odintsova et al: GIS Project ROSAArt. 13, page 2 of 7
Creation of the web service for the further visualization of the ROSA database objects and its attributive information in the ArcGIS environment allows to present all deposits as a single world map with various base maps and provides a user with various spatial algorithmic tools for data analysis. Our goal is to intro-duce and combine heterogeneous data in a unified manner and to represent oil and gas information that is well coordinated through each of the FAIR principles.
Findable. Metadata and data of the ROSA GIS Project are findable for both researchers and computers by their description with a plurality of accurate and relevant attributes. Digital object identifier (DOI) is assigned to data thanks to “Earth Science DataBase” Project initiated by the Geophysical Center RAS. The use of keywords and cross-cutting parameters for all levels of the database makes the data handling much easier and data files more findable for users.
Accessible. Creation of the web service provides users with the capacity to access data without a need to install any specific software. Thus, the data access protocol is open, free, and universally implementable. In addition, the protocol allows for authentication and authorisation procedure, as appropriate.
Interoperable. Data of the ROSA GIS Project are integrated with other relevant data using the dedicated web service. It allows to compare and correlate oil and gas data with numerous spatial and other data on infrastructure, economy, climate, etc. Advanced algorithmic toolbox of the web service extends basic data storage and visualization features and enables its further processing and more sophisticated analysis.
Reusable. ROSA database is equipped with well-described relevant metadata (Summary, Description, Credits, Use limitations etc.) for further optimization of the data reuse. In addition, all heterogeneous data are reduced to a common standard of petroleum industry for further possibility of replicated sampling and combining in different settings and models. Furthermore, ROSA database is fitted with bibliography guide to authenticate or discover data provenance and quality.
Challenges: data collection, data integration, data reliabilityData collection and its further analysis will remain challenging in various aspects. Among a major barriers to data collection is low availability of data, due to the specific nature of the data and their secrecy, particularly in the case of Near and Middle East countries. Therefore, some fields of attribute tables of ROSA database appear insufficiently representative. Sometimes null values (empty fields) can be found in database.
Another challenge is data integration. Since the data come from diverse sources in different languages in a variety of formats (textual and graphic material) and standards, special attention should be paid to converting data to the unified standard. Significant number of differences between Russian and foreign terminology should be also taken into account. One example is the classification of deposits according to their reserves. In the global oil and gas industry, the classifiers of the above indicators and their units of measure are significantly different. The main classifications are: SPE-PRMS (Society of Petroleum Engineers and Petroleum Resources Management System, respectively) that takes into account both the probability of finding oil and gas in the fields and the economic efficiency of extracting these reserves and applicable in audits and consulting; US Classification (Securities and Exchange Commission SEC Classification of the Securities Market Commission); American Association of Petroleum Geologist Classification, United Nations, etc. (BP Statistical Review of World Energy). Thus, the principle of data unification is extremely important to overcome semantic and technical differences.
Another important issue is the data reliability. As many sources include contradictions, the data collec-tion should be accurate and avoid invalid sources. For the verification purpose ROSA database is linked to bibliographic summary that testifies the reliability of obtained results and provides an efficient tool for its further analysis.
Consequently, data used in the ROSA Project should have an appropriate systematization model enabling unified data comparison from a single point of view for their further merging and harmonization.
The ROSA database requires a system approach to overcome the challenges listed above and at the same time meets the requirements of the comprehensive investigation of the oil and gas industry development. A proper model should be established to provide a data comparison for its further matching and merging.
Building the databaseScientific knowledge is much more than a simple compilation of data units. Among the key issues is the way we manage the data. The application of system analysis methods is the most effective tool that allows to systematize data for conducting further extensive analysis. In this way, to advance data analysis tools, the database represents multidimensional and multilevel structure.
Odintsova et al: GIS Project ROSA Art. 13, page 3 of 7
In keeping with these principles in the first phase of the Project a number of subtasks were carried out in order to efficiently organize and compile a geospatial database. The database objects were the largest oil and gas fields in Russia and other countries in the 20 and 21 centuries. Adherence to the given principles makes the database as verified as possible due to a better control of the quality of data.
We made a comprehensive literature review covering over 500 open specialized Russian and foreign bib-liographic sources and as a result, an annotated bibliography was compiled. It consists of the individual thematic blocks linked to the corresponding bibliographic sources that testify the reliability of obtained results and provide a tool for their verification (Cumo 2014; Facey 1994; Fattah, El-Katatney, Dahab 2011; Oil geology 1968; Golf-Rakht 1986; Nahai & Kimbell 1963; Nehring 1978; World oil).
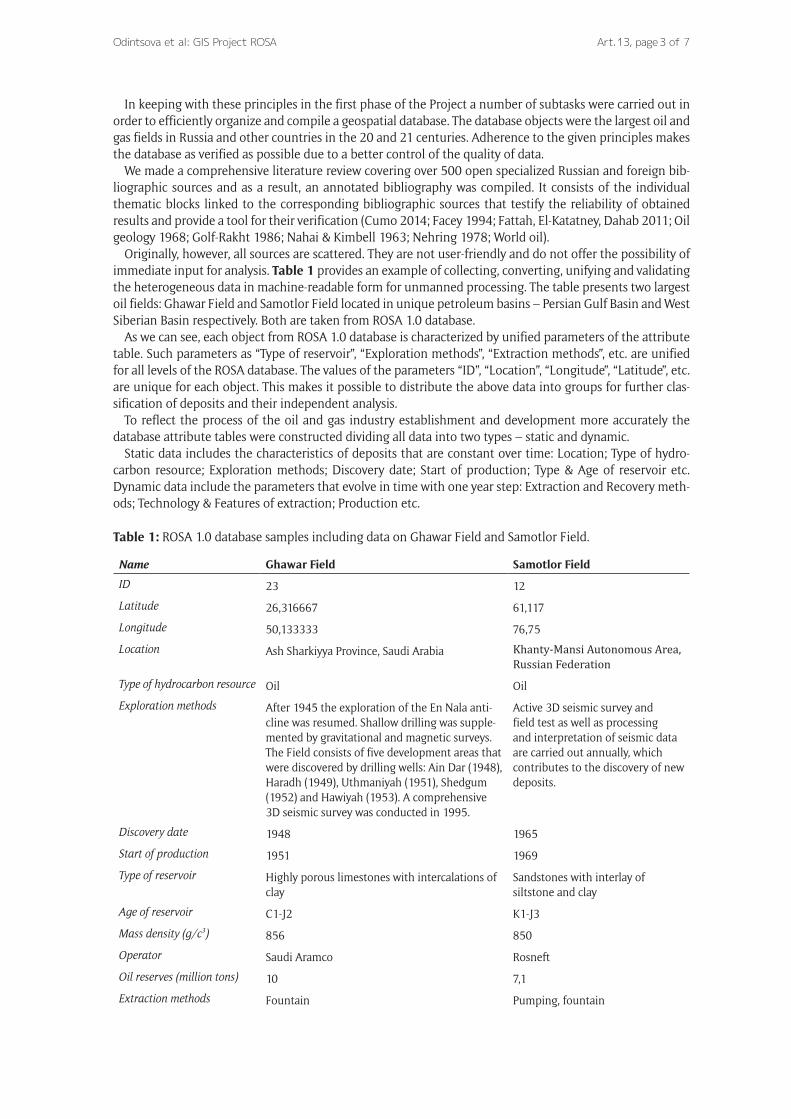
Originally, however, all sources are scattered. They are not user-friendly and do not offer the possibility of immediate input for analysis. Table 1 provides an example of collecting, converting, unifying and validating the heterogeneous data in machine-readable form for unmanned processing. The table presents two largest oil fields: Ghawar Field and Samotlor Field located in unique petroleum basins – Persian Gulf Basin and West Siberian Basin respectively. Both are taken from ROSA 1.0 database.
As we can see, each object from ROSA 1.0 database is characterized by unified parameters of the attribute table. Such parameters as “Type of reservoir”, “Exploration methods”, “Extraction methods”, etc. are unified for all levels of the ROSA database. The values of the parameters “ID”, “Location”, “Longitude”, “Latitude”, etc. are unique for each object. This makes it possible to distribute the above data into groups for further clas-sification of deposits and their independent analysis.
To reflect the process of the oil and gas industry establishment and development more accurately the database attribute tables were constructed dividing all data into two types – static and dynamic.
Static data includes the characteristics of deposits that are constant over time: Location; Type of hydro-carbon resource; Exploration methods; Discovery date; Start of production; Type & Age of reservoir etc. Dynamic data include the parameters that evolve in time with one year step: Extraction and Recovery meth-ods; Technology & Features of extraction; Production etc.
Table 1: ROSA 1.0 database samples including data on Ghawar Field and Samotlor Field.
Name Ghawar Field Samotlor Field
ID 23 12
Latitude 26,316667 61,117
Longitude 50,133333 76,75
Location Ash Sharkiyya Province, Saudi Arabia Khanty-Mansi Autonomous Area, Russian Federation
Type of hydrocarbon resource Oil Oil
Exploration methods After 1945 the exploration of the En Nala anti-cline was resumed. Shallow drilling was supple-mented by gravitational and magnetic surveys. The Field consists of five development areas that were discovered by drilling wells: Ain Dar (1948), Haradh (1949), Uthmaniyah (1951), Shedgum (1952) and Hawiyah (1953). A comprehensive 3D seismic survey was conducted in 1995.
Active 3D seismic survey and field test as well as processing and interpretation of seismic data are carried out annually, which contributes to the discovery of new deposits.
Discovery date 1948 1965
Start of production 1951 1969
Type of reservoir Highly porous limestones with intercalations of clay
Sandstones with interlay of siltstone and clay
Age of reservoir C1-J2 K1-J3
Mass density (g/c3) 856 850
Operator Saudi Aramco Rosneft
Oil reserves (million tons) 10 7,1
Extraction methods Fountain Pumping, fountain
Odintsova et al: GIS Project ROSAArt. 13, page 4 of 7
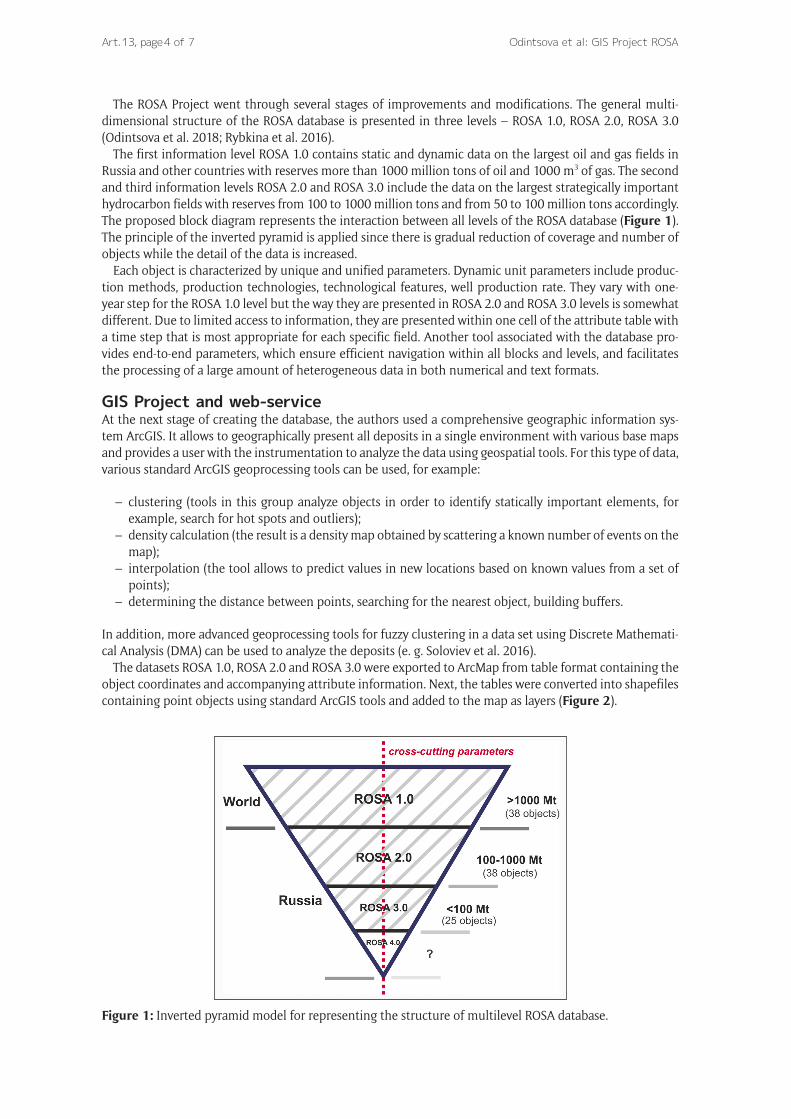
The ROSA Project went through several stages of improvements and modifications. The general multi-dimensional structure of the ROSA database is presented in three levels – ROSA 1.0, ROSA 2.0, ROSA 3.0 (Odintsova et al. 2018; Rybkina et al. 2016).
The first information level ROSA 1.0 contains static and dynamic data on the largest oil and gas fields in Russia and other countries with reserves more than 1000 million tons of oil and 1000 m3 of gas. The second and third information levels ROSA 2.0 and ROSA 3.0 include the data on the largest strategically important hydrocarbon fields with reserves from 100 to 1000 million tons and from 50 to 100 million tons accordingly. The proposed block diagram represents the interaction between all levels of the ROSA database (Figure 1). The principle of the inverted pyramid is applied since there is gradual reduction of coverage and number of objects while the detail of the data is increased.
Each object is characterized by unique and unified parameters. Dynamic unit parameters include produc-tion methods, production technologies, technological features, well production rate. They vary with one-year step for the ROSA 1.0 level but the way they are presented in ROSA 2.0 and ROSA 3.0 levels is somewhat different. Due to limited access to information, they are presented within one cell of the attribute table with a time step that is most appropriate for each specific field. Another tool associated with the database pro-vides end-to-end parameters, which ensure efficient navigation within all blocks and levels, and facilitates the processing of a large amount of heterogeneous data in both numerical and text formats.
GIS Project and web-serviceAt the next stage of creating the database, the authors used a comprehensive geographic information sys-tem ArcGIS. It allows to geographically present all deposits in a single environment with various base maps and provides a user with the instrumentation to analyze the data using geospatial tools. For this type of data, various standard ArcGIS geoprocessing tools can be used, for example:
– clustering (tools in this group analyze objects in order to identify statically important elements, for example, search for hot spots and outliers);
– density calculation (the result is a density map obtained by scattering a known number of events on the map);
– interpolation (the tool allows to predict values in new locations based on known values from a set of points);
– determining the distance between points, searching for the nearest object, building buffers.
In addition, more advanced geoprocessing tools for fuzzy clustering in a data set using Discrete Mathemati-cal Analysis (DMA) can be used to analyze the deposits (e. g. Soloviev et al. 2016).
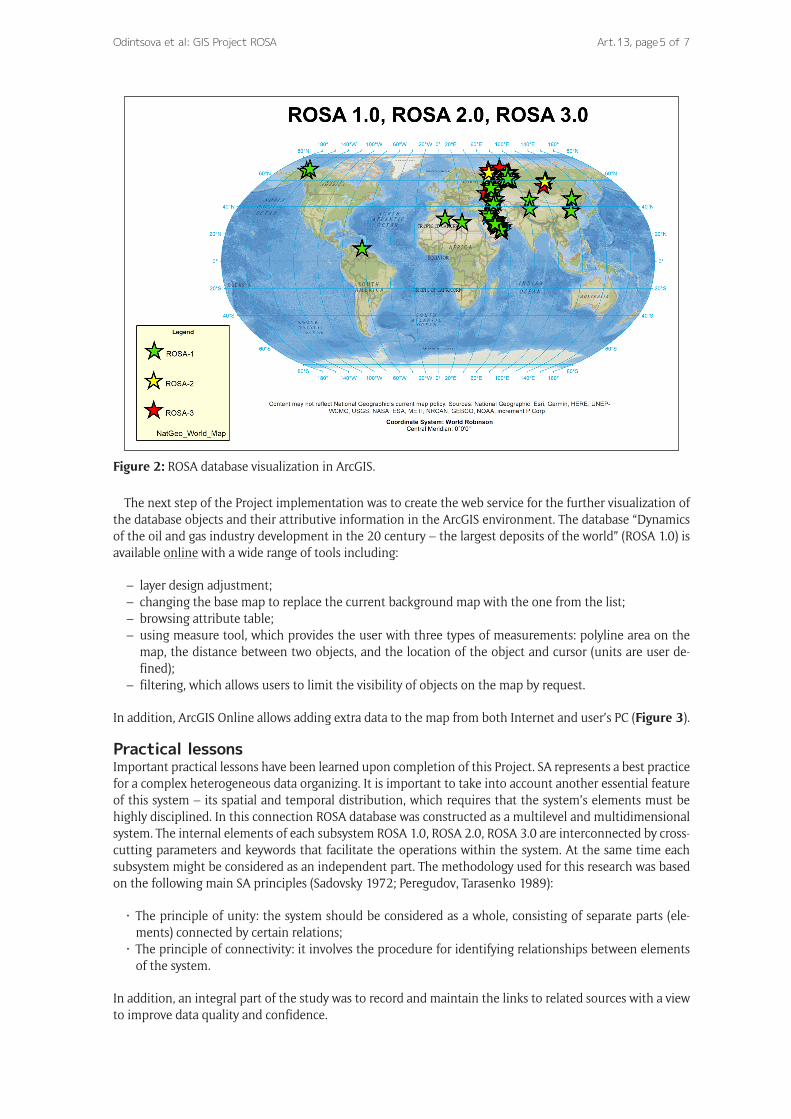
The datasets ROSA 1.0, ROSA 2.0 and ROSA 3.0 were exported to ArcMap from table format containing the object coordinates and accompanying attribute information. Next, the tables were converted into shapefiles containing point objects using standard ArcGIS tools and added to the map as layers (Figure 2).
Figure 1: Inverted pyramid model for representing the structure of multilevel ROSA database.
Odintsova et al: GIS Project ROSA Art. 13, page 5 of 7
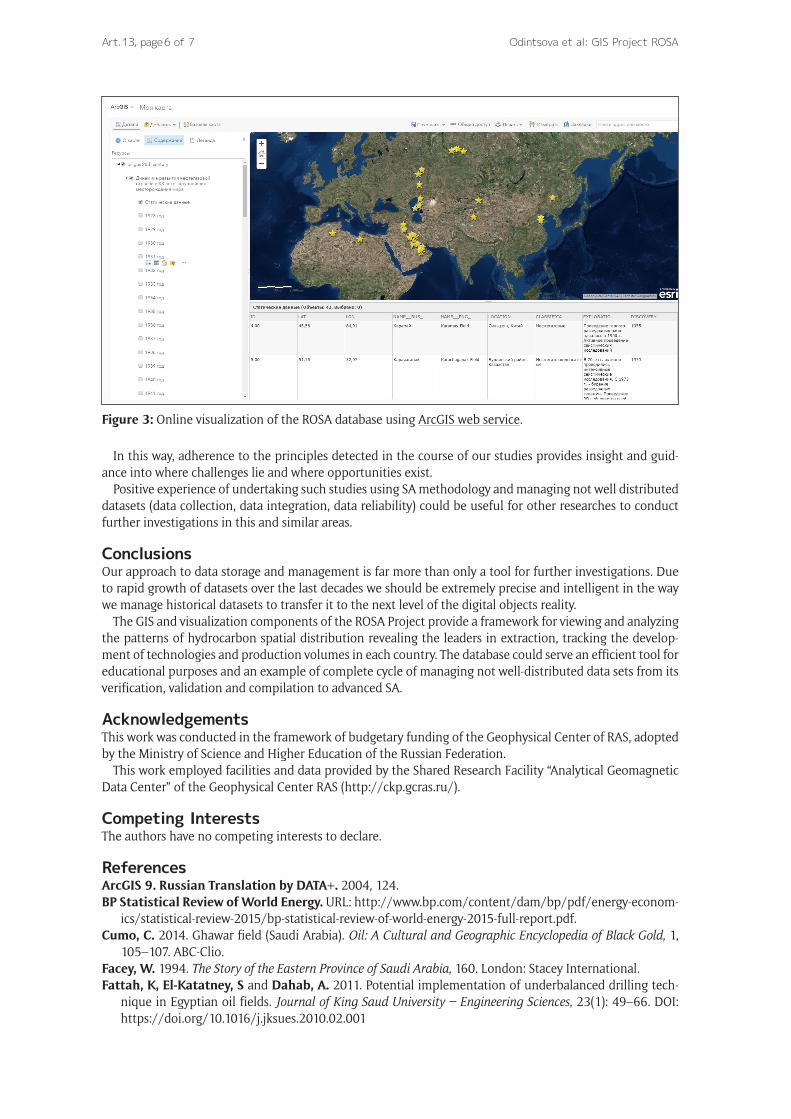
The next step of the Project implementation was to create the web service for the further visualization of the database objects and their attributive information in the ArcGIS environment. The database “Dynamics of the oil and gas industry development in the 20 century – the largest deposits of the world” (ROSA 1.0) is available online with a wide range of tools including:
– layer design adjustment;– changing the base map to replace the current background map with the one from the list;– browsing attribute table;– using measure tool, which provides the user with three types of measurements: polyline area on the
map, the distance between two objects, and the location of the object and cursor (units are user de-fined);
– filtering, which allows users to limit the visibility of objects on the map by request.
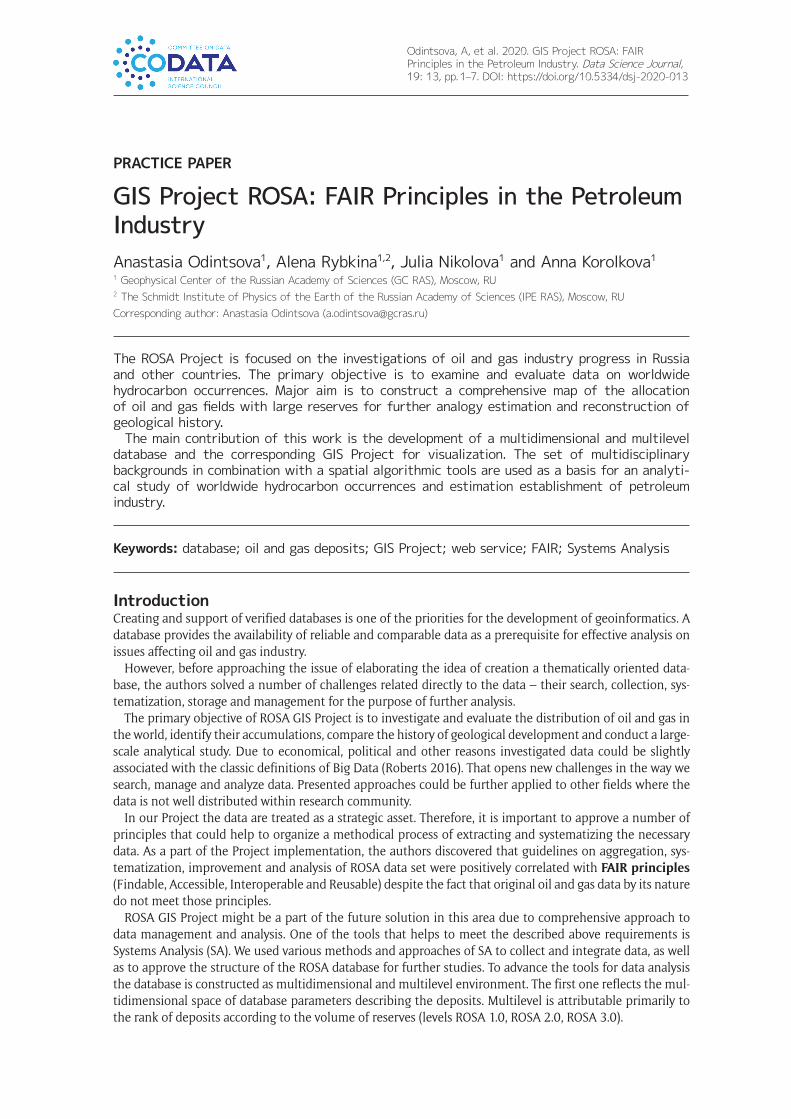
In addition, ArcGIS Online allows adding extra data to the map from both Internet and user’s PC (Figure 3).
Practical lessonsImportant practical lessons have been learned upon completion of this Project. SA represents a best practice for a complex heterogeneous data organizing. It is important to take into account another essential feature of this system – its spatial and temporal distribution, which requires that the system’s elements must be highly disciplined. In this connection ROSA database was constructed as a multilevel and multidimensional system. The internal elements of each subsystem ROSA 1.0, ROSA 2.0, ROSA 3.0 are interconnected by cross-cutting parameters and keywords that facilitate the operations within the system. At the same time each subsystem might be considered as an independent part. The methodology used for this research was based on the following main SA principles (Sadovsky 1972; Peregudov, Tarasenko 1989):
• Theprincipleofunity:thesystemshouldbeconsideredasawhole,consistingofseparateparts(ele-ments) connected by certain relations;
• Theprincipleofconnectivity:itinvolvestheprocedureforidentifyingrelationshipsbetweenelementsof the system.
In addition, an integral part of the study was to record and maintain the links to related sources with a view to improve data quality and confidence.
Figure 2: ROSA database visualization in ArcGIS.
Odintsova et al: GIS Project ROSAArt. 13, page 6 of 7
In this way, adherence to the principles detected in the course of our studies provides insight and guid-ance into where challenges lie and where opportunities exist.
Positive experience of undertaking such studies using SA methodology and managing not well distributed datasets (data collection, data integration, data reliability) could be useful for other researches to conduct further investigations in this and similar areas.
ConclusionsOur approach to data storage and management is far more than only a tool for further investigations. Due to rapid growth of datasets over the last decades we should be extremely precise and intelligent in the way we manage historical datasets to transfer it to the next level of the digital objects reality.
The GIS and visualization components of the ROSA Project provide a framework for viewing and analyzing the patterns of hydrocarbon spatial distribution revealing the leaders in extraction, tracking the develop-ment of technologies and production volumes in each country. The database could serve an efficient tool for educational purposes and an example of complete cycle of managing not well-distributed data sets from its verification, validation and compilation to advanced SA.
AcknowledgementsThis work was conducted in the framework of budgetary funding of the Geophysical Center of RAS, adopted by the Ministry of Science and Higher Education of the Russian Federation.
This work employed facilities and data provided by the Shared Research Facility “Analytical Geomagnetic Data Center” of the Geophysical Center RAS (http://ckp.gcras.ru/).
Competing InterestsThe authors have no competing interests to declare.
ReferencesArcGIS 9. Russian Translation by DATA+. 2004, 124.BP Statistical Review of World Energy. URL: http://www.bp.com/content/dam/bp/pdf/energy-econom-
ics/statistical-review-2015/bp-statistical-review-of-world-energy-2015-full-report.pdf.Cumo, C. 2014. Ghawar field (Saudi Arabia). Oil: A Cultural and Geographic Encyclopedia of Black Gold, 1,
105–107. ABC-Clio.Facey, W. 1994. The Story of the Eastern Province of Saudi Arabia, 160. London: Stacey International.Fattah, K, El-Katatney, S and Dahab, A. 2011. Potential implementation of underbalanced drilling tech-
nique in Egyptian oil fields. Journal of King Saud University – Engineering Sciences, 23(1): 49–66. DOI: https://doi.org/10.1016/j.jksues.2010.02.001
Figure 3: Online visualization of the ROSA database using ArcGIS web service.
Odintsova et al: GIS Project ROSA Art. 13, page 7 of 7
Geologiya nefti (Oil Geology). 1968. Т. 2, kn. 2. Neftyanye mestorozhdeniya zarubezhnyh stran (oil fields of foreign countries)/Redaktsiya I. V. Vysotskogo, 804. Мoscow: Nedra.
Go FAIR. URL: https://www.go-fair.org/fair-principles/ Accessed 5 April 2019.Golf-Rakht, T. 1986. Fundamentals of oilfield geology and the development of fractured reservoirs, 608.
Moscow: Nedra.Mir nefti (World oil). URL: http://www.mirnefti.ru/index.php?id=255 Accessed 15 Jun 2017.Nahai, L and Kimbell, C. 1963. The petroleum industry of Iran, 112. Washington: U.S. Dept. of the Interior,
Bureau of Mines.National Geographic World Map. URL: https://www.arcgis.com/home/item.html?id=b9b1b42219894
4fbbd5250b3241691b6 Accessed 11 Apr 2019.Nehring, R. 1978. Giant Oil Fields and World Oil Resources [Report]. Rand Corporation; R-2284-CIA.
Santa-Monica, CA.Odintsova, A, Gvishiani, A, Nakicenovic, N, Rybkina, A, Busch, S and Nikolova, J. 2018. The world’s
largest oil and gas hydrocarbon deposits: ROSA database and GIS Project development. Russian Journal of Earth Sciences, 18: ES3002. DOI: https://doi.org/10.2205/2018ES000621
Peregudov, F and Tarasenko, F. 1989. Introduction to Systems Analysis, 608. Moscow: High School.Roberts, F. 2016. What is Big Data and how has it changed? In: Book of Abstracts of the International Con-
ference ‘Data Intensive System Analysis for Geohazard Studies’, Kedrov, E (ed.), BS4002. Sochi region, Mountain cluster, Russia, 18–21 July 2016. Moscow: GC RAS.
Rybkina, A, Odintsova, A, Gvishiani, A, Samokhina, O and Astapenkova, A. 2016. Development of geospatial database on hydrocarbon extraction methods in the 20th century for large and super large oil and gas deposits in Russia and other countries. Russian Journal of Earth Sciences, 16(6): ES6002. DOI: https://doi.org/10.2205/2016ES000584
Sadovsky, V. 1972. General Systems Theory: its Tasks and Methods of Construction. “General Systems”, 17: 171–179.
Soloviev, A, Zharkikh, J, Krasnoperov, R, Nikolov, B and Agayan, S. 2016. GIS-oriented solutions for advanced clustering analysis of geoscience data using ArcGIS platform. Russian Journal of Earth Sciences, 16: ES6004. DOI: https://doi.org/10.2205/2016ES000587
How to cite this article: Odintsova, A, Rybkina, A, Nikolova, J and Korolkova, A. 2020. GIS Project ROSA: FAIR Principles in the Petroleum Industry. Data Science Journal, 19: 13, pp. 1–7. DOI: https://doi.org/10.5334/dsj-2020-013
Submitted: 04 December 2019 Accepted: 17 February 2020 Published: 20 March 2020
Copyright: © 2020 The Author(s). This is an open-access article distributed under the terms of the Creative Commons Attribution 4.0 International License (CC-BY 4.0), which permits unrestricted use, distribution, and reproduction in any medium, provided the original author and source are credited. See http://creativecommons.org/licenses/by/4.0/.
Data Science Journal is a peer-reviewed open access journal published by Ubiquity Press. OPEN ACCESS